Matching performance of vehicle icons in graphical and textual formats
13
Matching performance of vehicle icons in graphical and textual formats Chia-Fen Chi * , Ratna Sari Dewi Department of Industrial Management, National Taiwan University of Science and Technology, Taipei 106, Taiwan article info Article history: Received 27 June 2012 Accepted 13 November 2013 Keywords: Image-related Icon taxonomy Confusion matrix abstract The current research classified 82 vehicle icons into seven categories (image-related, concept-related, semi-abstract, arbitrary, abbreviation, word, and combined) for their matching accuracy, matching sequence, and matching time. These data can be compared and used as a framework for future icon development. Forty participants, all with a university degree, took part in this experiment. Half of the participants had intensive driving experience, while the other half never driven a car. The results indi- cated that on average, word icons had a significantly greater matching accuracy than the other icon formats; ranging from 4.7 to 20.8% difference. Regarding the matching sequence, participants matched image-related icons before other icon formats. Arbitrary and combined icons took significantly longer to match than other icon formats by 1.4e6.2 s. Based on the high matching accuracy (86.3%) and high ratings on subjective design features, word format can be used for functions describable using simple English for users with English reading ability. Confusion matrices showed that 63.2% of the mis- understandings were caused by similarity in format or function. Ó 2013 Elsevier Ltd and The Ergonomics Society. All rights reserved. 1. Introduction With the increase in the number of functions in the driving environment, icons that are compact and international (language) (Horton, 1994) are often used in a vehicle to convey information to the driver (Green, 1993). Effective icons can provide the driver with a quick and complete understanding of the information to ensure driver safety (Baber and Wankling, 1992). But designing compre- hensible icons is not a simple task. Saunby et al. (1988) showed that only 16 of 25 car icons tested could be matched correctly by a minimum 75% of experimental participants. An icon may be comprised of border, background, symbol (consisting of graphical elements), and textual labels (Fig. 1) (Campbell et al., 2004b; Horton, 1994) although not all of these components must be present. Each icon component can add meaning to an icon in its own way. Borders can make icons appear more consistent; background can help to group icons; and graph- ical and textual elements convey the main meaning of the icon (Carney et al., 1998). As indicated by Wang et al. (2007), icon taxonomy can fulfill a variety of functions including classifying icons into different types to evaluate the effectiveness of each type to be used as a framework for the future development of icons. Most icon taxonomy systems were developed to classify graphical icons according to how ab- stract or concrete they are (Wang et al., 2007). For example, graphical icons can be classified into image-related (pictorial), concept-related (analogy), or arbitrary based on how far the graphical elements in an icon (Fig. 1) resemble their referents (Goonetilleke et al., 2001; Lodding, 1983). Image-related icons are typical pictorial representations of the object or action. Concept- related icons attempt to visualize a concept that is not far but separate from the concrete image. Arbitrary icons have no obvious reference to their intended meaning, but become meaningful only through convention and education (Goonetilleke et al., 2001; Lodding, 1983). However, according to Blattner et al. (1989), semi- abstract icons combine an image-related (representational) picto- rial element with an abstract (concept-related or arbitrary) symbol. For example, a folder with an arrow that indicates placing items in it. Similar semi-abstract icons can be found in cars, for example for rear window demisting and defrosting, the square depicts the rear window while the wavy arrow lines symbolize hot air flow. Besides graphical icons, two more categories can be added if incorporating textual elements into the icons: textual and com- bined (Reder and Mccallum, 2004). Textual icons can be further divided based on whether they contain words or abbreviations. Therefore, all icons can be classified into seven categories (image- * Corresponding author. E-mail address: [email protected] (C.-F. Chi). Contents lists available at ScienceDirect Applied Ergonomics journal homepage: www.elsevier.com/locate/apergo 0003-6870/$ e see front matter Ó 2013 Elsevier Ltd and The Ergonomics Society. All rights reserved. http://dx.doi.org/10.1016/j.apergo.2013.11.009 Applied Ergonomics xxx (2013) 1e13 Please cite this article in press as: Chi, C.-F., Dewi, R.S., Matching performance of vehicle icons in graphical and textual formats, Applied Ergonomics (2013), http://dx.doi.org/10.1016/j.apergo.2013.11.009
-
Upload
independent -
Category
Documents
-
view
1 -
download
0
Transcript of Matching performance of vehicle icons in graphical and textual formats

lable at ScienceDirect
Applied Ergonomics xxx (2013) 1e13
Contents lists avai
Applied Ergonomics
journal homepage: www.elsevier .com/locate/apergo
Matching performance of vehicle icons in graphical and textualformats
Chia-Fen Chi*, Ratna Sari DewiDepartment of Industrial Management, National Taiwan University of Science and Technology, Taipei 106, Taiwan
a r t i c l e i n f o
Article history:Received 27 June 2012Accepted 13 November 2013
Keywords:Image-relatedIcon taxonomyConfusion matrix
* Corresponding author.E-mail address: [email protected] (C.-F. Chi
0003-6870/$ e see front matter � 2013 Elsevier Ltdhttp://dx.doi.org/10.1016/j.apergo.2013.11.009
Please cite this article in press as: Chi, C.-Ergonomics (2013), http://dx.doi.org/10.1016
a b s t r a c t
The current research classified 82 vehicle icons into seven categories (image-related, concept-related,semi-abstract, arbitrary, abbreviation, word, and combined) for their matching accuracy, matchingsequence, and matching time. These data can be compared and used as a framework for future icondevelopment. Forty participants, all with a university degree, took part in this experiment. Half of theparticipants had intensive driving experience, while the other half never driven a car. The results indi-cated that on average, word icons had a significantly greater matching accuracy than the other iconformats; ranging from 4.7 to 20.8% difference. Regarding the matching sequence, participants matchedimage-related icons before other icon formats. Arbitrary and combined icons took significantly longer tomatch than other icon formats by 1.4e6.2 s. Based on the high matching accuracy (86.3%) and highratings on subjective design features, word format can be used for functions describable using simpleEnglish for users with English reading ability. Confusion matrices showed that 63.2% of the mis-understandings were caused by similarity in format or function.
� 2013 Elsevier Ltd and The Ergonomics Society. All rights reserved.
1. Introduction
With the increase in the number of functions in the drivingenvironment, icons that are compact and international (language)(Horton, 1994) are often used in a vehicle to convey information tothe driver (Green, 1993). Effective icons can provide the driver witha quick and complete understanding of the information to ensuredriver safety (Baber and Wankling, 1992). But designing compre-hensible icons is not a simple task. Saunby et al. (1988) showed thatonly 16 of 25 car icons tested could be matched correctly by aminimum 75% of experimental participants.
An icon may be comprised of border, background, symbol(consisting of graphical elements), and textual labels (Fig. 1)(Campbell et al., 2004b; Horton, 1994) although not all of thesecomponents must be present. Each icon component can addmeaning to an icon in its own way. Borders can make icons appearmore consistent; background can help to group icons; and graph-ical and textual elements convey the main meaning of the icon(Carney et al., 1998).
As indicated by Wang et al. (2007), icon taxonomy can fulfill avariety of functions including classifying icons into different types
).
and The Ergonomics Society. All ri
F., Dewi, R.S., Matching perfo/j.apergo.2013.11.009
to evaluate the effectiveness of each type to be used as a frameworkfor the future development of icons. Most icon taxonomy systemswere developed to classify graphical icons according to how ab-stract or concrete they are (Wang et al., 2007). For example,graphical icons can be classified into image-related (pictorial),concept-related (analogy), or arbitrary based on how far thegraphical elements in an icon (Fig. 1) resemble their referents(Goonetilleke et al., 2001; Lodding, 1983). Image-related icons aretypical pictorial representations of the object or action. Concept-related icons attempt to visualize a concept that is not far butseparate from the concrete image. Arbitrary icons have no obviousreference to their intended meaning, but become meaningful onlythrough convention and education (Goonetilleke et al., 2001;Lodding, 1983). However, according to Blattner et al. (1989), semi-abstract icons combine an image-related (representational) picto-rial element with an abstract (concept-related or arbitrary)symbol. For example, a folder with an arrow that indicates placingitems in it. Similar semi-abstract icons can be found in cars, forexample for rear window demisting and defrosting, the squaredepicts the rear window while the wavy arrow lines symbolize hotair flow. Besides graphical icons, two more categories can be addedif incorporating textual elements into the icons: textual and com-bined (Reder and Mccallum, 2004). Textual icons can be furtherdivided based on whether they contain words or abbreviations.Therefore, all icons can be classified into seven categories (image-
ghts reserved.
rmance of vehicle icons in graphical and textual formats, Applied
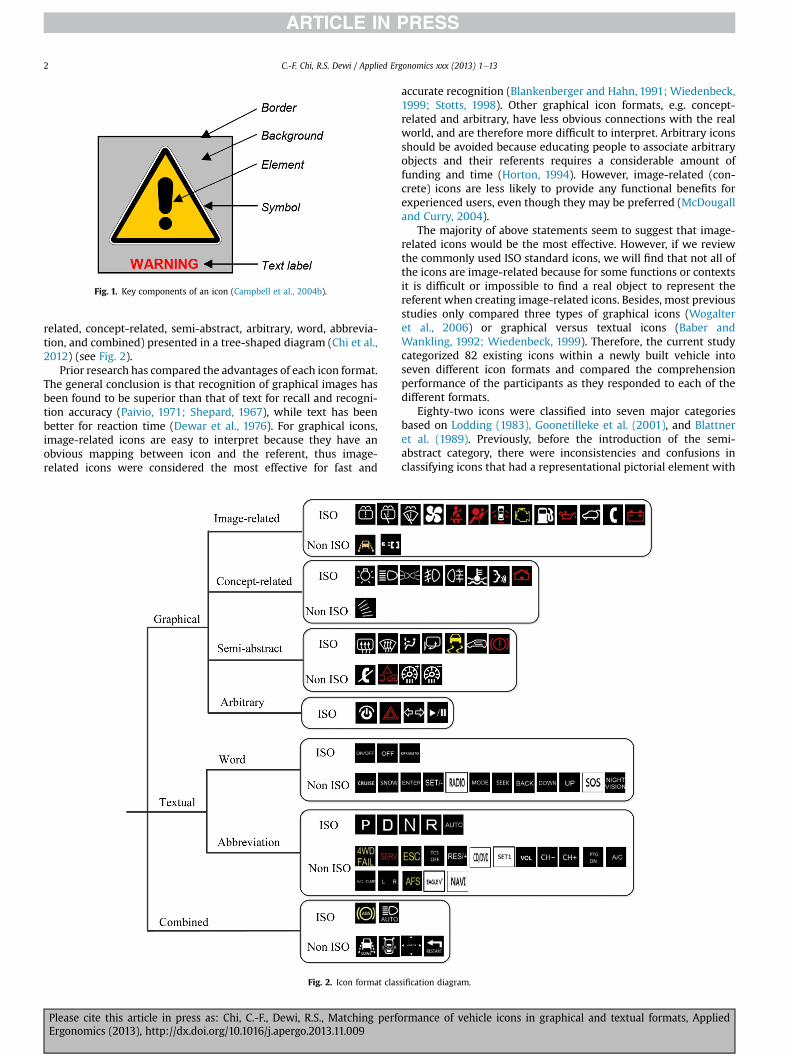
Fig. 1. Key components of an icon (Campbell et al., 2004b).
C.-F. Chi, R.S. Dewi / Applied Ergonomics xxx (2013) 1e132
related, concept-related, semi-abstract, arbitrary, word, abbrevia-tion, and combined) presented in a tree-shaped diagram (Chi et al.,2012) (see Fig. 2).
Prior research has compared the advantages of each icon format.The general conclusion is that recognition of graphical images hasbeen found to be superior than that of text for recall and recogni-tion accuracy (Paivio, 1971; Shepard, 1967), while text has beenbetter for reaction time (Dewar et al., 1976). For graphical icons,image-related icons are easy to interpret because they have anobvious mapping between icon and the referent, thus image-related icons were considered the most effective for fast and
Fig. 2. Icon format clas
Please cite this article in press as: Chi, C.-F., Dewi, R.S., Matching perfoErgonomics (2013), http://dx.doi.org/10.1016/j.apergo.2013.11.009
accurate recognition (Blankenberger and Hahn, 1991; Wiedenbeck,1999; Stotts, 1998). Other graphical icon formats, e.g. concept-related and arbitrary, have less obvious connections with the realworld, and are therefore more difficult to interpret. Arbitrary iconsshould be avoided because educating people to associate arbitraryobjects and their referents requires a considerable amount offunding and time (Horton, 1994). However, image-related (con-crete) icons are less likely to provide any functional benefits forexperienced users, even though they may be preferred (McDougalland Curry, 2004).
The majority of above statements seem to suggest that image-related icons would be the most effective. However, if we reviewthe commonly used ISO standard icons, we will find that not all ofthe icons are image-related because for some functions or contextsit is difficult or impossible to find a real object to represent thereferent when creating image-related icons. Besides, most previousstudies only compared three types of graphical icons (Wogalteret al., 2006) or graphical versus textual icons (Baber andWankling, 1992; Wiedenbeck, 1999). Therefore, the current studycategorized 82 existing icons within a newly built vehicle intoseven different icon formats and compared the comprehensionperformance of the participants as they responded to each of thedifferent formats.
Eighty-two icons were classified into seven major categoriesbased on Lodding (1983), Goonetilleke et al. (2001), and Blattneret al. (1989). Previously, before the introduction of the semi-abstract category, there were inconsistencies and confusions inclassifying icons that had a representational pictorial element with
sification diagram.
rmance of vehicle icons in graphical and textual formats, Applied

Table 1Definition of each subjective design features.
Subjective design features Definition
Familiarity The level of experience that an individual has withan icon (McDougall and Curry, 2004)
Concreteness The extent to which they depict real-world objectsor actions; those that do not depict real objects oractions are abstract (McDougall et al., 1999).
Visual complexity The level of intricacy or detail in an icon; designguidelines typically suggest that icons should bekept as simple as possible (McDougall et al., 1999;Ng and Chan, 2008).
Semantic distance The measure of the closeness of the relationshipbetween the symbol and what it represents(McDougall et al., 1999).
C.-F. Chi, R.S. Dewi / Applied Ergonomics xxx (2013) 1e13 3
an abstract symbol, i.e., air flow control ( ) and recirculated air( ). Most of these confusions were between image-related andconcept-related; or among image-related, concept-related, andarbitrary, which could be resolved by categorizing them into thesemi-abstract category. Besides, there was some confusionabout classifying the car key reminder indicator ( ), as eitherimage-related or concept-related, because of its poor imagequality. Since image quality was not an attribute for theclassificationofeach iconformat ( )wasclassifiedas image-related.
Since subjective rating scales are easy to administer, at timesthey can be more sensitive than objective measurements (Chi andLin, 1998). Therefore, these 82 icons were also evaluated based onsome subjective design features (McDougall and Reppa, 2008) suchas familiarity, concreteness, visual complexity, and semantic dis-tance. Each will be defined as in Table 1. The subjective ratingfeatures can help to explain why some icons could be betterrecognized than others (Liu and Ho, 2012).
Among the seven differential icon formats, all four subjectivedesign features (familiarity, concreteness, complexity, and seman-tic distance) can be used to evaluate image-related, concept-related, semi-abstract, arbitrary, and combined icons. However, for
Fig. 3. Matching test task sc
Please cite this article in press as: Chi, C.-F., Dewi, R.S., Matching perfoErgonomics (2013), http://dx.doi.org/10.1016/j.apergo.2013.11.009
word and abbreviation formats, besides semantic distance, partic-ipants were also asked about whether they understood themeaning of the word or abbreviation in an icon. One small flaw inthe evaluation of subjective design features is that the text meaningof the combined icons was not measured.
The education level (university education versus without) (Ngand Chan, 2007) and experience (Goonetilleke et al., 2001;Isherwood et al., 2007) of the respondents were found to havesignificant effects on comprehension. Our experiment chose to testparticipants with at least a university-level education and dividedtheir driving experience into having no driving experience andhaving intensive driving experience. Driving can be seen as a formof training that can increase icon recognition significantly(Goonetilleke et al., 2001). The current experiment measured iconrecognition using novice drivers and experienced drivers to derivethe proper baseline performance and evaluate the beneficial effectof experience on recognizing the different icon formats.
In evaluating the comprehensibility of symbols, Wolff andWogalter (1998) recommend using appropriate context showingthe environment in which the symbol will likely be placed. Eighty-two icons copied from the steering wheel, center stack, and dash-board of a newly built vehicle would be presented on three taskscreens, respectively. Each task screen deals with maneuvering thevehicle, setting turning signals and activating the windshieldwipers to increase driving safety, and serving the entertainmentand information functions (Geiser, 1985; Tonnis et al., 2006). Iconsin other locations, e.g. hood, trunk, and gas tank; were not includedbecause it takes tremendous time to build each context and find-ings from the current three task screens can be generalized to iconsin other contexts. Besides providing appropriate context, Wolff andWogalter (1998) and SAE J2830 published by SAE International(2008) also recommended the use of an open-ended test. Sincethe scoring of open-ended responses is subjective and difficult, andmean comprehension on multiple-choice test with plausible dis-tractors was not significantly different from the result generatedfrom the open-ended test (Wolff and Wogalter, 1998), the current
reen for steering wheel.
rmance of vehicle icons in graphical and textual formats, Applied
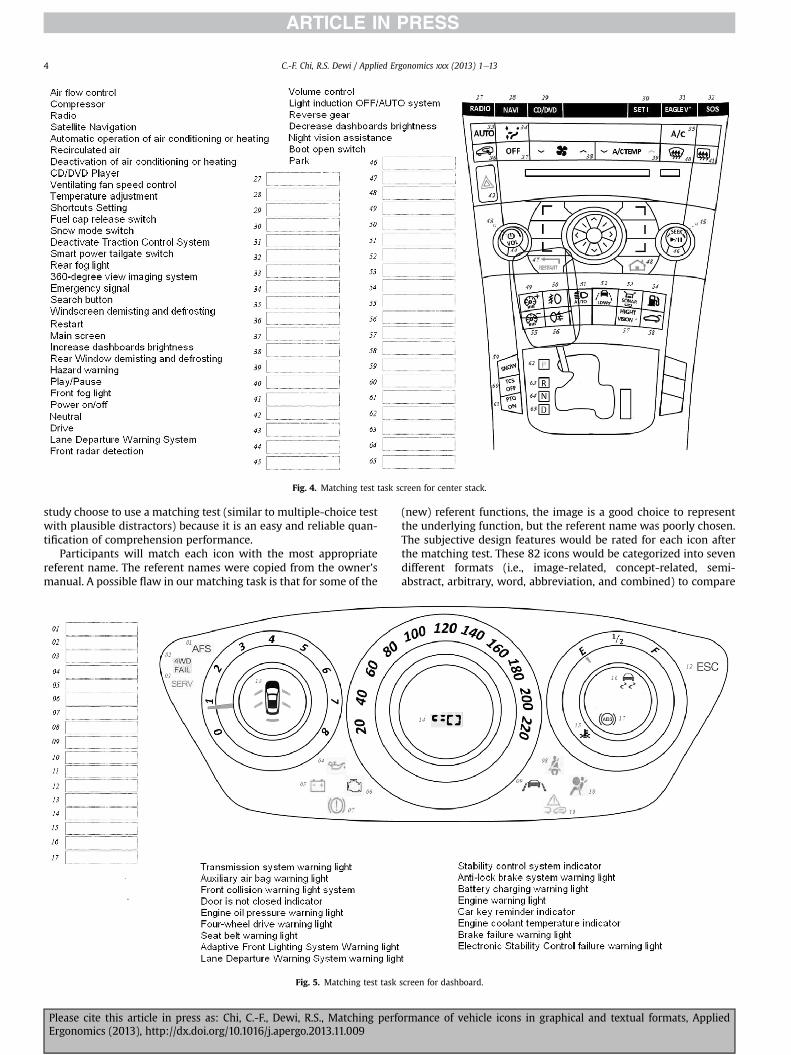
Fig. 4. Matching test task screen for center stack.
C.-F. Chi, R.S. Dewi / Applied Ergonomics xxx (2013) 1e134
study choose to use a matching test (similar to multiple-choice testwith plausible distractors) because it is an easy and reliable quan-tification of comprehension performance.
Participants will match each icon with the most appropriatereferent name. The referent names were copied from the owner’smanual. A possible flaw in our matching task is that for some of the
Fig. 5. Matching test task
Please cite this article in press as: Chi, C.-F., Dewi, R.S., Matching perfoErgonomics (2013), http://dx.doi.org/10.1016/j.apergo.2013.11.009
(new) referent functions, the image is a good choice to representthe underlying function, but the referent name was poorly chosen.The subjective design features would be rated for each icon afterthe matching test. These 82 icons would be categorized into sevendifferent formats (i.e., image-related, concept-related, semi-abstract, arbitrary, word, abbreviation, and combined) to compare
screen for dashboard.
rmance of vehicle icons in graphical and textual formats, Applied

Table 2Matching test output.
Icon and its correct referent name Trial n Trial (n� 1) Trial (n� 2)
Time Referent name Time Referent name Time Referent name
Adaptive front lighting system warning light 0:00:24 Anti-lock brake system warning light
Four-wheel drive warning light 0:00:16 Four-wheel drive warning light
Transmission system warning light 0:00:26 Car key reminder indicator 0:00:04 Brake failure warninglight
Engine oil pressure warning light 0:00:05 Engine oil pressure warning light
Battery charging warning light 0:00:35 Battery charging warning light
Engine warning light 0:00:03 Engine coolant temperature indicator 0:00:06 Front collision systemwarning light
Brake failure warning light 0:00:01 Electronic Stability Control failure warning light
Seat belt warning light 0:00:04 Seat belt warning light
Lane departure warning system warning light 0:00:10 Lane departure warning system warning light
Auxiliary air bag warning light 0:00:09 Auxiliary air bag warning light
Front collision warning light system 0:00:22 Front collision warning light system
Electronic stability control failure warning light 0:00:13 Engine warning light
C.-F. Chi, R.S. Dewi / Applied Ergonomics xxx (2013) 1e13 5
the matching accuracy, time, and sequence produced by the par-ticipants. The results obtained for the different icon formats onthese performance measures can be used to perfect ISO standard2575 published by the International Organization ofStandardization (2010) to facilitate the design of new icons fornew contexts or applications.
2. Methods
2.1. Participants
A matching experiment was designed to collect comprehensionperformance data on 82 icons followed by subjective ratings oftheir design features. The comprehension performance wasmeasured by the matching time, matching sequence, and the per-centage of participants who matched the icon correctly with its
Fig. 6. Example of subject
Please cite this article in press as: Chi, C.-F., Dewi, R.S., Matching perfoErgonomics (2013), http://dx.doi.org/10.1016/j.apergo.2013.11.009
functional name (Carney et al., 1998). Forty participants aged be-tween 23 and 53 years old (mean ¼ 30 years) took part in thisexperiment. All participants are students or staff members of Na-tional Taiwan University of Science and Technology with at least auniversity-level education. They consisted of two different groups:those having driving experience (drive at least once a week) andthose without any driving experience (not having a driver’s licenseand having never driven a car). Collecting data from two differentexperience groups can determine whether image-related (con-crete) icons are less likely to provide any functional benefits forexperienced users (McDougall and Curry, 2004).
Prior to the experiment, all participants were screened for visualacuity abnormalities and color blindness. They were briefed aboutthe purpose of the experiment, and practiced the matching testroutine. After the matching test, participants were asked to giveratings on each of the subjective design features.
ive rating test screen.
rmance of vehicle icons in graphical and textual formats, Applied

Table 3Mean performance measures for each icon format.
Icon format Performance measures Number of icons
Matching accuracy (%) Matching sequence Matching time (s)
ND D Meana ND D Meana ND D Meana
Image-related 74.0� 25.4 82.3� 17.9 78.2 ab 9.1� 4.0 10.7� 4.6 9.9 a 16.1� 3.0 18.6� 3.7 17.4 bc 15Concept-related 68.9� 20.3 81.7� 15.6 75.3 ab 14.9� 4.7 16.9� 7.5 15.9 b 12.9� 1.8 17.0� 3.5 15.0 ab 9Semi-abstract 72.3� 18.6 90.9� 10.4 81.6 ab 15.1� 7.1 15.1� 7.0 15.1 b 13.1� 2.2 18.1� 4.6 15.6 ab 11Arbitrary 71.3� 18.9 82.5� 23.6 76.9 ab 17.9� 6.5 17.3� 6.8 17.6 bc 13.3� 2.3 26.8� 6.5 20.0 c 4Word 83.3� 14.4 89.3� 12.9 86.3 c 16.7� 3.9 15.9� 4.2 16.3 b 10.9� 3.4 16.8� 5.4 13.8 a 15Abbreviation 55.5� 26.9 75.5� 27.3 65.5 a 18.1� 7.6 16.9� 8.0 17.5 bc 13.0� 3.9 18.7� 6.1 15.8 ab 22Combined 60.0� 26.3 76.7� 9.8 68.3 a 21.5� 8.2 21.2� 9.0 21.3 c 13.6� 1.5 24.1� 4.9 18.8 c 6All icon 68.8� 23.9 82.4� 19.4 75.6 15.7� 6.9 15.7� 7.0 15.7 13.2� 3.4 18.9� 5.5 16.1 82
Note: ND and D refer to participants without driving experience and with driving experience.a Significant differences in means are indicated by alphabet (p < 0.05).
C.-F. Chi, R.S. Dewi / Applied Ergonomics xxx (2013) 1e136
2.2. Equipment and computer programs
Two experimental modules were conducted on two LenovoThink Centre A70z computers equipped with 1900 monitors, i.e. thematching test and subjective rating evaluation. In the matchingtest, icons were displayed on a car dashboard layout to give context,as suggested by Vukelich and Whitaker (1993) and Wolff andWogalter (1998). Since context provides ecologically valid cueswould limit the possible referents and raise the matching perfor-mance scores (Wolff and Wogalter, 1998), matching accuracy maynot have enough sensitivity. The matching sequence of each iconwas derived from reviewing the videotape as an index of thematching difficulty.
Eighty-two icons were divided into three task screens e steeringwheel, center stack, and dashboard e according to the icons’ relativepositions on a newly built vehicle (Figs. 3e5). In other words, theicon format was nested within the task screen. The three taskscreens would be shown to each participant in random sequence tominimize the learning effect. Participants were asked to click onwhat they thought was the most appropriate referent name for aspecific icon and drag it to the answer box. Each participant wasallowed to revise her/his answer during the experiment withoutany time limit. The computer program would collect the name ofeach icon and the time it took to match it. Reaction time wasmeasured as the time between placing the two referent names(previous and current) onto the two respective answer boxes. If aparticipant changed his/her answer, the reaction time wasmeasured by the accumulation of all attempted trials. If thematching result had been altered in any way, all previous matchingresults would also be recorded (Table 2) and analyzed togetherwithin the confusion matrix.
In the subjective rating of design features, participants wereasked to rate each icon in accordance with how familiar, concrete,simple, and strongly related to its referent on a 1e7 scale theyperceived the icon to be (Preston and Colman, 2000). Fig. 6 showsthe test screen for subjective ratings of the design features. Unlikethematching test where icon formats were nested in three separatetask screens, on this subjective rating test screen, each icon wasevaluated on an individual basis.
3. Results
3.1. Analysis of variance
Mean performance measures of all experimental conditions arepresented in Table 3 and Fig. 7. The nested analysis of variance(ANOVA) was performed on matching accuracy and matching timeto examine whether icon format and driving experience had a
Please cite this article in press as: Chi, C.-F., Dewi, R.S., Matching perfoErgonomics (2013), http://dx.doi.org/10.1016/j.apergo.2013.11.009
significant effect on them. Since the sum of the matching sequencefor all icons is the same for all participants, the effect of drivingexperience would not be tested on the matching sequence. Dun-can’s multiple range test was conducted on all the performancemeasures to analyze significant differences between each iconformat.
The ANOVA result indicated that the task screen had a signifi-cant effect on all three performance measures (see Table 4), whiledriving experience and icon format had a significant effect on thematching accuracy (p< 0.01). Participants with driving experiencehad better recognition accuracy than participants without expe-rience. On average, word icons had significantly greater matchingaccuracy than other formats (Table 3) because all participants hada university-level education and basic reading ability for English.Even participants without driving experience had 100% recogni-
tion rate for (snow mode switch) and (CD/DVD player),
and an above 90% recognition rate for (select down option),
(mode switch), (confirm key), (radio), and
(deactivation of air conditioning or heating).Icon format had a significant effect on matching sequence
(p < 0.01). Analysis for all 82 icons (Table 3) shows that image-related icons had a significantly smaller mean matching sequencethan all other icon formats; indicating that image-related iconswere recognized faster than other formats. Most of the combined
icons referred to advance driving assistance system such as
(Lane Departure Warning System) and (front radar detection)
werematched later in the sequence because they are newandmoredifficult for all participants to recognize.
Icon format and driving experience both had a significant effecton the matching time. Arbitrary and combined icons took signifi-cantly longer than all other formats (see Table 3). Quite unexpect-edly, participants with driving experience took significantly longerthan inexperienced participants. Based on HickeHyman Law, re-action time can be affected by the number of unmatched icons left(Cockburn et al., 2007). However, after reviewing the videotape toderive the reaction time versus thematching sequence curve, it wasfound that several icons matched later in the sequence hadsignificantly longer reaction times (see Fig. 8) from those predictedby HickeHyman Law. The matching accuracy raised to 70% forthose without driving experience and 80% for those with experi-ence because the number of possible options left reduced gradually(Wolff and Wogalter, 1998). Under such conditions, the matchingsequence is more sensitive and reliable than thematching accuracy,and the sequence indicated that participants chose tomatch image-related icons before icons of other formats. This has very importantimplications because the duration of any given glance during
rmance of vehicle icons in graphical and textual formats, Applied
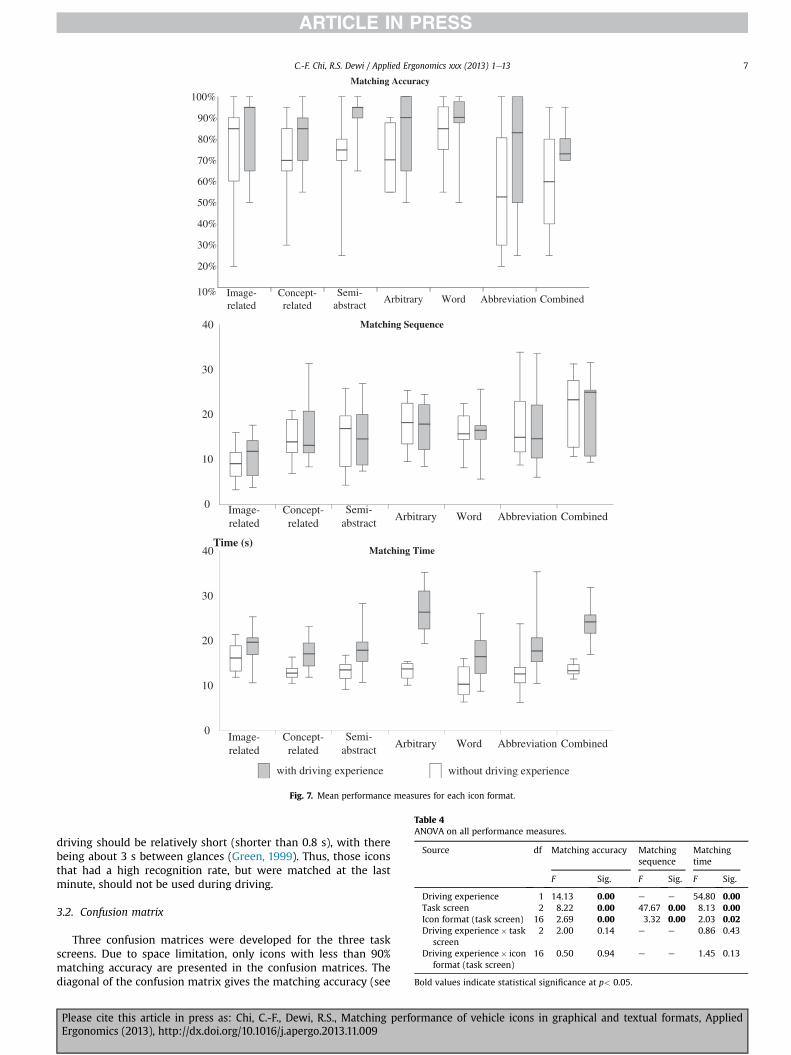
Image-related
Concept-related
Semi-abstract
Arbitrary Word Abbreviation Combined10%
20%
30%
40%
50%
60%
70%
80%
90%
100%
Matching Accuracy
Image-related
Concept-related
Semi-abstract
Arbitrary Word Abbreviation Combined0
10
20
30
40 Matching Sequence
Image-related
Concept-related
Semi-abstract
Arbitrary Word Abbreviation Combined0
10
20
30
40 Matching TimeTime (s)
with driving experience without driving experience
Fig. 7. Mean performance measures for each icon format.
Table 4ANOVA on all performance measures.
Source df Matching accuracy Matchingsequence
Matchingtime
F Sig. F Sig. F Sig.
Driving experience 1 14.13 0.00 e e 54.80 0.00Task screen 2 8.22 0.00 47.67 0.00 8.13 0.00Icon format (task screen) 16 2.69 0.00 3.32 0.00 2.03 0.02Driving experience� task
screen2 2.00 0.14 e e 0.86 0.43
Driving experience� iconformat (task screen)
16 0.50 0.94 e e 1.45 0.13
Bold values indicate statistical significance at p< 0.05.
C.-F. Chi, R.S. Dewi / Applied Ergonomics xxx (2013) 1e13 7
driving should be relatively short (shorter than 0.8 s), with therebeing about 3 s between glances (Green, 1999). Thus, those iconsthat had a high recognition rate, but were matched at the lastminute, should not be used during driving.
3.2. Confusion matrix
Three confusion matrices were developed for the three taskscreens. Due to space limitation, only icons with less than 90%matching accuracy are presented in the confusion matrices. Thediagonal of the confusion matrix gives the matching accuracy (see
Please cite this article in press as: Chi, C.-F., Dewi, R.S., Matching performance of vehicle icons in graphical and textual formats, AppliedErgonomics (2013), http://dx.doi.org/10.1016/j.apergo.2013.11.009

12
14
16
18
20
22
24
26
0 5 10 15 20 25 30 35 40Matching time vs sequence of center stack
Matching time predicted by Hick-Hyman Law
Sequence
Time (s)
Fig. 8. Matching time versus matching sequence for center stack.
C.-F. Chi, R.S. Dewi / Applied Ergonomics xxx (2013) 1e138
Figs. 9e11). All confusions outside the diagonal were analyzedfurther, to see whether the confusions were caused by similarity informat or function.
From all three confusion matrices, 26.2% of the confusions in thefinal answers took place in icons where they share similarity inboth format and function. Commonly seen icons on the steering
wheel (see Fig. 9), such as rear window washer ( ), rear window
washer and wiper ( ), and windscreen washer and wiper ( )
had relatively low matching rates and were confused with each
Fig. 9. Confusion matrix
Please cite this article in press as: Chi, C.-F., Dewi, R.S., Matching perfoErgonomics (2013), http://dx.doi.org/10.1016/j.apergo.2013.11.009
other because of the similarity in both icon format and their rela-tion to the vehicle window cleaning function. Similarly, rear fog
light ( ) and front fog light ( ) were confused easily (see
Fig. 10). Such confusions were also found in Green and Pew (1978)using native-born American participants. In their study, partici-pants also were confused by the front and rear fog light and be-tween the windshield wiper and windshield washer icons. Similarfindings between their study and the current experiment indicatedthat the confusion between those icons can be generalized for alldrivers regardless of their racial identity.
Icons with similar functions were confused easily as well
(24.5%), e.g., rear window washer ( ) and the cleaning agent
( ) or between engine coolant temperature indicator ( ) and
the engine warning light ( ) because they are related to vehicle
window cleaning function (see Fig. 9) or engine function (seeFig. 11), respectively. Icons that share similar formats accounted foranother 12.5% of the confusions. For example, abbreviation icons onthe dashboard including the transmission system warning light
( ), electronic stability control failure warning light ( ), and
adaptive front lighting system warning light ( ) were confused
with each other easily (see Fig. 11). There are another 36.8% ofconfusions that cannot be attributed to similarity in format orfunction. Several of these confusions were because of the intro-duction of new/advanced functions such as deactivate traction
control system ( ) and lane departure warning system ( ) or
between smart power tailgate switch ( ) and light induction OFF/
AUTO system ( ).
The information about participant’s self-corrections in thematching test was also incorporated in the confusion matrices. The
for steering wheel.
rmance of vehicle icons in graphical and textual formats, Applied

Fig. 10. Confusion matrix for center stack.
C.-F. Chi, R.S. Dewi / Applied Ergonomics xxx (2013) 1e13 9
numbers written in the brackets indicate the number of partici-pants who initially matched a specific icon with a designatedreferent name then changed their answer later. For each referent,the significant positive correlation between the number of confu-sion in the end and confusion during the matching process(r ¼ 0.37, p-value < 0.01) indicated that icons which were wronglymatched in the end were the ones that participants had troublematching during the process. Since the final confusion matrixcorrelated highly with their confusion during the process, thematching test is still a reliable measure.
3.3. Subjective rating on icon design features
The means of the subjective ratings for each design feature arelisted in Table 5. The analysis of variance was conducted to analyzewhether icon format and driving experience have a significant ef-fect on each design feature for graphical and combined formats.Since each iconwas evaluated individually, without the task screencontext, factorial ANOVAwas conducted on the subjective ratings ofthe design features. The ANOVA result (Table 6) indicated thatexperienced participants provided significantly higher ratings forall design features except for semantic distance. Icon format had asignificant effect on almost all design features, but the effect onconcreteness was the only icon design feature that had not reacheda significant level (F(4,80) ¼ 2.08, p ¼ 0.09). Image-related iconswere expected to have higher ratings on concreteness and semanticdistance than arbitrary icons. However, arbitrary icons had higher
Please cite this article in press as: Chi, C.-F., Dewi, R.S., Matching perfoErgonomics (2013), http://dx.doi.org/10.1016/j.apergo.2013.11.009
ratings on most design features because all arbitrary iconsfollowed the ISO standards and have been used in other contexts
such as power on/off ( ) and hazard warning ( ) which are
used in electronic devices and road signs, respectively. Due to thefact that all participants had a university-level education and couldread English, word icons were perceived to have higher semanticdistance ratings than image-related icons. On the contrary, allconcept-related and combined icons were related to functions used
only in vehicles, such as front fog light ( ), engine coolant tem-
perature indicator ( ), and the anti-lock brake system warning
light ( ), thus, novice participants gave relatively lower ratings
on most of the subjective rating scales. A t-test was conducted tocompare text meaning and semantic distance ratings betweenicons in word and abbreviation formats. The result indicated thatword icons have significantly higher ratings for both text meaning(t¼ 2.98, p< 0.01) and semantic distance (t¼ 2.24, p¼ 0.03). Basedon these results, word format would be a good choice for icons thatcan be described using simple English for users with some level ofEnglish ability.
Although participants were asked to rate four different attri-butes: familiarity, concreteness, simplicity, and semantic distance,therewere significant inter-correlations among ratings for differentattributes as well (Liu and Ho, 2012), experienced participantsgave significantly greater ratings on all attributes. The inter-correlation among attributes and higher ratings perceived by the
rmance of vehicle icons in graphical and textual formats, Applied

Fig. 11. Confusion matrix for dashboard.
C.-F. Chi, R.S. Dewi / Applied Ergonomics xxx (2013) 1e1310
experienced participants indicated that subjective ratings onlyprovide an overall sense of the icon design. Subjective ratings canbe more sensitive than objective measurements (Chi and Lin, 1998),but they are not diagnostic. Besides, various researchers havesuggested different criteria based on different application domainsor data collection methods. For example, Huang et al. (2002) sug-gested icons should incorporate the following design criteria:styling, message quality, meaningfulness, locatability, and meta-phor, but the current study choose to rate on familiarity,concreteness, simplicity, and semantic distance.
4. Discussion
Kern and Schmidt (2009) suggested that designing user in-terfaces for computer domains where the user pays full attention tothe application is totally different from that for cars, where theuser’s main focus has to be on the primary task of driving. Ng andChan (2008) indicated that people with a university-level educa-tion, or above, perform significantly better in symbol comprehen-sion tests than those without a university-level education. This
Table 5Mean subjective ratings on icon design features.
Icon format Icon design features
Familiarity Concreteness Com
ND D ND D ND
Image-related 5.3 6.0 5.3 5.9 5.4Concept-related 4.7 5.4 4.4 5.1 4.9Semi-abstract 4.6 5.6 4.6 5.7 5.0Arbitrary 6.2 6.3 5.5 5.8 6.2Combined 4.4 4.9 4.9 5.4 4.9WordAbbreviation
Note: ND refers to subjects without driving experience; and D refers to subject with dri
Please cite this article in press as: Chi, C.-F., Dewi, R.S., Matching perfoErgonomics (2013), http://dx.doi.org/10.1016/j.apergo.2013.11.009
study recruited participants with a university-level education and,as a result, all the recognition performances may have been infla-ted. Also, recognition performance improves dramatically withdriving experience (Isherwood et al., 2007; Margono andShneiderman, 1993). The car manufacturer and interface de-signers must be aware that if a great number of icons tested cannotbe recognized with the user’s full attention then worse recognitionperformance is expected in a real driving situation and for userswithout a university-level education and without drivingexperience.
If we divided the experience level of the 20 participants into lessthan 10 years, 10e20 years, and more than 20 years, and comparetheir performance in terms of matching accuracy and matchingtime, it was discovered that matching time is proportional to agewhile participants with the middle level of experience (10e20) hadthe greatest matching accuracy (see Table 7). Chi and Lin (1998)divided jobs into age-enhanced, age neutral/counteracted andage-impaired, based on whether age is an enhanced or negativefactor (Warr, 1994). Based on a similar concept, we can perhapsclassify (matching) time as an “age-impaired measure” as age
plexity Semantic distance Text meaning
D ND D ND D
6.2 5.4 5.85.9 4.6 5.26.1 5.1 5.86.5 6.5 6.35.5 5.0 5.5
5.8 6.1 6.0 6.44.9 5.6 4.4 5.7
ving experience.
rmance of vehicle icons in graphical and textual formats, Applied

Table 6ANOVA on subjective rating of icon design features.
Source df Familiarity Concreteness Complexity Semantic distance
F Sig. F Sig. F Sig. F Sig.
Icon format 4 3.30 0.01 2.08 0.09 2.90 0.03 3.39 0.01Driving experience 1 4.56 0.04 6.13 0.02 14.78 0.00 2.91 0.09Icon format� driving experience 4 0.26 0.90 0.25 0.91 0.53 0.72 0.32 0.86
Note: this analysis is conducted only for image-related, concept-related, semi-abstract, arbitrary and combined icons.Bold values indicate statistical significance at p < 0.05.
C.-F. Chi, R.S. Dewi / Applied Ergonomics xxx (2013) 1e13 11
played a negative factor and (matching) accuracy as “age-counter-acted measure” for the negative impact of age can be partiallycompensated for by additional knowledge and modification ofbehavior (Chi and Lin, 1998).The age effect could explain whyparticipants with driving experience took significantly longer thanthose without driving experience.
Although Lodding (1983) stated that pictorial communicationpredates text communication and it is more natural to communi-cate with images, the current study failed to prove that image-related icons have a better matching accuracy than the textualicons. The result can be partially explained by the poor designquality with some of the image-related icons, just as Lodding(1983) suggested, that image-related icons will be clearer andeasier to understandwhen the image bears a close resemblance to aparticular object and context is provided. For example, both the carkey reminder indicator ( ) and the engine warning light ( )had poor recognition rates mainly because both images have poorresolution and do not resemble closely to the key or engine,respectively. The findings highlighted the importance of legibilityon icon recognition performance (Rousek and Hallbeck, 2011;Campbell et al., 2004b).
In this study, any given iconwas tested in one format. There is anobvious confounding between referent function and icon format,the image-related icon format does not seem to have betterrecognition performance. A study conducted by Sayer and Green(1998) provided better proof that image-related icons were thebest icon format. In their study, 32 drivers were asked to rank 142candidate icons for 25 functions based on their meaningfulness inrepresenting the described function. Even though they did notdiscuss icon formats, but for any given function, almost all of themost meaningful candidates ranked by drivers were image-related,while concept-related and arbitrary icons had inferior rankings.
Besides the confounding between referent function and iconformat, there are at least two other factors that could have affectedthe comparison between different icon formats: user’s experienceand ISO standards. For experienced users, image-related (concrete)icons are less likely to provide any functional benefits (McDougalland Curry, 2004). Previous studies suggest that arbitrary iconsshould be avoided, for they have no obvious reference to theirintended meaning (Goonetilleke et al., 2001; Lodding, 1983).However, most arbitrary icons in this experiment adopted from ISO2575:2010, had amuch bettermatching performance thanwhat we
Table 7Mean performance measures and age of participants with driving experience.
Drivingexperience(1e10 years)
Drivingexperience(10e20 years)
Driving experience(more than 20 years)
Average of age (years) 20.8 33.3 34.4Number of participants 6 7 7
Performance measuresMatching accuracy (%) 76.4 88.7 81.4Matching time (s) 14.0 19.6 22.3
Please cite this article in press as: Chi, C.-F., Dewi, R.S., Matching perfoErgonomics (2013), http://dx.doi.org/10.1016/j.apergo.2013.11.009
had expected. If we divided all 82 icons into the ISO group (n ¼ 42)(adopted from standardized symbols for controls and indicatorsprovided by ISO 2575: 2010) and the non-ISO group (n ¼ 40), the t-test results proved that experienced participants had a significantlygreater matching accuracy for icons following the ISO standards(ISO ¼ 86%, NONeISO ¼ 78%). But the difference for novice par-ticipants (ISO¼ 71%, NONeISO¼ 66%) had not reached a significantlevel. The confounding between referent function and icon format,and the use of ISO standard icons could also explain why image-related icons did not have significantly higher ratings onconcreteness and semantic distance than other icon formats.
Since the matching performance was always better than that ofthe non-ISO for both novice and experienced drivers, for conven-tional functions, icons should follow the ISO standards. Forexample, the icon for the forward collision warning has beenincluded in ISO standards ( ) (Campbell et al., 2004a), and itshould be used to replace the current icon for the collision warninglight system ( ). Since a majority of the icons appearing on thecenter stack screen were new and no ISO standard was available tobe followed, the confusion pattern for the center stack is morespread out and more difficult to describe (see Fig. 10).
In order to conclude all of the above findings, a backwardstepwise multivariate analysis was conducted to predict thematching accuracy and matching time using the icon category, setsize (number of icons on each test screen), semantic distance rating,and driving experience. The icon category was tested with sixdummy variables (Cohen et al., 2003) using the combined format asthe reference group. Semantic distance was the only subjectiverating included in the regression analysis because all the subjectiveratings were highly correlated and the semantic distance wastested for all icon categories. Age, instead of experience, was chosenfor predicting the matching time since matching time is propor-tional to age (see Table 7).
As shown in Table 8, semantic distance, icon category, drivingexperience, and set size were associated with matching accuracywhile age, icon category, and set size were significant for pre-dicting the matching time. The squared semipartial correlation(sr2) gave the unique contribution for each predicting factor(Cohen et al., 2003) and R2 indicated the overall varianceexplained by the model including all significant factors. Inter-estingly, semantic distance alone can explain 26% of the variancein predicted matching accuracy, but semantic distance was notsignificant for predicting the matching time. Identical to ourearlier statement that matching time is proportional to age, 30%of the variance in predicted matching time can be explained bythe age factor. Table 8 also indicated that icons with a greatersemantic distance rating or belonging to either image-related,concept-related, semi-abstract, or word categories had a greatermatching accuracy. On the other hand, icons belonging toconcept-related, semi-abstract, word, and abbreviation had asignificantly shorter matching time. Notice that the generaliza-tion of our findings related to icon category can be limited by theconfounding between the referent function and icon format. We
rmance of vehicle icons in graphical and textual formats, Applied

Table 8Multiple regression analysis on matching accuracy and matching time.
Predicting factor Matching accuracy Predicting factor Matching time
Coefficient p-Value sr2 R2 Coefficient p-Value sr2 R2
(Constant) �0.13 0.10 0.52 (Constant) 5.61 0.00 0.39Semantic distance 0.11 0.00 0.26 Age 0.33 0.00 0.30Image related 0.12 0.00 0.03 Concept related �3.28 0.01 0.03Concept related 0.15 0.00 0.04 Semi-abstract �2.76 0.02 0.02Semi-abstract 0.14 0.00 0.04 Word �4.59 0.00 0.08Word 0.13 0.00 0.04 Abbreviation �2.71 0.00 0.03Driving experience 0.08 0.00 0.03 Set size 0.09 0.03 0.02Set size 0.00 0.01 0.02
C.-F. Chi, R.S. Dewi / Applied Ergonomics xxx (2013) 1e1312
expect that the seven icon categories could better predict thematching accuracy and matching time if the confounding be-tween the referent function and icon format could be bettercontrolled as mentioned earlier.
Regarding set size, Table 8 also indicated that a greater set sizeincreased both the matching accuracy and matching time. Sincereaction time is critical for driving, one important implication fromthe current study is the number of functions that can be accessedeasily without overloading the driver (Kern and Schmidt, 2009).After seeing the test results and feedback from car users, icon de-signers should be more cautious in placing too many icons (func-tions) into their newmodels. Luckily, some control functions can bereplaced by automatic sensors or redundant coding. For example,the automatic induction light system can relieve the driver fromhaving to turning on the beam light; the turning signal seldomrelies on the visual sense, but more on the sense of feel or touch.Above all, the most important issue may not lie in the icon designitself, but in the system design stage to determine what functionsneed to exist to meet the system objectives and performancespecifications (Stevens et al., 2002).
Last but not least, is the limitation in the matching test. Eventhough Wolff and Wogalter (1998) suggested that mean compre-hension on amultiple-choice test with plausible distractors was notsignificantly different from the results generated from an open-ended test, there are still flaws in both the correct and incorrectmatching results. For the correct matching result, it is possible thatparticipants could match the referent to the icon, but may actuallyhave no idea what the icon does or represents. In such cases, par-ticipants might have guessed the correct answer. The matchingsequence and matching times collected in this study can help toidentify the icons that had a high recognition rate, but werematched later in the sequence or took significantly longer to
recognize; such as rear window demisting and defrosting ( ) and
automatic operation of air conditioning or heating ( ). On the
other hand, an incorrect matching result could have been caused bythe poor design of an icon (what we intend to measure), a poor/uncommon referent name, or the participants may not understandwhat the icon represents. This is why the SAE (2008) recommendedemploying only participants with a driving license, who drive atleast twice a month, to avoid recruiting participants who may notunderstand what the icon represents. However, by testing partici-pants without driving experience allows us to identify the iconsthat can be matched perfectly by experienced drivers, but could notbe properly recognized by novice drivers. For icons that have asignificant difference in the matching rate between participants
with and without driving experience, e.g., rear fog light ( ), en-
gine coolant temperature indicator ( ), reverse gear ( ) and
drive ( ), most of these icons only appeared in a driving context.
It is necessary to educate novice drivers about the icons’ meaningsin order to promote safe driving.
Please cite this article in press as: Chi, C.-F., Dewi, R.S., Matching perfoErgonomics (2013), http://dx.doi.org/10.1016/j.apergo.2013.11.009
5. Conclusions
This study evaluated 82 vehicle icons in seven icon formats(image-related, concept-related, semi-abstract, arbitrary, word,abbreviation, and combined) with two groups of participants, withand without driving experience. The results indicated that drivingexperience had a significant effect on matching accuracy, while thematching sequencewas affected by the icon format. All participantschose to match image-related icons before other icon formats.Incorporation of new icons (functions) should be carefullyreviewed at the system design stage and be restrained to minimizethe visual and information processing load for the driver. Campbellet al. (2004b) suggested a general development process for icons beused in all vehicles. The guidelines identify which in-vehicle mes-sages required an icon. Since the matching performance of ISOicons was always better than that of the non-ISO for all participants,the icon designer should consult the relevant standards to check if astandard icon exists and follow the (ISO) standards wheneverpossible. In cases where no standard icon is available, the designerneeds to use production tests to generate ideas for icons, identifycandidate icons for further testing, then conduct appropriatenessranking tests to screen the candidate icons and select the best onesfor further testing. To ensure candidate icons can be recognizedproperly, the designers can choose to conduct a recognition test oncandidate icons with a representative group of participants orconduct a matching test on a complete set of icons. Based on thetest results, redesigning the icons that have poor recognition per-formance ormatching performance (e.g., fail to reach at least 85% or67% correct) should be done. In the end, icons that are redesignedshould go through a comprehension test or matching test to ensureproper recognition performance.
Acknowledgments
The authors also would like to thank Li-Kai Tseng and Shin-Cheng Chen for their invaluable help during the development ofthe matching test program.
References
Baber, C., Wankling, J., 1992. An experimental comparison of test and symbols forin-car reconfigurable displays. Appl. Ergon. 23, 255e262.
Blankenberger, S., Hahn, K., 1991. Effects of icon design on humanecomputerinteraction. Int. J. Man. Mach. Stud. 35, 363e377.
Blattner, M.M., Sumikawa, D.A., Greenberg, R.M., 1989. Earcons and icons: theirstructure and common design principles. Hum. Comput. Interact. 4, 11e44.
Campbell, J.L., Hoffmeister, D.H., Keifer, R.J., Selke, D.J., Green, P.A., Richman, J.B.,2004a. Comprehension testing of active safety symbols (2004-01-0450). In:2004 SAE World Congress and Exhibition Technical Papers, pp. 8e11.
Campbell, J.L., Richman, J.B., Carney, C., Lee, J.D., 2004b. Guidelines. In: In-vehicleDisplay Icons and Other Information Elements, vol. I. Office of Safety Researchand Development, Federal Highway Administration.
Carney, C., Campbell, J.L., Mitchell, E.A., 1998. In-vehicle Display Icons and OtherInformation Elements: Literature Review (No. FHWA-rd-98e164). FederalHighway Administration.
rmance of vehicle icons in graphical and textual formats, Applied

C.-F. Chi, R.S. Dewi / Applied Ergonomics xxx (2013) 1e13 13
Chi, C.F., Lin, F.T., 1998. A comparison of seven visual fatigue assessment techniquesin three data-acquisition VDT tasks. Hum. Factors 40, 577e590.
Chi, C.F., Tseng, L.K., Jang, Y., 2012. Prune a decision tree of selecting computer-related assistive devices for the disable user. IEEE Trans. Neural Syst. Rehabil.Eng. 20 (4), 564e573.
Cockburn, A., Gutwin, C., Greenberg, S., 2007. A predictive model of menu perfor-mance. In: Proceedings of the SIGCHI Conference on Human Factors inComputing Systems, pp. 627e636.
Cohen, A., Cohen, P., West, S.G., Aiken, L.S., 2003. Applied Multiple Regression/Correlation Analysis for the Behavioral Sciences, third ed. Lawrence ErlbaumAssociates, Inc, New Jersey.
Dewar, R.E., Ells, J.G., Mundy, G., 1976. Reaction time as an index of traffic signperception. Hum. Factors 18, 381e392.
Geiser, G., 1985. Man machine interaction in vehicles. ATZ 87, 74e77.Goonetilleke, R.S., Heloisa, M.S., On, H.K., Fritsch, J., 2001. Effects of training and
representational characteristics in icon design. Int. J. Hum. Comput. Stud. 55,741e760.
Green, P., 1999. Visual and Task Demands of Driver Information Systems. TechnicalReport UMTRI-98e16. University of Michigan Transportation Research Institute,Ann Arbor, MI.
Green, P., 1993. Design and evaluation of symbols for automobile controls anddisplays. In: Peacock, B., Karwowski, W. (Eds.), Automotive Ergonomics. Taylor& Francis Ltd, London, pp. 237e268.
Green, P., Pew, R.W., 1978. Evaluating pictographic symbols: an automotive appli-cation. Hum. Factors 20, 103e114.
Horton, W., 1994. The Icon Book: Visual Symbols for Computer Systems andDocumentation, first ed. Wiley, New York.
Huang, S.-M., Shieh, K.-K., Chi, C.-F., 2002. Factors affecting the design of computericons. Int. J. Ind. Ergon. 29, 211e218.
International Standards Organization, 2010. Road Vehicles-symbols for Controls,Indicators and Tell-tales (ISO Standard 2575). International Standards Organi-zation, Geneva, Switzerland.
Isherwood, S.J., McDougall, S.J.P., Curry, M.B., 2007. Icon identification in context:the changing role of icon characteristics with user experience. Hum. Factors 49,465e476.
Kern, D., Schmidt, A., 2009. Design space for driver-based automotive user in-terfaces. In: Proceedings of the First International Conference on AutomotiveUser Interfaces and Interactive Vehicular Applications, AutomotiveUI’09. ACM,New York, NY, USA, pp. 3e10.
Liu, Y.C., Ho, C.H., 2012. The effects of age on symbol comprehension in central railhubs in Taiwan. Appl. Ergon. 43, 1016e1025.
Lodding, K.N., 1983. Iconic interfacing. IEEE Comput. Graph. Appl. 3, 11e20.Margono, S., Shneiderman, B., 1993. A study of file manipulation by novices using
commands vs direct manipulation. In: Sparks of Innovation in Human-computer Interaction, 39 pp.
McDougall, S., Curry, M., 2004. More than just a picture: icon interpretation incontext. In: Proceedings of First International Workshop on Coping withComplexity. University of Bath.
McDougall, S.J.P., Curry, M.B., de Bruijn, O., 1999. Measuring symbol and iconcharacteristics: norms for concreteness, complexity, meaningfulness, famil-iarity, and semantic distance for 239 symbols. Behav. Res. Methods 31, 487e519.
Please cite this article in press as: Chi, C.-F., Dewi, R.S., Matching perfoErgonomics (2013), http://dx.doi.org/10.1016/j.apergo.2013.11.009
McDougall, S.J.P., Reppa, I., 2008. Why do I like it the relationships between iconcharacteristics, user performance and aesthetic appeal. In: Proceedings of theHuman Factors and Ergonomics Society Annual Meeting, 52, pp. 1257e1261.
Ng, A.W.Y., Chan, A.H.S., 2008. The effects of driver factors and sign design featureson the comprehensibility of traffic signs. J. Safety Res. 39, 321e328.
Ng, A.W.Y., Chan, A.H.S., 2007. The guessability of traffic signs: effects of prospective-user factors and sign design features. Accid. Anal. Prev. 39, 1245e1257.
Paivio, A., 1971. Imagery and Verbal Processes. Holt, Rinehart& Winston, Oxford.Preston, C.C., Colman, A.M., 2000. Optimal number of response categories in rating
scales: reliability, validity, discriminating power, and respondent preferences.Acta Psychol. 104, 1e15.
Reder, P.J., Mccallum, C.A., 2004. Flexible Mouse-driven Method of User Interface.U.S. Patent 6,727,919.
Rousek, J.B., Hallbeck, M.S., 2011. Improving and analyzing signage within ahealthcare setting. Appl. Ergon. 42, 771e784.
SAE International, 2008. Process for Comprehension Testing of In-vehicle Icons (SAEJ2830). SAE International, Warrendale, PA.
Saunby, C.S., Farber, E.I., DeMello, J., 1988. Driver Understanding and Recognition ofAutomotive ISO Symbols. SAE Technical Papers, 885182. Society of AutomotiveEngineers, Warrendale, PA.
Sayer, J.R., Green, P., 1998. Current ISO Automotive Symbols versus Alternatives: AReference Study. SAE Technical Papers, 880057. Society of Automotive Engi-neers, Warrendale, PA.
Shepard, R.N., 1967. Recognition memory for words, sentences, and pictures.J. Verbal Learning Verbal Behav. 6, 156e163.
Stevens, A., Quimby, A., Board, A., Kersloot, T., Burns, P., 2002. Design Guidelines forSafety of In-vehicle Information Systems. Transport Research Laboratory, PA,3721/01.
Stotts, D.B., 1998. The usefulness of icons on the computer interface: effect ofgraphical abstraction and functional representation on experienced and noviceusers. In: Proceedings of the Human Factors and Ergonomics Society AnnualMeeting, 42, pp. 453e457.
Tonnis, M., Broy, V., Klinker, G., 2006. A survey of challenges related to the design of3D user interfaces for car drivers. In: IEEE Symposium on 3D User Interfaces(3DUI 2006), pp. 127e134.
Vukelich, M., Whitaker, L.A., 1993. The effects of context on the comprehension ofgraphic symbols. In: Proceedings of the Human Factors and Ergonomics SocietyAnnual Meeting, pp. 511e515.
Wang, H.F., Hung, S.H., Liao, C.C., 2007. A survey of icon taxonomy used in theinterface design. In: Proceedings of the 14th European Conference on CognitiveErgonomics: Invent! Explore!, ECCE’07. ACM, New York, NY, USA, pp. 203e206.
Warr, P., 1994. Age and employment. In: . In: Triandis, H.C., Dunnette, M.D.,Hough, L.M. (Eds.), Handbook of Industrial and Organizational Psychology,second ed., vol. 4. Consulting Psychologists Press, Palo Alto, CA, pp. 485e550.
Wiedenbeck, S., 1999. The use of icons and labels in an end user applicationprogram: an empirical study of learning and retention. Behav. Inf. Technol.18, 68e82.
Wogalter, M.S., Silver, N.C., Leonard, S.D., Zaikina, H., 2006. Warning symbols. In:Wogalter, M.S. (Ed.), Handbook of Warnings. Lawrence Erlbaum Associates,Mahwah, NJ.
Wolff, J.S., Wogalter, M.S., 1998. Comprehension of pictorial symbols: effects ofcontext and test method. Hum. Factors 40, 173e186.
rmance of vehicle icons in graphical and textual formats, Applied