Consumers' Response to Sugar Label Formats in Packaged ...
14
ORIGINAL RESEARCH published: 16 June 2022 doi: 10.3389/fnut.2022.896784 Frontiers in Nutrition | www.frontiersin.org 1 June 2022 | Volume 9 | Article 896784 Edited by: Camila Corvalan, University of Chile, Chile Reviewed by: Lorena Saavedra-Garcia, University of North Carolina at Chapel Hill, United States Fernanda Mediano, University of North Carolina at Chapel Hill, United States *Correspondence: Tailane Scapin [email protected] Specialty section: This article was submitted to Nutrition and Food Science Technology, a section of the journal Frontiers in Nutrition Received: 15 March 2022 Accepted: 23 May 2022 Published: 16 June 2022 Citation: Scapin T, Fernandes AC, Shahid M, Pettigrew S, Khandpur N, Bernardo GL, Uggioni PL and Proença RPdC (2022) Consumers’ Response to Sugar Label Formats in Packaged Foods: A Multi-Methods Study in Brazil. Front. Nutr. 9:896784. doi: 10.3389/fnut.2022.896784 Consumers’ Response to Sugar Label Formats in Packaged Foods: A Multi-Methods Study in Brazil Tailane Scapin 1 *, Ana Carolina Fernandes 1 , Maria Shahid 2 , Simone Pettigrew 2 , Neha Khandpur 3,4 , Greyce Luci Bernardo 1 , Paula Lazzarin Uggioni 1 and Rossana Pacheco da Costa Proença 1 1 Nutrition in Foodservice Research Centre (NUPPRE), Nutrition Postgraduate Program (PPGN), Federal University of Santa Catarina (UFSC), Florianópolis, Brazil, 2 The George Institute for Global Health, Faculty of Medicine, University of New South Wales, Sydney, NSW, Australia, 3 Department of Nutrition, Faculty of Public Health, University of São Paulo, São Paulo, Brazil, 4 Department of Nutrition, Harvard T.H. Chan School of Public Health, Boston, MA, United States Providing information about the sugar content of packaged foods on product labels is an important strategy to lower consumers’ sugar intake. This study assessed the effect of exposure to different sugar labels on consumers’ understanding of the sugar content of foods and their food choices. In the first phase, five focus groups were conducted with a convenience sample of Brazilian adults to explore their perceptions about food labelling in general and sugar labelling in particular. Based on the qualitative results, four sugar label formats were developed and subsequently tested in a five-arm study on 1,277 adults via a randomised controlled online survey. The formats were: (i) no sugar information—control, (ii) total and added sugar content displayed in the Nutrition Information Panel (NIP), (iii) a front-of-package (FoP) octagonal warning for “high-in-sugar” products, (iv) a FoP magnifying glass warning for “high-in-sugar” products, and (v) a “high-in-sugar” warning text embedded on the NIP. Participants from the focus groups reported being confused about the meaning of “sugar” and “added sugar” on food labels and indicated that more interpretive labels, such as the FoP warnings, would help them choose products with low sugar content. In the experiment, all intervention sugar label formats improved participants’ understanding of the sugar content of the tested food products, with the FoP warnings (iii and iv) showing the best results. While non-significant differences among label conditions were observed for food choices, the FoP octagonal warning prompted participants to choose high-in-sugar products less often. Given current public policy agendas aiming to reduce added sugar intake, there is a need to strengthen food labelling policies and nutrition disclosure policies that target the display of added sugar and build consumer awareness in using these tools to avoid high-in-sugar products. Keywords: food labelling, sugary foods, health claims, warning labels, consumer behaviour, trial
-
Upload
khangminh22 -
Category
Documents
-
view
1 -
download
0
Transcript of Consumers' Response to Sugar Label Formats in Packaged ...

ORIGINAL RESEARCHpublished: 16 June 2022
doi: 10.3389/fnut.2022.896784
Frontiers in Nutrition | www.frontiersin.org 1 June 2022 | Volume 9 | Article 896784
Edited by:
Camila Corvalan,
University of Chile, Chile
Reviewed by:
Lorena Saavedra-Garcia,
University of North Carolina at Chapel
Hill, United States
Fernanda Mediano,
University of North Carolina at Chapel
Hill, United States
*Correspondence:
Tailane Scapin
Specialty section:
This article was submitted to
Nutrition and Food Science
Technology,
a section of the journal
Frontiers in Nutrition
Received: 15 March 2022
Accepted: 23 May 2022
Published: 16 June 2022
Citation:
Scapin T, Fernandes AC, Shahid M,
Pettigrew S, Khandpur N,
Bernardo GL, Uggioni PL and
Proença RPdC (2022) Consumers’
Response to Sugar Label Formats in
Packaged Foods: A Multi-Methods
Study in Brazil. Front. Nutr. 9:896784.
doi: 10.3389/fnut.2022.896784
Consumers’ Response to SugarLabel Formats in Packaged Foods: AMulti-Methods Study in BrazilTailane Scapin 1*, Ana Carolina Fernandes 1, Maria Shahid 2, Simone Pettigrew 2,
Neha Khandpur 3,4, Greyce Luci Bernardo 1, Paula Lazzarin Uggioni 1 and
Rossana Pacheco da Costa Proença 1
1Nutrition in Foodservice Research Centre (NUPPRE), Nutrition Postgraduate Program (PPGN), Federal University of Santa
Catarina (UFSC), Florianópolis, Brazil, 2 The George Institute for Global Health, Faculty of Medicine, University of New South
Wales, Sydney, NSW, Australia, 3Department of Nutrition, Faculty of Public Health, University of São Paulo, São Paulo, Brazil,4Department of Nutrition, Harvard T.H. Chan School of Public Health, Boston, MA, United States
Providing information about the sugar content of packaged foods on product labels is an
important strategy to lower consumers’ sugar intake. This study assessed the effect of
exposure to different sugar labels on consumers’ understanding of the sugar content of
foods and their food choices. In the first phase, five focus groups were conducted with a
convenience sample of Brazilian adults to explore their perceptions about food labelling in
general and sugar labelling in particular. Based on the qualitative results, four sugar label
formats were developed and subsequently tested in a five-arm study on 1,277 adults via a
randomised controlled online survey. The formats were: (i) no sugar information—control,
(ii) total and added sugar content displayed in the Nutrition Information Panel (NIP),
(iii) a front-of-package (FoP) octagonal warning for “high-in-sugar” products, (iv) a FoP
magnifying glass warning for “high-in-sugar” products, and (v) a “high-in-sugar” warning
text embedded on the NIP. Participants from the focus groups reported being confused
about the meaning of “sugar” and “added sugar” on food labels and indicated that
more interpretive labels, such as the FoP warnings, would help them choose products
with low sugar content. In the experiment, all intervention sugar label formats improved
participants’ understanding of the sugar content of the tested food products, with the
FoPwarnings (iii and iv) showing the best results. While non-significant differences among
label conditions were observed for food choices, the FoP octagonal warning prompted
participants to choose high-in-sugar products less often. Given current public policy
agendas aiming to reduce added sugar intake, there is a need to strengthen food labelling
policies and nutrition disclosure policies that target the display of added sugar and build
consumer awareness in using these tools to avoid high-in-sugar products.
Keywords: food labelling, sugary foods, health claims, warning labels, consumer behaviour, trial

Scapin et al. Sugar Label Formats in Brazil
INTRODUCTION
Brazil, like many countries around the world, is facing theincreasing burden of non-communicable diseases (NCDs) acrossits population (1, 2). Up to 4% of the global disease burdenhas been related to an unhealthy diet (3), making diet animportant modifiable behavioural risk factor for NCDs. Of theseveral aspects of an unhealthy diet, the excessive consumptionof sugar has been associated with the development or aggravationof several NCDs (4–6). “Sugars” is the generic name of agroup of monosaccharides (glucose, galactose, and fructose)and disaccharides (sucrose, lactose, maltose, and trehalose).Colloquially, the term “sugar” is usually used to refer solely tosucrose or refined sugar—also known by table sugar (7). Sugarscan be classified as intrinsic, added or free, and total for dietarypurposes. Intrinsic sugars are found naturally within whole fruits,vegetables, dairy, and grains. Added sugars include sugars andsyrups added during the processing of foods (such as sucroseor dextrose) (8). The definition of free sugar includes addedsugars and further includes sugars found naturally within fruitjuices and fruit purees of all concentrations. Total sugar includeall sugar types (9). Further discussion around sugar definitionscan be found elsewhere (7, 10). In Brazil, 64% of the adultpopulation is eating more free sugar than recommended by theWorld Health Organization (WHO) (11), making the country theworld’s fourth-largest consumer of sucrose (12). Table sugar andsugary packaged foods are among the main sources of free sugarsintake (13).
Following the recommendations in the WHO guidelines (9),many countries are considering regulations or public healthpolicy measures aiming at lowering sugar intake in theirpopulation. Sugar labelling is located among these actions andhas been gaining prominence in health agendas worldwide asa strategy to inform consumers about the sugar content ofpackaged foods. Countries such as the United States, Australia,New Zealand, and members of the European Union follow theCodex Alimentarius recommendation on food labelling, whichstates that total sugar content should be displayed on labels (14).Requirements for declaration of added sugar are now also beingimplemented in some countries. The United States, for example,required the inclusion of the amount of both total and addedsugars in the nutrition facts panel by 2021 (15).
In Latin America, some countries have been establishingregulations on added sugar front-of-pack (FoP) warning labelsto help consumers avoid high-in-sugar products. FoP labellingincludes simplified information about nutritional content orhealth aspects of foods, and they are displayed on the front ofthe package to assist consumers make healthier food choicesduring their quick decision-making shopping process (16). InChile, a FoP octagonal warning label stating “high-in-sugar” ismandatory for food products exceeding defined sugar contentthresholds (17), and this same format has been implemented inPeru (18) and Uruguay (19) and approved to be implemented inMexico (20).
In Brazil, 71% of the packaged food available for sale at thesupermarket has at least one type of added sugar ingredient (21).However, it is not a requirement for total or added sugar contents
to be displayed on labels as the listing of this information is notmandatory under Brazil’s food labelling regulations from 2003—which is still enforced (22). In 2014, through The National HealthSurveillance Agency (ANVISA—Agência Nacional de VigilânciaSanitária), the Brazilian Ministry of Health began debating theBrazilian food labelling regulation, including the implementationof a sugar label format. A preliminary report from this discussionreinforced the need to declare sugar on the back-of-packNutrition Information Panel (NIP) and to implement a FoPwarning label for high-in-sugar products. At the time, a lack ofevidence prevented ANVISA from deciding which format wouldbe most effective to help Brazilian consumers identify sugaramounts through labels and discourage the selection of high-in-sugar foods (23). At the end of 2020, the Brazilian governmentannounced the final changes for the food labelling regulationin Brazil. These changes included the mandatory declarationof total and added sugar content in grammes in the NIP anda FoP magnifying glass warning indicating that a product ishigh in sugar (24). The magnifying glass format was put forthby ANVISA and it seems to be based on discussions made bythe government of Canada in 2017 (25), but without extensiveevidence of this format efficacy on consumers’ food choices(26). Although the changes in the Brazilian food labelling ruleswere published in 2020, food manufacturers are not mandatedto apply these changes on the label of their products untilOctober 2022. At the present point in time, the list of ingredientsdeclared on the packages is the only mandatory information toconsumers identify if a product has added sugar ingredients inits composition.
Studies investigating consumers’ understanding of foodlabels and their influence on food choices in the Brazilianpopulation are sparse (27–29), and they demonstrated apreference for labels in the form of FoP warnings. Giventhe gap in this area of research, this study focuses onsugar and provides additional information on consumerpreference for the presentation of this information byexploring Brazilian consumers’ responses to different sugarlabel formats. Specific study objectives include to: (a) exploreconsumer perceptions of what “sugar” means and whichlabel features would help them to identify sugar ingredientsin packaged foods; (b) compare the effectiveness of fourdifferent sugar label formats in improving consumers’understanding of the sugar levels in a set of products; and(c) evaluate the influence of the four label formats on consumers’food choices.
MATERIALS AND METHODS
A multi-method approach encompassing qualitative andquantitative phases was used to choose and test sugar labelformats for packaged food products. Initially, focus groups wereconducted with a convenience sample of young adult food-labelusers to explore perceptions of three pre-defined sugar labelformats. The results were used to adapt the formats to be testedin a survey evaluating the influence of sugar label formats onconsumers’ understanding of the sugar content in packaged
Frontiers in Nutrition | www.frontiersin.org 2 June 2022 | Volume 9 | Article 896784

Scapin et al. Sugar Label Formats in Brazil
foods and food choices. These two data collection phases aredescribed further below.
Qualitative PhaseMethodsFive focus groups were conducted in the city of Florianopolis(south Brazil) during June and July of 2019 with a conveniencesample of 32 young adults (18–33 years). Young adultswere chosen since they usually have a high intake of addedsugar, mainly sourced from packaged food and beverages (13).Only participants who self-reported usually using food labelinformation during their food shopping were included to ensurethey had previous experience with the subject of this study.Rather than seek findings generalisation, this qualitative phaseattempted to find examples of behaviours and clarify the thoughtsand feelings of individuals with a previous experience of thephenomena of interest (food label use) in order to produceevidence for developing the quantitative phase of this study.
Focus group size ranged from four to nine participants, witha mean group size of six participants. The mean age was 23 years(±4.1), 50% of the sample was female, 75% were undergraduatestudents, and 31% had at least one dietary restriction (mainlyin relation to lactose intolerance). Participants were recruitedvia posts on social media platforms for university study groups,flyers shared in the university campus, and snowballing amongthose registered for the study (i.e., participants who participatein the study were asked to invite relatives and friends to takepart of the study). Individuals with training in nutrition were notincluded. Further details about the qualitative phase are availableelsewhere (30).
The first author moderated all focus groups with thesupport of two observers who took notes. A semi-structuredinterview guide was developed based on the literature, includingour previous systematic review investigating sugar labellingformats and consumers’ understanding (31). The interviewguide included open-ended questions that covered participants’perception of sugar (e.g., What do you understand by sugars?What do you think “total sugar” and “added sugar” declaredon food labels mean?), food labelling use (e.g., What do youthink about food labelling information?), and reactions (e.g.,How would you identify if this is a high-in-sugar biscuit? Wouldthis format assist you while choosing a food product?) to threedifferent formats of food labels carrying information about sugar(Figure 1). The labels were fixed on real packages of a well-known brand of biscuit sold in Brazil. The order of presentationof the sugar label formats was from the least interpretativeformat (i), followed by some interpretation (ii), and, finally, themost interpretive one (iii). Participants had time to hold andobserve the packages before they were invited to express theirperceptions regarding the label formats, including how well theyunderstood the information in each format and how useful thisinformation would be for their food choices. The groups lastedfrom 45 to 70min and were audio-recorded. The recordings weretranscribed verbatim and imported into MAXQDA software(VERBI GmbH, Pty Ltd) for thematic analysis (32).
FindingsMost of the participants demonstrated a low understanding ofsugar and which names sugar is called on food labels. Almostall participants indicated they had never heard the term “addedsugars” before, and many of them were confused when both“total sugar” and “added sugar” information was presented onfood labels. Many participants were also confused about thedifferences between sugars and carbohydrates, and assumed thatthese terms were synonymous. There was a consensus amongparticipants that food labels should provide clear and easy-to-understand information about sugar to support consumers’food choices.
Participants unanimously perceived the first format [(i) noinformation about sugar on the NIP] as being the least usefulfor food choices. Many participants mentioned that with thisformat, they rely only on the confusing and small-font-size listof ingredients to determine the presence of sugar in a productand that the names of some sugar ingredients were unfamiliarto them. The second format [(ii) total sugar and added sugarcontents listed in the NIP] was preferred over the first formatto provide information about the exact quantity of sugar in afood product and to compare products within the same foodcategory. Although participants at first demonstrated confusionabout the differences in “total sugar” and “added sugar” contents,they found the space gap included in the heading “added sugars”under the “total sugar” sugar beneficial to identify those sugarswere part of the total sugar content.
“Now I understood the logic here, this space gap [talking about the
gap space in the headings for total and added sugar contents] is to
show us that the added sugars are part of the total sugars and all
of them are part of the carbohydrates. I always thought all carbs
were sugar, but since the contents of carbohydrates and sugars are
different here [format 2], I can see they are not the same thing!”
(Male, focus group 1).
When asked to evaluate if the biscuit had a high added sugarcontent, most participants experienced difficulty determiningwhat constitutes “high” content only by looking at the total andadded sugar content only. Some participants suggested includingsome kind of interpretation such as a “high-in-sugar” text closeto the amount of sugar on the NIP for better understanding ofthe sugar content.
“I liked this format [format 2] because it gives me the information
about the sugar content of this biscuit, but I think it would be good if
they [food manufacturers] include some interpretation close to the
sugar content to tell me “Caution, this is a high-in-sugar product”—
that would help me as I don’t know how to interpret the numbers
here” (Female, focus group 4).
The NIP + octagonal warning label (iii) was chosen as themost useful to obtain consumers’ attention and facilitate quickinterpretation of a product’s sugar content. Many participantsbelieved that this format could help consumers demystify whichproducts are high in sugar but also have a health halo (e.g., cerealbars and whole-grain biscuits). As the discussions evolved, manyparticipants suggested that format (iii) would suit their needs for
Frontiers in Nutrition | www.frontiersin.org 3 June 2022 | Volume 9 | Article 896784

Scapin et al. Sugar Label Formats in Brazil
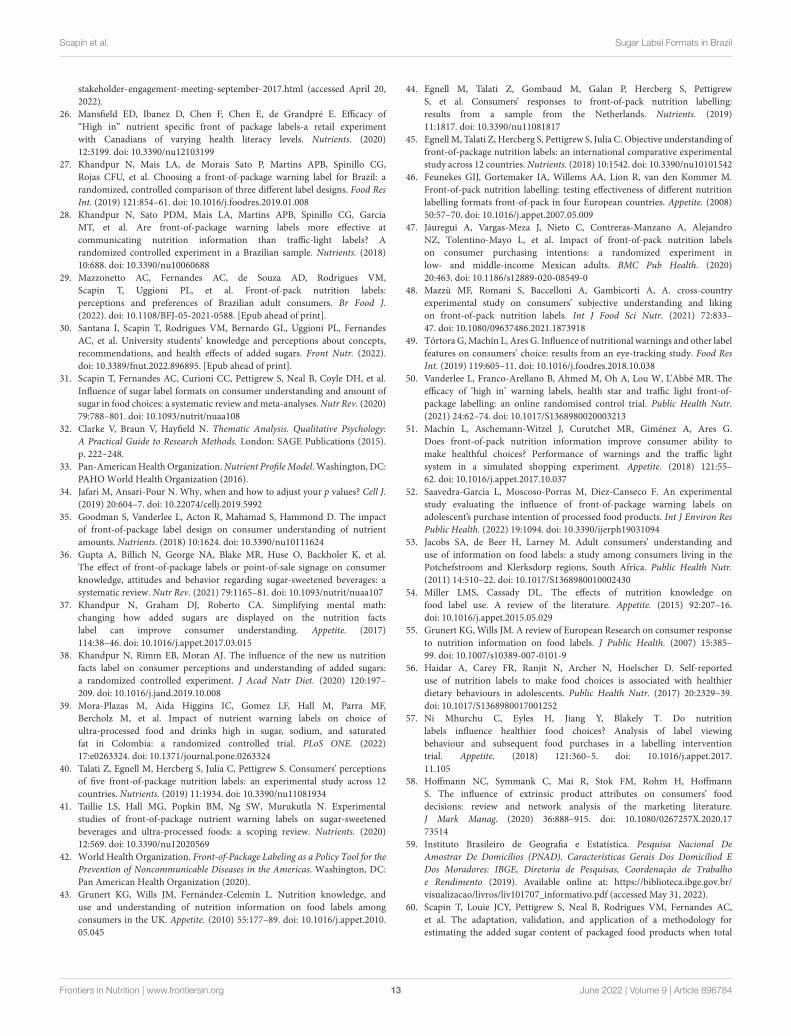
FIGURE 1 | Sugar label conditions used in the qualitative and quantitative phases. The ingredient list of each product was also provided during the survey. Formats (i),
(ii), and (iii) were used in the qualitative phase. All formats were used in the quantitative phase. NIP, Nutrition Information Panel; FoP, Front-of-Package; DV, Daily Value.
quantitative information about sugar (NIP) and a quick way todetermine the sugar level of a product (warning) at the pointof purchase, influencing their choice for lower sugar products.A few participants also indicated that any warnings or messageon labels should be endorsed by the Health Ministry and thatthis endorsement should appears on labels. In addition, manyparticipants felt that information voluntarily provided by thefood industry is untrustworthy.
“For me, this format with a warning [format 3] would be the best as
it gives me the information straight away (Male, focus group 2).
But if someone needs to compare two products, the best for me
would also have the sugar content information on the back. Then,
even if I am choosing between two high-in-sugar products, I can see
which of them is lower in sugar and pick that one. . . or I would
probably avoid both [laugh] (Female, focus group 2).”
Quantitative PhaseLabel ConditionsFor the quantitative phase of the study, the three label formatsused in the qualitative phase [(i), (ii), and (iii)], and two moreformats [(iv) and (v)] were included (Figure 1). Format (iv) wasincluded because it was proposed by a public consultation forfront-of-pack labelsmade by ANVISAwhich emerged in betweenthe qualitative and quantitative phases of this study. This formatincludes a magnifying glass warning indicating when a productis high in sugar (Figure 1). Format (v) includes interpretive“high in” sugar text embedded in the NIP, which was suggestedduring the focus groups discussion. The two formats with FoPinformation [(iii) and (iv)] also had text saying “Ministry ofHealth of Brazil,” as suggested during the focus groups. Thedecision to test sugar labelling formats for both the FoP and the
back of pack (NIP) labels was made to align with the changes inthe Brazilian food label rules, which will include modifications inboth sources of nutritional information on food packages. Threefood categories (whole-grain biscuit, cereal bar, and yoghourt)were tested in the quantitative phase. They were selected becausethey are commonly available in Brazilian supermarkets, havebrands with different sugar levels, and are often misperceivedas healthy.
Study SampleAn online randomised controlled experiment was conducted inPortuguese over a period of 6 weeks between May and June of2020. Participants were recruited from posts on social mediaplatforms of university study groups, e-mail lists of consumerassociation groups across Brazil, and via snowball technique.To avoid the possibility of the same person taking the surveymultiple times, IP address information from the device used bythe participant to take the survey was collected and duplicateIP address were removed. A virtual link providing access tothe survey hosted on the Qualtrics R© platform was created andshared in the ads for this study. People were eligible to participateif they were 18 years or older, provided consented to participate,and had access to a computer or tablet with internet access. Atthe beginning of the survey, participants were asked to provideinformation on sex, age, region of residence, education level,self-reported weight and height, dietary restrictions, and self-estimated level of health awareness and nutrition knowledge.They were also asked to declare the frequency of purchase of thetested food categories on a four-point scale (“Always,” “Often,”“Sometimes” and “Never”). Those who responded “Never” toall the three food categories were excluded to ensure responsesreflected real-world food choice behaviours. A total of 1,524
Frontiers in Nutrition | www.frontiersin.org 4 June 2022 | Volume 9 | Article 896784

Scapin et al. Sugar Label Formats in Brazil
people accessed the survey, of whom 1,277 fit the eligibilitycriteria and completed the survey (Figure 2).
Study Design and StimuliFor each food category, a set of three food products withdifferent levels of added sugar was created (total of nine differentproducts). Two of the three food products were high-in-sugaroptions, as defined by the parameters established by the NutrientProfile Model of the Pan-American Health Organization (33).To approximate the task with a real-world food choice scenario,food products selected for this study were well-known brandsavailable in Brazilian supermarkets. All products under the samefood category had their nutrition information standardised tothe same serving size to help consumers compare the productsduring the tasks.
Following the sociodemographic, lifestyle and nutrition-related questions, participants were randomly allocated toa single label format and asked to complete choice andunderstanding tasks. The image of the product’s front panelwas provided on the left-hand side of the survey screen, withthe respective NIP formats presented on the right-hand side.Participants allocated on FoP label formats [label conditions (iii)and (iv)] saw this information incorporated directly into theproducts’ image of the front panel, affixed at the same placein each package, covering the same area on the packages. Thelist of ingredients of all foods was also provided on the screenfor the five label conditions. Participants had the option tozoom in on the images of the food products during the tasks.Any other nutritional information or quality indicators (e.g.,nutrition claims) were digitally removed from the packages toavoid unduly influencing participants’ perceptions of the foodproducts. Examples of the stimuli used in the survey are displayedin Supplementary Figure S1.
Study ProceduresParticipants saw the same food products and responded tothe same set of questions for all the label conditions. Thepresence and type of label format on the food products werethe only aspects that differed across arms. To minimise primingparticipants to pay attention to the label formats and modifytheir choices accordingly, food choice was measured first for eachproduct category, and then participants answer questions aboutsugar content of the presented products.
First, participants viewed the three sets of food products oneat a time. For each set they were asked to select which of the threedisplayed products they would choose to purchase, with an “Iwould not choose any of these products” option also available.Participants who selected at least one product in this task wererequested to indicate the main reason for their choice for eachfood category across the following options that had their orderrandomised: “Brand preference,” “Nutritional information,” and“Taste.” In the second part of the survey, participants werepresented with the same set of food products and asked tonominate which of the three products had the highest amountof sugar. All choice tasks were completed for all food categoriesfirst, followed by the understanding tasks for all food categories.The order of presentation of the food categories was randomised
between respondents. Finally, the food label condition to whichthe participant has been assigned was presented as a medium-sized image in the middle of the screen and participants wereasked “Did you notice this information on the label on theprevious questions?” with a yes/no answer option. if they noticedthe label while completing the survey. They were then requestedto indicate on a 7-point Likert scale (1—totally disagree/7—totally agree) whether they agreed or disagreed with thesestatements: “This label influencedmy food choices in this survey”and “This label makes it easy to understand the amount of sugarin the food product”.
Statistical AnalysisChi-squared and one-way ANOVA tests were conducted to testfor differences in sociodemographic (age, sex, the region of living,and education) and health variables (BMI, health awareness,and nutrition knowledge) between label conditions at a 0.05alpha level. For the understanding outcome, the proportionsof participants who correctly nominated the product with thehighest sugar content were calculated by food category andsummarised for all categories (a maximum of three possiblecorrect answers). For the food choice outcome, the proportionsof participants who selected a high-in-sugar product werecalculated for each product category and across all three foodcategories. For the questions “This label influenced my foodchoices in this survey” and “This label makes it easy tounderstand the amount of sugar in the food product,” data werepresented as the proportion of agreement by summarising the“Strongly agree,” “Agree,” and “Somewhat agree” points from the7-points Likert scale.
Chi-squared tests were used to evaluate the relationshipbetween label conditions and the understanding and food choiceoutcomes, with significance set at a Bonferroni-corrected alphalevel of 0.01 [α/n = 0.05/5] as suggested in the literature(34). Data were treated as dichotomous variables for theunderstanding outcome (selecting the correct vs. the wronganswers) and the food choice outcome (selecting a high-in-sugar product vs. a non-high-in-sugar product). Participants whoselected the option “I wouldn’t choose any of these products”during the food choice task had results presented separately andwere removed from the association analysis for the related foodcategory as they have not chosen any product. Sensitivity analyseswere performed following the exclusion of participants who didnot recall seeing the label intervention during the survey. Abinary logistic regressionmodel was used to test for differences inodds ratios for the understanding outcome by label condition. Allanalyses were conducted using STATA/IC software version 13.0(College Station, TX: StataCorp. 2009).
EthicsBoth phases of this research were approved by the EthicsCommittee of the University where the study was conducted (No.3063750) and performed in accordance with the ethical standardslaid out in the Declaration of Helsinki. All participants werevolunteers and provided informed consent before completingthe study.
Frontiers in Nutrition | www.frontiersin.org 5 June 2022 | Volume 9 | Article 896784

Scapin et al. Sugar Label Formats in Brazil
FIGURE 2 | Flowchart of the participants included in the study.
RESULTS
Participants’ CharacteristicsSociodemographic, lifestyle and nutrition-related characteristicsof the study population are presented in Table 1. The finalsample included 1,277 Brazilian participants, of whom 78% werewomen, 72% were enrolled in or had an undergraduate degree,and the mean age was 33.0 (±11.7) years. Participants from allregions of the country were surveyed, with most living in theSouth and Southeast regions (79%). Most participants (84%)reported using food label information “always” or “often,” andthey presented a high median (5.7 for a 7-points Likert scale)of self-reported health awareness and nutrition knowledge. Nosignificant differences in sociodemographic and health variablesbetween label conditions were found.
Understanding (Primary Outcome)The proportions of correct answers for each label conditionand type of food are presented in Table 2. Compared tothe control condition, the proportion of participants whocorrectly selected the product with the highest sugar contentwas significantly higher in all intervention groups, except inthe case of the yoghourt category. Comparisons across theintervention formats showed no significant differences in theproportion of correct answers. In the sensitivity analyses, whichincluded only participants who recalled seeing the label formatstested during the survey, results remained similar for whole-grainbiscuit, yoghourt, and overall. For the cereal bar category, onlyinterventions (iv) [proposed NIP plus magnifying glass warning]and (v) [proposed NIP plus high in sugar text] were significantlydifferent from the control condition (Supplementary Table S1).
The odds ratio for the understanding outcome by labelcondition is presented in Table 3. Participants in all interventionconditions were more likely to identify products with the highestsugar compared to the control condition, although participantswho saw the FoP conditions (iii and iv) had the highest
odds ratios for that. The octagonal warning (iii) had the bestperformance for whole-grain biscuits, while the magnifying glasswarning (iv) produced more correct answers for the cereal barand yoghourt categories.
When asked whether the label format makes it easier toidentify the sugar content of the product, participants in allintervention conditions had higher proportions of agreementthan those in the control condition. A significant differencewas also found when comparing the intervention conditionson this variable, with participants in the NIP only conditions[(ii) and (v)] found to have a higher proportion of agreementthan participants in the NIP plus FoP conditions [(iii) and (iv)](Table 3). However, this distinction between the interventionconditions was not found in the sensitivity analysis.
Food Choice (Secondary Outcome)There were no significant differences in the proportions ofparticipants who chose high-in-sugar products between thelabel conditions, overall or by food category. The FoP warningconditions had the lowest proportions of participants who choseproducts high-in-sugar for whole-grain biscuits and yoghourts,but the differences were not significant. Moreover, participantsin the FoP octagonal warning condition (iii) had the lowestproportion of participants who chose high-in-sugar productsthrough all three sets of food categories. In contrast, thecontrol (i) and proposed NIP (ii) conditions had the highestproportion of agreement regarding the question of whetherthe label format influenced participants’ choices (Table 4).Although results were not statistically significant, in general,FoP warning seems to be useful to influence consumers tochoose products with lower sugar content. In sensitivity analyses,where only participants who recalled seeing the label formatstested during the survey were included, results remained similar(Supplementary Table S1). The proportion of participants whochose the “I would not choose any of these products” option
Frontiers in Nutrition | www.frontiersin.org 6 June 2022 | Volume 9 | Article 896784

Scapin et al. Sugar Label Formats in Brazil
TABLE 1 | Participant characteristics, total and by label condition.
Characteristics Total sample
(n = 1,277)
i. Control group
(n = 269)
ii. Proposed
NIP (n = 254)
iii. Proposed
NIP + FoP
octagonal
warning
(n = 250)
iv. Proposed
NIP + FoP
magnifying
glass warning
(n = 261)
v. Proposed
NIP + “high in
sugar” text
(n = 243)
p-value
Age mean years (SD) 33.0 (±12.7) 32.3 (±11.2) 32.8 (±11.8) 33.4 (±12.0) 33.9 (±12.5) 32.8 (±11.1) 0.560
Sex, n (%)
Female 1,001 (78%) 211 (78%) 199 (78%) 194 (78%) 204 (78%) 193 (79%) 0.993
Male 276 (22%) 58 (22%) 55 (22%) 56 (22%) 57 (22%) 50 (21%)
Education n (%)
High school or less 353 (28%) 76 (28%) 75 (30%) 67 (27%) 71 (27%) 64 (26%) 0.676
Undergraduate 309 (24%) 70 (26%) 60 (24%) 54 (22%) 67 (26%) 58 (24%)
MBA 219 (17%) 38 (14%) 43 (17%) 39 (16%) 53 (20%) 46 (19%)
Master/PhD 396 (31%) 85 (32%) 76 (30 %) 90 (36%) 70 (27%) 75 (31%)
BMI mean kg/square metre (SD) 24.2 (±4.3) 24.1 (±4.1) 24.3 (±4.3) 23.8 (±4.6) 24.6 (±4.5) 24.2 (±4.2) 0.252
Region of the country n (%)
North/Northeast 171 (13%) 31 (12%) 33 (13%) 35 (14%) 36 (14%) 36 (15%) 0.925
Central-west 95 (7%) 16 (6%) 19 (8%) 21 (8%) 19 (7%) 20 (8%)
South/Southeast 1,011 (79%) 222 (83%) 202 (80%) 194 (78%) 206 (79%) 187 (77%)
Dietary restriction n (%)
Yes 287 (23%) 60 (22%) 58 (23%) 57 (23%) 51 (20%) 61 (25%) 0.682
Frequency of nutrition label usea
n (%)
Always/often 1,057 (84%) 222 (85%) 199 (80%) 217 (87%) 223 (86%) 196 (81%) 0.107
Sometime/never 200 (15%) 38 (15%) 49 (20%) 32 (13%) 35 (14%) 46 (19%)
Health awarenessb, mean (SD) 6.1 (±1.0) 6.0 (±1.0) 6.1 (±0.9) 6.1 (±1.0) 6.1 (±1.1) 6.0 (±1.0) 0.571
Nutrition knowledgec, mean (SD) 5.7 (±1.4) 5.7 (±1.3) 5.6 (±1.5) 5.7 (±1.3) 5.6 (±1.3) 5.6 (±1.4) 0.543
Noticed the label in the survey, n (%)a 992 (79%) 227 (87%)iii,iv 218 (88%)iii,iv 166 (65%)i,ii,v 166 (64%)i,ii,v 215 (89%)iii,iv <0.001
Number superscripts (e.g.,i,ii,iii )indicate that a result is significantly different from the study condition with the corresponding number based on Bonferroni-corrected post hoc tests with
an alpha set at 0.01. aDifferent sample size for this question (n = 1,257). bMeasured by the question “I reflect a lot about my health” on a 7-point Likert scale, 1= strongly disagree,
7= strongly agree. cMeasured by the question “I know a lot about Nutrition” on a 7-point Likert scale, 1= strongly disagree, 7= strongly agree. NIP, Nutrition Information Panel;
FoP, Front-of-Package.
is shown in Table 4. While a low number of participants didnot choose any product throughout all food categories (3.9%),higher proportions were found by food category with 32, 31,and 19% for the whole-grain biscuit, cereal bar, and yoghourtcategories, respectively.
The most frequent reason for participants’ food choiceswas “Nutrition information” across all three food categories(Figure 3). There were no differences between the reasons forparticipants’ choices across the label conditions for the whole-grain biscuit and yoghourt categories. For the cereal bar category,participants more frequently selected “Nutritional information”in the proposed NIP plus magnifying glass condition (iv) than inthe control (i), proposed NIP only (ii), and proposed NIP plushigh in sugar text (v) conditions (p < 0.05).
DISCUSSION
Overall, our results showed a clear demand for sugar informationto be made available on the labels of packaged foods to informconsumers during food shopping. Compared with the controlcondition, all the sugar label formats have increased study
participants’ understanding of the sugar content of the products.However, none of them significantly decreased consumers’choices for products high in sugar.
The findings for understanding from this study are in linewith previous research from other countries that have shownthat information about sugar on labels increases consumers’understanding of the sugar level of packaged foods (35–39).Participants who saw the FoP warning label conditions weremore likely to correctly identify products with the highest contentof sugar than participants in the NIP only conditions. Theseresults are aligned with a key aim of FoP nutrition labels beingto provide nutrition information in a more understandable wayfor consumers (16). In contrast to these experimental results,the participants perceived the NIP only conditions as morestraightforward to identify the sugar content of the productsthan when FoP warning labels were also presented. This resultmay be partially due to the type of understanding task usedin this survey, where participants had to identify the productwith the highest sugar content. It requires consumers to checkthe sugar content in grammes in the NIP and then interpretit more than knowing if a product is high-in-sugar or not. A
Frontiers in Nutrition | www.frontiersin.org 7 June 2022 | Volume 9 | Article 896784

Scapin et al. Sugar Label Formats in Brazil
TABLE 2 | Participants’ understanding of the sugar content of the products and their perceived understanding of the labels [n (%)], by study arm (n = 1,277).
Outcomes Total sample
(n = 1,277)
i. Control
group
(n = 269)
ii. Proposed
NIP (n = 254)
iii. Proposed
NIP + FoP
octagonal
warning
(n = 250)
iv. Proposed
NIP + FoP
magnifying
glass warning
(n = 261)
v. Proposed
NIP + ‘high in
sugar’ text
(n = 243)
p-value
Understanding
The proportion of correct answers about which
product had the highest sugar content
Whole-grain biscuits 1,125 (88) 208 (77)ii,iii,iv,v 234 (92)i 232 (93)i 234 (90)i 217 (89)i <0.001
Cereal bars 1,204 (94) 234 (87)ii,iii,iv,v 241 (95)i 240 (96)i 253 (97)i 236 (97)i <0.001
Yogurt 1,218 (95) 255 (95) 243 (96) 237 (95) 250 (96) 233 (96) 0.953
All products 1,060 (83) 178 (66)ii,iii,iv,v 220 (87)i 226 (90)i 226 (87)i 210 (86)i <0.001
This label makes it easy to understand the amount of
sugar in the food product a,b
843 (67) 133 (51)ii,iii,iv,v 199 (80)i,iii,iv 164 (66)i,ii,v 157 (61)i,ii,v 190 (79)i,iii,iv <0.001
Number superscripts (e.g.,i,ii,iii )indicate that a result is significantly different from the study condition with the corresponding number based on Bonferroni-corrected post hoc tests with
an alpha set at 0.01. aProportion of people who agree by the summarising points 5, 6, and 7 from a 7-points Likert scale where 1 = strongly disagree and 7 = strongly agree. bDifferent
sample size for this question (n = 1,257).
NIP, Nutrition Information Panel; FoP, Front-of-Package.
TABLE 3 | Odds ratios (OR) and 95% confidence intervals (CI) for primary (understanding) outcome (n = 1,277).
Variables OR (95%CI)
Whole-grain biscuit Cereal bar Yogurt
Label condition
i. Control (ref) – – –
ii. Proposed NIP 3.91 (2.24–6.83)* 2.85 (1.42–5.71)* 1.08 (0.46–2.53)
iii. Proposed NIP + FoP octagonal warning 4.02 (2.28–7.11)* 3.47 (1.61–7.31)* 0.88 (0.40–2.00)
iv. Proposed NIP + FoP magnifying glass warning 2.92 (1.76–4.86)* 5.74 (2.42–13.57)* 1.42 (0.58–3.48)
v. Proposed NIP + ‘high in sugar’ text 2.65 (1.59–4.40)* 5.26 (2.22–12.47)* 1.20 (0.50–2.87)
*p-value at <0.01.
NIP, Nutrition Information Panel; FoP, Front-of-Package; CI, Confidence Interval.
previous study also found that nutrient warnings were perceivedas not containing enough information for consumers’ needs(40). In terms of consumers’ understanding of the nutritioncomposition of foods, both sources of information (NIP andFoP) can therefore be useful in a complementary way. While theFoP warning labels allow consumers to correctly, quickly, andeasily identify products containing excessive amounts of criticalnutrients (41, 42), the NIP provides them with specific nutrientamounts to permit more detailed product comparisons.
Our results on consumer understanding identified differencesaccording to food category. While participants’ understandingwas found to increase significantly for whole-grain biscuits andcereal bars, this was not the case for the yoghourt category.Participants in all study arms had high proportions of correctanswers when asked to identify which yoghourt was the highestin sugar (above 94%). Some explanations could be attributedto this. First, yoghourt has been previously described in otherpopulations as one of the products that consumers are morelikely to read nutrition information for when shopping (43).Second, because all the carbohydrate content of yoghourts aresugars (naturally present as lactose or added from other sources),
participants in the control groupmay have used the carbohydrateinformation available in the NIP as a guide to sugar content.This interpretation is reinforced by the fact that during our focusgroups, participants incorrectly associated all the carbohydratecontent of packaged food as equal to the sugar content. For thewhole-grain biscuit and cereal bar categories, other sources ofcarbohydrates, such as flour or nuts, were present in the products’composition, and the carbohydrate content in the NIP by itselfwas not enough to help consumers identify the sugar content ofthese products.
Many studies have tested the influence of different labelformats on consumers’ food choices or purchases, and mixedresults have been found according to the types of label andfood category tested, the methodology used, and participants’nationality (37, 39, 44–50). A systematic review investigatingsugar label formats and their influence on consumers’ food choicehas demonstrated that interpretive information (e.g., colours,“high in sugar” text, warnings, or health messages) is moreeffective than the standard NIP in encouraging consumers tochoose foods with less sugar (31). The results of the presentstudy showed that the sugar label formats tested did not
Frontiers in Nutrition | www.frontiersin.org 8 June 2022 | Volume 9 | Article 896784

Scapin et al. Sugar Label Formats in Brazil
TABLE 4 | Participants’ food choices for high-in-sugar products and perceived influence of the label in their choices [n (%)], by study arm (n = 1,277).
Outcomes Total sample
(n = 1,277)
i. Control
group
(n = 269)
ii. Proposed
NIP (n = 254)
iii. Proposed
NIP + FoP
octagonal
warning
(n = 250)
iv. Proposed
NIP + FoP
magnifying
glass warning
(n = 261)
v. Proposed
NIP + ‘high in
sugar’ text
(n = 243)
p-value
Food choice
The proportion of participants who chose a
high-in-sugar option
Whole-grain biscuits 342 (27) 85 (32) 68 (27) 58 (23) 61 (23) 70 (29) 0.067
Cereal bars 484 (38) 97 (36) 96 (38) 92 (37) 97 (37) 102 (42) 0.568
Yogurts 273 (21) 66 (25) 55 (22) 43 (17) 60 (23) 49 (20) 0.156
All products 97 (8) 23 (9) 19 (8) 13 (5) 21 (8) 21 (9) 0.583
The proportion of participants who chose the ’I
wouldn’t choose any of these products’ option
Whole-grain biscuits 406 (32) 87 (32) 77 (30) 87 (35) 77 (30) 78 (32) 0.740
Cereal bars 394 (31) 92 (34) 80 (32) 71 (28) 78 (30) 73 (30) 0.670
Yogurts 248 (19) 55 (20) 54 (21) 40 (16) 50 (19) 49 (20) 0.610
All products 50 (4) 9 (3) 13 (5) 10 (4) 9 (3) 9 (4) 0.845
This label has influenced my food choices in this
surveya,b713 (57) 154 (59)iv 165 (67)iii,iv 124 (50)ii 123 (48)i,ii,v 147 (61)iv <0.001
Number superscripts (e.g., i,ii,iii ) indicate that a result is significantly different from the study condition with the corresponding number based on Bonferroni-corrected post hoc tests with
an alpha set at 0.01. aProportion of people who agree by the summarising points 5, 6, and 7 from a 7-points Likert scale where 1 = strongly disagree and 7 = strongly agree. bDifferent
sample size for this question (n = 1,257).
NIP, Nutrition Information Panel; FoP, Front-of-Package.
significantly decrease consumers’ choices for products high insugar. Nevertheless, the proposed NIP plus an octagonal FoPlabel (iii) had the lowest proportion of participants choosinghigh-in-sugar products for whole-grain biscuits, yoghourts, andacross all products. Studies conducted in neighbouring LatinAmerican countries have demonstrated that FoP octagonalwarning labels effectively reduce consumer choice of foods highin critical nutrients (47, 49, 51, 52).
The non-significant effects observed for food choice in thepresent study could be related to our sample’s sociodemographicand behavioural profile. Most of the participants in our studywere female and had a high educational level, and these factorshave been previously described as influencing the use andunderstanding of nutritional information on labels (53, 54).In fact, 84% of the participants said they used nutritionalinformation frequently during their routine shopping, whichwould explain the high proportion of participants who selectednutritional quality as the main reason for their choices duringthe survey. It is known that the use of nutritional information isassociated with the level of understanding of this information byconsumers (43, 54, 55), which can lead to healthier food choices(56, 57). In our results, a high proportion of participants (83%)correctly understood the sugar content of all products tested,which would help to explain the low proportion of participantswho choose high-in-sugar products and the non-significantdifference between the label conditions.
Study Limitations and StrengthsStrengths of our study include the inclusion of a qualitativephase to support the development of the subsequent survey, the
voluntary participation of a large number of Brazilian consumersfrom various sociodemographic backgrounds, the investigationof two outcomes related to food label use (understanding andfood choice), and the comparison across multiple types of sugarlabel formats using a randomised approach. In addition, apotential learning bias was minimised by testing the food choicetask first and then objective understanding, as well as usingrandomisation of the presentation order across food categories.While product brand is understood to be a key aspect drivingconsumers’ food choices (58), the impact of brand preferenceseemed to be minimal in our study. By asking participants whythey had chosen specific food products, we were able to assessthe impact of using real brands in this experiment. The resultsindicate that brand preference was the least frequent reason fortheir choices, with no differences found across the conditions.This may have been due to the fact that we had a high-educatedand health-concerned sample of participants who give moreimportance to the nutritional aspects of food products ratherthan the products’ brand.
Some limitations need to be acknowledged. The choice foryoung food label users for the focus groups was made toexplore perceptions of an audience with lived experience onthe topic of investigation (food label usage) who commonlyhave a high sugar intake. However, participant perspectives inthe qualitative phase can be different from people with othersocioeconomic characteristics, mainly because our sample washighly educated. In this sense, findings from the qualitativephase have limited generalisation. Similarly, although the onlinesurvey was shared with several groups of people, our samplehas a sociodemographic profile different from the general adult
Frontiers in Nutrition | www.frontiersin.org 9 June 2022 | Volume 9 | Article 896784

Scapin et al. Sugar Label Formats in Brazil
FIGURE 3 | Proportional distribution of each reason for participants’ food choices, by food category. (A) Reason of product’ choice: whole-grain biscuit. (B) Reason
of product’ choice: cereal bar. (C) Reason of product’ choice: yoghurt. NIP, Nutrition Information Panel. FoP, Front-of-Package.
population in Brazil (59), requiring caution in the extrapolationof results. It is also important to note that certain elementsof the study design are likely to have influenced the results.
First, the study was conducted through an online platform,which was the only feasible way to get data collected due tothe COVID-19 restrictions enforced in Brazil when the data
Frontiers in Nutrition | www.frontiersin.org 10 June 2022 | Volume 9 | Article 896784

Scapin et al. Sugar Label Formats in Brazil
was collected. Because we collected the data via an onlineplatform that did not allow an interactive visualisation of theproducts, we only displayed the products’ image of the frontpanel of the product. Because of this, the FoP formats wereembedded in the images while the NIPs were displayed on theside. This arrangement gave FoP and back of pack (NIP + listof ingredients) information the same weight because participantssaw them simultaneously, which is different from what theysee for real-world packaged products. This may have drivenparticipants to pay more attention to the NIP than the FoP, aswe found in our results. However, a previous study has alsoreported a lower proportion of participants recalling seeing FoPblack-and-white warning symbol during food choice tasks (45).We tried to minimise this effect by instructing participants tozoom in on the images of the products during the tasks, butwe were unable to measure if they had done so. Nevertheless,caution should be taken when using our findings to informpublic policies. Another point is that many participants selectedthe “I wouldn’t choose any of these products” option duringthe food choice task, reducing the sample size for this outcomeand reducing the statistical power to find significant differencesbetween the groups.
It is also worth noting that only three food categorieswere tested, limiting the magnitude of the effects comparedto studies measuring the overall shopping cart or in a real-world environment. However, in our case, the number of setsand products within the sets had to remain limited given thattwo outcomes were investigated in the same survey, and thequestionnaire could not be too long for participants to complete.Finally, because the study was conducted before the approvedchanges in the food label rules in Brazil, we could not test theexact FoP format that will be implemented soon. However, ourlabel condition (iv) [FoP magnifying glass warning] is similar tothe approved format in Brazil, which allows for some inference ofthe effects found in our study to the approved format.
Practical Implications and Future ResearchThe results support the new changes in Brazil’s label policy,requiring a mandatory declaration of the total and added sugarcontents in grammes displayed in the nutrition informationpanel of all packaged foods available for sale in Brazil byOctober 2022. These changes will help consumers easily andquickly identify the sugar content of packaged foods duringtheir shopping, allowing comparisons between products withinthe same food category. Moreover, although results were non-significant, participants who had seen the FoP conditions hadthe lowest proportion choosing high-in-sugar products, whichsuggests that the inclusion of a mandatory FoP is beneficial.Our evidence suggests that an octagonal front-of-pack warningsimilar to the one used in other Latin-American countries wouldhave the best impact on incentivising Brazilian consumers toreduce their choices for products high in sugar. This is relevantconsidering recent evidence showing that most packaged foodsand beverages sold in Brazil have added sugar ingredients intheir composition (60), and that the Brazilian population is eatingmore added sugar than recommended by the WHO (11).
Furthermore, the enforcement of any FoP on labels shouldbe complemented by government campaigns that educateconsumers on how to use the labels and the differences betweensugars naturally found in fruit, vegetables and dairy productsand sugars added to the packaged food products, as well asthe differences between sugars and carbohydrates. In addition,as found during the focus groups, participants seem to trustinformation endorsed by the Health Ministry more than anydisclosure made by the food industry. Future researchers shoulduse the newly approved FoP formats being implemented in Brazilto test consumers’ perceptions, understanding, and food choicesin larger samples. In addition, groups other than universitystudents should be targeted for future qualitative research onfood label perceptions to ensure representation of a wide rangeof views and experiences. We also suggest that real-worldsupermarkets studies be conducted to investigate the effects ofsugar label formats during real decision-making processes.
CONCLUSIONS
Information about the sugar content of packaged foods displayedon either the NIP or FoP labels is a meaningful strategyto help Brazilian consumers compare products and correctlyidentify foods with higher sugar content among productswithin the same food category. While no significant differenceacross labels was observed for food choices, the sugar contentdisplayed in the NIP plus an octagonal warning demonstratedthe highest performance in stimulating consumers to avoid high-in-sugar products. Additional research is needed to understandhow sugar label formats impact the understanding and foodchoices of Brazilian samples from different socioeconomicgroups. Policymakers and researchers should be encouraged toinvestigate the efficacy of the approved food label changes inBrazil on consumer behaviour.
DATA AVAILABILITY STATEMENT
The raw data supporting the conclusions of this article will bemade available by the authors, without undue reservation.
ETHICS STATEMENT
The studies involving human participants were reviewed andapproved by the Human Research Ethics Committee (CEPSH)of the University of Santa Catarina (Process No. 3063750). Thepatients/participants provided their written informed consent toparticipate in this study.
AUTHOR CONTRIBUTIONS
TS was responsible for conceptualisation, methodology,formal analysis, investigation, writing—original draft, andwriting—review and editing. AF and RP were responsible forconceptualisation, methodology, writing—review and editing,and supervision. MS was responsible for formal analysisand writing—review and editing. SP was responsible for
Frontiers in Nutrition | www.frontiersin.org 11 June 2022 | Volume 9 | Article 896784

Scapin et al. Sugar Label Formats in Brazil
conceptualisation, methodology, resources, writing—review andediting, and supervision. NK, GB, and PU were responsible forconceptualisation and writing—review and editing. All authorscontributed to the article and approved the submitted version.
FUNDING
This study was financed in part by the Brazilian Federal Agencyfor Support and Evaluation of Graduate Education (CAPES) inthe form of a scholarship awarded to TS in Brazil and during herinternship carried out at the George Institute for Global Health,Sydney, Australia (Award Code No. 41/2018). The authors thankthe Brazilian National Council for Scientific and TechnologicalDevelopment (CNPq) of the Ministry of Science, Technology,
Innovation, and Communication for funding the wider projectNutrition Labelling of Brazilian Foods: A Thematic Analysisof the Use of Food Labels and their Influence on Consumers’Choices (Grant No. 440040/2014-0) and for the financial supportin the form of a research productivity scholarship granted to RP(Award No. 305068/2018-0). None of the sponsors influenced thestudy design, data collection or analysis, manuscript preparationor revision, or publication decisions.
SUPPLEMENTARY MATERIAL
The Supplementary Material for this article can be foundonline at: https://www.frontiersin.org/articles/10.3389/fnut.2022.896784/full#supplementary-material
REFERENCES
1. Felisbino-Mendes MS, Cousin E, Malta DC, Machado ÍE, Ribeiro ALP,Duncan BB, et al. The burden of non-communicable diseases attributable tohigh BMI in Brazil, 1990–2017: findings from the global burden of diseasestudy. Popul Health Metr. (2020) 18:18. doi: 10.1186/s12963-020-00219-y
2. Oliveira GMMd, Brant LCC, Polanczyk CA, Biolo A, Nascimento BR, MaltaDC, et al. Cardiovascular statistics—Brazil 2020. Arq Bras Cardiol. (2020)115:308–439. doi: 10.36660/abc.20200812
3. Murray CJ, Vos T, Lozano R, Naghavi M, Flaxman AD, MichaudC, et al. Disability-adjusted life years (DALYS) for 291 diseasesand injuries in 21 regions, 1990–2010: a systematic analysisfor the global burden of disease study 2010. Lancet. (2012)380:2197–223. doi: 10.1016/S0140-6736(12)61690-0
4. Bergwall S, Johansson A, Sonestedt E, Acosta S. High vs.low-added sugar consumption for the primary prevention ofcardiovascular disease. Cochrane Database Syst Rev. (2022)1:CD013320. doi: 10.1002/14651858.CD013320.pub2
5. Te Morenga L, Mallard S, Mann J. Dietary sugars and body weight: systematicreview and meta-analyses of randomised controlled trials and cohort studies.BMJ. (2013) 346:e7492. doi: 10.1136/bmj.e7492
6. Te Morenga LA, Howatson AJ, Jones RM, Mann J. Dietary sugars andcardiometabolic risk: systematic review and meta-analyses of randomizedcontrolled trials of the effects on blood pressure and lipids. AJCN. (2014)100:65–79. doi: 10.3945/ajcn.113.081521
7. Scapin T, Fernandes AC. Proença RPdC. Added sugars: definitions,classifications, metabolism and health implications. Rev de Nutr. (2017)30:663–77. doi: 10.1590/1678-98652017000500011
8. US Food andDrugAdministration.Added Sugars on the NewNutritional Facts
Label (2020). Available online at: https://www.fda.gov/food/new-nutrition-facts-label/added-sugars-new-nutrition-facts-label (accessed February 12,2021).
9. World Health Organization. Guideline: Sugars Intake for Adults and Children.World Health Organization (2015).
10. Mela DJ, Woolner EM. Perspective: total, added, or free? whatkind of sugars should we be talking about? Adv Nutr. (2018)9:63–9. doi: 10.1093/advances/nmx020
11. Fisberg M, Kovalskys I, Gómez G, Rigotti A, Sanabria LYC, García MCY, et al.Total and added sugar intake: assessment in eight latin American countries.Nutrients. (2018) 10:389. doi: 10.3390/nu10040389
12. International Sugar Organization. About Sugar: The Sugar Market. (2018).Available online at: https://www.isosugar.org/sugarsector/sugar (accessedJanuary 12, 2021).
13. Bueno MB, Marchioni DML, César CLG, Fisberg RM. Added sugars:consumption and associated factors among adults and the elderly.Rev Bras Epidemiol. (2012) 15:256–64. doi: 10.1590/S1415-790X2012000200003
14. WHO. Codex Alimentarius: Guideliness on Nutrition Organization Labelling.Food and Agricultural Organization of the United Nations. Rome:FAO (2012).
15. Food and Drug Administration. Changes to the Nutrition Facts Label.
United States Department of Health and Human Services (2016).Available online at: https://www.fda.gov/Food/GuidanceRegulation/GuidanceDocumentsRegulatoryInformation/LabelingNutrition/ucm385663.htm (accessed May 31, 2022).
16. Kanter R, Vanderlee L, Vandevijvere S. Front-of-package nutrition labellingpolicy: global progress and future directions. Public Health Nutr. (2018)21:1399–408. doi: 10.1017/S1368980018000010
17. Reyes M, Garmendia ML, Olivares S, Aqueveque C, Zacarías I, Corvalán C.Development of the chilean front-of-package food warning label. BMC Public
Health. (2019) 19:906. doi: 10.1186/s12889-019-7118-118. Boza S, GuerreroM, Barreda R, Espinoza M. Recent changes in Food
Labelling Regulations in Latin America: The Cases of Chile and Peru. WorldTrade Institute (2017). Available online at: https://www.wti.org/research/publications/1053/recent-changes-in-food-labelling-regulations-in-latin-america-the-cases-of-chile-and-peru/ (accessed May 31, 2022).
19. Ares G, Antúnez L, Cabrera M, Thow AM. Analysis of the policy processfor the implementation of nutritional warning labels in Uruguay.Public Health Nutr. (2021) 24:5927–40. doi: 10.1017/S1368980021002469
20. White M, Barquera S. Mexico adopts food warning labels, why now? HealthSyst Reform. (2020) 6:e1752063. doi: 10.1080/23288604.2020.1752063
21. Scapin T, Fernandes AC, Dos Anjos A, Proença R. Use of added sugarsin packaged foods sold in Brazil. Public Health Nutr. (2018) 21:3328–34. doi: 10.1017/S1368980018002148
22. Ministry of Health of Brazil. Resolução No 359, 2003: Aprova Regulamento
Técnico De Porções De Alimentos Embalados Para Fins De Rotulagem
Nutricional (Resolution—Rdc N. 359, of December 23, 2003: Approves the
Technical Rules for Packaged Food Serving Sizes for Purposes of Food
Labelling). In: Agência Nacional de Vigilância Sanitária (The National HealthSurveillance Agency), editor. Brasília: Ministry of Health of Brazil (2003).
23. Ministry of Health of Brazil. Relatório preliminar de análise de impacto
regulatório sobre rotulagem nutricional (Preliminary Report on Regulatory
Impact Analysis on Nutrition Labeling for Brazil). Brasília, DF: Gerência Geralde Alimentos. Agência Nacional de Vigilância Sanitária (The National HealthSurveillance Agency), ANVISA (2018).
24. Ministry of Health of Brazil. Resolução No 429, 2020: Dispõe sobre a rotulagemnutricional dos alimentos embalados (Resolution—Rdc No. 429, of October
2020: Approves the New Changes on the Food Labelling for Packaged Foods). In:Agência Nacional de Vigilância Sanitária (The National Health SurveillanceAgency), editor. Brasília: Ministry of Health of Brazil (2020).
25. Government of Canada. Front-of-Package Nutrition Labelling: September 18,
2017 Stakeholder Engagement Meeting (2017). Available online at: https://www.canada.ca/en/services/health/publications/food-nutrition/labelling-
Frontiers in Nutrition | www.frontiersin.org 12 June 2022 | Volume 9 | Article 896784
Scapin et al. Sugar Label Formats in Brazil
stakeholder-engagement-meeting-september-2017.html (accessed April 20,2022).
26. Mansfield ED, Ibanez D, Chen F, Chen E, de Grandpré E. Efficacy of“High in” nutrient specific front of package labels-a retail experimentwith Canadians of varying health literacy levels. Nutrients. (2020)12:3199. doi: 10.3390/nu12103199
27. Khandpur N, Mais LA, de Morais Sato P, Martins APB, Spinillo CG,Rojas CFU, et al. Choosing a front-of-package warning label for Brazil: arandomized, controlled comparison of three different label designs. Food Res
Int. (2019) 121:854–61. doi: 10.1016/j.foodres.2019.01.00828. Khandpur N, Sato PDM, Mais LA, Martins APB, Spinillo CG, Garcia
MT, et al. Are front-of-package warning labels more effective atcommunicating nutrition information than traffic-light labels? Arandomized controlled experiment in a Brazilian sample. Nutrients. (2018)10:688. doi: 10.3390/nu10060688
29. Mazzonetto AC, Fernandes AC, de Souza AD, Rodrigues VM,Scapin T, Uggioni PL, et al. Front-of-pack nutrition labels:perceptions and preferences of Brazilian adult consumers. Br Food J.
(2022). doi: 10.1108/BFJ-05-2021-0588. [Epub ahead of print].30. Santana I, Scapin T, Rodrigues VM, Bernardo GL, Uggioni PL, Fernandes
AC, et al. University students’ knowledge and perceptions about concepts,recommendations, and health effects of added sugars. Front Nutr. (2022).doi: 10.3389/fnut.2022.896895. [Epub ahead of print].
31. Scapin T, Fernandes AC, Curioni CC, Pettigrew S, Neal B, Coyle DH, et al.Influence of sugar label formats on consumer understanding and amount ofsugar in food choices: a systematic review andmeta-analyses.Nutr Rev. (2020)79:788–801. doi: 10.1093/nutrit/nuaa108
32. Clarke V, Braun V, Hayfield N. Thematic Analysis. Qualitative Psychology:
A Practical Guide to Research Methods. London: SAGE Publications (2015).p. 222–248.
33. Pan-AmericanHealth Organization.Nutrient ProfileModel. Washington, DC:PAHOWorld Health Organization (2016).
34. Jafari M, Ansari-Pour N. Why, when and how to adjust your p values? Cell J.(2019) 20:604–7. doi: 10.22074/cellj.2019.5992
35. Goodman S, Vanderlee L, Acton R, Mahamad S, Hammond D. The impactof front-of-package label design on consumer understanding of nutrientamounts. Nutrients. (2018) 10:1624. doi: 10.3390/nu10111624
36. Gupta A, Billich N, George NA, Blake MR, Huse O, Backholer K, et al.The effect of front-of-package labels or point-of-sale signage on consumerknowledge, attitudes and behavior regarding sugar-sweetened beverages: asystematic review. Nutr Rev. (2021) 79:1165–81. doi: 10.1093/nutrit/nuaa107
37. Khandpur N, Graham DJ, Roberto CA. Simplifying mental math:changing how added sugars are displayed on the nutrition factslabel can improve consumer understanding. Appetite. (2017)114:38–46. doi: 10.1016/j.appet.2017.03.015
38. Khandpur N, Rimm EB, Moran AJ. The influence of the new us nutritionfacts label on consumer perceptions and understanding of added sugars:a randomized controlled experiment. J Acad Nutr Diet. (2020) 120:197–209. doi: 10.1016/j.jand.2019.10.008
39. Mora-Plazas M, Aida Higgins IC, Gomez LF, Hall M, Parra MF,Bercholz M, et al. Impact of nutrient warning labels on choice ofultra-processed food and drinks high in sugar, sodium, and saturatedfat in Colombia: a randomized controlled trial. PLoS ONE. (2022)17:e0263324. doi: 10.1371/journal.pone.0263324
40. Talati Z, Egnell M, Hercberg S, Julia C, Pettigrew S. Consumers’ perceptionsof five front-of-package nutrition labels: an experimental study across 12countries. Nutrients. (2019) 11:1934. doi: 10.3390/nu11081934
41. Taillie LS, Hall MG, Popkin BM, Ng SW, Murukutla N. Experimentalstudies of front-of-package nutrient warning labels on sugar-sweetenedbeverages and ultra-processed foods: a scoping review. Nutrients. (2020)12:569. doi: 10.3390/nu12020569
42. World Health Organization. Front-of-Package Labeling as a Policy Tool for thePrevention of Noncommunicable Diseases in the Americas. Washington, DC:Pan American Health Organization (2020).
43. Grunert KG, Wills JM, Fernández-Celemín L. Nutrition knowledge, anduse and understanding of nutrition information on food labels amongconsumers in the UK. Appetite. (2010) 55:177–89. doi: 10.1016/j.appet.2010.05.045
44. Egnell M, Talati Z, Gombaud M, Galan P, Hercberg S, PettigrewS, et al. Consumers’ responses to front-of-pack nutrition labelling:results from a sample from the Netherlands. Nutrients. (2019)11:1817. doi: 10.3390/nu11081817
45. EgnellM, Talati Z, Hercberg S, Pettigrew S, Julia C. Objective understanding offront-of-package nutrition labels: an international comparative experimentalstudy across 12 countries.Nutrients. (2018) 10:1542. doi: 10.3390/nu10101542
46. Feunekes GIJ, Gortemaker IA, Willems AA, Lion R, van den Kommer M.Front-of-pack nutrition labelling: testing effectiveness of different nutritionlabelling formats front-of-pack in four European countries. Appetite. (2008)50:57–70. doi: 10.1016/j.appet.2007.05.009
47. Jáuregui A, Vargas-Meza J, Nieto C, Contreras-Manzano A, AlejandroNZ, Tolentino-Mayo L, et al. Impact of front-of-pack nutrition labelson consumer purchasing intentions: a randomized experiment inlow- and middle-income Mexican adults. BMC Pub Health. (2020)20:463. doi: 10.1186/s12889-020-08549-0
48. Mazzù MF, Romani S, Baccelloni A, Gambicorti A, A. cross-countryexperimental study on consumers’ subjective understanding and likingon front-of-pack nutrition labels. Int J Food Sci Nutr. (2021) 72:833–47. doi: 10.1080/09637486.2021.1873918
49. Tórtora G,Machín L, Ares G. Influence of nutritional warnings and other labelfeatures on consumers’ choice: results from an eye-tracking study. Food Res
Int. (2019) 119:605–11. doi: 10.1016/j.foodres.2018.10.03850. Vanderlee L, Franco-Arellano B, Ahmed M, Oh A, Lou W, L’Abbé MR. The
efficacy of ‘high in’ warning labels, health star and traffic light front-of-package labelling: an online randomised control trial. Public Health Nutr.
(2021) 24:62–74. doi: 10.1017/S136898002000321351. Machín L, Aschemann-Witzel J, Curutchet MR, Giménez A, Ares G.
Does front-of-pack nutrition information improve consumer ability tomake healthful choices? Performance of warnings and the traffic lightsystem in a simulated shopping experiment. Appetite. (2018) 121:55–62. doi: 10.1016/j.appet.2017.10.037
52. Saavedra-Garcia L, Moscoso-Porras M, Diez-Canseco F. An experimentalstudy evaluating the influence of front-of-package warning labels onadolescent’s purchase intention of processed food products. Int J Environ Res
Public Health. (2022) 19:1094. doi: 10.3390/ijerph1903109453. Jacobs SA, de Beer H, Larney M. Adult consumers’ understanding and
use of information on food labels: a study among consumers living in thePotchefstroom and Klerksdorp regions, South Africa. Public Health Nutr.
(2011) 14:510–22. doi: 10.1017/S136898001000243054. Miller LMS, Cassady DL. The effects of nutrition knowledge on
food label use. A review of the literature. Appetite. (2015) 92:207–16.doi: 10.1016/j.appet.2015.05.029
55. Grunert KG, Wills JM. A review of European Research on consumer responseto nutrition information on food labels. J Public Health. (2007) 15:385–99. doi: 10.1007/s10389-007-0101-9
56. Haidar A, Carey FR, Ranjit N, Archer N, Hoelscher D. Self-reporteduse of nutrition labels to make food choices is associated with healthierdietary behaviours in adolescents. Public Health Nutr. (2017) 20:2329–39.doi: 10.1017/S1368980017001252
57. Ni Mhurchu C, Eyles H, Jiang Y, Blakely T. Do nutritionlabels influence healthier food choices? Analysis of label viewingbehaviour and subsequent food purchases in a labelling interventiontrial. Appetite. (2018) 121:360–5. doi: 10.1016/j.appet.2017.11.105
58. Hoffmann NC, Symmank C, Mai R, Stok FM, Rohm H, HoffmannS. The influence of extrinsic product attributes on consumers’ fooddecisions: review and network analysis of the marketing literature.J Mark Manag. (2020) 36:888–915. doi: 10.1080/0267257X.2020.1773514
59. Instituto Brasileiro de Geografia e Estatística. Pesquisa Nacional De
Amostrar De Domicílios (PNAD). Características Gerais Dos Domicíliod E
Dos Moradores: IBGE, Diretoria de Pesquisas, Coordenação de Trabalho
e Rendimento (2019). Available online at: https://biblioteca.ibge.gov.br/visualizacao/livros/liv101707_informativo.pdf (accessed May 31, 2022).
60. Scapin T, Louie JCY, Pettigrew S, Neal B, Rodrigues VM, Fernandes AC,et al. The adaptation, validation, and application of a methodology forestimating the added sugar content of packaged food products when total
Frontiers in Nutrition | www.frontiersin.org 13 June 2022 | Volume 9 | Article 896784

Scapin et al. Sugar Label Formats in Brazil
and added sugar labels are not mandatory. Food Res Int. (2021) 114:110329.doi: 10.1016/j.foodres.2021.110329
Conflict of Interest: The authors declare that the research was conducted in theabsence of any commercial or financial relationships that could be construed as apotential conflict of interest.
Publisher’s Note: All claims expressed in this article are solely those of the authors
and do not necessarily represent those of their affiliated organizations, or those of
the publisher, the editors and the reviewers. Any product that may be evaluated in
this article, or claim that may be made by its manufacturer, is not guaranteed or
endorsed by the publisher.
Copyright © 2022 Scapin, Fernandes, Shahid, Pettigrew, Khandpur, Bernardo,
Uggioni and Proença. This is an open-access article distributed under the terms
of the Creative Commons Attribution License (CC BY). The use, distribution or
reproduction in other forums is permitted, provided the original author(s) and the
copyright owner(s) are credited and that the original publication in this journal
is cited, in accordance with accepted academic practice. No use, distribution or
reproduction is permitted which does not comply with these terms.
Frontiers in Nutrition | www.frontiersin.org 14 June 2022 | Volume 9 | Article 896784