Massachusetts Year 2016 Integrated List of Waters - EPA
143
0•• · •./"1 • 11- ~li' Vl l'IQ ll"' '"'A.t. .,no,c-eT t OM Massachusetts Year 2016 Integrated List of Waters Responses to Comments Pertaining to the Proposed Listing of the Condition of Massachusetts’ Waters Pursuant to Sections 305(b), 314 and 303(d) of the Clean Water Act CN 470.2 Commonwealth of Massachusetts Executive Office of Energy and Environmental Affairs Kathleen A. Theoharides, Secretary Massachusetts Department of Environmental Protection Martin Suuberg, Commissioner Bureau of Water Resources Kathleen Baskin, Assistant Commissioner
-
Upload
khangminh22 -
Category
Documents
-
view
1 -
download
0
Transcript of Massachusetts Year 2016 Integrated List of Waters - EPA

N• ♦♦ -1~•• ♦ •1 • 0•• · •./"1 • 11-~li'Vl l'IQ ll"' '"'A.t. .,no,c-eT t O M
Massachusetts Year 2016 Integrated List of Waters
Responses to Comments Pertaining to the Proposed Listing of the Condition of Massachusetts’ Waters Pursuant
to Sections 305(b), 314 and 303(d) of the Clean Water Act
CN 470.2
Commonwealth of Massachusetts Executive Office of Energy and Environmental Affairs
Kathleen A. Theoharides, Secretary Massachusetts Department of Environmental Protection
Martin Suuberg, Commissioner Bureau of Water Resources
Kathleen Baskin, Assistant Commissioner

NOTICE OF AVAILABILITY
This report is available via the Massachusetts Department of Environmental Protection’s (MassDEP) website: http://www.mass.gov/eea/agencies/massdep/water/watersheds/total-maximum-daily-loads-tmdls.html
DISCLAIMER
References to trade names, commercial products, manufacturers, or distributors in this report constituted neither endorsement nor recommendations by the Division of Watershed Management for use.
Massachusetts Year 2016 Integrated List of Waters
Responses to Comments Pertaining to the Proposed Listing of the Condition of Massachusetts’ Waters Pursuant to Sections 305(b), 314 and 303(d)
of the Clean Water Act
Prepared by:
Massachusetts Division of Watershed Management Watershed Planning Program
CN: 470.2
December, 2019
Massachusetts Department of Environmental Protection Division of Watershed Management
Watershed Planning Program 8 New Bond Street
Worcester, Massachusetts 01606

Table of Contents
Introduction....................................................................................................................................................1 Part I - Responses to General or Recurring Comments ...............................................................................3 Part II - Responses to Individual Commenters .............................................................................................7
Congamond Lakes group/Lake Management Committee, Town of Southwick..................................... 7 Jones River Watershed Association (JRWA) ........................................................................................9 Ipswich River Watershed Association (IRWA).....................................................................................13 OARS for the Assabet Sudbury & Concord Rivers..............................................................................19 Massachusetts Bays National Estuary Program .................................................................................25 Massachusetts Rivers Alliance ............................................................................................................28 United States Environmental Protection Agency (EPA) ......................................................................33 City of Cambridge, Cambridge, MA .....................................................................................................35 Buzzards Bay National Estuary Program ............................................................................................39 Neponset River Watershed Association (NepRWA)............................................................................45 Connecticut River Conservancy (CRC) ...............................................................................................57 Nashua River Watershed Association (NRWA)...................................................................................64 City of New Bedford, New Bedford, MA...............................................................................................70 Charles River Watershed Association (CRWA)...................................................................................76 Upper Blackstone Water Pollution Abatement District (UPWPAD) .....................................................90 Buzzards Bay Coalition (BBC).............................................................................................................96
Appendix ...................................................................................................................................................139 Notice of Availability: Proposed Massachusetts Year 2016 Integrated List of Waters..........................139
December, 2019 (7) Massachusetts Year 2016 Integrated List of Waters Responses to Comments CN: 470.2
ii

Introduction
This report presents responses to the comments received on the Proposed Massachusetts Year 2016 Integrated List of Waters (2016 Integrated List) that was prepared by the Massachusetts Department of Environmental Protection (MassDEP) in fulfillment of reporting requirements of sections 305(b) (Summary of Water Quality Report) and 303(d) (List of Impaired Waters) of the Clean Water Act (CWA).
The integrated list format provides the current status of all previously assessed waters in a single multi-part list. Each waterbody or segment thereof is placed in one of the following five categories:
1) Unimpaired and not threatened for all designated uses; 2) Unimpaired for some uses and not assessed for others; 3) Insufficient information to make assessments for any uses; 4) Impaired or threatened for one or more uses, but not requiring the calculation of a Total Maximum
Daily Load (TMDL); or 5) Impaired or threatened for one or more uses and requiring a TMDL.
Thus, the waters in Category 5 comprise the 303(d) List and, as such, are reviewed and approved by the U. S. Environmental Protection Agency (EPA). The remaining four categories are submitted in fulfillment of the requirements under § 305(b).
The Proposed Massachusetts Year 2016 Integrated List of Waters was placed on the MassDEP web site at http://www.mass.gov/dep/water/resources/tmdls.htm. Notice of its availability for public review and comment appeared in Vol. 88, Issue 8 of the Massachusetts Environmental Monitor (August 23, 2017) and was provided by electronic mail to approximately 150 different watershed associations and other interested parties (see Appendix). The public comment period ended on October 23, 2017.
A total of sixteen comment letters were received by the end of the public review period. Several commenters included with their letters data reports, graphical data displays and/or photographs in support of their comments. Three parties submitted data through MassDEP’s online data portal. All of the comment letters are included in this responsiveness document, in their entirety, unless otherwise noted. In some cases, lengthy attachments or appendices to the letters were not reproduced here in order to save space. All data submitted in support of the comments were reviewed for consistency with MassDEP’s guidelines for “External Data Submittals to the Watershed Planning Program” (http://www.mass.gov/eea/agencies/massdep/water/watersheds/external-data-submittals-for-the-wpp.html). Data determined to be scientifically sound and legally defensible (“Level 3 assessment-level” data) were considered when reviewing and responding to the comments.
This response document consists of two parts. Part I presents the responses to general, often recurring comments that convey broad programmatic areas of concern, such as the sources and age of data used for the assessments reflected in the 2016 Integrated List, as well as the lack of transparency with respect to the individual assessment and listing decisions. Questions and/or recommendations of the individual commenting parties regarding the assessment and listing of specific water bodies or assessment units (AU) are addressed in Part II. Here, applicable data and information used to make the original assessments and listing decisions are documented, case-by-case, in response to each site-specific comment. In addition, a determination is made with regard to the usefulness and applicability of any data submitted along with the comments. Finally, an explanation is provided on whether or not adjustments will be made to the final 2016 Integrated List based on each comment received.
MassDEP made a concerted effort to validate and report on its back-logged monitoring data and to streamline the assessment and listing process for the 2016 integrated reporting cycle. This resulted in the statewide assessment (i.e., all watersheds) of the shellfish harvesting, fish consumption, primary and secondary contact recreation and aesthetic uses, as well as the assessment of the aquatic life use-attainment status of fifteen watersheds and/or coastal drainages. It is a goal of the MassDEP to assess the status of the aquatic life use in the remaining watersheds during the next reporting cycle. Therefore, for the 2016 Integrated List, MassDEP is limiting its responses to comments pertaining to the aquatic life use to
December, 2019 (7) Massachusetts Year 2016 Integrated List of Waters Responses to Comments CN: 470.2
1

those fifteen watersheds for which the aquatic life use was assessed, but is responding to comments related to the other designated uses for all waters statewide. Comments and related data submitted as part of the 2016 Integrated List review that pertain to the deferred watersheds will be considered when completing the next assessment and listing process. A list of the watersheds scheduled to be assessed for the aquatic life use support status is presented in the table below. A final version of the 2016 Integrated List, incorporating the comments and responses presented in this document, will be submitted to EPA for final approval of the 303(d) List (i.e., Category 5).
List of watersheds and coastal drainage areas for which the assessment of the aquatic life use support status is scheduled for the next CWA assessment and listing cycle
Blackstone Connecticut North Coast Boston Harbor proper Housatonic Parker Cape Cod Merrimack Quinebaug Charles Mystic South Coast Chicopee Nashua Taunton Concord Neponset Weymouth/Weir
December, 2019 (7) Massachusetts Year 2016 Integrated List of Waters Responses to Comments CN: 470.2
2
Part I - Responses to General or Recurring Comments
MassDEP should provide more documentation supporting the assessment and listing of waters
Several commenters expressed their concern that MassDEP no longer promulgates individual watershed assessment reports, and that this has led to a lack of transparency with respect to the data and standards that were applied when making assessment and listing decisions. Commenters requested that MassDEP provide more information pertaining to the basis and rationale for assessing and listing individual waters so that these decisions can be more easily vetted by reviewers of the Integrated List.
MassDEP Response: MassDEP acknowledges the importance of providing transparency with respect to the basis for assessing and listing waters for 305(b)/303(d) reporting. The introductory narrative of the 2016 IR states that “Following the 2012 integrated reporting cycle the MassDEP discontinued the publication of individual watershed assessment reports in order to streamline the process and complete the assessments in a more timely fashion”. This streamlining process was undertaken to address a backlog of watershed assessments that was growing larger with each subsequent assessment and listing cycle. By eliminating the preparation of formal watershed assessment reports and automating the process of evaluating a number of the data flows utilized as part of the assessment decision process, MassDEP was able to complete a statewide assessment and listing decision update for the fish consumption, shellfish harvesting, primary and secondary contact recreation and aesthetic uses. In addition, the support status of the aquatic life use was updated for waters in nearly half of the watersheds and/or coastal drainages in the state.
While not presently formatted for public distribution, MassDEP is maintaining internal watershed “repository” documents where data and information supporting the assessments are stored, and the feasibility of providing more formal, public-facing versions of these documents will be explored in the future. For the 2016 IR cycle, MassDEP is providing documentation for individual assessment and listing decisions on a case-by-case basis as needed to respond to individual EPA and public comments received during the public review period (see Part 2). However, more information pertaining to the assessment and listing of particular waterbodies can be requested at any time by contacting the MassDEP’s Watershed Planning Program at (508) 767-2873.
MassDEP should provide more rationale for utilizing data that are over five years old
At least one commenter questioned the rationale for using data over five years old in light of the fact that the 2016 Consolidated Assessment and Listing Methodology (CALM) document states that it is MassDEP’s goal “to use the most recently validated data for making the use assessment decisions. Ideally these data are five years old or less.”
MassDEP Response: MassDEP strives to use the most recent data available that are deemed by MassDEP to be usable for assessment decisions. In some cases, however, data greater than five years old, and particularly biological, toxicological, and physico-chemical data generated by the MassDEP’s Watershed Planning Program (WPP) not yet utilized for assessment and listing decisions, are evaluated for integrated reporting purposes. Consistent with the CALM, unless significant changes in either land uses and/or effluent quality (e.g., WWTP upgrades, etc.) of discharges has occurred, MassDEP analysts typically consider such data to be representative of current conditions. If major changes that could affect water quality conditions in a receiving water occurred after water quality data were collected, then data collected prior to the changes would not be considered to be representative of current conditions and would not be used for assessments.
MassDEP should utilize more data from external sources, such as science-based watershed associations, and provide more guidance with regard to external data qualifications
Several commenters expressed concern that MassDEP is not using data from science-based watershed associations to inform assessment and listing decisions, even though those organizations often provide
December, 2019 (7) Massachusetts Year 2016 Integrated List of Waters Responses to Comments CN: 470.2
3

--
data that are much more recent than the data that are used by MassDEP. Commenters requested that MassDEP provide additional guidance with respect to the various levels of data and how watershed organizations can advance their data from Level 2 to level 3.
MassDEP Response: MassDEP recognizes the importance and value of monitoring activities performed by other groups, and strives to use quality-controlled data where appropriate in assessment and listing decisions. In 2014, MassDEP published guidance on submittal and review of external data, and created a mechanism for groups to provide surface water data for potential use in assessments. This external data submittal web “portal” was created to facilitate a more streamlined and standardized data submittal process, to foster greater collaboration between MassDEP and outside monitoring groups, and to provide guidance on QAPP submittal, data submittal, and MassDEP’s process for reviewing data submittals for quality and usability. The guidance stresses that submittal of data does not guarantee use by WPP in decision-making, due to possible QA/QC issues identified prior to and during the data reviews.
Within the last four years, WPP’s efforts to communicate to watershed monitoring groups in order to solicit data through the “portal” have included:
• Direct emails sent out on 5/20/2014 to ~24 groups announcing the data submittal “portal” • Direct emails sent in 9/2016 to 10 groups that had previously submitted data to solicit more recent
data • Direct emails sent and/or phone calls made in 9/2016 to ~30 groups that had not previously
submitted data • QAPP review comments recommending submittal of monitoring data through the “portal”, and
inclusion of text in the QAPP to this effect (on-going since 2014) • CWA “Vision” workshops • Miscellaneous correspondence as needed for additional information, clarifications, etc. (on-going)
Work on the 2016 assessments began back in March, 2014. As more data arrived through the “portal” in 2015, our available resources to review these data for usability in assessments were (and remain) limited, especially the capacity to perform these reviews in a timely fashion for use by assessment staff. Many of the data submittals were comprised of multiple years of data (for which we prioritized review of the more recent data) and lacked the necessary QC data. These and other factors prolonged the data review times. As we attempted to build capacity to better utilize external data with confidence, we were also making significant progress in streamlining our assessment procedures using our own data and that from other State agencies. Since we needed to move forward on the process improvement effort and generate a 2016 draft IR, it was decided that use of watershed group data for the 2016 cycle would be limited until we established greater capacity for reviewing and using external data. In order not to circumvent the progression of the assessment work, external data received after the assessment work was initiated for each watershed were generally not utilized in the draft decision-making process.
MassDEP has worked over the last two years to expand its capacity for performing external data reviews through the hiring of a new internal staff person and the formation of a UMass Data Collaborative. In the future, MassDEP intends to establish formal deadlines for data submittal and to increase its use of third-party data for water quality assessment.
For the 2016 reporting cycle, MassDEP conducted a statewide update for the Primary and Secondary Contact Recreational, Aesthetics, Shellfish Harvesting, and Fish Consumption Uses, and a partial update of the Aquatic Life Use for a sub-set of watersheds. Primarily, WPP data and data available from state agencies (MassDEP, MA DPH, MA DFG-DMF) were used. In addition, external data from the following groups were reviewed and evaluated for use in 2016 draft assessments:
• Deerfield RWA (benthic invertebrate, fish, habitat and bacteria data) • Millers RWA (benthic invertebrate data) • Buzzards Bay Coalition (WQ data)
Also, water quality data from the following groups were reviewed and evaluated for use in the final 2016 assessments during the public comment period:
December, 2019 (7) Massachusetts Year 2016 Integrated List of Waters Responses to Comments CN: 470.2
4

• Buzzards Bay Coalition • Nashua RWA • Neponset RWA • Charles RWA • Congamond Lakes Management Committee • Connecticut River Conservancy • USEPA
The following external data submittals were not utilized for the 2016 IR, since MassDEP was already actively engaged in assessments when the data were received. These included:
• Millers RWA bacteria data • Ipswich RWA 2014 benthic invertebrate and WQ data • Westport RWA data • Farmington RWA benthic invertebrate data (reviewed and deemed not usable as submitted) • Except for data submitted during the 2016 IR public comment period, any other external data
submitted after 2015 were also not included in the 2016 reporting cycle due to a streamlining effort that was employed by MassDEP staff to complete a statewide update for the Primary and Secondary Contact Recreational, Aesthetics, Shellfish Harvesting, and Fish Consumption Uses utilizing more standardized data sets available from state agencies (MassDEP, MA DPH, MA DFG-DMF), and to the fact that the Aquatic Life Use was updated for only a sub-set of watersheds for the 2016 IR.
Due to the delay in completing the final 2016 IR, MassDEP is evaluating alternatives for future integrated reporting that will synchronize actual IR publication with EPA’s intended publication dates. For the next cycle, MassDEP is striving to make a significant improvement in the amount of external data received, reviewed and utilized for 305(b) assessment decisions. External data submittals from the monitoring groups listed below are currently under review to identify applicable data relating to the assessment of the Aquatic Life Use (ALU) only. MassDEP plans to utilize those data that are deemed to be usable based on WPP’s detailed review. Please note that data relating to all other designated uses (only the ALU is being assessed in selected watersheds for the next IR) and to watersheds not currently under review will not be used in the next cycle but will be considered in a future listing cycle.
• Housatonic Valley Association • Upper Blackstone Water Pollution Abatement District • Charles RWA • Neponset RWA • Nashua RWA • Organization for the Sudbury, Assabet and Concord Rivers (OARS)
MassDEP should review and update the Massachusetts surface water quality standards every three years as required by the CWA
Several commenters expressed concern about the pace of review and updating of the Massachusetts surface water quality standards and noted that, pursuant to the CWA, states are required to hold public hearings at least once every three years (triennial review) to review and, where appropriate, revise their water quality standards. Details were requested pertaining to the proposed revisions to the standards for 2017 mentioned in the Proposed 2016 Integrated List.
MassDEP Response: MassDEP acknowledges the excessive time that has elapsed since the last revision of the surface water quality standards, as well as the further delay beyond the anticipated release of an updated version in 2017. Nonetheless, MassDEP has been working diligently to complete revisions to the standards that reflect the latest scientific information available, and to release a new version for public review and comment sometime in 2019. While taking longer to prepare than had been hoped, this regulatory package is also more comprehensive than originally planned and will include, among other changes, improvements to the surface water classification tables 1 through 27 (within section 314 CMR 4.06) including the listing of approximately 150 new cold water streams; an update to the Site-specific
December, 2019 (7) Massachusetts Year 2016 Integrated List of Waters Responses to Comments CN: 470.2
5

Criteria in Table 28; the adoption of EPA's 2012 recommended recreational criteria for bacteria; and the incorporation of a new toxic pollutants table listing EPA ambient water criteria for aquatic life and human health (new Table 29).
General request for more interaction with MassDEP’s monitoring and assessment programs
The Massachusetts Rivers Alliance (Mass Rivers), as well as other reviewers, made the following request: “We ask that MassDEP contact relevant watershed associations and Mass Rivers in advance of assessments with the monitoring plan, including field assessments schedules, sampling site locations, and proposed sampling parameters, for both the probabilistic and deterministic monitoring described in the Integrated List. In addition, we ask that the final Integrated List include a complete description of MassDEP’s deterministic and probabilistic sampling network, specifically including information on the frequency, number of locations, wet or dry weather monitoring and time of year for monitoring for all sites statewide monitored across the five year wadeable stream survey and the three-year lakes survey. We ask that the final Integrated List also reports which watersheds have received probabilistic and deterministic monitoring since 2012.”
MassDEP Response: While some of the recommendations and requests in this comment extend beyond the scope of the integrated reporting requirements for sections 305(b), 303(d) and 314 of the CWA, as defined in EPA guidance, much of the information requested is provided through other reports that can be found on MassDEP’s website. For example, summaries of the surface water monitoring activities carried out by MassDEP’s Watershed Planning Program every year from 2005 up to and including 2017 are available online at https://www.mass.gov/lists/annual-monitoring-summaries. These annual reports present brief overviews of the monitoring projects completed each year and include site locations, sampling frequency, and analytical coverage for both probabilistic and deterministic monitoring programs. In addition, general information pertaining to MassDEP’s water monitoring programs is presented at https://www.mass.gov/service-details/water-quality-monitoring-program..
In March, 2018 MassDEP released A Strategy for Monitoring and Assessing the Quality of Massachusetts’ Waters to Support Multiple Water Resource Management Objectives 2016 – 2025. This document updates and expands on the 2005 Monitoring Strategy, first released in September, 2005. Major components of the proposed monitoring program fulfill requirements of the CWA and are consistent with design and implementation criteria recommended by EPA in a guidance document entitled Elements of a State Water Monitoring and Assessment Program. Descriptions of MassDEP’s probabilistic monitoring designs for both shallow streams and lakes and ponds will be provided in appendices to this report. The monitoring strategy can be found online at https://www.mass.gov/files/documents/2018/02/26/dwm-monitoring-strategy-2016-2025.pdf.
Finally, MassDEP has embarked on the development of a long-term vision for the assessment, restoration, and protection of Massachusetts’ surface waters under the Clean Water Act (CWA) which is designed to increase communication and collaboration among all interested parties. In December, 2013, EPA announced a new framework for implementing the CWA: A Long-Term Vision for Assessment, Restoration and Protection under the Clean Water Act Section 303(d) Program (the Vision). The Vision was developed using over two decades of experience assessing and reporting on water quality and developing total maximum daily loads or TMDLs for impaired waters. States and EPA used those lessons learned to develop a framework for enhancing efficiency in achieving water quality improvement and protection goals. The framework consists of six key elements: prioritization, monitoring, assessment, alternatives, engagement and integration. Within this context, MassDEP’s Watershed Planning Program organized a series of workshops and invited a wide variety of stakeholders to provide input to the development of a 10-year vision for the assessment, restoration, and protection of surface waters in Massachusetts. To promote continued stakeholder engagement in the future, MassDEP intends to form a “Technical Advisory Committee (TAC) for Programs Under the Clean Water Act” comprised of representatives from key organizations interested in MassDEP’s water quality management programs including water quality standards, monitoring and assessment and TMDL.
December, 2019 (7) Massachusetts Year 2016 Integrated List of Waters Responses to Comments CN: 470.2
6
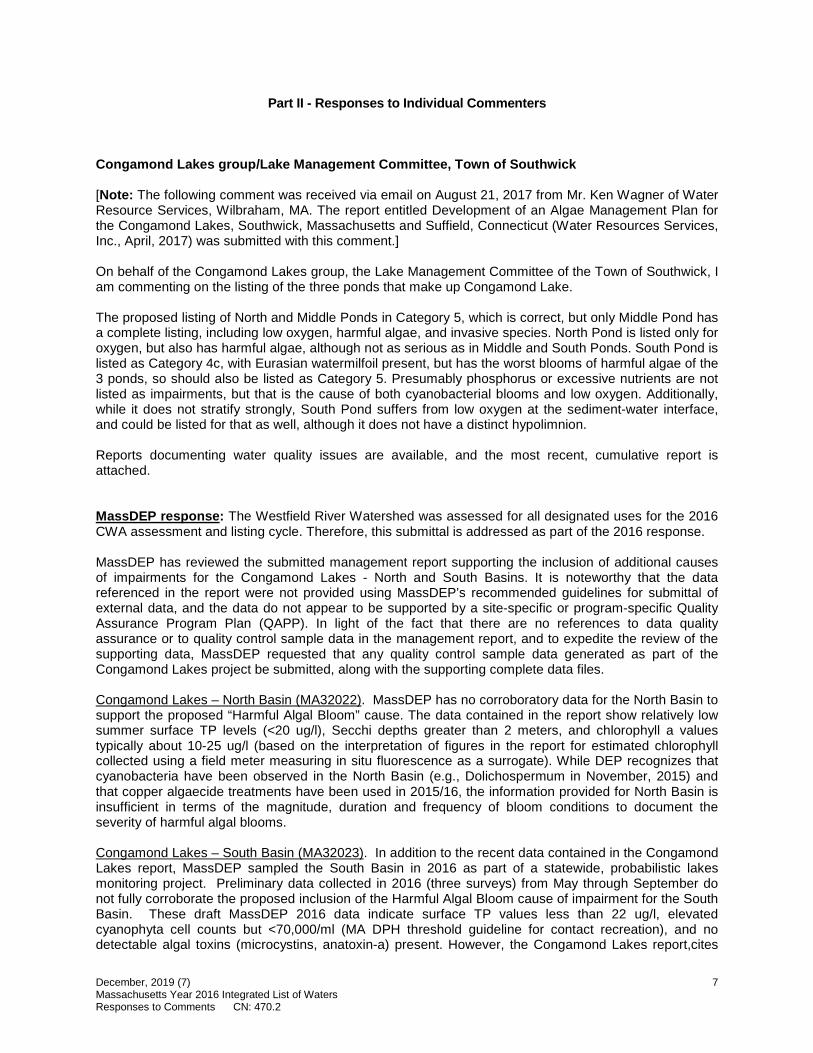
Part II - Responses to Individual Commenters
Congamond Lakes group/Lake Management Committee, Town of Southwick
[Note: The following comment was received via email on August 21, 2017 from Mr. Ken Wagner of Water Resource Services, Wilbraham, MA. The report entitled Development of an Algae Management Plan for the Congamond Lakes, Southwick, Massachusetts and Suffield, Connecticut (Water Resources Services, Inc., April, 2017) was submitted with this comment.]
On behalf of the Congamond Lakes group, the Lake Management Committee of the Town of Southwick, I am commenting on the listing of the three ponds that make up Congamond Lake.
The proposed listing of North and Middle Ponds in Category 5, which is correct, but only Middle Pond has a complete listing, including low oxygen, harmful algae, and invasive species. North Pond is listed only for oxygen, but also has harmful algae, although not as serious as in Middle and South Ponds. South Pond is listed as Category 4c, with Eurasian watermilfoil present, but has the worst blooms of harmful algae of the 3 ponds, so should also be listed as Category 5. Presumably phosphorus or excessive nutrients are not listed as impairments, but that is the cause of both cyanobacterial blooms and low oxygen. Additionally, while it does not stratify strongly, South Pond suffers from low oxygen at the sediment-water interface, and could be listed for that as well, although it does not have a distinct hypolimnion.
Reports documenting water quality issues are available, and the most recent, cumulative report is attached.
MassDEP response : The Westfield River Watershed was assessed for all designated uses for the 2016 CWA assessment and listing cycle. Therefore, this submittal is addressed as part of the 2016 response.
MassDEP has reviewed the submitted management report supporting the inclusion of additional causes of impairments for the Congamond Lakes - North and South Basins. It is noteworthy that the data referenced in the report were not provided using MassDEP’s recommended guidelines for submittal of external data, and the data do not appear to be supported by a site-specific or program-specific Quality Assurance Program Plan (QAPP). In light of the fact that there are no references to data quality assurance or to quality control sample data in the management report, and to expedite the review of the supporting data, MassDEP requested that any quality control sample data generated as part of the Congamond Lakes project be submitted, along with the supporting complete data files.
Congamond Lakes – North Basin (MA32022). MassDEP has no corroboratory data for the North Basin to support the proposed “Harmful Algal Bloom” cause. The data contained in the report show relatively low summer surface TP levels (<20 ug/l), Secchi depths greater than 2 meters, and chlorophyll a values typically about 10-25 ug/l (based on the interpretation of figures in the report for estimated chlorophyll collected using a field meter measuring in situ fluorescence as a surrogate). While DEP recognizes that cyanobacteria have been observed in the North Basin (e.g., Dolichospermum in November, 2015) and that copper algaecide treatments have been used in 2015/16, the information provided for North Basin is insufficient in terms of the magnitude, duration and frequency of bloom conditions to document the severity of harmful algal blooms.
Congamond Lakes – South Basin (MA32023). In addition to the recent data contained in the Congamond Lakes report, MassDEP sampled the South Basin in 2016 as part of a statewide, probabilistic lakes monitoring project. Preliminary data collected in 2016 (three surveys) from May through September do not fully corroborate the proposed inclusion of the Harmful Algal Bloom cause of impairment for the South Basin. These draft MassDEP 2016 data indicate surface TP values less than 22 ug/l, elevated cyanophyta cell counts but <70,000/ml (MA DPH threshold guideline for contact recreation), and no detectable algal toxins (microcystins, anatoxin-a) present. However, the Congamond Lakes report,cites
December, 2019 (7) Massachusetts Year 2016 Integrated List of Waters Responses to Comments CN: 470.2
7

cyanobacteria observations in the South Basin (e.g., Aphanizomenon in November, 2015), and notes many occasions of surface TP concentrations greater than 20 ug/l and spikes (>60 ug/l) in chlorophyll a levels on two occasions in 2016. Based on the report, there were numerous occasions in 2015-16 when Secchi disk depth readings were between 1-2 meters. Elevated chlorophyll a values (>30 ug/l) were also observed by MassDEP during a July, 2016 survey (Secchi depths observed by MassDEP in 2016 ranged from 2.1-2.4 meters). Although the evidence is not entirely conclusive, and given the fact that copper algaecide was used in 2015/16 to treat blooms, there appears to be sufficient weight-of-evidence to support impairing the Aquatic Life Use for the Nutrient/Eutrophication Biological Indicators cause (Category 5).
With regard to the proposed inclusion of the Dissolved Oxygen cause of impairment for the South Basin, the data from the Congamond Lakes report indicate that a significant percentage of the lake area and volume exhibit dissolved oxygen (DO) levels less than 5 mg/l in the bottom waters. The summer (June, July, Aug) profiles show DO concentrations consistently below 5 mg/l at 5 m and deeper (sometimes slightly shallower at 4 m). Draft MassDEP data collected in 2016 corroborate low levels of dissolved oxygen below approximately 6 meters on each of three surveys. Based on the available information, MassDEP concurs with the addition of Dissolved Oxygen as a cause of impairment to the Aquatic Life Use.
December, 2019 (7) Massachusetts Year 2016 Integrated List of Waters Responses to Comments CN: 470.2
8

Jones River Watershed Association (JRWA)
December, 2019 (7) Massachusetts Year 2016 Integrated List of Waters Responses to Comments CN: 470.2
9

Mr. Arthur Johnson MassDEP
October 10, 2017
Division of Watershed Ma:nage.me,nt W ater:shed Plannmg Program 8 Ne-v Bond Street Worcester. MA 0 1606. Arthnq obmon,a .stlll:e..ma u:;
RE: Massadru,.e1ts Year _o 16 Inte2rated List of\\ a ers.: Propose-ti listing of the Condition of Massadms,etts· Water:s Pnnmantto Sections 30S(b~,. 314 aind 303{d) of the Clean Water Act
Dear 1k Johnson:
The Jones River W 11:ershed .Association (JR WA) in Kingston, MA offers the following comments relative to the proposed integrated fat ofwatei:s for _QI6. For thirty years the Jones Rivex \Vate.rs.b.ed Association bas been working ti.Ieiessly on 11rater qn'lll.ity improv,ements habit.at improvement~, wa.ternhed protectio·n, and adlvoca..cy for healthy fakes and rivers. As you say in yonr report, "The benefits to sociely of d e-an water can hardly be over-stated .. " That fa a gui:ding principle of cmr organization a.nd our woo:k. \\ e rnllabornte \1.'i:lb. Joca.l nmnic.ipaclitie~ oUJ.er N GOs, and. the regional comrnmnif'j in order to achieve many of the s-a:me goals a.s the Clean Water Act And we rely on the au!horiity of the C\l A to help n,; achieve thos-egoa.ls.
Specific comments:
·•
·•
In several of the. tablecS MassDEP define£ segments of the Jones Rive;i- in Kingston rela,li,;re to, -~dam (NATID·:MA04l-396) near \li. apping Road". This dam was fully rem.o\•ed in 2011. It no longer exists ru;. a specific feahne which would physica.11y define a segment of the .fone.s River. MassDEP may want to re\'t'llt how the Jones R.i\.·er is segmented on ,the 303(d) hst. At a mm.imum, all references to this dam should eilher be removed or noted! a..s "former~.
The only lake phos.phoms TMDL for tills update is for Monponsett Pond. Unfort1.m11tel!y due to interbasin lr.msfers, ms pond is an important driver of water quality m bolh the Taunton River basin and the South Coastal basin. In January, '.!0 17 JRWA prmrided e.xtensive collllllents on the Drn.ft TMDL report for Monpansett Pond. We hope fuat those comments will be addressed in lhe f':irn.al 'I'MDL for Monpomett Pond. however we have no way to know if tha t will be the case. As a result, it con.aems us -that the proposed in.t-e.grnted fu t of waters does not 17e1J!ect the ch_:mges that m.aiy or may not came with the F inal Monpon-wtt Pond ThIDL. We think i- is important that we. have an opportunity fo review and comme.m on my change. th.e TMDL maj have to fui:i:J 1016 lllfograted Ii.s.t of .va et .
As noted m fue report, 'M ajor themes inhere;nt in both lhe Ma.ssDEP' s water management programs and the monitoring elements th-at support th.em a.re ... fue focus on fue water?;hed as the
December, 2019 (7) Massachusetts Year 2016 Integrated List of Waters Responses to Comments CN: 470.2
10

fundamental pl:mnmg writ for water quality management., As a. watershed association ourselves
ffi:WA strongl . agrees "':iith dris app1oaeh. I dlo~s not appear that thi'l approach is fl!lll:y embraoe,dl when it comes in water transfers_ Th.e iuterhasin. lransfor:s from .Monponsett Pond to i]ver I.ake effecti\iel expand Sililer L:d:e's wat,ernhed to mdude the ar,eas armmd Monponsett Ponili. ·\Jj e mge Ma~sDEP to· oru;:ider lhe ''urnter:shed" i.mpliC:tltions of ::ilLowed v.rateT lransfera_ The polfotants of the C.\ite,gory 5 Mo1:1pfil1Se:tt Pon<l ar,e rmrl:in.ely l:rarls-f:e.rred in to the Category 4C' Silver Lal.."e:·. Uris mn.s., counter to, the goals and principle,;; of l:he C\l,; A.
Gi"neral c:o:mm~11ts:
• MassDEP describes he exte:mal somces it use.s for availi.bie da _ Mas .. DEP sh.ornd consid:e·r addm.g the Department of Conseivt1Jtiou and Rec:rea.ti.on, Office of Dam Safe!} (ODS) to the list of
sources. There are dozen,<; of dam rem.ovals and modifications occurring in Massachusetts. th.a have significant impacts on the quality of our rivers. It rui.ould be ,f'35)' enough for MassDEP to
eras;;. check their mte~a ed. wate,n; list with ODS in order to b.ave 1he most up-to-date infonnaho:n about dams that have been. r·emo1.sed. MassDER is also a gooo! . .sm.1rne- of infom1a.tion 011 dam re,movals. Howeve.L sinc.e .Ma.ssDEP ahe:idy fats MilSsDER as a data source 1mt doe;; not seem to "be capturiing dl:.im removal information, i.t '-',.-ould be pmdent to also confer with ODS. The tables in fue Dr11ft _0 H'i Integrated list of Waten i!nclude "category · and impaimlent" for
eac.h asr.essment mri . The .integrated l'I.Hiter;;. data la) er on MassGES also includes a comm:n. for "source.". Tiris "somce column provides valuable iuformation a.bout ,vhat i..s c:mmig ilie "'i.mpaim:I.enf' .in ,e .ch asses/imen · unit F' or exam;p]e,_ in the Jones Rivei[ there: are many l!i:sted 'i.mpaim:I.en.ts" including:- Fish-Passage BanieT, Low flow alterations, Aquatic Pllants Mm:rnphyte5_ Excess A]g . Growth, etc. The MassGIS data layer als.o include:. iille somce" of these unpainnems ' .including: Hydtoslmcrure Impacls on F'isb. Pas.;,age, F'J.o,,, Al eraticms from. Water Divef.sions etc. These "sources" :should be included irn the tables ,of the 20 ] 6 Integrated. List of Waters. Allowing all stake;holdecs to kuo,w aud. rutdecstand fh.e rowces of ilie impa:innents
will allow for more effi ient and foCUS1ed wid,e.r qna.li:ty ilnpro11'einenits_
We greatly appTeciate yom depa.Jtmenfs efforts towards updating the integrated list of waters. We Ii.ope these comments add!. \'alu.e to fue :fi:ea] document
Sincerely p:>,~rJ Exrecuti~ Jones River \\ atershed Association
r-Ay-r~ Alex 'iaosfi.eJd Ecology Program. Director Jones River Watershed Association
MassDEP responses to the JRWA’s general comments:
• MassDEP has been working with both the Division of Ecological Restoration (DER) and the Division of Marine Fisheries (DMF) to update information pertaining to dam removals and fish passage issues and is integrating this information case-by-case as each watershed is assessed for aquatic life use support status. New assessment guidance is in development and will be described in the 2018 CALM document, particularly with respect to the status of diadromous fish habitat. The Jones River, situated in the South Shore Coastal Drainage Area, was not assessed for the aquatic life use for the 2016 CWA assessment and listing cycle but will be assessed for 2018. The status of fish passage and dam removals will be updated for the South Shore coastal drainage area in accordance with the new guidance.
December, 2019 (7) Massachusetts Year 2016 Integrated List of Waters Responses to Comments CN: 470.2
11

• While causes of impairment are presented in categories 4 and 5 of the Integrated Report (IR), MassDEP has never included the information on sources of impairment in this document, primarily due to space constraints. All assessment information (i.e., segment definitions, use-support status, causes and sources of impairment, etc.), for each designated use in every assessment unit, is stored in an EPA-designed electronic database (see below). MassDEP attempts to strike a balance between the amount of information presented for each assessment unit and the overall size of the IR report generated from that database. In doing so, MassDEP selects the output files that it deems most essential to include in the version of the IR released for public review and comment. MassDEP acknowledges that useful information, such as uses that are supported in waters not supporting other uses as well as sources of impairment, is not available in the IR document. As noted in JRWA’s comment, however, source information is provided in the MassGIS integrated list datalayer created after the final version of the IR is released and Category 5 (i.e., the 303(d) List) is approved by EPA. Furthermore, please be advised that the assessments reflected in the draft 2016 IR were stored in the Assessment Database (ADB) which is no longer supported by EPA. Therefore, all assessment information will be migrated from the ADB to the new EPA-developed ATTAINS relational database when the final 2016 IR is completed. The new ATTAINS database will provide direct access, through a web-based interface, to the assessment decisions for all designated uses and for all assessment units, including causes and sources of impairment, where applicable.
MassDEP responses to the JRWA’s specific comments : The South Shore Coastal Drainage System was not assessed for the Aquatic Life Use during the 2016 CWA assessment and listing cycle. Therefore, the JRWA’s comments pertaining to the Aquatic Life Use will be considered when completing the next assessment and listing process. Other comments are addressed below.
• MassDEP will review the descriptions of Jones River segments MA94-12 and MA94-13 and will adjust them to reflect the fact that the dam near Wapping Road has been removed.
• The JRWA expressed some concerns about the phosphorus TMDL for Monponsett Pond and the effect of the TMDL on the listing status of the pond for 2016. The JRWA submitted extensive comments on the Draft TMDL and these will be addressed as part of the response to all comments on the TMDL. However, it should be noted that, based on EPA’s review, MassDEP revised the stormwater loading estimates in the Draft TMDL, and this revision will be made available for additional public review and comment in mid-2019. Following this review, a single document will be prepared that addresses all of the public comments received during both the initial review and the review of the revised TMDL. Nonetheless, changes to the TMDL should not affect the 2016 integrated list. When all pollutants associated with Monponsett Pond are covered by one or more TMDLs, the pond will be listed in Category 4A, but the pond will still be considered impaired until it can be demonstrated using actual monitoring data that the designated uses are supported. Once approved by the EPA, the final TMDL will be posted on MassDEP’s website.
• JRWA’s comment concerning the interbasin transfer of water from Monponsett Pond to Silver Lake is outside of the scope of assessing and listing waters pursuant to sections 305(b) and 303(d) of the CWA. MassDEP acknowledges that, contingent upon the frequency and magnitude of water transfers from Monponsett Pond to Silver Lake, those interbasin transfers may “effectively expand Silver Lake’s watershed to include the areas around Monponsett Pond”. However, MassDEP does not infer the water quality condition of water bodies from an assessment of their watershed characteristics (e.g., land use). Rather, water quality and/or biological data and information must be available from the actual water body in question in order to make an assessment. Therefore, for assessment and listing purposes, Monponsett Pond and Silver Lake are independently evaluated based on the availability of scientific data from each water body.
December, 2019 (7) Massachusetts Year 2016 Integrated List of Waters Responses to Comments CN: 470.2
12
Ipswich River Watershed Association (IRWA)
December, 2019 (7) Massachusetts Year 2016 Integrated List of Waters Responses to Comments CN: 470.2
13

October 2.3, 2017
Arthur S. Johnson MassDEP Diviswn of Watershed Management Wa,te-rshed Plarmirig Progrnm a New Bond St. Worce· ter, MA Ol806
It!!: Com ment:s on 2.016 lrrte-gr~ed l..ist of Wi!ters
Dear Mr. Johnson,
Th •~wtch Riv@ rWate:rslned ASso-ciailion ha the fo l1lowil"lt; comments on the Prop&Sed Massachu$el:ts Year 2016 Integrated Us! of Waters. Th@s@oamrnents focus on. the ;,emoval of ;imp.i,ii:ments for several stream segments a,nd observatfonail evldlen.ce to :;upport desiBnatin1 spedfk impa rmen-ts..
w e note ·ma· 5he!i blo.i~s~~1r1 11H. Wd!. H:!111uv~t.l as. irnpairme11 for • owl~tt Drook (MA92·l7) n,nd Me,rtin! Broo·k (MA92-08). The e)C!pliinatlon given i.s "'Appl"c:able WQ.S atta ined accordi11g ro new asise>sment method.~ We• fuel that chi!11ges in assessment meth.ods shmdd not re s.ult in the remova l of • h i1mpaiirment unless there is recent fish commu,nity ,md habitat data ~howing o,therwi e. ·i:or Martins Brook in particula,r, lh.ibTtat and wate r quality conditions do notsupport removal of fis,h bioassessments impairment Th•e; a.U:ac:l1ed photos. are observational -evl,del'lce of dry strea,mbed conditions th at pre11ait.ed along Martins Brook in 2016. Martlns Brook routine~'{ goes dry 1iin U1e sumrner and str12amflow data fol" a t.a ion an M11r ·ns Brook, a.va ilal:lle th rough ti~ Mass. Division o,•f co,logical Resta1raticm Rl,FLS :Pm,gram (www.rifls.or!id, dornment thi~ oonditi.on. This evidence would wammt the continued deslgnatfon of imp,airments for fish bio,[email protected],ments in Martins Brook nd that impaim,ent fo,r iow #low alte rations should also .I! included for Martins Brook.
The Mil s Rive r (MA92-03) ad ecal ooliform impal m-ent remove-d due to, changes in he wat@r qLJ1ality standardi, Chang@:; to the water quality standard from fecal coliform to f,coli, :s,hould not resul in r mov.i l of his impairme nt without data for the new standard sh.owing othe1rwis:e.
No rns Br-oo,I< (MA92-11) lriad total suspe t1dl!!d solids (TSS) am! turbidity removed as impa ll'm nts wlth th@ i!!Kplan atio r1 th al the origina f basis forth listing was irnmrrect. We ask thauhe ,data sou rc.e a r d crlt a be tefererm~d to show why this f,mp,akm@nt i.wa'.'i. re-,eva luated.
Wills Brook (MA92·10) had fecal mliform and dissolved oxygen rnmo,..e-tl as imp.-i irm ~nts. As stat.eel pr viously, fet:a l «i1"form <-hm ilrl 11nt llP. rP..moved due to a chilln e· n ·the .s.ta,ndard withoiut new data showing otherwise,
Also, as stated p, vlously, we ask tha t he el<planation for removit)i:J diSS-Ol11ed oxYBen re Ferel'lc:e th@ data and crite·r a , ho,wlng why th e: o,rlgina-1 basis for l:lsting was incorm~t.
Thank you for consid, rin-g our commen ls. Pl a · oo:nti!<:t us if you h ve questions .
~
·oce e ly, L A-/
. astoriguay EXe-cutlve Director Ipswich River Water hed Association
143 Cmmll,• Road "' P.O. BOJ1 576 • lp!-\••lch, MA ffl LJ38 • <78.41£.8200 • .ix 978.4 l 2.9100 • wv.w.1pswichrivt".r,ar<J
December, 2019 (7) Massachusetts Year 2016 Integrated List of Waters Responses to Comments CN: 470.2
14

Martins Brook ,dry srreambed Taken
B/3/201.6, orth Read'ing, MA_ Lat
42_.577754, lo1'g- -71.129198
artim Brno d'ry5trearnbed. Taken
7 /24/16,, North Reading, MA. Lat
42.571564, 'Long. -71.'.l.01197
Martiru Brnok dry strearnlbed at Rt. 62
cro~sin:g and wefr. Taken 8/3/2.01.6,
Wilmington, MA Lat. 42_579646, ILong_ -
71.1389'.28
MassDEP response : The Ipswich River Watershed was assessed for all designated uses for the 2016 CWA assessment and listing cycle. Therefore, all of the IRWA’s comments will be addressed as part of the 2016 response.
• Howlett Brook (MA92-17) was first listed as impaired due to the results of “fishes bioassessment” in 2004, based on MDFW surveys in 1999 and 2002 that found the fish community heavily dominated by macrohabitat generalists with few fluvial fish present. At that time, MassDEP’s assessment methodology (later codified in the 2012 CALM guidance document) specified that in
December, 2019 (7) Massachusetts Year 2016 Integrated List of Waters Responses to Comments CN: 470.2
15

order to be considered in support of the aquatic life use, streams must contain fish communities “well represented by multiple age classes of fluvial specialist/dependent species” (see below).
2012 CALM Guidance:
Use is Supported Co ld Water Filshe
Us, · :S lmpalriidl Coi'.dl 'Wa,ter Fish -
Multlpte age classes ,~lndicallve or reproducing populations) of .a.my oolcl water fish
No Ush found or c:t'.Jld water species absent, DEL TS with abnormal fish histol
Use is Supported Warm1 Water Fisllie .· ·
Us.e "'s fmpairedl Warm Wateil' F she
In lotfc ernvironments the fish population should be well represented by multiple .age classes ,of lluvlal speolatl9!1d:epe-ndents
No fish found or fltNial fish ·were absent o, relaUvely scarce (few numbers), D1ELTS INilh ahnormal'lish histology
s cies (Note: DELTS refers to “Deformities, Eroded fins, Lesions, Tumors)
The MassDEP assessment methods were refined in the 2016 CALM guidance to differentiate between moderate/high-gradient streams and low-gradient streams when evaluating fish population information. Under the new guidance, fish communities in low-gradient streams need not necessarily be well-represented by fluvial specialist/dependent fishes to be considered in support of the aquatic life use as long as the species present are intolerant or only moderately tolerant of environmental stress (see 2016 guidance in the table below). Howlett Brook is a low-gradient stream along its entire length and, therefore, the above-mentioned fish population data from 1999 and 2002 were re-evaluated in light of the new CALM guidance. Since some fluvial specialist/dependent species, as well as intolerant or moderately tolerant fish, were present in the Howlett Brook samples, a decision of no impairment was rendered and the cause “fishes bioassessment” was removed.
2016 CALM Guidance:
Use is Supported Use is lmpair,ed Cold Water Fishery Cold Water Fishery
Presence of co ld water fi shes, mult iple age Absence of co ld water fi shes, or classes (indicat ive ofreproducin g dramat ic populat ion reduct ions relat ive populat ions) of any ~ .IJnQom, presence of to histori cal samples, DELTS with YOY iwJIDQUid~- abnormal fi sh histology _
Use is Supported Use is lmpair,ed Warm Water Fishery Warm Water Fishery
In moderate to high gradient streams the In moderate to high gradient st reams fi sh community should include fluv ial fluv ial fi sh are absent. In low gradient specialisUdependents species or at least streams no fi sh found or the absence one fluv ial species in moderate abundance. of fi sh which are intolerant or In low gradient streams, at least one fluv ial moderately tolerant to environmental species , or species whi ch are intolerant or perturbations. DELTS with abnormal moderately tolerant to environmental fi sh histology . perturbat ions should be !) resent
(Note: YOY refers t o “Young-of-the-year” DELTS refers t o “Deformities, Eroded fins, Lesions, Tumors)
• Martins Brook (MA92-08) was first listed as impaired by “fishes bioassessments” in 2010 when MassDEP migrated its historical assessment information from the Waterbody System (WBS) to the Assessment Database (ADB), as required by EPA. At that time, Martins Brook was listed as impaired by habitat alterations, low dissolved oxygen and pathogens. The application of the impairment code “fishes bioassessments” to Martins Brook during the conversion to the new database was an error. In response to the IRWA’s comment, MassDEP reviewed historical fish community information. Fish community sampling was conducted by DFWELE in July 1999. A
December, 2019 (7) Massachusetts Year 2016 Integrated List of Waters Responses to Comments CN: 470.2
16

I I
total of 139 fish (nine species) were collected. Dominant fish species included creek chubsucker, redfin pickerel, American eel, and white sucker. Pumpkinseed, chain pickerel, swamp darter, yellow bullhead, and a bluegill were also present. Sixty-two percent of the fish collected can be classified as macrohabitat generalists, while fluvial dependents and specialists comprised 38% of the sample. This information would lead to a determination that the aquatic life use was supported under both the 2012 and 2016 CALM guidance (see previous comment). Nonetheless, MassDEP’s biological survey of Martins Brook in 2005 revealed a severely impaired macroinvertebrate community and this impairment was added to this assessment unit in 2016.
Included with IRWA’s comment letter were photographs, taken in 2016, of dry streambed conditions in Martins Brook, and a request to add “low flow alterations” as a cause of impairment. Observations of low or no stream flow, such as those depicted in these photographs, are useful for highlighting streams that may be impaired and are in need of further confirmation. However, long-term stream discharge data and related information pertaining to the frequency, magnitude and duration of low-flow events are needed in order to determine whether observations of extreme low flow are representative of typical conditions. In this case, it is important to note that northeastern Massachusetts, including the Ipswich River Watershed, was subject to a drought warning throughout July – October, 2016 making it difficult to distinguish between anthropogenic impacts from natural conditions. For this reason MassDEP is not currently adding “low flow alterations” to this segment.
It should be emphasized here that stream flow is not effectively managed through the CWA 303(d) listing and TMDL process. Rather, as a part of the Sustainable Water Management Initiative (SWMI), MassDEP along with EEA and its member agencies, worked with numerous stakeholder groups to develop a new policy framework for comprehensively managing water withdrawals in the Ipswich River Watershed and throughout the Commonwealth to ensure an appropriate balance among competing water needs and the preservation of water resources. More information pertaining to SWMI can be found at https://www.mass.gov/guides/sustainable-water-management-swmi-technical-resources.
• Miles River (MA92-03) was originally listed as impaired by “pathogens” in 1998 and, without any new data with which to make an assessment, this cause code was mapped over to “fecal coliform” in 2010 when the transition to the Assessment Database (ADB) was made. Fecal coliform was not removed from this AU in 2016 simply because the indicator in the standards was changed to E. coli. Rather, E. coli data from five discreet sampling events in 2005, which had not been previously used for assessment, were used to determine that the primary and secondary contact recreational uses were supported in this brook and that the original bacterial indicator, fecal coliform, could be removed (see table below).
Summary of MassDEP Watershed Planning P rogram E. coli data collected in 2005 from Miles River at driveway of #187 County Road, (across from intersection with Lakeman Lane), Ipswich
UniqueID Year Date First Sample
Date Last Sample
Sample Count
Geometric Mean
Bacteria Type
W0121 2005 05/24/05 09/27/05 5 114 E. coli
• Norris Brook (MA92-11): This brook was first listed as impaired by suspended solids and turbidity in 1998 and with no new data or information upon which to base new assessments, these cause codes were carried over to each new listing cycle up to and including 2014. The original listings were apparently based on data collected during a MassDEP water quality survey in 1995. However, when these data were re-examined as part of the 2016 assessment and listing process, it was found that the total suspended solids data were low, ranging from < 2.5 mg/L to 3 mg/L (N = 3) (MassDEP WPP Data Warehouse1994-2004), indicating that the original listing was in error. In addition, the turbidity data from 1995 were either censored or qualified as likely
December, 2019 (7) Massachusetts Year 2016 Integrated List of Waters Responses to Comments CN: 470.2
17

I I
inaccurate (MassDEP WPP Data Warehouse 1994-2004), thus indicating that the original listing decision was inappropriate.
• Wills Brook (MA92-10): Dissolved oxygen was originally added to the 303(d) List in 1998 based on data collected from one site on only two occasions during the summer of 1995. DO was 6.5 mg/l on one survey date and 1.8 mg/l on the other. There were no notes recorded in the database of field observations regarding flow conditions, and no attempt was made to determine whether oxygen depletion may have resulted from natural conditions (e.g., wetland drainage). Whether or not the stream was actually flowing or not would be useful in determining the representativeness of so few samples. Furthermore, it has also been MassDEP policy not to base an impairment decision on a single measurement. It was therefore determined that an unacceptable level of uncertainty exists with respect to the original listing decision and, therefore, dissolved oxygen was removed from this segment.
Likewise, fecal coliform was originally added to the 303(d) List in 1998 based on one of two samples, collected in 1995, exceeding the fecal coliform standard. This was likely an error because it has never been MassDEP’s practice to base an impairment decision on a single violation of a water quality standard. Nonetheless, fecal coliform was not removed from this AU simply because the indicator in the standards was changed to E. coli. Rather, E. coli data from five discreet sampling events in 2005, summarized in the table below, were used to determine that the primary and secondary contact recreational uses were supported in this brook and that the original bacterial indicator, fecal coliform, could be removed.
Summary of MassDEP Watershed Planning Program E. coli data collected in 2005 from Wills Brook at a site near old railroad bed just upstream of confluence with Ipswich River, Lynnfield
UniqueID Year Date First Sample
Date Last Sample
Sample Count
Geometric Mean
Bacteria Type
W0135 2005 05/24/05 09/27/05 5 21 E. coli
December, 2019 (7) Massachusetts Year 2016 Integrated List of Waters Responses to Comments CN: 470.2
18
OARS for the Assabet Sudbury & Concord Rivers
December, 2019 (7) Massachusetts Year 2016 Integrated List of Waters Responses to Comments CN: 470.2
19
OARS FOR TME ASSABET SUDBURY & COMCORD RfVERS
23 8rodford Slroot • Concord, MA 01742 978 · 369 • 3956
o(fiee@oon3rlve,r,.org
October 2--3, 2017
Arlhw- S. Johnson
MusDEP Oi\'1.Sion of\Vater--..hed Management Watershed Pl.uuuug Prop-am
8 New Bond Street
Worcester, MA 01606
Re: C.Olllllle.nts on p:ropo,;;ed 2016 lntegrated List of\Vaters
Dear Mr. John.son,
OARS appreciates the opportunity to comme.llf on the proposed Massaeb:usetb Year 2016 Integrated List of Waters. OARS is the watershed organization for the Concord basin, comprising the Sudbury, Assabet and Concord Rivers in a 400-sqw.re mile
area w est of Boston.. A non•profit organization founded in 19S6, OARS wod.5- pnmarily through science-based advocacy
and education to dn•elop a scientific understanding .of the causes of rivel' degradation and works with communities to seek
effective solutions. Its mission lS "to protect, improve and prese.1,;e the Assabe:t, Sudbury, and Concord Ri:..:ers, their
b1Outaries a.nd w.1tenheds, for public.recreation, \'\'ater supply, and \\-ildlife habitat."
C.ne.ral Comment:s::
Exte.rnal Data: We applaud DEP's effort to include exte.roal data and hope that the Department "'-ill de-die ate resources: to t'eviev.eing and incorporating extema.l data in the funu:e. We understand that DE-P will be using ottr data for the 2018
Integrated list. To that end, we urge DEP to publish additional rec:omme.nd.a.tions for extern.a.l groups on the p3.ramete..r
spec:inc methods a.n.d data quality objectives that would result in acceptable d:atta for Level 3 "Regulatory/ Assessment" we by
DE.P. In refe.re.nce to the ac-cept.ability of u:te.rnal data, CALM documut says '"These DQOs are then co.mpared to the MassDEP DWM-WPP' s OQOs to look for any large discrepancies that could :affect acceptability," but does not quantify
what a "large disa~pancy" might be. OARS • Water Quality Monitoring Program has been collecting data on under an
approved QAPP since 2000. Although OARS' data for 2009 - 2016 has been rubu»tted to DEP, we understand that e.xte.rnal
data, indudmg OARS\ is still under reviel\' and is not included m the 2016 Integrated List Report.
Transparency: Publishing the 2016 Consolidated Assessment and Listing M ethodology and the OEP WPP QAPP 2015-2019
are significant steps towards transparency in the decision-making that goes into the Integrated list. We encourage. the department to publish the particular data and standards applied in the asseswent de.cisioD.S for each Assessment Unit
Su,faC6 Water Quafizy Sta1tdards: It is conC'mllllg that the Surface Wate.r Quality Standards have not be.en updated since
2006, although the Iote,grated list (Pg. 8) refers to an expected update of the standards for 2017. We urge the Department to
commit to a rMe.w .and lW'(iate of the SWQS, incotporating in particular EPA• s nutrient" criteria l'ecomme.ndations for
numeric nutrient standards.
Specific Comme.ots for the Concord B::iisin:
Concord Rn•er: OARS supports the removal of Total Phosphorus as an impairment from the Concord River sections
:MAS2A-07, t-.tAS2A--08, and MA82A-09. Our data indicate. that summer (Jwe - August) water column concentrations of
total phosphorus at the fow- Concord River sites N:sted have decreased be.hveen 2004 and 2016 (Fig 1; data submitted to DEP
previously), average d.is-..o]ved oxyge.n concentrations are generally above 70%,~ and our observations indicate. that the
December, 2019 (7) Massachusetts Year 2016 Integrated List of Waters Responses to Comments CN: 470.2
20

C001-wrd. Ri,:er does no g;e.oenlly ha:\ce the signiik.mt .grov.ihs of filamentolilS algae that ;ire apparenl im. the Assabet Ril'er
~ onndme.Di.!; (upsnie<!!m}. We regu-est that .DEP share the sr.md<mk <md data on wb.i.ch ihe d e('.icion to :re.mo-,e Total
Phom ho.rus a:, an impajmle.nt wa s based.
AYerage Summer otal Plflosphoru.s Con.ceFttra ons Concord IU'lf@r Site!I (June - Au-,gu 1200;'1 - l01
0.l.
ll.09
0..0
ll-'l?
ll.O
ll.05.
0..04
0..0
ll.01
01)2.
I .... •"1311 l'hc-.;ph00l5
-■
(I ■ l <IO!i- ..lOOG 2007 2J)!II! 2Xl1.0 otl 2.01 lOtl M1-4 l111S 10i5
Figure 1: A ·ua~ Sommer TP Caoce.nb'atio:ns:, Caoror River
Hop Broo.lr, Suril111zy: OARS ream,.m that "'&ct!~s A lga.I Growth~ not e r,e.move d .is au imp,a:u:mentfi:om Hop .Brook
">egmem MASlA-06. Om obsen;mom from L md.h.am Road ofilia.t section suggest that algal groTl\o-tb md exeess p ;mt growth
in general remains a prob em: in that s ection (se.e Figure 1 below}. W e r,eglilest lb.rt D EP .s.hare the standards and data ,on
which fue .decision to remov-e E-xces:s .A!:e: . Growth as an impainne.nt w .i!/:> ba:>ed.
Figure 2: Elop BroDk [MASlA-06) Landham Road. Su.dbLIIY, A~st 2016
December, 2019 (7) Massachusetts Year 2016 Integrated List of Waters Responses to Comments CN: 470.2
21

Coltl Watf;J" Str&:1'111\S: ·we: isegues _ ihat D EP roniider addinE" the 33 streams u!enlified bv Mass .. Di.·. ofFishenes a11:d Vil ildlife
as Col.du•ata· 'Pis e.v R.esources-m the Conc.o:rsd baSein (bttp:llv.-"'l\'l\r.ma' !l..go,•fee;alage:m::.1 df~df,; ·/wildl.ii"e-habitat-coosen,;.tio11/co dwate--fu:h-r,eromce,s,.-lis to the Asresmient Unit5 md classify tlre.m. as-CJa,s.Il Cold.\Vater streams
C11neutly ouly Jaclbmw Brook is identified as a Co d Vi ater Fishery m the. s,bod.u-~ for the Con-:::ord basm.. OARS ha-s
coll"e£ted and. is w · · · g to :;hare,, conhmwus tA:mperatw-,e data o."el' 5£'\'eral yeiil.1'5 for two streams vath smveyed populatiolil.5
ofhreedmg nab.¥e brco~k trout: _ T to Hop flrook (Fl'ou BTook) (S.4:RIS " 2 S3 0) and CJiallbeIT)· Brook (SA.FJS Ji 2478'&1). \
Th.anl yolil for com:idam.g these comme'.llts . Ple..se col!ltact w . if you have = :r quest1011LS.
Siucerely,
.Suzan:ne• !!'Iii.net
Staff Scieutis
CC: Mas:.a:ch11seru Ri\•ers Alliance Ma.ss. Divisicrn.<>f fi:;.he:ries and Wildlife-
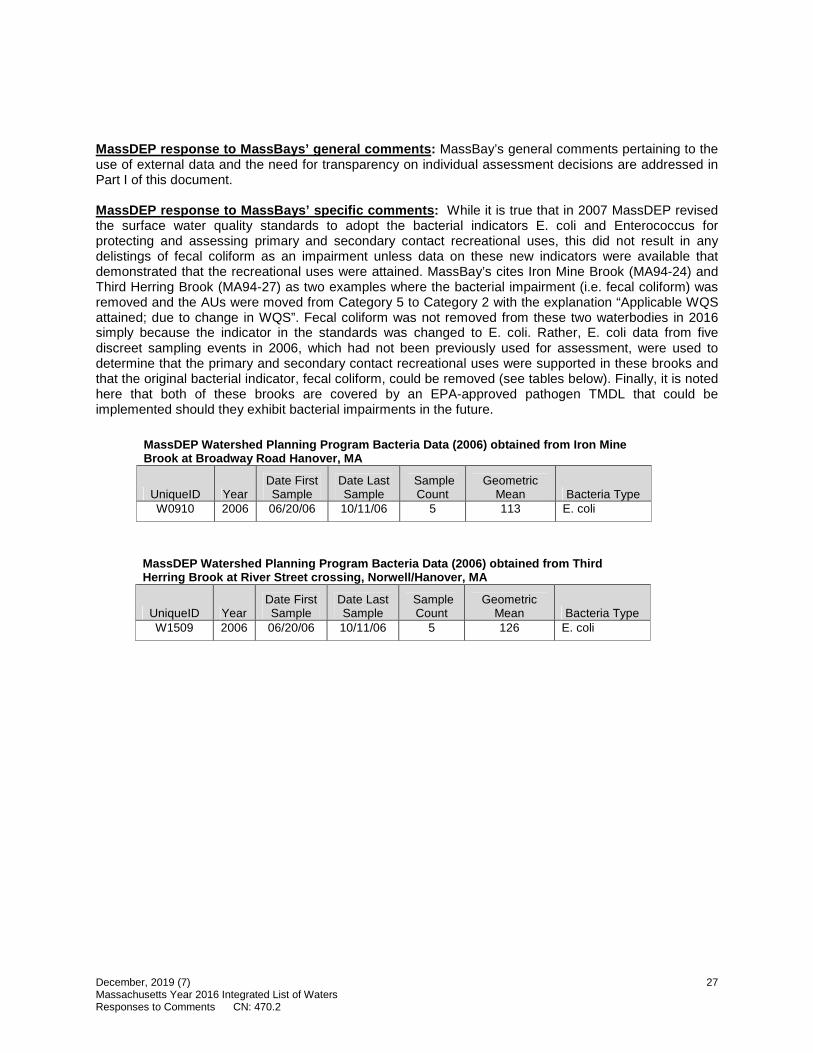
MassDEP response to OARS’ general comments : Responses to OARS’ general comments pertaining to external data, transparency and water quality standards can be found in Part I of this document.
MassDEP response to OARS’ specific comments : The Concord River Watershed was not assessed for the Aquatic Life Use during the 2016 CWA assessment and listing cycle. Therefore, OARS’ comments pertaining to the Aquatic Life Use will be considered when completing the 2018 assessment and listing process. Other comments are addressed below.
• While supporting MassDEP’s decision to remove the impairment Total Phosphorus from Concord River AUs MA82A-07, MA82A-08, and MA82A-09, OARs requested that MassDEP share the standards and data on which these delisting decisions were based. MassDEP is responding to this request now because Total Phosphorus had not been applied to the Aquatic Life Use, but to the Aesthetics Use. All three of these AUs were first listed as impaired by Nutrients in 1992 based on results of MassDEP’s 1990 Concord River surveys indicating that instream phosphorus concentrations were typically above 0.2 mg/l throughout these segments. When MassDEP converted from the Water Body System (WBS) to the Assessment Database (ADB) in 2010, the Nutrients cause code was mapped over to Total Phosphorus. At that time, data from more recent MassDEP surveys had not yet been utilized to perform new assessments of the Concord River. The assessment and listing decisions reflected in the 2016 integrated list were based on water quality surveys carried out from approximately 2005 – 2011 by MassDEP’s Division of Watershed Management (DWM) and Central Regional Office (SMART Program) and are briefly summarized below. Results of the DWM and SMART surveys are reported in technical memoranda online at http://www.mass.gov/eea/agencies/massdep/water/watersheds/water-quality-technical-memoranda.html and http://www.mass.gov/eea/agencies/massdep/water/watersheds/smart-monitoring-technical-memoranda.html, respectively.
Concord River MA82A-07 – The Aesthetics Use was assessed using data and field observations collected by DWM from four sites in 2006:
W1482 Monument Street bridge, Concord W1483 Route 225 bridge, Carlisle/Bedford
December, 2019 (7) Massachusetts Year 2016 Integrated List of Waters Responses to Comments CN: 470.2
22

W1484 Route 4 bridge, (Riverside) Billerica W1485 River Street bridge, Billerica
There were generally no noted objectionable conditions (odors, deposits, algae or other growths, or turbidity) recorded by DWM field sampling crews during the surveys, and the mean total phosphorus concentration from the above four stations (N=16) was 0.078 mg/l which is below EPA’s recommended instream criterion of 0.1 mg/l. Therefore, the Aesthetics Use was assessed as fully supporting, and Total Phosphorus was removed as a stressor to this AU.
Concord River MA82A-08 – The Aesthetics Use was assessed using data and field observations from the following two sites:
W1486 Pollard Street bridge, Billerica (2006) W2227 Rogers Street, Lowell (2011)
There were generally no noted objectionable conditions (odors, deposits, algae or other growths, or turbidity) recorded by MassDEP field sampling crews during the surveys, and total phosphorus concentrations were below 0.1 mg/l. Therefore, the Aesthetics Use was assessed as fully supporting, and Total Phosphorus was removed as a stressor to this AU.
Concord River MA82A-09 – The Aesthetics Use was assessed using data and field observations from the following sites and years:
W0679 USGS gauge downstream from Rogers Street, Lowell (2005, 2006, 2007) W1487 Route 110 bridge, Lowell (2006, 2008, 2009, 2010) W2227 Rogers Street, Lowell (2011)
Objectionable conditions, particularly filamentous algae and turbidity, were recorded by MassDEP field sampling crews and, therefore, the Aesthetics Use was assessed as Not Supporting. Nonetheless, total phosphorus concentrations were below 0.1 mg/l, and this impairment was delisted.
• OARS requested that Excess Algal Growth not be removed as an impairment from Hop Brook segment MA82A-06, and that MassDEP share the standards and data on which the decision to remove this impairment was based. Excess algal growth was originally included as an impairment of the Aesthetics Use in 1992 using the cause code available at the time (i.e., Noxious Aquatic Plants). For the 2016 integrated list the Aesthetics Use was assessed using data and field observations collected by DWM from the following site in 2006:
W0849 Landham Road bridge, Sudbury (formerly reported as Wash Brook) (2006)
There were generally no noted objectionable conditions (odors, deposits, algae or other growths, or turbidity) recorded by MassDEP field sampling crews during the surveys; however, 2 of 13 observations noted dense populations of macrophytes (arrowhead, emergent grasses, pondweed, milfoil, and pickerelweed). OARs commented that Hop Brook (MA82A-06) often experiences excess algal and plant growth based on their observations at Landham Road. While Total Phosphorus was retained as an impairment that will require a TMDL for this segment, the nutrient/eutrophication biological indicators cause code will be utilized to account for the excessive plant and algal growth noted by OARS staff. This impairment will be retained in the final version of the 2016 Integrated List for the recreational and aesthetic uses for MA82A-06.
• OARS requested that MassDEP consider creating assessment units (AU) for the streams in the Concord Watershed identified by MDFW as Coldwater Fishery Resources (CFR) and classify them as Class B Cold Water streams. In anticipation of the Aquatic Life Use assessment of the Concord Watershed planned for the next reporting cycle, MassDEP reviewed the MDFW’s CFR list and selected eight (8) streams for the establishment of new AUs based on the amount of data
December, 2019 (7) Massachusetts Year 2016 Integrated List of Waters Responses to Comments CN: 470.2
23

and information available for the assessment of those streams. These new AUs are described in the table below and will appear for the first time in the next integrated report.
The process of designating cold water streams in Massachusetts’ surface water quality standards (SWQS) differs from that used to create AUs for reporting and listing waters pursuant to CWA sections 305b and 303d. Section 303(c)(1) of the CWA and the EPA’s implementing regulations at 40 CFR 131.20 require that states review and revise, as appropriate, applicable SWQS at least once every three years. States may revise their SWQS in a variety of ways including additions of and revisions to designated uses, water quality criteria, antidegradation policies and adopted implementation procedures. Finally, revisions to the SWQS are subject to a formal public review process. MassDEP plans to release a new version of the SWQS for public review and comment sometime in 2019. This new regulatory package will contain improvements to the surface water classification tables including the addition of approximately 150 new cold water streams state-wide. These newly designated cold water streams were selected from the MDFW’s CFR list following a careful review of their names, descriptions and geographical settings. Although the remaining CFR waters were not included in the current regulatory package, the SWQS specify that where a cold water fish population has been identified by the MDFW as meeting their protocol for a CFR, but the water has not been documented to meet the cold water criteria in the SWQS, MassDEP will protect that population and its habitat as an existing use. MassDEP intends to designate additional MDFW CFR streams as cold water in future revisions of the SWQS.
AU ID Name Description Unofficial Name
MA82B-24 Unnamed Tributary
Unnamed tributary to Nashoba Brook, headwaters outlet unnamed pond east of Pope Road, Acton to mouth at confluence with Nashoba Brook, Acton.
NA
MA82B-25 Sheep Fall Brook
Headwaters, perennial portion north of Ash Street, Marlborough to mouth at confluence with Flagg Brook, Marlborough.
NA
MA82B-26 Howard Brook
Headwaters, perennial portion east of Green Street, Northborough to mouth at confluence with Assabet River, Northborough.
NA
MA82B-27 Unnamed Tributary
Unnamed tributary to Assabet River Reservoir, headwaters, perennial portion south of Route 30 (Nourse Street), Westborough to mouth at inlet of Assabet River Reservoir, Westborough.
“Nourse Brook”
MA82B-28 Unnamed Tributary
Unnamed tributary to Assabet River Reservoir, headwaters, perennial portion north of Nourse Street (Route 30), Westborough to mouth at inlet of Assabet River Reservoir, Westborough.
“Nourse Brook”
MA82A-36 Unnamed Tributary
Unnamed tributary to Hop Brook, headwaters outlet unnamed pond west of Vega Road, Marlborough to mouth at confluence with Hop Brook, Sudbury.
“Cranberry Brook”
MA82A-35 Unnamed Tributary
Unnamed tributary to Hop Brook, headwaters south of Graham Path, Marlborough to mouth at confluence with Hop Brook, Sudbury.
“Trout Brook”
MA82A-37 Allowance Brook
From outlet small unnamed pond south of Hiram Road, Framingham to mouth at confluence with Hop Brook, Sudbury.
NA
December, 2019 (7) Massachusetts Year 2016 Integrated List of Waters Responses to Comments CN: 470.2
24

Massachusetts Bays National Estuary Program
December, 2019 (7) Massachusetts Year 2016 Integrated List of Waters Responses to Comments CN: 470.2
25

fB Massachusetts Bays ~---~ ~ NATIONAL ESTUARY PROGRAM
Massachusetts Bays National Estuary Program, North & South Rivers Watershed Association
251 Causeway Street, Suite 800
Boston MA 02114
www.massbays.org
October 23, 2017
Arthur S. Johnson MassDEP Division of Watershed Management Watershed Planning Program 627 Main Street, Second Floor Worcester, MA 01608
Re: 2016 Integrated List of Waters Comments
Dear Mr. Johnson,
Thank you for the opportunity to comment on the 2016 Integrated List of Waters. My comments are as follows:
I appreciate that data availability and quality are a crucial part of the decisionmaking that goes into creating this list. As a scientist and technical resource for citizen science groups on the South Shore and beyond, I would like more clarity on the acceptability of citizen-collected water quality data. There is a Catch-22 that exists where MassDEP is short-staffed and more data is needed, but a significant amount of data that is collected is not acceptable to MassDEP. Through the MassBays Citizen Monitoring Network we are working with EPA and MassDEP to assist citizen groups with the effort of creating a QAPP, but greater use of the Level 2 (screening level) data collected by groups like ours would go a long way towards rounding out the findings of MassDEP’s official data collection.
I am pleased to see that there has been a transition in freshwater segments to E. coli as appropriate and that impairments like fish passage and algal blooms are being more carefully considered. This holistic approach to stream health will go a long way towards helping communities understand the issues that their water bodies are facing, and provide documented and citable evaluations of these impairments. That said, there are many more stream segments that are impaired for fish passage due to physical obstructions and low flow, and going forward towards the next round it would be worthwhile to ensure that the list is comprehensive.
Changes in category have occurred in segments like Iron Mine Brook and Third Herring Brook for the reason “Applicable WQS attained; due to change in WQS”. The data and rationale behind this is unclear, but it sounds as if the bar for the particular impairment (bacteria) has been lowered due to a change in indicator bacteria from fecal coliform to E. coli. If these are truly improvements that are simultaneous to a change in indicator, then that should be made clearer in the document. In general, there should be greater transparency to the data that supports the rationale for the category of each segment. I look forward to working with MassDEP on improving the way data are collected and checked for quality by citizen groups and fostering a positive relationship that will help inform future versions of the Integrated List.
Sincerely,
December, 2019 (7) Massachusetts Year 2016 Integrated List of Waters Responses to Comments CN: 470.2
26
Sara P. Grady NSRWA Watershed Ecologist MassBays South S hore Regional Coordinator
I I
I I
MassDEP response to MassBays’ general comments : MassBay’s general comments pertaining to the use of external data and the need for transparency on individual assessment decisions are addressed in Part I of this document.
MassDEP response to MassBays’ specific comments : While it is true that in 2007 MassDEP revised the surface water quality standards to adopt the bacterial indicators E. coli and Enterococcus for protecting and assessing primary and secondary contact recreational uses, this did not result in any delistings of fecal coliform as an impairment unless data on these new indicators were available that demonstrated that the recreational uses were attained. MassBay’s cites Iron Mine Brook (MA94-24) and Third Herring Brook (MA94-27) as two examples where the bacterial impairment (i.e. fecal coliform) was removed and the AUs were moved from Category 5 to Category 2 with the explanation “Applicable WQS attained; due to change in WQS”. Fecal coliform was not removed from these two waterbodies in 2016 simply because the indicator in the standards was changed to E. coli. Rather, E. coli data from five discreet sampling events in 2006, which had not been previously used for assessment, were used to determine that the primary and secondary contact recreational uses were supported in these brooks and that the original bacterial indicator, fecal coliform, could be removed (see tables below). Finally, it is noted here that both of these brooks are covered by an EPA-approved pathogen TMDL that could be implemented should they exhibit bacterial impairments in the future.
MassDEP Watershed Planning Program Bacteria Data (2006) obtained from Iron Mine Brook at Broadway Road Hanover, MA
UniqueID Year Date First Sample
Date Last Sample
Sample Count
Geometric Mean Bacteria Type
W0910 2006 06/20/06 10/11/06 5 113 E. coli
MassDEP Watershed Planning Program Bacteria Data (2006) obtained from Third Herring Brook at River Street crossing, Norwell/Hanover, MA
UniqueID Year Date First Sample
Date Last Sample
Sample Count
Geometric Mean Bacteria Type
W1509 2006 06/20/06 10/11/06 5 126 E. coli
December, 2019 (7) Massachusetts Year 2016 Integrated List of Waters Responses to Comments CN: 470.2
27
Massachusetts Rivers Alliance
December, 2019 (7) Massachusetts Year 2016 Integrated List of Waters Responses to Comments CN: 470.2
28

·--~ ~ Ocober _J , 2017
Arthl1f . Johnson M,issDEP Divisfon of Watershed lvfan.agemen.t \\ a.tersbed Plaooing Program 8 New .Bond Street \\arrester, MA. 01606
Re: Conunen.ts, on _O] 6 Integrarte.d List of Waters
Dear ~fr. Johnson,
Til:allk you for the opportunity to provide comments on the Proposed Mass acJmsetts Y:ea-r 016 Integrated Lisi af Waters.
The Massachusetts Rive:rs All:i..1nce is a non-profit organization v. hose mission i to pro ect :and restore rivers across the Commonwealth. fass Rirver:s crn:renHy mcludes ,67 member organizations from a:c:ros.s the state, several of whom are subfflitting comments on their concerns with the listing of water bodies m their individual \lratef:Sbeds. For this reason. our oonunents v.rill focus on our ov-er.arrl:ring concerns with the Proposed In.tegra.ted List of Waters. as this document play an important role in the protection and restoration of 'i¥,ner bodies across the Commomvealtb.
We vmuld like to first acknowledge and express our appreciari.on for the improvements made to theMassachusru't:S Consolidated A.ssessme.ni and Listing Methodology (CA.llf) Guidance
fanualfor tile 2016 J?.eporl.in,g Cyc.le. We appreciate the addition of appendices AB C, D, E and F which provide critical infonuation regarding the assessment of impaired wateruorues. We also applaud .fassDEP for the Del¥ addition of preseaoe of active CSO dlis'Charges in evaluating Primary Contaci Recre.ational Use,. \\ e ask tha: MassDEP fiurther d.arifies iin the Massachusetts Consolidated As:.sessment and Listing Methodolo (CAI.J,,f) Guidance Mam1al for the. ::.O 16 Reporting , de how CSOs v.rith variances will be -assessed for the e criteria
We are aware that substantial budge and staffing cuts at MassDEP have created a ignificaot challenge for waiter ,quality monitoring and assessments. \Vhile we recognize tha the. practice of ,vatershed maoa_gemen is :resource-intensive ,ve ffad it dlisoournging that MassDEP is .not able to produce and validate new data (< 5 )'ears old) for each of the 33 major watersheds for use in
MASSACHUSETTS
Rivers AUiance 14 Beacon Street, Suite 607, Boston, MA 02108
(8571 445-0208 ,., \1;111,/w.massriversa fiance.orQ
--
December, 2019 (7) Massachusetts Year 2016 Integrated List of Waters Responses to Comments CN: 470.2
29
bi.annual integrated list updates.. Furthermore, despite collection of considerable water quality data and field assessment information by science-based watush.ed associations, MassDEP ru also been slow to .adopt the use of external data, although in many cases it is the best available data source for a water body. While rei..-ognizing tl:rat there are many external data sources \\'llch inform the Integrated Lis: , more detail should be made public regarding the external data qmdifkations as described m the Massachusetts Consolidated Assessment and Listing Methodology (CALM) GuidanceManualforthe 2016Reporttng Cyde. Specifically_ more detail is needed for the d cription of the criteria for each level and .how they are used to infonn. the report. Since Level 3 data is most likely to fo.e used by the report, it would be useful to knmv how non-MassDEP stakeholders such as \vateirshed associations can advance their data from Level to Level 3.
We ask that MassDEP con.tact relev.ant watershed associ..1tions and :tvfass. Rivers in advance of as.sessments with the monitoring plan.. m.cluding fie]d 3SSessments schedu1es: amplin~ site locatiom, and proposed · amplmg parameters fur both the probabilistic and de1ernii:ni.stic monitoring described in the Integrated List In addition, we ask that the fina.:I Integrated Lis.t include a complete description of the MassDEP detenni.nisti.c an.d probabilistic samplmg net\vorlc, specifk.ally including information on the :frequency, nunibe-r of 1ocalions. wet or d1y weather monitoring and time of year for monitoring for all sites s1atewide monitored across the, five year wadable stream s1:.llvey and the three-year lakes survey. \\ e ask that the final Integrated List al.so reports \\"llicll watersheds have received probab!Jistic and deterministic monitoring since 1012.
In reviewing the list,. it is difficult to interpret -winch_ data sources are currently itoforming decisions to alter o:r remove iimpairmeuts in the draft Integrated List of Waters. We ask that rvfassDEP referenee specific data sources for its decisions to Ii.st and delist ao.y segment or wateroodies .in the fin.lit .Integrated Llst of Water. For e:.,,;;:amp]e: it would be useful to know the data sources Mas:sDEP is using lill hen the explanation. for removal of a egment is °" AppJicable WQ attained; reason. for recrnlery unspecill.ect" The ew Hampshire Department of .Enviromnental Services draft 303( d) list for 2016 provides an ideal tran.spMent model for source descriptions in. impairment eval.uaitions.
Mass Rivers also noted mnlhple 'de!istin~" (removal from category 5) for fecal co1iform bacteria with the provided expJanatioo "'Applic.able WQS attained· due to change in WQS.,, A change in ll1e water quaility stm.d.rrds from fuc..d colifom1 as the indicator bacteria to E. coli should .not in itselfjustifJ a delis.ting of this impamnent. The v; ate:rbody should be listed .as imp.med for E.coli untd recent data is av:alilabkto oollfum or negate this listing. Ifth:at i.s the case, the rationale provii.ded in the dornmro should be modified. The Alli.ance als,o has concerns regarding segm.ents delisted wi.th the on:ly explanation 'Origurnl basis for listing was .inconect." In the final List of Integrated V at.ers we ask that MassDEP provide .a detailed data-based justification to how tha the bas.iis for 1:he origmail li.sting was inrnmxt and provide recent data. to show that the 1Ma1ef body is not m fact ilnpaired by the relevant imprurmenf.
The list of waters where no assessment has. been completed (Category 3) is extensive and many others ha,~e bee11 only p:artly assessed for some designated tJSes. Category ). We ask tba.t MassDEP report the percentage of v,rater bodies (river and streams by mile, Jakes and ponds by
December, 2019 (7) Massachusetts Year 2016 Integrated List of Waters Responses to Comments CN: 470.2
30
acre. and estillaries. by square mile) th.at haive never ibem assessed and those that have been assessed within the previous five years by the agency in the fimJ. In:regGltoo List. The list of waters m Category .5. where MassDEP needs to develop a Tota] M,wmum Daily Load (lMDL) is also extensive. We ask th.at MassDEP uoiformlv mcfode n1 the final Integrated List of Waters how TMDI.s are matched. with impairments.
Finally, Mass Rivers and our member groups are extremely ooncerned about the paae of review and. updating of the l\llassa.d:msetts surface water quality st.andards (\VQS) . • fts noted in the Propos.ed List, the Clean \\ .ater Act specifies that states hold public hearings at least once e1. ery three years (triennia! review to review and, \liliere appropriate, revise thefrwater qu,dity standards. To our kl.10,\l·ledge Massachusetts has failed. to meet this obligation; in fact page 8 of the Proposed Ust says that there have been no updates m. a decade. The Proposed List also n.ote.s proposed revisions for _Q 17 to the 'Vi QS but cfoe.s .not provide adequate detail on the substance of these proposed changes or \Were this, information can be fmmd. Nor does iit provide i.nformahon about when public hearings wi.ll be held regarding these ohang~ , vi•hich by no,i;.r should be scheduled if the revisions. are truly 011 track for _,01'7. The state should commit to the public triellll.ial review.
'lbrulk you fur cons.idermg our c-onm1.e0ts. Ple.ase c.onta.ct us if you have any questions_
Sincerely,
Gabby Queen.an Policy Spedalis.t J\iassadms.etts Rivers Alliance
MassDEP response to Mass Rivers’ general comments : Responses to Mass Rivers’ general comments pertaining to external data, transparency, water quality standards and MassDEP’s monitoring and assessment programs can be found in Part I of this document.
MassDEP response to Mass Rivers’ specific comments :
• Mass Rivers commented “We also applaud MassDEP for the new addition of “presence of active CSO discharges” in evaluating Primary Contact Recreational Use. We ask that MassDEP further clarifies in the Massachusetts Consolidated Assessment and Listing Methodology (CALM) Guidance Manual for the 2016 Reporting Cycle how CSOs with variances will be assessed for these criteria.” In contrast with the presumptive impairments applied to waters receiving CSOs with no variances, MassDEP assesses water bodies that receive CSOs with variances in the same way as it assesses waters where no CSOs are present at all. These methods are outlined in the 2016 CALM guidance document.
• Mass Rivers noted multiple “delistings” from category 5 for fecal coliform bacteria with the provided explanation “Applicable WQS attained; due to change in WQS,” and argued, correctly, that a change in the water quality standards from fecal coliform as the indicator bacteria to E. coli should not in itself justify a delisting of this impairment. MassDEP agrees, and no delistings of fecal coliform as an impairment have been made unless data on the new indicators were available that demonstrated that the new standards were attained.
December, 2019 (7) Massachusetts Year 2016 Integrated List of Waters Responses to Comments CN: 470.2
31

• Mass Rivers requested that “MassDEP report the percentage of water bodies (river and streams by mile, lakes and ponds by acre, and estuaries by square mile) that have never been assessed and those that have been assessed within the previous five years by the agency in the final Integrated List”. While not included in the public review draft, EPA’s guidance on the development of the 305(b)/303(d) integrated report calls for a summary table containing the sizes of waters in each list category and this will be provided in the final version of the 2016 report. When this table becomes available, a rough approximation of the “percentage of waters that have never been assessed” for any designated use, could be obtained by dividing the total number of river miles, lake acres and coastal areas contained in all five list categories into the state total sizes of these waters presented in the Surface Water Atlas for Massachusetts included in the integrated report. The accuracy of the state-wide totals likely varies considerably by water type and information source. Nonetheless, MassDEP acknowledges that many waters have never been assessed and that the preferred method for determining the use-support status of all waters is through the use of random sampling designs, such as those employed for the shallow stream and lake probabilistic surveys. Finally, since the only substantive changes in the 2014 integrated list related to new TMDL approvals and fish edibility advisories, the 2016 report encompasses the assessments MassDEP has completed in the past five years; namely, a state-wide assessment (i.e., all watersheds) of the shellfish harvesting, primary and secondary contact recreation and aesthetic uses, as well as the assessments of the aquatic life use-attainment status of 15 watersheds and/or coastal drainages. Figure 3 in the 2016 integrated report depicts the uses assessed in each watershed for the 2016 listing cycle.
• Mass Rivers asked that “MassDEP uniformly include in the final Integrated List of Waters how TMDLs are matched with impairments.” While the CWA distinguishes between “pollutants” such as nutrients, metals, pesticides, solids and pathogens that all require TMDLs and “pollution” such as low flow, habitat alterations or non-native species infestations that do not require TMDLs, it is often the case that the implementation of a TMDL for a specific pollutant will correct other associated impairments. For example, it is generally expected that an implemented TMDL for phosphorus will address such nutrient-related impairments as “excess algal growth”, “chlorophyll a” and “nutrient-eutrophication biological indicators”. Therefore, these impairments would also be included as covered by a TMDL for phosphorus. However, this determination is made case-by-case, often as part of the TMDL development process, and, therefore, cannot be universally applied to all waters impaired by nutrients. For this reason, MassDEP cannot uniformly match impairments with TMDLs that have not yet been completed. As always, waters with approved TMDLs for all pollutants and related stressors are placed in Category 4a where they are still considered impaired until there is sufficient data and information to indicate that the impairments have been corrected and applicable designated uses are supported.
December, 2019 (7) Massachusetts Year 2016 Integrated List of Waters Responses to Comments CN: 470.2
32

United States Environmental Protection Agency (EPA)
December, 2019 (7) Massachusetts Year 2016 Integrated List of Waters Responses to Comments CN: 470.2
33

UNITED STATI.S :ENVIRO~,\ffi~"TAL PROTECTION AGENCY Region 1
5 Post Offk~ Square, Suite 100 Boston, l\Lt 02109-3912
October 19, 2017
Arthur S. Johnson
MassDEP
Division of Watershed Management Watershed Planning Program
8 New Bond Street
Worcester, MA 01606
Re: Comments on t he Proposed Massachusetts Year 2016 Integrated List of Waters related to the cambridge Reservoir Watershed
Dear Mr. Johnson,
The United States Environmental Protection Agency, Region 1, Orin king W ater Quality and Protection Unit is pleased to
provide the enclosed report and associated data submittal to support the addition of waters within the cambridge Reservoir Watershed onto the Final Massachusetts Year 2016 Integrated List of Waters pursuant to Sections 305(b), 314
and 303(d) of the Clean Water Act. Data presented in the report provide evidence that all four major t ributaries, and the
cambridge Reservoir itself, are impaired by chloride according to the federal standards and 3 14 CMR 4.0S(e); and
therefore, these waters should be added to the Final Year 2016 Integrated list of Waters a.s im paired for chloride.
Through collaborative monitoring efforts by the City of Cambridge Water Department and the U.S. Geological Survey,
the cambridge Reservoir W atershed has been extensively studied for road saJt impacts for nearly ten y ears. The impacts
revealed by these monitoring programs show a hydrologic system and drinking water supply severely impacted by road
salt. For exam ple, as described in the attached report, dur ing one year of monitoring from Dec 2013 to Oec 2014, 767
events of both chronic and acute chlor ide t oxicity occurred throughout the watershed. During this period, chloride
concentrations as high as 6,332 mg/I were r ecorded in the watershed, a value which is more than seven times t he acute
standard for aquatic life according to federal standards and 314 CMR 4.0S(e).
EPA Region 1 is providing this report and data submission a.s a comment on the Proposed M assachusetts Year 2016
Integrated List of Waters (CN 470.0) released in June 2017. Data have also been submitted to MassDEP via
[email protected] foUowing MassOEP's Data Submittal Guidelines for External Data. If you have any
questions about this submission, please contact me at [email protected] or 617-919-1239.
Sincerely,
M arcel Belaval, Hydrologist Drinking Water Quality and Protection Unit
CC: Jamie O'Conn.ell, City of Ca mbridge Water Department
Bryan Do re , EPA Rt Denise Springborg, EPA Rl Newton Tedder, EPA Rl
Andrea Travi;glia , EPA Rt
December, 2019 (7) Massachusetts Year 2016 Integrated List of Waters Responses to Comments CN: 470.2
34

City of Cambridge, Cambridge, MA
December, 2019 (7) Massachusetts Year 2016 Integrated List of Waters Responses to Comments CN: 470.2
35

CITY OF CAMBRIDGE MASSACHUSETTS Water Department
250 Fresh Pond Parli::wa-y Cambridge, MA 02138
617 349 4nO
fax 617 349 6616
October 23, 2017
Arthur S. Johnson MassOEP Division of Watershed Management Watershed Planning Program 8 New Bond Street
Worcester, MA 01606
Via email
Re: Comments in support of EPA Region 1 data submission and report regarding the Cambridge Watershed chloride impaim,ent
Dear Mr. Johnson,
The City of Cambridge Water Department (CWD) appreciates the opportunity t o submit comments in support of adding waters within the cambridge Reservoir Watershed onto the Final Massachusetts Vear 2016 Integrated List of Waters as impaired by chloride. CWO has reviewed the United States Environmental Protection Agency Region 1 (EPA) data submission package and report. ONO agrees with EPA's conclusion that the four major tributaries, and the cambridge Reservoir itself, are impaired by chloride. According to federal water quaJity criteria developed under Clean Water Act, as well as criteria for chloride set under 314 CMR 4.0S(e), waters in the cambridge Reservoir Watershed regularly exceeded both the acute a nd chronic toxicity standard for chloride. During the reporting period of December 2013 through December 2014, a combined 767 events exceeded one or both of these chloride standards. As results from the collaborative C\VD-Unit ed States Geological Survey demonstrate, chloride pollution is a persistent wate r quality problem in the cambridge Reservoir Watershed. Adding the cam bridge Reservoir Watershed to the Final Massachusetts Year 2016 integrated Ust of Waters is an important step towards a ddressing this longstanding water q ua lity impairment.
Sincerely,
;-a~ Jamie O'Connell Watershed Protection supervisor, City of cambridge [email protected] 617-349-4781
David Kaplan, Watershed Manager, CWD Sam Corda, Managing Director, C\VD Cambridge Water Board
December, 2019 (7) Massachusetts Year 2016 Integrated List of Waters Responses to Comments CN: 470.2
36
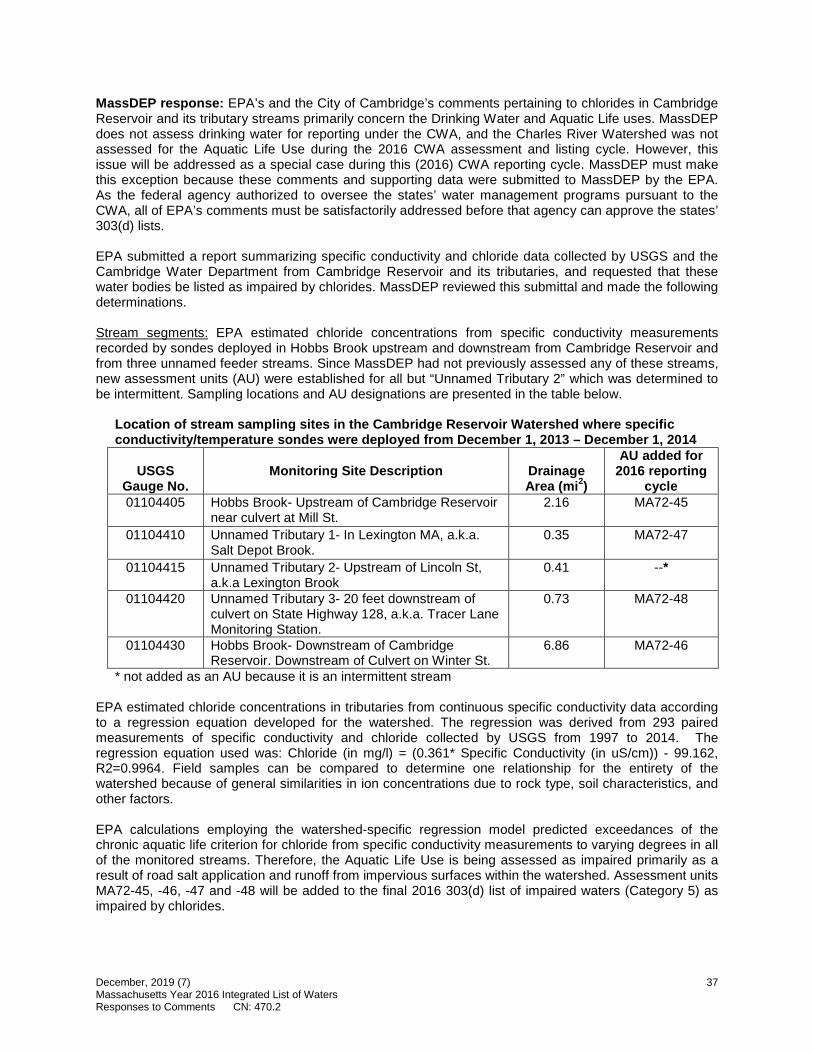
MassDEP response: EPA’s and the City of Cambridge’s comments pertaining to chlorides in Cambridge Reservoir and its tributary streams primarily concern the Drinking Water and Aquatic Life uses. MassDEP does not assess drinking water for reporting under the CWA, and the Charles River Watershed was not assessed for the Aquatic Life Use during the 2016 CWA assessment and listing cycle. However, this issue will be addressed as a special case during this (2016) CWA reporting cycle. MassDEP must make this exception because these comments and supporting data were submitted to MassDEP by the EPA. As the federal agency authorized to oversee the states’ water management programs pursuant to the CWA, all of EPA’s comments must be satisfactorily addressed before that agency can approve the states’ 303(d) lists.
EPA submitted a report summarizing specific conductivity and chloride data collected by USGS and the Cambridge Water Department from Cambridge Reservoir and its tributaries, and requested that these water bodies be listed as impaired by chlorides. MassDEP reviewed this submittal and made the following determinations.
Stream segments: EPA estimated chloride concentrations from specific conductivity measurements recorded by sondes deployed in Hobbs Brook upstream and downstream from Cambridge Reservoir and from three unnamed feeder streams. Since MassDEP had not previously assessed any of these streams, new assessment units (AU) were established for all but “Unnamed Tributary 2” which was determined to be intermittent. Sampling locations and AU designations are presented in the table below.
Location o f stream sampling sites in the Cambridge Reservoir Watershed where specific conductivity/temperature sondes were deployed from December 1, 2013 – December 1, 2014
USGS Gauge No.
Monitoring Site Description Drainage Area (mi 2)
AU added for 2016 reporting
cycle 01104405 Hobbs Brook- Upstream of Cambridge Reservoir
near culvert at Mill St. 2.16 MA72-45
01104410 Unnamed Tributary 1- In Lexington MA, a.k.a. Salt Depot Brook.
0.35 MA72-47
01104415 Unnamed Tributary 2- Upstream of Lincoln St, a.k.a Lexington Brook
0.41 --*
01104420 Unnamed Tributary 3- 20 feet downstream of culvert on State Highway 128, a.k.a. Tracer Lane Monitoring Station.
0.73 MA72-48
01104430 Hobbs Brook- Downstream of Cambridge Reservoir. Downstream of Culvert on Winter St.
6.86 MA72-46
* not added as an AU because it is an intermittent stream
EPA estimated chloride concentrations in tributaries from continuous specific conductivity data according to a regression equation developed for the watershed. The regression was derived from 293 paired measurements of specific conductivity and chloride collected by USGS from 1997 to 2014. The regression equation used was: Chloride (in mg/l) = (0.361* Specific Conductivity (in uS/cm)) - 99.162, R2=0.9964. Field samples can be compared to determine one relationship for the entirety of the watershed because of general similarities in ion concentrations due to rock type, soil characteristics, and other factors.
EPA calculations employing the watershed-specific regression model predicted exceedances of the chronic aquatic life criterion for chloride from specific conductivity measurements to varying degrees in all of the monitored streams. Therefore, the Aquatic Life Use is being assessed as impaired primarily as a result of road salt application and runoff from impervious surfaces within the watershed. Assessment units MA72-45, -46, -47 and -48 will be added to the final 2016 303(d) list of impaired waters (Category 5) as impaired by chlorides.
December, 2019 (7) Massachusetts Year 2016 Integrated List of Waters Responses to Comments CN: 470.2
37

Cambridge Reservoir: This water body comprises two assessment units in MassDEP’s assessment database – the main basin (MA72014) and upper basin (MA72156). Although no continuous measurements were taken from within either basin, the Cambridge Water Department collects regular grab samples from Trapelo Road in Lexington (within the main basin) and the Gatehouse near the outlet of the main basin in Waltham. During December, 2013 – December, 2014, five samples were taken at the Trapelo Road site, and 50 samples were obtained from the Gatehouse site. Over 60% of the samples collected at both sites exceeded the chronic aquatic life chloride criterion of 230 mg/l. Therefore, the Aquatic Life Use in the main basin (MA72014) is being assessed as impaired primarily as a result of road salt application and runoff from impervious surfaces within the watershed. Finally, although no chloride data are available from the upper basin proper, elevated chloride concentrations were documented in streams feeding this basin, as well as in the main basin and for this reason MassDEP will also impair the upper basin (MA72156) for chlorides.
December, 2019 (7) Massachusetts Year 2016 Integrated List of Waters Responses to Comments CN: 470.2
38

Buzzards Bay National Estuary Program
December, 2019 (7) Massachusetts Year 2016 Integrated List of Waters Responses to Comments CN: 470.2
39

Buzzards Bay
Natio11al Esfoan;
Progmm
rthur S. Johnson MassDEP Division of Watershed Management \Vatet'.shed Planning Program 627 Main Street Second Floor Worcester. MA 01608 via email: [email protected]
Re: Comments on 2016 Integrated List
Dear Mr. Johnson:
Octobe,· 23, 2017
The Buzzards Bay National Estua1y Program (NEP) has conducted a review of the Proposed Massachusetts Year 2016 Integrated List of Waters with respect to bacterial pollution related impaim1ents in Buzzards Bay. In pa1iicular. we looked at historical and existing bacteria related closures to shellfish growing areas repo1ied by the Massachusetts Division of Marine Fisheries (DMF)1. and bacteria related swimming beafh closures repo11ed by municipalities to the Massachusetts Depatiment of Public Health .
In our review of this data. it is apparent that some boundaries of bacterial impaised waters on the proposed Integrated List do not reflect existing conditions, or water quality improvements made during the past decade or more. To illustrate the scope of this problem, Figure 1 shows the bacterial impairments defined in the proposed 20 I 6 Integrated List. and Figure 2 shows actual shellfish growing area closures (seasonally, conditionally, or pennanently closed circa 2015) clue to bacterial pollution. Please take note of the inconsistencies between the designations. particularly on the south coast of Dartmouth. Nasketucket Bay in Fairhaven. Mattapoisett Harbor, areas of \Vareham, areas in Pocasset Boume, and Megansett Harbor at the BoumeFalmouth boundaiy. Based on our review, we recommend that MassDEP reexamine the Integrated List boundaries for bacterial impaired smface waters in Buzzards Bay to cletemiine where they should be made more consistent with actual bacteria-caused impaim1ents.
The inconsistencies between closures and impainnents arose in pad because. when the Buzzards Bay bacterial TMDL was adopted in 2009 (with our suppo1i). MassDEP generally used a whole embayment approach in defining bacterial i.mpainnents. This approach had some utility. because in the 1990s ai1d early 2000s, some embayment shellfish closures were more expansive than today, and many of these embayments were also classified as nitrogen-impaired at the whole
1 See wv,w.mass.2ov/e.ea/a2encies/dfg/dm £1pro2rams-and-projects/desi1ma1ed-shellfish-2rowing-areas.html 1 See http://ma.healthinspections.us/public 21/beaches.cfm
December, 2019 (7) Massachusetts Year 2016 Integrated List of Waters Responses to Comments CN: 470.2
40
embayment level. It would have been complicated to use differe:nt segments for each impaim1ent at the time. The 2009 bacterial TMDL also heavily relied on a D MF dataset with data from 1997-2001 that the Buzzards Bay NEP used in our 2003 Atlas of Stonmwater Discharges to Buzzards Bay. Since then, water quality has improved in some embayments.
hi the intervening years. we have begun to appreciate the inadvertent adverse consequences of classifying whole embayments as impaired by bacteria. especially when these impainnents affect a small percentage of the water body.
In particular, the Buzzards Bay NEP has been working with municipalities to ensure their compliance with the U.S. EPA's new MS4 pcnnit that will go in to effect in July of 2018. A new requirement u11de1· this pennit is the testing of stonnwater discharges to impaired waters for the contaminants cau sing the impainnent as defined in the Integrated List. The bacterial TMDL also imposes a challe.nging bacteria limit for stonnwater discharges to bacterial impaired waters (the fecal colifonn waste load allocation is only a geometric mean of 14 organisms per 100 ml and 10% of the samples cannot exceed 28 organisms per I 00 ml) . There is a high cost of meeting thes e requirements. and municipalities have limited resources. Where a whole embayment is designated for a bacterial pollution impairment. when only a small percentage of the water body is impaired. will result in municipal monitoring efforts in what s.J1ould be low priority areas. and for the treatment of stonnwater discharges not. causing impainnents. and diverting attention away from areas actually impaired by bacterial pollution.
One possible solution is to resegment affec t.eel estuaries to more closely reflect actual bacterial impainnents like shellfish bed closures. Updating the Integrated List in this way would remove potentially hundi-eds of acres of Buzzards Bay that are listed as bacterially impaired. but are in fact not impaired by bacteria. as they are open for shellfishing. Such action is important not only in focm,ing resources onto waters that are acnially impaired, but would al so acknowledge the successes ofDMF. MassDEP. and municipalities to reduce poin t and 11011-point sources contributing to shellfish bed and swimming beach closures.
\Ve recognize that resegmenting of the esniaries will involve consultation with MA DMF to define more meaningful boundaries based on a review of existing water quality data, and such an evaluation will require considerable effort. To that end. the Buzzards Bay NEP is willing to provide GIS and data analysis assistance to MassDEP in such am undertaking.
If you have any questions about these comments. please do not hesitate to call me.
cc. Bruce Carlisle. MCZM Mike Hickey, DMF
s, .. ~~1y, ~
h E . Costa. PhD utive Director
f C
December, 2019 (7) Massachusetts Year 2016 Integrated List of Waters Responses to Comments CN: 470.2
41
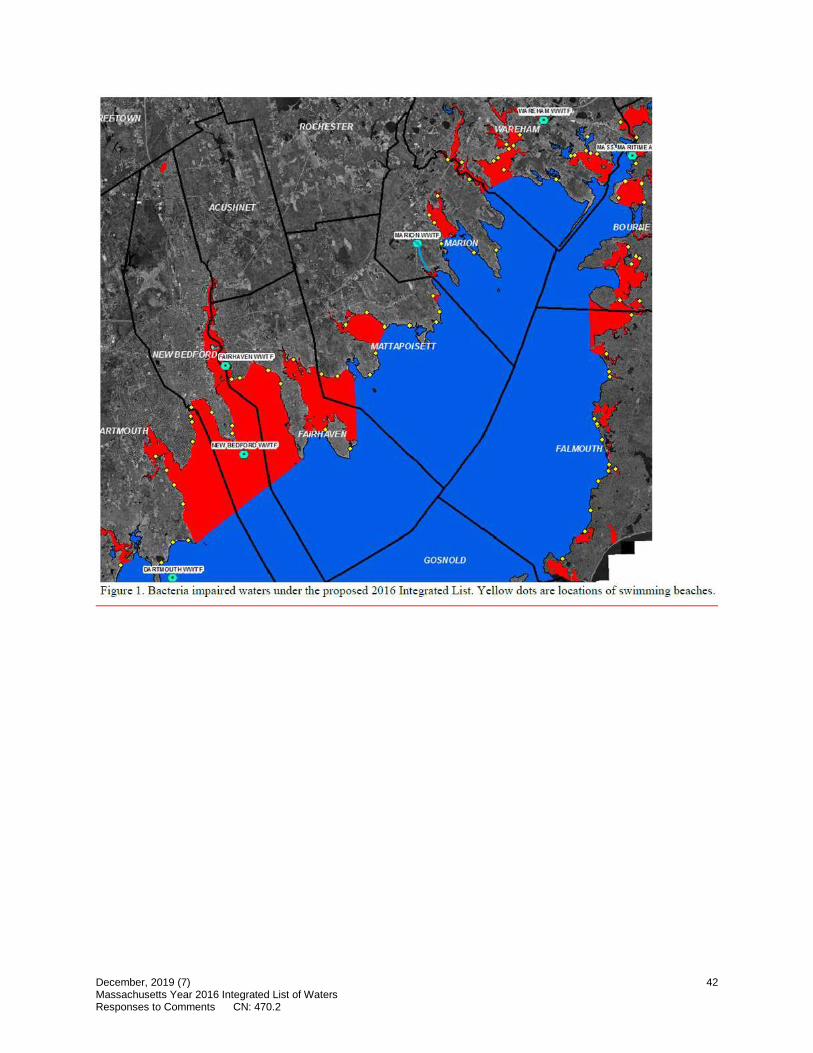
Figure 1. Bacteria impaired wate1·s under the proposed 2016 Integrated List. Yellow dots are locations of swimming beaches.
December, 2019 (7) Massachusetts Year 2016 Integrated List of Waters Responses to Comments CN: 470.2
42

Figure 2. Bacteria impaired designated shellfish growing area5 (2015 classification. based Oil from MA DMF repo11s. red shaded areas include seasonal and rainfall conditional closures). Yellow dots are locations of swimming beaches. No te that there are some small closmes that are associated with discharges from specific pipes or streams that are too small to be seen Oil a map of this scale .
MassDEP response:
MassDEP acknowledges that portions of assessment units (AUs) may support designated uses, such as shellfish harvesting and primary contact recreation, while other areas of the same AUs do not, and that adding up the status of waters state-wide, for multiple designated uses, overestimates the total river miles, lake acres or coastal square miles that may actually be impaired. It is also true that information pertaining to smaller-scale improvements in water quality within existing AUs is lost when reporting on a state-wide scale. However, the Clean Water Act (CWA) mandates that any and all verified impairments be identified in the integrated list and that those caused by pollutants be prioritized for TMDL development. The extent, magnitude and source(s) of the impairments are often not completely known when AUs are listed and their determination becomes part of the TMDL development process. Restoration measures are then targeted at confirmed sources of pollutants.
The 2016 integrated report provides a brief description of how AUs have been developed and refined over the years for purposes of reporting on the status of Massachusetts’ waters in accordance with the requirements of the Clean Water Act. Almost 2,500 AUs currently exist and new ones are created as assessments of previously unassessed waterbodies are completed. While adjustments to AU boundaries are sometimes made, it is MassDEP’s goal to limit changes to existing AUs as much as possible, with the ultimate goal of having relatively fixed boundaries which will allow for more efficient management and reporting through EPA’s ATTAINS (formerly ADB) assessment database. Periodic or ad-hoc re-segmentation of AUs to account for individual beaches, shellfish beds, eelgrass meadows, etc. would be impractical and unmanageable when presenting the condition of all of Massachusetts’ surface waters on a state-wide or major watershed scale, particularly when multiple designated uses are considered.
December, 2019 (7) Massachusetts Year 2016 Integrated List of Waters Responses to Comments CN: 470.2
43
MassDEP’s system of AUs has been in place since the 1970s, long before a decision was made to apply their impairments as monitoring requirements in individual MS4 stormwater permits, and the issues raised in this comment are an unintended consequence of doing so. Nonetheless, readjusting the boundaries of MassDEP’s AUs is not a workable solution for preventing costly monitoring in low-priority areas. Wherever applicable MS4 permits, BMPs, or other water quality improvement projects should be individually targeted to those areas where actual beach closures and/or closed shellfish beds are known to occur.
December, 2019 (7) Massachusetts Year 2016 Integrated List of Waters Responses to Comments CN: 470.2
44

Neponset River Watershed Association (NepRWA)
December, 2019 (7) Massachusetts Year 2016 Integrated List of Waters Responses to Comments CN: 470.2
45
~c neponset river ~ "' WATERSHED ASSOCIATION
Officers & Board
Robe1t McGregor. President Sharon
David Biggers, VP, Canton
./iJmes Green TfeiJsurer, C,mton
Stephen Blo)lton. Secretary, Dii!dllam
El1si:1 Bmiseye, 1-/y(ie Pat/<
.Jerry Hopcroft Nonvood
Ardis Johnston, Stoug ht on
Peter Kane. Westwood
Taber l<ea/ly, Milton
Pau l Lauenstem. Sh;,ron
Martha McDonough, Readv1lle
Brendan McLaughlin, Milton
Maura O'Gara, Quincy
Richard O'Mara. Dorchester
Les Tyra/a, Quincy
Laura Va,tes. Walpole
w,11,am Wiseman. Walpole
October 23, 2017
Arthur S. Johnson Massach usetts Department of Environmen tal Protection Division of Watrershed Management Watershed Planning Program 627 Main Street, Second Floor Worcester, MA 0 1608
RE: Comments on 2016 Integrated List of Waters
Dear Mr. Johnson:
The Neponset River Watershed Association (NepRWA) submits the following comments on tJhe Massachusetts Deprutment of Environmental Protection's (DEP) proposed 2016 Integrated List of Impaired Waters. NepRWA is a nonprofit conse1vatio11 organization working to dean up ru1d protect the Neponset River, its tributaries and surrounding watershed .
In general, NepRWA urges DEP to more clearly identify the data sources used when developing the list, and describe how ru1d when the department collects its data. Moreover, we ask that DEP identify if ru1d under what circumstances the department uses external in formation submitted by science-based watershed associations like ours. We also mge DEP to use external data whenever possible to Slllpplement their own data collection. Finally, we request specific changes to the proposed Integrated List concerning waterbodies in the Neponset River watershed, as described below. We have includ ed supportive data within this comment ru1d submit ted raw data sepru·ately as instructed for this comment process.
Neither DEP d a ta nor external data requirem en ts are transparen t; moreover, data appears to be significantly outdated for the Neponset River watershed .
Accompanying the proposed 2016 In tegrated Waters List is DEP's Consolidated Assessment ancil Listing Methodology (CALM), which describes DEP's assessment methods. However, the CALM does not provide adequate detail explaining what data sources were used to compile the proposed list .. While this document helpfully provides an ove1view of the process DEP uses to develop the integrated list, it does little to assure the public that recent (ru1cil most relevru1t) data is being used. Indeed, the last assessment for the Neponset River posted to DEP's website is from 2009. It is alrum ing that DEP is using data more than 5 yeru·s old to assess our watershed, pruticularly since our organization submits data eve1y yeru· (through 2015).
Federal law req uires that states evaluate "all existing ru1d readily available water quality-related data ru1d information" to develop the integrated list . ( 40 CPR 130.7(b)(5).) It is not dear that DEP actually uses external data, however. DEP
2173 Washington Street, Canton, MA 02021 781.575.0354 I [email protected] I www.neponset.org
December, 2019 (7) Massachusetts Year 2016 Integrated List of Waters Responses to Comments CN: 470.2
46
describes criteria for data acceptability in the CALM, and indicates that data from organizations such as ours are "often considered. " We are a science-based organization and maintain a high-le, el QAPP, approved by both DEP and EPA governing our data collection and analysis, but it is unclear whether our data or any external data) has actually been used in the assessments (,,ve suspect not for the reasons described below). Aligning our QAPP with DEP s monitoring program QAPP, or otherwise app1ising organizations like ours about external data qualifications 'INould benefit DEP in that that data we regularly submit may qualify as ''Level 3" data, the most likely to be used for regulatory and water quality assessment purposes. Incorporating well planned and rigorously collected external monitoring data 11vil1 fill critical data gaps that ctmently exist within DEP's assessment data set. With this data, DEP can mal<e better informed decisions regarding the status of the many waterbodies in the state of Massachusetts.
The data used to infonu decisions about adjustments to the list have not been adequately conummicated. DEP should reference specific data sources for its decisions to Est, alter and delist any segment or ,;,,•aterbodies in the final Integrated List of Water. For example, it would be useful to know the data sources DEP is using when the explanation for removal of a segm ent is "Applicable "\VQS attained; reason for reco.-eryunspecified. " The New Hampshire Department of Environmental Ser, ices draft 303 cl list for 2016 provides au excellent model for source descriptions in impainnent evaluations.
Additionally. the CALM indicates that DEP bases its assessments of primary and secondary contact impainnent only on the geometric mean of bacteria samples . ...-1olating the WQS regulations and further lirn.iting the data available for accurate water quality assessments. 314 CMR 4.05 requires the department to apply maxnnum bacteria concentrations to both the geometric mean of the 5 most recent samples during the same bathing season and srngle samples taken during the bathing season. The depa1tment does not have the discretion to disregard th e regulations, which establish an impo1tant safeguard relative to tl1e preferred method of evaluating bacterial i:mpainnents.
Finally epRWA is concerned about the department's failure to timely review and update the Massachusetts Surface Water Quality Standards {WQS). As noted in the Proposed Integrated List the Clean Water Act requires sta tes hold public. hearings at least once every three years to review and revise its water quality standards. In the list itself, DEP indicates that there have been no revisions to these standards since 2006. Failure to update the standards may significantly impac.t activities to improve and protect water quality throughout the state. In particular the Massachusetts Department of Fish and Grune Division of Fisheries ru1d Wildlife (DFWJ recognizes 10 waterbodies within the eponset River watershed as being Cold Water Fisheries; however, the current WQS do not identify any Cold Water Fisheries with.i11 the watershed. And 'While the CALJvI's Focus Topic is Cold Waters and in dicates that such waters :identified by DFW are considered by DEP to have an "existing use" as a Cold Water Fishery that will be protected, the lack of data transparency does not reassme us tha t DEP has, in fact, recognized these cold water resources for protection (as described below). The department must update the WQS using c.urreJ1t data.
Several impainuents within the Neponset River watershed have been omitted and should be included the 2016 Integrated List.
Several waterbodies with.in the eponset River watershed de1nonstrate quality impairments yet have not been included in the 2016 Proposed Integrated List. We urge DEP to consider more recent data (included below and separately submitted) and include the follm,ving in the 20 6 Integrated List:
December, 2019 (7) Massachusetts Year 2016 Integrated List of Waters Responses to Comments CN: 470.2
47

• Traphole Brook (MA73-17) is a valuable Cold Water Fishe1y (identified by DFW) and should be included as a Category 5 waterbocly impaired by temperature. According to the WQS, the average daily maximum temperah1re over seven consecutive clays should not exceed 68 °F for a Cold Water Fishery .. Our data show that the vast majority of Traphole Brook upstream of the mill pond dam in 01wood meet the temperah1re criteria of a cold water fishe1y. However the mill pond dam and associated pond are causing significant detrimental wanning effects on the brook downstream of them .. As you can see in the figure below running 7-day average meets the temperature criteria upstream from a mill pond dam in Nonvood, the running 7-day average de111onstrates a temperature impainnent below the dan1 (see Figme 1).
December, 2019 (7) Massachusetts Year 2016 Integrated List of Waters Responses to Comments CN: 470.2
48

Figure 1 Ten1J)C1'(1111ll of Trophole Brook
7 Day Running Average of Daily Maximum Temperature Upstream .of Dam on Tri!phole &rook
1CI -----------------------------------
i ~ --------------------+--#-------- ----- ----_..,_-.: i ~~l---~4-----,F------------------~~'-~'----I~· D
li
i "° ~ r~s ;;!
I ,~ - - ---------------------------------,,.,
! ,: !!I
54 - - ---------------------------------
S,Z 1-----------------------------------
7 Dav Ru nr'li1ng Average of Daily Ma,xiMur'r'I T e,mpenliture Downstream of Dam on Traphole Brook
7~ ~----------------------------------
·1 65 ~~--------------+-+-~----:8
I f r~ .i ~
~~ - - ---------------------------------
December, 2019 (7) Massachusetts Year 2016 Integrated List of Waters Responses to Comments CN: 470.2
49
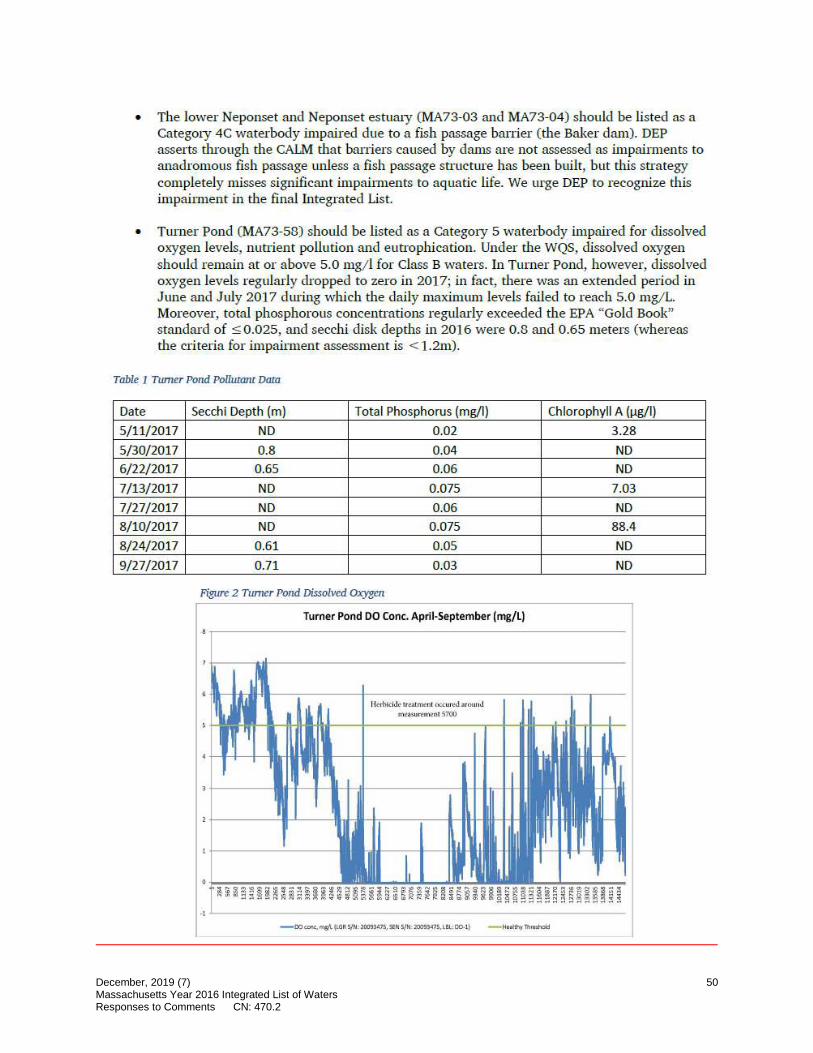
• The lower Neponset and Neponset esturuy (MA73-03 and MA73-04) should be listed as a Category 4C waterbody impaired due to a fish passage barrier (die Baker dam). DEP asserts throDgh the CAI.M that barriers caused by dams are not assessed as impairments to anadromous fish passage unless a fish passage structure has been built, but tbis strategy completely misses significant impai.iments to aquatic life. We urge DEP to recognize this i.inpaim1ent in the final Integrated Llst.
• Turner Pond (MA73-58) should be listed as a Category 5 waterbody impaired for dissolved oxygen levels, n utrient pollution and eutrophication. Under the WQS dissolved oxygen should remain at or above 5.0 mg/ 1 for Class B waters. In Turner Pond, however dissolved oxygen levels regularly dropped to zero in 2017; in fact, there was an extended peiiod in J lllle and J uly 2017 during which the daily maximum levels failed to reach 5.0 mg/ L. Moreover, total phosphorous concentrations regularly exceeded the EPA "Gold Book" standard of $0.025, and secchi disk depths in 2016 were 0.8 and 0.65 meters (whereas the criteiia for impairment assessment is < 1.2m).
Table 1 TIImer Pond Pollllmnr. D<Illl
Date Secchi Depth (m) Total Phosphorus (mg/I) Chlorophyll A (µg/ 1)
5/11/2017 ND 0.02 3.28
5/30/2017 0.8 0.04 ND 6/22/2017 0.65 0 . .06 ND 7/13/2017 ND 0.075 7.03
7/27/2017 ND 0 .06 ND 8/10/2017 ND 0.075 88.4
8/24/2017 0.61 0.05 ND 9/27/2017 0.71 0.03 ND
Figure 2 TIImer Pond Dissolved. Oxygen
Turner Pond DO Cone. April-September (mg/L)
I Gfl~-t-...-.1-fllr------:----t----------------.-,,-T-lcrbiciJt.'! li'eill~t:i l occun:..J. .1rn1mJ
l t'l l!:'.J.SLil'el)'H!i\l :57(H)
-1 ~--------------------------
December, 2019 (7) Massachusetts Year 2016 Integrated List of Waters Responses to Comments CN: 470.2
50

Several impairments within the Neponset River have been erroneously removed from Categories 4 or 5 of the in tegrated list.
Several waterbodies vvithin the Neponset River watershed have been identified in the Proposed Integrated List as no longer impaired for E. coli contamination and algal growth. However, om data indicate that several of these \Vaterbodies remain impaired and should therefore be included in the 2016 Integrated Lis t.
• The WQS establishes that for Class B waters, the geometric mean of the 5 most recent samples dllling the same bathing season shall not exceed 126 colonies per 100 ml, and that no single sample shall exceed 235 colonies per 100 ml. Our data demonstrates that: o Mother Brook (MA73-28) should remain as a Category 5 waterbody impaired for E.coli
contamination. Specifically, based on the geometric mean criteria, Mother Brook has been impaired during 7 out of the last 1 years. Using the single sample criteria, it has been impaired every year for the past 1 years.
Figure 3 Modwr Brook E.coli Co11centrarion
Geometric mean for E.<ioll concentrations fMPN) for Mother Brook
•liO.(I
◄CO ,(lo
~ •liO.O i' l Ii ~00-0 .,, 278.~ ~ ~~-7 ! 209.i ~ :iso.o .., "! ' ~ X,,(l ! ' 1 lSQ(l
z ., 11D<I
~.Q
0.0 ;,oc,; 1001 2008 lOO~ 2010 lOIL 2Jl12 l()~ 201• lOI? 2016
Y'H!I'
December, 2019 (7) Massachusetts Year 2016 Integrated List of Waters Responses to Comments CN: 470.2
51
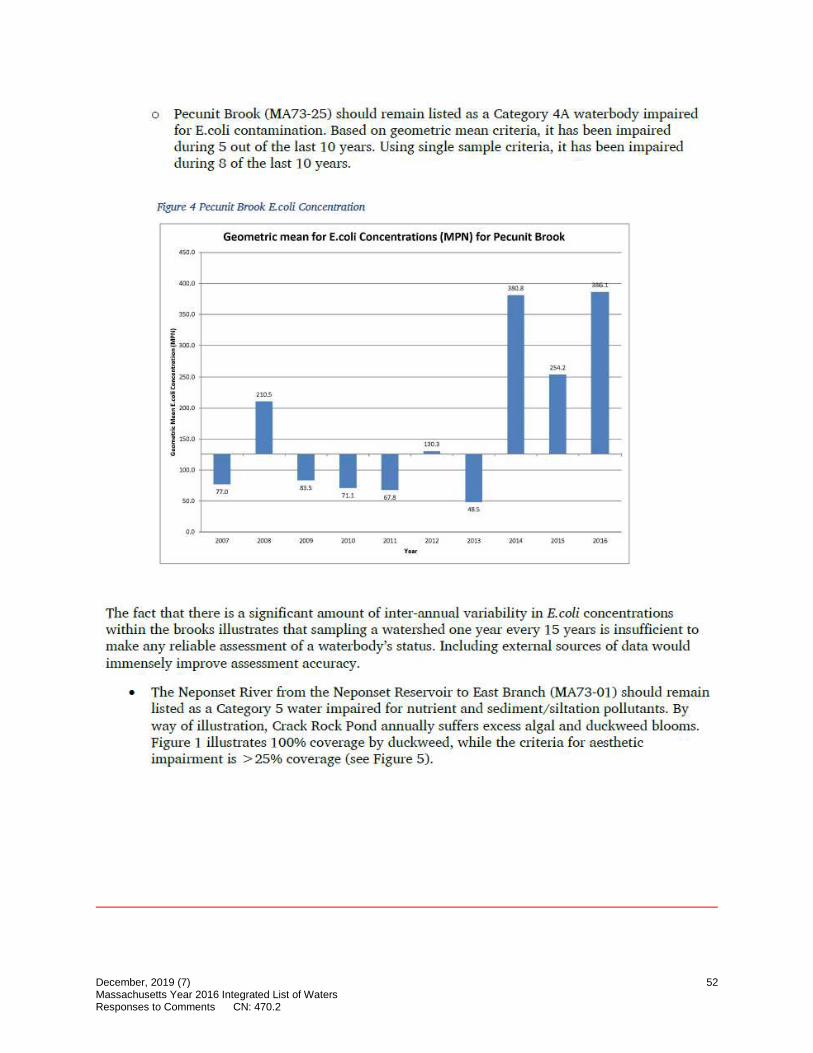
o Pecunit Brook (MA73-25) should re1naiu listed as a Categ01y 4A waterbody impaired for E.coli contamination. Based on geometric mean criteria, it has been impaired. during 5 out of the last 10 years. Using single sample criteria it has been impaired during 8 of the last 10 years.
Figure 4 Pecunit Brook E.coli Concerurat.ion
Geometric mean for £.coli ConcentraUons (MPN) for Pecunlt Brook "50.D ..-----------------------------
Jll0,0 +---------------------f ~ :!DOD +---------------------,i ·i i! ,50.0 .9
'i ~ .o
i 1 ~ 150.0 -j-----, .:!
100.0
0,0 ------------------------------l 001 2008 1<110 20ll 1011 2013 201,0
The fact that there is a significant an1ount of inter-annual variability in Ecoli concentrations within the brooks illustrates that sampling a watershed one year eve1y 15 years is insufficient to make any reliable assessment of a waterbody's status. Including external sources of data would immensely improve assessment accuracy.
• The Neponset River from the Neponset Rese1voir to East Branch (MA73-01) should remain listed as a Categ01y 5 water impaired for nutrient and sediment/siltation pollutants. By way of illustration, Crack Rock Pond annually suffers excess algal and duckweed blooms. Figure 1 illustrates 100% coverage by duckvveed, while the cdte1ia for aesthetic impainnent is > 25% coverage (see Figure 5).
December, 2019 (7) Massachusetts Year 2016 Integrated List of Waters Responses to Comments CN: 470.2
52

Figure 5. Crack Rock Poru:J. 2016
• Unquity Brook (MA73-26), Germany Brook (MA73-15) and Hawes Brook (MA73-16} should remain listed as impaired for Trash/Debris as such pollution is still a major issue in each waterbody as evident by visiting these waterbodies many times over the last several years.
• Unnamed Tributary (Meadow Brook) (MA73-33) should remain impaired for Taste/ Odor and Trash/Debris, as we have no data to support it being removed for having met the WQS crite1fa as evident by visiting these waterbodies many times over the last several years.
Conclusion
In sum, it is clear that DEP lacks the 1·esomces to collect and validate water quality data on a regular basis. DEP should clru-ify standards for external data to be used in assessment decisions so that regulady submitted data from science-based watersheds may be used to supplement DEP s data collection and better infom1 development of both the integrated list and WQS. Additionally, the WQS must be updated triennially as required by federal law in order to ensure that Massachusetts waters are protected for their most beneficial uses .. Finally, NepRWA urges DEP to add or maintain several waterbodies within the Neponset River watershed on the 2016 Integrated List, as supported by cunent data.
Thank you for the opportunity to comment on the Proposed Integrated List. Should you have any questions, or require additional infonnation, please don't hesitate to contact me.
Keny M. Snyder Advocacy Director
December, 2019 (7) Massachusetts Year 2016 Integrated List of Waters Responses to Comments CN: 470.2
53
I I
MassDEP response to NepRWA’s general comments: Part I of this document presents responses to NepRWA’s general comments pertaining to the age of data used in assessments, external sources of data, transparency of assessment decisions and the pace with which water quality standards are revised.
MassDEP response to NepRWA’s specific comments : NepRWA submitted monitoring data in support of their comments through MassDEP’s data portal, and a review of these data found them to be generally usable for making assessment and listing decisions. The Neponset River Watershed was not assessed for the Aquatic Life Use during the 2016 CWA assessment and listing cycle. Therefore, NepRWA’s comments pertaining to the Aquatic Life Use (i.e., MA73-03, MA73-04, MA73-17 and MA73058) will be considered when completing the next assessment and listing process. Other comments are addressed below.
• NepRWA commented that Mother Brook (MA73-28) should remain listed as a Category 5 waterbody impaired for E.coli contamination. MassDEP’s assessment of Mother Brook was based on its water quality survey data from 2009 that indicated that the recreational uses were supported and, therefore E. coli was delisted (see table below).
Summary of MassDEP Watershed Planning Program E. coli data collected in 2009 from Mother Brook at Reservation Road, (Hyde Park) Boston
UniqueID Year Date First Sample
Date Last Sample
Sample Count
Geometric Mean
Bacteria Type
W1949 2009 04/28/09 09/15/09 5 74 E. coli
NepRWA’s E. coli data collected from 2007 - 2016 at two sites on Mother Brook provide evidence that the brook is still impaired (data summarized below). Based on NepRWA data, therefore, E. coli will be retained as a cause of impairment in the final version of the 2016 Integrated List. Note: Mother Brook is covered by an EPA-approved pathogen TMDL, but remains in Category 5 due to other impairments.
Summary of NepRWA E. coli data collected from 2007 -2016 from Mother Brook at Reservation Road, Boston. Note: Data are summarized from those years for which five or more counts were available from within the primary contact recreation season (April 1 – October 15). Exceedances of the water quality standard are in bold.
Year Geometric
Mean Year Geometric
Mean Year Geometric
Mean 2007 167 2012 128 2016 186
2008 102 2014 326
2011 128 2015 169
Summary of NepRWA E. coli data collected from 2008 -2016 from Mother Brook at Washington Street, Dedham. Note: Data are summarized from those years for which five or more counts were available from within the primary contact recreation season (April 1 – October 15). Exceedances of the water quality standard are in bold.
Year Geometric
Mean Year Geometric
Mean Year Geometric
Mean 2008 561 2012 347 2016 161
2010 102 2013 64
2011 118 2015 457
• NepRWA commented that Pecunit Brook (MA73-25) should remain listed as a Category 4A waterbody impaired for E.coli contamination. MassDEP’s assessment of Pecunit Brook was based on its water quality survey data from 2009 that indicated that the recreational uses were supported and, therefore E. coli was delisted (see table below).
December, 2019 (7) Massachusetts Year 2016 Integrated List of Waters Responses to Comments CN: 470.2
54

I I
Summary of MassDEP Watershed Planning Program E. coli data collected in 2009 from Pecunit Brook approximately 360 feet upstream of Interstate 95, Canton
UniqueID Year Date First Sample
Date Last Sample
Sample Count
Geometric Mean
Bacteria Type
W1948 2009 04/28/09 09/15/09 6 80 E. coli
NepRWA’s E. coli data collected from 2007 - 2016 provide evidence that Pecunit Brook is still impaired (data summarized below) and, therefore, this brook will be returned, as requested, to Category 4A (covered by an EPA-approved pathogen TMDL) in the final version of the 2016 Integrated List.
Summary of NepRWA E. coli data collected from 2007 -2016 from Pecunit Brook at Elm Street, Canton. Exceedances of the water quality standard are in bold.
Year Geometric
Mean Year Geometric
Mean Year Geometric
Mean 2007 93 2011 99 2015 254
2008 226 2012 218 2016 386
2009 96 2013 66
2010 84 2014 686
• NepRWA commented that “Unquity Brook (MA73-26), Germany Brook (MA73-15) and Hawes Brook (MA73-16) should remain listed as impaired for Trash/Debris as such pollution is still a major issue in each waterbody as evident by visiting these waterbodies many times over the last several years”. These brooks were first listed for trash and debris on the 2002 integrated list, based primarily on field observations made by NepWRA during their monthly monitoring surveys. For example, at a site along Germany Brook there was evidence of a local resident dumping yard waste. When MassDEP performed monitoring surveys of these streams in 2009 there were generally no noted objectionable conditions (odors, deposits, growths, or turbidity) recorded by WPP field sampling crews, and so the impairment Trash/Debris was removed. Trash and debris are not pollutants requiring TMDLs and are more appropriately managed by enforcing litter laws and performing river cleanups. Because the improper disposal of trash and debris is ubiquitous and episodic throughout Massachusetts, MassDEP is attempting to limit the application of this impairment to the most egregious and long-standing cases of illicit solid waste dumping. As stated in the 2016 CALM document, “a waterbody will not be assessed as impaired for the occasional presence of litter or debris, but rather for persistent and/or other more serious indicators of aesthetic degradation”.
In response to this comment, MassDEP requested, on two separate occasions, that NepRWA provide further documentation, in the form of field notes, dates and times, that trash and debris remain serious impairments of designated uses in these three streams. However, no new information was provided and “Debris/Floatables/Trash” will remain delisted from these three streams in the final version of the 2016 Integrated List.
• NepRWA commented that “Unnamed Tributary (Meadow Brook) (MA73-33) should remain impaired for Taste/Odor and Trash/Debris, as we have no data to support it being removed for having met the WQS criteria as evident by visiting these waterbodies many times over the last several years”. This assessment unit has never been listed as impaired for trash/debris and, therefore, was not delisted for 2016. The brook was first listed for Taste and Odor on the 2002 integrated list, based on a field reconnaissance conducted by MassDEP in 2001 that revealed grey water and sewage odors. However, when MassDEP performed monitoring surveys of
December, 2019 (7) Massachusetts Year 2016 Integrated List of Waters Responses to Comments CN: 470.2
55

Meadow Brook in 2009 there were generally no noted objectionable conditions (odors, deposits, growths, or turbidity) recorded by WPP field sampling crews.
In response to this comment, MassDEP requested that NepRWA provide further documentation in the form of field notes, dates and times, that odors in this brook were noted by their sampling crews. NepRWA promptly submitted records of field observations made during the years 2006-2016 and these are summarized as follows. Sewage odors were noted in only 2 of 66 records (15 November 2006 and 12 August 2009), suggesting that objectionable odors were neither frequent nor persistent throughout the ten years of observations. In terms of clarity, 86% of the records were indicative of good conditions (e.g., clear, slightly turbid). Five of 66 (8%) observations noted suspended solids/murky or highly cloudy conditions (6 August 2008, 11 August 2010, and 29 May, 26 June, and 24 July 2014). No objectionable conditions were noted after July 2014. Based on the general lack of objectionable odors or turbidity noted by both NepRWA volunteers and MassDEP field staff the Taste/Odor impairment will not be applied to Unnamed Tributary (Meadow Brook) (MA73-33).
• NepRWA commented that the Neponset River (MA73-01) should remain listed in Category 5 impaired for nutrient and sediment/siltation pollutants citing that Crack Rock Pond, an impounded reach of this assessment unit annually suffers from excess algal and duckweed blooms (100% cover). MassDEP’s assessment of this segment of the Neponset River was based on its water quality survey data in 2009 that indicated that the aesthetic use was supported based on observations at two stations and, therefore sedimentation/siltation was delisted as an impairment for reasons described below.
Sedimentation/siltation issues in the Neponset River were documented around the Foxboro Park raceway in 1994. Specifically runoff from the horse race track and associated areas was the cause of sedimentation/siltation in this segment. This business has since closed and the Neponset River has been both daylighted and moved to the east of the current Patriots football stadium which occupies the former raceway location. Sedimentation and siltation originating from the former raceway are no longer ongoing. Downstream from the former raceway MassDEP field crews noted the water column was either "clear" or "slightly turbid" during 2009 sampling at two stations in the MA73-01 segment. Water quality samples had an average turbidity of less than 3 NTU at both 2009 sampling stations (W1943 in 2009 had an average turbidity of 2.2 NTU and W1933 average turbidity was 2.6 NTU). These observations and water quality sampling data provide further evidence which supports the delisting of the sediment/siltation impairment for MA73-01 which will be maintained in the final version of the 2016 Integrated List.
While MassDEP sampling in 2009 did not document any objectionable levels of algae or nuisance growths at either free-flowing sampling station W1933 or W1943 in this segment, MassDEP acknowledges NepRWA’s concern that the impounded reach of the Neponset River in Crack Rock Pond (the upper-most reach of this segment) does continue to exhibit problems with excessive growth of duckweed. While Total Phosphorus is listed as an impairment that will require a TMDL for this segment, the nutrient/eutrophication biological indicators cause code will be utilized to account for both duckweed and the excess algal growth. This impairment will be retained in the final version of the 2016 Integrated List for the recreational and aesthetic uses for MA73-01.
December, 2019 (7) Massachusetts Year 2016 Integrated List of Waters Responses to Comments CN: 470.2
56

Connecticut River Conservancy (CRC)
December, 2019 (7) Massachusetts Year 2016 Integrated List of Waters Responses to Comments CN: 470.2
57
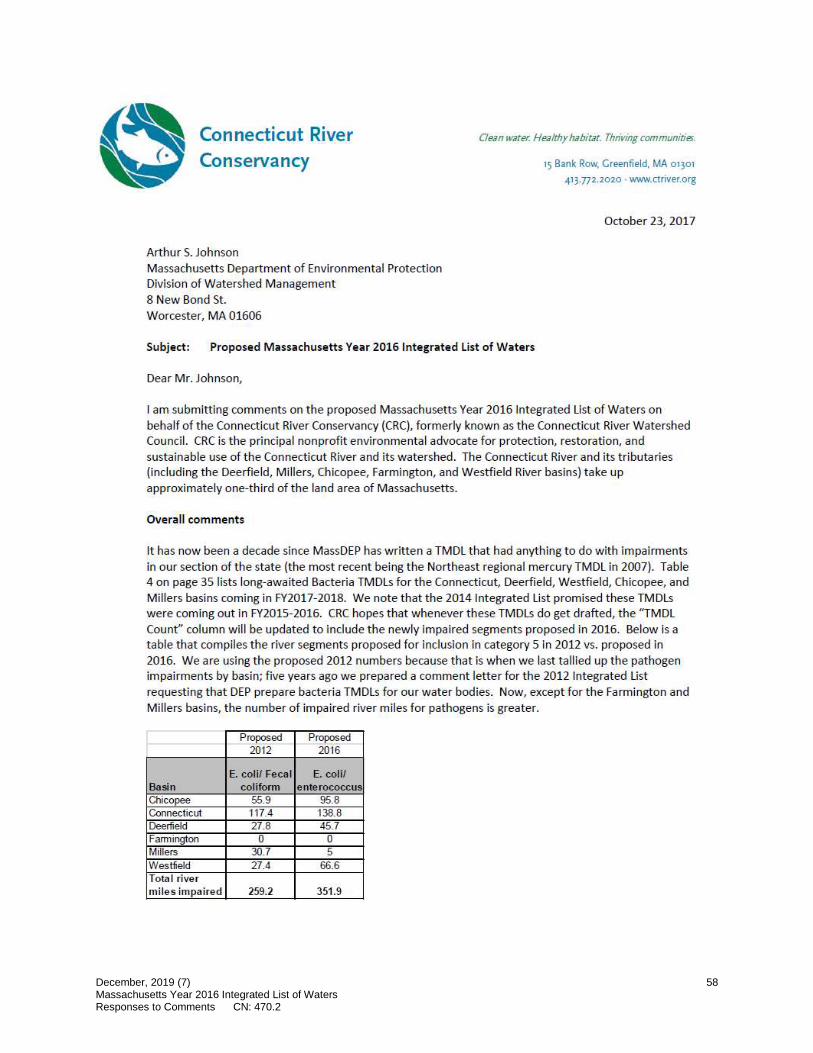
Connecticut River Conservancy
Arthur S. Johnson Massachusetts Department of Environmental Protection Division of Watershed Management
8 New Bond St. Worcester, MA 01606
Subject: Proposed Massachusetts Year 2016 Integrated List of Waters
Clean water. Healthy ha/Jit21. Thriving communioes.
15 Bank Row, Greenfield, MA 01301
413.772.2020 · www.ctriver.org
October 23, 2017
Dear Mr. Johnson,
I am submitting comments on the proposed Massachusetts Year 2016 Integrated List of Waters on behalf of the Connecticut River Conservancy {CRC), formerly known as the Connecticut River Watershed Council. CRC is the principal nonprofit environmental advocate for protection, restorat ion, and sustainable use of the Connecticut River and its watershed. The Connecticut River and its tributaries (including the Deerfield, Millers, Chicopee, Farmington, and Westfield River basins) take up approximately one-third of the land area of Massachusetts.
Overall comments
It has now been a decade since MassDEP has written a TMDL that had anything to do with impa irments in our sect ion of the state (the most recent being the Northeast regional mercury TMDL in 2007). Table 4 on page 35 lists long-awaited Bacteria TMDLs for the Connecticut, Deerfield, Westfield, Chicopee, and Millers basins coming in FY2017-2018. We note that the 2014 Integrated List promised these TMDLs were coming out in FY2015-2016. CRC hopes that whenever these TMDLs do get drafted, the "TMDL Count" column will be updated to include the newly impaired segments proposed in 2016. Below is a table that compiles the river segments proposed for inclusion in category 5 in 2012 vs. proposed in 2016. We are using the proposed 2012 numbers because that is when we last tallied up the pathogen impairments by basin; five years ago we prepared a comment letter for the 2012 Integrated List' requesting that DEP prepare bacteria TMDLs for our water bodies. Now, except for the Farmington and Millers basins, the number of impaired river miles for pathogens is greater.
Proposed Proposed 2012 2016
E.coli/ Fecal E.coli/ Basin C'Oliforrn enterococcus Chicopee 55.9 95.8 Connecticut 117.4 138.8 Deerfield 27.8 45.7 Farmington 0 0 Millers 30.7 5 Westfield 27.4 66.6 Tota l river miles impaired 259.2 351.9
December, 2019 (7) Massachusetts Year 2016 Integrated List of Waters Responses to Comments CN: 470.2
58

Appendioes 2 and 3 do not provide a ny data a nd not e no ugh ratio nale for us to eva luate proposed addit io ns o r remova ls to cat egories 4 o r 5. We recommend MassDE P review the New Hampshire Departme nt of Environmental! Service's equivale nt docu ment (online at https:Uwww.des .nh.gov/o rga nizatio n/divisions/wate r /wmb/swga/2016/ index. htm ). In many cases, NH DES provides graphs of actual data points a nd expllains its rationale fo r !list ing or de listing in det ail. Wit h MassDEP no lo nger pub lishing water quality assessment reports, CRC recommends that DEP co nside r overhau ling the way it prese nts info rmat io n in the Integ rated List. Data and rat ionale should be presented in a way that t he publ ic can unde rstand what data MassDEP is using and the rat io na le fo r changes in the list. The source a nd yea r of data s hou Id be included fo r a II assess ment list ings.
CRC includes a list as a n attachment to our letter with the glloba l request that the data or ratio na le fo r listing o r delisting be provided in detai l. We did not have t ime to look up a ll t he monito ri ng data t hat is ava illa ble o n line, but even if we d id, the informat io n is not ava ilab le in o ne place.
CRC requests that MassDEP administrative st aff take a few extra minutes to fo rmat the Integrated List documents in Acrobat such that someone ca n d ick on a section of the Table of Contents a nd jump to that sect ion. As someone who regu la rly consults this docume nt fo r mu lti ple basin, I find it very t imeconsuming to have to scro ll through pages a nd pages. Also, provid ing t he tables in Exce l coulld he lp in the preparation of comme nts .
Chico1Pee River Basin comments
MassDEP appears to be s lipping further behind in assess ing wate r bodies of the Chicopee basin. There a re 9 segments that were fo rme rlly assessed in some way in the 2014 Integrated List, but are now in category 3. Three of them a re t ributa ri es t hat drain into the Qua bbin Reservoir, which is t he Commonwealth's largest drinking water supply. Does the Department of Conservatio n a nd Recreat io n {DCR) conduct water qua li ty monito ri ng of st reams that d rain into the Quab bin Reservo ir, a nd does OCR share data with MassDEP? Nine segments in category 2 lost uses atta ined, potent ially due to lack of wate r monito ring data. Eight segments a re newly listed in category 5 a nd three impairme nts were added to a lready impaired waters .
Connecticut River Basin comments
MassDEP proposes to remove the tota l suspe nded soli ds impa irment fo r segment MA34-05, the CT Rirve r downst ream of the Holyoke Dam to t he CT state Ii ne. A look at t he DEP water quality data base ind iicates no sampling in t his st retch of rive r. There is a stat ion in Suffi e ld, CT, which was sampled on t hree dates in 2008. Is MassDEP basing its assessme nt on a sample that li es outside of the segme nt that is being de listed?
MassDEP pro poses to remove the E.co li impairme nt fo r the Mill Rive r, Northampton, segme nt MA34-28. CIRC has conducted weekly E.coli sampling fo r 19 weeks of t he yea r since 2012 at a loca t ion a lo ng the Mill Rive r a bit upst ream of Paradise Pond on t he Smith College cam pus. This s ite has freq ue nt ly not met wate r quality sta nda rds. We have worked to fi nd t he bacte ri a sou rce a nd t hi nk we have ident ified the gene ra l area of one, a nd have bee n in touch with the Northampton DPW. We have not had the t ime to fo rmat the data in to DEP database fo rmat, but the data is readily viewed and downloadable on line at http://www.connecticut rive r.us/site/node/ 18?city=Northampton&stat e=MA&status red=l&st atus yell ow=1&status blue=1&stat us white=1&stat us gray=l&sea rch=1. We do not agree that t his segment be
December, 2019 (7) Massachusetts Year 2016 Integrated List of Waters Responses to Comments CN: 470.2
59

delisted for IE . co li.
West Brook has been added as a new segment to t his year's list and is in Category 3. MassDIE P may be int erested to hear t hat the USGS Conte Anadromous Fish lab has been conducting a mult i-yea r brook tro1.J1t study on this water body and may have water quality dat a. A brief int ro to the study and contact names ca n be found on line at http://f elek.cns. umass.ed u :4444/i ndTagViz/WB/ dev/wb TagVizSplash.ht ml.
CRC request s t hat t he description of Barton Cove {MA34122), include information to indicate t hat t his is the sect ion of t he Connecticut River that is j ust upstream of the Turners Fallis Dam.
CRC request s t hat t he description of Log Pond Cove (MA34124) include information to indicate that this is a cove of the Connect icut River that is j ust upst ream of t he Holyoke Dam.
CRC notes that Sugarloaf Brook, which flows through Deerfield and Whately and discharges into the CT River nea r Herlihy Pa rk, is st ill not listed in the Integrated List as a water body. We recommend that DIEP add it t o the list and include it in your monitoring st rat egy. Sugarloaf Brook is impacted by groundwater withdrawa ls from Chang Farms, may be used for irrigat ion water from other farms, and formerliy received ii lega I discha rge from Cha ng Farms wastewater until the USIEPA required Cha ng Farms to get a NPDIES permit and d ischarge to t he Connecticut River. CRC sampled Sugarloaf Brook a few t imes in 2010 and 2011, and never found a bacteria problem. Temperature readings met co lldwater standards du ring the s1.J1mmer we samplled.
Spelling corrections: Sodom Brook, MA34-53, "Westampton" should be "Westhampton." Unnamed Tributary, MA34-60. "Wi llamanett Brook" sho1.J1ld be "Will iima nsett Brook." CRC confirms that th is water body is known as Wi llimansett Brook.
Deerfield River Basin comments
MassDIEP has added 100 new river segments in the Deerf ield basin to the 2016 Integrated List that have not been listed before. All new segments were assessed fo r t he f ish and aquatic life use only. It would be hellpful if DEP provided more information on what data was co llected during th is large effort t o assess much of this watershed. Of the 100 newly listed segments, four are conside red impaired. There are seve n segments previously listed that are newly considered impaired, and 2 impa irments added to already impaired water bodies. Two impairments are proposed to be removed.
The Deerfield River Wat ershed Association conducted a water quality program in the Dee rfield basin in 2017. Data are preliminary, bl.lit samples in several t ributa ries and t he Deerfield mainstem were tested fo r IE . co li, tota l phosphorus, tota l nit rogen, tota l suspended sollids, chloride, and vo lunt eers took temperatu re readings during sampling events.
Spelling corrections: Creamery Brook MA33-46, "Steady Line Road" sho1.J1ld be "Steady Lane Road." Fulller Brook, MA33-118, "Debuq ue State Forest'' should be "Dub1.J1que State Forest." "Kat ley Brook", MA33-99 sho1.J1 ld be "Kate ly Brook." South River, MA33-07 and MA33-101. " IEmme nts Road" should be "Emmet Road."
December, 2019 (7) Massachusetts Year 2016 Integrated List of Waters Responses to Comments CN: 470.2
60

Farmington Ri1ver Basin comments
MassDEP has added 23 new river segments in the Farmington basin to the 2016 Integrated List t hat have not been listed before. Most new segments were assessed fo r t he fish and aquat ic life use only. It would be hellpru l if DEP provided more information on what data was collected.
M illlers River Basin c,omments
Tlhis basin contains numerous addit ions and removals of impairments. Several segme nts are being delisted fo r " feca l colifo rm" with the rationale in Appendix 3 explained as "Applicable WQS atta ined; due to cha nge in WOS." This sounds to us like there has been no recent sampling for E. co li now that the state water quality standard has cha nged from feca l col iform to E.coli. However, the MassDEP database indicates that Beaver Brook (MA35-09) was sampled on six separate dates in 2011 fo r E. co li and all samples tested low. If" recent data are avai lable, DE P's rationale should possibly be based on water quality standards now being atta ined.
In Appendix 2, it wou Id be useful to refer people to page 28 of the Integrated List document to better understa nd the rationalle behind the new segments listed for PCB in fish t issue.
W estfield River Basin comments
MassDEP has added 25 new river segments in the Westfield basin to the 2016 Integrated List that have not been listed before. Water temperature and E. coli bacteria seem to be the most common new water quality impairment. It would be helpful if DEP provided more informat ion on what data was collected.
Tlhank you for the opportunity to comment. I can be reached at [email protected] or (413} 772-2020
x. 205.
Sinoerely,
Andrea F. Donlon Massachusetts River Steward
Attachme nt: List of segments that CRC is requesting data/rationale to be fu lly explained
December, 2019 (7) Massachusetts Year 2016 Integrated List of Waters Responses to Comments CN: 470.2
61

MassDEP Note: To save space, CRC’s list of all of the assessment units in need of further assessment and listing documentation is not included here.
MassDEP response :
Overall comments • Appropriate spelling corrections/updates noted by the CRC have been made to segment
descriptions in the Connecticut and Deerfield watersheds.
• As requested by the CRC, those assessment units that were newly impaired by bacteria in the proposed 2016 Integrated List will be included in the development of the planned Bacteria TMDLs for the Connecticut River and its tributaries (Deerfield, Millers, Chicopee, Farmington, and Westfield river watersheds).
• MassDEP acknowledges the need for greater transparency with respect to the basis for assessing and listing waters included in the proposed 2016 Integrated List. In fulfillment of this need, MassDEP has compiled its assessment and listing decisions, along with supporting data and information, into “data compendia” for the Connecticut watersheds where all of the designated use assessments were updated for the 2016 reporting cycle (i.e., Deerfield, Millers, Farmington, and Westfield) and these will be made available to the CRC. Data compendia were not prepared for the Chicopee and Connecticut watersheds because these two watersheds were not assessed for the Aquatic Life Use. However, the basis and rationale for listing and delisting decisions pertaining to those segments in the Connecticut and Chicopee watersheds that were specifically identified in the appendix to CRC’s comment letter have been documented and will also be made available to the CRC.
• The Integrated List document has been reformatted to include a Table of Contents with improved navigation capabilities to sections within the document.
Chicopee River Basin comments See details pertaining to listing and delisting decisions in the document entitled “Basis and rationale for listings and delistings in the Chicopee River Watershed for the proposed 2016 Integrated List” provided to the CRC under separate cover. MassDEP analysts will consider all third party data that meets data acceptability and usability requirements when completing the evaluation of the Aquatic Life Use planned for the 2018 reporting cycle. This may include DCR water quality monitoring data.
Connecticut River Basin Comments Details for listing and delisting decisions have been provided in the document entitled “Basis and rationale for listings and delistings in the Connecticut River Watershed for the proposed 2016 Integrated List” provided to the CRC under separate cover.
• Analysts did utilize sampling data collected from the mainstem Connecticut River (at the USGS gaging station in Thompsonville, CT) to assess the Connecticut River mainstem, segment MA34-05, from the Holyoke Dam Holyoke/South Hadley to Massachusetts/Connecticut border, Longmeadow. This sampling location offers good access and has long been considered representative of the condition of the Connecticut River in the segment upstream from the Massachusetts boundary. MassDEP sampled this location on multiple occasions (total of 6 visits) during the summer of 2008. Additional data including evaluations by CTDEEP as part of their IR reporting were also utilized.
• The CRC does not agree with MassDEP’s decision to remove E. coli as an impairment of the Mill River in Northampton (MA34-28), and they provided a link to bacteria data that they have collected since 2012 in support of their request to retain this impairment. The data were not submitted through MassDEP’s data portal at External Data Submittal to Watershed Planning Program MassDEP. Nonetheless, MassDEP downloaded and reviewed the referenced CRC data. These weekly E. coli data, collected during approximately June-October from 2012 to 2017
December, 2019 (7) Massachusetts Year 2016 Integrated List of Waters Responses to Comments CN: 470.2
62

and generated using the “Colilert” enzyme substrate analysis method, indicate impairment of the primary contact recreational use, based on a seasonal average of 234 MPN/100 ml for the six years of data and given that each seasonal geometric mean exceeded the criterion of 126 MPN/100 ml. While these data were not collected under a MassDEP-approved (or EPA-approved) QAPP, nor submitted through its data portal, MassDEP recognizes past efforts by the CRWC (now CRC) to conduct quality-assured monitoring (e.g., approved QAPP for 604b Project # 2009-13/ARRA 604 for E.coli monitoring; an approved 2008-09 QAPP). Given this and other considerations, there appears to be sufficient evidence to suggest that the online data are usable (with caveat) for 305(b) decision-making. Based on these recent data, MassDEP will revise its primary recreational use determination for the Mill River and will retain the E.coli impairment for segment MA34-28.
Deerfield River Basin comments A 2016 Deerfield Watershed Integrated Report Data Compendium document has been developed to provide the basis and rationale for assessing and listing waters in this watershed as part of the 2016 reporting cycle. All data sources utilized, including Deerfield River Watershed Association (DRWA) data, are provided in this document.
Farmington River Basin comments A 2016 Farmington Watershed Integrated Report Data Compendium document has been developed to provide the basis and rationale for assessing and listing waters in this watershed as part of the 2016 reporting cycle. All data sources utilized are provided in this document.
Millers River Basin comments A 2016 Millers Watershed Integrated Report Data Compendium document has been developed to provide the basis and rationale for assessing and listing waters in this watershed as part of the 2016 reporting cycle. All data sources utilized are provided in this document.
• No delistings for fecal coliform bacteria were made without sampling to demonstrate that bacteria levels were meeting the assessment guidance. Data summaries are provided in the Millers Watershed Integrated Report Data Compendium.
• At the request of the CRC, reference will be made in Appendix 2 of the final integrated report to the earlier text describing the rationale for listing new segments in the Millers River Watershed as impaired by PCB in fish tissue.
Westfield River Basin comments A 2016 Westfield Watershed Integrated Report Data Compendium document has been developed to provide the basis and rationale for assessing and listing waters in this watershed as part of the 2016 reporting cycle. All data sources utilized are provided in this document.
December, 2019 (7) Massachusetts Year 2016 Integrated List of Waters Responses to Comments CN: 470.2
63

Nashua River Watershed Association (NRWA)
December, 2019 (7) Massachusetts Year 2016 Integrated List of Waters Responses to Comments CN: 470.2
64
NASHUA RIVER WATERSHED
i\SSOCIATION -/>rqU,:1 l1,g '"" 11111te.r, our l11nd. 011,- romnrn11lrie1
October 23, 2017
Arthur S. Johnson
Massachusetts Department of Environmental Protection Division of Watershed Management Watershed Planning Program 627 Main Street, Second Floor Worcester, MA 01608
Re: Comments o·n Draft Proposed MA Year 2016 Integrated List of Watets
Dear Mr. Johnson,
The Nashua River Watershed Association {NRWA) submits the following comments on the
MassDEP's Proposed Massachusetts Yeor 2026 Integrated List of Waters:. The NRWA is a
regional leader in natural resource protection and environmental education for our 32
watershed communities In north central Massachusetts and southern New Hampshire. NRWA's
Water Monitoring Program has been monitoring rivers and streams In the Nashua River
watershed under the auspices of an EPA, MassDEP, and New Hampshire Department of
Environmental Services (NHDES)•approved QAPP since 2001. Data was provided to MassDEP
from 2008 through 2015 in accordance with DEP's requirements for data submission. NRWA
also takes part in, the NHOES Volunteer River Assessment Program (VRAP); data generated from
rivers and streams in New Hampshire are regularly used by NHDES in their Integrated list o f waters.
General Comments: Massachusetts Rivers Alliance (RA) is submitting a letter outlining some overarching comments regarding the Proposed 2016 Integrated List. NRWA supports RA's
comments, including the timeliness for data acquisit ion and evaluation, the concern regarding the dimin ishing resources MassDEP has for accomplishing the tasks needed to perform
evaluations, and ,especially with regard to the transparency of data sources MassDEP uses t o
decide which segments will be listed or delisted. NRWA has expended considerable time in
preparing data for submission to MassDEP to conform to data submission requirements. M~~sOFP ._triff hc11ve been in contact with u& regarding the d:>t.o. ft is undcor if any of NRWA' s
data have been used for this Integrated List. It's also unclear where and when MassOEP has
conducted sampling on their own in the watershed to support the decisions. More information
would be helpful regarding the probabilistic and determlni°stic monitoring conducted by MassDEP.
592 Main Sn,e,,n, Crou,n, MA 01450 ,J2)0 p 978.4.48,0299 f 9?8.•Ufl.094 I www.n9,}'10tuh·c,-.·;etml1cd .mg
December, 2019 (7) Massachusetts Year 2016 Integrated List of Waters Responses to Comments CN: 470.2
65

Baker Regarding impairments added to Categories 4 and 5: NRWA agrees with the addition of
(MA81-62) and Falulah (MA81-63) Brooks, and Wekepeke Brook (MA81-72) to Category 5 for
E.coli. NRWA's data support the listing of these streams for E.coli, though it would help to have
MassDEP clarify which data was used for the listing of these water bodies. We note that Pearl
Hill Brook (MA81-80) and Willard Brook (MA81-79), both fresh water streams, were listed for
Enterococcus. We presume this is a result of the MA Department of Conservation and
Recreation conducting Enterococcus sampling at Pearl Hill State Park and Willard Brook State
Park swimming beaches. Enterococcus is not listed as an impairment for any other freshwater
streams in the Nashua River watershed.
Regarding impairments removed from Categories 4 and 5: NRWA questions the removal of
Squannacook River segment MA81-18 for E.coli, given the explanation : "Applicable WQS
attained; reason for recovery unspecified." It is unclear what data were used to determine that
the WQS were attained. NRWA E.coli geomean data for 3 sites on the Squannacook, sampled 7
months each year from 2013 through 2015, support primary contact recreation. However,
secondary contact recreation WQS were exceeded 6 out of 21 sampling events at one site, and
2 out of 21 events at a second site. Data have been provided to the DEP. Given the NRWA
results, and the fact that two tributary streams to the Squannacook River are being listed for
the first time for Enterococcus impairment (Pearl Hill Brook, and Willard Brook - see comment
above), it seems prudent to leave the Squannacook River on the Category 5 list at this time.
The lack of comments regarding the remaining water bodies added or removed is not a
comment on these actions; NRWA has no data to support or refute the changes.
Thank you for this opportunity to comment.
Sincerely,
Mt:::~.!~ Executive Director Water Programs Director
MassDEP response to NRWA’s general comments: Responses to the NRWA’s general comments pertaining to the age and sources of data used in assessments and the transparency of the assessment decisions are presented in Part I of this document.
MassDEP response to NRWA’s specific comments :
December, 2019 (7) Massachusetts Year 2016 Integrated List of Waters Responses to Comments CN: 470.2
66

I I
I I
I I I I
• While the NRWA agreed with MassDEP’s decision to add Baker Brook (MA81-62), Falulah Brook (MA81-63) and Wekepeke Brook (MA81-72) to the 303(d) list as impaired by E. coli, they requested that MassDEP furnish the data that were used to support the decisions, and these data are summarized below.
Baker Brook – The assessment of Baker Brook was based on MassDEP’s water quality survey data from 2008. The geometric mean of six bacteria counts from samples collected at Crawford Road, Fitchburg exceeded the criterion for the Primary Contact Recreational Use, as outlined in the Consolidated Assessment and Listing Methodology (CALM) document and, therefore, Baker Brook was listed as impaired by E. coli (see table below).
Summary of MassDEP Watershed Planning Program E. coli data collected in 2008 from Baker Brook at Crawford Road, Fitchburg
UniqueID Year Date First Sample
Date Last Sample
Sample Count
Geometric Mean
Bacteria Type
W1836 2008 05/13/08 09/16/08 6 161 E. coli
Falulah Brook – MassDEP sampled Falulah Brook as part of its 2008 water quality surveys of the Nashua River Watershed and the geometric mean of the samples collected from Fisher Road, Fitchburg between April and September met the water quality standard for the Primary Contact Recreational Use (see table below). Nonetheless, there are two combined sewer overflow (CSO) outfalls that discharge to Falulah Brook downstream from MassDEP’s 2008 sampling site. MassDEP’s CALM document specifies that, unless otherwise authorized, “the presence of an active (i.e., open to discharge at some point) CSO discharge will be utilized by MassDEP analysts to make a presumptive impairment decision for the Primary Contact Recreational Use”. In the case of Falulah Brook, therefore, a presumptive impairment decision was applied since this waterbody does not have a CSO variance in place.
Summary of MassDEP Watershed Planning Program E. coli data collected in 2008 from Falulah Brook at Fisher Road, Fitchburg
UniqueID Year Date First Sample
Date Last Sample
Sample Count
Geometric Mean
Bacteria Type
W1837 2008 05/15/08 09/18/08 6 42 E. coli
Wekepeke Brook – This brook is defined as assessment unit (AU) MA81-72 for the first time in this integrated reporting cycle (2016) because MassDEP monitoring data were available from sites sampled in 2008 (Flanagan Hill Road, Sterling) and 2011 (Route 190 crossing, Lancaster) that had not been previously used for assessment. Data from these two sites indicated that the Primary Contact Use was supported (see table below). However, when creating the new AU for Wekepeke Brook, former segments MA81-61 (“Unnamed tributary…from outlet of Bartlett Pond to the North Nashua River”) and MA81009 (“Bartlett Pond”) were included within it. Segments MA81-61 and MA81009 had been previously listed as impaired in 2010 and 2012, respectively, based on elevated E. coli levels reported by the NRWA and, therefore, these historic impairments were applied to the new segment in 2016.
Summary of MassDEP Watershed Planning Program E. coli data collected from Wekepeke Brook at Flanagan Hill Road, Sterling (W1831) and at Route 190 crossing, Leominster (W2212)
UniqueID Year Date First Sample
Date Last Sample
Sample Count
Geometric Mean
Bacteria Type
W1831 2008 05/13/08 09/16/08 6 45 E. coli
W2212 2011 5/17/11 9/19/11 6 85 E. coli
December, 2019 (7) Massachusetts Year 2016 Integrated List of Waters Responses to Comments CN: 470.2
67
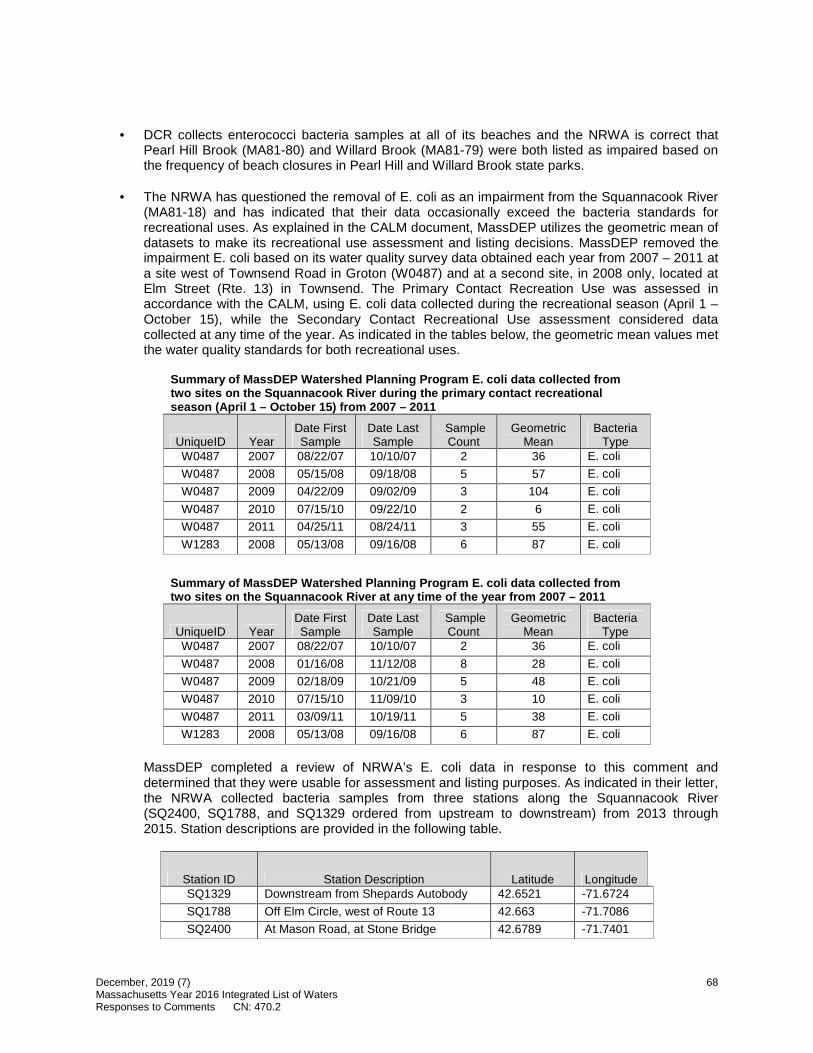
I
• DCR collects enterococci bacteria samples at all of its beaches and the NRWA is correct that Pearl Hill Brook (MA81-80) and Willard Brook (MA81-79) were both listed as impaired based on the frequency of beach closures in Pearl Hill and Willard Brook state parks.
• The NRWA has questioned the removal of E. coli as an impairment from the Squannacook River (MA81-18) and has indicated that their data occasionally exceed the bacteria standards for recreational uses. As explained in the CALM document, MassDEP utilizes the geometric mean of datasets to make its recreational use assessment and listing decisions. MassDEP removed the impairment E. coli based on its water quality survey data obtained each year from 2007 – 2011 at a site west of Townsend Road in Groton (W0487) and at a second site, in 2008 only, located at Elm Street (Rte. 13) in Townsend. The Primary Contact Recreation Use was assessed in accordance with the CALM, using E. coli data collected during the recreational season (April 1 – October 15), while the Secondary Contact Recreational Use assessment considered data collected at any time of the year. As indicated in the tables below, the geometric mean values met the water quality standards for both recreational uses.
Summary of MassDEP Wat ershed Planning Program E. coli data collected from two sites on the Squannacook River during the primary contact recreational season (April 1 – October 15) from 2007 – 2011
UniqueID Year Date First Sample
Date Last Sample
Sample Count
Geometric Mean
Bacteria Type
W0487 2007 08/22/07 10/10/07 2 36 E. coli
W0487 2008 05/15/08 09/18/08 5 57 E. coli
W0487 2009 04/22/09 09/02/09 3 104 E. coli
W0487 2010 07/15/10 09/22/10 2 6 E. coli
W0487 2011 04/25/11 08/24/11 3 55 E. coli
W1283 2008 05/13/08 09/16/08 6 87 E. coli
Summary of MassDEP Watershed Planning Program E. coli data collected from two sites on the Squannacook River at any time of the year from 2007 – 2011
UniqueID Year Date First Sample
Date Last Sample
Sample Count
Geometric Mean
Bacteria Type
W0487 2007 08/22/07 10/10/07 2 36 E. coli
W0487 2008 01/16/08 11/12/08 8 28 E. coli
W0487 2009 02/18/09 10/21/09 5 48 E. coli
W0487 2010 07/15/10 11/09/10 3 10 E. coli
W0487 2011 03/09/11 10/19/11 5 38 E. coli
W1283 2008 05/13/08 09/16/08 6 87 E. coli
MassDEP completed a review of NRWA’s E. coli data in response to this comment and determined that they were usable for assessment and listing purposes. As indicated in their letter, the NRWA collected bacteria samples from three stations along the Squannacook River (SQ2400, SQ1788, and SQ1329 ordered from upstream to downstream) from 2013 through 2015. Station descriptions are provided in the following table.
Station ID Station Description Latitude Longitude SQ1329 Downstream from Shepards Autobody 42.6521 -71.6724
SQ1788 Off Elm Circle, west of Route 13 42.663 -71.7086
SQ2400 At Mason Road, at Stone Bridge 42.6789 -71.7401
December, 2019 (7) Massachusetts Year 2016 Integrated List of Waters Responses to Comments CN: 470.2
68
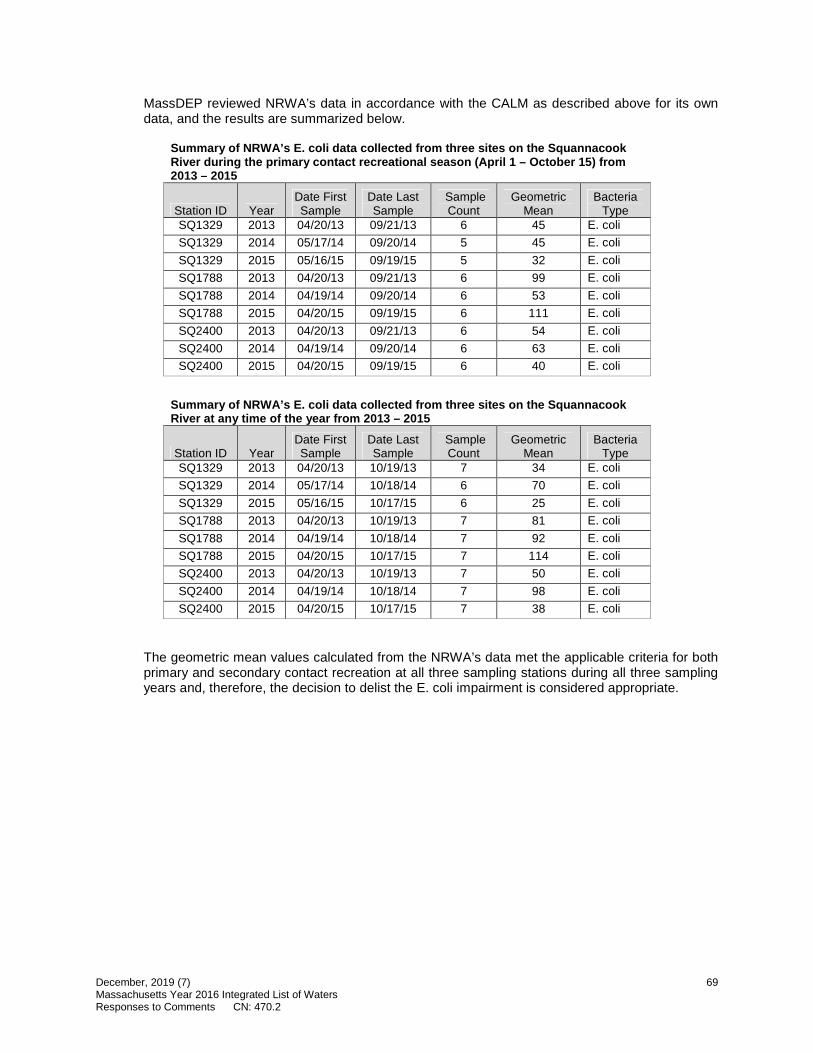
MassDEP reviewed NRWA’s data in accordance with the CALM as described above for its own data, and the results are summarized below.
Summary of NRWA’s E. coli data collected from three sites on the Squannacook River during the primary contact recreational season (April 1 – October 15) from 2013 – 2015
Station ID Year Date First Sample
Date Last Sample
Sample Count
Geometric Mean
Bacteria Type
SQ1329 2013 04/20/13 09/21/13 6 45 E. coli
SQ1329 2014 05/17/14 09/20/14 5 45 E. coli
SQ1329 2015 05/16/15 09/19/15 5 32 E. coli
SQ1788 2013 04/20/13 09/21/13 6 99 E. coli
SQ1788 2014 04/19/14 09/20/14 6 53 E. coli
SQ1788 2015 04/20/15 09/19/15 6 111 E. coli
SQ2400 2013 04/20/13 09/21/13 6 54 E. coli
SQ2400 2014 04/19/14 09/20/14 6 63 E. coli
SQ2400 2015 04/20/15 09/19/15 6 40 E. coli
Summary of NRWA’s E. coli data collected from three sites on the Squannacook River at any time of the year from 2013 – 2015
Station ID Year Date First Sample
Date Last Sample
Sample Count
Geometric Mean
Bacteria Type
SQ1329 2013 04/20/13 10/19/13 7 34 E. coli
SQ1329 2014 05/17/14 10/18/14 6 70 E. coli
SQ1329 2015 05/16/15 10/17/15 6 25 E. coli
SQ1788 2013 04/20/13 10/19/13 7 81 E. coli
SQ1788 2014 04/19/14 10/18/14 7 92 E. coli
SQ1788 2015 04/20/15 10/17/15 7 114 E. coli
SQ2400 2013 04/20/13 10/19/13 7 50 E. coli
SQ2400 2014 04/19/14 10/18/14 7 98 E. coli
SQ2400 2015 04/20/15 10/17/15 7 38 E. coli
The geometric mean values calculated from the NRWA’s data met the applicable criteria for both primary and secondary contact recreation at all three sampling stations during all three sampling years and, therefore, the decision to delist the E. coli impairment is considered appropriate.
December, 2019 (7) Massachusetts Year 2016 Integrated List of Waters Responses to Comments CN: 470.2
69

City of New Bedford, New Bedford, MA.
December, 2019 (7) Massachusetts Year 2016 Integrated List of Waters Responses to Comments CN: 470.2
70

OF NEW BEDFORD Jonathan F. Mitchell, Mayor
Department of Public Infrastructure
Manuel H. Silva Acting Commissioner
Water Wastewater
Highways Engineering Cemeteries
Park Maintenance Forestry
Energy October 23, 2017
Arthur S. Johnson MassDEP Division of Watershed Management Watershed Planning Program 8 New Bond Street Worcester, MA 01606 [email protected]
Dear Mr. Johnson:
The City of New Bedford, Massachusetts is writing in support of MassDEP's determination to
remove Segment ID MA95-63, Outer New Bedford Harbor, from the Draft Massachusetts Year 2016
Integrated List of Waters for the estuarine bioassessments, nitrogen (total), other, and dissolved oxygen impairments.
The City has made significant progress related to receiving water quality improvements over the
past 25 years. Since 1990, the City has constructed a new, secondary wastewater treatment plant and has implemented over $283 million (in 2016 dollars) in improvements to its wastewater and
stormwater systems. This infrastructure investment and commitment to environmental
stewardship has resulted in significant and consequential reductions on BOD and nutrient loadings,
a more than 90-percent reduction in combined sewer overflows, and the opening of 12,000 acres of shellfish beds that were previously closed. The City is pleased to see that its efforts have paid off, and that water quality has improved in the Outer Harbor. And while this significant improvement in
water quality in the Outer Harbor is notable, the City remains committed to further improving water quality in its area receiving waters. The City has developed an Integrated Capital Plan,
currently submitted as a draft to EPA and MassDEP, that outlines a 20-year plan consisting of WWTP, CSO, and stormwater improvements that will continue this positive trend in water quality
that is so well demonstrated by the Department's determination to remove these impairments from
the Outer New Bedford Harbor assessment unit.
Given the substantial nutrient load reduction achieved by the City as a result of its upgrade and
maintenance of the WWTP and an almost 17-fold reduction in CSO discharges to area receiving waters, it is unsurprising that water quality in the Outer New Bedford Harbor has improved. These
reductions are durable, founded as they are in permanent infrastructure improvements, and will be supplemented with additional improvements as the City implements it 20-year Integrated Capital Plan, which focuses both on maintenance of the existing system and additional upgrades.
December, 2019 (7) Massachusetts Year 2016 Integrated List of Waters Responses to Comments CN: 470.2
71

Arthur S. Johnson October 23, 2017 Page 2
WWTP Improvements
New Bedford constructed a new, secondary WWTP in 1996 at a cost of $179.6 million (2016 dollars). The new plant reduced BOD, TSS, TKN, and TN loading to the Outer Harbor by 96%, 83%, 94% and 79%, respectively, relative to pre-WWTP upgrade conditions. The 2017 monthly average effluent total nitrogen concentrations for the first 6 months of the year (January through June) are shown in Figure 1, and represent a significant decline in effluent total nitrogen concentrations compared with the pre-upgrade WWTP performance. The eutrophication-related impairments have been on the MassDEP Integrated list since at least the 1998 reporting cycle, suggesting that the data used to list this segment pre-dates the secondary WWTP1. Given the age of the data used to list this segment, the improvement in water quality is both expected and will persist given the substantial water quality improvements that the City has made and will continue to make.
As described in the draft Integrated Capital Plan, the City is working to further reduce nitrogen by optimizing the current plant operations. In 2017, the City finished a replacement project for the diffusers in the aeration basins which will allow them to be cycled to provide process control to this optimization process.
18
16
14
~ 12 E z 10 I-
t: 8 a., :,
:i= 6 u.J
4
2
0 Jan Feb Mar Apr May Jun
Figure 1: Recent Monthly Average Effluent Total Nitrogen Concentrations for the New Bedford WWTP
CSO Improvements
As noted above, the City has made a $283 million (2016 dollars) investment in its infrastructure since 1990, and has eliminated 13 CSO regulators and 11 CSO outfalls. This investment has significantly reduced bacteria and nutrient contributions to New Bedford Inner Harbor, New Bedford Outer Harbor, Clarks Cove, and Buzzards Bay waterbody segments. The sewer separation and CSO control efforts have significantly reduced system overflows from pre-1990 levels. As shown in Figure 2, estimated average annual untreated discharge volumes have been significantly reduced from an estimated 3.1 billion gallons in 1990 to approximately 183 million gallons in 2016. Similarly, the capture rate - the percentage of flow captured and retained within the system for treatment - has risen from roughly 59 percent to approximately 93 percent, well above the 85
1 Buzzards Bay Watershed 2000 Water Quality Assessment, MassDEP, 2003. http://www.mass.gov/eea/docs/dep/water /resources/71 wqar09 /9Swqar2.pdf (see page 105)
1105 Shawmut Avenue, New Bedford, MA 02746 Telephone 508-979-1550 Fax 1-508-961-3054
December, 2019 (7) Massachusetts Year 2016 Integrated List of Waters Responses to Comments CN: 470.2
72
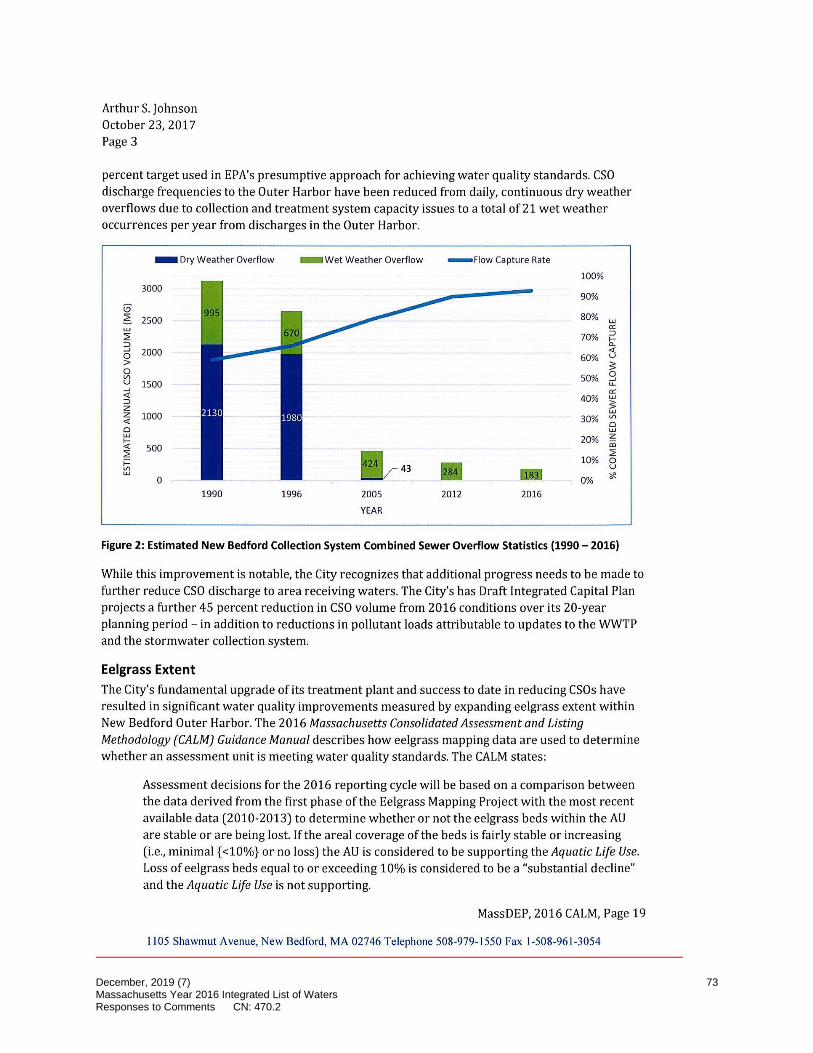
Arthur S. Johnson October 23, 2017 Page 3
percent target used in EPA's presumptive approach for achieving water quality standards. CSO discharge frequenc ies to the Outer Harbor have been reduced from daily, continuous dry weather overflows due to collection and treatment system capacity issues to a total of 21 wet weather occurrences per year from discharges in the Outer Harbor.
- Dry Weather Overflow Wet Weather Overflow - Flow Capture Rate
100% 3000
90% 0' ~ 2500 80% w w er:: ~ 70% =>
I--=> 0.. ...J 2000 <( 0 60% u > 5 0 0 V> 50% ...J u 1500 u.. ...J er:: <( 40% w => 5 z z 1000
w 30% Vl
<( 0 0 w w 20% z ~ 500 iii ~ ~ ~ 10% 0 V> u LU ~ * 0 0%
1990 1996 2005 2012 2016
YEAR
Figure 2: Estimated New Bedford Collection System Combined Sewer Overflow Statistics (1990 - 2016)
While this improvement is notable, the City recognizes that additional progress needs to be made to further reduce CSO discharge to area receiving waters. The City's has Draft Integrated Capital Plan projects a further 45 percent reduction in CSO volume from 2016 conditions over its 20-year planning period - in addition to reductions in pollutant loads attributable to updates to the WWTP and the stormwater collection system.
Eelgrass Extent The City's fundame ntal upgrade of its treatment plant and success to date in reducing CSOs have resulted in significant water quality improvements measured by expanding eelgrass extent within New Bedford Outer Harbor. The 2016 Massachusetts Consolidated Assessment and Listing Methodology {CALM) Guidance Manual describes how eelgrass mapping data are used to determine whether an assessment unit is meeting water quality standards. The CALM states:
Assessment decisions for the 2016 reporting cycle will be based on a comparison between the data derived from the first phase of the Eelgrass Mapping Project with the most recent available data (2010-2013) to determine whether or not the eelgrass beds within the AU are stable or are being lost. If the areal coverage of the beds is fairly stable or increasing (i.e., minimal { <10%} or no loss) the AU is considered to be supporting the Aquatic Life Use. Loss of eelgrass beds equal to or exceeding 10% is considered to be a "substantial decline" and the Aquatic Life Use is not supporting.
MassDEP, 2016 CALM, Page 19
1105 Shawmut Avenue, New Bedford, MA 02746 Telephone 508-979-1550 Fax 1-508-961-3054
December, 2019 (7) Massachusetts Year 2016 Integrated List of Waters Responses to Comments CN: 470.2
73
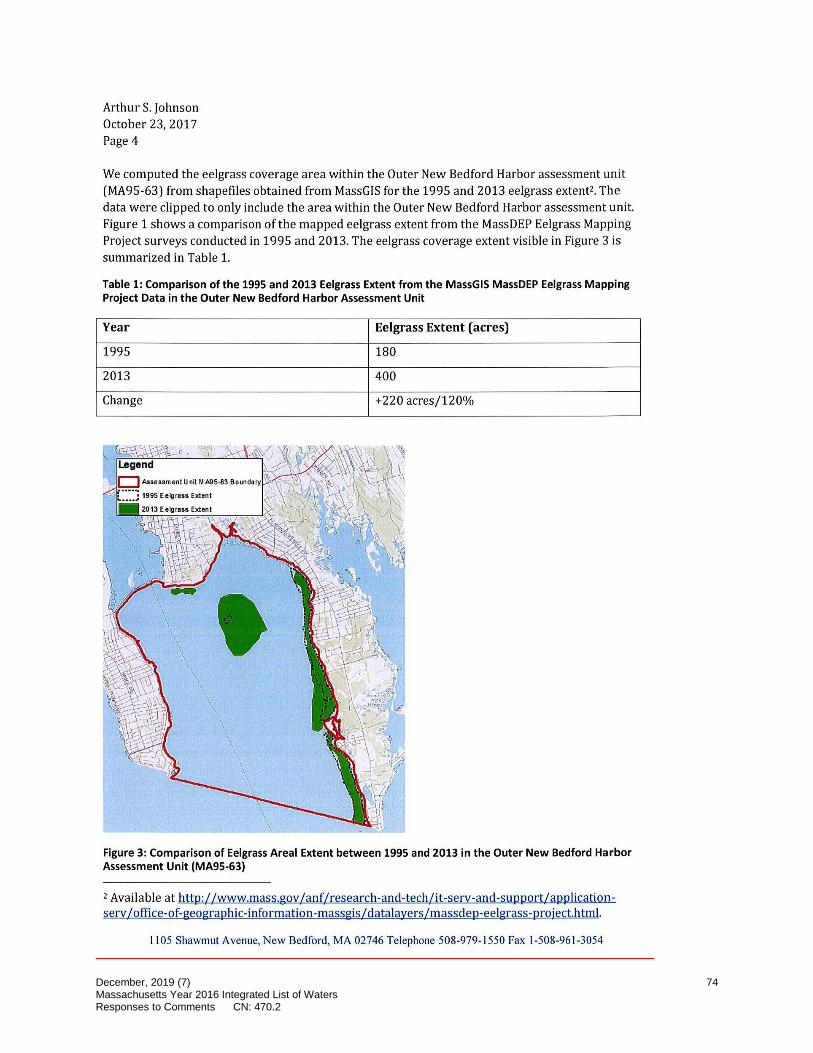
Arthur S. Johnson October 23, 2017 Page 4
We computed the eelgrass coverage area within the Outer New Bedford Harbor assessment unit (MA95-63) from shapefiles obtained from MassGIS for the 1995 and 2013 eelgrass extent2. The data were clipped to only include the area within the Outer New Bedford Harbor assessment unit. Figure 1 shows a comparison of the mapped eelgrass extent from the MassDEP Eelgrass Mapping Project surveys conducted in 1995 and 2013. The eelgrass coverage extent visible in Figure 3 is summarized in Table 1.
Table 1: Comparison of the 1995 and 2013 Eelgrass Extent from the MassGIS MassDEP Eelgrass Mapping Project Data in the Outer New Bedford Harbor Assessment Unit
Year
1995
Eelgrass Extent (acres)
180
2013 400
Change +220 acres/120%
'\
' \ \
\ \ \ \
\ \,.
Figure 3: Comparison of Eelgrass Areal Extent between 1995 and 2013 in the Outer New Bedford Harbor Assessment Unit (MA95-63)
2 Available at http://www.mass.gov/anf /research-and-tech/it-serv-and-support/applicationserv /offlce-of-geographic-information-massgis/datalayers/massdep-eelgrass-project.html.
I I 05 Shawmut Avenue, New Bedford, MA 02746 Telephone 508-979-1550 Fax 1-508-961-3054
December, 2019 (7) Massachusetts Year 2016 Integrated List of Waters Responses to Comments CN: 470.2
74

Arthur S. Johnson October 23, 2017 Page 5
The information shown in Table 1 and Figure 3 supports MassDEP's determination that the Outer New Bedford Harbor assessment unit meets the Aquatic Life Use based on the eelgrass bed mapping criteria listed in the CALM.
The City is pleased that its efforts on improving its WWTP water quality, reducing its CSO frequency and improvements to its stormwater and wastewater conveyance systems have resulted in the significant water quality improvements evidenced by the Department's decision to remove the Outer New Bedford Harbor from the draft 2016 Integrated List of Waters. The City looks forward to working with MassDEP and EPA to continue making improvements to New Bedford Harbor water quality.
Please let me know if you have any questions on this document.
Sincerely,
0laA1 ~f fl ~PJf Manuel H. Silva Acting Commissioner
cc: Jamie Ponte, Mikaela McDermott - City of New Bedford
MassDEP response: During the public review of the Proposed Massachusetts Year 2016 Integrated List of Waters, MassDEP received comments from parties in favor of and parties against the removal of the impairments “Estuarine Bioassessments”, “Nitrogen, Total” and “Dissolved Oxygen” from MA95-63 (Outer New Bedford Harbor). Furthermore, the Buzzards Bay Coalition (BBC) submitted more recent water quality monitoring data from this water body that had not been available at the time that the last assessment and 303(d) listing/delisting decisions were made. The BBC contended that, based on their monitoring data, it was inappropriate at this time to remove “Dissolved Oxygen” and “Nitrogen, Total” from Outer New Bedford Harbor. MassDEP reviewed the BBC’s data submittal and reassessed whether or not the proposed impairment delistings remained warranted in light of those data. All of the BBC’s comments and MassDEP’s responses can be found in the public responsiveness document. Please review MassDEP’s concurrence with the BBC’s rationale for retaining “Dissolved Oxygen” and “Nitrogen, Total” as causes of impairment in Outer New Bedford Harbor, while reaffirming its decision to delist “Estuarine Bioassessments” as a consequence of continued improvements in the health and extent of eelgrass populations. MassDEP recognizes the City of New Bedford’s many efforts to improve water quality in the harbor, and acknowledges the improvements in water quality that have been realized to date. MassDEP will continue to assess designated uses using the best available quality-assured data.
December, 2019 (7) Massachusetts Year 2016 Integrated List of Waters Responses to Comments CN: 470.2
75

Charles River Watershed Association (CRWA)
December, 2019 (7) Massachusetts Year 2016 Integrated List of Waters Responses to Comments CN: 470.2
76
CRWA Saving the Charles River since 1965
Arthur S. Johnson
MassDEP
Division of Watershed Management
Watershed Planning Program
627 Main Street, Second Floor
Worcester, MA 01608
October 23, 2017
Charles River Watershed Association (CRWA) has reviewed the Proposed 2016 Massachusetts Integrated List of Waters (IL) and provides the following comments.
Data Collection and Use
CRWA appreciates the explanation MassDEP has provided regarding catching up on a back log of data in
advance of the 2016 IL development process. Nevertheless, it is discouraging that MassDEP is not able
to produce and validate new data (< 5 years old) for each of the 33 major watersheds across the state
for use in biannual integrated list updates. MassDEP should provide a clear schedule for their data
collection, review and analysis timelines. Presently, it is unclear how it is possible to utilize data that are
less than 5 years old in the listing process given the lead time required to start the listing process and
the delay from when data is collected to when it is final and validated.
Furthermore, despite collection of considerable water quality data and field assessment information by
science-based watershed associations, MassDEP has also been slow to adopt the use of our data,
although, in many cases, it is the best available data source for segments of the Charles River and other
waterbodies in our watershed. CRWA requests more detail regarding the criteria for each level of data.
In particular, since Level 3 data are most likely to be used in the report, it would be useful to know how
non-MassDEP stakeholders such as watershed associations can advance their data from Level 2 to Level
3. CRWA’s data collection programs meet all the preliminary criteria for external data noted on p. 24 of
the IL. We would like to work directly with MassDEP to make adjustments to our sampling program, as
necessary, to comply with any requirements for Level 3 data.
CRWACRWA also requests that MassDEP contact us in advance of assessments in the Charles with the
details of its monitoring plan, including field assessments schedules, sampling site locations, and
proposed sampling parameters, for both the probabilistic and deterministic monitoring programs
described in the ILIL. In addition, we ask that the final ILIL include a complete description of MassDEP’s
deterministic and probabilistic sampling network, specifically including information on the monitoring
frequency, number of locations, wet or dry weather, and time of year for monitoring for all sites
statewide monitored across the five year wadeable stream survey, the three-year lakes survey, and
targeted watershed monitoring.
December, 2019 (7) Massachusetts Year 2016 Integrated List of Waters Responses to Comments CN: 470.2
77
CRWACRWA requested and received more detailed information regarding the specific data sources used
for listing decisions on the Charles River. We appreciate that MassDEP was able to respond to this
request,; however, we would encourage MassDEP to be more transparent and specific about data
sources and data collection date ranges timeframes for all waterbodies across the state.
Listing/Delisting Decisions
We ask that MassDEP reference specific data sources used to support its decisions to list or delist any
segment or waterbodies in the final ILIL. For example, it would be useful to know the data sources
MassDEP is using when the explanation for removal of a segment is, “Applicable WQS attained; reason
for recovery unspecified.” By comparison, the New Hampshire Department of Environmental Services
draft 303(d) list for 2016 provides an ideal, transparent model for source descriptions in impairment
evaluations.
We also noted multiple “de-listings” (removal from category 5) for fecal coliform bacteria with the
explanation provided as, “Applicable WQS attained; due to change in WQS.” A change in the water
quality standards from using fecal coliform to using E.coli as the indicator bacteria should not in itself
justify a delisting of this impairment. The waterbody should be listed as impaired for E.coli until recent
data is available to confirm or negate this listing. In the final list, MassDEP should provide a detailed,
data-based explanation to show that the water body is not in fact impaired by the relevant impairment.
MassDEP also needs to be more transparent in their revision of historical listings. Removing or changing a listing based on a claim that the “Original basis for listing was incorrect” should not occur without a detailed explanation. Furthermore, this explanation appears to be contrary to the listing methodology described in the Consolidated Assessment and Listing Methodology (CALM). Waterbody listings should only be altered when recent data (<5 years old) is available to support that change. Data used to make that decision should be published along with the list. On the final 2016 IL, MassDEP should replace any water body segment listing that was changed using the claim “Original basis for listing was incorrect.”
The list of waters in Category 5is extensive. We ask that MassDEP uniformly include in the final ILIL how TMDLs are matched with impairments.
Assessment Units
The list of waters where no assessment has been completed (Category 3) should be comprehensive for
all waters statewide. While developing assessment units for all unassessed water bodies is likely a time
consuming and labor -intensive task, CRWA requests that all Category 3 waterbodies be listed by name,
location, and “size” (length or area) on Category 3 to provide a general idea of the state’s progress in
meeting its requirement to assess all waterbodies. Unassessed waterbodies can be broken into
assessment units as they are assessed. We request that MassDEP report the percentage of rivers and
streams (by mile), and lakes and ponds (by acre), (1)that have ever been assessed and (2) that have
been assessed within the previous five years
State Surface Water Quality Standards (SWQS)
CRWA is dismayed about the process for review and update of the SWQS. As noted in the Proposed ILIL,
the Clean Water Act requires that states hold public hearings at least once every three years (triennial
December, 2019 (7) Massachusetts Year 2016 Integrated List of Waters Responses to Comments CN: 470.2
78
review) to review and, where appropriate, revise their water quality standards. To our knowledge, the
state has not been meeting this obligation. The Proposed ILIL also notes proposed revisions to the SWQS
for 2017, but does not provide adequate detail regarding these proposed changes or where that
information can be found; it also does not provide information about when public hearings will be held
regarding these changes. Review of SWQSs should be done in an open, transparent, public process.
With limited staff and resources, it appears that the agency is unable to assess all waterbodies in the
state and develop adequate plans for addressing impairments.
Additionally, CRWA submits the following comments regarding waterbodies within our watershed:
CRWA disagrees with the delisting of Stop River in Wrentham/Norfolk/Medfield for E.coli bacteria impairment. We monitor the Stop River River from the Noon Hill Avenue bridge on a monthly basis following field and laboratory procedures delineated in a Quality Assurance Project Plan (QAPP) approved by MassDEP and U.S. EPA . We routinely submit our E. coli bacteria sampling results to DEP on an annual basis. We have included a table of exceedances of the Massachusetts Water Quality Standards for E.coli bacteria for primary and secondary contact recreation during the recreation season (AprilApril 1
st –– October 15
th) between 2012 and 2016 (Table 1). The geometric mean for samples
collected at this site from 2016 April – September monitoring events is 178 MPN/100 mL, which exceeds the state swimming standard. Please provide the data that were used to propose this delisting.
CRWA disagrees with the placement of Bogastow Brook in the Category 2 list as attaining its use requirements for fish and wildlife use. In 2016, Bogastow Brook was dry in August and September, and empty freshwater clam shells littered the dry streambed (see photos below, taken September 12
th ,
2016). Bogastow Brook should be listed as impaired for flow alterations for fish and wildlife use. Refer to our macroinvertebrate monitoring data, previously submitted and included in the appendix to this letter.
December, 2019 (7) Massachusetts Year 2016 Integrated List of Waters Responses to Comments CN: 470.2
79
In the summer of 2016, many Charles River segments experienced historically low flows during the nearly statewide drought. While low flow conditions are to be expected during a drought, it is clear that river flow conditions were further exacerbated by watershed development and an increase in impervious cover. The USGS flow gauges in Dover and Waltham, located along assessment units MA72-06 and MA72-07, both logged all-time lows for their extensive periods of record. At the Dover gauge,
December, 2019 (7) Massachusetts Year 2016 Integrated List of Waters Responses to Comments CN: 470.2
80

mean daily flow was below the 79-year daily average for every day between June and December of 2016. On average, there was a 75% difference between 2016 mean daily flow and the 79-year mean daily flow. Record low flows were recorded in July (12 days), August (9 days), and September (13 days) (Table 4). At the Waltham gage, mean daily flow was below the 85-year average from June to December 2016. On average, there was a 79% difference between 2016 mean daily flow and the 79-year mean daily flow. Record low flows were recorded in June (5 days), July (8 days), and September (1 day). MassDEP should weigh these impacts in this and future evaluations of flow alteration impairments at these locations.
Alder Brook in Needham, Trout Brook in Dover, and Fuller Brook in Wellesley are listed as requiring a TMDL for nutrient/eutrophication biological indicators; however, they are not listed for any impairments that might indicate nutrient pollution or eutrophication, such as excess algal growth, macrophytes, or phosphorus. This makes it difficult to develop a plan to address the impairment. Similarly, Powissett Brook in Westwood/Dover is listed as impaired for combined biota/habitat bioassessments, but no other parameters. Transparency regarding the data that were used to make these listings would help address this concern.
MA72-04, the Charles River from Box Pond to Populatic Pond, is the only segment of the Charles River that is not listed as impaired for total phosphorus. This is particularly surprising, as Populatic Pond exhibits extreme symptoms of eutrophication, including routine algal blooms and a report of a possible cyanobacteria bloom during the summer of 20172017. The 2007 and 2011 nutrient TMDLs that were developed for the Upper/Middle and Lower Charles River Watershed encompass all segments of the Charles River. All segments of the Charles River should be categorized in the same way with respect to phosphorus impairments.. We monitor the Charles River at the Route 126 Crossing in Bellingham on a quarterly basis following field and laboratory procedures delineated in ourour QAPP routinely submitour phosphorus sampling results to DEP on an annual basis. We have included a table of exceedances of recommended phosphorus levels between 2012 and 2016 (Table 2).
Segments MA72-05 and MA72-06 in the middle of the Charles River are not listed as impaired due to E. coli bacteria. We monitor these river segments from several bridges on a monthly basis following field and laboratory procedures delineated in our QAPPour QAPP. We have included a table of exceedances of the Massachusetts Water Quality Standards for E.coli bacteria for primary and secondary contact recreation during the recreation season (May-October) between 2012 and 2016.As with the nutrient TMDLS, The geometric mean for E.coli bacteria levels in 2014 across both segments was 147 MPN/100 mL. The geometric mean for E.coli bacteria levels in 2016 was 197 MPN/100 mL. As with the nutrient TMDLS the 2007 TMDL for pathogens should be applied uniformly to all segments of the Charles River.
Segment MA72-38 of the Charles River is not listed as impaired for bottom deposits. This is typically one of the primary reasons given for not allowing swimming in this section of the Charles River. The USGS study, “Distribution and Potential for Adverse Biological Effects of Inorganic Elements and Organic Compounds in Bottom Sediment, Lower Charles River, Massachusetts” (2000) identified contaminants that could impact aquatic life in the sediments of the Charles, and, to our knowledge, no further study has been conducted to determine that this condition has changed. If this area has not been monitored, it should be integrated into MassDEP’s river sediment sampling schedule.
CRWA would also like to see the data DEP used to determine that Rock Meadow Brook in Westwood is no longer impaired for macrophytes and Beaver Brook in Waltham is no longer impaired for taste and odor. Because Beaver Brook is impaired due to excess algae, low dissolved oxygen, organic enrichment biological indicators, E. coli bacteria, and sedimentation/siltation, it seems likely that the brook would exhibit odors from time to time. CRWA’s benthic macroinvertebrate monitoring conducted on the brook within the past five years suggests that the brook has poor water quality.
December, 2019 (7) Massachusetts Year 2016 Integrated List of Waters Responses to Comments CN: 470.2
81

~ ~
According to a recent USGS publication, Loads and yields of deicing compounds and total phosphorus in the Cambridge drinking-water source area, Massachusetts, water years 2009–15 (Scientific Investigations Report 2017-5047):
Concentrations of dissolved Cl and Na in samples and those concentrations estimated from continuous records of specific conductance (particularly during base flow) often were greater than the U.S. Environmental Protection Agency (EPA) secondary drinking-water standard for Cl (250 mg/L), the chronic aquatic-life guideline for Cl (230 mg/L), and the Massachusetts Department of Environmental Protection drinking-water guideline for Na (20 mg/L). Concentrations of TP (range from 0.008 to 0.69 mg/L in all sub-basins) in tributary samples did not differ substantially between the Cambridge Reservoir and Stony Brook Reservoir Basins. About one-half of the concentrations of TP in samples collected during water years 2013–15 exceeded the EPA proposed reference concentration of 0.024 mg/L.
The Stony Brook Basin, within the Charles River watershed and currently included on the Category 2 and 3 lists, should be listed as impaired for Cl, Na and Total Phosphorus . Furthermore, the Stony Brook Basin, as a public water supply reservoir includes more protection than other surface water bodies in the watershed. It is noted in the USGS report that the Stony Brook watershed includes a large amount of transportation infrastructure, which is not unique to this subwatershed. It is likely that numerous water bodieswaterbodies throughout the watershed and the mainstem of the Charles are also impaired by the application of road salt and other de-icing products. MassDEP should publish all available data for these pollutants to demonstrate that other surface water bodies are not experiencing the same impacts from roadway runoff as the more highly-protected Stony Brook reservoir.
Thank you for this opportunity to provide public comments on the Massachusetts 2016 Integrated List of Waters. If you have any questions regarding these comments, please feel free to contact us at 781-788-0007 or [email protected]. CRWA looks forward to working with DEP to use this tool to protect and preserve our waterbodies.
Sincerely,
Elisabeth Cianciola
Aquatic Scientist
December, 2019 (7) Massachusetts Year 2016 Integrated List of Waters Responses to Comments CN: 470.2
82

MassDEP Note: To save space, the following tables appended to the CRWA’s letter were not reproduced here: Table 1. E. coli bacteria results from the Stop River in Medfield, 2012-2016. Table 2. Phosphorus results from the Charles River in Bellingham, 2012-2016. Table 3. E. coli bacteria results from the Charles River, Populatic Pond, Norfolk/Medway to Chestnut Street, Needham/Dover, 2012-2016. Table 4. Summer 2016 Flows at USGS Gauge Charles River, Dover. Table 5. 2016 Summertime Flows at USGS Gage Charles River, Waltham Table 6. Benthic macroinvertebrate Class I sampling results in the Charles River Watershed, 2013-2016. Table 7. Benthic macroinvertebrate Class II sampling results in the Charles River Watershed, 2013-2016. Table 8. Benthic macroinvertebrate Class III sampling results in the Charles River Watershed, 2013-2016. Table 9. Water quality scores from CRWA’s benthic macroinvertebrate sampling program, 2013-2016.
MassDEP response to CRWA’s general comments : Part I of this document presents responses to CRWA’s general comments pertaining to the age of data used in assessments, external sources of data, transparency of assessment decisions and the pace with which water quality standards are revised. A response to CRWA’s request for more interaction with MassDEP’s monitoring, assessment and restoration programs under the CWA is also provided in Part I.
MassDEP response to CRWA’s specific comments : The Charles River Watershed was not assessed for the Aquatic Life Use during the 2016 CWA assessment and listing cycle. Therefore, CRWA’s comments pertaining to the Aquatic Life Use (i.e., MA72-16, MA72-22, MA72-18, MA72-19, MA72-20, MA72014, MA72156, and MA72114) will be considered when completing the next assessment and listing process. Other comments are addressed below.
• The CRWA noted delistings from category 5 for fecal coliform bacteria with the provided explanation “Applicable WQS attained; due to change in WQS,” and argued, correctly, that a change in the water quality standards from fecal coliform as the indicator bacteria to E. coli should not in itself justify a delisting of this impairment. MassDEP agrees, and no delistings of fecal coliform as an impairment have been made unless data on the new indicators were available that demonstrated that the new standards were attained.
• The CRWA requested that “MassDEP report the percentage of water bodies (river and streams by mile, lakes and ponds by acre, and estuaries by square mile) that have never been assessed and those that have been assessed within the previous five years by the agency in the final Integrated List”. While not included in the public review draft, EPA’s guidance on the development of the 305(b)/303(d) integrated report calls for a summary table containing the sizes of waters in each list category and this will be provided in the final version of the 2016 report. When this table becomes available, a rough approximation of the “percentage of waters that have never been assessed” for any designated use, could be obtained by dividing the total number of river miles, lake acres and coastal areas contained in all five list categories into the state total sizes of these waters presented in the Surface Water Atlas for Massachusetts included in the integrated report. The accuracy of the state-wide totals likely varies considerably by water type and information source. Nonetheless, MassDEP acknowledges that many waters have never been assessed and that the preferred method for determining the use-support status of all waters is through the use of random sampling designs, such as those employed for the shallow stream and lake probabilistic surveys. Finally, since the only substantive changes in the 2014 integrated list related to new TMDL approvals and fish edibility advisories, the 2016 report encompasses the assessments MassDEP has completed in the past five years; namely, a state-wide assessment (i.e., all watersheds) of the shellfish harvesting, primary and secondary contact recreation and aesthetic uses, as well as the assessments of the aquatic life use-attainment status of 15 watersheds and/or coastal drainages. Figure 3 in the 2016 integrated report depicts the uses assessed in each watershed for the 2016 listing cycle.
December, 2019 (7) Massachusetts Year 2016 Integrated List of Waters Responses to Comments CN: 470.2
83

I I I I
• CRWA requested that “MassDEP uniformly include in the final Integrated List of Waters how TMDLs are matched with impairments.” While the CWA distinguishes between “pollutants” such as nutrients, metals, pesticides, solids and pathogens that all require TMDLs and “pollution” such as low flow, habitat alterations or non-native species infestations that do not require TMDLs, it is often the case that the implementation of a TMDL for a specific pollutant will correct other associated impairments. For example, it is generally expected that a TMDL for phosphorus will address such nutrient-related impairments as “excess algal growth”, “chlorophyll a” or “nutrient-eutrophication biological indicators”, to name a few. Therefore, these impairments would also be included as covered by a TMDL for phosphorus. However, this determination is made case-by-case, often as part of the TMDL development process, and, therefore, cannot be universally applied to all waters impaired by nutrients. For this reason, MassDEP cannot uniformly match impairments with TMDLs that have not yet been completed. As always, waters with approved TMDLs for all pollutants and related stressors are placed in Category 4a where they are still considered impaired until there is sufficient data and information to indicate that the impairments have been corrected and applicable designated uses are supported.
• CRWA requested the data that were used to propose the delisting of E.coli bacteria impairment from Stop River assessment unit MA72-10. MassDEP’s assessment of Stop River was based on its water quality survey data from 2007 that indicated that the recreational uses were supported and, therefore E. coli was delisted (see table below).
Summary of MassDEP Watershed Planning Program E. coli data collected in 200 7 from Stop River at Noon Hill Road, Medfield (W1151) and at Causeway Street, Medfield (W1716)
UniqueID Year Date First Sample
Date Last Sample
Sample Count
Geometric Mean
Bacteria Type
W1151 2007 05/15/07 10/02/07 5 88 E. coli
W1716 2007 06/19/07 06/19/07 1 100 E. coli
CRWA submitted E. coli data collected from 2009 – 2016 at Causeway Street in Medfield in support of their contention that Stop River is still impaired and, therefore, should not have been delisted. MassDEP reviewed this submittal and determined that CRWA’s data were generally usable for assessment and listing purposes. As outlined in the Consolidated Assessment and Listing Methodology (CALM) document, MassDEP calculated geometric means for each year included in CRWA’s data for which at least five individual bacteria counts were available during the recreational season (April 1 – October 15). Geometric means were calculated for the recreational season and year-round (if available) to assess primary and secondary contact recreational use support, respectively. CRWA’s data are summarized below.
Summary of CRWA E. coli data collected from Stop River at Causeway Street, Medfield during 2009-2016. Note: Data are summarized from those years for which five or more counts were available from within the primary contact recreation season (April 1 – October 15). One exceedance of the water quality standard for the primary contact recreational use is indicated in bold.
Year Annual geometric mean
Recreational Season geometric mean
Number of samples (annual, recreational season)
2009 36 82 12, 6
2010 48 104 11, 6
2011 31 81 11, 6
2012 46 67 12, 6
2013 43 46 6, 5
2014 79 81 12, 6
2015 52 77 11, 6
December, 2019 (7) Massachusetts Year 2016 Integrated List of Waters Responses to Comments CN: 470.2
84
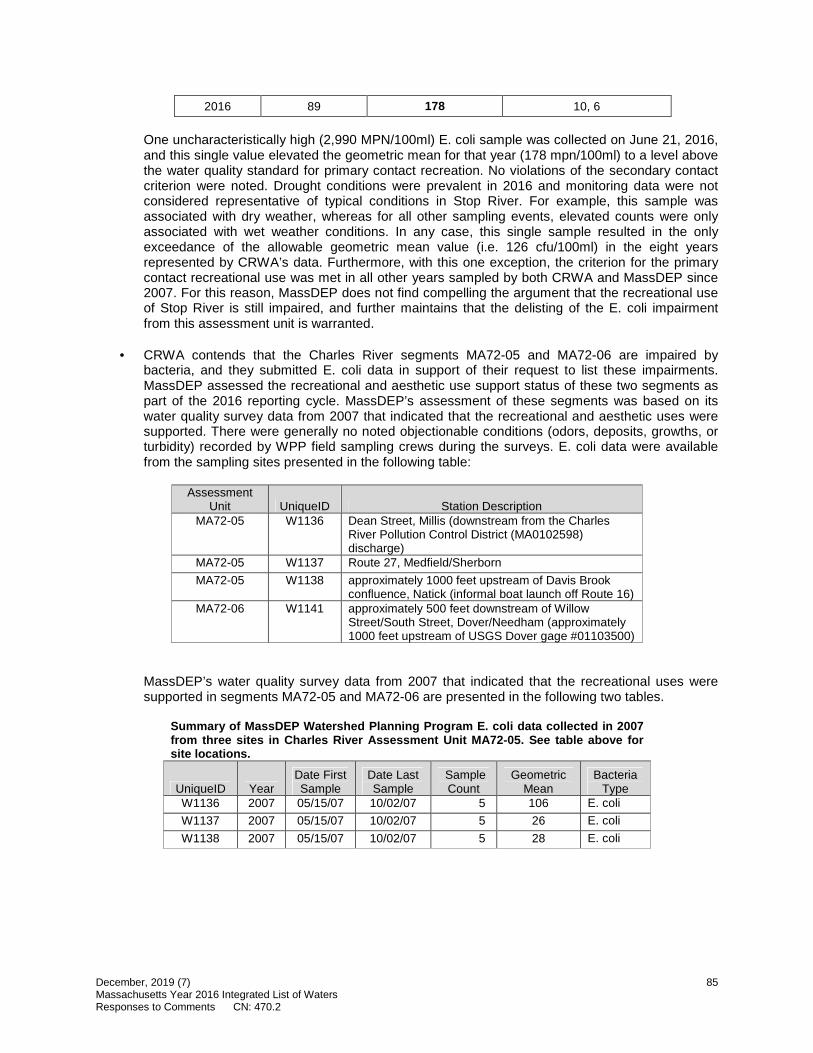
2016 89 178 10, 6
One uncharacteristically high (2,990 MPN/100ml) E. coli sample was collected on June 21, 2016, and this single value elevated the geometric mean for that year (178 mpn/100ml) to a level above the water quality standard for primary contact recreation. No violations of the secondary contact criterion were noted. Drought conditions were prevalent in 2016 and monitoring data were not considered representative of typical conditions in Stop River. For example, this sample was associated with dry weather, whereas for all other sampling events, elevated counts were only associated with wet weather conditions. In any case, this single sample resulted in the only exceedance of the allowable geometric mean value (i.e. 126 cfu/100ml) in the eight years represented by CRWA’s data. Furthermore, with this one exception, the criterion for the primary contact recreational use was met in all other years sampled by both CRWA and MassDEP since 2007. For this reason, MassDEP does not find compelling the argument that the recreational use of Stop River is still impaired, and further maintains that the delisting of the E. coli impairment from this assessment unit is warranted.
• CRWA contends that the Charles River segments MA72-05 and MA72-06 are impaired by bacteria, and they submitted E. coli data in support of their request to list these impairments. MassDEP assessed the recreational and aesthetic use support status of these two segments as part of the 2016 reporting cycle. MassDEP’s assessment of these segments was based on its water quality survey data from 2007 that indicated that the recreational and aesthetic uses were supported. There were generally no noted objectionable conditions (odors, deposits, growths, or turbidity) recorded by WPP field sampling crews during the surveys. E. coli data were available from the sampling sites presented in the following table:
Assessment Unit UniqueID Station Description
MA72-05 W1136 Dean Street, Millis (downstream from the Charles River Pollution Control District (MA0102598) discharge)
MA72-05 W1137 Route 27, Medfield/Sherborn
MA72-05 W1138 approximately 1000 feet upstream of Davis Brook confluence, Natick (informal boat launch off Route 16)
MA72-06 W1141 approximately 500 feet downstream of Willow Street/South Street, Dover/Needham (approximately 1000 feet upstream of USGS Dover gage #01103500)
MassDEP’s water quality survey data from 2007 that indicated that the recreational uses were supported in segments MA72-05 and MA72-06 are presented in the following two tables.
Summary of MassDEP Watershed Planning Program E. coli data collected in 2007 from three sites in Charles River Assessment Unit MA72-05. See table above for site locations.
UniqueID Year Date First Sample
Date Last Sample
Sample Count
Geometric Mean
Bacteria Type
W1136 2007 05/15/07 10/02/07 5 106 E. coli
W1137 2007 05/15/07 10/02/07 5 26 E. coli
W1138 2007 05/15/07 10/02/07 5 28 E. coli
December, 2019 (7) Massachusetts Year 2016 Integrated List of Waters Responses to Comments CN: 470.2
85

I I
Summary of MassDEP Watershed Planning Program E. coli data collected in 2007 from one site in Charles River Assessment Unit MA72-06. See table above for site location.
UniqueID Year Date First Sample
Date Last Sample
Sample Count
Geometric Mean
Bacteria Type
W1141 2007 05/15/07 10/02/07 5 16 E. coli
MassDEP reviewed CRWA’s E. coli data collected from 2009 – 2016 at eight sites along the Charles River and determined that they were generally usable for assessment and listing purposes. As outlined in the Consolidated Assessment and Listing Methodology (CALM) document, MassDEP calculated geometric means for each year included in CRWA’s data for which at least five individual bacteria counts were available during the recreational season (April 1 – October 15). Geometric means were calculated for the recreational season and year-round to assess primary and secondary contact recreational use support, respectively. CRWA’s data are summarized in the table below.
Summary of CRWA E. coli data collected from the Charles River in assessment units MA72-05 (five sites) and MA72-06 (three sites) during 2009-2016. Note: Data are summarized from those years for which five or more counts were available from within the primary contact recreation season (April 1 – October 15). Exceedances of the water quality standard for the primary contact recreational use are indicated in bold.
MassDEP Segment
CRWA Station
ID Year
Number of samples during
Recreation Season
Recreation Season
Geometric mean
Number of
samples during year
Annual Geometric
mean
MA72-05 229S 2009 6 50 12 135
2010 5 50 10 96
2012 7 44 12 53
2013 6 43 7 63
2014 5 65 10 69
2016 6 88 12 105
267S 2009 6 42 12 86
2010 5 55 11 86
2011 6 94 11 68
2012 7 26 11 47
2013 6 34 7 49
2014 6 56 11 66
2015 6 33 10 46
2016 6 94 12 61
290S 2009 6 41 10 43
2010 5 29 10 58
2011 6 67 11 47
2012 7 38 12 56
2013 6 33 7 48
2014 6 47 12 78
2015 6 46 10 43
December, 2019 (7) Massachusetts Year 2016 Integrated List of Waters Responses to Comments CN: 470.2
86
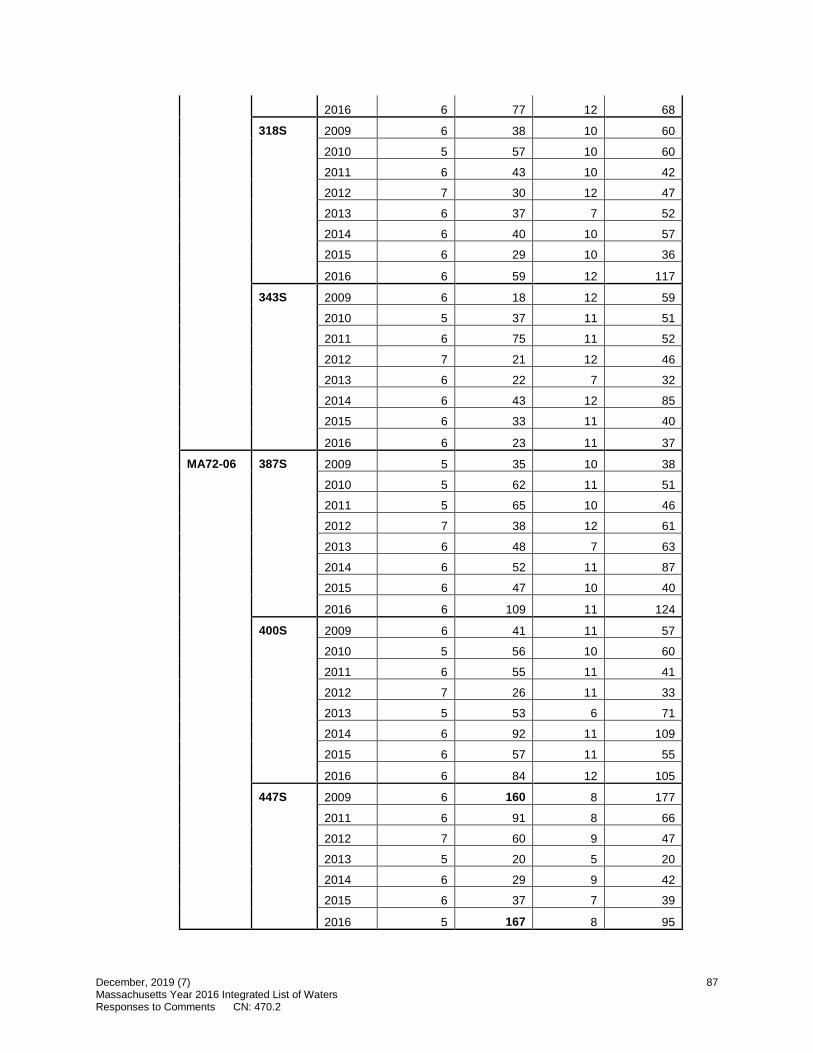
2016 6 77 12 68
318S 2009 6 38 10 60
2010 5 57 10 60
2011 6 43 10 42
2012 7 30 12 47
2013 6 37 7 52
2014 6 40 10 57
2015 6 29 10 36
2016 6 59 12 117
343S 2009 6 18 12 59
2010 5 37 11 51
2011 6 75 11 52
2012 7 21 12 46
2013 6 22 7 32
2014 6 43 12 85
2015 6 33 11 40
2016 6 23 11 37
MA72-06 387S 2009 5 35 10 38
2010 5 62 11 51
2011 5 65 10 46
2012 7 38 12 61
2013 6 48 7 63
2014 6 52 11 87
2015 6 47 10 40
2016 6 109 11 124
400S 2009 6 41 11 57
2010 5 56 10 60
2011 6 55 11 41
2012 7 26 11 33
2013 5 53 6 71
2014 6 92 11 109
2015 6 57 11 55
2016 6 84 12 105
447S 2009 6 160 8 177
2011 6 91 8 66
2012 7 60 9 47
2013 5 20 5 20
2014 6 29 9 42
2015 6 37 7 39
2016 5 167 8 95
December, 2019 (7) Massachusetts Year 2016 Integrated List of Waters Responses to Comments CN: 470.2
87

When analyzed in accordance with MassDEP’s CALM methodology, none of the five sampling sites in assessment unit MA72-05 exhibited exceedances of the E. coli criterion in any of the eight years represented by CRWA’s data. These results corroborate MassDEP’s determination that the recreational uses in this segment of the Charles River are supported. Likewise, two of the three sampling sites in MA72-06 exhibited no exceedances of the E. coli criterion throughout the eight years represented by the CRWA’s data. The geometric means at the third site (447S) were slightly elevated above the criterion of 126 in 2009 and 2016 but, within the context of the entire data set for MA72-06, these two values do not present sufficient evidence that the recreational uses are impaired in this assessment unit. As further rationale for this decision, MassDEP calculated geometric means for pooled data from all three sampling sites. Geometric mean values for the pooled E. coli data were 65 and 113 for the years 2009 and 2016, respectively.
• CRWA requested that “Bottom Deposits” be applied to Charles River segment MA72-38 as an impairment, and cite the 2000 USGS study entitled “Distribution and Potential for Adverse Biological Effects of Inorganic Elements and Organic Compounds in Bottom Sediment, Lower Charles River, Massachusetts” as evidence to support their case. MassDEP utilized the USGS study results to impair this assessment unit back in 2008, but chose the impairment code “Sediment Screening Value (Exceedence)” as a more accurate and representative description of how the sediment data were analyzed and interpreted. MassDEP typically uses “Bottom Deposits” as a general reference to any flocs, sheens, or other objectionable substances observed in the field for which no further information, such as chemical composition, are usually available. In the case of the USGS Charles River study, sediments were actually sampled and chemically analyzed and the results were compared to applicable criteria or other guidelines. Therefore, the more specific term “Sediment Screening Value (Exceedence)” is preferable to the “Bottom Deposits” impairment based on field observations alone.
• CRWA requested the data and information used by MassDEP to determine that Rock Meadow Brook (MA72-21) is no longer impaired by macrophytes. The impairment “Aquatic Plants (Macrophytes)” was originally applied to Rock Meadow Brook because objectionable growths of filamentous algae and macrophytes were noted in the lower 1.2 mile reach of this stream during the 2002 MassDEP water quality surveys. In recent years it has been MassDEP’s practice to subsume the impairment “Aquatic Plant (Macrophytes)” into the broader impairment code “Nutrient Eutrophication Biological Indicators” in cases where excessive macrophyte growth is believed to be in direct response to elevated nutrient levels. This serves to clarify that the water body is impaired by a pollutant (e.g., phosphorus) and requires a TMDL. While Rock Meadow Brook is covered by an approved TMDL for phosphorus, “Nutrient Eutrophication Biological Indicators” will continue to be applied to this segment until macrophytes, algal growth, etc. no longer indicate that the stream is impaired.
• The CRWA questioned the removal of the impairment “Taste and Odor” from Beaver Brook (MA72-28). They contend that “Because Beaver Brook is impaired due to excess algae, low dissolved oxygen, organic enrichment biological indicators, E. coli bacteria, and sedimentation/siltation, it seems likely that the brook would exhibit odors from time to time”. While such a presumption could probably be made for many impaired waters, MassDEP restricts the use of this impairment to waters exhibiting frequent and persistent odor problems that have been documented and verified in the field. During its water quality surveys in 2007 MassDEP sampling crews made 24 independent field observations at two locations along Beaver Brook and recorded no objectionable conditions (odors, deposits, growths, etc.). For this reason, the stream was determined to be supporting the Aesthetics Use and the impairment “Taste and Odor” was removed.
• In general, CRWA’s comments pertaining to Cambridge (MA72014, MA72156) and Stony Brook (MA72114) reservoirs concern the Drinking Water and Aquatic Life uses. As noted in the IR document, MassDEP does not assess drinking water for reporting under the CWA, and the Charles River Watershed was not assessed for the Aquatic Life Use during the 2016 CWA
December, 2019 (7) Massachusetts Year 2016 Integrated List of Waters Responses to Comments CN: 470.2
88

assessment and listing cycle. Therefore, questions pertaining to the effects of phosphorus on these reservoirs will be addressed as part of the 2018 aquatic life use assessments.
CRWA’s concerns relative to the impacts of road salt on these reservoirs is acknowledged by the MassDEP and, while primarily affecting aquatic life, this issue will be addressed as a special case for Cambridge Reservoir system only (i.e., MA72014, MA72156, as well as four new AUs MA72-45, MA72-46, MA72-47, and MA72-48) during this (2016) CWA reporting cycle. MassDEP must make this exception because similar comments and supporting data pertaining to the impact of chlorides on the Cambridge Reservoir subwatershed were submitted to MassDEP by the EPA. As the federal agency authorized to oversee the states’ water management programs pursuant to the CWA, all of EPA’s comments must be satisfactorily addressed before that agency can approve the states’ 303(d) lists. MassDEP’s response to comments with regard to chlorides in the Cambridge Reservoir subwatershed is found following the EPA and City of Cambridge comment letters earlier in this response document. Stony Brook Reservoir will be assessed as part of the 2018 assessment and listing cycle.
December, 2019 (7) Massachusetts Year 2016 Integrated List of Waters Responses to Comments CN: 470.2
89

Upper Blackstone Water Pollution Abatement District (UPWPAD)
December, 2019 (7) Massachusetts Year 2016 Integrated List of Waters Responses to Comments CN: 470.2
90

BOABP Pf 913fGJ96§
C1'131nnan Mal."J'leW J. U 00Vlte$
Worce6ter
VIC& cna1nnan Jelny C. MIICl'lel
""""" secretary
?NII) 0. GuMn Worce6ter
vemon L Jacu on. Jf. w es;Bo)'..ston
Gary F. ~ r
"''""'" oonaio G. Manseau
OM:n)'Vahy Sewer 0 1$:rtct
Lall1= COfln01'$ MIIDul)'
Rotiert L MOy!an. Jt , P.E. WO<OE<te<
MCl'IJel E. Tra)nor. E$4-WO<OE<te<
Jonn R.. WOOOSll'!al. 111
"""'"
UPPER. BLACKSTONE WATER POLLUTION ABATEMENT C>ISTRICT
Engineer Olr&ctor I TreGsurw Kafla H... Sarqey. P.E.
October 23, 2017
Mr. Arthur S. Johnson MassDEP Division of Watershed Planning Program 627 Main Street, Second Floor Worcester, MA 01608
Subject: Comments on Proposed Massachusetts Year 2016 Integrated List of Waters - Blackstone River
Via Email: Arthur.iohnson@state .. ma.us
Dear Mr. Johnson,
Upper Blackstone (the Upper Blackstone Water Pollution Abatement District) appreciates the opportunity to comment on the Proposed Massachusetts Year 2016 Integrated List of Waters (Draft Integrated Waters List) as it pertains to the Blackstone River. In addition to our comments provided below, we have inchided a brief summary of Upper Blackstone's ongoing monitoring activities in the Blackstone River watershed.
Ongoing Monitoring Summary Upper Blackstone has fonded water quality monitoring of the Blackstone River since 2004, when sampling was initiated to provide necessary data to develop updated river modeling. More recently, sampling programs were performed in 2012, 2013, 2014, 2015, 2016, and ongoing in 2017. This recent water quality monitoring has been focused on evaluating the river's response to reduced nutrient concentrations in the wastewater treatment facility effluent. The river monitoring program includes:
• April - November monthly water quality sampling for nutrients and chlorophyll-a at 8 monitoring locations in Massachusetts;
• July - Septen1ber monthly periphylon surveys at 3 locations in Massachusetts;
• Macroinvertebrate surveys in 2014 and 2015 at five locations in Massachusetts.
All of the Upper Blackstone backed river water quality monitoring has been
50 Route 20. Millbury. Massachusetts 0 1527 . 2199 tel 508 755 1286 Fax 508 755 1289
December, 2019 (7) Massachusetts Year 2016 Integrated List of Waters Responses to Comments CN: 470.2
91

completed m .dec a Quality Assurance Proj,ect Plan (QAPP) prepared jomtly by CDM Smlitb and th.e Universi:ty ofi!\llassaclmsetts Amherst, and shared with fass HEP. The fassDEP .has officially accepted the QAPP for sampling ye.m:s _O] 4, 2.015, 2016 and 2017. fa,ery year the scope of the sampling program. is slmed \1, itb MassDEP m advance. m our effort focus Jimited resources on monitoring parameters that would be rueful to add to the body of evidence neoess.-uy to understand rurnent water qu."Yity in the Blackstone .River.
Toe 1mtrient loads to the river from Upper Blackstone b.:r11'e decreased significantly as a result of bio.logical nutrient removal (BNR) upgrades 0011S-tructed ben.veen 2007 .and 2009. The resultine: m1trient ooncenfratio11s in river amples are much lo\1,'el" than historical values. The loads decreased further since
:0 t 3, when Upper Blackstone began additional BNR optinrization projects. In re.--ponse to lower mitrient ooncentratio11s, phytoplankton chlorophyll-a conoent:rations have also decreased. In fact, m1trient and chlorop11yll-a concentrations at several .m.omtormg locations ba,re shov.rn statistically significant decreasing tfends over the past five years (Blaclcrtona River Water Quali Monitoring Progrmn 2015-, 016 Sampling Seasom Report; Massachusetts \\fater .Resources ReseMc.h Ceoler, May ~O 17; acv:ai.fab]e at ub~pad.orn). Attachment A contains a sumnwy of the llistr:~cf s river monitoring activities and results for O 15 - 2016,. and a map showing Upper Blackstone's river sampling Jocatioru which .rre located in ]. iassDEP segmentsMA51-03~MA51--04, MA.51-05 andMASl-06.
Comments Uppe:r Blaclcstone offer: the fo11owing oommeuts to the Draft Integrated Waters List:
• It is not clear m the Draft Integrated Waters List wba data were used to perforn1 the water quality assessments for the Blackstone River_ fable 3 (page 27) of the document suggests thait the lates information used was from 008_ If this 1s the case, -thiis precedes the plant upgrades comp]eted at Upper Blackstone in ... 009, and the 2008 data '\I, mdd not reflect the river u:npmven1ents th1'1it have been noted since th.en.. Upper Bfacksto:n_e Sl!l_gge."1:s making this point clear :in the section "'Monitoring and Rehted Activities for the Bfa.c.kstone Ri\1er_"
• Under the he-ading "'Monitoring and Related Activities for the Blackstone River", there is reference to a USGS study documented m Zimmerman et al (-015). This report presents amilysis of\ln.ter quality data collected m the Blackstone .Ri"'ef from 007 - _QQl9_ A.s such, the :int.e1pretations of river conditions presented in this report do not reflect rurrent conditions, and Upper Blackstone suggests dcletiog this reference ftom the document, unles it is the basis of the current assessment in which case dacillcation should be: provided to indicate the data were from before the Upper Blackstone plant upgrade.
• Upper Blackstone has made the river quality data from its m.ou:itoring programs available to MassDEP via MassDEP' s data portal complete data set for 2014 - 2016 and selected data from 20L - 2013 per 1\/IassDEP s request) and continues to work with MassDEP to implement mowt.oring programs that are targeted to\\rards chanu:terizmg-river water quality conditions.. Suggested text to emphasize these points is presented below in the SUJlllllill)' section.
• The Draft Integrated Waters List hsts .. imprunnents associated wdh oo!Iient enrichment for Blackstone River segments MA51-03. IvM.5 l-04 J!vlA51--05 md MA51--06. The District's river sampling locations Me 1:oc.i:ted within these segments. A comparison of water quahtymonitoring results ftom Upper Blac ., tone· s monitoring progr.am. and the Massachusetts Consolidated Assessment and Listing Methodology (CALM) nutrient enrichment .i:ndkator screerung
tel ooa 755 12B6 fili( B 7&5 1200
December, 2019 (7) Massachusetts Year 2016 Integrated List of Waters Responses to Comments CN: 470.2
92

guidelines (MassDEP, 2016) is presented irn Table 1_ and indicates tliat rirver concentrations for most of the indicators are below the guideline vruues, while the diurnal DO indicator is l(gh.tly over the guideline value_ Smillady, total µhospharon:s concentrations, \i;hi.ch acoordmg o the CAIJ\if arre used to confirm (not indicate) mllrient enrichment, are erther below or s ighlly above gui.deline values,. U])JJ!tl Blackstone's river .monitoring program constitutes a oomprehensive data set and pper BJac.ksrone strongly advocates reporting that new i:nfonn..l!tion is available ince the impairments were originally designated and tlrat rerent data suggest wa:ter quality
improvements.
Summary Nutrient load..- to the river from the pper Blackstone effluent discharge_ have decreased s-ignific:mt1y since 009'. Il1e loads decreased filifher ~inae O 13 witb the most recent plant optiinization. effort. The reduced nutrient loruis have ~suited in lower ill!str,eam total phosphorous concentrations and lower chlorophyll-a. rnncemrat:ions compared \l.i:th pre..:upgrade. concent!dtions (Mas:saclrusetts \\ a1er !Resources Research Center, May 2017).
Upper Blackstone has ooen con-ducting river morutoring programs since 004, and routine monitoring since 2009. Water quality sampling results from the Districfs program indicate that river conditions are improving. The Proposed 1vlassachusetts Year 2016 Integrared List of\\.ater.s (1\,fas:sDEP 016) does not make referen,ce ·· o any changes in river quality in the Blackstone River_ Furthennore, it is not dear in the current Draft Integrated List \\hen water qnality as-:sessments v.tte c01uplered for the Blackstone River ,and what data be assessmems v;.rere based on..
Considering these points, Upper BJackstane rei:omme.n.ds admog additioml clarifymg text ttl supplement the ec.ti.on. "Monitoring and Relaited Activiities for the Blackstone .River .
Cun~.nf ext: ''.. 1asillEP .5laf.f member.s continue to work collaborattveJy uith the watershed associations, the Vpper Blaclcr.tone ater PoilUJion Abatemmit District (UBTVP AD and thei1• am:suilants Oil an ambi.ent monitortrig progmm for Jl:1e Blackstone Rive.1·. Fufilro ac.ttwttes will focus an !mi.Ming parl11f.!1"5hips 1 >ith intere:st.ed pmties at a·ll level.s of goverrrme11t, as well as the prtmte citizenry, to managepomt and .nonpointsom·ce.s o/polluiion throughout the B.lachtan,e. liJ.atershed_ •
Propos-ed Text: · 111 addition to engaging watershed associations. McwsDEP stajfme.mbus continue 10
1wark collabaratiwily with the Upper Blacksione Water Pollutiori Abatement District (Upper Blackstone) and their constiltants on an ambient monitoring programfor the Blachrone River. Since _ 0()4, upper Blackstone has conducted-watw quall monitoring of the Blacks.tone Jave,: Followingplam upgrades fti _ 009, [lppu Blackstone hnplemerlted a routine water quality mani.toring program with the gool of assessing fh£l river '.s rAfponse .to reduced nutrient concen!J'ations in the wastewater ll'eatment f acili.f)
,~uent. The program has consisted ofmonthly monttoringJrom April - 1~ovem~.r,. at eight ril-'t1J'
mainstem monitoring locations and , pically three. periphytcm sWl'zys at /ow· locations. MacroimYJ,rfe'bmte samp.lhrg was also conducted in 014 ,and _OJ 5. The 1'iver sampling has be-en completed under ,a MassDEP approl'ed Quali · Assurance Project Plan since 2014. The· 2014 - -016 data have been prol'ided to Mass.DEF 'ia its dataportai~ ,and will be utilizedforfuture watershed uw,Jitoring, assessmei1t, m:id managemMt {Jcfh!ities.
Future watershed monitoring tmd mam1gement activities in the ·watershed will foa,s on lmildmg partnerships lfilh intertJ.Sted partit>s at all lwe~ of gavemme.nt, as well as the pri",late cill-zenry~ to urarwge point a»d nonpon1t so1u:ce.s of pollution throi,ghoul the Blaclci.tone Watershed."
00Route 20, Millbuf)', Massachuserts 01~27 -21PQ tel 508 755 1286 Fax 008 55 l:?.811
December, 2019 (7) Massachusetts Year 2016 Integrated List of Waters Responses to Comments CN: 470.2
93

Upper Blacks-tone looks fonvard to continuing to work collaboratively with MassDEP in the future to track the improvement m the-Blackstone River \\'at.er quality. \\ e re.spectfully hope tbat the Department v.rill consi.der and incorpo1ate the comments presented above.
Verytmly yours; UPPER B.L!\.CKSIDNE WATER POLLUTIONABATEMENf DISTRICT
Kaela H. Sangrey, P.E. :&gine.f':[ Director / Ire-,asurer
c: Kristina K.. Masters.on, CD 1 mi.th Dr_ Paula Sturdevant Rees., ni.verr.ity of M<lssachru-etts
MassDEP Note: To save space, the Upper Blackstone’s 2015-2016 Blackstone River Monitoring Summary was not reproduced here.
MassDEP response: As explained in the general responses, MassDEP conducted a statewide assessment (i.e., all watersheds) of the shellfish harvesting, fish consumption, primary and secondary contact recreation and aesthetic uses, as well as the assessment of the aquatic life use-attainment status of fifteen watersheds and/or coastal drainages for the 2016 IR. Due to resource constraints, the Blackstone Watershed was not assessed for the aquatic life use in the 2016 cycle. Because MassDEP plans to assess the aquatic life use for the Blackstone watershed in the 2018 reporting cycle, the more recent nutrient-related data collected by the UBWPAD were not evaluated for the 2016 IR. Please note that comments and related data submitted as part of the 2016 Integrated List review that pertain to the Blackstone Watershed will be considered when completing the 2018 assessment and listing process.
Concerning the reference to the 2015 USGS data report for the Blackstone River, this project (and the 2012-16 USGS project) was noted only to describe the on-going MassDEP-USGS collaboration on nutrient and metals water quality in the Blackstone Watershed. The assessment of nutrient- and metals-related causes of impairment fall under the aquatic life assessment protocols, and the Aquatic Life Use for the Blackstone watershed was not included in the 2016 IR. Nonetheless, MassDEP maintains that these types of projects are relevant to include in the IR in order to describe the nature and extent of collaboration efforts.
Regarding suggested changes to the text description for “Monitoring and Related Activities for the Blackstone River”, MassDEP will revise the 2016 IR language in this section of the report to reflect UBWPAD’s past and on-going monitoring efforts. Specifically, the text will be revised as follows:
In addition to engaging watershed associations, MassDEP staff members continue to work collaboratively with the Upper Blackstone Water Pollution Abatement District (Upper Blackstone) staff and their consultants on an ambient monitoring program for the Blackstone River. Since 2004, Upper Blackstone staff have conducted water quality monitoring of the
December, 2019 (7) Massachusetts Year 2016 Integrated List of Waters Responses to Comments CN: 470.2
94

Blackstone River. Following plant upgrades in 2009, Upper Blackstone staff implemented a routine water quality monitoring program with the goal of assessing the river’s response to reduced nutrient concentrations in the wastewater treatment facility effluent. The program has consisted of monthly monitoring, from April – November, at eight river mainstem monitoring locations and typically three periphyton surveys at four locations. Macroinvertebrate sampling was also conducted in 2014 and 2015. The river sampling has been completed under a MassDEP approved Quality Assurance Project Plan since 2014. Recent (e.g., 2014 – 2016) data have been provided to MassDEP via its data portal, and will be evaluated for potential use in assessment decisions in the 2018 cycle.
Future watershed monitoring and management activities in the watershed will focus on building partnerships with interested parties at all levels of government, as well as the private citizenry, to manage point and nonpoint sources of pollution throughout the Blackstone River Watershed.”
Lastly, MassDEP recognizes and supports the on-going efforts by the UBWPAD to monitor the Blackstone River and provide the resulting data to MassDEP. With respect to the recent data collected by UBWPAD that may suggest that nutrient-related conditions are improving, these data will be evaluated for potential use in the 2018 IR reporting cycle.
December, 2019 (7) Massachusetts Year 2016 Integrated List of Waters Responses to Comments CN: 470.2
95

Buzzards Bay Coalition (BBC)
December, 2019 (7) Massachusetts Year 2016 Integrated List of Waters Responses to Comments CN: 470.2
96
October 23, 2017
Arthur Johnson Massachusetts Department of Environmental Protection Division of Watershed Manag,:ment 627 Main Si,eet, Second Floor Worce,,ter, MA OJ 608
Re: Proposed Mass:1cl111s ctts Year 2016 lnlcgmtcd List of' Waters
Denr Mr. Johnso.ll,
Plea.5(! accept the following as the Buzzards Day Coalition's ("Coalition's") comments on the Department of Ei1vironmental Ptotectioo's ("MassDEP's") proposed Massachusetts Year 2016 Integrated List of Waters. Tbe Coalition is a non-profit membership organi_zation dedicated lo the restoration, p:i:otection, and sustainable use and enjoyment ofDuzzatds Day and its watershed. We represent over 8,500 individuals, families, organizations and businesses in southea.stern Massachusetts who are committed to maintaining the health aod ecological vitality of the Bay.
Pursuant to §303(d) of the Clean Water Act, each state shall identify waters wiLhin its boundaries for which the cffiuent I imitations are not stringe,11 enough to maimain wmer quality standards applicable to sucli waters. 33 USC §l 313(d)(l)(A). f w'lhermore, federal regulations dictate that in pro1nulgatmg the 303(d) list the st.ate shall assemble and evaluate all existing and readily available water q uality-rclated data aud infonua1ion. Such information includes, but is not limited to, waters where water quality problems have lx..'Cn reported by local, state, or federal agencies; members of the public; or academic institutions. These osganizations and grour,s should be actively solicited for research they may be cornducting or reporting. 40 CFR 130.7(b)(5)(iii). As a mcmbeiship organization conducting on-going water quality monitoring in Buz,.ards Bay, it is pursuant 1<• this legal framework that the Coalition submits these comments.
COALITION
In swnmary, the Coalition asserts that: (1) The followitrJg waler bodies are fa1paircd und should remain on the 303(d) list:
• Outer New Bedford Ha,-bor • Nas.kett,1cket River • Acushne: River • Little River • Wcstpot1 River • Wild Harbor River
(2) The following waler bodiss should be listed on !ht 303(d) list as impaired for lotnl nitrogim: • Fiddlers :Cove • Wild Harbor • Rands Harbor
December, 2019 (7) Massachusetts Year 2016 Integrated List of Waters Responses to Comments CN: 470.2
97

.I. Backgrnund on. B11r.Zz,111:ds Bay Data Proridecl
A. I>ata Supporrini:; T hese Comments
The Coalition s 303(d) subntitta:1 snbstantiruly conforms to the Mas:sDEP Data. Submittal Guidelines C O _ 7 · (January, 2014)_ In support of thi.s letter_ a separate da:ta mbmission \\ill be transmitted electronically follov.ring the procedur:e outlined in the Data Submittal Guidehne.s. The Coalition notes tmt the MassDEP Data Submi:ttal Guidelines are recommmded guidelines and are intended to senie as guidance in order to help e aluate the accuracy, precisi.on and representativeness of the data and ar,e not intended to serve .as regulations or requirements. Therefore, the Coalition expects. that if MassDEP .fu:tds addi:tionaJ information necessary, they will present the Coalition with an opportunity to comply.
The Coalition submits dissoh,-ed oxygen data ( concenttation and saturation ., chlorophyll data_ and total rut:ro gen <la.ta in graphic presentation in this mHafrve_ The :raw data for these waterbodtes is. included :in the accomp.mying eJ.ee1rnnic submi.ss;ion. Furthermore, trus data was coUected consistent with the 1996., 2001, _006. 2009 and 0 14 MassDEP and U. . Environmental Protection Agency (EP'A) - approved QAPP_ 111:is darn dearly Sl.lpport the ii.sting ofthe above :identified watff!bodies. If you have any questions or concerns \Vtth this Fequest p lease contact us as soon as possible so we may clarify any issues .
B. lntmduc'ti:ou to the Bay1\'1J1tchers :Monitoring P'.rogi. m
The Coalition s water qua]ity monitoring program, Baywatchers, was established m 1992 as a joint effort between the Coalition., the Buzzards Bay National Estuary Program and scientists from the\\ oods Hole Oaeanographic. Institution. iUler 11997, the water quality mon.i1oring progrnm was coo.tmued as a: joint effort benveen the Coalition and the Scbool of Marine Science and Technology at U1vlas.s-Dartmoutb (S · [AST). Beginning in 2009, the Coalition prutn.ered wdh the Marine Biofogical Laooratrn:y (Eoosy terns Center MBL) in Woods Hole, MA to ran the water quality monitoring program The Project Quality Assur<lillce Officer is n.oVlr Dr. Chris Neill, FellO\V ofthe JvIBL Ecosystems Center, who also erves as Principle Science Advisor: Over the past 26 years the program. has developed mto a pre.nuer model for ciitizen monitoring prngr;m1s and OOIIBistent ypro\i'ides annual bay-wide data_
The monitoring program was initiated to document and evaluate .nutrient-related water quality and Joug~ten.n ecologie.al trends io Buzzards Bay and remains the pmnary source of long-term data raed to assess the health of eacb. of the Bay's 30 major haruors ;md coves from the Westport Rivers arotmd to Quissett Hatibor in Falmouth and the Eliz.a.be.th. Islands. Until the inception of the program, no comprehensive d..1itaoose existed on m1trient concentrations and the extent of eutroph.i.cation i:n the most seosi .i.ve areas of the Bay ecosystet11 It is designed to provi.de the i.nfonm.tion needed to make mformed, scientifically-based decisions abottt fhe restoration. and protechon of Buzzards. Bay.
Coalition voluntee,:rs measme early morning mssoh ed oxygen. levels, temperature, salinity, and water clarity on a set schedule approximately once a week from May to September:_ These basic
2
December, 2019 (7) Massachusetts Year 2016 Integrated List of Waters Responses to Comments CN: 470.2
98
parameters provide an immediate snapshot of the health of the Bay and are an excell.ent first -' arning system.. From these m.easurements. 'llolunteers can determine the percentage of oxygen samrahon in the water and rondihons in their spei:ific Bay location for mru:me or~.miEms throu~out the sutnmer months,.
In addition to weekly oxygen testm sra:ff and vohmteers collect samples for nutrient and chlorophyll analys~. These samples are coUected from fue inne,r to the outer portions of each. emh.1yment approximately four imes bet\veen July anrl August These samples are collected .i.n the field and brought to the Ecosystem;, Center .MBL Lahoratmi.es in Woods Hok MA for analysis of dissolved and prutic-ulate forms of nitrogen, phosphorous and chlorophyll-a. and pheophytin content The Ecos~--te1ns Center l\.ffiL rnutine]y participates m quaJity control samples as pan· of QC related to on-going National Science Foundation and other federallyftmded projects. Coalition staff and Ecosystems Center lvIBL scientists. collaborate on data Q - QC. data synthesis and interpretation relati\ie to written documents. reports, and prese.ntabom. All d.1ta collect.ion and analysis.is conducted m acc-.ord:mce with .ui EPA- and MassDEP~apprnved Quality Assmance Project Plan ( ee l:he accompanymg data uh~ion .
C. \Vhe.t'l' B.aovrratd1-'er·s Data is Bein: Used and ReJ!ied On.
The Massadmsetts Esl:1.laries. Pmject ("":fuIBP '), .1: c.oJlaboratiou ben.veeu the, assDEP and the Ul\.fass School for Marine Science and Technology to ei.iluate water quality conditions in southeastern Massachu selti( .. estuaries= :re.lies o:u the Coalition's data as backgrmmd w.ater quality data fur Buzzards Bay and its 30 harbors. ,and co ·es. The Coaliti.on is often r:ecognized i:n MEP reports as a partner e sentia:J in supporting nutrient assessment efforts around the Bay_
In addition, the CoaJition is often directly ' olicited by :regulatory agencie,s for our water quality data_ In ofder to de.teml:ine the impact a discb,,rge may ha · e on the recei1ling waters, state and federal regulatory a_gencies. contact the Coalition to review our water quality data to assess a discharge' s impact and will establish effluem limitatfo:ru; accordingly.
Smee the Coalition.' s dat."I! is actively sobcited and used by both state and federal regulators, as well as an academic: institution lt dearly meets the threshold of water quality d.'lit.1 to be considefed established by the EPA under 40 CFR 130. 7{b), and should be considered in promulgating trus 30.J(d) list Moreover the Coalition's Qt aldy Assurance Project Plan ('"Q.<\.P'P'') bas been revi.ewed and approved multiple· time.s by the EPA and MassDEP; approved in 1996, reviewed and approved m 2001 and reviewed and appro ed m 2006 and 2009 and reviei11ed and approved mos recently i:n 2014.
D. Quality A.ss:w·ance. Qualitv Couh'01 and Data Ya.Hdaticm
The Coalition provides the JU11e 18, "014 QAPP entitled The Buzzards Baiy Coalition Citizen, Water Quati:ly lv!onitorwg Program, 'Baywatchers ,,, EPA RF A No_ 1405 3 in. the accompanying electromc data subnlission.. The Bay,.vatchers. P'ro,g:ram is. colllDlltted to providing cont,innous and scientific.ally validated data on the m1trient he..'llth of fhe ?.raters, of Buzzards Bay. All monitoring data v;rru; collected a:s docwnented from our . 014 approved QAPP_ The Coalition partnered with.
3
December, 2019 (7) Massachusetts Year 2016 Integrated List of Waters Responses to Comments CN: 470.2
99

the Ecosysitems Center :MBL I.aooratorie:. to analyze ,vater qua]ity samples_ assis.t wi1h data iole!pret.1ti.on.. and provide assistance wif.:b training to, the citizens on proper sample collec ion and analysis tecbni.ques and equipm.eot to meet the _ 014 QAPP requirements i:n order to ensure pre.cise and accnrnte data results.
The personnel n1a1J.aging the monitoring program iinc1udes the Project Officer, Tony\\ illiarns, Director ofMomtoring Programs at ilie BUZZMds Bay Coalition; Project Quality Assurance Officer: Dr_ Chris Neill, B:.ooystems CenterMBL; EPA Project Offi.cer Ann Rodney, EPA; EPA Quality Assurance Offic.er Steve DiMatte,i EPA; and Mass.DEF Qua]irty .As sura.nc.e Officer Richard Chase, MassDEP _ Their contact mformation is provided in the Q.I\.PP a..s p:rrt of accompanying electronic data sooirnssion..
More information regarding QA,'Q!:- fa provided in the Q.APP as part of the accompanying e ectronic data submission._ The Coai1irion e-.xpec that i.f MassDEP finds additional inionuation necessary. they will present the Coalition with an.opportunity to co:mply_
II. The-Coalition Opposes th.e Delistmg ofthe Follonriing Buzzards Bay \Vat,e1:s .. A.bunda.nt Data Show th.at the:se ,,, aters ),:lust Rem.lliu Listed as Imp aifrecrl on the 20116 List of Categorv 5 ,, a.ter:s
The Coahtion s waitei- quality m:onitoring data i.s regularly used and relied upon by s ate and federal regJ1Jlators and meets-the Ma.ss.DEP' s and EPA' s Fe1mbil1ity requirements as msam ed above and detailed be.low_ That data cleady sho\vs that deli.sting of these waiteIS i.s inappropriate_ The Coalition requests that the foUov.ring waters re.t:nam on the Commonvi'ea:lfh of Massachusetts' 303( d) list ofCategory 5 waters as impail::ed
Impamnent M1.mic1pa:li1y Outer _ -ew Bedfo1'<1 Ha1~bo1· Ni!tJ:-ggen (Totail) FairhannJ_ ew Bediord Outer_ -ew Bedfm·d Ha1~bor Oxygen,. Dissoh-ed Fairhani1L ew Bedford Acushnet iRiYer Oxygen,. Dissoh-ed Acushnet Littl.e Rkel: ~ -it1:ogeu (T otai) Dartmouth _ . askenu:ket Rin!t" _ -ih:ogeu (Totai) FafrbmTeH Wild Ha1·bor .R.in.•1" ~ -inhi.eot/.EutropWcation Fa,I:mouth
B.tologicaJ Indiutol'
The MassachJUSetts Surface Water Quality Stand.mis desi.gnates the Acushnet River as a Cla:ss B ,vater and all the other Vt.rater segments as Class ' A waters_ Clas SA i.-i;-ater:s are \\raters ,vith excellent habitat for fish, other aquatic life and wildlife and for primarj and secondary contact recr~ation._ The standards. also dearly state that these ,vaters shall have ~--celle:nt aesthetic value (3M C1v1R 4 _05 ( 4)(a ) , have dissolved oxygen levels not belo,¥ 6J)mg.1 (314 C.-1'.iR 4_05(4 (a (l )(a)) requiring that: narural seasonal and daily variations al.)Olve this level be maintained (314 CMR 4 .05( 4 a) 1 )(b )). Class B waters are waters designated as ha.bitat for fish_ other aquatic life and wildlife and for primruy and se,coucL,ry contact :recreation_ The st.1nd.1rds also· deady state that these waters shall have consistently good aesthetic. value (314 CMR
4
December, 2019 (7) Massachusetts Year 2016 Integrated List of Waters Responses to Comments CN: 470.2
100
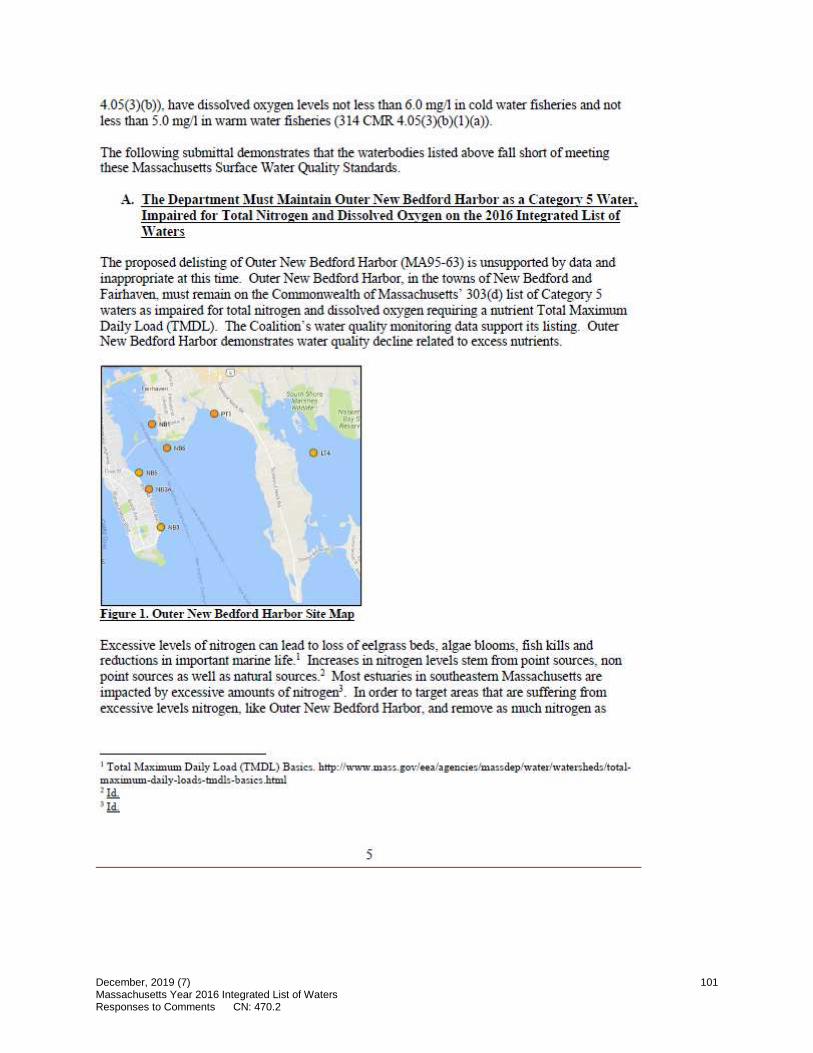
4.05(3 (b)), have dissol'l.'ed oxygen levels not less than 6.0 mg/1 m oold Vi ater fisheries and not less than 5.0 mg/l in w.arm water :fisheries (314 CMR 4.05(3)(b (ll (a)).
The following submittal demonstrates fhat the wateroodies listed above fall shon of nr1eeting these Massachusetts Smfa.oe Water Quality Staru:lards.
~.\. Tbe Departm.eot 1\Iust M.ainra~n OutH' _ ~ ew Bedfoni ffi 1;h1n· as a Categon:-- 5 W.at.er. lmpai:r,ed for I otiall. -itrng:en and. Dissotr:ed Oxygeu ou the 2016 Inrt-egrated Li-rt ,of \1\at,et·s.
The proposed delisting of Outer ew Bedford Harbor Qvll\95~63) ·s unsupported by dab and inappropriate at. this time_ Outer New Bedford Haruor in the tou,m of New Bedford and Fairhaven, must remain on the Commonwealth of Mass-achlllsett ' 3-0 3 ( d) list of ~t:egory 5 waters as impai.red for total nitrogen and rus:sotved oxygen requm.ng a nutrient Totail Maximum. Daily Load (l'M[)L). The Coalition s ,•,,;ater quality monitormg data support its listing. Outer New Bedford Harbor denlOUSttates ,vateF quality decline related to excess nutrients.
Excessive leveJs of nitrogen can le.ad to loss of-eelgrass beds, .algae bloon11S fish kills and reductions i:n important m.mne life.1 Increases in nitrogen le\ els stem from point sources, non point sourie:es acs well ais natural sources.2 lv!ost estuaries in -sm.rtlreastern Massachusetts are impacted by excessive amounts of nitrogen'. In order to target areas that are suffering from e.xcessive levels nitrogen, .like Outer ew Bedford Harbor, and remove as mu.ch nitrogen :as
i 'f otal 1:ll!lmllll Daily Load (TMDL) B2is1c:s. http:Hwinv.ma.ss. gov/ eealagenc1e~ mass,de.p/wate:dwate.r.;hed-d tolalm;ix:mium-d:ill.y-. oads 0 tmd.15-ha5ic!l..ll!fm! l lei i Id.
5
December, 2019 (7) Massachusetts Year 2016 Integrated List of Waters Responses to Comments CN: 470.2
101

possible from these areas. it is imperative that MassDEP list Outer New Bedford Harbor as impaired for dissolved oxygen and totaJ nitrogen, requiring a ThIDL for nutrients.
The Coalition subrnits multiple years of oxygen data taken ftom hvo locat~ons depicting ,v.iter quality impairment due to nulrient over-eruidm1ent The CoaJition' s. dissolved oxygen da a S:hmi.• that Outer e\v Bedford Harbor oonsistently fa.Us below the .m.mleri.c criteria of 6mg'I as designated 1n 314 CMR 4.05 4}.a)(l )(a arnd warrants listing on the 303,(d) li:St
Dissolved 0/1:.ygen at N ll!3A :14
llfssulved O,cygen at rltl\li6
0 +-,--,-,-1---,-,;-,-+--,,--1--,-f-~,j-,--+-,,-!--,-f--,-I Q +-.--+-.-!---,-,~+--1--.--+~1-,-+-,-1--.----1----.---l
.I $'~ .# .if ~ ,I' $ ,,, ~ .... .f'., '0f, f-~ $' $' ,I' tF ~., .f .f #' ,fl~ .f'"' ,e,1' of>~
F~nre :! . Dissolved Oxy:~n Conceotrarioos in Otti~·r ::"> ew Bedford R,rho1· (21ill diam is p1~limin.'lry)
The dissol.i;ed oqgm concentriations in Figure _ at sampling snes NB3A and NB6 d early show a significant mllllber of samples be]rn.v th e numeric dissolved oxygen cri eria established m the Massachusetts Surface Water Quality Stand~mls.. The dissolved oxygen saturation graphic for this site i.s presented in Attachment A.
2. Onwr New &-dford H.1Tbo1· Chlornph.vll .Data
The Coalitioo' s chlorophyll data show that Outer New Bedford Hairbor does not poss.ess the exceUent aes1hetic values required of SA v.raters pursuant to 314 Cl\i•IR 4.05(4)(a ·'These waters shall have excellent aesthetic v.ailue'" and wammts listing on the _)03 d) list
December, 2019 (7) Massachusetts Year 2016 Integrated List of Waters Responses to Comments CN: 470.2
102
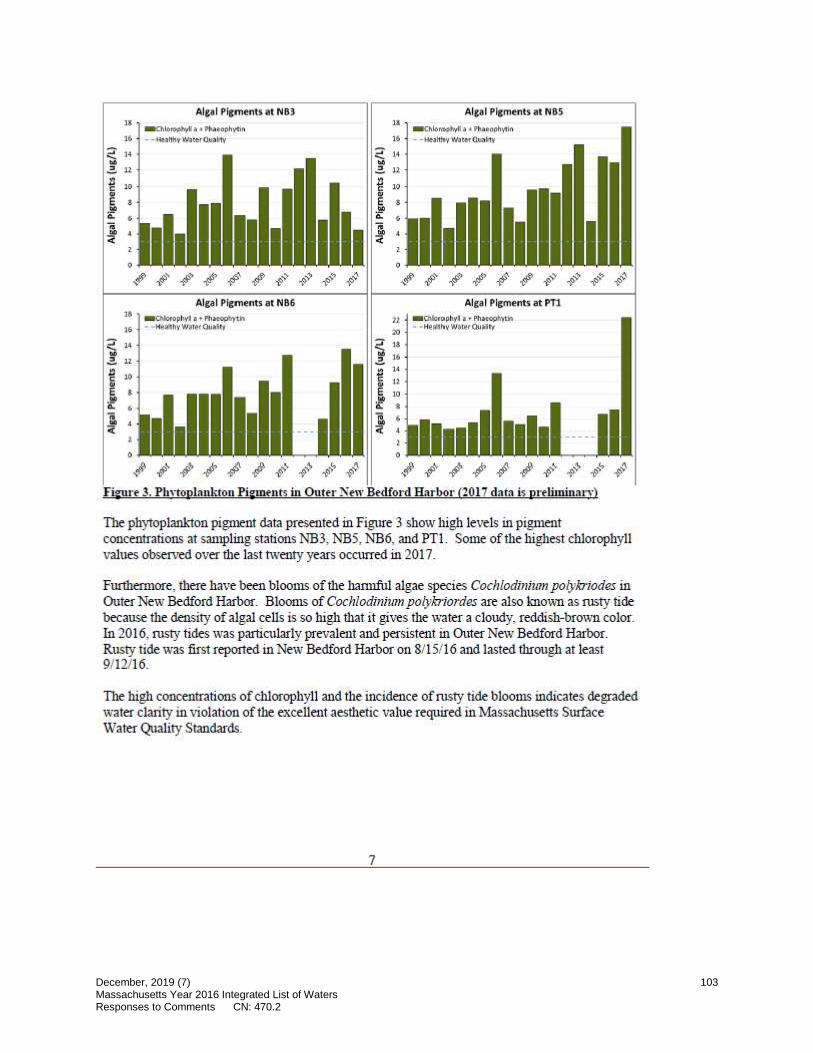
ll
16 - -He•ltlw Wate O~atitl•
Alg<!I Pf~eriu et f!li86 18 • 1ophyl • t lihHq;>Oftil 1~ • • tfo, n1• \J/~·•1 Cl!! llJ
~ ]A 51)
..3,. l.1.
:: !ii 10
I: s. • !19 0:,, 6i
iii lill 4
"" ,I" ,I' ,I' ..,. ,I -i• ,f>.:J, .~ .. "' -$,~
Al,;a PlflTIMt , at NOS J.I
lal:hlo-/11 • • f oo_ph\Olo 16 - - ~•ltlly ill• ,,c,.,,,
,Q/lg.11 PlgmellU at P1l 11 •• ,opltyJ • · lllurtq;e,iti> :ID • ti~ lie ~l\lr Q!ltll'I
~ I.S ~ u, _.. 1'-1 14,
~ " I: JD
l .. iii ' t 4
1
-0
.Fip:re 3 .. Phdoelaukton Pi;meots m Onte1. _ -t>w Bedford Harbor (?(H · data is p1-elimittm."Y)
The phytoplankton pigment data presented in Figure 3 show high levels in pigment couaentr.ations at S311ipling s.tati.ons NB 3, NBS NB6 and PTL Some ofthe hlgbest chlorophy l values obse1Ved over t11e last tv;'OOty ye31's oocmred iru 01 7 _
Furthermore, there have been b]ooms of the bann:fuJ algae spft:tes Cochlo.dinium polykrtode:s in Outer New Bedford Harbor. Blooms of Cochlodinium polykrion:las .u:e also knovm as rnsty tide because the density of alg;ll cells is so lrigh. that rt gives the water a cloudy, reddish-brown color. In 2016, msty tides was p..,1:fticulady prevalent. andpers.iiste:nt :in Outer New Bedford Harbor.. Rusty tide W3iS first reported m NeV1r Bedford Harbor on 8/15/16 and fasted fhroui!h at least 9/L '116.
The high concentrations of ch.Jorophyll and the incidence of rusty tide blooms indicates degraded water da:rity in viofati:on ofthe excelJent aesthetic \l<½Iue required in Massachusetts Surface Water Quality Standards.
7
December, 2019 (7) Massachusetts Year 2016 Integrated List of Waters Responses to Comments CN: 470.2
103

4,. Ima,e,es of nidi.'~pJ:1ead .nJ.SJty ride QUtsidie adj ac1ent Apponazan~t-tt Bay and in the Acushnet Rh-u in .?01 .
3. Oute.1· _ -ew Bedford Ha:rb,or Total itrogen Dara
The Coaldion' s data for Outer New Bedford Harbor mdicates tbat the nitrogen. levels are causing low dissolved oxygen m:unber: and promoting the .algae growth depicted in figure 3 _
tot I Nt,tto1eil ' Nb:3 Tot 1 r.1:troien · · Nb - N113T IC. N - MB5Tot>IO' N
1~ • - KS31llw:f,ad l-.l<N I~ - MRSDl..,,.,.dl~N - N.-,qiutlF ~ l ,.. ..~ - Nabli.;~~ Dwt li'" ,..J,.:i::!
-NVQ J;t.,I ~ iakN -mF11rlll.1171'nll; N 1..1) - NB Dl1300rd '"°'-" N LIi -,,n -Ots&oM,,J lm111on:t: N
- H..i...'lutul'! k/ LT~ ,rl><t_ - MiQ.ilut•te 1!11rt L 4 l,,t;dlp
OJ)
.I' # I' .,. J' .,, ~¥ ~--':/" .,.o:i{> ~--,\
F~-e 5;,, Total _ -it.rn~en in Outer _ en· Bedford H..-ucbor (201 ,diata is prelimma["I')
8
December, 2019 (7) Massachusetts Year 2016 Integrated List of Waters Responses to Comments CN: 470.2
104

:Figure 5 exhibits elevated totail ni.trogen concentrations in Outer _ ev.r Bedford Harbor at s.ampling sites NB3, NBS, NB6, and PTl _ It is important to note th.at file total nitrogen conaentrn.t:ioos measured in Outer_ el¥ Bedford Haroorregularly exceed those leve[s, identified to support healthy bentbic: comnnmitie.s and eelgrass meadows in other tems_ For instance, the EPA has established nitrogen limits for Pmnney.s Hamor in Bourne M~ through approved TMDLs. a a level of0-3 -mgJL tolail nitrogen. The NffiP · et a threshold nitrogen limit of 0-37 mgiL total nitrogen for the adjacent embaymeJlf _ Nasketucket Bay. ince 1999 there is, only one year m. ouc entire data record when the total nitrogen at all four stations dropped below Q_ 37 mg/L. inre then, total nitrogen couceo.trations have increased At aH stations., the ltighest total nitrogen -concentrations ofthe entire record have occurred after 2010. The incidences of high total nitrogen concentration and high chlorophyll indicate fuat the w·a;ter quality in Outer "ew Bedford Harbor is. not improving_ Outer New Be<lford Harbor fails to .att:un state water quahty s.tandards and must remain on the 303{d) list as unparired for .otal. nitrogen_
Taken toget:hM\ the data ahon, dearly :ind!ilca e hat Outer _ ,ew Bedford Hal'bo:r is suffering from ,entrnphl.rntion due ,to eX'fes.s nutJieut:,; and mu t be· listed on. the Commouwealth. of!-lassachusetts• 303(d tist of Category~ watet·s r,equir1ing a IMDL for otaE mtrogeu and di'>s~h·ed oxygen., llissohred oxygen darn for sampling sit NB3 A and NB6
are in dear violation ofsm:fare i.va er qualify .standards, fal1in2: below dissolved oxygen level.i, of 6mg/l Sa!ll]p]mg sites NB3 , NBS, NB6 and PTl have significantly elevated chlorophyll levels that degrade water dari.ty and aesthetic ,ratuec as well as otal nitrogen mooeatrations .high.er than similar estuaries \Villi established Il1DL.s or nitrogen thresholds_ A total nitrogen TMDL nwst be established for trus water body.
B. The Departmeut Must Maintari.n Acushnet ru,-er m; . Category 5 Water .. Impaincl fos· Dissolved o~ gen on tbe- 2.016 I.ntegrated List of '\ · aifers
The proposed delisting of the Acuslmet River (MA95-32) i.s lllllSupported by data and inappropriate at this time_ The Acushnet Ri, er in Acushnet 31l.d New Bedford, must remain on the Commonwealth of Massac_husetts' 3 03{ d) list of Category 5, waters as impaired for dissolved oxygen and .requiring a ootrient ThIDL. The Coalition· water qualtty monitoring dat1 support ds lisfulg_
9
December, 2019 (7) Massachusetts Year 2016 Integrated List of Waters Responses to Comments CN: 470.2
105

The Arusboe River demonstrates water quality decline refated · o excess nutrients_ TI1e Coalition. submits mu1tci:ple years of oxygen data taken from sampling sites ARH and ARO {figure 7) depi<cting water qua]iity• degradation.
1!I JA D:issolvecl Oxy1-en at .ARH
O +-,--+----.--+-~t----,--+----.--+-r-t---.--+-~t----.- Q +-,--+~-+--,--;f---r--;----r-+-,--+~-+-~t----,-~
.# ,,.. ii" 4' ,# .. ,.,s:,i ...,, .. # ' # #' #) # ,.# ~❖ # ~~
Figw:e · . Dissok-ed lliy2ieD Com:-eutrntions in tile .\rnshuet Rn·e1,·
The Coalition's dis.solved oxygen data show that the Acushnet Rii;..'er consistently falls below the numeric criteria of both 6 mg· for co d water fisheries and 5 mgl'l for ,1,amr1 water fisheries. Tue low dissolved oxyg:en com::entrailons wammts listing the Acushnet River on the 303, Hst fur failing to meet Massachusetts Surface Water Quality Standards. The dissolved oxygen s.111uration graphic for these sites are presented in Attachment A.
In 2016, extremely low dissolved oxygen. concent:I:ations were ob.served at site ARO. A rug;e fish kill occurred in September 016 near site ARO follov.ring the eKl:ended period of extremely lo\Y dissolved oxygen c.oncentrations. Low dis.solved oxygen con.c.em:ra.tiom v.rere stated as a likely reason for the fish. kill by a bio1ogiit from the tare Division ofMarine Fisheries.
,i' '\"".:;, 11 -I'
rn
December, 2019 (7) Massachusetts Year 2016 Integrated List of Waters Responses to Comments CN: 470.2
106

F~re 8 .. fu1aees ta~en ,oi1 ~he Ac:11:s.h:aet Sm,mI11 prope11T in Septt>mber .21U6.
The Acushnet River contimles to suffer m1pamnent .fi:om low dissol,re,d oxygen concentratioos. The Acushnet River does no meeJ surface \vate.r qualify standards falling below di.ssoh ed oxygen le"i. els of,6mgll the maj orily of the time in summ.ec. Th,e Acushnet Rh·er must 1:~emain fiL,;ted on the Commonu-:ealtb of Massacb.usetn• 303 d[ • list of t.:atego1·y 5 waters ars impaired for di.ssoh·ecl oxygen 1llld n,qooing a T. IDL.
C. \:\ estpot't Rh-er F ils to ..\ttaio State,,, ate1· Quiail!ity ta:odar.ds and Rem.am~., Impaired. for Tot.al Nitrngen.
The 2016 303( d.) list indicates that the Westport River (MA9.5-54 • should be ii.steel as a -categoi:y 4Awater, because the applicable water quality randard was attain.eel Category 4A is the desig.nati.on for water bodies v,rhere a TMDL is completed. A nitrogen TivIDL was finalized by EP'A in April 2017 for the entire Westport River Estuarine System4. Tus ThIDL applies to the Wes1port River (MA95-54J ilie East Branch of the Westport River (9 5-40) and the We:."1 B.ranc:b o.fthe \\ estpo11 River ~95-3 7).
However, the Coalirion.'s data indicates tha water quality stmdatds have not been attained in the \.\e:stport River. The TuIDL anticipates improvement in dmvustream water quality in the \.\ e:stport River as actions are taken up.stream to reduce oitro,gen loading:. The data presented here indicate that water quality impairment c.ontin.ues in the Westport River related to excess wtrients,.
~ Vi. estipmt R..i_,_·er Estuarine System Tot.al M.a:.'Ull!lumDaily Loads For ToralNitrogen (CN-375. ) dated .ll.pril 1 01
1l
December, 2019 (7) Massachusetts Year 2016 Integrated List of Waters Responses to Comments CN: 470.2
107

l. W,e-stport Rinr mssolnd Oxvgt>u
The Coa i:tion submits. mrutiple years of oxygen data taken from fbree locati011S depicting water quality irnpaiirment due to nutrient over-erui.cb:m.ent The Corui.tio11 s dissolved aqgen data show that Westport River often fulls be m,;i,- the numeric criteria of 6mgl'J. as designated in 314 C:MR4.05(4)(a)(l .a).
I I I I I I 0
.1.: .. . . .
0 +----+-----<,__-+--........ ~+-....+-....... -t-----+-....+~--1
_,, # ,t l-l -I I"#"';, I .I # ,p # J-i.-
01:.so lved 10xvgen at 111 W
.:! ... ~" .!' _,.._ ~ #i' ,l' #' ,,/ ,11 -r;" ~" ~I!,:,- ,i'
IA 1□tssoh1,e,d oq-gM at 1.os~
0 +--,-O-----<f---+-...... ~--t-....+---t----+-...-+~+--t
-t" ~., # 4-' -I # #"" #' J -I .I I' ,l -i-':,.
Tigu:re 10. Duisobred Oxygen Coureno·anons in Wes1pm,t R.fr.~;r (lOl data is Jlfl~llinina1 ')
12
December, 2019 (7) Massachusetts Year 2016 Integrated List of Waters Responses to Comments CN: 470.2
108
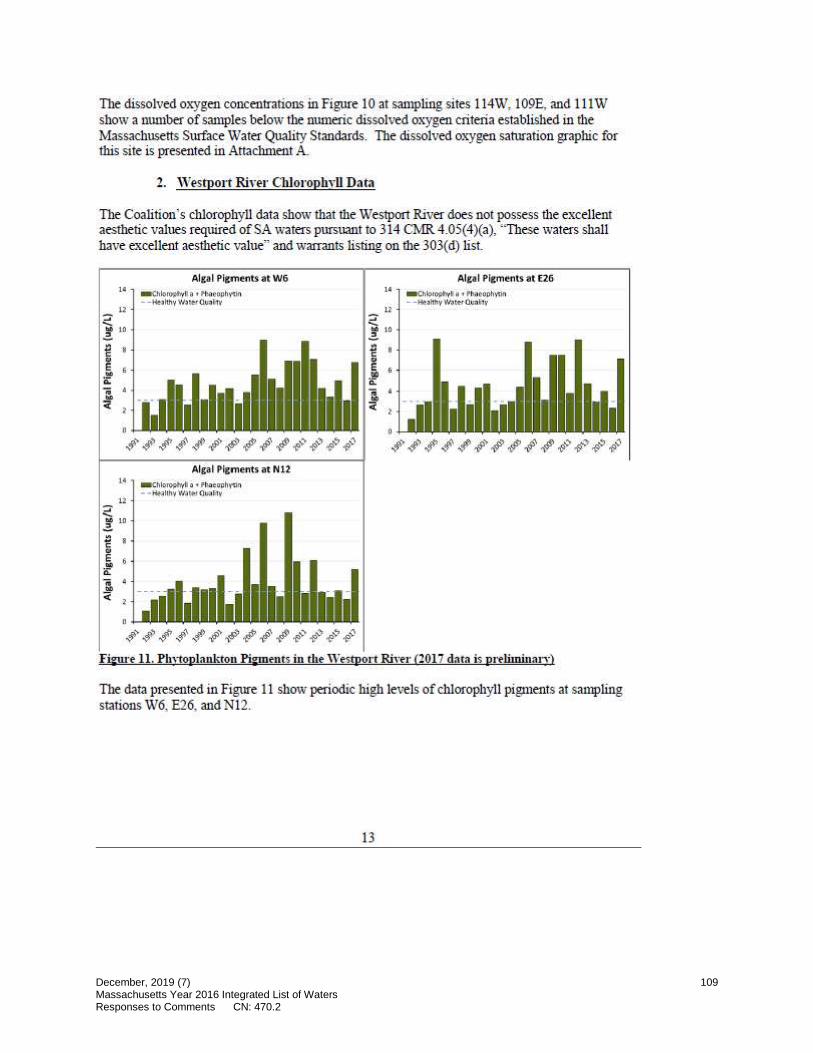
The dissolved o?..--ygen concentraitions in Figure 10 at sampling sites 1 MW, l 09E, and 111 \'V show a mJmber of ample.s be1ow the m.:uueric dissolved oxygen criteria established :in the Massachusetts S1Luf.'lce Water Quality Standards.. The ws:solve.d oxygen saturation graphic for this site i.s presented in Attaehment A
2. ,, estpo1·f Rivet' Chl1H•,ophyll. Dia:ta
The Coalition's chlorophyll data show that the Westport River does oo possess the e.'!{c-eUent aesthetic v,all!leS reqtmed of SA waters pursuant to 314 CJI.IR 4 _05( 4 )(a · , • These waters sball have excellent aesthetic value." and warrants listing on the 303( d) list
atW6
Alg<11I PIGmentiat Nll 1~ ~ hlo"'f'lt( a • Ph.!tophr,ln
- - _llhy ~~'1•-•"1~
$--..I.I' .I' .._,f'J -I"'~#' .f # ,f' -fr~#' f~
Al&;III Prp,,tt1ts t EZ!i, Ll1 aD!l;ir~ ii ,..,t1!. C(IDh'11
-- •hhy\11.lwO a r
u
..,¢' ./..., .f' ,.__-f'' ,..() . .f' ,r· i,I) -I' # ,f· .-rf' .rf' ~o
Fiw;t·e ll. Plntopfanlc-ton Pi,.,oment~ in d1e " ~esotpol."t Rini· ( ... -Ol dlata is 1weliminan)
The data presented in Figure 11 show periodic high levels of chlorophyll pigments at sampling stations \\60 E26i_ and_ 12.
13
December, 2019 (7) Massachusetts Year 2016 Integrated List of Waters Responses to Comments CN: 470.2
109

3. Westporr River Total Nin·ogen Data
Figure 12 exhibits elevated total nitrogen concentrations in the Westport River at sampling sites W6, E26, and Nl2. Toe nitrogen concentrations observed in the Westport River are higher than the concentrations identified in the MEP report for the threshold scenario.
0A
Tot)I Nitrogen at W6
- WGCo....i- t.-••N _..........,.,..,--~
¢' # ,-1' -I~,#'# -I .f #,&'',#'-I.;-
L1
o,
••
Total Nitrogen at NU • 111t l~10i,.o.W H - Nl1°"1wl~ltl(l~tN - W~~n .iotrNU tl'/'Clsl1'id
,p' $-' "' .,f ,.f' ,#' ,~- ,#' -I # -&-' -IP' .p-" #
Total Nitrogen at E26 ,.
e '-' .. ..e: 1.0 C t o~ ~ 0-' •. ,
00 -i-JOll"Cl=.Jw,i,.....,o.::
_ ,x lmll<lfpnk .. - 1:it.5~•-rpn or ll - -pc,n-l~JThtwll!<>l<I
,..4'...,, .# , .I' .._<i' #"" .f"' .,,.,d9 ,; ,..# -& ..... ,e:,.:, .p~ ,f
f igure 12. Total Nin·02:en in \Ytstport Rh-er (2017 data is preliminan·)
The Westport River rails to attain state water quality standards. Dissolved oxygen data for sampling sites 111 W, 114W, and 109E are in clear violation of stuface water quality standards, falling below dissolved oxygen levels of 6mgll. Sampling sites W6, E26, and Nl2 have chlorophyll levels that degrade water clarity and aestheti.c value, as well as total nitrogen concentrations higher than the modelled nitrogen concentrations when the Tlv!DL is met. The implementation of the Westport nitrogen TMDL will lea.d to the attainment ofstirface water quality standards in the. Westport River but the water quality standards have not been met yet. T he incidences of high total nitrogen concentration and high chlorophyll indicate that the water quali{)' rhe Westport Rinr is still impaired for nitrogen.
14
December, 2019 (7) Massachusetts Year 2016 Integrated List of Waters Responses to Comments CN: 470.2
110
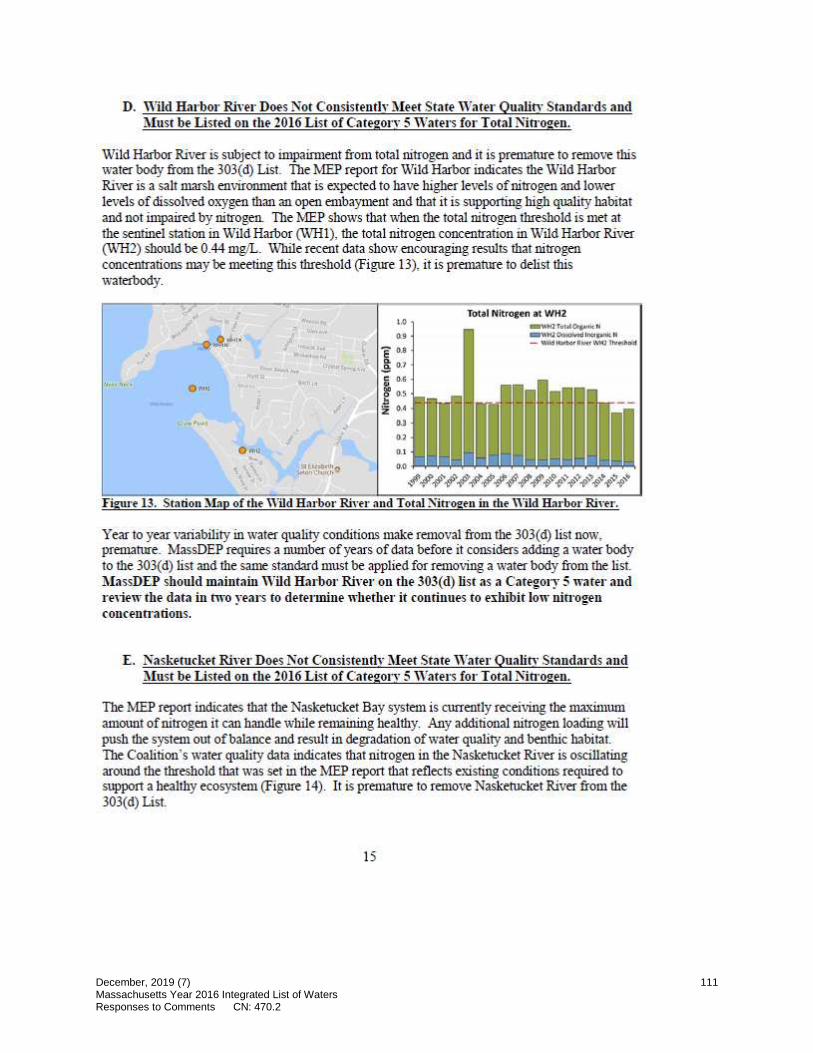
Wild Harbor Riwr DOE's Nor Consisrenrlv i\Ieet State Water Qualitv Standards and i\fusr be Lisred on rite 2016 Lisr of Caregorv 5 Warers for Total JliiO'ogen.
Wild Harbor River is subject to impairment from total nitrogen and it is premature to ren1ove tltis water body from the 303(d) List. Toe lv!EP repon for Wild Harbor indicates the Wild Harbor River is a salt marslt environment that is e.xpected to have higher levels of nitrogen and lower levels of dissolved o>.-ygen than an open en1bayment and that it is supporting high quality habitat and not impaired by nitrogen The MEP shows that when the total nitrogen threshold is met at the sentinel station in Wild Harbor (WHl), the total nitrogen concentration in Wild Harbor River (WH2) should be 0.44 mg/L. While recent data show encouraging results that nitrogen concentrations may be meeting this threshold (Figure 13), it is premature to delist tltis waterbody.
'' .,,. ' If,
I
14 ., [ 0,8:
.,e: OJ·
C 0.6
f :: ., ., .. , ,., ......... ,,,..
Total Nitrogen at WHZ - \\'klfai..t~N
- ~~•ncr•'""'" - Yllld""""°'ll,_\\WTlv.,tlll'd
~.,#'.I',,##., ,I.,~ ~•.p❖ .p".p>'.;,~ ,i'' .p~
Figure 13. Station Map of the Wild Harbor Rinr and Total Nin·ogen in the Wild Harbor Rinr.
Year to yearv.iriabiliry in water quality conditions make ren1oval from the 303(d) list now, preniarure. MassDEP requires a number of years of data before it considers adding a water body to the 303( d) list and the same standard must be applied for ren1oving a water body from the list. l\IassDf.P should maintain Wild Harbor River on rile 303(d) list as. a Categot1' 5 miter and re,iew the data in two years to determine whether it continues to e:rbibit low nin-ogen C'oucenn-ations.
E. Naskerucker Riwr Does Jliot Consistently Meet State Water Quality Standards and Musi be Listed on rile 2016 List of Category 5 Waters for Total Nitrogen.
The lv!EP repon indicates that the Naskerucket Bay system is cunenrly receiving the maximum amount of nitrogen it can handle while remaining healthy. Any additional nitrogen loading will push the system out of balance and result in degradation of water quality and bentltic habitat. The Coalition's water quality data indicates that nitrogen in the Nasketucket River is oscillating around the threshold that was set in the MEP repon that reflects existing conditions required to support a healthy eco,'}'Slem (Figure 14). It is premarure to remove Naske.rucket River from !he 303(d) List.
15
December, 2019 (7) Massachusetts Year 2016 Integrated List of Waters Responses to Comments CN: 470.2
111

$ mu
,, . f) m >'
' "
Total Nitrogen- NRl
E 10
! •• ~ ~ 0.6
.l1 z o.,
.. --~~-
- lllllTM._.l (Hea,,.(N - 1111.\0,,slqt,.,JlllO'J'l"kN - lbllli!WCl l:IIR?Mll\"C,C:l!(td
.&' ~ .f ✓ # ,p~ #'~~•-f>v~ #-"
Figw·e- 14. Station M'.ap of the- Naske-tucket Rini' and Total ~itroge-n in the Na-sketucke-t Rh'er.
Any additional development or new sources of nitrogen to the Nasketucket River Watershed may increase nitrogen in the Nasketucket River beyond the threshold and lead to nitrogen impainnent Considering that and the year to year variability in water quality condition~, it is premanire to remove the Nasketucket River from the 303(d) list llfassDEP should maintain the Naskemcket Rinr on the 303(d) list as a Category 5 water and re,iew the data in rwo years to determine whether it continues to ernbit low nin·ogeu couceun-alious. Monitoring of this system will be essential to determine whether increases in nitrogen and associated impairments occur.
f. Little Riwr Does Not CousisteuilY ;\feet State Water Oualif:\• Standards and Must be Listed on the 2016 List of Categon· 5 Waters for Total Nitrogeu.
The MEP report describes the Little River as a healthy salt marsh system that is capable of some additional nitrogen assinlilation. The Little River receives nitrogen from the Slocums River. The Sloc\llllS River is impaired for nitrogen. and the :MEP indicates that a 24% reduction of watershed loads are reqtlirced to restore water quality. The nitrogen concentrations in the Little River should decrease as nitrogen reductions are acllieved in the Sloc-11lllS River. If the reductions in the Slocums River are not achieved or ifthere are.any new sotirces of nitrogen added to the Little River Watershed, nitrogen concentrations may increase beyond the threshold and lead to nitrogen impaimlent.
The MEP repon establishes a 0.5 mg/L total nitrogen threshold for the Little River and it does not anticipate that the threshold will be reached at build-out However, the Coalition's water quality data indicates that 1he 0.5 mg/L threshold is occasionally exceeded (figmre 15). The variability from year to year in water quality conditions and the recent nitrogen values above the 0 .5 mg/L threshold denionstra!e that it is preman1re to remove the Little River from the 303( d) list Monitoring of this system will be essential to determine whether increases in nitrogen and associated inipairments oc.cur. l\IassDEP should maintain the Litde Riwr on the 303(cl) list as a Category 5 n-acer and re,iew the data in nvo years.
16
December, 2019 (7) Massachusetts Year 2016 Integrated List of Waters Responses to Comments CN: 470.2
112
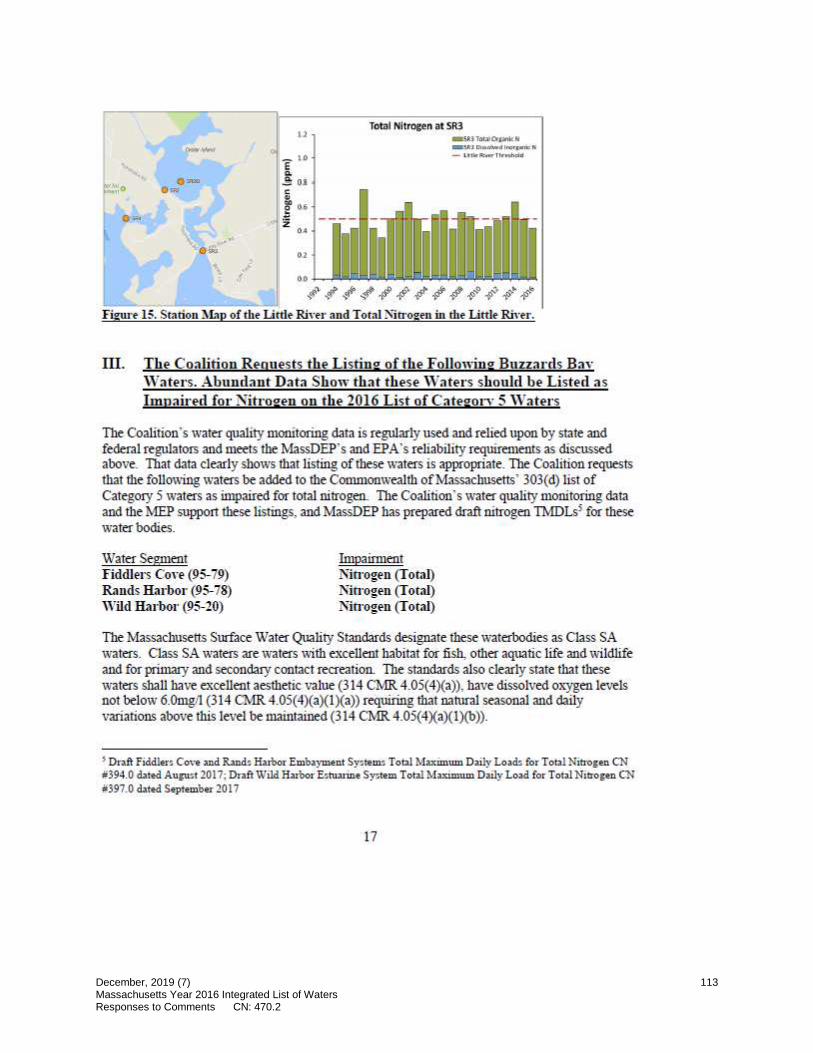
"• . "
"
., ••
TotaJ NJtrog-e.n at SR3 ~JlOQIO'pt\kM a.llU 1:1•-lllf'IC<c-w - Lulo-flYnl>:Od
. f' ,,, i ' 4" -if.#'# I' -f .l ,/' ~ 4-• Figur~ 15. Station Map of the Little Rinr and Total Nitrogon in the Little Rinr.
Ill. The Coalition Requests the Listino of the Followino Buzzards BaY ·waters. Abundant Data Show that these 'Waters shoulcl be Listecl as Impaired for Nitrooen on the 2016 List of CateoorY 5 ,vaters
Toe. Coalition's water quality monitoring data is regularly used and relied upon by state and federal regulators and meets the MassDEP's and EPA's reliability requirements as discussed above. That data clearly shows that listing of these waters is appropriate. The Coalition requests that the following waters be added to the Commonwealth of Massachusetts' 303( cl) list of Category 5 waters as impaired for total nitrogen. The Coalition's water quality monitoring data and the MEP support these listings, and MassDEP has prepared draft nitrogen TMDLs; for these water bodies.
Water Segment Impairment Fiddlers Cow (95-79) Nin-ogen (Total) Rands Harbor (95-78) Nin-ogen (Totill) Wild Harbor (95-20) Nin-ogen (Totill)
The Massachusetts Surface Water Quality Standards designate these waterbodies as Class SA waters. Class SA waters are waters with excellent habitat for fish, other aquatic life and wildlife and for primary and secondary contact recreation. The staindards also clearly state that these waters shall have excellent aesthetic value (314 CMR 4.05(4)(a)), have dissolved oxygen levels not below 6.0mg/1 (314 CMR 4.05(4)(a)(l)(a)) requiring that natural seasonal and daily variations above this level be maintained (314 CMR 4.05( 4)(a)(l)(b)).
s Draft fiddle.rs Co,.·e and Rand~ Harbor Embayuw.nt System:; Total Ma:rimtw1 Daily L-oads for Total Nifl-ogen CN #394.0 dated August 2017; Draft Wild Harbor Estuat,ne System Tota! Maxunum Daily Load for Total Nitrogen C:N #397 .0 d.,t«l September 2017
17
l
December, 2019 (7) Massachusetts Year 2016 Integrated List of Waters Responses to Comments CN: 470.2
113
The. following submittal demonstrates that the w-aterbodies listed above fall short of meeting these Massaclmsens Surface Water Quality Standards. The Coalition recognizes that while Fiddlers Cove, Rands Harbor, and Wild Harbor all have h:id additional related inipairments ( dissolved oxygen, nutrient/eutrophication biological indicators, and/or estuarine bioassessments) added 011 the 2016 list, it is critical that the regulatory agencies recognize that this water segment is inlpaired for nitrogen and list it as such.
Nutrient-specific assessments lead to direct ren1oval of nrntrients from the coastal waters of Buzzards Bay. Bioassesments or biomonitoring look at various factors to determine the overall health of a body of water. 6 \1,ihiJe these types of assessments are important and provide a general condition of the ecosystem, they are not focused enough to lead to action items or the actual immediate removal of pollutants, such as nitrogen, from the Bay.
MassDEP has classified nitrogen as a pollutant that requires a TMDL in many area~ of southeastern Massachusetts.1 In order to target areas that :ire suffering from excessive nitrogen levels and remove as nmch nitrogen as possible from these areas, it is imperative that MassDEP list Fiddlers Cove. Rands Harbor. and Wild Harbor as in1paired for nitrogen areas.requiring a TMDL for nitrogen.
A. fiddlers Con fails to 1\Ieet State War er Oualitx Standards and Must be Listed as Impaired for Total Nitrogen on the 2016 List of Catego1T 5 Waters.
The Coalition supports the addition of Fiddlers Cove (MA95-79), in the town of Fahnoutb to the Comm01nvealtb of.Massachusetts ' 303(d) list of Category 5 waters as inipaired for dissolved ox-ygen and estuarine bioassessments requiring a 1MDL. The Coalition requests that, in additiO!l, Fiddlers Cove be listed as inlpaired for total nitrogen. The Coalition's water quality monitoring data support its listing.
' Environme-ntal Monitoring~ Bio.assesments. http://"-'Ww.mass.gov/e.ealagEllcies/lll.,l~Sdepiv,ater/watersheds/environme.ntal-monitoring-biomorutorwg.htmi 7 Total Maximum Daily Load {TDML) Ba:;.ics. http:f/\'\l'>\'"l\'.m.a$s.gov/eealagencie,,-.Jlll:l$Sdeplwater/watersheds/tota1-maximum•daily-loads-tmdls-basic~.html
18
December, 2019 (7) Massachusetts Year 2016 Integrated List of Waters Responses to Comments CN: 470.2
114

Figure 16. Fiddlei~ Con Site Map
Fiddlers Cove demonstrates warer quality decline related 10 excess nutrients. As described above, excessive levels of nitrogen are common in southeastern Massachuse.ns and result in ecosysten1 degradation with impacrs including loss of eelgrass beds. algae blooms. fish kills and reductions in important marine life. In order 10 target areas that are. suffering from e.xcessive levels nitrogen, like Fiddlers Cove, and remove as much nitrogen as possible from these areas, it is in1pe.rative thar MassDEP list Fiddlers Cove as impaired for total nitrogen. requiring a Tl\1DL for nitrogen.
1. fiddlers Con Dissolved O:tYgen
The Coalition submits multiple years of oxygen data raken from site FClX depicting water quality inipainnent due to mnrient over-enrichment. Toe Coalition·s dissolved ox-ygen data show that Fiddlers Cove consistently falls below the ml1lleric criteria of 6mg/l as designated in 314 CMR 4.0S(4)(a){l)(a) and warrants listing on the 303{d) list.
" Dissolved Oxygen at FC1X
12
0 .......... -+-.-+-...+_,_,_....,. ..... -+-.-+-...+ ..... -<
.&>' .&>' .&>' .# .#' #' #"' # # -I' #' $'' #' -l Figure 17. DissolYed Qi·ygen Concentrations in Fiddlers Coye GOl; data is. preliminary)
19
December, 2019 (7) Massachusetts Year 2016 Integrated List of Waters Responses to Comments CN: 470.2
115

dissolved O"-')'gen concentrations in Figure 17 at sampling site FClX d early shows a significant number of samples below the numeric dissolved oxygen criteria established in the Massachusetts Surface Water Quality Stand.'lfds. Tue dissolved oxygen saturation graphic for this ,-ite is presented in Attachment A.
2. Ficldlers Con Chlorophvll Dara
Tue Coaliti011's chlorophyll data show that Fiddlers Cove does 1101 possess the excellent aesthetic values required of SA w-aters punmant to 314 CMR 4.05(4)(a), "These waters shall have excellent aesthetic value" and warrants listing on the 303(d) list.
Algel Pig.menu at fCtN U .-::1110~,. a • f t>.:,~opl!Y'in 1b - - ~.:,!11\y\'l~te-•&;,lty
< 1.~ .. 2, ll
€ 10
• -~ ! ~ . ;; fl •
• I' ,# .f' .; .; #' -l .f · .-;,~ .,/
Figure 18. PhytopL1nL.-to11 Pigments in Fiddlers Con
Tue phytoplank,011 pigment data presented in Figure 18 show high concentrations at sampling station FClN. The high concentrations of chlorophyll indicates degraded water clarity in violation of the excellent aesthetic value required in Massachusetts Surface Water Quality Standards.
3. Fiddlers Con Total Nitrogen Data
Tue Coalition's total nitrogen d.1ta for Fiddlers Cove (Figure 16) e.xbibits total nitrogen concentrations that are typically above the level modelled for the threshold scenario in the MEP report. Excess nitrogen levels will cause low dissolved 0"-'}'gen numbers and promote algae growth, results that are ilh1strated above. Toe incidences of high total nitrogen concentration and high chlorophyll indicate that Fiddlers Cove fails to attain state water quality standards and must also be listed 011 the 303(d) list as in1paired for total nitrogen.
20
December, 2019 (7) Massachusetts Year 2016 Integrated List of Waters Responses to Comments CN: 470.2
116
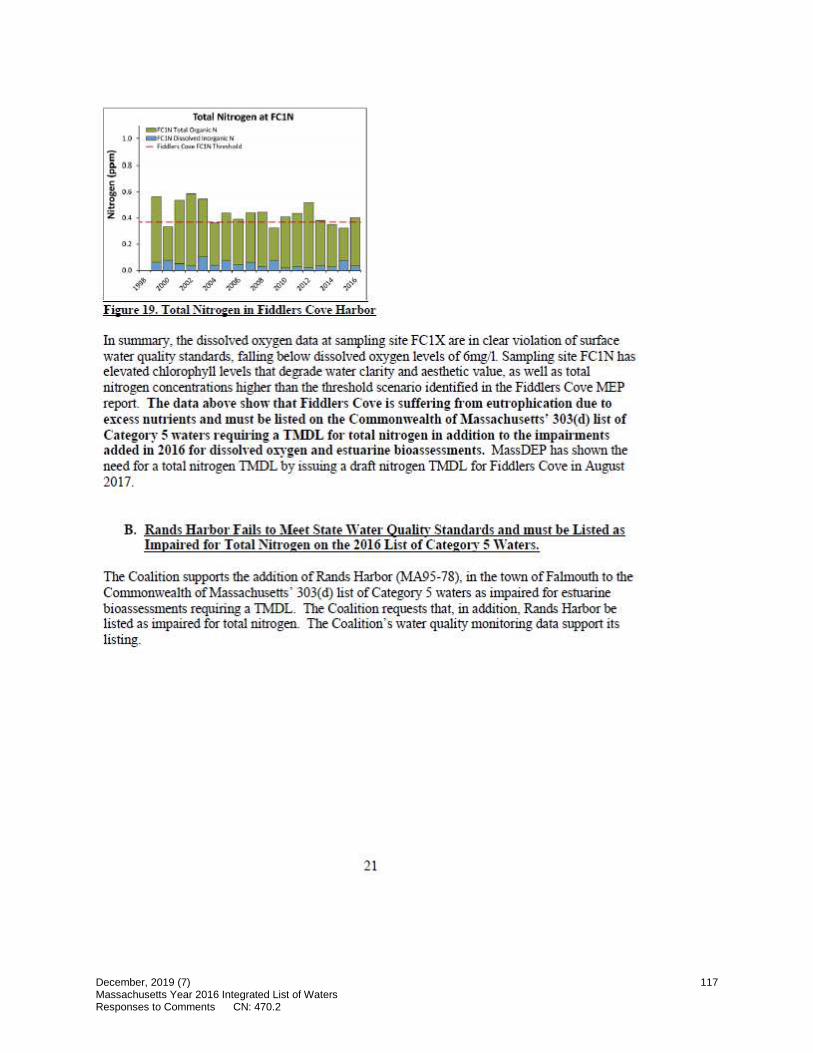
Nitroien at FClN -='CINT.uf~N
10 .aFC!Htw.QtndtllClfpt.cN - r~C...•rt'lHTI,, .. IK,ld
OJ
•• ,~ ,di' ~ # ~ #' ..,~ ,f' -~ ❖~
Figun 19. Total Nitrogen in Fiddlers CoYe H:ubor
In summary, the dissolved oxygen data at sampling site FCIX are in clear violation of surface water quality standards, falling below dissolved ox')'gen levels of 6mg/1. Sampling site FClN has elevated chlorophyll levels that degrade water clarity and aesthetic value, as well as total nitrogen coocentrations higher than the threshold scenario identified in the Fiddlers Cove MEP report. The data abow show that Fiddlers Cow is suffe1ing from eun·opbication due to excess nuttients and must be listed on the Commonwealth of;\Iassachusetts' 303(d) list of Category 5 warers requiring a TI\IDL for total nitrogen in addition to the impairments added in 2016 for dissolwd oxygen and estuarine bioassessments. MassDEP bas shown 1he need for a total nitrogen TMDL by issuing a draft nitrogen TMDL for Fiddlers Cove in Augu~ 2017.
B. Rands Harbor Fails 10 Meet State Water Oualitv Standards and must be Listed as Impaired for Total Nitrogen 011 the 2016 List of Category 5 Waters.
The Coalition supports the additioo of Rands Harbor (MA95-78), in the tov.,n of Falmouth to the Commonwealth of Massachusetts' 303(d) list of Category S waters as impaired for estuarine bioassessments requiring a TMDL. The Coalition requests that, in addition, Rands Harbor be listed as impaired for total nitrogen. The Coalition's ,vater quality monitoring data support its listing.
21
December, 2019 (7) Massachusetts Year 2016 Integrated List of Waters Responses to Comments CN: 470.2
117

. --g_ 'antis Harbor -~
sren\~
" NyP. Pa !ii i Q RHlA a
't. J ... -,, ~ <!l<i< Q RH3
,. "' " ?\11,q: t • a "I, " ~ .... ,d
"' 't ii: 9-,<) AHl
figure 20. R.1nd, Harbor Site M.,p
Rands Harbor demonstrates water quality decline related to excess nutrients. As described above. excessive levels of nitrogen are comniou in southeastern Massachuse.rts and result in ecosystem degradation with impacts including loss of eelg)'ass beds. algae bloolllS. fish kills and reductions in illlportant marine life. In order to target areas that are suffering from excessive nitrogen levels, like Rands Harbor. and remove as much nitrogen as possible from these areas, it is imperative that MassDEP list Rands Harbor as impaired for total nitrogen, requiring a Tu!DL for nutrienrs.
1. R.1nds Harbor Dissoh·ed Oxvgeu
The Coalition submits multiple years of o>.-ygen data taken from one location illustrating water quality inipairment due to nutrient over-enrichment. Toe Coalition's dissolved oxygen data show that Rands Harbor consistently falls below the numeric criteria of 6mgtl as designated in 314 O,,!R 4.05(4)(a)(l)(a) and warrants listing on the 303(c!) list.
" ::, ":a t◊ •
Dissolved Oxygen at RHl
e .·:·· . • -: a •:: •• :•::::::•,• :::•,::. 0 :::·::::::::1 !::·.::1 -1 " ••• .:.-- .. .. . t · 1-..:.i.. .... • · i, =- • • • • • • • • • • • • ••••• I • • . :··· ·: : 1: .. ::: v,, • • • : • :
~
0 +-------------+-+--+-+-<-$' .# .# # -l.#'4>"-!'-1 -~ ~- .f' ~--1
Figun 11. Dfasoh'ed Oxvgen Conceurradous in R.111ds R,rbor (2017 data fa; preliminan·)
22
December, 2019 (7) Massachusetts Year 2016 Integrated List of Waters Responses to Comments CN: 470.2
118
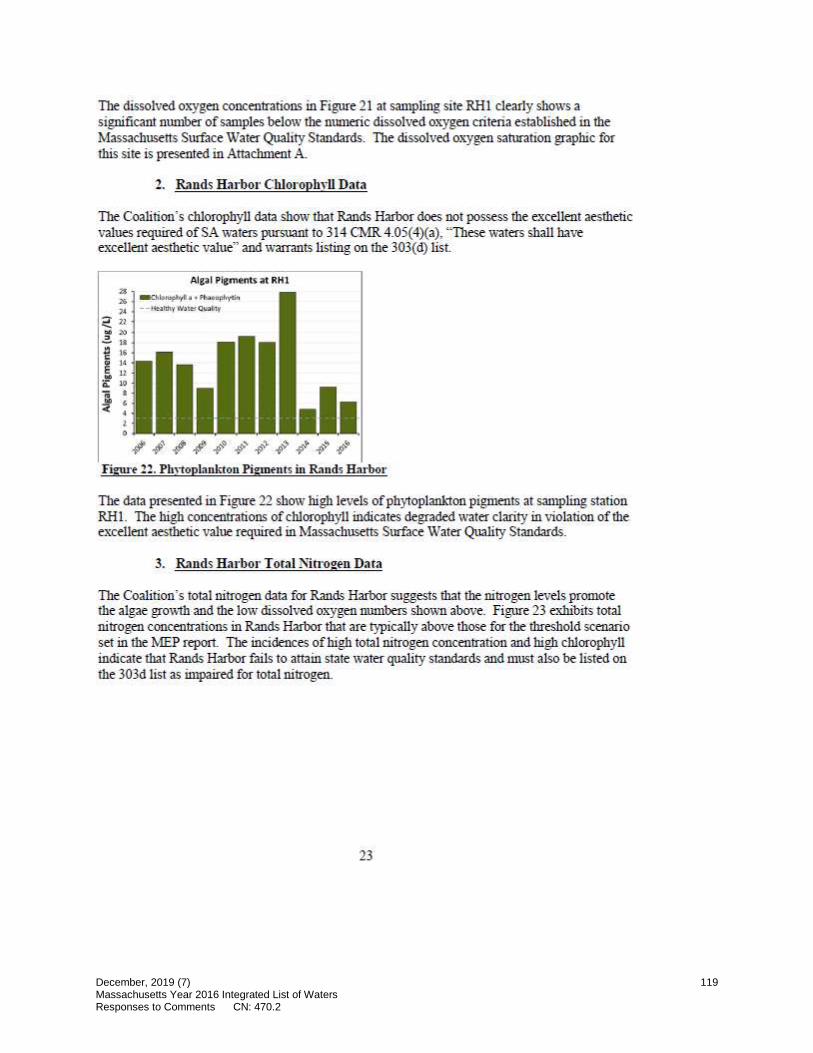
The dissolved oll.-ygen concentrations in Figure 21 at sampling site RH! clearly shows a significant number of samples below the numeric dissolved oxygen criteria established in the Massachusetts Surface. Water Quality Standards. The dissolved oxygen saturation graphic for this site is presented in Attachment A.
2. Rands Harbor CWorophvll Data
The Coalition's chlorophyll data show that R.,nds Harbor does not possess the excellent aesthetic values required of SA waters pursuam to 314 CMR 4.05(4)(a), "These waters shall have excellent aesthetic value" and warrants listing on the 303(d) list
Alg:al Plg-.ne.nu a1 RHl ,. ;:,s. -.:1,loi~ll• • fl\.:atilfll•Y'lin U --He~!lhy W~te,~1..il,ty
~: ~ 1a
€ " . " E ll .Z 10 -;; . 1 • •
' 0 I.I ~ -I # ~ .,/ ./ .p'' .,p -l l' l'
Figure .?2. Ph)ioplankton Pigtnents in R.·md~ Harbor
The data presented in Figure 22 show high levels of phytoplanl.'ton pigments at sampling station RH!. The high concentrations of chlorophyll indicates degraded water clarity in violation of the excellent aesthetic value required in Massachusetts Sutface Water Quality Standards.
3. Rands Harbor Total Nitrogen Data
The Coalition's total nitrogen data for Rands Harbor suggests that the nitrogen levels promote the algae growth and !he low dissolved oxygen numbers shown above .. Figure 23 exhibits total nitrogen concentrations in Rands Harbor that are typically above those for the threshold scenario set in the MEP report. The incidences of high total nitrogen concentration and high chlorophyll indicate that Rands Harbor fails to attain state water qualify standards and must also be listed on the 303d list as impaired for total nitrogen.
23
December, 2019 (7) Massachusetts Year 2016 Integrated List of Waters Responses to Comments CN: 470.2
119

Nitrogen at RHl - llril lou! 011/MiUI
to - lllt!O,.,.l•••lfn-,.,...H
1 OJ
- 11,nclJ ll;111'0f RIU tltffldcl
C r .. ;i OA
... - ,.. -- - ,. ,- ~
-., ~
Firore 23. Total Nitrogen in R.111ds Harbor
The abow data clearly i:ndicate that Rands Harbor is suffeting from eutrnphkation clue to excess nutJients and must be listed on the Commonwealth of :\Iassachusetts' 303(cl) lisl of Caregory 5 waters requiJring a IlIDL for total nitrogen, in addition to the impairment added for estuaiine bioassessments. Dissolved oxy-gen data at sampling site RH I are in clear violation of surface water quality standards, falling below dissolved oxygen levels of 6mgll. Sampling site RH! also has elevated chlorophyll levels that de.grade water clarity and aesthetic value, as well as total nitrogen concentratioas higher those for the nitrogen threshold scenario identified in the Rands Harbor MEP report. MassDEP has shown the need for a total nitrogen TMDL by issuing a draft :nitrogen TMDL for Rands Harbor in August 2017.
C. Wild Harbor Tails to l\l~t State Water Oualitv Standards and 7\Iust be Listed on the 2016 List of Cate.,on· 5 Watet'.S for Total Nitro"en.
The Coalition !mpports the addition of Wild Harbor (NLl\95-20), in the town of Falmouth, to the Commonwealth of Massachusetts' 303(d) list of Category 5 waters as in(paired for estuarine bioassessments and nutrient/eutrophication biological indicators requiring a Th:IDL. The Coalition requests that, in addition, Wild Harbor be listed as impaired for total nitrogen. The Coalition's water quality monitoring data support its listing.
24
December, 2019 (7) Massachusetts Year 2016 Integrated List of Waters Responses to Comments CN: 470.2
120
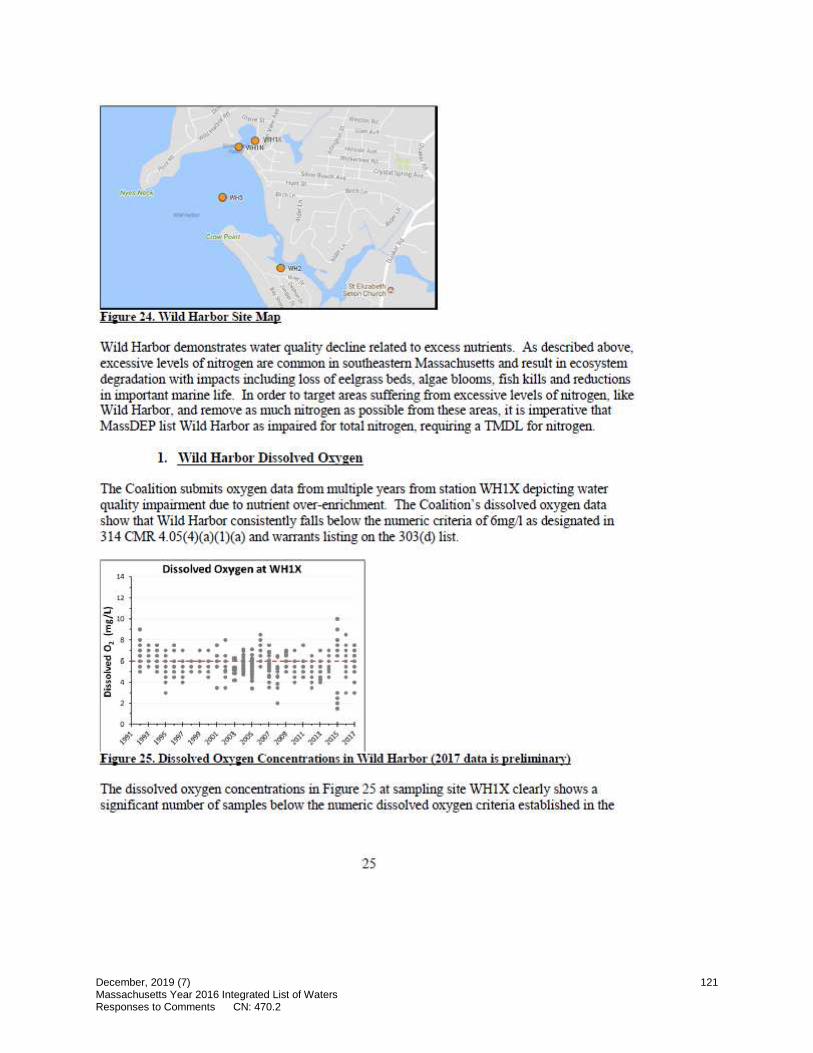
i.:.on~ ••
I ... . - • ...,. ... It\ f
C.)»,lil1"'0'4 ~ .... O •m
... 1 ..
I
Figur• ~4. Wild R'l!'bor Si to i\fap
Wild Harbor demonstrates water quality decline related to excess nutrients. As described above, excessive levels of nitrogen are common in southeastern Massachusetts and result in ecosystem degradation with impacts including loss of eelgrass. beds, algae blooms, fish kills and :reductions in important marine. life. In order to target areas suffering from excessive levels of nitrogen, like Wild Harbor. and remove as much nitrogen as possible from these areas, it is imperative that MassDEP list \'Vild Harbor as impaired for total nit:rogen, requiring a Tl'v!DL for nitrogen.
1. " 'ild Ha1·bor Dissolwd O:wgeu
The Coalition submits oxygen data from multiple years from station WHlX depicting water quality in1pairment due to nutrient over-enrichment. The Coalition's dissolved oiqrgen data show that Wild Harbor consistently falls below the numeric criteria of6mgll as designated in 314 CMR 4.05(4)(a)(l)(a) and warrants listing on the 303(d) list.
" Dissolved Oxygen at WHlX
"
0 +-+-+-+--+--+--+-+-+-+-<-<>-f--1
$>' ,~ J; -I ,~,#''$' #-I#'~'##~' figure 15. Dfasol,-ed Qxyoen Concentration$ in Harbor (10li data is p1-eliminan·) ,vnd!
The dissolved oxygen concentrations in Figure 25 at sampling site WHl X cle.arly shows a significant number of samples below the numeric dissolved oxygen criteria established in the
25
December, 2019 (7) Massachusetts Year 2016 Integrated List of Waters Responses to Comments CN: 470.2
121

Massachusetts SU!face Water Quality Standards. The dissolved oxygen saturation graphic for this site is presented in Attachment A.
2. Cb.loroph,·Jl Data
The Coalition's chlorophyll data show that Wild Harbor does not possess the excellent aesthetic values required of SA waters punmant to 314 CMR. 4.0S(4)(a). "These waters shall have excellent aes-thetic value" and warrants listing on the 303(d) list.
Alg.il Pigments al WH1N Alp l Pigmt.nts .at WH3 14
-CMo~••~h ~•J11hrtl:,
" --He-~llhV YhtetCIJ111tw
} 10
i • • . i ♦ .. f
0 . 0 ~--~~-~-~~
~,,-tP#'4Pff-#'#'#-/P~i>~i>"'i>'°'i>"+❖#',i," figure 26. PhnopLmk1on Pi"11lfn!s in Wild Ho,·bor
The data presented in Figure 26 show high levels of algal pigments at sampling stations WHIN and WH3. The high concentrations of chlorophyll indicate degraded water clarity in violation of the excellent aesthetic value required in Massachusetts Surface Water Quality Standards.
3. " ' ild Harbor I otal Nin·ogen Data
The Coalition's total nitrogen data for Wild Harbor suggests that the nitrogen levels are leading to the low dissolved oxygen numbers and promoting the algae gwwtb depicted above.
.# ~ -tP #'# ff ,p #'#',IP~ i>~ #' ,i,'> ,pi>❖#'.,,
LO - Wt!lll h;!lll(l1J¥1~1f
Toui,I Nhroa:en at WHlN
O.J _._-111 fl~IYK""1•i,11~ w - WiltJ~IIOI WIUHThlkl\1'!1111 e O.&
! 0 .1
ti: 0.6
t •• i 0.4 ., .,
0 .1
00
~,,of'#'#"'#'~,#'#,,,#'~ ,f>°" ,f>v ,i,"' ,i,''+" ~• Iirurt 27. Total Nitt·02:en in TI1ild IL'lrbor
E o.s ! 07
fi O.G r 0.1 Z 04 .,
., 0 .1
Tot,1I Nl1r01en at WH3
•• 1-,~~~~~~..-J~;i,li,U-l,l::::l;.,ij;-lld. ,-1' -I'#\#'#'#' #-I'#-' #'-1>,f> +"+"' ,i," ,l ~'#'
26
December, 2019 (7) Massachusetts Year 2016 Integrated List of Waters Responses to Comments CN: 470.2
122

Figure 27 exhibits total nitrogen concentrations in Wild Harbor that are above the con-centrations set for the threshold scenario in the MEP report. The incidences of high total nitrogen concentration and high chlorophyll indicate that Wiild Harbor fails to attain state watei- quality standards and must be listed on the 303d list as impaired for total nitrogen
The combined data abow demou.sn·ate that Wild Harbor is suffering from eutrophlcatiou due to excess nutrients and must be listed on the Commonwealcb ofMassachttsetts' 303(d) list of Categoi,· 5 wate1,s requiting a TIIIDL for total nitrogen in addition to the impairment added for es tuarine bioassessments. Dissolved oxygen data at sampling site \VHIN are in clear violation of sutface water qtk1lit:y standards, falling below dissolved oxygen levels of 6mg/l. Sampling sites WHlN and \VH3 al.so have elevated chlorophyll levels that degrade water clarity and aesthetic \>alue, as we.11 as total nitrogen concentrations higher than the nitrogen threshold identified in the Wild Harbor MlEP report. MassDEP has sho\1111 the need for a total nitrogen ™DL by issuing a draft nitrogen ThIDL for Wild Harbor in September 2017.
Summary It is critical that imprured water bodies are appropriately identifie.d so that resources are appropriately focused on areas in need of water quality restoration.. Sufficient data ensts demonsn·aring degraded water quality in the abow identified waterbodies. The Coalition's data ilhtStrate impaired health, requiring immediate action on the part ofMassDEP. We respe.ctfully request that these waters be listed as Category 5 waters on the 2016 list of impaired waters for nitrogen, nutrients and habitat alterations requiring a Th!DL.
The qtlality assured raw data supporting this submission is submitted electronically.
Thank you for this opportunity to submit this request
Sincerely,
~c:)~~ Rachel Jakuba, PhD Science Director
Attachments: A. Dissol\<ed Oxygen Saturation Graphics
Contents of Supporting Electronic Data Submission: 1. Statement of Data Integrity 2. Excel Raw Data File 3. MassDEP- and EPA-approved Quality Assurance Project Plan for the Coalition's
Wat~ Quality Monitoring Program.
Cc.: Dr. Chris Neill, Marine Biological Laboratory, Ecosystems Center AJlll Rocllley, US EPA Region I
27
December, 2019 (7) Massachusetts Year 2016 Integrated List of Waters Responses to Comments CN: 470.2
123

. Joseph E. Costa, Buzzards Bay National Estuary Program David Janik, MA Office of Coastal Zone Manage.men!
Senator Mark Montigny Senator Michael Rodrigues Senator Vinny deMacedo
Representative Antonio Cabral Representative Dylan Fernandes Representative Robert Koczera Representative Christopher Markey Representative Paul Schmid Representative William Straus
Mayor Jon Mitchell, City of New Bedford Fairhaven Board of Selectmen Acushnet Board of Selectmen Westport Board of Selectmen Dartmouth Select Board Fahnouth Board of Selectmen
28
December, 2019 (7) Massachusetts Year 2016 Integrated List of Waters Responses to Comments CN: 470.2
124

C .2 e a ~
0 ii .z
~
l C
i ~
0
1 I
l -~ i! a ~ a" .., I 1 iS
Attachment A. Dissolved Oxygen Saturation Graphics
, .... '""' , .... "" ... .,,. ,..
Dissolved Dxyg•n al NB3A
.. •
All tAno,.,, . .,,,,,.,i,.
• •
♦
•
•
"" '---''c.'""=•c."cc'-=~c.' '°"=· ---------
,$' i' $'#'#'#'-I' -I' ,if'.;,◊ i' -1/
""' Dissolved Oxvgen al ARO
'""' , ... "' -""
.. l •
• • • ••• "" •
.1,11 , ......... -,u U,-. • A\1..~«:uflo'Nt":>12°""
,, , .j' -~ ~' .,ft" #' ff #' .if' .9◊ ,/> ./Y
""' Olssollll!d O•vi:•n at 114W
.... '"" , .. •• '"' • ... '!JI' .01Mw.surtmOl'!U ~ · ~•et~.Offl~tt#,(/$1 .~
,it' -I'' ,I' .# .f ~ #' .f' .#' ,I' ,p-' ,p<> .;,-1' .;,◊
~ C 0
~ .l! ~ o· ii .z j
l l i5
t~ --; Dissolved Oxygen at NB6
'"" '"" l "" • ., "" .,. "" Al!M,., .. .,, .,,,. .. ,i,.
• A,~~ ofl.o<Nt'>l ~ "" '-====="---------,~- .i' ,.P -#' #' -I' 4' -I' .if' -If> .;,-1' -1/
Dissolved Oxygen at ARH
•
Olssollll!d Oxygen at 109E
. .. • .. m Al! Mt.;suttm111m
9% i · ~\l'N'o(C(/flll\l;f',S..-2()!it,•
i l •
• ' •
$' -I'' ,/'.# .f #' #'~,#,I'~-,.◊,&-'~'
l
December, 2019 (7) Massachusetts Year 2016 Integrated List of Waters Responses to Comments CN: 470.2
125
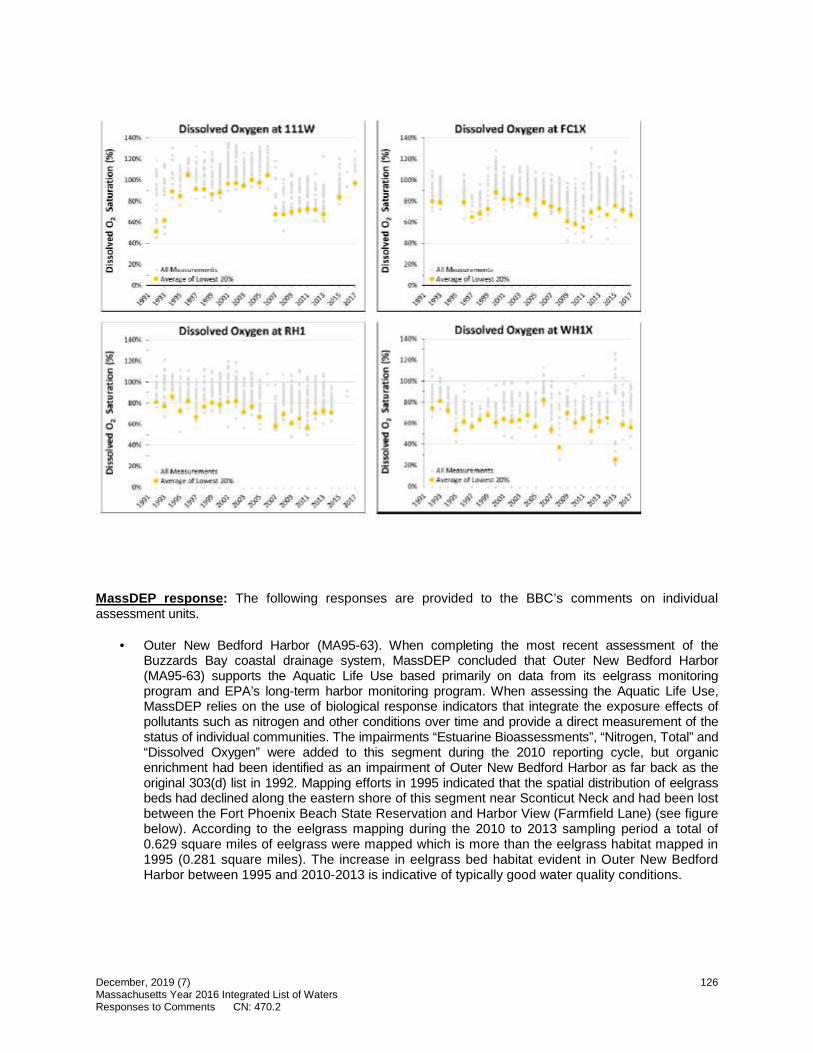
o,· iclved 0 11yg,e11 o1t :U lW Dis5C ved 0:q'plf! a1 FQ.}( -- ::1 ~ llffili l C ~ g
J~ Cl
·5 • ~ J.11111'
~ 3(J!i, ..a ~ :l d• ·~ o"' ~ 1l
(I'~ -1l ~ . .l!: it
~ m,, ~ c A f a•US'\l(JIIIFllllii c A M-.11.u r 1um 111 lai
11".ii. ,lm,/;\I• -.(~ ~
-!' $>"' -!'., J" .# .# .If .If .I ,,f .ffe ... -l' i' -I :>, -I'.# .f $ -v"' ¥'> -&~
Dli»olv@d OKW@II at IRH1 1~
D1bs-olved -O)(W.eli'I ,a1 W H1X U.W, -
~ ll(II/, i 1X!II(
-~ iooi.. -j
lotni:,
l! ! :a :a,
l ro:+. - 1i am,;, ..., !lft,
"' «!Ko ..
C C
1 ~ - 1 -i -a - Bl: roi,; ;a AW.,o;,,nt, a ... t.\,M]Jrv,, --
11"'> ...... ,~. <11'1.ow<:!a ,11!;1
{!lo ~ ar u....s, ?ffll\
.f' .,f'" I'' f' .f ,,, .. , !',,, ,f #" .p ~ -l ,,, ... ..,.fl ... -I' I' .,f"l .f· ,f' ,f' #' $' f".:;, .§' ~ :.:-1r
MassDEP response : The following responses are provided to the BBC’s comments on individual assessment units.
• Outer New Bedford Harbor (MA95-63). When completing the most recent assessment of the Buzzards Bay coastal drainage system, MassDEP concluded that Outer New Bedford Harbor (MA95-63) supports the Aquatic Life Use based primarily on data from its eelgrass monitoring program and EPA’s long-term harbor monitoring program. When assessing the Aquatic Life Use, MassDEP relies on the use of biological response indicators that integrate the exposure effects of pollutants such as nitrogen and other conditions over time and provide a direct measurement of the status of individual communities. The impairments “Estuarine Bioassessments”, “Nitrogen, Total” and “Dissolved Oxygen” were added to this segment during the 2010 reporting cycle, but organic enrichment had been identified as an impairment of Outer New Bedford Harbor as far back as the original 303(d) list in 1992. Mapping efforts in 1995 indicated that the spatial distribution of eelgrass beds had declined along the eastern shore of this segment near Sconticut Neck and had been lost between the Fort Phoenix Beach State Reservation and Harbor View (Farmfield Lane) (see figure below). According to the eelgrass mapping during the 2010 to 2013 sampling period a total of 0.629 square miles of eelgrass were mapped which is more than the eelgrass habitat mapped in 1995 (0.281 square miles). The increase in eelgrass bed habitat evident in Outer New Bedford Harbor between 1995 and 2010-2013 is indicative of typically good water quality conditions.
December, 2019 (7) Massachusetts Year 2016 Integrated List of Waters Responses to Comments CN: 470.2
126

I' CSOs (In -House)
/' MA_NPDES_allOutfalls
D 1995_Eelgrass
2001 _eelgrass
D 10to13_eelgrass
! H:"iiiJ eelgrass costa 1988
EPA calculated the Environmental Monitoring and Assessment Program’s (EMAP) benthic index for benthic infauna data collected as part of its long-term monitoring program for New Bedford Harbor. Index values for EPA’s outer harbor stations are almost all positive for every study year, which is indicative of good benthic conditions. (See “New Bedford Harbor (NHB) Long Term Monitoring Program: Comparative analysis 2014 LTM collection” by Dr. Barbara Bergen, EPA Atlantic Ecology Division, National Health and Environmental Effect Laboratory, Narragansett, RI, September, 2015). Based on the sensitive biological indicators eelgrass and benthic infauna, water quality conditions were presumed to be good and “Estuarine Bioassessments”, “Nitrogen, Total” and “Dissolved Oxygen” were removed as causes of impairment from the proposed 2016 303(d) list. It should also be noted that an upgrade to the New Bedford WWTP from primary to secondary treatment was completed in August/September, 1996. The discharge is now located 3,000 ft. offshore and outside of the Outer New Bedford Harbor assessment unit.
In their comment letter the BBC stated that the delisting of Outer New Bedford Harbor was inappropriate and that their data supported its continued 303(d) listing. The BBC provided monitoring data in support of this comment, separately, through MassDEP’s data portal for external data submittals, and these data were reviewed in order to determine whether there was sufficient evidence to overturn MassDEP’s decision to delist the above mentioned impairments from MA95-63. BBC monitored five sites in the Outer New Bedford Harbor assessment unit between 2006 and 2016 (see figure below). It should be noted that all of these sites were sampled either from a boat ramp or pier, or from a boat just off shore. This raises some questions pertaining to the representativeness of these sampling sites within the context of the water quality of the assessment unit in its entirety. For example, stations NB3, NB3A, NB5 and NB6 are located in the vicinity of CSOs, and water quality at NB5 and NB6 is likely influenced by the proximity of these sampling sites to the inner New Bedford Harbor. Open water sampling locations are generally preferred over
December, 2019 (7) Massachusetts Year 2016 Integrated List of Waters Responses to Comments CN: 470.2
127

nearshore/dock locations and none of the BBC’s stations are situated in open water or in proximity to the eel grass expansion areas. Nonetheless, MassDEP summarized and considered the BBC’s data as described below.
Buzzards Bay Coalition Sampling In Outer New Bedford Harbor
BBC’s submitted, through MassDEP’s data portal, total nitrogen, dissolved oxygen (DO) and chlorophyll data collected from multiple sites during the period 2006 - 2016 (see above map). General guidance pertaining to the use of these indicators for assessing waters pursuant to sections 305(b) and 303(d) of the CWA is provided in MassDEP’s 2016 Consolidated Assessment and Listing Methodology (“CALM”) document. Because there are no numerical water quality standards for many constituents in water, MassDEP relies on general guidelines obtained from various sources, such as criteria documents, literature values, etc. For example, threshold values above which risk of impairment exists for total nitrogen (<0.4 mg/L) and chlorophyll (> 10 mg/L) suggested by the Massachusetts Estuaries Project (MEP) are included in the CALM to provide some context for reviewing estuarine water quality data, but they are not water quality standards, and are not intended to be strictly applied when making use assessments. Furthermore, as explained in the CALM document, response indicators carry more weight than individual chemical variables. Consistent with general guidance provided in the CALM document,
December, 2019 (7) Massachusetts Year 2016 Integrated List of Waters Responses to Comments CN: 470.2
128
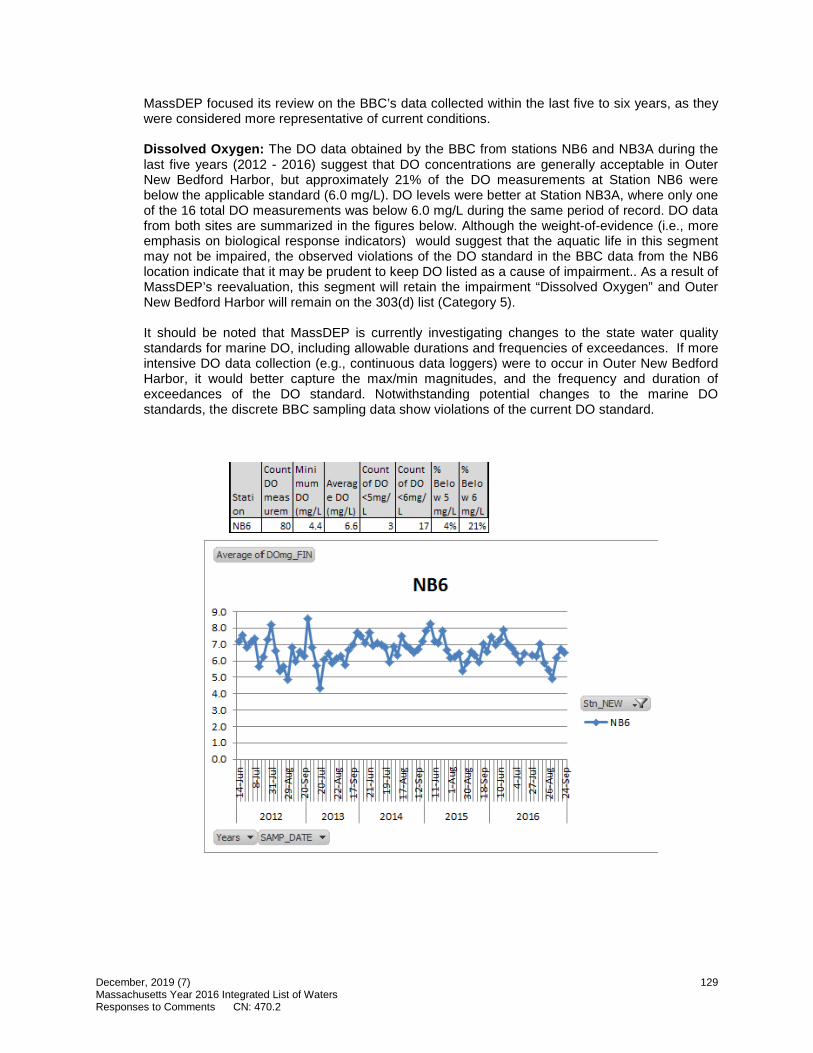
[Average of DDni FIN]
NBG 9.0 ~-----------------------
8.0 +a---f-- --tr--- ----:,c-:.:-----:---.t..-----,-+----7.0 -A~R-...... c-ff....--,-----,~~ ... A,;-:1--~.--:-""7""~~.-:---+---. 6.0 +---¥c..\.,#!t\4ri1111V-- ~~~- --U!li=-- ¥~rf= 5.0 -l----".11..-- V----------~ -------'lll.-
4.0 -1------.%....-----------------3.0 +------------------------2.0 -1------------------------1.0 +------------------------0.0 -1-n=======================
2012 2014 2015 2016
Years • SAMP DATE •
Stn NEW .'i/
--NB6
MassDEP focused its review on the BBC’s data collected within the last five to six years, as they were considered more representative of current conditions.
Dissolved Oxygen: The DO data obtained by the BBC from stations NB6 and NB3A during the last five years (2012 - 2016) suggest that DO concentrations are generally acceptable in Outer New Bedford Harbor, but approximately 21% of the DO measurements at Station NB6 were below the applicable standard (6.0 mg/L). DO levels were better at Station NB3A, where only one of the 16 total DO measurements was below 6.0 mg/L during the same period of record. DO data from both sites are summarized in the figures below. Although the weight-of-evidence (i.e., more emphasis on biological response indicators) would suggest that the aquatic life in this segment may not be impaired, the observed violations of the DO standard in the BBC data from the NB6 location indicate that it may be prudent to keep DO listed as a cause of impairment.. As a result of MassDEP’s reevaluation, this segment will retain the impairment “Dissolved Oxygen” and Outer New Bedford Harbor will remain on the 303(d) list (Category 5).
It should be noted that MassDEP is currently investigating changes to the state water quality standards for marine DO, including allowable durations and frequencies of exceedances. If more intensive DO data collection (e.g., continuous data loggers) were to occur in Outer New Bedford Harbor, it would better capture the max/min magnitudes, and the frequency and duration of exceedances of the DO standard. Notwithstanding potential changes to the marine DO standards, the discrete BBC sampling data show violations of the current DO standard.
December, 2019 (7) Massachusetts Year 2016 Integrated List of Waters Responses to Comments CN: 470.2
129
Count Mini Count Count % % DD mum Averag of DD of DD Be lo Be lo
Stati meas DD e DD <Smg/ <6mg/ ws v,6 on urem (mg/ L (mg/ L) L L mg/ L mg/ L
NB6 80 4.4 6.6 3 17 4% 21%
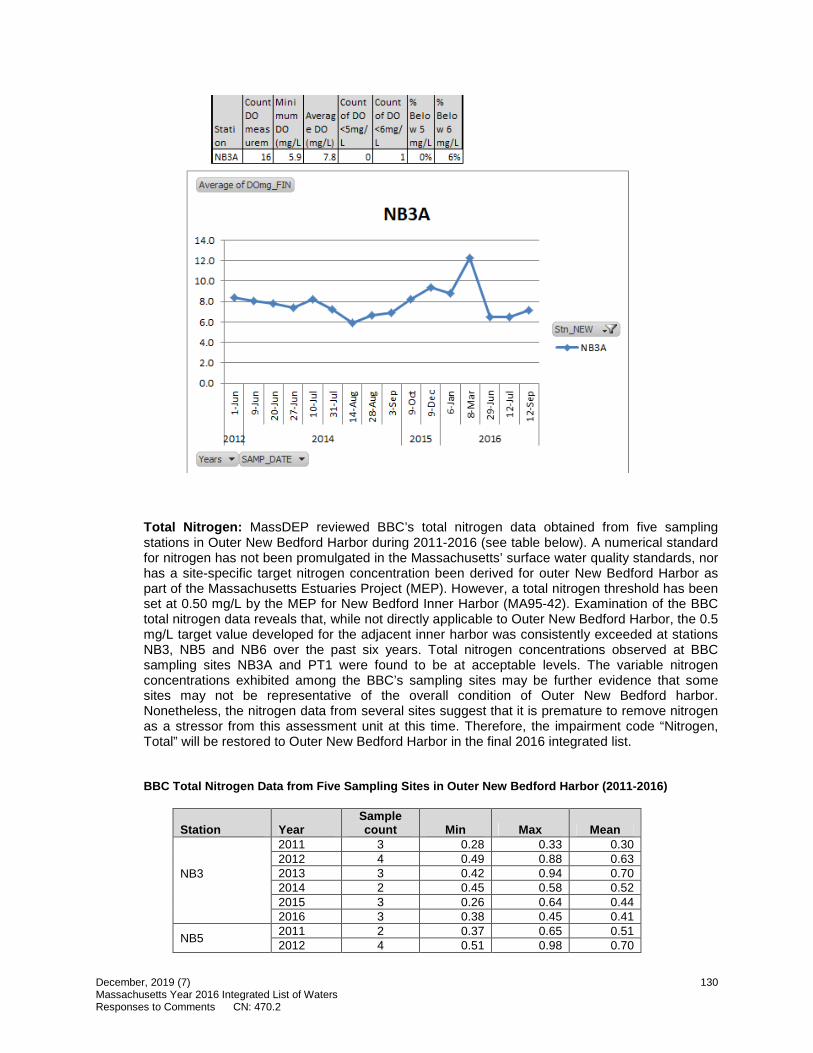
,-Count Mi ni Count Count % % DO mum Averag of DO of DO Bel o Belo
St at i mea~ DO e DO <Smg/ <6mg/ VI 5 V/6
o-n urem (mg/ L (mg/ L) L L mg/ L mg/ L
NB3A 16 5.9 7.8 0 1 O¾ 6%
Average of DOmg_FIN
NB3A 14.0 ~------------------------
12.0 -t---------------------------
10.0 +----------------r-----1-- - ----
8 .0 +'"""' ...... =.,,. .... =-----7,._--------1\---:--
4.0 +-------------------------
2.0 +-------------------------
0 .0 +----.-.....---,c---r--r---r--r---r-...---r-...-----.--.------,-.....---, C C C C :, :, bl) bl) C. tl u C ,;; C :, C. :, :, :, :, :, :, 11.)
0 11.) ro :, 11.)
~ ~ ~ ~ . . -<( -<( "' ,o 2
"" l/l
..'., d, a ,,-. 0 .-i st 00 en d, d, I.O 00 d,
"" .-i "' .-i N N .-i N N .-i
01 2014 2015 2016
Years ~ SAMP _DATE ~
Stn_NEW •
~ NB3A
Total Nitrogen: MassDEP reviewed BBC’s total nitrogen data obtained from five sampling stations in Outer New Bedford Harbor during 2011-2016 (see table below). A numerical standard for nitrogen has not been promulgated in the Massachusetts’ surface water quality standards, nor has a site-specific target nitrogen concentration been derived for outer New Bedford Harbor as part of the Massachusetts Estuaries Project (MEP). However, a total nitrogen threshold has been set at 0.50 mg/L by the MEP for New Bedford Inner Harbor (MA95-42). Examination of the BBC total nitrogen data reveals that, while not directly applicable to Outer New Bedford Harbor, the 0.5 mg/L target value developed for the adjacent inner harbor was consistently exceeded at stations NB3, NB5 and NB6 over the past six years. Total nitrogen concentrations observed at BBC sampling sites NB3A and PT1 were found to be at acceptable levels. The variable nitrogen concentrations exhibited among the BBC’s sampling sites may be further evidence that some sites may not be representative of the overall condition of Outer New Bedford harbor. Nonetheless, the nitrogen data from several sites suggest that it is premature to remove nitrogen as a stressor from this assessment unit at this time. Therefore, the impairment code “Nitrogen, Total” will be restored to Outer New Bedford Harbor in the final 2016 integrated list.
BBC Total Nitrogen Data from Five Sampling Sites in Outer New Bedford Harbor (2011-2016)
Station Year Sample count Min Max Mean
NB3
2011 3 0.28 0.33 0.30 2012 4 0.49 0.88 0.63 2013 3 0.42 0.94 0.70 2014 2 0.45 0.58 0.52 2015 3 0.26 0.64 0.44 2016 3 0.38 0.45 0.41
NB5 2011 2 0.37 0.65 0.51 2012 4 0.51 0.98 0.70
December, 2019 (7) Massachusetts Year 2016 Integrated List of Waters Responses to Comments CN: 470.2
130

2013 3 0.48 1.17 0.75 2014 3 0.40 0.98 0.68 2015 3 0.29 0.71 0.49 2016 3 0.48 1.35 0.84
NB6 2011 1 0.44 0.44 0.44 2014 1 1.04 1.04 1.04 2015 3 0.25 0.88 0.53 2016 3 0.35 0.64 0.53
NB3A 2015 7 0.25 0.50 0.34 2016 8 0.28 0.40 0.32
PT1 2011 1 0.36 0.36 0.36 2015 1 0.26 0.26 0.26 2016 1 0.48 0.48 0.48
Chlorophyll: Although “Chlorophyll-a” was not previously listed as a cause of impairment to the New Bedford Outer Harbor, MassDEP reviewed the BBC’s chlorophyll data submittal to determine whether they provide corroborating evidence for the BBC’s comment that this waterbody is impaired by nutrients and should remain listed for “Total Nitrogen”. The BBC submitted separate chlorophyll and phaeophytin data through MassDEP’s data portal. However, when graphically displaying the phytoplankton pigment data in their comment letter, the BBC combined both chlorophyll a and phaeophytin values and depicted the total as “Algal Pigments”. Phaeophytin is a compound formed by the degradation of chlorophyll and, as such, it is indicative of dead algae biomass. Therefore, it is inappropriate to compare “Algal Pigments” to guidance threshold values for chlorophyll a. MassDEP’s review of the BBC’s algal pigment data revealed that, in many instances, the phaeophytin concentrations represented a significant portion of the total algal pigment levels. MassDEP calculated annual mean chlorophyll concentrations for all BBC data collected at five sites (NB3, NB3A, NB5, NB6 and PT1) from 2011 – 2016 and compared these values to the CALM threshold value (> 10 mg/L). Individual samples exceeded the threshold value sporadically over the six years at all but one sampling station; however, the seasonal average chlorophyll levels were only exceeded in one year (2016) at two sites (NB5 and NB6). So while the chlorophyll data are not inconsistent with the decision to retain “Total Nitrogen” as a stressor to this AU, MassDEP does not consider this to be sufficient evidence to add “Chlorophyll-a” as a separate cause of impairment.
In summary, MassDEP typically relies on the use of biological response indicators that integrate the exposure effects of pollutants and, when completing the most recent assessment of the Buzzards Bay coastal drainage system, it was concluded that Outer New Bedford Harbor (MA95-63) supports the Aquatic Life Use based primarily on data from its eelgrass monitoring program and EPA’s long-term harbor monitoring program. After reviewing the BBC’s comment letter and accompanying data submittal, however, MassDEP acknowledges that the multiple lines of evidence available for determining the Aquatic Life Use support status of Outer New Bedford Harbor are not entirely consistent and, when viewed separately, can lead to different conclusions. Furthermore, entire waterbodies and/or individual impairments should not be removed from the 303(d) list when differing lines of evidence lead to uncertainty in the assessment and listing decision process. Therefore, while MassDEP contends that the Aquatic Life use is usually supported in Outer New Bedford Harbor, the DO depletion and elevated nitrogen concentrations exhibited in the BBC’s monitoring data suggest that the removal of these two impairments from the 303(d) list is not warranted at this time. The removal of the impairment “Estuarine Bioassessments” is defensible because eelgrass coverage has increased approximately 130% between 2010 and 1995, and recent EPA biomonitoring has characterized the benthic community as healthy. Outer New Bedford Harbor will be returned to the 2016 303(d) list as impaired by “Dissolved Oxygen” and “Nitrogen, Total” and will be the subject in the future of a detailed analysis under the Massachusetts Estuaries Program.
December, 2019 (7) Massachusetts Year 2016 Integrated List of Waters Responses to Comments CN: 470.2
131

• Acushnet River (MA95-32). As part of the aquatic life use assessment of the Buzzards Bay drainages, MassDEP removed the stressor “Oxygen, Dissolved” from the Acushnet River segment MA95-32. While the aquatic life use was still not supported because the aquatic macroinvertebrate community was found to be impaired, continuous dissolved oxygen (DO) measurements recorded by MassDEP in 2005 from a site just upstream of Tarkiln Hill Road/Main Street in New Bedford/Acushnet were all above the water quality standard of 5 mg/L. In their comment on the Proposed 2016 IR, the BBC disagreed with MassDEP’s decision to delist “Oxygen, Dissolved” from this assessment unit, and submitted their own DO data in support of their request to retain the “Oxygen, Dissolved” impairment of this segment.
BBC sampling was conducted at two stations: ARH at the Hamlin Street crossing in Acushnet and AR0 (behind the Mill Pond dam site), also in Acushnet. BBC measured dissolved oxygen on 77 occasions between 2006 and 2016 at station ARH. Over this time period the minimum dissolved oxygen was 4.0 mg/L and the average was 6.4 mg/L. Seven of 77 measurements were below 5.0 mg/L (~9%). At least three of the seven low measurements were taken during the severe drought in the summer of 2016. BBC’s DO data for station ARH are summarized below.
Count DO
measurem ents (2006· Minimum Average DO Count of Count of % Be low 5 % Below 6
Station 2016) DO (mg/L) (mg/L) DO <Smg/L DO <6mg/L mg/L mg/L
Average of DOmg FIN
ARH
_,,, .... .... 12.0 100 8.0 6.0 4.0 2.0 0.0
~ ... l I ......... ....... ...,. __ ....__ ... ~·- .. -~ ... ..... T&-. ...... T T T'9 T TT _,,.. T l,. T
~ $ :JJ IJ:
:p IJ: $ :JJ
ff 200i 2007 2008 2003 2010 0l l0!12013 2014
$ :p
2015
......... T
~
2016
Stn_NEW .'y
~ ARH
BBC also sampled the Acushnet River further downstream along the shoreline in the slightly impounded area upstream from the former Mill Pond Dam (Station AR0). DO measurements taken at this location (n=107) between 2006 and 2016 averaged 5.5 mg/L and 38 of the 107 measurements were less than 5.0 mg/L (36%). The lowest measurements were recorded during the extreme drought conditions that occurred during the summer of 2016 (minimum DO of 1.8 mg/L recorded on 8/31/2016), which also corresponded with the fish kill in September 2016 referred to in BBC’s comment. It is likely that the extreme drought resulted in low flow and stagnant conditions at AR0, resulting in the low DO. Between July 20th and September 18th DO was measured on 12 occasions and no values exceeded 3.0 mg/L; however, this sampling location in the former impounded reach was not necessarily representative of conditions in the main channel of the river. BBC’s DO data for Station AR0 are summarized below.
December, 2019 (7) Massachusetts Year 2016 Integrated List of Waters Responses to Comments CN: 470.2
132

Count DO measurem ents (2006- Mini mum Average DO Count of Count of % Below 5 % Below 6
Station 2016) DO (mg/ L) (mg/ L) DO <5mg/ L DO <6mg/ L mg/ L mg/ L
AAO 107 1.8 5.5 38 59 36% 55%
Average of DOmg FIN
ARO 1 5 .0 ~-------------------------~~------------
10 .0 ti~--------------=--------t1-:---,------------
S.O
0 .0 -m======================================~
Years ..- SAMP _DATE ..-
Stn_NEW .'y
~ ARO
In summary, BBC reported infrequent occurrences of low dissolved oxygen at the upstream end of this segment at station ARH between 2006 and 2016. Downstream, at station AR0, DO concentrations were typically lower than at ARH, although the sampling station location was not considered ideal. Nonetheless, BBC’s report of the September, 2016 fish kill in the vicinity of the Sawmill property, as well as an earlier report by the MA Division of Marine Fisheries of a fish kill in the lower Acushnet River the month before, are indicative of unfavorable water quality conditions caused, or exacerbated by, low DO levels. The above evidence, combined with the impaired aquatic macroinvertebrate community, suggests that MassDEP’s decision to remove low DO as a cause of impairment from this segment of the Acushnet River is inappropriate at this time. Therefore, the cause code “Oxygen, Dissolved” will remain as a listed impairment for assessment unit MA95-32 in the final version of the 2016 integrated report.
• The Westport River (MA95-54) was originally listed for nutrients (i.e., nitrogen) in 2002 at BBC’s request, based on a preliminary assessment by the staff of the SMAST Coastal Systems Group who assisted the BBC with the review and interpretation of available data. At that time, it was recommended that the Westport River System be considered for 303(d) listing. This decision was documented in Technical Memorandum Buzzards Bay 303(d) List-Embayment Analysis (Howes and Samimy 2003). Subsequently, a more detailed analysis of this system was performed as part of the MEP Project and documented in Massachusetts Estuaries Project Linked Watershed -Embayment Approach to Determine Critical Nitrogen Loading Thresholds for the Westport River Embayment System, Town of Westport, Massachusetts (Howes et al. 2013). The results of this analysis indicated that, while the west and east branches of the Westport River were impaired, the Westport River (referred to by SMAST as either “Westport River Estuary” or “Westport Harbor”) was assessed as healthy: “Westport Harbor has high water quality and stable eelgrass beds and sandy oxidized sediments with a low organic matter content”. Furthermore, “The benthic animal communities throughout most of the Westport River Estuary (except upper to mid East Branch) indicated generally healthy infaunal habitat, consistent with the tidally averaged nitrogen levels and levels of oxygen depletion which were in line with the ecosystem types represented.” Finally, SMAST acknowledged elevated total nitrogen concentrations, consistent with values reported by the BBC. However, SMAST concluded that “These TN levels supportive of eelgrass habitat in the Westport River Estuary are higher than generally found in high quality eelgrass habitat such as within deeper systems (>2 m)…however, in shallow systems like most of the areas that support eelgrass in the Westport River Estuary (with eelgrass generally at <1 m depth), eelgrass beds are sustainable at higher TN (higher chlorophyll-a) levels than in deeper waters…”. MassDEP contends that all of the evidence cited above supports the decision to delist “Nitrogen, Total” and “Estuarine Bioassessments” from the Westport River. The assessment unit MA95-54 remains in Category 4A, however, due to the impairment “Fecal Coliform” which is covered by an EPA-approved TMDL.
December, 2019 (7) Massachusetts Year 2016 Integrated List of Waters Responses to Comments CN: 470.2
133
• The Wild Harbor River (MA95-68) was originally listed in 2008 as impaired by “Nutrient/Eutrophication Biological Indicators” in response to the BBC’s request during the public review and comment process. Although SMAST concluded, in 2003, that there was insufficient evidence to place this river on the 303(d) list, the BBC submitted water quality data and photographic evidence of abundant algal growth that suggested that nutrient enrichment may have been contributing to the impairment of the aquatic life use in the Wild Harbor River. In 2013, SMAST published Massachusetts Estuaries Project Linked Watershed - Embayment Model to Determine Critical Nitrogen Loading Thresholds for the Wild Harbor Embayment System, Town of Falmouth, Massachusetts which concluded that Wild Harbor River is not impaired by nitrogen loading. SMAST reported “The Wild Harbor River is functioning as a non-nitrogen impaired salt marsh system with productive benthic communities typical of Cape Cod marsh creeks”. There is no water quality standard for total nitrogen, and MassDEP would not make an assessment decision based solely on nitrogen concentration. Rather, MassDEP determined that the Wild Harbor River was not impaired from SMAST’s review of response indicators, such as dissolved oxygen, chlorophyll a, and benthic infauna and, therefore, removed “Nutrient/Eutrophication Biological Indicators” from this water body during the 2016 assessment and listing cycle.
The BBC commented that the restoration of Wild Harbor (MA95-20) requires reductions in nitrogen loadings to the Wild Harbor River watershed and that those reductions will help to achieve the target nitrogen concentration established by the MEP TMDL for Wild Harbor. They acknowledged that recent data suggest that nitrogen concentrations in Wild Harbor River may be low enough to achieve the threshold value set for the Wild Harbor sentinel station, but suggested that it is premature to remove the Wild Harbor River from the 303(d) list. Instead, they requested that MassDEP maintain Wild Harbor River on the 303(d) list and continue to review nitrogen data for two more years to confirm that nitrogen concentrations remain at acceptable levels. MassDEP has concluded that this is a reasonable request, and will return Wild Harbor River (MA95-68) to the 303(d) list (Category 5) with the associated cause code “Nutrient/Eutrophication Biological Indicators”.
• The Nasketucket River (MA95-67) was originally listed for nutrients (i.e., nitrogen) in 2004 at BBC’s request. At that time, it was initially recommended in Technical Memorandum Buzzards Bay 303(d) List-Embayment Analysis (Howes and Samimy 2003) that the Nasketucket Bay System be considered for 303(d) listing. A more recent, detailed analysis of the entire system was performed as part of the MEP Project and documented in Massachusetts Estuaries Project Linked Watershed - Embayment Approach for Determination of Critical Nitrogen Loading Thresholds for the Nasketucket Bay Embayment System, Town of Fairhaven, Massachusetts (Howes et al. 2013) This report concluded that benthic infaunal communities within each of the major tributary basins to Nasketucket Bay, including Little Bay just downstream of the Nasketucket River, were generally indicative of high quality habitat (Little Bay has not historically supported eelgrass coverage), and that these conditions are largely due to the well-flushed basin characteristics of the Nasketucket embayment system. The report also concluded that within the tidal channel of the mouth of the Nasketucket River and its tidal wetlands (downstream of segment MA95-67) a “different benthic habitat was present, as seen in the dominance of organisms typical of salt marshes on Cape Cod, and the habitat was not impaired”, but that “the appearance of stress indicator species at some sites (e.g. capitellids) and dominance of polychaetes at others, coupled with periodic oxygen depletion, suggest that Little Bay is near or at its habitat threshold related to nitrogen enrichment”. The report also noted DO excursions below 5 mg/l downstream of NR1 at the head of Little Bay, likely due to nutrient transport from the river during ebb tides. To protect against nutrient-related impairments in the Little Bay/Nasketucket Bay system, the MEP report set a TN threshold for the Nasketucket River of 0.88 mg/l at station NR1. BBC data for mean TN at station NR1 indicate that the threshold value has been exceeded as recently as 2014 and from 2005-2008, although mean TN data appear to be trending in the right direction based on the two most recent years of data (i.e., 2015 and 2016).
December, 2019 (7) Massachusetts Year 2016 Integrated List of Waters Responses to Comments CN: 470.2
134
BBC has stated that the Nasketucket Bay system is “receiving the maximum amount of nitrogen it can handle while remaining healthy”, and that it is “premature to remove Nasketucket River from the 303(d) List.” Based on some degree of uncertainty regarding the variability in TN concentrations for MA95-67, MassDEP agrees that it may be premature to delist the river segment for “Nitrogen, Total” until additional data are available to verify that TN concentrations are consistently and significantly below the MEP threshold value for the Nasketucket River. The 2016 Integrated Report will be revised to retain the “Nitrogen, Total” cause of impairment for this segment.
• The Little River (MA95-66) was originally listed for nutrients (i.e., nitrogen) in 2004 at BBC’s request. Since then, the Little River was studied, along with Slocums River, as one of the initial 70 embayments included in the Massachusetts Estuaries Project (MEP) for which MassDEP partnered with SMAST to assess and, if necessary, complete TMDLs. The study report was first completed in 2007 (2000-2006) and then finalized in 2012 (Massachusetts Estuaries Project Linked Watershed - Embayment Model to Determine Critical Nitrogen Loading Thresholds for the Slocum’s and Little River Estuaries, Dartmouth, Massachusetts (Howes et al. 2012). . At the time of the publication of the MEP report SMAST concluded that the Little River Estuary was functioning primarily as a salt marsh dominated tidal basin that did not represent potential eelgrass habitat. Natural salt marshes, like the Little River, have extensive emergent vegetated areas and tidal creeks which have virtually complete flushing on each tide. The result is a high assimilative capacity for nitrogen, particularly when compared to shallow coastal embayments. The Little River estuary exhibited low levels of nitrogen enrichment (TN<0.4 mg/L), low to moderate chlorophyll-a concentrations, and rare occurrences of dissolved oxygen depletion. The infaunal communities in the Little River system were found to be consistent with a wetland dominated, organic matter enriched estuarine sediment, with moderate to high numbers of individuals and species and generally moderate to high diversity and evenness. The presence of high quality infaunal habitat is consistent with the generally low total nitrogen and chlorophyll-a levels. The excursions of dissolved oxygen concentrations observed are considered a natural condition typical of salt marshes, and not caused by cultural enrichment. Finally, accumulations of drift macroalgae were not typical of the Little River basin. Based on the above evidence, MassDEP determined that the aquatic life use was supported in the Little River and removed the stressor “Nitrogen, Total” from the proposed 2016 IR.
BBC is requesting that the Little River remain on the 303(d) List of Impaired Waters, in part, due to occasional exceedances of the 0.5 mg/L target total nitrogen threshold established for sentinel station SRT-15 in the Little River by the MEP TMDL analysis. BBC provided monitoring data in support of this comment through MassDEP’s data portal for external data submittals, and these data were reviewed in order to determine whether there was sufficient evidence to overturn MassDEP’s decision to delist MA95-66. MassDEP places more weight on biological response indicators of nitrogen enrichment than on water-column nitrogen concentrations when making aquatic life use-support decisions for coastal waters. Therefore, MassDEP focused on the BBC’s dissolved oxygen and chlorophyll a data collected from 2006 – 2016. The BBC submitted data from four sampling stations in the Little River (see photo below) but MassDEP has concerns about the representativeness of the data from Station SR2, which is a shoreline site and remote from the main flow of the river.
December, 2019 (7) Massachusetts Year 2016 Integrated List of Waters Responses to Comments CN: 470.2
135
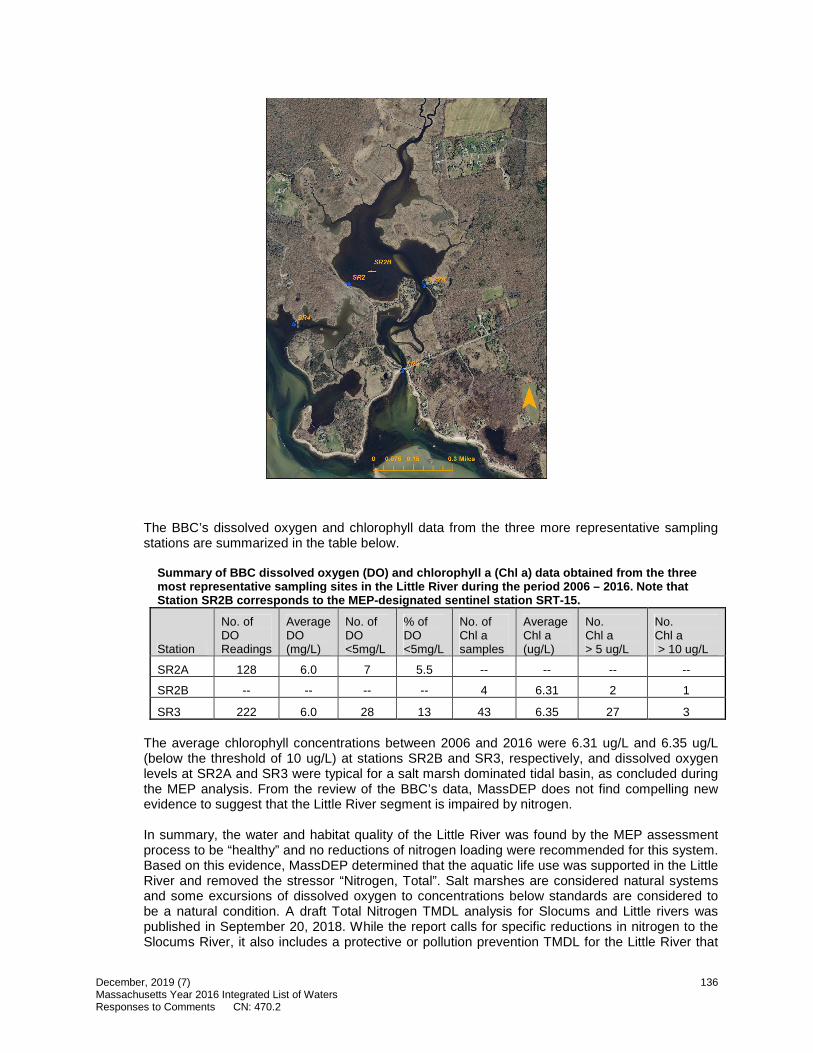
1
' -
-
I I I I I I I I l I I
The BBC’s dissolved oxygen and chlorophyll data from the three more representative sampling stations are summarized in the table below.
Summary of BBC dissolved oxygen (DO) and chlorophyll a (Chl a) data obtained from the three most representative sampling sites in the Little River during the period 2006 – 2016. Note that Station SR2B corresponds to the MEP-designated sentinel station SRT-15.
Station
No. of DO Readings
Average DO (mg/L)
No. of DO <5mg/L
% of DO <5mg/L
No. of Chl a samples
Average Chl a (ug/L)
No. Chl a > 5 ug/L
No. Chl a > 10 ug/L
SR2A 128 6.0 7 5.5 -- -- -- --
SR2B -- -- -- -- 4 6.31 2 1
SR3 222 6.0 28 13 43 6.35 27 3
The average chlorophyll concentrations between 2006 and 2016 were 6.31 ug/L and 6.35 ug/L (below the threshold of 10 ug/L) at stations SR2B and SR3, respectively, and dissolved oxygen levels at SR2A and SR3 were typical for a salt marsh dominated tidal basin, as concluded during the MEP analysis. From the review of the BBC’s data, MassDEP does not find compelling new evidence to suggest that the Little River segment is impaired by nitrogen.
In summary, the water and habitat quality of the Little River was found by the MEP assessment process to be “healthy” and no reductions of nitrogen loading were recommended for this system. Based on this evidence, MassDEP determined that the aquatic life use was supported in the Little River and removed the stressor “Nitrogen, Total”. Salt marshes are considered natural systems and some excursions of dissolved oxygen to concentrations below standards are considered to be a natural condition. A draft Total Nitrogen TMDL analysis for Slocums and Little rivers was published in September 20, 2018. While the report calls for specific reductions in nitrogen to the Slocums River, it also includes a protective or pollution prevention TMDL for the Little River that
December, 2019 (7) Massachusetts Year 2016 Integrated List of Waters Responses to Comments CN: 470.2
136

recommends that nitrogen loadings be maintained as closely as possible to present conditions in order to prevent impairment in the future. The final Slocums and Little Rivers Embayment System Total Maximum Daily Loads for Total Nitrogen report has been submitted to EPA for review and approval.
• Fiddler’s Cove (MA95-79), Rands Harbor (MA95-78) and Wild Harbor (MA95-20). BBC requested that the cause “Nitrogen (Total)” be added to three water bodies that are already on the 303(d) list for nutrient-related impairments. These are Fiddler’s Cove (MA95-79), Rands Harbor (MA95-78) and Wild Harbor (MA95-20). Because there is currently no numerical standard for nitrogen in the Massachusetts Surface Water Quality Standards, MassDEP usually does not include nitrogen concentration as a cause of impairment on the 303(d) List. Instead, the MassDEP relies, for assessment and listing purposes, on a number of indicators that represent biological responses to excessive nutrient enrichment. For example, the cause “Estuarine Bioassessments” is applied in cases where impairment from nutrient enrichment is indicated by the loss of sea grasses (e.g., eelgrass) over time. Furthermore, such nutrient-related “response indicators” as DO depletion and supersaturation, elevated chlorophyll concentrations and noxious algae blooms are all encompassed in the cause code “Nutrient/Eutrophication Biological Indicators”, which, when appearing on the 303(d) List, does imply that a TMDL for nitrogen is needed.
The development of site-specific critical total nitrogen (TN) thresholds for coastal embayments is an essential element of the Massachusetts Estuaries Project (MEP) and on February 13, 2018 EPA approved TMDLs for TN for all three of these embayments, which was long after the release of the 2016 integrated list for public review and comment. The TMDLs establish target nitrogen concentrations that need to be achieved at designated sentinel stations in order to restore water quality and biological condition in the embayments. Model outputs also identify target TN concentrations for additional sites within the assessment unit that would need to be achieved to meet the threshold at the sentinel site. The final TMDL for Fiddler’s Cove and Rands Harbor set target concentrations at 0.50 mg/L TN, while a threshold of 0.35 mg/L TN was established by the Wild Harbor TMDL. Target TN concentrations derived through the TMDL process were compared to BBC TN data to determine the appropriateness of adding “Nitrogen (Total)” as a cause of impairment to each embayment.
While the BBC did not monitor the sentinel station in Fiddler’s Cove, they submitted TN data collected from a site (FC1) for which a target concentration of 0.37 mg/L was established by the TMDL modeling effort. These data are summarized in the following table.
Summary of BBC total ni trogen data collected at Fiddler’s Cove Site FC1 between 2006 and 2016. Exceedances of the target concentration established by the TMDL (0.37 mg/L) are indicated in bold.
Year Count TN Mean TN (mg/L)
2006 4 0.39
2007 4 0.44
2008 4 0.44
2009 4 0.32
2010 4 0.41
2011 4 0.44
2012 4 0.52
2013 2 0.38
2015 3 0.32
2016 4 0.40
Although Fiddler’s Cove was already listed for “Estuarine Bioassessments”, “Nutrient/Eutrophication Biological Indicators” and “Oxygen, Dissolved”, BBC’s data provide
December, 2019 (7) Massachusetts Year 2016 Integrated List of Waters Responses to Comments CN: 470.2
137

evidence that the addition of “Nitrogen, Total” as a cause is also warranted, and this impairment will be added to assessment unit MA95-79 in the final version of the 2016 integrated report.
The BBC sampled Rands Harbor at a station (RH1) near the target sentinel station, as identified by the TMDL project. The target TN concentration to restore benthic habitat at this location is 0.50 mg/L. BBC sampled RH1 thirty-eight times between 2006 and 2016 and reported an average TN value of 0.54 mg/L. This segment was listed for “Estuarine Bioassessments” and “Nutrient/Eutrophication Biological Indicators”. These impairments are all due to nitrogen loading. From a review of the BBC data, the addition of “Nitrogen, Total” as a cause is justified, and this impairment will be added to assessment unit MA95-78 in the final version of the 2016 integrated report.
The BBC sampled Wild Harbor at a station (WH1) that corresponds with the target sentinel station, as identified by the MEP project. The target concentration needed to restore eelgrass at this location is 0.35 mg/L TN. BBC sampled WH1 on forty occasions between 2006 and 2016 and reported an average TN concentration of 0.46 mg/L. This segment was listed for “Estuarine Bioassessments” and “Nutrient/Eutrophication Biological Indicators”. These impairments are all due to nitrogen loading. From a review of the BBC data, the addition of “Nitrogen, Total” as a cause is justified, and this impairment will be added to assessment unit MA95-20 in the final version of the 2016 integrated report.
December, 2019 (7) Massachusetts Year 2016 Integrated List of Waters Responses to Comments CN: 470.2
138

Appendix
Notice of Availability: Proposed Massachusetts Year 2016 Integrated List of Waters
MassDEP has available for public review and comment the Proposed Massachusetts Year 2016 Integrated List of Waters (“Integrated List”), which represents the most recent update on the status of Massachusetts’ waters. This report is submitted to the United States Environmental Protection Agency (EPA) every two years in fulfillment of the reporting requirements of sections 305(b) (Summary of Water Quality Report) and 303(d) (List of Impaired Waters) of the Clean Water Act (CWA).
Section 303(d) of the CWA and the implementing regulations at 40 CFR 130.7 require states to identify those waterbodies that are not expected to meet surface water quality standards after the implementation of technology-based controls and to prioritize and schedule them for the development of a total maximum daily load (TMDL). A TMDL establishes the maximum amount of a pollutant that may be introduced into a waterbody and still ensure attainment and maintenance of water quality standards. The development of the 303(d) List includes a public review and comment process, and the final version of the list must be formally approved by the EPA.
The 2016 “Integrated List” is available for review and comment on MassDEP’s web site at https://www.mass.gov/total-maximum-daily-loads-tmdls. If you do not have access to the Internet, please contact MassDEP at (508) 767-2873.
Written comments on the 2016 “Integrated List” should be submitted no later than October 23, 2017 to:
Arthur S. Johnson MassDEP Division of Watershed Management Watershed Planning Program 8 New Bond Street Worcester, MA 01606 [email protected]
Data submittals in support of comments should be submitted through MassDEP’s on-line data portal in accordance with the guidelines for “External Data Submittals to the Watershed Planning Program” which can be found at:
https://www.mass.gov/guides/external-data-submittals-to-the-watershed-planning-program.
NOTE: For those choosing to submit data in support of their comments to [email protected], please include “Comments on 2016 Integrated List” on the Subject line.
December, 2019 (7) Massachusetts Year 2016 Integrated List of Waters Responses to Comments CN: 470.2
139