Mass Preferences for Compensating Vulnerability in the ...
69
Creating Climate Coalitions: Mass Preferences for Compensating Vulnerability in the World’s Two Largest Democracies * Nikhar Gaikwad † Federica Genovese ‡ Dustin Tingley § This draft: February 21, 2022 Abstract Combating climate change requires large economic adjustments with significant distributional impli- cations. To build coalitions of support, scholars and policymakers propose compensating individuals who will bear decarbonization’s costs. What are the determinants of public opinion regarding climate compensation and investment? We theorize that climate policy vulnerability and climate change vul- nerability induce support for distinct types of climate policy. Fielding original surveys in the United States and India, we show that people who reside in coal-producing regions prefer compensation for lost jobs. The general public privileges diffuse redistribution mechanisms and investments, discounting compensation to targeted groups. Those who are both physically and economically vulnerable have cross-cutting preferences. Nevertheless, there is considerable support across our samples for policies that compensate different coalitions of climate vulnerable citizens, in line with theories of ‘just energy’ transition and embedded liberalism. We trace the distinctive compensatory preferences of fossil fuel communities to a logic of shared community identities. Key Words: climate change, compensation, investment, vulnerability, United States, India, fossil fuels, decarbonization * We thank Garrett Adler, Anustubh Agnihotri, Patrick Bayer, Michael Bechtel, Xun Cao, Ricky Clark, Rohit Chan- dra, Anirvan Chowdhury, Alicia Cooperman, John Ferejohn, Lukas Fesenfeld, Jennifer Hadden, Erum Haider, Robert Keo- hane, Devin Judge-Lord, Maiken Maier, Lisa McKay, Matto Mildenberger, Nicholas Obradovich, Adam Przeworski, Shanker Satyanath, Kenneth Scheve, Anjali Thomas, Resul Umit, Johannes Urpelainen, Jonah Vorspan-Stein, Noah Zucker, the APSR editors and four anonymous reviewers. We also thank participants at the Center for Advanced Study in the Behavioral Sciences’ Comparative Politics of Climate Change Workshop, Stanford University’s Comparative Politics of Environmental Policymaking Workshop, the 2019 Political Economy of Energy Transitions Workshop, the London School of Economics’ International Relations Workshop, the 2019 American Political Science Association Annual Meeting, the 2019 International Political Economy Society conference, the 2020 Global Research in International Political Economy webinar, and the 2021 Environmental Politics and Governance Annual Conference for helpful feedback. Research for this paper, and discussion at several research meetings, was made possible by generous funding from the Balzan Foundation under the terms of a prize awarded in 2017 to Professor Robert O. Keohane and administered by Princeton University and the Center for Advanced Study in the Behavioral Sciences under his supervision. Additionally, Gaikwad thanks the President’s Global Innovation Fund at Columbia University, Genovese thanks the Global Challenges Research Fund at the University of Essex, and Tingley thanks the Weatherhead Center for International Affairs for support. We are especially grateful to Matto Mildenberger for generously sharing some data with us. Darrin Gilkerson, Diana Ding, Christoph Dworschak, Kylan Rutherford, Deepaboli Chatterjee, Jenny Xiao, and Aura Gonzalez provided excellent research assistance. All replication materials can be found in the APSR Dataverse at https://doi.org/10.7910/DVN/PHRNTQ. † Assistant Professor, Department of Political Science, Columbia University, Email: [email protected]. ‡ Associate Professor (Reader), Department of Government, University of Essex, Email: [email protected]. § Professor, Department of Government, Harvard University, Email: [email protected].
-
Upload
khangminh22 -
Category
Documents
-
view
2 -
download
0
Transcript of Mass Preferences for Compensating Vulnerability in the ...

Creating Climate Coalitions: Mass Preferences for Compensating Vulnerabilityin the World’s Two Largest Democracies∗
Nikhar Gaikwad† Federica Genovese‡ Dustin Tingley§
This draft: February 21, 2022Abstract
Combating climate change requires large economic adjustments with significant distributional impli-cations. To build coalitions of support, scholars and policymakers propose compensating individualswho will bear decarbonization’s costs. What are the determinants of public opinion regarding climatecompensation and investment? We theorize that climate policy vulnerability and climate change vul-nerability induce support for distinct types of climate policy. Fielding original surveys in the UnitedStates and India, we show that people who reside in coal-producing regions prefer compensation forlost jobs. The general public privileges diffuse redistribution mechanisms and investments, discountingcompensation to targeted groups. Those who are both physically and economically vulnerable havecross-cutting preferences. Nevertheless, there is considerable support across our samples for policiesthat compensate different coalitions of climate vulnerable citizens, in line with theories of ‘just energy’transition and embedded liberalism. We trace the distinctive compensatory preferences of fossil fuelcommunities to a logic of shared community identities.
Key Words: climate change, compensation, investment, vulnerability, United States,India, fossil fuels, decarbonization
∗We thank Garrett Adler, Anustubh Agnihotri, Patrick Bayer, Michael Bechtel, Xun Cao, Ricky Clark, Rohit Chan-dra, Anirvan Chowdhury, Alicia Cooperman, John Ferejohn, Lukas Fesenfeld, Jennifer Hadden, Erum Haider, Robert Keo-hane, Devin Judge-Lord, Maiken Maier, Lisa McKay, Matto Mildenberger, Nicholas Obradovich, Adam Przeworski, ShankerSatyanath, Kenneth Scheve, Anjali Thomas, Resul Umit, Johannes Urpelainen, Jonah Vorspan-Stein, Noah Zucker, theAPSR editors and four anonymous reviewers. We also thank participants at the Center for Advanced Study in the BehavioralSciences’ Comparative Politics of Climate Change Workshop, Stanford University’s Comparative Politics of EnvironmentalPolicymaking Workshop, the 2019 Political Economy of Energy Transitions Workshop, the London School of Economics’International Relations Workshop, the 2019 American Political Science Association Annual Meeting, the 2019 InternationalPolitical Economy Society conference, the 2020 Global Research in International Political Economy webinar, and the 2021Environmental Politics and Governance Annual Conference for helpful feedback. Research for this paper, and discussion atseveral research meetings, was made possible by generous funding from the Balzan Foundation under the terms of a prizeawarded in 2017 to Professor Robert O. Keohane and administered by Princeton University and the Center for AdvancedStudy in the Behavioral Sciences under his supervision. Additionally, Gaikwad thanks the President’s Global InnovationFund at Columbia University, Genovese thanks the Global Challenges Research Fund at the University of Essex, and Tingleythanks the Weatherhead Center for International Affairs for support. We are especially grateful to Matto Mildenberger forgenerously sharing some data with us. Darrin Gilkerson, Diana Ding, Christoph Dworschak, Kylan Rutherford, DeepaboliChatterjee, Jenny Xiao, and Aura Gonzalez provided excellent research assistance. All replication materials can be found inthe APSR Dataverse at https://doi.org/10.7910/DVN/PHRNTQ.†Assistant Professor, Department of Political Science, Columbia University, Email: [email protected].‡Associate Professor (Reader), Department of Government, University of Essex, Email: [email protected].§Professor, Department of Government, Harvard University, Email: [email protected].

Decarbonization is one of the most pressing and complex challenges facing governments around the
world. It requires international coordination across countries seeking to ratify effective emissions reductions
agreements (Keohane and Victor, 2016). At the same time, it necessitates convincing domestic audiences to
support national policies that will facilitate meaningful reductions in emissions (Bechtel and Scheve, 2013;
Meckling et al., 2015). Because these policies have significant distributional implications, they are poised
to generate vigorous opposition from adversely affected communities (Stokes, 2016; Breetz, Mildenberger
and Stokes, 2018; Jenkins, 2019). To alleviate these ‘carbon transition’ costs for the vulnerable and create
momentum for climate policy cooperation, governments increasingly propose compensation and investment
policies.
While existing work explicates the determinants of support and opposition for climate action (e.g.
Cooper, Kim and Urpelainen, 2018; Bechtel and Scheve, 2013), there is currently a dearth of theory and
evidence to clarify how individuals develop preferences regarding compensation and investment in climate
policy. These policies can include transfers to individuals likely to lose their jobs when carbon-intensive
industries shut down, investments in infrastructure to protect individuals from the deleterious ecological
effects of climate change, investments in green energy technologies, or carbon taxes equally redistributed to
all citizens. Given the key role that compensation plays in legislative action on environmental regulation
(Kono, 2020) as well as in normative debates regarding the ‘just energy’ transition (Carley, Evans and
Konisky, 2018), elucidating how compensatory/investment mechanisms can shift public opposition into
support for climate action is a matter of pressing scholarly and public policy concern.
What forms of compensation and investment are preferred by different coalitions of politically relevant
voters? To the extent that compensatory mechanisms and investment choices activate policy buy-in from
‘climate losers,’ answers to these questions shed light on the linkages between different types of vulnerability,
forms and targets of compensation policy, and climate action support among pivotal electoral coalitions in
democracies seeking to implement meaningful emissions reductions.
This paper provides a theoretical framework and a series of novel empirical tests to explain the de-
terminants of individual preferences for compensation and investments related to climate change policy.
1

Individuals may be sensitive to the material costs of addressing climate change, which we term their policy
vulnerability. We focus on employment-related costs associated with the implementation of decarbonization
policies (Meckling, 2011; Genovese, 2019). We expect regions with many voters linked to policy-vulnerable
sectors to be supportive of policies that compensate fossil fuel workers at risk.
We conjecture that climate change vulnerability crosscuts policy vulnerability when individuals suscep-
tible to employment-related costs also face physical threats from climate change, which have been shown
to drive climate preferences (Brody et al., 2007; Egan and Mullin, 2012). We expect cross-pressured groups
to support more mixed types of compensation compared to policy-vulnerable groups in regions less affected
by climate change. These communities are predicted to value more investments in adaptation.
We test these theoretical predictions with new survey data from the United States and India, the
world’s two largest democracies and major emitters of greenhouse gases. We first implemented nationally-
representative surveys to benchmark preferences. Then, for each country we conducted the same surveys in
targeted samples of citizens residing in fossil fuel-producing regions that are either physically vulnerable, and
thus cross-pressured, or less physically vulnerable. Our respondents were asked to allocate the revenue raised
from increased costs associated with cleaner energy to different forms of compensation and investments.
By examining how voters prefer to spend proceeds from costs imposed on carbon emissions, we place a
lens squarely on the distributional politics of climate policy (Aklin and Mildenberger, 2020; Bayer and
Urpelainen, 2016; Colgan, Green and Hale, 2021; Bergquist, Mildenberger and Stokes, 2020).
People in regions exposed to fossil fuel jobs but who are not particularly physically vulnerable (e.g.,
‘coal country’) prefer policies that direct resources to those who are economically vulnerable to climate
policy. These groups of voters have less appetite for broad-based instruments such as investments in green
technologies or payouts of carbon tax funds to all citizens. Individuals in cross-pressured regions mix in
adaptation spending at higher rates, indicating that physical climate change vulnerability crosscuts policy
vulnerability. The general population, by contrast, prefers less targeted investments in green technolo-
gies and broad-based redistribution. Nevertheless, the average voter in both the US and India is willing
to allocate meaningful funds for transfers to fossil fuel workers and for infrastructural investments in cli-
2

mate vulnerable communities, indicating considerable space for ‘just energy’ policies that compensate the
vulnerable.
We then focus on how compensatory transfers to the policy-vulnerable can be directed either at indi-
vidual fossil fuel workers poised to lose jobs or at broader communities (in the trade context, see Rickard
2020; Broz, Frieden and Weymouth 2021). We theorize and find that fossil fuel communities more of-
ten prefer community-oriented compensatory mechanisms to individual transfers than the general public.
This is because fossil fuel communities such as coal country tend to be geographically concentrated, occu-
pationally specialized, racially/ethnically homogeneous, and intergenerationally dependent on the carbon
economy. Drawing on theories of social identity (e.g., Shayo, 2009), we argue that perceived similarities be-
tween individuals in coal-producing regions create strong group-based affiliations, in turn influencing policy
preferences regarding the disposition of compensation. By contrast, the general public pays relatively less
attention to community issues.
Taken together, our findings underline how both the content of compensatory policies and the mecha-
nisms by which they target households and communities can impact popular support for climate action in
emissions-rich democracies. Our approach is the first to our knowledge to focus attention on the compen-
satory preferences of critical groups that lie at the center of climate policy decisions yet remain understudied
in public opinion work. Analysis of these preferences elucidates how governments can build coalitions of
support for decarbonization in large, heterogeneous societies. Our framework and results will be of interest
to those designing climate policies, and to those interested in the distributional politics of public policy
more generally.
1 Vulnerability and Compensation Preferences
Compensation is a mechanism for allocating resources to the losing parties of a redistributive economic
policy. As a burden-sharing tool, its distinctiveness stems from its goal to redress past or future costs.
Compensation can have important feedback effects on support for public policy for it can foster belief
in the government’s credibility in protecting vulnerable individuals and communities (Autor et al., 2014;
3

Ruggie, 1982). At the same time, compensation may fail to achieve policy goals if it is not judiciously
calibrated or implemented (Jenkins, 2019). How the public views compensation is critical for successful
policy enactment and compliance.
For our theoretical framework, the issue area of climate change is instructive because the politics of
emissions mitigation and climate adaptation are deeply rooted in distributive conflicts. ‘Climate losers’
constitute a compelling group with strong material and normative claims. Their demand for redress is
likely a condition for supporting credible policy (Bechtel and Scheve, 2013).1
1.1 Forms of Compensation and Investment in Climate Policy
We first outline a range of policy instruments that provide compensation to either select groups or to broad
sections of society. These policy instruments correspond to the main tools that policymakers and scholars
have proposed in climate debates across the world (see Appendix B for an extensive discussion of policy
debates regarding these instruments in the US and India, and the conclusion for discussion of other tools).
First, climate change action implies costly mitigation, bearing particularly on regions where socio-
economic activities contribute disproportionately to greenhouse gases, such as those with fossil fuel-producing
industries. Given the direct impact of decarbonization on job losses and household incomes in these in-
dustries, governments may choose to address vulnerability by providing direct fiscal transfers to affected
workers.2 More generally, directed transfers could provide spillover benefits to non-displaced individuals in
these geographically concentrated areas.
Second, climate change disrupts the livelihoods of those who are exposed to events such as floods,
droughts, hurricanes, and wildfires—creating existential threats to entire communities. Adaptation-related
costs could be addressed by protective infrastructural investments. These can materialize, for example, as
seawalls in low-lying coastal communities made by governments to protect exposed communities from the
adverse effects of climate change (Barbier, 2014). While some individuals in these regions may be able to1Parallel political economy research is largely understood in the context of individual attitudes towards taxation, economic
inequality, and trade adjustment (e.g. Margalit, 2011; Autor et al., 2014).2Based on surveys we fielded in 2016 and 2017, providing compensation to workers that lose jobs due to climate regulations
has broad bipartisan support among American voters. Details are reported in Appendix A.
4

afford building their own protections, vulnerable communities as a whole stand to benefit from higher levels
of adaptation spending.
While the policy levers discussed above concentrate compensation in the hands of a few, governments
may wish to also design compensatory instruments that spread benefits across broader sections of society.
Investments in clean energy and green technologies are redistributive to the extent that they contribute
both to carbon mitigation and economic revitalization in the form of new jobs and the accompanying local
economic growth that follows (Jenkins, 2019). However, it is also a more diffused mechanism, as green
energy infrastructure can be built in many places and the generation and distribution of renewable energy
often spills over beyond the specific locales where infrastructure resides, therefore creating a collective good
for the mass public (Bayer and Urpelainen, 2016).
Finally, rebates for all citizens who directly or indirectly contribute to carbon taxes may also be consid-
ered an equitable and credible instrument of redress that immediately compensates large sections of society
for the costs incurred in support of decarbonization efforts (Jagers, Martinsson and Matti, 2019). This last
instrument is much more diffuse in nature.3
1.2 Types of Vulnerability and Compensation Preferences
Support for these policies depends both on the type and degree of vulnerability experienced by targeted
groups and on how vulnerability is perceived by affected communities and society at large. Here we
investigate two dimensions of vulnerability and, therefore, two different sources of individuals’ preferences
related to the compensatory/investment mechanisms introduced above.
First, we consider policy vulnerability, which affects individuals whose economic well-being (notably
their wages and employment) depend on carbon-intensive industries. Our focus on these concerns stems
from prior work that highlights policy vulnerability as a catalyst of public opposition to climate cooperation
(Meckling et al., 2015; Carley, Evans and Konisky, 2018; Bechtel, Genovese and Scheve, 2019; Bergquist,3Another distinction between these policies is that some entail ex ante efforts to cut emissions while others involve ex post
efforts to manage climate change consequences—and some may address both goals simultaneously (e.g., green energy). Thisdistinction could also inform how individuals evaluate these policies.
5

Mildenberger and Stokes, 2020; Bayer and Genovese, 2020; Kono, 2020). Second, we consider physical
climate change vulnerability. The scholarship on public behavior has underlined this type of concern as an
important source of political activism (Egan and Mullin, 2012).
What preferences for compensatory climate policy does each form of vulnerability generate? We now
theorize the determinants of preferences for individuals residing in regions with different exposures to
vulnerabilities. We begin by focusing solely on policy vulnerability and then consider whether policy
vulnerability can be moderated by physical climate change vulnerability, and therefore if being exposed
to both risks changes preferences. We also discuss the setting where individuals and communities face
less policy vulnerability and climate change vulnerability. Finally we briefly examine the case where they
encounter only climate change vulnerability.
Policy Threatened but Not Climate Change Threatened We first consider those who are exposed
to the costs of carbon policy but who do not face immediate physical threats from climate change. This
group includes people pressured by the anxiety of losing jobs, wages, or welfare were the government to pass
stringent climate action legislation. Conceptually, two types of individuals may be affiliated with the fossil
fuel industry: those directly employed in jobs that contribute to fossil fuel production and those dependent
on the industry’s affiliated sectors. This form of vulnerability can be existential (Colgan, Green and Hale,
2021), involving substantial dislocation and the potential destruction of one’s community and way of life.4
In line with research that identifies a powerful effect of employment-based concerns in climate politics
(Meckling et al., 2015; Bechtel, Genovese and Scheve, 2019; Bergquist, Mildenberger and Stokes, 2020), we
predict that these individuals (both those directly and indirectly employed in fossil fuel jobs) are most eager
to integrate employment-based compensation in climate policy. Consequently, individuals in employment-
vulnerable environments should be most supportive of compensatory payments that offset potential wage
or job losses. We conjecture that these individuals will prefer instruments that compensate material losses
more than other groups. Therefore, we expect these individuals to support policies that emphasize trans-4While these individuals are less threatened by the physical effects of climate change, they of course may face other physical
stresses due to the local externalities of pollution from fossil fuel extraction. We return to this consideration in the conclusion.
6

fers to affected households and communities over other investments (such as, for example, investments in
adaptation infrastructure, green technologies, or tax rebates).
Policy Threatened and Climate Change Threatened We next consider individuals who are exposed
to the costs of carbon policy and who face clear and immediate physical threats from climate change. We
classify this group as ‘cross-pressured’ (Sprinz and Vaahtoranta, 1994). Cross-pressured individuals may
be inclined to support both transfers to affected individuals as well as more adaptation-oriented measures
(e.g., infrastructural investments), since each compensatory instrument addresses a distinct category of
vulnerability. We note that cross-cutting pressures may result in mixed preferences but may also be over-
whelmingly driven by one pressure rather than by the other pressure. For example, individuals may weigh
the probability of damage if no action is taken (e.g., odds that climate change will affect one’s livelihood)
against the cost of damage if action is taken (e.g., losing one’s job if climate policy is enacted) differently,
and form their preferences accordingly. Overall, we expect those exposed to high costs on both dimensions
to express support for policies that entail a mix of instruments, such as a combination of payments to off-
set workers’ costs stemming from climate mitigation policy as well as infrastructural investments designed
to offset the environmental costs of climate change. We predict that adaptation infrastructure spending
among these individuals will be higher than for those who are not climate change vulnerable, but support
for targeted compensation will be lower than in the policy-threatened only group.
Neither Policy Threatened Nor Climate Change Threatened As a benchmark, we consider in-
dividuals who are neither policy vulnerable nor physically climate change vulnerable—in other words, the
general public. We expect both the economic and physical dimensions of climate change to be less salient
for these individuals than for the other two groups. Consequently, we expect these individuals to be less
supportive of climate-related compensation in the form of transfers to vulnerable workers or investments
in adaptation infrastructure. Instead, these individuals are predicted to favor more spatially diffused allo-
cations of compensation, i.e. spending on projects that would benefit their collective interests, rather than
allocations that compensate specific material losses. We expect that individuals in the general public will
7

on average support policies that emphasize investments in green technologies or the equal redistribution of
public funds to tax-payers at higher levels than compensatory schemes targeted at specific groups.
Climate Change Threatened but Not Climate Policy Threatened Finally, there is a fourth cate-
gory of individuals—those who are only climate change vulnerable. Individuals in these regions are predicted
to weigh adaptation spending more than the other groups. This is because policies that build protective
infrastructure will safeguard homes and assets threatened by the physical effects of climate change. We
conjecture that individuals in communities facing high climate change vulnerability and no climate policy
vulnerability will support climate policies that protect against material losses from climate change to a
greater degree than in the other samples. We devote less attention to this group due to our focus on policy
vulnerability and its moderation by physical climate vulnerability, besides space constraints. However, in
the results section, we briefly discuss some findings for this important population from a US-based sample
(see Appendix H).5
Individual versus Community Impacts In the preceding discussion we explain how these vulnerabil-
ities impact individuals and the communities in which they live. Ultimately, individuals living in regions
with a high degree of vulnerability can be more or less vulnerable compared to others. For example, wealthy
individuals in climate vulnerable regions can build their own adaptation infrastructure or even purchase
costlier (and more protective) insurance policies. However, climate vulnerabilities can also produce broader
effects that are harder to insulate against. For example, damage to others in the area can produce nega-
tive externalities or broader infrastructural damage that is difficult to avoid or at least harder to engineer
around. Negative policy effects can similarly deteriorate the broader social community. Jobs and social
institutions outside of the policy impacted sectors can erode, as can broader social ties and a sense of col-
lective identity. Community-level effects can be stark; in the context of international trade, the knock-on
consequences of sector-specific job losses for broader communities range from high rates of opioid abuse,
mental illness, and suicide to support for populist politicians (Rickard, 2020; Broz, Frieden and Weymouth,5We note that climate change vulnerability may have both objective and subjective dimensions, and that ongoing research,
building off earlier work on solution aversion (e.g., Campbell and Kay, 2014), points to a potential disconnect betweenself-reported and objective climate concerns. We explore subjective measures of climate change vulnerability in Appendix G.
8

2021). Section 4 thus engages with community-level considerations directly.6
Furthermore, we do not argue that individuals who are not impacted by policy or climate change will
oppose transfers or infrastructure investments. A core philosophical principle in the concept of ‘just energy’
transition is that citizens should pay attention to norms of equity and fairness when adjudicating support
for climate policies, and should be willing to incur personal material costs in order to compensate other
groups that are perceived to be harmed by climate change or policy (e.g., Newell and Mulvaney, 2013;
Bhushan, Banerjee and Agarwal, 2020). Such other-regarding preferences play a powerful role in many
areas of politics (Mansbridge, 1990) and undergird theories of embedded liberalism (Ruggie, 1982). Our
argument is simply that less vulnerable individuals and communities will be less favorable of targeted forms
of compensation/investment.
Our empirical design discussed below does three things: (1) we carefully sample individuals living in
regions exposed and not exposed to these theoretically-informed vulnerabilities (for use of a similar targeting
strategy, see Malhotra, Margalit and Mo 2013); (2) we collect individual-level covariates such that we can
control for differences in attributes like resources; and (3) we investigate preferences for community- rather
than individual-level investments in the case of policy vulnerability in Section 4.
2 Research Design and Sampling Strategy
To test the predictions outlined above, we collected new survey data from voting-age citizens in the US
and India in 2019 and 2020. We selected these two countries for both substantive and methodological
reasons. The importance of the US to global decarbonization efforts is widely acknowledged in the climate
politics literature, and we chose this country to situate our analysis with other studies of climate policy and
public opinion (e.g. Bechtel and Scheve, 2013). India is the world’s most populous democracy, third largest
emitter of greenhouse gases, and an influential country in global climate negotiations (Dubash, 2012). It is
also highly vulnerable to climate change. As the country undergoes rapid industrialization, addressing the6Beyond individual-level factors like income that might insulate individuals from certain vulnerabilities, there are other
theoretically interesting covariates like trust in government that may or may not modulate preferences over policy tools(Hetherington, 2018; Peyton, 2020). We return to this possibility in the conclusion.
9

physical and economic downsides of climate inaction has become a pressing task, yet one that is politically
fraught (Urpelainen and Pelz, 2020; Gaikwad, Nellis and Wilkinson, 2021).
Methodologically, our research design allows us to interrogate the theoretical determinants of preferences
on climate policy across a set of distinct regions within each country. We further leverage the paired
two-country comparison to study whether coalitions of voters in theoretically similar regions in two very
different cases have congruent preferences regarding distributive climate policy. While the US and India are
democracies—serving as important cases for the study of voter preferences—they have markedly varying
social, economic, cultural, and political milieus.7 This allows us to make a controlled comparison, ruling
out the role of country-specific factors in shaping policy preferences that are similar across the two cases.
In what follows we describe how we identified each of the three politically relevant groups theorized
above in both countries. We then illustrate the questions asked to measure respondents’ compensation
choices and analyze the extent to which preferences vary across the samples.8
2.1 United States Sampling Strategy
In the US, we focused on the following samples: First, to capture the preferences of the average voter who
is less exposed to policy and climate vulnerability, we fielded the survey on a nationally representative
(“General Population”) sample. Our second sample included individuals from coal country communities
(“Coal Country”), which are US regions populated by a relative high density of individuals with little
physical vulnerability to climate change but high risks of job and wage losses due to climate policy (measured
as per capita fossil fuel employment). Third, we concentrated on a sample of coastal fossil fuel communities
with objective physical vulnerability to climate change due to their proximity to the coast as well as risk
of job losses related to climate policy due to their reliance on the fossil fuel industry (“Cross-Pressured”).
Our General Population sample was fielded in two waves by the survey firm Lucid. Setting aside
participants with particularly high response speeds, this sample includes 3,702 American adults. The7Apart from levels of economic development, the two countries differ in terms of their types of climate vulnerability and
in terms of the socio-economic characteristics of the sub-national regions within the two jurisdictions, among other factors.8A statement on research ethics is provided in Appendix C. We thank Stanford University and the Center for Advanced
Study in the Behavioral Sciences for hosting research workshops to give feedback on the theoretical hypotheses and researchdesign used in this paper prior to data collection.
10

Cross-Pressured survey and the Coal Country survey were fielded by Qualtrics, and include 1,428 and 516
individuals each, respectively. The identification of the counties to be included in the Cross-Pressured
and Coal Country samples was done using zip-code level measures of fossil fuel employment from the
U.S. Bureau of Economic Analysis. For the Cross-Pressured sample, our sampling strategy identified
communities mostly in the coastal south (mainly Louisiana and Texas) and Alaska. For the Coal Country
sample, the communities represented in our sample come for the most part from West Virginia, Virginia,
Kentucky, Wyoming, and Pennsylvania. Polling the two targeted samples required intensive resources,
and our sample sizes reflect the maximum number of respondents surveyors could reach in each region.
Appendix D visualizes this geographic distribution and provides descriptive statistics.
The samples reflect expected patterns in terms of vulnerability to policy costs and concerns about
physical climate change risks. In the General Population sample, 7% of respondents identify themselves or
someone in their families as employed in the fossil fuel industry. This is realistic given that the U.S. Depart-
ment of Energy calculated that traditional energy sectors employed approximately 6.4 million Americans in
2017. By contrast, in the Cross-Pressured and Coal Country samples, 29% and 38%, respectively, identify
themselves or someone in their household as employed in the fossil fuel industry. Our coastal samples also
reported higher levels of flood insurance ownership or desire for such insurance.
Our targeted sampling strategy enabled us to reach individuals in communities that are absent from
other surveys that focus on national representativeness. For example, in Bergquist, Mildenberger and Stokes
(2020), only one respondent came from one of the US counties we targeted in our coal country and coastal
fossil fuel samples. In a US nationally representative follow-up sample that we discuss below, we found no
overlap.
2.2 India Sampling Strategy
Our samples in India parallel those chosen in the US, with some additions. Our nationally representative
(“General Population”) survey was fielded using telephone-based interviewing techniques (n = 2,102).
The survey relied on the population-wide database of all landline and mobile phones; automated predictive
11

dialers selected numbers randomly from all Indian telecom circles and digital exchanges.9 Next, analogous to
our US strategy, we sampled respondents vulnerable to economic policies poised to threaten coal production.
The India coal communities (“Coal Country”) sample (n = 1,556) combines (a) a representative sample of
706 individuals residing in 39 districts (from nine states) that have the highest reported rates of coal mining
employment with (b) a sample of 850 coal miners from three of those states. In India’s Coal Country sample,
62% of respondents are employed or have a member in their household employed in the coal industry.
To construct a cross-pressured sample, we collected data from two groups. The first, a coal mines cross-
pressured sample, identified four districts (n = 735) containing at least one coal mine and which ranked
high on a country-wide index of climate vulnerability.10 The second, a coal plants cross-pressured sample,
represents 25 districts containing at least one operating coal plant and ranking high in exposure to climate
vulnerability (n = 838).11 Our policy and climate change vulnerable (“Cross-Pressured”) sample combines
these two groups (n = 1,573).12 In the Cross-Pressured sample, 10% of respondents report being employed
in the fossil fuel industry. For all mentioned samples except for the targeted coal miners, respondents were
polled proportionately to the population size of districts. Appendix D visualizes this geographic distribution
and provides descriptive statistics for standard demographics. Additionally, Appendix E provides extensive
details regarding our India sampling strategy, which created to our knowledge the most comprehensive
samples to date of climate policy and climate change vulnerable groups across the country.
9The survey was offered in Hindi, Punjabi, Gujarati, Marathi, Kannada, Malayalam, Tamil, Telugu, Odiya, Bangla, andAsamiya.
10We identified districts containing coal mines based on the Government of India’s 2015 publication, “Statistics of Mines inIndia,” which provides a comprehensive listing of all coal mines in the country. Climate vulnerability was ascertained usingthe Central Research Institute for Dryland Agriculture’s “Atlas on Vulnerability of Indian Agriculture to Climate Change,”which ranks each district in India based on climate vulnerability.
11To identify coal plants, we relied on the Global Coal Plant Tracker database, which contains information on the universe ofcoal plants that are located in India. The locations of coal plants in the Global Coal Plant Tracker database were webscrapedand assigned latitude and longitude information. For this step in the research, we are grateful to Johannes Urpelainen, RickyClark, and Noah Zucker.
12In what follows, we present results for the combined Cross-Pressured sample, but similar findings obtain when we analyzethe Coal Mines Cross-Pressured and the Coal Plants Cross-Pressured separately.
12

3 Preferences for Allocation of Compensation
We first focus on individual preferences for the allocation of public funds raised from higher fossil fuel prices
to different compensatory mechanisms. After collecting pre-treatment demographic indicators, climate
science beliefs and subjective measures of climate change concern, we introduced respondents to a series of
climate policies aimed at curbing the use of fossil fuels. These policies would raise the cost of fossil fuels,
leading to higher energy costs (i.e., the equivalent of a carbon tax) for all citizens. In turn, these policies
would be predicted to lead to job or wage losses in the fossil fuel sectors.
Importantly, the proposed policies would also include government allocation of the raised funds toward
compensatory ends. Respondents were asked to allocate raised funds to four goals: (1) transfers to workers
in fossil fuel industries who stand to lose jobs due to climate policy, (2) infrastructural investments to protect
individuals whose homes and properties will be harmed by climate change, (3) spending on the development
of green energy sources, and finally (4) an even distribution of funds to all taxpayers. These categories
reflect the theoretically informed range of instruments available to policymakers and cover options that
surfaced as priority policies in a pilot study as well in contemporary policy discussions (see Appendix B for
an overview of these policy discussions in the US and India).
We gave respondents three different scenarios that altered the cost per household associated with the
policy: $16, $64, or $256 per month for the US and |140, |560, |2,240 for India.13 The costs represented
0.5, 1.5, and 2.5 percent of the per capita GDP of each country, representing the range of values that
scholars have argued countries would need to contribute to meaningful climate mitigation efforts (Bechtel
and Scheve, 2013). We randomized the order of the costs for each respondent.14 After each scenario, we
asked respondents what percentage of the money raised should be spent on each compensation option listed
above (with allocations summing to 100), as shown in Figure 1.13We intentionally presented these values as increased energy costs rather than taxes, given the well-documented opposition
to tax increases in the US and given the reliance on sales and value added taxes in India. We included different costs toexplore if the allocation choices between the studied samples would diverge more as costs increase. As shown in Appendix F,we uncovered few qualitative differences in allocation choices across the different cost levels; exceptions are noted below.
14For our India coal miners sample, each respondent saw all three prices and answered separately to each. For the otherIndia samples, each respondent was randomly assigned to consider one of the three prices.
13

Our outcome measure lets us understand how respondents would prioritize spending. Note that this
measure does not directly tap unilateral support for policies or bundles of them (e.g., Bergquist, Milden-
berger and Stokes, 2020). However, our results do not change when we asked individuals in a follow-up
question to choose a level of spending that they would support, and then allocated these funds across the
four categories (see below and Appendix J).
Figure 1: Proposed policies and allocations. This figure shows the English version of the exercise presentedto respondents (the $ and | values were randomized).
14

3.1 Allocation of Funds and Choice of Climate Compensation
The allocations exercise returns a rich set of findings. We discuss each country separately and in comparative
focus. Figure 2 shows the results in the US for the middle ($64) energy cost level scenario. The results are
largely similar to the allocations chosen at the other two cost levels; differences are noted below. Preferences
are reported for each of our three samples of theoretical interest. Horizontal lines represent the average
percentage contribution (mean with 95% confidence interval) across contribution categories.
General Population
Cross−Pressured
Coal Country
20 30Average Allocations
Allocation Type
Climate Vulnerable Infrastructure
Compensation to Coal/Oil Workers
Equal Rebates for all Citizens
Investments in Green Energy
cost=$64
Figure 2: US preferences for allocation purposes of climate policy funds, by sample. This figure denoteshow respondents in our three samples allocated funds raised. Symbols represent average allocation andlines represent 95% confidence intervals.
Examining the General Population sample, we find that the average American is most in favor of green
investments (34%), followed by an equal rebate to taxpayers (29%).15 These results are consistent with
our argument that the average voter in the general population, who is not particularly vulnerable to either
climate change or climate policy adjustments, is the least interested in targeted forms of compensation such
as transfers and adaptation investments. Instead, she allocates more to compensatory options that benefit
broad sections of society.
The Coal Country sample comprises individuals who are exposed only to the economic risks of climate
policy. In contrast to the general population, these voters are decidedly in favor of direct transfers to
workers whose employment is threatened by climate policy, allocating 35% of funds (significantly larger15At the highest policy cost ($256), the preferred top choices flip, and respondents allocate more to equal taxpayer rebates
than to renewable energy investments (see Appendix F).
15

than the 22% allocated by the General Population) to transfers. This preference for direct fiscal transfers
to policy-vulnerable individuals is evident even at the highest carbon tax level ($256). Coal Country is the
only sample that consistently allocates more money to direct transfers than to other options.
The Cross-Pressured sample supported the highest level of adaptation spending across the three groups,
although these investments feature as the sample’s least favored option. Overall, this group’s rankings
mirror those of the general population, yet the rankings also evidence much more of a mixture compared
to the other groups, with, for example, higher levels of support for fossil fuel worker compensation than
the general public.16 Cross-Pressured respondents are more evenly split among the different compensatory
mechanisms proposed in the survey. This suggests that the Cross-Pressured group heeds concerns stemming
from both policy and physical vulnerability while formulating compensation preferences.
Figure 3 presents results from India.17 Strikingly, India’s General Population sample ranks green in-
vestments first, selecting an allocation of funds—34%—that is identical to the proportion allocated in the
US. This preference persists at the highest tax level (|2,240). The general public in the world’s two largest
democracies converge in prioritizing green technology investments as their top target of compensation.
●
●
●
General Population
Cross−Pressured
Coal Country
15 20 25 30 35Average Allocations
Allocation Type
●
Climate Vulnerable Infrastructure
Compensation to Coal/Oil Workers
Equal Rebates for all Citizens
Investments in Green Energy
cost=560 Rupees
Figure 3: India preferences for allocation purposes of climate policy funds, by sample. This figure denoteshow respondents in our three samples allocated funds raised. Symbols represent average allocation andlines represent 95% confidence intervals
Unlike in the US, however, the average Indian does not prefer equal rebates to taxpayers, and in fact16The aversion to adaptation infrastructure spending in all US groups may reflect voters’ preferences for policies in which
compensation generates material gains in the short run rather than prevent material losses in the long run.17Differences in cost levels have little impact; responses are even more stable in India than in the US. Because of this
consistency, we present only the middle (|560) energy cost responses; Appendix F reports results for the other cost levels.
16

ranks this policy last. A similar aversion to equal taxpayer rebates emerges in all of the India samples.
The fall in support for equal rebates matches rising approval for investments in adaptation infrastructure,
which are preferred at the same level as transfers in the General Population sample.
Respondents in India’s Coal Country sample revealed policy preferences that mirror those uncovered
in the US Coal Country sample. They ranked fiscal transfers to coal workers first, with an allocation
(32%) that approximates the proportion estimated in the US coal sample. This parallel finding across
the two countries corroborates the congruent desire for compensation to which climate policy vulnerable
communities feel entitled.
India’s Cross-Pressured sample largely mirrors the General Population sample. One potential explana-
tion for this convergence is that, in contrast to the US, the average voter in India is simply more concerned
about climate vulnerability, bringing General Population preferences closer to those of the Cross-Pressured
group. This could occur if among individuals who are not currently exposed to climate change, those in
poorer countries are more concerned about future climate change vulnerability given their lack of access to
protective mechanisms. Consistent with this explanation, we find both that physical climate change vul-
nerability is higher in India than in the US and that the General Population and Cross-Pressured samples
are less differentiated in India than in the US (see Appendix D).
Why do preferences for equal rebates and infrastructure investments reverse across India and the US?
Existing research predicts that individuals in poorer countries have less individual capacity to adapt and may
be less willing to sacrifice economic growth for mitigation (Greenstone and Jack, 2015). This may explain
why our India samples evidence high levels of support for adaptation infrastructure. The de-prioritization
of equal rebates in India may stem from the lower rates of tax payments among the citizenry and from
lack of faith in the execution of redistribution in India.18 We view these interpretations as suggestive,
since additional socio-economic differences across the sub-national regions in the two jurisdictions could
also impact observed differences across the US and India.18India has been described as a ‘patronage democracy,’ where many aspects of government-supplied benefits including jobs,
financial assistance, and public goods are distributed along ethnic lines (Chandra, 2004). Thus, even if redistribution wereappealing, respondents may deem the idea impractical or prone to clientelistic interference.
17

In both countries, the General Population and the Coal Country samples are the groups with the most
divergent preferences. The average voter in both countries evidences high levels of support for broad-based
compensatory mechanisms that will benefit society as a whole. By contrast, the coal samples’ consistently
top choices are targeted transfers to compensate workers economically harmed by decarbonization policy.
At the same time, our results give credence to the claim that voters’ allocation choices are motivated by
factors other than self-interest. In particular, we note the considerable baseline support in the General
Population surveys for transfers to vulnerable workers, both in the US (21%) and in India (26%). This
support is in line with theories of embedded liberalism, which predict a societal contract whereby voters
agree to compensate domestic losers of redistributive international economic policies (e.g., Ruggie, 1982),
and with philosophical principles of equity and fairness that are central to contemporary climate-related
debates on the ‘just energy’ transition (e.g., Newell and Mulvaney, 2013; Bhushan, Banerjee and Agarwal,
2020). This is an important finding, because material self-interest would indicate sharp distributive conflict
across societal groups. Our results shed light on how conflict is not the necessary outcome, and how
considerable space for cooperation exists across groups that have diverging economic interests.
Individual-Level Covariates The preceding analyses exclude individual-level information about our
respondents. This might be important because our samples differ somewhat along other variables that could
predict allocation preferences, like ideology (see Appendix D). Do the sample contrasts within each country
persist when we include these controls? Appendix G presents regression results where we include covariates
like income, ideology, individual subjective concern about climate change, and fossil fuel employment. The
sample differences are consistent with the preceding discussion.
Individual-level covariates produce interesting results as well. Individuals reporting less subjective
concern for climate change, for example, report less support for climate adaptation spending. Self-reported
fossil fuel employment is positively correlated with support for direct transfers to workers.
Climate Vulnerable Only The preceding results left out the case of individuals living in regions that
are especially climate vulnerable but have less specific policy vulnerability. To probe this case, we ran an
18

additional study in the US where we more precisely targeted individuals living in coastal flood zones and
compared them to those living in adjacent areas that are not in a flood zone. The results, presented in
Appendix H, show that these especially vulnerable individuals rank climate adaptation spending higher
than the other three samples reported above, and at greater levels compared to this additional sample’s
adjacent group.
Relationship to Actual Support for Climate Policy As discussed above, some previous research
has shown that the precise composition of climate policy can have an impact on support for costly climate
policies (Bergquist, Mildenberger and Stokes, 2020). Our analyses only examined how voters would design
climate policy; we did not examine actual climate policy support, which represents a different research
question. However, to speak to this issue we did several things. First, we subsequently asked respondents
to pick an amount they would be willing to pay in higher energy costs, and then among those reporting
something greater than zero, we elicited preferences for allocation of funds. Appendix J reports the results;
the core takeaway is that the vast majority of our samples were willing to pay some amount of money and
their allocation choices strongly correlated with the allocation choices that they originally reported.
Second, we ran a separate nationally representative survey in the US, where we probed respondents about
their own willingness to pay $64 in average monthly household costs for one of the four randomly assigned
allocation policies (see Appendix I). The main result was in line with the rankings from our allocation
exercise: green investments are the most supported policy lever, followed by equal rebates, transfers, and
infrastructure investments. These findings are informative as they point to differences in absolute levels of
support for the policies that mirror the allocation exercise.
Third, focusing on the US, we retrieved the data from Bergquist, Mildenberger and Stokes (2020) and
investigated whether having a policy dimension that included funds to retrain fossil fuel workers received
greater climate policy support among individuals living in states with high fossil fuel production. We found
that this was true for the main coal-producing states of West Virginia, Wyoming, and Kentucky, as well as
Louisiana and Alaska. We did not find this result for Texas. The results of this reanalysis are included in
the replication materials uploaded to the Dataverse.
19

3.2 Open-Ended Responses
Our results show clear differences among climate policy designs that deserve further analysis. In order to
explore the rationales behind the policy choices highlighted above, we leverage open-ended responses that
were shared by our participants to explain their preferred policy instrument. We then hand-coded and
systematically explored the themes that emerge in these responses in a number of ways that are reported
in Appendix K. An interesting theme, which we develop next in Section 4, relates to the importance of
community and shared identities.
Our coding shows that—in both the US and India—the open-ended responses are substantially more
community-oriented in Coal Country than in the other samples (see Appendix K.1). In the US, 32% of
Coal Country respondents justified their policy choice by referencing themes that evoked prior generations,
families, schools, local shops, or regional community identities. Community themes emerged in 9% of the
Cross-Pressured sample responses. The General Population respondents were the least likely—at only 4%
of the sample—to refer to community as an object that justified their choices. Qualitatively similar results
obtain in India. Additionally, group-centered justifications for policy options in Coal Country were not
exclusive to the choice of compensatory transfers: community themes also emerged among the respondents
that chose adaptation infrastructure investments (see Appendix K.2).
In the words of a US respondent:
“In the area I live we are coal mining country. I have seen people have to leave, lose their homes,divorce, and have horrible repercussions because of the loss of coal mining jobs left in the area. Inturn, I have seen once thriving family men lose everything and become addicts to cope. We are also inthe lead for the opioid epidemic. Eastern Kentucky needs help. We need more job options and trainingto replace the only thriving industry we once had. It was ingrained into our culture to become coalminers. Now that that option is gone people are lost.”
Similar illustrative responses capture the salience of community issues among our policy vulnerable samples.
Importantly, such themes are nearly absent in the General Population sample. Does the sense of community
that emerged in the unprompted responses of our policy vulnerable samples also influence preferences
regarding transfers? We turn next to explore this question systematically.
20

4 Preferences for the Disposition of Compensation
We now narrow our focus to targeted compensation schemes that would benefit fossil fuel-producing regions
poised to be adversely impacted by decarbonization. These policy mechanisms have political implications
given that they are aimed at identifying and mobilizing political communities. For example, in the US,
transfer schemes exhibit bipartisan support among the public (see Appendix A), and countries seeking to
transition away from fossil fuel production, such as Germany, are exploring transfer schemes in detail.
The broad question of “how” to deploy such transfers can be tackled from various perspectives. For
example, economic analyses might focus on efficiency considerations or on how to structure re-training
opportunities for workers. We focus squarely on a political dimension: the disposition of funds—namely,
whether transfers should flow to the households of individuals directly impacted by the loss of fossil fuel
jobs, or whether transfers should flow to communities and community organizations. Scholars investigating
transfer mechanisms in the context of the trade adjustment literature have argued that community-level
transfers are potentially preferable to individually-focused transfers (Rosen, 2008; Schoepfle, Beckman and
Richardson, 2000). A focus on community transfers is also justified by recent work which shows that
group-level considerations influence preferences for redistribution policy more generally. This distinction
matters for compensatory climate policy because governments can structure compensation in either more
concentrated or diffused ways (Carley, Evans and Konisky, 2018).
We theorize that voters in coal-producing regions, as well as those who are cross-pressured, prefer more
community-oriented compensatory mechanisms to individual transfers than the general public. This is
because group identities in coal mining regions are closely linked to the carbon economy. For both economic
and social reasons, individuals in these regions have shared interests. From an economic perspective, coal
workers as well as non-coal workers in services and secondary sectors within coal-producing regions depend
on the coal industry. The latter may reasonably anticipate material losses from decarbonization policy
and seek redress. Materially, then, non-coal workers are predicted to support community-level transfers to
those that directly compensate coal-related job losses. Coal workers, by contrast, have immediate economic
21

interests related to coal employment. Pocketbook considerations should lead these workers to support
transfers that directly target coal job losses.
Yet coal communities also exhibit strong collective social identities. Theories of social identity predict
that when group affiliation is high, individuals are willing to forego material benefits to support policies
that augment group welfare (Shayo, 2009; Gaikwad, 2022). Specifically, Shayo (2009, 147-148) argues that
individuals share their identity with members of a group both when they perceive similarity with other
group members (termed “distance”) and when they care about the group’s position (defined as “status”);
it is this process of identification that in turn leads to a “willingness to sacrifice material payoffs in order to
enhance group status,” because “in many situations enhancing a group’s status is equivalent to enhancing
the welfare of other group members.”
There are strong reasons to anticipate high degrees of social identification and group attachments in
fossil fuel communities such as coal country. These communities are geographically concentrated and oc-
cupationally specialized (e.g., Carley, Evans and Konisky (2018, 136) describes coal regions as historical
“mono-industry economies” with coal holding “the entire community together”), racially and ethnically
homogeneous (Mayer, Smith and Rodriguez, 2020; Trotter, 2015; McDuie-Ra and Kikon, 2016), and inter-
generationally dependent on employment in coal. Duncan (1999)’s magisterial study, for example, presents
a wealth of ethnographic evidence from coal miners in Appalachia to buttress this claim. Residents of coal
communities “embrace—and even identify with—coal,” both as “a marker of community identity” and “as
a total ‘way of life’” (Lewin, 2019, 54). Bell and York (2010, 134) terms this as “community economic
identity,” noting that the coal industry “appears to be more than a provider of jobs; it embodies all of the
characteristics of the archetypal West Virginian.”
In India, too, the coal industry has historically been concentrated in regions with high proportions of
Scheduled Tribe and Scheduled Caste communities. McDuie-Ra and Kikon (2016, 263-264) discusses how
coalfield rights have remained within tribal community institutions and how members of tribal groups have
resisted government coal mining bans. Many scholars point to the role of a strong community economic
identity surrounding coal in the Indian context (Lahiri-Dutt, 2014; Kikon, 2019). Thus, existing work
22

points to perceptions of shared similarities—corresponding to the concept of “distance” discussed above—
galvanizing social identification in coal country.
Concerns regarding group “status” are also salient in coal-producing regions. Sociological studies find,
for example, that individuals in coal country “believed that preserving mining as a viable occupation would
honor forbearers who had mangled their bodies in the mines to provide for them as children,” that “miners
upheld the dignity of rural life in the face of urban onslaught,” and that coal job losses “wiped away the
little pride [the region] had left” (Lewin, 2019, 56-62). Carley, Evans and Konisky (2018, 136) present
corroboratory interview evidence from coal workers:
There is also a sense of grief that comes along with it, you know, coal mining is really a partof the culture here and it’s interwoven into the way people feel about themselves and their ownidentity and their identity as a community. And so to lose that so quickly is really, it createsa sense of grief among people about losing their way of life and a piece of their culture that isreally engrained and a part of who they are.
These ethnographic accounts suggest that social identification is augmented through group status predilec-
tions in embattled mining communities in both the US and India (Glasmeier and Farrigan, 2003; Kikon,
2019; McDuie-Ra and Kikon, 2016).
If individuals in coal country perceive a strong sense of identification with members of their community,
then they would interpret policies that are beneficial to the group as helping all members of the group
and therefore view compensation in a collective lens. Evidence that fossil fuel workers prefer community
transfers over direct transfers to their own households would be consistent with this point of view.
By contrast, members of broad-based communities such as the general population are predicted to be less
attentive to group concerns. Individuals in large, socially and economically diverse groups are less likely to
have developed a shared identity tied to geographically concentrated occupations since both “distance” and
“status” concerns militate against social identification. The average voter is predicted to be less interested
in allocating funds to community-oriented compensatory mechanisms than to individual transfers; this is
especially the case for the small minority of individuals with fossil fuel jobs in non-fossil fuel-producing
regions. In a similar vein, the general public should be less sensitive to community concerns, and less likely
23

to associate policy support with community welfare considerations.
Finally, individuals facing both policy and climate change vulnerability are predicted to have more
community-oriented preferences than the general population. On the one hand, these individuals share
interests linked to fossil fuel jobs, and face many of the community-related socio-economic pressures that
scholars have associated with carbon-intensive production sectors. At the same time, cross-pressured indi-
viduals face more climate change vulnerability than coal country residents, which might lead them to prefer
a different mix of community- and individual-level resource transfers.
4.1 Preferences for Targets of Compensation Deployment
To test these conjectures, we gauged whether respondents preferred that fiscal transfers be given to indi-
vidual workers or to broader communities affected by climate policy. Respondents were asked if they prefer
the government to provide funding only to the individuals affected by climate policy, or provide funding to
entire communities where such individuals reside.19 We look at the descriptive frequencies of individuals
preferring each type of deployment, breaking down the frequencies by whether respondents or members of
their households are employed in the fossil fuel industry. Figure 4 reports the US results, namely the share
of preferred transfers at the community level for the three US samples. The broad patterns in Figures 4–7
hold in multivariate regression analyses that control for individual-level covariates such as gender, age and
partisanship (see Appendix L).
Recall, residents of regions that are economically dependent on fossil fuel production on average allocated
more to compensatory transfers. We see here that these respondents are particularly supportive of transfers
that are directed to the community. Individuals in the Coal Country sample are proportionally more in
favor of community-level compensatory transfers compared to the general population, irrespective of their
employment status. These results are consistent with claims that both material and non-material factors are
important determinants of climate policy preferences in Coal Country. Economic self-interest may explain19Respondents were given the following prompt: “In one policy option, the government transfers funds to those who are
harmed by job losses in the fossil fuels industry. Would you prefer that the government: (1) Transfers funds only to specificindividuals who lose jobs as a result of the policy (for example, coal miners who lose jobs when coal mines are closed), (2)Transfers funds to entire communities that experience job losses as a result of the policy (for example, communities in coalmining regions where coal mines are closed).”
24

52
49
37
30%
40%
50%
60%
Coal Country (n=194)
Cross−Pressured (n=419)
General Population (n=253)
Respondents employed in fossil fuels
Perc
enta
ge o
f sam
ple
61
58 58
30%
40%
50%
60%
Coal Country (n=322)
Cross−Pressured (n=1009)
General Population (n=3446)
Respondents not employed in fossil fuels
Perc
enta
ge o
f sam
ple
Support for Compensating Communities Instead of Individuals
Figure 4: US preferences for transfers at the community (versus individual household) level by sample andfossil fuel employment. The bars report the percent preferring community transfers. The black lines report95% confidence intervals.
25

why individuals who are not employed in fossil fuel jobs in Coal Country prefer community transfers the
most. Yet the stark divergence in the preferences of fossil fuel-employed workers—those in Coal Country are
15 percentage points more likely to support community transfers than those in the General Population—
suggests that group affiliation and identity-related factors motivate allocation choices in Coal Country.
When comparing respondents who are or are not employed in fossil fuel jobs within each sample, we reach
a similar conclusion. In the General Population sample, individual-level compensation is preferred more by
those employed in fossil fuels, a pattern consistent with materialist accounts of preference formation. By
contrast, there is a high degree of support for community-level compensation among those not employed
in the fossil fuel sector. This suggests that the average voter seems to understand and respect issues of
community identity in Coal Country. In Coal Country, and the Cross-Pressured sample, however, the gap
between workers who are or are not employed in fossil fuel jobs diminishes considerably.
56
72
54
40%
50%
60%
70%
80%
Coal Country (n=945)
Cross−Pressured (n=149)
General Population (n=140)
Respondents employed in fossil fuels
Perc
enta
ge o
f sam
ple
60
65
51
40%
50%
60%
70%
80%
Coal Country (n=585)
Cross−Pressured (n=1391)
General Population (n=1877)
Respondents not employed in fossil fuels
Perc
enta
ge o
f sam
ple
Support for Compensating Communities Instead of Individuals
Figure 5: India preferences for transfers at the community (versus individual household) level by sampleand fossil fuel employment. The bars report the percent preferring community transfers. The black linesreport 95% confidence intervals.
26

Figure 5 reports the results from India. There are high levels of support for community level compensa-
tion relative to individual compensation.20 Like in the US, the General Population sample is least in favor
of community transfers; the average Indian is less likely than individuals in the other samples to weigh
group considerations when considering compensation deployment, although like in the US there remains
marked support for community-based concerns. At the same time, it is noteworthy that the majority of
fossil fuel workers in the General Population prefer community transfers, unlike fossil fuel workers in the
US General Population sample. Their de-emphasis of material self-interest may be indicative of stronger
cross-sectoral empathy in India relative to the US, a proposition that future research should consider.
The Coal Country sample in India has similar preferences to its US counterpart with respect to fossil
fuel workers and non-fossil fuel workers. Interestingly, in contrast to the US, India’s Cross-Pressured group
registers the highest support for community-level compensation; intersecting policy and physical vulnerabil-
ity is associated with heightened group-based considerations in India. Fossil fuel workers in this group are
most supportive of community transfers, pointing again to the role of other-regarding preferences in shaping
deployment choices. Overall, group-related considerations feature highly in India’s policy and physically
vulnerable regions. India’s Coal Country and Cross-Pressured samples are on average significantly more
likely to prefer community transfers to individual transfers than the General Population (see Appendix L).
This supports our conjecture that decarbonization risks affect not only those employed specifically in fossil
fuel industries but also broad sections of society in regions dependent on fossil fuel production.
Comparing the results from the US and India, our main conclusion is that community-oriented senti-
ments appear strong among voters in regions of both countries that face policy threats from climate change.
These voters value the community fabric that has evolved from high levels of fossil fuel industry employment
and plausibly fear the material losses that the community as a whole stands to incur from decarbonization
policies. This finding is in line with evidence indicating the diffused consequences of economic retrenchment
in trade-affected industries (Margalit, 2011).20This pattern may be explained by a point discussed earlier: Indians across all samples report more concern about climate
change than Americans (see Appendix D for self-reported indicators of climate concerns).
27

4.2 Role of Community Identity
We have shown that individuals in embattled coal mining regions have distinct preferences supporting
community-oriented transfers. We next ask if these regions differ by support for policies that could threaten
the identities of coal workers. Protecting the identity of coal miners and their communities has been a topic
of considerable political debate, surfacing repeatedly, for example, during the 2016 and 2020 US presidential
campaigns and provoking sustained political mobilization in India.
Extensive qualitative research in sociology, anthropology, and history underlines a strong sense of com-
munity identity in coal communities in both the US and India. Appendix M provides a comprehensive
overview of the findings of these sources, and we preview some themes here: In the US, coal is framed
as the common bond that holds the community together; coal employment is often multi-generational;
coal is deemed a pillar of community pride; miners are romanticized as the archetype of cherished commu-
nity values and guardians of the region’s cultural heritage; coal communities are relatively homogeneous;
unionization has strengthened the collective identity of coal workers; increasing rhetoric against fossil fuel
industries has brought communities together in defense of identities and incomes; and decarbonization is
viewed to represent a threat to the region’s traditional way of life.
Similar themes emerge in India: coal reduction represents an existential threat to mining communi-
ties; coal regions depend almost exclusively on the coal industry for employment; mining degraded local
environments, reducing agricultural employment opportunities, and fostering a strong economic identity
surrounding coal; coal is closely tied to India’s post-colonial identity and ability to control its natural
resources; unionization and Indian working class identities were born through coal mining; coal mining re-
gions disproportionately comprise indigenous Scheduled Tribe and Scheduled Caste communities as well as
low-caste groups who migrated for the job opportunities coal has historically provided; employment tends
to be inter-generational; local opposition to state-led bans on coal mining have been led by tribal groups.21
21Our survey data reflects some of these trends. In the US, whites are over-represented in Coal Country, while minoritiesare over-represented in the Cross-Pressured sample. In India, lower castes and tribes are over-represented in Coal Country,and other backward classes are over-represented in the Cross-Pressured sample (Appendix D).
28

Safeguarding community identities is central to the concept of group “status” in Shayo (2009)’s social
identification theory discussed above. In communities featuring high degrees of group identification, indi-
viduals are predicted to prioritize policies that augment the welfare of other group members. If the strong
preferences for community-oriented transfers that we uncovered in fossil fuel communities were connected to
identity-related concerns, then we would expect to see evidence that members of these groups are concerned
about protecting the identities and well-being of members of coal communities.
We therefore designed a question to probe whether identity-related considerations featured highly among
members of fossil fuel communities. While the qualitative research reviewed in Appendix M has already
established identity-related themes in coal country, prior work has not tested whether there is a link between
policy support and coal identities. To measure the importance that respondents attach to the identity (and
therefore political salience) of coal communities, we asked:Some people say that the government should not pass policies that harm jobs in industries like thecoal industry because such policies will threaten the identities of coal workers and their surroundingcommunities, which are closely tied to coal mining. Do you agree? [(1) strongly disagree to (4) stronglyagree]
Note that our question directly links identity-related concerns to policy support for decarbonization,
which we deemed to be an important avenue of inquiry based on the large body of qualitative and ethno-
graphic scholarship that highlights the centrality of community identities in coal-producing regions. At the
same time, by tying policy support to identity-related concerns, it is possible that answers also captured
respondents’ policy preferences, in turn increasing the proportion of individuals who reported concern about
the impact of the policy on community identities. Our analysis therefore focuses on differences across our
samples rather than on absolute magnitudes within samples.
Figures 6 and 7 present the results for US and India, respectively. Concerns about protecting worker and
community identities were highest in Coal Country (72 percent in the US and 74 percent in India), second
highest in the Cross-Pressured sample, and lowest in the General Population sample (57 percent in the US
and 61 percent in India). In Appendix L, we document that these findings are robust to the introduction of
controls in multivariate analyses. In analyses of the Coal Country sample, we find that both the majority of
29

72
68
57
60%
70%
80%
Coal Country (n=516)
Cross−Pressured (n=1428)
General Population (n=3701)
Perc
enta
ge o
f sam
ple
Opposition to Policies Threatening the Identity of Coal Communities
Figure 6: US preferences for blocking policy measures that threaten the identity of the coal communities.The bars report the percent of opposing respondents by sample. The black lines report 95% confidenceintervals.
30

people directly connected to fossil fuels and those without a direct connection opposed identity-threatening
policies. Overall, in both countries, respondents in Coal Country oppose identity-threatening policies at
greater rates than in the General Population, with Cross-Pressured samples falling in between.
74
65
61
60%
70%
80%
Coal Country (n=1545)
Cross−Pressured (n=1549)
General Population (n=2056)
Perc
enta
ge o
f sam
ple
Opposition to Policies Threatening the Identity of Coal Communities
Figure 7: India preferences for blocking policy measures that threaten the identity of the coal communities.The bars report the percent of opposing respondents by sample. The black lines report 95% confidenceintervals.
These findings can be interpreted in light of the qualitative literature on coal identities and the open-
ended answers provided by our respondents. As we see in Appendix K.1– K.2, themes related to identity
surfaced repeatedly in respondents’ answers in Coal Country but were relatively scarce in the General Pop-
ulation sample. In the coal miner’s survey in India, we included an additional question asking respondents
why they chose community versus individual transfers. Appendix K.3 summarizes these results, noting that
identity themes arose frequently in these respondents’ unprompted answers.
These identity results help explain our prior finding that those residing in coal-producing regions favor
31

community transfers most. Coal mining regions are consolidated in voicing resistance to policies threatening
the identities of coal workers and their surrounding communities and in seeking transfers to compensate
the community at large. The cross-sectoral basis of this support points to identity-related factors as
important determinants of preference formation over the disposition of compensation policy in these regions.
The general public by contrast is less interested in compensating broad-based vulnerability in fossil fuel
communities. Evidently, to purchase societal buy-in from coal communities, policies will need to go beyond
appeasing individual workers and instead engage communities, since demand for compensation arises from
more than just the individual employees who will directly bear the costs of decarbonization.
Finally, our theory and evidence provide some scope conditions to debates about industrial decline,
social identification, and political mobilization. Notably, we obtain similar findings between the oil and
gas cross-pressured group in the US and the coal cross-pressured sample in India, even though coal is a
historically older and relatively more unionized and labor-intensive industry. Fossil fuel communities that
have developed communal economic identities tied to particular industries may thus have shared theoretical
characteristics. The existential threat of a lost industry appears to be sufficient to trigger similar forms
of policy support in communities reliant on emissions-intensive sectors that cannot easily be decarbonized.
Parallels with other senescent industries with similar features, such as steel, warrant further analysis (see
also Bell and York, 2010, 118; Duncan, 1999).
5 Conclusion
Just as in other policy arenas where net welfare gains accompany concentrated losses, such as trade policy,
acting on climate change requires understanding the salience of policy preferences and overcoming the
resistance of localized policy “losers.” Against this backdrop, we explored preferences over different forms
of climate-related compensation for vulnerable communities within the US and India, the world’s two largest
democracies, prominent greenhouse gas emitters, and leading coal employers. Our study is one of the first
to seriously engage with the design of decarbonization policies that directly confront distributional political
32

realities (Kono, 2020; Bergquist, Mildenberger and Stokes, 2020).
Our research shows that different societal coalitions prefer distinct levels, forms, and targets of com-
pensation. The most cohesive and potentially antagonistic group standing in the way of mitigation policy
consists of the communities that are currently confronted by the wage and employment consequences of
climate policy but do not face significant climate change vulnerability. Appeasing these voters may be a
difficult task given the political barriers to compensating targeted groups. For example, the 2016 Wash-
ington State referendum on carbon taxes (Washington Initiative 732) failed in large part due to concerns
about interest groups gaining access to funds paid for by taxpayers. Low levels of trust in the redistribu-
tion process could exacerbate credibility problems inherent in longer-term promises of compensation and
investment (Gazmararian and Tingley, 2022). Broad-based investments in these communities, rather than
solely individual-level compensation, could be more effective, credible, and popular.
Voters who are pressured by both policy and climate change vulnerabilities desire a mix of allocations
for different types of compensation. If climate change continues to cause adverse weather events that
increase in frequency and intensity, more communities will probably become “cross-pressured,” thereby
further pushing the policy agenda to divide revenues among several compensatory programs. We note that
cross-cutting pressures result in mixed preferences but are largely driven by one pressure—in this case,
climate vulnerability—than by the other pressure. This appears to stem from an internal calculation that
weighs the probability of damage if no action is taken (climate impacts on one’s livelihood) against the
cost of damage if action is taken (the possibility of policy-driven wage or job losses). That voters are
willing to trade off the material consequences of policy in order to preclude costly government inaction on
climate change has implications for policy preferences in other domains, presenting new insights into how
individuals form distributive preferences.
We make two points regarding the general population surveys. First, in both countries the average
citizen prefers broad-based compensatory mechanisms like investments in green technologies. A referendum
33

on a climate action plan containing these policy levers could potentially muster broad support (see also
Bergquist, Mildenberger and Stokes, 2020). Second, we note that any system that raises revenues via
taxes is bound to face opposition unless the benefits are sufficiently tangible. Nevertheless, a salutary
feature of our findings is that the general public is willing to divert a non-negligible proportion of funds
collected from increased household energy costs to compensate job losses in the fossil fuel industry. This
points toward a path forward for policymakers seeking to mobilize support for climate policy from different
domestic constituencies. Our data show that compensation can in fact strengthen the public foundations
for ambitious climate policy if laid out in targeted and credible ways.
We conclude by charting a pathway for future research. One policy lever that we did not investigate in
this paper but do elsewhere is the importance of environmental remediation. This is especially germane in
regions with long histories of fossil fuel extraction that have created highly polluted environments. A better
understanding of the role of individual-level characteristics (e.g., trust or income) and how they relate to
vulnerabilities and support for the policy instruments considered here will be important. Urgently needed
also is survey research that investigates whether particular mixes of compensation and investment policies
increase citizens’ willingness to pay higher carbon taxes, whether increasing climate change vulnerability
shifts preferences regarding mitigation and adaptation, and whether cross-border financial transfers can
muster popular support.
Finally, further unpacking how identity-related concerns shape the preferences of economic communities
like those in coal country can help shed light on the political preferences of voters in other regions, such
as the Rust Belt, that have materially been impacted by globalization; compensatory schemes like the
Trade Adjustment Assistance might have under-performed because they focused on individually-displaced
workers at the expense of broader communities (Rickard, 2020). Our research indicates that the success
of embedded liberalism likely hinges on the ability of governments to understand when and how economic
vulnerability sprouts across communities and not just for individuals.
34

The authors declare the human subjects research in this article was reviewed and approved by universitycommittees at Columbia, Essex and Harvard, and certificate numbers are provided in the appendix. Theauthors affirm that this article adheres to the APSA’s Principles and Guidance on Human Subject Research.The authors declare no ethical issues or conflicts of interest in this research. This research was mainlyfunded by the Balzan prize awarded in 2017 to Professor Robert O. Keohane. Research documentationand data that support the findings of this study are openly available in the APSR Dataverse at https://doi.org/10.7910/DVN/PHRNTQ.
References
Aklin, Michael and Matto Mildenberger. 2020. “Prisoners of the Wrong Dilemma: Why Distributive
Conflict, Not Collective Action, Characterizes the Politics of Climate Change.” Global Environmental
Politics 20(4):4–27.
Autor, David, David Dorn, Gordon Hanson and Jae Song. 2014. “Trade Adjustment: Worker-level Evi-
dence.” The Quarterly Journal of Economics 129(4):1799–1860.
Barbier, Edward. 2014. “A Global Strategy for Protecting Vulnerable Coastal Populations.” Science
345(6202):1250–1251.
Bayer, Patrick and Federica Genovese. 2020. “Beliefs about Consequences from Climate Action under
Weak Climate Institutions: Sectors, Home Bias, and International Embeddedness.” Global Environmental
Politics 20(4):28–50.
Bayer, Patrick and Johannes Urpelainen. 2016. “It is All About Political Incentives: Democracy and the
Renewable Feed-in Tariff.” Journal of Politics 78(2):603–619.
Bechtel, Michael, Federica Genovese and Kenneth Scheve. 2019. “Interests, Norms and Support for the
Provision of Global Public Goods: The Case of Climate Co-operation.” British Journal of Political Science
49(4):1333–1355.
Bechtel, Michael and Kenneth Scheve. 2013. “Mass Support for Climate Cooperation Depends on Institu-
tional Design.” Proceedings of the National Academy of Sciences 110(34):13763–13768.
35

Bell, Shannon Elizabeth and Richard York. 2010. “Community Economic Identity: The Coal Industry and
Ideology Construction in West Virginia.” Rural Sociology 75(1):111–143.
Bergquist, Parrish, Matto Mildenberger and Leah Stokes. 2020. “Combining Climate, Economic, and Social
Policy Builds Political Support for Climate Action in the US.” Environmental Research Letters 15(5):1–9.
Bhushan, Chandra, Srestha Banerjee and Shruti Agarwal. 2020. Just Transition in India: An Inquiry
into the Challenges and Opportunities for a Post-Coal Future. New Delhi: International Forum for
Environment, Sustainability & Technology.
Breetz, Hanna, Matto Mildenberger and Leah Stokes. 2018. “The Political Logics of Clean Energy Transi-
tions.” Business and Politics 20(4):492–522.
Brody, Samuel, Sammy Zahran, Arnold Vedlitz and Himanshu Grover. 2007. “Examining the Relationship
Between Physical Vulnerability and Public Perceptions of Global Climate Change in the United States.”
Environment and Behavior 40(1):72–95.
Broz, J. Lawrence, Jeffry Frieden and Stephen Weymouth. 2021. “Populism in Place: The Economic
Geography of the Globalization Backlash.” International Organization 75(2):464–494.
Campbell, Troy and Aaron Kay. 2014. “Solution Aversion: On the Relation Between Ideology and Motivated
Disbelief.” Journal of Personality and Social Psychology 107(5):809–824.
Carley, Sanya, Tom Evans and David Konisky. 2018. “Adaptation, Culture, and the Energy Transition in
American Coal Country.” Energy Research & Social Science 37:133–139.
Chandra, Kanchan. 2004. Why Ethnic Parties Succeed: Patronage and Ethnic Head Counts in India.
Cambridge University Press.
Colgan, Jeff, Jessica Green and Thomas Hale. 2021. “Asset Revaluation and the Existential Politics of
Climate Change.” International Organization 75(S2):586–610.
Cooper, Jasper, Sung Eun Kim and Johannes Urpelainen. 2018. “The Broad Impact of a Narrow Conflict:
How Natural Resource Windfalls Shape Policy and Politics.” Journal of Politics 80(2):630–646.
36

Dubash, Navroz, ed. 2012. Handbook of Climate Change and India: Development, Politics and Governance.
New York: Earthscan.
Duncan, Cynthia. 1999. Worlds Apart: Why Poverty Persists in Rural America. Yale University Press.
Egan, Patrick and Megan Mullin. 2012. “Turning Personal Experience Into Political Attitudes: The Effect
of Local Weather on Americans’ Perceptions about Global Warming.” Journal of Politics 74(3):796–809.
Gaikwad, Nikhar. 2022. Identity Politics and Economic Policy. Columbia University, Book Manuscript.
Gaikwad, Nikhar, Gareth Nellis and Steven Wilkinson. 2021. “The Determinants of Popular Support for
Environmental Policy in India.” Paper Presented at the American Political Science Association Annual
Meeting.
Gazmararian, Alexander and Dustin Tingley. 2022. “Embedded Liberalism from the Ground Up: Credibility
and Climate Transitions.” Working paper .
Genovese, Federica. 2019. “Sectors, Pollution, and Trade: How Industrial Interests Shape Domestic Posi-
tions on Global Climate Agreements.” International Studies Quarterly 63(4):819–836.
Glasmeier, Amy and Tracey Farrigan. 2003. “Poverty, Sustainability, and the Culture of Despair: Can Sus-
tainable Development Strategies Support Poverty Alleviation in America’s Most Environmentally Chal-
lenged Communities?” ANNALS of the American Academy of Political and Social Science 590(1):131–
149.
Greenstone, Michael and B. Kelsey Jack. 2015. “Envirodevonomics: A Research Agenda for an Emerging
Field.” Journal of Economic Literature 53(1):5–42.
Hetherington, Marc. 2018. Why Trust Matters. Princeton University Press.
Jagers, Sverker, Johan Martinsson and Simon Matti. 2019. “The Impact of Compensatory Measures on
Public Support for Carbon Taxation: An Experimental Study in Sweden.” Climate Policy 19(2):147–160.
Jenkins, Jesse. 2019. “Why Carbon Pricing Falls Short.” Kleinman Center for Energy Policy.
URL: https://kleinmanenergy.upenn.edu/policy-digests/why-carbon-pricing-falls-short
37

Keohane, Robert and David Victor. 2016. “Cooperation and Discord in Global Climate Policy.” Nature
Climate Change 6:570–575.
Kikon, Dolly. 2019. Living with Oil and Coal: Resource Politics and Militarization in Northeast India.
University of Washington Press.
Kono, Daniel Yuichi. 2020. “Compensating for the Climate: Unemployment Insurance and Climate Change
Votes.” Political Studies 68(1):167–186.
Lahiri-Dutt, Kuntala, ed. 2014. The Coal Nation: Histories, Ecologies and Politics of Coal in India.
Routledge.
Lewin, Philip. 2019. “‘Coal is Not Just a Job, It’s a Way of Life’: The Cultural Politics of Coal Production
in Central Appalachia.” Social Problems 66(1):51–68.
Malhotra, Neil, Yotam Margalit and Cecilia Hyunjung Mo. 2013. “Economic Explanations for Opposition to
Immigration: Distinguishing Between Prevalence and Conditional Impact.” American Journal of Political
Science 57(2):391–410.
Mansbridge, Jane. 1990. Beyond Self-Interest. University of Chicago Press.
Margalit, Yotam. 2011. “Costly Jobs: Trade-related Layoffs, Government Compensation, and Voting in US
Elections.” American Political Science Review 105(1):166–188.
Mayer, Adam, E. Keith Smith and Jeff Rodriguez. 2020. “Concerned About Coal: Security, Dependence,
and Vulnerability Among Coal Dependent Communities in Western Colorado.” Energy Research & Social
Science 70:101680.
McDuie-Ra, Duncan and Dolly Kikon. 2016. “Tribal Communities and Coal in Northeast India: The Politics
of Imposing and Resisting Mining Bans.” Energy Policy 99(4):261–269.
Meckling, Jonas. 2011. Carbon Coalitions: Business, Climate Politics, and the Rise of Emissions Trading.
MIT Press.
38

Meckling, Jonas, Nina Kelsey, Eric Biber and John Zysman. 2015. “Winning Coalitions for Climate Policy.”
Science 349(6253):1170–1171.
Newell, Peter and Dustin Mulvaney. 2013. “The Political Economy of the ‘Just Transition’.” The Geograph-
ical Journal 179(2):132–140.
Peyton, Kyle. 2020. “Does Trust in Government Increase Support for Redistribution? Evidence from
Randomized Survey Experiments.” American Political Science Review 114(2):596–602.
Rickard, Stephanie. 2020. “Globalization, Compensation, and the Rise of the Far Right.” London School of
Economics, Working Paper.
Rosen, Howard. 2008. Designing a National Strategy for Responding to Economic Disclocation: Testimony
before the Subcommittee on Investigation and Oversight House Science and Technology Committee.
Ruggie, John Gerard. 1982. “International Regimes, Transactions, and Change: Embedded Liberalism in
the Postwar Economic Order.” International Organization 36(2):379–415.
Schoepfle, Gregory, Steven Beckman and J. David Richardson. 2000. U.S. Trade Adjustment Assistance
Policies for Workers. In Social Dimensions of US Trade Policies, ed. Alan Deardorff and Robert Stern.
University of Michigan Press pp. 95–128.
Shayo, Moses. 2009. “A Model of Social Identity with an Application to Political Economy: Nation, Class,
and Redistribution.” American Political Science Review 103(2):147–174.
Sprinz, Detlef and Tapani Vaahtoranta. 1994. “The Interest-based Explanation of International Environ-
mental Policy.” International Organization 48(1):77–105.
Stokes, Leah. 2016. “Electoral Backlash Against Climate Policy: A Natural Experiment on Retrospective
Voting and Local Resistance to Public Policy.” American Journal of Political Science 60(4):958–974.
Trotter, Joe. 2015. “The Dynamics of Race and Ethnicity in the US Coal Industry.” International Review
of Social History 60(S1):145–164.
39

Urpelainen, Johannes and Setu Pelz. 2020. “COVID-19 and a Just Transition in India’s Coal Mining
Sector.” Initiative for Sustainable Energy Policy, Policy Brief.
40

Appendix
“Creating Climate Coalitions: Mass Preferences forCompensating Vulnerability in the World’s Two Largest
Democracies”
The Appendix contains the following sections:
• Appendix A: Bipartisan Support for Compensating Fossil Fuel Workers• Appendix B: Contextual Information Regarding Climate Policy Categories• Appendix C: Research Ethics• Appendix D: Geographic Distribution and Descriptive Statistics of the US and India Samples• Appendix E: Additional Information Regarding India Samples• Appendix F: Choices of US and Indian Respondents in the Allocation Exercise Across All Tax Levels• Appendix G: Regression Models of Allocation Decisions Utilizing Individual-level Covariates• Appendix H: Results from a Separate Sampling Strategy Focusing on Climate Change Vulnerable Only
Individuals• Appendix I: Nationally Representative Data on Willingness to Pay to Support Four Policy Choices• Appendix J: Results of Allocation Decisions when Individuals were able to Choose a Cost• Appendix K: Analysis of Survey Respondents’ Open-ended Explanations for Survey Choices• Appendix L: Additional Analyses and Regression Models based on the Questions Regarding Community and
Identity for both the US and India Samples• Appendix M: Survey of Literature Discussing Coal Identities in the US and India
A Bipartisan Support for Compensating Fossil Fuel WorkersIn the paper we suggested that there is bipartisan support for compensating fossil fuel workers in democracies suchas the United States. Here we provide additional information to support this statement.
In 2017, we fielded a nationally representative survey via the AmericasBarometer project where we askedrespondents the following question: “Congress could consider many important bills in the next two years. If youwere in Congress would you vote FOR or AGAINST the following? Climate Adjustment Assistance: Provideseducation assistance and retraining to workers who have lost their jobs as a result of [policies designed to reduce/ reductions in] greenhouse gas emissions.” The text in brackets was randomly assigned but did not significantlyaffect answers. There was bipartisan support for the proposal in both of the treatment conditions above (62%Republican, 70% Independent, 85% Democrat). We observed similar bipartisan support for this question in anationally representative survey fielded in 2016 as part of the Cooperative Congressional Election Study (65%Republican support, 78% Independent support, 94% Democratic support).
B Contextual Information Regarding Climate Policy CategoriesIn this section we discuss how the compensation and investment options proposed in our survey reflect actual policychoices in the US and India. For each country we provide brief background information about each actual policymechanism and the political discussion around them.
B.1 USB.1.1 Compensation to Coal/Oil WorkersThe industrial decadence of coal and carbon-intensive activities has been intensely discussed in the public opiniondominion. It is agreed that shifting from fossil fuels to cleaner sources of energy threatens struggling communities,especially those dependent on coal. There is disagreement on how to help these communities. Historically, supportto workers has been provided in other realms. For example, Congress passed legislation in 1974 that establishedthe Trade Adjustment Assistance Program, which still operates today. Workers who can show that they have lost
0

jobs or wages because of increased international competition may petition the Department of Labor for benefitsadministered through state agencies, including cash payments, retraining, and assistance with relocation and jobsearches. However, some criticized this adjustment program as an ineffective “band-aid” (Fried, 2005). A mostdefined federal effort to help coal communities is the Partnerships for Opportunity and Workforce and EconomicRevitalization (POWER) Initiative launched by the Obama administration in 2015. The discussion to implementa bold program like the Appalachian Regional Commission for more US states seems to be picking up. PresidentBiden’s American Jobs Plan prioritizes the targeting of “long-term unemployment and underemployment” in thesetypes of communities.B.1.2 Infrastructure for Climate VulnerableGovernment-subsidized insurance, such as the U.S. National Flood Insurance Program (adopted in 1968), is amechanism to enhance climate resilience. It has, however, been criticized, as some believe it provides perverseincentives to develop properties in hazardous areas, thereby increasing overall risk (Burby, 2006). Resiliencestandards and construction were embedded in the 2009 American Recovery and Reinvestment Act, which calledfor an identification of economic sectors’ vulnerabilities to climate change. In a similar spirit, President Biden’sAmerican Jobs Plan calls on Congress to invest an additional $17 billion in inland waterways, coastal ports, landports of entry, and ferries to maximize the resilience of land and water resources to protect communities andthe environment. Accordingly, “President Biden’s plan will protect and, where necessary, restore nature-basedinfrastructure - our lands, forests, wetlands, watersheds, and coastal and ocean resources. Families and businessesthroughout the United States rely on this infrastructure for their lives and livelihoods.”22
B.1.3 Investments in Green EnergyDiscussions about clean energy transition in the US started in the 1960s, partly due to increasing environmen-tal awareness and partly because of the emergence of alternative and relatively low-cost sources of energy, e.g.hydroelectricity, in the late 1950s. The Obama administration favored the provision of government support andsubsidies to support the transition toward renewable energy. From 2006 to 2014, US households received morethan $18 billion in federal income tax credits for installing solar panels and other “clean energy” investments. The2009 American Recovery and Reinvestment Act included more than $70 billion in direct spending and tax creditsfor clean energy and associated transportation programs. During the Trump administration, the government tooka smaller role in major clean energy investment, but nonetheless renewables kept momentum through state gov-ernment initiatives and energy sector private investments. As of 2021, many initiatives indicate high governmentand private sector interest in green energy investments. President Biden’s $2 trillion infrastructure plan includesa 10-year extension to tax credits that have been a boon to wind, solar and other renewable energy projects (seethe American Jobs Plan in footnote 23).B.1.4 Equal Rebates to All CitizensRebates return the revenue of some form of tax on fossil fuels (e.g. carbon tax) to the general society. Proponentsof this policy argue that equal rebates could mediate against the negative impact of increased taxation on economicgrowth as well as increase public support for carbon taxation. In the past few years various representativesand senators in the U.S. Congress have proposed legislation authorizing a federal carbon tax (e.g. the EnergyInnovation and Carbon Dividend Act by Congressman Ted Deutch and the Climate Action Rebate Act by SenatorChris Coons). A preliminary analysis of the Deutch bill shows that carbon tax revenues would rise from $70 billionin 2020, to $400 billion in 2030, and that through a rebate mechanism nearly all revenue is used for annual dividendpayments, which would increase to about $1400 for adults and $600 to children by 2030.23 Much of the oppositionto rebates in the US is linked with opposition toward a carbon tax itself, and more generally, on how progressiveor regressive this tax should be.24
22The American Jobs Plan. Statement released on March 31, 2021. https://www.whitehouse.gov/briefing-room/statements-releases/2021/03/31/fact-sheet-the-american-jobs-plan/.
23SIPA Centre for Global Energy Policy (2021). https://www.energypolicy.columbia.edu/what-you-need-know-about-federal-carbon-tax-united-states.
24Diamond, John W., and Zodrow, George R. (2018). “The Effects of Carbon Tax Policies on the US Economy and theWelfare of Households.” Independent Report, New York: Columbia SIPA Center on Global Energy Policy.
1

B.2 IndiaB.2.1 Compensation to Coal/Oil WorkersIndian workers in sectors most affected by climate change policies, such as the coal and fossil fuel industries, aremore likely to engage in informal work and lack social protection. Therefore, to achieve just transition, the countryneeds to extend protection to the informal workforce (United Nations Framework Convention on Climate Change,2020). Chandra Bhushan (2020), a prominent environment expert in India, also highlights the need for a justtransition—to ensure that coal- and fossil fuel-dependent communities do not suffer financially from the closing ofmines and power plants. In the poorest regions in India, the eastern states of Chhattisgarh, Jharkhand, MadhyaPradesh, Telangana, and Odisha, the livelihoods of entire communities are dependent on the production of coal(Roy, Kuruvilla and Bhardwaj, 2019). Currently, Indian labor unions have begun engaging in the question of thecountry’s just transition. The New Trade Union Initiative, a non-partisan labor initiative founded in 2002, hasadvocated for broadening the social security net in the process of energy transition and insisted that the countrymaintain its “right to develop” while adopting more climate-friendly policies (Roy, Kuruvilla and Bhardwaj, 2019).B.2.2 Infrastructure for Climate VulnerableWith its monsoon climate and a long and densely populated coastline, India is home to the world’s largest climatevulnerable population. In the aftermath of recent cyclones Fani, Gaja, and Hudhud as well as a number ofsevere floods, many coastal states in India have taken initiatives to make their infrastructure more climate-resilient(Roy, 2019). As the majority of India’s urban metropoles are located along its coastline, upgrading its coastalinfrastructure is critical not only for the welfare of local residents but also for the nation’s economic growth. So far,federal and local governments have made significant efforts to strengthen the country’s climate infrastructure, suchas improving coastal protection, building cyclone shelters, and planting coastal forests and mangroves (Governmentof India, 2008; Roy, 2019). In 2008, the government issued the National Action Plan on Climate Change (NAPCC),which marks one of India’s most significant efforts to combat climate change. The NAPCC lists out the government’splans to develop regional ocean modeling systems and establish more efficient cyclone and flood warning systems(Government of India, 2008). The government has also partnered with the World Bank on a series of infrastructuredevelopment programs that seek to enhance climate resilience. For instance, the Bihar Kosi Basin DevelopmentProject focuses on upgrading the region’s flood control infrastructure and the Puducherry Coastal Disaster RiskReduction Project aims to build resilient coastal housing, evacuation shelters, and a cyclone resilient electricalnetwork (World Bank India, 2021). Following the outbreak of the COVID-19 pandemic, the Indian governmentannounced a series of infrastructure projects to reboot the country’s economy.B.2.3 Investments in Green EnergyThe country began its initial green energy exploration in the 1960s, constructing windmills to exploit wind energyfor irrigation (Bhattacharya and Jana, 2009). In the 1970s and 80s, the Indian government launched two nationalsolar energy programs and continued to develop the country’s wind capacity (Bhattacharya and Jana, 2009).Investing in green energy is a cornerstone of the Indian government’s climate strategy. In the 2008 NAPCC, theIndian government stated its ambitious goal of increasing renewable energy contribution’s to 15% of the country’selectricity production by 2020 and announced the establishment of the National Solar Mission, which aims to add22 GW of solar capacity by 2022 (Government of India, 2008; India Ministry of New and Renewable Energy, 2010).During the 2014 Obama-Modi climate talks, the two countries reached major renewable energy investment deals,which included the construction of extensive solar pipelines to fulfill the Indian government’s solar energy goals(Office of the Press Secretary, 2016). In 2018, the Indian government passed an amendment in tariff policy tofurther attract foreign investment in the renewable energy sector (Kumar J. and Majid, 2020).B.2.4 Equal Rebates to All CitizensAs a form of “revenue recycling,” rebates return carbon tax revenue to the general society (Beiser-McGrath andBernauer, 2019). Proponents of this policy argue that equal rebates could mediate against the negative impact ofincreased taxation on economic growth as well as increase public support for carbon taxation (Ojha, Pohit andGhosh, 2020). Shakti Sustainable Energy Foundation (2018), a think tank in India, published a detailed reportstudying developed countries’ implementation of revenue recycling programs and suggests that India could adoptsimilar policies to compensate citizens for their increased costs of living due to a carbon tax. Opponents of therebate program, however, point out that universal cash transfers might not work for developing countries like India
2

because the policy would only reach individuals with financial access but would not compensate households thatare not covered by the income tax (Rathore and Bansal, 2013). In addition, they point out that carbon tax rebatesmight be an insufficient incentive for the poor to move away from cheaper, but less climate-friendly, sources ofenergy (Azad and Chakraborty, 2020).
C Research EthicsThis study was approved by the Institutional Review Board of Columbia University (Protocol IRB-AAAS2410),the Committee on use of Human Subjects of Harvard (CR17-1328-04), and the Ethical Review Board of Universityof Essex (21-01-19).
Voluntary informed consent was obtained by all human subjects. In the US surveys, which were conductedonline, informed consent was obtained electronically and was built into the survey flow. In the India surveys,which were conducted via telephone and in person, informed consent was obtained verbally or in a signed format.Subjects were free to decline participation.
Prior to providing consent, subjects were informed about the goals of the research, foreseeable risks and benefitsassociated with the research, the scholarly nature of the research, compensation, and the voluntary nature of thestudy, and were provided relevant contact information. No deception was used in the surveys.
Survey respondents in India were not compensated monetarily for participating in the study; respondents weresampled at random from the respective population groups and asked if they were interested in participating in asurvey. In the US, we worked with two survey companies (Lucid and Qualtrics) that do market research and docompensate survey takers.
Finally, for the India surveys, in order to ascertain the appropriateness of the study with respect to local lawsand cultural, social, and political contexts, our research design and study was reviewed by a country expert.
D Descriptive StatisticsD.1 US SampleOur sampling scheme is visualized in Figure A.1. Table A.1 provides descriptive statistics for the US.
Figure A.1: This map shows the counties from which our respondents were sampled. Red denotes countiesin the Coal Country sample; blue denotes counties in the Cross-Pressured sample; dark grey representscounties from our General Population sample.
3

General Population Cross-Pressured Coal CountryFemale 53% 60% 62%Median Age 46 years 35 years 37 yearsCollege Degree 68% 60% 58%Employed 54% 62% 51%Ideology: Liberals 29% 15% 18%Ideology: Conservatives 34% 43% 39%White 75% 65% 95%Black/African American 13% 26% 2%Latino/Hispanic 8% 9% 2%Concerned by Climate Change 76% 73% 69%N 3702 1428 516
Table A.1: Descriptive statistics of US samples. ‘College Degree’ includes college graduates and graduatedegrees. ‘Employed’ refers to self-employed or paid employees.
D.2 India SampleOur sampling scheme is graphed in Figure A.2. Table A.2 provides descriptive statistics for India.
Figure A.2: This map shows the Indian districts from which our respondents were sampled. Red denotesdistricts in the Coal Country sample; blue denotes districts in the Cross Pressured sample; dark greyrepresents districts from our General Population sample.
4

General Population Cross-Pressured Coal CountryFemale 65% 59% 30%Median Age 36 years 35 years 36 yearsAttained Secondary School 48% 48% 42%Employed 77% 78% 75%Voted for BJP 60% 65% 48%Below National Median Income 40% 42% 46%Scheduled Caste/Dalits 12% 12% 22%Scheduled Tribes 3% 5% 10%Other Backward Classes 35% 45% 32%Upper Caste 39% 30% 31%Muslim 8% 6% 5%Other Ethnicity 3% 2% 1%Concerned by Climate Change 91% 89% 93%N 2102 1573 1556
Table A.2: Descriptive statistics of India samples. ‘Secondary School’ includes individuals who have com-pleted secondary school or higher. ‘Employed’ refers to self-employed or paid employees. ‘Voted for BJP’refers to whether respondents voted for the Bharatiya Janata Party (BJP) in the last Lok Sabha election.
E Additional Information Regarding India SamplesImplementing our surveys in India required a more involved sampling strategy than in the US. Here we describethe decisions we took to identify the relevant samples.
E.1 General PopulationThe General Population sample was conducted using Computer Assisted Telephone Interviewing (CATI), drawingon all mobile phone and landline connections in India.25 Our research firm employed an automated predictive dialerto select phone numbers from all telecom circles and digital exchanges in India. India’s high telephone density rateallowed enumerators to access the vast majority of demographic groups in the country.26 Members of low-frequencydemographic groups were over-sampled to obtain a geographically and socio-economically representative sample.The sample covered the entire geography of India, excluding only some remote north-eastern states and unionterritories. Respondents could choose to take the survey in eleven languages: Hindi, Punjabi, Gujarati, Marathi,Kannada, Malayalam, Tamil, Telugu, Odiya, Bangla and Asamiya. The survey was conducted by the firm CVoterNews Pvt. Ltd.
E.2 Coal CountryThe Coal Country sample captures the parts of India that are heavily dependent on coal industry employment, andthus vulnerable to the economic threats of climate policy. This sample was constructed by combining two surveys:a representative survey of coal mining districts as well as a targeted survey of coal miners, as described below.(a) Coal Mining DistrictsFirst, we identified districts in India that are most heavily dependent on coal mining employment in order to captureparts of the Indian population most exposed to potential job losses from decarbonization. We identified coal miningdistricts using the 2015 Government of India publication, “Statistics of Mines in India: Volume I (Coal),” which
25Telephone surveys are advantageous since they alleviate privacy and social desirability concerns for respondents in groupsettings. Additionally, the medium facilitates interviews with hard-to-reach demographic groups, boosting the representative-ness of the sample. Interviews were recorded and supervised in real time, augmenting the quality of responses.
26Because incoming calls are free of cost, we were able to access poorer citizens in our sample frame.
5

provides statistics on “employment, production, productivity and other associated aspects in coal mines” in India(Government of India, 2018). In association with the Mines Act (1952) and the Coal Mines Regulations (1957),India’s central government provides this regular statistical report on the country’s coal mines and operations. Weused the report’s record of average daily employment to construct a list of all districts across India with at leastone coal mine in operation that actively employs workers.27 From this list, we excluded 4 districts that also rankedhigh on ecological vulnerability; these districts were classified and sampled as cross-pressured districts (see below).Our final sample contains 39 districts from nine states (Assam, Chhattisgarh, Jammu and Kashmir, Jharkhand,Madhya Pradesh, Maharashtra, Orissa, Telengana, and West Bengal), and represents to our knowledge the mostcomprehensive sample of districts with coal mining employment in India.(b) Coal MinersGiven India’s high levels of population density, we anticipated difficulty in locating workers employed directly in coalmines through the representative sample of coal mining districts above. Therefore, to supplement our Coal Countrysample, we selected three districts with high coal employment—Dhanbad, Sahdol, and West Bardhman28—in whichwe conducted in-person interviews with 850 coal industry workers. These individuals were identified and interviewedby the survey firm Morsel Research & Development. These interviews involved the same list of questions as ourother samples, along with additional qualitative follow-up questions asking respondents about how they madedecisions regarding allocations, community or individual transfers, and other key responses.
E.3 Cross-PressuredCross-Pressured districts capture parts of India’s population exposed to both job losses from decarbonization policyand the ecological threat of climate change. For completeness, we distinguished between coal mine and coal plantdistricts, and then identified those districts that were ranked high on measures of climate vulnerability.(a) Coal Mines Cross-PressuredTo identify the coal mines cross-pressured districts, we combined the district-level coal mines data (discussed above)with an index of climate vulnerability developed by researchers at India’s Central Research Institute for DrylandAgriculture (CRIDA). The CRIDA “Atlas on Vulnerability of Indian Agriculture to Climate Change” ranks eachdistrict in India based on four indicators: exposure, sensitivity, adaptive capacity, and vulnerability (Rama Raoet al., 2013). Based on these rankings, each district is assigned one of following five vulnerability ratings: VeryHigh, High, Medium, Low, and Very Low. From the universe of coal mining districts, we selected all districtsthat were ranked “Very High” in terms of overall climate vulnerability. This procedure generated a sample of fourdistricts (Godda, Pakur, Bokaro, and Bilaspur) across two states that we deemed cross-pressured.(b) Coal Plants Cross-PressuredWe used the Global Coal Plant Tracker database to identify the universe of coal plants that are located in India.29
The database contains information on 1,866 coal plants in India—including those that are in operation, have beenretired, have been announced, and are in development. The database also contains information on individual plantcapacity and estimates of each plant’s associated annual carbon dioxide emissions. The locations of coal plants inthe Global Coal Plant Tracker database were webscraped and assigned latitude and longitude information.30
We used geo-coordinates to situate each coal plant within one of the 652 districts in present day India. We foundthat 423 districts in India are not associated with coal production; by contrast, 229 districts have some association
27Coal mining districts vary in intensity of coal employment. The largest district (Dhanbad in Jharkhand) contained 88mines and employed 50,567 workers in 2015, while the smallest district (Narsigpur in Madhya Pradesh) contained 1 mine andemployed 20 workers in 2015.
28These districts are in the states of Jharkhand, Madhya Pradesh, and West Bengal, respectively. We selected districtswith the highest levels of coal employment that were feasible to survey. Dhanbad and West Bardhman have the country’s toptwo levels of coal employment. Sahdol has the country’s fifth highest level of coal employment. We excluded two districts inTelangana state with higher levels of coal employment than Sahdol due to local conflicts that posed a threat to enumeratorsafety.
29See https://endcoal.org/tracker/ (accessed last on October 13, 2017).30For this step in the research process, we are grateful to Johannes Urpelainen, Noah Zucker, and Ricky Clark, who kindly
shared with us the latitude and longitude data of existing coal mines.
6

with coal activity. For each district in the country, we pulled in the total population, rural population, urbanpopulation, and educational achievement indicators from the 2011 India census. We also hand-coded whether adistrict was located on a coast or not and whether it was neighboring a coastal district.
We then combined this district-level plant data with the climate vulnerability index developed by CRIDA(discussed above). We looked at both coal mines and coal plants because we were open to the possibility thatboth types of production could generate policy vulnerability. Our final sample for the Coal Plants Cross-Pressuredgroup includes all districts that have a plant and also rank among the country’s top 140 most climate vulnerabledistricts. In the end, 25 districts across the states of Bihar, Gujarat, Haryana, Jharkhand, Karnataka, MadhyaPradesh, Maharashtra, Rajasthan, Tamil Nadu and Uttar Pradesh were included in the sample.
F Allocations Across All Tax LevelsF.1 US SampleIn the main text, we presented the results of the compensation choices respondents made based on a policy thatwould raise household energy cost by $64. In Figure A.3 we further present results (i.e., average allocations) fromthe lower ($16) and upper ($256) cost levels presented to US participants. The main findings are as follows:
• The average respondent in the “General Population” is least interested in targeted forms of compensationsuch as fiscal transfers or adaptation infrastructure spending and most interested in compensatory optionsthat benefit broad sections of society. They especially favor rebates at high tax levels.
• The average respondent in the “Coal” sample is significantly in favor of direct transfers to people whoseemployment stands to be threatened by climate policy, at all levels of tax.
• The average respondent in the “Cross-Pressured” (coastal/fossil fuel) sample has preferences that lie inbetween those of the “Coal” and the “General Population” samples.
F.2 India SampleFigure A.4 presents the average allocations for the three policy cost levels (|140, |560, and |2,240) presented toIndia participants.
The main findings are as follows:
• While the US “General Population” sample prefers green technology investments at the lower two cost levelsand equal rebates to tax payers at the higher cost level, the average Indian is most interested in greentechnology investments at all cost levels. These investments constitute relatively diffused compensatoryoptions that benefit broad sections of society.
• Like in the US, the average respondent in the “Coal Country” sample is significantly in favor of direct transfersto people whose employment stands to be threatened by climate policy, at all levels of tax.
• The average respondent in the “Cross-Pressured” (coal employment/high ecological vulnerability) samplehas preferences that lie very close to the “General Population” sample. This is possibly driven by the highlevels of concern for climate change in the general population (see Appendix D).
G Multivariate AnalysesHere we analyze each allocation using both sample indicators and a set of individual-level covariates (see Figures A.5and A.6). We use a simple linear regression, though both tobit models as well as fitting all categories with aDirichelet regression (Maier, 2014) produce similar results.
7

General Population
Cross−Pressured
Coal Country
20 25 30 35Average Allocations
Cost
$16
$64
$256
Transfers
General Population
Cross−Pressured
Coal Country
12.5 15.0 17.5Average Allocations
Cost
$16
$64
$256
Infrastructure
General Population
Cross−Pressured
Coal Country
25 30 35Average Allocations
Cost
$16
$64
$256
Investments in Green Energy
General Population
Cross−Pressured
Coal Country
20 25 30Average Allocations
Cost
$16
$64
$256
Equal Rebates
Figure A.3: US average allocations by cost treatment
8

●
●
●
General Population
Cross−Pressured
Coal Country
24 28 32Average Allocations
Cost
●
R 140
R 560
R 2,240
Transfers
●
●
●
General Population
Cross−Pressured
Coal Country
24 26 28 30Average Allocations
Cost
●
R 140
R 560
R 2,240
Infrastructure
●
●
●
General Population
Cross−Pressured
Coal Country
26 30 34 38Average Allocations
Cost
●
R 140
R 560
R 2,240
Investments in Green Energy
●
●
●
General Population
Cross−Pressured
Coal Country
121314151617Average Allocations
Cost
●
R 140
R 560
R 2,240
Equal Rebates
Figure A.4: India average allocations by cost treatment
9

G.1 US ResultsFor basic background covariates, we included self-reported income, age, binary gender, and dummy variables forconservative and moderate ideology (liberals were the excluded category; derived from a 7-point scale). We alsomeasured whether the respondent or someone in their household was employed in the fossil fuel sector. Based on therespondent’s location, we used data on climate change-induced economic damages as a percentage of county incomefrom Hsiang et al. (2017) to include a measure for expected damages. We also included a set of covariates designedto tap climate change risk. This included a self-report on whether the respondent was personally concerned aboutthe impacts of climate change, whether they own or want flood insurance, and whether or not they had smelledsmoke from a forest fire. Finally, we estimated a model with state fixed effects. We estimated a range of modelsin order to explore the stability of the results: 1) base model: sample indicators and basic demographics (age,ideology, gender, income), 2) base model plus fossil fuel employment and county economic damages, 3) base modelplus fossil fuel employment, flood insurance ownership/desire, and whether the respondent has smelled a forestfire, 4) base model plus fossil fuel employment and self-concern about climate change, 5) base model plus fossil fuelemployment, self-concern about climate change, and state fixed effects.
After controlling for various demographics, as well as individual- and county-level variables, the influence of thesample indicators remain relatively stable. The only exception is a more muted effect once state fixed effects areincluded, though this does not completely wash out the effect of support for transfers from those in coal country andsupport for climate vulnerable infrastructure from those in the coastal fossil fuel sample. Amongst other things,controlling for these sample indicators, we also observe support for transfers by those directly employed in thefossil fuel sector. Those not personally concerned about the effects of climate change were less likely to supportinfrastructure spending, and those who had or wanted flood insurance wanted more infrastructure spending.
G.2 India ResultsBackground covariates for our India sample were designed to parallel the US study as closely as possible. We includeself-reported income, age, and gender. In lieu of our US measure of ideology, we include a dummy variable for self-reported vote for the BJP in the most recent Lok Sabha election. Other vote breakdowns produce similar results.Relative to the US sample, we obtained an identical self-report of personal concern about climate change. However,our other indicators of climate change damage and risk were modified to be more applicable to the India sample.We asked participants if their region had experienced a drought in the past two years, and personal concern aboutheat waves in their community. Our models for India are as follows: 1) base model: sample indicators and basicdemographics (age, dummy BJP vote, gender, income), 2) base model plus fossil fuel employment and drought, 3)base model plus fossil fuel employment and concern over heat waves, 4) base model plus fossil fuel employment andself-concern about climate change, 5) base model plus fossil fuel employment, self-concern about climate change,and state fixed effects.
As with the US data, the influence of sample indicators remains stable under different controls. Including statefixed effects does appear to increase the estimated effect of the Coal Country sample on the preferred share oftransfers to fossil fuel workers and investments in green energy. Self-reported risk indicators seem to have limitedeffects. Heat wave concern appears to shift support toward investments in green energy and away from equalrebates.
H Climate Change Vulnerability Only AnalysisIn 2020 we participated in a survey targeting individuals in regions with a high degree of coastal flooding vulnera-bility in California, Florida, Virginia, and New Jersey (see Mildenberger et al., 2021 for more details). Essentially,specific buildings that were in a flood plain as identified by U.S. National Oceanic and Atmosphere AdministrationSea Level Rise maps were identified. Then, within the same locales, buildings that were not in a flood plain wereidentified. Survey invitations were sent by mail to these households and respondents filled out an online surveyand received a small gift card upon completion. In addition, some respondents were randomly assigned to receivea map showing their house on a map. If the house was in a flood plain, this flood plain was shown. This createsfour separate groups. In the survey, which contained questions about climate policy, our exact allocation questionat the $64 level was included.
Figure A.7 reports the average allocation results for these samples. As in other samples, investments in greenenergy get the highest support across all groups. Relevant for our purposes, individuals in flood zones were more
10

Male
Moderate
Conservative
Age
Not Concerned CC Effects
Have/Want Flood Insurance
Smelled Forest Fires
CC−Damages%CountyIncome
FF Employed
Income
Cross−Pressured
Coal Country
−5 0 5 10 15Average Allocations
Model
1
2
3
4
5
Transfers
Male
Moderate
Conservative
Age
Not Concerned CC Effects
Have/Want Flood Insurance
Smelled Forest Fires
CC−Damages%CountyIncome
FF Employed
Income
Cross−Pressured
Coal Country
−7.5 −5.0 −2.5 0.0 2.5Average Allocations
Model
1
2
3
4
5
Climate Vulnerable Infrastructure
Male
Moderate
Conservative
Age
Not Concerned CC Effects
Have/Want Flood Insurance
Smelled Forest Fires
CC−Damages%CountyIncome
FF Employed
Income
Cross−Pressured
Coal Country
−10 0Average Allocations
Model
1
2
3
4
5
Investments in Green Energy
Male
Moderate
Conservative
Age
Not Concerned CC Effects
Have/Want Flood Insurance
Smelled Forest Fires
CC−Damages%CountyIncome
FF Employed
Income
Cross−Pressured
Coal Country
−5 0 5 10Average Allocations
Model
1
2
3
4
5
Equal Rebates for all Citizens
Figure A.5: Multivariate analyses of allocations in the United States. Separate models are color codeddifferently. Model with state fixed effects excludes the state estimates.
11

●
●
●
●
●
●
●
●
Male
Did Not Vote BJP
Age
Not Concerned CC Effects
Heat Waves
Drought
FF Employed
Income
Cross−Pressured
Coal Country
−15 −10 −5 0 5Average Allocations
Model
●
1
2
3
4
5
Transfers
●
●
●
●
●
●
●
●
Male
Did Not Vote BJP
Age
Not Concerned CC Effects
Heat Waves
Drought
FF Employed
Income
Cross−Pressured
Coal Country
−20 −10 0Average Allocations
Model
●
1
2
3
4
5
Climate Vulnerable Infrastructure
●
●
●
●
●
●
●
●
Male
Did Not Vote BJP
Age
Not Concerned CC Effects
Heat Waves
Drought
FF Employed
Income
Cross−Pressured
Coal Country
−10 0 10 20 30 40 50Average Allocations
Model
●
1
2
3
4
5
Investments in Green Energy
●
●
●
●
●
●
●
●
Male
Did Not Vote BJP
Age
Not Concerned CC Effects
Heat Waves
Drought
FF Employed
Income
Cross−Pressured
Coal Country
−20 −15 −10 −5 0 5Average Allocations
Model
●
1
2
3
4
5
Equal Rebates for all Citizens
Figure A.6: Multivariate analyses of allocations in India. Separate models are color coded differently.Model with state fixed effects excludes the state estimates.
12

likely to support adaptation spending compared to individuals that lived near but not directly in a flood zone.Providing a map to respondents increased this effect. These results hold if we control for a range of covariates.
Non−flood area/Map
Non−flood area/No Map
Flood area/Map
Flood area/No Map
10 20 30 40 50Average Allocations
Allocation Type
Climate Vulnerable Infrastructure
Compensation to Coal/Oil Workers
Equal Rebates for all Citizens
Investments in Green Energy
cost=$64
Figure A.7: US preferences for allocation purposes of climate policy funds, by climate change vulnerabilitysamples. This figure denotes how respondents allocated funds raised from a policy increasing the averagemonthly household energy costs by $64 across four spending options. Symbols represent average allocationand lines represent 95% confidence intervals.
Figure A.8 takes the coastal flood sample that did not receive the experimental map treatment and plots itagainst the samples analyzed in the paper. We see that this group prefers higher levels of adaptation spendingcompared to all three groups.
Coastal flood area
General Population
Cross−Pressured
Coal Country
20 30 40Average Allocations
Allocation Type
Climate Vulnerable Infrastructure
Compensation to Coal/Oil Workers
Equal Rebates for all Citizens
Investments in Green Energy
cost=$64
Figure A.8: Combining main text’s samples with non-map flood vulnerable/non-map condition from Fig-ure A.7. Symbols represent average allocation and lines represent 95% confidence intervals.
I Willingness to Pay for Four PoliciesIn our primary analysis, we asked respondents to “divide the dollar” and allocate spending between four policyoptions. In a follow-up survey experiment, conducted on a nationally representative sample of US adults viaQualtrics in Fall 2020, we fielded an alternate version of the survey question intended to adjudicate individuals’absolute preferences and willingness to personally support each of the four policy choices. Respondents wererandomly presented only one of the four policy options. They were informed that the policy would raise theaverage cost per household by $64 per month, and were asked whether they were personally willing to pay thisaverage monthly cost to support the policy.31 The randomized design allows us to study absolute preferences foreach policy lever.
31The question was worded as follows, with experimental treatments in bold:
13

Table A.3 presents the results of our analysis. We find that at the $64 monthly cost level, entirely in line withthe rankings from our allocation exercise, green investments are the most supported policy lever (43% support),followed by equal rebates (39% support), transfers (37% support), and infrastructure investments (35% support).These findings are informative as they point to differences in absolute levels of support for the policies that mirrorthe allocation exercise.
At the same time, it is also important to note that each of the policies have absolute baseline levels of support;even when respondents are not forced to “divide the dollar” and allocate funds to each policy, a significant portionstill supports paying taxes to support each of the policies. Following Bergquist, Mildenberger and Stokes (2020),combining several dimensions of policies could increase support even more (which is consistent with the fact thatin our divide the dollar exercise, respondents rarely allocated everything to one category).
Because this survey was nationally representative, we did not get respondents from our coastal fossil fuel orcoal country regions.
$64Transfers (n=446) Infrastructure (496) Green Investment (450) Redistribute (469)
Support 37% 35% 43% 39%Oppose 63% 65% 57% 61%
Table A.3: Willingness to Pay to Support Individual Climate Policies
J Allocations for a Chosen PriceThe spending allocation tasks presented in the main text were set on three a priori household cost levels. In aseparate section of our survey, we allowed the respondents to choose their own price of the government policy, inorder to investigate (a) if and how many respondents would not want any cost and hence choose a price of zero,and (b) how congruent the ranking of the compensation and investment options is compared to the ranking in ourmain results. Just like in the main tasks, the total proportion of the policy spending had to add up to 100%.
J.1 USOnly a small fraction of the US respondents said they would rather not have any policy at any cost. Specifically:• 99 Coal Country respondents want to pay $0 (19% of this sample); median chosen cost is $16 ($20 if we
exclude the 0s)
• 191 Cross-Pressured respondents want to pay $0 (13% of this sample); median chosen cost is $25 ($35 if weexclude the 0s)
• 440 General Population respondents want to pay $0 (12% of this sample); median chosen cost is $20 ($25 ifwe exclude the 0s)
When individuals could allocate across the categories when they could choose the cost, did their allocations mirrortheir previous elections? For these individuals, the Pearson correlation between the ranking choices with a ‘forced’cost ($64) and a chosen cost (above $0) are positive and strong:
“To combat climate change, the use of fossil fuels like coal and oil will need to be reduced. To reduce coal and oil production,the United States government is considering a policy to raise the costs of fossil fuels. This policy will affect average Americansbecause they currently use energy that comes from fossil fuels. Continuing to use these sources of energy will lead to higherhousehold energy costs for average Americans. Suppose the policy implemented by the government raises the average costper household by $64 per month.
If money raised by this policy is used to compensate workers in the coal and oil industries who will lose jobsdue to the policy / help individuals whose homes and properties will be harmed by climate change, such asthose who live in coastal areas / invest in forms of renewable energy like solar or wind energy / distributethe money equally to all citizens in order to offset the higher costs that they will have to pay for energy
Would you be willing to pay $64 more on average per month in energy costs and support the policy or would you opposethe policy?”
14

• Compensation to vulnerable coal/oil workers: r=0.69
• Infrastructure investments to climate vulnerable: r=0.53
• Investments in green energy: r=0.74
• Equal rebates for all citizens: r=0.65
These strong correlations are not driven by one particular sample but they are strong across the samples (e.g.regarding compensation to vulnerable workers, the Pearson correlations in Coal Country, Cross-Pressured andGeneral Population are respectively .83, .69 and .65; for infrastructure investments they are respectively .55, .51and .53; for green energy investments, .66, .73 and .75; for equal rebates, .60, .67 and .65).
J.2 IndiaAs with the US sample, only a small fraction of respondents in India opted for no policy at any cost. Specifically:
• 167 Coal Country respondents want to pay |0 (11% of this sample); median chosen cost is |100 (stays at|100 if we exclude the 0s)
• 99 Cross-Pressured respondents want to pay |0 (6% of this sample); median chosen cost is |200 (|250 if weexclude the 0s)
• 299 General Population respondents want to pay |0 (14% of this sample); median chosen cost is |140 (|200if we exclude the 0s)
There is a strong, positive Pearson correlation in the India sample between ‘forced’ cost allocations (|560) andchosen cost allocations. For all four categories the correlation within the India sample is slightly stronger relativeto the US.
• Compensation to vulnerable coal/oil workers: r=0.72
• Infrastructure investments to climate vulnerable: r=0.59
• Investments in green energy: r=0.82
• Equal rebates for all citizens: r=0.67
The India sample similarly exhibits strong cross-sample correlation. For compensation to vulnerable workers, thePearson correlations in Coal Country, Cross-Pressured and General Population are respectively .73, .66 and .70;for infrastructure investments they are respectively .68, .69 and .44; for green energy investments, .82, .84 and .78;for equal rebates, .66, .72 and .64.
K Open-Ended ResponsesIn our surveys, we invited all the respondents in our US and India samples to explain why they ranked their firstpolicy choice in an open-ended manner. Specifically, all our respondents were asked, “you previously told us whatyou think would be the most important way for the money to be spent; please take some time now to tell us whyyou made the choice you did.” Respondents then provided justifications, many of which touched upon identifiablethemes.
To navigate the open-ended responses and their themes in a systematic manner, we performed a manualqualitative coding of their content. A researcher read each response, and then coded in a binary fashion a numberof variables. A second coder provided inter-coder reliability checks for a subset of data and independently codedthe small subset of responses that were deemed difficult to classify. We first describe the binary variables that,irrespective of the favorite policy, refer to issues of community. We then move to more granular policy-specificvariables.
15

K.1 Community Themes AnalysisThe researcher recorded if, regardless of their favorite spending option, an individual defended their response bymentioning a ‘community’-related theme that justified their preferred policy. For ‘community’ the key criteria iswhether the respondent is alluding to some targeted community-based rationales (as opposed to individual-basedrationales). For example, a reference to implications for families or older generations in a town/state would becoded as a 1 in this variable. A reference to themselves only or, e.g., the general labour force, would not have thatconnotation, and would be coded as a 0.K.1.1 ResultsHere, we report the percentage of open-ended responses that covered ‘community’ themes (and therefore wereassigned a value of 1 in our coding of the ‘community’ variable) in the US and India by sample. We find that in theUS, 32% of Coal Country respondents mention themes related to community issues. In India, 18% of Coal Countryrespondents justify their favorite policy choice with community themes. Like our quantitative results suggested, theGeneral Population participants in both countries are the ones whose open-ended responses mention communitythemes the least (4% and 10% in US and India, respectively), while Cross-Pressured responses are in between (9%and 12% in US and India, respectively).
The results provide complementary strength to our argument that in Coal Country, the preferred policy choice—and thus the support for compensatory transfers to vulnerable workers in polluting sectors—is driven by a sensethat this will help communities (or, vice versa, that without those policies entire communities will be vulnera-ble). Additionally, the qualitative responses indicate that Coal Country respondents are more likely than otherrespondents to present a justification based on identity among the reasons for why they chose their top-rankedpolicy.K.1.2 Illustrative QuotesTo give a more vivid sense of the themes of some of the Coal Country respondents and illustrate how they referto issues related to community and identity, we report here a number of selected quotes. Many of the US CoalCountry responses relate compensatory transfers to issues related to children’s education in the local community(quote #989) and poor people and working families (quote #2077):
# 989: “In WV we have to many mountains for the solar system to work properly. The coal minerslose their jobs, they can not feed their families and they are always the lasts ones to get help. Also myhusband is a disabled coal miner. Also the government doesn’t care about the poor people that has topay those increases. Most people are struggling now just to make ends meet at the end of the month.In most families both parents are working and they don’t have time for their children and that’s why wehave so many drop outs in school. We need to educate these children that is our future generations tobe able to make decisions and work with other come up with a solution to our problems that no one hasto suffer in the process.”
# 2077: “I live in coal country. I see all the coal miners out of jobs due to all the regulations on coalnow. There is not enough jobs in the area to sustain the men and they have no other training to doanother job. Many are too old to go to college and try another career. Some are not smart enough forcollege and would not make the money they made in the coal mines even if they did. I see the familieslosing their homes, cars, and dignity when they have lost their jobs in the mines and can’t find another.I support sending/spending any and all money to help them get training in another field that will paythem close to what they are used to making in the mines. It’s hard to go from making great money andhaving it all to nothing and expected to live that way because of some big shot who sits in an office andmakes more money doing pretty much nothing than those who risk their lives underground everyday”
Similarly, in India, the quotes—which are distinctively shorter than the US quotes due to the translation of theresponses—indicate that Coal Country respondents chose more predominantly compensatory transfers to vulnerable
16
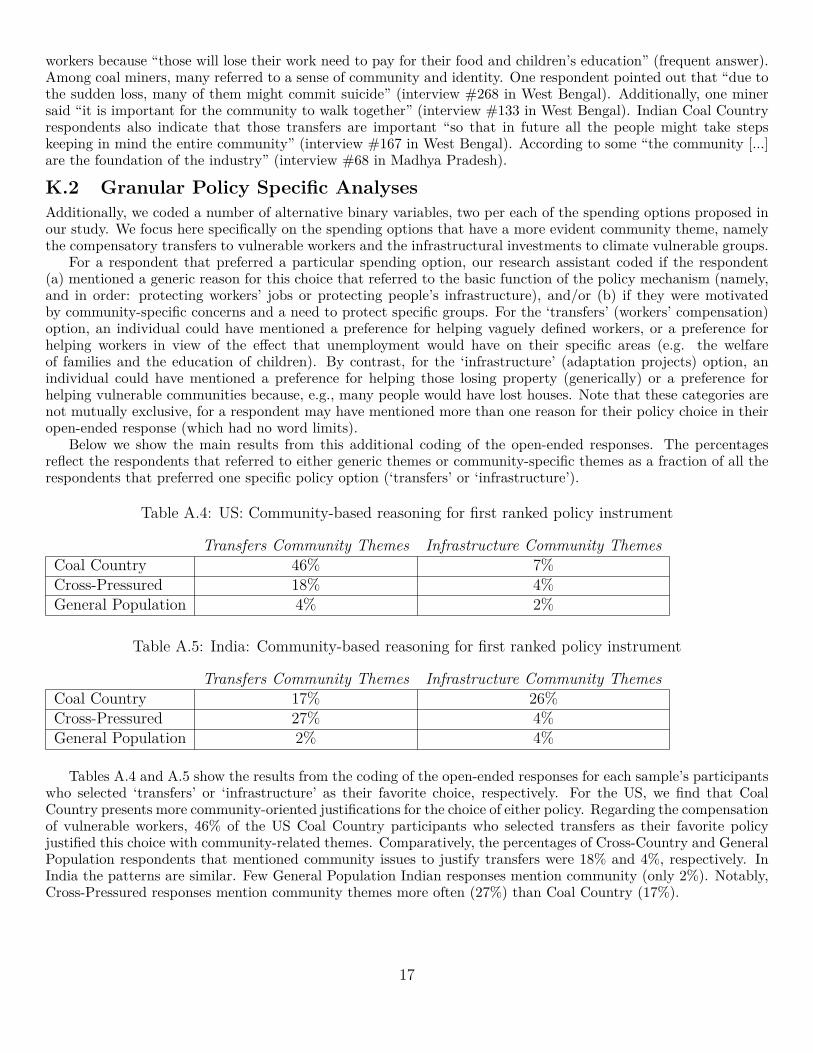
workers because “those will lose their work need to pay for their food and children’s education” (frequent answer).Among coal miners, many referred to a sense of community and identity. One respondent pointed out that “due tothe sudden loss, many of them might commit suicide” (interview #268 in West Bengal). Additionally, one minersaid “it is important for the community to walk together” (interview #133 in West Bengal). Indian Coal Countryrespondents also indicate that those transfers are important “so that in future all the people might take stepskeeping in mind the entire community” (interview #167 in West Bengal). According to some “the community [...]are the foundation of the industry” (interview #68 in Madhya Pradesh).
K.2 Granular Policy Specific AnalysesAdditionally, we coded a number of alternative binary variables, two per each of the spending options proposed inour study. We focus here specifically on the spending options that have a more evident community theme, namelythe compensatory transfers to vulnerable workers and the infrastructural investments to climate vulnerable groups.
For a respondent that preferred a particular spending option, our research assistant coded if the respondent(a) mentioned a generic reason for this choice that referred to the basic function of the policy mechanism (namely,and in order: protecting workers’ jobs or protecting people’s infrastructure), and/or (b) if they were motivatedby community-specific concerns and a need to protect specific groups. For the ‘transfers’ (workers’ compensation)option, an individual could have mentioned a preference for helping vaguely defined workers, or a preference forhelping workers in view of the effect that unemployment would have on their specific areas (e.g. the welfareof families and the education of children). By contrast, for the ‘infrastructure’ (adaptation projects) option, anindividual could have mentioned a preference for helping those losing property (generically) or a preference forhelping vulnerable communities because, e.g., many people would have lost houses. Note that these categories arenot mutually exclusive, for a respondent may have mentioned more than one reason for their policy choice in theiropen-ended response (which had no word limits).
Below we show the main results from this additional coding of the open-ended responses. The percentagesreflect the respondents that referred to either generic themes or community-specific themes as a fraction of all therespondents that preferred one specific policy option (‘transfers’ or ‘infrastructure’).
Table A.4: US: Community-based reasoning for first ranked policy instrument
Transfers Community Themes Infrastructure Community ThemesCoal Country 46% 7%Cross-Pressured 18% 4%General Population 4% 2%
Table A.5: India: Community-based reasoning for first ranked policy instrument
Transfers Community Themes Infrastructure Community ThemesCoal Country 17% 26%Cross-Pressured 27% 4%General Population 2% 4%
Tables A.4 and A.5 show the results from the coding of the open-ended responses for each sample’s participantswho selected ‘transfers’ or ‘infrastructure’ as their favorite choice, respectively. For the US, we find that CoalCountry presents more community-oriented justifications for the choice of either policy. Regarding the compensationof vulnerable workers, 46% of the US Coal Country participants who selected transfers as their favorite policyjustified this choice with community-related themes. Comparatively, the percentages of Cross-Country and GeneralPopulation respondents that mentioned community issues to justify transfers were 18% and 4%, respectively. InIndia the patterns are similar. Few General Population Indian responses mention community (only 2%). Notably,Cross-Pressured responses mention community themes more often (27%) than Coal Country (17%).
17

K.3 Additional Evidence from India Coal Miners SampleFor the coal miner sub-sample in India, enumerators gathered open-ended responses to several questions central toour analysis. Morsel, the firm coordinating this sample, translated these qualitative responses to English. In thisprocess, they condensed each individual’s response into a one or two sentence distillation focused on a main theme.
In these face-to-face interviews with coal miners, the miners were asked why they answered the way the did afterthey had indicated whether they preferred community over individual transfers to address job loss in the fossil fuelsindustry. In this sub-sample, a majority emphasized a motivation along the lines of everyone in the communitybeing linked. At a minimum, their preference was motivated by fairness and compensation to all affected:
• “It is just not about an individual’s loss but loss for the whole community [WB 90].”
• “Communities depend upon industries just as much as individuals do [JH 139].”
• “They all depend on each other economically so they all should be given some amount of money[WB 235].”
• “The entire community will fall into debt trap otherwise [WB 240].”
Some miners seem to have been motivated less by fairness and more by the communal and family bonds theyexperience in the mining community:
• “All the families are linked and all are poor [JH 330].”
• “Everyone need to be paid, as they live in close fellowship [WB 164].”
• “The impact of a job loss if never limited to an individual only [JH 154].”
A third notable group emphasized the role the community had played in sustaining miners in their area. For them,a reasonable compensation should take into account not just present economic impact, but the loss of generationsof communal investment in the industry:
• “Without the community the individual would not have survived in the industry [MP 49].”
• “Individuals can survive if the community does [JH 136].”
• “Community should get it because they are the foundation of the industry [MP 68].”
• “Everyone has a stake in the industry [JH 9].”
Of the 474 miners who chose community over individual transfers, 312 expressed a sentiment along the lines ofeveryone needing help and everyone being connected. The next most common sentiment was a fear of falling intopoverty. On the other hand, of the 376 miners who chose individual transfers, a near majority (180) emphasized afear of falling into poverty over connection or communal linkage.
L Identity and Community Additional AnalysesWe present additional findings based on the questions regarding community and identity. We explore whether theoverall differences in support for community transfers and the protection of identities documented in the manuscripthold when we split apart the samples and control for the other relevant variables. In Tables A.6 (US) and A.7 (India)we estimate a regression model for each sample and include a dummy variable indicating whether an individual isemployed in the fossil fuel industry along with the set of controls.
For the US, we find that the difference between fossil fuel workers and non-fossil fuel workers remains smallfor Coal Country and Cross-Pressured samples. Though as noted in Appendix K, community themes were moresalient in the open-ended explanations in Coal Country. In contrast, fossil fuel workers in the General Populationsamples more starkly prefer direct compensation over community-based schemes. For the question on protectingidentity, we also recover similar results as reported in the body of the paper. In the India regressions, we seesmall differences between fossil fuel workers and non-fossil fuel workers across samples, in line with the findingdocumented above that the major differences in India are cross-sample.
18

Tabl
eA
.6:
US
Res
ults
BySa
mpl
e
Dep
ende
ntva
riab
le:
Com
mun
ityO
ver
Indi
vidu
alTr
ansfe
rsPr
otec
ting
Job
Iden
tity
(Coa
lCou
ntry
)(C
ross
-Pre
ssur
ed)
(Gen
eral
Popu
latio
n)(C
oalC
ount
ry)
(Cro
ss-P
ress
ured
)(G
ener
alPo
pula
tion)
Foss
ilFu
elEm
ploy
men
t−
0.09
1−
0.09
1∗∗−
0.17
2∗∗0.
179∗∗
0.08
5∗∗0.
264∗∗
(0.0
48)
(0.0
30)
(0.0
33)
(0.0
40)
(0.0
27)
(0.0
31)
Age
−0.
001
0.00
2∗0.
001∗∗
0.00
02−
0.00
3∗∗−
0.00
2∗∗
(0.0
02)
(0.0
01)
(0.0
01)
(0.0
01)
(0.0
01)
(0.0
005)
Gen
der:
Mal
e0.
004
−0.
008
−0.
038∗
−0.
109∗∗
−0.
031
0.01
0(0
.047
)(0
.028
)(0
.017
)(0
.039
)(0
.025
)(0
.016
)
Educ
atio
n:H
igh
0.01
1−
0.00
80.
009
−0.
017
−0.
134∗∗
−0.
071∗∗
(0.0
48)
(0.0
29)
(0.0
18)
(0.0
39)
(0.0
26)
(0.0
17)
Ideo
logy
:C
onse
rvat
ive
−0.
028
−0.
039
−0.
089∗∗
0.46
2∗∗0.
267∗∗
0.39
9∗∗
(0.0
63)
(0.0
40)
(0.0
21)
(0.0
52)
(0.0
36)
(0.0
19)
Ideo
logy
:M
oder
ate
−0.
049
0.02
4−
0.01
00.
297∗∗
0.10
3∗∗0.
254∗∗
(0.0
65)
(0.0
41)
(0.0
21)
(0.0
53)
(0.0
37)
(0.0
19)
Con
stan
t0.
684∗∗
0.50
6∗∗0.
550∗∗
0.37
8∗∗0.
695∗∗
0.47
9∗∗
(0.0
93)
(0.0
50)
(0.0
31)
(0.0
76)
(0.0
45)
(0.0
29)
Obs
erva
tions
466
1,30
23,
538
466
1,30
23,
540
∗ p<
0.05
;∗∗p<
0.01
Not
e:Fo
rth
e”C
omm
unity
Ove
rIn
divi
dual
Tran
sfer
s”de
pend
entv
aria
ble,
com
mun
itypr
efer
ence
isco
ded
as‘1
,’an
din
divi
dual
pref
eren
ceis
code
das
‘0.’
19

Tabl
eA
.7:
Indi
aR
esul
tsBy
Sam
ple
Dep
ende
ntva
riab
le:
Com
mun
ityO
ver
Indi
vidu
alTr
ansfe
rsPr
otec
ting
Job
Iden
tity
(Coa
lCou
ntry
)(C
ross
-Pre
ssur
ed)
(Gen
eral
Popu
latio
n)(C
oalC
ount
ry)
(Cro
ss-P
ress
ured
)(G
ener
alPo
pula
tion)
Foss
ilFu
elEm
ploy
men
t−
0.06
2∗0.
070
0.01
80.
039
0.02
9−
0.05
9(0
.031
)(0
.041
)(0
.044
)(0
.027
)(0
.041
)(0
.042
)
Age
−0.
002∗
−0.
002
−0.
002∗
0.00
20.
0003
−0.
0001
(0.0
01)
(0.0
01)
(0.0
01)
(0.0
01)
(0.0
01)
(0.0
01)
Gen
der:
Mal
e0.
055
0.01
00.
012
0.09
5∗∗−
0.00
5−
0.01
4(0
.032
)(0
.025
)(0
.024
)(0
.028
)(0
.025
)(0
.023
)
Educ
atio
n:H
igh
0.01
30.
008
0.05
0∗−
0.08
9∗∗−
0.01
2−
0.06
8∗∗
(0.0
27)
(0.0
25)
(0.0
23)
(0.0
23)
(0.0
25)
(0.0
22)
Did
Not
Vote
for
BJP
−0.
012
0.05
1∗0.
007
0.04
7∗−
0.02
70.
006
(0.0
26)
(0.0
26)
(0.0
23)
(0.0
23)
(0.0
26)
(0.0
22)
Con
stan
t0.
611∗∗
0.67
6∗∗0.
543∗∗
0.49
4∗∗0.
654∗∗
0.66
4∗∗
(0.0
71)
(0.0
57)
(0.0
52)
(0.0
62)
(0.0
57)
(0.0
50)
Obs
erva
tions
1,52
21,
523
1,98
91,
537
1,53
12,
027
∗ p<
0.05
;∗∗p<
0.01
Not
e:Fo
rth
e”C
omm
unity
Ove
rIn
divi
dual
Tran
sfer
s”de
pend
entv
aria
ble,
com
mun
itypr
efer
ence
isco
ded
as‘1
,’an
din
divi
dual
pref
eren
ceis
code
das
‘0.’
20

M Community and Identity LiteratureExisting literature indicates strong group-based affinities in coal-producing regions in both the United States andIndia. Within the coal communities in both countries, coal is often equated with a sense of economic security,shared community, working-class solidarity, masculine pride, and national power (Bell, 2009; Bell and Braun, 2010;Bell and York, 2010; Lahiri-Dutt, 2014; Scott, 2010). Such popular imaginations create a strong coal identitybased on perceived solidarity and a shared interest in protecting in-group status. This section provides a review ofpublished work from interdisciplinary sources on the nature of coal identities in the two countries.
In the US, coal workers have historically maintained a strong shared identity based on their employment inthe coal industry. These communities have tended to be dependent on coal mining over multiple generations, asmany miners note that their grandfathers’ or even great-grandfathers’ generation had been employed in the miningindustry (Carley, Evans and Konisky, 2018; Duncan, 1999, 31-32).32 The influence of coal also extends beyondthose immediately employed by the industry (Bell and York, 2010). As Carley, Evans, and Konisky (2018, 136)note about residents of coal country:
The historic roots of coal not only steer individuals toward the profession but also shape the broaderculture within these communities. Scholars have identified previously that a strong sense of identityto extractive industries is common, and we found significant evidence of coal culture in Appalachia.Coal was frequently framed as the common bond–or identity–that held the entire community together.This sense of identity is amplified by strong attachments to location, landscape, and personal networks,which not only makes it challenging for individuals to generate a conception of self that transcends coal,but also makes it particularly difficult psychologically for individuals that need to leave Appalachia fornew employment opportunities.
Indeed, the transition away from coal triggers a “dual crisis” in coal communities—an existential threat fromthe loss of an industry and an onslaught on their identity and pride as coal miners. In some rural communitiesin Western Colorado, the coal industry has long served as the primary source of employment and tax revenueand the pillar of community pride (Mayer, Smith and Rodriguez, 2020). During his fieldwork in Shale Countyin Appalachia, Lewin (2019, 56) discovered that most residents in the region believed that mining offered “theonly real opportunity for gainful employment in the county,” and that community organizations depended on thetaxation of, and donations from, coal companies. The Shale County community has historically constructed aheroic image of the miner as an embodiment of the region’s cherished values: “independence, self-sufficiency, hardwork, devotion to family, selflessness, and dedication to community” (Lewin, 2019, 58). The decline of the miningindustry, however, has forced residents onto welfare and undermined their shared pride and solidarity.
Aside from their employment in the coal industry, coal workers’ sense of perceived similarity also originatesfrom their common ethnic and regional identities. The Appalachian region, one of the main coal-producing areas inthe U.S., has been home to Scottish and Irish immigrant communities since the 18th century (Douglas and Walker,2017). Due to its geographical isolation and lack of arable land, the region did not attract slave plantations andthus remained relatively culturally homogeneous (Douglas and Walker, 2017). Such homogeneity contributed to animage of white landscapes in rural America and a racial narrative of white settlers making a living in the emptyAmerican heartland (Holloway, 2007; Kojola, 2019; see also Trotter (2015) for how coal identities cross racial linesin parts of coal country).
Coal extraction is also deeply linked with American nationalist imaginations, as natural resources often cometo embody the nation and coal-mining as a pathway towards citizenship (Kojola, 2019; Whitehead, Jones andJones, 2007). In American popular culture, European immigrants to the rural heartland are often depicted as
32Duncan (1999) presents a wealth of ethnographic interview evidence from coal miners in Appalachia to buttress this claim,e.g.: “Whatever I’ve made had gone back into this country. I’ve got five kids, and they all live here. And I suspect theirchildren will live here” (24); “Most of our key people at our operation have been with Daddy since they were young, so thereis a bond there with them and their families” (29); “These coal mines, it’s usually generation after generation, father to son,uncle, nephew” (31); “I think it’s unique here in that you’re either exposed to the mining industry, which is high skill, ornothing. Or welfare. We don’t have a lot of work that’s in between the two...I think it’s apparent to everybody that we coulduse something other than coal. But I wonder if you could get five hundred people that would work for a wage lower than theminer? Maybe they would just say, “The heck with it, I’ll draw welfare,” and maybe get a bit less and not work...Really, coalis about all we got” (58).
21

hard-working individuals striving to realize their “American dream” (Leap and Thompson, 2018). Scott (2010,143, 168) describes how coal-rich Appalachia contributes to the cultural construction of the American nation:
The patriotic sacrifices of miners constitute the terms for Appalachia’s membership in the Americannation... Appalachia’s marginal status as a natural resource colony ironically provides coalfield com-munities a way to claim a core national identity. The hardships of mining can be read as evidence oftheir patriotic devotion to America and their central role in the national economy.
The unionization of coal workers provides yet another anchor for their shared identity. Residents of WestVirginia, for instance, have a deeply rooted identity linked to “Union People,” as the union served to unite thecoal workers around a collective identity, providing them economic security and a sense of respect in the broadercommunity (Bell, 2009). The denial of these “Union People” to work for a community coal mine meant not only aloss of employment but also a loss of identity and a breakdown of the community’s social fabric (Bell, 2009).
For male coal workers—the vast majority of those working in mines—coal employment is often tied to a notionof hegemonic masculinity. In the words of Maggard (1994, 30), masculinity in the coal camps has been equatedwith “a willingness to work in dangerous conditions.” Beckwith (2001, 310) adds that the mining industry incertain regions, such as the Central Appalachian coal camps, has been so male-dominated that “miner” and “male”identities have become virtually exchangeable. Fearing the loss of social status and masculine pride, men in thesecoal regions have been more reluctant to speak out about the consequences of irresponsible mining practices. Asan environmental activist in Central Appalachia puts it, “Men were the coal miners, so it’s a little harder for themto let go of that sense of, you know, this is how I put cornbread on the table” (Bell and Braun, 2010, 806).
The collective identities of coal communities have also been exploited by the coal industry to mobilize pop-ular opposition to environmental regulation. In West Virginia, local coal companies have supported the (faux)“grassroots” organization “Friends of Coal” in an attempt to construct an “industry ideology” that centers theWest Virginian identity on coal production (Bell and York, 2010). In a similar vein, coal producers in Central Ap-palachia promote a narrative of shared coal heritage that portrays themselves as guardians of the region’s culturalheritage (Lewin, 2019). These narratives induce local residents to “embrace - and even identify with - coal notjust as a market of community identity, but as a total ‘way of life”’ (Lewin, 2019, 54). The industry’s efforts toconstruct what Bell and York (2010) call a “community economic identity” explain how the coal industry, despiteits diminishing economic importance, still occupies a central position in regional identities and manages to mobilizepopular support for its preservation.
In addition to their resistance to environmental movements, residents of coal-producing regions have turnedto populist politicians in the hope of “bringing back the mines” and the “way of life” associated with the miningindustry (Kojola, 2019). Lewin (2019) argues that Appalachia’s “subordinate relationship” to the rest of the countryhas conditioned locals to feel like they are abandoned and devalued by the federal government. Such perceptionsfuel pro-industry, pro-fossil fuel views that resonate with the rhetoric of right-wing populist leaders (Lewin, 2019).At the same time, coal communities have grown increasingly suspicious of what they see as a liberal “attack” oncoal and the “liberal political agenda” to replace fossil fuels with renewable energy (Olson-Hazboun, 2018).
The loss of mining triggers a keen perception of an existential threat among Indian coal miners. Two factorscontribute to their greater vulnerability. First, a high percentage of Indian coal workers are employed informallyand lack the social benefits of secure employment. Siddiqui and Lahiri-Dutt (2015) estimate that in 2015, more than42%, or an estimated 1.4 million, of mining and quarrying households are “marginal,” earning irregular incomesand lacking access to services and utilities. In Ramgarh, one of the top five coal-producing districts in Jharkhandstate, one in four households depends economically on local coal mining, yet only 7% of households have a formaljob in the industry (Bhushan, Banerjee and Agarwal, 2020, 11). Lahiri-Dutt (2003) estimates that in the coaldeposits in the Raniganj coalbelt, over 500,000 people are employed in the illegal mining sector, surviving on amixture of coal scavenging and subsistence farming.
Second, the emergence of the coal industry destroyed local environments, significantly reducing alternativeemployment opportunities in the agricultural sector. In the Barjora colliery area of West Bengal, participation inthe agricultural sector has declined from 62% in the pre-mining period to merely 3% in the post-mining period(Banerjee and Mistri, 2019). As of 2019, up to 55% of the residents in the area were employed in the mining industry(Banerjee and Mistri, 2019). Similarly, in the Ib Valley coalfield of Western Odisha, 51% of local residents dependon mining as their primary source of income (Das and Mishra, 2015, 86). This is due to the common practice amongIndian coal mining companies of acquiring farmland and and then offering mining jobs to the former landowners
22

(Bhushan, Banerjee and Agarwal, 2020, 95).33 Aggarwal (2020) argues that “India is a coal-dependent economyand is home to many towns and cities whose entire economy is directly or indirectly based on coal...highlightinghow deeply connected to coal, the economy of such regions is.” The closure of coal mines in India, Aggarwal (2020)notes, will need to accommodate social and economic disruptions, with new forms of economic opportunities andinfrastructure being made available “to support and enhance the livelihoods of those dependent on coal.”
The economic vulnerability of India’s coal communities is compounded by the government’s lack of planning inthe transition away from coal. The socio-economic consequences have been especially severe in older coal miningregions such as Jharkhand, where many mines have closed down due to unprofitability (Bhushan, Banerjee andAgarwal, 2020). As of 2020, 106 out of 203 leased mines in Jharkhand were temporarily or permanently closed andthe percentage of closed mines was even higher in certain districts (Department of Mines and Geology, 2020). Allfive mines were closed in Jamtara as well as 16 out of the 25 mines in Bokaro (Bhushan, Banerjee and Agarwal,2020, 44). The closure of coal pushes coal communities further into poverty. For skilled workers, alternativejob opportunities in the region are limited, and for unskilled and uneducated laborers, there are few fallbackemployment options (Bhushan, Banerjee and Agarwal, 2020, 95). Small businesses and local retailers also sufferfrom mine closures, as many developed initially due to the emergence of coal mining (Bhushan, Banerjee andAgarwal, 2020, 96). Local residents also expressed concern that the economic fallout from mine closures could leadto a spike in crime and substance abuse, undermining the region’s social stability (Bhushan, Banerjee and Agarwal,2020, 96).
The tremendous vulnerability of India’s coal communities has amplified a strong economic identity in the coalindustry. In the words of Bhushan, Banerjee, and Agarwal (2020, 95), the “predominant perception of dependenceon coal for income makes it impossible for most people in the mining areas to imagine a future without coal mining.”A survey of Ramgarh residents demonstrates a “palpable sense of dependence” on coal, with 77% of locals statingthat coal mining contributed to their income in “some way”; this “reflects a ‘coal-centered’ life that has evolved inthese old mining regions over decades and the complex economic fabric it has helped create” (Bhushan, Banerjee andAgarwal, 2020, 87). Similar to American coal communities, many Indian coal workers report that older generationsof their family have been employed in the coal industry and many even directly inherited their jobs from theirfathers (Bhushan, Banerjee and Agarwal, 2020, 95). The district’s coal-centered economic identity extends beyondindividuals working directly in coal mining. Those gathering and selling coal, laborers who transport slurry, andthose engaged in leveling and loading also expressed a strong economic dependence on the coal industry (Bhushan,Banerjee and Agarwal, 2020).
Coal miners in India also associate their work with feelings of nationalist pride as well as working-class solidarity.Lahiri-Dutt (2014), in her work on the Indian “coal nation,” demonstrates that coal played a vital role in helpingIndia form a post-colonial identity. While coal mining was historically associated with the colonial state, after1947, as the newly independent state exerted control over its natural resources, the industry assumed a new roleas a symbol of national independence and modernization (Lahiri-Dutt, 2014). Coal mining created a workingclass of migrants and indigenous laborers and subsequently gave birth to the trade union movement, which unitedworkers against the exploitation of coal companies (Lahiri-Dutt, 2016). The nationalization of coal mining in 1971further fostered an image of a “national coal” identity, which is seen to have played a pivotal role in the country’sindustrialization (Lahiri-Dutt, 2016).
Though concerns for community pride and shared identity perhaps amplified workers’ demands to retain themining industry, the main driving force behind coal communities’ pro-mining activism is their perception of anexistential threat from mine closures. In Naginimora, a town in the northeastern state of Nagaland, local residentshave long resisted the state government’s takeover of their mining rights. A Konyak landowner explains why localsrejected the state government’s offers of employment in exchange for their land:
They promise us employment and other benefits, but we have none of that. How can they take landfrom people who are uneducated and cannot read and write? We have to protect it, so we have allsaid no to the government’s move. (Kikon, 2019, 120)
McDuie-Ra and Kikon (2016, 263-264) discusses how coalfield rights have remained within tribal community in-stitutions and how members of tribal groups have resisted government coal mining bans. In the words of a female
33Such practices have at times triggered local resistance to coal extraction, particularly among the indigenous Adivasi peoplewho inhabit much of the country’s coal-rich jungle areas. See also: Banerjee and Mistri, 2019; Dasgupta, 2020; Lahiri-Dutt,2003; Padel and Das, 2010; Oskarsson, 2018.
23

coal trader,
I told the minister, you have come to this village for this first time and then order us to stop coalmining...you are coming to stop what is being produced from our own farm—the coal is coming outfrom our own land. It is not your land, it is our land and we will not allow you to ban it.
For residents of coal-rich regions, coal holds the promise of a better life and a transformation of their fortunes.Kikon (2019, 120) found that “Naga villages perceived oil and coal as resources that could radically transform theirlives ... [and] people fantasized about a prosperous carbon future and potential benefits from oil exploration.” Foreven more marginalized communities, coal might be the only source of viable income. In the Raniganj collieries,local individuals excluded from the formal mining industry have attempted to reassert their claims on the coalfieldsby drawing on their traditional rights and customs (Lahiri-Dutt, 2003). In Meghalaya, where the government issueda mining ban, indigenous communities invoked their special status granted by the Indian Constitution to justifytheir mining rights (Lahiri-Dutt, 2017; McDuie-Ra and Kikon, 2016; Stokke, 2017). A local villager defends hercommunity’s engagement in “illegal coal mining”:
Yes, we dig coal–this is our main income. But tell me, why would we not take coal from here? Wasthis not the land of our ancestors? The collieries came and took our lands from us. They took ourlands, and gave us nothing in return. They took our forests, and now we have no land, no forests.Why is this coal not ours? It is ours. Of course I will take it! (Lahiri-Dutt, 2017, 799)
Historically, India’s coal communities were ethnically concentrated with tribal and semi-tribal groups (desig-nated as Scheduled Tribes by the Indian government), although in recent years Indian coalfields have attractedmigrants from nearby regions (Das and Mishra, 2015; Gupta, 1985). This demographic composition can be explainedby the history of coal mining in India. As large-scale mines were opened in forest areas, local inhabitants—oftenindigenous populations and low-caste peasants—were removed from their lands and incorporated into the miningeconomies.34 Mining companies drew laborers from both displaced locals and migrants from neighboring districts(Gupta, 1985; Lahiri-Dutt, 2003). In the Laitrumbai region, for example, Bangladeshi migrants were willing towork for lower wages than local laborers because they would have been paid even less for doing similar jobs intheir home country (Lahiri-Dutt, 2014, 93). The Rabha and Hajong minorities also seek temporary employmentin the mining sector during the agricultural lean season (Lahiri-Dutt, 2014, 93). These migrant laborers are com-monly seen by local residents as threats to their cultural identity and economic welfare (Lahiri-Dutt, 2014, 93).Nevertheless, even among migrant miners, who typically come from tribal and low-caste communities, there hasbeen a “persistence of strong traditional kinship and family ties from which the miners used to draw support andsuccour” (Gupta, 1985, 26). Scholars underscore how local opposition to state-led bans on coal mining have beenled by tribal groups, including the Movement for Indigenous Peoples’ Rights and Livelihood (MIPRL), who havehighlighted constitutional protections for “tribal rights over land and land use” (McDuie-Ra and Kikon, 2016, 266).
To conclude, coal identities in India appear to be driven by a sense of existential threat; such threats also definecoal identities in the U.S., alongside perceptions of community heritage and solidarity. American coal communitiesare tied together by strong feelings of regional identity, ethnic similarity, and shared culture. In India, members ofmining communities also come from tribal backgrounds and low-caste ethnic affiliations. The gradual disappearanceof the industry triggers an existential crisis for coal communities in both countries, mobilizing community members’economic identities and generating widespread resistance against mine closures. For American miners, the energytransition threatens to end their traditional “way of life.” Similarly in India, for those affiliated with the miningindustry, mine closures pose a threat to their basic subsistence.
34Gupta (1985, 18) writes, “The mines in both Bengal and Bihar came to be located in remote, formerly jungle areas–inhabited by tribal and semi-tribal populations and low-caste Hindus engaged in a somewhat crude form of agriculture andalso partly dependent on the gathering of forest produce. In the early years virtually the entire mining labour force wascomposed of tribal and low-caste peasant and artisan groups. From the earliest days of mining, labourers were drawn fromvillages either within the two coal bearing districts or neighbouring districts. Till 1921 the overwhelming majority of the minelabour force consisted of local people or at most short-distant migrants.”
24

ReferencesAggarwal, Mayank. 2020. “There is a Path to Prosperity for India’s Coal-Dependent Towns, but it’s Tough.”
Mongabay, November 24.URL: https://bit.ly/3uNkPkN
Azad, Rohit and Shouvik Chakraborty. 2020. “Green Growth and the Right to Energy in India.” EnergyPolicy 141:111456.
Banerjee, Rakesh and Biswaranjan Mistri. 2019. “Impact of Coal Mining in Diversification of Rural Liveli-hoods: A Case Study in the Barjora Colliery Area of Bankura District, West Bengal.” Space and Culture,India 6(5):228–240.
Beckwith, Karen. 2001. “Gender Frames and Collective Action: Configurations of Masculinity in thePittston Coal Strike.” Politics & Society 29(2):297–330.
Beiser-McGrath, Liam and Thomas Bernauer. 2019. “Could Revenue Recycling Make Effective CarbonTaxation Politically Feasible?” Science Advances 5(9):eaax3323.
Bell, Shannon Elizabeth. 2009. “‘There Ain’t No Bond in Town Like There Used to Be’: The Destructionof Social Capital in the West Virginia Coalfields.” Sociological Forum 24(3):631–657.
Bell, Shannon Elizabeth and Richard York. 2010. “Community Economic Identity: The Coal Industry andIdeology Construction in West Virginia.” Rural Sociology 75(1):111–143.
Bell, Shannon Elizabeth and Yvonne Braun. 2010. “Coal, Identity, and the Gendering of EnvironmentalJustice Activism in Central Appalachia.” Gender & Society 24(6):794–813.
Bergquist, Parrish, Matto Mildenberger and Leah Stokes. 2020. “Combining Climate, Economic, and SocialPolicy Builds Political Support for Climate Action in the US.” Environmental Research Letters 15(5):1–9.
Bhattacharya, S.C. and Chinmoy Jana. 2009. “Renewable Energy in India: Historical Developments andProspects.” Energy 34(8):981–991.
Bhushan, Chandra. 2020. “Energy Transition and Just Transition Must Go Hand in Hand – As Coal MinesBecome Rapidly Unprofitable.” The Times of India, November 28.
Bhushan, Chandra, Srestha Banerjee and Shruti Agarwal. 2020. Just Transition in India: An Inquiryinto the Challenges and Opportunities for a Post-Coal Future. New Delhi: International Forum forEnvironment, Sustainability & Technology.
Burby, Raymond. 2006. “Hurricane Katrina and the Paradoxes of Government Disaster Policy: BringingAbout Wise Governmental Decisions for Hazardous Areas.” Annals of the American Academy of Politicaland Social Sciences 604(1):171–191.
Carley, Sanya, Tom Evans and David Konisky. 2018. “Adaptation, Culture, and the Energy Transition inAmerican Coal Country.” Energy Research & Social Science 37:133–139.
Das, Nabanita and Niharranjan Mishra. 2015. “Assessing the Impact of Coal Mining on Diversified Sourcesof Rural Livelihoods: A Case Study in the Ib Valley Coalfield Area of Western Odisha, India.” Interna-tional Research Journal of Social Sciences 4(6):83–88.
Dasgupta, Abir. 2020. “Adani Foists Coal Mines and Hinduism on Communities.” Adani Watch, July 7.URL: https://bit.ly/3pyAzXX
Department of Mines and Geology. 2020. “Lease Status Report.” Government of Jharkhand.URL: https://bit.ly/3iiCBd5
Douglas, Stratford and Anne Walker. 2017. “Coal Mining and the Resource Curse in the Eastern UnitedStates.” Journal of Regional Science 57(4):568–590.
25

Duncan, Cynthia. 1999. Worlds Apart: Why Poverty Persists in Rural America. Yale University Press.
Fried, Shana. 2005. “Strengthening the Role of the US Court of International Trade in Helping Trade-Affected Workers.” Rutgers Law Review 58:747.
Government of India. 2008. National Action Plan on Climate Change.
Government of India. 2018. Statistics of Mines in India: Volume I (Coal). Directorate General of MinesSafety, Ministry of Labour & Employment.
Gupta, Ranajit Das. 1985. “Migrants in Coal Mines: Peasants or Proletarians, 1850s-1947.” Social Scientist13(12):18–43.
Holloway, Sarah. 2007. “Burning Issues: Whiteness, Rurality and the Politics of Difference.” Geoforum38(1):7–20.
Hsiang, Solomon, Robert Kopp, Amir Jina, James Rising, Michael Delgado, Shashank Mohan, D.J. Ras-mussen et al. 2017. “Estimating Economic Damage from Climate Change in the United States.” Science356(6345):1362–1369.
India Ministry of New and Renewable Energy. 2010. Jawaharlal Nehru National Solar Mission: BuildingSolar India.URL: https://digital.library.unt.edu/ark:/67531/metadc29365/
Kikon, Dolly. 2019. Living with Oil and Coal: Resource Politics and Militarization in Northeast India.University of Washington Press.
Kojola, Erik. 2019. “Bringing Back the Mines and a Way of Life: Populism and the Politics of Extraction.”Annals of the American Association of Geographers 109(2):371–381.
Kumar J., Charles Rajesh and M.A. Majid. 2020. “Renewable Energy for Sustainable Development in India:Current Status, Future Prospects, Challenges, Employment, and Investment Opportunities.” Energy,Sustainability and Society 10(2):1–36.
Lahiri-Dutt, Kuntala. 2003. “Informal Coal Mining in Eastern India: Evidence from the Raniganj Coalbelt.”Natural Resources Forum 27(1):68–77.
Lahiri-Dutt, Kuntala. 2016. “The Diverse Worlds of Coal in India: Energising the Nation, EnergisingLivelihoods.” Energy Policy 99:203–213.
Lahiri-Dutt, Kuntala. 2017. “Resources and the Politics of Sovereignty: The Moral and Immoral Economiesof Coal Mining in India.” South Asia: Journal of South Asian Studies 40(4):792–809.
Lahiri-Dutt, Kuntala, ed. 2014. The Coal Nation: Histories, Ecologies and Politics of Coal in India.Routledge.
Leap, Braden and Diego Thompson. 2018. “Social Solidarity, Collective Identity, Resilient Communities:Two Case Studies from the Rural U.S. and Uruguay.” Social Sciences 7(12):1–19.
Lewin, Philip. 2019. “‘Coal is Not Just a Job, It’s a Way of Life’: The Cultural Politics of Coal Productionin Central Appalachia.” Social Problems 66(1):51–68.
Maggard, Sally Ward. 1994. “From Farm to Coal Camp to Back Office and McDonald’s: Living in theMidst of Appalachia’s Latest Transformation.” Journal of the Appalachian Studies Association 6:14–38.
Maier, Marco. 2014. “DirichletReg: Dirichlet Regression for Compositional Data in R.” Vienna Universityof Economics and Business, Report 125.
Mayer, Adam, E. Keith Smith and Jeff Rodriguez. 2020. “Concerned About Coal: Security, Dependence,and Vulnerability Among Coal Dependent Communities in Western Colorado.” Energy Research & SocialScience 70:101680.
26

McDuie-Ra, Duncan and Dolly Kikon. 2016. “Tribal Communities and Coal in Northeast India: The Politicsof Imposing and Resisting Mining Bans.” Energy Policy 99(4):261–269.
Mildenberger, Matto, Alexander Sahn, Michelle Hummell, Chris Miljanich and Mark Lubell. 2021. “RiskSalience and Intertemporal Welfare Trade-offs in Climate Policymaking.” Working Paper.
Office of the Press Secretary. 2016. “Fact Sheet: The United States and India – Moving Forward Togetheron Climate Change, Clean Energy, Energy Security, and the Environment.” The White House, June 7.URL: https://bit.ly/3ckuAjN
Ojha, Vijay, Sanjib Pohit and Joydeep Ghosh. 2020. “Recycling Carbon Tax for Inclusive Green Growth:A CGE Analysis of India.” Energy Policy 144:111708.
Olson-Hazboun, Shawn. 2018. “‘Why Are We Being Punished and They Are Being Rewarded?’ Views onRenewable Energy in Fossil Fuels-based Communities of the U.S. West.” The Extractive Industries andSociety 5(3):366–374.
Oskarsson, Patrik. 2018. Landlock: Paralysing Dispute Over Minerals on Adivasi Land in India. Canberra,Australia: ANU Press.
Padel, Felix and Samarendra Das. 2010. “Cultural Genocide and the Rhetoric of Sustainable Mining inEast India.” Contemporary South Asia 18(3):333–341.
Rama Rao, C.A., B.M.K. Raju, A.V.M. Subba Rao, K.V. Rao, V.U.M. Rao, Kausalya Ramachandran, B.Venkateswarlu and A.K. Sikka. 2013. “Atlas on Vulnerability of Indian Agriculture to Climate Change.”Central Research Institute for Dryland Agriculture, Hyderabad. Accessed September 28, 2020.URL: https://bit.ly/36sLCdJ
Rathore, Pooja and Sangeeta Bansal. 2013. “Distributional Effects of Adopting Carbon Tax in India: AnEconomic Analysis.” Review of Market Integration 5(3):271–302.
Roy, Aparna. 2019. “Making India’s Coastal Infrastructure Climate-resilient: Challenges and Opportuni-ties.” Observer Research Foundation, Occasional Paper No. 207.
Roy, Ashim, Benny Kuruvilla and Ankit Bhardwaj. 2019. Energy and Climate Change: A Just Transitionfor Indian Labour. In India in a Warming World: Integrating Climate Change and Development. Oxford:Oxford University Press pp. 284–300.
Scott, Rebecca. 2010. Removing Mountains: Extracting Nature and Identity in the Appalachian Coalfields.Minneapolis: University of Minnesota Press.
Shakti Sustainable Energy Foundation. 2018. “Discussion Paper on Carbon Tax Structure for India.” Ernst& Young LLP.URL: https://shaktifoundation.in/report/discussion-paper-carbon-tax-structure-india-full-report/
Siddiqui, Md Zakaria and Kuntala Lahiri-Dutt. 2015. “Livelihoods of Marginal Mining and QuarryingHouseholds in India.” Economic & Political Weekly 50(26/27):27–32.
Stokke, Hugo. 2017. “Legal Limits to Tribal Governance: Coal Mining in Meghalaya, India.” Chr. MichelsenInstitute Brief 16(2):1–4.
Trotter, Joe. 2015. “The Dynamics of Race and Ethnicity in the US Coal Industry.” International Reviewof Social History 60(S1):145–164.
United Nations Framework Convention on Climate Change. 2020. “Just Transition of the Workforce, andthe Creation of Decent Work and Quality Jobs.” April 21.URL: https://unfccc.int/documents/226460
Whitehead, Mark, Rhys Jones and Martin Jones. 2007. The Nature of the State: Excavating the PoliticalEcologies of the Modern State. New York: Oxford University Press.
World Bank India. 2021. “Climate Smart Engagement”.
27