Market Trends, Marketing Spend and Sales Strategies in the Global Construction Industry
153
© Timetric. This report is a licensed product and is not to be photocopied Global Construction Industry Supplier Outlook Survey 2013–2014: Market Trends, Marketing Spend and Sales Strategies in the Global Construction Industry Reference code: CN2145SU Published: June 2013 Timetric John Carpenter House 7 Carmelite Street London EC4Y 0BS United Kingdom Tel: +44 (0)20 7936 6400 Fax: +44 (0)20 7336 6813 Website: www.timetric.com
-
Upload
independent -
Category
Documents
-
view
2 -
download
0
Transcript of Market Trends, Marketing Spend and Sales Strategies in the Global Construction Industry

© Timetric. This report is a licensed product and is not to be photocopied
Global Construction Industry Supplier
Outlook Survey 2013–2014:
Market Trends, Marketing Spend and Sales Strategies in
the Global Construction Industry
Reference code: CN2145SU
Published: June 2013
Timetric
John Carpenter House
7 Carmelite Street
London EC4Y 0BS
United Kingdom
Tel: +44 (0)20 7936 6400
Fax: +44 (0)20 7336 6813
Website: www.timetric.com
TABLE OF CONTENTS
Global Construction Supplier Industry Outlook Survey 2013–2014:
Market Trends, Marketing Spend and Sales Strategies in the Global Construction Industry Page 2
© Timetric. This product is licensed and is not to be photocopied Published: June 2013
TABLE OF CONTENTS
1 Introduction .................................................................................................................. 8
1.1 What is this report about? ...................................................................................................... 8
1.2 Definitions .............................................................................................................................. 8
1.3 Methodology .......................................................................................................................... 9
1.4 Global Construction Industry: Profile of Survey Respondents .............................................. 11
1.4.1 Global construction industry: profile of contractor and developer respondents ........................... 11
1.4.2 Global construction industry: profile of supplier respondents ...................................................... 12
2 Executive Summary ................................................................................................... 14
3 Global Construction Industry Dynamics .................................................................. 16
3.1 Revenue Growth Projections in the Global Construction Industry ........................................ 17
3.1.1 Revenue growth projections by company type ............................................................................ 19
3.1.2 Revenue growth projections by region ......................................................................................... 21
3.1.3 Revenue growth projections by turnover ..................................................................................... 22
3.1.4 Revenue growth projections by senior-level respondents ........................................................... 24
3.2 Future Developments in Business Structure in the Global Construction Industry ................. 25
3.2.1 Future developments in business structure by contractors and developers ................................ 25
3.2.2 Future developments in business structure by suppliers ............................................................. 28
3.3 Merger and Acquisition Activity Projections in the Global Construction Industry ................... 31
3.3.1 M&A activity projections by contractors and developers ............................................................. 31
3.3.2 M&A activity projections by suppliers ........................................................................................... 33
3.3.3 M&A activity projections by region ............................................................................................... 37
3.3.4 M&A activity projections by company turnover ............................................................................ 38
3.4 Estimation of Capital Expenditure in the Global Construction Industry ................................. 39
3.4.1 Estimation of capital expenditure by contractors and developers ................................................ 39
3.4.2 Estimation of capital expenditure by suppliers ............................................................................. 41
3.4.3 Estimation of capital expenditure by region ................................................................................. 43
3.4.4 Estimation of capital expenditure by company turnover .............................................................. 44
3.5 Planned Change in Staff Recruitment Activity in Global Construction Industry ..................... 45
3.5.1 Planned change in staff recruitment activity by contractors and developers ............................... 45
3.5.2 Planned change in staff recruitment activity by suppliers ............................................................ 47
3.5.3 Planned change in staff recruitment activity by region ................................................................ 48
3.5.4 Planned change in staff recruitment activity by company turnover.............................................. 49
4 Global Construction Industry Market Growth Outlook ........................................... 50
4.1 Global Construction Industry – Demand in Emerging Markets ............................................. 51
4.1.1 Demand in emerging markets by contractors and developers .................................................... 51
4.1.2 Demand in emerging markets by suppliers .................................................................................. 53
4.1.3 Demand in emerging markets by region ...................................................................................... 57
4.1.4 Demand in emerging markets by company turnover ................................................................... 58
4.2 Global Construction Industry – Growth Projections in Developed Countries ........................ 59
TABLE OF CONTENTS
Global Construction Supplier Industry Outlook Survey 2013–2014:
Market Trends, Marketing Spend and Sales Strategies in the Global Construction Industry Page 3
© Timetric. This product is licensed and is not to be photocopied Published: June 2013
4.2.1 Growth projections in developed countries by contractors and developers ................................ 60
4.2.2 Growth projections in developed countries by suppliers .............................................................. 62
4.2.3 Growth projections in developed countries by region .................................................................. 65
4.2.4 Growth projections in developed countries by company turnover ............................................... 67
5 Threats and Opportunities for the Global Construction Industry .......................... 68
5.1 Global Construction Industry – Leading Business Concerns for 2013–2014 ........................ 69
5.1.1 Leading business concerns for 2013–2014 by company type ..................................................... 72
5.1.2 Leading business concerns for 2013–2014 by region ................................................................. 74
5.1.3 Leading business concerns for 2013–2014 by company turnover .............................................. 75
5.2 Global Construction Industry – Key Supplier Actions to Maintain and Win Buyer Business .. 76
5.2.1 Actions to maintain and secure buyer business by company type .............................................. 76
5.2.2 Actions to maintain and secure buyer business by region ........................................................... 78
5.2.3 Actions to maintain and secure buyer business by turnover ....................................................... 80
5.2.4 Actions to maintain and secure buyer business by senior-level respondents ............................. 81
5.3 Global Construction Industry – Key Variations in Operational Costs .................................... 82
5.3.1 Key variations in operational costs by contractors and developers ............................................. 82
5.3.2 Key variations in operational costs by suppliers .......................................................................... 84
5.3.3 Key variations in operational costs by region ............................................................................... 86
5.3.4 Key variations in operational costs by company turnover ............................................................ 87
5.4 Global Construction Industry – Impact of Costs on Product Pricing ...................................... 88
5.4.1 Impact of costs on product pricing by contractors and developers .............................................. 88
5.4.2 Impact of costs on product pricing by suppliers ........................................................................... 89
6 Global Construction Industry - Supplier Marketing Spend Activity ...................... 90
6.1 Annual Marketing Budgets – Global Construction Industry Suppliers ................................... 91
6.1.1 Annual marketing budgets by suppliers ....................................................................................... 91
6.1.2 Annual marketing budgets by region ........................................................................................... 93
6.1.3 Annual marketing budgets by company turnover ......................................................................... 94
6.2 Planned Change in Marketing Expenditure Levels – Global Construction Industry Suppliers95
6.2.1 Planned change in marketing expenditure by suppliers .............................................................. 96
6.2.2 Planned change in marketing expenditure by region ................................................................. 100
6.2.3 Planned change in marketing expenditure by company turnover .............................................. 101
6.2.4 Planned change in marketing expenditure levels by revenue growth expectations .................. 102
6.3 Future Investment in Media Channels – Global Construction Industry Suppliers ................ 103
6.3.1 Future investment in media channels by suppliers .................................................................... 103
6.3.2 Future investment in media channels by region ........................................................................ 106
6.3.3 Future investment in media channels by company turnover ..................................................... 107
6.4 Global Construction Industry Suppliers' Future Investment in Marketing and Sales Technology
108
6.4.1 Planned investment in marketing and sales technologies by suppliers ..................................... 108
6.4.2 Planned investment in marketing and sales technologies by region ......................................... 110
6.4.3 Planned investment in marketing and sales technologies by company turnover ...................... 111
7 Marketing and Sales Behaviors and Strategies in 2013–2014 ............................. 112

TABLE OF CONTENTS
Global Construction Supplier Industry Outlook Survey 2013–2014:
Market Trends, Marketing Spend and Sales Strategies in the Global Construction Industry Page 4
© Timetric. This product is licensed and is not to be photocopied Published: June 2013
7.1 Key Marketing Aims for 2013–2014 – Global Construction Industry ................................... 113
7.1.1 Key marketing aims by suppliers ............................................................................................... 113
7.1.2 Key marketing aims by region .................................................................................................... 116
7.1.3 Key marketing aims by company turnover ................................................................................. 116
7.1.4 Key marketing aims by revenue growth expectations ............................................................... 117
7.2 Essential Amendments to Marketing Activities in 2013–2014 ............................................. 118
7.2.1 Amendments to marketing activities by suppliers ...................................................................... 118
7.2.2 Amendments to marketing activities by region .......................................................................... 120
7.2.3 Amendments to marketing activities by company turnover ....................................................... 122
7.3 Best Uses of New Media for Business Prospects – Global Construction Industry .............. 123
7.3.1 Best uses of new media by suppliers ......................................................................................... 123
7.3.2 Best uses of new media by region ............................................................................................. 125
7.3.3 Best uses of new media by company turnover .......................................................................... 127
7.4 Critical Success Factors for Choosing a Marketing Agency ............................................... 129
7.4.1 Critical success factors by suppliers .......................................................................................... 129
7.4.2 Critical success factors for choosing a marketing agency by region ......................................... 132
7.4.3 Critical success factors for choosing a marketing agency by company turnover ...................... 133
8 Appendix ................................................................................................................... 134
8.1 Survey Results – Closed Questions ................................................................................... 134
8.2 Methodology ...................................................................................................................... 152
8.3 Contact Us ......................................................................................................................... 152
8.4 About Timetric.................................................................................................................... 152
8.5 Disclaimer .......................................................................................................................... 153

TABLE OF CONTENTS
Global Construction Supplier Industry Outlook Survey 2013–2014:
Market Trends, Marketing Spend and Sales Strategies in the Global Construction Industry Page 5
© Timetric. This product is licensed and is not to be photocopied Published: June 2013
LIST OF FIGURES
Figure 1: Revenue Growth Optimism in the Global Construction Industry (%), 2009–2013 ......................................................................18 Figure 2: Revenue Growth Optimism in the Global Construction Industry by Company Type (%), 2009–2013 .........................................21 Figure 3: Revenue Growth Optimism in the Global Construction Industry by Region (%), 2013 ...............................................................22 Figure 4: Revenue Growth Optimism in the Global Construction Industry by Turnover (%), 2013 ............................................................23 Figure 5: Revenue Growth Optimism by Senior-Level Respondents (%), 2013 ........................................................................................24 Figure 6: Key Expected Changes in the Business Structure of Construction Contractors and Developers (%), 2013 ...............................27 Figure 7: Key Expected Changes in the Business Structure of Construction Equipment and Materials Suppliers (%), 2013 ....................29 Figure 8: Key Expected Changes in the Business Structure of Other Construction Suppliers (%), 2013 ..................................................30 Figure 9: M&A Activity Projections of Construction Contractors and Developers (%), 2009–2013 ............................................................33 Figure 10: M&A Activity Projections of Construction Equipment and Materials Suppliers (%), 2009–2013 ...............................................35 Figure 11: M&A Activity Projections of Other Construction Suppliers (%), 2009–2013 .............................................................................36 Figure 12: Capital Expenditure Expectations by Construction Contractors and Developers (%), 2013 .....................................................40 Figure 13: Capital Expenditure Expectations by Construction Equipment and Materials Suppliers (%), 2013 ..........................................41 Figure 14: Capital Expenditure Expectations by Other Construction Suppliers (%), 2013.........................................................................42 Figure 15: Global Construction Industry – Increase in Capital Expenditure by Region (%), 2013 .............................................................43 Figure 16: Global Construction Industry – Increase in Capital Expenditure by Turnover (%), 2013 ..........................................................44 Figure 17: Global Construction Industry – Planned Change in Staff Recruitment Activity by Contractors and Developers (%), 2013 .......46 Figure 18: Global Construction Industry – Planned Change in Staff Recruitment Activity by Suppliers (%), 2013 ....................................47 Figure 19: Global Construction Industry – Planned Change in Staff Recruitment Activity by Region (%), 2013 ........................................48 Figure 20: Global Construction Industry – Planned Change in Staff Recruitment Activity by Company Turnover (%), 2013 .....................49 Figure 21: Global Construction Industry – Top Ten Growth Regions (%), 2013 ........................................................................................50 Figure 22: Global Construction Industry – Top Five Emerging Markets, 2013 ..........................................................................................51 Figure 23: Demand in Emerging Markets by Construction Contractors and Developers (%), 2013...........................................................53 Figure 24: Demand in Emerging Markets by Construction Equipment and Materials Suppliers (%), 2013 ................................................55 Figure 25: Global Construction Industry – Increase of Demand in Emerging Markets by Company Turnover (%), 2013 ..........................58 Figure 26: Global Construction Industry – Top Five Developed Regions by Growth (%), 2013 ................................................................59 Figure 27: Construction Contractors and Developers – Growth Projections in Developed Countries (%), 2013 ........................................61 Figure 28: Construction Equipment and Materials Suppliers – Growth Projections in Developed Countries (%), 2013 .............................63 Figure 29: Other Construction Suppliers – Growth Projections in Developed Countries (%), 2013 ...........................................................65 Figure 30: Global Construction Industry – Increase in Growth Projections of Developed Countries by Region (%), 2013 .........................66 Figure 31: Global Construction Industry – Top Five Leading Business Concerns, 2013–2014 .................................................................70 Figure 32: Global Construction Industry – Leading Business Concerns (%), 2009–2013 .........................................................................71 Figure 33: Global Construction Industry – Securing Buyer Business: Buyer vs. Supplier Responses (%), 2013 .......................................77 Figure 34: Global Construction Industry – Securing Buyer Business by Region (%), 2013 .......................................................................79 Figure 35: Global Construction Industry – Securing Buyer Business by Senior-Level Respondents (%), 2013 .........................................81 Figure 36: Key Variations in Operational Costs of Construction Contractors and Developers (%), 2013 ..................................................83 Figure 37: Key Variations in Operational Costs of Construction Equipment and Materials Suppliers (%), 2013 ........................................85 Figure 38: Key Variations in Operational Costs of Other Construction Suppliers (%), 2013 ......................................................................86 Figure 39: Impact of Changing Costs on Product Pricing by Construction Contractors and Developers (%), 2013 ...................................89 Figure 40: Annual Marketing Budgets – Construction Equipment and Materials Suppliers (%), 2009−2013 .............................................92 Figure 41: Annual Marketing Budgets – Other Construction Industry Suppliers (%), 2009−2013 .............................................................92 Figure 42: Annual Marketing Budgets by Region – Global Construction Industry Suppliers (%), 2013 .....................................................93 Figure 43: Annual Marketing Budgets by Company Turnover – Global Construction Industry Suppliers (%), 2013 ..................................94 Figure 44: Planned Change in Marketing Expenditure (%), 2009−2013 ...................................................................................................95 Figure 45: Planned Change in Marketing Expenditure – Construction Equipment and Materials Suppliers (%), 2009−2013 ....................97 Figure 46: Planned Change in Marketing Expenditure – Other Construction Industry Suppliers (%), 2009−2013 .....................................99 Figure 47: Planned Change in Marketing Expenditure Levels by Turnover (%), 2013 ............................................................................ 101 Figure 48: Future Investment in Media Channels by Region (% ‘Increase’ Responses), 2013 ............................................................... 106 Figure 49: Planned Investment in Marketing and Sales Technologies by Suppliers (%), 2013 ............................................................... 110 Figure 50: Key Marketing Aims – Construction Equipment and Materials Suppliers (%), 2013 ............................................................... 114 Figure 51: Key Marketing Aims – Other Construction Industry Suppliers (%), 2013 ............................................................................... 115 Figure 52: Key Marketing Aims by Region – Global Construction Industry Suppliers (%), 2013 ............................................................. 116 Figure 53: Amendments to Marketing Activities by Global Construction Industry Suppliers (%), 2013–2014 .......................................... 120 Figure 54: Best Uses of New Media – Global Construction Industry Suppliers (%), 2013 ....................................................................... 124 Figure 55: Global Construction Industry Suppliers – Best Uses of New Media by Region (%), 2013 ...................................................... 126 Figure 56: Global Construction Industry Suppliers – Best Uses of New Media by Turnover (%), 2013 ................................................... 128 Figure 57: Critical Success Factors – Construction Equipment and Materials Suppliers (%), 2009−2013 .............................................. 130 Figure 58: Critical Success Factors – Other Construction Industry Suppliers (%), 2009−2013 ............................................................... 131

TABLE OF CONTENTS
Global Construction Supplier Industry Outlook Survey 2013–2014:
Market Trends, Marketing Spend and Sales Strategies in the Global Construction Industry Page 6
© Timetric. This product is licensed and is not to be photocopied Published: June 2013
LIST OF TABLES
Table 1: Global Construction Industry Survey Respondents by Company Type, 2013 .............................................................................11 Table 2: Global Construction Industry Contractor and Developer Respondents by Job Role (%), 2013 ...................................................11 Table 3: Global Construction Industry Contractor and Developer Respondents by Company Turnover (%), 2013 ...................................12 Table 4: Global Construction Industry Contractor and Developer Respondents by Region (%), 2013 ......................................................12 Table 5: Global Construction Industry Supplier Respondents by Job Role (%), 2013 ...............................................................................13 Table 6: Global Construction Industry Supplier Respondents by Company Turnover (%), 2013 ...............................................................13 Table 7: Global Construction Industry Supplier Respondents by Region (%), 2013 .................................................................................13 Table 8: Revenue Growth Optimism in the Global Construction Industry (%), 2009–2013 .......................................................................18 Table 9: Revenue Growth Optimism in the Global Construction Industry by Contractors and Developers (%), 2009–2013 ......................20 Table 10: Revenue Growth Optimism in the Global Construction Industry by Suppliers (%), 2009–2013 .................................................20 Table 11: Revenue Growth Optimism in the Global Construction Industry by Region (%), 2013 ..............................................................22 Table 12: Revenue Growth Optimism in the Global Construction Industry by Turnover (%), 2013 ...........................................................23 Table 13: Revenue Growth Optimism by Senior-Level Respondents (%), 2013 .......................................................................................24 Table 14: Key Expected Changes in the Business Structure of Construction Contractors and Developers (%), 2013 ..............................26 Table 15: Key Expected Changes in the Business Structure of Construction Equipment and Materials Suppliers (%), 2013 ...................29 Table 16: M&A Activity Projections of Construction Contractors and Developers (%), 2009–2013 ...........................................................32 Table 17: M&A Activity Projections of Construction Equipment and Materials Suppliers (%), 2009–2013 ................................................34 Table 18: M&A Activity Projections of Other Construction Suppliers (%), 2009–2013 ..............................................................................36 Table 19: Global Construction Industry – M&A Activity Projections by Region (%), 2013 .........................................................................38 Table 20: Global Construction Industry – M&A Activity Projections by Turnover (%), 2013 ......................................................................38 Table 21: Capital Expenditure Expectations by Construction Contractors and Developers (%), 2013 ......................................................40 Table 22: Capital Expenditure Expectations by Other Construction Suppliers (%), 2013 ..........................................................................42 Table 23: Global Construction Industry – Increase in Capital Expenditure by Region (%), 2013 ..............................................................43 Table 24: Global Construction Industry – Increase in Capital Expenditure by Turnover (%), 2013 ...........................................................44 Table 25: Global Construction Industry – Planned Change in Staff Recruitment Activity by Contractors and Developers (%), 2013.........46 Table 26: Global Construction Industry – Planned Change in Staff Recruitment Activity by Suppliers (%), 2013 ......................................47 Table 27: Global Construction Industry – Planned Change in Staff Recruitment Activity by Region (%), 2013 .........................................48 Table 28: Global Construction Industry – Planned Change in Staff Recruitment Activity by Company Turnover (%), 2013 ......................49 Table 29: Demand in Emerging Markets by Construction Contractors and Developers (%), 2013 ............................................................52 Table 30: Demand in Emerging Markets by Construction Equipment and Materials Suppliers (%), 2013 .................................................54 Table 31: Demand in Emerging Markets by Other Construction Suppliers (%), 2013 ...............................................................................56 Table 32: Global Construction Industry – Increase of Demand in Emerging Markets by Region (%), 2013 ..............................................57 Table 33: Construction Contractors and Developers – Growth Projections in Developed Countries (%), 2013 .........................................61 Table 34: Construction Equipment and Materials Suppliers – Growth Projections in Developed Countries (%), 2013 ..............................63 Table 35: Other Construction Suppliers – Growth Projections in Developed Countries (%), 2013 ............................................................64 Table 36: Global Construction Industry – Increase in Growth Projections of Developed Countries by Region (%), 2013 ..........................66 Table 37: Global Construction Industry – Increase in Growth Projections of Developed Countries by Turnover (%), 2013 .......................67 Table 38: Global Construction Industry – Leading Business Concerns (%), 2009–2013...........................................................................71 Table 39: Leading Business Concerns by Company Type (%), 2013–2014 .............................................................................................73 Table 40: Global Construction Industry – Leading Business Concerns by Region (%), 2013–2014 ..........................................................74 Table 41: Global Construction Industry – Leading Business Concerns by Turnover (%), 2013–2014 .......................................................75 Table 42: Global Construction Industry – Securing Buyer Business: Buyer vs. Supplier Responses (%), 2013 ........................................77 Table 43: Global Construction Industry – Securing Buyer Business by Region (%), 2013 ........................................................................78 Table 44: Global Construction Industry – Securing Buyer Business by Turnover (%), 2013 .....................................................................80 Table 45: Key Variations in Operational Costs of Construction Contractors and Developers (%), 2013 ...................................................83 Table 46: Key Variations in Operational Costs of Construction Equipment and Materials Suppliers (%), 2013 .........................................84 Table 47: Key Variations in Operational Costs of Other Construction Suppliers (%), 2013 .......................................................................85 Table 48: Key Variations in Operational Costs by Region (%), 2013 ........................................................................................................86 Table 49: Key Variations in Operational Costs by Company Turnover (%), 2013 .....................................................................................87 Table 50: Impact of Changing Costs on Product Pricing by Construction Contractors and Developers (%), 2013 ....................................88 Table 51: Impact of Changing Costs on Product Pricing by Suppliers (%), 2013 ......................................................................................89 Table 52: Annual Marketing Budgets – Construction Equipment and Materials Suppliers (%), 2009−2013 ..............................................91 Table 53: Annual Marketing Budgets – Other Construction Industry Suppliers (%), 2009−2013 ...............................................................92 Table 54: Annual Marketing Budgets by Region – Global Construction Industry Suppliers (%), 2013 ......................................................93 Table 55: Annual Marketing Budgets by Company Turnover – Global Construction Industry Suppliers (%), 2013 ...................................94 Table 56: Planned Change in Marketing Expenditure – Construction Equipment and Materials Suppliers (%), 2009−2013 .....................97 Table 57: Planned Change in Marketing Expenditure – Other Construction Industry Suppliers (%), 2009−2013 ......................................99 Table 58: Planned Change in Marketing Expenditure Levels by Region (%), 2013 ................................................................................ 100 Table 59: Planned Change in Marketing Expenditure Levels by Revenue Growth Expectations (%), 2013 ............................................ 102 Table 60: Future Investment in Media Channels – Construction Equipment and Materials Suppliers (%), 2013 ..................................... 104 Table 61: Future Investment in Media Channels – Other Construction Industry Suppliers (%), 2013 ..................................................... 105 Table 62: Future Investment in Media Channels by Turnover (% ‘Increase’ Responses), 2013 .............................................................. 107 Table 63: Planned Investment in Marketing and Sales Technologies by Suppliers (%), 2013 ................................................................ 109

TABLE OF CONTENTS
Global Construction Supplier Industry Outlook Survey 2013–2014:
Market Trends, Marketing Spend and Sales Strategies in the Global Construction Industry Page 7
© Timetric. This product is licensed and is not to be photocopied Published: June 2013
Table 64: Planned Investment in Marketing and Sales Technologies by Region (%), 2013 .................................................................... 111 Table 65: Planned Investment in Marketing and Sales Technologies by Company Turnover (%), 2013 ................................................. 111 Table 66: Key Marketing Aims – Construction Equipment and Materials Suppliers (%), 2013 ................................................................ 114 Table 67: Key Marketing Aims – Other Construction Industry Suppliers (%), 2013................................................................................. 115 Table 68: Key Marketing Aims by Turnover – Global Construction Industry Suppliers (%), 2013 ........................................................... 117 Table 69: Key Marketing Aims by Revenue Growth Expectations (%), 2013 .......................................................................................... 117 Table 70: Amendments to Marketing Activities by Global Construction Industry Suppliers (%), 2013–2014 ........................................... 119 Table 71: Amendments to Marketing Activities by Region – Global Construction Industry (%), 2013–2014 ............................................ 121 Table 72: Amendments to Marketing Activities by Turnover – Global Construction Industry (%), 2013–2014 ......................................... 122 Table 73: Best Uses of New Media – Global Construction Industry Suppliers (%), 2013 ........................................................................ 124 Table 74: Global Construction Industry Suppliers – Best Uses of New Media by Region (%), 2013 ....................................................... 125 Table 75: Global Construction Industry Suppliers – Best Uses of New Media by Turnover (%), 2013 .................................................... 127 Table 76: Critical Success Factors by Region – Global Construction Industry (%), 2013........................................................................ 132 Table 77: Critical Success Factors by Turnover – Global Construction Industry Suppliers (%), 2013 ..................................................... 133 Table 78: Global Construction Industry Survey Results – Closed Questions .......................................................................................... 134

INTRODUCTION
Global Construction Supplier Industry Outlook Survey 2013–2014:
Market Trends, Marketing Spend and Sales Strategies in the Global Construction Industry Page 8
© Timetric. This product is licensed and is not to be photocopied Published: June 2013
1 Introduction
1.1 What is this report about?
This report is the result of an extensive survey drawn from Timetric’s exclusive panel of leading
construction industry companies. This report provides the reader with a definitive analysis of the global
construction industry outlook, and explores how business opportunities and demands are expected to
change in 2013–2014. This report not only provides access to the opinions and strategies of business
decision makers and competitors, but also examines the actions surrounding business priorities. The
report provides respondent information by region, company type and size.
The report also examines:
Revenue growth expectations: projects the revenue growth expectations of major stakeholders of
the industry
Market-specific growth opportunities: identifies the main growth prospects in order to provide
assistance for companies in effectively allocating their marketing activities and budgets
M&A: expectations surrounding M&A activity and core influencing factors
Leading business concerns: identifies leading business concerns and subsequent efforts to
negate them
Marketing expenditure trends: tracks the marketing budgets of supplier companies and forecasts
possible changes to expenditure
Key factors for marketing agency selection: provides insights into the marketing needs of
competitors among supplier companies
1.2 Definitions
Construction contractors and developers (buyer): includes construction contractors or
subcontractors, private-sector project sponsors, developers or investors, and public-sector project
sponsors and developers.
Construction equipment and material suppliers (supplier 1): includes construction equipment
suppliers; building merchants or products distributors; construction materials or building products
manufacturers; furniture, fittings or interior products manufacturers; and other suppliers for raw
materials, logistics and factory equipment.
Other construction industry suppliers (supplier 2): includes architecture and design companies,
planning; surveying or civil engineering companies; trade bodies; academia or industry observers;
government or public-sector organizations; and other suppliers of technology and consultancy
services.

INTRODUCTION
Global Construction Supplier Industry Outlook Survey 2013–2014:
Market Trends, Marketing Spend and Sales Strategies in the Global Construction Industry Page 9
© Timetric. This product is licensed and is not to be photocopied Published: June 2013
Email marketing: It is defined as directly marketing a business message to a group of customers
using email.
Customer relationship management (CRM): It involves using technology to organize, automate,
and synchronize sales, marketing, customer service, and technical support.
Company turnover: companies with turnover of less than US$100 million are identified in the
report as small companies. In addition, companies with turnover between US$100 million–US$1
billion are referred to as medium-sized companies, and companies with turnover of more than US$1
billion as large companies.
1.3 Methodology
All Timetric reports are rigorously sourced and created according to a comprehensive four-stage
methodology:
1) Online survey
The research source in this report is based on the surveyed opinions and expectations of senior
industry professionals. Timetric conducted an extensive online survey in March-April 2013, which was
taken by 126 senior global industry executives worldwide; the respondents include C-level executives,
directors, and managers.
The survey’s respondents are drawn from the Timetric Industry Insight Panel, an exclusive industry
panel covering over 2 million business professionals worldwide. Respondents represent a dedicated
professional community where participants are surveyed ‘in context’, drawn from industry magazine and
media communities including the readership of Blueprint, designbuild-network.com, Tunnels &
Tunneling International and Cranes Today, as well as delegate relationships across Timetric’s global
industry conference and forum events. These business communities are made up of qualified
professionals who rely on Timetric’s flagship media brands, enabling Timetric to access informed
industry opinions.
INTRODUCTION
Global Construction Supplier Industry Outlook Survey 2013–2014:
Market Trends, Marketing Spend and Sales Strategies in the Global Construction Industry Page 10
© Timetric. This product is licensed and is not to be photocopied Published: June 2013
2) Secondary research
Collection of the latest market-specific data from a wide variety of respected third-party industry
sources:
Government statistics
Industry associations
Company filings
Broker reports
International organizations
Industry news websites
Industry reports
3) Data analysis and report writing
The results of this research have been analyzed and evaluated by Timetric’s industry-specific in-house
analysts. The analysts’ research and expertise, pedigree in marketing, market research, consulting
backgrounds in their industry, and ongoing education on leading economic and industry news have
shaped their analytical judgments and conclusions of the opinions gathered.
4) Quality control
Detailed process manuals
Standardized report templates and accompanying style guides
Advanced data analysis and survey programming tools
QC checklists
Randomized spot checks on data integrity
Peer review
Senior-level QC

INTRODUCTION
Global Construction Supplier Industry Outlook Survey 2013–2014:
Market Trends, Marketing Spend and Sales Strategies in the Global Construction Industry Page 11
© Timetric. This product is licensed and is not to be photocopied Published: June 2013
1.4 Global Construction Industry: Profile of Survey Respondents
Timetric’s in-depth industry survey was completed by 126 respondents, employed by the organizations
shown in the table below:
Table 1: Global Construction Industry Survey Respondents by Company Type, 2013
Company Type Number of Respondents
Construction contractors and developers 60
Construction equipment and materials suppliers 43
Other construction industry suppliers 23
Overall 126
Source: Timetric Industry Survey 2013 © Timetric
1.4.1 Global construction industry: profile of contractor and developer respondents
The contractors and developers in the global construction industry include construction contractors or
subcontractors; private-sector project sponsors, developers or investors; and public-sector project
sponsors and developers. Of the survey’s total respondents, 48% were from construction contracting
and developer companies.
Of all contractor and developer respondents, 12% belong to organizations with a turnover of more than
US$1 billion, and 72% belong to organizations with a turnover of less than US$100 million. In addition,
71% of all contractor and developer respondents are C-level or director-level executives, while the
remaining 29% are managers and professionals with technical backgrounds. Furthermore, 48% of
contractor and developer respondents are from companies in Europe, 25% are from companies in
North America and 18% are from companies in the Asia-Pacific.
Table 2: Global Construction Industry Contractor and Developer Respondents by Job Role (%),
2013
Role Percentage of Operator Respondents
CEO / president / MD / board member / C-level executive 22%
Director / VP / SVP 25%
Head of business unit 7%
Head of department 17%
Manager 12%
Professional and technical staff (e.g. lawyer, engineer, architect) 13%
Staff 5%
Overall 100%
N.B. Results may not equal 100% due to rounding
Source: Timetric Industry Survey 2013 © Timetric

INTRODUCTION
Global Construction Supplier Industry Outlook Survey 2013–2014:
Market Trends, Marketing Spend and Sales Strategies in the Global Construction Industry Page 12
© Timetric. This product is licensed and is not to be photocopied Published: June 2013
Table 3: Global Construction Industry Contractor and Developer Respondents by Company
Turnover (%), 2013
Turnover Percentage of Operator Respondents
Less than US$100 million 72%
US$100 million–US$1 billion 17%
More than US$1 billion 12%
Overall 100%
N.B. Results may not equal 100% due to rounding
Source: Timetric Industry Survey 2013 © Timetric
Table 4: Global Construction Industry Contractor and Developer Respondents by Region (%),
2013
Region Percentage of Operator Respondents
North America 25%
Europe 48%
Asia-Pacific 18%
Rest of the World 9%
Overall 100%
Source: Timetric Industry Survey 2013 © Timetric
1.4.2 Global construction industry: profile of supplier respondents
Suppliers to the global construction industry include construction equipment and materials suppliers,
and other construction industry suppliers. Construction equipment and materials suppliers include
construction equipment suppliers; building merchants or products distributors; construction materials or
building products manufacturers; furniture, fittings or interior products manufacturers; and other
suppliers for raw materials, logistics and factory equipment. Other construction industry suppliers
include architecture and design companies; planning, surveying or civil engineering companies; trade
bodies; academia or industry observers; government or public-sector organizations; and other suppliers
of technology and consultancy services. Of all survey respondents, 34% are from construction
equipment and materials supplier companies, while 18% are from other construction industry supplier
companies.
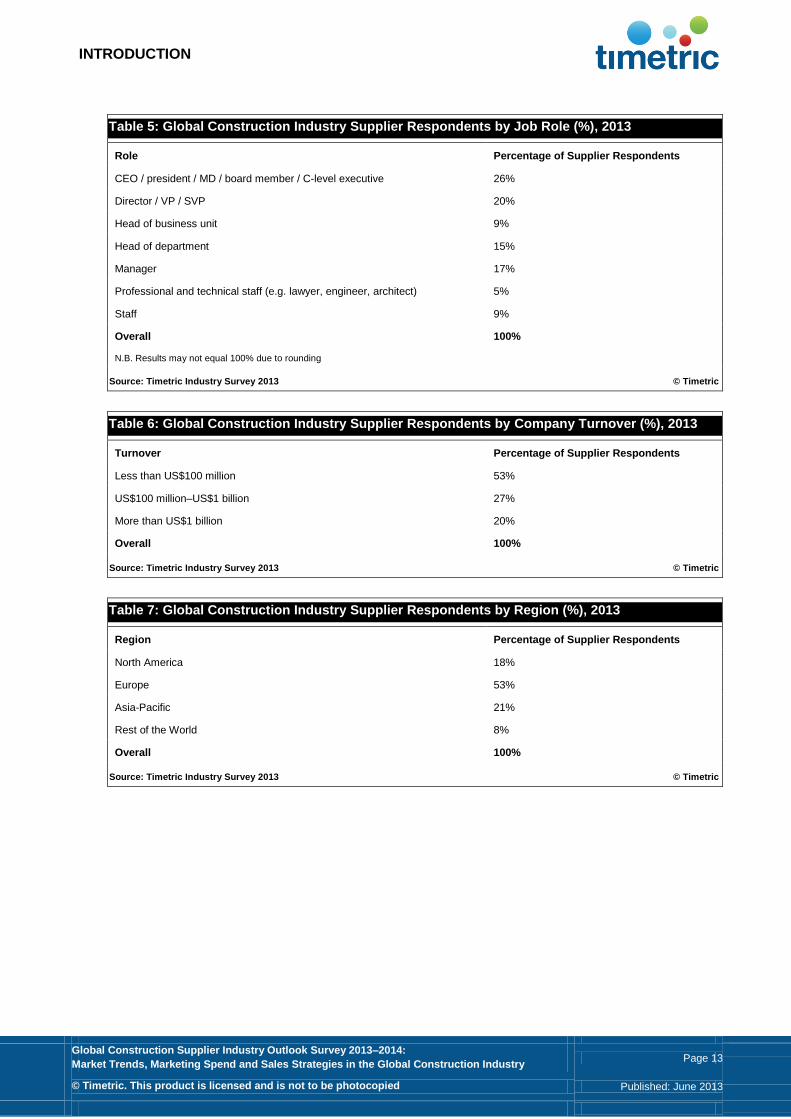
Of all supplier respondents, 20% belong to organizations with a turnover of more than US$1 billion, and
53% belong to organizations with turnover of less than US$100 million. In addition, 70% of all supplier
respondents are C-level or director-level executives, while the remaining 30% represent managers and
professionals with technical backgrounds.
INTRODUCTION
Global Construction Supplier Industry Outlook Survey 2013–2014:
Market Trends, Marketing Spend and Sales Strategies in the Global Construction Industry Page 13
© Timetric. This product is licensed and is not to be photocopied Published: June 2013
Table 5: Global Construction Industry Supplier Respondents by Job Role (%), 2013
Role Percentage of Supplier Respondents
CEO / president / MD / board member / C-level executive 26%
Director / VP / SVP 20%
Head of business unit 9%
Head of department 15%
Manager 17%
Professional and technical staff (e.g. lawyer, engineer, architect) 5%
Staff 9%
Overall 100%
N.B. Results may not equal 100% due to rounding
Source: Timetric Industry Survey 2013 © Timetric
Table 6: Global Construction Industry Supplier Respondents by Company Turnover (%), 2013
Turnover Percentage of Supplier Respondents
Less than US$100 million 53%
US$100 million–US$1 billion 27%
More than US$1 billion 20%
Overall 100%
Source: Timetric Industry Survey 2013 © Timetric
Table 7: Global Construction Industry Supplier Respondents by Region (%), 2013
Region Percentage of Supplier Respondents
North America 18%
Europe 53%
Asia-Pacific 21%
Rest of the World 8%
Overall 100%
Source: Timetric Industry Survey 2013 © Timetric

EXECUTIVE SUMMARY
Global Construction Supplier Industry Outlook Survey 2013–2014:
Market Trends, Marketing Spend and Sales Strategies in the Global Construction Industry Page 14
© Timetric. This product is licensed and is not to be photocopied Published: June 2013
2 Executive Summary
Overall, respondents are optimistic about revenue growth in 2013
Of the survey respondents across the global construction industry, 53% are ‘more optimistic’ about
revenue growth for their companies in 2013, due to increased investments in IT infrastructure and other
public and private-sector construction projects, and growing demand for sustainable construction. The
key expected changes for 2013 are ‘expand in current market’ and ‘improving operational efficiency’,
while in 2012, the emphasis was on ‘improving operational efficiency’, ‘expand operations in domestic
market’, ‘stabilize company finances’ and ‘manage pricing strategies’.
Mergers and acquisitions in the global construction industry expected to increase in 2013
Executives from the global construction industry expect to see increased levels of consolidation, with
50% of respondents anticipating either a significant increase or an increase in M&A activity in 2013.
Slow recovery in the global economy and weak market conditions, a growing desire for large
construction companies to increase their global presence, and increased pressure of rising costs on
small and medium-sized construction companies are considered the key drivers for participating in M&A
activity. Respondents across the global construction industry anticipate a considerable increase in
capital expenditure on ‘new product developments’, ‘IT infrastructure developments’ and ‘machinery
and equipment purchases’. Respondents also anticipate increases in their current workforce in 2013.
China, India, the UAE, Brazil, and Eastern Europe are considered key emerging markets in 2013
Respondents from construction contractor and developer companies identified India, Brazil, the UAE,
China and Saudi Arabia as promising emerging markets for 2013. Construction activity in India has
increased steadily due to growth in infrastructure development in housing, roads, ports, aviation
infrastructure and power generation, leading the country to become one of the emerging markets in the
global construction industry. Additionally, the US, Canada, Singapore, Australia and the UK were
identified as chief growth regions among developed countries. France, Italy and Spain are expected to
offer low growth potential.
Companies face key challenges due to ‘cost containments’, market uncertainty’, ‘retention or
recruitment of skilled staff’ and ‘rising competition’
‘Cost containments’ will be a leading challenge for the global construction industry in 2013–2014, as
expressed by 56% of industry respondents, while 55% identified ‘market uncertainty’ as important.
Regardless of company size, global construction industry companies consider ‘market uncertainty’ and
‘cost containments’ as leading business concerns. As a result, the key objectives for suppliers were
identified as ‘provide support for generating new businesses’ and the adoption of practices to ‘innovate
product’ and ‘improve customer services’, as identified by construction contractors and developers.
EXECUTIVE SUMMARY
Global Construction Supplier Industry Outlook Survey 2013–2014:
Market Trends, Marketing Spend and Sales Strategies in the Global Construction Industry Page 15
© Timetric. This product is licensed and is not to be photocopied Published: June 2013
Supplier marketing budgets are projected to increase by 7% in 2013
Timetric’s industry survey revealed that the average supplier marketing budgets, of both construction
equipment and material suppliers and other construction industry suppliers, are expected to rise by 7%
in 2013. Moreover, 67% of respondents from the construction equipment and materials supplier
companies expect an increase in their marketing budgets in 2013. The average size of the annual
marketing budget of global construction industry supplier respondents’ companies is US$5.4 million for
2013. In 2013, the average marketing budget is US$4.4 million for construction equipment and material
supplier companies, and is US$7.3 million for other construction industry supplier companies.
‘Email and newsletters’, ‘social media and networking sites’, ‘online portals’ and ‘corporate and
brand websites’ to dominate future investment
Of all construction equipment and material supplier companies, 63% of respondents plan to increase
marketing expenditure on ‘email and newsletters’, 62% of respondents plan to increase marketing
expenditure on ‘social media and networking sites’, and 52% plan to increase expenditure on ‘corporate
and brand websites’. ‘CRM systems’ and ‘market intelligence research’ emerged as the two marketing
and sales solutions that will receive the most investment in 2013. In contrast, marketing and sales
solutions such as ‘customer segmentation solutions’, ‘loyalty solutions’ and ‘direct internet distribution
systems’ are expected to register the least amount of investment in 2013.
Customer retention, customer acquisition and brand building dominate key marketing aim of
suppliers for 2013–2014
‘Customer retention’, ‘brand building or awareness’, and ‘customer acquisition’ are the key marketing
aims of supplier respondents for 2013, as expressed by 87%, 79%, and 72% respectively. Key
amendments to marketing agencies for 2013, as identified by global construction industry suppliers,
include changes in ‘web design and development’, ’branding and imaging’, and ‘direct marketing’
respectively. Other amendments expected to be included are ‘advertizing’, ‘special programs’ and
‘interactive marketing’.
‘Ability to target specific audience niches’, ‘ability to generate leads or setup customer
meetings’ and ‘low cost’ are the three leading critical success factors for suppliers in 2013
In 2013, the ‘ability to target specific audience niches’, ‘ability to generate leads or setup customer
meetings’ and ‘low cost’ are identified as important factors when sourcing marketing vendors by global
construction industry suppliers. This is due to the fact that, as a result of an increase in business
competition and expectations of gradual economic recovery, the need for strategic and tactical inputs
on specific target segments has gained importance. Moreover, of all construction equipment and
material supplier respondents, 49% identified ‘email promotions’ as an effective use of new media to
generate business in 2013, while 44% identified ‘networking through social media websites’ and 26%
anticipated ‘email educational messages’ to be important uses of new media.

INDUSTRY DYNAMICS
Global Construction Supplier Industry Outlook Survey 2013–2014:
Market Trends, Marketing Spend and Sales Strategies in the Global Construction Industry Page 16
© Timetric. This product is licensed and is not to be photocopied Published: June 2013
3 Global Construction Industry Dynamics
In this chapter, survey respondents in the global construction industry detail the future growth
expectations of their companies, and provide insights into mergers and acquisitions (M&A) and
business structure in the global construction industry. This chapter provides an overview of the
business outlook for the global construction industry, including the overall change in organizations’
capital expenditure and staff recruitment activity. Industry trends in this area are also analyzed in
comparison with the results of the 2009, 2011 and 2012 construction industry surveys, providing an
opportunity to follow changes in respondents’ attitudes.
Key Findings:
Of all respondents across the global construction industry, 53% are ‘more optimistic’ about revenue growth in 2013 as compared with the previous 12 months
A total of 62% of contractor and developer respondents are ‘more optimistic’ about revenue growth in 2013
Respondents from companies operating in the Rest of the World and North America are more
optimistic about revenue growth in 2013
‘Expand in current market’ and ‘improving operational efficiency’ are the key priorities for
construction contractors and developers in 2013
In total, 50% of construction contractors anticipate either a ‘significant increase’ or ‘increase’ in
M&A activity during 2013
Survey results reveal that 46% of construction industry supplier respondents expect either a
‘significant increase’ or ‘increase’ in M&A activity in 2013
‘New product developments’, ‘IT infrastructure developments’, and ‘machinery and equipment
purchases’ are expected to increase significantly in 2013
A total of 40% of respondents from construction contractor and developer companies anticipate a
maximum 2% increase of their current workforce in 2013
INDUSTRY DYNAMICS
Global Construction Supplier Industry Outlook Survey 2013–2014:
Market Trends, Marketing Spend and Sales Strategies in the Global Construction Industry Page 17
© Timetric. This product is licensed and is not to be photocopied Published: June 2013
3.1 Revenue Growth Projections in the Global Construction Industry
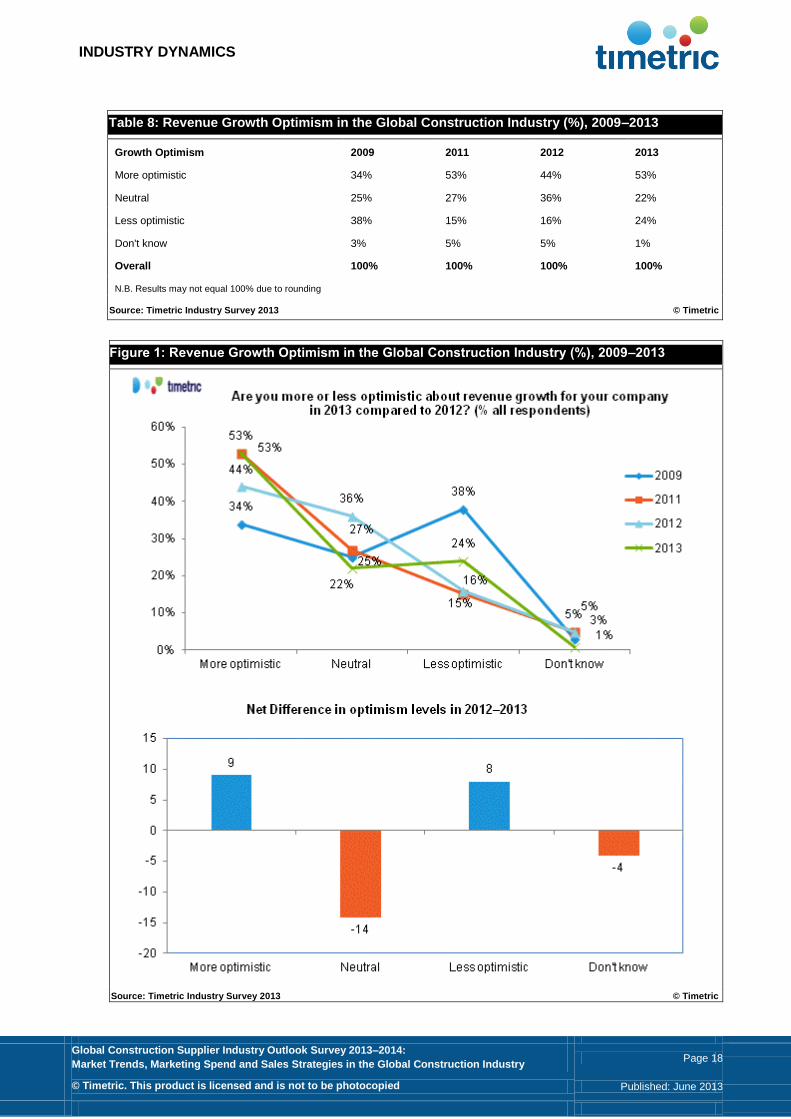
Within the global construction industry, 53% of survey respondents are ‘more optimistic’ about revenue
growth expectations in 2013 as compared to the previous 12 months. Meanwhile, 24% of respondents
are ‘less optimistic’ about revenue growth, while 22% expect ‘no change’ whatsoever. Increased
investments in IT infrastructure and other public and private-sector construction projects, in tandem with
growing demand for sustainable construction, are considered key drivers of revenue-growth optimism
for 2013. For example, according to a press release from Singapore’s Building and Construction
Authority (BCA) in January 2013, construction demand in Singapore is forecast to register a growth of
53%, totaling US$26–32 billion for 2013. The BCA notes that growth is expected due to the sector’s
healthy performance in 2012, and strong growth potential generated from the public sector and rail
construction. The key public-sector projects in Singapore which are likely to be awarded in 2013, as
projected by the BCA, include:
Construction of undergraduate halls in Nanyang Technological University
Construction of storage tanks at Jurong Island
Construction of Jurong Town Corporation’s large floating oil storage structure at Pulau Sebarok
Construction contracts for the Thomson Mass Rapid Transit Line
Furthermore, according to the 2013 Timetric Research survey results, revenue growth optimism levels
increased by nine percentage points in comparison to 2012, though optimism levels remained similar to
2011’s survey results. This indicates that the construction sector is forecast to perform well in 2013 as
compared with 2012, mainly due to the growing number of projects in the pipeline that are expected to
benefit global construction companies and stakeholders. For example, Primoris Services Corporation, a
contractor and engineering company serving the US power and energy sectors, secured new contracts
worth US$322.7 million between January 2013 and March 2013. These contracts are spread across
power, pipeline, gas utility, water, wastewater treatment and highway infrastructure projects throughout
the US.
Similarly, in January 2013, Manchester City Council UK announced the selection of Solutions 4
Brunswick (S4B) consortium as its preferred developer for the US$118 million Brunswick regeneration
scheme. The project includes the renovation of 650 council homes, construction of 500 new homes for
rent or sale, as well as new road layouts and open spaces. A senior executive from Brunswick S4B
commented:
“The area deserves and needs substantial investment to bring the homes and environment up to decent
modern homes’ standards set by the government.”
INDUSTRY DYNAMICS
Global Construction Supplier Industry Outlook Survey 2013–2014:
Market Trends, Marketing Spend and Sales Strategies in the Global Construction Industry Page 18
© Timetric. This product is licensed and is not to be photocopied Published: June 2013
Table 8: Revenue Growth Optimism in the Global Construction Industry (%), 2009–2013
Growth Optimism 2009 2011 2012 2013
More optimistic 34% 53% 44% 53%
Neutral 25% 27% 36% 22%
Less optimistic 38% 15% 16% 24%
Don't know 3% 5% 5% 1%
Overall 100% 100% 100% 100%
N.B. Results may not equal 100% due to rounding
Source: Timetric Industry Survey 2013 © Timetric
Figure 1: Revenue Growth Optimism in the Global Construction Industry (%), 2009–2013
Source: Timetric Industry Survey 2013 © Timetric
INDUSTRY DYNAMICS
Global Construction Supplier Industry Outlook Survey 2013–2014:
Market Trends, Marketing Spend and Sales Strategies in the Global Construction Industry Page 19
© Timetric. This product is licensed and is not to be photocopied Published: June 2013
3.1.1 Revenue growth projections by company type
In total, 62% of contractors and developers are ‘more optimistic’ about revenue growth in 2013 as
compared to the previous 12 months. The improvement is expected to be driven by gradual recovery in
both the residential and non-residential construction markets, and expansion in the real estate industry
in several countries, including the US, one of the largest construction markets. For example, in
February 2013, project development and construction group, Skanska, secured a US$48 million
contract for the Green Court Bucharest office project in Bucharest, Romania.
Furthermore, a total of 51% of construction equipment and materials suppliers, and 35% of other
construction industry suppliers are ‘more optimistic’ about revenue growth in 2013, primarily driven by
increases in construction contracts. For example, in March 2013, crane dealer Manitex US announced
an increase in its overall revenue by 44% from US$142.3 million in 2011 to US$205.2 million in 2012.
The company notes that the increase in sales was due to the higher level of penetration of products
specifically targeting construction projects in the energy and power line distribution sectors. Moreover,
the company expects healthy returns for 2013 with a set target of US$350 million by 2015. Emphasizing
this point, a senior executive from the company noted:
“We have 25% of our current sales coming from products that we've recently introduced into the
markets. We've considered that trend by introducing into the fourth quarter a 15-ton Badger crane,
which we believe will show some positive returns in the not-too-distant future. And we are very excited
about seven new products which we will be introducing this year.”
Similarly, engineering services provider, Sparrows Group, from Scotland secured contracts worth
US$285 million in the first quarter of 2013, from clients such as Shell, CNR, ConocoPhillips, Perenco,
and Wood Group in the North Sea. The company also won orders and contracts worth US$60 million in
the US, the Middle East, and Asia. It also secured renewals of agreements to work with BP in Angola
and CNR in Gabon and Côte d’Ivoire. The company notes that its new contract wins for 2013 succeed
favorable results in 2012, when its revenues grew by 10% from 2011. A senior executive from Sparrows
commented:
“We will be reporting robust results for 2012 later this year and, with these latest contract wins, are well
on course to deliver exceptional results for 2013. Our focus is firmly on excelling in delivery for our
clients. We have a strong reputation for delivering on our promises and this is underlined by the amount
of renewals we are securing.”
Notably, 28% and 22% of respondents respectively from the two supplier categories expressed neutral
sentiments about revenue growth, while 43% from other construction industry suppliers are ‘less
optimistic’ about revenue growth in 2013. The recent deceleration in the growth rate of several
economies due to the impact of the European sovereign debt crisis may have adversely affected some
construction companies due to unforeseen delays and postponements.

INDUSTRY DYNAMICS
Global Construction Supplier Industry Outlook Survey 2013–2014:
Market Trends, Marketing Spend and Sales Strategies in the Global Construction Industry Page 20
© Timetric. This product is licensed and is not to be photocopied Published: June 2013
Table 9: Revenue Growth Optimism in the Global Construction Industry by Contractors and
Developers (%), 2009–2013
Growth Optimism 2009 2011 2012 2013
More optimistic 35% 53% 40% 62%
Neutral 25% 21% 37% 18%
Less optimistic 36% 23% 21% 18%
Don't know 4% 3% 3% 2%
Overall 100% 100% 100% 100%
N.B. Results may not equal 100% due to rounding
Source: Timetric Industry Survey 2013 © Timetric
Table 10: Revenue Growth Optimism in the Global Construction Industry by Suppliers (%), 2009–
2013
Growth Optimism Construction Equipment and Materials Suppliers Other Construction Industry Suppliers
2009 2011 2012 2013 2009 2011 2012 2013
More optimistic 32% 56% 56% 51% 35% 45% 43% 35%
Neutral 20% 10% 33% 28% 25% 13% 35% 22%
Less optimistic 46% 30% 10% 21% 36% 30% 10% 43%
Don't know 1% 4% 1% 0% 4% 13% 12% 0%
Overall 100% 100% 100% 100% 100% 100% 100% 100%
N.B. Results may not equal 100% due to rounding
Source: Timetric Industry Survey 2013 © Timetric

INDUSTRY DYNAMICS
Global Construction Supplier Industry Outlook Survey 2013–2014:
Market Trends, Marketing Spend and Sales Strategies in the Global Construction Industry Page 21
© Timetric. This product is licensed and is not to be photocopied Published: June 2013
Figure 2: Revenue Growth Optimism in the Global Construction Industry by Company Type (%),
2009–2013
Source: Timetric Industry Survey 2013 © Timetric
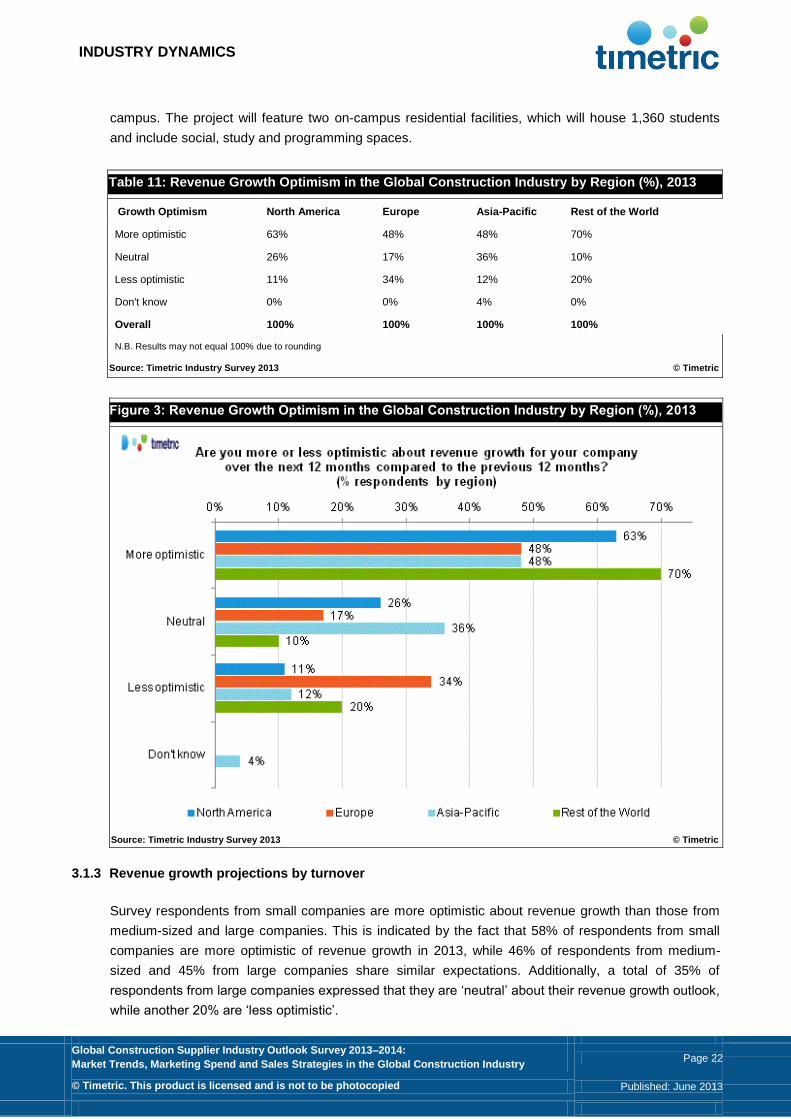
3.1.2 Revenue growth projections by region
Of all survey respondents, 70% from companies that operate in the Rest of the World and 63% from
companies operating in North America are optimistic about revenue growth in 2013. Meanwhile, 48% of
respective respondents from companies operating in Europe and Asia-Pacific are optimistic about
revenue growth in 2013.
Interestingly, a significant percentage of respondents from companies operating in the Rest of the
World anticipate increased optimism for revenue growth due to the rising number of infrastructure
projects in several countries. For example, in March 2013, construction equipment manufacturer
Liebherr Group, based in Germany, opened a new sales and service subsidiary in Mexico. This unit will
initially handle sales and servicing of Liebherr mobile cranes in Mexico and other neighboring countries
in Central America. The company noted that the move to establish a Mexican subsidiary was in
response to the growing importance of this market for Liebherr, as large-scale investments in Mexico’s
energy sector and infrastructure have contributed for increased demand for mobile and crawler cranes.
The reason respondents from companies operating in North America are more optimistic about revenue
growth is because the US construction industry has started to recover alongside the country’s
improving GDP. In reference to the trend, in March 2013, Howard University in Washington, DC
partnered with Campus Apartments for a US$107 million residential expansion at its Northwest DC
INDUSTRY DYNAMICS
Global Construction Supplier Industry Outlook Survey 2013–2014:
Market Trends, Marketing Spend and Sales Strategies in the Global Construction Industry Page 22
© Timetric. This product is licensed and is not to be photocopied Published: June 2013
campus. The project will feature two on-campus residential facilities, which will house 1,360 students
and include social, study and programming spaces.
Table 11: Revenue Growth Optimism in the Global Construction Industry by Region (%), 2013
Growth Optimism North America Europe Asia-Pacific Rest of the World
More optimistic 63% 48% 48% 70%
Neutral 26% 17% 36% 10%
Less optimistic 11% 34% 12% 20%
Don't know 0% 0% 4% 0%
Overall 100% 100% 100% 100%
N.B. Results may not equal 100% due to rounding
Source: Timetric Industry Survey 2013 © Timetric
Figure 3: Revenue Growth Optimism in the Global Construction Industry by Region (%), 2013
Source: Timetric Industry Survey 2013 © Timetric
3.1.3 Revenue growth projections by turnover
Survey respondents from small companies are more optimistic about revenue growth than those from
medium-sized and large companies. This is indicated by the fact that 58% of respondents from small
companies are more optimistic of revenue growth in 2013, while 46% of respondents from medium-
sized and 45% from large companies share similar expectations. Additionally, a total of 35% of
respondents from large companies expressed that they are ‘neutral’ about their revenue growth outlook,
while another 20% are ‘less optimistic’.

INDUSTRY DYNAMICS
Global Construction Supplier Industry Outlook Survey 2013–2014:
Market Trends, Marketing Spend and Sales Strategies in the Global Construction Industry Page 23
© Timetric. This product is licensed and is not to be photocopied Published: June 2013
Table 12: Revenue Growth Optimism in the Global Construction Industry by Turnover (%), 2013
Growth Optimism Less than US$100 million US$100 million–US$1 billion More than US$1 billion
More optimistic 58% 46% 45%
Neutral 18% 25% 35%
Less optimistic 23% 29% 20%
Don't know 1% 0% 0%
Overall 100% 100% 100%
N.B. Results may not equal 100% due to rounding
Source: Timetric Industry Survey 2013 © Timetric
Figure 4: Revenue Growth Optimism in the Global Construction Industry by Turnover (%), 2013
Source: Timetric Industry Survey 2013 © Timetric
INDUSTRY DYNAMICS
Global Construction Supplier Industry Outlook Survey 2013–2014:
Market Trends, Marketing Spend and Sales Strategies in the Global Construction Industry Page 24
© Timetric. This product is licensed and is not to be photocopied Published: June 2013
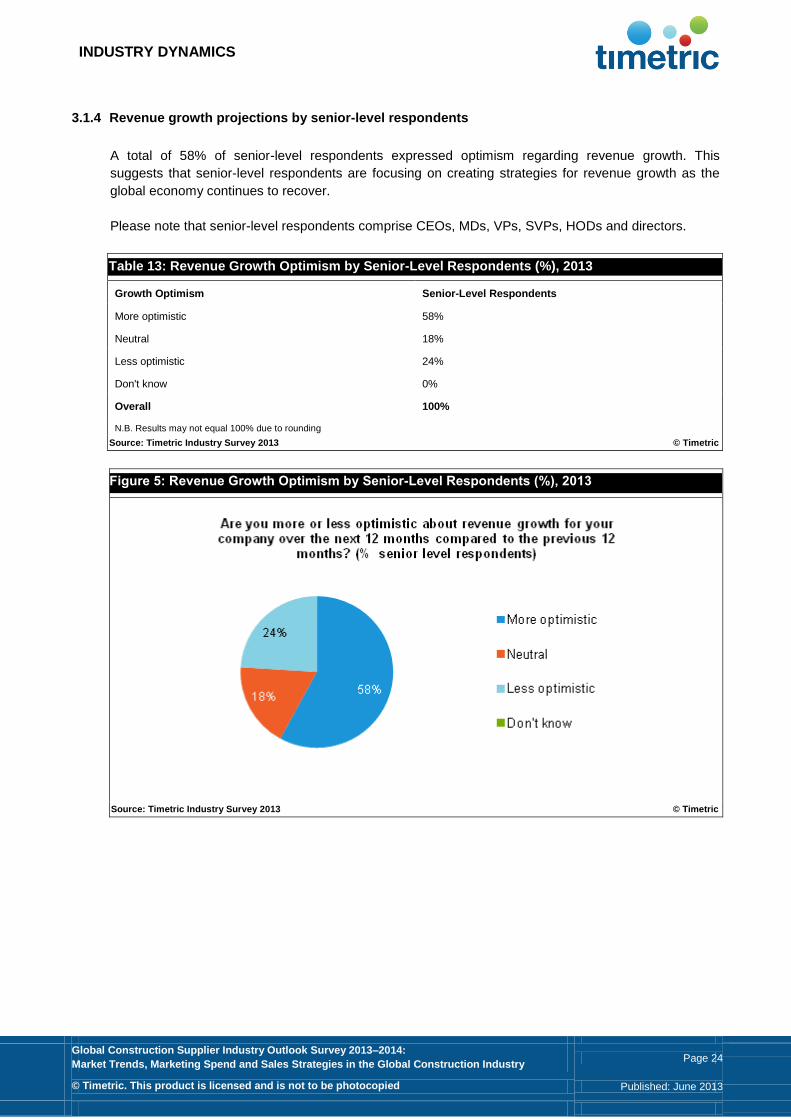
3.1.4 Revenue growth projections by senior-level respondents
A total of 58% of senior-level respondents expressed optimism regarding revenue growth. This
suggests that senior-level respondents are focusing on creating strategies for revenue growth as the
global economy continues to recover.
Please note that senior-level respondents comprise CEOs, MDs, VPs, SVPs, HODs and directors.
Table 13: Revenue Growth Optimism by Senior-Level Respondents (%), 2013
Growth Optimism Senior-Level Respondents
More optimistic 58%
Neutral 18%
Less optimistic 24%
Don't know 0%
Overall 100%
N.B. Results may not equal 100% due to rounding
Source: Timetric Industry Survey 2013 © Timetric
Figure 5: Revenue Growth Optimism by Senior-Level Respondents (%), 2013
Source: Timetric Industry Survey 2013 © Timetric

INDUSTRY DYNAMICS
Global Construction Supplier Industry Outlook Survey 2013–2014:
Market Trends, Marketing Spend and Sales Strategies in the Global Construction Industry Page 25
© Timetric. This product is licensed and is not to be photocopied Published: June 2013
3.2 Future Developments in Business Structure in the Global Construction Industry
Construction companies across the world are being forced to adjust their business structures due to the
changing economic conditions. As a result, construction companies are focusing more on the business
structures that affect their future developments. Respondents were asked what their top priorities are in
developing their company's business structure in 2013. Respondents were also asked if they will be
expanding or diversifying into specific regions or product types. The answers have been analyzed into
different groups, which identify the apparent changes anticipated across the industry and provide an
insight into general global construction industry dynamics.
3.2.1 Future developments in business structure by contractors and developers
Overall, the key anticipated changes in business structure for construction contractors and developers
have not changed considerably from those identified in the 2012 Timetric construction survey. The main
priorities identified by construction contractors and developers for 2013 are the need to ‘expand in
current market’ and ‘improving operational efficiency’. The priorities indentified in the 2012 survey were
‘improving operational efficiency’, to ‘expand operations in domestic market’, ‘stabilize company
finances’, and ‘manage pricing strategies’.
‘Expand operations in domestic market’ has emerged as an important business priority for construction
contractors and developers. With the gradual recovery of the global construction industry, these
companies are looking to shift their focus from survival to growth. For example, in March 2013, London-
based construction services firm, Morgan Sindall, won a contract to build a new US$36 million office
building in Glasgow as part of the Clyde Gateway regeneration project. Morgan Sindall will redevelop
the vacant land on the banks of the River Clyde into 11,000 sq. m of office accommodation in a new
five-story building by October 2014. Similarly, in February 2013, Australian property development firm,
Stockland, selected Brookfield Multiplex as the preferred contractor for its US$125 million
redevelopment of the Stockland Wetherill Park shopping centre in south-west Sydney. Commenting on
the agreement, a senior executive from Brookfield Multiplex said:
“We have forged a strong relationship in recent years, having been involved in the redevelopment of
Stockland Merrylands, completed in October 2012, as well as Stockland Shellharbour which we're set
to hand over mid this year.”
For ‘improving operational efficiency’, several construction companies have started to implement
advanced IT technologies such as building information modeling (BIM). A company’s operational
efficiency directly affects its profit margins, and construction contractors and developers are
increasingly employing technological initiatives to improve their operational efficiency. In April 2013,
radio systems developer HBC-radiomatic, based in Germany, announced the introduction of Spectrum
E, a new radio control system, which has space for a large number of operating elements and features.
The device is suited for applications with large function ranges, such as bucket excavators, special
transport vehicles, and drilling machines, and also features a newly developed live video transmission
and user identification with the HBC data logger.
INDUSTRY DYNAMICS
Global Construction Supplier Industry Outlook Survey 2013–2014:
Market Trends, Marketing Spend and Sales Strategies in the Global Construction Industry Page 26
© Timetric. This product is licensed and is not to be photocopied Published: June 2013
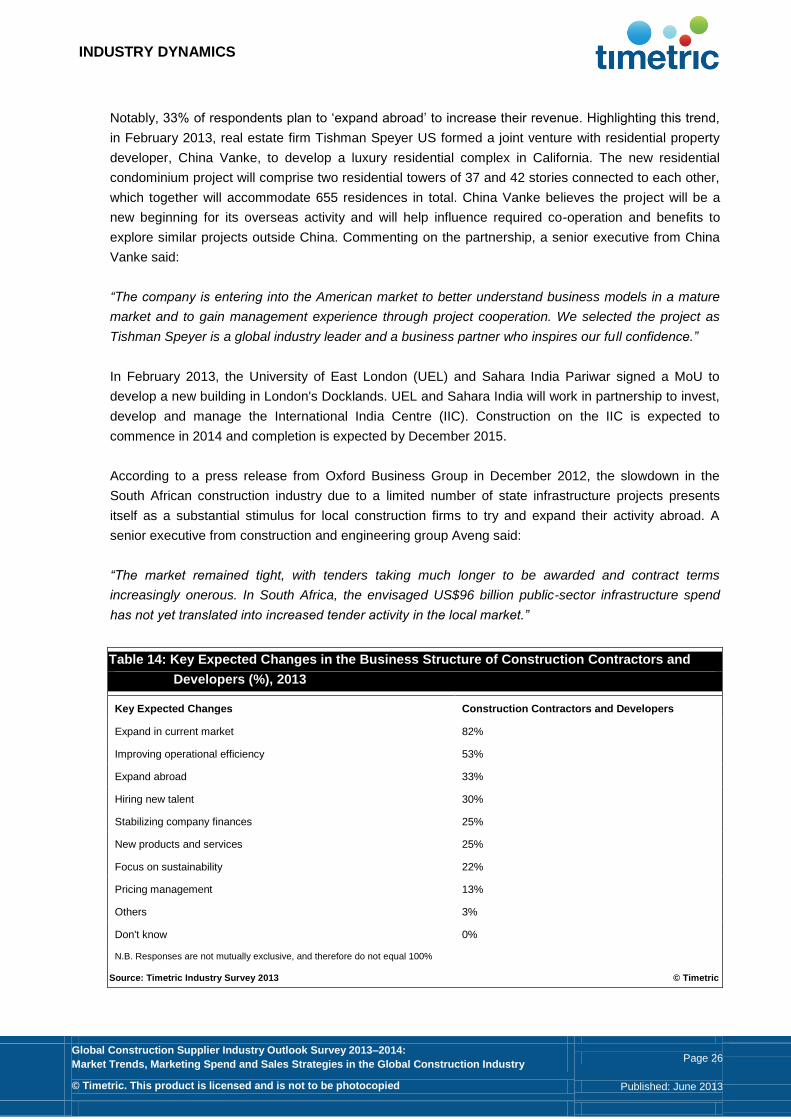
Notably, 33% of respondents plan to ‘expand abroad’ to increase their revenue. Highlighting this trend,
in February 2013, real estate firm Tishman Speyer US formed a joint venture with residential property
developer, China Vanke, to develop a luxury residential complex in California. The new residential
condominium project will comprise two residential towers of 37 and 42 stories connected to each other,
which together will accommodate 655 residences in total. China Vanke believes the project will be a
new beginning for its overseas activity and will help influence required co-operation and benefits to
explore similar projects outside China. Commenting on the partnership, a senior executive from China
Vanke said:
“The company is entering into the American market to better understand business models in a mature
market and to gain management experience through project cooperation. We selected the project as
Tishman Speyer is a global industry leader and a business partner who inspires our full confidence.”
In February 2013, the University of East London (UEL) and Sahara India Pariwar signed a MoU to
develop a new building in London's Docklands. UEL and Sahara India will work in partnership to invest,
develop and manage the International India Centre (IIC). Construction on the IIC is expected to
commence in 2014 and completion is expected by December 2015.
According to a press release from Oxford Business Group in December 2012, the slowdown in the
South African construction industry due to a limited number of state infrastructure projects presents
itself as a substantial stimulus for local construction firms to try and expand their activity abroad. A
senior executive from construction and engineering group Aveng said:
“The market remained tight, with tenders taking much longer to be awarded and contract terms
increasingly onerous. In South Africa, the envisaged US$96 billion public-sector infrastructure spend
has not yet translated into increased tender activity in the local market.”
Table 14: Key Expected Changes in the Business Structure of Construction Contractors and
Developers (%), 2013
Key Expected Changes Construction Contractors and Developers
Expand in current market 82%
Improving operational efficiency 53%
Expand abroad 33%
Hiring new talent 30%
Stabilizing company finances 25%
New products and services 25%
Focus on sustainability 22%
Pricing management 13%
Others 3%
Don't know 0%
N.B. Responses are not mutually exclusive, and therefore do not equal 100%
Source: Timetric Industry Survey 2013 © Timetric

INDUSTRY DYNAMICS
Global Construction Supplier Industry Outlook Survey 2013–2014:
Market Trends, Marketing Spend and Sales Strategies in the Global Construction Industry Page 27
© Timetric. This product is licensed and is not to be photocopied Published: June 2013
Figure 6: Key Expected Changes in the Business Structure of Construction Contractors and
Developers (%), 2013
Source: Timetric Industry Survey 2013 © Timetric

INDUSTRY DYNAMICS
Global Construction Supplier Industry Outlook Survey 2013–2014:
Market Trends, Marketing Spend and Sales Strategies in the Global Construction Industry Page 28
© Timetric. This product is licensed and is not to be photocopied Published: June 2013
3.2.2 Future developments in business structure by suppliers
The key changes in business priorities identified by construction equipment and materials supplier
companies for 2013 are ‘expand in current market’, ‘new products and services’, and ‘improving
operational efficiency’.
Survey results demonstrate that a total of 77% of supplier respondents are willing to ‘expand in current
market’. For example, in February 2013, All Erection & Crane Rental, based in Ohio, added 66 new
Link-Belt cranes including 14 truck cranes, 32 rough-terrain cranes and 20 crawler cranes to its national
fleet. A senior executive from the company commented:
“It's a huge deal, but a regular part of our annual fleet expansion. Doing such a large package here in
the first quarter reflects more on the surging appetite for cranes. Spread out to our branches, the cranes
will immediately start answering local needs, from daily rentals to major projects begging for longer-
term rentals."
Suppliers are also more focused on launching new products and services, to add value to their product
offerings and subsequently increase sales, as identified by 67% of respondents. For example, in April
2013, manufacturer of heavy equipment, Terex Corporation, announced the introduction of its new five-
axle all-terrain crane range at the Bauma Trade Fair 2013.
‘Improving operational efficiency’ is the business priority identified by the largest share, 51%, of
construction equipment and material supplier respondents. By improving operational efficiency,
suppliers can significantly reduce their operational expenses and improve their profitability. For
example, in April 2013, crane software supplier Hirschmann announced the introduction of the qScale
I2 telescopic crane control system through its Mobile Machine Control Solutions division. The new
crane control system is intended to simplify applications for smaller and medium-sized telescopic
cranes, and features both visualization and load moment indication for load measurement.
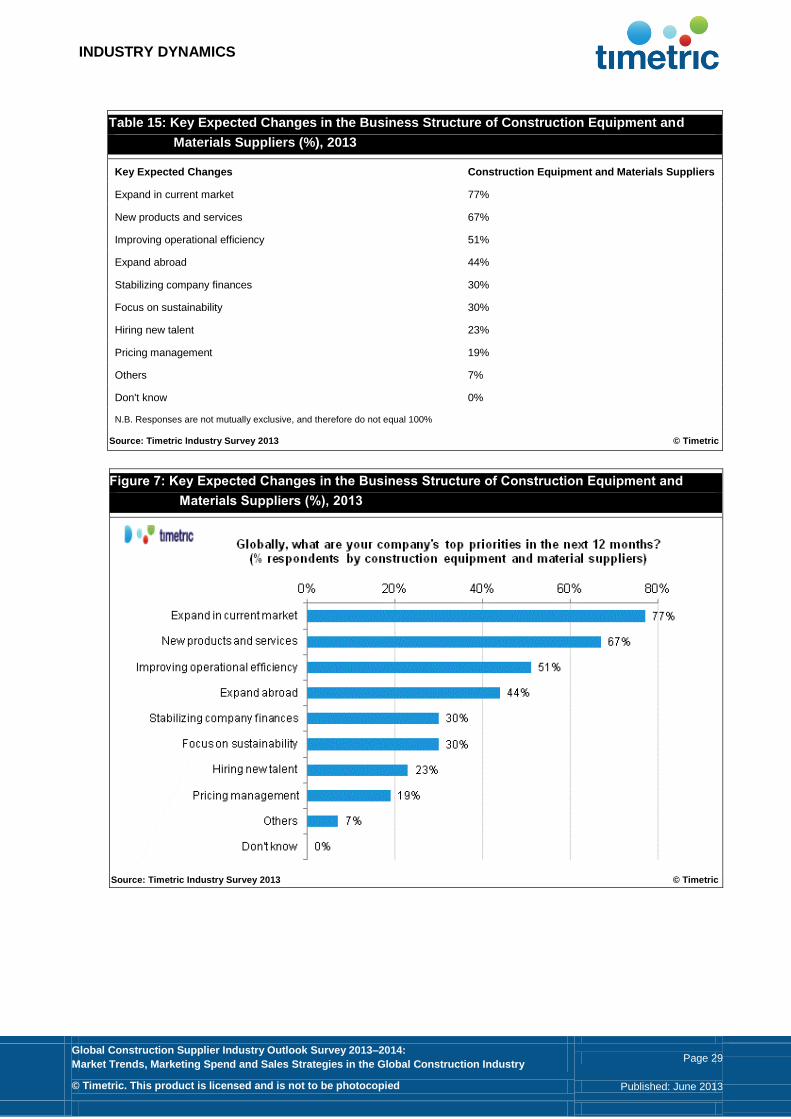
INDUSTRY DYNAMICS
Global Construction Supplier Industry Outlook Survey 2013–2014:
Market Trends, Marketing Spend and Sales Strategies in the Global Construction Industry Page 29
© Timetric. This product is licensed and is not to be photocopied Published: June 2013
Table 15: Key Expected Changes in the Business Structure of Construction Equipment and
Materials Suppliers (%), 2013
Key Expected Changes Construction Equipment and Materials Suppliers
Expand in current market 77%
New products and services 67%
Improving operational efficiency 51%
Expand abroad 44%
Stabilizing company finances 30%
Focus on sustainability 30%
Hiring new talent 23%
Pricing management 19%
Others 7%
Don't know 0%
N.B. Responses are not mutually exclusive, and therefore do not equal 100%
Source: Timetric Industry Survey 2013 © Timetric
Figure 7: Key Expected Changes in the Business Structure of Construction Equipment and
Materials Suppliers (%), 2013
Source: Timetric Industry Survey 2013 © Timetric

INDUSTRY DYNAMICS
Global Construction Supplier Industry Outlook Survey 2013–2014:
Market Trends, Marketing Spend and Sales Strategies in the Global Construction Industry Page 30
© Timetric. This product is licensed and is not to be photocopied Published: June 2013
The key changes in business structure as identified by other construction industry supplier companies
for 2013 are ‘expand in current market’, ‘expand abroad’, and introduce ‘new products and services’.
Due to the increasing number of construction projects in several regions, many suppliers are recording
an increase in their business activities, and plan to expand their operations abroad. For example,
Manitowoc, a supplier company based in the US, announced the expansion of its customer support
services in Australasia with the opening of a new contact center in Sydney. Through this initiative, the
company strives to improve customer support for the growing number of its dealers and customers in
the region. The center, staffed by experienced engineers and technicians, organizes on-site support
and training, dispatches parts, provides technical assistance, and all other additional services to ensure
the correct and effective use of its products. A senior executive from the company stated:
“The new center is designed to promote better crane use and efficient operation while creating a new
platform to deliver customer support. We are expanding our operations in Australia and New Zealand,
and remain committed to helping our dealers and customers get the most from their cranes. This new
channel of communication will provide assistance and advice based on global experience and expert
knowledge. It will also help us to improve our services and meet the specific needs of customers and
dealers across the region."
Figure 8: Key Expected Changes in the Business Structure of Other Construction Suppliers (%),
2013
Source: Timetric Industry Survey 2013 © Timetric
INDUSTRY DYNAMICS
Global Construction Supplier Industry Outlook Survey 2013–2014:
Market Trends, Marketing Spend and Sales Strategies in the Global Construction Industry Page 31
© Timetric. This product is licensed and is not to be photocopied Published: June 2013
3.3 Merger and Acquisition Activity Projections in the Global Construction Industry Executives from the global construction industry anticipate increased levels of consolidation in 2013, as
50% of respondents expect either a ‘significant increase’ or an ‘increase’ in merger and acquisition
(M&A) activity during 2013, as compared to 49% in 2012.
Slow recovery in the global economy and weak market conditions, a growing desire by large
construction companies to increase their global presence, and increased pressure of rising costs on
small and medium-sized construction companies are considered key drivers of M&A in 2013. In
January 2013, ground engineering company Keller Group UK announced the acquisition of Geo-
Foundations Contractors, based in Toronto, for US$9.3 million. Geo-Foundations offers design-build
solutions to the construction and mining industries across Canada, in addition to micro-piling, ground
anchors and specialty grouting services. Keller added that a combination of increasing market
acceptance of these techniques in Canada, along with the ground improvement techniques and
assistance from Keller’s existing US business, is expected to fuel significant growth over time. A senior
executive from Keller stated:
“Keller has worked in partnership with Geo-Foundations on a number of projects in recent years,
building a relationship of mutual respect. I am confident that together we are well positioned to fully
exploit the opportunities in this attractive market. This acquisition builds on our strong track record of
expanding into higher-growth geographic regions through both organic growth and targeted
acquisitions.”
3.3.1 M&A activity projections by contractors and developers
Respondents from construction contractor and developer companies expect increased levels of
consolidation in 2013, and 50% of contractor and developer respondents forecast either a ‘significant
increase’ or an ‘increase’ in M&A activity as a result of gradual recovery in the global construction
industry, growing infrastructure needs due to urbanization, and increased demand for sustainable
construction. A staff-level executive from a construction contractor company based in North America
stated:
“We expect a continued consolidation within the industry due to pressure on medium-sized firms, as
large construction companies seem to ride the uneven market conditions better and have better orders
on the books.”
Several construction contractors and developers view mergers and acquisitions as a preferred method
for enhancing their operational efficiency. An executive from a construction sub-contractor company
based in Europe noted:
“As the construction industry is oversubscribed with a number of wealthy players looking to broaden
skills and market exposure, we forecast an increase in M&A activity in 2013.”
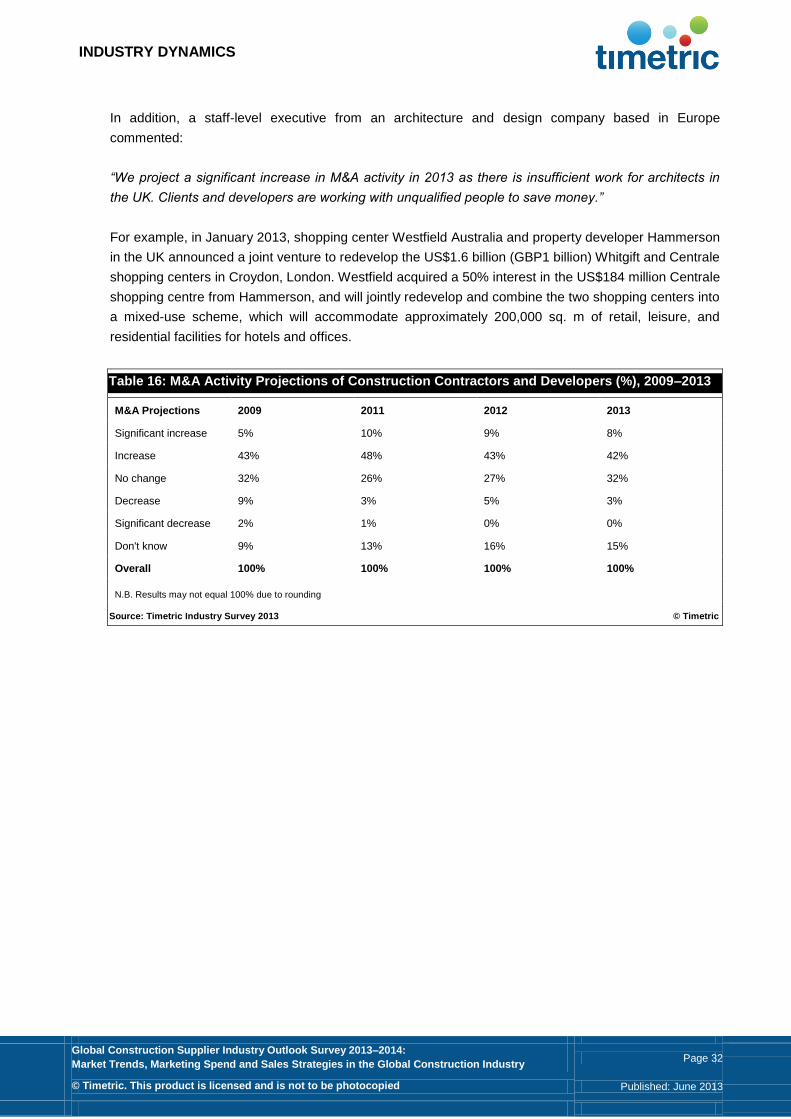
INDUSTRY DYNAMICS
Global Construction Supplier Industry Outlook Survey 2013–2014:
Market Trends, Marketing Spend and Sales Strategies in the Global Construction Industry Page 32
© Timetric. This product is licensed and is not to be photocopied Published: June 2013
In addition, a staff-level executive from an architecture and design company based in Europe
commented:
“We project a significant increase in M&A activity in 2013 as there is insufficient work for architects in
the UK. Clients and developers are working with unqualified people to save money.”
For example, in January 2013, shopping center Westfield Australia and property developer Hammerson
in the UK announced a joint venture to redevelop the US$1.6 billion (GBP1 billion) Whitgift and Centrale
shopping centers in Croydon, London. Westfield acquired a 50% interest in the US$184 million Centrale
shopping centre from Hammerson, and will jointly redevelop and combine the two shopping centers into
a mixed-use scheme, which will accommodate approximately 200,000 sq. m of retail, leisure, and
residential facilities for hotels and offices.
Table 16: M&A Activity Projections of Construction Contractors and Developers (%), 2009–2013
M&A Projections 2009 2011 2012 2013
Significant increase 5% 10% 9% 8%
Increase 43% 48% 43% 42%
No change 32% 26% 27% 32%
Decrease 9% 3% 5% 3%
Significant decrease 2% 1% 0% 0%
Don't know 9% 13% 16% 15%
Overall 100% 100% 100% 100%
N.B. Results may not equal 100% due to rounding
Source: Timetric Industry Survey 2013 © Timetric

INDUSTRY DYNAMICS
Global Construction Supplier Industry Outlook Survey 2013–2014:
Market Trends, Marketing Spend and Sales Strategies in the Global Construction Industry Page 33
© Timetric. This product is licensed and is not to be photocopied Published: June 2013
Figure 9: M&A Activity Projections of Construction Contractors and Developers (%), 2009–2013
Source: Timetric Industry Survey 2013 © Timetric
3.3.2 M&A activity projections by suppliers
Respondents from global equipment and materials supplier companies expect increased levels of
consolidation in the global construction industry in 2013, as 46% of respondents expect either a
‘significant increase’ or ‘increase’ in M&A activity. Some of the main reasons for this projected increase
include uneven market conditions, growing infrastructure needs, rising operational costs, and the need
for geographic expansion. A C-level executive from construction materials supplier based in North
America commented:
“The rate at which companies are liquidating is still high versus the pre-recession period, and to survive,
organizations will pursue mergers within their industry sectors to create larger barriers to entry for new
entrants, and ensure more substantial economies of scale.”
In addition, a manager-level executive from a construction equipment supplier stated:
“The ongoing financial constraints will continue to drive companies to reduce costs and consolidate.”
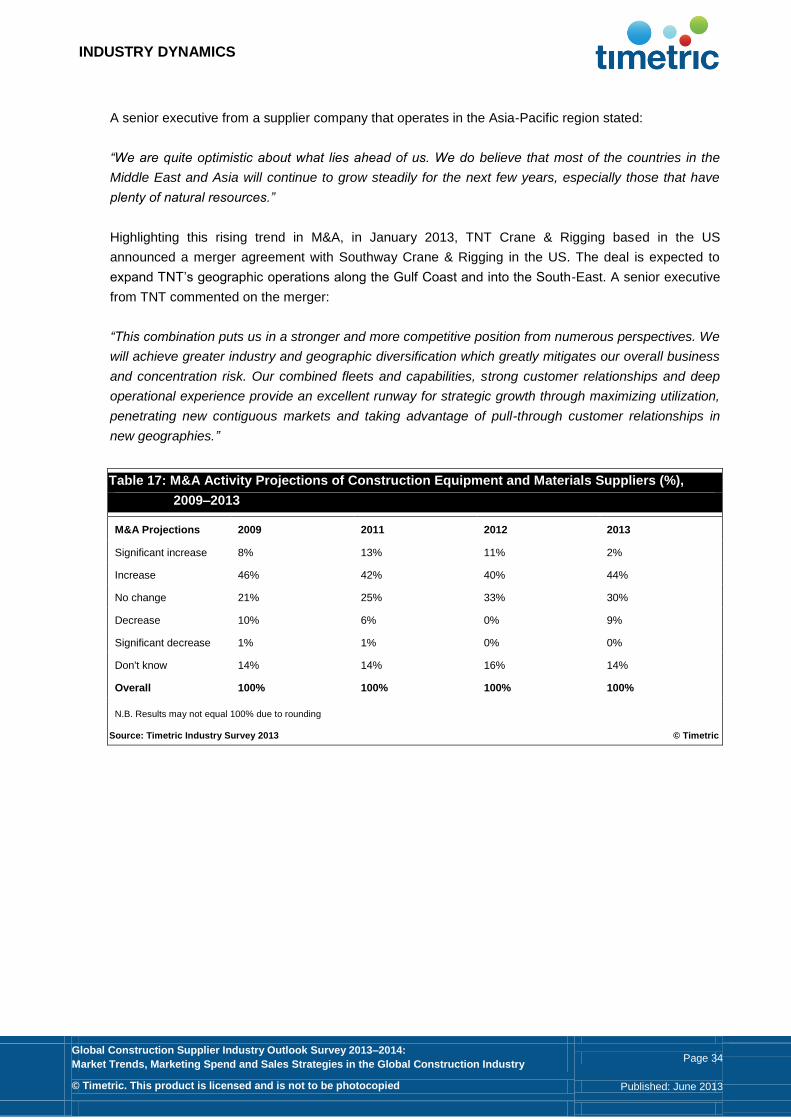
INDUSTRY DYNAMICS
Global Construction Supplier Industry Outlook Survey 2013–2014:
Market Trends, Marketing Spend and Sales Strategies in the Global Construction Industry Page 34
© Timetric. This product is licensed and is not to be photocopied Published: June 2013
A senior executive from a supplier company that operates in the Asia-Pacific region stated:
“We are quite optimistic about what lies ahead of us. We do believe that most of the countries in the
Middle East and Asia will continue to grow steadily for the next few years, especially those that have
plenty of natural resources.”
Highlighting this rising trend in M&A, in January 2013, TNT Crane & Rigging based in the US
announced a merger agreement with Southway Crane & Rigging in the US. The deal is expected to
expand TNT’s geographic operations along the Gulf Coast and into the South-East. A senior executive
from TNT commented on the merger:
“This combination puts us in a stronger and more competitive position from numerous perspectives. We
will achieve greater industry and geographic diversification which greatly mitigates our overall business
and concentration risk. Our combined fleets and capabilities, strong customer relationships and deep
operational experience provide an excellent runway for strategic growth through maximizing utilization,
penetrating new contiguous markets and taking advantage of pull-through customer relationships in
new geographies.”
Table 17: M&A Activity Projections of Construction Equipment and Materials Suppliers (%),
2009–2013
M&A Projections 2009 2011 2012 2013
Significant increase 8% 13% 11% 2%
Increase 46% 42% 40% 44%
No change 21% 25% 33% 30%
Decrease 10% 6% 0% 9%
Significant decrease 1% 1% 0% 0%
Don't know 14% 14% 16% 14%
Overall 100% 100% 100% 100%
N.B. Results may not equal 100% due to rounding
Source: Timetric Industry Survey 2013 © Timetric
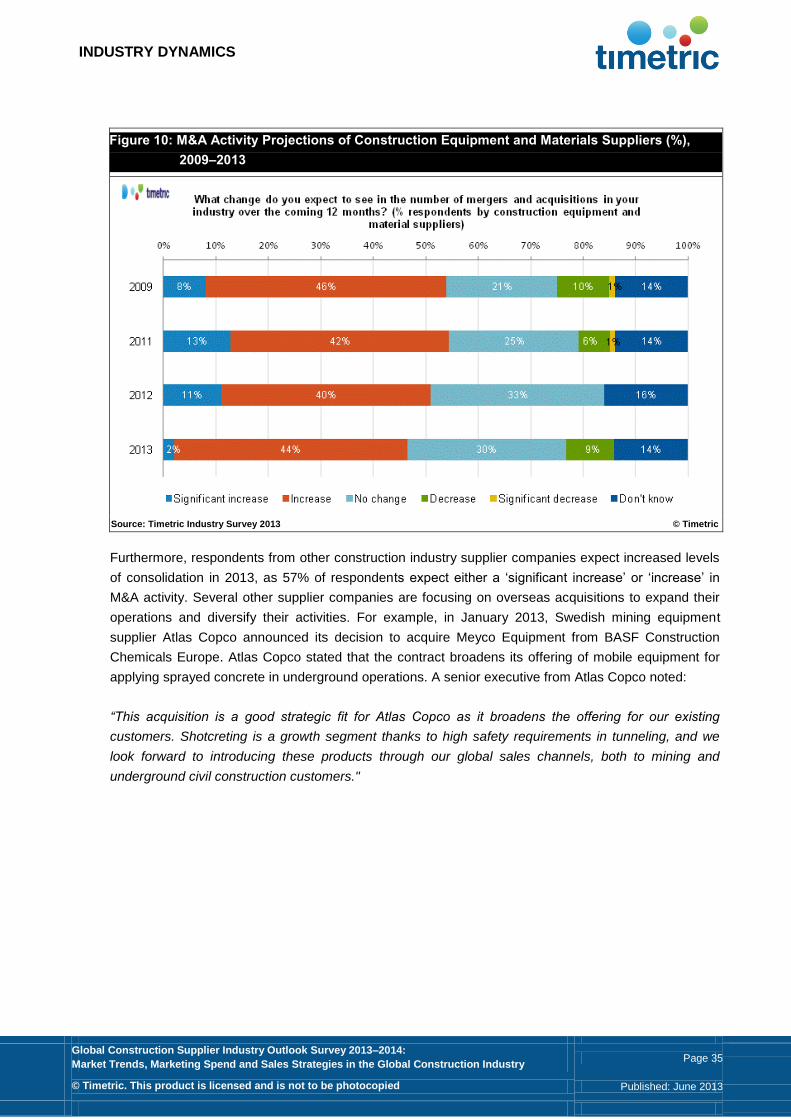
INDUSTRY DYNAMICS
Global Construction Supplier Industry Outlook Survey 2013–2014:
Market Trends, Marketing Spend and Sales Strategies in the Global Construction Industry Page 35
© Timetric. This product is licensed and is not to be photocopied Published: June 2013
Figure 10: M&A Activity Projections of Construction Equipment and Materials Suppliers (%),
2009–2013
Source: Timetric Industry Survey 2013 © Timetric
Furthermore, respondents from other construction industry supplier companies expect increased levels
of consolidation in 2013, as 57% of respondents expect either a ‘significant increase’ or ‘increase’ in
M&A activity. Several other supplier companies are focusing on overseas acquisitions to expand their
operations and diversify their activities. For example, in January 2013, Swedish mining equipment
supplier Atlas Copco announced its decision to acquire Meyco Equipment from BASF Construction
Chemicals Europe. Atlas Copco stated that the contract broadens its offering of mobile equipment for
applying sprayed concrete in underground operations. A senior executive from Atlas Copco noted:
“This acquisition is a good strategic fit for Atlas Copco as it broadens the offering for our existing
customers. Shotcreting is a growth segment thanks to high safety requirements in tunneling, and we
look forward to introducing these products through our global sales channels, both to mining and
underground civil construction customers."
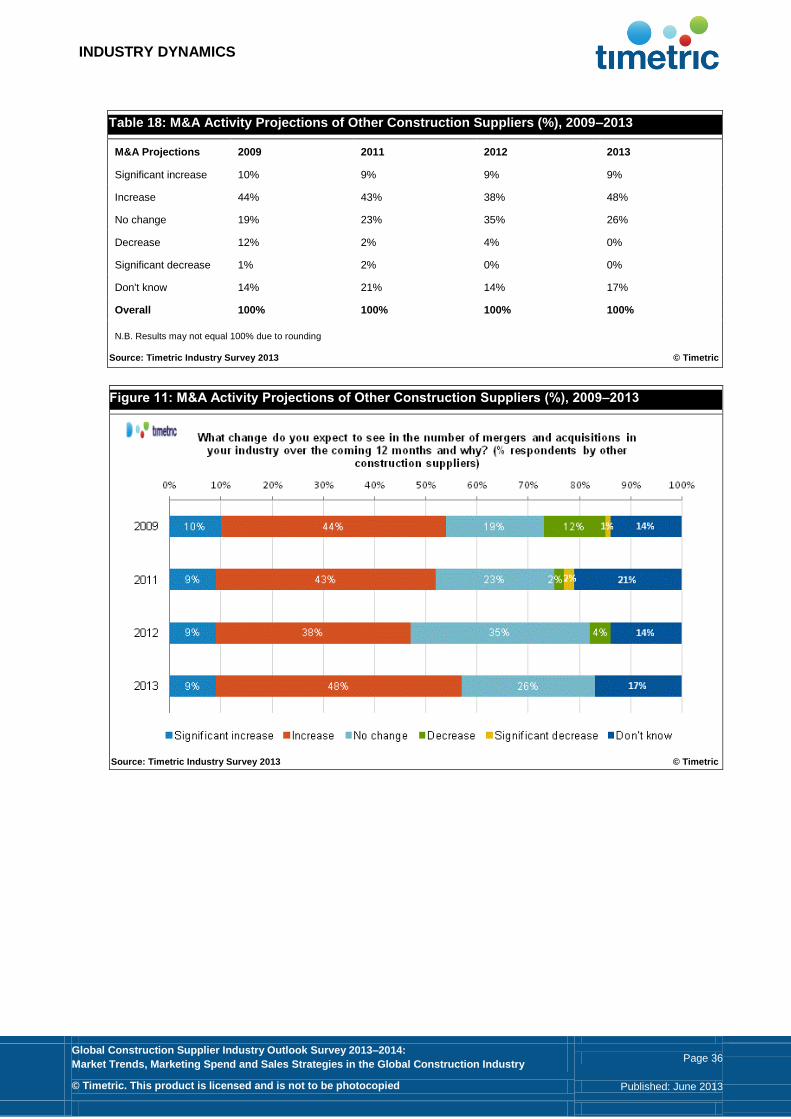
INDUSTRY DYNAMICS
Global Construction Supplier Industry Outlook Survey 2013–2014:
Market Trends, Marketing Spend and Sales Strategies in the Global Construction Industry Page 36
© Timetric. This product is licensed and is not to be photocopied Published: June 2013
Table 18: M&A Activity Projections of Other Construction Suppliers (%), 2009–2013
M&A Projections 2009 2011 2012 2013
Significant increase 10% 9% 9% 9%
Increase 44% 43% 38% 48%
No change 19% 23% 35% 26%
Decrease 12% 2% 4% 0%
Significant decrease 1% 2% 0% 0%
Don't know 14% 21% 14% 17%
Overall 100% 100% 100% 100%
N.B. Results may not equal 100% due to rounding
Source: Timetric Industry Survey 2013 © Timetric
Figure 11: M&A Activity Projections of Other Construction Suppliers (%), 2009–2013
Source: Timetric Industry Survey 2013 © Timetric
INDUSTRY DYNAMICS
Global Construction Supplier Industry Outlook Survey 2013–2014:
Market Trends, Marketing Spend and Sales Strategies in the Global Construction Industry Page 37
© Timetric. This product is licensed and is not to be photocopied Published: June 2013
3.3.3 M&A activity projections by region
The majority of respondents from companies that operate in North America and Europe expect an
increase in M&A activity during 2013. Specifically, 53% of respondents from companies that operate in
Europe expect increased levels of M&A activity, along with 52% of respondents from companies that
operate in North America and 44% of respondents from companies operating in Asia-Pacific.
Interestingly, European construction companies are particularly focused on acquiring firms in the rapidly
developing regions of India and China. Such initiatives will not only help companies improve their
profitability over the long term, but also diversify and mitigate risks. For example, a C-level executive
from an architecture company based in Europe stated:
“As businesses are still struggling following the economic downturn, it makes sense for companies to
join forces, even in an informal partnership setup.”
The Asia-Pacific and the Rest of the World regions have also emerged as important hubs in M&A for
construction equipment suppliers, due to the introduction of large-scale construction projects across key
countries. For example, in February 2013, Finnish engineering and technology firm Metso Corporation
announced its decision to strengthen its presence and capabilities in mining and construction through
the acquisition of manganese steel foundry, JX, in China. Metso notes that the acquisition of JX will
improve its capabilities to supply wear parts to customers in China and other markets of Asia Pacific. A
senior executive from Metso commented on the acquisition:
“The acquisitions of JX and Shaorui Heavy Industries Ltd and the joint venture with LiuGong Group
Corp. Ltd, announced in November 2012, significantly strengthen our supply capabilities for mining and
construction industries in China. Metso now has a complete range of capital equipment and wear parts
covering a wide range of customer requirements. By acquiring a new steel foundry in China we are able
to better serve the needs of our Chinese customers. We already have the most extensive services hub
and distribution network in our industry. With this acquisition we will strengthen our manufacturing
presence in China and further develop our services business. We will improve our capability to supply
wear parts to our mining and construction customers close to their operations and increase the flexibility
and resilience of our wear-products supply chain. We also intend to use the acquired site as a platform
to further develop our services capabilities in China.”
Zamil Industrial Investment Company, based in Saudi Arabia, announced the purchase of two
undisclosed companies for US$80 million in 2013. Zamil Industrial posted a 39.4% increase in its third-
quarter net profits in 2012, and forecasts similar growth in 2013 due to heavy expenditure by the
government of Saudi Arabia on infrastructure. A senior executive from the company noted:
“We think expanding through acquisitions along with organic growth gives us the targeted growth that
we aspire to attain.”
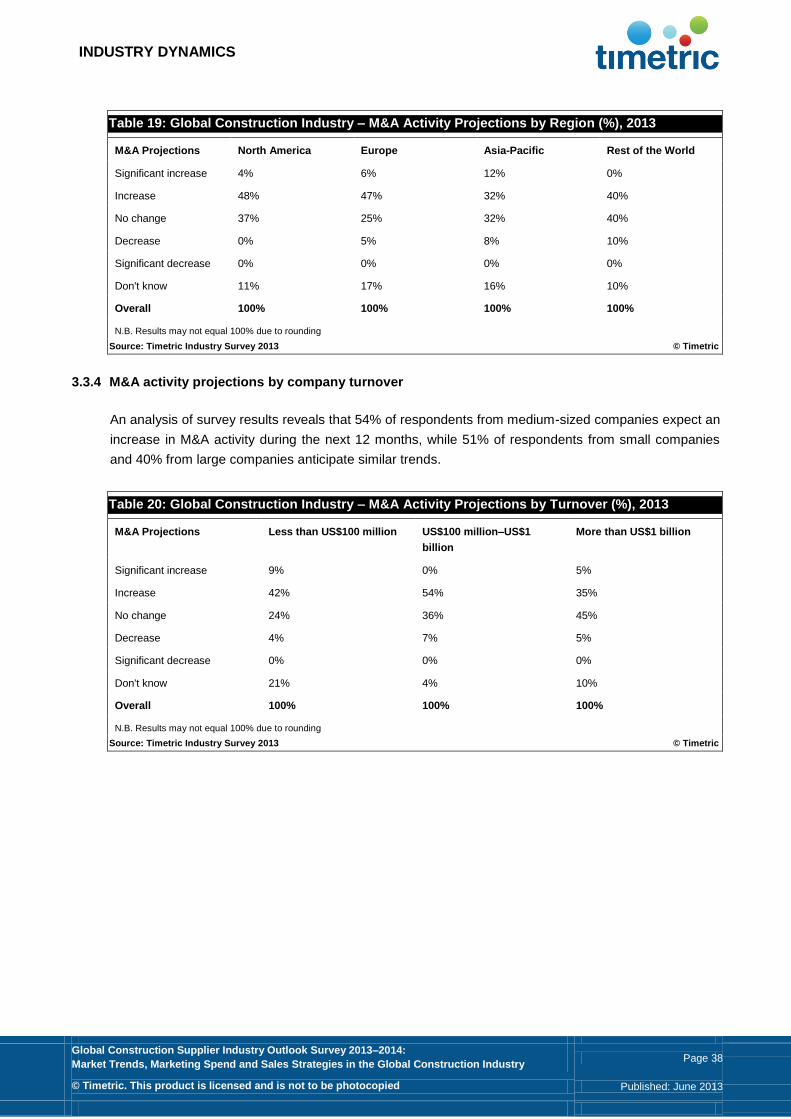
INDUSTRY DYNAMICS
Global Construction Supplier Industry Outlook Survey 2013–2014:
Market Trends, Marketing Spend and Sales Strategies in the Global Construction Industry Page 38
© Timetric. This product is licensed and is not to be photocopied Published: June 2013
Table 19: Global Construction Industry – M&A Activity Projections by Region (%), 2013
M&A Projections North America Europe Asia-Pacific Rest of the World
Significant increase 4% 6% 12% 0%
Increase 48% 47% 32% 40%
No change 37% 25% 32% 40%
Decrease 0% 5% 8% 10%
Significant decrease 0% 0% 0% 0%
Don't know 11% 17% 16% 10%
Overall 100% 100% 100% 100%
N.B. Results may not equal 100% due to rounding
Source: Timetric Industry Survey 2013 © Timetric
3.3.4 M&A activity projections by company turnover
An analysis of survey results reveals that 54% of respondents from medium-sized companies expect an
increase in M&A activity during the next 12 months, while 51% of respondents from small companies
and 40% from large companies anticipate similar trends.
Table 20: Global Construction Industry – M&A Activity Projections by Turnover (%), 2013
M&A Projections Less than US$100 million US$100 million–US$1
billion
More than US$1 billion
Significant increase 9% 0% 5%
Increase 42% 54% 35%
No change 24% 36% 45%
Decrease 4% 7% 5%
Significant decrease 0% 0% 0%
Don't know 21% 4% 10%
Overall 100% 100% 100%
N.B. Results may not equal 100% due to rounding
Source: Timetric Industry Survey 2013 © Timetric
INDUSTRY DYNAMICS
Global Construction Supplier Industry Outlook Survey 2013–2014:
Market Trends, Marketing Spend and Sales Strategies in the Global Construction Industry Page 39
© Timetric. This product is licensed and is not to be photocopied Published: June 2013
3.4 Estimation of Capital Expenditure in the Global Construction Industry
Capital expenditure is the amount spent on buying fixed assets, including mergers and acquisitions.
Capital expenditure accounts for all the investments designed to drive future growth of a construction
company. This section identifies the change in the capital expenditure of construction industry
contractors and developers and suppliers. Respondents were asked: “How do you expect your firm’s
capital expenditure to change in 2013?” The responses have been analyzed by company type, region
and turnover.
3.4.1 Estimation of capital expenditure by contractors and developers
An analysis of responses by construction contractor and developer companies reveals that capital
expenditure is expected to increase in 2013 on ‘new product developments’, ‘IT infrastructure
developments’, and ‘machinery and equipment purchases’.
‘New product developments’ or new project development is an important area of capital investment for
construction contractors and developers. For example, in March 2013, LuLu Group of the UAE
announced investments of US$293 million to open a new shopping mall in India, designed by UK
engineering consultancy firm Atkins. Similarly, in January 2013, American soccer team New York
Cosmos submitted a proposal to the New York's Empire State Development to construct a US$400
million soccer stadium at Belmont Park racetrack in Nassau County, New York, in cooperation with
Turner Construction. Cosmos employed architecture and construction companies such as Populous,
Spector Group and Cameron Engineering for building the project, named Elmont Crossings, on 28
acres of land with seating capacity for 25,000 people.
Additionally, in April 2013, UK construction and support services firm Interserve announced a joint-
venture agreement with Tiger Developments to construct a US$307 million mixed-use development
next to Haymarket station in Edinburgh. Furthermore, in March 2013, real estate firm Education Realty
Trust (EdR), based in the US, secured a contract to develop a US$46.1 million collegiate housing
community at Duke University in Durham, North Carolina. EdR will provide development, construction
oversight, and management services for the 386-bed community building.
Furthermore, construction developers have started investing in IT solutions to improve productivity and
lower overhead charges. They have also started to invest in technologies such as cloud computing and
enterprise resource planning applications, leading to significant savings. For example, in January 2013,
Rendsburg Port Authority in Germany announced an investment in Tandem Lift Assistant through Terex
Port Solutions, a supplier of industrial cranes. The new unit allows the two existing cranes at its port to
be used simultaneously for computer-controlled tandem lifts. A senior executive from Rendsburg Port
Authority stated:
“The Tandem Lift Assistant enables us to perform lifts with loads weighing up to 250 tons, which is
more than any other crane in this region of Germany. Thanks to this capability, our cranes offer
customers around the Kiel Canal a unique opportunity, which, of course, ensures us a competitive
advantage when it comes to handling large, bulky and very heavy cargoes.”
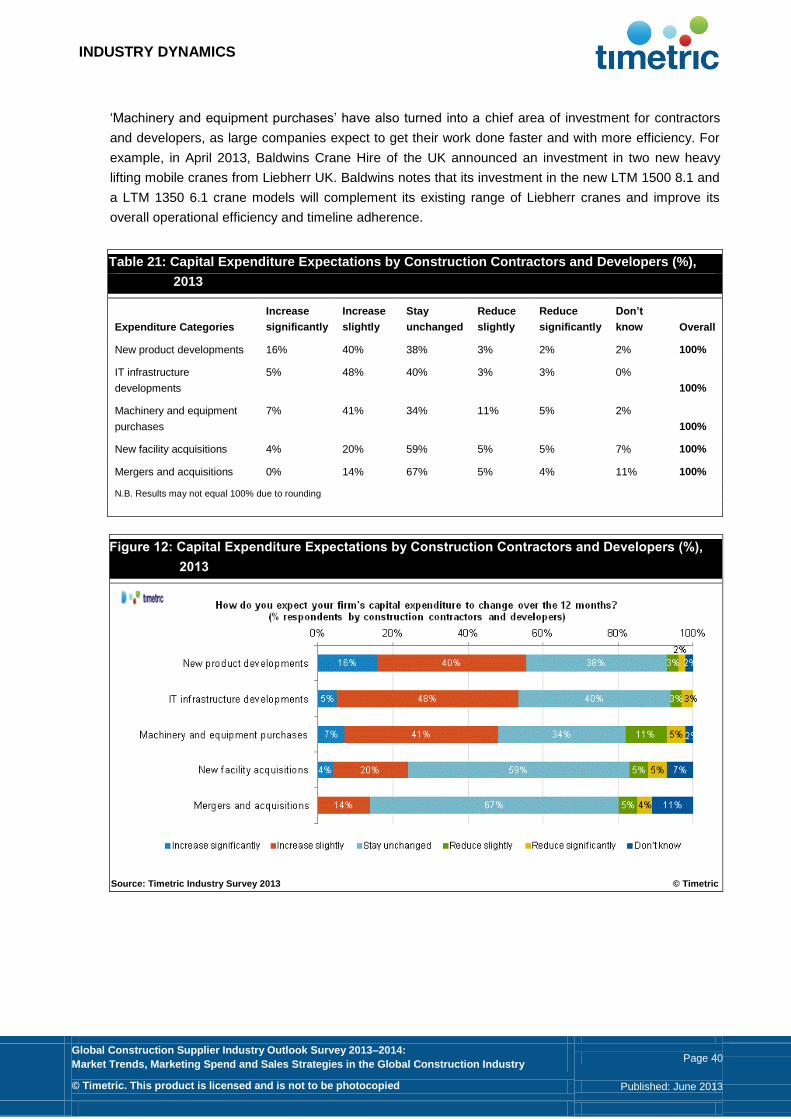
INDUSTRY DYNAMICS
Global Construction Supplier Industry Outlook Survey 2013–2014:
Market Trends, Marketing Spend and Sales Strategies in the Global Construction Industry Page 40
© Timetric. This product is licensed and is not to be photocopied Published: June 2013
‘Machinery and equipment purchases’ have also turned into a chief area of investment for contractors
and developers, as large companies expect to get their work done faster and with more efficiency. For
example, in April 2013, Baldwins Crane Hire of the UK announced an investment in two new heavy
lifting mobile cranes from Liebherr UK. Baldwins notes that its investment in the new LTM 1500 8.1 and
a LTM 1350 6.1 crane models will complement its existing range of Liebherr cranes and improve its
overall operational efficiency and timeline adherence.
Table 21: Capital Expenditure Expectations by Construction Contractors and Developers (%),
2013
Expenditure Categories
Increase
significantly
Increase
slightly
Stay
unchanged
Reduce
slightly
Reduce
significantly
Don’t
know Overall
New product developments 16% 40% 38% 3% 2% 2% 100%
IT infrastructure
developments
5% 48% 40% 3% 3% 0%
100%
Machinery and equipment
purchases
7% 41% 34% 11% 5% 2%
100%
New facility acquisitions 4% 20% 59% 5% 5% 7% 100%
Mergers and acquisitions 0% 14% 67% 5% 4% 11% 100%
N.B. Results may not equal 100% due to rounding
Source: Timetric Industry Survey 2013 © Timetric
Figure 12: Capital Expenditure Expectations by Construction Contractors and Developers (%),
2013
Source: Timetric Industry Survey 2013 © Timetric

INDUSTRY DYNAMICS
Global Construction Supplier Industry Outlook Survey 2013–2014:
Market Trends, Marketing Spend and Sales Strategies in the Global Construction Industry Page 41
© Timetric. This product is licensed and is not to be photocopied Published: June 2013
3.4.2 Estimation of capital expenditure by suppliers
Construction equipment and materials suppliers plan to increase capital expenditure on ‘new product
developments’ in 2013, as indicated by 70% of survey respondents. Several suppliers focus on
developing new and innovative solutions, and have started to invest in R&D to develop their product
portfolios and gain business from new contractors and developers. For example, in January 2013,
metal roofing solutions provider, S-5, introduced its new S-5-N attachment clamp, designed specifically
for distinctive one-inch nail strip-metal roof profiles and solves a long-standing problem within the metal
roof industry, that of attaching ancillaries to nail strip profiles.
In 2013, suppliers also plan to increase capital expenditure on ‘IT infrastructure developments’ and
‘machinery and equipment purchases’ as identified by 56% and 54% of respondents respectively. For
example, in April 2013, French anti-collision system manufacturer SMIE launched Prosite Safety, the
first module of its completely new crane management system. Designed in consultation with SMIE
customers and users, the company expects this new modular system to satiate the needs of the
business and help construction professionals in their day-to-day site-management activities.
Figure 13: Capital Expenditure Expectations by Construction Equipment and Materials Suppliers
(%), 2013
Source: Timetric Industry Survey 2013 © Timetric
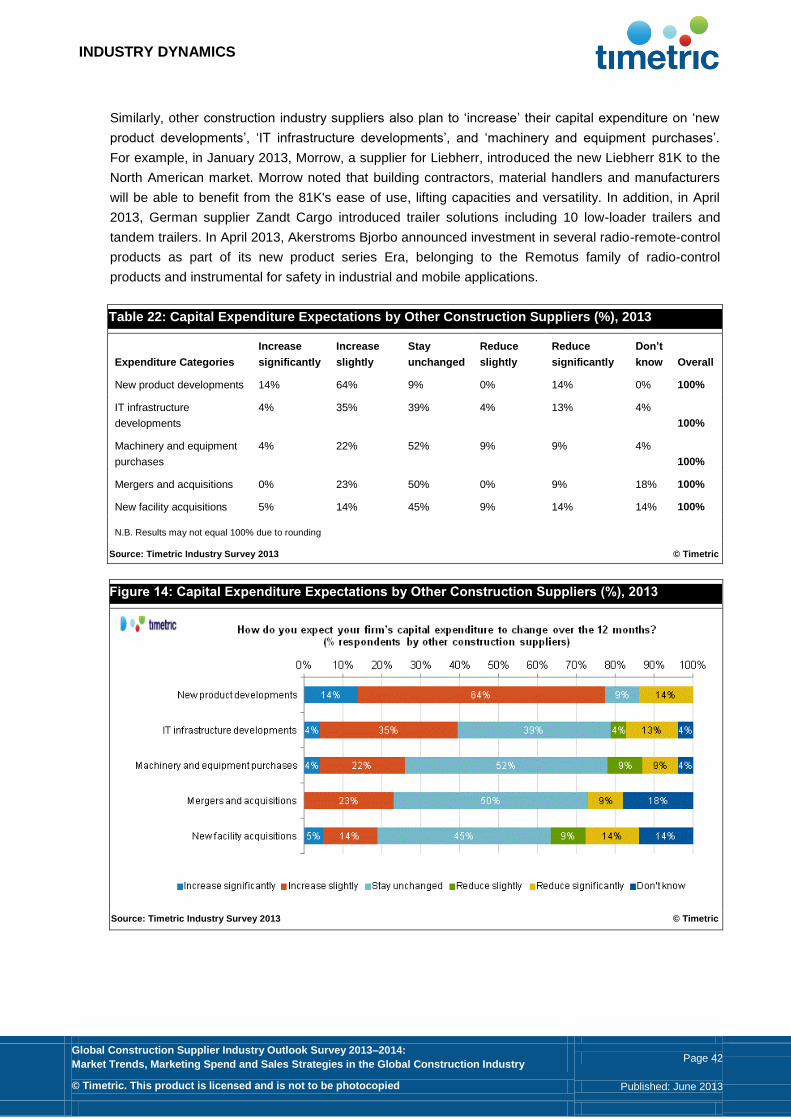
INDUSTRY DYNAMICS
Global Construction Supplier Industry Outlook Survey 2013–2014:
Market Trends, Marketing Spend and Sales Strategies in the Global Construction Industry Page 42
© Timetric. This product is licensed and is not to be photocopied Published: June 2013
Similarly, other construction industry suppliers also plan to ‘increase’ their capital expenditure on ‘new
product developments’, ‘IT infrastructure developments’, and ‘machinery and equipment purchases’.
For example, in January 2013, Morrow, a supplier for Liebherr, introduced the new Liebherr 81K to the
North American market. Morrow noted that building contractors, material handlers and manufacturers
will be able to benefit from the 81K's ease of use, lifting capacities and versatility. In addition, in April
2013, German supplier Zandt Cargo introduced trailer solutions including 10 low-loader trailers and
tandem trailers. In April 2013, Akerstroms Bjorbo announced investment in several radio-remote-control
products as part of its new product series Era, belonging to the Remotus family of radio-control
products and instrumental for safety in industrial and mobile applications.
Table 22: Capital Expenditure Expectations by Other Construction Suppliers (%), 2013
Expenditure Categories
Increase
significantly
Increase
slightly
Stay
unchanged
Reduce
slightly
Reduce
significantly
Don’t
know Overall
New product developments 14% 64% 9% 0% 14% 0% 100%
IT infrastructure
developments
4% 35% 39% 4% 13% 4%
100%
Machinery and equipment
purchases
4% 22% 52% 9% 9% 4%
100%
Mergers and acquisitions 0% 23% 50% 0% 9% 18% 100%
New facility acquisitions 5% 14% 45% 9% 14% 14% 100%
N.B. Results may not equal 100% due to rounding
Source: Timetric Industry Survey 2013 © Timetric
Figure 14: Capital Expenditure Expectations by Other Construction Suppliers (%), 2013
Source: Timetric Industry Survey 2013 © Timetric

INDUSTRY DYNAMICS
Global Construction Supplier Industry Outlook Survey 2013–2014:
Market Trends, Marketing Spend and Sales Strategies in the Global Construction Industry Page 43
© Timetric. This product is licensed and is not to be photocopied Published: June 2013
3.4.3 Estimation of capital expenditure by region
Analysis of responses by region reveals no significant variations in capital expenditure expectations.
Most respondents expect investment to increase in ‘new product development’ and ‘IT infrastructure
developments’, regardless of their region of operation. Respondents from North America, Europe and
the Rest of the World also prefer ‘machinery and equipment purchases’.
The figure and table below compare the opinions of respondents, and only include the percentage of
responses that expect an increase in capital expenditure.
Table 23: Global Construction Industry – Increase in Capital Expenditure by Region (%), 2013
Expenditure Categories North America Europe Asia-Pacific Rest of the World
IT infrastructure developments 66% 50% 46% 40%
Machinery and equipment purchases 70% 42% 31% 50%
Mergers and acquisitions 8% 21% 21% 20%
New facility acquisitions 27% 27% 33% 30%
New product developments 85% 62% 59% 40%
N.B. Responses are not mutually exclusive, and therefore do not equal 100%
Source: Timetric Industry Survey 2013 © Timetric
Figure 15: Global Construction Industry – Increase in Capital Expenditure by Region (%), 2013
Source: Timetric Industry Survey 2013 © Timetric

INDUSTRY DYNAMICS
Global Construction Supplier Industry Outlook Survey 2013–2014:
Market Trends, Marketing Spend and Sales Strategies in the Global Construction Industry Page 44
© Timetric. This product is licensed and is not to be photocopied Published: June 2013
3.4.4 Estimation of capital expenditure by company turnover
Respondents’ capital expenditure expectations demonstrate minor variations according to company
size. ‘New product development’ is the area most expected to receive increased investment, regardless
of company turnover.
The figure and table below compare the opinions of respondents, and only include the percentage of
responses that expect an increase in capital expenditure.
Table 24: Global Construction Industry – Increase in Capital Expenditure by Turnover (%), 2013
Expenditure Categories
Less than
US$100 million
US$100 million–
US$1 billion
More than
US$1 billion
IT infrastructure developments 53% 50% 47%
Machinery and equipment
purchases
49% 52% 30%
Mergers and acquisitions 15% 26% 20%
New facility acquisitions 30% 30% 25%
New product developments 61% 66% 70%
N.B. Responses are not mutually exclusive, and therefore do not equal 100%
Source: Timetric Industry Survey 2013 © Timetric
Figure 16: Global Construction Industry – Increase in Capital Expenditure by Turnover (%), 2013
Source: Timetric Industry Survey 2013 © Timetric
INDUSTRY DYNAMICS
Global Construction Supplier Industry Outlook Survey 2013–2014:
Market Trends, Marketing Spend and Sales Strategies in the Global Construction Industry Page 45
© Timetric. This product is licensed and is not to be photocopied Published: June 2013
3.5 Planned Change in Staff Recruitment Activity in Global Construction Industry
This section identifies the expected change in staff recruitment by construction buyer and supplier
companies over the next 12 months. Respondents were asked: “What change do you expect in hiring
staff at your organization in 2013?” The responses are analyzed by company type, region and company
turnover.
3.5.1 Planned change in staff recruitment activity by contractors and developers
Regardless of the slow growth rate in many economies, hiring activity is expected to increase in the
construction industry over 2013. According to the survey, a total of 40% of respondents from
construction contractor and developer companies anticipate a maximum 2% increase of their current
workforce in 2013. Information released by the Associated General Contractors of America and
Computer Guidance Corporation in January 2013 reveals that more construction firms are planning to
add new staff as demand for various private-sector construction projects is forecast to increase in 2013.
A senior executive from the association commented:
“While the outlook for the construction industry appears to be heading in the right direction for 2013,
many firms are still grappling with significant economic headwinds. With luck and a lot of work, the
hard-hit construction industry should be larger, healthier, more technologically savvy and more
profitable by the end of 2013 than it is today.”
In addition, in January 2013, the BCA of Singapore revealed that strong construction demand is
projected for 2013, along with increased demand for manpower development programs. The BCA also
noted that, along with its current BCA-Industry undergraduate scholarship, diploma scholarship and
sponsorship and apprenticeship programs, it intends to roll out two new manpower development
programs – a full-time undergraduate sponsorship program and an ITE scholarship program. A senior
executive from BCA commented:
“The two new programs are the latest additions to BCA’s comprehensive suite of manpower
development programs to meet the strong demand from the industry and to attract and retain talents to
pursue a meaningful and rewarding career in the built environment sector.”
Furthermore, in March 2013, according to the data released by the Associated General Contractors of
America, the construction industry in the US recruited 48,000 people in February 2013. Residential
construction firms added 19,400 jobs in February 2013, while non-residential construction, including
building, specialty trade, and heavy and civil engineering construction, expanded by 29,000 employees.
A senior executive from the association commented:
“With construction employment increasing by the largest amount for a single month in nearly six years,
the steady improvement in construction hiring is particularly encouraging. The job gains are coming
from every part of the construction industry, and while the sector’s unemployment rate remains
stubbornly high, it is heading in the right direction.”
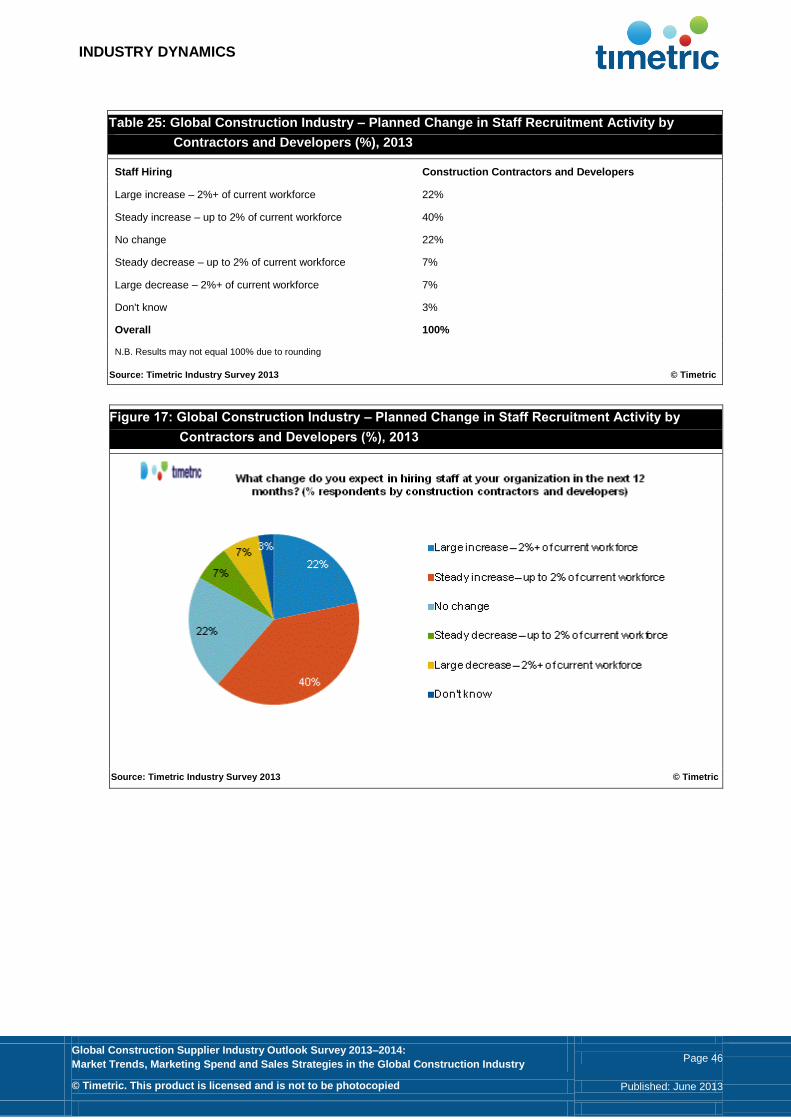
INDUSTRY DYNAMICS
Global Construction Supplier Industry Outlook Survey 2013–2014:
Market Trends, Marketing Spend and Sales Strategies in the Global Construction Industry Page 46
© Timetric. This product is licensed and is not to be photocopied Published: June 2013
Table 25: Global Construction Industry – Planned Change in Staff Recruitment Activity by
Contractors and Developers (%), 2013
Staff Hiring Construction Contractors and Developers
Large increase – 2%+ of current workforce 22%
Steady increase – up to 2% of current workforce 40%
No change 22%
Steady decrease – up to 2% of current workforce 7%
Large decrease – 2%+ of current workforce 7%
Don't know 3%
Overall 100%
N.B. Results may not equal 100% due to rounding
Source: Timetric Industry Survey 2013 © Timetric
Figure 17: Global Construction Industry – Planned Change in Staff Recruitment Activity by
Contractors and Developers (%), 2013
Source: Timetric Industry Survey 2013 © Timetric

INDUSTRY DYNAMICS
Global Construction Supplier Industry Outlook Survey 2013–2014:
Market Trends, Marketing Spend and Sales Strategies in the Global Construction Industry Page 47
© Timetric. This product is licensed and is not to be photocopied Published: June 2013
3.5.2 Planned change in staff recruitment activity by suppliers
Overall, 56% of respondents from construction equipment and materials supplier organizations, and
39% of respondents from other construction industry supplier companies expect a maximum increase
of 2% of their current workforce in 2013. A total of 16% of respondents from construction equipment
and materials supplier companies and 13% of respondents from other construction industry supplier
companies expect substantial increases in staff recruitment of over 2% of their current workforce in
2013.
Table 26: Global Construction Industry – Planned Change in Staff Recruitment Activity by
Suppliers (%), 2013
Staff Hiring
Construction Equipment and
Materials Suppliers
Other Construction
Industry Suppliers
Large increase – 2%+ of current workforce 16% 13%
Steady increase – up to 2% of current workforce 40% 26%
No change 30% 39%
Steady decrease – up to 2% of current workforce 7% 17%
Large decrease – 2%+ of current workforce 7% 4%
Don't know 0% 0%
Overall 100% 100%
N.B. Results may not equal 100% due to rounding
Source: Timetric Industry Survey 2013 © Timetric
Figure 18: Global Construction Industry – Planned Change in Staff Recruitment Activity by
Suppliers (%), 2013
Source: Timetric Industry Survey 2013 © Timetric
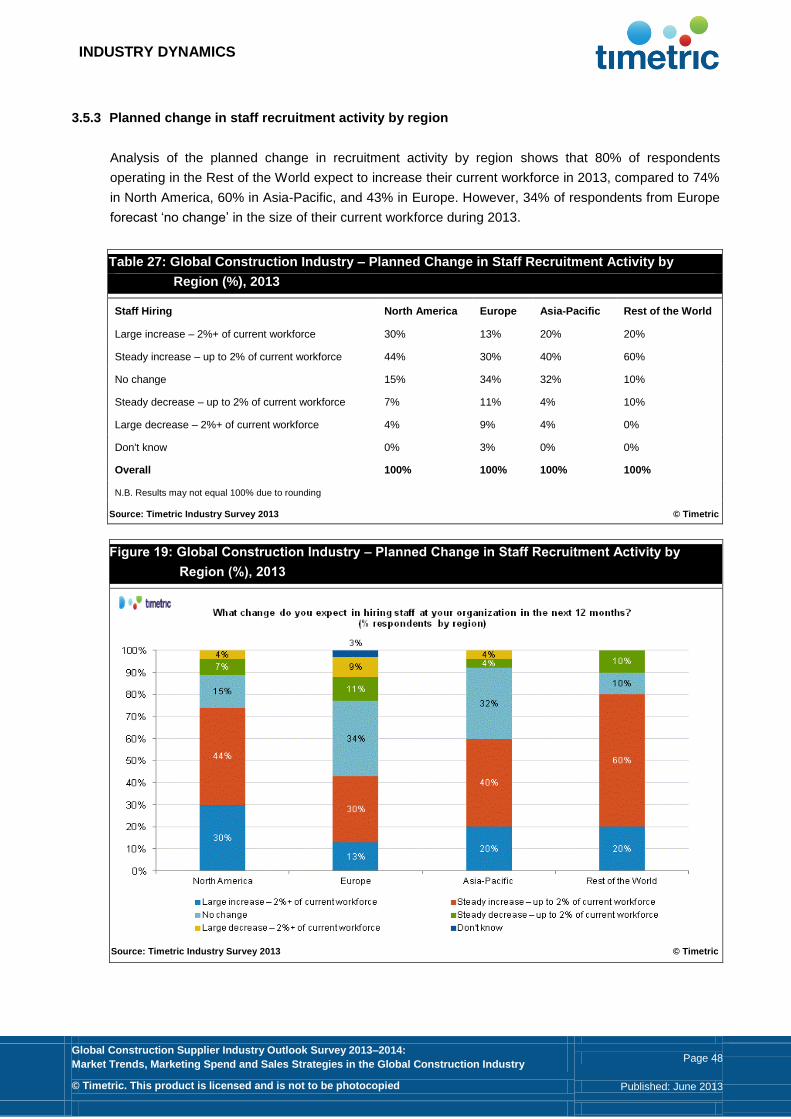
INDUSTRY DYNAMICS
Global Construction Supplier Industry Outlook Survey 2013–2014:
Market Trends, Marketing Spend and Sales Strategies in the Global Construction Industry Page 48
© Timetric. This product is licensed and is not to be photocopied Published: June 2013
3.5.3 Planned change in staff recruitment activity by region
Analysis of the planned change in recruitment activity by region shows that 80% of respondents
operating in the Rest of the World expect to increase their current workforce in 2013, compared to 74%
in North America, 60% in Asia-Pacific, and 43% in Europe. However, 34% of respondents from Europe
forecast ‘no change’ in the size of their current workforce during 2013.
Table 27: Global Construction Industry – Planned Change in Staff Recruitment Activity by
Region (%), 2013
Staff Hiring North America Europe Asia-Pacific Rest of the World
Large increase – 2%+ of current workforce 30% 13% 20% 20%
Steady increase – up to 2% of current workforce 44% 30% 40% 60%
No change 15% 34% 32% 10%
Steady decrease – up to 2% of current workforce 7% 11% 4% 10%
Large decrease – 2%+ of current workforce 4% 9% 4% 0%
Don't know 0% 3% 0% 0%
Overall 100% 100% 100% 100%
N.B. Results may not equal 100% due to rounding
Source: Timetric Industry Survey 2013 v © Timetric
Figure 19: Global Construction Industry – Planned Change in Staff Recruitment Activity by
Region (%), 2013
Source: Timetric Industry Survey 2013 © Timetric

INDUSTRY DYNAMICS
Global Construction Supplier Industry Outlook Survey 2013–2014:
Market Trends, Marketing Spend and Sales Strategies in the Global Construction Industry Page 49
© Timetric. This product is licensed and is not to be photocopied Published: June 2013
3.5.4 Planned change in staff recruitment activity by company turnover
An analysis of the planned change in staff recruitment activity by company turnover shows that 57% of
respondents from both small and medium-sized companies expect an increase in their companies’
workforces in 2013, compared to 50% from large companies. However, 40% of respondents from large
companies anticipate ‘no change’ in the size of their current workforce during 2013.
Table 28: Global Construction Industry – Planned Change in Staff Recruitment Activity by
Company Turnover (%), 2013
Staff Hiring
Less than US$100
million
US$100 million–
US$1 billion
More than US$1
billion
Large increase – 2%+ of current workforce 22% 11% 15%
Steady increase – up to 2% of current workforce 35% 46% 35%
No change 28% 18% 40%
Steady decrease – up to 2% of current workforce 9% 11% 5%
Large decrease – 2%+ of current workforce 4% 14% 5%
Don't know 3% 0% 0%
Overall 100% 100% 100%
N.B. Results may not equal 100% due to rounding
Source: Timetric Industry Survey 2013 © Timetric
Figure 20: Global Construction Industry – Planned Change in Staff Recruitment Activity by
Company Turnover (%), 2013
Source: Timetric Industry Survey 2013 © Timetric
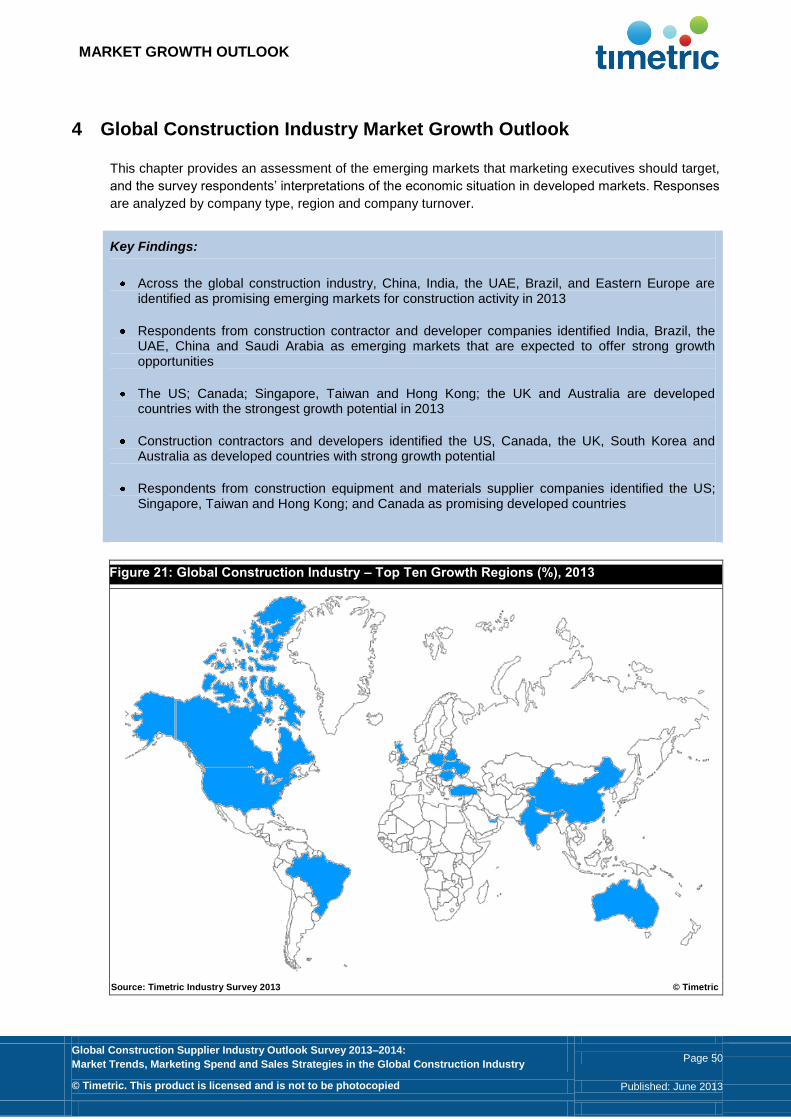
MARKET GROWTH OUTLOOK
Global Construction Supplier Industry Outlook Survey 2013–2014:
Market Trends, Marketing Spend and Sales Strategies in the Global Construction Industry Page 50
© Timetric. This product is licensed and is not to be photocopied Published: June 2013
4 Global Construction Industry Market Growth Outlook
This chapter provides an assessment of the emerging markets that marketing executives should target,
and the survey respondents’ interpretations of the economic situation in developed markets. Responses
are analyzed by company type, region and company turnover.
Key Findings:
Across the global construction industry, China, India, the UAE, Brazil, and Eastern Europe are identified as promising emerging markets for construction activity in 2013
Respondents from construction contractor and developer companies identified India, Brazil, the UAE, China and Saudi Arabia as emerging markets that are expected to offer strong growth opportunities
The US; Canada; Singapore, Taiwan and Hong Kong; the UK and Australia are developed countries with the strongest growth potential in 2013
Construction contractors and developers identified the US, Canada, the UK, South Korea and Australia as developed countries with strong growth potential
Respondents from construction equipment and materials supplier companies identified the US; Singapore, Taiwan and Hong Kong; and Canada as promising developed countries
Figure 21: Global Construction Industry – Top Ten Growth Regions (%), 2013
Source: Timetric Industry Survey 2013 © Timetric
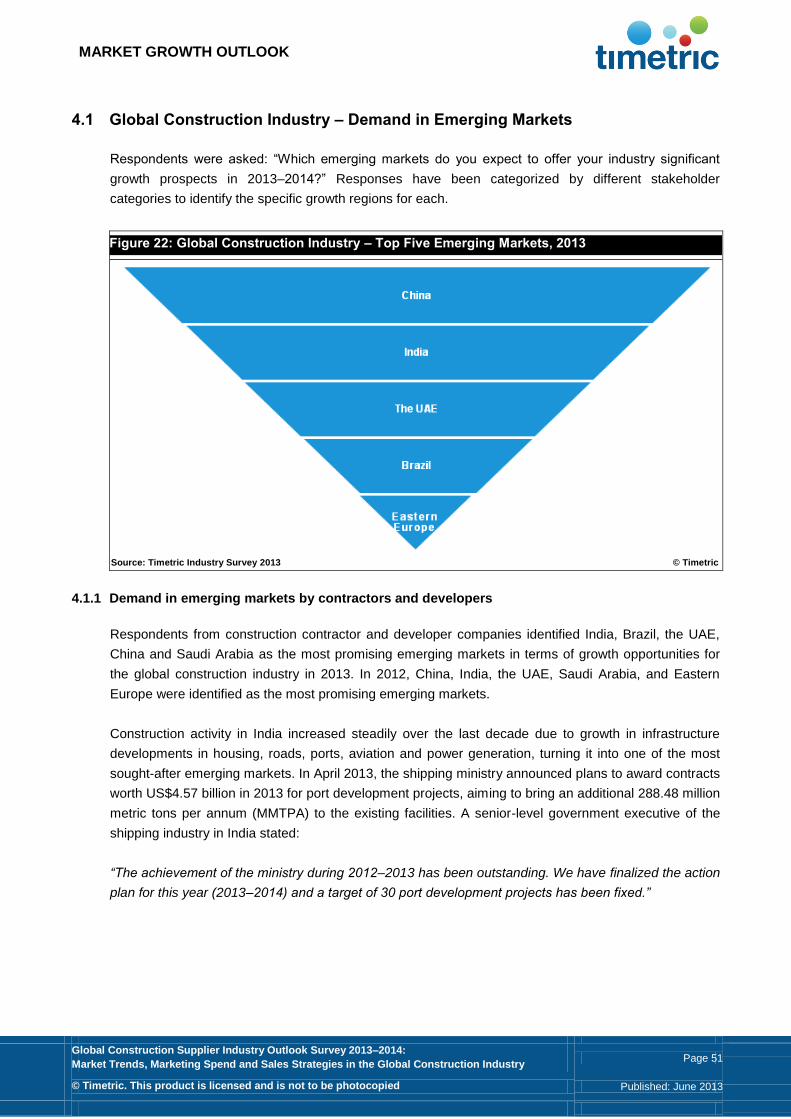
MARKET GROWTH OUTLOOK
Global Construction Supplier Industry Outlook Survey 2013–2014:
Market Trends, Marketing Spend and Sales Strategies in the Global Construction Industry Page 51
© Timetric. This product is licensed and is not to be photocopied Published: June 2013
4.1 Global Construction Industry – Demand in Emerging Markets
Respondents were asked: “Which emerging markets do you expect to offer your industry significant
growth prospects in 2013–2014?” Responses have been categorized by different stakeholder
categories to identify the specific growth regions for each.
Figure 22: Global Construction Industry – Top Five Emerging Markets, 2013
Source: Timetric Industry Survey 2013 © Timetric
4.1.1 Demand in emerging markets by contractors and developers
Respondents from construction contractor and developer companies identified India, Brazil, the UAE,
China and Saudi Arabia as the most promising emerging markets in terms of growth opportunities for
the global construction industry in 2013. In 2012, China, India, the UAE, Saudi Arabia, and Eastern
Europe were identified as the most promising emerging markets.
Construction activity in India increased steadily over the last decade due to growth in infrastructure
developments in housing, roads, ports, aviation and power generation, turning it into one of the most
sought-after emerging markets. In April 2013, the shipping ministry announced plans to award contracts
worth US$4.57 billion in 2013 for port development projects, aiming to bring an additional 288.48 million
metric tons per annum (MMTPA) to the existing facilities. A senior-level government executive of the
shipping industry in India stated:
“The achievement of the ministry during 2012–2013 has been outstanding. We have finalized the action
plan for this year (2013–2014) and a target of 30 port development projects has been fixed.”
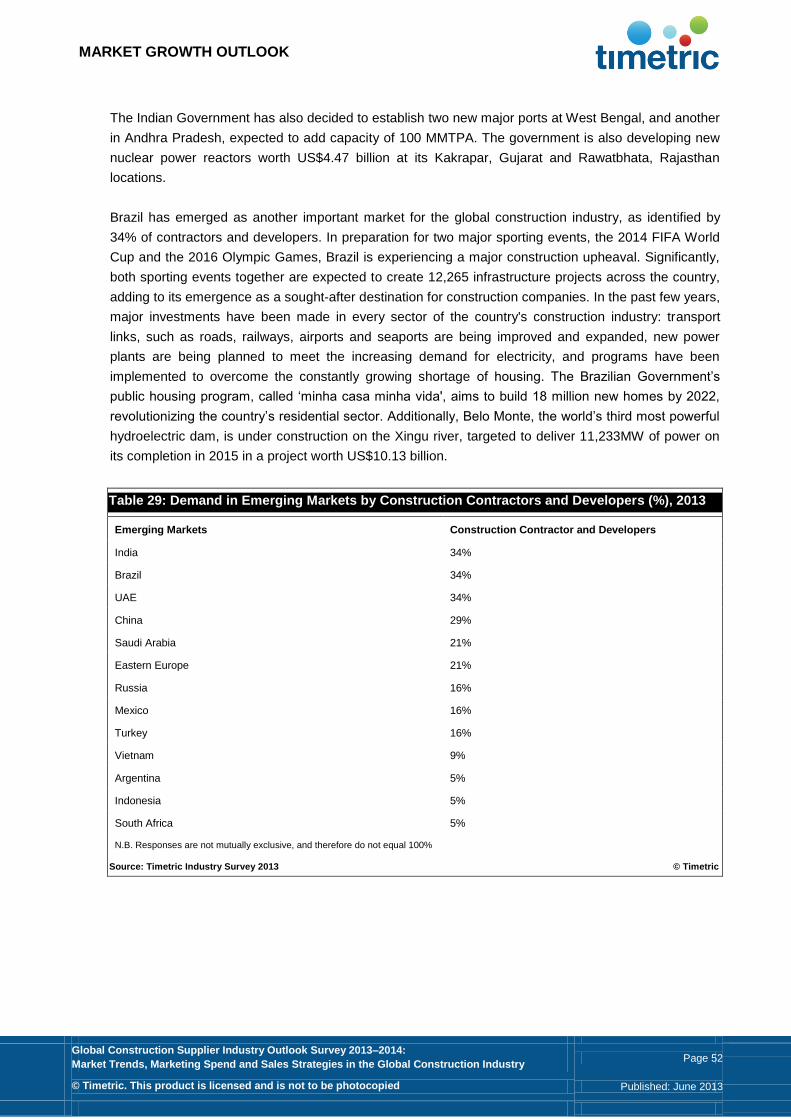
MARKET GROWTH OUTLOOK
Global Construction Supplier Industry Outlook Survey 2013–2014:
Market Trends, Marketing Spend and Sales Strategies in the Global Construction Industry Page 52
© Timetric. This product is licensed and is not to be photocopied Published: June 2013
The Indian Government has also decided to establish two new major ports at West Bengal, and another
in Andhra Pradesh, expected to add capacity of 100 MMTPA. The government is also developing new
nuclear power reactors worth US$4.47 billion at its Kakrapar, Gujarat and Rawatbhata, Rajasthan
locations.
Brazil has emerged as another important market for the global construction industry, as identified by
34% of contractors and developers. In preparation for two major sporting events, the 2014 FIFA World
Cup and the 2016 Olympic Games, Brazil is experiencing a major construction upheaval. Significantly,
both sporting events together are expected to create 12,265 infrastructure projects across the country,
adding to its emergence as a sought-after destination for construction companies. In the past few years,
major investments have been made in every sector of the country's construction industry: transport
links, such as roads, railways, airports and seaports are being improved and expanded, new power
plants are being planned to meet the increasing demand for electricity, and programs have been
implemented to overcome the constantly growing shortage of housing. The Brazilian Government’s
public housing program, called ‘minha casa minha vida', aims to build 18 million new homes by 2022,
revolutionizing the country’s residential sector. Additionally, Belo Monte, the world’s third most powerful
hydroelectric dam, is under construction on the Xingu river, targeted to deliver 11,233MW of power on
its completion in 2015 in a project worth US$10.13 billion.
Table 29: Demand in Emerging Markets by Construction Contractors and Developers (%), 2013
Emerging Markets Construction Contractor and Developers
India 34%
Brazil 34%
UAE 34%
China 29%
Saudi Arabia 21%
Eastern Europe 21%
Russia 16%
Mexico 16%
Turkey 16%
Vietnam 9%
Argentina 5%
Indonesia 5%
South Africa 5%
N.B. Responses are not mutually exclusive, and therefore do not equal 100%
Source: Timetric Industry Survey 2013 © Timetric

MARKET GROWTH OUTLOOK
Global Construction Supplier Industry Outlook Survey 2013–2014:
Market Trends, Marketing Spend and Sales Strategies in the Global Construction Industry Page 53
© Timetric. This product is licensed and is not to be photocopied Published: June 2013
Figure 23: Demand in Emerging Markets by Construction Contractors and Developers (%), 2013
Source: Timetric Industry Survey 2013 © Timetric
4.1.2 Demand in emerging markets by suppliers
Respondents from construction equipment and materials supplier companies identified China, India
Russia, Eastern Europe and Brazil as emerging markets that offer strong growth potential for the global
construction industry in 2013. These results vary slightly from those recorded in the 2012 survey, where
China, Russia, Brazil, South Africa and Saudi Arabia were identified as promising emerging markets.
Unlike contractors and developers, who chose India, equipment and materials suppliers consider China
to be a promising emerging market, as indicated by 46% of respondents. Demand for construction
equipment and materials in China has increased in the last five years due to increased investments in
the infrastructure sector, as plans for the construction of roads, rail projects, high-rise residential
complexes, hotels and urban planning projects are under way in different states across China. In
September 2012, US construction equipment manufacturer Caterpillar forecast that China's
construction equipment market would finally emerge from its downturn in 2013, following an
announcement by the Chinese government’s infrastructure investment program. A senior executive
from Caterpillar commented:
“With the announcement of the US$150 billion infrastructure investments made by China's National
Development and Reform Commission, we could expect to see some positive change in the industry,
maybe as early as the first quarter of 2013. In addition, China's decision to accelerate investment in
infrastructure projects is going to have a direct positive impact on our industry and Caterpillar's
business in China."
In March 2013, the Urban Planning and Design Institute of Shenzhen and architectural firm Hassell
together secured a deal for an urban planning project in China. This has created opportunities for
construction equipment and materials suppliers to develop strategies for strengthening their positions in
China.

MARKET GROWTH OUTLOOK
Global Construction Supplier Industry Outlook Survey 2013–2014:
Market Trends, Marketing Spend and Sales Strategies in the Global Construction Industry Page 54
© Timetric. This product is licensed and is not to be photocopied Published: June 2013
Russia has also emerged as an important emerging market, as identified by 34% of construction
equipment and materials suppliers. The Russian government’s focus on improving infrastructure has
increased investments in the sector, with various road construction and highway development projects
until 2020. Russia is also hosting the Winter Olympics 2014 in Sochi, followed by the Russian Grand
Prix at the same location. The construction of Olympic venues, race tracks and the development of rail
and highway projects connecting Sochi worth US$18 billion are under way. Russia also won the bid to
host the 2018 FIFA World Cup, and the sports ministry has already announced a budget of US$19
billion for efficient commissioning of the tournament. Significantly, 40% of this amount will be invested
towards the renovation and construction of stadiums, presenting substantial opportunities for suppliers.
Table 30: Demand in Emerging Markets by Construction Equipment and Materials Suppliers (%),
2013
Emerging Markets Construction Equipment and Materials Suppliers
China 46%
India 37%
Russia 34%
Eastern Europe 32%
Brazil 27%
UAE 24%
Turkey 22%
Mexico 20%
Saudi Arabia 20%
Indonesia 15%
Argentina 12%
Vietnam 12%
South Africa 10%
N.B. Responses are not mutually exclusive, and therefore do not equal 100%
Source: Timetric Industry Survey 2013 © Timetric

MARKET GROWTH OUTLOOK
Global Construction Supplier Industry Outlook Survey 2013–2014:
Market Trends, Marketing Spend and Sales Strategies in the Global Construction Industry Page 55
© Timetric. This product is licensed and is not to be photocopied Published: June 2013
Figure 24: Demand in Emerging Markets by Construction Equipment and Materials Suppliers (%),
2013
Source: Timetric Industry Survey 2013 © Timetric
Overall, respondents from other construction industry supplier companies identified China, the UAE,
Russia, Brazil and Turkey as emerging markets with growth potential in 2013. These results slightly
differ from 2012, when China, Brazil, India, Russia and South Africa were identified as promising
markets.
In 2013, China emerges as a key market that will offer strong growth opportunities, as identified by 43%
of the respondents. In January 2013, Atkins was selected by Karamay Construction Bureau, China, to
design the new Donghu central leisure area in Karamay, China. Additionally, in March 2013, Atkins
secured a contract to design a hotel and residential complex in Sanya, China. In March 2013,
Germany-based GMP Architekten won an international competition to design a 1.2 million sq. m
exhibition centre in China for Tianjin Planning Bureau, while in February 2013, Dutch architecture firm
OMA won a competition to design a financial office tower in Shenzhen, China.
The UAE is considered another significant emerging market by 35% of other construction industry
supplier respondents. According to a study by the Dubai Chamber of Commerce and Industry in
January 2013, the UAE's construction industry is expected to show sustainable growth in the next few
years, with investments gained from both public and private enterprises. Interestingly, the construction
industry contributed 10.3% of UAE’s GDP in 2011, and is forecast to contribute 11.1% in 2015.
Therefore, noticeable growth in the UAE’s construction industry is expected to provide significant
opportunities for construction suppliers to expand their operations in the country. For example, in
November 2012, the UAE government unveiled plans for a new city in Dubai which will feature a park
30% larger than Hyde Park in London, and in February 2013, US architectural firm Skidmore, Owings &
Merrill designed a 50-story twin-tower project for Emaar properties in Dubai.
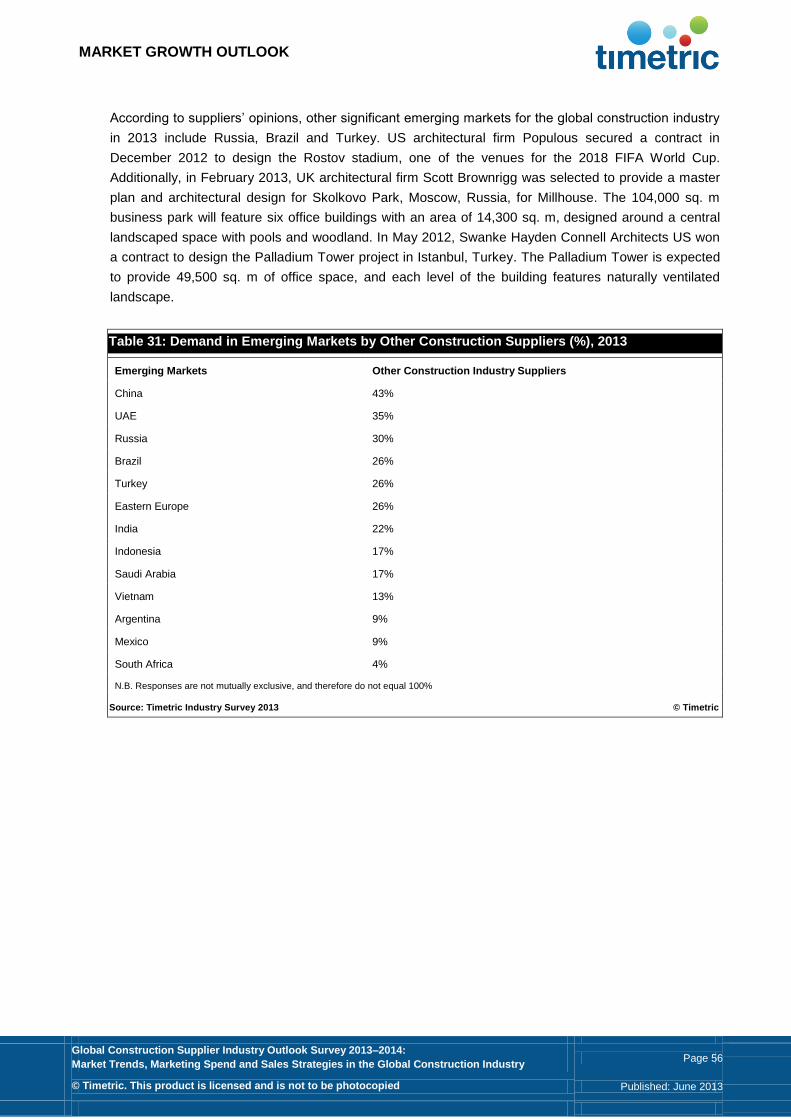
MARKET GROWTH OUTLOOK
Global Construction Supplier Industry Outlook Survey 2013–2014:
Market Trends, Marketing Spend and Sales Strategies in the Global Construction Industry Page 56
© Timetric. This product is licensed and is not to be photocopied Published: June 2013
According to suppliers’ opinions, other significant emerging markets for the global construction industry
in 2013 include Russia, Brazil and Turkey. US architectural firm Populous secured a contract in
December 2012 to design the Rostov stadium, one of the venues for the 2018 FIFA World Cup.
Additionally, in February 2013, UK architectural firm Scott Brownrigg was selected to provide a master
plan and architectural design for Skolkovo Park, Moscow, Russia, for Millhouse. The 104,000 sq. m
business park will feature six office buildings with an area of 14,300 sq. m, designed around a central
landscaped space with pools and woodland. In May 2012, Swanke Hayden Connell Architects US won
a contract to design the Palladium Tower project in Istanbul, Turkey. The Palladium Tower is expected
to provide 49,500 sq. m of office space, and each level of the building features naturally ventilated
landscape.
Table 31: Demand in Emerging Markets by Other Construction Suppliers (%), 2013
Emerging Markets Other Construction Industry Suppliers
China 43%
UAE 35%
Russia 30%
Brazil 26%
Turkey 26%
Eastern Europe 26%
India 22%
Indonesia 17%
Saudi Arabia 17%
Vietnam 13%
Argentina 9%
Mexico 9%
South Africa 4%
N.B. Responses are not mutually exclusive, and therefore do not equal 100%
Source: Timetric Industry Survey 2013 © Timetric
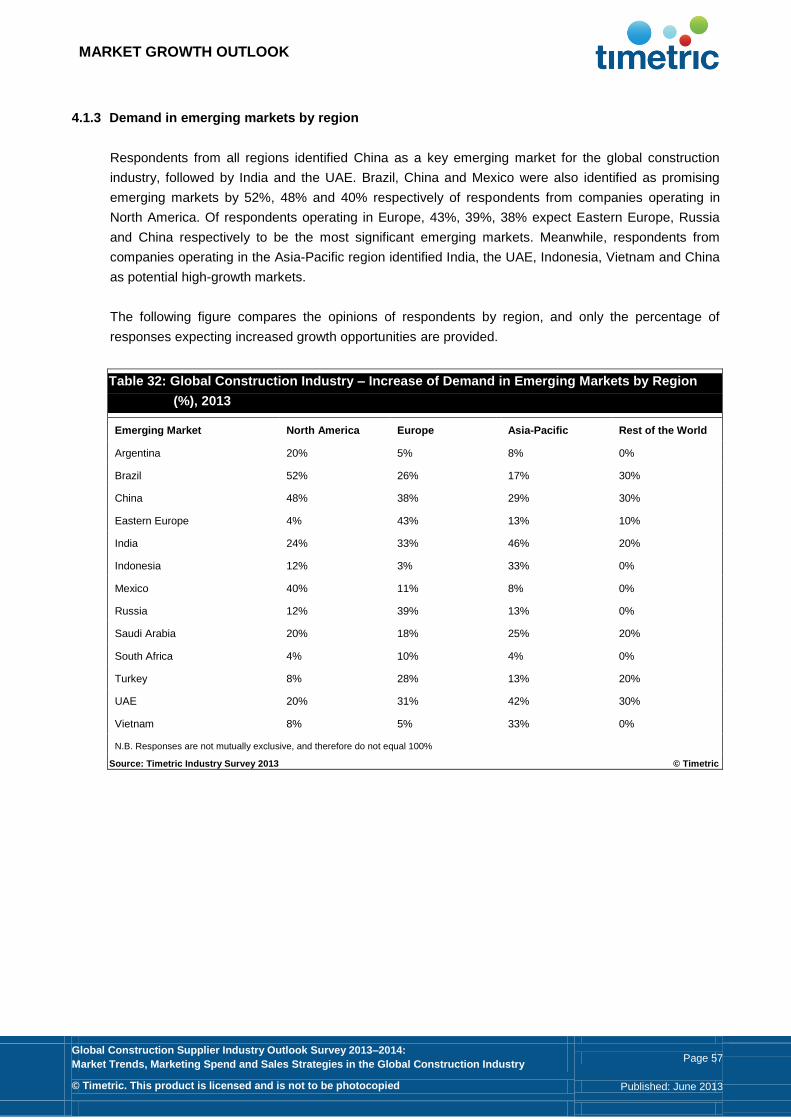
MARKET GROWTH OUTLOOK
Global Construction Supplier Industry Outlook Survey 2013–2014:
Market Trends, Marketing Spend and Sales Strategies in the Global Construction Industry Page 57
© Timetric. This product is licensed and is not to be photocopied Published: June 2013
4.1.3 Demand in emerging markets by region
Respondents from all regions identified China as a key emerging market for the global construction
industry, followed by India and the UAE. Brazil, China and Mexico were also identified as promising
emerging markets by 52%, 48% and 40% respectively of respondents from companies operating in
North America. Of respondents operating in Europe, 43%, 39%, 38% expect Eastern Europe, Russia
and China respectively to be the most significant emerging markets. Meanwhile, respondents from
companies operating in the Asia-Pacific region identified India, the UAE, Indonesia, Vietnam and China
as potential high-growth markets.
The following figure compares the opinions of respondents by region, and only the percentage of
responses expecting increased growth opportunities are provided.
Table 32: Global Construction Industry – Increase of Demand in Emerging Markets by Region
(%), 2013
Emerging Market North America Europe Asia-Pacific Rest of the World
Argentina 20% 5% 8% 0%
Brazil 52% 26% 17% 30%
China 48% 38% 29% 30%
Eastern Europe 4% 43% 13% 10%
India 24% 33% 46% 20%
Indonesia 12% 3% 33% 0%
Mexico 40% 11% 8% 0%
Russia 12% 39% 13% 0%
Saudi Arabia 20% 18% 25% 20%
South Africa 4% 10% 4% 0%
Turkey 8% 28% 13% 20%
UAE 20% 31% 42% 30%
Vietnam 8% 5% 33% 0%
N.B. Responses are not mutually exclusive, and therefore do not equal 100%
Source: Timetric Industry Survey 2013 © Timetric

MARKET GROWTH OUTLOOK
Global Construction Supplier Industry Outlook Survey 2013–2014:
Market Trends, Marketing Spend and Sales Strategies in the Global Construction Industry Page 58
© Timetric. This product is licensed and is not to be photocopied Published: June 2013
4.1.4 Demand in emerging markets by company turnover
Survey results show that respondents from large companies expect India, Brazil and China to provide
higher growth prospects. Meanwhile, respondents from small companies expect China, the UAE, India,
Brazil, Eastern Europe and Russia to offer the most growth opportunities. Respondents from medium-
sized companies identified China, Eastern Europe, Brazil, Russia, Turkey, India, and the UAE as
promising emerging markets for the global construction industry.
The following figure compares the opinions of respondents by company turnover. Only the percentage
of responses expecting increased growth opportunities are provided.
Figure 25: Global Construction Industry – Increase of Demand in Emerging Markets by Company
Turnover (%), 2013
Source: Timetric Industry Survey 2013 © Timetric

MARKET GROWTH OUTLOOK
Global Construction Supplier Industry Outlook Survey 2013–2014:
Market Trends, Marketing Spend and Sales Strategies in the Global Construction Industry Page 59
© Timetric. This product is licensed and is not to be photocopied Published: June 2013
4.2 Global Construction Industry – Growth Projections in Developed Countries
In the recovering global economy, expectations over developed markets to offer growth opportunities
are raising. This section identifies the developed markets that are expected to offer growth potential for
the global construction industry during 2013–2014. Respondents were asked: “For the following
developed markets, how do you expect demand to change in 2013–2014?”
Survey results indicate that the five developed markets that are projected to generate strong growth
prospects for the global construction industry in 2013 are the US, Canada, Singapore, Australia and the
UK.
Figure 26: Global Construction Industry – Top Five Developed Regions by Growth (%), 2013
Source: Timetric Industry Survey 2013 © Timetric
MARKET GROWTH OUTLOOK
Global Construction Supplier Industry Outlook Survey 2013–2014:
Market Trends, Marketing Spend and Sales Strategies in the Global Construction Industry Page 60
© Timetric. This product is licensed and is not to be photocopied Published: June 2013
4.2.1 Growth projections in developed countries by contractors and developers
Overall, of respondents from construction contractor and developer companies, 40% identified the US
as a developed market with strong growth opportunities, followed by Canada, as identified by 29%, and
the UK, as identified by 25% of respondents. These differ from the 2012 construction industry survey,
where Singapore, Taiwan and Hong Kong; the US and Australia, were identified as promising
developed markets.
According to the Bureau of Economical Analysis in the US, the percentage contribution of the
construction industry to the country’s GDP increased by 0.11% in 2012, as compared to -0.01% in
2011. Low interest rates, a gradual decline in unemployment, and overall improvement in the economy
have contributed to the US construction sector gaining strength in 2013, which is expected to provide
significant opportunities for construction contractors and developers. For example, in January 2013,
EPR Properties, in cooperation with Empire Resorts and Monticello Raceway Management, received
approval from the Thompson Town Board to construct a US$600 million resort in New York by 2014.
The development will feature an indoor water park, golf course, an entertainment village with a cinema
and supporting retail, a casino resort including horse racetrack and grandstand, and a hotel. In March
2013, Malaysian gaming company Genting unveiled plans to construct a US$2 billion development
project, known as Resorts World Las Vegas, in Nevada. On completion in 2016, the project will feature
25,000 sq. m of retail space, over 50,000 sq. m of convention space, a hotel, theatre and a water theme
park.
Suppliers have also identified Canada as a developed market with ample growth opportunities for the
construction industry. Statistics Canada stated that overall profits of the construction industry grew from
US$3.2 billion in 2011 to US$3.7 billion in 2012. After an encouraging year in 2012, Statistics Canada
also forecasts an upward trend for the Canadian construction industry in 2013. For example, in January
2013, Bondfield Construction, based in Canada, secured the construction and financing contract for
renovating the Etobicoke Olympium community aquatics center at a cost of US$20 million, to be jointly
funded by the Government of Canada and the City of Toronto.
Among other developed markets, the UK is expected to offer strong growth opportunities in 2013, as
identified by 25% of respondents. For example, in March 2013, a Miller Construction-led consortium
won the bid for North Tyneside's Quality Homes for Older People project worth US$457 million. The
consortium, called Solutions for North Tyneside, will carry out the refurbishment and construction work,
and the development will feature over 900 apartments across 10 new and 16 refurbished sheltered
housing schemes. In April 2013, the University of Portsmouth in the UK selected ISG Construction for
the extension of the New Theatre Royal in Hampshire, a project that will include a four-floor extension
to the existing theatre, at a cost of US$18 million.
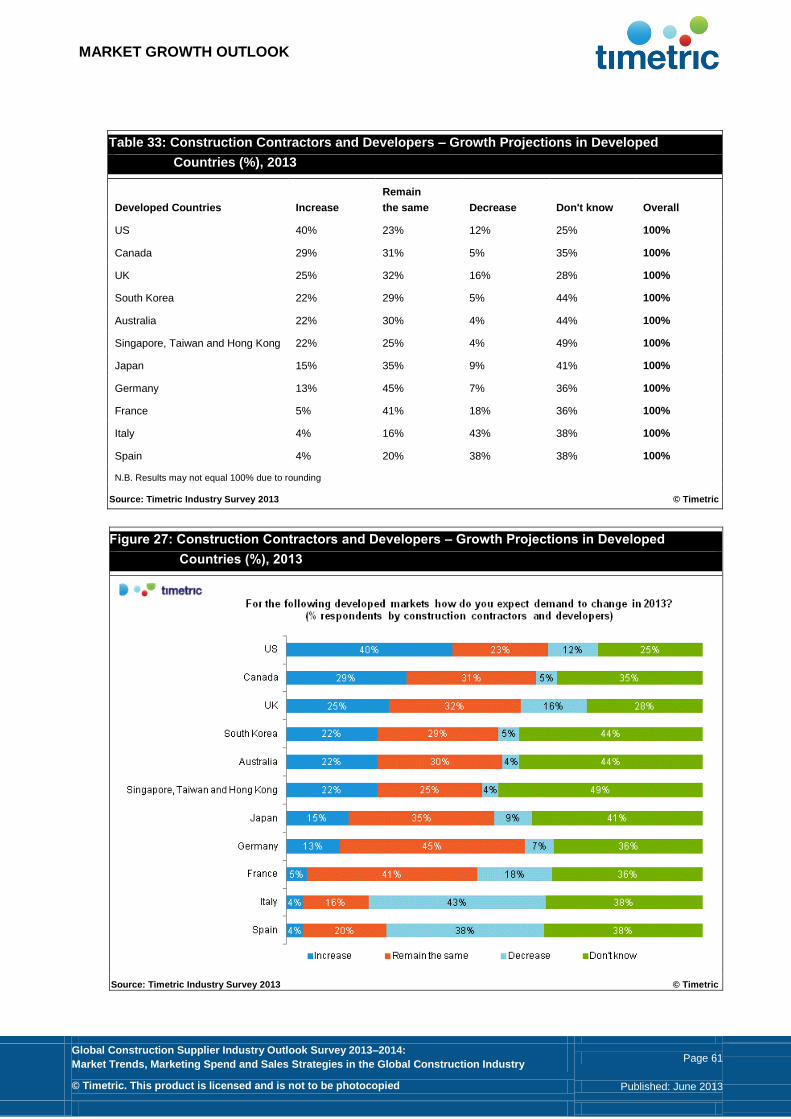
MARKET GROWTH OUTLOOK
Global Construction Supplier Industry Outlook Survey 2013–2014:
Market Trends, Marketing Spend and Sales Strategies in the Global Construction Industry Page 61
© Timetric. This product is licensed and is not to be photocopied Published: June 2013
Table 33: Construction Contractors and Developers – Growth Projections in Developed
Countries (%), 2013
Developed Countries Increase
Remain
the same Decrease Don't know Overall
US 40% 23% 12% 25% 100%
Canada 29% 31% 5% 35% 100%
UK 25% 32% 16% 28% 100%
South Korea 22% 29% 5% 44% 100%
Australia 22% 30% 4% 44% 100%
Singapore, Taiwan and Hong Kong 22% 25% 4% 49% 100%
Japan 15% 35% 9% 41% 100%
Germany 13% 45% 7% 36% 100%
France 5% 41% 18% 36% 100%
Italy 4% 16% 43% 38% 100%
Spain 4% 20% 38% 38% 100%
N.B. Results may not equal 100% due to rounding
Source: Timetric Industry Survey 2013 © Timetric
Figure 27: Construction Contractors and Developers – Growth Projections in Developed
Countries (%), 2013
Source: Timetric Industry Survey 2013 © Timetric
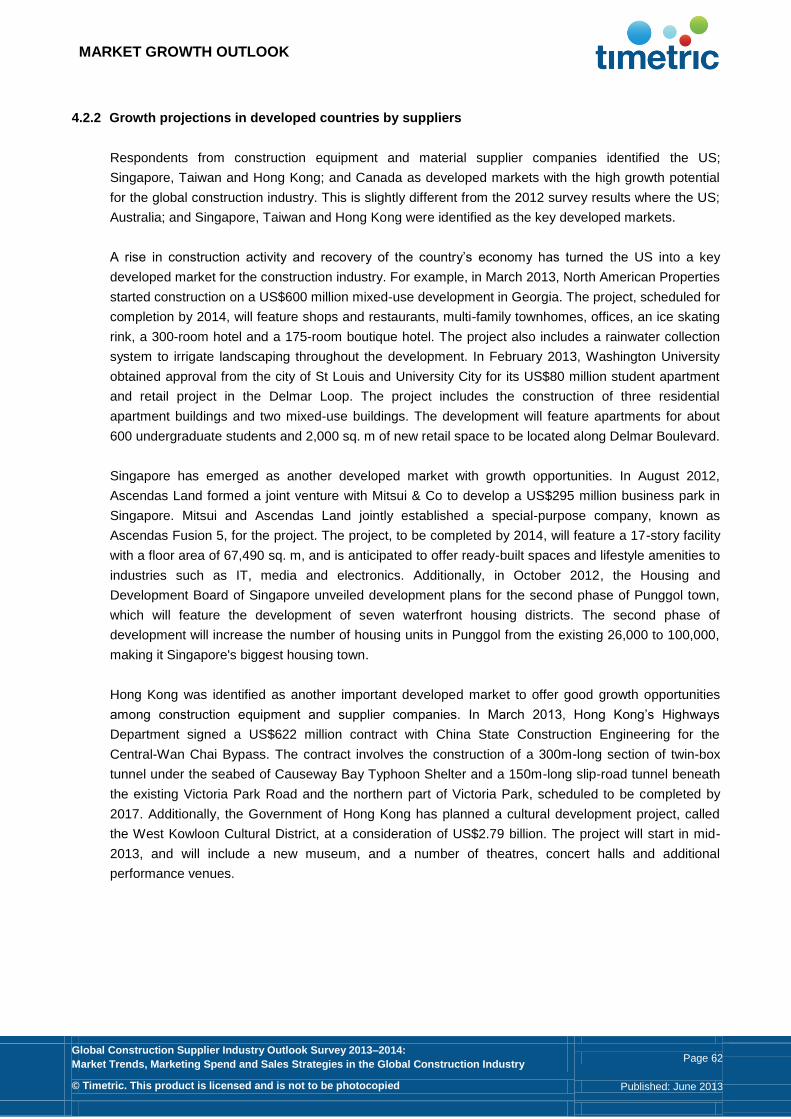
MARKET GROWTH OUTLOOK
Global Construction Supplier Industry Outlook Survey 2013–2014:
Market Trends, Marketing Spend and Sales Strategies in the Global Construction Industry Page 62
© Timetric. This product is licensed and is not to be photocopied Published: June 2013
4.2.2 Growth projections in developed countries by suppliers
Respondents from construction equipment and material supplier companies identified the US;
Singapore, Taiwan and Hong Kong; and Canada as developed markets with the high growth potential
for the global construction industry. This is slightly different from the 2012 survey results where the US;
Australia; and Singapore, Taiwan and Hong Kong were identified as the key developed markets.
A rise in construction activity and recovery of the country’s economy has turned the US into a key
developed market for the construction industry. For example, in March 2013, North American Properties
started construction on a US$600 million mixed-use development in Georgia. The project, scheduled for
completion by 2014, will feature shops and restaurants, multi-family townhomes, offices, an ice skating
rink, a 300-room hotel and a 175-room boutique hotel. The project also includes a rainwater collection
system to irrigate landscaping throughout the development. In February 2013, Washington University
obtained approval from the city of St Louis and University City for its US$80 million student apartment
and retail project in the Delmar Loop. The project includes the construction of three residential
apartment buildings and two mixed-use buildings. The development will feature apartments for about
600 undergraduate students and 2,000 sq. m of new retail space to be located along Delmar Boulevard.
Singapore has emerged as another developed market with growth opportunities. In August 2012,
Ascendas Land formed a joint venture with Mitsui & Co to develop a US$295 million business park in
Singapore. Mitsui and Ascendas Land jointly established a special-purpose company, known as
Ascendas Fusion 5, for the project. The project, to be completed by 2014, will feature a 17-story facility
with a floor area of 67,490 sq. m, and is anticipated to offer ready-built spaces and lifestyle amenities to
industries such as IT, media and electronics. Additionally, in October 2012, the Housing and
Development Board of Singapore unveiled development plans for the second phase of Punggol town,
which will feature the development of seven waterfront housing districts. The second phase of
development will increase the number of housing units in Punggol from the existing 26,000 to 100,000,
making it Singapore's biggest housing town.
Hong Kong was identified as another important developed market to offer good growth opportunities
among construction equipment and supplier companies. In March 2013, Hong Kong’s Highways
Department signed a US$622 million contract with China State Construction Engineering for the
Central-Wan Chai Bypass. The contract involves the construction of a 300m-long section of twin-box
tunnel under the seabed of Causeway Bay Typhoon Shelter and a 150m-long slip-road tunnel beneath
the existing Victoria Park Road and the northern part of Victoria Park, scheduled to be completed by
2017. Additionally, the Government of Hong Kong has planned a cultural development project, called
the West Kowloon Cultural District, at a consideration of US$2.79 billion. The project will start in mid-
2013, and will include a new museum, and a number of theatres, concert halls and additional
performance venues.

MARKET GROWTH OUTLOOK
Global Construction Supplier Industry Outlook Survey 2013–2014:
Market Trends, Marketing Spend and Sales Strategies in the Global Construction Industry Page 63
© Timetric. This product is licensed and is not to be photocopied Published: June 2013
Table 34: Construction Equipment and Materials Suppliers – Growth Projections in Developed
Countries (%), 2013
Developed Countries Increase Remain the same Decrease Don't know Overall
US 50% 37% 3% 11% 100%
Singapore, Taiwan and Hong Kong 48% 30% 0% 21% 100%
Canada 41% 32% 5% 22% 100%
Germany 40% 43% 9% 9% 100%
Australia 40% 37% 3% 20% 100%
UK 39% 33% 17% 11% 100%
South Korea 26% 32% 6% 35% 100%
Japan 21% 32% 12% 35% 100%
France 17% 46% 26% 11% 100%
Italy 9% 43% 37% 11% 100%
Spain 9% 35% 41% 15% 100%
N.B. Results may not equal 100% due to rounding
Source: Timetric Industry Survey 2013 © Timetric
Figure 28: Construction Equipment and Materials Suppliers – Growth Projections in Developed
Countries (%), 2013
Source: Timetric Industry Survey 2013 © Timetric

MARKET GROWTH OUTLOOK
Global Construction Supplier Industry Outlook Survey 2013–2014:
Market Trends, Marketing Spend and Sales Strategies in the Global Construction Industry Page 64
© Timetric. This product is licensed and is not to be photocopied Published: June 2013
Respondents from other construction supplier companies identified the US, Canada and Australia as
developed markets with strong growth potential for the global construction industry in 2013. This varies
from the 2012 survey results, where Singapore, Taiwan and Hong Kong, Canada and the US were
considered promising developed markets
Of all respondents, 55% from other construction suppliers expect an increase in demand for
construction activities in the US. For example, the John F Kennedy Center for the Performing Arts has
selected Steven Holl Architects to design a US$100 million expansion project. The project will feature
rehearsal space, classroom space and multipurpose rooms for the center’s arts education and arts
management education programs.
Respondents from other construction supplier companies also expect Australia to offer growth
opportunities among the developed markets in 2013, as identified by 33% of respondents. In April 2013,
Paramatta city council announced plans to build a 90-story residential complex worth US$375 million in
Paramatta, New South Wales. The tower will feature 700 apartments, retail space in the lower levels
and a 150-room hotel. A senior executive from architectural company Grimshaw stated:
"The project has the ability to be transformative of its place and of the standards that can be achieved
within the models of affordable urban intensification."
Furthermore, property and infrastructure firm Sweett Group has been awarded a project management
contract worth US$653 million by CBus Property for its 1 William Street skyscraper project. On
completion, this project will be the second-tallest tower in Brisbane.
Table 35: Other Construction Suppliers – Growth Projections in Developed Countries (%), 2013
Developed Countries Increase Remain the same Decrease Don't know Overall
US 55% 27% 14% 5% 100%
Canada 41% 36% 0% 23% 100%
Australia 33% 24% 10% 33% 100%
Singapore, Taiwan and Hong Kong 33% 29% 0% 38% 100%
South Korea 24% 29% 0% 48% 100%
UK 23% 45% 18% 14% 100%
Japan 19% 29% 19% 33% 100%
Germany 14% 48% 19% 19% 100%
Spain 10% 5% 62% 24% 100%
France 9% 45% 27% 18% 100%
Italy 0% 29% 48% 24% 100%
N.B. Results may not equal 100% due to rounding
Source: Timetric Industry Survey 2013 © Timetric
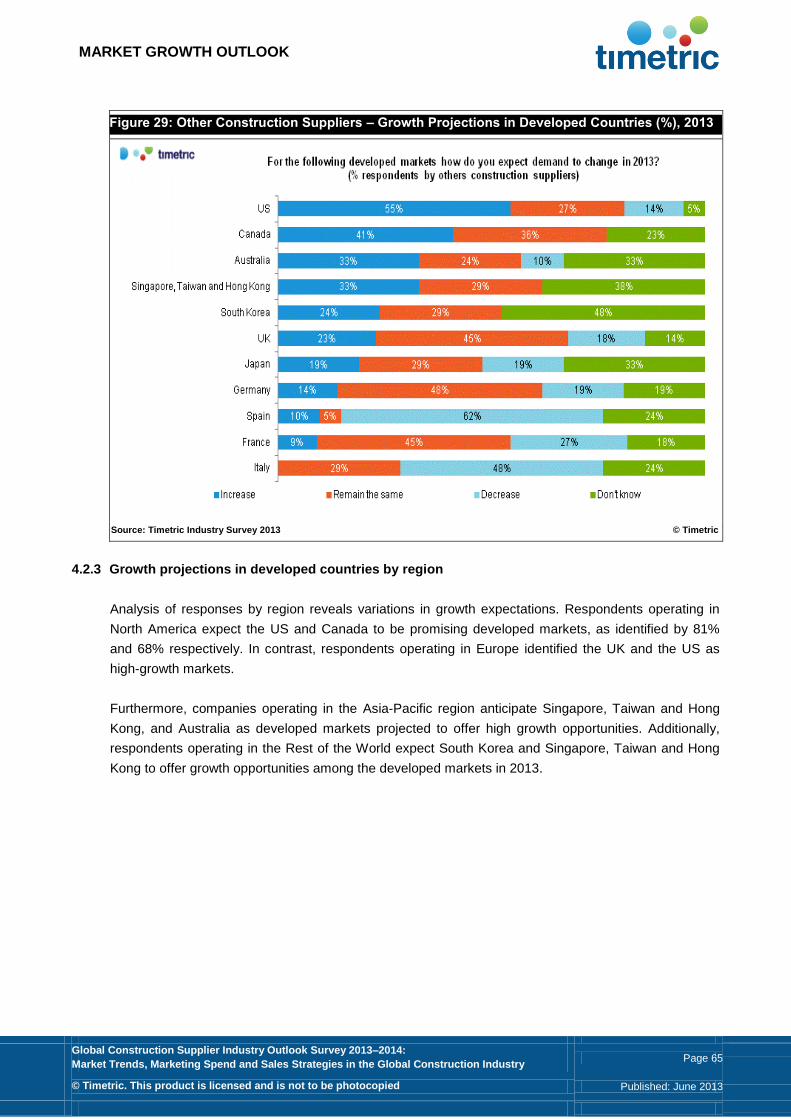
MARKET GROWTH OUTLOOK
Global Construction Supplier Industry Outlook Survey 2013–2014:
Market Trends, Marketing Spend and Sales Strategies in the Global Construction Industry Page 65
© Timetric. This product is licensed and is not to be photocopied Published: June 2013
Figure 29: Other Construction Suppliers – Growth Projections in Developed Countries (%), 2013
Source: Timetric Industry Survey 2013 © Timetric
4.2.3 Growth projections in developed countries by region
Analysis of responses by region reveals variations in growth expectations. Respondents operating in
North America expect the US and Canada to be promising developed markets, as identified by 81%
and 68% respectively. In contrast, respondents operating in Europe identified the UK and the US as
high-growth markets.
Furthermore, companies operating in the Asia-Pacific region anticipate Singapore, Taiwan and Hong
Kong, and Australia as developed markets projected to offer high growth opportunities. Additionally,
respondents operating in the Rest of the World expect South Korea and Singapore, Taiwan and Hong
Kong to offer growth opportunities among the developed markets in 2013.
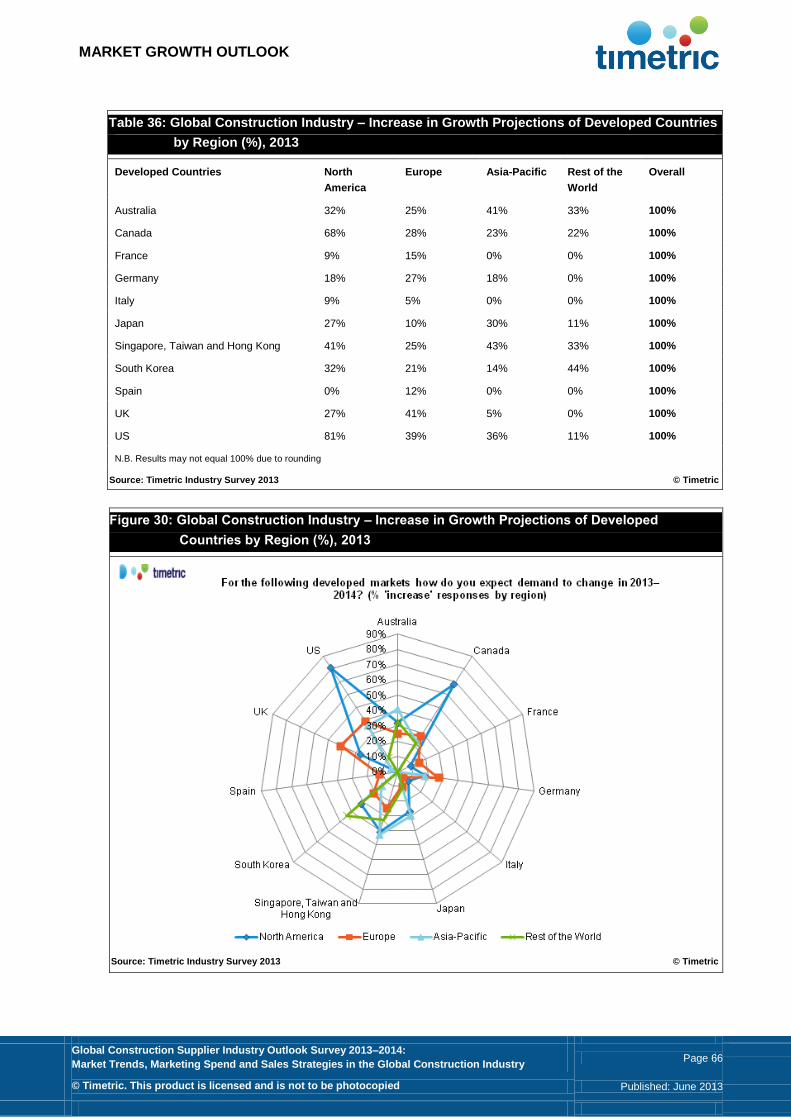
MARKET GROWTH OUTLOOK
Global Construction Supplier Industry Outlook Survey 2013–2014:
Market Trends, Marketing Spend and Sales Strategies in the Global Construction Industry Page 66
© Timetric. This product is licensed and is not to be photocopied Published: June 2013
Table 36: Global Construction Industry – Increase in Growth Projections of Developed Countries
by Region (%), 2013
Developed Countries North
America
Europe Asia-Pacific Rest of the
World
Overall
Australia 32% 25% 41% 33% 100%
Canada 68% 28% 23% 22% 100%
France 9% 15% 0% 0% 100%
Germany 18% 27% 18% 0% 100%
Italy 9% 5% 0% 0% 100%
Japan 27% 10% 30% 11% 100%
Singapore, Taiwan and Hong Kong 41% 25% 43% 33% 100%
South Korea 32% 21% 14% 44% 100%
Spain 0% 12% 0% 0% 100%
UK 27% 41% 5% 0% 100%
US 81% 39% 36% 11% 100%
N.B. Results may not equal 100% due to rounding
Source: Timetric Industry Survey 2013 © Timetric
Figure 30: Global Construction Industry – Increase in Growth Projections of Developed
Countries by Region (%), 2013
Source: Timetric Industry Survey 2013 © Timetric

MARKET GROWTH OUTLOOK
Global Construction Supplier Industry Outlook Survey 2013–2014:
Market Trends, Marketing Spend and Sales Strategies in the Global Construction Industry Page 67
© Timetric. This product is licensed and is not to be photocopied Published: June 2013
4.2.4 Growth projections in developed countries by company turnover
Regardless of company turnover, respondents identified the US as a promising developed market for
the global construction industry in 2013. Respondents from small companies identified the UK and
Canada as other developed markets with growth potential. Respondents from large companies expect
Singapore, Taiwan and Hong Kong, and South Korea as promising markets among the developed
nations. Respondents from large and medium-sized companies expect Canada and Australia to provide
the most growth opportunities in 2013.
The following figure compares the opinions of respondents by company turnover. Only the percentage
of responses expecting increased growth opportunities are provided.
Table 37: Global Construction Industry – Increase in Growth Projections of Developed Countries
by Turnover (%), 2013
Developed Countries Less than
US$100 million
US$100 million–
US$1 billion
More than
US$1 billion
Overall
Australia 22% 44% 40% 100%
Canada 28% 48% 40% 100%
France 10% 13% 5% 100%
Germany 24% 20% 15% 100%
Italy 3% 8% 5% 100%
Japan 17% 17% 21% 100%
Singapore, Taiwan and Hong Kong 26% 29% 58% 100%
South Korea 20% 17% 45% 100%
Spain 6% 13% 0% 100%
UK 30% 29% 25% 100%
US 39% 50% 65% 100%
N.B. Results may not equal 100% due to rounding
Source: Timetric Industry Survey 2013 © Timetric

CONSTRUCTION INDUSTRY SUPPLIER MARKETING SPEND ACTIVITY
Global Construction Supplier Industry Outlook Survey 2013–2014:
Market Trends, Marketing Spend and Sales Strategies in the Global Construction Industry Page 68
© Timetric. This product is licensed and is not to be photocopied Published: June 2013
5 Threats and Opportunities for the Global Construction Industry
Constantly changing business dynamics present both threats and opportunities to companies in the
global construction industry. The important challenges currently facing contractors and developers and
suppliers, and how these can be overcome, have been identified in our industry survey. Respondents
were also surveyed on how suppliers can better maintain or secure business from contractors and
developers, and what the key opportunities for the global construction industry are during the next 12
months.
Key Findings
‘Cost containments’, ‘market uncertainty’, ‘retention or recruitment of skilled staff’ and ‘rising competition’ are immediate business concerns for the global construction industry
For construction contractors and developers, the three leading concerns for 2013–2014 are ‘cost containments’, ‘market uncertainty’ and ‘retention or recruitment of skilled staff’
The three leading concerns for other construction industry supplier respondents are ‘market uncertainty’, ‘cost containments’ and ‘rising competition’
Contractor and developer respondents consider supplier efforts to ‘provide support for generating new businesses’ and the adoption of practices to ‘innovate product’ and ‘improve customer services’ will help their businesses
As identified by senior-level executives, the most useful actions that suppliers should undertake are to ‘innovate products’, ‘improve customer services’ and ‘provide support for generating new businesses’
A total of 71% of respondents from construction contractor and developer companies expect ‘raw material’ costs, and 65% expect ‘energy’ costs, to ‘increase by less than 10%’ for 2013
According to the survey, 40% of respondents from construction equipment and materials supplier companies expect to increase their ‘energy’ costs by ‘5–25%’ during 2013
The majority of contractor and developer respondents indicate that their change in the costs structure will positively impact their contract values in 2013

CONSTRUCTION INDUSTRY SUPPLIER MARKETING SPEND ACTIVITY
Global Construction Supplier Industry Outlook Survey 2013–2014:
Market Trends, Marketing Spend and Sales Strategies in the Global Construction Industry Page 69
© Timetric. This product is licensed and is not to be photocopied Published: June 2013
5.1 Global Construction Industry – Leading Business Concerns for 2013–2014
‘Cost containments’ emerged as a leading challenge for the global construction industry in 2013–2014,
as showcased by the largest share, 56%, of industry respondents, while 55% identified ‘market
uncertainty’ as a key challenge. Other challenges that industry executives expect to face in 2013 are
‘retention or recruitment of skilled staff’ and ‘rising competition’. This indicates that the leading business
concerns of construction industry executives’ have not changed significantly from results recorded in
construction survey reports in 2009, 2011 and 2012.
Across the industry, ‘cost containment’ and ‘market uncertainty’ were identified as key business
concerns, reflecting industry sentiment that these factors could force industry contractors and
developers to re-evaluate their pricing strategies to adapt to market fluctuations, as well as compelling
suppliers and vendors to reduce prices as a result of an increased focus on cost preservation.
Moreover, companies plan to address ‘cost containment’ issues through the adoption of various
methods such as the streamlining of operations, usage of renewable sources of energy, mainly bio-
fuels, and the efficient utilization of equipment and resources. In April 2013, components supplier SKF
announced plans to introduce a new system to detect leakage within the centralized lubrication systems
of construction machines. The new system eliminates leakage, prevents the impact of leakage on the
environment, and also reduces clean-up and disposal costs.
Additionally, ‘retention or recruitment of skilled staff’ was identified as an important concern by 45% of
respondents in 2013. As demand for construction increases, the ‘retention or recruitment of skilled staff’
will be a key challenge for builders, as recruitment processes have been slowed down due to their
failure to locate skilled construction workers. For example, in February 2013, Rampart Construction US
announced the addition of 25 skilled workers in 2012, but cannot expand its worker count in 2013, as
many skilled workers have left the field to find other jobs due to uneven market conditions. A senior
executive from the company comments:
“People had to find other work to survive. Some of the laborers during the housing boom were
immigrants who went back to their home countries and haven't returned. In addition, our subcontractors
– such as those that install sheet rock – have also had a difficult time filling their staff, and are working
with smaller crews, which mean projects take longer to complete.”
Noticeably, ‘climate change challenges’ was identified as an important concern by 15% of respondents
in 2009. However, fewer respondents from the construction industry identified this as a concern in
2013. This suggests that companies are successfully implementing measures to combat the effects that
climate change will have. Furthermore, ‘rising competition’ has led to increased ‘pricing pressure’ for
many companies, which has negatively affected their bottom-line performance.

CONSTRUCTION INDUSTRY SUPPLIER MARKETING SPEND ACTIVITY
Global Construction Supplier Industry Outlook Survey 2013–2014:
Market Trends, Marketing Spend and Sales Strategies in the Global Construction Industry Page 70
© Timetric. This product is licensed and is not to be photocopied Published: June 2013
Figure 31: Global Construction Industry – Top Five Leading Business Concerns, 2013–2014
Source: Timetric Industry Survey 2013 © Timetric

CONSTRUCTION INDUSTRY SUPPLIER MARKETING SPEND ACTIVITY
Global Construction Supplier Industry Outlook Survey 2013–2014:
Market Trends, Marketing Spend and Sales Strategies in the Global Construction Industry Page 71
© Timetric. This product is licensed and is not to be photocopied Published: June 2013
Table 38: Global Construction Industry – Leading Business Concerns (%), 2009–2013
Business Concerns 2009 2011 2012 2013
Cost containments 39% 42% 31% 56%
Market uncertainty 51% 54% 57% 55%
Retention or recruitment of skilled staff 25% 33% 31% 45%
Rising competition 0% 35% 32% 42%
Responding to pricing pressure 53% 44% 43% 38%
Reducing demand for products and services 47% 30% 26% 29%
Regulatory changes 16% 21% 21% 22%
Political interference 11% 25% 21% 21%
Lack of liquidity 26% 19% 15% 18%
Dealing with staff shortages 29% 16% 16% 17%
Debt 17% 23% 15% 14%
Climate change challenges 15% 9% 9% 7%
Natural hazards 0% 6% 4% 2%
Others 5% 3% 1% 5%
None of these 0% 0% 2% 1%
N.B. Responses are not mutually exclusive, and therefore do not equal 100%
Source: Timetric Industry Survey 2013 © Timetric
Figure 32: Global Construction Industry – Leading Business Concerns (%), 2009–2013
Source: Timetric Industry Survey 2013 © Timetric

CONSTRUCTION INDUSTRY SUPPLIER MARKETING SPEND ACTIVITY
Global Construction Supplier Industry Outlook Survey 2013–2014:
Market Trends, Marketing Spend and Sales Strategies in the Global Construction Industry Page 72
© Timetric. This product is licensed and is not to be photocopied Published: June 2013
5.1.1 Leading business concerns for 2013–2014 by company type
The three leading concerns identified by construction contractors and developers for 2013–2014 are
‘cost containments’, ‘market uncertainty’, and ‘retention or recruitment of skilled staff’. Several
companies in the global construction industry are uncertain about the industry’s future growth due to
market uncertainty. To address this, companies are looking to improve productivity, expand into new
markets, strengthen their product portfolios, reduce unprofitable businesses, and use new technology
and materials. In February 2013, building contractor DPR Construction in California announced plans to
expand into South-East USA by acquiring Atlanta-based general contractor Hardin Construction. A
senior executive from DPR construction stated:
“Hardin is involved in the South-East and Florida and Texas, and was perfect for how we were trying to
grow.”
High employee attrition rates are an important cause of concern for many construction contractors and
developers, as organizations have to invest time and resources in hiring and training new recruits.
Several companies are, therefore, concentrating on developing strategies to retain their workforces by
providing quality training, enhancing their facilities and providing better amenities.
The three leading business concerns indentified by construction equipment and material supplier
respondents are ‘market uncertainty’, ‘cost containments’ and ‘responding to pricing pressure’. In
addition, ‘market uncertainty’, ‘cost containments’, and ‘rising competition’ are key concerns as
identified by other construction industry supplier respondents. This indicates that respondents still
consider cost-containment measures to be as effective as working-capital-management strategies, and
this could lead to pricing pressures and the promotion of unsustainable pricing in the global construction
industry. Consequently, many companies are planning to restructure their businesses and overhaul
their operational costs to improve profitability.
In January 2013, CoverGlobal, a Finnish manufacturer of balcony and terrace glazing products,
successfully restructured its global business operations. A senior executive from the company
commented that:
“The strength of our operation lies in our multi-cultural core team which is able to serve customers in six
different languages. In addition to Finns, the team has employed people from Asia, Africa and South
America. We feel that it is important to truly understand the culture and conditions of the country our
products are sold in and where our partner is operating in. In addition, Cover has developed a customer
program to support its partners; our company uses the program to help local operators develop their
own businesses. The program includes training and a versatile selection of tools which help the partner
launch their business operation with Cover solutions.”

CONSTRUCTION INDUSTRY SUPPLIER MARKETING SPEND ACTIVITY
Global Construction Supplier Industry Outlook Survey 2013–2014:
Market Trends, Marketing Spend and Sales Strategies in the Global Construction Industry Page 73
© Timetric. This product is licensed and is not to be photocopied Published: June 2013
Table 39: Leading Business Concerns by Company Type (%), 2013–2014
Business Concerns
Construction
Contractors
and Developers
Construction
Equipment
and Materials
Suppliers
Other Construction
Industry Suppliers
Climate change challenges 7% 9% 4%
Cost containments 53% 60% 52%
Dealing with staff shortages 22% 14% 9%
Debt 15% 19% 4%
Lack of liquidity 20% 21% 9%
Market uncertainty 43% 70% 57%
Natural hazards 0% 5% 4%
Political interference 23% 16% 22%
Reducing demand for products and services 25% 30% 35%
Regulatory changes 28% 16% 17%
Responding to pricing pressure 32% 49% 35%
Retention or recruitment of skilled staff 50% 47% 30%
Rising competition 42% 42% 43%
Others 3% 7% 4%
None of these 2% 0% 0%
N.B. Responses are not mutually exclusive, and therefore do not equal 100%
Source: Timetric Industry Survey 2013 © Timetric

CONSTRUCTION INDUSTRY SUPPLIER MARKETING SPEND ACTIVITY
Global Construction Supplier Industry Outlook Survey 2013–2014:
Market Trends, Marketing Spend and Sales Strategies in the Global Construction Industry Page 74
© Timetric. This product is licensed and is not to be photocopied Published: June 2013
5.1.2 Leading business concerns for 2013–2014 by region
When survey responses are analyzed by region, the results indicate that construction industry
companies across the globe have minor variations in their challenges. ‘Market uncertainty’ and ‘cost
containments’ are leading concerns for respondents operating from North America, Europe and Asia-
Pacific. In addition, ‘responding to pricing pressure’, ‘regulatory changes’ and ‘political interference’ are
key challenges identified by respondents from the Rest of the World region. Moreover, for respondents
from companies operating in North America and Asia-Pacific, the main business concern includes the
‘retention or recruitment of skilled staff’, while the main business concerns for those in Europe include
‘rising competition’.
Table 40: Global Construction Industry – Leading Business Concerns by Region (%), 2013–2014
Business Concerns North America Europe Asia-Pacific Rest of the
World
Climate change challenges 7% 6% 8% 10%
Cost containments 59% 55% 68% 20%
Dealing with staff shortages 33% 5% 24% 30%
Debt 15% 13% 16% 20%
Lack of liquidity 7% 19% 32% 10%
Market uncertainty 48% 61% 64% 10%
Natural hazards 0% 2% 4% 10%
Political interference 15% 20% 20% 40%
Reducing demand for products and services 15% 39% 20% 20%
Regulatory changes 15% 22% 24% 40%
Responding to pricing pressure 37% 41% 32% 40%
Retention or recruitment of skilled staff 63% 36% 56% 30%
Rising competition 37% 47% 44% 20%
Others 7% 5% 4% 0%
None of these 0% 2% 0% 0%
N.B. Responses are not mutually exclusive, and therefore do not equal 100%
Source: Timetric Industry Survey 2013 © Timetric

CONSTRUCTION INDUSTRY SUPPLIER MARKETING SPEND ACTIVITY
Global Construction Supplier Industry Outlook Survey 2013–2014:
Market Trends, Marketing Spend and Sales Strategies in the Global Construction Industry Page 75
© Timetric. This product is licensed and is not to be photocopied Published: June 2013
5.1.3 Leading business concerns for 2013–2014 by company turnover
Regardless of company size, survey respondents in the global construction industry consider ‘market
uncertainty’ and ‘cost containments’ to be leading business concerns. However, the ‘retention or
recruitment of skilled staff’ was identified as an important business concern by more respondents from
small and large companies than medium-sized companies. In addition, ‘responding to pricing pressure’
is identified as a business concern by respondents from medium-sized companies.
Table 41: Global Construction Industry – Leading Business Concerns by Turnover (%), 2013–
2014
Business Concerns
Less than
US$100 million
US$100 million–
US$1 billion
More than US$1
billion
Climate change challenges 6% 11% 5%
Cost containments 54% 57% 60%
Dealing with staff shortages 18% 11% 20%
Debt 18% 7% 10%
Lack of liquidity 21% 7% 25%
Market uncertainty 51% 54% 70%
Natural hazards 1% 7% 0%
Political interference 23% 11% 25%
Reducing demand for products and services 32% 32% 10%
Regulatory changes 27% 18% 10%
Responding to pricing pressure 35% 54% 30%
Retention or recruitment of skilled staff 44% 36% 65%
Rising competition 38% 46% 50%
Others 3% 7% 10%
None of these 0% 4% 0%
N.B. Responses are not mutually exclusive, and therefore do not equal 100%
Source: Timetric Industry Survey 2013 © Timetric

CONSTRUCTION INDUSTRY SUPPLIER MARKETING SPEND ACTIVITY
Global Construction Supplier Industry Outlook Survey 2013–2014:
Market Trends, Marketing Spend and Sales Strategies in the Global Construction Industry Page 76
© Timetric. This product is licensed and is not to be photocopied Published: June 2013
5.2 Global Construction Industry – Key Supplier Actions to Maintain and Win Buyer
Business
Global economic uncertainty has forced companies in the global construction industry to prioritize cost
concerns in their business agenda. The industry’s demand dynamic is changing as regular purchasing
patterns have become disrupted due to the recession and the subsequent signs of recovery in some
areas of the world. These changes require proactive and improved methods of securing new business
and maintaining current business for supplier respondents, as construction industry contractors and
developers will review their current supplier base with increased scrutiny to identify potential cost
savings.
5.2.1 Actions to maintain and secure buyer business by company type
Contractors and developers, and suppliers were simultaneously asked about the three important ways
that suppliers can help secure business from contractors and developers during the current economic
climate. A comparison of contractors and developers’ and suppliers’ responses indicates little disparity
between contractors and developers’ expectations and suppliers’ understanding. Contractor and
developer respondents consider that supplier efforts to ‘provide support for generating new businesses’
and the adoption of practices to ‘innovate product’ and ‘improve customer services’ will help their
businesses. In comparison, supplier respondents are of the view that strategies to ‘innovate product’,
‘improve customer service’, and ‘reduce prices’ will benefit suppliers to stabilize their business. In the
2012 survey, contractors, developers and suppliers identified the need to ‘improve customer service’ as
an effective way for suppliers to gain business from contractors and developers.
It is evident from the results that contractors and developers’ requirements have changed slightly
between the 2012 and 2013 surveys, suggesting that although the industry is optimistic about revenue
growth expectations, concerns such as volatility in demand and supply, pricing pressures, rising costs,
and slow economic recovery have forced contractors and developers to shift their focus to ‘innovate
product’ and ‘provide support for generating new businesses’. For example, in April 2013, Italian truck-
mounted crane manufacturer Fratelli Ferrari announced the introduction of its new 700 series crane
model and new FL stability system. The new 729 crane is available with up to eight hydraulic
extensions and two jib versions: A4J4 and A6J4. The company will also be introducing a new stability
control system, named FL, which will be optional on most of its small range. This system will improve
control of the crane and make its operation much safer.
Notably, 14% of contractor and developer respondents want suppliers to ‘provide other concessions
and incentives’, whereas only 6% of suppliers are willing to do so. Moreover, ‘cost containment’ was
mentioned as one of the leading business concerns by 53% of contractor and developer respondents in
section 5.1.1 and, as a result, contractors and developers are focusing their efforts to reduce
unnecessary expenses and minimize costs; any help offered by the suppliers to supplement these
efforts should ensure increased loyalty to their services.

CONSTRUCTION INDUSTRY SUPPLIER MARKETING SPEND ACTIVITY
Global Construction Supplier Industry Outlook Survey 2013–2014:
Market Trends, Marketing Spend and Sales Strategies in the Global Construction Industry Page 77
© Timetric. This product is licensed and is not to be photocopied Published: June 2013
Table 42: Global Construction Industry – Securing Buyer Business: Buyer vs. Supplier
Responses (%), 2013
Actions
Contractors and
Developers Suppliers
Innovate products 41% 45%
Improve customer services 37% 39%
Provide support for generating new businesses 36% 32%
Reduce prices 34% 33%
Improve payment terms 32% 30%
Work harder to reduce costs 20% 32%
Engage in partnerships to optimize working capital and reduce costs 20% 23%
Offer more flexibility in delivery 17% 14%
Provide other concessions and incentives 14% 6%
Provide support for offsetting existing business attrition 12% 5%
Sign longer-term agreements 7% 6%
Demonstrate better ROI 7% 9%
Others 2% 3%
None of these 0% 2%
N.B. Responses are not mutually exclusive, and therefore do not equal 100%
Source: Timetric Industry Survey 2013 © Timetric
Figure 33: Global Construction Industry – Securing Buyer Business: Buyer vs. Supplier
Responses (%), 2013
Source: Timetric Industry Survey 2013 © Timetric

CONSTRUCTION INDUSTRY SUPPLIER MARKETING SPEND ACTIVITY
Global Construction Supplier Industry Outlook Survey 2013–2014:
Market Trends, Marketing Spend and Sales Strategies in the Global Construction Industry Page 78
© Timetric. This product is licensed and is not to be photocopied Published: June 2013
5.2.2 Actions to maintain and secure buyer business by region
Respondents from companies across all regions consider efforts to ‘innovate products’ as an important
action that suppliers should take to secure business from contractors and developers. However, there
are some minor variations in different regions. Respondents from companies that operate in Europe
and Asia-Pacific assigned high importance to the need to ‘reduce prices’ and ‘improve customer
services’. Meanwhile, respondents from companies operating in North America identified ‘improve
payment terms’ and ‘provide support for generating new businesses’ as important actions that suppliers
can take to improve secure business from contractors and developers. Respondents from companies
operating in the Rest of the World identified ‘reduce prices’ as an important action for 2013.
Table 43: Global Construction Industry – Securing Buyer Business by Region (%), 2013
Actions North America Europe Asia-Pacific Rest of the
World
Demonstrate better ROI 11% 6% 8% 10%
Engage in partnerships to optimize working capital
and reduce costs
22% 17% 33% 20%
Improve customer services 37% 42% 46% 0%
Improve payment terms 41% 25% 38% 30%
Innovate products 41% 41% 50% 50%
Offer more flexibility in delivery 15% 20% 8% 0%
Provide other concessions and incentives 11% 8% 13% 10%
Provide support for generating new businesses 44% 34% 21% 30%
Provide support for offsetting existing business
attrition
7% 6% 4% 30%
Reduce prices 22% 36% 38% 40%
Sign longer-term agreements 0% 5% 17% 10%
Work harder to reduce costs 26% 33% 13% 20%
Others 4% 2% 4% 0%
None of these 0% 2% 0% 0%
N.B. Responses are not mutually exclusive, and therefore do not equal 100%
Source: Timetric Industry Survey 2013 © Timetric
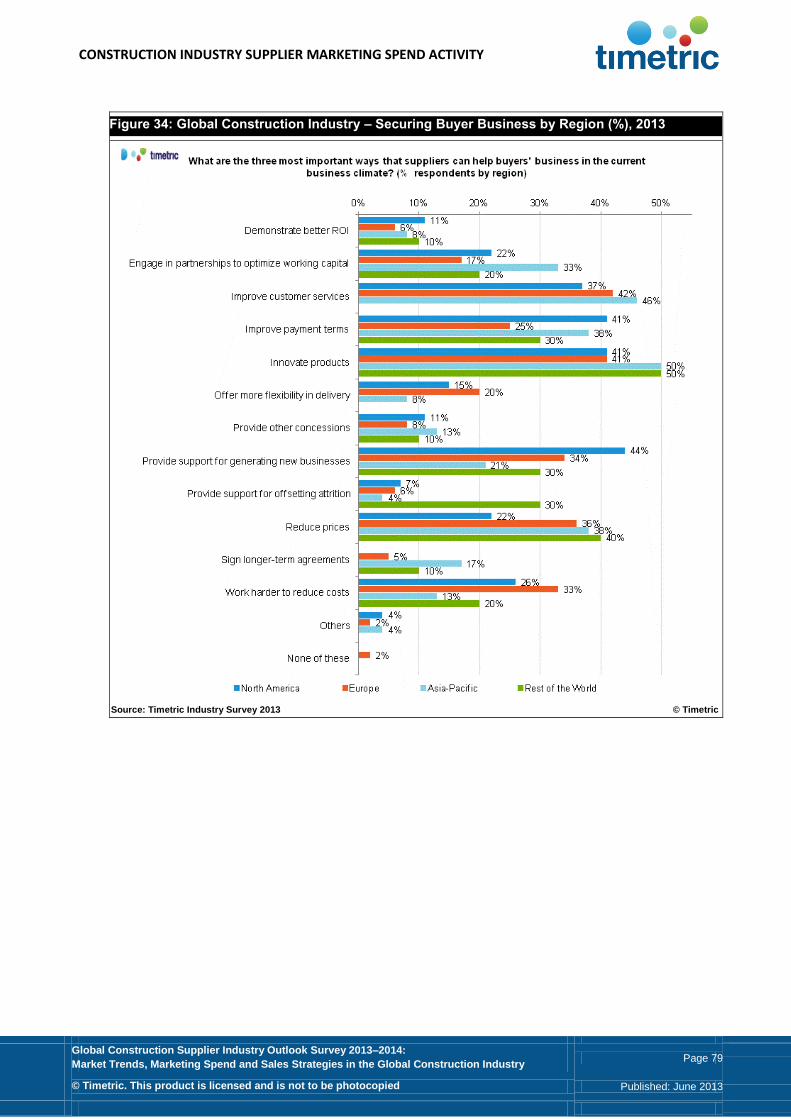
CONSTRUCTION INDUSTRY SUPPLIER MARKETING SPEND ACTIVITY
Global Construction Supplier Industry Outlook Survey 2013–2014:
Market Trends, Marketing Spend and Sales Strategies in the Global Construction Industry Page 79
© Timetric. This product is licensed and is not to be photocopied Published: June 2013
Figure 34: Global Construction Industry – Securing Buyer Business by Region (%), 2013
Source: Timetric Industry Survey 2013 © Timetric
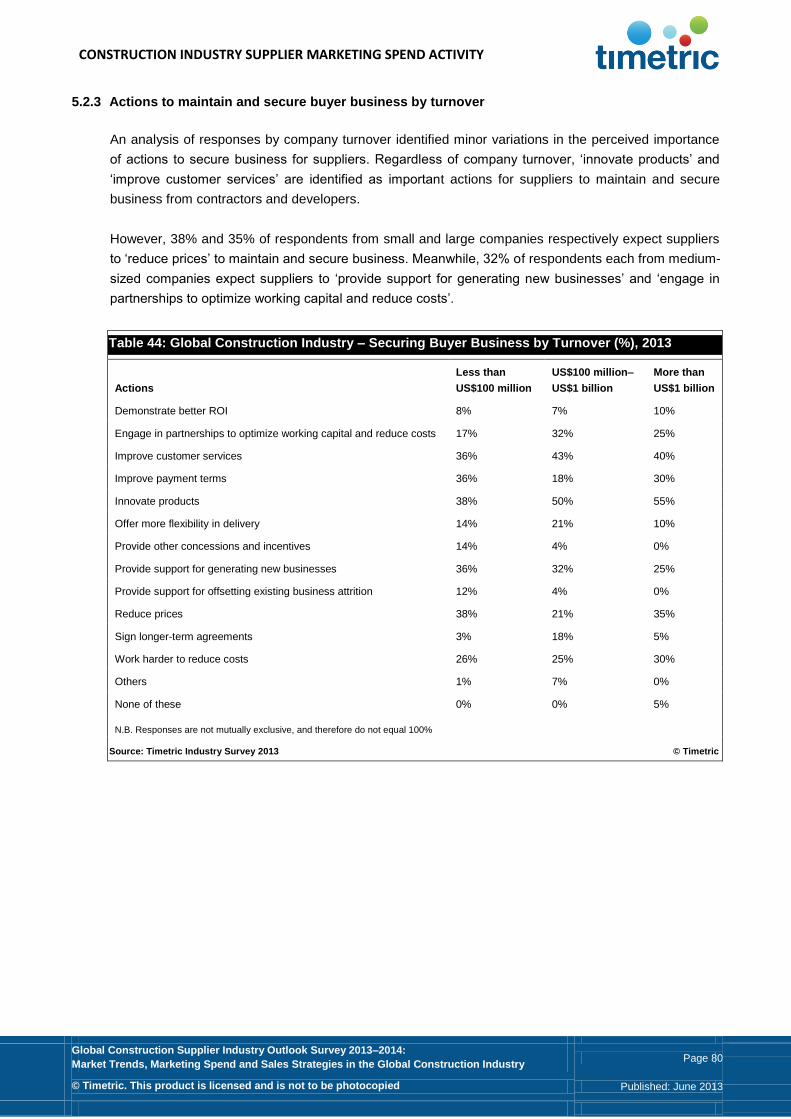
CONSTRUCTION INDUSTRY SUPPLIER MARKETING SPEND ACTIVITY
Global Construction Supplier Industry Outlook Survey 2013–2014:
Market Trends, Marketing Spend and Sales Strategies in the Global Construction Industry Page 80
© Timetric. This product is licensed and is not to be photocopied Published: June 2013
5.2.3 Actions to maintain and secure buyer business by turnover
An analysis of responses by company turnover identified minor variations in the perceived importance
of actions to secure business for suppliers. Regardless of company turnover, ‘innovate products’ and
‘improve customer services’ are identified as important actions for suppliers to maintain and secure
business from contractors and developers.
However, 38% and 35% of respondents from small and large companies respectively expect suppliers
to ‘reduce prices’ to maintain and secure business. Meanwhile, 32% of respondents each from medium-
sized companies expect suppliers to ‘provide support for generating new businesses’ and ‘engage in
partnerships to optimize working capital and reduce costs’.
Table 44: Global Construction Industry – Securing Buyer Business by Turnover (%), 2013
Actions
Less than
US$100 million
US$100 million–
US$1 billion
More than
US$1 billion
Demonstrate better ROI 8% 7% 10%
Engage in partnerships to optimize working capital and reduce costs 17% 32% 25%
Improve customer services 36% 43% 40%
Improve payment terms 36% 18% 30%
Innovate products 38% 50% 55%
Offer more flexibility in delivery 14% 21% 10%
Provide other concessions and incentives 14% 4% 0%
Provide support for generating new businesses 36% 32% 25%
Provide support for offsetting existing business attrition 12% 4% 0%
Reduce prices 38% 21% 35%
Sign longer-term agreements 3% 18% 5%
Work harder to reduce costs 26% 25% 30%
Others 1% 7% 0%
None of these 0% 0% 5%
N.B. Responses are not mutually exclusive, and therefore do not equal 100%
Source: Timetric Industry Survey 2013 © Timetric
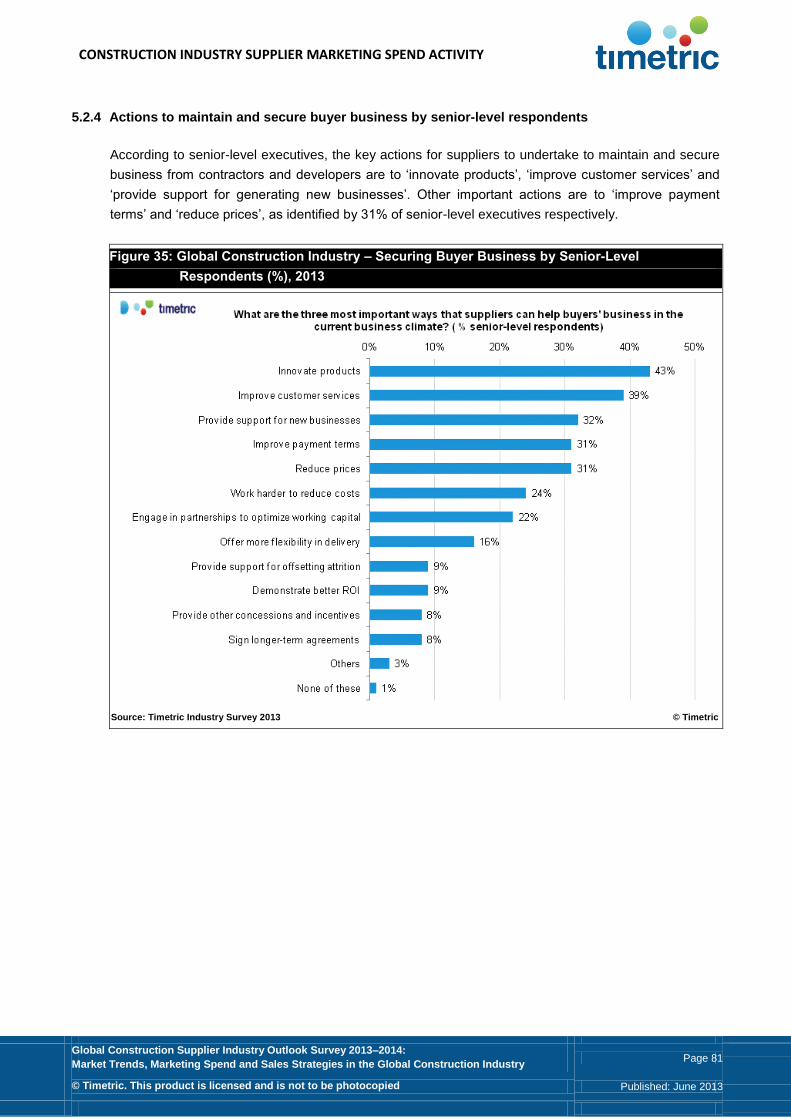
CONSTRUCTION INDUSTRY SUPPLIER MARKETING SPEND ACTIVITY
Global Construction Supplier Industry Outlook Survey 2013–2014:
Market Trends, Marketing Spend and Sales Strategies in the Global Construction Industry Page 81
© Timetric. This product is licensed and is not to be photocopied Published: June 2013
5.2.4 Actions to maintain and secure buyer business by senior-level respondents
According to senior-level executives, the key actions for suppliers to undertake to maintain and secure
business from contractors and developers are to ‘innovate products’, ‘improve customer services’ and
‘provide support for generating new businesses’. Other important actions are to ‘improve payment
terms’ and ‘reduce prices’, as identified by 31% of senior-level executives respectively.
Figure 35: Global Construction Industry – Securing Buyer Business by Senior-Level
Respondents (%), 2013
Source: Timetric Industry Survey 2013 © Timetric
CONSTRUCTION INDUSTRY SUPPLIER MARKETING SPEND ACTIVITY
Global Construction Supplier Industry Outlook Survey 2013–2014:
Market Trends, Marketing Spend and Sales Strategies in the Global Construction Industry Page 82
© Timetric. This product is licensed and is not to be photocopied Published: June 2013
5.3 Global Construction Industry – Key Variations in Operational Costs
This section discusses the overall expected increase of operational costs in the construction industry in
2013. The section will provide a comparative view of the changes in the cost structure of contractors
and developers and suppliers. The survey responses will be analyzed by company type, region and
company turnover.
5.3.1 Key variations in operational costs by contractors and developers
A total of 71% of respondents from construction contractor and developer companies expect their ‘raw
material’ costs, and 65% expect their ‘energy’ costs, to increase by ‘less than 10%’ for 2013. However,
12% of respondents expect an ‘increase of 10–25%’ in their ‘energy’ costs. Increases in raw material
costs such as cement and steel, and higher labor costs are creating challenges for construction
developers and contractors. Moreover, rising oil and energy costs have increased surcharges in
deliveries, and have also encouraged prices to rise for other types of raw materials such as concrete,
insulation and waterproofing materials. As a result, the production costs of construction contractors and
developers have increased significantly.
Additionally, construction services suffered severely from the uneven market conditions. As a result, the
profit margins of several construction contractors and developers have been impeded, and some are
looking for solutions to improve their operational efficiency, such as using energy-efficient equipment
and advanced IT in their production processes. For example, a study by the UK’s National Association
of Home Builders (NAHB) in February 2013 reported that architects and contractors are looking for
energy-efficient options that will guarantee lower utility costs and greater durability. A senior executive
from Priority Energy, an energy efficiency services provider based in Chicago, noted:
“We have found that construction contractors are often unaware of advanced construction components
and building standards, or it is assumed these measures will be too expensive or time-consuming. In
actuality, with the stricter IECC 2012 Building codes in effect this year, these high-performance
products can save builders time and money by making it easier for their homes to pass the more
rigorous efficiency tests while increasing marketability. Raw material products such as Aeroseal for duct
sealing, and EnviroDri as an exterior air and moisture barrier, have attained unsurpassed efficiency,
comfort and durability results.”
Notably, 22% and 21% of respective contractor and developer respondents anticipate ‘no change’ in
their ‘labor costs and salaries’ and ‘energy costs’. Deteriorating confidence among construction
contractors and developers due to uneven market conditions may restrict ‘labor costs and salaries’ in
2013.
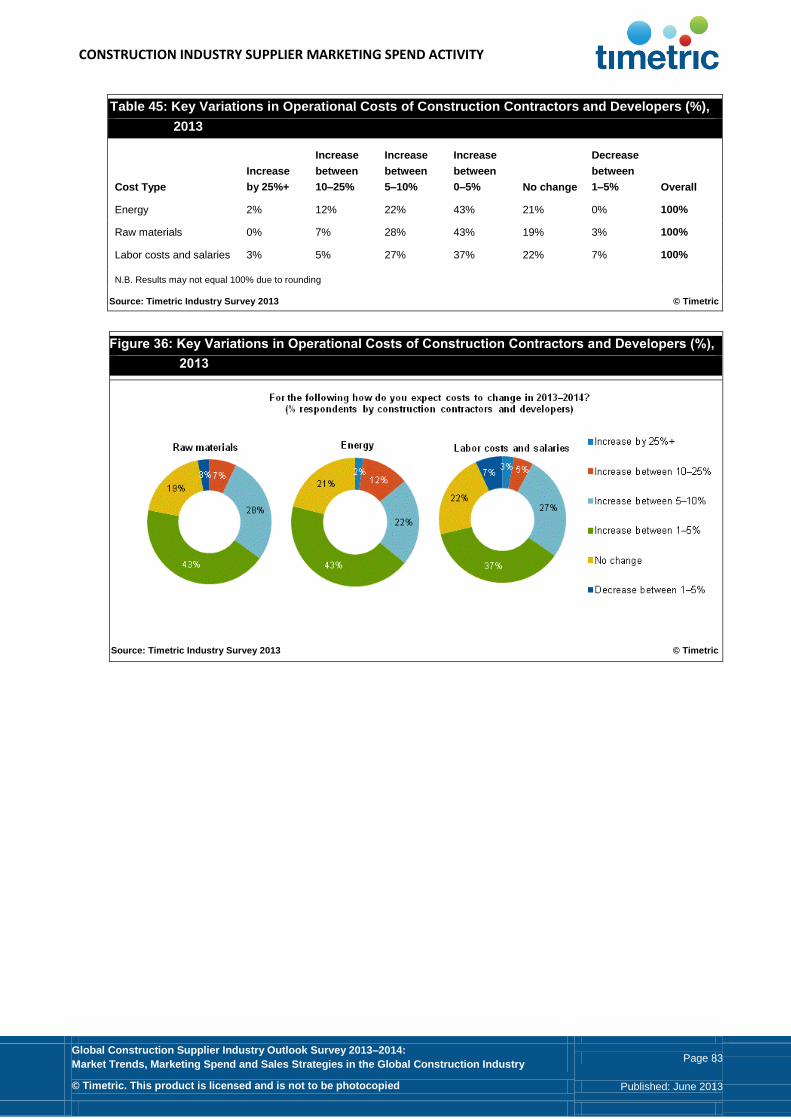
CONSTRUCTION INDUSTRY SUPPLIER MARKETING SPEND ACTIVITY
Global Construction Supplier Industry Outlook Survey 2013–2014:
Market Trends, Marketing Spend and Sales Strategies in the Global Construction Industry Page 83
© Timetric. This product is licensed and is not to be photocopied Published: June 2013
Table 45: Key Variations in Operational Costs of Construction Contractors and Developers (%),
2013
Cost Type
Increase
by 25%+
Increase
between
10–25%
Increase
between
5–10%
Increase
between
0–5% No change
Decrease
between
1–5% Overall
Energy 2% 12% 22% 43% 21% 0% 100%
Raw materials 0% 7% 28% 43% 19% 3% 100%
Labor costs and salaries 3% 5% 27% 37% 22% 7% 100%
N.B. Results may not equal 100% due to rounding
Source: Timetric Industry Survey 2013 © Timetric
Figure 36: Key Variations in Operational Costs of Construction Contractors and Developers (%),
2013
Source: Timetric Industry Survey 2013 © Timetric

CONSTRUCTION INDUSTRY SUPPLIER MARKETING SPEND ACTIVITY
Global Construction Supplier Industry Outlook Survey 2013–2014:
Market Trends, Marketing Spend and Sales Strategies in the Global Construction Industry Page 84
© Timetric. This product is licensed and is not to be photocopied Published: June 2013
5.3.2 Key variations in operational costs by suppliers
A total of 40% of respondents from construction equipment and materials supplier companies expect an
increase of 5–25% in their ‘energy’ costs during 2013. However, 79% of respondents expect their ‘labor
costs and salaries’ to increase by less than 10%.
Therefore, with the globally rising ‘energy’ costs, construction equipment and material suppliers are
focused on energy-efficient solutions, such as energy-efficient heating and lighting systems for
production facilities and energy-efficient production technologies. For example, in February 2013,
sustainable solutions provider Kebony AS, based in Norway, won the 2013 Rushlight Responsible
Products or Service Award for its sustainable wood. The company notes that through the
environmentally friendly process of 'Kebonization', sustainable wood species are turned into Kebony,
which is more durable, harder and stable than tropical hardwood. This new wood has been used in a
number of projects in applications including decking, flooring, cladding, roofing, windows, furniture and
other construction materials.
French cement manufacturer Lafarge is also focusing on reducing its carbon footprint through a gradual
reduction in its production of clinker, by developing and selling blended cements that utilize more
environmentally-friendly cement additives.
Furthermore, a total of 7% of respondents expect to increase their ‘raw materials’ prices by 10–25%
during 2013. ‘Raw materials’ prices are increasing due to the price volatility in steel, iron and polymer.
As a result, many construction supplier companies are required to increase their project prices to
accommodate the increasing operational prices.
Table 46: Key Variations in Operational Costs of Construction Equipment and Materials
Suppliers (%), 2013
Cost Type
Increase
by 25%+
Increase
between
10–25%
Increase
between
5–10%
Increase
between
0–5%
No
change
Decrease
between
1–5% Overall
Labor costs and salaries 2% 2% 14% 65% 16% 0% 100%
Raw materials 2% 7% 23% 49% 12% 7% 100%
Energy 2% 5% 35% 37% 19% 2% 100%
N.B. Results may not equal 100% due to rounding
Source: Timetric Industry Survey 2013 © Timetric
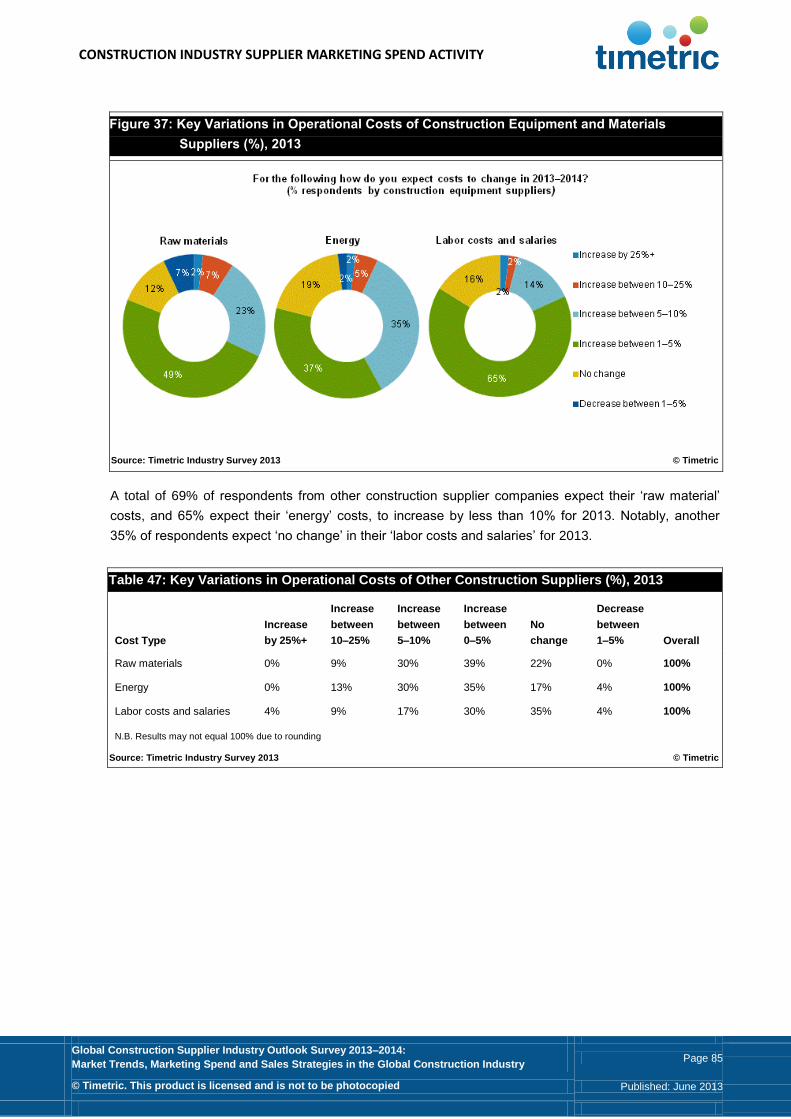
CONSTRUCTION INDUSTRY SUPPLIER MARKETING SPEND ACTIVITY
Global Construction Supplier Industry Outlook Survey 2013–2014:
Market Trends, Marketing Spend and Sales Strategies in the Global Construction Industry Page 85
© Timetric. This product is licensed and is not to be photocopied Published: June 2013
Figure 37: Key Variations in Operational Costs of Construction Equipment and Materials
Suppliers (%), 2013
Source: Timetric Industry Survey 2013 © Timetric
A total of 69% of respondents from other construction supplier companies expect their ‘raw material’
costs, and 65% expect their ‘energy’ costs, to increase by less than 10% for 2013. Notably, another
35% of respondents expect ‘no change’ in their ‘labor costs and salaries’ for 2013.
Table 47: Key Variations in Operational Costs of Other Construction Suppliers (%), 2013
Cost Type
Increase
by 25%+
Increase
between
10–25%
Increase
between
5–10%
Increase
between
0–5%
No
change
Decrease
between
1–5% Overall
Raw materials 0% 9% 30% 39% 22% 0% 100%
Energy 0% 13% 30% 35% 17% 4% 100%
Labor costs and salaries 4% 9% 17% 30% 35% 4% 100%
N.B. Results may not equal 100% due to rounding
Source: Timetric Industry Survey 2013 © Timetric

CONSTRUCTION INDUSTRY SUPPLIER MARKETING SPEND ACTIVITY
Global Construction Supplier Industry Outlook Survey 2013–2014:
Market Trends, Marketing Spend and Sales Strategies in the Global Construction Industry Page 86
© Timetric. This product is licensed and is not to be photocopied Published: June 2013
Figure 38: Key Variations in Operational Costs of Other Construction Suppliers (%), 2013
Source: Timetric Industry Survey 2013 © Timetric
5.3.3 Key variations in operational costs by region
Regardless of region of operation, respondents from the global construction industry expect a
significant rise in ‘energy’, ‘raw materials’ costs and ‘labor costs and salaries’ for 2013. For example,
according to a press release from MEED Events, an organizer of Qatar Projects, Qatar’s construction
industry will have to deal with rising construction costs as the country is organizing the 2022 FIFA World
Cup. MEED notes that the construction costs in 2017 will be 18% higher than the 2013 price levels. As
a result, the rise in costs is expected to impact Qatar’s overall supply chain and the value of contract
awards from 2013. A senior executive from MEED events stated that:
“Qatar Projects presents an unrivalled opportunity to understand the full spectrum of Qatar’s projects
market and to leverage the insights gained to not only take full advantage of opportunities but also to
effectively mitigate risks, such as a projected increase in construction costs and ultimately higher
project values.”
The following figure below compares the opinions of respondents by region, and only the percentage of
responses expecting increased growth opportunities are provided.
Table 48: Key Variations in Operational Costs by Region (%), 2013
Cost Type North America Europe Asia-Pacific Rest of the World
Energy 82% 75% 83% 90%
Labor costs and salaries 88% 60% 92% 80%
Raw materials 89% 74% 83% 80%
N.B. Responses are not mutually exclusive, and therefore do not equal 100%
Source: Timetric Industry Survey 2013 © Timetric

CONSTRUCTION INDUSTRY SUPPLIER MARKETING SPEND ACTIVITY
Global Construction Supplier Industry Outlook Survey 2013–2014:
Market Trends, Marketing Spend and Sales Strategies in the Global Construction Industry Page 87
© Timetric. This product is licensed and is not to be photocopied Published: June 2013
5.3.4 Key variations in operational costs by company turnover
A total of 94% and 93% respectively of respondents from medium-sized companies plan to increase
their ‘energy’ and ‘raw materials’ costs in 2013. Additionally, 80% and 73% of respondents from large
and small companies respectively expect to increase their expenditure on ‘raw material’ costs.
The following figure below compares the opinions of respondents by company turnover, and only the
percentage of responses expecting increased growth opportunities are provided.
Table 49: Key Variations in Operational Costs by Company Turnover (%), 2013
Cost Type Less than US$100 million US$100 million–US$1 billion More than US$1 billion
Energy 74% 94% 75%
Labor costs and salaries 67% 86% 80%
Raw materials 73% 93% 80%
N.B. Responses are not mutually exclusive, and therefore do not equal 100%
Source: Timetric Industry Survey 2013 © Timetric
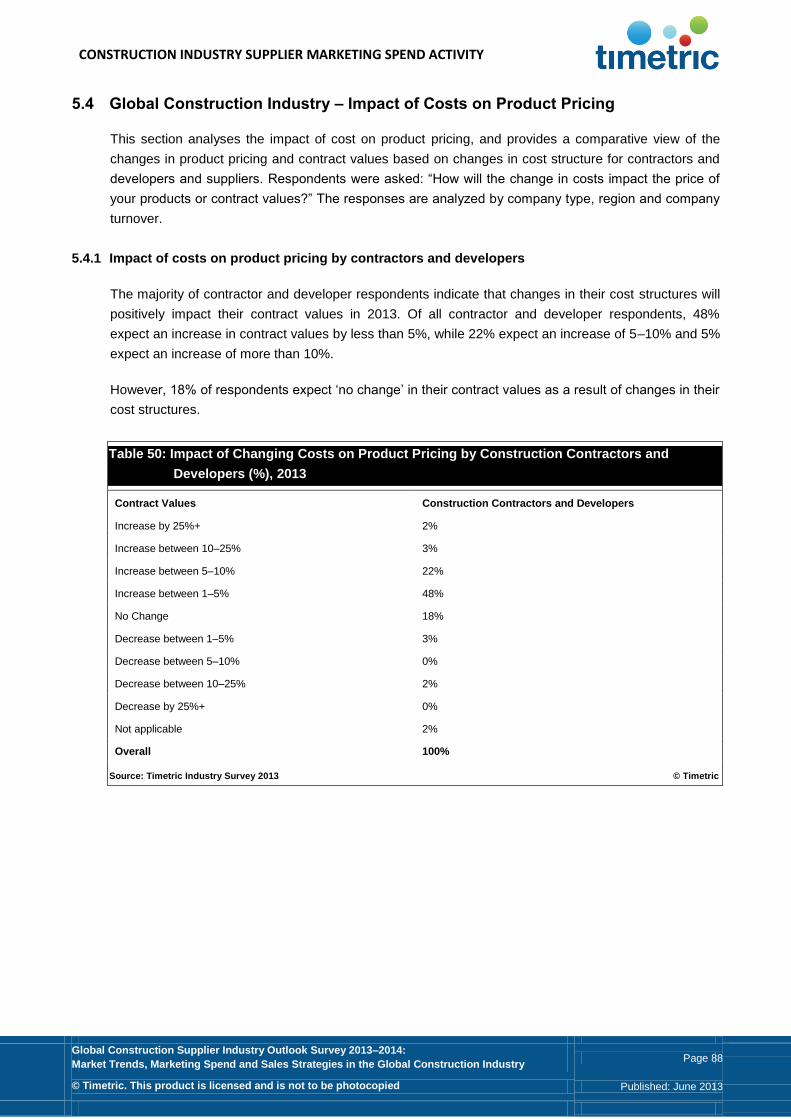
CONSTRUCTION INDUSTRY SUPPLIER MARKETING SPEND ACTIVITY
Global Construction Supplier Industry Outlook Survey 2013–2014:
Market Trends, Marketing Spend and Sales Strategies in the Global Construction Industry Page 88
© Timetric. This product is licensed and is not to be photocopied Published: June 2013
5.4 Global Construction Industry – Impact of Costs on Product Pricing
This section analyses the impact of cost on product pricing, and provides a comparative view of the
changes in product pricing and contract values based on changes in cost structure for contractors and
developers and suppliers. Respondents were asked: “How will the change in costs impact the price of
your products or contract values?” The responses are analyzed by company type, region and company
turnover.
5.4.1 Impact of costs on product pricing by contractors and developers
The majority of contractor and developer respondents indicate that changes in their cost structures will
positively impact their contract values in 2013. Of all contractor and developer respondents, 48%
expect an increase in contract values by less than 5%, while 22% expect an increase of 5–10% and 5%
expect an increase of more than 10%.
However, 18% of respondents expect ‘no change’ in their contract values as a result of changes in their
cost structures.
Table 50: Impact of Changing Costs on Product Pricing by Construction Contractors and
Developers (%), 2013
Contract Values Construction Contractors and Developers
Increase by 25%+ 2%
Increase between 10–25% 3%
Increase between 5–10% 22%
Increase between 1–5% 48%
No Change 18%
Decrease between 1–5% 3%
Decrease between 5–10% 0%
Decrease between 10–25% 2%
Decrease by 25%+ 0%
Not applicable 2%
Overall 100%
Source: Timetric Industry Survey 2013 © Timetric
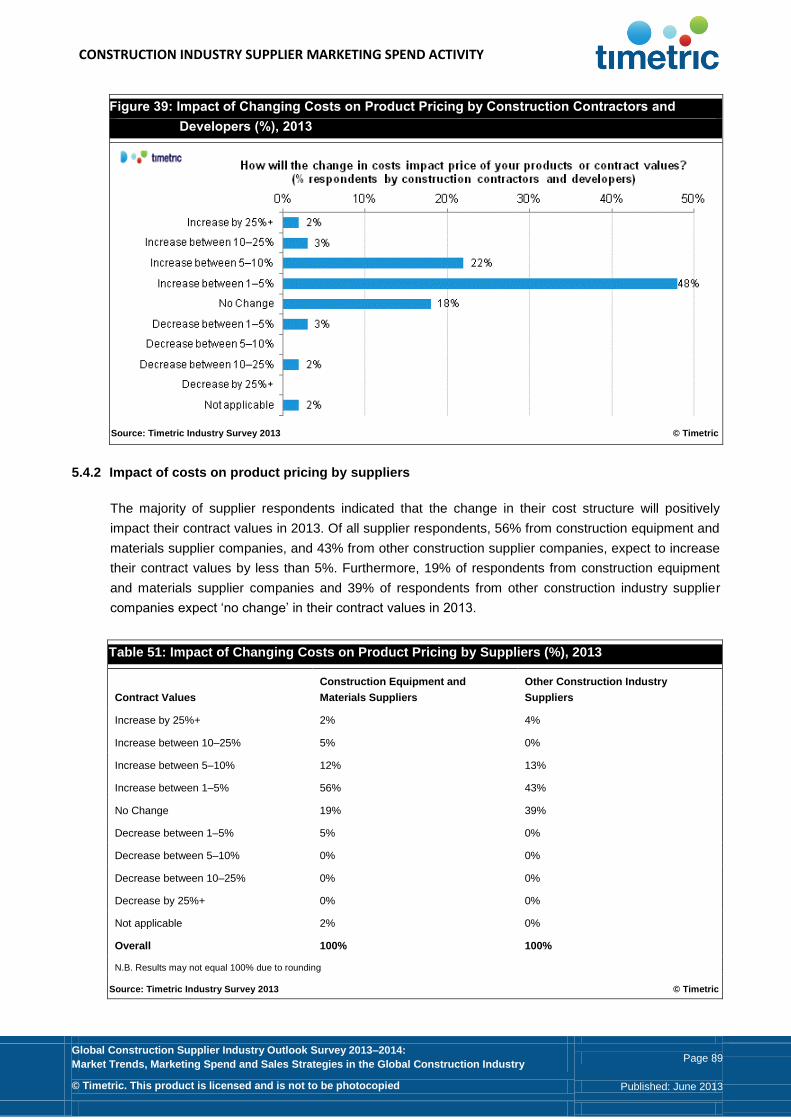
CONSTRUCTION INDUSTRY SUPPLIER MARKETING SPEND ACTIVITY
Global Construction Supplier Industry Outlook Survey 2013–2014:
Market Trends, Marketing Spend and Sales Strategies in the Global Construction Industry Page 89
© Timetric. This product is licensed and is not to be photocopied Published: June 2013
Figure 39: Impact of Changing Costs on Product Pricing by Construction Contractors and
Developers (%), 2013
Source: Timetric Industry Survey 2013 © Timetric
5.4.2 Impact of costs on product pricing by suppliers
The majority of supplier respondents indicated that the change in their cost structure will positively
impact their contract values in 2013. Of all supplier respondents, 56% from construction equipment and
materials supplier companies, and 43% from other construction supplier companies, expect to increase
their contract values by less than 5%. Furthermore, 19% of respondents from construction equipment
and materials supplier companies and 39% of respondents from other construction industry supplier
companies expect ‘no change’ in their contract values in 2013.
Table 51: Impact of Changing Costs on Product Pricing by Suppliers (%), 2013
Contract Values
Construction Equipment and
Materials Suppliers
Other Construction Industry
Suppliers
Increase by 25%+ 2% 4%
Increase between 10–25% 5% 0%
Increase between 5–10% 12% 13%
Increase between 1–5% 56% 43%
No Change 19% 39%
Decrease between 1–5% 5% 0%
Decrease between 5–10% 0% 0%
Decrease between 10–25% 0% 0%
Decrease by 25%+ 0% 0%
Not applicable 2% 0%
Overall 100% 100%
N.B. Results may not equal 100% due to rounding
Source: Timetric Industry Survey 2013 © Timetric

CONSTRUCTION INDUSTRY SUPPLIER MARKETING SPEND ACTIVITY
Global Construction Supplier Industry Outlook Survey 2013–2014:
Market Trends, Marketing Spend and Sales Strategies in the Global Construction Industry Page 90
© Timetric. This product is licensed and is not to be photocopied Published: June 2013
6 Global Construction Industry - Supplier Marketing Spend Activity
This chapter reveals the current size of construction equipment and material supplier companies’ and
other construction industry supplier companies’ marketing and advertizing budgets, and how
expenditure by construction suppliers will change over 2013. As such, this chapter provides insights
into the global construction industry marketing behavior. Expectations regarding expenditure and
investment in specific marketing solutions, along with key marketing adoptions in 2013–2014, reveal the
future needs and strategies of the respondents in the global construction industry.
Key Findings:
For 2013, the average annual marketing budget of global construction industry supplier
respondents is US$5.4 million
The percentage of respondents spending between ‘US$250,000–US$1 million’ on marketing
activities in 2013 remained similar to 2012
Timetric’s construction industry survey revealed that, in 2013, the average marketing budget
for construction equipment and material supplier respondents is projected at US$4.4 million,
and US$7.3 million for other construction industry suppliers
In total, 67% of construction equipment and materials suppliers, and 79% of other construction
supplier respondents expect their marketing budgets to increase in 2013
Respondents from both supplier groups expect to increase their marketing expenditure on
‘email and newsletters’, ‘social media and networking sites’, ‘online portals’ and ‘corporate and
brand websites’
‘CRM systems’ and ‘market intelligence research’ emerged as the two important marketing
and sales solutions in 2013

CONSTRUCTION INDUSTRY SUPPLIER MARKETING SPEND ACTIVITY
Global Construction Supplier Industry Outlook Survey 2013–2014:
Market Trends, Marketing Spend and Sales Strategies in the Global Construction Industry Page 91
© Timetric. This product is licensed and is not to be photocopied Published: June 2013
6.1 Annual Marketing Budgets – Global Construction Industry Suppliers
The size of construction equipment and material supplier companies’ and other construction industry
supplier companies’ annual marketing budgets reveal the scope of marketing investment in 2013–2014.
This section identifies the marketing budgets of suppliers by company type, turnover and geography.
For 2013, the average annual marketing budget of global construction industry supplier respondents is
US$5.4 million.
When segmented by groups, an average marketing budget of US$4.4 million is projected for
construction equipment and material supplier respondents, in comparison to US$7.3 million for other
construction industry suppliers. This is compared to 2012 results, which revealed an average marketing
budget of US$4.9 million for construction equipment and material supplier respondents, against a
budget of US$1.7 million for other construction industry suppliers. Incidentally, the average annual
marketing budget for other construction industry supplier companies increased significantly in 2013 in
comparison to 2012, which indicates an increased focus by suppliers to enhance sales and sustain
uneven market conditions.
Please note that there will be some discrepancy due to different sample sets being interviewed in the
2012 and 2013 industry surveys.
6.1.1 Annual marketing budgets by suppliers
A total of 53% of respondents from construction equipment and materials supplier companies will spend
‘less than US$250,000’ on marketing, while 21% will spend between ‘US$250,000–US$1 million’.
Notably, the percentage of respondents spending between ‘US$250,000–US$1 million’ on marketing
activities in 2013 remained similar to 2012. Additionally, 68% of respondents from other construction
industry suppliers intend to spend ‘less than US$250,000’ for marketing activities, while 14% will spend
‘more than US$50 million’.
Table 52: Annual Marketing Budgets – Construction Equipment and Materials Suppliers (%),
2009−2013
Budgets 2009 2011 2012 2013
Less than US$250,000 72% 80% 58% 53%
US$250,000–US$1 million 13% 12% 21% 21%
US$1–US$10 million 13% 7% 10% 16%
US$10–US$50 million 2% 0% 8% 7%
More than US$50 million 0% 1% 4% 2%
Overall 100% 100% 100% 100%
N.B. Results may not equal 100% due to rounding
Source: Timetric Industry Survey 2013 © Timetric

CONSTRUCTION INDUSTRY SUPPLIER MARKETING SPEND ACTIVITY
Global Construction Supplier Industry Outlook Survey 2013–2014:
Market Trends, Marketing Spend and Sales Strategies in the Global Construction Industry Page 92
© Timetric. This product is licensed and is not to be photocopied Published: June 2013
Figure 40: Annual Marketing Budgets – Construction Equipment and Materials Suppliers (%),
2009−2013
Source: Timetric Industry Survey 2013 © Timetric
Table 53: Annual Marketing Budgets – Other Construction Industry Suppliers (%), 2009−2013
Budgets 2009 2011 2012 2013
Less than US$250,000 70% 93% 75% 68%
US$250,000–US$1 million 10% 5% 11% 14%
US$1–US$10 million 13% 3% 13% 5%
US$10–US$50 million 5% 0% 0% 0%
More than US$50 million 2% 0% 2% 14%
Overall 100% 100% 100% 100%
N.B. Results may not equal 100% due to rounding
Source: Timetric Industry Survey 2013 © Timetric
Figure 41: Annual Marketing Budgets – Other Construction Industry Suppliers (%), 2009−2013
Source: Timetric Industry Survey 2013 © Timetric

CONSTRUCTION INDUSTRY SUPPLIER MARKETING SPEND ACTIVITY
Global Construction Supplier Industry Outlook Survey 2013–2014:
Market Trends, Marketing Spend and Sales Strategies in the Global Construction Industry Page 93
© Timetric. This product is licensed and is not to be photocopied Published: June 2013
6.1.2 Annual marketing budgets by region
A comparison of global marketing budgets by operating region shows that construction industry supplier
companies that operate in the Rest of the World region have the highest average marketing budgets of
US$10.2 million in 2013, as compared to US$8.3 million in North America and US$4.9 million in
Europe.
Table 54: Annual Marketing Budgets by Region – Global Construction Industry Suppliers (%),
2013
Budgets North America Europe Asia-Pacific Rest of the World
Less than US$250,000 34% 59% 72% 80%
US$250,000–US$1 million 25% 18% 21% 0%
US$1–US$10 million 25% 15% 0% 0%
US$10–US$50 million 8% 3% 7% 0%
More than US$50 million 8% 6% 0% 20%
Overall 100% 100% 100% 100%
N.B. Results may not equal 100% due to rounding
Source: Timetric Industry Survey 2013 © Timetric
Figure 42: Annual Marketing Budgets by Region – Global Construction Industry Suppliers (%),
2013
Source: Timetric Industry Survey 2013 © Timetric

CONSTRUCTION INDUSTRY SUPPLIER MARKETING SPEND ACTIVITY
Global Construction Supplier Industry Outlook Survey 2013–2014:
Market Trends, Marketing Spend and Sales Strategies in the Global Construction Industry Page 94
© Timetric. This product is licensed and is not to be photocopied Published: June 2013
6.1.3 Annual marketing budgets by company turnover
A comparison of global annual marketing budgets by company turnover indicates that construction
industry supplier respondents with turnover of ‘more than US$1 billion’ have an average budget of
US$21.8 million. This can be compared to companies with turnover of ‘US$100 million–US$1 billion’,
whose average marketing budget is US$3.3 million, and companies with turnover of ‘less than US$100
million’, whose average marketing budget is US$0.3 million.
Table 55: Annual Marketing Budgets by Company Turnover – Global Construction Industry
Suppliers (%), 2013
Budgets Less than US$100 million US$100 million–US$1 billion More than US$1 billion
Less than US$250,000 88% 42% 0%
US$250,000–US$1 million 12% 30% 23%
US$1–US$10 million 0% 24% 30%
US$10–US$50 million 0% 6% 15%
More than US$50 million 0% 0% 31%
Overall 100% 100% 100%
N.B. Results may not equal 100% due to rounding
Source: Timetric Industry Survey 2013 © Timetric
Figure 43: Annual Marketing Budgets by Company Turnover – Global Construction Industry
Suppliers (%), 2013
Source: Timetric Industry Survey 2013 © Timetric
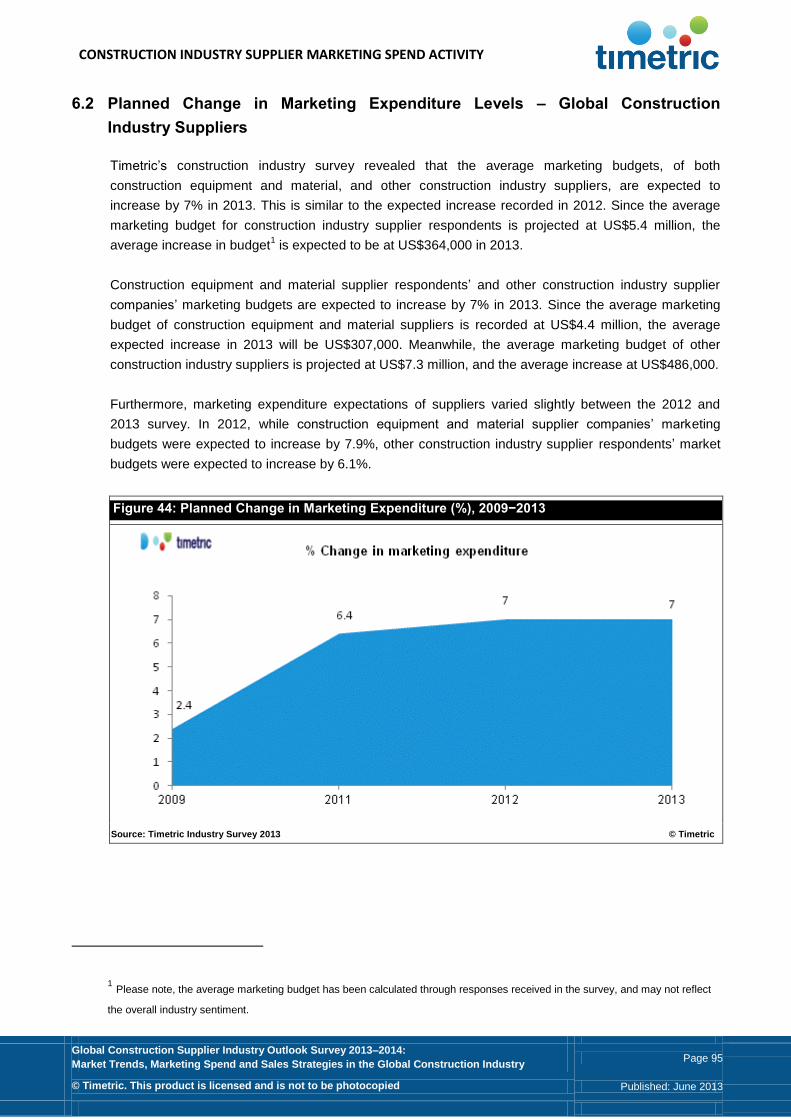
CONSTRUCTION INDUSTRY SUPPLIER MARKETING SPEND ACTIVITY
Global Construction Supplier Industry Outlook Survey 2013–2014:
Market Trends, Marketing Spend and Sales Strategies in the Global Construction Industry Page 95
© Timetric. This product is licensed and is not to be photocopied Published: June 2013
6.2 Planned Change in Marketing Expenditure Levels – Global Construction
Industry Suppliers
Timetric’s construction industry survey revealed that the average marketing budgets, of both
construction equipment and material, and other construction industry suppliers, are expected to
increase by 7% in 2013. This is similar to the expected increase recorded in 2012. Since the average
marketing budget for construction industry supplier respondents is projected at US$5.4 million, the
average increase in budget1 is expected to be at US$364,000 in 2013.
Construction equipment and material supplier respondents’ and other construction industry supplier
companies’ marketing budgets are expected to increase by 7% in 2013. Since the average marketing
budget of construction equipment and material suppliers is recorded at US$4.4 million, the average
expected increase in 2013 will be US$307,000. Meanwhile, the average marketing budget of other
construction industry suppliers is projected at US$7.3 million, and the average increase at US$486,000.
Furthermore, marketing expenditure expectations of suppliers varied slightly between the 2012 and
2013 survey. In 2012, while construction equipment and material supplier companies’ marketing
budgets were expected to increase by 7.9%, other construction industry supplier respondents’ market
budgets were expected to increase by 6.1%.
Figure 44: Planned Change in Marketing Expenditure (%), 2009−2013
Source: Timetric Industry Survey 2013 © Timetric
1 Please note, the average marketing budget has been calculated through responses received in the survey, and may not reflect
the overall industry sentiment.
CONSTRUCTION INDUSTRY SUPPLIER MARKETING SPEND ACTIVITY
Global Construction Supplier Industry Outlook Survey 2013–2014:
Market Trends, Marketing Spend and Sales Strategies in the Global Construction Industry Page 96
© Timetric. This product is licensed and is not to be photocopied Published: June 2013
6.2.1 Planned change in marketing expenditure by suppliers
In total, 67% of respondents from construction equipment and materials supplier companies expect an
increase in their marketing budgets for 2013, while 23% expect ‘no change’ and 9% expect a decrease.
Overall, the percentage of respondents who expect their marketing budgets to increase in 2013 has
dipped slightly by 3 percentage points, when compared to survey results for 2012.
Construction industry suppliers plan to increase their marketing budgets to capitalize on the emerging
business opportunities in the global construction industry. The main motivations for increasing
marketing budgets include the need to explore opportunities for business growth, capitalize on
improving consumer confidence, support the introduction of new products and services, increase
market share, and expand customer base. For example, a director-level executive from a construction
equipment supplier company operating in Europe states:
“We expect an ‘increase of 5–10%’ in our marketing expenditure in 2013 as we need to grow our overall
market share and also gain new clients. Moreover, we see opportunity in the markets we currently
serve, as some of our competition has exited. As a result, we plan to increase our share through heavy
marketing.”
A business unit head of a supplier company operating in Asia-Pacific comments:
“Increasing our marketing budget is the best avenue to growth in our sales. Therefore, we are in plans
to increase our marketing budget to grow proportionate to the market.”
Additionally, some respondents plan to increase their company’s revenues by expanding operations to
other countries. For example, a managerial executive from a construction equipment supplier company
operating in Europe notes:
“We expect to increase our marketing budget by 5–10% to enhance our brand awareness across the
global market.”
Companies which expect a ‘decrease’ or ‘no change’ in marketing expenditure consider overall budget
constraints and uncertainty in local markets as key triggers. Evidencing the trend, a technical staff
executive from a construction supplier company operating in Europe states:
“We expect ‘no change’ in our marketing budgets in 2013 as we are already spending adequate
amounts on marketing and all our working capital is devoted to basic operational issues.”
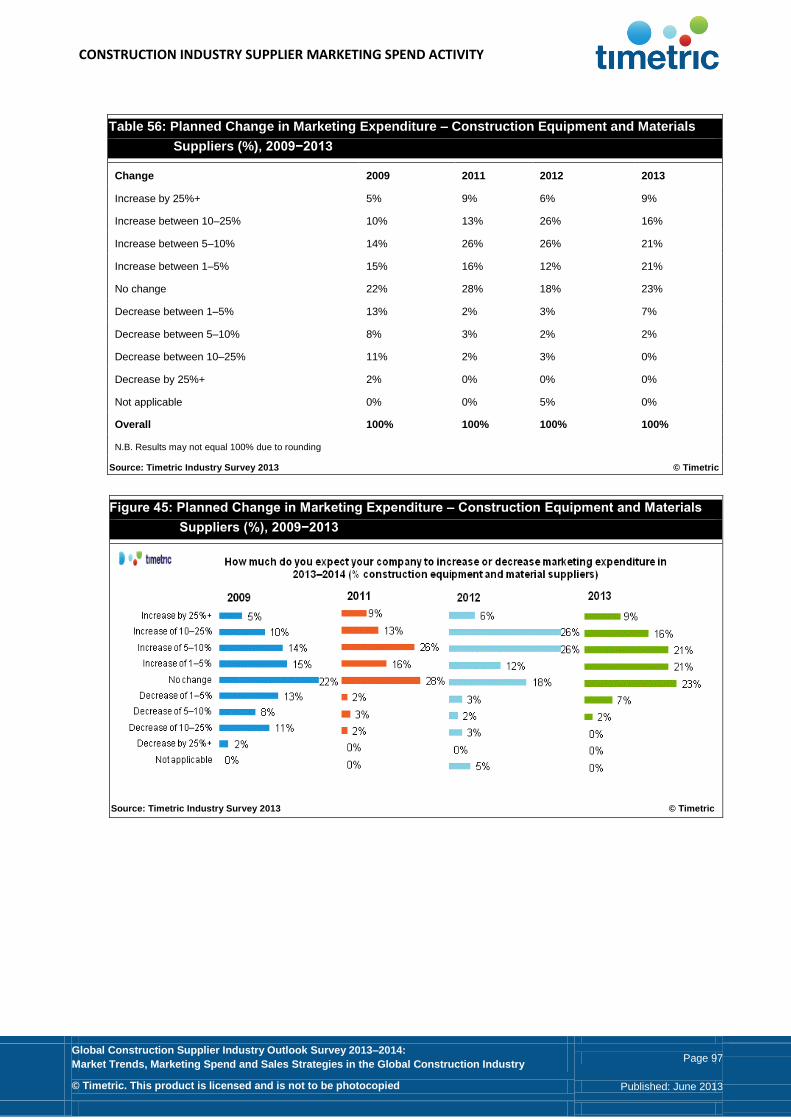
CONSTRUCTION INDUSTRY SUPPLIER MARKETING SPEND ACTIVITY
Global Construction Supplier Industry Outlook Survey 2013–2014:
Market Trends, Marketing Spend and Sales Strategies in the Global Construction Industry Page 97
© Timetric. This product is licensed and is not to be photocopied Published: June 2013
Table 56: Planned Change in Marketing Expenditure – Construction Equipment and Materials
Suppliers (%), 2009−2013
Change 2009 2011 2012 2013
Increase by 25%+ 5% 9% 6% 9%
Increase between 10–25% 10% 13% 26% 16%
Increase between 5–10% 14% 26% 26% 21%
Increase between 1–5% 15% 16% 12% 21%
No change 22% 28% 18% 23%
Decrease between 1–5% 13% 2% 3% 7%
Decrease between 5–10% 8% 3% 2% 2%
Decrease between 10–25% 11% 2% 3% 0%
Decrease by 25%+ 2% 0% 0% 0%
Not applicable 0% 0% 5% 0%
Overall 100% 100% 100% 100%
N.B. Results may not equal 100% due to rounding
Source: Timetric Industry Survey 2013 © Timetric
Figure 45: Planned Change in Marketing Expenditure – Construction Equipment and Materials
Suppliers (%), 2009−2013
Source: Timetric Industry Survey 2013 © Timetric
CONSTRUCTION INDUSTRY SUPPLIER MARKETING SPEND ACTIVITY
Global Construction Supplier Industry Outlook Survey 2013–2014:
Market Trends, Marketing Spend and Sales Strategies in the Global Construction Industry Page 98
© Timetric. This product is licensed and is not to be photocopied Published: June 2013
A total of 79% of respondents from other construction industry supplier companies expect an increase
in their marketing budgets in 2013, while 13% expect ‘no change’ and 4% anticipate a ‘decrease’.
Notably, 35% of other suppliers expect to increase their marketing budgets by 1–5% in 2013. Moreover,
the overall percentage of respondents who expect an increase in marketing budgets for 2013 has
increased by 24 percentage points as compared to 2012.
Other construction industry supplier companies that have grown rapidly over the past few years will
continue to invest in marketing to maintain their growth levels. For example, a manager from a
technology supplier company operating in North America states:
“As we plan to launch new products into the construction market, we expect to promote these products
by increasing our marketing expenditure by 5–10% in 2013. Moreover, as we are forecasting growth in
our new product segments, we definitely identify a need to increase marketing budgets in line with
revenue expectations.”
Some respondents also foresee business opportunities in the global construction industry, and are
investing in marketing to capitalize on these opportunities. A departmental head from a supplier
company operating in Europe states:
“We are expecting an ‘increase of 25%’ in our marketing budgets in 2013 to invest more in terms of
participating on various exhibitions for marketing our new products.”
A senior executive from a construction industry supplier company from Asia-Pacific states:
“There are opportunities out there to win contracts, so more effort is being placed on marketing to
position oneself to take advantage of these.”
Furthermore, some respondents consider it to be the ideal time to invest in marketing activities as most
economies are emerging from the adverse effects of the economic downturn. For example, a staff-level
executive from a construction material supplier company based in North America states:
“Marketing has not typically been a main function in our organization until 2011. That is changing, as we
have hired a marketing manager in 2012 in response to positive growth in the economy and we are in
plans to invest more on promotions and advertising of our new products in 2013.”
Additionally, a staff-level executive from a supplier company with headquarters in Asia-Pacific
comments:
“We are increasing our marketing budget by 5–10% in 2013, as we are allocating more funds towards
online advertising and SEO expenses and on other premium promotional materials.”
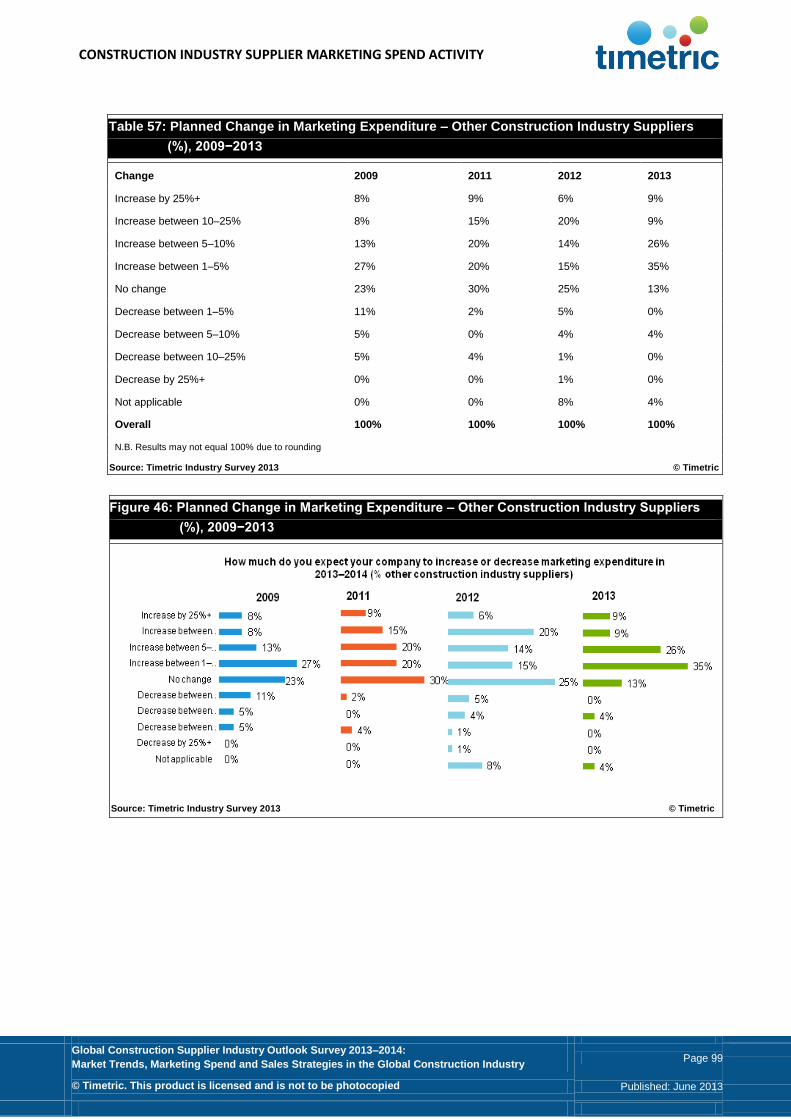
CONSTRUCTION INDUSTRY SUPPLIER MARKETING SPEND ACTIVITY
Global Construction Supplier Industry Outlook Survey 2013–2014:
Market Trends, Marketing Spend and Sales Strategies in the Global Construction Industry Page 99
© Timetric. This product is licensed and is not to be photocopied Published: June 2013
Table 57: Planned Change in Marketing Expenditure – Other Construction Industry Suppliers
(%), 2009−2013
Change 2009 2011 2012 2013
Increase by 25%+ 8% 9% 6% 9%
Increase between 10–25% 8% 15% 20% 9%
Increase between 5–10% 13% 20% 14% 26%
Increase between 1–5% 27% 20% 15% 35%
No change 23% 30% 25% 13%
Decrease between 1–5% 11% 2% 5% 0%
Decrease between 5–10% 5% 0% 4% 4%
Decrease between 10–25% 5% 4% 1% 0%
Decrease by 25%+ 0% 0% 1% 0%
Not applicable 0% 0% 8% 4%
Overall 100% 100% 100% 100%
N.B. Results may not equal 100% due to rounding
Source: Timetric Industry Survey 2013 © Timetric
Figure 46: Planned Change in Marketing Expenditure – Other Construction Industry Suppliers
(%), 2009−2013
Source: Timetric Industry Survey 2013 © Timetric

CONSTRUCTION INDUSTRY SUPPLIER MARKETING SPEND ACTIVITY
Global Construction Supplier Industry Outlook Survey 2013–2014:
Market Trends, Marketing Spend and Sales Strategies in the Global Construction Industry Page 100
© Timetric. This product is licensed and is not to be photocopied Published: June 2013
6.2.2 Planned change in marketing expenditure by region
Regional analysis of marketing budgets indicates that the highest budget increases are expected by
companies that operate in the Rest of the World region; this is in contrast to Europe, where
respondents expect lower expenditure increases.
The marketing budgets of supplier respondents whose companies operate in the Rest of the World
region are expected to increase by 9%, while respondents in North America anticipate an increase of
8.1%. Additionally, respondents from Asia-Pacific expect to increase their marketing budgets by 7%, as
compared to 5.9% of respondents from Europe. In terms of value, the average increase in budget for
respondents from the Rest of the World region is expected to be US$867,000, as compared to
US$674,000 in North America.
Table 58: Planned Change in Marketing Expenditure Levels by Region (%), 2013
Change North America Europe Asia-Pacific Rest of the World
Increase by 25%+ 11% 9% 8% 10%
Increase between 10–25% 15% 16% 8% 20%
Increase between 5–10% 22% 20% 36% 10%
Increase between 1–5% 37% 13% 28% 30%
No change 15% 30% 16% 20%
Decrease between 1–5% 0% 6% 4% 0%
Decrease between 5–10% 0% 3% 0% 0%
Decrease between 10–25% 0% 2% 0% 0%
Decrease by 25%+ 0% 2% 0% 0%
Not applicable 0% 0% 0% 10%
Overall 100% 100% 100% 100%
N.B. Results may not equal 100% due to rounding
Source: Timetric Industry Survey 2013 © Timetric
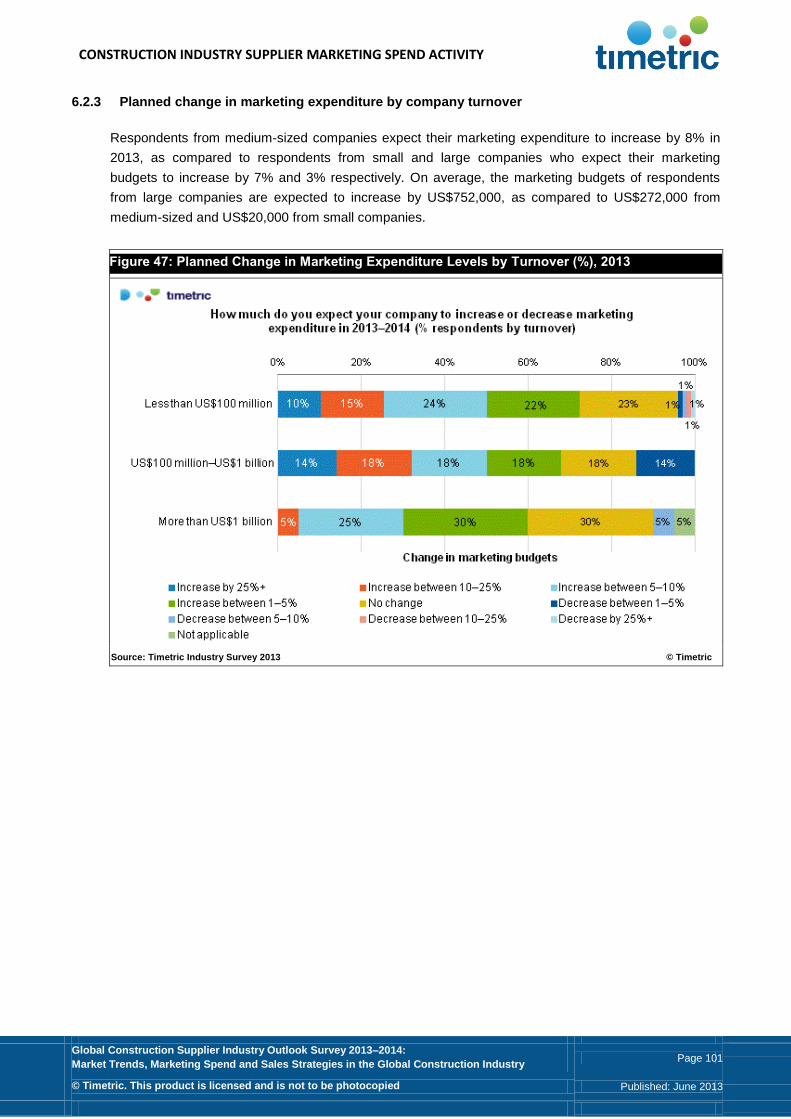
CONSTRUCTION INDUSTRY SUPPLIER MARKETING SPEND ACTIVITY
Global Construction Supplier Industry Outlook Survey 2013–2014:
Market Trends, Marketing Spend and Sales Strategies in the Global Construction Industry Page 101
© Timetric. This product is licensed and is not to be photocopied Published: June 2013
6.2.3 Planned change in marketing expenditure by company turnover
Respondents from medium-sized companies expect their marketing expenditure to increase by 8% in
2013, as compared to respondents from small and large companies who expect their marketing
budgets to increase by 7% and 3% respectively. On average, the marketing budgets of respondents
from large companies are expected to increase by US$752,000, as compared to US$272,000 from
medium-sized and US$20,000 from small companies.
Figure 47: Planned Change in Marketing Expenditure Levels by Turnover (%), 2013
Source: Timetric Industry Survey 2013 © Timetric

CONSTRUCTION INDUSTRY SUPPLIER MARKETING SPEND ACTIVITY
Global Construction Supplier Industry Outlook Survey 2013–2014:
Market Trends, Marketing Spend and Sales Strategies in the Global Construction Industry Page 102
© Timetric. This product is licensed and is not to be photocopied Published: June 2013
6.2.4 Planned change in marketing expenditure levels by revenue growth expectations
In total, 86% of respondents from companies that are optimistic about revenue growth expect marketing
budgets to increase in 2013. Meanwhile, 27% of respondents from companies that are less optimistic
about revenue growth expect their marketing budgets to decrease, and 29% of respondents from
companies that have neutral revenue growth expectations expect no change whatsoever in their
marketing budgets in 2013.
Table 59: Planned Change in Marketing Expenditure Levels by Revenue Growth Expectations
(%), 2013
Change More optimistic Neutral Less optimistic
Increase by 25%+ 13% 6% 5%
Increase between 10–25% 30% 0% 0%
Increase between 5–10% 20% 35% 16%
Increase between 1–5% 23% 29% 26%
No change 10% 29% 26%
Decrease between 1–5% 0% 0% 16%
Decrease between 5–10% 0% 0% 11%
Decrease between 10–25% 0% 0% 0%
Decrease by 25%+ 0% 0% 0%
Not applicable 3% 0% 0%
Overall 100% 100% 100%
N.B. Results may not equal 100% due to rounding
Source: Timetric Industry Survey 2013 © Timetric

CONSTRUCTION INDUSTRY SUPPLIER MARKETING SPEND ACTIVITY
Global Construction Supplier Industry Outlook Survey 2013–2014:
Market Trends, Marketing Spend and Sales Strategies in the Global Construction Industry Page 103
© Timetric. This product is licensed and is not to be photocopied Published: June 2013
6.3 Future Investment in Media Channels – Global Construction Industry Suppliers
Survey respondents in the global construction industry have provided their specific media channel
spending expectations for the next 12 months. Respondents revealed which channels they are planning
to increase or decrease their investment in 2013.
It is evident from the survey results that a significant proportion of respondents from both construction
equipment and material supplier companies and other construction industry supplier companies expect
to increase their marketing expenditure on ‘email and newsletters’, ‘social media and networking sites’,
‘online portals’ and ‘corporate and brand websites’. These respondents plan to shift their marketing
expenditure from traditional marketing channels to more modern online marketing channels due to the
cost effective nature of modern media. After comparing survey responses from the 2012 and 2013
construction industry surveys, it can be concluded that the use of social media and networking sites is
increasing in business-to-business marketing.
6.3.1 Future investment in media channels by suppliers
Of all construction equipment and material supplier companies, 63% of respondents plan to increase
marketing expenditure on ‘email and newsletters’, while 62% of respondents plan to increase marketing
expenditure on ‘social media and networking sites’, and 52% plan to increase expenditure on ‘corporate
and brand websites’. On the other hand, investment in traditional media channels such as ‘television
and video’, ‘radio’ and ‘sponsorship’ are expected to receive the lowest increase in marketing budgets.
This indicates that marketers expect to allocate a higher proportion of their marketing budgets to new
media such as ‘email and newsletters’, ‘social media and networking sites’ and ‘corporate or brand
websites’.
‘Email marketing’ is a low-cost and highly efficient method for reaching potential customers. Email
marketing allows construction suppliers to promote their products in a personalized approach and is
considered one of the most effective tools for increasing sales performance. Consequently, many
marketers are now including email in their marketing strategies.
Moreover, marketers have started to focus more on ‘social media and networking sites’, as they provide
opportunities for businesses to build relationships with clients. The rapid development of online social
networking provides new opportunities for respondents to effectively communicate messages between
industry partners. Exploring the opportunities of internet marketing can enable companies in the global
construction industry to save a significant proportion of their marketing budgets, and internet marketing
can also allow companies to target niche customer groups. In addition, effective online promotions can
help suppliers strengthen their business relationships whilst attempting to procure new project
contracts. Social media channels help construction industry suppliers to enhance their business
opportunities. Twitter allows companies to send short messages under 140 characters in length to
construction contractors. LinkedIn primarily targets business-to-business environments and supports
networking and sharing expertise. Similarly, YouTube allows a supplier company to post and share
videos with customers and Facebook allows suppliers to post company updates and equipment photos
to target end customers. For example, Volvo, a construction equipment supplier, uses social media
channels such as YouTube, Facebook, Twitter, LinkedIn and Google Plus for promoting its product
range to its customers.
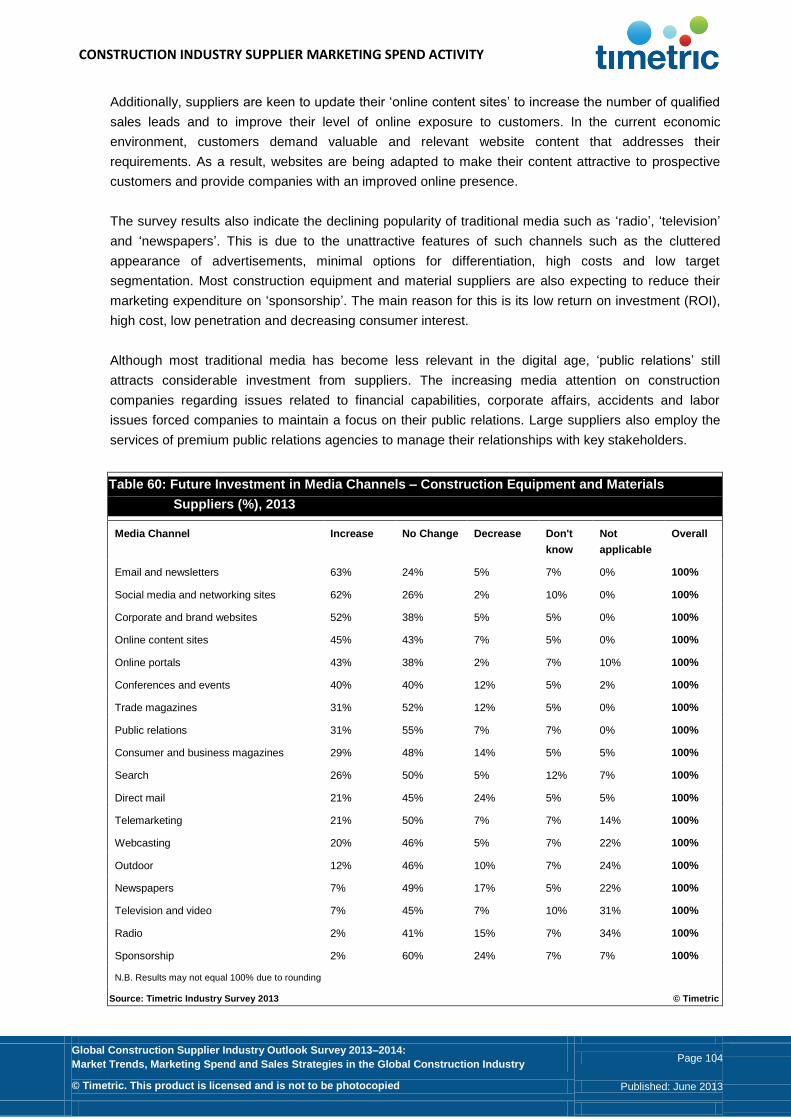
CONSTRUCTION INDUSTRY SUPPLIER MARKETING SPEND ACTIVITY
Global Construction Supplier Industry Outlook Survey 2013–2014:
Market Trends, Marketing Spend and Sales Strategies in the Global Construction Industry Page 104
© Timetric. This product is licensed and is not to be photocopied Published: June 2013
Additionally, suppliers are keen to update their ‘online content sites’ to increase the number of qualified
sales leads and to improve their level of online exposure to customers. In the current economic
environment, customers demand valuable and relevant website content that addresses their
requirements. As a result, websites are being adapted to make their content attractive to prospective
customers and provide companies with an improved online presence.
The survey results also indicate the declining popularity of traditional media such as ‘radio’, ‘television’
and ‘newspapers’. This is due to the unattractive features of such channels such as the cluttered
appearance of advertisements, minimal options for differentiation, high costs and low target
segmentation. Most construction equipment and material suppliers are also expecting to reduce their
marketing expenditure on ‘sponsorship’. The main reason for this is its low return on investment (ROI),
high cost, low penetration and decreasing consumer interest.
Although most traditional media has become less relevant in the digital age, ‘public relations’ still
attracts considerable investment from suppliers. The increasing media attention on construction
companies regarding issues related to financial capabilities, corporate affairs, accidents and labor
issues forced companies to maintain a focus on their public relations. Large suppliers also employ the
services of premium public relations agencies to manage their relationships with key stakeholders.
Table 60: Future Investment in Media Channels – Construction Equipment and Materials
Suppliers (%), 2013
Media Channel Increase No Change Decrease Don't
know
Not
applicable
Overall
Email and newsletters 63% 24% 5% 7% 0% 100%
Social media and networking sites 62% 26% 2% 10% 0% 100%
Corporate and brand websites 52% 38% 5% 5% 0% 100%
Online content sites 45% 43% 7% 5% 0% 100%
Online portals 43% 38% 2% 7% 10% 100%
Conferences and events 40% 40% 12% 5% 2% 100%
Trade magazines 31% 52% 12% 5% 0% 100%
Public relations 31% 55% 7% 7% 0% 100%
Consumer and business magazines 29% 48% 14% 5% 5% 100%
Search 26% 50% 5% 12% 7% 100%
Direct mail 21% 45% 24% 5% 5% 100%
Telemarketing 21% 50% 7% 7% 14% 100%
Webcasting 20% 46% 5% 7% 22% 100%
Outdoor 12% 46% 10% 7% 24% 100%
Newspapers 7% 49% 17% 5% 22% 100%
Television and video 7% 45% 7% 10% 31% 100%
Radio 2% 41% 15% 7% 34% 100%
Sponsorship 2% 60% 24% 7% 7% 100%
N.B. Results may not equal 100% due to rounding
Source: Timetric Industry Survey 2013 © Timetric
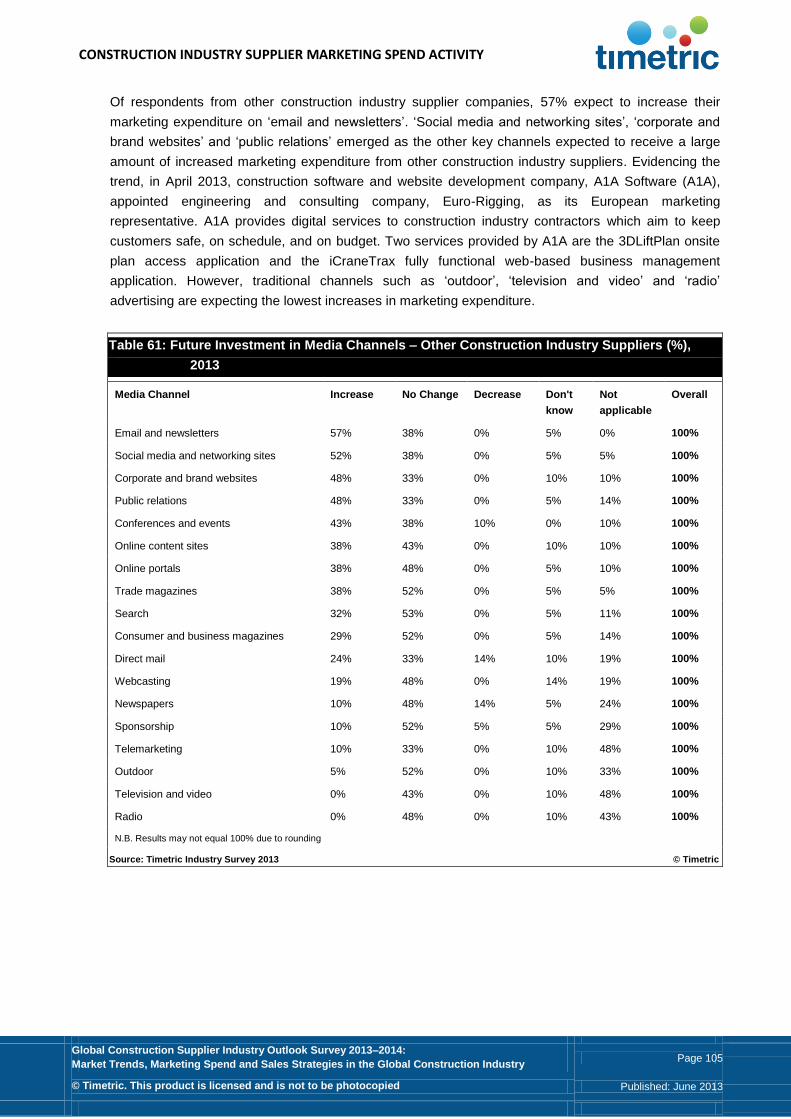
CONSTRUCTION INDUSTRY SUPPLIER MARKETING SPEND ACTIVITY
Global Construction Supplier Industry Outlook Survey 2013–2014:
Market Trends, Marketing Spend and Sales Strategies in the Global Construction Industry Page 105
© Timetric. This product is licensed and is not to be photocopied Published: June 2013
Of respondents from other construction industry supplier companies, 57% expect to increase their
marketing expenditure on ‘email and newsletters’. ‘Social media and networking sites’, ‘corporate and
brand websites’ and ‘public relations’ emerged as the other key channels expected to receive a large
amount of increased marketing expenditure from other construction industry suppliers. Evidencing the
trend, in April 2013, construction software and website development company, A1A Software (A1A),
appointed engineering and consulting company, Euro-Rigging, as its European marketing
representative. A1A provides digital services to construction industry contractors which aim to keep
customers safe, on schedule, and on budget. Two services provided by A1A are the 3DLiftPlan onsite
plan access application and the iCraneTrax fully functional web-based business management
application. However, traditional channels such as ‘outdoor’, ‘television and video’ and ‘radio’
advertising are expecting the lowest increases in marketing expenditure.
Table 61: Future Investment in Media Channels – Other Construction Industry Suppliers (%),
2013
Media Channel Increase No Change Decrease Don't
know
Not
applicable
Overall
Email and newsletters 57% 38% 0% 5% 0% 100%
Social media and networking sites 52% 38% 0% 5% 5% 100%
Corporate and brand websites 48% 33% 0% 10% 10% 100%
Public relations 48% 33% 0% 5% 14% 100%
Conferences and events 43% 38% 10% 0% 10% 100%
Online content sites 38% 43% 0% 10% 10% 100%
Online portals 38% 48% 0% 5% 10% 100%
Trade magazines 38% 52% 0% 5% 5% 100%
Search 32% 53% 0% 5% 11% 100%
Consumer and business magazines 29% 52% 0% 5% 14% 100%
Direct mail 24% 33% 14% 10% 19% 100%
Webcasting 19% 48% 0% 14% 19% 100%
Newspapers 10% 48% 14% 5% 24% 100%
Sponsorship 10% 52% 5% 5% 29% 100%
Telemarketing 10% 33% 0% 10% 48% 100%
Outdoor 5% 52% 0% 10% 33% 100%
Television and video 0% 43% 0% 10% 48% 100%
Radio 0% 48% 0% 10% 43% 100%
N.B. Results may not equal 100% due to rounding
Source: Timetric Industry Survey 2013 © Timetric

CONSTRUCTION INDUSTRY SUPPLIER MARKETING SPEND ACTIVITY
Global Construction Supplier Industry Outlook Survey 2013–2014:
Market Trends, Marketing Spend and Sales Strategies in the Global Construction Industry Page 106
© Timetric. This product is licensed and is not to be photocopied Published: June 2013
6.3.2 Future investment in media channels by region
An analysis of responses by region reveals some variations regarding future investments in media
channels. Regardless of region of operation, ‘social media and networking sites’, ‘emails and
newsletters’ and ‘corporate and brand websites’ are the main media channels that are expected to
receive the most marketing expenditure from companies.
Respondents in North America also expect ‘conferences and events’, ‘online portals’, ‘online content
sites’ and ‘trade magazines’ to attract increased investment in the next 12 months, while respondents in
Europe expect ‘public relations’ to attract increased expenditure.
The following figure shows the percentage of respondents that expect an increase in expenditure on the
corresponding media channels.
Figure 48: Future Investment in Media Channels by Region (% ‘Increase’ Responses), 2013
Source: Timetric Industry Survey 2013 © Timetric

CONSTRUCTION INDUSTRY SUPPLIER MARKETING SPEND ACTIVITY
Global Construction Supplier Industry Outlook Survey 2013–2014:
Market Trends, Marketing Spend and Sales Strategies in the Global Construction Industry Page 107
© Timetric. This product is licensed and is not to be photocopied Published: June 2013
6.3.3 Future investment in media channels by company turnover
Regardless of company turnover, ‘social media and networking sites’ and ‘email and newsletters’ are
expected to attract increased expenditure in 2013. Moreover, an analysis of responses by company
turnover reveals some variation regarding future investments in media channels. Although some
similarities exist between companies of different turnovers regarding investment increases in media
channels, the order of importance assigned to different channels varies by company size. The highest
proportion of respondents from small companies expect expenditure to increase in ‘online portals’ and
‘corporate and brand websites’. Meanwhile, the largest proportion of respondents from medium-sized
and large companies expect expenditure to increase in ‘corporate and brand websites’.
The following table provides the percentage of respondents that expect an ‘increase’ in expenditure on
the corresponding media channels.
Table 62: Future Investment in Media Channels by Turnover (% ‘Increase’ Responses), 2013
Media Channel Less than
US$100 million
US$100 million–US$1 billion More than
US$1 billion
Conferences and events 41% 50% 31%
Consumer and business magazines 31% 33% 15%
Corporate and brand websites 53% 50% 46%
Direct mail 25% 33% 0%
Email and newsletters 75% 53% 38%
Newspapers 9% 6% 8%
Online content sites 47% 44% 31%
Online portals 56% 39% 8%
Outdoor 6% 22% 0%
Public relations 34% 44% 31%
Radio 0% 6% 0%
Search 39% 22% 8%
Social media and networking sites 56% 67% 54%
Sponsorship 3% 11% 0%
Telemarketing 19% 28% 0%
Television and video 3% 11% 0%
Trade magazines 34% 39% 23%
Webcasting 19% 28% 8%
N.B. Results may not equal 100% due to rounding
Source: Timetric Industry Survey 2013 © Timetric

CONSTRUCTION INDUSTRY SUPPLIER MARKETING SPEND ACTIVITY
Global Construction Supplier Industry Outlook Survey 2013–2014:
Market Trends, Marketing Spend and Sales Strategies in the Global Construction Industry Page 108
© Timetric. This product is licensed and is not to be photocopied Published: June 2013
6.4 Global Construction Industry Suppliers' Future Investment in Marketing and
Sales Technology
Survey respondents in the global construction industry were asked: ‘Which of the following marketing
and sales solutions do you expect your company to invest in 2013–2014?’ The responses indicate the
key investments planned for the sales strategies of suppliers. The responses received help companies
understand the evolution of marketing tools and solutions in the global construction industry, and
provide a guide for suppliers to adjust their marketing offerings with the new anticipated standards.
‘CRM systems’ and ‘market intelligence research’ emerged as the two important marketing and sales
solutions in 2013. In contrast, marketing and sales solutions such as ‘customer segmentation solutions’,
‘loyalty solutions’ and ‘direct internet distribution systems’ are expected to register the least amount of
investment in 2013.
6.4.1 Planned investment in marketing and sales technologies by suppliers
The survey results show that 53% of respondents from construction equipment and material supplier
companies plan to increase their investment in ‘CRM systems’, as compared to 49% in ‘market
intelligence research’ and 35% in ‘ERP solutions’. Of respondents from other construction industry
supplier companies, 45% and 41% plan to increase their investment in ‘CRM systems’ and ‘market
intelligence research’ respectively.
Building strong relationships with existing buyers has the potential to reduce marketing costs for
respondents and could also help buyers to gain new business. Additionally, increasing investment in
‘CRM systems’ yields increased supply performance dividends both strategically and operationally. The
majority of companies use CRM systems to increase customer retention, respond to competitive
pressures, and improve customer service. The systems are used by companies to develop existing
customer target groups. To compete effectively in the marketplace, companies need an effective CRM
system to attract and nurture high-quality clients and referrals. They also help companies to execute
business strategies on a more consistent and cost-effective basis. Moreover, companies are able to
manage customer experience through all points of contact, including initial online and offline inquiries,
follow-up contact, sales experience, customer service, aftercare, and loyalty programs.
Investment in ‘market intelligence research’ will enable suppliers to improve their recognition of the
changing industry dynamics and gain data on products and services, relevant competitors, business
trends, and target markets. An analysis of these factors helps companies to understand the impact of
external factors on their business.
Comparatively, respondents from other construction industry supplier companies across all markets
conduct some form of competitive intelligence activities, such as continuous monitoring, regular reviews
and ad-hoc reports on the industry dynamics. ‘Competitor intelligence research’ enables suppliers to
benchmark their market intelligence activities against those of their leading competitors. Competitor
intelligence also helps suppliers identify merger and acquisition targets and strategic allies that share a
common interest.
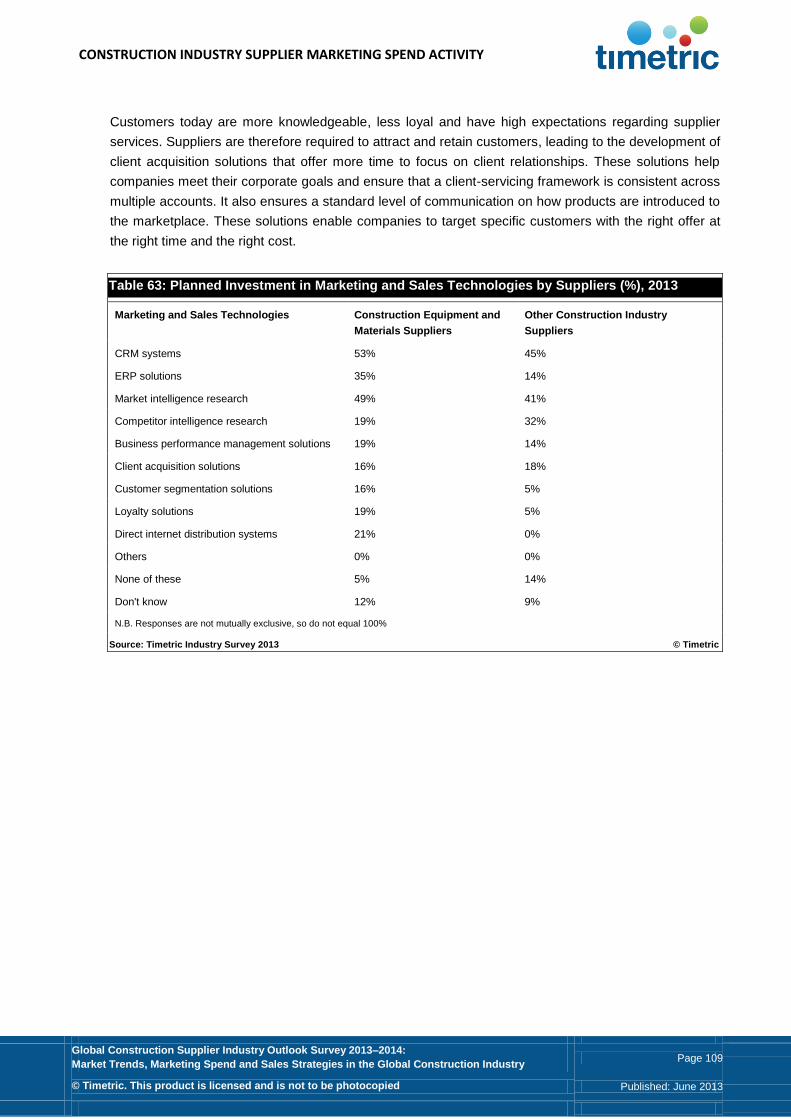
CONSTRUCTION INDUSTRY SUPPLIER MARKETING SPEND ACTIVITY
Global Construction Supplier Industry Outlook Survey 2013–2014:
Market Trends, Marketing Spend and Sales Strategies in the Global Construction Industry Page 109
© Timetric. This product is licensed and is not to be photocopied Published: June 2013
Customers today are more knowledgeable, less loyal and have high expectations regarding supplier
services. Suppliers are therefore required to attract and retain customers, leading to the development of
client acquisition solutions that offer more time to focus on client relationships. These solutions help
companies meet their corporate goals and ensure that a client-servicing framework is consistent across
multiple accounts. It also ensures a standard level of communication on how products are introduced to
the marketplace. These solutions enable companies to target specific customers with the right offer at
the right time and the right cost.
Table 63: Planned Investment in Marketing and Sales Technologies by Suppliers (%), 2013
Marketing and Sales Technologies Construction Equipment and
Materials Suppliers
Other Construction Industry
Suppliers
CRM systems 53% 45%
ERP solutions 35% 14%
Market intelligence research 49% 41%
Competitor intelligence research 19% 32%
Business performance management solutions 19% 14%
Client acquisition solutions 16% 18%
Customer segmentation solutions 16% 5%
Loyalty solutions 19% 5%
Direct internet distribution systems 21% 0%
Others 0% 0%
None of these 5% 14%
Don't know 12% 9%
N.B. Responses are not mutually exclusive, so do not equal 100%
Source: Timetric Industry Survey 2013 © Timetric
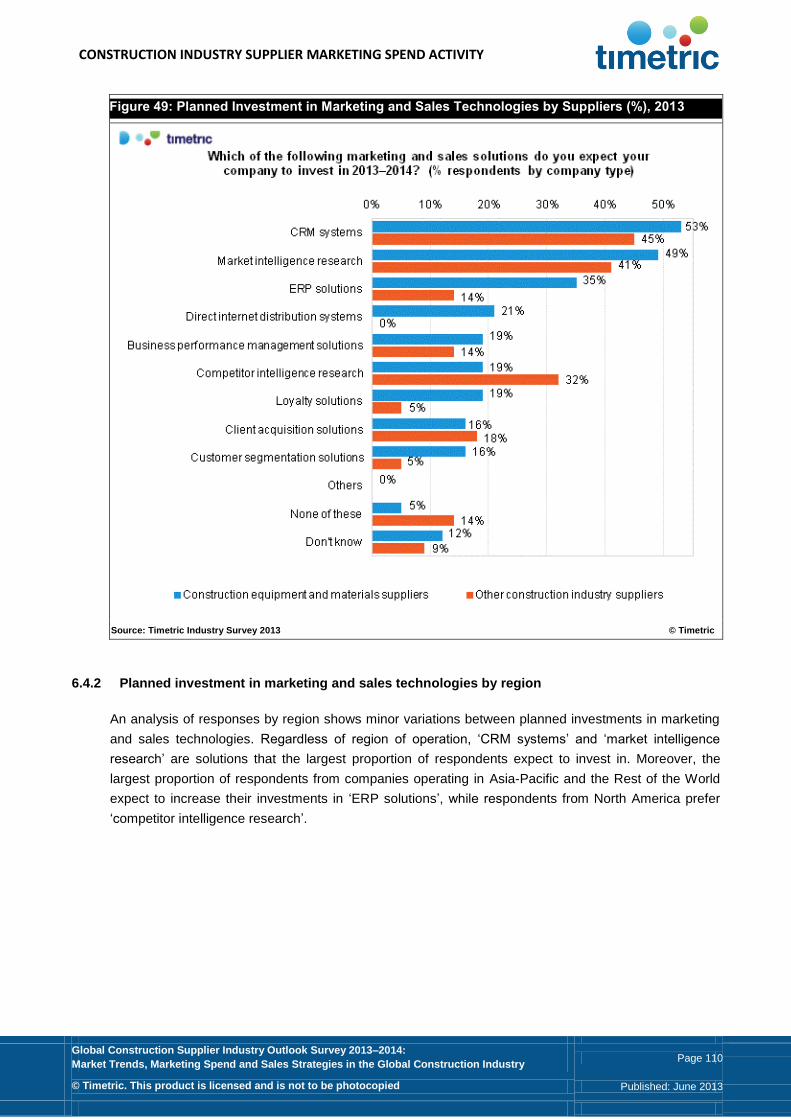
CONSTRUCTION INDUSTRY SUPPLIER MARKETING SPEND ACTIVITY
Global Construction Supplier Industry Outlook Survey 2013–2014:
Market Trends, Marketing Spend and Sales Strategies in the Global Construction Industry Page 110
© Timetric. This product is licensed and is not to be photocopied Published: June 2013
Figure 49: Planned Investment in Marketing and Sales Technologies by Suppliers (%), 2013
Source: Timetric Industry Survey 2013 © Timetric
6.4.2 Planned investment in marketing and sales technologies by region
An analysis of responses by region shows minor variations between planned investments in marketing
and sales technologies. Regardless of region of operation, ‘CRM systems’ and ‘market intelligence
research’ are solutions that the largest proportion of respondents expect to invest in. Moreover, the
largest proportion of respondents from companies operating in Asia-Pacific and the Rest of the World
expect to increase their investments in ‘ERP solutions’, while respondents from North America prefer
‘competitor intelligence research’.
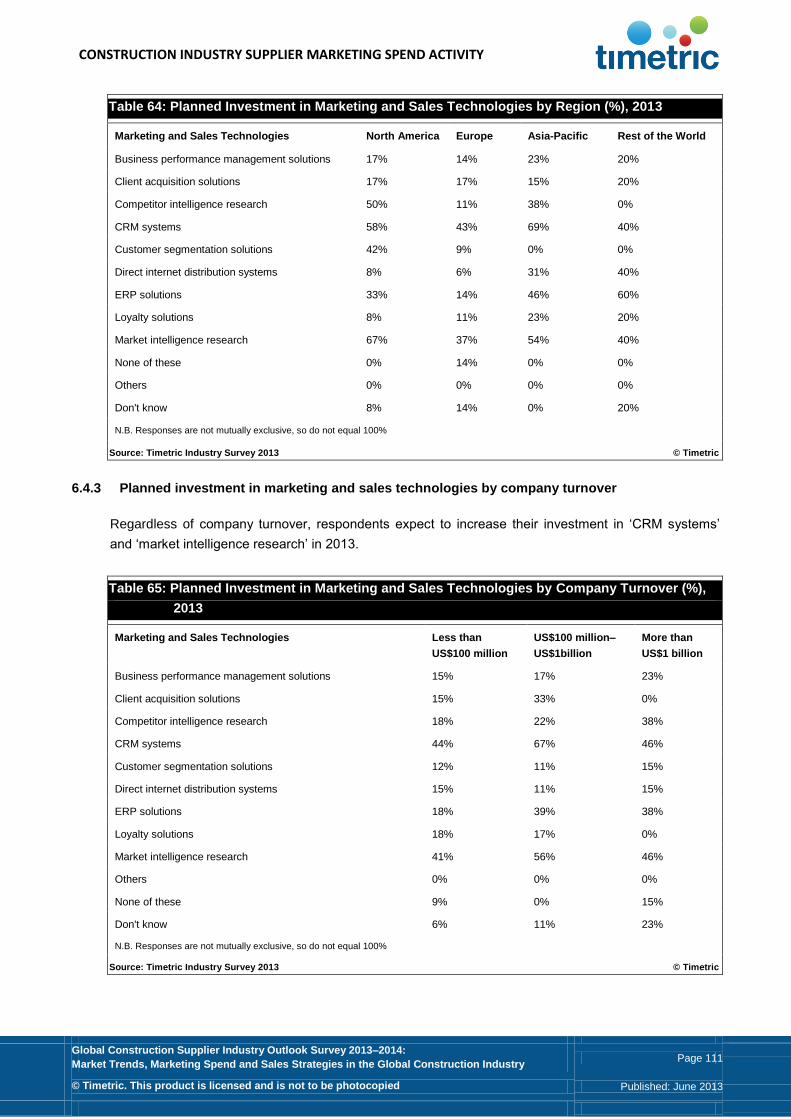
CONSTRUCTION INDUSTRY SUPPLIER MARKETING SPEND ACTIVITY
Global Construction Supplier Industry Outlook Survey 2013–2014:
Market Trends, Marketing Spend and Sales Strategies in the Global Construction Industry Page 111
© Timetric. This product is licensed and is not to be photocopied Published: June 2013
Table 64: Planned Investment in Marketing and Sales Technologies by Region (%), 2013
Marketing and Sales Technologies North America Europe Asia-Pacific Rest of the World
Business performance management solutions 17% 14% 23% 20%
Client acquisition solutions 17% 17% 15% 20%
Competitor intelligence research 50% 11% 38% 0%
CRM systems 58% 43% 69% 40%
Customer segmentation solutions 42% 9% 0% 0%
Direct internet distribution systems 8% 6% 31% 40%
ERP solutions 33% 14% 46% 60%
Loyalty solutions 8% 11% 23% 20%
Market intelligence research 67% 37% 54% 40%
None of these 0% 14% 0% 0%
Others 0% 0% 0% 0%
Don't know 8% 14% 0% 20%
N.B. Responses are not mutually exclusive, so do not equal 100%
Source: Timetric Industry Survey 2013 © Timetric
6.4.3 Planned investment in marketing and sales technologies by company turnover
Regardless of company turnover, respondents expect to increase their investment in ‘CRM systems’
and ‘market intelligence research’ in 2013.
Table 65: Planned Investment in Marketing and Sales Technologies by Company Turnover (%),
2013
Marketing and Sales Technologies Less than
US$100 million
US$100 million–
US$1billion
More than
US$1 billion
Business performance management solutions 15% 17% 23%
Client acquisition solutions 15% 33% 0%
Competitor intelligence research 18% 22% 38%
CRM systems 44% 67% 46%
Customer segmentation solutions 12% 11% 15%
Direct internet distribution systems 15% 11% 15%
ERP solutions 18% 39% 38%
Loyalty solutions 18% 17% 0%
Market intelligence research 41% 56% 46%
Others 0% 0% 0%
None of these 9% 0% 15%
Don't know 6% 11% 23%
N.B. Responses are not mutually exclusive, so do not equal 100%
Source: Timetric Industry Survey 2013 © Timetric
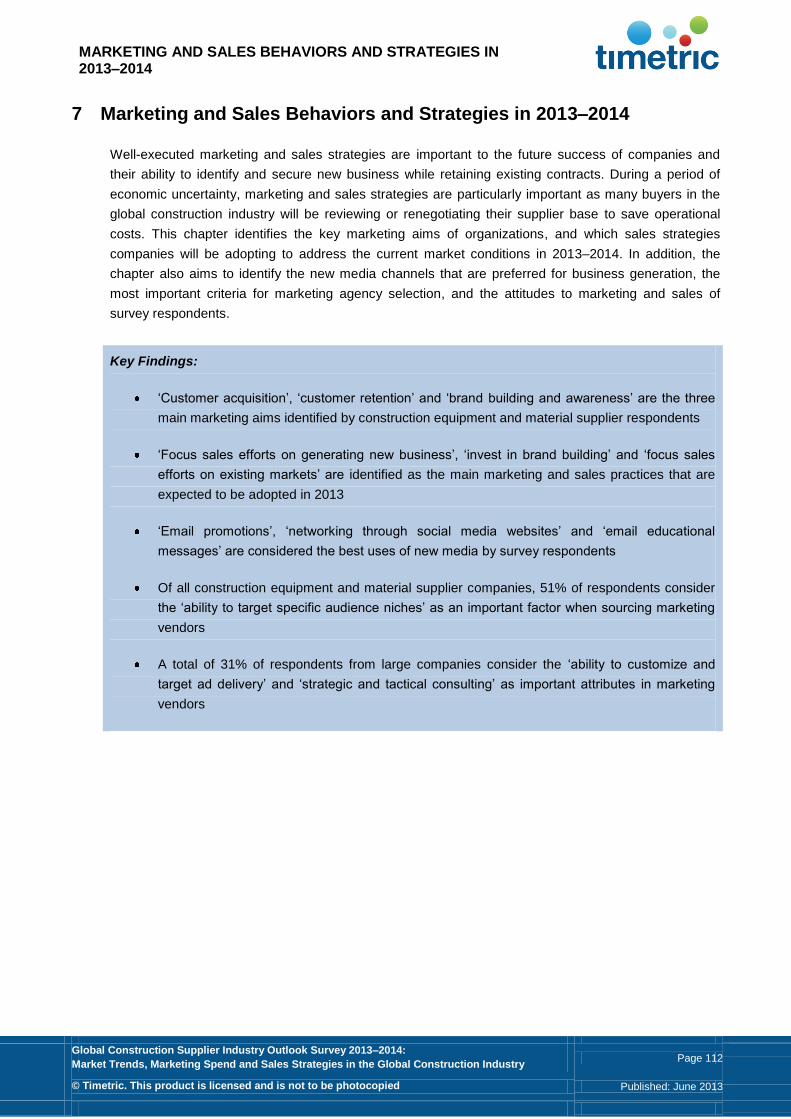
MARKETING AND SALES BEHAVIORS AND STRATEGIES IN 2013–2014
Global Construction Supplier Industry Outlook Survey 2013–2014:
Market Trends, Marketing Spend and Sales Strategies in the Global Construction Industry Page 112
© Timetric. This product is licensed and is not to be photocopied Published: June 2013
7 Marketing and Sales Behaviors and Strategies in 2013–2014
Well-executed marketing and sales strategies are important to the future success of companies and
their ability to identify and secure new business while retaining existing contracts. During a period of
economic uncertainty, marketing and sales strategies are particularly important as many buyers in the
global construction industry will be reviewing or renegotiating their supplier base to save operational
costs. This chapter identifies the key marketing aims of organizations, and which sales strategies
companies will be adopting to address the current market conditions in 2013–2014. In addition, the
chapter also aims to identify the new media channels that are preferred for business generation, the
most important criteria for marketing agency selection, and the attitudes to marketing and sales of
survey respondents.
Key Findings:
‘Customer acquisition’, ‘customer retention’ and ‘brand building and awareness’ are the three
main marketing aims identified by construction equipment and material supplier respondents
‘Focus sales efforts on generating new business’, ‘invest in brand building’ and ‘focus sales
efforts on existing markets’ are identified as the main marketing and sales practices that are
expected to be adopted in 2013
‘Email promotions’, ‘networking through social media websites’ and ‘email educational
messages’ are considered the best uses of new media by survey respondents
Of all construction equipment and material supplier companies, 51% of respondents consider
the ‘ability to target specific audience niches’ as an important factor when sourcing marketing
vendors
A total of 31% of respondents from large companies consider the ‘ability to customize and
target ad delivery’ and ‘strategic and tactical consulting’ as important attributes in marketing
vendors
MARKETING AND SALES BEHAVIORS AND STRATEGIES IN 2013–2014
Global Construction Supplier Industry Outlook Survey 2013–2014:
Market Trends, Marketing Spend and Sales Strategies in the Global Construction Industry Page 113
© Timetric. This product is licensed and is not to be photocopied Published: June 2013
7.1 Key Marketing Aims for 2013–2014 – Global Construction Industry
In this section, the marketing goals of construction equipment and material supplier companies and
other construction industry supplier companies have been identified. The suppliers were asked: “How
important are each of the following objectives to your company’s marketing strategy over 2013–2014?”
7.1.1 Key marketing aims by suppliers
‘Customer acquisition’, ‘customer retention’ and ‘brand building and awareness’ are the three main
marketing aims identified by construction equipment and material supplier respondents. When this is
compared to the global construction industry survey results in 2012, it can be noted that suppliers
assign a higher importance to ‘brand building or awareness’ than ‘sales and marketing organizational
alignment’ in 2013.
‘Customer acquisition’ is an important aim of marketing activities and is a key aspect of direct
marketing. The introduction of new technology to aid client acquisition could lead to higher marketing
investment, with technology playing an increasingly important role in customer acquisition strategies.
For example, in October 2012, North American company Reliance Foundry Co. Ltd, a supplier of
bollards and custom castings, announced the introduction of solar-powered lighting bollards in co-
operation with First Light Technologies. The company notes that its new lighting bollards are used to
guide pedestrian traffic and provides illumination that increases safety during construction.
‘Customer retention’ is considered an important marketing aim for supplier organizations. This
demonstrates the importance of customer retention to the growth of suppliers’ businesses through
better awareness of buyers’ expectations, and the development of products that match buyers’
requirements. As discussed in section 6.4, ‘market intelligence’ and ‘CRM systems’ were presented as
chief reasons for an increase in marketing expenditure. These strategies are aimed at retaining and
acquiring customers and are directly linked to increased marketing budgets. Notably, the key marketing
aims of supplier companies remain similar in comparison to the 2012 Timetric survey, in which
‘customer retention’, ‘brand building and awareness’, and ‘customer acquisition’ were presented as key
aims.
Overall, 86% of all supplier respondents consider ‘brand building and awareness’ to be an ‘important’ or
‘very important’ marketing aim of their organization. Although building brand awareness may take more
time than customer retention and acquisition activities, it offers advantages such as the opportunity to
reduce marketing expenditure, long-term planning, ensuring a premium price, setting entry barriers for
competitors and increasing business value.
Additionally, ‘lead generation’ and ‘sales and marketing organizational alignment’ were presented as
other important marketing aims by 83% and 73% of respondents respectively in 2013.

MARKETING AND SALES BEHAVIORS AND STRATEGIES IN 2013–2014
Global Construction Supplier Industry Outlook Survey 2013–2014:
Market Trends, Marketing Spend and Sales Strategies in the Global Construction Industry Page 114
© Timetric. This product is licensed and is not to be photocopied Published: June 2013
Table 66: Key Marketing Aims – Construction Equipment and Materials Suppliers (%), 2013
Marketing Objectives Very
important
Important Moderately
important
Least
important
Don't
know
Overall
Customer acquisition 49% 46% 2% 0% 2% 100%
Customer retention 73% 17% 10% 0% 0% 100%
Brand building and awareness 43% 43% 14% 0% 0% 100%
Lead generation 43% 40% 10% 2% 5% 100%
Sales and marketing organizational alignment 34% 39% 17% 7% 2% 100%
Marketing performance measurement 7% 56% 24% 7% 5% 100%
Online presence 34% 29% 27% 10% 0% 100%
Cross-selling and up-selling 21% 40% 29% 5% 5% 100%
N.B. Results may not equal 100% due to rounding
Source: Timetric Industry Survey 2013 © Timetric
Figure 50: Key Marketing Aims – Construction Equipment and Materials Suppliers (%), 2013
Source: Timetric Industry Survey 2013 © Timetric

MARKETING AND SALES BEHAVIORS AND STRATEGIES IN 2013–2014
Global Construction Supplier Industry Outlook Survey 2013–2014:
Market Trends, Marketing Spend and Sales Strategies in the Global Construction Industry Page 115
© Timetric. This product is licensed and is not to be photocopied Published: June 2013
Of all other construction industry supplier respondents, 64% consider ‘customer retention’ to be a ‘very
important’ marketing strategy, while 50% and 41% consider ‘brand building and awareness’ and ‘lead
generation’ respectively to be ‘important’ marketing strategies.
Table 67: Key Marketing Aims – Other Construction Industry Suppliers (%), 2013
Marketing Objectives Very
important
Important Moderately
important
Least
important
Don't
know
Overall
Customer retention 64% 18% 18% 0% 0% 100%
Brand building and awareness 27% 50% 18% 5% 0% 100%
Lead generation 32% 41% 14% 5% 9% 100%
Sales and marketing organizational alignment 27% 45% 14% 14% 0% 100%
Marketing performance measurement 26% 43% 17% 13% 0% 100%
Online presence 43% 26% 17% 13% 0% 100%
Customer acquisition 36% 27% 18% 14% 5% 100%
Cross-selling and up-selling 14% 45% 27% 5% 9% 100%
N.B. Results may not equal 100% due to rounding
Source: Timetric Industry Survey 2013 © Timetric
Figure 51: Key Marketing Aims – Other Construction Industry Suppliers (%), 2013
Source: Timetric Industry Survey 2013 © Timetric
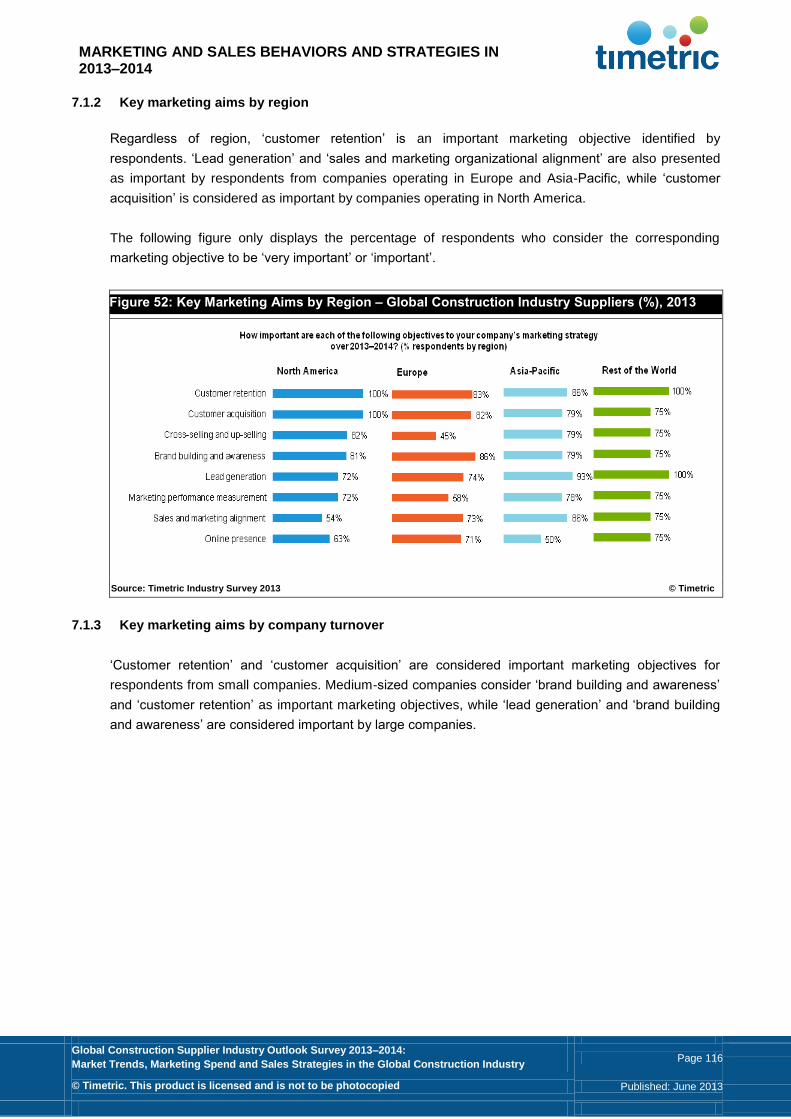
MARKETING AND SALES BEHAVIORS AND STRATEGIES IN 2013–2014
Global Construction Supplier Industry Outlook Survey 2013–2014:
Market Trends, Marketing Spend and Sales Strategies in the Global Construction Industry Page 116
© Timetric. This product is licensed and is not to be photocopied Published: June 2013
7.1.2 Key marketing aims by region
Regardless of region, ‘customer retention’ is an important marketing objective identified by
respondents. ‘Lead generation’ and ‘sales and marketing organizational alignment’ are also presented
as important by respondents from companies operating in Europe and Asia-Pacific, while ‘customer
acquisition’ is considered as important by companies operating in North America.
The following figure only displays the percentage of respondents who consider the corresponding
marketing objective to be ‘very important’ or ‘important’.
Figure 52: Key Marketing Aims by Region – Global Construction Industry Suppliers (%), 2013
Source: Timetric Industry Survey 2013 © Timetric
7.1.3 Key marketing aims by company turnover
‘Customer retention’ and ‘customer acquisition’ are considered important marketing objectives for
respondents from small companies. Medium-sized companies consider ‘brand building and awareness’
and ‘customer retention’ as important marketing objectives, while ‘lead generation’ and ‘brand building
and awareness’ are considered important by large companies.

MARKETING AND SALES BEHAVIORS AND STRATEGIES IN 2013–2014
Global Construction Supplier Industry Outlook Survey 2013–2014:
Market Trends, Marketing Spend and Sales Strategies in the Global Construction Industry Page 117
© Timetric. This product is licensed and is not to be photocopied Published: June 2013
The following table only displays the percentage of respondents who consider the corresponding
marketing objective to be ‘very important’ or ‘important’.
Table 68: Key Marketing Aims by Turnover – Global Construction Industry Suppliers (%), 2013
Marketing Objectives Less than
US$100 million
US$100 million–US$1 billion More than
US$1 billion
Customer retention 88% 100% 67%
Customer acquisition 88% 88% 69%
Cross-selling and up-selling 57% 61% 69%
Brand building and awareness 78% 94% 77%
Lead generation 78% 83% 77%
Marketing performance measurement 68% 65% 61%
Sales and marketing organizational alignment 75% 82% 53%
Online presence 74% 64% 46%
N.B. Responses are not mutually exclusive, and therefore do not equal 100%
Source: Timetric Industry Survey 2013 © Timetric
7.1.4 Key marketing aims by revenue growth expectations
Regardless of revenue growth expectations, ‘customer retention’ and ‘customer acquisition’ have been
identified as important marketing aims by the largest proportion of respondents in the 2013 survey.
However, 93% of respondents who are ‘more optimistic’ about revenue growth also consider ‘brand
building and awareness’ to be an important marketing objective, while 78% of respondents who are
‘less optimistic’ about revenue growth consider ‘sales and marketing organizational alignment’ to be an
marketing objective.
The following table only displays the percentage of respondents who consider the corresponding
marketing objective to be ‘very important’ or ‘important’.
Table 69: Key Marketing Aims by Revenue Growth Expectations (%), 2013
Marketing Objectives More optimistic Neutral Less optimistic
Customer retention 100% 75% 79%
Customer acquisition 86% 82% 84%
Cross-selling and up-selling 72% 63% 42%
Brand building and awareness 93% 69% 79%
Lead generation 89% 76% 68%
Marketing performance measurement 71% 59% 64%
Sales and marketing organizational alignment 78% 59% 78%
Online presence 79% 53% 58%
N.B. Responses are not mutually exclusive, and therefore do not equal 100%
Source: Timetric Industry Survey 2013 © Timetric

MARKETING AND SALES BEHAVIORS AND STRATEGIES IN 2013–2014
Global Construction Supplier Industry Outlook Survey 2013–2014:
Market Trends, Marketing Spend and Sales Strategies in the Global Construction Industry Page 118
© Timetric. This product is licensed and is not to be photocopied Published: June 2013
7.2 Essential Amendments to Marketing Activities in 2013–2014
In relation to marketing and sales practices, industry executives from construction industry supplier
companies were asked: ‘Which of the following does your company plan to adopt in 2013–2014?’ The
survey results show that the most significant strategies construction industry supplier companies will
employ are to ‘focus sales efforts on generating new business’ and to ‘focus sales efforts on existing
markets’.
Supplier respondents are optimistic regarding revenue growth in 2013, and plan to ‘focus sales efforts
on generating new business’. Most respondents intend to expand their marketing activities to
counteract the effects of the global economic instability and to gain business from their competitors.
These respondents plan to take advantage of the expiration of many buyer contracts and also dominate
competitors that have been forced to reduce their expenditure on marketing and sales due to uneven
market conditions.
7.2.1 Amendments to marketing activities by suppliers
Overall, 65% of respondents from construction equipment and materials suppliers consider the need to
‘focus sales efforts on generating new business’ as a marketing activity they plan to adopt. Meanwhile,
49% of respondents plan to ‘invest in brand building’ and 47% plan to ‘focus sales efforts on existing
markets’. Moreover, the respondents from other construction industry suppliers also intend to adopt
these three marketing activities, however the proportion of those who intend to adopt these activities
varies. In addition, ‘trial new and innovative products in the market’ is another important activity they
plan to adopt in 2013.
Evidencing the trend, in February 2013, Chinese tunnel boring machine (TBM) supplier CREC-TBM
announced the launch of its new international division, CTE Limited. CTE Limited has been established
in Hong Kong with the purpose of marketing and presenting the TBMs manufactured by CREC-TBM
and to provide support to users of the machines. A senior executive from CTE commented:
“As a result of several technical meetings, factory and site visits, we became convinced that CREC-
TBM lacked international factor. Consequently, CREC-TBM, along with some other internationally
experienced partners, decided to form a new company that would manage all of CREC-TBM's interests
on the international stage."
Most of the changes to marketing activities are being undertaken to help companies address their
current business concerns, such as market uncertainty, responding to price pressures and rising
competition. To ‘focus sales efforts on existing markets’ could ensure that companies have a higher
chance of winning contracts, and, as suppliers have previous relationships with buyers, this could help
them overcome the falling demand in core markets. Focusing sales efforts on existing markets could
also provide suppliers with accurate information about the needs of their existing clients, which could
improve their product and service offerings.

MARKETING AND SALES BEHAVIORS AND STRATEGIES IN 2013–2014
Global Construction Supplier Industry Outlook Survey 2013–2014:
Market Trends, Marketing Spend and Sales Strategies in the Global Construction Industry Page 119
© Timetric. This product is licensed and is not to be photocopied Published: June 2013
To ‘invest in brand building’ is of key importance among construction suppliers due to uneven economic
conditions. To survive in the competitive market, construction industry suppliers need to acquire new
business opportunities by constantly investing in brand building. For example, in April 2013, Atlas crane
dealers, with headquarters in the UK, undertook global expansion activity for Effer branded cranes.
Effer and Atlas started a mutual cooperation for the UK market in 2012 and its immediate success
paved the way for global expansion.
Table 70: Amendments to Marketing Activities by Global Construction Industry Suppliers (%),
2013–2014
Marketing Amendments Construction
Equipment and
Materials Suppliers
Other Construction
Industry Suppliers
Focus sales efforts on generating new business 65% 68%
Invest in brand building 49% 55%
Focus sales efforts on existing markets 47% 41%
Re-organize sales efforts 47% 23%
Trial new and innovative products in the market 42% 45%
Adapt product portfolios and positioning 33% 36%
Invest in measurable marketing communications 30% 32%
Standardization of marketing approach 26% 36%
Increase advertising 26% 14%
Review pricing policies 23% 14%
Reallocate marketing budgets away from new or trial products to core
products
12% 14%
Reduce sales commission rates 0% 0%
None of these 2% 5%
Others 0% 0%
N.B. Responses are not mutually exclusive, so do not equal 100%
Source: Timetric Industry Survey 2013 © Timetric
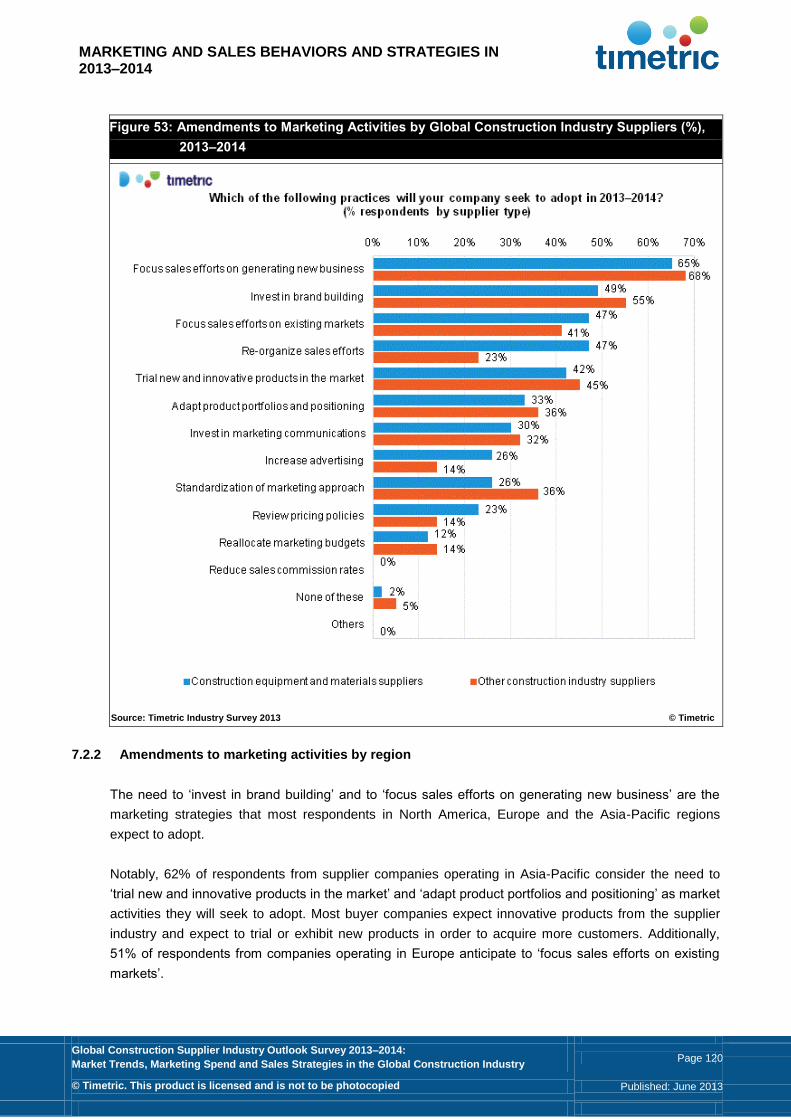
MARKETING AND SALES BEHAVIORS AND STRATEGIES IN 2013–2014
Global Construction Supplier Industry Outlook Survey 2013–2014:
Market Trends, Marketing Spend and Sales Strategies in the Global Construction Industry Page 120
© Timetric. This product is licensed and is not to be photocopied Published: June 2013
Figure 53: Amendments to Marketing Activities by Global Construction Industry Suppliers (%),
2013–2014
Source: Timetric Industry Survey 2013 © Timetric
7.2.2 Amendments to marketing activities by region
The need to ‘invest in brand building’ and to ‘focus sales efforts on generating new business’ are the
marketing strategies that most respondents in North America, Europe and the Asia-Pacific regions
expect to adopt.
Notably, 62% of respondents from supplier companies operating in Asia-Pacific consider the need to
‘trial new and innovative products in the market’ and ‘adapt product portfolios and positioning’ as market
activities they will seek to adopt. Most buyer companies expect innovative products from the supplier
industry and expect to trial or exhibit new products in order to acquire more customers. Additionally,
51% of respondents from companies operating in Europe anticipate to ‘focus sales efforts on existing
markets’.
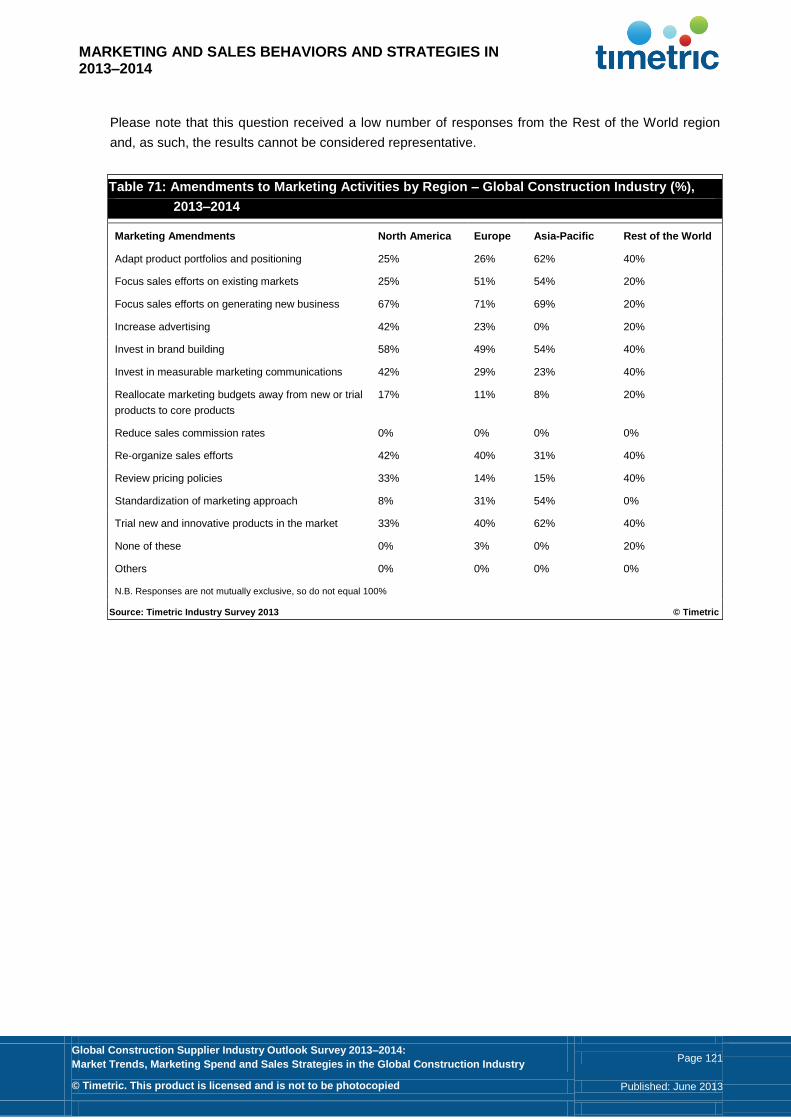
MARKETING AND SALES BEHAVIORS AND STRATEGIES IN 2013–2014
Global Construction Supplier Industry Outlook Survey 2013–2014:
Market Trends, Marketing Spend and Sales Strategies in the Global Construction Industry Page 121
© Timetric. This product is licensed and is not to be photocopied Published: June 2013
Please note that this question received a low number of responses from the Rest of the World region
and, as such, the results cannot be considered representative.
Table 71: Amendments to Marketing Activities by Region – Global Construction Industry (%),
2013–2014
Marketing Amendments North America Europe Asia-Pacific Rest of the World
Adapt product portfolios and positioning 25% 26% 62% 40%
Focus sales efforts on existing markets 25% 51% 54% 20%
Focus sales efforts on generating new business 67% 71% 69% 20%
Increase advertising 42% 23% 0% 20%
Invest in brand building 58% 49% 54% 40%
Invest in measurable marketing communications 42% 29% 23% 40%
Reallocate marketing budgets away from new or trial
products to core products
17% 11% 8% 20%
Reduce sales commission rates 0% 0% 0% 0%
Re-organize sales efforts 42% 40% 31% 40%
Review pricing policies 33% 14% 15% 40%
Standardization of marketing approach 8% 31% 54% 0%
Trial new and innovative products in the market 33% 40% 62% 40%
None of these 0% 3% 0% 20%
Others 0% 0% 0% 0%
N.B. Responses are not mutually exclusive, so do not equal 100%
Source: Timetric Industry Survey 2013 © Timetric
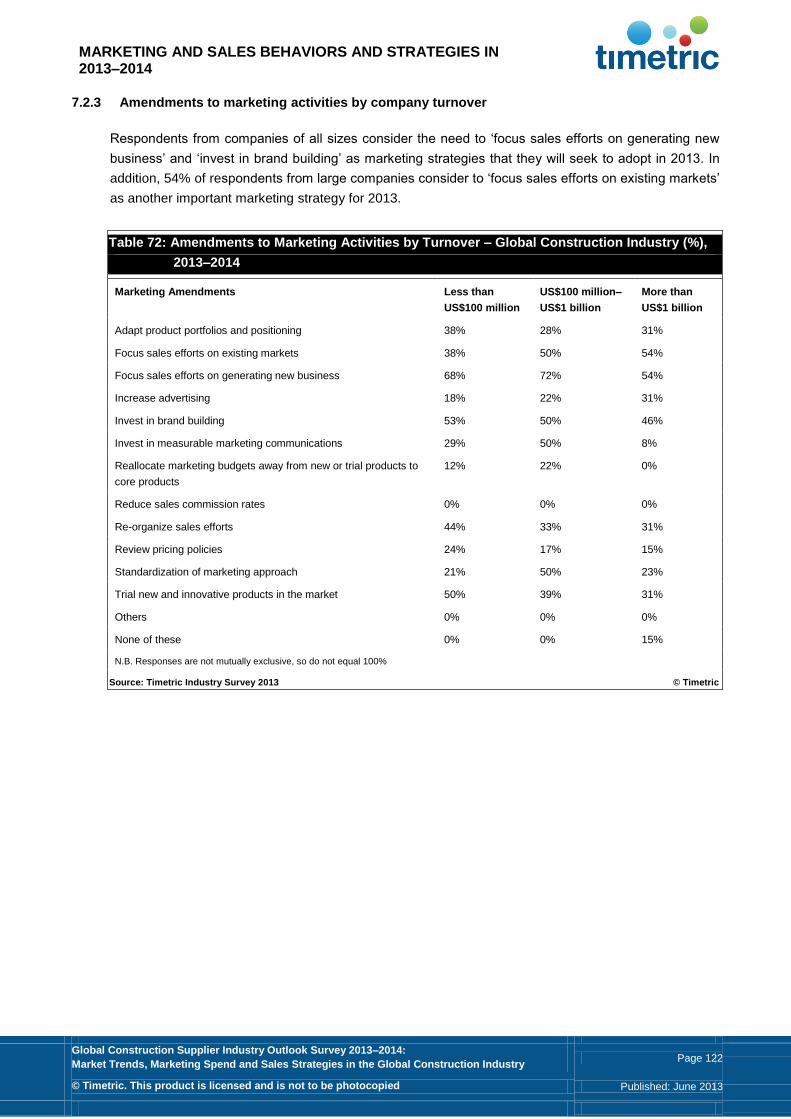
MARKETING AND SALES BEHAVIORS AND STRATEGIES IN 2013–2014
Global Construction Supplier Industry Outlook Survey 2013–2014:
Market Trends, Marketing Spend and Sales Strategies in the Global Construction Industry Page 122
© Timetric. This product is licensed and is not to be photocopied Published: June 2013
7.2.3 Amendments to marketing activities by company turnover
Respondents from companies of all sizes consider the need to ‘focus sales efforts on generating new
business’ and ‘invest in brand building’ as marketing strategies that they will seek to adopt in 2013. In
addition, 54% of respondents from large companies consider to ‘focus sales efforts on existing markets’
as another important marketing strategy for 2013.
Table 72: Amendments to Marketing Activities by Turnover – Global Construction Industry (%),
2013–2014
Marketing Amendments Less than
US$100 million
US$100 million–
US$1 billion
More than
US$1 billion
Adapt product portfolios and positioning 38% 28% 31%
Focus sales efforts on existing markets 38% 50% 54%
Focus sales efforts on generating new business 68% 72% 54%
Increase advertising 18% 22% 31%
Invest in brand building 53% 50% 46%
Invest in measurable marketing communications 29% 50% 8%
Reallocate marketing budgets away from new or trial products to
core products
12% 22% 0%
Reduce sales commission rates 0% 0% 0%
Re-organize sales efforts 44% 33% 31%
Review pricing policies 24% 17% 15%
Standardization of marketing approach 21% 50% 23%
Trial new and innovative products in the market 50% 39% 31%
Others 0% 0% 0%
None of these 0% 0% 15%
N.B. Responses are not mutually exclusive, so do not equal 100%
Source: Timetric Industry Survey 2013 © Timetric
MARKETING AND SALES BEHAVIORS AND STRATEGIES IN 2013–2014
Global Construction Supplier Industry Outlook Survey 2013–2014:
Market Trends, Marketing Spend and Sales Strategies in the Global Construction Industry Page 123
© Timetric. This product is licensed and is not to be photocopied Published: June 2013
7.3 Best Uses of New Media for Business Prospects – Global Construction Industry
Construction industry suppliers are increasingly planning to employ new media channels in order to
receive higher ROI on their marketing expenditure. In this section, construction industry executives
were asked to identify the best uses of new media channels to generate business in the current
economic climate.
7.3.1 Best uses of new media by suppliers
Of all construction equipment and material supplier respondents, 49% identified ‘email promotions’ as
an effective use of new media to generate business in 2013, while 44% identified ‘networking through
social media websites’ and 26% anticipated ‘email educational messages’ to be important uses.
A total of 55% of respondents from other construction industry suppliers identified ‘networking through
social media websites’ as an effective use of new media, while 45% consider ‘email promotions’ and
36% of respondents each consider ‘email educational messages’ and ‘community and industry online
forums’ to be the best uses.
Social media networking enables organizations to discuss and share their ideas on a common and
shared platform. Social media sites provide word-of-mouth publicity for businesses, who then use these
sites to build customer relationship networks. Supplier respondents plan to develop more location-
aware advertising, which enables them to market products and services to consumers in areas where
the product can be purchased locally. Suppliers also intend to adopt loyalty marketing strategies to
increase their customer base. In general, supplier companies use social networks such as Twitter and
Facebook, online communities, blogs, photo-sharing websites such as Flickr, and video-sharing
websites such as YouTube, in order to reach their target customers. The nature of the social media
medium also allows buyers to research and purchase products and services at their own convenience,
while the ease of tracking, measuring and testing social media marketing campaigns appeals to
suppliers in the global construction industry.
New media channels such as ‘email promotions’, ‘online forums’, ‘webinars’, ‘educational email
messages’ and ‘web conferencing’ are relatively inexpensive in terms of the ratio of cost to reach
customers. As such, companies can use these new media channels to reach a wider audience for a
fraction of their traditional marketing budgets.

MARKETING AND SALES BEHAVIORS AND STRATEGIES IN 2013–2014
Global Construction Supplier Industry Outlook Survey 2013–2014:
Market Trends, Marketing Spend and Sales Strategies in the Global Construction Industry Page 124
© Timetric. This product is licensed and is not to be photocopied Published: June 2013
Table 73: Best Uses of New Media – Global Construction Industry Suppliers (%), 2013
New Media Construction Equipment and
Materials Suppliers
Other Construction
Industry Suppliers
Email promotions 49% 45%
Networking through social media websites 44% 55%
Email educational messages 26% 36%
White paper downloads 16% 23%
Web conferencing for sales presentations 12% 18%
Community and industry online forums 12% 36%
Webinars for sales 9% 18%
Others 2% 0%
None of these 12% 5%
Don't know 16% 9%
N.B. Responses are not mutually exclusive, so do not equal 100%
Source: Timetric Industry Survey 2013 © Timetric
Figure 54: Best Uses of New Media – Global Construction Industry Suppliers (%), 2013
Source: Timetric Industry Survey 2013 © Timetric

MARKETING AND SALES BEHAVIORS AND STRATEGIES IN 2013–2014
Global Construction Supplier Industry Outlook Survey 2013–2014:
Market Trends, Marketing Spend and Sales Strategies in the Global Construction Industry Page 125
© Timetric. This product is licensed and is not to be photocopied Published: June 2013
7.3.2 Best uses of new media by region
An analysis of responses by region shows no chief variations in the perceived best uses of new media
for generated business sales. ‘Email promotions’ is considered the best use of new media as identified
by the respondents from companies operating in Europe, Asia-Pacific and the Rest of the World
regions. In addition, a total of 58% of respondents from North America and 49% of respondents from
Europe consider ‘networking through social media websites’ as one of the best uses of new media.
Table 74: Global Construction Industry Suppliers – Best Uses of New Media by Region (%), 2013
New Media North America Europe Asia-Pacific Rest of the World
Community and industry online forums 17% 26% 15% 0%
Email educational messages 25% 23% 46% 40%
Email promotions 17% 51% 62% 60%
Networking through social media websites 58% 49% 38% 40%
Web conferencing for sales presentations 17% 9% 15% 40%
Webinars for sales 17% 14% 8% 0%
White paper downloads 25% 20% 0% 40%
Others 0% 0% 8% 0%
None of these 25% 9% 0% 0%
Don't know 17% 11% 8% 40%
N.B. Responses are not mutually exclusive, so do not equal 100%
Source: Timetric Industry Survey 2013 © Timetric

MARKETING AND SALES BEHAVIORS AND STRATEGIES IN 2013–2014
Global Construction Supplier Industry Outlook Survey 2013–2014:
Market Trends, Marketing Spend and Sales Strategies in the Global Construction Industry Page 126
© Timetric. This product is licensed and is not to be photocopied Published: June 2013
Figure 55: Global Construction Industry Suppliers – Best Uses of New Media by Region (%), 2013
Source: Timetric Industry Survey 2013 © Timetric
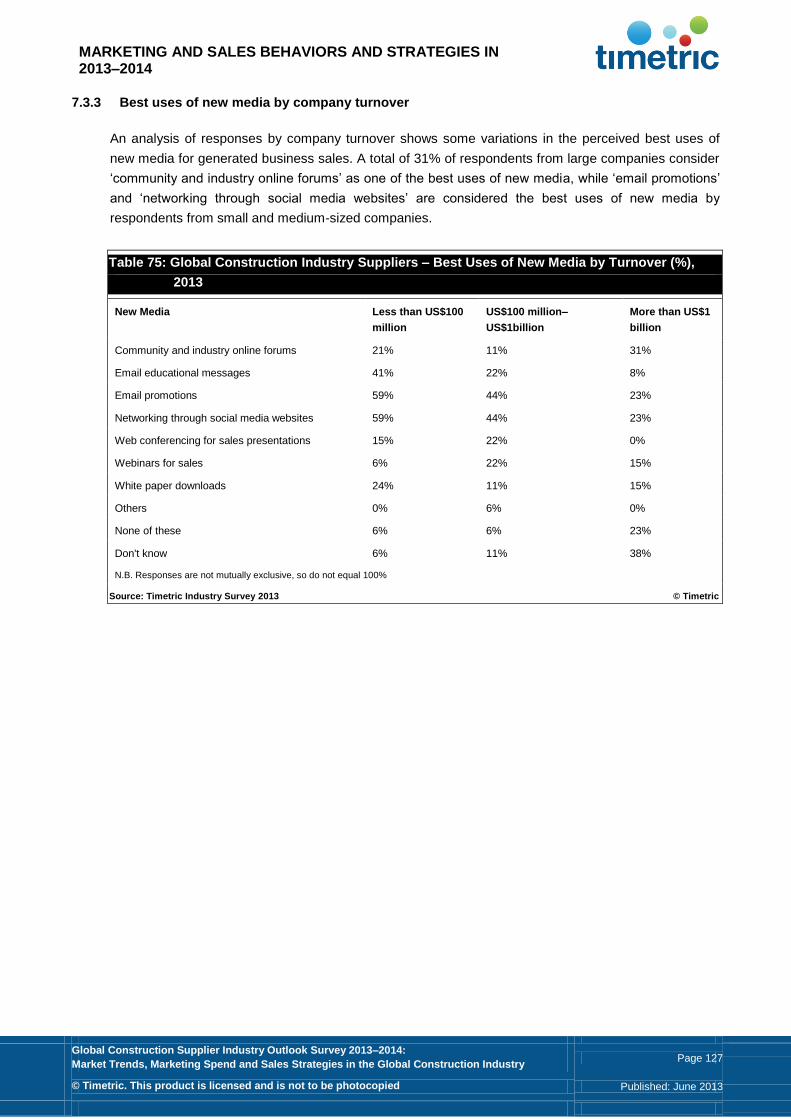
MARKETING AND SALES BEHAVIORS AND STRATEGIES IN 2013–2014
Global Construction Supplier Industry Outlook Survey 2013–2014:
Market Trends, Marketing Spend and Sales Strategies in the Global Construction Industry Page 127
© Timetric. This product is licensed and is not to be photocopied Published: June 2013
7.3.3 Best uses of new media by company turnover
An analysis of responses by company turnover shows some variations in the perceived best uses of
new media for generated business sales. A total of 31% of respondents from large companies consider
‘community and industry online forums’ as one of the best uses of new media, while ‘email promotions’
and ‘networking through social media websites’ are considered the best uses of new media by
respondents from small and medium-sized companies.
Table 75: Global Construction Industry Suppliers – Best Uses of New Media by Turnover (%),
2013
New Media Less than US$100
million
US$100 million–
US$1billion
More than US$1
billion
Community and industry online forums 21% 11% 31%
Email educational messages 41% 22% 8%
Email promotions 59% 44% 23%
Networking through social media websites 59% 44% 23%
Web conferencing for sales presentations 15% 22% 0%
Webinars for sales 6% 22% 15%
White paper downloads 24% 11% 15%
Others 0% 6% 0%
None of these 6% 6% 23%
Don't know 6% 11% 38%
N.B. Responses are not mutually exclusive, so do not equal 100%
Source: Timetric Industry Survey 2013 © Timetric
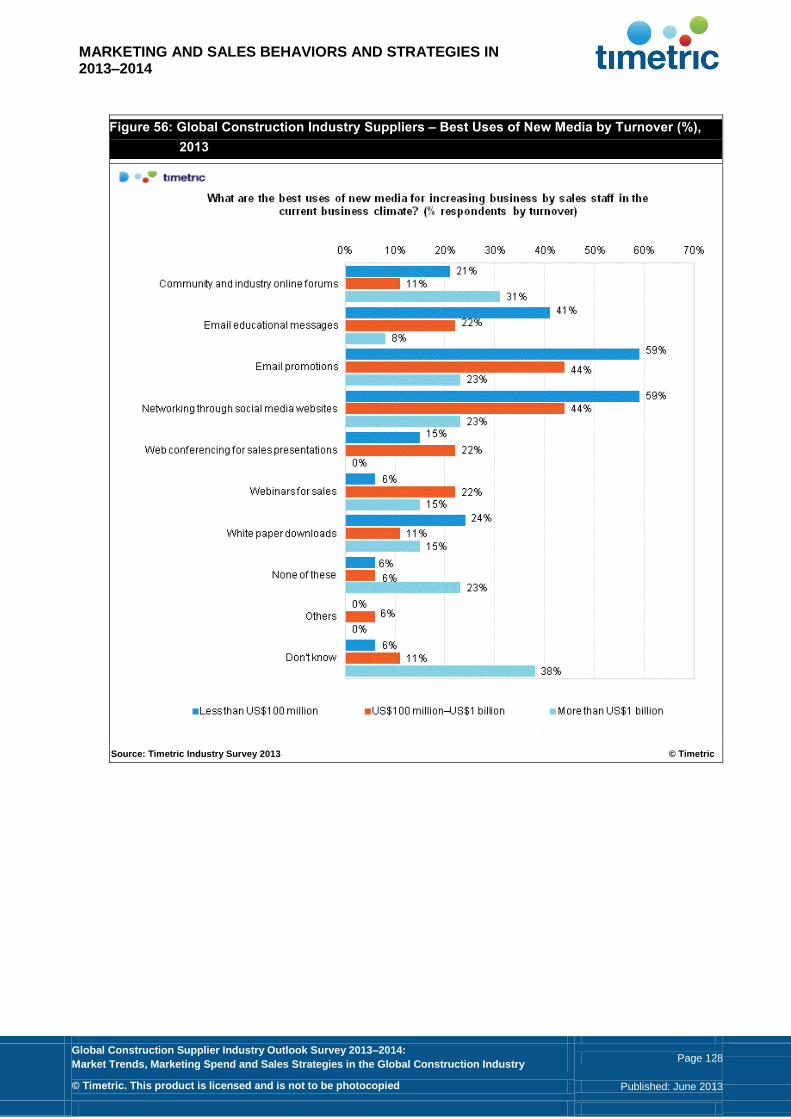
MARKETING AND SALES BEHAVIORS AND STRATEGIES IN 2013–2014
Global Construction Supplier Industry Outlook Survey 2013–2014:
Market Trends, Marketing Spend and Sales Strategies in the Global Construction Industry Page 128
© Timetric. This product is licensed and is not to be photocopied Published: June 2013
Figure 56: Global Construction Industry Suppliers – Best Uses of New Media by Turnover (%),
2013
Source: Timetric Industry Survey 2013 © Timetric
MARKETING AND SALES BEHAVIORS AND STRATEGIES IN 2013–2014
Global Construction Supplier Industry Outlook Survey 2013–2014:
Market Trends, Marketing Spend and Sales Strategies in the Global Construction Industry Page 129
© Timetric. This product is licensed and is not to be photocopied Published: June 2013
7.4 Critical Success Factors for Choosing a Marketing Agency
This section provides an insight into the marketing requirements of construction equipment and material
supplier companies and other construction industry supplier companies, and how they plan to develop
marketing and sales strategies in the future. The survey respondents were asked: “What are the three
most-important attributes of a marketing or advertising vendor for your company?”
7.4.1 Critical success factors by suppliers
Of all construction equipment and material supplier companies, 51% of respondents consider the ‘ability
to target specific audience niches’ as an important factor when sourcing marketing vendors. Meanwhile,
37% of respondents consider the ‘ability to generate leads or setup customer meetings’ and 35% of
respondents highlight ‘low cost’ as important attributes of marketing and advertising vendors for their
companies. Moreover, the ‘ability to generate leads or setup customer meetings’ was identified as
important in the 2012 construction industry survey.
A total of 59% of respondents from other construction industry supplier companies consider ‘ability to
target specific audience niches’ and 45% consider ‘ability to generate leads or setup customer
meetings’ as important factors for selecting their marketing vendors. This is due to the fact that, as a
result of an increase in business competition and expectations of gradual economic recovery, the need
for strategic and tactical inputs on specific target segments has gained importance. Furthermore, 36%
of other construction industry supplier respondents also consider ‘access to specific audience
demographics’ to be an important attribute in their marketing vendors. Construction industry products
tend to be oriented towards specific customer groups, and marketing agencies need to be capable of
penetrating every area of the global construction industry to help suppliers increase their business
opportunities. As such, marketing agencies need to possess the ability to design marketing strategies
suitable for reaching specific audience demographics.
The ‘ability to generate leads or setup customer meetings’ is a key attribute as suppliers tend to choose
marketing agencies that can proactively generate leads through customer meetings, seminars and
education. These events can also improve the supplier’s understanding of their customer requirements.
In addition, ‘flexibility in customizing services’ is considered an important attribute in the marketing
vendors of construction equipment and material suppliers, as companies in the global construction
industry tend to source marketing vendors that are flexible enough to customize their services to
various locations across the globe.
As the global construction industry shows signs of improvement, suppliers have set aggressive sales
targets to generate growth. As such, marketing vendors are being pushed to generate leads and
increase the number of meetings with potential clients. In comparison to the construction industry
survey in 2012, the number of respondents who consider ‘low cost’ as an important attribute for
marketing and advertising vendors has increased. This indicates that suppliers are becoming more
concerned about the cost of their sales and marketing activities. This trend also indicates that
construction industry supplier companies are willing to spend on quality delivery at a low cost from
marketing and sales vendors.
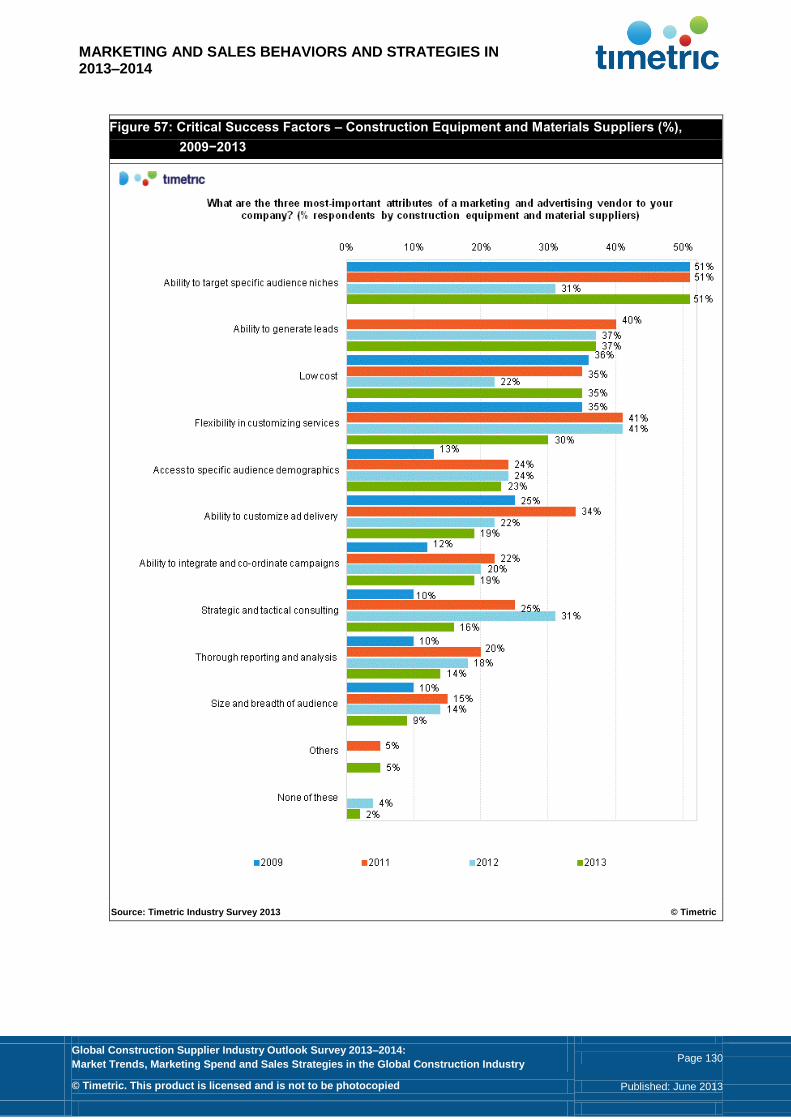
MARKETING AND SALES BEHAVIORS AND STRATEGIES IN 2013–2014
Global Construction Supplier Industry Outlook Survey 2013–2014:
Market Trends, Marketing Spend and Sales Strategies in the Global Construction Industry Page 130
© Timetric. This product is licensed and is not to be photocopied Published: June 2013
Figure 57: Critical Success Factors – Construction Equipment and Materials Suppliers (%),
2009−2013
Source: Timetric Industry Survey 2013 © Timetric
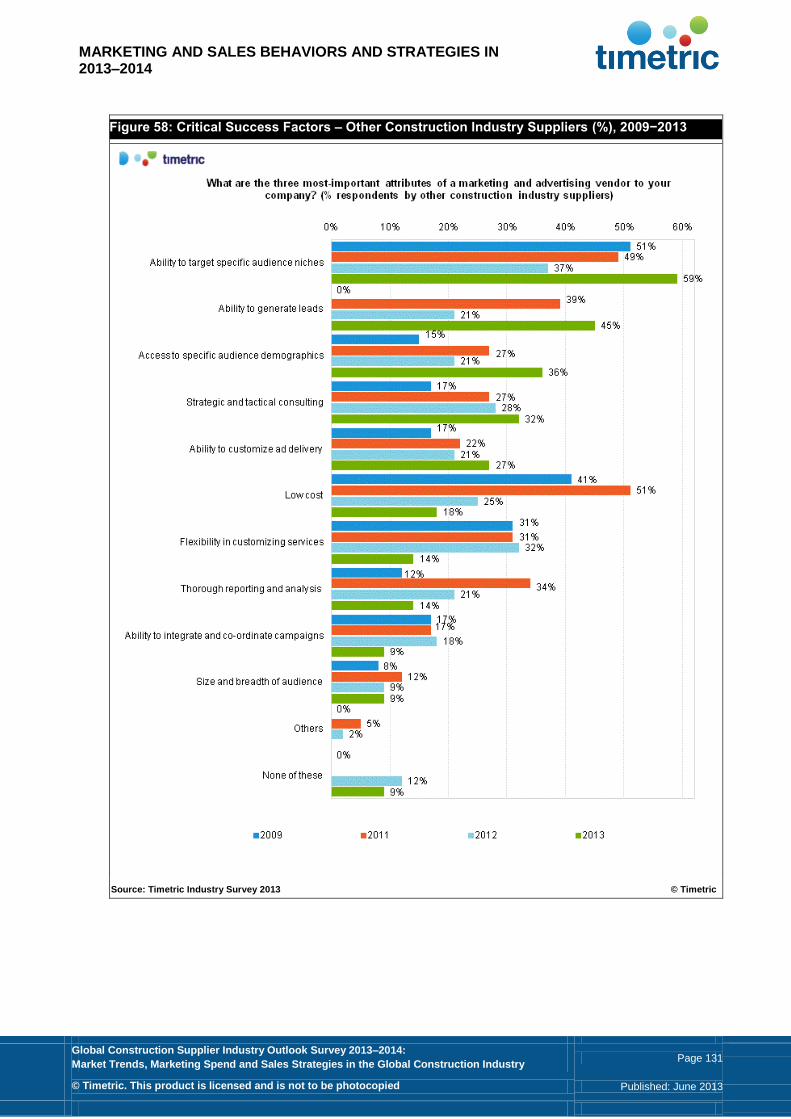
MARKETING AND SALES BEHAVIORS AND STRATEGIES IN 2013–2014
Global Construction Supplier Industry Outlook Survey 2013–2014:
Market Trends, Marketing Spend and Sales Strategies in the Global Construction Industry Page 131
© Timetric. This product is licensed and is not to be photocopied Published: June 2013
Figure 58: Critical Success Factors – Other Construction Industry Suppliers (%), 2009−2013
Source: Timetric Industry Survey 2013 © Timetric
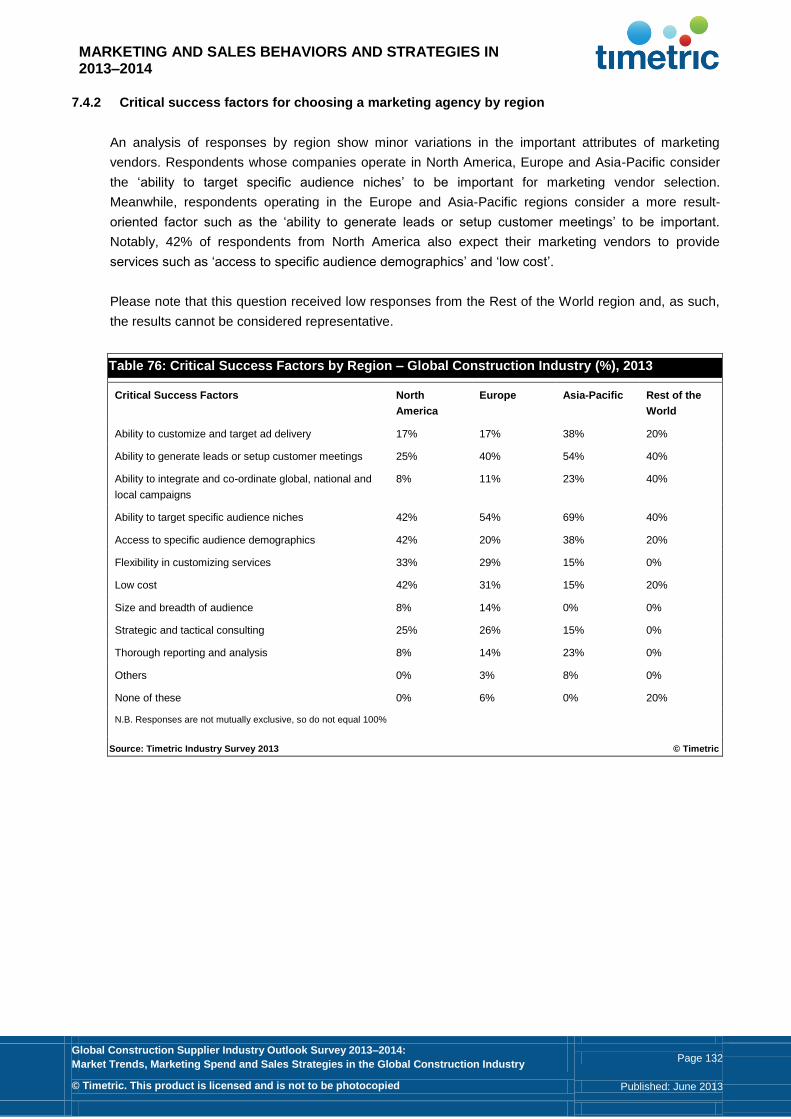
MARKETING AND SALES BEHAVIORS AND STRATEGIES IN 2013–2014
Global Construction Supplier Industry Outlook Survey 2013–2014:
Market Trends, Marketing Spend and Sales Strategies in the Global Construction Industry Page 132
© Timetric. This product is licensed and is not to be photocopied Published: June 2013
7.4.2 Critical success factors for choosing a marketing agency by region
An analysis of responses by region show minor variations in the important attributes of marketing
vendors. Respondents whose companies operate in North America, Europe and Asia-Pacific consider
the ‘ability to target specific audience niches’ to be important for marketing vendor selection.
Meanwhile, respondents operating in the Europe and Asia-Pacific regions consider a more result-
oriented factor such as the ‘ability to generate leads or setup customer meetings’ to be important.
Notably, 42% of respondents from North America also expect their marketing vendors to provide
services such as ‘access to specific audience demographics’ and ‘low cost’.
Please note that this question received low responses from the Rest of the World region and, as such,
the results cannot be considered representative.
Table 76: Critical Success Factors by Region – Global Construction Industry (%), 2013
Critical Success Factors North
America
Europe Asia-Pacific Rest of the
World
Ability to customize and target ad delivery 17% 17% 38% 20%
Ability to generate leads or setup customer meetings 25% 40% 54% 40%
Ability to integrate and co-ordinate global, national and
local campaigns
8% 11% 23% 40%
Ability to target specific audience niches 42% 54% 69% 40%
Access to specific audience demographics 42% 20% 38% 20%
Flexibility in customizing services 33% 29% 15% 0%
Low cost 42% 31% 15% 20%
Size and breadth of audience 8% 14% 0% 0%
Strategic and tactical consulting 25% 26% 15% 0%
Thorough reporting and analysis 8% 14% 23% 0%
Others 0% 3% 8% 0%
None of these 0% 6% 0% 20%
N.B. Responses are not mutually exclusive, so do not equal 100%
Source: Timetric Industry Survey 2013 © Timetric
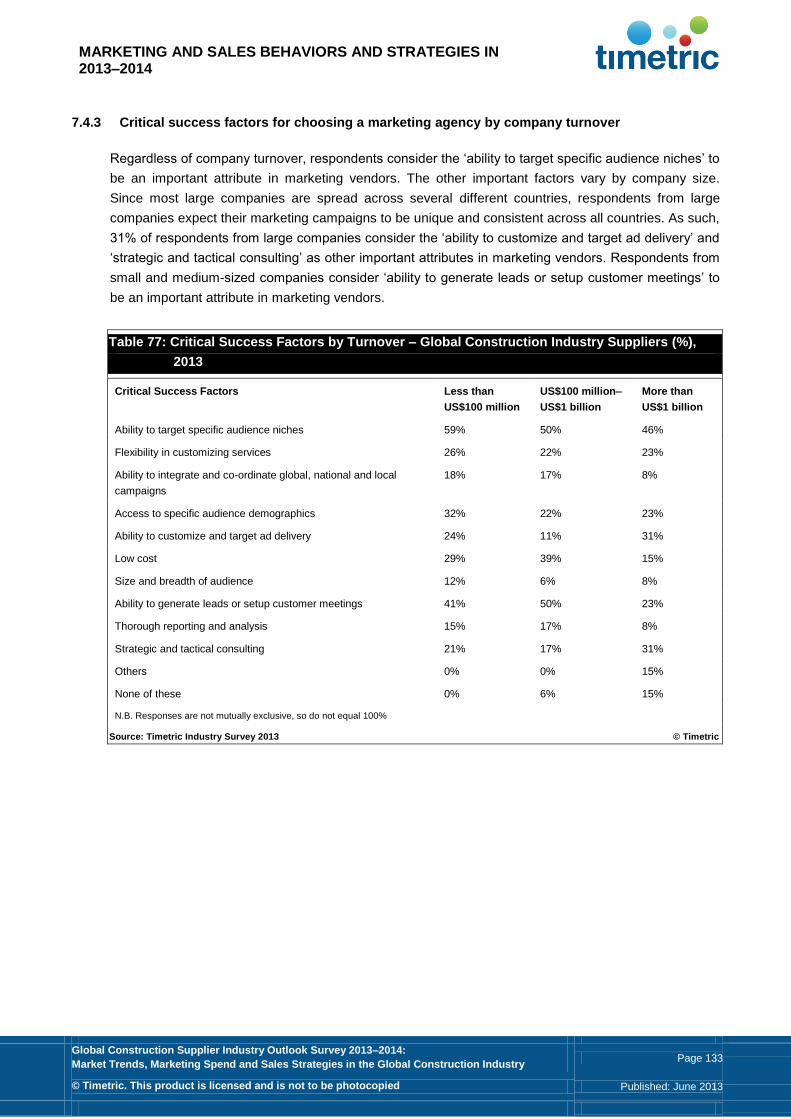
MARKETING AND SALES BEHAVIORS AND STRATEGIES IN 2013–2014
Global Construction Supplier Industry Outlook Survey 2013–2014:
Market Trends, Marketing Spend and Sales Strategies in the Global Construction Industry Page 133
© Timetric. This product is licensed and is not to be photocopied Published: June 2013
7.4.3 Critical success factors for choosing a marketing agency by company turnover
Regardless of company turnover, respondents consider the ‘ability to target specific audience niches’ to
be an important attribute in marketing vendors. The other important factors vary by company size.
Since most large companies are spread across several different countries, respondents from large
companies expect their marketing campaigns to be unique and consistent across all countries. As such,
31% of respondents from large companies consider the ‘ability to customize and target ad delivery’ and
‘strategic and tactical consulting’ as other important attributes in marketing vendors. Respondents from
small and medium-sized companies consider ‘ability to generate leads or setup customer meetings’ to
be an important attribute in marketing vendors.
Table 77: Critical Success Factors by Turnover – Global Construction Industry Suppliers (%),
2013
Critical Success Factors Less than
US$100 million
US$100 million–
US$1 billion
More than
US$1 billion
Ability to target specific audience niches 59% 50% 46%
Flexibility in customizing services 26% 22% 23%
Ability to integrate and co-ordinate global, national and local
campaigns
18% 17% 8%
Access to specific audience demographics 32% 22% 23%
Ability to customize and target ad delivery 24% 11% 31%
Low cost 29% 39% 15%
Size and breadth of audience 12% 6% 8%
Ability to generate leads or setup customer meetings 41% 50% 23%
Thorough reporting and analysis 15% 17% 8%
Strategic and tactical consulting 21% 17% 31%
Others 0% 0% 15%
None of these 0% 6% 15%
N.B. Responses are not mutually exclusive, so do not equal 100%
Source: Timetric Industry Survey 2013 © Timetric

APPENDIX
Global Construction Supplier Industry Outlook Survey 2013–2014:
Market Trends, Marketing Spend and Sales Strategies in the Global Construction Industry Page 134
© Timetric. This product is licensed and is not to be photocopied Published: June 2013
8 Appendix
8.1 Survey Results – Closed Questions
Table 78: Global Construction Industry Survey Results – Closed Questions
Which of the following best describes your company / organization?
Construction contractor or subcontractor 23%
Private sector project sponsor / developer / investor 2%
Public sector project sponsor / developer 2%
Architecture / Design company 21%
Construction equipment supplier 6%
Building merchants or products distributor 2%
Construction materials or building products manufacturer 18%
Furniture, fittings or interior products manufacturer 5%
Planning / surveying / civil engineering company 2%
Other supplier: technology, consultancy & other services 8%
Other supplier: raw materials, logistics, factory equipment 4%
Trade body, academia or industry observer 2%
Government / public sector organization 0%
Others 6%
In which region do you operate?
North America 21%
Europe 51%
Asia-Pacific 20%
Rest of the World 8%
What best describes your position in your organization?
CEO / president / MD / board member / C-level executive 24%
Director / VP / SVP 22%
Head of business unit 8%
Head of department 16%
Manager 14%
Professional and technical staff (e.g. lawyer, engineer,
architect)
9%
Staff 7%

APPENDIX
Global Construction Supplier Industry Outlook Survey 2013–2014:
Market Trends, Marketing Spend and Sales Strategies in the Global Construction Industry Page 135
© Timetric. This product is licensed and is not to be photocopied Published: June 2013
Table 78: Global Construction Industry Survey Results – Closed Questions
What is the total global revenue of your organization in US dollars?
Up to US$20m 45%
US$20m to US$100m 17%
US$100m to US$500m 14%
US$500m to US$1bn 8%
US$1bn to US$5bn 6%
US$5bn to US$10bn 2%
US$10bn or more 7%
Are you more or less optimistic about revenue growth for your company in 2013 compared to 2012?
More optimistic 53%
Neutral 22%
Less optimistic 24%
Don't know 1%
Not applicable 0%
Globally, what are your company's top priorities for 2013–2014?
Expand in current market 76%
Expand abroad (please specify country) 38%
Stabilizing company finances 26%
New products and services 42%
Improving operational efficiency 49%
Hiring new talent 26%
Pricing management 14%
Focus on sustainability 23%
Others 6%
Don't know 0%
How do you expect your firm’s capital expenditure to change in 2013–2014?
New product developments
Increase significantly 16%
Increase slightly 48%
Stay unchanged 29%
Reduce slightly 2%
Reduce significantly 3%
Don’t know 1%
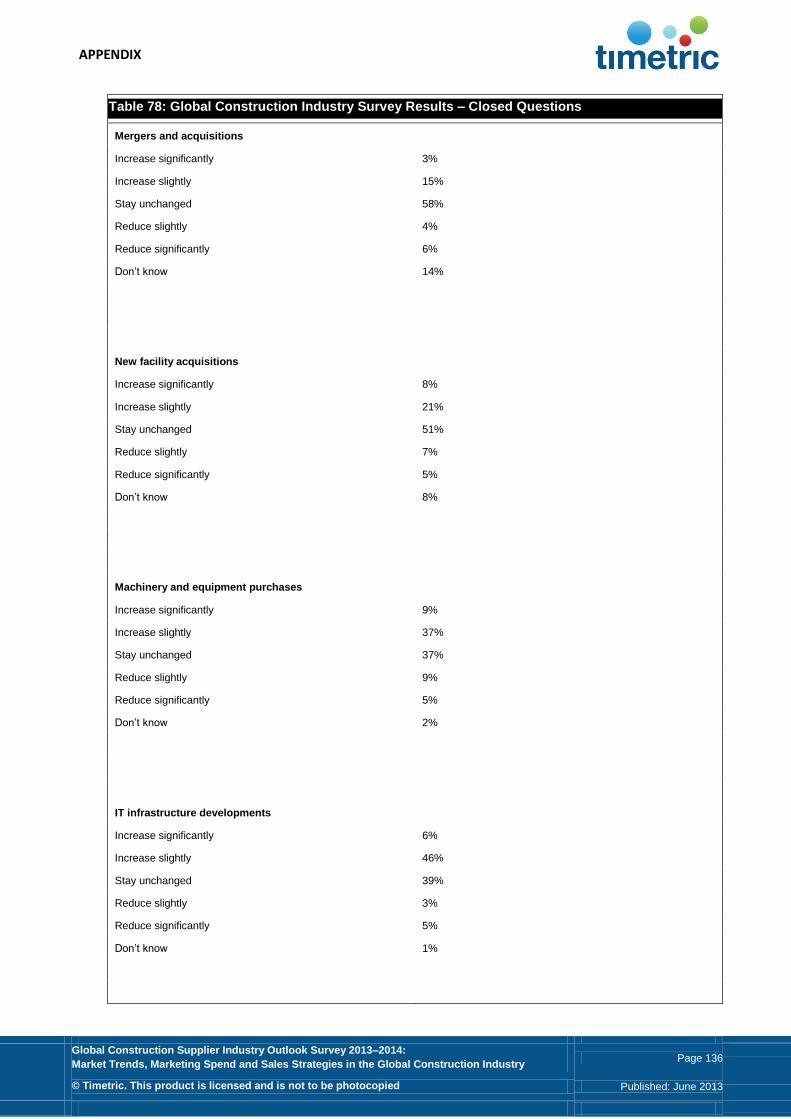
APPENDIX
Global Construction Supplier Industry Outlook Survey 2013–2014:
Market Trends, Marketing Spend and Sales Strategies in the Global Construction Industry Page 136
© Timetric. This product is licensed and is not to be photocopied Published: June 2013
Table 78: Global Construction Industry Survey Results – Closed Questions
Mergers and acquisitions
Increase significantly 3%
Increase slightly 15%
Stay unchanged 58%
Reduce slightly 4%
Reduce significantly 6%
Don’t know 14%
New facility acquisitions
Increase significantly 8%
Increase slightly 21%
Stay unchanged 51%
Reduce slightly 7%
Reduce significantly 5%
Don’t know 8%
Machinery and equipment purchases
Increase significantly 9%
Increase slightly 37%
Stay unchanged 37%
Reduce slightly 9%
Reduce significantly 5%
Don’t know 2%
IT infrastructure developments
Increase significantly 6%
Increase slightly 46%
Stay unchanged 39%
Reduce slightly 3%
Reduce significantly 5%
Don’t know 1%

APPENDIX
Global Construction Supplier Industry Outlook Survey 2013–2014:
Market Trends, Marketing Spend and Sales Strategies in the Global Construction Industry Page 137
© Timetric. This product is licensed and is not to be photocopied Published: June 2013
Table 78: Global Construction Industry Survey Results – Closed Questions
What changes do you expect in hiring staff at your organization in 2013–2014?
Large increase – 2%+ of current workforce 18%
Steady increase – Upto 2% of current workforce 37%
No change 28%
Steady decrease – Upto 2% of current workforce 9%
Large decrease – 2%+ of current workforce 6%
Don't know 2%
For the following how do you expect costs to change in 2013–2014?
Raw materials
Increase by 25%+ 1%
Increase between 10–25% 7%
Increase between 5–10% 27%
Increase between 1–5% 44%
No change 17%
Decrease between 1–5% 4%
Energy
Increase by 25%+ 2%
Increase between 10–25% 10%
Increase between 5–10% 28%
Increase between 1–5% 40%
No change 19%
Decrease between 1–5% 2%

APPENDIX
Global Construction Supplier Industry Outlook Survey 2013–2014:
Market Trends, Marketing Spend and Sales Strategies in the Global Construction Industry Page 138
© Timetric. This product is licensed and is not to be photocopied Published: June 2013
Table 78: Global Construction Industry Survey Results – Closed Questions
Labor costs and salaries
Increase by 25%+ 3%
Increase between 10–25% 5%
Increase between 5–10% 21%
Increase between 1–5% 45%
No change 22%
Decrease between 1–5% 4%
How will the change in costs impact the price of your products or contract values?
Increase by 25%+ 2%
Increase between 10–25% 3%
Increase between 5–10% 17%
Increase between 1–5% 50%
No Change 22%
Decrease between 1–5% 3%
Decrease between 5–10% 0%
Decrease between 10–25% 1%
Decrease by 25%+ 0%
Not applicable 2%
Which emerging markets do you expect to offer your industry significant growth prospects over 2013–2014?
Russia 25%
China 38%
India 33%
Brazil 30%
Argentina 8%
Indonesia 11%
Mexico 16%
Saudi Arabia 20%
South Africa 7%
Turkey 20%
Vietnam 11%
UAE 31%
Eastern Europe 26%
Others 16%

APPENDIX
Global Construction Supplier Industry Outlook Survey 2013–2014:
Market Trends, Marketing Spend and Sales Strategies in the Global Construction Industry Page 139
© Timetric. This product is licensed and is not to be photocopied Published: June 2013
Table 78: Global Construction Industry Survey Results – Closed Questions
For the following developed markets how do you expect demand to change in 2013–2014?
US
Increase 46%
Remain the same 28%
Decrease 9%
Don't know 16%
Canada
Increase 35%
Remain the same 32%
Decrease 4%
Don't know 28%
UK
Increase 29%
Remain the same 35%
Decrease 17%
Don't know 20%
Germany
Increase 21%
Remain the same 45%
Decrease 10%
Don't know 24%
France
Increase 10%
Remain the same 43%
Decrease 22%
Don't know 25%
Italy
Increase 4%
Remain the same 27%
Decrease 42%
Don't know 27%
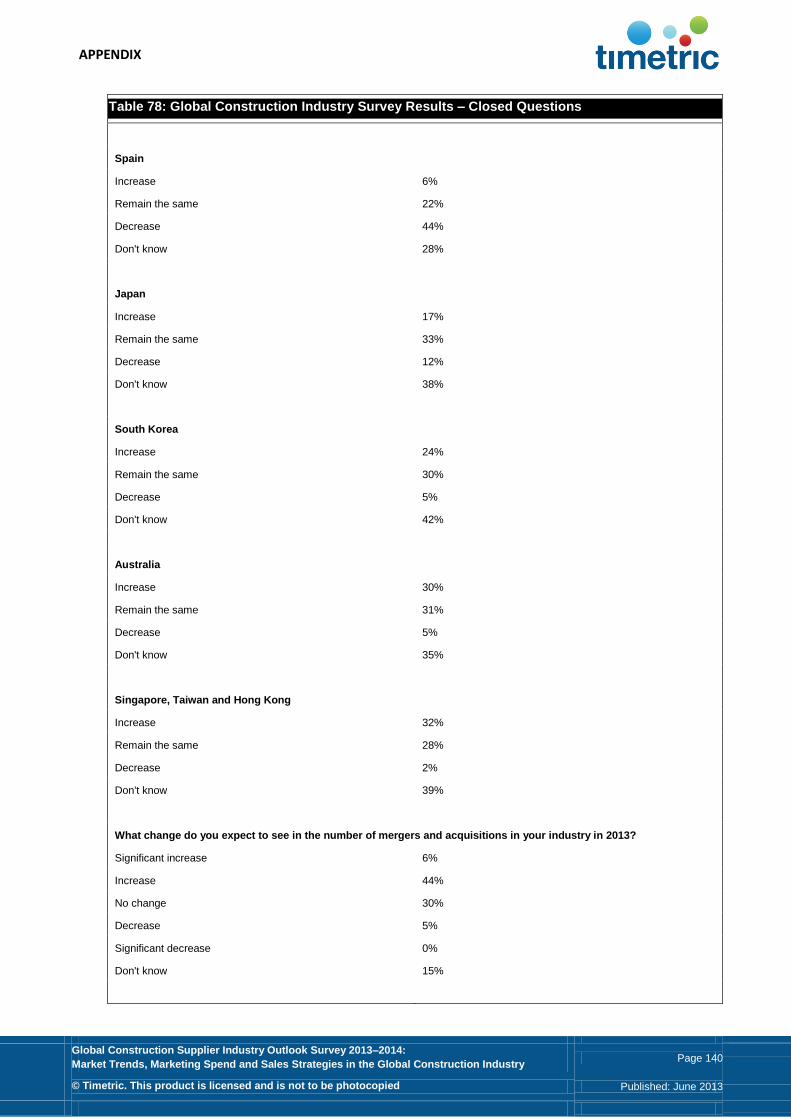
APPENDIX
Global Construction Supplier Industry Outlook Survey 2013–2014:
Market Trends, Marketing Spend and Sales Strategies in the Global Construction Industry Page 140
© Timetric. This product is licensed and is not to be photocopied Published: June 2013
Table 78: Global Construction Industry Survey Results – Closed Questions
Spain
Increase 6%
Remain the same 22%
Decrease 44%
Don't know 28%
Japan
Increase 17%
Remain the same 33%
Decrease 12%
Don't know 38%
South Korea
Increase 24%
Remain the same 30%
Decrease 5%
Don't know 42%
Australia
Increase 30%
Remain the same 31%
Decrease 5%
Don't know 35%
Singapore, Taiwan and Hong Kong
Increase 32%
Remain the same 28%
Decrease 2%
Don't know 39%
What change do you expect to see in the number of mergers and acquisitions in your industry in 2013?
Significant increase 6%
Increase 44%
No change 30%
Decrease 5%
Significant decrease 0%
Don't know 15%
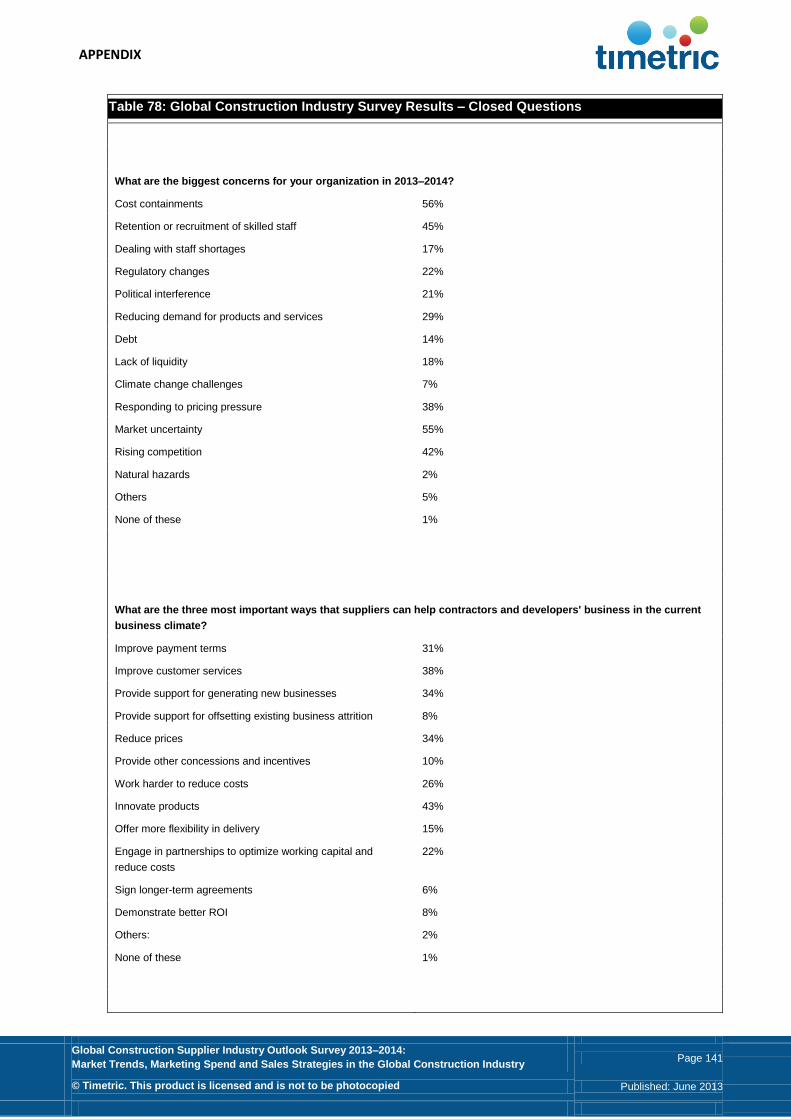
APPENDIX
Global Construction Supplier Industry Outlook Survey 2013–2014:
Market Trends, Marketing Spend and Sales Strategies in the Global Construction Industry Page 141
© Timetric. This product is licensed and is not to be photocopied Published: June 2013
Table 78: Global Construction Industry Survey Results – Closed Questions
What are the biggest concerns for your organization in 2013–2014?
Cost containments 56%
Retention or recruitment of skilled staff 45%
Dealing with staff shortages 17%
Regulatory changes 22%
Political interference 21%
Reducing demand for products and services 29%
Debt 14%
Lack of liquidity 18%
Climate change challenges 7%
Responding to pricing pressure 38%
Market uncertainty 55%
Rising competition 42%
Natural hazards 2%
Others 5%
None of these 1%
What are the three most important ways that suppliers can help contractors and developers' business in the current
business climate?
Improve payment terms 31%
Improve customer services 38%
Provide support for generating new businesses 34%
Provide support for offsetting existing business attrition 8%
Reduce prices 34%
Provide other concessions and incentives 10%
Work harder to reduce costs 26%
Innovate products 43%
Offer more flexibility in delivery 15%
Engage in partnerships to optimize working capital and
reduce costs
22%
Sign longer-term agreements 6%
Demonstrate better ROI 8%
Others: 2%
None of these 1%

APPENDIX
Global Construction Supplier Industry Outlook Survey 2013–2014:
Market Trends, Marketing Spend and Sales Strategies in the Global Construction Industry Page 142
© Timetric. This product is licensed and is not to be photocopied Published: June 2013
Table 78: Global Construction Industry Survey Results – Closed Questions
How important are each of the following objectives to your company’s marketing strategy over 2013–2014?
Customer retention
Very important 70%
Important 17%
Moderately important 13%
Least important 0%
Don't know 0%
Customer acquisition
Very important 44%
Important 40%
Moderately important 8%
Least important 5%
Don't know 3%
Cross-selling and up-selling
Very important 19%
Important 42%
Moderately important 28%
Least important 5%
Don't know 6%
Brand building and awareness 100%
Very important 38%
Important 45%
Moderately important 16%
Least important 2%
Don't know 0%
Lead generation -
Very important 39%
Important 41%
Moderately important 11%
Least important 3%
Don't know 6%

APPENDIX
Global Construction Supplier Industry Outlook Survey 2013–2014:
Market Trends, Marketing Spend and Sales Strategies in the Global Construction Industry Page 143
© Timetric. This product is licensed and is not to be photocopied Published: June 2013
Table 78: Global Construction Industry Survey Results – Closed Questions
Marketing performance measurement -
Very important 14%
Important 52%
Moderately important 22%
Least important 9%
Don't know 3%
Sales and marketing organizational alignment
Very important 32%
Important 41%
Moderately important 16%
Least important 10%
Don't know 2%
Online presence
Very important 38%
Important 28%
Moderately important 23%
Least important 11%
Don't know 0%
Do you expect to increase or decrease in expenditure on the following media in 2013–2014?
Online content sites
Increase 43%
No change 43%
Decrease 5%
Don't know 6%
Not applicable 3%
Online portals
Increase 41%
No change 41%
Decrease 2%
Don't know 6%
Not applicable 10%

APPENDIX
Global Construction Supplier Industry Outlook Survey 2013–2014:
Market Trends, Marketing Spend and Sales Strategies in the Global Construction Industry Page 144
© Timetric. This product is licensed and is not to be photocopied Published: June 2013
Table 78: Global Construction Industry Survey Results – Closed Questions
Consumer and business magazines
Increase 29%
No change 49%
Decrease 10%
Don't know 5%
Not applicable 8%
Trade magazines
Increase 33%
No change 52%
Decrease 8%
Don't know 5%
Not applicable 2%
Newspapers
Increase 8%
No change 48%
Decrease 16%
Don't know 5%
Not applicable 23%
Television and video
Increase 5%
No change 44%
Decrease 5%
Don't know 10%
Not applicable 37%
Radio
Increase 2%
No change 44%
Decrease 10%
Don't know 8%
Not applicable 37%

APPENDIX
Global Construction Supplier Industry Outlook Survey 2013–2014:
Market Trends, Marketing Spend and Sales Strategies in the Global Construction Industry Page 145
© Timetric. This product is licensed and is not to be photocopied Published: June 2013
Table 78: Global Construction Industry Survey Results – Closed Questions
Direct mail
Increase 22%
No change 41%
Decrease 21%
Don't know 6%
Not applicable 10%
Email and newsletters
Increase 61%
No change 29%
Decrease 3%
Don't know 6%
Not applicable 0%
Search
Increase 28%
No change 51%
Decrease 3%
Don't know 10%
Not applicable 8%
Sponsorship
Increase 5%
No change 57%
Decrease 17%
Don't know 6%
Not applicable 14%
Webcasting
Increase 19%
No change 47%
Decrease 3%
Don't know 10%
Not applicable 21%

APPENDIX
Global Construction Supplier Industry Outlook Survey 2013–2014:
Market Trends, Marketing Spend and Sales Strategies in the Global Construction Industry Page 146
© Timetric. This product is licensed and is not to be photocopied Published: June 2013
Table 78: Global Construction Industry Survey Results – Closed Questions
Corporate and brand websites
Increase 51%
No change 37%
Decrease 3%
Don't know 6%
Not applicable 3%
Social media and networking sites
Increase 59%
No change 30%
Decrease 2%
Don't know 8%
Not applicable 2%
Conferences and events
Increase 41%
No change 40%
Decrease 11%
Don't know 3%
Not applicable 5%
Outdoor
Increase 10%
No change 48%
Decrease 6%
Don't know 8%
Not applicable 27%
Telemarketing
Increase 17%
No change 44%
Decrease 5%
Don't know 8%
Not applicable 25%

APPENDIX
Global Construction Supplier Industry Outlook Survey 2013–2014:
Market Trends, Marketing Spend and Sales Strategies in the Global Construction Industry Page 147
© Timetric. This product is licensed and is not to be photocopied Published: June 2013
Table 78: Global Construction Industry Survey Results – Closed Questions
Public relations
Increase 37%
No change 48%
Decrease 5%
Don't know 6%
Not applicable 5%
Which of the following marketing and sales solutions do you expect your company to invest in 2013–2014?
CRM systems 51%
ERP solutions 28%
Market intelligence research 46%
Competitor intelligence research 23%
Business performance management solutions 17%
Client acquisition solutions 17%
Customer segmentation solutions 12%
Loyalty solutions 14%
Direct internet distribution systems 14%
None of these 8%
Others 0%
Don't know
What is your company’s global annual marketing and advertising budget in US dollars?
Up to US$50,000 34%
US$50,000–100,000 11%
US$100,000–250,000 14%
US$250,000–500,000 8%
US$500,000–US$1 million 11%
US$1–5 million 8%
US$5–10 million 5%
US$10–20 million 0%
US$20–50 million 5%
More than US$50 million 6%

APPENDIX
Global Construction Supplier Industry Outlook Survey 2013–2014:
Market Trends, Marketing Spend and Sales Strategies in the Global Construction Industry Page 148
© Timetric. This product is licensed and is not to be photocopied Published: June 2013
Table 78: Global Construction Industry Survey Results – Closed Questions
Which of the following practices will your company seek to adopt in 2013–2014?
Invest in measurable marketing communications 31%
Standardization of marketing approach 29%
Adapt product portfolios and positioning 34%
Reallocate marketing budgets away from new or trial products
to core products
12%
Trial new and innovative products in the market 43%
Focus sales efforts on existing markets 45%
Focus sales efforts on generating new business 66%
Review pricing policies 20%
Re-organize sales efforts 38%
Invest in brand building 51%
Increase advertising 22%
Reduce sales commission rates 0%
None of these 3%
Other s 0%
What are the best uses of new media for increasing business by sales staff in the current business climate?
Networking through social media websites 48%
Email promotions 48%
Email educational messages 29%
Webinars for sales 12%
Web conferencing for sales presentations 14%
White paper downloads 18%
Community and industry online forums 20%
None of these 9%
Other (please specify): 2%
Don't know 14%
What are the three most-important attributes of a marketing and advertising vendor to your company?
Ability to target specific audience niches 54%
Flexibility in customizing services 25%
Ability to integrate and co-ordinate global, national and local
campaigns
15%
Access to specific audience demographics 28%
Ability to customize and target ad delivery 22%
Low cost 29%
Size and breadth of audience 9%
Ability to generate leads or setup customer meetings 40%
Thorough reporting and analysis 14%
Strategic and tactical consulting 22%
None of these 5%

APPENDIX
Global Construction Supplier Industry Outlook Survey 2013–2014:
Market Trends, Marketing Spend and Sales Strategies in the Global Construction Industry Page 149
© Timetric. This product is licensed and is not to be photocopied Published: June 2013
Table 78: Global Construction Industry Survey Results – Closed Questions
How important are each of the following factors when promoting your company to key buyers in the industry?
Product quality
Very important 70%
Important 25%
Moderately important 2%
Least important 2%
Don't know 2%
Price
Very important 21%
Important 48%
Moderately important 24%
Least important 6%
Don't know 2%
Innovation
Very important 41%
Important 45%
Moderately important 11%
Least important 2%
Don't know 2%
Speed of delivery
Very important 30%
Important 44%
Moderately important 22%
Least important 2%
Don't know 2%
Level of service
Very important 59%
Important 33%
Moderately important 6%
Least important 0%
Don't know 2%

APPENDIX
Global Construction Supplier Industry Outlook Survey 2013–2014:
Market Trends, Marketing Spend and Sales Strategies in the Global Construction Industry Page 150
© Timetric. This product is licensed and is not to be photocopied Published: June 2013
Table 78: Global Construction Industry Survey Results – Closed Questions
Reputation for reliability
Very important 67%
Important 25%
Moderately important 7%
Least important 0%
Don't know 2%
Existing relationship with buyer
Very important 42%
Important 39%
Moderately important 16%
Least important 2%
Don't know 2%
Proximity to buyer operations
Very important 13%
Important 31%
Moderately important 37%
Least important 15%
Don't know 5%
Brand reputation
Very important 51%
Important 33%
Moderately important 14%
Least important
Don't know 2%
Corporate social responsibility reputation
Very important 22%
Important 33%
Moderately important 34%
Least important 8%
Don't know 3%

APPENDIX
Global Construction Supplier Industry Outlook Survey 2013–2014:
Market Trends, Marketing Spend and Sales Strategies in the Global Construction Industry Page 151
© Timetric. This product is licensed and is not to be photocopied Published: June 2013
Table 78: Global Construction Industry Survey Results – Closed Questions
Environmental record
Very important 29%
Important 32%
Moderately important 23%
Least important 13%
Don't know 3%
Financial strength and stability of supplier
Very important 27%
Important 44%
Moderately important 25%
Least important 2%
Don't know 2%
Knowledge of buyer's market
Very important 45%
Important 42%
Moderately important 8%
Least important 2%
Don't know 3%
How much do you expect your company to increase or decrease marketing expenditure in 2013–2014?
Increase by 25%+ 10%
Increase between 10–25% 14%
Increase between 5–10% 23%
Increase between 1–5% 22%
No change 23%
Decrease between 1–5% 4%
Decrease between 5–10% 2%
Decrease between 10–25% 1%
Decrease by 25%+ 1%
Not applicable 1%
Source: Timetric Industry Survey 2013 © Timetric

APPENDIX
Global Construction Supplier Industry Outlook Survey 2013–2014:
Market Trends, Marketing Spend and Sales Strategies in the Global Construction Industry Page 152
© Timetric. This product is licensed and is not to be photocopied Published: June 2013
8.2 Methodology
Timetric dedicated research and analysis teams consist of experienced professionals with an industry
background in marketing, market research, consulting and advanced statistical expertise.
Timetric adheres to the codes of practice of the Market Research Society (www.mrs.org.uk) and the
Society of Competitive Intelligence Professionals (www.scip.org).
All Timetric databases are continuously updated and revised.
8.3 Contact Us
If you have any queries about this report, or would like any further information, please contact
8.4 About Timetric
Timetric is an independent economic and business research firm providing critical intelligence on
emerging economies and key global industries. The company offers detailed economic and sector
intelligence, business insights and independent and authoritative commentary.
Underpinning all of Timetric’s research services is a belief that data – if gained following the right
technologies and analysis frameworks – can provide unique and powerful economic and business
insights.
Timetric’s economic and industry intelligence centers are premium decision tools providing access to
comprehensive research, data and expert analysis. They provide invaluable decision support presented
in an easily digestible format and grounded in rich, proprietary data and data analysis frameworks.
Each year, Timetric produces hundreds of high quality research reports across countries, industries and
companies. These reports draw on in-depth primary and secondary research, proprietary data and high
quality modeling and analysis to give the readers/clients’ deep insight into global market dynamics and
economic trends.
Timetric helps its clients to:
Benefit from unbiased, expert insight from a genuinely independent, trusted source
Save time in researching, visualizing and comparing economic and industry data
Access the latest and most useful data sets, indices and forecasts
Gain access to a unique methodology for understanding economic trends
Forecast and predict trends more accurately
For further information, email [email protected]
APPENDIX
Global Construction Supplier Industry Outlook Survey 2013–2014:
Market Trends, Marketing Spend and Sales Strategies in the Global Construction Industry Page 153
© Timetric. This product is licensed and is not to be photocopied Published: June 2013
8.5 Disclaimer
All rights reserved.
No part of this publication may be reproduced, stored in a retrieval system or transmitted in any form by
any means, electronic, mechanical, photocopying, recording or otherwise, without the prior permission
of the publisher, Timetric.
The facts of this report are believed to be correct at the time of publication but cannot be guaranteed.
Please note that the findings, conclusions and recommendations that Timetric delivers are based on
information gathered in good faith from both primary and secondary sources, whose accuracy we are
not always in a position to guarantee. As such, Timetric can accept no liability whatsoever for actions
taken based on any information that may subsequently prove to be incorrect.