MARKET AND CUSTOMER KNOWLEDGE AND THE ROLE OF VALUE IN FIRM PERFORMANCE
157
The Pennsylvania State University The Graduate School The Mary Jean and Frank P. Smeal College of Business MARKET AND CUSTOMER KNOWLEDGE AND THE ROLE OF VALUE IN FIRM PERFORMANCE A Dissertation in Business Administration by Katrina Jane Bens © 2011 Katrina Bens Submitted in Partial Fulfillment of the Requirements for the Degree of Doctor of Philosophy August 2011
Transcript of MARKET AND CUSTOMER KNOWLEDGE AND THE ROLE OF VALUE IN FIRM PERFORMANCE
The Pennsylvania State University
The Graduate School
The Mary Jean and Frank P. Smeal College of Business
MARKET AND CUSTOMER KNOWLEDGE AND THE ROLE
OF VALUE IN FIRM PERFORMANCE
A Dissertation in
Business Administration
by
Katrina Jane Bens
© 2011 Katrina Bens
Submitted in Partial Fulfillment of the Requirements
for the Degree of
Doctor of Philosophy
August 2011
ii
The dissertation of Katrina Bens was reviewed and approved* by the following:
William T. Ross Jr. ING Global Professor, University of Connecticut Dissertation Adviser Co-Chair of Committee
Arvind Rangaswamy Anchel Professor of Marketing Co-Chair of Committee
Gary L. Lilien Distinguished Research Professor of Management Science
John Christman Professor of Philosophy, Political Science, and Women’s Studies
Duncan Fong Professor of Marketing Chair of Marketing Department
*Signatures are on file in the Graduate School

iii
ABSTRACT
Market and Customer Knowledge and the Role of Value in Firm Performance
provides a multi-tiered look at how and when market orientation impacts seller
performance. While market orientation is generally accepted as a key factor in above-
average firm or SBU performance, the published literature has numerous examples of
inconsistent research results.
In the first essay, I look narrowly at the impact of market orientation on seller
performance and find that market orientation impacts performance through its role in
helping firms create offerings that customers value. Value partially mediates the market-
orientation-to-performance relationship. Besides excluding value as a potential mediator,
researchers have been using the terms and scales for market orientation and customer
orientation virtually interchangeably.
In the second essay, I attempt to resolve what turns out to be more than a semantic
issue by developing two separate scales, for market orientation and customer orientation.
The two scales are not interchangeable and have different roles in predicting firm
performance. Through these two essays, I offer a more complete model of how and when
knowing about a firm’s market and/or customers will lead to above-average performance.
iv
TABLE OF CONTENTS LIST OF FIGURES………………………………………………………………………vi LIST OF TABLES……………………………………………………………………….vii ACKNOWLEDGEMENTS……………………………………………………………..viii FOREWORD……………...………………………………………………………………1 BIBLIOGRAPHY FOREWORD…………………………………………………….8 1.1. INTRODUCTION: Market Orientation and Performance: The Role of Value …....10 1.2. BACKGROUND AND DEVELOPMENT……………………………...………….14 1.2.1 Theoretical Development……………………………………………………..14 1.2.2 Evidence for a mediated model……………………………………………….15 1.2.3 What is perceived value?...................................................................................18 1.2.4 How is value measured?....................................................................................21 1.2.5 Market orientation and performance measures in other studies………………23 1.3. HYPOTHESES ON MARKET ORIENTATION, VALUE, AND PERFORMANCE…………………………………………………………………..26 1.3.1 H1: Market orientation: The direct approach…………………………………26 1.3.2 H2: Value mediation model…………………………………………………..27 1.4. METHODOLOGY………………………………………………………………….28 1.4.1 Sample and data collection……………………………………………………28 1.4.2 Measures………………………………………………………………………32 1.5. RESULTS OF MODEL TESTING…………………………………………………37 1.5.1 Introduction…………………………………………………………………...37 1.5.2 Statistical Methods……………………………………………………………38 1.5.3 Model 1……………………………………………………………………….43 1.5.4 Model 2……………………………………………………………………….45 1.5.5 Model Comparison…………………………………………………………...46 1.5.6 Decomposing market orientation……………………………………………..47 1.5.7 Three-factor market-orientation model……………………………………….49 1.6. DISCUSSION……………………………………………………………………….52 1.6.1 Theoretical Implications………………………………………………………53 1.6.2 Managerial Implications………………………………………………………54 1.6.3 Limitations and Implications for Future Research……………………………55 1.6.4 Conclusions…………………………………………………………………...58 APPENDIX A: Questions Included in the Market Orientation to Performance Models..59 A.1 Market Orientation Measures (20 items)………………………………………59 A.2 Value Measures (Eight items)………………………………………………….60 A.3 Performance Measures (Three items)…………………………………………..60 A.4 Objective Measures…………………………………………………………….60 A.5 Hyper Competition……………………………………………………………..61 A.6 Competitive Intensity…………………………………………………………..61 A.7 Control Variables……………………………………………………………….61 BIBLIOGRAPHY ESSAY #1…………………………………………………………...75
v
2.1. INTRODUCTION: Market-Oriented And Customer-Led: Should a Successful Firm Be Both?.......................................................................................................81 2.2. BACKGROUND AND DEVELOPMENT………………………………..………..84 2.2.1 Theoretical development……………………………………………………...84 2.2.2 Evidence for a moderated model……………………………………………...86 2.2.3 Evidence for a mediated model……………………………………………….87 2.2.4 Customer orientation versus market orientation……………………………...89 2.2.5 Customer-led is not market-oriented………………………………………….92 2.3. HYPOTHESES ON MARKET ORIENTATION AND CUSTOMER LEADERSHIP………………………………………………………………………94 2.3.1 Hypotheses on performance…………………………………………………..95 2.3.2 Hypotheses on moderation, market environment……………………………..97 2.3.3 Hypotheses on Mediation……………………………………………………..99 2.4. RESEARCH DESIGN……………………………………………………………..101 2.4.1 Data collection and sample…………………………………………………..101 2.4.2 Development of customer-led and market-oriented measures………………104 2.4.3 Additional measures…………………………………………………………105 2.5 RESULTS OF MODEL TESTING………………………………………………...110 2.5.1 Introduction………………………………………………………………….110 2.5.2 Methodology………………………………………………………………...111 2.5.3 PLS Model…………………………………………………………………...116 2.5.4 Results of testing of performance hypotheses (H1 and H2)…………………118 2.5.5 Results of testing of moderation: market environment (H3)………………...118 2.5.6 Results of testing for mediation……………………………………………...119 2.6. DISCUSSION……………………………………………………………………...124 2.6.1 Theoretical Implications……………………………………………………..124 2.6.2 Managerial Implications……………………………………………………..125 2.6.3 Limitations and Implications for Future Research…………………………..126 APPENDIX A: Orientation Scales……………………………………………………..128 APPENDIX B: Measures……………………………………………………………….132 BIBLIOGRAPHY ESSAY #2………………………………………………………….145
vi
LIST OF FIGURES
Figure 1–1. Model 1 the Market Orientation to Performance Direct Link
Benchmark Model………………………………………………………………..69
Figure 1–2. Model 2 the Value Mediation Model………...……………………………..69
Figure 1–3. Distribution of Market Orientation Scores……….…..……………………..70
Figure 1–4. Final Model 1…………………………………………………...………….71
Figure 1–5. Final Model 2……………………….….……...………………..…………..72
Figure 1–6. Final Model 1.3…………………………..………………..………………..73
Figure 1–7. Final Model 2.3..……………………………………...…...………………..74
Figure 2–1. Hypotheses 1 to 6……………………....………...………………………..142
Figure 2–2. Model without Mediators or Moderators…………………...……………..143
Figure 2–3. Final Model……..……………………......………………………………..144

vii
LIST OF TABLES
Table 1–1. Performance Measures and Their Relationship with Market
Orientation………………………………….………………………..…………..62
Table 1–2. Published Market and Customer Orientation Studies and Their
Components….………………………………...……….…………...………….63
Table 1–3. Comparison of PLS, OLS and LISREL…………….….………………..…..65
Table 1–4. Correlation Between Performance Measures at Two Years….…….…..…..66
Table 1–5. Correlation Between Performance Measures at Four Years…..………....….66
Table 1–6. Correlation Between Latent Variables….………………….…..…......……..67
Table 1–7. Final Items for Three Factor Market Orientation Analysis…...……...……...68
Table 2–1. Moderators ……………………………………………………………...….135
Table 2–2. Mediators……………………………………………………………...……137
Table 2–3. Differences Between Customer-led and Market-oriented…………...……138
Table 2– 4. The Impact of Market Orientation and Being Customer-led on
Long- and short-term Performance……………………………………………..138
Table 2–5. Items and Their Sources Included in Measure Pre-test #1 and #2
and the Final Survey…………………………………………………..………..139
Table 2–6. Correlation Between Performance Measures at Two Years…….………….141
Table 2–7. Correlation Between Performance Measures at Four Years……….....…….141
Table 2–8. Latent Variable Correlations…………………………….……..……….…..141

viii
ACKNOWLEDGEMENTS I would like to thank my advisor, Bill Ross, for all his help and encouragement as I pursued this long-term, long-distance endeavor. Also, I never would have made this journey without the support of my friend, Meg Meloy, who always took time to ask tough questions, celebrate any victory and provide needed wisdom for over 20 years! Throughout the process, my children, Lincoln and Lydia, have provided needed laughter many times. This is for them. Thank you also to my husband, Dan, especially for taking the kids to the park many mornings so that I could work in peace.
1
FOREWORD
Competition in U.S. markets continues to increase as barriers to trade are broken
down and regulations relaxed. The old rules of competition were for relatively stable
environments, and with change occurring slowly, firms had the luxury of watching the
competition and benchmarking to what competitors were doing. Firms themselves helped
hold down the rate of competition and change in their industries by using barriers to entry
and tacit collusion. Such moderately competitive environments allowed firms to maintain
long-term sustainable advantage and profits (D'Aveni, 1995). However, over the last 40
years, many markets have become increasingly competitive (Thomas, 1996), allowing
only short periods of advantage and profit as competitors are always working to catch up
or outmaneuver each other (D'Aveni, 1995). As competition intensifies, sellers attempt to
understand the changing markets and determine what market drivers will enhance seller
performance. Temporarily, concentrating on operational effectiveness provided a
competitive advantage for sellers. Focusing on core competencies, outsourcing, investing
in IT, relentlessly benchmarking against key competitors, and copying best practices have
become the norm for companies. Unfortunately, this focus on operational effectiveness
and the easily visible and imitable processes promoted by benchmarking does not provide
sustainable comparative advantage (Porter, 1996). Instead, sellers find themselves in an
ever-escalating competitive environment.
In the search for sustainable competitive advantage, sellers must understand
market drivers that are not easily visible or imitable by competitors. To do this, sellers
2 must develop resources, processes, and/or capabilities that are unique to the firm. Unlike
the Theory of Perfect Competition, which assumes homogeneous and mobile factor
markets, the Resource Based View (RBV) assumes heterogeneous and immobile factor
markets (Priem & Butler, 2001). By acknowledging that firms have different inputs and
processes which translate into different resources and capabilities, firms can develop
organizational processes and capabilities that are valuable, rare, inimitable, and not
substitutable (Barney, 1991). These processes and capabilities that others cannot easily
observe or understand allow sellers to have a competitive advantage that other sellers
cannot copy, driving enhanced seller performance. These market drivers, when
understood and practiced by sellers, become resources or competencies that others have
difficulty viewing or imitating. Market orientation is one possible resource (Morgan,
Vorhies, & Mason, 2009). While benchmarking and operational effectiveness promote
performing functions in the same or very similar ways as competitors, with inimitable
competencies, sellers can achieve competitive advantage.
Each of the two essays included in the dissertation build on the importance and
role of market orientation on seller performance. While the first essay looks at a narrow
area of marketing, market orientation, the next essay builds on the first and expands the
focus of the dissertation. A first look at market orientation and its impact on seller
performance reveals that the role of customer value had been relegated to a minor
position within the market orientation scale. As the importance of creating offerings that
customers value becomes widely accepted (Hunt & Duhan, 2002), Essay #1 takes a first
step at explaining how market orientation impacts performance by looking at the role of
value.
3 When studying the role of value and market orientation in determining seller
performance, inconsistencies across past academic studies became apparent. Up to now,
market orientation and customer orientation have been used interchangeably, but I argue
that they, in fact, have two different meanings. Additionally, work by Christensen and
Bower (1996) concludes that firms that are close to their customers actually under-
perform those that are not close to their customers. In Essay #2, then, I first attempt to
unravel the differences between market and customer orientation. Then, once there is a
clear differentiation between the two types of orientation, I determine under what
conditions being close to customers is ideal and when it is not. Building on Essay #1, I
show how both market orientation and customer orientation individually impact value,
innovation, and then seller performance.
In order to empirically test the theories and hypotheses in both essays, I collected
data from a national survey of publicly traded, single SBU firms. Using publicly traded,
single SBU firms allows me to combine the survey data with the financial data that the
firms are required to file with the U.S. Securities and Exchange Commission (SEC). The
models for both essays are estimated using partial least squares (PLS).
In the following sections, I discuss each essay in detail.
ESSAY #1
To develop competitive advantage, a seller must recognize and use a unique
capability, resource, or process. Academic studies have identified some of these potential
tools. Naming all capabilities, resources, or processes is impossible (Day, 1994), but
some that have been identified are assets, patents, firm attributes, information, and/or
knowledge. One other capability, market orientation, has been widely studied.
4 Yet, results from the academic literature show that while market orientation is widely
accepted to be a market driver that enhances firm performance (Ellis, 2006), study results
are still inconsistent. When investigating the impact of market orientation on firm or
Strategic Business Unit (SBU) performance, some studies have found mixed results
(Harris, 2001; Jaworski & Kohli, 1993), while others have found non-significant or
negative relationships (Greenley, 1995; Voss & Voss, 2000). Though the first studies
hypothesized a direct link from market orientation to performance, later studies have
looked for a moderated link (Chou, 2009; Matsuno, Mentzer, & Rentz, 2000) or a
mediated link (Hult, Ketchen, & Slater, 2005). Even these augmented studies have not
completely resolved the inconsistencies in the literature.
Until now, creating value for the customer has simply been an item embedded in
the market orientation scale. Recently, however, value, or customer value delivery, has
come to the forefront as not only a part of the market orientation scale, but a distinct
factor in explaining competitive advantage, especially in the increasingly transparent
markets that firms compete in today. As Slater and Narver (1998) suggest, the objective
of market orientation is to create value for customers; in Essay #1 I remove value from
the market orientation scale and build a separate value measure with discriminant
validity. When value is removed from the market orientation scale and modeled as a
separate factor, the data support the hypotheses that while market orientation does lead to
enhanced seller performance, the relationship is partially mediated by value. Therefore, a
firm taking a market oriented approach gains knowledge of the market and customer to
aid in creating offerings that customers value, which in turn leads to improved
performance.
5 ESSAY #2
One way to resolve past inconsistencies noted in Essay #1 is to remove value
from the market oriented scale to a separate factor. However, another potential problem
needs to be resolved. Past studies have generally used the terms and scales for market
orientation and customer orientation interchangeably. Indeed, a 1996 MSI study
(Deshpandé & Farley, 1996) showed that the most commonly used market orientation
and customer orientation scales were highly correlated and all helped explain enhanced
seller performance. The results of the study appear to have granted researchers license to
use market orientation and customer orientation interchangeably. In fact, the issue might
have been left as a problem of semantics if a piece by Christensen and Bower
(Christensen & Bower, 1996) had not concluded that firms that are too close to their
customers had poor performance (as compared to those that were less close).
The problem then appears to be more than semantic. In order to clarify the issue,
Slater and Narver (1998) posit that a clear differentiation between customer orientation
and market orientation exists and that the differences should be developed and studied.
To tease out these separate meanings, I argue that customer orientation should be defined
as a short-term focus on meeting the expressed needs of current customers, and I call it a
“customer-led” approach. A market oriented-focus, on the other hand, tries to elicit latent
and future needs of both current and prospective customers in the long term, predicting
how the market will or will not be able to meet those needs. Depending on the goals and
market environment of a seller, a balance between the two types of orientation must be
struck.

6 Essay #2 attempts to resolve the debate between market orientation and customer
orientation by clarifying the differences and synergies between the two. To test the
impact of each type of orientation, both long and short-term performance measures are
included in the study. To create the scales, I culled items from exiting market orientation
and customer orientation scales and created ones based on marketing theory. After
multiple rounds of pre-testing, two scales emerged. One has a short-term customer focus,
and I label it “customer led.” The second scale is comprised of items with a longer-term
and market focus; therefore, I label the second one “market-oriented.”
An additional area of inconsistency is the moderating role of market environment
on market orientation’s impact on performance. Even though previous research has been
inconsistent about the role of market environment when looking only at market
orientation’s impact on performance, I hypothesize that the balance a seller must strike
between being customer-led and having a market orientation depends on the market
environment. Therefore, variables for market environment are included in the model. By
developing separate scales for both customer led and market oriented, I am able to assess
their differing impacts on firm performance. As value was found in Essay #1 to be a
mediator in the market-orientation-to-performance relationship and previous research
showed innovation to mediate the market-orientation-to-performance relationship (Han,
Kim, & Srivastava, 1998), both are included in the model as mediators. I find that value
mediates the customer-led-to-short-term-performance relationship, but not the ones to
long-term performance or objective performance. In the case of innovation, while both
customer led and market oriented are statistically significant estimators of innovation,
innovation is not a statistically significant estimator of performance.
7
CONCLUSION
The two essays that comprise Market and Customer Knowledge and the Role of
Value in Firm Performance are designed to build on the findings of each of the essays,
yet individually each stands alone by answering unique hypotheses. Market orientation
and its impact on firm performance has been widely studied over the past two decades,
and this dissertation seeks to resolve past inconsistencies in findings about the impact of
market orientation:
• under which market conditions does market orientation significantly impact seller
performance?
• when is the impact of market orientation non-significant?
First, in Essay #1, I find that creating customer value is an important role for market
orientation, and I remove value from the market orientation scale and create a separate
factor to measure value. In order to delve into market orientation’s role, the differences
between market orientation and customer orientation are clearly delineated and tested in
Essay #2. Both singly and together, the essays that follow offer deeper understanding and
clarification of the role of market and customer orientation in enhancing seller
performance.
8
BIBLIOGRAPHY FOREWORD
Barney, J. 1991. Firm Resources and Sustained Competitive Advantage. Journal of Management, 17(1): 99-120.
Chou, H.-J. 2009. The Effect of Market Orientation Intention and Superiority on New Product Performance. Journal of American Academy of Business, Cambridge, 14(2): 93.
Christensen, C. M., & Bower, J. L. 1996. Customer Power, Strategic Investment, and the Failure of Leading Firms. Strategic Management Journal, 17(3): 197-218.
D'Aveni, R. A. 1995. Coping with Hypercompetition: Utilizing the New 7S's Framework. The Academy of Management Executive, 9(3): 45.
Deshpandé, R., & Farley, J. U. 1996. Understanding Market Orientation: A Prospectively Designed Meta-Analysis of Three Market Orientation Scales. MSI Working Paper, 96-125: 1-22.
Ellis, P. D. 2006. Market Orientation and Performance: A Meta-Analysis and Cross-National Comparisons*. The Journal of Management Studies, 43(5): 1089.
Greenley, G. E. 1995. Market Orientation and Company Performance: Empirical Evidence From UK Companies. British Journal of Management, 6: 1 - 13.
Han, J. K., Kim, N., & Srivastava, R. K. 1998. Market orientation and organizational performance: Is innovation a missing link? Journal of Marketing, 62(4): 30-45.
Harris, L. C. 2001. Market orientation and performance: Objective and subjective empirical evidence from UK companies. Journal of Management Studies, 38(1): 17-43.
Hult, G. T. M., Ketchen, J. D. J., & Slater, S. F. 2005. Market Orientation and Performance: an Integration of Disparate Approaches. Strategic Management Journal, 26(12): 1173-1181.
Hunt, S. D., & Duhan, D. F. 2002. Competition in the Third Millennium: Efficiency or Effectiveness? Journal of Business Research, 55: 97-102.
Jaworski, B. J., & Kohli, A. K. 1993. Market orientation: Antecedents and consequences. Journal of Marketing, 57(3): 53.
Matsuno, K., Mentzer, J. T., & Rentz, J. O. 2000. A Refinement and Validation of the MARKOR Scale. Academy of Marketing Science. Journal, 28(4): 527.
Morgan, N. A., Vorhies, D. W., & Mason, C. H. 2009. Market orientation, marketing capabilities, and firm performance. Strategic Management Journal, 30(8): 909-920.
Porter, M. E. 1996. What is Strategy. Harvard Business Review, November-December: 61 - 78. Priem, R. L., & Butler, J. E. 2001. Is the Resource-Based "View" a Useful Perspective for
Strategic Management Research? Academy of Management Review, 26(1): 22-40. Thomas, L. G., III. 1996. The Two Faces of Competition: Dynamic Resourcefulness and the
Hypercompetitive Shift. Organization Science, 7(3, Special Issue Part 1 of 2: Hypercompetition): 221-242.
Voss, G. B., & Voss, Z. G. 2000. Strategic orientation and firm performance in an artistic environment. Journal of Marketing, 64(1): 67-83.

9
MARKET ORIENTATION AND PERFORMANCE: THE ROLE OF VALUE
Essay 1
10 1.1. INTRODUCTION: Market Orientation and Performance: The Role of Value
Driven by increasingly global and competitive markets, organizations are striving
to better understand the drivers of market performance. Companies continue to search for
the next area of competitive advantage. Researchers have recognized market orientation
and an outward customer focus as key drivers in market performance (Day, 1990;
Ruekert, 1992). Even so, past research into market orientation and firm or strategic
business unit (SBU) performance has shown inconsistencies in predicting performance.
Delivery of customer value, a concept that I will detail later in the chapter, is coming to
the forefront as a way to gain competitive advantage. However, to date, most evidence is
anecdotal or speculative, based on a few well-publicized cases. While market-orientation
scales have included perceived value, relegating this core issue to one or two questions in
a scale has led to insufficient investigation of the importance of customer value in
explaining firm or SBU performance. This study fills a void in the marketing literature by
explicitly bringing customer value to the forefront in the chain of market orientation to
performance, and by establishing the increased explanatory power of a model that
separates customer value from market orientation. The analyses I performed also shed
light on the importance of using a scale that divides market orientation into multiple
factors. Additionally, this study is the first to include objective performance data from
10K reports, required by the SEC (Securities Exchange Commission) and filed by single
SBU firms. Using this data mitigates concerns about mono-method bias.
Over the years, numerous studies have focused on defining market orientation and
its link to performance at the firm or SBU level (Dawes, 2000; Kumar, Subramanian, &
11 Yauger, 1998; Narver & Slater, 1990). Some researchers hypothesize that the link from
market orientation to performance is direct (Narver & Slater, 1990), while others have
looked for a moderated link (Jaworski & Kohli, 1993; Matsuno & Mentzer, 2000; Slater
& Narver, 1994), and still others have hypothesized a mediated link (Han et al., 1998). In
explaining the impact of market orientation on performance, previous studies have
recognized the importance of value or creating value for the customer (Day & Wensley,
1988; Narver & Slater, 1990). However, these studies have not examined value
separately from the orientation scale.
At the same time, recognition has increased regarding the importance of value as
a competitive advantage in increasingly global and transparent markets (Hunt & Duhan,
2002; Sawhney, 2002; Woodruff, 1997). In the 1930s, Chamberlin first advanced his
theory of monopolistic competition, which recognized the importance of value in
determining firm performance (Chamberlin, 1965). More recently, resource advantage
theory (R-A theory) explicitly discusses firms’ comparative advantage for producing
market offerings that have value for customers (Hunt & Duhan, 2002; Hunt & Morgan,
1995). The ability to create value for the customer is part of the market-orientation scales
(Deshpandé, Farley, & Webster, 1993; Han et al., 1998; Jaworski & Kohli, 1993; Narver
& Slater, 1990), suggesting implicitly that value is part of a market-orientation scale. But
is this the best manner of incorporating value in the orientation-to-performance model?
Slater and Narver (1998) argue that the objective of market orientation is to create
offerings that deliver value for customers, which in turn would suggest that value is a
mediating variable between market orientation and firm performance. Therefore, rather
12 than including value in the orientation scale, it may be preferable to think of value as a
separate construct that provides a necessary link between orientation and performance.
There is evidence to suggest the need for a model that more accurately describes
the role of value and orientation on performance. While researchers have generally
accepted the connection of orientation-to-firm performance (Deshpandé & Farley, 1996;
Kumar et al., 1998; Wood, Bhuian, & Kiecker, 2000), some studies have found mixed
results (Harris, 2001; Jaworski & Kohli, 1993), and others have found insignificant or
negative relationships (Greenley, 1995; Voss & Voss, 2000). Clearly, a model that more
consistently describes the nature of the relationship between market orientation and firm
performance or SBU performance is desirable. Therefore, to enhance the traditional
market-orientation-to-firm-performance model, I include a value construct, as suggested
by resource advantage theory (R-A). This will improve the knowledge and understanding
of how and when market orientation impacts performance.
This chapter investigates the role of value in firm or SBU performance,
specifically value’s role in the orientation-to-performance link. I start by exploring the
theoretical and anecdotal evidence for including value as the link between market
orientation and performance. Then, I bring together the multiple definitions of value used
in the marketing literature and define value for the purposes of this paper. I also include a
review of the inconsistencies and discrepancies of past market-orientation studies.
Given the importance of value in developing a competitive advantage, I next
hypothesize that value should be removed from the market-orientation scales and
promoted to a mediational position between orientation and performance. I perform
empirical testing with self-reported data from a national survey of publicly traded single
13 SBU firms in the US and objective performance data, showing that value mediates the
market-orientation-to-performance relationship with the self-reported performance
measures, but not with the objective performance measures. The empirical evidence
highlights the enhanced explanatory powers of the mediated model. The results increase
understanding of firm and SBU performance by explicitly including value as a mediator
between market orientation and performance. The R²s of the objective performance
measure variable is lower than the R²s of the self-reported performance measures in both
the short- and long-term. In the section “Limitations and Implications for Future
Research” I give possible reasons for this relationship.
Then—in contrast with most of the marketing and management literature which
has focused on market orientation as a one-factor scale—I examine the three components
of market orientation (intelligence generation, intelligence dissemination, and
responsiveness) proposed by Kohli and Jaworski (1993) and their individual effects on
the performance variables. By examining the three components, I seek to increase
understanding of why firms with similar levels of market orientation (as measured on a
one-factor scale) may have differing performance outcomes. This study aims to
contribute to the published market-orientation literature in the following four ways:
1. by investigating the link between the complete market-orientation scale and short-
and long-term self-reported performance measures
2. by examining the mediating impact of value
3. by assessing the consequences of the individual components of market orientation on
three measures of firm performance
4. by testing the relationship when objective financial data is used to measure
performance
14 1.2. BACKGROUND AND DEVELOPMENT
1.2.1 Theoretical Development
The resource-based view (RBV) of the firm provides a theoretical foundation
from which to investigate the market-orientation-to-performance model. As with most
theories of the firm, the RBV seeks to explain why some companies enjoy superior
financial performance. Rather than examining the product side of firms, the RBV focuses
on the resource side of the firm and the relationship between resources and profitability
(Wernerfelt, 1984). Compared to neoclassical theory or the Theory of Perfect
Competition, both of which assume homogeneous and mobile factor markets, the RBV
assumes heterogeneous and immobile factor markets (Priem & Butler, 2001). The
difference lies in looking at the resource side of firms and allowing firms to have
different inputs and resources. Resources can be common across firms (such as a
software package or machine). However, if the resource is valuable, rare, inimitable, and
non-substitutable (VRIN), it can be the source of a sustainable competitive advantage,
which in turn can lead to superior firm performance (Barney, 1991). VRIN resources are
sometimes referred to as “strategic” resources; they create a competitive advantage which
increases firm performance. Resources that are not VRIN do not lead to a sustainable
competitive advantage as other firms can easily obtain or copy the resource. Some
examples of strategic resources are assets, patents, copyrights, capabilities, organizational
processes, firm attributes, and information or knowledge (Day, 1994). Of these resources,
one of the more abstract is capabilities. Businesses develop their own set of capabilities
based on the competitive environment. A market orientation, an asset based on market
15 knowledge, is one possible strategic resource (Morgan et al., 2009). Market orientation is
VRIN: it is valuable because it improves product quality and enables firms to better serve
their markets; rare because little is known about creation and implementation of a market
orientation; inimitable and non-substitutable because it is complex and embedded in the
firm. Market orientation is made up of company values, beliefs, and culture (Zhou,
Brown, Dev, & Agarwal, 2007). It is difficult for competitors to see and copy (Slater &
Narver, 1995). Through intimate knowledge of customers’ latent and expressed needs,
knowledge of the competitors in the marketplace, and sharing of information throughout
the organization, market-oriented firms can outperform rivals with a lesser market
orientation. Some would argue that a resource-based view is tautological (Connor, 2007),
however, Hult et al. (2005) suggest that the misunderstanding is because previous studies
have focused on the direct link between strategic resources and performance. Instead,
future researchers need to investigate how market orientation leads to enhanced
performance. In this essay, I investigate how market orientation leads to enhanced firm
performance through creating products and services that customers value.
1.2.2 Evidence for a mediated model
While researchers usually assume that the market-orientation-to-performance
relationship is direct, there is considerable evidence calling for a mediated model. Day
and Wensley (1988) first made the case for a value-mediated model when they
hypothesized that strategic resources, such as a superior market orientation, lead to
positional advantages (the mediator), which themselves lead to enhanced performance.
16 Day (1988) has suggested both superior customer value and lower relative costs as
positional advantages or mediators.
Building on the positional advantage idea of Day and Wensley (1988), Hult and
Ketchen (2001) empirically tested a mediated model in which market orientation,
entrepreneurship, innovativeness, and organizational learning all lead to positional
advantage, which in turn influences performance. They found that each of the four first-
order indicators had a positive and significant relationship with the latent construct—
positional advantage—that was not measured directly. Positional advantage had a
positive and significant impact on all three performance measures tested. Their results
support the theory that the path from market orientation to performance is not direct but
rather is a more intricate one (Hult & Ketchen, 2001). Hult et al. (2005) later tested
organizational responsiveness as a mediator and found that it fully mediates the market-
orientation-to-performance path. Organizational learning emerged in a mediational
position in a later study (Jiménez-Jiménez & Cegarra-Navarro, 2007).
Slater and Narver proposed that innovation mediates the market-orientation-to-
performance relationship (Slater & Narver, 1994). Han et al. (1998) investigated this
more intricate relationship by theorizing that innovation mediates orientation and
performance. The authors built on two previous ideas: market orientation leads to
innovation, and innovation leads to superior performance. However, no previous research
had tested the orientation-to-innovation-to-performance relationship. The researchers
tested the impact of orientation on performance with innovation as a mediator.
While the researchers found that innovation mediates the orientation-to-
performance relationship (Han et al., 1998), not all research has consistently and fully
17 replicated their results. Previously, some researchers found innovation to be only a partial
mediator (Baker & Sinkula, 1999), and while different researchers found innovation to
fully mediate the relationship (Matear, Osborne, Garret, & Gray, 2002). A study by
Siguaw (1998) found customer trust in suppliers, a relationship indicator, to be a positive
and significant mediator, but the same study found another relationship indicator,
customer willingness to be cooperative with suppliers, a negative mediator. Another
potential mediator, product quality, was only a partial mediator (Chang & Chen, 1998).
While mediation by innovation had been studied in multiple published studies, I
could find no published research including value as a mediator. Yet, evidence suggests
that value is another possible mediator in the market orientation-to-performance
relationship. As a first step to including value in the market orientation literature, I focus
this first essay solely on the mediational role of value. Recall that superior customer
value is one positional advantage described by Day and Wensley’s (1988) three-stage
model (mentioned earlier) that includes superior customer value as the step between
sources of advantage, such as superior market orientation and performance. R-A theory
(Hunt & Morgan, 1996) involves the use of resources to create offerings that have value
for customers. This research supports the idea that market orientation is a resource if it
provides information to the company that is then used to produce products that customers
value (Hunt & Morgan, 1995). The key to R-A theory is developing market offerings that
offer value. Slater and Narver (1998) also explicitly detail the objective of market
orientation: to create value. Creation of value translates to competitive advantage. Value
creation, then, is the outcome of market orientation, and value creation leads to enhanced
firm performance.
18 If we consider that R-A theory explicitly includes creation of value as a precursor
to superior firm performance (Hunt & Morgan, 1996), and that the objective of market
orientation is to create customer value (Slater & Narver, 1999), we can combine this
evidence with RBV to lead us to hypothesize that value should be removed from the
general orientation scales and placed in a mediating role between orientation and
performance. Would such a model better represent market orientation’s influence on
performance through creation of perceived value?
1.2.3 What is perceived value?
R-A theory specifically states that superior firm performance comes from creating
market offerings that have “value” to the customers. Much like the “tangible and
intangible” resources that companies can employ to create comparative advantage,
value—though discussed extensively in the marketing literature—remains a nebulous
concept. While most researchers accept that the creation of value is integral in creating a
Research has identified market orientation as a key driver of market performance;
however, past studies have shown an inconsistent impact on performance. I hypothesize
that a crucial link between market orientation and performance is “perceived value.”
Throughout this section I will summarize how the concept of “perceived value” appears
in the literature, then define the term for the context of my study.
firm’s competitive advantage (Parasuraman, 1997; Porter, 1985), an agreed-upon exact
definition does not exist.
19 Definitions of value in the marketing literature have as their foundation poorly
defined or vague words such as worth, benefits, quality, and, of course, utility (Woodruff,
1997). With such loose definitions, quantifying value or determining what has value calls
for general measures that rely on personal interpretations of the terms used. However, the
definitions I quote below share an emphasis on the importance of comparing offerings to
others available in the marketplace. Zeithaml (1988), for example, investigated price,
quality, and value and found that four definitions of value for consumers emerged from
focus groups:
1. value is low price
2. value is whatever I want in a product
3. value is the quality I get for the price I pay
4. value is what I get for what I give
Zeithaml (pg. 14, 1988) combines these definitions: “Perceived value is the consumer’s
overall assessment of the utility of a product based on perceptions of what is received and
what is given.” A second definition specifically includes benefits or quality instead of
utility: “Buyers’ perceptions of value represent a tradeoff between the quality or benefits
they perceive in the product relative to the sacrifice they perceive by paying the price”
(Monroe 1990, p. 46).
Even focusing primarily on the monetary exchange aspect of “value,” researchers’
explanations depend on the field of study (consumer v. business markets) and further
complicate the process of defining perceived value. Instead of developing one definition
that combines both consumer and business markets, theorists writing about business-to-
business markets define value primarily from the basic utility theories of economics,
20 equating value with utility. For example:
Value in business markets [is] the perceived worth in monetary units of the set of economic, technical, service and social benefits received by a customer firm in exchange for the price paid for a product, taking into consideration the available suppliers’ offerings and prices. (Anderson et al. 1993, p.5)
Business-to-business literature has used Anderson et al.’s definition above, which
includes many aspects of an offering to define value. However, the researchers agree that
quantifying some parts of the value equation will be difficult.
Combining many of the above definitions and incorporating both individual and
business customers explicitly, Dowling arrived at the following formula:
For most customers (whether individuals or organizations), value is a function of (perceived or expected) benefits relative to the price (to be) paid, namely: Value = Benefits – Price. (Dowling, Lilien, Rangaswamy, & Thomas, 2000, p. 2–4)
Also important to the concept of value are social and emotional elements, which are
usually difficult to quantify in monetary terms (Anderson & Narus, 1998). Woodruff
(1997) focuses on the nonmonetary aspect of “value” in one of his definitions:
By customer value, we mean the emotional bond [emphasis in the original] established between a customer and a producer after the customer has used a salient product or service produced by that supplier and found the product to provide an added value. (Butz Jr. & Goodstein, 1996, p. 63)
Perceived benefits derive from what the purchasers believe the product will do for
them (or the company) based on both its tangible and intangible features. These benefits
may be socio-emotional, such as providing status through a name brand or promoting a
belief of the purchaser (e.g. driving a hybrid car or S.U.V.). They can also be technical,
referring to how well a product functions in its intended capacity. Price incorporates not
only the monetary aspect of a product, but also the perceived risk of a product (e.g.
buying a new, unknown brand) and convenience (Lilien, Rangaswamy, & Bruyn, 2007).
21 For example, a dishwasher that is difficult to load will have a higher “price” than one that
is easily loaded. Given the different meanings of “benefits” and therefore “value” for
various people, individuals, and organizations, what has value to each will result from the
individual’s personal understanding of the attribute. Individuals will give different
weights to the various components of value depending on the person and the market
segment (DeSarbo, Jedidi, & Sinha, 2001)1
1.2.4 How is value measured?
. The above definitions of value all contain
common threads from which I develop my definition of perceived value: Perceived
value is a customer’s perception that an offering represents an advantageous
combination of the socio-emotional, technical, and/or economic aspects that make
that customer prefer that offering to another.
Just as no consensus exists for the definition of value, the published literature
contains many scales for value. In synthesizing the scale of perceived value used in this
study, I started with the numerous scales used in previous studies. Most research into
value is done from the consumer’s perspective, asking the consumer how much value an
item or service provides. In consumer research, scales usually equate value with price
(Biswas, Pullig, Yagci, & Dean, 2002; Lichtenstein, Ridgway, & Netemeyer, 1993;
1 Not only do people have personal definitions of value, but perceptions about value depend on both situation and context (Olshavsky, Aylesworth, & Kempf, 1995. The Price-Choice Relationship – a Contingetn Processing Approach. Journal of Business Research, 33(3): 207 -218). The situational and contextual issues can lead to people rating an offering highly, but when given a choice, choosing or preferring a lower-rated offering. This seemingly inconsistent result, or “preference reversal” takes into account the perceived risks or benefits of an offering as well as the manner in which it is presented (Tversky, A., Slovic, P., & Kahneman, D., 1990. The Causes of Preference Reversal. The American Economic Review, 80(1): 204-217). Further investigation into the role of preference reversal is beyond the scope of this research, but the phenomenon underscores the difficulty in measuring value.
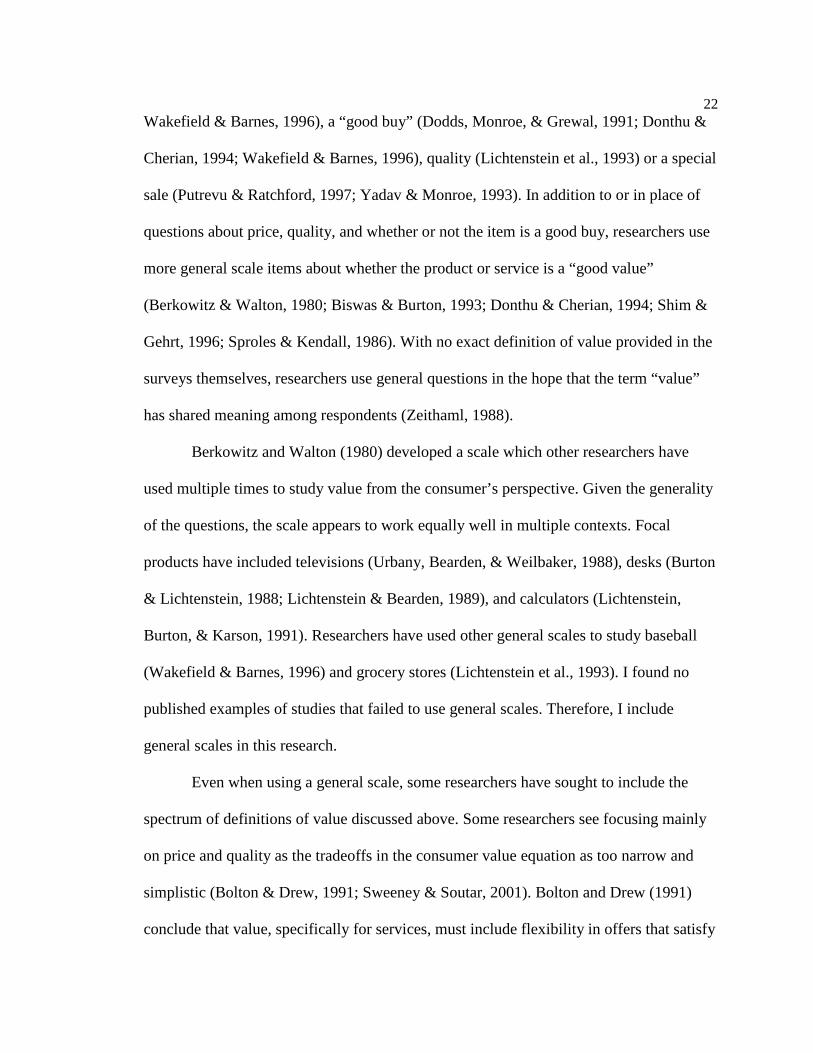
22 Wakefield & Barnes, 1996), a “good buy” (Dodds, Monroe, & Grewal, 1991; Donthu &
Cherian, 1994; Wakefield & Barnes, 1996), quality (Lichtenstein et al., 1993) or a special
sale (Putrevu & Ratchford, 1997; Yadav & Monroe, 1993). In addition to or in place of
questions about price, quality, and whether or not the item is a good buy, researchers use
more general scale items about whether the product or service is a “good value”
(Berkowitz & Walton, 1980; Biswas & Burton, 1993; Donthu & Cherian, 1994; Shim &
Gehrt, 1996; Sproles & Kendall, 1986). With no exact definition of value provided in the
surveys themselves, researchers use general questions in the hope that the term “value”
has shared meaning among respondents (Zeithaml, 1988).
Berkowitz and Walton (1980) developed a scale which other researchers have
used multiple times to study value from the consumer’s perspective. Given the generality
of the questions, the scale appears to work equally well in multiple contexts. Focal
products have included televisions (Urbany, Bearden, & Weilbaker, 1988), desks (Burton
& Lichtenstein, 1988; Lichtenstein & Bearden, 1989), and calculators (Lichtenstein,
Burton, & Karson, 1991). Researchers have used other general scales to study baseball
(Wakefield & Barnes, 1996) and grocery stores (Lichtenstein et al., 1993). I found no
published examples of studies that failed to use general scales. Therefore, I include
general scales in this research.
Even when using a general scale, some researchers have sought to include the
spectrum of definitions of value discussed above. Some researchers see focusing mainly
on price and quality as the tradeoffs in the consumer value equation as too narrow and
simplistic (Bolton & Drew, 1991; Sweeney & Soutar, 2001). Bolton and Drew (1991)
conclude that value, specifically for services, must include flexibility in offers that satisfy
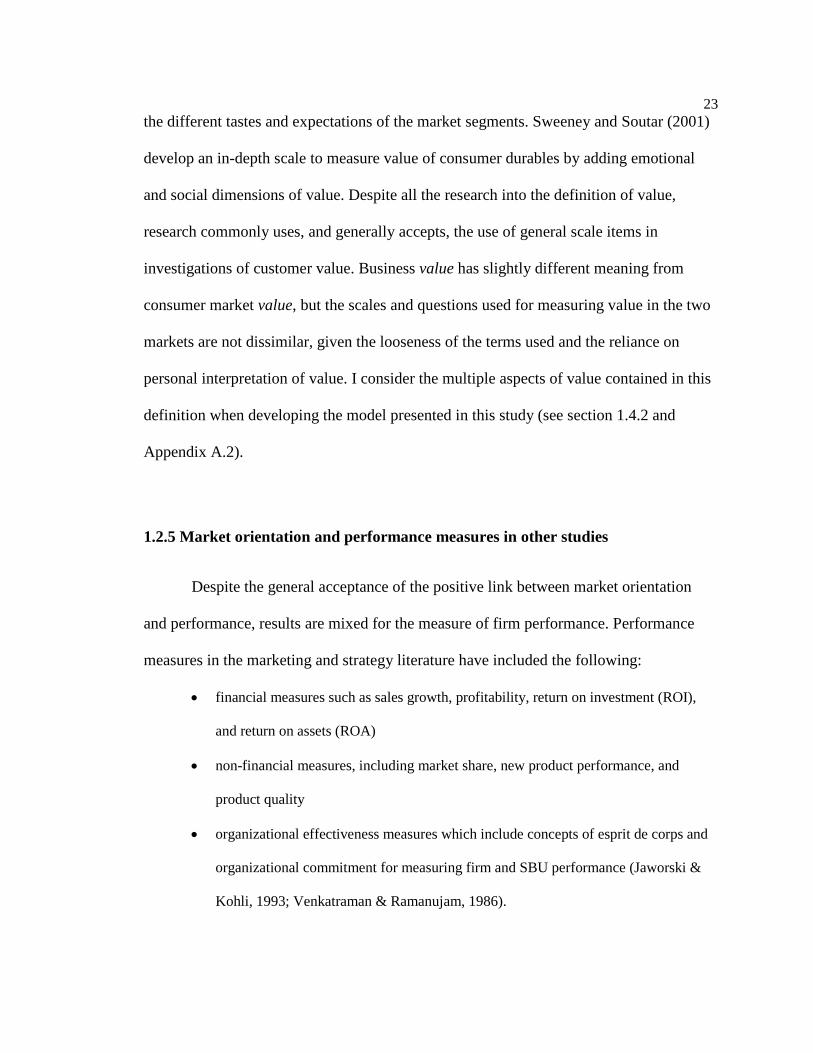
23 the different tastes and expectations of the market segments. Sweeney and Soutar (2001)
develop an in-depth scale to measure value of consumer durables by adding emotional
and social dimensions of value. Despite all the research into the definition of value,
research commonly uses, and generally accepts, the use of general scale items in
investigations of customer value. Business value has slightly different meaning from
consumer market value, but the scales and questions used for measuring value in the two
markets are not dissimilar, given the looseness of the terms used and the reliance on
personal interpretation of value. I consider the multiple aspects of value contained in this
definition when developing the model presented in this study (see section 1.4.2 and
Appendix A.2).
1.2.5 Market orientation and performance measures in other studies
Despite the general acceptance of the positive link between market orientation
and performance, results are mixed for the measure of firm performance. Performance
measures in the marketing and strategy literature have included the following:
• financial measures such as sales growth, profitability, return on investment (ROI),
and return on assets (ROA)
• non-financial measures, including market share, new product performance, and
product quality
• organizational effectiveness measures which include concepts of esprit de corps and
organizational commitment for measuring firm and SBU performance (Jaworski &
Kohli, 1993; Venkatraman & Ramanujam, 1986).
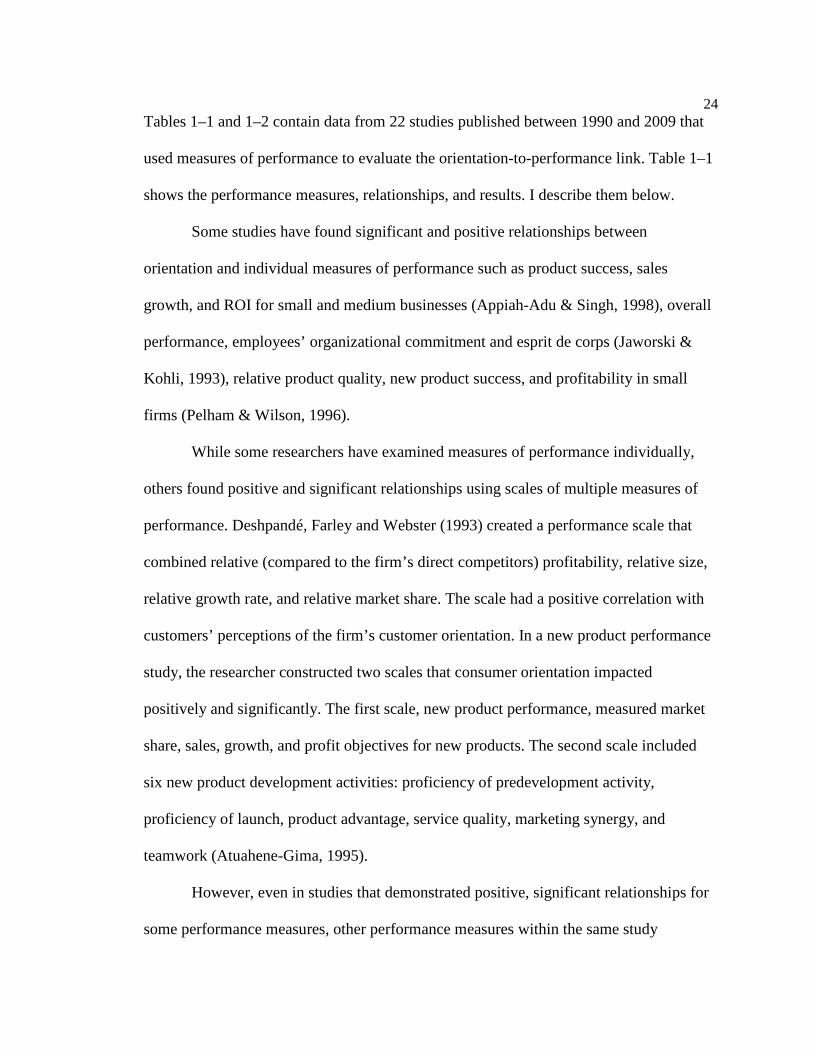
24 Tables 1–1 and 1–2 contain data from 22 studies published between 1990 and 2009 that
used measures of performance to evaluate the orientation-to-performance link. Table 1–1
shows the performance measures, relationships, and results. I describe them below.
Some studies have found significant and positive relationships between
orientation and individual measures of performance such as product success, sales
growth, and ROI for small and medium businesses (Appiah-Adu & Singh, 1998), overall
performance, employees’ organizational commitment and esprit de corps (Jaworski &
Kohli, 1993), relative product quality, new product success, and profitability in small
firms (Pelham & Wilson, 1996).
While some researchers have examined measures of performance individually,
others found positive and significant relationships using scales of multiple measures of
performance. Deshpandé, Farley and Webster (1993) created a performance scale that
combined relative (compared to the firm’s direct competitors) profitability, relative size,
relative growth rate, and relative market share. The scale had a positive correlation with
customers’ perceptions of the firm’s customer orientation. In a new product performance
study, the researcher constructed two scales that consumer orientation impacted
positively and significantly. The first scale, new product performance, measured market
share, sales, growth, and profit objectives for new products. The second scale included
six new product development activities: proficiency of predevelopment activity,
proficiency of launch, product advantage, service quality, marketing synergy, and
teamwork (Atuahene-Gima, 1995).
However, even in studies that demonstrated positive, significant relationships for
some performance measures, other performance measures within the same study
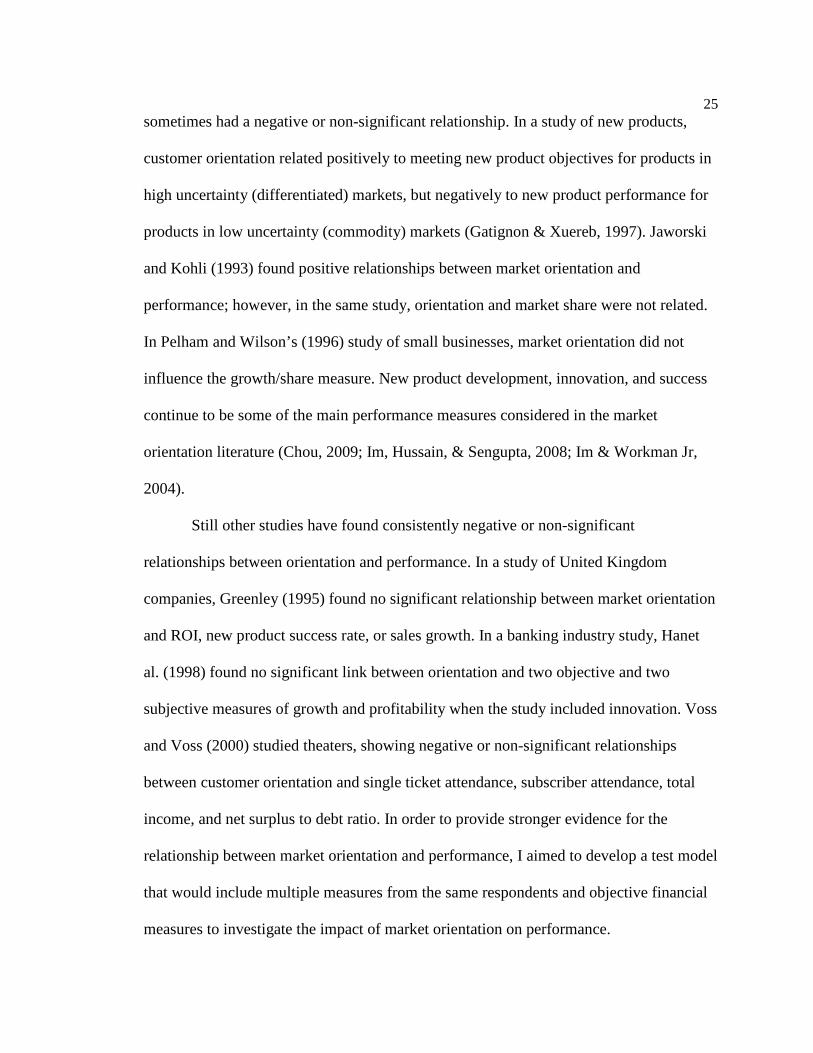
25 sometimes had a negative or non-significant relationship. In a study of new products,
customer orientation related positively to meeting new product objectives for products in
high uncertainty (differentiated) markets, but negatively to new product performance for
products in low uncertainty (commodity) markets (Gatignon & Xuereb, 1997). Jaworski
and Kohli (1993) found positive relationships between market orientation and
performance; however, in the same study, orientation and market share were not related.
In Pelham and Wilson’s (1996) study of small businesses, market orientation did not
influence the growth/share measure. New product development, innovation, and success
continue to be some of the main performance measures considered in the market
orientation literature (Chou, 2009; Im, Hussain, & Sengupta, 2008; Im & Workman Jr,
2004).
Still other studies have found consistently negative or non-significant
relationships between orientation and performance. In a study of United Kingdom
companies, Greenley (1995) found no significant relationship between market orientation
and ROI, new product success rate, or sales growth. In a banking industry study, Hanet
al. (1998) found no significant link between orientation and two objective and two
subjective measures of growth and profitability when the study included innovation. Voss
and Voss (2000) studied theaters, showing negative or non-significant relationships
between customer orientation and single ticket attendance, subscriber attendance, total
income, and net surplus to debt ratio. In order to provide stronger evidence for the
relationship between market orientation and performance, I aimed to develop a test model
that would include multiple measures from the same respondents and objective financial
measures to investigate the impact of market orientation on performance.

26 1.3. HYPOTHESES ON MARKET ORIENTATION, VALUE, AND PERFORMANCE
Thus far, the literature has presented the market-orientation-to-performance link
as a direct link from orientation to performance without including value as a mediator.
However, as markets become more competitive, more interest increases in the notion of
value as the means to create above-average firm performance (Payne & Holt, 2001;
Sharma, Krishnan, & Grewal, 2001). To date, investigation into the relationship among
value, market orientation, and performance is incomplete. This section on hypotheses
seeks to remedy the omission in the published literature.
1.3.1 H1: Market orientation: The direct approach
After examining the traditionally accepted model of direct market orientation to
performance, I used my findings to inform creation of a benchmark for the value
mediation model, utilizing the commonly accepted scale of market orientation within a
firm created by Kohli and Jaworski (1993). Their scale included openness to sharing
information about customers across the organization, meeting with customers, and doing
market research, in congruence with research that has shown closeness to the customer
and sharing of information with the firm to be part of the market orientation of the firm.
Their scale also includes measures that allude to value creation (Jaworski & Kohli, 1993;
Kohli, Jaworski, & Kumar, 1993). As a benchmark with which to compare the alternative
model, I posit:
H1: Market orientation has a positive and direct impact on performance
27 The above hypothesis leads to Model 1 pictured in Figure 1–1.
Model 1 serves to test the generally accepted direct market-orientation-to-
performance hypothesis, H1. It also serves as the benchmark model against which the
value mediation model will be compared.
1.3.2 H2: Value mediation model
As the market orientation (MO) research evolves, simply measuring the direct
model is not sufficient to explain how MO impacts performance. Indeed, the MO
capability allows firms to create superior performance. Firms may gather information
about customers’ needs and competitors’ actions and share the information within the
firm, providing the insight to produce products and services that customers value (Zhou,
Li, Zhou, & Su, 2008). Firms that create products/services that customers value have
superior performance (Hult et al., 2005). MO will have a positive and significant impact
on firm performance indirectly through creating products that customers value (Hunt &
Duhan, 2002). To investigate this relationship I posit in contrast to the direct model above
(Model 1, H1):
H2: Value mediates the relationship between market orientation and performance. Hypothesis 2 describes the value mediation model (Model 2) that Figure 1-2 shows.
28 1.4. METHODOLOGY
I first test Model 1 to show that while the currently accepted model of market
orientation’s impact on performance does, in fact, hold. The introduction of value in
Model 2, the hypothesized value mediation model (H2), will offer more explicit evidence
about the manner in which market orientation impacts performance.
1.4.1 Sample and data collection
Based on interviews with senior managers at 12 large companies, I started
developing the survey instrument. Questions to the managers included how they viewed
their customers, market orientation, and information orientation. Once I developed the
preliminary questionnaire, I conducted three separate pre-test phases with a total of 90
representative managers. Pre-testing included debriefing participants after they completed
the survey to find out which questions might be confusing, unclear, or ambiguous. After
each round of pre-testing, I updated and refined the survey instrument. Additionally, I
analyzed pre-test data to make sure that measures loaded on factors as intended.
After the first rounds of pre-testing, I conducted a national survey with 335 usable
responses. Based on that data, I presented a preliminary study at a national conference.
While the market-orientation measures used were similar to previously used scales, I
determined that including scales that are already accepted by the academic community
would strengthen the research. Therefore, I developed and pre-tested a new survey
instrument including the Kohli and Jaworski (1993) scales for marketing orientation.
29 For this round of pre-tests, MBA and Executive MBA students at a large Midwestern
University filled out 98 usable surveys.
In order to investigate firm performance without correcting for multiple SBUs and
variable performance among the SBUs within one company, I surveyed only single SBU
firms. The survey included only publicly traded companies. This was to ensure that the
definition of a single SBU firm would be similar among the companies. Until 1998, the
S.E.C. (Securities and Exchange Commission) required firms to report financial
information for segments by product line rather than reporting information by SBU. Few
companies had internal structures that matched their product lines. This resulted in such
anomalies as IBM having to report segment level data for only one “segment” as they
only have one product line as defined by the S.E.C. The updated rules, which went into
effect for fiscal years starting after December 15, 1997, require publicly traded
companies to report financial data at the segment level based on the actual internal
structure of the company. As a result of the rule change, IBM is required to report
segment level data for seven segments instead of just one (Berger & Hann, 2003). Now,
the definition of a publicly traded, single SBU firm is more uniform across companies
and industries. Firms that are single SBU firms under the new regulations include
Southwest Airlines, Pixar, Blockbuster, and Whirlpool Corporation. This change allows
us to obtain responses from a company without the noise of multiple business units.
To obtain a sample of only single SBU firms, I searched the WRDS database of
10K filings (required for publicly traded companies by the S.E.C.), and selected only
those that report single SBU. 10K filings lag the calendar year, and I used the available
information for 2003. In 2003, there were 4,154 single segment companies. Of those
30 companies, 3,768 had employer identification numbers (EIN). In order to find mailing
addresses and contact names for each company, I used the Dun & Bradstreet (D&B)
service. D&B includes the EIN of each company within its database, and they provided
us with contact names, job titles and addresses only for the single SBU firms. Of the
3,768 companies with EINs, 1,526 companies had D&B listings which included contact
information for a person in sales, marketing, vice-president, or president of the company.
40 percent of the contact names were for the company president and 20 percent held a
title of “manager.” Many companies (589) had more than one contact name available.
Through the job titles, I was able to target those who were in positions that dealt with the
issues covered by the survey. The data frame included companies from all 50 states in the
U.S. I did not base any specific selection on state or geographic location, except to limit
the sample to U.S. companies and not include overseas firms or establishments of US
firms overseas.
Once I had identified the contacts, I mailed each an eight page questionnaire
booklet (seven inches by eight and a half) along with a postage paid envelope for the
survey’s return. The mailing included a cover letter along with the questionnaire. It also
offered a five-dollar donation to one of six charities for completion of the survey. The
charities that the participants could choose from were Habitat for Humanity, Make a
Wish Foundation, World Wildlife Fund, Big Brothers/Big Sisters, St. Jude Children’s
Hospital, and the Susan G. Komen Breast Cancer Foundation. Ten days after the mailing,
I sent reminder postcards.
The first wave of mailings resulted in 119 of the packets returned as
“undeliverable” and 46 responses. Two weeks after the reminder postcard, I sent another
31 questionnaire booklet, cover letter, and postage-paid envelope to the 1,950 who had not
responded. Again, ten days later, I followed up with a second reminder postcard to the
non-responders. The second wave brought 27 responses for a total response rate of 4
percent. The first wave of survey booklets was yellow, and the second wave was white in
order to easily identify which mailing elicited a response from each respondent2
I compared the responses from the mail survey to 56 responses from evening and
executive MBA students at a large Midwestern University. The responses between the
evening and executive students did not differ significantly. However the responses
between the mail-survey responders and the MBA students differed significantly (the
means of 35 percent of the questionnaire items were statistically different). This
difference appears to be due to the great difference in numbers of years of experience for
the MBA students versus the mail survey respondents (9.7 years versus 27.4 years).
Given the prevalence of people with the title of “President” to whom I sent the survey,
this difference is not surprising. I chose to use the 73 responses from the mail survey in
the data analyses because their companies are single SBU firms, and I can connect their
responses to their 10K data filed with the SEC.
. No
company had more than one responder. Having only one respondent from a company
may result in mono-method bias, and I discuss this issue in the section entitled
“Limitations and Implications for Future Research.”
2 A non-response analysis was performed comparing early and late responses (Armstrong, J.S. & Overton, T. S., 1977. Estimating Nonresponse Bias in Mail Surveys. Journal of Marketing Research, XIV(August): 396-402). The results of the analyses of respondents and responses show no significant differences and indicate that non-response bias is not an issue with our sample.
32 1.4.2 Measures
I developed measures for competitive intensity because pre-tests on a previously
published scale did not show a high Cronbach’s alpha. For all other constructs, I used
existing measures. Appendix A contains all the measures used in the analyses.
Market orientation (Appendix A.1)
I measured the components of market orientation using the widely accepted scale
developed by Kohli and Jaworski (1993). As Appendix A.1 shows, the scale consists of
20 questions all of which I included in the survey and the analyses. The coefficient alpha
for the 20 items was 0.87 and the composite reliability, 0.88, well above the 0.70
minimum suggested (Nunnally & Bernstein, 1994).
Value (Appendix A.2)
Following my definition of perceived value (Section 1.2.3 above), I used eight
items to measure the social, emotional, economic, and technical aspects of offerings
which make the purchaser prefer a product. The survey instructed firms to answer all
eight of the value questions in the context of how the company’s customers view its
offerings in comparison to the competitors. To measure the economic aspect of value,
researchers commonly ask how the offering’s value for the money compares to that of the
direct competitors. The technical aspects are covered by the questions in which
respondents rate their product quality and how the company deals with problems. To
cover the social and emotional aspects, the respondents rated their companies on how
understanding they are, how they are at collaborating, and how their customer service
33 compares to their competitors’ customer service. Some of the value questions cover
multiple aspects; for example, all aspects of value are covered in the question that asks
the respondents if their firm offers the best total solution to their customers. The technical
and socio-emotional aspects are both incorporated in the question about responsiveness.
All of these questions together integrate the multiple aspects of value. The eight questions
have a coefficient alpha of 0.81 and a composite reliability of 0.86, well above the
minimum suggested (Nunnally & Bernstein, 1994).
Performance
Self-reported performance (Appendix A.3)
Again, I measured firm performance three ways because companies are interested
not only in profit, but also sales growth and customer retention, depending on their
strategic focus. In this study, I use self-reported measures of how the firm performed in
comparison to their direct competitors over the last two years (short-term) and
additionally in the long-term (four years) and measures from the 10K filings of the
respondent companies. For the self-reported measures, participants reported performance
on a 5-point, single item scale with endpoints of “Much Better” and “Much Worse” than
competitors. The three measures had a coefficient alpha of 0.81 for the comparison at two
years and 0.84 for four years.
Objective performance measures (Appendix A.4)
Having only self-reported measures from one member of each company does not
allow for triangulation of responses and may lead to mono-method bias. Therefore, I
34 supplement the subjective data with objective data from the 10K filings of the firms. In
order to use performance measures from the 10K filings of single SBU firms, I used data
found on Compustat. I obtained ROA and Sales Growth data for all publicly traded,
single SBU firms from 2005 through 2008. The 2005 survey asked respondents to rate
their companies in the present. Therefore, 2005 data should show the impact of current
market orientation and value on reported performance measures in 2005. I found 5,513
firms that had at least some data for the performance measures I was interested in during
at least one of the years. I identified the respondent companies within this group of firms.
Not all the responding firms had data for the timeframe I was interested in. I retained
those with data for at least one of the performance measures. Of these, 49 firms had data
for Sales Growth and 45 for ROA in 2005. For the years after 2005, even fewer
respondent firms had data for the performance measures of my research. This may have
been caused by the firms expanding and becoming multiple SBU firms, or they could
have been acquired by another firm. One firm had gone private; some may have delisted
from the stock exchange, and consequently no longer needed to file a 10K report.
Therefore, I consider only the 2005 data. I cannot test for a lag effect of market
orientation or value on performance.
As there is no a priori reason to believe that sales growth and ROA should be
similar for different types of firms in the same year (for example, a fall in mineral prices
may reduce ROA for a mining company but have no impact on casinos), I sorted the
firms by SIC code (the S.E.C. still uses SIC codes and not the newer NAICS codes). I
used only the first three digits of the code because grouping by complete SIC code would
have created very small and sometimes single-firm groups. If any three-digit SIC group
35 had no responding firms in the group, I removed it from the analyses. A total of 2,422
companies remained, including the respondent companies. There were 34 groups of
companies, the largest group with 569 companies and the smallest with 3 companies.
The respondents ranked their company on performance as compared to each of
their competitors. Each of the three-digit company groups was considered the competitors
for the respondent companies within the group. My study considered the data for sales
growth and ROA separately. The firms do not report sales growth or ROA. Instead they
report the data needed to calculate these measures. I calculated the measures using
standard accounting definitions. Sales Growth is defined as the difference between this
year’s sales and last year’s sales divided by last year’s sales. ROA is net income plus
after tax interest expense, all divided by the total assets at the beginning of the year. After
calculating Sales Growth and ROA for all the companies, I calculated the average and
standard deviation for Sales Growth and ROA for the three-digit SIC code group.
Outliers were removed if their ROAs or Sales Growth figures were five or more standard
deviations from the mean of the group. Different types of firms, as identified by their
three-digit SIC codes, will have different average ROA and sales growth due to outside
factors that may not influence ROA and sales growth of different types of firms.
Therefore, to compare performance of the companies from different SIC codes, the
companies’ sales growth (ROA) rank within their SIC code group is the actual
performance measure. This compares the performance of the company to the competitors,
similarly to how the respondents rated their company performance relative to their
competitors. Then, I linked the 10K performance measures for the respondent companies
to the self-reported survey data for value, market orientation, and the control variables.
36
Moderators: Competitive intensity (Appendices A.5 and A.6)
I measured competitive intensity with two scales. I developed measures based on
D’Aveni’s work on hyper competition (D'Aveni, 1994, 1995). Appendix A.5 shows the
scale. I compared the hyper competition scale that I developed to a previously developed
competitive intensity scale (Song & Parry, 1997a, b) which appears in Appendix A.6.
The scales include questions about price competition and how aggressively firms position
themselves against each other in the respondent’s competitive market. In the first pre-test
with 98 MBA students, the Cronbach’s α for the Song and Parry competitive intensity
scale was 0.36 while the α for the scale I developed was 0.78. However, I chose to
include both scales in the final survey despite the low α of the Song and Parry measure,
as it had been previously published in the marketing literature. The α for the Song and
Parry competitive intensity scale with the responses from the final sample only improved
to 0.41 while the α for the hyper competition scale I developed was 0.77, which is above
the 0.7 cutoff suggested by Nunnally (1994).
Control variables (Appendix A.7)
I included control variables for competitive factors that might influence firm
performance. As Table 1–2 shows, previous researchers have investigated control
variables such as firm size, buyer power, market position, ease of market entry
(Atuahene-Gima, 2005; Chou, 2009; Hult et al., 2005). In the final survey, respondents
answered questions about four competitive factors: self-reported size of firm (as
compared to the direct competitors), cost disadvantage of the responding firm as
37 compared to their major competitors, barriers to entry, and buyer power. Appendix A.7
includes the single item measures.
1.5. RESULTS OF MODEL TESTING
1.5.1 Introduction
This section presents the results of testing the two models which I hypothesize in
this study: the direct link model (Model 1) and the value-mediated model (Model 2).
First, I describe the methodology used to test the models. Then, I test and evaluate Model
1 and, subsequently, Model 2. A comparison of the two models shows that, in Model 2,
value acts as a mediator of the path between market orientation and performance. Then, I
decompose market orientation into the three parts suggested by Kohli et al. (1993):
intelligence generation, intelligence dissemination and responsiveness. Results show that
intelligence generation is a statistically significant predictor of performance in the long-
term. Intelligence dissemination is a statistically significant predictor of all three
composite performance measures. Responsiveness is not a statistically significant
predictor of performance for any of the composite performance measures; however, it is a
statistically significant predictor of value. Value does not mediate the dissemination to
performance path, but it does partially mediate the generation to performance path.
38
1.5.2 Statistical Methods
A review of the recent literature showed that market-orientation research most
commonly uses either regression analysis or structural equation modeling (SEM.). Table
1–2 shows 13 marketing orientation papers published in peer reviewed journals in a five-
year period. Eight used regression (62 percent), three used SEM (23 percent) and the
other two were conceptual or descriptive. While most studies that use SEM utilize
maximum likelihood (ML) estimation procedures, usually through the programs LISREL
or AMOS, I chose to use partial least squares (PLS) estimation utilizing the SmartPLS
(Ringle, Wende, & Will, 2005) program for path modeling. Path modeling with PLS
provides advantages over regression analysis and ML based SEM. Table 1–3 contains a
comparison of the three methodologies. Below, I provide an overview of PLS and its
advantages.
Both ordinary least squares (OLS) and LISREL require an assumption that the
data are measured without error. Measurement error can be caused by something as
simple as the order of the questions in the survey. PLS theory does not require normally
distributed, continuous variables that are measured without error, and by using PLS, I
avoid the assumption that my data were measured without error.
Additionally, path modeling with PLS is preferable to regression for investigating
moderation and mediation. Testing for mediation and/or moderation is complicated using
OLS’s simple linear structure. The most common test for mediation requires three
separate regressions (Baron & Kenny, 1986; Zhao, Lynch, & Chen, 2010). However,
39 with PLS and LISREL, the mediators and moderators can all be included in the model
and their significance tested with one estimation model (Haenlein & Kaplan, 2004).
PLS allows a more complete look at the multiple performance indicators in the
models. OLS depends on a simpler model, allowing only one dependent variable at a
time. Both PLS and LISREL can estimate more complex models and allow multiple
dependent variables to be included simultaneously in the model.
Additionally, researchers usually assume that latent indicators are reflective. This
may be because other than using PLS, there is no simple way to construct formative
indicators. Formative indicators are causal, meaning that they cause the latent variable,
while reflective indicators are effects of the latent variable (Diamantopoulos &
Winklhofer, 2001). Haenlein and Kaplan (2004) offer examples of formative and
reflective indicators. They explain that life stress is a formative latent variable which
could be caused by writing a dissertation, getting a divorce, having a parent die, or
becoming ill. A person does not need to suffer with all of the stress-causing experiences
to have life stress; any one will do. In this case, the experiences (items) are uncorrelated,
though they do not have to be.
The items of reflective indicators are correlated and are the effect of the latent
variable. For example, timeliness (the latent variable) means a person is usually on time
to meetings, meets deadlines, and responds to telephone calls and emails promptly. If the
person were not on time to meetings or did not return calls promptly, they would not be
considered timely. Therefore, timeliness is an example of a reflective indicator. PLS,
unlike OLS or LISREL, allows indicators to be either reflective or formative, and both
types can be included in the same model.
40 An important advantage of PLS over LISREL is that fewer observations are
required. As with other methods of data analysis, more is better; however, PLS can
estimate models with fewer observations than LISREL (Haenlein & Kaplan, 2004).
LISREL and OLS do have an advantage over PLS in that there are multiple goodness of
fit measures for both those methods. PLS has some goodness of fit measures (R², t-
statistics, Average Variance Extracted, and Cronbach’s alpha for example), but LISREL
in particular has many more. Because of this, PLS is less desirable than LISREL for
comparing models, but is adequate for theory building (Henseler, Ringle, & Sinkovics,
2009).
Given the low number of observations and the desire to test both mediators and
moderators, PLS was an obvious choice for my data analyses. Additionally, using PLS
allowed me to model multiple dependent variables and use both formative and reflective
indicators in the same model.
In order to run the path models for Models 1 and 2, I assigned each company a
market-orientation score. While PLS can estimate models with large numbers of
indicators and few observations, the results are more likely to be valid when there are
more observations than indicators. The market orientation score is composed of the
responses to the 20 market-orientation measures that Section 1.4.2 of this paper
describes. As the respondents rated their companies on a scale of one to five for each
measure, the market-orientation scores could range from a low of 20 to a high of 100.
The highest score recorded in the data set was 99 and the lowest 29. The average score is
73.6 and the median was 74. Figure 1–3 shows the distribution of the market-orientation
scores for the sample.
41 Model 2 requires value to be included in the model. As with market orientation, I
constructed a value creation score from the eight items described in section 1.4.2.
Respondents rated each of the eight value items on a scale of one to five. Therefore, the
value score had a total possible score of 40. The scores in the sample ranged from a low
of 15 to a high of 40. The mean was 31, and the median, 32.
In estimating performance for the models, I depart from previous work that only
focuses on a single measure, and with PLS, I can include multiple dependent variables in
a model. Therefore, in the estimations of Models 1 and 2, I include profit, revenue, and
customer retention in the short and long term as well as the objective performance
measures. A priori, there is no reason to believe that all the indicators measure the same
type of performance, and orientation and value may have differing relationships with the
individual performance measures and time frames (Venkatraman & Ramanujam, 1986;
Voss & Voss, 2000). As Table 1–1 shows, previous studies have had mixed results when
investigating growth and profitability separately. As Tables 1–4 and 1–5 show, in the
observed data which I used to test the models, the correlations between any two of the
self-reported measures range from 0.53 to 0.66. The coefficient alpha is 0.80 for the three
measures at both two years and four years. Therefore, I included all the self-reported
performance variables in the model and the two 10K performance variables. The three
subjective short-term measures are indicators of short-term composite performance, the
three subjective long-term measures are indicators of long-term composite performance,
and the two objective 10K measures are indicators of composite 10K performance. As I
model the performance variables in a composite manner, I will refer to short-term
42 performance (long-term performance or 10K performance) in reference to the composite
variables.
As mentioned previously, PLS demonstrates an advantage over both OLS- and
ML-based SEM methods; PLS indicators can be either formative or reflective, and both
types can be included in the same model. Usually, indicators in marketing research are
assumed to be reflective, possibly for ease of modeling and estimation. One study
showed that in the top four marketing journals, only eight percent of formative constructs
are correctly modeled (Jarvis, MacKenzie, & Podsakoff, 2003). The other 92 percent are
modeled as if they were reflective constructs. The authors also offer a set of criteria to
determine if the constructs should be modeled as reflective or formative. Following the
researchers’ criteria, the multiple measures of composite performance should be
considered indicators of a formative construct, and therefore, I have included them in my
model in a formative manner.
Another advantage of PLS over OLS is that while multicollinearity of the data
causes estimation problems in OLS, it is not a problem in PLS. Even so, I checked the
correlations between the latent variables, which appear in Table 1–6. Only the
correlations between the variables in the same model are shown. Therefore, no
correlation for the full market orientation score with any of the three factors of market
orientation (intelligence generation, intelligence dissemination, or responsiveness) appear
in the table. The correlation of the composite short- and long-term performance measure
is the highest at 0.814. This is not unexpected, for if a firm has good customer retention
(revenue, profitability) in one year, it most likely will have similar performance on the
43 measure in the subsequent year. I further checked the data with VIF tests, and they do not
show any signs of multicollinearity.
Using PLS to test for mediation, I compare the magnitude and significance of the
coefficients in the path model. My model estimation includes competitive intensity and
the control variables—firm size, buyer power, cost disadvantage, and ease of market
entry. The control variables and competitive intensity are not significant in all the
models. Below, I discuss each model in detail.
1.5.3 Model 1
I ran Model 1 first to test the fit of the observed data with the previously accepted
direct model of market-orientation-to-performance. Model 1, as shown previously in
Figure 1–1, has a direct path from market-orientation-to-firm performance. To test Model
1, I built a path model with the three groups of performance measures (long-term, short-
term, and 10K measures) included in the model. Each of the three performance constructs
are comprised of the corresponding indicators and yield formative results. In developing
the final model, I first included all the control variables, and then removed those that did
not have a statistically significant impact on the performance measure. The final model is
shown in Figure 1–4. Firm size is only significant for short-term and long-term
performance and not for the 10K measures considered. The barriers to entry effect has a
significant, negative effect on the 10K performance measures.
Figure 1–4 contains the coefficients and t-statistics for Model 1. The data support
H1 that market orientation has a direct, significant, and positive impact on the three types
44 of performance measured. The loadings on the short-term performance construct here
suggest that revenue is not a strong measure of short-term performance as described in
this model, nor is long-term profit a strong measure of long-term performance.
For both short- and long-term performance, firm size is positive and statistically
significant. Barriers to entry have a negative impact on 10K performance. This shows
that in markets where it is difficult for new competitors to enter, performance is
negatively impacted. I expected the opposite result; if the market is difficult to enter,
firms should be able to earn higher profits than if competitors can enter easily. Zhou, et
al. (2007) found that respondent firms erected barriers to entry that had a significant
positive impact on firm performance. In their research, they specified that a barrier to
entry was the respondent firm building a hotel in a prime location, leaving the
competitors to build their hotels in less desirable locations. In my study, the respondents
rated their market on how difficult it is for a new competitor to enter. As I included firms
from many different industries, this question may have been too general and the
respondents may each have construed different types of barriers. For example, in some
situations, a market may be difficult to enter because of some type of protection such as
governmental controls, regulations, licensing, permit requirements, or high start-up costs,
and in other situations, a market may be difficult to enter because there is a high level of
competition. If the difficulty of entering a market is primarily due to its highly
competitive nature, then we should expect lower ROA and sales growth.
The other control and moderator variables are not significant predictors of the
performance measures.

45 SmartPLS calculates the R²s for each of the performance variable estimations.
The R² is 0.434for short-term performance, 0.389 for long-term performance, and 0.207
for the 10K measures. These values are similar to previous research on market orientation
that has found R²s of between .21 and .48 (Deshpandé & Farley, 1998b). And the R²s are
in line with those considered “substantial” in a more recent market orientation study
(Morgan et al., 2009).
1.5.4 Model 2
To run the value mediation model, Model 2, I included the value score as a
mediator in the path model and compared it to Model 1 for the three performance
constructs. Figure 1–5 shows the final model and the coefficients and t-statistics for each
of the variables. Market orientation has a positive and statistically significant impact on
value. In this model, value does not mediate the market-orientation-to-performance path
for the 10K measures. However, it does mediate the paths from market-orientation-to-
short-and-long-term performance. Following the Baron and Kenney descriptions of
mediation, value is a partial mediator of these paths, as the direct path from market
orientation to both short-term and long-term performance constructs remains significant,
but the market orientation coefficient decreases (1986). Including value in the model
increases the R² of the short-and long-term performance estimations. The R² of short-term
performance increases to 0.56, and that of long-term performance increases to 0.49. In
this estimation, firm size is again a positive predictor of short- and long-term
performance. Unlike in Model 1, where buyer power was not a statistically significant

46 predictor of any of the performance measures, here buyer power has a negative and
significant impact on long-term performance.
1.5.5 Model Comparison
In Figures 1–4 and 1–5, I detail the results of the empirical tests of the models.
Figure 1–4 shows that the data support H1 that market orientation is a positive and
statistically significant predictor of all three of the performance constructs. However,
Figure 1–5 shows that H2 is only partially supported by the data, as the results depend on
the performance measure. Value does not mediate the market-orientation-to-performance
path when the 10K measures are the dependent variable, but it partially mediates the
paths to both short-term and long-term performance. Firm size is a positive and
statistically significant predictor of both short- and long-term performance in both
models. This demonstrates that being larger than the direct competitors gives firms a
performance boost. As Figure 1–5 shows, the R²s of the short-term and long-term
performance paths increase when value is included in the path model. Value, then, is one
link that helps explain when and how market orientation leads to enhanced performance.
By examining the paths from market orientation to performance both indirectly
through value and directly from market orientation to firm performance, I get a deeper
understanding of how market orientation impacts firm performance. I can break down the
influence of market orientation on performance into its direct effect (path directly from
market orientation to performance) and its indirect effect (effect from market orientation
through value to Performance). When the model includes value as a separate construct,
the result is a reduction in the direct effect of market orientation to performance. A model
47 omitting value as a separate construct would not correctly explain the impact of market
orientation on performance.
1.5.6 Decomposing market orientation
The estimation of Models 1 and 2 above included market orientation as a one-
factor scale. As shown in Table 1–2, this is usually how researchers have estimated
market orientation. However, as described earlier, Kohli et al. (1993) suggest that market
orientation is correctly specified as three separate constructs. Doing so, they propose,
allows for greater exploration of the potential for another factor’s mediation between
market orientation and performance. They show that what is usually considered one 20-
item factor could be split into three separate ones: intelligence generation, intelligence
dissemination, and responsiveness. The authors suggest that the three separate factors
will have differing impacts on performance and on value.
As a prelude to doing my own decomposition, I reviewed the market-orientation
literature and found two studies which broke market orientation into the three factors
suggested by Kohli et al. (1993). First, Rose and Shohan (2002) examined the role of
overall market orientation and then its three components on four separate measures of
export performance in Israeli exporters. They found that overall market orientation,
intelligence generation, and responsiveness were positive and related in a statistically
significant way to three of the performance measures, but that no statistically significant
relationship existed between intelligence dissemination and any of the performance
measures they tested (p. 222).
48 In the second study to use the three factors, researchers conducted a market-
orientation study in China to investigate reliability and validity of the Kohli and Jaworski
market-orientation measures in an environment other than the U.S. They tested the
reliability of the three components, and then used the three components to describe
differences between consumer products companies and industrial products companies.
However, while they correlate the complete market-orientation scale with performance,
they do not investigate the role of the three components of market orientation on their
performance measures (Kaynak & Kara, 2004).
The complete market-orientation scale produced mixed results in the model
without value, tested above. Also, without published studies examining the role of
mediation with the three components of market orientation, I sought to further investigate
the role of market orientation and value on firm performance by decomposing market
orientation into the three factors that Kohli et al. (1993) specify.
Confirmatory factor analysis of market orientation:
In order to decompose market orientation, I conducted confirmatory factor
analysis starting with the original 20 items included in the complete market-orientation
scale to determine whether the data showed the same three-factor structure found by
Kohli et al. (1993). The data had a tendency to cross load on factors. Specifically, the
items which represent the responsiveness factor cross loaded on the intelligence-
dissemination factor. After cleaning the cross-loading items and removing items that did
not load on any factor, I was left with a three-factor solution composed of the nine items
shown in Table 1–7. The p-value of the solution was 0.228, showing that three factors are
49 sufficient. Three of the items that were not included in the one-factor solution are
included in the three-factor solution. The three factors, intelligence generation,
intelligence dissemination, and responsiveness, have composite reliabilities of 0.89, 0.85,
and 0.78 respectively, and Cronbach’s alphas of 0.76, 0.75, and 0.61. Furthermore, the
average variance extracted (AVE) of the three factors are all above the suggested cut-off
of 0.5 (0.81, 0.58, and 0.55 respectively) showing convergent validity. Discriminant
validity is supported by the Fornell-Larker criterion as the AVE of each is greater than
the highest squared correlation with any other variable.
1.5.7 Three-factor market-orientation model
Model 1.3
I first reran Model 1 with the three factors of market orientation, replacing the
single, universal market orientation variable. I shall refer to this model as Model 1.3. As
in section 1.5.3, the path model includes the three factors of market orientation and the
three groups of performance measures as well as the control variables. To reach the final
model, I first included all the paths possible, and then removed those that did not have a
statistically significant impact on the performance measures. The final model is shown in
Figure 1–6. As in the original Model 1, both barriers to entry and firm size have
statistically significant effects on some of the performance measures but not all.
Additionally, cost disadvantage has a statistically significant impact on the 10K and
short-term performance measures.
50 Figure 1–6 contains the coefficients and t-statistics for Model 1.3. The data show
that the three components of market orientation have different impacts on firm
performance. As the results show, responsiveness does not have a statistically significant
impact (even at α = 0.10 level) on any of the performance variables included in this
model. Intelligence generation impacts the self-reported short- and long-term measures,
while dissemination has a statistically significant impact (greater than α = 0.05) on all
three performance variables. The coefficient on firm size shows a positive and
statistically significant effect (at α = 0.05) on both short- and long-term performance. The
coefficient of cost disadvantage shows a negative and statistically significant impact (α =
0.05) on 10K and short-term performance, but not on long-term performance. Barriers to
entry continue to have a negative and statistically significant impact on the 10K
measures. The other control and moderator variables are not included in the final model
as they do not have a statistically significant impact on any of the performance measures.
The R²s of the performance variables are 0.490 for short-term performance, 0.444 for
long-term performance, and 0.266 for the 10K measures. As in both Model 1 and Model
2, the R² of the 10K measure variable is the smallest.
Model 2.3
Even when no direct effect exists, one can test for mediation (Zhao et al., 2010).
Therefore, I ran the value mediation model, Model 2.3, and included the three
components of market orientation. Then, I compared it to Model 1.3. For value to
mediate the model, each of the three components should have a positive and statistically
significant impact on value. In fact, both intelligence generation responsiveness have
51 positive and statistically significant (α = 0.05 and α = 0.10 respectively) impacts on
value. Intelligence dissemination, however, does not demonstrate a statistically
significant impact on value. Next, mediation requires that value have a positive and
statistically significant impact on each of the three performance measures. However, the
data only support value having a positive and statistically significant impact on short- and
long-term performance, but not on the 10K measures. This result is similar to the result in
Model 2 above. Finally, even though generation has a statistically significant path to
value, it continues to have a direct path to long-term performance that is also statistically
significant (α = 0.05). Therefore, the data support a conclusion of value only as partial
mediator in the market-orientation-component-to-performance path.
Cost disadvantage has a negative and statistically significant (α = 0.05) impact on
both 10K performance and on short-term performance. Barriers to entry also have a
statistically significant and negative impact on 10K performance. As in Models 1, 2, and
1.3, firm size has a statistically significant and positive impact on both short- and long-
term performance. The R² for the 10K performance part of the model remains the same as
in Model 1.3 the variables impacting 10K performance remain unchanged. With the
inclusion of value in the model, the R²s of both short- and long-term performance
increase from 0.490 to 0.605 for short-term performance, and from 0.444 to 0.541 for
long-term performance.
Results of the three-factor model
The results of testing the three-factor solution, rather than the more commonly
used one-factor market orientation scale, highlight the need to be specific not only about
52 the performance measure used, but also about what part of market orientation is a
company’s strength. For example, a firm that is good at intelligence dissemination will
experience a positive impact on its performance in both the short- and long-term and
improve the 10K measures included in this study. In contrast, a customer responsive
focus will not lead to a positive impact on firm performance. Intelligence dissemination
does not have a statistically significant impact on creating offerings of value to
customers. However, both intelligence generation and responsiveness do aid in creating
offerings that customers value. A firm trying to improve performance should determine
its weakest areas of market orientation and improve the parts that will have the largest
impact on its performance.
1.6. DISCUSSION
For scholars, this study shows that value, at least partially, mediates the market-
orientation-to-performance link when the research uses self-reported measures. While
published research has discussed the importance of market orientation on value,
researchers had not previously tested value’s mediating effect. Although the market-
orientation-to-performance link is generally accepted, mixed results in previous studies
suggest a need for an improved model. Value’s mediation impact suggests a more
complete understanding of how market orientation impacts firm or SBU performance. If
replications of this research support the findings, then the importance of competing on
value in a competitive environment will be supported.
53 1.6.1 Theoretical Implications
As I discussed earlier, both Hunt’s and Chamberlin’s theories suggest separating
value from the overall market-orientation scale and, instead, viewing value as linking
market orientation and performance (Chamberlin, 1965; Hunt & Morgan, 1995). As Day
and Wensley (1988) suggested, a superior market orientation leads to a positional
advantage, which in turn leads to enhanced performance. These results support the value-
mediated model depending on the performance measure. Previous studies have shown
mixed results for the orientation-to-performance relationship. One interpretation of my
study results could be that some of these differences may be due not only to excluding
value as a mediator, but also to the performance measure used. Additionally, control
variables that were included in my models had statistically significant impacts on the
performance variables. This shows the importance of including the variables.
My results also partially support the three-component structure of the market-
orientation construct proposed by Kohli et al. (1993). While one previous study found
that intelligence generation and responsiveness both lead to performance (Kaynak &
Kara, 2004), I found that intelligence dissemination leads to enhanced self-reported and
objective performance. Intelligence generation in my study has a directionally correct
(positive) influence on performance in the short-term, but it is not statistically significant.
In the long-term, however, it is statistically significant. In contrast, responsiveness is not
a significant predictor of performance. Additionally, I found that value at least partially
mediates even the paths from responsiveness and intelligence generation to self-reported
performance. The previous study had not tested for mediation. My finding that size of the
firm in relation to its competitors, buyer power, barriers to entry, and cost disadvantage

54 also impact the performance of the single SBU firm has implications for building future
theories on why and when firms will have good performance.
1.6.2 Managerial Implications
As markets become more transparent and as information becomes more easily
available via the internet, price and barriers to information are no longer viable
competitive strategies. Instead, value moves to the forefront. In order to compete on
value, firms must know who their customers and competitors are and what their needs are
(Sawhney, 2002). While increased information for both buyers and suppliers leads to
markets that are closer to a classical perfect competition scenario, buyers will never have
homogenous needs. Knowing your customers and providing offerings that they value will
lead to above-average performance.
This study’s results offer preliminary information for managers about the
components of market orientation. Before focusing on value creation, management
should examine the components of market orientation that impact value and performance.
By breaking market orientation into its three components, firms can determine where on
the market-orientation scale they are deficient. If firms already generate intelligence and
respond to customers but do not score as highly on intelligence dissemination, they
should focus on dissemination to improve. This is especially important as the results
show intelligence dissemination to be a statistically significant predictor of the three
performance measures included in the study.
55 1.6.3 Limitations and Implications for Future Research
Although market orientation and its three components each contribute to
performance, value partially mediates some of the relationships. Because the research
used survey data and not experimental data, I cannot show causality. Even so, applying
the framework of the mediated model gives a deeper understanding of the roles of value
and market orientation.
Using PLS, future research could further investigate the relationship between the
three components of market orientation and performance. PLS allows both formative and
reflective indicators in the same model. A more in-depth model than the one presented
here would have measures for the three components of market orientation, and then a
separate measure for market orientation. The three components would lead to market
orientation, and then market orientation would lead to value and then to performance. My
data did not contain a separate measure of market orientation which would have allowed
me to model the components in such a manner.
Researchers examining the impact of market orientation on performance have
mainly focused on innovation, without considering value. Recently, a few researchers
have discussed value when using innovation as a proxy for customer value delivery
(Srinivasan, Pauwels, Silva-Risso, & Hanssens, 2009). While innovation may enhance an
aspect of a product or service that customers value, not all innovations will necessarily
lead to increased perceived value. For example, an innovation may lead to increased
quality of a product, but the innovation will translate into increased perceived value only
if customers value higher quality. Some customers may not need higher quality.
56 For my survey, respondents answered questions about innovation from a scale
that has been previously studied in the context of market orientation and performance
(Calantone, Garcia, & Droge, 2003; Hurley & Hult, 1998). Innovation and value have a
negative correlation of 0.123 which is statistically different from zero. VIF tests show no
evidence of multicollinearity. When I included both innovation and value as mediators in
the same model, value is statistically significant, while innovation is not. The path from
market orientation to innovation is not statistically significant, nor are any of the paths
from innovation to the performance variables. Adding innovation into the model with
value does not increase the R²s of any of the performance variables either. Still, as this
was an exploratory study of innovation and value, future researchers should consider both
innovation and value as mediators in the same model to determine if they are separate or
if value subsumes innovation.
Related research also sheds light on the need to identify what impacts the links
between value and market orientation. Narver and Slater (1990) control for nine market-
level factors, such as industry growth and concentration, entry barriers, buyer power, and
seller power. They found five of the nine factors to be significantly different from zero.
In 1994, however, Slater and Narver concluded that industry characteristics have little
impact on the link from market orientation to performance. Likewise, research on Indian
companies found that supplier power, competitive hostility, and market turbulence were
not moderators of the orientation-to-performance relationship (Subramanian &
Gopalakrishna, 2001).
My study controls for some industry effects by asking respondents to compare
themselves to their direct competitors and includes self-reported measures of barriers to

57 entry, buyer power, firm size, and cost disadvantage. However, given the contradictory
findings of past studies, future cross-industry research should continue to control for
market-level factors.
Further analyses could divide the data by industry type to determine if these
results vary by industry type. Another way of further scrutinizing the role of value would
be to dissect the data into product manufacturers versus service providers to investigate
and compare the role of value in these two different types of industries. Ideally, further
analyses might reveal interactions between industry or market characteristics that would
more fully explain the role of value. Sampling would most likely need to move beyond
single SBU firms and the contact data available for those firms, as a larger number of
respondents would be unlikely.
As with past studies of orientation (Gatignon & Xuereb, 1997; Greenley, 1995),
the self-reported measure part of this one suffers from the potential for mono-method bias
which may affect the survey responses. With only one respondent from each company,
triangulating the responses is not possible, especially those of the self-reported
performance variables. I attempted to improve the meaningfulness of the results by using
concrete performance measures from 10K reports. The results using these performance
measures, while interesting, are not as strong as they could be. This may be because I
must assume that all competitors of publicly traded, single SBU firms are also publicly
traded, single SBU firms, and the rankings of ROA and sales growth omit firms with
multiple SBU’s that compete in multiple-SIC codes. Future research should use multiple
informants and objective measures at either the SBU or firm level.
58 1.6.4 Conclusions
This study is an important step in understanding the orientation-to-performance
link. By including value in the orientation-to-performance equation, I see that value is at
least a partial mediator, and the impact of orientation is overwhelmingly indirect, through
value for self-reported measures. For managers, the implications of the study are clear.
Previously, much research showed that market orientation was the key to above-average
firm or SBU performance. However, this study shows that across diverse firms and
industries, learning about customers and markets and then using that knowledge to create
valuable offerings for the customers will lead to above-average performance. Value
serves as a link between market orientation and performance. In the competitive
marketplace, firms should focus on value creation, facilitated by a market orientation, to
enhance firm performance.

59
APPENDIX A:
A.1 Market Orientation Measures (20 items)
Questions Included in the Market Orientation to Performance Models
Strongly Strongly Disagree Agree
1. In this business unit, we meet with customers at least once a year to find out what products or services they will need in the future. 1 2 3 4 5
2. In this business unit, we do a lot of in-house market research.** 1 2 3 4 5 3. We are slow to detect changes in our customers’ product preferences.* 1 2 3 4 5 4. We poll end users at least once a year to assess the quality of our products and services. 1 2 3 4 5 5. We are slow to detect fundamental shifts in our industry (e.g., competition, technology,
regulation).* ** 1 2 3 4 5
6. We periodically review the likely effect of changes in our business environment (e.g. regulation) on customers. 1 2 3 4 5
7. We have interdepartmental meetings at least once a quarter to discuss market trends and developments.** 1 2 3 4 5
8. Marketing personnel in our business unit spend time discussing customers’ future needs with other functional departments.** 1 2 3 4 5
9. When something important happens to a major customer or market, the whole business unit knows about it in a short period. 1 2 3 4 5
10. Data on customer satisfaction are disseminated at all levels in this business unit on a regular basis. 1 2 3 4 5
11. When one department finds out something important about competitors, it is slow to alert other departments.* 1 2 3 4 5
12. It takes us forever to decide how to respond to our competitors’ price changes.* 1 2 3 4 5 13. For one reason or another we tend to ignore changes in our customers’ product or service needs.* 1 2 3 4 5
14. We periodically review our product development efforts to ensure that they are in line with what customers want. 1 2 3 4 5
15. Several departments get together periodically to plan a response to changes taking place in our business environment. 1 2 3 4 5
16. If a major competitor were to launch an intensive campaign targeted at our customers, we would implement a response immediately. 1 2 3 4 5
17. The activities of the different departments in this business unit are well coordinated. 1 2 3 4 5 18. Customer complaints fall on deaf ears in this business unit.* 1 2 3 4 5 19. Even if we came up with a great marketing plan, we probably would not be able to implement it in a timely fashion.* 1 2 3 4 5
20. When we find that customers would like us to modify a product or service, the departments involved make concerted efforts to do so. 1 2 3 4 5
(Kohli & Jaworski, 1993) *NOTE: Starred measures were reverse coded for data analyses. **Questions 2, 5, 7 and 8 were not included in the final, one-factor solution.

60 A.2 Value Measures (Eight items)
How does your target customer segment compare your business to your direct competitors on the following attributes:
A.3 Performance Measures (Three items) How has your business unit’s performance in the past two years compared to your direct competitors’?*
Much Better Better Equal Worse
Much Worse
A.3.1. Revenue Growth
A.3.2. Profitability .......
A.3.3. Customer Retention ......................
*NOTE: Performance measures were reverse coded for data analyses Also, long-term question asked “How has your business unit’s performance in the past four years compared to your direct competitors?”
A.4 Objective Measures
Sales Growth = (This year’s sales – Last year’s sales)/ Last year’s sales
Return on Assets = (Net income + After tax interest expense) / (Total beginning assets)
A.2.1 Least responsive Most responsive to their individual needs
A.2.2 Worst product Quality Best product quality
A.2.3 Least Understanding of their needs
Most understanding of their needs
A.2.4 Offers the worst total solution
Offers the best total solution
A.2.5 Most difficult to collaborate with
Easiest to collaborate with
A.2.6 Worst customer value for the money
Best customer value for the money
A.2.7 Worst customer service Best customer service
A.2.8 Worst at dealing with problems and queries
Best at dealing with problems and queries

61 A.5 Hyper Competition
Strongly Strongly Disagree Agree
1. In our market, firms aggressively position against one another by attempting to disadvantage competitors. 1 2 3 4 5
2. In our market, firms create new competitive advantages which make obsolete or match competitors’ advantages. 1 2 3 4 5
3. In our market, firms attempt to stay ahead of their competitors.
1 2 3
4 5
4. In our market, firms create new competitive advantages that make the competitors’ advantages irrelevant by moving to compete in another arena. 1 2 3 4 5
5. In our market, temporary advantage and short periods of profit are achievable until competitors catch up with or outmaneuver the aggressor’s last competitive move. 1 2 3 4 5
A.6 Competitive Intensity
Strongly Strongly Disagree Agree
1. There is no price competition in this market.* 1 2 3 4 5
2. There are many strong competitors in this market. 1 2 3 4 5
3. There is a strong, dominant competitor, with large market share, in the market. 1 2 3 4 5
4. Potential customers are very loyal to competitors’ products. 1 2 3 4 5
5. Potential customers are not satisfied with competitors’ products. 1 2 3 4 5
6. New product introductions by competitors are frequent in this market. 1 2 3 4 5 (Song & Parry, 1997a, b) *NOTE: Starred measures were reverse coded for data analyses.
A.7 Control Variables
Strongly Strongly Disagree Agree
1. We are at a cost disadvantage compared to our major competitors. 1 2 3 4 5
2. It is difficult for a new competitor to enter this market. 1 2 3 4 5
3. Buyers in this market are able to negotiate favorable prices. 1 2 3 4 5
4. We are one of the largest firms in our field. 1 2 3 4 5
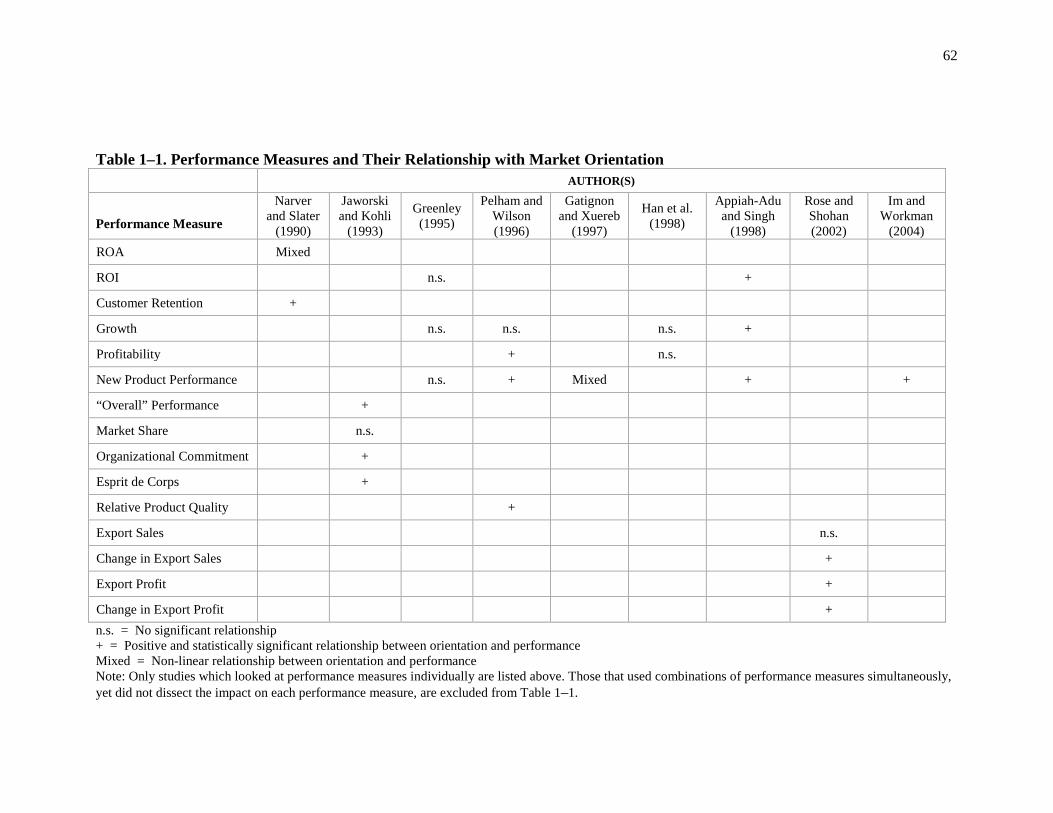
62
Table 1–1. Performance Measures and Their Relationship with Market Orientation AUTHOR(S)
Performance Measure
Narver and Slater
(1990)
Jaworski and Kohli
(1993)
Greenley (1995)
Pelham and Wilson (1996)
Gatignon and Xuereb
(1997)
Han et al. (1998)
Appiah-Adu and Singh
(1998)
Rose and Shohan (2002)
Im and Workman
(2004) ROA Mixed
ROI n.s. +
Customer Retention +
Growth n.s. n.s. n.s. +
Profitability + n.s.
New Product Performance n.s. + Mixed + +
“Overall” Performance +
Market Share n.s.
Organizational Commitment +
Esprit de Corps +
Relative Product Quality +
Export Sales n.s.
Change in Export Sales +
Export Profit +
Change in Export Profit + n.s. = No significant relationship + = Positive and statistically significant relationship between orientation and performance Mixed = Non-linear relationship between orientation and performance Note: Only studies which looked at performance measures individually are listed above. Those that used combinations of performance measures simultaneously, yet did not dissect the impact on each performance measure, are excluded from Table 1–1.
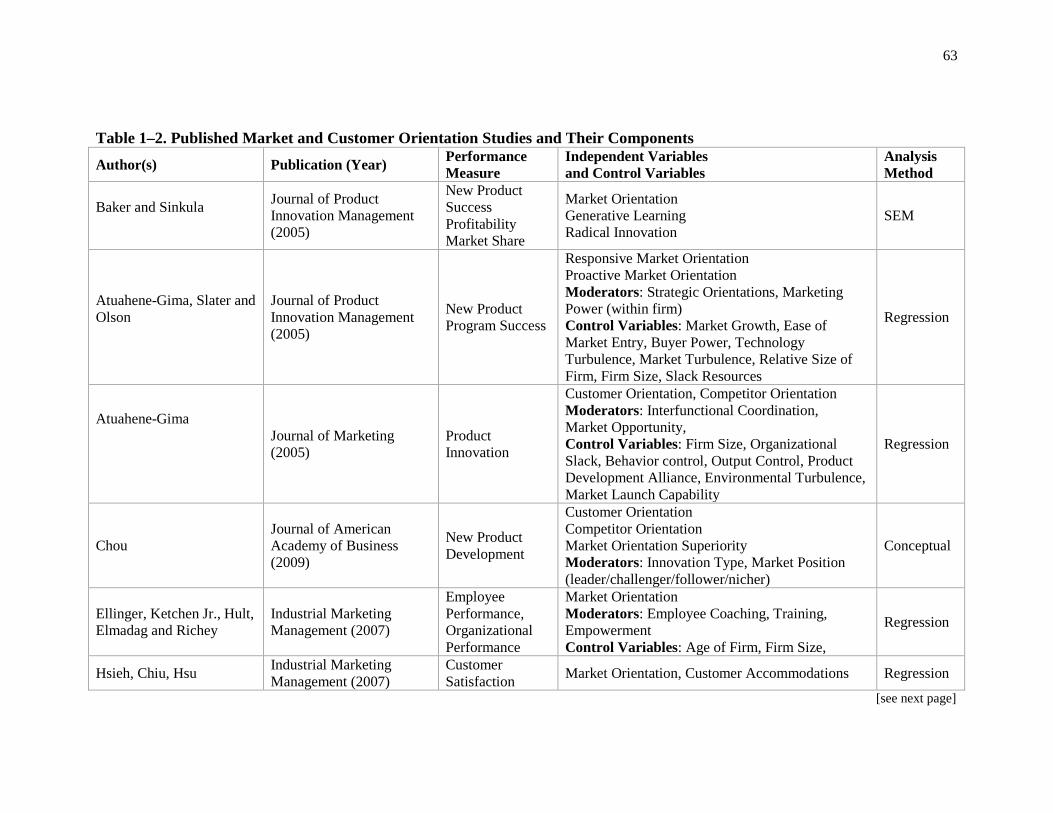
63
Author(s)
Table 1–2. Published Market and Customer Orientation Studies and Their Components Publication (Year) Performance
Measure Independent Variables and Control Variables
Analysis Method
Baker and Sinkula
Journal of Product Innovation Management (2005)
New Product Success Profitability Market Share
Market Orientation Generative Learning Radical Innovation
SEM
Atuahene-Gima, Slater and Olson
Journal of Product Innovation Management (2005)
New Product Program Success
Responsive Market Orientation Proactive Market Orientation Moderators: Strategic Orientations, Marketing Power (within firm) Control Variables: Market Growth, Ease of Market Entry, Buyer Power, Technology Turbulence, Market Turbulence, Relative Size of Firm, Firm Size, Slack Resources
Regression
Atuahene-Gima
Journal of Marketing (2005)
Product Innovation
Customer Orientation, Competitor Orientation Moderators: Interfunctional Coordination, Market Opportunity, Control Variables: Firm Size, Organizational Slack, Behavior control, Output Control, Product Development Alliance, Environmental Turbulence, Market Launch Capability
Regression
Chou Journal of American Academy of Business (2009)
New Product Development
Customer Orientation Competitor Orientation Market Orientation Superiority Moderators: Innovation Type, Market Position (leader/challenger/follower/nicher)
Conceptual
Ellinger, Ketchen Jr., Hult, Elmadag and Richey
Industrial Marketing Management (2007)
Employee Performance, Organizational Performance
Market Orientation Moderators: Employee Coaching, Training, Empowerment Control Variables: Age of Firm, Firm Size,
Regression
Hsieh, Chiu, Hsu Industrial Marketing Management (2007)
Customer Satisfaction Market Orientation, Customer Accommodations Regression
[see next page]
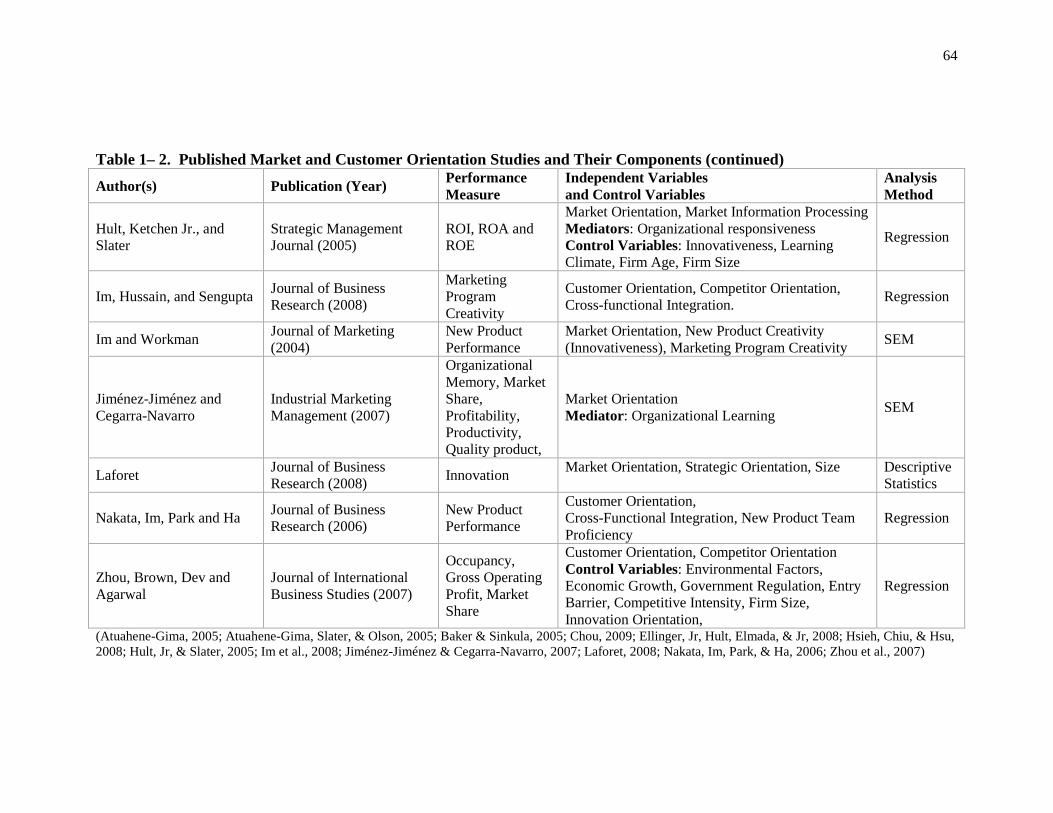
64
Table 1– 2. Published Market and Customer Orientation Studies and Their Components (continued) Author(s) Publication (Year) Performance
Measure Independent Variables and Control Variables
Analysis Method
Hult, Ketchen Jr., and Slater
Strategic Management Journal (2005)
ROI, ROA and ROE
Market Orientation, Market Information Processing Mediators: Organizational responsiveness Control Variables: Innovativeness, Learning Climate, Firm Age, Firm Size
Regression
Im, Hussain, and Sengupta Journal of Business Research (2008)
Marketing Program Creativity
Customer Orientation, Competitor Orientation, Cross-functional Integration. Regression
Im and Workman Journal of Marketing (2004)
New Product Performance
Market Orientation, New Product Creativity (Innovativeness), Marketing Program Creativity SEM
Jiménez-Jiménez and Cegarra-Navarro
Industrial Marketing Management (2007)
Organizational Memory, Market Share, Profitability, Productivity, Quality product,
Market Orientation Mediator: Organizational Learning SEM
Laforet Journal of Business Research (2008) Innovation Market Orientation, Strategic Orientation, Size
Descriptive Statistics
Nakata, Im, Park and Ha Journal of Business Research (2006)
New Product Performance
Customer Orientation, Cross-Functional Integration, New Product Team Proficiency
Regression
Zhou, Brown, Dev and Agarwal
Journal of International Business Studies (2007)
Occupancy, Gross Operating Profit, Market Share
Customer Orientation, Competitor Orientation Control Variables: Environmental Factors, Economic Growth, Government Regulation, Entry Barrier, Competitive Intensity, Firm Size, Innovation Orientation,
Regression
(Atuahene-Gima, 2005; Atuahene-Gima, Slater, & Olson, 2005; Baker & Sinkula, 2005; Chou, 2009; Ellinger, Jr, Hult, Elmada, & Jr, 2008; Hsieh, Chiu, & Hsu, 2008; Hult, Jr, & Slater, 2005; Im et al., 2008; Jiménez-Jiménez & Cegarra-Navarro, 2007; Laforet, 2008; Nakata, Im, Park, & Ha, 2006; Zhou et al., 2007)
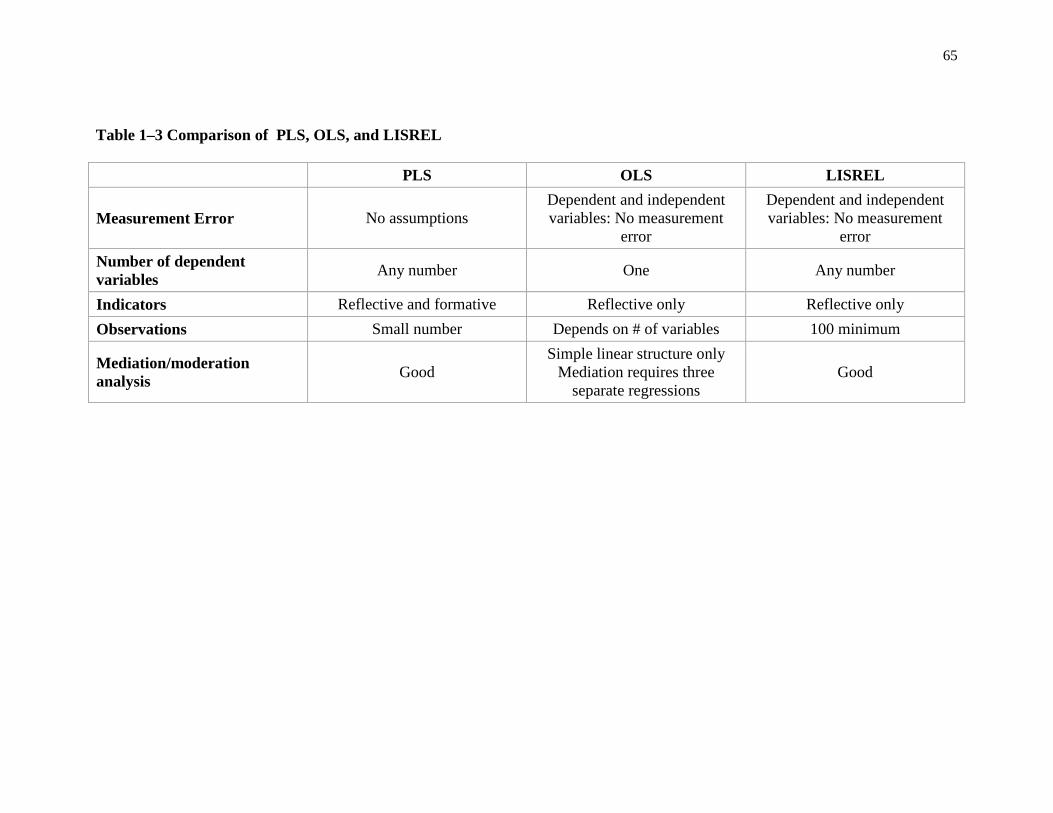
65
Table 1–3 Comparison of PLS, OLS, and LISREL PLS OLS LISREL
Measurement Error No assumptions Dependent and independent variables: No measurement
error
Dependent and independent variables: No measurement
error Number of dependent variables Any number One Any number
Indicators Reflective and formative Reflective only Reflective only Observations Small number Depends on # of variables 100 minimum
Mediation/moderation analysis Good
Simple linear structure only Mediation requires three
separate regressions Good

66
Table 1–4. Correlation Between Performance Measures at Two Years
Revenue Profit Customer Retention
Revenue 1
Profit 0.66 1
Customer Retention 0.53 0.56 1
Table 1–5. Correlation Between Performance Measures at Four Years
Revenue Profit Customer Retention
Revenue 1
Profit 0.66 1
Customer Retention 0.59 0.65 1
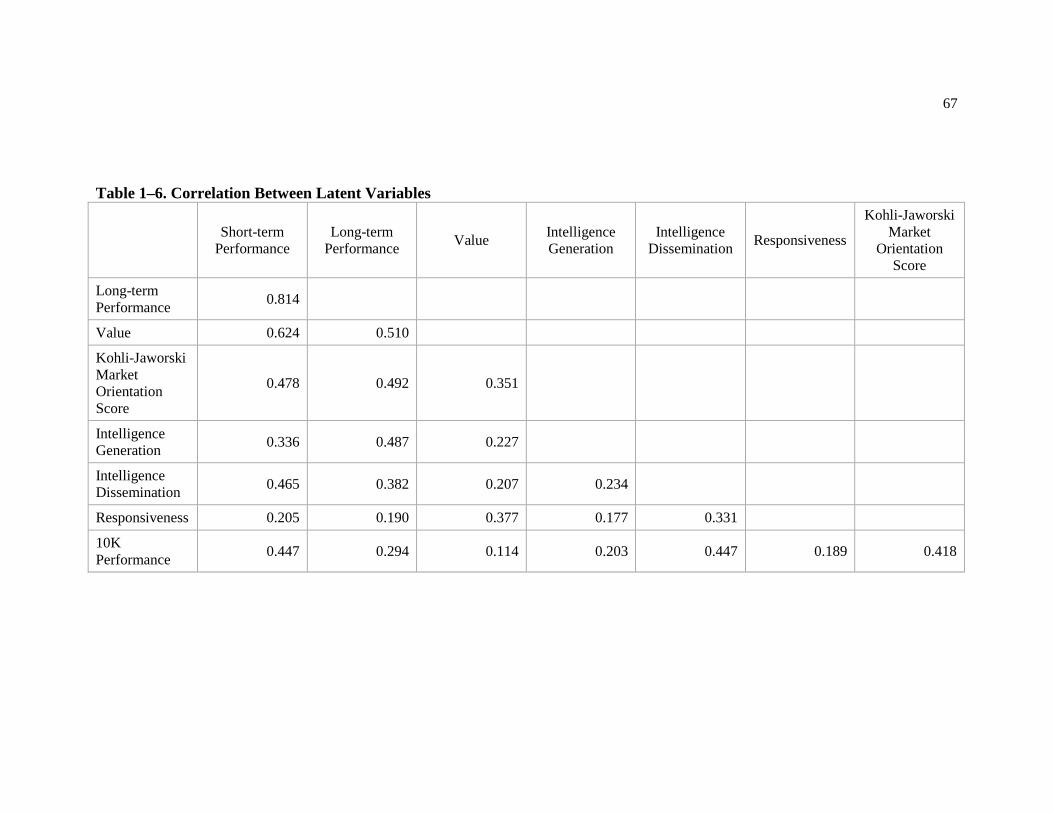
67 Table 1–6. Correlation Between Latent Variables
Short-term Performance
Long-term Performance Value Intelligence
Generation Intelligence
Dissemination Responsiveness
Kohli-Jaworski Market
Orientation Score
Long-term Performance 0.814
Value 0.624 0.510
Kohli-Jaworski Market Orientation Score
0.478 0.492 0.351
Intelligence Generation 0.336 0.487 0.227
Intelligence Dissemination 0.465 0.382 0.207 0.234
Responsiveness 0.205 0.190 0.377 0.177 0.331
10K Performance 0.447 0.294 0.114 0.203 0.447 0.189 0.418
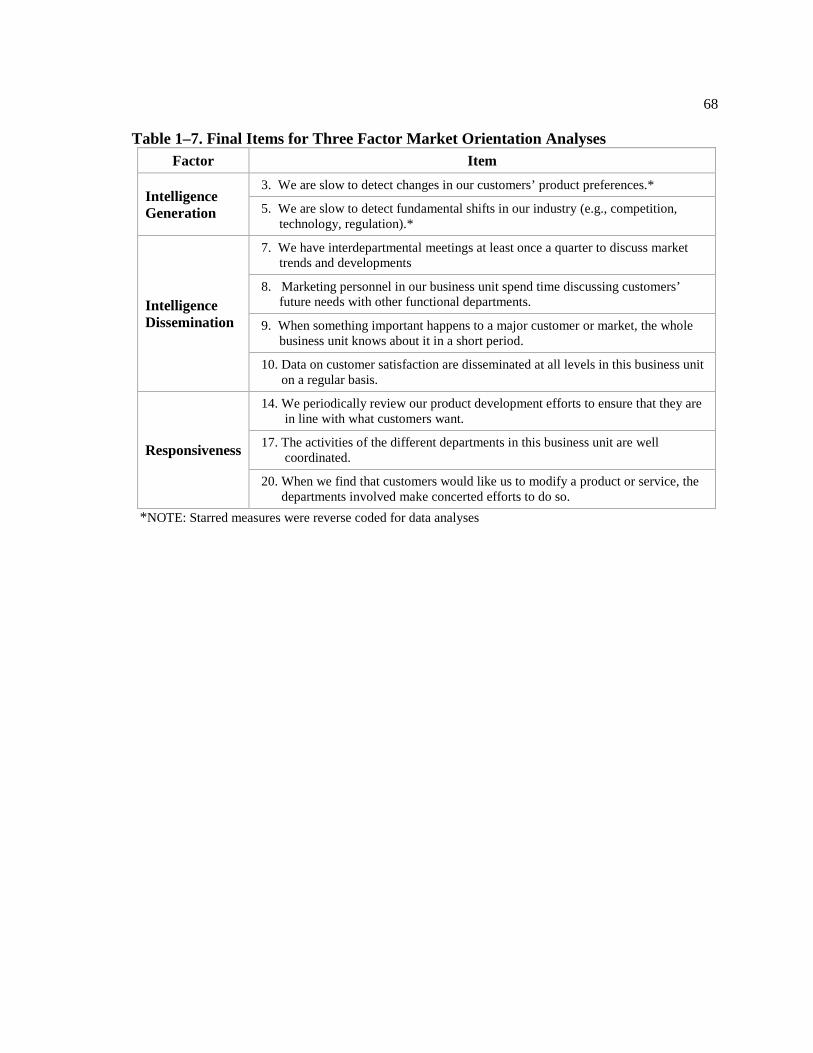
68 Table 1–7. Final Items for Three Factor Market Orientation Analyses
Factor Item
Intelligence Generation
3. We are slow to detect changes in our customers’ product preferences.*
5. We are slow to detect fundamental shifts in our industry (e.g., competition, technology, regulation).*
Intelligence Dissemination
7. We have interdepartmental meetings at least once a quarter to discuss market trends and developments
8. Marketing personnel in our business unit spend time discussing customers’ future needs with other functional departments.
9. When something important happens to a major customer or market, the whole business unit knows about it in a short period.
10. Data on customer satisfaction are disseminated at all levels in this business unit on a regular basis.
Responsiveness
14. We periodically review our product development efforts to ensure that they are in line with what customers want.
17. The activities of the different departments in this business unit are well coordinated.
20. When we find that customers would like us to modify a product or service, the departments involved make concerted efforts to do so.
*NOTE: Starred measures were reverse coded for data analyses
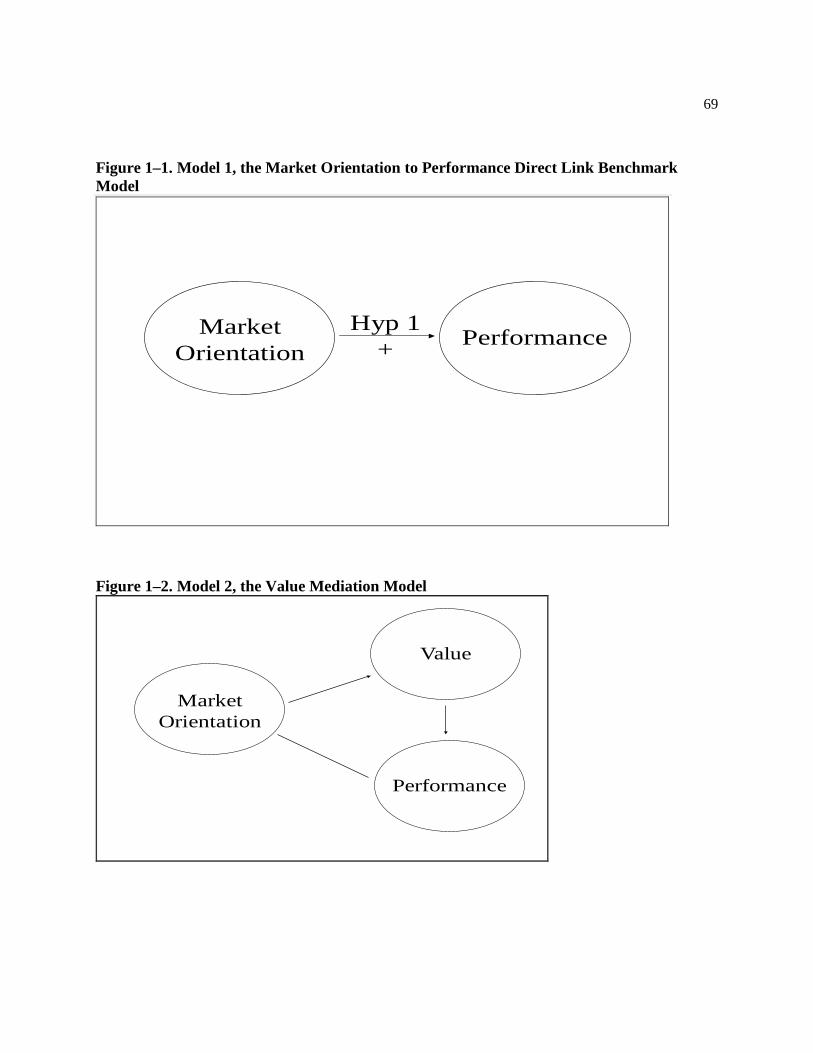
69 Figure 1–1. Model 1, the Market Orientation to Performance Direct Link Benchmark Model
Hyp 1+
MarketOrientation
Performance
Figure 1–2. Model 2, the Value Mediation Model
Market Orientation
Value
Performance
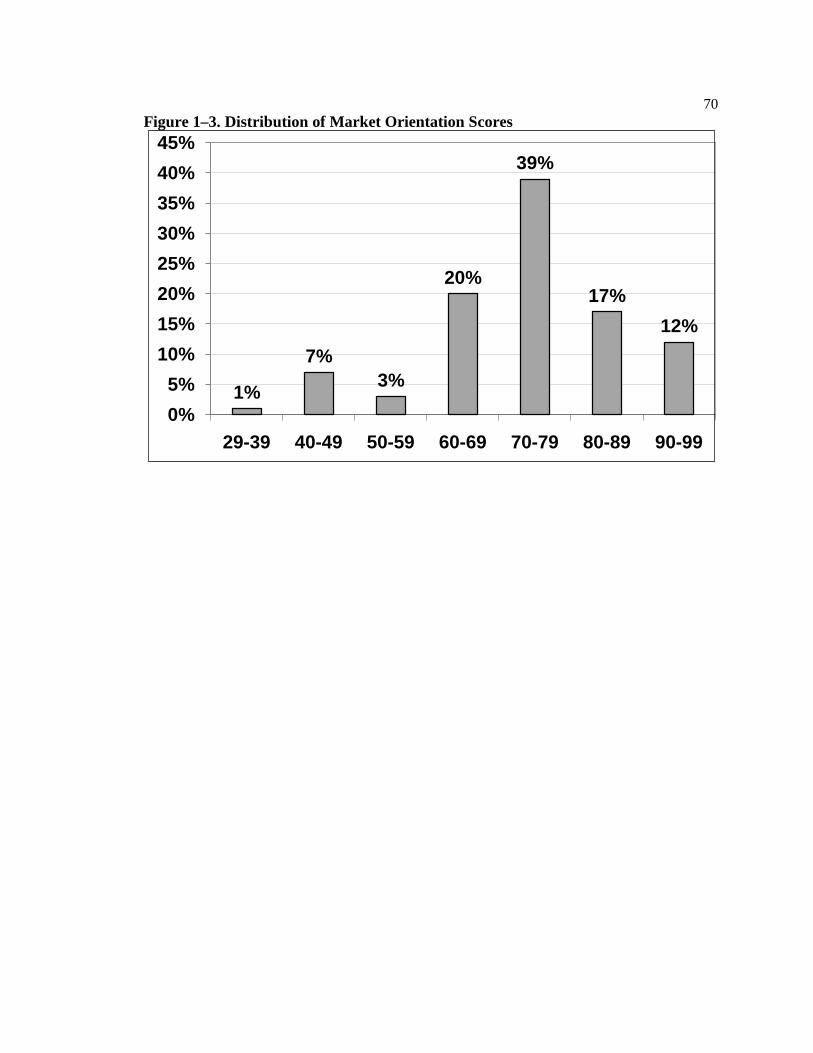
70 Figure 1–3. Distribution of Market Orientation Scores
1%
7%3%
20%
39%
17%12%
0%5%
10%15%20%25%30%35%40%45%
29-39 40-49 50-59 60-69 70-79 80-89 90-99
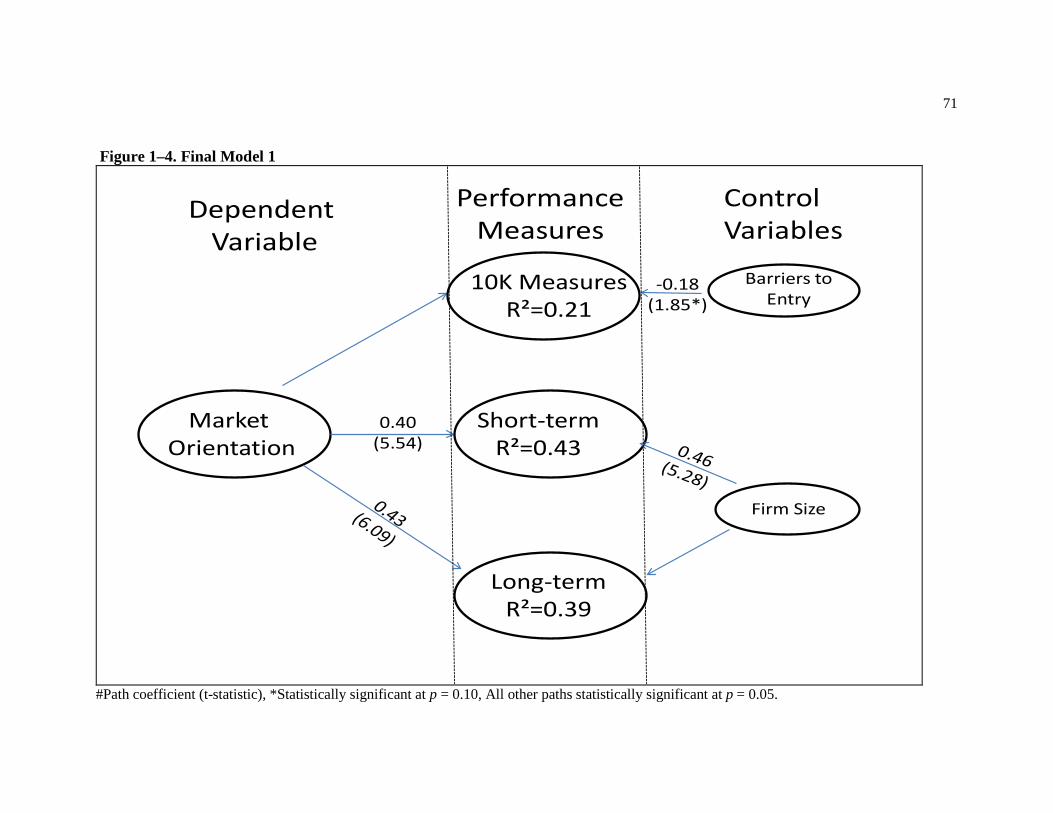
71 Figure 1–4. Final Model 1
Market Orientation
10K MeasuresR²=0.21
Short-termR²=0.43
Long-termR²=0.39
Firm Size
Barriers toEntry
PerformanceMeasures
-0.18(1.85*)
0.40(5.54)
Control Variables
Dependent Variable
#Path coefficient (t-statistic), *Statistically significant at p = 0.10, All other paths statistically significant at p = 0.05.
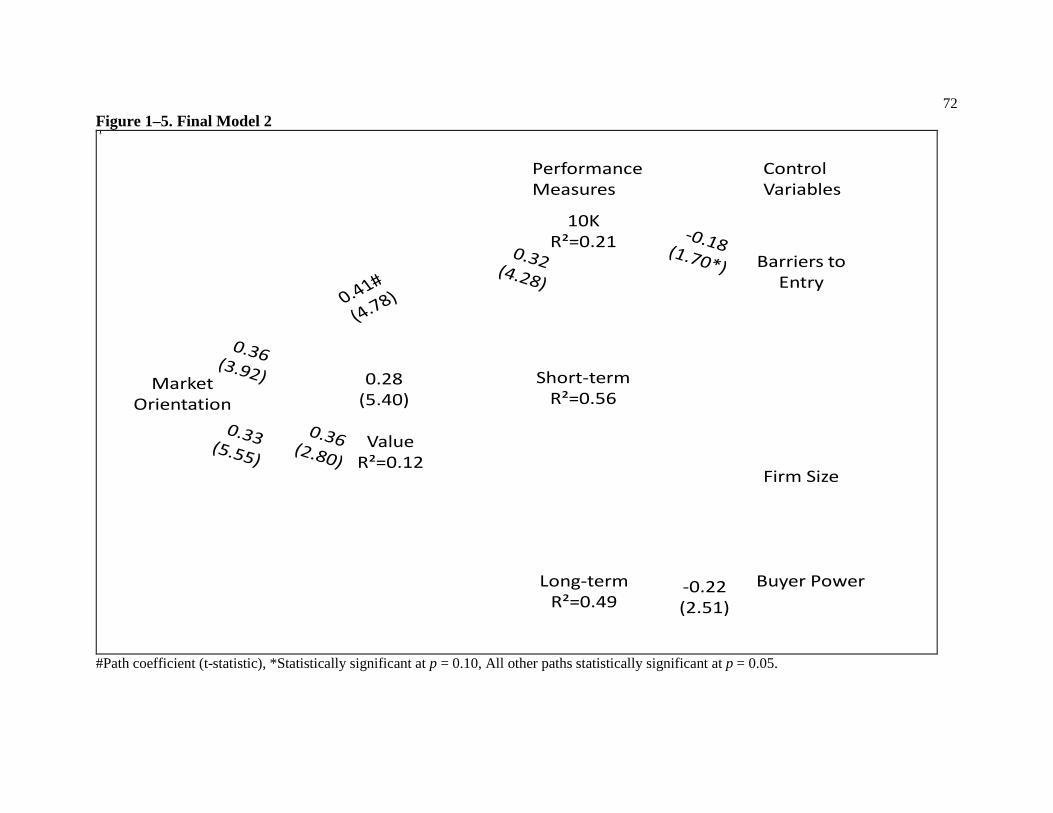
72 Figure 1–5. Final Model 2
MarketOrientation
ValueR²=0.12
10KR²=0.21
Short-termR²=0.56
Long-termR²=0.49
PerformanceMeasures
Control Variables
Firm Size
Barriers toEntry
Buyer Power
0.28(5.40)
-0.22(2.51)
#Path coefficient (t-statistic), *Statistically significant at p = 0.10, All other paths statistically significant at p = 0.05.
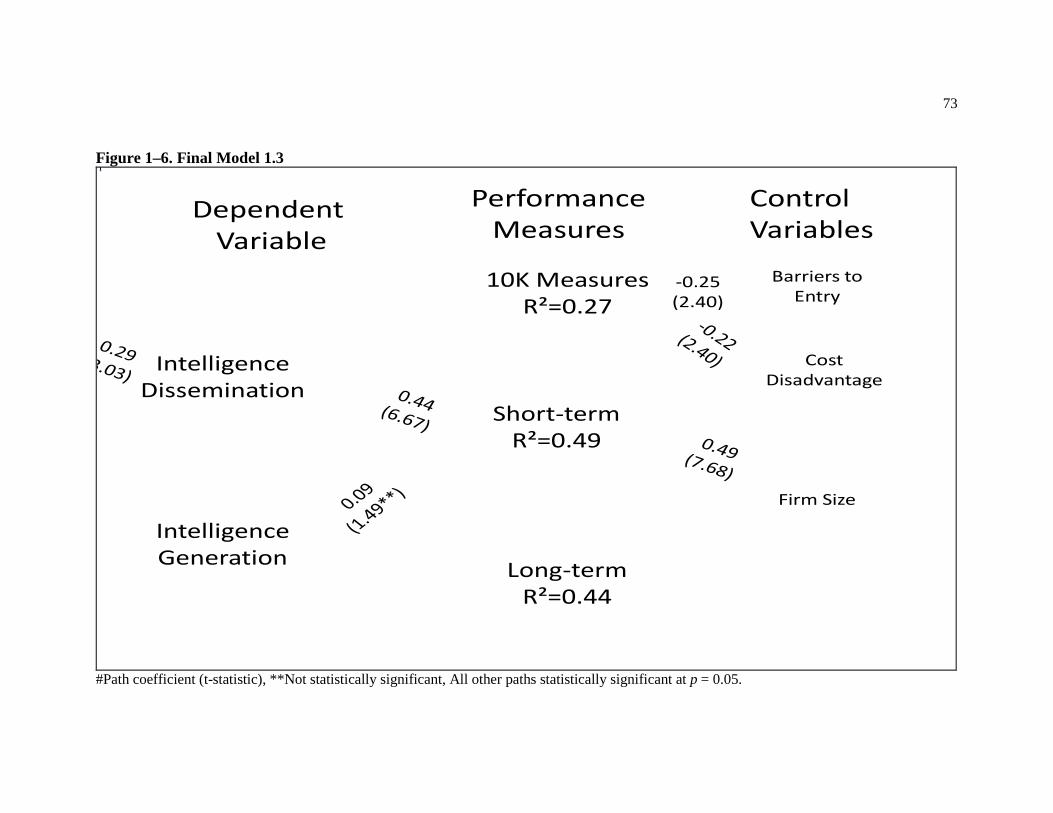
73 Figure 1–6. Final Model 1.3
IntelligenceDissemination
10K MeasuresR²=0.27
Short-termR²=0.49
Long-termR²=0.44
Firm Size
Barriers toEntry
PerformanceMeasures
-0.25(2.40)
Control Variables
Dependent Variable
IntelligenceGeneration
CostDisadvantage
#Path coefficient (t-statistic), **Not statistically significant, All other paths statistically significant at p = 0.05.

74 Figure 1–7. Final Model 2.3
IntelligenceGeneration
ValueR²=0.17
10KR²=0.27
Short-termR²=0.61
Long-termR²=0.54
PerformanceMeasures
Control Variables
Firm Size
Barriers toEntry
Buyer Power-0.16(2.07)
Responsiveness
IntelligenceDissemination
0.23(3.06)
CostDisadvantage
#Path coefficient (t-statistic), All paths statistically significant at p = 0.05.
75
BIBLIOGRAPHY ESSAY #1
Anderson, J. C., & Narus, J. A. 1998. Business Marketing: Understand What Customers Value. Harvard Business Review, 76: 53 - 65.
Appiah-Adu, K., & Singh, S. 1998. Customer Orientation and Performance: A Study of SMEs. Management Decision, 36(6): 385.
Atuahene-Gima, K. 1995. An Exploratory Analysis of the Impact of Market Orientationon New Product Performance. Journal of Product Innovation Management, 12(September): 275 - 293.
Atuahene-Gima, K. 2005. Resolving the Capability-Rigidity Paradox in New Product Innovation. Journal of Marketing, 69(4): 61.
Atuahene-Gima, K., Slater, S. F., & Olson, E. M. 2005. The Contingent Value of Responsive and Proactive Market Orientations for New Product Program Performance. The Journal of Product Innovation Management, 22(6): 464.
Baker, W. E., & Sinkula, J. M. 1999. Learning Orientation, Market Orientation, and Innovation: Integrating and Extending Models of Organizational Performance. Journal of Market Focused Management, 3(4): 295-308.
Baker, W. E., & Sinkula, J. M. 2005. Market Orientation and the New Product Paradox. The Journal of Product Innovation Management, 22(6): 483.
Barney, J. 1991. Firm Resources and Sustained Competitive Advantage. Journal of Management, 17(1): 99-120.
Baron, R. M., & Kenny, D. A. 1986. Moderator-Mediator Variables Distinction in Social Psychological Research: Conceptual, Strategic, and Statistical Considerations. Journal of Personality and Social Psychology, 51(6): 1173-1182.
Berger, P. G., & Hann, R. 2003. The impact of SFAS no. 131 on information and monitoring. Journal of Accounting Research, 41(2): 163.
Berkowitz, E. N., & Walton, J. R. 1980. Contextual Influences on Consumer Price Responses: An Experimental Analysis. Journal Of Marketing Research, 17(3): 349 - 358.
Biswas, A., & Burton, S. 1993. Consumer Perceptions of Tensile Price Claims in Advertisements: An Assessment of Claim Types Across Different Discoutnt Levels. Journal of the Academy of Marketing Science, 21: 217 - 229.
Biswas, A., Pullig, C., Yagci, M. I., & Dean, D. H. 2002. Consumer evaluation of low price guarantees: The moderating role of reference price and store image. Journal of Consumer Psychology, 12(2): 107-118.
Bolton, R. N., & Drew, J. H. 1991. A Multistage Model of Customers Assessments of Service Quality and Value. Journal of Consumer Research, 17(4): 375-384.
Burton, S., & Lichtenstein, D. R. 1988. The Effect of Ad Claims and Ad Context on Attitutde Towards the Advertisement. Journal of Advertising, 17(1): 3 - 11.
Butz Jr., H. E., & Goodstein, L. D. 1996. Measuring Customer Value: Gaining the Strategic Advantage. Organizational Dynamics, 24(Winter): pp. 63 - 77.
Chamberlin, E. H. 1965. The Theory of Monopolistic Competition: A Re-orientation of the Theory of Value (Eighth ed.). Cambridge: Harvard University Press.
Chang, T. Z., & Chen, S. J. 1998. Market Orientation, Service Quality and Business Profitability: A Conceptual Model and Empirical Evidence. The Journal of Services Marketing, 12(4): 246-264.
Chou, H.-J. 2009. The Effect of Market Orientation Intention and Superiority on New Product Performance. Journal of American Academy of Business, Cambridge, 14(2): 93.
Connor, T. 2007. Market orientation and performance. Strategic Management Journal, 28(9): 957.
76 D'Aveni, R. A. 1994. Hypercompetition: Managing the Dynamics of Strategic Maneuvering.
New York: The Free Press. D'Aveni, R. A. 1995. Coping with Hypercompetition: Utilizing the New 7S's Framework. The
Academy of Management Executive, 9(3): 45. Dawes, J. 2000. Market orientation and company profitability: Further evidence incorporating
longitudinal data. Australian Journal of Management, 25(2): 173. Day, G. S. 1990. Market Driven Strategy: Processes for Creating Value. New York: Free Press. Day, G. S. 1994. The Capabilities of Market-Driven Organizations. Journal of Marketing, 58(4):
37. Day, G. S., & Wensley, R. 1988. Assessing Advantage: A Framework for Diagnosing
Competitive Superiority. Journal of Marketing, 52: 1 - 20. DeSarbo, W. S., Jedidi, K., & Sinha, I. 2001. Customer value analysis in a heterogeneous market.
Strategic Management Journal, 22(9): 845-857. Deshpandé, R., & Farley, J. U. 1996. Understanding Market Orientation: A Prospectively
Designed Meta-Analysis of Three Market Orientation Scales. MSI Working Paper, 96-125: 1-22.
Deshpandé, R., & Farley, J. U. 1998. Measuring Market Orientation: Generalization and Synthesis. Journal of Market Focused Management, 2: 213-232.
Deshpandé, R., Farley, J. U., & Webster, F. E. J. 1993. Corporate Culture, Customer Orientation, and Innovativeness. Journal of Marketing, 57(1): 23.
Diamantopoulos, A., & Winklhofer, H. M. 2001. Index Construction with Formative Indicators: An Alternative to Scale Development. Journal of Marketing Research XXXVIII(May): 269-277.
Dodds, W. B., Monroe, K. B., & Grewal, D. 1991. The Effects of Price, Brand, and Store Information on Buyers' Product Evaluations. Journal of Marketing Research, 28(3): 307 - 319.
Donthu, N., & Cherian, J. 1994. Impact of Strength of Ethnic Identification on Hispanic Shopping Behavior. Journal of Retailing, 70(4): 383 - 393.
Dowling, G., R., Lilien, G. L., Rangaswamy, A., & Thomas, R. J. 2000. Harvesting Customer Value: Understanding and Applying Customer-Value Based Segmentation.
Ellinger, A. E., Jr, D. J. K., Hult, G. T. M., Elmada, A.-e. B., & Jr, R. G. R. 2008. Market orientation, employee development practices, and performance in logistics service provider firms. Industrial Marketing Management, 37(4): 353.
Fornell, C., & Bookstein, F.L. 1981. Two Structural Equation Models: LISREL and PLS Applied to Consumer Exit-Voice Theory. Journal of Marketing Research, XIX(November): 440-452.
Gatignon, H., & Xuereb, J. M. 1997. Strategic orientation of the firm and new product performance. Journal of Marketing Research, 34(1): 77-90.
Greenley, G. E. 1995. Market Orientation and Company Performance: Empirical Evidence From UK Companies. British Journal of Management, 6: 1 - 13.
Haenlein, M., & Kaplan, A. M. 2004. A Beginner's Guide to Partial Least Squares Analysis. Understanding Statistics, 3(4): 283-297.
Han, J. K., Kim, N., & Srivastava, R. K. 1998. Market orientation and organizational performance: Is innovation a missing link? Journal of Marketing, 62(4): 30-45.
Harris, L. C. 2001. Market orientation and performance: Objective and subjective empirical evidence from UK companies. Journal of Management Studies, 38(1): 17-43.
Henseler, J., Ringle, C. M., & Sinkovics, R. R. (Eds.). 2009. The Use of Partial Least Squares Path Modeling in International Marketing. (Vol. 20). Bingley: Emerald Group.
77 Hsieh, Y.-C., Chiu, H.-C., & Hsu, Y.-C. 2008. Supplier market orientation and accommodation of
the customer in different relationship phases. Industrial Marketing Management, 37(4): 380.
Hult, G. T. M., Jr, D. J. K., & Slater, S. F. 2005. Market orientation and performance: an integration of disparate approaches. Strategic Management Journal, 26(12): 1173.
Hult, G. T. M., & Ketchen, J. D. J. 2001. Does Market Orientation Matter?: A Test of the Relationship Between Positional Advantage and Performance. Strategic Management Journal, 22(9): 899-906.
Hult, G. T. M., Ketchen, J. D. J., & Slater, S. F. 2005. Market Orientation and Performance: and Integration of Disparate Approaches. Strategic Management Journal, 26(12): 1173-1181.
Hunt, S. D., & Duhan, D. F. 2002. Competition in the Third Millennium: Efficiency or Effectiveness? Journal of Business Research, 55: 97-102.
Hunt, S. D., & Morgan, R. M. 1995. The Comparative Advantage Theory of Competition. Journal of Marketing, 59(April): 1 - 15.
Hunt, S. D., & Morgan, R. M. 1996. The Resource-Advantage Theory of Competition: Dynamics, Path Dependencies, and Evolutionary Dimensions. Journal of Marketing, 60(4): 107 - 114.
Hurley, R. F., & Hult, G. T. M. 1998. Innovation, Market Orientation, and Organizational Learning: An Integration and Empirical Examination. Journal of Marketing, 62(3): 42.
Im, S., Hussain, M., & Sengupta, S. 2008. Testing interaction effects of the dimensions of market orientation on marketing program creativity. Journal of Business Research, 61(8): 859.
Im, S., & Workman Jr, J. P. 2004. Market Orientation, Creativity, and New Product Performance in High-Technology Firms. Journal of Marketing, 68(2): 114-132.
Jarvis, C. B., MacKenzie, S. B., & Podsakoff, P. M. 2003. A Critical Review of Construct Indicators and Measurement Model Misspecification in Marketing and Consumer Research. The Journal of Consumer Research, 30(2): 199-218.
Jaworski, B. J., & Kohli, A. K. 1993. Market orientation: Antecedents and consequences. Journal of Marketing, 57(3): 53.
Jiménez-Jiménez, D., & Cegarra-Navarro, J. G. 2007. The performance effect of organizational learning and market orientation. Industrial Marketing Management, 36(6): 694.
Kaynak, E., & Kara, A. 2004. Market Orientation and Organizational Performance: A Comparison of Industrial Versus Consumer Companies in Mainland China Using Market Orientation Scale (MARKOR). Industrial Marketing Management, 33(8): 743-753.
Kohli, A., Jaworski, B. J., & Kumar, A. 1993. MARKOR: A measure of market orientation. Journal Of Marketing Research, 30(4): 467.
Kumar, K., Subramanian, R., & Yauger, C. 1998. Examining the market orientation-performance relationship: A context-specific study. Journal of Management, 24(2): 201-233.
Laforet, S. 2008. Size, strategic, and market orientation affects on innovation. Journal of Business Research, 61(7): 753.
Lichtenstein, D. R., & Bearden, W. O. 1989. Contextual Influences on Perceptions of Merchant-Supplied Reference Prices. Journal of Consumer Research, 16(1): 55 - 56.
Lichtenstein, D. R., Burton, S., & Karson, E. J. 1991. The Effect of Semantic Cues on Consumer Perceptions of Reference Price Ads. Journal of Consumer Research, 18(3): 380 - 391.
Lichtenstein, D. R., Ridgway, N. M., & Netemeyer, R. D. 1993. Price Perceptions and Consumer Shopping Behavior: A Field Study. Journal of Marketing Research, 30(2): 234 - 245.
Lilien, G. L., Rangaswamy, A., & Bruyn, A. D. 2007. Principles of Marketing Engineering: Trafford Publishing.
Matear, S., Osborne, P., Garret, T., & Gray, B. J. 2002. How Does Market Orientation Contribute to Service Firm Performance? European Journal of Marketing, 36(9-10): 1058-1075.
78 Matsuno, K., & Mentzer, J. T. 2000. The effects of strategy type on the market orientation-
performance relationship. Journal of Marketing, 64(4): 1-16. Morgan, N. A., Vorhies, D. W., & Mason, C. H. 2009. Market orientation, marketing capabilities,
and firm performance. Strategic Management Journal, 30(8): 909-920. Nakata, C., Im, S., Park, H., & Ha, Y.-W. 2006. Antecedents and consequence of Korean and
Japanese new product advantage. Journal of Business Research, 59(1): 28. Narver, J. C., & Slater, S. F. 1990. The Effect of a Market Orientation on Business Profitability.
Journal of Marketing, 54(4): 20 - 35. Nunnally, J. C., & Bernstein, I. H. 1994. Psychometric Theory (3rd ed.). New York: McGraw-
Hill. Parasuraman, A. 1997. Reflections on Gaining Competitive Advantage Through Customer Value.
Journal of the Academy of Marketing Science, 25(2): 154-161. Payne, A., & Holt, S. 2001. Diagnosing customer value: Integrating the value process and
relationship marketing. British Journal of Management, 12(2): 159-182. Pelham, A. M., & Wilson, D. T. 1996. A longitudinal study of the impact of market structure,
firm structure, strategy, and market orientation culture on dimensions of small-firm performance. Journal of the Academy of Marketing Science, 24(1): 27.
Porter, M. E. 1985. Competitive Advantage. New York: Free Press. Priem, R. L., & Butler, J. E. 2001. Is the Resource-Based "View" a Useful Perspective for
Strategic Management Research? Academy of Management Review, 26(1): 22-40. Putrevu, S., & Ratchford, B. T. 1997. A Model of Search Behavior with an Application to
Grocery Shopping. Journal of Retailing, 73(4): 463 - 486. Ringle, C. M., Wende, S., & Will, S. 2005. Smart PLS 2.0 (M3) Beta, 2.0 (M3) Beta ed.
Hamburg. Ruekert, R. W. 1992. Developing a Market Orientation: An Organizational Strategy Perspective.
International Journal of Research in Marketing, 9(3): 225 - 245. Sawhney, M. 2002. Profit from Transparency: Should your customers compare prices, post
opinions and pit you against your competitors? Absolutely. CIO, 15(17): 1. Sharma, A., Krishnan, R., & Grewal, D. 2001. Value creation in markets - A critical area of focus
for business-to-business markets. Industrial Marketing Management, 30(4): 391-402. Shim, S., & Gehrt, K. 1996. Hispanic and Native American Adolescents: An Exploratory Study
of their Approach to Shopping. Journal of Retailing, 72(3): 307 - 324. Slater, S. F., & Narver, J. C. 1994. Does Competitive Environment Moderate the Market
Orientation- Performance Relationship. Journal of Marketing, 58(1): 46-55. Slater, S. F., & Narver, J. C. 1995. Market Orientation and the Learning Organization. Journal of
Marketing, 59(3): 63-74. Slater, S. F., & Narver, J. C. 1999. Market-Oriented is More Than Being Customer Led. Strategic
Management Journal, 20(12): 1165 - 1168. Song, X. M., & Parry, M. E. 1997a. A cross-national comparative study of new product
development processes: Japan and the United States. Journal of Marketing, 61(2): 1. Song, X. M., & Parry, M. E. 1997b. The determinants of Japanese new product successes.
Journal of Marketing Research, 34(1): 64. Sproles, G. B., & Kendall, E. L. 1986. A Methodology for Profiling Consumers' Decision-
Making Styles. Journal of Consumer Affairs, 20: 267 - 279. Srinivasan, S., Pauwels, K., Silva-Risso, J., & Hanssens, D. 2009. Product Innovations,
Advertising, and Stock Returns. Journal of Marketing, 73(1): 24. Subramanian, R., & Gopalakrishna, P. 2001. The market orientation-performance relationship in
the context of a developing economy - An empirical analysis. Journal of Business Research, 53(1): 1-13.
79 Sweeney, J. C., & Soutar, G. N. 2001. Consumer perceived value: The development of a multiple
item scale. Journal of Retailing, 77(2): 203-220. Urbany, J. E., Bearden, W. O., & Weilbaker, D. C. 1988. The Effect of Plausible and Exaggerated
Reference Prices on Consumer Perceptions and Price Search. Journal of Consumer Research, 15(1): 95 - 110.
Venkatraman, N., & Ramanujam, V. 1986. Measurement of Business Performance in Strategy Research: A Comparison of Approaches. The Academy of Management Review, 11(4): 801 - 814.
Voss, G. B., & Voss, Z. G. 2000. Strategic orientation and firm performance in an artistic environment. Journal of Marketing, 64(1): 67-83.
Wakefield, K. L., & Barnes, J. H. 1996. Retailing Hedonic Consumption: A Model of Sales Promotion of a Leisure Service. Journal of Retailing, 72(4): 409 - 427.
Wernerfelt, B. 1984. A Resource-based View of the Firm. Strategic Management Journal, 5: 171 - 180.
Wood, V. R., Bhuian, S., & Kiecker, P. 2000. Market orientation and organizational performance in not-for- profit hospitals. Journal of Business Research, 48(3): 213-226.
Woodruff, R. B. 1997. Customer value: The next source for competitive advantage. Journal of the Academy of Marketing Science, 25(2): 139-153.
Yadav, M. S., & Monroe, K. B. 1993. How Buyers Perceive Savings in a Bundle Price: An Examination of a Bundle's Transaction Value. Journal Of Marketing Research, 30(3): 350 - 358.
Zeithaml, V. A. 1988. Consumer Perceptions Of Price, Quality, And Value: A Means-End Model and Synthesis of Evidence. Journal of Marketing, 52(3): 2.
Zhao, X., Lynch, J. G. J., & Chen, Q. 2010. Reconsidering Baron and Kenny: Myths and Truths about Mediation Analysis. Journal of Consumer Research, 37(August).
Zhou, K. Z., Brown, J. R., Dev, C. S., & Agarwal, S. 2007. The effects of customer and competitor orientations on performance in global markets: a contingency analysis. Journal of International Business Studies, 38(2): 303.
Zhou, K. Z., Li, J. J., Zhou, N., & Su, C. 2008. Market orientation, job satisfaction, product quality, and firm performance: evidence from China. Strategic Management Journal, 29(9): 985.

80
MARKET-ORIENTED AND CUSTOMER-LED:
SHOULD A SUCCESSFUL FIRM BE BOTH?
Essay 2
81 2.1. INTRODUCTION: Market-Oriented And Customer-Led: Should A Successful Firm Be Both?
As companies struggle to chart a course for strong market performance,
conflicting directions continue to emerge from the marketing and strategic management
literature. While research generally accepts market orientation as a positive influence on
performance (Day, 1990; Ruekert, 1992), the issue is still cloudy and has become even
more so as the result of semantic muddling. For years “customer orientation” and “market
orientation” have been used almost interchangeably. Sometimes, customer orientation is
considered as a part of market orientation, and at other times, as a standalone scale. An
analysis of the three most commonly used customer orientation and market orientation
scales showed high correlation among the three scales (Deshpandé & Farley, 1996). The
results of the Deshpandé and Farley study appear to authorize researchers to continue to
use “customer” and “market” orientation interchangeably. In fact, in a meta-analysis of
market orientation research, Langerak (2003) includes works that used a customer-
orientation scale in the review with little reference to the fact that the work measured
only customer orientation and not market orientation. While misleading, this finding may
not be unusual, given the high correlation of the customer orientation and market
orientation scales and common, interchangeable usage of the two terms.
However, some research concluded that firms that were too close to their
customers performed poorly (Christensen & Bower, 1996). As new studies found
contradictions, the debates re-emerged between
1. market orientation and customer orientation, and
2. the link between orientation and performance.
82 Slater and Narver (1998) suggest that part of the problem is the lack of clarity in
differentiating between customer orientation (the authors dub firms with a customer
orientation “customer-led,” and following their usage, I will use the term also) and
market orientation. The former has a short-term focus and the latter a long-term
perspective. In the market environment, Slater and Narver (1998) suggest that a firm
should have enhanced performance if it properly calibrates its long- and short-term focus.
Researchers have tried to explain the inconsistencies of the impact on
performance of both market and customer orientations; they hypothesize that the path is
not direct, but is instead a mediated relationship. Studies have examined mediation in the
market-oriented- and customer-led-to-performance link, with innovation (Han et al.,
1998), value (Bens, Day, & Ross Jr, 2003), customer relationships (Siguaw, Simpson, &
Baker, 1998), and product quality (Chang & Chen, 1998) among the potential mediators
investigated. Others (Christensen & Bower, 1996) have looked at the impact of market
orientation on innovation and resource allocation without then going on to the next step,
firm performance. The published studies appear to indicate that a mediated model better
explains the market/customer orientation-to-performance link.
This research helps to resolve the debate and clarify both the differences and
synergies between customer-led (customer oriented) and market orientation. To achieve
the goals of the research, I investigate two main issues:
1. Are customer led and market oriented two distinct orientations?
2. In what market environments should a firm or strategic business unit (SBU)
be either customer led or market oriented, or should a successful firm be a
combination of both?

83 Previous market and customer orientation studies have either not included market
environmental factors as moderators or have had inconsistent results. Including
environmental moderators will also illuminate when being customer led and/or market-
oriented is an advantage.
This essay investigates the differences and similarities between being customer
led and market-oriented; it also deals with which orientation a company should focus on,
given its market environment. In developing the research, I review market and customer
orientations in studies published in the academic literature. I look first at studies that
considered market environments as potential moderators and then at studies with
mediators. Next, I explore the inconsistencies and discrepancies of previous customer-
and market-orientation literature. By extricating the similarities and overlap of customer
and market orientation, I show that previously the two terms have been closely related
and used interchangeably. At the same time, I discuss the distinct characteristics of
customer-led and market-oriented companies based on past research and recent articles.
My research begins with definitions of the two approaches in order to adapt
existing scales and develop new ones that show discriminant validity for customer and
market orientations. This essay incorporates the preliminary research by Narver, et al.
(2000) that investigates the differences between what they call “reactive” market
orientation and “proactive” market orientation. I test additional measures for market-
oriented and customer-led characteristics that the previously developed scales (Narver,
Slater, & MacLachlan, 2000) do not contain. I then use the new scales to empirically test
the hypothesized model. The empirical evidence highlights the need for measuring
market-oriented and customer-led scores separately. The results will aid in resolving the
84 debate between market-oriented and customer-led, by showing that they are different and
have different relationships with performance.
2.2. BACKGROUND AND DEVELOPMENT
2.2.1 Theoretical development
Langerak (2003) comprehensively reviews the results of 51 published studies that
measured the impact of orientation on performance. The review includes four articles that
use a customer-orientation scale. All of the studies in the review used either the
• Deshpandé et al. (1993), customer-orientation scale (7 percent),
• (Kohli et al., 1993) MARKOR, a market-orientation scale
(34 percent),
• Narver and Slater’s 1990 market-orientation scale (41 percent), or
• an adaptation of one of the previously mentioned scales (18 percent).
The Deshpandé et al.’s (1993) customer-orientation scale has the lowest share of positive
effects of orientation on performance. A caveat is necessary, as it is the least used of any
of the published scales. By examining the percent of positive effects, non-significant
effects and negative effects of orientation on performance found with each scale across
numerous published studies, Langerak (2003) concludes that the predictive power of a
model is partially dependent on the scale used.
While the positive relationship between market orientation and, to a lesser extent,
customer orientation and seller performance has been generally accepted, Langerak’s
review suggests that being market or customer oriented does not always—or at least does
85 not overwhelmingly—lead to enhanced performance. In fact, only 52 percent of the
studies report significant and positive effects of market orientation on performance.
Another 24 percent report non-significant effects, 20 percent have mixed effects, and four
percent report significantly negative effects (Langerak, 2003).
Results may depend on the measure of business performance used. Single
measures of business performance (as opposed to indices composed of multiple
measures) reveal inconsistencies. For example, three studies (Avlonitis & Gounaris,
1997; Pelham & Wilson, 1996; Ruekert, 1992) found that market orientation had a
positive and significant impact on profitability. Four studies (Deshpandé, Farley, &
Webster, 2000; Greenley, 1995; Han et al., 1998; Pelham & Wilson, 1996) found the
impact of customer or market orientation to be not significantly different than zero.
However, customer orientation’s impact on growth was positive in another (Appiah-Adu
& Singh, 1998). Two more studies found market orientation to have a positive impact on
“Overall” performance (Baker & Sinkula, 1999; Jaworski & Kohli, 1993). Langerak
(2003) presents a complete review of the customer and market orientation studies.
These mixed and inconclusive results highlight the need for a model that better
explains when and how customer and market orientation impact performance. Coltman
and his co-authors (2008) suggest that misspecification of the market orientation scale
and model are causes of the inconsistencies in results. Others suggest that the
inconsistencies are a result of considering market orientation as a single scale (Atuahene-
Gima, 2005; Atuahene-Gima et al., 2005). Kohli and Jaworski (1993) and Narver and
Slater (1998) mention that their scales consist of multiple components; in general, models
should include separate components rather than aggregating the scale items to one market
86 orientation scale. Additionally, when modeling the multiple components of market
orientation, formative models should be used instead of the reflective models that are
assumed in most marketing literature (Coltman, Devinney, Midgley, & Venaik, 2008).
2.2.2 Evidence for a moderated model
Inconsistent results of previous orientation studies underscore the fact that market
research needs a moderated model. Inconsistencies run both within and across studies.
Slater and Narver first demonstrated the need to include moderators when they controlled
for nine market-level factors, five of which they found to be significant (industry growth,
concentration, entry barriers, buyer power, and seller power) (Slater & Narver, 1994).
Later, they found that competitive hostility was not a significant moderator and market
growth was a significant and negative moderator of the market-orientation-to-sales-
growth path. They also found that market turbulence negatively moderates the market-
orientation-to-Return-on-Assets (ROA) path. At the same time, technological turbulence
negatively moderates the path to new product development success (Slater & Narver,
1994).
Across studies, a potential moderator could show positive, non-significant, non-
monotonic, or negative impacts on performance. For example, Jaworski and Kohli (1993)
found competitive intensity to be non-significant. Two other researchers found
moderation by competitive intensity to be positive on both new product success and
organizational performance (Appiah-Adu, 1997; Bhuian, 1997). However, still another
study showed competitive intensity had a significant, non-monotonic, moderating impact
on the customer-orientation-to-sales-growth path (Appiah-Adu & Singh, 1998).
87 Competitive intensity negatively moderates market-orientation-to-“performance after a
crisis” (Grewal & Tansuhaj, 2001). More recently, Ellinger et al. (2007) found that
empowerment was not a significant moderator, but employee coaching and training did
have significant impacts, depending on the type of performance measured. While Matear
et al.’s (2002) study showed no significant impact of innovation as a moderator, Chou
(2009) hypothesizes that it should have an impact. Given the contradictory results within
and between studies, the current research needs clarification. Table 2–1 contains 11 of the
studies which included moderators for the customer- or market-orientation-to-
performance path.
2.2.3 Evidence for a mediated model
While the empirical evidence for a mediated model is less than that for the
moderated model, and researchers usually assume the market-orientation-to-performance
relationship is direct, theorists have expressed the need for a mediated model since the
late ‘80s (Day & Wensley, 1988). Day and Wensley (1988) first hypothesized, but did
not empirically test their hypotheses, that superior customer value and lower relative
costs were mediators in the orientation-to-performance relationship.
Though some researchers believe that innovation is a moderator, Slater and
Narver (1994) hypothesized that innovation would mediate the market-orientation-to-
performance path. Han et al. (1998) investigated this more intricate relationship by
theorizing that innovation mediates orientation and performance. The authors built on
previous research in innovation that had shown that market orientation lead to innovation
88 and separate literature that showed that innovation lead to superior performance.
However, before Han et al. (1998), none had tested the orientation-to-innovation-to-
performance relationship.
While Han et al. (1998) found that innovation mediates the orientation-to-
performance relationship, not all research has consistently and fully replicated their
results. Researchers subsequently included innovation as a mediator in their
investigations. First, Baker and Sinkula observed only partial (though positive) mediation
(1996), then Matear et al. (2002) find complete positive mediation by innovation.
Investigating other potential moderators, one study found that customer trust in suppliers,
a relationship indicator, was a positive and significant mediator, but the same study found
another relationship indicator, customer willingness to be co-operative with suppliers, to
be a negative mediator (Siguaw et al., 1998). Later, researchers discovered that
organizational responsiveness and organizational learning are positive and complete
mediators of performance (Hult et al., 2005; Jiménez-Jiménez & Cegarra-Navarro, 2007).
Table 2–2 contains eight studies that have investigated or theorized about the role of
mediators in the customer- and/or market-orientation-to-performance path. Of the nine
mediators reported in these studies, innovation, including technological innovation, is the
most commonly identified mediator.
Given the repeated positive (at least partial) mediation of innovation on the
customer-led- and/or market-orientation-to-performance path and the previously
investigated impact of customer value as a mediator, this study includes both innovation
and customer value as potential mediators in the same model. While the inclusion of
moderators and mediators should aid in reducing the inconsistencies in the market and/or
89 customer orientation studies, another area of confusion also needs to be cleared up. Some
of the differences in the impact or role of the moderators and/or mediators, as discussed
above, may come from whether the authors are investigating customer orientation or
market orientation. In the ensuing sections, I discuss the differences and similarities of
market orientation and customer orientation.
2.2.4 Customer orientation versus market orientation
One area of semantic confusion coming from the marketing literature is in the use
of the terms “customer orientation” and “market orientation.” Studies have described
customer orientation as “the sufficient understanding of one’s target buyers to be able to
create superior value for them continuously” (Narver & Slater, 1990) or simply as
“getting close” to the customer (Shapiro, 1988). At the same time, market orientation
“characterizes an organization’s disposition to deliver superior value to its customers
continuously” (Han et al., 1998; Slater & Narver, 1994). What is not elucidated is, what
is the difference between customer orientation and market orientation? Scales measure
one, the other, or both. Some authors choose to use the term market orientation and others
refer to customer orientation (Appiah-Adu & Singh, 1998). Anecdotally, a belief existed
that market orientation and customer orientation were very similar if not definitions of
the same thing (Shapiro, 1988). Research by Deshpandé and Farley (1996) supports the
interchangeability of the two terms.
Narver and Slater (1990) view customer orientation as one of three parts of
market orientation along with competitor orientation and inter-functional coordination.
90 They developed a 15-item scale that covers all three of these areas. At approximately the
same time Narver and Slater were developing their scale, Deshpandé, Farley, and
Webster (1993) were developing what they called “a customer-orientation scale” even
though the nine-item scale considered the role of competitors. The researchers included
questions regarding the extent to which a company knows its customers and the degree to
which it is customer focused, compared to its competitors. Kohli, Jaworski, and Kumar
(1993) developed a third scale, also referred to as a market-orientation scale. This 20-
item scale measured many aspects of customer and competitor focus as well as the firm’s
own practices.
In order to compare the three scales and see if there were similarities between
market- and customer-orientation measures, Deshpandé and Farley (1996) conducted a
prospective meta-analysis of the three most common scales:
• Kohli et al. (1993) (MARKOR, Appendix A, Scale 3a),
• Narver and Slater (1990) (NS, Appendix A, Scale 3b), and
• Deshpandé, Farley, and Webster (1993) (DFW, Appendix A, Scale 3c).
These were the first widely recognized scales for customer and market orientation.
Deshpandé and Farley conducted a survey which contained all three scales in order to test
reliability, predictive validity, and discriminative validity. In addition, they then created a
new 10-item scale that incorporated items from all three scales. They found that all three
of the original scales had sufficient reliability, all measured market orientation, and all
had statistically significant predictive validity with the performance measures used. As
should be expected, they found high correlations among the three original scales. Because
some items in each scale are redundant, and because the scales appear “interchangeable,”
91 the authors condensed the scales to one scale. From the 44 items that comprise the
original three scales, the authors used factor analysis to show that of the three distinct
factors, one factor explains 30.4 percent of the variance, while the other two factors
explain only 7.9 percent and 5.4 percent. The one factor has ten items that come from all
three of the original scales. Five items come from NS, two from DFW, and three from
MARKOR. Appendix A Scale 3d shows the synthesized scale (Deshpandé and Farley
1996). The more parsimonious model correlates highly with the three original models,
and performs well as a predictor of performance. The drawback to this new scale is that
the items all deal with “customer focus.” Competitor orientation and competitive
intelligence items do not load on the new scale. The authors specifically state that
“[f]urther development of scales which uniquely measure dimensions such as Competitor
Orientation would be helpful (p. 225)” (Deshpandé & Farley, 1998b). This new scale,
while more parsimonious than any of the three original scales, has not been widely
adopted in the published academic literature.
While the results of Deshpandé and Farley (1996 and 1998) would appear to
support the interchangeability of customer orientation and market orientation,
inconsistencies in previous market/customer orientation literature and the different
explanatory power of the scales themselves show that caution is warranted. The problem
with blindly accepting the interchangeability of market/customer orientation came to light
when Christensen and Bower (1996) concluded that firms close to their customers
performed poorly as compared to those that were not so close, contradicting conventional
wisdom of academic researchers and managers. Therefore, while the scales are highly
92 correlated, there is evidence, as I will discuss below, that they should not be considered
as measuring the same seller characteristics.
2.2.5 Customer led is not market oriented
Despite the common confusion between customer orientation and market
orientation, Slater and Narver (1998) suggest that the inconsistencies in previous
orientation literature are caused by the misuse of these similar but distinct orientations:
“…without realizing it, scholars are talking about two separate management
philosophies” (p. 1002). To decrease the semantic confusion, they refer to “customer
led” rather than “customer oriented” or “customer orientation.” In this essay, I follow
Slater and Narver and use the term “customer-led” instead of “customer orientation” even
when discussing past studies that specifically referred to customer orientation. Slater and
Narver further reduce the confusion by offering concrete definitions of both customer-led
and market-oriented firms. Table 2–3 highlights the distinct characteristics of market-
oriented and customer-led companies. A customer-led philosophy consists of short-term
responses to expressed customer needs and wants. The market-oriented seller has a
longer term view, is committed to understanding the latent needs of customers, and
develops innovative products or services that meet the latent needs of current and
potential customers. Being customer led may be sufficient in a stable environment (e.g.
retail banking). However, it may be inadequate in turbulent environments (Slater &
Narver, 1998).
93 Slater et al. (2000) delve further into Deshpandé and Farley’s (1996) work by
asserting the existence of three types of market orientation: reactive, proactive, and total
market orientation. A firm with a reactive market orientation meets or responds to
immediate needs of customers, and a firm with a proactive market orientation searches
for future needs of customers. The third type, total market orientation, is a simple average
of the two other market orientations. Reactive market orientation and proactive market
orientation focus specifically on customers, their needs (present and future, respectively),
and their satisfaction. Additionally, these scales include items about dissemination of
information about customers within the seller’s organization. While these scales
specifically do not include items about competitor focus or potential customer and market
focus, Slater and Narver’s 1998 paper explicitly discussed the importance of learning
about the capabilities and plans of competitors and searching for potential customers and
unserved markets (see Table 2–3). However, the reactive or proactive market orientation
scales that they later developed do not include measures for these facets of market
orientation.
Recent research into the differences between responsive (or reactive) market
orientation and proactive orientation shows that both are needed for positive new product
performance, and that simply aggregating the two scales into one does not explain new
product program performance as well as the two separate scales (Atuahene-Gima et al.,
2005). Coltman et al. (2008) used the reactive and proactive scales, developing what
they termed reactive and proactive performance measures (level of repeat business with
valuable customers and success at generating revenues from new products, respectively)

94 to test their hypothesis that the traditionally accepted market orientation scales should be
broken into their components and modeled formatively instead of reflectively.
While Slater and Narver (1998) say that being entirely customer-led may be
sufficient in a stable environment, they do not advocate being either solely market-
oriented or solely customer-led. Indeed, they suggest that businesses today need to
balance both current and future needs of their customers and prospective customers if
they wish to flourish. The question is then: what ratio of market oriented to customer-led
strategies should a company strive for? I hypothesize that the level of market orientation
and the existence of customer leadership in a company impacts the long- and short-term
financial performance of sellers. Market environment, competitive factors, and size of
firm can determine the position (Connor, 1999). Following, I develop hypotheses to help
explain the trade-offs a seller faces in being customer led and/or market oriented.
2.3. HYPOTHESES ON MARKET ORIENTATION AND CUSTOMER LEADERSHIP
While market-oriented and customer-led terms have until now been used
interchangeably, there is sufficient evidence to suggest that this mixing of two truly
distinct concepts increases the inconsistencies in studies of market orientation’s impact
on business performance (Slater & Narver, 1998, 1999). In this research, I separate short-
term, customer-led components from long-term, market-oriented components, thereby
enabling a clearer view into when and how orientation impacts business performance.
Additionally, as a result of this separation, I can articulate a more informed balance
between customer leadership and market orientation to help firms improve success in
95 competitive markets. Despite previous research in market orientation, the relationships
between
1. customer-led organizations and business performance and
2. market-oriented organizations and business performance
remain unclear. Given the differences between the two, I hypothesize that being customer
led will have a positive impact on short-term performance, while being market oriented
will have a positive impact on long-term performance. In general, the hypotheses on the
impact of market orientation and being customer led appear in Table 2–4. However,
market orientation will have more impact on performance in turbulent and highly
competitive markets, while being customer led is sufficient in stable markets. Table 2–4
does not reflect the impact of market environment or mediation. The ideal balance
between customer-led and market-oriented approaches will depend on the market
environment. As previous studies have found, I hypothesize that market orientation will
have a positive impact on innovation (Han et al., 1998), while being customer-led will
not positively impact innovation. Additionally, both will have positive impacts on the
second mediator, value creation. Figure 2–1 graphically shows the hypotheses and the
results of the hypothesis testing.
2.3.1 Hypotheses on performance
H1: The short-term impact of being customer led
By definition, being customer led implies a short-term focus, centering on the
expressed needs of current customers. Customer-led companies use satisfaction surveys
96 and snapshots of current behaviors and events to calibrate activities (Slater & Narver,
1998). Slater and Narver (1998) explain that customer-led theory has been
…criticized for contributing to many things including incremental and trivial product development efforts (Bennett & Cooper, 1979), myopic R&D programs (Frosch, 1996), confused business processes (Macdonald, 1995) and even a decline in America’s industrial competitiveness (Hayes & Wheelwright, 1984) (p.1001).
Some studies of the link between customer-led and business performance find a
positive relationship (Appiah-Adu & Singh, 1998; Deshpandé & Farley, 1998a). Based
on the short-term focus implied by customer leadership, I hypothesize:
H1a: Being customer led will have a positive impact on short-term firm performance. Even though being customer led is a short-term focus and should impact short-
term seller performance, there is no reason to believe that being reactive and meeting the
immediate needs of customers will enhance long-term financial and non-financial
performance. The lack of long-term focus in customer-led companies leads me to
hypothesize:
H1b: Being customer led will have no significant impact on long-term firm performance.
H2: Market orientation, the long-term impact
In contrast, being market oriented suggests a long-term focus by trying to meet
the latent needs of both current and potential customers (Slater & Narver, 1998). While
past research has been inconsistent, numerous studies have shown the positive and
significant impact of market orientation on Performance (Deshpandé & Farley, 1996;
97 Kumar et al., 1998). Market-oriented firms look not only for the immediate payoff from
current customers but also search for ways to gain new customers by developing new
offerings that the customers would value (Slater & Narver, 1998). Since a market-
oriented firm concentrates more on future needs and value creation, rather than focusing
on immediate customer satisfaction as a customer-led firm does, being market oriented
should have a less positive effect on short-term financial and non-financial performance.
Building on the long-term focus and past studies of market orientation, I hypothesize:
H2a: Being market-oriented will have no significant impact on short-term firm performance. and H2b: Being market-oriented will have a positive impact on long-term firm performance.
2.3.2 Hypothesis on moderation, market environment
Previous studies of moderators of the customer/market-orientation-to-
performance path have had numerous inconsistencies. Of the 15 moderators reported in
the literature and shown previously in Table 2–1, three stand out as most consistently
studied: market turbulence, technological turbulence, and competitive intensity. Market
turbulence focuses on the changing composition of a firm’s customers and the customers’
changing preferences. Technological turbulence deals with the rate of change of the
technology used to produce or deliver goods and services to customers (Kohli and
Jaworski, 1990). Song and Parry (2009) define competitive intensity as “the ability and
willingness of competitors to alter marketing mix decisions in order to gain competitive
98 advantage” (p.146). Researchers have examined technological turbulence and found it to
be non-significant in four studies (Appiah-Adu, 1997; Bhuian, 1997; Harris, 2001;
Jaworski & Kohli, 1993). Research has found market turbulence to be significant,
although two published studies reported it as a non-significant moderator (Jaworski &
Kohli, 1993; Subramanian & Gopalakrishna, 2001). Greenley (1995) and Harris (2001)
found market turbulence to be a significant non-monotonic moderator, while Slater and
Narver (1994) and Appiah-Adu (1997) found a significant but negative moderation
impact of market turbulence.
Researchers have also explored competitive intensity. First, Jaworski and Kohli
(1993) found competitive intensity to be non-significant. Later, researchers found it to be
a negative moderator after a crisis (Grewal & Tansuhaj, 2001). Three other studies found
competitive intensity to be either a significant and positive moderator (Appiah-Adu,
1997; Bhuian, 1997) or a significant non-monotonic moderator (Appiah-Adu &
Ranchhod, 1998).
Slater and Narver offer an explanation as to when highly competitive markets
may act as moderators of the market-oriented- and customer-led-to-performance paths.
Being customer led is, by definition, reactive and short term in focus. In a stable
environment, a customer-led company will be able to sufficiently respond to the
expressed needs of current customers and keep customers happy (measured through
satisfaction surveys). In contrast, in highly competitive markets, being responsive to
current customers’ expressed needs is insufficient. With rapid changes by the competitors
and the customers, firms cannot respond to only what goes on around them; they must
sense what is going to happen and behave proactively (1998). Therefore, despite the
99 inconsistent results of previous research on competitive intensity, I posit that competitive
intensity will moderate both the path from being market oriented to performance and the
path from being customer led to performance. However, as the impact will not be the
same, I offer a two-part hypothesis:
H3: Competitive intensity will moderate the performance impacts of being market oriented and customer led.
a. Being customer led will have a positive impact on performance in stable markets but not in highly competitive markets.
b. Being market oriented will have positive impact on performance in highly competitive markets but not in stable markets.
2.3.3 Hypotheses on Mediation
As in Essay #1, I study the impact of mediators in the orientation-to-performance
relationship. Table 2–2 (Mediators) contains previous research into the impact of market
and/or customer orientation on performance, including the possible role of mediators.
The published mediation literature has shown most mediators to be positive with the
exception that cooperative norms have a negative impact on performance (Siguaw et al.,
1998). Innovation is the most studied mediator. Research results show it completely
mediates the market-orientation-to-performance path (Baker & Sinkula, 1999; Han et al.,
1998) or at least partially mediates the relationship (Matear et al., 2002). I include
innovation in the model and also, building on Essay #1, value.

100 Innovation
Market-oriented businesses look for new customers they can serve, and they try to
meet their current customers’ (and potential customers’) latent needs. In studies of market
orientation’s impact on performance, Han et al. (1998), Baker and Sinkula (1996), and
Matear et al. (2002) found that innovation at least partially mediated the market-
orientation-to-performance path. Innovative companies, like market-oriented ones, will
try to meet latent needs of customers. Therefore, I hypothesize:
H4: Innovation will mediate the market-oriented-to-performance path in both the short- and long-term.
In contrast, customer-led companies will suffer from the “tyranny of the served
market” and will make only small changes (Hamel & Prahalad, 1994). Therefore, I
hypothesize:
H5: Innovation will not mediate the customer-led-to-performance path.
Value
Businesses that are market-oriented, customer-led, or both are intrinsically
interested in creating value for their customers. Market-oriented firms create value for
current and prospective customers while customer-led firms create value for their current
customers by meeting their expressed needs. Prior research (Day & Wensley, 1988;
Sawhney, 2002) hypothesized value as a mediator of the customer/market-orientation-to-
performance path: however, later research (Bens et al., 2003) shows it to be a partial
mediator. In order to show that both market-oriented and customer-led businesses create

101 value for their customers, I will include value in the model as a potential mediator for
both. Building on Essay #1, I posit:
H6: Value will mediate both the customer-led-to-performance and market- oriented-to-performance relationship.
The above hypotheses describe the customer-led and market-oriented performance model
pictured in Figure 2–1.
2.4. RESEARCH DESIGN
2.4.1 Data collection and sample
In order to develop the survey instrument, I surveyed two waves of MBA and
Executive MBA students at a large Midwestern University. From these pre-tests, I
received 59 usable surveys in the first wave and 39 usable surveys for the second pre-test.
In order to investigate firm performance without having to receive multiple
responses from each company or without correcting for multiple SBUs, with their
varying performance within a company, I surveyed single SBU firms. Additionally, the
firms had to be publicly traded to be included in the survey. This was to ensure that the
definition of a single SBU firm would be similar among the companies and that
performance information from publicly filed reports would be available.
To obtain a sample of only single-SBU firms, I searched the WRDS database of
10K filings (required for publicly traded companies by the S.E.C.), and selected only
those that report one SBU. The 10K filings lag the calendar year, and I used the available
information for 2003. In 2003, there were 4,154 single-segment companies. Of those
102 companies, 3,768 had employer identification numbers (EIN). In order to find mailing
addresses and contact names for each company, I used the Dun & Bradstreet (D&B)
service. D&B includes the EIN of each company within its database, and they provided
us with contact names, job titles, and addresses for only the single-SBU firms. Of the
3,768 companies with EINs, 1,526 companies had D&B listings which included contact
information for a person in sales, marketing, vice-president, or president of the company.
40 percent of the contact names were for the company president and 20 percent held a
title of “manager.” Of the total, 589 of the companies had more than one contact name
available. Using job titles, I was able to target those who were in positions that dealt with
the issues covered by the survey. The data frame included companies from all 50 states in
the U.S. No specific selection was based on state or geographic location, except to
exclude overseas firms or establishments of US firms overseas.
Once I had identified the contacts, I mailed the prospective respondents an eight-
page questionnaire booklet (seven inches by eight and a half) along with a postage paid
envelope for the survey’s return. The mailing included a cover letter with the
questionnaire and information on a five-dollar donation that would be made to one of six
charities if the respondent completed the questionnaire. The charities that the participants
could choose from were Habitat for Humanity, Make a Wish Foundation, World Wildlife
Fund, Big Brothers/Big Sisters, St. Jude Children’s Hospital, and the Susan G. Komen
Breast Cancer Foundation. Ten days after the survey was mailed, I sent reminder
postcards to all recipients who had not responded. 119 of the packets came back labeled
as “undeliverable.” The first wave of mailing brought 46 responses. Two weeks after the
reminder postcard went out, I mailed another questionnaire booklet, cover letter and
103 postage-paid envelope to the 1,950 who had not responded. Again, ten days later, a
second reminder postcard went to the non-responders. From this second wave, 27 more
responses arrived, for a total response rate of four percent. The first wave of survey
booklets was yellow, and the second wave was white in order to easily identify which
mailing elicited a response from each respondent. No company had more than one
responder, which could result in mono-method bias. I discuss this issue within
“Limitations and Implications for Future Research,” and, as described later, I also address
the issue by supplementing the survey data with objective performance measures from
the 10K filings of the surveyed firms.
In an attempt to increase the number of respondents, I also surveyed students in
an evening and an executive MBA program at a large Midwestern University. Of the 56
students who responded to the questionnaire, the differences between evening and
executive students were not statistically significant. However, the responses between the
mail survey responders and the MBA students differed significantly (responses to 35
percent of the questionnaire items were statistically different). This difference appears to
be due to years of experience for the MBA students versus the mail survey respondents
(9.7 years versus 27.4 years). Given the prevalence of people with the title of “President”
to whom the survey was mailed, this is not surprising. I chose to use the 73 responses
received from the mail survey in the data analyses because their companies are single
SBU firms, and I can connect their responses to their 10K data filed with the SEC.
104 2.4.2 Development of customer-led and market-oriented measures
Following commonly accepted methods for scale development (Churchill, 1979),
I developed scales for being customer-led and market-oriented. I based the scale
construction on a large set of previously published and tested measures, and I developed
and pretested additional questions that are based on the definition of customer-led
organizations in Slater and Narver (1998). The first pretest included all the items from
Narver et al.’s (2000) market orientation “reactive” and market orientation “proactive”
scales (Appendix A Scales 1 and 2). In addition to these 15 items, the first pretest
included five items from other published and tested scales and eight new items based on
the definition of customer-led organizations (Slater & Narver, 1998). All the items
included in the pre-test appear in Table 2–5. All items were structured for a 5-point Likert
scale from 1, “Strongly Disagree,” to 5, “Strongly Agree.”
The pool of 59 MBA students came from a large, private, Midwestern university;
they served s pre-testers. I conducted a factor analysis on the 28 items, and a three-factor
solution was the best model. Of the original items, 20 loaded on the three factors. The
first factor, which included many of the customer-led items, accounted for 24 percent of
the variance of the sample. Ten items loaded only on this factor without cross-loading
above .4 on other factors. The factor has a Cronbach’s alpha of .89, well above the level
(0.7) suggested for exploratory research (Nunnally & Bernstein, 1994). The second factor
contained six items, all from Narver and Slater’s MOPRO scale (Proactive market
orientation). The alpha was 0.82, and the factor accounted for 17 percent of the variance
in the sample. A third factor had three items focused on a customer-led orientation; this
factor accounted for 10 percent of the variance and had an alpha of 0.76. One item cross-
105 loaded on both the customer-led factor and the MOPRO factor.
After the first round of pre-testing, 20 items from the original 28 remained. In a
second round, 39 different MBA students from the same university pre-tested the
remaining 20 items by rating them in a questionnaire (See Table 2–5).
The second pre-test included the complete MARKOR scale. The results of the
second pre-test show that the items comprise two factors. The market orientation factor
accounts for 28 percent of the variance in the sample and has a Cronbach’s alpha of 0.84.
The customer-led factor accounts for 25 percent of the variance and has an alpha of 0.81.
All 20 items appeared in the final questionnaire.
2.4.3 Additional measures
The questionnaire included measures for performance, mediators, moderators and
control variables in addition to the customer-led and market-oriented scales described
above. Below, I discuss additional measures that I developed or that do not appear in
previously published work. Scales which other researchers developed appear in Appendix
B, but they are not discussed below.
Value (Appendix B.1a and B.1b)
Building on a previous study of market orientation, I included five value items
that measure relational advantage and included three more measures of value that rate
product advantage (Day & Van den Bulte, 2003). The eight items that I used to measure
value include economic, technical, service, and social aspects of offerings (Anderson,
106 Thomson, & Wynstra, 2000). I structured all eight of the survey questions such that
respondents had to compare how the company’s customers view its offerings versus that
of its direct competitors. One of the most common questions used to measure the
economic facet of value is asking how the offering’s value for the money compares to
that of direct competitors. Company responsiveness to individual needs was addressed by
questions about service and technical aspects of value, such as
• the best total solution,
• the ease of collaboration, and
• the ability to deal with problems and queries.
Quality is another commonly considered aspect of value in consumer research. In the
model presented here, quality is explicitly included in a question about how the
respondent firm’s quality compared to that of its direct competitors. In distilling the
questions about value to be included in the model, I used confirmatory factor analysis
(Gerbing & Anderson, 1992). The reliability of the eight items is 0.81.
Market environment (Appendix B.3a and B.3b)
I developed one scale based on D’Aveni’s work on hyper competition (D'Aveni,
1994, 1995). The high intensity competition scale appears in Appendix B.3b; it compares
to a previously developed competitive intensity scale (Song & Parry, 1997a, b) which
Appendix B.3a shows. These scales include questions about price competition and degree
of aggressiveness when firms position themselves against each other in the respondent’s
competitive market. In the first pre-test with 98 MBA students, the Cronbach’s α for the
Song and Parry competitive intensity scale was 0.36 while the α for the scale I developed
107 was 0.78. However, I chose to include both scales in the final survey despite the low α of
the Song and Parry measure because the marketing literature included it. The α for the
Song and Parry competitive intensity scale with the responses from the final sample only
improved to 0.41 while the α for the high intensity competition scale I developed was
0.79. The AVE (Average variance extracted) is 0.55 and the composite reliability is 0.85,
showing good convergent validity for the scale I developed (Fornell & Bookstein, 1981).
The respondents rated the items from one to five (strongly disagree to strongly agree).
The highest company scored a 25, while the minimum a company scored was 6. A high
score would demonstrate high competitive intensity while a low score would be a
relatively stable market environment. The mean score was 16.3 and the median score was
17.
Self-reported Performance (Appendix B.4 and Appendix B.5)
Respondents rated their performance three ways, as companies are not interested
only in profits, but also sales growth and customer retention. Also, as previous studies
have shown differing relationships between orientation and performance depending on
the performance measure, I wanted to have more than one measure to test the model.
Following previous research (Slater & Narver, 1994), I utilized self-reported measures of
how a firm performed in comparison to its direct competitors over the last two years
(short-term) and four years (long-term). Participants reported performance on a five-point
Likert scale with endpoints of “Much Better” and “Much Worse” than competitors. The
three short-term measures had a coefficient alpha of 0.81, and the long-term measures
108 had a coefficient alpha of 0.84. Having respondents compare themselves to competitors is
one way to control for differing rates of average performance by industry and served
markets. Additionally, Pearce (1987) and Dess (1984) found strong correlations between
subjective and objective measures of performance, and researchers have used them
extensively in previously published studies of market oriented and customer-led firms
(Gatignon & Xuereb, 1997; Pelham & Wilson, 1996).
Objective performance measures (Appendix B.6)
By using single SBU firms that are publicly traded, I was able to supplement the
subjective data with objective data from the 10K filings of the respondent firms. From
Compustat, I obtained the data needed to calculate ROA and sales growth for all publicly
traded, single SBU firms from 2005 through 2008. I calculated the measures using
standard accounting definitions. Sales Growth is the difference between this year’s sales
and last year’s sales divided by last year’s sales. ROA is net income plus after tax interest
expense all divided by the total assets at the beginning of the year. In the survey I
conducted in 2005, I asked respondents to rate their companies on market orientation and
environmental characteristics of their markets in the present. Therefore, 2005 Compustat
data should show the impact of current market orientation and value creation. The 5,513
firms had at least some data for ROA and sales growth between 2005 and 2008. Not all
the respondent companies had data for this timeframe. This may be a result of firms
expanding and becoming multiple SBU firms, being acquired by another firm, going
bankrupt, or delisting from the stock exchange, and consequently no longer needing to
file a 10K report. In one case, the company went from being a publicly traded company

109 to a privately held company, and therefore no longer filed a 10K report. 49 of the
respondent companies had data for sales growth and 45 for ROA in 2005. After 2005,
even fewer companies had data. For this reason, I consider only the 2005 data.
A priori, there is no reason to believe that sales growth and ROA should be
similar for different types of firms in the same year. For example, the Mississippi River
floods of 2011 shut down and damaged many casinos in the path of the floods. Therefore,
one can expect lower casino ROA and sales growth for casinos. At the same time, the
destruction of the floods will cause people to need to rebuild homes and businesses,
increasing sales for construction-related industries. To mitigate the differences among
types of industries, I sorted firms by the first three digits of their SIC codes. If there were
no respondent companies in a three digit SIC code group, I discarded that group. The
2,422 firms that remained were divided into 34 groups. Groups ranged in size from 3 to
569 companies. For the self-reported measures, the respondents had rated their
companies as compared to their direct competitors. Ideally, their direct competitors
would come from their three-digit SIC code group.
To develop the ROA and sales growth measures used in the models, I first
calculated averages and standard deviations for sales growth and ROA for each SIC code
group. I removed outliers if their ROAs or sales growth figures were five or more
standard deviations from the mean of the group. Again, as average ROA and sales growth
will vary across the SIC code groups, I rank the companies within their group. This
compares the performance of the company to the competitors within their group. Finally,
I linked the 10K performance measures for the respondent companies to the self-reported
survey data.
110
Control variables
Previous research has not been consistent in including control variables, nor has
any one variable, or set of variables, emerged as necessary in modeling market
orientation and firm performance. Previous researchers have included variables such as
firm size, buyer power, market position, and ease of market entry (Atuahene-Gima, 2005;
Chou, 2009; Hult et al., 2005). The final survey included items for self-reported firm size,
cost disadvantage as compared to their major competitors, barriers to entry in their
market or industry, and buyer power. The single item measures appear in Appendix B.7
2.5. RESULTS OF MODEL TESTING
2.5.1 Introduction
This section presents the results of testing the hypotheses presented above. First I
describe the differences between being customer led and market oriented; then, I test the
hypotheses. A comparison of the measures for customer-led and market-oriented
approaches shows that they are positively correlated with each other and the larger,
market orientation scale developed by Kohli and Jaworski (1993). However, they have
different impacts on firm performance. I test for mediation by value and by innovation.
Finally I also test the role of competitive intensity in moderating the impact of being
customer led or market oriented. As in Essay #1, value acts as a mediator; however,
innovation is not a statistically significant mediator in the model I test. My data do not
show that competitive intensity is a moderator in this model.
111 2.5.2 Methodology
In a review of studies of market orientation between 2005 and 2009, I found 13
papers published in peer reviewed journals. Of these 13, eight used regression (OLS) and
three used structural equation modeling (SEM). The other two were conceptual or
descriptive. In the past, most researchers have chosen to apply SEM with a maximum
likelihood (ML) estimation with a program such as LISREL or AMOS. However, given
the nature of my data and limited number of observations, I chose to use partial least
squares estimation (PLS), utilizing SmartPLS (Ringle et al., 2005). I provide a short
overview of PLS and the reasons for my choice.
Both OLS- and ML-based SEM require the researcher to assume that her data are
measured without error. As measurement error could be caused by the order of the
questions in the questionnaire, I cannot assume that there is no measurement error. PLS
does not require the assumption of variables that are measured without error. Therefore,
PLS is a better choice than OLS or SEM given my data.
My research includes both moderators and mediators, and PLS is preferable to
regression when moderators and/or mediators are included. Mediation is usually tested
with OLS by applying the Baron & Kenny (1986) 3-step method, and recently additional
steps have been added to test for the specific kind of mediation (Zhao et al., 2010). By
applying path modeling, I can include the mediators and moderators in the same model
and test for their significance in one step (Haenlein & Kaplan, 2004).
Researchers in the business disciplines usually assume a reflective model.
Coltman et al. (2008) found that 95 percent of papers in the Journal of International
Business Studies and the Journal of Marketing in 2006 used reflective constructs without
112 mentioning the possibility that a construct might be better measured as formative. This
reliance on reflective construction may be a result of the modeling limitations of OLS and
ML methods. PLS, however, allows both formative and reflective constructs to be
estimated in the same model.
One drawback to PLS is the lack of goodness-of-fit measures. LISREL and OLS
have more. Therefore, while PLS is adequate for theory building, it is less desirable than
LISREL or AMOS for model comparison (Henseler et al., 2009).
One other advantage of PLS over ML methods is that fewer observations are
required to obtain valid results (Haenlein & Kaplan, 2004). I have chosen to apply PLS
for my model, because I have a low number of observations, multiple dependent
variables, moderators, mediators, and I cannot assume away measurement error.
While most researchers assume that market orientation is a reflective index, recent
research has suggested that when market orientation is broken down, the components (in
this case market oriented and customer led) should be modeled as formative indicators.
One potential problem with modeling the variables formatively is that there are no rules
of thumb for creating an index from the formative indicators (Coltman et al., 2008). This
could be an issue with my data; I had planned to create indices to reduce the number of
variables in my model. However, I decided to examine whether the items I had pre-tested
for the market-oriented and customer-led variables could be formative indicators. Using
SmartPLS, I created two formative variables with the items that I had previously
identified as either customer led or market oriented. Unfortunately, few of the paths were
statistically significant even at the α = 0.10 level, and those that were almost significant
cross-loaded on the other variables. After cleaning the data by removing the non-

113 significant items and those that cross-loaded, I was left with one indicator for each
variable. Coltman et al. (2008) suggest that one issue with modeling indices in a
formative manner when they have previously been considered reflective is that the items
themselves may not be appropriate for a formative index. Given that only two items
remained when I attempted to model the variables in a formative manner, I chose to
model the indices in a reflective form.
Starting with the items that had emerged from the pre-tests as loading on the two
variables, I used factor analysis in SmartPLS to remove the items that cross-loaded. One
item loaded heavily on a performance measure. Once I removed the cross-loading items
and those without statistically significant paths, three items remained that loaded on the
customer-led latent variable and four that loaded on the market-oriented latent variable.
Table 2–5 contains the questions that remained. The final variables have convergent
validity as both have AVEs of 0.5 or above (Fornell & Bookstein, 1981). The AVE of a
customer-led approach is 0.53 and that of a market-oriented approach is 0.5. The
Cronbach’s alphas are 0.51 and 0.71, and they have composite reliabilities of 0.78 and
0.82 respectively. While the Cronbach’s alpha of customer led is low, this is likely due to
the scale only having three items, and Cronbach’s alpha is prone to estimation errors. The
composite reliabilities are both greater than 0.6 which is adequate for exploratory scales
(Chin, 1998). Using the loadings on each of the items from PLS, I created an index for
customer led and one for market oriented.
Given the semantic issues surrounding customer and market orientation, and the
various scales used to measure the orientations, I checked the correlations among the
scores and the scale that Kohli and Jaworski (1993) developed. The survey respondents

114 had also completed the Kohli and Jaworski scale items. 16 of the 20 items included in the
scale were found to load heavily on one factor. The p-value of the one factor Kohli and
Jaworski scale is 0.08—meaning that I can accept that one factor is sufficient and an
additional factor is not necessary to explain the variance in the sample. The Cronbach’s
alpha of the 16-item scale was 0.90 which is well above the accepted minimum for alphas
(Nunnally and Bernstein 1994). The three scales are all positively correlated, which is to
be expected as common practice has been to freely interchange the terms and items used
to make up the scales for years. The market-oriented and Kohli-Jaworski scores are the
most highly correlated (0.70), while the customer-led and Kohli-Jaworski scores have a
correlation coefficient of only 0.44. Customer led and market oriented have a correlation
coefficient of 0.48. The data support the contention that market oriented is not identical to
customer led and the two should not be used interchangeably.
I continued to use PLS for factor analysis of the market environment (hyper
competition) scale. The AVE for this index is 0.55, the Cronbach’s alpha is 0.79 and the
composite reliability is 0.85. These values show convergent validity for the index. Using
the loadings on each item, I created an index for market environment. The index aids in
decreasing the number of variables in each model estimation.
Innovation is also a multi-item scale. Again, I used PLS to analyze the scale.
While the Cronbach’s alpha of the scale was 0.63, the AVE was only 0.41 and the
reliability 0.63. With an AVE below 0.50, the convergent validity is weak. Only three of
the four items had significant loadings. When I removed the item with the non-significant
loading, the AVE of the three item scale increased to 0.6 and the reliability increased to
0.81. The Cronbach’s alpha only increased to 0.67, but given the high reliability, I chose

115 to keep the scale in the model. The results for the three item scale show good convergent
validity. With the loadings from the factor analysis, I created an index for innovation
from the three item scale. Appendix B.2 shows the items that remained in the final scale.
To estimate performance, I departed from previously published work which
mostly focuses on a single measure and only one time period. For that reason, I tested the
self-reported performance measures profit, revenue, and customer retention. Additionally,
I assessed long-term (past four years) and short-term (past two years) results for each of
the measures. A priori, there is no reason to believe that all three indicators measure the
same type of performance. Customer-led or market-oriented practices may require
differing performance measures (Voss & Voss, 2000). Tables 2–6 (Correlation between
Performance Measures at Two Years) and 2–7 (Correlation between Performance
Measures at Four Years) show that the measures are positively correlated, with
correlations between two factors ranging from 0.53 to 0.66. In order to test short-term
and long-term performance separately, I combined the three short-term measures into one
composite short-term performance variable and the three long-term measures into one
composite long-term performance variable. In a meta-analysis, Ellis (2006) found market
orientation to have higher correlations with subjective performance measures than
objective performance measures. Therefore, I included a third composite variable with
the 10K measures. The three composite performance variables, short-term performance,
long-term performance, and 10K performance, are modeled formatively, so I did not
create indices for the items.
While multicollinearity causes problems in OLS estimation, this is not a problem
in PLS. Even so, I checked the correlations of the latent variables. The correlations
116 appear in Table 2–8 below. The short-term and long-term performance composite
variables have the highest correlations at 0.767. V.I.F. tests of the variables do not show
multicollinearity to be a problem. Innovation is negatively correlated with the customer-
led variable, but positively correlated with market-oriented. The correlation between
customer led and market oriented is 0.48. Even though the two latent variables each have
good convergent validity, and the correlation between them is below 0.75, I further tested
that they were separate constructs by putting all the items into one variable. This
compound variable had poor convergent validity with an AVE of 0.35. This adds
evidence that the two variables should be modeled separately.
2.5.3 PLS Model
One advantage of using PLS over OLS is that I can estimate all the relationships
hypothesized above in one model. This allows me to test all the relationships at the same
time and not in a piecemeal fashion. I did, however, model the data without any
mediators or the moderator as shown in Figure 2–2 to compare it with the final model
shown in Figure 2–3. In this manner I can comment on the increases in R² with the
inclusion of the mediating variables. Figures 2–2 and 2–3 show the statistically
significant paths, their coefficients, and their t-statistics. The R²s of the dependent
variables are also included in the figures. The model contains the three formative
composite performance variables (short-term performance, long-term performance and
10K performance). The model includes both the self-reported and the objective data from
the 10K reports. While value mediates the relationship between customer-led and short-

117 term performance, it is not a mediator in any of the other customer-led- or market-
oriented-to-performance paths.
In the case of innovation, both customer-led and market-oriented criteria have
statistically significant paths to innovation. However, the innovation variable is not a
statistically significant predictor of any of the composite performance measures.
While competitive intensity was a significant moderator in some previously
published studies, in this study, my data do not support hypothesis H3. The final model
for which I report the results does not include competitive intensity because none of the
relationships was statistically significant.
By using SmartPLS, I can report the total effect of market oriented or customer
led on the performance variables, and not just the direct paths between the variables. The
R2 of short-term performance increases from 0.457 without the mediators to 0.539 when
they are included. In the case of long-term performance, the R2 increases from 0.362 to
0.454 when the mediators are included in the model. Including the mediators does not
increase the R2 of the 10K measure which is 0.161 when there are no mediators and 0.154
when they are included. The R²s for short- and long-term performance are higher than
most found in previously published studies (Deshpandé & Farley, 1998b), and they are
higher than in Coltman et al.’s (2008) research, which showed an R² of 0.19 for their
reactive performance measure and 0.24 for their proactive performance measure.
118 2.5.4 Results of testing of performance hypotheses (H1 and H2)
The first hypotheses are about the short- and long-term impact of being a
customer-led and/or market-oriented firm on performance. H1a posited that being
customer led should have a significant and positive impact on short-term performance.
Indeed, the total effect of customer led on short-term performance is significant at p
=0.05, supporting H1a. H1b posited that being customer led would not have a statistically
significant impact on long-term performance. The data also support H1b, as the
coefficient of the total effect of customer led on the composite long-term performance
variable is not statistically significant, and neither is customer led a statistically
significant predictor of the composite 10K performance variable.
In contrast to the impact of being a customer-led firm, H2a posits that being a
market-oriented firm will not have a significant impact on short-term performance. The
data partially support H2a, as the coefficient of the total effect of market-oriented on
short-term performance is significant at p=0.10 but not at p=0.05. For both the long-term
performance variable and the 10K composite performance variable, the coefficient of the
total effect of market-oriented for each is statistically significant at p =0.05 This result
supports H2b that being market oriented will have a positive long-term impact on
performance.
2.5.5 Results of testing of moderation: Market environment (H3)
In H3, I posit that competitive intensity will moderate the performance impacts of
being market oriented and/or customer led. SmartPLS permits the inclusion of

119 moderating variables in the model. When I included the competitive intensity index
described above in the model, none of the path coefficients was statistically significant.
The data do not support H3. Given the mixed results of testing competitive intensity as a
moderator in previous work (as shown in Table 2-1), this result is not completely
unexpected. In fact, in a meta-analysis, researchers have noted that there was not enough
consistent empirical evidence to support the hypothesis that competitive intensity is a
moderator in the market-orientation-to-performance relationship (Kirca, Jayachandran, &
Bearden, 2005). One reason for the non-significance may be that my model does not
correctly specify the relationship; the true relationship could be non-monotonic as
reported by Appiah-Adu et al (1998). In research of the hotel industry, competitive
intensity was a control variable. However, the authors found no significant impact of
competitive intensity on performance (Zhou et al., 2007). In more recent research,
competitive intensity was an antecedent to perceived desired level of market orientation,
but it was not a precursor to firm performance (Song & Parry, 2009).
2.5.6 Results of testing for mediation
Innovation (H4 and H5)
Using the innovation index from the survey responses, I tested H4 which posits
that innovation will positively mediate the market-oriented-to-performance path in both
the short- and long-term. However, while the market-oriented variable has a statistically
significant impact on innovation at p=0.10, innovation is not a statistically significant
predictor of the long-term performance variable nor of the 10K performance variables.
120 Ideally, in the long term, innovation would pay off with higher profits, but the data do not
support H4 that innovation has a positive impact on performance over four years.
While previous research tested innovation as a mediator, recent research tested
innovation not as a mediator, but as a result of customer/competitor orientation.
Innovation was hypothesized to be a precursor of perceived quality and satisfaction.
Perceived quality and satisfaction, in turn, lead to increased profits for the firms.
Therefore, innovation itself did not lead to increased profits (Zhou, Brown, & Dev,
2009). That is, innovation does not lead to firm performance directly, but influences other
variables that impact firm performance.
The results may also be caused by the nature of innovation itself. While
incremental innovations are rather safe investments, truly innovative products fail more
often than an incremental innovation (Calantone et al., 2003). Therefore, a company may
be innovative, but it may not always have success with its innovations. While having a
blockbuster breakthrough innovation, such as the Sony Walkman, will increase a firm’s
profits, most companies will not have such ground-breaking innovations very often, if at
all. As my research only included self-reported data for four years and 10K data for two,
the truly innovative firms may not have had a break through innovation in that time
period. Therefore, a firm that focuses on incremental innovations may have better firm
performance than a very innovative firm (one that scored highly on the innovativeness
scale in my survey).
While the data support H5, which states that innovation is not a mediator of the
customer-led-to-performance relationship in the short term, the negative sign on the
coefficient from customer led to innovation was unexpected. Past research has found
121 innovation to be a positive mediator (see Table 2–2. “Mediators”) of market orientation,
but my data show that being customer led has a negative impact on innovation. The path
from innovation to short-term performance is also negative, but not statistically
significant. Also, because of the negative path from customer led to innovation, the total
effect of a customer-led approach on 10K performance is negative when innovation is
included in the model, but it is not statistically significant. These negative paths could
lead one to conclude that being too close to the customer is, indeed, bad for performance
as Christensen and Bower (1996) stated. The negative path could be symptomatic of
highly customer-led companies focusing more on incremental innovations or
improvements in products and not looking for ground breaking innovations.
Value (H6)
In order to test the mediational impact of value, I constructed a value creation
index as described above. I include value as an index in the PLS model to reduce the
number of variables in the final model. As in Essay #1, H6 posits that value will mediate
the relationship between both customer led and market oriented and the performance
variables. Both market oriented and customer led are statistically significant predictors of
the value variable. The R² of the value variable is 0.36. However, value is a statistically
significant predictor for only short- and long-term performance, not for the 10K
performance variable. With value in the model, the total effect of customer-led on short-
term performance is statistically significant, while the direct effect is not. Likewise, the
total effect of market-oriented on long-term performance is statistically significant, while
the direct effect is not. This shows that value mediates the customer-led-to-short-term
122 performance relationship and also mediates the market-oriented-to-long-term-
performance relationship. In the case of customer-led-to-long-term-performance
relationship, value does not fully mediate the relationship even though the coefficient and
the statistical significance of the direct path from customer-led-to-long-term performance
decreases when value is added to the model. The direct path when value is not included
in the model is not significant. For the market-oriented-to-short-term-performance
relationship, the total effect of market-oriented on short-term performance is significant
(p = 0.10) and the direct effect is not statistically significant. However, the direct effect
without mediators is not significant either. Value does not mediate the path from
customer-led to 10K performance as the effect (direct or total) of customer led on 10K
performance is not statistically significant with or without value. In the case of market-
oriented-to-10K, the direct path and the total effect are both statistically significant when
value is in the equation; however, the path from value to 10K is not statistically
significant. Therefore, there is partial support for H6. Value mediates the customer-led-
to-short-term path and the market-oriented-to-long-term path, but not the other paths.
Value is not a statistically significant predictor of 10K performance.
Control Variables
I included four control variables in the model. Cost disadvantage is not a
statistically significant predictor of any of the performance variables, and I removed it
from the final model. The three remaining control variables, were statistically significant
(at p = 0.05 unless otherwise noted) predictors for at least one of the performance
variables.
123 Firm size is a positive and statistically significant predictor of short- and long-
term performance, but not 10K performance. This relationship demonstrates that the
larger a firm, the more positive the impact on its performance measures. Buyer power is a
negative and statistically significant predictor of long-term performance, meaning that in
a market where buyers have the power to push for price breaks and special deals, the
long-term performance of the firm is reduced. Buyer power does not have a statistically
significant relationship with the other two performance variables.
Barriers to entry have a negative impact on short-term performance (p = 0.10).
This shows that in markets where it is difficult for new competitors to enter, short-term
performance is negatively impacted. I expected the opposite result: if the market is
difficult to enter, firms should be able to earn higher profits than if competitors can enter
easily. Zhou et al. (2007) found that when respondent firms erected barriers to entry, it
had a significant positive impact on firm performance. In their research, they specified
that a barrier to entry was the respondent firm building a hotel in a prime location,
leaving the competitors to build their hotels in less desirable locations. In my study, the
respondents rated their market on how difficult it is for a new competitor to enter. As I
included firms from many different industries, this question may have been too general
and the respondents may each have construed different types of barriers. For example, in
some situations, a market may be difficult to enter because there is some type of
protection such as governmental controls, regulations, licensing, permit requirements, or
high start-up costs, and in other situations, a market may be difficult to enter because
there is a high level of competition. If the difficulty of entering a market is primarily due
to its highly competitive nature, then we should expect lower ROA and sales growth.
124 2.6. DISCUSSION
For scholars, this study shows that the difference between being customer led and
market oriented is more than just semantic. Building on the findings of Essay #1, this
study shows that value mediates both the market-oriented- and customer-led–to-
performance path. The data do not support the hypothesis (H4) that innovation mediates
the market-oriented-to-performance path. As hypothesized (H5), innovation does not
mediate the customer-led-to-performance path. The data also do not support the
hypothesis (H3) about the need to focus on being either customer-led or market-oriented
depending on competitive intensity.
2.6.1 Theoretical Implications
Previous published studies have referred to market orientation and customer-led
orientation almost interchangeably. Through scale development, I show that market-
oriented and customer-led approaches are not measuring the same aspects of firm
structure. The results of this study also highlight the different impact that being either
market oriented or customer led has on performance. As previous studies have shown
differing effects of market and customer orientation on performance, one interpretation of
the results of this study could be that some of the differences may be due to the actual
type of orientation being measured. Therefore, it is not sufficient to refer to market-
oriented and customer-led strategies interchangeably. One stark example of this is the
customer-led versus market-oriented impact on short-term performance. A customer led
strategy has a positive and statistically significant impact on short-term performance,
125 while a market-oriented strategy has no statistically significant impact (at p =0.05) on
short-term performance.
My results also partially support the hypothesis (H6) that value mediates the
market-oriented- and customer-led-to-performance path. While value had been included
in previous market-orientation scales, researchers had not tested it as a mediator of the
market-oriented/performance relationship. The data here support value mediation.
However, the full extent of mediation depends both on the performance measures and the
orientation measures the study investigates.
This leads to another result of this study: it shows that the type of performance
measure matters. The impacts of being customer led or market oriented, and the role of
value as a mediator, depend on the performance measure used. For example, being
customer led is not a statistically significant predictor of long-term performance or 10K
performance, but it is of short-term performance. Broad generalizations about being
customer led or market oriented cannot be made given the data in this study. Instead,
researchers should make it clear that their results depend on the performance measure
that they are including in their models.
2.6.2 Managerial Implications
The results from this research suggest that being customer led will have a
negative impact on innovation, while being market oriented does not have a negative
impact on innovation. Innovation does not have a statistically significant impact on any
of the performance variables in this study. However, given the low R² of the innovation
126 variable (0.06), I can conclude that there are precursors to innovation other than being
customer led or market oriented.
By measuring whether the company is focused on the market (market-oriented) or
focused on the customer (customer-led), or both, managers can determine areas for
improvement of the firm’s performance. The data support a focus on customer-led
strategies to enhance short-term performance or a focus on market-oriented strategies for
long-term performance and 10K performance. If the firm wants to focus on both short-
term and long-term performance, then being both market oriented and customer led are
important. In most cases, being a market-oriented and/or customer-led firm impacts
performance through value creation. It is no longer sufficient to concentrate on being
simply a market-oriented firm or a customer-led firm; firms must bring value creation,
derived from market-oriented or customer-led strategies to the forefront.
Results change by the type of performance (self-reported short-term, self-reported
long-term, or 10K). Therefore, conclusions about the effect of market or customer focus
on performance must refer to the measure used; researchers and managers should not
accept general, sweeping conclusions about the impact of either market or customer
orientation on performance.
2.6.3 Limitations and Implications for Future Research
While being market oriented or customer led contributes to value, I cannot
conclude from this study that they cause value. In order to make such a conclusion, more
experimental data would be needed. The limitation of survey research is that the data
show only correlation and not a causal relationship. Even so, pointing out the correlation

127 between being market oriented and/or customer led and value gives us a deeper
understanding of value. Future research should focus on improving the understanding of
how firms create offerings that customers value.
Unlike past published studies involving the innovation scale that I used for this
research, the data here show a negative relationship between innovation and short-term
performance. This could be due to the time period studied or the performance measures
used. Further research into innovations role and its short- and long-term impact on
different performance measures is needed.
The low number of respondents was a hindrance to this study. While PLS can
estimate models with low numbers of observations, in order to include many variables
individually instead of in indices, I needed a larger number of observations.
As with past studies of orientation, the self-reported measures suffer from the
potential for mono-method bias, which may influence the conclusions derived from the
survey data. I tried to correct for this by using publicly traded, single SBU firms as the
focus of the research so that I could collect objective performance measures.
Unfortunately, the contacts for these companies were overwhelmingly presidents or
CEO’s of their companies, which can impact the response by decreasing the number of
respondents. While I have created formative indices of performance, the loadings of the
performance items on the variables varies. Measuring and reporting the performance
measures separately would allow a more complete picture of the impact of being
customer led and market oriented on performance. More responses would allow a more
complete picture of the influence of customer-led and market-oriented strategies on
performance.
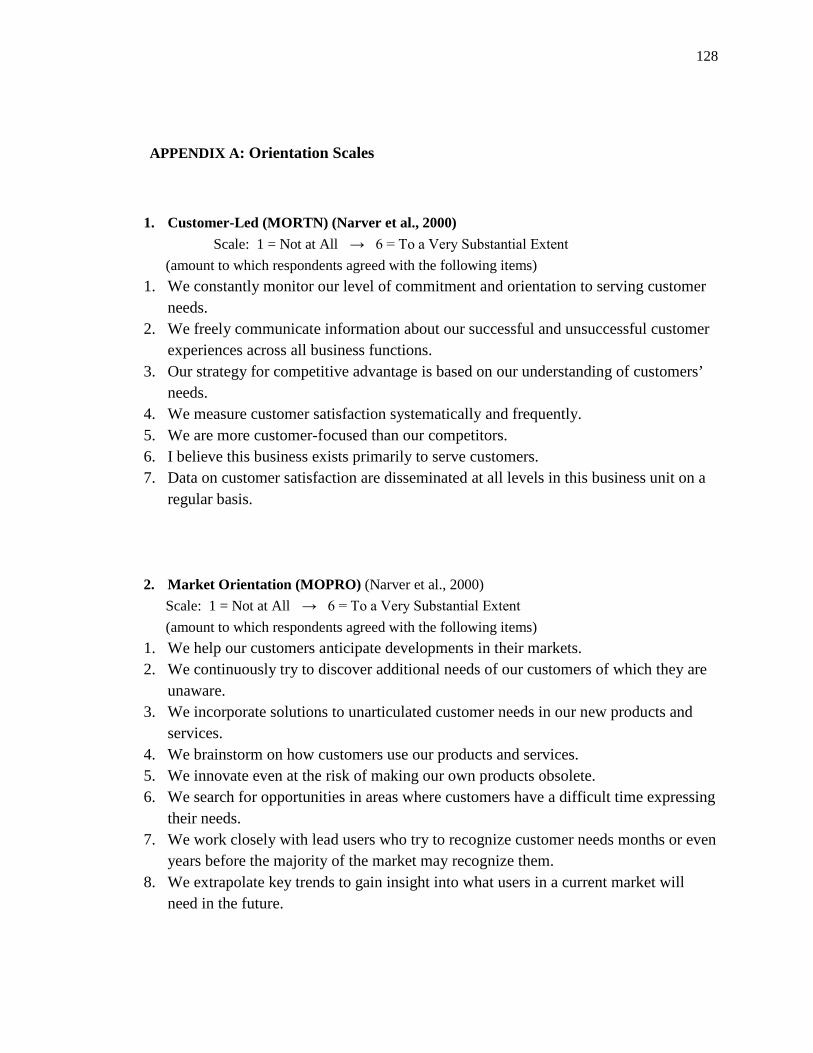
128
APPENDIX A
: Orientation Scales
1. Customer-Led (MORTN) (Narver et al., 2000) Scale: 1 = Not at All → 6 = To a Very Substantial Extent
(amount to which respondents agreed with the following items) 1. We constantly monitor our level of commitment and orientation to serving customer
needs. 2. We freely communicate information about our successful and unsuccessful customer
experiences across all business functions. 3. Our strategy for competitive advantage is based on our understanding of customers’
needs. 4. We measure customer satisfaction systematically and frequently. 5. We are more customer-focused than our competitors. 6. I believe this business exists primarily to serve customers. 7. Data on customer satisfaction are disseminated at all levels in this business unit on a
regular basis. 2. Market Orientation (MOPRO) (Narver et al., 2000) Scale: 1 = Not at All → 6 = To a Very Substantial Extent (amount to which respondents agreed with the following items) 1. We help our customers anticipate developments in their markets. 2. We continuously try to discover additional needs of our customers of which they are
unaware. 3. We incorporate solutions to unarticulated customer needs in our new products and
services. 4. We brainstorm on how customers use our products and services. 5. We innovate even at the risk of making our own products obsolete. 6. We search for opportunities in areas where customers have a difficult time expressing
their needs. 7. We work closely with lead users who try to recognize customer needs months or even
years before the majority of the market may recognize them. 8. We extrapolate key trends to gain insight into what users in a current market will
need in the future.
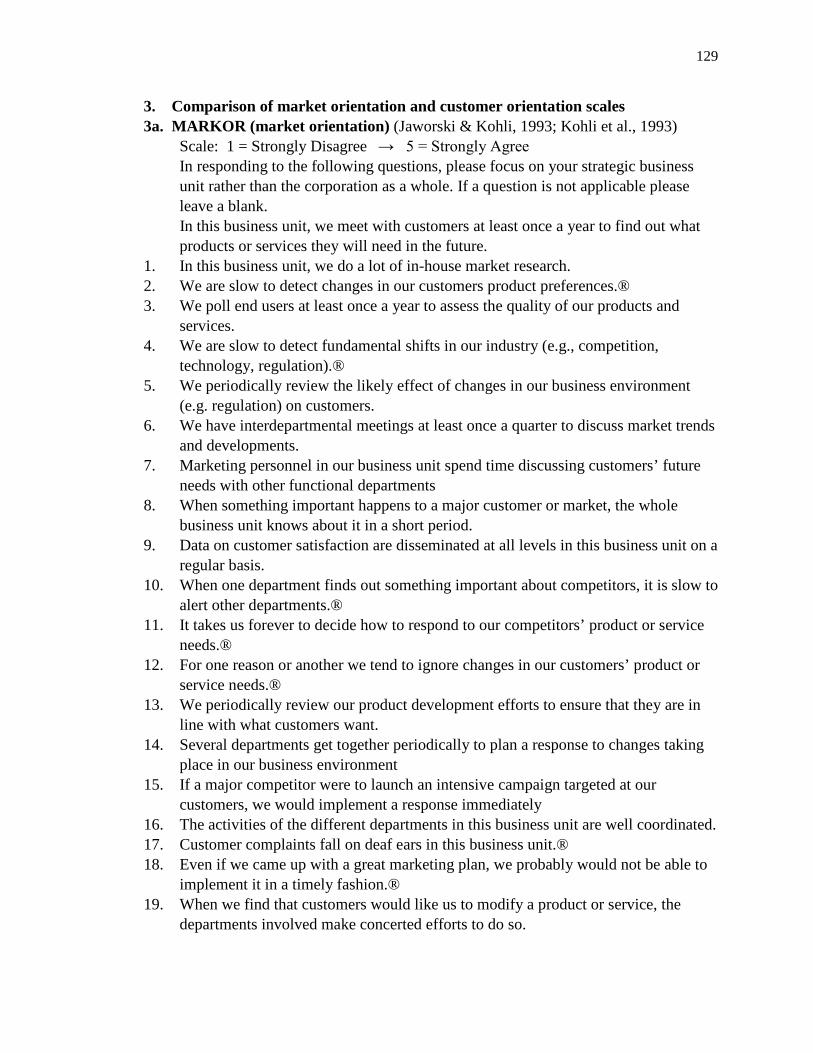
129
3. Comparison of market orientation and customer orientation scales 3a. MARKOR (market orientation) (Jaworski & Kohli, 1993; Kohli et al., 1993) Scale: 1 = Strongly Disagree → 5 = Strongly Agree
In responding to the following questions, please focus on your strategic business unit rather than the corporation as a whole. If a question is not applicable please leave a blank.
In this business unit, we meet with customers at least once a year to find out what products or services they will need in the future.
1. In this business unit, we do a lot of in-house market research. 2. We are slow to detect changes in our customers product preferences.® 3. We poll end users at least once a year to assess the quality of our products and
services. 4. We are slow to detect fundamental shifts in our industry (e.g., competition,
technology, regulation).® 5. We periodically review the likely effect of changes in our business environment
(e.g. regulation) on customers. 6. We have interdepartmental meetings at least once a quarter to discuss market trends
and developments. 7. Marketing personnel in our business unit spend time discussing customers’ future
needs with other functional departments 8. When something important happens to a major customer or market, the whole
business unit knows about it in a short period. 9. Data on customer satisfaction are disseminated at all levels in this business unit on a
regular basis. 10. When one department finds out something important about competitors, it is slow to
alert other departments.® 11. It takes us forever to decide how to respond to our competitors’ product or service
needs.® 12. For one reason or another we tend to ignore changes in our customers’ product or
service needs.® 13. We periodically review our product development efforts to ensure that they are in
line with what customers want. 14. Several departments get together periodically to plan a response to changes taking
place in our business environment 15. If a major competitor were to launch an intensive campaign targeted at our
customers, we would implement a response immediately 16. The activities of the different departments in this business unit are well coordinated. 17. Customer complaints fall on deaf ears in this business unit.® 18. Even if we came up with a great marketing plan, we probably would not be able to
implement it in a timely fashion.® 19. When we find that customers would like us to modify a product or service, the
departments involved make concerted efforts to do so.
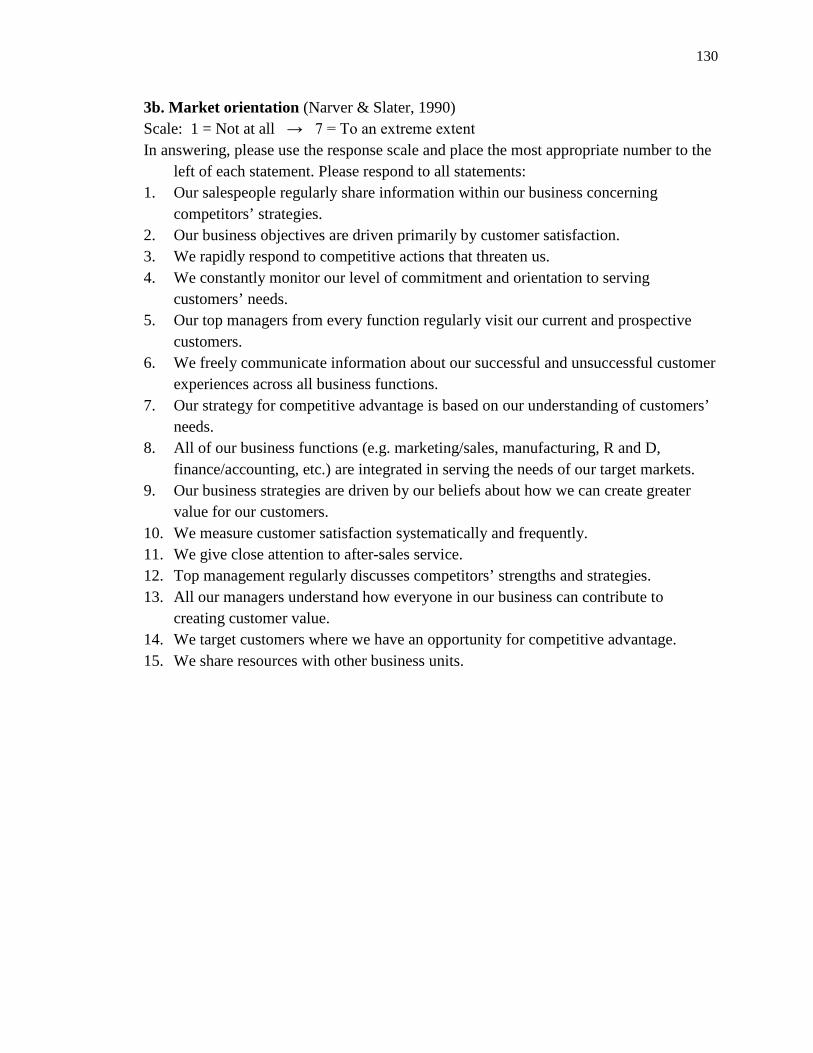
130
3b. Market orientation (Narver & Slater, 1990) Scale: 1 = Not at all → 7 = To an extreme extent In answering, please use the response scale and place the most appropriate number to the
left of each statement. Please respond to all statements: 1. Our salespeople regularly share information within our business concerning
competitors’ strategies. 2. Our business objectives are driven primarily by customer satisfaction. 3. We rapidly respond to competitive actions that threaten us. 4. We constantly monitor our level of commitment and orientation to serving
customers’ needs. 5. Our top managers from every function regularly visit our current and prospective
customers. 6. We freely communicate information about our successful and unsuccessful customer
experiences across all business functions. 7. Our strategy for competitive advantage is based on our understanding of customers’
needs. 8. All of our business functions (e.g. marketing/sales, manufacturing, R and D,
finance/accounting, etc.) are integrated in serving the needs of our target markets. 9. Our business strategies are driven by our beliefs about how we can create greater
value for our customers. 10. We measure customer satisfaction systematically and frequently. 11. We give close attention to after-sales service. 12. Top management regularly discusses competitors’ strengths and strategies. 13. All our managers understand how everyone in our business can contribute to
creating customer value. 14. We target customers where we have an opportunity for competitive advantage. 15. We share resources with other business units.
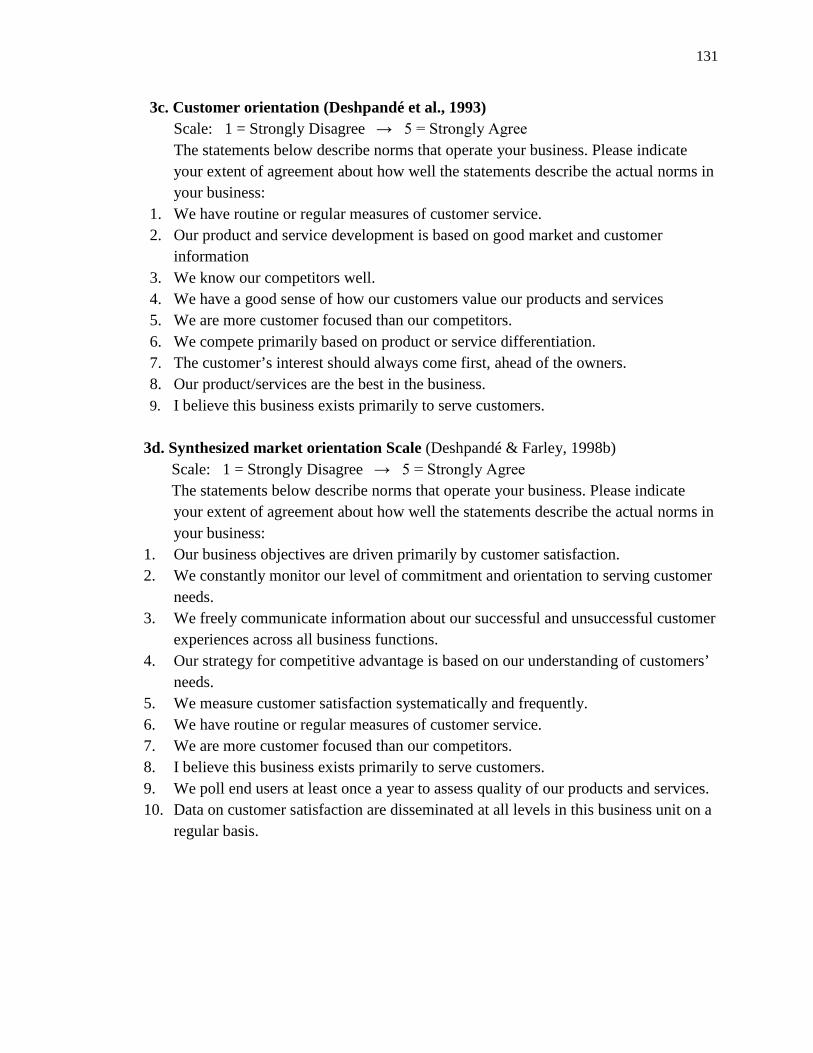
131
3c. Customer orientation (Deshpandé et al., 1993) Scale: 1 = Strongly Disagree → 5 = Strongly Agree The statements below describe norms that operate your business. Please indicate
your extent of agreement about how well the statements describe the actual norms in your business:
1. We have routine or regular measures of customer service. 2. Our product and service development is based on good market and customer
information 3. We know our competitors well. 4. We have a good sense of how our customers value our products and services 5. We are more customer focused than our competitors. 6. We compete primarily based on product or service differentiation. 7. The customer’s interest should always come first, ahead of the owners. 8. Our product/services are the best in the business. 9. I believe this business exists primarily to serve customers.
3d. Synthesized market orientation Scale (Deshpandé & Farley, 1998b) Scale: 1 = Strongly Disagree → 5 = Strongly Agree The statements below describe norms that operate your business. Please indicate
your extent of agreement about how well the statements describe the actual norms in your business:
1. Our business objectives are driven primarily by customer satisfaction. 2. We constantly monitor our level of commitment and orientation to serving customer
needs. 3. We freely communicate information about our successful and unsuccessful customer
experiences across all business functions. 4. Our strategy for competitive advantage is based on our understanding of customers’
needs. 5. We measure customer satisfaction systematically and frequently. 6. We have routine or regular measures of customer service. 7. We are more customer focused than our competitors. 8. I believe this business exists primarily to serve customers. 9. We poll end users at least once a year to assess quality of our products and services. 10. Data on customer satisfaction are disseminated at all levels in this business unit on a
regular basis.
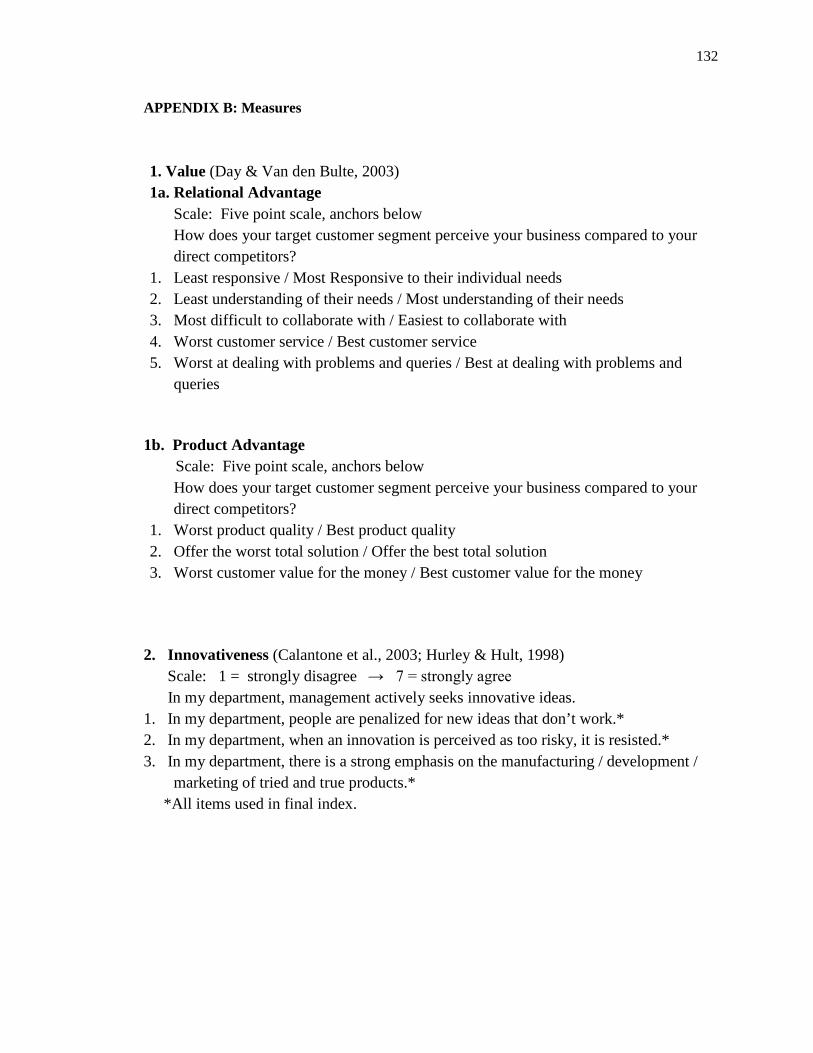
132
APPENDIX B: Measures 1. Value (Day & Van den Bulte, 2003) 1a. Relational Advantage Scale: Five point scale, anchors below How does your target customer segment perceive your business compared to your
direct competitors? 1. Least responsive / Most Responsive to their individual needs 2. Least understanding of their needs / Most understanding of their needs 3. Most difficult to collaborate with / Easiest to collaborate with 4. Worst customer service / Best customer service 5. Worst at dealing with problems and queries / Best at dealing with problems and
queries
1b. Product Advantage Scale: Five point scale, anchors below How does your target customer segment perceive your business compared to your
direct competitors? 1. Worst product quality / Best product quality 2. Offer the worst total solution / Offer the best total solution 3. Worst customer value for the money / Best customer value for the money
2. Innovativeness (Calantone et al., 2003; Hurley & Hult, 1998) Scale: 1 = strongly disagree → 7 = strongly agree In my department, management actively seeks innovative ideas. 1. In my department, people are penalized for new ideas that don’t work.* 2. In my department, when an innovation is perceived as too risky, it is resisted.* 3. In my department, there is a strong emphasis on the manufacturing / development /
marketing of tried and true products.* *All items used in final index.

133
3. Market Environment 3a. Competitive Intensity (Song & Parry, 1997a, b) Scale: 0 = Strongly Disagree → 10 = Strongly agree 1. There is no price competition in this market ® 2. There are many competitors in this market 3. There is a strong, dominant competitor – with a large market share – in the market 4. Potential customers are very loyal to competitor’s products 5. Potential customers are not satisfied with competitor’s products ® 6. New product introductions by competitors are frequent in this market
3b. High Intensity Competition (or “Hyper competition”) Scale: from Strongly Disagree to Strongly Agree In my competitive market: 1. Firms aggressively position against one another by attempting to disadvantage
opponents. 2. Firms create new competitive advantages which make obsolete or match opponents’
advantages. 3. Firms attempt to stay ahead of their competitors. 4. Firms create new competitive advantages that make the opponents’ advantages
irrelevant by moving to compete in another arena. 5. Temporary advantage and short periods of profit are achievable until competitors
catch up with or outmaneuver the aggressor’s last competitive move.
4. Performance Measures: Short-term (subjective)
Scale: 1 = Much Better → 5 = Much Worse How does your firm’s performance in the past fiscal year compare to the
competition’s? 1. Revenue Growth 2. Profitability 3. Customer Retention
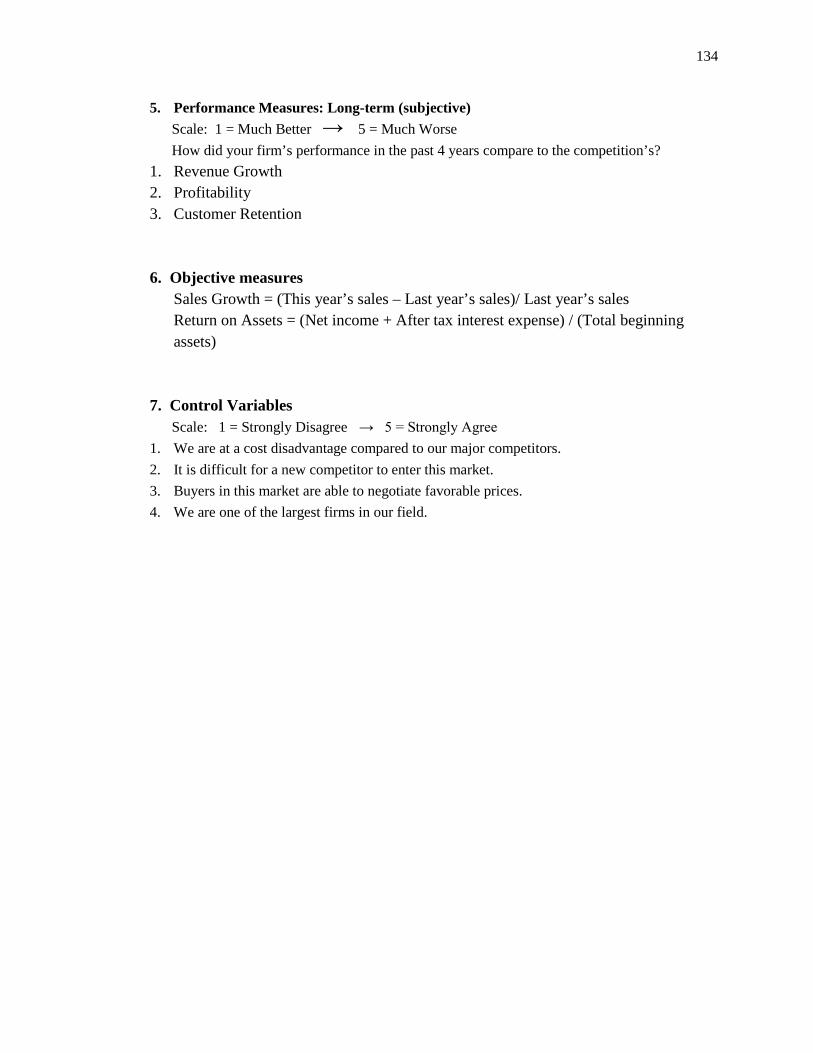
134
5. Performance Measures: Long-term (subjective) Scale: 1 = Much Better → 5 = Much Worse How did your firm’s performance in the past 4 years compare to the competition’s? 1. Revenue Growth 2. Profitability 3. Customer Retention 6. Objective measures Sales Growth = (This year’s sales – Last year’s sales)/ Last year’s sales Return on Assets = (Net income + After tax interest expense) / (Total beginning
assets) 7. Control Variables Scale: 1 = Strongly Disagree → 5 = Strongly Agree 1. We are at a cost disadvantage compared to our major competitors. 2. It is difficult for a new competitor to enter this market. 3. Buyers in this market are able to negotiate favorable prices. 4. We are one of the largest firms in our field.
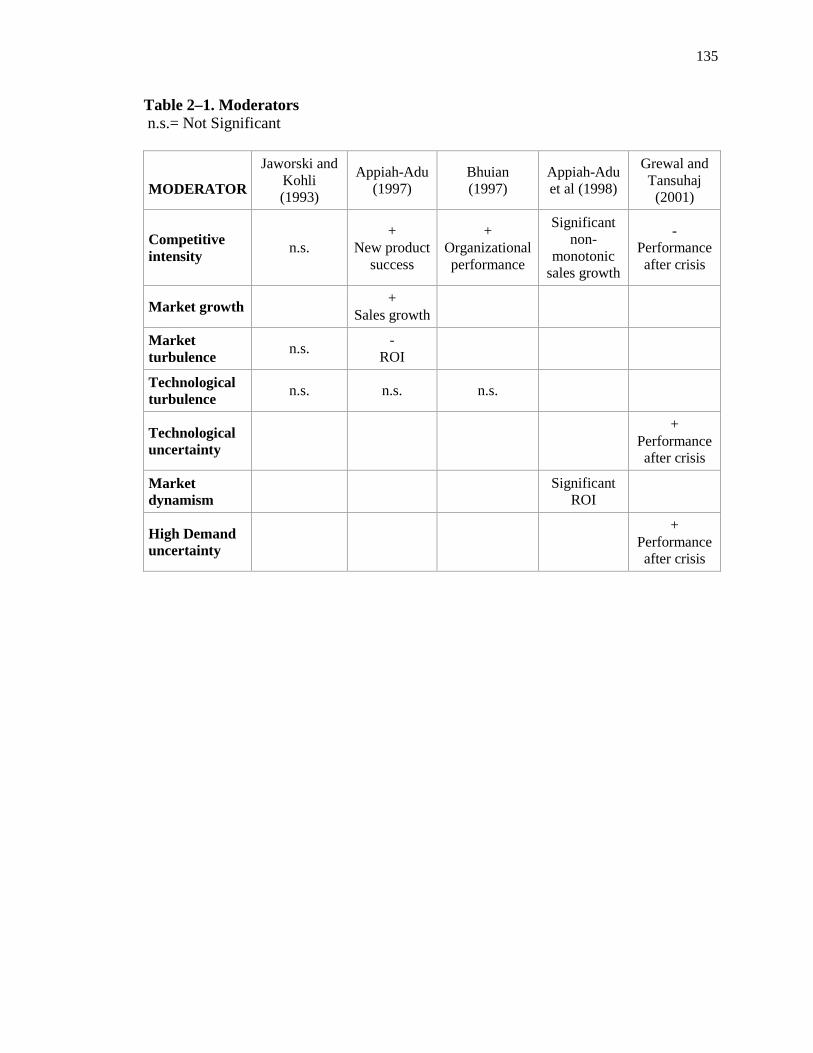
135
Table 2–1. Moderators n.s.= Not Significant
MODERATOR
Jaworski and Kohli (1993)
Appiah-Adu (1997)
Bhuian (1997)
Appiah-Adu et al (1998)
Grewal and Tansuhaj
(2001)
Competitive intensity n.s.
+ New product
success
+ Organizational performance
Significant non-
monotonic sales growth
- Performance after crisis
Market growth + Sales growth
Market turbulence n.s. -
ROI
Technological turbulence n.s. n.s. n.s.
Technological uncertainty
+ Performance after crisis
Market dynamism Significant
ROI
High Demand uncertainty
+ Performance after crisis
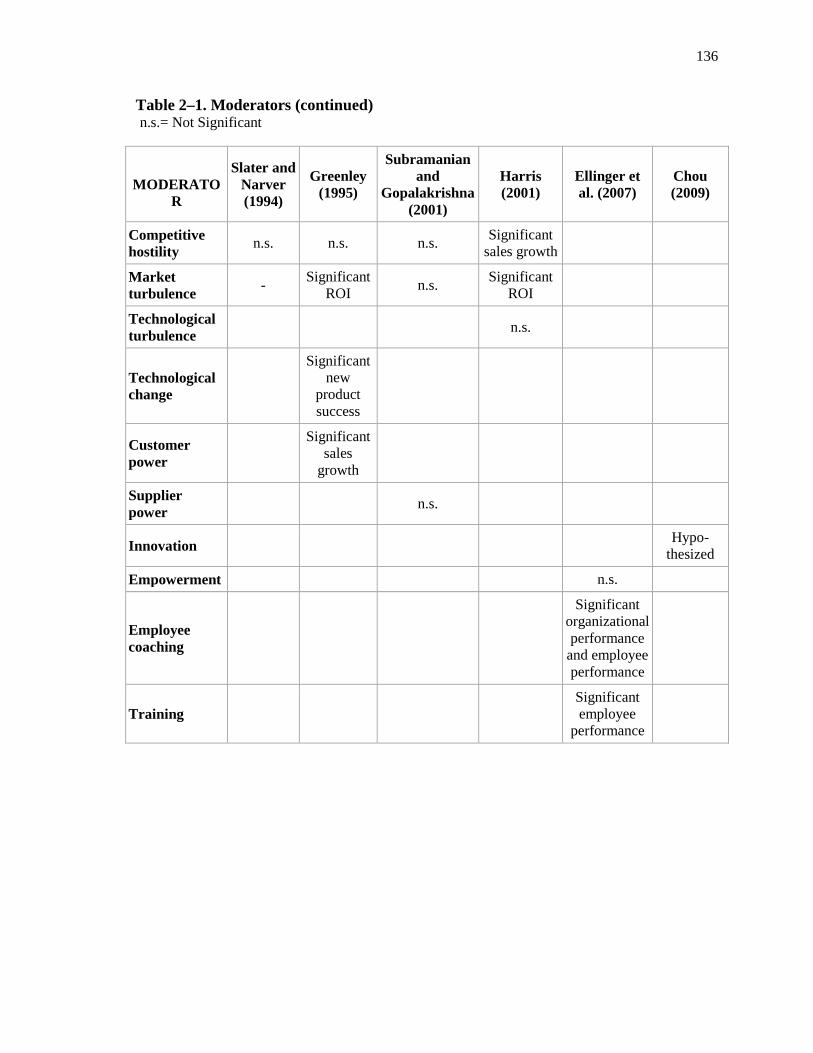
136
Table 2–1. Moderators (continued) n.s.= Not Significant
MODERATO
R
Slater and Narver (1994)
Greenley (1995)
Subramanian and
Gopalakrishna (2001)
Harris (2001)
Ellinger et al. (2007)
Chou (2009)
Competitive hostility n.s. n.s. n.s. Significant
sales growth
Market turbulence - Significant
ROI n.s. Significant ROI
Technological turbulence n.s.
Technological change
Significant new
product success
Customer power
Significant sales
growth
Supplier power n.s.
Innovation Hypo-thesized
Empowerment n.s.
Employee coaching
Significant organizational performance
and employee performance
Training Significant employee
performance

137
Table 2–2. Mediators
MEDIATOR Day and Wensley (1988)
Slater and Narver (1994)
Baker and Sinkula
(1996) JMFM
Han et al. (1998)
Siguaw et al. (1998)
Matear et al. (2002)
Hult et al. (2005)
Jiménez-Jiménez et al.
(2007)
Customer Value
+ (Hypothesis) Performance
Lower Relative Costs
+ (Hypothesis) Performance
Innovation + (Hypothesis) Performance
+ Organizational Performance
+ Partial Financial Performance and Market Performance
Administrative Innovations
+ Business Performance
Technological Innovations
+ Business Performance
Trust
+ Satisfaction with Performance
Co-operative Norms
- Satisfaction with Performance
Organizational Responsiveness
+ ROI, ROA and ROE
Organizational Learning
+ Organizational memory, Market Share
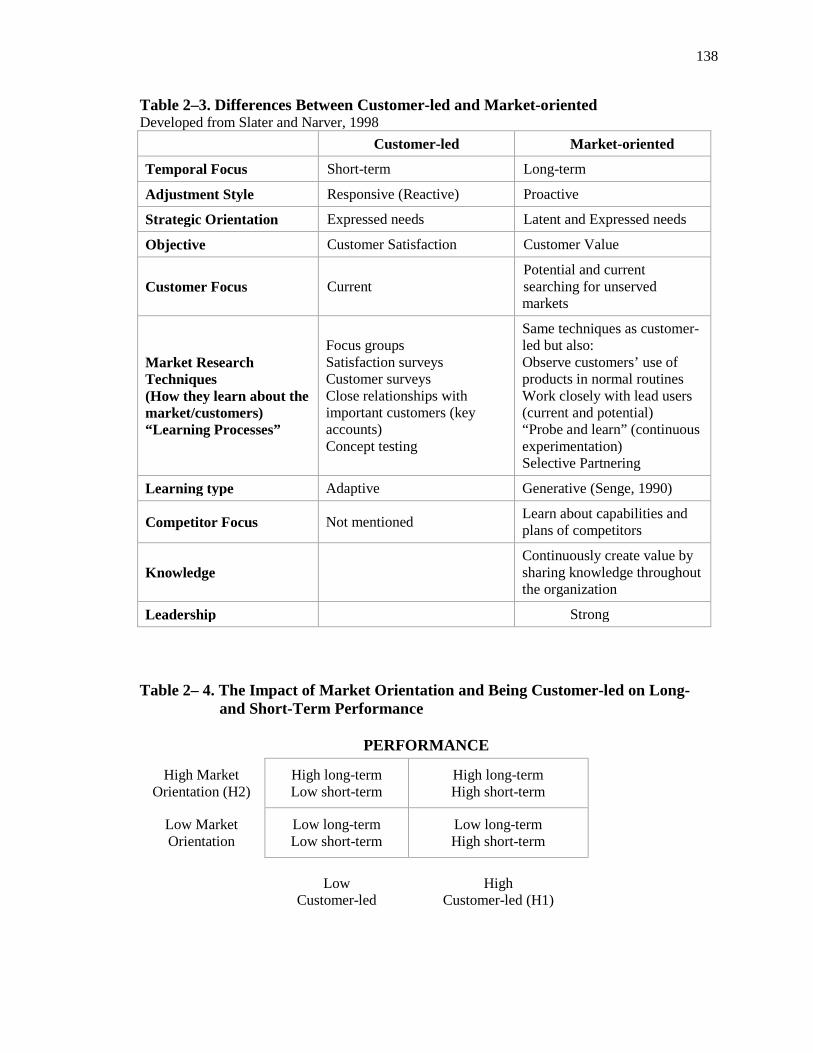
138
Table 2–3. Differences Between Customer-led and Market-oriented Developed from Slater and Narver, 1998
Customer-led Market-oriented
Temporal Focus Short-term Long-term
Adjustment Style Responsive (Reactive) Proactive
Strategic Orientation Expressed needs Latent and Expressed needs
Objective Customer Satisfaction Customer Value
Customer Focus Current Potential and current searching for unserved markets
Market Research Techniques (How they learn about the market/customers) “Learning Processes”
Focus groups Satisfaction surveys Customer surveys Close relationships with important customers (key accounts) Concept testing
Same techniques as customer-led but also: Observe customers’ use of products in normal routines Work closely with lead users (current and potential) “Probe and learn” (continuous experimentation) Selective Partnering
Learning type Adaptive Generative (Senge, 1990)
Competitor Focus Not mentioned Learn about capabilities and plans of competitors
Knowledge Continuously create value by sharing knowledge throughout the organization
Leadership Strong Table 2– 4. The Impact of Market Orientation and Being Customer-led on Long- and Short-Term Performance
PERFORMANCE
High Market Orientation (H2)
High long-term Low short-term
High long-term High short-term
Low Market Orientation
Low long-term Low short-term
Low long-term High short-term
Low
Customer-led
High
Customer-led (H1)
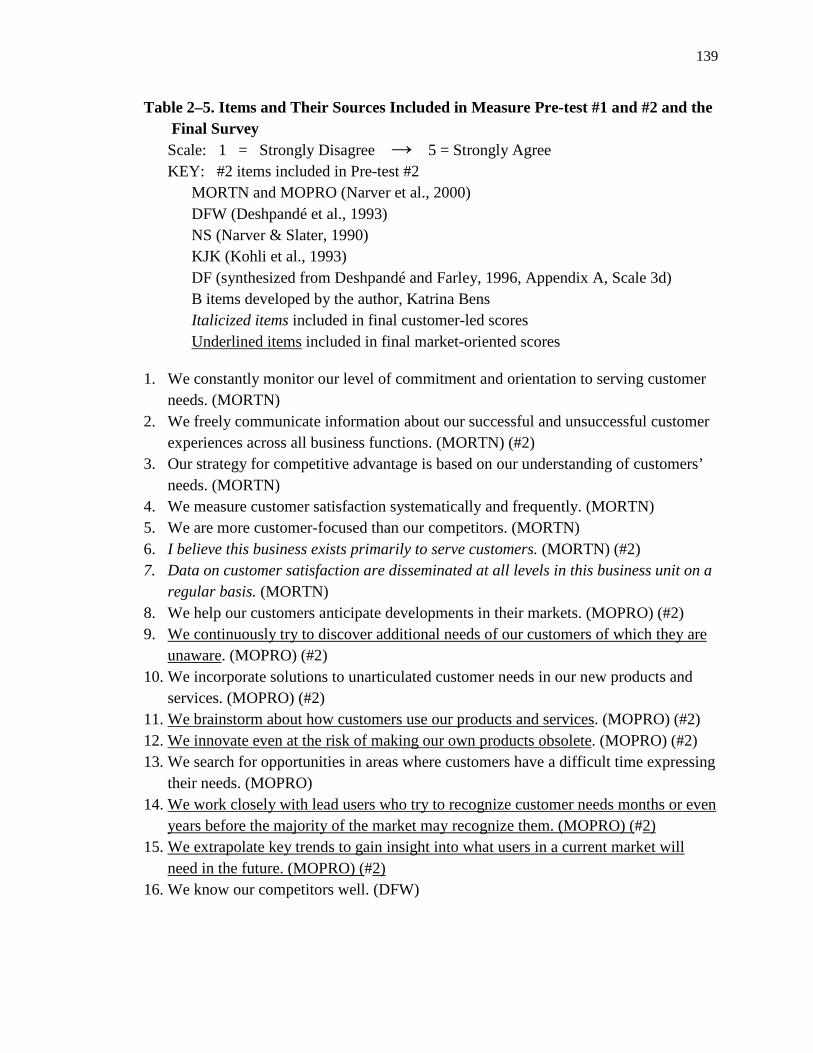
139
Table 2–5. Items and Their Sources Included in Measure Pre-test #1 and #2 and the Final Survey Scale: 1 = Strongly Disagree → 5 = Strongly Agree KEY: #2 items included in Pre-test #2
MORTN and MOPRO (Narver et al., 2000) DFW (Deshpandé et al., 1993) NS (Narver & Slater, 1990) KJK (Kohli et al., 1993) DF (synthesized from Deshpandé and Farley, 1996, Appendix A, Scale 3d) B items developed by the author, Katrina Bens Italicized items included in final customer-led scores Underlined items
included in final market-oriented scores
1. We constantly monitor our level of commitment and orientation to serving customer needs. (MORTN)
2. We freely communicate information about our successful and unsuccessful customer experiences across all business functions. (MORTN) (#2)
3. Our strategy for competitive advantage is based on our understanding of customers’ needs. (MORTN)
4. We measure customer satisfaction systematically and frequently. (MORTN) 5. We are more customer-focused than our competitors. (MORTN) 6. I believe this business exists primarily to serve customers. (MORTN) (#2) 7. Data on customer satisfaction are disseminated at all levels in this business unit on a
regular basis. (MORTN) 8. We help our customers anticipate developments in their markets. (MOPRO) (#2) 9. We continuously try to discover additional needs of our customers of which they are
unaware10. We incorporate solutions to unarticulated customer needs in our new products and
services. (MOPRO) (#2)
. (MOPRO) (#2)
11. We brainstorm about how customers use our products and services12.
. (MOPRO) (#2) We innovate even at the risk of making our own products obsolete
13. We search for opportunities in areas where customers have a difficult time expressing their needs. (MOPRO)
. (MOPRO) (#2)
14. We work closely with lead users who try to recognize customer needs months or even years before the majority of the market may recognize them. (MOPRO) (#
15. 2)
We extrapolate key trends to gain insight into what users in a current market will need in the future. (MOPRO) (#
16. We know our competitors well. (DFW) 2)
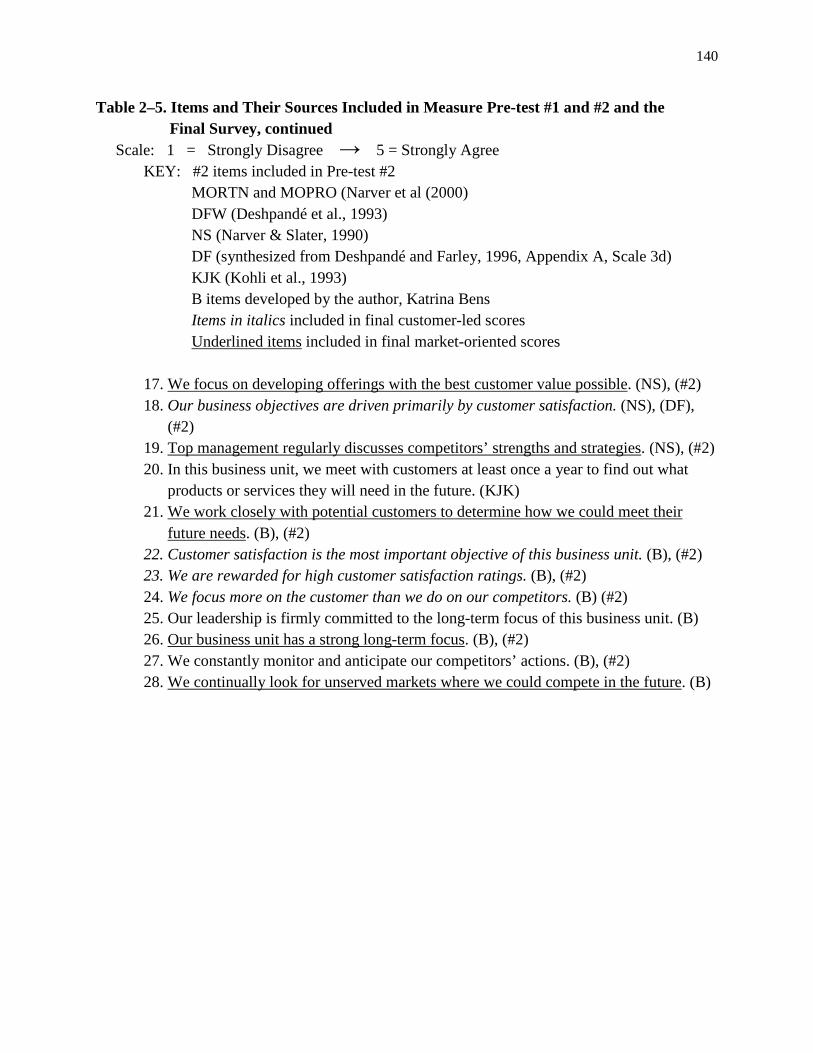
140
Table 2–5. Items and Their Sources Included in Measure Pre-test #1 and #2 and the Final Survey, continued
Scale: 1 = Strongly Disagree → 5 = Strongly Agree KEY: #2 items included in Pre-test #2
MORTN and MOPRO (Narver et al (2000) DFW (Deshpandé et al., 1993) NS (Narver & Slater, 1990) DF (synthesized from Deshpandé and Farley, 1996, Appendix A, Scale 3d) KJK (Kohli et al., 1993) B items developed by the author, Katrina Bens Items in italics included in final customer-led scores Underlined items
included in final market-oriented scores
17. We focus on developing offerings with the best customer value possible18. Our business objectives are driven primarily by customer satisfaction. (NS), (DF),
(#2)
. (NS), (#2)
19. Top management regularly discusses competitors’ strengths and strategies20. In this business unit, we meet with customers at least once a year to find out what
products or services they will need in the future. (KJK)
. (NS), (#2)
21. We work closely with potential customers to determine how we could meet their future needs
22. Customer satisfaction is the most important objective of this business unit. (B), (#2) . (B), (#2)
23. We are rewarded for high customer satisfaction ratings. (B), (#2) 24. We focus more on the customer than we do on our competitors. (B) (#2) 25. Our leadership is firmly committed to the long-term focus of this business unit. (B) 26. Our business unit has a strong long-term focus27. We constantly monitor and anticipate our competitors’ actions. (B), (#2)
. (B), (#2)
28. We continually look for unserved markets where we could compete in the future
. (B)
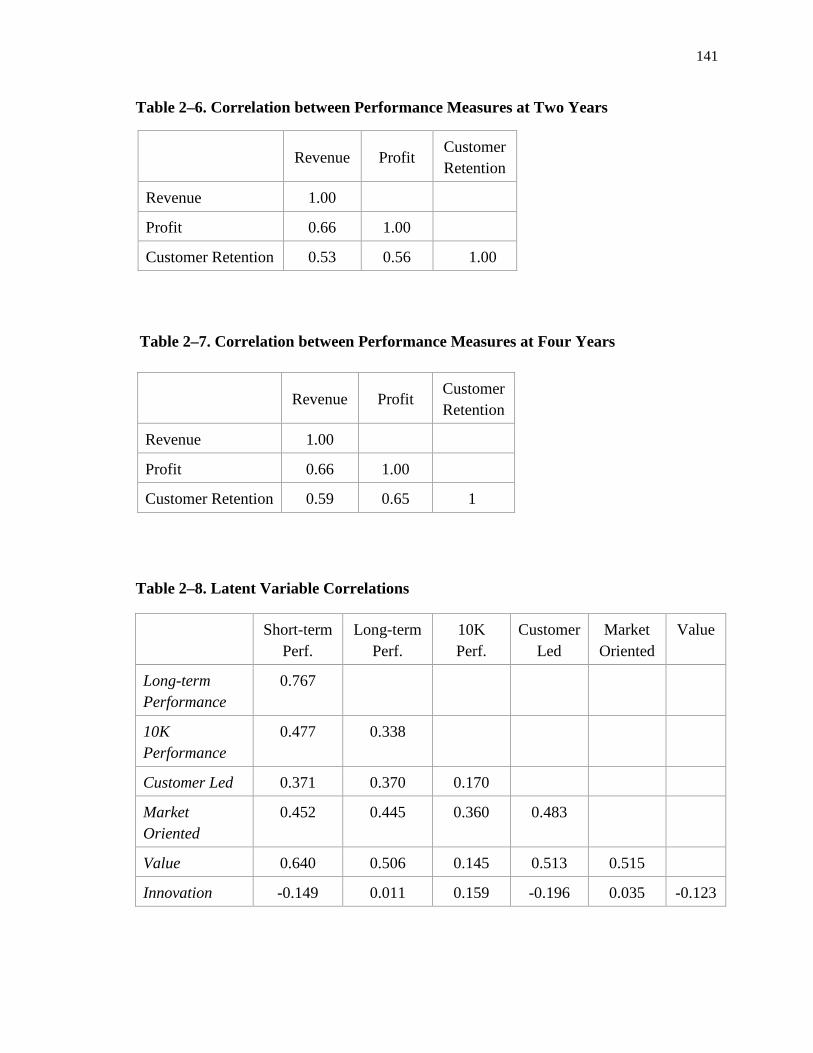
141
Table 2–6. Correlation between Performance Measures at Two Years Table 2–7. Correlation between Performance Measures at Four Years
Revenue Profit
Customer Retention
Revenue 1.00
Profit 0.66 1.00
Customer Retention 0.59 0.65 1 Table 2–8. Latent Variable Correlations
Revenue Profit
Customer Retention
Revenue 1.00
Profit 0.66 1.00
Customer Retention 0.53 0.56 1.00
Short-term Perf.
Long-term Perf.
10K Perf.
Customer Led
Market Oriented
Value
Long-term Performance
0.767
10K Performance
0.477 0.338
Customer Led 0.371 0.370 0.170
Market Oriented
0.452 0.445 0.360 0.483
Value 0.640 0.506 0.145 0.513 0.515
Innovation -0.149 0.011 0.159 -0.196 0.035 -0.123
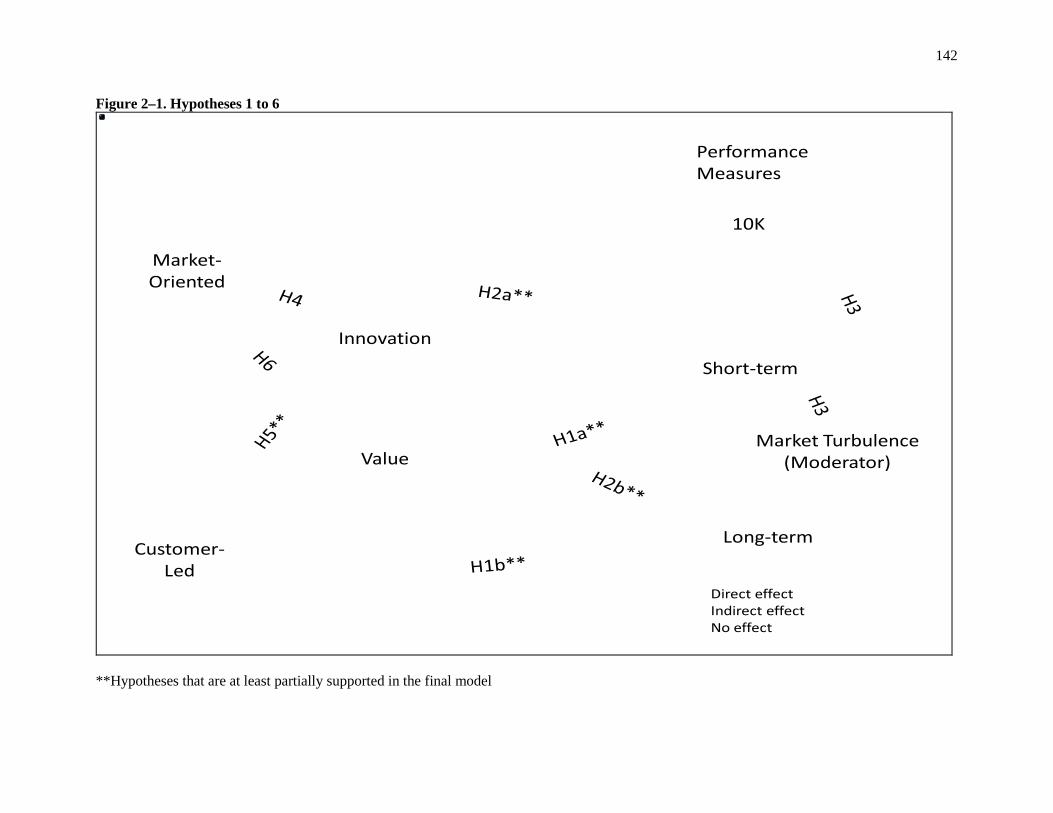
142
Figure 2–1. Hypotheses 1 to 6
Customer-Led
10K
Short-term
Long-term
PerformanceMeasures
Market-Oriented
Innovation
Value
Direct effectIndirect effectNo effect
Market Turbulence(Moderator)
**Hypotheses that are at least partially supported in the final model
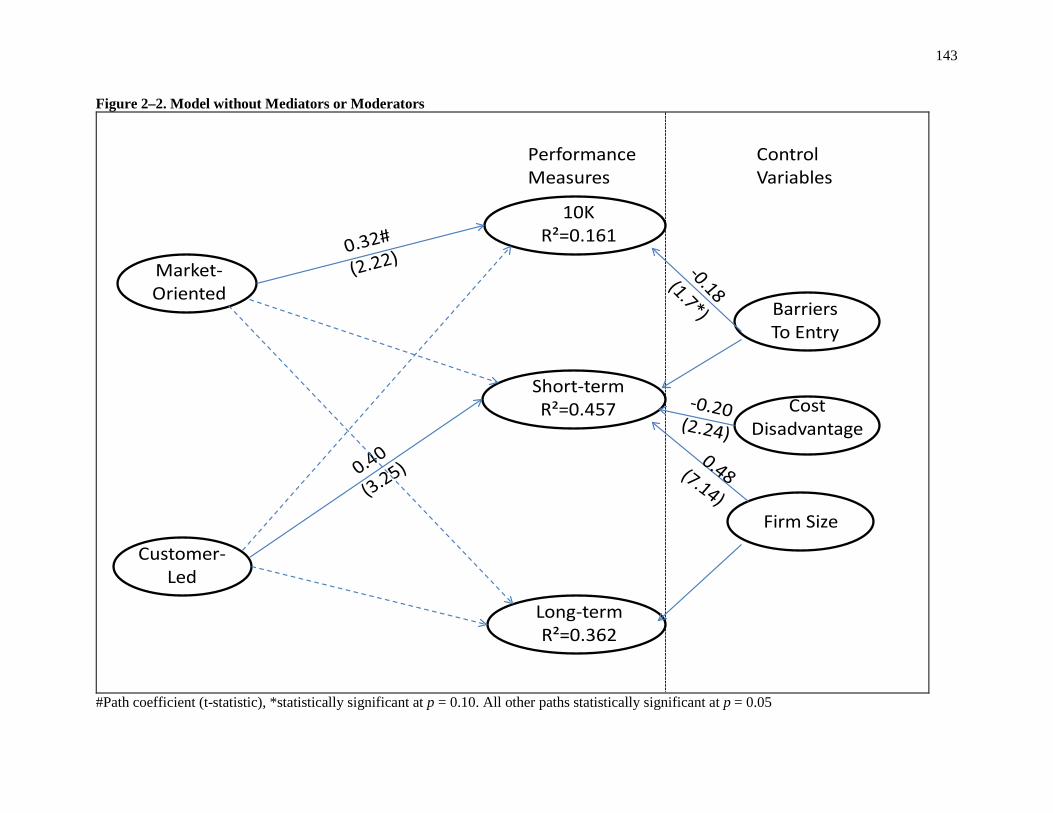
143
Figure 2–2. Model without Mediators or Moderators
Customer-Led
10KR²=0.161
Short-termR²=0.457
Long-termR²=0.362
PerformanceMeasures
Control Variables
Firm Size
Market-Oriented
BarriersTo Entry
CostDisadvantage
#Path coefficient (t-statistic), *statistically significant at p = 0.10. All other paths statistically significant at p = 0.05
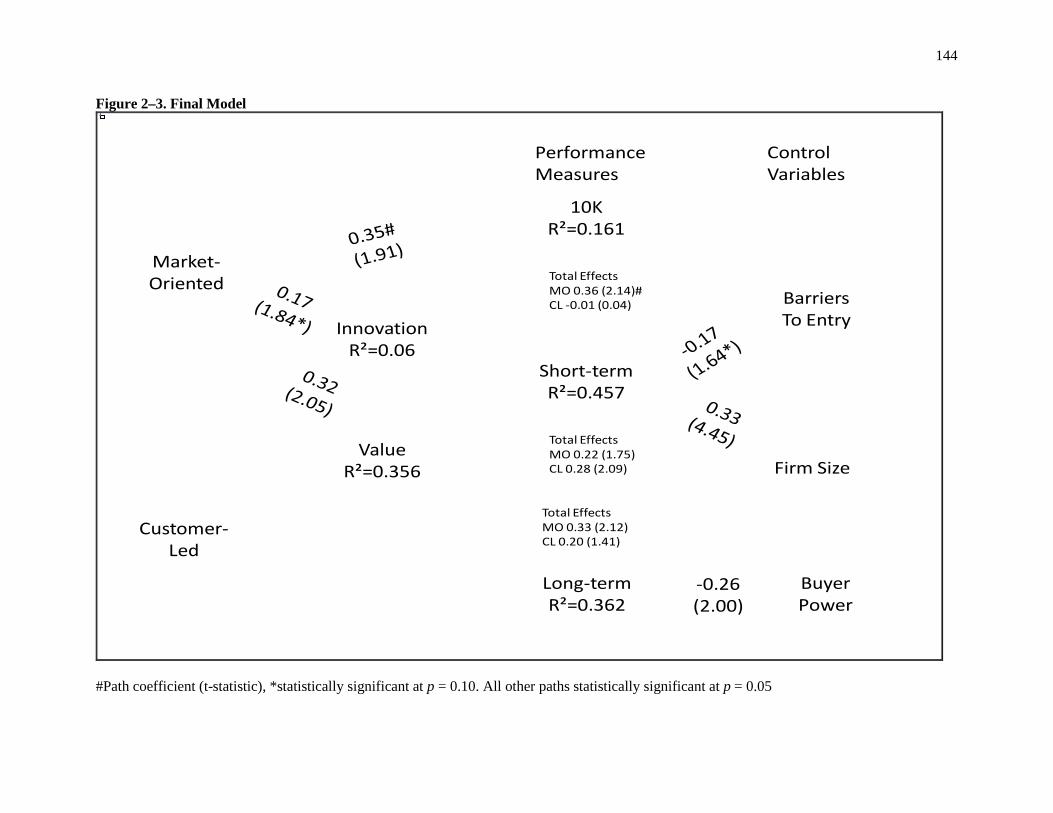
144
Figure 2–3. Final Model
Customer-Led
10KR²=0.161
Short-termR²=0.457
Long-termR²=0.362
PerformanceMeasures
Control Variables
Firm Size
Market-Oriented
BarriersTo EntryInnovation
R²=0.06
ValueR²=0.356
Buyer Power
-0.26(2.00)
Total EffectsMO 0.36 (2.14)#CL -0.01 (0.04)
Total EffectsMO 0.22 (1.75)CL 0.28 (2.09)
Total EffectsMO 0.33 (2.12)CL 0.20 (1.41)
#Path coefficient (t-statistic), *statistically significant at p = 0.10. All other paths statistically significant at p = 0.05
145
BIBLIOGRAPHY ESSAY #2
Anderson, J. C., Thomson, J. B. L., & Wynstra, F. 2000. Combining Value and Price to Make
Purchase Decisions in Business Markets. International Journal of Research in Marketing, 17(4): 307.
Appiah-Adu, K. 1997. Market Orientation and Performance: Do the Findings Established in Large Firms Hold in the Small Business Sector. Journal of Euromarketing, 6(3): 1 - 26.
Appiah-Adu, K., & Ranchhod, A. 1998. Market Orientation and Performance in the Biotechnology Industry: An Exploratory Empirical Analysis. Technology Analysis & Strategic Management, 10(2): 197-210.
Appiah-Adu, K., & Singh, S. 1998. Customer Orientation and Performance: A Study of SMEs. Management Decision, 36(6): 385.
Atuahene-Gima, K. 2005. Resolving the Capability-Rigidity Paradox in New Product Innovation. Journal of Marketing, 69(4): 61.
Atuahene-Gima, K., Slater, S. F., & Olson, E. M. 2005. The Contingent Value of Responsive and Proactive Market Orientations for New Product Program Performance. The Journal of Product Innovation Management, 22(6): 464.
Avlonitis, G. J., & Gounaris, S. P. 1997. Marketing orientation and company performance - Industrial vs. consumer goods companies. Industrial Marketing Management, 26(5): 385-402.
Baker, W. E., & Sinkula, J. M. 1999. Learning Orientation, Market Orientation, and Innovation: Integrating and Extending Models of Organizational Performance. Journal of Market Focused Management, 3(4): 295-308.
Bennett, R., & Cooper, R. 1979. Beyond the Marketing Concept. Business Horizons(June): 76-83.
Bens, K. J., Day, G. S., & Ross Jr, W. T. 2003. Market Orientation and Performance: The Role of Value. Working Paper.
Bhuian, S. 1997. Exploring Market Orientation in Banks: an Empirical Examination in Saudi Arabia. The Journal of Services Marketing, 11(5): 317-328.
Calantone, R., Garcia, R., & Droge, C. 2003. The effects of environmental turbulence on new product development strategy planning. The Journal of Product Innovation Management, 20(2): 90.
Chang, T. Z., & Chen, S. J. 1998. Market Orientation, Service Quality and Business Profitability: A Conceptual Model and Empirical Evidence. The Journal of Services Marketing, 12(4): 246-264.
Chin, W. W. 1998. The partial least squares approach for structural equation modeling. In G. A. Macoulides (Ed.), Modern methods for Business Research: 295-336. Mahway, NJ: Lawrence Erlbaum Associates.
Chou, H.-J. 2009. The Effect of Market Orientation Intention and Superiority on New Product Performance. Journal of American Academy of Business, Cambridge, 14(2): 93.
Christensen, C. M., & Bower, J. L. 1996. Customer Power, Strategic Investment, and the Failure of Leading Firms. Strategic Management Journal, 17(3): 197-218.
Churchill, G. A. J. 1979. A Paradigm for Developing Better Measures of Marketing Constructs. Journal of Marketing Research, 16(1): 64 - 73.

146 Coltman, T. R., Devinney, T. M., Midgley, D. F., & Venaik, S. 2008. Formative versus
Reflective Measurement Models: Two Applications of Formative Measurement. Journal of Business Research, 61(12): 1250-1262.
Connor, T. 1999. Customer-led and Market-oriented: A Matter of Balance. Strategic Management Journal, 20(12): 1157-1163.
D'Aveni, R. A. 1994. Hypercompetition: Managing the Dynamics of Strategic Maneuvering. New York: The Free Press.
D'Aveni, R. A. 1995. Coping with Hypercompetition: Utilizing the New 7S's Framework. The Academy of Management Executive, 9(3): 45.
Day, G. S., & Van den Bulte, C. 2003. Superiority in Customer Relationship Management: Consequences for Competitive Advantage and Performance. MSI Working Paper.
Day, G. S., & Wensley, R. 1988. Assessing Advantage: A Framework for Diagnosing Competitive Superiority. Journal of Marketing, 52: 1 - 20.
Deshpandé, R., & Farley, J. U. 1996. Understanding Market Orientation: A Prospectively Designed Meta-Analysis of Three Market Orientation Scales. MSI Working Paper, 96-125: 1-22.
Deshpandé, R., & Farley, J. U. 1998a. The Market Orientation Construct: Correlations, Culture, and Comprehensiveness. Journal of Market Focused Management, 2: 237 - 239.
Deshpandé, R., & Farley, J. U. 1998b. Measuring Market Orientation: Generalization and Synthesis. Journal of Market Focused Management, 2: 213-232.
Deshpandé, R., Farley, J. U., & Webster, F. E. 2000. Triad lessons: Generalizing results on high performance firms in five business-to-business markets. International Journal of Research in Marketing, 17(4): 353-362.
Deshpandé, R., Farley, J. U., & Webster, F. E. J. 1993. Corporate Culture, Customer Orientation, and Innovativeness. Journal of Marketing, 57(1): 23.
Fornell, C., & Bookstein, F. L. 1981. Two Structural Equation Models: LISREL and PLS Applied to Consumer Exit-Voice Theory. Journal of Marketing Research XIX(November): 440-452.
Frosch, R. A. 1996. The customer for R&D is always wrong! Research Technology Management, 39(6): 22.
Gatignon, H., & Xuereb, J. M. 1997. Strategic orientation of the firm and new product performance. Journal of Marketing Research, 34(1): 77-90.
Gerbing, D. W., & Anderson, J. C. 1992. Monte Carlo Evaluations of Goodness of Fit Indices for Structural Equation Models. Sociological Methods and Research, 21(2): 132 - 160.
Greenley, G. E. 1995. Market Orientation and Company Performance: Empirical Evidence From UK Companies. British Journal of Management, 6: 1 - 13.
Grewal, R., & Tansuhaj, P. 2001. Building organizational capabilities for managing economic crisis: The role of market orientation and strategic flexibility. Journal of Marketing, 65(2): 67-80.
Haenlein, M., & Kaplan, A. M. 2004. A Beginner's Guide to Partial Least Squares Analysis. Understanding Statistics, 3(4): 283-297.
Hamel, G., & Prahalad, C. K. 1994. Competing for the Future. Boston: Harvard Business School Press.
Han, J. K., Kim, N., & Srivastava, R. K. 1998. Market orientation and organizational performance: Is innovation a missing link? Journal of Marketing, 62(4): 30-45.
Harris, L. C. 2001. Market orientation and performance: Objective and subjective empirical evidence from UK companies. Journal of Management Studies, 38(1): 17-43.
Hayes, R., & Wheelwright, S. 1984. Restoring our Competitive Edge: Competing Through Manufacturing. New York: Wiley.
147 Henseler, J., Ringle, C. M., & Sinkovics, R. R. (Eds.). 2009. The Use of Partial Least Squares
Path Modeling in International Marketing. (Vol. 20). Bingley: Emerald Group. Hult, G. T. M., Jr, D. J. K., & Slater, S. F. 2005. Market orientation and performance: an
integration of disparate approaches. Strategic Management Journal, 26(12): 1173. Hurley, R. F., & Hult, G. T. M. 1998. Innovation, Market Orientation, and Organizational
Learning: An Integration and Empirical Examination. Journal of Marketing, 62(3): 42. Jaworski, B. J., & Kohli, A. K. 1993. Market orientation: Antecedents and consequences.
Journal of Marketing, 57(3): 53. Jiménez-Jiménez, D., & Cegarra-Navarro, J. G. 2007. The performance effect of organizational
learning and market orientation. Industrial Marketing Management, 36(6): 694. Kirca, A. H., Jayachandran, S., & Bearden, W. O. 2005. Market Orientation: A Meta-Analytic
Review and Assessment of Its Antecedents and Impact on Performance. Journal of Marketing, 69(2): 24 - 41.
Kohli, A., Jaworski, B. J., & Kumar, A. 1993. MARKOR: A measure of market orientation. Journal Of Marketing Research, 30(4): 467.
Kumar, K., Subramanian, R., & Yauger, C. 1998. Examining the market orientation-performance relationship: A context-specific study. Journal of Management, 24(2): 201-233.
Langerak, F. 2003. An Appraisal of Research on the Predictive Power of Market Orientation. European Management Journal, 21(4): 447 - 464.
Macdonald, S. 1995. Too close for comfort?: The strategic implications of getting close to the customer. California Management Review, 37(4): 8.
Matear, S., Osborne, P., Garret, T., & Gray, B. J. 2002. How Does Market Orientation Contribute to Service Firm Performance? European Journal of Marketing, 36(9-10): 1058-1075.
Narver, J. C., & Slater, S. F. 1990. The Effect of a Market Orientation on Business Profitability. Journal of Marketing, 54(4): 20 - 35.
Nunnally, J. C., & Bernstein, I. H. 1994. Psychometric Theory (3rd ed.). New York: McGraw-Hill.
Pelham, A. M., & Wilson, D. T. 1996. A longitudinal study of the impact of market structure, firm structure, strategy, and market orientation culture on dimensions of small-firm performance. Journal of the Academy of Marketing Science, 24(1): 27.
Ringle, C. M., Wende, S., & Will, S. 2005. Smart PLS 2.0 (M3) Beta, 2.0 (M3) Beta ed. Hamburg.
Ruekert, R. W. 1992. Developing a Market Orientation: An Organizational Strategy Perspective. International Journal of Research in Marketing, 9(3): 225 - 245.
Sawhney, M. 2002. Profit from Transparency: Should your customers compare prices, post opinions and pit you against your competitors? Absolutely. CIO, 15(17): 1.
Shapiro, B. P. 1988. What the Hell is 'Market Oriented'? Harvard Business Review, 66: 19 - 25. Siguaw, J. A., Simpson, P. M., & Baker, T. L. 1998. Effects of Supplier Market Orientation on
Distributor Market Orientation and the Channel Relationship: The Distributor Perspective. Journal of Marketing, 62(July): 99-111.
Slater, S. F., & Narver, J. C. 1994. Does Competitive Environment Moderate the Market Orientation- Performance Relationship. Journal of Marketing, 58(1): 46-55.
Slater, S. F., & Narver, J. C. 1998. Customer-led and Market-oriented: Let's not Confuse the Two. Strategic Management Journal, 19(10): 1001-1006.
Slater, S. F., & Narver, J. C. 1999. Market-Oriented is More Than Being Customer Led. Strategic Management Journal, 20(12): 1165 - 1168.
Song, M., & Parry, M. E. 2009. The desired level of market orientation and business unit performance. Journal of the Academy of Marketing Science, 37(2): 144-160.
Song, X. M., & Parry, M. E. 1997a. A cross-national comparative study of new product development processes: Japan and the United States. Journal of Marketing, 61(2): 1.
148 Song, X. M., & Parry, M. E. 1997b. The determinants of Japanese new product successes.
Journal of Marketing Research, 34(1): 64. Subramanian, R., & Gopalakrishna, P. 2001. The market orientation-performance relationship in
the context of a developing economy - An empirical analysis. Journal of Business Research, 53(1): 1-13.
Voss, G. B., & Voss, Z. G. 2000. Strategic orientation and firm performance in an artistic environment. Journal of Marketing, 64(1): 67-83.
Zhao, X., Lynch, J. G. J., & Chen, Q. 2010. Reconsidering Baron and Kenny: Myths and Truths about Mediation Analysis. Journal of Consumer Research, 37(August).
Zhou, K. Z., Brown, J. R., & Dev, C. S. 2009. Market Orientation, Competitive Advantage, and Performance: A Demand-based Perspective. Journal of Business Research, 62: 1063-1070.
Zhou, K. Z., Brown, J. R., Dev, C. S., & Agarwal, S. 2007. The effects of customer and competitor orientations on performance in global markets: a contingency analysis. Journal of International Business Studies, 38(2): 303.

The Pennsylvania State University Ph. D., Marketing
August 2011
The Wharton School, University of Pennsylvania
M.A., Marketing Dec. 2000
Cornell University
M.S., Agricultural Economics May 1993
Williams College
B.A., Double Major in Economics and Spanish May 1989
WORK EXPERIENCE
Visiting Senior Lecturer, University of Illinois, Urbana-Champaign,Illinois Department of Business Administration
2004-2005
University of Illinois: List of Teachers Rated as Excellent
Trade Marketing Manager, S.C. Johnson & Son de Venezuela, Caracas Developed and implemented trade promotions Participated in sales forecasting Created marketing tools and presentations for the sales force
1995-1997
Consultant, Luque Carulla y Associados, Bogotá, Colombia
Worked in project development in Agricultural and Food sectors 1993-1995
Lecturer, Universidad de los Andes, Bogotá, Colombia, School of Business
Taught undergraduate, MBA, and executive education classes 1993-1995
Supervisor, Automated Packaging Systems, Lombard, Illinois
Oversaw direct sales force and distributors in eight states Created budget
1989-1990
SERVICE
Ad hoc reviewer, American Marketing Association Winter Conference
2004, 2007, 2009
Vice President, Smeal Ph.D. Association (SPA), Wharton School
Participated in founding and developing of SPA Conducted survey of all Smeal Ph.D. students
2002-2004
Board Member, University of Pennsylvania, Graduate Student Association
Represented 3,250 students Wharton Representative to Graduate Student Association
1998-2000
LANGUAGE SKILLS Fluent in written and spoken Spanish
Vita Katrina Jane Bens
EDUCATION