Corporate Governance Quality and Firm Value in Brazil
33
Electronic copy available at: http://ssrn.com/abstract=923310 Corporate Governance Quality and Firm Value in Brazil Alexandre Di Miceli da Silveira a School of Economics, Management and Accounting of University of São Paulo (FEA/USP) – Brazil Lucas Ayres B. de C. Barros b Mackenzie Presbyterian University – Brazil June, 2007 a Professor of Finance and Accounting at School of Economics, Management and Accounting of University of São Paulo (FEA/USP). Tel: (+55) 11 5054-1888. e-mail: [email protected] (contact author). Telephones: +55 11 8149-8115 / +55 11 5054-1888 / +55 11 3091-5820 branch 162. b Professor of Finance at Mackenzie Presbyterian University. Tel: (+55) 11 3871-2689. e-mail: [email protected] . Telephones: +55 11 9645-4435 / +55 11 3871-2689.
-
Upload
independent -
Category
Documents
-
view
4 -
download
0
Transcript of Corporate Governance Quality and Firm Value in Brazil
Electronic copy available at: http://ssrn.com/abstract=923310
Corporate Governance Quality and Firm Value in Brazil
Alexandre Di Miceli da Silveiraa
School of Economics, Management and Accounting of University of São Paulo
(FEA/USP) – Brazil
Lucas Ayres B. de C. Barrosb
Mackenzie Presbyterian University – Brazil
June, 2007
a Professor of Finance and Accounting at School of Economics, Management and Accounting of
University of São Paulo (FEA/USP). Tel: (+55) 11 5054-1888. e-mail: [email protected] (contact
author). Telephones: +55 11 8149-8115 / +55 11 5054-1888 / +55 11 3091-5820 branch 162.
b Professor of Finance at Mackenzie Presbyterian University. Tel: (+55) 11 3871-2689. e-mail:
[email protected]. Telephones: +55 11 9645-4435 / +55 11 3871-2689.
Electronic copy available at: http://ssrn.com/abstract=923310
2
Corporate Governance Quality and Firm Value in Brazil
ABSTRACT
This paper investigates the influence of corporate governance quality on market value of 154 Brazilian
listed companies in 2002. In order to obtain a proxy for corporate governance quality, a broad governance
index was built. The investigation was carried out by different econometric approaches in increasing order
of complexity, including multiple regressions by Ordinary Least Squares (OLS), instrumental variables
approach and systems of simultaneous equations. The results obtained in all econometric approaches show
a positive and significant influence of corporate governance quality on firm’s market value. OLS results
with market value variables Tobin’s Q and PBV multiple suggest that, ceteris paribus, a worst-to-best
change in governance quality would result in a market capitalization increase of around 85% and 100%,
respectively. The paper also finds evidence of corporate governance variable endogeneity and proposes
different instruments for estimation by instrumental variables approach. Moreover, results by
simultaneous equation approach indicate a relation of reverse causality between corporate governance
quality and firm valuation.
Key-words: Corporate Governance, Governance Index, Corporate Attributes, Firm Value.
JEL classification: G32, G34.
3
1. INTRODUCTION
The whole corporate governance discussion starts from the hypothesis that governance mechanisms
influence firms’ performance. The basic issue in research boils down to knowing whether companies’
market value is determined by internal and/or external governance mechanisms. However, there is no
theoretical framework or conclusive empirical evidence on how (and if) corporate governance
mechanisms influence corporate performance and on whether the relation between these mechanisms is
complementary or substitute.
Most research analyzes the possible influence of specific governance mechanisms (ownership
structure, board of directors’ structure, capital structure, presence of a takeover market, remuneration
policy, etc.) on corporate performance variables (such as accounting indicators of profitability and market
value metrics) individually. In these studies, governance mechanisms act as explanatory variables and
performance variables as dependent variables.
Thus, most studies assume that governance mechanisms are exogenous variables, not determined by
other governance mechanisms or firm characteristics. However, some governance mechanisms or overall
corporate governance quality itself may actually be endogenous variables, that is, variables influenced by
other governance mechanisms or company attributes. If this is true, previous researches aimed at capturing
the isolated impact of governance mechanisms on performance may have produced biased and
inconsistent results, since they have adopted the premise that governance mechanisms are exogenous in
their influence on corporate performance.
In this context, our study aims to examine how corporate governance quality influences market value
of Brazilian listed companies by means of different econometric approaches in increasing order of
complexity, including multiple regressions by Ordinary Least Squares (OLS), instrumental variables
approaches and systems of simultaneous equations, in order to verify the robustness of results about the
relation between corporate governance and value with different econometric models and techniques. This
is considered important in recent literature, as multiple regression approaches by ordinary least squares
4
(OLS) treat corporate governance as an exogenous variable, while those using instrumental variables and
simultaneous equation systems treat it as an endogenous variable. The latter are used to mitigate problems
of omitted variables and reverse causality between corporate governance and value. Our research is
primarily based on the works of Agrawal and Knoeber (1996), Barnhart and Rosenstein (1998), Cho
(1998), Bhagat and Jefferis (2002), Claessens et al. (2002), Demsetz and Villalonga (2001), Klapper and
Love (2004), Bøhren and Ødegaard (2003) and Leal and Carvalhal-da-Silva (2005).
The main contributions of this study are the following: 1) discussing the importance of obtaining
adequate instruments in corporate governance research in order to minimize endogeneity problems and
proposing new instruments to be used in future studies; 2) treating governance mechanisms not only as
exogenous, but also as endogenous variables, by constructing a simultaneous equation system in which
governance and performance variables are interrelated and coefficients are jointly estimated. According to
Bøhren and Ødegaard (2003, p. 2), the simultaneous equation approach copes better with reverse causality
and endogeneity problems and has only recently been used in studies about this subject; 3) comparing
results obtained on the relation between corporate governance and firm value by different econometric
approaches in increasing order of complexity, enabling a comparison of whether the direction and
significance of coefficients depend on the econometric approach adopted. The comparison between results
using instrumental variables and simultaneous equations approaches and the results from the traditional
multiple regressions approach by OLS can be very useful to discuss validity and consistency of previous
research results.
The paper is structured as follows: section 2 presents the theoretical background. Section 3 describes
the methodology, including the operational definition of the variables, research model and sampling
criteria. Section 4 discusses the main results and section 5 concludes.
5
2. THEORETICAL BACKGROUND
The studies that look for evidence on the influence of corporate governance quality on company value
can be classified in terms of their econometric approach. Bøhren and Ødegaard (2003, p. 8) propose the
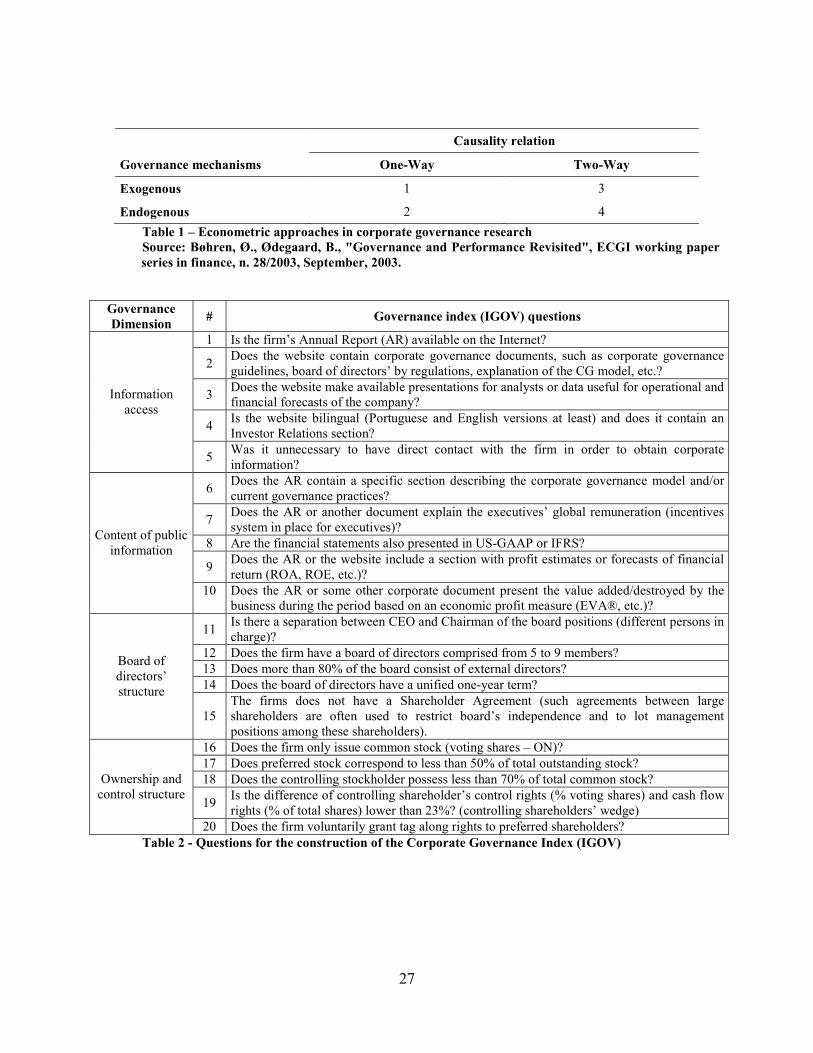
classification shown in Table 1.
[insert Table 1 here]
According to Bøhren and Ødegaard (2003), almost all corporate governance studies fit into cell 1,
employing an econometric approach that departs from three premises: i) governance mechanisms are
exogenous variables; ii) a one-way causal relation exists between corporate governance and firm value;
and iii) regressions are treated by means of isolated equations, using one or more governance mechanisms
as regressors. The most common governance mechanisms employed in the literature are internal
mechanisms like ownership concentration, board structure and executive remuneration, and external
mechanisms like the market for corporate control, financial leverage, product markets competition, and
investor protection.
Bøhren and Ødegaard (2003) observe that some studies, such as Himmelberg et al. (1999), are closer
to the approach presented in cell 2. In this kind of study, authors analyze one-way causal relations from
ownership structure to performance, similarly to cell 1 studies. However, the authors treat ownership
concentration as an endogenous variable, analyzing its possible determinants by panel data techniques that
take into account firms’ fixed effects (non-observable corporate characteristics that do not vary across the
period of analysis). Regarding cell 3, Bøhren and Ødegaard (2003, p. 9) argue that this type of study is
unfeasible, since a two-way causal relation cannot be modeled without considering at least one
governance mechanism as endogenous in relation to firms’ performance. Finally, cell 4 corresponds to
researches estimating coefficients of corporate governance mechanisms and performance variables
through simultaneous equation systems, using instrumental variables. Examples are Agrawal and Knoeber
(1996), Barnhart and Rosenstein (1998), Cho (1998) and Demsetz and Villalonga (2001).
6
The fact that there is a considerable probability of econometric problems related to reverse causality
and endogeneity in corporate governance studies favor cell 4 approach, which copes with these problems.
However, correct implementation of these methods depends on whether theory offers adequate and
conceptually solid restrictions for the equation systems. According to Bøhren and Ødegaard (2003, p. 9),
theoretical corporate governance literature has yet not determined how governance mechanisms interact,
which variables are exogenous and what is the balance among them that would eventually lead to an
optimal combination of governance mechanisms. In short, given the lack of a corporate governance
theory, it remains an unsolved key issue whether results from cell 4 approach provide more reliable
evidence on the relation between governance mechanisms and value than results from traditional and
simpler cell 1 studies.
A wide range of studies have attempted to relate governance mechanisms with firm value. Next, we
present the results of researches we consider more compatible with our study methodology. These studies
construct broad corporate governance indices that reduce information related to different governance
mechanisms and practices into one single measure, as a way of obtaining a proxy for corporate
governance quality. Leal (2004), Bhagat and Jefferis (2002) and Denis and McConnell (2003) summarize
the main empirical studies on the relation between governance and performance.
Black (2001) evaluated the hypothesis that the behavior of governance practices affects Russian firms’
market value. As a proxy of corporate governance quality, the authors used a ranking created by
Brunswick Warburg investment bank, which attributed a score from 0 to 60 points, with higher indices
pointing towards greater “corporate governance risk”. The results of this study indicated a strong positive
relation between companies’ corporate governance quality and market value, suggesting that the firm’s
behavior in terms of governance practices can exert a considerable effect on its market value, mainly in
countries where investor protection is weak. The same author emphasized, however, that results were
limited by the small sample (sixteen companies) and lack of control variables.
7
Klapper and Love (2004) evaluated corporate governance quality differences among companies from
fourteen emerging countries, based on a corporate governance index created by Credit Lyonnnais
Securities Asia (CSLA). The authors found a strong positive correlation between governance quality and
market value. Since their results were obtained by the least square method for a one-year period, the
authors alerted to a possible endogeneity problem in the relation among variables, avoiding conclusions on
any causal relation between governance quality and firm performance.
Bøhren and Ødegaard (2003) analyzed the relation between corporate governance and performance in
Norway. First, the authors carried out isolated regressions with different governance mechanisms acting as
independents variables. Results of this first section evidenced that governance mechanisms are significant
for the analyzed firms’ performance. Next, the same authors used a simultaneous equation approach,
finding a lack of significance or even inversed signals on the relations between governance mechanisms
and value variables. The authors believe that the change in the results was much more due to the
methodological difficulty of using a simultaneous equation system with still underdeveloped theories to
explain interactions between corporate governance and performance.
Black, Jang and Kim (2006) presented evidence that corporate governance is an important factor to
predict firms’ market value in South Korea using a broad governance index. Initially, carrying out
regressions by OLS, they observed a strong positive relation between governance quality and market
value. Acknowledging the possibility of endogeneity problems, the authors then estimated coefficients
through instrumental variables, using two-stage (2SLS) and three-stage least squares estimators (3SLS).
The main difficulty task to use this econometric approach is to find an adequate corporate governance
instrument. The authors argued that South Korean legislation offers singular characteristics to construct a
good governance instrument, as various governance requirements only apply to companies with assets of
at least 2 trillion won. Therefore, they constructed an instrument that is per definition an exogenous
variable determined by law and correlated with governance quality. Results obtained by combining 2SLS
and 3SLS with the described instrument showed a causal relation between good governance practices and
8
higher market value. Thus, Black, Jang and Kim (2006) offered new and strong evidence that better
governance practices would probably lead to higher stock prices in emerging markets.
Durnev and Kim (2005) examined how certain firm attributes influence the choice of corporate
governance practices and interact with the legal environment where the firms are inserted in. The authors
developed a theoretical model resulting in three predictions: i) growth opportunities, need for external
funding and ownership concentration are the three main attributes that lead firms to adopt better
governance practices; ii) companies with better governance practices are valued higher by markets; and
iii) the adoption of better governance practices is more relevant in countries with weak legal investor
protection. Next, the authors carried out empirical tests and found evidence that corroborates all of their
predictions. However, it should be highlighted that, as a governance quality proxy, the authors used two
alternative indexes: one created by Credit Lyonnnais Securities Asia (CSLA) based on different subjective
questions to be answered by analysts, and another created by Standard & Poor’s (S&P), restricted to
information transparency issues. Moreover, both indexes only evaluate the largest companies of each
country.
Leal and Carvalhal-da-Silva (2005) also investigated the relationship between corporate governance
and firm value in Brazil. The authors constructed a broad corporate practices index (CGI) composed of 24
objective and binary questions for the period from 1998 to 2002. All questions received equal weight, so
that companies’ scores ranged from 0 to 24. As the main result, the authors found a positive, significant,
and robust relationship between CGI and corporate value, suggesting that the improvement of corporate
governance practices do pay off in Brazil. Specifically, the authors showed that a worst-to-best
improvement in the CGI in 2002 (last year of data available) would lead to a 0.38 increase in Tobin’s Q,
and that a one-point increase in the CGI would lead to a 6.8% increase in the stock price of the average
firm. The tests were conducted through panel data analysis using common, fixed and random effect
9
procedures, besides simultaneous equations. In addition, the authors evidenced a modest general
improvement in firms’ governance practices captured by CGI evolution in the 1998-2002 period.
3. RESEARCH METHODOLOGY
3.1. Research model and methodological discussion
The relation between corporate governance and firm value was estimated by a set of distinct
econometric approaches: ordinary least squares, instrumental variables (estimated by two-stage least
squares - 2SLS, and by the generalized method of moments - GMM) and simultaneous equation systems
(estimated by GMM, three-stage least squares - 3SLS and the full information maximum likelihood
method - FIML). Initially, we carried out multiple regressions using a series of corporate attributes as
control variables, according to the following model:
( )
1 2 3 4 5 6
17
7 8 9
1
log
i i i i i i
i i j ji iij
VALUE GOV OWNSTRC CAPSTRC LIQ PAYOUT PROFIT
REVG REV TANG IND
β β β β β β
β β β δ ε=
= ∗ + ∗ + ∗ + ∗ + ∗ + ∗
+ ∗ + ∗ + ∗ + +∑
Equation 1
Where:
OWNSTRC - ownership structure; CAPSTRC - capital structure (financial leverage);
LIQ - stock liquidity; PAYOUT - stock payout ratio; PROFIT - operational profitability; REVG - growth
opportunities; ( )log REV - firm size; TANG - type of operations (asset tangibility); IND - binary variables
identifying the company’s industry.
Equation 1 was estimated by ordinary least squares method (OLS). In spite of using different control
variables, coefficients estimated by OLS can be biased and inconsistent, due to the possible endogeneity
of the corporate governance variable, as discussed below.
The two main endogeneity problems in corporate governance research refer to the possible presence
of omitted variables and potential simultaneous determination of the variables of interest. Regarding the
omitted variables, firm’s characteristics that are not directly measurable or controllable in the regression
10
can simultaneously influence the regressors and dependent variables. These not perfectly controllable
characteristics include, for instance, the company’s growth perspectives and the controlling shareholder’s
opportunities to expropriate minority stockholders. As an example, the possibility to expropriate minority
shareholders could be negatively correlated with firms’ market value and positively correlated with
corporate governance quality (as a way for the controlling shareholder to signalize the market that he or
she has no intent on expropriating other investors, by enjoying certain private benefits of control). If this
hypothesis is true, this variable (if not observable) could induce an apparently null or negative relation
between companies’ corporate governance and value. In this case, the occasional weakness of results
obtained by OLS would be due to the problem of omitted variables.
The simultaneous determination problem occurs if there is a structural reverse causality between
firms’ governance quality and market value. In this case, the influence would not only go from the
adoption of better governance practices to the firm’s market value, but also in the opposite sense, with
firms with a higher market value adopting better governance practices. In this type of situation, the
variables of interest should be simultaneously determined (in equilibrium) and estimation by OLS would
generally produce biased and inconsistent estimators.
As corporate governance literature contains strong suspicions about governance mechanisms being
endogenous variables, the relation between governance quality and value should be treated more
adequately than by simple OLS. One solution for endogeneity problems would be the use of instrumental
variables. These should have two main properties: strong correlation with corporate governance quality
and null correlation with the error term in the original equation. In other words, the instruments should
affect the value variable only through corporate governance and other observable and controllable
variables2.
An ideal instrument could originate in an intrinsically exogenous phenomenon. One example of a
good instrument would be if the government randomly sorted some companies and obliged them to
2 While the correlation between corporate governance and the instrumental variable can be observed, the hypothesis of a null correlation between the instrument and the error term is not directly observable and needs to be based on theoretical suppositions.
11
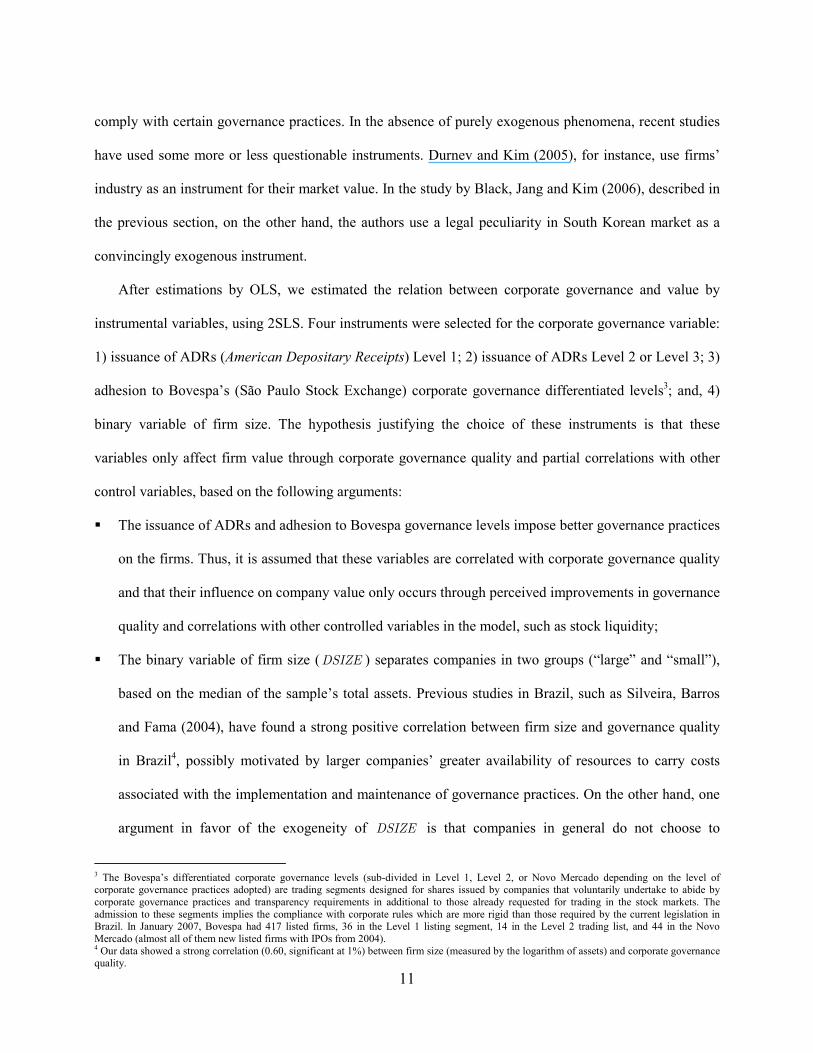
comply with certain governance practices. In the absence of purely exogenous phenomena, recent studies
have used some more or less questionable instruments. Durnev and Kim (2005), for instance, use firms’
industry as an instrument for their market value. In the study by Black, Jang and Kim (2006), described in
the previous section, on the other hand, the authors use a legal peculiarity in South Korean market as a
convincingly exogenous instrument.
After estimations by OLS, we estimated the relation between corporate governance and value by
instrumental variables, using 2SLS. Four instruments were selected for the corporate governance variable:
1) issuance of ADRs (American Depositary Receipts) Level 1; 2) issuance of ADRs Level 2 or Level 3; 3)
adhesion to Bovespa’s (São Paulo Stock Exchange) corporate governance differentiated levels3; and, 4)
binary variable of firm size. The hypothesis justifying the choice of these instruments is that these
variables only affect firm value through corporate governance quality and partial correlations with other
control variables, based on the following arguments:
� The issuance of ADRs and adhesion to Bovespa governance levels impose better governance practices
on the firms. Thus, it is assumed that these variables are correlated with corporate governance quality
and that their influence on company value only occurs through perceived improvements in governance
quality and correlations with other controlled variables in the model, such as stock liquidity;
� The binary variable of firm size (DSIZE ) separates companies in two groups (“large” and “small”),
based on the median of the sample’s total assets. Previous studies in Brazil, such as Silveira, Barros
and Fama (2004), have found a strong positive correlation between firm size and governance quality
in Brazil4, possibly motivated by larger companies’ greater availability of resources to carry costs
associated with the implementation and maintenance of governance practices. On the other hand, one
argument in favor of the exogeneity of DSIZE is that companies in general do not choose to
3 The Bovespa’s differentiated corporate governance levels (sub-divided in Level 1, Level 2, or Novo Mercado depending on the level of corporate governance practices adopted) are trading segments designed for shares issued by companies that voluntarily undertake to abide by corporate governance practices and transparency requirements in additional to those already requested for trading in the stock markets. The admission to these segments implies the compliance with corporate rules which are more rigid than those required by the current legislation in Brazil. In January 2007, Bovespa had 417 listed firms, 36 in the Level 1 listing segment, 14 in the Level 2 trading list, and 44 in the Novo Mercado (almost all of them new listed firms with IPOs from 2004). 4 Our data showed a strong correlation (0.60, significant at 1%) between firm size (measured by the logarithm of assets) and corporate governance quality.
12
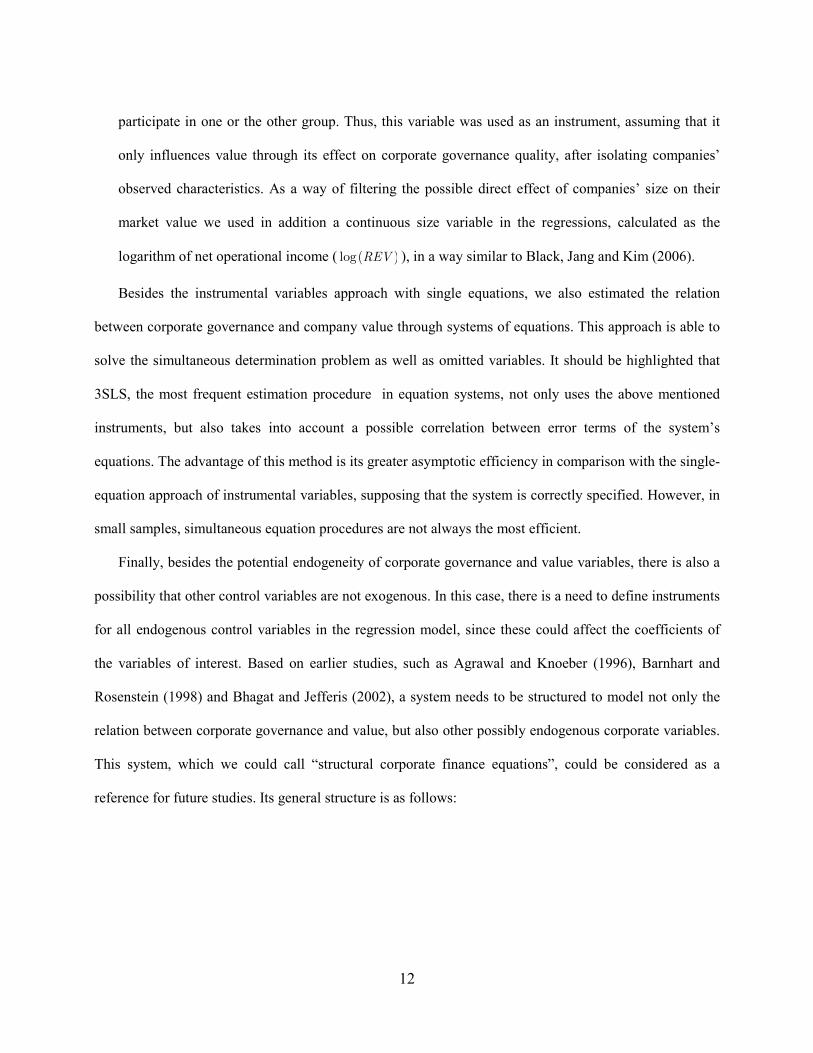
participate in one or the other group. Thus, this variable was used as an instrument, assuming that it
only influences value through its effect on corporate governance quality, after isolating companies’
observed characteristics. As a way of filtering the possible direct effect of companies’ size on their
market value we used in addition a continuous size variable in the regressions, calculated as the
logarithm of net operational income ( ( )log REV ), in a way similar to Black, Jang and Kim (2006).
Besides the instrumental variables approach with single equations, we also estimated the relation
between corporate governance and company value through systems of equations. This approach is able to
solve the simultaneous determination problem as well as omitted variables. It should be highlighted that
3SLS, the most frequent estimation procedure in equation systems, not only uses the above mentioned
instruments, but also takes into account a possible correlation between error terms of the system’s
equations. The advantage of this method is its greater asymptotic efficiency in comparison with the single-
equation approach of instrumental variables, supposing that the system is correctly specified. However, in
small samples, simultaneous equation procedures are not always the most efficient.
Finally, besides the potential endogeneity of corporate governance and value variables, there is also a
possibility that other control variables are not exogenous. In this case, there is a need to define instruments
for all endogenous control variables in the regression model, since these could affect the coefficients of
the variables of interest. Based on earlier studies, such as Agrawal and Knoeber (1996), Barnhart and
Rosenstein (1998) and Bhagat and Jefferis (2002), a system needs to be structured to model not only the
relation between corporate governance and value, but also other possibly endogenous corporate variables.
This system, which we could call “structural corporate finance equations”, could be considered as a
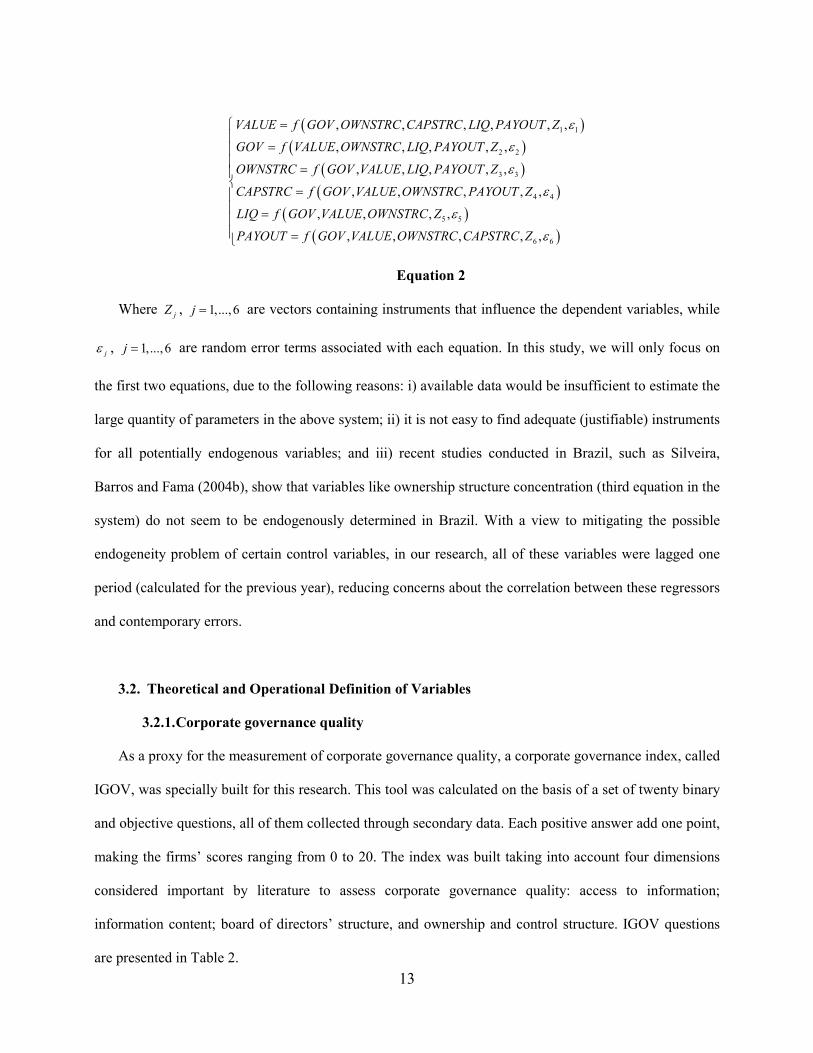
reference for future studies. Its general structure is as follows:
13
( )( )
( )( )
( )
1 1
2 2
3 3
4 4
5 5
, , , , , ,
, , , , ,
, , , , ,
, , , , ,
, , , ,
, ,
VALUE f GOV OWNSTRC CAPSTRC LIQ PAYOUT Z
GOV f VALUE OWNSTRC LIQ PAYOUT Z
OWNSTRC f GOV VALUE LIQ PAYOUT Z
CAPSTRC f GOV VALUE OWNSTRC PAYOUT Z
LIQ f GOV VALUE OWNSTRC Z
PAYOUT f GOV VALUE OW
ε
ε
ε
ε
ε
=
=
=
=
=
= ( )6 6, , ,NSTRC CAPSTRC Z ε
Equation 2
Where jZ , 1,...,6j = are vectors containing instruments that influence the dependent variables, while
jε , 1,...,6j = are random error terms associated with each equation. In this study, we will only focus on
the first two equations, due to the following reasons: i) available data would be insufficient to estimate the
large quantity of parameters in the above system; ii) it is not easy to find adequate (justifiable) instruments
for all potentially endogenous variables; and iii) recent studies conducted in Brazil, such as Silveira,
Barros and Fama (2004b), show that variables like ownership structure concentration (third equation in the
system) do not seem to be endogenously determined in Brazil. With a view to mitigating the possible
endogeneity problem of certain control variables, in our research, all of these variables were lagged one
period (calculated for the previous year), reducing concerns about the correlation between these regressors
and contemporary errors.
3.2. Theoretical and Operational Definition of Variables
3.2.1. Corporate governance quality
As a proxy for the measurement of corporate governance quality, a corporate governance index, called
IGOV, was specially built for this research. This tool was calculated on the basis of a set of twenty binary
and objective questions, all of them collected through secondary data. Each positive answer add one point,
making the firms’ scores ranging from 0 to 20. The index was built taking into account four dimensions
considered important by literature to assess corporate governance quality: access to information;
information content; board of directors’ structure, and ownership and control structure. IGOV questions
are presented in Table 2.
14
[insert Table 2 here]
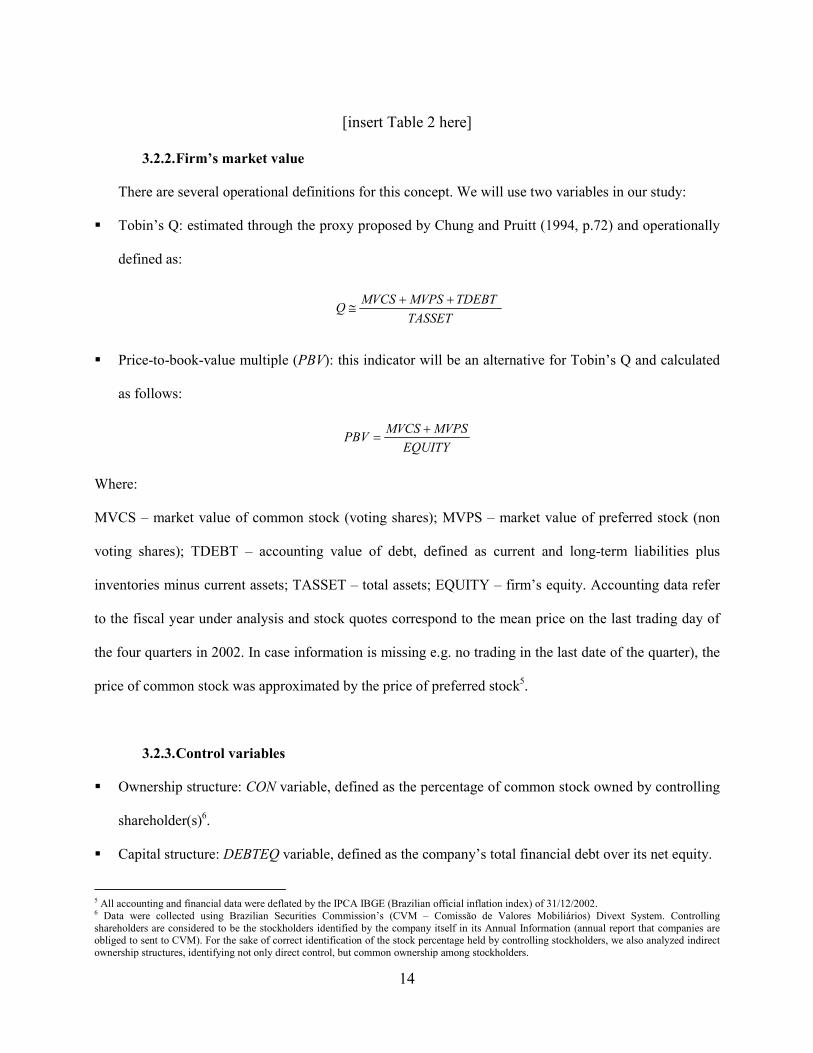
3.2.2. Firm’s market value
There are several operational definitions for this concept. We will use two variables in our study:
� Tobin’s Q: estimated through the proxy proposed by Chung and Pruitt (1994, p.72) and operationally
defined as:
� Price-to-book-value multiple (PBV): this indicator will be an alternative for Tobin’s Q and calculated
as follows:
MVCS MVPSPBV
EQUITY
+=
Where:
MVCS – market value of common stock (voting shares); MVPS – market value of preferred stock (non
voting shares); TDEBT – accounting value of debt, defined as current and long-term liabilities plus
inventories minus current assets; TASSET – total assets; EQUITY – firm’s equity. Accounting data refer
to the fiscal year under analysis and stock quotes correspond to the mean price on the last trading day of
the four quarters in 2002. In case information is missing e.g. no trading in the last date of the quarter), the
price of common stock was approximated by the price of preferred stock5.
3.2.3. Control variables
� Ownership structure: CON variable, defined as the percentage of common stock owned by controlling
shareholder(s)6.
� Capital structure: DEBTEQ variable, defined as the company’s total financial debt over its net equity.
5 All accounting and financial data were deflated by the IPCA IBGE (Brazilian official inflation index) of 31/12/2002. 6 Data were collected using Brazilian Securities Commission’s (CVM – Comissão de Valores Mobiliários) Divext System. Controlling shareholders are considered to be the stockholders identified by the company itself in its Annual Information (annual report that companies are obliged to sent to CVM). For the sake of correct identification of the stock percentage held by controlling stockholders, we also analyzed indirect ownership structures, identifying not only direct control, but common ownership among stockholders.
MVCS MVPS TDEBT Q
TASSET
+ +≅
15
� Liquidity: LIQ variable, calculated by database system Economática®7, based on stock trade volumes
throughout the year.
� Payout ratio: PAYOUT variable, defined as dividends paid per stock over net earnings per share during
the fiscal year.
� Operational profitability: EBITDA variable, defined as income before interests, income tax,
depreciation and amortization over total assets:
� Future growth opportunities: REVG variable, defined as accumulated percentage growth of
operational income over the last three years.
� Firm size: ( )log REV variable, defined as the logarithm of the company’s net operational income. We
also used the binary variable DSIZE, equal to 1 (one) if the company’s total assets are higher than the
median of the study sample’s8 total assets and equal to 0 (zero) if the opposite is true.
� Type of operations: TANG variable, defined as gross fixed assets over net operational income. It is a
proxy of the tangibility level of company operations.
� Industry: set of binary variables (DIND) to represent different sectors in the models. These variables
attribute 1 to companies that belong to a specific sector and 0 to companies from other sectors. We
adopted the classification criterion of the Economática® database, which provides a list of companies
and their respective sectors. This broad ranking divides companies into 18 categories.
� Identity of controlling shareholders: set of binary variables (IDENT) to represent different types of
controlling shareholders: (i) foreign private ownership: control in the hands of a multinational or
group of foreign investors ( 1IDENT ); (ii) national private ownership: control in the hands of a group
of national investors outside the entrepreneur or founding family of the firm ( 2IDENT ); (iii) family
ownership: control in the hands of one family or one single investor, including control by foundations
7 Economatica® is a database system focused on Latin American firms. 8 The median of total company assets in the sample was approximately R$ 1.4 billion (around US$ 700 million on earlier 2007). Thus, companies whose total assets exceeded this value received 1 (one) in the size dummy, while others received 0 (zero). 10 These binary variables of ADR issuing were separated due to the fact that ADRs Level 1 refer to the over-the-counter market, while ADRs Level 2 and Level 3 refer to the stock market (thus requiring firms to comply with additional corporate governance practices, including the filing of 20-F annual reports and compliance with Sarbanes-Oxley Act).
16
or holdings representing the company founders or their heirs ( 3IDENT ); (iv) banks and other financial
institutions ownership: control in the hands of a bank and/or financial institution ( 4IDENT ); (v)
pension funds ownership: control exercised by pension funds ( 5IDENT ); (vi) state-owned firms:
control exercised by the Union, States or Cities ( 6IDENT ).
� Issuance of ADRs: ADR1 or ADR23 variable. These binary variables are equal to 1 (one) if the
company trades ADRs on the New York stock exchange or NASDAQ (ADR1 if the company trades
ADRs level 1 and ADR23 if the company trades ADRs level 2 or 3) and equal to 0 (zero) if the
opposite is true10.
� Adhesion to Bovespa Corporate Governance levels: BOV binary variable, equal to 1 (one) if the
company is listed on Bovespa’s Differentiated Corporate Governance Levels or Novo Mercado and
equal to 0 (zero) if the opposite is true.
3.3. Population, Sample and Data Collection
The study sample comprises all non-financial listed companies traded at São Paulo Stock Exchange –
Bovespa with significant liquidity levels in 2002. Companies with significant liquidity levels were
considered to be those companies whose annual liquidity ratio as calculated by Economática® was higher
than 0.001% of the ratio corresponding to the most liquid company. This cut-off range was chosen due to
the fact that firms with very low stock liquidity levels have a low probability that their quotation would be
correct relative to their market value (the stock market value quotation is needed to calculate Tobin’s Q
and the PBV multiple).
During data collection process, some companies presented insufficient data to construct all variables,
reducing the sample to 154 firms. Although this sample size is considered significant regarding the total
number of firms listed at Bovespa, strictly speaking, probabilistic sampling would be needed to allow for
generalization of the results. Secondary data were collected from the information systems Economática®
and Divext System of Brazilian Securities and Exchange Commission (CVM – Comissão de Valores
17
Mobiliários). To reduce the influence of possible outliers, all control variables, besides value variables,
were winsorized11 by 2.5% and 97.5%, although original variables have also been used in regressions.
Stata/SE 9.1, Eviews 4.0 and GiveWin 2.10 were used for econometrical tests.
4. ANALYSIS OF RESULTS
4.1. Descriptive statistics of corporate governance index(IGOV)
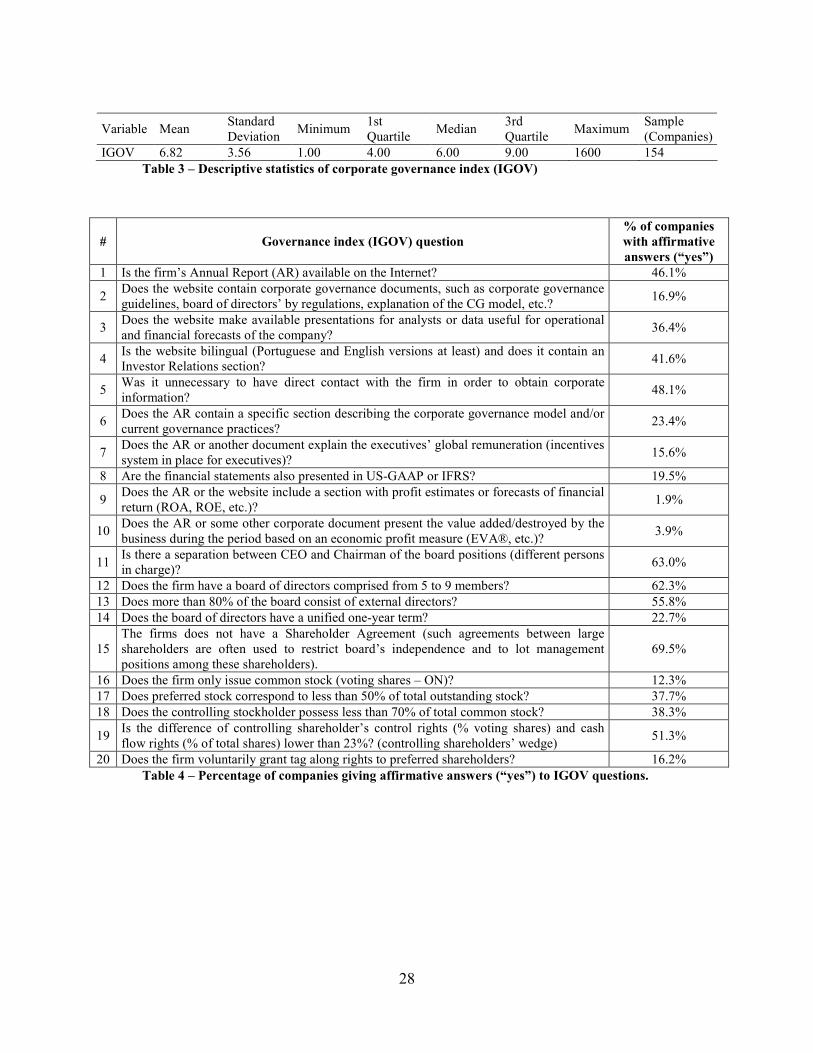
Descriptive statistics for the corporate governance index (IGOV) computed for our sample is shown in
Table 3.
[insert Table 3 here]
According to Table 3, mean IGOV was 6.82, with 75% of companies scoring 9 (nine) or lower. Mean
IGOV scores indicates the poor quality of corporate governance practices among Brazilian listed firms,
since we asked basic questions about information access, transparency, board and ownership structure in
our index. Table 4 shows the percentage of companies whose answers were considered positive (“yes”)
for each index question.
[insert Table 4 here]
We observe in Table 4 that less than half (46.1%) of the firms make available their annual reports to
investors through the Internet for download, and that only 16.9% make available governance documents
such as corporate governance guidelines, board of directors’ regulations, etc. on their website. Moreover,
the content of Annual Reports seems to be relatively poor, mainly in terms of explanations on what
governance practices are currently implemented (23.4%) and on executive remuneration policy (15.6%).
Less than one-fifth (19.5%) presents financial statements converted into international accounting
principles (US-GAAP or IFRS). One negative characteristic is the rarely disclosure of financial results
using a value-added metric based on any measure of economic profit (3.9%). As managers’ main function
11 Winsorization, a procedure originally proposed by the biostatistician C. P. Winsor, consists in trimming the extreme values (below or above defined minimum and maximum percentiles), and replacing them by he remaining extreme values in the distribution. This procedure has been
18
is to create shareholder value, this finding can be considered relevant, since firms rarely report whether
they are creating or destroying value. Regarding the board of directors, in general, companies have an (at
least formally) adequate board structure, in line with corporate governance recommendations, with
different people occupying both CEO and chairman positions (63.0%), and with board sizes from five to
nine members12 (62.3%). Few companies issue only voting shares (12.3%) and the voluntary granting of
tag along rights13 to non voting shareholders is not very usual (16.3%).
4.2. Correlations and preliminary relations between governance quality and firm value
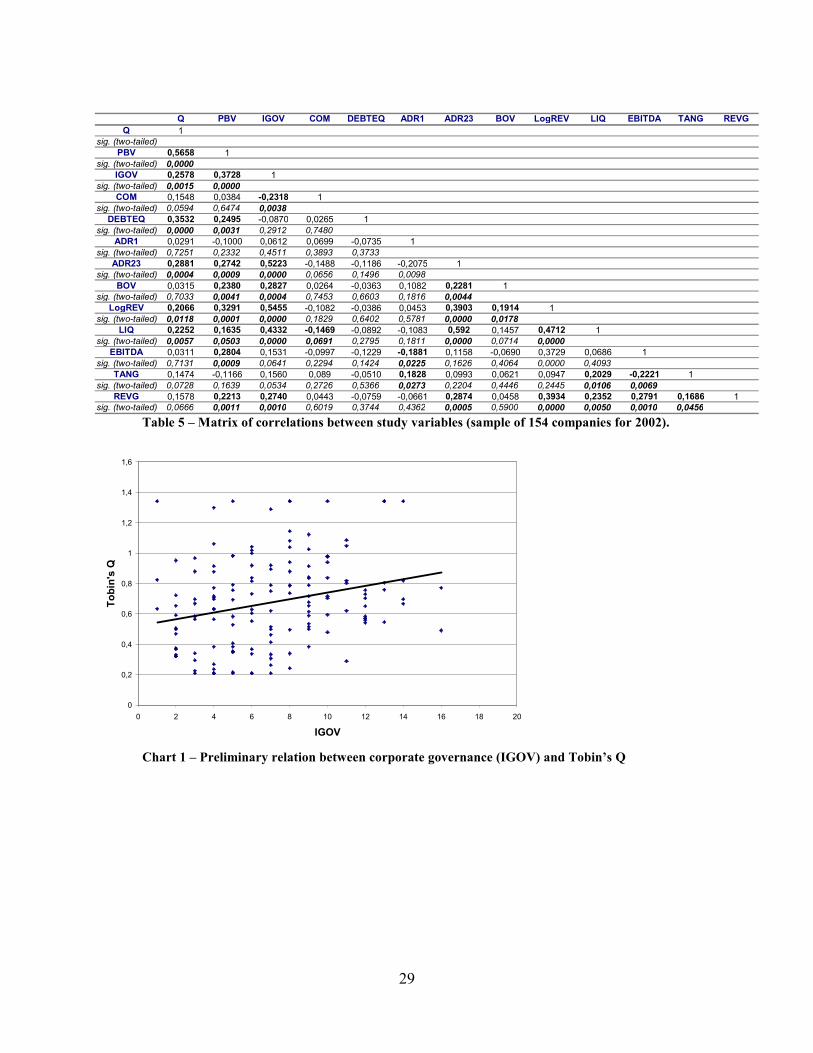
Table 5 shows the correlation matrix between the variables.
[insert Table 5 here]
According to Table 4, we see a significant positive correlation at 1% between IGOV and the value
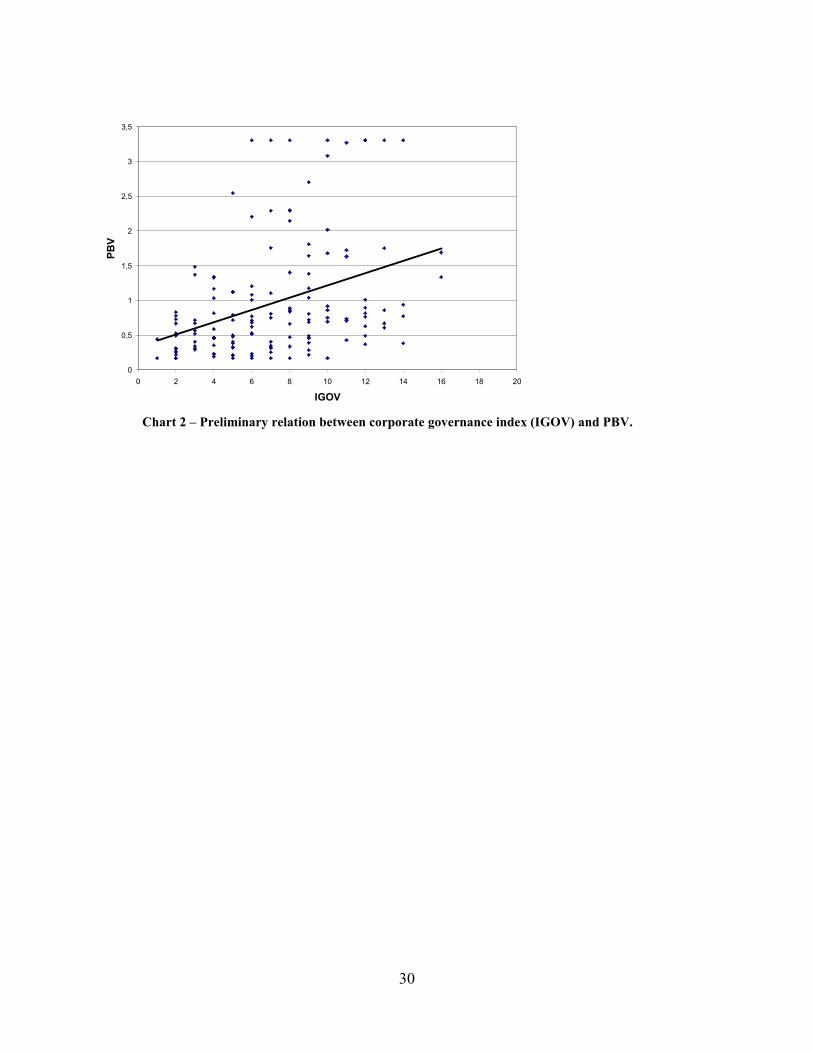
variables Tobin’s Q and PBV. Another preliminary and qualitative relation between variables is shown in
the Charts 1 and 2. They demonstrate a positive relation between the variables. However, the causal
relation from IGOV to Q and PBV depends on more appropriate econometric techniques.
[insert Chart 1 here]
[insert Chart 2 here]
4.3. Results using multiple regressions, instrumental variables and simultaneous equation
systems
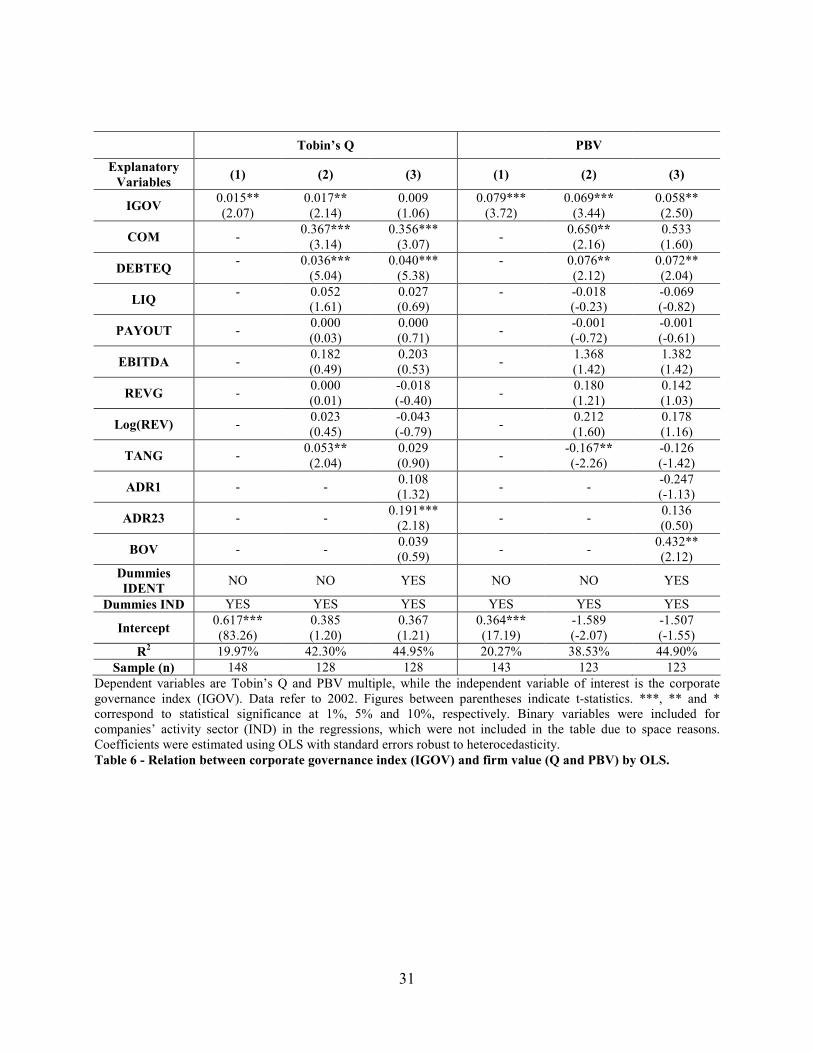
Initially, we carried out multiple regressions using ordinary least squares (OLS) using different
research model specifications. The results are presented in Table 6.
[insert Table 6 here]
used in recent studies, such as Black, Jang and Kim (2006) and Durnev and Kim (2005). 12 The Brazilian Institute of Corporate Governance – IBGC, considered the main institution of the subject in Brazil, recommends a board of directors comprised from five to nine members in its code of best practices. 13 Tag along is a right that guarantee minority shareholders a price similar to the price paid for controlling shareholders’ shares in case of the firm being acquired. Therefore, it limits the voting premiums in such events.
19
Specification 1 in Table 5 involves the application of a regression model that considers only industry
differences among firms. This model indicated a significant positive relation at a level of 5% between
IGOV and Q and at a 1% level between IGOV and PBV. Specification 2, based on the model presented in
Equation 1, is considered the basic model of research. Results according to this specification also showed
a significant positive relation at 5% between IGOV and Q and at 1% between IGOV and PBV. The
magnitude of the IGOV coefficient (0.017) informs that a worst-to-best change in corporate governance
quality of the sample (increasing IGOV from 1 to 16) would result in a 0.25 rise in Tobin’s Q of the
analyzed company. For a company’s Tobin’s Q equal to the sample’ mean Q (0.68) and with a total debt /
total assets ratio equal to the sample mean (0.39), that would represent an 85% increase in its market
capitalization, ceteris paribus. The magnitude of PBV variable (0.069) shows that a similar improvement
in corporate governance would result in a 1.03 increase of the average firm PBV multiple. Therefore, if
the company’s PBV multiple were equal to the sample’s mean PBV (1.03), a valuation of about 100%
would be expected as a result of better governance quality, ceteris paribus. In summary, no matter which
value variable is used, the basic research model forecasts a substantial increase in firm’s value due to
improvements in corporate governance practices. Specification 3 also used variables related to ADR
issuance, adhesion to Bovespa corporate governance levels and identity of controlling shareholders. In this
specification, IGOV variable lost significance regarding Tobin’s Q and kept statistical significance with
PBV. This loss of significance was mainly due to the inclusion of ADR Level 2 or 3 issuance ( 23ADR ).
As the issuance of ADRs on the stock market can also be considered a movement towards good
governance practices (since companies assume a commitment to greater transparency and stricter investor
protection standards), including these variables does not invalidate the hypothesis that corporate
governance influences firm value.
All OLS regressions were calculated using standard errors robust to heterocedasticity with correction
for finite samples. In some regressions, binary industry variables were excluded due to multicollinearity

20
problems (measured by FIV – variance inflation factor14). These variables revealed to be redundant and
impaired the numeric stability of estimates. We carried out alternative regressions without the presence of
outliers, which were identified based on the regressions’ studentized residues, and the main results were
maintained. One possible problem when estimating coefficients by OLS is the bias caused by omitted
variables, as described previously. We carried out Ramsey’s tests (RESET) for omitted variables in order
to evaluate evidences of this problem. These tests did not reject the null hypothesis that no variable was
omitted in the model, providing greater credibility to OLS estimates.
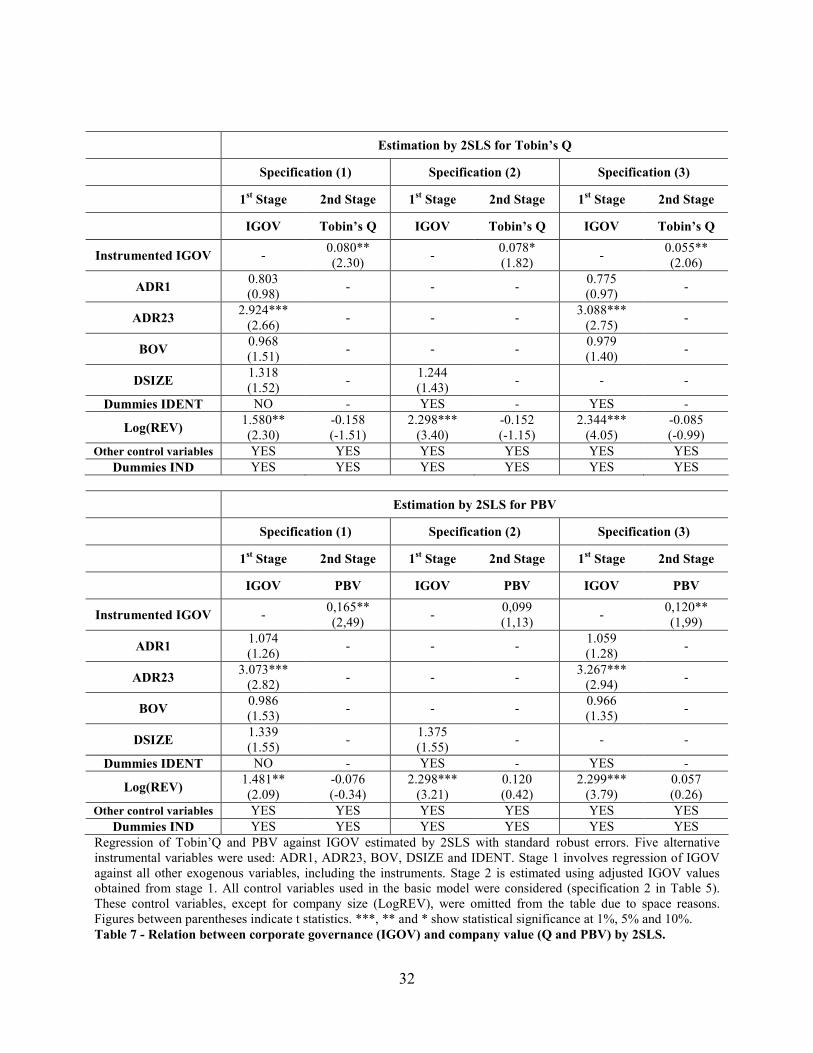
After OLS regressions, we performed 2SLS. As presented in the previous section, we chose four
instruments as alternatives for the corporate governance variable: 1) issuance of ADR Level 1 ( 1ADR ); 2)
issuance of ADR Level 2 or 3 ( 23ADR ); 3) adhesion to Bovespa corporate governance levels (BOV );
and, 4) binary variable of company size (DSIZE ). Table 7 shows the results of regressions by 2SLS using
different model specifications.
[insert Table 7 here]
Results were obtained by applying 2SLS estimator with standard error robust to heterocedasticity and
to contemporary errors’ correlation. Moreover, for the sake of conservatism, the critical values adopted to
make inferences on the obtained coefficients’ statistical significance were based on Student’s t instead of
Normal distribution. Hansen’s test of overidentifying restriction was used to assess the adequacy of the
instruments. This test evaluates instruments’ exogeneity. The joint null hypothesis is that: i) the
instruments chosen for IGOV are not correlated with errors and ii) excluding the instruments from the
regression that determines Tobin’s Q and PBV is acceptable. Thus, the non rejection of the null hypothesis
suggests that instruments are adequate15. In all specifications, the p-value of Hansen’s J statistics was
higher than 0.10, not rejecting the null hypothesis and thus evidencing that the instruments chosen are
acceptable from a statistical point of view.
14 All variables with variance inflation factors above 20 were excluded. It should be highlighted that all excluded variables were binary industry variables that revealed to be redundant in the regression model. 15 Hansen’s test is similar to the better known Sargan test but, as opposed to the latter, it is robust to heterocedasticity.
21
The results presented in Table 6 indicated a significant positive relation at 5% between IGOV and Q
and between IGOV and PBV, robust to different model specifications and instruments. However,
coefficients and t statistics obtained through regressions by 2SLS should be interpreted with care. t
statistics for the instrumented IGOV in stage 2 indicate the instruments’ influence in predicting Q and
PBV, and not the IGOV’s direct influence in predicting Tobin’s Q and PBV multiple. Finally, we carried
out the Durbin-Wu-Hausman (DWH)16 test to evaluate the statistical plausibility of the hypothesis about
the endogeneity of IGOV (which is the fundamental premise to apply the 2SLS method). This is a
consistency test of the OLS estimator, comparing the estimates obtained through these methods with the
results obtained by using an instrumental variables (IV) estimator. The null hypothesis is that both
estimators are consistent. Thus, if not rejected, estimation by OLS is preferable, as it is more efficient. All
DWH tests rejected the null hypothesis at common significance levels, corroborating the supposition that
IGOV is an endogenous variable and that estimates using instrumental variables are more adequate
(assuming that instruments are valid). We carried out additional regressions using generalized least
squares (GLS). These results were similar to results by 2SLS and are not reported here due to space
limitations.
After analysis by 2SLS, the relation between IGOV and value variables was estimated by
simultaneous equation systems using three-stage least squares (3SLS) by the generalized method of
moments (GMM), and by the full information maximum likelihood method (FIML)17. As discussed under
section 3.1, although a six-equation system could be estimated (considering other potentially endogenous
corporate variables), we concentrated on the relation between governance variables and value, modeled
through the following system:
16 Durbin-Wu-Hausman’s endogeneity test is equivalent to Hausman’s test, which is better known. 17 Estimating the equation system by different methods is important due to each method’s different characteristics and premises. Estimation by 3SLS assumes homocedasticity of error terms, while FIML and GMM are robust to heterocedasticity. As to differences between FIML and GMM, the former assumes normal distribution of error terms, while the latter does not. Although estimation by GMM is more robust, provided that the premise of normal distribution is true, estimation by FIML is more efficient.
22
( )
11 21 31 41 51 61
17
71 8 9 1 1
1
12 22 32 42 52 62 72
82
log
1
23
i i i i i i i
i i j ji iij
i i i i i i i i
i
Q GOV COM DEBTEQ LIQ PAYOUT EBITDA
REVG REV TANG IND
IGOV Q COM PAYOUT LIQ EBITDA REVG ADR
ADR
β β β β β β
β β β δ ε
β β β β β β β
β
=
= ∗ + ∗ + ∗ + ∗ + ∗ + ∗
+ ∗ + ∗ + ∗ + +
= ∗ + ∗ + ∗ + ∗ + ∗ + ∗ + ∗
+ ∗ +
∑
( )5 17
92 102 112 2 2 2
1 1
logi i l li j ji iil j
BOV REV TANG IDENT INDβ β β γ δ ε= =
∗ + ∗ + ∗ + + +
∑ ∑
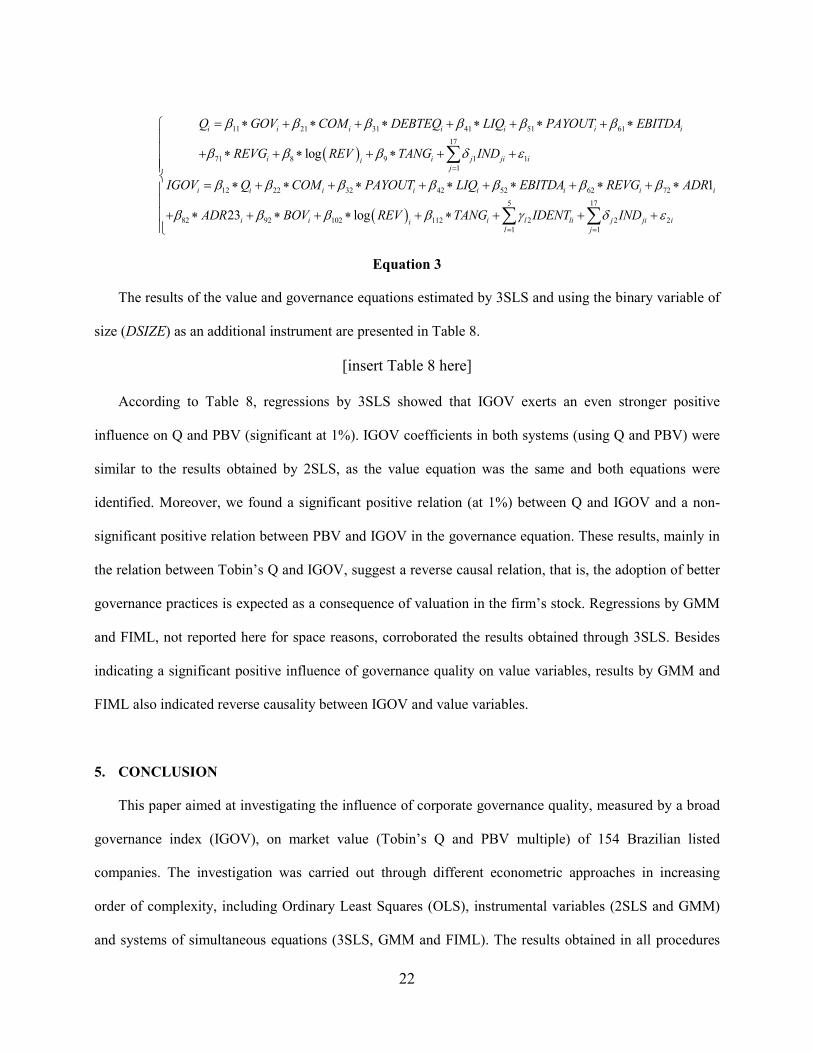
Equation 3
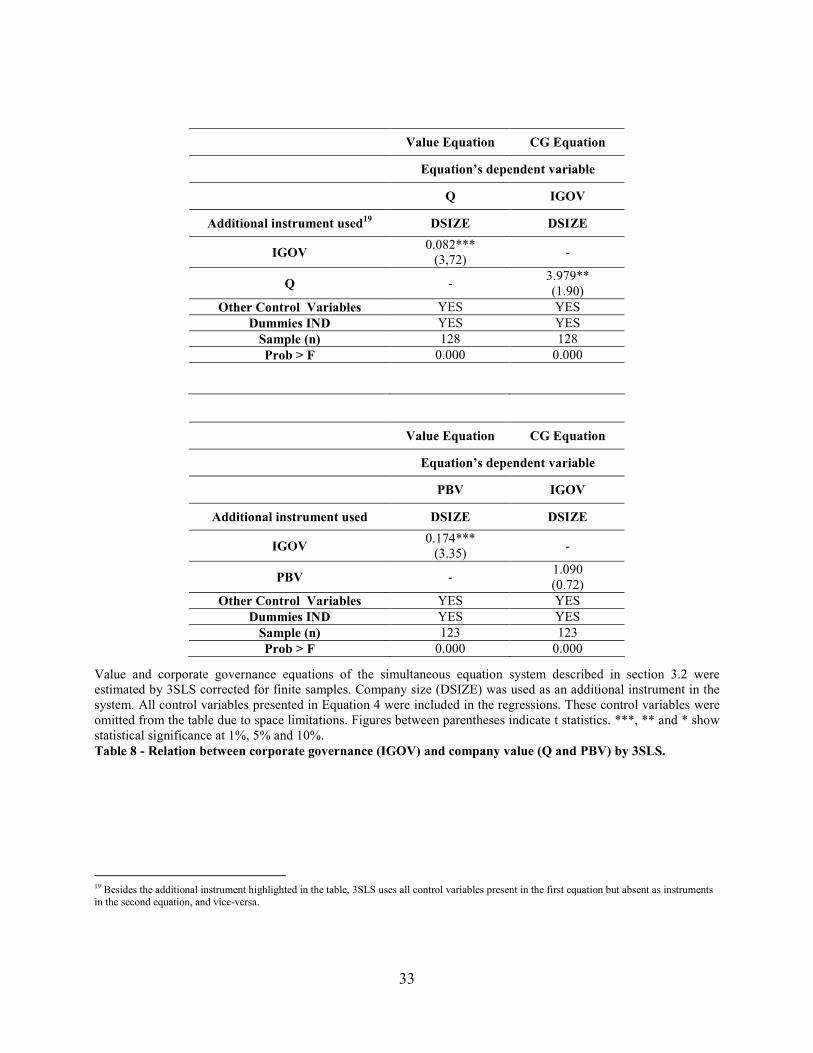
The results of the value and governance equations estimated by 3SLS and using the binary variable of
size (DSIZE) as an additional instrument are presented in Table 8.
[insert Table 8 here]
According to Table 8, regressions by 3SLS showed that IGOV exerts an even stronger positive
influence on Q and PBV (significant at 1%). IGOV coefficients in both systems (using Q and PBV) were
similar to the results obtained by 2SLS, as the value equation was the same and both equations were
identified. Moreover, we found a significant positive relation (at 1%) between Q and IGOV and a non-
significant positive relation between PBV and IGOV in the governance equation. These results, mainly in
the relation between Tobin’s Q and IGOV, suggest a reverse causal relation, that is, the adoption of better
governance practices is expected as a consequence of valuation in the firm’s stock. Regressions by GMM
and FIML, not reported here for space reasons, corroborated the results obtained through 3SLS. Besides
indicating a significant positive influence of governance quality on value variables, results by GMM and
FIML also indicated reverse causality between IGOV and value variables.
5. CONCLUSION
This paper aimed at investigating the influence of corporate governance quality, measured by a broad
governance index (IGOV), on market value (Tobin’s Q and PBV multiple) of 154 Brazilian listed
companies. The investigation was carried out through different econometric approaches in increasing
order of complexity, including Ordinary Least Squares (OLS), instrumental variables (2SLS and GMM)
and systems of simultaneous equations (3SLS, GMM and FIML). The results obtained in all procedures
23
show a positive and significant relation between corporate governance quality and value variables.
Moreover, results suggest that this effect is causal, with an improvement in corporate governance quality
(as defined in the study) predicting greater market capitalization for these companies.
Firstly, we carried out OLS multiple regressions. Results indicated a significant positive relation at 5%
between IGOV and Q and at 1% between IGOV and PBV multiple. The magnitude of the IGOV
coefficient (0.017) suggests that a worst-to-best change in corporate governance quality would result in a
0.25 rise in Tobin’s Q of the average company, ceteris paribus. If the company’s Tobin’s Q were equal to
the sample’ mean Q (0.68) and a total debt / total assets relation equal to the sample mean (0.39), an 85%
increase in its market capitalization, ceteris paribus, would be expected as a result of corporate
governance quality improvements. Similarly, the magnitude of the PBV variable (0.069) shows that a
worst-to-best change in governance quality would result in a 1.03 increase in the company’s PBV
multiple. If the firm’s PBV were equal to the sample’s mean PBV (1.03), a valuation of about 100%
would be expected as a result of better governance quality, ceteris paribus.
However, estimations by OLS can produce biased and inconsistent estimators due to the possible
endogeneity of the corporate governance variable. Therefore, we carried out regressions using
instrumental variables, estimated by 2SLS and GMM. We chose four instruments, used jointly and/or
alternatively: 1) issuance of ADR Level 1; 2) issuance of ADR Level 2 or 3; 3) adhesion to Bovespa
corporate governance levels; and, 4) binary variable of company size. Justifications for using these
instruments are presented in the paper. The results from 2SLS and GMM indicated a significant positive
relation at 5% between IGOV and Q and between IGOV and PBV, robust to different model specifications
and instruments. Moreover, we found evidence that the corporate governance variable is endogenous,
indicating that estimations by OLS are inconsistent.
Next, the relation between IGOV and value variables Q and PBV was assessed by simultaneous
equation systems using 3SLS, GMM and FIML. Regressions were carried out for a system with two
equations, so as to capture the possible presence of a reverse causal relation between governance and
24
value. Results showed an even stronger positive relation between IGOV and Q or PBV (significant at 1%).
Moreover, we found important evidence of a reverse causal relation between governance quality and
company value, in which a higher valuation of the company stock would lead to the adoption of better
governance practices.
These results should be interpreted with care, due to difficulties in finding truly exogenous
instruments. For the sake of validity of the current results, we need to assume that: 1) the system was well
specified; and 2) there does not exist any serious problem of omitted variables being correlated with the
instruments. Our results are supported by evidence showing the adequacy of our instruments (through
Hansen’s test of overidentifying restriction) and that no relevant variables were omitted in the basic model
(through Ramsey’s RESET test).
The results of this study are compatible with studies by Black (2001), Black et al. (2006), Durnev and
Kim (2005), Bai et al. (2003), Beiner et al. (2004) and Brown and Caylor (2004), which also used broad
governance indices and found a significant positive relation between corporate governance quality and
firm value. As a suggestion for future studies, the search for better instruments and the development of
formal models (constructed on the basis of theories) that qualify for empirical testing are research
questions with great potential. This is an urgent need, since the results of the econometric analysis results
can be quite sensitive to equation system specifications and instruments chosen.
25
REFERENCES
AGRAWAL, Anup, KNOEBER, Charles. Firm performance and mechanisms to control agency problems
between managers and shareholders. Journal of Financial and Quantitative Analysis, v. 31, p. 377-
397, September, 1996.
BAI, Chong-En, LIU, Qiao, LU, Joe Zhou, SONG, Frank e ZHANG, Junxi. Corporate
governance and market valuation in China. William Davidson Institute Working Paper No
564, April, 2003. Available at <http://papers.ssrn.com/abstract_id=393440>.
BEINER, Stefan, DROBETZ, Wolfgang, SCHIMD, Markus e ZIMMERMANN, Heinz. An
Integrated framework of corporate governance and firm valuation – Evidence from
Switzerland. ECGI finance working paper series, n. 34/2004, January, 2004. Available at
<http://papers.ssrn.com/abstract_id=489322>.
BROWN, Lawrence, CAYLOR, Marcus. Corporate governance and firm performance,
December, 2004. NBER Working Paper. Available <http://papers.ssrn.com/
abstract_id=586423>.
BARNHART, Scott, ROSENSTEIN, Stuart. Board composition, managerial ownership and firm
performance: an empirical analysis. The Financial Review, n. 33, p. 1-16, November, 1998.
BHAGAT, Sanjai, JEFFERIS, Richard. The Econometrics of Corporate Governance Studies. 1st ed.
Massachusetts Institute of Technology, 2002.114 p.
BLACK, Bernard. The corporate governance behavior and market value of Russian firms. Emerging
Markets Review, v. 2, p. 89-108, 2001.
BLACK, Bernard, JANG, Hasung, KIM, Woochan. Does corporate governance predict firms' market
values? Evidence from Korea. Journal of Law, Economics, and Organization, v. 22, n. 2, Fall,
2006.
BØHREN, Øyvind, ØDEGAARD, Bernt Arne. Governance and performance revisited. ECGI working
paper series in finance, n. 28/2003, September, 2003. Available at
<http://ssrn.com/abstract_id=423461>.
CHO, Myeong-Hyeon. Ownership structure, investment, and the corporate value: an empirical analysis.
Journal of Financial Economics, v. 47, p. 103-121, 1998.
CHUNG, Kee, PRUITT. Stephen. A simple approximation of Tobin's Q. Financial Management, v. 23,
n. 3, p. 70-74, Autumn, 1994.
26
CLAESSENS, Stijn, DJANKOV, Simeon, FAN, Joseph P.H., LANG, Larry H.P. Disentangling the
Incentive and Entrenchment Effect of Large Shareholdings. The Journal of Finance, v. 57, n.6, p.
2741-2771, December 2002.
DEMSETZ, Harold, VILLALONGA, Belén. Ownership structure and corporate performance. Journal of
Corporate Finance. v. 7, p. 209-233, 2001.
DENIS, Diane, McCONNELL, John. International corporate governance. Journal of Financial and
Quantitative Analysis. v. 38, n. 1, p. 1-36, March, 2003.
DURNEV, Art, KIM, Han. To steal or not to steal: firm attributes, legal environment, and valuation.
Journal of Finance, v. 60, n. 3, p. 1461-1493, June, 2005.
KLAPPER, Leora, LOVE, Inessa. Corporate governance, investor protection, and performance in
emerging markets. Journal of Corporate Finance, v. 10, p. 703-728, (2004).
LEAL, Ricardo. P., Governance practices and corporate value – a recent literature survey. Revista de
Administração de Empresas da USP – RAUSP, v. 39, n. 4, p. 327-337, 2004.
LEAL, Ricardo. P., CARVALHAL-DA-SILVA, André L. Corporate governance and value, in Brazil
(and in Chile), Inter-American Development Bank, Latin American Research Network, Research
Network Working Paper #R-514, 2005. Available at
<http://www.iadb.org/res/pub_desc.cfm?pub_id=R-514>.
HIMMELBERG, Charles, HUBBARD, Glenn, PALIA, D. Understanding the determinants of managerial
ownership and the link between ownership and performance. Journal of Financial Economics, v. 53,
p. 353-384, 1999.
SILVEIRA, Alexandre M., BARROS, Lucas A., FAMA, Rubens. Determinants of Corporate Governance
Quality of Brazilian Listed Companies. IV Meeting of the Brazilian Finance Society, Rio de Janeiro,
22 e 23 de julho, 2004. Available at <http://www.sbfin.org.br/> (only in portuguese).
SILVEIRA, Alexandre M., BARROS, Lucas A., SILVEIRA, Héber P. Determinants of Controlling
Shareholders’ Stock Ownership in Brazil. IV Meeting of the Brazilian Finance Society, Rio de
Janeiro, 22 e 23 de julho, 2004. Available at <http://www.sbfin.org.br/> (only in portuguese).
27
Causality relation
Governance mechanisms One-Way Two-Way
Exogenous 1 3
Endogenous 2 4
Table 1 – Econometric approaches in corporate governance research
Source: Bøhren, Ø., Ødegaard, B., "Governance and Performance Revisited", ECGI working paper
series in finance, n. 28/2003, September, 2003.
Governance
Dimension # Governance index (IGOV) questions
1 Is the firm’s Annual Report (AR) available on the Internet?
2 Does the website contain corporate governance documents, such as corporate governance guidelines, board of directors’ by regulations, explanation of the CG model, etc.?
3 Does the website make available presentations for analysts or data useful for operational and financial forecasts of the company?
4 Is the website bilingual (Portuguese and English versions at least) and does it contain an Investor Relations section?
Information access
5 Was it unnecessary to have direct contact with the firm in order to obtain corporate information?
6 Does the AR contain a specific section describing the corporate governance model and/or current governance practices?
7 Does the AR or another document explain the executives’ global remuneration (incentives system in place for executives)?
8 Are the financial statements also presented in US-GAAP or IFRS?
9 Does the AR or the website include a section with profit estimates or forecasts of financial return (ROA, ROE, etc.)?
Content of public information
10 Does the AR or some other corporate document present the value added/destroyed by the business during the period based on an economic profit measure (EVA®, etc.)?
11 Is there a separation between CEO and Chairman of the board positions (different persons in charge)?
12 Does the firm have a board of directors comprised from 5 to 9 members?
13 Does more than 80% of the board consist of external directors?
14 Does the board of directors have a unified one-year term?
Board of directors’ structure
15 The firms does not have a Shareholder Agreement (such agreements between large shareholders are often used to restrict board’s independence and to lot management positions among these shareholders).
16 Does the firm only issue common stock (voting shares – ON)?
17 Does preferred stock correspond to less than 50% of total outstanding stock?
18 Does the controlling stockholder possess less than 70% of total common stock?
19 Is the difference of controlling shareholder’s control rights (% voting shares) and cash flow rights (% of total shares) lower than 23%? (controlling shareholders’ wedge)
Ownership and control structure
20 Does the firm voluntarily grant tag along rights to preferred shareholders?
Table 2 - Questions for the construction of the Corporate Governance Index (IGOV)
28
Variable Mean Standard Deviation
Minimum 1st Quartile
Median 3rd Quartile
Maximum Sample (Companies)
IGOV 6.82 3.56 1.00 4.00 6.00 9.00 1600 154
Table 3 – Descriptive statistics of corporate governance index (IGOV)
# Governance index (IGOV) question
% of companies
with affirmative
answers (“yes”)
1 Is the firm’s Annual Report (AR) available on the Internet? 46.1%
2 Does the website contain corporate governance documents, such as corporate governance guidelines, board of directors’ by regulations, explanation of the CG model, etc.?
16.9%
3 Does the website make available presentations for analysts or data useful for operational and financial forecasts of the company?
36.4%
4 Is the website bilingual (Portuguese and English versions at least) and does it contain an Investor Relations section?
41.6%
5 Was it unnecessary to have direct contact with the firm in order to obtain corporate information?
48.1%
6 Does the AR contain a specific section describing the corporate governance model and/or current governance practices?
23.4%
7 Does the AR or another document explain the executives’ global remuneration (incentives system in place for executives)?
15.6%
8 Are the financial statements also presented in US-GAAP or IFRS? 19.5%
9 Does the AR or the website include a section with profit estimates or forecasts of financial return (ROA, ROE, etc.)?
1.9%
10 Does the AR or some other corporate document present the value added/destroyed by the business during the period based on an economic profit measure (EVA®, etc.)?
3.9%
11 Is there a separation between CEO and Chairman of the board positions (different persons in charge)?
63.0%
12 Does the firm have a board of directors comprised from 5 to 9 members? 62.3%
13 Does more than 80% of the board consist of external directors? 55.8%
14 Does the board of directors have a unified one-year term? 22.7%
15 The firms does not have a Shareholder Agreement (such agreements between large shareholders are often used to restrict board’s independence and to lot management positions among these shareholders).
69.5%
16 Does the firm only issue common stock (voting shares – ON)? 12.3%
17 Does preferred stock correspond to less than 50% of total outstanding stock? 37.7%
18 Does the controlling stockholder possess less than 70% of total common stock? 38.3%
19 Is the difference of controlling shareholder’s control rights (% voting shares) and cash flow rights (% of total shares) lower than 23%? (controlling shareholders’ wedge)
51.3%
20 Does the firm voluntarily grant tag along rights to preferred shareholders? 16.2%
Table 4 – Percentage of companies giving affirmative answers (“yes”) to IGOV questions.
29
Q PBV IGOV COM DEBTEQ ADR1 ADR23 BOV LogREV LIQ EBITDA TANG REVG
Q 1
sig. (two-tailed)
PBV 0,5658 1
sig. (two-tailed) 0,0000
IGOV 0,2578 0,3728 1
sig. (two-tailed) 0,0015 0,0000
COM 0,1548 0,0384 -0,2318 1
sig. (two-tailed) 0,0594 0,6474 0,0038
DEBTEQ 0,3532 0,2495 -0,0870 0,0265 1
sig. (two-tailed) 0,0000 0,0031 0,2912 0,7480
ADR1 0,0291 -0,1000 0,0612 0,0699 -0,0735 1
sig. (two-tailed) 0,7251 0,2332 0,4511 0,3893 0,3733
ADR23 0,2881 0,2742 0,5223 -0,1488 -0,1186 -0,2075 1
sig. (two-tailed) 0,0004 0,0009 0,0000 0,0656 0,1496 0,0098
BOV 0,0315 0,2380 0,2827 0,0264 -0,0363 0,1082 0,2281 1
sig. (two-tailed) 0,7033 0,0041 0,0004 0,7453 0,6603 0,1816 0,0044
LogREV 0,2066 0,3291 0,5455 -0,1082 -0,0386 0,0453 0,3903 0,1914 1
sig. (two-tailed) 0,0118 0,0001 0,0000 0,1829 0,6402 0,5781 0,0000 0,0178
LIQ 0,2252 0,1635 0,4332 -0,1469 -0,0892 -0,1083 0,592 0,1457 0,4712 1
sig. (two-tailed) 0,0057 0,0503 0,0000 0,0691 0,2795 0,1811 0,0000 0,0714 0,0000
EBITDA 0,0311 0,2804 0,1531 -0,0997 -0,1229 -0,1881 0,1158 -0,0690 0,3729 0,0686 1
sig. (two-tailed) 0,7131 0,0009 0,0641 0,2294 0,1424 0,0225 0,1626 0,4064 0,0000 0,4093
TANG 0,1474 -0,1166 0,1560 0,089 -0,0510 0,1828 0,0993 0,0621 0,0947 0,2029 -0,2221 1
sig. (two-tailed) 0,0728 0,1639 0,0534 0,2726 0,5366 0,0273 0,2204 0,4446 0,2445 0,0106 0,0069
REVG 0,1578 0,2213 0,2740 0,0443 -0,0759 -0,0661 0,2874 0,0458 0,3934 0,2352 0,2791 0,1686 1
sig. (two-tailed) 0,0666 0,0011 0,0010 0,6019 0,3744 0,4362 0,0005 0,5900 0,0000 0,0050 0,0010 0,0456 Table 5 – Matrix of correlations between study variables (sample of 154 companies for 2002).
0
0,2
0,4
0,6
0,8
1
1,2
1,4
1,6
0 2 4 6 8 10 12 14 16 18 20
IGOV
Tobin's Q
Chart 1 – Preliminary relation between corporate governance (IGOV) and Tobin’s Q
30
0
0,5
1
1,5
2
2,5
3
3,5
0 2 4 6 8 10 12 14 16 18 20
IGOV
PBV
Chart 2 – Preliminary relation between corporate governance index (IGOV) and PBV.
31
Dependent variables are Tobin’s Q and PBV multiple, while the independent variable of interest is the corporate governance index (IGOV). Data refer to 2002. Figures between parentheses indicate t-statistics. ***, ** and * correspond to statistical significance at 1%, 5% and 10%, respectively. Binary variables were included for companies’ activity sector (IND) in the regressions, which were not included in the table due to space reasons. Coefficients were estimated using OLS with standard errors robust to heterocedasticity.
Table 6 - Relation between corporate governance index (IGOV) and firm value (Q and PBV) by OLS.
Tobin’s Q PBV
Explanatory
Variables (1) (2) (3) (1) (2) (3)
IGOV 0.015** (2.07)
0.017** (2.14)
0.009 (1.06)
0.079*** (3.72)
0.069*** (3.44)
0.058** (2.50)
COM - 0.367*** (3.14)
0.356*** (3.07)
- 0.650** (2.16)
0.533 (1.60)
DEBTEQ - 0.036***
(5.04) 0.040*** (5.38)
- 0.076** (2.12)
0.072** (2.04)
LIQ - 0.052
(1.61) 0.027 (0.69)
- -0.018 (-0.23)
-0.069 (-0.82)
PAYOUT - 0.000 (0.03)
0.000 (0.71)
- -0.001 (-0.72)
-0.001 (-0.61)
EBITDA - 0.182 (0.49)
0.203 (0.53)
- 1.368 (1.42)
1.382 (1.42)
REVG - 0.000 (0.01)
-0.018 (-0.40)
- 0.180 (1.21)
0.142 (1.03)
Log(REV) - 0.023 (0.45)
-0.043 (-0.79)
- 0.212 (1.60)
0.178 (1.16)
TANG - 0.053** (2.04)
0.029 (0.90)
- -0.167** (-2.26)
-0.126 (-1.42)
ADR1 - - 0.108 (1.32)
- - -0.247 (-1.13)
ADR23 - - 0.191*** (2.18)
- - 0.136 (0.50)
BOV - - 0.039 (0.59)
- - 0.432** (2.12)
Dummies
IDENT NO NO YES NO NO YES
Dummies IND YES YES YES YES YES YES
Intercept 0.617*** (83.26)
0.385 (1.20)
0.367 (1.21)
0.364*** (17.19)
-1.589 (-2.07)
-1.507 (-1.55)
R2 19.97% 42.30% 44.95% 20.27% 38.53% 44.90%
Sample (n) 148 128 128 143 123 123
32
Regression of Tobin’Q and PBV against IGOV estimated by 2SLS with standard robust errors. Five alternative instrumental variables were used: ADR1, ADR23, BOV, DSIZE and IDENT. Stage 1 involves regression of IGOV against all other exogenous variables, including the instruments. Stage 2 is estimated using adjusted IGOV values obtained from stage 1. All control variables used in the basic model were considered (specification 2 in Table 5). These control variables, except for company size (LogREV), were omitted from the table due to space reasons. Figures between parentheses indicate t statistics. ***, ** and * show statistical significance at 1%, 5% and 10%.
Table 7 - Relation between corporate governance (IGOV) and company value (Q and PBV) by 2SLS.
Estimation by 2SLS for Tobin’s Q
Specification (1) Specification (2) Specification (3)
1st Stage 2nd Stage 1
st Stage 2nd Stage 1
st Stage 2nd Stage
IGOV Tobin’s Q IGOV Tobin’s Q IGOV Tobin’s Q
Instrumented IGOV - 0.080** (2.30)
- 0.078* (1.82)
- 0.055** (2.06)
ADR1 0.803 (0.98)
- - - 0.775 (0.97)
-
ADR23 2.924*** (2.66)
- - - 3.088*** (2.75)
-
BOV 0.968 (1.51)
- - - 0.979 (1.40)
-
DSIZE 1.318 (1.52)
- 1.244 (1.43)
- - -
Dummies IDENT NO - YES - YES -
Log(REV) 1.580** (2.30)
-0.158 (-1.51)
2.298*** (3.40)
-0.152 (-1.15)
2.344*** (4.05)
-0.085 (-0.99)
Other control variables YES YES YES YES YES YES
Dummies IND YES YES YES YES YES YES
Estimation by 2SLS for PBV
Specification (1) Specification (2) Specification (3)
1st Stage 2nd Stage 1
st Stage 2nd Stage 1
st Stage 2nd Stage
IGOV PBV IGOV PBV IGOV PBV
Instrumented IGOV - 0,165** (2,49)
- 0,099 (1,13)
- 0,120** (1,99)
ADR1 1.074 (1.26)
- - - 1.059 (1.28)
-
ADR23 3.073*** (2.82)
- - - 3.267*** (2.94)
-
BOV 0.986 (1.53)
- - - 0.966 (1.35)
-
DSIZE 1.339 (1.55)
- 1.375 (1.55)
- - -
Dummies IDENT NO - YES - YES -
Log(REV) 1.481** (2.09)
-0.076 (-0.34)
2.298*** (3.21)
0.120 (0.42)
2.299*** (3.79)
0.057 (0.26)
Other control variables YES YES YES YES YES YES
Dummies IND YES YES YES YES YES YES
33
Value and corporate governance equations of the simultaneous equation system described in section 3.2 were estimated by 3SLS corrected for finite samples. Company size (DSIZE) was used as an additional instrument in the system. All control variables presented in Equation 4 were included in the regressions. These control variables were omitted from the table due to space limitations. Figures between parentheses indicate t statistics. ***, ** and * show statistical significance at 1%, 5% and 10%.
Table 8 - Relation between corporate governance (IGOV) and company value (Q and PBV) by 3SLS.
19 Besides the additional instrument highlighted in the table, 3SLS uses all control variables present in the first equation but absent as instruments in the second equation, and vice-versa.
Value Equation CG Equation
Equation’s dependent variable
Q IGOV
Additional instrument used19 DSIZE DSIZE
IGOV 0.082*** (3,72)
-
Q - 3.979** (1.90)
Other Control Variables YES YES
Dummies IND YES YES
Sample (n) 128 128
Prob > F 0.000 0.000
Value Equation CG Equation
Equation’s dependent variable
PBV IGOV
Additional instrument used DSIZE DSIZE
IGOV 0.174*** (3.35)
-
PBV - 1.090 (0.72)
Other Control Variables YES YES
Dummies IND YES YES
Sample (n) 123 123
Prob > F 0.000 0.000