E-Governance - CiteSeerX
289
E-Governance Techno-Behavioural Implications
-
Upload
khangminh22 -
Category
Documents
-
view
0 -
download
0
Transcript of E-Governance - CiteSeerX

E-Governance Techno-Behavioural Implications

www.excelpublish.com

Acknowledgement
This book is a collection of selected research papers contributed by scholars and practitioners for the 8th ICEG 2011 on the theme “Government Transformation: Agenda for EGov 2.0”. We express our deep sense of gratitude to all who have put in their dedicated efforts to give shape to this book. This book would not have been possible without the support, cooperation and encouragement of several people whom it would be difficult to acknowledge individually, thus we take this opportunity to express our heartful thanks to them.
We express our sincere gratitude to our patrons Shri Ravi Saxena, Addl. Chief Secretary, DST‐Govt. of Gujarat; Mr. M.D. Agarwal–President, Mr. Satish Babu–Vice‐President, Computer Society of India; Padmashri Dr. Karsanbhai Patel‐President, Shri Ambubhai Patel‐Vice President, Dr. N.V. Vasani‐Director General, Nirma University for their valuable directions and blessings. We convey our deep respect to all the members of the Advisory Council of ICEG 2011 for their vital inputs and constructive support. This council comprised of Prof Ashok Agarwal, Chairman‐EWB India Hyderabad (India), Major General R.K. Bagga, Advisor (Outreach Division), IIIT Gachibowli Hyderabad‐India, Prof. M.P. Gupta, Indian Institute of Technology, New Delhi (India) and Dr. Neeta Shah, Director, Gujarat Informatics Ltd, Gandhinagar, India provided useful and timely inputs from the stage of conception till its final implementation.
We remain especially indebted to Prof. C. Gopalkrishnan, Director, Institute of Management, Nirma University (IMNU), for his benign cooperation during the entire execution. We are also thankful to Shri D.P. Chhaya, Executive Registrar, Shri K.K. Patel, Chief Operating Officer, Nirma University and Mr. G.R. Nair, Deputy Registrar, IMNU for their support. Mr. Jwalant Trivedi, Deputy Secretary, DST‐Govt. of Gujarat also deserves our special thanks.
We are grateful to all the national and international scholars, academicians, practitioners and participants at ICEG 2011. We also thank all the sponsors of ICEG 2011. Our thanks are due to all the members of the review committee for their whole‐hearted support. Doctoral students of IMNU—Tejas Shah, Natasha Kaul, Soumi Chatterjee, Jyoti Verma, Sapna Choraria and Debjani Dass deserve special accolades for their excellent academic support for timely publication. We sincerely thank all members of the IT Club ‘Clique’ of IMNU too.
A distinctive mention must be made of the efforts put in by Mr. Jigar Barot round the clock in supporting entire stream of activities related to ICEG. Thanks are also due to Ms. Monali Shah–GIL, Mr. Vimal Kumar–IITD, Mr. Vijay Kumar–CSI, Mr. Biresh Kumar, Mr. Mahesh Solanki and Ms. Sujata Pillai of IMNU for their administrative support. Finally, we express our sincere thanks to Excel Publishers for timely publication of this book within a short period.


About the Editors
Dr. Nityesh Bhatt holds MBA and Ph.D (e‐Governance) degrees from M.L. Sukhadia University, Udaipur. He has also completed four months Faculty Development Programme (FDP) of IIM‐A and Online Internet Governance Capacity Building Programme of Diplo Foundation, Malta in year 2006. Out of more than 13 years of experience in academia, corporate training and research; in his first nine years, he was associated with NIIT and First Computers, and Pacific Institute of Management, Udaipur. In 1998, he was awarded the best faculty of NIIT in North India.
Credited with good number of research papers and management cases, he has also co‐edited three books in the areas of technology and management. Two students have been awarded Ph.D under his guidance. In year 2006, he was invited to participate in first Internet Governance Forum (IGF) meet jointly organized by United Nations–IGF Secretariat and Government of Greece at Athens. Since year 2007, he is a member of the National Executive Committee of Special Interest Group on eGovernance (SIGeGov) set up by Computer Society of India. Dr. Bhatt is also a research consultant with Indian Space Research Organisation (ISRO), Ahmedabad in ICT area. He was awarded as ‘Best Teacher of Information Technology” in 17th B‐School Affaire & Devang Mehta B–School Award for year 2009. He has imparted lectures in almost 200 MDPs for more than 30 leading companies like ONGC, BPCL, BOSCH, HZL, Reliance Power, Sterlite, Alstom Power, Kalpataru Power, J.K. Cement, Parle, Zydus, Torrent Pharma, GMDC, SBI, Bank of Baroda, Indian Air Force etc at different levels.
Prof. Akshai Aggarwal is working as Vice Chancellor, Gujarat Technological University, Ahmedabad, India. Before joining as the Vice‐Chancellor, he was working as the Director of School of Computer Science, University of Windsor, Canada. At Windsor, he established the High Performance & Grid Computing Laboratory along with 3 Centers. He worked as Professor and Head of Department of Computer Science at Gujarat University for about 10 years. Before that he was Professor and Head, Department of EE at M.S. University of Baroda. He was Chairman of IEEE India Council for two years. He initiated IEEE activities in Gujarat by starting the first IEEE Student Branch at M.S. University of Baroda. Later he initiated the establishment of the Student Branch at Gujarat University. He was also the founder Chairman of IEEE Gujarat Section, the IEEE Computer Society Chapter and the IEEE Joint Chapter of Industry Applications, Industrial Electronics and Power Electronics. The Section conducted two International Conferences and one national Seminar during his Chairmanship.
He graduated with a B.Sc. (EE) from Punjab Engg. College and studied at MS University of Baroda for his Master’s and Doctoral work. He has published a large number of research papers in national and international journals and conference proceedings. At GTU, he has initiated National Conferences on Business Ethics and Financial Services. GTU is setting up Centers for studies in the areas of Business Ethics and CSR, Financial Services, Governance Systems in businesses, industries, universities, hospitals, mass transportation systems, NGOs and governments.


Prologue
Digital interactions of government with all its stakeholders: citizens, businesses, employees and other government departments give rise to government to citizens (G2C), government to businesses (G2B), government to employees (G2E) and government to governments (G2G) kinds of E‐Governance. This interaction can take place using information technology, email, internet, world‐wide‐web (W3) technologies. This book contains 27 learned papers on various aspects of e‐Governance. We hope that it will make the readers aware of the progress made in the fields of e‐Governance implementation, research and evaluation.
Technologies for E‐Governance also encompass wireless networks and services, CCTV, RFID, biometric identification, smart cards, mass media like TV and radio for delivering a wide gamut of information and services to various entities involved. With telephone, fax, PDA, SMS, MMS and other relevant technologies, communication revolution is creating a need for a fast movement from e‐governance towards m‐Governance. Five papers on m‐governance explore and evaluate the progress of using mobile devices for e‐governance. When mobile devices are used for sensitive tasks, security of operations and maintenance of integrity of data and privacy of information, even when the mobile device is misplaced has to be studied for every operation of interest.
In recent years, more engaging technologies like Web 2.0 have been deployed in e‐Governance, paving the way for e‐Governance 2.0. Web 2.0 includes web applications that facilitate participatory information sharing, interoperability, user‐centered design, and collaboration on the W3. Since Web 2.0 involves automatic access to large data bases by machines and processing of data by using a multiplicity of applications, dispersed widely geographically and owned by different entities, issues of privacy and security of data have become very important areas of research. All social networking sites like Facebook, blogs, wikis, video sharing sites like Youtube etc have transformed almost every sphere of human society i.e. business, entertainment, education, media, health, interaction in less than a decade. Governments are also racing fast to join this bandwagon to effectively engage and collaborate with its stakeholders mainly citizens. This phenomenon known as e‐Gov 2.0 has the potential to transform governments by enabling the government’s transition from mere information provider to active engagement, participation and involvement of citizens and other stakeholders. With use of all these technologies, misuse and abuse are also inevitable. This may also make many more groups visible and seemingly powerful. It can create disharmony and discourage integration and nation‐building in new nation‐states.
A set of five papers examine the use of cloud computing in e‐Governance. The location of sensitive data in cloud computing can be an issue. The governments may require such data to be stored within its national boundaries, particularly at this stage when an effective international control of hackers and misfeasors does not seem to be possible. Cloud computing may reduce costs but it requires serious efforts in terms of data security, application security and infrastructure security. Privacy concerns also emerge from the use of these technologies. A Cloud Security Alliance (https://cloudsecurityalliance.org/) is working to promote the use of best practices for providing security assurance within Cloud Computing, and provide education on the uses of Cloud Computing to help secure all other

x Prologue
forms of computing. Another problem in Cloud Computing is the lack of standards. This makes the task of migration from one service‐provider to another a complex operation. A Clouds Standards Coordination wiki has been set up. However as of now, users get locked into an embrace with the technologies of their service‐provider and it may prove to be a task, costly both in time and money, to migrate away towards another service‐provider.
While technology problems related to e‐Governance can be corrected with great ease, handling human challenges require herculean efforts. To overcome the resistance of people (Bureaucrats, politicians, employees, citizens, businesses) coupled with their low IT literacy, there is a need for strong and progressive digital leadership to make e‐Governance implementation successful.
We believe that this book will provide an opportunity to the readers to appreciate the research efforts of scholars from academia, government and industry that address many of these issues in the technological and behavioural areas of e‐Governance implementation.
Nityesh Bhatt Akshai Aggarwal

Contents
Acknowledgement v About the Editors vii Prologue ix
SECTION I: E-GOVERNANCE & EMERGING TECHNOLOGIES
1. A Consistent Approach for Structurally Interoperable Data Layer Rajesh Chauhan and Amar Jeet Singh 3 2. Applications Integration in e-Governance–Opportunities & Challenges Sanjay Buch and Rajan Ananthanarayanan 15 3. Integration of Virtualization with Cloud Computing:
Challenges for Government & IT Industry Amit Joshi 33 4. Cloud Services for Consumer in Federated Environment–Simple View of
Discovery and Monitoring Vivek Gaur, Praveen Dhyani and O.P. Rishi 47 5. Towards a New Paradigm Knowledge as a Service (KaaS) from
e-Governance Cloud for Citizens of the Country Tejas Shah 52 6. Cloud Computing for Economic Optimization in e-Governance: A Case Study Rama Krushna Das, Manmohan Brahma and Ajita Kumar Misro 59 7. E-waste Management in India—An Emerging Issue G.P. Sahu and Rajeev Srivastava 72 8. Information Security Issues with Emerging Next Generation Networks in
Indian Context Manmohan Chaturvedi, Manmohan Prasad Gupta and
Jaijit Bhattacharya 78 9. Secured Governance using Data Security Subhash Chander 91 10. A Framework for Determining the Hacker’s Most Probable Path in a
Wireless Telemedicine Network using Markov Model Saini Das, Arunabha Mukhopadhyay and Girija Shukla 99 11. e-Governance and Mobile Devices: Possibilities for India Nilay M. Yajnik 113 12. From e-Governance to m-Governance—The Way Forward Romit Pandey and K.S. Vijaya Sekhar 117 13. Indian Ecosystem for Mobile Based Service Delivery Ranjan Kumar, Kapil Kant Kamal and Manish Kumar 129

xii Contents
SECTION II: BEHAVIOURAL ASPECTS OF e-GOVERNANCE
14. Impact of Internet on Political Outcome—A Case Study Sudeepa Banerjee and Tapati Basu 141 15. e-Goveranance in Rural Area—Acceptance and Challenges in Developing Countries Deepak Kumar Singh and G.P. Sahu 152 16. e-Government Enhancement using Knowledge Management Shailesh Chaudhari 167 17. e-Governance Project Management Issues and Challenges Pabitrananda Patnaik, Susanta Kumar Panda and
Manas Ranjan Patra 173 18. Towards Validation of Key Success Factors of e-Government Initiatives R.K. Mitra and M.P. Gupta 184 19. Employing Technology Acceptance Model (TAM) to Examine Factors Influencing
RFID Systems Use in Library Kawal Kapoor, Yogesh K. Dwivedi and Michael D. Williams 197 20. Proposal of Commodity Exchange Model using ICT to Reduce Corruption in NREGA Harish Kumar and R.K. Singla 211 21. ICT-Enabled Change in Indian Police—A Case of Leadership and Drive in Karnataka Jaba Mukherjee Gupta and Vinit Thakur 218 22. A Comparative Analysis between ICTs Based Public Service Delivery System and Manual Service Delivery Systems in Bilaspur City of India Anupama Saxena and Ankit Sharma 228 23. E-Healthcare in Infectious Diseases Subash Chandra Mahapatra, Rama Krushna Das,
Manoj Ranjan Nayak and Ajita Kumar Misro 235 24. Analyzing the Impact of Mobile Governance in Maternal and Child Healthcare in India Aman Kwatra and Stan Kachnowski 244 25. Drivers and Inhibitors for the Mobile Transformation—
A Case of Australian Healthcare Setting Raj Gururajan, HengSheng Tsai and Abdul HafeezBaig 252 26. Sweetening Bitter Pills to be Swallowed Hari Mohan Jha Bidyarthi and Pavan M. Kuchar 261 27. Integrating Records of Rights with Property Registration and Cadastral Maps—A Step towards
Migration from Presumptive Land Titling to Conclusive Land Titling System Ghan Shyam Bansal and Gurpreet Singh Saini 269
AUTHOR INDEX 279

Section I E-Governance & Emerging Technologies
The paper “A Consistent Approach for Structurally Interoperable Data Layer” makes an effort to present interoperable and language based solution for defining and publishing data layer to eliminate structural inconsistencies for e‐government solutions. The paper “Applications Integration in eGovernance–Opportunities & Challenges” asserts that application integration of e‐Governance would bring about efficiency in data collection, increase accuracy of data and thereby enhance the value of the technology investments made by the government.
“Integration of Virtualization with Cloud Computing: Challenges for Government & IT Industry” discusses various aspects of virtualization and cloud computing, their mutual dependence and its impact on the IT industry. Similarly, the paper “Cloud services for Consumer in Federated Environment – Simple view of Discovery and Monitoring” proposes an architectural framework, which effectively maps the user requirements with the available cloud services and their providers, and enable quality monitoring and service migration, which would be intelligent as well as accessible by all. The paper “Towards a New Paradigm Knowledge as a Service (KaaS) from eGovernance Cloud for Citizens of the Country” studies the KaaS paradigm and attempts to provide a fresh perspective on knowledge empowerment by extracting knowledge from e‐governance cloud. The paper “Cloud computing for Economic Optimization in eGovernance: A Case Study” proposes a model with cloud‐based infrastructure and economically optimized software solutions, useful for end‐users by integrating low cost hardware and open‐source software and platform.
The paper on “EWaste Management in India : An Emerging Issue”, analyses the volume of e‐waste, its consequences and proposes recommendations. The paper “Information Security Issues with Emerging Next Generation Networks in Indian Context” provides insight on key management issues during India’s transition to NGN and takes a synergetic approach to secure migration in terms of opportunities, challenges and innovative options and alternatives for the India’s ICT sector as migration to NGN unfolds. Paper “Secured Governance Using Data Security” highlights that human being should be at the core of information security measures.
The paper “A Framework for Determining the Hacker’s Most Probable Path in a Wireless Telemedicine Network using Markov Model” proposes a framework to determine the most vulnerable path that can be exploited. “EGovernance and Mobile Devices: Possibilities for India” discusses the possibilities of mobile government applications in the areas of banking, healthcare, education and agriculture in India. The paper “From eGovernance to mGovernance: The way forward” analyzes the potential of m‐Governance in the Indian scene and also rivets on M‐Health and M‐PESA

2 Section I E‐Governance & Emerging Technologies
projects. The paper “Indian Ecosystem for Mobile based Service Delivery” describes initiatives taken by the Government of India for developing mobile based service delivery ecosystem in India, with special emphasis on Mobile Service Delivery Platform (MSDP).

A Consistent Approach for Structurally Interoperable Data Layer
Rajesh Chauhan and AmarJeet Singh Himachal Pradesh University, Shimla
Email: [email protected], [email protected]
Abstract—Most eGovernment solutions deal with multiple databases that may store data about different versions of same entity. Multiple view point about entity during design phase and independent analysis by different organizations lead to different versions of same entity that are structurally incoherent or inconsistent. Hence defining and centralized publishing of entities play useful role in reducing the duplication of efforts involved in eGovernment projects. Present paper is an effort to present interoperable and language based solution for defining and publishing data layer to eliminate structural inconsistencies. Language for Entity Definition has been proposed to define structure (vocabularies) for government entities and their metadata. Its adoption by authorities will ensure structural consistency among federal databases and allow the organization to harness the power of reusability and facilitate the rapid development of services based on similar entities.
Keywords: Interoperability, Structural Inconsistencies, Entity Definition, eGovernment, Data Layer.
INTRODUCTION
A large number of e‐Government services and solutions are currently being developed under the National E‐Governance Policy, aiming to enhance access and delivery of government services. Core of all these services are well designed entities which eventually developed into data layer of solutions that can be implemented in any vendor specific databases. Meticulously designed entities that conform to some standard not only bring interoperability among the applications, but also bring interoperability at data layer by maximizing the structural coherence among entities defined by different organizations.
E‐government Solutions can be tiered into two layers; one is data layer, which deals with the identification of structure of data, its attributes, constraints, relationship etc and other is application layer, which deals with the user interface and services to connect with the data layer. At data layer, data about entities and their interaction is stored in terms of attributes, constraints and relationship and application layer deals with the behavioral aspects of solution which largely depends on the operations/methods defined for the manipulation of entities. Identifying entities, their relationship, scope, hierarchies, role they play in organization, their attributes and the methods through which entity perform its tasks, are crucial tasks before designer. E‐Governance is the area where similar services/solutions are expected in different context (depends on the provincial limit of cities and departmental administration) and thereby increases probability of dealing with similar kind of entities. Analyzing and designing of data layer consume significant time and efforts on the part of analyst and designer and well designed entities, if not conform to standards become useless in long run and affect sustainability of solution. Since 70% of the time government deals with the similar kind of entities with different interaction context, hence framework for single consistent definition of entity reduces the duplication of effort in designing data

4 E‐Governance: Techno‐Behavioural Implications
layer every time and also reduces structural inconsistencies (different structure of same entity) among data layer of similar solutions. These structural inconsistencies may hinder data integration, migration and transformation from one data layer to another. Rest of the paper focuses on the structural inconsistencies, data layer in e‐Government context and related works and finally introduces Language for Entity Definition vocabulary, which is a tailored XML implementation, suggesting a common structure for defining similar entities.
RELATED WORK
Data layer, which starts with the development of conceptual schema, eventually lead to database consumes significant amount of time in whole development process. Either data driven [1] [2] [3] or functional [4] approach is used for designing. Good literature has been found on the major factors that increase the overall effectiveness of database [5][6]. Conceptual designing of database is mainly based on Entity‐Relationship (ER) model or Unified Modeling Language (UML) based class diagrams using either indirect or direct method. Indirect method is used for designing complex databases and is evolved over the time after integration of schemas [7] and need advance knowledge of designing and even then outcomes are uncertain. Direct method is used to design small independent databases. These independent databases are called data silos [8] and are prevalent in e‐Government. Independent design of schema in small databases lead to collisions in expressing real world constraints and rules [7] and are found with full of structural anomalies [9].
Fundamental principal of database is to present unified representation of organizational data and can be achieved by various approaches of schema integration [10] and data integration [11][12][13]. Egovernment data layer is federated [14] and lacks single global view [15]. Federated databases are encountered with problems of maintenance of a federated schema to cope with local schema evolution in a tightly coupled federation [16]. Most of schema integration approaches that work with heterogeneous databases also work with federated databases. Problems of integration of heterogeneous legacy databases [17] and approaches towards global schema derivation by integrating existing databases [15] are worked upon by researchers. [18]. Some more prominent work that reflect development and implementation in related area are [19] [20] [21] [22] [23] [24].
Data layer should be meticulously designed [5] [6] and must be free from inconsistencies [25]. In government, inconsistencies are not only found in data layer but found in documents also [26]. Various semantic [26] and metadata [27] based approaches [28], based on analyzing the actual instances of real data, can be followed to eliminate consistency problem [29]. GIF of various countries [30] [31] [32] explores the idea of consistent interoperable data standards that are helpful in exchange of data but these standards lack basic guidelines for defining the data layer through which interoperable definition of entities are possible for similar entities and structural

A Consistent Approach for Structurally Interoperable Data Layer 5 inconsistencies [9] can be reduced. Language based approach [33] [34] and idea of description of object and use embedded metadata with the object to define data layer using object oriented languages is also worked upon [35]. Responsibilities of objects in data layer are also studied [36] [37] [38]. Some efforts in this direction can be seen in [39].
Cited literature reveals a gap for possibility of development of a language through which entities can be easily and readily described. Such language provides vocabulary for defining entities so that other similar projects can use those definitions and develop structurally consistent data layer for all similar projects. Most of literature in this context is available under the ambit of schema integration and deals with providing global view of schema where as structural coherence aiming at providing facility to define entities that eventually lead to data layer which automatically become compatible with similar solutions and hence increase reusability of existing data layer and lessens the impedance mismatch [40][41], and other related problem of data conversion [42] and also eliminates the need of schema integration for similar solutions across organizations.
STRUCTURAL INCONSISTENCY IN DATA LAYER OF E-GOVERNMENT SERVICES
Meticulously designed data layer in e‐Government applications contributed towards long term sustainability, reusability, data sharing, and integration of e‐Government services. Higher level of interoperability and coherence are desired not only for better integration but also desired for rapid development of services among different government agencies thus allowing them to exchange data as well as knowledge about data [43][44]. Proliferations of independent e‐Government projects that have limited coherence and are largely uncoordinated often have inconsistent structure of similar entities at data layer [9]. Multiple view points about similar entities during design phase further increase structural inconsistencies which mean similar entities working in similar context for similar solutions may have different structure for same entity. Besides, communication gap among solution developers/designer, involvement of independent designers/developers for every solution, and lack of common guidelines/framework to follow for entity design are cause of structural inconsistency.
Structure of the data layer, in the form of entities, their attributes and relationships among entities, represent the overall design for the storage of contents. During design of data layer, entity name, attributes, constraints, roles, relationship are considered [1][2][3] but due to differences in the view points during modeling and design phase, structural inconsistency, paves its way to data layer and limits its capability in other similar contexts. Although existing design technologies [37] are good for non‐technical users, But boxes, lines etc don’t have consistent meaning across the system structure diagrams and in practical, solution have quite sophisticated rules about the interaction and shared representations. On the other hand E‐R, UML modeling require an advanced knowledge of designing and even then outcomes are uncertain [7].

6 E‐Governance: Techno‐Behavioural Implications
Limited coherence and lack of coordination make the data layer of similar solutions structurally inconsistent. With the passage of time, these data layers or data islands evolves as federal databases or federation, which is very common phenomena in e‐government solutions [8]. Federation is seen as collection of possible heterogeneous, interoperating but autonomous component databases. Federation needs preservation of local database autonomy, in the sense that the component databases cannot be modified for the purpose of integration, and their instances and schemas may evolve independently [16]. Federation makes data silos (small independent local databases) structurally different and limits its use in other similar environment. Increased distribution and heterogeneity among information sources are observed in government sector which is further made complex by independent addition of new resources and changing of old resources and thus make the process of data layer development incremental. Autonomy of data layer (structure & data) at local level also needs to be preserved, otherwise various consistency problems arise on modification of local schemas in the process of conforming them to global schema [16].
Process of integration and transformation of structure or adoption of structure to new but similar context are common and arise need to establish framework based on successful solutions of data layer that enhances reusability and easy transformation of data layer to vendor specific databases. Various inconsistency and impedance mismatch problems can also be mitigated by defining data layer in platform independent manner. The basic idea is that shared data definitions are stored only once and maintained by the producer. In this way, data definitions in use are always up to date and no redundant versions need to be stored [45] and is known as data interoperability [46], which requires a single data definition for all similar services. When a single set of definitions is mandated for all applications, definitions are no longer locally optimal, and therefore the successful implementation of such mandates, centralized agreeable initiative is needed. Data layer needs to be structurally interoperable to reuse existing definitions.
Following are some common approaches to achieve data interoperability
• Object orientation: This is a technically promising approach for developing data definitions by encapsulating the internal details of the data.
• Extensible data model: This approach uses an extensible data model and standardized interface. The Simple Network Management Protocol is an example.
• Extensible Markup Language (XML): This approach requires agreement on the contents and meaning of the XML schema for entities. Schema can be extended for the structure of database to provide structural consistency. This requires meticulous design effort and centralized control over the entity definitions. This approach can be combined with the “Object Orientation Approach” where Extensible Markup Language is used to define object which will widen the scope of conventional entities [1] [2] [3] and include methods (Constructor, General Method) and other object oriented feature to give versatility to entities and also define their scope and behaviors more precisely within application context.

A Consistent Approach for Structurally Interoperable Data Layer 7
ENTITY DEFINITION: LANGUAGE BASED APPROACH
Database design in organization for specific projects starts with the requirement (Data and Functional) gathering [3] and conceptual schema thus designed, responsible for reliable and consistent data layer. Fulfillment of functional requirements becomes the responsibility of language in which application is going to be developed. Conceptual schema is generally implemented in commercial databases that mostly use relational technology and has limited functionality to store complete object (attributes, methods and metadata) [47]. Any solution for organization generally need to store following type of data at basic level.
• Data Related to Entities: This is the data held in columns of any relational data base i.e. values of attributes. This data is permanent non‐transactional in nature.
• MetaData about Entities: This is the extra information about the entities by which the entities can be better understood and used. This information also tells about the scope and usability of entities.
• Master data of organization: This refers to the static data about the organization and frequently needed to develop application /services.
• Relational Data: Refers to the data generated during the interaction of entities, which is contextual in nature but depends on the structure and role of entities in an organization.
In this context, data can be categorized as general data, which represents the data that solution need from database and held in its data layer and eventually contribute to building the database, and other is administrative data that provides assistive information to solution and helps in integrating the services/solution in new environment. At least four conditions must be met to harness the full power of interoperability [48] at data layer
• Entities must be consistently defined within or across the organizations with e‐governance point of view.
• Entities should publish their minimal interfaces, which include minimal set attributes with data type and most common operations performed by entities with signature so that other similar entities in other organizations take advantages of successful designing, for if the interfaces are well defined, the chances of interoperability increases [49].
• Interaction among the entities must generate data independence of specific solution for sharing it with other solutions.
• There must be platform independent administrative data available to tell the scope of entities in better way.
Language based solution need entities and their behavior, defined in platform independent manner and also needs vocabulary to hold administrative data (meta‐data) as well as master data. Centralized registry of organization wise government specific

8 E‐Governance: Techno‐Behavioural Implications
entities and associated definitions, that developer or organization can consult when building or modifying solution needs to be established. Without such a registry, developers are less likely to build solution using compatible entity definitions. With this arrangement, developers have the incentive to reuse entity structures found in the registry because doing so reduces costs and brings about structural coherence and interoperability with other existing systems [50]. Successfully designed and implemented entities in organizations are helpful in developing similar projects in other organizations. Such language based solution for entity definition is able to solve some challenges of data sharing addressed in [51]; semantics can easily be defined for frequently evolving entities through such language. Entity definition language resolves the issue of conceptual schema diversity, which increases duplication of work among developers community, by defining the entity and its role in the whole conceptual schema so that the same elements will not be semantically differ within the different conceptual schemas and hence produce more consistent, robust and scalable base for solution. For interoperability point of view, Language has vocabulary for incorporation of embedded metadata within the entity for better semantics and data value reconciliation [51].
LANGUAGE FOR ENTITY DESCRIPTION: OVERVIEW
Language for entity definition is an orchestration of set of elements responsible for providing the interoperability and coherence among entities at data layer. To achieve the goal of faster and sustainable e‐Government development, it is important to have a common format for specifying the structure for data at data layer and reuse the definition of entities that are successfully implemented. Idea is that the entities can be standardized and the more structurally designed entities are available, it is easier to design better database. Language for entity definition data vocabulary is presented as a proposed document and these vocabularies are tailored XML implementation suggesting a common XML structure for describing entities and their behavior. eXtensible Markup Language (XML) is widely recognized as a key technology for interoperability and act as meta language in the development of language for entity description. More specifically, in order to serialize entity definition language document in XML format, an XML schema was implemented for the validation of their structure. XML schema validation mechanism was preferred from Document Type Definition (DTD) because it provides a richer set of data types and allows user to derive their own data types and take advantages of inheritance of elements, attributes and definition of data‐types [52][53], Document describing the entity emerges from the XML schema language for entity definition and appropriate transformations can be applied to look the entities previously described by other organizations. XML schema can be easily extended, modified and maintained in the future according to the need.
One aim of language for entity definition, an open XML document structure aiming at support definitions of entities and this will lead to lessen the backend overhead to design and create database for implementation of one stop government. If all entities

A Consistent Approach for Structurally Interoperable Data Layer 9 (responsible for the data in database) could speak the same language, they could talk directly to each other in ways natural to the application without artificial technical barriers. Entity repository is centralized facility, under the supervision of group of experts, responsible for holding the minimal definition of entities that are registered. Entities are defined by the central authority with the minimal interface (abstract entities) and published from centralized location. Centralized authority and some doctrine or policy is must for interoperability [54]. Using unique, nonstandard data definitions and structures, by organizations will make the data non‐shareable externally and defeating the purpose of defining the entity without having centralized repository.
GovML, a language for describing the life events and public services [42] has been developed, where every life event triggers public service. Accessing public service eventually triggers access to database to cater the need of life event [42]. Quality, reusability and sustainability of public service depends upon how well database is designed and which depends on how well the entities and their relationships are designed and what attributes and functionality are induced in those designed entities. Language for entity definition is based on three types of elements 1) Entity Data 2) Entity’s Meta data 3) Organization’s Master Data which is more related to organization than entity. In the context of entities, metadata represents the detail of entity used to collaborate with another entity like scope of entity, synonym, primary repository name and intended applications etc. Domain specific knowledge can be induced in the entities and thus makes them more useful and scalable for future applications. Entities are defined with the Entity specific metadata and entity definition. Entity specific metadata contains the extra information about the entity like author of entity, publisher of entity, use of entity etc. and entity definition contains minimal abstract definition of entity i.e. attributes in the entity, methods in entity with the signature of methods etc.
Purpose of entity repository is to provide consistent and coherent definition of entities to act as a guideline for entities going to be developed in other similar project and hence plays important role in creating coherent database for storing the data related to entities, which leads to the unified structure of entities and hence easier exchange of information without changing the format at data layer is possible without worrying about impedance mismatch about the number of essential attributes, their data types, primary keys, methods and their behavior. This not only makes the structure of database coherent and consistent but also makes it easy to create and deploy already created services in new context. Along with the definition of entity, links of customized and concrete successful implementation is also maintained with the entity metadata. Power of the entity lie in how better the entity is capable in capturing the real scenario i.e. most usable attributes, behavior of entity and their relationship with other entities. Core of services is almost always a data layer, and rapid development of data layer is only possible if already designed entities are available to developers. To successfully implement the solution in large multi‐site organization like government, solution must be based on some defined set of standards and interoperable in nature. At data level,

10 E‐Governance: Techno‐Behavioural Implications
entities are the basic structures in which the data resides. Language for entity definition will provide unambiguous definition of entities involved in the system and their behavior, it is better to use the published entity and use it rather than to reverse engineer the entity and customize the solution.
DATA VOCABULARY OF LANGUAGE FOR ENTITY DEFINITION
The proposed language for entity definition addresses the common structure and interoperability challenges. Entity description includes metadata, master data and actual description of entity. Elements of language for entity definition are identified based on studying the actual structure of databases of various organizations in government [9], reviewing the government Interoperability Framework (GIF) of various countries available online and studying literature [31][32]. Table‐1 shows the Data vocabulary of Entity Description language.
TABLE 1: DATA VOCABULARY
Entity Meta Data Author Name: Refers to the name of individual or group or organization who creates the Entity and to whom this entity originally belongs. Primary Repository Name: Name of the central organization that holds the definition of entities Secondary Repository Name: List of repositories of similar entities that are successfully implemented in some projects or where the concrete implementation is found. Domain: Broader area of organization or application e.g finance, inventory, central diary etc. Every domain also has numeric representation which is used in the version of entity. SubDomain: Refers to the specific area of main domain. Every sub‐domain also has numeric representation which is used in the version of entity. Date of Creation: This refers to the date on which Entity is created. Date of Last Updation: Refers to the Date on which Entity's definition is last modified Candidate Organizations: Refers to the list of other organizations which are the prospective candidate for the use of this entity. Candidate Applications: Refers the list of application in which entity can be used. Referenced Entities: List the other entities use to create current entity. IntraEntityRelationship: Refers to the one‐to‐one, one‐to‐many, many‐to‐many, many‐to‐one relationship with other entities. This feature is discouraged because every entity has its own identity apart from the identity it gained from having the relationship with other. Moreover the relationship is more related with how they are analyses rather than having fixed status. Constraints: Refers to the constraints imposed on the entity by parent organization. Description: This refers to the details description of entity. Version Number: Refers to the version number of entity. Synonyms: List of alias names by which entity is known Concrete Implementation: List the organization where the concrete implementation of the entity can be found.
Table 1 (Contd.)……

A Consistent Approach for Structurally Interoperable Data Layer 11 ….Table 1 Contd. Role: Refers to the role of entity in the application for which entity is originally
designed and created. RightUseCondition : Refers to rights and conditions under which the entity can be reused by other applications/organizations Remarks: Other secondary information about the entity.
Master Data
This is organization wide static data which is used by the service/application to be developed for the particular organization.
Entity Description
Name: Refers to the name of entityAttributes: Refers to the constituents of attribute like attribute name, data type, whether data type is array or not, if data type is an array then size of array, whether attribute act as primary key or not, default value of attribute, description of attribute, constraint (null, check, unique) on attribute. Methods: Refers to the name of methods, return type, name and data type of argument it will take. If data type isan array then size of array, type of method (normal or constructor).
Production of instance document starts with analyzing and identifying entities during analysis phase. After identifying the initial requirements, organization may adopt definition of existing entities and develop data layer based on previous successful data layer or the organization simply starts defining entities by producing new instance document, which can be validated against language schema. Newly instance document is published from central location so that other similar projects take advantages of its designing. Language document hold all the information related to the entities like meta data, entity definition etc. Apart from this, facility to store master data is also provided in language schema. The whole database part of application can be developed rapidly by reusing definition and design effort of previous entities.
CONCLUSION
In E‐Governance where large numbers of applications are being developed, saving analysis time enhance the productivity and contributes to shorter solution development time. Language for entity description not only takes care of describing full entity (attributes, methods, constraints, meta data etc.) but also take care of management of meta data and master data. Using entities that are defined by entity description language make the structure of database consistent across organizations that provide similar services. This also makes the information sharing easier without worrying about impedance mismatch and format conversion. Such language contributes towards the rapid development of consistent, coherent, and interoperable data layer in E‐Government services.
REFERENCES [1] Abbott & Daisy (2009), DCC Briefing Paper: Interoperability, Digital Curation Centre,
https://www.era.lib.ed.ac.uk/handle/1842/3363. [2] Andersen, David F., Sharon S. & Dawes. (1991). Government Information Management: A Primer and
Casebook. Englewood Cliffs, NJ: Prentice Hall.

12 E‐Governance: Techno‐Behavioural Implications
[3] Batini, C., Lenzerini, M. & Navathe, S.B. (1986), A comparative analysis of methodologies for database schema integration, ACM Computing Surveys (CSUR), Volume 18 Issue 4, Dec. 1986.
[4] Bednárek, D., Yaghob, J. & ZavoralData, F. (2005), Integration Using DataPile Structure, http://citeseerx.ist.psu.edu/viewdoc/download?doi=10.1.1.142.6687&rep=rep1&type=pdf.
[5] Brazhnik, O. & John F. Jones (2007), Anatomy of Data Integration, Journal of Biomedical Informatics, Volume 40, Issue 3, June 2007, Pages 252–269, http://www.sciencedirect.com/science/article/pii/S1532046406000967.
[6] Chauhan, R. & Singh, A., (2011), Generalizing Meta‐Data Elements: Global Scenario and Indian Perspective, JOAAG, Vol. 5. No.1.
[7] Chauhan, R., Singh, A.J. (2011), Akgec Journal OF Technology, Vol. 2, No. 1, ISSN 0975–9514, Theoretical Categorization of Interoperability in E‐Government, http://www.akgec.org/akg_journal_jan‐june11.aspx
[8] Davidson, L. (2007): Ten Common Database Design Mistakes, http://www.simple‐talk.com/sql/database‐administration/ten‐commondatabase‐design‐mistakes. [On‐line], Accessed on : 22 July, 2010
[9] Draper, D. (2004), “Mapping between XML and Relational Data”, article at http://www.informit.com/ [10] Elaasar, M. & Briand, L.(2004), An Overview of UML Consistency Management,Technical Report SCE‐
04–18, http://www.citeseerx.ist.psu.edu/viewdoc [11] Elmasri,R. & Navathe, S. (2007), Fundamental of database systems, ISBN 978–81–317–1625–0,
Published by Pearson Education, Third edition. [12] Freitas, F., Candeias, Z. & Stuckenschmidt, H.(2011), new Usage for Semantic Technologies for
E‐government: Checking [13] Official Documents’ Consistency, Electronic Journal of e‐Government Volume 8 Issue 2, 2010
(pp121–134), ISSN 1479–439X, http://www.ejeg.com [14] Gail Hodge (2001), Metadata Made Simpler, Published by NISO Press, National Information Standards
Organization, ISBN: 1–880124–50–5, http://www.ncsi.iisc.ernet.in/raja/is214/214‐2001‐2002/Metadata_Bklt.pdf
[15] GAO (2002), Electronic Government : Challenges to effective adoption of the Extensible Markup Language, United State General Accounting Officer, Retrieved from http://www.gao.gov/new.items/d02327.pdf
[16] Gornshtein, D.& Tamarkin, B. (2004), Features, strengths and weaknesses comparison between MS SQL 2005 (Yukon) and Oracle 10g databases, Revision 1.3, WisdomForce Technologies, Inc, http://www.wisdomforce.com
[17] Govedarica M (2002)., An Automated Development of Information System Application Prototypes. PhD Thesis, University of Novi Sad, Faculty of Technical Sciences, Novi Sad, Serbia and Montenegro, 2002. Govedarica M., Lukovic I., Mogin P (2004)., Generating XML Based Specifications of Information Systems. Computer Science and Information Systems (ComSIS), Belgrade, Serbia and Montenegro, Vol. 1, No. 1 2004, pp. 117–140.
[18] Hamilton & Murtagh (2000), Enabling Interoperability Via Software Architecture, Technical Reports,AD Number: ADA458021, Retrieved from http://www.dtic.mil/dtic/
[19] Helander (2005), deeply embedded XML communication: towards an interoperable and seamless world, International Conference on Embedded Software, Proceedings of the 5th ACM international conference on Embedded software. Jersey City, NJ, USA, Pages: 62 – 67, ISBN: 1‐59593‐091‐4.
[20] Joseph Fong, Kamalakar Karlapalem, Qing Li, Irene Kwan(1999), Methodology of Schema Integration for New Database Applications: A Practitioner’s Approach, Journal of database management, http://www.irma‐international.org/viewtitle/51209/
[21] Kasunic. M & Anderson W (2004), Measuring Systems Interoperability: Challenges and Opportunities, Software Engineering Measurement and Analysis Initiative, Technical Note CMU/SEI–2004–TN–003, http://www.sei.cmu.edu/library.
[22] Kavadias, G & Tambouris, E (2003), GovML : A markup laguage for describing public services and life events, Knowledge Management in Electronic Government, 4th IFIP international Working Conference, KMGov 2003 Rhodes, Greece, May 26–28 2003 Proceedings published by Springer.

A Consistent Approach for Structurally Interoperable Data Layer 13 [23] Korth, H. & Silberschatz, A. (2006)., Database System Concepts. 5th ed., McGraw‐Hill, ISBN
007–124476‐x [24] Lewis & Wrage (2004), Approaches to constructive interoperability, Carnegie Mellon Software
Engineering Institute, Pittsburg, Technical report, CMU/SEI–2004–TR–020, ESC–TR–2004–020, Retrieved from http://www.citeseerx.ist.psu.edu
[25] Lukovic, I., Ristic, S., Mogin, P., Pavic, J. evic (2006), Database Schema Integration Process: A Methodology and Aspects of its Applying, Novi Sad J. Math. Vol. 36, No. 1, 2006, 115–140, http://www.kurims.kyotou. ac.jp/EMIS/journals/NSJOM/Papers/36_1/NSJOM_36_1_115_140.pdf.
[26] Loukis, E. & Xenakis, A. (2011), Knowledge Interoperability of Parliaments’ and Government Agencies’ Information Systems, DOI: 10. 4018/978–1–61520–887–6. ch016, http://www.irma‐international.org/viewtitle/45795/
[27] Mary A. Finn (2001), Fighting Impedance Mismatch at the Database Level, http://www.intersystems.com/cache/whitepapers/matchwp.html.
[28] Mogin P., Lukovic I. (1995), A Prototyping CASE Tool. XXVIII International Symposium ́ on Automotive Technology and Automation, Stuttgart, Germany, September 18–22, 1995, Proceedings for the Dedicated Conference on Rapid Prototyping in the Automotive Industries, pp. 261–268.
[29] Mogin P., Lukovic ́ I., Govedarica M. (2004), Database Design Principles, 2nd Edition. University of Novi Sad, Faculty of Technical Sciences, Novi Sad, Serbia and Montenegro, 2004.
[30] Moller,A. & Schwartzbach, M.(2006), An Introduction to XML and Web Technologies, Pearson Education Ltd., ISBN 978–81–317–2607–5.
[31] Motz, R. (2002), Problems in the Maintenance of a Federated Database Schema, Proceedings of the XXII International Conference of the Chilean Computer Science Society (SCCC’02). 1522–4902/02 IEEE, se‐pubs.dbs.unileipzig. de/files/Motz2002Problemsinthemaintenanceof.pdf
[32] National Research Council (2002), Information Technology Research, Innovation, and E‐Government, National Academy Press, Washington. D.C. ISBN: 0–309–50031–1, Retrieved from http://www.nap.edu.
[33] Nebbe R.D. (1996), Semantic Structure: a Basis for Software Architecture, Software Composition Group, Retrieved from http://www.scg.unibe.ch/archive/famoos/Nebb98m/nebbe_oosa.pdf
[34] OGCIO (2006), HKSARG, XML Schema Design and Management Guide v1.3, [Online], Retrieved from http://www.ogcio.gov.hk/eng/infra/eif.htm
[35] Olteanu, A.M., Mustière, S. & Ruas, A. (2006) Matching imperfect spatial data, 7th International Symposium on Spatial Accuracy Assessment in Natural Resources and Environmental Sciences. http://www.citeseerx.ist.psu.edu
[36] Pankowska, M. (2008), National frameworks’ survey on standardization of e‐Government documents and processes for interoperability, Journal of Theoretical and Applied Electronic Commerce Research, ISSN 0718–1876 Electronic Version, Vol 3/Issue 3, http://www.jtaer.com.
[37] Pavic evic, J.(2005), Development of A CASE Tool for Automated Design and Integration of Database Schemas. M.Sc. Dissertation, University of Montenegro, Faculty of Science, Podgorica, Serbia and Montenegro, 2005.
[38] Pitoura(1997), Providing Database Interoperability through Object‐Oriented Language Constructs, Journal of Systems Integration, 7, 99–126, Kluwer Academic Publishers, Boston. Retrieved from http://www.springerlink.com/content/m0087636781550j2/
[39] Rahm, E. & Hai, H. Do (2000), Data Cleaning: Problems and Current Approaches, Bulletin of the IEEE Computer Society Technical Committee on Data Engineering, IEEE Computer Society, and Vol. 23 No. 4. http://citeseerx.ist.psu.
[40] Ristic, S., Lukovic ́ I., Mogin P., Pavic evi, J. (2005), Integrating a Database Schema Using IIS*Case Tool. 13th Scientific Conference on Industrial Systems IS’05, Herceg Novi, September 07–09, 2005, Proceedings pp. 331–340.
[41] Schmalz M.S., Hammer J., Wu M., Topsakal O (2003)., EITH–A Unifying Representation for Database Schema and Application Code in Enterprise Knowledge Extraction. Proceedings of the 22nd International Conference on Conceptual Modeling, Chicago, IL, November 2003.
[42] Seligman. L. & Rosenthal.A (2001), The Impact of XML on Databases and Data Sharing, MITRE Corporation, Retrieved from http://www.reference.kfupm.edu.sa

14 E‐Governance: Techno‐Behavioural Implications
[43] Senn. James A. (1989), Analysis and Design of Information Systems, McGraw‐Hill Inc.,US. ISBN 9780070562875.
[44] Singh, A.J. Chauhan, R. (2010), Indian Journal of Computer Science and Engineering, E‐Government Databases: A Retrospective Study, Vol 1 No 2, 66–73, ISSN: 0976–5166.
[45] Shaw, M. & Garlin, D. (1994), Characteristics of higher‐level Languages for Software Architecture, CMU‐CS‐94–210, Retrieved from http:// www.cs.cmu.edu/afs/cs/project/vit/ftp/pdf/salang‐reqts‐tr.pdf
[46] Shaw. M & Garlan. D (1996), Software architecture: perspective on an emerging discipline, Prentice‐Hall of India, ISBN–81–203–1470–0.,
[47] Sheth, A. & Larson, J. (1990). Federated Database Systems for Managing Distributed, Heterogeneous and Autonomous Databases. ACM Computing Surveys, 22(3).
[48] Siegel, M., Madnick, Stuart E(2010)., Schema Integration Using Metadata, http://web.mit.edu/smadnick/www/wp2/1989‐06‐SWP%233092.pdf.
[49] Ullman, J.D.,& Widom, J. (1997), A First course in database systems, Prentice Hall International, Inc. ISBN 0–13–887647–9
[50] UNDP (2007), e‐Government Interoperability: A Review of Government Interoperability Framework in Selected Countries, ISBN: 978–974–13–1624–3, Retrieved from http://www..ibm.com/ibm/governmentalprograms/undp‐gif‐review.pdf
[51] Williams, K. (2000), Professional XML Databases, Wrox Press Ltd, ISBN–1861003587. [52] Winter (2002), Chapter on Interoperability, European Territorial Management Information
Infrastructure (ETeMII ), http:// www.ecgis.org/etemii/reports/chapter3.pdf [53] Yugang, Z., Luying, L. (2006), Architecture and Implementation of an XML‐based Heterogeneous
Database Integration System,http://en.cnki.com.cn/Article_en/CJFDTOTAL‐JSJC200602029.htm. [54] Zeng (1999), Metadata Elements for Object Description and Representation: A Case Report from a
Digitized Historical Fashion Collection Project, Journal of the American Society for Information Science. 50(13): 1193–1208, Retreived from http://polaris.gseis.ucla.edu/gleazer/260_readings/Zeng.pdf.

Applications Integration in e-Governance– Opportunities & Challenges
Sanjay Buch1 and RajanAnanthanarayanan2 1Assistant Vice President, IT Projects, Reliance (RIL) Group, India
2Vice President, Projects, Reliance (RIL) Group, India Email: [email protected], [email protected]
Abstract—Since turn of the new millennium state and central governments in India have launched several eGovernance initiatives. Most of these initiatives are ‘departmentcentric’ and have enabled them to move away from paper based records to digitized data, for storage and easy retrieval. These ‘departmentcentric’ data tend to be siloed and therefore, restrict their usage to the department which owns the initiative. For example, data of the Census department cannot be readily used by the Revenue department and vice versa. While some data would be specific to the departments the basic data of customers / citizens and their demographic data which is required for all the departments is the same leading to duplicate and inconsistent data. In addition, various proofs of the citizen are also duplicated across the departments. This increases the workload on the department and frustrates the citizen to no end. In order to enable sharing of data across the various government departments, an ‘application integration’ initiative is suggested. This would bring about efficiency in data collection, increase accuracy of data and thereby enhance the value of the technology investments made by the government.
This paper presents the steps and challenges involved in data integration with the help of a hypothetical example. In summary, application integration project offers uniformity and consistency of data, which would benefit both the government and the citizens.
Keywords: eGovernance, Data Integration, Enterprise Application Integration (EAI), System Integration
OVERVIEW
Over 91,00,000 tax payers filed their income tax return on‐line in the financial year 2010‐111. Three out of five in the metro cities prefer to make their train ticket reservation via internet, which indeed is a testimony for IRCTC website (www.irctc.co.in) receiving National Award for eGovernance 2010‐2011. Both Central and State Governments have been encouraging eGovernance initiatives in various departments.While a host of eGovernance initiatives have been launched of which only a few are visible to the customers/citizens and many are behind the scenes and their usage is limited to the departments of the Government. Though we have many eGovernance initiatives, the citizens of India are still longing for a single view (See Annexure – B imagination of a netizen2) of their identification numbers such as Permanent Account Number (PAN), Driving License Number, Passport Number, Electoral ID, and so on, which will make their life simpler. This intriguing thought compelled the authors to explore the opportunities that exist in ApplicationIntegration of eGovernance initiatives and their challenges.
1 An advertisement in the website http://economictimes.indiatimes.com/ accessed on July 30, 2011 2A person who is a frequent or habitual user of the Internet.

16 E‐Governance: Techno‐Behavioural Implications
The letter “e” in the term eGovernance implies technology driven governance. eGovernance is the application of Information and Communication Technology (ICT) for delivering government Services, exchange of information, tracking transactions, integration of various stand‐alone systems and services between Government‐to‐citizens (G2C), Government‐to‐Business(G2B), Government‐to‐Government (G2G) as well as back office processes and interactions within the entire government frame work. Saugata B., and Masud R R. (2007)3
ORIGIN OF EGOVERNANCE IN INDIA4
eGovernance originated in India during the seventies with a focus on in‐house government applications in the areas of defence, economic monitoring, planning and the deployment of ICT to manage data intensive functions related to elections, census, tax administration etc. In the eighties, National Informatics Center (NIC) was established to connect all the district headquarters of the states. From the early nineties, eGovernance has seen the use of ICT for wider sectoral applications with emphasis on reaching out to rural areas. These initiatives have started taking in more inputs from NGOs and private sector as well.
ORIGIN OF DATA SILOS5
In the turn of the new millennium, the ICT infrastructure improved dramatically throughout our country. It gave impetus to automation / computerization of Government departments for electronic file handling, public grievance systems, and service delivery for high volume routine transactions such as payment of bills and tax dues. Additionally, in order to meet poverty alleviation goals and to offer access to entitlements to the citizens, Government promoted different entrepreneurial models such as PPP (Private, Public Partnership). Such initiatives focused on easing the citizen‐state interface, improving government services and bettering livelihoods for citizens. With electronic information system, we got rid of paper based data, but ended up creating silos of information witheach initiative(Read: soft data).
PROBLEM = OPPORTUNITY
It will be in the interest of government departments and citizens to have consistent, accurate and reliable integrated Personal Information. Interestingly, this data lies in each of the system / initiative of the different departments of Government as defined by the individual department. Such disparate, disjointed data can jeopardize initiatives by Taxation authorities, Registrar of Societies (Residence identification), Traffic Police (Driving License), Service providers such as electricity board, water supply board, etc.,
3 Implementing E‐Governance Using OECD Model (Modified) and Gartner Model (Modified) Upon Agriculture of Bangladesh. IEEE.1‐4244‐1551‐9/07.
4 Source: Dataquest Magazine 5 Source: Dataquest Magazine

Applications Integration in e‐Governance–Opportunities & Challenges 17
(See Annexure – B ‘Touch Points of a citizen’) when they rely on data drawn from multiple sources.
Especially in the era of outsourcing, even Government departments choose to outsource repetitive jobs. For instance, an application form which captures data of a citizen could be outsourced to a vendor. Below is a typical situation when a name could be defective and get unnoticed till the time data reaches the citizen.
Example: Following are the opportunities of defects in spelling coauthor’s name. Rajan Ananthanarayanan Rajan Anathanarayanan Rajan Anantha Narayanan Rajan Anantanarayanan Rajan Ananthanarayan A. Rajan Ananthanarayan Rajan Ananthanarayanan Rajan Rajan. A A.N. Rajan
This makes life a citizen miserable when he/she have to go through justifications as the authority challenges the discrepancy. It must be noted, such discrepancy is not the fault of the citizen.
This would not only result in dissatisfaction amongst the stakeholders, but also increase the cost. Therefore, it is important to integrate the systems, which can not only lower costs, but also improve productivity, efficiency and satisfaction of stakeholders by promoting consistent, accurate and reliable data across the departments of Government.
ENTERPRISE6 APPLICATION INTEGRATION (EAI)
EAI is a process by which data generated and stored in one application is shared with one more applications within the enterprise, on a continual basis. Such sharing of data saves time for the users of the enterprise. Example: In a corporate scenario, data related to orders and sales from an ERP7 system of an organization could be shared with their CRM8 system. This makes availability of sales related data seamlessly in CRM system and 6Enterprise could be either a corporate entity or a public service department. 7ERP: Enterprise resource planning (ERP) is a process. Information technology is an enabler of an ERP process. Enterprises use ERP systems to automate and maintain their records of their activities involving, finance/accounting, manufacturing, sales and service, etc. As an integrated software application, ERP system facilitates the flow of information between all business functions inside the boundaries of the organization and manages the connections to outside stakeholders.Adapted from http://en.wikipedia.org/Enterprise_resource_planning accessed on August 5, 2011
8CRM: Customer relationship management (CRM) is process. Enterprises use CRM as a strategy for managing a company’s interactions with customers, clients and sales prospects. Technology based CRM system enable to organize, automate, and synchronize business processes—principally sales activities, but also those for marketing, customer service, and technical support. The overall goals are to find, attract, and win new clients, nurture and retain those the company already has, entice former clients back into the fold, and reduce the costs of marketing and client service. Adapted from http://en.wikipedia.org/Customer_relationship_management accessed on August 5, 2011

18 E‐Governance: Techno‐Behavioural Implications
helps customer service personnel, in handling any queries. In a government scenario, data available with Census department could be seamlessly used by Revenue department so that name, date of birth, place of birth and residential address are consistent. This data in turn could be used by other departments such as Water supply and Electricity board.
COMPONENTS OF AN IT SYSTEM & INTEGRATION LAYERS
Usually an application in an IT system (Figure ‐ 1) consist of Data, Business Processes, User Interaction (UI) and an IT system itself could have multiple applications within its ambit.
FIG. 1
User Interaction indicates the ultimate access (or) touch‐point of the user. This could be a portal (or) website. It could also be an output such as invoice, which could be a hard copy or a soft copy.
Business Process indicates the transactional processes implemented in the system. For example, generation of an ‘Invoice’ to charge the customer for consumption of a utility, say water or electricity. Invoicing is a process which accounts for the consumption of electricity or water consumed by a consumer. Utility application may have many other processes, such as Customer creation, Creating a connection, etc., Data is ‘granular most’ (or) micro levelinformation which is stored for retrieval purposes.

Applications Integration in e‐Governance–Opportunities & Challenges 19
DEVELOPING A FRAMEWORK FOR ENTERPRISE APPLICATION INTEGRATION
A thorough understanding of data layers of different applications enables one to articulate the imperatives namely,
• Complexities of existing applications (AS IS) • Potential simplifications, which would help users after integration processes
(TO BE).
Once the gap between ‘AS IS’ and ‘TO BE’ is identified, an entity can proceed to develop work breakdown structure (WBS9). Figure – 2 shows the steps involved in planning, executing and maintaining an entity’s application integration project.
FIG. 2: A TYPICAL WBS FOR AN EAI PROJECT
It must be noted that selection of technology or technique, for data transfer & monitoring depend on configurability & scalability. Multiplicity of data sharing protocols, volume of data and need for parallel processing determine the configurability and scalability of an EAI tool & technique. Eco system of application is outlined below
ECO-SYSTEM OF APPLICATION INTEGRATION
Apart from the ICT systems of an organization, data integration involves tools & techniques for enabling unified and consistent view of enterprise business data. Figure ‐3 depicts an ecosystem for data / system integration. Selection of tools & technique is dependent on the nature of integration requirements.
9Work Breakdown Structure (WBS) is a well known project management methodology

20 E‐Governance: Techno‐Behavioural Implications
FIG. 3: ECO-SYSTEM FOR DATA/SYSTEM INTEGRATION
TECHNOLOGY SELECTION FOR DATA INTEGRATION
FIG. 4
Many technologies and tools fit into one of the categories described in the ecosystem of data / system integration. The ecosystem can be simplified into four steps (See Figure– 4). Though, continuous technological advancement supports multiple integration levels, four steps involved in setting up the integration platform still hold valid.

Applications Integration in e‐Governance–Opportunities & Challenges 21
• Applicationscould be defined as custom‐built or vendor‐developed solutions that utilize one or more data integration products.
• Productsare generally, off‐the‐shelf commercial or bespoke solutions that support one or more data integration technologies.
• Technologiesimplement one or more data integration techniques. • Techniquesare technology‐independent approaches for doing data integration.
Real World Challenges
The idiom “It takes two to tango” suggests the importance of pairing persons or entities for an action. In systems integration parlance, it is said, “it is easy to make a pair of persons to talk to each other, but it is difficult to make a pair of systems to do so”. Challenges exist in any integration project, be it private enterprise or public department; they can be broadly grouped into (a) Organizational and (b) Technological (See Table – 1)
TABLE 1
Organizational Technological • Organizational Culture ‐ ability to change • Systems and processes
• Databases (both local and remote) • Number of applications • Existing levels of interface of applications • Data sharing protocols
This article is limited to technological issues involved in an enterprise application integration project
Database
Depending upon the application used by an entity, database may be either local (or) remote. When the database is in a remote location, it is important to have necessary bandwidth10 so that data can be accessed and fetched, when needed.
It is also likely that applications are built in different vintages or bought from different vendors; this results in different type of databases (example: Oracle, DB2, etc.)
Number of Applications
Number of applications used in an entity; Figure – 5 is an example of various applications used by government
Existing Levels of Interface
Now‐a‐days, manyapplicationsolution providershavedevelopedembeddedroutines whichresolve many of the complexities of data integration. These may exist within the application itself or in ‘stored procedure’11 code within the database.
10In this context, Bandwidth referred to the ability / rate of data transfer between two systems considering one at a remote location. It is measured in bits per second (bps) / megabits per second (mbps) http://en.wikipedia.org/wiki/Bandwidth accessed on August 3, 2011

22 E‐Governance: Techno‐Behavioural Implications
Data Sharing Protocols
Data sharing protocols may be defined by the system’s ability to generate files in different formats (example: ASCII, XML, CSV, etc)
Application integration challenges in an eGovernance scenario are outlined with the help of a case example.
Case Example
FIG. 5
Figure – 5representsa portfolio of applications in a Government Entity.
Key Assumptions
• Information technology based applications exist in a government entity. • The government entity is aiming at providing a single view of their data to their
users.
The preparation needed for integrating all these applications in order to enable government entity to improve its service delivery is outlined below.
Planning-Data Integration Needs
Data integration needs depend on business goals of an eGovernance initiative. It could be visualized that government department would like to create a single view of database of citizens, by combining records of home registration (property tax data) and census records. Single view of data may consist of Name, Date of Birth, Place of Birth and
11In computer science, a stored procedure is a subroutine available to applications accessing a relational database system. It is a condition for updating a record / data in a system. Whereas a subroutine (also called procedure, function, routine, method, or subprogram) is a portion of code within a larger program that performs a specific task and is relatively independent of the remaining code. Adapted from http://en.wikipedia.org/Stored_procedure accessed on August 5, 2011

Applications Integration in e‐Governance–Opportunities & Challenges 23
Residential Address along with identity (Ration Card) offered by Public Distribution System (PDS). This would enable the government department to track home ownership along with census data.
System Analysis-Determining Integration Points
From the above example, let us consider two applications namely, (1) Census department and (2) Revenue department (Property Tax).
At database level, it is important to identify the datasets which are either ‘fixed’ or ‘transactional’: For example, ‘RECORD NUMBER’ in Census department may not change, which is ‘fixed data’. ‘Transactional data’ represents the changes carried out in the application by way of updating the data: for example, when a house owner changes his/her residence, the data would be sent to Census department. This is to update the new address ‘. The same change can be reflected in the system used by Revenue department.
At system level, it is important to identify volume of data and the frequency of its update: for example if an application of Census dept. has more data than that of Revenue dept., it is worth considering the transfer of data from latter and vice versa. Similarly, if the frequency of update is faster in the application held by Census, then ideally that would determine the data transfer.
Next step would be to identify the output (as explained in data sharing protocols) of each system which is compatible for data transfer.
Data Analysis
Following steps are involved in data analysis.
• Establishing data relationship within a system as well as with others • Source to target mapping • Sequencing the data processing
Establishing Data Relationship
Different departments collect same information in different ways and identify them differently.
For example, an application used by census department may haveuser’s records to define addresses of the residents and their sex, date of birth, place of birth, qualification, profession, etc. Typically the details could be stored as shown in Figure – 6. ‘RECORD NUMBER’ is common across these three tables.

24 E‐Governance: Techno‐Behavioural Implications
FIG. 6
In another example, housing board department may have records to define the ownership of properties based on their registration number. Typical details could be stored as shown in Figure – 7. ‘REGN NUMBER’ is common across these three tables. Difference in capturing the address can be noted in the example.
FIG. 7
Potentially sharing of these records with other departments would enable a government entity to arrive at (1) No. of households, (2) No of adults, male, female, (3) Per capita consumption of water and other commodities, etc.,
It may be noted that, sharing of these two records in the existing manner may not be useful as there is no commonality. i.e., ‘REGISTRATION NUMBER12’ cannot be readily related with ‘RECORD NUMBER’. Therefore, additional ‘data processing’ would be required, before sharing these records with other departments such as PublicDistribution system (PDS), Water Supply etc. This is explained in the next step.
12REGN NUMBER and REGISTRATION NUMBER are written interchangeably. Generally data modelers avoid these kinds of variations in a database design.

Applications Integration in e‐Governance–Opportunities & Challenges 25
Source to Target Mapping
‘Source’ is defined as the system from where the data has to be pulled or transferred. ‘Target’ is the destination where the data could be stored for integration and its usage. This mapping is an important step as it ensures data accuracy and consistency.
Sequencingof Data Processing
Sequencing is explained with an example (Figure – 8), a view of records from Census and Revenue (property registration) departments which can be shared with Water Supply and PDS. It is important to note a ‘commondependency’ has been created between the ‘census record’ and ‘property record’. Intention of this dependency is to facilitate identification of the consumer. Here, ‘Consumer Number’ is a common identification for both Water Supply and PDS.
FIG. 8
As a first step, it is important to create a unique primary key for each table when any new record is inserted. Then, ‘Consumer Number’ record, is inserted under ‘Consumer Name’ and then linked to Address based on ‘Registration Number’ of the property; then the ‘Census record number’ is linked with ‘Dependents’ table.
The above is a simple example for illustration purpose. The relationships and dependencies in enterprise applications can be more complex. It is typical to have multiple child tables associated with one parent table alongwith multiple levels of parent‐child relationships. Many applications even have “link tables”that serve as a parent for two related child tables to create many‐to‐many relationships between tables. Attempting to insert a recordthat spans a number of target tables requires sophisticated processinglogic.

26 E‐Governance: Techno‐Behavioural Implications
This integrated data would enable the Water Supply department to estimate per capita consumption of water. Similarly, it also would enable PDS department to quantify procurement pattern of the households. This would improve the efficiency of these departments and satisfaction of the citizens.
Validation & Standardization of Input Data
Data validation is the process of ensuring that a system stores clean, correct and useful data. In Structured Query Language (SQL), it uses routines or stored procedures, often called "validation rules" or "check routines", for ensuring correctness, meaningfulness, and security of data that are input to the system. The rules may be implemented through the automated facilities of tool and technique deployed in enterprise integration project.
Standardization of data depends on the method in which data is stored in system(s). An entity could standardize their data by Meta‐data management or Master Data Management (MDM) or combination of both. It must be noted these are organizational processes / disciplines by which a data modeler helps in maintaining thedefinition of the data andthe data uniform across the enterprise systems.
Meta‐data management13 (also known as metadata management, without the hyphen) involves storing information about other data. Meta data is definition of data stored in the system. It can also consist of some attributes of the data like the data type of the data, the possible limits or values it can take and the interpretation of those values. For example, attributes of ‘CONSUMER NUMBER’ in Water supply department would same as that of in Electricity department. If such uniformity is practiced in the systems across the enterprise, complexity in data integration reduces.
Master Data Management14 (MDM) comprises a set of processes and tools that consistently defines and manages the ‘Fixed data’ entities of an organization (which may include reference data). MDM has the objective of providing processes for collecting, aggregating, matching, consolidating, persisting and distributing such data throughout an organization to ensure consistency and control in the ongoing maintenance and application use of this information. Example: ‘VADODRA’ may be written as BARODA. Data such as names of cities / towns / villages could form as master data to ensure uniformity across the applications.
Executing
Data Transfer & Monitoring
This execution level of data integration, can be subdivided into three areas namely
• Workflow • Error handling
13 Adapted from http://en.wikipedia.org/Meta‐data_management accessed on August 6, 2011 14 Adapted from http://en.wikipedia.org/Master_data_management accessed on August 6, 2011
Applications Integration in e‐Governance–Opportunities & Challenges 27
• Managing data sharing protocols
Workflow
A workflow15 consists of a sequence of connected steps. In EAI, it is a depiction of a sequence of operations performed while transferring and storing the data.
Within the context of public services department in India, sheer population number results increation and storage of large volume of data; when large data has to be transferred from one (source) to another (target), errors may occur. Typically, three types of occurrences impact the flow of processingfor a given transaction or record
• The existence of a record in the target • The value of certain fields within the source record and • Error conditions that occur within the process.
Work‐flow could be ‘predefined’ or ‘dynamically adjusted’ or combination of both; generally the integration tools support such workflow techniques. Processingof a transaction or record can be affected by the existence of a record in the target or changes carried out. Example: New registration of a property: This means ‘REGN NUMBER’ in the application maintained by revenue department needs to be changed. Simultaneously, ‘RECORD NUMBER’ of census department required is to be related to ‘REGN NUMBER’
During data integration, ‘REGN NUMBER’ recordinto the system,update it, ifitis alreadyin the target database. Ifitdoes not exist inthe target database,insert the ‘REGN NUMBER’ and also call another processwithinthe application that assigns the same in the system. The processingof a transaction or record can also be affectedby the value of certain fields in the source record.
In our example, data transfer to systems of other departments should take place only after ‘REGN NUMBER’ is updated in revenue department and linked with RECORD NUMBER of census department.
Error Handling16
It is said, ‘To err is human’. Errors do occur in data stage as a result of manual entry. When erroneous records are transferred to other systems, an error gets complicated. It leads to mismatch of records.
Most of EAI tools have some error handling functionality; however it is limited to the handling of technical errors.Some errors can be resolved by performing some automated activities; a few may require manual intervention. Typical error handling cycle is shown in Figure – 9. Example: ‘CONSUMER NUMBER’ is to be specified in 15 characters. If a specific record has 16 characters, it is likely to be rejected during data 15 Adapted from http://en.wikipedia.org/Workflow accessed on August 6, 2011 16 Adapted from http://www.eai‐ideas.com/implementation‐ideas/errorhandling accessed on August 6, 2011

28 E‐Governance: Techno‐Behavioural Implications
transfer process. If the 16th character is ‘space’, then the error handler could trim and accept in the target system. Such conditions are specified in the integration tool.
FIG. 9: ERROR HANDLING PROCESS
‘Error reporting’ forms part of an EAI tool and its architecture. Records that are rejected are available for the people for further processing.
Managing Data Sharing Protocols
Databases could be maintained in multiple servers. Therefore it is important to manage the data sharing protocols in order to ensure continuity of data transfer. If changes are carried out in any of the servers, then concerned persons are to be notified.
Maintaining–Configurability and Scalability
Changes in systems and processes, technological advancement, etc., compel needs for newer applications and thereby revisions in integration needs. EAI architecture should be able to handle such changes and data volume.

Applications Integration in e‐Governance–Opportunities & Challenges 29
Annexure – Cgives the EAI technologies offered by software vendors along with commonly used features for reference. Annexure – D is a partial list of variables which need to be considered while selecting an EAI tool & technique.
KEY SUCCESS FACTORS FOR EAI IN GOVERNMENT17
• Government commitment: eGovernance projects need key persons, not only from technological aspect, but from other aspects as well. Necessary financial support should be granted for the project.
• Integration within the government department to ensure consistency of data • Assessment of local needs and customizing eGovernance solutions to meet those
needs • Change Management & Training: Train the government staff at all levels • Infrastructure: Connectivity and availability of ICT infrastructure across the
departments of government • Content: Use of local language, would promote the use of eGovernance systems
by citizens • Sustainability – EAI is as on‐going process. As data continues to change it needs
to be updated regularly. Therefore, a dedicated team of professionals & infrastructure is necessary to maintain EAI process.
CONCLUSION/SUMMARY–BENEFITS OF APPLICATION INTEGRATION IN EGOVERNANCE
In DIKW‐Hierarchy 18(abbreviating the terms Data, Information, Knowledge, Wisdom), data represents just a symbol or information and falls at bottom most of the ‘Knowledge Pyramid’. Insights can be drawn from the data only if it is made contextual.Therefore, ‘Application Integration’ initiative is recommended to develop more meaningful expressions from the siloeddata lying in various eGovernance systems.
An EAI initiative presents challenges described above dependent on the number of applications, data volume, etc.. Since there are already host of eGovernance applications, the earlier we go for integration the easier it will be to achieve rather than trying later when we would have more of these initiatives making it harder to amalgamate the data.
Firstly, application integration project helps individual departments to get their data corrected and updated in their systems. Secondly, the data becomes uniform across the systems used in the departments. Uniform data would help in matching, linking and consolidating multiple data sources together for efficient use by each and every public department.
Subsequently, the information can be shared to create single consistent view of citizensby giving accurate information (Name, address, date of birth, place of birth etc.): this implies name and address of the consumer in an electric bill would be same as in other service provider(s). 17Adapted from http://www.it.iitb.ac.in/~prathabk/egovernance/challenges.htmlaccessed on August 6, 2011 18 Derived from http://en.wikipedia.org/wiki/DIKWaccessed on August 8, 2011

30 E‐Governance: Techno‐Behavioural Implications
Integration would also help in making decisions, reports, forecasts, etc., and offering grievance management by the government departments.
ACKNOWLEDGEMENT
Authors acknowledge the support of Mrs. MaheshwariRajan, FCA, formerly Asst. Professor at Dr. V.N. Bedekar Institute of Management Studies (VNBIMS), for her reviews & guidance.
REFERENCES [1] Dr. Sanjay Buch, “Enterprise Application Integration (EAI) – A Changing Landscape of an IT
Organization”, Paper – ID 669, NJSIT‐2010 [2] http://dataflux.com/knowledgecenter/di “Data Integration – Moving Beyond ETL” by Data Flux (A SAS
Company), 2011, [3] Peter R Chase, The Seven Hidden Challenges of Application Integration, 2000 [4] www.tibco.com [5] www.tdwi.org

Applications Integration in e‐Governance–Opportunities & Challenges 31
ANNEXURE–A: IMAGINATION OF A NETIZEN
FIG. 1
Netizen Picture is acknowledged to © 1997 Mick Stevens from The Cartoon Bank.
ANNEXURE-B: TOUCH POINTS OF A CITIZEN
FIG. 2
ANNEXURE–C: COMMONLY KNOWN EAI TECHNOLOGIES AND THEIR FEATURES
EAI Technology
• ETL (Extract, Transform and Load) • EAI (Enterprise Application Integration) • EII (Enterprise Information Integration) • EDR (Enterprise Data Replication) • ECM (Enterprise Content Management) • In‐house developed

32 E‐Governance: Techno‐Behavioural Implications
Common Features in an EAI Tool
• Data transformation and aggregation • Data security • Data profiling and quality management • Metadata management • Error handling • Multiple data integration technologies • Real‐time data and event capture • Connectivity to main frames/Legacy data • Connectivity to packaged applications • Monitoring and debugging • Performance and scalability
ANNEXURE–D: PARTIAL LIST OF VARIABLES IN AN EAI PROJECT TABLE 1
Data Type • Structured (Through the application database) • Semi‐Structured (XML, ASCI, EXCEL,
ACCESS,…etc) • Unstructured (Document/Content management
database) • Packaged Application (ERP or any third party
integrated solution) • EAI (Third party solutions like TIBCO, IBM Web
sphere, MS Biz,..) • Web Service • Meta Data
Data Currency (latency) and access • Real‐time • Near real‐time • Point‐in‐time • Read‐only or read‐write
Data Organization • Homogeneous or Heterogeneous • Centralized or distributed (integrated data and
metadata) • Federated (Integrated data) or dispersed (no
integrated data)
Data Integration Technique/Mode • Consolidation, Federation, Propagation,
Changed Data capture • Event push or on‐demand pull • Synchronized or asynchronous
Data Transformation Requirement • Data restructuring • Data Cleansing • Data reconciliation • Data aggregation • Data extraction
Data Scale/Dimension • Number of database/data stores • Database/data store size • Volatility of database/data store

Integration of Virtualization with Cloud Computing: Challenges for Government & IT Industry
Amit Joshi Pacific University (Paher), Udaipur, Rajasthan
Email: [email protected]
Abstract—Virtualization and cloud computing comprise as platforms and operational models respectively. Virtualization is fast emerging and updating as a gamechanging technology in the enterprise computing space. It is viewed as a technology useful for testing and development and is affecting the entire datacentre ecosystem.
Cloud computing, the longheld dream of computing as a utility, has the potential to transform a large part of the IT industry, making software even more attractive as a service. Cloud computing refers to both the applications delivered as services over the internet and the hardware and systems software in the data centres that provide those services. The services are referred as Software as a Service (SaaS), Infrastructure as a Service (IaaS), Platform as a Service (PaaS).
With the increased penetration and uses of virtualization and cloud computing, the technology is well out of the concept stage and into fruition. Although mostly virtualization and clouds are often tied together, they are not necessarily fused. In this paper we have discussed all aspect of virtualization and cloud computing and the dependence of both on each other and the role played by virtualization when building or selecting cloud services for implementation.
The paper also highlights and discusses the drastic change which cloud computing has brought and describes its impact on IT industry.
Keywords: Virtualization, Cloud Computing, Data centre, Security, Cloud Vendors
INTRODUCTION
Many a times, emergent and vast setups in an IT company can become a bit too complicated to handle. Different servers, networks activities, operating systems, databases, programs etc that are being used in the company increase the complexity of design and can lead to management and security issues. This can be sorted out by using virtualization. Virtualization involves practices creating virtual components of the devices being used in IT areas. For example: virtual servers, disks or LAN. By using virtualization one can even reallocate and split up a server into sub servers or a LAN into sub virtual LAN. Though these sub servers and LAN work the same way as physical components they are actually virtual and you do not have to install new components.
Virtualization provides security and enables the organization for attaining significant gains in efficiency and cost‐effectiveness, along with the additional benefits of a greener consolidated data centre, increased scalability and improved time to resource fulfilment.
“cloud” computing – a very recent term, builds on decades of research in virtualization, distributed computing, utility computing, and more recently networking, web and software services. Cloud computing is a more recent and latest version of grid

34 E‐Governance: Techno‐Behavioural Implications
computing. It implies a service oriented and implemented architecture, reduced information technology overhead for the end‐user, great flexibility, reduced total cost of ownership, on‐demand services and many other things [1].
Cloud computing, considered as long‐held dream for making computing as a utility, has the potential to transform a large part of the IT industry, making software even more attractive as a service and shaping the way for designing IT hardware. Cloud computing can be considered now as a pay and use service. More you pay more services you get. With its growing features and demands the day is not far when the world will make greater use of the technology across server infrastructures, in other areas of the IT stack, and at the desktop is widely anticipated. The uptake and intake of software‐as‐a‐service (SaaS) applications such as salesforce.com, and the success of the service outsourcing demonstrate how centralized remote computing approaches also can provide more efficient ways to deliver technology resources to users, helping cloud computing to gain greater buy‐in from corporate decision‐makers. But as the industry is moving towards a better and new IT infrastructure play, what are the implications on IT security is a big issue.
Both IT practitioners and cloud providers face that there's a lack of integration across storage, backup, networking, security, and management functions in virtualized environments. This lack of implementation and integration is constricting their ability to more aggressively pursue virtualization and cloud computing and host more applications from their portfolios on both internal and external clouds.
The speed with which the clouds are forming and multiplying strongly suggests that cloud computing will not only meet many of the needs of enterprise computing as we have come to know it, but also could form the digital platform for a shaping strategy guiding next generation enterprises in their migration to and participation in such ecosystems. Without virtualization there we will not be able to access all features of cloud‐ that's what enabled the emergence of this new, sustainable industry”.
INTEGRATION OF VIRTUALIZATION & CLOUD COMPUTING
Cloud computing has become the latest buzzword in the IT industry among companies as it is expected to "free" people from their desktop computers/personal computers and let them access data services anytime, anywhere with the help of an network/internet connection. IT infrastructures have become too complex for the pace and dynamism of business in today’s scenario. 70% of current IT investment remains active and focused on maintenance, leaving little resources for innovation. With users clamoring and requiring for faster response times and management demanding lower costs, it needs a better strategy. Cloud computing offers a new model that cuts through IT complexity by leveraging the efficient pooling of on‐demand, self‐managed virtual infrastructure, consumed as a service.
Virtualization is an emerging IT paradigm/frame work that separates general computing functions and technology implementations/adaptations from physical hardware. Cloud computing is inclusive of virtualization and its features and a way to

Integration of Virtualization with Cloud Computing: Challenges for Government & IT Industry 35
implement it. However cloud can be implemented without virtualization and its features as well. Cloud and virtualization both help in order to deliver optimized resources, on‐demand utilization, shared data centers, flexibility and scalability. Cloud was implemented more of a outsourced/hosted application based model first and then slowly being adopted for virtualization within the enterprise firewall as an hosted architecture. Virtualization on hand is implemented and on the other hand was started within the boundaries and walls of enterprise firewall and then was utilized in hosted environments with latest trends.
ISSUES IN VIRTUALIZATION
Power and Head Costs
One of the major problems often overlooked is the high power consumption and high heat output of a physical server hosting multiple virtualized servers. Remember that virtualized and unauthenticated servers cause the hardware to run at a higher utilization rate, which means the power required to operate the physical server hardware goes up, as does the heat output.
A physical or additional server running and implementing many virtual machines may run at a constant 80% or higher utilization rate, at which point the hardware is pulling quite a bit more power than a non‐virtualized server running on average around 15% utilization.
Many data centres are not equipped to deal with the new power requirements that are necessary to support virtual servers. For example, you might require four 20‐amp power circuits for each 42U data cabinet that is fully loaded with standard 2U servers, in order to satisfy power needs and to provide power redundancy (the ability to withstand a single circuit failure). This power scheme is definitely double the standard power layout, which provisions only two 20‐amp power circuits per cabinet. Doubling and increasing the power per cabinet creates new problems of its own, especially if it means the data centre needs to upgrade its whole power infrastructure.
Management
Virtualization has also raised new management perquisites and concerns, especially in the areas of patching, backup, host provisioning, security, monitoring and hardware requirement.
Patching
In a large effective and virtualized production environment, it can be a challenge to apply software patches to both the physical host servers and the virtual machines. If system reboots/restarts are required, it impacts business a whole lot more to take down a physical machine hosting hundreds of virtual servers than it does to reboot a machine that serves as only one server.

36 E‐Governance: Techno‐Behavioural Implications
So while in a non‐virtualized and error free environment, a company may not have to significantly plan for downtime around a Windows Update patch, in a virtualized environment, patching and rebooting a single host server creates a much more significant impact. Planning downtime for and around something as simple as patching becomes an arduous task. Companies running vast and large enterprise environments with hundreds of virtualized host servers face a complicated maintenance window, leading some to apply only the most critical patches which leaves them in a more vulnerable state.
Some companies like for ex. Internet Security Systems (ISS), offer virtual security patch technologies to protect servers without having to go through the actual patching process. This does not, however, entertain and resolve the problem of applying stability or bug patches, which have to be applied on the physical server. In these cases, reboots are unavoidable.
The bottom line adopted is that physical server reboots/restarts can be very costly in virtualized platforms.
Backup
Implementing a sound and effective backup solution in a virtualized environment is another major pain point. The first and foremost question is what data do you want to backup, which is then quickly followed by how often? Is the answer backing up your entire virtual disk repository and all disk images? Or perhaps you should consider only backing up the base images and then the various REDO or UNDO disks?
Either way, you could be facing an uphill battle. The correct amount of data required to be backed up can be staggering. Unless the company is good enough to have a very robust SAN or some kind of a backup‐to‐disk solution, backing up many terabytes of data to tape is way too slow and inefficient, and we still haven't even considered how to go about backing up the physical host server or its operating system configuration.
Provisioning
Automated physical host provisioning is highly desirable and can cut down drastically on the physical server deployment time. But physical server provisioning is only half the battle. We have to consider automated provisioning of the virtual servers once the physical host server is up and running and fully configured.
Many technology companies provide an automated solution for deploying and provisioning physical servers. Many of those same companies, such as Altiris, are now capable of automatically provisioning virtual servers as well. But the process can be complex, especially if your organization has a heterogeneous virtualization environment with multiple virtualization platforms such as VMware and Microsoft Virtual Server. The additional complexity of automating both a physical and virtual environment has to be carefully weighed and considered.

Integration of Virtualization with Cloud Computing: Challenges for Government & IT Industry 37
Security
Security issues are more complex in a virtualized environment because you now have to keep track of security on two tiers: the physical host security and the virtual machine security. If the physical host server's security becomes compromised, all of the virtual machines residing on that particular host server are impacted. And a compromised virtual machine might also wreak havoc on the physical host server, which may then have an ill effect on all of the other virtual machines running on that same host.
Monitoring
Monitoring is another critical and equipped area in which virtualization has its own set of challenges and unique problems. You will have to monitor both the virtual servers and the physical/virtual machines to make sure that your environment is fully operational, since losing a physical host server translates to losing several virtual machines.
Running monitoring and configuring software or agents on the physical host server can potentially cause a negative impact to the performance of the virtual machines by taking away valuable memory and CPU cycles that would be consumed by the virtual machines. It's important to obtain the percentage of physical resources used by the monitoring software to see if you can spare those resources.
CLOUD COMPUTING
Cloud computing is essentially the ability to deliver a resource on demand, configured however the users chooses, and paid for according to consumption. From a supplier's perspective, including both service providers and internal IT groups, it means being able to deliver and manage resource pools and applications in a multi‐tenancy environment, to deliver the user an on‐demand, pay‐per‐use service. A cloud service can presumed to be infrastructure for hosting applications or data storage, a development platform, or even an application that you can get on‐demand, either off‐site at a provider, such as SunGard or Sales force, or built onsite within IT.
But even more rapidly, we have seen new technologies evolve over the past decade that are essential to the notion of the cloud. The key technology is virtualization. In addition to few amazing cost savings and goodness for the environment, virtualization's ability to separate the OS and application from the hardware give it ideal properties to best deliver these on‐demand cloud services. Charles King, A Principal Analyst at Pund‐IT put it succinctly: "Without virtualization there is no cloud‐ that's what enabled the emergence of this new, sustainable industry."
In a typical cloud scenario, a user uploads the code and data of their workload to a cloud provider, which in turn runs this workload without knowledge of its code internals or its configuration. Users benefits from offloading the management of their workload to the provider, while the provider gains from efficiently sharing their cloud

38 E‐Governance: Techno‐Behavioural Implications
infrastructure among workloads from multiple users. This sharing of execution environment together with the fact that the cloud user lacks control over the cloud infrastructure raises significant security concerns about the integrity and confidentiality of a user’s workload. One underlying mechanism enabling cloud computing is virtualization, be it at the hardware, middleware, or application level. While a large amount of research has focused on improving the security of virtualized environments, our ongoing work on building virtualization‐aware security mechanisms for the cloud has taught us that existing security techniques do not necessarily apply to the cloud because of the mismatch in security requirements and threat models.
Features of Cloud Computing
• Cloud provides the resources, which are on demand as there is isolation so no need to actual sharing.
• It is heterogeneous in nature. • It adds the virtualization to the data and hardware resources too. • It deals with end user security. • Up‐to‐date Clouds are operated by single companies, but we envision federated
Clouds facing similar problems as grids [2], [3]. • Clouds are easily usable hiding the deployment details from the user [4], [5]. • Cloud users are regularly billed using a pay per‐use model. More advanced
payment models and SLA enforcement in a federated Cloud are just starting to be explored that will tear down one of the barriers to moving traditional applications to the Cloud: the loss of cost control [6].
• Clouds also provide limited set of features exposed (i.e. they present a higher abstraction level to the user). For instance, the Simple Storage Service by Amazon can be regarded as a limited data Grid when compared to the CERN data Grid [7].
Cloud Computing Players in India
As a key player in the it field, india is poised to be a billion dollar market in the next 5 years according to a study by an it infrastructure firm. The study claims that this growth will be driven by the rapid increase in data such as text and media moving online.
Some numbers shared in the study are quite interesting, it is expected that information stored online will reach a staggering 2.3 million petabytes (from 40,000 petabytes.) India’s top it firms, infosys, tcs, wipro and tech mahindra have cloud projects to their names. The competition is fierce as the market is nascent and big international names like microsoft, ibm have dedicated resources as well. Support from the government to get basic infrastructure (cheaper and faster internet) in place will go a long way in ensuring india’s it prominence [8]. The cloud computing players of india are shown in table i. In year 2010 microsoft and hp got into a strategic partnership to provide businesses with end‐to‐end cloud solutions. 2010 has also been dubbed as the “year of the cloud”.

Integration of Virtualization with Cloud Computing: Challenges for Government & IT Industry 39
The major cloud computing companies are shown in table 1. TABLE 1: CLOUD OFFERINGS BY COMPANIES
Figures for Cloud Computing in India
Gartner estimated that SaaS market in India was US$27 million in 2007. According to a study by Springboard Research, the Indian SaaS market would experience a CAGR (compound annual growth rate) of 77% during 2006‐2010 and will reach US$165 million in 2010 [9]. In September 2008, IBM opened a cloud centre in Bangalore, which targets mid‐market vendors, universities, government bodies and microfinance and telecommunications companies [10]. Indian universities are banking and generating records on the cloud to develop innovative research and education activities. The Indian Institute of Technology (IIT), Kanpur and other academic institutions use the cloud [11], [12].
In July 2009, VMware opened a cloud centre in Pune. Likewise, the U.S. Company, Parallels announced a plan to establish cloud operations in India [13]. In November 2009, Microsoft India announced commercial availability of cloud services such as e‐mail, collaboration, conferencing and productivity starting US$2 per user per month [14]. These services are mainly targeted to SMEs.
The SaaS vendor, Salesforce.com, which started its operations in 2005, is focusing on cities such as Bangalore, Gurgaon and Mumbai and is taking measures to create cloud awareness. Salesforce.com clients include big companies such as Bharti AXA General Insurance, eBay India, Sify Technologies, Polaris Software Labs, Lodha Group, Servion, Maytas Properties, HCL, Sasken Communication Technologies, Ocimum Biosolutions, and state owned National Research Development Corporation (NRDC) [15]. The Indian off shoring industry is probably the prime example of an industry that is likely to feel the impact of cloud computing. The demand for cloud related services is especially high in the offshoring industry and technology hubs such as Bangalore and Delhi [16].

40 E‐Governance: Techno‐Behavioural Implications
According to a study by India’s National Association of Software Companies (NASSCOM) and Mckinsey, remote infrastructure management will be a US$15 billion industry in India by 2013 [17].
The India Data Center Services market is growing very fast and is expected to grow at a 23% CAGR over the three years to 2012. Third Party Data Center Services are slated efficiently to grow at 34 during the same period. These key and major findings have emerged from a new CyberMedia Research (CMR) study titled India Data Center Services Market Review 2011.While 80% of data center services business was still driven by captive data centers in 2010, it is the growth story for third‐party data center services, which would show greater promise going forward. In the three years to 2012, the India third‐party data center services market would grow at a CAGR of 34% as compared to a more moderate CAGR of 23% for overall India data center services.
The percentage ratio of the Indian market is shown in figure 1.
FIG. 1: INDIAN MARKET ANALYSIS
Source: Cloud, Virtualization: State of The Market 2011 Survey, February 10, 2011
Challenges of Cloud Computing
Today, new and established vendors are trying to deliver cloud services. The challenge for end users becomes choosing the right offering. Many of the offerings are efficiently designed to encourage development on the vendor's proprietary platform, limiting switching abilities and propagating the offering through applications built for the external cloud only. This is appealing and informative to the development community as it enables quick access to infrastructure and development platforms on which to create a cloud application. But this can become a nightmare for serviced provided by IT when the application has to come back into the enterprise for production‐level support, as well as
Integration of Virtualization with Cloud Computing: Challenges for Government & IT Industry 41
dealing with SOX and IP risks. The viability and authenticity of this solution is potentially the unearthing of a more significant problem, the inability of IT to deliver infrastructure on demand to meet the dynamic needs of these groups. However in many cases, unless you're going to build an application from scratch, most businesses don't have the time or resources to rewrite their production applications to work in the cloud on a proprietary platform.
Users should choose a cloud strategy that enables the fastest development time for new applications, with the broadest support for various OSs and development environments, as well as the ability to support production‐level applications on‐ and off‐premise as needed.
The other challenge is mobility and choice in location for running applications, internally in a private cloud or externally in a public cloud. Another approach we see in the market is the "superstore phenomenon." Organizations such as Amazon, Microsoft and Google all plan to battle it out over whose superstore data centre will be the place your developers will build and house their cloud applications. It is true that these are all stable brands and their infrastructure will likely be a safe place to run your applications; however, in the event of outages, downtime and the inability to access your applications, what options will you have? Additionally, how will you manage these instances, where they live long term and what risks will be imposed by keeping them off site? Users should be able to move their applications at will from one cloud to another, whether internally or externally.
Obviously, the encapsulation offered in virtualization and the mobility found in technology like VMware VMotion ‐ which enables a live virtual machine to be moved with no downtime for the application ‐ increase a user's ability to move virtual machines as needed. VMware's approach to the cloud is not about vendor lock‐in, but is about enabling its ecosystem of partners to build and deliver services on a common platform, allowing users to simplify the federation of clouds, on or off premise as needed, to a broad base of service providers.
Role of Virtualization in Building/Selecting Cloud Services/Vendors
Clearly, there's a new trend which is emerging with lots of options, but also many challenges that could cost big money to reverse. How does virtualization address such challenges and allow a seamless transition to a cloud strategy, either on‐ or off‐premise?
As mentioned the key requirements you should demand from your cloud providers are: broad application support without lock‐in, ease in mobility of environments, broad choice of locations (internal or external), and innovation that drives simplified federation of on‐ and off‐premise clouds. Additionally, as an enterprise, a look for innovation in building the internal (private) cloud to evolve your ability to offer dynamic services.

42 E‐Governance: Techno‐Behavioural Implications
As noted, virtualization is the key. Most companies' first step on the virtualization path is to consolidate their servers, using virtualization to run multiple applications on each server instead of just one, increasing the utilization rate of (and getting more value from) every server and, thus, dramatically reducing the number of servers they need to buy, rack, power, cool, and manage.
Having consolidated servers, you realize that not only have you substantially cut the capital and operating costs of your server environments, but as a result the entire data centre has become far more flexible. Along the way, you may have started to think about and to use IT resources ‐ including servers, storage, networks, desktops, and applications ‐ not as isolated silos that must be managed individually but as pools of resources that can be managed in the aggregate.
This means that you can now move resources around at will across the network, from server to server, data centre to data centre, and even out into the cloud, to balance loads and use compute capacity more efficiently across the entire global IT environment. In other words, users look at the computing power as a centralized resource that they can now allocate to business units on demand, while still maintaining control and operational excellence. Leveraging virtualization to efficiently serve users gives your organization the obvious lower TCO, but also allows for accountability of usage, simplifies and meets the needs of on‐demand infrastructure requests, and allows for your ability to serve, control and manage SLAs.
With the largest choice for location and interoperability of platforms, the broadest application and OS support, and leading virtualization and cloud technologies, VMware and its cloud strategy offer users a safe, reliable, and robust on‐ramp to the cloud, whether on or off premise.
Major Challenges for Government in Implementation of Cloud Computing
• Scalability. • High Reliability. • Securing Data in the Cloud. • Open Standards and Interoperability. • Revise Procurement Practices. • Resolve Potential Legal Issues. • Regulate the ‘Cloud Market’. • Redefine the Roles of the IT Workforce. • Assess and renders the Return on Investment of Cloud Computing. • Government Cloud Coordination.
Impact on IT industry
The Cloud has become the way that people live now. It has become the part and way of life. If an example of Facebook is taken, about 500 million people today keep their photo albums in the Cloud. Over 87,000 companies in the world use the Cloud. Some of them are small start‐ups, others are some of the largest organizations in the world. “Dell”, for

Integration of Virtualization with Cloud Computing: Challenges for Government & IT Industry 43
instance adopted and deployed collaboration tool across 100,000 employees in recent days. Accordingly, it could be said that Cloud computing means, the technology being used at the other end is invisible and irrelevant as far as the customer's concerned. The Cloud is never about technology, it is the abstraction of technology for delivering pure services. The Cloud services has finally led to the civilization of services because, in the case of Cloud computing, what you pay for is what you get [18].
FUTURE OF CLOUD COMPUTING IN INDIA
National e‐governance plan, has some 27 mission mode projects. About 11 projects are in the state sector, five each, that states can choose, which makes it 16 projects in the state sector alone. When these 16 projects are executed across 35 states, it will become something like 600 projects. Further, a single project in the municipalities, that itself send the number of projects to thousands. There is a huge opportunity in the government for cloud computing implementation, due to the amount of time and the resources are wasted for doing a standard way of procurement, as no alternative is available. Cost cutting is another issue. “the way forward is to have a private cloud,”
The figure shows how cloud services are being used in India and what would be there future. The figure states that till now we were using a traditional cloud services. Now we have moved to Virtualized services which are of prime importance.
FIG. 2: CLOUD SERVICES SCENARIO
CLOUD COMPUTING BENEFITS FOR GOVERNMENT SECTOR
Lower ICT costs
Sustainable reduction to certain extent in the operational costs and behaviour of ICT across the public sector. Reduction in the cost of transition and translation of applications or services to a new provider or user. Rationalization of the applications have been made across the public sector resulting in:

44 E‐Governance: Techno‐Behavioural Implications
• A significant reduction in application numbers. • Aggregated demand becomes less for the reduced numbers of applications. • Higher volume discounts (availed) for common applications.
An overall reduction in the procurement cost(including benefits) of new services (both common and bespoke) through collective purchasing processes.
Faster, More Flexible, and More Joined up Government Services
To support a better citizen and user level experience of government services by allowing government to provide new ICT and technical services faster to meet citizen needs. Enabling improved responsiveness (for cloud services) to ministerial and business generated changes through faster deployment of ICT and technical services.
Reduction in the Government ICT Services Carbon Footprint
Through consolidating and optimizing use of spare ICT capacity and decommissioning unused capacity. Adoption of more carbon efficient technology.
Efficient Data Centre Estate
Data centre consolidation will reduce the number of data centers so the services used by central government to host government cloud and other ict services to between approximately 10 and 12, and should target a 60‐80% reduction for the broader public sector. This will bring substantial savings in cost(for services) and energy consumption. By establishing the government cloud and implementing data centre consolidation will involve change in the way that ICT is procured and supplied, which will in turn require new ways of working in both ict suppliers and public sector organizations.
Delegation of Non-critical Applications
Outsource non‐critical applications to service providers and focus agency it resources on business‐critical applications.
Better Collaboration
Sharing documents and group collaboration: applications and documents accessible from anywhere in india, facilitating group collaboration on documents and projects.
CONCLUSION
Cloud computing is the next big wave in computing. It has many good features and benefits, such as better hardware management, since all the computers are the same and run the same hardware. It also provides better and easier management of data security, since all the data is located on a central server, so administrators can control who has and doesn't have access to the files.

Integration of Virtualization with Cloud Computing: Challenges for Government & IT Industry 45
Cloud computing infrastructures have become next generation platforms that can provide tremendous value to companies of any size. They can help companies achieve more efficient use of their IT hardware and software investments and provide a means to accelerate the adoption of innovations. Cloud Computing increases profitability by improving the resource utilization. Costs are driven down by delivering appropriate resources only for the time those resources are needed.
Virtualization is the technology that has allowed service providers to deliver lower‐cost hosting environments to businesses of all sizes today. Just as virtualization enabled for consolidation of servers and do more with less hardware, it also lets you support more users per piece of hardware, and deliver applications ‐ and the servers on which they run ‐ faster to those users. Virtualization has played and often continues to play a huge role in cloud computing.
REFERENCES [1] B. Rochwerger, D. Breitgand, E. Levy, A. Galis, and K. Nagin et al. The reservoir model and architecture
for open federated cloud computing. IBM Systems Journal. Submitted for publication. [2] Cloud Burst: Salesforce Leaps Ahead, www. networkcomputing, July
2009.http://networkcomputing.in/Cloud‐Burst‐Salesforce‐Leaps‐Ahead‐Special‐Feature‐001Jul009.aspx (Accessed 1 December 2009).
[3] Dion Hinchcliffe. 2007: The year enterprises open their soas to the internet? ZD Net, January 2007. Electronic magazine, article available at http://blogs.zdnet.com/Hinchcliffe/?p=77.
[4] Get your software from a cloud, save money, 23 April 2009. http://economictimes.indiatimes.com/Infotech/Software/Get‐your‐software‐from‐a‐cloud‐savemoney/ articleshow/4438436.cms (Accessed 1 December 2009).
[5] Google, Zoho Challenge Microsoft Abroad, Too, September 13.http://www.businessweek.com/technology/content/sep2009/tc20090911_644394.htm. (Accessed 1 December 2009).
[6] http://www.amazon.com/gp/browse.html?node=16427261 dated 29 January, 2011. [7] http://www.expresscomputeronline.com/20101213/interview01.shtml
(Accessed on March 21, 2011). [8] http://www.zdnet.com/blog/india/cloud‐computings‐latest‐battlefield‐india/179. Retrieved 2011–
03–20. [9] IBM’s India lab to innovate cloud computing solutions, September
24.http://www.livemint.com/2008/09/24222631/IBM8217s‐India‐lab‐to‐innov.html (Accessed 1 December 2009).
[10] Indian industry seeks cutting edge IT solutions from vendors, Indo‐Asian News Service, August 17, 2008.
[11] Irving Wladawsky‐Berger. Cloud computing, grids and the upcoming cambrian explosion in it. Keynote at the 22nd Open Grid Forum, abstract available at http://www.ogf.org/OGF22/.
[12] Jeremy Geelan. Twenty one experts define cloud computing. Virtualization, August 2008. Electronic Magazine, article available at http://virtualization.sys‐con.com/node/612375.
[13] Microsoft evaporating to a Cloud, Hindustan Times November 9, 2009. [14] Mladen A. Vouk, Cloud Computing – Issues, Research and Implementations, Journal of Computing and
Information Technology ‐ CIT 16, 2008, 4, 235–246. [15] Nir Kshetri, Cloud Computing in Developing Economies: Drivers, Effects and Policy Measures, PTC’10
Proceedings. [16] Rajkumar Buyya, Chee Shin Yeo, and Srikumar Venugopal. Market‐oriented cloud computing: Vision,
hype, and reality for delivering it services as computing utilities. CoRR, (abs/0808.3558), 2008.

46 E‐Governance: Techno‐Behavioural Implications
[17] Significant Part of India will Adopt Cloud, July 31.http://www.channeltimes.com/India/News/Significant_Part_of_India_will_Adopt_Cloud/551‐105021‐819.html. (Accessed 1 December 2009).
[18] XIBM launches cloud computing center in India, September 25, 2008. http://www.infoworld.com/news/feeds/08/09/25/IBM‐launches‐cloud‐computing‐center‐in‐India.html (Accessed 1 December 2009).

Cloud Services for Consumer in Federated Environment– Simple View of Discovery and Monitoring
Vivek Gaur1, Praveen Dhyani2 and O.P. Rishi3 1Birla Institute of Technology, Mesra Ranchi Ext. Centre, Jaipur, Rajasthan
2Rajasthan Central University, Rajasthan 3Rajasthan Central University, Rajasthan
Email: [email protected], [email protected], [email protected]
Abstract—Cloud Computing has become a scalable services consumption and delivery platform in the field of Services Computing. Cloud services and Service oriented Architecture designed to facilitate rapid prototyping and deployment of on demand services that enhance flexibility, communication performance, robustness, and scalability. In this paper, we propose an architectural framework, which effectively maps the user requirements with the available cloud services and their providers, and enable quality monitoring and service migration, which would be intelligent as well as accessible by all.
Keywords: Cloud computing, Service Level Agreement, central service depository, service discovery and monitoring agent.
INTRODUCTION
The goal of Cloud Computing is to share resources among the cloud service consumers, cloud partners, and cloud vendors in the cloud value chain. The resource sharing at various levels results in various cloud offerings such as infrastructure cloud (e.g. hardware, IT infrastructure management), software cloud (e.g. software as service, focusing on middleware as a service, or traditional customer relation management (CRM) as a service, application cloud (e.g. application as a service, unified modeling language, modeling tools as a service and social network as a service), and business cloud (e.g. business process as a service) (Karuna &Tim&Yelena,2009).
The availability of the multiple services by multiple providers is like looking for a needle in a haystack for the consumer. So, it has become very necessary to facilitate the user with a tool to help to get the service that is best suited to his requirements with the highest level of satisfaction.
The Discovery and Monitoring component undertakes the following activities:
• Updates the resource status metrics including utilization, heat dissipation, power consumption based on feedback given by the sensor component;
• Facilitates the market and policy engine in periodically publishing the pricing policies, SLA rules to the Cloud Exchange;
• Aids the scheduling and allocation component in dynamically discovering the clouds that offer better optimization for SLA constraints such as deadline and budget limits; and

48 E‐Governance: Techno‐Behavioural Implications
• Helps the virtualization component in determining load and power consumption; such information aids the Virtualization component in per‐forming load‐balancing through dynamic VM migration. [Rajkumar et. al 2009]
Several similar attempts have been made to address the problem either in form of resource allocation and scheduling by (Rajkumar, 2009) or a lifecycle of IT services in a cloud environment by Karuna, 2009. He suggested a methodology that divides the IT service lifecycle on the cloud into five phases. In sequential order of execution they are requirements, discovery, negotiation, composition, and consumption.
The work describes each phase and it’s sub‐phases in detail along with the information that needs to flow between them. We extend the work by emphasizing the phases in particular the service discovery and monitoring phase with an aim to enable the consumer to avail the best required and matched services provided by the different service providers and pay – as –you use.
The service discovery process is suggested to do searching and matching, using efficient search algorithm. For example, nearest neighbors’ algorithm and similarity matrix for monitoring the delivered services.
PROPOSED FRAMEWORK METHODOLOGY
We divide the work in two phases to address the service discovery and service monitoring. The work suggests design of components for proposed framework and their integration as follows:
Service Discovery: Service providers that offer services matching the specifications detailed in the RFS are searched (or discovered) in the cloud. The discovery is constrained by functional and technical attributes defined, and also by the budgetary, security, data quality and agent policies of the consumer [karuna, 2009].
The consumer makes the request for service along with specific parameters to the Service discovery engine as computing cloud. This engine searches for the best‐matched service available or provider using nearest neighborhood algorithm. The central service registry serves as a storage cloud to maintain the matched services provided by the service provider so that to optimize the searching and matching process. In case a new service provider is needed to fetch the required service the comparison will take place among the entire N service provider for any P service.
Service Monitoring
Enable quality monitoring and service termination, if needed. This will involve alerts to humans or automatic termination based on policies defined using the quality related ontology that need to be developed. The service monitor sub‐phase measures the service quality and compares it with the quality levels defined in the SLA. This phase spans both the consumer and cloud areas, as performance monitoring is a joint responsibility. If the consumer is not satisfied with the service quality, s/he should have the option to terminate the service and stop service payment (Karuna 2009).
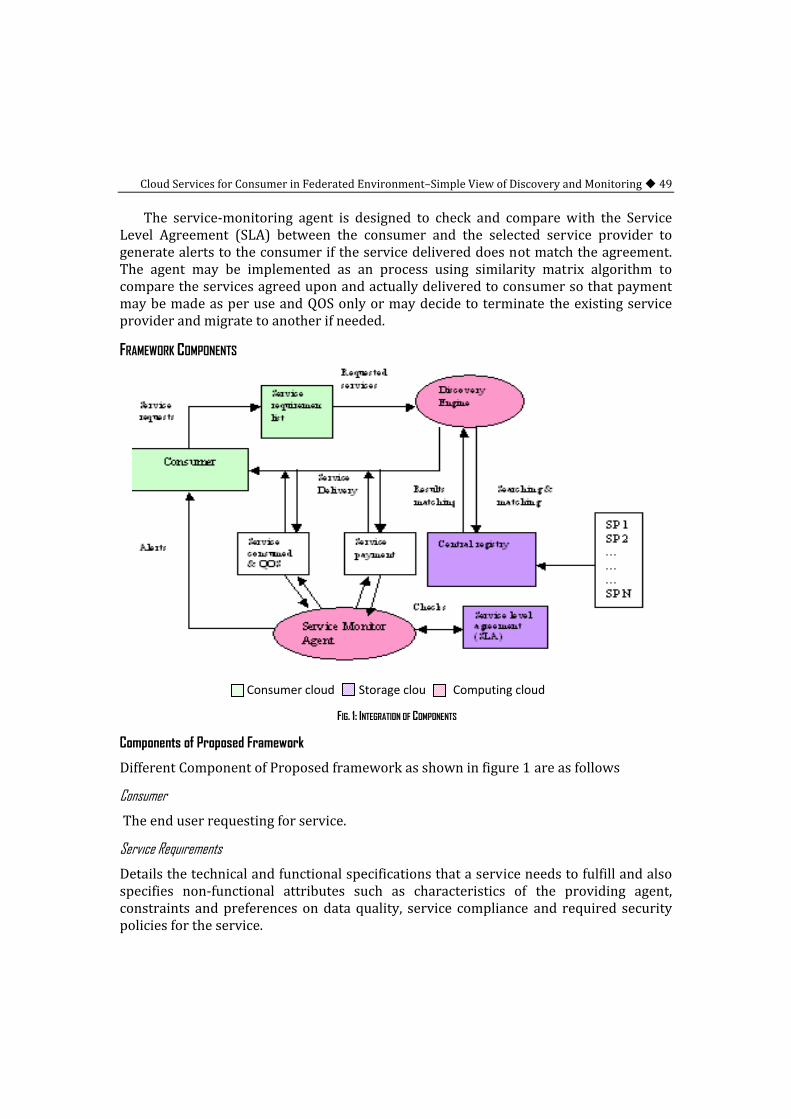
Cloud Services for Consumer in Federated Environment–Simple View of Discovery and Monitoring 49
The service‐monitoring agent is designed to check and compare with the Service Level Agreement (SLA) between the consumer and the selected service provider to generate alerts to the consumer if the service delivered does not match the agreement. The agent may be implemented as an process using similarity matrix algorithm to compare the services agreed upon and actually delivered to consumer so that payment may be made as per use and QOS only or may decide to terminate the existing service provider and migrate to another if needed.
FRAMEWORK COMPONENTS
Consumer cloud Storage clou Computing cloud
FIG. 1: INTEGRATION OF COMPONENTS
Components of Proposed Framework
Different Component of Proposed framework as shown in figure 1 are as follows
Consumer
The end user requesting for service.
Service Requirements
Details the technical and functional specifications that a service needs to fulfill and also specifies non‐functional attributes such as characteristics of the providing agent, constraints and preferences on data quality, service compliance and required security policies for the service.
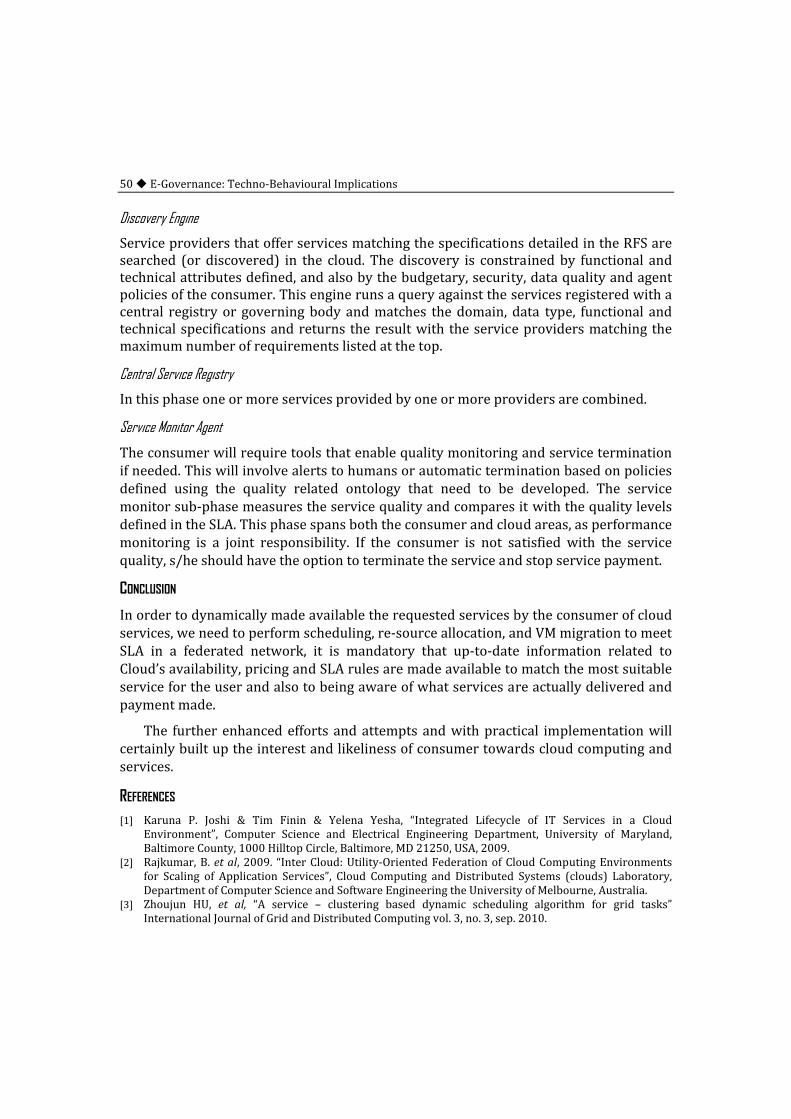
50 E‐Governance: Techno‐Behavioural Implications
Discovery Engine
Service providers that offer services matching the specifications detailed in the RFS are searched (or discovered) in the cloud. The discovery is constrained by functional and technical attributes defined, and also by the budgetary, security, data quality and agent policies of the consumer. This engine runs a query against the services registered with a central registry or governing body and matches the domain, data type, functional and technical specifications and returns the result with the service providers matching the maximum number of requirements listed at the top.
Central Service Registry
In this phase one or more services provided by one or more providers are combined.
Service Monitor Agent
The consumer will require tools that enable quality monitoring and service termination if needed. This will involve alerts to humans or automatic termination based on policies defined using the quality related ontology that need to be developed. The service monitor sub‐phase measures the service quality and compares it with the quality levels defined in the SLA. This phase spans both the consumer and cloud areas, as performance monitoring is a joint responsibility. If the consumer is not satisfied with the service quality, s/he should have the option to terminate the service and stop service payment.
CONCLUSION
In order to dynamically made available the requested services by the consumer of cloud services, we need to perform scheduling, re‐source allocation, and VM migration to meet SLA in a federated network, it is mandatory that up‐to‐date information related to Cloud’s availability, pricing and SLA rules are made available to match the most suitable service for the user and also to being aware of what services are actually delivered and payment made.
The further enhanced efforts and attempts and with practical implementation will certainly built up the interest and likeliness of consumer towards cloud computing and services.
REFERENCES [1] Karuna P. Joshi & Tim Finin & Yelena Yesha, “Integrated Lifecycle of IT Services in a Cloud
Environment”, Computer Science and Electrical Engineering Department, University of Maryland, Baltimore County, 1000 Hilltop Circle, Baltimore, MD 21250, USA, 2009.
[2] Rajkumar, B. et al, 2009. “Inter Cloud: Utility‐Oriented Federation of Cloud Computing Environments for Scaling of Application Services”, Cloud Computing and Distributed Systems (clouds) Laboratory, Department of Computer Science and Software Engineering the University of Melbourne, Australia.
[3] Zhoujun HU, et al, “A service – clustering based dynamic scheduling algorithm for grid tasks” International Journal of Grid and Distributed Computing vol. 3, no. 3, sep. 2010.

Cloud Services for Consumer in Federated Environment–Simple View of Discovery and Monitoring 51
[4] Rastogi, A (2010). “A Model based Approach to Implement Cloud Computing in E‐Governance” International Journal of Computer Applications (0975–8887) Volume 9–No. 7, November 2010.
[5] Joshi K. (2009). “A Framework for Relating Front stage and Backstage Quality in Virtualized Services”, UMBC Tech Report TR–CS–09–01, May 2009.
[6] C.S. Yeo & R. Buyya. 2009. “Utility oriented scheduling and allocation in federation environment of computing system”, (clouds) Laboratory, University of Melbourne, Australia.

Towards a New Paradigm Knowledge as a Service (KaaS) from e-Governance Cloud for Citizens of the Country
Tejas Shah M.Sc. (I.T.) Programme, Veer Narmad South Gujarat University, Surat
Email: [email protected]
Abstract—The cloud computing is emerging as a servicing infrastructure, providing the support for the use of already existing services. The citizen of any country is striving for the knolwedge from realted governance. In this paper the focus is given on generation of knowledge by incorporating Knowledge as a Service (KaaS) paradigm in egovernance. The egovernance exisiting frameworks are providing information to citizens and other stakeholders limited to the country and state. If the different governments' system are merged in one egovernance cloud, and if KaaS paradigm is implemented, then available knowledge will be directly utilized as a service. With the help of egovernance any customer (citizen) can be in touch with government in 24*365 pattern. The problem of scarcity of the resources and services in developing countries like India can be solved through cloud computing. My focus in this paper is that stakeholder will also get the required and knowledgable content from the country wide egovernance cloud. This analysis opens a new vision of knowledge empowerment by extracting knowledge from egovernance cloud.
Keywords: Knowledge as a Service, cloud computing, egovernance, KaaS paradigm
THE E-GOVERNANCE CLOUD
The e‐governance in India is enhancing, and several projects are successfully implemented like “E‐chaupal”, “Gyandoot” etc. The KPMG in India has supported numerous successful initiatives across various government sectors and has specialized experience in multiple domains mentioned below (Advisory of KPMG in India ‐ 2009)
• Education • Health • Infrastructure (utilities) • Emigration • Revenue, Excise & Taxation • Transport & Logistics • Urban Development • Rural Development (Panchayati Raj) • NeGP Infrastructure
The report have studied the services of domain specialists for specific deliverables in each of the projects undertaken. This strategy can add value to clients by ensuring that the advise offered by them is based on well‐informed, sound and knowledgeable inputs which are enriched with the ground experience.
The book (UN government survey – 2008) focuses that for public sector managers e‐government symbolizes the immensely complicated set of challenges in creating more interoperable architectures in order to facilitate front‐end outcomes, either by the release of resources which would otherwise be deployed in back office processing or

Towards a New Paradigm Knowledge as a Service (KaaS) from e‐Governance Cloud for Citizens 53
through improvements in business processes and information management that enable front‐end delivery and social policy development. So, the e‐governance network need to be integrated into one e‐governance cloud.
Cloud Computing refers to both the applications delivered as services over the Internet and the hardware and systems software in the datacenters that provide those services. These services themselves have long been referred to as Software as a Service (SaaS). The datacenter hardware and software is called a cloud. When a Cloud is made available in a pay‐as‐you‐go manner to the general public, it can be called as Public Cloud; the service being sold is Utility Computing. The term Private Cloud refers to internal datacenters of a business or other organization not made available to the general public. Thus, Cloud Computing is the sum of SaaS and Utility Computing, but does not include Private Clouds. People can be users or providers of SaaS, or users or providers of Utility Computing. The focus on SaaS Providers (Cloud Users) and Cloud Providers, which have received less attention than SaaS Users (Above the clouds, technical report ‐ 2009). When we are talking about the e‐governance cloud, it can be useful to the normal citizen of the country at nominal cost.
The Software as a Service (SaaS) paradigm is the main theme of cloud computing. It is possible to have the knowledge cloud especially e‐governance knowledge cloud from which we can generate a new paradigm related to the knowledge extraction and the use of the that knowledge in an effective manner. This paper focuses the Knowledge as a Service (KaaS) paradigm, which constructs the knowledge available from different e‐governance network and strategies.
With the advancement in web based services, the e‐governance is playing vital role for making everything online and information is accessible from anywhere anytime. Using Information Communication Technology, e‐governance is approaching the citizens to provide them web‐based services at lower cost and higher efficiency. Among the various components of e‐governance, using G2C the citizen can directly interact with Government as mentioned by Soha Maad et Al. (2005). When the end user, here the citizen wants to get some knowledge regarding its own family detail or related to the professional work from the government like income tax, from any channels it should be available by sharing the network of the e‐governance.
The KaaS paradigm in e‐governance cloud tries to establish an appropriate match between the citizen and the e‐governance cloud. The e‐governance is now not limited to serving from one central portal. There are many more services available in an effective manner. Some of the services are mentioned below.
Services of e-Governance
• National Citizen Database • Income Tax • Insurance • Pensions • Passport and Immigration

54 E‐Governance: Techno‐Behavioural Implications
• Central Excise • Land Records • Property Registration • Road Transport • Police • Agriculture • Employment Exchanges
The state government and central government already offer these services. But the horizon of this e‐governance is in innovating mode. With the enhancement of web based services, many internet users of the country are now connected with each other. The government is also planning to give best services from the available resources. But the developing countries are running short of the resources, where many villegers are unable to register for their birth, death and marriage. With the new enhancement in e‐governance, every citizen will be able to get the required information. The e‐governance services can be helpful to provide job services across the state for employees. The e‐chaupal and e‐gyandoot, which have been already established in many states of India, but still there are many challenges for agriculture crops, land registration, and commodities market.
The use of latest knowledge based system helps in many areas of e‐governance. The normal citizen, farmers, advocate, tax payers, land owners can take the advantage of already developed and existing system within the e‐governance network converted into cloud. The e‐governance cloud is aim to provide the various governance services mentioned earlier to the direct end users of the country. The knowledge extraction and collaboration from the existing e‐governance networked system will benefit a lot with cost effectiveness. The cloud‐computing era is trying to provide the users everything as a service. As the service‐oriented architecture is producing meaningful information with the integration of all the services, we can consider the knowledge as a service to be used only as and when required. The provision of knowledge as integrated service from the modern knowledge based system collaborating with the cloud computing has been discussed here.
KNOWLEDGE AS A SERVICE (KAAS) PARADIGM
With the use of Knowledge as a Service (KaaS) paradigm one can be benefited from reusability and sharing of the data. E.g. The citizen of the country can have the required content and respective semantics of the governance from the knowledge cloud system. Another advantage is to reuse the knowledge, which emerges from the collection of components.
The application usage of the knowledge based system is placed on the cloud, so everyone can access it and users need to pay only for what they are using. But for general service like birth and death certificate, it should be easily available and accessible at nominal cost.

Towards a New Paradigm Knowledge as a Service (KaaS) from e‐Governance Cloud for Citizens 55
FIG. 1: THE KAAS PARADIGM IN E-GOVERNANCE CLOUD
The Knowledge as a Service Paradigm will include following components. When knowledge system is implemented inside, the cloud Knowledge can be used as the separate service relevant to the application. Here the consideration of knowledge paradigm is with respect to the e‐governance cloud system.
Software as a Service (SaaS)
A SaaS application runs entirely in the cloud (that is, on servers at an Internet‐accessible service provider). The on‐premises client is typically a browser or some other simple client. The most well‐known example of a SaaS application today is probably Salesforce.com, from where user can get the direct service of provider.
Attached Services
Every on‐premises application provides useful functions on its own. An application can sometimes enhance these by accessing application‐specific services provided in the cloud, as these services are used only by this particular application, they can be thought of as attached to it. For example, Apple’s iTunes which can work as desktop application used for playing music, recording sound and many more applications, while an attached service allows buying new audio and video content. Microsoft’s Exchange Hosted Services provides an enterprise example, adding cloud‐based spam filtering, archiving, and other services to an on‐premises Exchange server. (Above the clouds, technical report ‐ 2009)

56 E‐Governance: Techno‐Behavioural Implications
Knowledge as a Service (KaaS)
A KaaS application runs to extract the knowledge from the modern knowledge based expert system inside the cloud system and provides this directly to the end user. Every processing on data and information is done on the system side and after extraction one will get the knowledge as the end user service. With respect to this paper, citizen of the country will get the immediate help on the services, bill payment detail, taxes detail, agriculture and crop detail. The aspect which can be covered in the knowledge cloud is that the e‐governance is providing vast amount of information, but the KaaS approach converts it into knowledge which provides future directions to the citizen. E.g. The farmer may get information regarding the future crop harvesting process, the demand of the crop in another state so production is made according to that target.
Cloud Platforms
A cloud platform provides cloud‐based services for creating applications. Rather than building their own custom foundation, for example, the creators of a new SaaS application could instead build on a cloud platform. Understanding cloud platforms requires some agreement on what the word “platform” means in this context. One perspective to think about it is to view a platform as any software that provides developer accessible services for creating applications. (David Chappell‐2008) The Figure 1 shows the architecture from where the user can get the service of knowledge, if knowledge based system can be incorporated on to the cloud. As indicated in the Figure 1, citizens can be benefited from the knowledge‐based cloud and they can get the immense knowledge which directly helps them to achieve the desired output on whichever services of the e‐governance citizen wants.
The cloud platform also provides the facility of using Platform as a Service (PaaS) in coordination with attached devices, which can be shared. This new paradigm generates knowledge from the cloud system and gives the semantic output to the knowledge end user. Data in the cloud refers to the cloud storage idea, where data is stored somewhere on the Web through abstract APIs with loose schemas and without any constraint of space, availability and scalability. Clients can completely rely on the data cloud and count on loose coupling, as access is not tied to particular access patterns dependent on the use of specific schemas. Simperl, Krummenacher & Nixon (2007) has indicated that Triplespace Computing is an emerging coordination paradigm combining semantics, tuplespaces and Web Service technology for the persistent publication of knowledge and the coordination of services using that knowledge.
The Triplespace Computing paradigm with data in the cloud forms the “knowledge in the cloud” vision, which incorporates support for knowledge (semantic data), coordination (collaboration) and self‐organization (internal optimisation). (R. Meersman, Z. Tari & P. Herrero ‐ 2008)

Towards a New Paradigm Knowledge as a Service (KaaS) from e‐Governance Cloud for Citizens 57
Citizen can save the semantic of the different services and facilities in the cloud database. The retrieval of these services can be available on demand from e‐governance cloud. When extraction is going on system side, the user can get the knowledge regarding the taxes, crops, billing as and when required by using the respective web services.
ISSUES AND CHALLENGES
The implementation of the KaaS paradigm in the integrated e‐governance cloud is having certain issues and challenges that needs to be addressed.
Pay as Per you Use
The KaaS paradigm requires payment for the knowledge service the user gets from the system. For commercial users it is easy to implement payment systems. However, for users like citizen of the country it is challenging to implement online payment systems, as the every citizen is not aware about the internet payment methods.
Secondly, it is very difficult to measure the quantum of knowledge, that user uses from the system. We require another expert system, which calculates the knowledge, which is extracted from the system and given to the end user.
Converting Data into Knowledge
The knowledge helps in making several decisions in various systems. The cloud system takes the input of data of related domain, which is only the raw material so here the challenge is to convert it into the knowledge that is desirable by the end users. The system should have expert system including the intelligent agent which is capable to convert the data received from the end user citizen, government to knowledge and store it in appropriate form.
Deploying the e-Governance Cloud from Knowledge Perspective
As the e‐governance cloud will cover many government institutes, state government bodies, central and state authorities, organizing and monitoring the cloud is a challenging task. Further, for maintaining various levels of knowledge, confidentiality, sharing, deployment issues and policies need careful considerations.
Accessibility
The IT savvy citizen can easily access the e‐governance cloud. But to provide the facilities to the citizen like framer it is very diffcult to provide the channel through which he can access the knowledge. But with the major efforts e‐chaupal is running successfuly, however direct use of knowledge cloud is diffcult in provison.
The knowledge‐based system may be made universal across the country and when expert system is implemented above the platform of the cloud, it should be accessible from different access points because knowledge is provided as one service.
58 E‐Governance: Techno‐Behavioural Implications
CONCLUSION
As the vistas of knowledge are expanding, it requires a system which can generate the governance knowledge and collaborate it throughout the country with the help of cloud computing covering major e‐governance applications. The architecture for providing Knowledge as a Service (KaaS) paradigm specified here will take care of providing the knowledge required by citizen of the country in efficient and cost effective way. However, there are many issues and challenges regarding implementation and management of such knowledge systems. If the issues are resolved, KaaS paradigm for e‐governance clouds will be proved as a revolution in the knowledge society.
REFERENCES [1] Advisory (2009) TP4_White paper, e‐Governance, Enabling transparency and efficiency in government,
KPMG in India [2] Guido Bertucci, Director, Division for Public Administration and Development Management (2008),
from e‐Government to connected governance, U.N. Government survey 2008, ISBN 978–92–1–123174–8, ST/ESA/PAD/SER.E/112, Location: United Nations publication, Sales No. E.08.II.H.2
[3] R. Meersman, Z. Tari, and P. Herrero (2008) Towards Knowledge in the Cloud OTM 2008 Workshops, LNCS 5333, pp. 986–995,2008. c_Springer‐Verlag Berlin Heidelberg
[4] Simperl, E., Krummenacher, R., Nixon, L.(2007), A Coordination Model for Triplespace Computing, In: 9th Int’l. Conference on Coordination Models and Languages, pp. 1–18
[5] Soha Maad, Brian Coghlan, John Ryan, Eamonn Kenny, Ronan Watson, Gabriele Pierantoni, The horizon of the grid for e‐government (2005), eGovernment Workshop ’05 (eGOV05), Brunel University, West London UB8 3PH, U.K.
Website
[6] Above the Clouds: A Berkeley View of Cloud Computing” Technical Report No. UCB/EECS–2009–28. Availabe at: http://www.eecs.berkeley.edu/Pubs/TechRpts/2009/EECS‐2009‐28.html Accessed August 15, 2011.
[7] Short introduction to cloud platforms an enterprise‐ oriented view, August 2008. Available at: http://www.davidchappell.com Accessed August 12, 2011.
Cloud Computing for Economic Optimization in e-Governance—A Case Study
Rama Krushna Das1, Manmohan Brahma2 and Ajita Kumar Misro3 1National Informatics Centre, Berhampur
2IBM India Systems & Technology Group, Bangalore 3Berhampur University, Orissa
Email: [email protected], [email protected], [email protected]
Abstract—There is an increase in the online eGovernance services provided by federal and provincial government in India. It is a country with more than one billion people, where proper implementation of these online services faces a lot of problem in delivering efficient and cost effective services. Cloud computing is the future generation of computing which is a very new concept in the field of computing characterized by four main entities Software, Platform, Infrastructure and Hardware. The software, platform and infrastructure are availed as service. In this regard we propose a model with cloudbased infrastructure and economically optimized software solutions, useful for endusers by integrating low cost hardware and opensource software and platform.
Keywords Cloud Computing, eGovernance, Economic Optimization, Open Source, SaaS , PaaS , IaaS.
INTRODUCTION
The government of India is putting in a lot of effort towards going IT savvy and making its services more useful for citizens equally in urban and rural areas. However, there are many key issues in making the citizen‐centric services accessible in rural areas. It is difficult for the service providers to reach the user needs and scale up the functionality. Accessibility and affordability are major issues for the community with living cost Below Poverty Line (BPL). Different provincial governments and their departments are placed at varying levels of e‐governance maturity, as a result, citizens and government businesses processes get varying degrees of accessibility and quality of government services across India. Usage of cloud computing can ensure the reach of citizen services in all provinces of India irrespective of their present e‐Governance readiness. Government to Citizen (“G2C”) services sometime witness periodic unpredictable demand. As a result, ICT infrastructure created as part of e‐Governance initiatives often hold excess capacity, which is unused most of the time. There is a clear need to build a super ecosystem and bring the entire community under one roof. This is possible through cloud computing. One instance of an application hosted in the cloud is cheaper and easier to manage than individual copies of similar software installed on each user’s desktop system. Upgrading a cloud application only has to be done one time, where upgrading traditional software has to be done for each system on which that software is installed. Speaking of cost, because cloud services follow the one‐to‐many model, cost is significantly reduced over individual desktop program deployment.
In section 2 we will deal with current setup and their drawbacks by taking the example of traditional collectrate office in India. We will provide a brief introduction about cloud computing in section 3, followed by the new model which uses open source software and platform over cloud for citizen centric accessibility and affordability for e‐

60 E‐Governance: Techno‐Behavioural Implications
Governance operations as our solution in section 4. Going ahead we describe a scenario from the revenue department Orissa province in India.
PRESENT SCENARIO
This section basically describes about the situation and conditions which led to a costlier computing environment. Here we discuss the various places of investment and security flaws in the current e‐Governance scenario. Hardware & Software
Hardware & Software
One of the most popular scenarios to be discussed in the field of e‐Governance can be an Office of the Collector in India. Basically they are running with different systems for different departmental operations. All the systems have their own set of hardware infrastructure.
TABLE 1: MINIMAL HARDWARE USED IN THE PCS OF GOVERNMENT OFFICES
Hardware Specification Processor Intel Pentium 4 / AMD Athlon 64 Storage 40 GBMemory 512 MBSound Line Out, Mic InGraphics VGA Adapter
Moreover the systems are loaded with the software suited for the official work which can be depicted from the table below.
TABLE 2: MINIMAL SOFTWARE USED IN THE GOVERNMENT OFFICES
Software Commercial Implementation Operating System Microsoft Windows XPOffice Suite Microsoft Office 2003/2007Anti Virus Kaspersky Anti Virus
So if we consider the data of table # 1 and table # 2 then we can easily determine how much expensive is the entire system (Computerization of Collectorates in India).
Security
These days computers especially which are powered by Microsoft Windows based operating system [1] are greatly infected with virus. Even though we are using Anti‐Virus they are incapable of checking virus at time of operating system booting. Flash Disk is rapidly used in the systems for the transfer of data. This adds a promotion to virus, spyware and malware. This will lead to User level personal data such as phone contacts, annual confidential reports can be transferred automatically. Intruders can rapidly try to intrude into system and once getting a breakthrough they may use the resources causing reduction in the system performance. So to avoid these flaws in security we need to go for specialized anti‐virus, firewall and intrusion detection system for each machine, which too costly in nature.
Cloud Computing for Economic Optimization in e‐Governance: A Case Study 61
CLOUD COMPUTING
We define the booming term Cloud Computing as a Big Computing environment. A Cloud Computer is nothing but a big computer explained as a four layered model. The Hardware, IaaS (Infrastructure as a Service), PaaS(Platform as a Service), SaaS (Software as a Service) are its major components.
Hardware
The Hardware refers to the province of art of computing and networking equipments capable enough to handling a larger load. It includes efficient processing engines, storage solutions, fast networks and larger memory etc.
Infrastructure as a Service
As there would be a larger mass to utilize the resources, a suitable quota management is enforced to distribute the hardware among the users. Infrastructure refers to the Operating System and its virtualization along with other associated tools. The same hardware will behave as different machines for different users. They will be allocated with dedicated CPU, Memory, Disk, etc virtually depending upon the user needs.
Platform as a Service
When the environment is used by programmers, the first term they think about it is the platform. It points to the programming models, execution method and programming environment.
Software as a Service
The most important part of the model from the user point of view is the application software as a service. Basically the selected software will be availed to the user as service; for which they need not to have a disk at their terminal installed with the application software suite. They would be accessing the software online and storing the data back in the cloud.
PROPOSED SOLUTION
In this section we provide the overall architecture of our solution and provide more detail on the central component and thus we discuss how the solutions exactly address the problems above.
Overall Architecture
The overall architecture of our solution is illustrated in Figure. 1. The terminal at the end user side can be a simple computer running with a minimal version of any open source operating system. The user would be has an access to the security services running in the security server, which in turn having access to a private cloud. The security server is an intermediate machine which is powered with the best intrusion detection system

62 E‐Governance: Techno‐Behavioural Implications
Snort [2], IPCop Firewall and a security validator and is availed to the user as software as a service. The central idea of presence of open sourced IDS and firewall is to reduce workload and unauthorized access to the cloud with a minimal cost. The cloud is powered with only open source software instead of proprietary alternatives except for few which don’t have an open source alternative. The end – user terminal on successful validation at the security server will be connected to the cloud through a secure tunnel. All the operations are performed over the secure connection services.
FIG. 1: AN OVERVIEW OF THE PROPOSED ARCHITECTURE
Operation
The internal operation can be seen in Figure. 1. In the proposed architecture all the office terminals would be provided with a unique user‐id and password. The office user request for an access to the security service running in the security server with HTTPS or SSL protocol through their web browser. The firewall service running here checks for an authorised IP and then validates the particular terminal by means of the security validator. In case there is any terminal who is trying to login but failed thrice, will be redirected to the intrusion detection service, which in turn will try to deal with the unauthorised access and threat management. Once the user qualifies the tests conducted by the security services then they will get an access to the cloud through a secure tunnel service. Flash disk and other media devices can be mounted from any terminal at any

Cloud Computing for Economic Optimization in e‐Governance: A Case Study 63
point of time. The media so connected will be restricted to the local terminal itself. No other terminal can access the same device. When a terminal wanted to save a file over the cloud then it will be processed meticulously at the anti‐virus services.
The End–user Terminal
The end–user terminal is a small computer which will be located at the users for e‐Governance operations. The terminals should have their own set of hardware infrastructure. We recommend the offices to use the data in Table # 3 as a standard configuration for such terminals.
TABLE 3: MINIMAL HARDWARE USED FOR THE TERMINALS
Hardware Specification Processor 1.2 GHz Marvell ARMFlash Memory 512MBMemory 128MB DDR2Ethernet 54mbpsSound Line Out, Mic InGraphics VGA Adapter
The terminal can contain a minimal open source operating system like TinyCoreLinux, Damn Small Linux or Puppy Linux.
FIG. 2: INTERNAL MECHANISM

64 E‐Governance: Techno‐Behavioural Implications
The Security Server
A Security Server is a special system that would be working as a security check post for any cloud. The hardware configuration depends upon the number of clients or terminals that would be connecting simultaneously. This server will be connected to the private cloud through a secure tunnel service. This is responsible for providing various security solutions such as firewall, intrusion detection, anti – virus etc… as services to the user.
The server would be running with the software listed in Table 4. TABLE 4: SOFTWARE TO BE USED AT THE SECURITY SERVER
Software Open Source Tools to be used Operating System NetBSD , OpenBSDIntrusion Detection System SnortFirewall IPCopAnti‐Virus Clam Anti‐Virus
The Cloud Computer
A cloud computer is a high end device for general but multipurpose operations. This comprises of hardware and/or software products that are specifically designed for the delivery of services [3]. This is considered to be the most important portion of the entire model. This can be treated as a supercomputer that would be capable enough to take enormous work load. The hardware specification for this depends upon the various factors which are beyond the scope of the paper to be discussed.
The cloud delivers all the solutions along with its three services IaaS, PaaS and SaaS which we have already discussed. To have an optimistic computing we propose to use open source software over the server to maintain the robustness of model in terms of availability of softwares and easily affordability.
TABLE 5: SOFTWARE TO BE USED AT THE CLOUD COMPUTER
Software Open Source Tools to be used Perating System EyeOS , NetBSD , OpenBSD Virtualization Suite Sun Virtual Box OSE Office Suite OpenOffice E‐Learning Suite Moodle Many more…
In the beginning we can use EyeOS [13] which is a disruptive desktop entirely usable from a web browser, which includes a office suite and some collaboration application like moodle, as well as a full framework to develop new web based applications behaving as if they were desktop applications. Because these are free and open source software so there would be no problem by putting these in the proposed cloud and keeping all the data under the cloud control. EyeOS is not only a web desktop with its own valuable applications; it has been designed from the beginning to enable easy development and creation of new applications. EyeOS 2.0 is the perfect development framework for quick and easy creation of rich internet applications [16]. It has been

Cloud Computing for Economic Optimization in e‐Governance: A Case Study 65
completely developed with open technology and widely accepted standards such as PHP, MySQL, JavaScript, Qooxdoo, log4php, PHPUnit, OpenOffice and others, enabling the system to function on a common web server without any modifications, and which can easily used by a standard browser without any additional plug‐ins installed. However, if open source alternative for a particular purpose like GIS is unavailable , then under that situation the software needs to be purchased in one investment only.
Outcome of the Solution
In this section we discuss how the proposed solution may be used to address the issues raised within the scenarios presented in section 2.
Cost Optimization Evaluations
E. Deelman et.al [15]… studied the various cost models associated with a cloud and they have been found that the cloud in market is package that includes cost per processing, cost per application software and cost per bandwidth. The total cost of cloud computing is the sum of the cost for infrastructure service and software bundle service.
Cost Benefit in Fully Non–Commercial Model
We assume all the employees of a government office in India are of usage level Ө. If it is assumed that the marginal value of software usage by every employee is µ. The utility factor can be defined as U, then all employees at usage level Ө can be represented as
U [Ө, µ] = Ө* µ (1)
Let us consider the following parameters important for the said model. Price that a commercial software vendor charges for one license of the software (Pt), upgrading charge (σ), the annual maintenance and service charges (δ). Let NӨ denotes the number of licenses purchased and YӨ denotes the number of years the software will be used by the employee of user level Ө.
The typical existing installation (Ct) can be defined as
Ct = Pt NӨ + YӨ (σ + δ) (2)
If the upgradation and maintenance charges for the first one year is free then
Ct = Pt NӨ + (YӨ ‐ 1)(σ + δ) (3)
The costing parameters with the proposed system can be discussed in detail as following.
Let there would be no commercial software usage and let σ and δ follow their usual representation. Let YӨ denotes the number of years the software will be used by the employee of user level Ө.
If Cu denote the total cost with the proposed model then

66 E‐Governance: Techno‐Behavioural Implications
Cu = σ (YӨ ‐1) + YӨ δ (4)
Let us consider for example an office equipped with 1000 PCs with same configuration. Each machine is installed with same software to be used by employees of usage level Ө. If the application licensing fee is 100$ per PC then Pt NӨ is 100000 $ for the office. Generally for up gradation, annual maintenance and service the vendors charge 10% the initial cost, hence σ + δ = 1000 $.
Assuming the product to be running for 5 years with the existing configuration and service policy the total cost will be evaluated as
Ct=100000 + 4 X 1000 = 104000 $
Applying the same values for the proposed model total estimated cost will be evaluated as Cu (≈ 5000 $), which indicates that there is a straight declination of 90 % in the cost with the proposed model.
Cost Benefit in Partial Commercial Model
Let us suppose there are m number of users of a commercial service and p number of users who needs the commercial service fully. α denotes the total number of users who need the service partially
α= m‐p (5)
If we will assume that all the minimal problems can be solved by the open source software services then the number of target audience β = m‐p.
Thus, β = α (6)
The above formulation is based on one software as service. The world of open source is so vast that for every commercial software there exists an open source alternative [14]. If n be the total number of open source software which needs to be implemented with c as the cost parameter and if the utilization and work level with the commercial tool is 100% then the cost incurred in commercial utilization ¥ can be defined as
¥ = m X c X n (7)
If the utilization and work level with the open source tool is 100% then the cost incurred in open source utilization £ can be defined as
£ = (m‐p) X c X n (8)
Thus, Optimization factor ξ = ¥ / £ (9)
Cost Benefit in Infrastructures
Ch denotes the actual cost of each system installed at each employee’s desk at any typical government office and Cl denotes the cost per system with the proposed model.

Cloud Computing for Economic Optimization in e‐Governance: A Case Study 67
The systems are highly configured and have their independent processing power and storage. If N is the total number of systems installed and Coi denotes the total cost then
Coi = Ch X N (10)
Referring data in Table 3, we can say
Cl << Ch (11) Let Cc denotes the cost for implementing the cloud based infrastructure and Cni denotes total cost
involved in implementing of the new model.
Cni = Cl X N + Cc (12)
Now for very large value of N
Coi >> Cni (13)
Thus net benefit in new Infrastructure ƒ
ƒ= Coi – Cni (14)
Security
People bother a lot when a solution comes integrated with remote storage. The first question hits them is how much safe is our data? In this connection we are not addressing all the security issues but we surely cover few of them. The systems present at the employee’s desk are having an interface to access the data present at the cloud. Even though the data is present remotely, the users will b feeling as if they are accessing a standalone machine and data is present locally. All the communication is done over a secure tunnel through a security server. The intermediary security server is fully guarded with powerful intrusion detection system, firewall and anti‐virus. The employees are free to use flash disk. Anything they want to store in the cloud must pass through the Anti‐virus. The effort of updating system and security patches is no longer required. We need to update the cloud and the security server.
DISCUSSION
In a conversation with cloud solution architects and specialists at IBM India Systems Solution Center we derived the curve presented in Figure 3.
This figure represents something what we call as a Cost analysis Sheet. In this representation we are finding two thin lines of two different colors. The sky blue curve represents the cost factor with reference to the increase in system quantity of the existing model where as the brown color represents similar parameters for the proposed model. The vertical axis represents the number of nodes where as the first row in the horizontal table depicts the data serial number, the second row is the number of systems in existing model and that of row three is number system in the proposed model. Now let us assume in an office we have requirement of 2 systems only, than at

68 E‐Governance: Techno‐Behavioural Implications
that point of time the proposed model will not work successfully. The essence of the proposed model is observed clearly when the requirement of number of systems goes beyond 10. If we will see in the traditional PC based setup the kind of investments and cost involved is although comparatively low when we have a small number of system but we mark a huge difference in terms of system initial investment, power and cooling requirement, manageability and so on when our setup is quite high. It has been observed this model is very much successful where we consolidate huge PC based setups.
FIG. 3: COST BENEFIT EVALUATIONS WITH RESPECT TO TOTAL COST AND NUMBER OF NODES USED IN THE COMPUTATION
CASE STUDY
The Revenue Department in Orissa province of India[20], is the custodian of all lands and is concerned with all land related works, such as i)Assessment and Collection of land revenue, recovery of land ii) Declaration of ceiling surplus land and distribution of the same among the landless poor ii) Maintenance of law and order with the help of police administration iv) Issue of Land Pass Book v) Conduct of Revenue Courts vi) Consolidation and Settlement of Holdings and vii) Redressal of Public Grievances. The department is headed by the Commissioner‐cum‐Secretary who is in overall charge of the revenue administration, relief and rehabilitation of the victims of the natural calamities. There are three, Revenue Divisional Commissioners (RDC) for Northern, Southern and Central Division to supervise ten districts each. The head of the revenue

Cloud Computing for Economic Optimization in e‐Governance: A Case Study 69
administration in the district is the Collector (District Magistrate) and is the main officer in charge of land related matters and maintenance of law and order problem. The district is divided in two subdivisions looked after by sud‐divisional magistrate, which is further subdivided into tahasils looked after by Tahasildars. The Tahasil is further subdivided into revenue circles which work as the real revenue administration office for some nearby villages under the supervision of Revenue Inspector (RI). For smooth revenue administration the Orissa province is divided into 30 revenue districts, 58 sub‐division, 316 Tahasils and 953 revenue circles. To effectively monitor all the above functions of the department using e‐Revenue software hardware systems are deployed at different office premises like 20 systems at secretariat, 10 each at RDC offices, 10 each at district collector office, 5 each at subdivisional office, 3 each at Tahasils and 2 each at RI offices. Altogether 3,494 systems are deployed excluding the servers used for storing the data at NIC data centre. Once the proposed cloud based architecture is put in use, it would be very economic as shown in the graph.
FIG. 4: COST BENEFIT FOR ORISSA STATE, INDIA
Although in the present scenario we are using 3494 systems but we assume to have at least 100 systems to apply analytics upto the no of systems in actual. From the curve we can very well depict that there is a steep increase in the Total Cost Benefit in the present model and the same cost is comparatively very less in the suggested model.
RELATED WORK
A large portion of the work in cloud computing technology for the e‐Governance mainly focused on the cost‐effectiveness and easy maintenance of the systems [1]. Most of the

70 E‐Governance: Techno‐Behavioural Implications
work has been descriptive in nature. A special category of work has been done to address a generalized class of computing popularly known to be the high performance computing [2]. The work is greatly accepted by Fouquet et. al [3] and they further enhanced the system by introducing open source tools for live video streaming so as to avail such systems to the common mass. A virtual cloud computer has been described for mobile devices [4]. The author introduces an analysis on smart phones, context awareness, cloud and restful based web services, and explains how these components can interact to create a better experience for mobile phone users.
Mowbray et. al. [5] discussed security at the client side and worked for a privacy manager. Author [6] worked for maintaining the privacy with data present at the cloud while designing up the services. Dan et. al described a new vision towards addressing the issues of the data protection in the Cloud [7]. The authors present the current issues and explain how the issues are resolved by introducing various data protection models. To address risks while handling image publishers and image retrievers of a cloud's image repository, the authors proposed an image management system that controls access to images, tracks the provenance of images, and provides users and administrators with efficient image filters and scanners that detect and repair security violations [8].
Open Source Cloud computing services are available from a number of Organization, for example DuraSpace [9], OpenNebula [10] ,Globus Nimbus [11] , OpenStack [12] etc... Especially OpenStack is a perfect candidate for realizing our system, all that would be required are changes to the user‐interface to make Cloud service compatible with the security architecture so as to be usable for non‐developers.
CONCLUSION
Cloud computing has the potential to change how organizations manage IT and transform the economics of hardware and software at the same time. On‐demand services and Software‐as‐a‐Service (SaaS) solutions have become the preferred mechanisms for e‐governance applications to better leverage the power of cloud computing. For any government department, the transition to the cloud is a major decision. Concerns like data control, management, accessibility and security hold the departments back from switching to the cloud. Before implementing cloud any department should first identify and prioritize IT issues and challenges within itself; next the benefits of cloud computing should be mapped against these IT issues. From the point of view of each government agency or department, creating a cloud migration strategy may be of importance. This may call for inter‐departmental collaboration to identify the solutions which are easier to transition and create necessary volumes to realize cost benefits. This could be done by the nodal information technology agencies at the apex. Instead of making large investments in creating data centers and networks for e‐governance needs, the solution given in our model may be of help for easier transition to cloud.

Cloud Computing for Economic Optimization in e‐Governance: A Case Study 71
REFERENCES [1] “A Client‐Based Privacy Manager for Cloud Computing”: Mowbray, Miranda, Pearson, Siani: In: (2009).
Proceedings of COMSWARE’09. ACM Dublin, Ireland. [2] “Can Cloud Computing Reach The TOP500?”: Napper, Jeffrey, Bientinesi, Paolo:. In: (2009).
Proceedings of UCHPC‐MAW’09, pp. 17‐20. ACM Ischia, Italy. [3] “Cloud Computing for the Masses”: Fouquet, Marc, Niedermayer, Heiko, Carle, Georg: In: (2009).
Proceedings of U‐NET’09, pp. 31‐36. ACM Rome, Italy. [4] “Cloud Computing: Future solution for e‐Governance”: Pokharel, Manish, Park, Jong, Sou:. In: (2009).
Proceedings of ICEGOV 2009, pp. 409‐410. ACM Bogota, Colombia. [5] “Data Protection Models for Service Provisioning in the Cloud”: Lin, Dan, Squicciarini, Anna:. In:
(2010). Proceedings of SACMAT’10. pp. 183‐192. ACM Press Pittsburgh, Pennsylvania, USA. [6] “E‐Government on Cloud Computing and Service – Oriented Architecture”: Wojciech Cellary, Sergiusz
& Strykowski. (2009). Proceedings of ACM in ICEGOV2009, pp. 5 – 10. [7] “Managing Security of Virtual Machine Images in a Cloud Enviroment”: Wei, Jinpeng, Zhang, Xiaolan,
Ammons, Glenn, Bala, Vasanth, Ning, Peng:. In: (2009). Proceedings of CCSW’09. pp. 91‐96. ACM Press Chicago, Illinois, USA.
[8] “Taking Account of Privacy when Designing Cloud Computing Services”: Pearson, Siani:. In: (2009). Proceedings of ICSE’09 Workshop. pp. 44‐52. IEEE Vancouver, Canada.
[9] “The Cost of Doing Science on the Cloud: The Montage Example”: E. Deelman, G. Singh, M. Livny, B. Berriman, J. Good. (2008). ACM/IEEE conference on Supercomputing (SC ’ 08). Piscataway, NJ, USA: IEEE Press, , pp. 1–12.
[10] “Using RESTful web‐services and cloud computing to create next generation mobile applications”: Christensen, J., H.: In: (2009). Proceeding of the 24th conference on Object oriented programming systems languages and applications ‐ OOPSLA '09. pp. 627. ACM Press New York, USA.
[11] Article on “Lack of admin rights mitigates most Microsoft vulnerabilities” Posted on 12 April 2011. [12] DuraCloud, https://wiki.duraspace.org/display/duracloud/DuraCloud [13] EyeOS – Cloud Computing Operating System, http://eyeos.org [14] Globus Nimbus, http://www.nimbusproject.org/, Last visited April 25, 2011 [15] Open Souce Alternative – http://www.ossalt.com [16] OpenNebula, http://www.opennebula.org/ [17] OpenStack, http://openstack.org/ [18] Website http://sectools.org/ids.html [19] Website http://www.net‐security.org/secworld.php?id=10886 [20] IBM Cloud Computing Website
http://www.ibm.com/smarterplanet/in/en/cloud_computing/ideas/index.html [21] Official Website of Government of Orissa, Revenue department,
http://www.orissa.gov.in/revenue/index.htm, Last visited April 22, 2011
E-waste Management in India—An Emerging Issue
G.P. Sahu1 and Rajeev Srivastava2 1Associate Professor, MNNIT, Allahabad
2Faculty (I.T.), IMS, Dehradun Email: [email protected],[email protected]
Abstract—The benefits of ICT in terms of time, money are also accompanied with certain drawbacks like growing volume of ewaste that, if ignored, may be a big concern to India’s environment, human health etc. So the ICT strategy of India must consider these aspects on a priority basis. The aim of this paper is to understand the meaning of ewaste, analyses the volume of ewaste, how hazardous it is and what should be done to solve this issue.
Keywords: Ewaste, Toxic, Recycling, WEEE, ICT, Landfills
INTRODUCTION
India is one of the fastest growing economies in the world. In the recent years the growth ofinformation and communication technology1 (ICT) sector is unprecedented in India. This hasfuelled the consumption of electrical and electronic equipment (EEE) both from theinstitutional users and households. With the advent of this higher rate of consumption, andthe shortened product lives due to rapid advancement of technology, electronic waste (e‐waste) such as discarded television, mobile phones, computer and related equipment etc., hasemerged as a fastest growing waste stream. In India, e‐waste quantity is expected to be morethan 800,000 tons by 2012.
E‐waste contains many hazardous substances such as lead, arsenic, mercury, hexavalentchromium, cadmium, barium and phosphorous. These substances are not only affectenvironment but also the health of people if these substances are not properly treated at theend of life (Eol) of the equipment. In India, e‐waste is mainly handled by people in informalsector. Informal sector uses crude techniques such as burning of cables and acid bath torecover precious metals. Effluents from these techniques pollute environment and cause harmto the health of the people. The resource efficiency of these processes is also abysmal.
In 2004, more than 180 million personal computers (PCs) were sold worldwide. In thesame year, an estimated 100 million obsolete PCs entered waste streams and were eitherrecycled for the recovery of materials or finally disposed of. A PC may contain up to 4 gof gold and other valuable materials that can be recovered at a profit, particularly if thework is done in low‐income countries. However, as is the case with almost all present‐dayelectronic products, a PC also contains toxic substances such as lead, mercury, arsenic,cadmium, selenium, and hexavalent chromium. In many parts of the world, both formaland informal recycling industries that deal with the rapidly growing streams of WasteElectrical and Electronic Equipment (WEEE), or e‐waste for short, have emerged.

E‐Waste Management in India—An Emerging Issue 73
The rapidly increasing WEEE mass flow, combined with the trend towards embeddedelectronics, makes WEEE an emerging risk for society. Reinsurance companies use theterm demerging risk in cases where a high potential for damage has to be assumed, but thetraditional quantification of the risk as the extent of damage weighted by the probability ofoccurrence is not or not yet applicable because the type of risk is novel and has evolvedgradually (Spuehler 2003).
E‐waste broadly covers waste from all electronic and electrical appliances and comprises of items such as computers, mobile phones, digital music recorders/players, refrigerators, washing machines, televisions (TVs) and many other household consumer items.[11].
The increasing 'market penetration' in the developing countries, 'replacement market' in the developed countries and 'high obsolescence rate' make e‐waste one of the fastest waste streams. [2].
The electronic and electrical goods are largely classified under three major heads, as: 'white goods,' comprising of household appliances like air conditioners, dishwashers, refrigerators and washing machines; 'brown goods,' comprising of TVs, camcorders, cameras, etc.; 'grey goods,' like computers, printers, fax machines, scanners, etc. The grey goods are comparatively more complex to recycle due to their toxic composition. [11].
E-WASTE CONCERN ON ENVIRONMENT AND HUMAN HEALTH
E‐waste constitutes more than 1000 different substances. The significant fractions are plastics, metals, glass, ceramics, and paper etc. It contains many hazardous substances such as lead, arsenic, mercury, hexavalent chromium, cadmium, barium and phosphorous. These substances cannot only affectenvironment but also the health of people if these substances are not properly treated at the end of lifeof the equipment. Upon contact with these toxic elements humans can have health problems such asbreathing difficulties, respiratory irritation, coughing, choking, pneumonitis, tremors, neuropsychitricproblems, convulsions, comas and even dealth (Halluiteet al. 2005).
Disposal methods such aslandfilling can generate leachate that can contaminate the soil and ground water and incineration cangive rise to dioxins that pollute air and cause health abnormalities to the people. E‐waste also containsprecious metals such as gold, silver, platinum and palladium and lucrative non‐ferrous metals such asaluminium and copper. Considering the effects on health and environment and economic value ewasterecycling and disposal methods should be given proper care.
Over 1 million poor people in India are involved in the manual recycling operations.[10] Most of the people working in this recycling sector are the urban poor with very low literacy levels and hence very little awareness regarding the hazards of e‐waste toxins. There are a sizeable number of women and children who are engaged in

74 E‐Governance: Techno‐Behavioural Implications
these activities and they are more vulnerable to the hazards of this waste. [11] A comprehensive study is yet to be made of the health problems of women and children employed by the scrap dealers.[6]
The rate of e‐waste generation and the current methods of disposal in Mumbai pose grave environmental and health risks to the city at large due to its dense population and spatial character. [12] Study by the ChittaranjanNational Cancer Institute, Kolkatta, found that people in Delhi are about twice as likely to suffer from lung ailments as those in the countryside due to the huge amount of e‐waste generated. [7]
The amount of e‐waste generated poses a grave threat to the environment as well as to public health. [8]
Workers in e‐waste disposal sector are poorly protected against the risk of it. They dismantle e‐waste, often by hand, in appalling conditions. About 25,000 workers are employed at scrap‐yards in Delhi alone, where 10,000 to 20,000 tons of e‐waste is handled every year, with computers accounting for 25 percent of it. Other e‐waste scrap‐yards exist in Meerut, Ferozabad, Chennai, Bangalore and Mumbai.[13]
The hazardous substances found in the e‐waste include substantial quantities of lead, cadmium, chromium etc.Cathode ray tubes and components with high lead content are considered dangerous to health. Inhaling or handling such substances and being in contact with them on a regular basis can damage the brain, nervous system, lungs, kidneys and the reproductive system Working in poorly‐ventilated areas.
HOW MUCH E-WASTE IS THERE
Studies so far reveal that the total e‐waste generation in India is approximately 1,46,000 tonnes[3‐5] to 3.3 lakh tonnes a year and is expected to touch 4.7 lakh tonnes by 2011.[10]'The projected growth for e‐waste generation for India is about 34% year on year' says Sinha (Associate Director of Toxics Link).[9]
Of the total e‐waste generated in the country, western India accounts for the largest population at 35%, while the southern, northern and eastern regions account for 30, 21 and 14%, respectively. The top states in order of highest contribution to waste electrical and electronic equipment (WEEE) include Maharashtra, Andhra Pradesh, Tamil Nadu, Uttar Pradesh, West Bengal,Delhi, Karnataka, Gujarat, Madhya Pradesh and Punjab. The city‐wise ranking of the largest WEEE generators is Mumbai, Delhi, Bangalore, Chennai, Kolkatta, Ahmedabad, Hyderabad, Pune, Surat and Nagpur.[5]
Total WEEE generation in Maharashtra is 20,270.6 tonnes, of which Navi Mumbai contributes 646.48 tonnes, Greater Mumbai 11,017.06 tonnes, Pune 2584.21 tonnes and Pimpri‐ Chinchwad 1032.37 tonnes. An estimated 30,000 computers become obsolete every year from the IT industry in Bangalore alone.[5] Home to more than 1200 foreign

E‐Waste Management in India—An Emerging Issue 75
and domestic technology firms, Bangalore figures prominently in the danger list of cities faced with e‐waste hazard. As many as 1000 tonnes of plastics, 300 tonnes of lead, 0.23 tonnes of mercury, 43 tonnes of nickel and 350 tonnes of copper are annually generated in Bangalore.[3] While on the basis of scrap handled by the Delhi‐based scrap dealers, their total number of personal computers (PCs) meant for dismantling would be around 15,000 per year. This figure does not include PCs handled by large dealers who get scraps from foreign sources.[10] Mumbai, the financial nerve‐center of India, alone throws away 19,000 tonnes of electronic waste a month, excluding the large e‐waste it imports from developed nations through its port.[9]
The main sources of computer usage and thereby e‐waste generations are the use ness sector (government departments, public or private sector, multinational corporation offices, etc.), accounting for 78% of the total installed PCs today. Other sources are individual households (22%), foreign embassies, PC manufacturing units, PC retailers, secondary markets of old PCs and imported electronic scrap of other countries.[10]
The following three categories of WEEE account for almost 90% of the generation[5]
1. Large household appliances: 42%, 2. Information and communications technology equipment: 33.9% and 3. Consumer electronics: 13.7%.
E-WASTE RECYCLING IN INDIA
TPL (Trishyiraya Recycling India Pvt. Ltd.) is the only Indian company that offers safe and reliable disposal of e‐waste.It is located strategically in the High Security MEPZ.The Govt. of India as well as the Pollution Control Board have certified the company.
In India e‐waste from corporate consumers and households enters a city specific informal e‐waste recycling system. The collection and allocation of e‐waste is done by middlemen, scrap dealers and rag pickers, also known as «kabadiwalas». The informal recycling system includes acceptable processes such as dismantling and sorting but also very harmful processes such as burning and leaching in order to extract metals from electronic equipment.
As per Green peace report 2005 dust samples from battery dismantling workshops in Mayapuri and Buradi districts were particularly heavily contaminated, the former containing 8.8% by weight lead and the latter 20% cadmium.This last figure is around 40 thousand times higher than levels typical for indoor dust samples. Soil and dust samplescollected from two locations in New Delhi (Kantinagar and Brijgang) used to store cathode ray tubes (CRTs), from televisions or computer monitors, demonstrated the potential for contamination of these materials with heavy metals from the tubes. Cadmium, zinc and yttrium sulphides have been used in the “phosphor” coatings inside

76 E‐Governance: Techno‐Behavioural Implications
CRTs while lead oxide occurs in the glass itself. Levels of all these metals were elevated in the dusts and soils collected in the CRT storage areas.
RECOMMENDATIONS FOR ACTION
Ban Hazardous e-Waste Imports
All imports of hazardous e‐waste must be banned. This isconsistent with the Basel Ban Amendment decision by the Basel Convention to ban all trade of hazardous wastes from OECD to non‐OECD countries. There is no reason for the poor of the world to bear the burden of environmental risk, particularly when they have not benefited from the products and services that created that risk in the first place.
Make Producer Responsible
Producers must be responsible for their products. The principle of ‘Extended Producer Responsibility’ (EPR) requires accountability on producers over the entire life‐cycle of their products. So far, manufacturers have passed on these costs to the consumers, and now to developing countries where the products eventually land up for recycling.
Making producers financially responsible for end‐of‐life waste will provide them with a financial incentive to design their products with less hazardous and more recyclable materials.An effective example of EPR is product take‐back where a producer takes the product back at the end of its life.
Inform the Consumer
Manufacturers of computer monitors, televisions and other electronic devices containing hazardous materials must be responsible for educating consumers and the general public regarding the potential threat to public health and the environment posed by their products and for raising awareness for the proper waste management protocols.
Focus on Reduce, Reuse and Recycling
Firstly we have to focus on reduce then reuse , when it finally becomes necessary to recycle an electronic device, the device must be designed to ensure clear, safe, and efficient mechanisms for recovering its raw materials. Input materials must be suitable for safe reconstitution and recycling and there must be a pre‐identifiable recycling market and mechanism established for the input material. Equipment components must be properly labeled to identify plastic and metal types. Warnings must be placed for any possible hazard in dismantling or recycling and the product must be made for rapid and easy dismantling or reduction to a usable form.

E‐Waste Management in India—An Emerging Issue 77
CONCLUSION
There is an urgent need for improvement in e‐waste management covering technological improvement, institutional arrangement, operational plan, protective protocol for workers working in e‐waste disposal and last but not the least education of general population about this emerging issue posing a threat to the environment as well as public health.
REFERENCES [1] Available from: http://www.mait.com/pressupdate.1jsp?id=77. [last accessed on 2008 Jan 1]. [2] Available from: http://www.cpcb.nic.in/Electronic%20Waste/Chapter1. [3] http://www.cpcb.nic.in/Electronic%20Waste/ Chapter2.html. [last accessed on 2008 Jan 1]. [4] Beary H. Bangalore faces e‐waste hazards.Available from: http://www.
news.bbc.co.uk/1/hi/world/south_asia/4222521.stm. [last accessed on 2008 Jul 1]. [5] E‐Waste: The next hazard wave. Consumer Voice 2007;3:6.
eWaste Guide. Available from: http://www.ewaste.in. [last accessed on 2008 Jan 1]. [6] E‐waste posing health hazard. Available from: http://www.hindu.co
m/2006/03/20stories/2006032019320300.htm. [last accessed on 2008 [7] E‐waste a health hazard. Available from: http://www.cities.expressindia.com/full‐
story.php?newid=81450 [Last accessed on 2007 Jun 11]. [8] E‐waste posing health hazard. Available from: http://www.hindu.com/2006/03/20/
stories/2006032019210400.htm. [Last ac‐ cessed on 2007 Jun 11]. [9] Kukday K. Making profit from mining of e‐waste.Available from: http://
timesofindia.indiatimes.com/articleshow/2107581.cms. [last accessed on 2008 Jan 1]. [10] Scrapping the hi‐tech myth: Computer waste in India. Published inToxics Link 01/02/2003. Available
from: http://www.toxicslink.org/pub‐view. php?pubnum=37. [last accessed on 2008 Jan 1]. [11] Sinha S. Downside of the Digital Revolution. Published in Toxics Link, 28/12/2007. Available from:
http://www.toxicslink.org/art‐view. php?id=124. [last accessed on 2008 Jan 1] [12] Spuehler J. Emerging Risks; Swiss Re; 2003. Available at: www.swissre.com; accessed 18.04.2005. [13] Urban hazard: Mumbai choking on e‐ waste. [Last updated on 2007 Feb 24].Availablefrom:
http://www.timesofindia. indiatimes.com/NEWS/India/Urban_haz‐ ard_Mumbai_choking_on_e‐waste/RssAr‐ ticle/articleshow/1671262. [Last accessed on 2007 Jun 11].
[14] Vinutha V. The e‐waste problem. Available from: http://www.expresscomputeronline. com.[Lastaccessedon2007Jun11].line.com
Website
[15] http://india.ewasteguide.info/Initial [16] www.greenpeace.org/international/Global/international/planet‐/report/2005/10/recycling‐of‐
electronic‐waste.pdf

Information Security Issues with Emerging Next Generation Networks in Indian Context
Manmohan Chaturvedi, Manmohan Prasad Gupta and Jaijit Bhattacharya IIT Delhi
Email: [email protected], [email protected], [email protected]
Abstract—The ICT sector is on the threshold of migration to fully Internet Protocol (IP) enabled Next Generation Networks (NGN). NGNs will ultimately replace traditional circuit switched telecommunication networks and services and traditional fixed line carriers have begun to invest in and deploy IP based networks, usually as overlays of their existing networks which continue to offer traditional services. While NGN migration is a gradual process, it is anticipated that in developed countries, fully fixed NGNs are expected to be in place by 2012 and mobile by 2020, enabling the full and true convergence of fixed and mobile, voice and data, data and video and the Information Technology (IT) and telecoms and broadcast sectors. The paper attempts to provide insight on key management issues during India’s transition to NGN while it races forward to IT enabled business and governance processes. By looking at India’s problems with creative mind set, a synergetic approach is evolved for secure migration in terms of opportunities, challenges and innovative options and alternatives for the India’s ICT sector as migration to NGN unfolds.
Keywords: Information Security, Next Generation Networks (NGN), egovernance, ecommerce,
INTRODUCTION
The Public Switched Telephone Networks (PSTN) which has been in existence for more than a century is evolving with the emerging technology. Optical fiber with very large information capacity is replacing copper in the local loop, while packet‐based technology using the Internet Protocol is replacing existing circuit‐based switching technologies. These changes require policy makers to review and reassess existing regulations and policy frameworks and ensure that all issues including Information Security are adequately addressed while migrating to new technology.
Communication networks have become a key economic and social infrastructure in world economies. The network infrastructure supports all economic sectors, and is therefore crucial to the national and international exchange of goods and services. It acts as a main catalyst in changing economic inter‐relationships through rapid technological change and the proliferation of a range of new services (Convergence and Next Generation Networks, 2008).
The Next Generation Network (NGN) is an IP ‐ based carrier‐grade telecommunications network providing QoS‐enabled services via diverse types of broadband access technologies. The NGN architectural framework separates application layer from transport layer, as shown in Figure 1. Several international organizations viz. ITU‐T (International Telecommunication Union ‐ Telecommunication Standardization
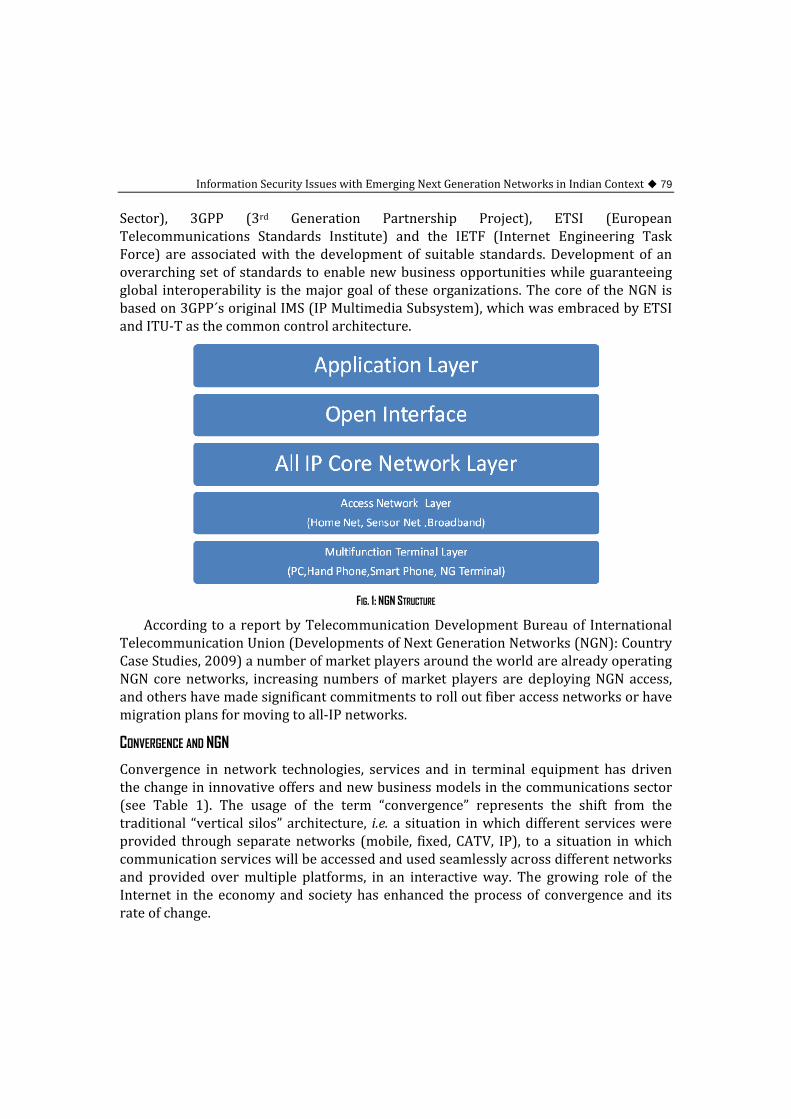
Information Security Issues with Emerging Next Generation Networks in Indian Context 79
Sector), 3GPP (3rd Generation Partnership Project), ETSI (European Telecommunications Standards Institute) and the IETF (Internet Engineering Task Force) are associated with the development of suitable standards. Development of an overarching set of standards to enable new business opportunities while guaranteeing global interoperability is the major goal of these organizations. The core of the NGN is based on 3GPP´s original IMS (IP Multimedia Subsystem), which was embraced by ETSI and ITU‐T as the common control architecture.
FIG. 1: NGN STRUCTURE
According to a report by Telecommunication Development Bureau of International Telecommunication Union (Developments of Next Generation Networks (NGN): Country Case Studies, 2009) a number of market players around the world are already operating NGN core networks, increasing numbers of market players are deploying NGN access, and others have made significant commitments to roll out fiber access networks or have migration plans for moving to all‐IP networks.
CONVERGENCE AND NGN
Convergence in network technologies, services and in terminal equipment has driven the change in innovative offers and new business models in the communications sector (see Table 1). The usage of the term “convergence” represents the shift from the traditional “vertical silos” architecture, i.e. a situation in which different services were provided through separate networks (mobile, fixed, CATV, IP), to a situation in which communication services will be accessed and used seamlessly across different networks and provided over multiple platforms, in an interactive way. The growing role of the Internet in the economy and society has enhanced the process of convergence and its rate of change.

80 E‐Governance: Techno‐Behavioural Implications
TABLE 1: CONVERGENCE AND ITS DIMENSIONS
What is convergence?
The path towards convergence was led mainly by the increasing digitalization of content, the shift towards IP‐based networks, the diffusion of high‐speed broadband access, and the availability of multi‐media communication and Computing devices.
Dimensions of Convergence
Network convergence
Driven by the shift towards IP‐based broadband networks. It includes fixed‐mobile convergence and ‘three‐screen convergence’ (mobile, TV and computer).
Service convergence
Stemming from network convergence and innovative handsets, which allows the access to Web‐based applications, and the provision of traditional and new value‐added services from a multiplicity of devices.
Industry/market convergence Brings together in the same field industries such as information technology, telecommunication, and media, formerly operating in separate markets.
Legislative, institutional and regulatory convergence
Co‐operation – taking place between broadcasting and telecommunication regulation. Policy makers are considering converged regulation to address content or services independently from the networks over which they are provided (technology neutral regulation).
Device convergence
Most devices include today a microprocessor, a screen, storage, input device and some kind of network connection – increasingly they provide multiple communication functions and applications.
Converged user experience Unique interface between end‐users and telecommunications, new media, and computer technologies.
Source: Convergence and Next Generation Networks, 2008
Previously distinct communication networks and services are today converging onto one network, because of the digitalization of content, the emergence of IP, and the adoption of high‐speed broadband.
Traditional services such as voice and video are increasingly delivered over IP networks and the development of new platforms is facilitating the provision of converged services (Table 2). These converged services are appearing in markets as "triple" or "quadruple" play offers which provide data, television, fixed and mobile voice services.
Internet service providers started offering VoIP as a cheaper way to communicate over the Internet. Services were offered on a “best‐effort” basis by third parties, over any Internet connection.

Information Security Issues with Emerging Next Generation Networks in Indian Context 81
TABLE 2: COMPARISON OF TELECOMMUNICATION AND IP-BASED CONVERGED ENVIRONMENTS
Telecommunication environment Next generation IP‐based converged environmentSingle purpose networks Multi‐purpose networksPSTN, cellular , broadcast IP network (providing voice, video and mobile
services) Narrowband BroadbandVertical silos Destroys compartmentalization. Traditional
boundaries between industry segments (e.g., telephony, cable TV, broadcasting, wireless) are blurring – Need to re‐think market definitions (product definition and geographic boundaries definition)
Network‐service link New services and content developed independently of the network
Operators control services to end users Increased consumer controlSource: Convergence and Next Generation Networks, 2008
Services provided over next generation networks are expected to be superior in terms of quality as compared with services currently provided over the public Internet which is based on a “best effort” approach, where the quality of transmission may vary depending on traffic loading and congestion in the network.
RARE HIGH
FIG. 2: AN ILLUSTRATION OF THE HIGH CONSEQUENCE RISKS WITH NGNS
Source: Atay S., Masera M., 2010

82 E‐Governance: Techno‐Behavioural Implications
In NGN packet delivery is enhanced with Multi Protocol Label Switching (MPLS). This allows operators to ensure a certain degree of Quality of Service – similar to the more constant quality of circuit switched networks – through traffic prioritization, resource reservation, and other network‐based control techniques, as well as to optimise network billing as in circuit‐switched transport.
NGN AND NETWORK SECURITY
ITU’s Telecommunication Standardization Sector ITU‐T report “Trends in Telecommunication Reform: the Road to NGN” published in September 2007, predicts that full implementation of NGN in fixed line networks in developed countries will be deployed by 2012 and in mobile networks by 2020 (Next‐Generation Networks and Energy Efficiency, 2008).
With creation of NGN infrastructure, the information availability would be ubiquitous. The new network infrastructure will inevitably inherit known and yet to be discovered vulnerabilities, threats, and security risk of Internet Protocol (IP) of the existing Internet. The Centre for the Protection of National Infrastructure (CPNI), in its report on the identification of the high consequence risks faced by the UK (National Risk Register of UK Government, 2008), predicts that growing interconnectivity among networks would increase the probabilities and impact of attacks within an NGN scenario.
As depicted in Figure 2 the NGN environment is characterized by high‐impact, high‐likelihood risk (Atay S., Masera M., 2010). The Critical Infrastructures like banking, finance, energy and natural resources, telecommunications and internet service providers, transportation and mass transport face grave risk as their disruption can impact the ‘Information age’ society in unpredictable manner.
As operators move from trials to wide commercial roll‐out, questions regarding how to guarantee security across multiple networks are becoming more urgent. IP‐based next generation networks and the traditional circuit switched networks operate in different environments and are therefore exposed to different types of threats and attacks, both from within or externally. With converged networks, operators are migrating from a stand‐alone “closed” environment, such as the PSTN, to an open environment. The PSTN infrastructure is controlled by operators, and users have a lesser amount of information on its structure and functioning, as well as fewer possibilities to misuse the network. This provides security by obscurity and is in contrast with the design of the IP infrastructure, based on open protocols, which were not originally designed for security implementation. IP networks enable the provision of services – such as voice, data, and multimedia – provided by multiple access and service providers, and are connected with a growing number of devices, which are moving to open platforms, becoming increasingly powerful, and providing users with the possibility to actively interact with the network.

Information Security Issues with Emerging Next Generation Networks in Indian Context 83
From a national security perspective, as the Internet is increasingly becoming a “critical infrastructure”, security and robustness of the Internet are naturally becoming issues of major concern. These concerns may find their solutions in closed forms of Internet connectivity through the emergence of secure islands or of restricted connectivity, hence breaking the openness characteristics of the Internet (Schwarz da Silva, 2007).
New and advanced solutions to security issues are being discussed at national and international levels, and several initiatives are currently underway. The borderless nature of IP networks means that security threats affecting the converged infrastructure can arise from anywhere. The main challenges across borders include the necessity to improve co– operation of law enforcement activities against security offences, with particular attention to consistency of cybercrime legislation and regulations. In addition, international co–ordination and exchange of information is essential to create a global understanding of security risks and solutions linked to converged networks.
International standard development organizations (SDOs) such as ITU, ETSI, ISO, IETF, and 2GPP/3GPP2, are currently working to integrate security into the definition of NGN standards and protocols, in order to appropriately address security in the design phase of the new generation of networks.
The ITU Resolution X.805 (ITU, 2005) on "security architecture for systems providing end‐to‐end communications” identified five possible threats menacing a networked environment
• Destruction–destruction of information and/or network (an attack on availability).
• Corruption–unauthorised tampering with an asset (an attack on integrity). • Removal–theft, removal or loss of information and/or other resources (an attack
on availability). • Disclosure–unauthorised access to an asset (an attack on confidentiality). • Interruption–network becomes unavailable or unusable (an attack on
availability).
A specific example of possible security issues in an NGN environment can be provided by Voice over IP services. Voice is a critical service which in the past has benefited from separate PSTN and mobile networks, and had a certain degree of reliability. Shifting from PSTN to IP, the existing redundancy may be lost due to network convergence, and VoIP may inherit many of the problems already experienced by TCP/IP protocol data communications, such as attacks on confidentiality, integrity, availability and authenticity. Some of the current threats include transmission of viruses and malware, eavesdropping, Denial of Service (DoS) attacks, but also power failures (see Table 3).

84 E‐Governance: Techno‐Behavioural Implications
TABLE 3: THREATS AND RISKS FOR VOIP
Threats Risk Issues
Eavesdropping through interception and/or duplication
Access can be gained through any access point to the voice network (particularly if there are wireless access points in the same network that supports the VoIP service). Once access has been gained, network sniffer tools are commonly available to intercept IP–based traffic.
Loss, alteration or deletion of content
Exposure to programmed attack e.g. programmed substitution of Dual‐Tone Multi‐Frequency (DTMF) or Interactive Voice Response (IVR).
Caller ID/location may not be identified in an emergency
Complex numbering schemes, combined with incorrect PSTN access point routing, may provide wrong location information to emergency services. There is a greater risk of this happening when calls from remote offices are routed over a Wide Area Network (WAN) before reaching the PSTN.
Lack of capacity/system Management Other network traffic can impact on VoIP traffic.
Denial of service attack Swamping of network traffic resulting in no capacity to support voice. Can be targeted from within the enterprise or externally.
Viruses and other malware
Swamping of network traffic resulting in no capacity to support voice. Can be targeted from within the enterprise or externally. Viruses can also target specific VoIP protocols.
Power failure
VoIP is different to traditional telephony in that voice services are potentially vulnerable to a number of power failure points within the data network, e.g. local router and switches. In contrast, traditional telephony handsets are powered from one centralised point, usually with a backup battery bank.
Source: Convergence and Next Generation Networks, 2008
In USA, at the President’s National Security Telecommunications Advisory Committee (NSTAC) XXVII Meeting held on May 19, 2004, the NSTAC Principals requested that a task force be created to address how the Government can continue to best meet national security and emergency preparedness (NS/EP) telecommunications requirements and address emerging threats in the evolving NGN environment. The task force report submitted in March 2006 (Next Generation Networks Task Force Report, 2006) concluded that “As the NGN is in an early implementation stage, actual access, transport, and service availability today may not fully support anticipated NS/EP user requirements. It is the responsibility of the Federal Government to ensure that NS/EP requirements are articulated and coordinated among its users, standard bodies and the broad range of service providers. In order for the NGN to broadly meet essential NS/EP community requirements in a consistent, continuous and reliable manner on an end‐to‐end basis, common operational criteria must be defined and adopted by entities supplying network access, transport and infrastructure services for this community.”

Information Security Issues with Emerging Next Generation Networks in Indian Context 85
ANALYSIS OF THREATS TO NGN BY THE NSTAC TASK FORCE
The task force analyzed threats to various user class viz. Government agencies connected with national security and emergency preparedness, Communication and Internet service providers, Critical National Infrastructures, other organizations and general public.
Following four levels of threat classes were identified based on motivations and capabilities.
Class A, a nation‐state or agency with extensive resources Class B, Ideological/NGO groups with adequate resources Class C, Organized Crime/Corporate with moderate resources Class D, an individual with limited resources
These threat classes were evaluated not just based on resources but also on their motivations and their anticipated and developed cyber and kinetic capabilities (e.g., computer network attack, electronic warfare, psychological operations, military deception, kinetic).
As a threat modeling exercise, the NGN scenarios, user classes and their requirements were combined with the threat landscape and an analysis of susceptibility of a particular user class (in the context of an NGN scenario) to the various threat actor classes was performed. The result was enumeration of the threat types to which each user class was likely to be susceptible. The analysis addressed threats to the confidentiality, integrity, and availability of information or services in an NGN environment. The threat types were based on the STRIDE classification method proposed by Howard and LeBlanc. STRIDE denotes Spoofing, Tampering, Repudiation, Information Disclosure, Denial of Service, and Escalation of Privilege. The threat analysis for the NGN environment and scenarios was primarily focused on cyber and/or blended cyber/kinetic attacks. The result of this exercise was a matrix detailing the anticipated and likely threats for each user class within the context of an NGN NS/EP scenario. In this analysis, several threat trends surfaced. The key findings of the analysis are given below.
Widespread Susceptibility
Most user classes were susceptible to significant threat types from virtually every threat actor class. For example, in the Continuity of Government scenario, information disclosure and denial of service are significant threats to all user classes including the National Command Authority (NCA). In addition, the most secure NCA mechanisms (e.g., nuclear launch) may be very unlikely to be threatened but other operational functions, such as emergency response authority, may be highly susceptible to a wide range of threat types.

86 E‐Governance: Techno‐Behavioural Implications
Threat Actor Convergence
Due to the complex web of relationships between threat actors, the threat landscape has become converged leaving old methods of threat analysis potentially obsolete. For example, the growing financial motivation for cyber crimes has overshadowed motivations around personal fame and reputation for individual hackers. The likelihood of collaboration across threat classes is extremely high. For example, a nation‐state, foreign intelligence service, terrorist group, or organized crime group could employ an individual hacker who is motivated by financial gain but does not necessarily share his employer’s motivations and/or ideological views. Conversely, an individual hacker with no affiliation to a nation state or terrorist group might be sympathetic to the political or ideological cause and become a voluntary agent in the furtherance of that cause. Finally, the insider threat is not a standalone threat class but one that crosses all threat classes—there can be insiders in every scenario that are employed by any threat actor.
Network Convergence Threat Impacts
Convergence in the NGN environment will create an inherently more complex environment where various “planes” (i.e. control, data, user, etc.) are merged. Convergence creates a scenario where the threats and adversaries of the individual converged systems are inherited by the entire converged system. In a converged network, the threat to data integrity/validity must also be examined in addition to threats to network elements. Convergence will present a greater threat to control systems as control and management networks via wireless, PSTN, and the Internet are converged. Finally convergence, legacy network interoperability requirements, the infancy of converged network management tools, and other factors in the NGN environment have made network management in the NGN environment increasingly difficult.
CURRENT STAGE OF NGN DEPLOYMENT IN INDIA
NGN deployment in India is still in its infancy. While there has been some migration to NGN technologies in the core network by incumbents, the access network is particularly poor and will take many years to be 100% transitioned to NGN (TRAI,2006).
Communication infrastructures are heavily dependant on public policy frameworks and economic regulation. A study by Srivastava and Samarajiva (2001) deals with the impact of regulation on the degree of disaster preparedness of network operators and the recovery of the infrastructure after a disaster has hit. Their analysis draws on two case studies, namely, the impact of a cyclone on the power supply system of the Indian state of Orissa and the consequences of bombings on the restructured Sri Lanka telephone system. The study identifies the main issues and suggests a set of solutions in respect of the regulatory design of systems. According to the study, disaster management does not appear as a regulatory priority either in telecom or in energy. In regional context, when many countries around the Indian Ocean are confronted with the

Information Security Issues with Emerging Next Generation Networks in Indian Context 87
immediate need to react to similar disasters, review of these issues and the conclusions presented may be of immense value to policy makers. Need for a regulatory framework that provides incentives to achieve the desired robustness of the system at reasonable cost, without infringing on the managerial autonomy of the operators is most essential in the liberalized systems.
Disaster preparedness should be part of the license conditions of service providers. Long‐term regulatory framework for disaster mitigation and management should highlight risk before new investors enter the market, so that incentives are properly aligned. The investor has to bear some part of the costs of recovery, to act as incentive to build and maintain robust systems.
INDIA’S CHALLENGE
Post liberalization, electricity and telecom sector has witnessed large investments by private sector. Infrastructure development using private investment is being pursued in many developing countries including India. However, inadequate focus to disaster preparedness and recovery in regulatory frameworks is a cause of concern. No single operator controls the Telecom or Power sectors and, therefore, responsibility to prepare for, and recover from, disasters is diffused. All operators are driven by the “bottom line,” and cannot expend resources on activities that do not contribute to profit (Srivastava, Samarajiva, 2001).
Enterprise level customers value reliable service, including adequate levels of disaster preparedness and recovery. They would be willing to pay for the reliability and survivability of business critical ICT infrastructure. However, in the absence of institutionalized vulnerability analysis and benchmarking of ICT infrastructure, status quo is maintained.
In view of the grave repercussions of infrastructure failure in core sectors like power and telecom government driven regulatory, initiative would be justified even after liberalization. Pragmatic regulation would achieve twin objectives of attracting and retaining private investment to the infrastructure sector; and, efficacy in terms of disaster preparedness and recovery.
Government agencies, business houses and common citizen alike are embracing the fast evolving telecommunication infrastructure to facilitate India’s march towards e‐governance and e‐commerce. However, vulnerability of this infrastructure to natural and man made disaster and consequent cascading effect on our national security remains unarticulated.
National Telecom Policy (NTP, 1999) while emphasizing need for growth of our communication infrastructure, does not specifically address vulnerabilities and action plan. National Disaster Management Authority has highlighted need for reliable and robust communication support for disaster management and expected performance objectives are being firmed up (NDMA, 2007). The consultation paper of Telecom

88 E‐Governance: Techno‐Behavioural Implications
Regulatory Authority of India (TRAI) has recognized the security risks associated with NGN (TRAI, 2006). It would be prudent to bring these issues in the open through government–industry dialogue to evolve mutually beneficial arrangements.
OPTIONS AT NATIONAL LEVEL
The scenario presented in this paper emphasizes the generic risks faced by the existing Information & Telecommunication infrastructure in Indian context. While these risks are equally applicable to all ‘Information age’ societies across the world, the steps taken by any country to cover them would decide the outcome. The additional risks associated with the Internet Protocol (IP) based Internet are already well documented and agenda for action already in place. Likely migration to NGN has compounded the risk and urgency for comprehensive action at national level to secure Cyber Space is indicated. The dimensions of a comprehensive construct of National Information Security have been earlier suggested by authors of this paper (Chaturvedi et al, 2010) as indicated in Figure 3.
The identification of most important indicators of these dimensions and calculation of relative weights of these dimensions and their constituent indicators is undertaken by a research project at IIT Delhi. Indian government has to take a leadership role in initiating steps to cover all dimensions of Information Security. The majority of ICT infrastructure that supports Cyber domain is owned by private sector. The national security that depends on this infrastructure is responsibility of national Government. Government with the authority to regulate and stakes in national security can ill afford to remain isolated.
CONCLUDING REMARKS
The transition to NGN from legacy networks is essentially driven by technology but fuelled by innate needs of individuals and society to acquire functionalities that provide ubiquitous connectivity. It changes the way society and individuals within society function.
Like any major transition the existing framework of regulation needs to be revisited to ensure smooth change over. Choice is not about whether to transit but about when to transit. Vacillation to finalize rules of the game can harm our national interest as we should be in step with the rest of the world that stands on the cusp of future opportunities. In a globalized world we cannot insulate our communication infrastructure from rest of the world. International effort coordinated by ITU on this subject is moving ahead in a focused manner. Department of Telecommunication (DOT) and Telecom Regulatory Authority of India (TRAI) have taken pro‐active measures to generate a consensus amongst all stakeholders as we move in un‐chartered waters.

Information Security Issues with Emerging Next Generation Networks in Indian Context 89
It is recommended that the existing and planned telecommunication infrastructure of the nation, both in public and private domain be analyzed by a group of experts under aegis of TRAI to suggest suitable operational arrangements to minimize their vulnerability to perceived attacks by inimical elements and natural disasters. This would entail rigorous technical analysis of current and emerging wireless and wired communication systems. The expert group may find and recommend suitable mix of redundancies in the critical communication networks supporting the governance structure of the nation. The focused analysis of the vulnerabilities and their protection, would lead to recommendations that would avoid duplication of effort and, therefore, economical at national level.
FIG. 3: MODEL OF NATIONAL INFORMATION SECURITY INDEX CONSTRUCT
Source: Chaturvedi et al, 2010
It would be in our best interest to embrace the change with a spirit of accommodation with government providing a facilitator’s role. Telecommunication has important connotation for a developing country like India where tele‐density in rural areas is woefully poor. The leverage that NGN provides to India with minimal existing investments in rural India is worth factoring in our policy decisions. We have advantage of ‘late mover’ in the sense that we can learn from mistakes of developed nations. In a liberalized economy we have a mature telecom regulator in the form of TRAI. Telecom sector is booming and FDI is pouring in to take advantage of this growing Indian market. We need to resolve various issues under the aegis of Department of Telecommunication and TRAI in a mature and light touch regulatory frame work to transition to NGN.

90 E‐Governance: Techno‐Behavioural Implications
REFERENCES [1] Atay S., Masera M. (2010). Challenges for the security analysis of Next Generation Networks,
Information Security Technical Report (2010), doi:10.1016/j.istr.2010.10.010 [2] Chaturvedi. M., Gupta.M.P. & Bhattachrya.J.(2010),“ Model of National Information Security Index
Construct in Indian Context” –Presented at the Seventh International Conference on E‐Governance (ICEG 2010), at IIM Bangalore on 22nd – 24th April 2010.
[3] Convergence and Next Generation Networks (2008). OECD Ministerial Meeting on the future of Internet Economy,Seoul,Korea,17‐18 June 2008, DSTI/ICCP/CISP(2007)2/FINAL.
[4] Developments of Next Generation Networks (NGN): Country Case Studies (2009) Retrieved on 16 July 2011. .http://www.itu.int/ITU‐D/treg/Documentation/ITU‐NGN09.pdf.
[5] DOT(2007), Retrieved August, 2007 from http://www.dot.gov.in [6] ITU (2005). ITU X805 Resolution. Retrieved on 16 July 2011
http://www.itu.int/itudoc/gs/promo/tsb/86261. pdf. [7] National Risk Register of UK Government, last updated 09 Nov. 2008.
http://www.cabinetoffice.gov.uk/media/cabinetoffice/corp/assets/publications/reports/national_risk_register/ national_risk_register_introduction.pdf.
[8] NDMA (2007), Retrieved August 7, 2007 from http://www.ndma.gov.in [9] Next‐Generation Networks and Energy Efficiency, ITU‐Technology Watch Briefing Report Series, No. 7,
August 2008. [10] Next Generation Networks Task Force Report (2006), Retrieved on 16 July 2011. [11] http://www.ncs.gov/nstac/reports/2006/NSTAC%20Next%20Generation%20Networks%20Task%2
0Force%20Report.pdf. [12] NTP (1999), Retrieved August 7, 2007 from http://www.dot.gov.in [13] Schwarz da Silva, J.(2007). Future Internet Research: The EU framework. ACM SIGCOMM Computer
Communication Review 85 Volume 37, Number 2 [14] Srivastava Leena, Samarajiva Rohan , (2001), Regulatory design for disaster preparedness and recovery
by infrastructure providers: South Asian experience, Paper presented at Economics of Infrastructures Section, TBM Faculty, TU Delft, Jaffalaan 5, 2628 BX Delft, Netherlands,www.delft2001.tudelft.nl/paper%20files/paper2055.doc
[15] TRAI, Consultation Paper On Issues pertaining to Next Generation Networks (NGN) , (12th January 2006) ,Retrieved Aug 2008. www.trai.gov.in .
Secured Governance using Data Security
Subhash Chander Assistant Professor, Govt. P.G. College Karnal, Haryana
Email: [email protected]
Abstract—The world is going to be digital day by day. Use of Information Technology (IT) in various processes is increasing the question of security considerably. Various new applications of ICT are appearing day by day but with increase in security breaching. The concept of computer security is being stressed for research and this also makes sense in a world where ecommerce and EGovernance are becoming the norms of the day. Along with their potential for making life easier and smarter for people, these systems also carry with them the danger of insecurity. In this paper, certain security measures have been highlighted. Certain problems and their solutions regarding information security have been discussed in the paper. One of the major factors in data security considered here is user awareness and value of data one is handling with.
Keywords: UID, NeGP, IRM, RITE, ICT, CSC
INTRODUCTION
Earlier, data about individuals or organizations was maintained as paper records to be dispersed in separate business or organizational units. In modern era, computer files are used that can be easily accessed by large number of people. More companies and Governments store business and individual information on computer than ever before. Many businesses are solely based on information stored in computers. Through communication network, various information systems can be interconnected and therefore chances of unauthorized access, abuse, fraud increase manifold because of many access points. Obviously, when data is stored in electronic form then it is more vulnerable as compared to the data in manual form. In case of e‐government, security has a vital role to play. Enhancing security, privacy and trust deserve top priority in e‐government. Strategies and efforts need to include a large variety of measures and principles such as purpose specification, security safeguards, accountability, encouraging the use of privacy enhancing technologies and quality certificates [Georg Aichholzer, 2004].
Identities are very valuable and are more prone to misuse. It is therefore very important that they are protected and made accessible only to authorized persons. At the same time, people want to use their various digital devices to access information. Various E‐Governance projects are being implemented but security is not given its due weightage. Globally, government agencies and authorities have gradually understood the significance of IT and its role in reaching out to people in implementing various beneficial schemes and policies today. In this deep sea of cyber world, the wave of E‐Governance will not have a smooth sailing without security ahead in time. Data in most of the cases is in the form of files of MS‐Office. Also huge amount of storage, bandwidth and desktop resources are required to manage these files. In a way, inside attackers are also of great concern. Threats at business user level and enterprise level need to be tackled seriously. Security is fundamentally about the provision of core security

92 E‐Governance: Techno‐Behavioural Implications
services. Service confidentiality is about keeping data secret. An integrity service prevents data from being altered in an unauthorized way. Entity authentication is a process whereby one entity is assured of the identity of another entity. Data origin authentication is assurance that data came from its reputed source. Availability is the property of being accessible and usable upon demand by an authorized entity [Sharma yogesh K, Bagla A., 2009)]. Information security is the process of protecting information. It protects its availability, privacy and integrity.
INFORMATION SECURITY PROBLEMS AND GOALS
In the modern corporate world, information security is generally not given a top priority and many professionals do not give adequate importance to these security concerns of an organization. Even if they do, they come up with solutions that are over‐complicated. Indeed the widespread use of information technology by businesses today has given rise to ‘security blindness’ on part of the users [Backhouse and Dhillon ,1999].Information security is not only related to the confidentiality of information but also integrity and availability of desired information in time.
Information security is necessary because there are many risks involved. Risks involve viruses erasing the entire system, someone breaking into system and alter files, someone using computers to attack others or someone stealing secret information like credit card information and making unauthorized purchases. The security in case of mobile phones is another serious issue. At this time, there is lack of awareness among the masses about the mobile security. In India, the mobile security is at very nascent stage. Mobile payments and mobile banking services are protected with only single level of security ‐ user name and password. If someone is able to get these two, it can cause a lot of financial loss. All Governments are digitizing its data. Governments across the world hold terabytes of information. This information in digital format today is more vulnerable to threats than ever before [cybermedia News, 2011].
Cyber attacks can destabilize, interfere with or disable online national security assets or entities of a state or government. Protection against these types of attacks must go beyond the usual countermeasures of firewalls, antivirus and intrusion detection or prevention and must include programs that can instantly relay all information about an attack. Today all state governments are busy in implementing National E‐Governance Plan (NeGP) and on the other side; process of Unique Identification Numbers (UIDs) is going. In this scenario, the role of security of Government information has increased manifold. Securing data is an essential process for proper functioning of various E‐Governance projects. Today, right to privacy of information becoming more complex, data protection and the prevention of data loss is rapidly gaining significance. These scenarios warrant not just more efficient technology, but also fool proof data protection and privacy rules and regulations [cybermedia News, 2011]. There are certain problems with technology based security solutions.
Secured Governance using Data Security 93
1. Technological solutions are expensive. 2. Technology is capable of making mistakes. Till date, no software is 100% error
free and secure. 3. Technology based solutions are implemented by human beings. There may be so
many options to implement for better security. But these options may not be proper utilized. In case of every antivirus, one does not have full knowledge about meanings and use of various options whether to check or uncheck?
Human beings are also threat to the organization many times if
1. He is careless and even careful employees may sometimes commit mistakes. 2. Staff member who choose weak passwords, share user IDs, give out sensitive
information etc. may create vulnerabilities that may be exploited by others. 3. Wrong results due to Information security breaches cause human and
organizational impacts. Staff naturally tends to distrust systems that often produce meaningless information, even if those errors are the result of data entry mistakes by users [Gary Hinson, 2003].
E-GOVERNANCE AND SECURITY
E‐Governance is application of IT to the processes of Government functioning to bring out responsible, responsive, efficient and transparent governance. E‐Governance refers to the use of Information and Communication Technologies (ICTs) to improve the efficiency, effectiveness, transparency and accountability to government [Gupta D.N., 2008]. Traditionally, one has to visit an office for any government or business service. But now, with the emergence of ICT, it is possible to locate service centers closer to the citizens. E‐Governance is composed of IT, people and governments. It is an application of electronic means to improve interaction between Government and citizens; and to increase the administrative effectiveness and efficiency in the internal government operations. It is application of IT to the Government processes to bring Simple, Moral, Accountable, Responsive and Transparent (SMART) Governance [Ramadoss B,R. Palanisamy, 2002]. It is not only just computerization of services but also reinventing the new ways of governance.
Advent of internet technology has changed the traditional government to E‐Government. Such a government would bring transparency; check on corruption if it is implemented successfully. E‐Government is a technology led administration where citizen can avail government services like getting a copy of land records, tax return filing, various types of certificates, E‐Governance involves formulation of laws and regulations such as domain name to govern cyber space [Gupta M.P,Kumar P,Bhattachrya J., 2004]. Some hackers are computer genius and attack big targets [Blamire, 2004]. Government information is no exception for that. Despite numerous studies in the areas of security and trust, there is a dearth of research that addresses the impact of security trust and security awareness on the prevalence of online activities [Chen Jim Q, Schmidt, Mark B, Phan Dien D et.al., 2008]. For successful E‐Governance

94 E‐Governance: Techno‐Behavioural Implications
application, there is a need to build the trust of citizens in the system. There is strong need that all data and transactions of the citizens are secure. If a system takes care of security then only they can become addict to that system. When a citizen does any transaction with Government, he may have to give a lot of personal and critical information, which can be misused by the private sector and anti‐social elements. Thus, the citizen should be ensured that the information flow would pass through reliable channels and seamless network. Also there is need to identity and verify citizens requesting services before they access or use the services. Here digital signature and biometrics play an important role in delivery of such services. Other various security concerns for an E‐Governance system may be virus attacks, outside and inside attacks, impersonation, denial of service attack, breach of anonymity and accountability, loss of monetary value etc.
INFORMATION SECURITY SOLUTIONS AND HUMAN BEING
Information systems play a vital role in the success of a business. Thus, better computer literacy, increased computer user sophistication, and availability of advanced software tools may contribute to information system security abuses in the future. The organizations must protect their valuable information from loss just as they protect any other valuable asset, such as tangible property, equipment, money, or staff. Organizations must ensure that all the information security loopholes are covered. The information assets must be protected against accidental or malicious unauthorized disclosure, modification, or destruction. [Mohammed Maqsood, M.Sameer, Mansoor M.A, Lohana M.K, 2003].
Mobile Security: In case of secured mobile transactions, one should not put his username and password at one place or in mobile phones. Human beings are the most vulnerable part in the security of information. Before conducting any transaction through mobile, its pros and cons need to be kept in mind. Users should regularly change its password if mobile banking softwares are being utilized frequently. Users of the service must ensure the security of the network being used for making transactions. Concerned banks must aware the users about tips of safe and secure transactions through mobile banking. Users must be involved within the domain of information security management. Human beings disregard basic security precautions, if they are given the opportunity to do so.
Desktop Security: For preventing misuse of desktop by the employees of the organization, one can apply Information Rights Management (IRM) feature offered by various companies. Confidential information may be the research data, product design, customer data or military related data is to be shared within organization employees. Passwords can be one of the ways to prevent unauthorized persons to view and misuse of such critical information. Most suites don’t have protection against such threats if any trusted employee passes this information to the competitor or any other interested user. IRM is the feature which uses a right management server to identify intended users of

Secured Governance using Data Security 95
particular document. IRM protected documents are normally read only and users can not forward, mail, copy or print such documents. Even print screen does not work. IRM also maintains inter departmental confidentiality of information. Private Information Protection is one of the most ignored areas. Before sending any document outside the organization there is a need to remove many things like properties, username, track changes, hidden objects or text, comments etc. Removing such things from each document is a lengthy process and therefore is skipped very often. But it should be mandatory part of security and compliance policy.
Defining a security policy can be a complicated task as each Government must decide beforehand which aspects of protection are most important, thereby compromising between security and ease of use [Vasu Deva, 2005]. Companies must be increasingly vigilant in their efforts to prevent and to mitigate sophisticated attacks.New employees must be trained in information security and must know what they should and should not do with respect to their computers and the company’s networks. Due to rise in both employees’ and companies’ use of social media such as Twitter, Facebook, LinkedIn and other mobile applications, legal counsel and companies must regularly review their information security policies and procedures and adjust them accordingly [Hadley Roy ,2011]. This adjustment must include making certain that all employees are adequately trained with respect to the company’s policies and procedures, and are aware of the ongoing and ever increasing risks with respect to the protection of the company’s information assets and intellectual property. Proactively managing information security risks involves assessing and reassessing all the threats, vulnerabilities and impacts and successively improving controls [Gary Hinson, 2003].
General Security Awareness: Information security awareness is must for the users. Lack of awareness on information security is the major reason for breaches and violations. Campaigning can be done for security education and this can be done with the help of a poster, newsletters, making a list of dos and don’ts. Quizzes can be organized for users to know their ideas about the security of information they are dealing with. Users must be motivated by providing them an easy to use interface. Also users tend to favor quick decisions based on the learned rules and heuristics. Employees may be rewarded periodically for reporting security incidences spreading awareness about information security.
Existing Principles of Security: The basic three principles of information system security are confidentiality, integrity and availability. Preserving personal privacy is one of the major objectives of confidentiality. Confidentiality prevents the unauthorized disclosure of information and restricts the data access to only those who are authorized [Mohammed Maqsood, M.Sameer, Mansoor M.A, Lohana M.K., 2003]. In any business organization having information system, the values of data is of utmost importantce. This issue is referred to integrity within an organization which is the prevention of the unauthorized modification.Availability is referred to as accessibility of information and in usable form when and where it is required. Sometimes, it is also explained as the

96 E‐Governance: Techno‐Behavioural Implications
prevention of unauthorized withholding of data or resources. RITE [Backhouse and Dhillon, 1999] principles also hold key for successfully managing security in future. Summary of all the traditional and new principles of security can easily be depicted through Figure 1. One can control threats to information security by fixing rules and regulations and enforcing those policies and procedures followed up with strict adherence. Responsibility means knowledge of rules and understanding of responsibilities. In the modern environment, it is important for the members of the organization to develop their own work practices, on the basis of their understanding of responsibilities that work even in unusual situations. Feeling of integrity as a member of an organization and loyalty to the employer and the organization is important when employees handle business sensitive information [Ella Kolkowska, 2004]. In modern geographically dispersed organizations where self control is more important than external controls and responsibility are more effective than supervision, there have to be mutual systems of trust. Employees have to be trusted to act according to company norms and accepted patterns of behavior [Ella Kolkowska, 2004]. One must expose morality instead to rules. Rules apply in foreseen and predictable circumstances and cannot be invoked in new and dynamic situations. Hence, it is important that employees must act according to ethical practices. The information security can be controlled through people, process and technology [Verma virender K., 2011].
FIG. 1: EXISTING MODEL FOR PRINCIPLES OF INFORMATION SECURITY
Proposed Security Solutions: Internet security threats will continue to be an issue as long as information is shared across world using Internet. There is a need to check that staff understand and follow security policies, management authorization processes are being followed correctly, help desk staff don’t give out passwords and security patches are checked and applied consistently. Information security requires ongoing management attention. Special security rules need to be framed for the E‐Governance transactions according to level of services. In E‐Governance applications, information provided by citizens must be secured using Anti‐virus softwares. Firewalls must be used for securing network. On the software part, one can provide certain warning or suggestive messages for making any transaction or providing any private and secret information. For providing various solutions of security, there is a need to re‐engineer the on going processes. But all these rules discussed above will be fruitless until user is
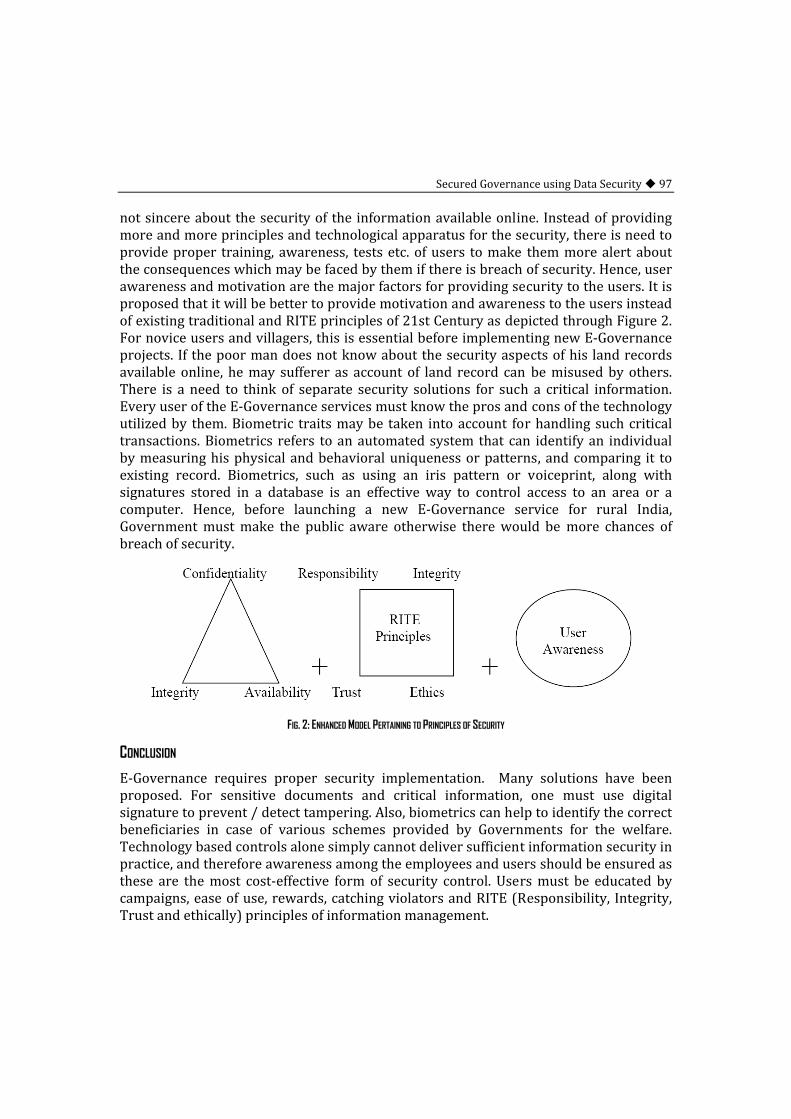
Secured Governance using Data Security 97
not sincere about the security of the information available online. Instead of providing more and more principles and technological apparatus for the security, there is need to provide proper training, awareness, tests etc. of users to make them more alert about the consequences which may be faced by them if there is breach of security. Hence, user awareness and motivation are the major factors for providing security to the users. It is proposed that it will be better to provide motivation and awareness to the users instead of existing traditional and RITE principles of 21st Century as depicted through Figure 2. For novice users and villagers, this is essential before implementing new E‐Governance projects. If the poor man does not know about the security aspects of his land records available online, he may sufferer as account of land record can be misused by others. There is a need to think of separate security solutions for such a critical information. Every user of the E‐Governance services must know the pros and cons of the technology utilized by them. Biometric traits may be taken into account for handling such critical transactions. Biometrics refers to an automated system that can identify an individual by measuring his physical and behavioral uniqueness or patterns, and comparing it to existing record. Biometrics, such as using an iris pattern or voiceprint, along with signatures stored in a database is an effective way to control access to an area or a computer. Hence, before launching a new E‐Governance service for rural India, Government must make the public aware otherwise there would be more chances of breach of security.
FIG. 2: ENHANCED MODEL PERTAINING TO PRINCIPLES OF SECURITY
CONCLUSION
E‐Governance requires proper security implementation. Many solutions have been proposed. For sensitive documents and critical information, one must use digital signature to prevent / detect tampering. Also, biometrics can help to identify the correct beneficiaries in case of various schemes provided by Governments for the welfare. Technology based controls alone simply cannot deliver sufficient information security in practice, and therefore awareness among the employees and users should be ensured as these are the most cost‐effective form of security control. Users must be educated by campaigns, ease of use, rewards, catching violators and RITE (Responsibility, Integrity, Trust and ethically) principles of information management.

98 E‐Governance: Techno‐Behavioural Implications
REFERENCES [1] Backhouse and Dhillon (1999), “Working towards principles for information security management in
the 21st century”, a paper available at www.csrc.lse.ac.uk [2] Chen Jim Q,Schmidt,Mark B,Phan Dien D et.al.(2008),”E‐commerce security threats: awareness, trust
and practice” International Journal of Information Systems and Change Management Volume 3, Issue 1 , pp.16‐32
[3] Cybermedia News (2011) “E‐Governance amidst cyber threats”, Available at www.Ciol.com [4] Ella Kolkowska (2004),” Managing of information security with consideration of individual values and
organizational form”, a paper available at www.information‐institute.org [5] Gary Hinson (2003),” Human factors in information security “a white paper Available at
www.IsecT.com [6] Georg Aichholzer(2004), “Scenerios of e‐Government in 2010 and implications for strategy design”
Electronic journal of E‐Government Volume2 issue 1, Pp 1‐10, available at ejeg.com [7] Gupta D.N.(2008),” E‐Governance, A comprehensive framework” century Publications, New Delhi [8] Gupta M.P,Kumar P,Bhattachrya J.(2004), “Government Online opportunities and Challenges”,Ch‐1,TMH
Publication. [9] Hadley Roy (2011), “Technology: We're all human when it comes to info security” Available at
www.insidecounsel.com [10] Mohammed Maqsood,M.Sameer,Mansoor M.A,Lohana M.K, (2003) ,“Information Systems Security and
Control” a Project Report, available at www.ida.liu.se [11] Ramadoss B,R. Palanisamy (2002)” Issues and Challenges in electronic Governance Planning” a Concept
paper [12] Sharma yogesh K, Bagla A.(2009),”Security challenges for Swarm robotics” International Journal of
Information Technology and Knowledge Management, Volume 2 No.1 Pp 45‐48. [13] Vasu Deva (2005)Vasu Deva,”E‐Governance In India‐ A reality”,Commonwealth publishers, New Delhi [14] Verma virender K(2011),” Information security is beyond Confidentiality”, Proceedings of 5th National
Conference IndiaCom , BVICAM, New Delhi.

A Framework for Determining the Hacker’s Most Probable Path in a Wireless Telemedicine Network using Markov Model
Saini Das, Arunabha Mukhopadhyay and Girija Shukla IIM Lucknow
Email: [email protected], [email protected], [email protected]
Abstract—Telemedicine networks are susceptible to cyber breaches that pose an immense threat to the CIA (confidentiality, integrity and availability) of patients’ electronic medical records. We propose a framework using Markov Model to determine the most vulnerable path that the attacker might exploit to reach his target. This is based on the hacker’s preference for the path of least resistance in the forward direction. We propose a formula using three criteria: (i) the angle generated between the current, the adjacent and the destination cell, (ii) the Manhattan distance (iii) number of proberesponse packets from the destination cell, to calculate the transition probability from one cell to the next. These probabilities are then used to generate the state transition matrix which the Markov model uses to determine the number of steps taken to reach the target in each probable path. This framework can be used to estimate the hacker’s move apriori to determine what precaution should be taken at which step to undermine the attacker.
Keywords: Telemedicine, Markov model, Proberesponse, Manhattan Distance, Transition probability.
INTRODUCTION
In April, 2004, stolen health records containing sensitive medical information about hundreds of U.S. patients were discovered on a computer server in Malaysia controlled by cyber criminals. The stolen files included names of health care providers, medical history summaries, diagnoses, prescriptions, insurance details and other personal information, such as Social Security numbers, birthdates and addresses of the patients (Brewin, 2008). In July 2010, an unknown virus hit the information system of the Kern Medical Centre (KMC). No patient records were stolen. But the online services of KMC were disrupted for three consecutive days forcing the entire hospital to work on paper and pencil (Burger, 2010). In May 2009, California regulators fined Kaiser Permanente $250,000 for failing to prevent healthcare workers from accessing the electronic health records (EHR) of a woman who had given birth to octuplets. Cyber attacks on patients’ Electronic Medical Records (EMR) and health information systems (HIS) can lead to severe consequences like patient identity disclosure, embarrassment, privacy violation and in the worst case, integrity violation resulting in patient’s death.
Similar incidents will lead to disastrous consequences on HIS and other telemedicine initiatives listed below. International MedioNet of China (IMNC) network initiative connects 300 hospitals (i.e., 3000 specialists) to remote patients through telephone lines and the internet (Wang and Gu, 2004). In Ethiopia, primary healthcare facilities for the rural population are very poor. In such a country telemedicine (teleradiology, teleophthalmology, and telecardiology) will to enable 85% of the country’s population living in rural areas to access healthcare (Solomon, Kifle, Mbarika and Okoli, 2004).

100 E‐Governance: Techno‐Behavioural Implications
In India too, telemedicine has been transforming lives of the rural population. It can facilitate medical consultation and treatment through information communication and technology (ICT) to remote areas. Indian Space Research Organization (ISRO) in collaboration with various state governments has provided a telemedicine network that stretches to around 100 hospitals all over the country with 78 remote/rural/district hospitals connected to 22 speciality hospitals located in major cities. Another telemedicine project has been implemented in Andhra Pradesh on a public‐private partnership (PPP). The district hospitals serve as Telemedicine Consulting Centre (TCC) and a private Hospital serves as Telemedicine Specialist Centre (TSC) (Ramani, 2004). Another example of a successful telemedicine project in India, is the Aravind Eye Care System, the largest private eye‐care provider in the world by volume. It has deployed a rural wireless telemedicine system in southern India, enabling patients from remote rural areas to get eye check‐ups and treatment at a minimal rate from their locality. In 2006-2007 alone, Aravind saw 2.3 million patients and was able to perform 270,000 eye surgeries (Surana, Patra, Nedevschi and Brewer, 2008). Such high profile wireless healthcare systems run high risk of being attacked by cyber hackers.
Telemedicine is the use of electronic information and communication technologies to provide healthcare to participants who are separated by distance (Liqiong and Marshall, 2002). It is an effective solution for providing speciality healthcare to rural patients in the form of easy access and low cost. Telemedicine is an important and perhaps the most challenging sector of e‐governance. E‐healthcare is the delivery of health information via the internet to improve public health while simultaneously controlling health care costs and is enticing to consumers, health care providers, insurance companies, employers and all other stakeholders of the healthcare industry (Mukherjee and McGinnis, 2007). Both telemedicine and e‐healthcare projects have to face challenges like (i) integration with the medical practice and the healthcare system, (ii) identification with the e‐governance vision and policies of the nation, (iii)it’s economic implication and (iv) it’s social impact (Solaiman, Cauvin, Puentes, Le Guillou, Brunet, Debon and Roux, 2001). Apart from these there are several other challenges like (v) sustainability, (vi) security, (vii)legal and ethical issues still related to e‐healthcare (Surana et al., 2008; Stanberry, 2001).
In this paper we use Markov model to determine the most preferred paths that a hacker will use to break into a wireless telemedicine network to compromise electronic medical record (EMR) of patients. This path will generally be the one of least resistance (Johnston, 2000) and is the weakest link in the network as the security components deployed along the route are vulnerable. We assume that a hacker will direct his attacks only in the forward direction from this current location (i.e., cell). Our hypothesis is that hackers rarely move in random direction; rather they move towards some predefined destinations availing this path of least resistance. He employs the concept of direction based mobility. The hacker can change direction only on reaching the centre of a cell, using a Markov model.

A Framework for Determining the Hacker’s Most Probable Path in a Wireless 101
This paper is structured as follows. Section 2 gives some details of cyber attacks on e‐healthcare organizations in terms of impact and type. In section 3, we provide review of related work in this area. In Section 4 we describe the use of theories in our proposed framework including probability theory and Markov model. We describe our proposed framework in Section 5. Section 6 shows the results using an example. Concluding remarks are found in Section 7.
DETAILS OF CYBER ATTACKS
Implications of Cyber Attacks on E-Healthcare and Telemedicine
Patients using telemedicine are worried about the privacy of their transmitted medical record from which their identities could be revealed. Patient’s medical records contain very sensitive and confidential information which should not be made accessible to unauthorized persons in order to protect patient privacy, integrity and confidentiality. At the same time, the patient information also needs to be readily available to all authorised health‐care providers, in order to ensure the proper treatment of the patient. Any tampering with the integrity of an EMR can result in consequences as severe as the death of a patient. Thus the requirements of C‐I‐A (confidentiality, integrity and availability) of patient health data have to be met in any e‐healthcare network (Kovacevic, Kovac and Knezovic, 2007; Mukherjee and McGinnis, 2007). The already known security challenges to telemedicine and e‐healthcare have become even more complex in the presence of newer trends in like wireless networking (Puentes, Bali, Wickramasingha and Naguib, 2007). Hence, impact assessment of a cyber attack on any network has gained importance to analyse the security risk to it. Event study methodology has often been used to determine the stock market impact of a cyber attack on a firm. It has been found that web‐based companies like those specializing in online business or depending majorly on the internet for their daily activities are negatively impacted in the stock market by the declaration of a cyber breach (Das, Mukhopadhyay and Anand, 2011).
Attack Types in Wireless Network
Sniffing and spoofing are very common types do attack in a wireless network. While sniffing is eavesdropping on the network by sending a program that intercepts and decodes network traffic for finding open access points, spoofing attack is one where an attacker disguises as another by using false IP address or MAC address. Wireless network probing is another form of attack in which the attacker sends artificially constructed packets to a target to trigger responses. A denial of service (DoS) attack can happen on a wireless network in which case the network would remain unavailable for some time. Such attacks are difficult to prevent, stop and the victim and clients may not even detect the attacks. Man‐in‐the‐middle attack is another form of attack in which the attacker makes independent connections between the victims by intercepting all communication between them and also injecting new ones (Mateti, 2005).

102 E‐Governance: Techno‐Behavioural Implications
RELATED WORK
Several studies have been conducted regarding the information security risks in e‐healthcare and telemedicine. Smith and Eloff (2006), assess the risk in a particular phase of the route followed by a patient admitted to a hospital for an operation using cognitive fuzzy logic approach.
Warren (2001) proposes the ODESSA framework of reviewing security within healthcare by using security profiling, data use and baseline security countermeasure while protecting the healthcare information system.
Mukherjee and McGinnis (2007), stated that e‐healthcare systems enable healthcare organizations to improve efficiency, reduce costs, and provide quality healthcare across multiple facilities. They also identified the five major themes of e‐healthcare research: cost savings; virtual networking; electronic medical records; source credibility and privacy concerns; and physician‐patient relationships.
Ramani (2004) identified the problems faced by government hospitals in India such as inadequate resources, insufficient funds, lack of administrative support, poor interface with the citizens etc. He discussed three successful IT enabled applications (telemedicine, e‐governance, and BPR) to satisfactorily address some of these problems in government hospitals in India.
Huston (2001) states that as the dependence on information system grows in healthcare organizations, so does the probability of financial loss and compromise of patient confidentiality. Top management has a strategically important role to play to protect the organization from loss of information. There should be a security plan according to te organization’s business objectives. Security evaluation should also be included in the analysis and design of health information systems (HIS).
Wozak, Schabetsberger and Ammmenwerth (2006) suggested a model for providing end‐to‐end security in telemedicine networks from origin to destination. This consists of three parts: authentication and access control, transport security, as well as system security. This method is based on construction of abuse case models at each part described above, so that it is easy to identify the risk and devise countermeasures. Thus from literature we can find various methods that have been used to counter security risks in e‐healthcare and telemedicine networks.
THEORIES USED IN OUR PROPOSED FRAMEWORK
Path Formulation using Probability Theory
In a hexagonal network, a hacker can move in all six directions from his current cell with equal probability (i.e., 1/6) (Camp, Boleng and Davies, 2002). But in direction based mobility, probability of moving into adjacent cells in a hexagonal network is not uniform. Since we consider forward mobility, we assume that the attacker can move to only three cells that conform to the forward direction, keeping its target in mind. Figure

A Framework for Determining the Hacker’s Most Probable Path in a Wireless 103
1 shows the possible directions of movement according to our model. Movement can only be made to cells marked, 1, 2 and 3. x1, x2 and x3 are the angles made by the three directions closest to the direction of the destination, D from the current cell, S.
FIG. 1: DIRECTION OF MOVEMENT IN FORWARD DIRECTION-BASED MOBILITY
Markov Theory
A Markov process is a stochastic process such that the probability distributions of its future detvelopment depend only on the present state and not on how the process arrived at that state (Trivedi, 2002). Let the observations of successive states of the system at time steps, 0, 1,2,…n,…. be defined by the random variables, X0, X1, X2,…,Xn, respectively. If Xn = j, then the state of the system at time step n is j. X0 is the intitial state of the system. The markov property can be stated as:
P(Xn = in|X0 = i0, X1 = i1,….,Xn‐1 = in‐1) = P(Xn = in | Xn‐1 = in‐1) (1)
Let pj(n) denote the probability of the random variable Xn being in state j,
pj(n) = P(Xn = j) (2)
and let the conditional probability be:
pjk(m,n) = P(Xn = k | Xm = j), 0 ≤ m ≤ n (3)
denote the probability that that the process makes a transition from state j at step m to state k at step n. Thus, pjk(m,n)is the transition probability of the Markov chain.
Let the two states of an information system be good and bad. Good is the state of the system prior to any cyber attack. Bad is the state of the system when it has been compromised after a cyber attack. Let the probability of moving from good to bad state

104 E‐Governance: Techno‐Behavioural Implications
be a. Therefore the probability of remaining in Good state is 1‐a. Similarly, let the probability of moving from bad to good state be b. Therefore the probability of remaining in bad state is 1‐b. The following diagram represents the state diagram of the Markov model, target in a wireless telemedicine network. Figure 3. shows the proposed framework that a hacker uses to determine the number of steps to be taken to reach a predefined target after breaking into the system using the wireless access points. He uses the network structure, various security components installed and ports and IPs of the target as inputs to determine the path. He then sends probe requests to the various target IPs and ports and waits for them to respond. Once they respond, he determines the probability with which he moves to the adjacent cells using (i) information about the angles formed between the cells (C1), (ii) the Manhattan distance between the cells (C2) and (iii) the number of probe response packets obtained in the adjacent cells (C3). These probabilities form the input for the state transition matrix. The attacker then determines the number of steps in which he can reach a target using a particular available path by using a Markov model and the state transition matrix.
We propose three criteria to decide to which adjacent cell movement should be made. All the three criteria facilitate the attacker to choose the path of least resistance.
FIG. 2: STATE DIAGRAM OF THE MARKOV MODEL
Therefore, the transition probability matrix will be: TABLE 1: TRANSITION PROBABILITY MATRIX
Good Bad Good 1‐a a Bad b 1‐b

A Framework for Determining the Hacker’s Most Probable Path in a Wireless 105
OUR PROPOSED FRAMEWORK
We propose a framework to find the most preferred paths that a hacker can avail to reach a
FIG. 3: FRAMEWORK TO DETERMINE THE NUMBER OF STEPS IN THE MOST PREFERRED (VULNERABLE) PATH
Angle between the Source Cell, Adjacent Cell and Destination Cell (C1)
FIG. 4: ANGLES BETWEEN THE SOURCE CELL (S), ADJACENT CELLS AND DESTINATION CELL (D)

106 E‐Governance: Techno‐Behavioural Implications
Figure 4. shows how the probability with which an attacker transitions from one cell to its neighbour is derived. A hacker wants to attack a target D placed at cell (2,3).Hacker is at source cell (0,0). The entire network is formed of hexagonal cells. So from each cell the hacker can move to adjacent 6 cells with a probability of 1/6. But, considering the principle of forward mobility we assume that from each cell, movement can be made only in three forward directions. For example, in figure 1., from the source cell (0,0), movement can be made only to three destination cells, 1(0,1), 2 (1,1) and 3(1,0).
The probability with which the object moves from one cell to the next adjacent one depends on the angle that the destination cell makes with the line drawn from source to destination. Let the red dashed line represent the line from the source to the destination. Lets name it SD. Let us assume that the probable destination cell (0, 1) makes an angle x1 (40°), cell (1,1) makes an angle x2 (20°) and cell (1,0) makes an angle x3 (80°) with SD. The probability of moving to the next cell is given by the formula:
(4) Going by this formula the probabilities of moving to cell (0,1), (1,1) and (1,0) are
5/14, 6/14 and 3/14 respectively. Similarly, at each new cell we evaluate the probability of moving to the next adjacent cell using the probability formula above by calculating the angle between the direction of movement and the line drawn between the new cell and the destination.
Manhattan Distance (C2)
The Manhattan distance measure is used to calculate the probability of transitioning from cell (i1, j1) to its adjacent cell (i2, j2) (Sadhukhan, Mandal, Bhaumik and Saha, 2010). Let the destination cell D have co‐ordinates (α, β). Then according to Manhattan distance the probability of moving from cell (i1, j1) to its adjacent cell (i2, j2) in forward mobility is given by:
(5) Here, i1 ≤ i2 ≤ α; j1≤ j2 ≤ β. For example, the probability of moving from cell (0,0) to cell (1,1) when destination
is (2,3) is:
Probe Response (C3)
The probe‐response criteria, in which the attacker determines the number of response packets that have reached the adjacent cell from the target cell, is used to determine the

A Framework for Determining the Hacker’s Most Probable Path in a Wireless 107
probability of transitioning to the adjacent cell. When an attacker selects a target he sends probe requests towards the target. Such probe requests are usually in the form of artificially constructed packets to a target that trigger useful responses. This activity is also known as active scanning. The target might send response packets to the attacker. This way the attacker world identify which port or IP address is vulnerable and exploitable. He would then attack those vulnerable ports or IPs. The target may sometimes discover that it is being probed; it might even be a honey pot. The attacker would try his best to minimize this risk. Hence he would follow the path of least resistance to attack the target as quickly as possible. To do this he would move to the adjacent cell that has highest number of response packets sent by the vulnerable target. By following this method at each step the attacker would easily and quickly be able to find the vulnerable target to attack.
FIG. 5: NUMBER OF PACKETS IN EACH ADJACENT CELL FROM THE TARGET
Figure 5 shows a hexagonal network where the attacker sends probe requests to various ports P1, P2 and P3 of the destination target D. Out of teh three ports only port P2 responds. It sends response packets to the source S. The response packets pass through the different cells. Let the number of response packets from destination D to cell 1, 2 and 3 be N1, N2 and N3 respectively. Then the probability of transitioning into the adjacent cell 1 is given by the formula:
(6)
We assign weights to the three different criteria depending on their relative importance. Let the weights for the three different criteria be W1, W2 and W3.

108 E‐Governance: Techno‐Behavioural Implications
(7)
Now combining the three factors with their weights we can find the overall probability of moving from one cell (i1, j1) to its adjacent cell (i2, j2) using equations (1), (2), (3) and (4).
(8) Where, α, β are the coordinates of the destination cell; x1, x2, x3 are the angles that
cells 1, 2 and 3 respectively make with the line joining the source and the destination; N1, N2 and N3 represent the number of response packets from destination D to cell 1, 2 and 3 respectively.
Next we form the step 1 transition matrix of the Markov model. This shows the probabilities of transitioning from each cell to its three adjacent cells, for the entire network. Each cell represents a state in the Markov process. In our example we have 8 states. The number of steps taken to reach the destination through each path is obtained by the number of steps in which the probability of reaching the final destination comes to 1.
RESULTS
We use and example to show the results of our framework on a hypothetical network.
FIG. 6: A HYPOTHETICAL NETWORK USED TO SHOW THE PROBABILITY OF TRANSITIONING FROM ONE CELL TO THE NEXT

A Framework for Determining the Hacker’s Most Probable Path in a Wireless 109
Probability Evaluation
Let us start moving from source cell S (0,0). Let us assume that the probable destination cell (0, 1) makes an angle x1 (40°), cell (1,1) makes an angle x2 (20°) and cell (1,0) makes an angle x3 (80°) with SD. Let N1 (4), N2 (5) and N3 (6) be the number of response packets that reach the cells 1, 2 and 3 respectively, from destination D. Let us assume the weights to be W1 = .5, W2 = .3, W3 = .2.
Therefore using equation (8) the probability of moving from the source cell S to cell 1 with coordinates (0,1) is
Using equation (8) the probability of moving from the source cell S to cell 2 with
coordinates (1,1) is
Similarly, using equation (8) the probability of moving from the source cell S to cell 3
with coordinates (1,0) is
In a similar manner, the transition probabilities from all the cells in the network to
their adjacent cells are calculated. Let us assume N4 = 6, N5 = 4, N6 = 5. Figure 6. shows that at cell 2 (1,1), the angles made by cells 4, 5 and 6 with the straight line joining 2 and D are, 30°, 30°and 90° respectively. At cell 3 (1,0), the angles made by cells 2 and 6 with the straight line joining 3 and D are, 20° and 40° respectively. Each of these probabilities forms an element of the transition matrix.
Transition Matrix Generation
The probabilities generated using Equation (8) are used to generate the state transition matrix showing the probability of movement from one cell to another.
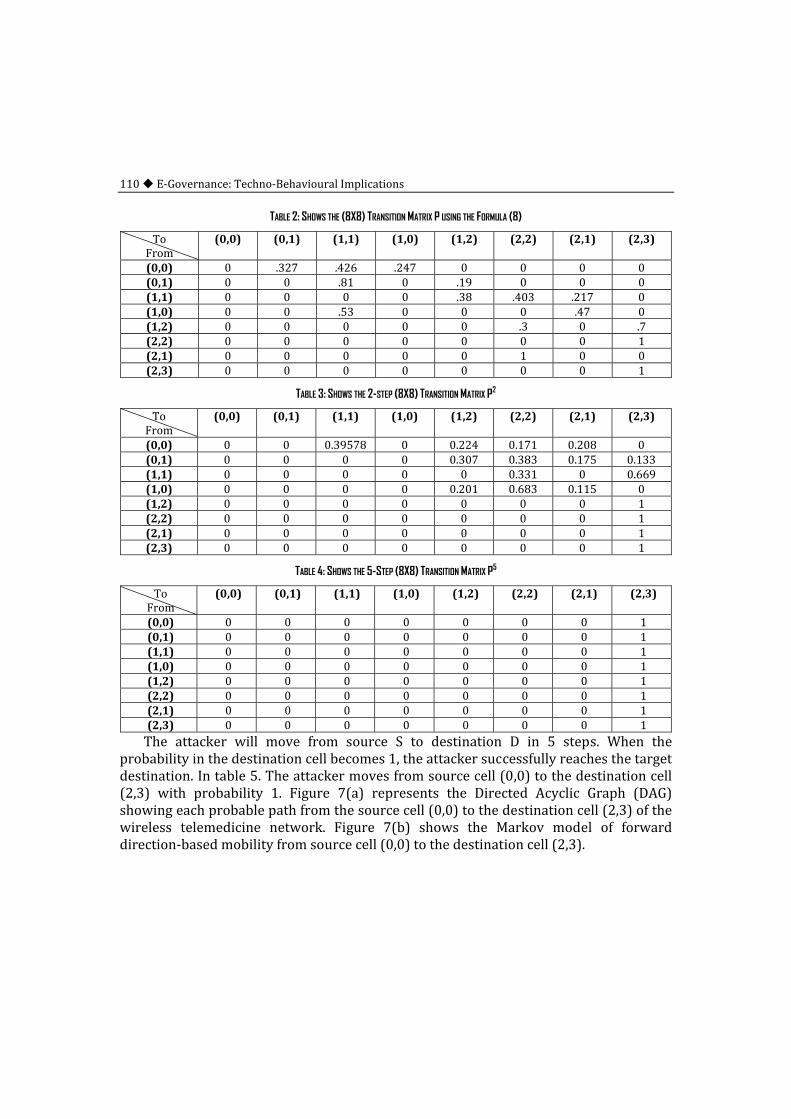
110 E‐Governance: Techno‐Behavioural Implications
TABLE 2: SHOWS THE (8X8) TRANSITION MATRIX P USING THE FORMULA (8)
To From
(0,0) (0,1) (1,1) (1,0) (1,2) (2,2) (2,1) (2,3)
(0,0) 0 .327 .426 .247 0 0 0 0 (0,1) 0 0 .81 0 .19 0 0 0 (1,1) 0 0 0 0 .38 .403 .217 0 (1,0) 0 0 .53 0 0 0 .47 0 (1,2) 0 0 0 0 0 .3 0 .7 (2,2) 0 0 0 0 0 0 0 1 (2,1) 0 0 0 0 0 1 0 0 (2,3) 0 0 0 0 0 0 0 1
TABLE 3: SHOWS THE 2-STEP (8X8) TRANSITION MATRIX P2
To From
(0,0) (0,1) (1,1) (1,0) (1,2) (2,2) (2,1) (2,3)
(0,0) 0 0 0.39578 0 0.224 0.171 0.208 0 (0,1) 0 0 0 0 0.307 0.383 0.175 0.133(1,1) 0 0 0 0 0 0.331 0 0.669(1,0) 0 0 0 0 0.201 0.683 0.115 0 (1,2) 0 0 0 0 0 0 0 1 (2,2) 0 0 0 0 0 0 0 1 (2,1) 0 0 0 0 0 0 0 1 (2,3) 0 0 0 0 0 0 0 1
TABLE 4: SHOWS THE 5-STEP (8X8) TRANSITION MATRIX P5
To From
(0,0) (0,1) (1,1) (1,0) (1,2) (2,2) (2,1) (2,3)
(0,0) 0 0 0 0 0 0 0 1 (0,1) 0 0 0 0 0 0 0 1 (1,1) 0 0 0 0 0 0 0 1 (1,0) 0 0 0 0 0 0 0 1 (1,2) 0 0 0 0 0 0 0 1 (2,2) 0 0 0 0 0 0 0 1 (2,1) 0 0 0 0 0 0 0 1 (2,3) 0 0 0 0 0 0 0 1 The attacker will move from source S to destination D in 5 steps. When the
probability in the destination cell becomes 1, the attacker successfully reaches the target destination. In table 5. The attacker moves from source cell (0,0) to the destination cell (2,3) with probability 1. Figure 7(a) represents the Directed Acyclic Graph (DAG) showing each probable path from the source cell (0,0) to the destination cell (2,3) of the wireless telemedicine network. Figure 7(b) shows the Markov model of forward direction‐based mobility from source cell (0,0) to the destination cell (2,3).

A Framework for Determining the Hacker’s Most Probable Path in a Wireless 111
FIG. 7(A): DIRECTED ACYCLIC GRAPH (DAG) SHOWING EACH PROBABLE PATH
FROM THE SOURCE CELL (0,0) TO THE DESTINATION CELL (2,3) FIG. 7(B): MARKOV MODEL OF FORWARD DIRECTION-BASED MOBILITY FROM
SOURCE CELL (0,0) TO THE DESTINATION CELL (2,3)
CONCLUSION
Information security breaches continue to plague telemedicine and e‐healthcare systems and pose an immense threat to the C‐I‐A (confidentiality, integrity and availability) of patients’ electronic medical records (EMR). We propose a framework based on hacker’s propensity to move in the forward direction along the path of least resistance to determine the most preferred path to reach the target. We also determine the number of steps required in each path to reach the target. We use three parameters : the angle created, the Manhattan distance and the probe‐response packets of each cell to determine the probability with which an attacker will move to an adjacent cell. These probabilities are then used to generate a transition probability matrix. The Markov model uses this state transition matrix to determine the number of steps in which the attacker will move from the source to the destination along any preferred path.
From the managerial perspective, using this method the CTO can estimate the hacker’s move apriori and decide upon the security precautions that can be taken to prevent the attack. They can also decide where to place the various security components in a wireless network depending upon the hops that the attacker might take to reach his ultimate target.
REFERENCES [1] Brewin. B (2008). URL: Cyber criminals overseas steal U.S. electronic health records. Available at:
http://www.nextgov.com/nextgov/ng_20080516_2203.php. Accessed July 19, 2011. [2] Burger. J(2010). URL: Kern Medical Center battling virus. Available at:
http://www.bakersfield.com/news/local/x534570019/Kern‐Medical‐Center‐battling‐virus. Accessed July 19, 2011.
[3] Camp. T., Boleng. J., and Davies. V., “A Survey of Mobility Models for Ad Hoc Network Research”, Wireless Communication & Mobile Computing Journal, Vol. 2, no 5, pp. 483‐502, 2002.

112 E‐Governance: Techno‐Behavioural Implications
[4] Das. S., Mukhopadhyay. A., Anand. M. (2011) “Determining the stock market response to public announcement of an information security breach using firm and attack characteristics”. Proceedings of CISTM, 2011.
[5] Huston.T. (2001). “Security Issues for implementation of E‐Medical Records”. Communications of the ACM. Vol. 44, No. 9
[6] Johnston. M. (2000). “DSL (Defending Someone’s Lair) in the ‘Always‐On’ World of High‐Speed Internet from the Home”. Global Information Assurance Certification Paper. SANS Institute.
[7] Kovacevic. S., Kovac. M. and Knezovic. J. (2007) “System for Secure Data Exchange in Telemedicine” 9th International Conference on Telecommunications
[8] Liqiong. D. and Marshall. S. (2002). “Learning Through Telemedicine Networks”. Hawaii International Conference on System Sciences 2003.
[9] Mateti. P (2005). “Hacking Techniques in Wireless Networks”. Hossein Bidgoli.The Handbook of Information Security. John Wiley & Sons, Inc.
[10] Mukherjee. A, McGinnis. J. (2007). “E‐healthcare: an analysis of key themes in research”. International Journal of Pharmaceutical and Healthcare Marketing. Vol. 1 No. 4, pp. 349‐363.
[11] Puentes. J., Bali. R.K., Wickramasinghe. N., Naguib. R.N.G. (2007). “Telemedicine trends and challenges: a technology management perspective” International Journal of Biomedical Engineering and Technology. Vol. 1, No.1 pp. 59 ‐ 72.
[12] Ramani. K. V. (2004). “IT Enabled Applications in Government Hospitals in India: Illustrations of telemedicine, e‐governance, and BPR”. Proceedings of the 37th Hawaii International Conference on System Sciences.
[13] Sadhukhan. S., Mandal. S., Bhaumik. P. and Saha. D. (2010). “A novel direction‐based diurnal mobility model for handoff estimation in cellular networks”. India Conference (INDICON)
[14] Solaiman. B., Cauvin. J.M., Puentes. J., Le Guillou. C., Brunet. G., Debon. R. and Roux. C. (2001) “Enabling Technology for Telemedicine and Telehealth”. Proceedings of the 23rd Annual International Conference on Engineering in Medicine and Biology Society.
[15] Stanberry. B. (2001). “Legal ethical and risk issues in telemedicine”. Computer Methods and Programs in Biomedicine. Vol 64(3) pp. 225‐33.
[16] Surana. S., Patra. R., Nedevschi. S. and Brewer.E. (2008). “Deploying a Rural Wireless Telemedicine System: Experiences in Sustainability”. Computer. Vol 41 No. 6. pp 48‐56.
[17] Trivedi. K (2002). "Probability and Statistics with Reliability, Queueing and Computer Science Applications"(Second Edition). New York: John Wiley & Sons, Inc.
[18] Wang. Z and Gu. H. (2009). “A Review of Telemedicine in China”. Online Journal of Space Communication. Issue No. 14
[19] Warren. M, (2001). “A Risk Analysis Model to Reduce Computer Security Risks among Healthcare Organizations”, Risk Management, Vol. 3, No. 1. pp. 27‐37
[20] Wozak F., Schabetsberger T. and Ammmenwerth E.(2006). “End‐to‐end Security in Telemedical Networks–A Practical Guideline”. International Journal of Medical Informatics. Vol. 7 6. pp 484–490.

e-Governance and Mobile Devices: Possibilities for India
Nilay M. Yajnik Professor, Narsee Monjee Institute of Management Studies, Mumbai
Email: [email protected]
Abstract—There has been a very rapid penetration of mobile phones in India. There are also increasing expectations from Government for transparent functioning as well as convenience of interactions. There are several Government services which could be made more accessible to Indians and the mobile phone is a device which could make this happen. This paper will discuss the possibilities for mobile government applications in India.
INTRODUCTION
The mobile phone was introduced in India around 1993.At that time the phone was a very bulky device and was used only for talking. The phones were expensive and the call rates were astronomically high. A little before the mobile phone came to India, a device known as a pager was launched. The life of the pager was very short .The mobile phone short messaging service did the same job as the pager. In other words, the pager was merged with the mobile phone. Subsequently the mobile phone became smaller in size and the screen became larger. The screen, which was till then only a black and white display , became a color display. Subsequently a camera with high resolution lens was embedded into the mobile phone and then internet connectivity, radio, TV and video conferencing were also packaged in the mobile phone. Therefore the mobile phone, which was only a phone for the purpose of talking when it was launched in India , became an information appliance with capabilities much more than just talking.
This evolution of the mobile phone into an information appliance has opened up a vast range of opportunities for improving the way Government interacts with its citizens.
Interesting Applications of Mobile Phones in e-Governance
Research has also shown that the rural population of India is keen on using mobile phones, however they are not very keen on using very feature rich phones. Therefore a large number of very low priced mobile phone models have been introduced recently in rural India. These phones permit very basic level applications, but these are acceptable to the rural Indian. This would be an excellent opportunity for the Government to provide the service of information to these citizens in a transparent manner.
The younger generation globally is very IT savvy and use hand held devices such as mobile phones , smart phones , tablets very extensively. A similar trend can be seen in India too. It is therefore very important for the Government at the Central, State and Panchayat levels to use these devices as well as various social networking tools and the Web 2.0 to communicate and connect with them effectively. It is important for Government to develop application interfaces which will encourage and make it very

114 E‐Governance: Techno‐Behavioural Implications
easy to re‐broadcast content. Applications of mobile Government could range from broadcasting a missing person via a social network to Government agencies to conducting opinion polls through mobile social networks which could be used by the Government. One such application is viral messaging. Viral messaging is an approach by which content gets re‐broadcast to an ever increasing group of people. Therefore for every person who creates content 100 people see the content and 10 people rebroadcast the content, which is again seen by 1000 people and rebroadcast by 100 people. This cycle continues and therefore the reach of the message becomes very vast. Government can use this viral messaging approach to reach out to the masses.
There are several innovative applications of mobile government around the world. Spain, for example, uses the mobile phone as a bus ticket for public transport. Dubai uses SMS to inform the public and lawyers about the time of their sessions and status of their cases. Sweden has implemented a project called “Gateway Sweden” which allows truck drivers to get customs clearance through their mobile phones. The police department in Northern Ireland uses an Emergency SMS system for people with disabilities who may be in need of help in an emergency. Kenya’s project, M‐Pesa , uses mobiles for money transfer.
The Government should work towards partnering with several private organizations to enable innovative applications of mobiles in healthcare and education in India. Some examples where the Government could partner with private firms are as follows:
Mobile phones to enable banking to the people who do not have banking facilities: The company EKO, is a project funded by the Bill and Melinda Gates foundation and is supported by the State Bank of India.
In this project, small shopkeepers have been appointed as banking correspondents. A villager who is interested in conducting a banking transaction goes to the shopkeeper and deposits or withdraws money from him. The shopkeeper updates the transaction details in the core banking system of the bank through his mobile phone. This project is currently being run as a pilot project near the Delhi area of India. Since the company uses mobile phones as the medium and since the operating model is very simple it is very likely that this project will become very popular in India and will enable banking services to reach out to the rural population of India.
Gartner Group has predicted that the volume of sales of smartphones will, in a few years, overtake PC and Laptop sales. It is also a fact that India today has nearly 700 million mobiles, which means a teledensity of nearly 70. Reaching out to the Indian citizen by the Government will therefore be easier through mobiles.
Mobile phones to enable a wider reach of healthcare: In many villages in India the Health Care Centre is very far away from the village. Patients have to travel a long distance to visit a hospital. To address this problem a project in Kerala in South India has been initiated to use mobile phone SMS’s for basic level information. Named as “Dr. SMS” the project is a very simple yet highly functional communication medium between

e‐Governance and Mobile Devices: Possibilities for India 115
patient and Health Care Centre. The patient sends an SMS mentioning his/her symptoms. The Health Care Centre receives and analyses the SMS based symptoms and provides information through a reply SMS giving details of the nearest appropriate Hospital/Clinics. Another project of this type is in the Indian state of Andhra Pradesh named as “HMRI 104 Advice”. In this project a patient in a remote village can connect to a call centre and narrate his health issues through his/her mobile phone. The Call Centre routes his call to the appropriate doctor. As on date this call centre receives nearly 50,000 queries per day. This service has been used even in very small villages (population less than 1,500). As on today nearly four lakh callers have availed of this service.
Mobile phones and Education: In several developed Nations experiments are currently in progress to use modern ICT tools to enhance the learning experience. As an example, in the USA a few schools have replaced textbooks with iPad’s. The textbook is downloadable in multimedia format and the lecture can be made a lot more interactive on a real time basis. In Singapore a few schools are currently experimenting with the use of smartphones in the class. The students are able to download multimedia content while the Teacher is explaining a topic in the class. They can also collaborate on project work almost on a real time basis. As the prices of these devices reduces over time, it will be possible to use them in schools and colleges in the interior parts of India. As of today there are already several examples of video based lectures being conducted in India. At the Indian Institute of Technology Bombay, a live lecture from an IIT Professor is beamed to several colleges in tier II and tier III towns of India. The IIT Bombay classroom therefore gets extended to remote colleges of India. EDUSAT is another project in which lectures from prestigious institutions are beamed live to remote colleges in India. As mobile penetration in India grows rapidly it will be possible to beam these live lectures directly on to the mobiles of people in remote areas thereby enabling inclusive education
Mobile Phones and Agriculture: Power cuts are very frequent in many villages in India. When a power cut happens, the farmer is forced to go into the field, many times in the night , to switch the pump on again when the power resumes. The farmer is exposed many times to snake bites and is forced to walk several hundred meters in the night to switch the pump on again. This is very inconvenient to the farmer. A project by the name of “Nanoganesh” has attempted to solve this problem by making the mobile phone a remote control for the pump. The farmer, therefore, can switch on the pump from his home through the mobile phone.
The Government can play a major role in making such mobile applications in education, healthcare, banking and agriculture available to a large population of rural Indians through partnering with such private firms.
CONCLUSION
In emerging economies like India, the mobile phone will play a very major role in future due to its rapid penetration in the Indian markets. Applications will also evolve to make better use of the features of mobile phones and smart phones. Government, therefore ,

116 E‐Governance: Techno‐Behavioural Implications
can very effectively use this media to connect with citizens and help address their issues. The emergence of regional language interfaces on the mobile phone will be a major impetus in enabling Mobile Government in India in the not too distant future.
REFERENCES [1] http://en.wikipedia.org/wiki/M‐government accessed on June 12 , 2011 [2] http://www.egov.com/Solutions/Innovative/Pages/MobileGov.aspx EGov mobile applications USA ,
accessed on June 12 , 2011 [3] http://www.egov4dev.org/mgovernment/ accessed on June 12,2011 [4] http://www.mgovworld.org/ accessed on June 1 , 2011 [5] http://www.mgovworld.org/future‐of‐e‐government‐services accessed on June 12 , 2011 [6] http://www.mobilecommercedaily.com/2010/03/22/arkansasgov‐offers‐mobile‐payments‐for‐
egovernment‐services (article dated March 2010 , accessed on June 12 , 2011 [7] http://www.purpleforge.com/index.php/Press‐Releases/purple‐forge‐to‐speak‐at‐the‐government‐
web‐20‐and‐social‐media‐infonex‐conference.html , accessed on August 19 , 2011 [8] http://www.slideshare.net/johncraig01/mobile‐egovernment‐solutions , accessed on August 19 , 2011 [9] Inclusive Growth in India: The Role of the IT Industry by Nilay M.Yajnik , Abstract Published in the
Proceedings of the International Conference on Inclusive growth organized by IIM Ahmedabad and the Strategic Management Forum
[10] Low End Mobile Phones Empower Underclass by Kim Arora , The Times of India , August 15 , 2011 [11] Participatory Government:Mobile Internet , www.purplerforge.com [12] Streamlining subsidy: Nielkani panel to hear States’ views by Shishir Sinha , Business Line , August 15 ,
2011 [13] Transcending E‐Government:A Case of Mobile Government in Beijing by Song Gang , The First
European Conference on Mobile Government, Brighton, July 2005 , http://mobility.grchina.com/ [14] White Paper: Mobile Government:2010 and Beyond by Rain Rannu, Siim Saksing, Triin Mahlakõiv ,
January 2010 , European Union Regional Development Fund [15] www.nanoganesh.com , accessed on September 6 , 2011

From e-Governance to m-Governance—The Way Forward
Romit Pandey and K.S. Vijaya Sekhar IIIT, Hyderabad
Email: [email protected], [email protected]
Abstract—India is the fastest growing mobile subscribers market in the world with more than 850 million subscribers. Mobile phones have become an important component in Indian household. mGovernance is envisaged to propel the functioning of the government, to the next higher level. In this paper, we analyze the true potential of mGovernance in the Indian scene. Also, we examine the areas where the eGovernance services can be made available through wireless and mobile technologies. The paper also rivets on MHealth, studies some successful mGovernance projects implemented in other countries and examines the MPESA mobile commerce project.
Keywords: eGovernance, mGovernance, mHealth, mPESA.
INTRODUCTION
Information delivery to public is a key task in a democracy and often not an easy task. It is the responsibility of the government to keep their citizens informed of what is happening around them. Citizens need this information and sometimes it is critical for them in making decisions and forming any opinions. Timely information delivery to public promotes democracy in the country and creates accountability. The basic and universal cornerstones of good governance are quality of service, quick response mechanisms and above all accountable and transparent process mechanism. With advances taking place in the field of e‐Governance, the government is able to easily offer good governance for the convenience of the people. The first generation e‐governance initiatives resulted in computerization of the legacy systems/practices in government with limited ability to internalize the advances in Information and Communication Technologies (ICT).The conventional e‐Government efforts focus on providing services through internet portals, but it doesn’t cater to the mobility of the government and the mobile society.
Today, India is moving towards m‐Governance, after its foray into e‐Governance. The speedy diffusion of mobile ICT such as laptops, mobile phones, PDAs (Personal Digital Assistants), along with emails, instant messaging and other networking services have rapidly fuelled the mobilization of interaction. Our society is increasingly getting mobile, and people want everything available on their handsets. Nearly 850 million people in India own a mobile phone today. India is the second largest telecommunication network in the world in terms of number of wireless connections after China. The Indian Mobile subscriber base has increased in size by a factor of more than one hundred since 2001 when the number of subscribers in the country was approximately 5 million to 752 Million by Feb 2011. As the fastest growing telecommunications industry in the world, it is projected that India will have 1.159 billion mobile subscribers by 2013. According to recent reports, India was purported to

118 E‐Governance: Techno‐Behavioural Implications
overtake China to become the world's largest mobile telecommunications market by the year 2013 (However recent trends indicate that the event may occur as early as October 2011).
These statistics provide an unprecedented opportunity for the Telecom Players, System Integrators, Industry Associations, Civil Society and Government Agencies to explore the utilization of the mobile / wireless applications for transforming public services. m‐Governance not only improves communication between Government to citizen (G2C) and Citizen to Government (C2G) but also improves operations among government agencies and Government to Employees (G2E).
eGovernment: “e‐Government” refers to the use by government agencies of information technologies (such as Wide Area Networks, the Internet, and mobile computing) that have the ability to transform relations with citizens, businesses, and other arms of government. These technologies can serve a variety of different ends: better delivery of government services to citizens, improved interactions with business and industry, citizen empowerment through access to information, or more efficient government management. E‐government aims to make the interaction between government and citizens (G2C), government and business enterprises (G2B), and inter‐agency relationships (G2G) more friendly, convenient, transparent, and inexpensive.
mGovernment: Mobile government, sometimes referred to as m‐Government, is the extension of e‐Government to mobile platforms, as well as the strategic use of government services and applications which are only possible using cellular/mobile telephones, laptop computers, personal digital assistants (PDAs) and wireless internet infrastructure. In addition, m‐government is a better option compared to e‐Government in delivering services and public information to citizens due to its nature of being available anywhere, anytime and from any internet enabled device. Mobile Government addresses the mobility of Government itself. m‐Government is not meant to be a replacement for e‐government but a complement to e‐government.
mGovernance can be defined as ‘a strategy for the implementation of Governance and its implementation involves the utilization of all kinds of wireless and mobile technologies, services, applications, and devices. It improves upon the benefits for those involved in e‐governance, including citizens, businesses, and all government units'.
Mgovernance Projects Implemented in other Countries: Mobile technology allows developing countries to leapfrog in adopting new technologies. This is very important for development in developing countries. Realizing the benefits of mobile and wireless technologies, many countries are now implementing and developing solutions to better deliver government services to public. Developing countries seems to be embracing these technologies too. Here we look at some of the m‐Government cases which have been taken up in different parts of the world, and look at the feasibility with respect to the Indian setting.

From e‐Governance to m‐Governance—The Way Forward 119
TABLE 1: SHOWING MOBILE TECHNOLOGIES FOR VARIOUS SERVICES
S.No Industry Segment
Segment details Information requirement Applicability for mGovernance
1 Agriculture Harvesting, Marketing, pest control, crop rotation
Online advice, Transactions, information retrieval
Alerts, Advice, transactions can be handled by SMS based applications or via thin client mobile browser based interfaces
2 Health Care Hospitals, clinics, doctors, nursing, and other health services.
Data sharing, Expert advice, registration for public health service, appointment, alerts, notifications
SMS based applications for information/alerts and transactions based on Wi‐Fi / GPRS connectivity at home and hospitals for real time heavy data uploads / downloads
3 Financial Services
Banking, securities, insurance.
Mobile Banking, Financialtransactions, Micro finance, Micro Insurance Information retrieval (account, loan inquiry, status check), Banking transactions, payments, requests (DD, Chequebook,etc)
SMS / WAP based applications. Thin client mobile browser based interfaces.
4 Manufacturing automotive, industrial, electrical and commercial equipment, medical equipment and supplies, computer and high‐technology, electronics, transportation Equipment and all other discrete manufacturing.
Mobile Field Force , real time updates, low cost supply chain management – info access
SMS based applications as well thick client based models for storing information for offline access. Real time data updates of movements of goods with Wi‐Fi and GPRS networks.
5 Transportation water, rail and air transportation, urban passenger transit, motor freight Transit, pipelines, warehousing, couriers, and transportation support services.
Fleet Management (real time updates), M Ticketing, Schedule updates
SMS based applications for updates, m ticketing, schedule updates, status check
Source: Gnanapriya C and Puneet Gupta W3C Position paper‐Infosys
• Citizens in Singapore receive passport renewal notifications via SMS. This service can be very useful in a country like India, which such large population. The only drawback is when a citizen changes his/her mobile number.

120 E‐Governance: Techno‐Behavioural Implications
• In rural parts of South Africa, domestic violence against women and children can be reported via SMS. This kind of service has a useful function in India, where nearly 60% of population lives in rural areas, and domestic violence against women and children has always been a cause for concern for the government. This will also help in women empowerment.
• Mobese or Mobile Electronic System Integration is one of the pioneer mobile government applications in Turkey. This application is a G2G mobile government application for law enforcement agency. This project is mainly an infrastructure enabling the law enforcement units to be more efficient and effective. It connects the law enforcement units to their respective police stations via a GPRS internet connection allowing the mobile law enforcement units to query citizens regarding validation of their identity, checking their record history. This service allows the mobile law enforcement units to be more efficient in their job.
• TrafikBilgiSistemi (TBM) or Traffic Information System is another major mobile government application in Turkey. Mobile traffic units are equipped with tablet PCs to quickly conduct queries regarding offending drivers’ license and vehicle information. This increases the efficiency of the mobile traffic units. In addition, location of each mobile traffic unit can be extracted and the respective unit be dispatched instantly to a particular location such as a traffic incident.
• TXT CSC ‐ an SMS service launched by Civil Service Commission (CSC) in Philippines. Its aim is to increase the efficiency and speed of service delivery. Citizens use this service as a weapon to pressure the government agencies to move towards this goal. This is useful in ensuring government accountability.
• A city in Estonia has introduced municipal m‐Governance services wherein citizens can enquire about security, law and order, utilities, and disaster management by way of SMS. This is a useful service as it caters to times when there is an emergency situation like Tsunami, earthquake, floods etc. This way it provides information to citizens who are in remote areas, and in the vicinity of danger area.
• Many countries like Estonia have enabled M‐Voting, where the parliament approved mobile technology for the 2011 elections. Polling coverage through SMS is another area where big media houses in Philippines have partnered to provide real time polling statistics during elections. This service gives the citizens convenience, ease and mobility in getting updated polling information.
• Crime denunciation.Mobile technology has made easier the denunciation and reporting of crime in Ireland and Peru by providing real‐time exchange of information between citizens and law enforcement units. In Ireland, MMS (multimedia SMS) has been used to send photos of criminal suspects to law enforcement agencies; in Peru, crime reporting systems have helped in the reduction of crime.

From e‐Governance to m‐Governance—The Way Forward 121
mHealth: Technology advancement in healthcare sector has a great potential to promote a healthy lifestyle, improve decisions taken by health care professionals as well as by patients while improving quality of healthcare services. Real time access to medical information and facilitating instant communication was not possible earlier. The increased usage of technology in the health care sector has resulted in lowered cost, convenience and enhanced efficiency.
In the current scenario most of the developing countries like India are facing health care related challenges. Diseases and lack of preventive care have taken a significant toll on both growing population as well as on the economy. Despite of current economic advancement there is still pressing need to improve health care services. The following facts are of critical importance to understand the reasons:
1. A child born in developing country is 33 times more likely to die within the first five years of life than a child born in any developed country.
2. Every year around 250 women per 100,000 die due to complications related to pregnancy or child birth.
3. There are more than two million people who are infected with HIV in India. 4. Due to lack of access to proper drugs and medical treatment diseases such as TB,
malaria continues to claim people’s life. The increasing cost to plug in wired devices has paved way for the usage of wireless
technologies in several hospitals. More advanced mobile phone technologies are enabling the potential for further healthcare delivery. Smartphone technologies are now in the hands of a large number of physicians and other healthcare workers in low‐ and middle‐income countries. Although far from ubiquitous, the spread of Smartphone technologies opens up doors for M‐Health projects such as technology‐based diagnosis support, remote diagnostics and telemedicine, web browsing, GPS navigation, access to web‐based patient information, and decentralized health management information systems (HMIS).
mHealth (mobile health) is a term used for the practice of medical and public health, supported by mobile devices. The term is most commonly used in reference to using mobile communication devices, such as mobile phones and PDAs, for health services and information. e‐Health can mean creating electronic versions of patient records across a national system while m‐Health can serve as access points to provide remote information to healthcare providers.
IT plays a major role in m‐health implementation and deployment. The deployment of m‐health in any health care organization provides the opportunities to maximize their IT infrastructure and deliver valuable solutions which provide the meaningful ROI to the organization.
Applications in the field of mHealth: Education and awareness: SMS messages are sent directly to user’s phones to offer information about various subjects, including testing and treatment methods, availability of health services, and disease management. This helps user to be up to dated and well informed.

122 E‐Governance: Techno‐Behavioural Implications
Helpline: This involves a dedicated phone number which an individual can call to get access to a range of medical services like availability of drugs, information on facilities, availability of mobile health clinics etc. Eg: ‐ Health Management and Research Institute (HMRI), Dr.SMS was another project in this direction, undertaken in Kerala.
Telemedicine: Patients take a photograph of a wound or illness and allow a remote physician diagnose to help treat the medical problem. Diagnosis and treatment support projects attempt to mitigate the cost and time of travel for patients located in remote areas. Eg: Tele‐doc and mQure. In order to provide effective patient care and enhanced nurse access for quality care and knowledge transfer, mobile technology is playing a vital role. The training through mobile enhances professional development and improves quality of care for the patient. M‐Health applications in other countries: There are varieties of M‐Health applications in other countries, which can be incorporated in India by the Government. There are projects in the area of disease surveillance, remote data collection and epidemic outbreak tracking in countries like Brazil and Kenya which operate to utilize the mobile phone’s ability to collect and transmit data quickly and efficiently. These kinds of projects can be particularly useful during emergencies, in order to identify where the greatest medical needs are within the country.
In places like South Africa where HIV/AIDS made serious stigma, people can receive text messages personally which helps in creating awareness and education. HIV Confidant, running on palm500 was successfully used in Africa to manage the HIV test result of a patient. Figure 1 shows the working of HIV confidant.
FIG. 1: PALM-500
Asia Pacific has been characterized as a region that has significantly low quality healthcare when compared to the western world. The introduction of web cameras and other mobile technologies can aid in extending health services in these areas. With the advent of mobile technology in the rural areas, efforts can be taken to provide real‐time monitoring of health related issues. SMS alerts can be used to target people in areas where clinics and healthcare workers are limited. Also, data collection programs can be offered through smart phones, mobile phones and PDAs than manual entry which can

From e‐Governance to m‐Governance—The Way Forward 123
contribute to bridging the gap that exists in the current scenario. Usage of mobile phones can be helpful in improving communication amongst the healthcare providers to enhance patient care. This can also be used to monitor outbreak of infectious disease.
Additionally, m‐Health has not been practiced in an organized, regular way, and thus has not produced enough definitive evidence and science that M‐Health produces concrete beneficial health outcomes. Nor has it been advertised enough to doctors as something that can save them time and money. We see that entertainment and finance applications have made great strides towards the mobile phones of Indian people. Thus, m‐Health solutions that are more centered on fun, entertaining experiences using game mechanics, and incorporate easy payment options will both increase positive health outcomes and drive consumer demand more than any amount of press or conference attention. While technology will play a key role in making m‐Health a success in India, user centric design and awareness of improved health outcomes plus cost savings for doctors (and payers) will be the key drivers of growth.
The field of m‐Health is at critical juncture with dozens of projects implemented and proven beneficial for the end user. Technological innovation will bring enhanced benefits particularly in the area of data collection, patient monitoring and remote diagnostic where application development is already proceeding at path‐breaking speed. A lot of initiatives have been taken by the Government of India and state governments in the field of m‐Health. Initiatives from private sector companies have provided lot of encouragement in this regard. Government should look for methods of providing these services at low prices. Also, the concept of telemedicine should be introduced in the district and rural hospitals, so that large number of rural people can benefit from it. Health needs in developing world are rapidly evolving including chronic diseases and communicable diseases. m‐Health is placed well to address the challenges using currently available technologies. For example SMS in m‐Health can be useful in increasing public health awareness of HIV/AIDS. Emerging technologies like BAN will also be an asset for the today’s fast paced world. M‐Health is coming in a big way and will rule the world in near future.
Although the implementation of online and mobile health technologies seem appealing and impressive, their proliferation into several fields of healthcare could take time due to issues like security breaches and difference in opinion amongst healthcare professionals. Nevertheless, this technology in future could contribute to improved patient care, increased healthcare efficiency and most importantly reduce healthcare costs overall.
M-PESA: A Case Study
By far the most successful example of mobile money is M‐Pesa. M‐Pesa is a joint venture between Vodafone and Safaricom (the local mobile operator) with the backing of Citibank and Commercial Bank of Africa.

124 E‐Governance: Techno‐Behavioural Implications
MPESA (M for mobile, pesa is Swahili for money) is the product name of a mobile‐phone based money transfer service whose initial concept and design was most assuredly developed by Sagentia (later transferring to IBM in September 2009) for Vodafone. The development was initially sponsored by the UK‐based Department for International Development (DFID) in 2003–2007.M‐PESA is a mobile phone‐based service for sending and storing money offered by Safaricom, Kenya’s largest mobile service provider. Safaricom customers can register for M‐PESA by visiting one of more than 10,000 merchants who act as “agents” for account opening, handling of deposits and withdrawals into the customer’s virtual “wallet,” and customer support. Customers can then use an application on their mobile phone to check their balance, send money to other people, pay bills, and purchase mobile phone airtime. Customer funds are held in a special trust account at the Commercial Bank of Africa.
M‐PESA allows users to make following basic types of transaction:
• Deposit and withdraw money. • Transfers from person to person • Transfers from individuals to businesses • Pay Bills • loan receipt or repayment • Purchase airtime.
Observation of Impact of M‐PESA in Kenya:
• Users began to make smaller, more frequent transfers. • The income of rural recipients increased by up to 30 percent since they started
using M‐PESA. • M‐PESA empowers rural women by making it easier for them to solicit funds
from their husbands and other contacts in the city. • Urban migrants began to make home visits less frequently after adopting M‐
PESA. • Users are integrating M‐PESA into their savings portfolio. As a result, savings
patterns are changing.
Factors behind M‐Pesa’s success:
• Large Market Share: Market share of Safaricom in Kenya was in excess of 80% at the time of launch of the service. This large base could ring in the network effect which is reflected in the high consumer adoption.
• Trust: Safaricom selected the agents with a lot of care to ensure agents with high integrity are there on its network. Since the service involves money, it is important gain user trust. Safaricom communicated a lot with the users; if the server is slow, it would communicate that to the users so that there is no anxiety amongst the users. The survey conducted by FSD confirms the faith reposed by users in the M‐Pesa service.

From e‐Governance to m‐Governance—The Way Forward 125
• Relationship with the Regulator and other Banks: Safaricom never had any confrontation with the regulators. It involved the central bank right from the very beginning. It always tries to accommodate concerns of the regulator and the banking industry. The Kenyan Government had voiced concerns over the possibility of criminals using the service to launder money, and on May 4th 2009 had ordered the Central Bank to audit Safaricom’s M‐Pesa service. Safaricom welcomed the Government’s decision and passed the audit due to complete transparent operations and proactive sharing of data with the regulator. The Central Bank declared the service safe and in line with Government’s objectives of financial inclusion.
• Simple Communication: At the start of the service, the communication was simple, “Send Money Home” targeting the migrant workers. The communication’s focus on what the single largest service (rather than all that M‐Pesa) could do was a well articulated value proposition. The video below is the commercial on “Send Money Home”
• Pricing: Safaricom kept the pricing of the product very transparent and lower than other alternatives. Free registration and no monthly fee helped the agents in persuading the potential user to subscribe to the service. This helped in building up the customer base initially that was important for agent and merchant recruitment.
• Store Management: Safaricom ensured consistent branding, training and constant supervision of the stores to deliver the right user experience. It worked tirelessly for proper liquidity management at the stores.
• KYC: M‐Pesa was not positioned as a bank alternative and hence the “Know Your Customer” requirements were quite relaxed. The users were required to submit only the identity proof to get the service started. This limited KYC helped many Kenyans especially in the rural areas where the address proofs and other documents required by the banks are not available with most of the Kenyans. People who were not able to fulfill the documentation requirements of the bank saw M‐Pesa a good alternative.
• Dedicated Customer Care Line: In Kenya, not everyone can read, so sometimes people make mistakes and send money to the wrong person, so Safaricom established back office support to assist people get the money back where possible. M‐PESA has its own dedicated call centre with its own number. Safaricom ensures that a very high quality of customer care is maintained. The strong back office support has helped the company in not only building trust but also attracted the users who are afraid of technology.
Rapid adoption and frequent use of M‐PESA engendered a variety of positive outcomes, as well as unintended consequences. Specific design elements of the M‐PESA system shape these impacts. Most important, by allowing money to flow electronically rather than physically, M‐PESA lessens, and in some cases eliminates, many of the

126 E‐Governance: Techno‐Behavioural Implications
spatial and temporal barriers to money transfer. This releases money flows in Kenya and allows such flows to penetrate rural areas where cash is difficult to access. Also, as M‐PESA reached a critical mass of users, network effects began to develop. Despite being touted as a financial inclusion service, M‐Pesa user households are twice more likely to have a bank account than non‐user households. It is young, male, urban migrants who are driving the uptake of services – customer adoption. Hence, the adoption is not uniform across social strata. Also the service availability is not uniform across the country. The service availability is defendant on the network availability which is strong in the south‐west corner of the country. There are only 2000 towers of Safaricom which are not sufficient to cover the entire country.
FIG. 2: M-PESA TRANSACTION SYSTEM
Source: MPesa
Originally, M‐PESA intended just to design and test a platform that would allow customers to receive money and repay small loans using their handsets. This service can be further used to pay school fees, or for sending pocket money to students in rural areas. This service provides opportunities for employment of large number of agents, as it grows further.
CONCLUSION
M‐Governance is part of a broader phenomenon of mobile‐enabled development, taking electronic services and making them available using devices such as mobile phones. M‐Governance has the potential to help make public information and governance services available “anytime, anywhere” to citizens and officials and provides the much needed last‐mile‐connectivity in developing countries. Mobile / wireless technologies are the key to reach the citizens at the bottom of the pyramid and making the public services delivery inclusive. Mobility only enlarges the scope of e‐Governance rather than substitute it.

From e‐Governance to m‐Governance—The Way Forward 127
There is a need to fast pace the deployment of state of the art e‐Governance services and it is possible to leap‐ frog only by learning about the best practice models in other countries. The applications of m‐government differ from country to country. In Turkey m‐government applications are mostly confined to G2G whereas in Philippines and Estonia, m‐government applications are utilized for both G2C and C2G. We see that in developed countries, most of the m‐government applications are highly interactive, on the other hand, in developing countries the interactions are mostly one way i.e. G2C or C2G. This pattern seems quite reasonable, based on the current mobile phone infrastructure (GSM) in developing countries.
In India, Government can start implementing m‐government in three different phases. Firstly, applications should be developed to reach citizens in time of crisis such as earthquakes, fire, floods, disease outbreaks etc. These types of services are mainly government to citizen (G2C) and the flow of information is one way. Secondly, more interactive m‐government applications can be developed to allow citizens’ participation in government activities. This will encourage citizens’ participation and enhance democracy and brings accountability. Thirdly, highly interactive m‐government applications can be developed. These applications range from simple transactions such as payment of taxes, bills and inquiries to mobile identification cards where a citizens’ mobile phone functions not only as device for making calls but also an identification card, payment wallet, driving license and health insurance card.
The mobiles have the ability to push information rather than the user needing to pull information. The UID project is a perfect example for the use of mobile technologies, where the services can be targeted to a specific set of citizens such as those eligible for NREGA or BPL benefits. In fact, with a combination of IMEI no, phone number, and voice biometric authentication, mobile device itself can be used as an identification device.
It is equally important for the policy makers in India to keep in mind various organizational issues in planning and implementing an m‐government application. It should be amply supported by top government authorities and should have the required political will and support, as it might face resistance within the government. The government agencies related to the newly planned m‐government application should be highly involved in the planning and implementation phases of the new service.
Successful m‐government applications rely on effective backend to support them. Necessary considerations and infrastructure should be made available to support all the m‐government applications. It might be the case that creating many independent m‐government applications may create an island of information where there is no integration between one m‐government service and another at the initial stage, but need arises for integration later on. Therefore, m‐government projects should be planned strategically and carefully, to reduce the chances of such islands of information dilemma. Minimizing the cost and complexity is another challenge involved with mobilizing

128 E‐Governance: Techno‐Behavioural Implications
applications. Also, protecting privacy and providing security for the data and interactions should be one of the important focuses of the application.
Language is another aspect, where due consideration needs to be given if M‐Governance has to reach every segment and remote areas. Localization of content is important, i.e. data needs to be provided in regional languages.Developing an m‐government application does not necessary means that it will be used by all citizens. The success of mobile governance would largely depend on our ability to focus on reaching the maximum number of mobile users. Thus, the M‐Government application must serve a specific purpose. Awareness should be made to the citizens about these applications and citizens need to be educated on the use of these applications and services. For this, the benefits of these services should be highlighted.
Also, there is no existing M‐Governance policy in India, because of which it’s not a wise option to utilize M‐Governance services in India. We also do not have a dedicated legal framework for m‐governance in India. This may create problems in cases of mobile banking, m‐governance, m‐commerce, etc. Although there is information technology act 2000 (IT Act 2000) as the cyber law of India, yet it is far from perfect for even e‐governance purposes and is not at all applicable to m‐governance environment.
ACKNOWLEDGEMENT
We are thankful to Prof Rajeev Sangal, Director, IIIT‐Hyderabad, Andhra Pradesh, India for providingthe resources to focus and work on this paper. We would like to thank MajGen (Retd) DrRKBagga, Advisor, Outreach division, IIIT‐Hyderabad for his able guidance throughout the period.
REFERENCES [1] Diatha Krishna, SundarShashankGarg “M‐Governance:A Framework for Indian Urban Local Bodies” [2] Gang Song, Tony Cornford “Mobile Government: Towards a Service Paradigm” [3] Government transformation forum report ‐2009. [4] http://egovworld.org/index.php/Thematic/mobile‐governance.html [5] http://web.worldbank.org [6] KlasRoggenkamp “Development modules to unleash the potential of Mobile Government”. [7] National E‐Governance plan annual report‐ India. [8] Olga Morawczynski and Mark Pickens “Mobile Financial services” [9] Raul Zambrano “M‐Governance: fostering social inclusion.” [10] Sanjay Vijayakumar, Sabarish K, Gokul Krishnan “Innovation and M‐Governance: The Kerala Mobile
Governance Experience and Road‐Map for a Comprehensive M‐Governance Strategy”

Indian Ecosystem for Mobile Based Service Delivery
Ranjan Kumar, Kapil Kant Kamal and Manish Kumar CDAC, Mumbai
Email: [email protected], [email protected], [email protected]
Abstract—Mobile governance (mgovernance) is the obvious next step of eGovernance and many countries have started providing various government services on Mobile Devices. This paper describes initiatives taken by the Government of India for developing Mobile based service delivery ecosystem in India. The outcome of this initiative is a Mobile Service Delivery Platform (MSDP) which can be used to deliver public services through the various channels available on mobile phones
Keywords: Mobile Services Delivery Platform (MSDP), Mobile Services Delivery Gateway(MSDG), Application Store, Mobile Network Operators (MNO).
INTRODUCTION
e‐Governance has emerged as a popular phenomenon to deliver government services around the world. However, e‐Governance in an implementation sense is restricted primarily to the use of computer based internet access to deliver services. In countries where the penetration of computers and internet is relatively low, such as in India, there is an apprehension that the reach of e‐Governance may be limited. The limited reach of e‐Governance has made government think of new technologies, such as mobile phones, to reach the citizens and deliver public services.
The purpose of this paper is to provide the details about the initiatives taken by Government of India for public services delivery through mobile phones and describe the key components of the Mobile based Service Delivery Platform for e‐Governance, which will facilitate the Service Delivery to the citizen on the mobile devices through various channels.
The growth of telecom‐subscribers in India has been phenomenal with over 851.70 Million users at the end of June 2011. The overall tele‐density in June 2011 was 71.11. The net additions are growing at the rate of over 15 Million per month. This means that India would have over 900 Million mobile‐users by 2012[2]. Looking at the increasing number of mobile subscribers, it has become imperative to offer Government services over mobile‐phones. This ensures the vision of NeGP(National eGovernance Plan by Government of India) of provideing Government services to every citizen near their doorstep, becomes a reality.
Mobiles can be one of the largest Service Access Points for the government using its e‐Gov exchange consisting of NSDG (National eGovernance Service Delivery Gateway), SSDGs (State eGovernance Service Delivery Gateways) and Domain Gateways [19]. The current eGovernance gateway infrastructure should be extended for mobile governance. A separate infrastructure is required for:
• Seamless integration with backend departments through existing eGov exchange

130 E‐Governance: Techno‐Behavioural Implications
• Common interface for mobile based services (SMS, USSD, GPRS, 3G, Cell Broadcasting, Location Based Services, etc). Mobile devices pose constraints in generating as well as rendering of the contents for the service delivery.
If we look at the type of mobile handsets used by the Indian citizens, we categorize them in three classes based on the type of channels available for service delivery on that particular mobile handset.
Basic Phones which are very low cost handset and have minimal features, e.g. SMS and voice calls which can be used as the mode of service delivery.
Smart Phones which are currently costly, but are mobile operating system based and offer most of the features and channels for service delivery.
Semismart Phones, which comes in between the above two categories in terms of price and the features. Most of the phones in this category may not have the mobile operating system but at least most of them have J2ME or Java ME available.
RELATED WORK
The Government of Kerala has launched mobile based public services in a number of state government departments, such as agriculture, health, district administration, tourism, fisheries, motor vehicles, police, elections, etc..Health department in Kerala has launched “Dr. SMS”, a SMS based m‐health information system for providing information on health resources and the medical facilities available in the locality of the resident [1][10].
The Government of Goa has launched a mobile governance initiative by establishing a SMS Gateway for providing SMS based services to residents. These services include SMS alerts for receipt of applications, shortcomings in the applications, and status tracking. The Gateway has integrated SMS into the e‐services through API integration. Currently, the SMS Gateway services are being provided to the following departments: Goa State Pollution Control Board, Directorate of Accounts, Directorate of Printing and Stationery, Inspectorate of Factories and Boilers, Animal Husbandry and Veterinary services, and Commercial Taxes [1][11].
The Ministry of External Affairs, Government of India has launched a SMS based status tracking service for passport applications. Passport Office, Delhi provides this service to all applicants enabling them to get the status of their applications by sending a SMS to a short code. Similar services have been launched by several other passport offices across the country, such as Ghaziabad, Hyderabad, and Madurai [1][12][13].
Greater Hyderabad Municipal Corporation has launched a unique mobile phone based Intelligent Garbage Monitoring System that enables the sanitary supervisors to report the status of cleaning of garbage bins through their GPS enabled mobile phones. They can also upload pictures of the cleaned bins through their mobiles in real time on

Indian Ecosystem for Mobile Based Service Delivery 131
the website. Any resident can view the status of cleaning of the bins at anytime on the website [1] [14].
The State Bank of India offers Mobile Banking services on Java enabled mobiles phones through SMS/GPRS/WAP and on non Java enabled phones through WAP. The user of the Mobile Banking services is required to download an application which is available on their website [1] [15].
Interbank Mobile Payment Service (IMPS) of National Payments Corporation of India (NPCI) provides instant, 24X7, interbank electronic fund transfer service through mobile phones [16].
Many countries around the world have also launched mobile based public service delivery. The Government of Singapore has identified mobile service delivery as one of the strategic thrust areas for Singapore’s iGov 2010 Master Plan [1][17]. The Government of Bahrain provides one of the most comprehensive suite of mobile phone based 45 public services [1][18].
MOBILE SERVICES DELIVERY PLATFORM (MSDP)
MSDP (Mobile e‐governance Services Delivery Platform) provides an integrated platform for delivery of government services to citizen over mobile devices using SMS, USSD, MMS, Voice, LBS, WAP, or through mobile applications installed on the mobile phones.
FIG. 1: MSDP ARCHITECTURE
The MSDP have the following subsystems to provide an integrated platform for the delivery of government services:
• Mobile e‐governance Service Delivery Gateway (MSDG) • SMS Gateway as a Service

132 E‐Governance: Techno‐Behavioural Implications
• M‐Gov App Store • Mobile Payment Services • Location Based Services • Service Delivery on other channels e.g. USSD, MMS, Cell Broadcasting, IVRS etc.
MOBILE SERVICES DELIVERY GATEWAY [MSDG]
NSDG/SSDG [19] had not been developed keeping in mind the requirement of the access of government services from mobile devices. MSDG is messaging middleware which facilitates e‐governance services delivery on mobile devices, which is based on e‐Governance Standard protocols IIP (Interoperability Interface Protocol and Specifications), IIS (Interoperability Interface Specification), IGIS (Inter Gateway Interconnect Specification) and leverage on existing infrastructure components i.e. constellation of gateways[19].
MOBILE APPLICATIONS AND APPLICATION STORE
There are lot of efforts are already being put in India, in terms of Back‐end department automation and their connectivity via NSDG and SSDG[19]. Till now except for efforts in some States and Central government, the main channels of service delivery had been only web via CSCs (Citizen Service Centres) and through National and State portals. As the number of mobile subscribers is increasing, the mobile handset can be used as the service access provider.
As discussed above the mobile applications can be developed based on the three categories of mobile handsets described above. SMS and Voice based applications can be developed for the basic phones. Smart phones will be able to run most of the type of mobile applications developed. For the third category of phones, including SMS and voice, J2ME/Java ME based applications can be developed. These applications can be developed by independent developers or by any software firm. There is a scope for development of thousands of mobile applications in the e‐governance domain. For hosting and managing these large numbers of applications, a application store is required same as provided by Apple, Google, RIM, Nokia, Samsung, LG, Microsoft etc. Once the developers have developed the mobile application, he/she has the biggest challenge of promoting the application and generating revenue. So there is a requirement of developing an ecosystem around the application store which offers the developers, channels to distribute and market the mobile applications.
DISTRIBUTION CHANNELS FOR MOBILE APPLICATIONS
Qusay H. Mahmoud [20], discussed various distribution channels for mobile applications.
Device Manufactures: With collaboration of mobile device manufactures, app store application can be loaded in the mobile phone itself. This can allow the citizen to search, find, purchase and download mobile applications directly to their phones. In this

Indian Ecosystem for Mobile Based Service Delivery 133
distribution system developer decides the price of the application and receive some percentage of the revenue and does not pay for marketing, hosting, credit card, or charges for free applications. The Apple App Store [21] shares 70% revenue with the developer, whereas Blackberry AppWorld [22] shares 80% revenue with the developer.
Mobile Network Operators: Network operators also provide their sites to display, distribute ad sell mobile applications. Operators such as Vodaphone [23] and Airtel [24] also operate mobile application portal. In this model, billing is easier to the citizen for the purchased application. However the developers are charged with some fees for hosting their application.
Third Party Distributors: Third party distributors act as a middleman for the developer and the customer/citizen. The proposed m‐governance application store fits in this model. The application store needs to handle the marketing, distribution, sales, and reporting processes of mobile applications on behalf of the developer. In exchange of this app store may take some percentage of the revenue generated. App Store needs to have partnership with phone manufactures, network operators, and technology vendors for testing the application on the mobile handset in that particular network.
Business Model
The mobile application development and the management of the application store infrastructure must be on the self sustainable model. This requires generating profits and revenue for the interested parties.
Advertisements can be displayed at number of locations and different points of time in the application. This is particularly relevant for free applications for generating the revenue. Mobile Marketing Association and the iAB (Interactive Advertisement Bureau) have published many guidelines for mobile advertisement which can be used.
Revenue can be shared from the network service provider, from the revenue generated from the increased usage of the network in downloading applications.
Sharing of revenue with the developer on each purchase of the mobile application.
Technical Details
The application after downloaded on the mobile handset can talk to the backend application via MSDG using SMS/http/https/WAP protocols. Application needs not to bother about the gateway protocols. MSDG will make all the gateway specific calls to the NSDG/SSDG. For example it will make Service Request and Service Poll on NSDG/SSDG on behalf of the application.
SMS Gateway as a Service
The SMS Gateway will act as the common service of MSDG. This will help delivering the government services using SMS. SMS is the way of asynchronous communication on the mobile platform.

134 E‐Governance: Techno‐Behavioural Implications
The SMS based services have been broadly categorized into:
• Push SMS • Pull SMS
PUSH based Services: In case of PUSH based services, the response/ information is sent to the subscriber who has expressed his/her consent/ concurrence / willingness to receive such response/ information or solicited such response/ information on periodic basis at some point of time and not necessarily on per MO basis as in case of PULL based services.
Push based services can mostly be used for the notifications to the citizens. Suppose a backend department receives a request from the NSDG/SSDG for a particular service and the department wants the citizen to keep him/her updated about all the Service Processing Status. Let us consider a department which issues some certificates and defines the following types of status.
Status 1: We have received your application for the Certificate, your application id: xyz.
Status 2: We could not process your application, because one of the supporting documents was missing.
Status 3: Your application is processed and it will be delivered to you by post in xxx no. of days.
Now suppose the department application has just received the certificate request from the NSDG/SSDG. The department application can check that whether user has mentioned the mobile number in the application for the certificate. If it is there, then the department application can send the SMS to the citizen with the content in status 1. For this the department will make the SMS request message on the following url with mobile number(s), message content and provide username and password:
http://msdgweb.mgov.gov.in/esms/sendsmsrequest
This is one interface of MSDG, where it listens for the SMS requests. Once the MSDG, receives the SMS request on the above mentioned url, it forwards the request to the SMS gateway component, which in turn sends to the SMSC (SMS Center) of a Mobile Network Operator. This SMSC of the MNO forwards the SMS to the respective mobile number.
PULL Based Services: The PULL based services are those where the subscriber asks/ requests/ solicits for information/response for each query/ SMS sent to the application server on per message originated (MO) basis.
Shortcode 51969 has been allocated to MSDP by the department of telecomunication. This shortcode is the single point of access for all the pull based sms services on MSDG for the whole country.
The various stages of using the pull based services on the shortcode 51969 are:

Indian Ecosystem for Mobile Based Service Delivery 135
Stage 1: Identifying Services to be customized for SMS pull model‐ Choosing the Right Services
Short and focused services are keys. There are two kinds of services usually deployed:
Informational Services for citizen requests for the status of a particular activity. A typical example is the status of the ration card application. When the citizen sends
an SMS “GOA RATIONC XXXX” to the short‐code 51969, the first word represents the keyword for the State, the second word RATIONC represents for keyword for the Ration Card service and the third word represent the application number. The citizen receives back a SMS with details of the status of ration card application with the application number XXXX.
Transactional Services for when a citizen registers himself for a service for later delivery. A typical example is a citizen requesting for delivery of state‐wide examination results. When he/she sends an SMS “MH SSLC 787689”, the first word being the name of the state and the second the name of the service e.g. name of the examination, third his registration number, the application stores his mobile number against his registration number and sends him the correct results when it is published.
Stage 2: Choosing Keywords, Sub‐Keywords and Response Message Formats
Components of an Incoming SMS:
To make shortcode 51969 services easier to use, a citizen should not have to
remember complicated keywords and sub‐keywords for a service. A good shortcode service thus has a very flat hierarchy and should be simple to explain in the length of a single text message.
A suggested configuration has been described below. • Keywords: Names of States • Sub‐Keywords: Names of Services and parameters/arguments • Responses: Usually less than a single text message.
Example
When the citizen sends an SMS “GOA RATIONC XXXX” to the short‐code 51969, the first word represents the keyword for the State, the second word RATIONC represents for keyword for the Ration Card service and the third word represent the application number.

136 E‐Governance: Techno‐Behavioural Implications
Recommendation: It is also recommended that every keyword has a configured HELP sub‐keyword for service discovery. In case of an invalid SMS being sent, an instruction to use the HELP discovery service should be sent back.
Mobile Payments
The citizen needs to pay for services and for downloading applications from appstore, which are not free. Therefore MSDP has requirement of mobile payment services.
Mobile payment can be defined as a payment method where a citizen can use a mobile phone to pay for a pubic service. There are different ways in which payment can be done using mobile devices. In India, RBI (Reserve Bank of India), has issued regulations for mobile payment using bank account. Under the RBI regulations, various banks have come with different application which can be deployed on the mobile devices and can be used for mobile payments.
IMPS (Interbank Mobile Payment Service), launched by NPCI (National Payments Corporation of India) [29], can be used for mobile payment. To avail this service, user should have a mobile number registered with the bank where the user has the account and get a 7 digit MMID (Mobile Money Identifier) number.
RBI has also allowed for prepaid payment instruments also commonly known as Mobile Wallet. The service will enable the subscribers to exchange physical cash for virtual money which can be stored on mobile phones to pay for goods and services. Once the user loads up his phone with prepaid cash he can walk into specified merchant locations and purchase goods and services. The value stored on such instruments represents the value paid for by the holder, by cash, by debit to a bank account, or by credit card.
Other Channels of Service Delivery (Future Roadmap)
FIG. 1

Indian Ecosystem for Mobile Based Service Delivery 137
Other Mobile technologies will also get integrated with MSDP over a due course of time. It has been envisaged that the following services will also be made available on the MSDP:
• Voice Gateway • USSD Gateway • Location Based Services • Billing Gateway • MMS Gateway • 3G Gateway • Cell Broadcasting Gateway • SIM Toolkit • On Device Portal • Other Mobile Developments
CONCLUSION
As the number of mobile subscribers is increasing rapidly and given its reach, it has become imperative to offer Government services over mobile‐phones to ensure that the Government services are delivered to every citizen to their doorsteps.
Mobiles itself can be one of the largest Service Access Provider for the government services provided through eGov exchange formed through NSDG, SSDGs and Domain Gateways. The current architecture of NSDG/SSDG or the domain gateway should be supplemented with separate infrastructure for mobile governance. A separate infrastructure is required as:
• Seamless integration with backend department through existing NSDG/SSDG eGov exchange infrastructure
• It will provide common interface for mobile based services (SMS, USSD, GPRS, 3G, Cell Broadcasting, Location Based Services, etc)
• Mobile devices are constrained environment • Needs to generate as well as render the contents for delivering the service on the
mobile.
REFERENCES [1] Advances in Security and Payment Methods for Mobile Commerce by Wen‐Chen Hu, Chung‐wei Lee &
Weidong Kou. [2] Airtel App Central,
http://www.airtel.in/wps/wcm/connect/About%20Bharti%20Airtel/bharti+airtel/media+centre/bharti+airtel+news/mobile/pg‐india‐first‐mobile‐application‐store‐airtel‐app‐central.
[3] Apple App Store, www.apple.com/iphones/apps‐for‐iphone. [4] Blackbery App World, na.blackberry.com/eng/services/appworld. [5] Dr. Rajendra Kumar, Ms. Kavita Bhatia,
http://www.mit.gov.in/sites/upload_files/dit/files/Draft_Consultation_Paper_on_Mobile_Governance_110411.pdf

138 E‐Governance: Techno‐Behavioural Implications
[6] http://passport.gov.in/delhi.html. [7] http://passport.gov.in/ghaziabad.html. [8] http://www.egov.gov.sg, http://www.ecitizen.gov.sg/mobile/index.html. [9] http://www.infotechgoa.com/smsgateway.php. [10] http://www.itmission.kerala.gov.in/mobile‐governance‐initiatives‐in‐departments.html. [11] http://www.npci.org.in/aboutimps.aspx. [12] http://www.osrt.in:8080/igms/ebin/ebin.jsp,
http://www.hindu.com/2011/03/13/stories/2011031363050500.htm. [13] http://www.statebankofindia.com/. [14] http://www.wsa‐mobile.org/winner/mobile‐portal‐kingdom‐bahrain‐49820101104. [15] Interactive Advertisement Bureau, http://www.iab.net/. [16] Martyn Mallick, Mobile and Wireless Design Essentials – ISBN:0471214191. [17] Mobile Marketing Association, http://www.mmaglobal.com. [18] MSDP–ERICSSON, http://www.ericsson.com/ourportfolio/telecom‐operators/mobile‐service‐delivery‐
platform. [19] MSDP–HP, http://www.hp.com/products1/solutioncenters/pdfs/MSDP_blueprint.pdf. [20] MSDP–inov8 Limited, http://www.ericsson.com/ourportfolio/telecom‐operators/mobile‐service‐
delivery‐platform. [21] National Payments Corporation of India, http://www.npci.org.in/home.aspx [22] Qusay H. Mahmoud and Pawel Popowicz, Towards a Framework for the Discovery and Acquisition of
Mobile Applications–Ninth International Conference on Mobile Business ‐2010/ Ninth Global Mobility Roundtable ‐ 2010.
[23] The SDP Alliance, http://www.thesdpalliance.com/thesdp.shtml. [24] TRAI (Telecom Regulatory Authority of India)
http://www.trai.gov.in/WriteReadData/trai/upload/PressReleases/835/Press%20Release%20June11.pdf.
[25] Vânia Gonçalves, Nils Walravens, Pieter Ballon, “How about an App Store? – Enablers and Constraints in Platform Strategies for Mobile Network Operators” 2010 Ninth International Conference on Mobile Business / 2010 Ninth Global Mobility Roundtable
[26] Vijay Jain, Rajeev Srivastava, Ranjan Kumar, Rahul Upadhyay, Kapil Kant Kamal, Breaking Barrier to Technology: e‐Governance Messaging Middleware ‐ 5th International Conference on Theory and Practice of Electronic Governance (ICEGOV2011).
[27] Wikipedia, http://en.wikipedia.org/wiki/Service_delivery_platform.. [28] Vodaphone App Store, http://www.vodafone.in/vas/downloads/pages/appstore.aspx. [29] www.nsdg.gov.in.

Section II Behavioural Aspects of e-Governance
The paper “Impact of Internet on Political Outcome: A Case Study” tries to analyze through an exploratory case study on Andhra Pradesh the principal question of what can be the impact of over emphasis on Internet on the political outcome in a democratic process. The study concludes most of the electorate could not find any direct benefit and felt that the huge spending on the infrastructure was a huge waste and the government had neglected the cause of the common man in its pursuit of bringing in internet. The paper “EGovernance in Rural Area: Acceptance and Challenges in Developing Countries” emphasizes on the reason why E‐ governance is not fully accepted by developing countries and seeks to formulate a roadmap for delivering value proposition to the rural populace and equipping them for the better use of E‐governance.
The paper titled, “eGovernment Enhancement using Knowledge Management” gives a model of e‐Governance built on KM cycle of Knowledge capturing, Knowledge sharing, Knowledge enhancing, and Knowledge preserving for the public sector. “eGovernance Project Management Issues and Challenges” studies the issues and challenges related to the e‐Governance project management area and finds some suitable suggestions for making the e‐Governance projects more successful. Paper “Towards Validation of Key Success Factors of EGovernment Initiatives” identifies trend in research followed by an attempt to validate whether existing framework are capable of explaining success of E‐government initiatives and thereby identify some policy and operational insight that can benefit decision makers and project managers responsible for formulating and implementing E‐government initiatives.
“Employing Technology Acceptance Model (TAM) to Examine Factors Influencing RFID Systems Use in Library”, suggests that perceived usefulness and perceived ease of use positively influence consumer attitude towards the RFID‐enabled services. The authors of the paper, “Proposal of Commodity Exchange Model Using ICT to Reduce Corruption in NREGA”, have developed a model which can be implemented at village / cluster of village’s level for the NREGA scheme. In this model, wages are to be distributed in form of commodity as well as money from any business establishment using ICT tools like smart cards along with unique identity number and biometric authentication. The paper on “ICTEnabled Change in Indian Police: A Case of Leadership and Drive in Karnataka“, traces the leadership role in Crime and Criminal Tracking Network System [CCTNS] and Common Integrated Police Application [CIPA] and various other systems to make the task of policing easier and bring citizen‐centricity more in focus.
“A Comparative Analysis Between ICTs Based Public Service Delivery System and Manual Service Delivery in Bilaspur City of India“ concludes that though ICTs based public service delivery system is better than the manual system but the lack of administrative and political will restricts the popularization of this system. The paper

140 Section II Behavioural Aspects of e‐Governance
“EHealthcare in Infectious Diseases” proposes a Cloud based e‐healthcare service, which can be implemented, irrespective of availability of other amenities. The paper “Analyzing the Impact of Mobile governance in Maternal and child healthcare in India” reviews and analyzes the impact of ICT initiatives (like Aarogyam and other innovative programs) on maternal and child care (MNCH) and proposes steps that can be taken by the Indian government to support them.
Paper “Drivers and Inhibitors for the Mobile Transformation: A Case of Australian Healthcare Setting” investigates the views of healthcare professionals to understand the current progress, drivers and challenges in the process of m‐transformation in the healthcare environment. The findings of the study indicate that m‐transformation is still in early stages in healthcare industry. The paper “Sweetening Bitter Pills to be Swallowed” studies the diffusion of innovation of ICT specially in healthcare sector of India.
The paper “Integrating Records of Rights with Property Registration and Cadastral Maps–A Step towards Migration from Presumptive Land Titling to Conclusive Land Titling System” briefly describes initiatives taken for integration of the process of Registration, Mutations, Records‐of‐Rights and cadastral maps in Haryana.

Impact of Internet on Political Outcome: A Case Study
Sudeepa Banerjee1 and Tapati Basu2 1Asst. Professor (SG), IISWBM, Kolkata
2HODDepartment of Journalism and Mass Communication, Calcutta University, Kolkata
Email: [email protected]
Abstract—The study has tried to analyse through an exploratory case study on Andhra Pradesh the principal question of what can be the impact of over emphasis on Internet on the political outcome in a democratic process. The scientific research is based on five focus group interviews with 10 knowledgeable members in each who had voted in the 2004 elections. The interviews focused on the economic development under Chandrababu Naidu, contributions of the Naidu government towards development of IT facilities and IT industry in the state, whether over emphasis on Internet had an impact on the way the electorate voted, did the electorate benefit because of the introduction of Internet based services, did this new technology bring in opportunities for employment and a summary for the reasons of the democratic defeat of the government. The study concludes that inspite of all the utilities that the egovernance projects in Andhra Pradesh provided as well as the various popular projects that the government undertook; the focus on Internet technology had a very negative impact on the fate of the ruling party. The people were not comfortable using the medium. The reach was not adequate and the infrastructure requirements were also beyond the common man’s means. Most of the electorate could not find any direct benefit and felt that the huge spending on the infrastructure was a huge waste and the government had neglected the cause of the common man in its pursuit of bringing in Internet.
Keywords: eGovernance, Internet, Andhra Pradesh, Sell, Technology, Government
INTRODUCTION
E‐governance is the application of electronic means in the interaction between government and citizens and government and businesses and internal government operations to simplify and improve democratic, government and business aspects (Backus, 2001) of governance.The strategic objective of e‐governance is to support and simplify governance of all parties: government, citizens and businesses. Internet technology can connect these three parties and support processes and activities that they engage in.
E‐governance involves new styles of leadership, new ways of listening to citizens, new ways of educating the public and the service providers and new ways of delivering information and services.
The common expectation in scientific and public opinion is that intervention through Internet technology will change power relations in many, if not all domains in society. While some think that centralization will occur, most think decentralization will take place. The most popular expectation is that it will empower users of all kinds: citizens, consumers, workers, patients, students and audiences. It is also perceived that those in power reach more power in their control of design, investment and implementation of this technology.It is necessary to examine these perceptions and also try and understand how it changes the relations between governments and citizens. Further, the level of three types of access to this technology in the domain under

142 E‐Governance: Techno‐Behavioural Implications
consideration: first, physical access to computers, the Internet and other digital media; secondly, digital skills and finally, use, that is the quantity and quality or kinds of applications also need to be known as that may interfere with the perception of the technology itself.
It is essential to find answers to these questions in one of the largest democracies in the world‐ India where governments are formed and broken based on the perceptions and reaction of people to changes brought in. It is also necessary to understand how the general public perceives the Internet in terms of it providing governance facilities. As in other countries, in India too most of the remote villages and towns are outside the Internet map. Merely making government documents, forms and tax returns available on the Internet is not enough, since the spread of Internet has not been uniform across metro cities, town, villages or remote villages and the usefulness of this medium as a medium for providing government services has not been experienced by all. Because of the basic requirement of a computer or a high‐end mobile phone for this technology, it is still perceived as elitist and a luxury. Therefore when a government tries to implement such a technology in a widespread manner people may not like it, they may not be able to access it and they may find it expensive. Further the barrier of illiteracy may hinder even more. This study will try to investigate the complex relationship through a case where Internet technology was brought in very early to see how and why the citizens had reacted so adversely to it.
DEMOCRACY, CITIZENS AND TECHNOLOGY
A democracy is a creative, beneficial, powerful force that encourages participation, citizenship and political activity in a public environment. In India we follow the Parliamentary or Westminster model known as a popular democracy as people have the ultimate powers and all powers are drawn from the people. A problem that plagues a modern democracy is that large number of the educated population do not participate in the political and civic life; further some people also feel dis‐empowered.
However, there is an unpredictability of outcome of using modern technology to achieve these political ideals (Sawyer & Eschenfelder,2002). Studies have been conducted to see the contribution of information and knowledge in solving social problems(Kling & Callahan,2003) and the relationship between democracy, social justice and equity with information access and use(Kochen,1983).Technology however can be employed by governments to help citizens in many ways.
Doctor's (1992, P80) broader overview of the role of information technology in social equity demonstrates that, "existing data provide warning signals about significant disparities in the distribution and use of information resources".
It also needs to be noted that there are other issues with the use of this technology‐ costs, investments, access, skill, education. So even though a section of the community will be greatly advantaged when a governement starts using this technology, there will be a significant number who will not be impacted at all. Therefore, because of these

Impact of Internet on Political Outcome: A Case Study 143
differences the advantages are not always visible, integrated (Carveth & Metz, 1996) or equally accessible by all in similar settings.
When Internet technology is used in governance, there can be two major predictions in the outcome‐highly optimistic or technological utopianism or highly pessimistic or technological dystopianism (Dijk, 2000), both these views are significant in creating citizens views and perceptions. Such use of technology is also affected by society and its institutions (Bellamy & Taylor,1998). This view places technology in a lower rank in comparison to culture, society and political processes. The nature and even existence of technology and its range of usage is determined by the social, political and cultural factors prevalent in a society (Mackenzie & Wajcman,1999). These days’ governments are trying to connect with the electorate by becoming more service oriented. These are also exercises in rebuilding trust, bringing in transparency and trying to get more people involved in the government processes (Bellamy and Taylor, 1998).
Internet is able to deliver information far easily and at relatively lower costs Thus it can be used a tool to implement public policy (Kettl,2000). Different government circulars,orders etc can be uploaded on websites for easy access by citizens. This will also create greater awareness amongst people. However, governmental services also influence power structures (La Porte, Demchak and De Jong, 2002). Implementation of e‐governance is not an easy task and is not about the technology alone.There will be many powerful people with vested interests who will feel threatened by this technology and will try to stall the implementation;because if governments implement this technology then the governance will become far more transparent which may be detrimental to their interests.
It is seen that the impact of the Internet is, ironically, disproportionately greater than its overall spread. This fits within the general argument that the libertarian culture accorded by ICTs shift the balance of power between states and citizens, especially in developing countries (Ott,1998).Again this medium can also serve as a medium of public participation(Zhang,2002) but citizens should be motivated to judge the information from alternative points of views (Becker,2001). By using this medium governments can deliver services as well as information and engage in one‐way or two‐way communication with its citizens. This will lead to their empowerment(Klein,1999). However, there is a view that Internet technology has an amplifying tendency that tends to make politically active people more active and the politically inactive even more detached(La Porte,Demchak and De Jong,2002). Thus use of such technology may add to the existing economic, social and political disparities in a society, as traditional groups do not adopt such technology in political arenas so easily.Using technology on a greater scale will be possible when the required infrastructure can be made available. Governments cannot insist on accepting only online applications if the facility of forwarding online application is not available uniformly across the country.Therefore in countries like India,where great disparities exist amongst people in terms of economic factors,education,area of residence etc,using technology to serve people remains a big challenge for governments. India is plagued by poor infrastructure, high rural

144 E‐Governance: Techno‐Behavioural Implications
population, problems of electricity and water, illiteracy, lack of IT training and language barriers (Dasgupta,2006), which are possible reasons for the poor implementation of e‐governance projects. People rely more on hand written documents and are not satisfied with computerized copies. Further, our existing systems are not adequate. Good systems require good manpower, appropriate technologies and efficient processes. IT and Internet are only enablers. It is important to reengineer processes and systems before computerization. E‐governance cannot transform a country immediately or forever. It is a process, most often a struggle that presents costs and risks‐both financial and political. Achieving success requires a change management process to create awareness, understanding, trust, common reason and willingness from all quarters to move it from an idea to reality. The challenges are enormous and ironically more cultural than technical.
BACKGROUND
Andhra Pradesh is the fourth largest state of India situated on the south east coast;it is also one of the less developed states of India. The population of the state according to the 2001 census is 76.2 million with a literacy rate of 52.4 % that had shown a good rise from the past decade. Almost 73% of the people of Andhra Pradesh work in the agricultural sector as farmers and agricultural labourers.It has historically been described as the ‘Rice bowl of India’.
Andhra Pradesh, in the early 1990’s saw the rise of a new and prolific political leader from the Telegu Desam party –Nara Chandrababu Naidu.He became the Chief Minister of the state in September 1995 by overthrowing N.T Rama Rao from the same party who was his father‐in‐law and brought in with him a lot of liberalization in reforms that changed the track of development in the state. Chandrababu Naidu during his nine‐year rule had introduced several market‐based reforms as also many time tested populist schemes, which no other Chief Minister of Andhra Pradesh had ever launched. Information technology and information technology based service sectors boomed during his tenure, giving rise to a separate state level IT policy. Mr. Naidu was a member of the first National task force on Information Technology and software development in May 1998.He focused very heavily in building the IT infrastructure of the state and competed strongly with Bangalore and Karnataka to be the Silicon valley of India. He was successful in converting Hyderabad into a Hi‐tech city. He was also instrumental in making use of the Internet for governance or e‐governance. However, in the 2004 national and state polls the TDP under the leadership of Chandrababu Naidu faced a devastating defeat unparallel in the history of Andhra Pradesh.. Chandrababu Naidu’s over emphasis on IT and ITES was cast as the main reason for this defeat as the rural community felt neglected despite all his development and e‐governance projects.
RESEARCH QUESTION
In a democratic country like ours, the impact of Internet and its technology on the fate of a political party is necessary to study. Very few studies could be found that focused on

Impact of Internet on Political Outcome: A Case Study 145
this aspect. The present researcher wishes to fill in some of the gap in knowledge regarding the political outcome rather than the technological outcome of use of such technology in politics by answering the following question:
What was the Political Outcome of Internet in a Democratic Process?
To be able to answer the above question better, the focus of the study will be in the following areas:
1. Economic development under Chandrababu Naidu 2. Contributions of the Naidu government towards development of IT facilities and
IT industry in the state. 3. Did over emphasis on Internet have an impact on the way the electorate voted? 4. Did the electorate benefit because of the introduction of Internet based services? 5. Did this new technology bring in opportunities for employment? 6. A summary for the reasons of failure
STUDY DESIGN
The study is an exploratory case study based on focus group interviews. The findings have been presented in terms of the economic development under Chandra babu Naidu, contributions of the Naidu government towards development of IT facilities and IT industry in the state, the problems with the strategy, the summary of the findings and the conclusions drawn.
METHODOLOGY
A focus group interview method was felt to be the best method to address the specific questions mentioned above.The expert focus groups comprised of journalists, renowned academicians, software professionals, government officials and other residents from different parts of Andhra Pradesh who had voted in the 2004 state polls. The role of the researcher was that of a moderator, to make the discussion one‐dimensional. The group discussions continued for nearly an hour each and a consensus building approach had been taken to identify relevant dimensions in questions. Five such focus groups were formed comprising of ten individuals in each interview. In all 50 people were interviewed.
No incentive or remuneration was paid to the participants. However, the participants agreed to the discussion based on an informal agreement to keep their identities undisclosed. The interviews were held in Hyderabad and Vizag between 16th August and 31st December 2008.
The interpretations of the outcome of the discussion have been presented below.
RESULTS OF THE FOCUS GROUP INTERVIEWS
Nara Chandrababu Naidu brought with him a lot of hope and expectation to the citizens when he became the Chief Minister by declaring Andhra Pradesh a company, the citizens

146 E‐Governance: Techno‐Behavioural Implications
its stakeholders and himself the CEO or Chief Executive officer of the same. This was in marked contrast to the populist attitude of past politicians specially the likes of N T Rama Rao. The new Chief Minister soon hiked the power tariff, water tariff, transport charges, land registration charges and also raised the price of rice under the subsidy scheme from Rs 2 per kilo upto Rs 6 per kilo. He privatized several public sector undertakings during his tenure rendering over 10 lakh people jobless. Chandrababu Naidu however, had introduced several populist schemes too, like the Janmabhoomi program in 1997, the Chief Minister’s Empowerment of Youth program in 1996;the Adharana program in 1998; the Girl Child Labour Rehabilitation program; the Back to School program in 1997,the Deepam scheme in 1999; the Mundadugu program and the Roshni project. Then there were the Self Help Groups created by the state government covering rural poor women for ensuring their financial security. The Neeru Meeru program was launched in April 2000 with the objective of sustainable utilization of water. Priority was given to villages and mandals with water scarcity. The Clean & Green A.P Campaign was started in 1998 with the objective of making every habitation and Municipal ward clean and green. The Aptha Bandhu program was started to give compensation to families of accident victims.
ECONOMIC DEVELOPMENT UNDER CHANDRA BABU NAIDU
During the nine‐year tenure of the Naidu government, the farmers were hard hit due to lack of power supply in the villages, drought and faulty policies of the past governments as revealed in the discussion.
The groups felt that Naidu did not concentrate much on rural development, especially in the agriculture sector on which more than 60% of the population was dependent. According to the experts, 70% of the population then resided in the rural areas where there was no proper infrastructure, no water facilities and drainage facilities. Farmers suffered from water shortage, poor power supply, ineffective power reforms, lack of strategy for marketing their products, non‐availability of cheaper loans and dependence on power for irrigation. All this led to complete loss of trust in the TDP government by the rural population, which had been the backbone of support for the party in the past.
The groups mentioned statistics and stated that the economics of the state were not good and kept fluctuating. Naidu had from the beginning, wanted to develop the state under different plans and schemes but the state was already facing a monetary crunch. By supporting the BJP led, National Democratic Alliance (NDA) government in the center from outside he was able to mobilize lots of connections for funding in the state and also divert some money into the state from the centre. He was also able to forge ties with the World Bank and the British led DFID. Further, he appointed the global consultant McKinsey to devise and design the road map of future reforms applicable for the state. Based on their joint reports the World Bank, agreed to fund the state and a vision document was created. Very soon the Implementation Secretariat or IS was also created

Impact of Internet on Political Outcome: A Case Study 147
which would function above the state assembly and act as the principal consultant to the state. The Naidu government created the ‘Vision –2020: Swarna Andhra Pradesh ‘document. The main focus of this document was on Information technology (IT) and Information Technology and Enabled services (ITES), biotechnology and other knowledge based services. It is clear, because of these developments the expert groups opined, that the focus had clearly shifted out from the rural and agrarian policies of the past.
Contributions of the Naidu Government towards Development of IT Facilities and IT Industry in the State
All the members of the groups felt that Chandrababu Naidu was known for his strong affinity towards Information Technology. He initiated several e‐governance projects during his tenure as he felt that Information Technology was a tool that opened up tremendous opportunities for providing basic government services to a much broader segment of the population at the optimal quality, time, place and cost and thus the government should leverage its strength in IT to open up these services to all its citizens. Andhra Pradesh emerged as one of the leading states in India in e‐government applications, with the State government implementing a comprehensive plan for the same.
In 1998, the state government along with a consortium of public sector IT companies from Singapore set up the APVAN or Andhra Pradesh Value Added Network to focus on revenue, commercial taxes, transaction charges, registrations and managing and maintaining the related data.
The APSWAN or Andhra Pradesh State Wide Area Network was created to facilitate e‐governance and connected the secretariat to 23 district head quarters, Tirupati and Vijaywada. This would help the government to have live interactions with the collectorates and other essential village officials and officers across the state, ensuring regular and daily monitoring, during crisis and in emergency situations. These groups felt that this was a foray of the administration into e‐governance.
The CARD project (Computer‐aided Administration of Registration Department) was a comprehensive project of computerizing "The Registration & Stamps Department".
E‐seva started off as a pilot project in 1999 in the twin cities of Hyderabad and Secunderabad and was called TWINS or Twin cities Integrated Network Systems. Through the TWIN project, 19 basic services were made available at a single point service station that included payment of bills, issue of different application forms, vehicles and learner’s driving licenses, submission of passport forms, payment of property tax, certain examination fees, registration of birth, death,etc. The TWIN project gained lot of popularity and support across the state from all sections in the society. The groups concurred that this project too showed an initial urban bias‐for the place of start as well as the nature of initial services like driver’s licenses or submission of passport forms.

148 E‐Governance: Techno‐Behavioural Implications
The FAST (Fully Automated System for Transport) project also Internet based was well accepted too as it deals with issue and renewal of driving licenses, payment of license fees, registration of vehicles, transfer of ownership and allied documentation. Its popularity was based on the ease and speed. The experts commented that this popular project was also available in mostly urban areas, even though Internet based data can be made available anywhere.
The APonline was a web portal developed to provide all basic information about the state. The website http://www.aponline.gov.in/ provided a link to several services like exam results, tourism etc information related to the state.
The SAPNET or Society for Andhra Pradesh Network project was also initiated, which was a major communication and infrastructure initiative of the department of IT and Communication. It was essentially an education‐oriented service and was also meant to be a resource for E‐governance, rural and agriculture development and telemedicine. Another initiative in creating a socio‐economic database of all residents and a database of all land records was done through a multi –purpose household survey that covered over a thousand mandals in several districts of the state. This reached e‐governance facilities to the grass root level and in a matter of very short time issue –caste, birth and nativity certificates.
Apart from these projects, Naidu concentrated on developing the state in IT and allied areas. About 23% of the total software professionals in the United States are from Andhra Pradesh and it has a strong number of skilled manpower in the area of IT. The state ranked 3rd in India in terms of software exports in the year 2003. Established in 1992, STPI‐H (Software Technology Park‐Hyderabad) grew in export and numbers.
Chandrababu Naidu had also focused on developing both the Cyber city and the Hi Tech city. The Cyber City was meant for companies who wanted to invest in the state; they were provided land and necessary infrastructure. Chandrababu Naidu was able to bring software giants like Microsoft, Oracle and GE to the state and they all invested very heavily.
PROBLEMS WITH THE STRATEGY
The groups concurred that the number of STP units in Andhra Pradesh grew very sporadically and the focus was mainly on big cities like Hyderabad and Vizag. A great disparity in uniform growth in the IT industry was created. This was ascribed by the members as one of the reasons why IT failed to contribute to the rural sector in Andhra Pradesh. The CM had justified his stand of showcasing Hyderabad by stating it was necessary to attract foreign investments and felt that it would create ripple effects in the neighbouring areas and debated that he had also spent a lot of money in the villages on health, education, power, irrigation and infrastructure; but the plight of the poor has been so bad and with drought adding to their misery it was not possible to bring immediate relief and hence people felt he had not done enough.

Impact of Internet on Political Outcome: A Case Study 149
Another observation of the groups was that, inspite of the rise of the IT and ITES sector in the state, it failed to generate adequate employment to its citizens. Moreover, the employments created were based on a basic education and knowledge of computers and software applications. Language was a major problem. This growth could therefore not offer much to the rural population in a state that had a high rural population and low literacy. For the urban youth as well, these investments by large multi‐national companies did not bear direct benefits in terms of very high employment‐less than a lakh jobs were only created and most of these were for technical and support staff.
Chandrababu Naidu had contributed to education by setting up the IIIT (Indian Institute of Information Technolgy), Nalsar‐Law University, Indian School of Business and many more large educational institutes of higher learning. These were expensive institutions and attracted students mostly from wealthier states. The local community could not directly benefit much.
SUMMARY OF THE FINDING
It would be worthwhile to analyse the Andhra experience of using the Internet for socio‐economic development, improved governance, and generation of employment and as a change agent in the various government organizations.
In a state, where more than 73% of the population resides in rural areas, 50% are dependent on agriculture the sole focus on growth of the IT and ITES sectors at the cost of primary sectors like industry, agriculture and allied sectors proved to be very dear for Chandrababu Naidu. Most of the electorate viewed this expenditure as wasteful expenditure of public money.
His e‐governance initiatives, though praise worthy have also been termed by many as a political gimmick. When such massive projects with such large number of stakeholders are to be handled, then a lot of political will and leadership is required. The Andhra government had both and yet failed to return to power. Of the many reasons ascribed to the failure, one major cause was that all the development projects using technology were centered on the Chief Minister. This contradicts the concept of a democracy where the public is only expected to follow. This can be a serious setback for a politician. This observation agrees with previous research (Schudson,1992).
Further, many employees found themselves lacking in skills to adapt to these changes with IT as the driving force. The public was also not so acquainted with the new medium and never realized the potential and the convenience of the Internet. Another reason for this could be that it was a concept still ahead of its times in an economy like India.
Most of the e‐governance projects succeeded in the urban areas, as people were better educated and had better access to the technology. This seems to have changed the perception of Internet as being elitist and created a further divide in the society between the users and non‐users of the Internet.

150 E‐Governance: Techno‐Behavioural Implications
While the Government had taken up a number of key initiatives for promoting the pervasive use for IT in the state, it is significant to note that technology appeared to be relatively less of a critical issue in these processes of change. Rather than introducing and using technology, it is the administration of the entire change management exercise that seems more critical in such cases.
Successes of projects of this nature and magnitude also depend on how well the government has been able to sell to the public and how well the public has bought it. Even though the CM used the platform of weekly live television program‐‘Dial your CM’ to emphasize the importance and relevance of IT for development, it still did not meet the desired level of public confidence.
The new policies observed that several staff could be reduced and also relocated ; upto as high as 80%. These suggestions naturally never go down well with employee associations, more so in a poor country like India. These also result in projects not delivering the required outcomes due to resistance, sabotage and fear. Further, when at the various stages of a project; the stakeholders are not involved in the planning, designing, implementation and maintenance of systems, they do not feel involved or develop a sense of ownership for the project and feel its only an imposition on them leading to resistance and apathy. These lead to incomplete projects, which are then, viewed as wasteful expenditure. When stakeholders were involved in the CARD project, it became a success since both the customers and employees realized the convenience.
CONCLUSION
In the end, the study has indicated that the relationship between technology and government is very complex that may have several unintended and unpredicted consequences and confusing outcomes in India. The study has confirmed that in a democracy it is necessary to involve people in the processes required to bring about such revolutionary changes in administration. Further, in a country like India, with low level of literacy, huge urban‐rural divide in terms of infrastructure, facilities and development and a large rural population where the basic means of survival are not available to a large section of the population, investments in technology are viewed as wasteful and indulgent. It is necessary to be able to explain the gain to the various stakeholders successfully, educate them and involve them rather than impose it on them. Introducing new technology is more about managing change successfully than the technology itself and can have very serious implications for the administration.
The introduction of Internet technology for governance purpose in Andhra Pradesh was not only a complex and co‐evolutionary process along with social changes but also with unintended and unpredicted consequences and ambiguous outcomes which may have endangered future socio‐institutional and political changes. Such outcomes have also been reported in the past (Manchester, 1998).

Impact of Internet on Political Outcome: A Case Study 151
It may be concluded in agreement with the observations of Richard Sclove (1995) that the development of any new technology has broader social implications than those to which it was supposedly intended and these externalities are often overlooked. Sclove (ibid. P20) emphasizes that "all technologies are associated with manifold latent social effects and meanings, and that it is largely in virtue of these that technologies come to function as social structures”.
REFERENCES [1] Backus, M., (2001). E‐governance in developing countries. International Institute for Communication
and Development Research report, 1‐4. [2] Becker, T., (2001). Rating the impact of new technology on democracy. Communication of the ACM,
44(1), 39‐43. [3] Bellamy, C., & Taylor, J.A., (1998). Governing in the information age, Buckingham,UK, Open University
Press. [4] Bryan, C., Manchester (1998). Democratic implications of an economic initiative. In R. Tsagarousianou,
D. Tambini, & C. Bryan (Eds.), Cyberdemocracy: Technology, cities and civic networks (152‐166), London: Routledge.
[5] Carveth, R., & Metz, J., (1996). Frederick Jackson Turner and the democratization of the electronic frontier. American Sociologist, 27 (1), 72‐100.
[6] Dasgupta, D., (2006). E‐governance in India.Global CEO, November, 26‐28 [7] Dijk, J.V., (2000). Widening Information Gaps and Policies of Prevention.In K. Hacker & J. van Dijk (Eds.)
Digital Democracy, Issues of theory and practice, (166‐183), London, Thousand Oaks, New Delhi: Sage Publications.
[8] Doctor, R. D., (1992). Social equity and information technologies: Moving toward information democracy. Annual Review of Information Science and Technology, 27, 43‐96.
[9] Kettl, D. F., (2000). Public Administration at the Millennium:The State of the Field. Journal of Public Administration Research and Theory, 10(1), 7‐34.
[10] Klein, Hans,(1999), Tocqueville in Cyberspace: Using the Internet for Citizen Associations.The Information Society, 15,1‐4.
[11] Kling, R., & Callahan, E., (2003). Electronic journals, the Internet, and scholarly communication.Annual Review of Information Science and Technology, 37, 127‐177.
[12] Kochen, M., (1983).Information and society. Annual Review of Information Science and Technology, 18, 277‐304.
[13] La porte, T.M., Demchak, C.C., & De Jong, M., (2002). Democracy and bureaucracy in the age of the web: Empirical findings and theoretical speculations.Administration and society, 34(4), 411‐446.
[14] La porte, T.M., Demchak, C.C., & De Jong, M., (2002). Democracy and bureaucracy in the age of the web: Empirical findings and theoretical speculations.Administration and Society, 34(4), 411‐446.
[15] Mackenzie, D., & Wajcman,J.,(Eds),(1999). The social shaping of technology (2nd edn), Buckingham, UK, Open University press.
[16] Ott, D., (1998). Power to the people: The role of electronic media in promoting democracy in Africa, First Monday, 3(4). Retrieved January 20,2008, from http://www.firstmonday.dk/issues/issue3_4/ott/index.html.
[17] Sawyer, S., & Eschenfelder, K. R., (2002). Social informatics: Perspectives, examples, and trends. Annual Review of Information Science and Technology, 36, 427‐467.
[18] Schudson, M., (1992). The limits of Teledemocracy. The American Prospect, 41‐45. [19] Sclove, R., (1995). Democracy and Technology, Guilford Press, London. [20] Special website on National task force on IT and Software development. Available at http://it‐
taskforce.nic.in/ accessed on 26/12/2008. [21] Zhang, J., (2002). Will the government serve the people? The development of Chinese e‐government.
New Media & Society, 4(2), 163‐184.

e-Governance in Rural Area: Acceptance and Challenges in Developing Countries
Deepak Kumar Singh1 and G.P. Sahu2 1BBD University, Lucknow
2School of Management Studies, MNNIT, Allahabad Email: [email protected], [email protected]
Abstract—Good governance is one of the key requirements for any developing nation. It is perceived as a key of better government implemented through National eGovernance Plan, to bring efficiency and effectiveness in citizencentric services, socioeconomic transformation, especially in the fields of education, health, skillbuilding, entrepreneurship and in creating employment opportunities. But this cannot be achieved by developing countries because of unavailability of required infrastructure. On this basis, paper emphasizes on the reason why Egovernance is not fully accepted by developing countries. The reason is the rural area and the lighting point of this paper is how to reach the section of the society which has remained tangential to the government sphere due to cost and accessibility reasons. It seeks to formulate a roadmap for delivering value proposition to the rural populace and equipping them for the better use of Egovernance.
Keywords: EGovernance, citizen centric services, entrepreneurship, value proposition
INTRODUCTION
E‐governance, which has now become the most talked word around the world, is a government website on the Internet. It is a process to reform the Government work that can share information and deliver services to external and internal clients for the benefit of government, citizens, companies, customers, and public intuitions through the application of modern Information and communication technologies. E‐governance is the use of information and communications technologies (ICT) to transform government by making it more accessible, effective and accountable. The main aim of E‐governance is to provide support to all governments, citizens and businesses.
The extent to which E‐governance develops in a country is a function of the collective national and local capital supplying IT services and of informal social and human capital creating a demand for E‐governance. But there lies certain differences in terms of leading and lagging countries based upon capacity of countries to supply standard E‐government services, economical labor, organizational and technological infrastructure.
This paper deals with the problems and solutions why rural areas and developing countries are not able to accept the E‐governance. It focuses on the problem of last miles collection in developing countries i.e. unavailability of required infrastructure. It has been witnessed that developing countries have deeper telephonic /mobile penetration than the internet penetration that causes an information gap between western and developing countries.
This paper tries to reach to the section of the society which has remained tangential to the government sphere due to cost and accessibility reasons. Diffusion of E‐

e‐Governance in Rural Area: Acceptance and Challenges in Developing Countries 153
governance is much needed to reach out to these peripheral sections in the developing countries. The model proposed in this article improves upon the “time‐to‐public” and “time‐in‐public” of E‐governance services. The article provides a roadmap to bridge the rural‐urban digital divide based on an analysis of successful E‐governance projects. It seeks to formulate a framework for delivering value‐proposition to Rural populace and equipping them for the better use of E‐governance that can results in more transparency, greater convenience, less corruption, revenue growth, and cost reduction and help the people to interact with government and each other. The article focus upon improving the condition of people in developing countries by improving access to information that will become useful to their daily lives, providing government services, and offering new opportunities so that they can participate in the political process starting from the rural farmlands of Gyandoot in India to small villages in Africa.
What Challenges Does Developing Nation have While Accepting e-Governance?
Government is a machinery or institutional arrangement for exercising the sovereign power, while Governance is the process as well as the result of taking authoritative decisions for the benefit of society, managing a country’s social and economic resources. If the Governance does not bring maximum benefits for maximum number of people, it results into mal‐governance. In a welfare state, the aim is to be Good Governance, and “Good” Governance can be achieved only when it have the honesty, equitability, transparency and accountability.
FIG. 1: E-GOVERNANCE FOCUSING
e‐Governance and
Access to Information
Transparency and accountability of government functions to civil society and development increased
Citizens’ participation, especially of vulnerable groups, in policy dialogue increased through enhanced
access to information

154 E‐Governance: Techno‐Behavioural Implications
Imagine a situation in which all interaction with the government can be done through one counter 24 hours a day, 7 days a week, without waiting in lines at government offices. This can be possible through the feature called E‐governance where internet technology is used to decentralize responsibilities and processes facilitating each citizen to contact government through a website where all forms, legislation, news and other information will be available 24/7.
E‐Governance is ubiquitous. But in terms of success of E‐Governance projects, developed nations are far ahead of developing nations, resulting in a digital divide. Developing nations have failed to exploit the full benefits of ICT. A plethora of causes are responsible for this, like, lack of proper technology, poor funding facility, lack of political commitment etc. This paper is an attempt to illustrate such issues, by taking the experiences from some developing countries around the world.
The paper focuses on failure of E‐governance in rural areas of developing countries. One of the reason behind this can be the government are focusing more on internal efficiency rather than service delivery, and the projects that focus on service delivery are confined to licenses and taxes, and are mostly urban focused where needs of poor have not been targeted. Countries like India where some states have made considerable progress in electronic delivery of services to urban populations face the following challenges in implementing pro‐poor e‐Governance:
• To bring clarity to the objectives of pro‐poor targeting. • To ensure delivery of public services in rural areas. • To balance standardization and localization. • To leverage private sector and build Public‐Private‐Partnerships (PPPs) to
serve rural areas. • To make independent impact assessment of what as worked.
Differences in the capacity‐building among countries, that supply standard e‐government services reflecting the degree of modern resources and e‐participation facilities which shows the political openness and extent of corruption. In countries with a high degree of modern resources and a majority of adults online, digital choice creates limits as well as opportunities for e‐governance.
The online users in rural areas mainly prefer telecommunication or mailing (writing letter) process to contact Local and Central government. In the most modern and open societies the diffusion of the Internet is most likely to promote Government efficiency and the virtual linkage of disparate public agencies serving the same client that are not achieved by it even it may be possible because of lack of knowledge. And if some one wants to spread knowledge like, in many countries some have experimented with Telecenters as a delivery mechanism in Rural Areas. But these all are failed because these Telecenters are not piping in Government services. This may be due to a lack of computerization in Government agencies or a lack of coordination between Government agencies and the private owners of Telecenter. Most Telecenter projects are in a pilot

e‐Governance in Rural Area: Acceptance and Challenges in Developing Countries 155
stage. Furthermore there has been limited scaling up of Telecenters and therefore only a minuscule of the rural population has been covered by such centralisation. This can be the reason why E‐governance is not so much popular in developing countries.
FIG. 2: ARCHITECTURE OF E-GOVERNANCE
The problems that are generally faced by the Rural Areas and Developing Countries are:
INFRASTRUCTURE AND CONNECTIVITY
Most developing countries lack the necessary Infrastructure to build computerized system and provide access to such systems via the internet in rural and remote areas. Even the basic Infrastructure of a stable electricity supply does not exist in rural/remote areas of most countries. In the absence of telecommunication infrastructure, providing internet access in rural areas becomes expensive.
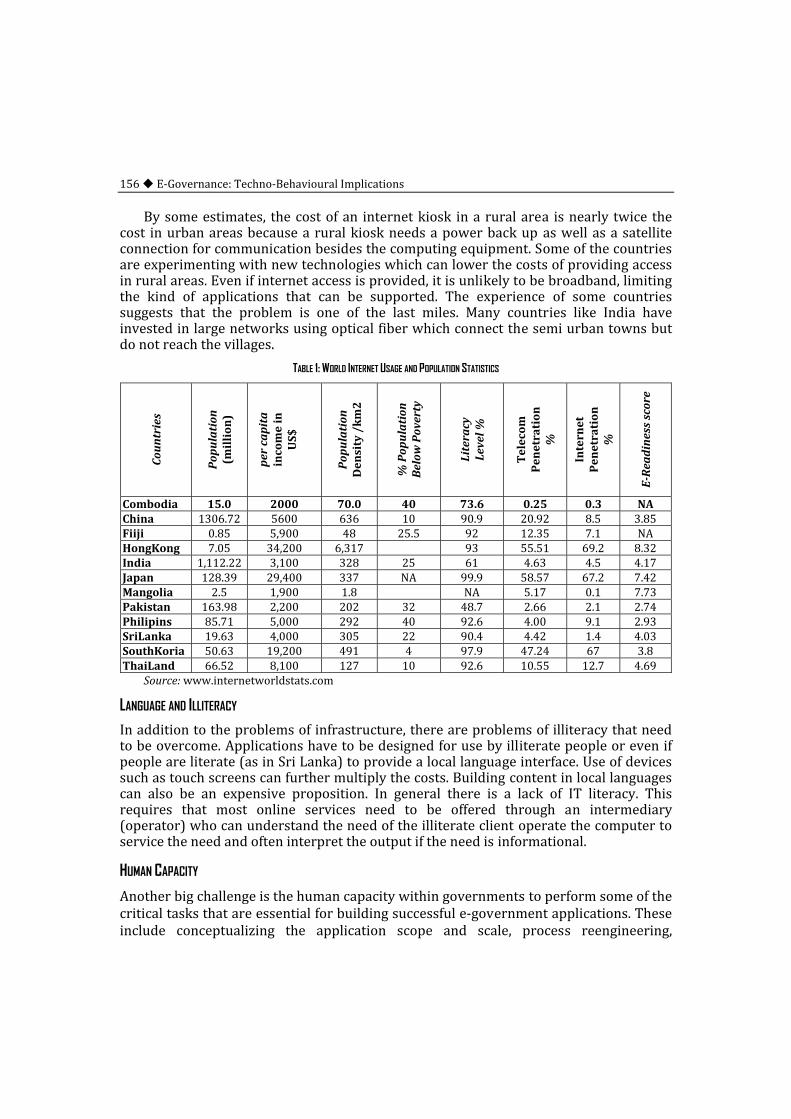
156 E‐Governance: Techno‐Behavioural Implications
By some estimates, the cost of an internet kiosk in a rural area is nearly twice the cost in urban areas because a rural kiosk needs a power back up as well as a satellite connection for communication besides the computing equipment. Some of the countries are experimenting with new technologies which can lower the costs of providing access in rural areas. Even if internet access is provided, it is unlikely to be broadband, limiting the kind of applications that can be supported. The experience of some countries suggests that the problem is one of the last miles. Many countries like India have invested in large networks using optical fiber which connect the semi urban towns but do not reach the villages.
TABLE 1: WORLD INTERNET USAGE AND POPULATION STATISTICS
Countries
Population
(million)
per capita
income in
US$
Population
Density /km2
% Population
Below
Poverty
Literacy
Level %
Telecom
Penetration
%
Internet
Penetration
%
EReadiness score
Combodia 15.0 2000 70.0 40 73.6 0.25 0.3 NA China 1306.72 5600 636 10 90.9 20.92 8.5 3.85Fiiji 0.85 5,900 48 25.5 92 12.35 7.1 NA HongKong 7.05 34,200 6,317 93 55.51 69.2 8.32India 1,112.22 3,100 328 25 61 4.63 4.5 4.17Japan 128.39 29,400 337 NA 99.9 58.57 67.2 7.42Mangolia 2.5 1,900 1.8 NA 5.17 0.1 7.73Pakistan 163.98 2,200 202 32 48.7 2.66 2.1 2.74Philipins 85.71 5,000 292 40 92.6 4.00 9.1 2.93SriLanka 19.63 4,000 305 22 90.4 4.42 1.4 4.03SouthKoria 50.63 19,200 491 4 97.9 47.24 67 3.8 ThaiLand 66.52 8,100 127 10 92.6 10.55 12.7 4.69
Source: www.internetworldstats.com
LANGUAGE AND ILLITERACY
In addition to the problems of infrastructure, there are problems of illiteracy that need to be overcome. Applications have to be designed for use by illiterate people or even if people are literate (as in Sri Lanka) to provide a local language interface. Use of devices such as touch screens can further multiply the costs. Building content in local languages can also be an expensive proposition. In general there is a lack of IT literacy. This requires that most online services need to be offered through an intermediary (operator) who can understand the need of the illiterate client operate the computer to service the need and often interpret the output if the need is informational.
HUMAN CAPACITY
Another big challenge is the human capacity within governments to perform some of the critical tasks that are essential for building successful e‐government applications. These include conceptualizing the application scope and scale, process reengineering,

e‐Governance in Rural Area: Acceptance and Challenges in Developing Countries 157
architecting the solutions, software development, maintenance of hardware/software, and training. Citizen participation is still low, due to a lack of initiative, and due to the inertia left behind by a command‐administrative system. The low population density, financial constraints and underdeveloped communication networks has added barriers to participation, while there exists a poor understanding of democracy and human rights.
Sri Lanka has used a least cost subsidy approach to identify partners from NGOs to set up Telecenters. Not all Telecenter projects have been successful in the past. The reasons cited for failure in Mongolia include capacity, management, and budgets. The paper from Fiji identifies the high costs that need to be incurred for opening Telecenters in remote islands.
One of the critical issues is the economic viability of rural telecenters. Some evidence is presented from the Sri Lanka programs on the challenges of attracting adult population to rural telecenters and creating an appetite for information and knowledge amongst the poor. It has similarly been reported that many telecenters in India have no takers for Internet use that is offered. They survive because of local applications such as training, digital photography and entertainment (viewing CDs).
Thailand has taken many initiatives to focus on the poor. A centralized data base profiling poverty will allow centralized planning for poverty alleviation. An interesting initiative (called OTOP) for promoting E‐Commerce in Rural areas of Thailand has not been very successful in the absence of other inputs such as design and the lack of logistic facilities to move products to markets. Other interventions are sometimes necessary to exploit the full potential of ICT. The temptation to use technology based interactive communication to project the achievements of the Government, rather than to understand the needs of the poor is also highlighted by the Thailand paper. The use of video conference technology to conduct interviews of migrant workers in China is an innovative idea that saves travel costs and prevents wage loss of poor migrant workers. The Chinese example illustrates a pragmatic approach of seeking a technology solution for an existing social problem rather than a technology looking for a problem to solve.
A large number of pilots have built Telecenters to provide access to information and services in rural areas. Some of them have been successful in catalyzing and servicing the demand. However, few of these pilots have been scaled up. Finally it is the scale that can create an impact on the poor. The efforts needed to reform processes, manage change and scale up have been under estimated by e‐Government planners.
Apart from all these the another research made by Heeks (2003) who told that, most implementation in developing countries fails, with 35% being classified as total failure(E‐government was not implemented or was implemented but immediately abandoned) and 50% as partial failure(major goals was not attained and/or there were undesirable outcomes)this is just the disturbing facts especially in developing countries that lead because of limited number of resources at their disposal and cannot afford to

158 E‐Governance: Techno‐Behavioural Implications
wastefully spend large amount of money typically of such projects. As such this article makes a contribution by the questioning the often unrealistic expectation often attached to E‐government application in developing countries.
The problem that often arises with developing countries is that there is frequently a mismatch between the current and future system, due to the large gap in the physical, cultural, economic and various other contexts between the software designer and the place in which the system is being implemented (Heeks, 2002).The model has lead Heeks (2003) to identify archetypes of situation where design‐reality gaps are common. These are:
Hard-Soft Gap
The difference between the actual technology (hard) and reality of the social context (people, culture, etc.) in which the system operates (soft).
Private-Public Gap
The difference between the private and public sectors means that a system that work in one sector often does not work in the other, due to gaps between the system designed for the private sector and the reality of the public sector into which the system is transferred.
Country-Context Gap
The gap exist when trying to use the e‐government system for both developed and developing countries, which arises from the gap between the system designed for one country and the reality of developing country into which the system is transferred.
It is this idea of gaps as conceptualized by Heeks (2002) that can be seen as a framework upon which almost all available literature on the failure of the E‐government in developing countries is based.
ISSUES IN NATIONAL POLICY/ STRATEGY
Lack of Pro-Poor e-Government Strategy Formulation
The primary concern is one of lack of focus of national E‐Government strategies on policies on vulnerable groups‐whether these are poor who can not afford to access services or those groups which are denied an opportunity to access because of some other barrier. As the Chinese paper indicated, the political profile of these groups will need to be raised for them to receive consideration from the policy makers.
However, even if the intent to serve the poor exists, the process of developing a national strategy needs to be such so that the interest of the vulnerable groups are represented and articulated. Often, the processes of strategy formulation are not participative. They are driven by the central IT departments/ministries. Sometimes other agencies and departments that are responsible for pro‐poor programs may not

e‐Governance in Rural Area: Acceptance and Challenges in Developing Countries 159
even be formally consulted. There is less likely hood of consultation with the civil society‐groups which work closely with the vulnerable sections and can articulate there needs. The extent to which the voice of the poor can be heard and addressed efficiently is a function of the level of democracy; freedom of speech; and commitment of the government to tackle digital divide. NGOs can be used to facilitate communication between the people and their government, provided that a genuine commitment exists at the political level to dialog with the NGOs.
Top-Down Versus Bottom-up
Perhaps it will be easier to target the poor and the vulnerable if the applications are developed at the local levels of Government. However, in many countries the development of E‐Government strategy is top down from the national Government.
For example, the Philippines paper discusses the strategy of development of ICT applications for local Government in the Philippines and debates the choice between a totally centralized specification, design, and implementation versus a completely decentralized process of development. It recommends a middle path of centrally defined standards and local development. A variety of middle paths have been explored by other countries. Therefore, keeping the balance between central coordination and agency ownership is an important issue when the programs are driven by central Governments as was also pointed out in the Thailand paper.
Appropriate Mix of Technologies
As the experience from Philippines and Mie Prefecture suggests, there are many different technologies that can be used to promote participation by the common citizens in the affairs of the Government. Therefore, national policies have to encourage an appropriate mix of media and technology for sharing information and community building. This may include SMS through cell phones, community radio, and the Internet.
Poor Implementation and Lack of Public-Private-Civil Society Partnerships
A partnership between Government, civil society and private sector going is the best way to promote digital inclusion and pro‐poor Government programs. Private sector can bring in the investments and operational management expertise; Government can provide the enabling policies and bridging subsidies and the civil society can intermediate between the technology and illiterate populations by interpreting the needs and scouting for solutions. Governments need to develop pragmatic policies on providing subsidies to compensate for higher costs of taking ICTs to rural areas or vulnerable groups.
Lack of Proper Assessments
One aspect that gets ignored in most national plans is the need to assess impact of projects in a systematic way. Several E‐Government projects were described in different papers including some that were designed to help the vulnerable groups. However, very few of the papers were able to shed light on the usage of these applications and the
160 E‐Governance: Techno‐Behavioural Implications
impact on citizens. There is therefore no way for the policy makers to understand as to what works and what does not and to get any guidance on the nature of projects that should be taken up.
India is addressing some of the above issues through its national e‐governance plan which aim to:
• Implement mission mode projects in key departments (that focus on development or serve rural populations) with large public interface.
• To ensure that even the remote areas can be benefited from ICT. • To provide generic program components including capacity building and • Build a component on impact assessment. • Apart from all these issues we must also have Training and Funding Assistance
that can promote the E‐governance in developing countries • Training programs for Project leaders who can Define project deliverables, deal
(negotiate) with Consultants and vendors and manage an Outsourced development process.
• Funding to build internet infrastructure, procure E‐Government solutions, get customized software developed to implement applications.
• Programmatic loans for implementing an E‐Government strategy. • Loans for building networking and communications infrastructure. • Seed loans/grants to SMEs, NGO to build kiosks in rural and urban areas.
There are some E‐governance Toolkit are also available that aims to demystify concepts behind e‐government and strengthen the understanding of all those involved in planning and execution of E‐government projects.
The Toolkit offers an action framework involving all the stakeholders in developing nations including parliamentarians, government executives, institutions as well as non governmental organizations and guides them through various phases in their e‐government initiatives.
IT DEPARTMENT
With the implementation of e‐governance, IT is becoming more and more important in government operations. The need for a professional IT department will increase not only during implementation but also for maintenance of software, hardware and infrastructure.
The first steps towards E‐governance solutions and the delivery of services as mentioned in the E‐Governance model combine short ‐term results and long‐term goals. The relation between long‐term and short‐term is crucial. Only if projects are in alignment with a long‐term vision success will be secured.
The E‐governance model presented can serve as a reference for governments to position where a project fits in the overall evolution of an E‐governance strategy. An E‐

e‐Governance in Rural Area: Acceptance and Challenges in Developing Countries 161
governance strategy is necessary to achieve the desired goal. In other words, the goal is the ambition level of the government regarding democracy, government and business aspects of E‐governance.
The model assumes that governments have defined an ICT and E‐governance vision (policy), which describes the ambition level for each aspect. Only some Western countries have a clear vision of E‐governance. In most developing countries the first step will be to investigate what the ambition level is. The model also assumes that all necessary infrastructures, telecommunications and Internet access is available. In most Western countries this is the case; in developing countries this will be quite different. The strategy should also deal with these boundary conditions and constraints.
The objective, through this toolkit, is to offer a helping hand to policy makers and senior executives in the developing nations by endowing them with comprehensive information about what, how and when to be done to embark successfully on the road to E‐government.
These all helps in achieving the following target like:
24/7 Service Model
Systems and processes need to be adapted to a completely new service model. Intake processes are made self‐service and even in the middle of the night a citizen should get an immediate (automated) response about the status of the application. Citizen’s expectations towards government’s response times will change because of the new communication medium. E‐mail should be seen a new but serious channel besides the traditional channels such as telephone, physical counter, post and fax.
Need for Content
Websites consist of content (information). Governments will have to collect (buy), produce and update content on regular basis. In phase 1, content will be static, but in phase 2, content will be changing every day. Content managers in each (large) department are responsible for updating information on the website.
Human Resources
Maintaining technological infrastructure requires IT skilled resources. Governments will have to compete with the private (commercial) sector to recruit the necessary IT skilled people increasing employment opportunity.
Think BIG, Start SMALL and Scale Up
Projects will only have a structural value for development when embedded in a vision and supported by a strategy. Andersen consulting has defined an approach to implement E‐governance projects:
Thinking big is required to set the overall vision and objectives of e‐governance. Starting small is essential to create instant success and keep a positive driving force, both internally as externally. Scaling fast is only possible with a profound strategy that

162 E‐Governance: Techno‐Behavioural Implications
secures all necessary resources available in time to know and take care the bottlenecks and aligning project planning with the overall vision and objectives.
Key Learning for Successful Implementation
Trial is important
Think BIG, start SMALL and scale up
Justification for projects
Clarity about benefits. Many projects still see IT as an end.
Raising resources (Bankable Projects)
Poor are willing to pay: should deliver value
Private sector involvement ‐ BOOT, BOLT
Organization to design, develop and implement
Strong Internal Leadership
Insource Analysis; Outsource Design, Development
Project management
Rolling out to large number of sites
FIG. 3: IMPLEMENTATION OF E-GOVERNANCE
So to have E‐governance in the rural and developing countries is must and it should satisfy the following criteria these are:

e‐Governance in Rural Area: Acceptance and Challenges in Developing Countries 163
SUCCESS FACTORS
In developing countries a lot of inhibitors exist. It is difficult to tell what the main bottleneck is because a lot of basic aspects of Good Governance are not in place yet.
When successful, E‐Government initiatives optimize government operations and service delivery. If not successful, these initiatives can cost governments millions of dollars and eno rmous amounts of wasted time.
FIG. 4: E-GOVERNANCE PHASE
The following aspects have to be taken into account when examining the risk of implementing E‐governance solutions.
• Political stability (elections, democracy or dictatorial Regime) • Level of trust in Government (perception of service levels) • The importance of Government identity(Fragmentation or integration) • Economic structure (education, agriculture, industry or service) • Government structure (centralized or decentralized) • Different levels of maturity (weakest part of the chain determines speed) • Constituent demand (pushes or pulls).
Awareness is much important for the promotion that can be possible through:
A NATIONAL E-GOVERNANCE SUMMIT
A Summit to create a document laying out process and structure, programmed and project priorities for the national e‐governance initiative, including any targets should be organized. It should ensure participation from all stakeholders concerned political parties, bureaucrats, academia, private sector, NGO and the citizens.
Raising Awareness among Leaders
In addition to the Summit, other mechanisms would need to be used to raise awareness and commitment among senior officials. These would include the President, Prime Minister, Ministers, Chief Ministers, Secretaries and leaders of other institutions of civil society who largely determine whether and how change takes place. By addressing both

164 E‐Governance: Techno‐Behavioural Implications
government and civil society leaders, drivers to E‐governance are created both inside and outside the government. For senior officials, private and personalized training will be required. In order to sustain skills and confidence, direct and continuing use of ICTs will be beneficial.
Political Acceptability
Despite the importance of technology and infrastructures, it is the politics of E‐governance initiatives that probably hold the key. E‐Governance projects have made slow progress in many countries because they do not serve the political self‐interests of the major stakeholders, particular senior public officials. The views of senior public officials are therefore absolutely critical; hence the emphasis laid on the issues of leadership and commitment, the emphasis on building awareness and confidence, and the emphasis on 'winning hearts and minds'. Public officials must be convinced that e‐governance is in their self‐interest:
• In order to gain election victory, • In order to respond to threats, • In order to gain control, credibility, kudos, and other intangible resources
Other civil society stakeholders – managers, users, citizens in some cases – have less power but can still delay, skew or block e‐governance initiatives. Building capacities, listening, addressing self‐interest and motivation, and devising adequate incentives will all have a role to play here.
ADVERTISEMENT
Providing certain slogan or message to customers through advertisement will help them in identifying the E‐government activities. Another important strategy is for agencies across the enterprise to present a unified front. All collateral materials sent to "traditional" customers should stipulate the source and location of the alternative electronic way of doing business. For example, on a tax form there should be the location of its source like a website address. Agencies should encourage front‐line employees to promote to customers going online next time they wish to transact business.
CONCLUSION
Thus from above discussions we conclude that E‐Governance implementation is the need of the hour. For successful implementation standards, infrastructure, legislations, strategy all needs to be in place. It also requires establishment of various institutions under the Ministry of Information Technology. It requires a global vision and local implementation. And above all it requires E‐readiness in the minds of citizens and the Government employees.
e‐Governance in Rural Area: Acceptance and Challenges in Developing Countries 165
The papers tries to present many different perspectives on pro‐poor E‐Governance. The conclusions as have been reported in this paper point to an overall lack of serious concern for the poor and vulnerable in the design and implementation of e‐Governance programs.
In the concluding sessions of the paper it is suggested that,
• Each country should define as to which sections of the population constitute the vulnerable group that needs to be targeted. Their geographical spread needs to be mapped. Participatory approaches need to be used in developing e‐Government programs and plans, so that the needs of the poor are well articulated and can be reflected in the choice of applications and their design.
• Existing national e‐Government programs and e‐Government projects should be audited in a systematic way to determine the potential and actual impact on poor and the vulnerable. A Tool Kit can be designed for the purpose of carrying out such an audit.
• Policy makers need to be sensitized to the fact that the digital divide will be further exacerbated unless e‐Government specifically focuses on the poor and the vulnerable and that e‐Government has the potential to deliver significant benefits to the vulnerable/poor.
• Capacity needs to be built for e‐Government program designers to promote participation by relevant stakeholder groups from civil society in formulating e‐Government plans and strategies.
• Define policy frameworks that promote the use of different technologies that are relevant for the poor; provide incentive for creation of appropriate content, and create affordable and convenient access points
• Make application choices that can potentially impact the poor/vulnerable • Create partnership with NGOs, media, and Private Sector in implementing pro‐
poor e‐Governance • Capacity needs to be built for project implementers to use participative methods
in design and implementation of projects/applications focused on the poor/vulnerable.
• A large amount of training material (case studies, tool kits) needs to be created to support capacity building.
• There is considerable scope for regional cooperation in sharing telecommunication infrastructure for creating access points, build content and exchange best practices. Moreover regional and cross‐border development issues such as HIV/AIDS, natural resources and disaster management, trade and transport, tourism etc are areas where regional e‐government cooperation could be of significant mutual benefit. Mechanisms need to be evolved for developing such cooperation.

166 E‐Governance: Techno‐Behavioural Implications
REFERENCES [1] Bhatnagar S.C. (2004). “E‐Government: From Vision to Implementation – A Practical Guide with Case
Studies”, SAGE Publications Pvt. Ltd., New Delhi. [2] Bhoomi, Computerizing Land records, http://www.revdept‐01.kar.nic.in/Bhoomi/Home.htm ,
http://www.revdept‐01.kar.nic.in/Bhoomi/Faq.htm [3] CEG, IIMA (2002). An Evaluation of Gyandoot, [4] CEG, IIMA (2002). Computerized Interstate Check Posts of Gujarat State, India, A Cost Benefit
Evaluation Study, http://www1.worldbank.org/publicsector/bnpp/Gujarat.PDF , World Bank. [5] CEG, IIMA (2002). Dairy Information Services Kiosk and Dairy Portal, Proceedings of CEG Worksop at
IIMA, http://www.iimahd.ernet.in/faculty/centers_egov_a.htm [6] Gyandoot: The Purveyor of Knowledge, http://gyandoot.nic.in/ [7] Heeks, R.B. (2002). eGovernment in Africa: promise and practice, Information Polity, 7(2‐3), 97‐114 [8] Heeks, R.B. (2003). Most eGovernment‐for‐Development Projects Fail: How Can Risks be Reduced?,
IDPM i‐Government Working Paper no.14, University of Manchester http://www.sed.manchester.ac.uk/idpm/publications/wp/igov/igov_wp14.htm
[9] http://edevelopment.media.mit.edu/SARI/papers/uncrd_report_7.8.021.pdf [10] http://www1.worldbank.org/publicsector/bnpp/Gyandoot.PDF , World Bank. [11] IT Action Plan Part III, Long Term National IT Plan,
http://www.nasscom.org/download/action_plan_3.pdf [12] PicoPeta Simputers Pvt.Ltd., http://www.simputer.org/simputer/ [13] Public Affairs Center, Bangalore (2002). Report Card on service of Bhoomi Kiosks, World Bank,
http://www1.worldbank.org/publicsector/bnpp/Bhoomi.PDF [14] Rama Rao, T.P., Venkata Rao, V., Bhatnagar S.C. & Satyanarayana J. (2004). E‐Governance Assessment
Frameworks, http://egov.mit.gov.in , E‐Governance Division, Department of Information Technology. [15] Richa Kumar & Jhunjhunwala Ashok (2002). Taking Internet to Village: A case study of Project at
Madurai Region, United Nations Centre for Regional Development, [16] Satyanarayana J. (2004). “E‐Government.. The Science of the Possible”, Prentice Hall of India Pvt. Ltd.,
New Delhi. [17] Sustainable Access in Rural India, http://www.tenet.res.in/rural/sari.html

e-Government Enhancement using Knowledge Management
Shailesh Chaudhari VNSGU, Surat
Email: [email protected]
Abstract—The primary aim of the egovernment applications is the fast citizen service and the accomplishment of governmental functions. This paper discusses the knowledge management for egovernment development in the needs and role. Today, knowledge is increasingly recognized as an important, strategic resource by all types of organizations and institutions, whether private or public, service oriented or production oriented. This paper will focus on knowledge management in the public sector. Common challenges and concerns that affect public sectors are identified as: driving efficiencies across all public services; improving accountability; making informed decisions; enhancing partnerships with stakeholders; capturing the knowledge of an ageing workforce, and; improving overall performance. Our model of eGovernance based on Knowledge Management System (KMS) is built on KM cycle of Knowledge capturing, Knowledge sharing, Knowledge enhancing, and Knowledge preserving. This model provides an environment where the system grows with the people.
Keywords: eGovernment, Knowledge Management, Citizens, ePortal
INTRODUCTION
Government has been the principal user of knowledge since times immemorial. Primary function of government is decision‐making and e‐government provides unique support to decision‐making. Government also has largest repositories of information and databases and e‐government helps in their efficient management. Government always had access to the best available technology of the day to manage its affairs and e‐government provides some of the latest and best available technology. There has also been information explosion in recent years and e‐government provides an important tool to cope up with it. Office documents lead in storage on paper, which highlights the need for paperless office, and which is an important promise of e‐government.
The objective of the conventional e‐Governance is to help citizens in (i) paying utility bills (telephone, water, electricity, etc.), taxes and so on, (ii) handling registration formalities for land ownership, marriage, birth, and death (iii) processing application forms and renewals of driving licenses, work permits and passports (iv) lodging complaints. The e‐Governance will cut the frontiers of time and space. It helps citizens to access information at anytime, at any place using net‐enabled system.
Knowledge Management (KM) for government may be defined as leveraging knowledge for improving internal processes, for formulation of sound government policies and programmes and for efficient public service delivery for increased productivity. Knowledge Management (KM) for e‐government may be defined as management of knowledge for and by e‐government for increased productivity. Knowledge Management (KM) for e‐government is a management tool for government decision makers and its programme implementers.

168 E‐Governance: Techno‐Behavioural Implications
LITERATURE REVIEW
Knowledge management (KM) for government may be defined as leveraging knowledge for improving internal processes, for formulation of sound government policies and programmes and for efficient public service delivery for increased productivity [6]. It can be defined as management of knowledge for and by e‐government for increased productivity. KM for e‐government is a management tool for government decision makers and its programme implementers.
Primary function of government is decision‐making and e‐government provides unique support to decision‐making [1]. Government also has largest repositories of information and databases and e‐government helps in their efficient management. Office documents lead in storage on paper, which highlights the need for paperless office, and which is an important promise of e‐government [2] [3].
In this Knowledge Age, intellect and creative, innovative and inventive ideas become a primary source of advantage and wealth. These factors also carry a promise of dramatically advancing human development and increasing the quality of life [4] [5]. As one of the largest producers and consumers of information and knowledge, the government can act as a model user of these resources through the development of sound management policies and an understanding of the impact of effective knowledge application on government and governance. We examine how the public sector generates, captures, manages and uses its knowledge resources, current public sector approaches to knowledge management, the components of government knowledge management strategies and action plans and other good governance goals.
In the area of e‐Government, the development of e‐Government Transformation Project Management ontology aims at adopting and customizing the existing project management approaches according to the specific challenges encountered in e‐Government environment [7]. The elaboration of ontology contributes for the standardization and classification of concepts and terminologies and it has been happening in some sectors, as, for example, in the software engineering, the e‐Government services implementation and the project management. Knowledge Management is the management of information, skill, experience, innovation, and intelligence [8]. While e‐commerce and e‐learning involve information management, e‐governance involves knowledge management (KM).
Knowledge Management is needed to facilitate information exchange and transaction processing with citizens, as well as to enable inter‐government knowledge sharing and integration [9]. Knowledge Management solutions, will be the most appropriate for developing countries, while enterprise solutions are not suitable. Knowledge Management strategies in e‐government will demonstrate how governments can benefit by adopting strategies that harness the potential of knowledge management technologies to transform their e‐business activities and provide an overview of the driving and impeding forces that help and hinder proper deployment of knowledge management strategies in e‐government[10]. Social network analysis metrics and

e‐Government Enhancement using Knowledge Management 169
visualizations have been applied to aid the quality assurance, pattern discovery and communication of complex knowledge taxonomies for e‐government metadata carried out in a multi‐user engineering environment [11].
MAJOR ISSUES IN e-GOVERNMENT
There are a number of major issues of concern faced in e‐government, identified below:
• E‐government content is haphazard: Often contents are not meaningfully organized for an easy access of information.
• Information is not updated regularly, which is of great importance for both public and the private sectors to make informed policies. Out of date information and dead links frustrate users and sometimes they may be unaware that the information concerned is redundant.
• All necessary information is not available, that leaves an e‐portal incomplete. • Most e‐government sites do not allow for citizen‐government interaction. This
hampers citizen empowerment and government transparency; while knowledge management is a dynamic and interactive strategic management tool.
• Often the latest information technologies are not used or embraced quickly enough to keep the pace with the global society, and this influences the e‐government initiatives negatively.
• Government portals are often designed by ‘non professionals’, who are not trained in knowledge application tools and techniques. They do not know how to adequately create, capture, store, share and update the site information.
• Knowledge is presented in a standard format, which may not be suitable for all citizens and stakeholders.
• Data mining is another tool to obtain information and aid in making informed decisions. In e‐government the focus of data mining is predominantly on the management of interactions between the government and citizens or business, whereas, using data mining a good deal of knowledge can be extracted from several government transactional data and enhance decision making capabilities.
• The current e‐government practice in developing economies is project‐specific. This approach thwarts e‐government initiatives. It should be seen as a government‐wide ongoing approach, where knowledge needs to be reviewed and updated to avail the most recent information to citizens and other stakeholders.
• There is a lack of strong leadership to understand, motivate, involve, influence and support e‐government initiatives.
• Budgetary constraints obstruct the affordability of basic infrastructure for e‐government.

170 E‐Governance: Techno‐Behavioural Implications
• There is a lack of good policies and legislation to provide a roadmap and action plan to manage knowledge on government e‐portals; and,
• A lack of understating of ethical behavior in e‐government is another issue of concern.
PROPOSED MODEL OF KNOWLEDGE MANAGEMENT
As shown in figure 1 KM can be viewed as a cycle consisting of four successive phases: 1. Knowledge Creation/ Acquisition, 2. Knowledge Organizations and Storage, 3. Knowledge Distribution, 4. Knowledge Review.
Knowledge Creation/ Acquisition
Members of an organization develop knowledge through learning, problem solving, innovation, creativity, and importation from outside sources. Members acquire and capture information about knowledge in the explicit forms. The system provides a platform for discussion, debate, snap poll, referendum for the communities. The goals are to provide flexible collaborative environments with targeted services for the different parts of the community, to support interactions between organizations and research networks where new social issue or need or change is floated, defined and analyzed. The outcome of these events are stored and forwarded to appropriate destination.
Ask a series of questions like: Who collects what information? Why is it collected? Is it collected in time? Is collected knowledge put to any use? Is there a better way of collecting knowledge? Is required information being collected? Take stock of existing knowledge. Assess knowledge needs of the organization. Determine who will create what information, when and in what format Use knowledge management (KM) tools for knowledge creation.
FIG. 1: PROPOSED MODEL OF E-GOVERNANCE USING KNOWLEDGE MANAGEMENT

e‐Government Enhancement using Knowledge Management 171
Knowledge Organization and Storage
• Organize knowledge in written material and knowledge bases • Transform tacit knowledge into storable explicit knowledge • Record one‐to‐one conversation • Record a brainstorming session • Record minutes of the meetings and other proceedings • Record success profile of individual e‐government champions • The system stores and retrieves the data, documents, and records of government • The system is smart enough to extract statistical and intelligent forecast reports
for future planning • Organize knowledge into codifiable and non‐codifiable categories • Use electronic media for knowledge storage • Open a knowledge centre in the ministry/department • Identify and use “best practices” in knowledge storage
Knowledge Distribution
KM aims to make knowledge available whenever it is needed. Knowledge captured and stored should be made accessible to all concerned personnel. Distribute and share knowledge. Set up knowledge distribution and knowledge sharing mechanisms. Provide knowledge inputs to policy makers. Monitor knowledge use
The system uses Knowledge Sharing approaches to assist development organizations in sharing their capabilities, experiences and knowledge with the goal of increasing the effectiveness of development work overall. The aim is also to support and nurture collaboration within individual organizations as well as the development community as a whole. It will also promote a range of services to offer to its members and other interested parties such as training, consulting and facilitation.
Knowledge Review
Scan the horizon to anticipate knowledge needs of ministry/department Review the existing stock and flow of knowledge. Make use of simple but effective knowledge indicators. Involve stakeholders in knowledge review. Has knowledge led to better decision making and/or higher productivity?
Knowledge management portals are another knowledge management tools “to extract analyze and categorize both structured and unstructured information, and reveals the relationship between content, people, topics and user activities in the organization. They can provide users with many interactive facilities such as e‐mail, chat rooms, personalized news, search engines, RSS feedbacks, and external links. In India, different Government departments and ministries have individual knowledge portals to exchange and disseminate information among government and citizens.

172 E‐Governance: Techno‐Behavioural Implications
The system provides a platform where multiple perspectives have an opportunity to interact, where different disciplines cross one another, where good is challenged by bad, rich is challenged by poor, and revolutionary ideas are challenged by conservative ideas. The system encourages social activists, researchers, business people and knowledge workers from all sectors to join there to create some real innovative breakthroughs in technology, new organizational forms and methods, new leadership skills, new collaborations beyond age boundaries, beyond discipline boundaries, and beyond sector boundaries.
CONCLUSION
Maintaining the knowledge management as a part of egovernment model provides the government system with facilities to conduct the knowledge in its environment, and improving the efficiency of government function. Knowledge management running in e‐government environment, is an electronic workflow to be controlled, stressed the cooperation between different departments and staff’s awareness of cooperation. Maximizing the priority and awareness about knowledge, gains the government with global advantages.
REFERENCES [1] Wagner, C. 2003. Knowledge management in e government. Americas Conference on Information
Systems (AMCIS), p 845. [2] Mohd Hasan Selamat, Rusli Abdullah1 and Christi Joseph Paul. 2006. Knowledge management frame
work in a technology support environment. (IJCSNS) International Journal of Computer Science and Network Security, VOL.6 No.8A.
[3] D.C.Misra. 2007. Ten Guiding Principles for Knowledge Management in Egovernment in Developing countries. First International Conference on Knowledge Management for Productivity and Competitiveness, New Delhi.
[4] Priti, Jain. 2009. Knowledge Management in e‐Government. Journal of Knowledge Management Practice, Vol. 10, No. 4.
[5] Sharma, S. K. and Gupta, J. N. D. 2003. Building Blocks of an E‐government – A Framework, Journal of Electronic Commerce in Organizations, (1:4), pp. 34‐48.
[6] Zhitian Zhou, Feipeng Gao. 2007. E‐government and Knowledge management. (IJCSNS) International Journal of Computer Science and Network Security, VOL.7 No.6.
[7] Demetrios Sarantis, Dimitris Askounis. 2010. Knowledge Exploitation via Ontology Development in e‐Government Project Management. International Journal of Digital Society (IJDS), Volume 1, Issue 4.
[8] Arun Kumar Chakraborty. 2008. Symbiosis between Knowledge Society and E‐Governance. DESIDOC Journal of Library and Information Technology, Vol. 28, No. 5, pp. 27‐34.
[9] Christian Wagner, Karen Cheung, Fion Lee, Rachael Ip. 2003. Enhancing E‐government in Devloping Countries: Managing Knowledge through Virtual Communities. The electronic journal of Information Systems in Devloping countries, Vol. 14, No. 4, pp. 1‐20.
[10] Zhou Ping. 2008. A Strategy for Knowledge Management in E‐Government. International Seminar on Business and Information Management.
[11] Per Myrseth, Jørgen Stang, David Skogan. 2011. Visualization of Complex Relations in E‐Government Knowledge Taxonomies. 15th International Conference on Information Visualisation.

e-Governance Project Management Issues and Challenges
Pabitrananda Patnaik1, Susanta Kumar Panda2 and Manas Ranjan Patra3 1ScientistE (Technical Director), National Informatics Centre, New Delhi
2ScientistF (Sr. Technical Director), National Informatics Centre, New Delhi 3Berhampur University, Orissa
Email: [email protected], [email protected], [email protected]
Abstract—Project Management is a wellsuited approach for managing and controlling the projects to meet its objective. Projects are finite in length and need to be completed within a stipulated time period and estimated budget. The small and simple projects can be managed with common sense, but large and complex projects need well suited approaches and methodologies for succeeding and longer use. eGovernance projects are the special type of projects in which the formal approaches may not always be successful. Further, these are high funding, tightly scheduled and complex projects that need some special care to make it successful. At many times, in eGovernance applications, it is required to take up some uncertain event and to make a certain promise to deliver within tightly time schedule and cost. One such application is eCounselling, in which the project needs to be completed within a very specific time with zero percent error tolerance and transparency. National Informatics Centre, a pioneering organisation in the field of eGovernance in India has taken such challenges at many times and shown its output with its proven competence level and best practices. Project Management is a very vast area in the field of eGovernance applications. In India, with varied functional styles, large population, with different languages, culture and policies it is too cumbersome to chalk out a simplified methodology and adopting it. The objective of this paper is to focus on the very close aspects that impact the project output of eGovernance applications. This paper emphasises on the issues and challenges related to the eGovernance project management area and finds some suitable suggestions for making the eGovernance projects more successful.
Keywords: Project Management, Programme Management, eCounselling, National Informatics Centre
INTRODUCTION
Project Management means planning, controlling and monitoring of projects for its successful implementation. Projects are the set of activities to meet a designed objective within estimated time frame, cost and limited number of resources. e‐Governance project management is one of the areas of project management in the field of information technology. In this area, software is the nucleus part, and in addition to it many other factors are also there which are required to be properly planned and monitored for successful implementation of e‐Governance projects. Project management provides different methodologies and approaches but these are not 100% implementable for e‐Governance projects. For simple and small projects, the techniques would not be required, but, when the project becomes large and complex it needs, special attention to make it successful.[14]
The core part of an e‐Governance project is the software. So the software engineering techniques as well as System Requirement Specification (SRS), System Design Document (SDD), testing methodologies and implementation strategies etc. are being used. As the software development is invisible, complex and flexible, so the development is only measurable by its output.

174 E‐Governance: Techno‐Behavioural Implications
In e‐Governance projects, the software is generally a bespoke software in which the requirement of the user is studied and freezed and then the software is either customised or newly developed. From the cost point of view, the software cost of e‐Governance project is very less in comparison to the total project cost but it is the main part without which the whole project would fail. The success of the software leads much way ahead for succeeding the e‐Governance projects. In this paper, the e‐Counselling software for Diploma and Degree courses for Engineering, Medical, Pharmacy, MBA and MCA is considered and its analysis for the admission year of 2010 is done for verifying the issues and challenges in project management in the field of e‐Governance. The e‐counselling software provides the web based service to all the entrance qualified candidates to register them, submitting their choices and allotting the seats to the candidates following the rules and regulations of Orissa government, its reservation policies and guidelines. The allotted candidates generate their allotment letters from the website and either can take the admission in the institutions or can apply for upgradation if any vacancy arises during next round of seat allotment. All these things are done maintaining the security and transparency of the e‐Governance application. The software is tightly scheduled job that needs to be executed on time and requires 100% error free result.
TABLE 1: STATISTICS OF THE CANDIDATES ADMITTED THROUGH E-COUNSELLING DURING 2010 (INCLUDING 1ST ENTRANCE, SPOT REGISTRATION AND 2ND ENTRANCE)
Sl.No Name of the Courses No. of Qualified Candidates
No. of Registered Candidates
No. of Admitted Candidates
1 Degree Engineering 50506 29159 17352 2 Degree Engineering (Lateral Entry‐
Diploma & B.Sc.)7617 5474 4094
3. Degree Pharmacy 9997 1075 446 4. Degree Pharmacy (Lateral Entry –
Diploma & B.Sc.)198 160 127
5. MBBS/BDS 1294 808 446 6. MBA 8369 8369 2271 7. MCA 4459 2485 1451 8 Diploma Engineering 44508 25283 15798 9 Diploma Engineering (Lateral
Entry – ITI & +2 Sc.) 9267 7623 3121
Source: Data available in the database of National Informatics Centre
In Table–1, the tabular data of e‐counselling statistics for both Degree and Diploma courses for which the candidates were allotted seats from 1st entrance test, spot registration and 2nd entrance test conducted by the government of Orissa. It was handled for 80436 candidates to register into the system out of which 45106 took admission under different rounds of counselling.
ISSUES RELATED TO E-GOVERNANCE PROJECT MANAGEMENT
Application Characteristic Issues
Unique Working Style: The rules, policies and procedure of each functional unit in the government are different. For example, the reservation policy system of each state is different from another. So the software developed for one state can not be directly implemented in another state, It needs to be customized or developed afresh.[24][27]
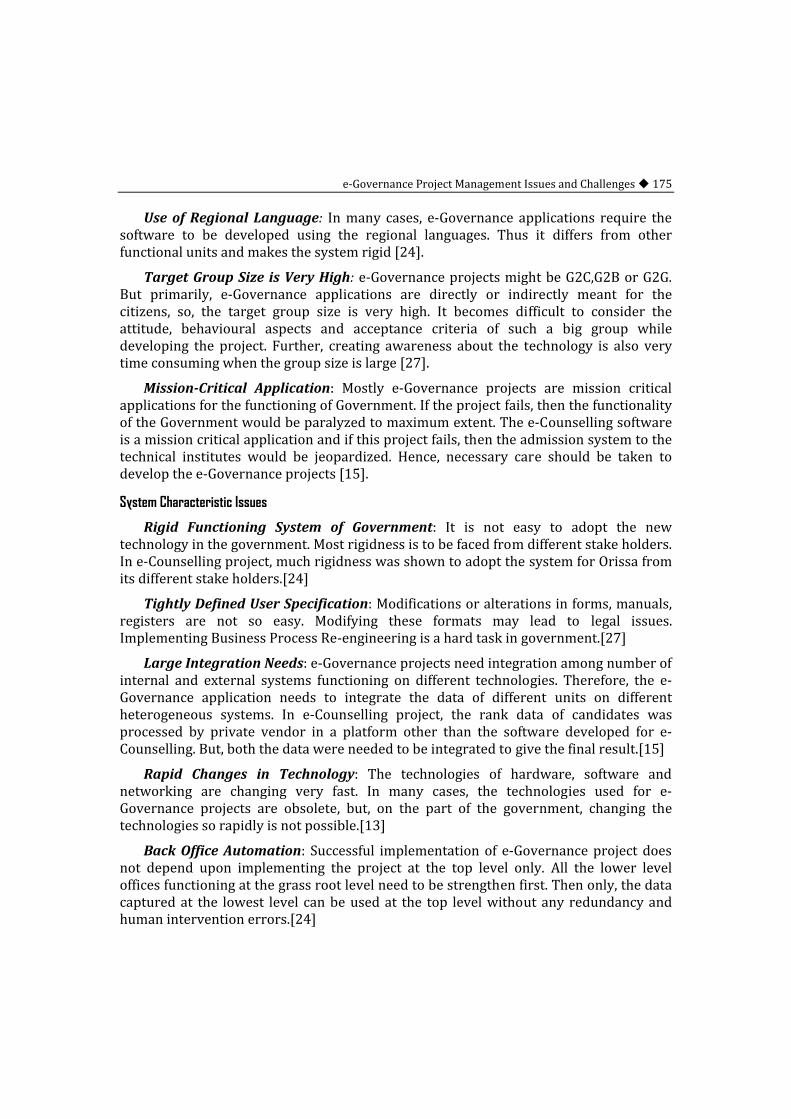
e‐Governance Project Management Issues and Challenges 175
Use of Regional Language: In many cases, e‐Governance applications require the software to be developed using the regional languages. Thus it differs from other functional units and makes the system rigid [24].
Target Group Size is Very High: e‐Governance projects might be G2C,G2B or G2G. But primarily, e‐Governance applications are directly or indirectly meant for the citizens, so, the target group size is very high. It becomes difficult to consider the attitude, behavioural aspects and acceptance criteria of such a big group while developing the project. Further, creating awareness about the technology is also very time consuming when the group size is large [27].
MissionCritical Application: Mostly e‐Governance projects are mission critical applications for the functioning of Government. If the project fails, then the functionality of the Government would be paralyzed to maximum extent. The e‐Counselling software is a mission critical application and if this project fails, then the admission system to the technical institutes would be jeopardized. Hence, necessary care should be taken to develop the e‐Governance projects [15].
System Characteristic Issues
Rigid Functioning System of Government: It is not easy to adopt the new technology in the government. Most rigidness is to be faced from different stake holders. In e‐Counselling project, much rigidness was shown to adopt the system for Orissa from its different stake holders.[24]
Tightly Defined User Specification: Modifications or alterations in forms, manuals, registers are not so easy. Modifying these formats may lead to legal issues. Implementing Business Process Re‐engineering is a hard task in government.[27]
Large Integration Needs: e‐Governance projects need integration among number of internal and external systems functioning on different technologies. Therefore, the e‐Governance application needs to integrate the data of different units on different heterogeneous systems. In e‐Counselling project, the rank data of candidates was processed by private vendor in a platform other than the software developed for e‐Counselling. But, both the data were needed to be integrated to give the final result.[15]
Rapid Changes in Technology: The technologies of hardware, software and networking are changing very fast. In many cases, the technologies used for e‐Governance projects are obsolete, but, on the part of the government, changing the technologies so rapidly is not possible.[13]
Back Office Automation: Successful implementation of e‐Governance project does not depend upon implementing the project at the top level only. All the lower level offices functioning at the grass root level need to be strengthen first. Then only, the data captured at the lowest level can be used at the top level without any redundancy and human intervention errors.[24]

176 E‐Governance: Techno‐Behavioural Implications
Project Management Issues
Time: Some e‐Governance projects are tightly time bound projects. It needs to be delivered within stipulated time period. This tight scheduling puts much pressure on the software developers and may cause errors in the product. The e‐Counselling project was a time bound job and the seat allotment result was to be published as per the dates notified on the website. Minor deviation in that schedule was requiring to inform the stake holders through different media. [24]
Software engineering provides different time estimation methodologies. But, it is not easy to calculate the exact time requirement for such projects
Cost: e‐Governance projects are highly funded projects. Therefore, many vendors are attracted towards these projects expecting good returns. They are agreed to develop the projects without understanding the fundamental things and ground realities. COCOMO model is one of the good cost estimation models in software engineering. Still it is not easily implementable in e‐Governance projects.[24][26]
Resources: The resource management of e‐Governance applications such as machine, money, manpower and methods become very critical. In addition to the developers other human beings who have impact on e‐Counselling projects are the Candidates, Participating Institutes, Nodal Centres, Administrators, Government and Political Leaders. [24]
Quality Issues
Insufficient Domain Knowledge: Most of the times the e‐governance applications are developed without having sufficient domain knowledge of the developers. This creates the problem for the software to be implemented in practical scenario. The e‐Governance applications domain is not very much generalized so it needs the very clear knowledge of the developers in the domain.[7]
Improper Skilled Personnel: Different softwares are developed in different platforms. Sometimes, the softwares are developed by semi skilled or unskilled people who may not have required skill set. This leads the failure of the softwares in long run. [7]
Poor Acquisition Practices: It creates problems in acquiring the technology. Even the quality standards like CMMI levels also not always guaranteed that the software is a high quality product. [7]
e‐Governance applications do not need only the software development, it also requires the quality of data, procedures, methods, security, reliability and availability etc. Software engineering provides different standards like ISO, SEI CMM levels, IEEE, Six Sigma etc., still these standards always do not ensure the quality of software products. Further, the users do not require, what type of quality standards was used in the software development, rather they focus on the output required and the input

e‐Governance Project Management Issues and Challenges 177
supplied are accordingly done or not. In addition to this, applying all the things systematically, it requires more time and voluminous documentations which goes beyond the deadline of the software.
Risk Management Issues
A risk is an event or situation that would badly affect the software projects during development or implementation or at any other stages. It is the latent or hidden factor that affects the productivity. The objective of the risk management is to control or limit the likelihood of something bad to the software project. Therefore, it should be the practice of the project managers to forecast the risk factors in advance and take necessary controlling and corrective measures well in advance, so that, the project would not suffer during its life time. The different types of risk management issues and challenges are described below.[25]
The study is already being taken by the author on Risk Management of Indian e‐Governance projects focusing on the e‐Counselling project and putting the Poisson’s Distribution the risk factors are already calculated from the likelihood and impact probability distribution.
Poisson’s Distribution
The study shows that, for e‐Counselling, the risk probability of 34% is having Risk
impact of 41%.[25]
FIG. 1: RISK PROBABILITIES AND RISK IMPACT

178 E‐Governance: Techno‐Behavioural Implications
From the figure‐ 1, it is observed that, the risk probabilities is directly proportional to risk impact. When the chances of risk increases, then its impact is also increased.
Technical Risk: These type of risk factors are due to the poor design of software, improper skill set of software developers or the wrong selection of hardwares, system softwares and the networking technologies.[24][25]
Managerial Risk: All the managers are not equal in performance. It depends upon the managerial capability of the person who is responsible for the project. So, poor management skill of Project Managers, Project Leaders and Administrators may lead to affect the software project.[1]
Economical Risk: The proper cost‐benefit analysis is done before execution of the project. Particularly, the e‐Governance projects are high priced projects. Many a times, the benefits of the project are drawn in long run. If the project is not properly planned and started in a hurry without considering all the factors, a large amount of fund is wasted. [25]
Political Risk: The internal as well as the external politics not suitable to the project environment is also badly affect the project productivity. If good inter personal relation is not maintained among the persons involved in the project then the project would not be succeeded. [24]
Behavioural Risk: The behaviour, attitude and mindset of the team for planning, developing, executing and accepting the project is a major factor of project productivity. For e‐Governance projects the behaviour of Political Leaders, Administrators, Vendors, Consultants, User Department and after all the behaviour of Citizens should be positive. [25]
Non Technological Issues and Challenges: During requirement specification, the functional and non‐functional requirements are thoroughly identified and taken care of. In non‐functional requirement reliability, security, availability etc. are focused. But, some other unseen and intangible issues and challenges are also to be addressed properly and taken care of to make the software more successful. However, Software Engineering Institute SEI, ACM and IEEE also emphasise on this area of ethical and professional responsibilities. These are discussed below.
ETHICAL AND PROFESSIONAL ISSUES AND CHALLENGES
Every personnel have some desire or aim in life to fulfil, and that can not be sacrificed by any individual. For the benefit of the individual, he/she must not play some mischief while developing the software product. The developer should emphasise on the ethical responsibility as software becomes the lifeline to many systems [28].
Different ethical and professional issues and challenges are as given below.

e‐Governance Project Management Issues and Challenges 179
Human factors: Human beings become the central part of a software project and lot of understanding and logical thinking is required for developing the software. If the individual neglects this task then there is chance of error occurrence in the software. Further, if the individuals involved in the project commits some mistakes knowingly or suppress the error occurrence to the user then that becomes an ethical issue. Because, every individual is having some responsibilities for the betterment of the society.[28]
Lack of team spirit and teamwork: Most of the times the software development becomes an individual task instead of a team work. Some one becomes the key person for a software project and develops it in his own style. As a result, it becomes difficult on the others part to take the job.[16]
Individual performance difference: The performance of one person differs from that of others. Not only in software, in other areas also, there is difference in the performance from person to person.[16]
Poor Management: In general, Project Managers, Project Leaders and Team Leaders are leading the software projects. So, the managerial capabilities of these personnel are directly affecting the software productivity. [16]
For an e‐Governance project, the stake holders are the Bureaucratic Leaders/Administrators, Political Leaders, Vendors, Institutes, Developers and Customers /Citizens. In e‐Counselling project, the target groups were the candidates who have qualified successfully in the entrance tests. As it is a very sensitive and zero percent error tolerance project, in which, if error comes, it could not be easily rectifiable once the allotment of seats are over, so the ethical responsibility was highly important.
PROJECT MANAGEMENT CHALLENGES
There are many approaches and methodologies to be used for better project management. Few of the approaches are
Traditional approach: The different phases of this approach are project initiation, planning and design, execution, monitoring and completion. All the projects may not need to follow all the stages. It depends on the situation and requirement.
Critical Chain Project Management: In this approach, priority is given on critical chain for making the project successful. More emphasis is given on planning and managing on resources required to execute the tasks.
Extreme Project Management: All the projects may not be executed on PERT based models. So light weight models such as Extreme programming is used. The generalisation of the extreme programming is Extreme Project Management.
Agile Management: In this approach, the project is divided into a series of relatively small tasks instead of a complete pre‐planned process and then these tasks are executed.

180 E‐Governance: Techno‐Behavioural Implications
PRINCE2: It is a structured approach to project management. It is the combination of original PRINCE (Projects IN Controlled Environment) methodology with MITP (managing the implementation of total project). PRINCE2 provides a method for managing projects within a clearly defined framework. It describes procedures to coordinate people and activities in a project, how to design and supervise the project, and what to do if the project has to be adjusted if it does not develop as planned.
Process Based Management: This approach use the Maturity models such as the CMMI (Capability Maturity Model Integration) and SPICE (Software Process Improvement and Capability Determination).
None of the approaches is fully applicable for an e-Governance application. But, these approaches help in guiding the execution of e-Governance projects.
PERT/CPM based Models
FIG. 2: PERT/CPM CHART OF DEGREE ENGINEERING E-COUNSELLING FOR THE YEAR 2010
TABLE 2: TIME CALCULATION OF DEGREE ENGINEERING E-COUNSELLING FOR THE YEAR 2010
Sl.No Activity Normal Time (Days)
Earliest Time Latest Time Slack Time Available (Days) Start
(Days) Finish (Days)
Start (Days)
Finish (Days)
1 Registration & Choice Filling
7 0 7 0 7 0
2 Choice Change & locking
15 7 22 7 22 0
3 Document verification & Fee deposit
15 7 22 7 22 0
4 Seat Allotment & verification
5 22 27 22 27 0
5 Choose Upgradation 7 27 34 27 34 0 6 Accept & Report 7 27 34 27 34 0 7 Vacancy Creation 3 34 37 34 37 0 8 Final Allotment 5 37 42 37 42 0 Source: Time estimation for preparation of e‐Counselling Schedule during the year 2010 Where
1
2
3
4
5
6
7 8

e‐Governance Project Management Issues and Challenges 181
Ei Earliest expected start time Li Latest expected start time Dij Expected duration activity i j Tij Schedule duration for completion activity i j Ej = Max { Xi + Dij } i Li = Min { Lj – Tij } j In figure‐2, it is observed that in e‐Counselling project all the activities are critical
activities. So, delay in any activities will affect the project delivery certainly.[3][4] Best Practices: The practices followed for one application certainly provides some
light for other type of similar activities. Therefore, the best practices are more useful for e‐Governance applications.
Interoperability and Programme Management: One programme may consist of many projects. So the inter project dependencies are needed to be understood for successful project management. In the present scenario, there is no proper synchronisation among different e‐Governance projects. Govt. of India is focusing to develop the interoperable framework for e‐Governance applications. [5]
EGovernance Standardisation: With the development and use of e‐Governance applications, Govt. of India has set up an institutional mechanism for formulation of standards through collaborative efforts of stakeholders like DIT, NIC, STQC, other Govt. departments, Academia, Technology experts, Domain experts, Industries, BIS, NGOs etc. In this process of e‐Governance standards, there is a provision of formal public review of the documents and it invites the comments from all on its draft version.[5]
National eGovernance Plan (NeGP): It is an extremely ambitious programme of the Government of India, aims at improving the quality, accessibility and effectiveness of government services to citizens and business with the help of ICT. The NeGP focuses on Government Process Reengineering, Capacity Building, Training Assessment and Awareness. Thus it aims at the substantially increasing the pace of e‐governance activities in the Center as well as in the States. [5][12]
National Informatics Centre (NIC): NIC, pioneer in e‐Governance projects is taking the leading role in developing and implementing e‐Governance applications in various sectors. Through its state‐of‐the‐art technology and competent professionals it makes many e‐Governance projects successful.[12]
KEY FINDINGS OF THE PAPER
• Clearly identify the qualitative and quantitative issues and address them in time, so their impact would not harm the project output.

182 E‐Governance: Techno‐Behavioural Implications
• E‐governance projects are bespoke projects, so the user requirement should be clearly defined. The requirement should not be changed very frequently.
• Quality reduces errors and creates confidence in users’ mind. So, quality systems must be followed at every stage of the project life cycle.
• Always use standardised methodologies and approaches. • Risk identification, prioritization and management should be done. • Focus on best practices of e‐Governance projects. • Interoperability of e‐Governance projects and programmed management should
be emphasised.
CONCLUSION
Project Management issues and challenges are many, but, the use of e‐Governance projects in different sectors in India is also increasing. There is no such area where computerisation is not being started and benefits of Information and Communication Technology (ICT) are not being explored. Different e‐Governance projects are implemented and gradually the things are streamlined using the best practices of its stakeholders. For a standard e‐Governance project like e‐Counselling with average complexity, normal volume of work and highly sensitive project would require around 4 years to come to a stable stage. In the 1st year, the core requirement is focused for error free output. In the 2nd year all the allied activities could be emphasised and in the 3rd year all refinement and optimisation would be carried out. From 4th year onwards, the application will be stable and can continue in full fledge for a longer period. Project Management is essentially required for completing such projects successfully. The purpose of this paper is to identify the key issues and challenges of a project and taking necessary measures to make it successful.
REFERENCES [1] Aggarwal K.K.,Singh Y., Software Engineering, New Age International Publishers, Third Edition, Pages
139‐202. [2] Choudhury R.D.,Banwet D.K.,Gupta M.P.(2007),Identifying Risk Factors in for E‐governance Projects [3] Goel B.S., Production Operations Management, Pragati Prakashan, Eleventh Edition, Pages 150‐198 [4] Gordon G., System Simulation, Prentice Hall of India, Second Edition, Pages 38‐52 [5] Gupta P.K,Swarup K.,Mohan M(1988),Operations Research,Sultan Chand & Sons,Fourth Revised
Edition, Pages 711‐749 [6] http://egovstandards.gov.in/ [7] http://en.wikipedia.org/wiki/Risk_assessment [8] http://itmanagement.earthweb.com/entdev/article.php/3827841/Top‐Five‐Causes‐of‐Poor‐Software‐
Quality.htm [9] http://sei.cmu.edu [10] http://www.acm.org/ [11] http://www.ieee.org [12] http://www.intmath.com/counting‐probability/13‐poisson‐probability‐distribution.php [13] http://www.nic.in/ [14] http://www.scribd.com/doc/14340261/Software‐Engineering‐Rajib‐Mall [15] http://www.mindtools.com/pages/article/newPPM_00.htm

e‐Governance Project Management Issues and Challenges 183
[16] Hughes B.,Cotterell M.(2001), Software Project Management, Tata McGraw‐Hill, Second Edition, Pages 1‐18,269‐280
[17] Kellner Marc I., Non‐Technological issues in Software Engineering, [18] http://portal.acm.org/citation.cfm?id=256664.256728 [19] Kumar K.(2005),Technology Challenges in e‐Governance
http://pcquest.ciol.com/content/fx/2005/105070103.asp [20] Mall Rajib, Introduction to Software Engineering, [21] Mastek(1995),Government http://www.mastek.com/e‐governance.asp [22] Mishra S.C. et el(2006),Different Techniques for Risk Management in Software Engineering: A Review,
Eric Sprott School of Business,Carleton University [23] MoCullough Sterling J(1991), Software Quality Assurance Methodology Evaluation, Conference Record.
IEEE International Conference on 23‐26 June 1991 Page(s): 364‐368 vol.1 [24] Ojha A., E‐Governance in Practice, GIFT Publishing, Pages 33‐41 [25] Patnaik P.,Das R.K.,Patra M.R. (2008), Key Characteristics of Indian e‐Governance Projects: A Special
Reference to “Bhoomi”, http://www.csi‐sigegov.org/egovernance_pdf/5_33‐41.pdf [26] Patnaik P.,Panda S.K.,Patra M.R. (2011), Risk Management of Indian e‐Governance Projects, eWorld
Forum, 2011 [27] Pressman Roger S.(1992),Software Engineering, A Practitioner’s Approach, McGraw Hill International
Editions. Pages 42‐61 [28] Singh A.(2005),Sidestepping Pitfalls
http://dqindia.ciol.com/content/egovernance/2005/105052101.asp [29] Sommerville I., Software Engineering, Pearson, Eighth Edition, Pages 116‐136, 217‐231 [30] Valsangakar P(2005)., Relevance of Program management in Large e’governance Projects

Towards Validation of Key Success Factors of e-Government Initiatives
R.K. Mitra1 and M.P. Gupta2 1Dy. Registrar, Indian Institute of Foreign Trade, New Delhi
2Professor (IT), Department of Management Studies, Indian Institute of Technology, New Delhi
Email: [email protected], [email protected]
Abstract—One of the emerging areas on which researchers are trying to build some theoretical framework relates to realization of IT value in public sector in general and in the field of Egovernment in particular. As to what factors can generally be associated with success of Egovernment is not an easy job. Nevertheless, contemporary researches have been able to generate a framework of success factors for Egovernment initiatives. In this paper, an attempt has been made to capture the trend in research towards this end followed by an attempt to validate if such a framework is indeed capable of explaining success of Egovernment initiatives and if so what kind policy and operational insight can be derived for the benefit of decision makers and project managers responsible for formulating and implementing Egovernment initiatives.
Keywords: Egovernment, Key Success Factor, Key Success Strategy.
INTRODUCTION
E‐government, as a technology, has an extraordinary agility to fit into any segment of governance and is capable of adding significant value by way of bringing improvement in work process and consequent managerial and administrative effectiveness, provisioning of public services, promotion of transparency and accountability thereby demystifying the decision‐making process, rendering superior quality of decision making, better knowledge management etc. Initial apprehension over a variety of trade‐ offs namely, high‐end vs. low‐end E‐government technology, fixed vs. evolving E‐government (Hwang et al. 1999), top down vs. bottom‐up E‐government strategy etc (Fletcher 1997), all got resolved into one fundamental understanding: E‐government is no longer an option, it is a compulsion. Technologically, E ‐ government offers a wide spectrum of choices – low or high (Hwang et al. 1999), use‐wise it may be intensive or generalized (Gil‐Garcia and Pardo 2005), the common thread is a realization of the potential of E‐government in creating value‐ no‐matter at which end it is embraced at the beginning.
Given a global scenario where government departments are engaged in E‐government way, a question arises, particularly in view of a rather high failure rate of E‐government projects in public sector (Fountain and Osoria‐urzua 2001), is it possible to delineate a set of key success factors and to hypothesize their direction and nature of impact on the success of E‐government initiatives? This constitutes the main research inquiry of this paper. This is proposed to be accomplished first, by reviewing contemporary literature and presenting two import framework of success factors as emerged from current literature and then to see if these two independently developed
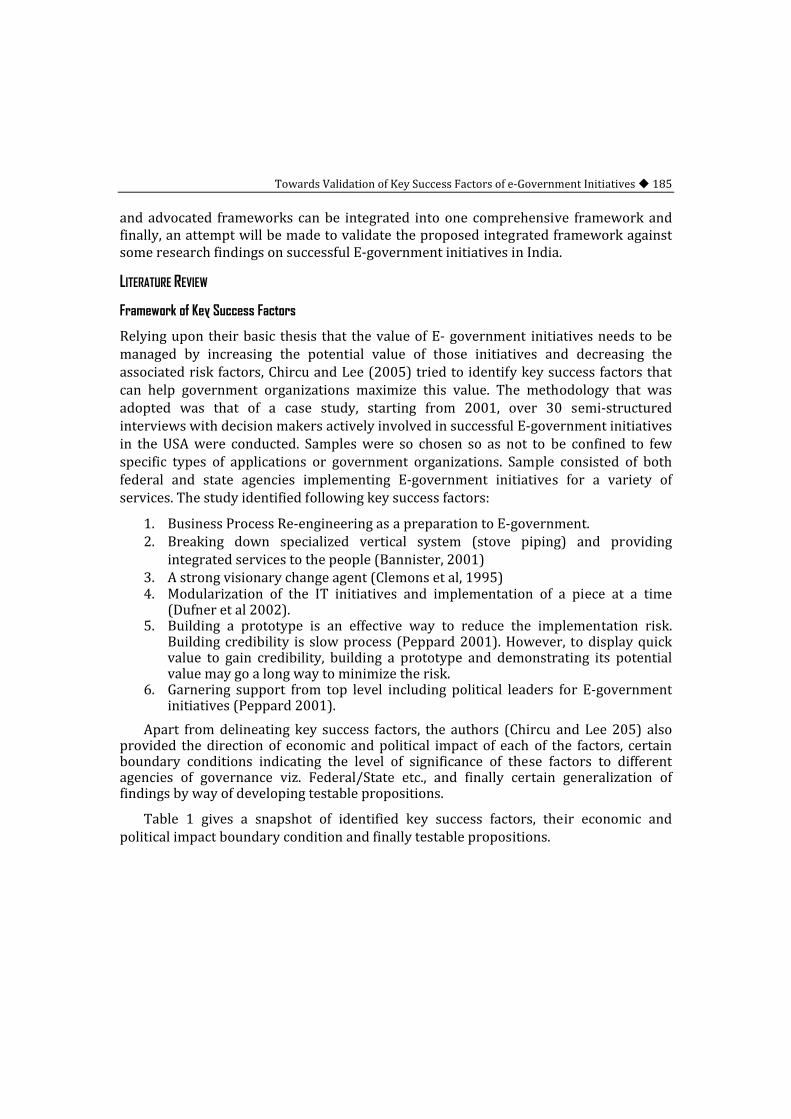
Towards Validation of Key Success Factors of e‐Government Initiatives 185
and advocated frameworks can be integrated into one comprehensive framework and finally, an attempt will be made to validate the proposed integrated framework against some research findings on successful E‐government initiatives in India.
LITERATURE REVIEW
Framework of Key Success Factors
Relying upon their basic thesis that the value of E‐ government initiatives needs to be managed by increasing the potential value of those initiatives and decreasing the associated risk factors, Chircu and Lee (2005) tried to identify key success factors that can help government organizations maximize this value. The methodology that was adopted was that of a case study, starting from 2001, over 30 semi‐structured interviews with decision makers actively involved in successful E‐government initiatives in the USA were conducted. Samples were so chosen so as not to be confined to few specific types of applications or government organizations. Sample consisted of both federal and state agencies implementing E‐government initiatives for a variety of services. The study identified following key success factors:
1. Business Process Re‐engineering as a preparation to E‐government. 2. Breaking down specialized vertical system (stove piping) and providing
integrated services to the people (Bannister, 2001) 3. A strong visionary change agent (Clemons et al, 1995) 4. Modularization of the IT initiatives and implementation of a piece at a time
(Dufner et al 2002). 5. Building a prototype is an effective way to reduce the implementation risk.
Building credibility is slow process (Peppard 2001). However, to display quick value to gain credibility, building a prototype and demonstrating its potential value may go a long way to minimize the risk.
6. Garnering support from top level including political leaders for E‐government initiatives (Peppard 2001).
Apart from delineating key success factors, the authors (Chircu and Lee 205) also provided the direction of economic and political impact of each of the factors, certain boundary conditions indicating the level of significance of these factors to different agencies of governance viz. Federal/State etc., and finally certain generalization of findings by way of developing testable propositions.
Table 1 gives a snapshot of identified key success factors, their economic and political impact boundary condition and finally testable propositions.

186 E‐Governance: Techno‐Behavioural Implications
TABLE 1: IDENTIFIED KEY SUCCESS FACTORS, THEIR ECONOMIC AND POLITICAL IMPACT, THE BOUNDARY CONDITIONS TESTABLE PROPOSITIONS
1 2 3 4 Key Success Factors Economic and Political
Impacts Boundary Conditions: Relevance to Local State, and FEDERAL Governments
Testable Propositions
1. Conduct Business Process Reengineering (BPR) in Preparation for E‐government
Not only this effort increases efficiency with E‐government implementation (i,e., economic benefits), but also reduces the political risk of system not being adopted by involving potential users early
This factor is relevant at all levels of government in some degree. The adage," if you automate inefficient processes, they will become more inefficient" is applicable across the board
P1: The higher the level of reengineering of processes, the higher is the success of E‐government initiatives and business value realized from that initiative.
P2a: The higher the number of services offered by one E‐government site, the higher the business value realized from that site.
P2b: Agencies integrating E‐government applications into a city sate/country‐wide portal realize more business value than those developing independent applications.
P3: E‐government initiatives managed by a vision change agent will realize more business value than those without a visionary manager.
P4: Agencies that implement E‐government applications using a phased approach based on a common platform realize more business value than those attempting to deliver l services at once.
2. Offer one‐stop E‐government solution
This effort aids in accomplishing a much discussed goal for government: government without wall (i.e., effectiveness and efficiency).In addition, it address the political importance of providing integrated services to the citizens
Due to their limited resources, local government may not be able to or need to develop their own portal systems. They can be a part of state‐wide portals, providing seamless and integrated government service to the citizens. First government is one example where the federal government provided a platform for one‐stop solution and local state government participated as appropriate. Universal truth in all aspects of driving business value of IT
3. Appoint visionary change agent
A strong visionary change agent is critical in balancing the trade‐off between functionality risk (i.e., system not addressing the business needs) and political risk (i.e., system is too complex and difficult to use that users do not adopt the system). Also vision commands what political value can be created by implementing a specific E‐government application.
Adding functionalities at once (i.e., big bang approach) increase functionality and political risk at Federal, State and Local levels. Successful agencies start from their common launch pad and build their E‐government application‐ one modularized component at a time.
4. Divide and conquer
This effort increases the probability that a proposed E‐government application will demonstrate a quick economic and financial return. In additional ,this piece‐by‐piece approach allows public sector organization to display fiscal prudence of not haphazardly investing in applications that no one really needs or wants (i.e., accountability)
While Federal government may have more resources than do State and Local governments, it can still benefit from doing this as much as its smaller counterparts. A prototype is the first step in a Division and conquers strategy. Prototyping can be a useful State–wide strategy, where early adopter‐ agencies showcase e‐government solutions to others.
Table 1 (Contd.)….

Towards Validation of Key Success Factors of e‐Government Initiatives 187
…Table 1 Contd. 5. Build a prototype
Prototype often uncovers hidden demands and user requirements so that an eventual system can truly serve its purpose without wasting money (i.e., accountability). Further, the lessons learned through a pilot project can increase system and process efficiency through re‐use and customization.
Mandate is necessary to overcome resistance in the public sector which may be especially unresponsive to technology driven change. To be effective, mandate needs to come from higher‐up. Therefore Federal and State governments need to provide overarching mandates, while Local organizations can be at the fore‐front in requiring systems adoption for business, government and citizen users. To this end, local organizations need to ensure the potential adopters have the required infrastructure and training to adopt E‐government.
P5a: Agencies that use a prototype to demonstrate the capabilities of E‐government have more successful future E‐government initiatives.
P5b: States that demonstrate the value of E‐government using a prototype implementation in one state agency have more successful future E‐government initiatives in other agencies.
P 6a. Federally and State–mandated E‐government initiatives are more successful than voluntary ones.
P 6b. Agencies mandating adoption of their E‐government system will realize more values than those who do not.
P 6c. The level of agency support (in terms of E‐government infrastructure, training and customer service) moderates the impact of mandating adoption on E‐government.
6. Mandate change The value that government organizations attach to IT initiatives is often defined by their political mission (e.g., saving people’s lives) and mandate is critical in capturing this value by positively mobilizing government resources for the E‐government implementation. Also, this usage mandate increases the probability that an implemented system is used beyond the threshold level to reap cost savings.
Source: Chircu and Lee (2005)
FRAMEWORK OF KEY SUCCESS STRATEGY
There is another school of researchers who have approached the problem differently. They believe that by identifying challenges and their core aspects, it is possible to derive key success strategy (Chengalur‐Smith and Duchessi 2000, DeLone and Mclean 2003, DeSanctis and poole 1994, Daws and Pardo 2002). By focusing on technology, management, policy, information and organizational issues, it is possible to develop a knowledge base about challenges of E‐government initiatives. Gil‐Garcia and Pardo (2005) suggested five categories of challenges according to their core aspects:
• Information and data • Information Technology

188 E‐Governance: Techno‐Behavioural Implications
• Organizational and managerial • Legal and regulatory • Institutional and environmental
The methodology that was followed was, first, a review of current literature in information system research to identify factors found to have influenced the success of IT initiatives was conducted. This review included scanning of last 5 years (1999‐2003) of five top journals in public administration. Articles with a focus on e‐ government success factors were selected. The challenge category, challenges and key success strategy as found during the review are summed up in Table 2.
TABLE 2: CHALLENGES OF E-GOVERNMENT
Challenge category Challenges Key Success Strategy Information and Data Information and data quality Overall plan
Continuous feed back Quality assurances Training
Information Technology Information needs Usability Security Issue Technological incompatibility Technological complexity Technical skill Technology newness
Ease of useUsefulness Demonstration and prototypes
Organizational and managerial
Project sizeManager’s attitude and behavior organizational diversity Lack of alignment with organizational goals Resistance to change Turf and conflict
Project skill and expertise Respected IT leader Realistic goals Identification of stakeholders End‐ user involvement Planning Clear milestones and measurable deliverables Good communication Previous Business process improvement Adequate training Adequate and innovative funding Current or best practice review
Legal and regulatory Restrictive lawsOne year budget Inter‐government relationships
IT policies and standards
Institutional and environmental
Privacy concernsAutonomy Political pressures Environmental context
Executive leadership and sponsorship Legislative support Strategic outsourcing and public private partnership
Source: Gill‐Garcia and Pardo (2005)

Towards Validation of Key Success Factors of e‐Government Initiatives 189
It may be seen from the above table, the framework of key success strategy traces the success factors differently, mainly, through the ‘challenges’ that the E‐government initiatives confront and group them into three broad five categories. Once it is possible to pin‐point a challenge, derivation of mitigation ‘strategies’ to control or minimize its inhibiting impact is comparatively easy task. A knowledge base of various types of challenges that an E‐government initiative is likely to face helps the policy/decision makers responsible for its implementation to keep a strategy in place well in advance and operate strategically to minimize its adverse impact.
THE COMMONALITY AND INTEGRATION
A simple comparison of the factors under both framework would reveal more or less similar kind and nature of stress on similar core areas with the only difference that categorization of factors has been differently suggested or stated. Demonstration and prototypes figure in both frameworks. Similarly, previous business process improvement/re‐engineering is common factor in both the frameworks. Leadership under Gill‐Garcia and Pardo framework is same as visionary agent under Chircu and Lee framework. It is not difficult to link a success factor and its corresponding strategy and thus, it is of research interest to see if one framework can be superimposed on the other.
Table 3 seeks to depict as to how both can be integrated into one comprehensive framework by linking success factors to success strategy. No testable proposition has been suggested as it is beyond the scope of the present study, although at the time of final validation against empirical findings, some broad trends have been indicated.
The idea behind integrating the two frameworks is strongly driven by a sincere belief that both the frameworks i.e., the framework of key success factors and the framework of key success strategy essentially seek to achieve a common objective: an objective to equip the policy/decision makers responsible for formulating and implementing E‐government initiatives with necessary and adequate insight as to which factors in which manner need to be managed to ensure high business value of E‐government initiatives. Speaking from risk management perspective, such a robust and comprehensive insight definitely helps to minimize the risk of E‐government initiative in a much better and definite way. The other objective, which is served in the process, is to pin point if any specific success factor remains out side the ambit of the framework of the key success factors. The third objective is much more micro level concern. In the absence of an integrated framework, one has to refer back and forth to both the framework individually and may miss out the inherent linkage between a key success factor and its success strategy. De‐linking the two may prove to be fatal to implementation of E‐government initiatives and hence the decision policy makers of E‐government can ill‐afford to allow such a situation.

190 E‐Governance: Techno‐Behavioural Implications
TABLE 3: ANN INTEGRATED FRAMEWORK
No. Key Strategy Factors Challenges Category Key Success Strategy 1. Business Process Re‐
engineering (BPR) Information and dataIT Organizational and managerial Legal Institutional and environmental
PlanningFeedback Training Usefulness Ease of use Project skill End‐use involvement Realistic goals Current practice review Legal acceptability Strategic outsourcing
2. One‐Stop E‐government solution
Information Technology Technological compatibility /incompatibility Technological success Technical skill Security Clear milestones
3. Appoint visionary change agent
Environmental or institutional Executive leadership
4. Divide and Conquer Organizational and managerial Realistic goalsMeasurable deliverables Demonstrations and prototypes
5. Build a prototype Information technology Demonstrations and prototypes Project skill Planning
6. Mandate Legal and regulatoryEnvironmental or institutional
Information technology policies and standards Legislative support
VALIDATION
Validation of the proposed integrated framework is proposed to be done in the light of empirical findings of a very successful E‐government initiative in State Police administration of Madhya Pradesh.
A BACKGROUND TO INDIAN POLICE
India is Federal in nature. At the Centre, there is Union Government and at the States, there are State Governments. The Constitution of India provides for clear cut distribution of subjects of responsibility for the Union Government and State Governments. ‘Police’ as a subject is allocated to States. Thus each State has raised its own police force in the State is the Director General of Police (DGP), who is responsible to the State government for the administration of the police force in the State and for advising the State government on police matters. States are divided territorially into administrative units known as Districts. An officer of the rank of Senior Superintendent of Police (SSP)/Superintendent of Police (SP) heads the district police force (District Police Chiefs). A group of Districts forms a range, which is looked after by an officer of

Towards Validation of Key Success Factors of e‐Government Initiatives 191
the rank of Deputy Inspector General of Police (DIGP). Some States have zones comprising two or more ranges under the charge of an officer of the rank of an Inspector General of Police (IGP). Every district is divided into sub‐divisions. A sub‐division is under the charges of an officer of the rank of Assistant Superintendent of Police (ASP)/Deputy Superintendent of Police (DSP). Every sub‐division is further divided into a number of police stations, depending on its areas, population and volume of crime. Between the police station and the sub‐division, there are police circles in some States each circle headed generally by an Inspector of Police. Depending upon size and population, a police station is headed by an Inspector of police or Sub‐Inspector of Police (for smaller Police Stations). Assistant Sub‐Inspectors, Police Head Constables and Police Constables which constitute the bulk of police force are the staff of Police Stations.
There is similar uniformity in duties and responsibilities of State police forces. This is because of a mother legislation called the Indian Police Act, 1861 which guide the duties and responsibilities of the police in general.
Police Computerization Initiatives (PCI) in the State Police Administration of Madhya Pradesh
The case which is proposed to be used for the purpose of validation of the framework belong to one such State Police administration, namely, State Police of Madhya Pradesh. State of Madhya Pradesh is one of the biggest States in northern part of India. The State Government of Madhya Pradesh has embraced ICT in their own way. ‘Gyandoot’, one of the earliest community based e‐government initiatives, which got acclaim globally, was developed in one of the Districts (namely, Dhar) of the State of Madhya Pradesh. Thus, an environment conducive to E‐government did exit in the State of Madhya Pradesh.
Police Computerization Initiatives (PCI) in the State of Madhya Pradesh was targeted to improve functioning of Police Stations (PS). Functionally and organizationally, a Police Station in India is the basic unit of police administration through which both crime (as enunciated in the Indian Police Act, 1861) and non‐crime duties are discharged. Police Stations are the places where complaints and First Information Reports (FIRs) are lodged. Police Stations also serve as the window of ‘citizen interface’ for the police. Common people approach Police Stations for assistance. The Police Stations occupy the centre stage of attention from the top administrations. This being the importance of a Police Station, the Zonal Inspector General of Police (IGP), the executive head of a number of District Police forces under his jurisdiction decided to use ICT as a modernization strategy for improvement in police performance. A deep insight about the importance of a given organizational unit (Police Station in this case), of all the units in the structure, led him to focus on the right place i.e., Police Stations and on right people i.e. the Inspectors, Sub Inspector, Assistant Sub Inspectors, Head Constables and Constables who man Police Stations and constitute the largest ratio in police pyramid. PCI, at the initial stage, was targeted at two important PSs in Indore, one of the Districts in the Range. Looking into the grave constraint in the form of acute shortage of in‐house IT skill, the Range IGP, the executive leader in this case, partnered with a local

192 E‐Governance: Techno‐Behavioural Implications
Application Service Provider (ASP) which a local technical education institute was called Indian Institute Professional Studies (IIPS). A system study of the Police Stations revealed a large chunk of redundant work processes in the activities, maintenance of a large number of manual registers, duplication of works. Once the system study brought into light the redundancies in the system, at the next stage, the objective set was to give a software solution for major activities of a Police Station.
The software named as Police Computerization Initiatives (PCI) offered following benefits:
• No interference with any procedure or norm of police functioning. • Entire software was in vernacular (Hindi, a language spoken and understood in
that part of the country). • A strong in‐built security feature • Generation of reports of various types The system was developed in the work station (PS) only with full involvement of all
policemen at the Police Station. The project team members of the local Application Service Provider (ASP) interacted with the policemen at the Police Stations frequently, thereby ensuring full participation of the end‐users from the day one of the development and also served to train the policemen to work on the new system. Installed initially at two Police Stations in 2002, the system was installed and made operational at all the 16 Police Stations of Indore District by the end of 2003.
Impact Measurement of PCI
TABLE 4: TEST OF STATISTICAL SIGNIFICANCE
Parameters Before After tvalue Mean Standard
Deviation Mean Standard
Deviation Time taken in completing verification (like police verification for passport/domestic help verification/character verification (in days)
5.06 2.89 1.25 0.58 5.17**
Time taken in servicing warrants during the year (in days)
4.19 4.79 1.75 1.98 2.30*
Time taken in sending a requested Information from your Police Station to other Police Station (in days)
6.31 6.81 2.38 0.89 2.54*
Time taken in registering an FIR (in minutes) 30.44 6.32 16.50 4.13 15.79**Number of favourable media report about your Police Station during the year (in numbers)
5.38 2.53 6.06 4.33 1.03
Number of adverse media report about your Police Station during the year (in numbers)
5.38 2.83 3.88 2.83 1.98
Number of complaints of inaction by your Police Station during the year (in numbers)
8.13 3.50 1.50 1.03 8.28**
Time taken in days for a complainant in getting information about status of his complaint lodged earlier (in days)
6.13 1.75 1.31 0.48 10.71**
*Significant at.05 Level **Significant at.0001 Level

Towards Validation of Key Success Factors of e‐Government Initiatives 193
To measure the impact of operation of PCI–both on police performance and public service dimensions, as set of parameters were identified. They were so chosen as to represent police efficiency (internal) at Police Stations and public satisfaction dimensions of police functioning.
Data was collected from the Chiefs of 16 Police Stations were PCI was uniformly in operation with effect from May 2003. The parameters used and the performance dimensions they represent along with statistical findings are shown in Table 4. Since the purpose was to see if there was any statistically significant difference between pre‐PCI and Post PCI period,‘t’ test was applied.
Except for two parameters i.e., number of favourable media reports and number of adverse media report, the difference is found to be statistically significant with respect rest of parameters signifying impact both on internal efficiency and public satisfaction dimensions of police functioning at Police Stations. The success of the PCI lied not only in enhancing police internal efficiency at the cutting edge level but also in improving service delivery by the police.
Table 6 capture the successful factors with reference to Police Computerization Initiatives (PCI) of Indore Police District Administration of the State of Madhya Pradesh
CONCLUDING REMARKS
The frameworks of key success factors and key success strategy are outstanding contributions in their own rights towards generating valuable policy and operational insight to the policy/decision makers and project managers responsible for formulation and implementation of E‐government initiatives. However, a success factor, per se, can not drive success. It has to be ‘managed’ and it is towards this end, this paper has tried to contribute to by liking success factors to success strategies and finally, by suggesting a comprehensive framework for this purpose, which can help to drive a road map for success of E‐government initiatives.
TABLE 6: VALIDATION OF KEY SUCCESS FACTOR FRAMEWORK-CASELET I: POLICE COMPUTERIZATION INITIATIVES (PCI)
1 2 3 4 Economic and political
impacts as emerging from the caselet.
Key success strategy Results of validation and the broad trends emerging therefrom
1. Conduct Business Process Reengineering (BPR) in preparation for e‐government
Immediately after system study BPR was set in by way of automation of various registers, data organization and retrieval. It increased efficiency and involved the policemen at the police stations
PlannedContinuous feedback as the project was developed on site The project team and end‐users (i.e., policemen at police station) was deeply involved and training was in built in the process of development. Software was easy‐to‐use (Vernacular interface) and useful.Very realistic goals Strategically outsourced by co‐opting an ASP Software was so developed that police (legal) procedures were not disturbed at all.
Result of BPR were instantaneous and made way for full fledged E‐government endeavour involving more police stations. Presence of all key success strategies, as shown in Col (3), made it successful.
Table 6 (Contd.)…

194 E‐Governance: Techno‐Behavioural Implications
…Table 6 Contd. 2. Offer one‐stop
E‐government solution
Although not in a big scale as often is observed with 'portals', PCI is 'one‐stop' in the sense that in the matter of lodging a complaint with the police station, the complainant is not required to come for the same service again or is not required to go to multiple windows. There was no fragmentation in the matter of delivery of services it offered to a citizen in the matter of lodging a complaint and disseminating status.
Technical skill of the project team was adequate. Technological compatibility on the same platform was ensured
That the public satisfaction was positively impacted was evident from Statistical finding (Table 4). This served as a political importance of the project.
3. Appoint Visionary change agent
Although not appointed specifically for the E‐government project, the senior police officers [the Range Inspector General (IG), the Senior Superintendent of Police (SSP) played their role very well. They could comprehend the 'political values' of the project, By selecting Police Stations as the target, they could make the success more conspicuous
Executive leadership provided by the Range Inspector General of Police (IGP) and District Senior Superintendent of Police (SSP)
Indore district Police administration was the pioneer in going E‐government way while conditions and constraints relating to resources, infrastructure probable resistance to change etc, were uniform for all the districts of the State. What made a different was the role played by senior police officers in driving the project and their insight about critically of police performances.
4. Divide and conquer
There was no big bang approach‐ it was essentially incremental‐ starting with automation of the records at one Police Station and subsequently embracing more functionalities and at more Police Stations.
Very very realistic goals (one or two Police Stations to begin with ) Specific and measurable deliverables (automation of records, data organization retrieval etc). Demonstrations and prototypes (PCI itself was a prototype).
It was truly a phased approach. However, in case of PCI, the backend was taken up first and the customer face end was taken up later on. Thus, there is no actual trade–off between internal vs. external focus. It is a matter of how one sees it.
5. Build a prototype The project was initially implemented in one police station (Palasia, Indore) and this served as a prototype to demonstrate the value it could create and thereby gaining credibility and minimizing the risk.
Planning by the District police administration coupled with skill of the project team.
No sooner the IT value of the project at one police station become evident, it started spreading to other Police Stations. Prototypes and demonstrations, in effect, played the role of change.
Table 6 Contd. …

Towards Validation of Key Success Factors of e‐Government Initiatives 195
…Table 6 Contd. 6. Mandate change Apart from senior police officers
viz Range Inspector General and Superintendent of police Indore, the PCI had full support of the local politicians. Event the Chief Minister of the state volunteered to inaugurate PCI at some police stations at Indore.
There was an IT policy and IT vision at the State Police Headquarters level but PCI was not rolled out of such a State level initiative. It was conceived and operationalized locally – more as a voluntary project. But due to existence of a State level IT road map, a mandate did exit in any case.
PCI was more of a localized initiative than a State mandated initiative although there was a 'mandate' in the form of a State level IT vision and IT policy road map. This finding has very important implications in the sense that while mandate is necessary but it need not necessarily be mandated Federally or at the State level. A local mandate can drive an e‐government initiative. However, its change of adoption – State wide or country wide would depend on a number of complex administrative and political forces. Despite great success of PCI in enhancing police efficiency and public satisfaction factor, PCI was never implemented beyond Indore. Neither the Federal agency called National Crime Records Bureau (NCRB), which is entrusted with the job of promoting police e‐governance in the country nor the State Police Headquarter adopted it for its wider adoption across the State let alone across the country. To conclude, while 'mandate change ' is indeed a valid key success factor to overcome resistance to change or political resistance, it may not necessarily be in the form of active support by way of funding etc., at the Federal level or at the State level. A local mandate in the from of support of top officers of the organization, citizens, partnership with ASPs etc. can drive successful e‐ government initiatives.
The above findings establish that the success factors go hand in hand with success strategy and a comprehensive framework which capturers both can be of great help for management of IT value for E‐government initiative.

196 E‐Governance: Techno‐Behavioural Implications
REFERENCES [1] Bannister, F (2001), dismantling the silos; extracting new value from IT investments in public
administration Information system Journal, Vol.11, pp. 65‐84. [2] Chengalur‐ Smith, 1., & Duchessi, P. (2000). Client‐server implementation: Some management pointers
Transactions on Engineering Management 47(i), 127‐145; Ibid., p. 2 (Dawes: [3] Chircu, A.M. and lee, D.H. (2005), E‐ govt: key success factor for value discovery and realization
Electronic Government, Vol , pp. 12‐25. [4] Clemons, E,.Thatcher, M. and Tow, M. (1995) Identifying sources of reengineering failures: a study of
the behavioral factors contributing to reengineering risks, Journal of management Information System Vol 12, pp. 9‐36;
[5] Dawes S.S. & Pardo T (2002) Building collaborative digital government System in W.J. Melver & A.K. Elmagarmid (Ed.) Advances in Digital Govt. Technology, Human Factors and Policy Norwell, MA Kluwer Academic Publishers;
[6] DeLone W. & McLean. E. (2003). The deLone and MeLean model of information systems: A ten year update, Journal of Management Information Systems. 19(4), 9‐30;
[7] DeSanctis G., & Poole, M.S. (1994) Capturing the complexity in advanced technology use: Adaptive structuration theory, Organization Science, 5(2), 121‐147: lbid., p. 2, Landsbergen and Wolken;
[8] Dufner, D., Holley, L.M. and Reed, B.J. (2002), Can private sector strategic information systems planning techniques works for the public Sector?, Communication of the Association for Information System, Vol. 8, pp. 413‐431
[9] Fletcher P.D. (1997) , Local govt. and information technology management: Policy emerging for practices, Government Information Quarterly, Vol 14, no. 3, pp. 313‐324.
[10] Fountain, J., and Osoria–Urzua, C.,(2001), Public sector: early stage of a deep transformation, in Ed, R.L. and Rivlin, a.A. (EdS), The Economic Payoff from the Internet Revolution, Brookings Institution Press, Washington DC.
[11] Gil‐Garcia J.R., Pardo T.A., (2005), E‐government success factors: Mapping practical tools to theoretical foundations, Government Information Quarterly, Vol 22, pp. 187‐216.
[12] Guy, M.E., (2000), Public management, in Shafritz, J.M. (Ed), Defining Public Administration. Westview Press, Boulder, co.
[13] Hwang S.D., Choi Y., Myeong S.H., (1999), E‐governance in South Korea: Conceptional problems, Government Information Quarterly, Vol 16, No.3, pp. 277‐288.
[14] Mitra, R.K., (2004), Issues and Challenges of E‐governance in India Police Administration: A Study, PhD Thesis, Indian Institute of Technology, Delhi.
[15] Peppard, J.(2001), Bridging the gap between the IS organization and the rest of the business plotting a route, Information Systems Journal, Vol. 11, pp. 249‐270.
[16] Rocheleau, B., and Wu, L. (2002), Public versus private Information systems: do they differ in important ways? A review and empirical test, American Review of Public Administration, December, Vol.32. No.4, pp. 379‐397.
[17] Yuan, Y., Zhang, J. and Zheng, W.(2004), Can e‐government help China meet the Challenges of joining the World trade Organization?, Electronic Government, Vol.1, No. 2, pp. 77‐91.

Employing Technology Acceptance Model (TAM) to Examine Factors Influencing RFID Systems Use in Library
Kawal Kapoor, Yogesh K. Dwivedi and Michael D. Williams Swansea University, UK
Email: [email protected], [email protected], [email protected]
Abstract—New technologies necessitate the need for research and investigations to better comprehend consumer attitudes towards usage and adoption. Radio Frequency Identification (RFID) has revolutionized the system of item identification and tracking. RFID reflects a unification of former day, radio frequency technology with recent day’s microchip technology. Available literature shows that the research on RFID related issues are largely concentrated on technical, organizational and implementation issues and less attention has been invested in understanding consumer/user behavior and satisfaction. This article aims to understand factors affecting the use of RFID systems in a library context by integrating and empirically testing constructs from Technology Acceptance Model and DeLone and McLean's IS Success Model. A questionnaire based survey method was deployed for data collection from 197 active users of an RFID based library system. The findings suggest that perceived usefulness and perceived ease of use, positively influence consumer attitude towards the RFIDenabled services.
Keywords: Adoption Factors, Consumer Attitude, RFIDenabled Services, Use, User Satisfaction
INTRODUCTION
RFID refers to the technology of reading and writing data remotely using radio waves (Ampatzidis and Vougioukas, 2009). In a typical RFID system radio waves are generated, modulated, amplified and then transmitted by a radio frequency transmitter via an antenna. The radio waves in turn are received and processed by RFID tags, which send back a unique ID and other data via radio waves to a radio frequency receiver (Ampatzidis and Vougioukas, 2009). RFID allows automated identification of products by embedding chips with wireless antennas on objects (Bose et al., 2009). The technology comes in numerous shapes and sizes functioning at a variety of frequencies and distances. RFID systems can be both readonly, where unidirectional data transfer occurs from the tag to the reader and readwrite, which refers to two‐way communication (Landt, 2005). RFID at the highest level can be classified into two categories – (i) active tags (ii) passive tags. Active tags function with either a powered source connection or with energy stored within an integrated battery. With passive tags, their lifetime is spread over both, the stored energy capacity and the number of read operations the device functions for (Want, 2004). As Yu (2007, p56) explains, “An RFID system provides diversified frequency bands, transmittal modes, and internal structure. It not only covers the functions of traditional auto‐ID, such as the information record by memory card, but also includes security management by smart card, sensor control by magnetic card, and detects identification number by barcode. It has a reaction time that processes speedier than the barcode, and presents a contactless way of communication”.

198 E‐Governance: Techno‐Behavioural Implications
RFID as a technology is surfacing at an incredibly rapid pace, creating space full of conjecture concerning the advantages that its investments may have to offer (Irani et al., 2010). Library management using RFID based systems is one of popular application of this technology. The implementation of RFID in libraries dates back to late 1990’s. The literature suggests that probably the first ever deployment of RFID in a library environment was in 1998 at the Singapore Public Library (Engel, 2006). Singapore has also been the first country in the world to implement RFID systems across all of its 21 public libraries (Ayre, 2005). Since then there were several studies published that have highlighted advantages/benefits, challenges/limitations and implementation of RFID systems in a library context.
Although, the two universally acknowledged advantages/benefits of RFID systems in library context are patron self check and patron satisfaction (Kern, 2004), there are several other advantages reported from its application both in library management and other application areas. Some of such benefits include: Automation/ elimination or reduction in labor (Ferrer et al., 2010); Capacity expansion (Ferrer et al., 2010 ; Ngai et al., 2007); Cost effective, inexpensive, easy and low maintenance (Liu et al., 2009, Tesoriero et al., 2010); Self service/ reduction of staff injury (Ayre, 2005; Ching and Tai, 2009; Engel, 2006; Erwin et al., 2003; Hicks, 1999; Yu, 2007; Yu, 2008); Enhanced customer satisfaction (Ferrer et al. 2010; Lin et al. 2009; Park et al. 2008); Facilitates communication with multiple tags simultaneously (Abad et al., 2009; Kim and Choi, 2010; Kumar et al., 2009; Lau et al., 2010, Yu, 2007; Wang et al., 2010); Faster response time/ greater speed/ reduced cycle time (Apte et al., 2006; Coyle, 2005; Kern, 2004; Kumar et al., 2009; Tesoriero et al., 2010); Inventory tracking and visibility/ enhanced forecasting/ reduced stockouts/ closed loop tracking (De Kok et al., 2008; Doerr et al., 2006; Ferrer et al., 2010; Kang and Stanley, 2005; Kumar et al., 2009, Lee et al., 2007; Lee et al., 2009; Niederman et al., 2007; Wen, 2010); Longer lifetime (Tesoriero et al., 2010; Coyle, 2005; Kern, 2004); Increased data storage (Kumar et al., 2009; Phillips et al., 2005; Wu and Yen, 2007); No line of sight required (Abad et al., 2009; Bansode and Desale, 2009; Kumar et al., 2009); Reduces theft and counterfeiting (De Kok et al., 2008; Staake et al., 2005). All these advantages and benefits compound the fact that RFID is very practical and can be opportunely implemented (Liu et al., 2009).
Like advantages and benefits of RFID application, previous studies have identified several challenges and limitations that organizations encounter when implementing RFID. Some of such challenges and limitations include: Cost (Abad et al., 2009; Ching and Tai, 2009; Kumar et al., 2009; Roberts, 2006); Difficulty in reading tags on products with high amount of water and metals (Kumar et al., 2009); Difficulty in reading ultra high frequency tags near a human body (Kumar et al., 2009; Roberts, 2006); Intermittent and unreliable reads (Rappold, 2003; Roberts, 2006; Sarma, 2004); Middleware design (Chen et al., 2010); Multiple Items Read (Smart and Schaper, 2004); Perpendicular orientation of the tag to the antenna of the reader make reading difficult/ Large number of tagged objects randomly placed also may cause invisibility (Want, 2004); Privacy and Security (Atkinson, 2004; Ayoade, 2006; Berthold et al., 2005; Edwards and Fortune, 2008; Erwin et al., 2003; Jones et al., 2004; Kelly and Erickson, 2005; Kumar et al., 2009; Muir, 2007;

Employing Technology Acceptance Model (TAM) to Examine Factors Influencing RFID 199
Roberts, 2006; O’Conner, 2005; Ohkubo et al., 2005; Ouafi, 2008); Recycling (Kumar et al., 2009); Standardization (Abad et al., 2009; Chin et al., 2008; Ching and Tai, 2009; Glover and Bhatt, 2006; Loebbecke and Huyskens, 2008); Managerial Issues (Hildner, 2006), and Vandalism (Coyle, 2005; Engel, 2006; Gomez‐Gomez, 2007; Hopkinson and Chandrakar, 2006; Kern, 2004).
Despite the fact that patron self check and patron satisfaction (Kern, 2004) have been recognized as the two most imperative benefits of RFID application in libraries, our literature analysis discloses that, there barely are any previous efforts invested in empirically examining these benefits. A handful of studies (Pramatari and Theotokis, 2009; Rothensee and Spiekermann, 2008) from the retail domain suggest that, staff/user resistance and the associated consumer apprehensions in accepting this technology, effectively result in failure of such implementations. It then becomes critical to scrutinize the factors affecting customer acceptance or rejection in other areas of RFID application including library management. Therefore, this research aims to examine factors (based on Technology Acceptance Model) that determine usage and user satisfaction of RFID based systems in libraries. The proposed aim was achieved by undertaking an empirical examination of user perceptions with the aid of an online survey method.
The following part of the paper has been structured as follows: The immediate section concentrates on presenting an account of the developed conceptual model and the adopted research methodology. The survey instrument is detailed, later with quantitative findings being documented. It is followed by the discussion and recommendations in direct relation to the data collected. Lastly, the conclusions for the study are deduced effectively.
THEORETICAL BASIS Although many appropriate theories and models are available to examine attitude, intention and actual use, we decided to integrate constructs from two dominant models ‐ Technology Acceptance Model (TAM) and the Delone and Mclean’s IS Success Model. All constructs except intention were adopted from TAM. Constructs, perceived usefulness and perceived ease of use had already been tested by a previous study on user acceptance of RFID based systems in the retail domain (Pramatari and Theotokis, 2009). Since our aim was to examine the user satisfaction, just this particular construct was picked from Delone and Mclean’s IS Success Model and integrated.
The consumer attitude is considered to be the initial trigger towards any technology adoption (Angeles, 2007). A customer’s attitude towards the service to which RFID is applied to a considerable extent controls customer’s acceptance of the same service when upgraded with RFID (Pramatari and Theotokis, 2009). Considering this, we decided to use attitude as the first dependent or mediating construct.
The proposed model (Figure 1) postulates that, perceived ease of use and perceived usefulness will determine the attitude of library users towards RFID based systems. The model also puts forth that attitude and user satisfaction will significantly affect the use of the system. Altogether, use and consumer attitude were proposed to significantly affect user satisfaction. Since the word count limitations restrict detailed discussion on

200 E‐Governance: Techno‐Behavioural Implications
individual constructs, only the definitions and sources for each are made available in Table 1.
FIG. 1: CONCEPTUAL MODEL FOR RFID SYSTEMS IN LIBRARY AND USER SATISFACTION (ADAPTED FROM DAVIS ET AL. 1989; DELONE AND MCLEAN 2003)
TABLE 1: PARAMETERS AFFECTING CONSUMER ADOPTION
PARAMETERS DESCRIPTION and SOURCE Consumer Attitude
Customer Attitude is the degree to which a user likes or dislikes the RFID systems. (Davis et al., 1989). Attitude towards any technology based service will positively persuade attitude when that service concept is augmented by the RFID technology. Angeles (2007), Berthold et al. (2005), Gedenk et al. (2007), Hossain and Prybutok (2008), Katz and Rice (2009), Pramatari and Theotokis (2009), Rothensee and Spiekermann (2008)
Percieved ease of use
Perceived ease of use is the degree to which a person believes that using a particular system would be free from effort (Davis et al., 1989). It will positively persuade customer attitude towards the RFID technology augmented services. Eckfeldt (2005), Pramatari and Theotokis (2009), Rothensee and Spiekermann (2008)
Percieved usefulness
Perceived usefulness is the degree to which a person believes that using a particular system would enhance his or her job performance (Davis et al., 1989). It will positively persuade customer attitude towards the RFID technology augmented services. Angeles (2007), Berthold et al. (2005), Katz and Rice (2009), Pramatari and Theotokis (2009)
Use Use is a measure of the spread of the technology. Gedenk et al. (2007), Gunther and Spiekermann (2005), Hossain and Prybutok (2008), McGinity (2004), Pramatari and Theotokis (2009), Resatsch et al. (2008)
User Satisfaction
User Satisfaction measures the successful adoption of the technology Eckfeldt (2005), Osterhues (2006), Pramatari and Theotokis (2009), Rothensee and Spiekermann (2008)
Perceived Usefulness
Attitude
Perceived ease of use User Satisfaction
Use

Employing Technology Acceptance Model (TAM) to Examine Factors Influencing RFID 201
RESEARCH METHOD
The survey research method, employing online questionnaires, was considered an appropriate method to examine the adoption of RFID systems in a library context. The questionnaire created in this context acts as the instrument channelizing the intended information towards the researcher for formulating the authentic responses to the research queries.
Survey Instrument
The target variables for the quantitative research relevant here are the specific characteristics of the students towards the RFID enabled services at the selected library. Within the realm of library services, the survey was aimed at the university students to determine (i) usage habits with reference to the RFID services (ii) usage frequency (iii) the challenges faced and the benefits garnered (iv) preferences and (v) awareness in the RFID context. The questionnaire consisted of 24 questions in total, all of which were multiple‐choice by nature that were aimed at examining the discernment of the respondents. The respondents had to rate each question on a five point Likert Scale – (5) Strongly Disagree (4) Disagree (3) Strongly Agree (2) Agree (1) Neither Agree nor Disagree. “Likert scaling presumes the existence of an underlying (or latent or natural) continuous variable whose value characterizes the respondents’ attitudes and opinions” (Clason and Dormody, 1994, p31). These questions originated to be measured against five different constructs. Each construct was made up of a specific set of questions from the survey. The 24 survey questions were mapped against the respective constructs in a manner as exemplified in table 2.
TABLE 2: CONSTRUCTS AND CORRESPONDING ITEMS
Constructs Survey Questions/Items (Sources: Adapted from Delone and Mclean 1993; 2003, Pramatari and Theotokis 2009; Venkatesh et al. 2003)
Percieved ease of use (EU)
EU1: I find it easy to use self‐issue/return terminals at the library. EU2: I can easily understand and use self‐issue/return terminals.
Percieved usefulness (PU)
PU1: The library’s self‐return/issue terminals are very helpful.PU2: The library’s self‐return/issue terminals make book loan/issue convenient for me. PU3: The library’s self return/issue terminals make me more efficient at the library.
Consumer Attitude (CA)
CA1: Using library’s self issue/return terminals is a good idea.CA2: I like the idea of using library’s self issue/return terminals. CA3: Using the library’s self issue/return terminals is more pleasant.
Use (U) U1: I use self issue terminal to issue books at the library.U2: I use self return terminal to return issued books.
User Satisfaction (US)
US1: The self issue/return terminals meet my library (book issue/return) needs. US2: I am satisfied with self issue/return terminals’ efficiency. US3: Overall, I am satisfied with the self issue/return terminals.
PILOT STUDY
With the instrument of survey fully designed and in place, before targeting a larger population, a pilot study was conducted to ensure the questionnaire understandability and ease from the respondent perspective. The pilot study involved a total of five

202 E‐Governance: Techno‐Behavioural Implications
students and care was taken to involve students from different study programs. The respondents found the survey simple to understand and quick to complete in terms of the time required for finishing the survey. There were nominal comments/suggestions that were addressed and incoporated in the final version of the questionnaire.
Data Collection
Students at selected library, who were the prime users of RFID enabled services installed at the library were sought to be the appropriate population to be aimed at for measuring the usage of this technology, and as a consequence the satisfaction level of these users with respect to the technology. It was then essential to circulate the survey to all the students who used library services, for which the library staff was contacted. The library then e‐mailed the questionnaire in the mid of July 2010 to all students at the university, asking for those interested to fill the survey. Taking into account the size of the university, it was thought appropriate to conduct a questionnaire based survey for data collection purposes. The respondents were requested to return the completed questionnaires within 15 days. We received 197 fully completed questionnaires within the specified duration which in effect were considered adequate for analysis purposes. The limitations of the data collection method will be outlined and discussed in the concluding section.
FINDINGS
Respondents’ Profile
In conducting a survey on RFID, it was of interest to identify if the survey respondents were aware of the technology that they repeatedly use in their everyday library transactions. The table 3 also shows that 54.4% respondents, which is the largest category, are not familiar with RFID technology at all. The second most prevalent group was with 22.1% having only heard about the technology and the next group with 16.9% had some knowledge of the technology. Desolately the least accounted category with only 6.7% respondents agreed that they knew all about RFID as a technology.
TABLE 3: DEMOGRAPHIC PROFILE OF SURVEY RESPONDENTS
Frequency of Library
Visit
Many times a week 37 18.8 Once a week 37 18.8 Once in 2 weeks 53 26.9 Once a month 56 28.4 Others 13 6.6 Total 196 99.5 Missing Value 1 .5 Grand Total 197 100.0
RFID Awareness I am not familiar with it at all 106 53.8
I have only heard about it 43 21.8 I have some knowledge of what it is 33 16.8 I know all about RFID 13 6.6 Total 195 99.0 Missing Value 2 1.0 Grand Total 197 100.0

Employing Technology Acceptance Model (TAM) to Examine Factors Influencing RFID 203
The demographics investigated were spread across four factors ‐ age, gender, educational qualification and RFID awareness scale. Collected data reveals that, of a total 197 respondents, 68.5% of them belonged to group aged between 18‐24 years, which constitutes the largest respondent group. There were 21.3% responses from the group aged between 25‐34 years forming the second largest response group. While groups 25‐34 and 45‐54 consist 4.6% each of the respondent population, the 55+ years group becomes the smallest group with only 1% respondent rate. In terms of gender, as evident from Table 3, 63.8% of female respondents are almost that of the male respondent. The educational qualification of the survey respondents shows that 59.5% of the respondents are undergraduates making up the largest responding category for the study, 22.1% belong to the postgraduate‐taught program and not too far is the postgraduate‐research group with 16.4% respondents. Table 3 shows, while the largest cluster is with 28.6% of responses favoring a visit once a month, with a little more than a percent less at 27% is a response group who prefer visiting fortnightly. The next group is close with 18.9% of the respondents using the library services once a week and also at 18.9% is another group most frequently making visits to the library.
Reliability Test
Cronbach’s alpha is one such reliability statistics that provides a measure of the internal consistency or an average correlation among the items involved in the instrument to estimate its reliability (Santos, 1999). A reliability test was conducted on the survey instrument for this research, the results of which are presented in table 4. According to Hinton et al. (2004) there are four cut off points for Cronbach’s alpha representative of reliability, which are ‐ (i) 0.90 and above indicating excellent reliability (ii) 0.70‐0.90 for high reliability (iii) 0.50‐0.70 reflecting moderate reliability and (iv) 0.50 and below for low reliability.
TABLE 4: RELIABILITY TEST
Constructs N Items Cronbach’s Alpha (α) Reliability Type Percieved ease of use 195 2 0.894 High Percieved usefulness 191 3 0.878 High Consumer Attitude 194 3 0.745 High Use 193 2 0.888 High User Satisfaction 193 3 0.898 High
In table 4, N represents the sample size and Items refer to the number of items/questions making up the respective constructs. As comprehensible from the table all of the five constructs applied in the study have an excellent reliability measure. The Cronbach’s alpha values range between 0.74 for consumer attitude and 0.898 for user satisfaction. None of the five fall in the moderate or low category. After consumer attitude, with the next higher alpha value is perceived usefulness with 0.87 followed by use at 0.88 superceded by perceived ease of use with an alpha of 0.89. On the other hand both, use and user satisfaction display almost equally good values at 0.88 and 0.89 respectively. The high Cronbach’s α values for all constructs imply that all items of the

204 E‐Governance: Techno‐Behavioural Implications
individual constructs of which the instrument is comprised of, are highly internally consistent which in effect is indicative of that, the responses from this instrument are highly reliable.
Descriptive Statistics
The descriptive statistics for each individual construct are represented with their mean and standard deviation values in table 5. Table 5 indicates that Use is the construct with the highest average mean value of 4.51 of all the five constructs, and these high mean values infer that the respondents strongly agree with the items of the construct. This is followed by the Percieved ease of use construct with an average value of 4.32 (SD=.959; table 5). Very close is the construct, Percieved usefulness with the average mean of 4.25 (SD = .882). Both User Satisfaction and Consumer Attitude are almost in equal alignment with the respondents’ choice at average mean values of 4.14 (SD=.877) and 4.10 (SD=.842) respectively.
TABLE 5: DESCRIPTIVE STATISTICS
Constructs N Items Mini Maxi Mean Std Deviation Use 193 2 1.00 5.00 4.5155 .84148 Perceived ease of use 195 2 1.00 6.00 4.3205 .95981 Perceived usefulness 191 3 1.00 5.00 4.2531 .88289 User Satisfaction 193 3 1.00 5.00 4.1468 .87717 Consumer Attitude 194 3 1.00 5.00 4.1082 .84237
Regression Analysis
The linear regression analysis provides an estimate of the linear equation coefficients, concerning one or more independent variables that result in the best prediction of the dependent variable value (Draper and Smith, 1998). A regression analysis was thus conducted for a total of 197 cases; in correspondence with the proposed conceptual model (See Section 2), three sets of regression analysis were performed. The individual constructs are abbreviated as ‐ Percieved ease of use, EU; Percieved usefulness, PU; Consumer Attitude, CA; Use, U; User Satisfaction, US.
Regression Analysis I-Influence of Perceived Ease of Use on Perceived Usefulness
Within first regression cycle perceived usefulness was taken to be the dependent variable and perceived ease of use formed the only predictor variables for the analysis. From the analysis, a significant model emerged: (F (1, 197) =310.302, p<.001) with an adjusted R square value of 0.619. In terms of impact of individual construct, finding suggests that the significant predictor variable was PU (β=.788, p<.001).
Regression Analysis II-Influence of Perceived Usefulness and Perceived Ease of Use on Attitude
A second round of analysis was carried out with Consumer Attitude as the dependent variable and two predictor variables, perceived usefulness and perceived ease of use were taken into account. The resultant model was: (F (2, 197) =124.606, p<.001). The

Employing Technology Acceptance Model (TAM) to Examine Factors Influencing RFID 205
adjusted R square value was .567. Out of both the predictor variables, one proved to be significant, PU (β=.625, p<.001) and the other EU (β=.160, p=.035). The β value is indicative of influence of that predictor variable on the variations in the dependent variable.
Regression Analysis III-Influence of Attitude and User Satisfaction on Use
A third round of regression analysis was performed with Use as the dependent variable and consumer attitude and user satisfaction as the predictor variables. The model obtained was significant: (F (2, 197) =56.310, p<.001). Out of two variables, impact of US (β=.441, p<.001) was more significant and that of CA (β=.213, p=.012) was observed to be insignificant.
Regression IV-Influence of Consumer Attitude and Use on User Satisfaction
The final round of regression analysis had User Satisfaction as the dependent variable and consumer attitude and use as the predictor variables. The model obtained was significant: (F (2, 197) =133.662, p<.001). CA (β=.572, p<.001) turned out to be significant and U (β=.291, p<.001) was concluded as insignificant.
DISCUSSIONS
The Use of the technology is dependent on a number of factors and these factors have been in an ensemble with four other factors presented as constructs for this study. According to the literature, the use of a technology is majorly determined by these factors (Pramatari and Theotokis, 2009). The descriptive statistics rank it in the first position with the highest average mean value of 4.515 where respondents are in the highest agreement for both its items. The regression analysis further compounds these results for this construct with a beta value of .291 and p<0.001. The literature showcases evidence of increased customer satisfaction with the introduction of this technology (Ferrer et al. 2010; Park et al. 2008). The survey also presented the similar favorable results.
The descriptive statistics demonstrate that the construct, User Satisfaction has all its three items in constructive agreement with the respondents’ opinions with an average mean value of 4.146. There is a fairly good amount of literary record present for effort and performance expectancies and both are expected to influence user attitude towards the use of the technology (Angeles, 2007; Pramatari and Theotokis, 2009). The survey statistics are also in agreement with the literature, where Percieved ease of use leads the second highest position with a mean of 4.320 and Percieved usefulness comes third with 4.253.
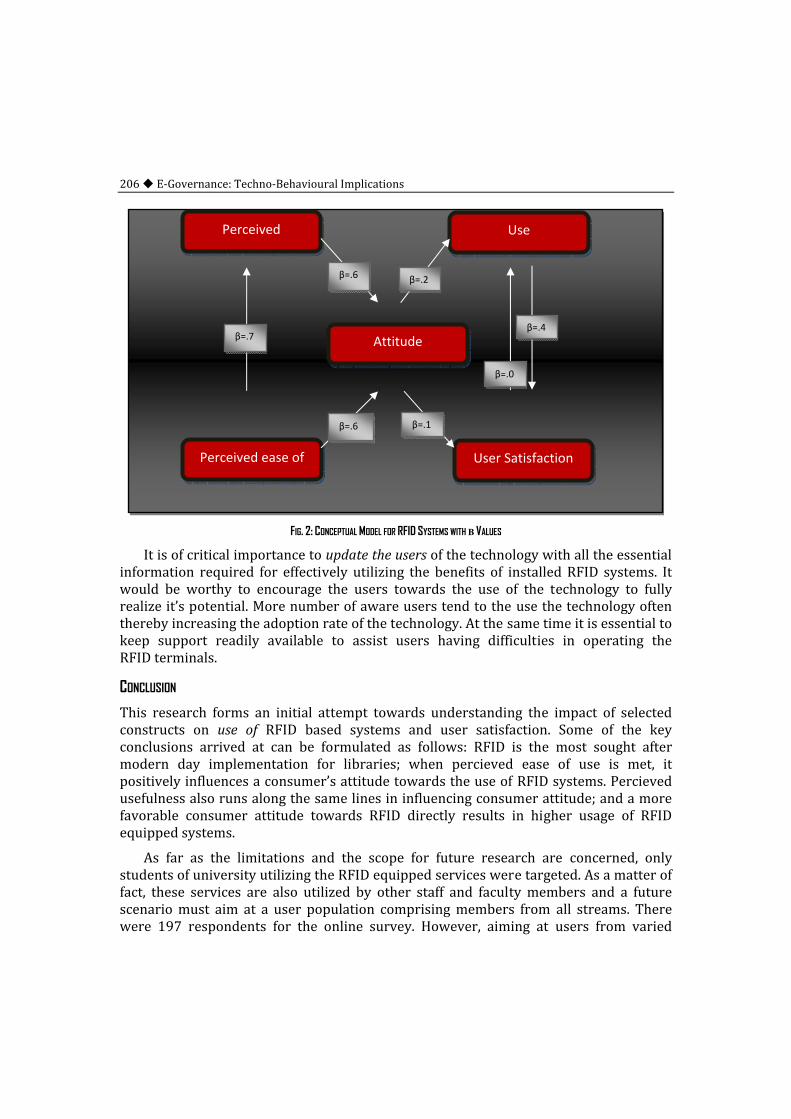
206 E‐Governance: Techno‐Behavioural Implications
FIG. 2: CONCEPTUAL MODEL FOR RFID SYSTEMS WITH Β VALUES
It is of critical importance to update the users of the technology with all the essential information required for effectively utilizing the benefits of installed RFID systems. It would be worthy to encourage the users towards the use of the technology to fully realize it’s potential. More number of aware users tend to the use the technology often thereby increasing the adoption rate of the technology. At the same time it is essential to keep support readily available to assist users having difficulties in operating the RFID terminals.
CONCLUSION
This research forms an initial attempt towards understanding the impact of selected constructs on use of RFID based systems and user satisfaction. Some of the key conclusions arrived at can be formulated as follows: RFID is the most sought after modern day implementation for libraries; when percieved ease of use is met, it positively influences a consumer’s attitude towards the use of RFID systems. Percieved usefulness also runs along the same lines in influencing consumer attitude; and a more favorable consumer attitude towards RFID directly results in higher usage of RFID equipped systems.
As far as the limitations and the scope for future research are concerned, only students of university utilizing the RFID equipped services were targeted. As a matter of fact, these services are also utilized by other staff and faculty members and a future scenario must aim at a user population comprising members from all streams. There were 197 respondents for the online survey. However, aiming at users from varied
Perceived
User Satisfaction
Use
Attitude
Perceived ease of
β=.7β=.4
β=.0
β=.1β=.6
β=.2β=.6

Employing Technology Acceptance Model (TAM) to Examine Factors Influencing RFID 207
streams would also mean increasing the chances of receiving a high response rate which will only contribute towards increasing the strength of survey analyses. Also this in a way may have led to the introduction of Self Selection Bias i.e. it might have been a case that only those students who either are frequent users of the RFID terminals or either those interested in the technology participated in the survey. This in effect increases the chances of the non‐adopters or the low frequency users of this technology having not participated in the survey. Hence the survey results may have been deprived of the perception of the non‐adopter population making the findings biased towards the adopter population. Such problems can be eliminated by using the probability sampling approach and carefully observing the non‐response bias in future research.
REFERENCES [1] Abad, E., Palacio, F., Nuin, M., de Zarate, A. G., Juarros, A., and Gomez, J. M. 2009. “RFID smart tag for
traceability and cold chain monitoring of foods: Demonstration in an intercontinental fresh fish logistic chain,” Journal of Food Engineering (93:4), pp. 394‐399.
[2] Ampatzidis, Y. G., and Vougioukas, S. G. 2009. “Field experiments for evaluating the incorporation of RFID and barcode registration and digital weighing technologies in manual fruit harvesting,” Computers and Electronics in Agriculture (66:2), pp. 166‐172.
[3] Angeles, R. 2007. “An empirical study of the anticipated consumer response to RFID product item tagging,” Industrial Management and Data Systems (107:3‐4), pp. 461‐483.
[4] Apte, U. M., Dew, N. and Ferrer, G. 2006. “What is the right RFID for your process? Acquisition,” Research Sponsored Report Series, 1‐78.
[5] Atkinson, W. 2004. “Tagged: The risks and rewards of RFID technology,” Risk Management (14:1). [6] Ayoade, J. 2006. “Security implications in RFID and authentication processing framework”, Computers
and Security (25:3), pp. 207‐212. [7] Ayre, L. B. 2005. Position paper: RFID and libraries cited in S. Garfinkel and B. Rosenberg (eds.), Wireless
Privacy: RFID, Bluetooth and 802.11. Boston, MA: Addison Wesley/Prentice Hall, 228‐241. [8] Bansode, S. Y., and Desale, S. K. 2009. “Implementation of RFID technology in University of Pune
Library,” ProgramElectronic Library and Information Systems (43:2), pp. 202‐214. [9] Berthold, O., Gunther, O., and Spiekermann, S. 2005. “RFID: Consumer fears and consumer protection,”
Wirtschaftsinformatik (47:6), pp. 422‐430. [10] Bose, I., Ngai. E. W. T., Teo. S. H., and Spiekermann. S. 2009. “Managing RFID projects in organizations,”
European Journal of Information Systems (18), pp. 534‐540. [11] Chen, M., Gonzalez, S., Leung, V., Zhang, Q. and Li, M. 2010. “A 2g‐Rfid‐Based E‐Healthcare System”, IEEE
Wireless Communications (17:1), pp. 37‐43. [12] Chin, S., Choi, C., Liu, L. and Kim, C. S. 2008. Issues and Benefits from the applications of RFIDbased
project management system in real world construction projects. Webinar zpresentation from Sung Kyun Kwan University
[13] Ching, S. H. and Tai, A. 2009. “HF RFID versus UHF RFID ‐ Technology for Library Service Transformation at City University of Hong Kong,” Journal of Academic Librarianship (35:4), pp. 347‐359.
[14] Clason, D.L. and Dormody, T.J. 1994. “Analyzing data measured by Individual Likert‐Type Items,” Journal of Agricultural Education (35:4), pp. 31‐35.
[15] Coyle. K. 2005. “Management of RFID in Libraries,” The Journal of Academic Librarianship (31:5), pp. 486‐489.
[16] Davis, F. D., Bagozzi, R. P., and Warshaw, P. R. (1989). User acceptance of computer technology: A comparison of two theoretical models. Management Science, 35(8), 982‐1003.
[17] De Kok, A. G., Donselaar, K. H. and Woensel, T. 2008. “A break‐even analysis of RFID technology for inventory sensitive to shrinkage,” International Journal of Production Economics (112:2), pp. 521‐531.

208 E‐Governance: Techno‐Behavioural Implications
[18] DeLone, W. H. and McLean, E. R. 1992. “Information Systems Success: The Quest for the Dependent Variable,” Information Systems Research (3:1), pp. 60‐95.
[19] DeLone, W. H. and McLean, E. R. 2003. “The Delone and Mclean Model of Information Systems Success: A Ten‐Year Update,” Journal of Management Information Systems (19:4), pp. 9‐30.
[20] Doerr, K. H., Gates, W. R. and Mutty, J. E. 2006. “A hybrid approach to the valuation of RFID/MEMS technology applied to ordnance inventory,” International Journal of Production Economics (103:2), pp. 726‐741.
[21] Eckfeldt, B. 2005. “What does RFID do for the consumer?” Communications of the ACM (48:9), pp. 77‐79. [22] Edwards, S. and Fortune, M. 2008. “BIC e4libraries project: A Guide to RFID in Libraries,” Available at
http://www.bic.org.uk/e4libraries/11/RFID‐/ [23] Engel, E. 2006. RFID Implementations in California Libraries: Costs and Benefits, Report:U.S. Institute of
Museum and Library Services, under the provisions of the Library Services and Technology Act, 2006. [24] Erwin, E. and Kern, C. 2003. “Radio‐frequency‐identification for security and media circulation in
libraries,” Library and Archival Security (18:2), pp. 23‐38. [25] Ferrer, G., Dew, N. and Apte, U. 2010. “When is RFID right for your service?” International Journal of
Production Economics (124:2), pp. 414‐425. [26] Gedenk, K., Ruhle, A., and Knaf, M. 2007. “Not all consumers accept RFID,” Fleischwirtschaft (87:5), pp.
62‐. [27] Glover, B. and Bhatt, H. 2006. RFID essentials, O'Reilly, 276. [28] Gomez‐Gomez, A., Ena‐Rodriguez, B., and Priore, P. 2007. “RFID in library management and
maintenance,” Profesional De La Informacion (16:4), pp. 319‐328. [29] Gunther, O. and Spiekermann, S. 2005. “RFID and the perception of control: The consumer's view,”
Communications of the ACM (48:9), pp. 73‐76. [30] Hicks, P. 1999. “RFID and the book trade,” Publishing Research Quarterly (15:2), pp. 21‐23. [31] Hildner, L. 2006. “Defusing the threat of RFID: Protecting consumer privacy through technology‐
specific legislation at the state level,” Harvard Civil RightsCivil Liberties Law Review (41:1), pp. 133‐176. [32] Hinton, P.R., Brownlow, C., McMurray, I. and Cozens, B. 2004. SPSS explained. Routledge Inc., East
Sussex, England. [33] Hopkinson, A. and Chandrakar, R. 2006. “Introducing RFID at Middlesex University learning resources,”
ProgramElectronic Library and Information Systems (40:1), pp. 89‐97. [34] Hossain, M. M. and Prybutok, V. R. 2008. “Consumer acceptance of RFID technology: An exploratory
study,” IEEE Transactions on Engineering Management (55:2), pp. 316‐328. [35] Irani, Z., Gunasekaran, A., and Dwivedi, Y.K. 2010. “Radio Frequency Identification (RFID): Research
Trends and Framework,” International Journal of Production Research (49:9), pp. 1‐27. [36] Jones, P., Clarke‐Hill, C., Hillier, D., Shears, P., and Comfort, D. 2004. “Radio frequency identification in
retailing and privacy and public policy issues,” Management Research News (27:8/9), pp. 46‐56. [37] Kang, Y. and Stanley, B. 2005. “Information accuracy in inventory systems: stock loss and stock out,” IIE
Transaction (37:9), pp. 843‐859. [38] Katz, J. E. and Rice, R. E. 2009. “Public views of mobile medical devices and services: A US national
survey of consumer sentiments towards RFID healthcare technology,” International Journal of Medical Informatics (78:2), pp. 104‐114.
[39] Kelly, E. P. and Erickson, G. S. 2005. “RFID tags: commercial applications vs. privacy rights,” Industrial Management and Data Systems (105:6), pp. 703‐713.
[40] Kern, C. 2004. “Radio‐frequency‐identification for security and media circulation in libraries,” The Electronic Library (22:4), pp. 317‐324.
[41] Kim, U. and Choi, J. 2010. “Design of A Wideband Rectangular Loop Tag Antenna For Uhf Rfid Library Management,” Microwave and Optical Technology Letters (52:6), pp. 1439‐1445.
[42] Kumar, P., Reinitz, H. W., Simunovic, J., Sandeep, K. P. and Franzon, P. D. 2009. “Overview of RFID Technology and Its Applications in the Food Industry,” Journal of Food Science (74:8), pp. 101‐106.
[43] Landt, J. 2005. “The History of RFID,” IEEE Potentials (24:4), pp. 8–11. [44] Lau, P. Y., Yung, K. K. O., and Yung, E. K. N. 2010. “A Low‐Cost Printed CP Patch Antenna for RFID Smart
Bookshelf in Library,” IEEE Transactions on Industrial Electronics (57:5), pp. 1583‐1589.

Employing Technology Acceptance Model (TAM) to Examine Factors Influencing RFID 209
[45] Lee, H., and Ozer, O. 2007. “Unlocking the value of RFID,” Production and Operations Management (16:1), pp. 40‐64.
[46] Lee, J. H., Lin, C., Lim, H. and Lee, J. M. 2009. “Sliding Mode Control for Trajectory Tracking of Mobile Robot in the RFID Sensor Space,” International Journal of Control Automation and Systems (7:3), pp. 429‐435.
[47] Liu, T. Y., Tan, T. H. and Chu, Y. L. 2009. “Outdoor Natural Science Learning with an RFID‐Supported Immersive Ubiquitous Learning Environment,” Educational Technology and Society (12:4), pp. 161‐175.
[48] Loebbecke, C. and Huyskens, C. 2008. “A competitive perspective on standard‐making: Kaufhof’s RFID project in fashion retailing,” Electronic Markets (18:1), pp. 30‐38.
[49] McGinity, M. 2004. “RFID: Is this game of tag fair play? Tracking the circuitous tradeoffs of potential consumer benefit versus marketer intrusiveness,” Communications of the ACM, (47:1), pp. 15‐18.
[50] Muir, S. 2007. “RFID security concerns,” Library Hi Tech (25:1), pp.95‐107. [51] Ngai, E. W. T., Moon, K. K. L., Riggins, F. J., and Yi, C. Y. 2007. “RFID research: An academic literature
review (1995‐2005) and future research directions,” International Journal of Production Economics (112:2), pp. 510‐520.
[52] Niederman, F., Mathieu, R. G., Morley, R. and Kwon, I. W. 2007. “Examining RFID applications in supply chain management,” Communications of the ACM (50:7), pp. 92‐101.
[53] Ohkubo, M., Suzuki, K. and Kinoshita, S. 2005. “RFID privacy issues and technical challenges,” Communications of the ACM (48:9), pp. 66‐71.
[54] Osterhues, M. 2006. “Optimized processes up to the customer. Nolke forces more positive experiences with RFID and the application of new technologies,” Fleischwirtschaft (86:8), pp. 26‐28.
[55] Ouafi, K., Raphael, and Phan, C.W. 2008. “Privacy of Recent RFID Authentication Protocols,” Information Security Practice and Experience (49:91), pp. 263‐277.
[56] Park, Y. J., Heo, P. S. and Rim, M. H. 2008. “Measurement of a Customer Satisfaction Index for Improvement of Mobile RFID Services in Korea,” Etri Journal (30:5), pp. 634‐643.
[57] Phillips, T., Karygiannis, T. and Huhn, R. 2005. “Security Standards for the RFID Market,” IEEE Security and Privacy (3:6), pp. 85‐89.
[58] Pramatari, K. and Theotokis, A. 2009. “Consumer acceptance of RFID‐enabled services: a model of multiple attitudes, perceived system characteristics and individual traits,” European Journal of Information Systems (18:6), pp. 541‐552.
[59] Rappold, J. 2003. “The risks of RFID,” Industrial Engineer (35:11), pp. 37‐38. [60] Resatsch, F., Sandiner, U., Leimeister, J.M. and Krcmar, H. 2008. “Do point of sale RFID‐based
information services make a difference? Analayzing consumer perceptions for designing smart product information services in retail business,” Electronic Markets (18:1), pp. 216‐231.
[61] Roberts, C. M. 2006. “Radio frequency identification (RFID),” Computers and Security (25:1), pp. 18‐26. [62] Rothensee, M. and Spiekermann, S. 2008. “Between extreme rejection and cautious acceptance ‐
Consumers' reactions to RFID‐Based IS in retail,” Social Science Computer Review (26:1), pp. 75‐86. [63] Santos, J.R.A 1999. Cronbach's Alpha: A Tool for Assessing the Reliability of Scales Journal of Extension.
37(2) Available from: http://www.joe.org/joe/1999april/tt3.html. Accessed date: 30‐08‐2010 [64] Smart, L and Schaper, L. 2004. “Making sense of RFID,” Library Journal, 4. [65] Staake. T., Thiesse, F. and Fleisch, E. 2005. “Extending the EPC network: the potential of RFID in anti
counterfeiting,” Proceedings of the 2005 ACM symposium on Applied computing, 13‐17. [66] Tesoriero, R., Tebar, R., Gallud, J. A., Lozano, M. D. and Penichet, V. M. R. 2010. “Improving location
awareness in indoor spaces using RFID technology,” Expert Systems with Applications (37:1), pp. 894‐898.
[67] Thomas, R.M. 2003. Blending qualitative and quantitative research methods in theses and dissertations. Corwin Press.
[68] Venkatesh, V., Morris, M.G., Davis, G.B. and Davis, F.D. 2003. “User acceptance of information technology: Toward a unified view,” MIS Quarterly (27:3), pp. 425‐478.
[69] Wang, H. W., Chen, S. and Xie, Y. 2010. “An RFID‐based digital warehouse management system in the tobacco industry: a case study,” International Journal of Production Research (48:9), pp. 2513‐2548.
[70] Want, R. 2004. “The magic of RFID,” ACM Queue (2:7), pp. 41‐48.

210 E‐Governance: Techno‐Behavioural Implications
[71] Wen, W. 2010. “An intelligent traffic management expert system with RFID technology,” Expert Systems with Applications (37:4), pp. 3024‐3035.
[72] Wu, Y.C.J. and Yen, T.C. 2007. “RFID technology innovations: the use of patent data,” International Journal of Manufacturing Technology and Management (10:1), pp. 106–120.
[73] Yu, S.C. 2007. “RFID implementation and benefits in libraries,” The Electronic Library (25:1), pp. 54‐64. [74] Yu, S.C. 2008. “Implementation of an innovative RFID application in libraries,” Library Hi Tech (26:3),
pp. 398‐410.
Proposal of Commodity Exchange Model using ICT to Reduce Corruption in NREGA
Harish Kumar1 and R.K. Singla2 1University Institute of Engineering & Technology,
Punjab University, Chandigarh 2DCSA, Panjab University, Chandigarh
Email: [email protected], [email protected]
Abstract—The Mahatma Gandhi National Rural Employment Guarantee Act (NREGA) is one of the prominent schemes introduced by Government of India (GoI) for providing minimum work to the unemployed rural area citizens, so that they can at least earn their daily needs respectfully. This scheme benefits a huge part of the population. Due the enormous size of the people involved, managing this scheme is extremely difficult. Corruption is also a menace which has a shadow over the NREGA scheme. This menace has several faces like corruption at the government officer level or it can be the misuse of money earned through wages by the workers/ husband of women workers on purchase of alcohol or drugs. Information Communication Technology (ICT) is a tool which can help to reduce the corruption level in NREGA scheme. We have proposed a commodity exchange model (CEM) in this paper which can be implemented at village / cluster of village’s level. In this model, wages are distributed in shape of daily use commodity as well as money by empowering the worker to get commodity from any business establishment using ICT. Smart cards along with unique identity number and biometric authentication can be used to identify the worker at the time of getting that commodity. In CEM, banks also need to open special accounts which will debit a particular amount only for the purchase of commodities. NREGA administration will credit the wages to these accounts. Bank will ensure that only fixed percentage of money can be withdrawn as cash, for the other amount worker should purchase daily use items. Periodic requirement of commodities of a family can be calculated on per district basis because in every district requirements and rates can vary. These accounts can be monitored by a district level committee. It can reduce the menace of purchase of drugs by the people using NREGA money. Also the proposal includes the integration of ICT to check the corruption by government officers.
Keywords: NREGA, ICT Application, Commodity Model, EGovernance
INTRODUCTION
The Mahatma Gandhi National Rural Employment Guarantee Act (NREGA), 2005 is one of the prominent schemes introduced by Government of India (GoI) for providing minimum work to the unemployed rural area citizens, so that they can at least earn their daily needs respectfully. Under this scheme GoI offers guaranteed minimum of 100‐days wage employment in a financial year to a rural house whose adult members are willing to do un‐skilled manual work in their respective area. India has around 68% population living in the rural area. Hence this scheme benefits a huge part of the population. Due the enormous size of the people involved, managing this scheme is extremely difficult. Corruption is also a menace which has a shadow over the NREGA scheme. This menace has several faces like corruption at the government officer level or it can be the misuse of money earned through this system on purchase of alcohol or drugs.
Information Communication Technology (ICT) is a tool which can help to reduce the corruption level in NREGA scheme. According to the Mahatma Gandhi’s vision ‘Every

212 E‐Governance: Techno‐Behavioural Implications
village has to become a self‐sufficient entity’. To fulfill this vision, we have proposed a Commodity Exchange Model (CEM) in this paper which can be implemented at village / cluster of village’s level. ICT can be used to manage such a commodity exchange model. Rest of the paper is organized into four different sections. Section‐2 discusses the NREGA setup. Section‐3 discusses the role of ICT in various segments of society. Section‐4 describes the proposed Commodity Exchange Model (CEM) and its impact. Finally section‐5 concludes the paper.
NREGA SET UP
The National Rural Employment Guarantee Act, (NREGA) was notified in 2005.The objective of the Act is to enhance livelihood security in rural areas by providing at least 100 days of guaranteed wage employment in a financial year to every household whose adult members volunteer to do unskilled manual work. It empowers the rural poor through the processes of the rights‐based law. It covers the entire country except the districts having 100% urban population. This act provides equal opportunity to both men and women to work and earn. Work site facilities like crèche, drinking water, shade etc. are also ensured under this scheme. As no contractor and machinery is allowed under the work allotted this scheme, hence it gives direct benefit to the citizens who work under this scheme. Men and women must be paid the same wage. All adults can apply for employment. Following steps are applicable for getting work under NREGA:
1. Adult members of rural households submit their name, age and address with a photo to the Gram Panchayat.
2. The Panchayat registers households after verification and issues a job card. The job card contains the details of the adult member enrolled and his/her photo.
3. A registered person can submit an application for work in writing (for at least fourteen days of continuous work) either to the panchayat or to Programme Officer.
4. Work will be assigned to worker within 15 days otherwise he/she is entitled to daily unemployment allowance as per the act.
Figure 1 shows the work creation and allocation process. The work under NREGA can generate productive assets, empower rural women, reduce migration to urban areas etc. Wage payment is the connecting point for the proposed (CEM) model.
IT AND SOCIETY
Information technology is the study, design, development, application, implementation, support or management of computer‐based information systems. The technological advancements have and are changing human kind forever. Every human endeavor is influenced by information technology and the increasing rate of its development has created a revolution. The Innovations such as television, internet, radio, cellular phones, etc have improved the life style of men and women all around the world. IT aims to combine efficiency together with speed in any sphere of life. Information Technology
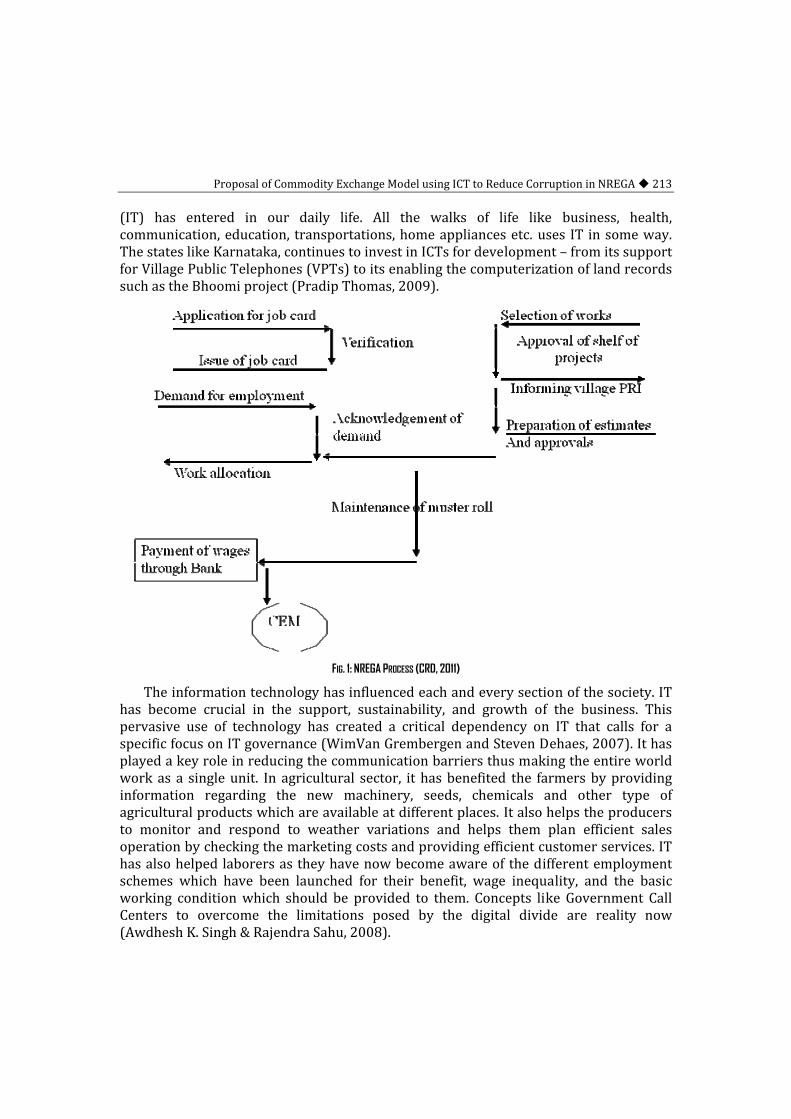
Proposal of Commodity Exchange Model using ICT to Reduce Corruption in NREGA 213
(IT) has entered in our daily life. All the walks of life like business, health, communication, education, transportations, home appliances etc. uses IT in some way. The states like Karnataka, continues to invest in ICTs for development – from its support for Village Public Telephones (VPTs) to its enabling the computerization of land records such as the Bhoomi project (Pradip Thomas, 2009).
FIG. 1: NREGA PROCESS (CRD, 2011)
The information technology has influenced each and every section of the society. IT has become crucial in the support, sustainability, and growth of the business. This pervasive use of technology has created a critical dependency on IT that calls for a specific focus on IT governance (WimVan Grembergen and Steven Dehaes, 2007). It has played a key role in reducing the communication barriers thus making the entire world work as a single unit. In agricultural sector, it has benefited the farmers by providing information regarding the new machinery, seeds, chemicals and other type of agricultural products which are available at different places. It also helps the producers to monitor and respond to weather variations and helps them plan efficient sales operation by checking the marketing costs and providing efficient customer services. IT has also helped laborers as they have now become aware of the different employment schemes which have been launched for their benefit, wage inequality, and the basic working condition which should be provided to them. Concepts like Government Call Centers to overcome the limitations posed by the digital divide are reality now (Awdhesh K. Singh & Rajendra Sahu, 2008).

214 E‐Governance: Techno‐Behavioural Implications
Employers have also been benefited as they are now able to maintain the record of the number of laborers and the skills they have as such it has become easier to plan the manpower. The industrial sector has also been highly influenced by this boom in the IT sector. In business sector, IT has helped everyone ranging from the small shopkeepers to the industrialists. It has reduced the gap between the demand and supply by facilitating them with the information like which product has demand over the others, which set of consumers should be addressed and where to buy raw material. The tertiary sector of our economy is not far behind; the information technology has changed the entire scenario of the service sector. In banking, the development of ATM machines has made the life of each and every individual easy. Not only this the computerization of all the branches of banks has made the interoperability easy and they have now reached even the far flung areas which were earlier inaccessible. Mobile banking is the upcoming reality in the banking sector (Jonathan Donner & Camilo Andres Tellezb, 2008). In the field of medicine, new methods have been developed for the treatment of diseases which were earlier incurable as such death rate has slashed. In transportation sector, it has now become easy to make reservations, know about the availability of seats etc. In education sector, the system of imparting the knowledge has been changed drastically as both the theoretical and practical methods of teaching have been improved. Also with the advent of e‐ learning it is now possible to provide education to those who live in remote areas. IT has also lead to the advancement in outsourcing thus reducing the unemployment throughout the world. The entertainment sector has also developed leaps and bounds. The development of iphones, ipads, notebooks etc have created a revolution. In addition to all other benefits, IT has also helped the government in better governance .As it allows to do strategic planning and implement different policies keeping in mind the population of the nation, development of different sectors etc. But largest penetration of IT applications is only limited to the life style of rich or middle income group only. Technology for the poorest of the poor only means using of TV or telephone.
Thus, IT has affected people of almost all ages and professions and no one has been left behind. It has lead to the social, economic and cultural development of the entire society. Despite of all these benefits there are also some negative effects of Information technology. The ease of exchange of information has threatened the security of the society as the hackers are able to access, modify and use the confidential information for their personal interests. Not only this, the social life of individuals is also getting negatively affected as the social contact is getting nullified thus leading to the increase in number of mental diseases. Also the children are getting exposed to the uncensored information which affects their growth process. Last but not the least the failure of hardware or software in any field may bring down the entire economy of the world. Hence it is the need of the hour to use this boon in an appropriate manner so that it does not convert in to a bane.

Proposal of Commodity Exchange Model using ICT to Reduce Corruption in NREGA 215
PROPOSED MODEL
In this section proposed Commodity Exchange Model (CEM) has been discussed. Management of CEM using ICT has also been proposed. The basic idea behind CEM is that instead of offering money as wage to a citizen, he/she should be empowered to directly purchase daily use commodities along with some cash money withdrawal from bank account. Daily use commodities include pulse, rice, wheat, sugar, cloths, medicines, books etc. For purchase of commodities a smart card can be used. For this purpose a smart card needs to be issued to all the workers. This card may have biometric authentication mechanism. Banks should be instructed that cash withdrawal by a worker only up‐to a particular limit is allowed even though the money is available in that account. So banks need to open special NREGA worker accounts. Remaining money will be debited only when worker will purchase some commodity using the smart card. In this model commodities are given to workers for the work they have completed. Due to this reason we have given it a name of CEM. Division of the money can be done as follows:
• M: Total Monthly Money entitlement of a citizen for services under NREGA. • N: Average monthly requirement of a person for the various commodities. • A : Average number of adults in a family • C : Average number of children in a family Money required for monthly needs of
a family, MFN : (A+C) * N • Cash money withdrawal limit of the citizen from bank account : (M – MFN)
The average values can be calculated per district basis by taking a sample of data from among the NREGA workers. District basis data can be used for managing payments to workers in that particular district only. It will give better implementation of the scheme.
Various entities which can participate in CEM are:
• Financial Institutions like Bank • NREGA Local Office • NREGA District Office • Local Business Establishments like grocessory shops, medical shops, cloth
merchants etc. • Public utilities like educational institutions, hospitals etc.
Figure 2 shows the working of the model. In this model NREGA worker will be provided with a debit card cum ATM card having biometric identification. Worker can go to any local business establishment or any service provider like hospital, school etc. and pay the bill using debit card. Biometric identification can ensure the identity of the worker.

216 E‐Governance: Techno‐Behavioural Implications
Implementation Issues in CEM
Technology has no constraint to implement CEM. Smart cards having biometric identification in compliance with UID are already in the pipeline. A merchant account option for transfer of money through debit card to the business establishment account is already available with the banks. Workers are also getting the wages into their account. But there is need to pursue the banks to upgrade their software to limit the cash withdrawal limit but to allow the debit card transactions on such accounts. Further CEM can be integrated with the mobile phone, so that worker can purchase the commodities while sitting at home. This integration can reduce the travel time of the worker. There is need to do the expenditure analysis of the families of NREGA workers on the district basis to find out the average requirement of commodities. Based on this analysis account limits can be fixed.
FIG. 2: WORKING OF PROPOSED COMMODITY EXCHANGE MODEL (CEM)
Expected Impact on Drug Menace
In certain cases in rural India husband beat the wife and snatch her earning to fulfill his requirement of drugs. In such scenario, if the woman is NREGA worker then money earned by that worker is indirectly going to purchase the drugs. By providing CEM, we are proposing empowering the women worker to get large portion of their wage as commodities for their household use. Hence, incident of bringing money to home will reduce and flow towards drug purchase by husband will also decrease. This kind of domestic violence can’t be eliminated entirely in the poor strata of society by using law or force. But CEM can help at least misuse of NREGA money.

Proposal of Commodity Exchange Model using ICT to Reduce Corruption in NREGA 217
Expected Impact on Corruption
Using CEM, worker can contact any of local business establishment for commodities. If a particular shop is not providing the required quality of the products then worker can switch over to another shop. Hence sales of mischievous business‐man will decrease. Under these circumstances, business man will always try to supply the good quality product. Even quality control department can also be engaged to check the commodities quality at various participating business establishments.
CONCLUSIONS AND FUTURE SCOPE
NREGA is one of the prominent schemes introduced by Government of India (GoI) for providing minimum 100 days work to the unemployed, unskilled rural area citizens, so that they can at least earn their daily needs respectfully. Wages are distributed to the workers through various financial institutions and are credited to their accounts electronically. Drug menace and corruption are two major problem areas eating up a large pie out of the NREGA money. In this paper we have proposed a commodity exchange model. Under this model, it can be insured that large portion of the wage money should go the daily house hold needs of the worker. If this model can be implemented, then large amount of money can actually help the citizens to better utilize the money. In future, work can be carried out to implement this model on pilot basis at some district level by taking certain sample districts.
REFERENCES [1] Commissionerate of Rural Development (CRD), “Implementation of NREGA in Gujarat”, Gandhinagar,
2010 Web Site : ruraldev.gujarat.gov.in Last seen on June 10, 2011 [2] Donner, J., and Tellezb, C., A. 2008. Mobile banking and economic development: linking adoption,
impact, and use. Asian Journal of Communication, Vol.18, Issue 4, pp 318 – 332. [3] Grembergen, W., V., and Dehaes, S. 2007. Implementing Information Technology Governance: Models,
Practices and Cases. IGI Publishing Hershey, PA, USA. [4] Ministry of Rural Development (MRD), GoI, “The Mahatma Gandhi National Rural Employment
Guarantee Act 2005 Website http://www.nrega.nic.in”, Last seen on June 15, 2011 [5] Singh, A., K., and Sahu, R. 2008. Integrating Internet, telephones, and call centers for delivering better
quality e‐governance to all citizens. Government Information Quarterly, Vol. 25, Issue 3, pp 477‐490. [6] Thomas, P. 2009. Bhoomi, Gyan Ganga, e‐governance and the right to information: ICTs and
development in India. Journal of Telematics and Informatics, Vol. 26, Issue 1, pp 20‐31.

ICT-Enabled Change in Indian Police: A Case of Leadership and Drive in Karnataka
Jaba Mukherjee Gupta1 and Vinit Thakur2 1Associate Professor & ChairpersonEGPX,
T. A. Pai Management Institute, Manipal, Karnataka 2Professor, T.A. Pai Management Institute, Manipal, Karnataka
Email: [email protected], [email protected]
Abstract—The Government of India has introduced Crime and Criminal Tracking Network System (CCTNS) and Common Integrated Police Application (CIPA) and various other systems to make the task ofpolicing easier and bring citizencentricity more in focus. For instance, through the National Crime Record Bureau (NCRB), crime tracking has become much simpler. Systems are in place to ensure protection from any internal or external interference. Some states, having proactive leadership, have already begun to harness the potential of Information and Communication Technology (ICT) to bring about change. With leadership driving the change, such states are clearly at an advantage. A case in point is Karnataka. This article traces the leadership role of an IPS officer who is credited with the CCTNS missionin Karnataka: Sri Sanjay Sahay, IPS, IGP, Karnataka. This article is about the journey to fulfil the promise he made to himself and his department.
Keywords: eGovernanace, ICTenabled change, Leadership and drive, Karnataka Police IT implementation
India is a country of over a billion people vying with each other for a better life and existence. Crime rates are high and the Police force in India has the not‐so‐envious task (among many other things) of preventing crime, tracking and nabbing criminals who may escape to any part of the world to find a safe haven and plan another strike. There is also a very high demand for police activities, which include counter‐terrorism activities, VIP security, etc. Needless to say, pressure on police stations is mounted by those affected by the crimes and criminal activities. Apart from tracking crimes and criminals, the police force also takes care of a host of other related duties to maintain public peace and order. In this situation, having access to information is crucial. IT has provided solutions by which the information may not only be harnessed but can be used to analyze the data, produce relevant reports and act speedily to complete crime‐related activities. The volumes of work expected from the police department is extremely high and with the shortage of manpower, taking care of entering the data manually and maintaining it in acceptable shape is next to impossible. In the absence of the IT systems, it was a constant struggle to find manpower to record manually and carry out the task of maintaining law and order among other important tasks of the police. The efficiency with which the police perform is a function of speed and accuracy. Information Systems tailor‐made to the needs of the police provided the solution.
The Government of India therefore decided to introduce Crime and Criminal Tracking Network System (CCTNS) and Common Integrated Police Application (CIPA) and various other ways of making the police tasks easier and bringing citizen‐centricity more in focus. For instance, through the National Crime Record Bureau (NCRB), State

ICT‐Enabled Change in Indian Police: A Case of Leadership and Drive in Karnataka 219
Crime Record Bureaux (SCRB) and District Crime Record Bureaux (DCRB) crime tracking has become much simpler. Systems are in place to make sure that the FIR lodged by a citizen is entered into the system and cannot be taken off thereby ensuring protection from any internal or external interference. Some states, having proactive leadership, had already begun to harness the potential of Information and Communication Technology (ICT) to bring about change. A case in point is Karnataka, where Police IT software was introduced successfully. This article traces the role of an IPS officer who is credited with the mission.
Sri Sanjay Sahay, IPS, Inspector General of Police Department of Karnataka, was given the charge of the Police Computer Wing (PCW) of Karnataka State Police with the expectation of making a turnaround in the ERP creation and successful deployment of the Police IT software in a year’s time (2010). He had been hand‐picked on account of the department’s immense faith and trust in his abilities. He has been involved in the entire process of technology integration, manpower training and deployment in the state of Karnataka.
After taking on the responsibility, he took stock of the situation. Things were at ground zero waiting for his initiative and action plan. There were huge resource gaps that needed his attention. It would be a challenge to get the task started, but Mr.Sahay loved challenges. He believed that life runs on the dictum, Power is the ability to make things happen. From his determined journey to the school of his choice, St. Xavier’s School, Bokaro to St. Stephen’s college he had amazed everyone. This was even more laudable as he had started from a small district town, Daltonganj in Jharkhand. Later, being selected as an IPS officer, allotted to the Karnataka cadre, there was no looking back for him. Success was the only way ahead. Turning back was not an option. The CCTNS had already been announced by the Central Government. CCTNS was becoming a buzzword in the proactive police circles and the IT industry across the country. Mr. Sanjay Sahay had to find solutions for Karnataka. Not only did he succeed, but Karnataka went on to become one of the lead states in the country. Subsequently he was invited to make presentations at several high level gatherings, meetings, workshops, symposiums, and to the IT industry itself, to share his experiences with the rest of the country. His outreach ranged from being a regular speaker at CCTNS training sessions at Delhi to HCL CXO Summit at Udaipur to Indian Institute of Management, Bangalore. This article is about the journey to fulfil the promise he made to himself and his department. It traces his role as a leader.
BACKGROUND
CCTNS in Karnataka1
Under the leadership of Mr. Sanjay Sahay, Karnataka is today one of the lead states in the country (along with AP and Gujarat) in terms of CCTNS implementation. The mission of 1CCTNS in Karnataka—Experience Sharing by Mr. Sanjay Sahay, IG [PCW], Karnataka
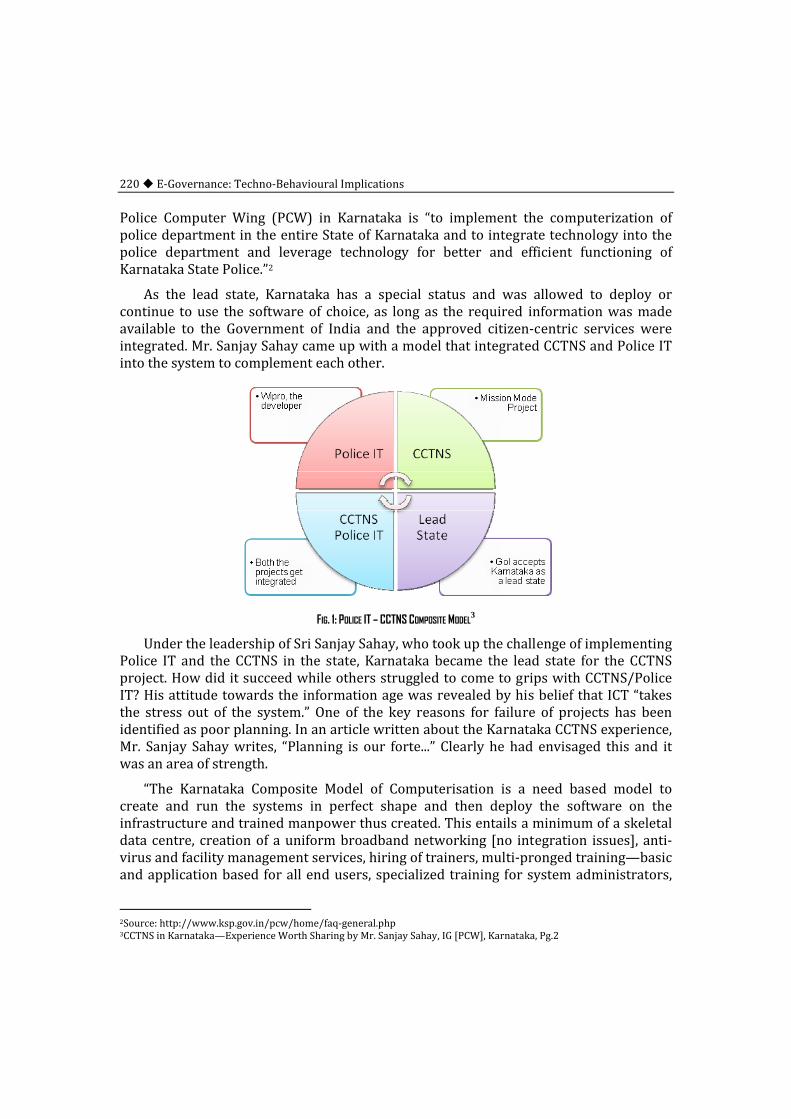
220 E‐Governance: Techno‐Behavioural Implications
Police Computer Wing (PCW) in Karnataka is “to implement the computerization of police department in the entire State of Karnataka and to integrate technology into the police department and leverage technology for better and efficient functioning of Karnataka State Police.”2
As the lead state, Karnataka has a special status and was allowed to deploy or continue to use the software of choice, as long as the required information was made available to the Government of India and the approved citizen‐centric services were integrated. Mr. Sanjay Sahay came up with a model that integrated CCTNS and Police IT into the system to complement each other.
FIG. 1: POLICE IT – CCTNS COMPOSITE MODEL3
Under the leadership of Sri Sanjay Sahay, who took up the challenge of implementing Police IT and the CCTNS in the state, Karnataka became the lead state for the CCTNS project. How did it succeed while others struggled to come to grips with CCTNS/Police IT? His attitude towards the information age was revealed by his belief that ICT “takes the stress out of the system.” One of the key reasons for failure of projects has been identified as poor planning. In an article written about the Karnataka CCTNS experience, Mr. Sanjay Sahay writes, “Planning is our forte...” Clearly he had envisaged this and it was an area of strength.
“The Karnataka Composite Model of Computerisation is a need based model to create and run the systems in perfect shape and then deploy the software on the infrastructure and trained manpower thus created. This entails a minimum of a skeletal data centre, creation of a uniform broadband networking [no integration issues], anti‐virus and facility management services, hiring of trainers, multi‐pronged training—basic and application based for all end users, specialized training for system administrators,
2Source: http://www.ksp.gov.in/pcw/home/faq‐general.php 3CCTNS in Karnataka—Experience Worth Sharing by Mr. Sanjay Sahay, IG [PCW], Karnataka, Pg.2

ICT‐Enabled Change in Indian Police: A Case of Leadership and Drive in Karnataka 221
multi organizational workforce, ERP End to End Software Solution and above all perfect synchronization of all activities and processes.”4
THE STRATEGY USED IN IMPLEMENTATION OF POLICE IT
1. Talent Acquisition within the police force The crucial point of differentiation was in the recognition that the personnel would have to be drawn and trained from within the police force as they knew how the police force worked and could be depended on to ensure that the software worked the police way. Among those who were being trained to run the Police IT software, some were technical personnel—some non‐technical officers who had been asked to help out.
2. Constables were selected for training. There were some younger constables with qualifications like MCA, etc. With 1439 locations of around 75 units had to be covered—this was challenging. In order to fulfil the need for personnel to man the Technical infrastructure, which was supposed to help build the entire ICT‐enabled change, help was sought from the senior authorities. This was granted.
Robust Training Models for the operating staff
The training imparted:
• 48 hour Basic Computer Awareness Training • Police IT Application Module Based Training • Specialized Training for System Administrators • Training of Trainers • Training of Handholding Staff • Evolution‐ training of Senior Police Managers in Change Management, Make
them Change Agents
• The staff to be trained were put through rigorous training 75 Nodal offices were set up –and a policy framed. 75 nodal officers were nominated out of the serving senior officers to the district, in so many they were the district SPs—1 per unit. Their task was to supervise and monitor the implementation—pre‐cursor to the rollout, deployment—usage—consolidation and coordination of the activities of all service providers/vendors. At a later stage, the nodal officers would take charge of administration of non‐software related issues. The User Acceptance Test Team Leader would take of the deployment of that particular module.
• Next level training: System Administrators—75 of them were put through a customized training program and then completed MCSE [Microsoft Certified Systems Engineer], of which 54 have already complete their CCNA certification and others are in the process of taking the test shortly. 350 candidates took the exams and then 75 were selected after rigorous training—complete with weekly
4CCTNS in Karnataka—Experience Worth Sharing by Mr. Sanjay Sahay, IG [PCW], Karnataka, Pg.2

222 E‐Governance: Techno‐Behavioural Implications
test and monthly tests. CCNA5 was the next stage—5 of them would be selected and dedicated to data centre management. They would be put through a small course and exposure to data centre management. They are likely to be selected from among the constables. This thought process resulted in 8 MCSE certified police staff managing the Data Centre, besides the Data Centre Head, who is also one of the products of the same training.
The training is customized for the police force— it is very different from the generic courses. This was done with the specific intent of creating specialized courses for the Police Dept. How were the police personnel convinced and motivated to undertake the training? Mr. Sanjay Sahay explained that he had taken personal interest in ensuring that this process of training was accepted by all. He had made it clear to his men that they were the specially chosen ones and would have to deliver. He took good care of them with regard to stay, transportation, etc. However, he had made it clear that they would have to overcome all their personal problems to focus on the training, which was to be a global benchmark for the Dept. Nothing less was acceptable to him. He believed in keeping a personal one‐on‐one contact with his trainees, while being at the same time very demanding about the standards to be met. This gave him results beyond his expectation. All 75 officers were successfully trained and certified by Microsoft.
Apart from his personal drive, interest and commitment, which became an example, the training was done using standard methods—and using the local language which everyone is familiar with. Language barriers were thus removed and the policemen worked in a zone of comfort.
The persistence of the leadership to fight back resistance to acceptance of technology yielded results as the end users started appreciating the ease of functioning in the new system. Undeniably it was forced upon them to start with but as the advantages of software started exploding the end users had an experience which they had not imagined. The official functioning slowly moved on to the digital level. They realised what an ERP could deliver. The rigorous application training with a combination of persuasion and aggression was the ideal formula for change management creating an enabling environment for deploying and use the software.
The approach of the leader was to achieve inclusive growth by identifying internal talent and upgrading their knowledge andskillsthrough rigorous training. Those who were selected knew that this was a rare opportunity. The support and encouragement they received gave them greater confidence.
5Cisco Certified Network Associate (CCNA®) validates the ability to install, configure, operate, and troubleshoot medium‐size route and switched networks, including implementation and verification of connections to remote sites in a WAN. CCNA curriculum includes basic mitigation of security threats, introduction to wireless networking concepts and terminology, and performance‐based skills. This new curriculum also includes (but is not limited to) the use of these protocols: IP, Enhanced Interior Gateway Routing Protocol (EIGRP), Serial Line Interface Protocol Frame Relay, Routing Information Protocol Version 2 (RIPv2), VLANs, Ethernet, access control lists (ACLs).

ICT‐Enabled Change in Indian Police: A Case of Leadership and Drive in Karnataka 223
Adequate Compensation and Benefit Schemes
All the immediate needs were taken care of including stay and transport for the training period. The motivating factor for the trainees was also the knowledge that they would drive the ICT‐enabled change in the entire state.
High Level of Motivation from Leadership
Sri Sanjay Sahay was personally involved at all stages of the training. Apart from the selection of the training package and the trainers, he handpicked the candidates for this training and spent time interacting with them after every training module. The involvement of a senior leader acted as a morale booster and made a big difference to the final outcome.
Balanced Stakeholder Management
Sri Sanjay Sahay was completely committed to the task and said that he would visit and/or talk to anyone who could make a difference to this mission (while not compromising his dignity or ethical code of conduct). He ensured that all the stakeholders understood the goal and worked towards it. There were regular meetings that helped in building relationships across the departments—getting people to pitch in for the ultimate goal of implementing CCTNS. He used his network of personal and professional relationships and created support systems—where people loved to collaborate in his projects and came together to help. Academics also came forward to help. Anyone who could provide intellectual support in IT related knowledge transfer and/or the project at hand was welcomed.
Choosing Appropriate Implementation Partner
Wipro was the implementation partner in this project. Instead of depending on the partner blindly, he had put in place checks and reviews so that he was in control.
Interacting with intellectuals (Intelligentsia)
Even though he had a robust plan in place and was constantly interacting with the trainer and the trainees to ensure that there was rigour, Sri Sanjay Sahay did not rest on his laurels. He interacted with professionals in the field and faculty members from reputed management institutes on a regular basis. He also read significant management books to keep himself updated. In spite of his busy schedule, taking time out for these interactions and keeping the options to examine, think, critique and renew his efforts based on insights, made this leader different.
Role of Leadership
Once he had taken on the responsibility, Sri Sanjay Sahay studied the situation, identified the gaps in the requirement and was completely in control, whether it concerned the technology aspects, the process or the people. To cite an example, one of

224 E‐Governance: Techno‐Behavioural Implications
the findings of the audit report for eCops was that the training had not been taken seriously. It was left to the vendor. As a result the training did not prepare specific individuals for the ICT operations as expected. In the case of Karnataka, the scenario was very different. He selected the candidates, the training and ensured that the vendor delivered what was expected.
Leading from the front, and sending out a strong message that the training was to be taken seriously made a big difference. Selected candidates were put through rigorous training for MCSE and had to clear examinations for certification. This left a lasting impact on the trainees and they brought the same commitment to project rollout and implementation.
People Management: Sri Sanjay Sahay treated the officers and staff working under him with dignity6 but was a no‐nonsense leader when it came to being completely focused on the task at hand. Anyone who was disinterested was free to leave the training. The policemen selected for the training were treated like the lucky chosen ones who would make the difference in the implementation of CCTNS in Karnataka. At the same time he did not give in to weaknesses, whims and fancies. The men were told that they were on an important mission and small personal problems should not come in the way. In other words, he demanded complete loyalty to the cause and commitment to complete the work. This spirit of commitment was the impetus that drove the project and saw it through. He reiterated that loyalty to the Department should not be compromised by lucrative offers from other quarters after the training, as the Government had invested heavily on the trainees.
Top Management Commitment [Political/ bureaucratic] Commitment
In the role of the leader who had taken on the onerous task of rolling out/implementing CCTNS‐Police IT in Karnataka, Sri Sanjay Sahay had the support of top management in the Karnataka Police and the State machinery which was geared up to help him achieve his ends. The DGP, who had selected him to carry out this task, had taken a commitment from him about the start and the end date of the implementation of Police IT. His commitment was that the task would begin on January 1, 2010 and end on December 31, 2010. This “time lock‐in” galvanized the activities towards the fulfilment of the goal. The top management had complete faith in his ability and helped him to achieve his target and having given this assurance, Sri Sanjay Sahay dedicated himself to the task. He was also ready to seek help whenever needed [e.g. He wrote to the higher authority asking for external help to initiate the IT and Systems training and this was granted].
As Mr. Sanjay Sahay reflects, “Projects fail because they are not dynamic—static things do not work—one should be able to integrate everything that is useful.” He has in many ways done just that by balancing the technology, process and people7 aspects; 6Interview with Sri Sanjay Sahay and observation of the officer at work 7The enablers of eGovernance as stated in Unlocking E‐Government Potential: Concepts, Cases and Practical Insights, SubhashBhatnagar
ICT‐Enabled Change in Indian Police: A Case of Leadership and Drive in Karnataka 225
networking with professionals, drawing lessons from the failures in other states. The Karnataka experience has shown that complete and positive involvement of the leader in the complex task of implementing CCTNS has made a significant impact.
The Leadership Imperative
The role of leadership in a venture like the CCTNS implementation in Karnataka is crucial. How did Mr. Sanjay Sahay succeed?
There were four crucial factors that made a difference:
• Vision—beginning with the end in mind • During the interviews with him it was evident that the leadership role was of the
essence: “Internalization and having a vision of the entire structure—the ability to see the larger picture—is crucial for the leader.”
• He began with the goal in mind and kept his focus on the objective at all times. This helped him to overcome hurdles: “One has to be versatile so that the system cannot limit you...cross the boundaries...skills and passion should act as the antidote to the system.”
Communicating for “Buy-in”8—Effective in Bringing in Change
Mr. Sanjay Sahay was able to communicate this vision to the trainees he had selected for the successful implementation of the project. His presence, interaction and commitment helped to bring them on board and make them a part of the process. The ownership of this project was possible because of the buy‐in achieved through effective communication.
Involving the subordinates and making them feel a part of the change process, helped to build solidarity also. The leader should, as Mr.Sahay said, “...work with all levels—a subordinate may have a wonderful approach to resolve an issue. The person is recognized and he is empowered and feels more loyal. Thus there is an integration of legacy support system.”
Networking with Professionals—willing to Unlearn and Relearn
Understanding the importance of interdependence in the modern workplace, he was ready to network with other departments and other professionals. This ability to network with other professionals who were from diverse areas helped Mr.Sahay to achieve the desired results effectively. There was also readiness to unlearn the redundant and learn from the environment which put him a very special position.
As Mr.Sahay said, “Your knowledge base should be far beyond your organization. Collaborate with people outside, translate collaboration framework into a workable model and get it to work for you. My reading has certainly helped, but it is the drive, network and collaboration that have helped most.” 8A step in John Kotter’s theory of effective Change Management
226 E‐Governance: Techno‐Behavioural Implications
“Networking—working with good people who lend support has been a rejuvenating experience. By involving everyone in the task one is able to work on several areas together...and succeed in doing the work of several professionals together!”
Strong Will to Succeed—No Room for Failure
The strong will to succeed against all odds was the most important driving factor in the case. A focused approach with the drive to bring about the envisioned change in spite of barriers helped this leader to succeed leaving several other states behind.
Using an image to explain the force that must work to bring success, Mr.Sahay said, “Barriers are temporary in nature....the strength of a surgeleaves the embankment broken, engulfs everything–unstoppable in its pursuit!”He believes that being action‐oriented is crucial for success.
CONCLUSION
Exemplary leadership as shown by Mr. Sanjay Sahay is the need of the hour and can help transform our nation. The study shows that leadership and drive coupled with the will to succeed can bring change even in domains that are run by systems that have been suspicious of change in the past.
There are several states struggling to implement CCTNS successfully. Some of these lessons would be useful for them. Looking at the issue from a leadership angle, one may conclude:
1. Managing people and getting them to accept the change proposed/implemented is crucial for the success of a project—this is perhaps the most challenging in the present context
2. Understanding how technology can be used to find solution to problems is essential;
3. There is also an imminent need for sound processes that will help in effective implementation.
Therefore, the ability to manage technology, processes and people would help in successful implementation of thiseGovernance project. The involvement of the leader in the change process would certainly help to bring about the desired results.
Along the journey to the realization of the vision for change, the paths may be blocked by hurdles, but a determined leader is not daunted by them. The ability to garner the support of all the positive forces in the environment makes the journey more meaningful and fulfilling. A leader who works with the people, is able develop a feeling of pride and ownership among them. This in turn helps them to align with the vision or the ultimate objective of the organization or Department. Thus the vision is fulfilled by the willing contribution from the stakeholders.

ICT‐Enabled Change in Indian Police: A Case of Leadership and Drive in Karnataka 227
ACKNOWLEDGEMENT
We would like to acknowledge the support and immense help received from Sri Sanjay Sahay, IGP, Karnataka to write this article. We also thank the T. A. Pai Management Institute, Manipal for supporting this research venture in eGovernance.
REFERENCES [1] Bhatnagar, S. (2009). Unlocking E‐Government Potential: Concepts, Cases and Practical Insights
(1st ed.), India: Sage Publications [2] Interview 1 with Sri Sanjay Sahay, IPS, IG (PCW) on June 26, 2010. [3] Interview 2 with Sri Sanjay Sahay, IPS, IG (PCW) on Feb. 19, 2011. [4] Home [police]/Information Technology and Communications Department, Information Technology
Audit of eCops—an e‐Governance initiative by Government. (2004) Available at: http://www.icisa.cag.gov.in/Printed%20reports/State%20Reports/Andhra%20Pradesh/IT%20Audit%20of%20eCops%20‐%20an%20e%20Gov%20initiative%20of%20Andhra%20Pradesh.pdfAccessed June 20, 2010
[5] Karnataka State Police, Police Computer Wing Home page. Available at: http://www.ksp.gov.in/pcw/home/faq‐general.php Accessed June 20, 2010.
[6] Kotter, J. P. (2002) The Heart of Change, Harvard Business School Press: Boston, MA [7] Sahay, S. (2010), “CCTNS in Karnataka—an Experience worth Sharing.” Network for Improved Policing
in South Asia [NIPSA]. Available at: http://www.nipsa.in/newsletter/newletter‐1/cctns‐in‐karnataka‐%E2%80%93‐an‐experience‐worth‐sharing/Accessed June 20, 2010

A Comparative Analysis between ICTs Based Public Service Delivery System and Manual Service Delivery Systems in
Bilaspur City of India
Anupama Saxena1 and Ankit Sharma2 1Associate Professor, Department of Political Scienceand Public Administration, Guru Ghasidas University, Bilaspur, Chattisgarh
2PG Student, Department of Political Science and Publics Administration, Guru Ghasidas University, Bilaspur, Chhattisgarh
Email: [email protected]
Abstract—Egovernance is at its nascent stage in India with strong potential for growth in the future. The present paper provides a comparative study between ICTs based public service delivery system and mManual service delivery system in Chhattisgarh State of India. It concludes that though ICTs based public service delivery system is better than the manual system but the lack of administrative and political will restricts the popularization of this system.
Keywords: EChoice, Chhattisgarh, Public Delivery System
INTRODUCTION
E‐Governance helps simplify processes and makes access to government information easier. The other anticipated benefits of e‐governance include efficiency in services, improvement in services delivery, standardization of services, better accessibility of services, and more transparency and accountability (Himadri, 2009). E‐governance is at its nascent stage in India with strong potential for growth in the future. Rise in demand for services and information by consumers across the nation has fostered the need for fast and smooth transfer of knowledge (E‐Governance Market in India, 2011). But there are various hurdles in successful implementation of e‐governance schemes.
Chhattisgarh is a state in Central India, came into existence in 2000. It is one of the most socially and economically challenged states of India. More than 45% of the population belongs to below poverty line segment. 40% population is of scheduled tribal and 12% is of scheduled casts. The state has recognized the importance of Information Communication Technologies (ICTs) as a key enabler in its economic development and in improving the lives of its citizens. The ‘Chhattisgarh InfoTech and Biotech Promotion Society’ CHiPS has been set up to give impetus to IT growth in the state and to implement initiatives for overall socio‐economic development.
Brief Introduction of CHOiCE
CHOiCE is the acronym to ‘ Chhattisgarh Online Information for Citizen Empowerment’ aims at establishing ICTs based citizen service centers across Chhattisgarh state to deliver more than 131 public services at one single window. The project involves a 360 degree view of all Citizen Government interaction and offers citizens choices among

A Comparative Analysis between ICTs Based Public Service Delivery System and Manual 229
modes of payment, obtaining information of forms, submitting the same, tracking them and getting delivery at the end/ service product in a variety of ways including in person, through authorized nominee, through phone, through fax, through the web,through the post etc. It is implemented on decentralized Public Private Partnership (PPP) model1 where any private person with requisite infrastructures and qualifications can serve as CHOiCE agent. CHOiCE is the largest open source‐governance project of India. With this project for the first time in the country, private citizens ( CHOiCE Agents) are notified as public servants under information technology (IT) act and they are enabled to process government documents.
Bilaspur is the third largest city in Chhattisgarh state. Total population of the city is 3,54,233. Bilaspur city is the district head quarter of Bilaspur District and Tahasil Head Quarter of Bilaspur Tahsil2. The High Court and the Central University are located in the city. Currently public Services are delivered through following two system.
CHOiCE Centres: CHOiCE Centres provides ICTs based public service delivery. Bilaspur is one of the pilot cities where the CHOiCE scheme was launched on 1st September 2008. In a short period of time 16 CHOiCEs were set up in Bilaspur. Currently only 08 centers are in operation and 08 are closed.
Manual System: Manual System is traditional system. Government Tahasil Level office provide public service delivery manually.
METHODOLOGY
Data on profile of CHOiCE operators and number of customers for different services was collected from the office records of all 08 CHOiCE Centers that are currently operational. To collect information from customer’s, 04 CHOiCE Centers were selected from 04 different corners of the city. Personal Interview method was used to collect data from customers and the operators. Customers were selected on random basis among the daily visiting customers. The project staff visited selected CHOiCE 04 Centers one by one continuously for three days each and interviewed first 04 customers on the basis of questionnaire. Out of 08 CHOiCE Centers that are closed the owners of 04 were interviewed. Data on number of customers for manual service was collected from the office records of Tahasil office. To collect data from customers of manual system same method was used. 02 concerned government officers were also interviewed. Data is also collected from the website of government of Chhattisgarh, CHIPS etc.
Findings
Number and Type of Services Provided by both of the Systems are Same: A total of 15 services are being provided by CHOiCE Centers and Tahasil Office.
1Tahasil offices are the territorial offices headed by the “Tahasildar” who is the gadgeted officer of state subordinate services. One Tahasil office covers about 250 villages.

230 E‐Governance: Techno‐Behavioural Implications
Fees for Various Services are Different in Two Systems: Following table indicates that except Birth and Marriage certificate other services are provided free of cost in manual system whereas services are charged in ICTs based system. This is obvious because the ICTs based services are provided by the private operators.
TABLE 1: FEE UNDER MANUAL SYSTEM & ICT BASED SYSTEM
Sl. No Service Fee for ICTs based System
(In INR3) Fee for Manual System
(in INR) 1. Birth Registration 15 40 2. Death Registration 15 00 3. Gumasta/ Trade License4 NA NA 4. Alteration In Gomasta/Trade Licence NA NA 5. Correction of Birth Certificate 00 00 6. Correction of Death Certificate 00 00 7. Ration Card5 15 00 8. Alternation of Ration Card 00 00 9. Surrender of Ration Card 00 00 10. Inclusion of Name in Ration Card 15 00 11.. Domicile Certificate 15 00 12. Marriage Certificate 15 20 13. Income Certificate 15 00 14. ST/SC Caste6 Certificate 15 00 15. OBC Cast 7Certificate 15 00 Total There is a significant difference between the Number of customers for both of the
services:
Following table clearly indicates that the customers for manual system are more than five times as compared to ICTs based system.
3INR is Indian National Rupee, the official currency of India 1 INR is equal to 0.0221352 $ 4Registration, Renewal or modification of Shops & establishment 5A card certifying the bearer's right to purchase rationed goods 6Scheduled Cast (SC) is any of the historically disadvantaged Indian castes of low rank, Scheduled Tribes (ST) is a member of any of the aboriginal peoples of India. Both of the groups are, now under government protection and enjoy constitutional privileges.
7Cclasses involved in menial tasks: in India, an official categorization of people involved in tasks regarded as menial or excluded from other castes, who are considered disadvantaged and granted special treatment

A Comparative Analysis between ICTs Based Public Service Delivery System and Manual 231
TABLE 2: NUMBER OF CUSTOMERS BETWEEN TWO SYSTEMS
Sl. No. Name of the service
No of customers in CHOiCE8
% to total no of customers
No of customers in Manual System9
% to total no of customers
Total No of Customers in Both Systems
1. Birth Certificate
4321 40.95 6230 59.05 10551
2. Death Certificate
2684 38.77 4238 61.23 6922
3. Gomasta License
601 50.76 583 49.24 1184
4. Alteration In Gomasta
22 75.86 7 24.14 29
5. Correction of Birth Certificate
362 45.47 434 54.53 796
6. Correction of Death Certificate
141 53.20 124 46.80 265
7. Ration Card 461 7.38 5789 92.62 6247 8. Alternation of
Ration Card 26 7.42 324 92.57 350
9. Surrender of Ration Card
13 22.41 45 77.59 58
10. Inclusion of Name in Ration Card
07 17.95 32 82.05 39
11.. Local Residence
61 2.30 2586 97.70 2647
12. Marriage Certificate
96 5.43 1674 94.57 1770
13. Income Certificate
61 1.70 3542 98.30 3603
14. ST/SC Caste Certificate
50 0.95 5213 99.05 5263
15. OBC Cast Certificate
16 0.40 3978 99.60 3998
Total 8595 19.80 34796 80.20 43391 Significant difference in the number of customers for various services: It is
evident from the following table that Birth Certificates and Death Certificates are the most popular services among customers. The reason for this is that to access various government schemes these certificates are mandatory requirement.
8Data is collected on total number of customers who availed different services in different centers between
the period of 01‐08‐2008 to 08‐12‐2010(28 Months) 9Data is also collected on total number of customers who availed different services through manual system between the periods of 01‐012009 to 31‐12‐2010(24 Months)

232 E‐Governance: Techno‐Behavioural Implications
TABLE 3: NUMBER OF CUSTOMERS IN VARIOUS SERVICES
Sl no Name of the Service
No of Customers in CHOiCE10
% to Total Number of
Customers for Choice
No of Customers in Manual System11
% to Total Number of Customers for Manual System
1. Birth Certificate 4321 50.27 6230 17.90 2. Death Certificate 2684 31.23 4238 12.17 3. Gomasta Licence 601 6.99 583 1.67 4. Alteration In
Gomasta 22 0.26 7 0.02
5. Correction of Birth Certificate
362 4.22 434 1.24
6. Correction of Death Certificate
141 1.64 124 0.34
7. Ration Card 461 5.37 5789 16.20 8. Alternation of
Ration Card 26 0.30 324 0.90
9. Surrender of Ration Card
13 0.15 45 0.12
10. Inclusion of Name in Ration Card
07 0.09 32 0.089
11.. Local Residence 61 0.70 2586 7.25 12. Marriage
Certificate 96 1.11 1674 4.69
13. Income Certificate
61 0.70 3542 9.91
14. ST/SC Caste Certificate
50 0.58 5213 14.6
15. OBC Cast Certificate
16 0.18 3978 11.13
Total 8595 34796 Level of Customers’ Satisfaction is Higher in ICTs Based Public Service Delivery
System: 100% customers told that they feel 100% satisfied with the CHOiCE service delivery system. Whereas the customers of manual system told that they experience various problems like:
Unfriendly and uncooperative behavior of government officials: Work is not done on Sundays and other holidays. During working days also the offices are open only during the office time 10.30‐5.30. Many of the government officials are not present on their offices in time. Even if they are present they are not willing to provide information regarding the process, forms etc.
10Data is collected on total number of customers who availed different services in different centers between the period of 01‐08‐2008 to 08‐12‐2010(28 Months)
11Data is also collected on total number of customers who availed different services through manual system between the periods of 01‐012009 to 31‐12‐2010(24 Months)

A Comparative Analysis between ICTs Based Public Service Delivery System and Manual 233
1. Demand of Bribe to provide the services: Many customers complained about the demand of bribe by government employees who are on duty in manual service delivery system. If the demand is not met undue delays are caused in providing services.
2. Those with connections are served better and faster 3. Comparatively CHOiCE Centers are faster. To get a birth certificate issues a
CHOiCE centers takes only two days whereas through manual system it takes at the least seven days.
CHOiCE Centre Operators Experiencing Many Problems
Lack of adequate number of customers is the major problems faced by the CHOiCE Centre operators. This affects their income. All operators depend fully on the income of the centers. Although they have also started other works like typing, DTP etc but still the income is not satisfactory and that has been the reason for closing of 08 centers. It’s an obvious question that instead of better service delivery system and higher customer satisfaction level why CHOiCE Centres are not getting customers. Even the fee for most sought after service birth certificate is double in manual system. According to CHOiCE operators. The only reason is lack of publicity of CHOiCE centers facilities. The information regarding this facility is only available on the website that is not accessed by most of the common citizens. Government is not keen to publicize the scheme and CHOiCE operators do not have resources for this.
TABLE 4: GENDER RESPECTIVE OF CHOICE USAGE
Sl no CHOiCE Centre No
Total Customers
Service Seeking Pattern of Male Customers
Service Seeking Pattern of Female Customers
Total Male Customers
For self
For Other Male
For Female
Total Female
Customers
For Self
For Male
For other Female
1. C‐1 1046 848 320 387 141 198 48 63 87 2. C‐2 553 469 135 347 60 84 12 23 49 3. C‐3 1834 1490 347 576 567 344 35 143 1664. C‐4 1465 1185 477 510 198 280 56 130 94 5. C‐5 1039 805 273 403 129 234 56 80 98 6. C‐6 636 564 245 239 80 72 20 23 29 7. C‐7 968 803 380 230 193 165 40 58 67 Total 8595 6164 2177 2692 1368 1377 267 520 590
According to CHOiCE operators the concerned government officers are not committed towards proper implementation of ICTs based system. They cause undue delays in processing the documents. They also demand bribe.

234 E‐Governance: Techno‐Behavioural Implications
A Gender Perspective
Following table clearly indicates that mainly male visits the CHOiCE Centres. Services are also sought for more for males. The reason behind this is that generally the government certificates are required for government work and in India male dominate the public sphere hence the certificates are required for them mainly.
SUGGESTIONS
1. This scheme should be given wide publicity through advertisement in the local news papers, posters at the main locations in the city, local radio and TV Channels etc.
2. There must be a time bound plan to close the manual based system. Its parallel existence tempts the government officials to create hurdles for ICTs based system to solve their vested interests.
CONCLUSION
It is evident from the above analysis that e‐governance initiatives like CHOiCE have much scope in India. These initiatives are successfully providing a corruption free, easier and faster public service delivery to the common citizen. But at the same time the government officers are not keen to support these initiatives as they harm their vested interests. They also create hurdles in the operation of the schemes. This should be kept in mind that application of ICTs to the process of governance is not only requires a technical transformation but also requires the transformation in the mindset of those who have been controlling the public delivery system for ages. This conclusion is also supported by other major studies on e‐governance initiatives in India “However there are also strong vested lobbies which feel threatened by this transparent governance and many a times they were seen to do anything to either discredit a new project or not allow it to take off at all” (SAI India). Strong will at higher political and administrative levels is must for the success of such initiatives.
REFERENCES [1] E‐Governance Market in India (2011), Market Research Report, available online at
http://www.bharatbook.com/detail.asp?id=185641&rt=E‐Governance‐Market‐in‐India‐2011.html, accessed on 16‐ 05‐2011
[2] Himadri Burman (2009), E‐Governance in India: How Citizens Benefit?, (Manuscript for talk broadcasted on 07.10.2009 over All India Radio, Dibrugarh on the topic as mentioned above, available online athttp://himadri.cmsdu.org/documents/EGovernance.pdf accessed on 16‐05‐2011
[3] SAI India, “Why E Governance Projects Fail” available online at, accessed on 16‐05‐2011 [4] http://www.intosaiitaudit.org/muscat/India‐Why_EGovernance_Projects_Fail.pdf

e-Healthcare in Infectious Diseases
Subash Chandra Mahapatra1, Rama Krushna Das2, Manoj Ranjan Nayak3 and Ajita Kumar Misro4
1Professor & Director (Academic), Dept. of Medicine & GeriatricsIMS & SUM Hospital, SOA University, Bhubaneswar
2National Informatics Centre, Orissa 3SOA University, Bhubaneswar
4Berhampur University Email: [email protected], [email protected], [email protected], [email protected]
Abstract—Infectious disease will assume prominence in 21st century in developing nations. Issues related to infectious disease in the context of global health are on the agenda for health policy makers. Attention is focused on scientific challenges like vaccine development. Blunt of infection on economy and development of a nation has significant shift on approach of government towards research in the field of infectious disease. The sequencing of human and microbial genome and advances in genomics will unmask many untouched areas in this field. War of mankind with microbial world seems unending as the foe is resilient and invincible. Infectious diseases are continuing danger everywhere. AIDS pandemic, Rota virus diarrhoea in children, SARS, West Nile virus infection, Malaria, Tuberculosis are examples of emerging and reemerging infection. In this paper we are proposing a Cloud based ehealthcare service, which can be implemented, irrespective of availability of other amenities.
Keywords: Infectious Diseases, Epidemic, eHealthcare, Cloud Computing.
INTRODUCTION
Ambitious programmes by the government to provide better health care to rural people is constrained mostly due to improper planning.75% of population residing in remote and tribal areas are deprived of basic needs including health services. Unfortunately they are victims of infection and morbidity due to poverty, improper nutrition, lack of sanitation, unsuitable habitation, and air & water pollution. Outbreak of Diarrhea, Cholera, Dengue, Chicken‐guinea, Plague, acute respiratory infection (Bird & Swine flu) is major challenges. Re‐emergence of resistant or complicated malaria and MDR Tuberculosis is noticed in rural Odisha. Non‐availability of service providers in health sectors is our main concern. With our earlier experience in various projects on e‐health like e‐governance scenario in health sector in India [2], e‐gram [1] and gramsat bridging the digital divide, pulmonary scintigraphy in AIDS[4], telereferal services, A helping hand for the doctors and inhabitants of KBK district of Orissa [3] etc., we are presenting here a cloud based e‐health care service in relation to infection control in rural and tribal Odisha. In addition to Health Electronic Record (HER), Personal Health Record (PHR), Electronic Medical Record (EMR) & Hospital computerization, a new approach is e‐healthcare using cloud computing. When health care professionals plan to offer service to more patients scattered in a huge area and greater distance, they use tele‐services using information and communication technology. Because of lack of infrastructure, e‐health care may take long time to reach inaccessible remote areas but

236 E‐Governance: Techno‐Behavioural Implications
mobile services have revolutionized ICT application. Cloud is a new architecture in the field of ICT to provide expert service in emergency like epidemic and to create better awareness on infection. A concept based on virtualization applicable to mass. It is a four layered model comprising of infrastructure, hardware, platform & software used as services. Creation of a separate website for infection control and timely sending E‐mail supplemented by effective mobile use is valuable. Comparison of cloud based e‐healthcare with conventional use of mobile as a method of ICT through planned Governance will play important role in outbreak of infection in rural area. In present scenario of rural Odisha, suitable and effective use of mobile networks supplemented by cloud architecture will be discussed. Success of mobile use in most remote part of the country prompted E‐healthcare specialist to combine web based information with mobile services to reach the rural mass easily and very fast to prevent spread of infection. Medical alerts, SMS, MMS based on symptoms and signs are to be prepared. Central theme of prevention and treatment can also be prepared in advance in form of software. They may be sent to ASHA workers for guidance and awareness of people at village level. For that segment that has access to computer can derive benefit from cloud based e‐health. Only two major e‐health suits are running in India with limited facility. They are Google Health & Microsoft health vault. Google health is a personal health information centralization service containing secured personal data with user password. MS vault is a web based tool to store health information from many sources accessible to any online user.
Primary objective is to live long and healthy life. Orissa is one of the most backward states in the country with various health inequities in different geographical regions due to Poor socio economic status, lower income and lack of education. Equity is not equality .It stress on being fair and just in approach. Gajapati, Rayagada, Malakanagiri, Bolangir and Kandhamal are tribal dominated areas. Costal districts like Ganjam, Puri, Cuttack, and Balesore are accessible plane areas. Low human development index seen in tribal areas are consequence of low income, poor education and inadequate health services. Improper supply and demand of health care, burden of infectious disease and under nutrition, poor housing and lack of education reflect the low socioeconomic status. 80% of population lives in rural areas, 47% are BPL, 95 casts and 62 tribes live in Orissa.
Web based information with cloud computing, Email, preparation of suitable mobile SMS, data storing & updating will be helpful & rewarding for inflection control at personal & community level in rural area.
With already ongoing UID project “Aadhaar” of G.O.I this cloud based e‐healthcare implementation is feasible in rural India. This paper describes the architecture component and scope for future enhancement.
CURRENT INFECTION SCENARIO
Oral Transmission by Food and Water causes Diarrhoea, Cholera, Gastro enteritis and Typhoid. Droplet spreads Pneumonia and Influenza. Vector Borne diseases are Malaria,

e‐Healthcare in Infectious Diseases 237
Filaria, Dengue, Chikengunia, sleeping sickness, schistosomiasis, kalazar and Japanese encephalitis. First four are prevalent in Orissa. Blood Contact spreads Hepatitis B, Hepatitis C& HIV. Follow up of suspected cases of H1N1 using the e‐health concept to create an electronic Medical Registry “Flu tool” has been found to be useful. Preparing a format containing Virologic test result, Indication for admission, Grading the severity, notification to Infection Control Committee and follow up may be attempted. Design of software services for computer based infection control and Antibiotic Management is necessary. Use of different types of mask, suppression of coughing and sneezing, and use of Tami Flu prevents mortality. Delivery of Malaria R.D.T (Rapid Diagnosis and treatment) and challenges of end user in testing and its interpretation are to be simplified. Malaria treatment are: 1) Presumptive treatment to be given to Test Negative patent by Full course of Chloroquin 2) Evidence based medicine to test positive patients by giving Artesunate Combination Therapy containing Artesunate , Sulphadoxin & Pyrimethamine. Integrated vector control for Malaria, Dengue, Filaria and Chikengunia can be achieved by Spraying of DDT , use of Insecticide Treated Mosquito Net (ITMN), Mosquito Repellents and Biological control by releasing larvivorous fish in breeding sites .In Aug. 2011,an epidemic of Dengue has started in Anugul district of Orissa with high morbidity and mortality. Adequate steps are being taken for its control.
Pattern of Infection in Developing and Developed Countries
Measles, diphtheria, pertussis, tetanus, Hepatitis B, Malaria, Diarrhoea, Gastroenteritis and Meningococcal disease are fatal in children but preventable. Chronic and persistent disease is TB, Leprosy, Filaria, Trypanosomiasis and Scistosomiasis. Epidemic /pandemic diseases are Cholera, Typhoid, influenza, sars, H1N1, HIV, and TB in HIV, Kalazar, Typhus and Relapsing fever. Vector borne infections are Dengue (India Thailand), Plague (Vietnam) African Trypanosomiasis (Zambia,) Anthrax (USA—bioterrorism), Yellow Fever(Kenya, Nigeria).
In developed countries, the pattern is modified by Immunisation, Antibiotics, balanced food, hygienic living. Good housing & improved sanitation Factors influencing infection in developed countries are 1) VACCINE polio, smallpox are eradicated. Diphtheria, Tetanus, Pertussis has decreased. New vaccines are (H.Influenzi A for H1N1), Strepto.pnumoni, Hepatitis A, Typhoid ,HIB(Hemophy.Influenzi.B) HepatitisA&B , MMR, Chickenpox, BCG, Plague, Meningococcal A&C(2)Food Processing problem leads to Salmonella & Campylobacter infection by poultry and eggs. E‐COLI cause haemorrhagic colitis by Beefs. LISTERIA spread through soft Cheese.3) Sexual Behaviour influences STD, HIV.4) Anti‐microbial resistance produces MRSA, gm.‐negative bacilli, St.Pneumoni, Vancomycin resistant Mycobact.TB & Enterococci infections. 5) International travels spreads Yellow fever, HIV, malaria, influenza A , Pulmonary, Travellers diarrhoea, Legionnaires disease from holiday homes.6 )Immunosupression is associated with cancer chemo ,organ transplant. 7) Re‐emergence of TB with HIV globally, polio in Netherland,Streptococal infection & Rheumatic fever in USA, Hepatitis A, Measles, Typhoid and Diphtheria, Malaria in USA and resistant Malaria in India.

238 E‐Governance: Techno‐Behavioural Implications
Transmission and Spread
Contact spreads HIV, Hepatitis B, and skin infection. Soil contamination leads to Tetanus, Burle ulcer, Hookworm, Leptospirosis Schistosomiasis. Air borne diseases are Influenza A&B, Measles, Mumps, Chickenpox, Rubella, TB, RTI, Pertusis.Waterborne & feco‐oral spread Legionnaires, cholera, Typhoid, Hepatitis Bacillary dysentery, E.COLI, Campylobacter, Toxoplasma. Trans placental spread occurs in Rubella, Toxoplasma, HIV, Syphilis, CMV, Malaria. Nosocomial infections are HepatitisB and C, HIV, Pseudomonas, Proteus, Staphylococci. Zoonoses (Animal to human) following foods transmit specific diseases: Beef/pork spreads cysticercosis, Toxoplasma, Trichinella.Poultry eggs transmits Typhoid, E.coli, Campylobacter, and HINI. Infected milk causes, Brucellosis, and Campylobacter. Cheese spreads listerias and Brucellosis. Dog Bite causes Rabies. Dog faeces transmits Toxocara, Toxoplasma, Hydatid cyst.Rat/dog urine may spread Leptospira and LASA fever. Birds cause Psittacosis. Fish cause tapeworm infection.
Disease control can be achieved by vaccination (Yellow fever, Hepatitis B, H1N1, etc.),vector control (Malaria, Filaria, Kalazar, Dengue, Sleeping sickness, Plague)Better living standard (Diarrhoea, Plague, Typhus,)Safe food &water (food poisoning, Cholera, Gastroenteritis, Typhoid, Dysentery, Hepatitis). The disease can reappear if control is not perfect. Epidemic of cholera in Asia and meningitis in Africa are examples of poor and temporary control. Migration to urban slum leads to gastroenteritis, TB, AIDS. Deforestation leads to Malaria, Kalazar, and Schistosomiasis. Lack of resources, low budget, and costly treatment of HIV are impediments. Finally epidemic outbreak in India is linked to natural disaster like famine, flood, draught, earthquake causing highest mortality and morbidity. Asha workers have been trained to function as Fever Treatment Depots (FTD) in 50 blocks of 21 districts of Orissa. The Objective is to eradicate Filaria, Leprosy and Polio, to reduce mortality due to malaria, TB, Vector borne and Water borne diseases, to control STD, HIV, Malaria to reduce under nutrition and Anaemia. Southern hilly and Tribal dominated districts are plugged in Illiteracy, poverty, inaccessibility. There is underutilisation of health services due to lack of transport, lack of information, social and cultural habits, remote and terrain location. Proper manpower deployment, facilities and infrastructure, development of Information, Education and Communication (IEC) and addressing of health seeking behaviour of tribal population and access to health services will be helpful.
Prevention
Hand washing, personal hygien, sanitation, hot food, safe boiled drinking water, effective use of vaccine and immunization schedule, awareness on mode of transmission, and route of entry.
Food: Improper processing and storage of food like chiken, meat, fish, egg, milk products and infected vegetables, salads should be prevented. Soil contamination, fermentation are also important factors .Water source disinfection is top priority .Animal Contact with Cattle, goat, dog cat rat, bird pig should be avoided

e‐Healthcare in Infectious Diseases 239
Sms and E-Mail for Various Diseases
Cholera ,Diarrhoea and gastroenteritis SMS “hot food boiled drinking water”,“hand washing with soap” email “diarrhoea spreads by infected food & water.Do not expose food to insect &fly. Take fresh, hot food”
Malaria & Dengue: SMS “spread by mosquito, use mosquito nets”, “clear stagnant water”, “clean the surrounding” email: “Aedes mosquito bites in the day. Cover whole body. Use ITMN (insecticide treated mosquito net) to prevent dengue, use insecticide spray and mosquito repellent. RDT (Rapid diagnosis and treatment) for malaria”
For Hepatitis B&C, HIV‐‐‐‐‐SMS “spreads by blood contact and sexual route. Be careful in hospital, blood bank, diagnostic centres & hair cutting saloon”. E mail: “needle prick, blood contact, unprotected sex transmit aids. Attend VCTC/ART CENTRE for help”
CHALLENGES AND INITIATIVES
There are various challenges that are faced by government while providing better healthcare services in rural and backward areas of the country. One of the reasons is the unwillingness of doctors to work in rural hospitals, due to lack of other basic amenities like education, professional knowledge updating, communication etc. It has been noticed that, many a time due to lake of proper awareness among the rural population regarding treatment as well as preserving the data, most of the patients lose their medical records quite often. Even, once the people come to urban hospitals, they need to wait for days to get an appointment. Even after appointment and initial treatment, follow‐ups becomes an issue, as the patient needs to go again and again to the same doctor. In urban areas, every hospital has their own IT infrastructure, their own book keeping process. So every time a new hospital is referred, the data on old treatment is lost. These problems mentioned above emphasizes the importance of a mechanism, by which all of them can be taken care of. This realistic possibility arises due to the fact that information technology has done so many wonders to solve these types of issues. Recently cloud computing has been picking quite a bit of interest as a platform for solving many such issues.
Institute of medical science and SUM hospital is a medical college under Sikshya O Anusandhana (SOA) University, with a tertiary teaching hospital having all super speciality departments providing quality healthcare at affordable cost. Hospital service and healthcare are being upgraded by computerisation and application of ICT in various health programmes. Of late a special website foe geriatric and infection control is under development to create awareness among elderly and needy people for prevention and control of diseases. A separate website s for infectious disease updated containing data and email alert to Asha, teachers and social workers/ NYKS volunteers are under preparation.
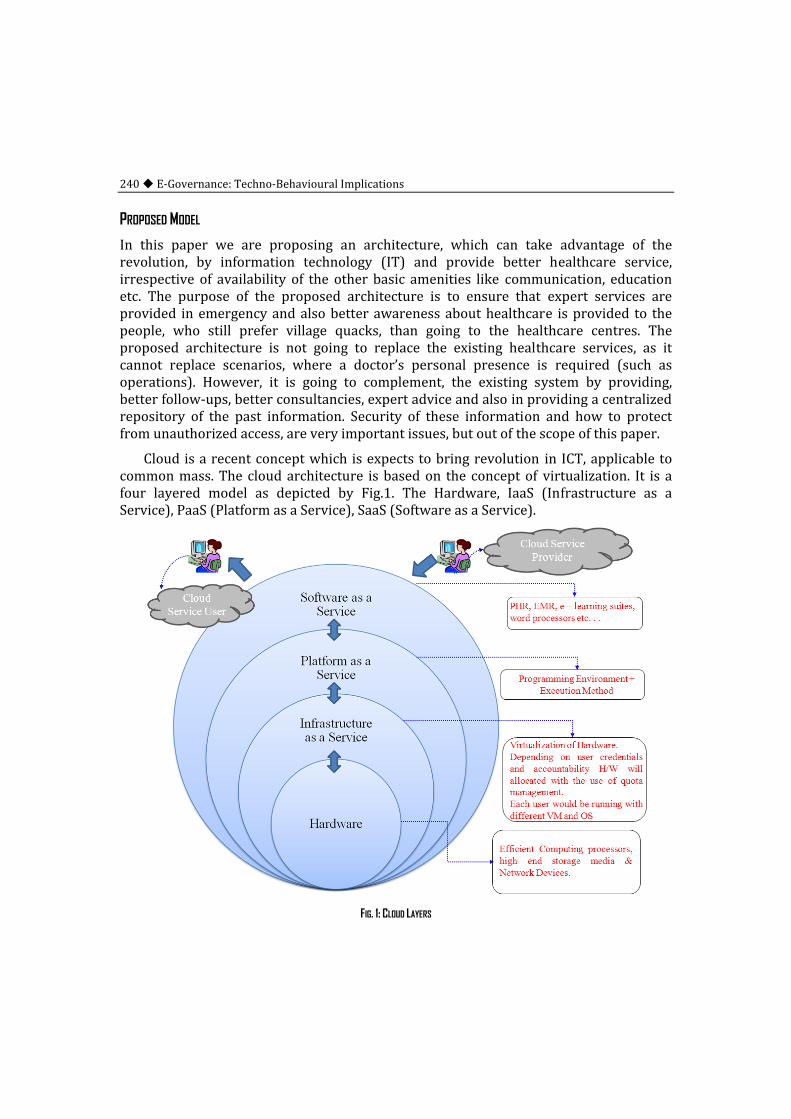
240 E‐Governance: Techno‐Behavioural Implications
PROPOSED MODEL
In this paper we are proposing an architecture, which can take advantage of the revolution, by information technology (IT) and provide better healthcare service, irrespective of availability of the other basic amenities like communication, education etc. The purpose of the proposed architecture is to ensure that expert services are provided in emergency and also better awareness about healthcare is provided to the people, who still prefer village quacks, than going to the healthcare centres. The proposed architecture is not going to replace the existing healthcare services, as it cannot replace scenarios, where a doctor’s personal presence is required (such as operations). However, it is going to complement, the existing system by providing, better follow‐ups, better consultancies, expert advice and also in providing a centralized repository of the past information. Security of these information and how to protect from unauthorized access, are very important issues, but out of the scope of this paper.
Cloud is a recent concept which is expects to bring revolution in ICT, applicable to common mass. The cloud architecture is based on the concept of virtualization. It is a four layered model as depicted by Fig.1. The Hardware, IaaS (Infrastructure as a Service), PaaS (Platform as a Service), SaaS (Software as a Service).
FIG. 1: CLOUD LAYERS

e‐Healthcare in Infectious Diseases 241
Infrastructure as a Service
As there would be a larger mass to utilize the resources, a suitable quota management is enforced to distribute the hardware among the different users. Infrastructure refers to the Operating System and its virtualization. The same hardware will behave as different machines for different users. They will be allocated with dedicated CPU, Memory, Disk virtually depending upon their accountability and creditability.
Platform as a Service
There are certain hospitals who would be very much interested to run their own applications, in this situation the platform as service model provides them a base to execute the same over their required programming environment. The service should be capable enough to provide different execution environment.
Software as a Service
The most important from the user point of view is the application software as a service. Here the selected software will be availed to the user as service, which means that they need not have a disk at their local machine installed with the application software suite. They would be accessing the software online and storing the data back in the cloud. All the software such as HER, PHR etc… is availed web enabled modules for the clients.
The management of the services of different levels and the user accountability is implemented by a cloud manager. The following services can be included in the cloud, so as to improve the current status of e‐Healthcare.
Personal Health Records (PHRS) For Public
An electronic application through which individuals can access, manage and share their health information, and that of others for whom they are authorized, in a private, secure, and confidential environment [5]. There are several types of PHR like paper – based, pc – based, web – based etc… In a scenario of cloud computing we would like to suggest the web based PHR as of our purpose. This service allows consumers to maintain their information in private online accounts, which they access by logging in with a unique user name and password. Web‐based platforms do not require software other than a Web browser. They may include secure e‐mail, document sharing, and video‐conferencing for home consultations [7].
Electronic Medical Records (EMRS) for Hospitals
An application environment composed of the clinical data repository, clinical decision support system, controlled medical vocabulary, computerized provider order entry, pharmacy and clinical documentation applications [6]. The EMR and the PHR are not one and the same. The difference lies with the mode of operation. The PHR is maintained by the patient itself whereas the EMR is operated by the care delivery organizations like hospitals, clinics and physician’s office.

242 E‐Governance: Techno‐Behavioural Implications
E–Learning Suite for Doctors, Registered Medical Practitioners and NGOS
An e–learning application in the cloud will work completely as a training technology suite for doctors, practitioners and NGOs in an interactive mode [8]. Doctors can learn new surgical techniques, advanced medical equipment technologies whereas practitioners and NGOs can know about the distribution of medicines for common diseases. E‐Learning 2.0 can be used as a standard for this purpose [9].
Online Consultation Suite
The cloud manager should organize a panel of doctors and specialist who will provide service to the patient 24 X 7 on shift duty basis. Patients should have flexibility to choose a doctor as per their problem and chat through various mechanisms such as VoIP. As a part of enhancement subsequently we will add the language interfacing modules that will convert the regional language into English. Thus the patients in the villages can consult with an expert not of their region.
FIG. 2: THE PROPOSED SOFTWARE AS SERVICES OFFERED BY E–HEALTHCARE CLOUD
Medical Alert Programme through Video Processing
Medical Alert is a program that provides important information to the person who turns on your device in your treatment in case of an emergency. Are you allergic to a drug? What is your blood type? Who should be contacted if you fall seriously ill? What type of Medical coverage do you have? What is your medical history? These kinds of data should

e‐Healthcare in Infectious Diseases 243
be visible through this program. Serious mistakes can be made during emergency medical treatment unless the special problem of the person is known [10]. A diabetic patient could be neglected and die because he/she was thought to be intoxicated. A shot of penicillin could end the life of one who is allergic to it. Persons dependent on medications must continue to receive them at all times.
CONCLUDING REMARKS
Creation of an interactive website with regular updating during outbreak of epidemics of infectious diseases like Dengue, Chikengunia, Influenza A(H1N1 flu), Cholera, Gastroenteritis etc. supported by SMS alert, e‐mail, cloud computing will significantly reduce morbidity and mortality. Awareness programme on spread of diseases and its arrest can be addressed in remote and inaccessible areas by utilising ICT efficiently and effectively. Emergence of new infectious disease (swine flu) and re‐emrgence of existing known infection like resistant malaria, MDR Tuberculosis in a more aggressive form have created panic in society in both urban and rural population . This can be better handled by spreading message on preventive measures and facts regarding vaccination to enable people to utilize available health services. Efficient use of e‐healthcare applications results in improved access to patients and reduced cost for patients and also reduces the isolation of doctors.
REFERENCES [1] “e‐Grama: A tool for bridging Digital Divide in Rural India” : Das RK, Patra MR and Mahapatra SC(2008).
proceedings of ICEGOV‐2008, Cairo, Egypt, ACM Publication PP: 361‐6. [2] “Current e‐Governance Scenario in Healthcare sector of India”: Mahapatra SC, Das RK, and Patra
MR(2008). Proceedings ICEG 2008, New Delhi Gift Publication PP: 121‐127. [3] “Telereferal service of NIC – A helping hand for the doctors and inhabitants of KBK district of Orissa”:
Das R.K, Dash SS et al., (2007). Proceedings of ICEG 2007Gift Publication PP: 253‐8. [4] “Pulmonary Scintigraphy in AIDS”: Mahapatra SC (2004). Updates in Medicine 2004 Vol‐1 PP: 32‐5 [5] Trisha Torrey (2010): What is a Personal Health Record (PHR)? One Type of Digital Patient Health and
Medical Record, http://patients.about.com/od/electronicpatientrecords/a/phr.htm, Accessed on 14 August 2011
[6] “Electronic Patient Records”: Dave Garets, Mike Davis (2005). Healthcare Informatics. [7] Markle Foundation (2004): Connecting for Health. “Connecting Americans to their Healthcare: Final
Report”, http://www.connectingforhealth.org/resources/wg_eis_final_report_0704.pdf, Accessed on 14 August 2011.
[8] “'Minds of Fire' Open Education, the Long Tail, and Learning 2.0”: John Seely Brown, Richard P. Adler (2008). Tata McGraw, Hill.
[9] “Review of Learning 2.0 Practices: Study on the Impact of Web 2.0 Innovations on Education and Training in Europe”: Redecker, Kirsti Ala – Mutka, Margherita Bacigalupo, Anusca Ferrari, Yves Punie (2009). Official Publications of the European Communities.
[10] Richard M. Hamilton (2004): “Who needs Medic Alert ? The Police Notebook”, http://www.ou.edu/oupd/ medalert.htm Viewed on 14 August 2011.

Analyzing the Impact of Mobile Governance in Maternal and Child Healthcare in India
Aman Kwatra and Stan Kachnowski Healthcare Innovation & Technology Lab, United States Email: [email protected], [email protected]
Abstract—India, with over 1.2 billion citizen and17.5% of the world’s population is struggling to provide a reliable and cost effective healthcare system for its people, which is a monumental challenge due to its vast geography and the scarcity of resources. The healthcare quality gap is worse for the healthcare facilities in rural areas with especial consequences for maternal and child care (MNCH). India's maternal mortality rate is about 212 per 100,000 live births (200709) and infant mortality rate is at 50 per 1,000 live births in 2009, way behind its Millennium Development Goals. Many initiatives to address these problems make use of Information and Communication Technologies (ICT) (Aarogyam and other innovative programs). This paper reviews and analyzes the impact of such initiatives and their contribution to MNCH care. The paper also proposes next steps to be taken by the Indian government to support MNCH initiatives.
Keywords: Healthcare, maternal care, child care, egovernance, mgovernance
INTRODUCTION
India, the 2nd most populous country in the world with a population of over 1.2 billion people, has one of the fastest‐growing economies in the world. Its annual economic growth is recorded to be about 8 to 9 percent in the last 10 years [1]; However, India is still a country undergoing development transition, with over 700 million of the citizens living on incomes less than $2 a day [2]. With nearly 60% of the country living in poverty, India is facing a huge challenge in creating a robust healthcare system for its citizens. In building this system, the country faces a severe scarcity in terms of both material and human resources.
MATERNAL AND CHILD HEALTHCARE (MNCH) IN INDIA
One of the biggest problem areas for healthcare delivery in India is Maternal and Child Healthcare (MNCH). As a result of poverty and inadequate healthcare system, almost 2 million young children die each year which amounts to one‐fourth of the world’s infant and child deaths. India has a similar ranking for maternal mortality: around one‐fourth of the world’s maternal deaths, approximately 120,000 women a year occur in India. According to Indian government’s data [3], maternal mortality rate (MMR) is about 212 per 100,000 live births (2007‐09) and infant mortality rate (IMR) 50 per 1,000 live births in 2009. Improving the survival rate and health of mothers and children is crucial to improve the future of people of the country as well as addressing the political challenge which is represented by this inequity. Certainly it would be impossible for India to meet its MDGs without accelerated and sustained progress in MNCH.
The Ministry of Health and Social welfare has launched several programs to address the MNCH need. In September 2009, the Ministry inaugurated a program called Navjaat

Analyzing the Impact of Mobile Governance in Maternal and Child Healthcare in India 245 Shishu Suraksha Karyakram[4] (which is a new born care programme). The government also launched Janani Suraksha Yojana (JSY), an initiative that promotes delivery in hospital settings. The latter program has increased its number of beneficiaries from 7.39 lakh in 2005‐06 to about 1 crore in 2009‐10, registering an increase of 10 lakh during 2009‐10.
Most recently the ministry instituted a system for name based tracking of pregnant women and children for ante‐natal Care and immunization. The tracking system will record the contact numbers of patients and their health providers. This will assist in monitoring the health status of pregnant women and infants / children across the country. A call‐centre is also being established to cross‐check the health services delivered to these mothers and children.
GROWTH OF TELEPHONY IN INDIA
The Indian telecommunication industry [5] is the fastest growing in the world after China with about 811.59 million mobile phone subscribers as of March 2011. After China, India boasts the second largest telecommunications network in the world based on sheer volume of wireless connections. The number of landlines in India, as of March 2011, stands at 34.73 million connections. The Tele‐density in India as of March, 2011 is 70.89 % and is expected to reach 75% in 2013. Mobile phones have huge presence in each strata of society and have penetrated the most geographically remote areas, which makes it the most preferred medium of communication, ahead of the internet, which is only in use by 7% of the population.
M-GOVERNANCE INITIATIVES IN MATERNAL AND CHILD HEALTHCARE
With the rising penetration of mobile phones and landline phones in the country, several organizations have adopted mobile technology as a powerful tool to improve MNCH especially in rural areas which lack other type of resources. The following sections describe several pioneering projects which make use of mobile and landline telephony to address the Maternal and Child healthcare:
Project Aarogyam
Aarogyam [6], "Complete freedom from illness" in English, is a project that aims at universal healthcare, with an especial focus on mothers and children. Preventive health is the central theme of this initiative. It is India's unique end to end community based digital health mapping. Aarogyam is based on the idea that “Knowledge is Power”. It provides family centered information on child immunization, ante natal care/ pre natal care (ANC/PNC care), etc by cellular telephone, thereby ensuring health care for the families involved. This model attempts to bridge the digital divide by using voice based services instead of text services. As of now, the project is successfully running in two districts of Uttar Pradesh (Baghpat and JP Nagar), covering around 40 lakh people and

246 E‐Governance: Techno‐Behavioural Implications
benefitting around 1 lakh families. The project is the brainchild of Ms. Ritu Maheshari (IAS) and Mr. Mayur Maheshwari (IAS) and becomes operational in October, 2008.
They began with a comprehensive survey of district was conducted which included more than 13 parameters and assigned a unique health identification number to each family. The survey results were uploaded into database housed on a central server with links to IVRS (Interactive Voice Response System). This project is based on a four pronged strategy [7]:
Proactive Approach
Aarogyam situates the citizen at the centre of its healthcare model and by providing automatic telephone and SMS alerts to each family in Hindi. The messages address the following themes:‐
• Immunization details for children up to 2 years of age and information about the place and date for future vaccination as well as keep track of previous immunization.
• ANC/PNC information for pregnant and lactating mothers as regards due date for Tetanus injection, tablet intake etc.
• Institutional delivery about Expected Date of Delivery (EDD), devolving information related to Janani Suraksha Yojana (JSY) and benefits therein.
• Generating specific calls for Pulse Polio campaign, also emphasizing need to bring child to booth.
Interactive Approach
• The model allows citizens to interact with the system, whereby through in‐dial option on a helpline number, one can gather maternal and child health care information
• Citizens can also dial‐in the helpline numbers and lodge specific health related complaints.
• The Integrated Voice Response system would record all complaints lodged and the complainant shall be given a number against his/her complaint.
Reactive Aproach
• It acts on information fed‐in through complaint recording mechanism, whereby complaints generated are forwarded to the concerned Medical Officer/ANM through Auto Dial up/SMS mode.
• This system would be linked on web based portal, as to enable DM/ CMO to monitor and check pendency status. Another aspect is strengthening of the actual delivery mode by generating reminder calls to ANM's for all uncovered families per village.
• The reminder calls also go to the family concerned and village pradhan for ensuring all round participation at the village level.
Analyzing the Impact of Mobile Governance in Maternal and Child Healthcare in India 247
Educative Approach
• Aarogyam provides educative support to various health campaigns like Pulse Polio, Anti‐Epidemic campaign, PNDT tests, JSY, etc.
• It can also be integrated with campaigns for other departmental activities as in Education, ICDS, Total Sanitation, etc as and when needed. All above tools clearly demonstrate the incremental output capacity of Aarogyam, whereby it leads to betterment of socio‐economic status for one and all.
Achievements of this Project
• Improved responsibility and accountability of service providers. Instant messages and calls to service providers have made them (Medical Officer/ANM's) more responsible and accountable. This helped to ensure the timely delivery of health care services to the communities.
• Transparency and stake holder’s participation: With the help of Aarogyam, transparency in service provisions has been ensured. The approach also ensures the participation of different stakeholders at different level such as ICDS, ASHAs and village Pradhans.
• The model has helped health department to refocus its strategy and change to Preventive Medicare whereby on the basis of demand generated and complaints lodged in, one can immediately take corrective steps and achieve results.
• Improvement in measurable indicators: So far as measurable health indicators are concerned, there is a positive trend over a period of time. Within less than 6 month of time the indicators have started showing encouraging results.
• Pregnancy registration has increased from 2373 to 2830 over a period of three months. 3rd ANC and 2nd TT dose are also showing a very good result after implementation of Aarogyam. It should also be noted that these are the results without much community mobilization efforts. It is planned to supplement the Aarogyam with systematic community mobilization activities by ASHA, ANM and village pradhan.
• Similarly a good trend in institutional delivery is evident after implementation of Aarogyam in the district. During the period of March 2009 it was 10,992 (79.40 %) which went up to 12774 (92.27 %) in the month of March, 2010 after initiation of Aarogyam (District Baghpat). A similar trend has been observed during the same period in JP Nagar district where Aarogyam is being implemented.
• Achievement in child immunization is also very encouraging and showing a consistent improvement. It is evident from BCG to measles that the innovative approach has started showing result. For DPT Booster, the rise has been tremendous, from 20104 (55.98 %) in March 2009 to 27696 (75.80 %) in March, 2010 (District Baghpat).

248 E‐Governance: Techno‐Behavioural Implications
• The best result has been in terms of knowledge empowerment of the henceforth left‐ outs, economically/socially impoverished families. Sitting at home one gets specific knowledge about one’s health profile, and this has resulted in a tremendous hike in demand for health related services especially immunization.
• The project has provided a specific health database wrt measurable indicators of the target group and each individual therein. Having access to this, our entire future strategy wrt disease control can be planned and thereby made highly focused.
Recognition
• The project has also won the prestigious NASSCOM SOCIAL INNOVATION HONORS‐ 2010[8].
• M‐billionth awards south‐Asia 2010 ‐ Supported by Digital empowerment foundation (A south Asia level mobile governance initiative)
• Nominated by the U.P. State Govt. for Prime Minister's Award for Excellence in Public Administration
• Winner of National e‐governance award.
Project Manthan
This four‐year, $4 million initiative [9]—funded by the Bill & Melinda Gates Foundation—is aimed at improving the health of the mothers and newborns in Northern India. Uttar Pradesh, a northern Indian state, has the highest percentage of maternal and neonatal deaths in India. Launched in November 2009, the project aim to provide support and assistance to the Department of Family Welfare, Government of Uttar Pradesh to implement evidence based maternal and newborn health (MNH) interventions during antenatal, delivery and the immediate postpartum period, and the first twenty‐eight days of life.
The Department of Family Welfare, has identified two districts—Jhansi and Bahraich—to demonstrate and disseminate for bringing evidence based maternal and neonatal health interventions to scale in Uttar Pradesh; the results and outcomes of which are likely to act as a benchmark for future resource allocation to maternal and neonatal health programs in the state.
The project’s activities span three inter‐related components [10]:
Plan: Work collaboratively with the State Government and other stakeholders to strengthen maternal and neonatal health participatory planning and implementation processes that lead to increase in coverage of evidence based maternal and neonatal health interventions in public and private sectors.
Demonstrate: Demonstrate and document operational strategies that expand coverage of evidence based maternal and neonatal health interventions in the two districts, Jhansi and Bahraich.

Analyzing the Impact of Mobile Governance in Maternal and Child Healthcare in India 249 Advocate: Advocate at district, state and national levels to promote widespread
adoption and scale up of evidence based maternal and neonatal health interventions and operational strategies based on existing evidence as well as evidence generated through experience in two districts.
Project Manthan has launched an initiative called as m‐Sakhi which is a personalized, customized & interactive mobile based application for ASHAs (community workers). It provides multimedia content to support them through voice text, image and voice as well as help them to improve their interactions with the beneficiaries of this project as well as management of their payments.
Rohtak Administration Immunization SMS initiative
The Haryana government has launched new software to send web based SMS alerts on scheduled dates for immunization to people in the Rohtak district of state [11].
The software‐ 'Immunization Information System'[12], is the brainchild of Vikas Gupta, 2001 batch Haryana cadre IAS officer and deputy commissioner of Rohtak. The launch of the software in the district has made Rohtak the first district in Haryana to have software wherein parents will be informed about the immunization dates through an SMS. The system was introduced while keeping in mind the indifference of parents towards maintaining proper immunization records and vaccinating their children against polio, hepatitis B, measles and other such diseases.
The SMS will be sent to the parents/guardians of children below the age of 5 years thrice. The first SMS will be sent 10 days prior to the immunization date, the second will be sent three days prior to the immunization date and the last one will be sent on the day of immunization. The project has been initiated in the rohtak and maham areas of district rohtak and within the first month of its operation about 2100 children were enrolled for this initiative. This mobile number is fed into our system with details of the child and the immunization so far. While such a system was needed to drive home the importance of vaccination in rural areas, the response from parents registering their numbers for reminders is also catching up. This assumes special importance given the fact that against 100 per cent coverage, Haryana has achieved only 65 per cent coverage in the vaccination program according to the last national family health survey, which was conducted in 2005.
The advantage of such system is its simplicity and low costs. With the SMS costs nearly 1 paisa per message the total cost of reminding the parents for the upcoming vaccination is just 9 paisa which is a meager amount. Yet it is found to be highly effective in increasing the rate of immunization/vaccination among the target groups.
Steps Needed to be Taken by to Encourage Such Initiatives
• The government should encourage the development of technical infrastructure such as 3G, internet etc. in the rural areas by public enterprises (BSNL, MTNL), private operators as well as public private partnerships.

250 E‐Governance: Techno‐Behavioural Implications
• Government should tie up with such initiatives and provide them with necessary trainings for local health workers about new technology.
• It is important to make these initiatives self sustainable for their survival in long term as well as growth.
• A Public Private Partnership model can be developed to support such initiatives where corporate world can contribute as a part of their Corporate Social Responsibility.
• An integration platform should be made to assimilate the knowledge that each initiative possess. This will help in tracking the progress on a larger scale as well as adopt the best practices and setting benchmarks. Experts from government bodies can provide consulting to these organizations to increase their effectiveness as well as solve the issues that they are facing.
• A national level database as well as tracking system should be enabled to keep track of all such activities and create synergies between them. This will also help in effectively monitoring the patterns and changes that will emerge as a result of such initiatives.
CONCLUSION
Mobile governance due to the sheer penetration of mobile technology is poised to play a crucial role in impacting the Indian healthcare system especially the maternal and child care. But at the same time the onus lies on the government to provide a suitable environment through its policies and infrastructure to encourage such initiatives by both public as well as private entities. The government should be very careful and balanced in its approach towards its policies as it must act as an enabler and facilitator rather than a controller which can have an adverse effect on these activities.
REFERENCES [1] Aarogyam, India's first end to end digital health mapping & pregnancy tracking. Available at:
http://aarogyam.co.in/aarogyam%20brochure.html accessed August 5, 2011. [2] Department of Administrative Reforms & Public Grievances, Government of India, 14th e‐Governance
awards 2011: p:15 [3] E‐Health Online, ICT is a vital tool for efficient delivery of healthcare services. Available at:
http://www.ehealthonline.org/interview/interview‐details.asp?Title=%93ICT‐is‐a‐vital‐tool‐for‐efficient‐delivery‐of‐healthcare‐‐services%94&interviewid=728 accessed July 31, 2011.
[4] International Monetary Fund (IMF). Country specific data and economic indicators. Available at: http://www.imf.org/external/pubs/ft/weo/2011/01/weodata/weorept.aspx?sy=2008&ey=2011&scsm=1&ssd=1&sort=country&ds=.&br=1&c=534&s=NGDPD%2CNGDPDPC%2CPPPGDP%2CPPPPC%2CLP&grp=0&a=&pr.x=49&pr.y=13 accessed August 5, 2011.
[5] IntraHealth International. The Manthan project in India. Available at: http://www.intrahealth.org/page/the‐planning‐for‐improving‐maternal‐and‐neonatal‐health‐in‐northern‐india‐project accessed August 9, 2011.
[6] Ministry of Health & Family Welfare, Government of India, Navjaat Shishu Suraksha Karyakram Training Manual: 2010.
[7] Ministry of Health & Family Welfare, Government of India. Annual Report on Health: 2010 p: 4‐12.

Analyzing the Impact of Mobile Governance in Maternal and Child Healthcare in India 251 [8] Stockholm Challenge Awards 2010 finalists, Health. Available at:
http://www.stockholmchallenge.org/project/2010/aarogyam accessed August 8, 2011 [9] Telecom Regulatory Authority of India, The Indian Telecom Services Performance Indicator: January ‐
March 2011: 28th July,2011 p: 1‐10 [10] The Times of India, Immunization alerts via SMS in Haryana. Available at:
http://articles.timesofindia.indiatimes.com/2011‐03‐27/india/29194521_1_sms‐haryana‐government‐deepender accessed August 8, 2011.
[11] The Tribune, Rohtak admn to keep track of vaccination schedule will send SMSes to parents about approaching dates. Available at: http://www.tribuneindia.com/2011/20110425/haryana.htm#3 accessed August 8, 2011.
[12] United States Agency for International Development (USAID). Maternal and Child Healthcare Program in India. Available at: http://www.usaid.gov/our_work/global_health/mch/countries/asia/india.pdf accessed August 5, 2011.

Drivers and Inhibitors for the Mobile Transformation: A Case of Australian Healthcare Setting
Raj Gururajan, HengSheng Tsai and Abdul HafeezBaig School of Information Systems, Faculty of Business and Law,
University of Southern Queensland, Toowoomba, Qld 4350, Australia Email: [email protected], [email protected], [email protected],
Abstract—This study uses qualitative methodology, Semi structure interview technique to study to investigate the views of healthcare professionals towards mobile transformation in the healthcare setting. There were 17 interviews in total and participants were selected from public and private hospitals, as well as government medical sector. The purpose of this study is to understand the current progress, drivers and challenges in the process of mtransformation in the healthcare environment. The findings of the study indicate that mtransformation is still in early stages in healthcare industry. This study is able to identify some driving and inhibitors for the mobiletransformation in the healthcare domain. These factors are summarized and analysed in a systematic manner, and the result provides insight for healthcare professionals, administrators, government and nongovernment officials in developing policies and procedures for mobile transformation in healthcare domain. This study is also expected to facilitate the implementation of mobile transformation in the healthcare setting as well. Finding of this study is limited to single state of Australia and cannot be generalized.
Keywords: Mobile Transformation, Healthcare, MTransformations, Technology Management
INTRODUCTION
In recent years, Internet with mobile technology is transforming employee, supply chain, and customer interaction, and providing new innovation, cost‐reduction and revenue opportunities (Kalakota & Robinson 2001). For example, personal digital assistants (PDAs) support a wide variety of enterprise‐level applications in fields ranging from industrial manufacturing, the airline industry, to healthcare. Mylonopoulos and Doukidis (2003) defined mobile business (m‐business) as an ecosystem of individuals and business actors, in given historical socioeconomic contexts, engaging in multiple successive technological frames through a learning process of co‐creating new experiences of social interaction with the use of wireless and mobile technologies.
M‐transformation is an overall phenomenon in some industries, including healthcare (Tsai & Gururajan 2007). Mobile technologies can be helpful to business processes such as decision support, database applications and information service applications design (Carlsson 2002; Holliday, Agrawal & Abbadi 2002).Although some studies indicate there are difficulties for businesses in implementing new wireless systems (Fu et al. 2005), the overall investigation and suggested framework of business mobilisation process has not been available yet. Therefore, it motivates this study to investigate m‐transformation in Australian healthcare industry.
LITERATURE REVIEW
There are more definitions available for m‐commerce than for m‐business. For example, Gunasekaran and Ngai (2003) defined m‐commerce as any direct or indirect

Drivers and Inhibitors for the Mobile Transformation: A Case of Australian Healthcare Setting 253
transactions involving monetary value, and can be called m‐commerce as long as they are completed on wireless telecommunication networks. Some researchers also gave similar definitions (Clarke 2001; Liao et al. 1999; Tarasewich, Nickerson & Warkent in 2002).Moreover, the definitions of other researchers indicated that m‐commerce needs to build on the e‐commerce infrastructure and investments (Terziyan 2002; Tsalgatidou & Pitoura 2001).
The concept of m‐business emerged later than m‐commerce, and currently there are fewer existing definitions of m‐business. The concept of m‐business is not limited to transactions with mobile devices on wireless network infrastructures. For example, Kalakota and Robinson (2002)claimed m‐business should combine Internet, wireless technologies, and e‐business. Further, Mylonopoulos and Doukidis (2003) defined m‐business as an ecosystem of individuals and business actors, in given historical socio economic contexts, engaging in multiple successive technological frames through a learning process of co‐creating new experiences of social interaction with the use of wireless and mobile technologies. They also explained m‐business as a number of different industries (hardware, software, telecommunications, content provision, public organizations, etc.) in a process of convergence and competition toward a vague vision of a wireless future.
As to the business models, there are some definitions and classifications available. Business model is a logical architecture for products, services and information flows, including a description of the involved business actors and their roles, as well as sources of revenue (Timmers 1999; Tsalgatidou & Pitoura 2001). It is also a set of strategies for corporate establishment and management which includes a revenue model, high‐level business processes, and alliance (Leem 2002). Lam and Harrison‐Walker (2003) indicated that e‐business models are methods, concepts, frameworks, or architectures by which companies can use the Internet or the web to carry out their strategies of capturing dominant market positions, establishing viable market niches, adding value for their stakeholders, or sustaining themselves over time.
Prior studies have attempted to provide the classifications on the various business models. For example, Lam and Harrison‐Walker (2003) grouped the thirty‐three e‐business models into six groups, according to two key strategic objectives (relational and value‐based). Similarly, Lumpkin and Dess (2004) classified the Internet business models into seven types: commission‐based, subscription‐based, fee‐for‐service‐based, advertising‐based, referral‐based, mark‐up based, and production‐based. Hayes and Finnegan (2005) also collected and summarised the e‐business model classifications from the previous studies.
For the mobile business, Tsalgatidou and Pitoura (2001) believe business models should include content providers, mobile portals, WAP gateway providers (for m‐commerce over WAP), service providers, or a combination of the above. Olla andPatel (2002) further classified the mobile revenue models as mobile Intranet/extranet,

254 E‐Governance: Techno‐Behavioural Implications
customised infotainment, multimedia messaging service, mobile Internet, location‐based service, simple voice, and rich voice. Kalakota and Robinson (2002) also classified emerging mobile businesses into seven main areas: network infrastructure; access; content; commerce; software; hardware; and applications. Furthermore, Leem, Suh and Kim (2004) indicated that previous classifications are mainly focused on mobile service, not the mobile business model, and most of them only deal with services in the B2C area. Therefore, they not only summarized the classification schemes for mobile businesses according to the previous studies, but also subdivided the m‐business models into B2C and B2B/B2E.
Based on the above discussion, it can be found that the concept of m‐business is still developing, and the difference of e‐and m‐business models is vague. A clear description of m‐business and its models is helpful for further discussion.
It may be difficult for decision makers to choose the most suitable business model. Managers also face the risk of wasting company resources chasing a changing technological environment, consumer alienation, and erosion of e‐commerce market share (Hayes & Finnegan 2005). For assisting managers in conducting m‐transformation, Kalakota and Robinson (2002) have addressed a model for the process. In the second stage of this model, some key considerations are provided to help structure a firm’s capability assessment and ensure a clear alignment between a firm’s vision and its capabilities (see Figure 1). By analysing the figure, some clues for identifying the potential challenges of m‐transformation such as funding and leadership could be found. However, these challenges were not indicated nor depicted. In addition, this model was designed for general industries. Therefore, in this study aims at identifying these potential challenges and inhibitors, especially in healthcare context.
FIG. 1: KEY CONSIDERATIONS FOR CAPABILITY ASSESSMENT, KALAKOTA AND ROBINSON (2002)

Drivers and Inhibitors for the Mobile Transformation: A Case of Australian Healthcare Setting 255
RESEARCH DESIGN
The objective of this study is to explore and describe the m‐business transformation phenomenon in Australian healthcare. It uses a multiple case study method through interview techniques to explore the initial views and opinion.
The unit of analysis (the case) of this study is ‘organization’, for the reason m‐business transformation is based on the level of business/organization. The variables of interest are explored and identified from the multiple sources of evidence in this study, including face‐to‐face interviews with various positions in an organization, document collection and analysis, and demonstration of mobile systems or services.
This study used face‐to‐face in‐depth interviews as the main data collection method, with the complement of document analysis which is collected in the interviews. Most of the interviews were conducted with single respondent. The issues required to be considered prior to any form of interviewing include: what to ask (the specification of the topic guide) and whom to talk to (how to select the respondents) (Bauer & Gaskell 2006). Hence, the interview questions were developed prior to the interviews with some refinement by pilot tests. On the other hand, the respondents were chosen based on the convenience and accessibility. The interview questions were divided into five parts: personal and organizational information; status quo and business model exploration; motivations of m‐transformation; challenges of m‐transformation; and suggestions for further development. The questions are designed as a guideline to follow in the interviews through the literature. However, they are kept flexible for the exploratory purpose of this study. The questions for interviews are attached in Appendix B. The interview questions in this study are designed to answer the research questions and to examine the theoretical propositions.
After the initial general introduction, the interview questions were discussed in sequence. The interviews normally took about 45 to 90 minutes with digital recording. In order to ascertain the reliability of data gathered, two individuals participated in the process, in addition to the individual being interviewed. One was responsible for conducting the interview and controlling time. The other made key notes and further clarified some unclear issues. In total we conducted 17 interviews in this research.
After interviewing, the recordings were transcribed by two experienced administrative officers in the Faculty, as the preparation for data analysis. Before getting down to thoroughly analysis the qualitative data, one of the author check transcribed files against the actual recording for accuracy.
Therefore, after the transcripts were prepared as Microsoft Word files, each transcript was divided into 20 sections based on the interview questions, and ready for the content analysis. Content analysis is the only method of text analysis that has been developed within the empirical social sciences (Bauer & Gaskell 2006). It can be used to code groups of words in the transcripts into categories (Carson et al. 2001).

256 E‐Governance: Techno‐Behavioural Implications
FINDINGS AND DISCUSSION TABLE 1: SUMMARY OF DRIVERS AND INHIBITORS FOR M-TRANSFORMATION IN HEALTHCARE
No. Drivers Inhibitors1 Able to protect against external attacks Challenges in providing mobile services 2 Design process of mobile systems Issue of designing the architecture 3 Employee training Physical location of devices 4 Clinicians focus is on patients Wireless connections 5 Do not want to be worried about technology when
they are providing healthcare Security
6 Support for Clinicians as working day and night shifts on a 24-hour basis
Encryption of data
7 Support clinicians all the time Authentication 8 Changing the way of handling business is part of
the business process modification Protection against viruses
9 Needs agreement across the clinical areas Protection against denial of service attacks 10 Availability funding’s to actually change the
business practices Management of bandwidth
11 Access all patients’ medical information Applications used in the hospital do not tolerate delays
12 Doctors’ ability to diagnose and assist patients Challenges in deploying the technology 13 Communication benefit Training users in how to use it 14 Access to communicate with other staff members
and colleagues Delays in some actions from location to location
15 Improve the efficiency and speed of work Technology is normally introduced in support of a business process
16 Help reduce errors People can be resistant to Change 17 Improve the distribution and delivery of
information to the one who needs it Expertise and support is available to help
18 Lack of clinicians or skilled healthcare professionals
Clinicians are very busy and unable to remove themselves from the clinical environment
19 Streamlining some of the activities Funding champions is a big challenge 20 Technology can save time and provide
convenience Hospital is a health agency, not a technology agency
21 Ability of information entry into databases should be easier
Technologies cannot reduce the amount of work or cut the cost
22 Ability to retrieve information in appropriate format
Operating theatres characteristically have thick walls
22 Maximum connectivity speeds Wireless technology is not mature enough 23 Reliability of wireless connection Connection speed is too slow 24 Better connection speed to Intranet and Intranet
resources Benefit of mobile technology is limited
25 Availability of wireless connection in the operating theatre
Wireless signal connection are insecure and not reliable
26 Advanced security and the more advanced and reliable wireless technology
The qualitative analysis provided first hand insight about the views of healthcare professionals about the drivers and inhibitors to mobile transformations in a healthcare setting. Mobile technology can increase the speed of information input in this case. If

Drivers and Inhibitors for the Mobile Transformation: A Case of Australian Healthcare Setting 257
information can be entered into a patient’s database once, the administrative chain can be reduced. Even though it may increase the time that the clinical staff spend with patients to put their information into the mobile ICT system, it still reduces the chance of errors and other delays when they take patients’ information back to the office for someone else to enter it into the system. In the table below factors are identified from the content analysis of the transcripts. These factors are then summarized in a consolidated manner as the result of cross‐case analysis. The synthetic results including driving and inhibiting factors of m‐transformation are shown table below.
Two sets of factors (motivation and challenge) for m‐business transformation were consolidated in the process and summarized in table 1.
Qualitative data analysis revealed that there are challenges in providing mobile services in the healthcare environment and some of them are very unique to the healthcare domain. For example there is an issue of designing the architecture that the mobile infrastructure can fit into existing infrastructure and layout of the healthcare facility. This relates to things such as physical location of devices, and wireless connections, as well as security, encryption of data, authentication, protection against viruses, protection against denial of service attacks, and management of bandwidth within mobile technology environments. However other business environment and organization has met quite a number of these challenges with its design, whereas these finding are unique and provide challenges for the healthcare domain. For example, all mobile devices on the network, such as computers and PDAs, have an authentication process that involves encrypted certificates. They authenticate through a centrally‐controlled system, which incorporates data encryption and bandwidth controls. Therefore, the organization is able to protect against external attacks on the systems, whereas healthcare environment do not provide such a platform for the mobile transformation.
Findings of this study also indicate that hospitals including both public and private ones are in the process of introducing mobile technology on limited scale, services and devices into their organizations. In this stage, it seems the focus of mobile services is the employees. The developmental model of m‐transformation matches one of the three main categories of m‐business development (Leem, Suh & Kim 2004): business‐to‐employee (B2E), business‐to‐business (B2B) and business‐to‐customer (B2C). This may represent the characteristic of healthcare industry—the work of employees including pharmacists, doctors, nurses, and other medical professionals are highly dependent of information technology. The people deal with heavy workload with limited time and manpower, especially low tolerance for mistakes. In this context, mobile systems or services are expected to assist their work with better quality. Therefore, it is reasonable that the motivations and drivers of implementing mobile services include the factors such as improvement of information quality, operational efficiency, mobility, safety, and so forth.

258 E‐Governance: Techno‐Behavioural Implications
However, the process m‐transformation in the healthcare domain could be difficult. For example, one dilemma is when these people have high workloads and critical time, the implementation of mobile systems can be delayed, even resisted. It can be found that amongst the challenges of m‐transformation identified in this study, three factors of eight are directly relevant to ‘people’ (leadership; enthusiasm of employee; and training and implementation).Our study have been able to identify drivers and challenges to the administrators, leaders and other government and non‐government institutions in order to facilitate the implementation of mobile transformation in the healthcare environment. We acknowledge all the factors all the factors cannot be controlled simultaneously. However we recommend during the planning and implementation phase of mobile transformation the drivers and inhibitors identified in the table can facilitate successful mobile transformation in a healthcare facility.
CONCLUSION
This study uses qualitative methodology, Semi structured interviews, to explore the phenomenon of m‐business transformation in the healthcare domain. It summarizes the preliminary findings to understand the m‐business transformation, including the drivers for m‐transformation, and the possible challenges and inhibitors in the process. The transformation activity not only includes technical considerations, but also relates to the business functions, working processes, and management issues. Therefore, a successful transformation will need a comprehensive planning process to maximize the effects of drivers and minimize the effects of challenges mentioned in table 1. The findings of this study cannot be generalized further research is required to explore the mobile transformation for the wider healthcare community. However it can assist decision makers and policy maker in further understanding m‐transformation, thereby creating an environment for enhanced outcome sand smooth implementation of mobile transformation in the healthcare environment.
Future Research and Limitations
Finding in this study are only based on the qualitative data collected through interview. Before generalizing the finding of this study views of the wider healthcare community need to further studied. Also finding of this study are restricted to the single state of Australia and limited by the geographic factors. All the interviews were conducted in southeast part of the Queensland State. Since the findings are based on the three healthcare environments in Australia, the conclusion may be limited to this context.
REFERENCES [1] Babbie, E 2004, The practice of social research, 10th edn, Wadsworth, Belmont, California. [2] Bauer, MW & Gaskell, G (eds) 2006, Qualitative researching with text, image and sound: A practical
handbook, Sage Publications, London. [3] Carlsson, C 2002, 'Decision support in virtual organizations: the case for multi‐agent support', Group
Decision and Negotiation, vol. 11, no. 3, pp. 185‐221.

Drivers and Inhibitors for the Mobile Transformation: A Case of Australian Healthcare Setting 259
[4] Carson, D, Gilmore, A, Perry, C & Gronhaug, K 2001, Qualitative marketing research, Sage Publications, Thousand Oaks, California.
[5] Clarke, I 2001, 'Emerging value propositions for m‐commerce', Journal of Business Strategies, vol. 18, no. 2, pp.133‐48.
[6] Dholakia, RR & Dholakia, N 2004, 'Mobility and markets: emerging outlines of m‐commerce', Journal of Business Research, vol. 57, pp. 1391‐6.
[7] Fu, HP, Chang, TH, Shieh, LF & Wu, WH 2005, 'An implementation model for WEGS in WLAN applications: a Taiwanese case', Computer Standards & Interfaces, vol. 27, pp. 371‐81.
[8] Gunasekaran, A & Ngai, E 2003, 'Special issue on mobile commerce: strategies, technologies and applications', Decision Support System.
[9] Hayes, J & Finnegan, P 2005, 'Assessing the potential of e‐business models: towards a framework for assisting decision‐makers', European Journal of Operational Research, vol. 160, pp. 365‐79.
[10] Holliday, J, Agrawal, D & Abbadi, AE 2002, 'Disconnection modes for mobile databases', Wireless Networks, vol. 8, pp. 391‐402.
[11] Kalakota, R & Robinson, M 2001, E‐business 2.0: roadmap for success, Addison Wesley, New York. ‐‐‐‐2002, M‐business: the race to mobility, McGraw‐Hill, New York.
[12] Kumar, S & Zahn, C 2003, 'Mobile communications: evolution and impact on business operations', Technovation, vol. 23, pp. 515‐20.
[13] Lam, LW & Harrison‐Walker, LJ 2003, 'Toward an objective‐based typology of e‐business models', Business Horizons, vol. 46, no. 6, pp. 17‐26.
[14] Leem, CS 2002, 'Electronic commerce for service industries', in Encyclopedia of Information Systems, Academic Press, San Diego, California, pp. 71‐87.
[15] Leem, CS, Suh, HS & Kim, DS 2004, 'A classification of mobile business models and its applications', Industrial Management & Data Systems, vol. 104, no. 1, pp. 78‐87.
[16] Liao, S, Shao, YP, Wang, H & Chen, A 1999, 'The adoption of virtual banking: an empirical study', International Journal of Information Management, vol. 19, no. 1, pp. 63‐74.
[17] Lumpkin, GT & Dess, GG 2004, 'E‐business strategies and internet business models: how theinternet adds value', Organizational Dynamics, vol. 33, no. 2, pp. 161‐73.
[18] Miles, MB & Huberman, AM 1994, An expanded sourcebook: Qualitative Data Analysis, 2nd edn, Sage Publications, Thousand Oaks.
[19] ‐‐‐‐1994, Qualitative data analysis: an expended sourcebook, 2nd edn, Sage Publications, Thousand Oaks, California.
[20] Mylonopoulos, NA & Doukidis, GI 2003, 'Mobile business: technological pluralism, social assimilation, and growth', International Journal of Electronic Commerce, vol. 8, no. 1, pp. 5‐22.
[21] Oliva, RA 2003, 'Going mobile', Marketing Management, vol. 12, no. 4, pp. 46‐8. [22] Olla, P & Patel, NV 2002, 'A value chain model for mobile data service providers', Telecommunications
Policy, vol. 26, pp. 551‐71. [23] Phan, DD 2003, 'E‐business development for competitive advantages: a case study', Information &
Management, vol. 40, pp. 581‐90. [24] Porter, ME 2001, 'Strategy and the Internet', Harvard Business Review, vol. 79, no. 3, pp. 63‐77. [25] Roussos, G, Peterson, D & Patel, U 2003, 'Mobile identity management: an enacted view', International
Journal of Electronic Commerce, vol. 8, no. 1, pp. 81‐100. [26] Seale, C, Gobo, G, Gubrium, JF & Silverman, D (eds) 2004, Qualitative research practice, Sage
Publications Inc., Thousand Oaks, California. [27] Siebel, TM 2001, Taking care of e‐business: how today's market leaders are increasing revenues,
productivity, and customer satisfaction, Doubleday, New York. [28] Steinbock, D 2003, 'Globalization of wireless value system: from geographic to strategic advantages',
Telecommunications Policy, vol. 27, pp. 207‐35. [29] Tarasewich, P, Nickerson, RC & Warkentin, M 2002, 'Issues in mobile e‐commerce', Communications of
the Association for Information System, vol. 8, pp. 41‐64. [30] Terziyan, V 2002, 'Ontological modeling of e‐services to ensure appropriate mobile transactions',
International Journal of Intelligent Systems in Accounting, vol. 11, no. 3, pp. 159‐72.

260 E‐Governance: Techno‐Behavioural Implications
[31] Timmers, P 1999, Electronic commerce: strategies and models for business‐to‐business trading, Wiley, New York.
[32] Tsai, HS & Gururajan, R 2007, 'Motivationsand challenges for m‐business transformation: a multiple‐case study', the Journal of Theoretical and Applied Electronic Commerce Research, vol. 2, no. 2, pp. 19‐33.
[33] Tsalgatidou, A & Pitoura, E 2001, 'Business models and transactions in mobile electronic commerce: requirements and properties', Computer Networks, vol. 37, pp. 221‐36.
[34] Wu, JH & Hisa, TL 2004, 'Analysis of e‐commerce innovation and impact: a hypercube model', Electronic Commerce Research and Applications, vol. 3, pp. 389‐404.
[35] Yin, RK 2003, Casestudy research: design and methods, 3rd edn, Applied social research methods series, Sage Publications, Newbury Park, California.

Sweetening Bitter Pills to be Swallowed
Hari Mohan Jha Bidyarthi1 and Pavan M. Kuchar2 1Professor and Head, Department of Business Administration and Research, Shri Sant
Gajanan Maharaj College of Engineering, Shegaon, Maharashtra 2Lecturer, Department of Business Administration and Research,
Shri Sant Gajanan Maharaj College of Engineering, Shegaon, Maharashtra Email: [email protected], [email protected]
Abstract—“It takes an unusual mind to undertake the analysis of the obvious!”, what Alfred Whitehead told years before is exactly relevant today in case of diffusion of innovation of ICT specially in healthcare sector. Getting a new idea adopted, even when it has obvious advantages, is often very difficult. The reasons behind denial are plentiful and vary from person to person. But unless we comprehend the root obstacles, we may fail to come up with utilitarian answers.
Keywords: ICT, Healthcare sector, Diffusion of Innovation
INTRODUCTION
Since ancient times, people confronted with illness have striven to marshal information or expertise not available at the patient’s bedside, for example by going to a healer, describing the symptoms of a patient too sick to travel and then taking the recommended therapy back to the patient. This age‐old approach to telemedicine is still in use today in some remote areas. The term has been in use since 1967, when Dr Kenneth Bird created a two‐way audiovisual microwave circuit that enabled physicians at the Massachusetts General Hospital in Boston to provide medical care to patients three miles away at the Logan International Airport Medical Station. Today, of course, integration of various media into a single system around computers with telecommunication, videoconferencing and real‐time data transfer has revolutionized telemedicine. The power of the Internet to advance telemedicine was first brought to light by a seminal event in April 1995. The idea of the Electronic Health Record (EHR) system was first discussed during the 1960s but was not considered seriously until 1991, when the United States Institute of Medicine (IOM) issued a major report urging the adoption of computer‐based patient records. WHO undertook a global survey on eHealth with which to garner baseline data on the current state of eHealth. This indicates that after a slow start in the 1990s there is growing momentum for eHealth uptake by countries which is likely to continue as well. A similar effort was made in China; an SOS e‐mail message was sent through the Internet requesting international help for a Chinese university student named Zhu Lingling, who was suffering from an unknown, but what seemed to be a severe, disease. This led to the first recorded Internet diagnosis—of Guillian‐Barré syndrome by the use of ICT. Today, we can send imaging studies through the Internet and carry out live demonstrations and remote consultations through video‐conferencing. The idea is effectively used in the advertisement of BSNL 3G starring Dipika Padukone and movie 3 idiots showing child delivery using ICT.

262 E‐Governance: Techno‐Behavioural Implications
DEVELOPMENT OF ICT IN INDIA
National mechanisms such as an information policy, an eStrategy, and an eHealth policy have been put in place in India between 2000 and 2002 to promote the use of ICT. Specific health sector mechanisms, such as public‐private partnerships, procurement policies, public and private funding and eHealth standards have been successfully introduced since 1998. India’s most effective actions in building an enabling environment for the use of ICT in the health sector are enactment of the Information Technology Act 2000, providing a legal basis for all digitally related information actions and privacy issues, comprehensive guidelines and recommendations for IT infrastructure in health, and the creation of a task force on the topic of telemedicine. More than one hundred pilot projects in telemedicine have been created in India with funding support from the Indian Space Research Organization (ISRO). This has led to a significant increase in experience and expertise in the sphere of telemedicine and advanced several policy initiatives, the most important being the IT Infrastructure in Health policy. The other areas of ICT use are Vaccination Schedule, Maternity Care, Family Planning, Medicines, Ambulance Services and Transportation, Hospital / Primary Health Centers information, Blood Bank, Life Saving Drugs, Doctor’s Database, Appointment with Doctors, E‐Diagnostics, Materials Management System (Medicines) etc. Further, the Ministry of Finance has mandated that 3% of the budget of all government spending will go to ICT to foster a culture of ICT usage in government.
ICT IN HEALTH-MEANING
E‐health, or the use of information and communication technology in health, is defined as “the use, in the health sector, of digital data—transmitted, stored and retrieved electronically—for clinical, educational and administrative purposes, both at the local site and at a distance”. The Millennium Declaration acknowledges that ICT is an important tool to achieve the MDGs to alleviate poverty, improving delivery of education and health care, make government services more accessible.
SOME ICT ATTEMPTS IN HEALTH SECTOR
The idea of performing medical examinations and evaluations through the telecommunication network is not new. The Aaragonda Project of Apollo Telemedicine Enterprises Ltd, a non‐profit organization was set‐up for the purpose of implementing the telemedicine project. Telemedicine uses ICTs to provide specialized services to patients living in the different parts of the globe.
The ‘Sanjeeva Project’ of care foundation was setup for the purpose of implementing telemedicine project in the Mahboobnagar district of Andhra Pradesh. Telemedicine uses ICT to provide remote specialized services to patients who do not have access to them otherwise in the rural Andhra Pradesh. The entire project had the support of care foundation and APVVP and it was provided with the technical expertise by Phillips, Siemens and Karishma Software. The project also showed that the investments costs of
Sweetening Bitter Pills to be Swallowed 263
telemedicine services were high for low volume transactions. For telemedicine to be viable the transaction volumes have to go up. Platforms like telemedicine that require large investments; the ideal institutional form is public‐private partnership. As the technology gets matured the technology will get diffused. The dedication and commitment of Care Foundation was one of the critical success factors. This project attempted to test four hypotheses, namely:
1. New ICT platform provided increased access to information and resources. 2. ICT platform supported empowerment of the poor community and skill
development. 3. ICT platform empowers communities and helps them in making informed
decisions. 4. ICT platform helps in generating incomes through new ways of carrying out
business, reducing cycle times or increasing productivity.
ICT SCENARIO IN INDIA
India has great potential of ICT in improving health care as 65% of 1100 million are literate, 60% of rural India has access to TV coverage, there are 650,000 existing PCOs and internet kiosks, 400,000 villages already have telephone connections, Mobile users in India number 156.3 million, Internet users in India were 2million in Dec 2001 which rose to 8.5million in 2003 and is still rising, Hardware, software and brain ware all available as shown in following table nos. 1 & 2.
TABLE 1: SHOWING PC POPULATION AND IN USE PER 100 POPULATION IN INDIA
Year (March Ending) 2001 2002 2003 2004 2005 PC population (in million) 5.40 6 8 11 14.5 PC in use per 100 population 0.53 0.58 0.77 1.04 1.34
TABLE 2: SHOWING ICT PENETRATION IN INDIA IN MILLION NUMBERS OF POPULATION
Particulars 2007 2008 Times Increase Personal Computer Penetration 5.8 20 3.448276 Internet Subscribers 3.5 35 10 Telephone Lines 34 125 3.676471 Cellular Phones 5 45 9 Television Sets 98 225 2.295918 Cable TV Subscribers 38 70 1.842105
Internet World Stats (IWS) shows India in 5th place in terms of Internet usage with 42 million users. The Internet penetration is mere 3.7% of the population that is 3.6% of world users. There are just 64 broadband service providers with 24.22 lakh subscriber base and hence there is 0.2% broadband penetration in India. A brief statistics about ICT profile of India is given in the following table no. – 3.
The ICT is being currently used in India by large corporate hospitals and Academic Medical Institutions like SGPGIMS, Lucknow, Institute of Medical Sciences, Sevagram,

264 E‐Governance: Techno‐Behavioural Implications
SRMC, Chennai, AIMS, Kochi, CMC, Vellore etc. There are a number of ICT solution providers in India like Center for Development of Advanced Computing (CDAC), Wipro GE Healthcare, Tata Consultancy Services, Siemens Information Systems Ltd (SISL), Vepro (PACS), Sobha Renaissance Information Technology, Apollo Telemedicine Network Foundation, Online Telemedicine Research Institute, Televital India, Prognosys Medical Systems Pvt. Ltd., Medisoft Telemedicine Pvt. Ltd, I‐diagnosis Technologies, Karishma Software Ltd etc. Using these facilities the Govt. of India has already initiated several health projects such as Integrated Disease Surveillance Project, Tele‐ophthalmology project, National Telemedicine Grid, National Onconet Project, National Medical College Network, National Digital Medical Library Consortium, SAARC telemedicine network and Pan‐African e network project etc.
TABLE 3: SHOWING ICT PROFILE OF INDIA (YEAR 2009)
Sr. No. Particulars Count 1 Total population 1.037 billion2 Rural population as a percentage of total population 72%3 Key economic sectors Agriculture, industry, services, IT 4 Literacy in the national language(s) 52%5 Computer ownership per 100 inhabitants 0.66 Telephone lines per 100 inhabitants 4.27 Internet hosts per 10,000 inhabitants 0.358 Internet cafés/telecentres per 10,000 inhabitants 0.19 Internet users per 100 inhabitants 0.33 subscribers, 1.65 users 10 Cell phone subscribers per 100 inhabitants 1.73 (2001)11 Number of websites in the national language(s) 20,00012 Number of websites in English and other language(s) 130,00013 National bandwidth to and from the country 1,670.3 MbpsDespite these happenings, one cannot overlook the importance of the diffusion
phenomenon. Products and services tend to go through a life cycle. Initially a product is introduced at which phase its sale is low and people are unaware about it. Once it becomes accessible and user friendly its use is increased many folds. This is what is called as diffusion of innovation which is a gradual process. This had occurred in case of aeroplanes, telephones, television sets, to which services are not an exception at all. Eye surgery, usage and spread of family planning, even blood donation can be involved.
While the fields of health care and public health have many evidence‐based innovations, knowledge disseminates slowly. The failure to implement health interventions that have been demonstrated to be cost‐effective by high‐quality research affects both high‐income and low‐income countries. For example, a small group of obstetricians and nurses in a community hospital were able to safely reduce their cesarean delivery rates from 26% to 15%, but rates remained high for most of the other obstetricians in the hospital. Analogous problems exist in the field of global health. Low‐income countries face additional challenges to disseminating research evidence such as the weakness of their health systems, the lack of professional regulation and a lack of access to evidence. Best practices and innovations can take years, if not decades, to become standard practices. A pressing question in global health today is how to spread
Sweetening Bitter Pills to be Swallowed 265
best practices. There is a need to strengthen institutions and mechanisms that can systematically promote interactions between researchers, policy‐makers, and health workers who are positioned to influence the uptake of research findings.
Telemedicine has the potential to revolutionize the whole of the health care industry. In ICT platforms for medical consultation, behavioral issues such as the trust become important along with the cost of transaction. High investment platforms can be implemented only through public‐private partnerships. The critical success factors for sustaining the telemedicine network are:
• Economic sustainability of the platform • Connectivity of the platform and • Behavioral acceptability of the transactions • Reputation of the service provider
Reasons for Gap between Evidence and Implementation
The gap exists due to two main factors ‐ tradition‐bound individuals and institutions who insist on practicing their way, and a disconnection between those who create the evidence base and those who are positioned to implement the innovation. The underlying problem is in the way in which the production of evidence is organized institutionally with highly centralized mechanisms, whereas the application of that science is highly decentralized. This social distance prevails because scientists are more oriented to the international audiences of other scientists for which they publish than to the needs of practitioners, policy makers, or the local public.
Diffusion in Medicine
The dissemination of ideas in nations, crowds, physicians adopting a new drug or evidence‐based medical practice, public health officers adopting a new policy, and organizations adopting new administrative practices are some examples of diffusion in medicine. A basic notion of diffusion theory is that a new idea is adopted very slowly during the early stages of its diffusion process. Then, if the innovation is perceived as relatively advantageous by its early adopters, its rate of adoption takes off as the early adopters share their favorable experiences regarding the innovation with potential adopters. Three main factors influence the successful dissemination of an intervention: 1) the perceptions of the innovation, 2) characteristics of individuals who may adopt the change, and 3) contextual factors, especially involving communication, incentives, leadership, and management.
Ten Significant Dimensions of Innovation Diffusion
Innovation diffusion has following ten significant dimensions.
Relative Advantage: Relative advantage is not always clearly expressed when a technology diffuses.

266 E‐Governance: Techno‐Behavioural Implications
Trialability: Ability to try out an innovation without total commitment & with minimal investment.
Observability: Seeing how an innovation works by watching someone else using it & then acknowledging that the technology is safe and / or beneficial.
Communication Channels: User compatible & friendly mode of transmission can be used to communicate the idea from learned to the unaware person.
Homophilous Groups: Degree of similarity among the group members across which an innovation diffuses will affect the ease & speed of diffusion taking place.
Pace of Innovation/Reinvention: Technological innovations must be slow enough to facilitate the use & percolation of previous technology so as to create a platform for other advanced technology to be used with ease.
Norms, Roles & Social Networks: Diffusion is at faster pace in socially active group members than those isolated one.
Opinion Leaders: Most effective & efficient mode of transmission of idea.
Compatibility: The familiarity of innovation, its compatibility with the existing environment & behavior is strongly linked to its diffusion. The more an innovation can integrate & coexist with the technologies & social patterns already in place, the greater its prospects for adoption & diffusion.
Infrastructure: Presence of infrastructure which supports the innovation is the key to its functionality.
EFFORTS TOWARDS SURVIVAL OF THE WEAKEST
Scene of usage of ICT in healthcare has been initiated and is being enhanced quantitatively and qualitatively as well. This was possible only because of the truer part that, prior to it, all the above mentioned dimensions of diffusion of innovation were given serious and thorough thoughts. This can easily be observed beyond the walls of conventional hospitals in this very world. Better will it be to travel in the path ignited by some lighthouses as illustrated below.
Leading the Planet
Health care providers around the world use IT to reduce health care costs by increasing efficiency. A survey as early as 2002 found that more than 90 percent of physicians in Finland, Sweden, Germany, the Netherlands, the United Kingdom, and the United States used a computer in their practice. The same survey also found that approximately 79 percent of U.S. doctors and 61 percent of doctors in the European Union had Internet access in their practice. Individual European countries such as Finland, Sweden, and the Netherlands had more than 90 percent of doctors connected to the Internet. Many countries are implementing national e‐health strategies. The table no. – 4 given below shows ICT initiatives in health sector in different parts of the planet earth.

Sweetening Bitter Pills to be Swallowed 267
TABLE 4: SHOWING ICT INITIATIVES IN HEALTH SECTOR WORLD-WIDE
Sr. No. ICT Initiatives in Health Sector Nation(s) / Region(s) of the World Covered 1. Health Information Dissemination Centers East And Southern Africa2. Text To Change (TTC) ‐ a Dutch and Ugandan
based organization Africa
3. Health With ICT Tanzania4. Multi‐Media Health Promotion Nicaragua5. Distance Education Radio For Health Workers Nepal6. Improving Health through Information
System South Africa
7. United‐Kingdom‐based Isabel Medical Charity website Isabel.org.uk
The parents of Isabel created the site to provide clinical decision support for pediatricians in order to avert misdiagnoses and preventable illnesses.
8. Journey Of Life Radio Show Ethiopia9. Telemedicine Cambodia10. MEDINFO – an online reference source and
database Hungary
11. Communications For Better Health (CBH) Programme
Ghana
Healing the Nation
Back home in India are a number of ICT‐based projects initiated in its health sector to heal the nation. A list of some such successful projects is presented in the following table no. – 5.
TABLE 5: SHOWING ICT INITIATIVES IN HEALTH SECTOR IN DIFFERENT INDIAN STATES
Sr. No. ICT Initiatives in Health Sector Indian States / Locations Covered 1. Project Jeevandainee Zilla Parishad Wardha, Maharashtra2. Mcare – Mobile Phone Based Public C‐DAC Thiruvananthapuram, Kerala 3. Mobile Based Medical Decision Support Technology Karnataka4. indiaheart‐beat.com – first digital medical network in India National basis5. Government E‐Hospital National basisIn terms of acceptance of these ICT enabled health measures as listed above it is
found that in number of things have appeared as obstacles. The first foremost of it is the pace with which these innovations have taken place which never matched the pace of its diffusion to the end users. It is felt necessary that an innovative ICT health measure is diffused in a manner that it is absorbed by the practitioners and the patients in its entirety before making an attempt to innovate subsequently and diffuse it thereafter. Acceptance of previous innovations lays the platform for easy acceptance of the subsequent innovations by its users. It is also found that these ICT health measures are not available in local languages and are hence not user friendly restricting the pace of its diffusion. Competence of the medical staff in the use of ICT measures is equally important for its diffusion. It is but obvious therefore that these innovations are supported adequately by a well thought out training or skill enhancement program to raise the comfort levels of the practitioners in using the same. Unavailability of

268 E‐Governance: Techno‐Behavioural Implications
appropriate ICT infrastructure in far remote areas of the country is another issue that the policy makers had to address for penetration of innovative ICT health measures.
CONCLUSION
It can be easily revealed from the above listed ICT‐based health sector initiatives that there has been a lot of progress in ICT application in health sector. It needs to revolutionize everyone’s endeavor to try and to take care of the healthcare universally by assuming pre requisites of dimensions for diffusion of innovation. Prospective beneficiaries of ICT in healthcare are about to turn or even have turned into either late majorities or laggards which can be avoided only by providing serious and disinterested consideration to dimensions like triability, observability, communication channels, relative advantage, homophilous groups, pace of innovation, norms roles and social networks, opinion leaders, compatibility and infrastructure. Timely answers to all the questions related to these dimensions will save ICT from becoming a bitter pill to swallow.
REFERENCES [1] Berwick D. M., Disseminating Innovations in Health Care. Journal of the American Medical Association.
2003; 289 (15):1969‐1975. [2] Bhatnagar, Subhash. (2000) Enabling E‐Government in Developing Countries: From Vision to
Implementation, Sage Publications, New Delhi, pp. 39‐45 [3] Diffusion of innovations theory and work‐site AIDS programs. Journal of health communication. 1998;
3 (1):17 ‐28. [4] Diffusion Theory and Knowledge Dissemination, Utilization, and Integration in Public Health Annual
Review of Public Health. 2009; 30:151 ‐74. [5] Dutta, Subrat (2003) ‘Impact of Information Communication Technology on Society’, Yojana, Vol. 47, pp.
23‐32 [6] eHealth (Magazine), August 2011 [7] Kapoor, L., Mishra S. K. and Singh K. (2005) ‘Telemedicine: Experience at SGPGIMS, Lucknow’, Journal
of Postgraduate Medicine, Vol. 51, No. 4, pp. 312‐315. [8] Kim, Rhatigan, Jain, Porter “Values to Value” article in forthcoming lancet on Values in Global Health. [9] Mahapatra, A. K. and Mishra S. K. (2007) ‘Bringing the Knowledge and Skill Gap in Health Care:
SGPGIMS, Lucknow, India Initiatives’, Journal of e‐Health Technology and Application, Vol. 5, No. 2, pp. 67‐69.
[10] Moseley, S.F. Everett Rogers’ diffusion of innovations theory: Its utility and value in public health. Journal of Health Communication. 2004; 9(1): 149‐151.
[11] Rogers EM. Diffusion of Innovations. 4th ed. New York, NY: Free Press; 1995. [12] www.aarogya.com. [13] www.censusindia.gov.in/2001 [14] www.ehealthonline.org [15] www.enablingchange.com [16] www.her.oxfordjournals.org. [17] www.indianhealthcare.in/ [18] www.indiastat.com/health [19] www.maharashtra.gov.in [20] www.sciencedirect.com [21] www.who.org

Integrating Records of Rights with Property Registration and Cadastral Maps–A Step towards Migration from Presumptive
Land Titling to Conclusive Land Titling System
Ghan Shyam Bansal1 and Gurpreet Singh Saini2 1Sr. Technical Director, National Informatics Centre & State Informatics Officer,
Haryana State Centre, Chandigarh 2National Informatics Centre, Haryana
Email: [email protected], [email protected]
Abstract—Indian Registration Act, 1908 provides for registration of land deeds and documents only. In the registration process, merely the transaction is recorded. The transfer of ownership title remains Presumptive only. There is a significant time lag between registration process and mutation, which gives rise to scope of fraudulent transactions in land, disputes etc. Government of India has launched NLRMP (National Land Record Modernization Programme) with a primary objective of endtoend computerization of land records and property registration and subsequently, migration from existing presumptive land titling system to conclusive land titling system in India, which is also known as the Torrens System. In Haryana, the workflow based Property Registration Information System (HARIS) and Land Records Information system (HALRIS) have been dynamically integrated under a single unified database, standardized and stabilized across the state. Further, the cadastral maps of Ambala and Sirsa districts have been digitized and these maps have been integrated with corresponding textual RecordsofRights for more than 72 villages of Ambala Tehsil. This kind of integration is one of the major requirements for migrating from existing presumptive land titling system to proposed conclusive land titling system. This paper briefly describes initiatives taken for integration of the process of Registration, Mutations, RecordsofRights and cadastral maps in Haryana.
Keywords: HARIS, HALRIS, NLRMP, Presumptive Title, Conclusive Title
INTRODUCTION
Conclusive land Titling System: Indian Registration Act‐1908 provides for registration of land deeds and documents only, not the land titles. Merely the Transaction is recorded in the registration process, and transfer of ownership title remains Presumptive only. There is a significant time lag between registration and mutation process, which gives rise to scope of fraudulent transactions in land, disputes etc. Under the National Land Records Modernization Programme (NLRMP), the Government of India has planned to introduce the system of Conclusive land Titles, which is also known as the Torrens System. Robert Torrens introduced this system in 1858 in South Australia. The Torrens System involves registration of title, based on four principles i.e. single agency, mirror, curtain, title insurance.
Single Agency: A single agency is required to handle land records (including the maintenance and updating of textual records, maps, survey and settlement operations, registration of immovable property mutations etc.).
Mirror Principle: It states that at any given moment, the land records mirror the ground reality.

270 E‐Governance: Techno‐Behavioural Implications
Curtain Principle: It refers to the fact that, the record of title is true depiction of the ownership status; mutation is automatic, following the registration. There is no need of probing into the past title transactions, and the title is a conclusive proof of ownership.
Title Insurance: It refers to the fact that, the title is guaranteed for its correctness and the party concerned is indemnified against any loss arising because of inaccuracy in this regard.
Department of Revenue and Disaster Management Haryana: The department deals with maintaining and updating of revenue records, transactions in the records by way of sale, mortgage, collection of revenue, consolidation of land holdings, etc. In Haryana, there is a single line hierarchy for revenue and registration department. The Director Land Records is also the Inspector General registration of the State. Each Revenue Tehsil is headed by one officer, who function as revenue officer while dealing with Land Records and same officer also function as ex‐officio Sub Registrar for registration work. This kind of administrative setup of Revenue department exists only in the northern states of India. In southern states, Revenue department administer the Land Records management whereas the Finance departments look after the registration work.
Jamabandi: It is a document, which is prepared as part of the Record‐of‐Right for every revenue estate (village). It contains entries on ownership, cultivation and other rights of land. The presumption of truth is attached to the entries in Jamabandi under section 44 of the Punjab Land Revenue Act, 1887. All changes of rights in land, coming to the notice of the revenue agency, are reflected in the Jamabandi according to a set procedure, after the revenue officer has verified these.
As and when there is any change of ownership by way of sale, gift, mortgage or exchange, such changes are effected through mutation in the land records. At the time of registration, three copies of the registration deed are prepared. Original copy is given to the buyer, another copy is kept in the Sub‐registrar office record and the third copy is sent to the Patwari (Village Revenue Accountant) for entering mutation. Mutation for Change of ownership by way of inheritance, court orders are written by making an entry into the Roznamcha waquati. Kanoongo verifies the mutation and Circle Revenue Officer (CRO) sanction/reject it in a public meeting.
Cadastral Maps: These maps are part of Jamabandies, which are required to be updated with the changes due to the transactions, which are effected by way of sales, mortgage, exchange, gift, partition, etc and for which, a mutation order has been passed. In Haryana, the cadastral maps were prepared at the time of settlement operations, which were carried out in the parts of Haryana from 1905 to 1909. Survey of India surveyed the Joint Punjab (now comprising of Haryana and Punjab) in the late 50s and 60s, for demarcation of command area of Bhakhra Dam. The paper/cloth based cadastral maps, once converted into digital cadastral maps, is carried forward for deriving geodetic coordinates for each land parcel and in turn for each vertex of the

Integrating Records of Rights with Property Registration and Cadastral Maps 271
cadastral map. This is achieved through geo‐referencing the maps using real world coordinates of the ground control points (GCP’s). The GCP’s are derived from high‐resolution satellite data. The accuracy of geo‐referencing of the cadastral maps is analyzed, using the ground coordinates from satellite data.
HARYANA PROPERTY REGISTRATION INFORMATION SYSTEM (HARIS)
The registration of property documents were computerized at all Tehsils / sub‐Tehsils (a cluster of villages, also known as a Taluka) of Haryana, in a phased manner. The NIC‐Haryana State Centre developed the Haryana Registration Information System (HARIS) and first Tehsil was launched in June 2000. As on today, HARIS is being implemented at 100% Tehsils and sub‐Tehsils in Haryana. Twenty‐two types of applicable deed registration templates were studied, standardized and converted into XML documents. These templates were made available in all HARIS centres in the state to facilitate the general public.
Salient Features of the HARIS
• Usage of Hindi language • Provision to prepare deeds through software • Segment wise collector rates for each area • On‐line photo capturing of buyer, sellers and witnesses • Provision for Biometrics authentication
Implementation Model
Initially for implementing HARIS, in Haryana, District Red Cross Societies were found handy, as Dy. Commissioner is chairman and controller of its functions. District Red Cross Societies were taking service charges from each applicant as budgetary support for sustainability of the project.Later on District IT Society (DITS) were formed in each district, which are headed by Dy. Commissioner. The DIO, NIC‐Haryana Centre is the Technical Member of DITS. The service charges, collected from the HARIS are now divided into Red Cross (40%), DITS (50%) and remaining 10% are sent to the State Revenue department for sustainability of the project and further IT initiatives of the department.
Benefits Accrued to the Citizens
HARIS has improved the quality of service in Tehsils, by reducing the total time taken by the Tehsil staff for registration. Now registered deeds can be returned same day to the public, earlier sometimes it was taking weeks/months to get a registered deed.
HARIS uses the land rates, fixed by the collector, as reference rates, for computing the stamp duty. So in any case, it does not allow the registration of Land below the collector rates. This feature of HARIS has eliminated the requirements of pre registration audit. So state government has stopped the pre registration audit of the

272 E‐Governance: Techno‐Behavioural Implications
documents, which has saved the general public from the harassment at the hands of auditors.
In HARIS, the photographs of witnesses are also taken along with the sellers and buyers. This has reduced the incidents of wrong witnesses, which was very prevalent before the implementation of HARIS.
The district Red Cross society is also using the HARIS service charges for running social welfare programs for the weaker sections of the society.
Benefits to the Government
After the implementation of HARIS there has been significant increase in the stamp duty collection. This increase was possible due to following reasons:
• HARIS has forced the collectors to make their collector rates uniform. Earlier, there was big difference in the collector rate and the open market rates of the property. In HARIS, it is possible to fix a separate rate for different parts of the same locality by dividing it into number of segments. So this has reduced the practice of concealing the exact location of property for saving the stamp duty.
• In HARIS, it is not possible to register a document below the collector rate. This has stopped the revenue leakage caused by the registration of undervalued deeds.
• HARIS has also reduced the cases, under section 47‐A of registration act, to a considerable extent. It was a common practice to register an undervalued deed in the first instance, thereafter; the parties were getting these impounded from the Tehsildar. Later on people were able to get the deed back, by paying bribe or small amount of fine.
• HARIS project has been generating funds from more registrations as service charges, making HARIS a self‐sustainable project.
New Initiatives Taken on HARIS
• Transmission of registered deed’s data daily from the Tehsils/sub‐Tehsils to NIC state data center using automated web services & State wide area network/NICNET. Revenue department is using this data to prepare the summary reports related with the revenue collections.
• Token system is implemented in Tehsils where registration load is high like Gurgaon, Faridabad, Hisar etc. This system helps in the management of queues for the registration work.
• Old data from all the Tehsils/sub‐tehsils is being consolidated at state data center for establishing a data warehouse.
• HARIS has been dynamically linked with HALRIS (A unique pioneer feature in the country)

Integrating Records of Rights with Property Registration and Cadastral Maps 273
HARYANA LAND RECORDS INFORMATION SYSTEM (HALRIS)
After the successful implementation of HARIS, it was decided to convert the computerized land records system into a workflow based, integrated system with following goals and objectives:
• To link the registration with mutations, so that mutation notice can be generated immediately after the registration of document, thereby, doing away with the second visit by citizens to Tehsil office for mutation entry.
• To generate Nakal (Copy of Record‐Of‐Right) on‐line and issue it to general public at Tehsil level
• To generate new Jamabandies automatically. • To dynamically link the land registration and land records for the transactions,
related with the agricultural property, using a workflow based approach, so that complete solution can be provided to the citizens through a single window.
• All type of reported cases related to writing of jamabandi (ROR) and mutations were studied, standardized and simplified, so as to maintain uniformly across the state. The cases, which could not be simplified, were incorporated in HALRIS through suitable customization and enhancement of HALRIS. The first version of HALRIS was developed during year 2003, thereafter; there have been continuing enhancements.
SALIENT FEATURES OF HALRIS
• Dynamic integration of registration and mutations. • Automated mutation workflow. • Online mutation incorporation facility. • Automatic updating of Remarks in the Jamabandi. • Generation of new jamabandies and consignment in the e‐Record rooms. • Usage of Hindi language • Biometrics and role based security. • 2‐D Bar coded copies of Record‐of‐Rights (RoR) • Web enabled access to ROR data through http://jamabandi.nic.in & touch screen
based kiosks interface. A sample copy of a Record‐of‐Right is shown in Figure‐1.
Impact of HALRIS
• Availability of updated copies of ROR (Record of Right) to the public, through information kiosks added new dimensions to the delivery of services in the state.
• Reduction in litigations, due to on‐line availability of updated record. • Low manual intervention & data capturing at source, leading to less errors. • Web enabling to bring land records from bag of Patwari to whole world and to
bring transparency in accessing the ROR on anytime, anywhere basis. Dynamic integration of HARIS and HALRIS in an integrated workflow environment has provided a unified & complete system, which has been appreciated at national level, revenue secretaries conference of SAARAC (South Asian Association for Regional Cooperation) countries and visiting teams of World Bank.

274 E‐Governance: Techno‐Behavioural Implications
FIG. 1: A COPY OF THE SAMPLE RECORD-OF-RIGHT
DIGITIZATION OF CADASTRAL MAPS (SPATIAL RECORDS)
The digitization of Cadastral maps of Sirsa and Ambala district were taken‐up through HARSAC (Haryana Space Application Centre), Hisar. The HARSAC has digitized all available cadastral maps of Sirsa and 346 villages of Ambala. There are about 70,000 village maps (known as Mussavies / Cadastral Maps) in the State. The programme of digitization of cadastral maps of remaining districts has been outsourced, through open tenders, with the technical support of HARSAC and NIC Haryana State Centre. The process of digitization of Cadastral maps & methodology adopted is briefly discussed below.
For every village, there are cadastral maps having parcels of land (popularly known as Khasra), which form the basic record of revenue administration. Following steps were followed:
• Collection of village maps of the districts from the Patwaries. • Cleaning / correction of maps to make these scan ready. • Scanning of village maps at minimum 200 dpi gray scale mode in *.tiff format • Perform the process of noise removal of the scanned maps

Integrating Records of Rights with Property Registration and Cadastral Maps 275
• Take a print out of the scanned map on 90‐micron transparency sheet with 100% matching on 1:1 scale output and match them with the original maps, and if it matches with the original maps then take the final printout of the same.
• Conversions of scanned map to vector format ‐ in the on screen digitization process, the scanned maps are converted from raster to vector using software.
• Quality Assurance of digitized Maps: The digitized data of each feature is assigned along with appropriate feature code and symbols, finally leading to the arrangement of data as per layering scheme. Next step is to classify the line, point and polygon features. Then create the polygons and edit the problems like undershoot / overshoot and duplicate lines etc. Manual checking is done by the revenue staff ensuring matching of each and every plot. Corrections are done by following the required quality standards.
• After completing all the checks, final printout of the digitized maps are taken and in the process of map composition, a standard template is created wherein different layers such as point, text, line, area etc are used. The final composition is done from a particular layer including various non‐map features as letter boxes, railway lines etc.
• The final output map is the completely composed map, which is identical to the original map and the plot numbers are printed over them.
• The individual vectorized sheets are converted into shape file (.shp) format, which is used for integration with the Records‐of‐Rights.
A sample digitized cadastral map is shown in figure‐2.
FIG. 2: A SAMPLE DIGITIZED CADASTRAL MAP

276 E‐Governance: Techno‐Behavioural Implications
INTEGRATION OF HALRIS WITH DIGITIZED CADASTRAL MAPS
To integrate the digitized maps with the mutation process of HALRIS, so that maps can be updated automatically, Bhu‐Naksha software, which is based on open source GeoTools developed by NIC in Chhattisgarh, was studied for its replication and customization as per Haryana requirements. The primary objective was to create the database of cadastral maps in digitized form and linking the same into the existing HARLIS software, facilitating display, updating and printing of the cadastral maps. The system provide following functionalities:
• The system imports the digitized and verified cadastral vector data to the spatial database. The system has the provision of importing geo‐referenced spatial data.
• The software displays the complete cadastral map or single plot /multiple plots along with appropriate scale and north direction. The system displays the linear dimensions of plot boundaries. There is a provision to overlay other layers like canal layer, road layer etc.
• The standard symbols (alamaths) can be attached wherever required. • The software allows the user to split the plots in to multiple parts as per the
mutation process. It further assigns new plot numbers to divided parcels. The system also has the provision to merge plots.
• On selection of the Khasra (land plot) number, system shows the cadastral map along with the neighboring plots. It also shows the names of the owners of the plot. The system converts the output to print friendly version / pdf for citizen services.
• Software can provide spatial outputs based on queries on plots, ownership, government land, forest areas, and crop type as per the textual data availability.
The mutation process of HALRIS was customized and integrated with the Bhu‐naksha. In case of mutations involving the Tatima (division of plots) of khasras (plots), mutation entry component of HALRIS was enhanced to display the map of the selected khasra and division of the plot on the basis of map prepared by the patwari. After dividing and assigning the plots to the new owners, the mutation was saved in the two sets of databases (HALRIS and Bhu‐Naksha). Mutation incorporation process of HALRIS was enhanced to update the cadastral map in case of mutations involving the division of plots.
The Mutation incorporation effect is reflected simultaneously in Jamabandi and the cadastral map database. A sample map of land parcel generated through integrated system is shown in Figure‐3.

Integrating Records of Rights with Property Registration and Cadastral Maps 277
FIG. 3: A SAMPLE MAP OF INDIVIDUAL LAND PARCEL (RECORD-OF-RIGHT)
The pictorial workflow of integrated property registration, jamabandi, mutations, cadastral maps and RoR e‐Service delivery is depicted in Figure‐4.
FIG. 4: INTEGRATED WORKFLOW OF PROPERTY REGISTRATION, JAMABANDI, MUTATIONS, CADASTRAL MAPS AND ROR E-SERVICE DELIVERY

278 E‐Governance: Techno‐Behavioural Implications
CONCLUSION
The kind of integration of Property Registration, Land Records and Cadastral maps achieved in Haryana is a prerequisite, for migrating from the existing presumptive land titling system to the conclusive land titling system in India. The dynamic integration of the village wise land registration, record‐of‐right, mutations and cadastral maps system, facilitating online updating of mutations and issuing of copies of maps of land parcels, along with copy of record‐of‐right to the citizens, from across all Tehsils/sub‐tehsils is an ultimate e‐Governance solution, which is the primary objective of NLRMP of Government of India. The land parcel level spatial database with geo‐referencing and mosaic facilities will establish new horizons in the developmental planning upto micro levels.
The views expressed in this paper are personal to the authors and do not represent the views of either the Government of Haryana or the National Informatics Centre, Department of IT, Govt of India
ACKNOWLEDGEMENT
The authors are thankful to Chief Secretary Haryana, Director General National Informatics Centre and Financial Commissioner Revenue Haryana, for their continuing motivation, encouragement and guidance. The authors also acknowledge support provided by the officers of NIC Chhattisgarh, Land Records Division at NICHQ New Delhi, officers of DLR & DIT Haryana and HARSAC Hisar.

Author Index
Ananthanarayanan, Rajan, 15 Banerjee, Sudeepa, 141 Bansal, Ghan Shyam, 269 Basu, Tapati, 141 Bhattacharya, Jaijit, 78 Bidyarthi, Hari Mohan Jha, 261 Brahma, Manmohan, 59 Buch, Sanjay, 15 Chander, Subhash, 91 Chaturvedi, Manmohan, 78 Chaudhari, Shailesh, 167 Chauhan, Rajesh, 3 Das, Rama Krushna, 59, 235 Das, Saini, 99 Dhyani, Praveen, 47 Dwivedi, Yogesh K., 197 Gaur, Vivek, 47 Gupta, Jaba Mukherjee, 218 Gupta, Manmohan Prasad, 78, 184 Gururajan, Raj, 252 Hafeez‐Baig, Abdul, 252
Joshi, Amit, 33 Kachnowski, Stan, 244 Kamal, Kapil Kant, 129 Kapoor, Kawal, 197 Kuchar, Pavan M., 261 Kumar, Harish, 211 Kumar, Manish, 129
Kumar, Ranjan, 129 Kwatra, Aman, 244 Mahapatra, Subash Chandra, 235 Misro, Ajita Kumar, 59, 235 Mitra, R.K., 184 Mukhopadhyay, Arunabha, 99 Nayak, Manoj Ranjan, 235 Panda, Susanta Kumar, 173 Pandey, Romit, 117 Patnaik, Pabitrananda, 173 Patra, Manas Ranjan, 173 Rishi, O.P., 47 Sahu, G.P., 72, 152 Saini, Gurpreet Singh, 269 Saxena, Anupama, 228 Sekhar, K.S. Vijaya, 117 Shah, Tejas, 52 Sharma, Ankit, 228 Shukla, Girija, 99 Singh, Amar Jeet, 3 Singh, Deepak Kumar, 152 Singla, R.K., 211 Srivastava, Rajeev, 72 Thakur, Vinit, 218 Tsai, Heng‐Sheng, 252 Williams, Michael D., 197
Yajnik, Nilay M., 113