March 22, 2017 - New York State Department of Health
185
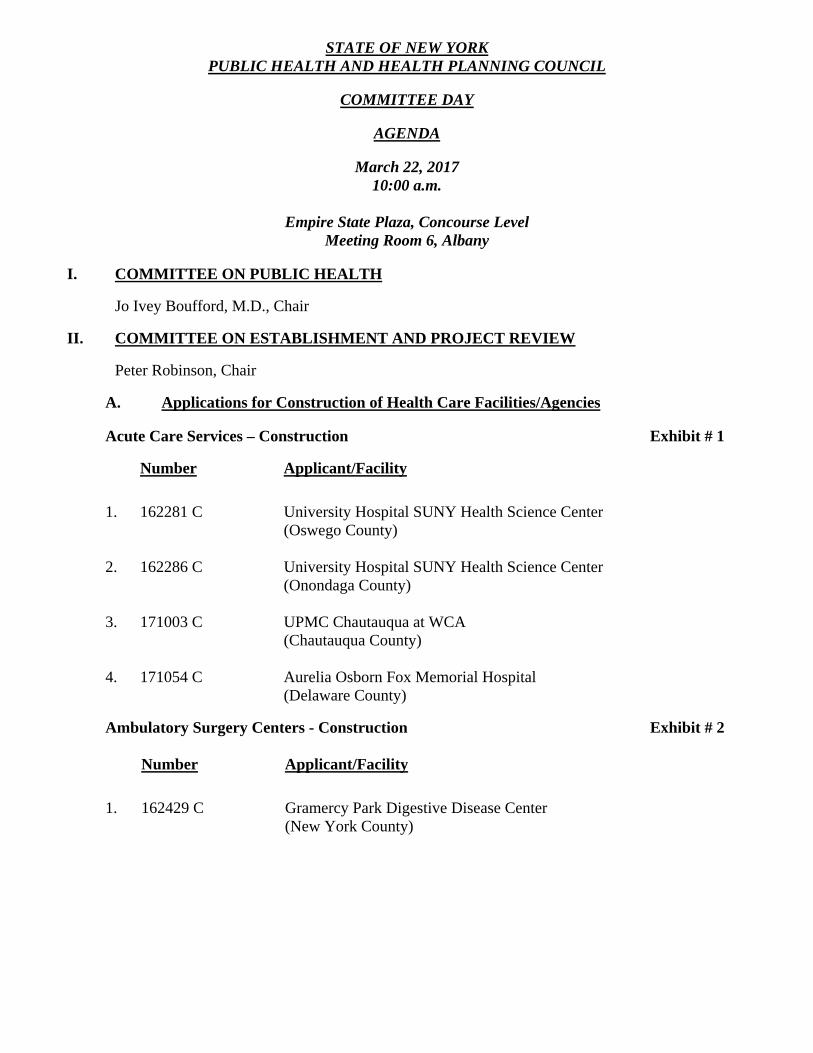
STATE OF NEW YORK PUBLIC HEALTH AND HEALTH PLANNING COUNCIL COMMITTEE DAY AGENDA March 22, 2017 10:00 a.m. Empire State Plaza, Concourse Level Meeting Room 6, Albany I. COMMITTEE ON PUBLIC HEALTH Jo Ivey Boufford, M.D., Chair II. COMMITTEE ON ESTABLISHMENT AND PROJECT REVIEW Peter Robinson, Chair A. Applications for Construction of Health Care Facilities/Agencies Acute Care Services – Construction Exhibit # 1 Number Applicant/Facility 1. 162281 C University Hospital SUNY Health Science Center (Oswego County) 2. 162286 C University Hospital SUNY Health Science Center (Onondaga County) 3. 171003 C UPMC Chautauqua at WCA (Chautauqua County) 4. 171054 C Aurelia Osborn Fox Memorial Hospital (Delaware County) Ambulatory Surgery Centers - Construction Exhibit # 2 Number Applicant/Facility 1. 162429 C Gramercy Park Digestive Disease Center (New York County)
-
Upload
khangminh22 -
Category
Documents
-
view
0 -
download
0
Transcript of March 22, 2017 - New York State Department of Health
STATE OF NEW YORK PUBLIC HEALTH AND HEALTH PLANNING COUNCIL
COMMITTEE DAY
AGENDA
March 22, 2017 10:00 a.m.
Empire State Plaza, Concourse Level Meeting Room 6, Albany
I. COMMITTEE ON PUBLIC HEALTH
Jo Ivey Boufford, M.D., Chair
II. COMMITTEE ON ESTABLISHMENT AND PROJECT REVIEW
Peter Robinson, Chair
A. Applications for Construction of Health Care Facilities/Agencies
Acute Care Services – Construction Exhibit # 1
Number Applicant/Facility
1. 162281 C University Hospital SUNY Health Science Center (Oswego County)
2. 162286 C University Hospital SUNY Health Science Center (Onondaga County)
3. 171003 C UPMC Chautauqua at WCA (Chautauqua County)
4. 171054 C Aurelia Osborn Fox Memorial Hospital (Delaware County)
Ambulatory Surgery Centers - Construction Exhibit # 2
Number Applicant/Facility
1. 162429 C Gramercy Park Digestive Disease Center (New York County)
2
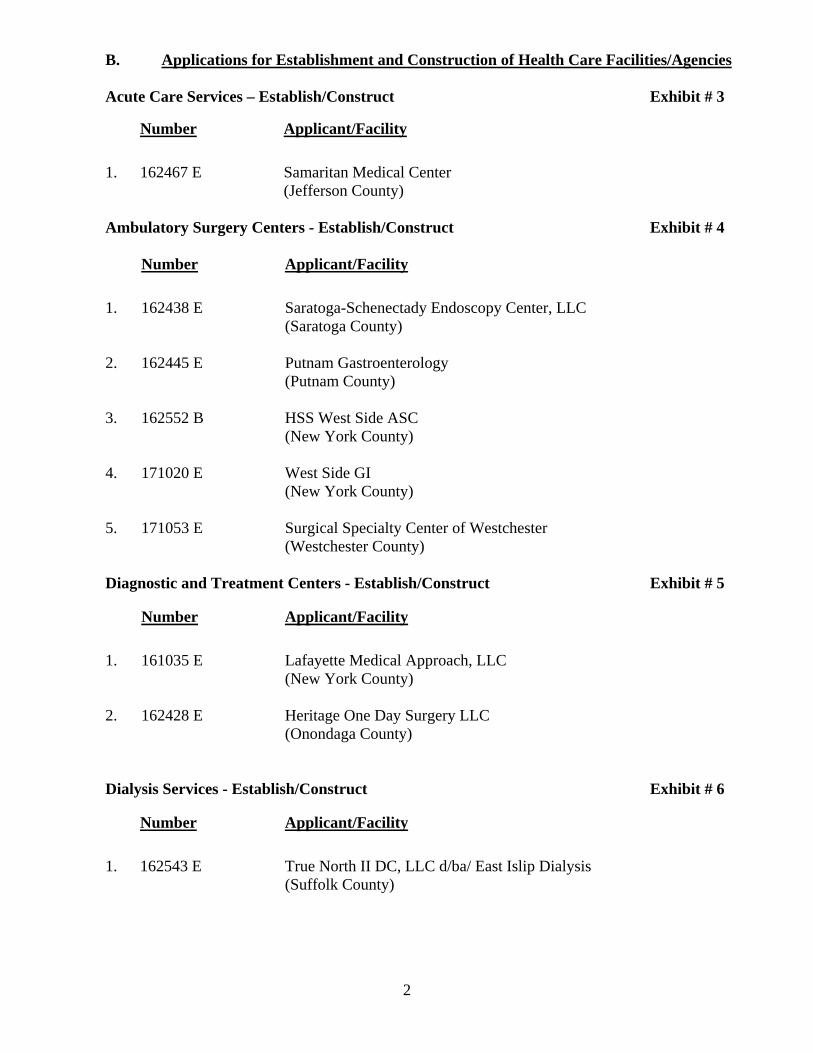
B. Applications for Establishment and Construction of Health Care Facilities/Agencies
Acute Care Services – Establish/Construct Exhibit # 3
Number Applicant/Facility
1. 162467 E Samaritan Medical Center (Jefferson County)
Ambulatory Surgery Centers - Establish/Construct Exhibit # 4
Number Applicant/Facility
1. 162438 E Saratoga-Schenectady Endoscopy Center, LLC (Saratoga County)
2. 162445 E Putnam Gastroenterology (Putnam County)
3. 162552 B HSS West Side ASC (New York County)
4. 171020 E West Side GI (New York County)
5. 171053 E Surgical Specialty Center of Westchester (Westchester County)
Diagnostic and Treatment Centers - Establish/Construct Exhibit # 5
Number Applicant/Facility
1. 161035 E Lafayette Medical Approach, LLC (New York County)
2. 162428 E Heritage One Day Surgery LLC (Onondaga County)
Dialysis Services - Establish/Construct Exhibit # 6
Number Applicant/Facility
1. 162543 E True North II DC, LLC d/ba/ East Islip Dialysis (Suffolk County)
3
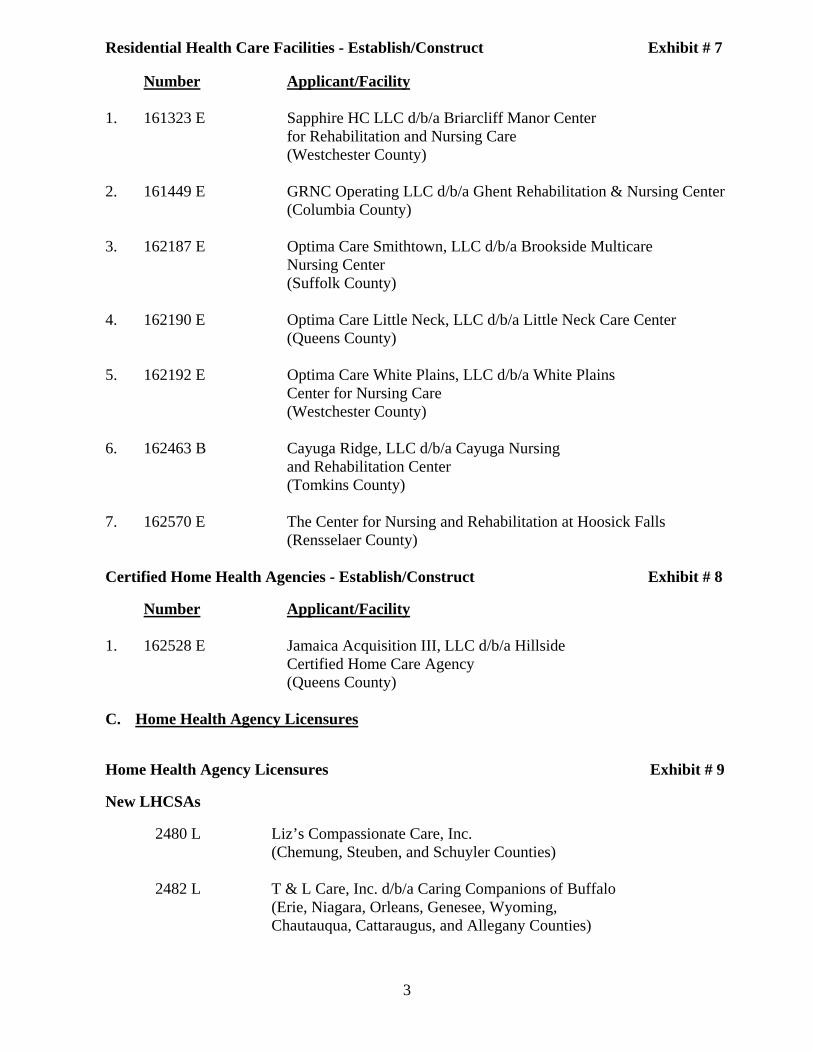
Residential Health Care Facilities - Establish/Construct Exhibit # 7
Number Applicant/Facility
1. 161323 E Sapphire HC LLC d/b/a Briarcliff Manor Center for Rehabilitation and Nursing Care (Westchester County)
2. 161449 E GRNC Operating LLC d/b/a Ghent Rehabilitation & Nursing Center (Columbia County)
3. 162187 E Optima Care Smithtown, LLC d/b/a Brookside Multicare Nursing Center (Suffolk County)
4. 162190 E Optima Care Little Neck, LLC d/b/a Little Neck Care Center (Queens County)
5. 162192 E Optima Care White Plains, LLC d/b/a White Plains Center for Nursing Care (Westchester County)
6. 162463 B Cayuga Ridge, LLC d/b/a Cayuga Nursing and Rehabilitation Center (Tomkins County)
7. 162570 E The Center for Nursing and Rehabilitation at Hoosick Falls (Rensselaer County)
Certified Home Health Agencies - Establish/Construct Exhibit # 8
Number Applicant/Facility
1. 162528 E Jamaica Acquisition III, LLC d/b/a Hillside Certified Home Care Agency (Queens County)
C. Home Health Agency Licensures
Home Health Agency Licensures Exhibit # 9
New LHCSAs
2480 L Liz’s Compassionate Care, Inc. (Chemung, Steuben, and Schuyler Counties)
2482 L T & L Care, Inc. d/b/a Caring Companions of Buffalo (Erie, Niagara, Orleans, Genesee, Wyoming, Chautauqua, Cattaraugus, and Allegany Counties)
4
2534 L Western New York Homecare, Inc. (Allegany, Cattaraugus, Chautauqua, Erie, Genesee, Monroe, Niagara, Orleans and Wyoming Counties)
152081 Angels at Heart Senior Care, LLC (Erie and Niagara Counties)
152104 Capital Region Home Care, LLC d/b/a Right at Home Albany (Albany, Greene, Columbia, Montgomery, Fulton, Saratoga, Schenectady and Rensselaer Counties)
161260 S.M.R. Cares, Inc. d/b/a Home Helpers/Direct Link of Buffalo (Alleghany, Cattaraugus, Erie and Wyoming Counties)
161284 New York Regional Home Care, LLC (Monroe, Genesee, Livingston, Ontario and Wayne Counties)
162441 Independence Home Care of New York, Inc. (Erie and Niagara Counties)
New LHCSAs – Affiliated with Assisted Living Programs (ALPs)
162121 Elegance Home Care LLC d/b/a Elegance at Home (Nassau, Queens, Rockland, Suffolk and Westchester Counties)
162301 St. Johnland LHCSA, Inc. d/b/a St. Johnland LHCSA (Suffolk and Nassau Counties)
162310 Ateret of Midwood LLC d/b/a Ateret Home Care (Kings, New York, Bronx, Richmond, and Queens Counties)
162311 St. Joseph’s Adult Care Home, Inc. d/b/a St. Joseph’s Home Care (Rockland County)
162312 Rosewood of Rochester, LLC d/b/a Rosewood of Rochester Home Care (Genesee, Ontario, Livingston, Wayne, and Monroe Counties)
5
Changes of Ownership
Number Applicant/Facility
161046 Advanced Care, Inc. (See exhibit for Counties served)
161186 YALR Operating, LLC (Westchester County)
161455 Brighton Home Care, Inc. (New York, Queens, Kings, Richmond, Bronx, and Nassau Counties)
162070 GALR Operating LLC d/b/a Ghent Assisted Living (Columbia County)
162302 Naidu Associates LLC d/b/a Comfort Keepers #512 (Dutchess, Putnam, Westchester and Bronx Counties)
162476 Better Choice Home Care Inc. (Bronx, Queens, Kings, Richmond, Nassau and New York Counties)
162499 MedPro Homecare Agency, Inc. (Bronx, Queens, Kings, Richmond, Nassau and New York Counties)
D. Certificates Exhibit # 10
Certificate of Amendment of the Certificate of Incorporation
Applicant
Troy Conference Geriatric Foundation, Inc.
Certificate of Amendment to the Certificate of Incorporation
Applicant
Winthrop South Nassau University Health System, Inc.
BFA A
ttachment A
- CO
N 162281
12/31/2016
$ 134,865
75,431
16,193
7,879
$
$
$
113,206
13,207
8,500
369,280
10,170
22,003
594
120,682
399.436
-0-
922,166
163,843
1,086,008
28,146
55,211
24,289
32,060
6,790
4,318
8,500
5,558
5,216
170,088
120,682
160,461
14,869
22,507
-0-
41,095
283,961
813,662
38,904
852,566
165,094
68,348
233,442
1,086,008
Audited 12/31/2015
$ 148,584
73,717
19,802
7,879
$
$
$
99,878
12,147
8,500
370,507
17,761
20,879
594
120,682
410,287
-0-
940,710
38.419
979,129
26,881
71,810
22,051
31.492
17,238
4,365
8,500
5,558
12,490
200,384
120,682
37,331
16,692
22,507
25,941
39,185
296,830
759,552
23,033
782,585
121,804
74,740
196.544
979,129
Increase (Decrease)
$ (13,718)
1,714
(3,610)
-0-
13.327
1,060
-0-
$
$
$
(1,227)
(7,591)
1,124
-0-
-0-
(10,851)
-0-
(18,544)
125,423
106,879
1,265
(16,598)
2,238
567
(10,448)
(46)
-0-
-0-
(7,274)
(30,297)
-0-
123, 129
(1,823)
-0-
(25,941)
1,910
(12,869)
54,110
15,871
69,981
43,290
(6,392)
36,899
106,879
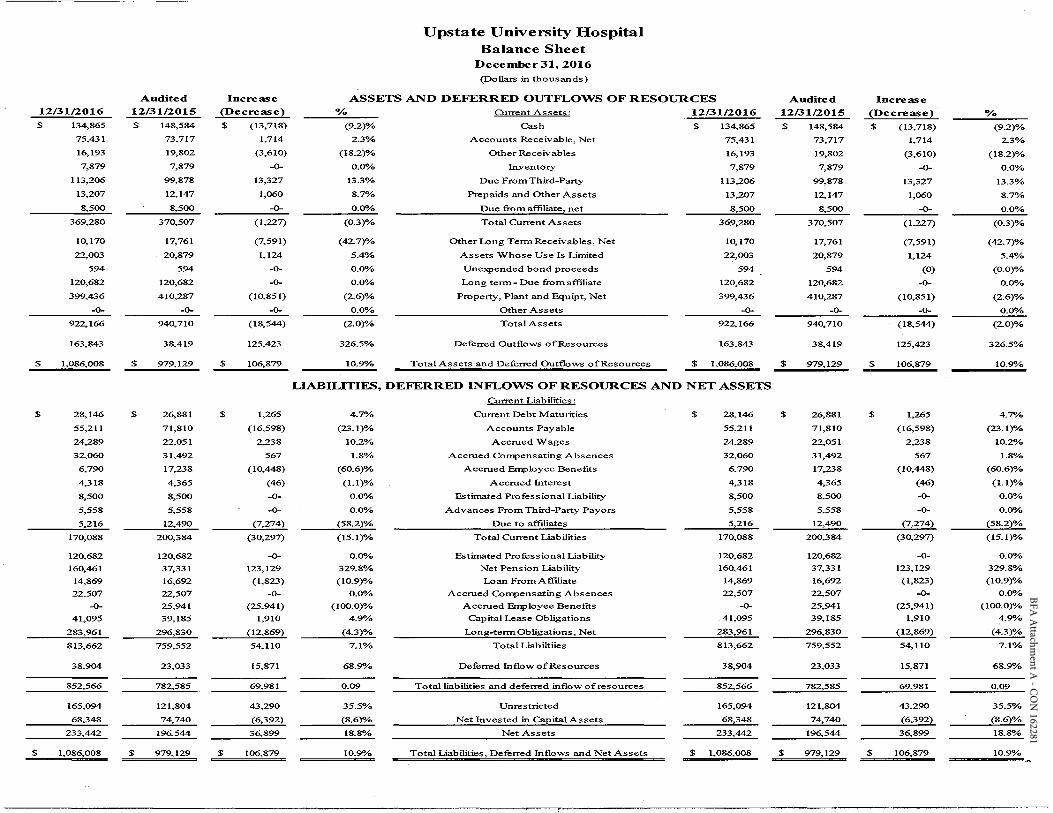
Upstate University Hospital Balance Sheet
December31, 2016 (Dollars in thousands)
ASSETS AND DEFERRED OUTFLOWS OF RESOURCES %
(9.2)%
2.3%
(18.2)%
0.0"/o
13.3%
8.7%
0.0"/o
(0.3)%
(42.7)%
5.4%
0.0%
0.0%
(2.6)%
0.0%
(2.0)%
326.5%
10.9%
Current Assets:
Cash
Accounts Receivable, Net
Other Receivables
lnyentory
Due From Third-Party
Prepaids and Other Assets
Due from affiliate, net
Total Current Assets
Other Long Term Receivables, Net
Assets Whose Use Is Limited
Unexpended bond proceeds
Long term- Due from affiliate
Property, Plant and Equipt, Net
Other Assets
Total Assets
Deferred Outflows ofResources
Total Assets and Deferred Outflo,vs of Resources
12/31/2016
$ 134,865
75,431
16,193
7,879
113,206
13,207
8,500
369,280
10,170
22,003
594
120,682
399,436
-0-
922,166
163,843
$ 1,086,008
LIABILITIES, DEFERRED INFLOWS OF RESOURCES AND NET ASSETS
4.7%
(23.1)%
10.2%
1.8%
(60.6)%
(1.1)%
0.0%
0.0%
(58.2)%
(15.1)%
0.0%
329.8%
(10.9)%
0.0"/o
(100.0)%
4.9%
(4.3)%
7.1%
68.9%
0.09
35.5%
(8.6)%
18.8",1,
10.9%
Current Liabilities:
Current Debt Maturities
Accounts Payable
Accrued Wages
Accnied Compensating Absences
Accrued Employee Benefits
Accrned Interest
Estimated Professional Liability
Advances From Third-Party Pay ors
Due to affiliates
Total Current Liabilities
Estimated Professional Liability
Net Pension Liability
Loan From Affiliate
Acctued Compensating Absences
Accrued Employee Benefits
Capital Lease Obligations
Long-term Obligations, Net
Total Liabiltiies
Deferred Inflow of Resources
Total liabilities and deferred inflow of resources
Unrestricted
Net Invested in Capital Assets
Net Assets
Total Liabilities, Deferred Inflows and Net Assets
$ 28,146
55.211
24,289
32,060
6.790
4,318
8,500
5,558
5,216
170,088
120,682
160,461
14,869
22,507
-0-
41,095
283,961
813,662
38,904
852,566
165,094
68,348
233,442
$ 1,086,008
Audited 12/31/2015
$ 148,584
73,717
19,802
7,879
$
$
$
99.878
12,147
8,500
370,507
17,761
20,879
594
120,682
410,287
-0-
940,710
38,419
979,129
26,881
71,810
22,051
31,492
17,238
4,365
8,500
5,558
12,490
200,384
120,682
37,331
16,692
22,507
25,941
39,185
296,830
759,552
23,033
782,585
121,804
74,740
196,544
979,129
Increase
(Decrease)
$ (13,718)
1,714
(3,610)
-0-
13,327
1,060
-0-
$
$
$
(1,227)
(7,591)
1,124
(0)
-0-
(10,851)
-0-
(18,544)
125,423
106,879
1,265
(16,598)
2,238
567
(10,448)
(46)
-0-
-0-
(7,274)
(30,297)
-0-
123,129
(1,823)
-0-
(25,941)
1,910
(12,869)
54,110
15,871
69,981
43.290
(6,392)
36,899
106,879
% (9.2)%
2.3%
(18.2)%
0.0%
13.3%
8.7%
0.0%
(0.3)%
(42.7)%
5.4%
(0.0)%
0.0%
(2.6)%
0.0"/o
(2.0)%
326.5%
10.9%
4.7%
(23.1)%
10.2%
1.8%
(60.6)%
(1.1)%
0.0%
0.0%
(58.2)%
(15.1)%
0.0%
329.8%
(10.9)%
0.0%
(100.0)%
4.9%
(4.3)%
7.1%
68.9%
0.09
35.5%
(8.6)%
18.8%
10.9%
BFA A
ttachment A
- CO
N 162281
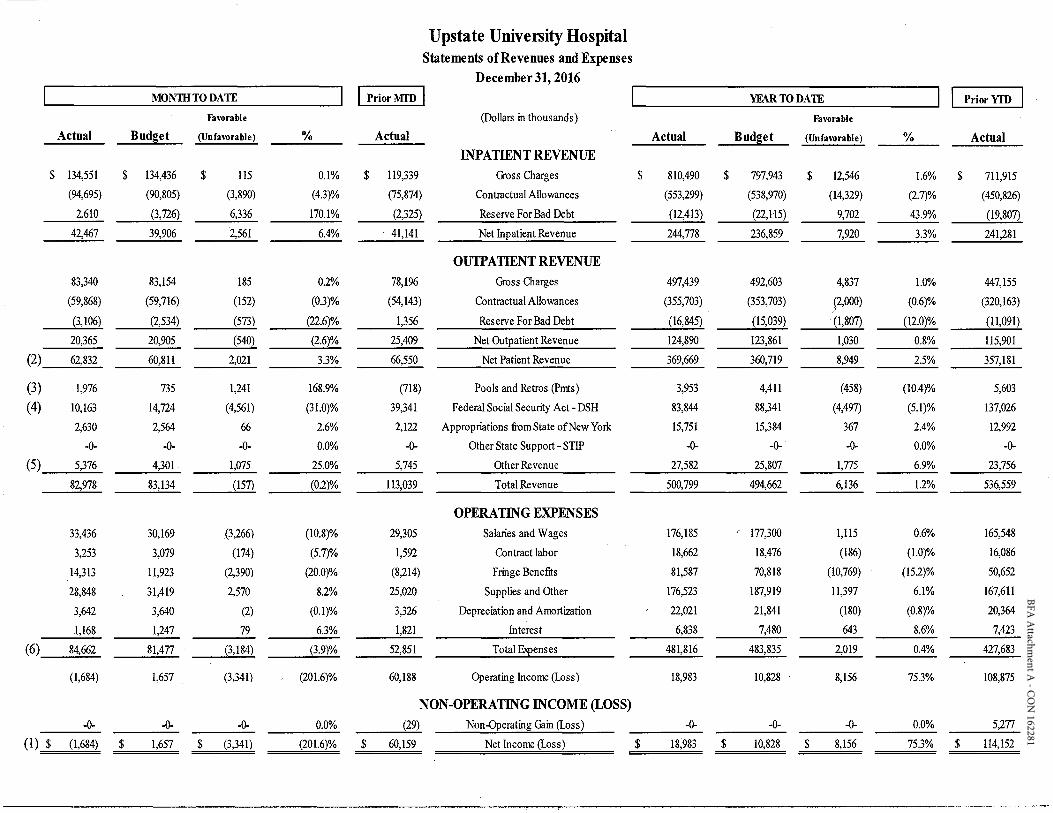
Upstate University Hospital Statements of Revenues and Expenses
December 31, 2016 I MONTHTODATE I I PriorMID I I YFAR TO DATE I I Prior YID I
Actual
$ 134,551
(94,695)
2,610
42,467
83,340
(59,868)
(3, 106)
20,365
(2) 62,832
(3)
(4)
1,976
10,163
2,630
-0-
(5) 5,376
82,978
33,436
3,253
14,313
28,848
3,642
1,168
(6) 84,662
(1,684)
Budget
$ 134,436
(90,805)
(3,726)
39,906
83,154
(59,716)
(2,534)
20,905
60,811
735
14,724
2,564
-0-
4,301
83,134
30,169
3,079
11,923
31,419
3,640
1,247
81,477
1,657
-0- -0----(1) $ (l,684) $ 1,657
Favorable (Dollars in thousands)
(Unfavorable}
$ 115
(3,890)
6,336
2,561
185
(152)
(573)
(540)
2,021
1,241
(4,561)
66
-0-
1,075
(157)
(3,266)
(174)
(2,390)
2,570
(2)
79
(3,184)
(3,341)
-0-
$ (3,341)
%
0.1%
(4.3)%
170.1%
6.4%
0.2%
(0.3)%
(22.6)%
(2.6)%
3.3%
168.9%
(31.0)%
2.6%
0.0%
25.0%
(0.2)%
(10.8)%
(5.7)%
(20.0)%
8.2%
(0.1)%
6.3%
(3.9)%
(201.6)%
0.0%
(201.6)%
Actual
$ 119,339
(75,874)
(2,325)
41,141
78,196
(54,143)
1,356
25,409
66,550
(718)
39,341
2,122
-0-
5,745
113,039
29,305
1,592
(8,214)
25,020
3,326
1,821
52,851
60,188
INPATIENT REVENUE Gross Charges
Contractual Allowances
Reserve For Bad Debt
Net Inpatient Revenue
OUTPATIENT REVENUE Gross Charges
Contractual Allowances
Reserve For Bad Debt
Net Outpatient Revenue
Net Patient Revenue
Pools and Retros (Pmts)
Federal Social Security Act - DSH
Appropriations from State ofNew York
Other State Support - STIP
Other Revenue
Total Revenue
OPERATING EXPENSES Salaries and Wages
Contract labor
Fringe Benefits
Supplies and Other
Depreciation and Amortization
Interest
Total Expenses
Operating Income (Loss)
NON-OPERATING INCOME (LOSS) (29) Non-Operating Gain (Loss)
$ 60,159 Net Income (Loss)
$
$
Actual
810,490
(553,299)
(12,413)
244,778
497,439
(355,703)
(16,845)
124,890
369,669
3,953
83,844
15,751
-0-
27,582
500,799
176,185
18,662
81,587
176,523
22,021
6,838
481,816
18,983
-0-
18,983
Budget
$ 797,943
$
(538,970)
(22,115)
236,859
492,603
(353,703)
(15,039)
123,861
360,719
4,411
88,341
15,384
-0-
25,807
494,662
177,300
18,476
70,818
187,919
21,841
7,480
483,835
10,828
-0-
10,828
Favorable
(Unfavorable}
$ 12,546
$
(14,329)
9,702
7,920
4,837
(2,000) )
(l,807)
1,030
8,949
(458)
(4,497)
367
-0-
1,775
6,136
1,115
(186)
(10,769)
11,397
(180)
643
2,019
8,156
-0-
8,156
%
1.6%
(2.7)%
43.9%
3.3%
1.0%
(0.6)%
(12.0)%
0.8%
2.5%
(10.4)%
(5.1)%
2.4%
0.0%
6.9%
1.2%
0.6%
(1.0)%
(151)%
6.1%
(0.8)%
8.6%
0.4%
75.3%
Actual
$ 711,915
(450,826)
(19,807)
241,281
447,155
(320,163)
(11,091)
115,901
357,181
5,603
137,026
12,992
-0-
23,756
536,559
165,548
16,086
50,652
167,611
20,364
7,423
427,683
108,875
0.0% 5,277
75.3% $ 114,152 =
BFA Attachment A - CON 162281
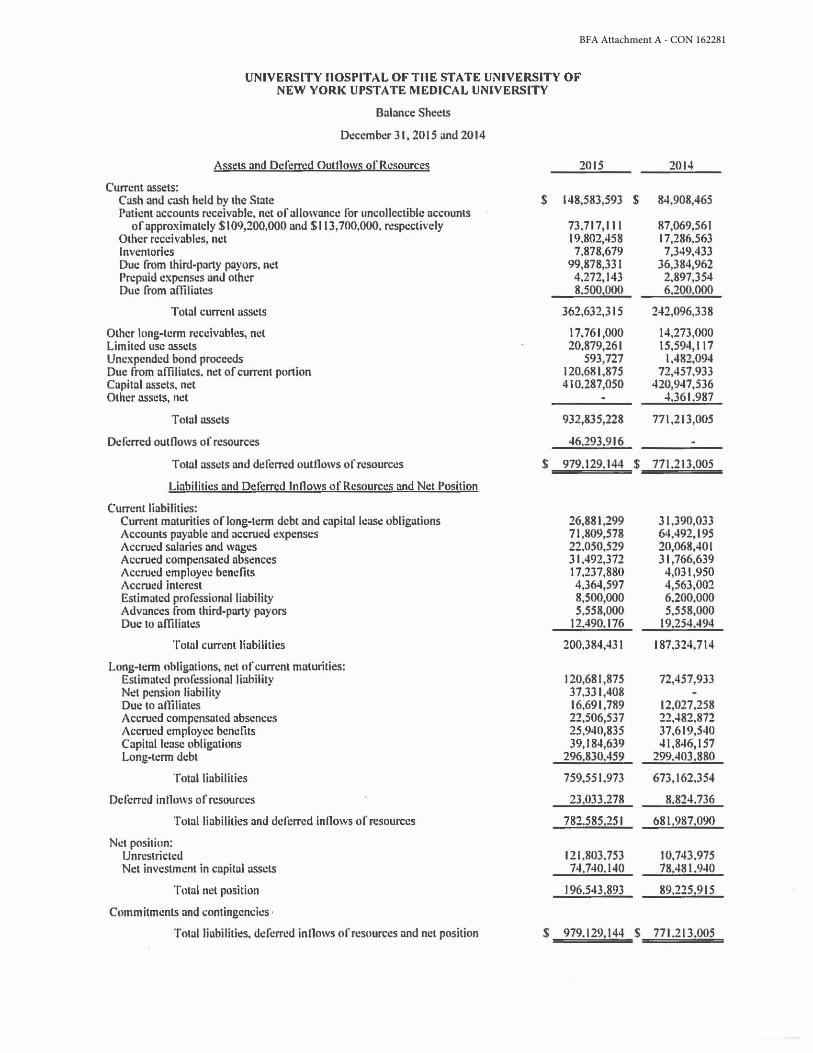
UNIVERSITY HOSPITAL OF THE STATE UNIVERSITY OF NEW YORK UPSTATE MEDICAL UNIVERSITY
Balance Sheets
December 31, 2015 and 2014
Assets and Defca:ed Outllow~ Qf Resources 2015
Current assets: Cash and 1.-.ish held by the State $ 148,583,593 Patient accounts receivable, net or allowance for uncollcctiblc accounts
of approximately $109,200,000 and $113, 700,000, respectively 73.717,111 Other receivables, net 19,802,458 Inventories 7,878,679 Due from third-party payors, net 99,878,331 Prepaid expenses and other 4,272,143 Due from affiliates 8.500.000
Total current assets 362,632,315
Other long-term receivables, net 17.761,000 Limited use assets 20,879,261 Unexpended bond proceeds 593,727 Due from affiliates. net or current portion 120,681,875 Capital assets, net 410.287,050 Other assets, net
Total assets 932,835,228
Deferred outflows of resources 46.293,916
Total assets and deferred outflows of resources $ 979. 129.144
Liabilities and Deforr~!.! lnllows of Resources and Net Position
Current liabilities: Current maturities oflong-t.:rm debt and capital least: obligations 26,881,299 Accounts payable and accrued expenses 71,809,578 Accru.:d salaries and wages 22.050,529 Accrued compensated absences 31,492,372 Accrued employee benefits 17,237,880 Accrued interest 4,364,597 Estimated professional liability 8,500,000 Advances from third-party payors 5,558,000 Due to affiliates 12.490.176
Total current liabilities 200,384,431
Long-term obligations, net of current maturities: Estimated professional liability 120,681,875 Net pension liability 37,331 ,408 Due to alliliates 16,691,789 Accrued compensated absences 22,506,537 Accrued employee benelits 25,940,835 Capital lease obligations 39,184,639 Long-term debt 296,830.459
Total liabilities 759.551.973
Deferred inllows of resources 23.033.278
Total liabilities and deferred inflows of resources 782.585,25 I
Net position: Unrestricted 121.803. 753 Net investment in capital assets 74.740.140
Total net position 196.543.893
Commitments and contingencies ·
Total liubilitic:s, deferred inllows of resources and net position $ 979.129.144
2014
$ 84,908,465
87,069,561 17,286,563 7,349,433
36,384,962 2,897,354 6.200.000
242,096,338
14,273,000 15,594,117
1.482,094 72,457.933
420,947,536 4.361.987
771 ,213,005
$ 771.213.005
31 ,390,033 64,492,195 20,068,401 31,766,639 4,031,950 4,563,002 6.200,000 5,558,000
19.254.494
187,324,714
72,457,933
12,027.258 22,482,872 37,619,540 41,846,157
299.403.880
673, 162.354
8.824.736
681.987.090
10.743.975 78.481. 940
89.225.915
$ 771.213.005
BFA Attachment A - CON 162281
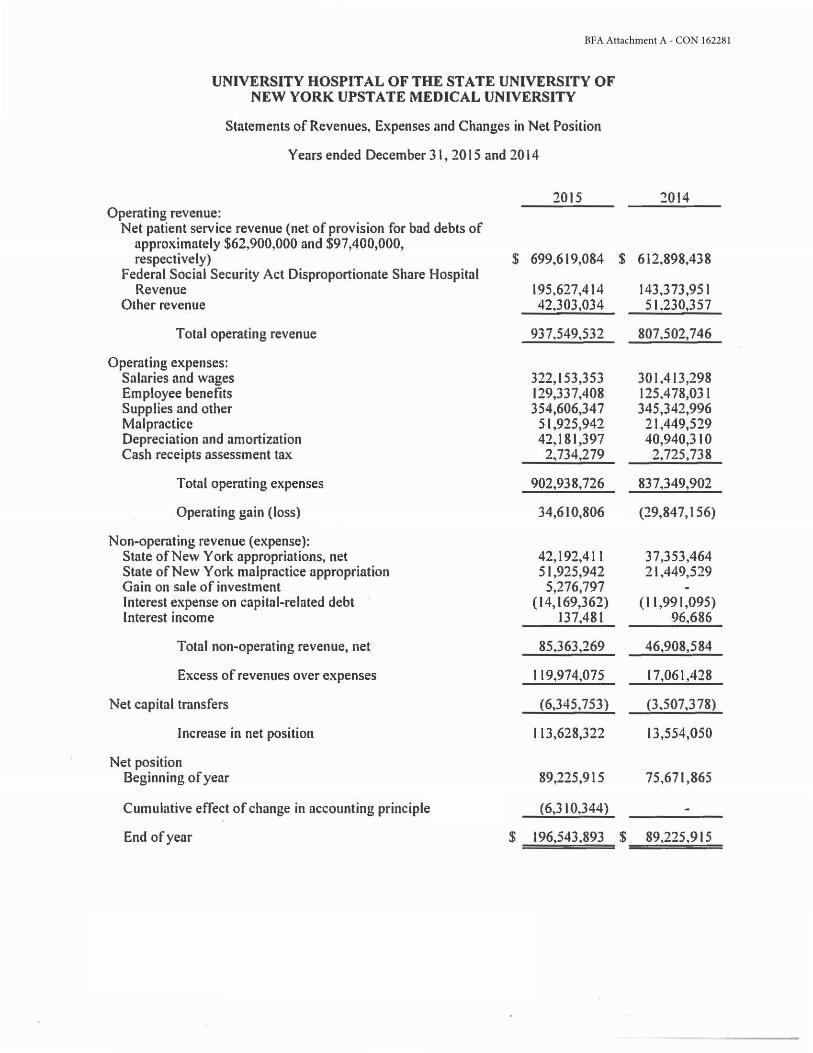
UNIVERSITY HOSPITAL OF THE STATE UNIVERSITY OF NEW YORK UPSTATE MEDICAL UNIVERSITY
Statements of Revenues, Expenses and Changes in Net Position
Years ended December 3 I, 2015 and 2014
2015 '.!014 Operating revenue:
Net patient service revenue (net of provision for bad debts of approximately $62,900,000 and $97 ,400,000, respectively) $ 699.619,084 $ 612,898,43 8
Federal Social Security Act Disproportionate Share Hospital Revenue 195,627,414 143,373,95 I
Other revenue 42.303,034 51.230,357
Total operating revenue 937,549,532 807,502,746
Operating expenses: Salaries and wages 322, I 53,3 53 301,413,298 Employee benefits 129,337,408 125.4 78,03 I Supplies and other 354,606,347 345,342,996 Malpractice 51,925,942 21,449,529 Depreciation and amortization 42,181,397 40,940,310 Cash receipts assessment tax 2,734,279 2,725,738
Total operating expenses 902,938,726 837,349,902
Operating gain (loss) 34,610,806 (29,847, 156)
Non-operating revenue (expense): State of New York appropriations, net 42, t 92,411 37,353,464 State of New York malpractice appropriation 51,925,942 21 ,449,529 Gain on sale of investment 5,276,797 Interest expense on capital-related debt (14,169,362) (I 1,991,095) Interest income 137,481 96,686
Total non-operating revenue, net 85,363,269 46,908,584
Excess of revenues over expenses 119,974,075 I 7,061,428
Net capital transfers (6,345,753) (3.507,378)
Increase in net position 113,628,322 13,554,050
Net position Beginning of year 89,225,915 75,671,865
Cumulative effect of change in accounting principle (6,310,344)
End of year $ 196,543,893 $ 89.225,915
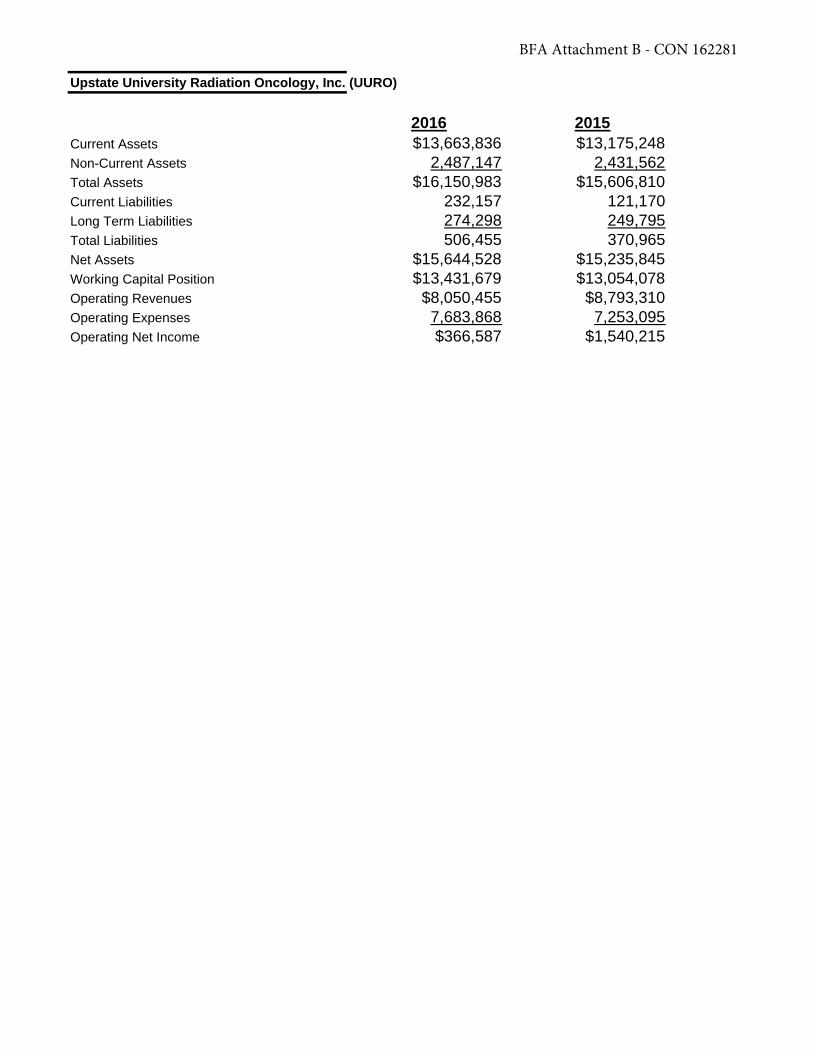
Upstate University Radiation Oncology, Inc. (UURO)
2016 2015Current Assets $13,663,836 $13,175,248Non-Current Assets 2,487,147 2,431,562Total Assets $16,150,983 $15,606,810Current Liabilities 232,157 121,170Long Term Liabilities 274,298 249,795Total Liabilities 506,455 370,965Net Assets $15,644,528 $15,235,845Working Capital Position $13,431,679 $13,054,078Operating Revenues $8,050,455 $8,793,310Operating Expenses 7,683,868 7,253,095Operating Net Income $366,587 $1,540,215
BFA Attachment B - CON 162281

12/3112016
$ 134.865
75,431
16, 193
7,879
$
s
$
113,206
13,207
8,500
369.280
10, 170
22.003
594
120,682
399..436
..()..
9 22, 166
163,843
1,086,008
2.8..146
55,211
24,289
32.060
6,790
4.3 18
8,500
5,558
5,216
170,088
120.682 160,461
14,869
22.507 ..()..
41,095
283,961
813,662
38,904
852.566
165.094
6&,348
233,442
1,086,008
Audited 12131 12015
$ 148.584
73,717
19,802
$
$
$
7,879
99,878
12,147
8,500
370,507
17,761
20,879
594
120,682
410,287
..()..
940,710
38,419
979.129
26,881
71,810
22,051
3 1.492
17,238
4,365
8,500
5,SS8
l b490
200,384
120.682 37,33 1
16,692
22,507 25,941
39, 185
296,830
759,552
23,033
7 8bS8 5
12 1,804
74,740
196.544
979, 129
Increase (Decrease) $ ( 13,718)
1,7 14
(3,610)
..()..
13,327
1,060
..()..
$
$
$
(1,227)
(7,591)
1,124
-0-..()..
( 10,851)
..()..
( 18,544)
125.423
106.879
1,265
(16.598)
2.238 567
(10.448)
(46)
-0-
..()..
(7,274)
(30,297)
..()..
123. 129
( 1.823) -0-
(25,941)
1,910
{12,869)
54. 110
15,871
69.98 1
43.290
(6,392)
36.899
106,879
Upstate U n iversity Hospital Balance S h eet
Decem ber 31, 2016 (Dolla.rs in thousands)
ASSETS AND D EFERRED OUTFLOWS OF RESOURCES o/o
(9.2)"/o
2.3%
(18.2 )%
0.00/.,
13.3%
8 .7%
0 .00/o
(0.3)%
(42.7)%
5.4%
0 .0%
0.0%
(2.6)%
0 .0"/o
(2.0)%
326.5%
10 .9%
Current A!t~~t1::
Cash
A ccou nts Receivab le, Net
Other Receivab les
ln:yentory
Due From Third-Party
P repaids and Other Assets
Due from affiliate. net
Total Cunent Assets
Other Lo n g Term Receivables , Net
Assets Whose Use ls Limited
Unexpended b ond proceed s
Long term- Due &om aff"tliate
Property, Plant and Equipt, Net
Other Assets
Total Ass ets
Deferred O utflows o f Resources
Tot9l A ssets and Deferred Outflow s of R esources
1 2/311201 6 $ 134,865
75,4 31
16, 193
7,879
113,206
13,207
8 ,500
369,280
10, 170
22.003
594
12 0.682
399,436
-0-
922.166
163,843
$ 1.086.008
LIABILITIES. D EFERR ED INFLOWS OF RESOURCES AND NET ASSETS Current Liabilities:
4 .7%
(23.1)%
10.2%
1.8%
(60.6)%
(1.1)%
0 .0"/o
0.00/o
{58.2)%
( 15.1)%
0.0%
329.8%
(10.9)% 0.0"/o
( 100.0)% 4 .9%
{4.3)%
7 .1%
68.9%
0 .09
35.5%
(8.6)%
18.8%
10.9%
Cunent Debt Maturities
Accounts Payable
Accrued Wages
Accrued Co~nsating Absences
Accrued Employee Benefas
Accrued Interest
Estimated Professional Liability
Advances From Third-Party P::1y o rs
Due to affiliat es
Tot a l Current Liabilities
Estimat ed Professional Liability Net Pension Liability
Loan From Affiliate
Accrued CoOJPensating Absc.n~s
Acc rued Employee Benefits Capital Lease Obligations
Lona- tenn Obligations, Net
To ta! Liabiltiies
Deferred Inflow of Resou rces
T otal liabilities and defen-ed inflow of reso u rces
Unres'tric:te-d
Net Invested in Capital Assets
Net Assets
Total Liabilities. Deferred Inflows and Net Assets
$ 28, 146
55.21 1
24.289
32,060
6.790
4 ,318
8,500
5,SS8
5,216
170,088
120,682
160,461
14 ,869
22,507 ...().
41,095
283,961
813,662
38,904
8SbS66
165,094
68,348
233,442
s l,086.008
Audited
12/31 /201 5
S 148,S84
73,717
19 ,802
7,879
$
$
s
99,878
12, 147
8 ,SOO
370,507
17,761
20,879
594
120,682
410,287
-0-
940,710
38,4 19
979.129
26,881
71.810
22,05 1
3 1,492
17,238
4 ,365
8,500
S,558
lb 490
200,384
120,682 37,33 1
16,692 22,507
25,941 39,185
296.830
759.552
23,033
782,585
12 1,804
74.740
196.544
979,129
Increase (Decrease) s (13,718)
1,714
(3,610)
-0-
13,327
1,060
..()..
$
s
$
(l,227)
(7,S91)
1, 124
(0)
..()..
( 10,851)
-0-
(18.544)
125,423
106.879
1.265
(16,598)
2,238
567
( 10,448)
(46)
-0-
-0-
(7,274)
(30,297)
-0-123,129
( 1,823) ...().
(25,941) 1,910
(12,869)
54. 110
15,871
69,981
43,.290
(6.392)
36,899
106,879
%
(9.2)%
2.3%
(18.2)%
0.00/o
13.3%
8.7%
0.00/o
(0.3)%
(42-7)%
~-4%
(0.0)%
0.C)%
(2.6)%
0 .0%
(2.0)%
326.5%
10.9%
4 .7"/o
(23.1)%
10.2%
1.8"/o
(60.6)%
( 1. 1)%
0.0%
0.0%
{.58.2)%
(lS.1)%
0.0"/o 329.8%
(1 0.9)%
0 .0%
( 100.0)% ~ 4.9'%
(4 .3)%
7.1%
68.9"/o
> > ~ 9 re s.
------> 0.09
35.5% ~ (8.6)% ~
18.8% ~ --- oo 0\
10.9%
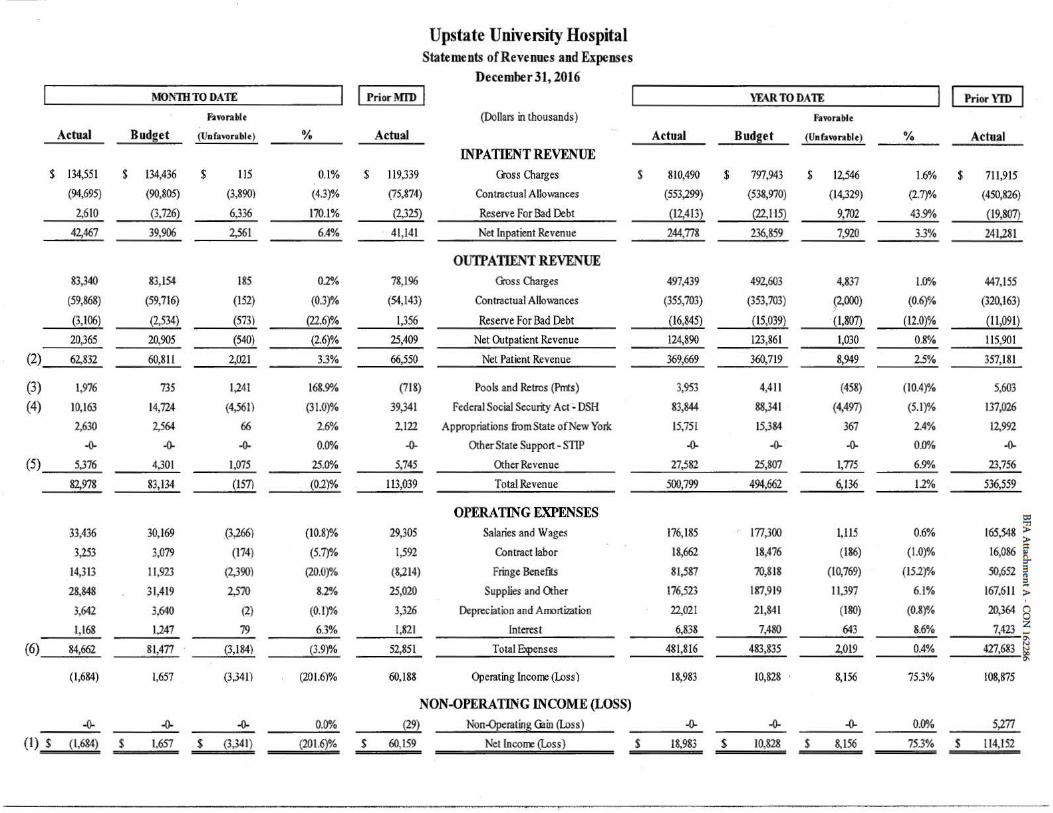
Upstate University Hospital Statements of Revenues and Expenses
December 31, 2016
I MOl\'lllTO DATE I I Prior MID I I YFARTODATE I I Prior YID I Fnorabh (Dollars in thousands} Favorable
Actual Budg!!_ (Unfavorable) % Actual Actual Budget (Unfnorable) % Actual INPATIENT REVENUE
$ 134,551 $ 134,436 $ l15 0.1% $ 119,339 Qoss C11arges s 810,490 $ 797,943 $ 12,546 1.6% $ 7ll,915
(94,695) (90,805) (3,890) (4.3)% (75,874) Contractual Al.lowances (553,299} (538,970) (14,329) (2.7)% (450,826)
2,610 (3,726) 6,336 170.1% (2,325) Reserve For Bad Debt (12,413) {22,1'15l 9,702 43.9% (19,807)
42,467 39,906 2,561 6.4% . 41,141 Net lneatient Revenue 244,778 236,859 7,<J1.0 33% 241,281
OUTPATIENT REVENUE 83,340 83,154 185 0.2% 78,196 Goss Oiarges 497,439 492,603 4,837 1.0% 447,155
(59,868) (59,716) (152) (0.3)% (54,143) Contractual Allowances (355,703) (353,703) (2,000) (0.6)% (320,163) )
(3,106) (2,534) (573) (22.6)% 1,356 Reserve For Bad Debt (16,845) ~15,039) (l,807) (12.0)% ~ll,091}
20,365 20,905 (540) (2.6)% 25,409 Net Outpatient Revenue 124,890 123,861 t,030 0.8"/o llS,901
(2) 62,832 60,811 2,021 3.3% 66,550 Net Patient Revenue 369,669 360,719 8,949 2.5% 357,181
(3) l,976 735 1,241 168.9% (718) Pools and Retros (Pnts) 3,953 4,4lt (458) (10.4)% 5,603
(4) 10,163 14,724 (4,561) (31.0)% 39,341 Federal Social Securty Act~ DSH 83,844 88,341 (4,497) (5.1)% 137,026
2,630 2,564 66 2.6% 2,122 Appropriations from State ofNew Yorlc 15,751 15,384 367 2.4% 12,992
--0- --0- --0- 0.0% --0- Other State ~upport - STIP --0- --0- --0- 0.0% --0-
(5) 5,376 4,301 1,075 25.0% 5,745 Other Revenue 27,582 25,807 1,775 6.9% 23,756
82,978 83,134 (157) (0.2)% 113,039 Total Revenue 500,799 494,662 6,136 1.2% 536,559
OPERATING EXPENSES °' 'Tl
33,436 30,169 .(3,266) (10.8)% 29,305 Salaries and Wages 176,185 ' 177,300 1,115 0.6% 165,548 ~
3,253 3,079 (174) (5.7)% 1,592 Contract labor 18,662 18,476 (186) (1.0)% 16,086 ~ 14,313 11,923 (2,390) (20.0)% (8,214) Fringe Benefits 81,587 70,818 (10,769) (152rlo 50,652 ~
::>
28,848 31,419 2,570 8.2% 25,020 Supplies and Other 176,523 187,919 l l,397 6.1% 167,611 ;:. . 3,642 3,640 (2) (0.1)% 3,326 Depreciation and Arrcrtization 22,021 21,841 (180) (0.8)% 20,364 8 l,168 1,247 79 6.3% 1,821 Interest 6,838 7,480 643 8.6% 7,423 : -- C\
(6) 84,662 81,477 (3,184) (3.9)% 52,851 Total Expenses 481,816 483,835 2,019 0.4% 427,683 ~
(1,684) 1,657 (3,341) (201.6)% 60,188 Operating Income (Loss) 18,983 10,828 8,156 75.3% 108,875
NON-OPERATING INCOME (LOSS) --0- --0- --0- 0.0% (29) Non-Operating Gain (Loss) ..(). --0- ..(). 0.()% 5,277
(l) $ (t,684) s 1,657 $ (3,341) (201.6r1o s 60,159 Net lncome (Loss) s 18,983 $ 10,828 s 8,156 153% $ 114,152
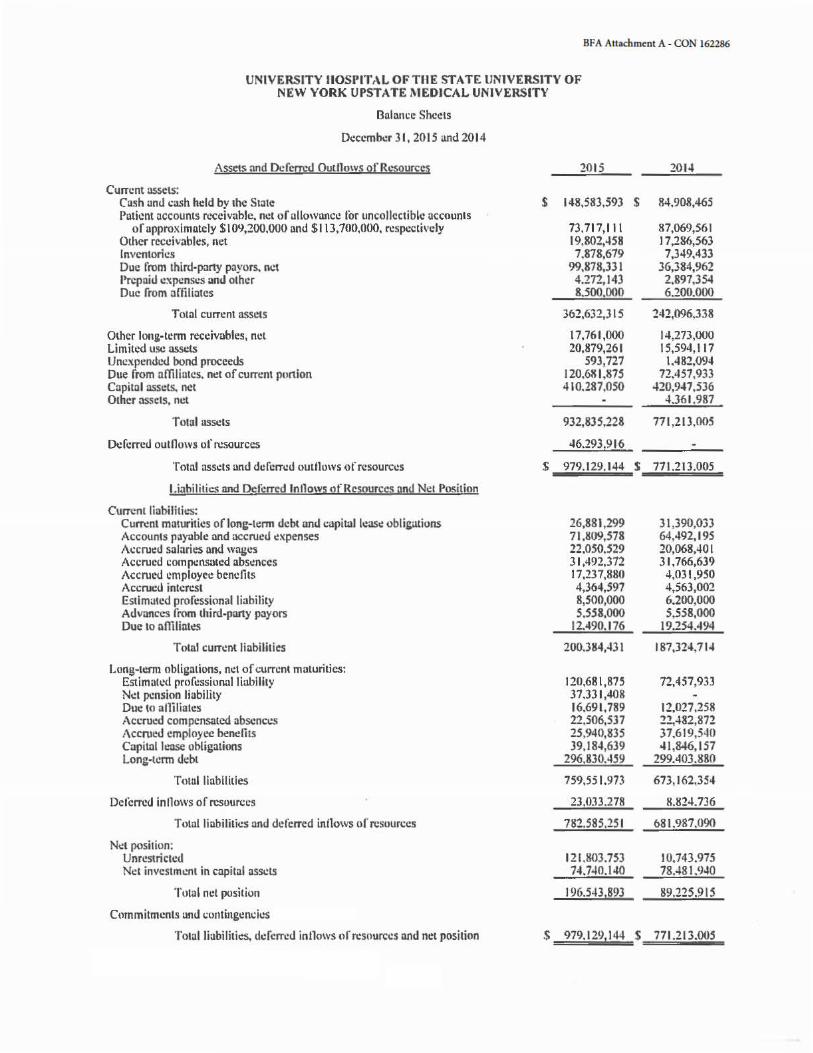
BFA Attachment A - CON 162286
UNIVERSITY llOSPITALOFTHE STATE UNIVERSITY OF NEW YORK UPSTATE MEDICAL UNIVERSITY
Balance Sheets
December 31, 2015 and 2014
Assets and De fcrrcd Outflows of Rs.-sources
Current assets: Cash and cash held by the State Patient accounts rs.-ccivablc, net of ullowuncc for uncollcctible uccounts
of approximately $I 09,200.000 and $113, 700,000, respectively Other receivables, net Inventories Due from third-party payors. net Prepaid expenses and other Due from affiliates
Total current assets
Olhcr lons-tcnn receivables, net Limited use nssi:ts Unexpended bond proceeds Due from affiliates. net of current portion Capital assets. net Other assets, net
Total assets
Deferred outnows of resources
Total assets and deferred outflows of resources
Liabilities and Deferred Inflows ofRcsourcc:s and Net Position
Current liabilitil:S: Cummt maturities oflong·h:rm debt and capitul ll!aSe obligations Accounts p.iyuble and accrued expenses Accrued salaries nnd wag1.'S Accrued compensated abs.:nces Accru1.'<.I employee benefits Accrued interest Estimated professional liability Advances from third-party payors Due to affiliates
Tolnl current liabilities
Long-term obligations, n.:t of current muturities: Estimatcd professional liability Nct pension liability Due lo alliliatcs Accrued compensated absences Accrued employee benefits Capitnl lt!nSe obligations Long-term debt
Total liubilities
DelCrred inllows of resources
Totnl liabilitics and deferred intlows of resources
Net position: Unrestricted Net investment in capital assets
Total net position
Commitments und i:ontingcncies
Total liabiliti.:s, d..:fcrn:d inflows of resources nnd net position
2015
$ 148,583,593
73.717,111 19,802,458 7.878,679
99,878,331 4.272,143 8.500.000
362,632,315
17,761,000 20,879,261
593,727 120.681,875 410.287,050
932,835,228
46.293.916
s 979.129.144
26,881 ,299 71,809,578 22.050,529 31,492,372 17,237,880 4,364,597 8,500,000 5.558,000
12.490.176
200.384,·B I
120,681,875 37.331,408 16.691,789 22,506,537 25.940,835 39,18-1,639
296.830.459
759,551.973
23.033.278
782.585.25 I
121.803.753 74.740.140
196.543,893
$ 979.1291144
2014
$ 84,908,465
87,069,561 17,286,563 7,349,433
36,384,962 2,897,354 6.200.000
242,096,338
14,273,000 15,594,117 1,482,094
72,4;7,933 420,947 ,536
4.361.987
771,213,005
$ 771.213.005
31,390,033 64,492,195 20,068,401 31,766,639 4,031,950 4,563,0-02 6.200,000 5,558,000
19.254.494
187,324,714
72,457,933
12,027.258 22,-l82,872 37,619,540 41,846, 157
299.403.880
673,162,354
8.824.736
681.987.090
10.743.975 78.481.940
89.225.915
s 771.213.005
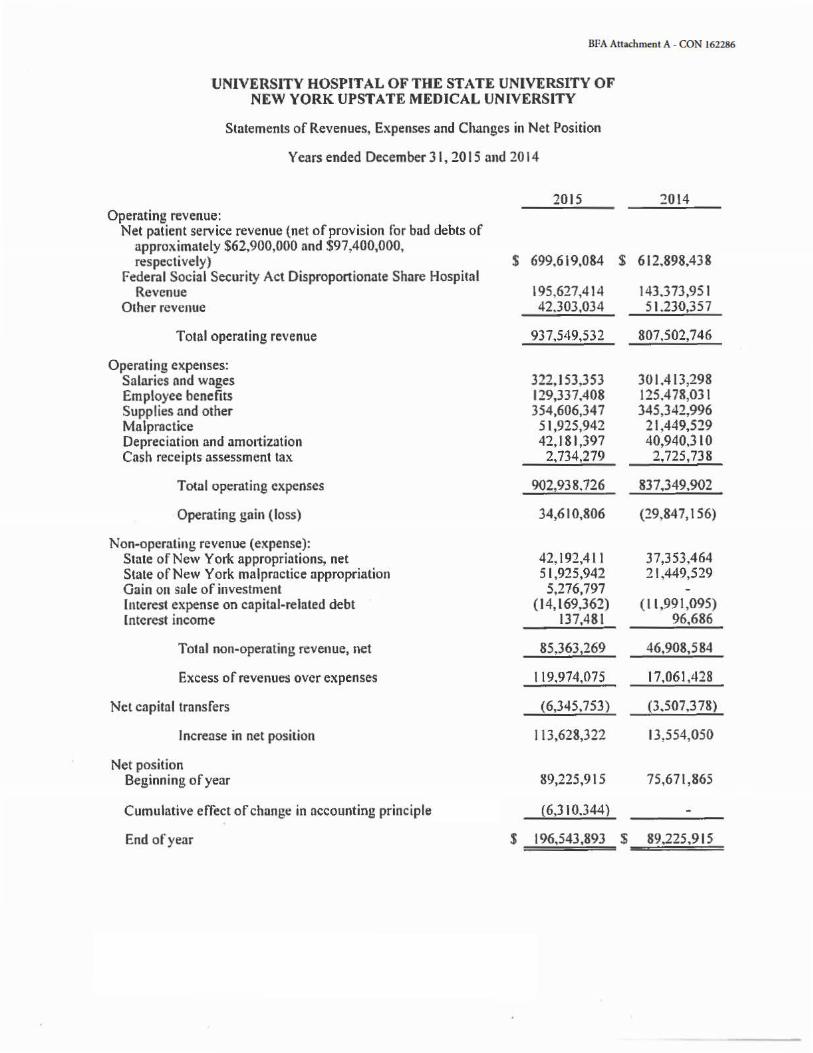
BFA Attachment A - CON 162286
UNIVERSITY HOSPITAL OF THE STATE UNIVERSITY OF NEW YORK UPSTATE MEDICAL UNIVERSITY
Statements of Revenues, Expenses and Changes in Net Position
Years ended December 3 I, 2015 and 20 14
2015 '.!014 Operating revenue:
Net patient service revenue (net of provision for bad debts of approximately $62,900,000 and $97,400,000, respectively}
Federal Social Security Act Disproportionate Share Hospital $ 699,619,084 $ 612,898,43 8
Revenue 195,627,414 143.373,951 Other revenue 42.303,034 51.230,357
Total operating revenue 937,549,532 807,502,746
Operating expenses: Salaries and wages 322,153,353 301,4 I 3,298 Employee benefits 129,337,408 125.4 78,031 Supplies and other 354,606,347 345,342,996 Malpractice 51,925,942 21,449,529 Depreciation and amo1tization 42,181,397 40,940,310 Cash receipts assessment tax. 2,734,279 2,725,738
Total operating expenses 902,938,726 837,349,902
Operating gain (loss) 34,610,806 (29,847, 156)
Non-operating revenue (expense): State of New York appropriations, net 42, 192,411 37,353,464 State of New York malpractice appropriation 51,925,942 21,449,529 Gain on sale of investment 5,276,797 Interest expense on capital-related debt (14,169,362) (l l,991,095) Interest income 137,481 96.686
Total non-operating revenue, net 85,363,269 46,908,584
Excess of revenues over expenses 119.974,075 17,061,428
Net capital transfers (6,345,753) (3.507,3 78)
Increase in net position 113,628,322 13,554,050
Net position Beginning of year 89,225,915 75,671,865
Cumulative effect of change in accounting principle (6,310,344)
End of year $ 196,543,893 $ 89.225,915
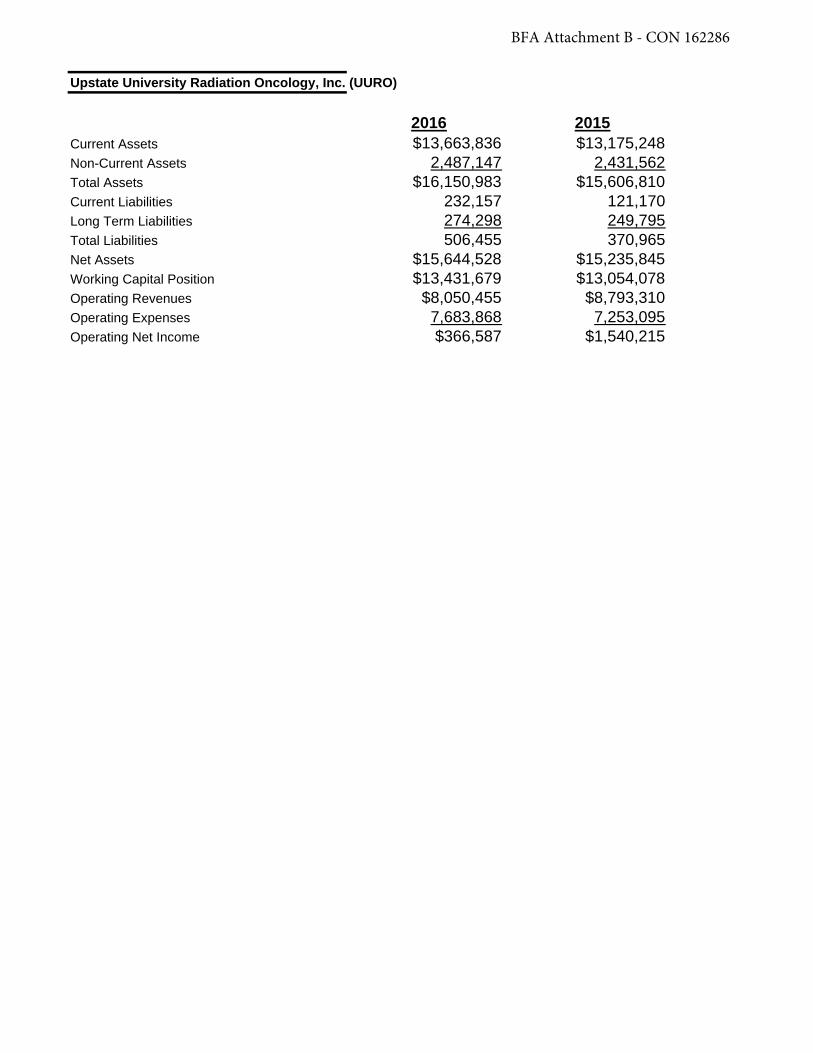
Upstate University Radiation Oncology, Inc. (UURO)
2016 2015Current Assets $13,663,836 $13,175,248Non-Current Assets 2,487,147 2,431,562Total Assets $16,150,983 $15,606,810Current Liabilities 232,157 121,170Long Term Liabilities 274,298 249,795Total Liabilities 506,455 370,965Net Assets $15,644,528 $15,235,845Working Capital Position $13,431,679 $13,054,078Operating Revenues $8,050,455 $8,793,310Operating Expenses 7,683,868 7,253,095Operating Net Income $366,587 $1,540,215
BFA Attachment B - CON 162286

CON#l71003 BFA Attachment A
THE WOMAN'S CHRISTIAN ASSOCIATION OF JAMESTOWN, N. Y. CONSOLIDATED BALANCE SHEETS December31, 2015 and 2014
ASSETS 2015 2014
Cunent ISiets: -/ Cash and cash equivalents s 3,113,818 $ 5,213,004 Patient accounts receivable, net of aUowance for doubtful accounts of approxlmataly $988.208 ($1, 127,000 • 2014) 11,699,895 13,180,832
Other racalvables • affillates 1,239 834 SUpplles 3,278,939 2,988,282 Prepaid expensea and other current assets 2,534,837 1,798,755 Assets IJmited as to use • currant portion 15,881 744,342 Estimated amounts due frDm lhlrd-party payors 1.164.229 5581333
Total currant aaaets 22,408,238 24,4n,eaz
Property, plant and equipment, net 38,842,976 42,882,134
Assets limited aa to use, net 5,955,427 5,374,845
Benefldal Interest In Iha net assets of w.c.A. Foundation 12,897,870 13,652.109
Other long-term reeelvable 925,000 875,000
Other anets, net 113071390 11387.538
Totalusete s 821134.898 s 885!291388
LIABILITIES AND NET ASSETS
Currant llablRU..: Una of credit s $ 1,500,000 Due to related parties 2,000.000 Current portion of long.term debt 3,135,508 2,820,888 Cwrent poJtlon Of capilal l111e obligations 258,841 518,517 Accounts payable and accrued expanses 8,947,927 7,148,703 Accrued payron and benefits 2,889,708 3,803,380 Deferred revenue 222,834 289,818 Estimated amounts due to third-party payors 2.482.794 2.504.788
Total current llabUltlea 15,895,410 200381,890
Long-term debt, net Of unamortfzad discount 24,099,548 27,323,105
capital lease obUgatfona, net 44,162 300,793
Other long-term llablllty 925,000 875,000
AcclUed pension llablllly 301092.941 31.681.859
Total llabllltle• 71,057,061 80,522,247
Net assets: Unrestricted
Pension Oablllty adjustment (34,591,223) (37,075,302) Other 301929,085 29,413,219 Total unrestricted net asseta.(defialt) (3,882, 138) (7,682,083)
Temporarily restricted 11,835,857 12,827,507 Permanently restricted 2.904:128 21841,715
Total net Ulltl 111on.841 8sfJ07,139
Total ll1bUltle8 and net assets $ 82.1341698 ! 88.6291388
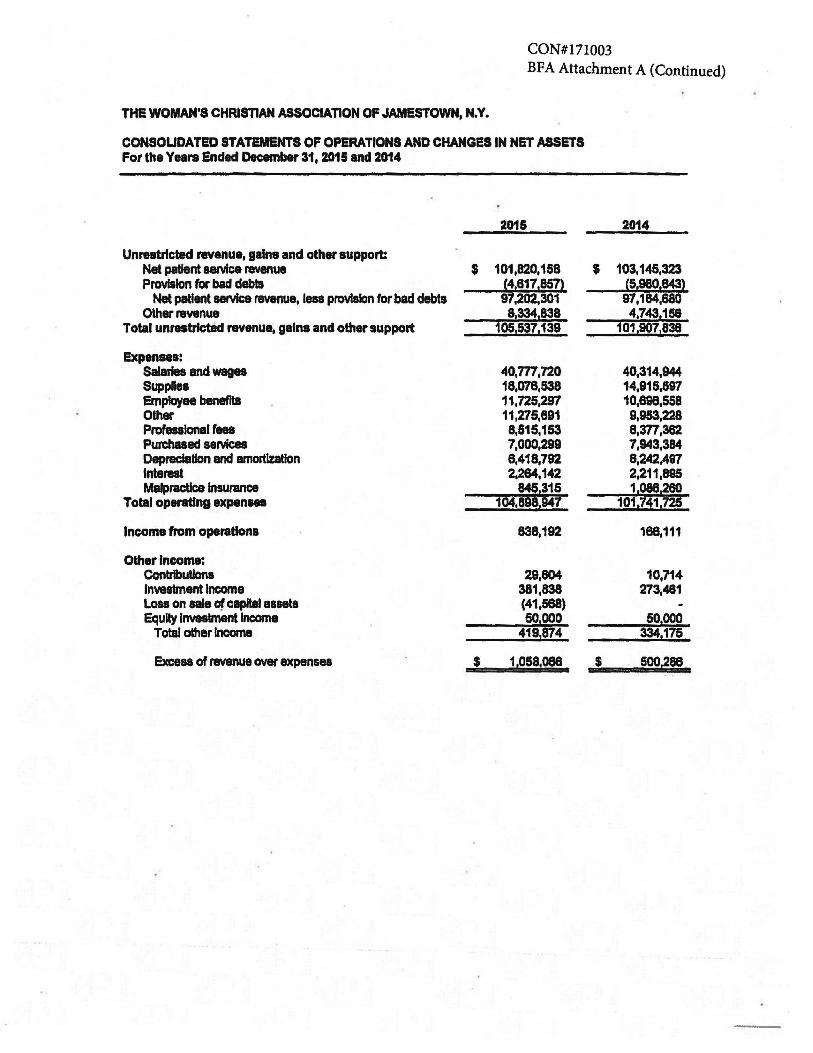
CON#l71003 BFA Attachment A (Continued)
THE WOMAN'S CHRISTIAN ASSOCIATION OF JAMESTOWN, N.Y.
CONSOLIDATED STATEMENTS OF OPERATIONS AND CHANGES IN NET ASSETS For the Years Ended December 31, 2015 and 2014
2015
Unrestrtcted revenue, gains and other support: Net patient service revenue $ 101,820, 158 Provision for bad debts i418171857}
Net patient service revenue, lea provlsJon for bad debts 97,202,301 Other revenue 6,3341838
Total unrestrlctad revenue, gains and other support 105,537,139
Expenses: Salaries and wages 40,m,120 SuppHes 18,078,538 Employee benefits 11,725,297 Other 11,275,691 Professional fees 8,815,153 Purdlaaed services 7,000,299 Oeprecfallon and amortlzatfon 6,418,792 Interest 2.284,142 Malpractice Insurance
Total operating expanll8 8461315
104,ess1947
Income from operation• 838,192
Other Income: Contrlbutlona 29,604 lnvaa1ment Income 381,838 Lou on sale of capital asset& (41,588) Equity Investment Income so.ooo
Total other Income 4191874
Excess of revenue tNer expenses $ 110581088
2014
$ 103, 145,323 ,5198018432 97,184,680 4,743,158
101,9071838
40,314,944 14,915,697 10,898,558 9,953,228 8,377,362 7,943,384 8,242,497 2,211,885 11oae12e0
101i741,725
188,111
10,714 273,481
501000 3341175
.$ sooaae
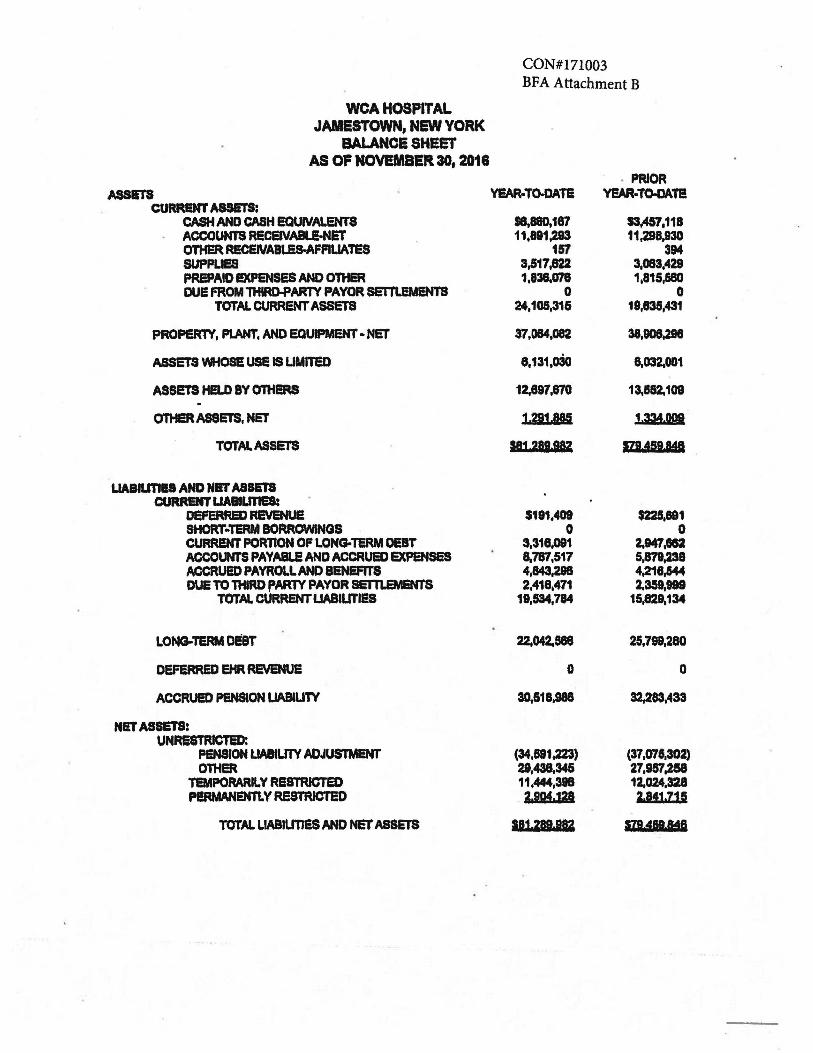
ASSETS
WCA HOSPITAL JAMESTOWN, NEW YORK
BALANCE SHEET AS OF NOVEMBER 30, 2018
CURRENT A8SETS: CASH AND CASH EQUIVALENTS ACCOUNTS RECEIVABLE-NET OTHER RECEIVABLEs.AFFIUATES SUPPLIES PREPAID EXPENSES AND OTHER DUE FROM THIRD-PARTY PAYOR SETTLEMENTS
TOTAL CURRENT ASSETS
PROPERTY, Pl.ANT, AND EQUIPMENT· NET
ASSETS WHOSE use IS LIMITED
ASSETS HELD BY O'nieRS
OTHERASSETS, NET
TOTAL ASSETS
IJABIUTIE8 AND Nl!T ASllTS CURRENT UABHJTl&S:
DEFERRED REVENUE SHORT·tEAM BORROWINGS CURRENT PORTION OF LONG-TERM DEBT ACCOUNTS PAYABLE AND ACCRUED EXPENSES ACCRUED PAYROLL ANO BENEFITS DUE TO THIRD PARTY PAYOR sem.EMENTS
TOTAL CURRENTUABIUTl!S
LONG-TERM OEaT
DEFERRED EHR REVENUE
ACCRUED PENSION UABIUTY
NET ASSETS: UNRESTRICTED:
PSNSION UABIUTY ADJUSTMENT Ont ER
TEMPORARILY RESTRICTED Pl!RMANENTLY RESTRICTED
TOTAL LIABIUTJ&S AND NET ASSETS
CON#l71003 BFA Attachment B
YIAA·To.DATE
$8.880.187 11,891,293
157 3,517,622 1,838.078
0 ~.105,316
37,084,082
8,131,o3o
12,897,870
j,DJ,llY
113 ,211-UZ
$191,409 0
3,318.0S1 6,787,517 4,843,288 2,418,471
19,534,784
22.042.S68
0
30,618.988
(34,681.223) 29,438.346 11,444,398 2.9Q4.128
111 mm
• PRIOR YEAR-TO-DAT!
13,457,118 11,298,930
394 3,083,429 1,815,680
0 19,835,431
38,908,298
6,032.001
13.562,108
l,334.RQI
EldUldl
$225,881 0
2.947,ea 5.879.238 4,218,544 2.359.999
15,829.134
25,799,280
a
32,283,433
(37,07t,302) 27,957,2S8 12,024,328 2.841315
m1u11e
......... 13 ::s .s ..... s:: 0 u -i::Q
5 §] - u ~~ "'*' < Z..:c: Or.x.. u i::Q
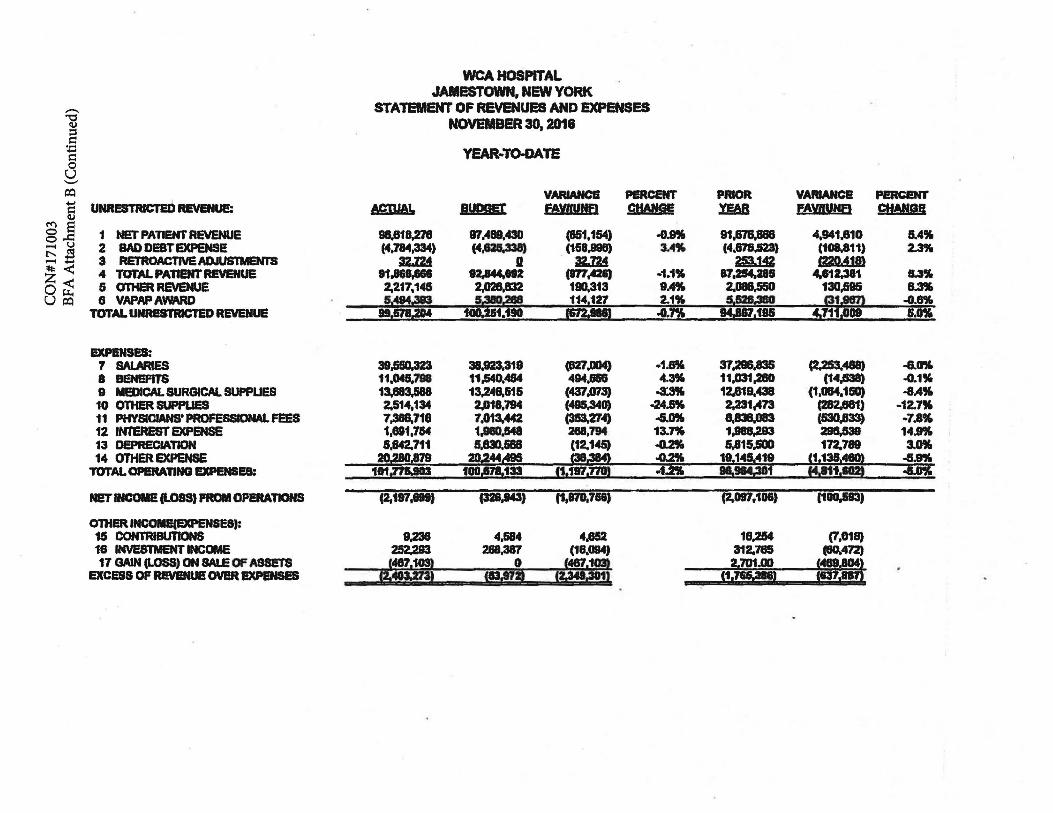
UNRESTRICTED REVENUE:
1 NET PATIENT REVENUE 2 BAO DEBT EXPENSE 3 RETROACTIVEAOJUSTMENTS 4 TOTALPA11ENTREVENUE 5 OTHER REVENUE 8 VN'AP AVMRD
TOTAL UNRl!Sl'FdC IEO REVENUE
EXPENSES: 7 SAlMtES 8 BENEFITS 8 MEDICAL SURGICAL SUPPLIES 10 onER SUPPLIES 11 PHYSICIANS' PROFESSIONAL FEES 12 INTEREST EXPENSE 13 DEPRECIATION 14 OTHER EXPENSE
TOTAL OPERATING EXPENSES:
NET INCOME CLOSS) FR<* OPERATIONS
OTHER INCOME(EXPEN&ESJ: 15 CONTRIBUTIONS 18 INVESTMENT INCOME 17 GAIN CLOSS) ON SALE OF ASSETS
EXCESS OF RIM!NUE£ 0VBR EXPENSES
WCA HOSPITAL JAMESTOWN, NEW YORK
STATEMENT OF REVENUES AND EXPENSES NOVEMBER 30, 2018
YEAR·TO-DATE
VARIANCE PERCENT ACTUAL BupgEJ' FAV«UNf) CHANGE
PRIOR ms
VARIANCE fA\fllUNB
98.818.278 87,489.430 (851, 154) .Oft 91.61&.888 4,941.810 (4,784,334) (4,121,331) (158,896) 18 (4.878.823) (108.811)
am a az.m mis IPMW 11.ae&,8&& 92,1144.nz (177.GI) -1.1% 11.-211 4,111,311 2,217, 146 2,028.B32 180.313 9.4% 2,088.550 130,&95 5."94.:JIQ - ~------ ·- 1~.127_ -· _2._'l'-l__ UB.380 ·---°'.98'11
99.&78.2M tG0.21t.t9D _ ___ l&'tUUI- -·- -~~-= -IQl7.115 4.711,0DI
P&RCENT CtfMGE
5.4% 2.3%
15.3% 8..3%
..0.8% S~K
38,550,323 38.923.319 (827.1114) ·1.CIVi 37.296.835 (2.253...a&) -8.0% 11.CM5,718 11,540,484 494,858 4.3% 11.1)31,280 (14.838) ..0.1% 13,883.588 13,248.&16 (437,D73) -3:3% 12.618.438 (1,084,150) -8.4% Z.514,134 2,018,794 (<f95,340) -24.&% 2.231t4C73 (282.881) -12.7% 7.388.71& 7.013.442 (353,274) ..a.ca &.838.IJ83 (530,833) -1.aw. 1,891,764 1.-.541 2611,794 13.n. 1,988,293 2118.538 14.9% 5.842.711 5,830,688 (12, 1.c&) .a.a &,815.SOO 172.789 3.0%
~.879 ~44- (38~ .a.a 18~9 ~~ -6.K 10177UDs toCn)tt t1.'iiifi1( -i.a i:~tt~ :S.K
C2,f87,m) (328.la) ff,870,718) (2.097;1111) (100.S93)
8.238 4,684 4.852 18.,254 (7,018) 252.293 288,387 (18,094) 312.785 (80.472) (487.ttm.. - - . _I) - - - (487,'ffm. 2.701.IJO . (489.ll04)
1!!1W?!I \138!) . p.pynl Ct.'NUllL- 113'1.;lifl
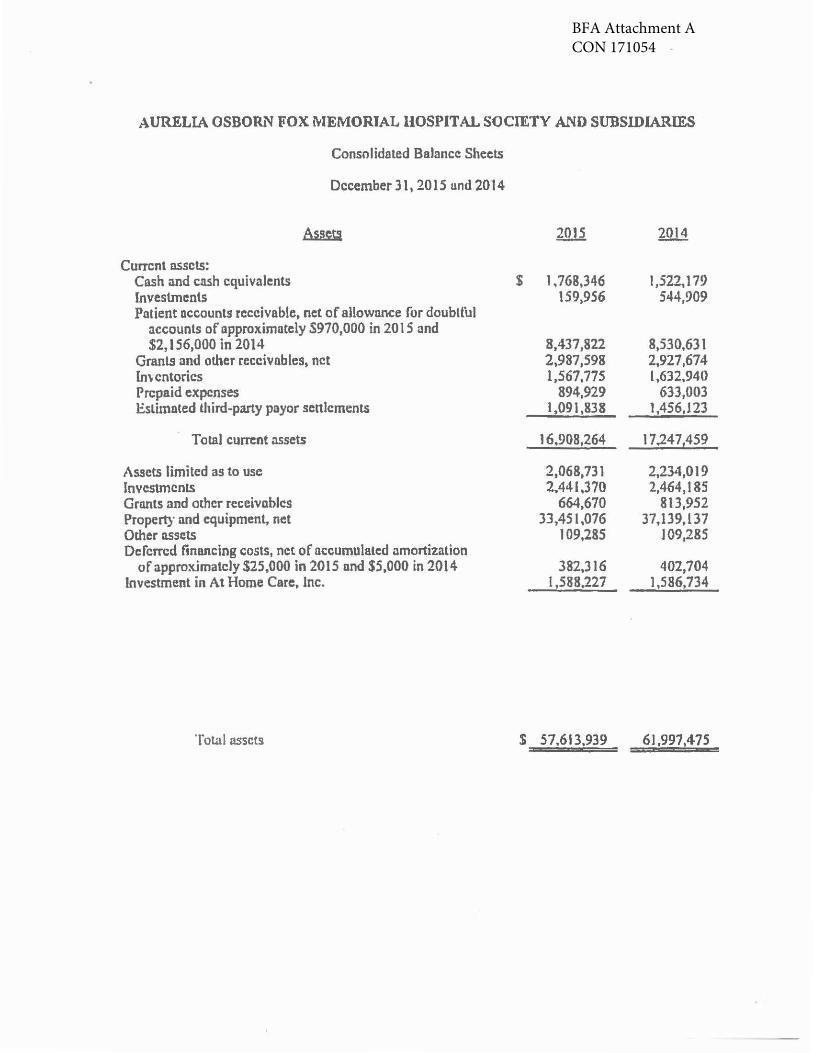
BFA Attachment ACON 171054
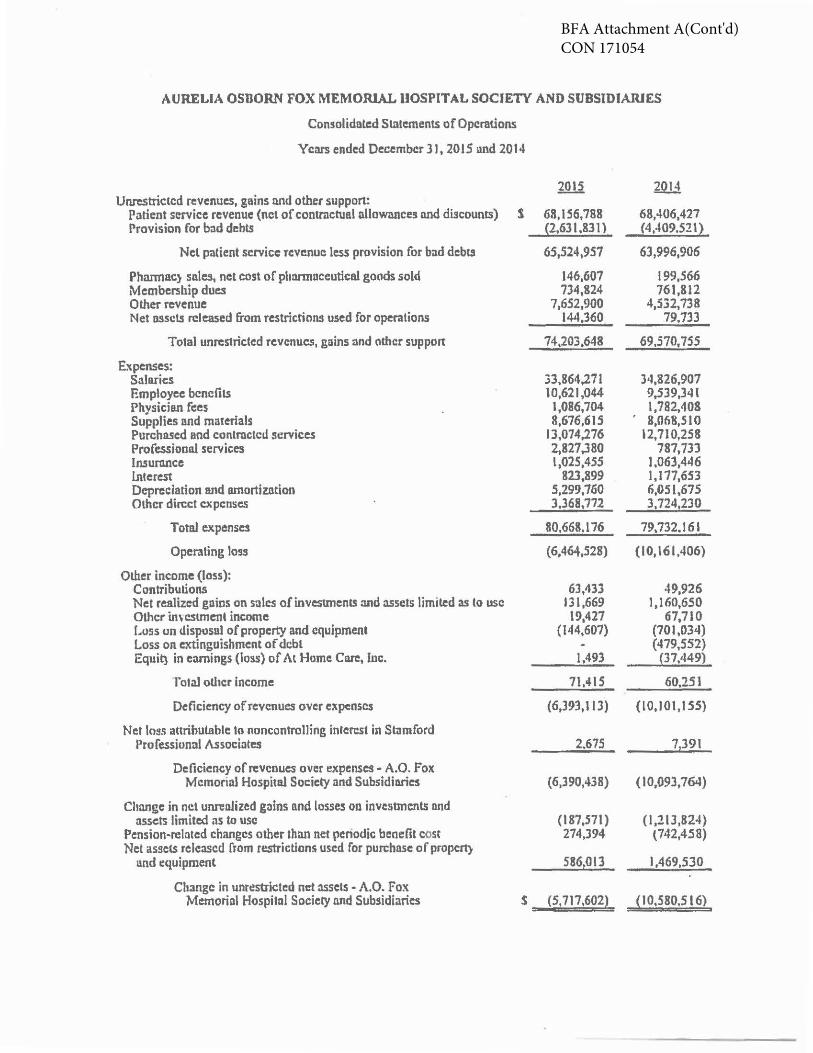
AURELIA OSBORN FOX MEMORIAL HOSPITAL SOCIETY AND SUBSIDIARIES
Current assets: Cash and cash equivalents investments
Consolidated Balance Sheets
December 31, 2015 und 2014
Patient accounts receivable, net of allownnce for doubtful accounts of approximately $970,000 in 2015 and $2,156,000 in 2014
Granl.9 and other receivables, net lm en tori cs Prepaid expenses Eslimaled third-party payar settlements
Tolal current assets
Assets limited as to use Investments Grants and other receivables Property and equipment, net Other assets Deferred financing costs, net of accumulated amortization
of approx.imatcly $25,000 in 2015 and $5,000 in 2014 Investment in At Home Care, Inc.
Total assets
2015 2014
$ 1,768,346 1,522,179 159,956 544,909
8,437,822 8,530,631 2,987,598 2,927,674 L,567,775 l,632.940
894,929 633,003 1,091,838 t,456,123
16.908,264 17.247,459
2,068,731 2,234,019 2.441.370 2,464,185
664,670 813,952 33,451.076 37,139,137
109,285 109,285
382,316 402,704 1,588.227 1,586,734
s 57.613.939 61,997,475
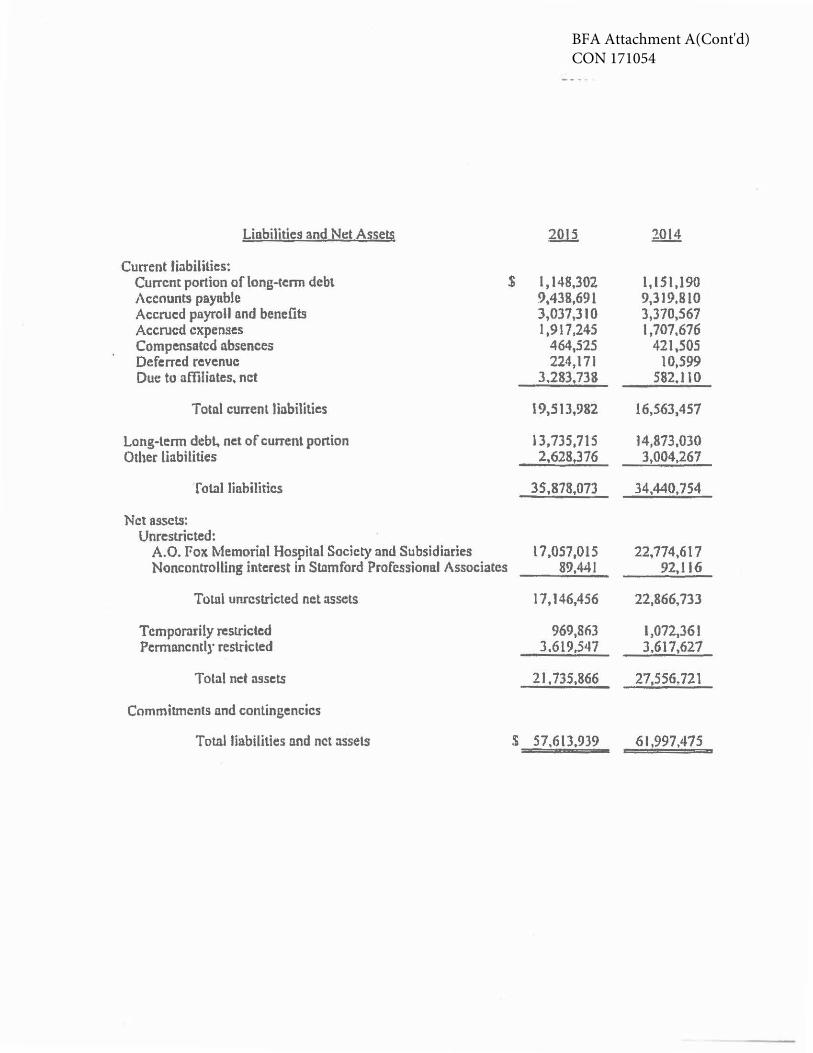
BFA Attachment A(Cont'd)CON 171054
Linbilities and Net Assets
Current liabilities: Current portion of long-tcnn debt Accounts payable Accrued payroll and benefits Accrued expenses Compensated absences Deferred revenue Due to affiliates, net
Total current liabilities
Long-lcnn debt.. net of current portion Other liabilities
f otal liabilities
Net assets: Unrestricted:
A.O. Fox Memorial Hospital Society and Subsidiaries Noncontrolling interest in Stamford Professional Associates
Totnl unrestricted net assets
Temporarily rcsu-ictcd Pcnnnncntly restricted
Total net assets
Commitments and contingencies
Total liabilities nnd net assets
2015 2014
.$ I, 148,302 l,151.190 9.438,691 9,319,810 3,037,310 3,370,567 1,917,245 I ,707,676
464,525 421,505 224,171 10,599
3.283,738 582.110
19,513,982 16,563,457
13, 735,71 s 14,873,030 2.628,376 3,004,267
35.878,073 34,440,754
l 7,057,015 22,774,617 89,441 92,J 16
17,146,456 22,866,733
969,863 1,072,361 3.619,547 3.617,627
21,735,866 27,556,721
$ 57,6 lJ,939 61,997,475
BFA Attachment A(Cont'd)CON 171054
AURELIA OSBORN FOX MEMORIAL HOSPITAL SOCIETY AND SUBSIDIARIES
Consolidated Statements of Operations
Yem ended December 31, 2015 und 2014
2015 2014 Unrestriclcd revenues, gains nnd other support:
Patient service revenue (net of contractual allowances and discounts) s 68,156,788 68,406,427 Provision for bad debts ~2.631.831 ) (4,409.521}
Nel patient service revenue less provision for b;id debts 65,524,951 63,996,906
Pharmnc} sales, net cost of pluumoceutical goads sold 146,607 199,566 Membership dues 734,824 761,812 Other revenue 7,652,900 4,532,738 Net asset! released from restrictions used for operations 144,360 79.733
Total unrestricted revenues, gains nnd other support 74,203,648 69,570,755
Expenses: Salaries 33,864,271 H,826,907 Employee benefits 10,621,044 9,S39,34l Physician fees 1,086,704 l,782,408 Supplies and materials 8,676,615 ' 8,068,SlO Purchnsed and eonlraclcd services 13,074,276 •2,710,258 Prof essionnl services 2,827,380 787,733 ln.sunince l,025,455 J,063,446 interest 823,899 1,177,653 Depreciation and amortization 5,299,7li0 6,051,675 Other din:ct expenses 3,368,772 3,724,230
Total expenses 80,668.176 79,732.161
Operating loss (6,46-+,528) (10,161,406)
Other income (loss): Contributions 63,433 49,926 Net realized gums on sales of investments and assets limited as to use 131,669 1,160,650 Other imc:slmenl income 19,427 67,710 Loss on disposal of property and equipment (144,607) (701,034) Loss on cxtinguishmcnt of debt (479,552) Equit} in earnings (loss) of At Home CntC, lnc. 1,493 (37,449)
Total other income 71.415 60,251
Deficiency of revenues over expenses (6,393,113) {10, I 01, l SS)
Net loss attributable to noncontrolling intcn:st in Stlmford Professional Associates 2.675 7 391
Deficiency of revenues over expenses· A.O. Fox Memorial Hospital Society and Subsidinries (6,390,438) ( 10,()93,764)
Change in net unrenlized giiins and loss~ on invesuncnts nnd assets limited as to use (187,571) (l,213,824)
Pension-related changes other thllll net penodic benefit cost 274,394 {742,4!i8) Net asscu released from restrictions used for purchnse of propcrt}
und equipment 586t013 1,469,530
Change in unr~strkted net :isscrs - A.O. Fox Memorial Hospital Society nnd Subsidiaries $ (5, 717,602~ ~I 0,580,S 16)
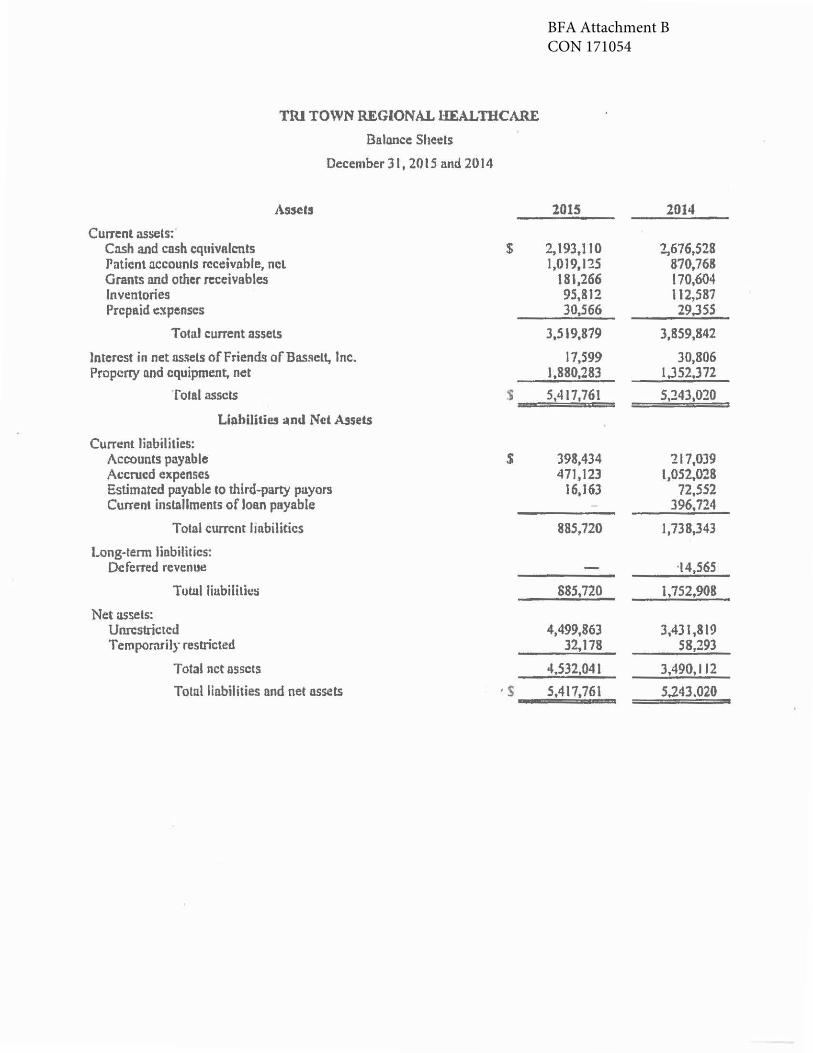
BFA Attachment BCON 171054
TIU TOWN REGIONAL HEALTHCARE
Balance Sheets
December 31, 2015 and 2014
Assels 2015 2014
Current assets: Cnsh and cash equivalents $ 2,193,110 2,676,528 Patient accounts receivable, net 1,019,125 870,768 Grants and other receivables 181,266 170,604 Inventories 95,812 112,587 Prepaid expenses 30,566 29,JSS
Total current assets 3,519,879 3,859,842
Jntcrest in net nssels of Friends ofBas~clt, 1nc. 17,599 30,806 Property and equipment. net 1,880,283 1,352.372
f otal assets $ 5,417,761 5,243,020
Liabilities :.lnd Net Assets
Current liabilities: Accounts payable $ 398,434 217,039 Accrued expenses 471,123 1,052,028 Estimated payable to third-party payors 16,163 72,552 Current installments of loan payable .396,724
Total current hnbilitics 885,720 1,738,343
Long-term Hobilitics: Deferred revenue ·14,565
Totul liubiHLics 885,720 1,752,908
Net assets: Unrestricted 4,499,863 3,431,819 Temporarily resuicted 32,178 58,293
Total net assets 4.532,041 3,490, 112
Total liabilities ond net assets . s 5,417,761 5.243.020
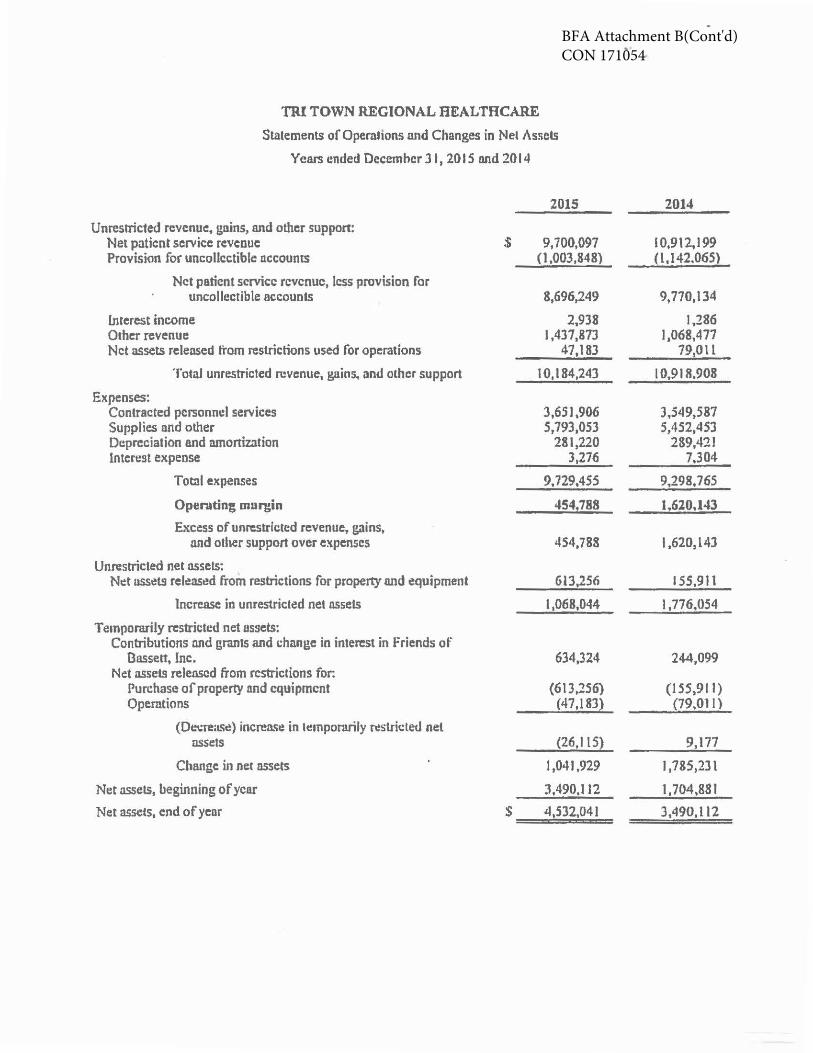
BFA Attachment B(Cont'd)CON 171054
TRI TOWN REGIONAL HEALTHCARE
Statements of Operations nnd Changes in Net Assets
Year.; ended Decemhcr 31, 2015 and 2014
2015 2014
Unrestricted revenue:, gains, and other support: Net patient service revenue :$ 9,700,097 l0,912,199 Provision for uncollcctiblc nccounts (1,003,848) (l,142.065)
Net patient service revenue, less provision for uncollectible accounts 8,696.249 9,770,134
Interest income 2,938 1,286 01her revenue l,437,873 1,068,477 Net assets released from restrictions used for operations 47,183 79,0ll
TotaJ unrestricted revenue, gains, and other support 10, l 84,243 10,918.908
Expenses: Contracted personnel services 3,651,906 3,549,587 Supplies and other 5,793,053 5,452,453 Depreciation and nmortization 281,220 289,421 Interest expense 3,276 7,304
Tomi expenses 9,729,455 9,298,765
Operdting murgin 454z788 1.620,143
Excess of unrestricted revenue, gains, Md other support over expenses 454,788 1,620,143
Unrestricted net assets: Nc:t USSl!ts released from restrictions for property and equipment 613,256 155,911
lncrcasc in unrestricted net nssets 1,068,044 t ,776,054
Temporarily restricted net assets: Contributions and grants and chnngc in interest in Friends of
Bassett, Inc. 634,324 244,099 Net assets relenscd from restrictions for:
Purchase of property and equipment (613,256) (155,911) Operations (47,183~ (79,011)
(Dt:cre:L<;c) increa.o;e in temporarily ~stricted net assets (26,1 lS! 9,177
Change in nef nssets 1,041,929 1,785,23\
Net assetst beginning ofycar J,490,112 1,704,881
Net assets, end of ycor $ 4,532,041 3,490,l 12
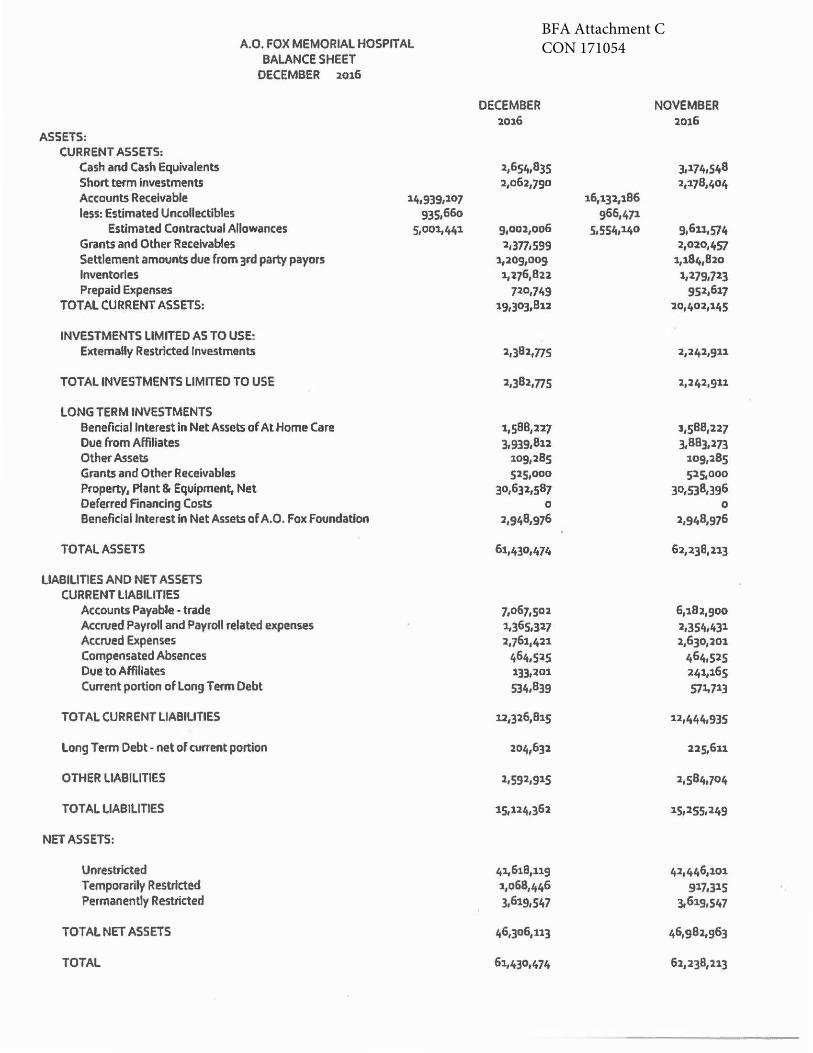
BFA Attachment CCON 171054
ASSETS: CURRENT ASSETS:
A.O. FOX MEMORIAL HOSPITAL BALANCE SHEET
DECEMBER 2016
Cash and Cash Equivalents Short term investments Accounts Receivable 14,939,107 less: Estimated Uncollectib!es
Estimated Contractual Allowances Grants and Other Receivables Settlement amounts due from 3rd party payors Inventories Prepaid Expenses
TOTAL CURRENT ASSETS:
INVESTMENTS LIMITED AS TO USE: Extemally Restricted Investments
TOTAL INVESTMENTS LIMITED TO USE
LONG TERM INVESTMENTS Beneficial Interest In Net Assets of At Home Care Due from Affiliates Other Assets Grants and Other Receivables Property, Plant & Equipment, Net Def erred Financing Costs Beneficial Interest in Net Assets of A.O. Fox foundation
TOTAL ASSETS
LIABILITIES AND NET ASSETS CURRENT LIABILITIES
Accounts Payable - trade Accrued Payroll and Payroll related expenses Accrued Expenses Compensated Absences Due to Affiliates Current portion of long Term Debt
TOTAL CURRENT LIABILITIES
Long Term Debt- net of current portion
OTHER LIABILITIES
TOTAL LIABILITIES
NET ASSETS:
Unrestricted Temporarily Restricted Permanently Restricted
TOTAL NET ASSETS
TOTAL
935,66o 5,ooi,441
DECEMBER 2016
2,654,835 2,062,790
9,002,006 2,377,599
1,209,009 i,276,822
720,749 19,303,812
2,382,775
2,382,775
1,588,227 ),939,812
209,285 525,000
30,632,587 0
2,948,976
61,430,474
7,067,502 i,365a27 2,761,421
464,525 133,201 534,839
u,326,815
204,632
2,592,915
15,124,362
4i.618,119 1,068,446 3,619,547
46,306,113
6i,430,474
16,132,186
966,471 5,554,140
NOVEMBER 2016
3,174,51,8 2,:i78,404
9,611,574 2,020,1,57
1,184,820 1,279,723
952,617 20,402,145
2,242,gn
2,242,911
1,588,227 3,883,273
209,285 525,000
30,538,396 0
2,948,976
62,238,213
6,182,900 2,354,431 2,630,201
461,,525 241,165 571.713
12,444,935
225,6u
2,584,704
25,255,249
42,446,101 917,315
3,619,547
46,982,963
62,238,213
BFA Attachment C(Cont'd)CON 171054
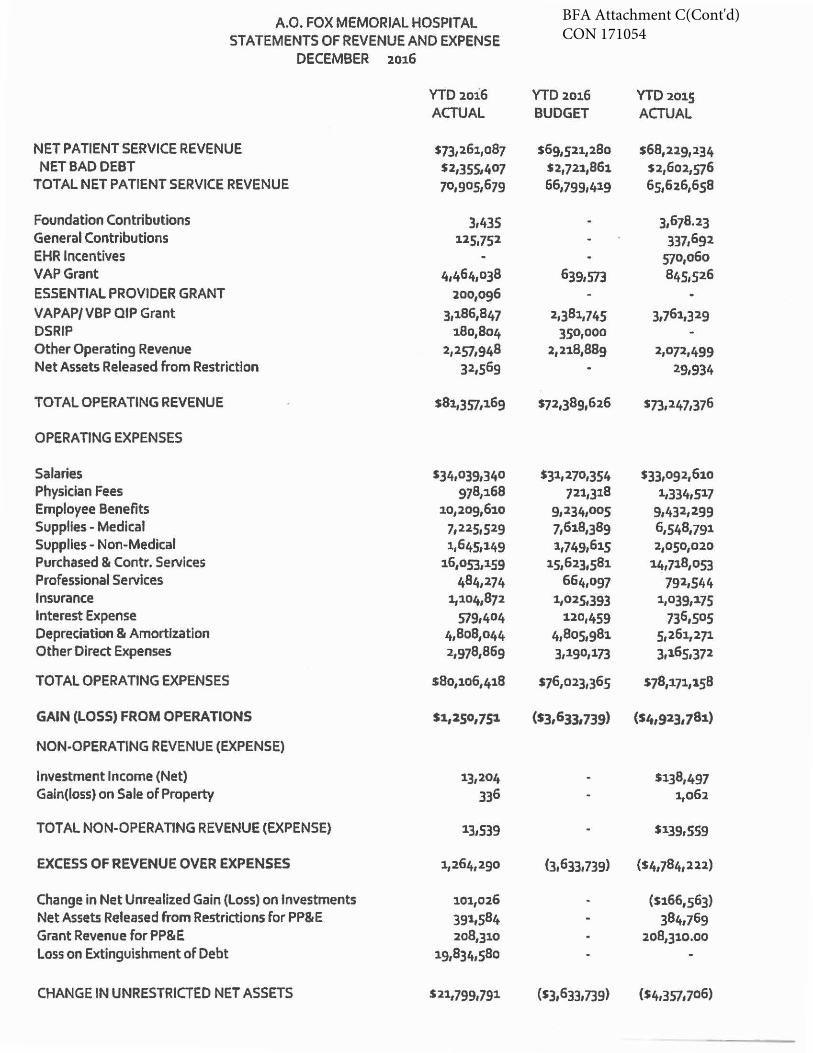
A.O. FOX MEMORIAL HOSPITAL STATEMENTS OF REVENUE AND EXPENSE
DECEMBER 2016
YTD 2016 YTD 2016 YT02015 ACTUAL BUDGET ACTUAL
NET PATIENT SERVICE REVENUE s73,261,087 sGg,521,280 s68,229,234 NET BAD DEBT s2,355,407 s2,721,B61 s21602,576
TOTAL NET PATIENT SERVICE REVENUE 70,905,679 66,799,419 65,626,658
Foundation Contributions 3,435 3,678.23 General Contributions 125,752 337,692 EHR Incentives 510,060 VAPGrant 4,464,038 639,573 845,526 ESSENTIAL PROVIDER GRANT 200,096 VAPAP/VBP QIP Grant 3,186,847 2,381,745 3,761,329 DSRIP 180,804 350,000 Other Operating Revenue 2,257,948 2,218,889 2,072,499 Net Assets Released from Restriction 32,569 29,934
TOTAL OPERATING REVENUE $81,357,169 s7213B9,626 s73,247a76
OPERATING EXPENSES
Salaries s34,039a40 s31,2701354 s33,092,610 Physician Fees 978,168 721,318 1,334,517 Employee Benefits 10,209,610 9,234,005 9,432,299 Supplies - Medical 7,225,529 7,6181389 6,548,791 Supplies - Non-Medical 1,645,149 2,749,615 1,050,020 Purchased & Contr. Services 26,053,159 15,623,581 14,718,053 Professional Services 484,274 664,097 792,544 Insurance i,104,872 1,02sa93 1,039,175 Interest Expense 579,404 120,459 736,505 Depreciation & Amortization 4,808,044 4,805,981 5,261,271 Other Direct Expenses 2,978,869 3,190,173 3,165,372
TOTAL OPERATING EXPENSES sao,1061418 $76,023,365 $78,171,158
GAIN (LOSS) FROM OPERATIONS S1,250,751 ($3,633,739) (s4,923, 781)
NON-OPERATING REVENUE (EXPENSE)
Investment Income (Net) 13,204 $138,497 Galn(loss) on Sale of Property 336 1,062
TOTAL NON-OPERATING REVENUE (EXPENSE) 13,539 $139,559
EXCESS OF REVENUE OVER EXPENSES 1,264,290 (3,633,739) (s4,784,222)
Change in Net Unrealized Gain (Loss) on Investments 101,026 ($166,563) Net Assets Released from Restrictions for PP&E 391,584 384,769 Grant Revenue for PP&E 208,310 208,)10.00 loss on Extinguishment of Debt 19,834,580
CHANGE IN UNRESTRICTED NET ASSETS s21,799,791 (s3,633,739) ($4,357,706)

BFA Attachment DCON 171054
TRI· TOWN REGIONAL HOSPITAL
BALANCE SHEE! December JI, 2016 and 201S
ASSETS
CURRENT:
CASH AND EQUIVALENTS NET ACCOUNTS RECEIVABLE INVENTORIES OTHER RECEIVABLES PREPAID EXPENSES AND ADVANCES THIRD PARTY PAYABLE
TOTAL CURRENT ASSETS
PROPERTY, PLANT AND EQUIPMENT: NET PROPERTY. PLANT AND EQUIPMENT
TOTAL ASSETS
1.JABILITIES AND NET ASSETS
CUR.RENT LIABILITIES:
ACCOUNTS PAYABLE OTHER ACCRUED EXPENSES CURRENT l'ORTION LONG TERM DEBT THIRD PARTY PAYABLES
TOT AL CURRENT LIABILITIES
LONO TERM LIABILITIES: PHILIPS CAPITAL LEASE
TOTAL LONO TERM LIABILITIES
NET ASSETS:
UNRESTRICTED TEMPORARILY RESTRICTED
TOTAL NET ASSETS
TOT AL LIABILITIES AND NET ASSETS
2
s
s
s
s
2016 2015
l.512.121 s 2,193,llO 1,179.41.5 1,019,IZS
113,100 95,812 219,017 198,866
32.,001 JO.Sri6 6,364
4,0f>2,019 3.537,479
t.921,24S 1,880.2K3
'S.983,164 s 5.417.761
388.222 s l1J8,434 483.421 471,123
19.JSS 16,163
890,4198 885.720
100,626
100.626
4,959,491 4.499,863 32.,148 32,178
4,991.640 4,Sl2,041
5,913,264 s S,417,761
BFA Attachment D(Cont'd)CON 171054
NET PATIENT REVENUES
NONPATIENT REVENUES
TOTAL REVENUES
EXPENSES:
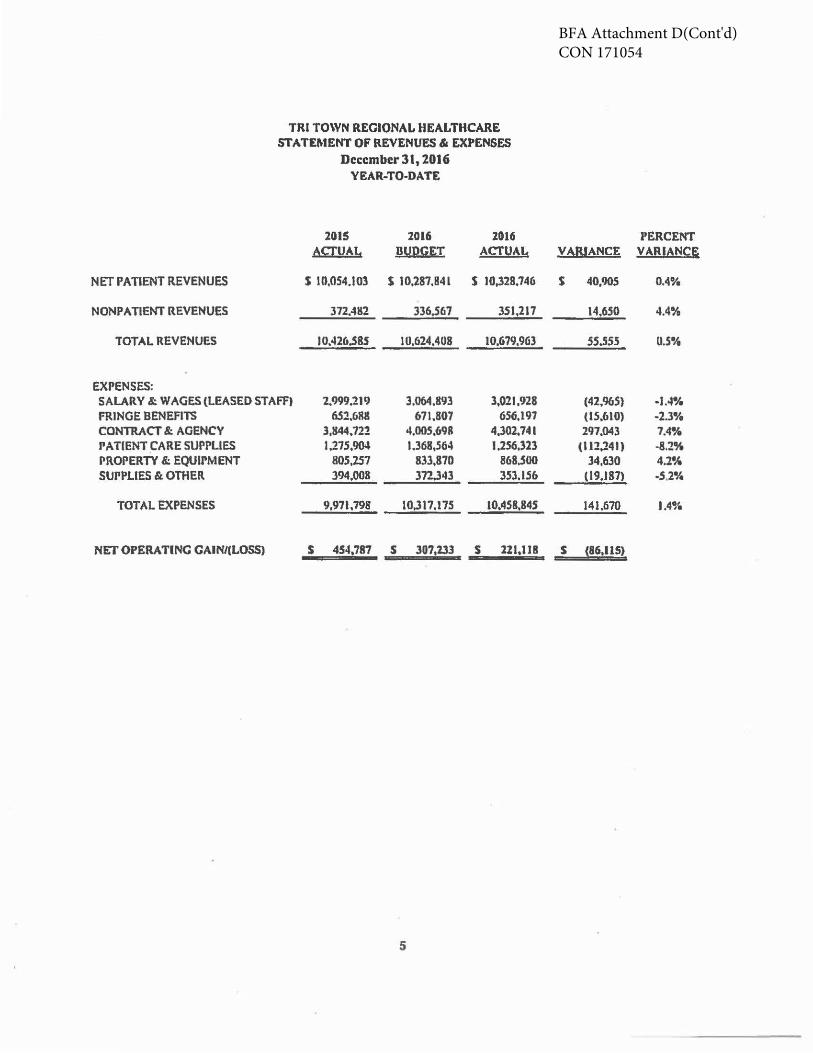
TRI TOWN REGIONAL HEALTHCARE ST ATEl\1ENT OF REVENUES & EXPENSES
Dcccmber31, 201Ci YEAR-TO·DATE
2015 2016 2016 ACTUAL BUDGET ACTUAL
S l0,054.IOl s 10,287,84l s 10,328.746
372.482 336.567 351,217
10,426.SSS IU.624,408 10,679,963
SALARY&:. WAGES(LEASED STAFFt 2,999,211) 3.064.893 3,021,928 FRINGE BENEFITS 652.688 671.807 6S6,197 CONTRACT&:. AGENCY 3.844.722 4,00S,698 4.302,741 PATIENT CARE SUPPLIES 1.275,904 l.368,564 1.256.323 PROPERTY&:. EQUIPMENT 805,257 833,870 868.SOO SUPPLIES & OTHER 394,00B 372.343 353.156
TOTAL EXPENSES 9,971,798 10.317.175 l0.4S8,84S
NET OPERA TINC CAIN/(LOSSJ s 454,787 s 307,233 s 121,1111
5
PERCENT VARIANCE VARIANCE
s 40,905 0.4o/e
14,650 4.4%
SS.SSS o.s·~
(42,965) ·l.4% (IS,610) -2.l"le 297.043 7.4%
(112.241) -8.2% 34,630 4.2%
(19,187) -5.2%
141.670 1.4%
s ~16,115)
BFA A
ttachment E
CO
N 171054
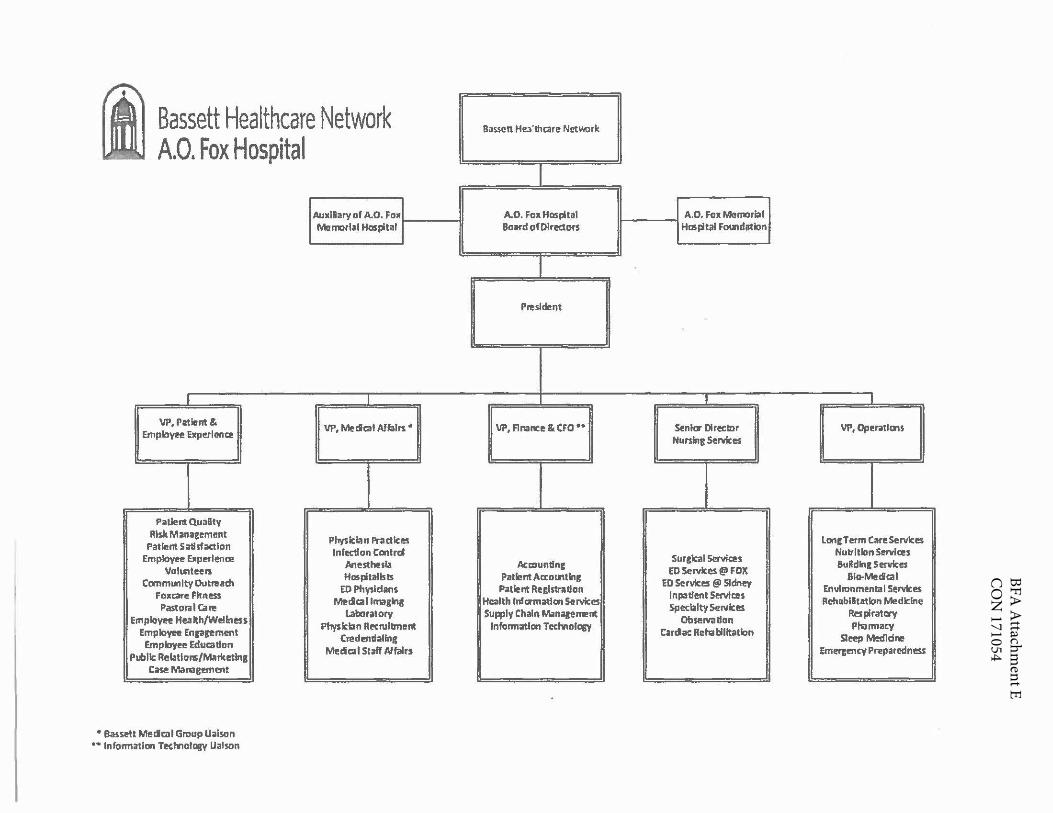
i Bassett Healthcare Network A.O. Fox Hospital
r VP, Patlimt &
Employtt Experience
Piltlent Qu3Dty IU§k Managem!Tlt
Patient Satisfaction Employtt Eltpl!t'lence
Volmleeis CcrnmU"1 lty Outn!ath
Fo11care Fhness Pastoral Can!
Employee Health/Wellness Employee Enpgement Employee Educallon
Pibllc Relatlom/Marketlns Case Milrragl!ITl"1t
• BasSl!lt M!!clail Group Ui11son •• In fonniltlon TeclwlolDllV Ualson
Au111Hary of A.O. Fo11 1 Mermrlal Haspltal
VP, Medical Affatrs"
PhyslcL'!n Pradlces lnfettl on Cent rd
Anesthesia Hmpltalls Is
ED Ph'f'ldans Meclcal hmgln11
laboratory Physlcbn R~l\lltmerit
Cre deuialln1 Mecical Staff Affairs
Bassett Hea'lhcare Nl!t"1:>rk
A.O. Fo11 Hospital Boll«! of Dlredors
Pruldent
VP, Ana nee & CFO ••
Acmundn1 Patient Aa:o111tln11
Piltlent Reglstrallon Health lnfamatlon Services Supply Chain Milnaaement
lnformlltlan Tec:hnology
II I A.O. Fo11 Mttrmrlal Has !:ital Fomdatlon
-. Senlcr Director Nursing Services
Surgical Services ED Sc:rvlces @.ii FOX
ED Services @ Sidney I npadent Setvlau Specialty SeNlces
Observation Cardiac Rehal::llltiltlon
I
VP, Operatlans
lcngTl!rm CareServlces Nutrition ~ces BuRdlnr; Services
Sia-Merical Envlronmf!ntal Services Rehablltatbn Medicine
Res pi rat~ Pharmacy
stet!!' Medldre Emergency Preparedness
BFA A
ttachment E(C
ont'd)C
ON
171054
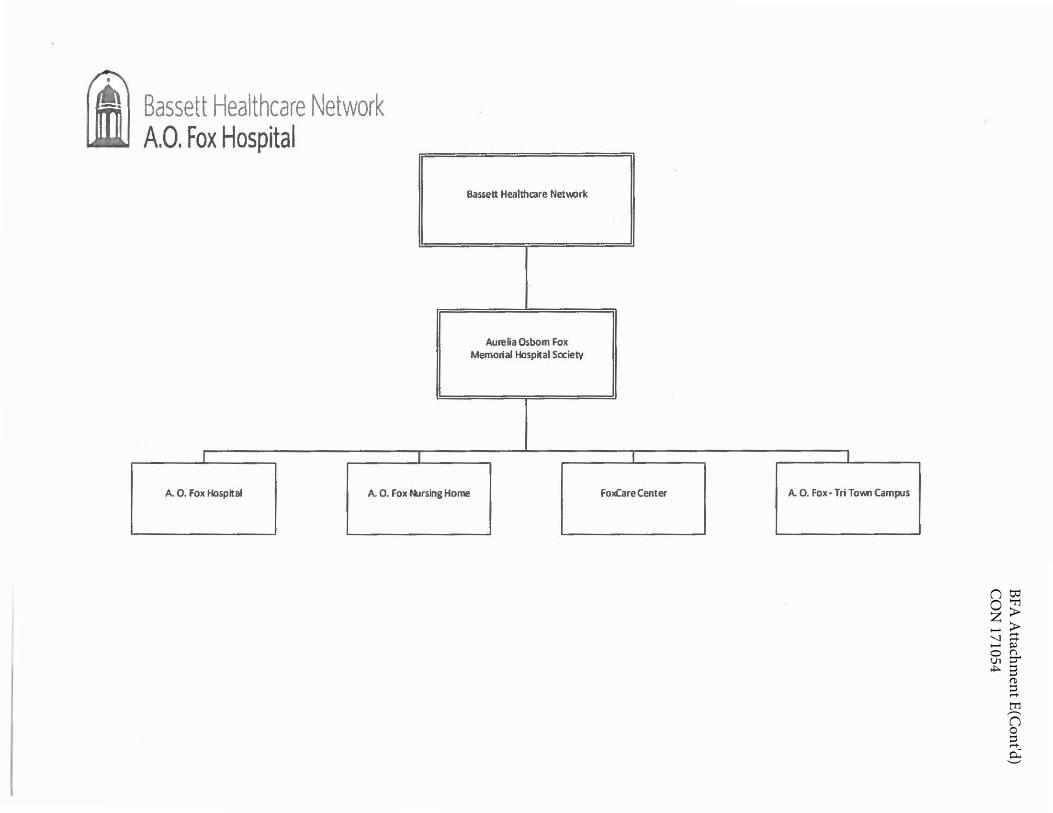
i Bassett Healthcare Network A.O. Fox Hospital
I
Bassett Healthcare Netv.ork
Aurelia Osborn fox Memorial Hospital Society
A. O. Fox Hospital A. O. fox lll.irsing Home
I I
FoxCare Center A.O. Fox- Tri TolMl Campus
BFA Attachment ACON 162429
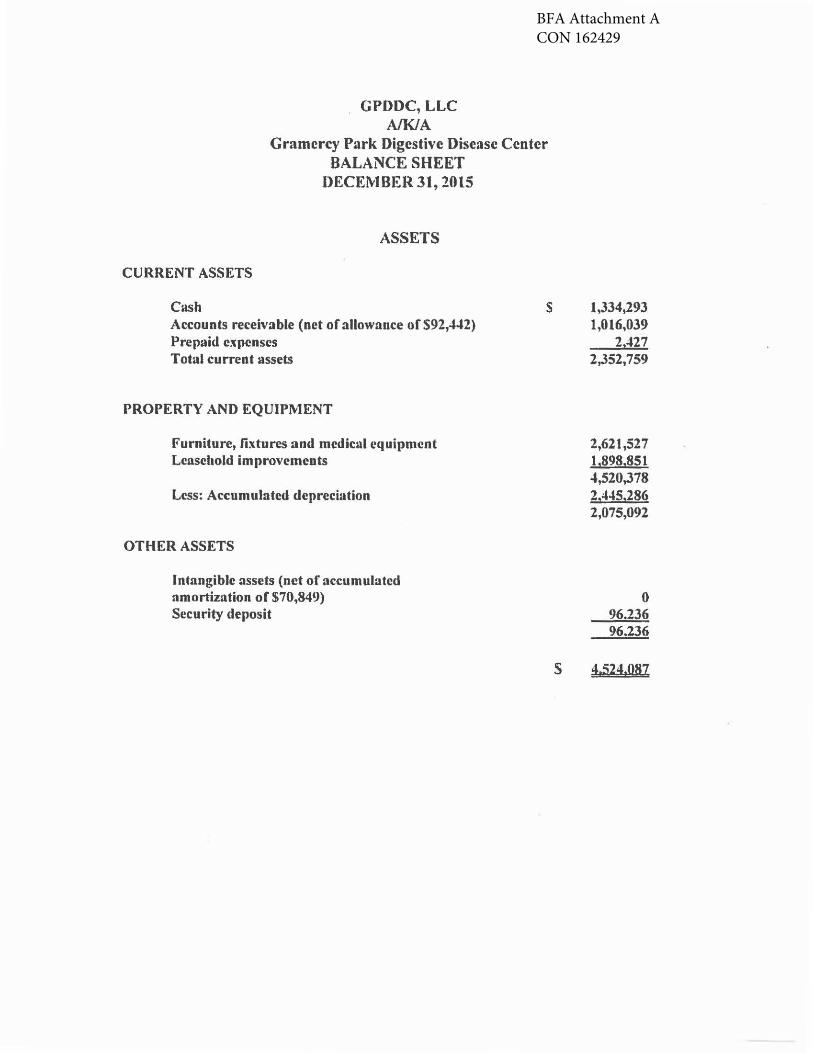
GPDDC,LLC A/K/A
Gramercy Park Digestive Disease Center BALANCE SHEET
DECEMBER 31, 2015
ASSETS
CURRENT ASSETS
Cash Accounts receivable (net of allowance of$92,442) Prepaid expenses Total current assets
PROPERTY AND EQUIPMENT
Furniture, fixtures and mcdicul equipment Lc11schold improvements
Less: Accumulated depreciation
OTHER ASSETS
Intangible assets (net of accumulated amortization of $70,849) Security deposit
s
$
1,334,293 1,016,039
2,427 2,352,759
2,621,527 1,898,851 4,520,378 2,445,286 2,075,092
0 96.236 96,236
4.524.0B:Z

BFA Attachment A(Cont'd)CON 162429
GPDDC,LLC A/KIA
Gramercy Park Digestive Disease Center BALANCE SHEET
DECEMBER 31, 2015
LIABILITIES AND MEMBERS' CAPITAL
CURRENT LIABILITIES
Accounts payable Atcrued expenses Business tax payable Payroll liabilities Pension liability Equipment financing payable Total current liabilities
OTHER LIABILITIES
Equipment financing payable - non-current Total liabilities
MEMBERS' CAPITAL
$
$
25,473 36,901
119,200 50,897 37,176
203,833 473,480
507.554 981,034
3,543,053
4.524.087
BFA Attachment A(Cont'd)CON 162429
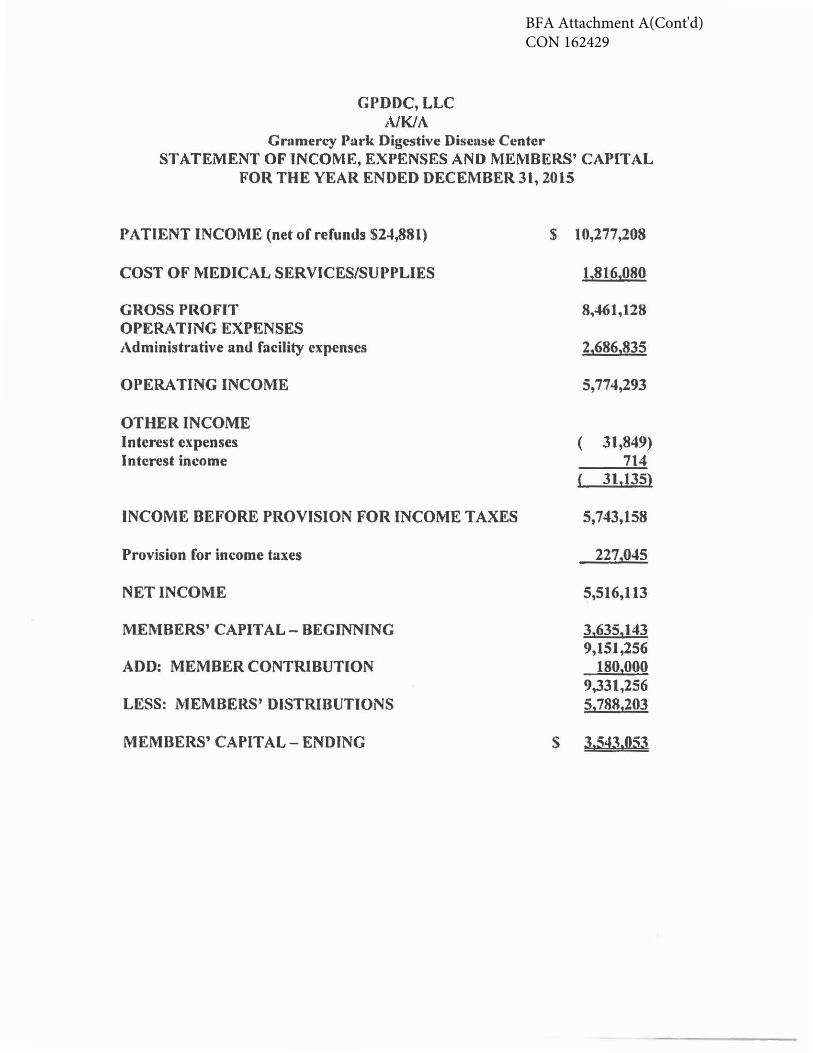
GPDOC, LLC 1VK/A
Grnmercy Park Digestive Discnse Center STATEMENT OF INCOME, EXPENSES AND MEMBERS' CAPITAL
FOR THE YEAR ENDED DECEMBER 31, 2015
PATIENT INCOME (net of refunds $24,881) $ 10,277,208
COST OF MEDICAL SERVICES/SUPPLIES 1,816,080
GROSS PROFIT 8,461,128 OPERA TING EXPENSES Administrative and facility expenses 2,686,835
OPERA TING INCOME 5,774,293
OTHER INCOME Interest expenses ( 31,849) Interest income 714
{ 31,135)
INCOME BEFORE PROVISION FOR INCOME TAXES 5,743,158
Provision for income taxes 227,045
NET INCOME 5,516,113
MEMBERS' CAPITAL - BEGINNING 326352143 9,151,256
ADD: MEMBER CONTRIBUTION 1802000 9,331,256
LESS: MEMBERS' DISTRIBUTIONS 5,788,203
MEMBERS' CAPITAL - ENDING $ 31:;!13.053
BFA Attachment BCON 162429
4:01 PM
01/27/17 Cash Basis
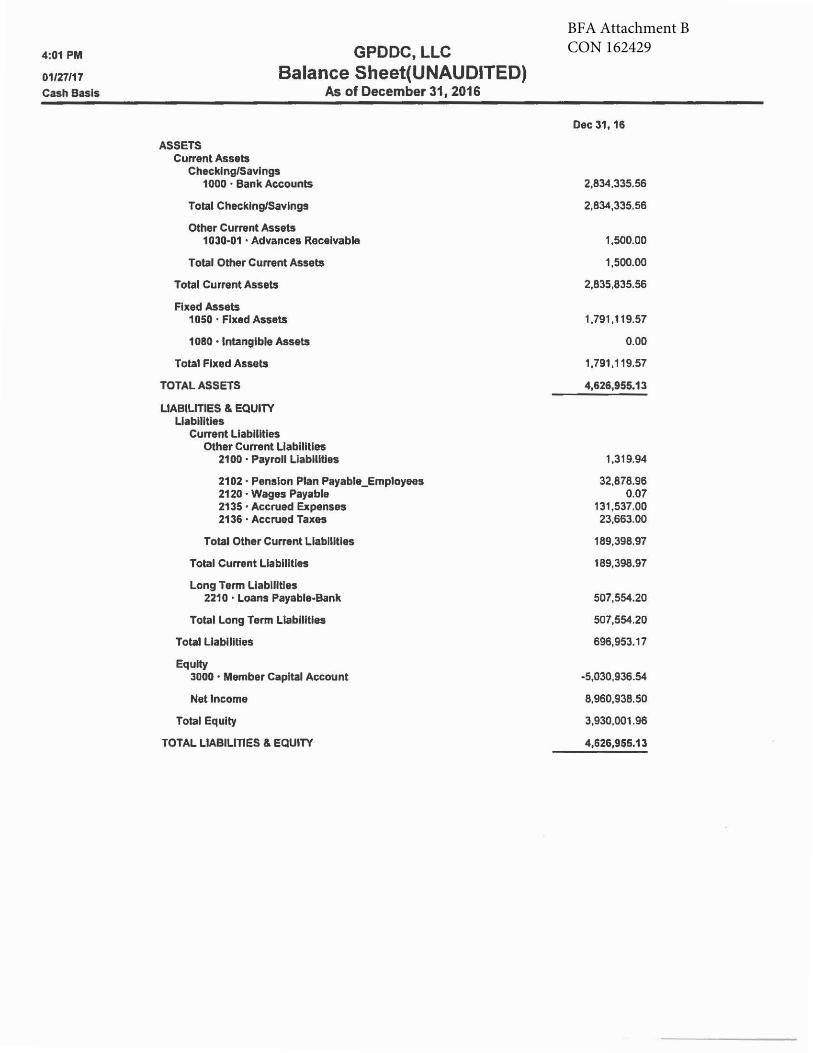
GPDDC, LLC Balance Sheet(UNAUDITED)
ASSETS Current Assets
Checking/Savings 1000 • Bank Accounts
Total Checking/Savings
Other Current Assets
As of December 31, 2016
1030-01 • Advances Receivable
Total Other Current Assets
Total Current Assets
Fixed Assets 1050 ·Fixed Assets
1080 ·Intangible Assets
Total Fixed Assets
TOTAL ASSETS
LIABILITIES & EQUITY Liabilities
Current Liabilities Other Current Liabilities
21 oo • Payroll Liabilities
2102 ·Pension Plan Payable_Employees 2120 • Wages Payable 2135 ·Accrued Expenses 2136 ·Accrued Taxes
Total Other Current Llabllltles
Total Current Liabilities
Long Term Liabilities 2210 ·Loans Payable-Bank
Total Long Term Liabilities
Total Liabilities
Equity 3000 • Member Capital Account
Net Income
Total Equity
TOTAL LIABILITIES & EQUITY
Dec 31, 16
2,834,335.56
2,834,335.56
1,500.00
1,500.00
2,835,835.56
1,791,119.57
0.00
1,791,119.57
4,626,955.13
1,319.94
32,878.96 0.07
131,537.00 23,663.00
189,398.97
189,398.97
507,554.20
507,554.20
696,953.17
·5,030,936.54
8,960,938.50
3,930,001.96
4,626,955.13
BFA Attachment B(Cont'd)CON 162429
4:02 PM
01127117 Cash Basis
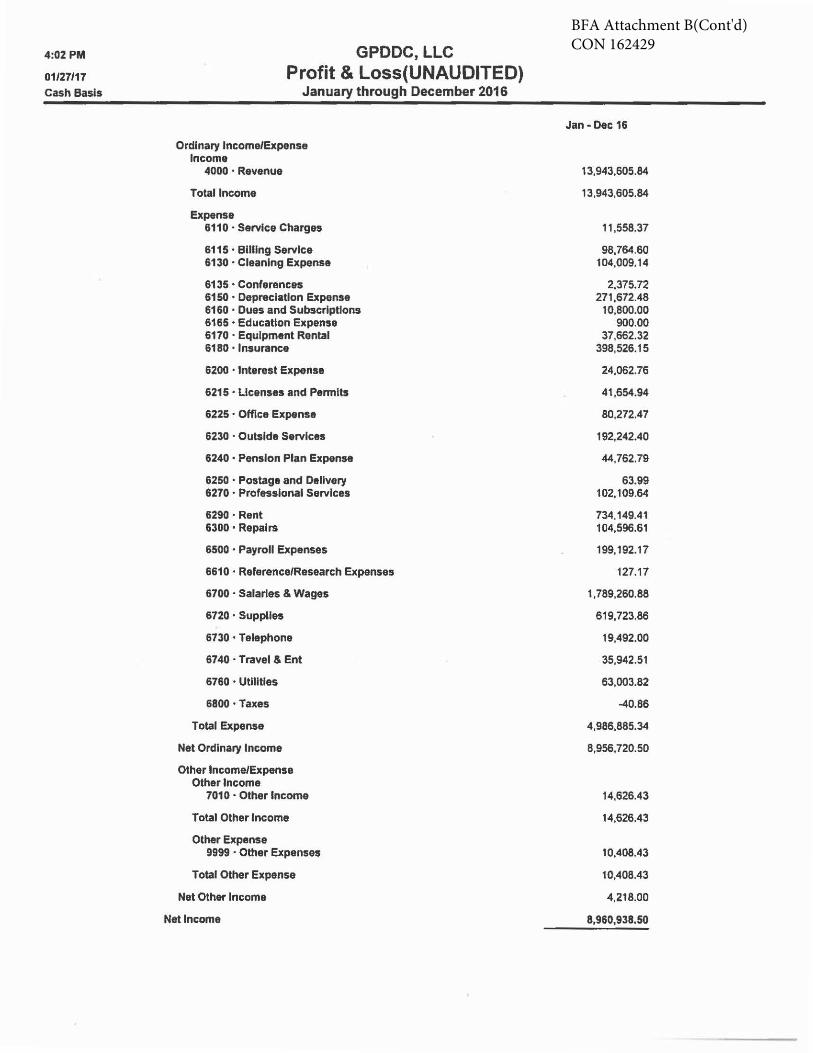
GPODC, LLC Profit & Loss(UNAUDITED)
January through December 2016
Ordinary Income/Expense Income
4000 • Revenue
Total Income
Expense 6110 ·Service Charges
6115 • Billing Service 6130 · Cleaning Expense
6135 • Conferences 6150 • Depreciation Expense 6160 ·Dues and Subscriptions 6165 ·Education Expense 6170 · Equipment Rental 6180 • Insurance
6200 • Interest Expense
6215 · Licenses and Permits
6225 · Office Expense
6230 • Outside Services
6240 • Pension Plan Expense
6250 • Postage and Delivery 6270 • Professlonal Services
6290 · Rent 6300 ·Repairs
6500 • Payroll Expenses
6610 · ReferencefResearch Expenses
6700 • Salaries & Wages
6720 · Supplies
6730 ·Telephone
6740 ·Travel & Ent
6760 • Utilities
6800 ·Taxes
Total Expense
Net Ordinary Income
Other Income/Expense Other Income
7010 · Other Income
Total Other Income
Other Expense 9999 · Other Expenses
Total Other Expense
Net Other Income
Net Income
Jan- Dec 16
13,943,605.84
13,943,605.84
11,558.37
98,764.60 104,009.14
2,375.72 271,672.48
10,800.00 900.00
37,662.32 398,526.15
24,062.76
41,654.94
80,272.47
192,242.40
44,762.79
63.99 102,109.64
734,149.41 104,596.61
199,192.17
127.17
1, 789,260.88
619,723.86
19,492.00
35,942.51
63,003.82
-40.86
4,986,885.34
8,956,720.50
14.626.43
14,626.43
10.408.43
10,408.43
4.218.00
8,960,938.50
CO
N#1
6246
7 BF
A
Atta
chm
ent A
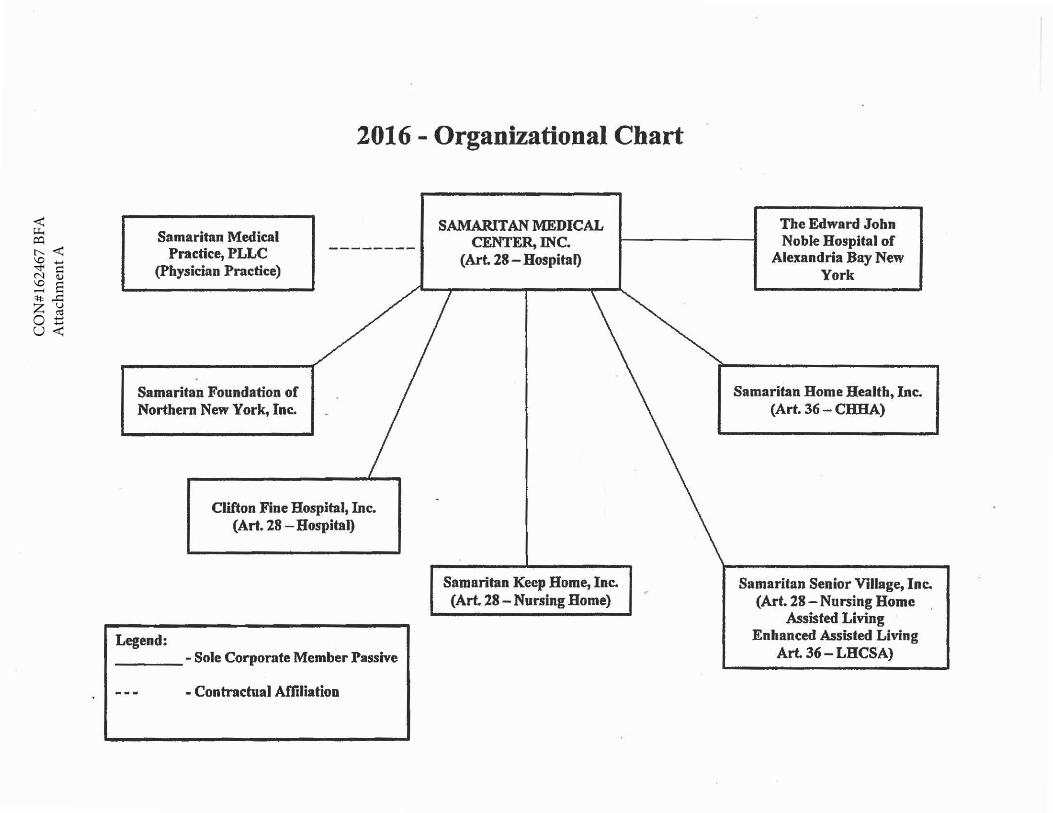
2016 - Organizational Chart
Samaritan Medical Practice, PLLC
(Physician Practice)
Samaritan Foundation of Northern New York, Inc.
Legend:
Clifton Fine Hospital, Inc. (Art. 28 - Hospital)
----- Sole Corporate Member Passive
- Contractual Afliliation
SAMARITAN MEDICAL CENTER, INC.
(Art. 28-Hospital)
Samaritan Keep Home, Inc. {Art 28 - Nursing Home)
The Edward John Noble Hospital of
Alexandria Bay New York
Samaritan Home Health, Inc. (Art. 36 - CHHA)
Samaritan Senior Village, Inc. (Art. 28 - Nursing Home
Assisted Living Enhanced Assisted Living
Art. 36- LBCSA)
CO
N#1
6246
7 BF
A A
ttach
men
t A(C
ontin
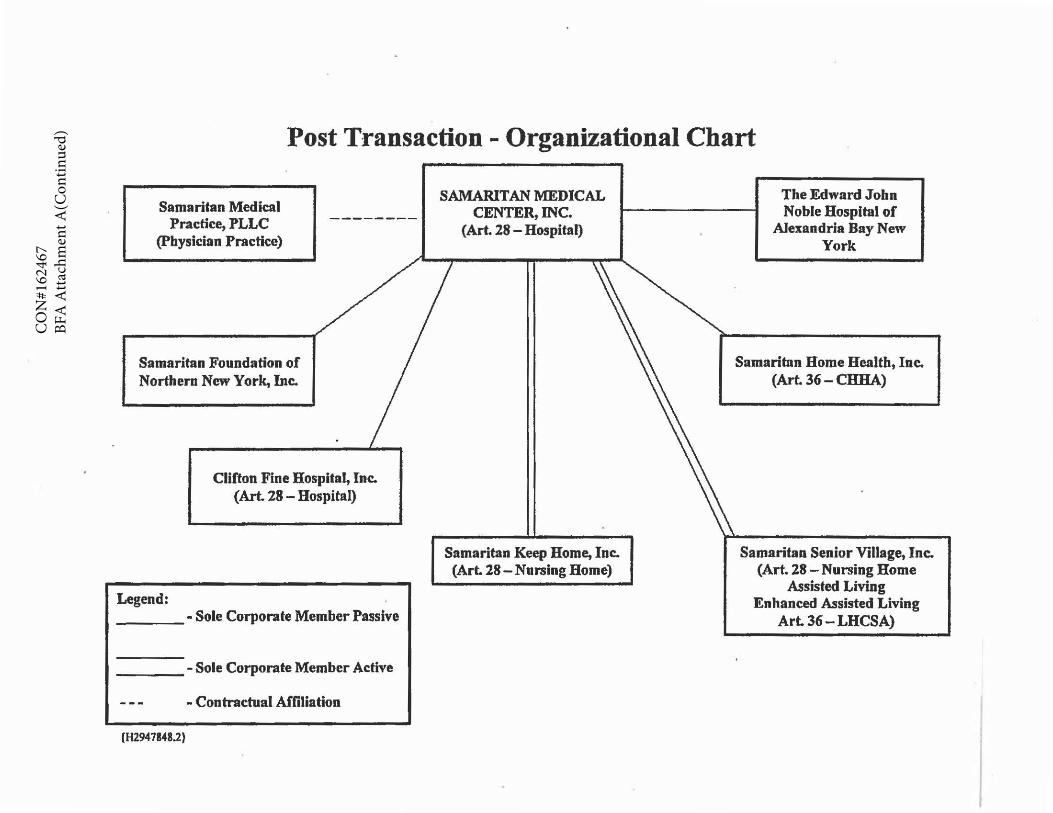
ued) Post Transaction - Organizational Chart
Samaritan Medical Practice, PLLC
(Physician Practice)
Samaritan Foundation of Northern New York, Inc.
Legend:
Clifton Fine Hospital, Inc. (Art. 28 - Hospital)
____ .. Sole Corporate Member Passive
----- Sole Corporate Member Active
-Contractual Affiliation
{H2947848.2}
SAMARITAN MEDICAL CENTER, INC.
(Art. 28 - Hospital)
Samaritan Keep Home, Inc. (Art. 28-Nursing Home)
The Edward John Noble Hospital of
Alexandria Bay New York
Samaritan Home Health, Inc. (Art. 36 - CHBA)
Samaritan Senior Village, Inc. (Art. 28 - Nursing Home
Assisted Living Enhanced Assisted Living
Art 36-LHCSA)
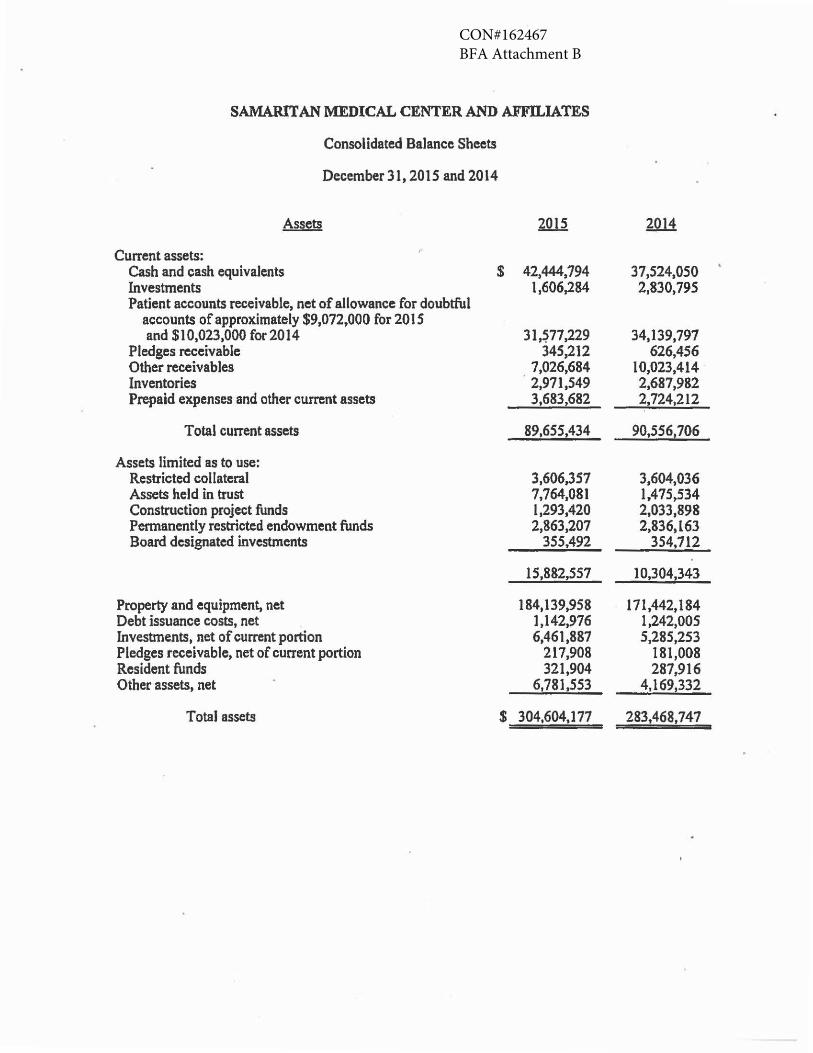
CON#162467BFA Attachment B
SAMARITAN MEDICAL CENTER AND AFFILIATES
Consolidated Balance Sheets
December 31, 2015 and 2014
Assets ~ lQli
Current assets: Cash and cash equivalents $ 42,444,794 37,524,050 Investments 1,606,284 2,830,795 Patient accounts receivable, net of allowance for doubtful
accounts of approximately $9 ,072,000 for 201 S and $10,023,000 for2014 31,~77,229 34,139,797
Pledges receivable 345,212 626,456 Other receivables 7,026,684 10,023,414 Inventories 2,971,549 2,687,982 Prepaid expenses and other current assets 3,683,682 2,724,212
Total current assets 89,655,434 90,556,706
Assets limited as to use: Restricted collateral 3,606,357 3,604,036 Assets held in trust 7,764,081 1,475,534 Construction project funds 1,293,420 2,033,898 Pennanently restricted endowment funds 2,863,207 2,836,163 Board designated investments 355.492 354,712
15,882,557 10,304,343
Property and equipment, net 184,139,958 171,442, 184 Debt issuance costs, net 1,142,976 1,242,005 Investments, net of current portion 6.461,887 5,285,253 Pledges receivable, net of current portion 217,908 181,008 Resident funds 321,904 287,916 Other assets, net 6,781,553 4,169,332
Total assets $ 304,604,177 283,468,747
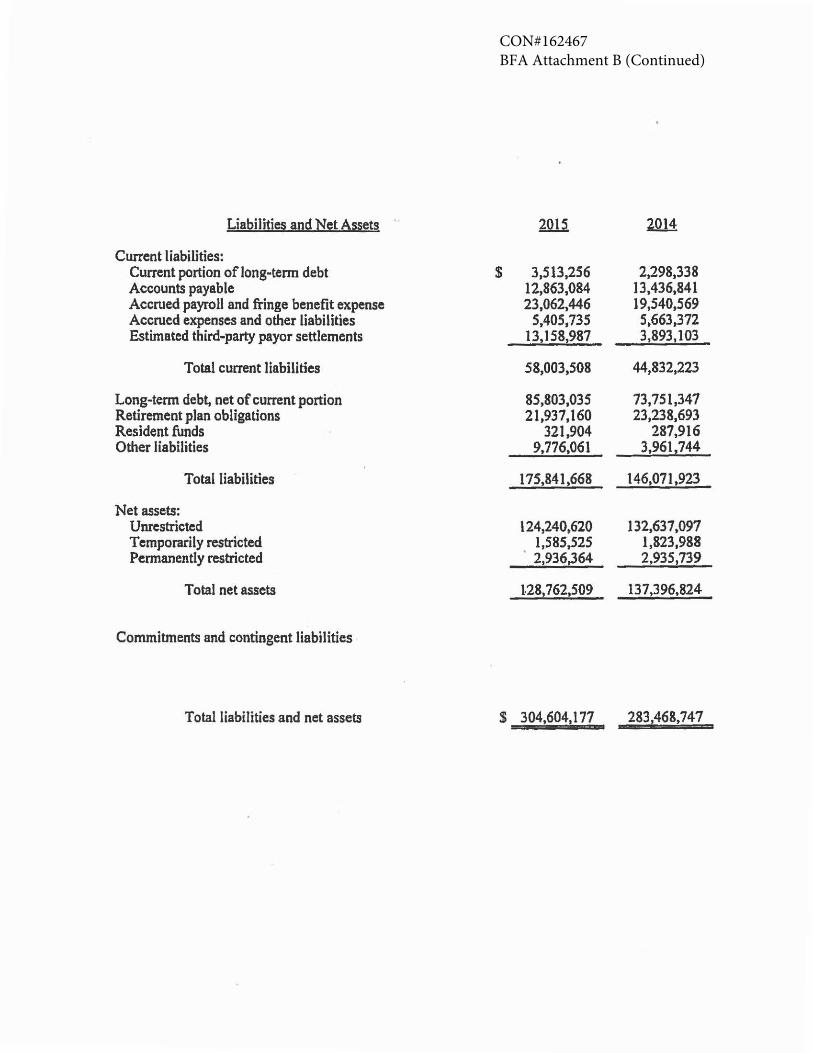
CON#162467BFA Attachment B (Continued)
Liabilities and Net Assets mi 2Ql!
Current liabilities: Current portion of Jong-term debt $ 3,513,256 2,298,338 Accounts payable 12,863,084 13,436,841 Accrued payroll and fringe benefit expense 23,062,446 19,540,569 Accrued expenses and other liabilities 5,405,735 5,663,372 Estimated third-party payer settlements 13,1581987 3,893,103
Total current liabilities 58,003,508 44,832,223
Long-term debt, net of current portion 85,803,035 73,751,347 Retirement plan obligations 21,937,160 23,238,693 Resident funds 321,904 287,916 Other liabilities 9,776,061 3,961,744
Total liabilities 175,841,668 146,071,923
Net assets: Unrestricted 124,240,620 132,637,097 Temporarily restricted 1,585,525 1,823,988 Permanently restricted . 2,936,364 2.935,739
Total net assets 1-28,762,509 137,396,824
Commitments and contingent liabilities
Total liabilities and net assets $ 304,604,177 283,468,747
CON#162467BFA Attachment B (Continued)
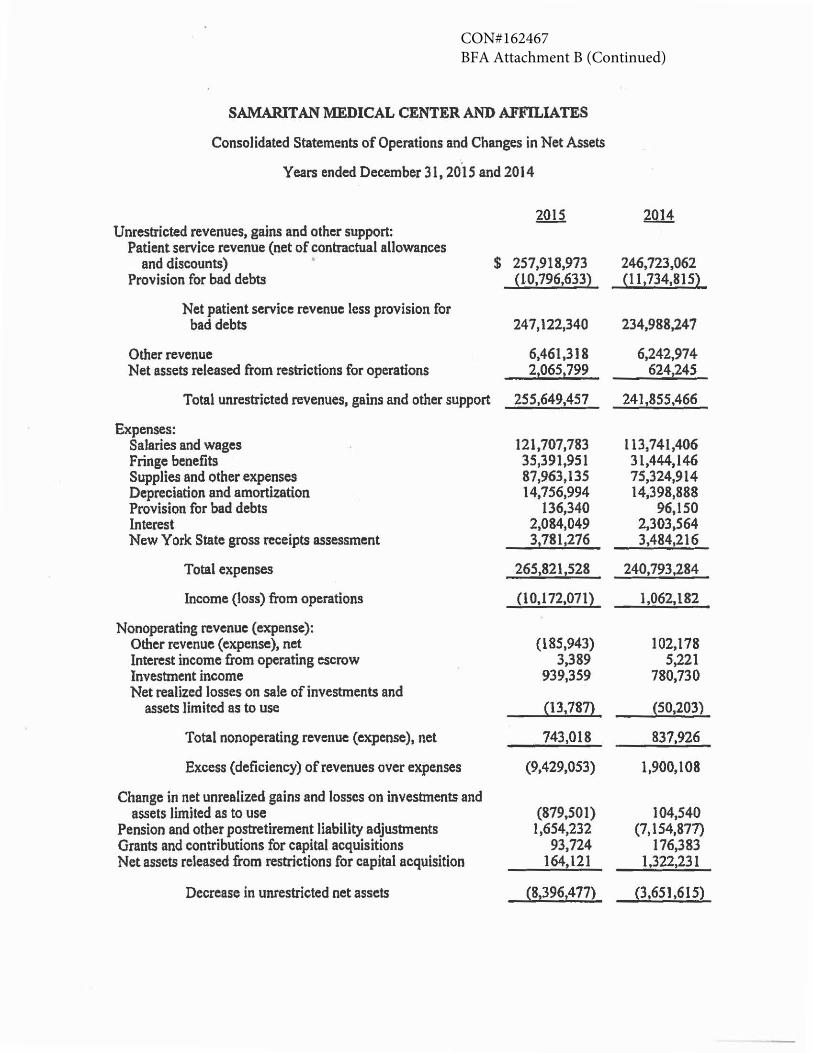
SAMARITAN MEDICAL CENTER AND AFFILIATES
Consolidated Statements of Operations and Changes in Net Assets
Years ended December 31, 2015 and 2014
Unrestricted revenues, gains and other support: Patient service revenue (net of contractual allowances
and discounts) • Provision for bad debts
Net patient service revenue less provision for bad debts
Other revenue Net assets released from restrictions for operations
Total unrestricted revenues, gains and other support
Expenses: Salaries and wages Fringe benefits Supplies and other expenses Depreciation and amortization Provision for bad debts Interest New York State gross receipts assessment
Total expenses
Income (loss) from operations
Nonoperating revenue (expense): Other revenue (expense), net Interest income from operating escrow Investment income Net realized losses on sale of investments and
assets limited as to use
Total nonoperating revenue (expense), net
Excess (deficiency) of revenues over expenses
Change in net unrealized gains and losses on investments and assets limited as to use
Pension and other postretirement liability adjustments Grants and contributions for capital acquisitions Net assets released from restrictions for capital acquisition
Decrease in unrestricted net assets
$ 257,918,973 (l0,796,633)
247'122,340
6,461,318 2,0651799
255,649,457
121,707,783 35,391,951 87,963,135 14,756,994
136,340 2,084,049 3,781,276
265,821,528
(10, 172,071)
(185,943) 3,389
939,359
(13,78:zl
743,018
(9A29,0S3)
(879,501) 1,654,232
93,724 164,121
~8,396,477)
246, 723,062 (11,734,815)
234,988,247
6,242,974 624,245
241,855.466
113,741,406 31,444,146 75,324,914 14,398,888
96,150 2,303,564 3,484,216
240,793,284
1,062,182
102,178 5,221
780,730
~50,203)
837,926
1,900,108
104,540 (7, 154,877)
176,383 1.322,231
~3.651,615)
CO
N#1
6246
7BF
A A
ttach
men
t C,,. Samaritan
V Medical Center
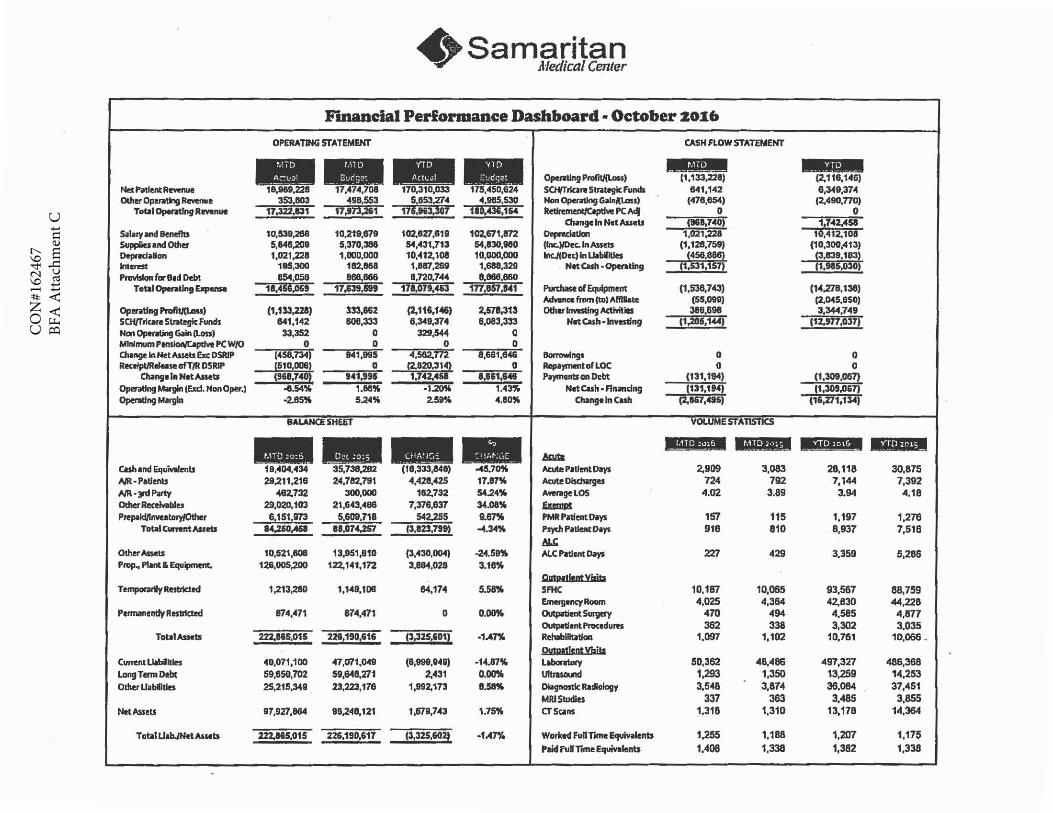
Financial Performance Dashboard· Oc:toher zo:16 OPERATING STATEMENT CASH FLOW STATEMENT
---- !&£''± &£ OpemlngProf".W.-) (1,133,2211) {2,116,1<46) NetP.il~Rewnue 18,11119,2211 17,474,708 170,310,033 175,450,624 SCH#TrkantStrat.gi(Funds 841,142 6,349,374 OtherOp~~I 353,803 498,553 5,1153.274 <4,985,530 NonOpemlngGalnj{l.ms) (478,654) (Z,490,770)
TatalOpentfngR- 17,322,llt tf,t73;2i1 175.K3,30f 116,di,1&4 R~PCA4 0 0 Chage In Net Assets (968,740) 1,T4Z.45i
~t.iyand Benefits 10,539,288 10,219,879 102.1127,819 102,671.872 Orpldallon 1,021,228 10,412, 108 SupplienndOther 5,IMll,208 5,370,3116 54,<431,713 54,1130,980 (lnc.}IOec.ln.Assets (1,128,759) (10,300,413) Depfedallon 1,021.228 1,000,000 10,<412,108 10,000,000 lncJ(Oec)lnU.blltles (<456,® (3,839,183) antinst 1115,300 1ez.w 1.187,289 1,688,329 ,._Cash -Opttadng 11.531,157 (1,915,ojO) PraW1onfar111dDt1n 854,058 aea,1186 a,no,744 8,eae,eao
T•talOpenltlng&pcnse 18,<456,1159 17,139,iii 17a,Oft,4d 177,e57,M1 PurdllseofEqulpmtnt (1,536,7<43) (1'4.278,13&) Adwmlce from(to) Af!111atc (55,099) (2,045,850)
Opinli"!IPrafttKLau) (1,1S3,221) 333,162 (2.11G,146) 2,m,313 OthttlmlestingActmtles 386,898 3,344,749 SCH/Tri<llnlStrateglcfuncls 8'41,1<42 608,333 8,349,374 8,083,333 N.CCa$h•lnvesllng (1;20i,1<iA) (fZ,977,037) Non Opemng Gain (loss) 33,352 O 329,544 O MlnlmumP~PCWJO 0 0 0 0 ClmigelnN~Assets&cDSRIP (458,734) 941,995 4,562.ffl 8,681,iS48 llorrowln9• 0 0 RKeiptJReleaseofTIRDSRIP (510,008) 0 (2.8~ 0 riep.,inentofLOC 0 0
ChangelllNetAIMts (961,7401 141,995 1,74 1.161,'48 P1ymentsonDcbt (131,194) (1,309,067) OpentlngMugln(Exd.NonOJN!r.) ~.5<4% 1.1111% ·1.20% 1.43% Net:Cash-Flnandng (131,194) (1,309.0&7) Operating~ -2.85% 5.2<4% 2.59% 4.83 0iange1n~ cziri,a&) (1&1%71,1i..)
8ALANCE SHEET VOLUME STA11STICS
- - - - &Mia wm•• 11
11·•1• •••• WJi+•• C&sh1ndEquiwlenlJ 19,'404,434 35,738,282 (18,3:13,848) -45.70% Acutl!PatlelltDays 2,909 3,083 28,118 30,875 ~-Pltlenu 29,211,21& 2<4,782,791 4,-429,425 17.87% AcuteDlsdlarges 724 792 7, 144 7,392 MH1nl Patty -462,732 300,000 192,732 54.24% Ave111ge LOS 4.02 3.89 3.94 4.18 ~Reulvabla 29,020, 103 21,643,486 7,378,837 34.0S% .Eumsll PrepaldllnvulafylOthtt 6,151,1173 5,609,718 5<42.255 9.~ PMltP1tlent01ys 157 115 1,197 1,276
TobllCUnerrtAsslb U,260,Gll H,174,2S7 (3.123,799) -.C.34% PsydiP1tlentOays 916 810 8,937 7,516 &!;
OtherAssas 10,521,808 13,951,810 (3,430,004) -24.59% ALCPltlwDlys 2Zl 429 3,359 5,286 l'nip.Pllllt&Equipctlcnt. 1211,005,200 122,141,172 3,884,028 3.111%
OUIPflltatVisib T~Restrkttd 1,213,280 1,149,108 M,174 5.58% SAfC 10,187 10,065 93,567 88,759
EmergenqoRoom 4,025 4,36<4 <42,830 44,228 PtnMnendyRllStllaRCI 1174,471 874,471 0 0.00% OutpstientSulgery 470 494 4,585 4,877
autprientl'roc1clum 362 338 3,302 3,035 TotalAsHts 222,115,0H 221,190,616 (3~25.101) ·1.47% Rehlbllltalion 1,097 1, 102 10,761 10,066 _
OW!idltntV!sils Cvnutl.llbOltles 41t,071,100 47,071,049 (8,999,849) ·14.87% L1bcntoly 50,362 48,<486 497,327 486,368 LongTermo.bt 59,850,702 59,848,271 2,431 O.OO'lro Ultrucund 1,293 1,350 13,259 14,253 OtherUablttles 25,215,3411 23,223,178 1,992,173 11.58% Di1gnostlc:R11dlology 3,5'48 3,874 36,084 37,451
MRIStuclles 337 363 3,"85 3,855 Net.AsselS 97,927,IMM 88,2411,121 1,879,70 1.75'% CT Suns 1,318 1,310 13, 178 14,364
TobllUab./NelAHeb 222,HS,015 226,19D,G17 (3,325,602) ·1A7% WorlcedfuRTimdquiv•lents 1,2S5 1.188 1,207 1,175 PaidFulTmeEquivalents 1,408 1,338 1,382 1,338

CO
N#1
6246
7BF
A A
ttach
men
t D
SAMARITAN MEDICAL CENTER AND AFFILIATES
Consolidating Balance Sheet
December31, 2014
The Samllri!An Samaritan Medical Center
Samaritan Samaritan Edward Keep Foundation Samaritan Medical Medical John Nursing ofNorthem Senior
mt! Center Pmcti~ P,~. Noble Hom~, Ins;. New York. l!l~ Villa&~ In~. IWmiaatlgna Tu!ll Cumnt assets:
Cash and cash cquivalcnlS $ 34,481,506 302,616 320,226 3Sl,73S 2.053,293 14,674 - 37,524,0.50 Investments l,628,458 - - - 1,202.,337 - - 2,830,795 Patient accounts receivable, net of allowanc:c for
doubtful accounts 25,181,203 1,483).22 - 4,144,449 - 3,330,923 - 34,139,797 Pledges receivnblc - - - - 626,4.56 - - 626,456 Other receivables 8,483,419 1.980 - 38,0IS - J,500,000 - I0,023,414 Inventories 2,224,336 335,097 - 73.218 - SS,331 - 2,687,982 Prepaid expcn5e5 and other current asselS 2~31904 54,494 - 199,917 10,000 205,897 - 2.724.212
TOfal current assets 74,.25~826 2,177.409 320,226 4,8071334 3,892,086 S,106,82.5 - --22,,SS6.106
Assets limited us to use: Restricted collatcnl - - - 2.104,036 - 1,.500,000 - 3,604,036 Assets held in trust - - - 1,475,534 . - . 1,475,.534 Construction project runds 2,033,898 - . - - - - 2,033,898 Permanently restricted endowment funds 874,471 - - - 1,961,692 - - 2,836,163 Board designated invcslmcnts 199.004 - - 141,932 13,776 - - 354,712
3,107,373 - - 3,721,502 1,9751468 1.soo.000 . 10,304,343
Property and equipment, net J07,822,Sl6 272,4$3 - 3,22S,61S - 60,121,510 - 171,442,184 Debt issuance costs, net 632,020 - . - - 609,985 - 1,242,00S lnvestmenis, net of current portion - - - - S,285,2.53 - . S,2BS,2S3 Pledges receivable, net of current portion - - - - 181,008 - - 181,008 Resident funds . - - 161,491 - 126,425 - 287,916 Other assets, net 41097J76 . - 50.000 - 22.056 - ___!!§9,332
Total assets s 189,912,011 2,449,892 320,22_6 11.9~6.~2_ _ 11,333,81_~ - ~7.4i6,l01 _ - - 2!3,4§8,747 -
CO
N#1
6246
7BF
A A
ttach
men
t D (C
ontin
ued)
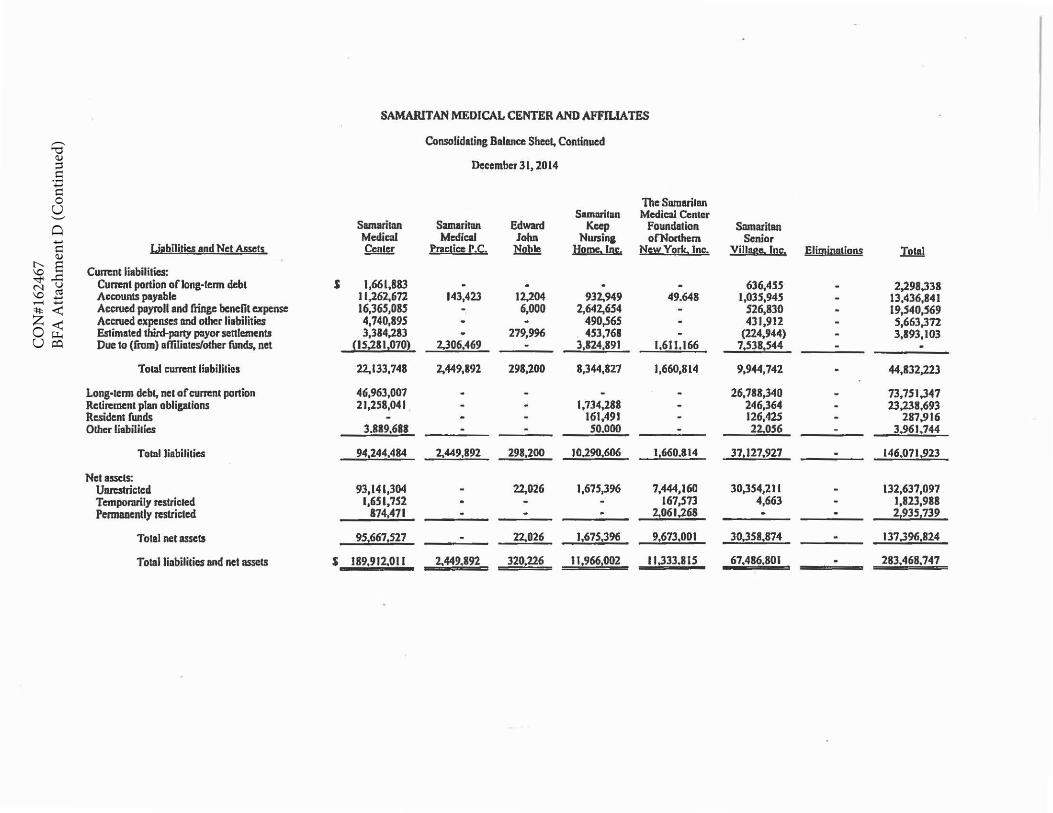
SAMARITAN MEDICAL CENTER AND AFFILIATES
Consolidating Balance Sheet, Continued
December 3l, 2014
The Smnarilon Sun mi Ian Medical Center
Samaritan Samaritan Edward Keep Foundation Smnaritan Medical Medical John Nursing orNorthem Senior
Liabilities and Net Assels ~ Practice r.c. Noble Hom;, Inc. New York. Inc. Village. Jnc. Elimjnotions Tulll Cumnt liabilities:
Current portion of long-lcnn debt s l,66l,883 - - - - 636,4SS - 2,298,338 Accounts payable 11,262,672 143,423 12,204 932.949 49.648 l,03S,94S - 13,436,841 Accrued payroll and ftingc benefit expense 16,365,0BS - 6,000 2,642,654 - 526,830 - 19,540,569 Accrued expenses and other liabilities 4,740,895 - - 490,565 - 431,912 - 5,663,372 Estimated third-party p11yor settlements 3,384,283 - 279,996 453,768 - (224,944) - 3,893,103 Due to (from) affili11tes/other funds, net {IS,2&11070} 2,306,<469 - 3,&24,891 l,6JI.166 7,538,544
Total current liabililics 22,133,748 2,449,892 298,200 8,344,827 1,660,814 9,944,742 - 44,832,223
Long-tenn debt, net of current portion 46,963,007 - - - - 26,788,340 - 73,751,347 Retirement plan obligations 21,258,041 . - - 1,734,288 - 246,364 - 23,238,693 Resident funds - - - 161,491 - 126,425 - 287,916 Other liabilities 3.889,618 - --- 50.000 - 22,056 - 3.961.744
TotDI liabililies 941244,484 2,449,892 298,200 10,290,606 1,660.814 37,127,927 - 146.071,923
Net assets: Unrestricted 93,141,304 - 22,026 1,67S,396 7,444,160 30,354,211 - 132,637,097 Tempororily rcstriclcd 1,651,752 . - - 167,573 4,663 - 1,823,988 Permanently restricted 874,471 - - - ~061.2M._ - - - 2,9ll,139 ---- --
Total net assets 9516671527 - 22,026 ),675,396 9,673,001 30,358,874 - 137,396,824
Total liabilities and net assct5 s 189,912.01 J 2,449.892 ~0.226 Jl,96§,002 I 1~33.815 67.486,801 . - 283.468.747
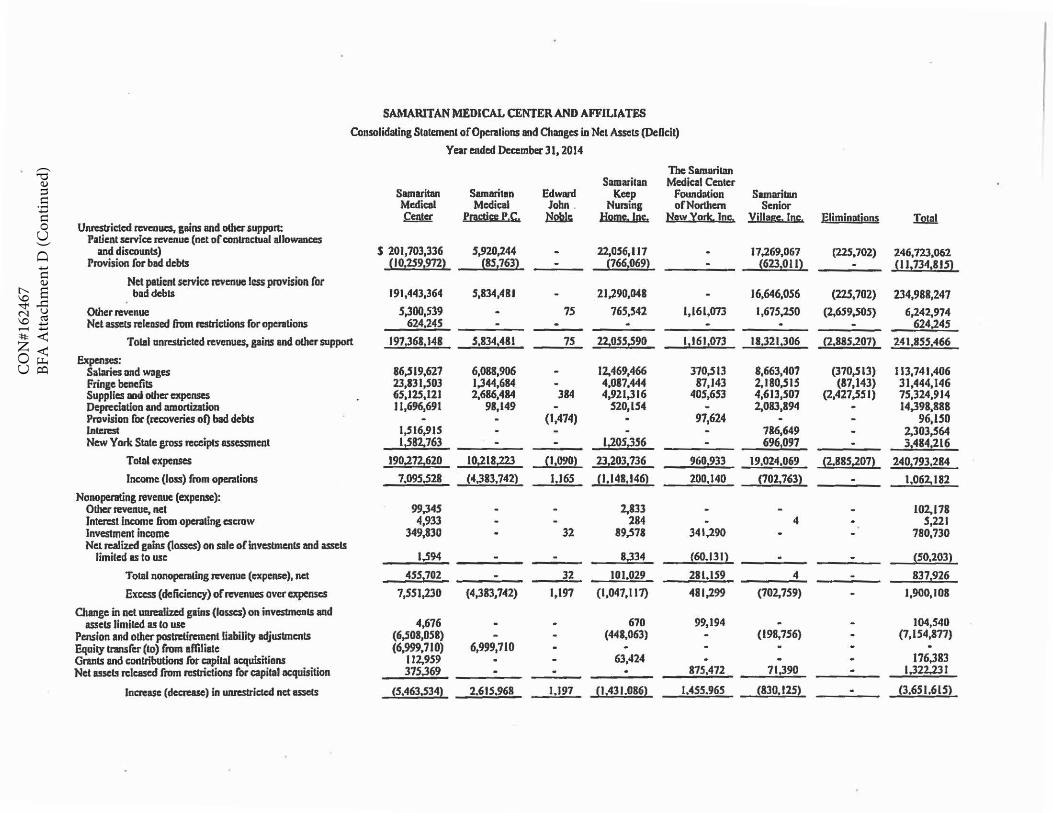
CO
N#1
6246
7BF
A A
ttach
men
t D (C
ontin
ued)
SAMARITAN MEDICAL CENTER AND AFFILIATES
Consolidllling Statement ofOperalions and Changes in Net Assets (De6cit)
Year ended December 3l, 2014
The Samaritan Samaritan Medical Center
Samaritan Samaritan Edward Keep Foundation Samaritan Medical Medical John . Nursing of Northern Senior
Unrestricted revenues, gains and other suppon: Palient service revenue (net of conll'llclual allowances
Center Practice P.C. ~ Home.Joe. New York. Ins, Village. Inc. Eliminations Th.!A!
and discounts) s 201,703,336 5,920,244 - 22,056,117 - 17,269,067 (22S,702) 246, 723,061 Provision for bad debts (10125919722 (8S1763} - '7661069} - {6231011} - !111734181~
Net palient service revenue less provision for b11ddcbts 191,443,364 S,834,481 - 21,290,048 - 16,646,056 (225,702) 234,988,247
Olher revenue S,300,539 - 1S 76S,S42 1,16l,073 1,675,250 (2,6S9,S05) 6,242,974 Net assets relellSed from ~ctions for operations 624,245 - - . . . - 624,245
Total unrestricted revenues, gains and other support 197,368,148 S,834,481 15 22.0SS,590 1,161,073 18,321,306 (2.885.207} _241,855,466
Expenses: Salaries ond wnges 86,519,627 6,088,906 - 12,469,466 370,SIJ 8,663,407 (370,513) 113,741,406 Frin&e benefits 23,131,503 1,344,684 - 4,087,444 87,143 2,180,515 (87,143) 31,444,146 Supplies aod other expenses 65,125,121 2,686,484 384 4,921,316 405,653 4,613,507 (2,427,551) 75,324,914 Depttciation and amortization I I,696,691 98,149 - 520,154 - 2,083,89" . 14,398,888 Provision ror (recoveries of) bad debts . - (1,474) . 97,624 . - 96,150 Interest 1,516,915 - - - - 786,649 - 2,303,564 New Yen Slllte gross rc=ipts assessment l,S82,763 - - IJ.OS~56 - 6961097 . 3,484,216
Totlll expenses 190,272.620 10~18~ (l,090) 23,203,736 9601933 19,024,069 (2.885~0!} 2401793,284
Income (loss) from operations 7.095,528 (4,383,742) l,J6S (l,148,146) 200,140 (702,763} - 1,062,182
Nonopeniling revenue (expense): Other revenue. net 99,345 - - 2,833 - . . 102,178 Interest income fiom operating escrow 4,933 - - 284 - 4 - 5,221 Investment income 349,830 . 32 89,S78 341,290 - - 780,730 Net realized gains (losses) on sale or investments and assets
limited IS to USC 1,594 - - 8,334 (60.131} . - ~50,203)
Totlll nonopcniting revenue (expense), net 4551702 - 32 101,029 281,159 4 - 837,926
Excess (deficiency) or revenues over expenses 1,SSJ,230 (4,383,742) 1,197 (1 ,047,117) 481,299 (702,759) - 1,900,108
Change in net unn:allzcd gains (losses) on investments and assets limited as to use 4,676 - - 670 99,194 . - 104,540
Pension and other poslrctimnent liability adjustments (6,508,058) - - (4"8,063) - (198,756) - (7,154,Bn) Equity tr.msfcr (to) from affiliate (6,999,710) 6,999,710 - - - - - . Grants and contn"bulions for capillll acquisitions 112,959 . - 63,424 - - . 176,383 Net asset! released from n:stric:tions for capital acquisition 375,369 - - . 875,472 71,390 - l,322,231
Increase (decrease) in unrestricted net assecs _{5,463,534} 2.615.968 _ l.197 __(J .43 l,086)_ l.4SS.96S {830,125} . 13.6Sl.61S>
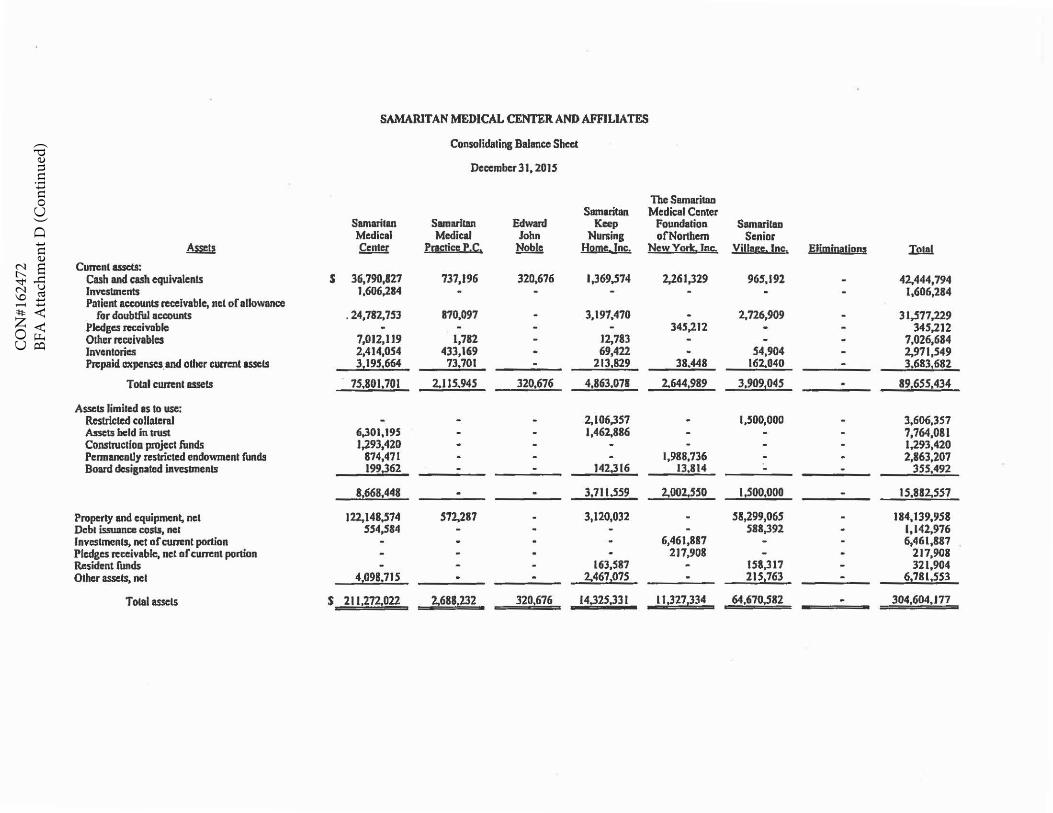
CO
N#1
6247
2BF
A A
ttach
men
t D (C
ontin
ued)
SAMARITAN MEDICAL CENTER AND AFFILIATES
Consolidating Balance Sheet
Dcccmbcr31,2015
The SamarilllD Samarican Medical Center
Samarilln Samaritan Edward Keep Foundalion Samarilao Medical Medical .lohn Nursing of Northern Senior
~ Center P~ceP,C, ~ H2im.I~. N~~ Yo!!. lnfi. Villggc,1~, f;limiQi!liOI!~ lJl1!l CutTCnt assets:
Cash and cash equivalents s 36,790,827 737,196 320,676 1,369.574 2,261,329 965,192 - 42,444,794 lnvcsllncnts 1,606,284 - - - - - - l,606,284 Patient accounts receivable, net of allowance
for doubtful accounts . 24,782,753 170,097 - 3,197,470 - 2,726,909 - 31,577,229 Pledges receivable - - - - 345,212 - - 345,212 Other receivables 7,012,119 l,782 - 12,783 - - - 7,026,684 Jnvenlories 2,414,0S4 433,169 - 69,422 - 54,904 - 2,971,549 Prepaid expenses.and other cum:nt asscls 3,1951664 73:701 - 213,829 38.448 162,040 - 3:683,682
Tocal cumnt assets __?1.801.701 2.US.94S 320.~76 4,863,07!_ _J.644,98_2._ 3.~.041_ - 89,6SS,434 -
Assets limited as lo use: Restricted collatenl - - - 2,106,357 - 1,500,000 - 3,606,357 Assets held in trust 6,301,195 - - 1,462,886 - - - 7,764,081 Construclloo project funds 1,293,420 - - - - - - 1,293,420 Pcnnanently restricted endowment funds 874,471 - - - 1,988,736 - - 2,863,207 Board dcsignalcd invcstmenls 199~62 - - 142.316 13.814 - - 3SS,492
8,668,448 - - 3,71 l.S59 2.002,550 1,500,000 -·-- 15,882,557
Property and equipment, nel 122,148.574 572,287 - 3,120,032 - 58,299,065 - 184,139,958 Debt issuance costs, net 554,584 - - - - 588,392 - l,142,976 lnvcslments, net of current portion - - - - 6,461,887 - - 6,461,887 Pledges receivable. net of current portion - - - - 217,908 - . 217,908 Resident funds - - - 163,587 - 158,317 - 321,904 Other assets, ncl 4,098!715 - - ~467,075 - lJS,763 - 61781,553
T otaJ assets $ _111.i7.2.022 1,,688,232 320,676 14,325,331 ll.321J3L _6_1.~o.ss2 - 304,604,177
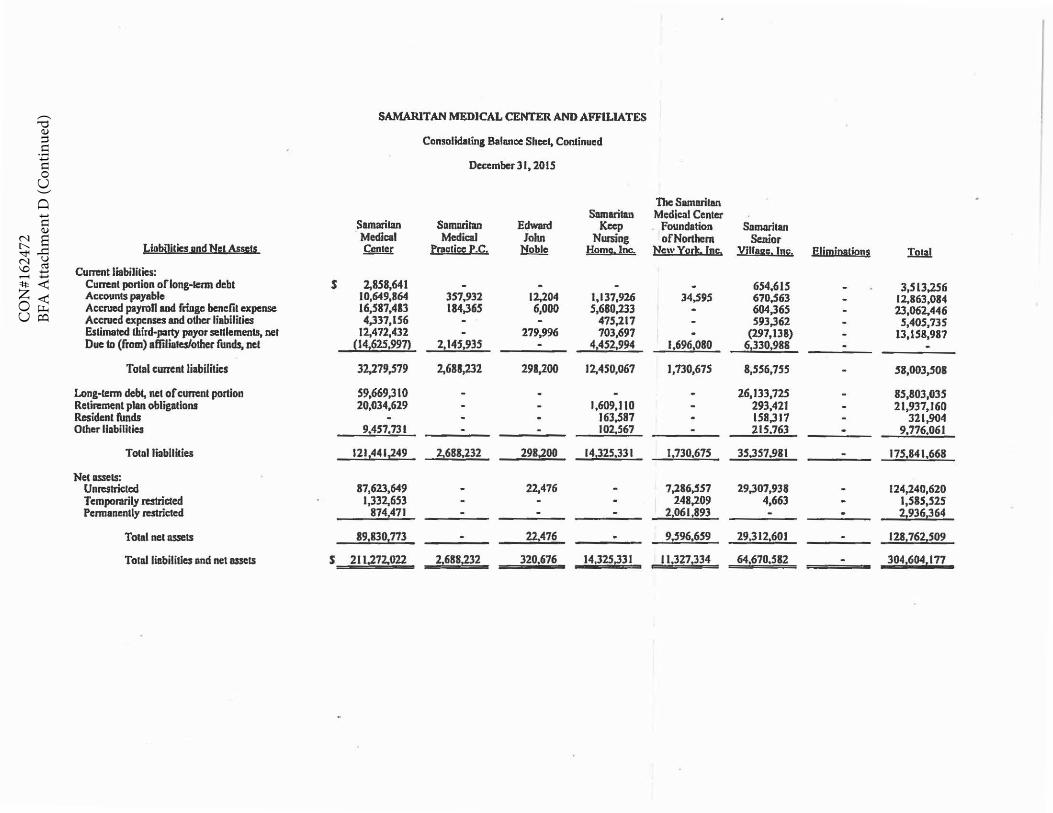
CO
N#1
6247
2BF
A A
ttach
men
t D (C
ontin
ued) SAMARITAN MEDJCAL CENTER AND AFFILIATES
Consolidating Balance Sheet, Continued
December 31, 2015
The Samaritan Samaritan Medical Center
Samaritan Somuritan Edward Keep Foundation Samaritan Medical Medical John Nursing ofNorthcna Senior
LiabilitiesJUld N!!U\ssms_ ~ Praotice P.C. ~ Home. Inc. New York. Inc, Village. Im;. Eljmjnation~ Th!!! Current liabilities:
Current portion oflong-tenn debt s 2,858,64] - - - - 6S4.61S - 3,513.256 Accounts payable 10,649,864 357,932 12,204 1,137,926 34,595 670,563 - 12,863,014 Accracd payroll and fringe benefit expense 16,587,413 184,36S 6,000 S,680,233 I - 604,36S - 23,062,446 Accrued expenses and other liabilities 4,337,156 - - 475,217 - 593,362 - S,405,735 Estimated third-party payor settlements, net 12,472,432 - 279,996 703,697 - (297,131} - 13,158,917 Due to (from) affiliates/other funds, net {141625,997) 2,14S,93S - 41452,994 1,6961080 613301988
Total current liabilities 32,279,579 2,688,232 298,200 12,450,067 J,730,675 8,556,155 - 58,003,508
Long-tenn debt, net or current portion 59,669,310 - - - - 26,133,725 - 85,803,035 Retin:mcnt plan obligations 20,034,629 - - 1,609,l 10 - 293,421 - 21,937,160 Resident funds - - - 163,587 - 158,317 - 321,904 Other liabilities 9.457,731 - - 102,567 - 215.763 - ---2t 776.061
Totnl liablllcies 1211441~49 2.688,232 298~00 14.325,331 1.730.675 35.357.981 - 175.841.668
Net assets: Unrcstriclcd 87,623,649 - 22,476 - 7,286,557 29,307,938 - 124,240,620 Temporarily restricted 1,332,653 - - - 248,209 4.663 - 1,585,525 Pcnnancntly restricted 874471 - - - 21061 ,893 - - ~936264
Total net assets 19,8301773 - 22.476 - 9,596,659 29,3121601 - 121.1621509
Total liabilities and net assets $ 211,272.022 2,688,232 320,676 14,325,33) _ 11,327,334 64,670,582 - 304,604,177
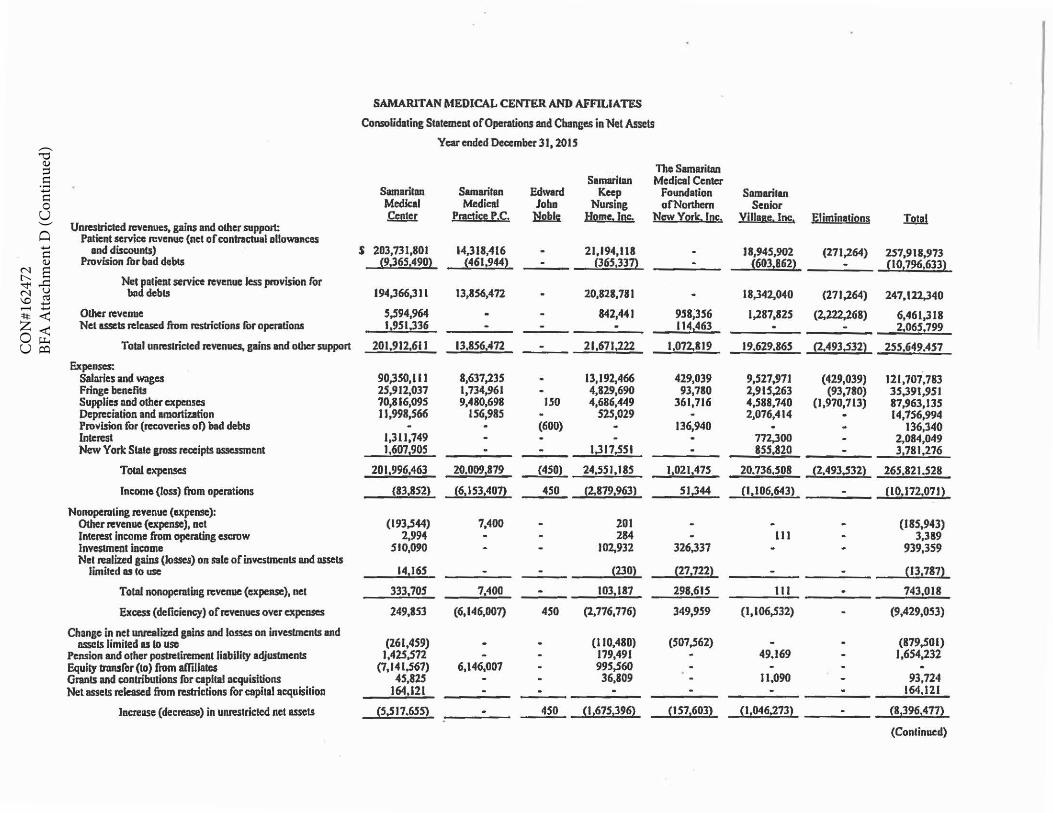
CO
N#1
6247
2BF
A A
ttach
men
t D (C
ontin
ued)
SAMARITAN MEDICAL CENTER AND AFFILIATES
Consolidating Statement of Operations and Changes in Net Assets
Year ended December 31, 2015
The Samuillln Samaritan Medical Center
Samaritan Samaritan Edw1rd Keep Foundation Somarilan Medical Medic:el John Nursing ofNorthcm Senior !&n!U Pm!i!i'~ P.~. N!2l!l£ H2~Joc. New York. f.m:. Village. Inc, Eliminations Th1l!l Unrestricted revenues, gains and olher support:
Patient service n:venuc (net of contractual ollowences and discounts) $ 203,731,801 14,318,416 . 21,194,118 - 18,945,902 (271,264) 257,918,973
Provision for bad debts {913651490} {461,944} . (365133!} - {6031862} . (I 01796,633}
Net patient servite revenue less provision for bnddebls 194,366,311 13,856,472 - 20,821,781 - 18,342,040 (271,264) 247,122,340
Other revenue 5,594,964 . . 842,441 958,356 J,287,825 (2.222,268) 6,461,318 Net assets released ftom restrictions for operations 11951.336 - . . 1141463 . . ~0651199
Total unrestricted revenues. gains and other support 201,912,611 13,856,472 . 21,671.222 1,072.819 ~.629.865 __{2,493,531) _JSS,649.451
Expenses: Salllries and wages 90,350,111 8,637,235 - 13,192,466 429,039 9,!127,971 (429,039) 121,707,783 Fringe benefit! 25,912,037 1,734,961 . 4,829,690 93,780 2,9ts,263 (93,780) 35.391,951 Supplies and other expenses 70,816,095 9,480,698 JSO 4,686,449 361,716 4,588,740 (l,970,713) 87,963,135 Depreciation and amortization 11,998,566 lS6,985 - 525,029 - 2,076,414 . 14,756,994 Provision for (recoveries of) bad debt! - . (600) - 136,940 . - 136,340 Interest 1,311,749 . - . - 772,300 - 2,084,049 New York Stale gross receipts BSSCJsment 1,6071905 - . 1~17,SSI . 8SS,820 - 31781,276
Total expenses 201,996,463 20.009,879 (450) 24,551,185 J,021.475 20.736,508 {2.493,532) 265,821.528
Income (loss) from operations (83,852) (6,153,407} 450 (2.879,963) 51,344 _{1,106,643)_ ----- . _(l()J72J)7J)
Nonoperaling revenue (expense): Other revenue (expense), net (193,544) 7,400 - 201 - - . (185,943) Interest Income from operating escrow 2,994 - - 284 - 111 - 3,389 lnYC$Ullmt income SI0,090 - - 102,932 326,337 - - 939,359 Net realized gains (losses) on sale ofinvcsbllents and assets
limited as to use 141J6S - - i230l {271722) - - (131787}
Total nonopcruting n:venue (expeASC), net 333!705 7,400 . 1031187 298,615 111 . 7431018
Excess (deficiency) of revenues over expenses 249,153 (6,146,007) 4!10 (2,776,776) 349,959 (1,106,532) - (9,429,053)
Change in ncl unrealized gains and losses on investments and (261,459) (110,480) (507,562) (879,501) ossets limited as lo use . . - .
Pension and other postretiremcnt liability adjustments 1,425,572 . - 179,491 - 49,169 . J,654,232 Equity transfer (to) from affiliates (7,141,S67) 6,146,007 - 995,560 . . - . Granes and contributions for capital acquisitions 45,825 - - 36,809 . 11,090 - 93,724 Net asselS released from RSlrictions for capilal acquisition 164.121 - . . . . - 164.121
Increase (decrease) in unreslricted net assets l5.S17.655) . 450 {11675~9~ {1571603} (11046,273) - (81396,477l
(Continued)
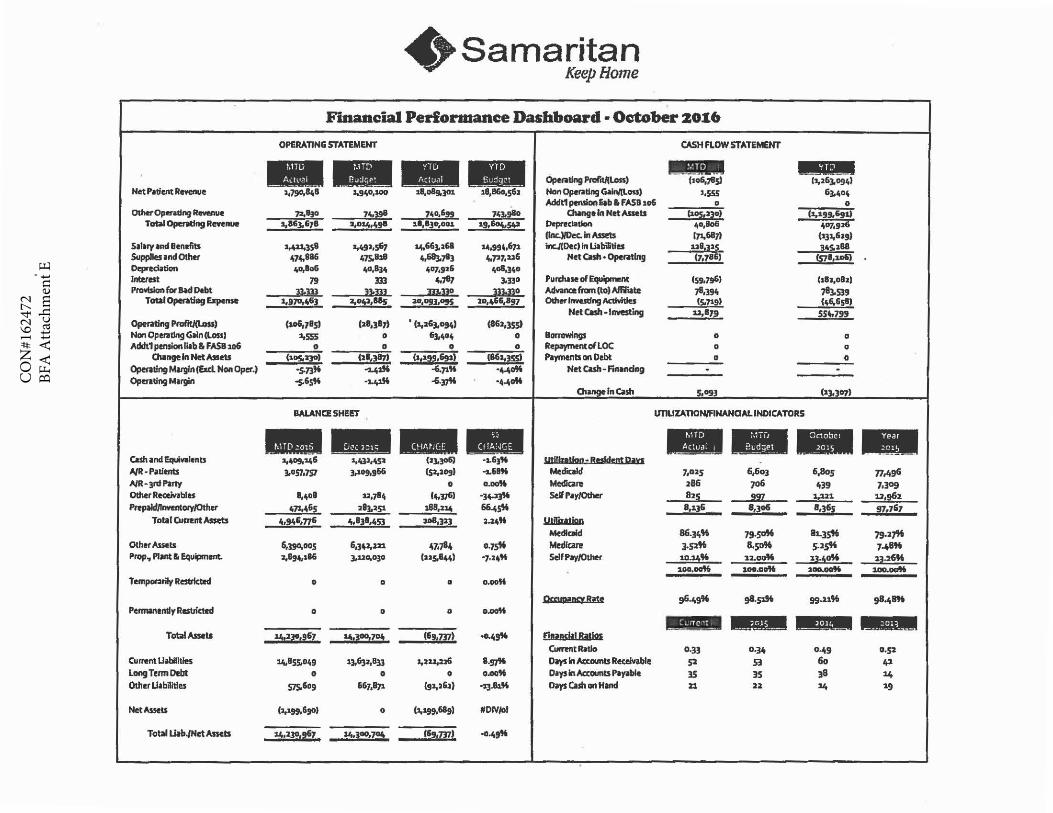
CO
N#1
6247
2BF
A A
ttach
men
t Eie.. Samaritan ...... Keep Home
F'man'1ial Pedormance Dashboard· October 20:16
OPERATING STATEMENT CASH FLOW STATEMENT
--- -Jll!I Ill• OptrallngP~) (to6,78S) (J,26), 094) HetP1tientRevenue -i;J9G.a~1· J,940,ioo :tl,ollg,301 18,B6o,562 Non Operating Galn/(loss) 1,555 6),404
Adclt1 pension S.b •FASS 1o6 0 0 Othef'Opontlng R-e 72.'30 74,)98 z40,'n m.2!!! CIYngeln Net Assets ~~.230) (s,199,&g&J
Tml aper.ting Rl!ftnue .. 8'],6711 2,ou,,4911 :i.1,130,001 19.~,51o2 Depreciation 410,eo& 4107,926 (lnc.)IDec. in Assm (71.611]) (13i,6a9)
Salary and Benefits J,411.358 .. 'd •• 5'7 14\,66).261 141,994,671 ir.cJ(Dec) In Ulibilitlts u8il2~ l4S.288 Suppl1enndOther 474,886 475.lb.B 4.68J.7'l t,,p7,u6 NetCuh•Opemlng (7.786) (571,111&) Oep'e~tlon r,o.lo6 40,834 407,926 4a8,340 Interest 79 m 4,787 J.330 Purdilse of Equipment (59,7g6) (18i,082) Pnwlslon fat BM! Debt ~:m um D1.no JJ~O Advance from (to) Affil~u 78.394 783.539
Total Opentlag Expense s,970,463 .,~,ns 20,09),095 l0,4&&,197 Odler lnvesdng ActMtles IS.719> (46,&sSI Net cash· Investing u,179 554.7,,
Optming Prafitl(l.Jm) (soi,71.5) (28,387) • (1,26J,094) (862,355) Non Open ting Gain (loss) :i.sss 0 6).404 0 BllmlWings 0 0 Addt1pensionRibllrFAS11l.o6 0 0 0 0 Re~ntofLOC 0 0
Change In Net Assets (1115.230) (28,3117> (1~~·'91) (861,)55) Payments on Debt 0 0
Operating M11gfn(&d. Non Oper.) ·s.n,. ""1.4:156 -6.71ff •4-411M Net c.sh • Financi11g Operating Margin -s-65'6 -i.t,1K -6.)11' •4..\IM
Ch In cash 5,093 (1),)071
BALANCE SHEET UTlUZAllON/FINANOALINDICATORS
---- -••w-Qsh ind Equivalents :a,409.246 .,ui,,51 l•J.305) ·J.6J'6 utlll:nU!m • Bald~lll Dil!I A/R • P;atltnts ),0$7.757 J,109,966 ($2,10,) ... &11'6 Mediceld 7,1115 6,603 6,8o5 77,496 AIR-vet Pliny 0 O.ooff Medi~ 286 7o6 ft39 7,309 Other RectNlbles 8,408 u,784 14,]76) -3~ Self Pay{Other 82~ :!2Z ~ u,g62 PttpMl/lllftllloryJOthcr 471,465 21),251 188,U'\ 66.45'6 8,i.36 ·,~o& 1,36i _..:Jp61
Total Current Assets ft,!JftG,776 4,8)1,453 :aoa,323 :1..24K 1lllliWislD Medlold 8G.3t,'6 79-saff 81.].sff 79.27"
Olher Assets 6,190,005 6,34:z,ui 47,784 o.is" Medi~ 3-52'41 8.So" 5-1.sff 7-4Bt6 Prop~ Plant a. Equipment. 7,894,116 ).U0,030 ln.s.'441 ·7.z4ff Self Pay/Ollttt 10:;!!'6 12.0°'6 1J-~°" ~.2696
100.0Cl'6 200.0°'6 2oo.oo'6 1llO.~
Temponn1y Restricted 0 0 g o.ooK
l)qup;iBQ! Bill! '6-49 .. gB.SJM 99.u'6 9'-48't PennanendyRestlkted 0 0 0 o..ooff • ftM &l?LW ''Ml4!!i 2 .., •.
Tota!Anets 11,,2]0,96L - 14,300,~ __ (69,737) .11.4,,. Flft1nslil Blllm CumntRatlo 0 .33 0.14 0-49 Cl.SJ
Current Uabilltit!s u.,an,01,9 1),Gp,833 J,2:u,b6 •·91" Days In Amlunts Reulvable S2 53 6o 42 Lang Tenn Otbt 0 0 0 o.ooff Days in Aaounts Payable lS 35 18 14 OtherUabmtles 57So6D9 667,871 (gi,26l) •i].lb.K Days Cash llfl Hand n :z:z 14 19
NetlwelS 11,199,6901 0 (~99.689) #DIV/01
Total Uab./Nct Assets u,,2~.~- - .. ~l'I0.70.\ __ J~.91D7l -0-49"
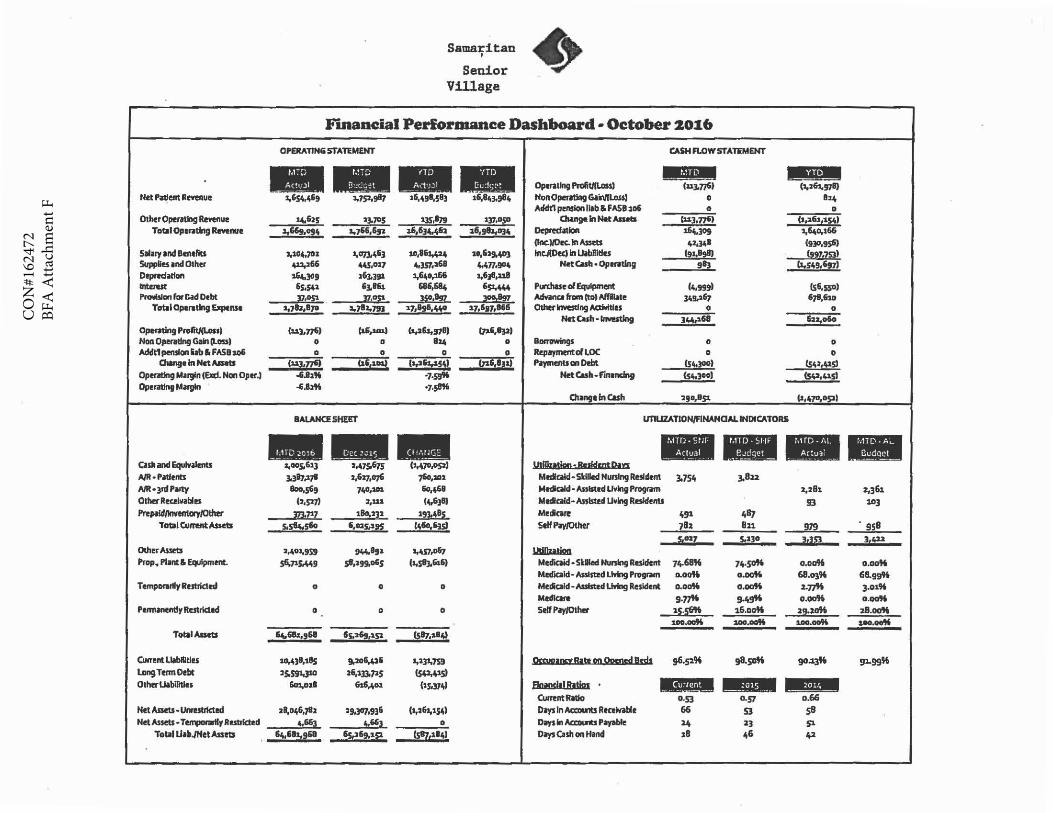
CO
N#1
6247
2BF
A A
ttach
men
t F
Net Pdent Rewenut
OtherOpentlng Revenue Total Cpanmg Relltnue
s.i1ry ilnd Battftu 5uppll6 Ind Other Depred1don lrltaest l'nMslm1 for Cad Dtbt
Tobi Cpent~ EJ<ptnse
Oparatlrig ProfiW,oss) Non OpeRtlng Gain (loss) /lddt1pemlodabUA!ihol5
Chang• In Nct.-..U Opemlng Matgln (Eld. Non Op tr.)
Operating Margin
CUii ;ind EqulvallntJ NR • P.cltnu NR•3f'CIP~ Otllef Reu1Y1blu l'repald/lllYemoryiother
Total CumntAssm
Other /ISSd5
Prop, Plant & Equlpmnt.
T empimltly Restricted
P1m11nentty R~ricted
Total Assets
Cumnt Llilblllllu LangTmn Debt OtherUibili\les
NetADeu·UnrtStrlct1d Net Assets· T~y Rutrlchd
Total U1b./Net Assm
Samaritan I
Senior Village
+ F'mancial Performance Dashboard• October 2016
CPERATIN&STATEMENT CASH FLOW STATEMENT
•11111 •••••• Operating Pn>fi1ln.oss) (U],776) (1,•61.971) Hon Operatlllg G1in/ll.oss) 0 B•4 Aidt! pension lllb & FASll 1o6 0 0
14.625 23.JOS 1JS,87g 1)7,0f! C!Mng• In N41t Ass.ts 12S3,776) (l,>1'21:&i41 ~"9.~4 a.7'6,692 :&6,634,461 16,g&.034 Depred~lon 2.64,309 1,640,166
(lnc.)/Cec. ln A$scU 4•~· (930,9561 "1114,701 1,07l.463 :ao,861,414 20,6•!1.W lnc.JIDec) In Uabllltlu (9s,8gl) 122!-m>
4ll,•66 w.021 4,1S7,>l68 4,477,904 Nateuta • Opnatlng 9'3 (1,m,!.!!I s64,309 16),391 i,'4c1,166 l,6Jl,u8 &s.so CJ.161 A&,614 &p.444 P~ol[qvlpmcnt (4,9991 (S&,550)
JZ•!!f! JZ.02; !5!·!2Z :ioo.1197 AdwnQ from (to) Affllate Ju,i67 678,'1o a.112,879 :a.7IZ.19J 17,!2!·"° 17,617,8115 Otherlnwesdng Acdwitlu 0 0
Net Cult· llMsting l'4,1U b;z.alo (113,7761 (alj,u.) (s,>16s,571) (7ai,IJJ)
0 IJ 824 0 BDn'OWings 0 0
0 0 0 0 Rep.rfmentOfl,OC 0 0
cui•ZZ!! 11i,U1) (s,1~5~ 17:&6,•p> Payments on Debt Cf4.JOO) (S41..41S) .&.81ff ·1·S'it' Net C.h. ""'"""'
($4,]ff) (51,2,4151 .u ... ·7·s8"
C1111nge fl'I c.sh 2!JD,8$f. (J,470, I
BALANCE SHEET llTIUZATION/FINANOALIHDIC/llOAS
--- ----a,oos,613 •·47$o675 (1,470,0$2) Wililasilm • llllidsas Elin J.317.271 2,C17,076 7'o,102 Mtdcaid ·Skilled Nursing Residtlll 3.754 ].812 lloo,5'9 740,us &o,461 Medlald • AnlSted Uvlng Progl'ilTI 2,281 2,361
(2,$27) 2,U:& (~&)I) Medlald·llsslsttd U•lng RaldelltS !ll SO]
m.111 18o,232 19}!48~ M11lcare 491 4'7 s.5'4,sfo 6,m.s,sgs lt,&o,'151 Self PmylOlhtr 78:& 811 979 958
i 02Z S.230 2&~~ i,422 •,4oi,9sg 91o4,892 1,~51.°'7 WlllJiliml
s6.11SM9 sf,299,oCS (s,$8).&l6} Medioid ·SUI~ Nunlng llalcfent 74-68K 74.Soff o.ooff o.ooK Medicaid· Asslsa!d Living Program o."" o.~ 68.~ .. 68.gg'I\
0 0 0 Medicaid· Autstcd Living Resident 0.0°'6 a.oat\ 2.n% 3.019' M1dlar9 9.,.,,. 9..\9" o.oo'K o.oo96
0 0 0 Self Pay/Olh1t l~-5!! 16.aoM 2g.2ofi 28.00ff 100~ 100~ 100.~ 200.~
1.\.68:&,2&1 as,269,152 <sll7~•41
SG,4)8,1115 g,106,426 1,2)1,759 °""Jl1aa: 8111 1111 ggsoal Jkds 96.52% g8.sa" go.i)9io 91-99" 2S.S9S.JJO 16,15725 (542.415)
6o1,oil """'°' (1s.371tl Flt!1ndt! BatjpJ • ••• .fLW ••·A* Ca.mnt RIClo 0 .53 0.S7 o.66
28,IJ,\6,7'11 •9.l07,936 (a.,261,154) Days In Acl:xMltS Ree11Yable 66 53 s8 4,663 4.'6,l 0 D"l'S In Aa:ow1ts Papble 1" 23 S1
'"''8:&,268 155,>1&9,151 '5117,:&l4J Oays Clsll Ol"I Hand 28 46 42
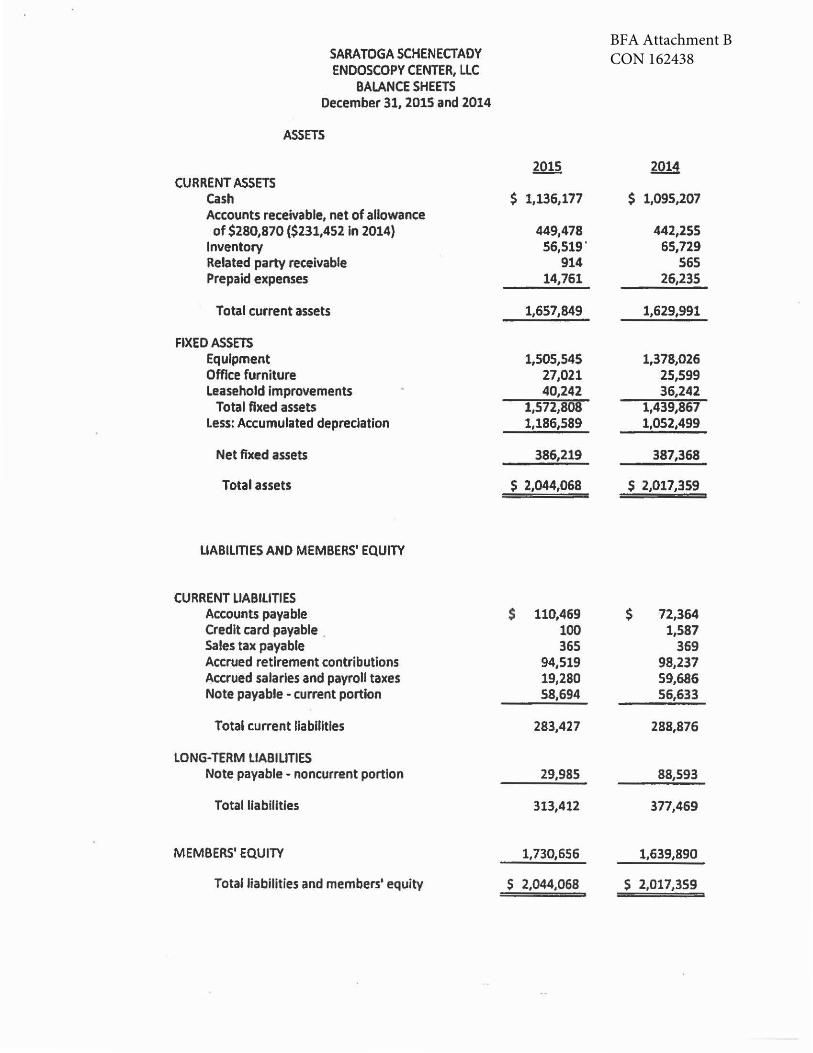
BFA Attachment BCON 162438SARATOGA SCHENECTADY
ENDOSCOPY CENTER, LLC BALANCE SHEETS
December 31, 2015 and 2014
ASSETS
CURRENT ASSETS cash Accounts receivable, net of allowance of $280,870 ($231,452 In 2014)
Inventory Related party receivable Prepaid expenses
Total current assets
FIXED ASSETS Equipment Office furniture Leasehold Improvements
Total fixed assets less: Accumulated depreciation
Net fixed assets
Total assets
LIABILITIES AND MEMBERS' EQUITY
CURRENT LIABILITIES Accounts payable Credit card payable . Sales tax payable Accrued retirement contributions Accrued salaries and payroll taxes Note payable - current portion
Total current liabilities
LONG-TERM LIABILITIES Note payable - noncurrent portion
Total liabilities
MEMBERS' EQUITY
Total liabilities and members' equity
$ 1,136,177
449,478 56,519'
914 14,761
1,657,849
1,505,545 27,021 40,242
1,572,808 1,186,589
386,219
s 2,044,068
s 110,469 100 365
94,519 19,280 58,694
283,427
29,985
313,412
1,730,656
s 2,044,068
$ 1,095,207
442,255 65,729
565 26,235
1,629,991
1,378,026 25,599 36,242
1,439,867 1,052,499
387,368
s 2,017,359
$ 72,364 1,587
369 98,237 59,686 56,633
288,876
88,593
377,469
1,639,890
s 2,017,359
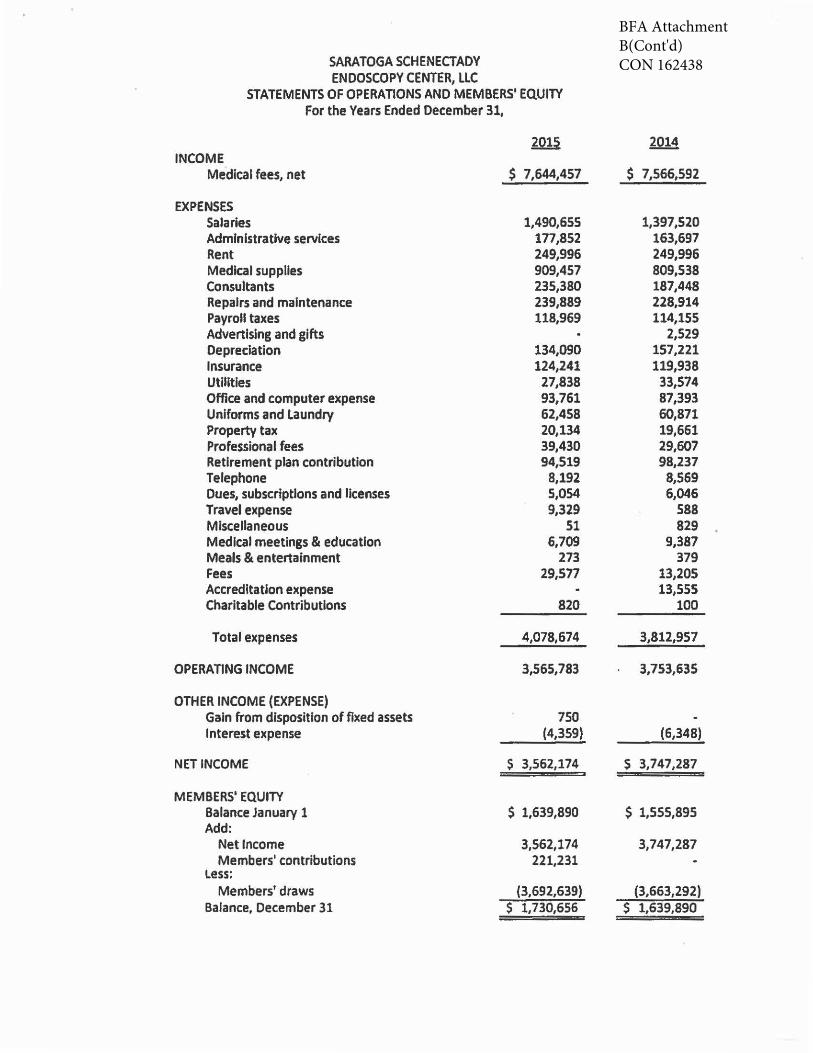
BFA Attachment B(Cont'd)CON 162438SARATOGA SCHENECTADY
ENDOSCOPY CENTER, LLC STATEMENTS OF OPERATIONS ANO MEMBERS' EQUITY
For the Years Ended December 31,
~ 2014 INCOME
Medical fees, net $ 7,644,457 $ 7,566,592
EXPENSES Salaries 1,490,655 1,397,520 Administrative services 177,852 163,697 Rent 249,996 249,996 Medical supplies 909,457 809,538 Consultants 235,380 187,448 Repairs and maintenance 239,889 228,914 Payroll taxes 118,969 114,155 Advertising and gifts 2,529 Depreciation 134,090 157,221 Insurance 124,241 119,938 Utilities 27,838 33,574 Office and computer expense 93,761 87,393 Uniforms and laundry 62,458 60,871 Property tax 20,134 19,661 Professional fees 39,430 29,607 Retirement plan contribution 94,519 98,237 Telephone 8,192 8,569 Dues, subscriptions and licenses 5,054 6,046 Travel expense 9,329 588 Miscellaneous 51 829 Medical meetings & education 6,709 9,387 Meals & entertainment 273 379 Fees 29,577 13,205 Accreditation expense 13,555 Charitable Contributions 820 100
Total expenses 4,078,674 3,812,957
OPERATING INCOME 3,565,783 3,753,635
OTHER INCOME (EXPENSE) Gain from disposition of fixed assets 750 Interest expense (4,359) (6,348)
NET INCOME s 3,562,174 s 3,747,287
MEMBERS' EQUITY Balance January 1 s 1,639,890 s 1,555,895 Add:
Net Income 3,562,174 3,747,287 Members' contributions 221,231
Less: Members' draws (3,692,639) (3,663,292)
Balance, December 31 s 1,730,656 s 1,639,890
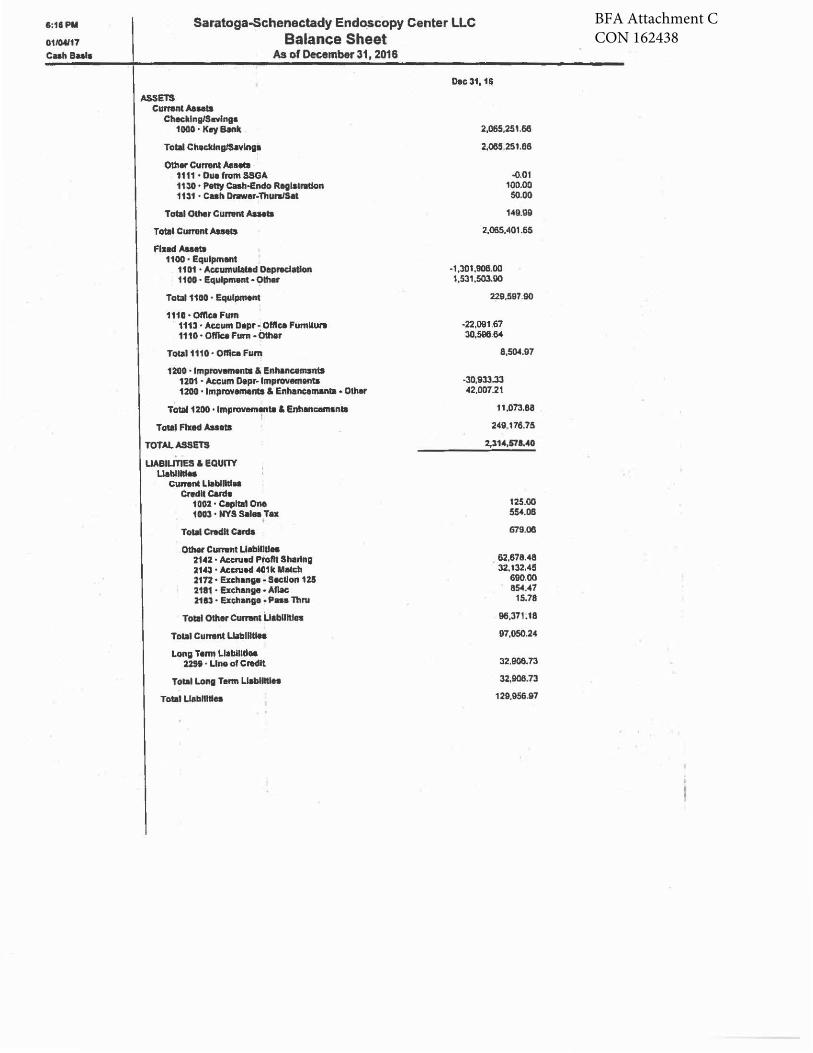
BFA Attachment CCON 162438
&:11 Pll
01/04117
CuhBula
Saratoga-Schenectady Endoscopy Center LLC Balance Sheet
As ofDecember31 , 2016
ASSETS Curr.nt MAIS
Chee .. ng/Savlnp 1000 • K.y a.Ill
Tot.I ChedllnglSavlngl
Oilier Cum1nt AP• .. tt t1 • Du• from SSGA 1130 • Patty C.h-Endo Rtglalr.uoct 1131 • C•lt Dfwwer-Thun/Sel
Total OCherCummtAaaab
Total Current AsMta
Flll8dAAMts ttoo • EqulpmMlt
1101 • Aeeum\IW8d Del>fKllltlon UOO • Equlpmant ·Other
Tot:il 1100 • Equipment
1110 • omea Furn 1113 • Aeeum D•pr-Offlca Fum1tu111 1110 • Offlea Fum ·Olh•r
Total 1110 . Olftce Fum
1100 ·1m~bl&E~ts 1201 • Accum Depr- lmpt0Vem1nts 1200 • lmpnwemenea I Enh•ncamsnta • Oth•r
Total 1200 • lmprovam, nta & Enh•ncemanta
Tow Flud AM•ts
TOTAL ASSETs
UABIUT1£S & EQUnY Liabllltlee
Cllft'enl Llabllltlu C111dllC.rd•
1002 • Cepltal One 1003 • NYS Sela Tax .
Tout Cl'9dlt C.
Olher C11r111nt Llablllll• 2142 • Acenl•d Profit Shllrlng 2143 • Accnaed 401k Match 2172 • Excl\•n11• • S•ctlon 125 2181 • El!change •Aflac 2113 • Enhang• • P ... Thru
TOlll 01herCumint Uabllltln
Total Cur111nt Uabllttlft
Long T•rm LlablllU.. 2291 • Line of Cl9dlt
Total Long Tenn LlabllltlH
Total U.bKltla
O.c31, 1&
2,065,251.68
2,065.251.66
-0.01 100.00 50.00
1<49.119
2,065.<401 .65
·1,301,906.00 1,531,503.90
229,597.90
·22,091 .67 30,596.6<4
8,504.97
·30,933.33 <42,007.21
11 ,073.68
249,178.75
2,31<4,571.40
125.00 554.08
679.0ll
62,678.48 32,132.45
690.00 854.<47
15.78
96,371 .18
97,050.24
32.906.73
32,llOB.73
129,956.117
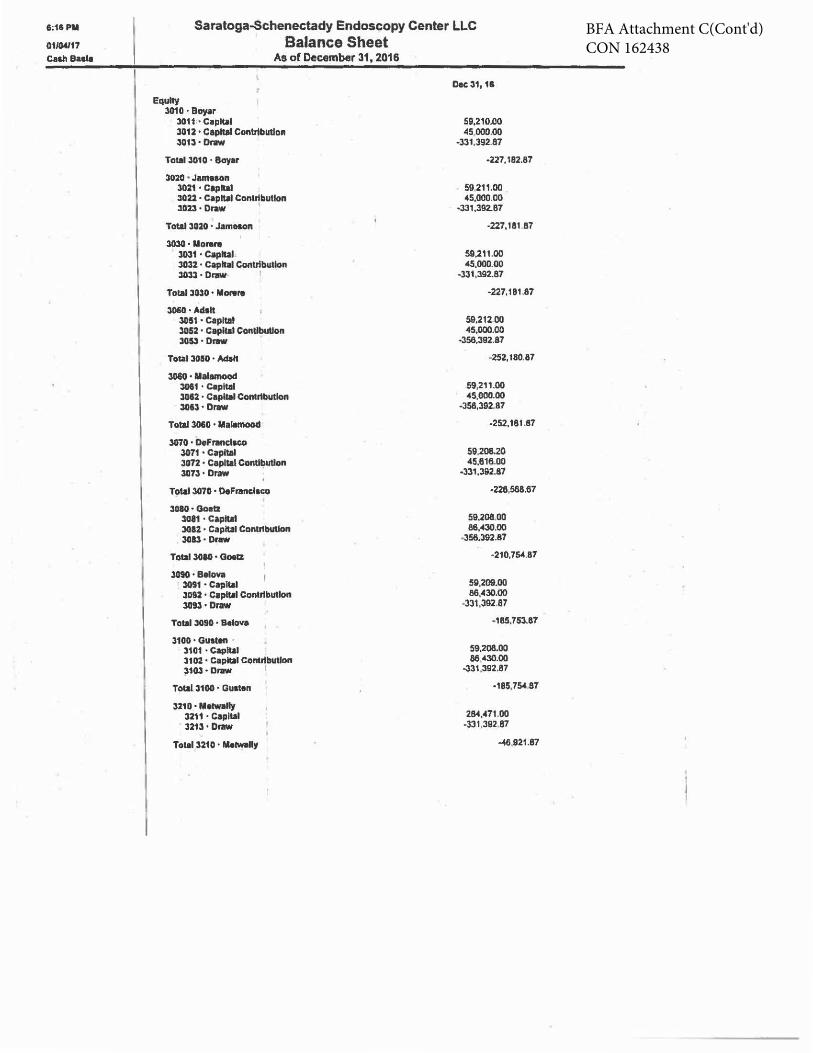
BFA Attachment C(Cont'd)CON 162438
1:11PM
01/04/f7
CHhBaai.
Saratoga-Schenectady Endoscopy Center LLC Balance Sheet
Equity 3010 ·Boyar
3011 • Capltal
As of December 31, 2016
3012 •Capital ConlJlbutJon l013 • Dnw
Total 3010 • Boyar
3020 • Jam.ion 3021 • Capita! 3022 • Capital Contribution 3023 • Draw
Total 3020 • Jam•on
3030 • Monini 3031 • Capllal 3032 • Capbl Contribution 3033 • D111W '
Total 3030 • Manire
3050 • Anlt 3051 • Capltat 3012 • CapiW Conllbullon 3053 • Oniw
Total lOllD • Malt
3060 • Malemood 31111 . Caplt.lll 31112 • Capl&M Contrtbutlon 3013 • Dl'llW
Total 30IO • Malllnoocl
3070 • OeFrancl.co 3071 • C'91ta' 3072 • Capita! ConllbutJon 3073 • Draw
Total 3070 • Defrancisco
lDIO·GoelZ 3Gt1 • Capbt 3012 • Ca pita! ContribuUon 3013 • 0nlw
Total 3080 • ooea 3090 • Belov. I
3091 • Capltal 3092 • Capital Contribution 3Cl93 • Draw
Total 3090 • Belove
3100 • Gusten · 3101 • Capltal 3102 • Caplllll Contribution ~10l • Drww I
Total 3100 • Ousten
3210 • Me!Wllly 3211 • C.,iltal
' 3213 • Dl'llW
Total 3210 • Me~lly
Dec31,15
59.210.00 45 000.00
·331.392.87
·227. 182.87
59 211.00 45.000.00
·llt.392.87
·227, 181 .87
59.211 ,00 ot5,000.00
·331.392.87
-227.181.87
59.212.00 45.000.00
·356.392.87
·252, 180.117
.59,211.00 45,000.00
-358,392-87
-252,181.87
59,208.20 45.616.00
·331.392.87
·2211,568.87
59,20ll.OO 86,430.00
-356.392.87
-210,754.87
59,209.00 86,430.00
-331,392.87
·11!5,753.17
59.208.00 86 -430.00
-331 .392.87
·185,754.87
2M.471 .00 ·331 ,392.87
-46,921.87
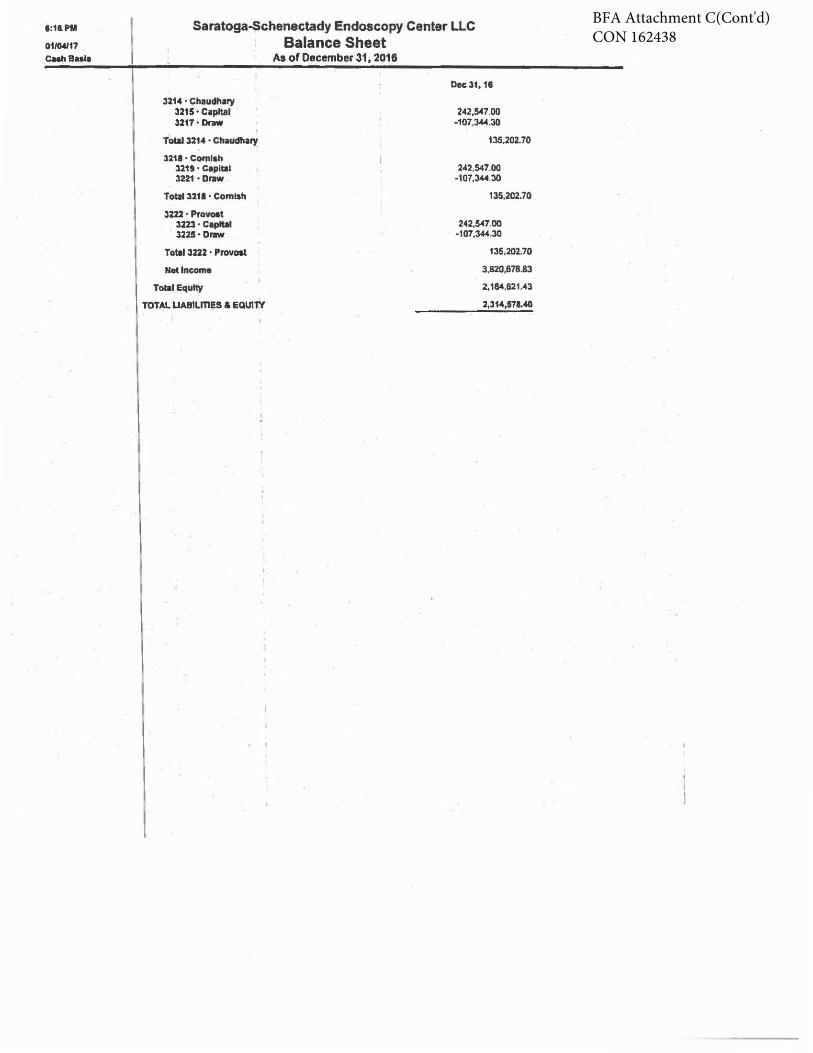
BFA Attachment C(Cont'd)CON 162438
1:11PM
01/04/17 C.hBni9
Saratoga-Schenectady Endoscopy Center UC Balance Sheet
3214 • Chaudhary 3215 ·Capital 3217 •Draw
Total 3214 • Chaudlla~
3211 • Comlah 321t • Caplcal 3221 • Draw
Tocal 3218 • Comi.h
3222 •Pro-t 3223 • Capltll 3225 · Craw
Tot.I 3222 • Provost
Netlncome
Total Equity
TOTAL LIABILm!s & EQUITY
As of December 31, 2016
0ec:u, 11
242,547,00 ·107,J.44.30
135,202.70
242,547.00 ·107,344.30
135,202.70
242.547.00 ·107,34-4.30
135,202.70
3,820,878-83
2, 184.821.43
2,314,571.40
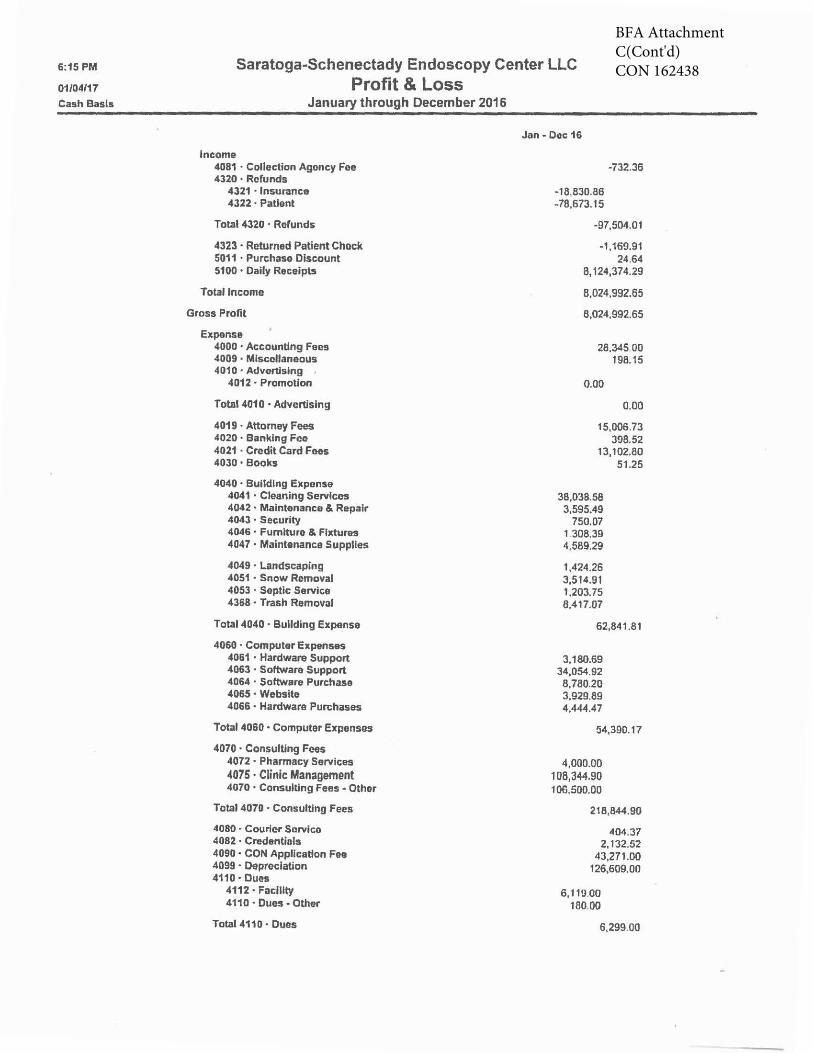
BFA Attachment C(Cont'd)CON 1624386:15 PM
01/04117
Cash Basis
Saratoga-Schenectady Endoscopy Center LLC Profit & Loss
January through December 2016
Income 4081 · Collection Agoncy Fee 4320 • Refunds
4321 · Insurance 4322 • Patient
Total 4320 • Refunds
4323 • Returned Patient Chock 5011 · Purchase Discount 5100 • Daily Receipts
Total Income
Gross Profit
Expense 4000 • Accounting Fees 4009 • Mlscollaneous 4010 • Advortlslng
4012 · Promotion
Total 4010 ·Advertising
4019 · Attorney Fees 4020 · Banking Fee 4021 · Credit Card Faes 4030• Books
4040 • Building Expense 4041 ·Cleaning Services 4042 • Malntonanca & Repair 4043 ·Security 4046 • Fumlturo & Fixtures 4047 • Maintenance Supplies
4049 · Landscaping 4051 • Snow Removal 4053 • Septic Service 4368 • Trash Removal
Total 4040 ·Building Expense
4060 · Computer Expenses 4061 • Hardware Support 4063 • Software Support 4064 · Software PurchaSll 4065 • Website 4066 • Hardware Purchases
Total 4060 ·Computer Expenses
4070 • Consulting Fees 4072 • Pharmacy Services -4075 • Clinic Management 4070 • Consulting Fees • Other
Total 4070 • Consulting Fees
4080 ·Courier Sorvico 4082 • Credentials 4090 • CON Application Fee 4099 • Oeproclation 4110 ·Dues
4112 • Facillty 4110 ·Dues - Other
Total 4110 ·Dues
Jan· Doc 16
-732.36
-18,830.86 -78,673.15
-97,504.01
-1,169.91 24.64
8, 124,374.29
8,024,992.65
6,024.992.65
28,345 00 198.15
0.00
0.00
15,006.73 398.52
13,102.80 51.25
38,038.58 3,595.49
750.07 1 308.39 4,589.29
1,424.26 3,514.91 1,203.75 8,417.07
62,841 .81
3,180.69 34,054.92
8,780.20 3,929.89 4,444.47
54,390.17
4,000.00 108,344.90 106,500.00
218,844.90
404.37 2, 132.52
43,271.00 126,609.00
6, 11!.J.OO 180.00
6,299.00
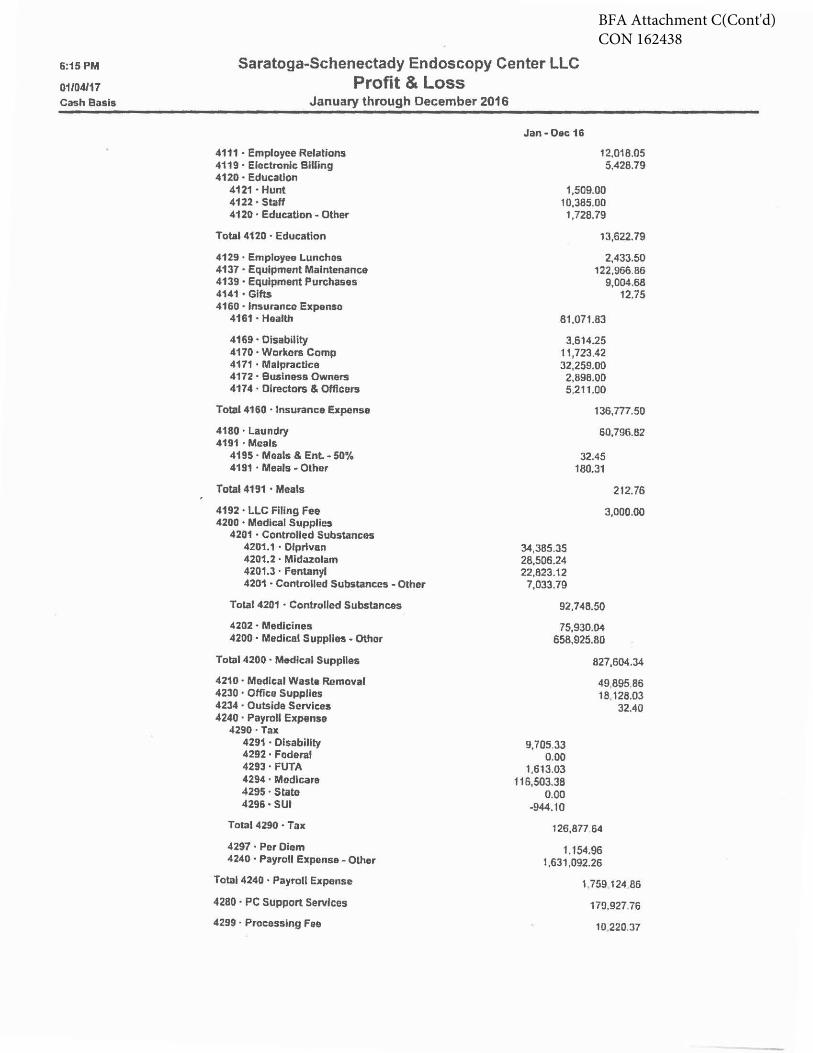
BFA Attachment C(Cont'd)CON 162438
6:15 PM
01104117 Cash Basis
Saratoga-Schenectady Endoscopy Center LLC Profit & Loss
January through December 2016
4111 · Employee Relations 4119 · Electronic BiUing 4120 • EducaUon
4121 ·Hunt 4122 ·Staff 4120 ·Education - Other
Total 4120 ·Education
4129 · Employee Lunchos 4137 ·Equipment Maintenance 4139 ·Equipment Purchases 4141 ·Gifts 4160 • lnsuranco Expense
4161 · Health
4169 · Disability 4170 · Workers Comp 4171 • Malpractice 4172 · Business Owners 4174 · Directors & Offlcors
Total 4160 · Insurance Exponse
4180 · Laundry 4191 ·Meals
4195 ·Meals & Ent.- 50'~ 4191 · Meals - Other
Total 4191 • Meals
4192 · LLC Filing Fee 4200 • Medical Supplies
4201 · Controlled Substances 4201.1 • Olprivan 4201.2 · Mldazolam 4201.3 · Fentanyl 4201 • Controlled Substances - Other
Total 4201 • Controlled Substances
4202 • Medicines 4200 ·Medical Supplies· Othor
Total 4200 · Medical Supplies
4210 • Modlcal Waste Removal 4230 • Office Supplies 4234 · Outside Services 4240 • Payroll Expense
4290 ·Tax 4291 • Disability 4292 · Fodera! 4293 · FUTA 4294 · Medicare 4295 ·State 4296 ·SUI
Total 4290 • Tax
4297 · Per Diem 4240 • Payroll Expense - Other
Total 4240 · Payroll Expense
4280 · PC Support Services
4299 ·Processing Fee
Jan-Dec 16
12.018.05 5,428.79
1,509.00 10,385.00 1,728.79
13,622.79
2,433.50 122,966.86
9,004.68 12.75
81 ,071.83
3.614.25 11 ,723.42 32,259.00 2,896.00 5,211 .00
34,385.35 28,506.24 22,823.12
7 ,033.79
1Js,n1.so 60,796.62
32.45 180.31
212.76
3,000.00
92,748.50
75,930.04 658,925.80
9,705 33 0.00
1,613.03 116,503.38
0.00 -944.10
827,604.34
49,895.86 18, 128.03
32.40
126,877 64
1.154.96 1.631,092.26
1 759 124.86
179,92776
10 220.37
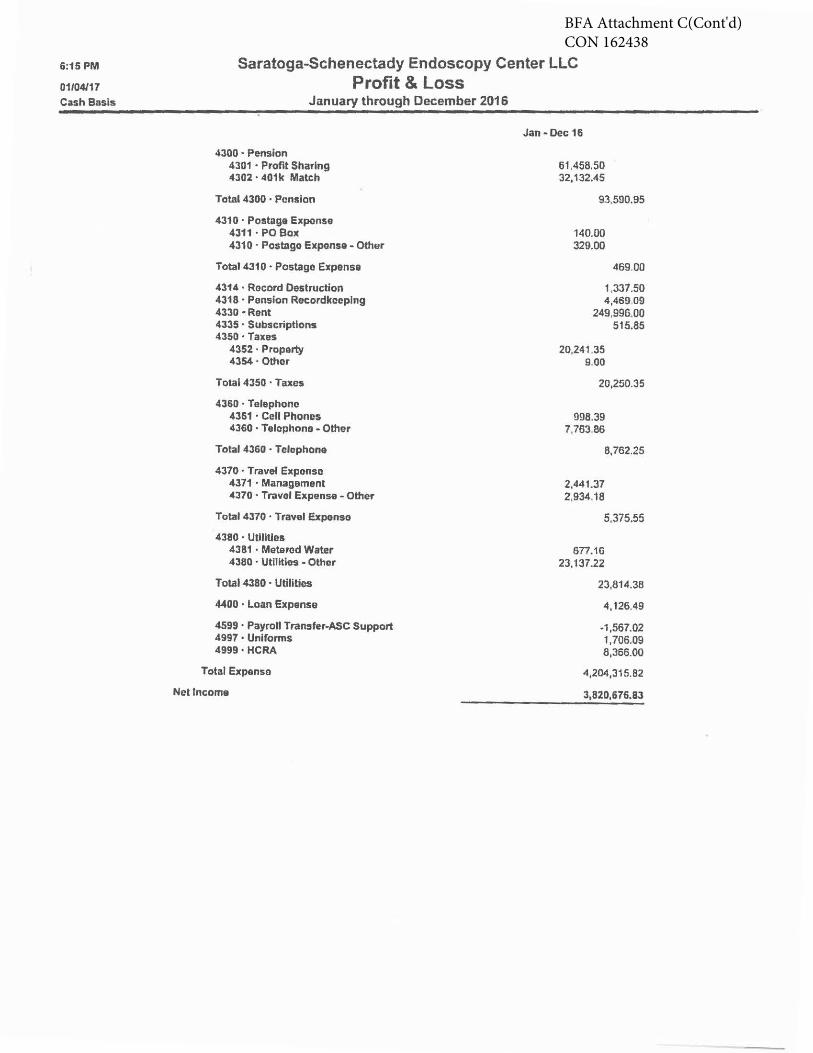
BFA Attachment C(Cont'd)CON 162438
6:15 PM
01104/17 C;ash Basis
Saratoga-Schenectady Endoscopy Center LLC Profit & Loss
January through December 2016
4300 • Pension 4301 · Profit Sharing •302 · 401k Match
Total 4300 • Pension
4310 · Postage Exponse 4311 · PO Bax 4310 · Postago Exponse · Other
Total 4310 · Postago Expense
4314 · Rocord Destruction 4318 · Pension Recordkeoplng 4330 •Rent 4335 · Subscriptions 4350 ·Taxes
4352 ·Property 4354 ·Other
Total 4350 · Taxes
4360 · Telephone 4361 • Cell Phones 4360 • Telephone - Other
To~I 4360 · Telephone
4370 • Travel Exponse 4371 • Management 4370 • Travel Expense • Other
Total 4370 · Travel Expenso
4380 • Utilities 4381 · Metered Water 4380 · Utilities • Other
Total 4380 • UtillUes
4400 • Loan Expense
4599 • Payroll Transfer-ASC Support 4997 • Uniforms 4999 • HCRA
Total Expense
Net Income
Jan· Dec 16
61.458.50 32,132.45
93.590.95
140.00 329.00
469.00
1,337.50 4,469.09
249,996.00 515.85
20,241.35 9 00
20,250.35
998.39 7,763.86
2,441.37 2,934.18
8,762.25
5,375.55
sn.1u 23, 137.22
23,814.38
4, 126.49
·1,567.02 1,706.09 8,366.00
4 ,204,315.82
3,820,676.83
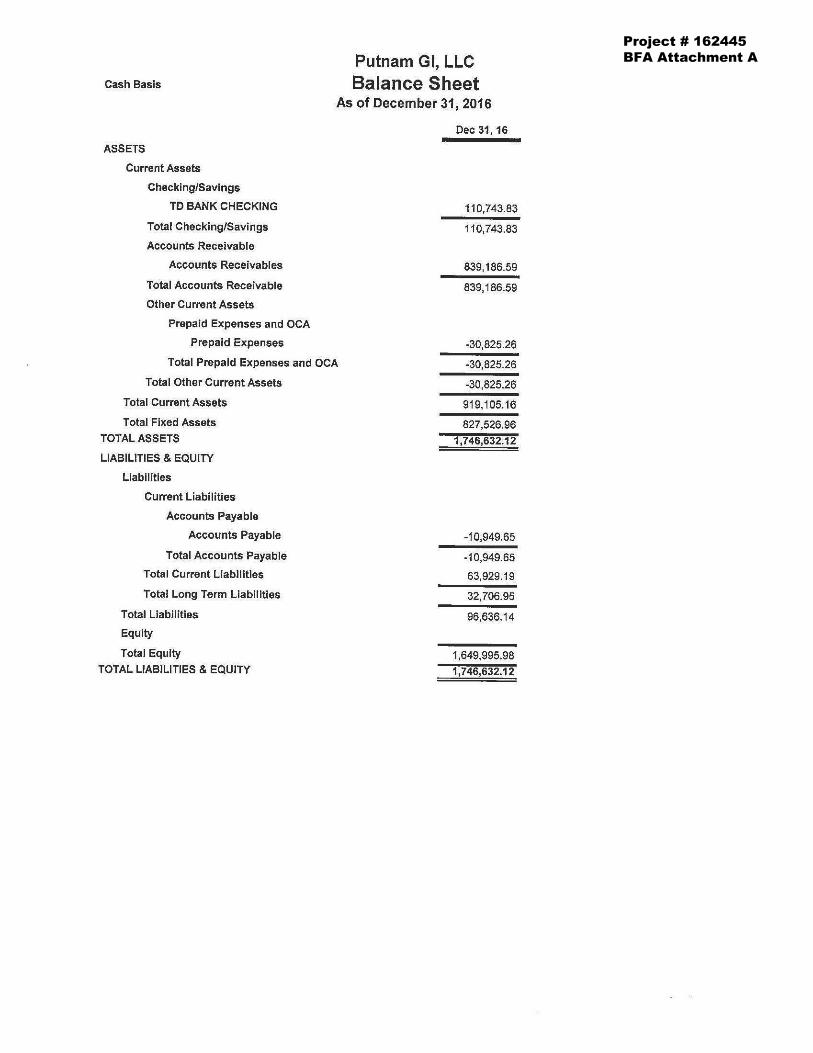
Project # 162445BFA Attachment A
Cash Basis
ASSETS
Current Assets
Checking/Savings
TD BANK CHECKING
Total Checking/Savings
Accounts Receivable
Accounts Receivables
Total Accounts Receivable
Other Current Assets
Prepaid Expenses and OCA
Prepaid Expenses
Putnam GI, LLC
Balance Sheet As of December 31, 2016
Dec 31, 16
110,743.83
110,743.83
839,186.59
839,186.59
-30,825.26
Total Prepaid Expenses and OCA
Total Other Current Assets
-30,825.26
-30,825.26
Total Current Assets
Total Fixed Assets
TOTAL ASSETS
LIABILITIES & EQUITY
Liabilities
Current Liabilities
Accounts Payable
Accounts Payable
Total Accounts Payable
Total Current Liabilities
Total Long Term Liabilities
Total Liabilities
Equity
Total Equity
TOTAL LIABILITIES & EQUITY
919,105.16
827,526.96 1,746,632.12
-10,949.65
-10,949.65
63,929.19
32,706.95
96,636.14
1,649,995.98 1,746,632.12
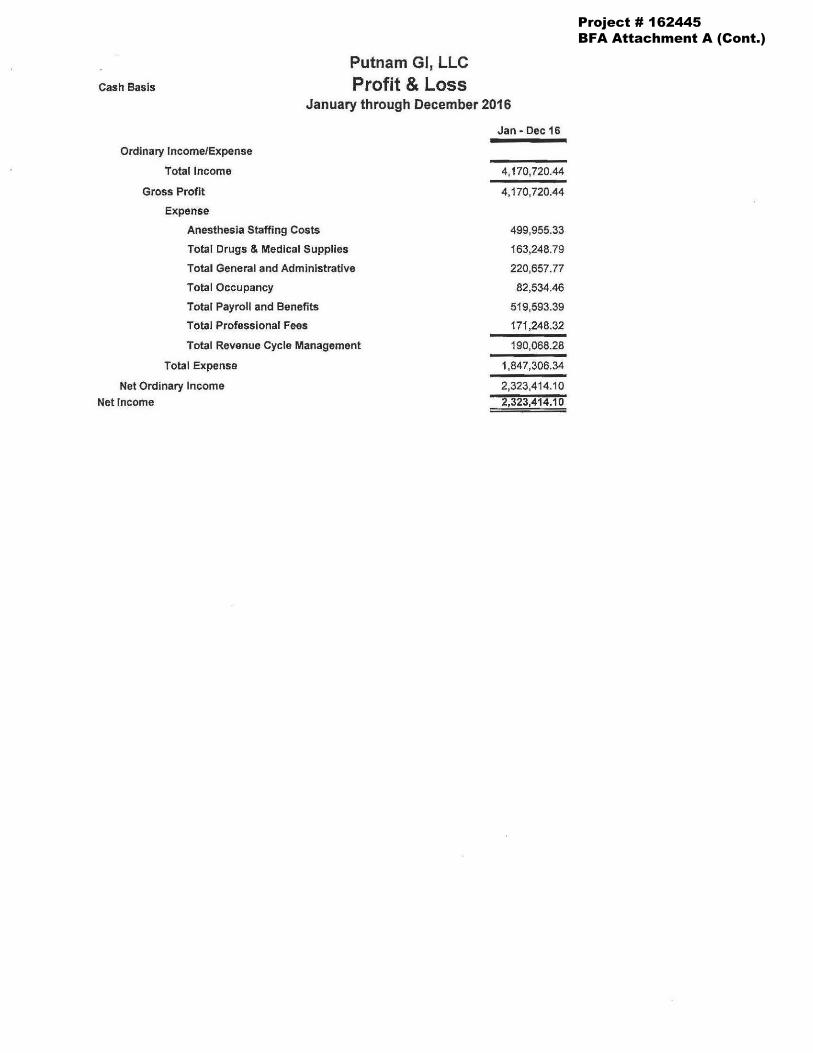
Project # 162445BFA Attachment A (Cont.)
Cash Basis
Putnam GI, LLC
Profit & Loss January through December 2016
Ordinary Income/Expense
Total Income
Gross Profit
Expense
Anesthesia Staffing Costs
Total Drugs & Medical Supplies
Total General and Administrative
Total Occupancy
Total Payroll and Benefits
Total Professional Fees
Total Revenue Cycle Management
Total Expense
Net Ordinary Income
Net Income
Jan - Dec 16
4, 170, 720.44
4, 170, 720.44
499,955.33
163,248.79
220,657.77
82,534.46
519,593.39
171,248.32
190,068.28
1,847,306.34
2,323,414.10
2,323,414.10
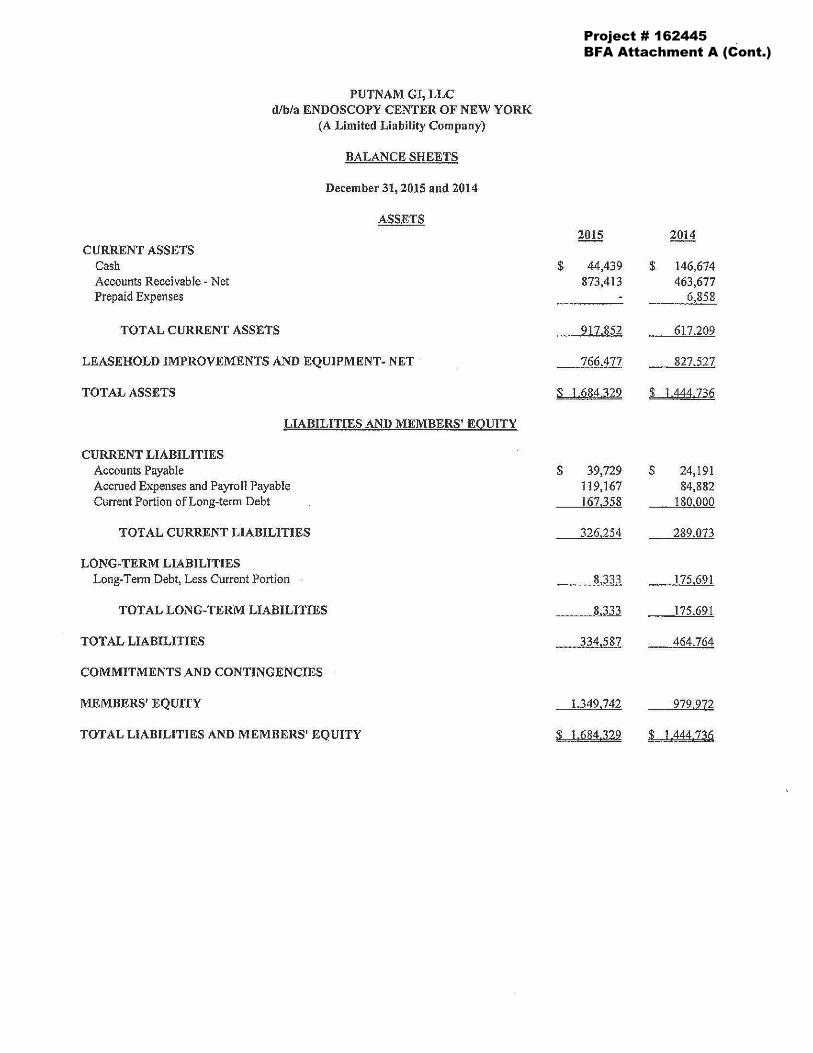
Project # 162445BFA Attachment A (Cont.)
PUTNAM GI, LLC d/b/a ENDOSCOPY CENTER OF NEW YORK
(A Limited Liability Company)
CURRENT ASSETS Cash Accounts Receivable - Net Prepaid Expenses
TOTAL CURRENT ASSETS
BALANCE SHEETS
December 31, 2015 and 2014
ASSETS
LEASEHOLD IMPROVEMENTS AND EQUIPMENT- NET
TOTAL ASSETS
CURRENT LIABILITIES Accounts Payable
LIABILITIES AND MEMBERS' EQUITY
Accrued Expenses and Payroll Payable Current Portion of Long-term Debt
TOTAL CURRENT LIABILITIES
LONG-TERM LIABILITIES Long-Term Debt, Less Current Portion
TOTAL LONG-TERM LIABILITIES
TOTAL LIABILITIES
COMMITMENTS AND CONTINGENCIES
MEMBERS' EQUITY
TOTAL LIABILlTlES AND MEMBERS' EQUITY
2015 2014
$ 44,439 $ 146,674 873,413 463,677
6,858
917.852 617.209
766 477 827.527
s l 684,329 $ l,441.T36
$ 39,729 $ 24,191 l I 9,167 84,882 167.358 180,000
326.254 289.073
8.333 175 691
8,333 175.691
334,587 464.764
1.349.742 979.972
$ 1.684,329
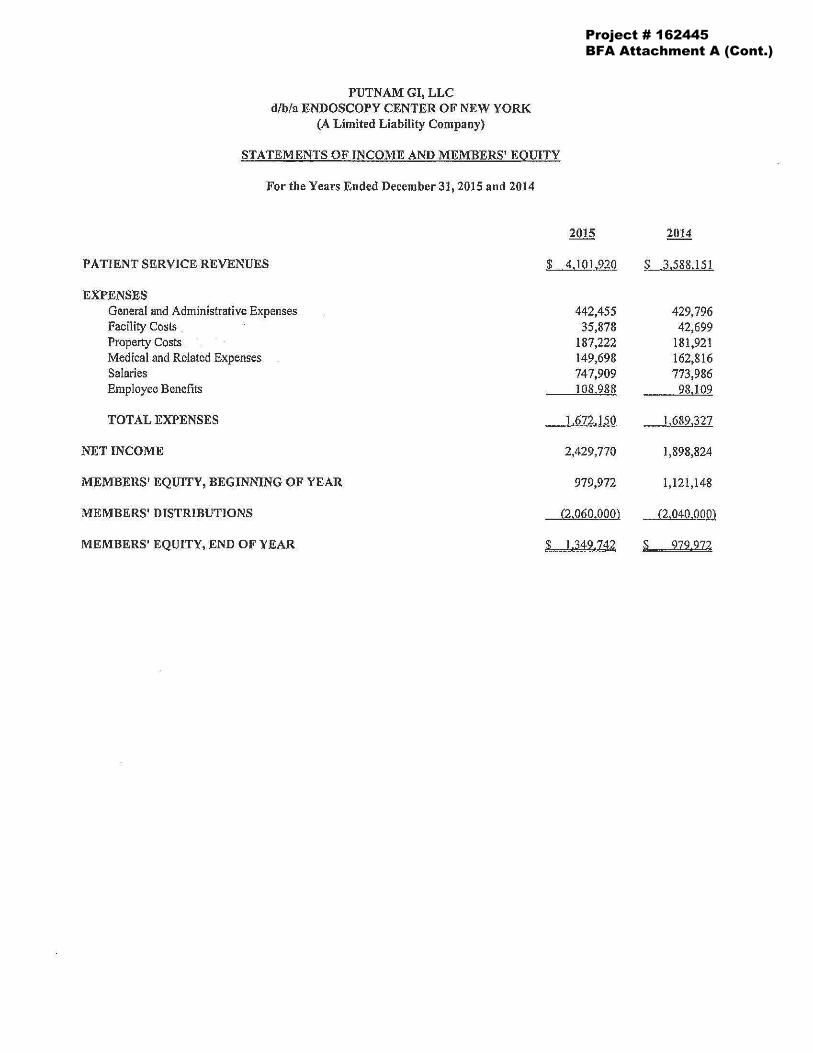
Project # 162445BFA Attachment A (Cont.)
PUTNAM GI, LLC d/b/a ENDOSCOPY CENTER OF NEW YORK
(A Limited Liability Company)
STATEMENTS OF INCOME AND MEMBERS' EQUITY
For the Years Ended December 31, 2015 and 2014
PATIENT SERVICE REVENUES $
EXPENSES General and Administrative Expenses Facility Costs Property Costs Medical and Related Expenses Salaries Employee Benefits
TOTAL EXPENSES
NET INCOME
MEMBEU.S' EQUITY, BEGINNING OF YEAR
MEMBERS' DISTRIBUTIONS
MEMBERS' EQUITY, END OF YEAR $
2015 2014
4,101,920 s 3,588.151
442,455 429,796 35,878 42,699
187,222 181,921 149,698 162,816 747,909 773,986 108,988 98.l 09
1,672.150 1,689,327
2,429,770 1,898,824
979,972 1,121,148
(2.060,000) (2,040.000)
J,~42,~2 ~ 2:Z9,2:Z~
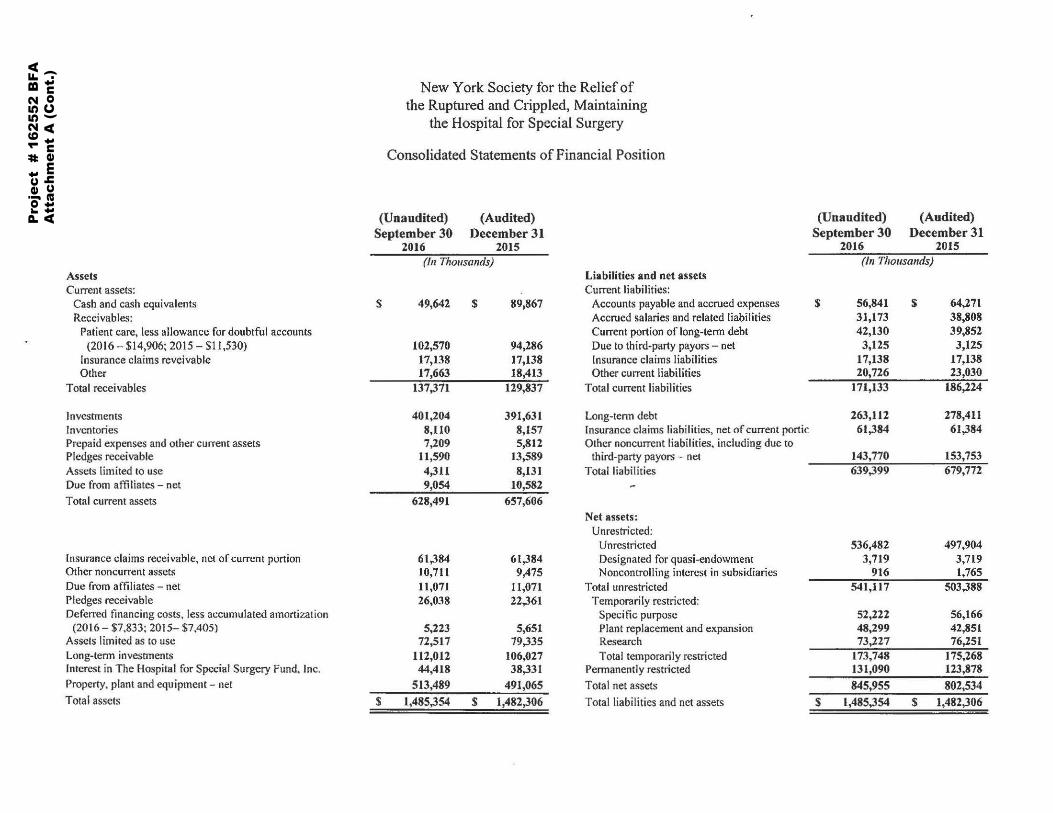
Pro
ject
# 1
6255
2 B
FA
Att
achm
ent
A (
Con
t.)
Assets Current assets:
Cash and cash equivalents Recei vab Jes:
Patient care, less allowance for doubtful accounts (2016 - $14,906; 2015 - $11,530)
Insurance claims revcivable Other
Total receivables
Investments Inventories Prepaid expenses and other current assets Pledges receivable Assets limited to use Due from affiliates - net
Total current assets
Insurance claims receivable, net of current portion Other noncurrent assets Due from affiliates - net Pledges receivable Deferred financing costs, less accumulated amortization
(2016- $7.833; 2015- $7.405) Assets limited as to use Long-term investments Interest in The Hospital for Special Surgery Fund. Inc. Property, plant and equipment - net
Total assets
New York Society for the Relief of the Ruptured and Crippled, Maintaining
the Hospital for Special Surgery
Consolidated Statements of Financial Position
(Unaudited) (Audited) September 30 December31
2016 2015 (!11 Thousands)
Liabilities and net assets Current liabilities:
s 49,642 s 89,867 Accounts payable and accrued expenses Accrued salaries and related liabilities Current portion of long-tenn debt
102,570 94,286 Due to third-party payors - net 17,138 17,138 Insurance claims liabilities 17,663 18,413 Other current liabilities
137,371 129,837 Total current liabilities
401,204 391,631 Long-tenn debt 8,110 8,157 Insurance claims liabilities, net of current portic 7,209 5,812 Other noncurrcnt liabilities, including due to
11,590 13,589 third-party payors - net 4,311 8,131 Total liabilities 9,054 10,582
628,491 657,606
Net assets: Unrestricted:
Unrestricted 61,384 61,384 Designated for quasi-endowment 10,711 9,475 Noncontrolling interest in subsidiaries 11,071 11,071 Total unrestricted 26,038 22,361 Temporarily restricted:
Specific purpose 5,223 5,651 Plant replacement and expansion
72,517 79,335 Research 112,012 106,027 Total temporarily restricted 44,418 38,331 Permanently restricted
513,489 491,065 Total net asselo;
s 1,485,354 $ 1,482,306 Total liabilities and net assets
(Unaudited) (Audited) September 30 December 31
2016 2015 (In Thousands)
s 56,841 s 64,271 31,173 38,808 42,130 39,852 3,125 3,125
17,138 17,138 20,726 23,030
171,133 186,224
263,112 278,411 61,384 61,384
143,770 153,753 639,399 679,772
536,482 497,904 3,719 3,719
916 1,765 541,117 503,388
52,222 56,166 48,299 42,851 73,227 76,251
173,748 175,268 131,090 123,878
845,955 802,534
$ l,485,354 $ l,482,306
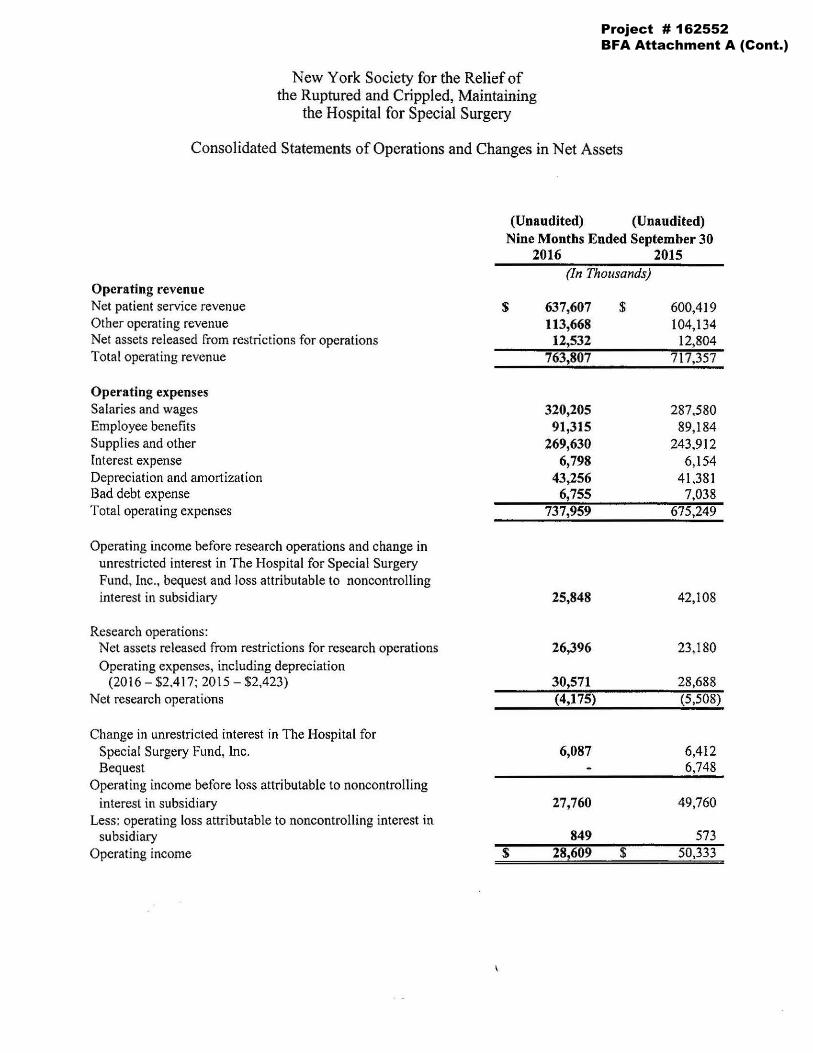
Project # 162552BFA Attachment A (Cont.)
New York Society for the Relief of the Ruptured and Crippled, Maintaining
the Hospital for Special Surgery
Consolidated Statements of Operations and Changes in Net Assets
(Unaudited) (Unaudited) Nine Months Ended September 30
2016 2015 (In Thousands)
Operating revenue Net patient service revenue $ 637,607 $ 600,419 Other operating revenue 113,668 104,134 Net assets released from restrictions for operations 12,532 12,804 Total operating revenue 763,807 717,357
Operating expenses Salaries and wages 320,205 287,580 Employee benefits 91,315 89,184 Supplies and other 269,630 243,912 Interest expense 6,798 6,154 Depreciation and amortization 43,256 41,381 Bad debt expense 6,755 7,038 Total operating expenses 737,959 675,249
Operating income before research operations and change in unrestricted interest in The Hospital for Special Surgery Fund, Inc ., bequest and loss attributable to noncontrolling interest in subsidiary 25,848 42,108
Research operations: Net assets released from restrictions for research operations 26,396 23,180 Operating expenses, including depreciation
(2016 -$2.417; 2015 - $2,423) 30,571 28,688 Net research operations (4,175) (5,508)
Change in unrestricted interest in The Hospital for Special Surgery Fund, Inc. 6,087 6,412 Bequest 6,748
Operating income before loss attributable to noncontrolling interest in subsidiary 27,760 49,760
Less: operating loss attributable to noncontrolling interest in subsidiary 849 573
Operating income $ 28,609 $ 50,333
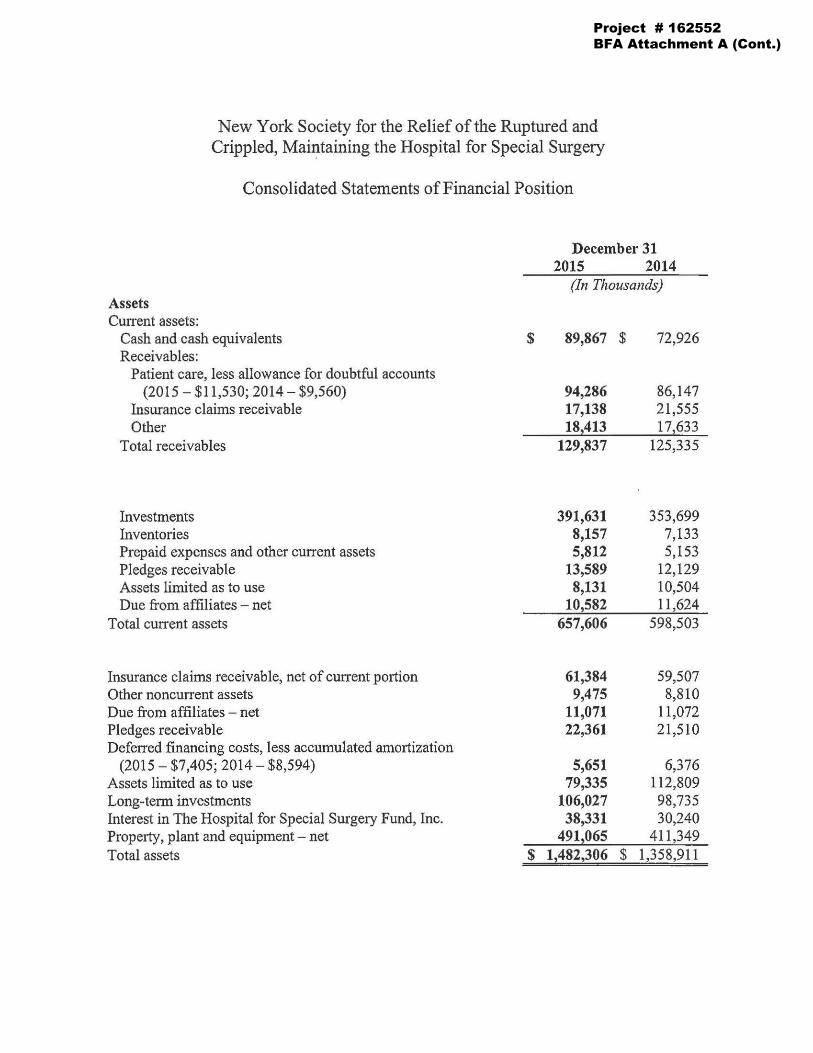
Project # 162552BFA Attachment A (Cont.)
New York Society for the Relief of the Ruptured and Crippled, Maintaining the Hospital for Special Surgery
Consolidated Statements of Financial Position
Assets Current assets :
Cash and cash equivalents Receivables:
Patient care, less allowance for doubtful accounts (2015 - $11,530; 2014- $9,560)
Insurance claims receivable Other
Total receivables
Investments Inventories Prepaid expenses and other current assets Pledges receivable Assets limited as to use Due from affiliates - net
Total current assets
Insurance claims receivable, net of current portion Other noncurrent assets Due from affiliates - net Pledges receivable DefetTed financing costs, less accumulated amortization
(2015 - $7,405; 2014- $8,594) Assets limited as to use Long-term investments Interest in The Hospital for Special Surgery Fund, Inc. Property, plant and equipment - net Total assets
$
$
December 31 2015 2014
(Jn Thousands)
89,867 $
94,286 17,138 18,413
129,837
391,631 8,157 5,812
13,589 8,131
10,582 657,606
61,384 9,475
11,071 22,361
5,651 79,335
106,027 38,331
4912065 1,4822306 $
72,926
86,147 21,555 17,633
125,335
353,699 7,133 5,153
12,129 10,504 11,624
598,503
59,507 8,810
11,072 21,510
6,376 112,809 98,735 30,240
411,349 1,358,911
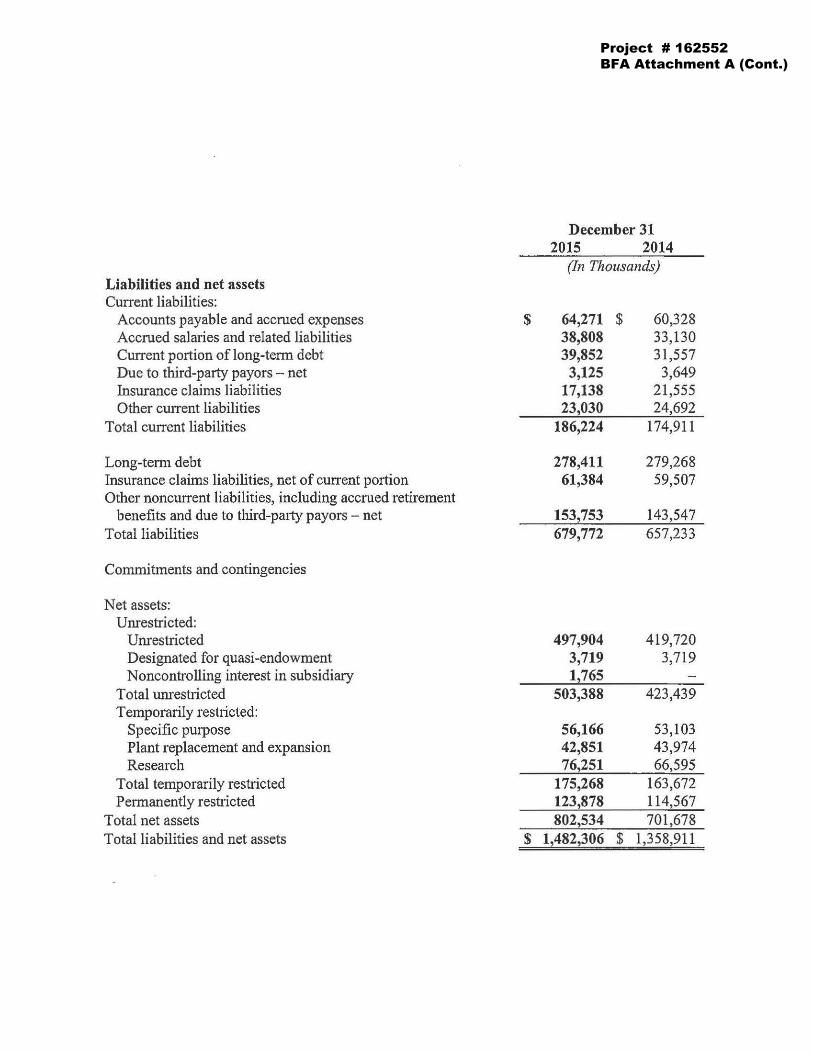
Project # 162552BFA Attachment A (Cont.)
December 31 2015 2014
(In Thousands) Liabilities and net assets Current liabilities:
Accounts payable and accrued expenses $ 64,271 $ 60,328 Accrued salaries and related liabilities 38,808 33,130 Current portion of long-term debt 39,852 31,557 Due to third-party payors - net 3,125 3,649 Insurance claims liabilities 17,138 21,555 Other current liabilities 23,030 24,692
Total current liabilities 186,224 174,911
Long-term debt 278,411 279,268 Insurance claims liabilities, net of current portion 61,384 59,507 Other noncurrent liabilities, including accrued retirement
benefits and due to third-party payors - net 1532753 143,547 Total liabilities 679,772 657,233
Commitments and contingencies
Net assets: Unrestricted:
Unrestricted 497,904 419,720 Designated for quasi-endowment 3,719 3,719 Noncontrolling interest in subsidiary 1 765
Total unrestricted 503,388 423,439 Temporarily restricted:
Specific purpose 56,166 53,103 Plant replacement and expansion 42,851 43,974 Research 762251 66,595
Total temporarily restricted 175,268 163,672 Permanently restricted 123,878 114,567
Total net assets 802,534 701,678 Total liabilities and net assets $ 1,482,306 $ 1,358,911
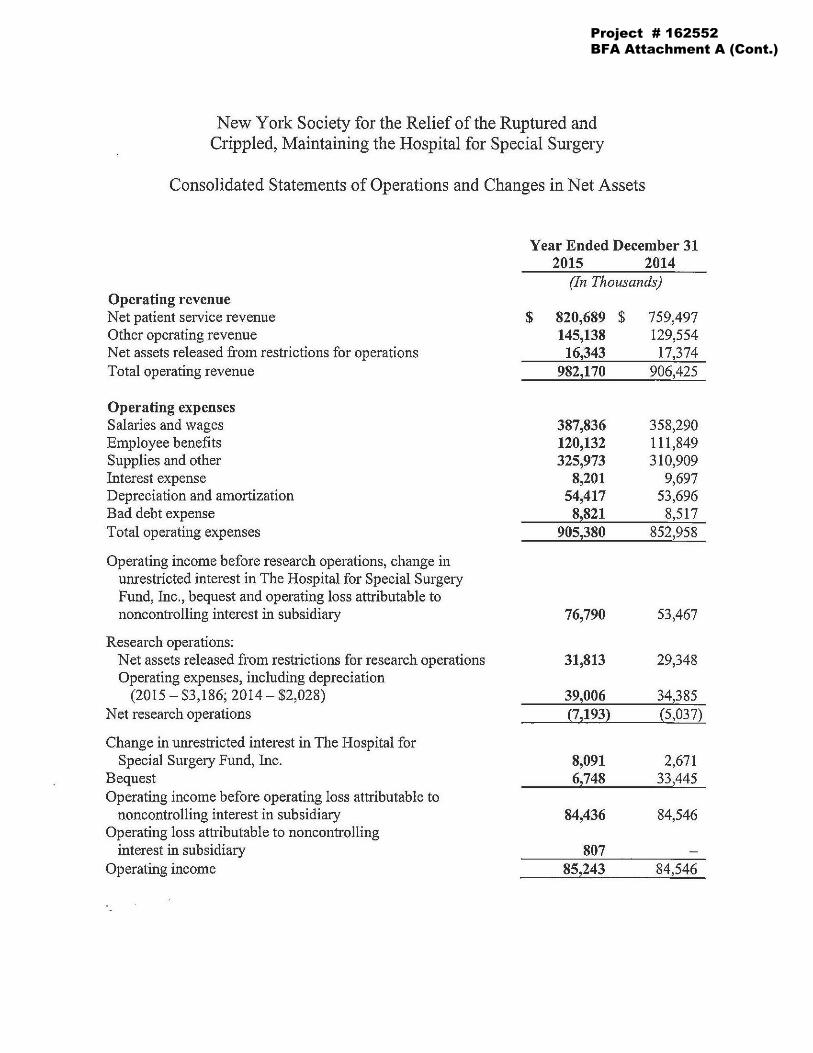
Project # 162552BFA Attachment A (Cont.)
New York Society for the Relief of the Ruptured and Crippled, Maintaining the Hospital for Special Surgery
Consolidated Statements of Operations and Changes in Net Assets
Year Ended December 31
Operating revenue Net patient service revenue Other operating revenue Net assets released from restrictions for operations Total operating revenue
Operating expenses Salaries and wages Employee benefits Supplies and other Interest expense Depreciation and amortization Bad debt expense Total operating expenses
Operating income before research operations, change in unrestricted interest in The Hospital for Special Surgery Fund, Inc., bequest and operating loss attributable to noncontrolling interest in subsidiary
Research operations: Net assets released from restrictions for research operations Operating expenses, including depreciation
(2015 - $3,186; 2014- $2,028) Net research operations
Change in unrestricted interest in The Hospital for Special Surgery Fund, Inc.
Bequest Operating income before operating loss attributable to
noncontrolling interest in subsidiary Operating loss attributable to noncontrolling
interest in subsidiary Operating income
$
2015 2014 (In Thousands)
820,689 145,138
16,343 982,170
387,836 120,132 325,973
8,201 54,417 8~821
905,380
76,790
31,813
39,006 (7,193)
8,091 6,748
84,436
807 85,243
$ 759,497 129,554
17,374 906,425
358,290 111,849 310,909
9,697 53,696
8,517 852,958
53,467
29,348
34,385 (5,037)
2,671 33,445
84,546
84,546
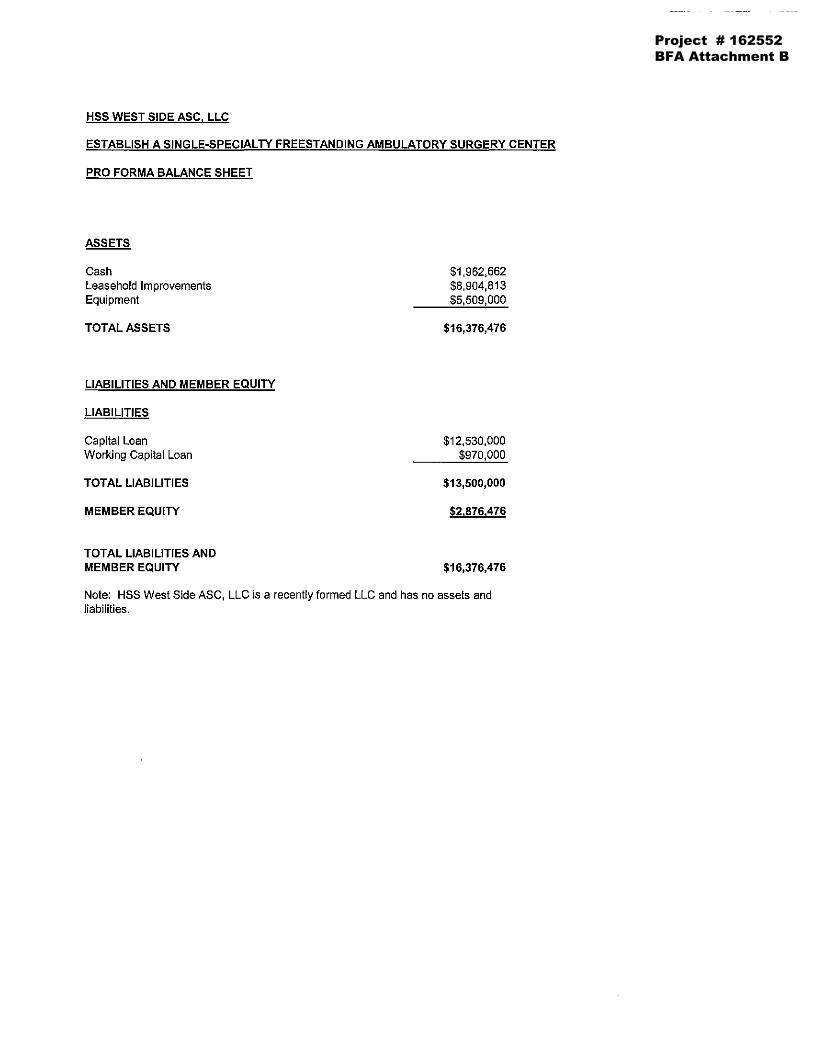
Project # 162552 BFA Attachment B
HSS WEST SIDE ASC, LLC
ESTABLISH A SINGLE-SPECIALTY FREESTANDING AMBULATORY SURGERY CENTER
PRO FORMA BALANCE SHEET
ASSETS
Cash Leasehold Improvements Equipment
TOTAL ASSETS
LIABILITIES AND MEMBER EQUITY
LIABILITIES
Capital Loan Working Capital Loan
TOTAL LIABILITIES
MEMBER EQUITY
TOTAL LIABILITIES AND MEMBER EQUITY
$1,962,662 $8,904,813 $5,509,000
$16,376,476
$12,530,000 $970,000
$13,500,000
$2,876,476
$16,376,476
Note: HSS West Side ASC, LLC is a recently formed LLC and has no assets and liabilities.
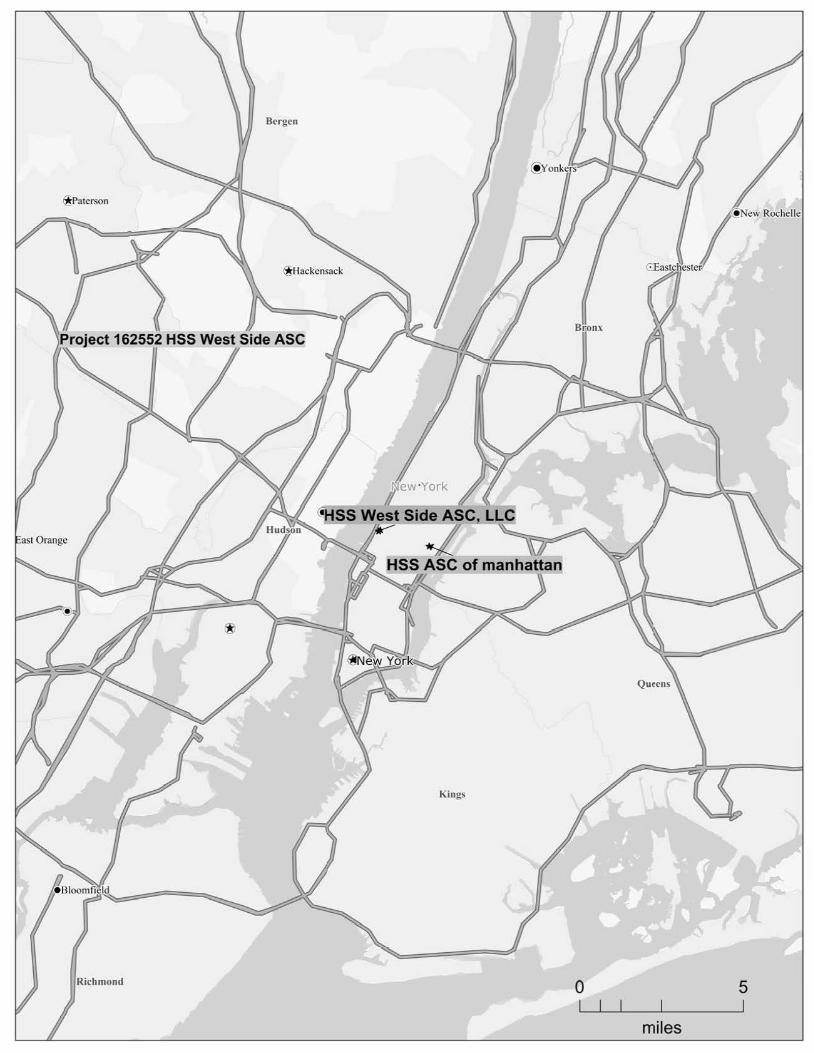
~Paterson
Kings
Richmond 0 5
miles
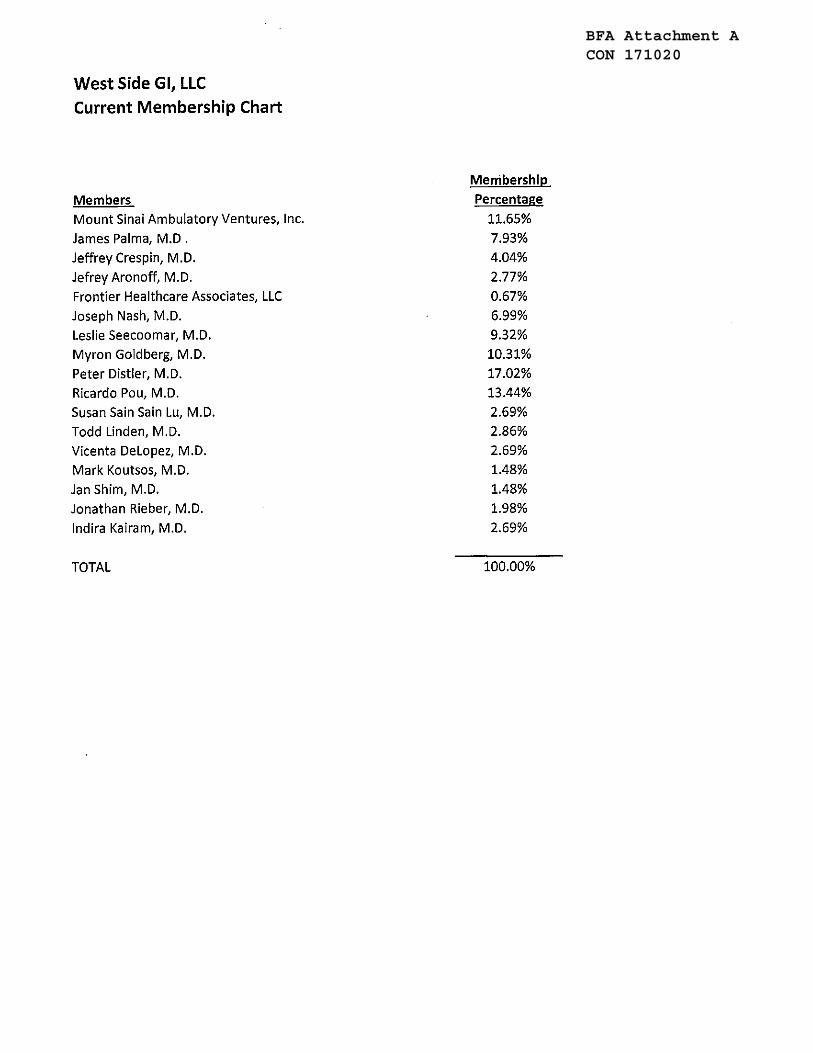
BFA Attachment A CON 171020
West Side GI, LLC Current Membership Chart
Members
Mount Sinai Ambulatory Ventures, Inc.
James Palma, M.D .
Jeffrey Crespin, M.D.
Jefrey Aronoff, M.D.
Frontier Healthcare Associates, LLC
Joseph Nash, M.D.
Leslie Seecoomar, M.D.
Myron Goldberg, M.D.
Peter Distler, M.D.
Ricardo Pou, M.D.
Susan Sain Sain Lu, M.D.
Todd Linden, M.D.
Vicenta DeLopez, M.D.
Mark Koutsos, M.D.
Jan Shim, M.D.
Jonathan Rieber, M.D.
Indira Kairam, M.D.
TOTAL
Membership
Percentage
11.65% 7.93% 4.04%
2.77% 0.67% 6.99%
9.32% 10.31% 17.02% 13.44%
2.69% 2.86% 2.69% 1.48%
1.48% 1.98%
2.69%
100.00%
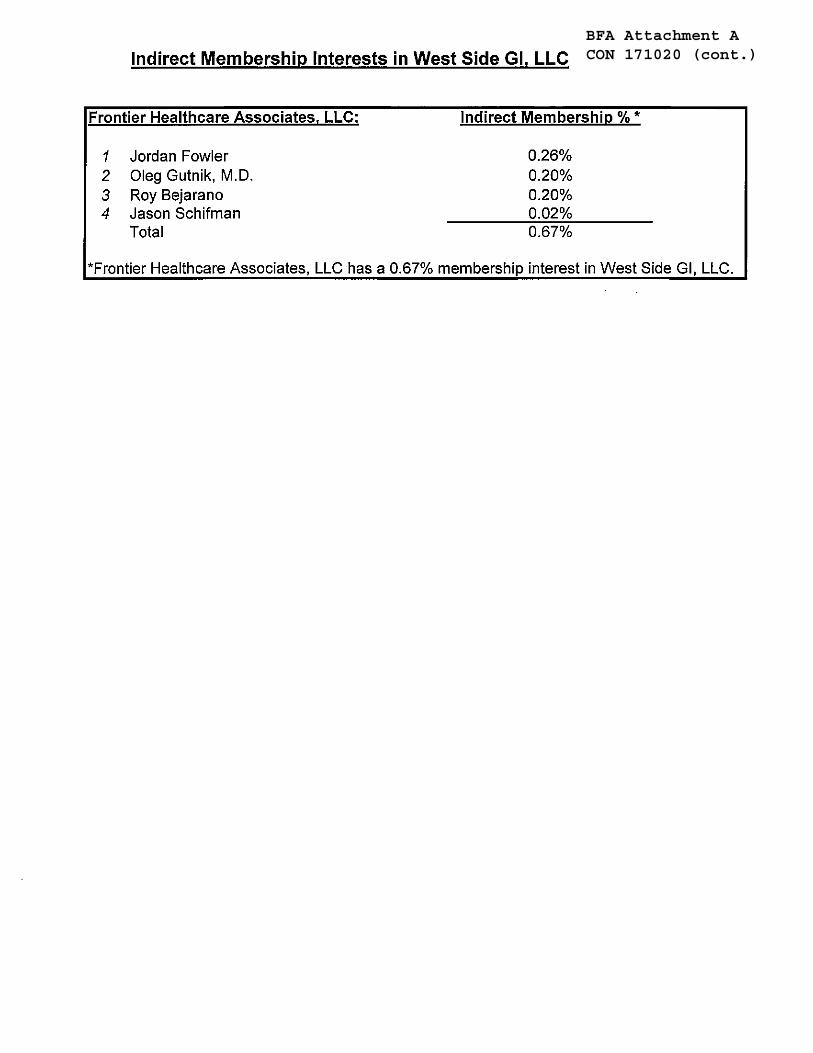
BFA Attachment A CON 171020 (cont.)Indirect Membership Interests in West Side GI, LLC
Frontier Healthcare Associates, LLC:
1 Jordan Fowler 2 Oleg Gutnik, M.D. 3 Roy Bejarano 4 Jason Schifman
Total
Indirect Membership%*
0.26% 0.20% 0.20% 0.02% 0.67%
*Frontier Healthcare Associates, LLC has a 0.67% membership interest in West Side GI, LLC.
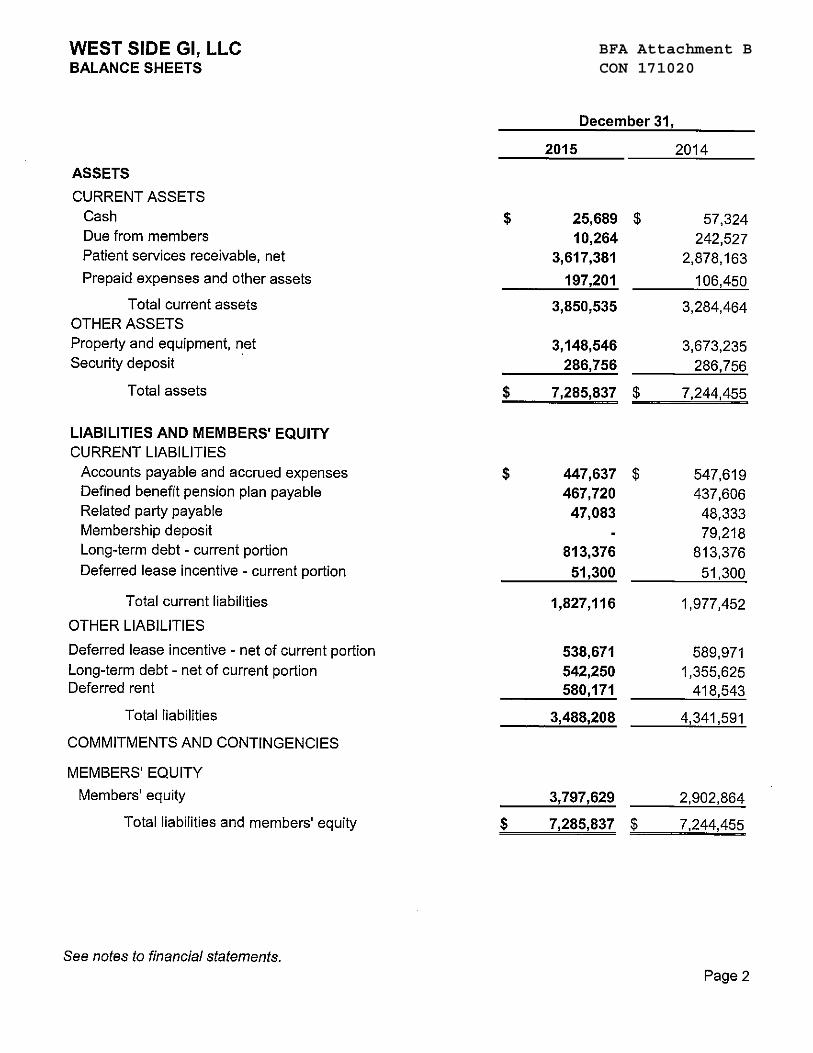
BFA Attachment B CON 171020
WEST SIDE GI, LLC BALANCE SHEETS
December 31,
2015 2014
ASSETS
CURRENT ASSETS Cash $ 25,689 $ 57,324 Due from members 10,264 242,527 Patient services receivable, net 3,617,381 2,878,163 Prepaid expenses and other assets 197,201 106,450
Total current assets 3,850,535 3,284,464 OTHER ASSETS Property and equipment, net 3,148,546 3,673,235 Security deposit 286,756 286,756
Total assets $ 7,285,837 $ 7,244,455
LIABILITIES AND MEMBERS' EQUITY CURRENT LIABILITIES
Accounts payable and accrued expenses $ 447,637 $ 547,619 Defined benefit pension plan payable 467,720 437,606 Related party payable 47,083 48,333 Membership deposit 79,218 Long-term debt - current portion 813,376 813,376 Deferred lease incentive - current portion 51,300 51,300
Total current liabilities 1,827,116 1,977,452
OTHER LIABILITIES
Deferred lease incentive - net of current portion 538,671 589,971 Long-term debt - net of current portion 542,250 1,355,625 Deferred rent 580,171 418,543
Total liabilities 3,488,208 4,341,591
COMMITMENTS AND CONTINGENCIES
MEMBERS' EQUITY
Members' equity 3,797,629 2,902,864
Total liabilities and members' equity $ 7,285,837 $ 7,244,455
See notes to financial statements. Page 2

BFA Attachment B CON 171020 (cont.)WEST SIDE GI, LLC
STATEMENTS OF INCOME
REVENUES
Net.patient service revenue
Total revenues
OPERATING EXPENSES Salaries and benefits Bad debt expense Professional fees Medical supplies and other Rent and occupancy
Depreciation and amortization Office expenses
Insurance
Total expenses
OPERATING INCOME
NON-OPERATING EXPENSE
INCOME BEFORE INCOME TAXES
INCOME TAX EXPENSE
NET INCOME
See notes to financial statements.
$
$
Years Ended December 31,
2015 2014
20,367,322 $ 18,238,212
20,367,322 18,238,212
3,669,360 3,610,835 1,129,489 835,625
955,133 847,196 865,123 823,017 866,243 769, 122
524,888 514,572
457,649 478,449 120,450 86,053
8,588,335 7,964,869
11,778,987 10,273,343
62,253 102,480
11,716,734 10, 170,863
445,982 419,500
11,270,752 $ 9,751,363
Page 3
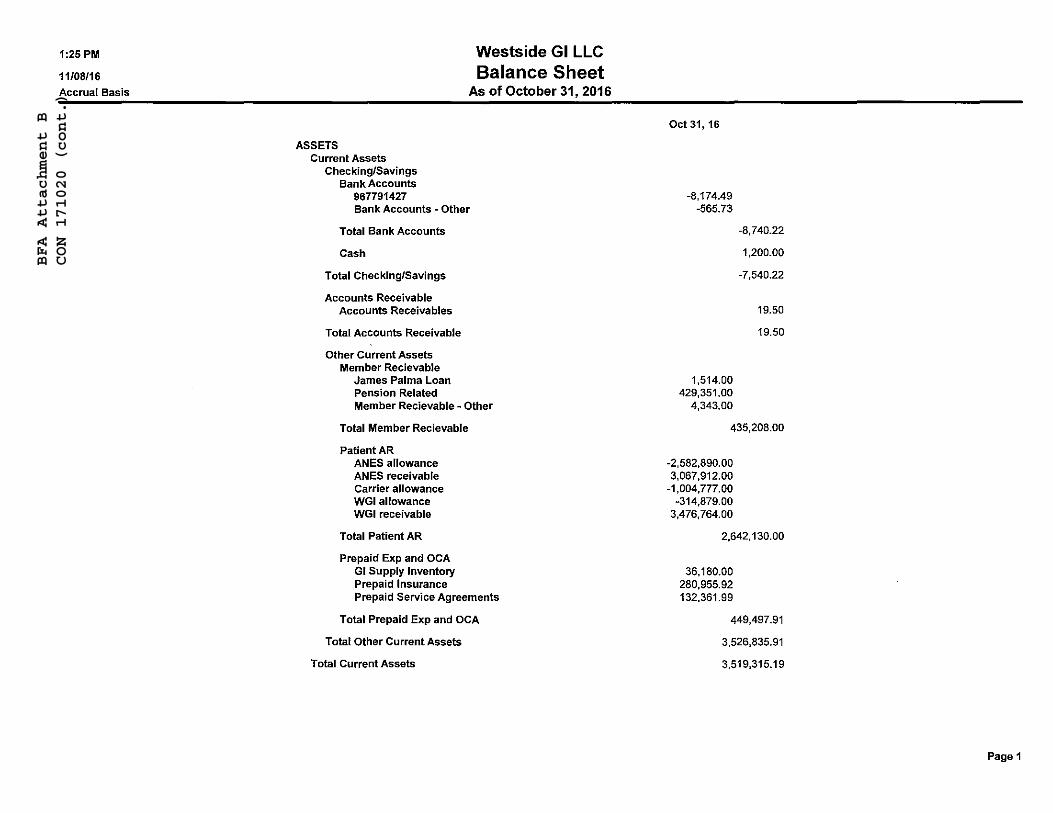
BFA Attachment B
CON 171020 (cont.)
1:25 PM
11/08/16 Accrual Basis
ASSETS Current Assets
Checking/Savings Bank Accounts
967791427
Westside GI LLC Balance Sheet
As of October 31, 2016
Bank Accounts - Other
Total Bank Accounts
Cash
Total Checking/Savings
Accounts Receivable Accounts Receivables
Total Accounts Receivable
Other Current Assets Member Recievable
James Palma Loan Pension Related Member Recievable - Other
Total Member Recievable
Patient AR ANES allowance ANES receivable Carrier allowance WGI allowance WGI receivable
Total Patient AR
Prepaid Exp and OCA GI Supply Inventory Prepaid Insurance Prepaid Service Agreements
Total Prepaid Exp and OCA
Total Other Current Assets
Total Current Assets
Oct 31, 16
-8, 174.49 -565.73
1,514.00 429,351.00
4,343.00
-8,740.22
1,200.00
-7,540.22
19.50
19.50
435,208.00
-2,582,890.00 3,067,912.00
-1,004,777.00 -314,879.00
3,476,764.00
2,642, 130.00
36, 180.00 280,955.92 132,361.99
449,497.91
3,526,835.91
3,519,315.19
Page 1
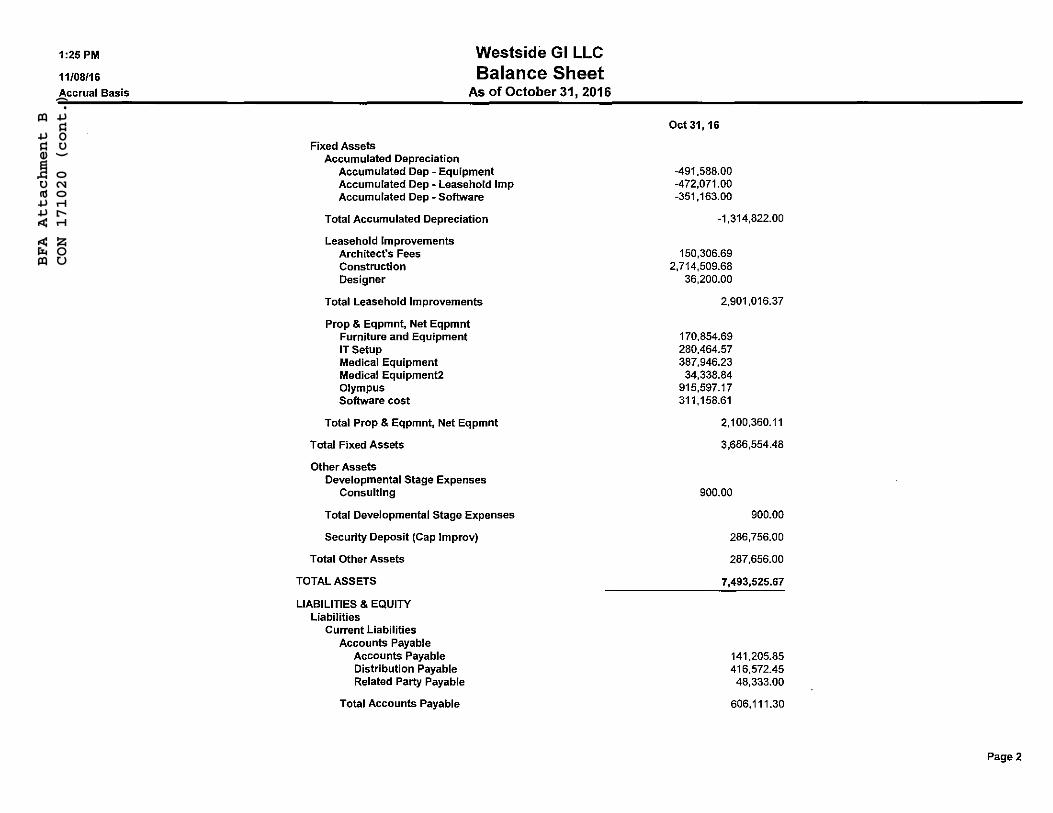
BFA Attachment B
CON 171020 (cont.)
1:25 PM
11/08/16 Accrual Basis
Fixed Assets
Westside GI LLC Balance Sheet
As of October 31, 2016
Accumulated Depreciation Accumulated Dep - Equipment Accumulated Dep - Leasehold Imp Accumulated Dep - Software
Total Accumulated Depreciation
Leasehold Improvements Architect's Fees Construction Designer
Total Leasehold Improvements
Prop & Eqpmnt, Net Eqpmnt Furniture and Equipment IT Setup Medical Equipment Medical Equipment2 Olympus Software cost
Total Prop & Eqpmnt, Net Eqpmnt
Total Fixed Assets
Other Assets Developmental Stage Expenses
Consulting
Total Developmental Stage Expenses
Security Deposit (Cap lmprov)
Total Other Assets
TOTAL ASSETS
LIABILITIES & EQUITY Liabilities
Current Liabilities Accounts Payable
Accounts Payable Distribution Payable Related Party Payable
Total Accounts Payable
Oct 31 1 16
-491,588.00 -472,071.00 -351,163.00
-1,314,822.00
150,306.69 2,714,509.68
36,200.00
2,901,016.37
170,854.69 280,464.57 387,946.23
34,338.84 915,597. 17 311,158.61
2, 100,360.11
3,686,554.48
900.00
900.00
286,756.00
287,656.00
7 ,493,525.67
141,205.85 416,572.45
48,333.00
606, 111.30
Page2
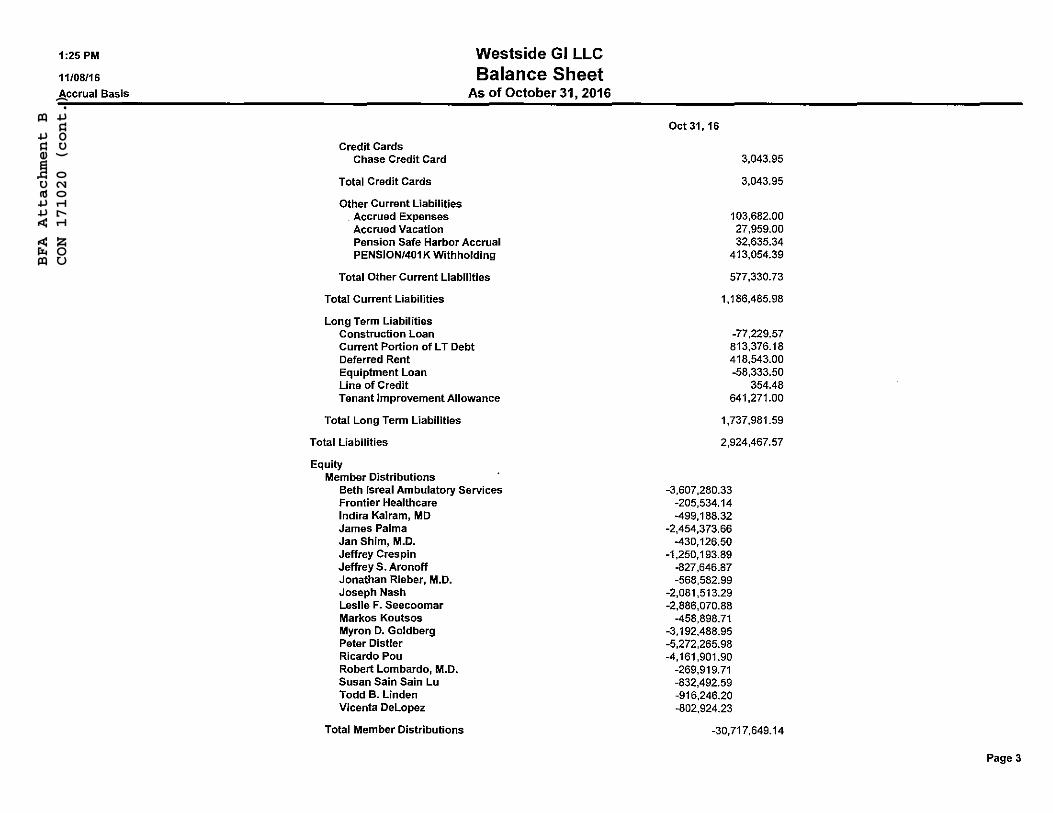
BFA Attachment B
CON 171020 (cont.)
1:25 PM
11108116 Accrual Basis
Credit Cards Chase Credit Card
Total Credit Cards
Other Current Liabilities . Accrued Expenses Accrued Vacation
Westside GI LLC Balance Sheet
As of October 31, 2016
Pension Safe Harbor Accrual PENSION/401 K Withholding
Total Other Current Liabilities
Total Current Liabilities
Long Term Liabilities Construction Loan Current Portion of LT Debt Deferred Rent Equiptment Loan Line of Credit Tenant Improvement Allowance
Total Long Term Liabilities
Total Liabilities
Equity Member Distributions
Beth Isreal Ambulatory Services Frontier Healthcare Indira Kairam, MD James Palma Jan Shim, M.D. Jeffrey Crespin Jeffrey 5. Aronoff Jonathan Rieber, M.D. Joseph Nash Leslie F. Seecoomar Markos Koutsos Myron D. Goldberg Peter Distler Ricardo Pou Robert Lombardo, M.D. Susan Sain Sain Lu Todd B. Linden Vicenta DeLopez
Total Member Distributions
Oct 31, 16
3,043.95
3,043.95
103,682.00 27,959.00 32,635.34
413,054.39
577,330.73
1, 186,485.98
-77,229.57 813,376.18 418,543.00 -58,333.50
354.48 641,271.00
1,737,981.59
2,924,467.57
-3,607,280.33 -205,534.14 -499, 188.32
-2,454,373.66 -430,126.50
-1,250,193.89 -827,646.87 -568,582.99
-2,081,513.29 -2,886,070.88
-458,898.71 -3, 192,488.95 -5,272,265.98 -4, 161,901.90
-269,919.71 -832,492.59 -916,246.20 -802,924.23
-30,717,649.14
Page3
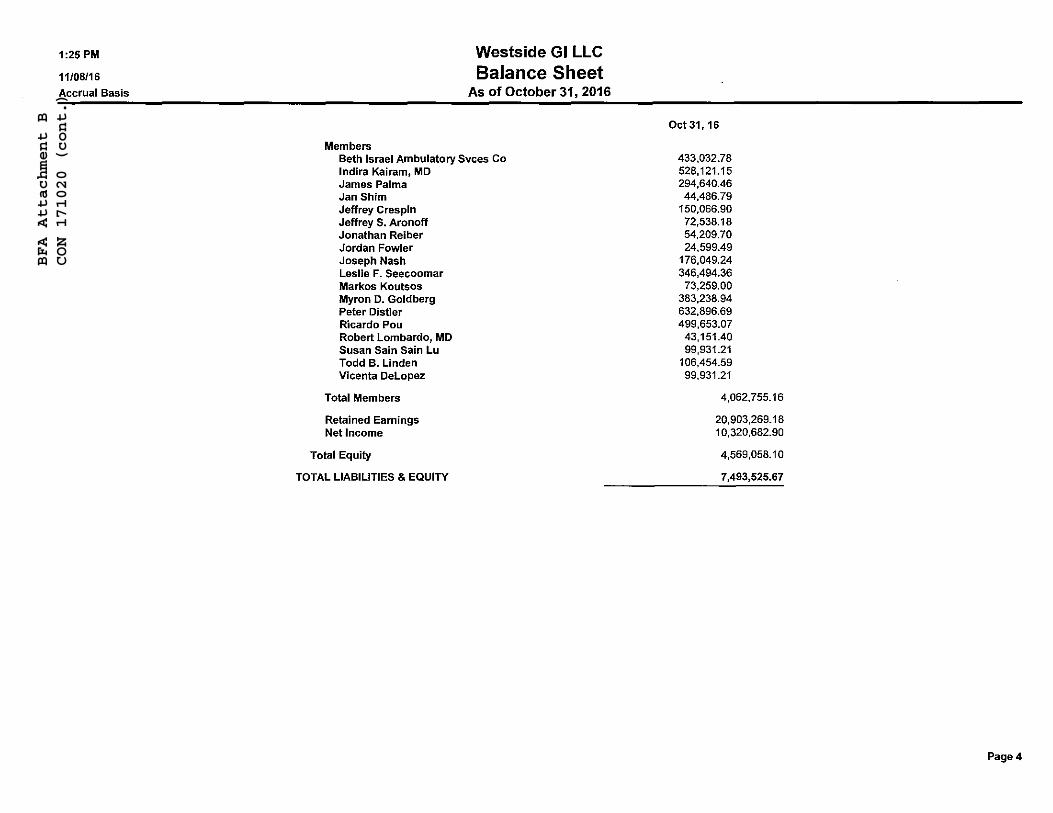
BFA Attachment B
CON 171020 (cont.)
1:25 PM
11/08/16
Accrual Basis
Members
Westside GI LLC Balance Sheet
As of October 31, 2016
Beth Israel Ambulatory Svces Co Indira Kairam, MD James Palma Jan Shim Jeffrey Crespin Jeffrey S. Aronoff Jonathan Reiber Jordan Fowler Joseph Nash Leslie F. Seecoomar Markos Koutsos Myron 0. Goldberg Peter Distler Ricardo Pou Robert Lombardo, MD Susan Sain Sain Lu Todd B. Linden Vicenta Delopez
Total Members
Retained Earnings Net Income
Total Equity
TOTAL LIABILITIES & EQUITY
Oct31,16
433,032.78 528.121.15 294,640.46 44.486.79
150.066.90 72,538.18 54.209.70 24,599.49
176,049.24 346,494.36
73.259.00 383,238.94 632.896.69 499.653.07
43,151.40 99,931.21
106.454.59 99,931.21
4,062, 755.16
20,903,269.18 10,320,682.90
4,569,058.10
7,493,525.67
Page4
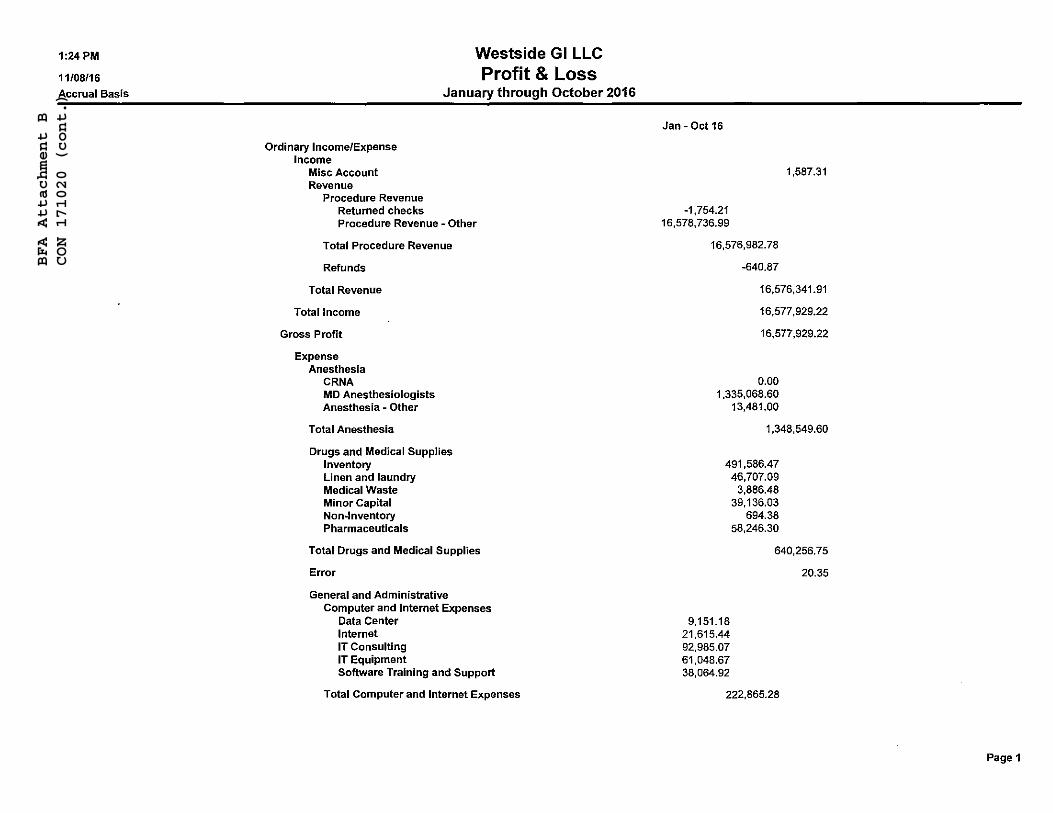
BFA Attachment B
CON 171020 (cont.)
1:24 PM
11/08/16 Accrual Basis
Ordinary Income/Expense Income
Misc Account Revenue
Procedure Revenue
Westside GI LLC Profit & Loss
January through October 2016
Returned checks Procedure Revenue - Other
Total Procedure Revenue
Refunds
Total Revenue
Total Income
Gross Profit
Expense Anesthesia
CRNA MD Anesthesiologists Anesthesia - Other
Total Anesthesia
Drugs and Medical Supplies Inventory Linen and laundry Medical Waste Minor Capital Non-Inventory Pharmaceuticals
Total Drugs and Medical Supplies
Error
General and Administrative Computer and Internet Expenses
Data Center Internet IT Consulting IT Equipment Software Training and Support
Total Computer and Internet Expenses
Jan - Oct 16
1,587.31
-1,754.21 16,578, 736.99
16,576,982.78
-640.87
16,576,341.91
16,577,929.22
16,577,929.22
0.00 1,335,068.60
13,481.00
1,348,549.60
491,586.47 46,707.09
9,151.18 21,615.44 92,985.07 61,048.67 38,064.92
3,886.48 39,136.03
694.38 58,246.30
640,256,75
20.35
222,865.28
Page 1
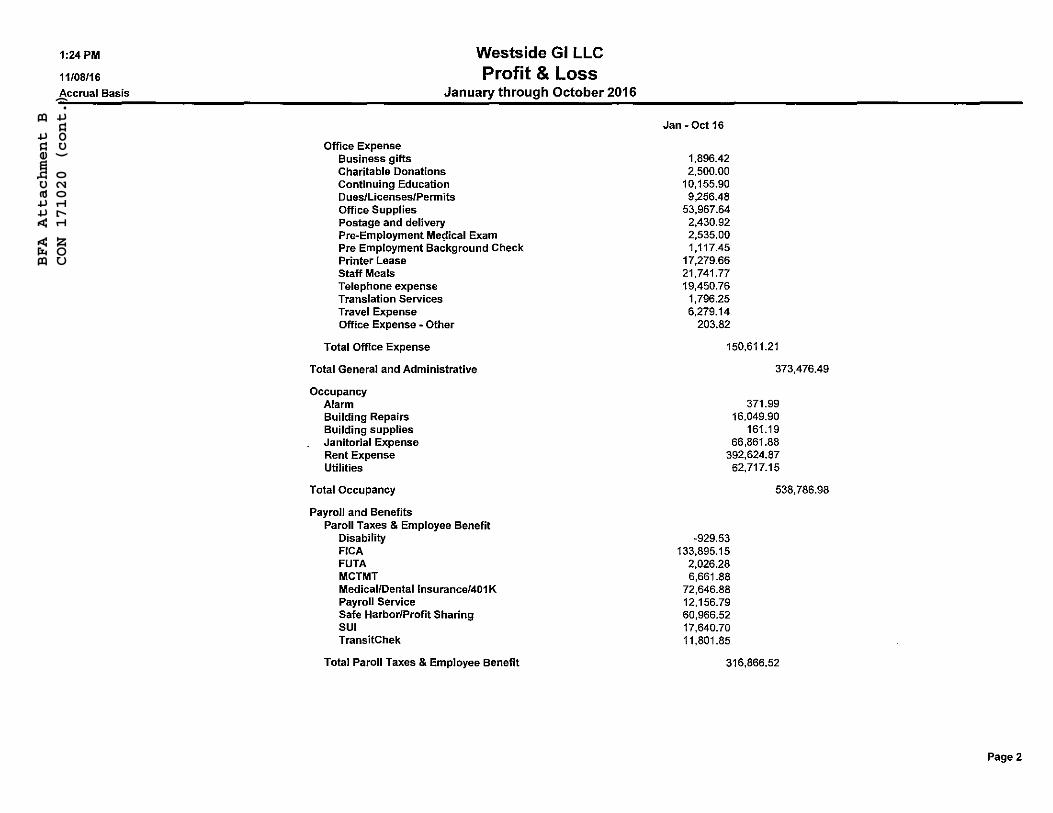
BFA Attachment B
CON 171020 (cont.)
1:24 PM
11108116 Accrual Basis
Office Expense Business gifts
Westside GI LLC Profit & Loss
January through October 2016
Charitable Donations Continuing Education Dues/Licenses/Permits Office Supplies Postage and delivery Pre-Employment Mec;:lical Exam Pre Employment Background Check Printer Lease Staff Meals Telephone expense Translation Services Travel Expense Office Expense - Other
Total Office Expense
Total General and Administrative
Occupancy Alarm Building Repairs Building supplies Janitorial Expense Rent Expense Utilities
Total Occupancy
Payroll and Benefits Paroll Taxes & Employee Benefit
Disability FICA FUTA MCTMT Medical/Dental lnsurance/401 K Payroll Service Safe Harbor/Profit Sharing SUI TransitChek
Total Paroll Taxes & Employee Benefit
Jan -Oct 16
1,896.42 2,500.00
10, 155.90 9,256.48
53,967.64 2,430.92 2,535.00 1,117.45
17,279.66 21,741.77 19,450.76
1,796.25 6,279.14
203.82
150,611.21
373,476.49
371.99 16,049.90
161.19 66,861.88
392,624.87 62,717.15
-929.53 133,895.15
2,026.28 6,661.88
72,646.88 12,156.79 60,966.52 17,640.70 11,801.85
538,786.98
316,866.52
Page 2
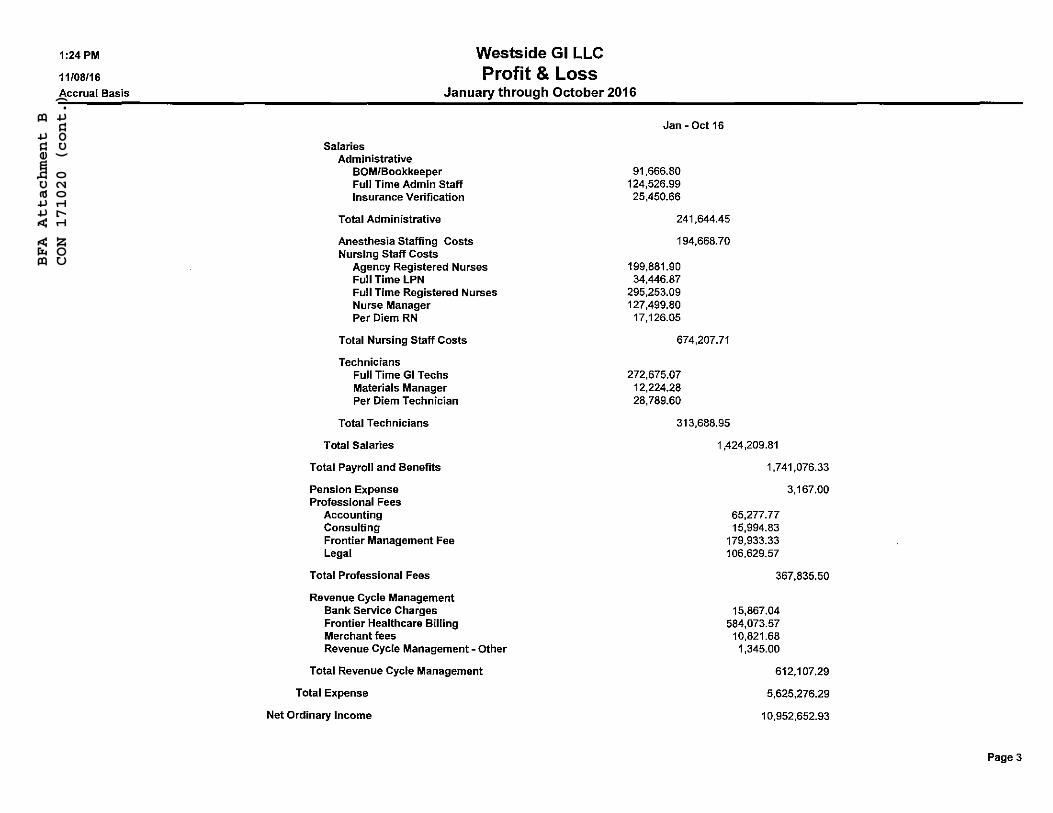
BFA Attachment B
CON 171020 (cont.)
1:24 PM
11/08/16
Accrual Basis
Westside GI LLC Profit & Loss
January through October 2016
Salaries Administrative
SOM/Bookkeeper Full Time Admin Staff Insurance Verification
Total Administrative
Anesthesia Staffing Costs Nursing Staff Costs
Agency Registered Nurses Full Time LPN Full Time Registered Nurses Nurse Manager Per Diem RN
Total Nursing Staff Costs
Technicians Full Time GI Techs Materials Manager Per Diem Technician
Total Technicians
Total Salaries
Total Payroll and Benefits
Pension Expense Professional Fees
Accounting Consulting Frontier Management Fee Legal
Total Professional Fees
Revenue Cycle Management Bank Service Charges Frontier Healthcare Billing Merchant fees Revenue Cycle Management - Other
Total Revenue Cycle Management
Total Expense
Net Ordinary Income
Jan - Oct 16
91,666.80 124,526.99
25,450.66
241,644.45
194,668.70
199,881.90 34,446.87
295,253.09 127,499.80
17,126.05
674,207.71
272,675.07 12,224.28 28,789.60
313,688.95
1,424,209.81
1,741,076.33
3,167.00
65,277.77 15,994.83
179,933.33 106,629.57
367,835.50
15,867.04 584,073.57
10,821.68 1,345.00
612,107.29
5,625,276.29
10,952,652.93
Page 3
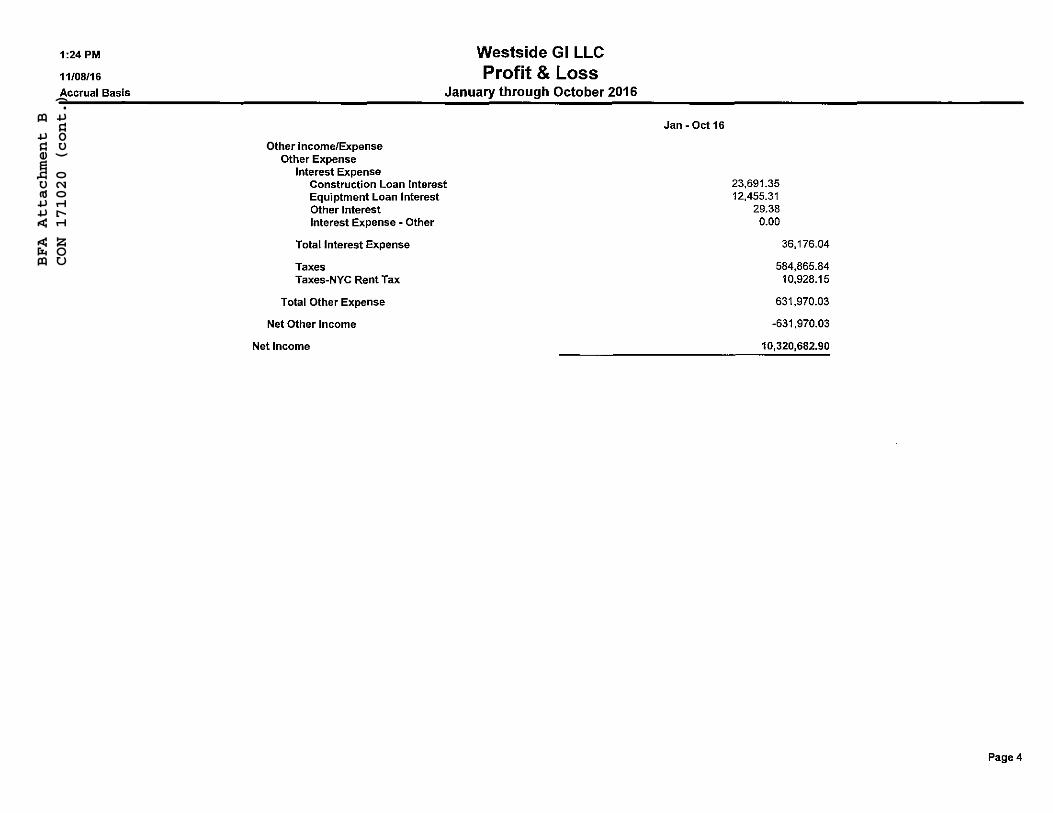
BFA Attachment B
CON 171020 (cont.)
1:24 PM
11/08/16 Accrual Basis
Other Income/Expense Other Expense
Westside GI LLC Profit & Loss
January through October 2016
Interest Expense Construction Loan Interest Equiptment Loan Interest Other Interest Interest Expense - Other
Total Interest Expense
Taxes Taxes-NYC Rent Tax
Total Other Expense
Net Other Income
Net Income
Jan - Oct 16
23,691.35 12,455.31
29.38 0.00
36,176.04
584,865.84 10,928.15
631,970.03
-631,970.03
10,320,682.90
Page4
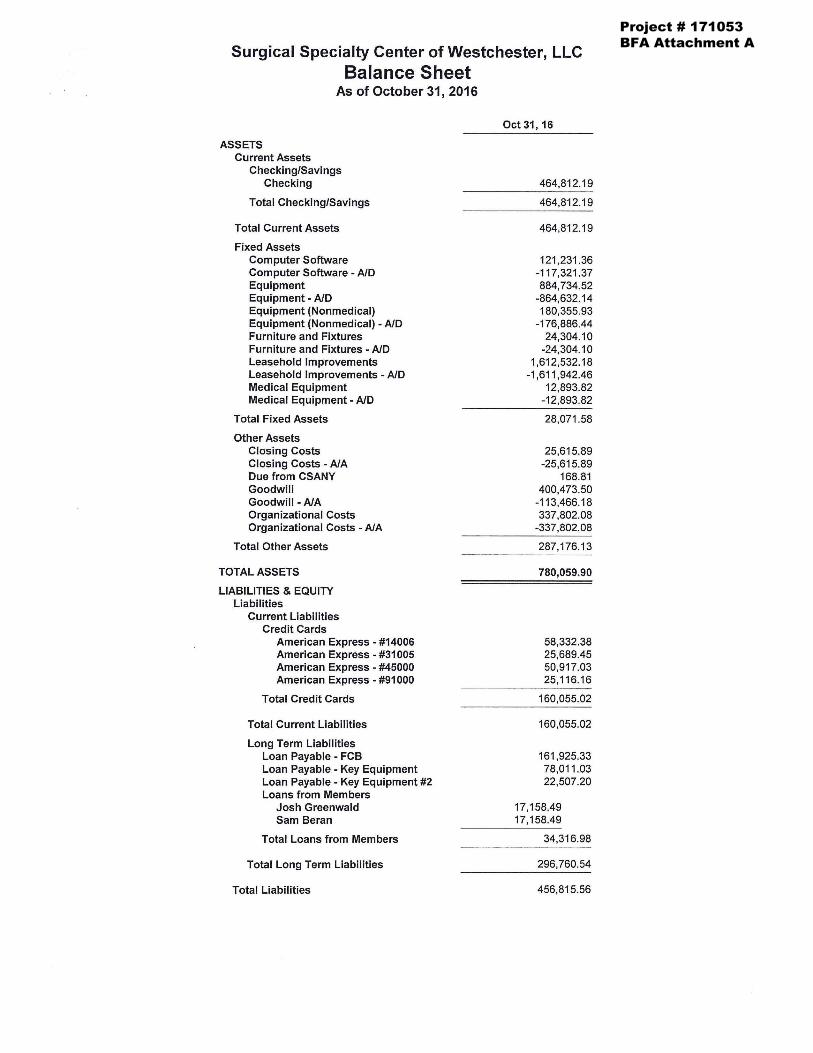
Project # 171053BFA Attachment A
Surgical Specialty Center of Westchester, LLC Balance Sheet
As of October 31, 2016
ASSETS Current Assets
Checking/Savings Checking
Total Checking/Savings
Total Current Assets
Fixed Assets Computer Software Computer Software - AID Equipment Equipment - AID Equipment (Nonmedical) Equipment (Nonmedical) - AID Furniture and Fixtures Furniture and Fixtures - AID Leasehold Improvements Leasehold Improvements - AID Medical Equipment Medical Equipment - AID
Total Fixed Assets
Other Assets Closing Costs Closing Costs - AIA Due from CSANY Goodwill Goodwill - AIA Organizational Costs Organizational Costs - AIA
Total Other Assets
TOTAL ASSETS
LIABILITIES & EQUITY Liabilities
Current Liabilities Credit Cards
American Express - #14006 American Express - #31005 American Express - #45000 American Express - #91000
Total Credit Cards
Total Current Liabilities
Long Term Liabilities Loan Payable - FCB Loan Payable - Key Equipment Loan Payable - Key Equipment #2 Loans from Members
Josh Greenwald Sam Beran
Total Loans from Members
Total Long Term Liabilities
Total Liabilities
Oct 31, 16
464,812.19
464,812.19
464,812.19
121 ,231 .36 -117,321.37 884,734.52
-864,632.14 180,355.93
-176,886.44 24,304.10
-24,304.10 1,612,532.18
-1,611,942.46 12,893.82
-12,893.82
28,071 .58
25,615.89 -25,615.89
168.81 400,473.50
-113,466.18 337,802.08
-337,802.08
287,176.13
780,059.90
58,332.38 25,689.45 50,917.03 25,116.16
160,055.02
160,055.02
161,925.33 78,011 .03 22,507.20
17, 158.49 17, 158.49
34,316.98
296,760.54
456,815.56
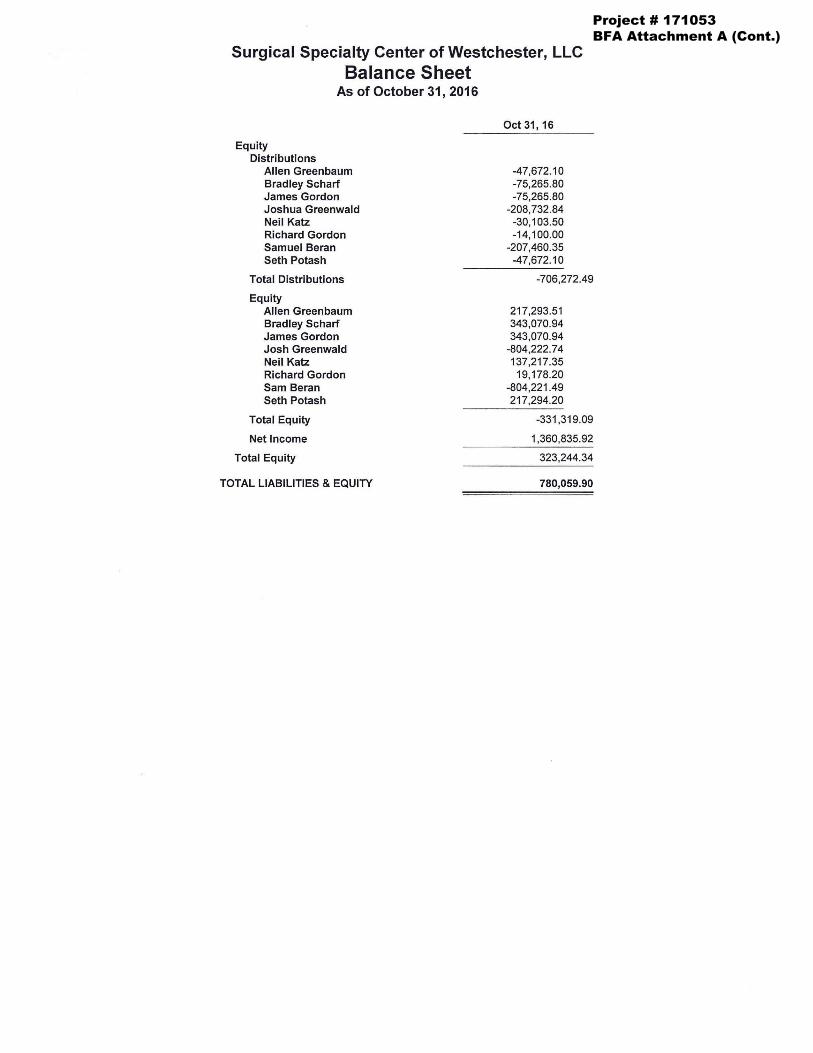
Project # 171053BFA Attachment A (Cont.)
Surgical Specialty Center of Westchester, LLC Balance Sheet
As of October 31, 2016
Equity Distributions
Allen Greenbaum Bradley Scharf James Gordon Joshua Greenwald Neil Katz Richard Gordon Samuel Beran Seth Potash
Total Distributions
Equity Allen Greenbaum Bradley Scharf James Gordon Josh Greenwald Neil Katz Richard Gordon Sam Beran Seth Potash
Total Equity
Net Income
Total Equity
TOTAL LIABILITIES & EQUITY
Oct 31, 16
-47,672.10 -75,265.80 -75,265.80
-208,732.84 -30,103.50 -14,100.00
-207,460.35 -47,672.10
-706,272.49
217,293.51 343,070.94 343,070.94
-804,222.74 137,217.35
19,178.20 -804,221 .49 217,294.20
-331,319.09
1,360,835.92
323,244.34
780,059.90
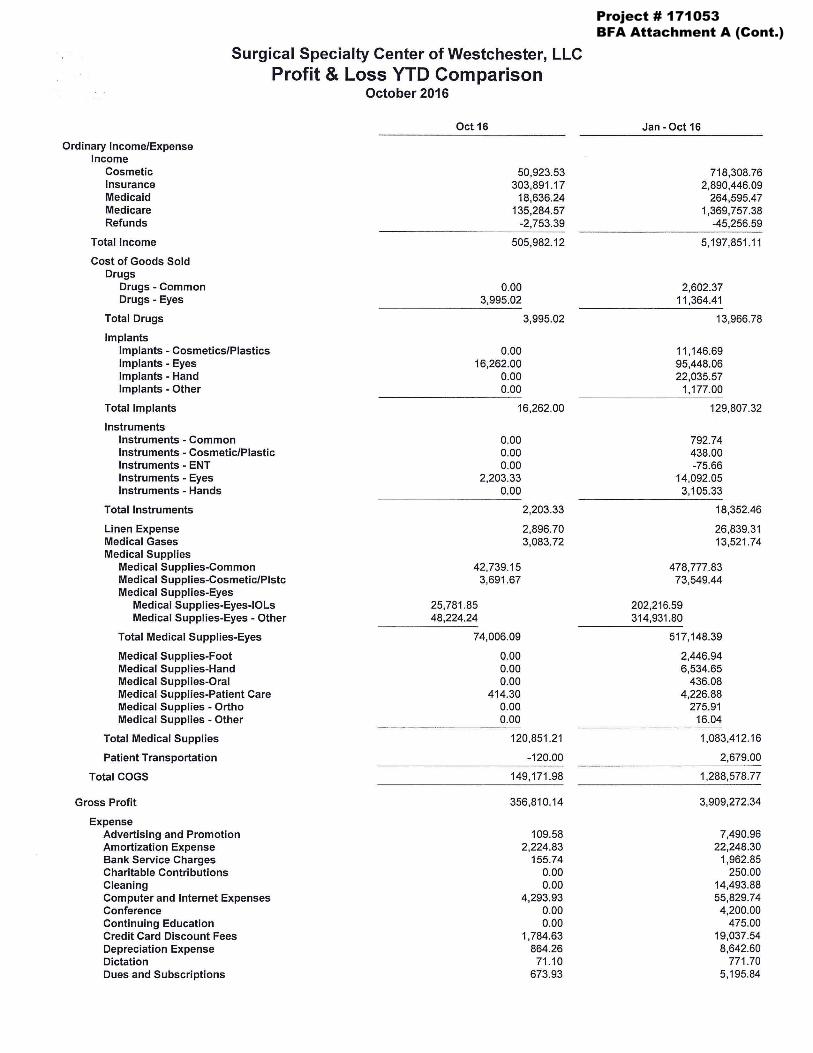
Project # 171053BFA Attachment A (Cont.)
Surgical Specialty Center of Westchester, LLC Profit & Loss YTD Comparison
October 2016
Ordinary Income/Expense Income
Cosmetic Insurance Medicaid Medicare Refunds
Total Income
Cost of Goods Sold Drugs
Drugs - Common Drugs - Eyes
Total Drugs
Implants Implants - Cosmetics/Plastics Implants - Eyes Implants - Hand Implants - Other
Total Implants
Instruments Instruments - Common Instruments - Cosmetic/Plastic Instruments - ENT Instruments - Eyes Instruments - Hands
Total Instruments
Linen Expense Medical Gases Medical Supplies
Medical Supplies-Common Medical Supplies-Cosmetic/Piste Medical Supplies-Eyes
Medical Supplies-Eyes-IOLs Medical Supplies-Eyes - Other
Total Medical Supplies-Eyes
Medical Supplies-Foot Medical Supplies-Hand Medical Supplies-Oral Medical Supplies-Patient Care Medical Supplies - Ortho Medical Supplies - Other
Total Medical Supplies
Patient Transportation
Total COGS
Gross Profit
Expense Advertising and Promotion Amortization Expense Bank Service Charges Charitable Contributions Cleaning Computer and Internet Expenses Conference Continuing Education Credit Card Discount Fees Depreciation Expense Dictation Dues and Subscriptions
Oct 16
50,923.53 303,891.17
18,636.24 135,284.57
-2,753.39
505,982.12
0.00 3,995.02
0.00 16,262.00
0.00 0.00
3,995.02
16,262.00
0.00 0.00 0.00
2,203.33 0.00
42,739.15 3,691 .67
25,781 .85 48,224.24
74,006.09
0.00 0.00 0.00
414.30 0.00 0.00
2,203.33
2,896.70 3,083.72
120,851 .21
-120.00
149,171.98
356,810.14
109.58 2,224.83
155.74 0.00 0.00
4,293.93 0.00 0.00
1,784.63 864.26
71.10 673.93
Jan - Oct 16
718 ,308.76 2,890,446.09
264,595.47 1,369,757.38
-45,256.59
5,197,851 .11
2,602.37 11,364.41
13,966.78
11,146.69 95,448.06 22,035.57
1,177.00
129,807.32
792.74 438.00 -75.66
14,092.05 3,105.33
18,352.46
26,839.31 13,521 .74
478,777.83 73,549.44
202,216.59 314,931 .80
517,148.39
2,446.94 6,534.65
436.08 4,226.88
275.91 16.04
1,083,412.16
2,679.00
1,288,578.77
3,909,272.34
7,490.96 22,248.30
1,962.85 250.00
14,493.88 55,829.74
4,200.00 475.00
19,037.54 8,642.60
771.70 5 ,195.84
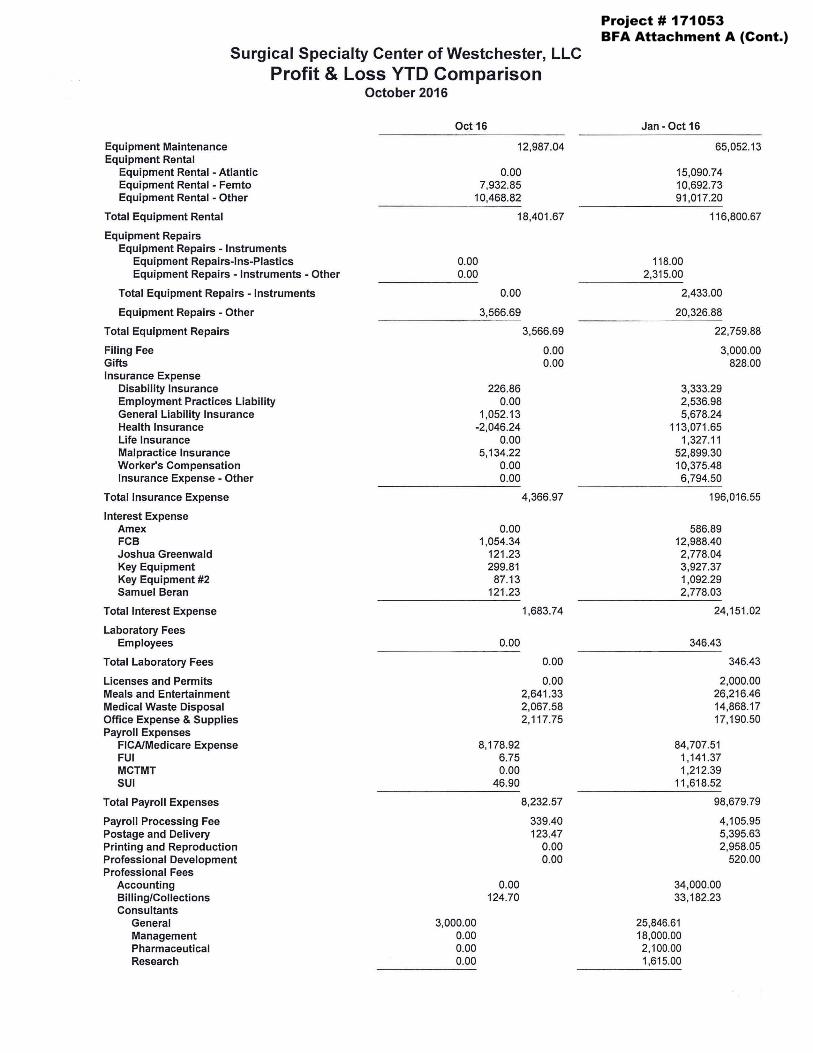
Project # 171053BFA Attachment A (Cont.)
Surgical Specialty Center of Westchester, LLC Profit & Loss YTD Comparison
October 2016
Equipment Maintenance Equipment Rental
Equipment Rental - Atlantic Equipment Rental - Femto Equipment Rental - Other
Total Equipment Rental
Equipment Repairs Equipment Repairs - Instruments
Equipment Repairs-Ins-Plastics Equipment Repairs - Instruments - Other
Total Equipment Repairs - Instruments
Equipment Repairs - Other
Total Equipment Repairs
Filing Fee Gifts Insurance Expense
Disability Insurance Employment Practices Liability General Liability Insurance Health Insurance Life Insurance Malpractice Insurance Worker's Compensation Insurance Expense - Other
Total Insurance Expense
Interest Expense Am ex FCB Joshua Greenwald Key Equipment Key Equipment #2 Samuel Beran
Total Interest Expense
Laboratory Fees Employees
Total Laboratory Fees
Licenses and Permits Meals and Entertainment Medical Waste Disposal Office Expense & Supplies Payroll Expenses
FICA/Medicare Expense FUI MCTMT SUI
Total Payroll Expenses
Payroll Processing Fee Postage and Delivery Printing and Reproduction Professional Development Professional Fees
Accounting Billing/Collections Consultants
General Management Pharmaceutical Research
Oct 16
12,987.04
0.00 7,932.85
10,468.82
18,401 .67
0.00 0.00
0.00
3,566.69
226.86 0.00
1,052.13 -2,046.24
0.00 5,134.22
0.00 0.00
3,000.00 0.00 0.00 0.00
0.00 1,054.34
121 .23 299.81
87.13 121 .23
0.00
8,178.92 6.75 0.00
46.90
0.00 124.70
3,566.69
0.00 0.00
4,366.97
1,683.74
0.00
0.00 2,641 .33 2,067.58 2,117.75
8,232.57
339.40 123.47
0.00 0.00
Jan - Oct 16
65,052.13
15,090.74 10,692.73 91,017.20
116,800.67
118.00 2,315.00
2,433.00
20,326.88
22,759.88
3,000.00 828.00
3,333.29 2,536.98 5,678.24
113,071.65 1,327.11
52,899.30 10,375.48 6,794.50
196,016.55
586.89 12,988.40 2,778.04 3,927.37 1,092.29 2,778.03
24, 151 .02
346.43
346.43
2,000.00 26,216.46 14,868.17 17, 190.50
84,707.51 1,141 .37 1,212.39
11,618.52
98,679.79
4,105.95 5,395.63 2,958.05
520.00
34,000.00 33,182.23
25,846.61 18,000.00 2,100.00 1,615.00
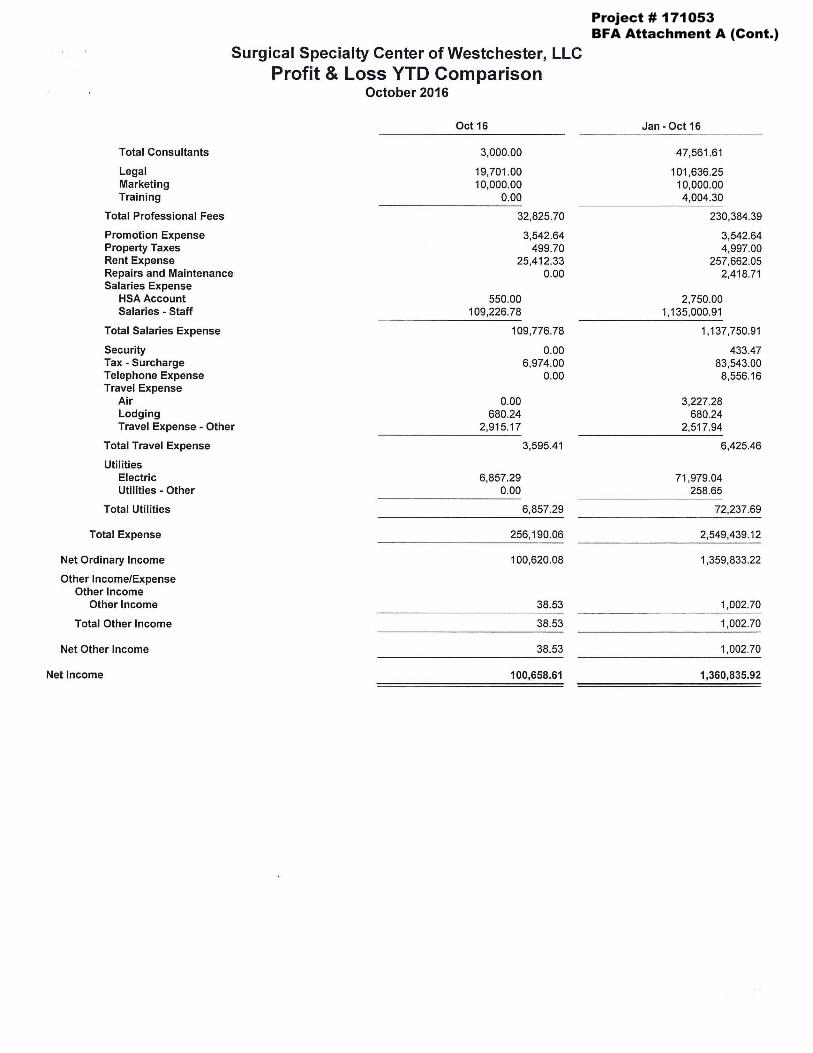
Project # 171053BFA Attachment A (Cont.)
Total Consultants
Legal Marketing Training
Total Professional Fees
Promotion Expense Property Taxes Rent Expense
Surgical Specialty Center of Westchester, LLC Profit & Loss YTD Comparison
October 2016
Oct 16
3,000.00
19,701 .00 10,000.00
0.00
32,825.70
3,542.64 499.70
25,412.33 Repairs and Maintenance 0.00 Salaries Expense
HSAAccount 550.00 Salaries - Staff 109,226.78
Total Salaries Expense 109,776.78
Security 0.00 Tax - Surcharge 6,974.00 Telephone Expense 0.00 Travel Expense
Air 0.00 Lodging 680.24 Travel Expense - Other 2,915.17
Total Travel Expense 3,595.41
Utilities Electric 6,857.29 Utilities - Other 0.00
Total Utilities 6,857.29
Total Expense 256,190.06
Net Ordinary Income 100,620.08
Other Income/Expense Other Income
Other Income 38.53
Total Other Income 38.53
Net Other Income 38.53
Net Income 100,658.61
Jan - Oct 16
47,561 .61
101,636.25 10,000.00 4,004.30
230,384.39
3,542.64 4,997.00
257,662.05 2,418.71
2,750.00 1, 135,000.91
1, 137,750.91
433.47 83,543.00
8,556.16
3,227.28 680.24
2,517.94
6,425.46
71 ,979.04 258.65
72,237.69
2,549,439.12
1,359,833.22
1,002 .70
1,002 .70
1,002.70
1,360,835.92
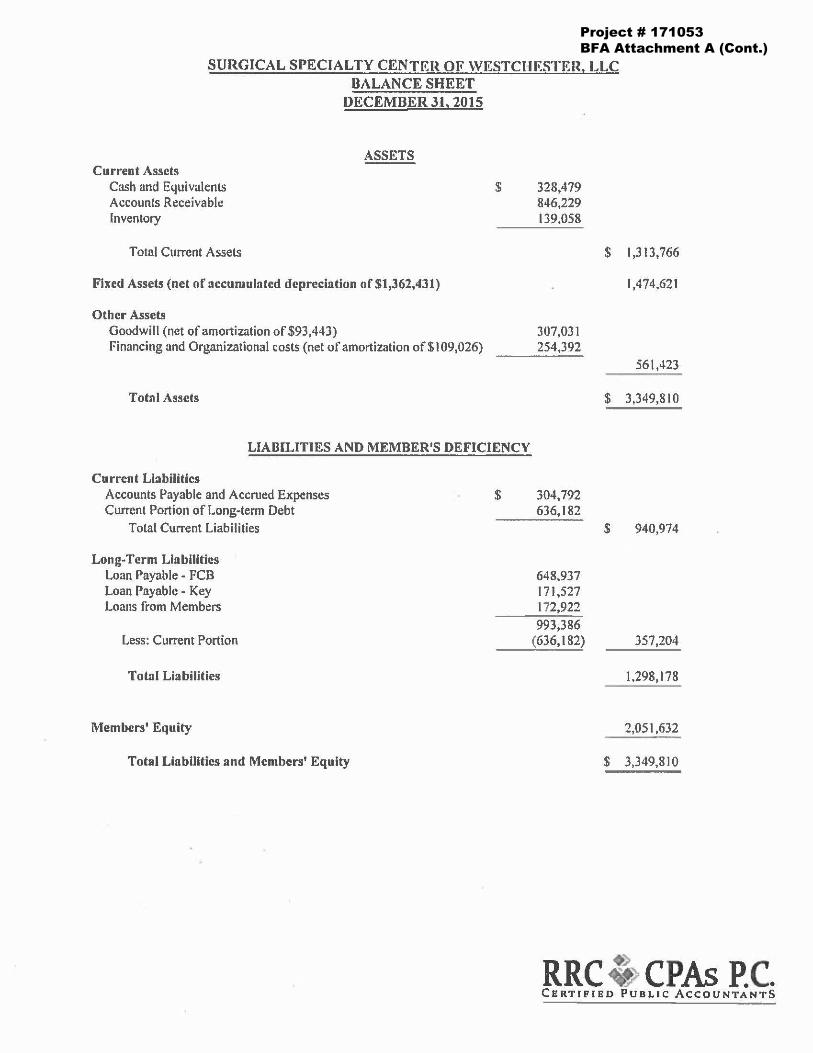
Project # 171053BFA Attachment A (Cont.)
SURGICAL SPECIALTY CENTRI~ OF WESTCHF.STF:n, LLC BALANCE SHEET
Current Assets Cash and Equivalents Accounts Receivable Inventory
Total Current Assets
DECEMBER 31, 2015
ASSETS
Fixed Assets {net of accumulated depreciation of St,362,431)
Other Assets Goodwill (net of amo1tization of $93,443) Financing and Organizational costs (net of amortization of$ I 09,026)
Total Assets
$
LIABILITIES AND MEMBER'S DEFICIENCY
Current Liabilities Accounts Payable and Accrued Expenses Current Portion of Long-term Debt
Total Current Liabilities
Long-Term Liabilities Loan Payable - FCB Loan Payable - Key Loans from Members
Less: Current Portion
Total Liabilities
Members' Equity
Total Liabilities and Members' Equity
$
328,479 846,229 139.058
$ 1,313,766
1,474.621
307,031 254,392
561,423
$ 3,349,810
304,792 636,182
$ 940,974
648,937 171,527 172,922 993,386
(636,182) 357,204
1.298,178
2,051,632
$ 3,349,810
RRC '~ CPAs P.C. CERTIFIBD PUBLIC ACCOUNTANTS
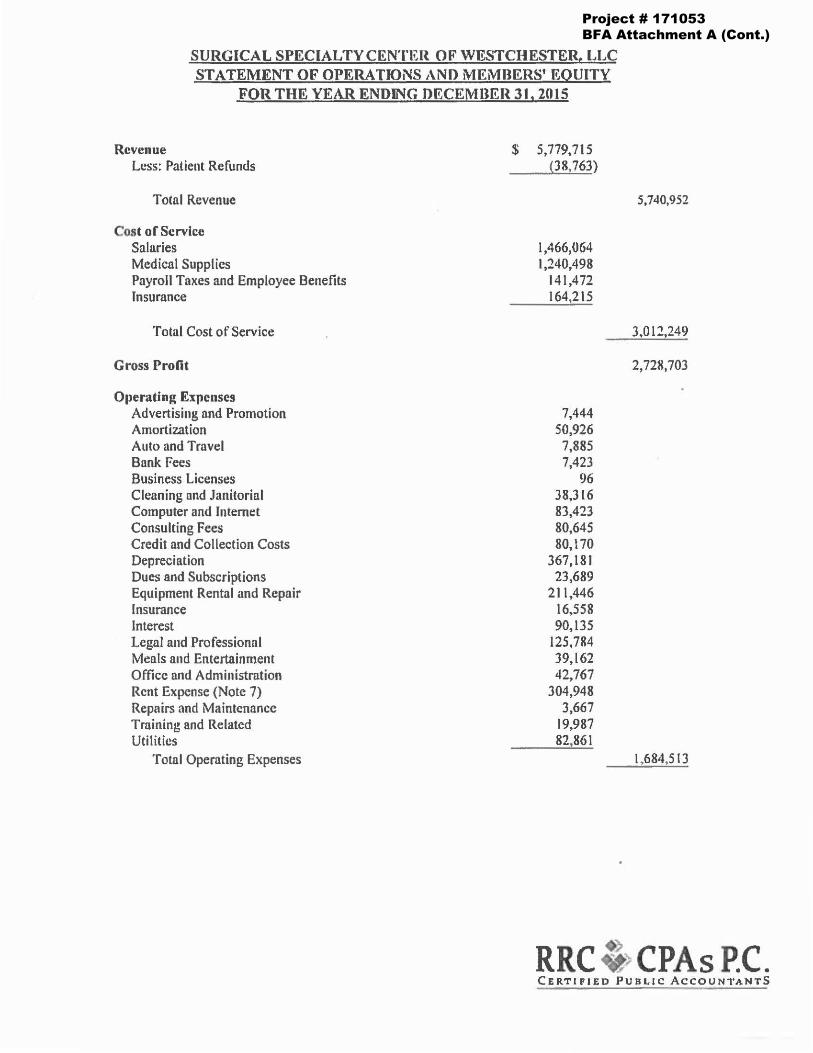
Project # 171053BFA Attachment A (Cont.)
SURGICAL SPECIALTY CENTEH. OF WESTCHESTERe LLC STATEMENT OF OPERATIONS ANO MEMBERS' EQUITY
FOR THE YEAR ENDING DECEMBER 31, 2015
Revenue $ 5,779,715 Less: Patient Refunds (38,763)
Total Revenue
Cost of Service Salaries 1,466,064 Medical Supplies 1,240,498 Payroll Taxes and Employee Benefits 141,472 Insurance 164,215
Total Cost of Service
Gross Profit
Operating Expenses Advertising and Promotion 7,444 Amortization 50,926 Auto and Travel 7,885 Bank Fees 7,423 Business Licenses 96 Cleaning and Janitorial 38,316 Computer and Internet 83,423 Consulting Fees 80,645 Credit and Collection Costs 80,170 Depreciation 367,181 Dues and Subscriptions 23,689 Equipment Rental and Repair 211,446 Insurance 16,558 Interest 90,135 Legal and Professional 125, 784 Meo.ls and Entertainment 39,162 Office and Administration 42,767 Rent Expense (Note 7) 304,948 Repairs and Maintenance 3,667 Training and Related 19,987 Utilities 82,861
Total Operating Expenses
5,740,952
3,012,249
2,728,703
1,684,513
RRC ; >CPAsP.C. CERTIPIED PUBLIC ACCOUNTANTS
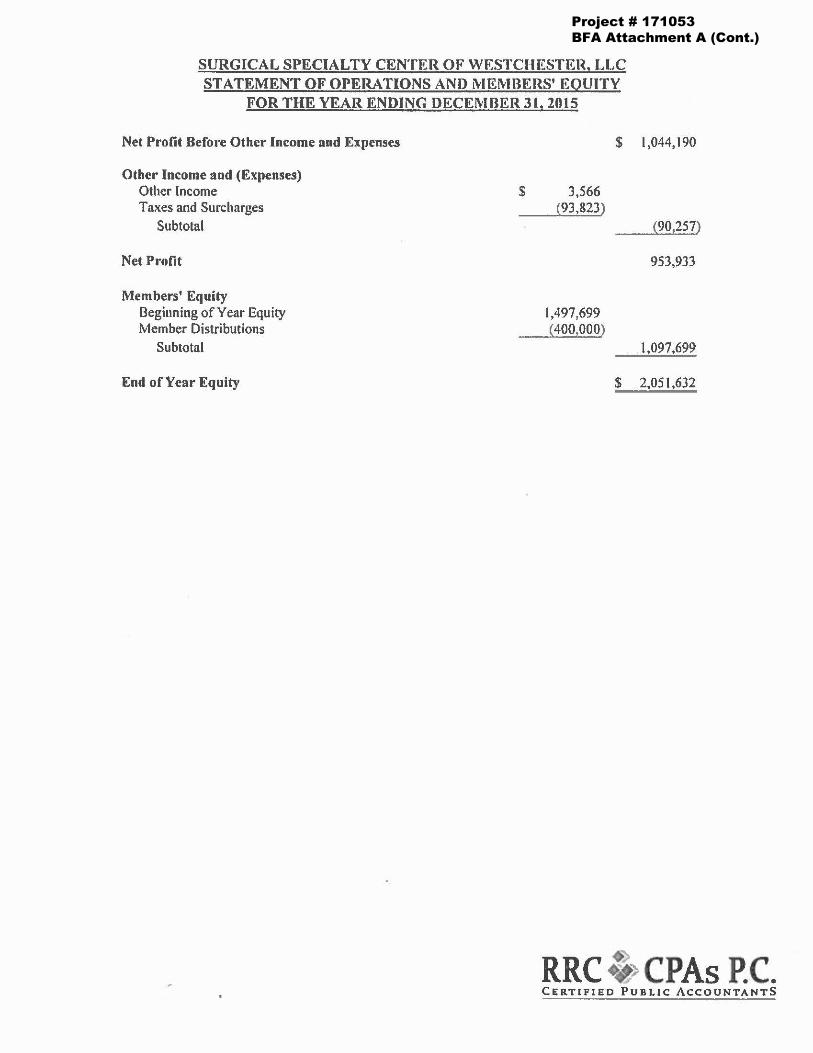
Project # 171053BFA Attachment A (Cont.)
SURGICAL SPECIALTY CENTER OF WJ~STCHESTER, LLC STATEMENT OF OPERATIONS AND MEMBERS' EQUITY
FOR THE YEAR ENDING DECEMBER 31, 2015
Net Prolit Before Other Income a11d Expenses $
Other Income and (Expenses) Other Income $ 3,566 Taxes aud Surcharges {93,823)
Subtotal
Net Profit
Members' Equity Beginning of Year Equity 1,497,699 Member Distributions (400%000)
Subtotal
End of Year Equity $
1,044,190
(90,257)
953,933
1,097,699
2,051,632
RRC ~ CPAs P.C. CERTIFIED PUBLIC ACCOUNTANTS
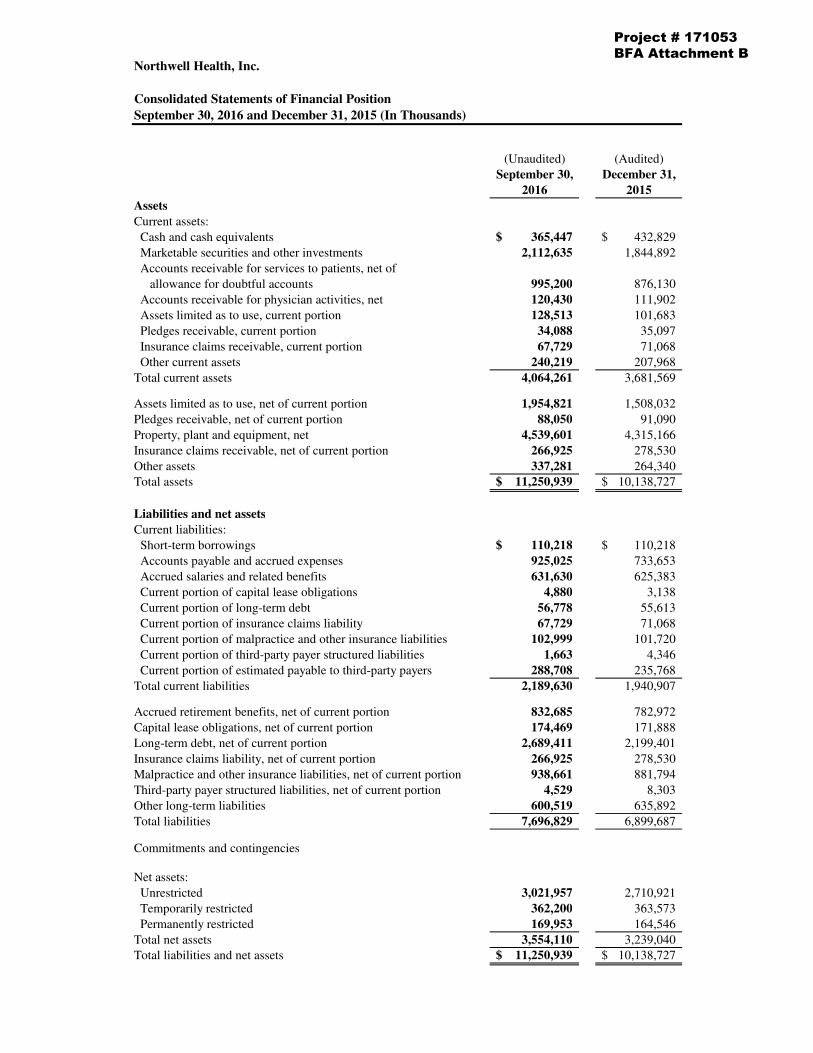
Northwell Health, Inc.
Consolidated Statements of Financial Position
September 30, 2016 and December 31, 2015 (In Thousands)
(Unaudited) (Audited)
September 30, December 31,
2016 2015
Assets
Current assets:
Cash and cash equivalents 365,447$ 432,829$
Marketable securities and other investments 2,112,635 1,844,892
Accounts receivable for services to patients, net of
allowance for doubtful accounts 995,200 876,130
Accounts receivable for physician activities, net 120,430 111,902
Assets limited as to use, current portion 128,513 101,683
Pledges receivable, current portion 34,088 35,097
Insurance claims receivable, current portion 67,729 71,068
Other current assets 240,219 207,968
Total current assets 4,064,261 3,681,569
Assets limited as to use, net of current portion 1,954,821 1,508,032
Pledges receivable, net of current portion 88,050 91,090
Property, plant and equipment, net 4,539,601 4,315,166
Insurance claims receivable, net of current portion 266,925 278,530
Other assets 337,281 264,340
Total assets 11,250,939$ 10,138,727$
Liabilities and net assets
Current liabilities:
Short-term borrowings 110,218$ 110,218$
Accounts payable and accrued expenses 925,025 733,653
Accrued salaries and related benefits 631,630 625,383
Current portion of capital lease obligations 4,880 3,138
Current portion of long-term debt 56,778 55,613
Current portion of insurance claims liability 67,729 71,068
Current portion of malpractice and other insurance liabilities 102,999 101,720
Current portion of third-party payer structured liabilities 1,663 4,346
Current portion of estimated payable to third-party payers 288,708 235,768
Total current liabilities 2,189,630 1,940,907
Accrued retirement benefits, net of current portion 832,685 782,972
Capital lease obligations, net of current portion 174,469 171,888
Long-term debt, net of current portion 2,689,411 2,199,401
Insurance claims liability, net of current portion 266,925 278,530
Malpractice and other insurance liabilities, net of current portion 938,661 881,794
Third-party payer structured liabilities, net of current portion 4,529 8,303
Other long-term liabilities 600,519 635,892
Total liabilities 7,696,829 6,899,687
Commitments and contingencies
Net assets:
Unrestricted 3,021,957 2,710,921
Temporarily restricted 362,200 363,573
Permanently restricted 169,953 164,546
Total net assets 3,554,110 3,239,040
Total liabilities and net assets 11,250,939$ 10,138,727$
Project # 171053BFA Attachment B
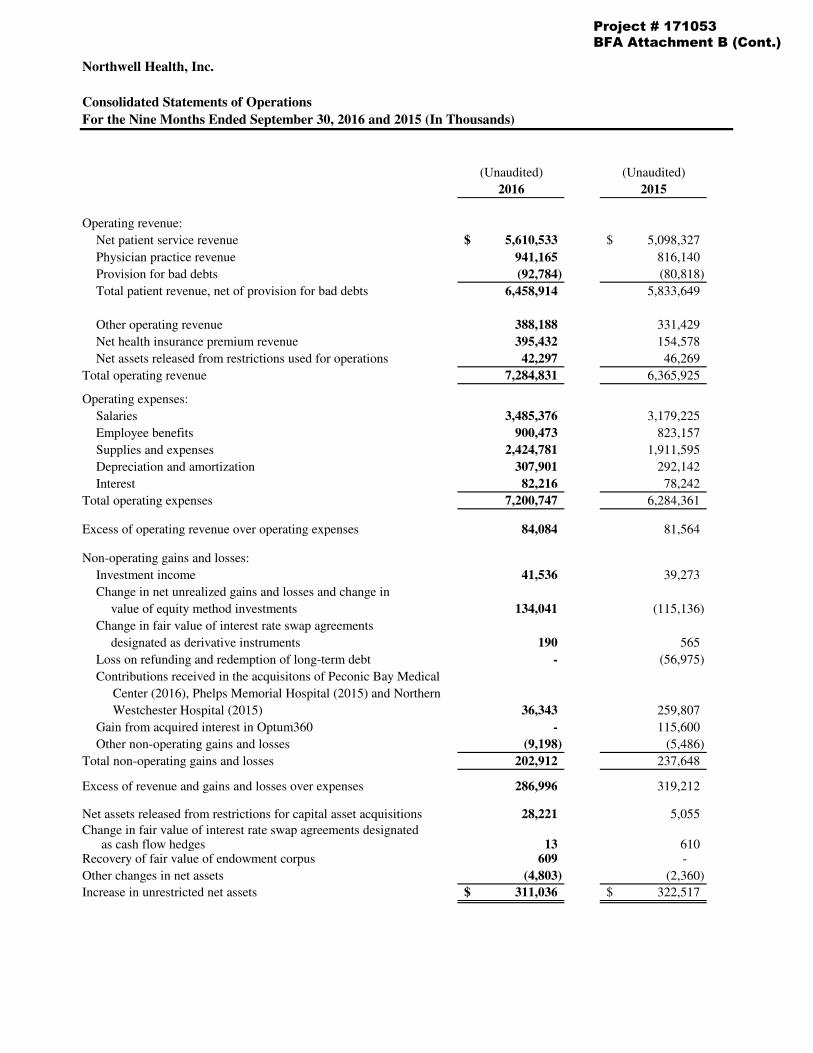
Northwell Health, Inc.
Consolidated Statements of Operations
For the Nine Months Ended September 30, 2016 and 2015 (In Thousands)
(Unaudited) (Unaudited)
2016 2015
Operating revenue:
Net patient service revenue 5,610,533$ 5,098,327$
Physician practice revenue 941,165 816,140
Provision for bad debts (92,784) (80,818)
Total patient revenue, net of provision for bad debts 6,458,914 5,833,649
Other operating revenue 388,188 331,429
Net health insurance premium revenue 395,432 154,578
Net assets released from restrictions used for operations 42,297 46,269
Total operating revenue 7,284,831 6,365,925
Operating expenses:
Salaries 3,485,376 3,179,225
Employee benefits 900,473 823,157
Supplies and expenses 2,424,781 1,911,595
Depreciation and amortization 307,901 292,142
Interest 82,216 78,242
Total operating expenses 7,200,747 6,284,361
Excess of operating revenue over operating expenses 84,084 81,564
Non-operating gains and losses:
Investment income 41,536 39,273
Change in net unrealized gains and losses and change in
value of equity method investments 134,041 (115,136)
Change in fair value of interest rate swap agreements
designated as derivative instruments 190 565
Loss on refunding and redemption of long-term debt - (56,975)
Contributions received in the acquisitons of Peconic Bay Medical
Center (2016), Phelps Memorial Hospital (2015) and Northern
Westchester Hospital (2015) 36,343 259,807
Gain from acquired interest in Optum360 - 115,600
Other non-operating gains and losses (9,198) (5,486)
Total non-operating gains and losses 202,912 237,648
Excess of revenue and gains and losses over expenses 286,996 319,212
Net assets released from restrictions for capital asset acquisitions 28,221 5,055
Change in fair value of interest rate swap agreements designated as cash flow hedges 13 610
Recovery of fair value of endowment corpus 609 -
Other changes in net assets (4,803) (2,360)
Increase in unrestricted net assets 311,036$ 322,517$
Project # 171053BFA Attachment B (Cont.)

Northwell Health, Inc. (Formerly, North Shore-Long Island Jewish Health System, Inc.)
Consolidated Statements of Financial Position (In Thousands)
December 31 2015 2014
Assets Current assets:
Cash and cash equivalents $ 432,829 $ 194,570 Marketable securities and other investments 1,844,892 1,905,161 Accounts receivable for services to patients, net of allowance for doubtful
accounts of $94,700 in 2015 and $91,200 in 2014 876,130 774,831 Accounts receivable for physician activities, net 111,902 74,058 Assets limited as to use, current portion 101,683 104,566 Pledges receivable, current portion 35,097 36,129 Insurance claims receivable, current portion 71,068 83,268 Other current assets 207,968 172,369
Total current assets 3,681,569 3,344,952
Assets limited as to use, net of current portion 1,508,032 1,365,666 Pledges receivable, net of current portion 91,090 101,423 Property, plant and equipment, net 4,315,166 3,762,104 Insurance claims receivable, net of current portion 278,530 312,169 Other assets 264,340 125,240 Total assets $ 10,138,727 $ 9,011,554
Liabilities and net assets Current liabilities:
Short-term borrowings $ 110,218 $ 110,218 Accounts payable and accrued expenses 733,653 607,224 Accrued salaries and related benefits 625,383 595,405 Current portion of capital lease obligations 3,138 5,902 Current portion of long-term debt 55,613 55,357 Current portion of insurance claims liability 71,068 83,268 Current portion of malpractice and other insurance liabilities 101,720 81,344 Current portion of third-party payer structured liabilities 4,346 4,346 Current portion of estimated payable to third-party payers 235,768 247,935
Total current liabilities 1,940,907 1,790,999
Accrued retirement benefits, net of current portion 782,972 706,145 Capital lease obligations, net of current portion 171,888 196,582 Long-term debt, net of current portion 2,199,401 1,822,743 Insurance claims liability, net of current portion 278,530 312,169 Malpractice and other insurance liabilities, net of current portion 881,794 758,983 Third-party payer structured liabilities, net of current portion 8,303 13,266 Other long-term liabilities 635,892 577,276 Total liabilities 6,899,687 6,178,163
Commitments and contingencies
Net assets: Unrestricted 2,710,921 2,340,552 Temporarily restricted 363,573 357,127 Permanently restricted 164,546 135,712
Total net assets 3,239,040 2,833,391 Total liabilities and net assets $ 10,138,727 $ 9,011,554
Project # 171053BFA Attachment B (Cont.)
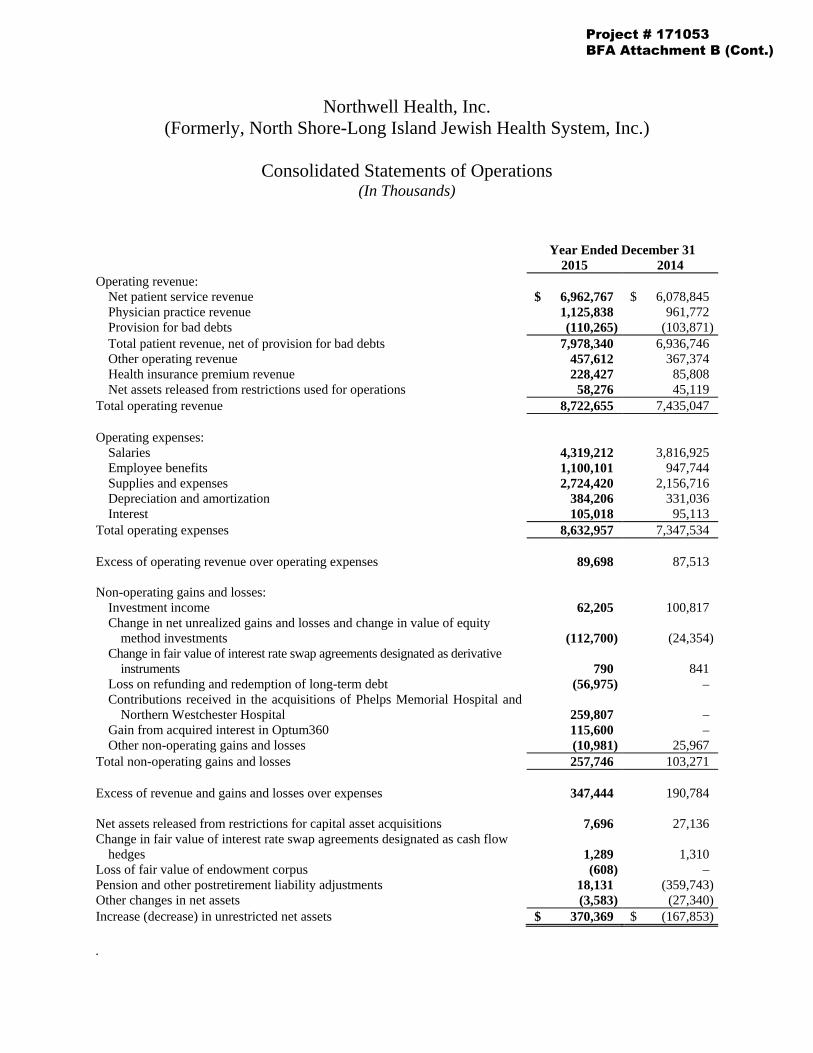
Northwell Health, Inc. (Formerly, North Shore-Long Island Jewish Health System, Inc.)
Consolidated Statements of Operations (In Thousands)
Year Ended December 31 2015 2014
Operating revenue: Net patient service revenue $ 6,962,767 $ 6,078,845 Physician practice revenue 1,125,838 961,772 Provision for bad debts (110,265) (103,871)Total patient revenue, net of provision for bad debts 7,978,340 6,936,746 Other operating revenue 457,612 367,374 Health insurance premium revenue 228,427 85,808 Net assets released from restrictions used for operations 58,276 45,119
Total operating revenue 8,722,655 7,435,047
Operating expenses: Salaries 4,319,212 3,816,925 Employee benefits 1,100,101 947,744 Supplies and expenses 2,724,420 2,156,716 Depreciation and amortization 384,206 331,036 Interest 105,018 95,113
Total operating expenses 8,632,957 7,347,534
Excess of operating revenue over operating expenses 89,698 87,513
Non-operating gains and losses: Investment income 62,205 100,817 Change in net unrealized gains and losses and change in value of equity
method investments (112,700) (24,354)Change in fair value of interest rate swap agreements designated as derivative
instruments 790 841 Loss on refunding and redemption of long-term debt (56,975) – Contributions received in the acquisitions of Phelps Memorial Hospital and
Northern Westchester Hospital 259,807 – Gain from acquired interest in Optum360 115,600 – Other non-operating gains and losses (10,981) 25,967
Total non-operating gains and losses 257,746 103,271
Excess of revenue and gains and losses over expenses 347,444 190,784
Net assets released from restrictions for capital asset acquisitions 7,696 27,136 Change in fair value of interest rate swap agreements designated as cash flow
hedges 1,289 1,310 Loss of fair value of endowment corpus (608) – Pension and other postretirement liability adjustments 18,131 (359,743)Other changes in net assets (3,583) (27,340)Increase (decrease) in unrestricted net assets $ 370,369 $ (167,853)
.
Project # 171053BFA Attachment B (Cont.)
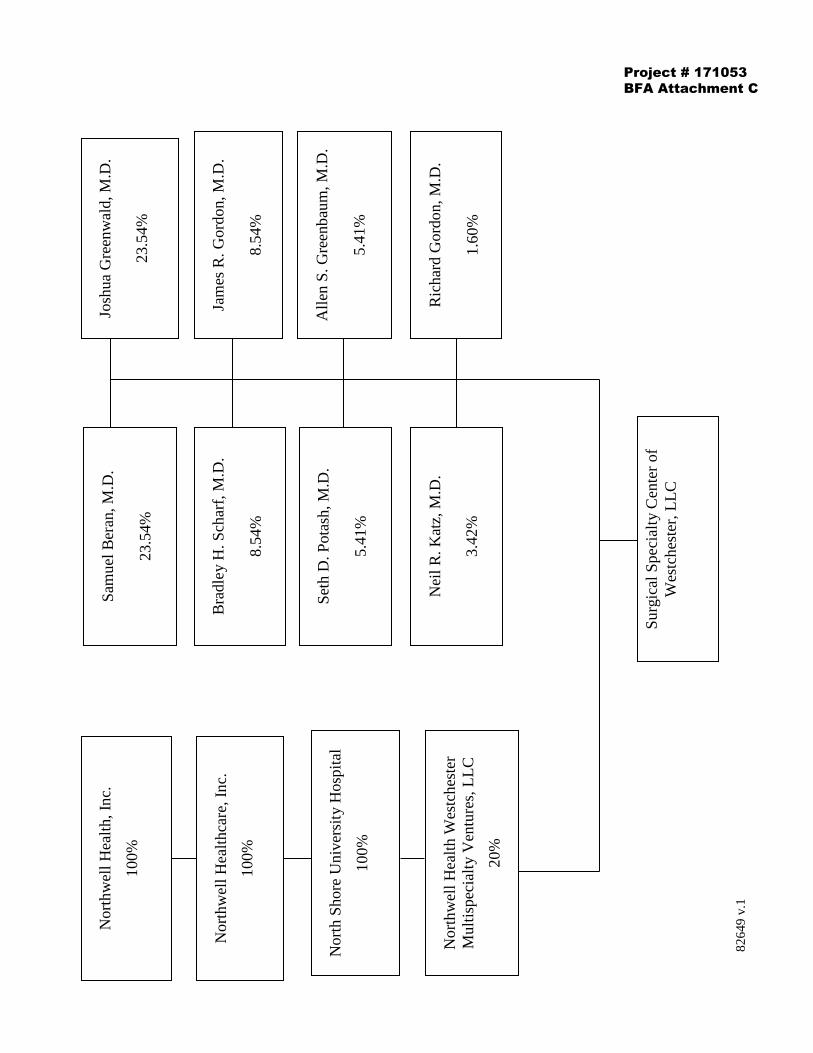
826
49 v
.1
Sur
gica
l Spe
cial
ty C
ente
r of
W
estc
hest
er, L
LC
Nor
thw
ell H
ealt
h W
estc
hest
er
Mul
tisp
ecia
lty
Ven
ture
s, L
LC
20%
Nor
thw
ell H
ealt
h, I
nc.
100%
Sam
uel B
eran
, M.D
.
23.5
4%
Josh
ua G
reen
wal
d, M
.D.
23.5
4%
Jam
es R
. Gor
don,
M.D
.
8.54
%
All
en S
. Gre
enba
um, M
.D.
5.41
%
Ric
hard
Gor
don,
M.D
.
1.60
%
Bra
dley
H. S
char
f, M
.D.
8.54
%
Set
h D
. Pot
ash,
M.D
.
5.41
%
Nei
l R. K
atz,
M.D
.
3.42
%
Nor
thw
ell H
ealt
hcar
e, I
nc.
100%
Nor
th S
hore
Uni
vers
ity
Hos
pita
l
100%
Project # 171053BFA Attachment C
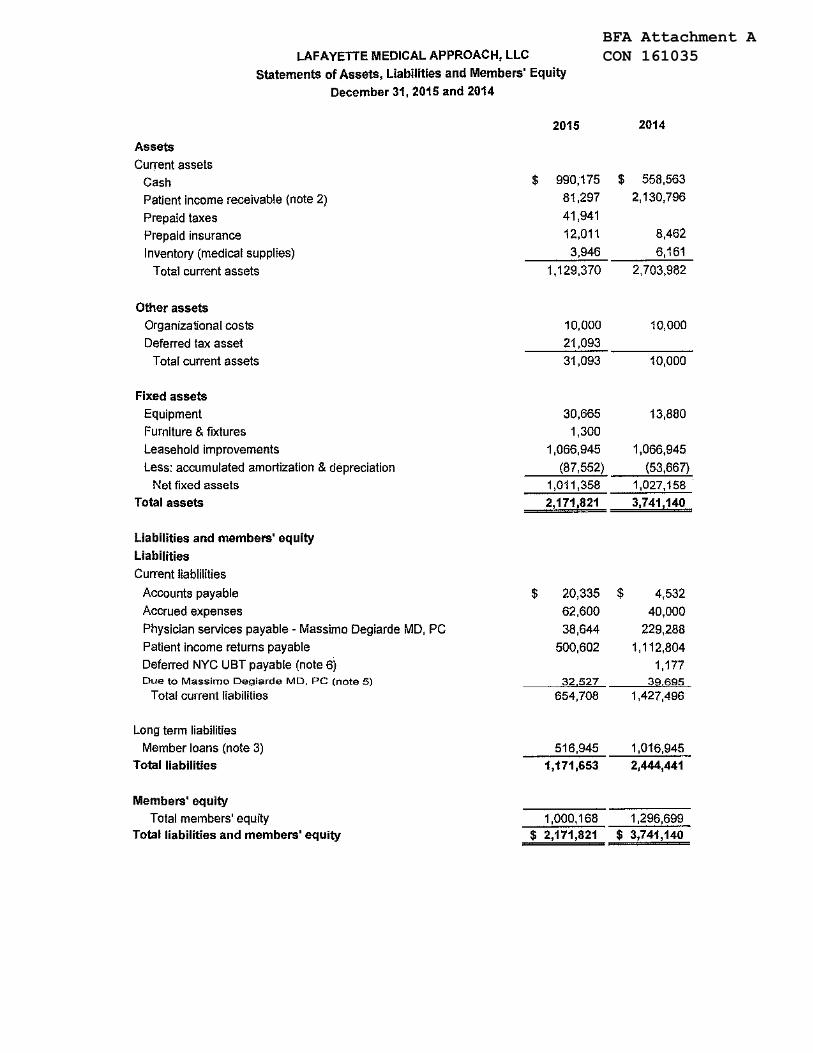
BFA Attachment ACON 161035LAFAYETIE MEDICAL APPROACH, LLC
Statements of Assets, Liabilities and Members' Equity
December 31, 2015 and 2014
2015 2014
Assets
Current assets
Cash $ 990, 175 $ 558,563
Patient income receivable {note 2) 81,297 2,130,796
Prepaid taxes 41,941
Prepaid insurance 12,011 8,462
Inventory {medical supplies) 3,946 6,161
Total current assets 1,129,370 2,703,982
Other assets
Organizational costs 10,000 10,000
Deferred tax asset 21,093
Total current assets 31,093 10,000
Fixed assets
Equipment 30,665 13,880 Furniture & fixtures 1,300
Leasehold improvements 1,066,945 1,066,945
Less: accumulated amortization & depreciation (87,552) (53,667) Net fixed assets 1,011,358 1,027,158
Total assets 2, 171,821 3,741140
Liabilities and members' equity
Liabilities
Current liablilities
Accounts payable $ 20,335 $ 4,532
Accrued expenses 62,600 40,000
Physician services payable. Massimo Degiarde MD, PC 38,644 229,288
Patient income returns payable 500,602 1,112,804
Deferred NYC UBT payable (note 6) 1,177 Due to Massimo Degiarde MD, PC (note 5) 32 527 3:;!§95
Total current liabilities 654,708 1,427,496
Long term liabilities
Member loans {note 3) 516,945 1,016,945 Total liabilities 1,171,653 2,444,441
Members' equity
Total members' equity 1,000,168 1,296,699 Total liabilities and members' equity $ 2,171,821 $ 3,741, 140
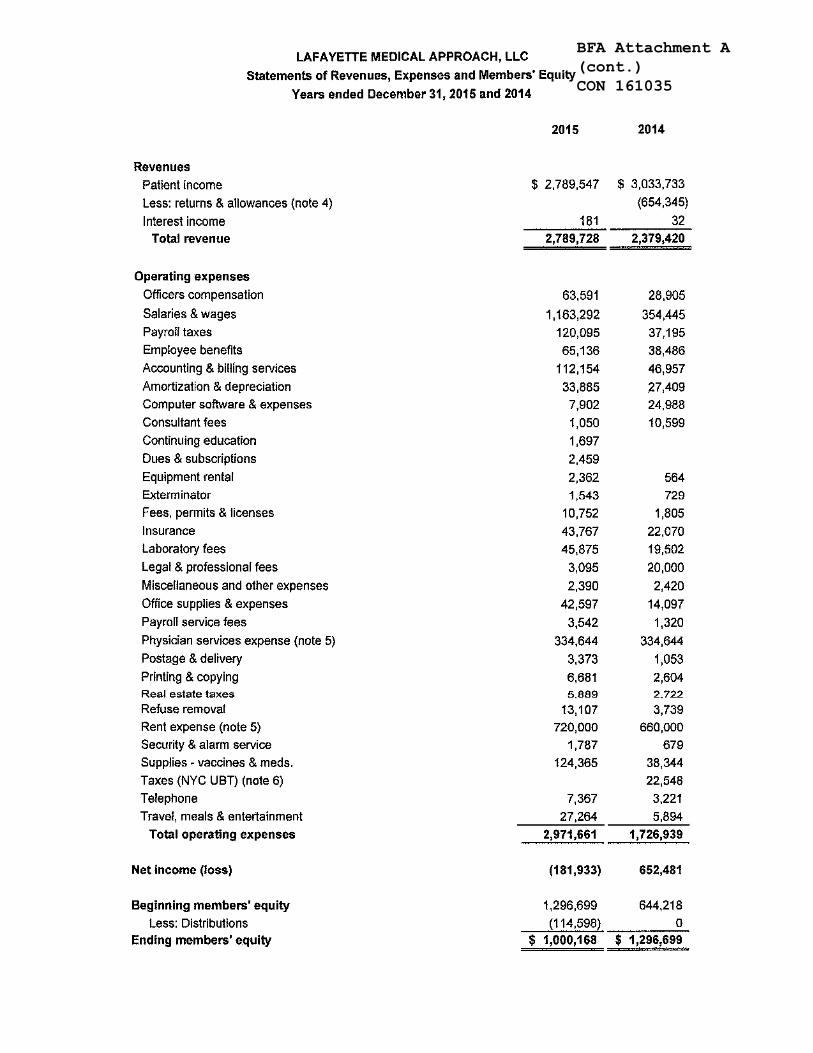
BFA Attachment A (cont.)CON 161035

Jan
1 - S
ep 2
7, 1
6
Ord
inar
y In
com
e/Ex
pens
eIn
com
eFe
e fo
r Ser
vice
Inco
me
Amer
igro
up49,344.48
MC
M-A
ffini
ty/B
eaco
n2,188.75
MC
M-A
mid
a/B
eaco
n12,495.00
MC
M-B
eaco
nHea
lth213,019.73
MC
M-E
mpi
re133,199.52
MC
M-F
idel
is47,841.96
MC
M-H
ealth
first
399,134.32
MC
M-H
ealth
plus
10,442.27
MC
M-M
etro
Plus
/Bea
con
350,648.37
MC
M-U
nite
dhea
lthca
re99,825.78
Med
icai
d475,353.90
NJP
LIG
A2,325.00
Fee
for S
ervi
ce In
com
e - O
ther
118,515.49
Tota
l Fee
for S
ervi
ce In
com
e1,914,334.57
Inte
rest
Inco
me
32.99
Tota
l Inc
ome
1,914,367.56
Gro
ss P
rofit
1,914,367.56
Expe
nse
Adve
rtis
ing
and
Prom
otio
n1,974.86
Alar
m S
ervi
ce1,733.83
Ban
k Se
rvic
e C
harg
es413.33
Bill
ing
Serv
ices
13,471.79
Cha
ritab
le D
onat
ions
200.00
Com
pute
r and
Inte
rnet
Exp
ense
s19,803.75
Con
sulta
nt F
ees
600.00
Con
tinui
ng E
duca
tion
533.00
Cop
ier l
ease
1,014.66
Cop
y Se
rvic
e5,507.40
Due
s an
d Su
bscr
iptio
ns0.00
Exte
rmin
ator
949.36
Fees
Exp
ense
Crim
inal
Bac
kgro
und
Che
ck199.70
payr
oll F
ees
3,266.27
Fees
Exp
ense
- O
ther
1,022.79
Tota
l Fee
s Ex
pens
e4,488.76
Gua
rent
eed
Paym
ent
11,562.00
Gua
rent
eed
Paym
entV
- AD
40,467.00
3:37
PM
LAFA
YETT
E M
EDIC
AL A
PPR
OAC
H L
LC09
/27/
16Pr
ofit
& L
oss
Accr
ual B
asis
Janu
ary
1 th
roug
h Se
ptem
ber 2
7, 2
016
BFA Attachment BCON 161035
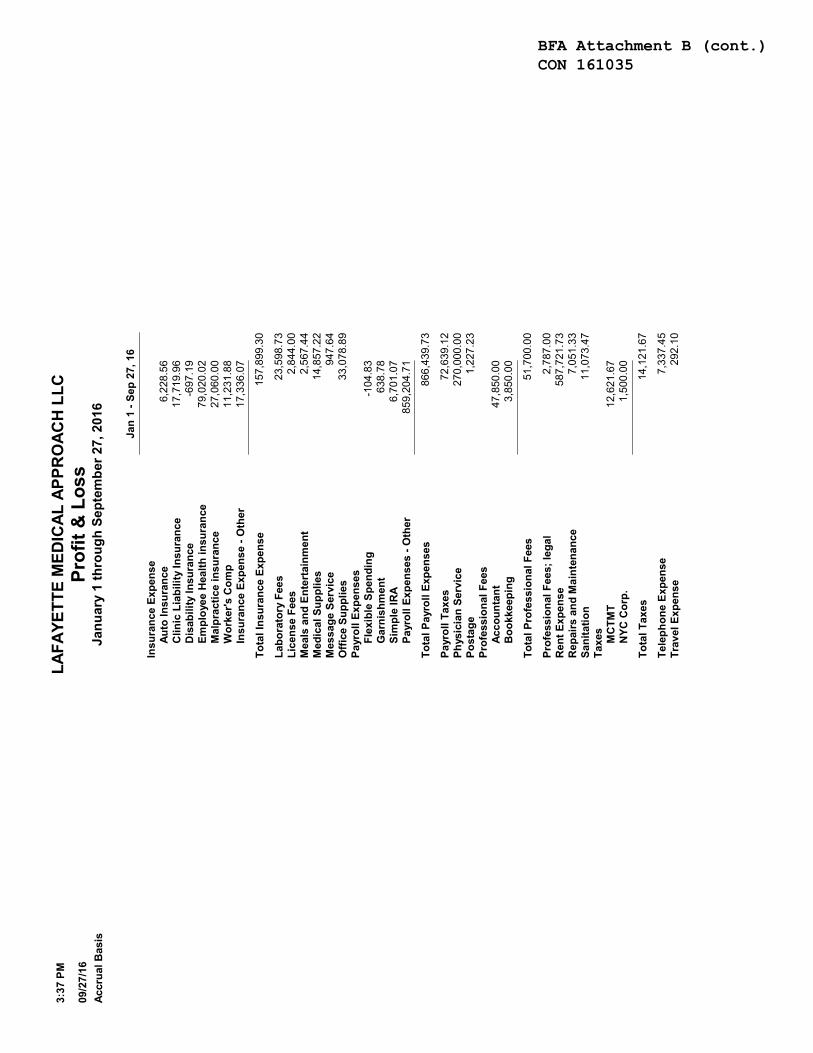
Jan
1 - S
ep 2
7, 1
6
Insu
ranc
e Ex
pens
eAu
to In
sura
nce
6,228.56
Clin
ic L
iabi
lity
Insu
ranc
e17,719.96
Dis
abili
ty In
sura
nce
-697.19
Empl
oyee
Hea
lth in
sura
nce
79,020.02
Mal
prac
tice
insu
ranc
e27,060.00
Wor
ker's
Com
p11,231.88
Insu
ranc
e Ex
pens
e - O
ther
17,336.07
Tota
l Ins
uran
ce E
xpen
se157,899.30
Labo
rato
ry F
ees
23,598.73
Lice
nse
Fees
2,844.00
Mea
ls a
nd E
nter
tain
men
t2,567.44
Med
ical
Sup
plie
s14,857.22
Mes
sage
Ser
vice
947.64
Offi
ce S
uppl
ies
33,078.89
Payr
oll E
xpen
ses
Flex
ible
Spe
ndin
g-104.83
Gar
nish
men
t638.78
Sim
ple
IRA
6,701.07
Payr
oll E
xpen
ses
- Oth
er859,204.71
Tota
l Pay
roll
Expe
nses
866,439.73
Payr
oll T
axes
72,639.12
Phys
icia
n Se
rvic
e270,000.00
Post
age
1,227.23
Prof
essi
onal
Fee
sAc
coun
tant
47,850.00
Boo
kkee
ping
3,850.00
Tota
l Pro
fess
iona
l Fee
s51,700.00
Prof
essi
onal
Fee
s; le
gal
2,787.00
Ren
t Exp
ense
587,721.73
Rep
airs
and
Mai
nten
ance
7,051.33
Sani
tatio
n11,073.47
Taxe
sM
CTM
T12,621.67
NYC
Cor
p.1,500.00
Tota
l Tax
es14,121.67
Tele
phon
e Ex
pens
e7,337.45
Trav
el E
xpen
se292.10
3:37
PM
LAFA
YETT
E M
EDIC
AL A
PPR
OAC
H L
LC09
/27/
16Pr
ofit
& L
oss
Accr
ual B
asis
Janu
ary
1 th
roug
h Se
ptem
ber 2
7, 2
016
BFA Attachment B (cont.) CON 161035
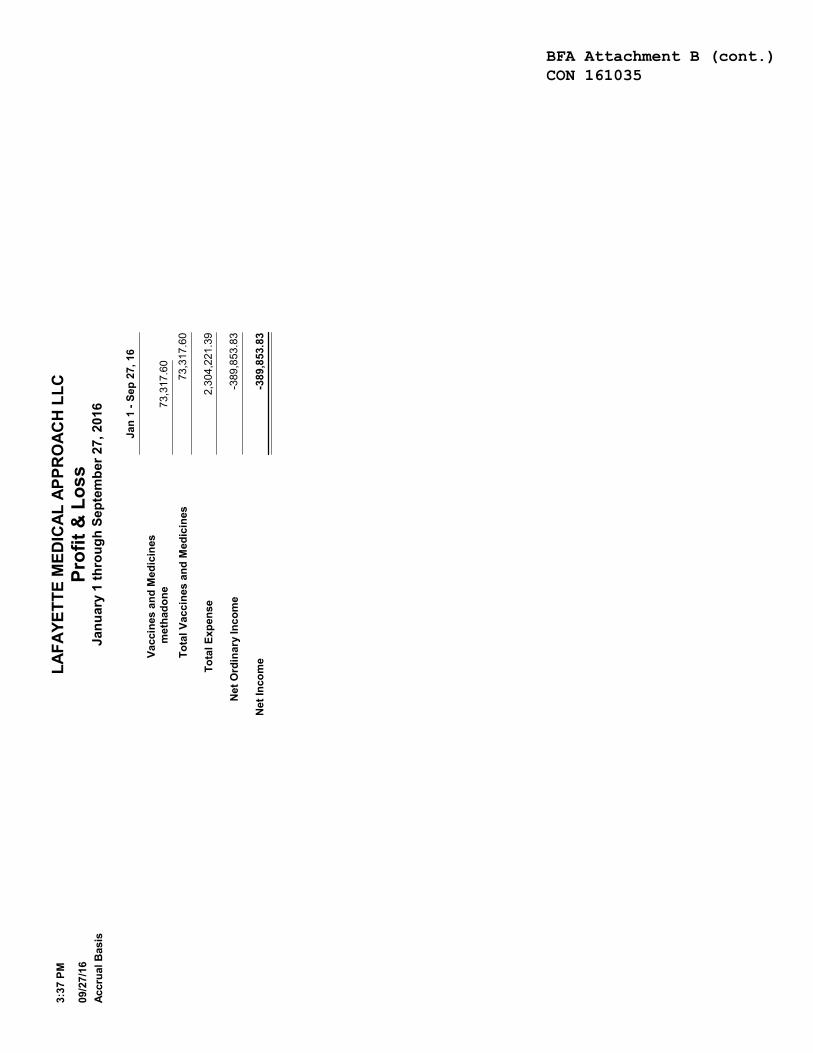
Jan
1 - S
ep 2
7, 1
6
Vacc
ines
and
Med
icin
esm
etha
done
73,317.60
Tota
l Vac
cine
s an
d M
edic
ines
73,317.60
Tota
l Exp
ense
2,304,221.39
Net
Ord
inar
y In
com
e-389,853.83
Net
Inco
me
-389
,853
.83
3:37
PM
LAFA
YETT
E M
EDIC
AL A
PPR
OAC
H L
LC09
/27/
16Pr
ofit
& L
oss
Accr
ual B
asis
Janu
ary
1 th
roug
h Se
ptem
ber 2
7, 2
016
BFA Attachment B (cont.) CON 161035
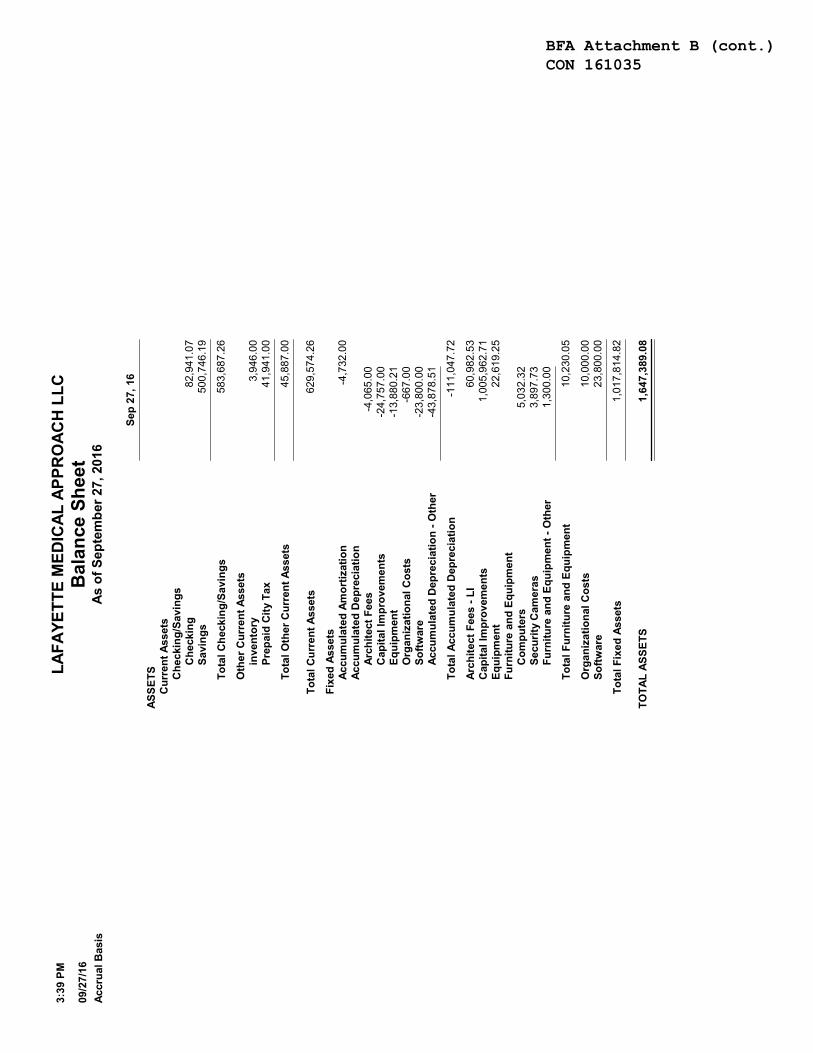
Sep
27, 1
6
ASSE
TSC
urre
nt A
sset
sC
heck
ing/
Savi
ngs
Che
ckin
g82,941.07
Savi
ngs
500,746.19
Tota
l Che
ckin
g/Sa
ving
s583,687.26
Oth
er C
urre
nt A
sset
sin
vent
ory
3,946.00
Prep
aid
City
Tax
41,941.00
Tota
l Oth
er C
urre
nt A
sset
s45,887.00
Tota
l Cur
rent
Ass
ets
629,574.26
Fixe
d As
sets
Accu
mul
ated
Am
ortiz
atio
n-4,732.00
Accu
mul
ated
Dep
reci
atio
nAr
chite
ct F
ees
-4,065.00
Cap
ital I
mpr
ovem
ents
-24,757.00
Equi
pmen
t-13,880.21
Org
aniz
atio
nal C
osts
-667.00
Softw
are
-23,800.00
Accu
mul
ated
Dep
reci
atio
n - O
ther
-43,878.51
Tota
l Acc
umul
ated
Dep
reci
atio
n-111,047.72
Arch
itect
Fee
s - L
I60,982.53
Cap
ital I
mpr
ovem
ents
1,005,962.71
Equi
pmen
t22,619.25
Furn
iture
and
Equ
ipm
ent
Com
pute
rs5,032.32
Secu
rity
Cam
eras
3,897.73
Furn
iture
and
Equ
ipm
ent -
Oth
er1,300.00
Tota
l Fur
nitu
re a
nd E
quip
men
t10,230.05
Org
aniz
atio
nal C
osts
10,000.00
Softw
are
23,800.00
Tota
l Fix
ed A
sset
s1,017,814.82
TOTA
L AS
SETS
1,64
7,38
9.08
3:39
PM
LAFA
YETT
E M
EDIC
AL A
PPR
OAC
H L
LC09
/27/
16B
alan
ce S
heet
Accr
ual B
asis
As o
f Sep
tem
ber 2
7, 2
016
BFA Attachment B (cont.) CON 161035
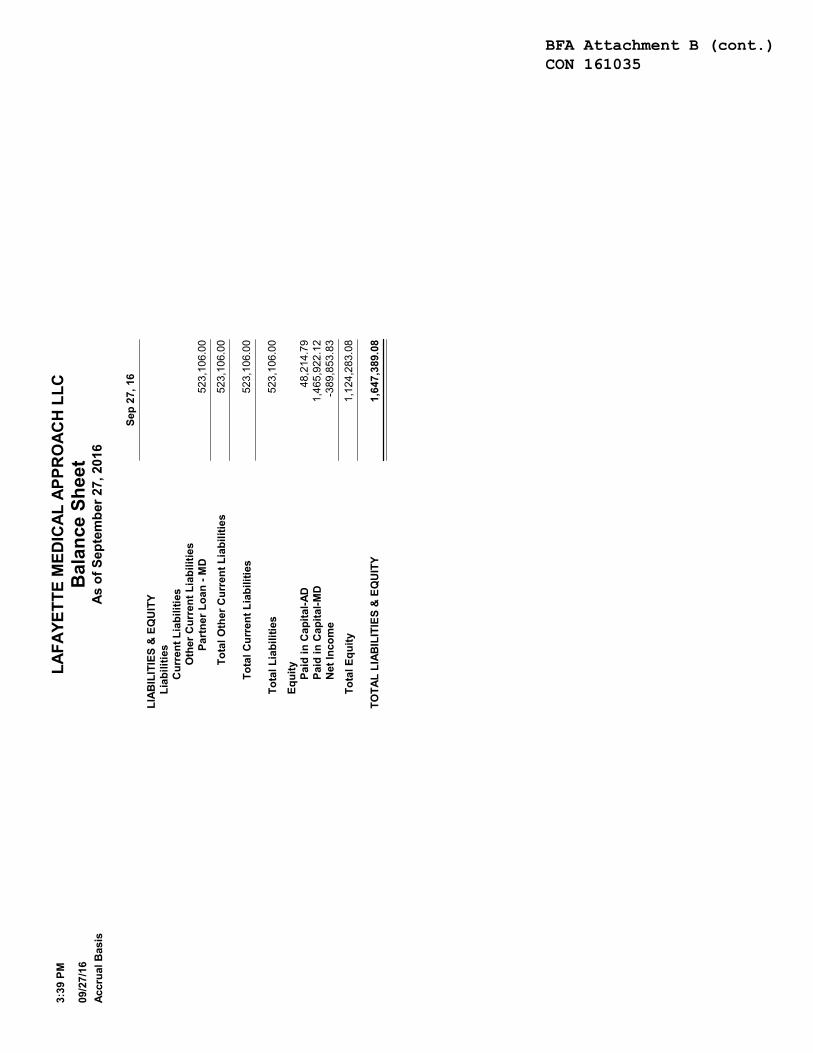
Sep
27, 1
6
LIAB
ILIT
IES
& E
QU
ITY
Liab
ilitie
sC
urre
nt L
iabi
litie
sO
ther
Cur
rent
Lia
bilit
ies
Part
ner L
oan
- MD
523,106.00
Tota
l Oth
er C
urre
nt L
iabi
litie
s523,106.00
Tota
l Cur
rent
Lia
bilit
ies
523,106.00
Tota
l Lia
bilit
ies
523,106.00
Equi
tyPa
id in
Cap
ital-A
D48,214.79
Paid
in C
apita
l-MD
1,465,922.12
Net
Inco
me
-389,853.83
Tota
l Equ
ity1,124,283.08
TOTA
L LI
ABIL
ITIE
S &
EQ
UIT
Y1,
647,
389.
08
3:39
PM
LAFA
YETT
E M
EDIC
AL A
PPR
OAC
H L
LC09
/27/
16B
alan
ce S
heet
Accr
ual B
asis
As o
f Sep
tem
ber 2
7, 2
016
BFA Attachment B (cont.) CON 161035
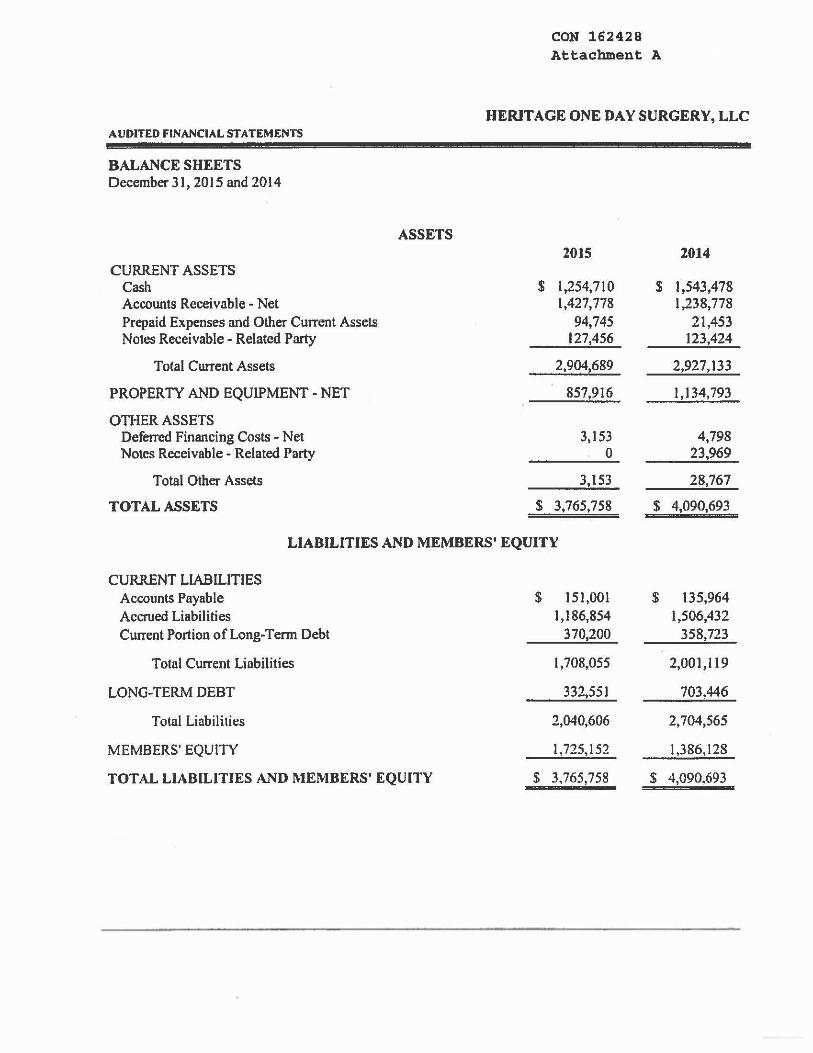
AUDITED FINANCIAL STATEMENTS
BALANCE SHEETS December 31, 2015 and 2014
ASSETS
CURRENT ASSETS Cash Accounts Receivable - Net Prepaid Expenses and Other Current Assets Notes Receivable - Related Party
Total Current Assets
PROPERTY AND EQUIPMENT - NET
OTHER ASSETS Deferred Financing Costs - Net Notes Receivable - Related Party
Total Other Assets
TOTAL ASSETS
CON 162428 Attachment A
HERITAGE ONE DAY SURGERY, LLC
2015 2014
$ 1,254,710 $ 1,543,478 1,427,778 1,238,778
94,745 21,453 127,456 123,424
2,904,689 2,927,133
857,916 1,134,793
3,153 4,798 0 23,969
3,153 28,767
$ 3,765,758 $ 4,090,693
LIABILITIES AND MEMBERS' EQUITY
CURRENT LIABILITIES Accounts Payable $ 151,001 $ 135,964 Accrued Liabilities 1,186,854 1,506,432 Current Portion of Long-Term Debt 370,200 358,723
Total Current Liabilities 1,708,055 2,001,119
LONG-TERM DEBT 332,551 703,446
Total Liabilities 2,040,606 2,704,565
MEMBERS' EQUITY 1,725,152 1,386, 128
TOT AL LIABILITIES AND MEMBERS' EQUITY $ 3,765,758 $ 4,090.693
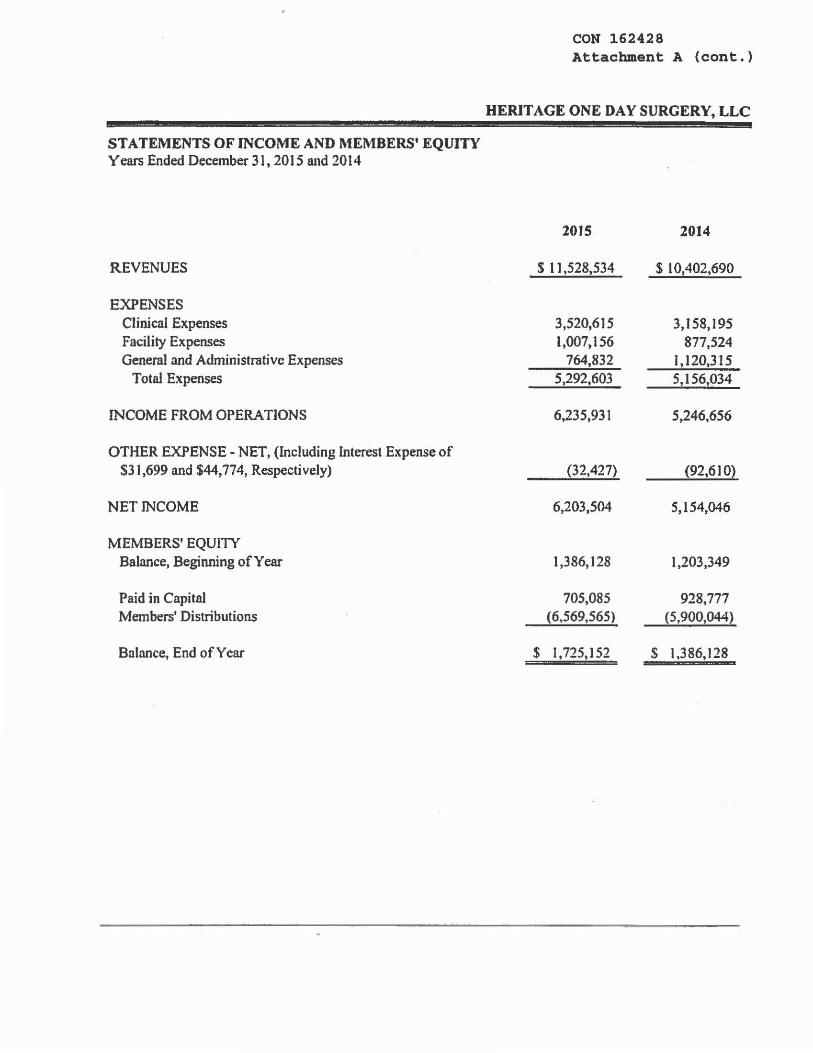
STATEMENTS OF INCOME AND MEMBERS' EQUITY Years Ended December 31, 2015 and 2014
REVENUES
EXPENSES Clinical Expenses Facility Expenses General and Administrative Expenses
Total Expenses
INCOME FROM OPERATIONS
OTHER EXPENSE - NET, (Including Interest Expense of $31,699 and $44,774, Respectively)
NET INCOME
MEMBERS' EQUITY Balance, Beginning of Year
Paid in Capital Members' Distributions
Balance, End of Year
CON 162428 Attachment A (cont.)
HERITAGE ONE DAY SURGERY, LLC
2015 2014
$ 11,528,534 S 10,402,690
3,520,615 3, I 58, 195 1,007,156 877,524
764,832 1, 120,315 5,292,603 5,156,034
6,235,931 S,246,656
(32,427) (92,610)
6,203,504 S,154,046
1,386,128 1,203,349
705,085 928,777 (6,569,565) (5,900,044)
$ 1,725,152 s l,386,128
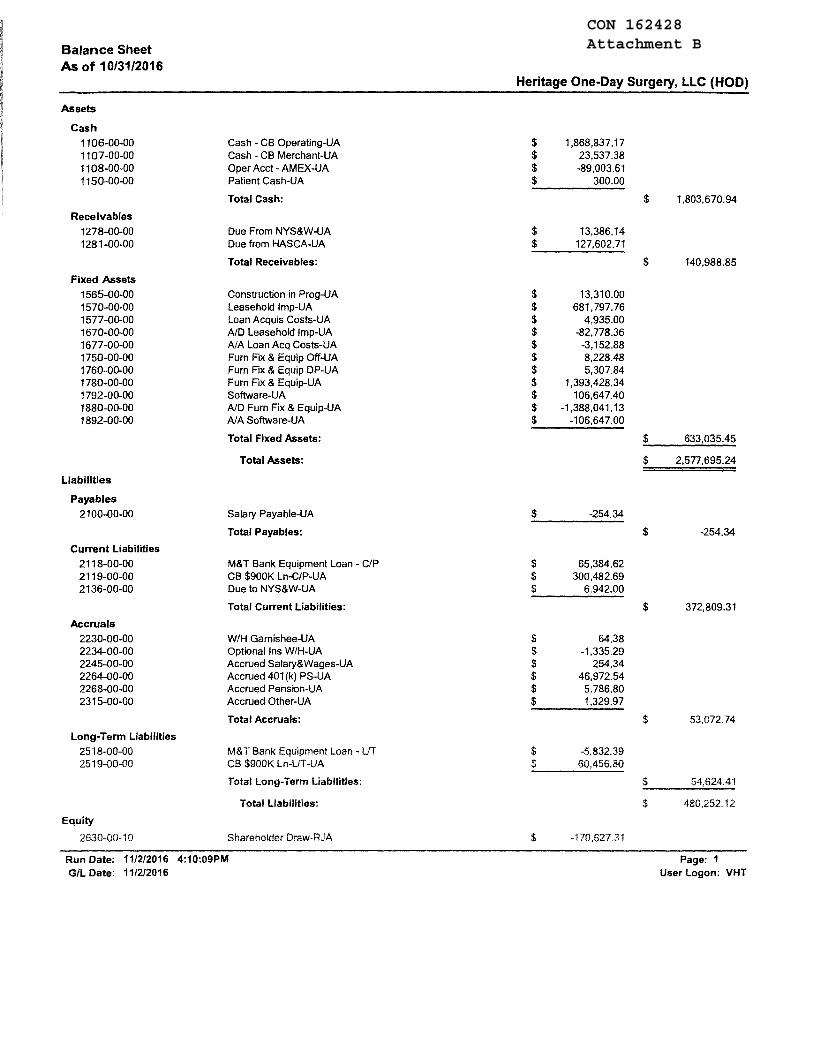
CON 162428Attachment BBalance Sheet
As of 10/31/2016 Heritage One-Day Surgery, LLC (HOD)
Assets
Cash
1106-00-00 Cash - CB Operating-UA $ 1,868,837.17 1107-00-00 Cash - CB Merchant-UA $ 23,537.38 1108-00-00 Oper Acct - AMEX-UA $ -89,003.61 1150-00-00 Patient Cash-UA $ 300.00
Total Cash: $ 1,803,670.94
Receivables
1278-00-00 Due From NYS&W-UA $ 13,386.14 1281-00-00 Due from HASCA-UA $ 127,602.71
Total Receivables: $ 140,988.85
Fixed Assets
1565-00-00 Construction in Prog-UA $ 13,310.00 1570-00-00 Leasehold lmp-UA $ 681,797.76 1577-00-00 Loan Acquis Costs-UA $ 4,935.00 1670-00-00 AID Leasehold lmp-UA $ -82,778.36 1677-00-00 AIA Loan Acq Costs-UA $ -3,152.88 1750-00-00 Furn Fix & Equip Off-UA $ 8,228.48 1760-00-00 Furn Fix & Equip DP-UA $ 5,307.84 1780-00-00 Furn Fix & Equip-UA $ 1,393,428.34 1792-00-00 Software-UA $ 106,647.40 1880-00-00 AID Furn Fix & Equip-UA $ -1,388,041.13 1892-00-00 AIA Software-UA $ -106,647.00
Total Fixed Assets: $ 633,035.45
Total Assets: $ 2,577,695.24
Liabilities
Payables
2100-00-00 Salary Payable-UA $ -254.34
Total Payables: $ -254.34
Current Liabilities
2118-00-00 M&T Bank Equipment Loan - C/P $ 65,384.62 2119-00-00 CB $900K Ln-C/P-UA $ 300,482.69 2136-00-00 Due to NYS&W-UA $ 6,942.00
Total Current Liabilities: $ 372,809.31
Accruals
2230-00-00 W/H Garnishee-UA $ 64.38 2234-00-00 Optional Ins W/H-UA $ -1,335.29 2245-00-00 Accrued Salary&Wages-UA $ 254.34 2264-00-00 Accrued 401 (k) PS-UA $ 46,972.54 2268-00-00 Accrued Pension-UA $ 5,786.80 2315-00-00 Accrued Other-UA $ 1,329.97
Total Accruals: $ 53,072.74
Long-Term Liabilities
2518-00-00 M&T Bank Equipment Loan - LIT $ -5,832.39 2519-00-00 CB $900K Ln-L/T-UA $ 60,456.80
Total Long-Term Liabilities:
Total Liabilities: $ 480,252.12
Equity
2630-00-10 Shareholder Draw-RJA $ -170 ,627 .31
Run Date: 11/2/2016 4:10:09PM Page: 1 GIL Date: 11/2/2016 User Logon: VHT
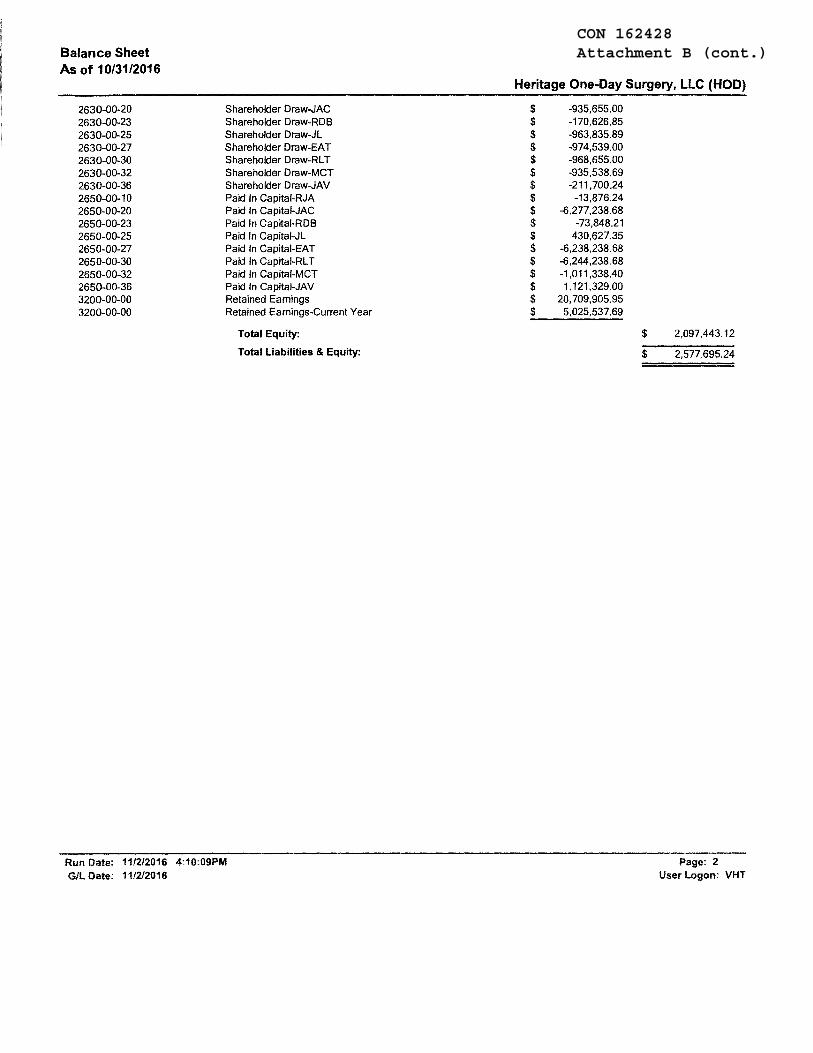
CON 162428Attachment B (cont.)Balance Sheet
As of 10/31/2016
2630-00-20 2630-00-23 2630-00-25 2630-00-27 2630-00-30 2630-00-32 2630-00-36 2650-00-10 2650-00-20 2650-00-23 2650-00-25 2650-00-27 2650-00-30 2650-00-32 2650-00-36 3200-00-00 3200-00-00
Shareholder Draw-JAC Shareholder Draw-ROB Shareholder Draw-JL Shareholder Draw-EAT Shareholder Draw-RL T Shareholder Draw-MCT Shareholder Draw-JAV Paid In Capital-RJA Paid In Capital-JAC Paid In Capital-ROB Paid In Capital-JL Paid In Capital-EAT Paid In Capital-RL T Paid In Capital-MCT Paid In Capital-JAV Retained Earnings Retained Earnings-Current Year
Total Equity:
Total Liabilities & Equity:
Run Date: 11/2/2016 4:10:09PM GIL Date: 11/2/2016
Heritage One-Day Surgery, LLC (HOD)
$ -935,655.00 $ -170,626.85 $ -963,835.89 $ -974,539.00 $ -968,655.00 $ -935,538.69 $ -211,700.24 $ -13,876.24 $ -6,277,238.68 $ -73,848.21 $ 430,627.35 $ -6,238,238.68 $ -6,244,238.68 $ -1,011,338.40 $ 1, 121,329.00 $ 20, 709,905.95 $ 5,025,537.69
$ 2,097,443.12
$ 2,577,695.24
Page: 2 User Logon: VHT
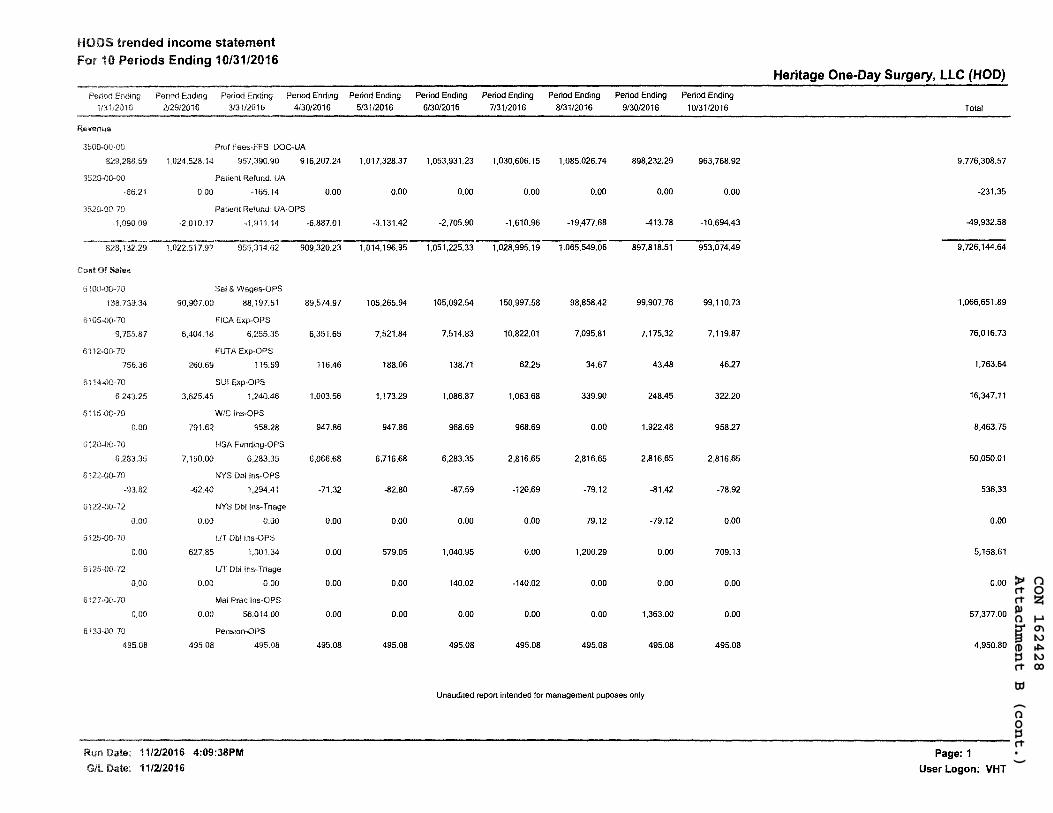
CON 162428
Attachment B (cont.)
trended income statement 10 Periods Ending 10/31/2016
Period Ending Period Ending
212912016 413012016
Prof DOC-UA
1,024.528. 14 957,390.90 916,207.24
Patient Refund: UA
0.00 -165.14 0.00
Patient Refund: UA-OPS
-2,010.17 -1,911.14
1,022,517.97 955,314.62
Sal & Wages-OPS
90.907.00 88, 197.61
FICA Exp-OPS
6,404.18 6,255.35
FUTA Exp-OPS
260.69 116.69
SUI Exp-OPS
3,625.45 1,240.46
WIC Ins-OPS
791.62 95828
HSA Funding-OPS
7,150.00 6,283.35
NYS Dbl Ins-OPS
-62.40 1.294A1
NYS Dbl Ins-Triage
0.00 0.00
Dbl Ins-OPS
627.85 1,001.34
Dbl Ins-Triage
0,00 0.00
Mal Prac Ins-OPS
0.00 56,014.00
Pension-OPS
495.08 495.08
11/2/2016 4:09:38PM
1112/2016
-6,887.01
909,320.23
89,574.97
6,351.65
116.46
1,003.56
947.86
6,066.68
-71.32
0.00
0.00
0.00
0.00
495.08
Period Ending
513112016
1,017.328.37
0.00
-3, 131.42
1,014,196.95
105,265.94
7,521.84
188.06
1,173.29
947.86
6,716.68
-82.80
0.00
579.05
0.00
0.00
495.08
Heritage One-Day Surgery, LLC (HOD)
Period Ending Period Ending Period Ending Period Ending Period Ending
6/30/2016 7/31/2016 8131/2016 9/30/2016 10/31/2016 Total
1,053,931.23 1,030,606.15 1,085,026. 74 898,232.29 963,768.92 9,776,308.57
0.00 0.00 0.00 0.00 0.00 -231.35
-2,705.90 -1,610.96 -19,477.68 -413.78 -10,694.43 -49,932.58
1,051,225.33 1,028,995, 19 1,065,549.06 897,818.51 953,074.49 9, 726, 144.64
105,092.54 150,997.58 98,858.42 99,907.76 99,110.73 1,066,651.89
7,514.83 10,822.01 7,095.81 7,175.32 7,119.87 76,016.73
138.71 62.25 34.67 43.48 46.27 1,763.64
1,086.87 1,063.68 339.90 248.45 322.20 16,347.11
968.69 968.69 0.00 1,922.48 958.27 8,463.75
6,283.35 2,816.65 2,816.65 2,816.65 2,816.65 50,050.01
-87.59 -120.69 -79.12 -81.42 -78.92 536.33
0.00 0.00 79.12 -79.12 0.00 0.00
1,040.95 0.00 1,200.29 0.00 709.13 5,158.61
140.02 -140.02 0.00 0.00 0.00 0.00
0.00 0.00 0.00 1,363.00 0.00 57,377.00
495.08 495.08 495.08 495.08 495.08 4,950.80
Unaudited report intended for management puposes only
Page: 1
User Logon: VHT
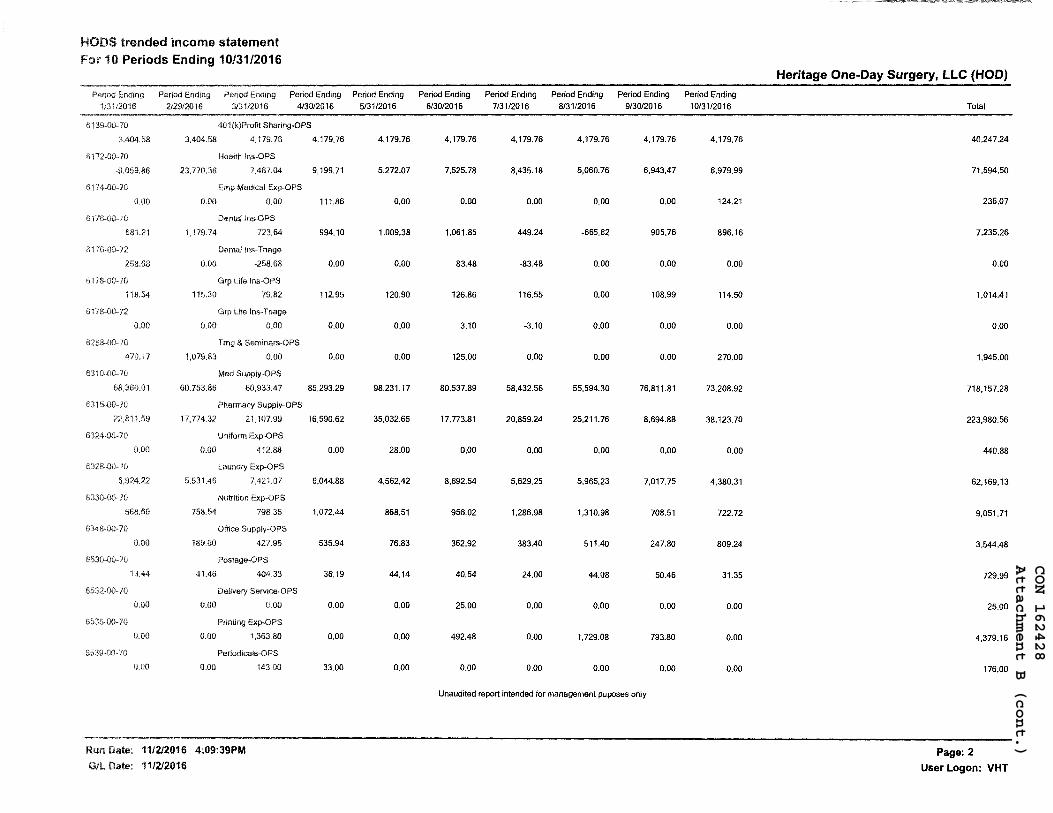
CON 162428
Attachment B (cont.)
trended income statement 10 Periods Ending 10/31/2016
Period Ending Ending Period Ending
212912016 313112016 413012016
40 I (k)Profit Sharing-OPS
3.404.58 4, 179.76 4, 179.76
Health
23,770.36 7,467.04 9,199.71
Medical Exp-OPS
0.00 0.00 111.86
Ins-OPS
1,179.74 723.64 994.10
Ins-Triage
0.00 -258.68 0.00
Grp Life Ins-OPS
118.54 115.30 79.82 112.95
Grp life Ins-Triage
0.00 0.00 0.00
Tmg & Seminars-OPS
17 1,079.83 0.00 0.00
Med Supply-OPS
60,753.86 60,933.47 85,293.29
Pha!Tl1acy Supply-OPS
17,774.32 21,107.99 16,590.62
Unifo!Tl1 Exp-OPS
0.00 412.88 0.00
Laundry Exp-OPS
5,531.46 7,421.07 6,044.88
Nutrition Exp-OPS
758.54 798.35 1,072.44
Office Supply-OPS
189.00 427.95 535.94
Postage-OPS
13.44 41.46 404.33 36.19
Delivery Service-OPS
0.00 0.00 0.00
Printing Exp-OPS
0.00 1,363.80 0.00
Periodicals-OPS
0.00 143.00 33.00
Date: 11/2/2016 4:09:39PM
11/212016
Period Ending
5131/2016
4,179.76
5,272.07
0.00
1,009.38
0.00
120.90
0.00
0.00
98,231.17
35,032.65
28.00
4,562.42
868.51
76.83
44.14
0.00
0.00
0.00
Heritage One-Day Surgery, LLC (HOD)
Period Ending Period Ending Period Ending Period Ending Period Ending
6/30/2016 7/31/2016 8/31/2016 9/30/2016 10/3112016 Total
4,179.76 4,179.76 4,179.76 4, 179.76 4, 179.76 40,247.24
7,525.78 8,435.18 5,060.76 6,943.47 6,979.99 71,594.50
0.00 0.00 0.00 0.00 124.21 236.07
1,061.85 449.24 -665.82 905.76 896.16 7,235.26
83.48 -83.48 0.00 0.00 0,00 0.00
126.86 116.55 0.00 108.99 114.50 1,014.41
3.10 -3.10 0.00 0.00 0.00 0.00
125.00 0.00 0.00 0.00 270.00 1,945.00
80,537.89 58,432.56 55,594.30 76,811.81 73,208.92 718,157.28
17,773.81 20,859.24 25,211.76 8,694.88 38,123.70 223,980.56
0.00 0.00 0.00 0.00 0.00 440.88
8,692.54 5,629.25 5,965.23 7,017.75 4,380.31 62,169.13
956.02 1,286.98 1,310.98 708.51 722.72 9,051.71
362.92 383.40 511.40 247.80 809.24 3,544.48
40.54 24.00 44.08 50.46 31.35 729.99
25.00 0.00 0.00 0.00 0.00 25.00
492.48 0.00 1,729.08 793.80 0.00 4,379.16
0.00 0.00 0.00 0.00 0.00 176.00
Unaudited report intended for management puposes only
Page:2
User Logon: VHT

CON 162428
Attachment B (cont.)
HODS trended income statement 10 Periods Ending 10/31/2016
Period Ending Period Ending Period Ending
212912016 313112016 4130/2016
Books & Pubs-OPS
109.70 198.44 0.00 0.00
& Member·OPS
60.00 0.00 0.00
Office Exp-OPS
540.65 293.73 598.76
Office Exp.ADM
0.00 57.00 0.00
MobiVTelephon&OPS
421.03 425.48 429.08
General lns·OPS
0.00 515.65 515.65 515.65
Computer Service..OPS
0.00 0.00 0.00 505.44
Cmptr Parts&Supplies--OPS
2,525.39 891.44 0.00
Outside Service..OPS
64,684.04 68,093.66 57,986.76
Outside Service..ADM
60.00 0.00 0.00
O&U Equip Maint-OPS
5,943.86 8,237.24 6,489. 11
O&U Equip Maint-OPS
0.00 0.00 0.00
O&U Cmp!r Maint-OPS
276.90 13,259.47 348.95
O&U Med Waste Disp-OPS
0.00 335.06 1,529.80
O&U Bldgs & Grounds-OPS
13,321.89 15,039.93 19,282.63
O&U Auto Fuel-OPS
0.00 30.00 0.00
O&U Rent-OPS
17,774.75 17,774.75 17,774.75
O&U Equip Rent-OPS
1,023.86 1.023.86 1,041.58
Date: 11/2/2016 4:09:39PM
11/2/2016
Peliod Ending
5131/2016
0.00
0.00
921.81
0.00
434.87
515.65
0.00
9,622.68
58.470.51
0.00
7,589.70
0.00
4,096.51
2,389.48
14,251.63
0.00
17,774.75
1,041.58
Heritage One-Day Surgery, LLC (HOD)
Peliod Ending Period Ending Period Ending Period Ending Period Ending
613012016 7/31/2016 8/31/2016 9/30/2016 1013112016 Total
0.00 0.00 0.00 0.00 169.00 477.14
0.00 0.00 0.00 0.00 305.00 365.00
3,774.61 1,534.08 450.56 511.17 373.80 9,230.67
0.00 0.00 0.00 0.00 0.00 57.00
429.34 425.96 422.34 429.97 429.03 4,269.87
515.65 515.65 0.00 1,031.30 515.65 4,640.85
0.00 0.00 0.00 0.00 0.00 505.44
1,249.87 0.00 0.00 748.39 401.82 15,439.59
56,424.86 56,836.33 58,733.15 58,368.83 72,174.30 612,346.61
3,583.00 0.00 0.00 0.00 0.00 3,643.00
7,866.34 5,030.97 5,372.51 6,960.59 4,798.07 63,737.73
0.00 0.00 0.00 0.00 0.00 1,890.34
11,389.80 363.15 1,301.25 11,307.95 333.45 42,944.58
225.00 740.00 0.00 -235.06 1,317.25 8,571.40
20,782.74 18,646.56 15,422.12 14,286.17 13,379.60 157,479.92
0.00 0.00 0.00 0.00 0.00 30.00
17,774.75 17,774.75 17,774.75 17,774.75 17,774.75 177,747.50
1,041.58 1,041.58 2,209.46 485.19 485.19 10,462.88
Unaudited report intended !or management puposes only
Page: 3
User Logon: VHT
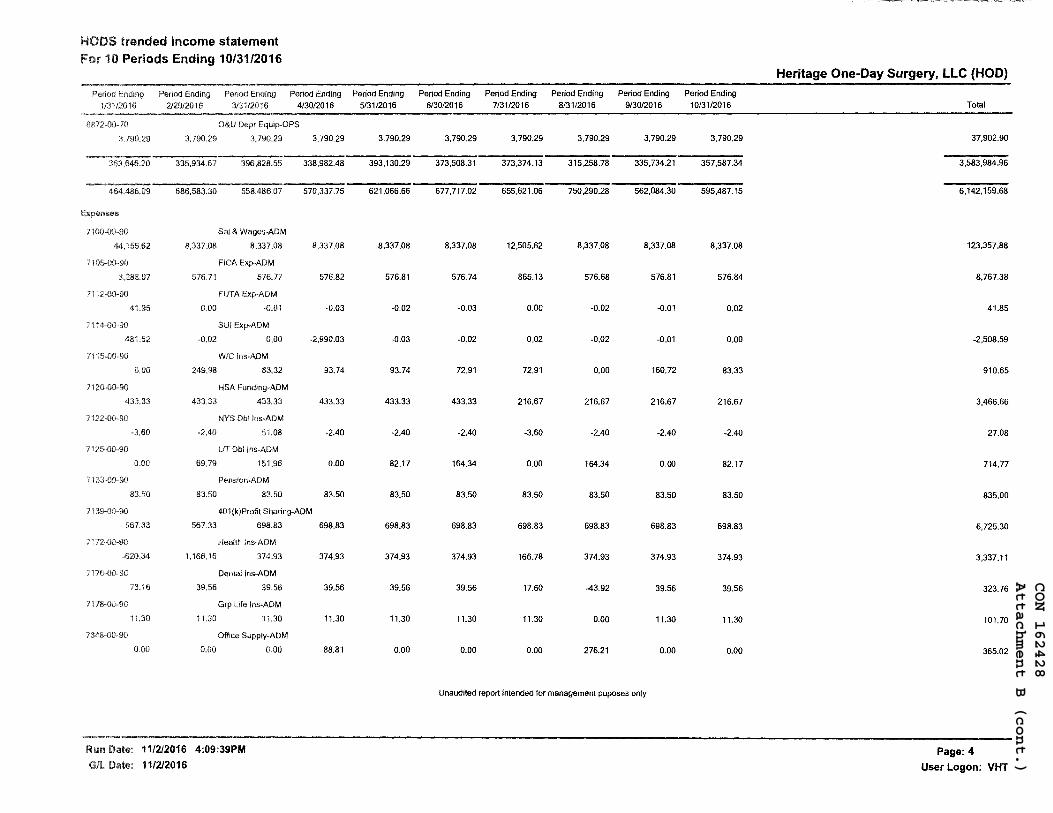
CON 162428
Attachment B (cont.)
trended income statement 10 Periods Ending 10/31/2016
Period Ending Period Ending
2129/2016 413012016
O&U Depr Equip-OPS
3,790,29 3.790.29 3,790.29
335,934.67 396,82855 338,982.48
-- 686,583.30 558,486.07 570,337.75
Sal & Wages-ADM
8,337,08 8,337.08 8,337.08
FICA Exp-ADM
576.71 576.77 576.82
Exp-ADM
0.00 -0.01 -0.03
Exp-ADM
-0,02 0,00 -2,990.03
WIC Ins-ADM
249.98 83.32 93.74
HSA Funding-ADM
433.33 433.33 433.33
NYS Dbl Ins-ADM
-2.40 51.08 -2.40
Dbl Ins-ADM
69.79 15L96 0.00
Pension-ADM
83.50 83.50 83.50
401 (k)Pro!it Sharing-ADM
567.33 698.83
Health Ins-ADM
1,166.16 374.93
Dental Ins-ADM
39.56 39.56
Grp life Ins-ADM
11.30 11.30
Office Supply-ADM
0.00 0.00
11/2/2016 4:09:39PM
11/2/2016
698.83
374.93
39.56
11.30
88.81
Period Ending
5/31/2016
3,790.29
393,130.29
621,066.66
8,337,08
576.81
-0.02
-0.03
93.74
433.33
-2.40
82.17
83.50
698.83
374.93
39.56
11.30
0.00
Heritage One-Day Surgery, LLC (HOD)
Period Ending Period Ending Period Ending Period Ending Period Ending
6130/2016 7/31/2016 813112016 9/30/2016 10/31/2016 Total
3,790.29 3,790.29 3,790.29 3,790.29 3,790.29 37,902.90
373,508.31 373,374.13 315,258.78 335,734.21 357,587.34 3,583,984.96
677,717.02 655,621.06 750,290.28 562,084.30 595,487.15 6,142,159.68
8,337.08 12,505.62 8,337.08 8,337.08 8,337.08 123,357.88
576.74 865.13 576.68 576.81 576.84 8,767.38
-O.D3 0.00 -0.02 -0.01 0.02 41.85
-0.02 0.02 -0.02 -0.01 0.00 -2,508.59
72.91 72.91 0.00 160.72 83.33 910.65
433.33 216.67 216.67 216.67 216.67 3,466.66
-2.40 -3.60 -2.40 -2.40 -2.40 27.08
164.34 0.00 164.34 0.00 82.17 714.77
83.50 83.50 83.50 83.50 83.50 835.00
698.83 698.83 698.83 698.83 698.83 6,725.30
374.93 166.78 374.93 374.93 374.93 3,337.11
39.56 17.60 -43.92 39.56 39.56 323.76
11.30 11.30 0.00 11.30 11.30 101.70
0.00 0.00 276.21 0.00 0.00 365.02
Unaudited report intended for management puposes only
Page:4
User Logon: VHT
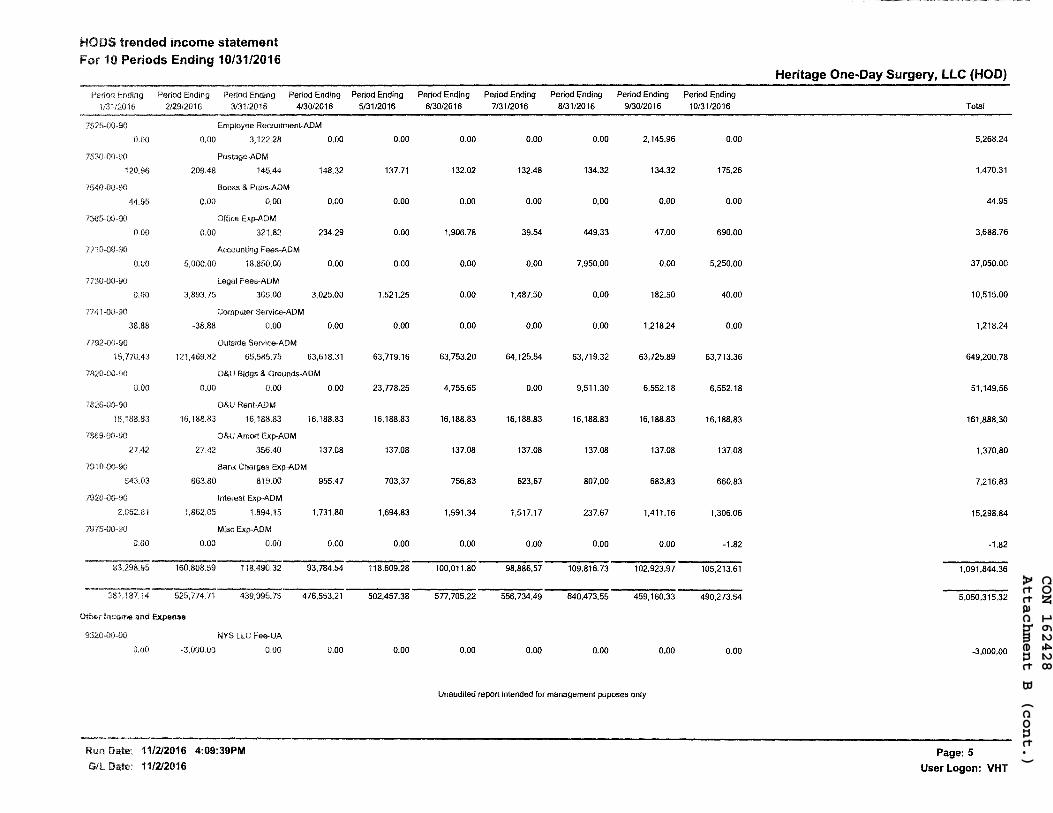
CON 162428
Attachment B (cont.)
HODS trended income statement 10 Periods Ending 10/31/2016
Period Ending Period Ending Period Ending
212912016 313112016 4130/2016
Employee Recruitment-ADM
0.00 0.00 3, 122.28 0.00
Postage-ADM
209.48 145.44 148.32
Books Pubs-ADM
44.95 0.00 0.00 0.00
Exp-ADM
0.00 0.00 321.82 234.29
Fees-ADM
5,000.00 18,850.00 0.00
Legal Fees-ADM
3,893.75 365.00 3,025.00
Computer Service-ADM
38.88 -38.88 0.00 0.00
Outside Service-ADM
121,469.82 65,585.75 63,618.31
O&U Bldgs & Grounds-ADM
0.00 0.00 0.00
O&U Rent-ADM
16, 188.83 16,188.83 16, 188.83
O&U Amort Exp-ADM
27.42 356.40 137.08
Bank Charges Exp-ADM
663.80 819.00 955.47
Interest E'.xp-ADM
1,862.05 1,894.15 1,731.80
Misc Exp-ADM
0.00 0.00 0.00
83.298.95 160,808.59 118.490.32 93,784.54
381,187.14 525,774.71 439,995.75 476,553.21
and Expense
NYS Fee-UA
-3,000.00 0.00 0.00
11/2/2016 4:09:39PM
11/2/2016
Period Ending
5/31/2016
0.00
137.71
0.00
0.00
0.00
1,521.25
0.00
63,719.16
23,778.25
16, 188.83
137.08
703.37
1,694.83
0.00
118,609.28
502,457.38
0.00
Heritage One-Day Surgery, LLC (HOD)
Period Ending Period Ending Period Ending Period Ending Period Ending
6/30/2016 7/31/2016 8/31/2016 9/30/2016 10/31/2016 Total
0.00 0.00 0.00 2,145.96 0.00 5,268.24
132.02 132.48 134.32 134.32 175.26 1,470.31
0.00 0.00 0.00 0.00 0.00 44.95
1,906.78 39.54 449.33 47.00 690.00 3,688.76
0.00 0.00 7,950.00 0.00 5,250.00 37,050.00
0.00 1,487.50 0.00 182.50 40.00 10,515.00
0.00 0.00 0.00 1,218.24 0.00 1,218.24
63,753.20 64,125.54 63,719.32 63,725.89 63,713.36 649,200.78
4,755.65 0.00 9,511.30 6,552.18 6,552.18 51,149.56
16,188.83 16,188.83 16, 188.83 16,188.83 16,188.83 161,888.30
137.08 137.08 137.08 137.08 137.08 1,370.80
756.83 623.67 807.00 683.83 660.83 7,216.83
1,591.34 1,517.17 237.67 1,411.16 1,306.06 15,298.84
0.00 0.00 0.00 0.00 -1.82 -1.82
100,011.80 98,886.57 109,816.73 102,923.97 105,213.61 1,091,844.36
577,705.22 556,734.49 640,473.55 459,160.33 490,273.54 5,050,315.32
0.00 0.00 0.00 0.00 0.00 -3,000.00
Unaudited report intended for management puposes only
Page: 5 User Logon: VHT
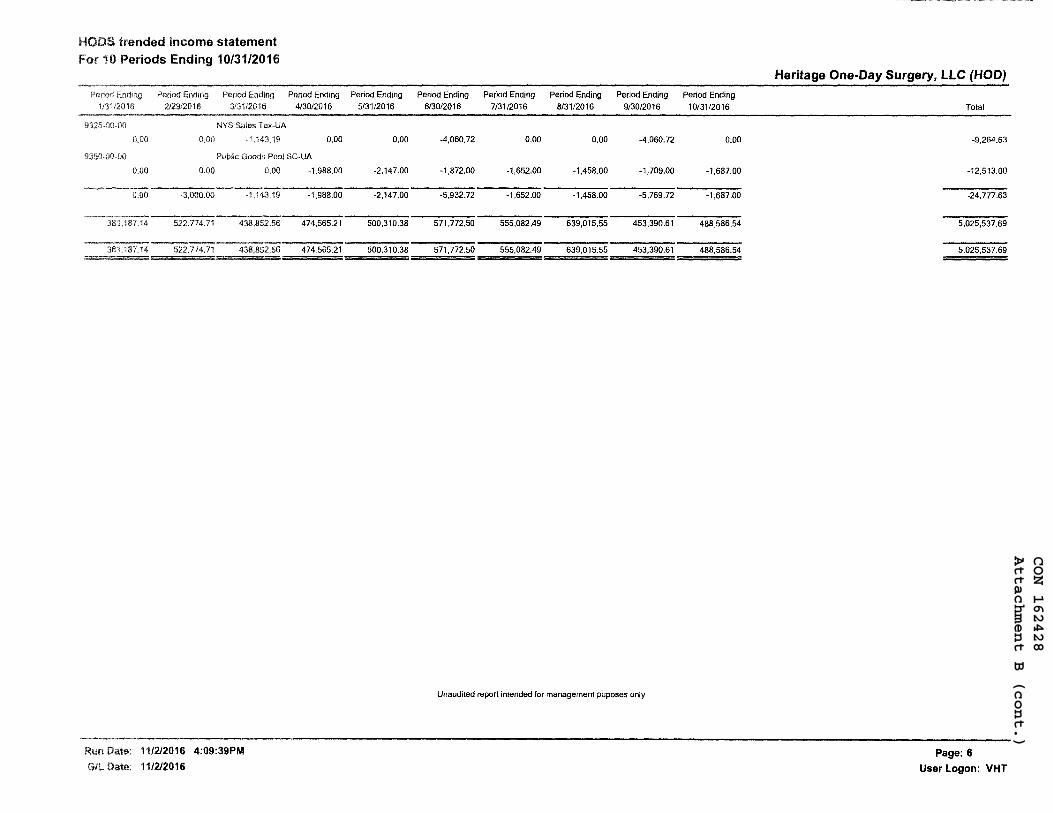
CON 162428
Attachment B (cont.)
trended income statement 10 Periods Ending 10/31/2016
Period Ending Period Ending
212912016 413012016
NYS 0.00
Goods Pool SC-UA
0.00 0.00
0.00 -3,000.00 ·1,143.19
381, 187.14 522,774.71 438,852.56
381.187.14 522,774.71 438,852.56
11/212016 4:09:39PM
11/2/2016
-1,988.00
-1,988.00
474,565.21
474,565.21
Period Ending
513112016
0.00
-2,147.00
-2,147.00
500,310.38
500,310.38
Heritage One-Day Surgery, LLC (HOD)
Period Ending Period Ending Period Ending Period Ending Period Ending
613012016 7/31/2016 8/31/2016 9/30/2016 10/31/2016 Total
-4,060.72 0.00 0.00 -4,060.72 0.00 -9,264.63
-1,872.00 -1,652.00 -1,458.00 -1,709.00 -1,687.00 -12,513.00
-5,932.72 -1,652.00 -1,458.00 -5,769.72 -1,687.00 -24,777.63
571,772.50 555,082.49 639,015.55 453,390.61 488,586.54 5,025,537.69
571,772.50 555,082.49 639,015.55 453,390.61 488,586.54 5,025,537.69
Unaudited report intended for management puposes only
Page: 6
User Logon: VHT
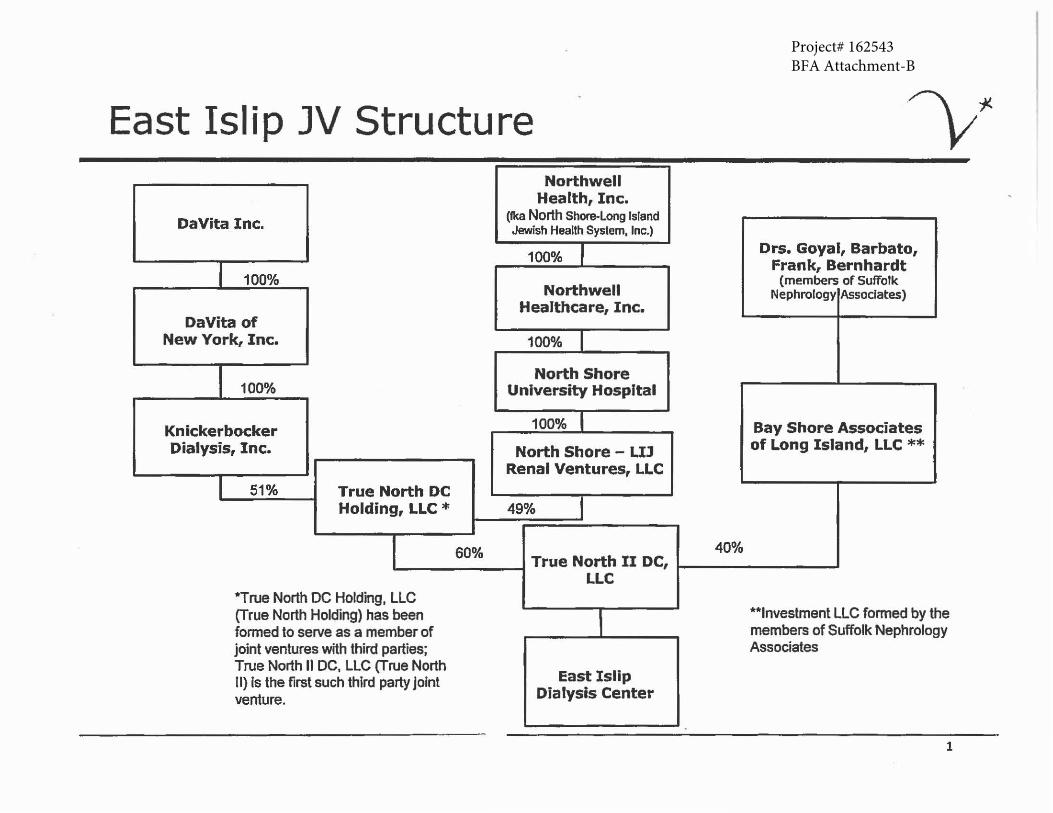
Project# 162543BFA Attachment-B
East Islip JV Structure
DaVita Inc.
I 100%
DaVita of New York, Inc.
I 100%
Knickerbocker Dialysis, Inc.
I s1% True North DC Holding, LLC *
Northwell Health, Inc.
(fka North Shore-Long Island Jewish Health System, Inc.)
100% I Northwell
Healthcare, Inc.
100% I North Shore
University Hospital
100% l North Shore - Ul
RenalVentures,LLC
49% I
Drs. Goyal, Barbato, Frank, Bernhardt
(members of Suffolk Nephrology Associates)
Bay Shore Associates of Long Island, LLC **
I 60% 40% ---------t True North II DC, t---------' LLC
*True North DC Holding, LLC (True North Holding) has been formed to serve as a member of joint ventures with third parties; True North II DC. LLC (True North 11) is the first such third party joint venture.
r
East Islip Dialysis Center
**Investment LLC formed by the members of Suffolk Nephrology Associates
1
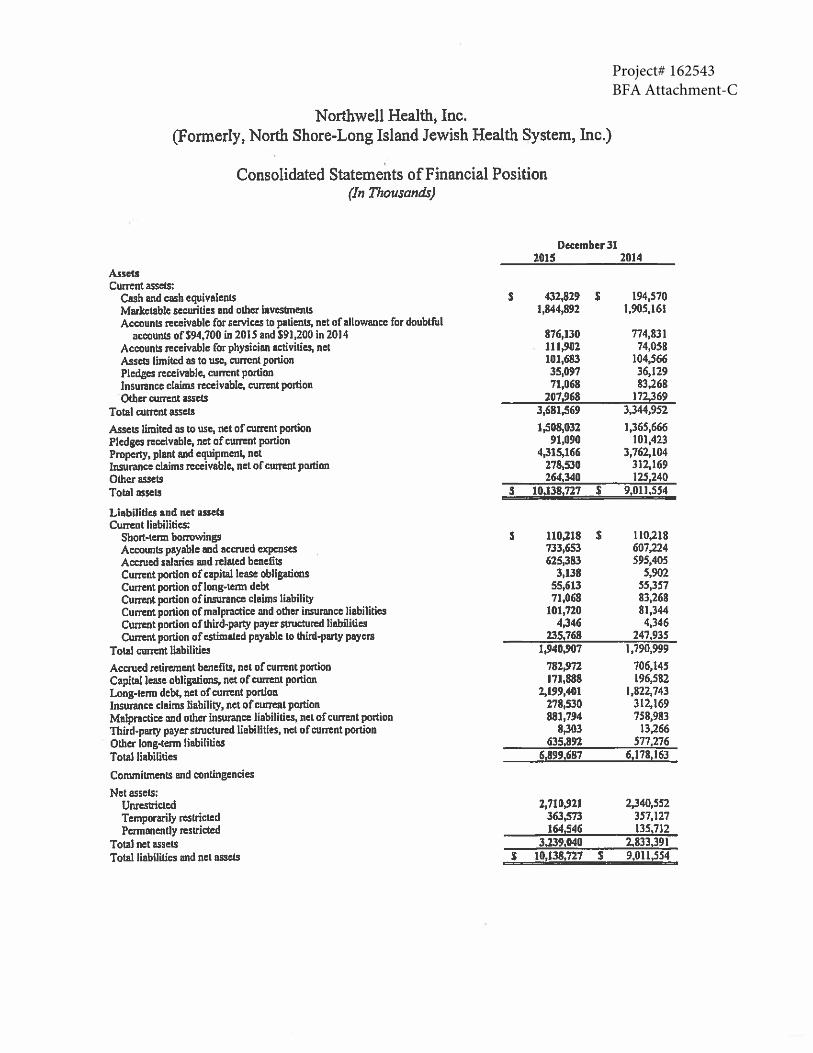
Project# 162543BFA Attachment-C
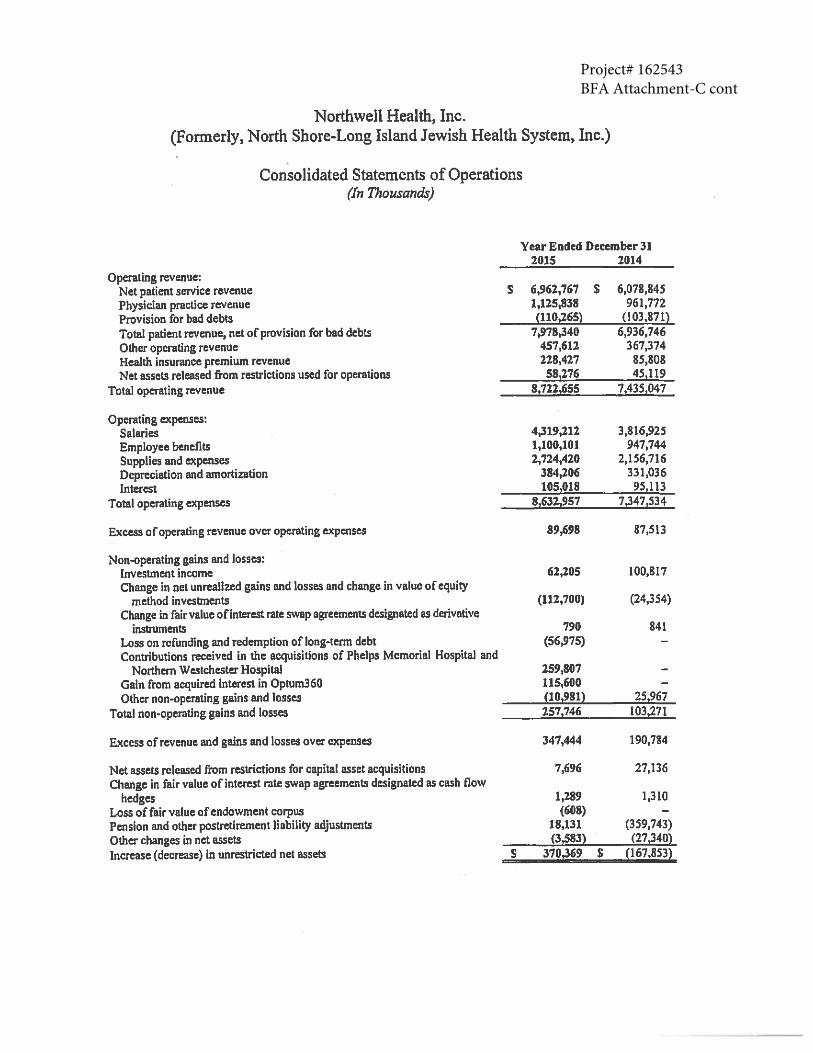
Project# 162543BFA Attachment-C cont
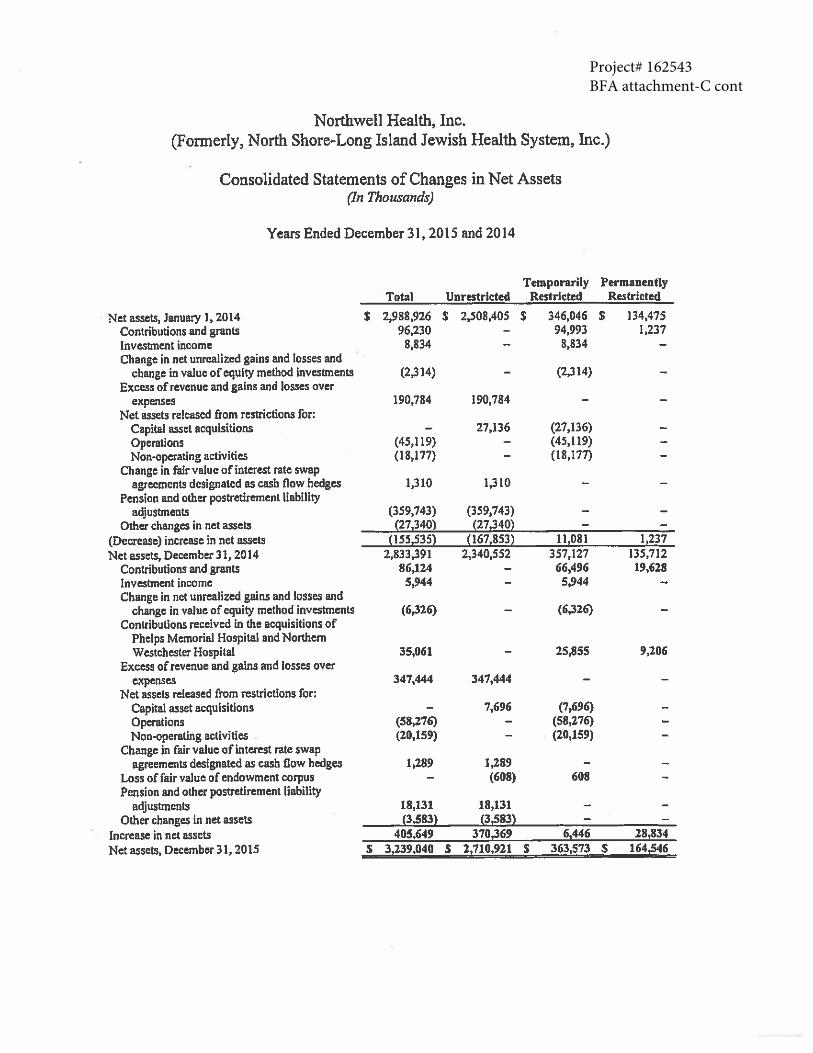
Project# 162543BFA attachment-C cont
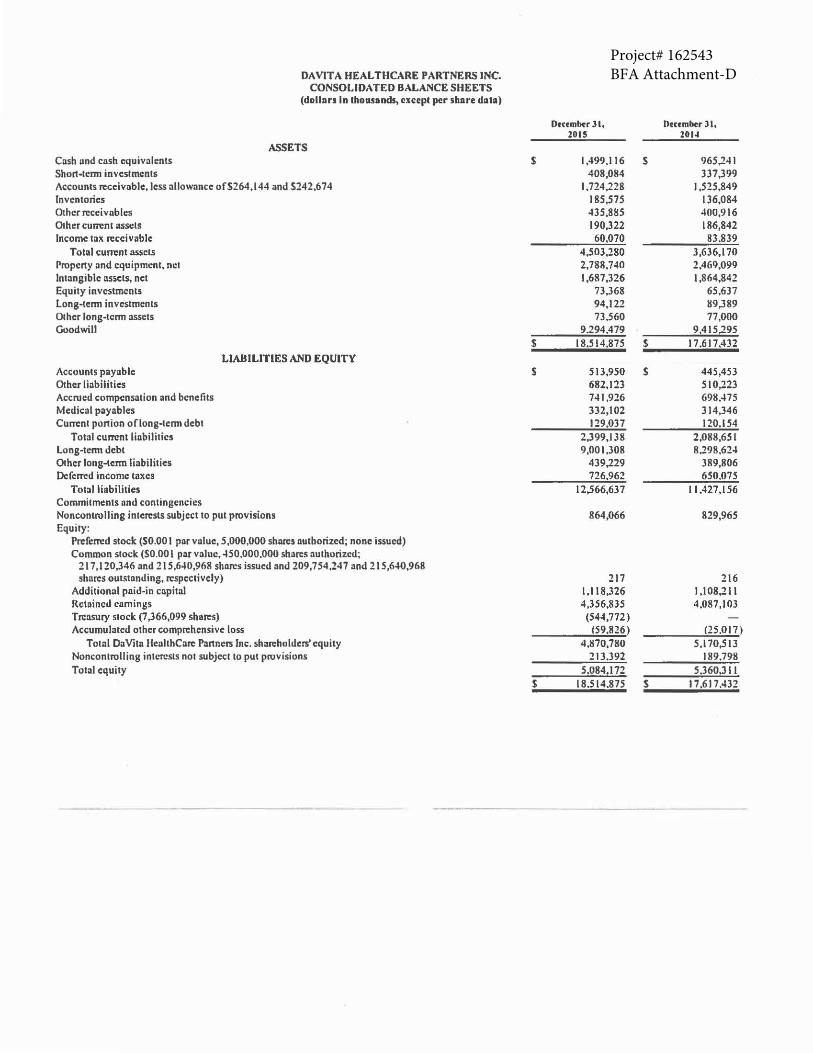
Project# 162543BFA Attachment-DDAVlTA HEALTHCARE PARTNERS INC.
CONSOLIDATED BALANCE SHEETS (dol111rs In thousands, cxccpl per share d11111)
Detember JI, llenmber31, 21>15 2014
ASSETS Cash und cash equivalents s 1,499.116 s 965,241 Short-term investments 408,084 337,399 Accounts receivable, Jess :allowance ofS264,144 and S242.674 1.724,228 1.525,849 Inventories 185,575 136,084 Other receivables 435,885 400,916 Other current assets 190,322 186,842 Income tax receivable 60,070 83.839
Total cuITTnt assets 4,503,280 3,636,170 Property and equipment, net 2,788,740 2,469,099 Intangible assets, net 1,687,326 1,864,842 Equity investments 73,368 65,637 long-term investments 94,122 89,389 Other long·tcrm assets 73.560 77,000 Goodwill 9.294.479 9.415d95
s 18.514.875 s 17.617.432
LIABILITIES AND EQUITY Accounts payable $ 513,950 s 445,453 Other liabilities 682,123 510,223 Accrued compensation and benefits 741,926 698,475 Medical payables 332,102 314,346 Current portion oflong•term debt 129.037 120.154
Tot:il current liabilities 2,399,138 2,088,651 Long-term debt 9,001,308 8,298,624 Other long-term I i11bilitics 439,229 389,806 DcfcITTd income t11xcs 726,962 650,075
Tot:il liabilitics 12,566,637 11,427,156 Commitments 1md contingencies Noncontrolling interests subject to put provisions 864,066 829,965 Equity:
PrefeITTd stoclc ($0.00 I por voluc, 5,000,000 shores outborized; none issued) Common stock (S0.00 I par value, 450,000,000 shares authorized;
217,120,346 and 215,640,968 sbnrcs issued :ind 209,754,247 and 215,640,968 shares outstanding, respectively) 217 216
Additional pnid-in capit:il 1,118,326 1,108,211 Retained cnmings 4,356,835 4,087,103 Trcnsuty slock (7,366,099 shares) (544,772) Accumulated other comprehensive loss (59,826) (25.017)
To1al D:iVitn HeahhCarc Partnc:rs Inc. shareholders' equity 4,870,780 5,170,513 Nonconlrolling interests not subjecl to put provisions 213.392 189.798 Total equity S.084.172 5.360.311
s 18.514.875 s 17.617.432
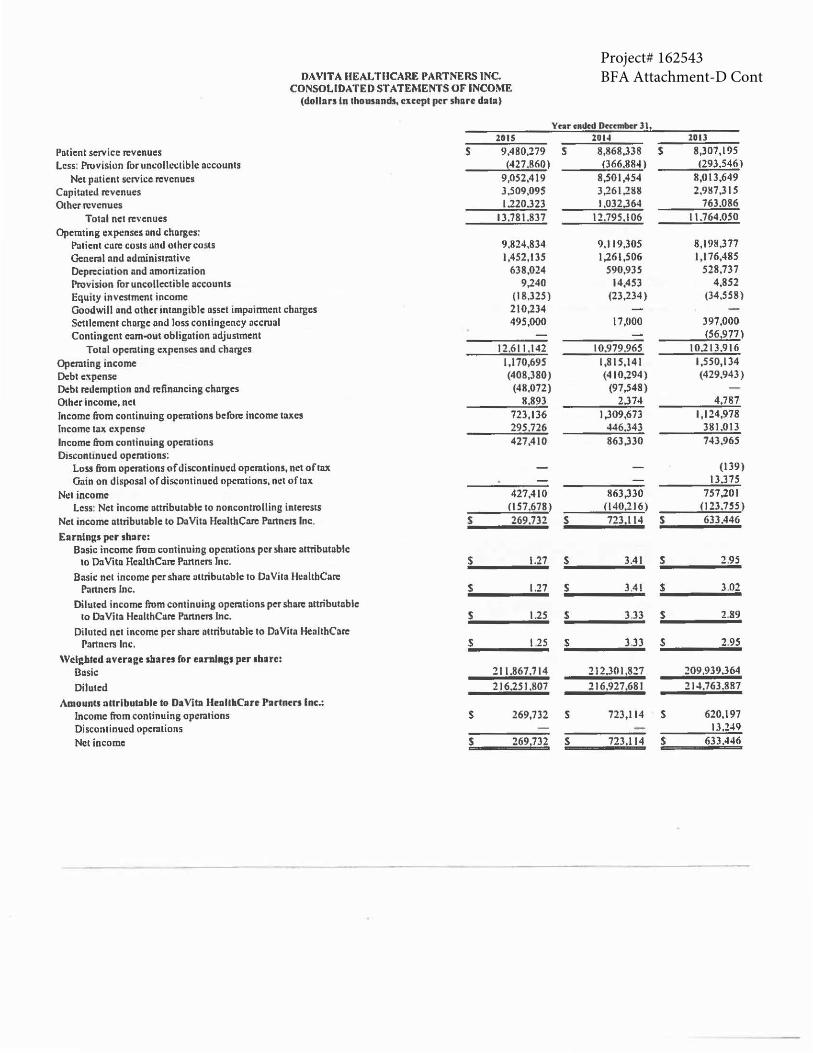
Project# 162543BFA Attachment-D ContDAVIT A HEAL TllCARE PARTNERS INC.
CONSOLIDATED STATEMENTS OF INCOME (dollars In thousands, except per sh11re data)
Yr.r called Drcrmber JI, 2015 2014 2Dll
Patient service revenues s 9.480,279 s 8,868,338 s 8,307,195 Less: Provision for uncollectible occounts (427.860) 1366.884) (293.546)
Net patient service revenues 9,052,419 8,501,454 8,013,649
Copitated revenues J,509,095 J,261.288 2,987,J 15
Other revenues 1.220.323 1,032.364 763.086
Total net revenues 13.781.837 12.795.106 I 1.764.050
Operating expenses ond chorges: Patient care costs and other costs 9.824.834 9,119,305 8,198,377 Gcner.11 and administr:itive 1,452,135 1,261,506 1,176,485
Dcpreciotion and amonization 638,024 590,935 528.737 Provision for uncollectible accounts 9,240 14,453 4,852
Equity investment income (18.325) (23,234) (34,558)
Goodwill ond other intangible nsset impuinncnt charges 210,234 Settlement charge and loss contingency accrual 495 ,000 17,000 397,000 Continacnt cam-out obligation adjustment !56,977)
Total operating expenses and chorges 12.611.142 10,979.965 10.213.916
Operating income l,170,695 1,815,141 1,550,134
Debt e11:pense (408,380) (410.294) (429,943)
Debt redemption and refinancing charges (48,072) (97,548)
Other income, net 8.893 2.374 4.787
Income from continuing operations before income taxes 723,136 1,309,673 1,124,978 Income tait citpcnsc 295.726 446.343 381.013
Income from continuing operations 427,410 863,330 743,965
Discontinued operations: Loss from operations of discontinued operations, net of tax (139)
Gain on disposal of discontinued operations, net oftait 13,375
Net income 427,410 863,330 757,201 Less: Net income attributable to noncontrolling interests (157.678) (140,216) (123.755)
Net income ottributoblc to DaVita HealthCare Panncn Inc. s 269.732 s 723.114 s 633.446
Earnings per sh11re: Basic income from continuing operations per share attributable
to DaVita HealthCare Pannc:rs Inc. s 1.27 s 3.41 s 2.95
Basic net income per share attributable to DaVita HcnlthCare Partners Inc. s 1.27 s 3.41 s 3,02
Diluted income from continuing operations per shlUC 11ttributable to DaVita HealthCare Ptutnen Inc. s 1.25 s 3.33 s 2.89
Diluted net income per share attributable to DaVita HealthC11re J>anners Inc. s l.25 s 3.33 s 2.95
Weighted average shares ror earnings per 1b11re: Basic 211.867.714 212.301.827 209.939.364
Diluted 216.251.807 216,927.681 214.763,887
Amounts 11ltrlbut11ble to D11 Vito HeollllC11re P11rtners Inc.: Income from continuing operations s 269,732 s 723,114 s 620,197
Discontinued operations 13.249
Net income s 269,732 s 723.114 s 633.446
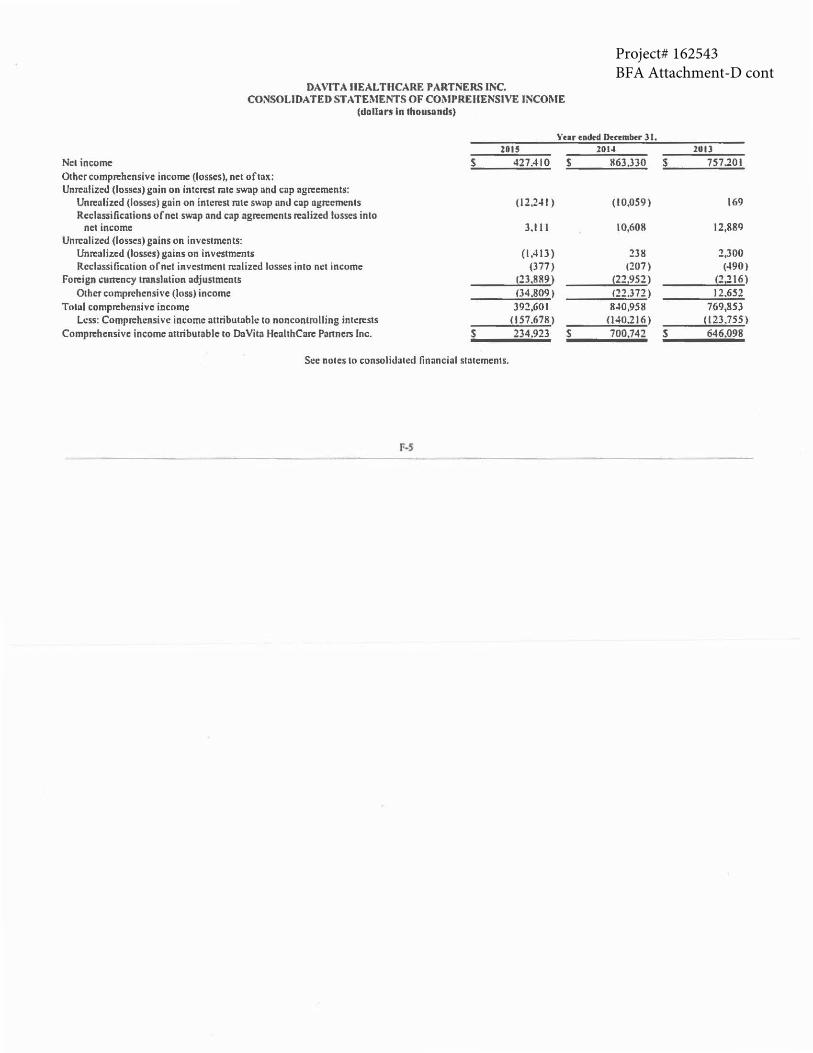
Project# 162543BFA Attachment-D cont
DA VITA HEAL TH CARE PARTNERS INC. CO~SOLIDATED STATEMENTS OF COMPREHENSIVE l~COME
(dolh1rs In thousands)
'r'ear ended Dccem!Kr 31. 211, 101.J
Net income s 427.410 s 863 .. 330 Othercompn:hensive income (losses), net oftnx; Unrealized (losses) gain on interest rate sw:ip and cap agreements:
Unn:alizcd (losses) gain on inten:sl rate swap and cap agreements (12.241) (I0,059) Reclassifications of net swap and cap agn:emcnts TC.'llizcd losses into
net income 3.111 10,608 Unn:nlizcd (losses) sains on investments:
Unrealized (losses) gnins on investments (1,413) 2311 Recl:1ssilicn1ion of net investment realized losses into net income (377) (207)
Foreign cum:ncy translation ndjustmcnts (23.889) (22,952) Other comprehensive (loss) income 134,809) (22.372)
Total comprehensive income 392,601 840,9511 Less: Comprehensive income nttribut;ible 10 noncontrolling inti:n:sts (157.678) 040.216)
Compn:hensivc income nttribu1ablc to DaVita HcnlthCnrc Partners Inc. s 234.923 s 700,742
See notes to consolidated linnncial st:uemcnts.
1113
s 757.201
169
12,81!9
2,300 (490)
<:?J16) 12,652
769,853 (123.755)
s 646.098
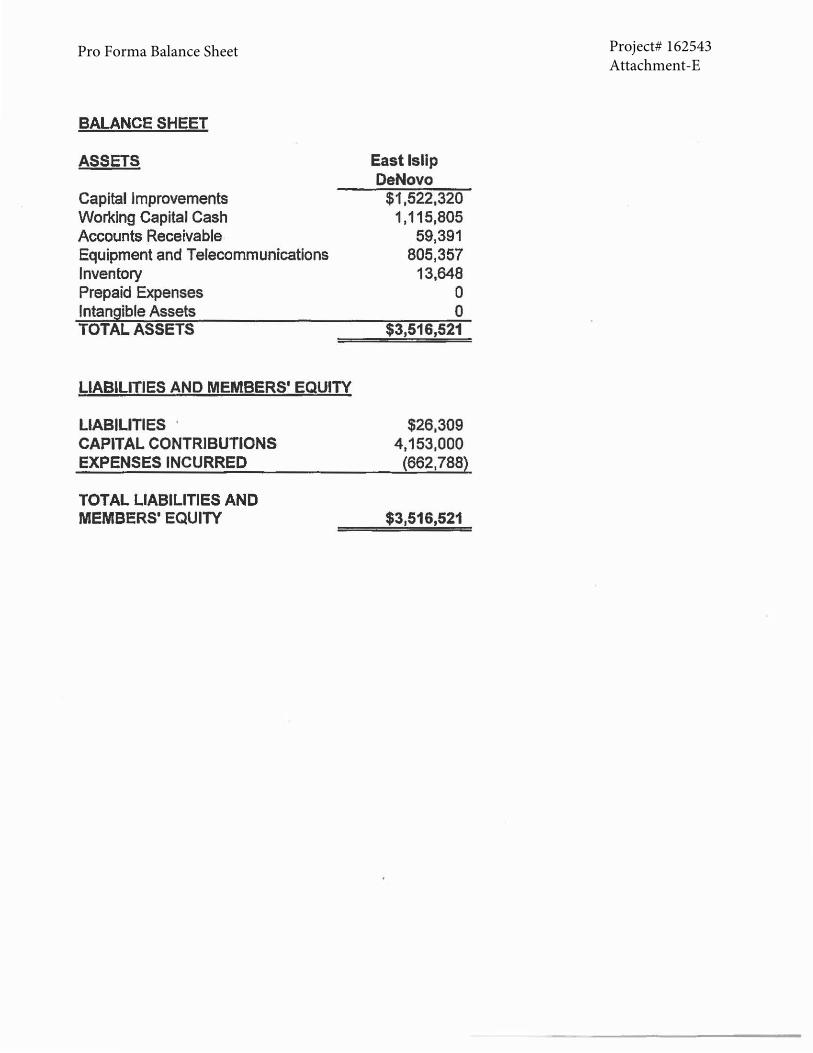
Pro Forma Balance Sheet Project# 162543Attachment-E
BALANCE SHEET
ASSETS
Capital Improvements Working Capital Cash Accounts Receivable Equipment and Telecommunications Inventory Prepaid Expenses Intangible Assets TOTAL ASSETS
LIABILITIES AND MEMBERS' EQUITY
LIABILITIES · CAPITAL CONTRIBUTIONS EXPENSES INCURRED
TOTAL LIABILITIES AND MEMBERS' EQUITY
East Islip DeNovo
$1,522,320 1,115,805
59,391 805,357
13,648 0 0
$3,516,521
$26,309 4,153,000
(662,788)
$3,516,521
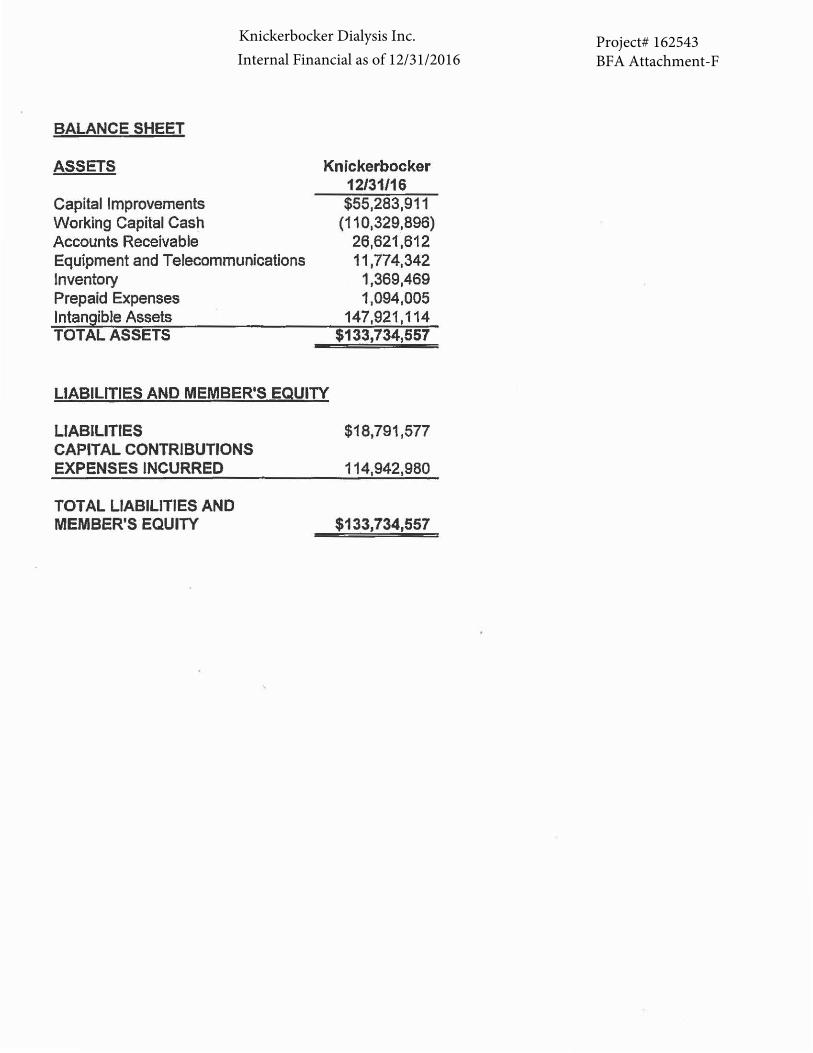
Internal Financial as of 12/31/2016Knickerbocker Dialysis Inc. Project# 162543
BFA Attachment-F
BALANCE SHEET
ASSETS
Capital Improvements Working Capital Cash Accounts Receivable Equipment and Telecommunications Inventory Prepaid Expenses Intangible Assets TOTAL ASSETS
Knickerbocker 12131/16 $55,283,911
(110,329,896) 26,621,612 11,774,342
1,369,469 1,094,005
147,921, 114 $133,734,557
LIABILITIES AND MEMBER'S EQUITY
LIABILITIES $18,791,577 CAPITAL CONTRIBUTIONS EXPENSES INCURRED
TOTAL LIABILITIES AND MEMBER'S EQUITY
114,942,980
$133,734,557
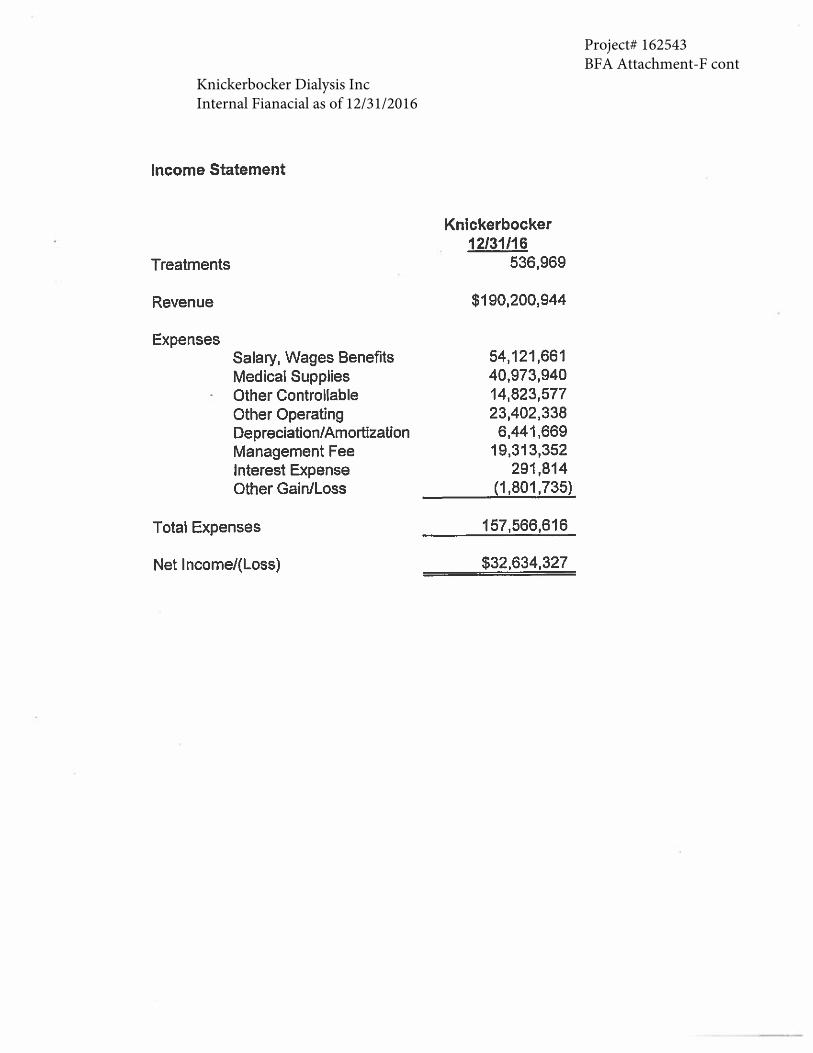
Knickerbocker Dialysis IncInternal Fianacial as of 12/31/2016
Project# 162543BFA Attachment-F cont

Project# 162543BFA attachment-F cont
DAVITAINC CONSOLIDATED BALANCE SHEETS
(un1udUcd) (dol111n In thousands, except per share data)
Stplflllbtr lO,
.... ··--L ....... ... . -- -·· .. -- ·-·--....:::11:.:1~'---Dtctftlb1r 31,
1015
i\SSETS _ 913,49.6 -· s ___ . t,499,JJ6
-·- _ ~S.S'.4?8 .• °4P8,984-.' COJJ!.!!'!~. ~ !!IJ'*.1lc11t1 .. · -·- ·· ··- _ ... ShJ>"-term.inves!me111$ • .. _ • . . • .. ··-··-·-·-·.
s
Accounts rccciv11blc, lcss :illowaacc ofS251,593 and $264,144 ~y~tci~:e;···· · · ..... ·· ·· · - · .. -- .... · · ·· • · --- .... · · · 1,BS0,425 !,n,4J2_8
7.o~.s~~·:~ .·. .18~,575 Othcnecciv11blcs Qib.;;,·i:Mm11~ as~"
451,953 o5,8_es. · • ·· · ·· ... -~··-: __ -~- ijfa~s _ lJ10.J~2.~
Income tucs receivable · Toiaic~rre~tasseti . Property and equipment, net ofaccumulated deprccia1io11ofS2,728,2I7 and S2,J97,007 Jn!•iiCi.l?l!l llS~JI~ ~(&CCUIJ\Ul~l!ld ~~on ofS~~Ml.4. ~od S'.ml,69.l ~quicyJ!'.~~!5 . .. •. __ • . • __ •.•. Looa-!~~!llY.~'~~~L- ...... --- •.• ~hc_!J~_ng·t~ ~~ _ qood~ll ...
.. LIABILIT_IES ,f.ND EQUITY
8.196 60 070 4,~6.l,359 4,503,28~ ~ J,044,988 2.788,740 l,5]6,15.7_ • l,~87,326
5 I 6,383 78,368 ~ . ·- . • ··-· - Too,7f~ . - a_?.~~)
42,984 73,560 9.Ji2.991f 9.294.479
s 18,925,653 .. s __ .. 1,.s • .,s~14~,s;.;.1-.s
-· . Acco11_11t~pay?,b!~ . . _ _ _ _ _ S • _ 4981422 S
l 513~50_ 682,123, : ~th~li~ilitl~~- - . 828,535
~cc11;1~_CJ1~i~n Ill!~ benefils . .. .. • _ ..... _ • _. ·~- _ _ 845,879 t.:1e!fic11I payJll!I~ _ ·-. _ • __ • • , • ··_-___ 3 l.3;~i9 .. Cu~.l.Jl~~J!l!l .of111nc-tl{Ol_~J _____ ._ _ .• • • •• _ ··- _ ... _. • 152,764 •. .• Totl!I ~11t,ll~.\li~I.~. . .. . ___ •• • _ . • •.•••••.. _ __ • . .. _ _ • _ l,~39,!J69 ·-Long4enn debt 0tlier iani:-te:nn l.labilitlea Dcfcncd income taxes
8,972,002 .. -·---· -· '420,939 ...
802,109
• 741,926 .. - ~~2,1~2 .
129.037 ),39p,p~ ·' 9,001,308
. 439,22.~ . ~ 726.962
~ TQi11t ll~bilitics ~ Commitmcntl and eontin8cneica:
12,83.4,UB. . _J2 .. S6~1im .
864,~§6_ ~o!Jc~otrqllinc iate~s.t~~\lbl~~.t 1.0.pui p~yj~o.ns . _ _ • . .• •. __ .. . - • •. _ -.~.n.74~-Equil}': . _ .. ----~ -···- • .. . • ..•. __ __ . • .. ___ • . • . . _ •• . .... --·-· .•.• __ J'rc:f~Jl_q~(S..O.Q!l•p!f:Y•l.!!!;· .~ .. ®.(!,Q@~~utfioriZt<l!;ll<!.nc,i9"ed) __ • ---· • ---· ••
Common stock ($0.00 I par value, 450,000,000 shares authorized; 217,338,629 1111d 2 I 7,120,346 shares issued 1111d 200,778,434 and 209,754.247
• ~h~.r~.H·~~~.i11s._rwimi.Y!l•Y> ____ . • .• ····--· _ 217 217 Ad4\lio,!'1!1p;)id~in1;11p_it1\ . Rct11incd camin115 tiC~~\liY. .. ;i9.cH1 §J.~9..!?t~4-i ~§~~'!Pi ~iiaiU. ~~''v!lYl · ~- ~ ~: = -: : · ··-· ·· · ·· --~~.1!1Ul!lt:4.o•.her~O!llprc~ensive IC)? _ .
... :r~~ .Q.a:Vi.1.~!n.C:·~~!~J·u~li,t~·c.CJ'!ity ___ . ~C)':JCC)~trol!!n& i~tcrcsts no~ subj~t to put p~vislons
• Tcital equity.
J,;g)2,j3t__':_: - .. . . I:-. I 8)26. j , •.• _ .. -·· ..••• __ S,Q7_8,9B~ •
(\,147,9~7)
. - - . . (52.226) . -·- .. ·-- ..... ,J l,74,6 -
207.645 5.119.391
$ 18.92S,6S3
. .. - ~ 4~~~.~~_5-....... - (S~,71.~) :
(59.826)
s
--· 4,870,7_8q :!13.392
5,084,172 18.Sl4,875
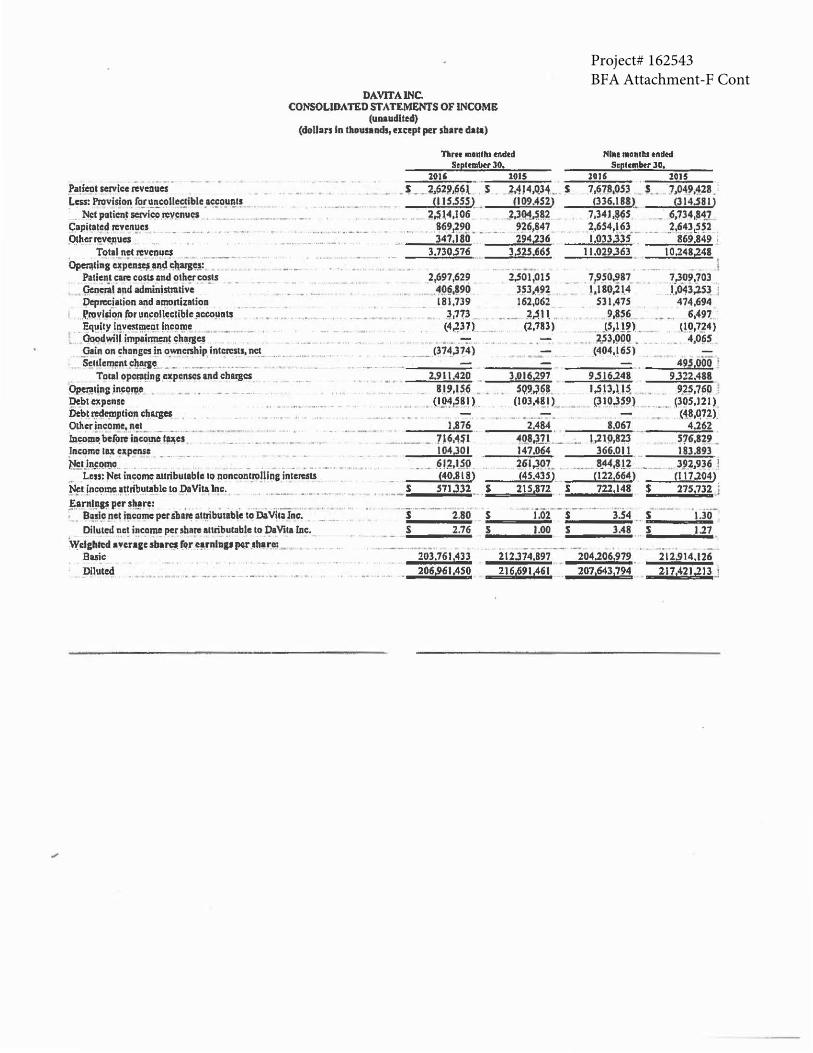
Project# 162543BFA Attachment-F Cont
DAVITA INC. CONSOLIDATED ST AT£MENTS OF INCOME
(uuudlted) (dollars In tbuunch, except per sbare dala)
Tllrn months ~dtd Stpltmbtr 30,
•' . - - ' . . 101' • . 2015 .
Nllle ma111l1s endtd Stptcmbtr JO,
201' . . %015 ~·iieot seJYlc:c ieve11ues • .. _ •. _ . . __ s __ 2,62M~l .s _ . . M!4,QH ... s 7,~78,053 _ $.~ J,04M28 • Less: Ptovlsion. fo!~!!_coll~iblc .•C!=O~'!!~ .- _ _ N!:t paticn~ seivico ~!)RllCS
Capitatcd revenues p~~c:r ~ve.l!ues • ·
Total net revenues ~tin's qpens~ and ~))Mg~~= -·--. - ..
Patient care costs and other costs -·~ml and admin!sttatlve .
Depn:cjation and •l!!Ortizatioa
. -··. • . .. .. _ 015.SSSL (IOUS2) ... _ _,, . _ • • ••. . :!J\4,106 . _2,3CMJ.!!~
. ··~· - ... - - - ~69.J99 •• - - - 926,847 347!180 294,236 '
3.730.576 3.525,665
2,697,629 - .. ~9~;,91)
181,739
2.SOl,OlS J~l,4,9~ 162,o62
(336.188l (314.SSI) 7,34J,~65 _ 6,734,~41 2,654,163._ --- J.64~.~~2 1.033,335 . 869,849 ;
11.029.363 I 0.248,248 !
i .~!J!Vi•iQ!I for lln~ol\c:ctiblc: _:i.c:coµnts - . 3,11:3 - E.q!'ilY !nve.UlllC':_l_t !l!CCll!IC: -· {4~37), -·-·.
7,9S0,981 i:180,21_4- - ·
531,47.S 9,8~6 .2).J l .. " ..
(2,783) . .lS111~l .• - .. ... - .. ).53,9QO • __
(404,165) ..•
7,309,703 .1)i4J,l5~ j
474,694 6,4n
.(!9.,7.~4) . 4,0~5 Goodwill impaimi;n~ ~halJ«;s
0.in on changes in ownctShip intcrcsts, net . • _ •• ,
&.1t1c~n1 .cli!l.!1~ _-. . ..• . .. . .... _·-(374,374)
49.s.ooo • Torat opcra!lng expenses and cha11cs
OpeJ1!tin1 .in~fP.e • 2.911.420 - ____ J..,.0 .... 16 • .2..,9.._7 9.Sl6.248 9.322.488
t~P.H5.. . 9.2s,1i;o ·i _ 819,l~.6 • _ SQ.9.J68 Debt expense De!»~~~c.mption charg~ . _
• (I ,!l~,S B. ~) _ (I 03,4~! )__ ·- (310,3~9) .. _ •• (305,121) _
Othcrincome,net 1.876 ID~~ be~orc in~olJIO-t~cs. · - ·· -----·. · -~- :-= ··-·.. . ... ··- - -- ~-~---- _ 7J6,'f~l Income lax expense I CJ.i,JO I 1-r.s.t.ln.i;~~-- . • - • • • _ . • .. .• •. _ _ .~!~.119.
Less: Net income: attributabl11 to noncontrolllna intc:resu (40.818) N~t !ncc:imc~ttributa_blctoDaVi~lnc. - .· . -··· . ........ _ .... __ .,.s __ s1 .. 1..,.3 .. J..,2 j:arnt111~ pers~_!r~: . . . _ . . .. - .• ,.. • • . • -· _ _. 1'J.~!i.c ptt iu~me per sb•it 1111,ributablc to D&Vic:a Inc.
Diluted net income per share attributable: to DaVita Inc:. Wdc~d ave.race sb~~ ~~.r -~~-~nln11 ~r .•h•;e: _
Buie Diluted
. . . -s·- -- --2:80
s 2.76
- :?03,761,433 . • • 206,961,450
s
2.484 . 41!8JjJ __ 147.064 ~61JO~. (4S.43S)_
215.872 s
8.067 1.,21!>,B~
366.011
----· 8.44.,.l~ (122,664) 722,148
s -· i.()1" --s-· ·- 3.54 -----...s __ ... 1 ... 00-. s 3.48
-. -- ·--- ·---212.374.897 204.206.979
.(4_8,Q72). 4.262
S76,829 ISJ .893 -
- -- - 3!_2,9_3~ ! (117.204)
$ 275,732 .l
f -- '1.30-s 1.27
216,691,461 207,643,794 • 212.914.126 217,421,2ll J
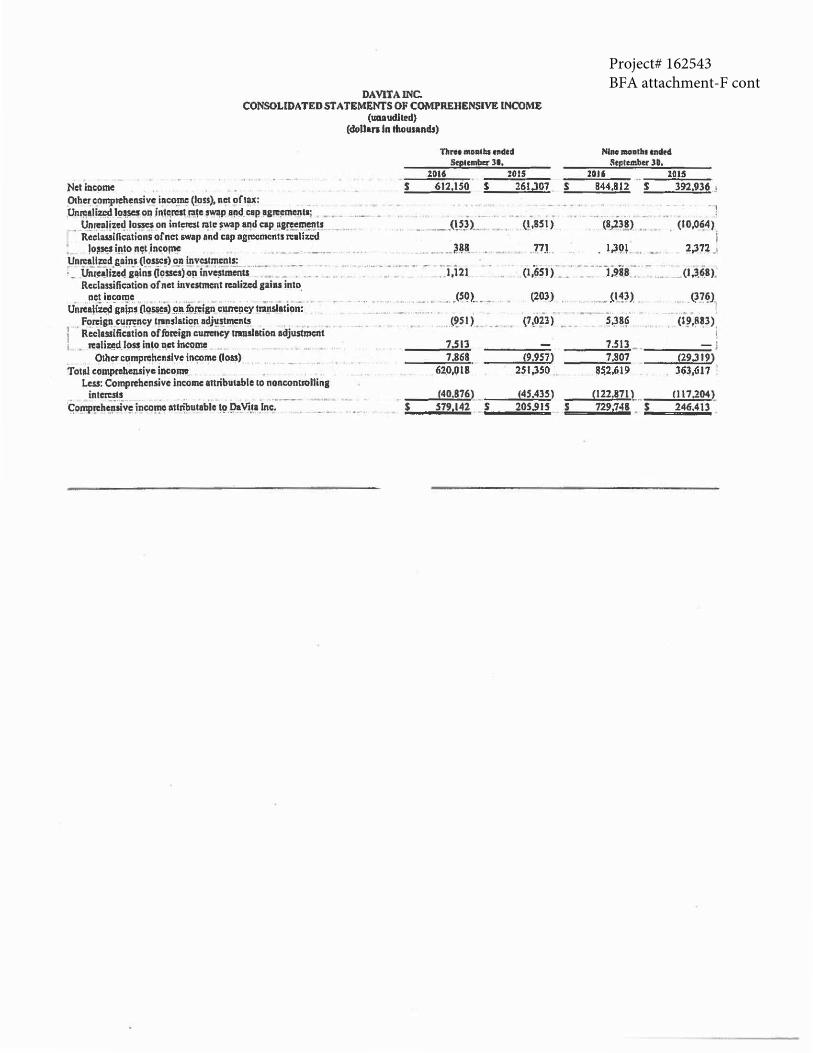
Project# 162543BFA attachment-F cont
DAVITA INC. CONSOLIDATED STATEMENTS OF COMPREHENSIVE INCOME
(unaudited) {dollan In lllousands)
2016 2015
Net income S 612,ISO S 261,307 S Other co~iehe11sive i11co~ (loss), 11et of1ax: . Unri;al~ ig.,~ on in!c;~ .!'!!e swap •!Kl. cap •&te~lllC!ll•;
• U!_l~lll iic~ lo~ on int~n:st ~II: ~wap •'!d cap •&!!_t;m~~ . •.. Reclassi lications of net swap and cap agl1lemcnts !l:alb:cd
. !o~s~ iP.to nc;t .lnco~ . Unn:allzcd gains (losses) on lnvcslmc:nts: : . ih\iiuie4 sl!lns ciossei>ci" inv~ti ·. : ..
Rcclassific:ation of net investment iealizcd gaiu into, net income
tinrea!i~ ·gai~s-(lo·ss~) 9.~'f9reian· cune!lcy 1r:U;s1i1loi;: · · . Forci11a_c:u~ncy ll'lnslaliC!!l •dj! s_tmcnts . .. •.
j Reclassification offoccign cunency tm1slerion adjustment 1 • n:oli~d.lossinton•ti~me _ .•
OthC'I' comprehensive income (loss) Total comprahensiye ine~_me . · .
Less: Comprehensive income 11tributable 10 nonconuollina intercm
~omp~he~siv~ jnco!l,IC att~butable ~9 P..Yi~• _1nc:·---
. ___ .<mL. •· u.8s•>
. .... --~'- 771.
... .. - ..... -. -· "j ,121 (1,651) -. -
• 1· · - ... ·- .. -- ·- •• (SQ)__ ~ (203)
- '" •• 1
. <?SI) . <7tOP>
7~13 7.868 {9.9S7)
62P,Q1B 2Sl,350 ..
[40,876) . [4S.43S) s 579.142 s 205.915 s
NIM moatltt .-.S S!!!l•.mbcr 31,
1016 1015
844.812 s 392,936 j
-, ;
(8_,23_!) •• - . (10,0~4) _ i
. 1,39~ -· .. 2,372 ·'
· - ----) :?as : - _(lj6a).
.... H~~L .Q~~l
s.~8~ (l,?,R~3). l
7.SIJ _ - ;
7,807 (29.319) ~~2.<il .9 JG3,<i17
t122.s11 L Cl17.204l 7291741 $ 246.413
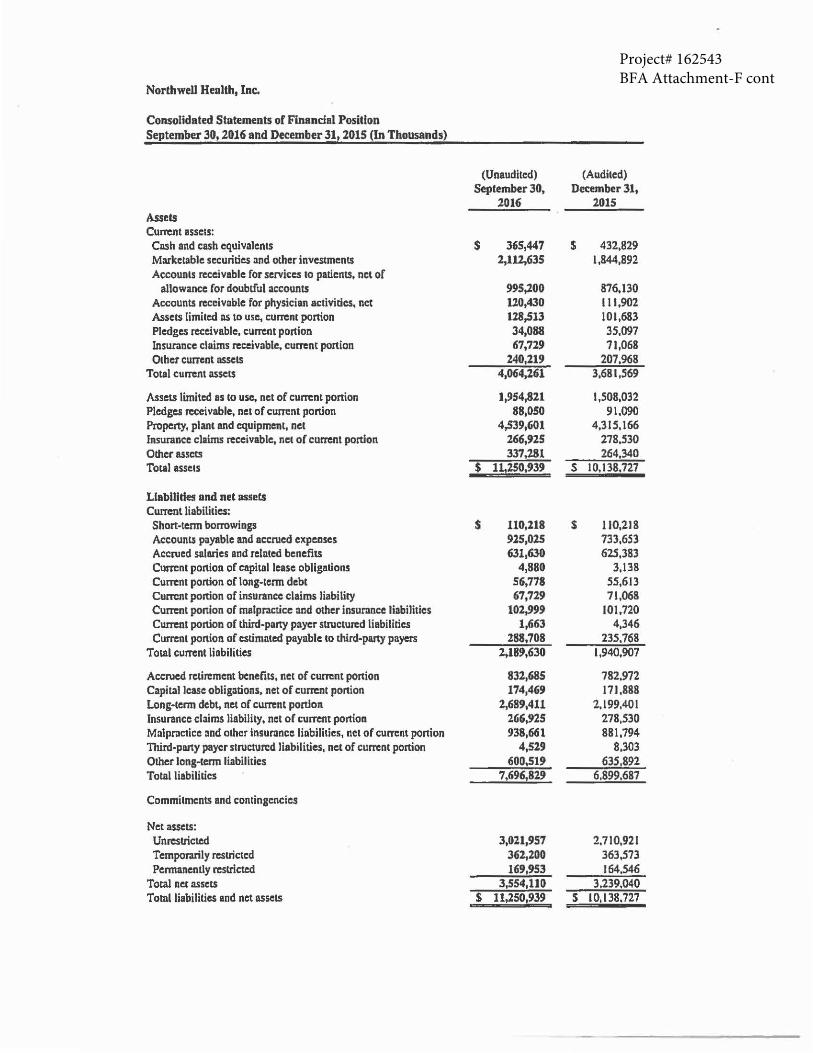
Project# 162543BFA Attachment-F cont
Northwell Health, Inc.
Consolidated Statements of Financial Position September 30, 2016 and December 31. 2015 (In Thousands)
(Unaudited) (Audited) September 30, December 31,
2016 2015 Assets Current assets: Cnsh and cash equivalents $ 365,447 s 432,829 Marketable securities and other investments 2,lU,635 l,844,892 Accounts receivable for services to patientS, net of
allowance for doubtful accounts 995,200 876,130 Accounts receivable for physician actividcs, net 120.430 111,902 Assets limited as to use, current portion 128,513 101,683 Pledges receivable, current portion 34,088 35,097 Insurance claims receivable. current portion 67,721) 71,068 Other current assets 240,211) 207,968
Total current assets 4,064,261 3,681,569
Assets limited as to use, net of current portion 1,954,821 l,508,032 Pledges receivable, net of current portion 88,050 91.090 Property, plant and equipment, net 4,SJIJ,601 4,315,166 Insurance claims receivable, net of current portion 266,925 278,530 Other assets 337,281 264,340 Total assets $ 11,250,931) s 10.138.727
Liabilities and net assets Currcnt liabilities: Short-tcnn borrowings $ 110,218 $ 110,218 Accounts payable and accrued expenses 925,025 733,653 Accrued salaries and related benefits 631,630 625,383 Current portion of capital lease obligations 4,880 3,138 Cum:nt portion of long-tenn debt 56,778 55,613 Current portion of insurance claims liability 67,729 71,068 Cum:nt ponion or malpractice and other insurance liabilities 102,99.9 101,720 Current portion of third-party payer structured liabilities 1,663 4,346 Current portion of estimated payable to third-party payers 288,708 235.768
Toial current liabilities 2,189,630 1,940,907
Accrued rctin:mcnt benefits, net of cuncnt portion 832.685 782,972 Capital lease obligations, net or current portion 174,46.9 171 ,888 Long-term debt, net of current portion 2,689,411 2.199.401 Insurance claims liability, net or cum:nt portion 266.925 278,530 Malpractice and other insurance liabilities, net of current portion 938,661 881,794 Third·puty payer structured liabilities, net of current portion 4,521) 8,303 Other long-term liabilities 600,519 635.892 Total liabilities 7,696,821) 6,899,687
Commitments and contingencies
Net assetS: Unrestricted 3,011,957 2.710,921 Temporarily restricted 362,200 363,573 Permanently restricted 169,953 164,546
Total net assets 3,554,110 3.239.040 Total liabilities and net assets $ 11,250,1)31) s 10,138.727
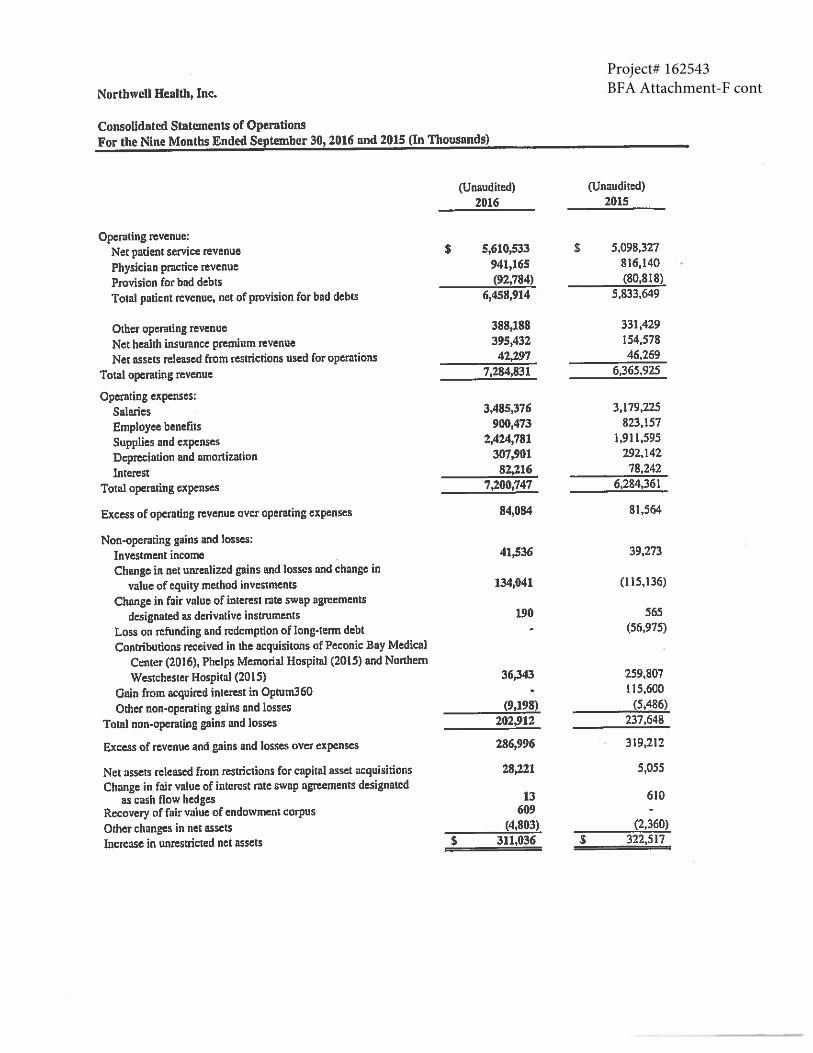
Project# 162543BFA Attachment-F cont
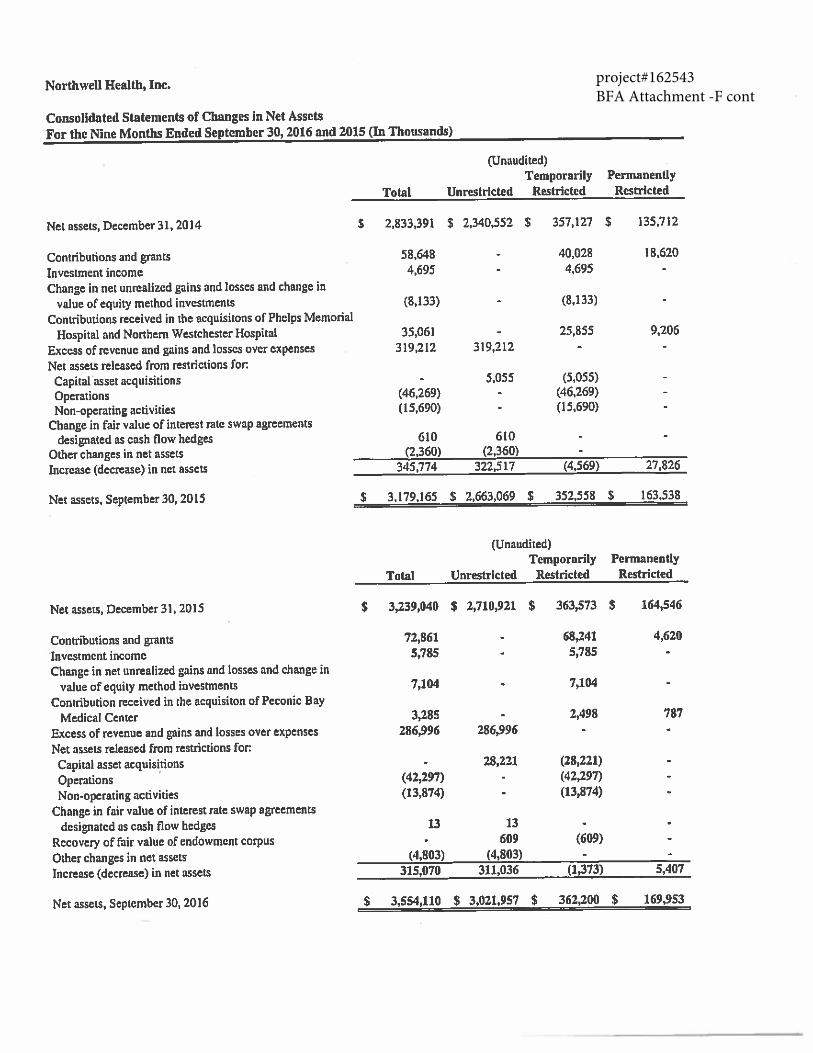
project#162543BFA Attachment -F cont
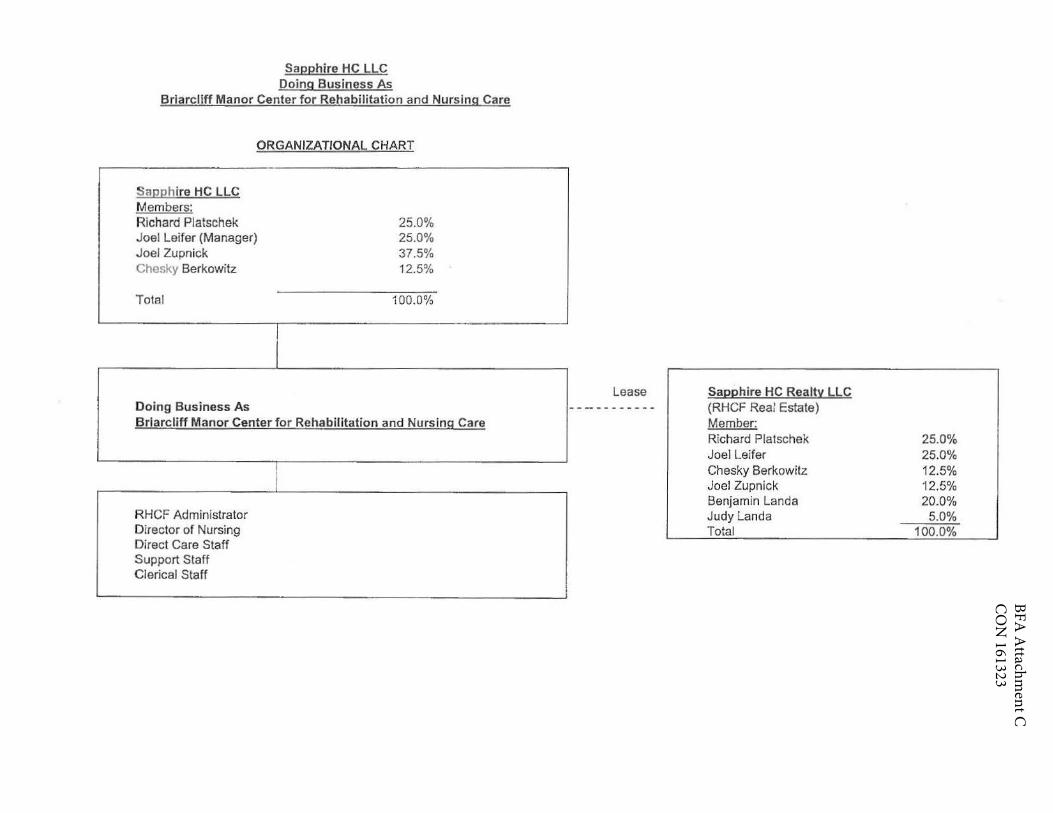
BFA A
ttachment C
CO
N 161323
Sapphire HC LLC Doing Bus iness As
Briarcliff Manor Center for Rehabilitation and Nursing Care
ORGANIZATIONAL CHART
Sa1;11;1hire HC LLC Members: Richard Platschek 25.0% Joel Leifer (Manager) 25.0% Joel Zupnick 37.5% Chesky Berkowitz 12.5%
Total 100.0%
Doing Business As Briarcliff Manor Center for Rehabilitation and Nurs ing Care
RHCF Administrator Director of Nursing Direct Care Staff Support Staff Clerical Staff
Lease Sapphire HC Realty LLC (RHCF Real Estate) Member: Richard Platschek Joel Leifer Chesky Berkowitz Joel Zupnick Benjamin Landa Judy Landa Total
25.0% 25.0% 12.5% 12.5% 20.0%
5.0% 100.0%
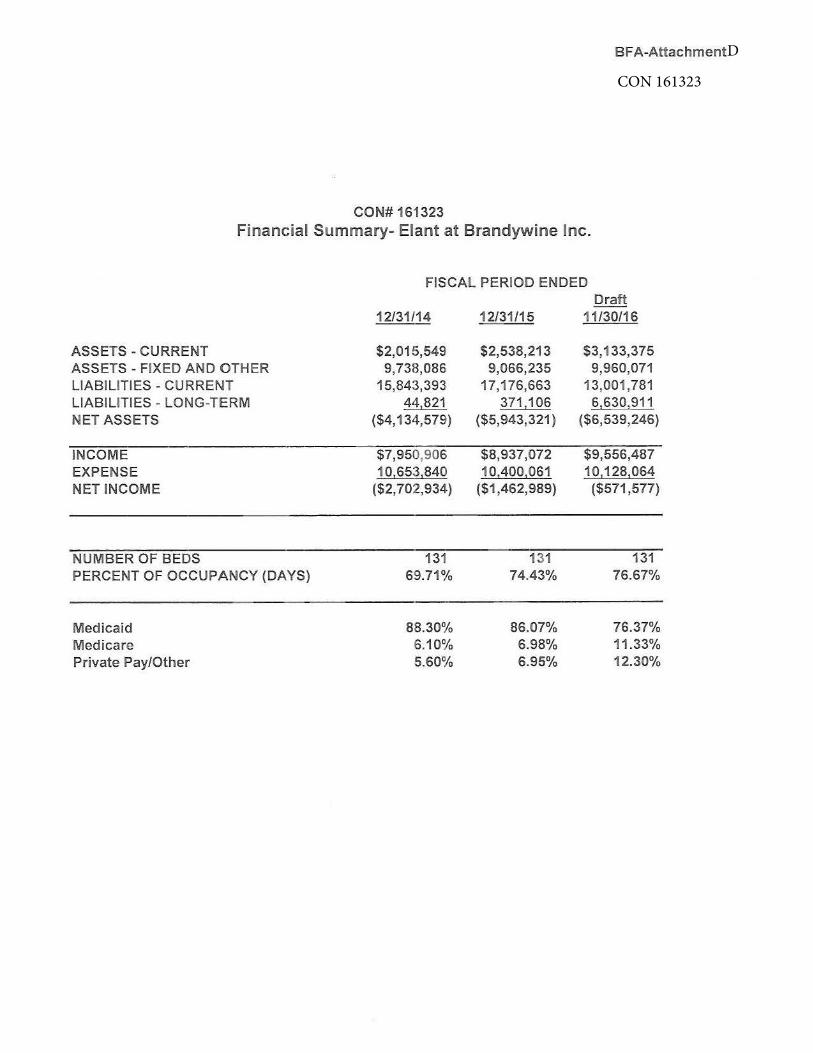
D
CON 161323
BF A-Attachment
CON# 161323 Financial Summary- Elant at Brandywine Inc .
FISCAL PERIOD ENDED Draft
12/31/14 12/31/15 11/30/16
ASSETS - CURRENT $2,015,549 $2,538,213 $3,133,375 ASSETS - FIXED AND OTHER 9,738,086 9,066,235 9,960,071 LIABILITIES - CURRENT 15,843,393 17,176,663 13,001,781 LIABILITIES - LONG-TERM 44,821 371,106 6,630,911 NET ASSETS ($4, 134,579) ($5,943,321) ($6,539,246)
INCOME $7,950,906 $8,937,072 $9,556,487 EXPENSE 10,653,840 10,400,061 10,128,064 NET INCOME ($2, 702,934) ($1,462,989) ($571,577)
NUMBER OF BEDS 131 131 131 PERCENT OF OCCUPANCY (DAYS) 69.71% 74.43% 76.67%
Medicaid 88.30% 86.07% 76.37% Medicare 6.10% 6.98% 11.33% Private Pay/Other 5.60% 6.95% 12.30%
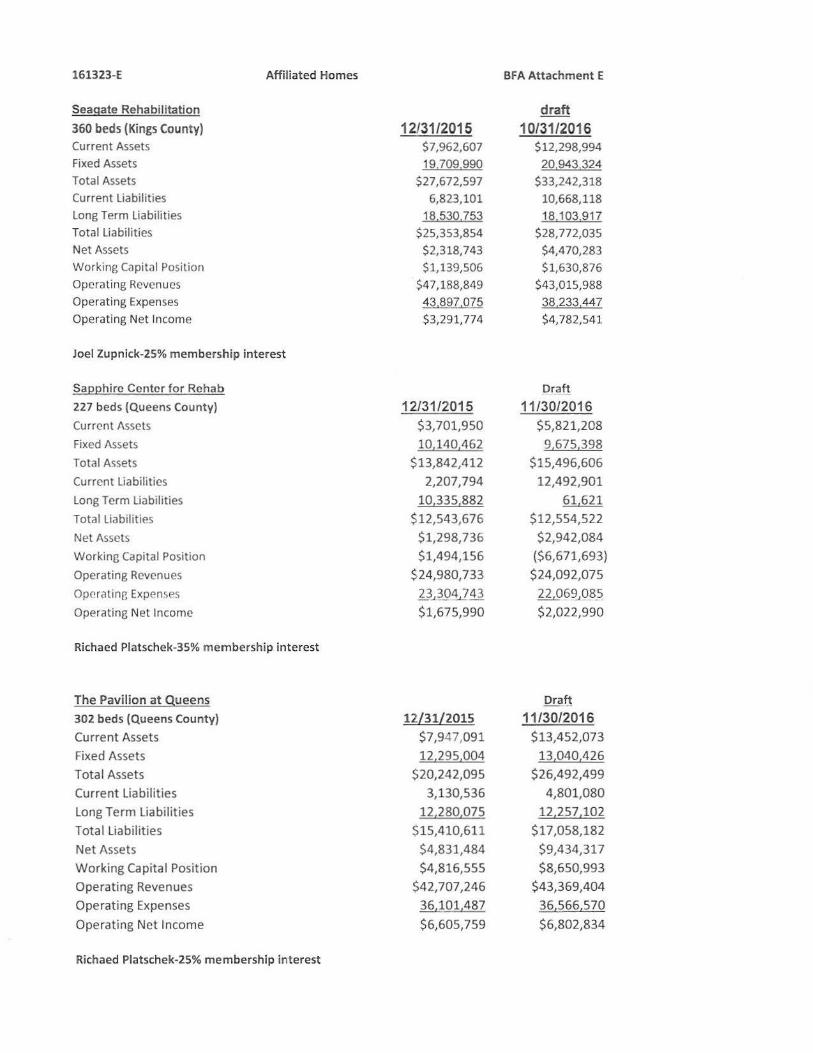
161323-E
Seagate Rehabi litation
360 beds (Kings County) Current Assets
Fixed Assets
Total Assets
Current Liabilities
Long Term Liabilities
Total Liabilities
Net Assets
Working Cc:ipital Posit ion
Operating Revenues
Operating Expenses
Operating Net Income
Affiliated Homes
Joel Zupnick-25% membership interest
Sapphire Center for Rehab
227 beds (Queens County)
Current Assets
Fixed Assets
Total Assets
Current Liabilities
Long Term Liabilities
Total Liabilities
Net Assets
Working Capital Position
Operating Revenu es
Operntinp, ExpP.nsPs
Operating Net Income
Richaed Platschek-35% membership interest
The Pavi lion at Queens
302 beds (Queens County)
Current Assets
Fixed Assets
Tota I Assets
Current Liabilities
Long Term Liabilities
Total Liabilities
Net Assets
Working Capital Position
Operating Revenues
Operating Expenses
Operating Net Income
Richaed Platschek-25% membership interest
12/31/2015 $7,962,607 19,709,990
$27,672,597 6,823,101
18,530,753
$25,353,854 $2,318,743 $1,139,506
$47,188,849 43,897,075
$3,291,774
12/31/2015 $3,701,950
10,1'10,462 $13,842,412
2,207,794 10,335,882
$12,543,676 $1,298,736 $1,494,156
$24,980, 733
2~,3J>4,_?43
$1,675,990
12[31[2015 $7,947,091
12,295,004 $20,242,095
3,130,536
12.280,075 $15,410,611
$4,831,484
$4,816,555 $42, 707 ,246
36,101,487
$6,605,759
BFA Attachment E
draft
10/31/2016 $12,298,994
20,943,324 $33,242,318
10,668,118 18 103 917
$28, 772,035 $4,470,283 $1,630,876
$43,015,988 38,233,447 $4,782,541
Draft
11/30/2016 $5,821,208
9,675,398 $15,496,606
12,492,901 61,621
$12,554,522 $2,942,084 ($6,671,693) $24,092,075
22.0Gio8..? $2,022,990
Draft
11/30/2016 $13,452,073
13,040,426 $26,492,499
4,801,080
12,257,102 $17,058,182
$9,434,317
$8,650,993 $43,369,404
36,566,570
$6,802,834
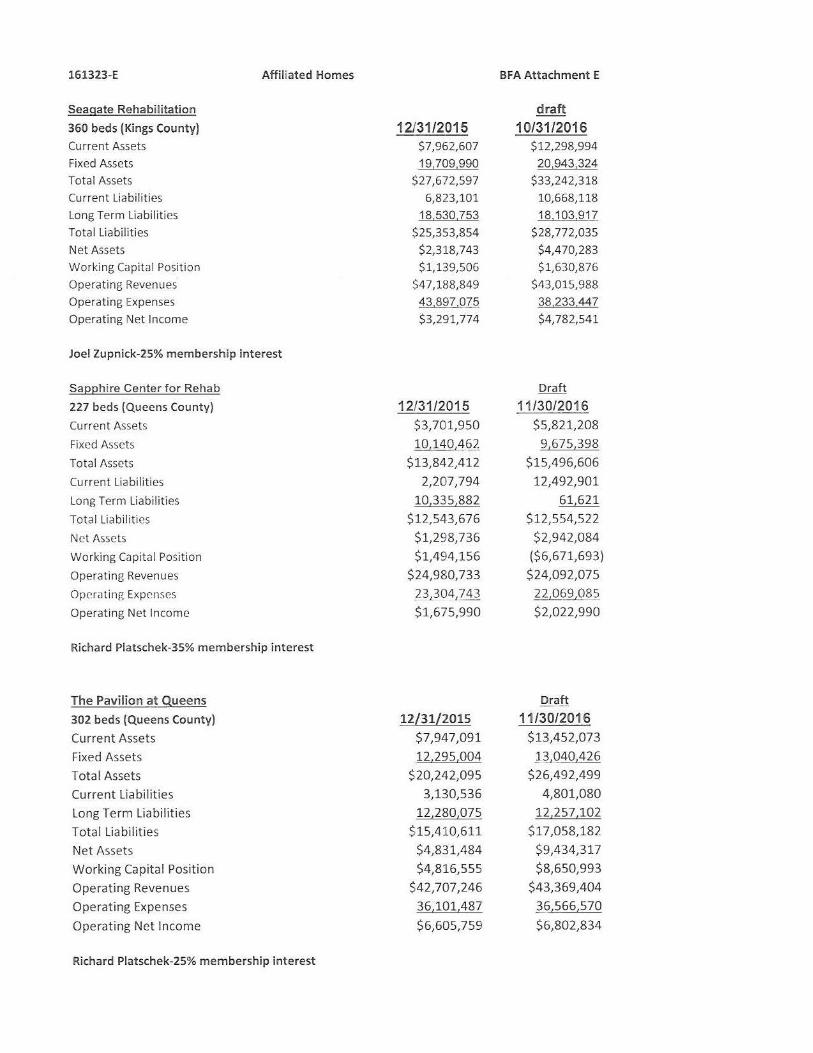
161323-E
Seagate Rehabilitation
360 beds (Kings County) Current Assets
Fixed Assets
Total Assets
Current liabilities
Long Term liabilities
Total liabilities
Net Assets
Working Capital Position
Operating Revenues
Operating Expenses
Operating Net Income
Affiliated Homes
Joel Zupnick-25% membership interest
Sapphire Center for Rehab
227 beds (Queens County)
Current Assets
Fixed Assets
Total Assets
Current Liabilities
Long Term Liabilities
Total Liabilit ies
Net Assets
Working Ccipital Position
Operating Revenues
Opern t ing Expenses
Operating Net Income
Richard Platschek-35% membership interest
The Pavil ion at Queens
302 beds (Queens County)
Current Assets
Fixed Assets
Total Assets
Current Liabilities
Long Term Liabil ities
Total Liabilities
Net Assets
Working Capital Position
Operating Revenues
Operating Expenses
Operating Net Income
Richard Platschek-25% membership interest
12/31/2015 $7,962,607 19,709,990
$27,672,597 6,823,101
18,530,753
$25,353,854 $2,318,743 $1,139,506
$47,188,849
~3.897,075
$3,291,774
12/31/2015 $3,701,950 10,140,1_62
$13,842,412
2,207,794
10,335,882 $12,543,676
$1,298,736 $1,494,156
$24,980, 733
2_~,_304,743
$1,675,990
12[31[2015 $7,947,091
12,295,004 $20,242,095
3,130,536
12,280,075 $15,410,611
$4,831,484
$4,816,555 $42,707,246
36,101,487
$6,605,759
BFA Attachment E
draft
10/31/2016 $12,298,994
20,943,324 $33,242,318
10,668,118 18,103,917
$28, 772,035 $4,470,283 $1,630,876
$43,015,988 38,233,447 $4,782,541
Draft
11/30/2016 $5,821,208
9,675,398 $15,496,606
12,492,901
61 ,621 $12,554,522
$2,942,084
($6,671,693) $24,092,075
22,069,085 $2,022,990
Draft
11/30/2016 $13,452,073
13,040,426
$26,492,499 4,801,080
12,257,102 $17,058,182
$9,434,317 $8,650,993
$43,369,404
36,566,570
$6,802,834
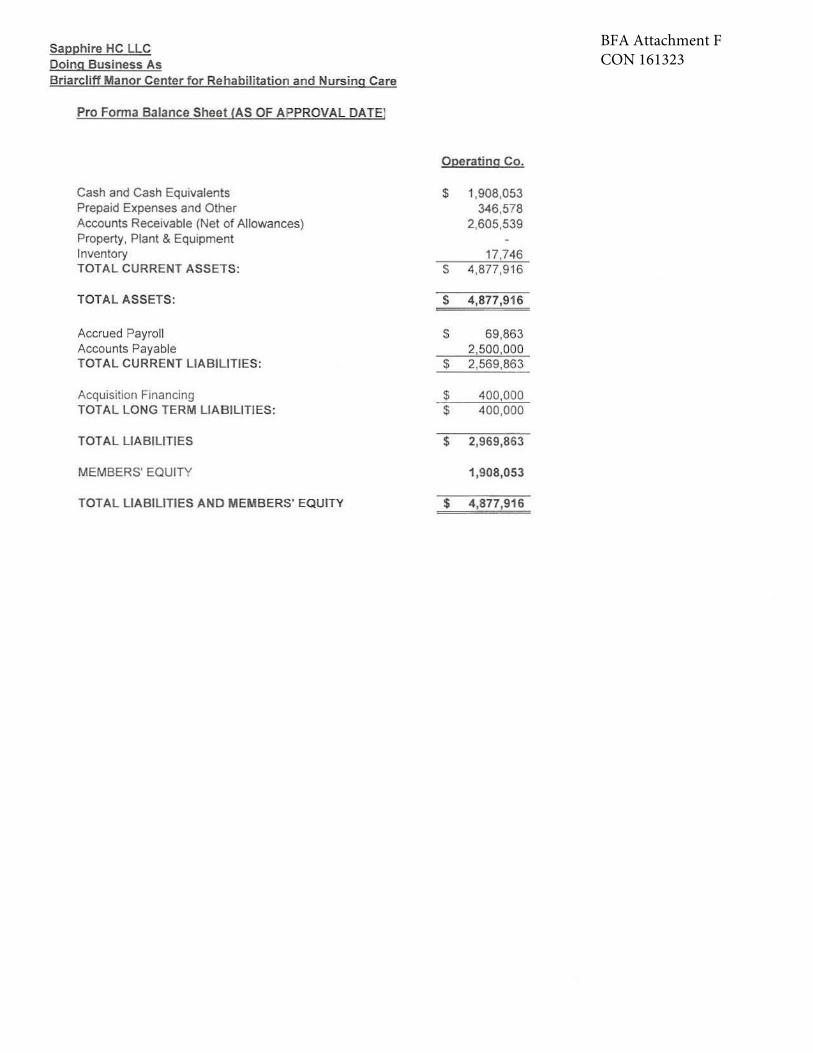
BFA Attachment FCON 161323
Sapphire HC LLC Doing Business As Briarcliff Manor Center for Rehabilitation and Nursing Care
Pro Fonna Balance Sheet (AS OF APPROVAL DATE)
Cash and Cash Equivalents Prepaid Expenses and Other Accounts Receivable (Net of Allowances) Property, Plant & Equipment Inventory TOTAL CURRENT ASSETS:
TOTAL ASSETS:
Accrued Payroll Accounts Payable TOTAL CURRENT LIABILITIES:
Acquisition Financing TOTAL LONG TERM LIABILITIES:
TOT AL LIABILITIES
MEMBERS' EQUITY
TOTAL LIABILITIES AND MEMBERS' EQUITY
Operating Co.
$ 1,908,053 346,578
2,605,539
17 746 $ 4,877,916
$ 4,877,916
s 69,863 215001000
$ 2,569,863
$ 400,000 $ 400,000
$ 2,969,863
1,908,053
$ 4,877,916
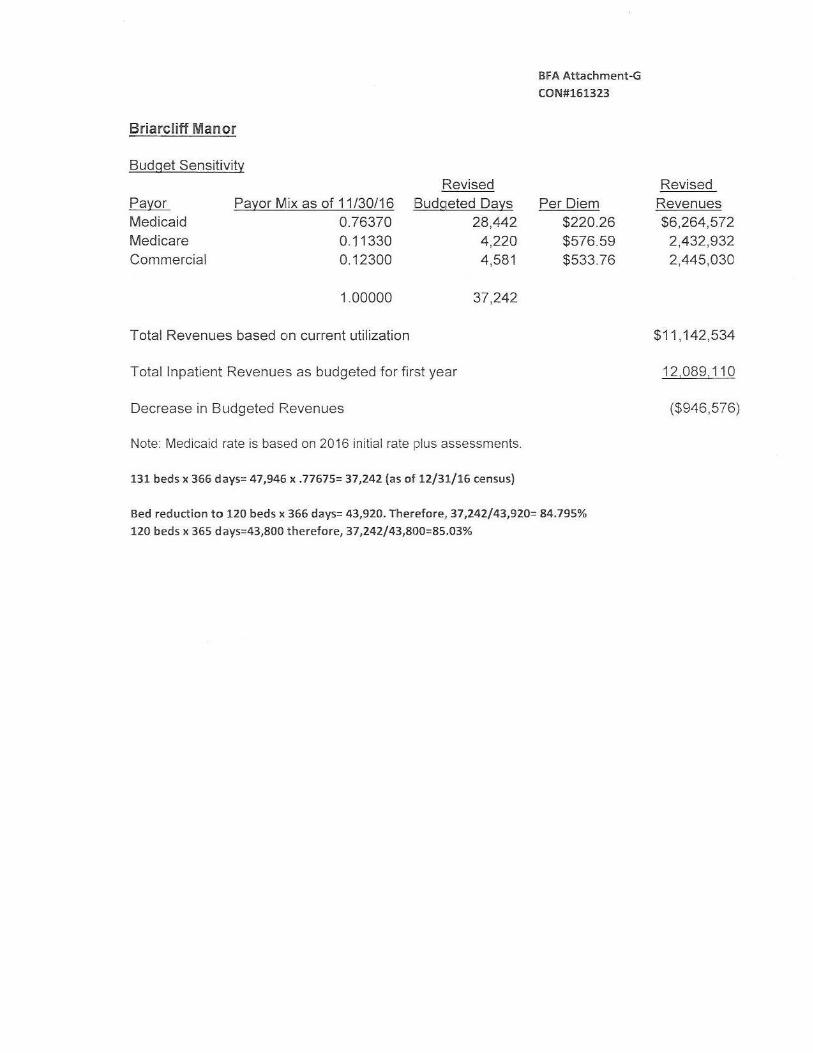
Briarcliff Manor
Budget Sensitivity
Payor Medicaid Medicare Commercial
Payor Mix as of 11 /30/16 0.76370 0.11330 0.12300
Revised Budgeted Days
28,442 4,220 4,581
1.00000 37,242
BFA Attachment-G
CON#161323
Per Diem $220.26 $576.59 $533.76
Revised Revenues $6,264,572
2,432,932 2,445,030
Total Revenues based on current utilization $11, 142,534
Total Inpatient Revenues as budgeted for first year 12,089, 110
Decrease in Budgeted Revenues ($946,576)
Note: Medicaid rate is based on 2016 initial rate plus assessments.
131 beds x 366 days= 47,946 x .77675= 37,242 (as of 12/31/16 census)
Bed reduct ion to 120 beds x 366 days= 43,920. Therefore, 37,242/43,920= 84.795%
120 beds x 365 days=43,800 t herefore, 37,242/43,800=85.03%

Briarcliff Manor
Budget Sensitivity Revised
Payor Payor Mix as of 11 /30/16 Budgeted Days Medicaid 0.76370 31,938 Medicare 0.11330 4 ,738 Commercial 0.12300 5,144
1.00000 41,820
BFA Attachment-H
CON#161323
Per Diem $220.26 $576.59 $533.76
Revised Revenues $7,034,649
2,732,002 2,745,587
Total Revenues based on current utilization $12,51 2,238
Total Inpatient Revenues as budgeted for first year j 2,089, 110
Decrease in Budgeted Revenues $423, 128
Note: Medicaid rate is based on 2016 initial rate plus assessments.
131 beds x 366 days= 47,946 x .77675= 37,242 (as of 12/31/16 census)
Bed reduction to 120 beds x 366 days= 43,920. Therefore, 37,242/43,920= 84.795%
120 beds x 365 days:::43,800 therefore, 95.48% X 43,800=41,820 inpatient days.
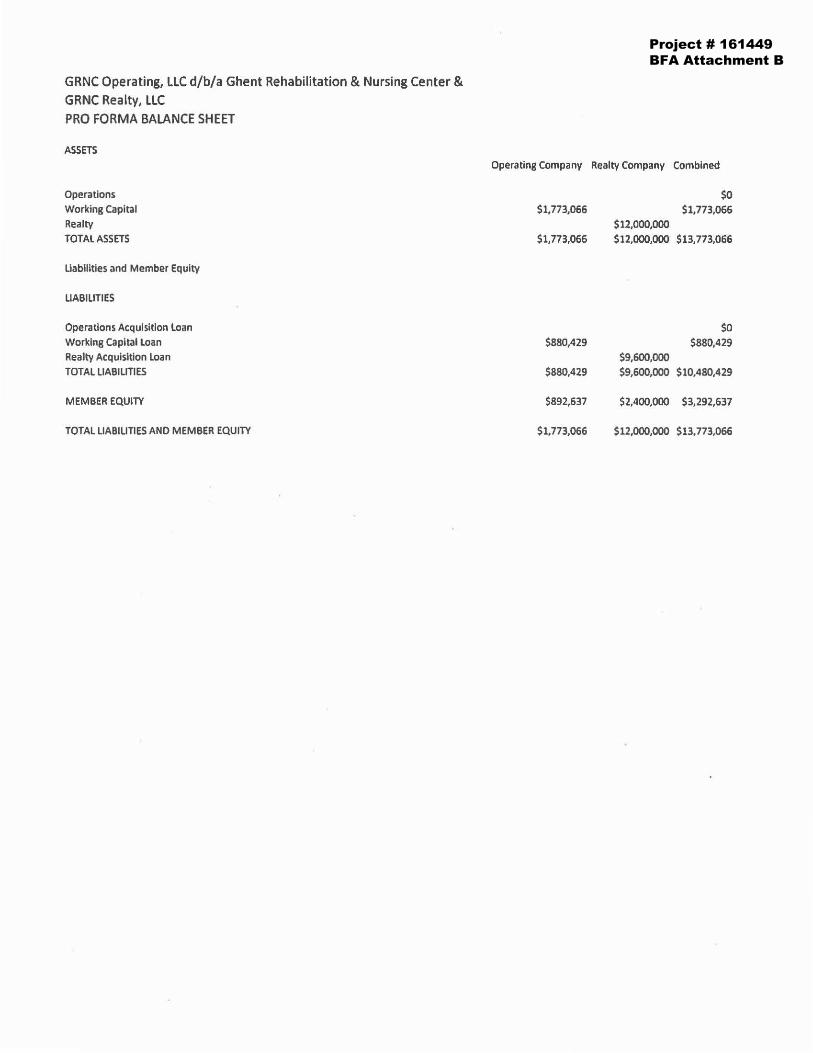
Project # 161449 BFA Attachment B
GRNC Operating, LLC d/b/a Ghent Rehabilitation & Nursing Center & GRNC Realty, LLC PRO FORMA BALANCE SHEET
ASSm
Operations Working Capital Realty
TOTAL ASSETS
Liabilities and Member Equity
LIABILITIES
Operations Acquisition Loan
Working Capital Loan Realty Acquisition Loan TOTAL LIABILITIES
MEMBER EQUITY
TOTAL LIABILITIES AND MEMBER EQUITY
Operating Company Realty Company Combined
$1,773,066
$1,773,066
$880,429
$880,429
$892,637
$1,773,066
$12,000,000
$0 $1,773,066
$12,000,000 $13,773,066
$9,600,000
$0 $880,429
$9,600,000 $10,480,429
$2,400,000 $3,292,637
$12,000,000 $13,773,066
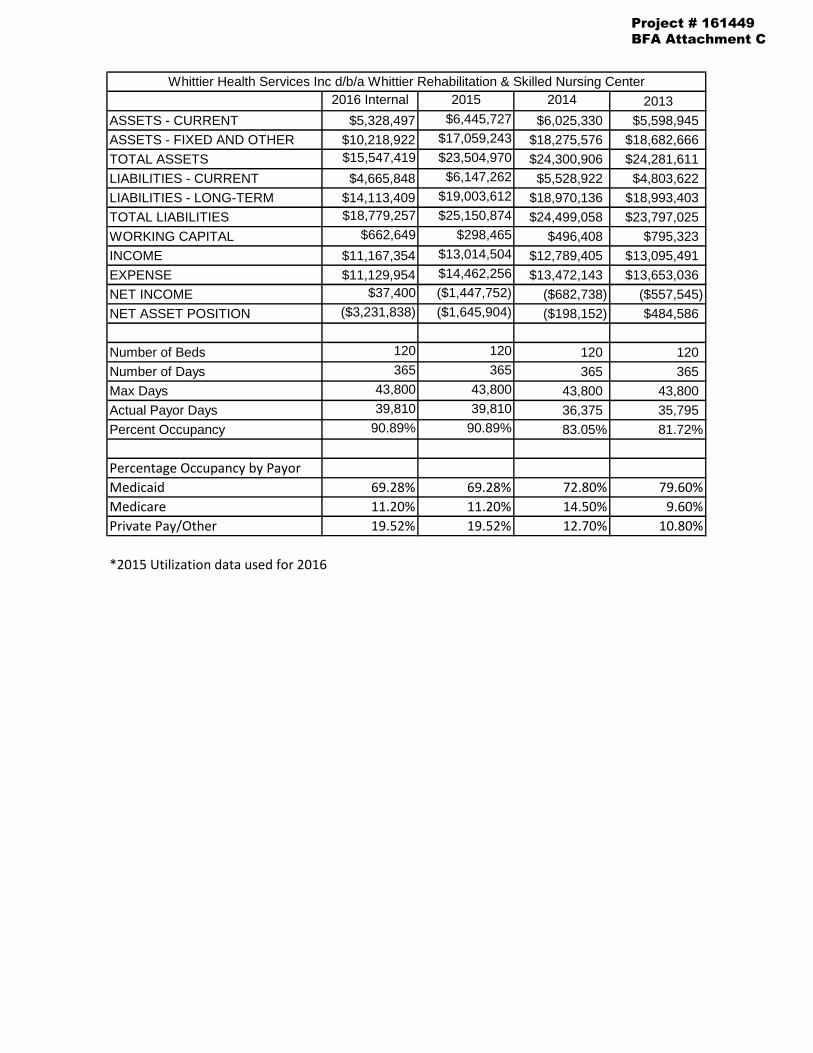
2016 Internal 2015 2014 2013
ASSETS - CURRENT $5,328,497 $6,445,727 $6,025,330 $5,598,945
ASSETS - FIXED AND OTHER $10,218,922 $17,059,243 $18,275,576 $18,682,666
TOTAL ASSETS $15,547,419 $23,504,970 $24,300,906 $24,281,611
LIABILITIES - CURRENT $4,665,848 $6,147,262 $5,528,922 $4,803,622
LIABILITIES - LONG-TERM $14,113,409 $19,003,612 $18,970,136 $18,993,403
TOTAL LIABILITIES $18,779,257 $25,150,874 $24,499,058 $23,797,025
WORKING CAPITAL $662,649 $298,465 $496,408 $795,323
INCOME $11,167,354 $13,014,504 $12,789,405 $13,095,491
EXPENSE $11,129,954 $14,462,256 $13,472,143 $13,653,036
NET INCOME $37,400 ($1,447,752) ($682,738) ($557,545)
NET ASSET POSITION ($3,231,838) ($1,645,904) ($198,152) $484,586
Number of Beds 120 120 120 120
Number of Days 365 365 365 365
Max Days 43,800 43,800 43,800 43,800
Actual Payor Days 39,810 39,810 36,375 35,795
Percent Occupancy 90.89% 90.89% 83.05% 81.72%
Percentage Occupancy by Payor
Medicaid 69.28% 69.28% 72.80% 79.60%
Medicare 11.20% 11.20% 14.50% 9.60%
Private Pay/Other 19.52% 19.52% 12.70% 10.80%
*2015 Utilization data used for 2016
Whittier Health Services Inc d/b/a Whittier Rehabilitation & Skilled Nursing Center
Project # 161449BFA Attachment C
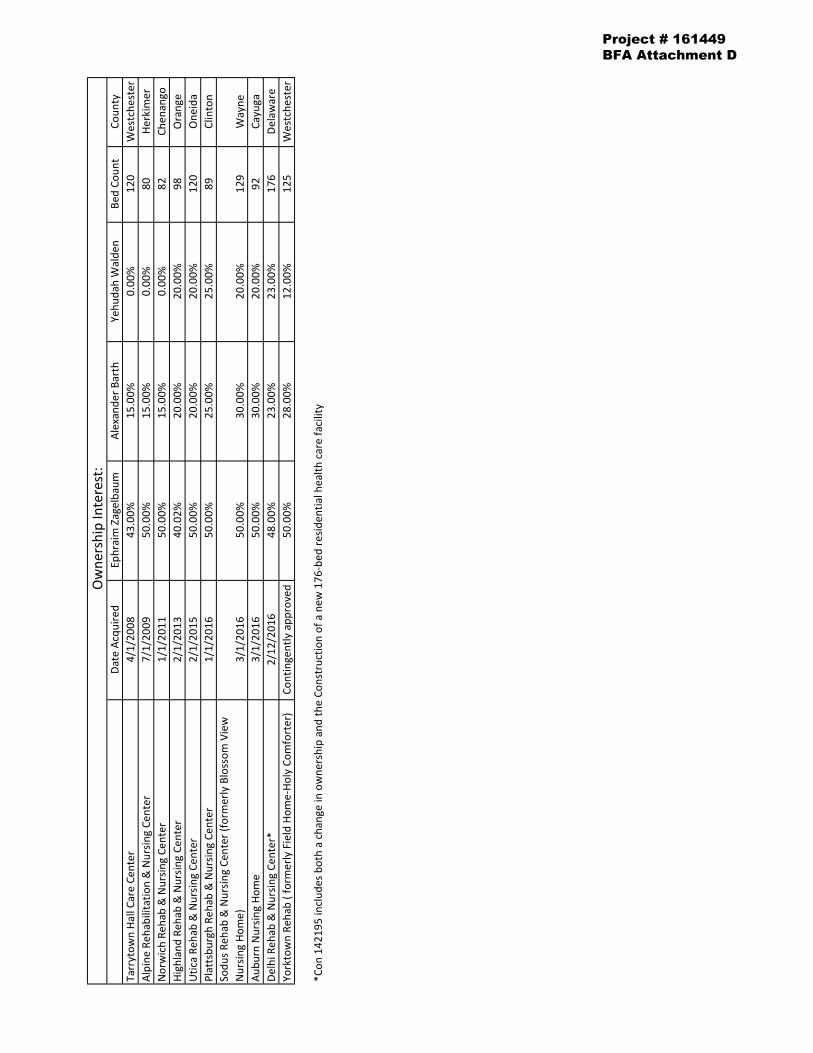
Date
Acq
uire
dEp
hrai
m Z
agel
baum
Alex
ande
r Bar
thYe
huda
h W
alde
nBe
d Co
unt
Coun
tyTa
rryt
own
Hall
Care
Cen
ter
4/1/
2008
43.0
0%15
.00%
0.00
%12
0W
estc
hest
erAl
pine
Reh
abili
tatio
n &
Nur
sing
Cent
er7/
1/20
0950
.00%
15.0
0%0.
00%
80He
rkim
erN
orw
ich
Reha
b &
Nur
sing
Cent
er1/
1/20
1150
.00%
15.0
0%0.
00%
82Ch
enan
goHi
ghla
nd R
ehab
& N
ursin
g Ce
nter
2/1/
2013
40.0
2%20
.00%
20.0
0%98
Ora
nge
Utic
a Re
hab
& N
ursin
g Ce
nter
2/1/
2015
50.0
0%20
.00%
20.0
0%12
0O
neid
aPl
atts
burg
h Re
hab
& N
ursin
g Ce
nter
1/1/
2016
50.0
0%25
.00%
25.0
0%89
Clin
ton
Sodu
s Reh
ab &
Nur
sing
Cent
er (f
orm
erly
Blo
ssom
Vie
w
Nur
sing
Hom
e)3/
1/20
1650
.00%
30.0
0%20
.00%
129
Way
neAu
burn
Nur
sing
Hom
e3/
1/20
1650
.00%
30.0
0%20
.00%
92Ca
yuga
Delh
i Reh
ab &
Nur
sing
Cent
er*
2/12
/201
648
.00%
23.0
0%23
.00%
176
Dela
war
eYo
rkto
wn
Reha
b ( f
orm
erly
Fie
ld H
ome-
Holy
Com
fort
er)
Cont
inge
ntly
app
rove
d50
.00%
28.0
0%12
.00%
125
Wes
tche
ster
*Con
142
195
incl
udes
bot
h a
chan
ge in
ow
ners
hip
and
the
Cons
truc
tion
of a
new
176
-bed
resid
entia
l hea
lth c
are
faci
lity
Ow
ners
hip
Inte
rest
:
Project # 161449BFA Attachment D

1/1/2016-11/30/2016
Internal 2015 2014 2013
ASSETS - CURRENT $5,676,024 $2,516,798 $2,415,385 $2,873,733
ASSETS - FIXED AND OTHER $4,386,969 $1,955,244 $2,165,657 $3,529,400
TOTAL ASSETS $10,062,993 $4,472,042 $4,581,042 $6,403,133
LIABILITIES - CURRENT $2,242,486 $2,670,917 $2,626,596 $3,575,620
LIABILITIES - LONG-TERM $4,882,395 $236,649 $442,200 $1,991,523
TOTAL LIABILITIES $7,124,881 $2,907,566 $3,068,796 $5,567,143
WORKING CAPITAL $3,433,538 ($154,119) ($211,211) ($701,887)
INCOME $7,610,580 $12,563,918 $13,387,389 $13,228,332
EXPENSE $5,441,418 $11,576,407 $12,699,397 $13,450,978
NET INCOME $2,169,162 $987,511 $687,992 ($222,646)
NET ASSET POSITION $2,938,112 $1,564,476 $1,512,246 $835,990
1/1/2016-11/30/2016
Internal 2015 2014 2013
ASSETS - CURRENT $4,187,501 $1,553,816 $1,016,167 $992,011
ASSETS - FIXED AND OTHER $5,162,234 $7,587,921 $1,961,371 $1,979,287
TOTAL ASSETS $9,349,735 $9,141,737 $2,977,538 $2,971,298
LIABILITIES - CURRENT $1,321,726 $1,729,905 $1,223,048 $1,330,282
LIABILITIES - LONG-TERM $6,716,595 $6,871,882 $674,514 $1,066,317
TOTAL LIABILITIES $8,038,321 $8,601,787 $1,897,562 $2,396,599
WORKING CAPITAL $2,865,775 ($176,089) ($206,881) ($338,271)
INCOME $6,564,516 $6,971,827 $6,834,997 $7,151,830
EXPENSE $5,343,052 $6,001,655 $6,314,353 $6,923,887
NET INCOME $1,221,464 $970,172 $520,644 $227,943
NET ASSET POSITION $1,311,414 $539,950 $1,079,976 $574,699
1/1/2016-11/30/2016
Internal 2015 2014 2013
ASSETS - CURRENT $6,120,585 $1,557,000 $1,390,988 $1,300,807
ASSETS - FIXED AND OTHER $2,821,168 $755,000 $542,743 $647,427
TOTAL ASSETS $8,941,753 $2,312,000 $1,933,731 $1,948,234
LIABILITIES - CURRENT $784,262 $1,191,000 $1,226,609 $1,665,260
LIABILITIES - LONG-TERM $7,103,792 $488,000 $243,026 $336,106
TOTAL LIABILITIES $7,888,054 $1,679,000 $1,469,635 $2,001,366
WORKING CAPITAL $5,336,323 $366,000 $164,379 ($364,453)
INCOME $7,336,407 $7,203,000 $7,496,798 $6,915,182
EXPENSE $5,520,304 $7,029,000 $6,978,336 $6,864,703
NET INCOME $1,816,103 $174,000 $518,462 $50,479
NET ASSET POSITION $1,053,699 $633,000 $464,096 ($53,132)
Tarrytown Hall Care Center
Alpine Rehabilitation & Nursing Center
Norwich Rehab & Nursing Center
Project # 161449BFA Attachment E
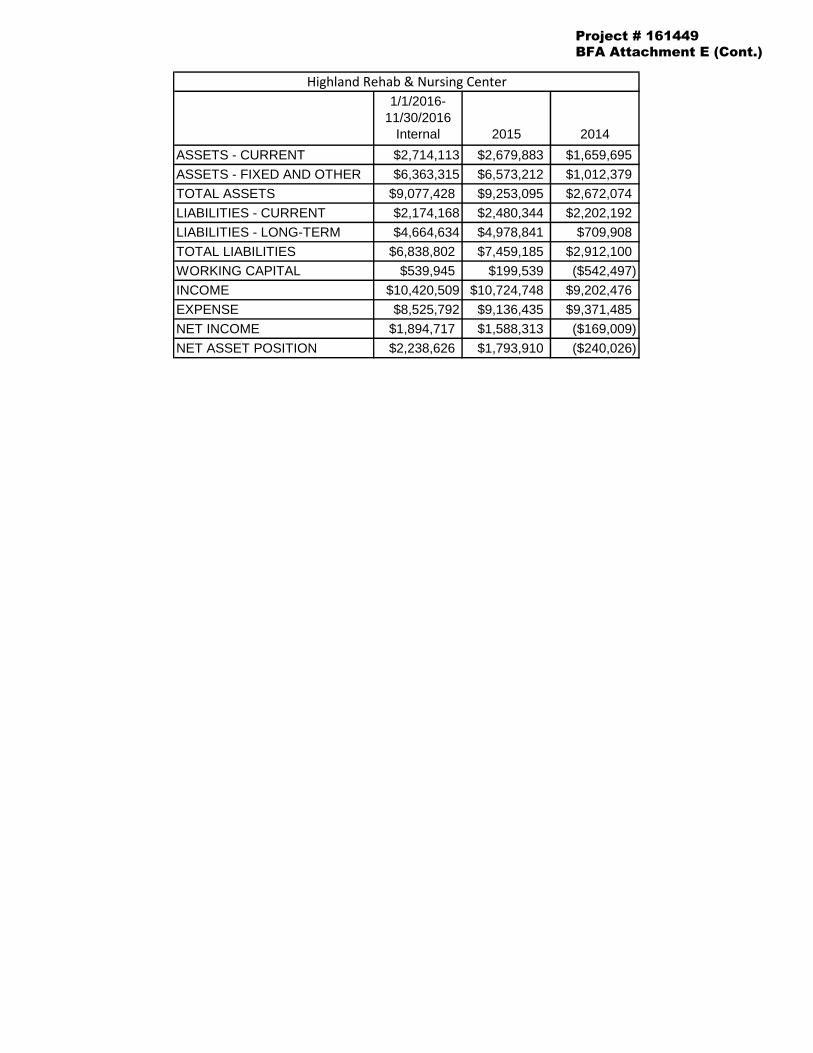
1/1/2016-11/30/2016
Internal 2015 2014
ASSETS - CURRENT $2,714,113 $2,679,883 $1,659,695
ASSETS - FIXED AND OTHER $6,363,315 $6,573,212 $1,012,379
TOTAL ASSETS $9,077,428 $9,253,095 $2,672,074
LIABILITIES - CURRENT $2,174,168 $2,480,344 $2,202,192
LIABILITIES - LONG-TERM $4,664,634 $4,978,841 $709,908
TOTAL LIABILITIES $6,838,802 $7,459,185 $2,912,100
WORKING CAPITAL $539,945 $199,539 ($542,497)
INCOME $10,420,509 $10,724,748 $9,202,476
EXPENSE $8,525,792 $9,136,435 $9,371,485
NET INCOME $1,894,717 $1,588,313 ($169,009)
NET ASSET POSITION $2,238,626 $1,793,910 ($240,026)
Highland Rehab & Nursing Center
Project # 161449BFA Attachment E (Cont.)
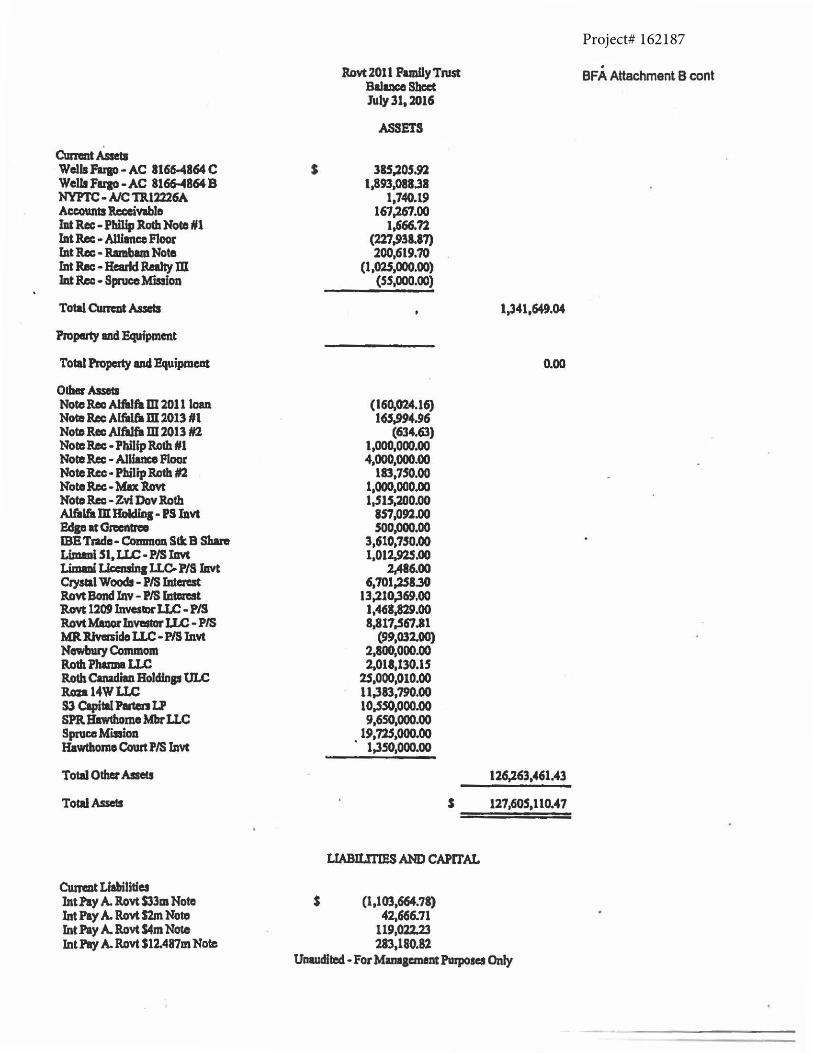
Project# 162187
Cumnt Assetl Wells Fugo - AC ll6M864 C WelllFugo-AC 816M864B NYPTC - A/C TR12226A Accounts Receivable lat Rec - Plll1fp JloCb Noce #1 Int Rec - Alliance Floor Int Rec - Rambm Note Int Rec- Headd Realty m Int Rec - SJlnlCO Mission
Total Ommt Assets
Property uul Equipment
Total Property and Equipment
Other Assets Note Reo Alfalfa m 2011 toan Note Rec Alfalfa m 2013111 NotD Rec AlfiJfa m 1013 Wl Note Rec· Philip Roch #1 Note Rec -Allfanco floor Note ltcc ·Philip Roth #12 Note Rec· Mu Rovt Note Rec- Zvi Dov Roth Alfalfa m Holdin1 ·PS lavt Edge at Grccncrm mETrade-CommaS~BSJwe Limlnl Sl, U.C-PIS JIM Limai Lkcnsing I.LC. P/S Invt Crystal Woodl- PIS Interest Rovt Bond Inv- PIS lnterat R.ovt 1209 lnvesior U.C-PIS RovtMIDor laYllS&Or U.C ·PIS MR. lUvarsido IJ.C-P/S Invt Newbury Commom R.otb Pharma u..c Roth Canadian Holdfnp ULC Roza14WLLC S3 Capital Putcn LP SPR. Hawthome Mbr U.C Spruce Mission Hawthomo Court PIS Invt
Total Ocher Assets
Toti! Assets
Current Llabilidet Int Pay A. llovt $33m Noto Int Pay A. llovt S2m Note Int Pay A. Rovt $4m Note Int Pr/ A. Rovt Sl2.487m Note
s
llovt2011FamflyTJUSt Balmnco Sheet July 31, 2016
ASSETS
385,.205.92 1.893.088.38
1,740.19 167,.261.00
1.666.12 (227,9!8.81) 200.619.70
(1.025.000.00) (55,000.00)
(160,cn..16) l~S,994.96
(634.63) 1.000.000.00 4.000.000.00
183,750.00 1.000.000.00 1.S15.2f)O.OO
857.092.00 soo.000.00
3.610.750.00 1,012,925.00
2,486.00 6,701,.258.30
13.210,369.00 1,461.829.00 8,817,567.11
(99.032.00) 2,aoo.000.00 2,0lt,130.lS
25,000.010.00 11.383,790.00 10..sso.000.00 9,650.000.00
19,72$,000.00 . 1.3.50.000.00
s
LIABIUI'IES AND CAPITAL
s (1,103.664.78) 42,666.71
119,022.23 283,180.81
1,341,649.04
0.00
126,263.461.43
127.605,110.47
Unaudited· For Management Purposes Only
. BFA Attachment 8 cont
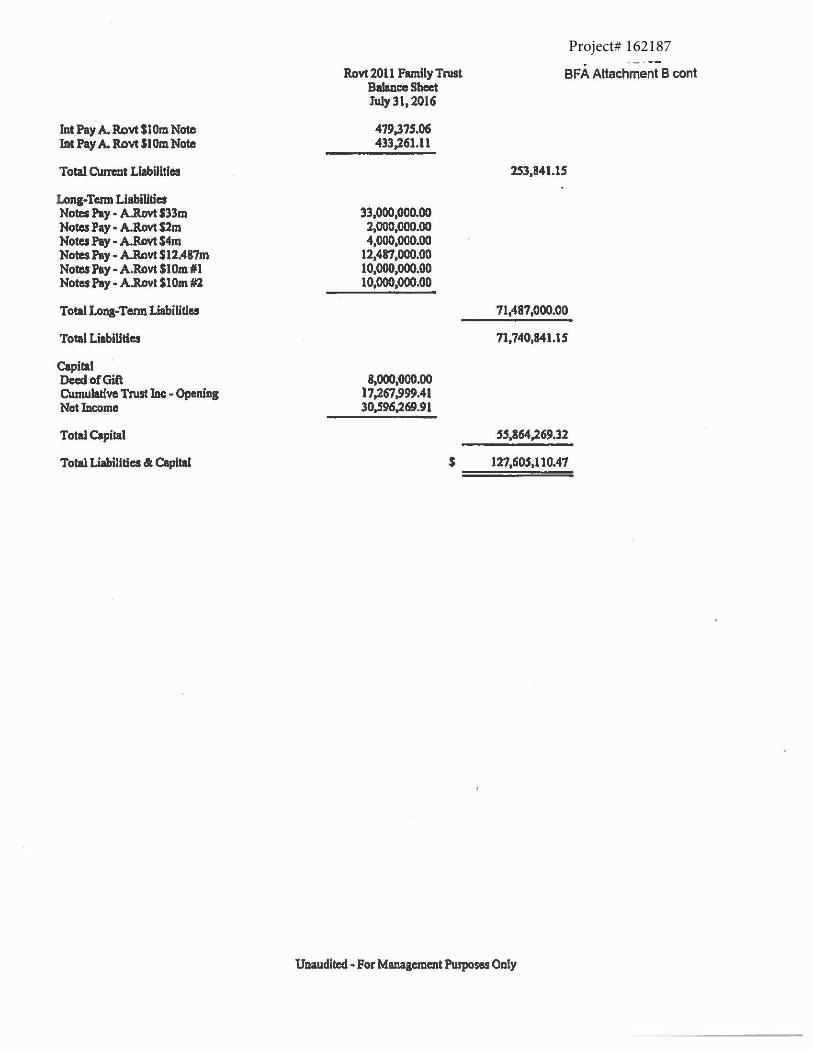
Project# 162187
Int Pay A. R.ovt SlOm Note Int Pay A. Ravt SI Om Note
Total current LlabUltles
Lone-Tenn Liabilides Notes Pay - A.Rovt S33m Notes Pay- A.Rovt Slm Notes Pay-A.Rovt S4m Notes Pay· A.Rovt $12.487m Notes Pay-A.Rovt SlOm #1 Notes Pay· A.R.ovt SlOm #2
Total Long-Tenn Liabilities
Total Liabilities
Capital DecdofGift Cumulative Trust 1nc - Opening Net Income
Total Capital
Total Liabilities & Capital
R.ovt 2011 fllnily Trust Balance Sheet
BFA Attachment B cont
July 31, 2016
479,375.06 433,261.11
33,000.000.00 2,000,000.00 4,000.000.00
12,487,000.00 10.000.000.00 10,000,000.00
a,000.000.00 l7,267,999.4l 30,596,269.91
lS3,841.1S
71,487 ,000.00
71,740,841.15
$ 127,tiOS,110.47 ====:::::::::==
Unaudited - Por Management Purposes Only
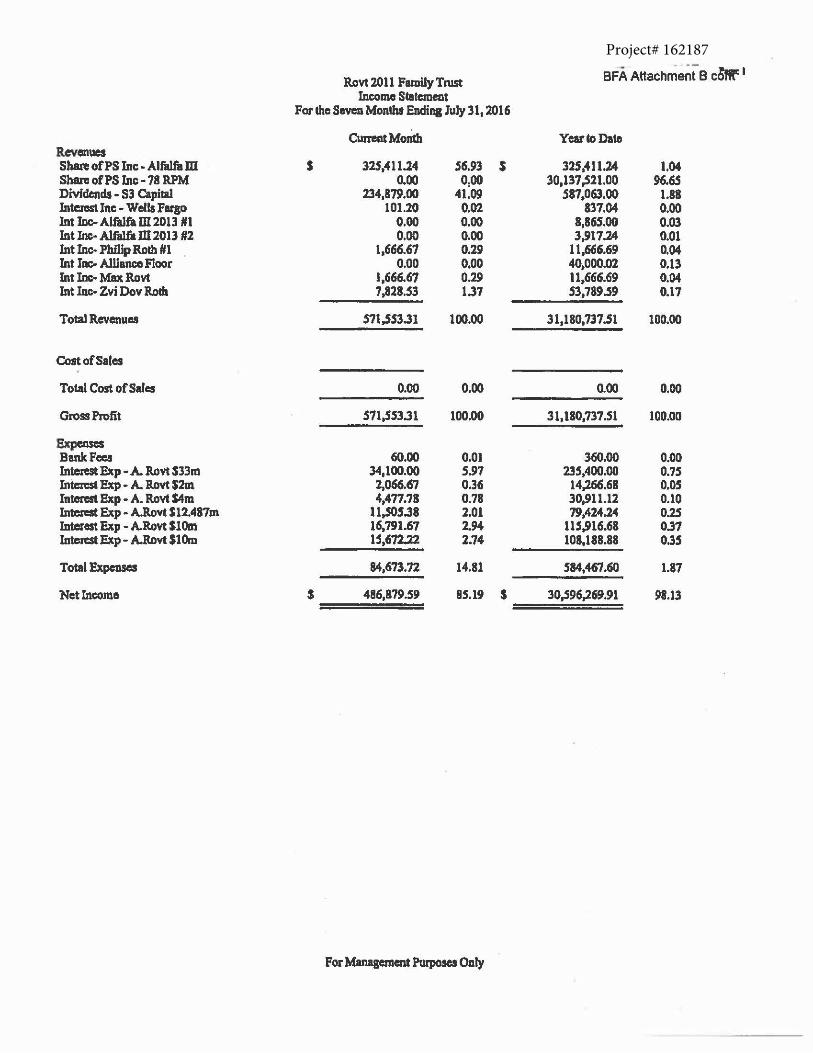
Project# 162187
Rovt 2011 Family Trust BFA Attach~~~t B cOftr 1
Income Statement For the Seven Monlhl Ending July 31, 201 fi
CumntMon1h YearfoDate Revenues Sh&R: of PS Inc -Alfalfit m s 325,411.24 Sfi.93 $ 32S,4U.2A 1.04 Share of PS Inc - 78 RPM 0.00 0:00 30,137,521.00 96.65 Dividends - S3 Capital 234,879.00 41.09 587.063.00 1.88 Interest Inc - Wells Fargo 101.20 0.02 837.04 0.00 lnt Inc-Alfalfa m 2013 #1 0.00 0.00 8,86S.OO 0.03 Int Inc- Alf8lf'a m 2ou #2 0.00 0.00 3,917.24 0.01 Int Inc- Plu11p Roth #1 1.666.67 0.29 11,666.69 0.04 Int Inc.- Alliance Floor 0.00 o.oo 40,000.02 0.13 Int Inc- Max Rovt 1,666.67 0.29 11.666.69 0.04 Int Inc- Zvi Dov Roth 7.828.53 1.37 53.789.59 0.17
Total Revenues 571,553.31 100.00 31.180,737.Sl 100.00
Cost of Sales
Total Cost of Sales 0.00 0.00 0.00 o.oo Gross Profit 571,553.31 100.00 3l,180,737 .Sl 100.00
Expenses Bank fees 60.00 0.01 360.00 o.oo Intemt Exp -A. Rovt S33m 34,100.00 S.91 235,400.00 0.75 Inicn:st Exp- A. Rovt S2m 2,066.67 0.36 14,.266.68 0.05 Interest Exp - A. Rovt S4m 4,477.78 0.78 30,911.12 0.10 InteRSt Exp· A.Rovt Sl2.487m 11..S05.38 2.01 79.414.24 0.25 Interest Exp • A.Rovt SlOm 16,791.67 2.94 115,916.68 0.37 Interest Exp- A.Rovt St Om IS,672.22 2.74 108.188.88 0.35
Total Expenses 84.673.72 14.81 S84,467.60 1.87
Net Income $ 486,879.59 85.19 s 30,596,.269.91 Sll.13
For Manaaement Purposes Only
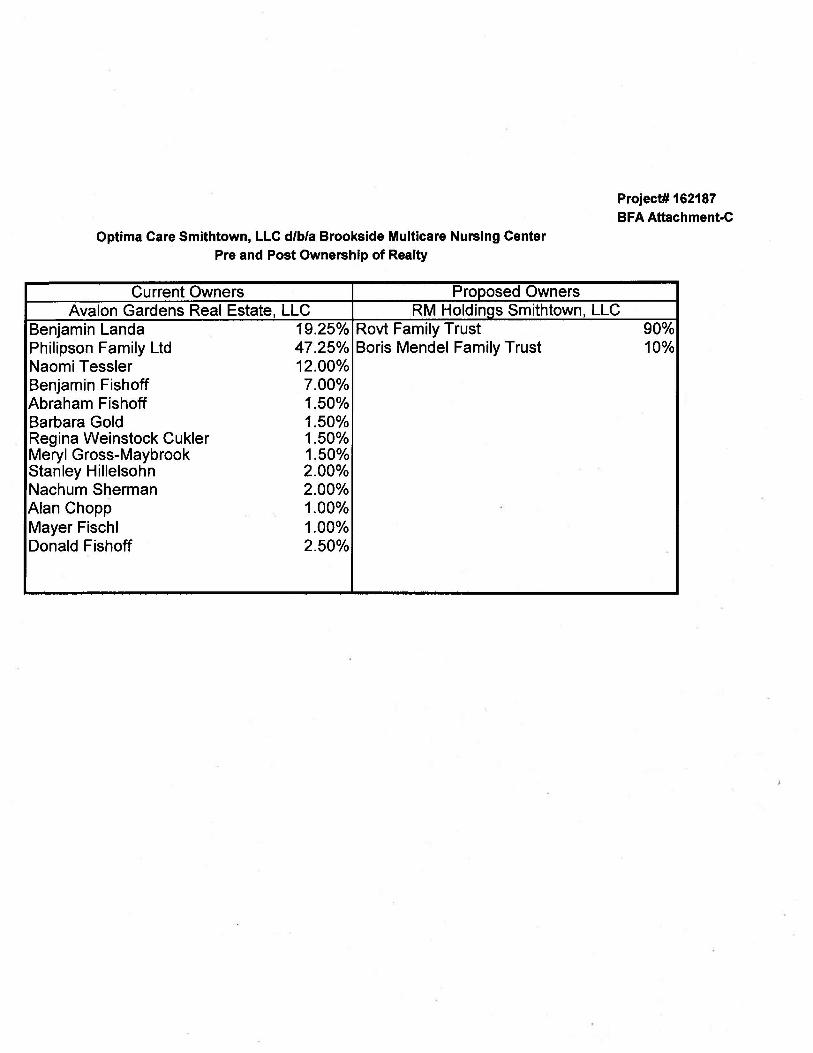
Optima Care Smithtown, LLC d/b/a Brookside Multicare Nursing Center Pre and Post Ownership of Realty
Current Owners Proposed Owners
Project# 162187 BFA Attachment-C
Avalon Gardens Real Estate, LLC RM Holdinas Smithtown, LLC Benjamin Landa 19.25% Rovt Family Trust 90% Philipson Family Ltd 47.25% Boris Mendel Family Trust 10% Naomi Tessler 12.00% Benjamin Fishoff 7.00% Abraham Fishoff 1.50% Barbara Gold 1.50% Regina Weinstock Cukler 1.50% Meryl Gross-Maybrook 1.50% Stanley Hillelsohn 2.00% Nachum Sherman 2.00% Alan Chopp 1.00% Mayer Fischl 1.00% Donald Fishoff 2.50%
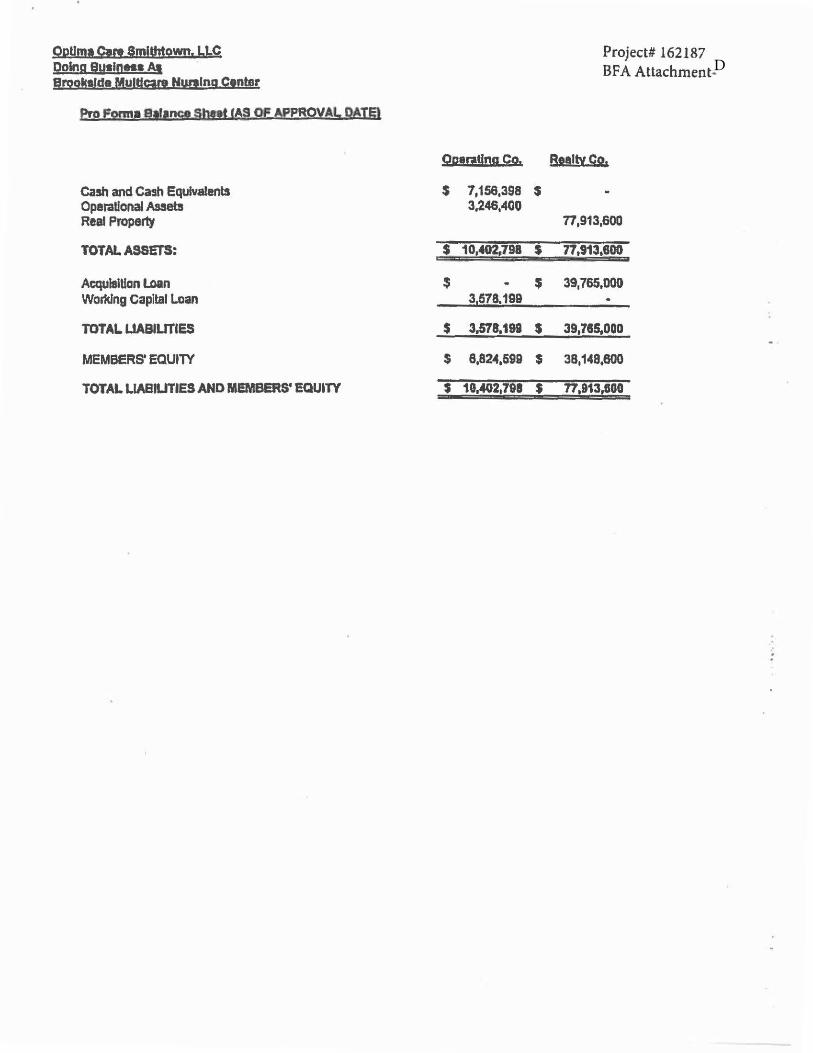
DOptima Care Smithtown. LLC Doing Bu•lneH At erqok•fd• Multfca[I Nunlng Ctnter
cash and Cash Equivalents Operational Assets Real Property
TOTAL ASSETS:
AcqulaiUan Loan Working Capital Loan
TOTAL UABIUTfES
MEMBERS' EQUITY
TOTAL LIABILITIES AND MEMBERS' EQU•TY
Optratlng Co.
s 7,156,398 3,246,400
s 10,40;+798
$ 3,578,199
$ 3,578.199
$ 8,824,599
$ 10,402,791
$
$
$
$
$
$
Project# 162187 BFA Attachment·
R!!llyQ9J
77,913,600
. 77,913,600
39,765,000
39,7SS.OQO
38,148,800
77!913,800
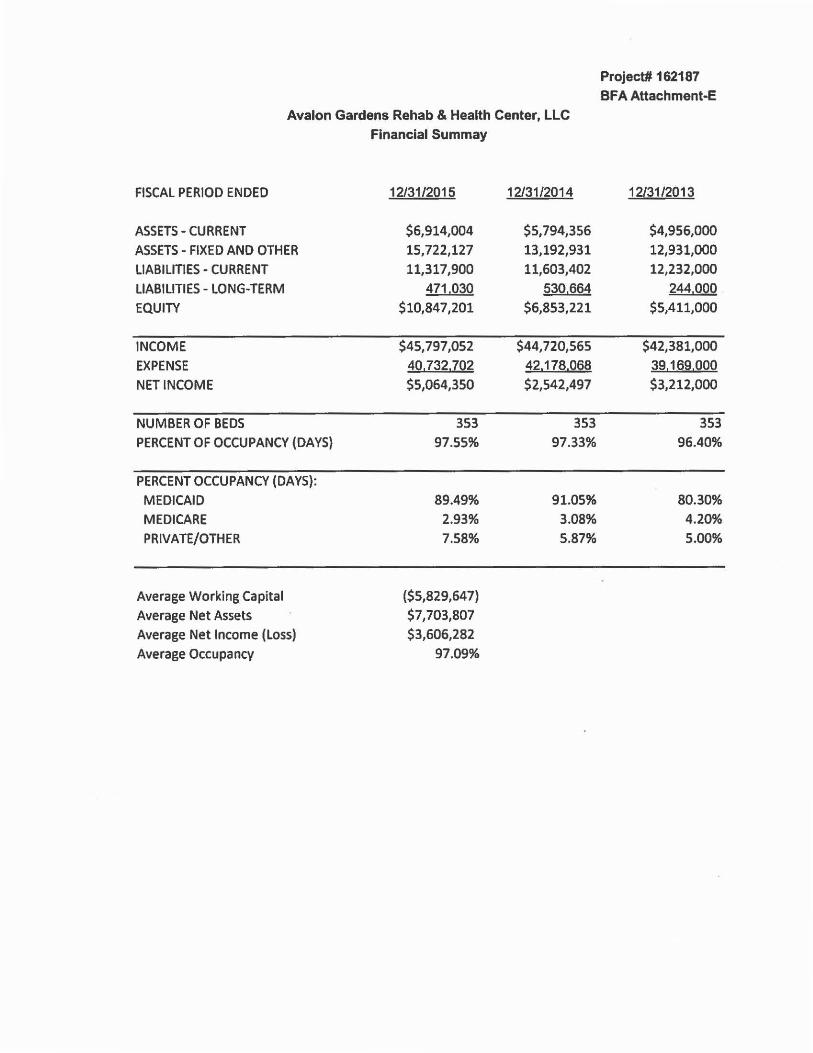
Avalon Gardens Rehab & Health Center, LLC Financial Summay
FISCAL PERIOD ENDED
ASSETS· CURRENT ASSETS- FIXED AND OTHER LIABILITIES - CURRENT LIABILITIES - LONG-TERM
EQUITY
INCOME EXPENSE
NET INCOME
NUMBER OF BEDS PERCENT OF OCCUPANCY (DAYS)
PERCENT OCCUPANCY (DAYS): MEDICAID MEDICARE PRIVATE/OTHER
Average Working Capital Average Net Assets Average Net Income (Loss) Average Occupancy
12131/2015
$6,914,004 15,722,127 11,317,900
471.030 $10,847,201
$45, 797 ,052 40,732,ZQ2 $5,064,350
353 97.55%
89.49% 2.93% 7.58%
($5,829,647) $7,703,807 $3,606,282
97.09%
12131/2014
$5,794,356 13,192,931 11,603,402
530,664 $6,853,221
$44,720,565 42,178,Q§S $2,542,497
353 97.33%
91.05% 3.08% 5.87%
Project# 162187
Bf A Attachment-E
12131/2013
$4,956,000 12,931,000 12,232,000
244.000 $5,411,000
$42,381,000 39,16~1QOO $3,212,000
353 96.40%
80.30% 4.20% 5.00%
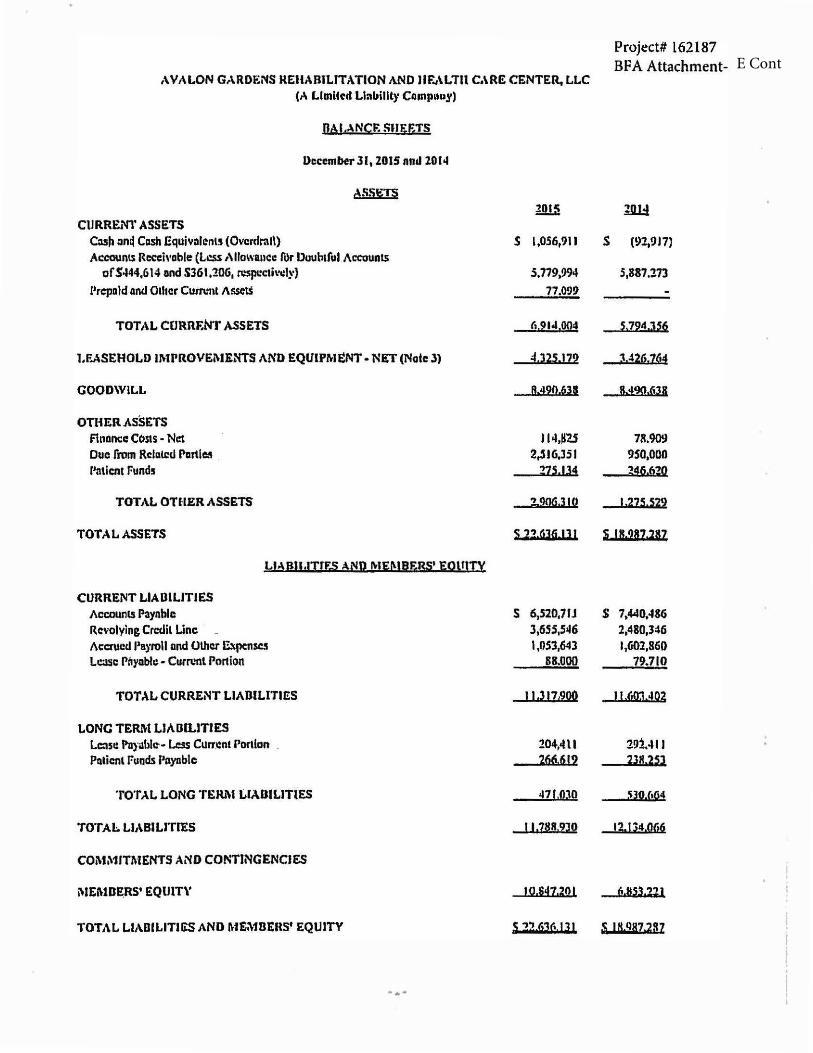
E ContA VA LON GARDENS ltEHARlLITATION ANO JIF.,\LTlt C.\RE CENTER. LLC
(A LhnlC~d Llnbillly Coinpitb.Y)
PAl.ANCF: SllE&TS
l>cccmber JI, 2015 nnd 2014
CURRENT ASSETS C:ish :m~ Cash Equivalents (Ovctdral\) Accounts Rccch•oble (Less 1\llowancc fl)r lluuhtful Accounts
ofS444,614 and $361,206, n:sp:cth..:ly} Prepaid ond Other Cum:nt i\ssetS
TOTAL CURRF.NT ASSETS
1.F.ASEHOLD IMPROVEMENTS AND EQUIPl'rJENT · NET (Note: 3)
GOODWILL
OTHER ASSETS ftnoncc: CC>sts - Net Due rrom Related PartlM Pa\icnt funds
TOTAL OTHER ASSETS
TOTAL ASSETS
LIABJl,ITJF.S AND MEl\lBERS' EOlfl!Y
CURRENT LlADlLITIES Accounl5 Paynblc Rcvolylng Crt.-dil Llnc _ Accrued Payroll nnd Other ll'tpcnscs Lc:ISt P~y4bl~ • Cum.'nl Portion
TOT AL CURRENT LIABILITIES
LONG TERM LJADILlTJES Lc:m: Pa)·able· l..ess Cum:nt Portion . Policnt Funds P11yoblc
TOT AL LONG TERM LIABILITIES
TOTAi:. LIABILITIES
COl\tMITl\lENTS AND CONilNG£NCJES
MEMDE.RS' £QUIT\'
TOTAL LIABILITIES AND MEMBERS' EQUITY
-.-
201!\
s l,056,911
.s.n9,994 77.099
6.91.&.004
4.325.172
R.491>.6311
114.~25 2,Jl6,JSI
275.134
?,9Q(j.3!Q
s l".6lii.ll l
s 6,S20,71J 3,6SS,S>l6 1,053,643
88.000
11.317,900
204,4U 266.6(2
47f.OJO
I l12~R,2J~
!0,847,201
s '.!2.!iJC..131
s
Project# l62187 BFA Attachment-
:m1:f
(92,917)
.S,387.273
S,794.356
:"426.764
S.490.631
78.909 9SO,OOO ?46.6?Q
1.275.522
s 1 a.2a2.uz
$ 7.440,486 2,480,346 1,602,860
79.710
tl.60'.'l.402
29:?.41 ! 2JH.2Sl
~30,664
1a.1~4,Qfi~
ti.ss3,ID
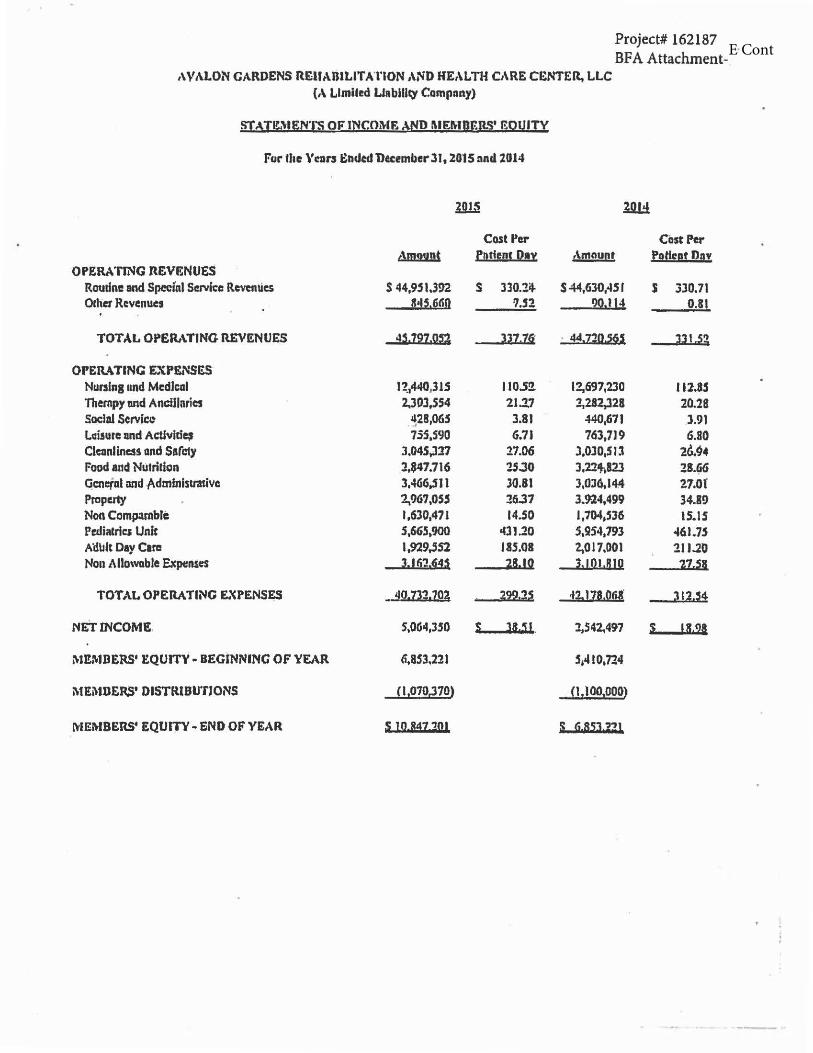
E ContProject# 162187 BFA Attachment·
A\' ALON GARDENS REUABlLIT A'l'ION AND HEALTH CARE CENTE~ LLC (A Llmiled LlabHI~ Campony)
SJAT&~IEN'l"S OF' INCOME ,\ND MEMOElll)' €0UJTY
Fur Uae \'tars Ended December 31, 2015 nnd 2014
lDJ1 10.li
Cost Per Cost Per Amoqgt f !!tf£DI 12•X Amnul!t P!!deat Dav
OPERA'flNG REVENUES Roudne and Speciitl Service RC\'CflliCS s 44,951.392 s 330.l~ $ 44,630,451 s 330.71 Orher Revenues ft:fS.6C'iQ ?.'2 20.114 0.81
TOTAL OPERATING REVENUES 45.797.0Sl 337,76' · 44.720.S6S Jl1.5~
OPERATING EXPENSES Nunlng und Medical IZ1440,31S 110.S!!. l:?,697,230 112.85 Thempy and Ancillaries 2,30J,SS4 21.17 l,212,328 20.28 Social Scrvic~ ~28,065 3.81 440,671 J.91 l.:isurc and ActJvltf~ 755,SCJO G.71 763,719 G.80 Cleanllne.n and Sarcty J,045,Jl7 27.06 l,030,Sll 2&.94 Food and Nutririon l,S47.716 25.JO J,?2",S23 28.~ Qc:nu(al and Administrative 3,466.,11 30.81 J,OJ6,14.4 21.ot Property 2,967,055 16.37 J.9l4,499 34.89 Non Comp:unble 1,630,471 14.SO l,704,,36 IS.IS Petliatrlc:1 Unit S,66S,900 ifll.20 S,954,793 .a61.75 A'dlllt Day Care 1,929,jSl UIS.08 2,017.001 21 J.20 No11 Allowable Expenses 3.16':!.§4~ 211.10 3.101.H I 0 p.SB
TOTAL OPERATING £."<PENSES _ _!10.7l2.702 292.lS •fl. 178.061' lll.54
NET INCOME. S,O<i4,J50 $ Jl.~1 . l,542,497 s 15,28
MEMBERS' EQUITY• BEGINNING OF \'EAR (i,853,221 S1.S I0,7l4
MEi\tDERS' DISTRlBU'fJONS Cl,070,370) (I, l 00,000)
MEMBERS• EQUITY - ENO OF YEAR ~ l!l B!!Z "DI s §.~~.~~u
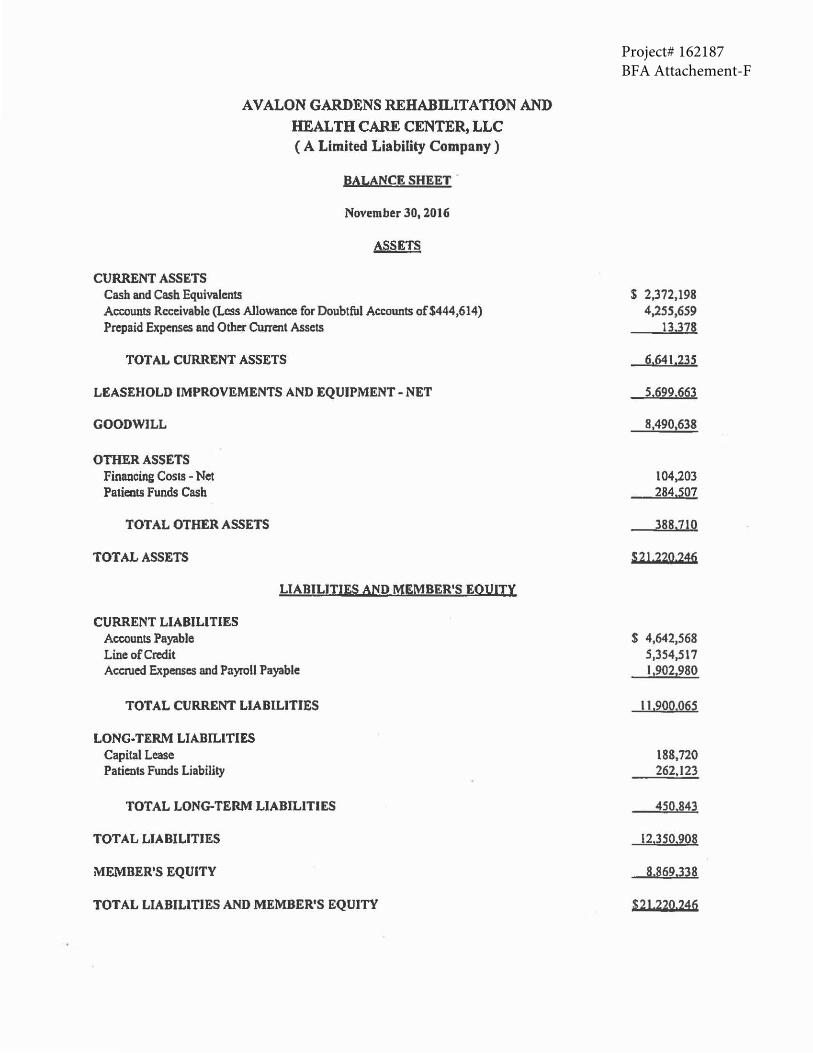
Project# 162187BFA Attachement-F
AVALON GARDENS REHABil.ITATION AND
HEALTH CARE CENTER, LLC ( A Limited Liability Company )
BALANCE SHEET .
November 30, 2016
ASSETS
CURRENT ASSETS Cash and Cash Equivalents Accounts Receivable (Less Allowance for Doubtful Accounts of$444,614) Prepaid Expenses and Other Cunent Assets
TOT AL CURRENT ASSETS
LEASEHOLD IMPROVEMENTS AND EQUIPMENT - NET
GOODWILL
OTHER ASSETS Financing Costs - Net Patients Funds Cash
TOTAL OTHER ASSETS
TOT AL ASSETS
CURRENT LIABILITIES Accounts Payable Line of Credit
LIABILITIES AND MEMBER'S EOUITY
Accrued Expenses and Payroll Payable
TOTAL CURRENT LIABILITIES
LONG-TERM LIABfLITIES Capital Lease Patients Funds Liability
TOTAL LONG-TERM LIABILITIES
TOTAL LIABILITIES
MEMBER'S EQUITY
TOTAL LIABILITIES AND MEMBER'S EQUITY
$ 2,372,198 4,255,659
13.378
6.641.235
5.699.663
8,490,638
104,203 284.507
388.710
$ 2 I .220.246
$ 4,642,568 5,354,517 1,902,980
l l.900.065
188,720 262,123
450.843
12.350,908
8.869,338
$2 l .270.246
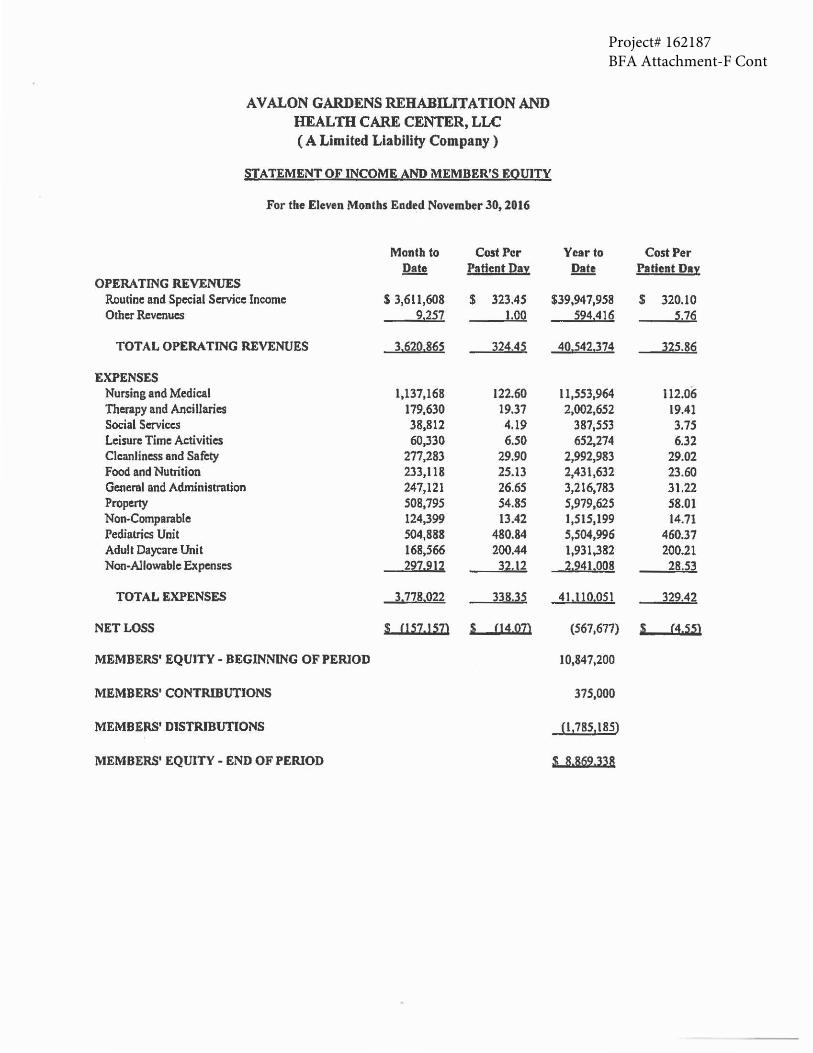
Project# 162187BFA Attachment-F Cont
AV ALON GARDENS REHABILITATION AND HEALTH CARE CENTER, LLC ( A Limited Liability Company )
STATEMENT OF INCOME AND MEMBER'S EQUITY
For the Eleven Months Ended November 30, 2016
Month to Cost Per Year to
ll!!! PatlentJ2aI Date OPERATING REVENUES
Routine and Special Service Income s 3,611,608 s 323.45 $39,947,958 Other Revenues 9,257 1.00 594.416
TOTAL OPERATING REVENUES 3.620.865 324.45 40.542.374
EXPENSES Nursing and Medical 1,137,168 122.60 11,553,964 Therapy and Ancillaries 179,630 19.37 2,002,652 Social Services 38,812 4.19 387,553 Leisure Time Activities 60,330 6.50 652,274 Cleanliness and Safety 277,283 29.90 2,992,983 Food and Nutrition 233,118 25.13 2,431,632 General and Administration 247,121 26.65 3,216,783 Property 508,795 54.85 5,979,625 Non-Comparable 124,399 13.42 1,515,199 Pediatrics Unit 504,888 480.84 S,504,996 Adult Daycare Unit 168,566 200.44 1,931,382 Non-Allowable Expenses 297.912 32.12 2.941.008
TOTAL EXPENSES 3.778.022 338.35 41.110.051
NET LOSS $ 057.157) $ 04 07) (567,677)
MEMBERS' EQUITY - BEGINNING OF PERJOD 10,847,200
MEMBERS' CONTRIBUTIONS 375,000
MEMBERS' DISTRIBUTIONS (1,785,185)
MEMBERS' EQUITY - END OF PERIOD ~ B.8~2.ll8
Cost Per Patient Da:t:
$ 320.10 5.76
325.86
112.06 19.41 3.75 6.32
29.02 23.60 31.22 58.01 14.71
460.37 200.21
28.53
329.42
$ (4.55)
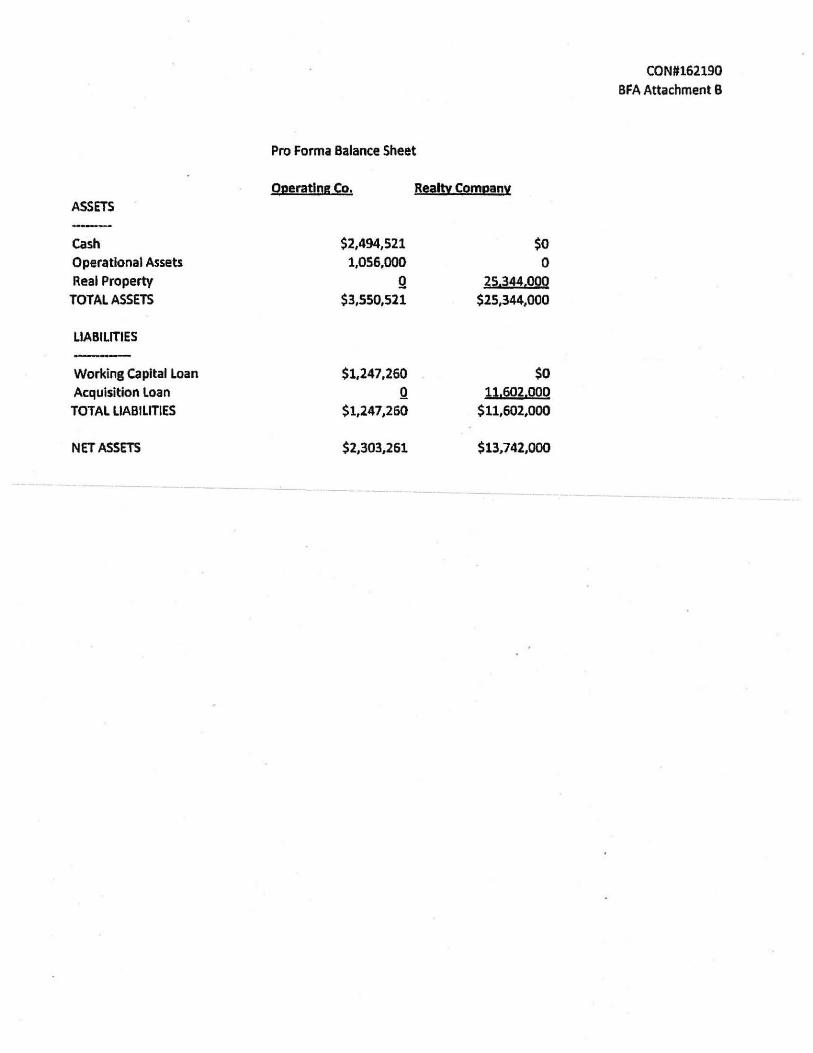
ASSETS
Cash Operational Assets Real Property
TOTAL ASSETS
LIABILITIES
Workins Capital Loan Acquisition loan
TOTAL LIABILITIES
NETASSm
Pro Forma Balance Sheet
Operating Co. R!al~ ~gmeanlf
$2,494,521 $0 1,056,000 0
Q 25.344.00Q
$3,550,521 $25,344,000
$1,247,260 so Q 11.602.000
$1,247,260 $11,602,000
$2,303,261 $13,742,000
CON#162190
BFA Attachment 8
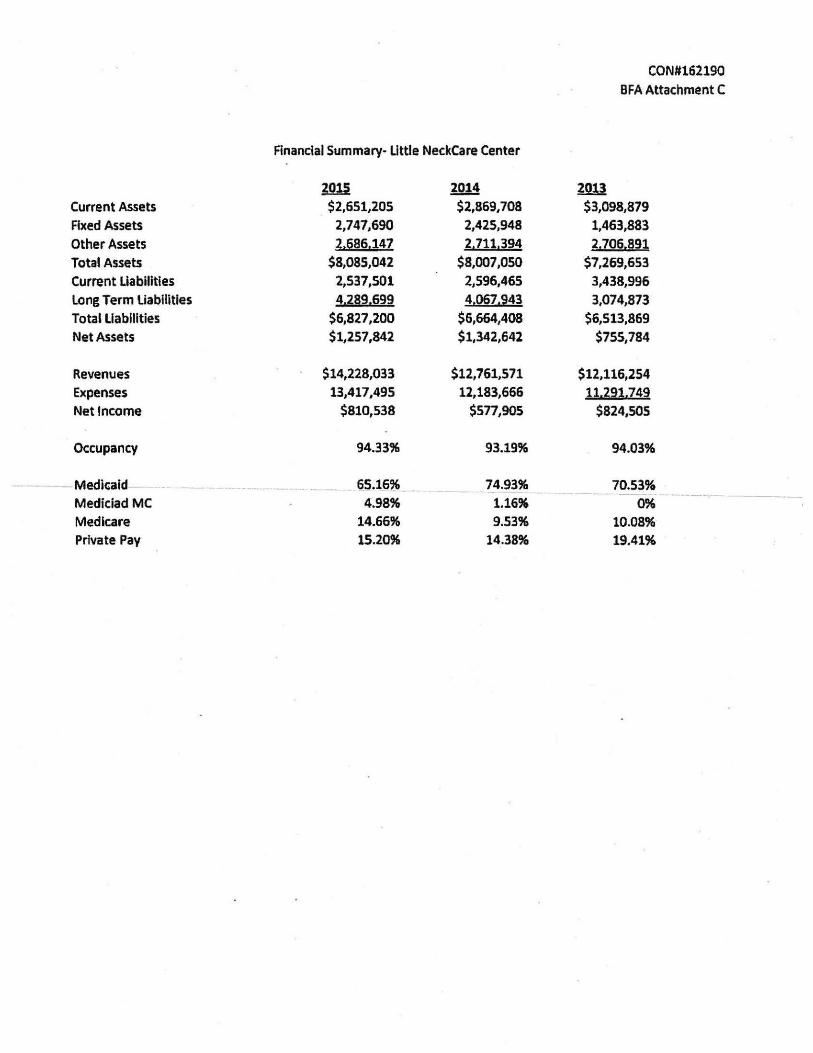
Current Assets Fixed Assets Other Assets Total Assets Current Liabilities long Term liabilities Total Llablllties Net Assets
Revenues Expenses Net Income
Occupancy
Medicaid -Mediciad MC Medicare Private Pay
Financial Summary- Little NeckCare Center
2015 2014 $2,651,205 $2,869,708
2,747,690 2,425,948 2.686.147 2.711.394
$8,085,042 $8,007,050 2,537,501 2,596,465 4 .289.699 4,067,943
$6,827,200 $6,664,408 $1,257,842 $1,342,642
$14,228,033 $12,761,571 13,417.495 12,183,666
$810,538 ssn,905
94.33% 93.19%
. - - - - 65.16% 74.93% 4.98% 1.16%
14.66% 9.53% 15.20% 14.38%
ml
CON#162190 BFA Attachment C
$3,098,879 1,463,883 2,706,891
$7,269,653 3,438,996 3,074,873
$6,513,869 $755,784
$12,116,254
11,2~J.,74~
$824,505
94.03%
70.53% 0%
10.08% 19.41%
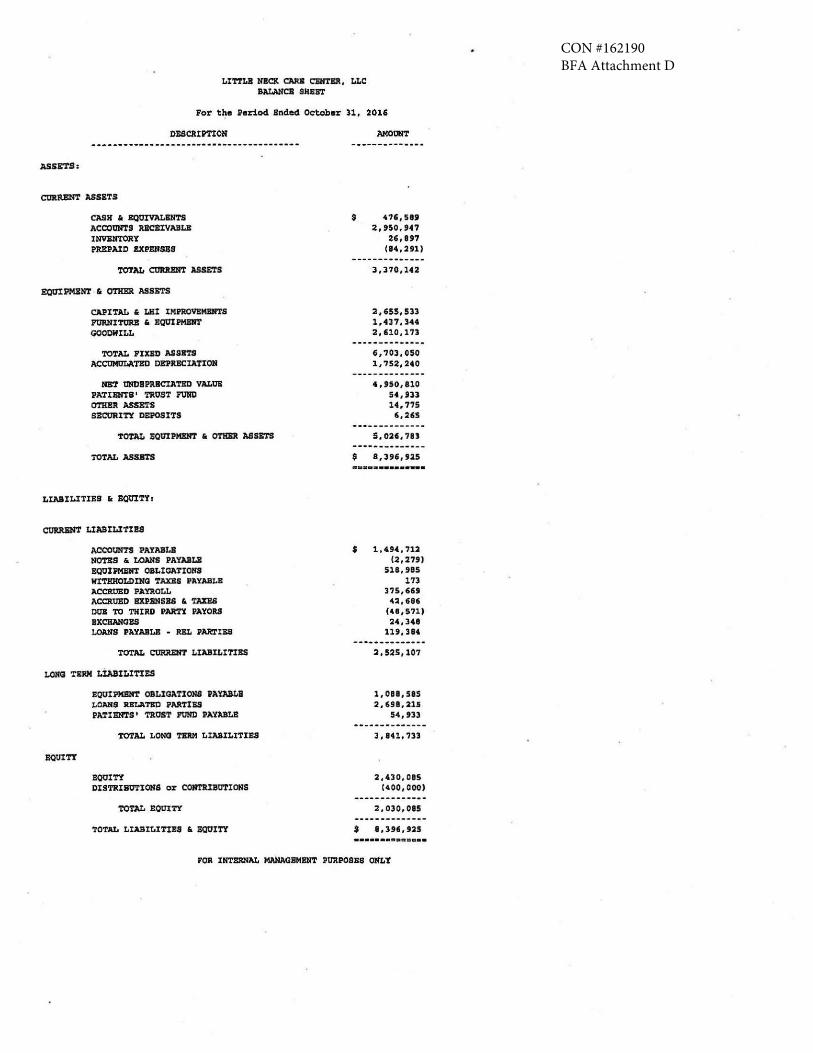
CON #162190BFA Attachment D
LITTLB NBOt CARil C'BllTBR, I.LC BAL/INCi SllBBT
For the Period ended Oc:tober n, 2016
OBSCAIPTION
ASSETS:
CllllRBNT ASSRTS
CASH lt l!QtJIVALINTS ACCOUNTS RBCl1:IVllllI.K INVBMTORY PREPAID BXPBNSllS
EQl1IPMiNT C. O'l'HBR ASSBTS
CAPITAL r. LIU IMPROVIMllllTS PORNITORB r. EQUIPMBllT GOODWILL
TOTAL PIXID AS9RTS ACCIJMl1IATED DEPJUICIATIOll
NB'? tJNDBPRBCIATED VALt!B PATIBllT9' TROST FUND OTHBR ASSETS SBCORITY DEPOSITS
TOTAL S011IPME!n' r. OTHl!1t ASSETS
TOTAL ASSBTS
LIAllILITIBS r. B011ITY:
CtJltRBNT LIABILJTIU
ACCOUNTS PAYNILB NOTES & L0.\118 PAYABLll BQtlIPMBllT OBLIGATIO~S WI'rl!HOLDillG TJIDS PJ.YABLB ACCltOBD PAYROLL ACCRUED BXPBNSBS r. TAXES DtJB TO THIRD PAJlTY PAYORS IXCHAllOZS LOANS PAYABt.B • REL PAR?IES
TOTAL CIJlUtENT LIABILI'l'IXS
LOlfG TllRM LilJIILITIES
BOU I TY
BQUIPKB!n' OBLIOATIONS PAYABLll LOANS R~TBD PARTIBS PATimr?S 1 TROST PUNll PAYABLI!
TOTAL LONO TBRM LIABILITIES
BOOITY DISTRilroTIOKS or COllTtlIBtrl'IONS
TOTAL LIABILITIES r. EQtJITY
$ 476,519 2,no,947
26, 897 (84,291)
3,370,142
2,655,533 1,437,30 2, '10, 173
6,703,0SO 1,752,240
4,950,810 St, 933 14, 775
6,2'5
S,026,7U
$ 8,396, 925
$ l , "9t , 712 (2,279)
518 , 915 173
375,60 4:.1,686
(41,571) 24,349
llt,3H
2,525,107
l,OH, 585 2,691, 215
54, 933
J. 841, 733
2,430,0BS (400, 000)
2, 030, 085
$ 8,396,925
FOR IllTERNAL MAllAGBMBNT PURPOSES ONLY
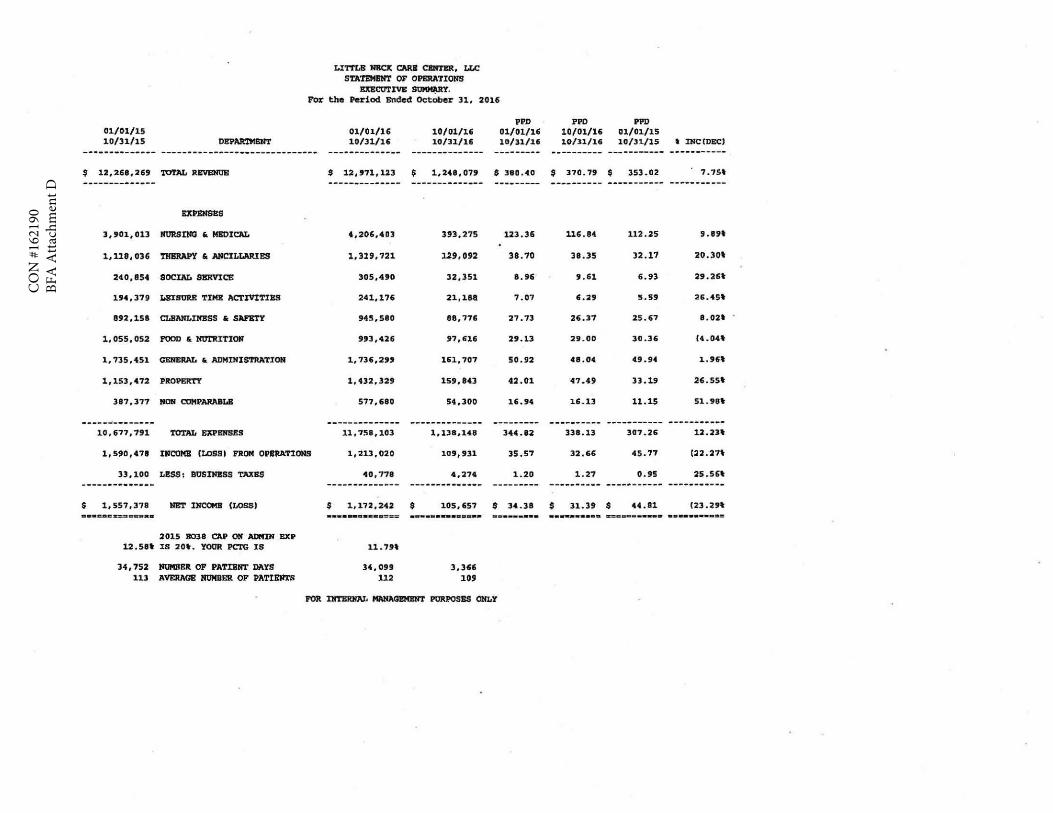
CO
N #
1621
90BF
A A
ttach
men
t DLI'JTLB HBCJt CARI CllRTBR, I.LC
STATEMINT OF OPERJl'J'IONS .BltBCOTIW StJMllWlT.
For the Period Ended Oct.:.t.er 31, 2016
PPD 01/01/15 01/01/16 10/01/16 01/01/16 10/31/15 Dlfi'IUt'l'MBNT 10/31/1' 10/31/1' 10/31/l.IS
-------------- ------------------------------ -------------- -------------- ---------$ 12,268,26, TOTAL RBVBNUB $ 12,971,123 $ 1,248,079 $ 380 .-to
-------------- -------------- -------------- ---------EXPBHSBS
J,,01,0ll lroRSINO '- MEDICAL 4,206,4DJ 3,3,275 123.36
1,1.18,0lG THBRAPY fc NICILLAAIBS 1,319,721 ].2.9,092 38.70
2-t0,854 SOCIAL SERVICE 305,490 32,351 11 . 96
194,379 LBISURE TIMI! l'ICTIVI'l'IES 241,176 21,1118 7.07
8,2,1511 CLBMLllfBSS I< SAFBTY 945,580 88,776 27 .73
1,055,052 FOOD • MtlTRITION ,93,426 ,7,616 29.13
1,735,451 GERERAL • ADMDfIS'?RATION 1,736,299 161,707 50.92
1,153,472 PROPERTY 1,432,32, 15,,843 42.01
387,377 NON COMPARABLB 577,680 54 , 300 16.H
-------------- -------------- -------------- ---------10,677,791 TOTAL BXPD!IJ!S 11,758,103 l, 138,148 344 . 82
1,5,0,471 IlfCOMB (LOSS) FROM OPIRllTlONs 1 ,213,020 109,931 35.57
33 . 100 L!SS: BOSDllSS TAXBS 40,778 4,274 1.20
-------------- -------------- -----------·-- ---------$ 1, 557 , 378 NET lNCOMB (LOSS) $ 1,172,242 $ 105,657 $ 34.38 •••a•tc•:D•-•• -·-·-····-=··=- ----·-······ ----·······
2015 B038 CAP ON ~ EXP 12. 51t IS 20t. Y0aR PCl'G 18 11 . 79t
34, 752 NUMBER OP PATI11RT DAYS 34,099 3,3" 113 AVEllAGI! HOMllER OF PATIRJl'l'S 1.1.2 109
FOil DITBRJIJU, tWfAOl!MllNT PURPOSES ONLY
PPO PPD 10/01/1' 01/01/15 10/:U/16 10/31/15 t DICIDP.:C)
---------- ----------- -----------$ 370. " $ 353.02 7.7St
---------- ----------- -----------
116.84 112.25 '·"' 38.JS )2.17 20.30t
,.61 6.93 29 .26'
6 . 29 5.59 26 . 4St
26 .37 25.67 8.02'
29.00 30.36 (4 . 04'
411.04 49 .94 1.96't
47 .49 33.19 26 . 55t
16.13 11.15 51 . 98t
---------- ----------- -----------3311.13 307.26 12. 2n
32 . 66 45.77 (22 . 27'
1 . 27 0 . 95 25 .56t
---------- ----------- -----------$ 31 . 3, $ 44.81 (23.2't ··--·-··-- -=--------· ----··--···
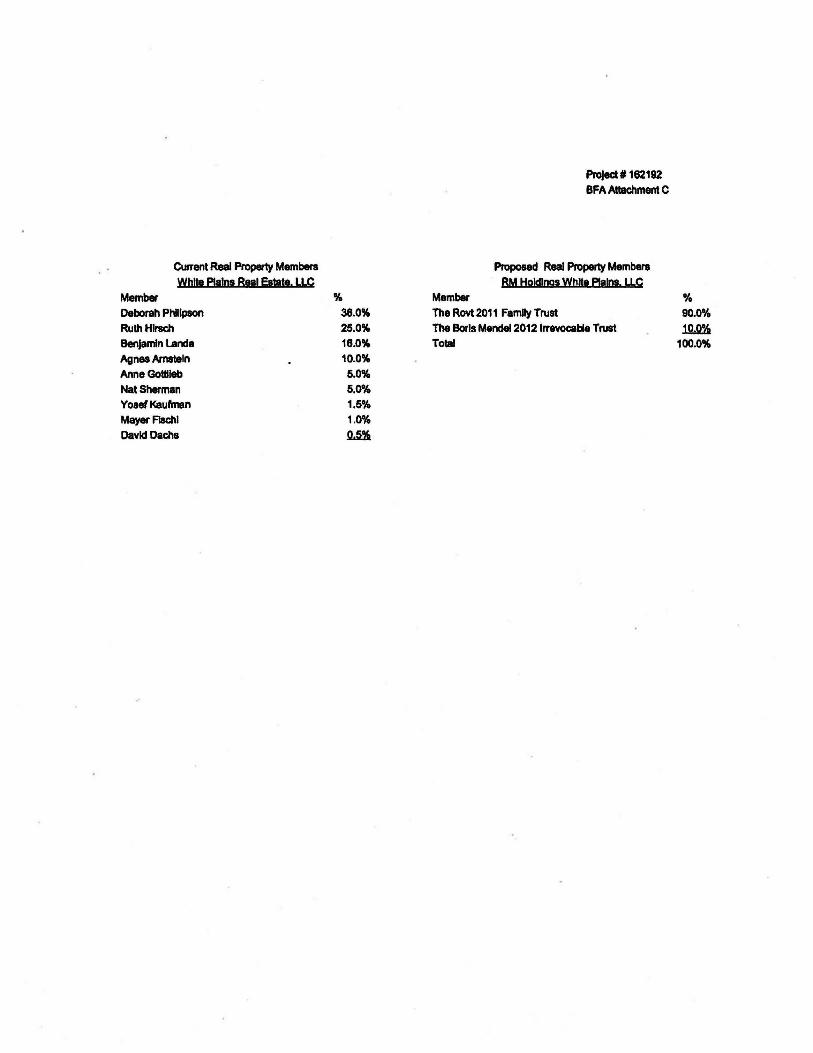
Member
C\l'Tent Real Property Members Whl!a f!alns Baal Eatate. lLC
Deborah Phllpaon Ruth Hirsch Benjamin Landa Agnes Amstein Anne Gotllleb Nat Sherman Yosef Kaufman Mayer Fischl David Dachs
% 38.0% 25.0% 16.0% 10.0% 5.0% 5.004 1.5% 1.0%
2.3.
Member
Project I 162192 BFA Attachment C
Proposed Real Property Memb11n1 RM Hokllngs Whitt P!alns. lLC
The Rovt 2011 Family Trust The Boris Mendel 2012 Irrevocable Trust Total
o/o 90.0%
~ 100.0%
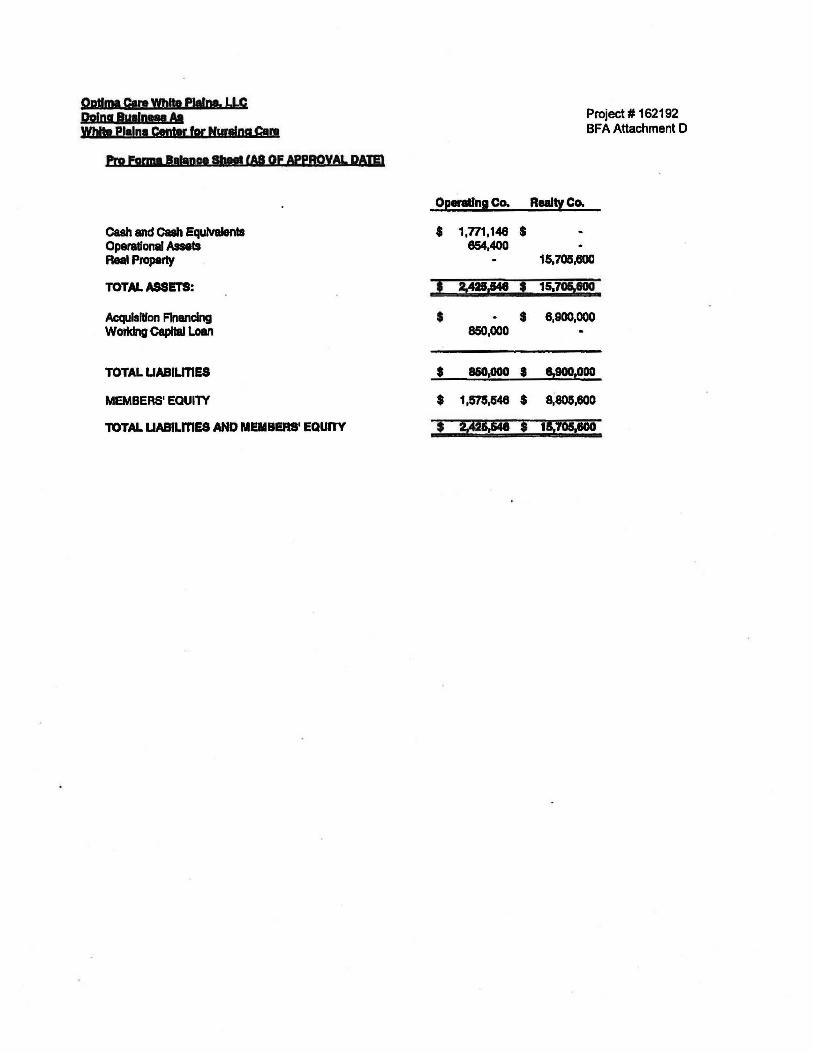
QDtlma Care l'fb!!I !JllDI. LLC Doing BytJDMI Al Project# 162192
Wblt! Piiiot Centtr fgr Nwalna Cam BFA Attachment D
Pro Fqnna .... st!!tl lAI OF APeeov& DAm
Opn!lngCo. RealtyCo.
CUh and Cuh Equtvalentl • 1,771,14e $ Operational Assets e54,400 Real Property 15,705,600
TOTAL ASSETS: ' 2,421,148 ! 15t70!,!00
Acquisition Financing • $ 6,900,000 Working C8pltal Loan 850,000
TOTAL LIABILITIES * 8&0,000 • 8,900,0DO
MEMBERS' EQUITY $ 1,575,548 $ ~805,600
TOTAL UABILmES AND MEMBERS' EQUnY i 2,425,548 i 1a;t05laoo
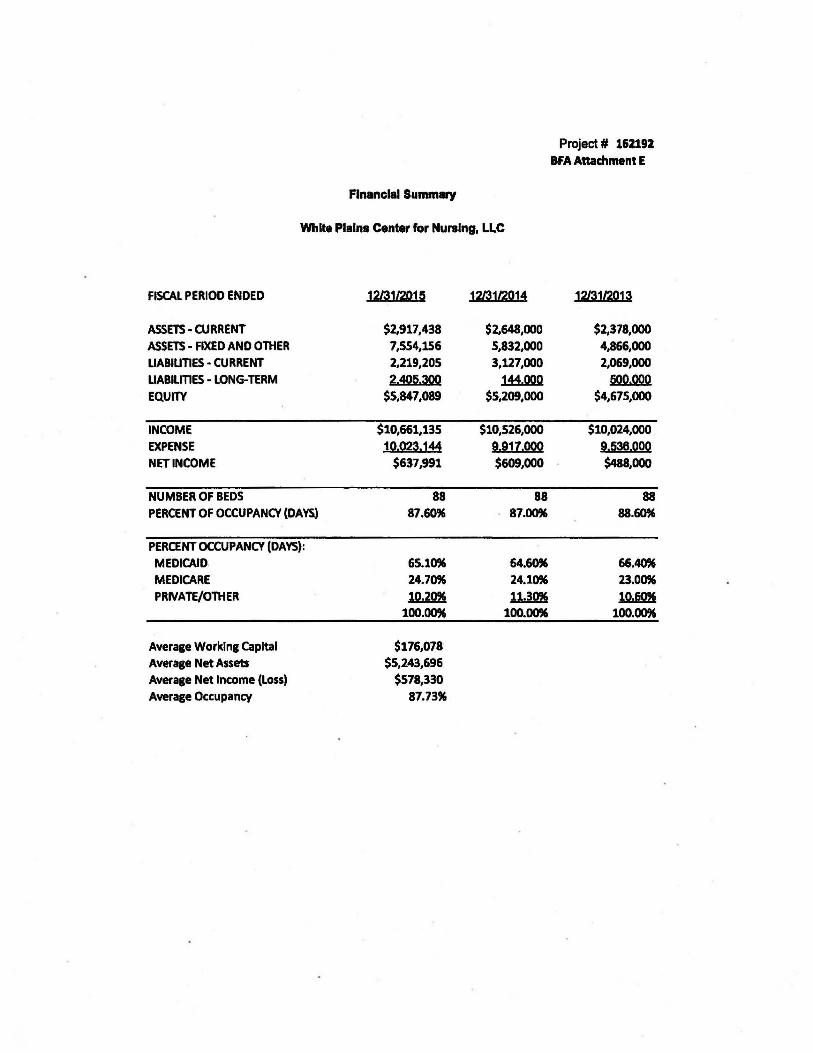
Flnanclal Summary
White Plalns Center for Nursing, LLC
FISCAL PERIOD ENDED 12131/2015 12/3112014
ASSETS· CURRENT $2,917,438 $2,648,000
ASSETS· FIXED AND OTHER 7,554,156 5,832,000 LIABILITIES· CURRENT 2,219,205 3,U7,000
LIABILffiES • LONG-TERM 2,405.300 144.000
EQUITY $5,847,089 $5,209,000
INCOME $10,661,135 $10,526,000
EXPENSE 1Q.~.l~ a.a1z,ggg NET INCOME $637,991 $609,000
NUMBER OF BEDS 88 88 PERCENT OF OCCUPANCY (DAYS) 87.60'6 87.00%
PERCENT OCCUPANCY (DAVS): MEDICAID. 65.10% 64.60% MEDICARE 24.70% 24.10'6 PRIVATE/OTHER ~ llaD
100.00% 100.00'6
Average Working Capital $176,078
Average Net Assets $5,243,696 Average Net Income (Loss) $578,330 Average Occupancy 87.73%
Project # 162192
BFA Attachment E
12/31/2013
$2,378,000 4,866,000 2,069,000
500,000 $4,675,000
$10,024,000
i.~.QOQ $488,000
88 88.60%
66.40%
23.00'6
~ 100.00%
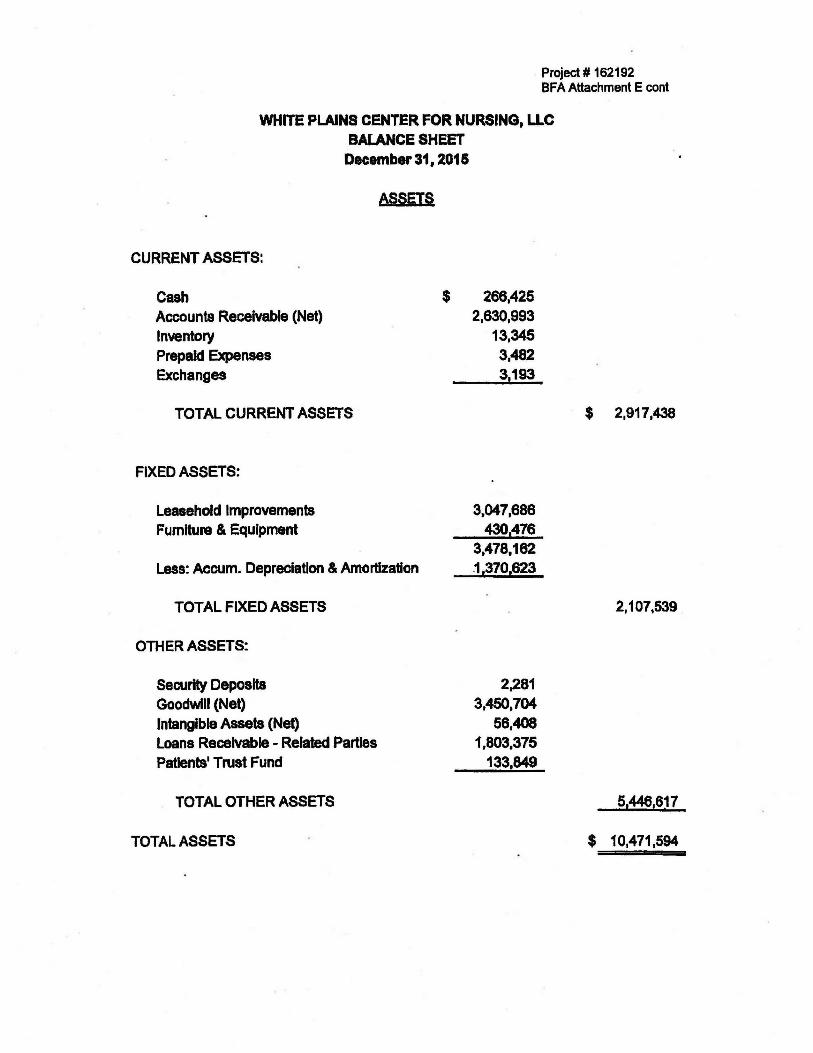
Project# 162192 BFA Attachment E cont
WHITE PLAINS CENTER FOR NURSING, LLC BALANCE SHEET December 31, 201 S
CURRENT ASSETS:
Cash Accounts Receivable (Net) Inventory Prepaid Expenses Exchanges
TOTAL CURRENT ASSETS
FIXED ASSETS:
Leasehold Improvements Furniture & Equipment
A§SETS
Less: Accum. Depreciation & Amortization
TOTAL FIXED ASSETS
OTHER ASSETS:
Security Deposits Goodwill (Net) Intangible Assets (Net) Loans Receivable - Related Parties Patients' Trust Fund
TOTAL OTHER ASSETS
TOTAL ASSETS
$ 266,425 2,630,993
13,345 3,482 3,193
3,047,688 4301476
3,478,162 .1,370,623
2.281 3,450,704
58,408 1,803,375
133,849
$ 2,917,438
2,107,539
51446,617
$ 10,471,594
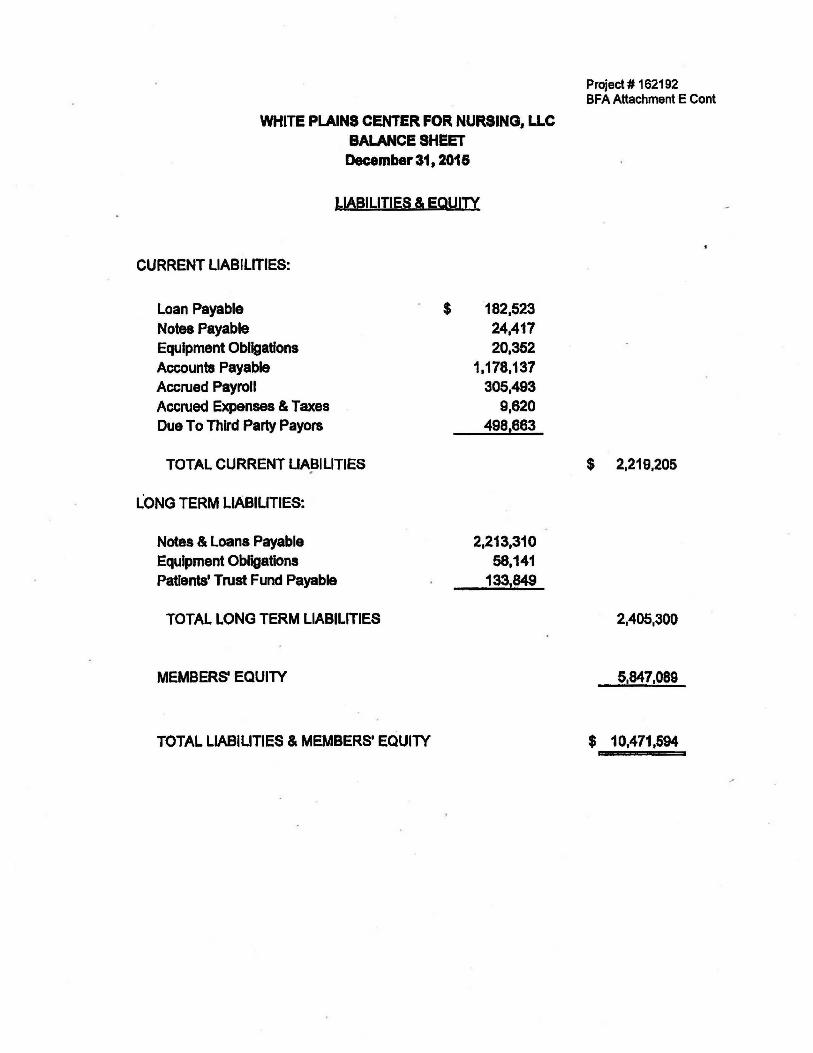
WHITE PLAINS CENTER FOR NURSING, LLC BALANCE SHEET December31, 2016
LIABILITIES & EQUITY
CURRENT LIABILITIES:
Loan Payable Notes Payable Equipment Obligations Accounts Payable Accrued Payroll Accrued Expenses & Taxes Due To Third Party Payors
TOTAL CURRENT UA!31LITIES
LONG TERM LIABILITIES:
Notes & Loans Payable Equipment Obligations Patients' Trust Fund Payable
TOTAL LONG TERM LIABILITIES
MEMBERS' EQUITY
TOTAL LIABILITIES & MEMBERS' EQUITY
$ 182.523 24.417 20.362
1.178.137 305.493
9,620 498.663
2.213.310 58,141
133.849
Project# 162192 BFA Attachment E Cont
$ 2,219,205
2.405,300
5,847,089
$ 10.471.594
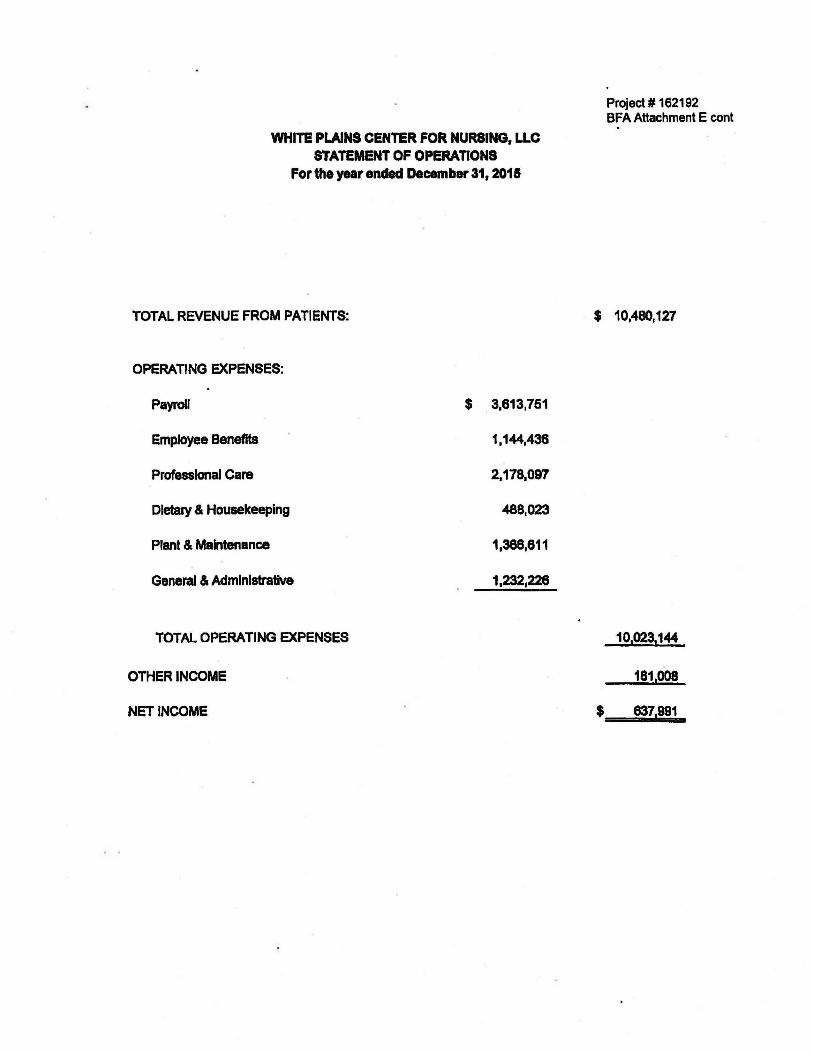
WHITE PLAINS CENTER FOR NURSING, LLC STATEMENT OF OPERATIONS
For the year ended December 31, 2018
TOTAL REVENUE FROM PATIENTS:
OPERATING EXPENSES:
Payroll $ 3,613,751
Employee Benefits 1,144,436
Professional Care 2,178,097
Dietary & Housekeeping -488,023
Plant & Maintenance 1,368,811
General & Administrative 1,232,226
TOTAL OPERATING EXPENSES
OTHER INCOME
NET INCOME
Project# 162192 BFA Attachment E cont
$ 10,480,127
10,023, 144
181,008
$ 837,991

WHITE PLAINS CENTER FOR NURSING, LLC STATEMENT OF MEMBERS' EQUITY
For the year ended December 31, 2016
MEMBERS' EQUITY:
Balance as of Beginning of Period
Net Income for the Period
TOTAL MEMBERS' EQUITY - END OF PERIOD
Project # 162192 BFA Attachment E cont
$ 5,209,098
637,991
$ 5,847,089
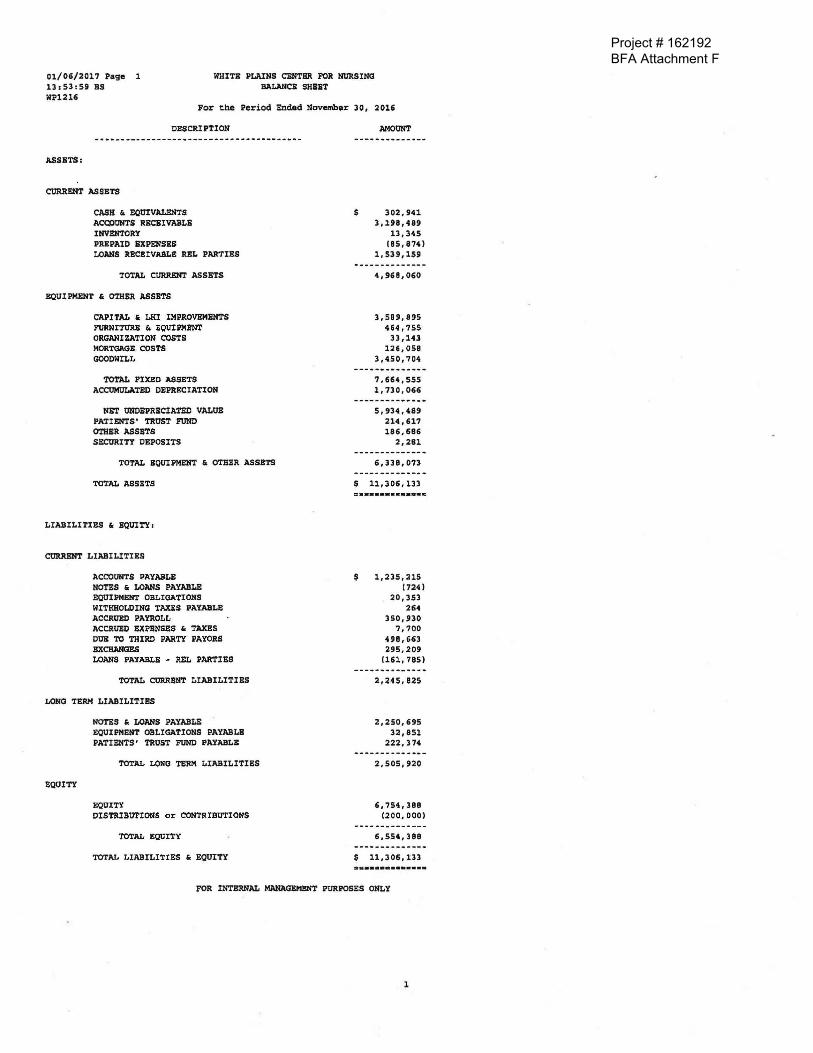
Project # 162192BFA Attachment F
01/06/2017 Page 1 13:53:59 BS WP1216
WITS PLAINS CENTER FOR NURSING BALANCE SHBBT
For ~he Period Ended November 30, 2016
DESCRIPTION
ASSBTS:
CURRENT ASSETS
CASH & EQUIVALENTS ACCPUNTS Rli:CBIVABLB INVENTORY PREPAID BXPENSBS LOANS RECEIVABLE REL PARTIES
TOTAL CURRENT ASSETS
EQUIPMENT & OTHER ASSBTS
CAPITAL & LHI IMPROVBMl!NTS l"URNITURB & BQUIPMBNT ORGANIZATION COSTS MORTGAGE COSTS GOODWILL
TOTAL PIXl!D ASSETS ACCOMULATED DEPRECIATION
NET tlRDBPRBCIATEO VALUE PATIENTS' TRUST FUND OTHER ASSBTS SECURITY DEPOSITS
TOTAL BQUIPMENT & OTHBR ASSBTS
TOTAL ASSETS
LIABILITIES & EQUITY:
CtlRRBNT LIABILITIES
ACCOUNTS PAYABLE NOTBS & LOANS PAYABLE EQUIPMENT OBLIGATIONS WITHHOLDING TAXES PAYABLE ACCRtJl!!D PAYROLL ACCRUl!D :SXPBNSES & TAXBS DUB TO THIRD PARTY PAYORS :SXCHAllGBS LOANS PAYABLE - REL PARTIES
TOTAL CURRENT LIABILITIES
LONG TERM LIABILITIES
EQUITY
NOTES & LOANS PAYABLE EQUIPMENT OBLIGATIONS PAYABLB PATIB!ITS' TRUST FUND PAYABLB
TOTAL LONG TERM LIABILITIBS
EQUITY DISTRIBUTIONS or CONTRIBUTIONS
TOTAL EQUITY
TOTAL LIABILITIES & EQUITY
$
AMOUNT
302 , 941 3,198,489
13,345 !BS, 874)
1,539,159
4,968,060
3,589,895 464,755
33,143 126,058
3,450,704
7,664,555 l,730,066
5,934,489 214. 617 186,686
2,281
6 , 338,073
$ ll,306,133
$ l,235,~15
(724) 20,353
264 350,930
7,700 498, 663 295,209
(161,785)
2,245, 825
2,250, 695 32,851
222, 374
2,505 , 920
6,754,388 (200, 000)
6,554,388
$ 11,306,133
FOR INTERNAL MANAGEMENT PURPOSES ONLY
1
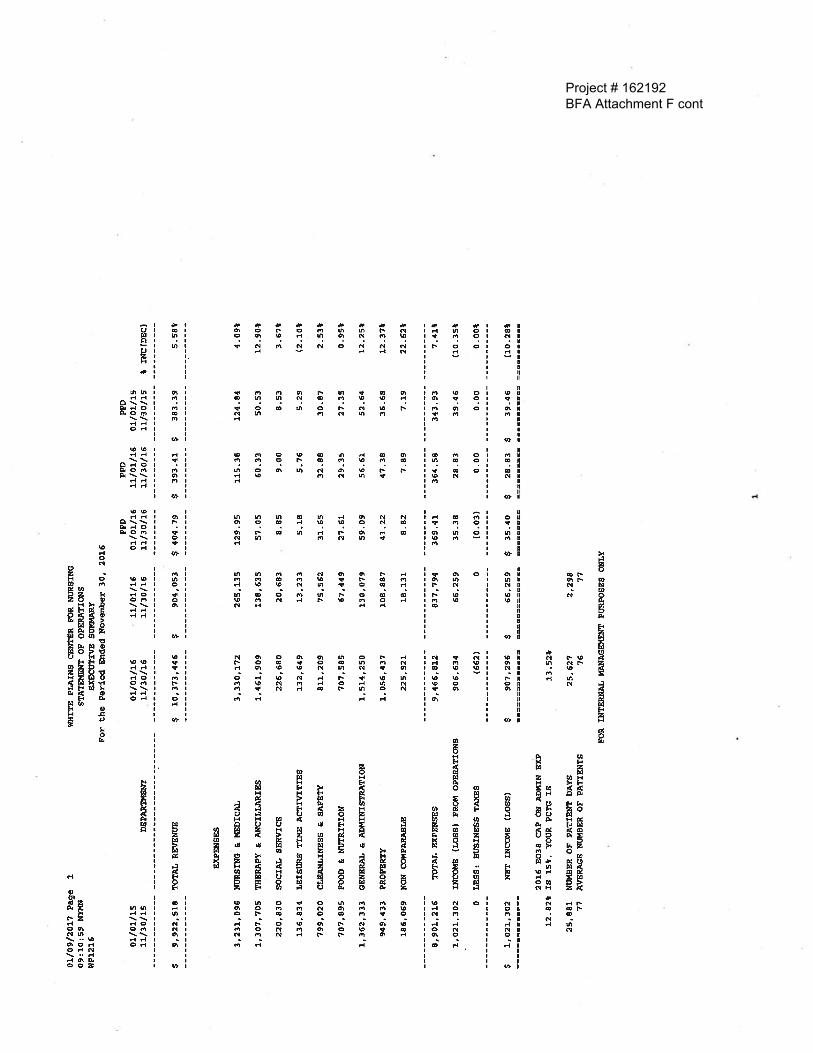
Project # 162192BFA Attachment F cont
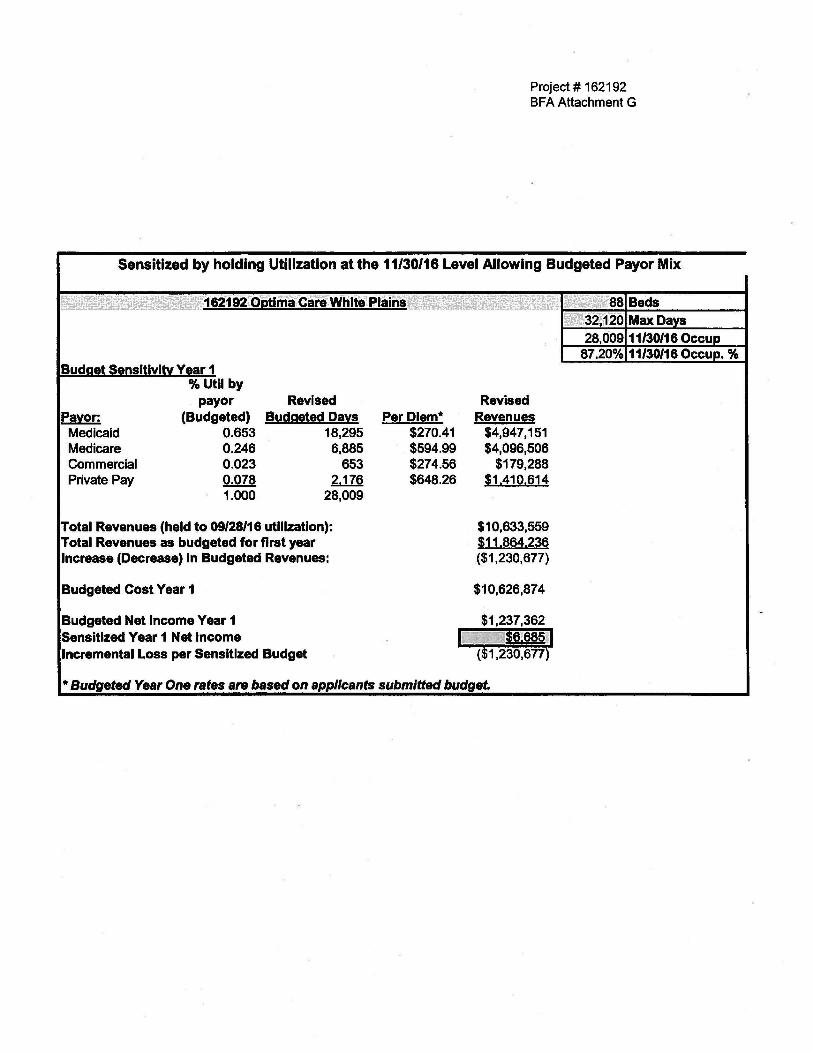
Project# 162192 BFA Attachment G
Sensitized by holding Utilization at the 11/30/16 Level Allowing Budgeted Payor Mix
Budget Sensitivity Year 1
Payor: Medicaid Medicare Commercial Private Pay
% Util by payor
(Budgeted) 0.653 0.246 0.023 0.078 1.000
Revised Budgeted Days
18,295 6,885
653 2.176
28,009
Total Revenues (held to 09/28/16 utlllzatlon): Total Revenues as budgeted for first year Increase (Decrease) In Budgeted Revenues:
Budgeted Cost Year 1
Budgeted Net Income Year 1 Sensitized Year 1 Net Income Incremental Loss per Sensitized Budget
Per Diem* $270.41 $594.99 $274.56 $648.26
Revised Revenues
$4,947,151 $4,096,506
$179,288 $1.410.614
$10,633,559 $11.864.236 ($1,230,677)
$10,626,874
$1,237,362 I~ - Jlm§M~I
($1,230,677)
*Budgeted Year One rates are based on applicants submitted budget.
28,009 11/30/16 Occup 87.20% 11/30/16 Occup. %
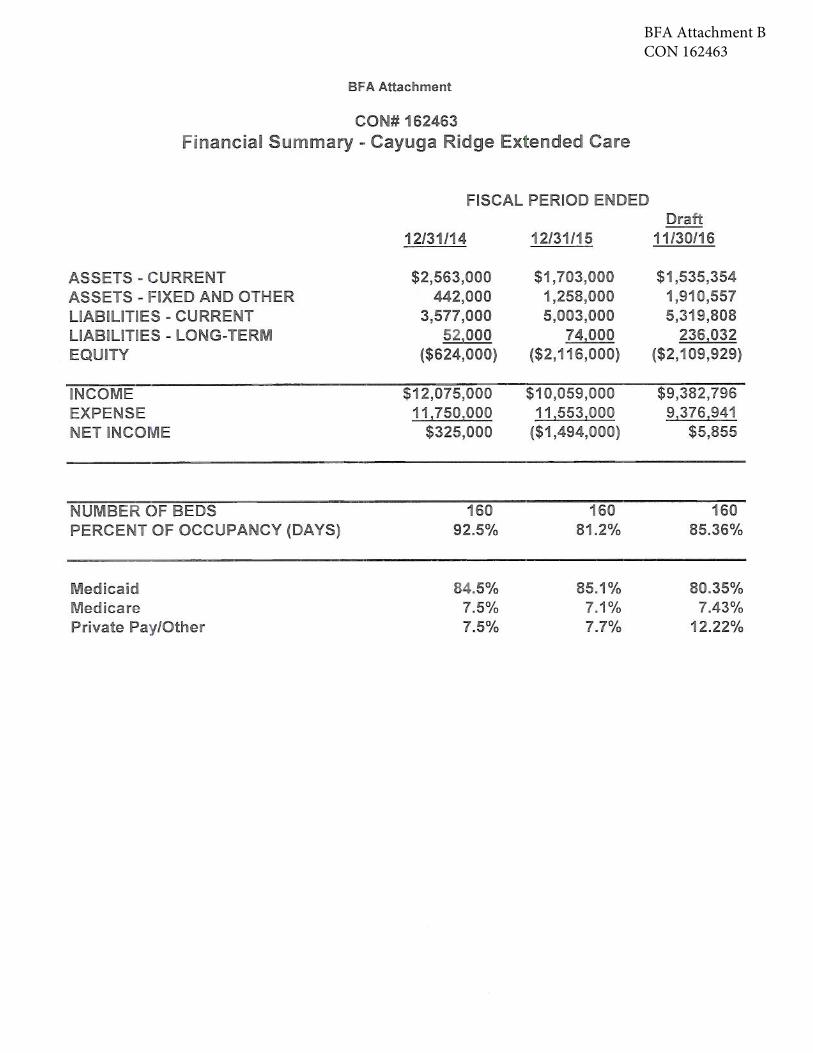
BFA Attachment BCON 162463
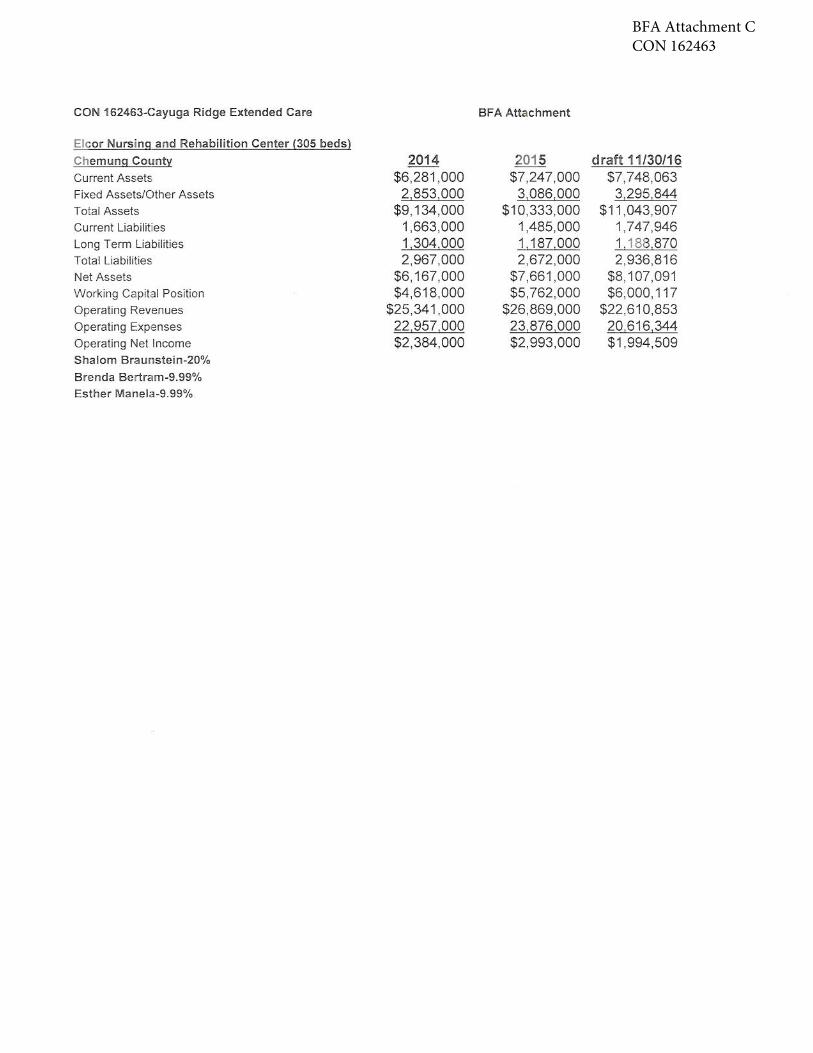
BFA Attachment CCON 162463
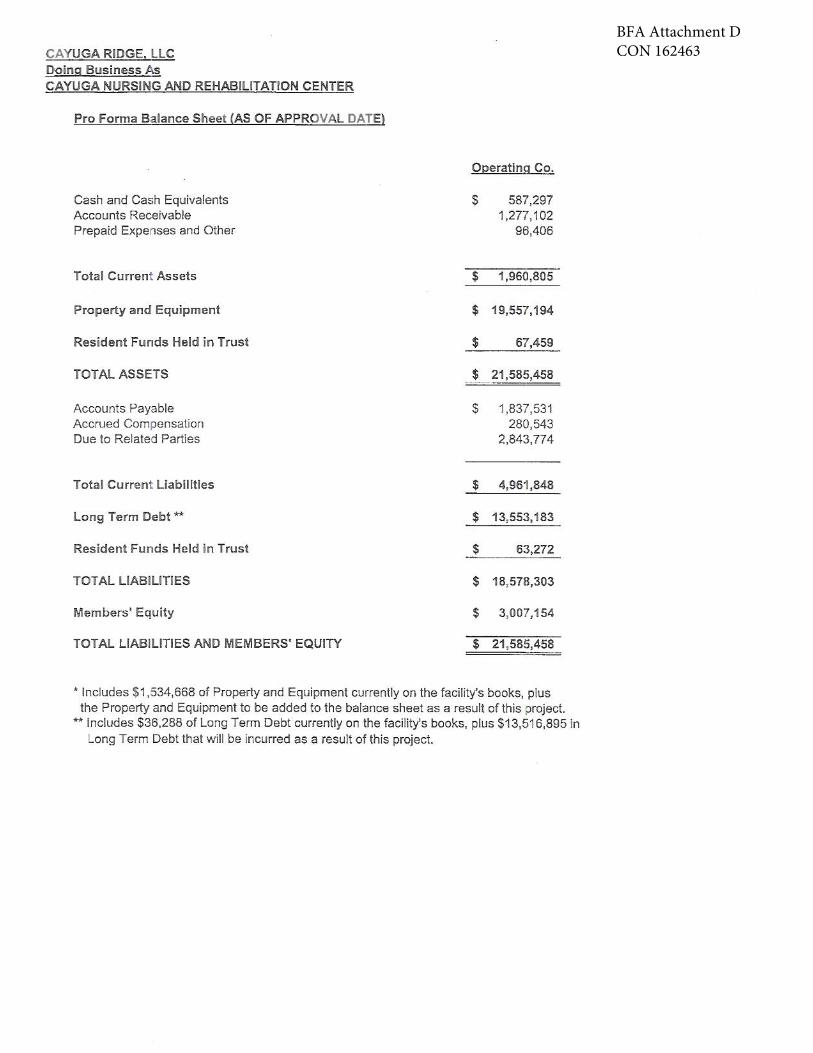
BFA Attachment DCON 162463
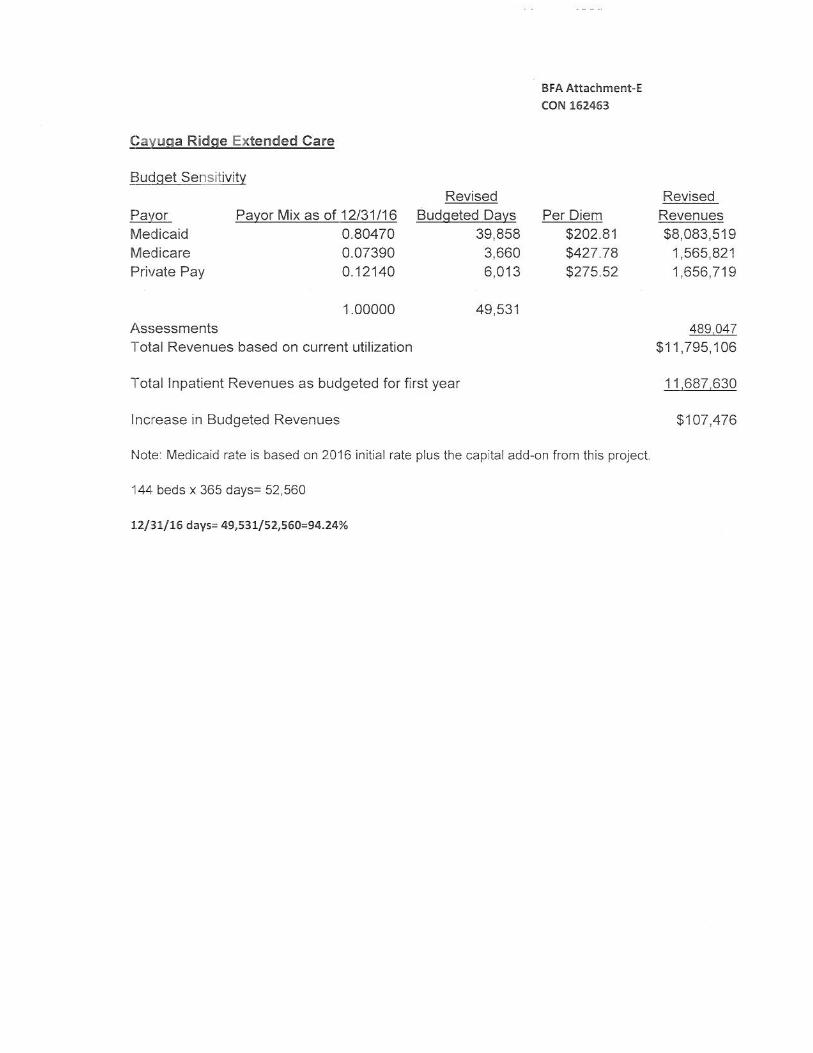
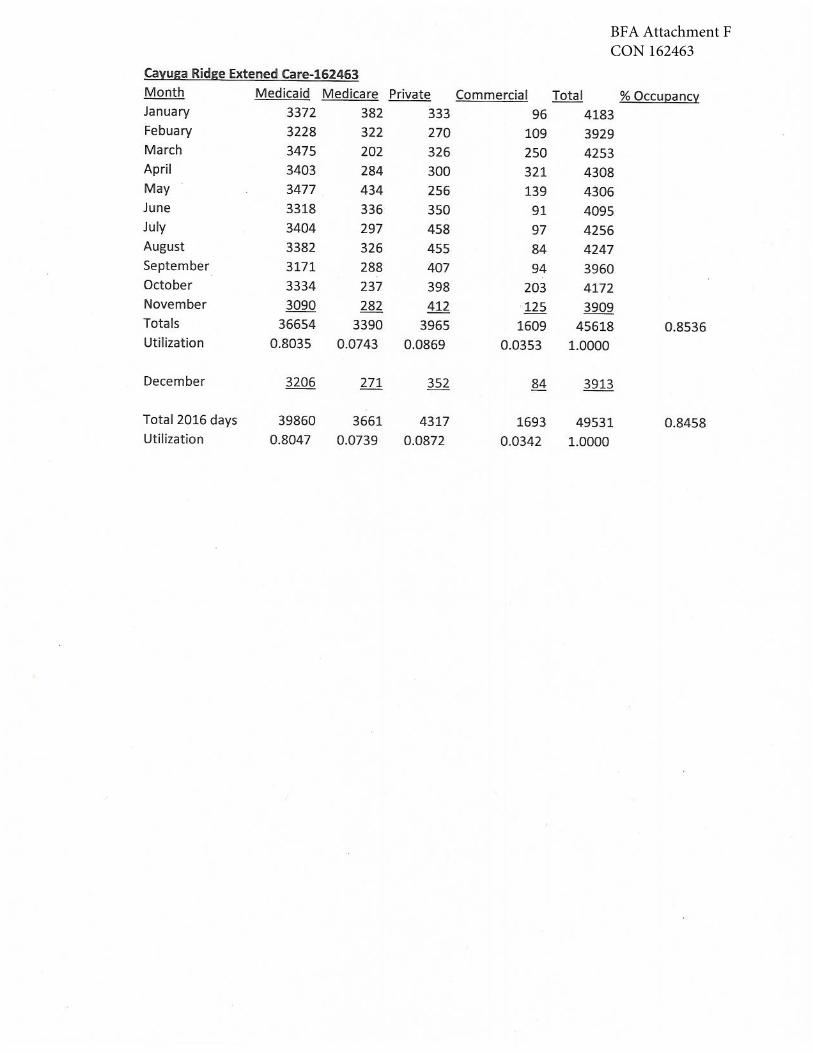
BFA Attachment FCON 162463
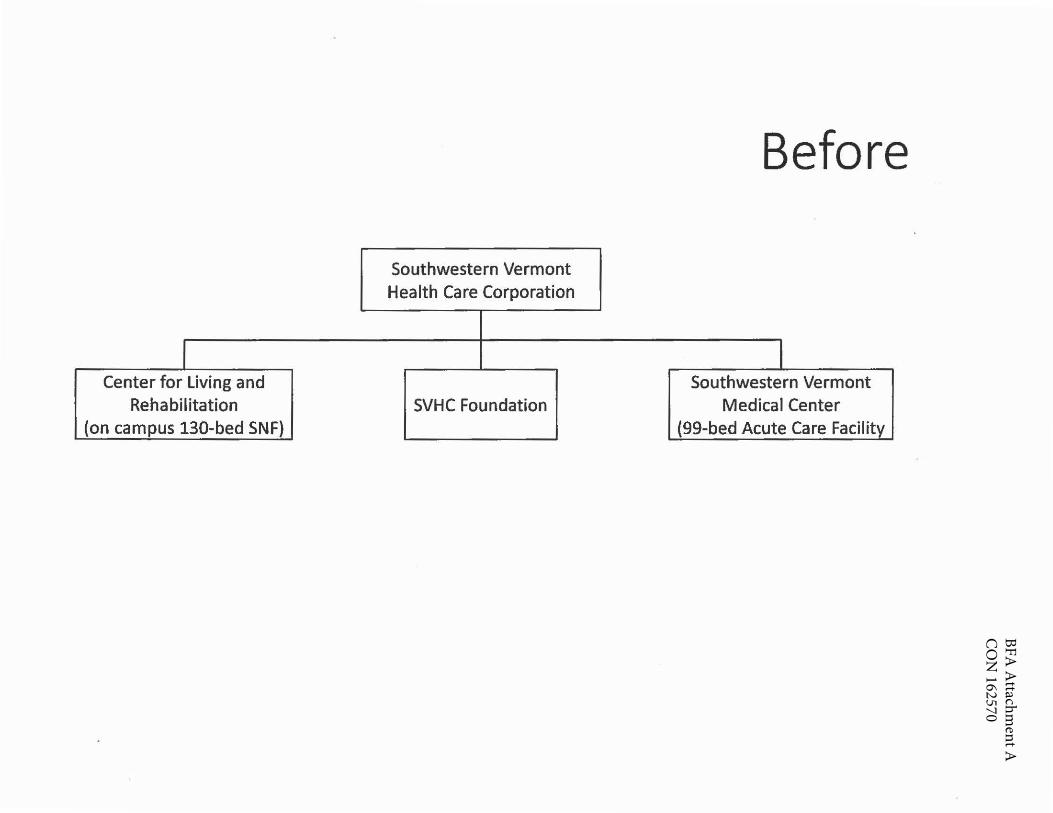
BFA A
ttachment A
CO
N 162570
Before
Southwestern Vermont Health Care Corporation
I I Center for Living and Southwestern Vermont
Rehabilitation SVHC Foundation Medical Center (on campus 130-bed SNF) (99-bed Acute Care Facility
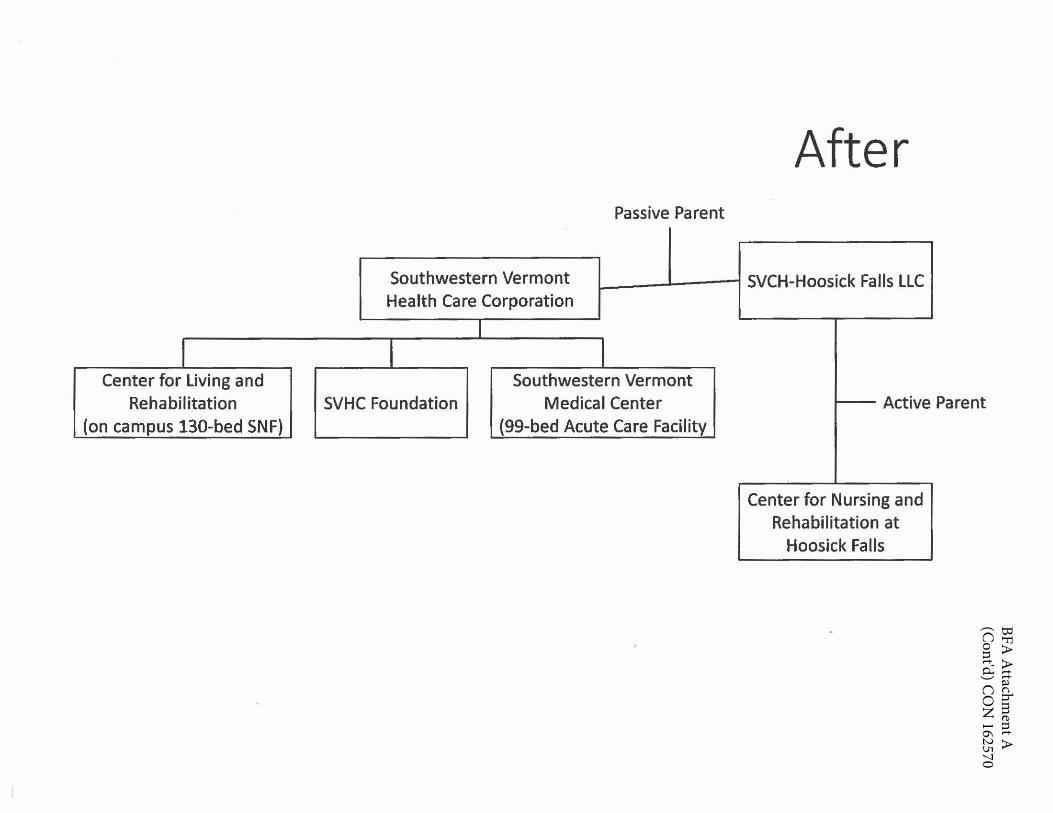
BFA A
ttachment A
(Cont'd) C
ON
162570
I Center for Living and
Rehabilitation (on campus 130-bed SNF)
After Passive Parent
Southwestern Vermont Health Care Corporation
L ' 1 SVCH-Hoosick Falls LLC
I I
SVHC Foundation Southwestern Vermont
Medical Center {99-bed Acute Care Facility
-- Active Parent
Center for Nursing and Rehabilitation at
Hoosick Falls
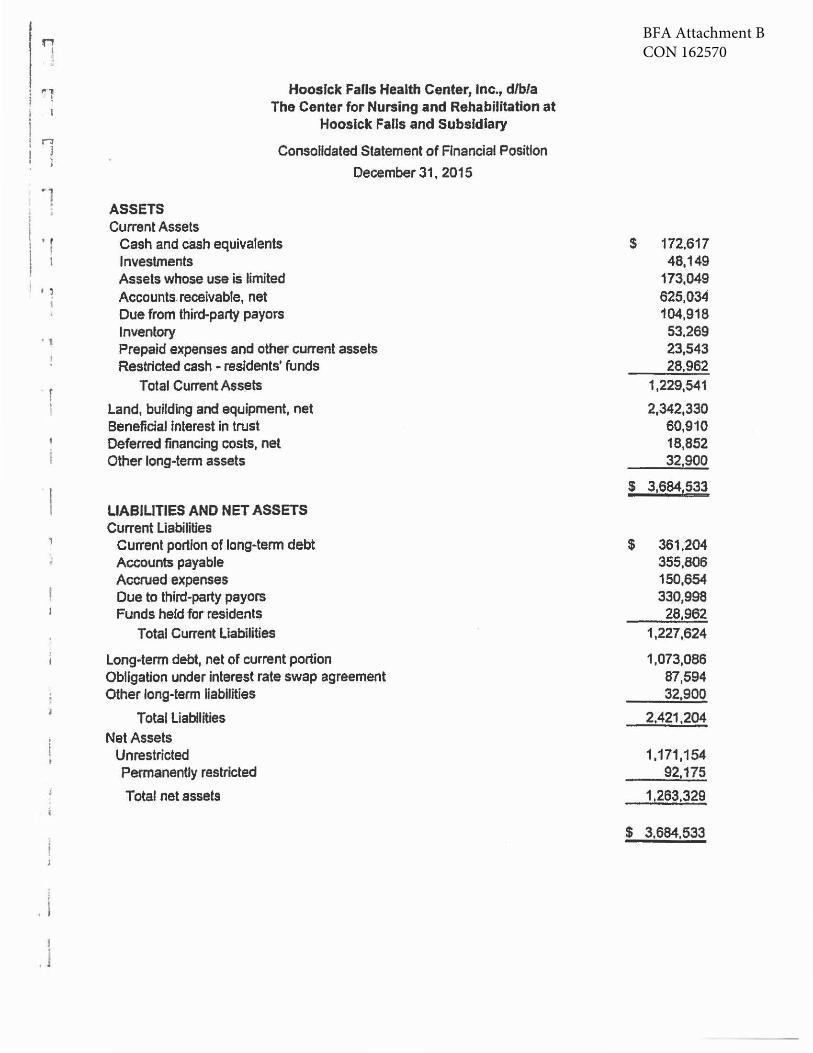
BFA Attachment BCON 162570
,. .. t
n J ' ,
• r t • I
I 1 I
• 1
. i I
. J
ASSETS Current Assets
Hoosfck Falls Health Center, Inc., d/b/a The Center for Nursing and Rehabilitation at
Hoosick Falls and Subsidiary
Consolidated Statement of Financial Position
December 31, 2015
Cash and cash equivalents Investments Assets whose use is limited Accounts. receivable, net Due from third-party payors Inventory Prepaid expenses and other current assets Restricted cash - residents' funds
Total Current Assets
land, building and equipment, net Beneficial interest in trust Deferred financing costs, net Other long-term assets
LIABILITIES AND NET ASSETS Current liabilities
Current portion of long-term debt Accounts payable Accrued expenses Due to third-party payors Funds held for residents
Total Current liabilities
Long-term debt, net of current portion Obligation under interest rate swap agreement Other long-term liabilities
Total liabilities Net Assets
Unrestricted Permanently restricted
Total net assets
$ 172,617 48,149
173,049 625,034 104,918 53,269 23,543 28,962
1,229,541
2,342,330 60,910 18,852 321900
$ 3,684,533
$ 361 ;204 355,806 150,654 330,998 28,962
1,227,624
1,073,086 87,594 32,900
2.421,204
1,171,154 92,175
1.263,329
$ 3,684.533
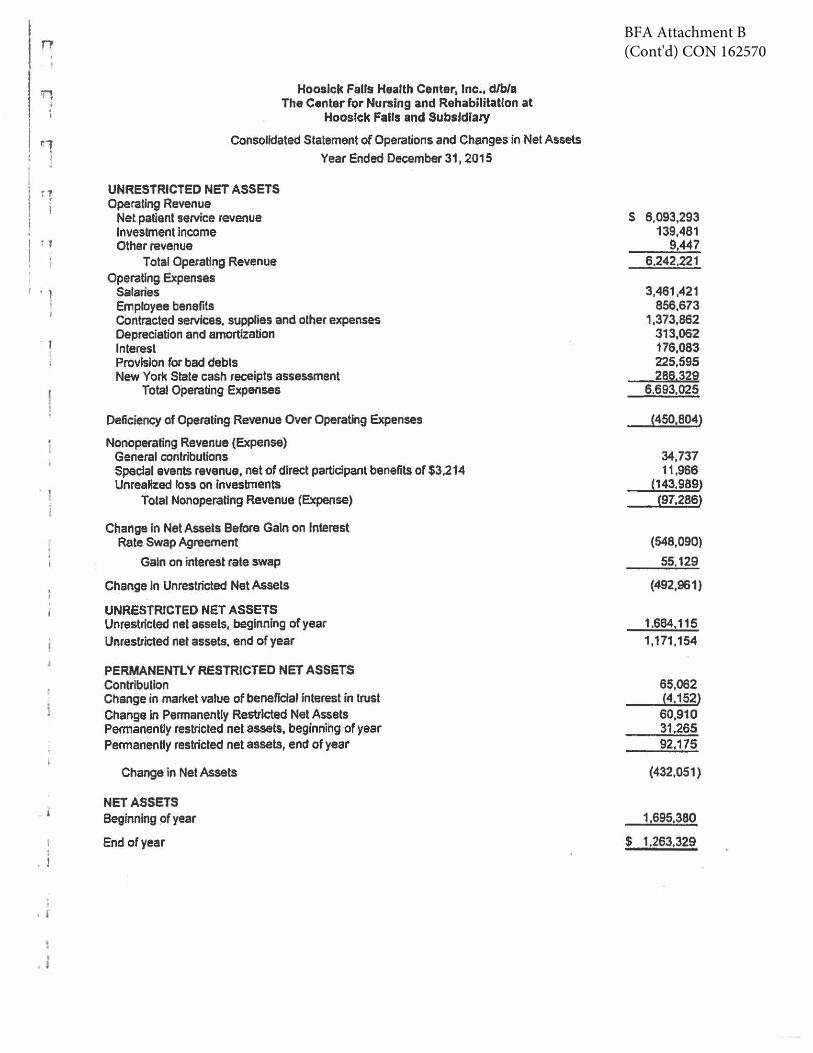
BFA Attachment B(Cont'd) CON 162570n
n Hoosick Falls Health Center, Inc., d/b/a The Center for Nursing and Rehabilitation at
Hoosick Falls and Subsidiary
r.·1 Consolidated Statement of Operations and Changes in Net Assets Year Ended December 31, 2015
rl UNRESTRICTED NET ASSETS Operating Revenue
Net patient seNice revenue s 6,093,293 Investment Income 139,461
n Other revenue 9.447 Total Operating Revenue 6,242,221
Operating Expenses I ' l Salaries 3,461,421
' Employee benefits 856,673 contracted seNices, supplies and other expenses 1,373,862 Depreciation and amortization 313,062 Interest 176,083 Provision for bad debts 225,595 New York State cash receipts assessment 28~,3~§!
Total Operating Expenses 6.693,025
Deficiency of Operating Revenue Over Operating Expenses {450,804)
Nonoperating Revenue (Expense) General contributions 34,737 Special events revenue, net of direct participant benefits of $3,214 11,966
• 1 Unrealized loss on investments ,143.989)
! Total Nonoperatlng Revenue (Expense) {97,286>
Change In Net Assets Before Gain on Interest Rate Swap Agreement (548,090)
Gain on interest rate swap 55.129
Change In Unrestricted Net Assets (492,961)
UNRESTRICTED NET ASSETS Unrestricted net assets, beginning of year 1.664.115 Unrestricted net assets, end of year 1,171,154
PERMANENTLY RESTRICTED NET ASSETS Contribulion 65,062 Change in market value of beneficial inlerest in trust {4.152) Change In Permanently Restricted Net Assets 60,910 Permanently restricted net assets, beginnihg -of year 31 ,265 Permanently restricted net assets, end of year 92,175
Change in Net Assets (432,051)
NET ASSETS Beginning pf year 1,695,380
I . End of year $ 1.263,329
. l
. r
I . ~
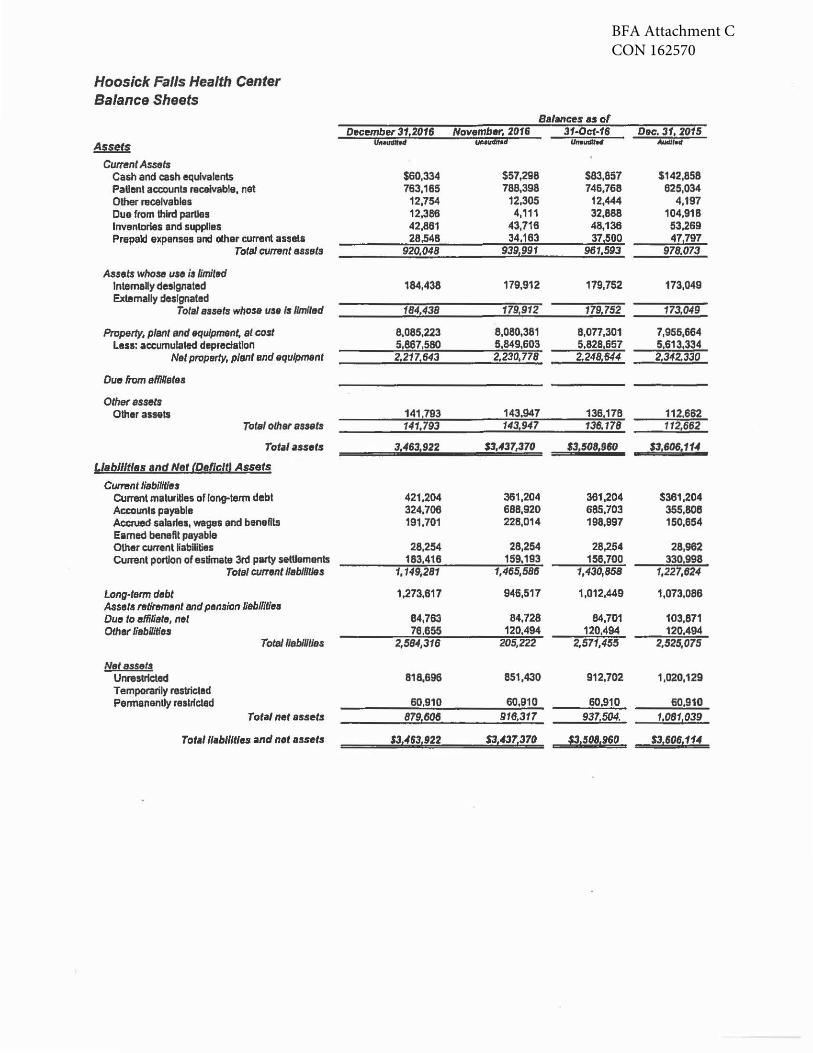
BFA Attachment CCON 162570
Hoosick Falls Health Center Balance Sheets
81/1nces 1s of December 31,2016 November, 2016 31.0ct-16 Dec. 31, 2015
Assets 1111•- UMudH'1d 11 ... udlt-4 _,_., Current Assets
Cash and cash equivalents $60,334 $57,298 $83,857 $142,858 Patient accounlll '8C81vable, net 763,185 788,398 746,768 62!5,034 Other racelvables 12,754 12,305 12,444 4,197 Due from third parties 12,386 4,111 32,888 104,918 Inventories and supplies 42,881 43,716 48,136 53,269 Prepaid expanses and other current assets 28.548 34.163 37,500 47,797
Total current assets 920,048 939,991 961,593 978.073
A1J1Jets whose use is limited lntamaly designated 184,438 179,912 179,752 173,049 Ext!lmally designated
Total asaels whose use Is Hmlted 184£438 179,912 179l52 173,049
Property, plant snd equipment, al cost 8,085,223 8,080,381 8,0n,301 7,956,664 Less: accumulated depredation 5,867,580 5,849,603 5.828,657 5,6131334
Ne/ property, plant and equipment 2,217,643 2,230,778 2.2481644 2,342,330
Due from effl//alea
Other assets Other assets 141,793 143,947 136,178 112.682
Total other au.ts 141,793 143,947 136,178 1121662
Total assets 3,4631922 $3,437,370 S31soa1960 $3,606, 114
Liabilities anfl. Net (DgflcltJ Assets
Current liabiHUes current maturities of long-term debt 421.204 361,204 361,204 $361,204 Accounts payable 324,706 688,920 685,703 355,806 ACCNed salaries, wages and beneftls 191.701 228,014 198,997 150,654 Eamed benefit payable OthercurrentNabllities 28,254 28,254 28,254 28,962 Current portion of esllmate 3rd party settlements 183.418 159, 193 158.700 330,998
Total cu"ent Hablllt/es 1, 149,281 1,465,586 1,430,858 1,227,624
Long-term debt 1,273,617 946,517 1,012,449 1,073,086 Assets retirement and pension Jiab/llUes Due to affiliate, net 84,763 84,728 84,701 103,871 Other liabUJties 78.655 120.494 120.494 120,494
Total lleb/11/les 2,584,316 205,222 2,571,455 2,525,075
Net asset! Unrestricted 818,696 851,430 912,702 1,020,129 Tempotarily restricted Pennanendyresltfcted 60,910 60,910 60,910 60,910
Total net assets 879 60G 916,317 9371504. 1,081,039
Total llabll/Ues and net assets 1314631922 $31437!370 S15oa19so SJ,6061114
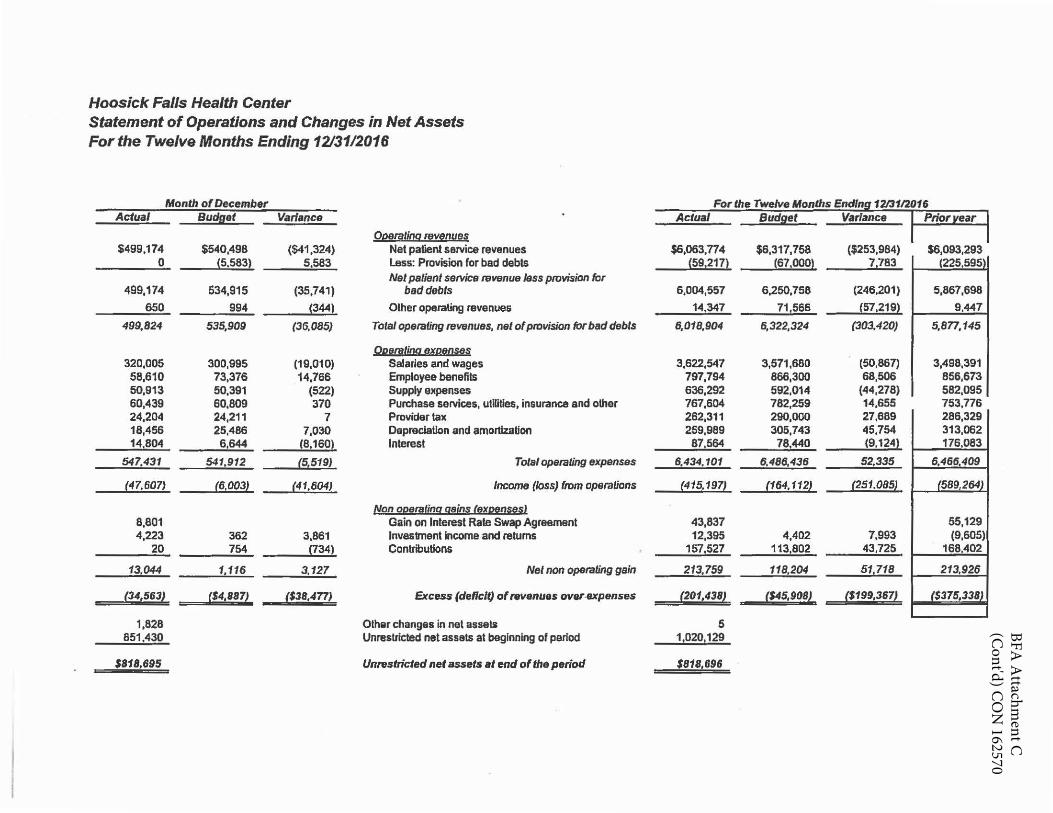
BFA A
ttachment C
(Cont'd) C
ON
162570
Hoosick Falls Health Center Statement of Operations and Changes in Net Assets For the Twelve Months Ending 1213112016
Month of December Actual Budget Variance
Ooaratinq 1evenues $499,174 $540,498 ($41,324) Net patient service revenues
0 (5,583) _5,583 Less: Provision for bad debts Net patient selVice 18venue Jess provisiOn for
499,174 534,915 (35,741) bad debts
650 994 (344) Other operating revenues
499,824 535,909 (35,085) Total operating revenutts, net of provision for bad debts
Operallna exoenS§s 320,005 300,995 (19,010) Salaries and wages 58,610 73,376 14,766 Employee benefits 50,913 50,391 (522) Supply expenses 60,439 60,809 370 Purchase services, utilities, insurance and other 24,204 24,211 7 Provider tax 18,456 25,486 7,030 DepreclaUon and amortization 14.804 6,644 (8.160) Interest
547.431 541,912 (5,519} Total operating expenses
(47.607} (~003) (41,604} Income (loss) from operalions
{!!,on Q~!lltin!Z ga~ (@l<QS!!!ffil 8,801 Gain on Interest Rate Swap Agreement 4,223 362 3,861 Investment Income and retums
~ 754 (!34) Contributions
13,044 1,116 3,127 Net non operating gain
(34,563} ($4,887) ($38,477} Excess (deflc:lt) of n1vanues over.expenses
1,828 Other changes in net assets 851 ,4~_ Unrestricted net assets at beginning of period
SB1B,695 Unrestricted net assets at end of the period
For the Twelve Months Endfnq 1213112016 Actual Budget Variance I Prior year
$6,063,774 $6,317,758 (591217) (67,000)
6,004,557 6,250,758
14,347 71,566
6,018,904 6,322,324
3,622,547 3,571,680 797,794 866,300 636,292 592,014 767,604 782,259 262,311 290,000 259,989 305,743
87,564 78.440
6,434.101 6,486,436
(415.197} (164.112)
43,837 12,395 4,402
157,527 113,802
213,759 118,204
(201,438) (S45,901Jl
5 1,020,129
$818,696
($253,984) 7,783
(246,201)
(57.219}
(303,420)
{50,867) 68,506
(44,278) 14,655 27,689 45,754 (9.124i
52,335
(251.085)
7,993 43,725
511718
($199,367)
$6,093,293 (225,595'
5,867,698
9,447
5,Bn,145
3,498,391 856,673 582,095 753,776 286,329 313,062 176,083
6,466409
(589 264J
55,129 (9,605)
168.402
213,926
($375,338}
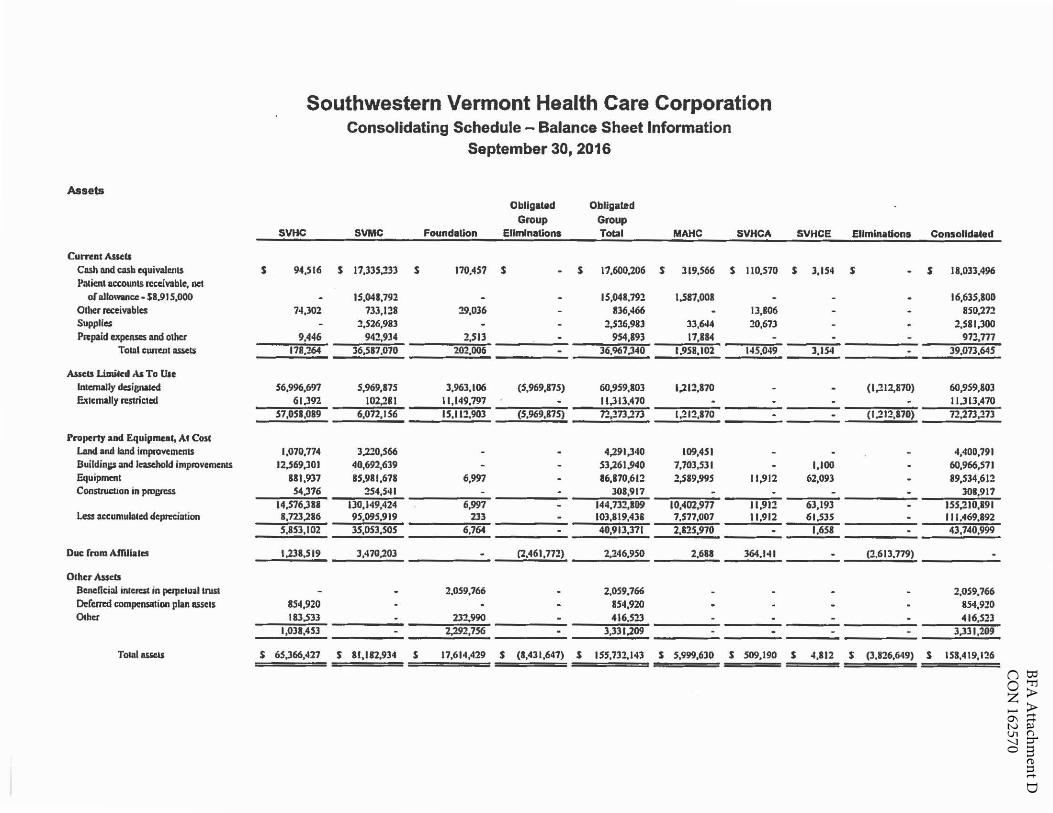
BFA A
ttachment D
CO
N 162570
Southwestern Vermont Health Care Corporation Consolidating Schedule - Balance Sheet Information
September 30, 2016
Assets Obligated Obligated
Group Group SVHC SVMC Foundation Elf ml nations TotJI MAHC SVHCA SVHCE Eliminations Consolidaled
Curn1u Auels Cash 1111d cash equivalents s 94,516 s 17,335,233 s 170,457 s - s 17,600,206 s ll9,S66 s 110,570 $ 3,154 s - $ 11,033,496 Patient actounts receivable, net
of llllO\YanCC - SB.91 S,000 - 15,041,792 - - 15,041.791 l,517,001 - - - 16,635,IOO Other receiYllblcs 74,302 733,1:?8 '.?9,036 - 136,466 - 13,806 - - IS0,27::? Supplies - :?,526,983 - - 2,S:l6,98l 33,644 20,673 - - 2,581,300 Piipaid expenses and other 9,446 94::?,934 2,513 - 954,193 17,884 - - - 972,777
Total c:unent llSKts 178,264 36,517,070 202,006 - 36,967.340 1,958,102 t45,049 l,154 - 39,073,645
Asuls Limik• As To Un lnlcmally designated 56,996,697 5,969,175 3,963,106 (S,969,175) 60,959,803 1.212,170 - - (1,212,870) 60,959,803 Externally RSUicted 61,392 102,281 11,149,797 - 11,313,470 - - - - 11.313,470
57,0Sl,089 6,072,156 IS,ll:?,903 (5,969,87S) 7::?,273,273 1,21::?,170 - - (I ,:?l:?,170) 7::?,273,273
rroperty aad Equipment. At Cose Land and land improvements 1,070,774 3,:U0,$66 - - 4,291,340 109,451 - - - 4,400,791 Buildin'5 and leasehold improvemelllS 12,569,301 40,692,639 - - 53,261,940 7,703,SJI - l,100 - 60,966,571 Equipment 111,937 85,911,678 6,997 - 16,870,611 2,SB9,99S 11,912 62,093 - 89,534,612 Consuucuon in pn>cius 54.376 254,5.al - - 301,917 - - - - 301,917
14,576.311 130,149,424 6,991 - 144.732,109 10,402,977 11,91:? 63,193 - 155,210,191 Less acc:umulaled deprrci111ion 8,nl,286 95,095,919 233 - 103,819,438 7,577,007 11,912 61,53S - 111.469,892
5,853,102 35,053,SOS 6,764 - 40,913,371 __ 2,825,970 - 1,658 - 43,740,999
Due: from Arrlllalcs 1,238,519 l,470,203 - (2,461,772} 2,246,950 2,611 364,1.al - (2,613.779)
Other Asscls Beneficial interest in papclu:ll trust - - 2,059,166 - 2,059,766 - - - - 2,059,766 Dcfcmd compensation plan assets 854,920 - - - 154,920 . . - - 854,920 Othct 183.Sll - 232,990 - 416,S:?l - - - - 416,523
1,031,453 - 2,292,756 - 3,331,209 - - - - 3)31,209
Total 11$S1!U s 65)66.427 s 81,182,934 s 17,614,429 s (l,431 ,647) s ISS,732.1.al S 5,999,630 s 509,190 s 4.112 s (3,826,649) s 158,419,126
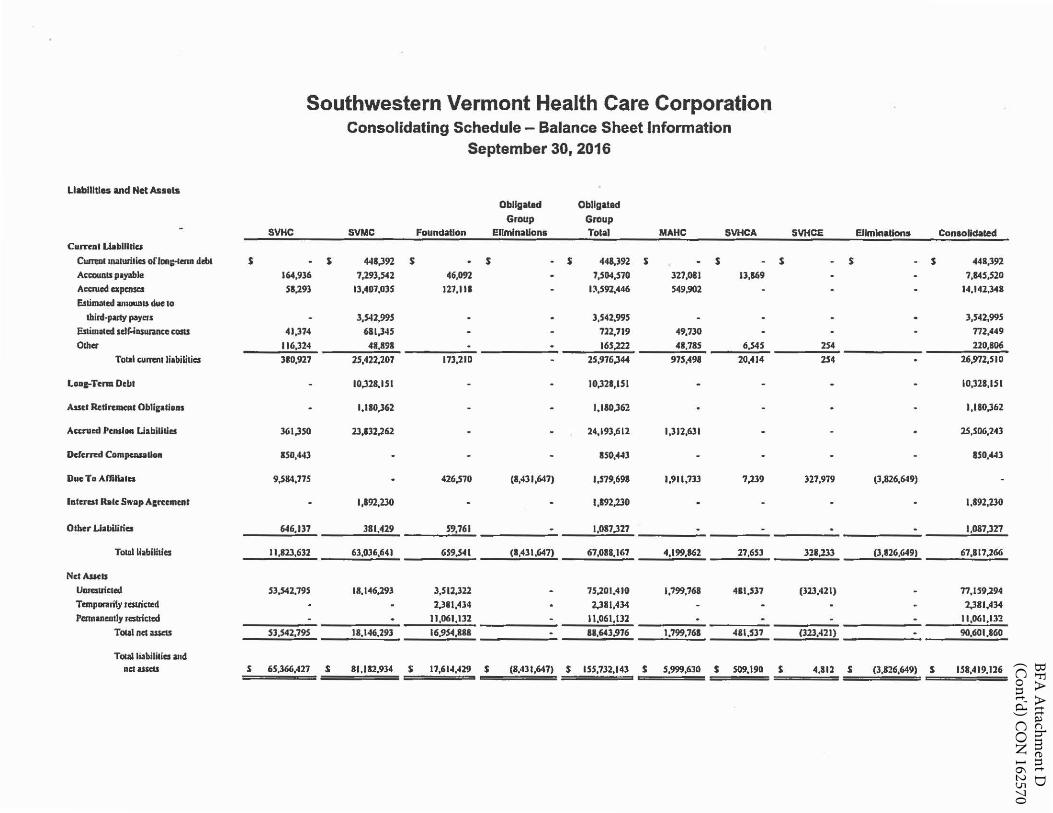
BFA A
ttachment D
(Cont'd) C
ON
162570
Southwestern Vermont Health Care Corporation Consolidating Schedule - Balance Sheet Information
September 30, 2016
Llablllt!es and NetAsHta
Obligated Obllgated
Group Group SVHC SVMC Foundation EllmlnaUona Tolal MAHC SVHCA SVHCE Ellmlnatlons Consolidated
Cu1TeDI U.bllldu
Cumnt lllillwitics ofl.,.;-iam debt s . s 4oll,392 s . $ . $ 441,)92 $ . $ - s . $ - s 441.392 Accouats payable 164,936 7,293,s42 46,092 . 7,S04,S70 327,081 13,S69 . . 7,145.S20
AcCl\led expenses 51,293 13,407,035 127,111 - 13,592,446 S49,902 - . . 14,142,341
Esti-1ed an10W1ll d11e to
lhinl-party paycis - 3,S42,!>9S . . 3,542,995 - . . . 3,542,995
Eslimlllcd sd~nswancc costs 41,374 681,345 . - 722,719 49,730 . . . nz . .c49
Olhcr 116,324 48,891 . . 165,222 48,715 6,s4S 254 220,806
Total c:urrtnt li1bilitics 310,927 lS,422,207 173,210 . 25,976,344 97S,498 20,414 254 . 26,972,SIO
looc-Tena Debt - 10,321,ISI - . 10,321,ISI . - . . I0,321,151
Asset RellruKaC Oblii:atioos . 1,110)62 - . 1,110,362 . - . . 1,110,362
Aa:ruod PtDSlo• LiabiUtlet 361,lSO 23,lll.262 . . 24,193,612 1,312,631 . . . 25,SD6,243
Ddcnm CompensaliH IS0,443 . . . 850,"43 - . . - 8S0,44l
Due To Affiliates 9,584,775 . 426,570 (8,431,647) l,S79,691 1,911,733 7,239 327,979 {3,826,649)
lutercst Ible Swap A&rcc111C11t . 1,892,230 . . 1,192,230 . - . . l.892,230
Other Uabilirics 646,1)7 3111,429 59,761 . ___ l,087.327 . - . . 1,017,327
Total liabilities 11,823,632 63,036,641 6S9,541 (8,431,647) 67,018,167 4,199,1162 27,6SJ 3:!8,133 (3,826.649) 67,817,266
Net Asstb
UllRSlric1cd S3,s42,79S 18,146,293 3,512.322 . 75,201,410 1,799,768 411,537 (323,421) . 77,IS9,294 Temporarily restricted . . 2,381,434 . 2,311,434 - . . . 2,3111,434 Pamaneotly rC$1rictcd - . 11,061,132 - 11,061,132 . . . . 11,061,13'.!
Toul net auctS Sl,S42,79S 18,146,293 16,95-4,1118 . 11,643,976 1,799,768 .C&l,537 (323,421) . 90,601 ,860
TOCill ha.bilitics and net assets s 65,366,427 s 81.112,934 s 17,614,429 s (8,411,647) s I 55,732,143 $ 5,999,630 s 509,190 s 4,812 $ (3,826,649) s 158,419,126
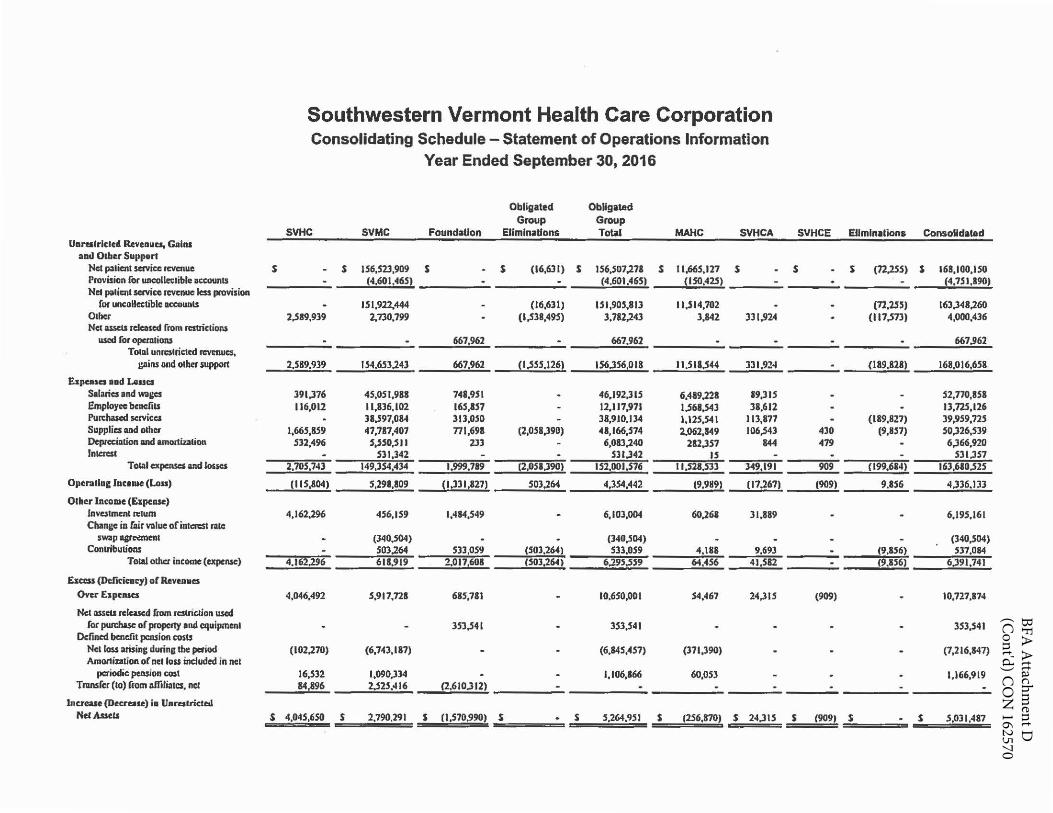
BFA A
ttachment D
(Cont'd) C
ON
162570
Southwestern Vermont Health Care Corporation Consolidating Schedule - Statement of Operations Information
Year Ended September 30, 2016
Obligated Obligated Group Group
SVHC SVMC Foundation Eliminations Tot.al MAHC SVHCA SVHCE Eliminations Consolldaled Uarealrldcd Revenues, Gains
and Oiiier Support Ncl pilient service revenue s - s IS6,S2J,909 s - s (16,631) s IS6,S07,271 s 1 l,66S,127 s - s - s (72,2SS) s 168,100,1.SO Pmvision for uncollci;tiblc accounts - (4,601 ,46S) - - (4.601,46S) (IS0,42S) - . - (4,7Sl,190) Net palitnt service revenue less pmvision
foe uncollcclible 1ccowi1S - 151,922.444 - (16,631) 1'1,90S,813 11,514,702 - . (72,ljS) 163,348,260 Other 2.SS9,9l9 2.730,799 - (l,Sll,495) 3,782,20 l,142 331,924 . (117.S73) 4,000,436 Net asscu rdeased from n:striclions
used for operations - . 667,962 - 667,962 . - - . 667.962 To111I unralrictcd n:vmues,
!lllins and othct support 2,589,939 I 54,653.243 6671962 __ (I ,SS5,126) IS6,3S6,018 ll,SllJ44 331,924 . (189.828) 168,016,658
E:11puSQ Hd Leases Salaries am! wai:es 391,376 45,051,988 748,9.SI - 46,192,]IS 6,489.221 19,]IS . - s2,no,ss8 Employee benefits 116,012 11,836,102 16S,IS7 - 12,117,971 1J68,s4l 31,612 . - 13,725,126 Purdwcd services - 31.S97,084 313,0SO - 38,9JO,IJ4 l,125,541 113,877 . (189,827) 39,959,725 Supplies cmd olhet l,66S,8S9 47,787,407 nl,698 (2,058,390) 41,166,574 2,062,849 106,543 430 (9,857) 50,326,539 Depreciulion mid amortization 532,496 S,SSO,SJI 2J3 - 6,083,240 282,357 844 '479 . 6,366,920 Jntaest - SJl,342 - - 531,342 u - - - SJl.JS7
Total expenses and loucs 2,70S,7 .. 3 , .. 9,354,434 1,999,719 (2,0Sl,390} I Sl,DO l,S76 ll,Slll,S33 349,191 909 (199,61 .. ) J 63 ,610.S2S
Opcralloi: Ioc•mc (Lou) (llS,804) S,298,109 (1,331,827) 503.264 4,354,442 (9,989) (17.267} __ (909) 9.156 4,336.133
Oiiier Income (E:i:peasc} lnv~tmml retum 4,162,296 4S6,IS9 l, .. 84,S49 - 6,103,004 60,261 31,189 - . 6,195,161 Chani:e in f4irwlueofiotCRSt nuc
swap agra:ment - (J40.S04) - - (340,.504) - . . - (340,504) Contributions - 503.264 533,059 (SOJ,264) S33,0S9 4,188 9,693 . 19,156) Sl7,084
Tolal other income (txptnsc) 4,162.296 618,919 2,0171601 (SOJ,264) 6,295,SS9 64,456 4J,S82 - (9.U6) 6,391,741
£uess (DcfKiCllcy) o( R.eVtalleS
Over E1pcucs 4,046,492 5,911.n1 615,711 - 10,6SO,OOI 54,467 24,JIS (909) - 10,727,874
Net :mets released from restnction wed foe ptuehasc of property and equipmcnl - - 3S3J41 - JSJ,541 - - - - 3S3,S41
Defined benefit pension costs Ncl loss arisin; durini: the period (102,270) (6,743, I 87) - - (6.845,457) (371,390) - . . (7,216,147) Amol1ization of nel loss included in ncl
periodic pension cost 16,532 1,090,334 - . 1,106,166 60,053 - - - 1,166,919 Tnansfcr (to) liocn affilio1cs, net 14,896 2,525,416 (2.610.312)
Jnerease (Dccrc1111e) i• U•ralrictcol NetA.ueu s 4,04S,6SO s 2,790,291 s (1,570.990) s . s .5,264,9SJ s (2S6,870) s 24,JlS s (9091 _j - s S,OJl,487
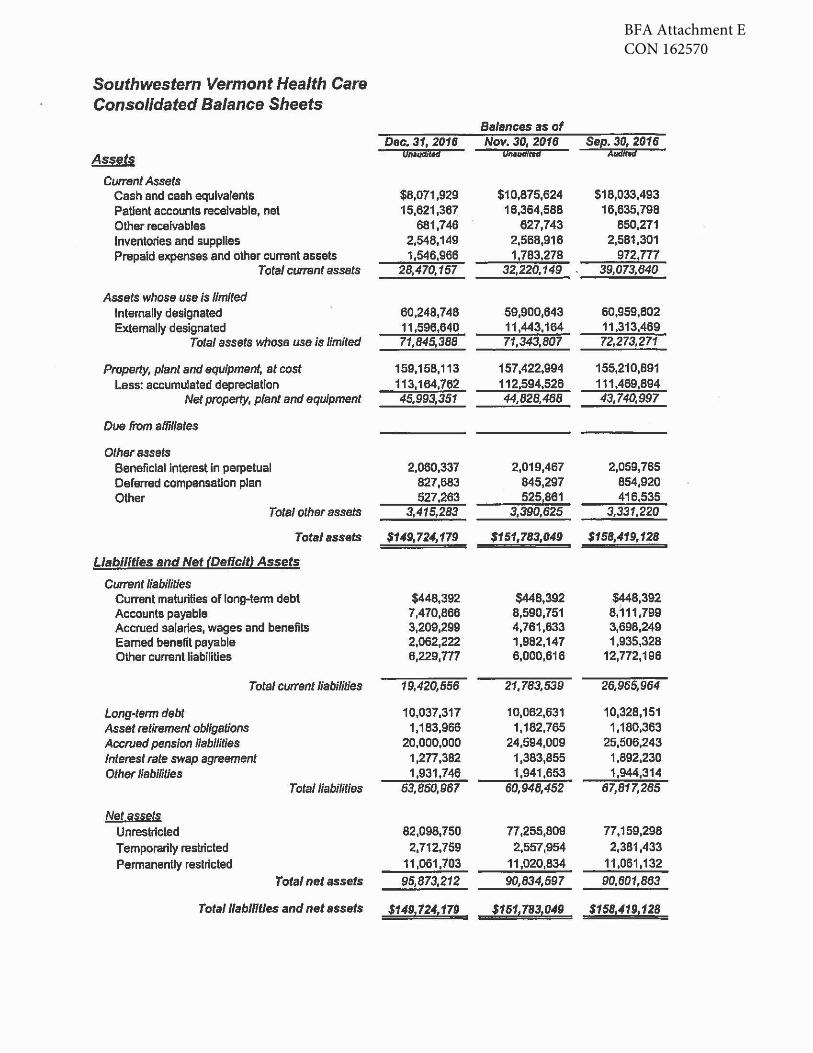
BFA Attachment ECON 162570
Southwestern Vermont Health Care Consolidated Balance Sheets
Balances as of Dec. 31, 2016 Nov. 30, 2016 Sep. 30, 2016
Assets u,,,™ Unaiidliid Aua11;a
CutTSnl Assets Cash and cash equivalents $8,071,929 $10,875,624 $18,033,493 PaUent accounts receivable, net 15,621,367'. 16,364,588 16,635,798 Other receivables 681,746 627,743 850,271 Inventories and supplles 2,548,149 2,568,916 2,581,301 Prepaid expenses and other current assets 1,546,966 1,783,278 e12,n1
Total current assets 28,470,157 32,220,149 39,073,640
Assets whose use Is limited Internally designated 60,248,748 59,900,643 60,959,802 Externally designated 11,596,640 11,443,164 11,313,469
Total assets whose use is limited 71,845,388 71,343,807 72,273,271
Property, plant and equipment, at cost 159,158,113 157,422,994 155,210,891 Less: accumulated depreciation 113,164,762 112,594,526 111,469,894
Net property, plant and equipment 45,993,351 44,828,468 43,740,997
Due from affiliates
Other assets Beneficial Interest In perpetual 2,060,337 2,019,467 2,059,765 Deferred compensaUon plan 827,683 845,297 854,920 Other 527,263 525,861 416,535
Total other assets 3,415,283 3,390,625 3,331,220
Total assets $149,724, 179 $151,783,049 $158,419, 128
Liabilities and Net (Deficit! Assets
Current liabilities Current maturities of long-term debt $448,392 $448,392 $448,392 Accounts payable 7,470,866 8,590,751 8,111,799 Accrued salaries, wages and benefits 3,209,299 4,761,633 3,698,249 Earned benefit payable 2,062,222 1,982,147 1,935,328 Other current liabiliUes 6,229,m 6,000,616 12,772,196
Total culT9nt liabilities 19,420,556 21,783,539 26,965,964
Long-term debt 10,037,317 10,062,631 10,328,151 Asset retirement obllgstions 1,183,966 1,182,765 1,180,363 Accrued pension /lab/I/ties 20,000,000 24,594,009 25,506,243 Interest rate swap agreement 1,277,382 1,383,855 1,892,230 Other liabilities 1,931,746 1,941,653 1,944,314
Total liabilities 53,850,967 60,948,452 67,817,265
Net assets Unrestricted 82,098,750 77,255,809 77,159,298 Temporarily restricted 2,712,759 2,557,954 2,381,433 PermanenUy restricted 11,061,703 11,020,834 11,061,132
Total net assets 95,873,212 90,834,597 90,601,863
Total /labllltles and net assets $14911241179 $15117831049 $15814191128
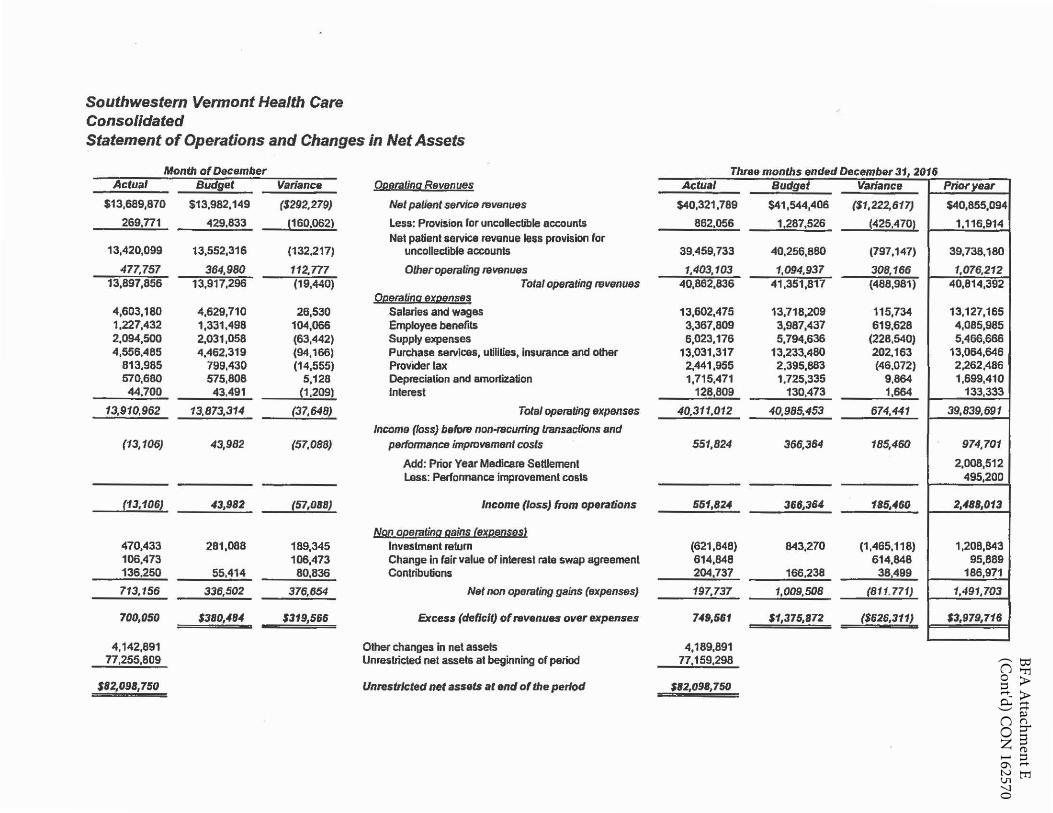
BFA A
ttachment E
(Cont'd) C
ON
162570
Southwestern Vermont Health Care Consol/dated Statement of Operations and Changes in Net Assets
Month of December Actual Budi_et Variance
$13,689,870 $13,982, 149 ($292,279)
269,ll.!.. 429.833 !160,062)
13,420,099 13,552,316 (132,217)
477,757 364,980 112,m 13,897,856 13,917,296 (19,440)
4,603,180 4,629,710 26,530 1,227,432 1,331,498 104,066 2,094,500 2,031,058 (63,442) 4,556,485 4,462,319 (94,166)
813,985 799,430 (14,555) 570,680 575,808 5,128 44,700 43,491 (1,209)
13,910,962 13,873,314 --1,37,648)
(13, 106) 43,982 (57,088)
(13,106) 43,982 __ (57,0BB)
470,433 281,088 189,345 106,473 106,473 136.250 55,414 80,836
713,156 338,502 376,654
700,050 $380,484 $319,566
4,142,891 77,255,809
$82,09B,750
Oeeralinq Revenues
Net patient service mvenues
Less: Provision ror uncoHectible accounts Net patient service revenue less provision for
uncollectible accounts
Other operating ravenues
Operalino expenses Salaries and wages Employee benefits Supply expenses
Total operating tf1venues
Purchase servlces, utilities, Insurance and other Provider lax Dep1eciation and amortization fnlerest
Total operating eKpensas
Income (toss) befom non-recurring transactions and performance improvement costs
Add: Prior Year Medicare Settlement Less: Pertonnance Improvement costs
Income (loss) from operations
Non operating gains (expenses> Investment reium Change in fair value of interest rate swap agreement Contributions
Net non operating gains (expenses)
Excess (deficit) of revenues over expenses
Other changes In net assets Unrestricted net assets at beginning of period
Unrestricted net assets at end of the period
Three months ended December 31, 2016 Actual
$40,321,789
862,056
39,459,733
1,403,103 40,862,836
13,602,475 3,367,809 6,023,176
13,031,317 2,441,955 1,715.471
128,809
40,311,012
551,824
551,824
(621,848) 614,848 204,737
197,737
4,189,891 77,159,298
$82,091,750
Budget Variance
$41,544,406 ($1,222,617)
1,287,526 (425,470l
40,256,880 (797,147)
1,094,937 308,166 41,351,817 (488,981)
13,718,209 115,734 3,987,437 619,628 5,794,636 (228,540)
13,233,480 202,163 2,395,883 (46,072) 1,725,335 9,864
130,473 1,664
40,985,453 674,441
366,364 185,460
366,364 1B5,460
843,270 (1,465, 118) 614,848
166,238 38,499
1,009,SDB (811.771)
$1,375,872 ($626,311)
Prior year
$40,855,094
1,116,914
39,738,180
1,076,212 40,814,392
13,127,165 4,085,985 5,466,666
13,064,646 2.262,486 1,699,410
133,333
39,839,691
974,701
2,008,512 495,200
2,488,013
1,208,843 95,889
186,971
1,491,703
$3,979,716
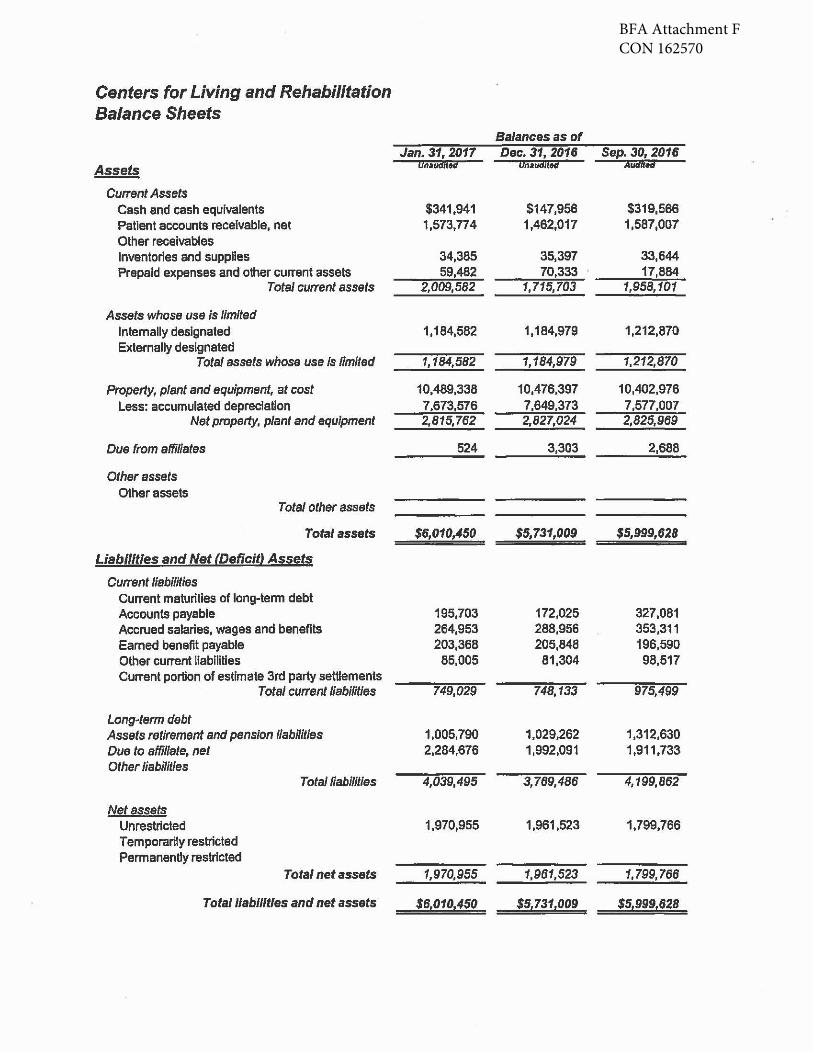
BFA Attachment FCON 162570
Centers for Living and Rehabilitation Balance Sheets
Balances as of Jan.31,2011 Dec. 31, 2016 Sep.30,2016
Assets OnaUdllid OnaUdl&ld Aildlitd
Cu"ent Assets Cash and cash equivalents $341,941 $147,956 $319,566 Patient accounts receivable, net 1,573,774 1,462,017 1,587,007 Other receivables Inventories and supplles 34,385 35,397 33,644 Prepaid expenses and other current assets 59,482 70,333 17,884
Total current assets 2,009,582 1,715,703 1,958, 101
Assets whose use Is limited Internally designated 1,184,582 1,184,979 1,212,870 Externally designated
Total assets whose use Is limited 1, 184,582 1, 184,979 1,212,870
Property, plant and equipment, at cost 10,489,338 10,476,397 10,402,976 Less: accumulated depreciation 7,673,576 7,649,373 7,577,007
Net property, plant and equipment 2,815,762 2,827,024 2,825,969
Due from affiliates 524 3,303 2,688
Other assets Other assets
Total other assets
Total assets $6,010,450 $5,731,009 $5,999,628
Liabllltles and Net £Deficitl Assets
Current liabilities Current maturities of long-term debt Accounts payable 195,703 172,025 327,081 Accrued salaries, wages and benefits 264,953 288,956 353,311 Eamed benefit payable 203,368 205,848 196,590 Other current liabllltles 85,005 81,304 98,517 Current portion of estimate 3rd party settlements
Total cu"ent liabilities 749,029 748, 133 975,499
Long-term debt Assets retirement and pension f/abilitles 1,005,790 1,029,262 1,312,630 Due to affiliate, net 2,284,676 1,992,091 1,911,733 Other liabilities
Total liabilities 4,039,495 3,769,486 4, 199,862
Net assets Unrestricted 1,970,955 1,961,523 1,799,766 Temporarily restricted Permanently restricted
Total net assets 1,970,955 1,961,523 1,799,766
Total liabllltfes and net assets $610101450 $511311009 $519991628
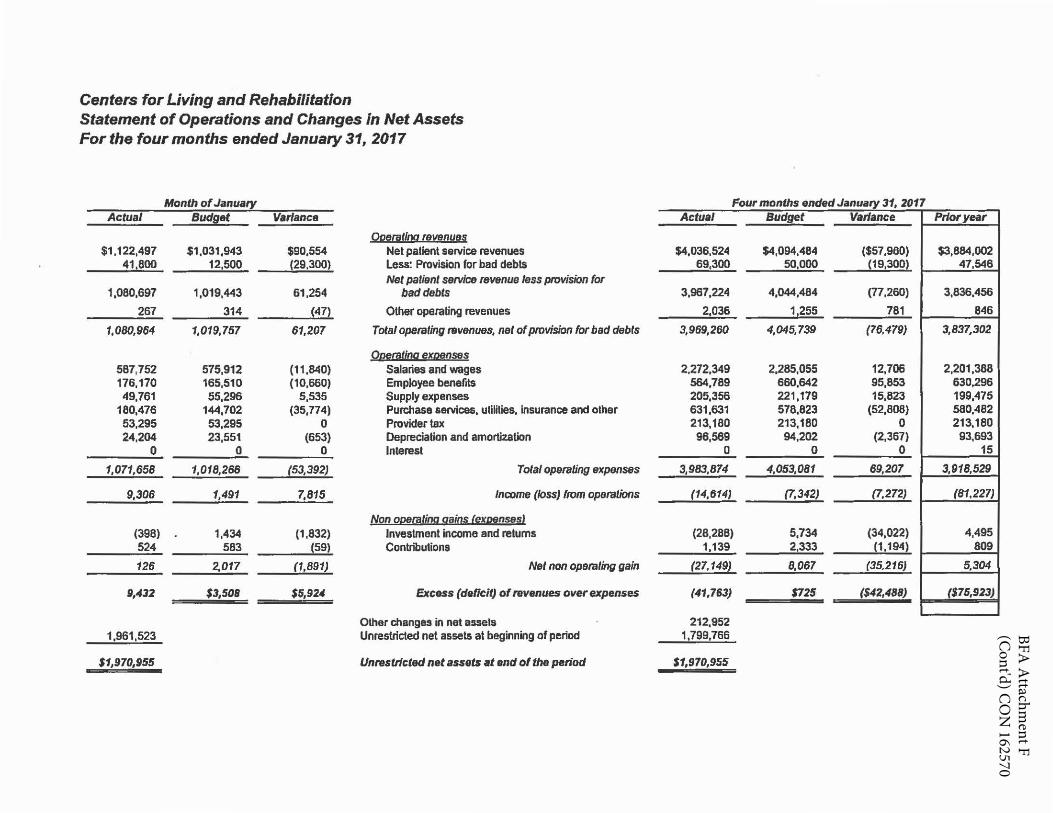
BFA A
ttachment F
(Cont'd) C
ON
162570
Centers for Living and Rehabilitation Statement of Operations and Changes in Net Assets For the four months ended January 31, 2011
Month of January Actual Budfl!!_ Variance
Ooeratina revenues $1,122,497 $1,031,943 $90,554 Net patient service revenues
41,800 12,500 (29,300} Less: Provision for bad debts Net patient S9IVice revenue less provision for
1,080,697 1,019,443 61,254 bad debts
267 314 (47) Other operating revenues
1,080,964 1,019,757 61,207 Total operating revenues, net of provision for bad debts
OoeratinQ exoonses 567,752 575,912 (11,840) Salaries and wages 176,170 165,510 (10,660) Employee benefits 49,761 55,296 5,535 Supply expenses
180,476 144,702 (35,774) Purchase services, utilities, Insurance and other 53,295 53,295 0 Provider tax 24,204 23,551 (653) Depreciation and amortization
!L 0 0 Interest
1,071,658 1,018,266 (53,392) Total operating expenses
9,306 1,491 7,815 Income (loss) from operations
Non of!!!.talina gains (exf!!!.nseri.l (398) 1,434 (1,832) Investment income and returns
fil... 583 (59) Contributions
126 2,017 (1,891) Net non operatinQ gain
9,432 $3,508 $5,924 Excess (deficit) of ravenues over expenses
Other changes in net assets 1,961,523 Unrestricted net assets at beginning of period
$1,970,955 Unrestricted net assets at end of the period
Four months ended January 31, 2017 -Actual
$4,036,524 69,300
3,967,224
2,036
3,969,260
2.272,349 564,789 205,356 631,631 213,180
96,569 0
3,983,874
(14,614,
(28,288) 1,139
(27.149)
212,952 1,799,766
$1,970,955
I
Budget
$4,094,484 50,000
4,044,484
11255
4,045,739
2,285,055 660,642 221,179 578,823 213,180 94,202
0
4,053,081
(7,342)
5,734 2,333
8,067
$725
Variance
($57,960) (19,300)
(77,260)
781
(76,479)
12,706 95,853 15,823
(52,808) 0
(2,367) 0
69,207
(7,272}
(34,022) (1, 194)
(35.216)
($42,488)
Prior year
$3,884,002 47,546
3,836,456
846
3,837,302
2,201,388 630,296 199,475 580,482 213,180
93,693 15
3,918,529
(81,227)
4,495 809
5,304
($75,923)
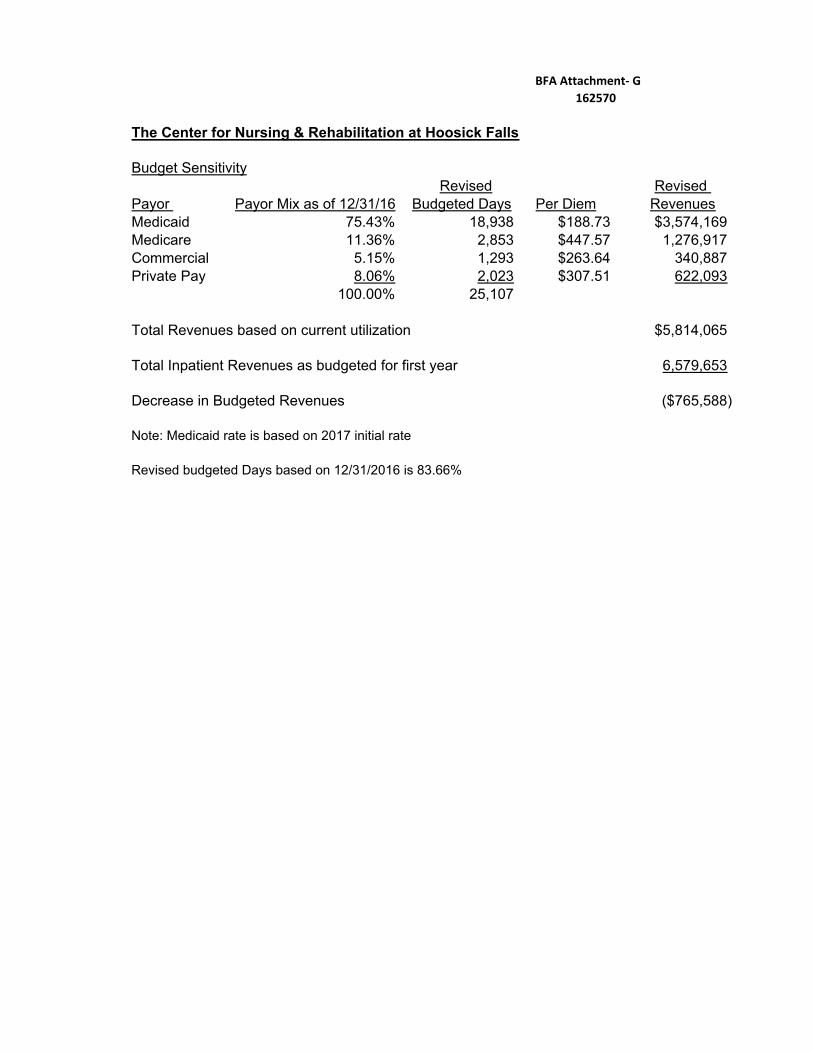
BFA Attachment‐ G
162570
The Center for Nursing & Rehabilitation at Hoosick Falls
Budget SensitivityRevised Revised
Payor Payor Mix as of 12/31/16 Budgeted Days Per Diem RevenuesMedicaid 75.43% 18,938 $188.73 $3,574,169Medicare 11.36% 2,853 $447.57 1,276,917Commercial 5.15% 1,293 $263.64 340,887Private Pay 8.06% 2,023 $307.51 622,093
100.00% 25,107
Total Revenues based on current utilization $5,814,065
Total Inpatient Revenues as budgeted for first year 6,579,653
Decrease in Budgeted Revenues ($765,588)
Note: Medicaid rate is based on 2017 initial rate
Revised budgeted Days based on 12/31/2016 is 83.66%
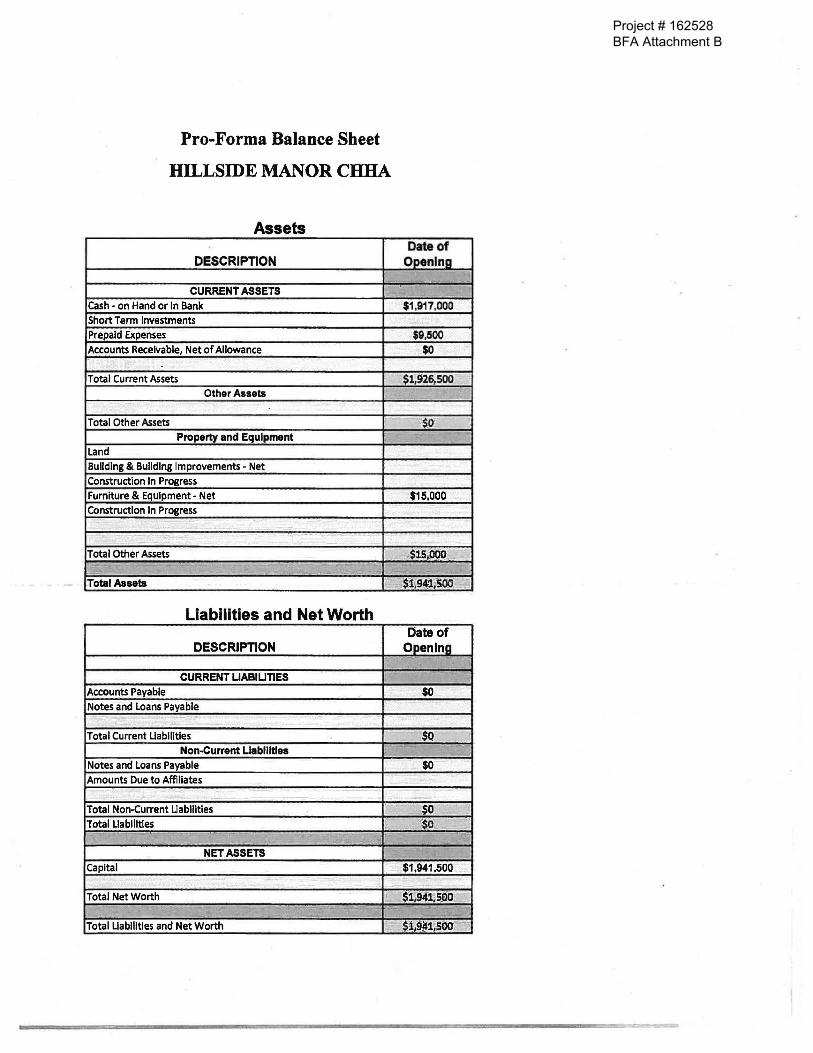
Project # 162528BFA Attachment B
Pro-Forma Balance Sheet
HILLSIDE MANOR CHHA
Assets Date of
DESCRIPTION Ooenlnn I
- -CURRENT ASSETS
Cash - on Hand or In Bank $1.917.000 Short Term Investments Prepaid Expenses $9,500 Accounts Receivable, Net of Allowance $0
Total Current Assets $1,926,500 ' Other Assets
Total Other Assets ·~· Property and Equipment
Land Bull ding & Building Improvements - Net Construction In Progress Furniture & Equipment - Net $15,000 Construction In Progress
.. . -
Total Other Assets '4S15Ji00,k... ~ ' ~- - · - --
TotalAaseta .::. .. $.l.sJ:1:s.oo:~--
Liabilities and Net Worth Date of
DESCRIPTION Opening
CURRENT LIABILITIES Accounts Payable $0 Notes and Loans Payable
~- ~ -Total Current Liabilities $Q
Non-Current Liabilities Notes and Loans Payable $0 Amounts Due to Affiliates
-Total Non-Current Uablllties so -Total Llabllltles ":'$.0
~ . '·
NET ASSETS -Capital $1.941.500
-Total Net Worth S'1i94l:soo· -
~
~- -~ ~
-- .. -Total Llabllltles and Net Worth '$1;9!1,'SOO r;
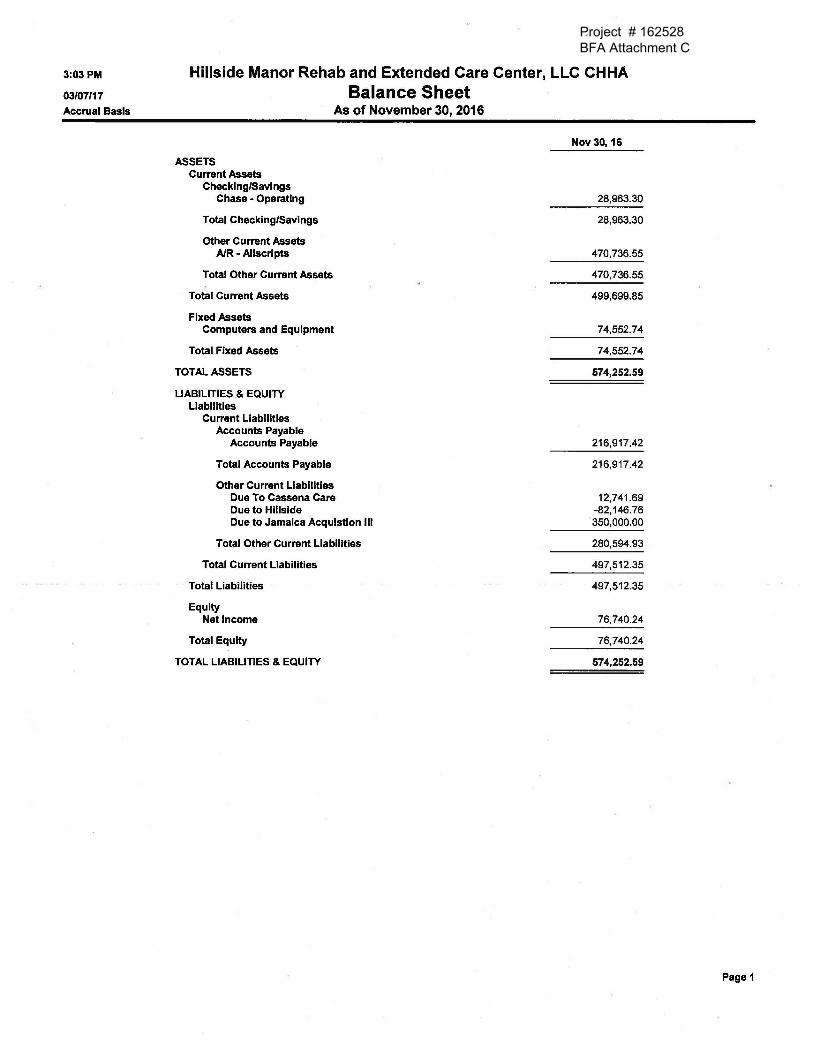
Project # 162528BFA Attachment C
3:03 PM
03/07/17
Accrual Basis
Hillside Manor Rehab and Extended Care Center, LLC CHHA Balance Sheet
As of November 30, 2016
ASSETS Current Assets
Checking/Savings Chase - Operating
Total Checking/Savings
Other Current Assets A/R-Allscrlpts
Total Other Current Assets
Total Current Assets
Fixed Assets Computers and Equipment
Total Fixed Assets
TOTAi. ASSETS
LIABILITIES & EQUITY Liabilities
Current Liabilities Accounts Payable
Accounts Payable
Total Accounts Payable
Other Current Liabilities Due To Cassena Care Due to Hillside Due to Jamaica Acqulstlon Ill
Total Other Current Liabilities
Total Current Llabllltles
Total Liabilities
Equity Net Income
Total Equity
TOTAL LIABILITIES & EQUITY
Nov 30, 16
28,963.30
28,963.30
470,736.55
470,736.55
499,699.85
74,552.74
74,552.74
574,252.59
216,917.42
216,917.42
12,741.69 -82,146.76 350,000.00
280,594.93
497,512.35
497,512.35
76,740.24
76,740.24
574,252.59
Page 1
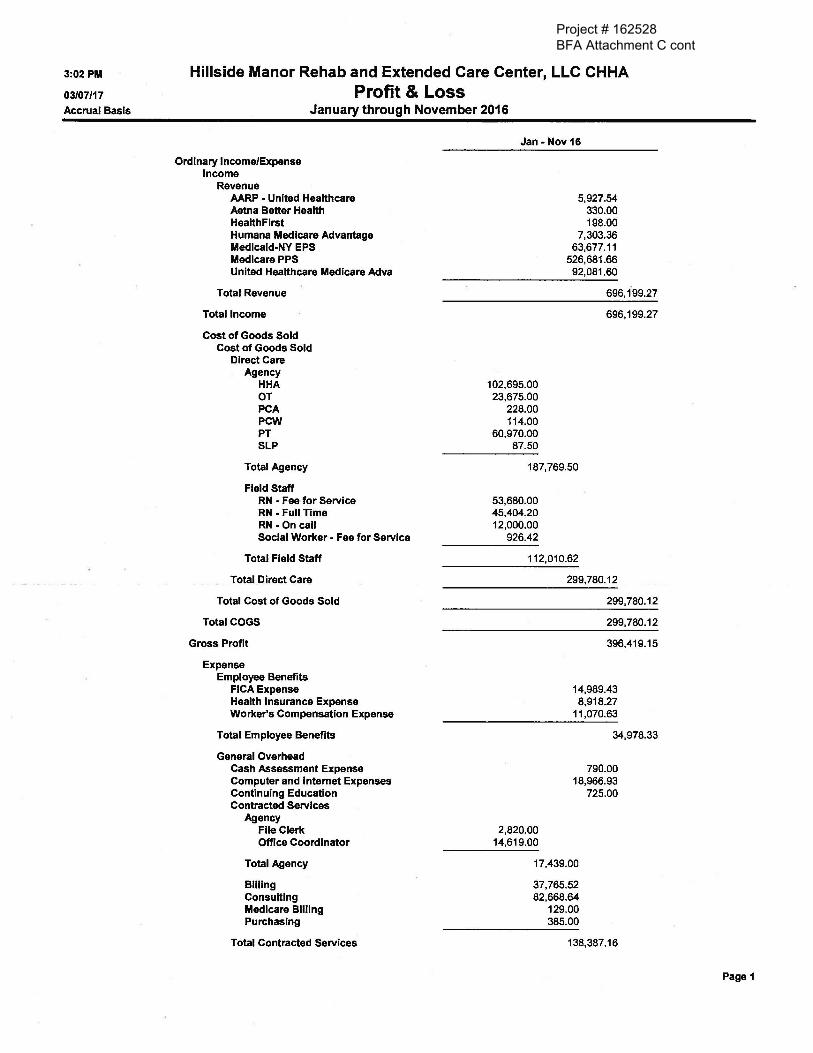
Project # 162528BFA Attachment C cont
3:02 PM
03/07/17
Accrual Basis
Hillside Manor Rehab and Extended Care Center, LLC CHHA Profit & Loss
January through November 2016
Ordinary Income/Expense Income
Revenue AARP - United Healthcare Aetna Better Health Health First Humana Medicare Advantage Medicaid-NY EPS Medicare PPS United Healthcare Medicare Adva
Total Revenue
Total Income
Cost of Goods Sold Cost of Goods Sold
Direct Care Agency
HHA OT PCA PCW PT SLP
Total Agency
Field Staff RN - Fee for Service RN-Full Time RN-On call Social Worker - Fee for Service
Total Field Staff
Total Direct Care
Total Cost of Goods Sold
Total COGS
Gross Profit
Expense Employee Benefits
FICA Expense Health Insurance Expense Worker's Compensation Expense
Total Employee Benefits
General Overhead Cash Assessment Expense Computer and Internet Expenses Continuing Education Contracted Services
Agency File Clerk Office Coordinator
Total Agency
Billing Consulting Medicare Billing Purchasing
Total Contracted Services
Jan -Nov 16
102,695.00 23,675.00
228.00 114.00
60,970.00 87.50
5,927.54 330.00 198.00
7,303.36 63,677.11
526,681.66 92,081.60
696,199.27
187,769.50
53,680.00 45,404.20 12,000.00
926.42
112,010.62
2,820.00 14,619.00
299,780.12
299,780.12
299,780.12
396,419.15
14,989.43 8,918.27
11,070.63
34,978.33
790.00 18,966.93
725.00
17,439.00
37,765.52 82,668.64
129.00 385.00
138,387.16
Page 1
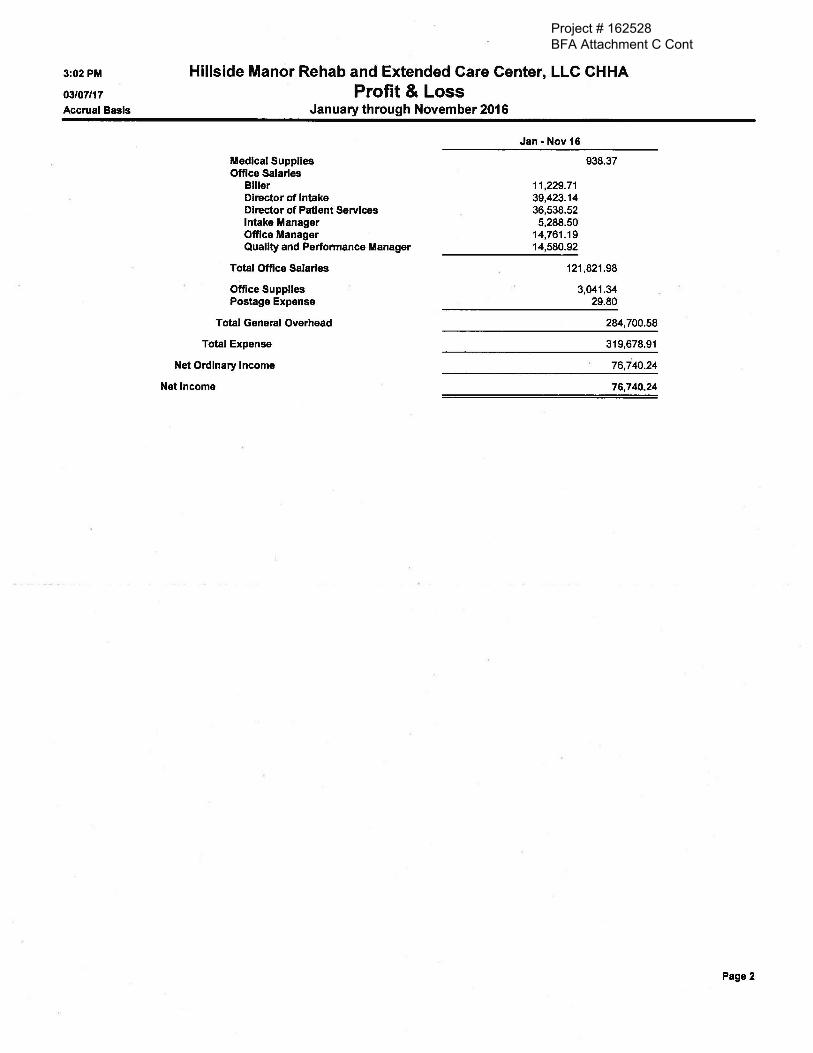
Project # 162528BFA Attachment C Cont
3:02 PM
03/07/17
Accrual Basis
Hillside Manor Rehab and Extended Care Center, LLC CHHA Profit & Loss
January through November 2016
Medical Supplies Office Salaries
Biller Director of Intake Director of Patient Services Intake Manager Office Manager Quality and Perfonnance Manager
Total Office Salaries
Office Supplies Postage Expense
Total General Overhead
Total Expense
Net Ordinary Income
Net Income
Jan - Nov 16
11,229.71 39,423.14 36,538.52 5,288.50
14,761.19 14,580.92
938.37
121,821.98
3,041.34 29.80
284,700.58
319,678.91
76,740.24
76,740.24
Page2