Mapping the potential distribution of five species of Passiflora in Andean countries
12
Genetic Resources and Crop Evolution 50: 555–566, 2003. 555 2003 Kluwer Academic Publishers. Printed in the Netherlands. Mapping the potential distribution of five species of Passiflora in Andean countries 1 2 3 4 5, * ´ Sergio Segura , G. Coppens d’Eeckenbrugge , L. Lopez , M. Grum and L. Guarino 1 2 UACH, Km. 38.5 Carr. Mex-Tex, 56230 Chapingo, Mexico; CIRAD-FLHOR / IPGR c / o CIAT, A. A. 6713, 3 4 Cali, Colombia; IPGRI c / o CIAT, A. A. 6713, Cali, Colombia; IPGRI c / o ICRAF, PO Box 30677, 5 * Nairobi, Kenya; Secretariat of the Pacific Community, Private mail bag, Suva, Fiji; Author for correspondence (e-mail: l.guarino@cigar.orgs) Received 29 May 2000; accepted in revised form 4 May 2001 Key words: Andean countries, Climatic adaptation, Germplasm collecting, GIS, Passiflora Abstract Geographic location data for 383 accessions of five Passiflora species from five Andean countries ( P . cumbalensis, P . mixta, P . tripartita var. mollissima, P . natistipula, and P . manicata) were linked to interpolated continental surfaces of monthly mean rainfall, monthly mean temperature, and monthly mean diurnal temperature range. This permitted us to identify the potential distribution of each species and document its climatic adaptation. Maps are presented showing regions where the climate is similar to that in areas where each species has been found, but from which no collections have yet been made, thus representing possible geographical gaps in collections. Some species showed evidence of intra-specific variation in their climatic adaptation. The study of Passiflora diversity in Andean countries continues and these maps based on passport data are expected to be useful tools for the planning of both ex situ and in situ conservation activities. Introduction sima, with few reports of their range and possible distribution, and until recently few germplasm acces- The subgenus Tacsonia of the genus Passiflora is sions under conservation (Escobar 1988; Holm- composed of more than 47 Andean species (13 with Nielsen et al. 1988). The diversity of these species is edible fruits) (Killip 1938; Escobar 1988). Three the result of the extreme heterogeneity of climatic and features mark the natural distributions of species of edaphic conditions in the Andes (Gentry 1989). the subgenus Tacsonia throughout the Andes: (i) their Recently, the Andean countries have received tech- intolerance of the warmer temperatures found at lower nical support from the International Plant Genetic altitudes, (ii) their affinity for moist environments and Resources Institute (IPGRI) and funding from the (iii) their limited frost tolerance (University of Texas, Interamerican Development Bank to implement a Austin Escobar L.A. 1980). P . tripartita var. mollis- project to collect, characterize and conserve genetic sima (Kunth) Holm-Nielsen and Jørgensen is culti- resources of the genus Passiflora, focusing on the vated and commercialized throughout the Andean subgenus Tacsonia. The first step of this cooperative region. Other widely distributed Tacsonia species– program involved germplasm collecting trips in Ven- including P . mixta L. f., P . cumbalensis (Karst.) ezuela, Colombia, Ecuador, Peru, and Bolivia (Lobo ´ Harms and P . pinnatistipula Cav.–and P . manicata 1997; Lopez 1997; Mazzani et al. 1997) in the mid (Juss.) Pers. (of the subgenus Manicata) are of more 1990s. local commercial importance and have potential for The goal of the work presented here was to identify improvement through breeding. However, knowledge areas climatically suitable for further collecting to fill about their environmental requirements is generally gaps in existing collections, using software that has much less extensive than for P . tripartita var. mollis- only become available recently. These maps also
-
Upload
st-andrews -
Category
Documents
-
view
0 -
download
0
Transcript of Mapping the potential distribution of five species of Passiflora in Andean countries

Genetic Resources and Crop Evolution 50: 555–566, 2003. 555 2003 Kluwer Academic Publishers. Printed in the Netherlands.
Mapping the potential distribution of five species of Passiflora in Andeancountries
1 2 3 4 5,*´Sergio Segura , G. Coppens d’Eeckenbrugge , L. Lopez , M. Grum and L. Guarino1 2UACH, Km. 38.5 Carr. Mex-Tex, 56230 Chapingo, Mexico; CIRAD-FLHOR /IPGR c /o CIAT, A.A. 6713,
3 4Cali, Colombia; IPGRI c /o CIAT, A.A. 6713, Cali, Colombia; IPGRI c /o ICRAF, PO Box 30677,5 *Nairobi, Kenya; Secretariat of the Pacific Community, Private mail bag, Suva, Fiji; Author for
correspondence (e-mail: [email protected])
Received 29 May 2000; accepted in revised form 4 May 2001
Key words: Andean countries, Climatic adaptation, Germplasm collecting, GIS, Passiflora
Abstract
Geographic location data for 383 accessions of five Passiflora species from five Andean countries (P. cumbalensis,P. mixta, P. tripartita var. mollissima, P. natistipula, and P. manicata) were linked to interpolated continentalsurfaces of monthly mean rainfall, monthly mean temperature, and monthly mean diurnal temperature range. Thispermitted us to identify the potential distribution of each species and document its climatic adaptation. Maps arepresented showing regions where the climate is similar to that in areas where each species has been found, butfrom which no collections have yet been made, thus representing possible geographical gaps in collections. Somespecies showed evidence of intra-specific variation in their climatic adaptation. The study of Passiflora diversity inAndean countries continues and these maps based on passport data are expected to be useful tools for the planningof both ex situ and in situ conservation activities.
Introduction sima, with few reports of their range and possibledistribution, and until recently few germplasm acces-
The subgenus Tacsonia of the genus Passiflora is sions under conservation (Escobar 1988; Holm-composed of more than 47 Andean species (13 with Nielsen et al. 1988). The diversity of these species isedible fruits) (Killip 1938; Escobar 1988). Three the result of the extreme heterogeneity of climatic andfeatures mark the natural distributions of species of edaphic conditions in the Andes (Gentry 1989).the subgenus Tacsonia throughout the Andes: (i) their Recently, the Andean countries have received tech-intolerance of the warmer temperatures found at lower nical support from the International Plant Geneticaltitudes, (ii) their affinity for moist environments and Resources Institute (IPGRI) and funding from the(iii) their limited frost tolerance (University of Texas, Interamerican Development Bank to implement aAustin Escobar L.A. 1980). P. tripartita var. mollis- project to collect, characterize and conserve geneticsima (Kunth) Holm-Nielsen and Jørgensen is culti- resources of the genus Passiflora, focusing on thevated and commercialized throughout the Andean subgenus Tacsonia. The first step of this cooperativeregion. Other widely distributed Tacsonia species– program involved germplasm collecting trips in Ven-including P. mixta L. f., P. cumbalensis (Karst.) ezuela, Colombia, Ecuador, Peru, and Bolivia (Lobo
´Harms and P. pinnatistipula Cav.–and P. manicata 1997; Lopez 1997; Mazzani et al. 1997) in the mid(Juss.) Pers. (of the subgenus Manicata) are of more 1990s.local commercial importance and have potential for The goal of the work presented here was to identifyimprovement through breeding. However, knowledge areas climatically suitable for further collecting to fillabout their environmental requirements is generally gaps in existing collections, using software that hasmuch less extensive than for P. tripartita var. mollis- only become available recently. These maps also

556
provide useful information to identify suitable areaswhere each species may be cultivated and potentialsites for the in situ and ex situ conservation of species,also goals of the program. Variation in climaticadaptation could also be compared with genetic vari-ation within the different species.
Methods: Mapping climatic probabilities
Data collection
The first step in producing maps of the distributions ofPassiflora species was to gather passport data fromcollecting reports and other publications. Growers’fields as well as wild forest area were then visited tomake new collections. Latitude, longitude and altitudedata from 307 passport records were complementedby 76 geo-coded data from Escobar (1988) collec-tions. The final numbers of records for the differentspecies were as follows: P. cumbalensis 5 76, P.manicata 5 31, P. mixta 5 144, P. tripartita var.mollissima 5 111 and P. pinnatistipula 5 21. Somebasic information on these five species is presented inTable 1. The complete data set is available from theIPGRI Regional Office for the Americas in Cali,Colombia.
Data analysis
The germplasm biodiversity mapping program calledFloraMap 1.1 (Jones and Gladkov 1999) was used todevelop climatic models for predicting the distribu-tions of each species in the study area. FloraMap wasdeveloped at CIAT (International Center for TropicalAgriculture, Cali, Colombia), for the prediction of thedistribution of organisms in the wild, when little ornothing is known of the ecophysiology of the speciesinvolved. It is assumed that the climate at the points ofobservation and/or collection of a species is repre-sentative of the environmental range of the organism.The climate at these points is used as a calibration setto compute a climate probability model. FloraMap 1.1uses climatic data from a 10 min grid (correspondingto 18 km at the Equator) derived from a network ofover 10000 meteorological station in Latin America.A simple interpolation algorithm based on the inversesquare of the distance between the station and theinterpolated point was used to develop the climatesurfaces included in FloraMap. For each interpolatedpixel, the five nearest stations are used in the inversedistance equation. The climatic variables included are T
able
1.Cha
racteristic
sof
fivetaxa
ofPassiflora
analyz
ed.
Spec
ies
Com
mon
name
Ecolog
yKno
wnge
ograph
icdistrib
ution
P.tripartitava
r.Pa
lcho
(Ven
)Curub
ade
Castilla
(Col)
Cultiv
ated
,200
0–35
00m
Throug
hout
theAnd
es(K
unth)
mollissimaHolm-N
ielsen
&Jørgensen
Tacsode
Castilla
(Ecu
)Tu
mbo
(Per,B
ol)
P.mixta
L.f.
Palcho
silvestre
(Ven
)Curub
ade
mon
te(C
ol)
Wild
,200
0–40
00m
mon
tane
Vene
zuelato
Ecua
dors
poradic
Tacsode
indio(E
cu)
forest
anddisturba
tedarea
sin
Peru
andBolivia
P.pinnatistip
ula
Cav
.Ti
ntin
(Per,B
ol)
Bac
kyard,
2000
–300
0m
NorthernColom
bia-So
uthe
rnChile
Prob
ably
originated
inBolivia
P.cumbalensis
(Karst)Harms
Curub
aBog
otan
a(C
ol)
Wild
,bac
kyard,
cultiva
ted25
00–3
500m
Northern-So
uthe
rnColom
biaM
osta
bund
antin
˜hu
mid
mon
tane
forest
Cau
caan
dNarinode
parta
men
ts
P.manicata(Jus
s)Pe
rs.
Sach
agullan(E
cu)
1500
–270
0m
Dry
And
eanhills
ides
Vene
zuelato
NorthernPe
ru
anddisturba
tedarea
s
Ven
:Ven
ezue
la;Col:Colom
bia;
Ecu
:Ecu
ador;Pe
r:Pe
ru;Bol:Bolivia
557
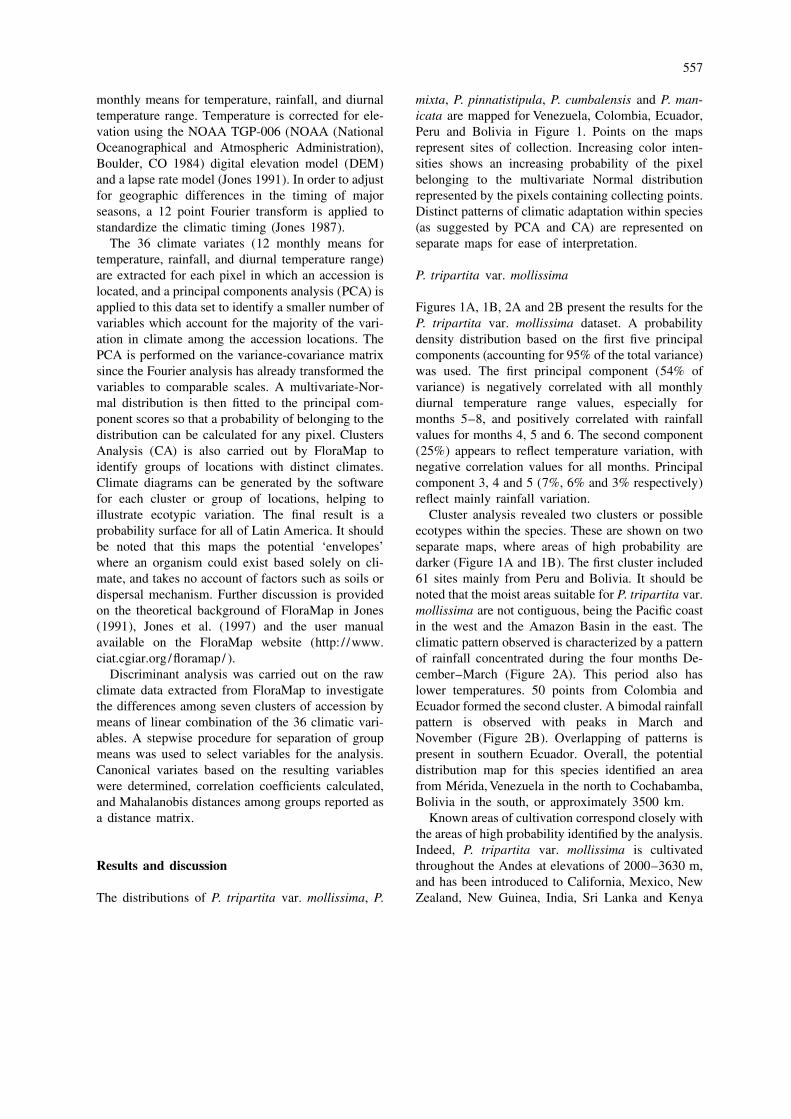
monthly means for temperature, rainfall, and diurnal mixta, P. pinnatistipula, P. cumbalensis and P. man-temperature range. Temperature is corrected for ele- icata are mapped for Venezuela, Colombia, Ecuador,vation using the NOAA TGP-006 (NOAA (National Peru and Bolivia in Figure 1. Points on the mapsOceanographical and Atmospheric Administration), represent sites of collection. Increasing color inten-Boulder, CO 1984) digital elevation model (DEM) sities shows an increasing probability of the pixeland a lapse rate model (Jones 1991). In order to adjust belonging to the multivariate Normal distributionfor geographic differences in the timing of major represented by the pixels containing collecting points.seasons, a 12 point Fourier transform is applied to Distinct patterns of climatic adaptation within speciesstandardize the climatic timing (Jones 1987). (as suggested by PCA and CA) are represented on
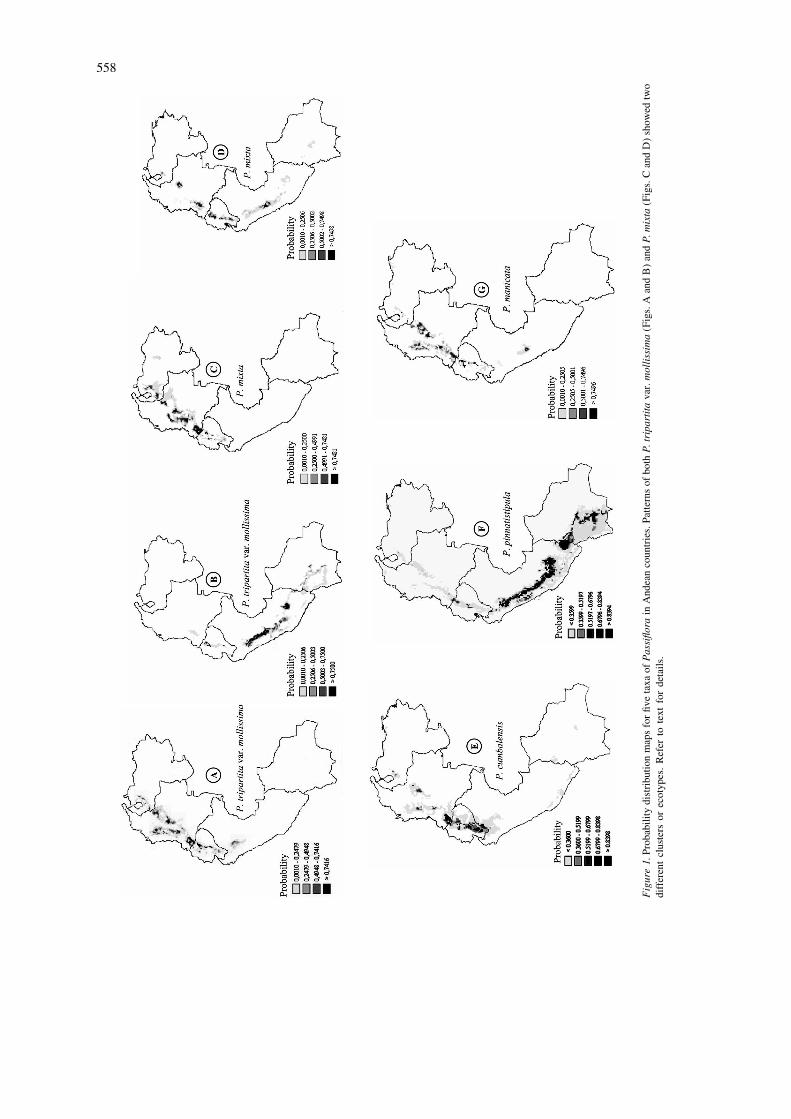
The 36 climate variates (12 monthly means for separate maps for ease of interpretation.temperature, rainfall, and diurnal temperature range)are extracted for each pixel in which an accession is P. tripartita var. mollissimalocated, and a principal components analysis (PCA) isapplied to this data set to identify a smaller number of Figures 1A, 1B, 2A and 2B present the results for thevariables which account for the majority of the vari- P. tripartita var. mollissima dataset. A probabilityation in climate among the accession locations. The density distribution based on the first five principalPCA is performed on the variance-covariance matrix components (accounting for 95% of the total variance)since the Fourier analysis has already transformed the was used. The first principal component (54% ofvariables to comparable scales. A multivariate-Nor- variance) is negatively correlated with all monthlymal distribution is then fitted to the principal com- diurnal temperature range values, especially forponent scores so that a probability of belonging to the months 5–8, and positively correlated with rainfalldistribution can be calculated for any pixel. Clusters values for months 4, 5 and 6. The second componentAnalysis (CA) is also carried out by FloraMap to (25%) appears to reflect temperature variation, withidentify groups of locations with distinct climates. negative correlation values for all months. PrincipalClimate diagrams can be generated by the software component 3, 4 and 5 (7%, 6% and 3% respectively)for each cluster or group of locations, helping to reflect mainly rainfall variation.illustrate ecotypic variation. The final result is a Cluster analysis revealed two clusters or possibleprobability surface for all of Latin America. It should ecotypes within the species. These are shown on twobe noted that this maps the potential ‘envelopes’ separate maps, where areas of high probability arewhere an organism could exist based solely on cli- darker (Figure 1A and 1B). The first cluster includedmate, and takes no account of factors such as soils or 61 sites mainly from Peru and Bolivia. It should bedispersal mechanism. Further discussion is provided noted that the moist areas suitable for P. tripartita var.on the theoretical background of FloraMap in Jones mollissima are not contiguous, being the Pacific coast(1991), Jones et al. (1997) and the user manual in the west and the Amazon Basin in the east. Theavailable on the FloraMap website (http: / /www. climatic pattern observed is characterized by a patternciat.cgiar.org /floramap/ ). of rainfall concentrated during the four months De-
Discriminant analysis was carried out on the raw cember–March (Figure 2A). This period also hasclimate data extracted from FloraMap to investigate lower temperatures. 50 points from Colombia andthe differences among seven clusters of accession by Ecuador formed the second cluster. A bimodal rainfallmeans of linear combination of the 36 climatic vari- pattern is observed with peaks in March andables. A stepwise procedure for separation of group November (Figure 2B). Overlapping of patterns ismeans was used to select variables for the analysis. present in southern Ecuador. Overall, the potentialCanonical variates based on the resulting variables distribution map for this species identified an area
´were determined, correlation coefficients calculated, from Merida,Venezuela in the north to Cochabamba,and Mahalanobis distances among groups reported as Bolivia in the south, or approximately 3500 km.a distance matrix. Known areas of cultivation correspond closely with
the areas of high probability identified by the analysis.Indeed, P. tripartita var. mollissima is cultivated
Results and discussion throughout the Andes at elevations of 2000–3630 m,and has been introduced to California, Mexico, New
The distributions of P. tripartita var. mollissima, P. Zealand, New Guinea, India, Sri Lanka and Kenya
558
Figure1.
Prob
ability
distribu
tionmap
sforfiv
etaxa
ofPassiflora
inAnd
eanco
untries.
Patte
rnsof
both
P.tripartita
var.mollissima(F
igs.
Aan
dB)an
dP.
mixta
(Figs.
Can
dD)sh
owed
two
differen
tclus
ters
orec
otyp
es.Refer
totext
forde
tails
.
559
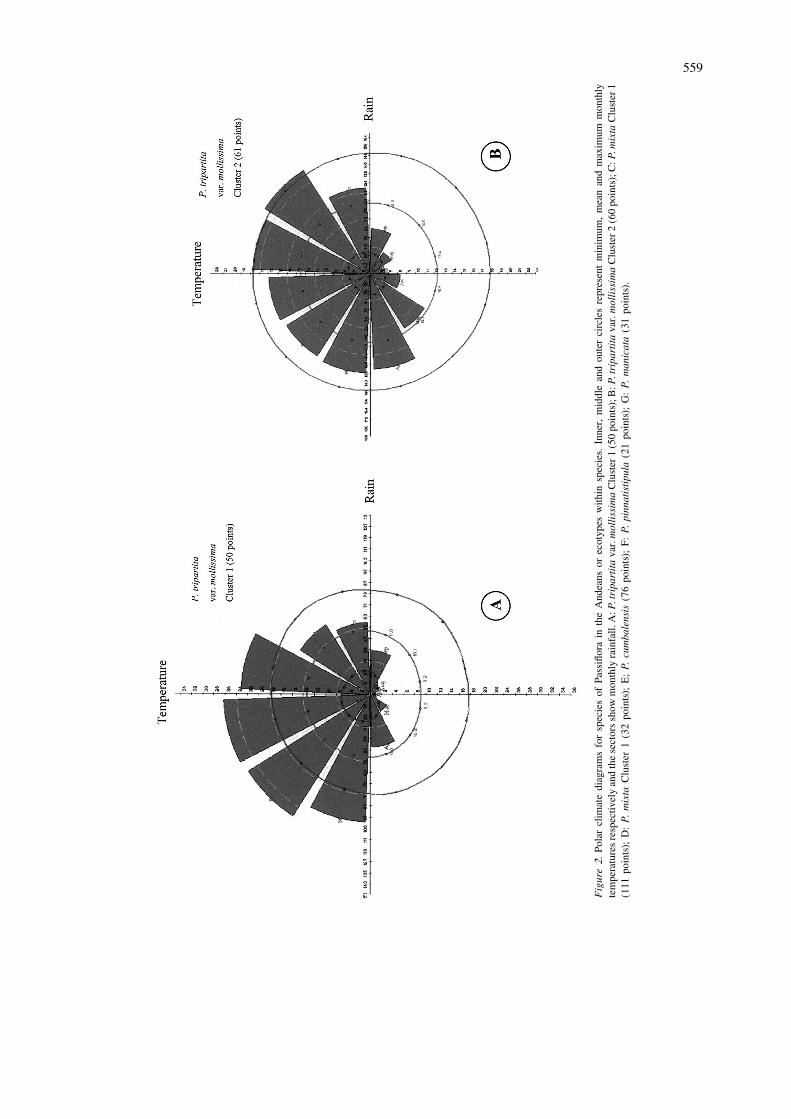
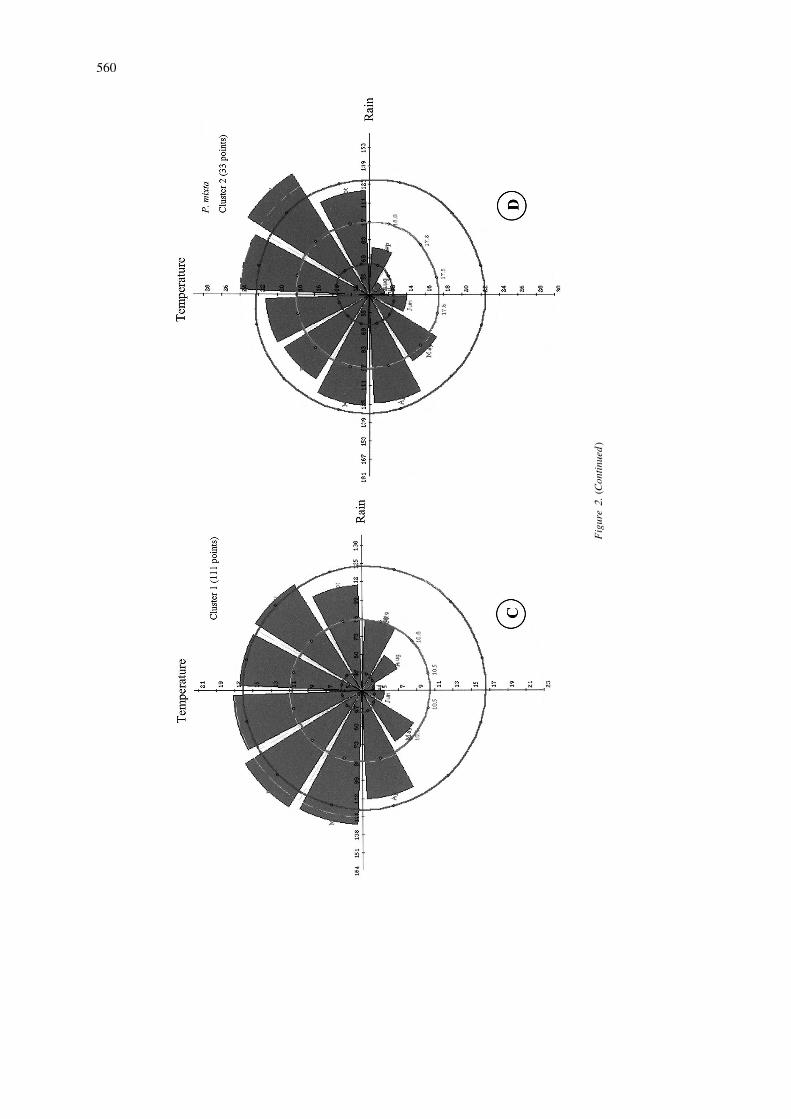
Figure2.
Polarclim
atediag
ramsforsp
eciesof
Passiflorain
theAnd
eans
orec
otyp
eswith
insp
ecies.
Inne
r,middlean
dou
tercirclesrepresen
tminim
um,mea
nan
dmax
imum
mon
thly
tempe
raturesresp
ectiv
elyan
dthesectorssh
owmon
thly
rainfall.
A:P
.tripartitava
r.mollissimaCluster
1(50po
ints);B:P
.tripartitava
r.mollissimaCluster
2(60po
ints);C:P
.mixta
Cluster
1(111
points);
D:P.
mixta
Cluster
1(32po
ints);
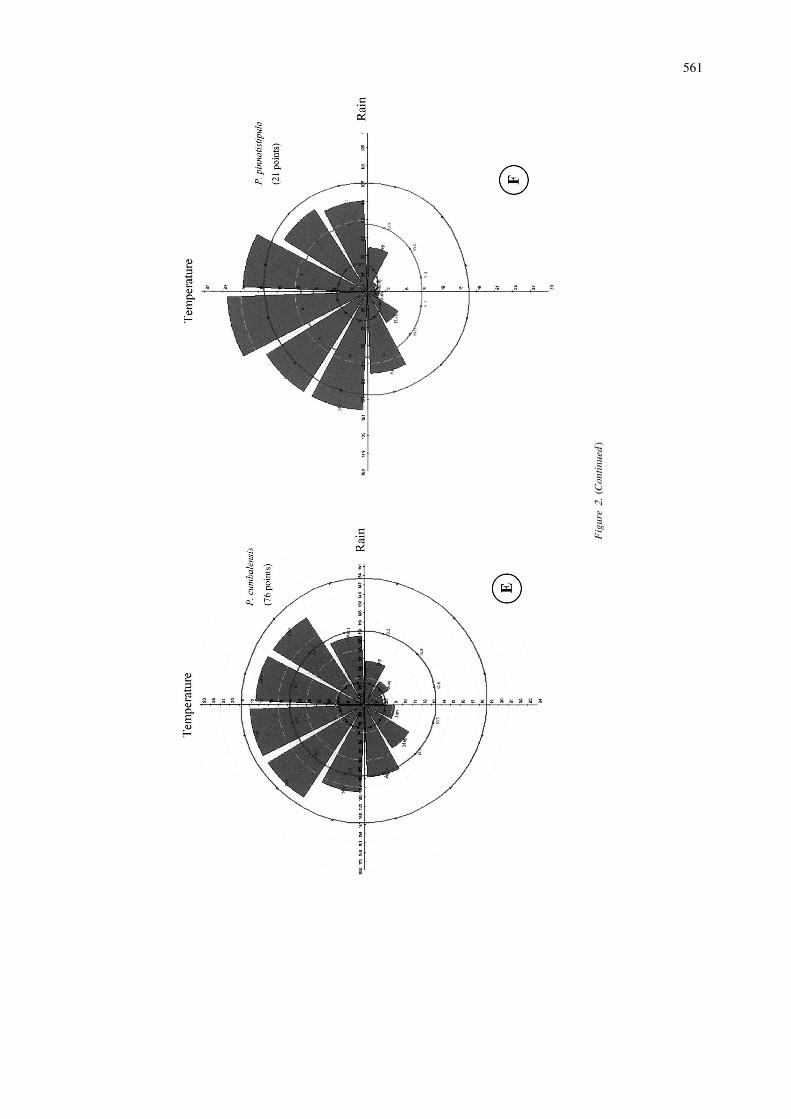
E;P.
cumbalensis
(76po
ints);
F:P.
pinnatistipula
(21po
ints);
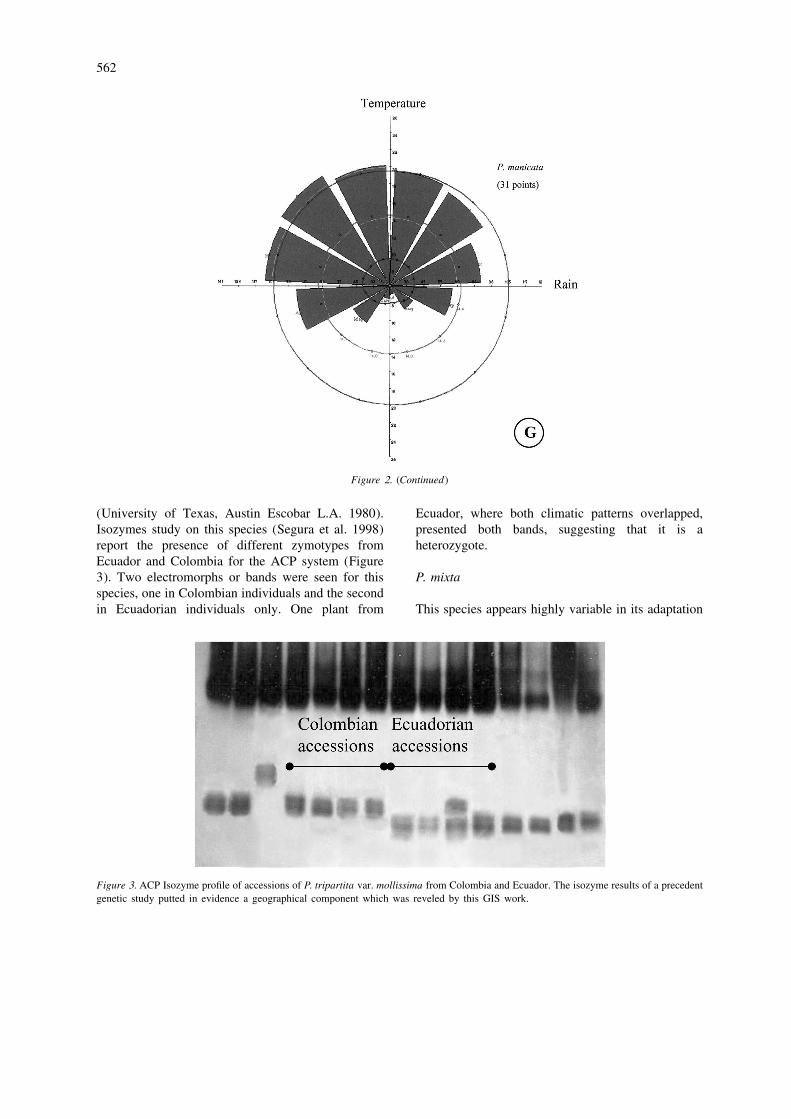
G:P.
manicata(31po
ints).
560
Figure2.
(Continued
)
561
Figure2.
(Continued
)
562
Figure 2. (Continued)
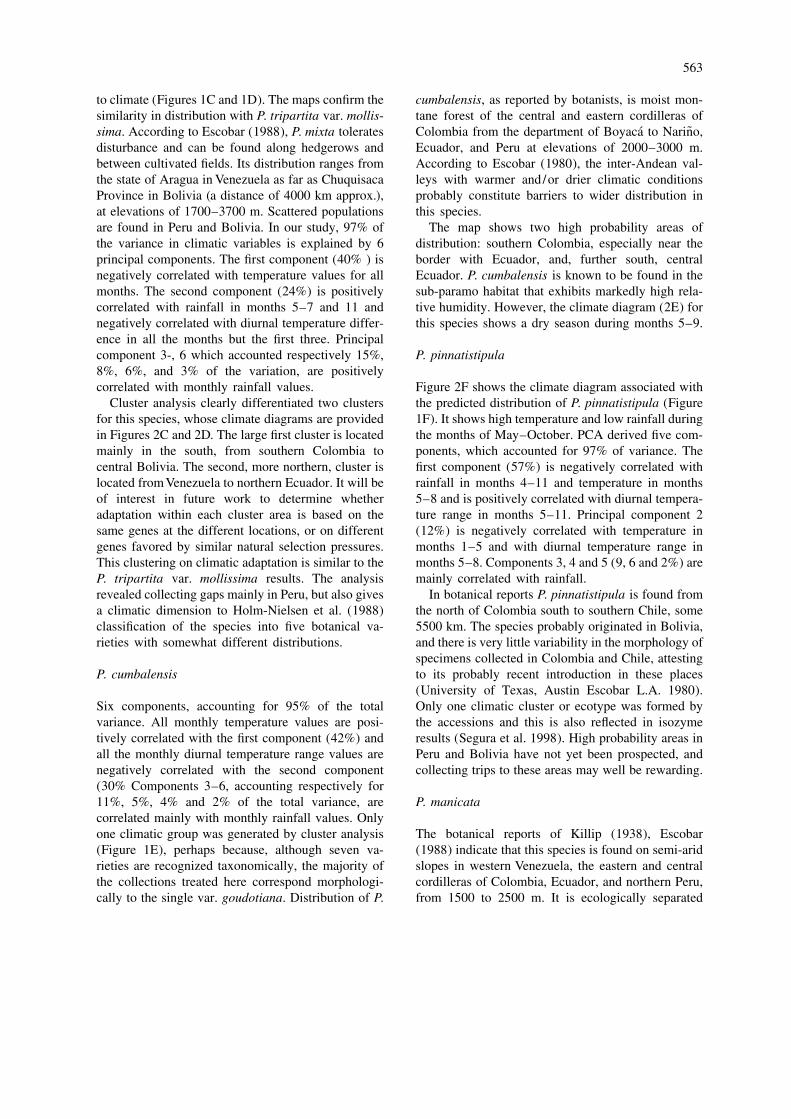
(University of Texas, Austin Escobar L.A. 1980). Ecuador, where both climatic patterns overlapped,Isozymes study on this species (Segura et al. 1998) presented both bands, suggesting that it is areport the presence of different zymotypes from heterozygote.Ecuador and Colombia for the ACP system (Figure3). Two electromorphs or bands were seen for this P. mixtaspecies, one in Colombian individuals and the secondin Ecuadorian individuals only. One plant from This species appears highly variable in its adaptation
Figure 3. ACP Isozyme profile of accessions of P. tripartita var. mollissima from Colombia and Ecuador. The isozyme results of a precedentgenetic study putted in evidence a geographical component which was reveled by this GIS work.
563
to climate (Figures 1C and 1D). The maps confirm the cumbalensis, as reported by botanists, is moist mon-similarity in distribution with P. tripartita var. mollis- tane forest of the central and eastern cordilleras of
˜´sima. According to Escobar (1988), P. mixta tolerates Colombia from the department of Boyaca to Narino,disturbance and can be found along hedgerows and Ecuador, and Peru at elevations of 2000–3000 m.between cultivated fields. Its distribution ranges from According to Escobar (1980), the inter-Andean val-the state of Aragua inVenezuela as far as Chuquisaca leys with warmer and/or drier climatic conditionsProvince in Bolivia (a distance of 4000 km approx.), probably constitute barriers to wider distribution inat elevations of 1700–3700 m. Scattered populations this species.are found in Peru and Bolivia. In our study, 97% of The map shows two high probability areas ofthe variance in climatic variables is explained by 6 distribution: southern Colombia, especially near theprincipal components. The first component (40% ) is border with Ecuador, and, further south, centralnegatively correlated with temperature values for all Ecuador. P. cumbalensis is known to be found in themonths. The second component (24%) is positively sub-paramo habitat that exhibits markedly high rela-correlated with rainfall in months 5–7 and 11 and tive humidity. However, the climate diagram (2E) fornegatively correlated with diurnal temperature differ- this species shows a dry season during months 5–9.ence in all the months but the first three. Principalcomponent 3-, 6 which accounted respectively 15%, P. pinnatistipula8%, 6%, and 3% of the variation, are positivelycorrelated with monthly rainfall values. Figure 2F shows the climate diagram associated with
Cluster analysis clearly differentiated two clusters the predicted distribution of P. pinnatistipula (Figurefor this species, whose climate diagrams are provided 1F). It shows high temperature and low rainfall duringin Figures 2C and 2D. The large first cluster is located the months of May–October. PCA derived five com-mainly in the south, from southern Colombia to ponents, which accounted for 97% of variance. Thecentral Bolivia. The second, more northern, cluster is first component (57%) is negatively correlated withlocated fromVenezuela to northern Ecuador. It will be rainfall in months 4–11 and temperature in monthsof interest in future work to determine whether 5–8 and is positively correlated with diurnal tempera-adaptation within each cluster area is based on the ture range in months 5–11. Principal component 2same genes at the different locations, or on different (12%) is negatively correlated with temperature ingenes favored by similar natural selection pressures. months 1–5 and with diurnal temperature range inThis clustering on climatic adaptation is similar to the months 5–8. Components 3, 4 and 5 (9, 6 and 2%) areP. tripartita var. mollissima results. The analysis mainly correlated with rainfall.revealed collecting gaps mainly in Peru, but also gives In botanical reports P. pinnatistipula is found froma climatic dimension to Holm-Nielsen et al. (1988) the north of Colombia south to southern Chile, someclassification of the species into five botanical va- 5500 km. The species probably originated in Bolivia,rieties with somewhat different distributions. and there is very little variability in the morphology of
specimens collected in Colombia and Chile, attestingP. cumbalensis to its probably recent introduction in these places
(University of Texas, Austin Escobar L.A. 1980).Six components, accounting for 95% of the total Only one climatic cluster or ecotype was formed byvariance. All monthly temperature values are posi- the accessions and this is also reflected in isozymetively correlated with the first component (42%) and results (Segura et al. 1998). High probability areas inall the monthly diurnal temperature range values are Peru and Bolivia have not yet been prospected, andnegatively correlated with the second component collecting trips to these areas may well be rewarding.(30% Components 3–6, accounting respectively for11%, 5%, 4% and 2% of the total variance, are P. manicatacorrelated mainly with monthly rainfall values. Onlyone climatic group was generated by cluster analysis The botanical reports of Killip (1938), Escobar(Figure 1E), perhaps because, although seven va- (1988) indicate that this species is found on semi-aridrieties are recognized taxonomically, the majority of slopes in western Venezuela, the eastern and centralthe collections treated here correspond morphologi- cordilleras of Colombia, Ecuador, and northern Peru,cally to the single var. goudotiana. Distribution of P. from 1500 to 2500 m. It is ecologically separated
564
from other species of subgenus Tacsonia because it is cal root, it appears that the differences among Passi-found at lower altitude and drier habitats. flora species and within-species clusters are mainly
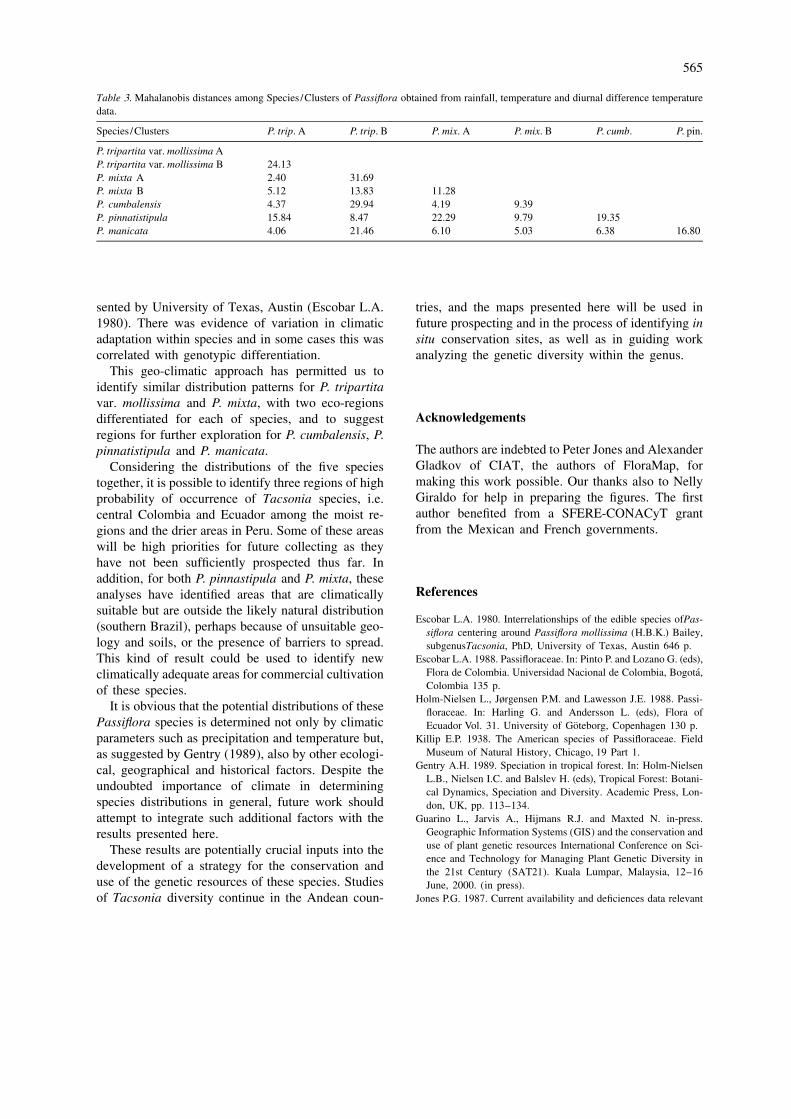
In our analysis, this species showed a narrow associated with diurnal temperature values in April–distribution, illustrated in Figure 1G. From the PCA, July, September, October and December. The rainfallthe first component (42%), is correlated with all data for March, May, August, September and par-monthly temperature values and the second compo- ticularly July are also associated with differencesnent (21%), is correlated negatively with most month- among species /clusters. Typically, regions near thely diurnal temperature range values. The third com- Equator present very small differences in diurnalponent (15%) is negatively correlated with rainfall in temperature ramge and pronounced rainfall duringmonths 4–7 and 9–11. Components 4, 5 and 6 (5, 4 July–September. In addition, the Mahalanobis dis-and 2%) are mainly correlated with rainfall. The tance values derived from the comparisons of species /climate diagram shows a dry season during May– clusters (Table 3), show large differences betweenAugust (Figure 2G). clusters A and B of P. tripartita var. mollissima. The
The potential distribution map presented in Figure A cluster of this species seems to be more related1G shows that the analysis has identified areas that are climatically to both clusters of P. mixta, and to P.climatically suitable for this species but have not been cumbalensis and P. manicata. The distance betweenprospected. We have confirmed the potential of this clusters A and B of P. mixta was also significant. P.approach by visiting Tenerife, a site in one such area pinnatistipula was strongly differentiated from thein southwestern Colombia where the species had not other species /clusters, mainly due to rainfall vari-been recorded, but was indeed present after all when ables.we looked for it. P. tripartita var. mollissima cluster A, P. mixta
cluster A and P. cumbalensis may according to theseanalyses be considered as a northern group of sympat-
Discriminant analysis ric taxa, and P. tripartita var. mollissima cluster B, P.mixta cluster B and P. pinnatistipula as a southern
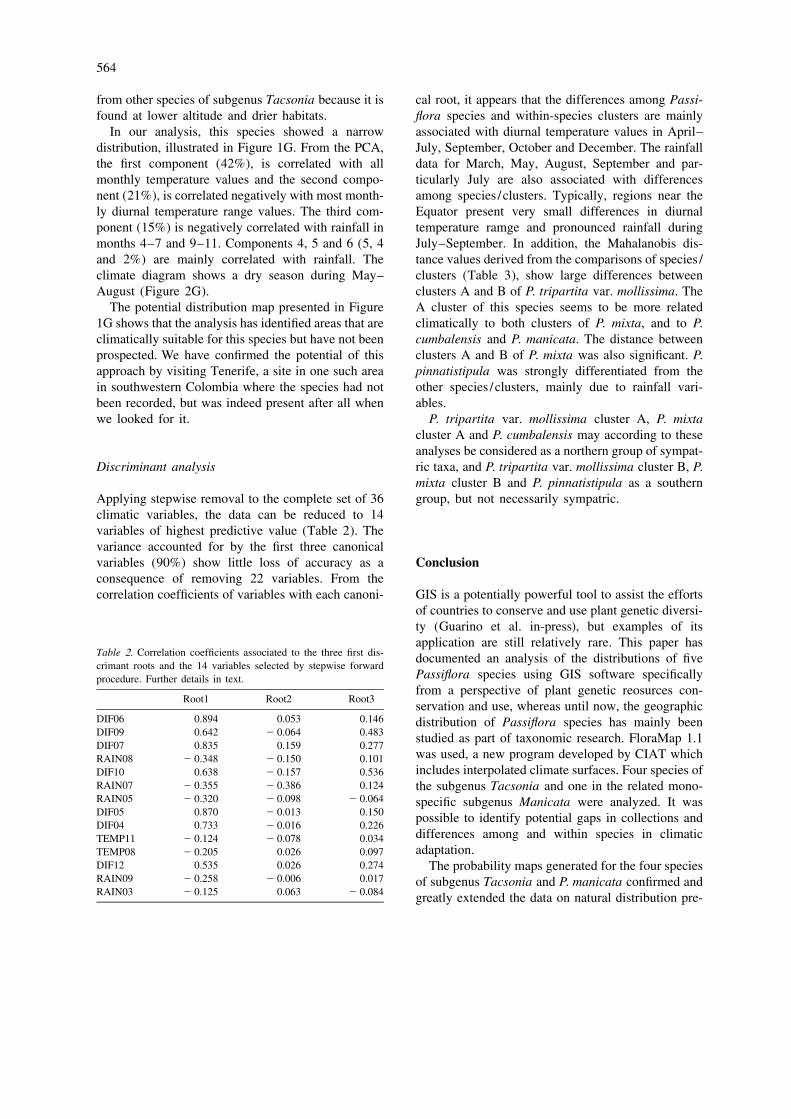
Applying stepwise removal to the complete set of 36 group, but not necessarily sympatric.climatic variables, the data can be reduced to 14variables of highest predictive value (Table 2). Thevariance accounted for by the first three canonicalvariables (90%) show little loss of accuracy as a Conclusionconsequence of removing 22 variables. From thecorrelation coefficients of variables with each canoni- GIS is a potentially powerful tool to assist the efforts
of countries to conserve and use plant genetic diversi-ty (Guarino et al. in-press), but examples of itsapplication are still relatively rare. This paper has
Table 2. Correlation coefficients associated to the three first dis- documented an analysis of the distributions of fivecrimant roots and the 14 variables selected by stepwise forward
Passiflora species using GIS software specificallyprocedure. Further details in text.from a perspective of plant genetic reosurces con-
Root1 Root2 Root3servation and use, whereas until now, the geographic
DIF06 0.894 0.053 0.146 distribution of Passiflora species has mainly beenDIF09 0.642 2 0.064 0.483 studied as part of taxonomic research. FloraMap 1.1DIF07 0.835 0.159 0.277
was used, a new program developed by CIAT whichRAIN08 2 0.348 2 0.150 0.101includes interpolated climate surfaces. Four species ofDIF10 0.638 2 0.157 0.536
RAIN07 2 0.355 2 0.386 0.124 the subgenus Tacsonia and one in the related mono-RAIN05 2 0.320 2 0.098 2 0.064 specific subgenus Manicata were analyzed. It wasDIF05 0.870 2 0.013 0.150 possible to identify potential gaps in collections andDIF04 0.733 2 0.016 0.226
differences among and within species in climaticTEMP11 2 0.124 2 0.078 0.034adaptation.TEMP08 2 0.205 0.026 0.097
DIF12 0.535 0.026 0.274 The probability maps generated for the four speciesRAIN09 2 0.258 2 0.006 0.017 of subgenus Tacsonia and P. manicata confirmed andRAIN03 2 0.125 0.063 2 0.084 greatly extended the data on natural distribution pre-
565
Table 3. Mahalanobis distances among Species /Clusters of Passiflora obtained from rainfall, temperature and diurnal difference temperaturedata.
Species /Clusters P. trip. A P. trip. B P. mix. A P. mix. B P. cumb. P. pin.
P. tripartita var. mollissima AP. tripartita var. mollissima B 24.13P. mixta A 2.40 31.69P. mixta B 5.12 13.83 11.28P. cumbalensis 4.37 29.94 4.19 9.39P. pinnatistipula 15.84 8.47 22.29 9.79 19.35P. manicata 4.06 21.46 6.10 5.03 6.38 16.80
sented by University of Texas, Austin (Escobar L.A. tries, and the maps presented here will be used in1980). There was evidence of variation in climatic future prospecting and in the process of identifying inadaptation within species and in some cases this was situ conservation sites, as well as in guiding workcorrelated with genotypic differentiation. analyzing the genetic diversity within the genus.
This geo-climatic approach has permitted us toidentify similar distribution patterns for P. tripartitavar. mollissima and P. mixta, with two eco-regions
Acknowledgementsdifferentiated for each of species, and to suggestregions for further exploration for P. cumbalensis, P.
The authors are indebted to Peter Jones and Alexanderpinnatistipula and P. manicata.Gladkov of CIAT, the authors of FloraMap, forConsidering the distributions of the five speciesmaking this work possible. Our thanks also to Nellytogether, it is possible to identify three regions of highGiraldo for help in preparing the figures. The firstprobability of occurrence of Tacsonia species, i.e.author benefited from a SFERE-CONACyT grantcentral Colombia and Ecuador among the moist re-from the Mexican and French governments.gions and the drier areas in Peru. Some of these areas
will be high priorities for future collecting as theyhave not been sufficiently prospected thus far. Inaddition, for both P. pinnastipula and P. mixta, these
Referencesanalyses have identified areas that are climaticallysuitable but are outside the likely natural distribution
Escobar L.A. 1980. Interrelationships of the edible species ofPas-(southern Brazil), perhaps because of unsuitable geo- siflora centering around Passiflora mollissima (H.B.K.) Bailey,logy and soils, or the presence of barriers to spread. subgenusTacsonia, PhD, University of Texas, Austin 646 p.This kind of result could be used to identify new Escobar L.A. 1988. Passifloraceae. In: Pinto P. and Lozano G. (eds),
´Flora de Colombia. Universidad Nacional de Colombia, Bogota,climatically adequate areas for commercial cultivationColombia 135 p.of these species.
Holm-Nielsen L., Jørgensen P.M. and Lawesson J.E. 1988. Passi-It is obvious that the potential distributions of these floraceae. In: Harling G. and Andersson L. (eds), Flora of
Passiflora species is determined not only by climatic ¨Ecuador Vol. 31. University of Goteborg, Copenhagen 130 p.parameters such as precipitation and temperature but, Killip E.P. 1938. The American species of Passifloraceae. Field
Museum of Natural History, Chicago, 19 Part 1.as suggested by Gentry (1989), also by other ecologi-Gentry A.H. 1989. Speciation in tropical forest. In: Holm-Nielsencal, geographical and historical factors. Despite the
L.B., Nielsen I.C. and Balslev H. (eds), Tropical Forest: Botani-undoubted importance of climate in determining cal Dynamics, Speciation and Diversity. Academic Press, Lon-species distributions in general, future work should don, UK, pp. 113–134.attempt to integrate such additional factors with the Guarino L., Jarvis A., Hijmans R.J. and Maxted N. in-press.
Geographic Information Systems (GIS) and the conservation andresults presented here.use of plant genetic resources International Conference on Sci-These results are potentially crucial inputs into theence and Technology for Managing Plant Genetic Diversity in
development of a strategy for the conservation and the 21st Century (SAT21). Kuala Lumpar, Malaysia, 12–16use of the genetic resources of these species. Studies June, 2000. (in press).of Tacsonia diversity continue in the Andean coun- Jones P.G. 1987. Current availability and deficiences data relevant
566
´to agroecological studies in the geographical area covered in Lopez L.E. 1997. Informe final del consultor sobre pasifloras.´ ´IARCS. In: Bunting A.H. (ed.), Agricultural enviroments: Cooperacion tecnica IPGRI-BID No. ATN/SF-44356-RG.
´characterization, classification and mapping. CAB International, IPGRI, Cali, Colombia, Diversidad, Conservacion y Uso Sosten-´ ´UK, pp. 69–82. ible de los Recursos Geneticos de Frutales Nativos de America
Jones P.G. 1991. The CIAT climate database version 3.41. Machine Tropical Mayo.´ ´readable database version 3.41. Centro Internacional de Agricul- Mazzani E., Gonzalez E., Perez D., Roa S., Tillet S., de Miranda et
´tura Tropical (CIAT), Cali, Colombia. M. et al. 1997. Recursos geneticos de Passiflora en Venezuela.´ ´ ´Jones P.G., Galwey N., Beebe S.E. and Tohme J. 1997. The use of Informe tecnico final. Cooperacion tecnica IPGRI-BID No.
geographical information systems in biodiversity exploration and ATN/SF-44356-RG. FONAIAP, Marzo, Venezuela, Diversidad,´ ´conservation. Biodivers. Conserv. 6: 947–958. Conservacion y Uso Sostenible de los Recursos Geneticos de
´Jones P.G. and Gladkov A. 1999. FloraMap: A computer tool for Frutales Nativos de America Tropical.predicting the distribution of plants and other organisms in the NOAA (National Oceanographical and Atmospheric Administra-wild; version 1. In: Jones L. (ed.), CIAT CD-Rom Series. Centro tion), Boulder, CO 1984. TGPO006 D. Computer compatibleInternacional de Agricultura Tropical (CIAT), Cali, Colombia. tape.
Lobo M. 1997. Informe final proyecto pasifloras CORPOICA. Segura S., Coppens d’Eeckenbrugge G. and Ollitrault P. 1998.´ ´Cooperacion tecnica IPGRI-BID No. ATN/SF-44356-RG., Di- Isozyme variation in five species of Passiflora subgenus Tac-
´versidad, Conservacion y Uso Sostenible de los Recursos Gen- sonia and Passiflora manicata. Proceedings of the Interamerican´ ´eticos de Frutales Nativos de America Tropical. Mayo. COR- Society for Tropical Horticulture. 42, pp. 260–266.POICA, Rionegro, Colombia.