
Mapping the elements of physical security towards the ...
276
Edith Cowan University Edith Cowan University Research Online Research Online Theses: Doctorates and Masters Theses 2007 Mapping the elements of physical security towards the creation of Mapping the elements of physical security towards the creation of a holistic physical security model a holistic physical security model Zachary J. Alach Edith Cowan University Follow this and additional works at: https://ro.ecu.edu.au/theses Part of the Environmental Design Commons Recommended Citation Recommended Citation Alach, Z. J. (2007). Mapping the elements of physical security towards the creation of a holistic physical security model. https://ro.ecu.edu.au/theses/1 This Thesis is posted at Research Online. https://ro.ecu.edu.au/theses/1
-
Upload
khangminh22 -
Category
Documents
-
view
2 -
download
0
Transcript of Mapping the elements of physical security towards the ...

Edith Cowan University Edith Cowan University
Research Online Research Online
Theses: Doctorates and Masters Theses
2007
Mapping the elements of physical security towards the creation of Mapping the elements of physical security towards the creation of
a holistic physical security model a holistic physical security model
Zachary J. Alach Edith Cowan University
Follow this and additional works at: https://ro.ecu.edu.au/theses
Part of the Environmental Design Commons
Recommended Citation Recommended Citation Alach, Z. J. (2007). Mapping the elements of physical security towards the creation of a holistic physical security model. https://ro.ecu.edu.au/theses/1
This Thesis is posted at Research Online. https://ro.ecu.edu.au/theses/1

Mapping the elements of physical security towards the
creation of a holistic physical security model
Zachary James Alach
BSc (Multidisciplinary Science) (Curtin University)
Faculty of Computing, Health and Science
School of Engineering and Mathematics
This thesis is presented for the degree of
Master of Science (Security Science)
at Edith Cowan University
May 2007

Edith Cowan University
Copyright Warning
You may print or download ONE copy of this document for the purpose
of your own research or study.
The University does not authorize you to copy, communicate or
otherwise make available electronically to any other person any
copyright material contained on this site.
You are reminded of the following:
Copyright owners are entitled to take legal action against persons who infringe their copyright.
A reproduction of material that is protected by copyright may be a
copyright infringement. Where the reproduction of such material is
done without attribution of authorship, with false attribution of
authorship or the authorship is treated in a derogatory manner,
this may be a breach of the author’s moral rights contained in Part
IX of the Copyright Act 1968 (Cth).
Courts have the power to impose a wide range of civil and criminal
sanctions for infringement of copyright, infringement of moral
rights and other offences under the Copyright Act 1968 (Cth).
Higher penalties may apply, and higher damages may be awarded,
for offences and infringements involving the conversion of material
into digital or electronic form.

USE OF THESIS
The Use of Thesis statement is not included in this version of the thesis.

iii
Abstract
This study has designed a theoretical mapping of complex element relationships within the field
of physical security. The main purpose of the mapping is to form individual knowledge
structures for modelling and provide a relative understanding of overall risk based on different
combinations of physical security arrangements. An understanding of overall risk for modelling
purposes should lead to improvements in providing support for decision making within this
field.
The final series of knowledge structures in this study have been represented by value matrices
for element pair assessments within the topic of physical security. The values that have been
presented in the knowledge matrices have been gathered from expert opinion and converted to
numerical data as a demonstration for a holistic approach to modelling physical security
elements. A profile for each respondent and each category group has been developed to be
compared for their degree of similarity with other profiles. A correlation technique provides an
indication of the degree of consensus within the results.
A single profile identified as the most appropriate standard of knowledge representing expert
opinion, provides the highest relative degree of consensus of expert opinion for the final eight
knowledge matrices. The hierarchical knowledge structures have each been set out as six by six
matrices. Universal elements have been ranked in relative order using dimensional scales to
provide a directional measure representing an overall benefit to security.
The research questionnaire was able to construct a semantic mapping of the universal elements
of the research by consideration of a hierarchy of relationships measured relative to each other
using selected units of time. The indicators for time have been presented in the questionnaire as
fuzzy incremental measures based on seconds, minutes, hours, days, weeks, months and years.
The time-based logarithmic scale value assessments of this research are able to be transformed
into values that enable further statistical application. The validity and reliability of the results
have been demonstrated for this research through the process of determining consensus using
correlation techniques.
A novel concept for modelling using mathematical tangent functions is presented in this study to
demonstrate the application of the knowledge matrices. An indication of overall effectiveness
for various physical security arrangements is able to be graphically interpreted considering the
concepts of delay probability, detection probability and response probability.
These concepts have been incorporated into the model structure and parameter values for the
model have been selected from the knowledge matrices of the research.

iv
The results of this research demonstrate that a conceptual mapping can be constructed within the
topic of physical security. The conceptual mapping reduces complexity within the knowledge
structure of physical security to assist decision making and has suggested techniques that may
produce similar success in other disciplines that exhibit high levels of complexity.
Keywords:
Conceptual mapping, physical security modelling, decision making, universal elements
hierarchical knowledge structures, consensus of expert opinion, semantic mapping.

v
DECLARATION
I certify that this thesis does not, to the best of my knowledge and belief:
i. incorporate without acknowledgement any material previously submitted for a
degree or diploma in any institution of higher education;
ii. contain any material previously published or written by another person except
where due reference is made in the text; or
iii. contain any defamatory material.
I also grant permission for the library at Edith Cowan University to make duplicate copies
of my thesis as required.

vi
Acknowledgements
I would like to express my thanks towards several people involved in the investigation that has
accompanied this research. My complete thanks go to Associate Professor Clif Smith who has
provided insightful advice and direction with patience and cheerful encouragement. Thanks go
to my family for providing a constant set of ears with the occasional input and all other methods
of invisible support. Other thanks go to Hazel and my work colleagues for their assistance and
input into the research. Special thanks go to Alf and Kris for their encouragement during the
more frustrating moments of being a student. I would also like to thank the staff at the PSDB for
providing valuable workplace experience and for the initial introduction to the topic.
My appreciation also goes out to the participants of this research who provided me with
valuable data.

vii
Table of Contents
1 Introduction .......................................................................................................................... 1 1.1 Background of Study ................................................................................................ 2 1.2 Research aims and objectives ................................................................................... 4 1.3 Scope of the research ................................................................................................ 5 1.4 Overview of the study considering assumptions and limitations.............................. 6
1.4.1 Events prior to the development of the research instrument..................................... 6 1.4.2 The main research instrument................................................................................... 8 1.4.3 Post distribution analysis and evaluations .............................................................. 11
1.5 Concluding remarks................................................................................................ 16 2 Literature Review ............................................................................................................... 17
2.1 Introduction to the literature review ....................................................................... 17 2.2 A method of inquiry................................................................................................ 18 2.3 Suspension of prior conceptions............................................................................. 22 2.4 Description of the phenomenon.............................................................................. 28 2.5 Determination of universal elements ...................................................................... 31 2.6 Apprehending of relationships................................................................................ 36 2.7 Attitudinal measurement......................................................................................... 37 2.8 Heuristics ................................................................................................................ 38 2.9 Concluding remarks................................................................................................ 40
3 Theoretical considerations.................................................................................................. 42 3.1 Introduction............................................................................................................. 42 3.2 Knowledge structures in physical security ............................................................. 42
3.2.1 Defence in depth and its functions.......................................................................... 43 3.2.2 Relational descriptors (action statements) .............................................................. 47 3.2.3 Concept continuums ............................................................................................... 48 3.2.4 Elements ................................................................................................................. 50
3.3 The Decision Matrix ............................................................................................... 51 3.4 Summary of theory ................................................................................................. 54
4 Research methodology ....................................................................................................... 55 4.1 Introduction............................................................................................................. 55 4.2 Philosophy of the instrument .................................................................................. 55 4.3 Developing the instrument through the research design......................................... 59 4.4 Population ............................................................................................................... 61
4.4.1 Group 1: Security Experts....................................................................................... 64 4.4.2 Group 2: Security Students ..................................................................................... 64 4.4.3 Group 3 Security Users........................................................................................... 64
4.5 The Pilot study........................................................................................................ 64 4.6 Interpretation of results of the pilot study............................................................... 67 4.7 Modification to the instrument ............................................................................... 68
4.7.1 The first question of each section considering complex value assessments ........... 69 4.7.2 The hierarchical structure of the universal elements .............................................. 72 4.7.3 The second through to the sixth question in each section....................................... 74
4.8 Reliability and Validity........................................................................................... 75 4.9 Concluding remarks................................................................................................ 78
5 Results ................................................................................................................................ 80 5.1 Introduction............................................................................................................. 80 5.2 Processing the raw data........................................................................................... 81
5.2.1 Processing of complex questions............................................................................ 82 5.2.2 Processing of non-complex questions..................................................................... 85
5.3 Analysis of the data ................................................................................................ 93 5.3.1 Stage 1: Creation of knowledge matrices ............................................................... 94 5.3.2 Stage 2: Determination of consensus...................................................................... 97
5.4 Concluding remarks.............................................................................................. 105 6 Interpretation and discussion of the results ...................................................................... 106
6.1 Introduction........................................................................................................... 106 6.2 Interpretations within the field of physical security ............................................. 107

viii
6.3 Conceptual mappings as a description of the phenomenon .................................. 109 6.4 A novel proposal for holistic modelling ............................................................... 116
6.4.1 Simple Model........................................................................................................ 118 6.4.1.1 Test Case 1: Worst Case Scenario .............................................................. 120 6.4.1.2 Test Case 2: Best Case Scenario................................................................. 121 6.4.1.3 Test Case 3: Medium – Strong Case Scenario............................................ 123 6.4.1.4 Test Case 4: Medium Case Scenario .......................................................... 124 6.4.1.5 Test Case 5: Medium – Weak Case Scenario ............................................. 125 6.4.1.6 Test Case 6: Medium Case Scenario II....................................................... 127 6.4.1.7 Test Case 7: Medium Case Scenario III ..................................................... 128
6.4.2 Extended Model.................................................................................................... 129 6.4.2.1 Test Case 8: Strong Attack – Strong Defence – Medium Response........... 132 6.4.2.2 Test Case 9: Strong Attack – Strong Defence – Medium Weak Response 133
6.4.3 The Extended Model summarised ........................................................................ 135 6.5 Interpretations outside of the field of physical security........................................ 137 6.6 Concluding remarks.............................................................................................. 139
7 Conclusion........................................................................................................................ 140 7.1 Overview of the study........................................................................................... 141 7.2 Research aims and objectives ............................................................................... 143
7.2.1 Determine a set of universal elements for physical security................................. 143 7.2.2 Create a tool that measures expert opinion as values to provide knowledge
structured data-sets for the universal element relationships of physical security
scenarios. .............................................................................................................. 145 7.2.3 Establish data matrices of elemental relationships representing a knowledge
structure. ............................................................................................................... 146 7.2.4 Determine that the knowledge structure is representative of common
knowledge by checking the degree of consensus to the data-sets among
participants............................................................................................................ 147 7.2.5 Present a method of modelling dissimilar conceptual entities for an overall
risk to physical security that acknowledges the functions of defence in depth
with appropriate theoretical considerations. ......................................................... 148 7.2.6 Identify future applications for this research and consider areas requiring
additional investigation......................................................................................... 148 7.3 Final summary ...................................................................................................... 149
References……………………………………………………………………......150
Appendices……………………………………………………………………….154

ix
List of Tables
Table 1.1 Limitations and assumptions prior to the research instrument...................................... 7
Table 1.2 Limitations and assumptions of the main research instrument ..................................... 9
Table 1.3 Limitations and assumption that were identified during the analysis and interpretation
of the results ....................................................................................................................... 13
Table 4.1 Number of respondents targeted and the number required ......................................... 63
Table 5.1 The Returned questionnaires summarised by group ................................................... 81
Table 5.2 Equivalence approximation values for qualitative time transformations .................... 84
Table 5.4: A summary of the sixth question of each of Sections A-H located within the
Appendices ......................................................................................................................... 86
Table 5.5 Section A, Sets 1-6 Element 1: Considering question 2a and 2b of the questionnaire 89
Table 5.6 Section A, Sets 1-6 Element 1: Considering question 4 of the questionnaire ............. 89
Table 5.7 Section A, Sets 1-6 Element 2: Considering question 3a and 3b of the questionnaire 90
Table 5.8 Section A, Sets 1-6 Element 2: Considering question 5 of the questionnaire ............. 90
Table 5.9 Section A: Considering question 6 of the questionnaire ............................................. 91
Table 5.10 Question 48 of the questionnaire............................................................................... 91
Table 5.11 Question 49 of the questionnaire............................................................................... 92
Table 5.12 Question 50 of the questionnaire............................................................................... 92
Table 5.13 Statistical indicators of combined values for Section A considering time based
relationship assessments between Element 1 and Element 2 for n=26 respondents........... 94
Table 5.14 A list showing the location of the knowledge matrices representing a conceptual
mapping for the research over the specified boundary conditions ..................................... 96
Table 5.15:A Relative relationship mapping (in ranked order) indicating the concept continuums
of force measured against strength for the action statement breaking (Section A). ........... 97
Table 5.16 Statistical mean values representing elemental relationships for the different groups
of respondents as standard profiles for Section A. ............................................................. 98
Table 5.17 An arbitrary rating scale for the correlation-consensus relationship......................... 99
Table 5.18 Group standard profiles correlated against each other over the list of 288 statistical
means representing combined value assessments............................................................... 99
Table 5.19 Group standard profiles correlated against each other over the list of 288 statistical
medians representing combined value assessments.......................................................... 100
Table 5.20 Group standard profiles correlated against each other over the list of 288 statistical
mode representing combined value assessments .............................................................. 101
Table 5.21 The standard profile for all respondents as the composite group over 288 values
against individual respondents presented as a summary by group ................................... 101
Table 5.22 The standard profile considering the group Security Experts (SE) over 288 values
against individual respondents presented as a summary by group ................................... 102

x
Table 5.23 The standard profile considering the group Security Students (SS) over 288 values
against individual respondents presented as a summary by group ................................... 103
Table 5.24 The standard considering the group Security Users (SU) over 288 values against. 104
individual respondents presented as a summary by group ........................................................ 104

xi
List of Figures
Figure 2.1 The “magic triangle” of research (Vallaster & Koll, 2002) ....................................... 17
Figure 3.1 A general decision matrix .......................................................................................... 52
Figure 4.1 Methodology identifying stages and testing methods of the research ....................... 60
Figure 4.2 Detection terminology showing element level hierarchy........................................... 72
Figure 4.3 Delay terminology showing element level hierarchy................................................. 73
Figure 4.4 Response terminology showing element level hierarchy........................................... 73
Figure 6.1: Conceptual diagram for delay probability and detection probability ..................... 108
Figure 6.2: Conceptual diagram for delay probability and detection probability ..................... 110
Figure 6.3: Conceptual diagram for delay probability and detection probability ..................... 111
Figure 6.4: Conceptual diagram for delay probability and detection probability ..................... 112
Figure 6.5: Conceptual diagram for delay probability and detection probability ..................... 113
Figure 6.6: Conceptual diagram for delay probability and detection probability ..................... 114
Figure 6.7: Conceptual diagram for delay probability and detection probability ..................... 115
Figure 6.8: A representative family of tangent curves .............................................................. 116
Figure 6.9: A model for the representation of the effectiveness of physical security using tangent
functions ........................................................................................................................... 119
Figure 6.10 Test Case 1: A conceptual map for demonstrating worst case scenario effectiveness
of physical security........................................................................................................... 121
Figure 6.11 Test Case 2: A conceptual map for demonstrating best case scenario effectiveness
of physical security........................................................................................................... 122
Figure 6.12 Test Case 3: A conceptual map for demonstrating medium – strong case scenario
effectiveness of physical security ..................................................................................... 123
Figure 6.13 Test Case 4: A conceptual map for demonstrating medium case scenario
effectiveness of physical security ..................................................................................... 125
Figure 6.14 Test Case 5: A conceptual map for demonstrating medium – weak case scenario
effectiveness of physical security ..................................................................................... 126
Figure 6.15 Test Case 6: A conceptual map for demonstrating medium case scenario
effectiveness of physical security ..................................................................................... 127
Figure 6.16 Test Case 7: A conceptual map for demonstrating medium case scenario
effectiveness of physical security ..................................................................................... 129
Figure 6.17 An extended model for the representation of the effectiveness of physical security
using tangent functions..................................................................................................... 131
Figure 6.18 Test Case 8: A conceptual map demonstrating effectiveness of physical security 133
Figure 6.19 Test Case 9: A conceptual map demonstrating effectiveness of physical security 134

1
1 Introduction
The introduction to this research places an emphasis on the descriptive nature of the title.
The title Mapping elements of physical security towards the creation of a holistic physical
security model suggests that by forming a conceptual mapping, elements of physical security
terminology may be linked into a structure for holistic modelling. This research will
demonstrate an investigative approach to determine element hierarchies by mapping element
relationships to numerical values. The sense of connection from the theoretical to the physical
world is maintained throughout this study with the research data based on the assessments and
opinions of practitioners knowledgeable in the field of physical security.
This study delivers its objectives as a series of knowledge structures represented by value
matrices that when combined together, identify a conceptual mapping of the elements of
physical security. The values that have been determined within the final knowledge matrices
have been gathered from expert opinion to provide a holistic approach in modelling the
complexity of physical security element relationship. Profiles of value (opinion) have been
created across a range of respondents with each individual profile containing assessment values
for 288 element pair relationships. Statistical analysis has enabled the approximation of a single
standard profile representing a combined knowledge structure. For each category group profile
within the research, similarity comparisons with other category groups using a correlation
technique have successfully established that a high degree of consensus is evident in the results.
This study has been able to determine its results through the construction of a theoretical
framework originating from various disciplines and by using an unusual investigative technique
to identify a suitable approach to the data requirements. The method of inquiry chosen for this
research was originally suggested in the text of Green et al. (1997) and is unusual in that the
method does not seek to provide a set of hypotheses for the research to prove, but instead
recommends an investigative approach to understanding a phenomenon through determining
element relationships. The method of inquiry identified was phenomenology.
Throughout this research the main terminology appropriate to the umbrella-like collective
termed physical security will be called “elements”. The specific elements identified in this study
will be designated as universal elements. For the purpose of this study, italics will be applied to
the majority of the important hierarchical terms associated with universal elements under the
umbrella-like collective of physical security. The term “physical security” for the purposes of
this study shall include all component elements that could be considered for the physical
environment surrounding an asset that preserves the ongoing integrity and security of the asset.
Physical security is an important concept within the discipline of security science.

2
The theoretical framework within the research was able to integrate the terminology that is often
associated with modern security technology within the structure of knowledge and existing
concepts of physical security such as defence in depth. A research questionnaire was developed
based on this theoretical framework to collect expert opinion from respondents as value
assessments representing the relationships of universal element pairs. The knowledge matrices
that represent the final conceptual mapping were designed to be similar to the decision theory
matrices of Giere (1991) and were able to arrange value assessments from all sections of the
questionnaire into a linked knowledge structure representing a conceptual mapping.
In order to determine the reliability and validity of the results, a method for profile comparison
has provided an indication of the degree of overall consensus using the combined assessments
of different respondent groups. The results for this research have indicated that the values within
the final knowledge matrices are able to be independently supported by the different groups of
the study to a high degree of consensus. The study has also proposed a novel interpretation for
modelling of the values in the knowledge matrices, using an adaptation of the well known
trigonometric tangent function to assess effectiveness between dissimilar conceptual entities.
This chapter considers the background of the study, the research aims and objectives, the scope,
and an overview of the study including a summary of limitations and assumptions. Chapter 2
considers the literature relevant to the research instrument and the method of inquiry chosen for
the research. Chapter 3 looks at the theoretical considerations to support the framework of
hierarchical mapping for the elements. Chapter 4 looks at the methodology of the research
instrument based on results from the pilot study and considers the research instrument’s
philosophy, development, validity and reliability. Chapter 5 looks at the collected data and
provides an analysis of the data in terms of the objectives of the study. Chapter 6 considers a
novel interpretation for modelling dissimilar conceptual entities and discusses an application of
results from this study. Chapter 7 concludes the research with a summary of the study objectives
and provides some recommendations for future work.
1.1 Background of Study
The physical security of any facility comprises many components that may work together to
provide the desired outcome of a secure environment. Components of physical security can
usually be described as functions of the security concept “defence in depth” in terms of their
ability to delay, detect, or respond (Garcia, 2001). The process of documenting the minimum
requirement for physical security combinations in a risk environment is labour intensive.
Thus any set of deliberations involved in obtaining an optimum solution for physical security
might typically involve several security risk assessments by experts or consultants in the
industry and will be by nature subjective.

3
The concept of scientific modelling in physical security has been previously considered in
literature. A relevant example of this considers the physical security requirements of prisons in
the United Kingdom through the procurement process (Lindfield & Rodger, 1992), with the
consideration of a computer-based simulation model developed for this area to quantitatively
compare different scenarios (Tarr, 1992). Further investigation into this same area has identified
standard policy-based guidelines for the construction of physical perimeters at selected
facilities; however variations in the environment and specific conditions at each facility cause
this approach to be problematic (Tarr, 1994). A hierarchical example of scientific modelling has
used decision tree-tools for detection systems (Peck & Trachier, 2004) and has attempted to
produce structured guidance in a process that requires complex parameter considerations.
Ideally modelling of physical security terminology requires that for any given arrangement of
physical security components, the relative properties of delay, detection and response would
combine to produce an overall relative risk value for each arrangement. A comparison of
relative risk values made within a single facility or over a range of facilities could support
decision making in the procurement process. If this process were available through modelling,
then the labour intensive approach that currently requires subjective human judgement on a case
by case basis would be complimented by computer aided decision support and in certain
situations could be replaced by computer aided decision making.
A consideration of the issues associated with developing a suitable model should first be
addressed with the nature of the primary problem to the model identified. This problem can be
identified as the reality that any human adversary may defeat an arrangement of physical
security components in a real-life scenario. In a worst-case scenario an adversary defeats the
physical security to obtain unrestricted access to an asset and presents a major risk to a facility.
The basis for effectiveness of physical security components in this regard may be typically
expressed as either probability of success or probability of failure. Further to this concept, an
assessment of physical security may be regarded as either relatively suitable or unsuitable.
Assessing the human factor in regard to modelling physical security is often expressed in terms
of motivation. When the range of potential human attack actions is considered, the exhaustive
availability of tools and technology to defeat physical security must also be considered.
Such complex permutations suggest a large (if not infinite) number of non-specific relationship
potentials leading to a vast range of probabilities of success or failure. Any model that attempted
to determine the effectiveness of an arrangement of physical security components would need to
consider the entire spectrum of available attack methods (ranging from a simple hammer,
to a ladder, to explosive devices) to be applicable in the real world.

4
Another area of conceptual uncertainty surrounding physical security terminology is that there is
often no physical means to measure properties of the components. An example is detection
sensitivity where a facility with harsher weather conditions may have a relatively poor
performance in detection, while another facility with the same detection system may perform
much better. The properties to determine the different types of harsh weather environments are
complex and may include relative items such as rain, frost, heat and these may interact at
various times of year. Thus without an adequate standard of measurement for each individual
component, the properties of physical security arrangements cannot easily be compared.
The primary limitations for computational modelling exist as identifying the boundaries of the
input data requirements for any quantitative approach to decision making. The list of elemental
components in any facility may be very large, and as more elements are introduced into a
model, the degree of variation expands proportionately to the number of element relationships.
The additional consideration for human interaction introduces major complexities that an input-
based computational modelling system is unable to accommodate. Thus modelling is currently
best suited to determine a relative risk value from an arrangement of predetermined physical
security components. Where a set of universal elements can represent the relative effectiveness
of a given arrangement of physical security, the process of modelling may achieve consistent
decision analysis across complex arrangements.
The proposal for this research suggests that knowledge of physical security elements may be
captured through the hierarchical consideration of expert opinion and that this will be able to
reduce the complexity of physical security assessments. This research suggests a process that is
able to reduce the complexity of a physical security scenario by determining an order of relative
risk arrangements of physical security universal elements components. The research
demonstrates that a reasonable consensus level can be identified in modelling physical security
by relative ordering.
1.2 Research aims and objectives
Research Aim: Through an investigative method provide a relationship map that determines
universal element relationships of physical security terminology and then attempt to construct a
hierarchical structure of the topic in order to capture holistic considerations for modelling and
decision making in the presence of large uncertainty.
The requirement for relational data in this study suggested the most appropriate and holistic
information source would exist within the experience and knowledge of practitioners in the field
of physical security. The process to relate data elements required a means for measurement

5
along ordered universal element relationship spectra. A suitable outcome of this study would
identify an overall consensus in values mapped into knowledge matrices. For modelling of
physical security arrangements to provide support in decision making, a strong connection to a
consensus viewpoint is important. Thus in considering the need to determine consensus, the
study outcome needed to ensure validity and reliability in its relational data.
The requirements for the research have been summarised as the following objectives:
• Determine a set of universal elements for physical security.
• Create a tool that measures expert opinion as a measure of effectiveness to provide
knowledge structures of data-sets for the universal element relationships in physical security
scenarios.
• Establish data matrices for elemental relationship knowledge structures in ordered format so
that relative effectiveness of physical security combinations can be determined.
• Determine that the knowledge structure is representative of common knowledge by
checking the validity and reliability of results as a degree of consensus among participants.
• Present a method for modelling dissimilar conceptual entities for an overall risk to physical
security (using the knowledge matrices) that acknowledges the functions of defence in depth
with appropriate theoretical considerations.
• Identify additional applications for this research both in the field of physical security and
other disciplines.
1.3 Scope of the research
The scope of this study was recognised as being strongly linked to the design of the knowledge
structures that enabled modelling of physical security terminology from expert data-sets. As this
study has proposed a method of inquiry that considers an investigative process, it is bound in its
scope by the absolute number of elements that may be chosen to represent physical security and
by the complexities of these elements. The investigative method was proposed to consider
universal elements for data purposes that adequately represented knowledge and established a
consensus viewpoint. Thus the scope of the methodology needed to establish a theoretical
framework that was able to distil a large amount of terminology into a tactical number of
universal elements that could represent the broader set of elements. The framework also needed
to be broadly based to enable techniques to ideally be transferable at a subject level.
The universal elements chosen for the study enable a complete framework for achieving the
required degree of consensus. The research literature provides an appropriate theoretical
background with a combination of ideas from various disciplines. The scope of the research
requires a consensus viewpoint for the data collection and analysis to be bounded by the
universal element links. The analysis of elemental relationships has therefore been effectively

6
restricted by the hierarchical structure presented in the theoretical framework and by the
boundary conditions that have been established in the development of the research
questionnaire.
This study has been influenced by the Delphi technique and to be true to this technique, the
research would ideally contain a series of iterations to refine its data assessments.
Where the research questionnaire considers comments from experts, these would ideally feed
back into the research instruments to be reiteratively examined by experts. Such a process is
beyond the scope of this thesis; however a single iteration of the technique using the established
research questionnaire has provided data-sets that can be used to model dissimilar conceptual
entities. Therefore the scope of this study also seeks to establish a single process that can be
representative of an iterative process.
1.4 Overview of the study considering assumptions and
limitations
This section gives an overview of the study that particularly considers the assumptions and
limitations that were identified in the initial proposal for the research and the pilot study.
It is important to recognise these in order to interpret the validity of the knowledge structure.
This research has considered an unusual method of inquiry and must consider each assumption
in order to progress with theoretical correctness. Assumptions are recognised as potential causes
for weakness in research and in order to provide support for the results of this study, this section
has considered three significant time-frames of the research with the main limitations and
assumptions recognised in each.
• Events prior to the development of the research instrument
• The main research instrument
• Post distribution analysis and evaluations
Discussion on these areas provides some mention for improvements to the research. For each of
the three sections, each limitation represents a potential for weakness in the study and a
corresponding assumption has enabled the research to progress acknowledging the limitation.
1.4.1 Events prior to the development of the research instrument
The pilot study determined that a research questionnaire would be the primary source of data for
the study and therefore the planning involved in its creation needed to be carefully considered to
maximise the usefulness of all information collected. The choice of method of inquiry was
recognised as most important to this research in order to achieve the most holistic approach to
the topic. The method of inquiry identified as the most appropriate was phenomenology and this

7
method has required that the universal elements of the study be determined and that the
corresponding elemental relationships be apprehended (Smart, 1976).
The research proposal suggested that the most appropriate method of data collection would be to
obtain expert opinion either through in-depth interviews or through the use of questionnaires.
Table 1.1 lists the limitation and assumptions identified prior to the development of the research
instrument.
Table 1.1 Limitations and assumptions prior to the research instrument
Limitations Assumptions
The best method of inquiry to provide the platform for holistic modelling appears to be one that requires the study to: suspend prior conceptions, provide a description of the phenomenon, determine the universal elements, and apprehend the element relationships (Smart, 1976).
Phenomenology or phenomenological sociology is appropriate for the study’s method of inquiry.
The likelihood exists that the set of universal elements (quantities) that this study is seeking to determine may be an infinite series of combinations and permutations of physical security terminology.
A finite set of universal elements exists such that consensus of expert opinion can agree that such as set is representative of a physical security standard.
The likelihood exists that the set of universal elements (qualities) that this study is seeking to determine, may be an infinite series of semantic interpretations of relationships in physical security terminology.
A finite set of universal elements exists such that consensus of expert opinion can agree that such as set is representative of a physical security standard.
As the number of universal elements and elemental relationships is expanded, the complexity in using quantitative methods of assessment is increased. The ability for computational methods to consider all potential influences existing in elemental relationships for latent variables in an unrestricted environment is greatly reduced.
Expert opinion can provide indications for universal element relationships by incorporating human techniques of generalisation, heuristic recall, and simulating overall benefit in physical security without specific details being available for each single elemental relationship.
Expert opinion may only be able to provide a limited input for data over a particular area of interest for the purpose of this research.
Questionnaires provide the best research instrument for capturing expert opinion over a large number of element relationships. Expert opinion targeted towards the most important concepts will optimise respondent’s representation of knowledge.
The length of the questionnaire and its complex nature directly influences the number of respondents that will be inclined to complete questionnaires. The three groups that the study sought to target could provide varying levels of expertise in physical security knowledge relative to their level of instruction and experience. These groups will provide the foundation on which all interpretations of the research will be made.
Expert opinion collected from three categories: Security Experts, Security Students, and Security Users, will provide a broad semantic interpretation of the universal elements of the research. These categories can be considered separately and together to provide a wide range of expertise and validate consensus.
…continued

8
The quality of expertise is subjective. Consensus already exists in our language structure in the form of common knowledge and therefore the research validity can be demonstrated as shared common knowledge, even with low numbers of respondents divided into subjective groups.
1.4.2 The main research instrument
After the study had identified that a single instrument would provide the primary source of data
for the research, the main research questionnaire was developed. The content and structure of
the questionnaire was considered through an investigative selection of the universal elements of
the study in accordance with recognised sources in the literature. The questionnaire was
developed as a tool for measuring the relationships of elements of the study. The questionnaire
also provided a mechanism for self-assessment of its techniques and to identify issues that may
require comment for the purpose of iterative adjustment.
The set of universal elements that were listed in the questionnaire were used in a manner so that
they each represented arbitrary reference points over a continuum of measurement along a scale.
In this way all listed elements could be considered universal elements in that they represented
other elements that could be located with theoretical proximity on the scales. The universal
elements were arranged in a proposed relative order (ordered by concept) on the questionnaire in
a process where defensive-type elements were paired against attacking-type elements to enable
relationship determinations. Those who responded to the questionnaires were able to make
value-based time judgements on the element pair relations in a bounded framework. Each value
suggested an indication for overall benefit to security relative to its scaled position.
Where different concept scales consider the same universal elements, it is appropriate to
hierarchically conceptualise each scale in an orthogonal-type relationship. The notion of
“orthogonal” for interrelating concept continuums is briefly considered for clarification.
In mathematics, orthogonal is synonymous with perpendicular when used as a simple
adjective that is not part of any longer phrase with a standard definition. It means at
right angles (Wikipedia, 2006).
The questionnaire was able to consider universal elements bound by a hierarchical structure of
these elements within their respective functions of defence in depth. This hierarchical
framework was determined by considering various concept continuums and relational
descriptors (action statements) relative to each of the functions of defence in depth.
The hierarchy that was established provided the scope for the research in a simple structure of
relationships relative to a theoretical point of reference.

9
Although expert opinion is inevitably subjective in nature, the collection of many opinions
toward a standard consensus of opinion, suggests that each component expert opinion is valid.
The questionnaire provides a tool for collecting deviation of opinion, while consensus and
validity can be aided by the creation of standards based on common understanding of the topic.
The questionnaire attempts to capture the instinct of each respondent with element relationship
values each representing a subjective and generalised case from the limited data available for
each boundary condition presented to the respondents.
The notion of a consensus is important to clarify in this introduction in order to better
understand when degrees of consensus can be achieved. A clear understanding of the term
provides direction upon which mathematical representations may demonstrate the measures of
various degrees of consensus.
Consensus has two common meanings. One is a general agreement among the
members of a given group or community. The other is as a theory and practice of
getting such agreements (Wikipedia, 2006).
The questionnaire was distributed to respondents through the mail and the returned information
was compiled for analysis. Table 1.2 considers the limitations and assumptions that were
identified during development of the main research instrument.
Table 1.2 Limitations and assumptions of the main research instrument
Limitations Assumptions
There were 60 universal elements presented in the questionnaire in total. They consisted of 30 representing the defensive components of security (defence in depth) and 30 representing various types of attack on physical security.
A valid set of universal elements has been determined for the research and a consensus of expert opinion agrees that these elements are able to define a region on a scale representing a continuum of a security concept.
The universal elements that have been presented in the questionnaire may be semantically ambiguous in their conception to varying degrees although an answer guide has provided general definitions for the research purposes. For the majority of the universal elements specific information for each has not been stated e.g. dimensions and defining qualities.
Expert opinion can provide relative value for universal element relationships by incorporating human techniques of generalisation, heuristic recall, and simulation for assessing levels of benefit to overall physical security without specific details being available for each elemental relationship.
The ranked order of universal elements may provide relative points on a continuum for a security concept, however the order originally presented in the questionnaire is open to debate. The number of elements defining each region for each continuum in the questionnaire has been set to 6 to permit the continuum to be divided into quintiles.
Consensus of expert opinion can demonstrate that ranked elements are representative of a security concept continuum and expert opinion able to better determine the approximate order of elements in relative terms. The continuum runs as a scale from a higher level of conceptual benefit in one direction through to a lower level of benefit in the other direction.
…continued

10
Limitations Assumptions
The hierarchical semantic relationships for the questionnaire are complex and incomplete. A total of only 10 different concept continuums exist in the questionnaire and these have been orthogonally paired over 8 action statements (verbs) describing physical security interactions. Each of the 8 action statements have been hierarchically positioned directly beneath the functions of defence in depth which in turn sit under the topic of physical security.
The common understanding mapped out by the semantic hierarchical path in this study is arbitrary yet valid. It is based on a theoretical platform from literature and is based on logical semantic associations identified in the pilot study.
Theory suggests that the conceptual mapping of physical security elements has n-dimensions and yet this research only considers 10 concept continuums in the questionnaire.
The 10 concept continuums of the questionnaire provide a representative structure of an ideal conceptual mapping of physical security. The demonstration for consensus fulfils the purpose of the research objectives. It is not within the scope of the study to evaluate all n-dimensions of the conceptual mapping; however future work in this area may attempt a broader mapping of the topic.
The 8 action statements chosen for this study as boundary conditions restrict the element interactions to a single framework. Indications from respondents will be strongly dependent on the wording of each question in the questionnaire and their satisfaction with the semantic hierarchy of physical security terms.
The common understanding mapped out by the semantic hierarchical path in this study is arbitrary yet valid. It is based on a theoretical platform from literature and is based on logical semantic associations identified in the pilot study.
The elemental pair relationships can only be assessed with respect to a single action statement at any point in time without adding unnecessary complexity to the assessment. The assessment can be considered for value in relative directional terms based on a higher overall benefit to physical security in one direction and a lower overall benefit in the other direction. Some ambiguity will exist in the concept of overall benefit as opinion cannot consider all of the possible factors. Respondents must use experience or knowledge to provide either a best case approximation, worst case approximation, or mid case approximation to use in their value assessment.
Expert opinion can provide relative value for universal element relationships by incorporating human techniques of generalisation, heuristic recall, and simulation for assessing levels of benefit to overall physical security without specific details being available for each elemental relationship. The “instinct” of the respondent will provide the most appropriate answer in all cases.
…continued

11
Limitations Assumptions
The tool for measurement in all assessments of value in elemental interactions is with the use of the exponential scaling of time. The divisions of the time scale are constant across all questions with the use of relative semantic time indicators. Each question provides a scale where a designated time value will provide some relative value of overall benefit to physical security. There is an inherent ambiguity acknowledged with the respondent able to indicate by this method both: actual time (as determined by the respondent’s best estimation), or alternatively a relative indication of preference against other listed element interactions. The available time choices are non-specific (fuzzy) to cope with each respondent’s general case approximations. For example, a response with the assessment of the term hours does not specify whether two hours or twenty three hours is more appropriate. The fuzziness permits the semantic range of this term to be valid.
The “instinct” of the respondent will provide the most appropriate answer in all cases. The fuzzy time indications listed in the questionnaire provide deliberate ambiguity to cope with respondent’s best general case approximation and value assessment to each question. Each question requiring a value measurement assessing time is detailed in the questionnaire in the Sections A-H.
It is expected that all respondents will have some degree of expert knowledge and are able to simulate an assessment based on general knowledge, common sense, or instinct in providing their assessment.
The “instinct” of the respondent will provide the most appropriate answer in all cases.
Respondents are requested to provide any additional comments, suggestions, or concerns in the questionnaire. This requires that they have a reasonable interest to assist in the research and provide information freely to improve knowledge structures in this topic area.
The “instinct” of the respondent will provide the most appropriate answer in all cases. Comments and critiques are able to strengthen the case for consensus. Comments about the method can be incorporated into future instruments in an iterative Delphi-type process. Respondent’s comments are able to critique the method that has been used for the research instrument.
1.4.3 Post distribution analysis and evaluations
The transformation of each questionnaire’s data into numerical format was complied for the
purposes of producing knowledge matrices covering the complete list of element pair
relationships. Standard profiles were created from a list of 288 numerical values representing
each of the 288 element pair relations of the study.
The value assessments for each element pair relationship are based on the use of time measures
on a scale indicating an overall benefit to security. The time measures used in this study were
different from traditional relational and linear scales suggested in literature. Results from the
pilot study suggested that time measures relative to a set of action statements would be the most
appropriate mechanism for determining ordered and scaled value from expert opinion.

12
This notion was developed from literature where knowledge structures have been influenced by
relational descriptors (Smith, 1984). These relational descriptors were interpreted to be action-
based measures which suggest a time based value of a statement.
The measures of time in the research are fuzzy to allow for the process of human generalisation
to be more effective. In this context generalisation is defined as the ability to consider a
complex scenario and incorporate generalised or non-specific detail over complicating
parameters when precise information is not available. In the process of generalisation, human
opinion can consider complex relationships with only limited data and yet identify areas of high
importance. In contrast a computer model often requires values for each parameter in its
algorithm to determine importance. Fuzzy time measures have been included to provide human
instinct with self-adjustment and a level of uncertainty in value assessments. For the purpose of
this research the conversion from fuzzy time measures to numerical values uses the base unit of
seconds for relative considerations of the minimum semantic interpretation of time.
Although the number of respondents used in the research is not large, the three target groups are
able to provide a strong indication of consensus using the mathematical process of correlation.
A correlation result is obtained by comparing the list of values of a single respondent profile
against a series of standard profiles of other category groups. The values for similarity range
between 0 and 1 where a value of 1 identifies perfect correlation. In this manner the degree of
consensus can be determined by comparing a series of correlation values over different group
profiles. Where correlation is high, consensus is likely to be strong.
The correlation method for this research was applied to values for each element pair over a list
of 288 numerical variables as a single profile. This study has combined each individual’s value
assessment using the overall statistical mean of the group to represent composite group profiles.
Each group profile was then considered as a standard profile and was compared against other
standard profiles. Individual respondent profiles were also independently correlated against the
various standards to identify the degree of individual variation. The use of the statistical mean as
function may potentially be replaced by the median, mode or by other graphical means to
interpret a consensus of opinion. The study has used mean values as indicators for each group’s
element pair relationship and the results show that while the mean is an arbitrary indicator, it is
the most effective representation of a group response.
The research has established value matrices to delivers its objectives as a series of knowledge
structures representing a conceptual mapping of the elements of physical security. The values
that have been determined within the final knowledge matrices have been created across the
entire group of respondents considering all of the 288 element pair relationship assessments.

13
Statistical analysis has enabled the determination of a combined standard profile representing a
single knowledge structure. Similarity comparisons of the combined standard against other
standards and individuals using the correlation technique have successfully established that a
high degree of consensus is evident in the results.
A novel interpretation for modelling of the results has been proposed by the study using the well
known mathematical tangent function to assess effectiveness between dissimilar conceptual
entities. The model proposed by the study uses empirically based coefficients for adaptations of
the trigonometric tangent functions combining delay, detection and response. The model is
designed from a series of conceptual time-probability diagrams, where the curves of the
diagrams were recognised as similar in shape to mathematical tangent curves. This model has
demonstrated test cases that are able to produce indications of relative effectiveness over a range
of physical security element combinations. All test cases successfully use values from the
matrices obtained from results of the research. All indications suggest that this model may be
the most appropriate mechanism to assess effectiveness between dissimilar conceptual entities
in physical security. Table 1.3 provides a list of the limitations and assumptions that were
recognised during the analysis and interpretation of the results.
Table 1.3 Limitations and assumption that were identified during the analysis and interpretation of the results
Limitations Assumptions
With only 26 respondents, the argument for identifying the degree of consensus is difficult. The composite group standard profile will be seemingly dependent upon the ratio between each group membership number to the entire number of respondents.
Increasing the number (n) of respondents for each group should increase values for correlation for the group’s profile against the composite group profile of towards a value of 1.0 to provide a better indication for consensus.
The theoretical base for the work has been taken from many disciplines and there may be criticism of the results due to the use of phenomenological approach and method of inquiry into the research objectives.
Phenomenological sociology is appropriate for the study’s method of inquiry.
The transformation from qualitative to quantitative data using a semantic scaling technique requires that the approximations are valid. The fuzziness inherent in the qualitative terminology is set to its minimum semantic association for each quantitative approximation.
The fuzzy time indications listed in the questionnaire provide deliberate ambiguity to cope with respondent’s best estimates. The quantitative time approximations remain appropriate when set to their minimum semantic time approximations. The values resulting from the transformation enables the data to be analysed statistically to provide an indication of relative order, order of magnitude, and correlation over group profiles to demonstrate consensus.
The research uses statistical means to base its consensus approach. A similar consideration can also be made with the median or mode.
The use of statistical means on which to base the analytical approach of the questionnaire is the most appropriate.
…continued

14
Limitations Assumptions
The research considers the standard deviation of the mean as an indicator that points to where a higher level of complexity may exist the concepts that require greater generalisation in their assessment. Concepts with a higher level of complexity require additional iterations of the process or lower levels of a hierarchical consideration in order to reduce complexity.
The use of standard deviations on which to consider the analytical approach of the questionnaire is able to suggest where more immediate hierarchical consideration is required in order to further reduce complexity in the semantic mapping.
The use of correlation in the study has been presented to identify the level of consensus over the values of respondents. Each correlation used in the research is conducted to investigate levels of similarity between groups considering the statistical means of each element interaction in the research (described as standard profiles). The similarity between the elemental relationship assessments across groups, suggests that it is more likely that the correlation of more standard profiles of new groups will converge to a value of 1.0 with each other. For full consensus to be demonstrated, the correlations over all groups would eventually converge to a value of 1.0 with each other.
The transformation of expert opinion into value demonstrates that a set of universal elements representing a physical security scenario can be determined as a standard set if consensus is reached. Consensus is able to be demonstrated with statistical correlation of standard profiles of different groups converging with each other to a theoretical correlation value of 1.0.
Convergence can only be demonstrated for the specific boundary conditions that have been proposed in considering it is an arbitrary hierarchical structure of the phenomenon of physical security.
The hierarchical path mapped out by semantic understanding in this study is arbitrary yet valid. It is based on a theoretical platform with logical and semantic associations identified in the pilot study and from literature.
The phrases: conceptual mapping, semantic mapping, knowledge structure, knowledge hierarchy and element mapping, all indicate an n-dimensional structure that combines elements and element relationships towards human knowledge and consensus. Each of these phrases suggests a theoretical structure however the study’s approach to modelling attempts to visually demonstrate value relationships in the conceptual mapping.
A knowledge structure is able to be mapped by determining its universal elements and apprehending its semantic relationships along concept continuums and relational descriptors. It can be represented as knowledge matrices.
The research proposal suggests holistic modelling of physical security components is desired from the conceptual mapping. A holistic approach is difficult to claim as an achievement as there will always be the potential for greater investigation and depth on a subject. Further iterations of this research would require continual input from a critical base (such as future respondents) to attain true holism. Effectively the conceptual hierarchy would needs to be expanded both across hierarchical levels and down the hierarchical structure.
A knowledge structure is able to be mapped by determining its universal elements and apprehending its semantic relationships along concept continuums and relational descriptors. The consideration of all possible real-life likelihoods can determine whether any claim can be considered holistic in nature. A semantic hierarchy needs to be continually expanded both across hierarchical levels and down the hierarchical structure to lower levels of universal elements.
…continued

15
Limitations Assumptions
The inter-related array of numbers that make up the mapping may be reduced for each action statement by subjecting an entire element list (including any non-listed extended elements) to an assessment over a 3-dimensional space within a facility. This 3-dimensional space could be chosen as a single cube within a facility i.e. a perimeter space or alternatively an inclusive cube that encompasses an entire complex. Each element could be given an approximate percentage of abundance within a 3-D space or a fixed length cube. For example each element might be assessed between 0% and 100% abundance in a given region such that the whole cube can be summated for approximate element abundance to a number between 0% and 100%.
Facility specific data should allow relative interpretations to be made between scenarios using the model and the universal elements presented in the research.

16
1.5 Concluding remarks
This chapter has outlined an overview of this research that has been undertaken as an
investigative approach to create element hierarchies through conceptually mapping element
relationships. Practitioners in the field have been designated as having “expert knowledge” and
were targeted in order to obtain the element relationship data for the research. The universal
element relationship data represents a holistic view for modelling physical security scenarios for
the purpose of decision making.
This chapter has considered the research topic, the background, the scope, as well as the
limitations and assumptions of the study. This research places an emphasis on theory and
incorporates an unusual investigative technique. The results of the conceptual mapping in this
study are available in the form of knowledge matrices. A novel interpretation for modelling of
the results has used an adaptation of the well known trigonometric tangent function to assess
effectiveness between dissimilar conceptual entities using values from these matrices.

17
2 Literature Review
2.1 Introduction to the literature review
This chapter describes several supporting concepts from literature that provide assistance in the
conceptual mapping of gathered expert opinion. All concepts will be considered for their
relevance to the subject areas of the research. In consideration of the research method, the
paradigm of Vallaster and Koll (2002) is worth contemplating, where the three key objectives
that all research seeks to achieve are realism, generalisability of results and precision of
measurement. A visual representation is shown in Figure 2.1 where the authors propose that
such a methodological perspective allows a richer understanding of the phenomena observed
(Vallaster & Koll, 2002) and they also consider that the exploration of meaning in research
should attempt to develop a theoretic-analytic framework that holds independent of interacting
individuals (Vallaster & Koll, 2002). The review by these authors suggests that qualitative
studies generalise their results with an emphasis in realism, while quantitative studies generalise
their results with an emphasis on precision of measurement.
Figure 2.1 The “magic triangle” of research (Vallaster & Koll, 2002)
This chapter initially considers the appropriate method of inquiry to provide a research path that
best combines the optimum of the three conflicting desiderata (Vallaster & Koll, 2002) in a
method that embraces both qualitative and quantitative approaches. Several other concepts in
literature recommend consideration toward this goal and these will be considered in the sections
of this chapter. In the attempt to create a holistic model of physical security terminology, the
study has identified that a common language approach in understanding concepts of knowledge
may provide the best mechanism to enhance realism in generalised results and at the same time
provide the required precision in the results.
Realism Precision of
measurement
Generalisability of
Results Quantitative
Research
Qualitative Research

18
This remainder of the chapter provides a review of studies that will either have direct relevance
to the topic of physical security, some relevance to the concept of modelling, or are applicable
to other areas of interest within the research. The range of these includes decision theory,
decision support systems, knowledge structures, semantic mapping, measurement techniques,
hierarchical considerations and heuristic bias.
2.2 A method of inquiry
Investigative methods in the behavioural sciences often use the natural sciences for guidance
with a research-based method of inquiry. A common understanding of language has been
suggested to provide the most appropriate linkable framework for a problem that deals with
terminology in physical security. Smart (1976) describes externalisation and objectification in
our existence as taking place primarily through language, through accounts, descriptions,
conversations and talk. He captures the beliefs of phenomenology and the phenomenologist
with a description of the social world as a linguistic and cognitive world, where the task of
sociology becomes one of describing the processes by which the social world is constructed
through accounts, readings, understandings and interpretive procedures (Smart, 1976, pp75).
The terms subjective and objective in sociological debate according to Smart (1976, p83), have
preconceived bias for; objective connoting true, scientific, rigorous and real, apparent to Any
Man, whereas the term subjective by contrast denotes arbitrary, biased, unscientific and
personal opinion. Subjective becomes in this sense a term of virtual condemnation, taboo for an
aspiring science. Green et al. (1988) provide a summary of four of the main types of method of
inquiry for research. This research considers that the objectivist, subjectivist, and Bayesian
would all follow similar steps in formulating a problem followed by developing, predicting and
testing of the hypothesis, and finally testing and analysing results. The phenomenologist is
opposed to the use of explanatory hypotheses of the phenomenon that represent preconceived
ideas that may be problematic in selective perception and measurement distortion (Green, Tull
& Albaum, 1988, pp41). While it is recognised that each method has benefits and limitations,
this study has chosen phenomenological sociology as the method of approach presenting the
greatest component of freedom in order to reduce complexity within a phenomenon.
Phenomenological Sociology in its most basic form deals with descriptions of phenomena by
using universal language. The descriptions of this method of inquiry by Smart (1976) and Green
et al. (1988) suggest that Phenomenological Sociology provides a most versatile method of
inquiry to bring together qualitative and quantitative considerations and for each to contribute
toward a theoretical understanding of physical security modelling. Green et al. (1988, pp41)
state the following in their text:

19
What is the method of phenomenology? An answer is that, although there is no one
universally accepted “method” as such, four steps are recognised by enough
phenomenologists to qualify as representative of the approach generally followed:
1. Suspension of prior conceptions
2. Description of the phenomenon
3. Determination of universal elements
4. Apprehending of relationships
In a real sense, this method of inquiry is analogous to what many researchers call a
“fishing expedition” without knowing anything about the body of water
(Green, Tull & Albaum, 1988, pp41).
An application of phenomenological sociology to data collection may be found within the
macro micro focus of a society. Smart (1976, pp87) mentions that within sociology the macro-
micro distinction works to allow the sociologist to shift the focus of his investigation or interest
from the “hard data” of social structure (macro) to the “soft data” of individual and group
experience of social reality. The ambition of behavioural scientists it seems is to create
syntheses of these different “levels” of analysis (Smart 1976, pp75). Some differences are
evident in describing the focus at the macro-level as the ‘more objective’, scientific and relevant
approach to the study of society and the micro-analysis regarded as secondary, supplementing
and small-scale areas of inquiry (Smart, 1976, pp87).
The four steps of Phenomenological Sociology have been chosen to act as section dividers for
the remainder of this chapter to provide a guiding framework for the literature review of the
study. The relevance of the literature review to the research instrument is described in each of
the sections of this chapter. The metaphor of a ‘fishing expedition’ seeks to emphasise the
exploratory nature that the chosen method of inquiry is able to represent in this research.
Green et al. (1988) state the following about exploratory studies:
The major purposes of exploratory studies are the identification of problems, the more
precise formulation of problems (including the identification of relevant variables), and
the formulation of new alternative courses of action. An exploratory study is often used
as an introductory phase of a larger study and results are used in developing specific
techniques for the larger study. The design of exploratory studies is characterised by a
great amount of flexibility and ad hoc versatility (Green, Tull, & Albaum, pp497).
In order to better combine all three parts of the magic triangle of research (Vallaster & Koll,
2002) to this study, the method of inquiry has not required set hypotheses in order to investigate
universal elements and element relationships within the knowledge structure of the topic. In
ensuring that the structure for modelling of physical security will be fully considered, the
20
metaphor of a fishing expedition will be used to support a wide range of relevant studies in the
current body of literature and knowledge and bring them together like a cast net from the
unknown body of water (Green, Tull & Albaum, 1988, pp41). The literature review will
rationalise all highlighted concepts to develop relevant techniques and identify influences that
may exist in considering the four steps of phenomenology.
The strong consideration of this research in reviewing its method of inquiry is that a universal
set of elements may be recognised through an investigative approach that considers the Delphi
technique. Green, Tull and Albaum (1988) suggest that this method has achieved increasing
application in recent years. They expand their description to the idea of using the Delphi
technique where a group of experts are polled regarding their judgements about when each of
some set of specified events falling within their area of expertise might happen. They may also
be asked to state their degree of confidence in each judgement and the implications for present
policies if the events were to occur (Green, Tull & Albaum, 1988, pp662). The research
instrument for this study has likewise drawn upon the conceptual input by inquiring from a
group of experts and also has considered the implications of time in judgements about when
specified events might happen.
Other authors have made comment on the Delphi technique such as White (1975, pp190) who
regards the technique as just a short term analogue of the long term collection, examination and
criticism of any knowledge, which takes place over centuries. Also Ziglio (1996) whose
investigation into the Delphi suggests recognised variations such as the Policy Delphi, Cross
Impact Analysis or Nominal Group Techniques may also be of future interest to the research
instruments. A theoretical rationale is given as per the following:
Dalkey argues that between knowledge and speculation is a grey area which is often
called “wisdom”, “insight” or “informed judgement”. Informed judgement is central to
the theoretical assumptions of the Delphi Method. The methodological procedure used
in the Delphi Method aims at structuring and distilling the vast mass of information for
which there is some evidence (but not yet knowledge) in order to achieve and improve
informed judgement and decision-making (Ziglio, 1996, pp6).
Risk assessments such as those undertaken by consultants in the field of physical security are
typically the combination of observation, professionalism and experience of professionals in the
field of security risk analysis. These judgements made by professionals can thus be translated
into expert opinion and can be recognised as a precious source of information for the purpose of
reducing complexity. In recognition of Ziglio (1996), experts in the field of physical security
were confirmed as the primary data source of the research instrument in this study.

21
Further consideration in the method of inquiry is borrowed from the concepts of structural
equation modelling (SEM). As many important marketing, psychological or cultural concepts
are latent constructs with unknown reliability, the use of SEM can relate important latent
constructs while taking into account the unreliability of the indicators. Reisinger and Turner
(2000, pp3) describe a commercial application LISREL in the following:
Lisrel stands for LInear Structural RELationships and is a computer program for
covariance structure analysis. It is a multivariate technique, which combines
(confirmatory) factor analysis modelling from psychometric theory and structural
equations modelling associated with econometrics. It was originally introduced by
Joreskog and Van Thillo in 1972 (Reisinger & Turner, 2000, pp 2)
The relationship of Lisrel to phenomenological sociology is apparent in the initial stage of its
method. This is demonstrated by the following steps which adapt the SEM analysis to the
topical constructs and variables. The eight stages listed below are associated with SEM:
• Stage 1 Development of a theoretical model (with defined causal relationships).
• Stage 2 Construction of a path diagram.
• Stage 3 Formal mathematical specification of the model
• Stage 4 Variance/covariance or correlation (assessment of the sample size)
• Stage 5 Model identification (enable parameter estimation)
• Stage 6 Assessment of the model fit
• Stage 7 Modifications to the model
• Stage 8 Cross-validation of the model
(Reisinger & Turner, 2000, pp 6-18)
These stages of SEM analysis have been considered to direct this study in a synergistic
combination with the steps of phenomenology and the Delphi technique. In particular the item
Stage 1 Development of a theoretical model (with defined causal relationships) is of
significance to this research as it seeks to evaluate causal relationships that would originate from
universal elements in a similar fashion to phenomenology. Reisinger and Turner (2000, pp2)
provide a discussion of SEM in seeking to explain patterns of dependence relationships
simultaneously between a set of (unobserved) latent constructs, each measured by one or more
manifest (observed) variables such as; distance, cost, weight and height (Reisinger & Turner,
2000, pp 3). These opinions suggest that manifest variables can be measured through
respondents, via data collection methods or even be gathered as secondary data from published
sources.
In summary three methods have been suggested that can assist and direct the method of inquiry
for this study in Phenomenological Sociology, the Delphi technique and structural equation

22
modelling. A combination of all these approaches has been used as general framework to
connect the literature review. The remainder of this chapter describes a selection of literature
that provides lower order guidance for the theoretical framework and considers the requirements
for modelling as the outcome of this study.
2.3 Suspension of prior conceptions
This section of the literature review combines the ideas from studies on topics related to the
relevant subject areas of this research, ideas from studies that provide direction for the
theoretical framework, and similar studies that have produced results of interest in relation to
the objectives of this study. Additionally there will be some comment on studies that suggest
data collection techniques of interest to this research.
This relevance of this section to the research is demonstrated in its attempt to identify what
defines a prior conception. As prior conceptions have provided the direction for this research, it
is suggested that a mix of ideas will provide further holistic considerations to achieve the
objectives required for physical security modelling. The suspension of prior conceptions seems
to suggest a “return to fundamentals” approach which seemed reasonable given the complexity
within the problem. A language-based view to theory gathering was identified as necessary and
this section of the literature review lists some of the theoretical concepts that have been draw
upon to establish the fundamentals into investigating a phenomenon to aid decision making.
Some of the topics that are covered include: decision theory, decision support systems,
modelling analysis, image theory, knowledge mapping and semantic mapping. In an attempt to
suspend prior conceptions, this research has identified some of the language concepts in
literature as part of the theoretical framework to be considered as fundamental.
Some of the concepts of decision theory have been considered as important fundamentals in this
research. They present a range of techniques to integrate the qualitative-quantitative approach to
data collection to best connect the subject system and object systems in making decisions which
is further clarified in the following: before one can undertake any decision analysis, one has to
consider the questions of ‘who are the decision makers?’ and ‘which is the system about which
the decisions are being made?’ The former group is referred to as the subject system, and the
latter is referred to as the object system (White, 1975, pp4). This notion considers the design of
models for decision making in the presence of large uncertainty compounded by the existence of
socially constructed variables. White (1975) provides some commentary on the issue of
unrepresentative modelling, where his viewpoint emphasises that modelling typically uses
quantitative properties in decision analysis and has the object system in mind, while greater
difficulties are usually seen if modelling is applied to the subject system. The importance of this
concept is identified in the original research proposal which determined that a holistic viewpoint

23
was the best way to maximise the benefit to a modelling system although according to White
(1975) greater difficulties may be expected.
Decision theory has substantial application across many disciplines and a number of sub-topics
have surfaced as a result. In his overview and summary article, White (1975, pp4) proposes that
where a model can be created as the result of combining several hypotheses, a theory is often a
creation of the consequential behaviour of statistics creating a special theory. On the possibility
of modifying a theory toward establishing modelling, he further states: We may seek properties,
in a suitable language, which will characterise the actual behaviour, and we may then examine
these properties as to their reasonableness (White, 1975, pp9). This reference to a suitable
language as a characterising tool for examining the property of reasonableness echoes the
sentiment of phenomenological sociology and suggests that language and terminology will
provide a sound basis for holistic modelling of physical security.
Bunn and Thomas (1975) make a contribution to decision theory with a description of an
interesting method for comparing an individual’s subjective data to that of an expert group.
Their proposal indicates that for many applications in life, probability measures can be extracted
from individuals where response methods can be classified direct if the person responds
explicitly e.g. placing a number on his subjective belief, and indirect if it is gathered from
another mode of response (Bunn & Thomas, 1975, pp118). This is strong theoretical support for
assessing a subjective set of probabilities over a set of propositions or alternatively assessing a
subjective distribution over a range of conceivable propositions. Moskowitz, (1975, pp328)
describes the need to begin with a theory as inherent in all modelling and states how a theory
can be expressed symbolically in terms of a formal axiomatic structure or explicitly stated as a
set of logical premises. He continues that the components of a model can be found in protocols
from decision-makers, the researchers’ experience, previous related research, etc. (Moskowitz,
1975, pp328). Both the suggestions of Bunn and Thomas (1975) and Moskowitz (1975) support
the proposal to use subjective opinion to provide raw data and from results of such an operation
form the components of a model.
Ward (1989) discusses basic issues of modelling in contemplating how much detail to
incorporate into a model in order to provide meaningful insight into reality:
Models achieve this by presenting problems in a structured, rational manner, with an
associated reduction in complexity relative to the real-life situation. Models which
attempt to mirror reality in every detail are not usually appropriate or feasible, but at
the same time, excessive reduction in complexity must be avoided if the model is not to
produce misleading inference.

24
With arguments for a constructively simple model, Ward (1989) suggests that one of the most
important properties of a model is its transparency. This is also a measure of how users and
operators react to the complexity of the model. Ward (1989) also argues that model building is
a management science intervention that requires approaches that are simple, flexible, easily
understood, appropriate to the situation, able to cope with low-quality data, and able to help
managers make decisions (Ward, 1989).
Real management problems require helpful models to allow managers to understand
unstructured real-world dilemmas and provide meaningful insights into reality. Models achieve
this by presenting problems in a structured, rational manner, with an associated reduction in
complexity relative to the real-life situation (Ward, 1989). Therefore models which attempt to
mirror reality in every detail are not usually appropriate or feasible, but at the same time,
excessive reduction in complexity may not present enough information for clear decision
making. Ward (1989) suggests that constructively complex models may provide output that
imply a degree of precision which is not justified by the quality of the input data and that
healthy suspicion of the data used and the processed results should be maintained (Ward, 1989).
A method that considers a reduction in complexity is of importance to this research. Ward
(1989) supports the view that there exists a common tendency to under-emphasise qualitative
aspects of a decision situation and in the following quantitative-style rationale of the
requirements he states typical advantages of using numbers:
• numbers form a common language for more effective and objective communication;
• decision situations can be precisely defined and ambiguity minimized;
• the logic of the decision process becomes more explicit;
• decisions, and subsequent changes in decisions, can be defended in a rational and
consistent manner. (Ward 1989)
Barron (1975) makes a point about the complexity with regard to secondary problems in
modelling and by this suggests that the concern about the minutiae of complexity is unwarranted
without the original conceptualisation of a model addressing the primary problem in the
following: The reasons for paying so much attention to the secondary problems are that they
have an influence on the resolution of the primary problem and that the process of identifying
them has a bearing on the decidability of the primary problem’. (Barron, 1975 pp203)
A brief description of decision support systems (DSS) provides another consideration for the
research to be more applicable to the wider decision making community. According to
Bennett’s (1984) explanation a DSS is a coherent system of computer-based technology
(hardware, software, and supporting documentation) used by managers as an aid to their

25
decision making in semistructured tasks that attempts to focus on improving the effectiveness of
decision making rather than on merely improving its efficiency (Bennett, 1984).
This research considers the requirements for DSS development as important. In addressing
holistic modelling, the ability for a model to provide sound policy directions for decisions
depends on the types of decision that may be considered. In a further description of the ideas of
Bennett (1984) a DSS considers that the decision rationale is important.
Not only are decision not gambles, they seldom even involve choices - most frequently
only one option is considered at a time, and the decision about each is whether to take
that option (change) or to remain with the status quo. Neither is the status quo treated
as just another option – it has a special status and is not easily abandoned. (Bennett,
1984).
According to Beach (1990) the decision support system needs to address not only the
phenomenon that it is modelling and interpreting but it also needs to model the policy makers
and social constraints on the decision making body as a whole.
One of the strong foundations of this research is the theoretical framework associated with
knowledge structures and conceptual mapping. The research into the semantics of astronomy by
Smith (1984) detailing knowledge structures in particular is most relevant to the development of
the research instrument. Smith (1984) undertakes data techniques using multidimensional
scaling with recognition of graphical proximity and considers the conceptual design of
knowledge structure using a continuum of variation between concepts along a scaled dimension.
This framework is of special interest to the design of the questionnaire as is the suggested use of
relational descriptors that form structure within a knowledge mapping. Further detailed
description of the work of Smith (1984) is considered in Chapter 3 and Chapter 4.
Several other authors have also described the use of expert mapping ranging over various fields
of application. This includes Miller and Linn (2000) who have conducted work in educational
assessments obtaining in the case of content, expert judgements about the process models and
their relationships to the construct are needed (Miller & Linn, 2000).
The reference to expert judgements is supportive of the directions of this research and its target
base requiring expert opinion value assessments.
The authors Chang, Sung and Chen (2002) review experimental education methods in text
comprehension by the use of questionnaires and they suggest that concept mapping is a graphic
strategy that can be applied to the learning of scientific subjects. While only a limited quantity
of research is available for the learning of linguistic content, Chang, Sung and Chen (2002) use

26
one-way analysis of covariates and include a post-hoc comparison in test scores using the
Bonferroni method. Bradley, Paul and Seeman (2006) use instructors and students to consider
the structure of expert knowledge. The authors have recognised levels of expertise that appear to
develop with experience. The findings of these authors suggest that an individual’s cognitive
ability to correctly structure experience is necessary for the attainment of expertise (Bradley,
Paul & Seeman, 2006).
An outline for a more effective concept mapping measurement system has been produced by
Aidman and Egan (1998). Some of the more relevant parts of this study consider an example
that was deliberately simplified to a set of eight concepts (where) faculty members acted as
domain experts, while the students were treated as learners possessing various degrees of
expertise (Aidman & Egan, 1998). These ideas are considered instructional in the development
of the research instrument of this study where the selection of eight concepts as a knowledge
base is mirrored in the research instrument philosophy of Chapter 4. Aidman and Egan’s (1998)
method strongly resembles a Delphi-type approach where the comparison between expert
concept mapping and student mapping demonstrated similarity. Chapter 5 of this research
considers the different respondent groups to compares the degrees of similarity.
Aidman and Egan (1998) have also used a technique that is of strong resemblance to this
research where the findings from their results are presented. The authors have developed
individual matrices of two dimensional projections representing spatial relationships between
mapped concepts. In their study where different groups included experts, students and novices,
the resultant proximity-type matrices were analysed for hierarchical clustering and segmented
into comparable levels of similarity between mapped concepts (Aidman & Egan, 1998). One of
the findings produced by this study suggests that individual differences in concept mapping
correlate with academic achievement in the domain subject (Aidman & Egan, 1998).
Chiu and Wolfe (2002) propose a method for analysing sparse data matrices in their goal to
achieve a reasonable assessment system involving human judgements. Their study investigates
an option for analysing missing data from the knowledge structure and interpolating in a way
that preserves the internal and external validity of the data to fully utilise all the information
collected. They suggest subdividing a sparsely filled data matrix into smaller subsets for
improved generalisability and their objectives were identified to show that nearly all the
information collected can be considered without discarding incomplete sets. The authors use
averaged variance components to achieve their goals in this study. They also state that the
averaged variance components can serve as the information upon which Decision Studies are
based (Chiu & Wolfe, 2002). This statement provides support to the averaging of the value
assessments of respondents in determining consensus in Chapter 5 of this research.

27
Other methods used in knowledge theory and concept mapping include latent class analysis
(Uebersax, 1999) within the field of medical analysis and research identifying patient latent
variable classes. This study proposed that latent variable traits were able to be considered for
levels of both independence and conditional dependence for the research based on measured
pair-wise dimensions (Uebersax, 1999). The pair-wise dimensions suggested by Uebersax
(1999) support the orthogonal relationship element pairs used in this research.
Some examples of semantic mapping appear in modern applications for the medical sector with
consideration of the problems of mapping language to aid diagnostic work. An example by Barb
and Shyu (2003) considers the content-based image retrieval system for medical images, where
these authors in particular use the concepts of user-specific profiles as well as considering
linguistic variables to model perceptual categories (Barb & Shyu, 2003). Other authors Bell and
Badiru (1993) use concept mapping and knowledge based expert systems for predicting trauma
disorder. These authors suggest that a model incorporating risk factors could provide
quantifiable and sound risk levels through the expert system (Bell & Badiru, 1993).
A further consideration of expert and knowledge based assessment is provided by Sikder, Mal-
Sarkar, and Mal (2006) in their consideration of risk species invasion. These authors introduce
the integration of expert judgement with empirical information to produce a knowledge-centric
risk model. They suggest that expert knowledge and judgements are often represented in value-
laden terms or preference-ordered criteria (Sikder, Mal-Sarkar, & Mal, 2006).
Abernethy et al. (2005) develop performance mapping drawing upon the knowledge of experts.
They state that causal knowledge is elicited from individuals who through their experience and
training have encoded relational or causal knowledge about complex systems (Abernethy,
Norne, Lillis, Malina & Selto, 2005). These authors consider a method that triangulates three
separate techniques of deriving a map for causality and they opt for a combination method in the
absence within the literature of any single method (Abernethy, Norne, Lillis, Malina & Selto,
2005).
Rowe and Davis (1996) provide some commentary on conceptual graphs that project pattern
matching operations. They suggest that graphs assist in the comprehension of concepts and
concept relations for larger quantities of variables and their opinions support the use of
knowledge based proximity graphs. They state that Causal mapping helps to frame strategic
problems by speeding up the convergence of ideas (Rowe & Davis, 1996).
A strong insight into the requirements of causal mapping with the following:

28
Causal mapping is useful for communicating problem situations because, typically,
participants have different mental models. One approach to causal mapping is to use
comprehensive situation mapping, which extends the mapping construct by assigning
strengths and direction to links. Links can model the necessary causality requirements
and help to model quantitative parameters describing complex situations.
When both data and objects are represented in causal maps, managing software
systems require the following:
1. Factor Identifier. This is used to identify critical factors in a situation.
2. Situation Mapper. This uses causal maps for describing a situation.
3. Scenario Simulator. This is used to test implications of assumptions that have been
made.
4. Assumption surfacer. This explores differences in maps.
5. Consensus formulator. Consensus on new maps is used to replace existing ones.
(Rowe & Davis, 1996).
The factors numbered 1-5 in the above extract are very similar in nature to the steps of
phenomenological sociology. These requirements suggest causal mapping is similar in needs to
a DSS and this support has been instrumental to the proposed design for creating a knowledge
structure. The similarity in a combination of approaches toward constructing the research
instrument is reflected by the suggestion for a consensus formulator by Rowe and Davis (1996)
with some additional thoughts on the problems of solving consensus measures is additionally
captured by Lo, Wang and Chao (2005) who deviate from the more traditional method of
consensus evaluation to consider the variation trend of group consensus using similarity
measures of consensus index (Lo, Wang & Chao, 2005).
The theoretical needs of knowledge systems and of DSS are converging after having evolved
separately according to Rowe and Davis (1996), who make the statement that there is now
increasing impetus to merge the two into knowledge-based, intelligent decision-support systems
(Rowe & Davis, 1996). This consideration provides support for a more holistic viewpoint as the
title of this study suggests.
2.4 Description of the phenomenon
This section of the chapter will incorporate studies that provide both background and an
overview to the originating problem of this study. The overview includes past investigations
into physical security modelling and looking at suggestions for modelling in this area.
This section will also consider some physical security terminology as concepts that surround the
phenomenon to be modelled.

29
The documented approach by Tarr and Peaty (1995) uses a physical security model to build a
virtual facility and recognises performance measures such as; probability of detection,
probability of intervention, worst intervention, false alarms, capital costs, and equivalent
annual cost. It can be seen that these attributes of physical security are sometimes difficult to
quantify and may lead to the case where calculations are made with large uncertainty.
The original work of Tarr (1994) was published as a design to achieve cost effective perimeter
security, and follows up on his previous publication (Tarr, 1992) where he advocates an
integration of both subjective and objective approaches for considering limitations to physical
security modelling. His investigation into the modelling of prison facilities, describes the lack of
integration of qualitative and quantitative methods inherent in any modelling process that he
suggests is a dichotomy (Tarr, 1992). His ideas suggest limitations to the success of any model
using either subjective or objective methods in isolation.
Lindfield and Rodger (1992) advise the importance of defining the respective responsibilities of
all parties concerned in the procurement system and stress the human aspect of formalising of
each series of document to provide the best history of installation and protect the commercial
and contractual interests of all parties. This identifies a critical requirement to model physical
security in order to establish documentation that could specify; user requirements, performance
specifications, commissioning procedures, system evaluation and routine audits (Lindfield &
Rodger, 1992). A statement by them clearly establishes a need for developing a platform of a
valid model: Clearly, users cannot perform real attacks against their installations in order to
ensure that a system is working to specification, and a non-destructive test strategy is needed.
(Lindfield & Rodger, 1992).
To translate the needs of a user into a set of criteria for the system designer, the operational
requirement and the performance specification should both:
• be written in user language
• state problems, not solutions
• detail all the constraints on the design
And;
• Specify performance in terms of measurable attributes
• Stipulate how those attributes will be measured, and
• Be legally valid and enforceable
(Lindfield & Rodger, 1992)
Houchin (1999) considers the difficulties in devising a robust costing model from the
perspective of a prison governor. He mentions the two spheres of interest, where complexity in

30
pursuing the options for refurbishment (procurement process) is compared to the complexity in
options for the individual components of technology. He describes the ultimate conclusion of
such a model where the goal of the development is to deliver the full set of operating
requirements at the least cost. Houchin (1999) considers the objectives as likely to be many and
complex and also the cost themselves having a range of components such as: initial and full-life
costs, capital and running costs, fixed and variable costs. He describes a trade-off where
technology and sophisticated equipment will at some stage offset staffing costs.
Limitations for modelling under high complexity will be based on the data input requirements.
The problem with a quantitative modelling approach is that a list of elements describing the
physical environment of any facility is potentially very large and after consideration of the
possibility of all human interaction, the complexity will become difficult if not impossible to
incorporate as data for a quantitative system.
A reason for high uncertainty in associating a value with a physical security element is that there
is often no physical means to obtain measurement. Introducing the human factor in a
quantitative assessment creates a large number of permutations as the potential resources
available to any attacker of physical security increases with each advance in technology.
Where there is an unlimited use of either tools or technology to defeat physical security, the
entire spectrum of available tools ranging from a simple hammer, to a ladder or even explosive
devices, needs to be considered beyond reasonable behavioural calculations.
In further consideration of actual physical security systems, Garcia (2001) provides a solid
approach in which her analysis and evaluation map out requirements for a system to provide
effectiveness in meeting physical security objectives. She compares both quantitative and
qualitative analysis for this purpose and lists advantages and disadvantages for each in different
scenarios. Her assessment of the physical protection system (PPS) is comprehensive and is
described in the following:
A PPS is a complex configuration of detection, delay, and response elements that can be
analysed to determine system effectiveness. The analysis will identify system
deficiencies, help evaluate improvements, and enable cost-versus-effectiveness
comparisons (Garcia, 2001. pp242)
Garcia (2001) describes effectiveness in a consideration of the design of a facility in meeting
security objectives. She considers both quantitative and qualitative approaches via adversary
paths through a facility and suggests that quantitative approaches would be more appropriate for
assets with an unacceptably high consequence of loss while in contrast qualitative approaches
would be more acceptable for assets with a lower consequence of loss (Garcia, 2001 pp242).

31
Her description of a path analysis is compatible with this research while some of the concepts
that Garcia (2001) describes for modelling are also of special interest to this research.
An example of this is where Garcia (2001) states that the, the probability of nondetection cannot
be quantified directly, however she does acknowledge that it is important to note that analysis
models use the probability of nondetection (Garcia, 2001 pp242). In consideration of Garcia
(2001) this research targets the probability of nondetection to quantify in relative terms.
The decision tree tool of Peck and Trachier (2004) is also of interest in framing the phenomenon
of the research. Their decision tree tool considers detection likelihood through a system of
modelling detection technologies and site conditions while considering security objectives such
as coverage, objectives, usage and intent (Peck & Trachier, 2004). The foundation for similarity
in the authors’ considerations with this research lies in the provision of ordered concepts of
increasing difficulty for determination of detection as well as similar interview frameworks
where they interpret descriptions of interview questions and answers (Peck & Trachier, 2004).
The decision tree tool does not advise on the selection of barrier technologies, but allows the
user to model choice based on assumptions of validity and security principles. While this type of
model is generally capable of assisting with decision making, it is unclear whether the data from
the different classes of detection capability within the model can actually represent real life data.
It is stated by the author that the intended user is someone who is unfamiliar with security
technology and uninformed about the effects of terrain, weather, system performance
constraints, and detection zone maintenance on the reliability of sensor-based physical security
(Peck & Trachier, 2004).
2.5 Determination of universal elements
This section looks at theory that provides supporting principles to the study, as well as
considering similar studies in physical security to better understand why the universal elements
of the research have been selected and looks at some evaluation procedures that may assist in
verifying the results of the study.
Modern physical security combinations have many components that may be considered as
elements and technology brings many more potential additions onto the market every year.
The ability to relate any particular component to each other is reduced by the lack of suitable
measurement method as many of the potential elements may be latent constructs.
Furthermore many of these constructs can be manipulated in human attacks that are limited only
by imagination. The importance of considering physical security elements paired in comparison
with a corresponding mode of attack is discussed with relevance to the research instrument in
Chapter 4.

32
For a set of elements to be considered as universal elements two potentials will exist. Either the
set of all possible elements must be considered universal elements or alternatively some
elements of low importance or unconfirmed status will need to be considered as non-universal
elements. For reasons of practicality and feasibility it is necessary for modelling to limit the
number of parameters to be considered and some elements must be omitted from the universal
element list. In this scenario all non-listed elements will need to have a potential to become
universal elements on demand with full properties and attributes of universal elements.
This effectively means that a system for modelling universal elements needs to be adaptive to be
able to extend any existing universal element membership. The grouping of elements into
clusters or hierarchies provides the best means of organising structures for large quantities of
elements and therefore also provides the best means to recognise the optimum set of universal
elements. The use of ordered hierarchies can therefore also reduce the number of element
relationship permeations that can result from large numbers of elements.
The hierarchies for determining which elements of this research are universal elements would
ideally follow the concepts suggested by Hill (1982). He has stated that hierarchical descriptions
will apply equally well to both structures and functions (Hill, 1982) in an assessment of General
Systems Theory where he considers the following:
The process of simplifying and isolating aspects of reality inevitably lead to
hierarchical or “stratified” descriptions. D Wilson (1969, p.302) credits Weyl with the
realization that understanding is a progressive series of descriptions at different levels.
Each level has its own set of terms, concepts and principles, and different kinds of
insight are yielded depending upon whether on moves up or down the hierarchy or
across a level (Hill, 1982).
Hill (1982) considers Guttman’s Radex Theory in detail and suggests that a lack of agreement
has existed regarding the process for creating taxonomic categories. His consideration finds that
most writers when discussing hierarchies have in mind part-whole or system-subsystem
relationships that are able to be represented as tree-diagram structures (Hill, 1982). The process
hierarchy that he bases his research position mainly relates to ordered considerations of
complexity or degrees of complexity. This research has attempted to use the concept of ranked
ordering to structure the defence in depth approach that physical security terminology is nested
within, where higher degrees of complexity require greater hierarchical considerations.
The type of element that should be considered for a universal set needs to contain certain
properties that are able to specify value. A number of publications concentrate on physical
security elements and typically give indications of the overall benefit as well as the
effectiveness of physical security. The following examples provide both attacking-type and

33
defensive-type considerations with Tarr (1994) suggesting some considerations for a physical
security model as follows:
Practitioners should also develop a knowledge of how effective these attack styles will
be against each barrier, and how well the various alarm systems perform against them,
at least in some qualitative way. They should also become familiar with the likelihoods
of each attack style, and the factors that influence it. The major influence is the actual
perimeter elements installed, but many environmental factors such as; availability of
tools/equipment, freedom of movement, scope for remaining inconspicuous, desperation
and alternative routes, also have some effect. (Tarr, 1994)
For barriers the mean delay times for each attack style are important. For alarms, it is
the detection probabilities for each combination of attack style and weather type, plus
false alarm rates. The translation of response force speeds into actual times should also
be developed… It is variations in delay/response times that permit Intervention
probabilities to be calculated. (Tarr, 1994)
It is argued in this research that the defensive elements of physical security should always be
referenced by the limit of considered attack on them rather than their standard performance
ratings. The interpretation of the results in Chapter 6 considers several of the concepts proposed
by Tarr (1994) and also that of Garcia (2001) that follow on her requirement for “nondetection”.
Other publications of interest provide examples of where more specialised physical security
elements are unlikely to be found on a list of universal elements, yet the category of the newly
suggested element is worthy of universal element status. The following example provides a
scenario considering a modern technological element and some appropriate attack methods
which are similar to the attack considerations on barriers in this research for a facility specific-
type scenario:
Fences have traditionally been made of rigid and stable structure. The resulting rigidity
gives Perimeter Intrusion Detection Systems (PIDS) a stable background energy to
work against. …There are, however, advantages in making a fence less rigid. A fence
that in some way reacts to an attack (an active fence) absorbs a proportion of the
energy from an impact from an imparted blow, making it more difficult to penetrate.
A swaying fence should also be more difficult to climb…has tested a range of active
fences in non-rigid or ‘floppy’ form ranging from those made of glass reinforced plastic
(GRP) tubes to composite fences made of chain link and mesh. These have been tested
for cutting, climbing and impact attacks. (Wassell, 1997)

34
Other indications for selecting a set of universal elements can be considered from a list of
concepts that provide insight into the design of physical protection systems. This is evident in
the following passage:
Security principles, such as detection before delay, protection-in-depth, balanced
protection, orientation of sensors, consideration of operating environment and nuisance
alarm rates, complimentary sensors, camera resolution, light-to-dark ratio, proper
equipment installation and maintenance, and response force training will still play an
active role in system effectiveness, whatever the type of analysis done (Garcia, 2001).
The extract from Garcia (2001) considers many important factors of physical security however
most of the principles listed will be attributes of a system. A hierarchy for conceptual
knowledge would consider these as universal elements only at a lower order of determination
from the type of system. A stepwise example is provided for justification.
1. Operating environment and nuisance alarm rates will be appropriately measured as
attributes for each type of detection system; therefore they should be placed in the hierarchy
lower than the type of detection system.
2. The complete range that describes the possible effects of environmental and nuisance issues
will be one of many considerations related to the performance of a detection system in the
event of an attack.
3. When many possibilities are considered as a larger picture, if a potential exits for an
attacker to use force or violent destruction against a detection system, then environment and
nuisance issues would no longer be given consideration
4. As a result of items 1-3, operating environment and nuisance alarm rates might be placed
lower in a hierarchy for importance than a specific type of detection system.
This example is one of many possible hierarchical interpretations of the suggested elements in
this section. The main point of the example is that determining universal elements for this
research is dependent upon the hierarchical determination of physical security. Garcia’s (2001)
assessment of the physical protection system (PPS) recognises the high level elements that this
research has based its approach which include threat definition, target asset identification,
detection, delay, and response. (Garcia, 2001, pp242)
Peck and Trachier (2004) have used an order scale to imply increased difficulty of detection in
their security technology decision tree tool. The ordered lists described by Peck and Trachier
(2004) provide one of the more interesting directions for the research questionnaire in that all
elements of the study could be positioned along an ordered list of a concept category. This idea
developed in conjunction with the concept continuums suggested by Smith (1984) represents an
ideal way to incorporate new elements along the concept scale of an existing universal element

35
list. The universal elements were considered in the questionnaire as indicators of value or
markers along concept continuums and it was proposed that extended element could be aligned
at any later stage as a complimentary element resource position in line with its relative value.
A further consideration by Peck (2002) considers weather and terrain effects on detection
systems in physical security planning. She analyses detection capability of intrusion detection
systems (IDS) as a function of their dependence on weather and terrain and provides a decision
aid. Some of the IDS included are infrared and microwave (Peck, 2002). The study from van
Voorthuijsen et al. (2005) presents CCTV surveillance as an IDS and considers factors
determining its effectiveness in physical security. The authors describe the optimisation issue as
a multidimensional problem where reliable image evaluation by a human observer is influenced
by many variables (van Voorthuijsen, Hoof, Klima, Roubik, Bernas & Pata, 2005). The research
instrument has considered these IDS examples from the two studies as universal elements for
the concepts continuum of detection systems.
Some other relevant publications to consider perimeter intrusion systems standards and
modelling are by Armstrong and Peile (2005) and Armstrong (2005). Both of these studies
consider concepts of attack as one of the major indicators for physical security effectiveness and
assessment. The publication by Armstrong and Peile (2005) considers that the concept of
Vulnerability to Defeat would be more difficult to include in an application-based standard as
the main vulnerabilities are generally technology specific. While the concepts of detection rate
and false alarm rate more readily provided in an evaluation rating for detection systems, the
authors suggest that Vulnerability to Defeat as defined as – a measure of a system’s capacity to
resist a direct attack on it or detect an intrusion attempt by a knowledgeable attacker intent on
disabling the system or exploiting the system’s weaknesses to defeat it (Armstrong & Peile,
2005) would need to be addressed separately. This leaves a potential gap in the standardisation
of evaluation measures for detection systems. This limitation echoes the suggestions by Garcia
(2001) that disabling of detection systems should also be strongly considered as a
complimentary type of attack on a facility to a stealth attack. These two action statements or
relative descriptors (Smith, 1984) in the evaluation of detection systems have been considered
along separate concept continuums for this research.
The publication by Armstrong (2005) considers a Physical Barriers Attack Standard he
describes as outdated and limiting due to an evolving technological capability. Therefore a full
suite of tools that the highest threat attacker was likely to acquire and use, may be missing from
any proposed standard (Armstrong, 2005). A disadvantage of any newly proposed physical
barrier standard as suggested by the author is that its comparative effectiveness will always be
subjective (Armstrong, 2005).
36
Several literature sources in this section have presented several possible selections for universal
elements to be used in this research. The main issue that requires consideration in the selection
process is the necessary structuring of the universal elements into adequate hierarchical
groupings large enough to be representative of a security facility and small enough to be
assessed against each other in order that consensus may be achieved.
2.6 Apprehending of relationships
This section reviews studies that assist in the apprehension of elemental relationships in the area
of knowledge structures and semantic mapping. Areas that may impact on this investigation
include analytical and measurement. Certain aspects of the measurement of element
relationships are investigated in this section and each is assessed with regard to its potential
usefulness in developing the research instrument.
In applying techniques such as the Delphi examined by Green et al. (1988) for marketing
research to the design of the research instrument, references to profiles have been considered by
this research as a tool for measurement. The concept of profiling groups of elements was
identified to combine physical security information in general areas of classification and
performance.. A profile of value assessments for each participant in the research was
incorporated into a group profile and further extended into a single profile representing
consensus with the concept of a “standard” introduced. Profiling has been briefly suggested in
the extract below and will be considered in more detail in Chapter 4 as it appears to have strong
relevance in conceptual mapping:
If we have n persons measured on m variables, the profile of each person can be
portrayed as a point in m dimensions. If we also know the group to which each person
belongs, and the groups differ in terms of average profiles, often called centroids, we
might expect to find different groups occupying different regions of the space. The less
overlap noted among intergroup profiles in that space, the more likely it is that
discriminant analysis can help us separate the groups (Green, Tull & Albaum, 1988,
pp107).
This suggests that a dimensional matrix comprising m element dimensions all suitably defined
by relationship values that could create a reference structure of knowledge as a profile that can
be used in a decision analysis model. Also the support for discriminant analysis as suggested by
Green et al. (1988) has been presented by others such as Smith and Robinson (1999, pp32) who
have demonstrated a two dimensional graphical relationship between pair-wise barrier types for
both a novice group and an expert group. In similar n dimensional representations matrix data
could be used as reference comparisons between a user’s knowledge and an expert’s knowledge.

37
The relevance to this study suggests that a questionnaire based n dimensional method can be
used to rank physical security data by relative value assessments. While expert and novice
groups are typically compared for differences (Smith & Robinson, 1999), this research proposes
that these two groups are also considered in union to identify the similarity trends in order to
obtain a relative consensus of opinion.
Supporting literature in the field of security suggests using multidimensional scaling and
multidimensional representations such as those proposed by Smith (2002) and perceptional
representations suggested by Brooks and Smith (2002). These examples indicate that the
representation of knowledge structures using data from categories such as novice groups and
expert groups can be collected by relational proximity scaling. The research questionnaire has
modified the multidimensional scaling technique in this study so that it applies as quasi-
qualitative time based measures instead of linear similarity based measures. The qualitative time
based measures considered for the research instrument present a logarithmic transformation to
quantitative elemental relationships when time is used as a fundamental unit.
The concepts of Hill (1982) are presented in this section where mathematical form is
recommended in the following:
The ability to translate theory into mathematical form has several advantages. It
permits precise test of predictions from the basic postulates of the theory. It also allows
for model adjustments in cases where a prediction is not supported by the data of a
study (Hill, 1982).
The relationships between elements can be further transformed from matrix format into visual
representation with development of a conceptual model suggesting defined causal relationships.
The model that has been presented in this study in Chapter 6 is a graphical conceptualisation of
the phenomenon of physical security with regard to the functions of delay, detection and
response.
2.7 Attitudinal measurement
As this research attempts to capture expert opinion, this expert opinion can be collected as the
measurement of human knowledge and experience, however it needs be wholly captured
through the research instrument. This part of the section investigates some methods used
previously in measurement of human opinion. An ongoing investigation has been documented
in the field of attitude measurement. The topic is well summarised by the editor Keeves (1997,
pp705) in the review Educational Research, Methodology, and Measurement: An International
Handbook - Second Edition. Some of the more interesting points of comparison are listed in this
section.

38
Keats considers that attitude measurement is possible as a result of Thurstones’s development of
scale values for stimuli on dimensions for which there is no corresponding physical measure
(Keats, 1997, pp759). Keats (1997, pp759) notes that the use of Likert methods for constructing
objective tests of cognitive abilities could be applied to the construction and use of scales for
measuring attitudes. These methods parallel requirements for qualitative data (attitudes) of
physical security effectiveness. Dunn-Rankin and Zhang (1997) consider unidimensional
scaling methodologies as recognised tools of measurement with some of the defined terms
including summated ratings, Likert scales, successive categories, or semantic differential scales
(Dunn-Rankin & Zhang, 1997, p792). The suggestion of the semantic differential scale has been
considered further in the research questionnaire.
One of the basic problems with scaling attitudes appears to be a lack of an absolute reference for
standard comparisons. The task of setting a mastery level or standard reference in terms of a test
score have been investigated in the field of education and range from the exercising of a value
judgement by curriculum experts through decision theory approaches which assume knowledge
of true mastery score to utilizing the ratio of the two costs of misclassification (i.e., false
positives and false negatives) and alternatively the use of an independent criterion such as
degree of success in a referral task (Keats, 1997, pp759). Within the field of education, a
problem identified as representing human cognitive performance in terms of a relatively small
number of cognitive factors (Keats, 1997, pp760). Factor analysis has also been investigated by
the author and there are methods specified such as; least squares and maximum likelihood
methods that are often used (Keats, 1997, pp760).
The parallels of attitude measurement in educational fields and the data required for physical
security modelling have been briefly summarised with examples from literature.
Some subjective aspects of physical security can be scaled, measured and interpreted based on
methods presented in educational research.
2.8 Heuristics
The collection of expert opinion in the research contains limitations inherent to the chosen
method of data collection. A major limitation is due to the fact that opinion is usually a
reflection of some simple heuristic bias. Some different types of heuristic bias have been
considered for guidance in this section.
Heath and Tindale (1994) list a range of heuristic considerations which will affect the type of
recall available to humans. This list is described as follows:

39
Probably the most often studied heuristic from the original three proposed by Tversky
and Kahneman (1974) is the “representativeness” heuristic. A person is said to be
using the representativeness heuristic when he or she judges the probability of an
uncertain event by the degree to which it (1) is similar in essential properties to its
parent population, or (2) reflects the salient features of the process by which it is
generated. (Heath & Tindale,1994).
It is expected that in this research, some participants to the research instruments will be using
recall mechanisms from personal experience to provide element relationship value assessments,
while other participants may be using information gained from academic instruction.
Participants with more experience may draw on the representativeness heuristic to judge
elemental relationship values. Those with academic instruction may draw upon the availability
heuristic as considered in the following:
Research has shown that most people underutilize base rate information. The
availability heuristic involves people’s tendencies to judge the probability of some event
by their ability to recall similar events. … As with representativeness, ease of recall
and frequency of occurrence are probably correlated in most instances. (Heath &
Tindale,1994).
A knowledge structure should represent the entire range of conceptualisation of element
relationships and in doing so a mixture of the heuristic influences will improve the diversity in
opinions and provide a more general (and holistic) base for relationships. The information that
the study has identified considers relative differences using heuristics as providing support:
The anchoring and adjustment heuristic is based on the assumption that people often
start the judgement process by focusing on some initial value (i.e anchor) and then
based on the other available information, adjust from that value to some final
judgement. (Heath & Tindale,1994).
As the research instrument considers concept continuums and elements in rank order of benefit
to security, the anchoring and adjustment heuristic will most likely be applied to estimate value
assessments for element relationships that are less common or even unknown to the participant.
This should assist the overall objectives of the research to provide relative indications for the
elements in a specific rank order of value. Anchoring and adjustment therefore should provide a
means for participants to provide educated guesses if necessary through the research instrument.
The simulation heuristic is also possible for consideration:
The simulation heuristic is related to the ease by which people can construct scenarios
that fit a particular event. The easier it is to generate scenarios that lead to the event,
the more probable the event is perceived. However, much of this work has tended to

40
focus more on simulations that lead to other outcomes (counterfactuals), the ease with
which such counterfactuals can be reproduced, and the types of changes they
encompass. (Heath & Tindale,1994).
Generally each of the heuristics listed seek to explain how relationships values may be obtained
from the knowledge assessments of all participants.
2.9 Concluding remarks
The literature review has considered the following sections: a method of inquiry, suspension of
prior conceptions, a description of the phenomena, determination of the universal elements,
apprehension of relationships, attitudinal measurements and heuristics.
The method of inquiry has sought to improve the distinction between qualitative and
quantitative research method which provides an unusual approach to the topic. The use of
phenomenological sociology as a consideration in the layout of the literature review is designed
to provide guidance for the structure of the research and appears to give the research the
freedom that allows it to undertake an investigative method of inquiry.
The suspension of prior conceptions is described in order to clearly identify what fundamentals
are being considered for the purpose of the research and to explicitly connect the relevance of
this theory to the study. In this way all other concepts are suspended unless they form part of the
universal element structure. The theory that have been examined in this section are those of
decision theory, decision support systems, modelling analysis, image theory, knowledge
mapping, and semantic mapping. Guidance from each of these areas has been selected as
examples in literature assembled toward developing the research instrument.
The section that describes the phenomenon is more specific to the topic of physical security
modelling. Several approaches toward modelling are discussed and the difficulties involved in
this process have been included for comparison and direction in this research.
Determining the universal elements is the third of the four steps of phenomenological sociology.
The section that considers many of the possible elements to be used in a universal element list
also considers the properties that the list may require. This section also considered as a universal
list that can readily includes new members. This section summarises that the universal element
will be derived from the consideration of a hierarchical construction of the elements in physical
security terminology.

41
The apprehending of the relationships of the elements is the topic of the next section and
suggests that profiling elements may be a powerful tool for measurements and to provide
guidance for consensus of the research findings. The section considers past physical security
studies that have considered multidimensional scaling techniques for comparisons between
groups in using similarity measures and provides a direction for this research to propose the
measurements of expert opinion in time units.
The final two sections of this chapter looks at work on attitudinal measurements in the field of
educational research to provide further guidance for the research instrument as well as a brief
look at the heuristic influences that participants in the research may draw upon in expressing
opinions as measurement.

42
3 Theoretical considerations
3.1 Introduction
This chapter aims to provide a theoretical framework to validate the formation of the research
questionnaire. As all data for the research is generated from the questionnaire, it is important to
identify theoretical links for all of the elements presented in the study in ordered groups within
the questionnaire. To develop the conceptual mapping identified in the research objectives, the
element relationships of physical security have been considered from areas of the literature
review and have been supported by knowledge structure theory, decision theory (decision
matrices), the hierarchical ordering of physical security terminology and defence in depth.
This chapter investigates the terminology of physical security presented in the main research
instrument in relation to its hierarchical structure and theoretical framework. It explains why
this structure is important in order to consider that elements selected along a series of concept
continuums are able to be universal elements of the study. Theoretical interpretations have been
necessary to conceptualise orthogonal dimensions as ordered scales in the research instrument.
This chapter sets the scene for the development of the arbitrary element hierarchies of the
questionnaire that enable the construction of knowledge matrices from assessment values
towards holistic modelling.
3.2 Knowledge structures in physical security
For the purpose of transferring knowledge to new problem situations, a description of
knowledge structures deals with concepts and relations at different levels of abstractedness with
the following explanation useful as an overview.
The knowledge is organised hierarchically, and is accompanied by explicit guidelines
specifying the application of this knowledge. The problem-solving model produced,
when operating on domain-specific knowledge, substantiates human problem-solving
observations (Smith, 1984).
Smith (1984) recognises two representations of conceptualisation of knowledge in human
memory as “logical” models of concept representation and “spatial” or “proximal” models of
concept representation (Smith, 1984). General description of logical models specified have
listed attributes that include relational descriptors and some semantic systems that identify
relations through studying the interrelating links of a knowledge structure. Spatial models in
contrast are defined by the inter-concept strengths and similarities with paired comparisons and
the presence of a continuum of variation between concepts along a semi-scaled dimension.
Smith (1984) further states that Nagy (1983) calls for a synthesis of logical and proximal

43
methodologies to better undertake exploration of conceptual relations (Smith, 1984).
In recognising the importance of this call for synthesis, this research has attempted to combine
aspects from both logical and proximal theoretical models in order to obtain a cumulative
benefit of both. The consideration of relational descriptors to describe and assist in constructing
an ordered hierarchy of physical security elements has been borrowed from the logical model
while the consideration of scaled concept continuums within the hierarchical structure has been
borrowed from the proximal model.
The work undertaken to develop the research questionnaire had identified four main areas of
terminology that have required further theoretical evaluation. These four areas comprise the
various physical security terminologies that were recognised as high-order levels in any
hierarchical structure. They are listed here in descending order of hierarchal importance:
1. Defence in depth and its functions
2. Relational descriptors (action statements)
3. Concepts (measured as concept continuums)
4. Elements
The remainder of this section has been considered from these four levels of hierarchy.
3.2.1 Defence in depth and its functions
Several theories of physical security have been considered by Garcia (2001) where a physical
protection system (PPS) is defined as a complex configuration of detection, delay, and response
elements that can be analysed to determine system effectiveness (Garcia, 2001). The concepts of
delay, detection, and response are widely accepted across the field of physical security as the
functions of defence in depth and these naturally form the highest level of consideration in risk
assessments in a theoretical structure of physical security. These high level functions are able to
be conceptualised as forming a hierarchical umbrella of physical security where classifications
of potentially all elements can be structured. It is also necessary to further understand the
relationships of each of these three with each other in order to consider their potential for
modelling purposes.
The fundamentals of defence in depth are evident in most modern physical security
considerations. Wikipedia (2006) states that the term defence in depth is originally a military
strategy that seeks to delay an attacker through buying time by yielding space while the term is
now widely used to describe non-military strategies (Wikipedia, 2006). The following extracts
are relevant in describing defence in depth where military concepts can been readily extended
into similar conceptual scenarios for the security industry.

44
Defence in depth strategy requires that a defender deploy his resources, such as
fortifications, field works … to a succession of prepared positions (to) extract a high
price from the advancing enemy while themselves avoiding the danger of being overrun
or outflanked. Delaying the enemy advance mitigates the attacker's advantage of
surprise and allows time to move defending military units to make a robust defence and
to prepare a counter-attack…. The defence in depth strategy is particularly effective
against an attacker who is able to concentrate his forces and attack a small number of
places on an extended defensive line (Wikipedia, 2006).
A well-planned defence in depth strategy will deploy forces in mutually supportive
positions and in appropriate roles. … Successive layers of defence may use different
technologies or tactics; for example … Defence in depth may allow a defender to
maximise the defensive possibilities of natural terrain and other advantages
(Wikipedia, 2006).
A further consideration by Wikipedia (2006) considers a non-military example of defence in
depth where fire prevention targets the deployment of fire alarms, extinguishers, evacuation
plans, mobile rescue and fire fighting equipment (Wikipedia, 2006). This description clearly
resembles the physical security defence in depth functions of delay, detection and response.
In this chapter the work of Garcia (2001) will be suggested as representative of the modern
theoretical understanding of the functions of delay, detection and response in designing systems
with physical security components. As a brief introduction to this, we can consider the position
that Garcia proposes in an attempt to explain the ordered theoretical relationships of the
functions of defence in depth:
The goal of an adversary is to complete a path to an asset with the least likelihood of
being stopped by the PPS or, conversely, the highest likelihood of successful attack. To
achieve this goal, the adversary may attempt to minimize the time required to complete
the path. This strategy involves penetrating barriers as quickly as possible with little
regard to the probability of being detected. An example of this adversary tactic is a
force attack. The adversary is successful if the path is completed before guards can
respond. Alternatively, the adversary may attempt to minimize detection with little
regard to the time required. This adversary tactic is based on a stealth attack. In this
case the adversary is successful upon completion of the path without being detected
(Garcia, 2001).
Garcia (2001) recognises two modes of attack where physical systems may serve to maintain
security. Effectiveness measures are considered by her firstly as minimum cumulative time delay

45
and secondly as cumulative probability of detecting. Both would able to assess an overall risk of
an attack on a physical security defence arrangement. In the former effectiveness measure,
Garcia (2001) notes that delay without detection is not appropriate as the response force must be
alerted in order to respond and interrupt the adversary. In the latter effectiveness measure, she
notes that no assessment for delay is considered which she reveals as a disadvantage (Garcia,
2001). The determination of response time as an effectiveness measure is generally seen to be
independent of the attack type and is often restricted only by limitations in defensive resources.
Garcia’s (2001) views consider that the adversary factor is the strong dependency factor in
effectiveness measures and the following extract reinforces the need to consider interconnected
theoretical structures for risk based option-consequence mapping. Further to this her ideas
suggest that the best effectiveness measure is one that combines all of the considerations of
minimum cumulative time delay, cumulative probability of detecting and response time.
Adversaries may use combinations of force, stealth, and deceit in order to accomplish
their goals. This is why a well-defined design basis threat is so important to system
effectiveness. The most successful adversary is assumed to be knowledgeable enough to
defeat or bypass detection along the path up to the CDP (critical detection point) and
also knows the response force time (Garcia, 2001).
Garcia (2001) has made assumptions in her description of the theory of defence in depth
where she doubts that the probability of “non-detection” can be measured. She additionally
assumes that for a series of physical security measures, delay time is calculated as a sum and
probability of detection is calculated as a product (Garcia, 2001). This statement is based upon
an assumption that delay is measured by time and that detection is measured by probability.
Although these may be logical considerations, they represent limiting assumptions in the
consideration of non-delay and non-detection.
This study has developed the questionnaire to enable measures of delay and detection to be
identified through expert opinion with both measures based on relative time associations which
are effectively likelihood considerations. This proposes that the concepts of delay and detection
can be calculated as either a sum or a product. In a further consideration for delay and detection
probabilities, Garcia (2001) assumes that with any assessment of a facility the analyst must
repeat this process for many adversary paths, find the most vulnerable path, and decide whether
this is a satisfactory result even though there are many adversary paths into a facility.
The critical path characterizes the effectiveness of the overall protection system in detecting,
delaying, and interrupting the adversary (Garcia, 2001).

46
These limiting theoretical considerations suggest that a protection system needs to identify its
critical path, while in reality the critical path may be elusive and strongly reliant on the
adversary factor which require that the effectiveness of the system, then, is somewhat dependent
on adversary tactics (Garcia, 2001). By this argument, without predetermined adversary tactics
any consideration of risk estimation leads to a circular argument involving the determination of
PPS path effectiveness.
Effectiveness assessments on elements of physical security (including all typical components)
such as those reported by Armstrong (2005), Armstrong and Piele (2005), Peck and Trachier
(2004), and others in this field, do not provide critical time delays or “non-detection”
probabilities. This is because it is not feasible to consider exhaustive physical testing with a true
range of adversary tactics. Therefore from a theoretical position, the units of measurement for
the assessment of delay, detection, and response are different and typically may include either
consideration of time or probability. This suggests that an assessment of overall effectiveness is
not feasible as an absolute measure for time or probability as both will be subject to many
parameters that may be unknown. This research considers that the solution in describing a
useful hierarchical structure as a framework of element relationships is mostly dependent on the
attack methods. The research questionnaire has developed a means of assessment that can
identify a relative understanding of the element-attack relationships available through the
mechanism of human generalisation. Therefore a hierarchy will be able to determine a relative
effectiveness when attack-measures are listed as comparable non-detection and non-delay
arrangements.
A consideration to obtain overall system effectiveness in the theoretical analysis of Garcia’s
(2001) work is difficult as her performance measures have different units. However she
considers that regardless of how the increased performance is obtained, any analysis of
proposed or necessary upgrades to effectiveness will assist the designer or analyst to optimise
system performance (Garcia, 2001). This notion supports the development of a model that
incorporates the dissimilar entities of delay, detection and response and is able to equate them
for assessment in relative terms. Such a model, according to Garcia (2001) should help the
analyst to optimise system performance.
As a final consideration of overall effectiveness, Chapter 6 of this research proposes a novel
concept for modelling that combines values for delay, detection and response and is able to
assess overall effectiveness between dissimilar conceptual entities. The model evaluates the
functions of defence in depth at the highest level of a hierarchical framework from values of
element relationships at a lower order and graphically identifies effectiveness in the process of
relating these functions.

47
3.2.2 Relational descriptors (action statements)
The relational descriptors that have been identified in this research are action statements that
come from separate consideration for each of the functions of defence in depth. The freedom
that the method of inquiry presents to this research enables both theory and interpretations of the
literature to play an integral role in providing solutions to the research objectives through the
development of the research instrument. The method of inquiry has identified appropriate
literature to theoretically construct the research questionnaire.
The term relational descriptors have also been called primitives or “action-on” statements and
also propositional relations by Smith (1984). They are recognised in the “logical” model of
concept representation in memory where this type of model strongly considers the relational
links between concepts in order to gain appreciation for the structure of memory as the
following states:
With the interview technique, propositional networks can produce a representation of
conceptual knowledge, where concepts are portrayed as nodes and propositions,
indicating the nature of the relations, link the concept points. Individual’s propositional
diagrams can be compared for similarity, differences, and absent links (Smith, 1984).
The questionnaire has incorporated concept links and relational descriptors to be analogous to
the boundary conditions that work to provide convergent knowledge structures. The relational
descriptors as the boundary conditions of the research instrument contain action statements that
give directional meaning through the knowledge structure enabling universal elements to
cluster. The relational descriptors are relevant to the individual functions of defence in depth
where the majority of elements can be clustered for at least one of these action statements.
A small number of all-inclusive action statements provide a simplified directional time-scale
that corresponds to the physical action description for each of the functions of defence in depth.
The boundary conditions not only represent the action statement within a framework for
conceptualisation but also incorporate the scale for time value assessments. This corresponds to
the directional time-scale and includes an indication of overall benefit to physical security.
Eight boundary conditions have been included in the research questionnaire. Of these eight
boundary conditions, five represent the functions of defence in depth with two representing
delay, two representing detection, and one boundary condition representing response.
The remaining three boundary conditions in the questionnaire consider the asset, the motivation
of the attacker, and the type of attack. All boundary conditions consider attacking element
contributions against defensive element contributions and provide a value assessment for overall
effectiveness that is dependent on adversary tactics (Garcia, 2001).

48
The theoretical position of Garcia (2001) has considered two potential forms of attack in stealth
attack and force attack. This study has re-identified these action statements as evading and
disabling in the research instrument in consideration of Garcia’s (2001) recommendations that a
measurement of non-detection is the quantity that is most desirable for determining overall
effectiveness. The term evading is seen as an action of non-detection and is synonymous with
the concept of a stealth attack. Similarly disabling is an action of non-detection and is
synonymous with the concept of force. These two boundary conditions for detection provide
inclusive coverage over a wide range of non-detection potentials and the research instrument
has suggested to participants that this may potentially cover all situations of non-detection.
In a similar manner, the report by Wassell (1997) lists cutting, climbing and impact attacks and
is supported in concept by Armstrong (2005) who considers attacks on barriers by force.
This study has utilised the action statements breaking and climbing for the research instrument.
By using these two descriptors attacks on a barrier may be identified through a divergent path
analysis or conceptually as a geometric direction of a path either going around a barrier or going
through a barrier. These concepts represent properties of “non-delay” in keeping with Garcia’s
(2001) desired property of non-detection. Any barrier that a can affect delay will be influenced
by the quality of the tools that are used in an attack. The relational descriptors of the research
instrument represent the attacking element contributions of the non-delay of barrier elements.
The concept of response is used as its own relational descriptor. A suitable response is able to
provide timely interaction in the event of an attack. Evaluating the likely success of different
response methods is outside the scope of this research; however it is a fair assumption to
conclude that once a response is enacted, the attack cannot continue without some adjustment.
The relational descriptors form mid level structure of the physical security hierarchy as action
statements that link the boundary conditions to concept continuums and the universal elements.
The action statements chosen for the research instrument are identified as attacking-type verbs.
The use of relational descriptors is supported in theory and provides a directional framework in
the hierarchical structure of knowledge for physical security.
3.2.3 Concept continuums
For each of the functions of defence in depth structured as relational descriptors, two concept
continuums have been presented as orthogonal measurement scales. The relational descriptors
consider both attack-type continuums and defence-type continuums through inter-comparison in
order to assess value judgements. The concept continuums are directional scales that indicate
the magnitude of a relative overall benefit to physical security for set each boundary condition.
The directional preference for benefit stated within each boundary condition is arbitrary;

49
however a preferred direction is usually apparent for a logical consideration of the relational
descriptor.
Smith (1984) describes Schaefer (1979) in considering the concept of a “concept” as existing in
three parts:
1. the logical core of the concept, which is the invariant structure representative of a
certain class of objects or events,
2. a name which is associated with the logical core of the concept, for communication
and memorisation by the individual, and
3. an associative framework which surrounds the logical core, and provides a tight
network of other associations (Smith, 1984).
The notion of a concept continuum has been interpreted from the work of Smith (1984), where
he considers the characteristics of the “Proximal” model for knowledge representation in
memory. The concepts are described along as variation along a dimension.
Proximity data can be represented by dimensional spatial models, or by non-
dimensional clustering models; the distinction between the models depends upon the
presence of a continuum of variation between concepts along a dimension, or the
discreteness of attributes in featural representation (Smith, 1984).
In the ordering of elements into a knowledge structure for physical security terminology, the
reference to a continuum of variation between concepts along a dimension (Smith, 1984)
provides a means of ranking particular elements of interest in this study. Concept continuums
have been developed to represent a dimension for an overall benefit to security in one direction
and an overall lack of benefit to security in the other direction. This is significant as it means
that elements can be ranked effectively in their overall benefit to security against other elements
along a measurement continuum. Thus element relations can be better organised into a
hierarchical structure using the concept continuum as a linking media for relational dimensions.
Further to addressing the concept continuum as a linking media, the consideration of “proximal”
models compares the similarity measures of concepts. This method uses hierarchical cluster
analysis in which successively less stringent criteria of proximity are imposed on the concepts
for lower hierarchies and also clustering within classes and hierarchical relations between
classes, provide a representation for conceptual interaction (Smith, 1984). The use of concept
continuums in this research attempts the reduction of elements of physical security into
universal elements as reference levels along dimensions that can be navigated.

50
This support in literature proposes that a list of elements could also be representative of many
other elements along a concept continuum which can be extended to suggest that a means of
reducing complexity can use a representative number of universal elements. The research
instrument provides several small lists of elements over two orthogonal concept continuums for
each relational descriptor using time as a measurement indicator. Thus each element chosen as
a reference level along the continuum may be used to locate other elements (or groups of
elements) relative to their position.
The concept continuums that have been chosen for the research fit in with the nature of the
relational descriptors. For the five relational descriptors used across the functions of defence in
depth, there have been nine independent high level concept continuums used. Over the total set
of eight boundary conditions, ten independent concept continuums have been used.
The presented concept continuums provide a broad enough coverage as dimensional scales to
consider most elements in simple physical security terminology. Examples of orthogonal
concept continuums that have been used in the research instrument include attack force against
material strength for the action statement breaking and detection system against stealth attack
for the action statement evading.
For all elements there is expected to be a range of potential for a maximum position of strength
with regard to the force continuum, a mean or average position of strength with regard to the
force continuum or for a minimum position of strength with regard to the force continuum.
The average value over the range could also be determined to give average conceptual reference
points along each concept continuum.
3.2.4 Elements
Elements described by natural language are recognised by both Phenomenological Sociology
and SEM as essential parts of modelling a phenomenon. Determination of the universal
elements for the questionnaire is recognised as an objective of the research. The elements that
have been selected for the research questionnaire are presented as universal elements of the
phenomenon in this section.
The determination of universal elements from the many possible element combinations of
terminology is identified through considering reference levels along a scale of each of the
concept continuums. Furthermore the most important universal elements in each concept
continuum are those that represent the outermost reference levels along the continuum for each
concept. An example supporting this notion considers the concept continuum of force attack and
the outermost elements of rock and explosive, where rock represents the lowest reference value
of force, explosive represents the highest reference level of force. All other universal elements

51
positioned along this dimensional scale can be considered as simple arbitrary points for
reference levels. These may represent a cluster of elements, or alternatively elements may
represent a sequence of regular divisions along the scale. This is not seen as important for the
scale in order to be represented adequately; however it is somewhat important that the universal
elements along the scale are dissimilar enough to be conceptually separated.
For this research the number of elements that has been used over each concept continuum is six.
This number has been determined in order to divide the dimensional scale into a relative ordered
sequence of the universal elements. For some concept continuums the universal elements will be
clustered together while along others the universal elements points will have greater separation.
The actual separation between the universal elements on a single dimensional scale is
determined by each orthogonal concept continuum while the relative assessment of each of the
universal elements in the conceptual mapping is constructed by the range of values in the data
matrices.
The justification of a universal element becomes a matter of whether or not it is the best choice
for representation along the scale of the concept continuum. As the two most important
universal elements are the highest reference point and the lowest reference point along the scale,
all other universal elements are arbitrarily important and cannot be further justified through any
benefit to the scale. It is therefore appropriate to determine when an element may not be a
universal element. Therefore all elements that do not appear on the scale of a concept continuum
can be considered unlisted elements without universal element status. This status is subject to
change as universal elements may be readily replaced by different elements with similar
properties. It is not a requirement that elements become “universal” in order to be analysed in
this modelling environment. All unlisted elements can be mapped into the concept continuum in
their most appropriate position based on the properties that they exhibit. For the purpose of this
research only universal elements have been considered for the value assessments of respondents
and these have been designated as appropriate as reference levels until better reference levels
along the scale of the concept continuum can be determined.
If it can be accepted that all the possible elements of physical security can be adequately
assessed through the boundary conditions of the research, then representative reference levels
called universal elements on a continuum of the knowledge mapping may act to reduce overall
complexity in this study.
3.3 The Decision Matrix
The theory of Giere (1991), which includes the graphical representation displayed in Figure 3.1,
has been identified as important to gain an understanding of how data that is collected through
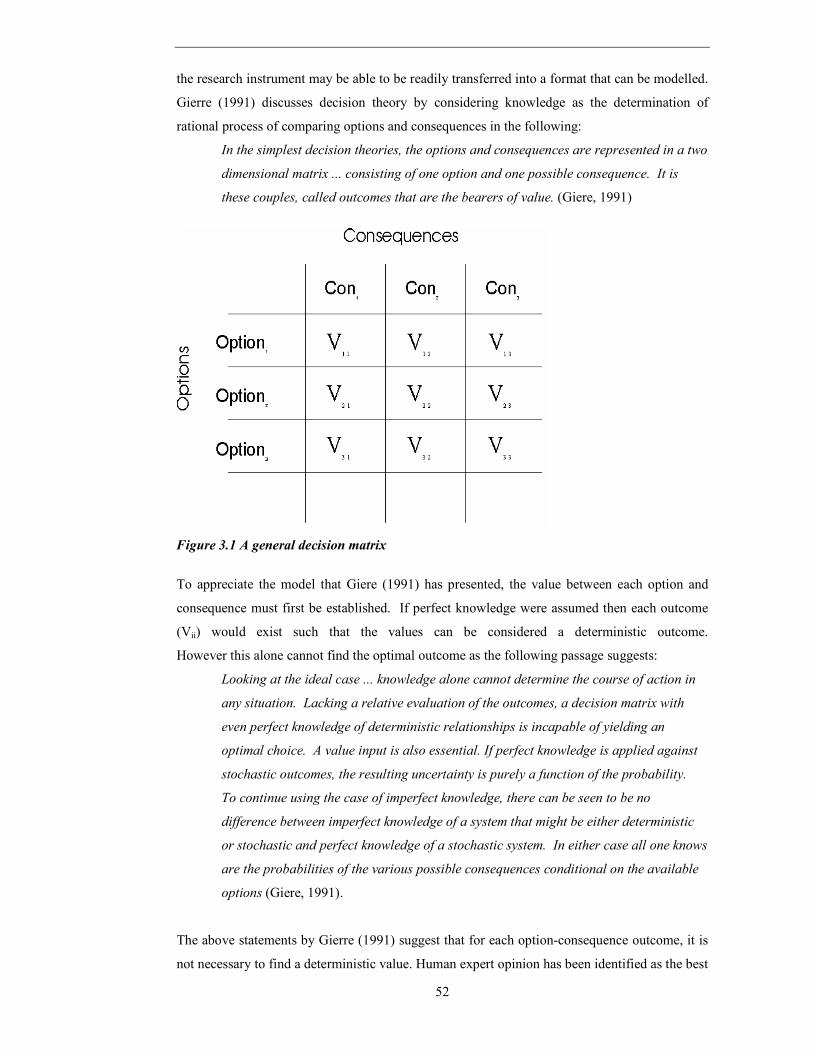
52
the research instrument may be able to be readily transferred into a format that can be modelled.
Gierre (1991) discusses decision theory by considering knowledge as the determination of
rational process of comparing options and consequences in the following:
In the simplest decision theories, the options and consequences are represented in a two
dimensional matrix ... consisting of one option and one possible consequence. It is
these couples, called outcomes that are the bearers of value. (Giere, 1991)
Figure 3.1 A general decision matrix
To appreciate the model that Giere (1991) has presented, the value between each option and
consequence must first be established. If perfect knowledge were assumed then each outcome
(Vii) would exist such that the values can be considered a deterministic outcome.
However this alone cannot find the optimal outcome as the following passage suggests:
Looking at the ideal case ... knowledge alone cannot determine the course of action in
any situation. Lacking a relative evaluation of the outcomes, a decision matrix with
even perfect knowledge of deterministic relationships is incapable of yielding an
optimal choice. A value input is also essential. If perfect knowledge is applied against
stochastic outcomes, the resulting uncertainty is purely a function of the probability.
To continue using the case of imperfect knowledge, there can be seen to be no
difference between imperfect knowledge of a system that might be either deterministic
or stochastic and perfect knowledge of a stochastic system. In either case all one knows
are the probabilities of the various possible consequences conditional on the available
options (Giere, 1991).
The above statements by Gierre (1991) suggest that for each option-consequence outcome, it is
not necessary to find a deterministic value. Human expert opinion has been identified as the best

53
source to establish the value content of matrix outcomes relative to each other.
Once all options, consequences and outcomes have been established to the best of scientific
knowledge there must be a comparison made. Under large uncertainty the Decision Theory has
three special cases described in the following:
• Complete Dominance, where one outcome value is superior to all others and is
clearly the preferred choice.
• Sufficiency, where it is not possible to find the best outcome, however one or more
options have outcome values judged sufficient and can all be judged acceptable.
• Cautionary, where it is possible to compare the lowest valued outcome for each
option and maximise from the set of options. This sets a lower value limit on the
total outcomes of the decision (Giere, 1991).
An investigation into the element relationship values for physical security can utilise the
decision matrix by considering all defence-type elements as options, and considering all attack-
type elements as consequences. Then determining the value outcome for each option-
consequence pair is possible by collecting expert opinion. Once matrices representing value
determinations have been created, a model combining these matrices can select values from
within the matrices based on each case description (Giere, 1991). The model that has been
proposed for this research combines a approach to using values in the matrices as described in
this section and is described in more detail in Chapter 6.
Using matrices to represent value assessments requires that the validity of the relationship
structure is suitably defined. Consideration of the functions of defence in depth within the main
research instrument identifies the following relationships:
PV(Detection ∫ evading) = [detection systems] X [stealth attack]
which can be read as the probability value for detection as a function of evading equals the
combination matrix for detection system and for force attack. Also;
PV(Detection ∫ disabling) = [detection systems] X [force attack]
which can be read as the probability value for detection as a function of disabling equals the
combination matrix for detection system and for stealth attack. Also;
PV(Delay ∫ breaking) = [barrier material] X [force attack]

54
which can be read as the probability value for delay as a function of breaking equals the
combination matrix for barrier material and for force attack. Also;
PV(Delay ∫ climbing) = [barrier height/topping/surface type] X [climbing attack]
which can be read as the probability value for detection as a function of disabling equals the
combination matrix for barrier height/topping/surface type and for climbing attack. Also;
PV(Response) = [response type] X [asset]
which can be read as the probability value for response equals the combination matrix for
response type and for asset.
3.4 Summary of theory
The theory that has been described in this chapter provides an introduction to the philosophical
considerations of the main research instrument and provides a sound base on which to interpret
the results of the research for modelling real-life scenarios from the knowledge structures.
Knowledge structures have been identified in theory and two models that have been considered
for this research are the “logical” model and the “proximal” model. Both have attributes from
their respective theory bases for a combination effect of these approaches to provide the
structure for a physical security hierarchy and the research instrument. These have been
identified in this study as defence in depth, relational descriptors and concept continuums.
The other term that has been identified and assessed for its theoretical relevance incorporates the
many physical security elements that have been identified as universal elements.
The important theoretical base of this research has been described in this chapter in reference to
the development of the hierarchical structure of physical security elements. The study has
established a theory behind the construction of the hierarchy in order to validate in a holistic
sense, results obtained from the research questionnaire. It is the questionnaire that determines
values for the relationship links between the elements and provides a knowledge structure that
represents human expert opinion in the field of physical security.

55
4 Research methodology
4.1 Introduction
This chapter provides a descriptive analysis of the experimental design with a primary focus on
the data collection instrument of the study. The experimental design is structured on ideas from
the literature review of the research that has acknowledged phenomenological sociology as the
most appropriate method of inquiry to achieve the research objectives. The method of inquiry
has suggested using linguistic accounts of individuals as well as interpretative understandings
(Smart, 1976). The research instrument described in this chapter consist of a two phase
approach that incorporates a preliminary series of in-depth interviews in a pilot study followed
by the main data collection by mail-out questionnaires to three specific groups of respondents.
The two phases developed for the purpose of data collection have been designated quasi-
qualitative, where the in-depth interviews provide a testing mechanism to determine the best
structure for data collection and the research questionnaire attempts to capture expert opinion.
The in-depth interviews were largely unstructured and provided insight into the way that
respondents were most likely to interpret their hierarchies of terminology that in turn reflected
their knowledge of physical security. The final questionnaire established an element relationship
measurement tool that enabled opinion based selections over a time based measurement scale
within a bounded structural hierarchy.
The study’s proposal initially identified three specific category groups of respondent prior to the
pilot study: Security Experts, Security Students, and Security Users. These category groups
have been discussed in more detail in this chapter as has the format of the questionnaire that
evolved after interviews with members of the group Security Students produced the pilot
study’s results. Comments were continually sought from respondents at all points of the data
collection process. The collection of comments provided an important means to identify
concerns in the data collection method as perceived by respondents to enable better
understanding of limitations and assumptions in developing the knowledge structures.
4.2 Philosophy of the instrument
The literature review in Chapter 2 discussed several proposals to incorporate both qualitative
and quantitative design into data collection. An attempt has been made to establish a moderate
position between qualitative and quantitative approaches in this research. It has been assumed
that a qualitative approach gains subjective views that are best captured in an unrestricted
narrative format over a small group of respondents, while quantitative results require higher
respondent numbers and can measure slight concept variations within a structured data format.

56
A qualitative assessment of a topic should therefore tend to provide more realism in the data
generalisation that represents experience and understanding. In contrast quantitative assessments
generally should provide greater statistical intuition with precision of measurement, although
assumptions will often be necessary to contend with real world complexities. The dichotomy of
either choosing a qualitative or quantitative approach (Tarr, 1992) to model physical security
concepts is the main reason behind the selection of phenomenological sociology as the method
of inquiry for this research. The resulting process suggests that a valid approach could consider
the phenomenon in terms of its elements and element relationships without specifying either a
qualitative or quantitative direction to data requirements.
The research of knowledge structures has investigated human cognitive processes across various
disciplines. In his investigation of the concept of learning through semantic memory (in the field
of astronomy), Smith (1984) reviews several contributions in literature including a description
of the “proximal” model of assessing knowledge structures and proposes several measures of
concept relatedness such as: methods of direct judgement, word association, and semantic
differential scales (Smith. 1984). His review is directly relevant to this research and is explained
further in this section.
The research proposal for this study had suggested that expert opinion would be the most
appropriate source to be able to capture a mix of both qualitative assessment and quantitative
assessment. The methodology in this research has attempted to combine a questionnaire format
to identify listed measures of concept relatedness. The extract below further clarifies the
foundation for the dimensional scales that have been presented in the research questionnaire to
assess expert opinion and to ultimately build a knowledge structure with complex element
relationships.
Spatial configurations of concepts in semantic memory are portrayed by
multidimensional scaling techniques, which derive structure with low dimensionality
from proximity data. A large number of studies have used spatial models to evaluate
cognitive structure …An important study by Nagy (1983) observed that different
methods for deriving matrices used on the same subjects, with the same set of concepts,
tend to produce similar relatedness matrices and hence similar structures.
Dimensional models represent concepts as points fitted in N-dimensional space such
that interpoint distances in the derived structure provide a best-fit for the interconcept
proximities in the original matrix
(Smith, 1984. P52).

57
The major indication from these extracts is that a knowledge structure can be considered as a
spatial mapping in semantic memory and should be able to display a degree of consensus
irrespective of the technique used. Smith (1984) has reported that the observations of different
methods for deriving matrices tended to produce similar relatedness matrices and similar
knowledge structures. The notion of a concept continuum is also revisited where he suggests
that spatial models involve a continuum of values for each dimension (Smith, 1984).
A further interpretation has been taken from Smith (1984) where a knowledge structure using
physical security terminology should be linked via propositional relations or relational
descriptors to create a common directional reference aspect for concepts. This linking
mechanism suggests a broader connecting framework for all elements within the hierarchy of
knowledge. The properties in this case that would define a relational descriptor would be those
permitting all elements to relate through a common measure in multidimensional space.
If the semantic measure is an action-on statement (Smith 1984) or has action-based properties
(i.e. properties of a verb), then each element can be conceptualised using time-based
multidimensional concept continuums relative to an action sequenced time measure.
The methods previously used to measure opinion have been discussed in Chapter 2 such as the
popular Likert scales and other attitude measurement scales. This research has instead designed
a customised logarithmic scale that is able to determine a relative order of magnitude based on a
semantic understanding of time. The custom scale used in the questionnaire allows the
respondent to choose time as a measurement option and caters relative fuzziness, where for
example the semantic use of the term seconds could equally mean two seconds or fifty seconds.
Arguably the most important attribute of time as a measurement indicator is that it allows for a
relative scale of magnitude to be established. As an example, the quantity that is represented by
the term seconds is very much smaller than the term days and much closer semantically to the
term minutes. The common terminology of time allows for an approximate quantification of
semantics, where each order of magnitude has a numerical approximation relative to other
terms. For an example the term hour is approximately 1/24 days or 3600 seconds and is also
equivalent to approximately 60 minutes. In a similar fuzzy way, the term hours can be
mathematically located somewhere in between 1/24 days to 1 day. Thus a semantic selection of
time assessing concept pairs can be graphed in nominal units (seconds) or alternatively by using
a natural logarithmic transformation to produce a linear time relation. Assessments that indicate
a relative increase in time or decrease in time have been presented in the questionnaire to
substitute for qualitative value consideration of an adjective pair continuum. These include
examples such as good-bad, or positive-negative as opposite points along a concept continuum
indicating the directional overall benefit to physical security.
58
An example is given where a physical barrier might be a wall that requires only seconds to
climb over which is of less overall benefit to physical security than a barrier such as a fence that
requires minutes to climb over. The labels of time have been presented in the questionnaire in an
attempt to standardise action-based assessments with a common unit of measurement over many
different concepts. The research acknowledges that the term seconds is the lowest semantic unit
of the time scale with each successive time value existing as a relative multiple of seconds.
The labels of time in semantic terms (e.g. seconds, minutes, hours, days, weeks, months, years)
are also measures that can consider likelihood as well as designating real time in a physical
sense. Alternative labels of time without a standard unifying measure have not selected for the
research questionnaire such as: now, soon, in a while, after a long time, and so on.
The distribution of time labels chosen for the questionnaire enables the relative structure of time
increments to signify relative importance. The importance is only able to be standardised after
determining whether the boundary condition considers a positive benefit in a security sense to
be associated with short time frames or long time frames. The fact that the common unit seconds
is a multiple in each of the time labels presented enables a logarithmic-linear scale to be
established for mathematical and statistical analysis where a relative order of magnitude of
universal elements can signify relative importance in benefiting physical security.
The use of defence in depth functions of delay, detection and response provide simple arbitrary
starting points for a physical security hierarchical structure and have be considered in detail in
Chapter 3. The selection of each of the action-based relational descriptors was very important
in the scheme of the questionnaire as it determined how many questions would be required to
relate to each of: delay, detection and response as primary functions of defence in depth.
This determination would provide the total number of independent sections in the questionnaire.
There were two relational descriptors chosen for the function of delay, two for the function of
detection and one for the function of response. The research questionnaire also applied three
additional relational descriptors to compliment the functions of defence in depth with asset,
attacker motivation and attack type. The additional relational descriptors were included in the
questionnaire to incorporate a complimentary attack consideration to defence in depth.
The pilot study acknowledged that the chosen action-based statements could be grouped with
synonyms of relational descriptors that could have equally been used to summarise the actions.
Thus delay includes the relational descriptors of breaking and climbing which could have been
equally interchanged for terms like “smashing” and “jumping”. It can be logically and
semantically argued that both verbs chosen to summarise delay cover a large range of
alternative actions that an attacker might feasibly use to counteract barriers however all
possibilities basically consider non-delay aspects that imply action through a facility’s barrier
system or going around a facility’s barrier system.

59
Garcia (2001) has supported the notion that providing non-detection concepts in preference to
defending-type actions is more appropriate for modelling analysis. It can be seen that the verb
pair for detection, presented in the questionnaire as evading and disabling, are semantically
related with the attack rather than the defence. Typically the measurement of detection
probability provides a manufacturer’s specification for detection, which is semantically related
to the function of defence. The measurement of detection in this manner assumes that the device
is able to work efficiently and effectively, and does not anticipate specific attack-type properties
for evading or disabling. In real life situations an attacking adversary is adaptive and therefore
semantically the evading or disabling of a working detection system is the most adaptive
response. These however are typically excluded in the measure of detection probability.
The verb elements in the questionnaire were specifically chosen to represent attacking-type
actions rather than defensive-type actions. This important distinction is supported by the fact
that attack is more irregular and naturally proactive in its effort to adapt to defence capabilities.
In contrast defence is more reactive and regular in its systems. The use of attacking-type verbs
may be in contrast to the way that standard device specifications are given in terms of
functionality. An attack on a facility could easily translate into an attack on a security device
and in this case the functionality of the device would be irrelevant if it has already been
compromised.
The verb elements used for response do not require an attacking-type action to be considered as
the concept of response is always a reactive type situation. The terms asset, attack type and
attacker motivation have not been assessed using action-based measures but instead consider
typical relational descriptors considering motivation, capability and opportunity.
4.3 Developing the instrument through the research design
The research proposal had suggested the original methodology of the study. This section
describes the step by step planning process of how the data would be collected. Figure 4.1 is a
flow-chart that has been identified from the research proposal and is an important for the
structure of this study in describing the approach used to collect data.

60
Figure 4.1 Methodology identifying stages and testing methods of the research
Identify in-depth-interview technique for collecting data
Investigate universal elements and semantic hierarchies of physical security terminology
using in-depth-interviews
Identify elements and semantic hierarchies from security science
students in a pilot study
Create a database of elements and potential hierarchies
Identify universal elements to establish the required semantic relationships for a physical
security knowledge mapping
Create questionnaires to determine elemental order of importance and
relative order of magnitude
Refine questionnaires to enable elemental relationship
(hierarchical) measurement
Collect data from respondents
Create standard profiles in database for respondent
groups
Test data and methodology for correctness from respondent
feedback
Define method of integration of qualitative and quantitative data
Test methodology and integration methods
Identify consensus of data to enable holistic physical security
decision modelling

61
The inclusion of testing at all stages of the methodology shown in Figure 4.1 is used in an
attempt to document instrument based assumptions from comments by respondents. The testing
of the methodology is meant to be a transparent process allowing respondents to input
comments together with data so that future replication of the study may include improvement in
the research instrument.
The methodology was effectively split into two phases. Phase 1 included the pilot study which
sought to identify and define the representative sets of elements of physical security through
in-depth interviews. The in-depth interviews were conducted with students enrolled in formal
tuition of a security science bachelor’s degree course. The pilot study was primarily a tool
designed to recognise and modify a potential universal element list for the questionnaire.
It presented an unstructured opportunity to determine how respondents organised elements
within a hierarchical framework to best represent their knowledge of physical security.
In order to determine the universal elements for the study, initial sets of elements were supplied
to the respondents as discussion lists. Common terminologies in physical security were
discussed and recorded in interviews with the participants.
Phase 2 of the research identified data collection through questionnaire to investigate the
relationships of elements based on relational descriptors and a series of concept continuums.
The methodology of Phase 2 included fixed boundary conditions and hierarchical structure of
universal elements. The relative order and the order of magnitude between these elements along
the continuum were assessed by respondents as opinion based values specifying physical
security benefit as interactions in time. The data collected from the questionnaires enabled a
series of profiles to be developed. The format of the questionnaire was able to collect data from
respondents to identify relative value assessments as a conceptual understanding of each
boundary condition through a measured format suitable for transformation into numeric data.
4.4 Population
Obtaining the data required for a conceptual mapping in physical security was a matter of
collecting large amounts of opinion-based assessments over the sets of elements listed in each
concept continuum. In considering the population that would have the best exposure to the
broadest uses of terminology in physical security, sources such as academic based knowledge
and industry based experience were targeted as were users of physical security technology.
Three subsets of the target population had been identified in the research proposal with each
capable of providing varying degrees of expert opinion to the relationship assessments of
physical security. The three groups were identified as Security Experts, Security Students and
Security Users. Each group’s individual expertise in physical security terminology is important

62
in order for a wide contribution of knowledge to determine an overall consensus within
boundary conditions of the research questionnaire.
Security expert respondents were targeted from within the university environment.
Security Students undertaking a bachelor’s degree course were recruited through seminar
presentations and Security Users were randomly recruited through interpersonal contact.
The defining method separating the group Security Experts from the group Security Students
considered a minimum requirement for completion of academic security science instruction.
Although any separation method is arbitrary, the composition of each of the groups is not as
vital as the ability of the different group profiles to be representative in overall comparisons
with each other through correlation techniques and ultimately support the notion of consensus.
The consensus of expert opinion involving combined category groups can translate into
knowledge structures and create “standard” profiles of knowledge.
For ethical issues in the collection and storage of data, the questionnaire was designed to be
anonymous for the most appropriate privacy requirements. The Statement of Disclosure that
accompanied the research questionnaires stated that the questionnaire was anonymous and made
a request for respondents not to enter their name or any other comments that would make them
identifiable. The Statement of Disclosure and the questionnaire are included in Appendix A.
The required collection of a large amount of opinion-based data toward obtaining a knowledge
structure meant that questionnaires would need to be long and complex. The inevitability that
busy people would decline involvement in the research suggested that a higher number of
participants should be targeted so that the number of completions would be adequate.
An arbitrary decision was made to limit the questionnaire length to approximately fifty minutes
to coincide with the hourly block requirements of a university environment. The complexity of
the data assessment and the terminology would also need to allow for an optimum number of
participants to comprehend the questionnaire’s requirements.
On the issue of sample sizes Green et al. (1988) suggest that sample size is related to the
precision of collected data. Some suggestions for determining sample size include; arbitrarily
determined, a minimum cell size, budget based, or by applying an error formula (Green, Tull &
Albaum, 1988, pp41). Given that the sample error in some statistical arrangements is related to
the square root of the sample number, for example, 5(2.2), 10(3.2), 15(3.9), it can be seen that
by using 25 respondents an argument for sample error estimate would be in the order of 5 or
20%. However as the research questionnaire is defined quasi-qualitative and because each
respondent’s viewpoint is deemed to be precise within the bounds of interpretation, an error of
20% is meaningless. In this case the number of respondents seems to be less important than the

63
ability to determine correlation and consensus between a number of individuals and between
groups. Thus the concept of sample error has not been a driving factor in deciding the
population and therefore more attention to detail has been considered in the questionnaire.
Further to the suggestion of Green et al. (1988) and together with the grouping of the
respondents into categories, the sample size has been chosen as an arbitrary number of 25
respondents.
In this research the group consisting of Security Students was the easiest to target in location as
they are generally located at a university campus. With practicality in mind, it was decided that
the majority of respondents would be targeted from this group. The final decision was that 60%
of respondents would be Security Students while the other two groups should contain similar
numbers to each other. Since Security Users have been more readily targeted from the
community, they were identified as the group least likely to provide a knowledge base that
would be convergent towards consensus for physical security element relationships.
The targeted population was the same as Security Experts at 20% of the composite group target.
The ability to locate and obtain input from Security Experts is limited in the community as their
population numbers are low and their expertise is highly desired.
The difference between the number of respondents identified for possibility and the number
projected for participation is given in Table 3.1. Of the groups chosen the non-return in the
Security Students group was considered to be the highest risk as this group were already
undertaking studies of their own and the questionnaire was most likely to become a low priority.
The expected return rate for the Security Students group was estimated at 33% while the
Security Experts and the Security Users return rate was expected to be closer to 50%.
Therefore the numbers of Security Students identified for interest was significantly higher than
the number projected for participation.
Table 4.1 Number of respondents targeted and the number required
Number of respondents
identified for possibility
Number of respondents
projected for participation
Phase 1 – pilot study
4 students targeted for possibility 4 students for participation
Phase 2 - research questionnaire
10 Security Experts targeted for possibility 5 Security Experts targeted for participation
45 Security Students targeted for possibility 15 Security Students required for participation
10 Security Users targeted for possibility 5 Security Users required for participation
64
4.4.1 Group 1: Security Experts
Persons fitting the title Security Experts may be found in the public sector, in the academic
sector and the private sector. In general the Security Expert group will have professional skills
in the assessment of risk and the management of risk and have a background of knowledge in
physical security terminology. It is expected that that could establish a relative order of
importance of terms and assess element relationships confidently and methodically.
4.4.2 Group 2: Security Students
Students from a bachelor’s degree course in Security Science were identified for Group 2.
The expert opinions of Security Students were expected to provide strong academic
understanding and knowledge of physical security terminology in a similar way to that of a
Security Expert. The level of difference in knowledge between a Security Student and a
Security Expert may be marginal however this was expected to exist within the extent of the
formal instruction received and the type of experience gained from terminology used in physical
security. Data collected from Security Students was expected to vary slightly from Security
Experts in terms of consistency and precision.
4.4.3 Group 3 Security Users
Security Users represented a group that dealt with the terminology of physical security from the
point of view of a purchaser or distributor of products of physical security. The group Security
Users was expected to represent the broadest range of opinion and demonstrate a lower level of
consensus in the range of their areas of expertise.
4.5 The Pilot study
The initial research proposal had identified that the universal elements of physical security be
determined and that an investigation of these elements would determine the best type of
framework for a knowledge structure to be constructed within the topic. A pilot study was
conducted in the form of in-depth interviews with four students undertaking tertiary study in the
field of security science.
The pilot study conducted investigations into the hierarchical nature of terminology associated
with physical security by direct interviews with respondents. It posed questions to participants
and recorded their replies as text using a purpose-built computer program (database) for
identifying hierarchical links. The recorded text was entered during the spoken interview and
arranged into the computer program as visually demonstrated hierarchies that best represented
each participant’s perception of the their structural knowledge of terminology. The final
hierarchical determination was checked visually by each participant at the termination of the in-
depth interview to reaffirm satisfaction with the computerised arrangement.

65
The method included simple spoken prompts during the interview that sought to identify nouns,
verbs and adjectives of physical security. Each prompt requested that participants identify
elements in their own perceived hierarchies of physical security terminology while considering
a scenario of a particular facility of their choice. Examples were suggested to them such as a
shop, a bank or a prison. Database separation of the responses into nouns, verbs and adjectives
was undertaken to allow the all terms to be considered for their linguistic and semantic qualities.
The research proposal had suggested that data collection methods for the research would require
an evolution of change through the entire process. In the pilot study, practicality allowed for 45
minutes of interview time with each participant. The participants were asked to provide
quantifiable or measurable parameters in a hierarchy for concepts of physical security.
The interview had to contend with subjective issues including each interviewee’s perceived
freedom in responding to the questions. This also included the interviewer’s prompts to provide
direction and guidance for each concept posed to the respondents. The first respondent’s data
showed very few repetitions or patterns that offered little likelihood of convergence toward
mapped knowledge. A formal list of boundary conditions was established after the first
respondent’s interview in an attempt to develop greater convergence in data sets. In order to
encourage hierarchical convergence toward a defined set of universal elements, the remaining
three participants of the pilot study were subsequently provided the formal list as conceptual
boundary conditions to consider.
The boundary conditions were established from the basic functions of defence in depth and were
as follows:
1. physically trying to stop an attacker from getting to an asset (delay),
2. determining if and when an attack is taking place with respect to physical security and an
asset (detection),
3. responding to an attack (response),
4. the asset,
5. the quality and quantity of resources available to the attacker.
The pilot study identified a wide range of physical security elements (n=241), and at the same
time identified that without convergence, the hierarchical structures of physical security would
provide adequately reduce complexity. A summary of the elements numbers determined from
the pilot study for each interview is available in Appendix B.

66
The pilot study collected 165 physical security noun-elements that would potentially expand to
infinitely larger numbers with additional interviews. The noun-elements collected from the pilot
study exhibited inconsistent grouping patterns which suggested endless possibilities for the
hierarchical structure of these elements. The indications from this finding was that although an
extensive list of nouns may be captured to describe a facility, a set of separate relational
descriptors would be needed in order for noun-elements to be adequately grouped or clustered
in hierarchical knowledge structures. The relational descriptors would need to be drawn from
either adjective-elements or verb-elements identified in the pilot study or from literature.
An analysis of the verbs that were determined by the pilot study recognised 8 specific action-
based measures covering the majority of concepts of attack. The pilot study recognised that
these verbs would present an ideal approach for relational descriptors in the questionnaire in
order to consider directional aspects for a physical security hierarchical structure of knowledge.
The verb-elements would therefore include the following: to break, to climb, to evade, to
disable, to respond, to be motivated, to be capable, and to have opportunity.
The adjective-element list that was identified from the pilot study was somewhat larger than the
corresponding range of verbs. A pattern emerged that identified pairs of adjectives as a potential
for optimising measurement in the questionnaire and also a means to provide quantifiable values
for terminology considerations. Approximately 49 adjective pairs were identified in the pilot
study. The pilot study highlighted that in order to be able to measure a value for the benefit of
physical security noun-element relationships, an adjective-element needed to be recognised as
either supporting attack on physical security or support defence of physical security.
The following list of 10 element adjectives was identified from the pilot study as the most likely
attack and defence measures for physical security assessments:
• good-poor,
• likely-unlikely,
• expensive-inexpensive,
• effective-ineffective,
• suitable-unsuitable,
• fast-slow,
• sensitive-insensitive,
• strong-weak,
• overt-covert,
• reliable-unreliable.
In summary the pilot study results suggested that noun-elements of physical security could be
related by action-based direction and then ordered and measured by adjective-elements within

67
appropriate physical security boundary conditions. Any nouns that were not included in the
study have the potential to be associated with at least one included noun with similar properties
on the continuum scale. An example that describes this is the comparison of a reinforced
concrete wall to a plain concrete wall. Both are similar enough to share similar properties for an
adjective pair continuum that could be represented as strong-weak. A different example could
be used for aluminium which would be more similar to wood in strength than steel on a
strength-related continuum; however both steel and aluminium are semantically closer as metals
in a material-related measurement continuum. Each noun-element could be associated to a
continuum whether listed in the questionnaire as a universal element or not and therefore
ordered in a hierarchical structure over an action-based assessment.
4.6 Interpretation of results of the pilot study
The implications of the pilot study suggested that each element of physical security was
appreciated by each respondent in their subjective multi-hierarchical knowledge structure.
The pilot study also suggested that a list of elements might be determined to be a set of
universal elements for a knowledge structure when used in conjunction with relational
descriptors. The pilot study indicated that if the hierarchical structure of elements could be held
constant with a boundary condition using relational descriptors as action-based measures, then
a small set of elements could be assessed for each boundary condition from expert opinion.
Common knowledge could be measured over each boundary condition when a set of relational
descriptors would effectively orientate a knowledge hierarchy direction (action) (Smith, 1984).
All action-based indicators would be verb-elements of physical security to determine noun-
element relationship links through a boundary condition in order to obtain convergence toward a
knowledge structure of elements and element relationships.
The most interesting finding of the pilot study was that a relatively low number of verbs could
be used for a large number of nouns and adjectives as concepts within physical security.
Of all verbs identified for this topic through the interviews of the pilot study; it was evident that
eight action-based measures were of special significance across the relationships of elements
within the topic of physical security. This set of action-based measures suggested a large
overlap in the number of element relationships within the topic of physical security.
Interpretations from the pilot study proposed that the relationship values could be determined
from eight questions representing eight action-based measures using an assessment of time (over
the duration of the action) to determine the desired value.
The design of the questionnaire has acknowledged several important considerations in the
research. The design sought to address several recognised problems apparent in the pilot study
and provide data in a form suitable to achieve the study goals. The following conclusions were
68
made on a theoretical level after the pilot study to extrapolate concepts from the pilot study to
the main research instrument and provide the best recognised format on which to investigate the
knowledge structures of physical security:
1. The eight verbs selected in the pilot study should be comprehensive in relating the extensive
list of noun-elements to each other within the concepts of defence in depth and each action
can be used to translate into values.
2. That an extensive number of elements, either listed in the questionnaire or from other
sources, should each be able to be included along a spectrum using a value measurement of
an adjective-element quality e.g. strong-weak.
3. That each respondent in a questionnaire could agree or disagree with the represented order
of elements in a spectrum of value measurement of a specific quality and provide reasons
for this decision.
4. That consensus of opinion can be determined for specific element pair relationships using
physical security verb-elements as the foundation of boundary conditions.
5. That the value of element relationship links would be determined on a time measurement
scales that could indicate on the scale either benefit to support attack on physical security,
or to support defence of physical security.
6. That feedback on the data collection methods is a necessary part of the knowledge structure
and a system for self adoption of suggested improvements will increase the method’s
validity.
The results of the pilot study are presented as Phase 1 of the data collection and have
determined the nature of the questionnaire. The format of the questionnaire has been limited by
the complexity required in extracting suitable data from respondents together with the
consideration of likelihood in the return rate of questionnaires from the targeted groups.
4.7 Modification to the instrument
For the main research instrument a questionnaire was designed with reference to the theoretical
framework of Chapter 3. This questionnaire was the primary instrument of data collection for
this research and as the primary source of data for the study it is also the primary source of error
within the study. All of the methods used to collect information from respondents have been
based on the framework presented. This discussion presents the techniques chosen to enable
measurement and to provide results that can be supported in general by the literature.
The questionnaire posed fifty questions in total to each respondent, eight of which were
complex. The fifty questions can be best divided into five categories based on the question type.
Each of these five categories has been considered separately in order to categorise relevance to
the research purpose. Full copies of the Research Questionnaire, the Answer Guide and the
Statement of Disclosure have been presented in Appendix A.

69
The use of eight concept based relational descriptors suggested by the pilot study has a
supporting parallel in a previous study with Aidman and Egan’s (1998) consideration of pre-
selected set of eight concepts derived from a domain of human perception (Aidman & Egan,
1998). These authors have explored expert knowledge as a computerized concept mapping and
recognised a set of eight concepts in cognitive psychology with a rationale for complexity that
stated if such a limited-size mapping can yield an acceptable level of discrimination between
learners, then the method is worth serious consideration for mapping more complex conceptual
structures (Aidman & Egan, 1998).
The questionnaire was divided into eight sections labelled Section A - H. Each of the eight
sections was based on a repetitive style template containing six questions. A final two questions
completed a total of fifty questions. The specific number of questions was chosen so that the
questionnaire could be completed in fifty minutes at a suggested rate of one question per
minute. The limiting factor determination the number of questions was considered to be the total
time requirement to complete the questionnaire which affected the likelihood of having
questionnaires completed and returned.
As stated previously and for the purpose of this section the description of all of the fifty
questions of the questionnaires have been discussed under five different category types of the
question which are:
1. The complex value assessment questions,
2. The questions evaluating the element scales used,
3. The questions evaluating the list of elements used,
4. The questions requiring comments on the element scales,
5. The questions evaluating the questionnaire method and research objectives.
4.7.1 The first question of each section considering complex value
assessments
The most complex question for each section of the questionnaire (Sections A-H) was the first
question of each section. This question requested that the respondent tick boxes in the
appropriate columns where they identified a value assessment of a qualitative time measure.
These qualitative time measures were listed and abbreviated as the following labels;
seconds (sec), minutes (min), hours (hrs), days (Da), weeks (We), months (Mo), years (Ye).
Each of the complex questions contained a preliminary description before the main question.
This description set up the framework for the relational descriptor to be applied to the question
and provided a common understanding for each value assessment required from the respondent.

70
This preliminary description forms the first part of the three part boundary condition that is
offered as an interpretive base for each section of the research questionnaire. For an example the
description preceding Question 1 of Section A has been included and reads as follows:
Two lists of elements are presented below. Both comprise a series of terms, which for
our purposes are called Sets 1-6. Sets 1-6 are based on the terminology of the concept
Attack and the verb Breaking. In particular they concentrate on the verb Breaking
within the concept of Delay. For further explanation of the terminology in Sets 1-6
please refer to the Definitions in the Answer Guide.
The two lists of elements referred to in the preliminary description contain universal elements of
this study and these are separated into columns of elements where Element 1 typically refers to
an attacking-type element and Element 2 typically refers to a defensive-type element.
The designations for Element 1 and Element 2 are continued in a similar manner throughout the
questionnaire. The terminology in the columns of Element 1 and Element 2 change throughout
the questionnaire with each new section and boundary condition, however there is also a small
degree of repetition between sections.
After the preliminary description the actual question forms the second part of the three part
boundary condition and requests input of time based value assessments with respect to an
action-based relational descriptor involving the Element 1 to Element 2 relationship.
For an example Question 1 of Section A has been included and reads as follows:
How long do you think it would take an attack of [Element 1] to break through an
[Element 2] barrier? Please complete for Sets 1-6 in the table below, checking your
answer in the appropriate column under “Estimated Time”.
The questionnaire next provides some supplementary notes for the respondent in order to
complete the third part of the boundary condition and avoid confusion in the selection of value
assessments to be made in the appropriate units for the measurement of time. The example of
Q1 is as follows:
Note the following:
− In this instance increased “time” represents better defence.
− It is appreciated that a wide range of time values could be used as answers, in
these cases please choose a value that would represent your initial thoughts of a
typical scenario for each.
− Please try to choose one of the listed “time” values (for further information please
see the Answer Guide).

71
The supplementary notes suggest that a typical scenario should be considered by each
respondent in order to best estimate in time units their value assessment for the question.
Aside from the given boundary condition and the listed element sets, no other information is
available for each question throughout the questionnaire. Although the Answer Guide provides
additional information for clarity; it does provide further clarification for making value
assessments or indicate a correct way for respondents interpret the terminology in the Element 1
and Element 2 lists. The Answer Guide provides a brief overview of the research objectives,
states the risks and benefits of the research, outlines the scale of measurement that has been
presented including the time value labels, and most importantly it states that there are no wrong
concepts and that all opinions are valid and valuable.
The terminology of both Element 1 and Element 2 lists have been provided in an arbitrarily
ordered scale, ranked along a concept continuum with six elements in each scale. The concept
continuum for Question 1 of Section A presents an Element 1 list in increasing order of
attacking force, where this means that the term explosive has a greater breaking ability than oxy
cutting, which has a greater breaking ability than an electric drill, than an axe, than a hammer
and finally than a rock. The opposing concept continuum (conceptually orthogonal) for
Question 1 in Section A presents the Element 2 list in increasing order of strength, where this
means that the term steel has a greater strength than concrete, which has a greater strength than
brick, than wood, than glass and finally than earth. The effective number of terminology pairs
for each complex question presented a six by six matrix requiring 36 values in total to be
assessed. Respondents were requested to make a selection for all of the 36 element
combinations by ticking a box in the appropriate column representing one of the qualitative time
indicators for each.
In the example of supplementary notes for Question 1 of Section A, the time scale presents a
directional measure for defence of physical security where increased time represents better
defence. As previously stated in this section, the time scale allows for relative value assessments
representing the expert opinion of the respondent.
Each question requiring complex value assessments in the questionnaire have presented
arbitrarily ordered lists of universal elements representing proxy reference levels along a
continuum of the concept. Within each complex question the final ranked order of the various
terms is suggested to be common understanding; however this ranking of the concept continuum
through the knowledge structure creates an individual knowledge profile for each respondent.
The remaining five questions within each of the Sections A-H ask the respondent to comment
on their level of agreement with the originally presented order of the scales of element lists.
These questions seek to determine an opinion of the proposal to hierarchically order terms.

72
4.7.2 The hierarchical structure of the universal elements
As described in Chapter 2, the phenomenological approach seeks to make a determination of the
universal elements of the phenomenon. A list of universal elements was identified for this
research; combining both sources from literature and considerations from the pilot study.
For the purpose of this research 60 elements have been chosen with 30 elements representing
the defensive-type terminology of physical security and 30 elements representing the attacking-
type terminology of a security threat. It is proposed by this research that the 60 elements
presented are universal elements of the phenomenon and can represent the phenomenon with
their elemental relationships.
Figure 4.2, Figure 4.3 and Figure 4.4 are provided to assist in the conceptualisation of the
structure of the elements in a theoretical hierarchy used for the research instrument.
The individual levels in the hierarchy have been designated by numbers within circles.
The numbers within the circles correspond to the structural level that represents a horizontal link
across the hierarchy. In these figures some of the boxes containing elements have been heavily
bolded at their border. This bold bordering highlights the defensive-type elements as simple
reference points that may be selected to represent a facility. The elements boxes without bold
borders represent attacking-type elements that influence the choice of defensive-type elements.
Delay Response
Risk Factors of physical security
Detection
Relational descriptor - evading
detection systems (continuum)stealth attack (continuum)
Relational descriptor - disabling
detection systems (continuum)force attack (continuum)
Stealth attack
LuckCreate false alarmsSmokeColour camouflageSystem knowledgeKnowledge & diversion
Relational descriptor - motivation
asset (continuum)attacker motivation (continuum)
Detection systems
Multiple systemsMicrowaveInfraredCCTVMobile human guardChance detection
Force attack
AccidentalPhysical intimidationElectrical interferenceCut powerViolent destructionExplosive
Relational descriptor - motivation
asset (continuum)attacker motivation (continuum)
1
2
3
3
4
2
3
Delay Response
Risk Factors of physical security
Detection
Relational descriptor - evading
detection systems (continuum)stealth attack (continuum)
Relational descriptor - disabling
detection systems (continuum)force attack (continuum)
Stealth attack
LuckCreate false alarmsSmokeColour camouflageSystem knowledgeKnowledge & diversion
Relational descriptor - motivation
asset (continuum)attacker motivation (continuum)
Detection systems
Multiple systemsMicrowaveInfraredCCTVMobile human guardChance detection
Force attack
AccidentalPhysical intimidationElectrical interferenceCut powerViolent destructionExplosive
Relational descriptor - motivation
asset (continuum)attacker motivation (continuum)
1
2
3
2
3
3
4
3
4
2
3
2
3
Figure 4.2 Detection terminology showing element level hierarchy

73
Relational descriptor - motivation
asset (continuum)attacker motivation (continuum)
Relational descriptor - motivation
asset (continuum)attacker motivation (continuum)
Relational descriptor - breaking
material strength (continuum)force attack (continuum)
Relational descriptor - climbing
barrier dimensions (continuum)climbing attack (continuum)
Delay Detection Response
Barrier dimensions & type
5 human high smooth brick wall + razor wire5 human high smooth brick wall5 human high steel small mesh fence3 human high smooth brick wall3 human high steel small mesh fence3 human high steel large mesh fence
1
2
3
2
3
3
4
Risk Factors of physical security
Climbing attack
No aidropeladderclimbing aidsprojectiles & wireflight assisted
Material strength
glasswoodearthbrickconcretesteel
Force attack
rockhammeraxeelectric drilloxy cuttingexplosive
Relational descriptor - motivation
asset (continuum)attacker motivation (continuum)
Relational descriptor - motivation
asset (continuum)attacker motivation (continuum)
Relational descriptor - breaking
material strength (continuum)force attack (continuum)
Relational descriptor - climbing
barrier dimensions (continuum)climbing attack (continuum)
Delay Detection Response
Barrier dimensions & type
5 human high smooth brick wall + razor wire5 human high smooth brick wall5 human high steel small mesh fence3 human high smooth brick wall3 human high steel small mesh fence3 human high steel large mesh fence
1
2
3
2
3
3
4
Risk Factors of physical security
Climbing attack
No aidropeladderclimbing aidsprojectiles & wireflight assisted
Material strength
glasswoodearthbrickconcretesteel
Force attack
rockhammeraxeelectric drilloxy cuttingexplosive
Figure 4.3 Delay terminology showing element level hierarchy
Figure 4.4 Response terminology showing element level hierarchy
Asset low value goods small cash personal valuables corporate data large cash human life
Response type high tech armed police insurance security patrol general public
Relational descriptor - responding asset (continuum) response type (continuum)
2
3
3
4
Delay Detection Response 1
Risk Factors of physical security
Asset low value goods small cash personal valuables corporate data large cash human life
Response type high tech armed police insurance security patrol general public
Relational descriptor - responding asset (continuum) response type (continuum)
2
3
2
3
3
4
Response Detection Delay 1
Risk Factors of physical security

74
4.7.3 The second through to the sixth question in each section
The second and third questions throughout Sections A-H identify the ranking of the presented
elements and comprise two parts that are designated parts a) and b). The fourth and fifth
questions in each section ask for modification to the ranked order of the listed elements.
The sixth question of each section asks for specific comments about the method used. The final
two questions of the questionnaire request comments about the objectives of the research.
Part a) for both the second and the third question of each section request a clear Yes or No
response to identify general agreement amongst respondents with their perception of the
presented ranking of elements in the scale.
The following part b) to each question asks the respondent to state a reason to justify the answer
in part a). This combination gives the respondent an opportunity to object to the scales presented
as well as the overall concept of ranking elements over a concept. This request for feedback
attempts to capture qualitative opinion that may assist in identifying limitations in the method
and further investigates the items of importance in conceptualising physical security scenarios.
The fourth and fifth questions in Sections A-H consider the ranked elements again and ask
respondents to modify, delete or add to the elements listed in the order that signifies their
preferred listing. It is proposed by this research that the elements listed as proxy values can also
be used as group headings to enable other similar but unlisted elements to be used for value
based comparisons in a physical security scenario.
As the universal elements of the research are used to develop simple reference levels over the
scale for each concept continuum, it was deemed to be important to also consider other possible
elements outside the presented element lists. The questionnaire attempts to broaden the
applicability of its presented list of elements by providing a means for respondents to suggest
new elements that approximate a similar scale location in the order of their preference.
The purpose of this part of the questionnaire is to give respondents the ability to modify the list
so that they can determine an alternate representative list of universal elements.
The sixth question of each Section A-H requests that the respondent provide comments on
specific aspects of the method used in the questionnaire. This series of questions initially allows
respondents to validate the information that the questionnaire has requested and to secondly
supply additional information that they feel should be stated to further qualify their responses
including perceived difficulties or frustrations that were identified within the research method.

75
The main purpose of the sixth question in each of the Sections A-H, was to obtain feedback
criteria for the method. This was recognised as beneficial regardless of whether the comments
received were positively biased or negatively biased overall. The critical commentary that this
section of the questionnaire requested from respondents forms a basis for justification and
consensus in the study.
The final two questions of the questionnaire request that the respondent provide comments on
whether they believed the objectives of the research were achievable and if they believed these
objectives could be practical in relation to real-life facilities. These questions provided
respondents with the opportunity to compliment their value assessments for each section with
other comments or overall opinion about the information that they have supplied. The opinion
on whether the respondents believe this research to be relevant to real-life issues provides an
insight into areas of concerns for a subjective system that includes decision makers.
4.8 Reliability and Validity
The reliability and validity of this study is important to establish with all data originating from
the main research instrument. A discussion on these concepts and how they are related to the
notion of consensus will provide a better indication of how the study is able to demonstrate both
precision and realism in its results.
Each respondent chosen for the study is a source for some degree of bias and error.
An overall consideration of the combined results will assume that the range of bias over the
entire group can be represented over the time scale using value assessments. This distribution of
opinion may exhibit normalised shaped curves or other statistical shape of value assessment
depending on how common knowledge is appreciated over each boundary condition by different
groups of respondents. The shape of the distribution was not considered as important as
identifying the range of viewpoints and acknowledging the most commonly held viewpoint.
For the purpose of this research a normalised shape is assumed, where evenly distributed
selections of value about the mean should be evident with increased target numbers.
This research contends that irrespective of the shape, the statistical combination of the results of
all respondents can provide a statistical mean and standard deviation that suggest a degree of
consensus. The statistical mean has been chosen to represent the moderate viewpoint towards
consensus with the standard deviation representing the strength of the degree of consensus.
While these selections are arbitrary, the data in Chapter 5 considers the validity of their
selection and describes the justification process where both provide strong indications for
consensus.

76
While other statistical considerations can also represent viewpoints of consensus, such as the
statistical median and the mode, the difference between the median and the mean is an absence
of the weighting of deviation to either side of the moderate viewpoint. The statistical mean
provides a moderate viewpoint allowing for the weight of opinion to skew its value toward the
majority. In reality all of these measures should be suitable to compare relative differences in
value assessments between element pair combinations.
The method that has been proposed to check large lists of numbers against a standard list is
computerised correlation. The function enabling this correlation is able to assess the variance
between correlating value items on two separate lists. The resulting correlation is able to assess
the total degree of similarity in two large comparative lists. The correlation used in this research
has been identified from the following statistical comparison.
Equation 4.1:
ρx,y = Coυ(X,Y) / σx . σy
Where -1 ≤ ρxy ≤ 1
And Coυ (X,Y) = 1/n Σ (xi – µx)(yi – µy)
(For this research all correlations are made using the MicroSoft Excel function CORREL in
version Office 2000.)
As long as the statistical measures chosen for determining consensus are consistent, relative
differences from one list to another should remain evident and provide an indication of
similarity. The standard profile of a group of respondents will be the combined statistical mean
for each value assessment over each of the Sections A-H. The correlation method is to be used
to assess each “standard profile” against the remaining groups using their own combined value
assessments to determine the degree of consensus for each “standard profile”. This correlation
method is also able to check individual respondents against their specific group profile and
against the other group profiles.
By correlating the various group profiles against each other and correlating individual’s profiles
against the group profiles, the degree of consensus can best determine the final knowledge
structure of physical security over the boundary conditions. This knowledge structure then
effectively represents a preferential ordering of element relationship values along continuums to
indicate the overall relative benefit to security.

77
The consideration within the research instrument to demonstrate reliability and validity is
important to gain confidence in the development of the knowledge structure and therefore the
overall results. Some guidance in this area has been taken from Armstrong and Peile (2005) who
consider standards that adhere to the following high level principles.
• impartiality,
• objectivity,
• repeatability,
• reproducibility,
• validity, and
• accuracy.
(Armstrong & Peile, 2005)
In their work Armstrong and Peile (2005) suggest impartiality is achieved when results are free
from bias. In the research questionnaire individual bias is collected purposefully as each
completed dataset represents the individual opinion of a respondent. It is unavoidable that
individual opinion is subjective and bias is inherent. The combination of datasets across groups
is able to demonstrate a complete range of bias and can indicate that impartiality can be
considered as the point where moderate opinion is the greatest for consensus purposes.
Objectivity requires that the evaluation of results be free from subjective judgement or opinion
(Armstrong & Peile, 2005). For this study the research has considered all input to be quasi-
qualitative judgement, therefore all data is subjective judgement and opinion. An analysis of this
range of opinion provides the resulting standard profiles with a statistical mean value
representing consensus opinion. An acknowledgement of the range of opinion within the
consensus allows the interpretation of the results to consider both extreme and moderate
viewpoints as the best possible way to realise objectivity in development of the knowledge
structure.
Repeatability requires that similar overall results should be seen from the same respondent
during any repeat evaluations of the same questionnaire (Armstrong & Peile, 2005).
This study acknowledges that time considerations for individual element pair combinations may
change slightly for a given respondent completing the questionnaire on a different day.
It is expected that the order and order of magnitude of values along a continuum should remain
relatively stable as characteristic pattern as long as a person’s knowledge is not altered.
Therefore with the relative order of consideration unlikely to change, the statistical results for
element pair relations should always remain relatively constant. Repeatability for this study is
demonstrated by the consistency of ordering of universal elements along a concept continuum.

78
Questions seeking an individual’s critical assessments along the concept continuum have been
as a cross-referenced by the second and third question of each Section A-H parts a) and b).
Reproducibility considers that a similar result should be obtained from a different respondent
considering the same questionnaire (Armstrong & Peile, 2005). The order and order of
magnitude of values for element considerations along a continuum will reflect a person’s
knowledge and understanding of the element pair relationships. Statistical means used for the
element pair relations correlation between group profiles become important. Reproducibility for
this study is the ability for individual results to be compared to the consensus of the relative
ordering of universal elements along a concept continuum.
Validity requires that evaluations of the questionnaire produce the most likely forms of value in
a realistic set of conditions (Armstrong & Peile, 2005). The answer guide to the questionnaire
has stated that for all responses that there are no wrong concepts and that all opinions are valid
and valuable. This statement underlines one of the main assumptions of the study.
This assumption is that all expert opinion is valid and that instinct provides the best assessment
in all cases. The reason for this assumption is that consensus should include both extreme and
moderate viewpoints. This approach therefore contains the most realistic and holistic
consideration of the phenomenon.
Accuracy requires precision and rigour to minimise unintentional interpretations. Accuracy is
considered at the point of the boundary condition that states: It is appreciated that a wide range
of time values could be used as answers, in these cases please choose a value that would
represent your initial thoughts of a typical scenario for each (Armstrong & Peile, 2005).
Accuracy in this case is left to a determination of the respondent however with some basic
guidance from the questionnaire.
4.9 Concluding remarks
This chapter has provided a description of the experimental design and the data collection
method of the study. The phenomenological approach seeks a combined emphasis between
qualitative and quantitative understanding of a topic and has determined that expert opinion is
the best source of data for the research. The quasi-qualitative assessment of the topic of physical
security will investigate terminology toward the process of obtaining a knowledge structure
through a combination of methods. The linking mechanisms required for a semantic mapping of
physical security elements in the knowledge structure will be achieved through opinion-based
value assessments over sets of elements represented along concept continuums.

79
The respondents for the research questionnaire have been chosen from three target population
groups: Security Experts, Security Students, and Security Users. A pilot study was undertaken
with in-depth interviews to refine the main research instrument of the study and has suggested
that hierarchical grouping of elements could be related by action-based statements.
Concept continuums were introduced into the questionnaire to provide a mechanism by which
universal elements could be identified and related over a dimension. A method for value
assessment for each element pair relationship has been recognised within appropriate physical
security boundary conditions. In order to provide directional indications and overall benefit to
physical security on the continuum, the chosen scale uses time relative to each action statement.
The questionnaire was constructed into eight sections labelled Section A-H. Each section was
based on a repetitive template style of questioning with each containing six questions and a final
two questions numbering fifty in total. The questionnaires have been described in five main
category types based on the question requirements in each section which include: the complex
value assessment questions, the questions evaluating the element scales used, the questions
evaluating the list of elements used, the questions requiring comments on the element scales;
and the questions evaluating the questionnaire method and research objectives.
The reliability and validity of the research instrument has also been discussed. A computerised
correlating function can be applied to the value lists determined for each respondent as their
individual profile. These profiles contain values that can also be combined into group profiles
which become standard profiles. The correlation method can be applied over the different
groups to determine the overall degree of consensus.

80
5 Results
5.1 Introduction
This chapter contains the results of the research and main emphasis of the study. The results
have been presented in two sections including the processing of the raw data and the analysis of
the processed data. These two sections are arranged so that the results originating from the
research instrument can demonstrate an achievement of the objectives of the study.
The questionnaire developed for the study is the primary data source and it is necessary to
demonstrate reliability and validity which extends from the expert opinion at the collection
point to the analysis and the presented interpretations.
The initial considerations for this chapter require processing of the raw data. The physical path
of the data can be identified from the respondent via the questionnaire into the custom built
database used for storage and formatting. The processing and transformation of data starting
from quasi-qualitative into numerical for analysis has been completed using a semantic-
equivalence transformation rule. The processing of data also considers the comments of
respondents which compliment the study’s reliability and checking mechanisms. The processing
of data summarises comments of the questionnaire for their relevance to the method in terms of
recognising concerns arising out of the relative ordering inconsistencies of the universal
elements and considers extended element lists for each concept continuum.
The analysis of the processed data considers two separate stages in order to demonstrate the
objectives of the study. The first stage identifies simplified knowledge structures by
constructing data sets as semantically mapped matrices. These are structured for each section of
the questionnaire as two grouped lists of universal elements presented over orthogonal concept
continuums. The knowledge matrices contain values that consider element pairs and represent
universal element relationships. This study presents a list of raw value assessments for each
individual to establish a profile for that individual. Additionally by using statistical averaging a
group of individual profiles is able to construct a group profile. In order to develop a group
profile, the statistical mean over each element pair relationship within a group of respondents
has been used to combine value assessments. In this research the statistical mean represents a
centralised point of opinion that displays good properties for demonstrating a degree of
consensus.
The second stage of the analysis of the data considers the ability to demonstrate consensus.
The technique of correlation is used to demonstrate how both individual and group profiles that
have been directly compared with each other, are able to support the notion of consensus.

81
The relative degree of consensus is able to be demonstrated through correlation as profiles are
compared against a standard profile in order to establish the degree of variation among both
groups and individuals. A single “standard profile” has been considered by combining the three
group profiles into a composite profile. The correlations recorded over the different group
profiles suggest that there is a relatively high consensus in the data collected by the research.
This method demonstrates that the information within the knowledge matrices is valid to a high
degree and exhibits reliability with completely independent groups able to correlate strongly
with each other. The degree of consensus is also able to establish that the values within the
knowledge matrices are representative of common knowledge in the field of physical security.
The study has determined that the composite group profile representing the all groups of
respondents provides the highest degree of consensus as the “standard profile”. This composite
group profile has been used to provide the content for the values in each of the final knowledge
matrices for each section of the questionnaire. This outcome is identified as one of the required
objectives of the study.
5.2 Processing the raw data
In this study all information was collected from respondents through the send-out questionnaire
package containing the questionnaire, an introductory letter, a statement of disclosure, a page of
definitions and a stamped self addressed envelope. The questionnaires were sent out to potential
respondents in target numbers based on pre-defined group categories. Table 5.1 provides an
indication for the total number of returned questionnaires (n) including total returns from the
group of Security Students (SS), total returns from the group of Security Experts (SE) and total
returns from the group of Security Users (SU).
Table 5.1 The Returned questionnaires summarised by group
Group SE Group SS Group SU Total (n)
Target numbers 5 15 5 25
Questionnaires sent 10 46 10 66
Actual Questionnaires returned 5 14 7 26
Rate of return 50% 30% 70% 39%
Although the rate of return from the group Security Students was lower than the other two
groups, this was not unexpected as a more impersonal recruitment style was conducted.
The other two groups were recruited with a more personal contact style and a better return rate
was evident. The numbers of questionnaires returned was close to predicted target numbers.
Questionnaires were coded prior to being sent out to respondents with each group code
indicating whether the participant belonged to the Security Expert group, the Security Student

82
group, or the Security User group. Upon receiving completed questionnaires through the post, a
formal logging system recorded details of all Sections A-H. The information was retrieved from
the questionnaires and transcribed from its physical format into a computer database through a
custom built interface that visually replicated the presentation of the questionnaire.
5.2.1 Processing of complex questions
In Chapter 4 it was noted that the first question in each of the eight sections of the questionnaire
was of a complex nature. For sections A-H of the questionnaire, each of these complex
questions directly compared a six element list (Element 1) with a corresponding six element list
(Element 2). Each respondent was asked to consider a one to one relationship for each element
pair to provide a total of thirty six value assessments per section. For each of these value
assessments, respondents were required to provide an indication by marking the appropriate
columns identifying each element pair to represent their initial thoughts using a selection of time
indicators. Boundary conditions were outlined for each section to provide a reference direction
for indicating value to imply an overall benefit to physical security. In summary Questions 1, 7,
13, 19, 25, 31, 37 and 43 were transcribed into eight corresponding database matrices each with
thirty six value assessments representing element pair relationships. As a result of this process
288 element relationship values were available to be assigned for each respondent profile.
All parts of the research questionnaire contained terminology based on common language and
common understanding. The study assumed that each respondent was able to comprehend the
lists presented to them in the context supplied by the boundary conditions to make their
appropriate value assessments. Each respondent’s knowledge structure profile in the field of
physical security was expected to differ slightly based on occupational exposure, academic
instruction and general experience; however this wide range of accumulated difference was
expected to provide an overall umbrella of knowledge for a conceptual mapping of the topic.
The assumption that all respondents would be able to understand the terminology and agree to
the tasks of the questionnaire did not hold for the entire range of assessments with a small
number of respondents omitting values in sections of the questionnaire. Overall the rate of full
completion of the questionnaires was very good. Often additional information was included by
respondents to provide explanatory notes to rationalise their value assessment choices.
For each respondent the 288 potential value indications collected from Questions 1, 7, 13, 19,
25, 31, 37 and 43 in the questionnaire have been designated as quasi-qualitative data.
For the purpose of this research, respondents were required to make comparative judgements in
quantitative assessments, though not in the manner of more common multiple choice
questionnaires, but rather to consider conceptual relationship based values of universal
elements. For this reason a series of qualitative representations of time were chosen as the scale

83
representing the labels and increments for value assessments of each relationship and these
include seconds, minutes, hours, days, weeks, months, and years. These may all be interpreted
as fuzzy time increments. In considering an element-element relationship and a boundary
condition, the respondent’s qualitative appreciation of the boundary condition is sought in order
to select a time based value. As the respondents were requested to provide time indications that
would best indicate their initial thoughts, they are interpreting the boundary conditions.
For the complex questions of the questionnaire the direction of time always implied some
overall benefit to security. For Questions 1, 7, 19, 31, 37 and 43, increased time implied better
defence of security and for Questions 13 and 25 decreased time implied better defence of
security. The questionnaire did not require respondents to differentiate reasons for choosing the
time values. For the purpose of this study, time has either represented an indication of relative
likelihood in overall benefit to security for each element combination or an actual “time”
approximated action event sequence. This research considers that both representations provide a
relative indication of elemental relationships between universal elements and are therefore both
equally valid. For each of the respondents, the 288 value assessments indicate a relative profile
as an overall benefit to security.
A quasi-qualitative to quantitative transformation was applied to each of the 288 value
assessments within the database for each of the 26 respondent profiles. An equivalent numerical
value was created for each fuzzy time indications in the questionnaire by applying the quasi-
qualitative to quantitative transformation methods presented in Transformation rule 5.1,
Transformation rule 5.2 and Transformation rule 5.3 with the results displayed in Table 5.2.
It should be noted from Table 5.2 that the quantitative time indications are exponential in nature.
In order to develop linear relationships to assist this research, Table 5.2 has applied the natural
logarithms for time estimations (mathematically represented as ln T). It should also be noted for
the purposes of conceptual mapping that arbitrarily setting time at its minimum semantic value
is able to demonstrate a relative ranked order between the values of element relationships.
For all relationships in Table 5.2, the minimum semantic quantitative equivalence designated as
secondsmin has been used.
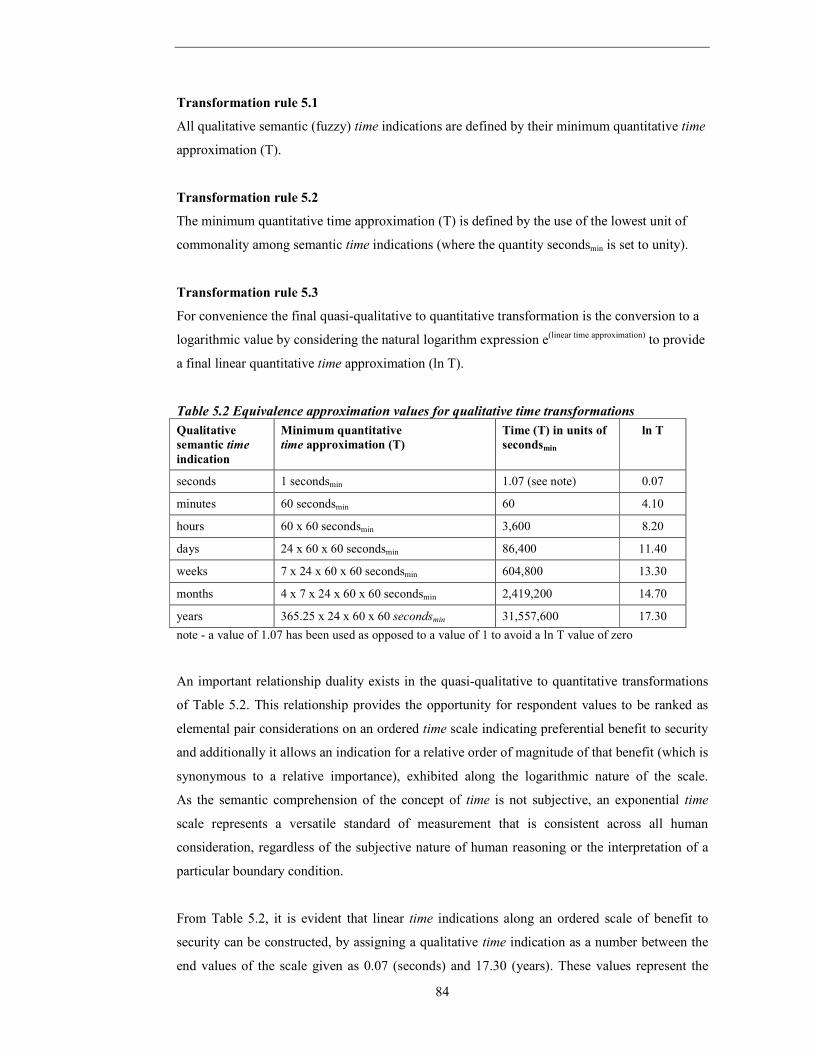
84
Transformation rule 5.1
All qualitative semantic (fuzzy) time indications are defined by their minimum quantitative time
approximation (T).
Transformation rule 5.2
The minimum quantitative time approximation (T) is defined by the use of the lowest unit of
commonality among semantic time indications (where the quantity secondsmin is set to unity).
Transformation rule 5.3
For convenience the final quasi-qualitative to quantitative transformation is the conversion to a
logarithmic value by considering the natural logarithm expression e(linear time approximation) to provide
a final linear quantitative time approximation (ln T).
Table 5.2 Equivalence approximation values for qualitative time transformations
Qualitative
semantic time
indication
Minimum quantitative
time approximation (T)
Time (T) in units of
secondsmin
ln T
seconds 1 secondsmin 1.07 (see note) 0.07
minutes 60 secondsmin 60 4.10
hours 60 x 60 secondsmin 3,600 8.20
days 24 x 60 x 60 secondsmin 86,400 11.40
weeks 7 x 24 x 60 x 60 secondsmin 604,800 13.30
months 4 x 7 x 24 x 60 x 60 secondsmin 2,419,200 14.70
years 365.25 x 24 x 60 x 60 secondsmin 31,557,600 17.30
note - a value of 1.07 has been used as opposed to a value of 1 to avoid a ln T value of zero
An important relationship duality exists in the quasi-qualitative to quantitative transformations
of Table 5.2. This relationship provides the opportunity for respondent values to be ranked as
elemental pair considerations on an ordered time scale indicating preferential benefit to security
and additionally it allows an indication for a relative order of magnitude of that benefit (which is
synonymous to a relative importance), exhibited along the logarithmic nature of the scale.
As the semantic comprehension of the concept of time is not subjective, an exponential time
scale represents a versatile standard of measurement that is consistent across all human
consideration, regardless of the subjective nature of human reasoning or the interpretation of a
particular boundary condition.
From Table 5.2, it is evident that linear time indications along an ordered scale of benefit to
security can be constructed, by assigning a qualitative time indication as a number between the
end values of the scale given as 0.07 (seconds) and 17.30 (years). These values represent the

85
useful boundaries of the time scale over the concept continuum for typical real-life physical
security considerations. In setting minimum semantic representative levels for arbitrary time
indications, a relative conceptual understanding between values should remain valid as the order
of magnitude between all time values will remain relative to the interpretation of secondsmin.
For example; the term weeks is set to its minimum representative value of 604,800 secondsmin
and is valid up to 2,419,200 secondsmin before the next semantic term months becomes more
appropriate in common understanding.
A combined table of the transformed data from Questions 1, 7, 13, 19, 25, 31, 37 and 43 was
completed for all value assessments over each respondent. Sections A-H of the questionnaire
can therefore be represented by 288 rows from the database across a list of 26 respondent
columns. The final table produced includes three labelled columns specifying Element 1,
Element 2, and the relational descriptor from the boundary condition for each relationship
assessment in Sections A-H.
5.2.2 Processing of non-complex questions
The remaining non-complex questions of the questionnaire were directed at the respondent’s
level of agreement with the element lists presented in the questionnaire as well as the level of
agreement with the techniques used to collect information. Transferring this information from
the questionnaire into the custom-built database required several format types including
comments, agreement/disagreement indicators and adjustable lists for any new elements for the
extended universal elements lists. Within each of the Sections A-H of the questionnaire the non-
complex questions (second, third, fourth, fifth, and sixth question) have been used to establish
respondent perception of the research validity.
The study attempted to collect a number of additional non-listed elements to construct a
complimentary membership to the universal elements listed in the questionnaire. The structure
of using universal elements as simple reference points over a concept continuum in which to
consider an overall benefit to security through ranking requires the dimension to be assessed by
each respondent, in order to critique the relationship measurements of the research.
The questionnaire presented universal elements in ordered scales based on the dimensions of
each concept continuum and boundary condition. Feedback from respondents has regarded the
sets of universal elements of the research, and has validated and extended the presented lists.
Respondents were free to provide any comments that they perceived to be important in the
consideration of these scales. For demonstration purposes Sections A will be briefly considered
in the body of this text with summaries considering the universal elements. Table 5.3 identifies
a summary for the remainder of Sections A-H located within the Appendices.

86
Table 5.3: A summary of the second to fifth questions of each of Sections A-H located within
the Appendices
Section of Questionnaire Appendix containing summary of the comments and
indications
Section A, Questions 2-5 Appendix C1
Section B, Questions 8-11 Appendix C2
Section C, Questions 14-17 Appendix C3
Section D, Questions 20-23 Appendix C4
Section E, Questions 26-29 Appendix C5
Section F, Questions 32-35 Appendix C6
Section G, Questions 38-41 Appendix C7
Section H, Questions 44-47 Appendix C8
Table 5.4: A summary of the sixth question of each of Sections A-H located within the
Appendices
Section of Questionnaire Appendix containing summary of the comments
Section A, Question 6 Appendix D1.
Section B, Question 12 Appendix D2
Section C, Question 18 Appendix D3
Section D, Question 24 Appendix D4
Section E, Question 30 Appendix D5
Section F, Question 36 Appendix D6
Section G, Question 42 Appendix D7
Section H, Question 48 Appendix D8
Question 49 Appendix D9
Question 50 Appendix D10
The comments concerning Section A from respondents provide some insight into the value
assessments that have been recorded in Question 1 of the questionnaire in considering element
pair combinations and relationships. The conceptual ordering of the selected elements into lists
presents a semantic challenge as a simple agreed order of terminology does not exist in
collective knowledge. Exceptions to the rule will inevitably present some contentious variation
in the absolute ranking of the order of latent variables. Despite the potential for exceptions
Table 5.5 and Table 5.7 both show high levels of acceptance among respondents to the ordered
lists presented with 71% agreement and 82% agreement respectively. Table 5.5 considered
elements along the concept continuum used in a force attack for the action statement breaking
and Table 5.7 considered elements over the concept continuum used for material strength for
the same action statement.
Comments received from respondents mainly indicated general agreement toward the ranked
order of elements listed however as can be seen in Table 5.5 and Table 5.7, some respondents
have indicated that the questionnaire did not supply enough specific information to suit their

87
preference when making these assessments. The overall implications of comments made by
respondents identified concern with the lack of specific information supplied with the boundary
conditions. This problem forms part of the original issues with modelling, where it would be
unfeasible and equally impractical to supply sufficient specific information for each
respondent’s requirements over each value assessment in a basic questionnaire. This leads to the
necessity of the research presenting a “general” case and requiring respondents to consider a
“general” solution when providing their element pair assessments. This “general” case suggests
that the many unspecified details for proper consideration in a particular judgement, needed to
be substituted through expertise and experience. Therefore the “general” case becomes heavily
moderated through respondent intuition and instinct. This research has assumed that experience
and other similar methods can provide valid distillation of real-world complexity.
It is this proposed “general” case that the research has considered as a means for reducing
complexity. It should be understood that each indication considering the “general” case will be
quite subjective and valid only within the confines of a single human knowledge structure.
However the combined consideration over an entire range of subjective and relative indications,
finds the resulting “general” cases providing value assessments that create a commonly
understood conceptual map of relationships in physical security terminology.
Further to considerations for the general case scenario, the identification of a definitive order
ranking the elements is not as important to this research as the understanding of the dimensional
magnitude of the element relationships. The order of the ranked elements provides a simple
overview of a scale while dimensional values indicate where the fuzzy edges of uncertainty may
exist for most scenarios. The elements listed in this research can be considered as true universal
elements when they are based on simple reference levels as an overview of a concept
continuum. The issue of whether these elements are slightly out of order or are mostly correct in
their rankings can be determined through the consideration of questionnaire value assessments
over paired element rankings along each corresponding and “orthogonal” dimension of a
boundary condition.
Table 5.5 demonstrates that for several respondents some uncertainty exists about the potential
order between an electric drill compared to a hammer and an axe. As there are complicating
factors that may be manifest in ranking these items, it is likely that individual “general” cases
may identify different comparisons. Respondents have identified that electric drills require
mains power or an alternative mobile power source, while axe and hammer are human powered.
Similarly hammer and axe work best against material structures of lower strength while electric
drills can work better against stronger based material structures but usually in a more localised
area. Many other complicating factors exist and it is beyond the scope of this research to discuss

88
them however it is the summary of comments from all respondents that form a library
presenting examples of these complicating factors for future consideration.
An example of an element that was particularly seen as a poor fit into a ranked order for several
respondent’s “general” case scenarios, was the element of oxy cutting. This element shows more
affinity to metallic type substances than ceramic type substances for the action statement
breaking. This indication by a reasonable number of respondents points to a need to continue
with additional iterations of a modified questionnaire to better understand this element.
Ideally additional iterations would be able to construct additional levels of hierarchy for many
of the universal elements where fuzziness exists in their ranking.
While it is beyond the scope of this research to provide additional iterations of the questionnaire
in order to improve the presented hierarchical structure of elements, if additional levels of
hierarchy were introduced through additional iterations of the questionnaire, this study’s method
should provide a framework for improvement to the results obtained. One of the objectives of
this research is to highlight suggestions from the comments of respondents, where this process
may provide a better degree of consensus and reduce complexity.
The results from Table 5.7 suggest that the strength and available quantity of any barrier is
likely to be directly proportional to the cost of materials. The respondents in the study have
generally agreed to the questionnaire’s suggestion that barrier strength is proportional to the cost
of material. This provides a suggestion to identify whether the requirement for modelling is
performance dependent or dependent on budget limitations. The consideration of cost for a
physical security scenario will in most cases be a simple calculation involving the quantities of
each of the physical security elements multiplied over a defined region as a cost per unit area.
Other cost factors that may affect this calculation include running and maintenance costs to the
physical security elements.
As indicated in Table 5.7 many respondents have also indicated from their comments that the
density and thickness need to be better established for more accurate value assessments.
This suggests the inclusion of additional iterations of the questionnaire and additional levels of
hierarchy to consider the effect of various densities and thicknesses on material strengths.
The extended list of elements has been compiled from the various respondents’ suggestions and
has been presented to indicate the potential for new elements to be added to the universal
elements listed and thus provide more reference points over the concept continuum.
The extended lists are presented in Table 5.6 and Table 5.8 where it is evident that the list of
extended elements provides a rich set of alternatives to the listed universal elements.

89
In both Table 5.6 and Table 5.8 the extended list suggests elements in more than one position of
ranked order. This would most likely indicate that the elements operate at a range of
effectiveness and this further suggests that a fuzzy ranking for each of these elements is
appropriate. In cases such as these, more specific information seems necessary and a
consideration of a lower order of hierarchy may be useful to better understand the fuzzy range
and its dependencies. The best examples of this from Table 5.6 are a jackhammer and diamond
tipped electric cutter, while for Table 5.8 examples of this include concrete and brick walls.
This study acknowledges that the lists of universal elements are not comprehensive lists of data
representing the dimensions of the concept continuum, however as simple reference levels along
each dimension they have been relatively successful in generating agreement among
respondents.
Table 5.5 Section A, Sets 1-6 Element 1: Considering question 2a and 2b of the questionnaire Question 2a: Consensus of agreement from “security experts” and “security students” groups
71% agreement for the presented ranked order from the least force to the greatest force downwards. Question 2b: Summary of comments on the presented rank order by
frequency of comment
Comment made Number of
Respondents (n)
General agreement in their comments. 10 The application of oxy cutting was specific to metal and would not be applicable on the other type materials e.g. brick, earth.
6
All tools worked differently for different materials which made assessment difficult.
3
Concern that an electric drill my not have the force of a hammer or an axe. 3 The lack of specific information made this assessment difficult e.g. unknown thickness of materials, weight of attack item, force of blow, speed of drill, etc.
1
The chemical structure needed to be assessed during the interaction when the tools were used.
1
Table 5.6 Section A, Sets 1-6 Element 1: Considering question 4 of the questionnaire Elements in
rank order
Question 4: Respondent’s extended and amended element members in rank order
rock knife, shovel, hand, fist, screwdriver, rock size, rock shape, hammer crow bar, bar/rod, hand, metal pole, air pressure hammer chisel, bat, chisel, what type of hammer, size & weight will make a difference power, sledge hammer, sledgehammer axe mallet, saw, bolt cutter, what size & type of axe, jackhammer hydraulic, hack saw electric drill tin snips, ((electric drill)) chain saw, angle grinder, handgun, what type of drill e.g. size &
speed & type of drill bit, oxy cutting diamond tipped electric cutter, O2 gas, electric saw oxy cutting jack hammer, ((oxy cutting)) sledge hammer, ((oxy cutting)) jackhammer, laser, what
type of oxy gas & tips used, car ram raid diamond tipped electric cutter, motor car explosive bomb, what type of explosive *((elements)) in double brackets signify suggested removal from that position in the list order.

90
Table 5.7 Section A, Sets 1-6 Element 2: Considering question 3a and 3b of the questionnaire Question 3a: Consensus of agreement from “security experts” and “security students” groups
82% agreement for the presented ranked order from the least material strength to the greatest material strength downwards. Question 3b: Summary of comments on the presented rank order by
frequency of comment
Comment made Number of
Respondents (n)
General agreement in their comments. 5 The thickness/density needed to be stated for different materials to make a better assessment of strength.
3
All tools worked differently for different materials which made assessment difficult.
3
Unsure about the inclusion of earth in the list. 3 The lack of specific information made this assessment difficult e.g. type of glass, type of wood, solid jarrah or ply, etc.
3
The order between concrete and steel may be swapped. 2 The order would be close between wood and brick. 1
Table 5.8 Section A, Sets 1-6 Element 2: Considering question 5 of the questionnaire Listed
Elements in
rank order
Question 5: Respondent’s extended and amended element members in rank order
earth no barrier, no barrier, paper, dirt, clay, glass sliding door, impaction of earth, no barrier wood glass window, window, glass, glass (normal), Perspex, plastic, window, strength, window safety glass, wire mesh, limestone wood door, plasterboard, door, ice, brick wall, tiles, tin roof, what type solid jarrah or plywood,
door bullet proof glass, colourbond fence, security mesh brick gyprock wall, wire fence, wood, concrete wall, brick and concrete are kind of similar,
wall, what type solid brick or verticore, brick wall composites concrete wall, brick wall, brick, steel, walls are generally more expensive than fences, plain
concrete or reinforced, concrete wall reinforced concretes steel wire mesh fence, ((steel)) reinforced concrete, concrete, reinforced concrete, thickness,
steel plated wall *((elements)) in double brackets signify suggested removal from that position in the list order.
Table 5.9 considers the final question in Section A. The questionnaire attempts to gauge
agreement from respondents in accepting an alternative list of elements as potential substitutes
for the presented universal elements. This alternative list provides the basis for extending the
universal element lists and also provides the basis for conceptualising the universal elements as
simple reference levels on a dimensional scale representing the concept continuums.
Table 5.9 displays general agreement from respondents to the suggestion of replacing the list.
Several respondents indicated the alternate list was more appropriate to real-world examples.
There was only a minor lack of agreement to Question 6. A comparison suggesting the
consideration of the Australian Standard provides an alternate list that may substitute for the
chosen universal elements.
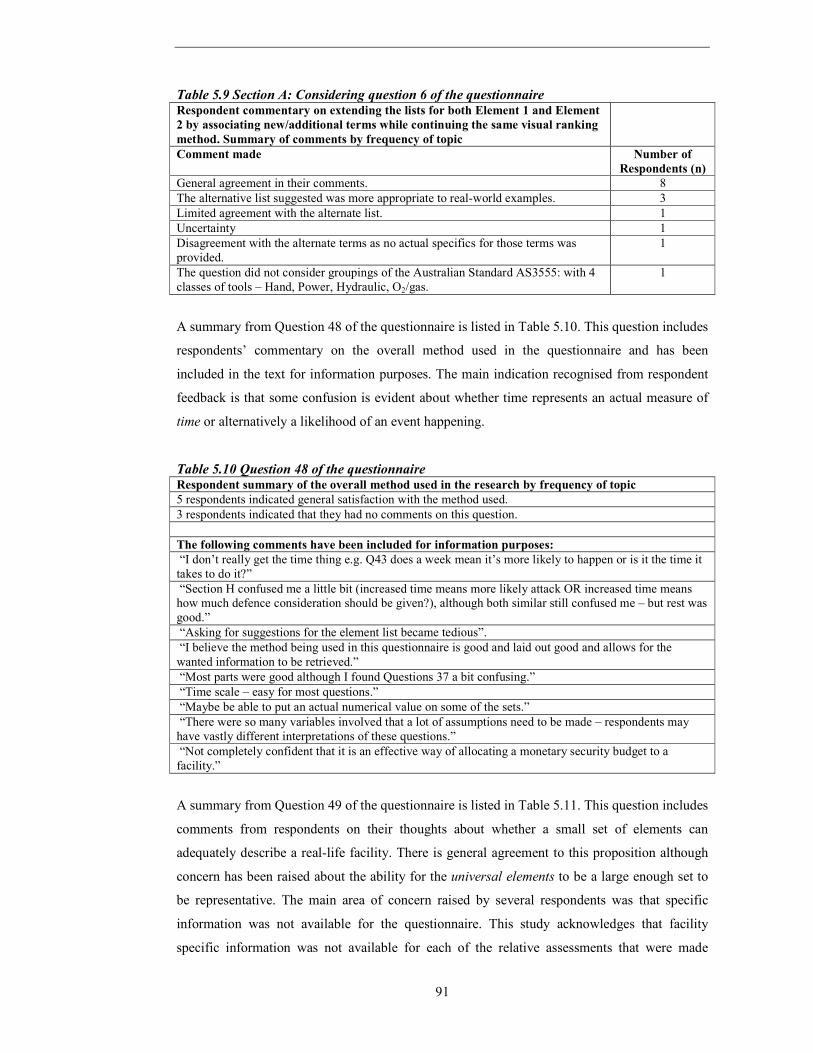
91
Table 5.9 Section A: Considering question 6 of the questionnaire Respondent commentary on extending the lists for both Element 1 and Element
2 by associating new/additional terms while continuing the same visual ranking
method. Summary of comments by frequency of topic
Comment made Number of
Respondents (n)
General agreement in their comments. 8 The alternative list suggested was more appropriate to real-world examples. 3 Limited agreement with the alternate list. 1 Uncertainty 1 Disagreement with the alternate terms as no actual specifics for those terms was provided.
1
The question did not consider groupings of the Australian Standard AS3555: with 4 classes of tools – Hand, Power, Hydraulic, O2/gas.
1
A summary from Question 48 of the questionnaire is listed in Table 5.10. This question includes
respondents’ commentary on the overall method used in the questionnaire and has been
included in the text for information purposes. The main indication recognised from respondent
feedback is that some confusion is evident about whether time represents an actual measure of
time or alternatively a likelihood of an event happening.
Table 5.10 Question 48 of the questionnaire Respondent summary of the overall method used in the research by frequency of topic
5 respondents indicated general satisfaction with the method used. 3 respondents indicated that they had no comments on this question. The following comments have been included for information purposes:
“I don’t really get the time thing e.g. Q43 does a week mean it’s more likely to happen or is it the time it takes to do it?” “Section H confused me a little bit (increased time means more likely attack OR increased time means how much defence consideration should be given?), although both similar still confused me – but rest was good.” “Asking for suggestions for the element list became tedious”. “I believe the method being used in this questionnaire is good and laid out good and allows for the wanted information to be retrieved.” “Most parts were good although I found Questions 37 a bit confusing.” “Time scale – easy for most questions.” “Maybe be able to put an actual numerical value on some of the sets.” “There were so many variables involved that a lot of assumptions need to be made – respondents may have vastly different interpretations of these questions.” “Not completely confident that it is an effective way of allocating a monetary security budget to a facility.”
A summary from Question 49 of the questionnaire is listed in Table 5.11. This question includes
comments from respondents on their thoughts about whether a small set of elements can
adequately describe a real-life facility. There is general agreement to this proposition although
concern has been raised about the ability for the universal elements to be a large enough set to
be representative. The main area of concern raised by several respondents was that specific
information was not available for the questionnaire. This study acknowledges that facility
specific information was not available for each of the relative assessments that were made

92
however an assumption of the study considers that a “general” case is appropriate within the
research boundary conditions.
Table 5.11 Question 49 of the questionnaire Respondent commentary on the proposition of whether a small set of elements (such as those in the
questionnaire) can adequately describe a real-life facility. Summary of comments received by frequency of topic
9 respondents indicated general agreement with the proposition. 4 respondents indicated that they did not agree with the proposition. 3 respondents indicated reduced agreement with the proposition and suggested that the lists as provided would not be large enough. The following comments have been included for information purposes:
“No not really, always depends on the situation, and different variables and everyone has to be thinking at the same level.” “Yes, though it may need to be tailored to individual facilities to ensure that the terms are accurate and that everything necessary is covered.” “No – some would fall outside the scope of the categories.” “How small is small. I feel that the list provided would not be large enough, but expand to say 10, and then OK.”
A summary from Question 50 is listed in Table 5.12. This question includes comments from
respondents on their thoughts about whether a small set of elements, such as those in the
questionnaire, can adequately describe the physical security of a real-life facility.
There is general agreement to this proposition although concern has been raised about the ability
for the universal elements to be a large enough set to be representative. A similar set of concerns
were received for this question as those for Question 49.
Table 5.12 Question 50 of the questionnaire Respondent commentary on the proposition of whether a small set of elements (such as those in the
questionnaire) can adequately describe the physical security of a real-life facility. Summary of
comments received by frequency of topic
8 respondents indicated general agreement with the proposition. 3 respondents indicated that they did not agree with the proposition. 3 respondents indicated reduced agreement with the proposition and suggested that the lists as provided would not be large enough. 1 respondent indicated that they were uncertain. The following comments have been included for information purposes:
“No, because every situation will have different variables.” “Yes and no. Used as guide yes but maybe not for an in-depth analysis.” “Not quite, needs to be more in depth, will provide a good general idea of what risks there are and where physical security may be required, but hard to be specific.” “Yes, but once again they should be customised for each building or facility.”
A general indication from the comments received for Question 49 and Question 50, suggests
that the model would not be able to be specific enough in situation based scenarios.
Although these comments raise an important consideration for the model, it is worth pointing
out that the universal elements are representing reference points along each concept continuum
mapped by the framework that has supported this research. This study proposes that the list of
universal elements is able to be representative for all situation based scenarios as a relative scale

93
when they are used as simple reference points. This can subsequently be used to determine
value for extended lists of elements that arise in specific environments.
Several questions within the questionnaire have required respondent feedback and have
provided a validation of the elemental lists and the method used to obtain the data. Respondents
have provided a series of comments that have been considered as a summary within the text to
give indication of the strengths and weaknesses of the research.
5.3 Analysis of the data
The analysis of the data collected in the complex questions of the research questionnaire will be
considered to represent knowledge structures for this research. The analysis will consider two
separate stages in order to best conceptualise a mapping of the universal elements of physical
security. The first stage will identify the matrices that will be used to represent knowledge
structures. These knowledge matrices in this first stage will indicate a directional benefit to
physical security based on ranked ordering of universal elements over orthogonal concept
continuums for a specific boundary condition. These matrices are based on value assessments
from expert opinion and are presented in order to meet the objectives of the study.
The second stage will aim to demonstrate validity for the knowledge matrices to suggest that
they are representative of a consensus of expert opinion. This second stage will attempt to
demonstrate the degree of consensus by conducting correlation measures on universal element
relationship value assessment profiles. The correlations assess the similarity comparisons
between different profiles and have been applied for individuals, for each category group and
against the composite group of respondents.
The raw data also provides a profile for each respondent consisting of a list of 288 values.
The 288 values that make up each profile consist of eight sections of 36 element pair
relationship assessments. A series of the profiles for each of the 26 individual respondents can
be viewed in full in Appendix E.

94
5.3.1 Stage 1: Creation of knowledge matrices
To investigate the potential for consensus various combinations and statistical interpretations of
respondent’s profiles can be considered. Table 5.13 provides an example for the results from
Section A of the questionnaire in this text, where the orthogonal concept continuums are
designated as Element 1 (force attack) and Element 2 (material strength). The boundary
condition for Section A considers the action statement breaking and indicates that increased
time represents better physical security defence. Table 5.13 demonstrates that different
statistical indicators can be applied over the combined data from all respondents where n=26.
The full set of tables representing each Section A-H of the study can be viewed in Appendix F.
Table 5.13 Statistical indicators of combined values for Section A considering time based
relationship assessments between Element 1 and Element 2 for n=26 respondents Section A, Question 1 – considering the action
statement “breaking” MEAN MEDIAN MODE
ST
DEV
Element 1 Element 2
explosive glass 0.07 0.07 0.07 0.00 explosive wood 0.07 0.07 0.07 0.00 explosive brick 0.22 0.07 0.07 0.79 explosive earth 0.22 0.07 0.07 0.79 explosive concrete 0.38 0.07 0.07 1.10 explosive steel 1.00 0.07 0.07 1.73 electric drill earth 0.53 0.07 0.07 1.31 electric drill glass 0.69 0.07 0.07 1.48 electric drill wood 1.47 0.07 0.07 2.55 electric drill brick 4.04 4.10 4.10 3.56 electric drill concrete 5.34 4.10 4.10 3.72 electric drill steel 6.69 6.15 4.10 4.02 oxy cutting glass 1.62 0.07 0.07 2.00 oxy cutting wood 3.18 4.10 0.07 3.10 oxy cutting steel 3.57 4.10 4.10 3.01 oxy cutting earth 3.99 0.07 0.07 5.49 oxy cutting brick 8.50 8.20 8.20 4.94 oxy cutting concrete 9.03 8.20 8.20 5.07 axe glass 0.07 0.07 0.07 0.00 axe earth 1.04 0.07 0.07 2.82 axe brick 5.05 4.10 4.10 2.66 axe wood 5.45 4.10 4.10 5.24 axe concrete 8.07 8.20 8.20 3.35 axe steel 12.27 13.30 14.70 3.51 hammer glass 0.24 0.07 0.07 0.82 hammer earth 0.91 0.07 0.07 2.06 hammer wood 4.62 4.10 4.10 2.19 hammer brick 5.09 4.10 4.10 2.66 hammer concrete 8.58 8.20 8.20 3.06 hammer steel 13.47 14.70 17.30 3.55 rock glass 0.07 0.07 0.07 0.00 rock earth 0.73 0.07 0.07 2.68 rock wood 7.73 8.20 8.20 1.34 rock brick 10.87 11.40 11.40 1.63 rock concrete 14.52 14.70 14.70 0.69 rock steel 17.30 17.30 17.30 0.00

95
The statistical indicators that have been listed in Table 5.13 include the mean, median, mode
and standard deviation for each element pair. Other indicators could also be considered here
such as the absolute maximum and minimum values. This research will argue that the use of
statistical indicators to achieve an indication for the degree of consensus in the data is also a
proper method to judge the validity and reliability of the data. The indicators used to gauge
consensus have been presented in Table 5.13 and in particular the values for the statistical mean
(indicated in bold font) are considered by this research to be the best indicator for consensus.
In working toward the common meaning of consensus as identified in Chapter 1, this study’s
objective implies obtaining a collective opinion or developing a standard of agreement.
Where a collective opinion can be identified over the subject area, this will inevitably include
both moderate and extreme points of view along the many relevant conceptual dimensions.
A common point of view for each relationship structure can be developed into a series of
standard reference points for agreement purposes, where the more extreme points of view would
surround a centralised reference point. The weight of expert opinion can also be interpreted as a
consideration of the most commonly held points of view. As can be seen in Table 5.13 the
mean, median and the mode all provide different indications of a more central opinion of a
collective group of values. The arbitrary selection of the statistical mean as the preferred
indicator towards consensus for this research enables a distributed weighting over the collective
opinion towards an optimum centralised point. The standard profile of agreement is presented as
the optimum common viewpoint consisting of mean value opinions for consensus.
The standard deviation in Table 5.13 is also useful as an indicator to determine the variation of
agreement from the centralised points of opinion as indicated by the mean, median and mode.
In this study the standard deviation is established as a rough indicator for the overall degree of
consensus. For example, where a large spread of opinion is evident from a large standard
deviation, this indicates that a particular element pair relationship may be fuzzy in its
comprehension. The usefulness of the standard deviation as an indicator may be applicable in
various ways including highlighting the potential for future hierarchical considerations to assess
fuzzy universal elements. The standard deviation may also be used in this research in
conjunction with the correlation technique as a basic indicator to check the consistency of the
results which would indicate a high degree of consensus.
The creation of relationship matrices presents an achievement as part of the objectives of the
study. The list of statistical means presented in Table 5.13 can also be rearranged into a single 6
by 6 matrix format. This can be completed for each Section A-H of the research with special
consideration given to the relative ordering of the elements along each concept continuum
through an overall value averaging process. The resulting matrices contain values for universal

96
elements specified in concept continuums that represent an overall directional benefit to security
for these elements. The final matrices representing a conceptual mapping of the universal
element of this study as knowledge structures for each Section A-H are considered in
Table 5.14 which lists the appendix locations. Each of the knowledge matrices presented in
Appendices G1-G8 are constructed from the statistical means over the composite group of all
respondents.
Table 5.14 A list showing the location of the knowledge matrices representing a conceptual
mapping for the research over the specified boundary conditions
Section of Questionnaire Relational descriptor Appendix containing knowledge
matrix
Section A breaking Appendix G1. Section B climbing Appendix G2
Section C evading Appendix G3
Section D disabling Appendix G4 Section E responding Appendix G5
Section F motivation by asset Appendix G6
Section G attack method by motivation Appendix G7 Section H attack method by asset Appendix G8
Table 5.15 has been included to provide an example of the matrix format of value assessments
determined for Section A as one of the objectives of the study. As well as the value assessments,
some additional information is included in the matrix giving an averaged value for each element
across the 6 corresponding orthogonal concept continuum elements and an indication of the
range (presented in brackets) over the orthogonal concept continuum elements. An example for
Section A considers steel and averages several statistical mean values over the orthogonal
values for rock, hammer, axe, oxy cutting, electric drill, and explosive. This creates a relative
ordering for steel with an average value of 9.07 along the concept continuum of material
strength. The benefits in providing this additional averaging are; firstly it allows the universal
elements along the concept continuum to be ordered according to these averaged values and
secondly, it provides a “general” case value when the type of attack on steel may be unknown.
Thus for Table 8 the correct relationship rank ordering of the elements is steel (9.05), concrete
(7.65), brick (5.63), wood (3.75), earth (1.24), and glass (0.46).
For Table 5.15 the matrix has been arranged by order of increasing ranked benefit to physical
security with the highest values represented in the top left hand corner. The ranked order of each
continuum is averaged over the orthogonally considered concept continuum indicated for force
attack and material strength and listed in the second column and the second row respectively.
The labels of the universal elements are also included for each concept continuum.

97
Table 5.15:A Relative relationship mapping (in ranked order) indicating the concept
continuums of force measured against strength for the action statement breaking (Section A). force attack rock hammer axe oxy cutting electric
drill
explosive
material
strength
Avg of means
over 6
elements
(range)
8.54
(0.07-17.30)
5.49
(0.24-13.47)
5.33
(0.07-12.27)
4.98
(1.62-9.03)
3.13
(0.53-6.69)
0.33
(0.07-1.00)
steel 9.05
(1.00 – 17.30) 17.30 13.47 12.27 3.57 6.69 1.00
concrete 7.65
(0.38 – 14.52) 14.52 8.58 8.07 9.03 5.34 0.38
brick 5.63
(0.22 – 10.87) 10.87 5.09 5.05 8.50 4.04 0.22
wood 3.75
(0.07 – 7.73) 7.73 4.62 5.45 3.18 1.47 0.07
earth 1.24
(0.22 – 3.99) 0.73 0.91 1.04 3.99 0.53 0.22
glass 0.46
(0.07 – 1.62) 0.07 0.24 0.07 1.62 0.69 0.07
Table 5.15 presents an example for this thesis of mapped element relationships as an outcome of
the research instrument in order to meet the objectives of the study. This particular knowledge
structure represented for Section A identifies the defence in depth function of delay, and has the
boundary condition determined by the relational descriptor considering breaking.
Measurement of expert opinion along the orthogonal concept continuums of force attack and
material strength provides a conceptual mapping which has established relative indications of
importance to overall benefit for physical security.
5.3.2 Stage 2: Determination of consensus
The second stage of the analysis of the data includes an evaluation of consensus by the
technique of correlation. The evaluation is conducted over all 288 value assessments as a single
profile and seeks the relative amount of similarity in the list when comparing a range of profiles.
Each group profile has independent membership and the composite group profile combines all
respondent profiles. High similarity in correlation is evident in all group profiles for this
research which suggest a High degree of consensus. Profiles for individual respondents have
also been considered against group profiles to gauge the overall range for the degrees of
consensus evident. A justification for the meaning of a High degree of consensus is further
explored in this section.
In applying considerations for validity and reliability in Chapter 4, it was suggested that the
degree of consensus across the group profiles listed in Table 5.16 could be considered using a
correlation technique across each of the four groups. The groups include: the composite group
of all respondents (Composite), the group of Security Experts (SE), the group of Security
Students (SS), and the group of Security Users (SU). The chosen technique requires that an
independent parameter list is compared against a dependent parameter list of the same length.

98
The correlation process results in an indication of the extent of relative similarity between
corresponding values over the two lists, and provides an output for an overall indication as a
value between 1 and 0. For this research all correlations have been made using the Microsoft
Excel function CORREL in version Office 2000.
Table 5.16 lists the statistical mean values for Section A as profiles for the composite group and
for each category group. The profiles in Table 5.16 have been complied using statistical means
as the consensus point of value across the group membership. It is interesting to note that a
simple visual comparison of the values in the four columns of Table 5.16 indicates a reasonably
strong similarity for most element pair assessments.
Table 5.16 Statistical mean values representing elemental relationships for the different
groups of respondents as standard profiles for Section A. Element relationships using the following
element combinations
Standard
Composite
Group
Standard
Group SE
Standard
Group SS
Standard
Group SU
Element 1 Element 2 MEAN
n=26
MEAN
n=5
MEAN
n=14
MEAN
n=7
explosive glass 0.07 0.07 0.07 0.07 explosive wood 0.07 0.07 0.07 0.07 explosive brick 0.22 0.88 0.07 0.07 explosive earth 0.22 0.07 0.07 0.64 explosive concrete 0.38 0.88 0.36 0.07 explosive steel 1.00 1.68 0.64 1.22 electric drill earth 0.53 0.88 0.07 1.22 electric drill glass 0.69 0.88 0.64 0.64 electric drill wood 1.47 1.68 0.94 2.38 electric drill brick 4.04 4.92 3.61 4.26 electric drill concrete 5.34 4.92 5.15 6.00 electric drill steel 6.69 7.20 6.55 6.58 oxy cutting glass 1.62 0.88 1.80 1.80 oxy cutting wood 3.18 3.29 2.68 4.12 oxy cutting steel 3.57 5.75 2.67 3.82 oxy cutting earth 3.99 0.88 4.92 4.35 oxy cutting brick 8.50 9.20 8.10 8.80 oxy cutting concrete 9.03 10.48 9.04 9.25 axe glass 0.07 0.07 0.07 0.07 axe earth 1.04 0.07 0.64 2.54 axe brick 5.05 4.92 4.70 5.86 axe wood 5.45 7.56 4.77 6.82 axe concrete 8.07 8.66 7.79 8.21 axe steel 12.27 13.36 12.39 11.24 hammer glass 0.24 0.88 0.07 0.07 hammer earth 0.91 0.07 0.93 1.70 hammer wood 4.62 4.11 4.69 4.92 hammer brick 5.09 6.56 4.63 4.92 hammer concrete 8.58 9.86 8.61 7.20 hammer steel 13.47 14.80 13.84 11.62 rock glass 0.07 0.07 0.07 0.07 rock earth 0.73 0.07 0.07 2.54 rock wood 7.73 8.20 8.20 6.44 rock brick 10.87 11.40 11.40 9.44 rock concrete 14.52 14.70 14.70 14.03 rock steel 17.30 17.30 17.30 17.30

99
Further details of the use of the correlation technique have been provided in Chapter 4.
A complete list of the group profiles for each of Sections A-H is listed in Appendix H.
It is necessary to determine the relationship between correlation and consensus that would
suggests a useful scale for similarity or alternatively degree of consensus. The relationships
proposed in Table 5.17 provide an arbitrary designation for this research. Where consensus is
measured in degrees between 1 and 0, this proposal provides simple partial classifications for an
initial correlation-consensus rating. The justification for these classifications will be developed
as more correlations are introduced through the rest of this section. A special case exists for
correlation-consensus purposes that provides for a correlation value of 1, where in this case a
profile is effectively compared against itself and has a precisely matching correlation list.
Table 5.17 An arbitrary rating scale for the correlation-consensus relationship
Correlation values Consensus rating
0.85 – 1.00 High
0.70 – 0.85 Medium - High
0.50 – 0.70 Low - Medium
0.00 – 0.50 Low
A key indicator for the achievement of consensus will be found in comparing the level of
correlation between group profiles of different membership. The statistical means have been
used to combine assessment values as profiles across different individuals within category
groups to compare them against other group profiles. This research has provided an indication
of how much variation is able to be seen between the groups over the 288 values assessments.
Table 5.18 provides the results from this comparison using the correlation technique for each
group profile against the other corresponding group profiles over 288 statistical mean value
assessments.
Table 5.18 Group standard profiles correlated against each other over the list of 288 statistical means representing combined value assessments
Composite
(n=26)
SE
(n=5)
SS
(n=14)
SU
(n=7)
Composite (n=26) 1 0.94 0.99 0.95
SE (n=5) 0.94 1 0.90 0.86
SS (n=14) 0.99 0.90 1 0.91
SU (n=7) 0.95 0.86 0.91 1
It is clearly evident from the values in Table 5.18 after consideration of the correlation-
consensus determination in Table 5.17, that the correlations all provide a High degree of
consensus. It can be seen that the results for the composite group profile provide the highest
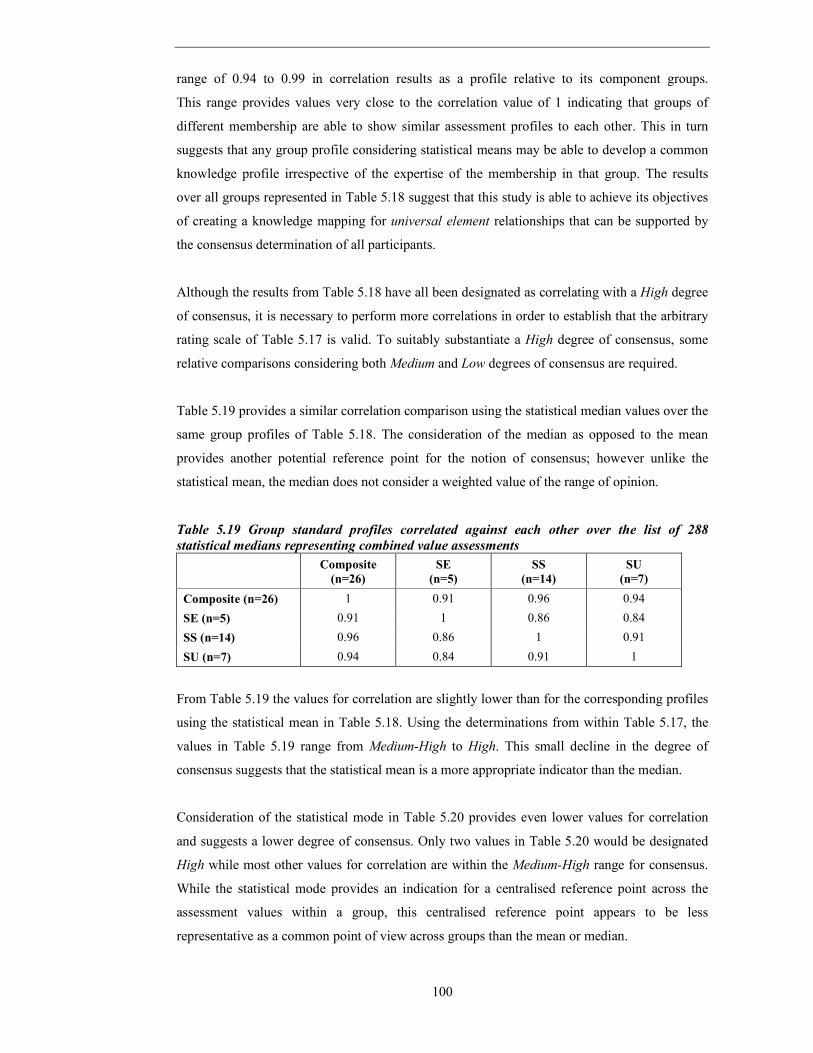
100
range of 0.94 to 0.99 in correlation results as a profile relative to its component groups.
This range provides values very close to the correlation value of 1 indicating that groups of
different membership are able to show similar assessment profiles to each other. This in turn
suggests that any group profile considering statistical means may be able to develop a common
knowledge profile irrespective of the expertise of the membership in that group. The results
over all groups represented in Table 5.18 suggest that this study is able to achieve its objectives
of creating a knowledge mapping for universal element relationships that can be supported by
the consensus determination of all participants.
Although the results from Table 5.18 have all been designated as correlating with a High degree
of consensus, it is necessary to perform more correlations in order to establish that the arbitrary
rating scale of Table 5.17 is valid. To suitably substantiate a High degree of consensus, some
relative comparisons considering both Medium and Low degrees of consensus are required.
Table 5.19 provides a similar correlation comparison using the statistical median values over the
same group profiles of Table 5.18. The consideration of the median as opposed to the mean
provides another potential reference point for the notion of consensus; however unlike the
statistical mean, the median does not consider a weighted value of the range of opinion.
Table 5.19 Group standard profiles correlated against each other over the list of 288
statistical medians representing combined value assessments
Composite
(n=26)
SE
(n=5)
SS
(n=14)
SU
(n=7)
Composite (n=26) 1 0.91 0.96 0.94
SE (n=5) 0.91 1 0.86 0.84
SS (n=14) 0.96 0.86 1 0.91
SU (n=7) 0.94 0.84 0.91 1
From Table 5.19 the values for correlation are slightly lower than for the corresponding profiles
using the statistical mean in Table 5.18. Using the determinations from within Table 5.17, the
values in Table 5.19 range from Medium-High to High. This small decline in the degree of
consensus suggests that the statistical mean is a more appropriate indicator than the median.
Consideration of the statistical mode in Table 5.20 provides even lower values for correlation
and suggests a lower degree of consensus. Only two values in Table 5.20 would be designated
High while most other values for correlation are within the Medium-High range for consensus.
While the statistical mode provides an indication for a centralised reference point across the
assessment values within a group, this centralised reference point appears to be less
representative as a common point of view across groups than the mean or median.

101
Table 5.20 Group standard profiles correlated against each other over the list of 288
statistical mode representing combined value assessments
Composite
(n=26)
SE
(n=5)
SS
(n=14)
SU
(n=7)
Composite (n=26) 1 0.88 0.89 0.83 SE (n=5) 0.88 1 0.80 0.79
SS (n=14) 0.89 0.80 1 0.78 SU (n=7) 0.83 0.79 0.78 1
The results from Table 5.18, Table 5.19 and Table 5.20 provide an indication as to why the use
of the statistical mean is the best representative profile for the degree of consensus among group
profiles. These tables show that the levels of correlation drop away from High consensus to
Medium-Low as the statistical indicator is changed over the mean, the median and the mode.
As the correlation-consensus determinations of Table 5.17 are arbitrary, the comparisons across
Table 5.18, Table 5.19 and Table 5.20 provide a relative range that is indicative of degrees of
consensus.
In order to establish that the determination for High consensus from Table 5.17 are truly relative
as opposed to Medium-High and Low-Medium determinations, correlations using individual
respondent’s profiles against group standard profiles were performed. Table 5.21, Table 5.22,
Table 5.23 and Table 5.24 provide group-based summaries from the correlation results of
individual profiles against the profiles for the composite group, Security Experts, Security
Students and Security Users respectively. It is of interest to note that the range of correlation
values in Table 5.18 of 0.86 - 0.99 is significantly higher than the majority of the values
obtained from correlations of individual profiles against the group profiles.
Table 5.21 provides a summary of the results of the correlation of individual respondent’s
profiles using 288 values, against the profile for the composite group of all respondents.
The results of Table 5.21 have been presented and summarised by group. This summary
provides a mean correlation value across the individuals in each group, the range for correlation
values across the individuals in each group and the standard deviation of the individuals within
each group.
Table 5.21 The standard profile for all respondents as the composite group over 288 values
against individual respondents presented as a summary by group
Group SE (n= 5) Group SS (n= 14) Group SU (n=7)
Correlation for individual
respondents (averaged) 0.804 0.732 0.684
Range of correlation for
respondents 0.754-0.851 0.612-0.881 0.361-0.810
Standard Deviation of
correlation for respondents 0.045 0.080 0.157

102
Table 5.21 shows that the group of Security Experts provides the best overall correlation results
with the lowest standard deviation and the smallest range. The averaged individual
determination for the group Security Experts is of Medium-High degree of consensus.
The determination for both the other groups is Low-Medium degree of consensus.
It is of interest to note that the highest individual consensus value is from the Security Students
group with 0.881. This may be due to large representative nature of Security Students
membership in the composite group standard. It is also worth noting that for Table 5.21 the
standard deviation increases by a factor of nearly 2 across the different groups, where in the
example of Security Experts to Security Students, the standard deviation doubles and then
doubles again from Security Students to Security Users.
Table 5.22 considers the standard profile for the Security Expert group. This standard is the
combination of members of the group that are expected to have a high uniformity of structure in
their knowledge. The low standard deviation that exists across correlation values of the Security
Expert group suggests that the conceptual structure of knowledge among the members of the
group is largely uniform. This idea is further supported by the medium increase seen in standard
deviation across the Security Students group and the larger increase seen in the standard
deviation of the Security Users group. It is expected that Security Students will have a slightly
less uniform knowledge structure than Security Experts, with a slightly more uniform structure
than Security Users who would represent typical user knowledge of security products.
Table 5.22 The standard profile considering the group Security Experts (SE) over 288 values
against individual respondents presented as a summary by group
Group SE (n= 5) Group SS (n= 14) Group SU (n=7)
Correlation for individual
respondents (averaged) 0.852 0.665 0.620
Range of correlation for
respondents 0.804-0.888 0.515-0.863 0.257-0.750
Standard Deviation of
correlation for respondents 0.032 0.109 0.176
From Table 5.22 the correlation values that can be seen in the group Security Experts exhibit a
determination with a Medium-High degree of consensus. The correlation value range of
0.804 - 0.888 represents the highest individual correlation values for the research and
corresponds to the group Security Experts. This is within research expectations as individuals
would be expected to correlate well when compared to their own group standard profile.
The lowest overall correlation value that can be seen in Table 5.22 of 0.257 from the Security
Users group is the lowest correlation value evident across all groups and all individual profiles.
The results of Table 5.22 can be compared to the value range in Table 5.18 of 0.94 - 0.99
representing a High degree of consensus. The determinations in Table 5.22 can be seen to be

103
more indicative of the range in degrees of consensus with values covering all four ranges
High, Medium-High, Low-Medium and Low. As Table 5.17 seems to be appropriate in
interpreting the level of consensus for Table 5.22, it would also seem to conclude that the
determinations from Table 5.17 are appropriate for Table 5.18 which suggests that the degree of
consensus in this research is High.
Table 5.23 provides results from the summary of the correlation values of each individual
respondent’s profile against the standard profile for the group Security Students (SS).
This standard profile is expected to have a medium level of uniformity within the structure of its
values.
Table 5.23 The standard profile considering the group Security Students (SS) over 288 values
against individual respondents presented as a summary by group
Group SE (n= 5) Group SS (n= 14) Group SU (n=7)
Correlation for individual
respondents (averaged) 0.769 0.742 0.654
Range of correlation for
respondents 0.712-0.828 0.614-0.872 0.329-0.781
Standard Deviation of
correlation for respondents 0.052 0.076 0.158
Table 5.23 indicates that even when the Security Student (SS) group standard is used, the
Security Expert group provides the strongest evidence of correlation to the standard.
The averaged correlation values for the Security Expert group and the Security Student group
are very similar for Table 5.23 and are determined at the Medium-High degree of consensus.
The range of correlation values from within the Security Users group is large and this further
supports the notion that the structure of this standard profile is less uniform than the
corresponding Security Expert standard profile.
Table 5.24 provides results from a summary of the correlation output of individual respondents
against the standard profile of the group Security Users. This standard profile is comprised from
values of the group whose membership is expected to provide the lowest level of uniformity in
the structure of its knowledge profile. It is interesting to note that the Security Expert group still
holds the highest level of correlation and lowest standard deviation for this standard profile even
though the standard is not considered to particularly originate from instruction or tuition.
The determination in degree of consensus for this standard profile for Security Experts and
Security Users is Medium-High and for Security Students is Low-Medium.

104
Table 5.24 The standard considering the group Security Users (SU) over 288 values against
individual respondents presented as a summary by group
Group SE (n= 5) Group SS (n= 14) Group SU (n=7)
Correlation for individual
respondents (averaged) 0.739 0.673 0.721
Range of correlation for
respondents 0.688-0.782 0.591-0.803 0.468-0.824
Standard Deviation of
correlation for respondents 0.040 0.067 0.125
Some other indications from Table 5.24 suggest that even though this standard profile is not
expected to contain a high level of conceptual uniformity, the correlation values are still similar
enough to provide a High degree of consensus of this standard to the composite standard (0.95)
as is evident in Table 5.18. Thus an extended suggestion to the method of this research is that in
combining value assessments over a group of people, even when that group is not expected to
have high expertise, this combined group opinion is likely to provide a High degree of
consensus and act like a source of high expertise.
It is evident from Table 5.21, Table 5.22, Table 5.23 and Table 5.24 that individuals generally
correlate best when considered against the representative group profile of their own group.
For an example members of the group Security Experts correlate at 0.852 (mean correlation of
all members) when the standard profile for SE group is used. It has been pointed out that the
group Security Experts also correlates the strongest over the entire range of group standards.
This is most likely attributed to the uniform knowledge structures that can be gained through
professional exposure and academic instruction. The next strongest group to correlate to each of
the standard profiles is the group Security Students for nearly all cases except when the Security
Users group standard is used. These results show a clear trend toward uniform structures in the
professional acquisition of knowledge tending towards higher degrees of consensus in
knowledge structures.
The comparison of group standard profiles and individual respondent’s profiles uses the same
method of correlation. The indications from Table 5.18 and Table 5.21 suggest that the
composite group standard profile provides the strongest correlation for all respondents.
Therefore the most appropriate group profile to represent the highest degree of consensus
among participants of this study is the composite group profile. This study suggests that the
statistical mean values contain the appropriate properties for profiling over the entire group of
respondents. This composite profile represents an optimum in consensus for this study and
provides validity for the data in the matrices of the knowledge structure. Thus the knowledge
structures presented in Appendix G1 through to Appendix G8 may be seen as valid
representations of expert opinion within the limitations of the research.
105
5.4 Concluding remarks
This chapter has presented the results of the study in two sections. The sections are designed to
firstly process the data that has been obtained from the research questionnaires, and secondly
analyse the data to create knowledge matrices and validate the data to determine the degree of
consensus with the results. The first section of this chapter considers the processing raw data of
the research and the second considers the analysis of the data.
The section on processing the raw data considers the path of the data from the respondent to a
computer database. The feedback components of the questionnaire are summarised for their
relevance to the study and have been identified from comments of respondents. These relate to
the relative ordering of the universal elements as well as identifying extended element lists for
the concept continuums.
The section on the analysis of the data considers the knowledge structures of the universal
elements of the research and identifies values for the universal element relationships from expert
opinion. The different groups of respondents are identified for the purposes of data collection
and the composite group that contains value assessments from all respondents is recognised as
the most appropriate group representing the highest degree of consensus. The use of statistical
means to create profiles for each respondent group forms the content of the knowledge matrices.
This is identified as one of the objectives of the study.
The technique of correlation is applied across the different groups within the study in order to
establish the degree of variation in knowledge profiles. This demonstrates that the data proposed
in the knowledge matrices is representative of knowledge in the area of physical security.
The correlations applied over the different category groups of the study have determined that
there is a High degree of consensus within the data collected from the different groups of the
research and this suggests that the information within the knowledge matrices contains the
properties of both validity and reliability.

106
6 Interpretation and discussion of the results
6.1 Introduction
This Chapter looks at the results of this study and provides a discussion with an interpretation of
the conceptual mapping as one of the main research objectives. A suggestion for modelling of
the results is introduced in this chapter based on a novel proposal that incorporates a
mathematical approach using tangent functions for holistic modelling of physical security.
This well known trigonometric function is able to be used to assess effectiveness between
dissimilar conceptual entities as conceptual maps presented for the concepts of delay
probability, detection probability and response probability. For this chapter the interpretations
of the results have been divided into two areas for consideration. The first area considers an
application of the results modelled considering a physical security environment. The second part
recognises the method used in the research and considers the general form of this method to
potentially be applicable outside the field of physical security.
A series of figures are presented in this chapter that describe the attributes of conceptual
mappings of physical security functions. Special consideration is given to two suggested
attributes that are able to produce the shape of the delay probability, detection probability and
response probability curves. These attributes can be identified as the gradient of a generated
curve and the lateral shift of each curve. In order to represent the universal elements of a facility
in a physical security arrangement, distinct values have been selected from each of the Sections
A-E of the knowledge matrices discussed in Chapter 5. These have been incorporated into an
empirical model that derives a gradient and a lateral shift for representative tangent curves.
A series of test cases have been presented to demonstrate the effectiveness of the model when
selecting values from each of the knowledge matrices and providing interpretations relating to
physical security. As relative assessments of effectiveness in specific arrangements of physical
security, these test cases are discussed for their relative implications in assessing physical
security scenarios. Particular regard is given to both the output of the model and the required
parameter inputs for the model. A brief discussion has also been presented in the interpretation
of the research. This considers that the objectives of this study such as the development of
knowledge matrices may be applicable to the wider community. Although the primary focus of
the research has been within the field of physical security, some of the methods that have been
presented in this study may achieve the reduction of complexity with effective modelling in
other disciplines that exhibit high levels of complexity within their systems. This chapter
provides some comment on the transferability of the method.

107
The first aspect of the interpretation of the results seeks to determine the effectiveness of
physical security arrangements via the consideration of distinct physical security attributes.
These attributes are able to be derived from values in the knowledge matrices to represent
simple relationship likelihood functions for the dissimilar entities of delay, detection and
response. Effectiveness measures of different combinations of the universal elements can be
determined for each of these dissimilar entities through the conceptual mapping of relationships
of physical security functions. The eight knowledge matrices of this research have mapped a set
of universal elements into structures.. The data for this is located in the first five matrices from
the research objectives labelled Sections A-E. These knowledge matrices are available for
further viewing as Appendix G1 through to Appendix G5.
The second aspect of the interpretation of the results considers the method of inquiry and the
techniques of this research as a foundation for providing an alternative means to establish
knowledge structures and providing the potential for modelling in other complex fields of
research and investigation. While the knowledge mapping is valid only over the boundary
conditions of this research, the method that has established the knowledge structures could be
conceptually applied to other disciplines and similar modelling techniques adapted for the
content of knowledge matrices. In this way the research has a wider application than may be
evident from identifying the objectives in terms of physical security.
This study has based its method of inquiry as an investigative approach into the complex
relationships of physical security universal elements. This investigation into the knowledge
matrices for physical security scenario assessments provides for another of the study’s
objectives.
6.2 Interpretations within the field of physical security
This research has established a conceptual mapping by measuring expert opinion for universal
element relationships. The relationship values have been determined from expert opinion and
can derive functions of defence in depth describing delay, detection and response. In seeking to
establish one of its objectives, the research attempts to evaluate the overall risk to security
through a conceptual mapping. The overall regard for any facility can be recognised through a
consideration for individual regions of a facility containing a set of recognisable elements.
A combination of elemental values from the conceptual mapping is able to provide a relative
effectiveness for an overall risk to physical security by generating tangent curves representing
delay probability, detection probability, and response probability. In order to determine a single
value for the overall risk to a facility, the terms suitable and unsuitable need to be defined in
relation to the functions of defence in depth.
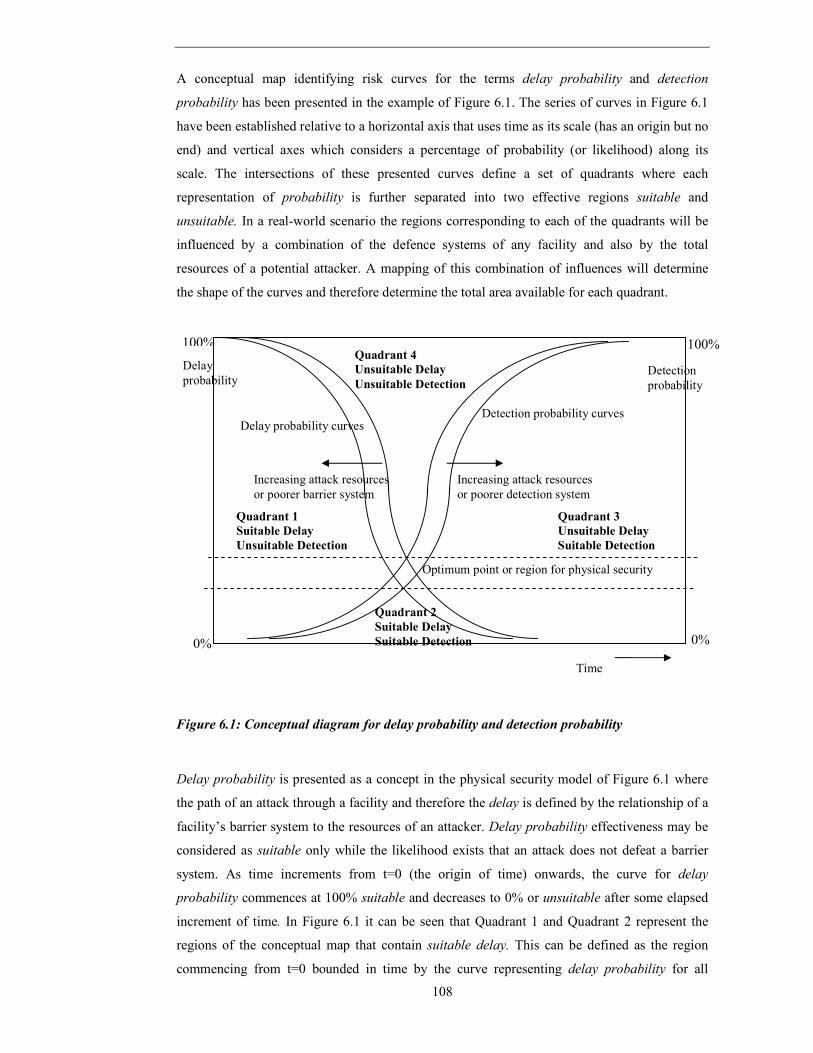
108
A conceptual map identifying risk curves for the terms delay probability and detection
probability has been presented in the example of Figure 6.1. The series of curves in Figure 6.1
have been established relative to a horizontal axis that uses time as its scale (has an origin but no
end) and vertical axes which considers a percentage of probability (or likelihood) along its
scale. The intersections of these presented curves define a set of quadrants where each
representation of probability is further separated into two effective regions suitable and
unsuitable. In a real-world scenario the regions corresponding to each of the quadrants will be
influenced by a combination of the defence systems of any facility and also by the total
resources of a potential attacker. A mapping of this combination of influences will determine
the shape of the curves and therefore determine the total area available for each quadrant.
Figure 6.1: Conceptual diagram for delay probability and detection probability
Delay probability is presented as a concept in the physical security model of Figure 6.1 where
the path of an attack through a facility and therefore the delay is defined by the relationship of a
facility’s barrier system to the resources of an attacker. Delay probability effectiveness may be
considered as suitable only while the likelihood exists that an attack does not defeat a barrier
system. As time increments from t=0 (the origin of time) onwards, the curve for delay
probability commences at 100% suitable and decreases to 0% or unsuitable after some elapsed
increment of time. In Figure 6.1 it can be seen that Quadrant 1 and Quadrant 2 represent the
regions of the conceptual map that contain suitable delay. This can be defined as the region
commencing from t=0 bounded in time by the curve representing delay probability for all
Delay probability curves Detection probability curves
100%
0% 0%
Time
Detection probability
Quadrant 4
Unsuitable Delay
Unsuitable Detection
Quadrant 1
Suitable Delay
Unsuitable Detection
Quadrant 2
Suitable Delay
Suitable Detection
Quadrant 3
Unsuitable Delay
Suitable Detection
Increasing attack resources or poorer barrier system
Increasing attack resources or poorer detection system
Optimum point or region for physical security
Delay probability
100%

109
values along t. Quadrant 3 and Quadrant 4 in this case represent the regions for unsuitable
delay.
Detection probability is presented as a concept in the physical security model of Figure 6.1
where a security system is able to detect that a breach of physical security has occurred.
The effectiveness of detection probability may be considered as suitable only after a correct
response to an attack can be generated. As time increments from t=0 onwards, the curve for
detection probability commences at 0% suitability and will increase over time after an attack
depending upon both the attack resources and the ability of the detection systems in place.
Suitability will eventually approach 100% after some elapsed time interval for any attack.
It is assumed that without a detection system there is infinite time available to breach physical
security systems. In Figure 6.1 it can be seen that Quadrant 2 and Quadrant 3 represent the
regions of the conceptual map that contain suitable detection. This region is bounded by the
curve representing detection probability and continues for all values for t increasing along the
time axis. Quadrant 4 and Quadrant 1 in this case represent the regions for unsuitable detection.
This region commences at t=0 and is bounded by the curve for detection probability.
The main interpretation from Figure 6.1 for describing the risk estimate of the overall
effectiveness of physical security suggests that when a larger region for Quadrant 2 exists, the
better the overall effectiveness of physical security. In comparison when a larger region of
Quadrant 4 exists, a poorer overall effectiveness for physical security will result. Figure 6.1 also
identifies an optimum region (or point) of effectiveness for physical security determined by the
intersection of the curves for delay probability and detection probability. Increasing this
intersection point maximising Quadrant 2 and minimising Quadrant 4 corresponds to increasing
the probability value. Similarly decreasing this intersection point in probability value effectively
corresponds to minimising Quadrant 2 and maximising Quadrant 4.
6.3 Conceptual mappings as a description of the phenomenon
In a scenario-type example, delay probability could be expressed in terms of attack time (t),
where as t approaches zero, the corresponding ability for a facility to delay an attack is closest to
100% for all barrier systems and the detection probability is closest to 0%. As t gradually
increases, delay will remain at 100% until an attack is able to compromise the barrier system.
For example poorer barrier systems and better attacker resources will lower the ability of the
barrier causing the delay curve to approach 0% more rapidly in time. In a similar manner the
detection probability can also be expressed in terms of the attack time (t) and the likelihood of
detection can be described commencing at 0% and increasing in time to approach 100%.

110
For example better detection systems and poorer attack resources will increase the likelihood of
detection causing a more rapid approach to 100%.
Figure 6.2 presents a single case using a delay probability curve and a detection probability
curve of a hypothetical facility with a demonstrated optimum point of effectiveness for physical
security. The examples illustrate the intersection points of the curves. This point is dependent
upon the gradient of each curve as well as the relative start of each curve and end of each curve
along the axis for time.
Delay probability curve
Detection probability curve1
100%
0% 0%
100%
Time
Delay probability
Detection probability
Optimum point for physical security effectiveness
Quadrant 4
Unsuitable Delay
Unsuitable Detection
Quadrant 1
Suitable Delay
Unsuitable Detection
Quadrant 3
Unsuitable Delay
Suitable Detection
Quadrant 2
Suitable Delay
Suitable Detection
Figure 6.2: Conceptual diagram for delay probability and detection probability

111
To consider the effects of the curve representing detection probability, Figure 6.3 presents a
case for improved overall effectiveness of the original facility arrangement where the curve for
delay probability has been kept constant to that of Figure 6.2 and the curve for detection
probability has been altered so that the gradient between 0% and 100% is much steeper.
This results in the optimum point of effectiveness increasing along the vertical axis and a
corresponding larger region for Quadrant 2. The curve for detection probability, although much
steeper in gradient than the detection probability curve in Figure 6.2, begins at the same point
along the axis of time. The change in the intersection point between the two graphs signifies a
large increase in the effectiveness of the physical security arrangement over the facility in
Figure 6.3. An electronic computer controlled system such as a microwave detection system
may provide a real-life example of a curve for a detection system that might steeply change
from 0% detection to 100% detection.
Delay probability curve
Detection probability curve100%
0% 0%
100%
Time
Delay probability
Detection probability
Optimum point for physical security effectiveness
Quadrant 4
Unsuitable Delay
Unsuitable Detection
Quadrant 1
Suitable Delay
Unsuitable Detection
Quadrant 3
Unsuitable Delay
Suitable Detection
Quadrant 2
Suitable Delay
Suitable Detection
Figure 6.3: Conceptual diagram for delay probability and detection probability

112
In Figure 6.4 the curve for delay probability has been kept constant once more. The curve for
detection probability has the same gradient as the original facility’s detection probability curve
of Figure 6.2, however it has been shifted laterally so that now the curve approaches the origin
at t=0. By shifting the whole curve closer to the origin on the axis of time, the point of
intersection of the two curves has increased relative to Figure 6.2. This means that the optimum
point of the conceptual map has increased compared to the intersection point in Figure 6.2
which therefore corresponds to larger region for Quadrant 2. While in this example the curve for
detection probability from 0% to 100% has a more gradual slope to that of Figure 6.3, the
concept mapping suggests that an earlier detection capability achieves the same outcome of
increased effectiveness in overall security. For a real-world example of this type of curve, where
early signs of an attack may be detected but cannot be necessarily confirmed until more
evidence is received (dictating a more gradual slope), could be conceptualised as a CCTV
system.
Delay probability curve
Detection probability curve
100%
0% 0%
Time
Delay probability
Detection probability
Optimum point for physical security effectiveness
Quadrant 4
Unsuitable Delay
Unsuitable Detection
Quadrant 1
Suitable Delay
Unsuitable Detection
Quadrant 3
Unsuitable Delay
Suitable Detection
Quadrant 2
Suitable Delay
Suitable Detection
100%
Figure 6.4: Conceptual diagram for delay probability and detection probability

113
In Figure 6.5 the curve for delay probability is again unchanged. The curve for detection
probability in this case has been shifted taking the curve further from the origin and opposite in
direction to the example of Figure 6.4,. The gradient of the curve remains the same as the curve
for detection probability in Figure 6.2, however by shifting the whole curve further from the
origin, the point of intersection has decreased relative to Figure 6.2. This decrease in the
optimum point represents poorer overall effectiveness of physical security in the conceptual
map and presents a smaller corresponding region for Quadrant 2. The conceptual map in
Figure 6.5 provides an example of the detection probability shifted along the axis of time.
The real world equivalent may be synonymous with not having the benefit of early detection of
an attack or fast action after initial warning signs of an attack. An example of this type of
detection system may include a mobile security patrol, where the human ability to detect is
based on several parameters such as experience, competence, patrol schedules and
communication equipment.
Delay probability curve
Detection probability curve
100%
0% 0%
Time
Optimum point for physical security effectiveness
Quadrant 4
Unsuitable Delay
Unsuitable Detection
Quadrant 1
Suitable Delay
Unsuitable Detection
Quadrant 3
Unsuitable Delay
Suitable Detection
Quadrant 2
Suitable Delay
Suitable Detection
100%
Delay probability
Detection probability
Figure 6.5: Conceptual diagram for delay probability and detection probability

114
In Figure 6.6 the curve for delay probability has now changed while the curve for detection
probability has been returned as the same curve as that of Figure 6.2. The gradient of the curve
for delay probability has decreased creating a more gradual curve from 100% towards 0%.
By decreasing the gradient of this curve, the point of intersection has increased relative to
Figure 6.2. This results in the optimum point of the conceptual map increasing and a
corresponding larger region for Quadrant 2. A barrier system that may fit this example to
provide a longer gentler curve would be a substance with high material strength that takes a long
time to defeat by force which may include substances like reinforced concrete. The gradient for
this example suggests that while localised parts of concrete can be damaged through force,
reinforced concrete will maintain most of its barrier qualities and the corresponding suitability
of the defence will be somewhere between 100% to 0% over a period of time.
Delay probability curve Detection probability curve
100%
0% 0%
100%
Time
Delay probability
Detection probability
Optimum point for physical security effectiveness
Quadrant 4
Unsuitable Delay
Unsuitable Detection
Quadrant 1
Suitable Delay
Unsuitable Detection
Quadrant 3
Unsuitable Delay
Suitable Detection
Quadrant 2
Suitable Delay
Suitable Detection
Figure 6.6: Conceptual diagram for delay probability and detection probability

115
In Figure 6.7 the curve for detection probability is the same as the curve from Figure 6.2 and the
curve for delay probability has now been shifted along the time axis so that the 100% starting
point of the curve begins further from the origin (t=0). The gradient of the curve is the same as
the curve for delay probability in Figure 6.2, however by shifting the whole curve further from
the origin, the point of intersection has increased relative to Figure 6.2 and Figure 6.6.
This represents an increase in overall effectiveness for physical security. For this example the
shift along the axis away from the origin suggests that the initial difficulties to defeat the barrier
require significant attacker resources. A real-life example of this kind may include a strong
sheet metal fence that is difficult to climb or defeat with force but may be defeated with
specialised cutting devices that take a longer period of time to set up.
Delay probability curve Detection probability curve
100%
0% 0%
100%
Time
Delay probability
Detection probability
Optimum point for physical security effectiveness
Quadrant 4
Unsuitable Delay
Unsuitable Detection
Quadrant 1
Suitable Delay
Unsuitable Detection
Quadrant 3
Unsuitable Delay
Suitable Detection
Quadrant 2
Suitable Delay
Suitable Detection
Figure 6.7: Conceptual diagram for delay probability and detection probability
The real-world suggestions that have been provided in the examples are simply meant to
illustrate an application of the conceptual maps and are not meant to be accurate representations.
The conceptual maps in Figure 6.1 to Figure 6.7 have been presented to demonstrate changes to
the optimum point for overall effectiveness of physical security through a combination of the
dissimilar entities of delay probability and detection probability. These conceptual maps have
also been used as an example to consider the four quadrants defining suitability.

116
6.4 A novel proposal for holistic modelling
This section presents a novel approach to simulating the curves of delay probability, detection
probability and response probability through an interpretative model. The model will be
presented to initially consider the curves of delay probability and detection probability in order
to simulate an inter-relation between these dissimilar conceptual entities. The inter-relation will
be determined as the intersection point of the two curves and will represent the relative
effectiveness of a physical security arrangement. Seven test cases have been applied to the
model. The model has also been extended to simulate a three way inter-relationship between the
measures of delay probability, detection probability and response probability in order to assess
effectiveness between these three dissimilar conceptual entities. Several more test cases have
been considered to interpret the model’s applicability within the knowledge matrices and to
real-world scenarios
The model is initially presented in an attempt to consider the curves of delay probability and
detection probability to simulate an inter-relational reference measure between these dissimilar
conceptual entities. The inter-relational measure will be defined as the intersection point of
these two curves and will represent the relative effectiveness in risk of a series of physical
security arrangements.
The novel concept for a model in this paper is based on mathematical tangent functions and it
has been presented in the absence of any similar type of modelling available in literature.
The tangent function commonly used in trigonometry (for right angles triangles) can be graphed
as a function of angle (θ). Figure 1 displays a family of tangent curves for tan θ, where θ is
considered from -90° to 90 with further data available in Appendix I.
Tan theta curves
-100
-80
-60
-40
-20
0
20
40
60
80
100
-90 -70 -50 -30 -10 10 30 50 70 90
theta
(T) tan theta values
Tan theta
5 Tan theta
10 Tan theta
(5 Tan theta) + 50
(5 Tan theta) + 10
Figure 6.8: A representative family of tangent curves

117
It is proposed that the tangent curve is able to represent the curves of delay probability and
detection probability as interrelating approximations based on the particular shape attributes of
the conceptual maps with examples provided in Figure 6.8. The family of tangent curves can be
written as:
T = m tan θ + b
The examples in Figure 6.8 are as follows:
T = tan θ for (-90° < θ < 90°)
T = 5 tan θ for (-90° < θ < 90°)
T = 10 tan θ for (-90° < θ < 90°)
T = 5 tan θ + 50 for (-90° < θ < 90°)
T = 5 tan θ + 10 for (-90° < θ < 90°)
The angles of θ are considered across the horizontal axis between -90° and 90° (which can also
be written mathematically as -π/2 < θ < π/2). In Figure 6.8 the gradient (or slope) of the tangent
curve is determined by the multiplying coefficient m preceding the tangent functions, and the
lateral shift along a relative axis (T) determined by the value of the constant b.
A striking similarity exists between the attributes of the curves in the conceptual maps proposed
in Figures 6.1 to Figure 6.7 with the family of tangent curves represented in Figure 6.8.
The similarity is identified as the transfer between a relative maximum (minimum) value to a
relative minimum (maximum) value via a variable gradient with an extended tapering toward
both the maximum and minimum points. In order to apply the tangent function to represent the
curves of the concept maps in Figure 6.1 to Figure 6.7, a suitable translation between graphs is
needed that identify corresponding axes. The axis that represents probability along the vertical
axis in Figure 6.1 to Figure 6.7 for example as 100% to 0% would need to correspond to the
range of angles (over θ) from -90° to 90° in Figure 6.8. The most appropriate translation of this
axis is: 90° equates to 100% probability, 45° equates to 75% probability, 0° equates to 50%
probability, -45° equates to 25% probability, -90° equates to 0% probability. The remaining
relative axis determined by the value of the constant b is able to represent time from a zero
origin onwards.
This study further proposes that the matrices containing value assessments reported in the
results are able to be supply the data for each individual tangent function. The intersection point
of the tangent functions is the indicator that is able to provide a measurement of relative
effectiveness over arrangements of physical security. The modelling of tangent functions using
data from the knowledge matrices is an interpretation of the results of this research and fulfils

118
one of the objectives of the study. The numerical values that appear in the matrices for each
element pair providing relationship measures are relative indications of value over each specific
boundary condition described in Sections A-H of the research questionnaire. Each boundary
condition considers relationship values of universal elements with respect to physical security
relational descriptors and the function of defence in depth.
6.4.1 Simple Model
In the model a combination of universal elements from each function of defence in depth has
been used to represent the gradient component m of each tangent curve. It is suggested from
Figure 6.1 to Figure 6.7 that for delay probability, a combination of stronger barriers coupled
with poorer attacker resources (i.e. a higher ranking of universal elements in their overall benefit
to security), would suggest a more gradual curve between a delay probability of 100% and 0%
over the axis of time. Thus for the representation, the higher the values substituted for m, the
more gradual the curve of the tangent function. In a similar way the combination of better
detection systems coupled with poorer attacker resources (i.e. a higher ranking of universal
elements in their overall benefit to security), would produce a steeper curve between the
detection probabilities of 0% and 100% over the axis of time. Therefore it is proposed that the
lower the value substituted for m for detection probability, the steeper the curve of the tangent
function. The conceptual representations from Figure 6.1 to Figure 6.7 have proposed that the
region for Quadrant 1 indicates suitability for delay probability and increases as its
representative curve is shifted along the time axis away from the origin at t=0.
Figure 6.1 also proposes that as suitability increases in the region for Quadrant 3, detection
probability as a curve is shifted along the time axis towards the origin at t=0.
The following relationships will hold for the model based on the data contained within the
knowledge matrices:
• The relative benefit to physical security increases for both Section A and Section B
knowledge matrices as the values in both of the matrices increases. Thus an additive
combination of Section A and Section B values determine relatively higher values for m.
• The relative benefit to physical security increases for Section D as values in the matrix
increase, while in contrast the relative benefit to physical security decreases as values in the
Section C knowledge matrix increase. An additive combination of Section D with an
inverse of Section C values determines relatively higher values for m.
• The horizontal intercepts of the tangent curve’s b constant shift will be identified by a
multiplicative combination of Section A and Section B values for delay probability.
• A multiplicative combination of Section D and Section C values will determine a b constant
shift value for the detection probability tangent curve.

119
The following model is presented as Figure 6.9 and has been empirically determined to present
a method of mathematical combination for the dissimilar concepts of delay and detection using
values within the knowledge matrices determined in this study. The principle functions of
defence in depth present a relative level of effectiveness for any physical security arrangement.
The test cases that follow the model in Figure 6.9 demonstrate the applicability of the research
data through the knowledge matrices in the proposed model.
This conceptual model uses tangent functions from -90° < θ < 90° to represent delay
probability and detection probability and obtains its data from the knowledge matrices of the
research labelled Section A through to Section D.
For Delay Probability tangent function T = m tan θ + b:
Let m value = (Section A) + (Section B) (minimum 0, maximum 34.6)
Let b value = - (Section A) * (Section B) (minimum -299.29, maximum 0)
For Detection Probability tangent function T = m tan θ + b:
Let m value = - 34.6 + (17.3 - (Section C)) + (Section D) (minimum -34.6, maximum 0)
Let b value =((17.3 - (Section C)) * (Section D)) – (299.29 / 2) (minimum -150, maximum 0)
Then Probability for Effectiveness (PE) for overall benefit to physical security is given (along
T and θ) by:
PE = Delay Probability ∩ Detection Probability
Figure 6.9: A model for the representation of the effectiveness of physical security using
tangent functions
To establish the validity of this proposed model a series of test cases have been considered
based on a series of defensive-type universal elements of this study. For the series of examples
labelled Test Case 1 to Test Case 7, the input to the model will be selected from averaged values
of universal elements in the knowledge matrices for Section A through to Section D.
Using these values the model is able to demonstrate the relationship between delay probability
and detection probability.
A brief consideration of the defensive-type universal elements available in the knowledge
matrices suggests that for the averaged values of the universal elements (averaged values over
all listed attack-type elements in the orthogonal continuum), there are six potential tangent
functions along a single concept continuum for the detection probability curves and thirty six
potential tangent functions along two concept continuums for delay probability curves.
The test cases have been specifically chosen to demonstrate the range of output of the model.

120
In order to directly compare the output of the test cases, several input parameters will be held
constant over the series of cases while other parameters are altered slightly to provide an
indication of how the model responds to variation.
For all of the conceptual graphs in the test cases, a “theta (degrees) - probability shared axis (P)”
will be considered from -90° < θ < 90° along the tangent curves representing physical security
effectiveness. For all conceptual graphs -90° corresponds to 0% probability and 90° corresponds
to 100% probability. The conceptual graphs are limited to providing relative information with
the intersection points of the various curves. Thus numbers on the “theta (degrees) - probability
shared axis (P)” have been provided for relative indications only.
6.4.1.1 Test Case 1: Worst Case Scenario
Identifying the worst case scenario of poor delay and poor detection values of physical security
effectiveness in the knowledge matrices (averaged values over all listed attack-type elements in
the orthogonal continuum). Considering the defensive-type universal elements we can assign
values for:
1. Section A, where the lowest averaged strength value is 0.46 (e.g. high percentage of glass in
the structure).
2. Section B, where the lowest averaged material dimensions value is 0.76 (e.g. equivalent to a
3 human high steel small mesh fence).
3. Section C, where the highest averaged detection value is 11.71 (e.g. chance detection).
4. Section D, where the lowest averaged detection value is 8.95 (e.g. chance detection).
These values can be considered for the model in Figure 6.9.
For Delay Probability:
m value = (Section A) + (Section B) = 1.22
b value = - (Section A) * (Section B) = -0.35
For Detection Probability:
m value = - 34.6 + (17.3 - (Section C)) + (Section D) = -20.06
b value = (17.3 - (Section C)) * (Section D) – (299.29 / 2) = -99.61
Figure 6.10 provides the conceptual map for Test Case 1 as tangent curves for the model
showing the delay probability - detection probability intersection point is approximately -78°.

121
-300
-250
-200
-150
-100
-50
0
-90 -80 -70 -60 -50 -40 -30 -20 -10 0 10 20 30 40 50 60 70 80 90
theta (degrees) - probability shared axis (P)
Tan theta - Time shared axis (T)
delay probability curve
detection probability curve
Figure 6.10 Test Case 1: A conceptual map for demonstrating worst case scenario effectiveness of physical security
The example for Test Case 1 presents the worst case of averaged values from the knowledge
matrices. The worst case intersection point of approximately -78° can be used as a reference
indicator for the other test cases. Any other test cases with intersection points in the vicinity of
this value will represent a poor physical security arrangement. In consideration of the proposed
quadrants of Figure 6.1 to Figure 6.7, the corresponding Quadrant 2 equivalent in the conceptual
graph of Figure 6.10 would equate to a very small region.
6.4.1.2 Test Case 2: Best Case Scenario
Identifying the best case scenario of strong delay and strong detection values of physical
security effectiveness in the knowledge matrices (averaged values over all listed attack-type
elements in the orthogonal continuum). Considering the defensive-type universal elements we
can assign values for:
1. Section A, where the highest averaged strength value is 9.05 (e.g. high percentage of steel
structure).
2. Section B, where the highest averaged material dimensions value is 7.22 (e.g. 5 human high
steel small mesh with razor wire).
3. Section C, where the lowest averaged detection value is 4.62 (e.g. multiple detection
systems).
4. Section D, where the highest averaged detection value is 9.35 (e.g. multiple detection
systems).

122
These values can be considered for the model in Figure 6.9.
For Delay Probability:
m value = (Section A) + (Section B) = 16.27
b value = - (Section A) * (Section B) = -65.34
For Detection Probability:
m value = - 34.6 + (17.3 - (Section C)) + (Section D) = -12.57
b value = (17.3 - (Section C)) * (Section D) – (299.29 / 2) = -31.09
Figure 6.11 provides the conceptual map for Test Case 2 as tangent curves for the model
showing the delay probability - detection probability intersection point at approximately 50°.
-300
-250
-200
-150
-100
-50
0
-90 -80 -70 -60 -50 -40 -30 -20 -10 0 10 20 30 40 50 60 70 80 90
theta (degrees) - probability shared axis (P)
Tan theta - Time shared axis (T)
delay probability curve
detection probability curve
Figure 6.11 Test Case 2: A conceptual map for demonstrating best case scenario effectiveness
of physical security
The example for Test Case 2 presents the best case scenario of averaged values from the
knowledge matrices. The best case intersection point of approximately 50° can be used as a
reference indicator in conjunction with the result for Test Case 1 as the worst case scenario.
All test cases with intersection points in the vicinity of 50° will represent a good physical
security arrangement. In comparison to Figure 6.10 the Quadrant 2 area in Figure 6.11 equates
to a much larger region.
The results of Test Case 1 and Test Case 2 suggest that the output of the model should display
effectiveness indications between the two reference indicators of -78° and 50° for each delay
probability - detection probability intersection point.

123
6.4.1.3 Test Case 3: Medium – Strong Case Scenario
Identifying a case for medium to strong delay and medium to strong detection values of physical
security effectiveness in the knowledge matrices (averaged values over all listed attack-type
elements in the orthogonal continuum). Considering the defensive-type universal elements we
can assign values for:
1. Section A, where a high averaged strength value is 5.63 (e.g. high percentage of brick
structure).
2. Section B, where a high averaged material dimensions value is 6.58 (e.g. 5 human high
smooth brick wall).
3. Section C, where a low averaged detection value is 4.84 (e.g. infrared detection).
4. Section D, where a high averaged detection value is 8.78 (e.g. infrared detection).
These values can be considered for the model in Figure 6.9.
For Delay Probability:
m value = (Section A) + (Section B) = 12.21
b value = - (Section A) * (Section B) = -37.05
For Detection Probability:
m value = - 34.6 + (17.3 - (Section C)) + (Section D) = -13.36
b value = (17.3 - (Section C)) * (Section D) – (299.29 / 2) = -40.25
Figure 6.12 provides the conceptual map for Test Case 3 as tangent curves for the model
showing the delay probability - detection probability intersection point at approximately -7°.
-300
-250
-200
-150
-100
-50
0
-90 -80 -70 -60 -50 -40 -30 -20 -10 0 10 20 30 40 50 60 70 80 90
theta (degrees) - probability shared axis (P)
Tan theta - Time shared axis (T)
delay probability curve
detection probability curve
Figure 6.12 Test Case 3: A conceptual map for demonstrating medium – strong case scenario effectiveness of physical security

124
The example for Test Case 3 presents a medium to strong case of averaged values from the
knowledge matrices. The intersection point of approximately -7° can be considered with the
results of Test Case 4 and Test Case 5 that both provide slight changes in parameter input to the
model. The single parameter that has been altered for Test Case 4 assumes a slightly lower
barrier height than Test Case 3.
6.4.1.4 Test Case 4: Medium Case Scenario
Identifying a case for strong delay (however slightly weaker than Test Case 3 with a slightly
lower barrier height) and strong detection values of physical security effectiveness in the
knowledge matrices (averaged values over all listed attack-type elements in the orthogonal
continuum). Considering the defensive-type universal elements we can assign values for:
1. Section A, where a high averaged strength value is 5.63 (e.g. high percentage of brick
structure).
2. Section B, where a high averaged material dimensions value is 3.52 (e.g. 3 human high
smooth brick wall).
3. Section C, where a low averaged detection value is 4.84 (e.g. infrared detection).
4. Section D, where a high averaged detection value is 8.78 (e.g. infrared detection).
These values can be considered for the model in Figure 6.9.
For Delay Probability:
m value = (Section A) + (Section B) = 9.15
b value = - (Section A) * (Section B) = -19.82
For Detection Probability:
m value = - 34.6 + (17.3 - (Section C)) + (Section D) = -13.36
b value = (17.3 - (Section C)) * (Section D) – (299.29 / 2) = -40.25
Figure 6.13 provides the conceptual map for Test Case 4 as tangent curves for the model
showing the delay probability - detection probability intersection crosses at -41°.
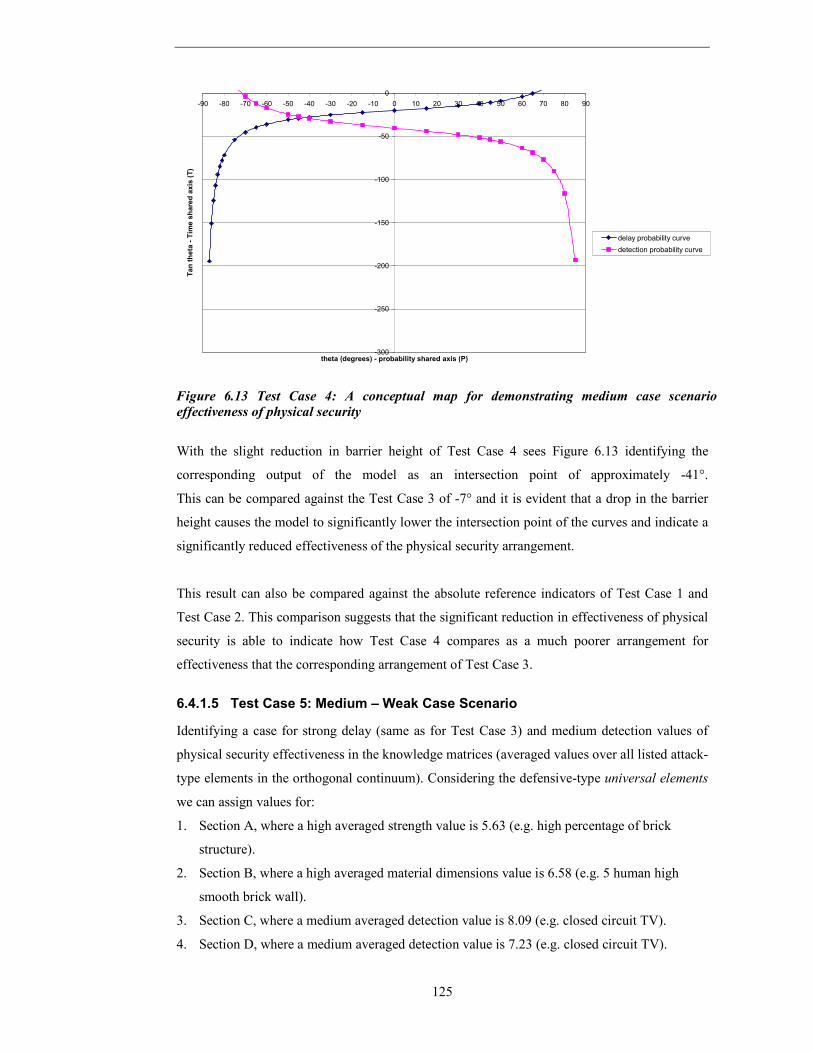
125
-300
-250
-200
-150
-100
-50
0
-90 -80 -70 -60 -50 -40 -30 -20 -10 0 10 20 30 40 50 60 70 80 90
theta (degrees) - probability shared axis (P)
Tan theta - Time shared axis (T)
delay probability curve
detection probability curve
Figure 6.13 Test Case 4: A conceptual map for demonstrating medium case scenario effectiveness of physical security
With the slight reduction in barrier height of Test Case 4 sees Figure 6.13 identifying the
corresponding output of the model as an intersection point of approximately -41°.
This can be compared against the Test Case 3 of -7° and it is evident that a drop in the barrier
height causes the model to significantly lower the intersection point of the curves and indicate a
significantly reduced effectiveness of the physical security arrangement.
This result can also be compared against the absolute reference indicators of Test Case 1 and
Test Case 2. This comparison suggests that the significant reduction in effectiveness of physical
security is able to indicate how Test Case 4 compares as a much poorer arrangement for
effectiveness that the corresponding arrangement of Test Case 3.
6.4.1.5 Test Case 5: Medium – Weak Case Scenario
Identifying a case for strong delay (same as for Test Case 3) and medium detection values of
physical security effectiveness in the knowledge matrices (averaged values over all listed attack-
type elements in the orthogonal continuum). Considering the defensive-type universal elements
we can assign values for:
1. Section A, where a high averaged strength value is 5.63 (e.g. high percentage of brick
structure).
2. Section B, where a high averaged material dimensions value is 6.58 (e.g. 5 human high
smooth brick wall).
3. Section C, where a medium averaged detection value is 8.09 (e.g. closed circuit TV).
4. Section D, where a medium averaged detection value is 7.23 (e.g. closed circuit TV).

126
These values can be considered for the model in Figure 6.9.
For Delay Probability:
m value = (Section A) + (Section B) = 12.21
b value = - (Section A) * (Section B) = -37.05
For Detection Probability:
m value = - 34.6 + (17.3 - (Section C)) + (Section D) = -18.16
b value = (17.3 - (Section C)) * (Section D) – (299.29 / 2) = -83.06
Figure 6.14 provides the conceptual map for Test Case 5 as tangent curves for the model
showing the delay probability - detection probability intersection point at approximately -58°.
-300
-250
-200
-150
-100
-50
0
-90 -80 -70 -60 -50 -40 -30 -20 -10 0 10 20 30 40 50 60 70 80 90
theta (degrees) - probability shared axis (P)
Tan theta - Time shared axis (T)
delay probability curve
detection probability curve
Figure 6.14 Test Case 5: A conceptual map for demonstrating medium – weak case scenario
effectiveness of physical security
The delay probability parameters of Test Case 5 are the same as Test Case 3; however a change
in detection parameter input has significantly reduced the intersection point of the two curves in
Figure 6.14 to -58°. This can then be considered relative to the output of the model in
Figure 6.12 of approximately -7°. Both values can be compared with the Test Case 4
intersection point of approximately -41°. The moderate reduction in detection probability causes
the model to significantly lower the intersection point of the two curves and therefore indicate a
significantly reduced effectiveness of the physical security arrangement. The model suggests
that this change of detection system presents a relatively poorer level of effectiveness than a
lower barrier height.

127
6.4.1.6 Test Case 6: Medium Case Scenario II
Identifying a test case for medium delay (low strength but tall wire mesh barriers) and strong
detection values of physical security effectiveness using data in the knowledge matrices.
Considering the defensive-type universal elements we can assign values for:
1. Section A, where a low averaged strength value is 3.75 (e.g. the equivalent in this case is a
high percentage of wood in the structure).
2. Section B, where the lowest averaged material dimensions value is 7.22 (e.g. equivalent to 5
human high steel small mesh with razor wire).
3. Section C, where the highest averaged detection value is 4.53 (e.g. microwave detection
systems).
4. Section D, where the lowest averaged detection value is 8.86 (e.g. microwave detection
systems).
These values can be considered for the model in Figure 6.9.
For Delay Probability:
m value = (Section A) + (Section B) = 10.97
b value = - (Section A) * (Section B) = -27.08
For Detection Probability:
m value = - 34.6 + (17.3 - (Section C)) + (Section D) = -12.97
b value = (17.3 - (Section C)) * (Section D) – (299.29 / 2) = -36.50
Figure 6.15 provides the conceptual map for Test Case 6 as tangent curves for the model
showing the delay probability - detection probability intersection point at approximately -21°.
-250
-200
-150
-100
-50
0
-90 -80 -70 -60 -50 -40 -30 -20 -10 0 10 20 30 40 50 60 70 80 90
theta (degrees) - probability shared axis (P)
Tan theta - Time shared axis (T)
delay probability curve
detection probability curve
Figure 6.15 Test Case 6: A conceptual map for demonstrating medium case scenario effectiveness of physical security

128
Test Case 5 represented in Figure 6.15 can be loosely compared to the previous test cases with
an intersection point of approximately -21°. The output of the model suggests for this example,
that the effectiveness of the physical security arrangement is inferior to Test Case 3 but superior
to Test Case 4.
6.4.1.7 Test Case 7: Medium Case Scenario III
Identifying a test case for strong delay (high strength and tall wire mesh barriers) and medium
detection values of physical security effectiveness in the knowledge matrices (averaged values
over all listed attack-type elements in the orthogonal continuum). Considering the defensive-
type universal elements we can assign values for:
1. Section A, where a low averaged strength value is 9.05 (e.g. equivalent to a high percentage
of steel in the structure).
2. Section B, where the lowest averaged material dimensions value is 7.22 (e.g. equivalent to 5
human high steel small mesh with razor wire).
3. Section C, where the highest averaged detection value is 9.47 (e.g. mobile human guard).
4. Section D, where the lowest averaged detection value is 8.88 (e.g. mobile human guard).
These values can be considered for the model in Figure 6.9.
For Delay Probability:
m value = (Section A) + (Section B) = 16.27
b value = - (Section A) * (Section B) = -65.34
For Detection Probability:
m value = - 34.6 + (17.3 - (Section C)) + (Section D) = -17.89
b value = (17.3 - (Section C)) * (Section D) – (299.29 / 2) = -80.11
Figure 6.16 provides the conceptual map for Test Case 7 as tangent curves for the model
showing the delay probability - detection probability intersection point at approximately -24°.

129
-300
-250
-200
-150
-100
-50
0
-90 -80 -70 -60 -50 -40 -30 -20 -10 0 10 20 30 40 50 60 70 80 90
theta (degrees) - probability shared axis (P)
Tan theta - Time shared axis (T)
delay probability curve
detection probability curve
Figure 6.16 Test Case 7: A conceptual map for demonstrating medium case scenario
effectiveness of physical security
It can be seen from Test Case 1 to Test Case 7 that the model provides reasonable indications
for relative effectiveness of physical security arrangements. This research acknowledges that
indications by the model for relative effectiveness may find only partial acceptance among all
security practitioners. It should be remembered however, that the model that has been presented
uses input data that has undergone analysis that has considered a High degree of consensus and
potentially representing common knowledge. The knowledge matrices have provided data to the
model of the study, based on the relationships between universal elements as reference levels on
concept continuums. The model has demonstrated that this data provides relative indications of
physical security effectiveness. To be able to include the concept of response probability into
the determination for effectiveness, an extension to the model is now considered.
6.4.2 Extended Model
The defence in depth function of response is a concept that is has been recognised by this study
as strongly dependent on the detection probability. This means that for a proposed response
probability to be suitable, the defence in depth function of detection in a physical security
scenario must have already occurred. The shape of the curve of response probability would
ideally be very similar to the shape of the curve for detection where as t gradually increases
response will commence at 0% probability increasing to 100% in time. The notion of response
probability is also co-dependent on the defence in depth function of delay as response
probability will only be suitable if an attack on a facility is delayed over a sufficient period of
time for the response action to be commenced.

130
This co-dependency will generate a series of curves for response between 0% and 100%.
The model suggests that with better response systems the curve’s gradient increases achieving
100% in less time after detection. Conversely poorer response systems decreases the curve’s
gradient over time. For the purpose of an extension to the model, response probability has been
interconnected to the detection probability curve through a common b value and interconnected
with the delay probability curve at its intersection point which has been designated as the point
representing overall effectiveness and benefit to physical security. It is worth noting that as
values in the knowledge matrix of Section E decrease, the benefit to security increases.
Therefore a strong response to an attack on physical security will have a corresponding low
value from the matrix.
An extension to the model provided in Figure 6.9 is presented as Figure 6.17. The extended
model has been empirically determined to present a method giving a mathematical combination
for the dissimilar concepts of delay, detection and response selecting values from within the
knowledge matrices determined in this study. The two test cases following Figure 6.17
demonstrate a further interpretation of the data in the knowledge matrices of the research.

131
This conceptual model uses tangent functions from -90° < θ < 90° to represent delay
probability, detection probability and response probability and obtains its data from the
knowledge matrices of the research labelled Section A through to Section E.
For Delay Probability tangent function T = m tan θ + b:
Let m value = (Section A) + (Section B) (minimum 0, maximum 34.6)
Let b value = - (Section A) * (Section B) (minimum -299.29, maximum 0)
For Detection Probability tangent function T = m tan θ + b:
Let m value = - 34.6 + (17.3 - (Section C)) + (Section D) (minimum -34.6, maximum 0)
Let b value =((17.3 - (Section C)) * (Section D)) – (299.29 / 2) (minimum -150, maximum 0)
For Response Probability tangent function T = m tan θ + b:
Let m value = - (Section A) * (Section B) * ((17.3 / (Section E)) - 1)
(minimum -5180, maximum 0)
Let b value =((17.3 - (Section C)) * (Section D)) – (299.29 / 2) (minimum -150, maximum 0)
Then Probability for Effectiveness (PE) for overall benefit to physical security is given (along
T and θ) by:
PE = (Delay Probability ∩ Detection Probability), (Delay Probability ∩ Response Probability)
Figure 6.17 An extended model for the representation of the effectiveness of physical security
using tangent functions To establish the validity of the extended model, two test cases will be considered for the
defensive-type universal elements of this study and a further four test cases will be available for
consideration in the appendices. The examples presented in the text will be labelled Test Case 8
and Test Case 9. The input to the model will be selected from the values of universal elements
in the knowledge matrices of Sections A through to Section E (see Appendices G1-G5).
The test cases have been specifically chosen in order to demonstrate the relationship for delay
probability, detection probability and response probability.
Test Case 8 has selected its input parameters from a combination of brick wall and infrared
detection systems and represents a similar arrangement to Test Case 3. Selected attack methods
have been chosen to enable specific values from within the knowledge matrix to provide a full
demonstration of the model and its application in determining the effectiveness of physical
security.
132
6.4.2.1 Test Case 8: Strong Attack – Strong Defence – Medium Response
Identifying a case for strong delay, strong detection and medium response values of physical
security effectiveness in the knowledge matrices (considering all values over all listed attack-
type elements in the orthogonal continuum). Considering the universal elements for both
defence and attack we can assign values for:
1. Section A, where a high strength value is 4.04 (e.g. high percentage of brick structure
considering an attack by electric drill).
2. Section B, where a high material dimensions value is 6.13 (e.g. 5 human high smooth brick
wall considering an attack by a ladder).
3. Section C, where a low detection value is 4.15 (e.g. infrared detection considering an attack
creating false alarms).
4. Section D, where a high detection value is 5.55 (e.g. infrared detection considering an attack
using system knowledge).
5. Section E, where a medium response value is 7.31 (e.g. high tech response considering
corporate data as an asset).
These values can be considered for the model in Figure 6.17.
For Delay Probability:
m value = (Section A) + (Section B) = 10.17
b value = - (Section A) * (Section B) = -24.77
For Detection Probability:
m value = - 34.6 + (17.3 - (Section C)) + (Section D) = -15.90
b value = (17.3 - (Section C)) * (Section D) – (299.29 / 2) = -76.66
For Response Probability:
m value = - (Section A) * (Section B) * ((17.3 / (Section E)) - 1) = -33.84
b value = (17.3 - (Section C)) * (Section D) – (299.29 / 2) = -76.66
Figure 6.18 provides the conceptual map for Test Case 8 as tangent curves for the model
showing the delay probability - detection probability intersection point at approximately -64°.
Figure 6.18 also presents the delay probability - response probability intersection point at
approximately -50°.

133
-300
-250
-200
-150
-100
-50
0
-90 -80 -70 -60 -50 -40 -30 -20 -10 0 10 20 30 40 50 60 70 80 90
theta (degrees) - probability shared axis (P)
Tan theta - Time shared axis (T)
delay probability curve
detection probability curve
response curve
Figure 6.18 Test Case 8: A conceptual map for demonstrating effectiveness of physical security
In the example for Test Case 8 the intersection points of the delay probability – detection
probability curves is approximately -64° which corresponds to a relatively poor overall
effectiveness for a physical security arrangement. The same defensive-type universal element
arrangement exists in Test Case 3 which has an intersection point of -7°, however the attacking-
type universal elements that have been selected for Test Case 8 can be considered as very strong
and therefore the physical security effectiveness intersection has been significantly reduced in
Figure 6.18 for the delay probability curve and the detection probability curve. The results from
Test Case 8 also indicate that the intersection point for the delay probability – response
probability curve is approximately -50°.
Test Case 9 considers similar input parameters to Test Case 8 considering a slight change in
response input that implies a weaker response.
6.4.2.2 Test Case 9: Strong Attack – Strong Defence – Medium Weak Response
Identifying a case with similarity to Test Case 8 considers slightly weaker response values of
physical security effectiveness in the knowledge matrices (considering all values over all listed
attack-type elements in the orthogonal continuum). Considering the universal elements for both
defence and attack we can assign values for:
1. Section A, where a high strength value is 4.04 (e.g. high percentage of brick structure
considering an attack by electric drill).
2. Section B, where a high material dimensions value is 6.13 (e.g. 5 human high smooth brick
wall considering an attack by a ladder).
3. Section C, where a low detection value is 4.15 (e.g. infrared detection considering an attack
creating false alarms).

134
4. Section D, where a high detection value is 5.55 (e.g. infrared detection considering an attack
using system knowledge).
5. Section E, where a medium response value is 8.76 (e.g. security patrol response considering
personal valuables as an asset).
These values can be considered for the model in Figure 6.17.
For Delay Probability:
m value = (Section A) + (Section B) = 10.17
b value = - (Section A) * (Section B) = -24.77
For Detection Probability:
m value = - 34.6 + (17.3 - (Section C)) + (Section D) = -15.90
b value = (17.3 - (Section C)) * (Section D) – (299.29 / 2) = -76.66
For Response Probability:
m value = - (Section A) * (Section B) * ((17.3 / (Section E)) - 1) = -24.14
b value = (17.3 - (Section C)) * (Section D) – (299.29 / 2) = -76.66
Figure 6.19 provides the conceptual map for Test Case 9 as tangent curves for the model
showing the delay probability - detection probability intersection point at approximately -64°.
Figure 6.19 also presents the delay probability - response probability intersection point at
approximately -58°.
-300
-250
-200
-150
-100
-50
0
-90 -80 -70 -60 -50 -40 -30 -20 -10 0 10 20 30 40 50 60 70 80 90
theta (degrees) - probability shared axis (P)
Tan theta - Time shared axis (T)
delay probability curve
detection probability curve
response curve
Figure 6.19 Test Case 9: A conceptual map for demonstrating effectiveness of physical security
The results from Test Case 9 indicate that the intersection for the delay probability – response
probability curve has dropped slightly to -58° from the Test Case 8 indication of -50°.
This demonstrates a slightly lower effectiveness for response probability. This result suggests

135
that the model correctly considers a weaker response parameter input to equate to a lower
intersection point on the response probability curve. While the model does not give any specific
meaning to the magnitude of this change (approximately 8°), the direction of the change is
logically correct.
6.4.3 The Extended Model summarised
Test Case 10, Test Case 11, Test Case 12 and Test Case 13 have been based on the model in
Figure 6.17 and can be further considered for validity in Appendix J.
A brief summary of these is included in this text for information. Test Case 10 seeks to further
demonstrate the interrelationship between the response probability and the delay probability for
the model. Test Case 11 provides a similar consideration to Test Case 10 but additionally
demonstrates the relationship between detection probability and response probability. Test Case
12 provides an example of an increase to the delay probability - response probability curve
intersection point for a stronger response system. Test Case 13 has been included to
demonstrate the strongest case for response consideration and is useful to be able to consider the
magnitude of the changes relating to the intersection point of the delay probability – response
probability curves in the previous examples.
The test cases for both the original model and the extended model in this section have
demonstrated an interpretation for the knowledge matrices of this study for relative
effectiveness of physical security arrangements. The model has been empirically determined
and presented as a novel method to interrelate the dissimilar defence in depth concepts of delay,
detection and response using values considered as a consensus of expert opinion in this study.
Three sections of the questionnaire Section F, Section G and Section H have not been
incorporated in either the simple or the extended model, but nevertheless provide some relative
indications for the motivation and attack. A suggestion for future work is to incorporate the data
from the remaining three knowledge matrices into both models presented in this chapter in order
to provide consideration of the concept continuums of asset and motivation into the
effectiveness of physical security. This may be achieved with further analysis of the axes that
has been used as representations of the model. As a suggestion, the effects of asset and
motivation may be able to better determine the numerical magnitude along the axis labelled
“Tan theta - Time shared axis (T)”.
The model presented in this chapter is strictly an indicative device for relative comparisons.
While the validity of the model may be critiqued in its own right, the model’s primary purpose
in this study is to provide a means of interpretation for the results of the study presented in the
136
knowledge matrices. These knowledge matrices represent the relationship assessment values for
the universal elements of the research. The model is presented as a vehicle to enable the data
within the matrices to be interpreted by the theoretical conceptualisation of physical security.
The theory for physical security has provided graphical interpretations for evaluating
effectiveness and the model has represented its novel approach designing the curves of delay
probability, detection probability and response probability as mathematical tangent functions.
The investigative nature of this research has been able to construct the knowledge matrices from
expert opinion and the model has been able to be constructed based on these knowledge
matrices as part of a conceptual mapping that incorporates existing theory from physical
security literature. The interpretation of the model suggests that the information within the
knowledge matrices is able to determine effectiveness over the range of universal elements
determined for the study. As the universal elements of the study represent reference levels along
a dimension for each concept continuum, both the knowledge matrices and the model may be
indicative for the majority of non-universal elements by a method of ranking non-universal
elements relative to the universal elements along each concept continuum.
The application of the model to facility specific requirements may be undertaken with the use of
a percentage representation of universal elements for each facility arrangement. This suggestion
proposes that each region or part of a facility can be represented by the concept continuums of
the model. In this way, the arrangement that is most appropriate in comparative effectiveness of
a physical security scenario can be supported by this research and in the presented model.
This study has considered high level concepts in the hierarchical structure of physical security.
The knowledge matrices provide relationship values for universal elements as reference levels
along concept continuums, however there is likely to be a fuzzy range within each of the
universal element reference levels that depend upon lower order hierarchical considerations.
An example of this would be the performance of detection systems based on a harsh weather
environment. The scope of this research has not enabled the model to go to this level of
consideration for universal elements and this may lead to criticism of the model and the
knowledge matrices. It should be pointed out however that the method that has been used to
establish the knowledge matrices and construct the model is able to be further considered by
extending iterations of the universal elements of physical security. With further considerations
and iterations of lower order hierarchical concept continuums for universal elements, a greater
range of depth may be approached within the research and the model.
Finally, it is important to understand that this research has intended an investigative approach
mapping universal elements of physical security to provide a platform for holistic modelling.

137
The data that has been collected in this case should be viewed as indicative of the type of
knowledge structure that may enable modelling. A suggested extension to this study can be
recognised as the calibration of the model in this research. The notion of a calibration in this
instance implies the refining of all parameters and mechanisms of the model to produce
outcomes that are better aligned with real-world data. An extension to this study would involve
testing the calibration of the model with the development of additional theory in physical
security.
6.5 Interpretations outside of the field of physical security
The objectives of this study have been predominantly targeted toward the field of physical
security. Although this focus has directed the investigative method and the techniques in this
thesis, the method of construction of the knowledge structures should be equally valid outside
the discipline of physical security.
The method of inquiry of this research was chosen in order to address the complex nature of the
problems involved in modelling physical security effectiveness. This study has presented
several interesting proposals that may be of value in research outside of physical security, where
complexity exists in latent variables of each discipline makes modelling of the issues difficult.
Where it can be identified that modelling would provide some assistance in decision making,
the process of creating knowledge structures in other disciples may be highly relevant.
Phenomenological sociology has suggested that a consideration of the universal elements as
well as a focus upon the universal element relationships of any particular discipline leads to a
better understanding of the phenomenon. This study has demonstrated that where universal
element relationships can be assessed for value by expert opinion, knowledge matrices can be
created to provide a foundation for modelling within the discipline. While the actual working
models for different disciplines may vary widely in structure, the theory of knowledge
supported by the literature for each discipline should be able to provide data in a similar matrix
format for boundary conditions considering relational descriptors and concept continuums as in
this research.
In this research the selection of universal elements from a larger number of potential elements is
suggested as one of the methods of distillation of complexity. This study has selected universal
elements based on reference levels along dimensions of concept continuums in order to reduce
complexity. The method in designing the creation of knowledge hierarchies has suggested that
suitable reduction in complexity can be achieved by controlling the number of universal
elements to be considered as reference levels. The consideration of relational descriptors in
conjunction with the use of concept continuums provides a foundation for the framework of

138
appropriate questionnaires that could assess knowledge relationships in any discipline.
The relational descriptors would form boundary conditions similar to those of this study and
could be applied to each question to support the value assessments of elements relationships.
This research has used quasi-qualitative measure of time to indicate relative value in universal
element relationships. Time measurement has been enabled due to the relational descriptors
having action-based properties. The time based value assessments in this research were able to
indicate relative benefit to physical security as well as being able to indicate an order of
magnitude of the benefit through exponential values indicating time. This concept of time
measurement can realistically be applied in knowledge structures in other disciplines using
selected universal elements. This method would provide an alternative to the commonly used
social indicators of agreement and disagreement used in multidimensional scaling in attitude
measurement studies.
The quasi-qualitative time indicators may also provide a further benefit to other studies in
developing knowledge structures, in that they allow for a degree of fuzziness for the estimations
of expert opinion. Time measurements using the presented scale such as seconds, minutes,
hours, etc. allow for an approximation to be made in the order of time that expert opinion
considers to best represents the element pair consideration and the boundary condition.
This study has suggested a method that establishes a case for consensus from a range of expert
opinion collected through the research questionnaire. The method used to determine the degree
of consensus in Chapter 5 is relatively uncomplicated in that it does not require specialised
computing software packages. The correlations considered over the statistical means of the
selected groups correlated between category groups have been able to demonstrate convergence
of opinion over the boundary conditions that were established in the research questionnaires.
It is the proposal of this study that the method described in this research will have potential
applications in other disciplines where large complexity is present and where modelling may
provide assistance in decision making. The development of knowledge matrices in other
disciplines may assist many potential applications in problem solving although specific
modelling. However it will inevitably be dependent upon the nature of the knowledge for that
field. Knowledge structures may have significant application in future for all research.

139
6.6 Concluding remarks
For the consideration of decision support with regard to the effectiveness of physical security
arrangements, the data that has been collected in the research and presented as knowledge
matrices are able to be interpreted in a concept mapping. This concept mapping relates to time-
based security considerations for the functions of defence in depth of physical security.
The conceptual mappings are presented as a selected set of curves where the gradient and the
relative positioning of the curves determine an overall benefit to physical security.
Selected curves relating to a facility can display an optimum point for the effectiveness of
physical security arrangements. Further consideration of the regions separated by the
intersection of the curves determines quadrants that are useful in describing physical security
mapping concepts. The concept of suitability has been introduced into the concept mappings in
order to define the regions created by these curves.
The model that has been presented in this section proposed a method for representing the
conceptual mappings of defence in depth functions and physical security effectiveness.
This method suggests the use of mathematical tangent curves to represent the concepts of delay
probability, detection probability and response probability. The input of the model has
considered the value assessments from the knowledge matrices of the research.
A number of examples have been presented in this chapter as test cases to provide relative inter-
relationship determinations for dissimilar concepts in physical security. The model has been
able to demonstrate its ability to represent relative effectiveness of physical security
arrangements. The series of test cases that have been used for examples considered selected
input parameters to demonstrate relative indicators for the probability measures that represent
delay probability, detection probability and response probability.
This study represents a method of interpreting universal element relationships in the field of
physical security and may potentially have applications for research in other disciplines.
The topic of physical security has provided a platform to demonstrate a concept mapping in
order to achieve the research objectives. This study has considered theoretical suggestions for
the conceptual mapping to establish a hierarchical framework supportive of knowledge.
Other disciplines may also be able to use techniques such as time measurement and value
assessments through the consideration of relational descriptors and concept continuums.

140
7 Conclusion
This study has described the research undertaken as an investigative approach to create
universal element hierarchies by conceptually mapping element relationships. The research has
based its data collection on an instrument used to assess the expert opinion of practitioners in
the field of physical security and has obtained a consensus of knowledge. The study has created
knowledge matrices that contain relationship information over universal elements of physical
security in order to represent a holistic view of modelling the effectiveness of physical security
arrangements for the purpose of supporting decision making.
The unusual investigative technique used for this study has been able to combine theoretical
considerations from a wide range of fields to achieve the data sets representing knowledge
through expert opinion. The method of inquiry chosen for this research described by Green et al.
(1997) as phenomenology is unusual in that it identifies an investigative approach toward a
phenomenon by the determination of its elements and element relationships without proposing
any set hypotheses. The study has also proposed a novel method that is able to model its results
using the well known mathematical tangent function to conceptualise effectiveness between
dissimilar conceptual entities.
The concept of modelling physical security effectiveness has been previously considered in
literature with most of the previous work recognising the functions of defence in depth as a
primary focus. This research has identified the relative effectiveness of delay probability,
detection probability and response probability to produce a single relative risk value for each
physical security arrangement. The comparison of relative risk values over a single facility or a
range of facilities can support decision making in the procurement process. The benefit of using
this modelling process may be able to eliminate labour intensive risk analyses as well as
minimising the subjective nature of practitioner’s techniques of security risk analysis for
complex physical security arrangements.
The original problem that was identified by this research considers the possibility where human
adversaries can defeat a physical security arrangement to obtain the benefit of an asset.
Thus the effectiveness of physical security can ultimately be expressed as a probability of
success or probability of failure. Currently practitioners in the field of physical security
undertake security risk assessments with analysis of complex risk scenarios that lead to
combinations of success or failure. Modelling of physical security effectiveness needs to be able
to cope with the human adversary factor and generalise for limited information across many
types of physical security arrangements.

141
The method of inquiry undertaken in the study has provided an investigation into the universal
element relationships of physical security terminology targeting expert opinion from
practitioners in the field of physical security and has measured these relationships as value
assessments. The results of the value assessments of the research have been presented in
decision matrices. The data from the matrices have been used in the study’s novel suggestion for
modelling of physical security arrangements and has been able to provide relative indications of
effectiveness which provides support in decision making over a range of scenarios and facilities.
The knowledge matrices developed in this research have demonstrated that for a given set of
boundary conditions, universal elements representing reference levels along orthogonal concept
continuums have been able reduce the complexity of a physical security scenario. The study has
developed methods to obtain the knowledge matrices from a theoretical framework in order to
structure a conceptual mapping of the phenomenon. The techniques establishing hierarchical
structure use time as a measurement indicator in value assessments through the consideration of
relational descriptors which are effectively action statements (Smith, 1984) as directional
indicators. The technique used to create the knowledge matrices may be applicable for
disciplines outside the field of physical security.
7.1 Overview of the study
This research has proposed several ideas that have been supported through an investigation into
the consensus of expert opinion of respondents. The final overview of the study considers the
approach to develop the research questionnaire and construct the data sets for modelling.
The research questionnaire was recognised as the primary source of data for the study and the
development of its structure was important in order to maximise the usefulness of the
information obtained for analysis. The method of inquiry concentrated on determining the
universal elements and element relationships to achieve the best likelihood of a holistic
consideration of the topic. The method of inquiry considers phenomenological sociology or
phenomenology, and is presented as the most flexible investigative approach for determining
the universal elements of the phenomenon. The best method for determining universal element
relationships was considered to be expert opinion in a Delphi-like approach.
The literature review identified methods of data collection to obtain expert opinion through in-
depth interviews and questionnaires. The complete source of data for the research was
considered to be found within the collective knowledge of practitioners in the field of physical
security. This range of expert opinion was targeted for the properties that would lead to a
determination of a degree of consensus through the inter-comparison of respondent groups.

142
The content and structure of the research questionnaire was considered to provide the
framework to assess the universal elements relationships of the study. The questionnaire also
provided a mechanism for self-assessment of the techniques used. The universal elements that
were listed in the questionnaire represented arbitrary reference levels along a dimension as a
scale over a continuum of concept measurement. All listed elements of the research
questionnaire were considered to be universal elements. The universal elements were arranged
on the questionnaire so that defensive-type elements were paired against attacking-type
elements to enable relationships determinations. The questionnaire structured universal elements
from a theoretical consideration of a hierarchy of the elements associated with their respective
functions of defence in depth. The hierarchical structures were determined by considering
orthogonal concept continuums as measurement scales and relational descriptors that produced
directional boundary functions relative to each of the functions of defence in depth.
The nature of the questionnaire sought to capture the instinctive considerations for each
respondent in the relative ordering of the elements of physical security. The individual value
assessments for each respondent created a profile as a list of 288 indications representing
element pair relationships of the study. The 288 value assessments from the questionnaire were
able to be transformed into numerical values to enable statistical analysis and consideration
towards consensus. Matrices were developed using a standard list of element pair relationships.
The assessment labels of time in the questionnaire were deliberately fuzzy to allow for each
respondent’s process of generalisation to be more effective. In this context of this study
generalisation has been used to mean the ability to take a complex scenario and incorporate
generalised or additional detail of the numerous complex factors where specific information
may be unavailable. The questionnaire was considered to contain a quasi-qualitative approach.
The three groups of respondents chosen for the research provided an adequate separation of
profiles to obtain consensus using the technique of correlating the different group profiles.
Group profiles were compared to each another as well as to a standard profile developed from
the composite group. The degree of consensus was able to be ascertained from these
comparisons. The process considered a correlation technique applied to the mean values for
each group’s element pair relationships as a list of 288 numerical variables. The group profiles
were able to establish a consensus for a standard list through comparisons to each other.
Each individual respondent’s profile was also correlated against the series of group standards to
ascertain the degree of consensus by a series of comparisons.
The creation of relationship matrices establishes one of the primary objectives of the study and
has been presented in 6 by 6 orthogonal format for each of the eight sections labelled Section A
to Section H of the research. The matrices contain values for universal elements relationship

143
links over the concept continuums measurement scales. The matrices were each used to
represent a knowledge structure that indicates a directional benefit of physical security
effectiveness. These have been represented through ranked ordering of universal elements over
orthogonal concept continuums for a specific boundary condition. The data for the matrices has
been supplied from value assessments of expert opinion that represents a consensus relationship
mapping of universal elements.
A novel interpretation for modelling of the results has been proposed by the study using
mathematical tangent functions to assess effectiveness between dissimilar conceptual entities.
The model was designed using empirically based coefficients for tangents functions that
represented delay probability, detection probability and response probability. These tangent
curves were able to establish an indication for overall relative effectiveness over a series of
specific physical security arrangements. The model demonstrated several test cases using
selected data from the knowledge matrices of the research. The results from the test cases
confirm that the model is able to predict overall benefit to security over a range of physical
security element combinations.
7.2 Research aims and objectives
The study objectives have been met by this research as follows:
7.2.1 Determine a set of universal elements for physical security
Phenomenological sociology as the method of inquiry adopted by this study has required that
the universal elements related to the phenomenon be determined. This was seen as a highly
significant component of the study considering the large number of potential elements that may
be identified within the field of physical security. Therefore an objective of the study was to
establish the notion of when a potential element would constitute a universal element.
While sources from literature suggested methods of grouping elements into clusters based on
the properties of the elements, other suggestions have included the use of concept continuums
(Smith, 1984). Combining the beneficial ideas from both of these concepts considers the
clustering of all elements around dimensional reference points using scales of concept
continuums. The determination of universal element status from all possible elements of
terminology was enabled by stating that universal elements would be considered as simple
arbitrary reference levels along the scales of each of the concept continuums.
Universal elements could also be considered along other concept continuums and in this way all
elements relationships of physical security could be represented by a discrete list of universal
elements.
144
The most important universal elements in each concept continuum were identified as those that
represented the outermost reference levels for each concept continuum. These outermost or end
reference points created the relative maximum and relative minimum conceptual opposites
along the dimension chosen for the concept continuum. The other listed universal elements
arranged between these end point values could ultimately be interchangeable with other non-
universal elements with the assumption that the dimension could be adequately represented in
increments between these relative end points. Each universal element along the scale of the
concept continuum would be considered as an arbitrary point representing a reference level that
could cluster a group of elements of similar properties. The study determined that it was not
important for the scale across the dimension to be represented by equal divisions, yet it
remained important that the universal elements along the scale were dissimilar enough to be
able to be separated in conceptualisation.
The number of elements chosen for each concept continuum in the study was six. This number
was determined as adequate for a scale of ordered universal elements to be conceptualised and
allowed the possible separation of the scale into quintiles. The study determined that some for
dimensions the universal elements would be closer together along the concept continuums while
for others they would be more separated. The determination of mathematical values for the
separation of the universal elements was identified as the required outcome of the investigation
by the research instrument. The separation between ordered universal elements was identified in
the knowledge matrices for each element over the orthogonal concept continuum using the
averaged positions along the scale. This was determined to be a useful indicator of the overall
relationship ranking between the universal elements.
The listed universal elements were chosen for the research as reference levels along concept
continuums and were mainly identified from literature. Suggestions from the pilot study were
also used to develop incremental terminology considerations for each concept continuum.
The universal elements were representative of physical security terminology combinations and
manifested as a range from a single word element to descriptive phrase. This study has made the
assumption that the universal elements of the research are valid and that they adequately
represent reference levels on the various dimensions of the concept continuums.
The questionnaire has considered a method to check this for validity and verify that a reasonable
framework has been presented. This method has enabled the respondents of the study to provide
comments or objections to this assumption.

145
7.2.2 Create a tool that measures expert opinion as values to
provide knowledge structured data-sets for the universal
element relationships of physical security scenarios.
The main data collection instrument of this study is the research questionnaire and it has been
designed to provide value assessments from expert opinion. The questionnaire has been created
from an investigative analysis of the theory of physical security and conceptual suggestions
from other areas of research. The method of inquiry has sought the determination of universal
elements and the apprehension of universal element relationships. The work of Smith (1984) has
suggested the foundation for the elemental scales that have been presented to experts in the
research questionnaire to assess their opinion and to ultimately build a knowledge structure
from complex element relationships.
The notion for considering a continuum of values for each dimension while using propositional
relations or relational descriptors (Smith, 1984) has provided a directional aspect to
relationships along concept scales that structure a hierarchy of knowledge. This study has
identified action-based relational descriptors where each universal element can be relatively
conceptualised in multidimensional space considering an action-bound boundary condition.
Orthogonal concepts are measured over the action sequence using increments of time as a
common link. One of the most important attributes of time as a measure is that it allows for a
relative scale of magnitude to be established, where for example the term seconds is
semantically very much smaller than the term days while it is much closer to the term minutes.
The relationships between concepts have been determined as a value assessment in time where a
relative increase/decrease in time represents a change in effectiveness of physical security.
The measurement of time in the questionnaire has attempted to standardise action-based
measurements in a common understanding over many different concepts. The designation of the
time structure chosen for the questionnaire enables a relative distribution of time judgements
that can signify importance. This relative importance is only able to be established after
establishing whether an overall benefit in a security sense is associated with shorter time frames
or longer time frames. The questionnaire identified common units of time as labels available to
the respondents that were then able to be transformed into a logarithmic-linear scale to enable
statistical analysis. This analysis is able to identify a relative order of magnitude of importance
in benefit to overall effectiveness of physical security.
The selection of action-based relational descriptors was important in the questionnaire as it
determined how the structure of elements would relate in each of the primary functions of
defence in depth. This selection provided eight repeating sections for the questionnaire.
The selection of relational descriptors determined were two for the function of delay, two for

146
the function of detection and one for the function of response, as well as three additional
relational descriptors to compliment the functions of defence in depth including asset, attacker
and attack.
The questionnaires were developed to represent the hierarchical structure of physical security
acknowledging the functions of defence in depth, relational descriptors, and universal elements
through concept continuums. Respondents were able to make value assessments considering
universal elements pairs from orthogonal concept continuum scales relative to a set of boundary
conditions that indicated a directional preference for time as an overall benefit to physical
security. This structure allowed respondents to provide value assessments as relative measures
of benefit over the entire list of universal elements based upon their knowledge, experience or
instinctive preferences. One of the main assumptions of the questionnaire is that the “instinct”
of the respondent has been the most appropriate answer in all cases.
7.2.3 Establish data matrices of elemental relationships
representing a knowledge structure.
The complex questions of the questionnaire have identified directional indications of time that
were able to imply overall benefit to security. The result of this outcome is that for each profile
of 288 value assessments, a relative benefit to security that has been identified for each
universal element pair depending upon the relevant boundary condition. A quasi-qualitative to
quantitative transformation was applied to each of the 288 value assessments within the
research. As the scale of time is exponential in nature, linear relations for the purpose of this
research have been determined from natural logarithms substituted as approximations in time for
convenience and conceptualisation. For the purposes of concept mapping, time has been
arbitrarily set at its minimum semantic value to demonstrate relativity between the ranked
values of element relationships.
The creation of relationship matrices as the main objective of the study has been presented as a
series of 6 by 6 matrices for each of the Sections A-H of the research. Special consideration has
been given to the ordering of the elements along the concept continuum using an averaging
process across data. The resulting matrices contain values for universal elements that are
specified along concept continuums and represent the relationship links between the universal
elements.
The matrices have been designed to represent knowledge structures that indicate a directional
benefit to physical security effectiveness based on ranked ordering of universal elements over
orthogonal concept continuums for a specific boundary condition. The matrices have been
developed from value assessments using the expert opinion of respondents of the study to

147
represent a demonstrated consensus of universal element relationships. The values collected
through this research forming a profile for each respondent comprising of a list of 288
numerical values comprising eight sections with each containing 36 element pair relationship
assessments.
A validity test for these knowledge matrices has demonstrated that they are strongly
representative of a consensus in expert opinion. The demonstration of consensus has been
achieved by means of conducting correlation measures based on comparisons of profiles
representing universal element relationship values, over the different groups of respondents and
over individual profiles. This key indicator for the achievement of consensus exhibited a high
degree of correlation between group profiles of different membership. The research has
considered a group’s interpretations to the boundary conditions of each question through
statistical means and obtained a combined assessment of values for each boundary condition.
7.2.4 Determine that the knowledge structure is representative of
common knowledge by checking the degree of consensus to
the data-sets among participants.
The notion of consensus implies a collective opinion or alternatively a standard of agreement
and therefore a common reference over all dimensions provided for agreement purposes.
In identifying the weight of collective opinion, an arbitrary selection of the statistical mean has
determined the preferred indicator towards consensus. An assessment of the validity of the
statistical mean was undertaken by checking correlation over alternative statistical indicators
using the median and the mode. While all three indicators have provided strong evidence of
consensus, the profile of mean values provided the best indicator for consensus. A combined
statistical mean profile has enabled the collective opinion of all respondents to be viewed
representing the collective knowledge structure through a moderate weighted position. This then
can be considered as a standard structure of knowledge over the boundary conditions.
The comparison of group standard profiles with individual respondent’s profiles has used the
same method of correlation and has demonstrated a relatively high degree of individual
agreement to each group standard. The indications in this research suggest that the composite
group standard (containing the averaged data over all respondents) has provided the strongest
correlation for all respondents and it also has suggested that the statistical mean values for the
profile of the entire group of respondents represented the optimum consensus. Thus the matrices
of the knowledge structure are valid as representations of expert opinion within the limitations
of the research.

148
7.2.5 Present a method of modelling dissimilar conceptual entities
for an overall risk to physical security that acknowledges the
functions of defence in depth with appropriate theoretical
considerations.
The effectiveness of physical security arrangements has been interpreted as a concept mapping
diagram relating to time-based security considerations for the functions of physical security
incorporating defence in depth. Interpretations of the conceptual mapping have been presented
as a selection of curves where the gradient and the relative positioning of the curves relate to an
overall benefit to physical security and are able to display an optimum point with regions of
suitability for the effectiveness of physical security arrangements.
The model that has been presented in this study has proposed a novel method for representing
the conceptual mappings of delay probability, detection probability and response probability
curves for physical security effectiveness. This method uses mathematical tangent curves to
represent the conceptualised modelling for each of delay probability, detection probability and
response probability. The model is able to select its input from the value assessments in the
knowledge matrices as coefficients for the respective tangent functions to determine the gradient
of the curves as well as the horizontal shift of the curves.
The application of the model has been demonstrated using a series of test cases using data from
the knowledge matrices of the study. The results from the test cases indicate relative
effectiveness can be determined for scenarios involving physical security element combinations.
7.2.6 Identify future applications for this research and consider
areas requiring additional investigation.
This study has considered high level concepts in developing the hierarchical structure of
physical security. The knowledge matrices provide relationship values for universal elements as
reference levels along concept continuums. It is acknowledged that there is likely to be a range
within each of the universal element reference levels that is fuzzy depending upon the
complexity of lower order hierarchical considerations. The scope of this research has not
enabled the model to proceed beyond high level concepts in the consideration of universal
elements; however a suggestion for future applications of this research may consider additional
iterations with slightly modified questionnaires using the same techniques as this study in order
to fine tune the universal element relationship values of the existing knowledge matrices.

149
This study has suggested a method that establishes a case for consensus over the range of expert
opinion that has been collected from the research questionnaire. The method used to determine
the degree of consensus has been able to demonstrate convergence of opinion over the boundary
conditions that were established in the research questionnaires. A suggestion for a further
application of this research proposes that the method has potential application in other
disciplines where large complexity is present among systems and where modelling may provide
assistance in decision making. The development of knowledge matrices for other disciplines
may determine that similar modelling applications can assist in problem solving although
specific hierarchical development will inevitably be dependent upon the nature of knowledge in
that field. Knowledge structures should have significant application in future for all research.
7.3 Final summary
This study establishes a methodology that is able to construct a theoretical hierarchy of physical
security elements in order to determine the complex relationships in a physical security
scenario. The research has provided a set of data matrices as an outcome that is able to represent
a knowledge structure.
The method that has been used to investigate the terminology of physical security has combined
an appropriate theoretical background through a combination of different literature sources.
The data that has been collected in this study provides relationships value assessments for a set
of universal elements and establishes that a consensus of expert opinion is able to determine a
universal element conceptual mapping. This study also provides discussion on the reliability and
validity of the results and especially considers the requirements to demonstrate the degree of
consensus of the final knowledge matrices. The applicability of the results to real-life scenarios
has been successfully identified through modelling using several test cases. The study has
essentially provided a theoretical structure for conceptual mapping toward the view to
improving decision making in the field of physical security.
The methodology of this study, although primarily directed toward modelling physical security,
has the potential for application in disciplines outside of physical security in areas where large
complexity exists and where modelling may assist decision making.

150
References
Abernethy, M.A., Horne, M., Lillis, A.M., Malina, M.A. and Selto, F.H. (2005). A multi-method approach to building causal performance maps from expert knowledge. Management Accounting Research Kidlington: Jun 2005. Vol. 16 Iss. 2, pp 135-155. Aidman, E.V. and Egan, G. (1998). Academic Assessment through Computerized Concept Mapping: Validating a Method of Implicit Map Reconstruction. International Journal of Instructional Media, Vol. 25, No. 3, pp 277-294. Anderson, L.W. (1988). Likert Scales. In Keeves, J.P. (Ed). Educational Research, Methodology, and Measurement: An International Handbook. Permagon Press, Oxford. pp 427-428. Armstrong, D. and Peile, C. (2005). Perimeter Intruder Detection Systems Performance Standard. In Proceedings of the 39th Annual 2005 International Carnahan Conference on Security Technology, 11-14 October, pp 33-36. Armstrong D. (2005). A Model for the Evaluation of Barriers and Containers and Their Resistance to Physical Attack. In Proceedings of the 39th Annual 2005 International Carnahan Conference on Security Technology, 11-14 October, pp 263-266. Barb, A. and Shyu, C.R. (2003). Semantics Modeling in Diagnostic Medical Image Databases Using Customised Fuzzy Membership Functions. The IEEE International Conference on Fuzzy Systems, 2003. pp 1159-1164. Barron, F.H. (1975). An Information Processing Methodology for Inquiring into Decision Processes. In White, D.J. (Ed). Theories of Decision in Practice. Hodder and Stoughton, London. pp 195-206. Beach, L.R. (1990). Image Theory: Decision Making in Personal and Organizational Contexts. John Wiley and Sons. England. Bell, P.M. and Badiru, A.B. (1993). Concept mapping as a knowledge acquisition tool in the development of a fuzzy rule-based expert system. Computers and Industrial Engineering. New York: Sep 1993. Vol. 25, Iss. 1-4, pp 115-119. Bennett, J.L. (1984). Overview. In Bennett, J.L. (Ed). Building Decision Support Systems. Addison-Wesley Publishing Company. California. Bevington, P.R. (1969). Data Reduction and Error Analysis for the Physical Sciences. McGraw-Hill Inc. New York, U.S.A. Bradley, J.H., Paul, R. and Seeman, E. (2006). Analyzing the structure of expert knowledge. Information & Management. Amsterdam: Jan 2006. Vol. 43, Iss. 1 pp 77-91. Brooks, D. and Smith, C.L. (2002). Public Street Surveillance: A psychometric study on the perceived social risk. 3rd Australian Information Warfare and Security Conference. Perth, Western Australia, 28-29 November 2002. Edith Cowan University. pp 28-37. Bunn, D.W. and Thomas, H. (1975). Assessing Subjective Probability in Decision Analysis. In White, D.J. (Ed). Theories of Decision in Practice. Hodder and Stoughton, London. pp 117-127. Chang, K.E., Sung, Y.T. and Chen, I.D. (2002). The Effect of Concept Mapping to Enhance Text Comprehension and Summarization. Journal of Experimental Education, Vol. 71 No. 1, 2002, 5-23.

151
Chiu, C.W.T. and Wolfe, E.W. (2002). A method for Analyzing Sparse Data Matrices in the Generalizability Theory Framework. Applied Psychological Measurement, Vol. 26 No. 3, September 2002, pp 321-338. Dunn-Rankin, P. and Zhang, S. (1997). Scaling Methods. In Keeves, J.P. (Ed). Educational Research, Methodology, and Measurement: An International Handbook. Second Edition. Permagon Press, Oxford. pp 790-798. Garcia, M.L. (2001). Analysis and Evaluation. In The Design and Evaluation of Physical Protection Systems. (Ch.13, pp 241-250). Boston: Butterworth-Heinemann. Giere, R.N. (1991). Knowledge, Values, and Technological Decisions: A Decision Theoretic Approach. In D.G. Mayo & R.D. Hollander (Eds.) Acceptable Evidence Science and Values in Risk Management. New York. Oxford University Press, Inc. Green, P.E., Tull, D.S. and Albaum, G. (1988). Research for Marketing Decisions. Fifth Edition. Prentice-Hall, International, New Jersey. Heath, L. and Tindale, R.S. (1994). Heuristics and Biases in Applied Settings. In Heath, L.,Tindale, R.S., Edwards, J., Posavac, E.J., Bryant, F.B., Henderson-King, E., Suarez-Balcazar, Y. and Myers, J. (Eds). Applications of Heuristics and Biases to Social Issues. Plenum Press. New York. pp 1-11. Hill, P.W. (1982). Process hierarchy theory: A holistic approach to theory building in Education. PhD Thesis, Murdoch University, Western Australia. Houchin, R. (1999). Reflections on the incorporation of modern technology in the refurbishment of a Victorian prison. Proceedings of IEEE 33rd Annual 1999 International Carnahan Conference on Security Technology. Madrid, Spain. pp 412-422. Keats, J.A. (1997). Measurement in Educational Research. In Keeves, J.P. (Ed). Educational Research, Methodology, and Measurement: An International Handbook. Second Edition. Permagon Press, Oxford. pp 755-762. Keeves, J.P. (1997). Introduction: Advances in Measurement in Education. In Keeves, J.P. (Ed). Educational Research, Methodology, and Measurement: An International Handbook. Second Edition. Permagon Press, Oxford. pp 705-712. Lindfield, A.G. and Rodger, R.M. (1992). Fence Detection Systems-Achieving the Desired Performance. Paper for ADPA 1992 Conference. Police Scientific Development Branch, Home Office, U.K. Lo, C.-C., Wang, P. and Chao, K.-M. (2005). Solving consensus measure of ambiguous MPDM problem vague sets – an application of risk assessment. Proceedings of the International Conference on Computer Supported Cooperative Work in Design. 24-26 May 2005, Vol. 2 pp 867-872. Miller, M.D. and Linn, R.L. (2000). Validation of Performance-Based Assessments. Applied Psychological Measurements, Vol. 24 No. 4, December 2000, pp 367-378. Moskowitz, H. (1975). Model Choice for Decision Making: Issues and Evidence Regarding the Use of Regression Models of Behaviour. In White, D.J. (Ed). Theories of Decision in Practice. Hodder and Stoughton, London. pp 328-340. Peck, L. (2002). Representation of weather and terrain effects on intrusion detection. In Proceedings of the 36
th Annual 2002 International Carnahan Conference on Security
Technology, 20-24 October, Atlantic City, New Jersey, pp 179-190.

152
Peck, L. and Trachier, G. (2004). Security Technology Decision Tree Tool. In Proceedings of the IEEE 38th Annual 2004 International Carnahan Conference on Security Technology, pp 91-98. Reisinger, Y. and Turner, L. (2000). Structural Equation Modelling with Lisrel: Application in Tourism. Working Paper 35/00, June 2000. Monash University, Faculty of Business & Economics. pp 1-29. Rodger, R.M., Leach, G. and Peaty, S.D. (1995). Alarm Verification Aids: Adding value to closed circuit television and detection systems. Proceedings of the 1994 International Carnahan Conference on Security Technology, Institute of Electrical and Electronics Engineers. pp 104-107. Rowe, A.J. and Davis, S.A. (1996). Intelligent Information Systems: Meeting the challenge of the knowledge era. Quorum Books. USA. Sikder, I.U., Mal-Sarker, S. and Mal, T.K. (2006). Knowledge-Based Risk Assessment Under Uncertainty for Species Invasion. Risk Analysis. Oxford: Feb 2006. Vol. 26, Iss. 1, pp 239-252. Smart, B. (1976). Sociology, phenomenology and Marxian analysis. Routledge & Kegan Paul, London. Smith, C.L. (1984). Learning astronomy and the organisation of astronomy concepts in semantic memory. PhD. Murdoch University, Western Australia. Smith, C.L. (2002). A Method for Understanding Students’ Perceptions of Concepts in the Defence in Depth Strategy. 3rd Australian Information Warfare and Security Conference. Perth, Western Australia, 28-29 November 2002. Edith Cowan University. pp 19-27. Smith, C.L. and Robinson, M. (1999). The understanding of security technology and its applications. Proceedings of IEEE 33rd Annual 1999 International Carnahan Conference on Security Technology, Keynote Address. Madrid, Spain. pp 26-37. Tarr, C.J. (1992). CLASP: A Computerised Aid to Cost-Effective Perimeter Security. Proceedings of the 1992 International Carnahan Conference on Security Technology, Institute of Electrical and Electronics Engineers. pp 164-168. Tarr, C.J. (1994). Cost Effective Perimeter Security. Proceedings of the 1994 International Carnahan Conference on Security Technology, Institute of Electrical and Electronics Engineers. pp 60-65. Tarr, C.J. and Peaty, S. (1995). Using CLASP to Assess Perimeter Security. Proceedings of the 1995 International Carnahan Conference on Security Technology, Institute of Electrical and Electronics Engineers. pp 93. Uebersax, J.S. (1999). Probit Latent Class Analysis with Dichotomous or Ordered Category Measures: Conditional Independence/Dependence Models. Applied Psychological Measurement, Vol. 23 No. 4, December 1999, pp 283-297. Vallaster, C. and Koll, O. (2002). Participatory group observation – a tool to analyze strategic decision making. Qualitative Market Research, 2002, 5, 1, 40-57. van Voorthuijsen, G., van Hoof, H., Klima, M., Roubik, K., Bernas, M. and Pata, P. (2005). In Proceedings of the 39th Annual 2005 International Carnahan Conference on Security
Technology, 11-14 October, pp 105-108.

153
Ward, S.C. 1989. Arguments for Constructively Simple Models. Journal of the Operational Research Society. vol 40 pp 141-153. Wassell, I. (1997). Active Fence Structures And Toppings. Proceedings of the 1997 International Carnahan Conference on Security Technology, Institute of Electrical and Electronics Engineers. pp 40-43. White, D.J. (1975). The Nature of Decision Theory. In White, D.J. (Ed). Theories of Decision in Practice. Hodder and Stoughton, London. pp 3-17. Wikepedia. (2006). Consensus. Available WWW March 2006 http://en.wikipedia.org/wiki/Consensus.
Wikepedia. (2006). Orthogonal. Available WWW March 2006 http://en.wikipedia.org/wiki/Orthogonal. Wikepedia. (2006). Orthogonal. Available WWW March 2006 http://en.wikipedia.org/wiki/Defence_in_depth. Ziglio, E. (1996). The Delphi Method and its Contribution to Decision-Making. In Adler, M. and Ziglio, E. (Eds). Gazing into the Oracle. Jessica Kingsley Publishers. London. pp 3-33.
154
Appendices
Appendix A
• Answer guide
• Research questionnaire
Appendix B
• Pilot study summary
Appendix C
• Respondent’s comments
Appendix D
• Respondent’s comments
Appendix E
• Raw data profiles
Appendix F
• Statistical summary for Sections A-H (n=26)
Appendix G
• Knowledge matrices for Sections A-H
Appendix H
• Group profile statistical summaries
Appendix I
• Tan curve examples
Appendix J
• Extended model test cases

Appendix A
Questionnaire ANSWER GUIDE RESEARCHER NAME: ......................................................................... DATE: ………………………………
EdithCowan University SecurityScience SchoolofEngineeringandMathematics JoondalupDveJOONDALUP COURSE NAME & STUDENT NUMBER: .....................................................................
COURSE SUPERVISOR: ................................................................. (If there are any queries or issues that cannot be addressed to the interviewer please forward them to the course supervisor).
Mapping elements of physical security towards the creation of a holistic physical security model
Aim: To assess terminology combination values relating to physical security systems - defined by time
relationships. To assess terminology of physical security systems using values within a defined spectrum so that a standard set of elements can be created.
How long will it take?: Approximately 50 minutes How difficult will it be?: All responses can be written on the questionnaire provided. There are no wrong concepts – all opinions are valid and valuable.
The format of the questions is repetitive, so once you have worked through the first few questions you will become familiar with the questionnaire.
Why?: Help me collect research data. Types of questions: There are two types of questions:
i) The first type is about defining physical security terminology. I would like you to define terminology sets of physical security by using the concept of time. For example, responses estimating time should be stated as either;
• Years (Ye) • Months (Mo) • Weeks (We) • Days (Da) • Hours (Hrs) • Minutes (Min) • Seconds (Sec)
ii) The second type of response will be a critical evaluation of the methods and measuring scales of this research.
Goal of questions: To collect the “time” values of certain terminology combinations. Point of reference: The respondent should try to adopt the role of a person responsible for the assets
of a facility when responding. (e.g. decision maker). Where possible the respondent should draw on their own experience or knowledge.
Format: 1. Name identification is optional but other information is required such as areas of expertise or potential
biases. 2. Identify terminology combinations for each concept and provide a time assessment for each as described
above. 3. List any underlying problems with the questionnaire or the method. If the respondent does not agree with
questions in the questionnaire they should state their concerns on the relevant pages. 4. All additional comments directed to the interviewer will be recorded.

Statement of Disclosure
This document is for information to participants involved in the research entitled Mapping elements of physical security
towards the creation of a holistic physical security decision model. The following is a brief description of the research.
The development of a physical security model may be useful in making decisions about physical security and
could provide the necessary supporting documentation for these decisions. This research presents an
investigation into universal elements within a physical security environment and the inter-relationship of each of these elements as defined by expert opinion. The investigation of elemental spectrums relationships
within physical security should assist in the creation of a conceptual mapping and may be able to determine
the usefulness of physical security modelling.
This is an anonymous questionnaire. Please ensure that you do not enter your name, or any other comments that will make
you identifiable should you not wish to be. By completing the questionnaire you are consenting to take part in this
research.
Procedure
Please follow the instructions on the questionnaire. If you are unsure about the interpretation of any questions or instructions, please enter your concerns about the question in the comment spaces provided.
The questionnaire should take approximately 50 minutes to complete.
The information that you enter into the questionnaire will be collected and stored in a database to create a conceptual
mapping of the elements of physical security. You will be asked to enter choices for various elements of physical security
and to evaluate the options available with respect to the relationships and importance of these elements.
Risks and Benefits
There are no anticipated physical or mental risks associated with being involved in this research. If at any point you decide
to withdraw from participating in this research, please cease completion of the questionnaire. If you feel that the involvement in the research has potential risks not covered by this Statement of Disclosure, please feel free to contact the
principle investigator or provide comments to this effect in the spaces provided by the questionnaire.
The benefits in obtaining a conceptual mapping of the elements of physical security should be able to assist in categorising
the complex environments of physical security and can be used as a guide to assist decision making. Anyone participating
in the research is encouraged to make a copy of the questionnaire and further extend the usefulness of the concepts with their own input and imagination. It is anticipated that with continuing development in this Delphi-type process, continual
review and amendments to the original concepts will ensure the usefulness of the research in the future.
Refusal to participate in this questionnaire will not exclude anyone from the benefits of the research and non-participants
are also encouraged to copy the questionnaire and review and suggest amendments to the process.
Further information
Any questions concerning the project entitled Mapping elements of physical security towards the creation of a holistic
physical security model, can be directed to Mr Z J Alach of School of Engineering and Mathematics, Edith Cowan
University on (08) 9400 5000 or (H) (08) 9387 2468.
If you have any concerns about the project or would like to talk to an independent person, you may contact Associate
Professor Clifton Smith (08) 9400 5000.

Definitions: Q1-6:
break – [To compromise the strength integrity of a barrier]
[Element 1]
rock, hammer, axe, electric drill, oxy cutting, explosive - [standard type tools or items for breaking through structure]
[Element 2]
earth - [sandy surface or bare ground],
glass, wood, brick, concrete – [to consider as wall barriers, windows, doors or other physical barriers],
steel – [to consider as a metal fence barrier]
Q7-12:
climb – [To scale the outside of a barrier first up and then back to a ground situation on the other side]
[Element 1]
no aid – [no climbing aid, only human attributes available e.g. running, jumping]
ladder, rope – [standard items for climbing, the length of the ladder or rope should be able to be readily constructed or purchased]
climbing aids – [individual hand and foot items to enable better gripping on surfaces]
projectiles & rope – [devices that use a propellant fuel to shoot a guide wire or rope high enough to assist climbing]
flight assisted – [to consider as air craft/engine enabled assistance]
[Element 2]
5 human high smooth brick wall + razor wire – [approximately 9m in height, smooth surface and a fence topping to increase the
difficulty for climbing]
5 human high smooth brick wall – [approximately 9m in height, smooth surface to increase the difficulty for climbing]
5 human high steel small mesh fence – [approximately 9m in height, semi-smooth surface where small steel mesh links increase the
difficulty to obtain footholds]
3 human high smooth brick wall – [approximately 6m in height, smooth surface to increase the difficulty for climbing]
3 human high steel small mesh fence – [approximately 6m in height, semi-smooth surface where small steel mesh links increase the
difficulty to obtain footholds]
3 human high steel large mesh fence – [approximately 6m in height, rough surface where large steel mesh links allow footholds]
Q13-18:
avoids – [remaining outside the fields of detection of any security system through stealth]
[Element 1]
luck – [trusting to fortune to evade a detection system]
colour camouflage – [using clothing items to evade detection]
create false alarms – [causing false alarms in another area to distract detection from a detection system]
smoke – [using smoke shields to evade detection]
system knowledge – [using previously obtained knowledge about a detection system to avoid detection]
knowledge & diversion – [using more that one method to evade detection such as false alarms and previously obtained knowledge, etc.]
[Element 2]
multiple systems – [more than one detection system in application within the same area]
microwave – [detection system using radiofrequency radiation like radar]
infrared – [movement detectors that work on infrared light or heat changes]
closed circuit tv – [closed circuit TV cameras with staff monitoring display terminals]
mobile human guard – [security staff driving or walking around a facility]
chance detection – [visual detection by a neighbour or an employee or a member of the public]
Q19-24:
disables – [altering the fields of detection of any security system through violent method]
[Element 1]
accidental – [disabling detection systems by non-deliberate means]
cut power – [disabling detection systems by stopping supply of mains voltage or other voltage]
violent destruction - [disabling detection systems by physically breaking critical devices or links]
physical intimidation – [disabling detection by threatening humans involved in the process]
electrical interference – [disabling detection systems by creating an incorrect electronic signal or electric current]
system knowledge – [using previously obtained knowledge about a detection system to disable detection]
[Element 2]
multiple systems – [more than one detection system in application within the same area]
microwave – [detection system using radiofrequency radiation like radar]
infrared – [movement detectors that work on infrared light or heat changes]
closed circuit tv – [closed circuit TV cameras with staff monitoring display terminals]
mobile human guard – [security staff driving or walking around a facility]
chance detection – [visual detection by a neighbour or an employee or a member of the public]

Definitions:
Q25-30:
responds – [the action taken towards restoring security after knowledge that a breach in defence has taken place]
[Element 1]
low value goods – [medium value items such as food, stationary or inexpensive electronic goods]
small cash – [a small amount of money, slightly more than trivial]
personal valuables – [personal valuables, e.g. jewellery, hi-fi items etc.]
corporate data – [data from a business interest, human resources information, etc]
large cash – [a large amount of money, a non-trivial amount]
human life – [the value of safety of human life]
[Element 2]
high tech – [the response of a computer aided electric system, e.g. alarm bells, electronic noise, etc.]
armed – [a military type response]
insurance – [the response of an insurance company]
security patrol – [an organised official type response with vehicle access and dedicated action parameters]
police – [a law enforcement response]
general public – [a response by ordinary people]
Q31-36:
consideration – [the human resources (in working hours) set aside to defensively counter a recognised threat prior to any action]
[Element 1]
low value goods – [medium value items such as food, stationary or inexpensive electronic goods]
small cash – [a small amount of money, slightly more than trivial]
personal valuables – [personal valuables, e.g. jewellery, etc.]
corporate data – [data from a business interest, human resources information, etc]
large cash – [a large amount of money, a non-trivial amount]
human life – [the value of safety and security of human life]
[Element 2]
extreme motivation – [a person of fanatical requirements]
high motivation – [a person of dedicated purpose to achieve their goals, a loyal follower]
moderate motivation - [a person of intermediate specific need or requirement, someone that may be influenced by monetary rewards]
low motivation – [a person of low need or requirement but potentially mischievous]
very low motivation - [a person of very low requirements or most likely somebody without prior intention]
accidental - [a person without any bad intention]
Q37-42:
pre-meditation – [the human resources (in total time) set aside to offensively counter an established defence]
[Element 1]
cut power – [disabling detection systems by stopping supply of mains voltage]
technological attack – [disabling detection systems by creating an incorrect electronic signal or electric current]
electric tools, explosive - [standard type tools for breaking through structure]
violent destruction - [disabling physical defence systems by physically breaking critical devices or links]
[Element 2]
extreme motivation – [a person of fanatical requirements]
high motivation – [a person of dedicated purpose to achieve their goals, a loyal follower]
moderate motivation - [a person of intermediate specific need or requirement, someone that may be influenced by monetary rewards]
low motivation – [a person of low need or requirement but potentially mischievous]
very low motivation - [a person of very low requirements or most likely somebody without prior intention]
accidental - [a person without any bad intention]
Q43-48:
consideration – [the human resources (in time and money) set aside to defensively counter a recognised threat prior to any action]
[Element 1]
low value goods – [medium value items such as food, stationary or inexpensive electronic goods]
small cash – [a small amount of money, slightly more than trivial]
personal valuables – [personal valuables, e.g. jewellery, etc.]
corporate data – [data from a business interest, human resources information, etc]
large cash – [a large amount of money, a non-trivial amount]
human life – [the value of safety and security of human life]
[Element 2]
cut power – [disabling detection systems by stopping supply of mains voltage]
technological attack – [disabling detection systems by creating an incorrect electronic signal or electric current]
electric tools, explosive - [standard type tools for breaking through structure]
violent destruction - [disabling physical defence systems by physically breaking critical devices or links]

Section A : Consideration of Attack by measuring the term Breaking
Two lists of elements are presented below. Both comprise a series of terms, which for our purposes are called Data Sets 1-6. Sets 1-6 are based on the terminology of the concept Attack and the verb Breaking. In particular they concentrate on the verb Breaking within the concept of Delay. For further explanation of the terminology in Sets 1-6 please refer to the Definitions in the Answer Guide.
Q1: How long do you think it would take an attack of [Element 1] to break through an [Element 2] barrier? Please
complete for Sets 1-6 in the table below, checking your answer in the appropriate column under “Estimated Time”.
Note the following: - In this instance increased "time" represents better defence. - It is appreciated that a range of times values could be used as answers, in these cases please choose a value
that would represent your initial thoughts of a typical scenario for each. - Please try to choose one of the listed "time" values (for further information please see the Answer Guide). As an example, the first set has been completed for your consideration. Element 1
Element 2
Estimated Time
Ye Mo We Da Hrs Min Sec
Set 1
rock breaks earth √ rock breaks glass √ rock breaks wood √ rock breaks brick √ rock breaks concrete √ rock breaks steel √
Set 2
hammer breaks earth hammer breaks glass hammer breaks wood hammer breaks brick hammer breaks concrete hammer breaks steel
Set 3
axe breaks earth axe breaks glass axe breaks wood axe breaks brick axe breaks concrete axe breaks steel
Set 4
electric drill breaks earth electric drill breaks glass electric drill breaks wood electric drill breaks brick electric drill breaks concrete electric drill breaks steel

Ye Mo We Da Hrs Min Sec
Set 5 oxy cutting breaks earth oxy cutting breaks glass oxy cutting breaks wood oxy cutting breaks brick oxy cutting breaks concrete oxy cutting breaks steel
Set 6 explosive breaks earth explosive breaks glass explosive breaks wood explosive breaks brick explosive breaks concrete explosive breaks steel
Q2a: For Element 1 (as listed above), the Data Sets 1-6 are listed in ascending order of force. By order of force it is
meant that explosives have a greater breaking ability than oxy cutting, which has a greater breaking ability than an electric drill, than and axe, than a hammer, and finally, than a rock.
Do you agree with the order for Sets 1-6 for Element 1? Please circle your response below.
Yes No
Q2b: Please state your reasons for your answer.
Q3a: For Element 2 (as listed above), the Data Sets 1-6 are listed in ascending order of strength and ascending
order of typical material cost. By order of strength it is meant that steel is stronger than concrete, which is stronger than brick, than wood, than glass, than earth.
Do you agree with the order for Sets 1-6 for Element 2? Please circle your response below.
Yes No
Q3b: Please state your reasons for your answer.

Q4: The Data Set 1-6 for Element 1 is intended to represent a spectrum of force. The terms are presented here to each represent a group of relative force. Can you think of any other items or group terms that could be added to the data set, or could replace items already in the data set? You may be able to even think of a new, and better list!
For example, you may want to add “knife” to the Element 1 list, or replace axe with tin snips, or even provide a new
list:
Add or Replace New list rock Knife
hammer Chisel
axe Tin snips Mallet
electric drill Tin snips
oxy cutting Jack hammer
explosive Bomb Provide your answer here:
Add or Replace New list
rock
hammer
axe
electric drill
oxy cutting
explosive
Q5: The Data Set 1-6 for Element 2 is intended to represent a spectrum of strength. The terms are presented here to each represent a group of relative strength. Can you think of any other items or group terms that could be added to the data set, or could replace items already in the data set? You may be able to even think of a new, and better list!
Add or Replace New list
earth no barrier
glass window
wood plasterboard door
brick wall
concrete wall
steel wire mesh wire mesh fence
Provide your answer here:
Add or Replace New list
earth
glass
wood
brick
concrete
steel
Q6: Do you agree with the alternate terms given in the examples for Q4 and Q5? Provide reasons:
Knife

Section B : Consideration of Attack by measuring the term Climbing
New data sets 7-12 are listed below. These sets are based on the terminology of the concept Attack and the verb Climbing. In particular they concentrate on the verb Climbing within the concept of Delay. For further explanation of the terminology in Sets 7-12 please refer to the Definitions in the Answer Guide.
Q7: How long do you think it would take [Element 1] to Climb an [Element 2] barrier to completion? Please complete
for Sets 7-12 in the table below, checking your answer in the appropriate column under “Estimated Time”.
Note the following: - In this instance increased "time" represents better defence. As an example, the first set has been completed for your consideration. Element 1
Element 2
Estimated Time
Ye Mo We Da Hrs Min Sec
Set 7
no aid climbs 5 human high smooth brick wall + razor wire
√
no aid climbs 5 human high smooth brick wall
√
no aid climbs 5 human high - steel small mesh fence
√
no aid climbs 3 human high smooth brick wall
√
no aid climbs 3 human high - steel small mesh fence
√
no aid climbs 3 human high steel large mesh fence
√
Set 8
ladder climbs 5 human high smooth brick wall + razor wire
ladder climbs 5 human high smooth brick wall
ladder climbs 5 human high - steel small mesh fence
ladder climbs 3 human high smooth brick wall
ladder climbs 3 human high - steel small mesh fence
ladder climbs 3 human high steel large mesh fence
Set 9
rope climbs 5 human high smooth brick wall + razor wire
rope climbs 5 human high smooth brick wall
rope climbs 5 human high - steel small mesh fence
rope climbs 3 human high smooth brick wall
rope climbs 3 human high - steel small mesh fence
rope climbs 3 human high steel large mesh fence
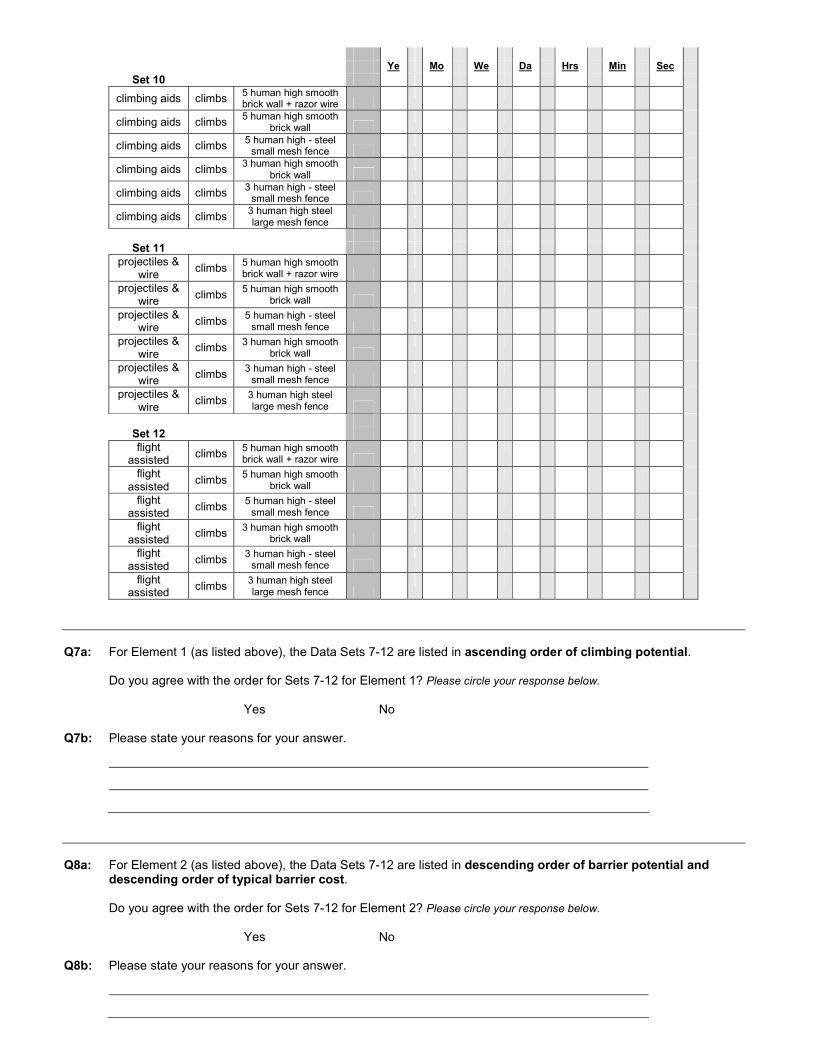
Ye Mo We Da Hrs Min Sec
Set 10
climbing aids climbs 5 human high smooth brick wall + razor wire
climbing aids climbs 5 human high smooth brick wall
climbing aids climbs 5 human high - steel small mesh fence
climbing aids climbs 3 human high smooth brick wall
climbing aids climbs 3 human high - steel small mesh fence
climbing aids climbs 3 human high steel large mesh fence
Set 11 projectiles &
wire climbs 5 human high smooth
brick wall + razor wire
projectiles & wire
climbs 5 human high smooth brick wall
projectiles & wire
climbs 5 human high - steel small mesh fence
projectiles & wire
climbs 3 human high smooth brick wall
projectiles & wire
climbs 3 human high - steel small mesh fence
projectiles & wire
climbs 3 human high steel large mesh fence
Set 12 flight
assisted climbs 5 human high smooth
brick wall + razor wire
flight assisted
climbs 5 human high smooth brick wall
flight assisted
climbs 5 human high - steel small mesh fence
flight assisted
climbs 3 human high smooth brick wall
flight assisted
climbs 3 human high - steel small mesh fence
flight assisted
climbs 3 human high steel large mesh fence
Q7a: For Element 1 (as listed above), the Data Sets 7-12 are listed in ascending order of climbing potential.
Do you agree with the order for Sets 7-12 for Element 1? Please circle your response below.
Yes No
Q7b: Please state your reasons for your answer.
Q8a: For Element 2 (as listed above), the Data Sets 7-12 are listed in descending order of barrier potential and
descending order of typical barrier cost.
Do you agree with the order for Sets 7-12 for Element 2? Please circle your response below.
Yes No
Q8b: Please state your reasons for your answer.

Q9: The Data Set 7-12 for Element 1 is intended to represent a spectrum of climbing potential. The terms are
presented here to each represent a group of relative climbing potentials. Can you think of any other items or group terms that could be added to the data set, or could replace items already in the data set?
Provide your answer here:
Add or Replace New list
no aid
ladder
rope
climbing aids
projectiles & wire
flight assisted
Q10: The Data Set 7-12 for Element 2 is intended to represent a spectrum of height potential. The terms are presented here to each represent a group of relative height potentials. Can you think of any other items or group terms that could be added to the data set, or could replace items already in the data set? You may be able to even think of a new, and better list!
e.g. considering smoothness, height and fence topping
Add or Replace New list
5 human high smooth brick wall + razor wire
8 human height steel mesh fence – small links + razor wire
5 human high smooth brick wall
6 human height steel mesh fence – small links + razor wire
5 human high - steel small mesh fence
4 human height steel mesh fence – small links + razor wire
3 human high smooth brick wall
3 human height steel mesh fence – small links + razor wire
3 human high - steel small mesh fence
3 human height steel mesh fence – large links + razor wire
3 human high steel large mesh fence
2 human height steel mesh fence – large links
Provide your answer here:
Add or Replace New list
5 human high smooth brick wall + razor wire
5 human high smooth brick wall
5 human high - steel small mesh fence
3 human high smooth brick wall
3 human high - steel small mesh fence
3 human high steel large mesh fence
Q11: Do you agree with considering “smoothness, height and fence topping” as alternate terms given in the example for Q10? Provide any reasons:

Section C : Consideration of Attack by measuring the term Evading
New data sets 13-18 are listed below. These sets are based on the terminology of the concept Attack and the verb Evading. In particular they concentrate on the verb Evading within the concept of Detection. For further explanation of the terminology in Sets 13-18 please refer to the Definitions in the Answer Guide.
Q13: How long do you think it would be possible for an attack using [Element 1] to Evade an [Element 2] detection
system? Please complete for Sets 13-18 in the table below, checking your answer in the appropriate column under “Estimated Time”.
Note the following: - In this instance decreased "time" represents better defence. As an example, the first set has been completed for your consideration. Element 1
Element 2
Estimated Time
Ye Mo We Da Hrs Min Sec
Set 13
luck
evades multiple systems
√
luck
evades microwave
√
luck
evades infrared
√
luck
evades closed circuit
tv
√
luck evades mobile
human guard
√
luck evades chance
detection
√
Set 14
colour camouflage
evades multiple systems
colour camouflage
evades microwave
colour camouflage
evades infrared
colour camouflage
evades closed circuit
tv
colour camouflage
evades mobile
human guard
colour camouflage
evades chance
detection

Ye Mo We Da Hrs Min Sec
Set 15
create false alarms
evades multiple systems
create false alarms
evades microwave
create false alarms
evades infrared
create false alarms
evades closed circuit
tv
create false alarms
evades mobile
human guard
create false alarms
evades chance
detection
Set 16
smoke
evades multiple systems
smoke
evades microwave
smoke
evades infrared
smoke
evades closed circuit
tv
smoke evades mobile
human guard
smoke evades chance
detection
Set 17 system
knowledge evades
multiple systems
system knowledge
evades microwave
system knowledge
evades infrared
system knowledge
evades closed circuit
tv
system knowledge
evades mobile
human guard
system knowledge
evades chance
detection
Set 18
knowledge & diversion
evades multiple systems
knowledge & diversion
evades microwave
knowledge & diversion
evades infrared
knowledge & diversion
evades closed circuit
tv
knowledge & diversion
evades mobile
human guard
knowledge & diversion
evades chance
detection
Q14a: For Element 1 (as listed above), the Data Sets 13-18 are listed in ascending order of evading potential.
Do you agree with the order for Sets 13-18 for Element 1? Please circle your response below.
Yes No

Q14b: Please state your reasons for your answer.
Q15a: For Element 2 (as listed above), the Data Sets 13-18 are listed in descending order of detecting potential and descending order of detecting cost.
Do you agree with the order for Sets 13-18 for Element 2? Please circle your response below.
Yes No
Q15b: Please state your reasons for your answer.
Q16: The Data Set 13-18 for Element 1 is intended to represent a spectrum of evading potential. The terms are
presented here to each represent a group of relative evading potentials. Can you think of any other items or group terms that could be added to the data set, or could replace items already in the data set?
Provide your answer here:
Add or Replace New list luck
colour camouflage
create false alarms
smoke
system knowledge
knowledge & diversion

Q17: The Data Set 13-18 for Element 2 is intended to represent a spectrum of detection potential. The terms are presented here to each represent a group of relative detection potentials. Can you think of any other items or group terms that could be added to the data set, or could replace items already in the data set? You may be able to think of new terminology. Example Add or Replace New list multiple systems
microwave
infrared
Motion sensors
closed circuit tv
mobile human guard
Security dogs
chance detection
Provide your answer here:
Add or Replace New list multiple systems
microwave
infrared
closed circuit tv
mobile human guard
chance detection
Q18: Do you agree with or have you previously heard of defence in depth in physical security? i.e. deterrence, detection, delay and response? Do you think the terms attack, attacker, and asset fit in with the above list?:

Section D : Consideration of Attack by measuring the term Disabling
New data sets 19-24 are listed below. These sets are based on the terminology of the concept Attack and the verb Disabling. In particular they concentrate on the verb Disabling within the concept of Detection. For further explanation of the terminology in Sets 19-24 please refer to the Definitions in the Answer Guide.
Q19: How long do you think it would take an attack by [Element 1] to Disable an [Element 2] detection system? Please
complete for Sets 19-24 in the table below, checking your answer in the appropriate column under “Estimated Time”.
Note the following: - In this instance increased "time" represents better defence. As an example, the first set has been completed for your consideration. Element 1
Element 2
Estimated Time
Ye Mo We Da Hrs Min Sec
Set 19
accidental
disables multiple systems
√
accidental
disables microwave
√
accidental
disables infrared
√
accidental
disables closed circuit
tv
√
accidental disables mobile
human guard
√
accidental disables chance
detection
√
Set 20
cut power
disables multiple systems
cut power
disables microwave
cut power
disables infrared
cut power
disables closed circuit
tv
cut power disables mobile
human guard
cut power disables chance
detection
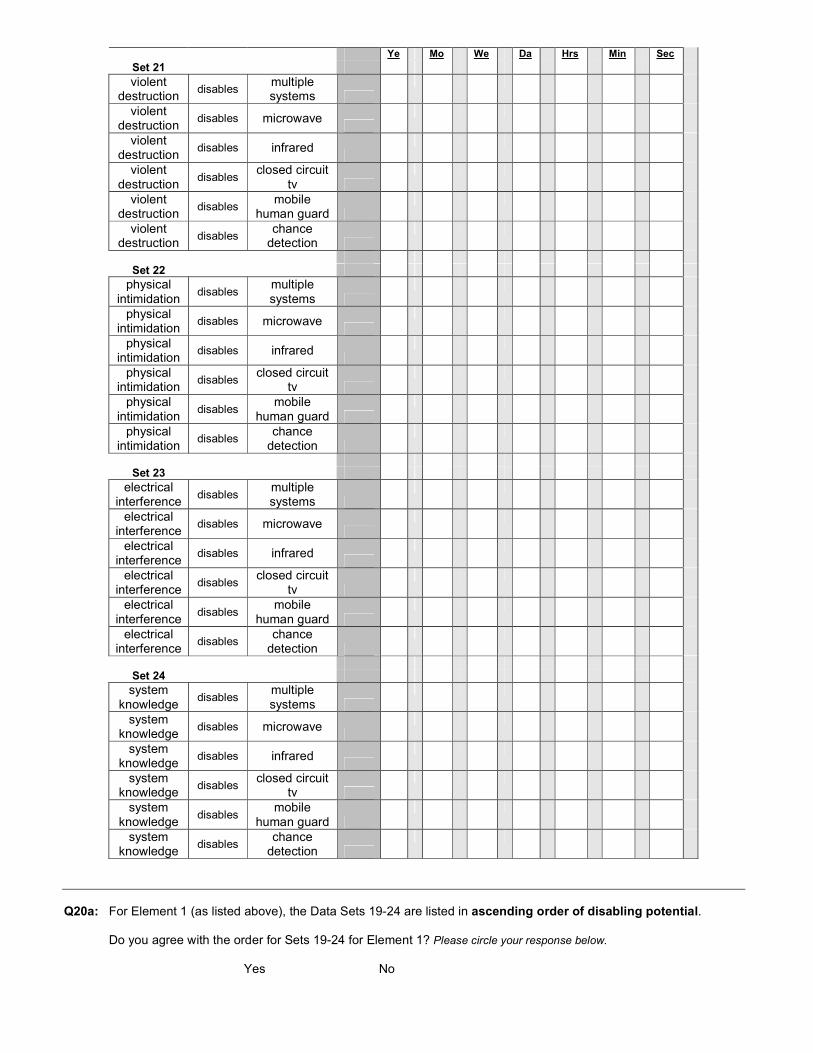
Ye Mo We Da Hrs Min Sec
Set 21
violent destruction
disables multiple systems
violent destruction
disables microwave
violent destruction
disables infrared
violent destruction
disables closed circuit
tv
violent destruction
disables mobile
human guard
violent destruction
disables chance
detection
Set 22
physical intimidation
disables multiple systems
physical intimidation
disables microwave
physical intimidation
disables infrared
physical intimidation
disables closed circuit
tv
physical intimidation
disables mobile
human guard
physical intimidation
disables chance
detection
Set 23 electrical
interference disables
multiple systems
electrical interference
disables microwave
electrical interference
disables infrared
electrical interference
disables closed circuit
tv
electrical interference
disables mobile
human guard
electrical interference
disables chance
detection
Set 24 system
knowledge disables
multiple systems
system knowledge
disables microwave
system knowledge
disables infrared
system knowledge
disables closed circuit
tv
system knowledge
disables mobile
human guard
system knowledge
disables chance
detection
Q20a: For Element 1 (as listed above), the Data Sets 19-24 are listed in ascending order of disabling potential.
Do you agree with the order for Sets 19-24 for Element 1? Please circle your response below.
Yes No

Q20b: Please state your reasons for your answer.
Q21a: For Element 2 (as listed above), the Data Sets 19-24 are listed in descending order of detecting potential and descending order of detecting cost.
Do you agree with the order for Sets 19-24 for Element 2? Please circle your response below.
Yes No
Q21b: Please state your reasons for your answer.
Q22: The Data Set 19-24 for Element 1 is intended to represent a spectrum of disabling potential. The terms are
presented here to each represent a group of relative disabling potentials. Can you think of any other items or group terms that could be added to the data set, or could replace items already in the data set?
Provide your answer here:
Add or Replace New list accidental
cut power
violent destruction
physical intimidation
electrical interference
system knowledge

Q23: The Data Set for Element 2 is intended to represent a spectrum of detection potential. The terms are presented here to each represent a group of relative detection potentials. Can you think of any other items or group terms that could be added to the data set, or could replace items already in the data set?
Provide your answer here:
Add or Replace New list multiple systems
microwave
infrared
closed circuit tv
mobile human guard
chance detection
Q24: Do you so far agree with the way the questionnaire is evaluating physical security terminology by using “time” as a measure? Provide any opinion:

Section E : Consideration of Response by measuring the term Asset
New data sets 25-30 are listed below. These sets are based on the terminology of the concept “Asset” and the verb “Respond” in particular considering the Asset type and the Response type. For an explanation of the terminology in Sets 25-30 refer to the Definitions in the Answer Guide.
Q25: How long do you think it would take [Element 2] to respond to a direct attack on an [Element 1] asset? Please
complete for Sets 25-30 in the table below, checking your answer in the appropriate column under “Estimated Time”.
Note the following: - In this instance decreased "time" represents better defence. As an example, the first set has been completed for your consideration. Element 1
Element 2
Estimated Time
Ye Mo We Da Hrs Min Sec
Set 25
low value goods
initial response by high tech
√
low value goods
initial response by armed
√
low value goods
initial response by insurance
√
low value goods
initial response by
security patrol
√
low value goods
initial response by police
√
low value goods
initial response by
general public
√
Set 26
small cash initial response by high tech
small cash initial response by armed
small cash initial response by insurance
small cash initial response by
security patrol
small cash initial response by police
small cash initial response by
general public
Set 27
personal valuables
initial response by high tech
personal valuables
initial response by armed
personal valuables
initial response by insurance
personal valuables
initial response by
security patrol
personal valuables
initial response by police
personal valuables
initial response by
general public

Ye Mo We Da Hrs Min Sec
Set 28
corporate data
initial response by high tech
corporate data
initial response by armed
corporate data
initial response by insurance
corporate data
initial response by
security patrol
corporate data
initial response by police
corporate data
initial response by
general public
Set 29
large cash initial response by high tech
large cash initial response by armed
large cash initial response by insurance
large cash initial response by
security patrol
large cash initial response by police
large cash initial response by
general public
Set 30
human life initial response by high tech
human life initial response by armed
human life initial response by
insurance
human life initial response by
security patrol
human life initial response by police
human life initial response by
general public
Q26a: For Element 1 (as listed above), the Data Sets 25-30 are listed in ascending order of asset value.
Do you agree with the order for Sets 25-30 for Element 1? Please circle your response below.
Yes No
Q26b: Please state your reasons for your answer.
Q27a: For Element 2 (as listed above), the Data Sets 25-30 are listed in descending order of typical response cost.
Do you agree with the order for Sets 25-30 for Element 2? Please circle your response below.
Yes No

Q27b: Please state your reasons for your answer.
Q28: The Data Set for Element 1 is intended to represent a spectrum of asset potential. The terms are presented here
to each represent a group of relative asset potentials. Can you think of any other items or group terms that could be added to the data set?
Provide your answer here:
Add or Replace New list low value goods
small cash
personal valuables
corporate data
large cash
human life
Q29: The Data Set for Element 2 is intended to represent a spectrum of response potential. The terms are presented here to each represent a group of relative response potentials. Can you think of any other items or group terms that could be added to the data set?
Provide your answer here:
Add or Replace New list high tech
armed
insurance
security patrol
police
general public
Q30: Do you have confidence in your opinions written in this questionnaire?

Section F: Consideration of Attacker by measuring the term Asset
New data sets 31-36 are listed below. These sets are based on the terminology of the concept Asset and the verb Attack in particular the consideration of the type of Attacker motivation. For an explanation of the terminology in Sets 31-36 please refer to the Definitions in the Answer Guide.
Q31: How much defence consideration should be given (in total working hours/time) to try to counter an attacker of
[Element 2] motivation relative to an [Element 1] asset? Please complete for Sets 31-36 in the table below, checking your answer in the appropriate column under “Estimated Time”.
Note the following: - In this instance increased "time" represents better defence. As an example, the first set has been completed for your consideration. Element 1
Element 2
Estimated Time
Ye Mo We Da Hrs Min Sec
Set 31
low value goods
pre-attack consideration
extreme motivation
√
low value goods
pre-attack consideration
high motivation
√
low value goods
pre-attack consideration
moderate motivation
√
low value goods
pre-attack consideration
low motivation
√
low value goods
pre-attack consideration
very low motivation
√
low value goods
pre-attack consideration accidental
√
Set 32
small cash pre-attack consideration
extreme motivation
small cash pre-attack consideration
high motivation
small cash pre-attack consideration
moderate motivation
small cash pre-attack consideration
low motivation
small cash pre-attack consideration
very low motivation
small cash pre-attack consideration accidental
Set 33
personal valuables
pre-attack consideration
extreme motivation
personal valuables
pre-attack consideration
high motivation
personal valuables
pre-attack consideration
moderate motivation
personal valuables
pre-attack consideration
low motivation
personal valuables
pre-attack consideration
very low motivation
personal valuables
pre-attack consideration accidental

Ye Mo We Da Hrs Min Sec
Set 34
corporate data
pre-attack consideration
extreme motivation
corporate data
pre-attack consideration
high motivation
corporate data
pre-attack consideration
moderate motivation
corporate data
pre-attack consideration
low motivation
corporate data
pre-attack consideration
very low motivation
corporate data
pre-attack consideration accidental
Set 35
large cash pre-attack consideration
extreme motivation
large cash pre-attack consideration
high motivation
large cash pre-attack consideration
moderate motivation
large cash pre-attack consideration
low motivation
large cash pre-attack consideration
very low motivation
large cash pre-attack consideration accidental
Set 36
human life pre-attack consideration
extreme motivation
human life pre-attack consideration
high motivation
human life pre-attack consideration
moderate motivation
human life pre-attack consideration
low motivation
human life pre-attack consideration
very low motivation
human life pre-attack consideration accidental
Q32a: For Element 1 (as listed above), the Data Sets 31-36 are listed in ascending order of asset value.
Do you agree with the order for Sets 31-36 for Element 1? Please circle your response below.
Yes No
Q32b: Please state your reasons for your answer.
Q33a: For Element 2 (as listed above), the Data Sets 31-36 are listed in descending order of attacker motivation.
Do you agree with the order for Sets 31-36 for Element 2? Please circle your response below.
Yes No

Q33b: Please state your reasons for your answer.
Q34: The Data Set 31-36 for Element 1 is intended to represent a spectrum of asset potential. The terms are presented
here to each represent a group of relative asset potentials. Can you think of any other items that could be added to the data set, or could replace items already in the data set? Provide your answer here: Add or Replace New list low value goods
small cash
personal valuables
corporate data
large cash
human life
Q35: The Data Set 31-36 for Element 2 is intended to represent a spectrum of attacker motivation. The terms are presented here to each represent a group of relative attacker motivations. Can you think of any other items that could be added to the data set?
Provide your answer here: Add or Replace New list extreme motivation
high motivation
moderate motivation
low motivation
very low motivation
accidental
Q36: Do you have any comments on the terminology that has been used in this questionnaire?

Section G: Consideration of Attacker by measuring the term Attack
New data sets 37-42 are listed below. These sets are based on the terminology of the concept Attacker motivation and the verb Attack considering pre-meditation. For further explanation of the terminology in Sets 37-42 please refer to the Definitions in the Answer Guide.
Q37: How long would you expect it to take (in total pre-meditated time) for an attacker of [Element 2] motivation to adapt
to attack by the method of [Element 1]? Please complete for Sets 37-42 in the table below, checking your answer in the appropriate column under “Estimated Time”.
Note the following: - In this instance increased "time" represents a stronger attack. As an example, the first set has been completed for your consideration.
Element 1
Element 2
Estimated Time
Ye Mo We Da Hrs Min Sec
Set 37
cut power attack pre-meditation
extreme motivation
√
cut power attack pre-meditation
high motivation
√
cut power attack pre-meditation
moderate motivation
√
cut power attack pre-meditation
low motivation
√
cut power attack pre-meditation
very low motivation
√
cut power attack pre-meditation accidental
√
Set 38
technological attack
attack pre-meditation
extreme motivation
technological attack
attack pre-meditation
high motivation
technological attack
attack pre-meditation
moderate motivation
technological attack
attack pre-meditation
low motivation
technological attack
attack pre-meditation
very low motivation
technological attack
attack pre-meditation accidental
Set 39
electric tools attack pre-meditation
extreme motivation
electric tools attack pre-meditation
high motivation
electric tools attack pre-meditation
moderate motivation
electric tools attack pre-meditation
low motivation
electric tools attack pre-meditation
very low motivation
electric tools attack pre-meditation accidental

Ye Mo We Da Hrs Min Sec
Set 40
physical intimidation
attack pre-meditation
extreme motivation
physical intimidation
attack pre-meditation
high motivation
physical intimidation
attack pre-meditation
moderate motivation
physical intimidation
attack pre-meditation
low motivation
physical intimidation
attack pre-meditation
very low motivation
physical intimidation
attack pre-meditation accidental
Set 41 violent
destruction attack pre-meditation
extreme motivation
violent destruction
attack pre-meditation
high motivation
violent destruction
attack pre-meditation
moderate motivation
violent destruction
attack pre-meditation
low motivation
violent destruction
attack pre-meditation
very low motivation
violent destruction
attack pre-meditation accidental
Set 42
explosive attack pre-meditation
extreme motivation
explosive attack pre-meditation
high motivation
explosive attack pre-meditation
moderate motivation
explosive attack pre-meditation
low motivation
explosive attack pre-meditation
very low motivation
explosive attack pre-meditation
accidental
Q38a: For Element 1 (as listed above), the Data Sets 37-42 are listed in ascending order of attack force.
Do you agree with the order for Sets 37-42 for Element 1? Please circle your response below.
Yes No
Q38b: Please state your reasons for your answer.
Q39a: For Element 2 (as listed above), the Data Sets 37-42 are listed in descending order of attacker motivation.
Do you agree with the order for Sets 37-42 for Element 2? Please circle your response below.
Yes No

Q39b: Please state your reasons for your answer.
Q40: The Data Set 37-42 for Element 1 is intended to represent a spectrum of attacking force. The terms are presented
here to each represent a group of relative attack potentials. Can you think of any other items or group terms that could be added to the data set, or could replace items already in the data set? Provide your answer here: Add or Replace New list cut power
technological attack
electric tools
physical intimidation
violent destruction
explosive
Q41: The Data Set 37-42 for Element 2 is intended to represent a spectrum of attacker motivation. The terms are presented here to each represent a group of relative asset potentials. Can you think of any other items or group terms that could be added to the data set? Provide your answer here: Add or Replace New list extreme motivation
high motivation
moderate motivation
low motivation
very low motivation
accidental
Q42: Do you have any comments on this questionnaire using “verbs” to help to measure “concepts” within the terminology presented?

Section H: Consideration of Attack by measuring the term Asset
New data sets 43-48 are listed below. These sets are based on the terminology of the concept Asset and the verb Attack considered pre-attack. For further explanation of the terminology in Sets 43-48 please refer to the Definitions in the Answer Guide.
Q43: How much defence consideration should be given (in total working hours/time) for an [Element 2] type attack
relative to an [Element 1] asset? Please complete for Sets 43-48 in the table below, checking your answer in the appropriate column under “Estimated Time”.
Note the following: - In this instance increased "time" represents a more likely attack. As an example, the first set has been completed for your consideration. Element 1
Element 2
Estimated Time
Ye Mo We Da Hrs Min Sec
Set 43
low value goods
pre-attack consideration
cut power
√
low value goods
pre-attack consideration
technological attack
√
low value goods
pre-attack consideration
electric tools
√
low value goods
pre-attack consideration
physical intimidation
√
low value goods
pre-attack consideration
violent destruction
√
low value goods
pre-attack consideration
explosive
√
Set 44
small cash pre-attack consideration
cut power
small cash pre-attack consideration
technological attack
small cash pre-attack consideration
electric tools
small cash pre-attack consideration
physical intimidation
small cash pre-attack consideration
violent destruction
small cash pre-attack consideration
explosive
Set 45
personal valuables
pre-attack consideration
cut power
personal valuables
pre-attack consideration
technological attack
personal valuables
pre-attack consideration
electric drill
personal valuables
pre-attack consideration
physical intimidation
personal valuables
pre-attack consideration
violent destruction
personal valuables
pre-attack consideration
explosive

Ye Mo We Da Hrs Min Sec
Set 46
corporate data
pre-attack consideration
cut power
corporate data
pre-attack consideration
technological attack
corporate data
pre-attack consideration
electric tools
corporate data
pre-attack consideration
physical intimidation
corporate data
pre-attack consideration
violent destruction
corporate data
pre-attack consideration
explosive
Set 47
large cash pre-attack consideration
cut power
large cash pre-attack consideration
technological attack
large cash pre-attack consideration
electric tools
large cash pre-attack consideration
physical intimidation
large cash pre-attack consideration
violent destruction
large cash pre-attack consideration
explosive
Set 48
human life pre-attack consideration
cut power
human life pre-attack consideration
technological attack
human life pre-attack consideration
electric tools
human life pre-attack consideration
physical intimidation
human life pre-attack consideration
violent destruction
human life pre-attack consideration
explosive
Q44a: For Element 1 (as listed above), the Data Sets 43-48 are listed in ascending order of asset value.
Do you agree with the order for Sets 43-48 for Element 1? Please circle your response below.
Yes No
Q44b: Please state your reasons for your answer.
Q45a: For Element 2 (as listed above), the Data Sets 43-48 are listed in ascending order of attacking force.
Do you agree with the order for Sets 43-48 for Element 2? Please circle your response below.
Yes No

Q45b: Please state your reasons for your answer.
Q46: The Data Set 43-48 for Element 1 is intended to represent a spectrum of asset potential. The terms are presented
here to each represent a group of relative asset potentials. Can you think of any other items or group terms that could be added to the data set, or could replace items already in the data set?
Provide your answer here:
Add or Replace New list low value goods
small cash
personal valuables
corporate data
large cash
human life
Q47: The Data Set 43-48 for Element 2 is intended to represent a spectrum of attacking force. The terms are presented here to each represent a group of relative attack potentials. Can you think of any other items or group terms that could be added to the data set, or could replace items already in the data set?
Provide your answer here:
Add or Replace New list cut power
electrical interference
electric drill
physical intimidation
violent destruction
explosive
Q48: Do you have any other comments on the overall method used in this questionnaire?

Q49: Do you think that real-life facilities (buildings) – when considering the terminology of their physical structures, can be represented (with each part defined as a physical security component) by using at least one of the terminology categories presented in this questionnaire?
i.e. Do you think that a small finite set of terms can adequately describe a real-life facility?
Q50: Do you think the physical security of a real-life facility can be adequately represented by using terminology spectrums as presented in this questionnaire?
i.e. Do you think that a small finite set of terms can adequately describe the physical security of a real-life
facility?
Thank you for completing this Questionnaire.

Appendix B
Summary of the elements numbers identified from each interview of the Pilot Study.
(Interviews 2, 3 and 4 include fixed boundary conditions)
Interview #1
Elements
Interview #2
Elements
Interview #3
Elements
Interview #4
Elements
Boundary condition /
Concept topic
Determining if and when an
attack is taking place
22 12 18
Physically slowing an attack
using the structure
surrounding an asset
45 11 21
Responding to an attack in
sufficient time
18 6 7
Considering the value of an
asset/quality and quantity of
resources
9 21 9
Target hardening 21
Alarms 8
Lighting 4
Locks 4
Fire safety 3
CCTV 2
Totals 42 94 50 55

Appendix C
C1: Section A
The considerations from Section A provide some insight into the choices that have been recorded in the Question 1 value assessments
of element pair combinations in the questionnaire. The conceptual ordering of the elements into lists presents a semantic challenge
where as in contrast to numeric ordering, a standard conceptual order of terminology does not exist in our understanding of knowledge.
Exceptions to rules will always be a contentious problem whenever an absolute statement on ranked order of latent variables is
presented. Despite the potential for exceptions Table 1 and Table 2 both show high acceptance among respondents to the ordered lists
presented with 71% agreement and 82% agreement respectively. Table 1 considered elements along the concept continuum used in a
force attack (breaking) and Table 2 indicated elements over the concept continuum used for material strength.
Comments received from respondents mainly indicated general agreement toward the ranked order of elements listed however as can
be seen in Table 1 and Table 2 some respondents have indicated that the questionnaire did not supply enough specific information to
suit their preference when making an assessment. The point being made by respondents, identified as a lack of specific information is
understandable for this research. It forms the original basis of the problem of modelling as it would be unlikely that sufficient specific
information for each value assessment could realistically be produced in a questionnaire format to suit all respondents. This leads to the
necessity of respondents considering a “general” case when providing their element pair assessments. The “general” case requires that
the many unspecified details relating to each judgement be subconsciously considered and moderated from respondent intuition,
representing a best estimate for moderation in all cases. It is this “general” case that this study has considered to provide a means to
reduce complexity through distillation of complicating factors through human judgement and yet still provide reasonably accurate
indications. However it must be understood that these indications will each be subjective and therefore relative to a single knowledge
structure. It is only by the consideration of many subjective and relative indications that value assessments can provide a more holistic
map of understanding. Thus a consensus approach should be representative of commonly accepted knowledge within the field of
physical security.
The identification of a definitive order between the elements is not as important to this research as the understanding of a dimensional
magnitude between them in a semantic and relational sense relative to the concept continuum that they each represent. The elements
listed can be considered as universal elements when they are simple reference levels on the dimension of each concept continuum.
Whether these elements are slightly out of order or absolutely correct in their rankings can only be determined with an exhaustive
comparison approach considering paired elements rankings along each corresponding and “orthogonal” dimension of each boundary
condition. The example for Table 2 exists where several respondents seemed unsure about the potential order was between an electric
drill compared to a hammer and an axe. This is reasonable as there are complicating factors that are manifest in ranking these items.
Electric drills ideally require mains power or otherwise a mobile power source, while axe and hammer are human powered. Similarly
hammer and axe work best against material structures of lower strength while electric drills can work better against stronger based
material structures but usually in a more localised area. Many other complicating factors exist and it is beyond the scope of this
research to discuss them.
A further example of an element that was particularly seen as a poor fit into a ranked order for several respondent’s general case
scenarios in was the element of oxy cutting, where this element shows more affinity to metallic type substances rather than ceramic
type substances for breaking purposes. This indication by a reasonable number of respondents points to a need to continue further value
assessment for this element in additional orders of hierarchy. While it is beyond the scope of this research to provide these to
eventually determine the hierarchical structure of complex elements in additional lower orders of hierarchy, further iterations of this
study’s method should be able to provide results that can be unanimously accepted by respondents.

It is however within the scope of this research to highlight from the comments of respondents any elements where this process may
provide a better indication of consensus. It is hoped that with a large range of respondents’ opinions that cases such as this throughout
the questionnaire would still provide a range of general case scenarios and that even considering contentious results should still be
indicative to some degree of consensus. There is a similar parallel to Table 2 where several respondents indicated that different
materials reacted differently to different tools.
The results from Table 2 suggest that the strength and available quantity of a barrier is likely to be directly proportional to the cost of
materials. The respondents in the study have generally agreed to the suggestion of the questionnaire that barrier strength is proportional
to an estimate of cost for each material and this provides a useful concept continuum for the mapping in terms of selection of barrier
relative to the asset. The consideration of cost for a physical security scenario will in most cases be a simple quantitative calculation of
each of the selected physical security elements over a defined region by a cost per unit area. Other cost factors may affect this
calculation such including potential future running and maintenance costs to physical security.
Table 2 has also indicated from respondent suggestions that the density and thickness need to be established for more accurate
assessments. The inclusion of an additional layer of hierarchy to consider the effect of various densities and thicknesses should provide
more accurate assessments. The general case for these materials however should still provide some indication of the relative
effectiveness and therefore some degree of consensus.
The extended list of elements compiled from respondent’s suggestions was designed to indicate where potential new elements could be
added to the universal elements listing in order to provide more reference points if required. An extended list is able in this manner to
provide a dictionary of alternate reference levels and in this manner it may be possible to consider an exhaustive list of elements within
a knowledge structure. For Table 1 and Table 2 it is evident that the list of extended elements provides a rich set of alternatives to the
universal elements listed. As can be seen by the extended in Table 1 and Table 2 some of the extended elements presented are actually
comments by respondents that begin with “what type of …”. These have been included in the extended list as they indicate that there
may be multiple forms of each element type. Although this is ideally the case for all elements to a degree, it would seem valuable for a
true and ideal extended list to recognise all variation and be able to rank them accordingly. The inclusion of several types of each
element would easily have increased the length of the questionnaire and potentially reduced questionnaire return rates. Therefore the
lists as they stand are not able to be better detailed in the scope of this research.
In both Table 1 and Table 2 the extended list suggests elements in more than one ranked order position. This would most likely suggest
that the elements operate at a range of effectiveness and this leads to a fuzzy ranking for each of these elements. In cases such as these
more specific information is needed and a consideration of a lower order of hierarchy may be useful to provide this specific
information. The best example of this from Table 1 are a jackhammer and diamond tipped electric cutter, while for Table 2 examples
of this include the ranges that have been selected for concrete and brick walls.
This study acknowledges that the lists of universal elements are not comprehensive lists of data representing the dimension of the
concept continuum, however as reference levels along this dimension they have been relatively successful in generating agreement
among respondents. The ranked order of the elements has been generally accepted by respondents and the extended lists of elements
have suggested many potential additions to the universal element list in a useful order for extended referencing of the dimension.

Table 1 Section A, Sets 1-6 Element 1 – considering the action “breaking through”
Elements in
rank order
Question 4: Respondent’s extended and amended element members in rank order
rock knife, shovel, hand, fist, screwdriver, rock size, rock shape, hammer
crow bar, bar/rod, hand, metal pole, air pressure
hammer chisel, bat, chisel, what type of hammer, size & weight will make a difference
power, sledge hammer, sledgehammer
axe mallet, saw, bolt cutter, what size & type of axe, jackhammer
hydraulic, hack saw
electric drill tin snips, ((electric drill)) chain saw, angle grinder, handgun, what type of drill e.g. size & speed & type of drill bit,
oxy cutting
diamond tipped electric cutter, O2 gas, electric saw
oxy cutting jack hammer, ((oxy cutting)) sledge hammer, ((oxy cutting)) jackhammer, laser, what type of oxy gas & tips used,
car ram raid
diamond tipped electric cutter, motor car
explosive bomb, what type of explosive
Question 2a: Consensus of agreement from “security experts” and “security students” groups
71% agreement for the presented ranked order from the least force to the greatest force downwards.
Question 2b: Summary of comments received by frequency of comment
10 respondents indicated general agreement in their comments.
6 respondents indicated that the application of oxy cutting was specific to metal and would not be applicable on the other type materials
e.g. brick, earth.
3 respondents indicated that all tools worked differently for different materials which made assessment difficult.
3 respondent indicated concern that an electric drill my not have the force of a hammer or an axe.
1 respondent indicated that the lack of specific information made this assessment difficult e.g. unknown thickness of materials, weight
of attack item, force of blow, speed of drill, etc.
1 respondent indicated that the chemical structure needed to be assessed during the interaction with the tools used.
*((elements)) in double brackets signify suggested removal from that position in the list order.

Table 2 Section A, Sets 1-6 Element 2 – considering the action “breaking through”
Listed Elements
in rank order
Question 5: Respondent’s extended and amended element members in rank order
earth no barrier, no barrier, paper, dirt, clay, glass sliding door, impaction of earth, no barrier
wood
glass window, window, glass, glass (normal), Perspex, plastic, window, strength, window
safety glass, wire mesh, limestone
wood door, plasterboard, door, ice, brick wall, tiles, tin roof, what type solid jarrah or plywood, door
bullet proof glass, colourbond fence, security mesh
brick gyprock wall, wire fence, wood, concrete wall, brick and concrete are kind of similar, wall, what type solid brick or
verticore, brick wall
composites
concrete wall, brick wall, brick, steel, walls are generally more expensive than fences, plain concrete or reinforced, concrete
wall
reinforced concretes
steel wire mesh fence, ((steel)) reinforced concrete, concrete, reinforced concrete, thickness, steel plated wall
Question 3a: Consensus of agreement from “security experts” and “security students” groups
82% agreement for the presented ranked order from the least material strength to the greatest material strength downwards.
Question 3b: Summary of comments received by frequency of comment
5 respondents indicated general agreement in their comments.
3 respondents indicated that the thickness/density needed to be stated for different materials to make a better assessment of strength.
3 respondents indicated that tools worked differently on different materials which made the assessment difficult.
3 respondents indicated that they had doubts about the inclusion of earth in the list.
3 respondent indicated that the lack of specific information made this assessment difficult e.g. type of glass, type of wood, solid jarrah
or ply, etc.
2 respondents indicated that the order between concrete and steel may be swapped.
1 respondent indicated that the order would be close between wood and brick.
*((elements)) in double brackets signify suggested removal from that position in the list order.

C2: Section B
The results from Section B consider Table 3 and Table 4 in Appendix C2 which present similar respondent sentiments to those for
Section A. The main similarity in the comments from respondents relate to the lack of specific information available to make value
assessments. The same rationale applies to Question 7 in the questionnaire where the necessity of respondents considering a “general”
case in providing element pair assessments requires that the many unspecified details relating to each judgement be subconsciously
considered and moderated from respondent intuition. In this “general” case complexity can be reduced through distillation of
complicating factors by human judgement. Table 3 considered elements along the concept continuum used in a climbing attack and
Table 4 indicated elements over the concept continuum used for barrier dimension and type.
The ordered scale of Table 3 in Appendix C2 shows a general lack of agreement with the ranked ordering with only 41% agreement.
This can mostly be described by the perception that most respondents saw the ordering of ladder and rope to be reversed, with a ladder
considered to be more of a general threat to security. Some concern was also evident from comments received as to the inclusion of the
term climbing aids. An additional problem that was brought up by two respondents was the issue of getting down from a steep barrier
after using a particular climbing method. Although this presents an interesting issue, it is beyond the scope of the study to consider it
further and it may be better considered by additional hierarchical investigation in any future work.
The ordered scale of Table 4 in Appendix C2 was found to have 82% agreement with the ranked order. The series of universal elements
in this part of the questionnaire were more specific than the corresponding element list representing Section A concept continuums. The
concept continuum included barrier dimensions and type with three variation parts including height, barrier smoothness, and barrier
topping. Due to this three part comparison the universal element list attempted to provide reference levels along the continuum for
climbing with two various height levels, three different types of smooth/rough surface types and one addition of fence topping for
comparison. A result of 82% percent agreement with the ranked order of this list is a good result in that it suggests that scale between
the lowest and easiest barrier 3 human high - steel large mesh fence and the highest and hardest barrier 5 human high smooth brick wall
+ razor wire is well represented with reference levels.
Given that the universal element list in Table 4 of Appendix C was more specific than those of Section A, the extended elements
suggested by respondents were more similar to those of the universal element list however it is noteworthy to identify the suggestions
for the lowest and highest barriers were suggested such that the lowest barrier presented an easer climbing potential and the highest
presented a more difficult design which effectively suggests that the scale could be broadened marginally. The extended list of Table 3
in Appendix C provided a few additional interesting methods of climbing however most of these were located nearer to the lowest
climbing potential methods listed no aid, ladder and rope.

Table 3 Section B, Sets 7-12 Element 1 – considering the action “climbing on”
Listed Elements
in rank order
Question 10: Respondent’s extended and amended element members in rank order
no aid human help, drive up car next to fence
small (define size) ladder, carpet, carpet
ladder
large (define size) ladder, multiple people, ((ladder)) rope, ((ladder)) rope, ((ladder)) rope, type, height, size of
ladder - no specifics as to tools used.,((ladder)) rope
rope no grapple, rope, pole vault, makes it hard to answer Q7 even though definitions have been provided there are
still other factors
rope
rope with grapple, ((rope)) ladder, ((rope)) climbing aids, attachments?, ((rope)) lift/hydrolics, ((rope)) ladder,
people, ((rope)) climbing aids, other things may effect outcome, ((rope)) climbing aids
climbing aids
((climbing aids)) projectiles & wire, trampoline, human assistance, ((climbing aids)) ladder, ((climbing aids))
ladder
large cannon
projectiles &
wire ((projectiles & wire)) tall ladder, cherry picker, cherry picker,
flight assisted helicopter, ((flight assisted)), ((flight assisted))
Question 8a: Consensus of agreement from “security experts” and “security students” groups
41.2% agreement for the presented ranked order from the least climbing aid to the greatest climbing aid downwards.
Question 8b: Summary of comments received by frequency of comment
8 respondents indicated that the order between ladder and rope may be swapped.
5 respondents indicated general agreement in their comments.
5 respondents indicated that the order between ladder and climbing aids or ladder and projectiles & wire may be swapped.
2 respondents indicated that getting down from the barrier height may pose a problem.
1 respondent indicated that the order between projectiles & wire and rope may be swapped.
1 respondent indicated that they had doubts about the inclusion of flight assisted in the list.
1 respondent indicated that they found climbing aids too general.
1 respondent indicated that the order would depend strongly on the type of element e.g. a sophisticated ladder.
1 respondent indicated they saw potential difficulty in carrying of a large ladder to a barrier.
*((elements)) in double brackets signify suggested removal from that position in the list order.

Table 4 Section B, Sets 7-12 Element 2 – considering the action “climbing on”
Listed Elements
in rank order
Question 11: Respondent’s extended and amended element members in rank order
5 human high
smooth brick
wall + razor wire
8 human height steel mesh fence - small links + razor wire, Palisade fence, slip / barbed wire / topping, 3m high
smooth concrete wall, 8 human height steel mesh fence - small links + razor wire, Palisade fence, & outriggers, 8
human high smooth… + razor
3 strands barbed wire, slip & barbed wire, razor wire is expensive compared to no wire
5 human high
smooth brick
wall
6 human height steel mesh fence - small links + razor wire, 3m high smooth brick wall, 6 human height steel mesh
fence - small links + razor wire, 6 human high smooth… + razor wire, barbed wire
barbed wire
5 human high -
steel small mesh
fence
4 human height steel mesh fence - small links + razor wire, 3m high 358 weld mesh fence, ((5 human high - steel
small mesh fence)) 3 human high smooth brick wall, 4 human height steel mesh fence - small links + razor wire, 5
human high smooth… + razor wire
slippery flat surface
3 human high
smooth brick
wall
3 human height steel mesh fence - small links + razor wire, 3m high expamet fence, ((3 human high smooth brick
wall)) 5 human high - steel small mesh fence, 3 human height steel mesh fence - small links + razor wire
flat
3 human high -
steel small mesh
fence
3 human height steel mesh fence - large links + razor wire, 3m high chain link fence, 3 human height steel mesh
fence - large links + razor wire
uneven surface
3 human high -
steel large mesh
fence
2 human height steel mesh fence - large links, 3m high ring lock fence, 2 human height steel mesh fence - large
links
Question 9a: Consensus of agreement from “security experts” and “security students” groups
82.4% agreement for the presented ranked order from the greatest climbing obstacle to the least climbing obstacle downwards.
Question 9b: Summary of comments received by frequency of comment
6 respondents indicated general agreement in their comments.
3 respondents indicated that brick walls would be more expensive and metal fences would be cheaper.
2 respondents indicated that it would be more difficult to climb a smaller brick wall than a larger steel fence in some circumstances.
1 respondent indicated uncertainty between the order of difficulty for a small mesh fence and a large mesh fence.
1 respondent indicated that any fence with razor wire would make it easier to hook a grappling device onto it.
1 respondent indicated that they considered razor wire expensive.
*((elements)) in double brackets signify suggested removal from that position in the list order.

C3: Section C
The results from Section C consider Table 5 and Table 6 in Appendix C3 which present similar respondent sentiments to those for
Section A with the main similarity again relating to the lack of specific information available to make value assessments. The “general”
case in providing element pair assessments is again required to be exercised for each judgement. Table 5 considered elements along the
concept continuum used in a stealth attack and Table 6 indicated elements over the concept continuum used for detection system.
The ordered scale of Table 5 in Appendix C3 shows a strong agreement with the ranked ordering of 88% agreement. The only
comment that seemed to counter the ranked order of the universal elements listed was a comment that the list of potential attacking
mechanisms was endless. Suggestions of uncertainty over the use of luck and smoke for evasion techniques were noted. The extended
element list for Table 5 contained several indications for the use of stealth however the ranked order of stealth was difficult to ascertain
as it varied in its suggested position with the few respondent’s indications. Insider assistance also varied across the scale. With such
variation these extended elements may provide more useful reference levels with an additional consideration of hierarchical levels and
investigation into the component elements of both stealth and insider assistance. The strong agreement for this concept continuum
indicates a good chance to achieve consensus.
The ordered scale of Table 6 in Appendix C3 was found to have 71% agreement with the ranked order. Some consideration of the
broadness in scope of mobile human guard was suggested as the greatest unknown entity. Several respondents considered human
guards to be the most cost effective while others considered electronic devices to be cheaper in the long run. One opinion considered
visual detection systems to be less effective while several opinions considered multiple systems to be the most effective. One
respondent indicated that the techniques listed were too different to compare. The figure of 71% agreement however indicates that a
majority of respondents did not consider the list to pose too many contentious issues and the lowest considered and the highest
considered detection systems of chance detection and multiple detection systems respectively provide a suitable scale for reference
levels to be provided for the other systems listed.
The extended elements suggested by respondents for Table 6 in Appendix C3 suggested most of the additional detection systems
located nearer to the highest detection potentials listed of multiple systems, microwave and infrared. The extended elements suggested
provides a rich series of alternate reference level items however as these all seem to be within the same region of effectiveness, it
would seem that it does not make a large difference which electronic detection system is in place with respect to the concept continuum
order of magnitude.
Comments obtained from research questionnaire have suggested that detection potential is a balance in cost between long term and
short term objectives. The results from the Table 6 in Appendix C3 suggest that the sensitivity and effectiveness of a detection system
may be directly proportional to the cost of technology and the cost of human expertise. This additional consideration provides another
potentially useful concept continuum for a knowledge mapping of this area in terms of selection of human or non-human measures for
detection expenditure. The consideration in a security scenario will in most cases be a simple quantitative calculation of the physical
security elements cost per unit over a defined region and perimeter length. Other cost factors will affect this calculation such as
running and maintenance costs.

Table 5 Section C, Sets 13-18 Element 1 – considering the action “evading detection”
Listed Elements
in rank order
Question 16: Respondent’s extended and amended element members in rank order
luck the potentials are endless, no it's a good list.
heat
colour
camouflage heat or cooling camouflage
wood shield
create false
alarms disguise, animals
stealth
smoke stealth, multiple people, inside helper, deception
system
knowledge using guard
stealth
knowledge &
diversion insider info
Question 14a: Consensus of agreement from “security experts” and “security students” groups
88.2% agreement for the presented ranked order from the least stealth-like activity to the greatest stealth-like activity downwards.
Question 14b: Summary of comments received by frequency of comment
8 respondents indicated general agreement in their comments.
2 respondents indicated that using luck as an evasion technique would seem very careless.
1 respondent indicated that large amounts of smoke would cause suspicions.
1 respondent indicated that any comparison would depend on the competence and training for mobile guards.
1 respondent indicated that the techniques being compared were too different to compare.
*((elements)) in double brackets signify suggested removal from that position in the list order.

Table 6 Section C, Sets 13-18 Element 2 – considering the action “evading detection”
Listed Elements
in rank order
Question 17: Respondent’s extended and amended element members in rank order
multiple systems
multiple system placement, In the long run, multiple systems, infrared, microwave, are going to be a cheaper
alternative than mobile human guards. -> initial cost expensive but cheap to maintain., sterile zone, pretty much
covers it
Dual tech - microwave & PIR, buried cable perimeter detection, acoustic detectors
microwave
Reed switches, fence mounted perimeter detection, In the long run, multiple systems, infrared & microwave, are
going to be a cheaper alternative than mobile human guards. ->initial cost expensive but cheap to maintain.,
microphone sensors, motion sensors
vibration sensor, microwave outdoor detection
infrared
motion sensors, acoustic sensor, electric field detection, In the long run - multiple systems, infrared, microwave,
are going to be a cheaper alternative than mobile human guards. -> initial cost expensive but cheap to maintain.,
motion sensors, trip
security dogs, outdoor PIR detection
closed circuit tv ((closed circuit tv)) mobile human guard, cameras, monitored cctv
glass breaks, security dogs
mobile human
guard
security dogs, ((mobile human guard)) closed circuit tv, guards are expensive, unpredictable, more expensive in the
long run, security guard
chance detection
Question 15a: Consensus of agreement from “security experts” and “security students” groups
70.6% agreement for the presented ranked order from the greatest detection system to the least detection system downwards.
Question 15b: Summary of comments received by frequency of comment
5 respondents indicated general agreement in their comments.
3 respondents indicated that electronic detection devices would be a cheaper expense in the long run.
2 respondents indicated that the number of detection systems in place would be more effective against an attack.
2 respondents indicated that they considered mobile human guards to be the most cost effective.
1 respondent indicated uncertainty in the order of effectiveness and cost between a mobile guard and cctv.
1 respondent indicated that any visual detection system would be less effective.
1 respondent indicated that humans were the greatest unknown entity in the list.
1 respondent indicated that multiple systems would cost a lot more than a single system.
1 respondent indicated that the techniques being compared were too different to compare.
*((elements)) in double brackets signify suggested removal from that position in the list order.

C4: Section D
The results from Section D consider Table 7 and Table 8 in Appendix C4 which present similar respondent sentiments to those for
Section C with the extract similarity being the detection systems used. Table 7 considered elements along the concept continuum used
in a force attack (disabling) and Table 8 indicated elements over the concept continuum used for detection system.
The ordered scale of Table 7 in Appendix C4 shows a weak agreement with the ranked ordering of 47% agreement. The ranked order
considered universal elements listed for disabling detection systems including violent destruction and physical intimidation. These two
universal elements in particular were considered to be in reversed order with violent destruction generally considered to be a more
effective means of disabling. A general sentiment for physical intimidation was that it should be represented lower in the ranked order
than its original listing. Of worthy note was some indication that cut power was very dependent on the existence of a uninterruptible
power source (UPS). The lowest and the highest disabling techniques of accidental and system knowledge respectively were not
disputed.
The ordered scale of Table 8 in Appendix C4 was found to have 65% agreement with the ranked order. This result was 6% lower for
the same concept continuum as Section C (Table 6 Appendix C3). It is difficult to explain the slight drop in agreement however this
does include a slight reduction in response rate over the questions of the questionnaire. The level of agreement of 65% nevertheless still
indicates a high probability of achieving consensus.
The extended elements suggested by respondents for Table 7 in Appendix C4 suggested some additional disabling techniques however
most were similar to the listed universal elements.

Table 7 Section D, Sets 19-24 Element 1 – considering the action “disabling detection”
Listed Elements
in rank order
Question 22: Respondent’s extended and amended element members in rank order
accidental Act of God, trip or power surge, bypass, accidental
disable phone line, physical intimidation
cut power
((cut power)), ((cut power)) tampering, with UPS or not?, pliers, depends if back up power is available or not (UPS
system), no maintenance on devices
violent
destruction
((violent destruction)), ((violent destruction)) physical intimidation, explosion, the potentials are endless, system
knowledge
physical
intimidation
((intimidation)), ((physical intimidation)), ((physical intimidation)) violent destruction, use of violence, army,
manipulation of operators
violent destruction, cut power, bribe, blackmail, intimidation
electrical
interference generator, violent destruction
cut power, insider help, insider
system
knowledge placement knowledge, disgruntled employee, disgruntled employee, cut power and backup power
Question 20a: Consensus of agreement from “security experts” and “security students” groups
47.1% agreement for the presented ranked order from the greatest detection system to the least detection system downwards.
Question 20b: Summary of comments received by frequency of comment
4 respondents indicated general agreement in their comments.
4 respondents indicated that physical intimidation would be better represented down the list as a lower force attack on detection
systems.
3 respondents indicated that physical intimidation could be swapped with violent destruction in the order.
3 respondents indicated that violent destruction should be represented higher in the order.
3 respondents indicated that to successfully cut power would depend on the presence of an uninterruptible power supply (UPS).
2 respondents indicated that physical intimidation could be swapped with cut power in the order.
1 respondent indicated that the techniques being compared were too different to compare.
*((elements)) in double brackets signify suggested removal from that position in the list order.

Table 8 Section D, Sets 19-24 Element 2 – considering the action “disabling detection”
Listed Elements
in rank order
Question 23: Respondent’s extended and amended element members in rank order
multiple systems defence in depth
Dual tech - microwave & PIR, pretty much covers them
microwave Reed switches
vibration sensor
infrared acoustic sensor
closed circuit tv ((closed circuit tv)) mobile human guard
glass breaks
mobile human
guard ((mobile human guard)) closed circuit tv, guards are expensive
chance detection accidental
Question 21a: Consensus of agreement from “security experts” and “security students” groups
64.7% agreement for the presented ranked order from the greatest detection system to the least detection system downwards.
Question 21b: Summary of comments received by frequency of topic
8 respondents indicated general agreement in their comments.
1 respondent indicated that electronic detection devices would be a cheaper expense in the long run although initially more expensive.
1 respondent indicated that they considered mobile human guards more effective.
1 respondent indicated that they considered mobile human guards to be expensive.
1 respondent indicated that mobile guard and cctv should be swapped.
1 respondent indicated that humans were the greatest unknown entity and that electronic devices were more reliable.
1 respondent indicated that the techniques being compared were too different to compare.
*((elements)) in double brackets signify suggested removal from that position in the list order.

C5: Section E
The results from Section E consider Table 9 and Table 10 in Appendix C5. Table 9 considered elements along the concept continuum
for assets and Table 10 indicated elements over the concept continuum of response type.
The ordered scale of Table 9 in Appendix C5 shows a strong agreement with the ranked ordering of 76% agreement. The only
comment that seemed to counter the ranked order of the universal elements listed were those that considered the assets of corporate
data and large cash to be similar and potentially to be swapped in order. The other noteworthy comment was one respondent
commented that human life was not able to be measured. This has been noted as human life is representative of the highest reference
level of the concept continuum for asset. The extended elements suggested by respondents for Table 9 in Appendix C5 suggested some
additional assets however most were similar to the listed universal elements.
The ordered scale of Table 10 in Appendix C5 was also found to have 76% agreement with the ranked order. The main noteworthy
comment from several respondents was that the general public, represented as the lowest considered type of response with respect to
time was not able to be relied upon during an attack and if they did it may not be constructive. A high tech response was noted as not so
applicable to human life and insurance as a response was thought by one respondent to be inappropriate for the list. The general
agreement for this list suggests reasonable likelihood of consensus. The extended elements suggested by respondents for Table 9 in
Appendix C5 suggested some additional response types with one in particular very important as it alters the broadness of the universal
element list. This is the addition of a full time security manager to the list which would ideally fit in as the highest considered type of
response type. This is conceptualised as a designated person that is able to coordinate a variable response within a very brief time
period after detection has occurred.

Table 9 Section E, Sets 25-30 Element 1 – considering the action “responding for”
Listed Elements
in rank order
Question 28: Respondent’s extended and amended element members in rank order
low value goods stationary
minor assets
small cash cash register
major assets
personal
valuables high value goods, jewellery
furniture/fittings, plant and equipment may be applied somewhere
corporate data
((corporate data)) large cash, ((corporate data)) large cash, ((corporate data)) large cash, large number of high value
goods, client info, company asset, ((corporate data))
high tech equipment
large cash ((large cash)) corporate data, ((large cash)) corporate data, ((large cash)) corporate data, safes
human life casualties
Question 26a: Consensus of agreement from “security experts” and “security students” groups
76.5% agreement for the presented ranked order
Question 26b: Summary of comments received by frequency of topic
7 respondents indicated general agreement in their comments.
3 respondents indicated that corporate data and large cash could be swapped in the order.
1 respondent indicated that corporate data was a very subjective concept.
1 respondent indicated that human life was not able to be measured.
1 respondent indicated that low value goods may be important although not necessarily valuable.
*((elements)) in double brackets signify suggested removal from that position in the list order.

Table 10 Section E, Sets 25-30 Element 2 – considering the action “responding for”
Listed Elements
in rank order
Question 29: Respondent’s extended and amended element members in rank order
high tech
((high tech)) multiple systems, high tech may not detect human life so well, full time security manager, motion
sensor, maybe each category could have been broken down to be more specific
armed, face recognition
armed ((armed)) high tech, pill boxes
insurance ((insurance)), ((insurance)), property insurance, ((insurance)) police
security patrol guards and dogs, size and skill of security patrol.
insurance
police ((police)) insurance
insurance
general public neighbours, ((general public))
Question 27a: Consensus of agreement from “security experts” and “security students” groups
76.5% agreement for the presented ranked order
Question 27b: Summary of comments received by frequency of topic
4 respondents indicated general agreement in their comments.
4 respondents indicated that the general public may not respond to a situation and if they did it may not be a constructive response.
2 respondents indicated that high tech response didn’t apply well to human life.
2 respondents indicated that they would swap insurance with police response.
1 respondent indicated that they would swap high tech with armed response.
1 respondent indicated that they considered electronic/high tech responses more reliable.
1 respondent indicated that insurance was not a valid response but instead a transfer of risk.
1 respondent indicated that armed/military type response is almost never called for.
1 respondent indicated that they considered a large security patrol more expensive than a high tech response.
*((elements)) in double brackets signify suggested removal from that position in the list order.

C6: Section F
The results from Section F consider Table 11 and Table 12 in Appendix C6. Table 11 considered elements along the concept
continuum for assets and Table 12 indicated elements over the concept continuum of motivation.
The ordered scale of Table 11 in Appendix C6 shows a strong agreement with the ranked ordering of 82% agreement. This agreement
level is 6% higher than for the same concept continuum in Section E (Table 9 in Appendix C5). This represents a potential high level
for consensus of ranked order.
The ordered scale of Table 12 in Appendix C6 was also found to have 100% agreement with the ranked order. This is to be expected as
the universal elements listed for this dimension are incremental.
Table 11 Section F, Sets 31-36 Element 1 – considering motivation by asset
Listed Elements
in rank order
Question 34: Respondent’s extended and amended element members in rank order
low value goods relate to dollar value?, office equipment, maybe the current categories could be more specific or further expanded.
small cash relate to dollar value?, wallets
personal
valuables relate to dollar value?, clothing
computers
corporate data corporate data is very subjective, relate to dollar value?, addresses
large cash relate to dollar value?, thousands of dollars or millions of dollars?, vaults
human life relate to dollar value?, armed robbery
Question 32a: Consensus of agreement from “security experts” and “security students” groups
82.4% agreement for the presented ranked order
Question 32b: Summary of comments received by frequency of topic
5 respondents indicated general agreement in their comments.
3 respondents indicated that corporate data and large cash could be swapped in the order.
2 respondents indicated that corporate data was a very subjective concept.
2 respondents indicated that the categories could be more specific.
1 respondent indicated that human life was not able to be measured.
1 respondent indicated that minor/major assets could be considered e.g. computers.
1 respondent indicated that the assets being presented were too different to compare.
*((elements)) in double brackets signify suggested removal from that position in the list order.

Table 12 Section F, Sets 31-36 Element 2 – considering motivation by asset
Listed Elements
in rank order
Question 35: Respondent’s extended and amended element members in rank order
extreme
motivation fanatical, jealousy, covers most of them
high motivation revenge
moderate
motivation anger
low motivation annoyance
very low
motivation principle
accidental ((accidental)) no intent, by mistake
Question 33a: Consensus of agreement from “security experts” and “security students” groups
100% agreement for the presented ranked order
Question 33b: Summary of comments received by frequency of topic
11 respondents indicated general agreement in their comments.
*((elements)) in double brackets signify suggested removal from that position in the list order.

C7: Section G
The results from Section G consider Table 13 and Table 14 in Appendix C7. Table 13 considered elements along the concept
continuum for attack types and Table 14 indicated elements over the concept continuum of motivation.
The ordered scale of Table 13 in Appendix C7 shows a strong agreement with the ranked ordering of 82% agreement. There was some
suggestion that the universal elements in this list were too different to compare. The level of agreement of 82% represents a potential
high level for consensus of ranked order. The ordered scale of Table 14 in Appendix C7 was also found to have 100% agreement with
the ranked order.
Table 13 Section G, Sets 37-42 Element 1 – considering attack types by motivation
Listed Elements
in rank order
Question 40: Respondent’s extended and amended element members in rank order
cut power hand tools, axe
stealth, smashing tools, etc, physical intimidation
technological
attack ((technological attack)) break through windows or doors, computer virus
electric tools drills, jigsaw
physical
intimidation ((physical intimidation)), threats
violent
destruction bombs
armed destruction
explosive LEDs
Question 38a: Consensus of agreement from “security experts” and “security students” groups
82.4% agreement for the presented ranked order
Question 38b: Summary of comments received by frequency of topic
6 respondents indicated general agreement in their comments.
2 respondents indicated that the definitions provided were too general or different to compare.
1 respondent indicated that physical intimidation should be represented lower in the list.
*((elements)) in double brackets signify suggested removal from that position in the list order.

Table 14 Section G, Sets 37-42 Element 2 – considering attack types by motivation
Listed Elements
in rank order
Question 41: Respondent’s extended and amended element members in rank order
extreme
motivation
high motivation
moderate
motivation
low motivation
very low
motivation
accidental
Question 39a: Consensus of agreement from “security experts” and “security students” groups
100% agreement for the presented ranked order
Question 39b: Summary of comments received by frequency of topic
11 respondents indicated general agreement in their comments.
1 respondent indicated that accidental might be replaced with no intent.
*((elements)) in double brackets signify suggested removal from that position in the list order.

C8: Section H
The results from Section H consider Table 15 and Table 16 in Appendix C8. Table 15 considered elements along the concept
continuum for assets and Table 16 indicated elements over the concept continuum of attack type. The ordered scale of Table 15 in
Appendix C8 shows a strong agreement with the ranked ordering of 65% agreement. This agreement level is 11% lower than Section E
(Table 9 in Appendix C5). And 17% lower than Section F (Table 11 in Appendix C6). Suggestion with the questionnaire indicated that
this reduced figure would appear to be a result of the repeated question format. This still represents a high level for consensus of ranked
order.
The ordered scale of Table 16 in Appendix C8 shows a strong agreement with the ranked ordering of 76% agreement. This represents a
reduction of 6% from the indication from Section G (Table 14 in Appendix C7). The level of agreement of 76% represents a high level
for consensus of ranked order.
Table 15 Section H, Sets 43-48 Element 1 – considering attack types by asset
Listed Elements
in rank order
Question 46: Respondent’s extended and amended element members in rank order
low value goods
small cash
personal
valuables
business interruption
corporate data ((corporate data)) restricted corporate data
corporate systems
large cash expand e.g. more then 1 million?
critical corporate data
human life
Question 44a: Consensus of agreement from “security experts” and “security students” groups
64.7% agreement for the presented ranked order
Question 44b: Summary of comments received by frequency of topic
6 respondents indicated general agreement in their comments.
3 respondents indicated that corporate data and large cash could be swapped in the order.
1 respondent indicated that human life was not able to be measured.
1 respondent indicated that the assets being presented were too different to compare.
*((elements)) in double brackets signify suggested removal from that position in the list order.

Table 16 Section H, Sets 43-48 Element 2 – considering attack types by asset
Listed Elements
in rank order
Question 47: Respondent’s extended and amended element members in rank order
cut power possibilities are endless
technological
attack
electric tools
physical
intimidation
violent
destruction
explosive
Question 45a: Consensus of agreement from “security experts” and “security students” groups
76.5% agreement for the presented ranked order
Question 45b: Summary of comments received by frequency of topic
7 respondents indicated general agreement in their comments.
2 respondents indicated that the definitions provided were too general or different to compare.
1 respondent indicated that physical intimidation should be represented lower in the list.
1 respondent indicated that physical intimidation was not appropriate for the list.
*((elements)) in double brackets signify suggested removal from that position in the list order.

Appendix D
D1: Section A
Table 17 considers a question posed by the questionnaire to gauge agreement from respondents in accepting an alternative list of
elements as potential universal elements. This presentation of an alternative list provides the basis for the extension of the universal
lists and also provides the basis for conceptualising the universal elements as simple reference levels on a dimension representing the
concept continuums. Table 17 shows that general agreement was identified from respondents to the concept of replacing the list.
Several respondents indicated the alternate list was more appropriate to real-world examples, however in attempting to create simple
reference levels any list of universal elements would seem to be appropriate.
The suggestion of one respondent that AS3555 should be considered instead of the list is interesting as this indicates that a standard
that is already in acceptance should replace the listed universal elements. A closer inspection of the list in comparison with AS3555
shows that the universal elements presented are able to be recognised within the categories of AS3555. This generally supports the
universal element list however the research has considered six reference levels for element pair comparisons while AS3555 only
incorporates 4 categories. It would be of potential interest to substitute the universal elements listed in the questionnaire with others
from the categories of AS3555 to test whether similar results from the element pair assessments would result. The rate of disagreement
and uncertainty to Question 6 was very low.
Table 17 Section A: Respondent commentary on extending the lists for both Element 1 and Element 2 by associating new/additional
terms while continuing the same visual ranking method
Question 6: Summary of comments received by frequency of topic
8 respondents indicated general agreement in their comments.
3 respondents indicated that the alternative list suggested was more appropriate to real-world examples.
1 respondent indicated some agreement with the alternate list.
1 respondent indicated that they were uncertain.
1 respondent indicated disagreement with the alternate terms as no actual specifics for those terms were provided.
1 respondent indicated that the question did not consider groupings of the Australian Standard AS3555: with 4 classes of tools – Hand,
Power, Hydraulic, O2/gas.
D2: Section B
Question 12 asked respondents whether considered the universal elements as representative of the alternate terms smoothness, height,
and fence topping. This question was designed to alert the respondents to the type of items that the climbing potential of a barrier was
rated. More than half of respondents agreed with the proposed alternate terms while an additional number suggested additional specific
terms to represent the list. Only one respondent disagreed which indicated that this list was most likely to be adequate for achieving a
high degree of consensus.

D3: Section C
Question 18 was presented to measure support for the inclusion of the concept continuums in each of Sections F, G and H in the
questionnaire. Investigation by the pilot study highlighted that the acknowledged functions of defence in depth in isolation were
potentially insufficient to determine likelihood of attack and therefore attack methods for modelling purposes should be supplemented
with consideration of motivation and asset in relation to attack types. Therefore the questionnaire presented 3 sections that were used to
assess the interaction between attack, attacker, and asset. Question 18 has achieved greater agreement than disagreement that the
Sections F,G, and H of the questionnaire may be seen as valid to compliment Sections A-E which deal with delay, detection and
response. Additionally one respondent indicated that the terms: capability, opportunity, and motivation were more appropriate. While
this suggestion is of importance to future considerations to the knowledge structure although to a large extent the Sections F, G, and H
do indirectly consider capability, opportunity, and motivation.
D4: Section D
Question 24 collected the respondents’ opinion about the use of time as a measuring tool. More respondents indicated agreement with
the time based approach than disagreement. Several respondents indicated the measure using time was sometimes hard to judge while
one respondent indicated that they preferred the Sandia model using delay time with probability of detection and response time. The
limitations of the Sandia model (Garcia, 2001) are addressed in Chapter 5 in the theoretical considerations of the relationships with
detection and delay. It is the proposal of this research that time is used to gauge the order of magnitude in the relationships between
universal elements and not in its normal use as a quantitative temporal measure with a start and finish value. One respondent indicated
the following statement that has been included as follows:
No, it just appears too general. There are so many factors that should be considered when determining measurements of time
(even though the definitions have been provided). When an attacker decides to implement an attack on an asset, they will
generally have done the necessary research and acquired the exact tools necessary to defeat the physical security measure.
The questionnaire may provide some measure of time however I am not confident that it will be a precise enough measure.
For example as a security manager of a prison you may be allocated millions of dollars to implement security measures. In
order to justify the decisions made you need more solid and specific data.
This statement while not in agreement with the technique of the questionnaire is actually a reinforcement for the method in the study.
Due to the fact that the statement consider the attacker to have the exact tools necessary to defeat the physical security measure then
“precise” time measurements of physical security would seem to be redundant in assessing physical security. In this regard only
consideration by experts can seek to counter such a resourced attack. The respondent also considers so many factors should be
considered and in this manner supports the direction of this research where it attempts to use respondent’s ability to consider a
“general” case in providing their element pair assessments. Where the many unspecified (so many factors to be considered) details can
be subconsciously considered from intuition to represent a best estimate for moderation in all cases. Further to this statement more
solid and specific data may be attempted with additional iterations of the element hierarchy in future work in this area.

D5: Section E
Question 30 was presented to measure the level of respondent confidence in answering the questionnaire. A large number of
respondents indicated unspecified confidence and several more indicated slightly reduced confidence in answering the questions of the
questionnaire and providing the value assessments. Several respondents indicated confidence with additional statements that
assumptions or grey areas existed in the way they were required to completed the questionnaire. Only one respondent indicated a lack
of confidence in completing the questionnaire requirements.
D6: Section F
Question 36 was left open for respondents to comment freely on any terminology that they thought was ambiguous or inappropriate. As
more respondents indicated general understanding with the concepts being investigated than indicated confusion, it would appear that
the choice of terminology in the questionnaire was not a comprehension issue. The main comment of note is that one respondent
suggested that the questionnaire should provide more detail in order to assist the value assessments and reduce the need for assumption.
D7: Section G
Question 42 considered the use of “verbs” to help measure the time relationships used in the questionnaire. Most respondents had no
comment on this question although several indication understanding with the specific use of verbs to measure relative time
assessments. One respondent indicated that they felt that the method seemed more complex than it needed to be.
D8: Section H
Question 48 asked for comments on the overall method used in the questionnaire and has been included in the text for information
purposes. The main indication here is that some confusion is evident about whether time represents an actual measure of time or
alternatively a likelihood of an event happening. As both provide a relative indication this issue is not seen as a major concern to the
research.
D9: Question 49
Question 49 included comments from respondents on their thoughts about whether a small set of elements (such as those in the
questionnaire) can adequately describe a real-life facility. There is general agreement to this proposition although concern has been
raised about the ability for the universal elements to be a large enough set to be representative. The main area of concern for several
respondents was that facility specific information was not available for the questionnaire. This study acknowledges that facility specific
information was not available and assumes that a “general” case is appropriate within the research boundary conditions.
D10: Question 50
Question 50 included comments from respondents on their thoughts about whether a small set of elements (such as those in the
questionnaire) can adequately describe the physical security of a real-life facility. There is general agreement to this proposition
although concern has been raised about the ability for the universal elements to be a large enough set to be representative.

Appendix E
E1:
Tab
le s
how
ing
raw
dat
a pr
ofile
for
eac
h re
spon
dent
for ea
ch o
f the
cat
egor
y gr
oups
of t
he res
earc
h
C
atego
ry g
roup
- Sec
urity
Exp
ert (
#1)
1 1
1 1
1
Var
Label
2
6 26
1
19
MEAN
ME
DIA
N
MO
DE
ST
DE
V
V16
exp
losi
ve b
reak
s gla
ss
0.1
0.1
0.1
0.1
0.1
0.1
0.1
0.1
0.0
V18
exp
losi
ve b
reak
s w
ood
0.1
0.1
0.1
0.1
0.1
0.1
0.1
0.1
0.0
V13
exp
losi
ve b
reak
s bric
k 4.1
0.1
0.1
0.1
0.1
0.9
0.1
0.1
1.8
V15
exp
losi
ve b
reaks
earth
0.1
0.1
0.1
0.1
0.1
0.1
0.1
0.1
0.0
V14
exp
losi
ve b
reak
s co
ncre
te
4.1
0.1
0.1
0.1
0.1
0.9
0.1
0.1
1.8
V17
exp
losi
ve b
reak
s st
eel
4.1
0.1
4.1
0.1
0.1
1.7
0.1
0.1
2.2
V9
ele
ctric
dril
l bre
aks
earth
0.1
0.1
4.1
0.1
0.1
0.9
0.1
0.1
1.8
V10
ele
ctric
dril
l bre
aks
gla
ss
0.1
0.1
4.1
0.1
0.1
0.9
0.1
0.1
1.8
V12
ele
ctric
dril
l bre
aks
wood
0.1
0.1
4.1
0.1
4.1
1.7
0.1
0.1
2.2
V7
ele
ctric
dril
l bre
aks
bric
k 4.1
4.1
8.2
4.1
4.1
4.9
4.1
4.1
1.8
V8
ele
ctric
dril
l bre
aks
con
crete
4.1
4.1
8.2
4.1
4.1
4.9
4.1
4.1
1.8
V11
ele
ctric
dril
l bre
aks
ste
el
8.2
4.1
11.4
8.2
4.1
7.2
8.2
8.2
3.1
V28
oxy
cutti
ng b
reak
s gla
ss
0.1
4.1
0.1
0.1
0.1
0.9
0.1
0.1
1.8
V30
oxy
cutti
ng b
reak
s w
ood
4.1
4.1
0.1
4.1
4.1
3.3
4.1
4.1
1.8
V29
oxy
cutti
ng b
reak
s st
eel
8.2
4.1
8.2
0.1
8.2
5.8
8.2
8.2
3.6
V27
oxy
cutti
ng b
reak
s ea
rth
4.1
0.1
0.1
0.1
0.1
0.9
0.1
0.1
1.8
V25
oxy
cutti
ng b
reak
s bric
k 8.2
17.3
4.1
8.2
8.2
9.2
8.2
8.2
4.9
V26
oxy
cutti
ng b
reak
s co
ncr
ete
11.4
17.3
8.2
4.1
11.4
10.5
11.4
11.4
4.9
V4
axe
bre
aks
gla
ss
0.1
0.1
0.1
0.1
0.1
0.1
0.1
0.1
0.0
V3
axe
bre
aks
earth
0.1
0.1
0.1
0.1
0.1
0.1
0.1
0.1
0.0
V1
axe
bre
aks
bric
k 4.1
4.1
8.2
4.1
4.1
4.9
4.1
4.1
1.8
V6
axe
bre
aks
wood
17.3
8.2
4.1
4.1
4.1
7.6
4.1
4.1
5.7
V2
axe
bre
aks
conc
rete
8.2
11.4
11.4
8.2
4.1
8.7
8.2
8.2
3.0
V5
axe
bre
aks
steel
14.7
17.3
13.3
13.3
8.2
13.4
13.3
13.3
3.3
V22
ham
mer bre
aks
gla
ss
0.1
0.1
4.1
0.1
0.1
0.9
0.1
0.1
1.8
V21
ham
mer bre
aks
earth
0.1
0.1
0.1
0.1
0.1
0.1
0.1
0.1
0.0
V24
ham
mer bre
aks
wood
4.1
8.2
4.1
0.1
4.1
4.1
4.1
4.1
2.9
V19
ham
mer bre
aks
bric
k 8.2
8.2
8.2
4.1
4.1
6.6
8.2
8.2
2.2
V20
ham
mer bre
aks
conc
rete
11.4
13.3
8.2
8.2
8.2
9.9
8.2
8.2
2.4
V23
ham
mer bre
aks
steel
17.3
17.3
13.3
14.7
11.4
14.8
14.7
17.3
2.6
V34
rock
bre
aks
gla
ss
0.1
0.1
0.1
0.1
0.1
0.1
0.1
0.1
0.0
V33
rock
bre
aks
earth
0.1
0.1
0.1
0.1
0.1
0.1
0.1
0.1
0.0
V36
rock
bre
aks
wood
8.2
8.2
8.2
8.2
8.2
8.2
8.2
8.2
0.0
V31
rock
bre
aks
bric
k 11.4
11.4
11.4
11.4
11.4
11.4
11.4
11.4
0.0
V32
rock
bre
aks
conc
rete
14.7
14.7
14.7
14.7
14.7
14.7
14.7
14.7
0.0
V35
rock
bre
aks
stee
l 17.3
17.3
17.3
17.3
17.3
17.3
17.3
17.3
0.0
v43
flight a
ssis
ted c
limbs
3 h
uman
hig
h s
mooth
bric
k w
all
0.1
0.1
0.1
0.1
0.1
0.1
0.1
0.1
0.0
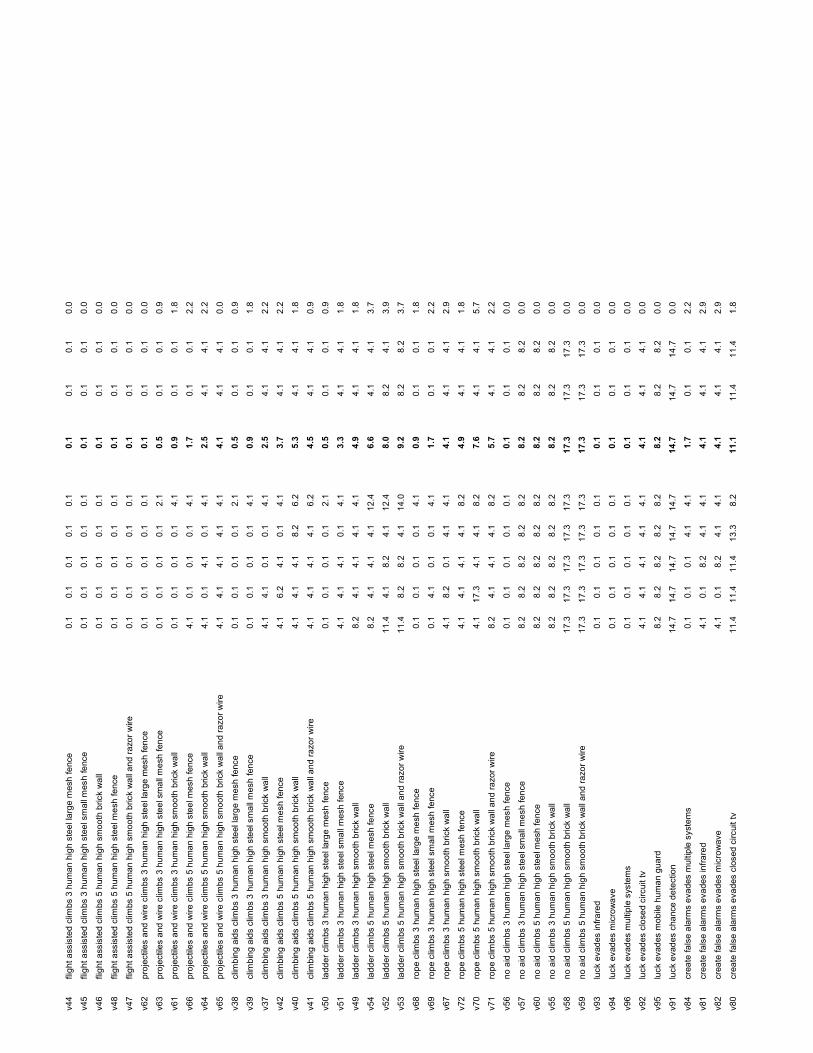
v44
flight a
ssis
ted c
limbs
3 h
uman
hig
h s
teel l
arg
e m
esh fe
nce
0.1
0.1
0.1
0.1
0.1
0.1
0.1
0.1
0.0
v45
flight a
ssis
ted c
limbs
3 h
uman
hig
h s
teel s
mall
mes
h fe
nce
0.1
0.1
0.1
0.1
0.1
0.1
0.1
0.1
0.0
v46
flight a
ssis
ted c
limbs
5 h
uman
hig
h s
mooth
bric
k w
all
0.1
0.1
0.1
0.1
0.1
0.1
0.1
0.1
0.0
v48
flight a
ssis
ted c
limbs
5 h
uman
hig
h s
teel m
esh
fenc
e
0.1
0.1
0.1
0.1
0.1
0.1
0.1
0.1
0.0
v47
flight a
ssis
ted c
limbs
5 h
uman
hig
h s
mooth
bric
k w
all
and razo
r w
ire
0.1
0.1
0.1
0.1
0.1
0.1
0.1
0.1
0.0
v62
pro
ject
iles
and
wire
clim
bs 3
hum
an h
igh s
teel l
arg
e m
esh fe
nce
0.1
0.1
0.1
0.1
0.1
0.1
0.1
0.1
0.0
v63
pro
ject
iles
and
wire
clim
bs 3
hum
an h
igh s
teel s
mall
mesh
fence
0.1
0.1
0.1
0.1
2.1
0.5
0.1
0.1
0.9
v61
pro
ject
iles
and
wire
clim
bs 3
hum
an h
igh s
moo
th b
rick
wall
0.1
0.1
0.1
0.1
4.1
0.9
0.1
0.1
1.8
v66
pro
ject
iles
and
wire
clim
bs 5
hum
an h
igh s
teel m
esh fe
nce
4.1
0.1
0.1
0.1
4.1
1.7
0.1
0.1
2.2
v64
pro
ject
iles
and
wire
clim
bs 5
hum
an h
igh s
moo
th b
rick
wall
4.1
0.1
4.1
0.1
4.1
2.5
4.1
4.1
2.2
v65
pro
ject
iles
and
wire
clim
bs 5
hum
an h
igh s
moo
th b
rick
wall
and razo
r w
ire
4.1
4.1
4.1
4.1
4.1
4.1
4.1
4.1
0.0
v38
clim
bin
g a
ids
clim
bs 3
hum
an h
igh s
teel
larg
e m
esh fe
nce
0.1
0.1
0.1
0.1
2.1
0.5
0.1
0.1
0.9
v39
clim
bin
g a
ids
clim
bs 3
hum
an h
igh s
teel
sm
all
mes
h fe
nce
0.1
0.1
0.1
0.1
4.1
0.9
0.1
0.1
1.8
v37
clim
bin
g a
ids
clim
bs 3
hum
an h
igh s
moo
th b
rick
wall
4.1
4.1
0.1
0.1
4.1
2.5
4.1
4.1
2.2
v42
clim
bin
g a
ids
clim
bs 5
hum
an h
igh s
teel
mesh
fenc
e
4.1
6.2
4.1
0.1
4.1
3.7
4.1
4.1
2.2
v40
clim
bin
g a
ids
clim
bs 5
hum
an h
igh s
moo
th b
rick
wall
4.1
4.1
4.1
8.2
6.2
5.3
4.1
4.1
1.8
v41
clim
bin
g a
ids
clim
bs 5
hum
an h
igh s
moo
th b
rick
wall
and razo
r w
ire
4.1
4.1
4.1
4.1
6.2
4.5
4.1
4.1
0.9
v50
ladder cl
imbs
3 h
uman h
igh s
teel l
arg
e m
esh fen
ce
0.1
0.1
0.1
0.1
2.1
0.5
0.1
0.1
0.9
v51
ladder cl
imbs
3 h
uman h
igh s
teel s
mall
mes
h fe
nce
4.1
4.1
4.1
0.1
4.1
3.3
4.1
4.1
1.8
v49
ladder cl
imbs
3 h
uman h
igh s
moo
th b
rick
wall
8.2
4.1
4.1
4.1
4.1
4.9
4.1
4.1
1.8
v54
ladder cl
imbs
5 h
uman h
igh s
teel m
esh
fenc
e
8.2
4.1
4.1
4.1
12.4
6.6
4.1
4.1
3.7
v52
ladder cl
imbs
5 h
uman h
igh s
moo
th b
rick
wall
11.4
4.1
8.2
4.1
12.4
8.0
8.2
4.1
3.9
v53
ladder cl
imbs
5 h
uman h
igh s
moo
th b
rick
wall
and razo
r w
ire
11.4
8.2
8.2
4.1
14.0
9.2
8.2
8.2
3.7
v68
rope c
limbs
3 h
uman h
igh s
teel l
arg
e m
esh
fence
0.1
0.1
0.1
0.1
4.1
0.9
0.1
0.1
1.8
v69
rope c
limbs
3 h
uman h
igh s
teel s
mall
mes
h fe
nce
0.1
4.1
0.1
0.1
4.1
1.7
0.1
0.1
2.2
v67
rope c
limbs
3 h
uman h
igh s
mooth
bric
k w
all
4.1
8.2
0.1
4.1
4.1
4.1
4.1
4.1
2.9
v72
rope c
limbs
5 h
uman h
igh s
teel m
esh fe
nce
4.1
4.1
4.1
4.1
8.2
4.9
4.1
4.1
1.8
v70
rope c
limbs
5 h
uman h
igh s
mooth
bric
k w
all
4.1
17.3
4.1
4.1
8.2
7.6
4.1
4.1
5.7
v71
rope c
limbs
5 h
uman h
igh s
mooth
bric
k w
all
and razo
r w
ire
8.2
4.1
4.1
4.1
8.2
5.7
4.1
4.1
2.2
v56
no a
id c
limbs
3 h
uman h
igh s
teel l
arg
e m
esh fe
nce
0.1
0.1
0.1
0.1
0.1
0.1
0.1
0.1
0.0
v57
no a
id c
limbs
3 h
uman h
igh s
teel s
mall
mes
h fe
nce
8.2
8.2
8.2
8.2
8.2
8.2
8.2
8.2
0.0
v60
no a
id c
limbs
5 h
uman h
igh s
teel m
esh fe
nce
8.2
8.2
8.2
8.2
8.2
8.2
8.2
8.2
0.0
v55
no a
id c
limbs
3 h
uman h
igh s
moo
th b
rick
wall
8.2
8.2
8.2
8.2
8.2
8.2
8.2
8.2
0.0
v58
no a
id c
limbs
5 h
uman h
igh s
moo
th b
rick
wall
17.3
17.3
17.3
17.3
17.3
17.3
17.3
17.3
0.0
v59
no a
id c
limbs
5 h
uman h
igh s
moo
th b
rick
wall
and razo
r w
ire
17.3
17.3
17.3
17.3
17.3
17.3
17.3
17.3
0.0
v93
luck
eva
des
infrare
d
0.1
0.1
0.1
0.1
0.1
0.1
0.1
0.1
0.0
v94
luck
eva
des
mic
row
ave
0.1
0.1
0.1
0.1
0.1
0.1
0.1
0.1
0.0
v96
luck
eva
des
multi
ple
sys
tem
s 0.1
0.1
0.1
0.1
0.1
0.1
0.1
0.1
0.0
v92
luck
eva
des
clo
sed c
ircuit
tv
4.1
4.1
4.1
4.1
4.1
4.1
4.1
4.1
0.0
v95
luck
eva
des
mobile
hum
an g
uard
8.2
8.2
8.2
8.2
8.2
8.2
8.2
8.2
0.0
v91
luck
eva
des
cha
nce d
ete
ctio
n
14.7
14.7
14.7
14.7
14.7
14.7
14.7
14.7
0.0
v84
crea
te fa
lse a
larm
s eva
des
multi
ple
sys
tem
s 0.1
0.1
0.1
4.1
4.1
1.7
0.1
0.1
2.2
v81
crea
te fa
lse a
larm
s eva
des
infrare
d
4.1
0.1
8.2
4.1
4.1
4.1
4.1
4.1
2.9
v82
crea
te fa
lse a
larm
s eva
des
mic
row
ave
4.1
0.1
8.2
4.1
4.1
4.1
4.1
4.1
2.9
v80
crea
te fa
lse a
larm
s eva
des
clos
ed c
ircui
t tv
11.4
11.4
11.4
13.3
8.2
11.1
11.4
11.4
1.8

v83
crea
te fa
lse a
larm
s eva
des
mobile
hum
an g
uard
11.4
11.4
13.3
8.2
11.4
11.1
11.4
11.4
1.8
v79
crea
te fa
lse a
larm
s eva
des
chanc
e d
ete
ctio
n
13.3
11.4
14.7
8.2
13.3
12.2
13.3
13.3
2.5
v102
smok
e e
vade
s m
ulti
ple
sys
tem
s 0.1
0.1
8.2
0.1
4.1
2.5
0.1
0.1
3.6
v100
smok
e e
vade
s m
icro
wav
e
0.1
0.1
4.1
0.1
4.1
1.7
0.1
0.1
2.2
v99
smok
e e
vade
s in
frare
d
0.1
0.1
0.1
4.1
4.1
1.7
0.1
0.1
2.2
v98
smok
e e
vade
s cl
osed
circ
uit
tv
8.2
17.3
11.4
8.2
9.8
11.0
9.8
8.2
3.8
v101
smok
e e
vade
s m
obile
hum
an g
uard
11.4
17.3
13.3
14.7
9.8
13.3
13.3
2.9
v97
smok
e e
vade
s ch
anc
e d
ete
ctio
n
13.3
17.3
14.7
13.3
9.8
13.7
13.3
13.3
2.7
v76
colo
ur ca
mou
flage e
vades
mic
row
ave
0.1
0.1
0.1
0.1
0.1
0.1
0.1
0.1
0.0
v75
colo
ur ca
mou
flage e
vades
infrare
d
0.1
0.1
0.1
0.1
4.1
0.9
0.1
0.1
1.8
v78
colo
ur ca
mou
flage e
vades
multi
ple
sys
tem
s 8.2
8.2
14.7
4.1
0.1
7.1
8.2
8.2
5.4
v74
colo
ur ca
mou
flage e
vades
clo
sed c
ircuit
tv
8.2
4.1
4.1
4.1
4.1
4.9
4.1
4.1
1.8
v77
colo
ur ca
mou
flage e
vades
mobile
hum
an g
uard
8.2
8.2
11.4
8.2
8.2
8.8
8.2
8.2
1.4
v73
colo
ur ca
mou
flage e
vades
chanc
e d
ete
ctio
n
11.4
8.2
14.7
13.3
11.4
11.8
11.4
11.4
2.4
v108
syst
em k
now
ledge e
vade
s m
ulti
ple
sys
tem
s 4.1
11.4
11.4
11.4
8.2
9.3
11.4
11.4
3.2
v106
syst
em k
now
ledge e
vade
s m
icro
wav
e
8.2
17.3
13.3
13.3
8.2
12.1
13.3
8.2
3.9
v105
syst
em k
now
ledge e
vade
s in
frare
d
11.4
17.3
8.2
13.3
8.2
11.7
11.4
8.2
3.8
v107
syst
em k
now
ledge e
vade
s m
obile
hum
an g
uard
17.3
4.1
14.7
17.3
13.3
13.3
14.7
17.3
5.4
v104
syst
em k
now
ledge e
vade
s cl
ose
d c
ircuit
tv
14.7
17.3
11.4
17.3
12.4
14.6
14.7
17.3
2.7
v103
syst
em k
now
ledge e
vade
s ch
anc
e d
ete
ctio
n
17.3
11.4
14.7
17.3
14.7
15.1
14.7
17.3
2.4
v90
know
ledge a
nd d
ivers
ion e
vade
s m
ulti
ple
sys
tem
s 8.2
11.4
8.2
13.3
11.4
10.5
11.4
8.2
2.2
v87
know
ledge a
nd d
ivers
ion e
vade
s in
frare
d
13.3
17.3
11.4
14.7
11.4
13.6
13.3
11.4
2.5
v88
know
ledge a
nd d
ivers
ion e
vade
s m
icro
wave
11.4
17.3
11.4
14.7
11.4
13.2
11.4
11.4
2.7
v86
know
ledge a
nd d
ivers
ion e
vade
s cl
osed
circ
uit
tv
17.3
17.3
13.3
17.3
13.3
15.7
17.3
17.3
2.2
v89
know
ledge a
nd d
ivers
ion e
vade
s m
obile
hum
an g
uard
17.3
11.4
14.7
17.3
14.7
15.1
14.7
17.3
2.4
v85
know
ledge a
nd d
ivers
ion e
vade
s ch
ance
dete
ctio
n
17.3
11.4
14.7
17.3
17.3
15.6
17.3
17.3
2.6
v140
viole
nt d
estruc
tion d
isable
s cl
ose
d c
ircuit
tv
4.1
0.1
0.1
4.1
9.8
3.6
4.1
4.1
4.0
v142
viole
nt d
estruc
tion d
isable
s m
icro
wav
e 4.1
0.1
0.1
4.1
4.1
2.5
4.1
4.1
2.2
v141
viole
nt d
estruc
tion d
isable
s in
frare
d
4.1
0.1
0.1
8.2
4.1
3.3
4.1
4.1
3.4
v143
viole
nt d
estruc
tion d
isable
s m
obile
hum
an g
uard
8.2
0.1
11.4
8.2
9.8
7.5
8.2
8.2
4.4
v144
viole
nt d
estruc
tion d
isable
s m
ulti
ple
sys
tem
s 11.4
0.1
4.1
8.2
4.1
5.6
4.1
4.1
4.3
v139
viole
nt d
estruc
tion d
isable
s ch
ance
dete
ctio
n
0.1
0.1
17.3
0.1
0.1
3.5
0.1
0.1
7.7
v134
syst
em k
now
ledge d
isable
s cl
osed
circ
uit
tv
0.1
4.1
0.1
4.1
11.4
3.9
4.1
0.1
4.6
v135
syst
em k
now
ledge d
isable
s in
frare
d
0.1
4.1
0.1
4.1
8.2
3.3
4.1
0.1
3.4
v136
syst
em k
now
ledge d
isable
s m
icro
wav
e 4.1
4.1
0.1
4.1
8.2
4.1
4.1
4.1
2.9
v138
syst
em k
now
ledge d
isable
s m
ulti
ple
sys
tem
s 8.2
8.2
0.1
8.2
4.1
5.8
8.2
8.2
3.6
v137
syst
em k
now
ledge d
isable
s m
obile
hum
an g
uard
4.1
17.3
17.3
4.1
11.4
10.8
11.4
4.1
6.6
v133
syst
em k
now
ledge d
isable
s ch
anc
e d
ete
ctio
n
0.1
17.3
17.3
0.1
4.1
7.8
4.1
0.1
8.9
v116
cut p
ow
er dis
able
s cl
osed
circ
uit
tv
4.1
8.2
0.1
4.1
6.2
4.5
4.1
4.1
3.0
v117
cut p
ow
er dis
able
s in
frare
d
8.2
0.1
0.1
4.1
6.2
3.7
4.1
0.1
3.6
v118
cut p
ow
er dis
able
s m
icro
wav
e
8.2
0.1
0.1
4.1
6.2
3.7
4.1
0.1
3.6
v120
cut p
ow
er dis
able
s m
ulti
ple
sys
tem
s 11.4
0.1
0.1
8.2
4.1
4.8
4.1
0.1
5.0
v115
cut p
ow
er dis
able
s ch
anc
e d
ete
ctio
n
0.1
17.3
17.3
17.3
0.1
10.4
17.3
17.3
9.4
v119
cut p
ow
er dis
able
s m
obile
hum
an g
uard
8.2
17.3
17.3
8.2
4.1
11.0
8.2
8.2
6.0
v122
ele
ctric
al i
nte
rfere
nce
dis
able
s cl
ose
d c
ircuit
tv
4.1
0.1
8.2
8.2
6.2
5.3
6.2
8.2
3.4

v123
ele
ctric
al i
nte
rfere
nce
dis
able
s in
frare
d 8.2
0.1
17.3
8.2
4.1
7.6
8.2
8.2
6.4
v124
ele
ctric
al i
nte
rfere
nce
dis
able
s m
icro
wav
e
8.2
0.1
4.1
13.3
4.1
6.0
4.1
4.1
5.0
v126
ele
ctric
al i
nte
rfere
nce
dis
able
s m
ulti
ple
sys
tem
s 11.4
0.1
11.4
8.2
4.1
7.0
8.2
11.4
4.9
v125
ele
ctric
al i
nte
rfere
nce
dis
able
s m
obile
hum
an g
uard
17.3
17.3
17.3
14.7
17.3
16.8
17.3
17.3
1.2
v121
ele
ctric
al i
nte
rfere
nce
dis
able
s ch
ance
dete
ctio
n
17.3
17.3
17.3
14.7
17.3
16.8
17.3
17.3
1.2
v131
phys
ical i
ntim
idatio
n d
isable
s m
obile
hum
an g
uard
13.3
4.1
0.1
8.2
8.2
6.8
8.2
8.2
5.0
v127
phys
ical i
ntim
idatio
n d
isable
s ch
ance
dete
ctio
n
17.3
0.1
17.3
8.2
4.1
9.4
8.2
17.3
7.8
v128
phys
ical i
ntim
idatio
n d
isable
s cl
osed
circ
uit
tv
17.3
17.3
17.3
4.1
11.4
13.5
17.3
17.3
5.8
v129
phys
ical i
ntim
idatio
n d
isable
s in
frare
d
17.3
17.3
17.3
4.1
17.3
14.7
17.3
17.3
5.9
v130
phys
ical i
ntim
idatio
n d
isable
s m
icro
wav
e
17.3
17.3
17.3
13.3
17.3
16.5
17.3
17.3
1.8
v132
phys
ical i
ntim
idatio
n d
isable
s m
ulti
ple
sys
tem
s 17.3
17.3
17.3
8.2
17.3
15.5
17.3
17.3
4.1
v109
acc
iden
tal d
isab
les
chanc
e d
ete
ctio
n
8.2
8.2
8.2
8.2
8.2
8.2
8.2
8.2
0.0
v113
acc
iden
tal d
isab
les
mobile
hum
an g
uard
11.4
11.4
11.4
11.4
11.4
11.4
11.4
11.4
0.0
v110
acc
iden
tal d
isab
les
close
d c
ircuit
tv
13.3
13.3
13.3
13.3
13.3
13.3
13.3
13.3
0.0
v114
acc
iden
tal d
isab
les
multi
ple
sys
tem
s 11.4
11.4
11.4
17.3
17.3
13.8
11.4
11.4
3.2
v111
acc
iden
tal d
isab
les
infrare
d
17.3
17.3
17.3
17.3
17.3
17.3
17.3
17.3
0.0
v112
acc
iden
tal d
isab
les
mic
row
ave
17.3
17.3
17.3
17.3
17.3
17.3
17.3
17.3
0.0
v152
hum
an li
fe in
itial r
esp
ons
e b
y ge
nera
l public
13.3
4.1
4.1
8.2
0.1
6.0
4.1
4.1
5.0
v155
hum
an li
fe in
itial r
esp
ons
e b
y po
lice
17.3
4.1
4.1
4.1
4.1
6.7
4.1
4.1
5.9
v156
hum
an li
fe in
itial r
esp
ons
e b
y se
curit
y patrol
17.3
4.1
4.1
8.2
4.1
7.6
4.1
4.1
5.7
v151
hum
an li
fe in
itial r
esp
ons
e b
y arm
ed
17.3
4.1
4.1
8.2
6.2
8.0
6.2
4.1
5.5
v153
hum
an li
fe in
itial r
esp
ons
e b
y hig
h te
ch
17.3
0.1
4.1
11.4
4.1
7.4
4.1
4.1
6.9
v154
hum
an li
fe in
itial r
esp
ons
e b
y in
sura
nce
17.3
13.3
4.1
11.4
11.4
11.5
11.4
11.4
4.8
v162
larg
e c
ash
initi
al r
esp
ons
e b
y se
curit
y patrol
14.7
4.1
8.2
8.2
4.1
7.9
8.2
4.1
4.3
v159
larg
e c
ash
initi
al r
esp
ons
e b
y hig
h te
ch
17.3
0.1
8.2
13.3
0.1
7.8
8.2
0.1
7.7
v161
larg
e c
ash
initi
al r
esp
ons
e b
y po
lice
14.7
4.1
4.1
8.2
4.1
7.0
4.1
4.1
4.6
v157
larg
e c
ash
initi
al r
esp
ons
e b
y arm
ed
17.3
0.1
4.1
8.2
4.1
6.8
4.1
4.1
6.6
v158
larg
e c
ash
initi
al r
esp
ons
e b
y ge
nera
l public
8.2
17.3
4.1
0.1
4.1
6.8
4.1
4.1
6.6
v160
larg
e c
ash
initi
al r
esp
ons
e b
y in
sura
nce
14.7
13.3
4.1
11.4
8.2
10.3
11.4
4.3
v147
corp
ora
te d
ata
initi
al r
esp
ons
e b
y hig
h te
ch
17.3
0.1
11.4
14.7
4.1
9.5
11.4
7.2
v149
corp
ora
te d
ata
initi
al r
esp
ons
e b
y polic
e
13.3
8.2
4.1
11.4
9.8
9.4
9.8
3.5
v150
corp
ora
te d
ata
initi
al r
esp
ons
e b
y se
curit
y patrol
14.7
9.8
8.2
13.3
11.4
11.5
11.4
2.6
v146
corp
ora
te d
ata
initi
al r
esp
ons
e b
y gene
ral p
ublic
4.1
17.3
0.1
8.2
13.3
8.6
8.2
6.9
v148
corp
ora
te d
ata
initi
al r
esp
ons
e b
y in
sura
nce
13.3
13.3
8.2
11.4
11.4
11.5
11.4
13.3
2.1
v145
corp
ora
te d
ata
initi
al r
esp
ons
e b
y arm
ed
17.3
17.3
11.4
14.7
13.3
14.8
14.7
17.3
2.6
v176
small
cash
initi
al r
esp
onse
by
gen
era
l public
8.2
4.1
8.2
4.1
11.4
7.2
8.2
8.2
3.1
v180
small
cash
initi
al r
esp
onse
by
secu
rity
patrol
13.3
8.2
11.4
8.2
8.2
9.9
8.2
8.2
2.4
v179
small
cash
initi
al r
esp
onse
by
polic
e
14.7
8.2
13.3
11.4
11.4
11.8
11.4
11.4
2.4
v177
small
cash
initi
al r
esp
onse
by
hig
h te
ch
14.7
0.1
14.7
17.3
17.3
12.8
14.7
14.7
7.2
v178
small
cash
initi
al r
esp
onse
by
insu
ranc
e
0.1
13.3
11.4
13.3
13.3
10.3
13.3
13.3
5.8
v175
small
cash
initi
al r
esp
onse
by
arm
ed
14.7
17.3
14.7
14.7
17.3
15.7
14.7
14.7
1.4
v170
pers
onal v
alu
able
s in
itial r
esp
onse
by
gene
ral p
ublic
4.1
4.1
4.1
0.1
8.2
4.1
4.1
4.1
2.9
v174
pers
onal v
alu
able
s in
itial r
esp
onse
by
secu
rity
patrol
13.3
8.2
8.2
8.2
8.2
9.2
8.2
8.2
2.3
v173
pers
onal v
alu
able
s in
itial r
esp
onse
by
polic
e
8.2
8.2
4.1
8.2
8.2
7.4
8.2
8.2
1.8
v171
pers
onal v
alu
able
s in
itial r
esp
onse
by
high te
ch
14.7
0.1
13.3
17.3
4.1
9.9
13.3
7.4

v172
pers
onal v
alu
able
s in
itial r
esp
onse
by
insu
rance
8.2
13.3
8.2
13.3
13.3
11.3
13.3
13.3
2.8
v169
pers
onal v
alu
able
s in
itial r
esp
onse
by
arm
ed
14.7
17.3
13.3
17.3
17.3
16.0
17.3
17.3
1.9
v164
low
valu
e g
ood
s in
itial r
esp
onse
by
gen
era
l public
4.1
4.1
4.1
4.1
4.1
4.1
4.1
4.1
0.0
v168
low
valu
e g
ood
s in
itial r
esp
onse
by
secu
rity
patrol
11.4
11.4
11.4
11.4
11.4
11.4
11.4
11.4
0.0
v167
low
valu
e g
ood
s in
itial r
esp
onse
by
polic
e
13.3
13.3
13.3
13.3
13.3
13.3
13.3
13.3
0.0
v166
low
valu
e g
ood
s in
itial r
esp
onse
by
insu
ranc
e
13.3
13.3
13.3
13.3
13.3
13.3
13.3
13.3
0.0
v165
low
valu
e g
ood
s in
itial r
esp
onse
by
hig
h te
ch
17.3
17.3
17.3
17.3
17.3
17.3
17.3
17.3
0.0
v163
low
valu
e g
ood
s in
itial r
esp
onse
by
arm
ed
17.3
17.3
17.3
17.3
17.3
17.3
17.3
17.3
0.0
v211
small
cash
pre
-atta
ck c
onsi
dera
tion a
ccid
enta
l 0.1
0.1
0.1
0.1
8.2
1.7
0.1
0.1
3.6
v216
small
cash
pre
-atta
ck c
onsi
dera
tion v
ery
low
motiv
atio
n
0.1
0.1
0.1
4.1
8.2
2.5
0.1
0.1
3.6
v214
small
cash
pre
-atta
ck c
onsi
dera
tion lo
w m
otiv
atio
n
4.1
4.1
4.1
8.2
11.4
6.4
4.1
4.1
3.3
v215
small
cash
pre
-atta
ck c
onsi
dera
tion m
odera
te m
otiv
atio
n
4.1
4.1
4.1
8.2
11.4
6.4
4.1
4.1
3.3
v213
small
cash
pre
-atta
ck c
onsi
dera
tion h
igh m
otiv
atio
n
8.2
8.2
11.4
13.3
13.3
10.9
11.4
8.2
2.6
v212
small
cash
pre
-atta
ck c
onsi
dera
tion e
xtre
me m
otiv
atio
n
11.4
8.2
11.4
14.7
13.3
11.8
11.4
11.4
2.4
v199
low
valu
e g
ood
s pre
-atta
ck c
onsi
dera
tion a
ccid
enta
l 0.1
0.1
0.1
0.1
0.1
0.1
0.1
0.1
0.0
v204
low
valu
e g
ood
s pre
-atta
ck c
onsi
dera
tion v
ery
low
motiv
atio
n
4.1
4.1
4.1
4.1
4.1
4.1
4.1
4.1
0.0
v202
low
valu
e g
ood
s pre
-atta
ck c
onsi
dera
tion lo
w m
otiv
atio
n
8.2
8.2
8.2
8.2
8.2
8.2
8.2
8.2
0.0
v203
low
valu
e g
ood
s pre
-atta
ck c
onsi
dera
tion m
ode
rate
motiv
atio
n
8.2
8.2
8.2
8.2
8.2
8.2
8.2
8.2
0.0
v200
low
valu
e g
ood
s pre
-atta
ck c
onsi
dera
tion e
xtre
me m
otiv
atio
n
11.4
11.4
11.4
11.4
11.4
11.4
11.4
11.4
0.0
v201
low
valu
e g
ood
s pre
-atta
ck c
onsi
dera
tion h
igh m
otiv
atio
n
11.4
11.4
11.4
11.4
11.4
11.4
11.4
11.4
0.0
v205
pers
onal v
alu
able
s pre
-atta
ck c
onsi
dera
tion a
ccid
enta
l 0.1
0.1
0.1
0.1
8.2
1.7
0.1
0.1
3.6
v210
pers
onal v
alu
able
s pre
-atta
ck c
onsi
dera
tion v
ery
low
motiv
atio
n
4.1
0.1
4.1
4.1
11.4
4.8
4.1
4.1
4.1
v208
pers
onal v
alu
able
s pre
-atta
ck c
onsi
dera
tion lo
w m
otiv
atio
n
4.1
4.1
4.1
8.2
11.4
6.4
4.1
4.1
3.3
v209
pers
onal v
alu
able
s pre
-atta
ck c
onsi
dera
tion m
odera
te m
otiv
atio
n
8.2
4.1
11.4
8.2
13.3
9.0
8.2
8.2
3.5
v207
pers
onal v
alu
able
s pre
-atta
ck c
onsi
dera
tion h
igh m
otiv
atio
n
8.2
8.2
13.3
13.3
13.3
11.3
13.3
13.3
2.8
v206
pers
onal v
alu
able
s pre
-atta
ck c
onsi
dera
tion e
xtre
me m
otiv
atio
n
8.2
8.2
13.3
14.7
13.3
11.5
13.3
8.2
3.1
v181
corp
ora
te d
ata
pre
-atta
ck c
onsi
dera
tion
acc
iden
tal
8.2
8.2
0.1
8.2
11.4
7.2
8.2
8.2
4.2
v184
corp
ora
te d
ata
pre
-atta
ck c
onsi
dera
tion
low
motiv
atio
n
8.2
8.2
8.2
8.2
13.3
9.2
8.2
8.2
2.3
v186
corp
ora
te d
ata
pre
-atta
ck c
onsi
dera
tion
very
low
motiv
atio
n
14.7
14.7
4.1
11.4
11.4
11.3
11.4
14.7
4.3
v185
corp
ora
te d
ata
pre
-atta
ck c
onsi
dera
tion
mode
rate
motiv
atio
n
11.4
11.4
11.4
11.4
14.7
12.1
11.4
11.4
1.5
v183
corp
ora
te d
ata
pre
-atta
ck c
onsi
dera
tion
hig
h m
otiv
atio
n
11.4
13.3
13.3
13.3
14.7
13.2
13.3
13.3
1.2
v182
corp
ora
te d
ata
pre
-atta
ck c
onsi
dera
tion
ext
rem
e m
otiv
atio
n
13.3
13.3
13.3
14.7
14.7
13.9
13.3
13.3
0.8
v193
larg
e c
ash
pre
-atta
ck c
onsi
dera
tion a
ccid
enta
l 8.2
8.2
0.1
11.4
13.3
8.2
8.2
8.2
5.1
v198
larg
e c
ash
pre
-atta
ck c
onsi
dera
tion v
ery
low
motiv
atio
n
8.2
8.2
8.2
13.3
14.7
10.5
8.2
8.2
3.2
v196
larg
e c
ash
pre
-atta
ck c
onsi
dera
tion lo
w m
otiv
atio
n
8.2
8.2
11.4
13.3
14.7
11.2
11.4
8.2
2.9
v197
larg
e c
ash
pre
-atta
ck c
onsi
dera
tion m
odera
te m
otiv
atio
n
8.2
11.4
11.4
13.3
17.3
12.3
11.4
11.4
3.3
v195
larg
e c
ash
pre
-atta
ck c
onsi
dera
tion h
igh m
otiv
atio
n
11.4
11.4
14.7
14.7
17.3
13.9
14.7
11.4
2.5
v194
larg
e c
ash
pre
-atta
ck c
onsi
dera
tion e
xtre
me m
otiv
atio
n
11.4
13.3
14.7
17.3
17.3
14.8
14.7
17.3
2.6
v192
hum
an li
fe p
re-a
ttack
con
sidera
tion v
ery
low
motiv
atio
n
13.3
11.4
11.4
8.2
14.7
11.8
11.4
11.4
2.4
v187
hum
an li
fe p
re-a
ttack
con
sidera
tion a
ccid
enta
l 11.4
11.4
0.1
14.7
13.3
10.2
11.4
11.4
5.8
v190
hum
an li
fe p
re-a
ttack
con
sidera
tion lo
w m
otiv
atio
n
13.3
11.4
11.4
11.4
17.3
13.0
11.4
11.4
2.6
v191
hum
an li
fe p
re-a
ttack
con
sidera
tion m
odera
te m
otiv
atio
n
14.7
13.3
13.3
13.3
17.3
14.4
13.3
13.3
1.7
v189
hum
an li
fe p
re-a
ttack
con
sidera
tion h
igh m
otiv
atio
n
14.7
14.7
14.7
17.3
17.3
15.7
14.7
14.7
1.4
v188
hum
an li
fe p
re-a
ttack
con
sidera
tion e
xtre
me m
otiv
atio
n
17.3
14.7
14.7
17.3
17.3
16.3
17.3
17.3
1.4
v218
cut p
ow
er atta
ck p
re-m
edita
tion e
xtre
me m
otiv
atio
n
4.1
4.1
4.1
4.1
4.1
4.1
4.1
0.0

v219
cut p
ow
er atta
ck p
re-m
edita
tion h
igh m
otiv
atio
n
4.1
4.1
4.1
4.1
4.1
4.1
4.1
0.0
v221
cut p
ow
er atta
ck p
re-m
edita
tion m
ode
rate
motiv
atio
n
4.1
4.1
4.1
4.1
4.1
4.1
4.1
0.0
v222
cut p
ow
er atta
ck p
re-m
edita
tion v
ery
low
motiv
atio
n
4.1
4.1
8.2
8.2
6.2
6.2
4.1
2.4
v220
cut p
ow
er atta
ck p
re-m
edita
tion lo
w m
otiv
atio
n
8.2
8.2
8.2
8.2
8.2
8.2
8.2
0.0
v217
cut p
ow
er atta
ck p
re-m
edita
tion a
ccid
enta
l 8.2
8.2
8.2
8.2
8.2
8.2
8.2
0.0
v236
phys
ical i
ntim
idatio
n a
ttack
pre
-med
itatio
n e
xtre
me m
otiv
atio
n
4.1
8.2
0.1
11.4
5.9
6.2
4.9
v237
phys
ical i
ntim
idatio
n a
ttack
pre
-med
itatio
n h
igh m
otiv
atio
n
4.1
11.4
0.1
11.4
6.7
7.8
11.4
5.6
v239
phys
ical i
ntim
idatio
n a
ttack
pre
-med
itatio
n m
ode
rate
motiv
atio
n
8.2
13.3
4.1
11.4
9.3
9.8
4.0
v238
phys
ical i
ntim
idatio
n a
ttack
pre
-med
itatio
n lo
w m
otiv
atio
n
8.2
13.3
8.2
13.3
10.8
10.8
8.2
2.9
v240
phys
ical i
ntim
idatio
n a
ttack
pre
-med
itatio
n v
ery
low
motiv
atio
n
11.4
14.7
11.4
14.7
13.1
13.1
11.4
1.9
v235
phys
ical i
ntim
idatio
n a
ttack
pre
-med
itatio
n a
ccid
enta
l 13.3
17.3
11.4
14.7
14.2
14.0
2.5
v224
ele
ctric
tools
atta
ck p
re-m
edita
tion e
xtre
me m
otiv
atio
n
4.1
13.3
11.4
11.4
10.1
11.4
11.4
4.1
v225
ele
ctric
tools
atta
ck p
re-m
edita
tion h
igh
motiv
atio
n
4.1
13.3
11.4
11.4
10.1
11.4
11.4
4.1
v227
ele
ctric
tools
atta
ck p
re-m
edita
tion m
ode
rate
motiv
atio
n
8.2
11.4
4.1
11.4
8.8
9.8
11.4
3.5
v226
ele
ctric
tools
atta
ck p
re-m
edita
tion lo
w m
otiv
atio
n
11.4
8.2
11.4
13.3
11.1
11.4
11.4
2.1
v228
ele
ctric
tools
atta
ck p
re-m
edita
tion v
ery
low
motiv
atio
n
11.4
8.2
14.7
13.3
11.9
12.4
2.8
v223
ele
ctric
tools
atta
ck p
re-m
edita
tion a
ccid
enta
l 13.3
11.4
17.3
13.3
13.8
13.3
13.3
2.5
v248
viole
nt d
estruc
tion a
ttack
pre
-med
itatio
n e
xtre
me m
otiv
atio
n
4.1
11.4
8.2
8.2
8.0
8.2
8.2
3.0
v249
viole
nt d
estruc
tion a
ttack
pre
-med
itatio
n h
igh m
otiv
atio
n
4.1
11.4
8.2
11.4
8.8
9.8
11.4
3.5
v251
viole
nt d
estruc
tion a
ttack
pre
-med
itatio
n m
odera
te m
otiv
atio
n
8.2
13.3
13.3
11.4
11.6
12.4
13.3
2.4
v250
viole
nt d
estruc
tion a
ttack
pre
-med
itatio
n lo
w m
otiv
atio
n
8.2
14.7
14.7
11.4
12.3
13.1
14.7
3.1
v252
viole
nt d
estruc
tion a
ttack
pre
-med
itatio
n v
ery
low
motiv
atio
n
11.4
17.3
11.4
13.3
13.4
12.4
11.4
2.8
v247
viole
nt d
estruc
tion a
ttack
pre
-med
itatio
n a
ccid
enta
l 13.3
11.4
13.3
13.3
12.8
13.3
13.3
1.0
v230
exp
losi
ve a
ttac
k pre
-med
itatio
n e
xtre
me m
otiv
atio
n
0.1
11.4
4.1
13.3
7.2
7.8
6.2
v231
exp
losi
ve a
ttac
k pre
-med
itatio
n h
igh m
otiv
atio
n
0.1
11.4
8.2
13.3
8.2
9.8
5.8
v233
exp
losi
ve a
ttac
k pre
-med
itatio
n m
ode
rate
motiv
atio
n
4.1
13.3
13.3
14.7
11.4
13.3
13.3
4.9
v232
exp
losi
ve a
ttac
k pre
-med
itatio
n lo
w m
otiv
atio
n
4.1
14.7
14.7
14.7
12.1
14.7
14.7
5.3
v234
exp
losi
ve a
ttac
k pre
-med
itatio
n v
ery
low
motiv
atio
n
8.2
17.3
17.3
17.3
15.0
17.3
17.3
4.6
v229
exp
losi
ve a
ttac
k pre
-med
itatio
n a
ccid
enta
l 11.4
13.3
17.3
17.3
14.8
15.3
17.3
3.0
v242
tech
nolo
gic
al a
ttack
atta
ck p
re-m
edita
tion e
xtre
me m
otiv
atio
n
8.2
13.3
0.1
13.3
8.7
10.8
13.3
6.2
v243
tech
nolo
gic
al a
ttack
atta
ck p
re-m
edita
tion h
igh m
otiv
atio
n
8.2
13.3
4.1
13.3
9.7
10.8
13.3
4.5
v245
tech
nolo
gic
al a
ttack
atta
ck p
re-m
edita
tion m
ode
rate
motiv
atio
n
11.4
11.4
11.4
13.3
11.9
11.4
11.4
0.9
v246
tech
nolo
gic
al a
ttack
atta
ck p
re-m
edita
tion v
ery
low
motiv
atio
n
14.7
8.2
13.3
14.7
12.7
14.0
14.7
3.1
v244
tech
nolo
gic
al a
ttack
atta
ck p
re-m
edita
tion lo
w m
otiv
atio
n
13.3
8.2
11.4
13.3
11.6
12.4
13.3
2.4
v241
tech
nolo
gic
al a
ttack
atta
ck p
re-m
edita
tion a
ccid
enta
l 17.3
8.2
17.3
17.3
15.0
17.3
17.3
4.6
v273
low
valu
e g
ood
s pre
-atta
ck c
onsi
dera
tion e
xplo
sive
0.1
0.1
0.1
0.1
0.1
0.1
0.1
0.0
v275
low
valu
e g
ood
s pre
-atta
ck c
onsi
dera
tion te
chno
logic
al a
ttack
0.1
0.1
0.1
0.1
0.1
0.1
0.1
0.0
v274
low
valu
e g
ood
s pre
-atta
ck c
onsi
dera
tion p
hys
ical i
ntim
idatio
n
8.2
8.2
8.2
8.2
8.2
8.2
8.2
0.0
v276
low
valu
e g
ood
s pre
-atta
ck c
onsi
dera
tion v
iole
nt d
estruc
tion
8.2
8.2
8.2
8.2
8.2
8.2
8.2
0.0
v271
low
valu
e g
ood
s pre
-atta
ck c
onsi
dera
tion c
ut p
ow
er
13.3
13.3
13.3
13.3
13.3
13.3
13.3
0.0
v272
low
valu
e g
ood
s pre
-atta
ck c
onsi
dera
tion e
lect
ric to
ols
13.3
13.3
13.3
13.3
13.3
13.3
13.3
0.0
v285
small
cash
pre
-atta
ck c
onsi
dera
tion e
xplo
sive
0.1
14.7
8.2
4.1
6.8
6.2
6.2
v287
small
cash
pre
-atta
ck c
onsi
dera
tion te
chno
logic
al a
ttack
8.2
11.4
13.3
8.2
10.3
9.8
8.2
2.5
v288
small
cash
pre
-atta
ck c
onsi
dera
tion v
iole
nt d
estruct
ion
4.1
14.7
8.2
11.4
9.6
9.8
4.5
v286
small
cash
pre
-atta
ck c
onsi
dera
tion p
hysi
cal i
ntim
idatio
n
4.1
13.3
8.2
11.4
9.3
9.8
4.0

v284
small
cash
pre
-atta
ck c
onsi
dera
tion e
lect
ric to
ols
4.1
11.4
8.2
11.4
8.8
9.8
11.4
3.5
v283
small
cash
pre
-atta
ck c
onsi
dera
tion c
ut p
ow
er
8.2
8.2
8.2
11.4
9.0
8.2
8.2
1.6
v279
pers
onal v
alu
able
s pre
-atta
ck c
onsi
dera
tion e
xplo
sive
0.1
17.3
4.1
4.1
6.4
4.1
4.1
7.5
v281
pers
onal v
alu
able
s pre
-atta
ck c
onsi
dera
tion te
chnolo
gic
al a
ttack
8.2
13.3
8.2
4.1
8.5
8.2
8.2
3.8
v282
pers
onal v
alu
able
s pre
-atta
ck c
onsi
dera
tion v
iole
nt d
est
ruct
ion
4.1
14.7
14.7
8.2
10.4
11.5
14.7
5.2
v278
pers
onal v
alu
able
s pre
-atta
ck c
onsi
dera
tion e
lect
ric to
ols
4.1
13.3
8.2
8.2
8.5
8.2
8.2
3.8
v280
pers
onal v
alu
able
s pre
-atta
ck c
onsi
dera
tion p
hys
ical i
ntim
idatio
n
4.1
14.7
14.7
8.2
10.4
11.5
14.7
5.2
v277
pers
onal v
alu
able
s pre
-atta
ck c
onsi
dera
tion c
ut p
ow
er
8.2
11.4
8.2
8.2
9.0
8.2
8.2
1.6
v255
corp
ora
te d
ata
pre
-atta
ck c
onsi
dera
tion
exp
losi
ve
0.1
17.3
8.2
8.2
8.4
8.2
8.2
7.0
v256
corp
ora
te d
ata
pre
-atta
ck c
onsi
dera
tion
phys
ical i
ntim
idatio
n
11.4
14.7
11.4
11.4
12.2
11.4
11.4
1.7
v254
corp
ora
te d
ata
pre
-atta
ck c
onsi
dera
tion
ele
ctric
tools
8.2
13.3
11.4
11.4
11.1
11.4
11.4
2.1
v258
corp
ora
te d
ata
pre
-atta
ck c
onsi
dera
tion
viole
nt d
estruc
tion
8.2
14.7
14.7
11.4
13.3
12.5
13.3
14.7
2.7
v253
corp
ora
te d
ata
pre
-atta
ck c
onsi
dera
tion
cut p
ow
er
0.1
11.4
11.4
4.1
6.7
7.8
11.4
5.6
v257
corp
ora
te d
ata
pre
-atta
ck c
onsi
dera
tion
tech
nolo
gic
al a
ttack
13.3
13.3
13.3
14.7
13.7
13.3
13.3
0.7
v267
larg
e c
ash
pre
-atta
ck c
onsi
dera
tion e
xplo
sive
8.2
17.3
17.3
14.7
14.4
16.0
17.3
4.3
v270
larg
e c
ash
pre
-atta
ck c
onsi
dera
tion v
iole
nt d
estruct
ion
4.1
14.7
14.7
17.3
12.7
14.7
14.7
5.9
v268
larg
e c
ash
pre
-atta
ck c
onsi
dera
tion p
hys
ical i
ntim
idatio
n
8.2
14.7
4.1
17.3
11.1
11.5
6.0
v266
larg
e c
ash
pre
-atta
ck c
onsi
dera
tion e
lect
ric to
ols
4.1
14.7
4.1
17.3
10.1
9.4
4.1
7.0
v265
larg
e c
ash
pre
-atta
ck c
onsi
dera
tion c
ut p
ow
er
11.4
13.3
13.3
13.3
12.8
13.3
13.3
1.0
v269
larg
e c
ash
pre
-atta
ck c
onsi
dera
tion te
chno
logic
al a
ttack
11.4
13.3
13.3
17.3
13.8
13.3
13.3
2.5
v263
hum
an li
fe p
re-a
ttack
con
sidera
tion te
chno
logic
al a
ttack
4.1
13.3
13.3
11.4
10.5
12.4
13.3
4.4
v259
hum
an li
fe p
re-a
ttack
con
sidera
tion c
ut p
ow
er
13.3
13.3
14.7
13.3
13.7
13.3
13.3
0.7
v260
hum
an li
fe p
re-a
ttack
con
sidera
tion e
lect
ric to
ols
11.4
14.7
14.7
13.3
13.5
14.0
14.7
1.6
v262
hum
an li
fe p
re-a
ttack
con
sidera
tion p
hys
ical i
ntim
idatio
n
13.3
14.7
8.2
14.7
12.7
14.0
14.7
3.1
v261
hum
an li
fe p
re-a
ttack
con
sidera
tion e
xplo
sive
11.4
17.3
8.2
14.7
12.9
13.1
4.0
v264
hum
an li
fe p
re-a
ttack
con
sidera
tion v
iole
nt d
estruct
ion
11.4
17.3
8.2
17.3
13.6
14.4
17.3
4.5

E2:
Tab
le s
how
ing
raw
dat
a pr
ofile
for
eac
h re
spon
dent
for ea
ch o
f the
cat
egor
y gr
oups
of t
he res
earc
h
C
ateg
ory
grou
p - Sec
urity
Stu
dent
s (#
2)
2 2
2 2
2 2
2 2
2 2
2 2
2 2
Var
Label
3
7 8
10
11
12
13
14
15
16
17
20
25
23
MEAN
MED
IAN
MO
DE
ST D
EV
V16
exp
losi
ve b
reak
s gla
ss
0.1
0.1
0.1
0.1
0.1
0.1
0.1
0.1
0.1
0.1
0.1
0.1
0.1
0.1
0.1
0.1
0.1
0.0
V18
exp
losi
ve b
reak
s w
ood
0.1
0.1
0.1
0.1
0.1
0.1
0.1
0.1
0.1
0.1
0.1
0.1
0.1
0.1
0.1
0.1
0.1
0.0
V13
exp
losi
ve b
reak
s bric
k 0.1
0.1
0.1
0.1
0.1
0.1
0.1
0.1
0.1
0.1
0.1
0.1
0.1
0.1
0.1
0.1
0.1
0.0
V15
exp
losi
ve b
reak
s earth
0.1
0.1
0.1
0.1
0.1
0.1
0.1
0.1
0.1
0.1
0.1
0.1
0.1
0.1
0.1
0.1
0.1
0.0
V14
exp
losi
ve b
reak
s co
ncre
te
0.1
0.1
0.1
0.1
0.1
0.1
0.1
0.1
0.1
0.1
4.1
0.1
0.1
0.1
0.4
0.1
0.1
1.1
V17
exp
losi
ve b
reak
s st
eel
0.1
0.1
0.1
0.1
0.1
0.1
0.1
0.1
0.1
0.1
4.1
0.1
4.1
0.1
0.6
0.1
0.1
1.5
V9
ele
ctric
drill
bre
aks
earth
0.1
0.1
0.1
0.1
0.1
0.1
0.1
0.1
0.1
0.1
0.1
0.1
0.1
0.1
0.1
0.1
0.1
0.0
V10
ele
ctric
drill
bre
aks
gla
ss
0.1
0.1
0.1
0.1
0.1
0.1
0.1
0.1
4.1
0.1
4.1
0.1
0.1
0.1
0.6
0.1
0.1
1.5
V12
ele
ctric
drill
bre
aks
wood
0.1
0.1
0.1
0.1
0.1
0.1
0.1
0.1
0.1
0.1
8.2
0.1
4.1
0.1
0.9
0.1
0.1
2.4
V7
ele
ctric
drill
bre
aks
bric
k 0.1
4.1
4.1
4.1
0.1
0.1
0.1
4.1
4.1
0.1
13.3
4.1
8.2
4.1
3.6
4.1
4.1
3.7
V8
ele
ctric
drill
bre
aks
con
crete
4.1
8.2
4.1
4.1
4.1
4.1
0.1
4.1
4.1
4.1
14.7
4.1
8.2
4.1
5.2
4.1
4.1
3.4
V11
ele
ctric
drill
bre
aks
ste
el
4.1
4.1
8.2
8.2
4.1
8.2
0.1
8.2
4.1
11.4
14.7
4.1
8.2
4.1
6.6
6.2
4.1
3.7
V28
oxy
cutti
ng b
reak
s gla
ss
4.1
4.1
4.1
4.1
0.1
0.1
0.1
0.1
4.1
0.1
0.1
0.1
0.1
4.1
1.8
0.1
0.1
2.1
V30
oxy
cutti
ng b
reak
s w
ood
8.2
0.1
8.2
0.1
0.1
0.1
0.1
4.1
4.1
0.1
0.1
0.1
4.1
8.2
2.7
0.1
0.1
3.4
V29
oxy
cutti
ng b
reak
s st
eel
8.2
0.1
8.2
0.1
0.1
0.1
0.1
4.1
0.1
0.1
4.1
4.1
4.1
4.1
2.7
2.1
0.1
3.0
V27
oxy
cutti
ng b
reak
s ea
rth
4.1
13.3
4.1
8.2
0.1
0.1
0.1
0.1
13.3
17.3
0.1
0.1
4.1
4.1
4.9
4.1
0.1
5.9
V25
oxy
cutti
ng b
reak
s bric
k 13.3
8.2
11.4
14.7
0.1
0.1
4.1
8.2
4.1
17.3
8.2
4.1
8.2
11.4
8.1
8.2
8.2
5.2
V26
oxy
cutti
ng b
reak
s co
ncr
ete
17.3
11.4
13.3
14.7
0.1
0.1
0.1
8.2
8.2
17.3
8.2
8.2
8.2
11.4
9.0
8.2
8.2
5.8
V4
axe
bre
aks
gla
ss
0.1
0.1
0.1
0.1
0.1
0.1
0.1
0.1
0.1
0.1
0.1
0.1
0.1
0.1
0.1
0.1
0.1
0.0
V3
axe
bre
aks
earth
0.1
0.1
0.1
0.1
4.1
0.1
0.1
0.1
0.1
0.1
0.1
0.1
4.1
0.1
0.6
0.1
0.1
1.5
V1
axe
bre
aks
bric
k 4.1
8.2
8.2
8.2
8.2
4.1
0.1
4.1
4.1
0.1
4.1
4.1
8.2
0.1
4.7
4.1
4.1
3.1
V6
axe
bre
aks
wood
14.7
8.2
8.2
14.7
8.2
0.1
0.1
4.1
0.1
4.1
4.1
0.1
0.1
0.1
4.8
4.1
0.1
5.3
V2
axe
bre
aks
conc
rete
8.2
11.4
8.2
11.4
13.3
4.1
0.1
8.2
8.2
4.1
8.2
8.2
11.4
4.1
7.8
8.2
8.2
3.6
V5
axe
bre
aks
steel
13.3
8.2
13.3
14.7
17.3
8.2
4.1
13.3
17.3
14.7
11.4
8.2
14.7
14.7
12.4
13.3
14.7
3.9
V22
ham
mer bre
aks
gla
ss
0.1
0.1
0.1
0.1
0.1
0.1
0.1
0.1
0.1
0.1
0.1
0.1
0.1
0.1
0.1
0.1
0.1
0.0
V21
ham
mer bre
aks
earth
0.1
4.1
0.1
0.1
4.1
0.1
0.1
0.1
0.1
0.1
0.1
0.1
4.1
0.1
0.9
0.1
0.1
1.7
V24
ham
mer bre
aks
wood
8.2
4.1
8.2
4.1
4.1
4.1
0.1
4.1
4.1
4.1
4.1
4.1
8.2
4.1
4.7
4.1
4.1
2.2
V19
ham
mer bre
aks
bric
k 4.1
0.1
4.1
8.2
4.1
4.1
4.1
4.1
4.1
0.1
8.2
4.1
11.4
4.1
4.6
4.1
4.1
3.0
V20
ham
mer bre
aks
concr
ete
8.2
8.2
4.1
11.4
13.3
8.2
4.1
8.2
8.2
4.1
11.4
8.2
14.7
8.2
8.6
8.2
8.2
3.2
V23
ham
mer bre
aks
steel
17.3
11.4
14.7
17.3
17.3
11.4
4.1
14.7
17.3
14.7
13.3
8.2
17.3
14.7
13.8
14.7
17.3
3.9
V34
rock
bre
aks
gla
ss
0.1
0.1
0.1
0.1
0.1
0.1
0.1
0.1
0.1
0.1
0.1
0.1
0.1
0.1
0.1
0.1
0.1
0.0
V33
rock
bre
aks
earth
0.1
0.1
0.1
0.1
0.1
0.1
0.1
0.1
0.1
0.1
0.1
0.1
0.1
0.1
0.1
0.1
0.1
0.0
V36
rock
bre
aks
wood
8.2
8.2
8.2
8.2
8.2
8.2
8.2
8.2
8.2
8.2
8.2
8.2
8.2
8.2
8.2
8.2
8.2
0.0
V31
rock
bre
aks
bric
k 11.4
11.4
11.4
11.4
11.4
11.4
11.4
11.4
11.4
11.4
11.4
11.4
11.4
11.4
11.4
11.4
11.4
0.0
V32
rock
bre
aks
conc
rete
14.7
14.7
14.7
14.7
14.7
14.7
14.7
14.7
14.7
14.7
14.7
14.7
14.7
14.7
14.7
14.7
14.7
0.0
V35
rock
bre
aks
stee
l 17.3
17.3
17.3
17.3
17.3
17.3
17.3
17.3
17.3
17.3
17.3
17.3
17.3
17.3
17.3
17.3
17.3
0.0
v43
flight a
ssis
ted c
limbs
3 h
um
an h
igh s
mooth
bric
k w
all
0.1
0.1
0.1
0.1
0.1
0.1
0.1
0.1
0.1
0.1
0.1
0.1
0.1
0.1
0.1
0.1
0.0
v44
flight a
ssis
ted c
limbs
3 h
uman
hig
h s
teel l
arg
e m
esh fenc
e
0.1
0.1
0.1
0.1
0.1
0.1
0.1
0.1
0.1
0.1
0.1
0.1
0.1
0.1
0.1
0.1
0.0
v45
flight a
ssis
ted c
limbs
3 h
um
an h
igh s
teel s
mall
mes
h fe
nce
0.1
0.1
0.1
0.1
0.1
0.1
0.1
0.1
0.1
0.1
0.1
0.1
0.1
0.1
0.1
0.1
0.0
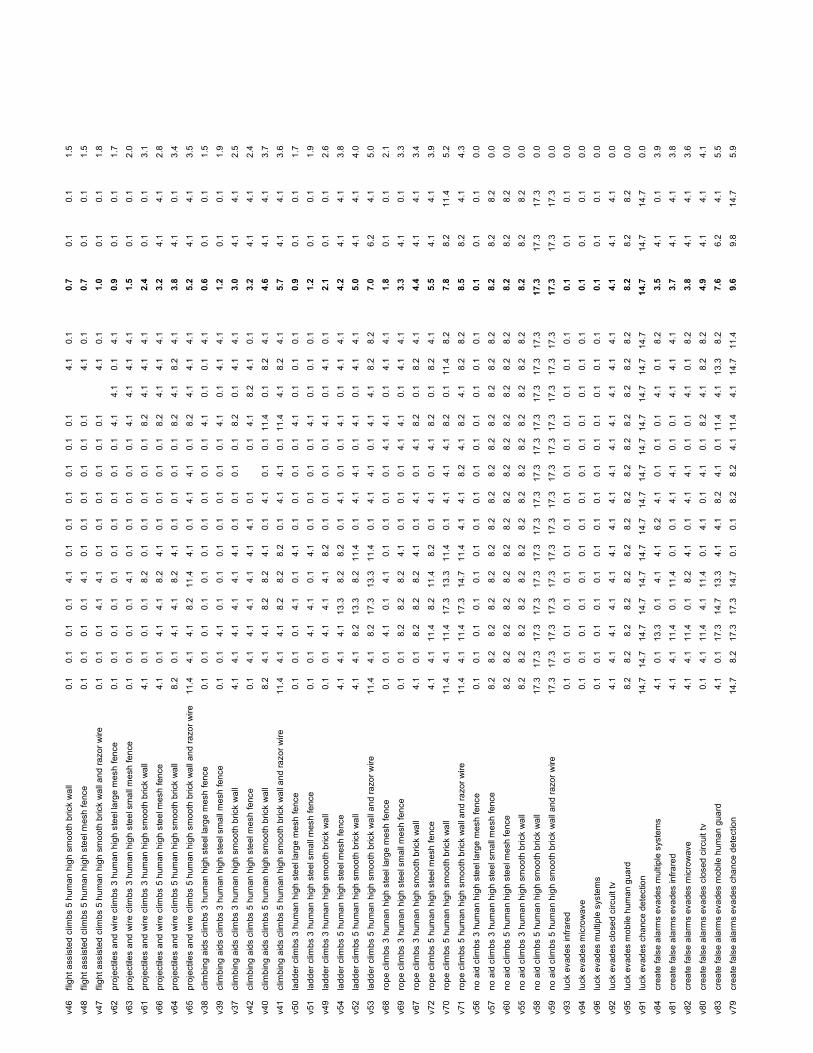
v46
flight a
ssis
ted c
limbs
5 h
uman
hig
h s
mooth
bric
k w
all
0.1
0.1
0.1
0.1
4.1
0.1
0.1
0.1
0.1
0.1
0.1
4.1
0.1
0.7
0.1
0.1
1.5
v48
flight a
ssis
ted c
limbs
5 h
um
an h
igh s
teel m
esh fe
nce
0.1
0.1
0.1
0.1
4.1
0.1
0.1
0.1
0.1
0.1
0.1
4.1
0.1
0.7
0.1
0.1
1.5
v47
flight a
ssis
ted c
limbs
5 h
um
an h
igh s
mooth
bric
k w
all
and razo
r w
ire
0.1
0.1
0.1
4.1
4.1
0.1
0.1
0.1
0.1
0.1
0.1
4.1
0.1
1.0
0.1
0.1
1.8
v62
pro
ject
iles
and
wire c
limbs
3 h
uman
hig
h s
teel l
arg
e m
esh fe
nce
0.1
0.1
0.1
0.1
0.1
0.1
0.1
0.1
0.1
0.1
4.1
4.1
0.1
4.1
0.9
0.1
0.1
1.7
v63
pro
ject
iles
and
wire c
limbs
3 h
uman
hig
h s
teel s
mall
mesh
fence
0.1
0.1
0.1
0.1
4.1
0.1
0.1
0.1
0.1
0.1
4.1
4.1
4.1
4.1
1.5
0.1
0.1
2.0
v61
pro
ject
iles
and
wire c
limbs
3 h
uman
hig
h s
moo
th b
rick
wall
4.1
0.1
0.1
0.1
8.2
0.1
0.1
0.1
0.1
0.1
8.2
4.1
4.1
4.1
2.4
0.1
0.1
3.1
v66
pro
ject
iles
and
wire c
limbs
5 h
uman
hig
h s
teel m
esh fen
ce
4.1
0.1
4.1
4.1
8.2
4.1
0.1
0.1
0.1
0.1
8.2
4.1
4.1
4.1
3.2
4.1
4.1
2.8
v64
pro
ject
iles
and
wire c
limbs
5 h
uman
hig
h s
moo
th b
rick
wall
8.2
0.1
4.1
4.1
8.2
4.1
0.1
0.1
0.1
0.1
8.2
4.1
8.2
4.1
3.8
4.1
0.1
3.4
v65
pro
ject
iles
and
wire c
limbs
5 h
uman
hig
h s
moo
th b
rick
wall
and razo
r w
ire
11.4
4.1
4.1
8.2
11.4
4.1
0.1
4.1
4.1
0.1
8.2
4.1
4.1
4.1
5.2
4.1
4.1
3.5
v38
clim
bin
g a
ids
clim
bs 3
hum
an h
igh s
teel
larg
e m
esh fen
ce
0.1
0.1
0.1
0.1
0.1
0.1
0.1
0.1
0.1
0.1
4.1
0.1
0.1
4.1
0.6
0.1
0.1
1.5
v39
clim
bin
g a
ids
clim
bs 3
hum
an h
igh s
teel s
mall
mes
h fe
nce
0.1
0.1
4.1
0.1
0.1
0.1
0.1
0.1
0.1
0.1
4.1
0.1
4.1
4.1
1.2
0.1
0.1
1.9
v37
clim
bin
g a
ids
clim
bs 3
hum
an h
igh s
moo
th b
rick
wall
4.1
4.1
4.1
4.1
4.1
4.1
0.1
0.1
0.1
0.1
8.2
0.1
4.1
4.1
3.0
4.1
4.1
2.5
v42
clim
bin
g a
ids
clim
bs 5
hum
an h
igh s
teel m
esh fe
nce
0.1
4.1
4.1
4.1
4.1
4.1
4.1
0.1
0.1
4.1
8.2
4.1
0.1
3.2
4.1
4.1
2.4
v40
clim
bin
g a
ids
clim
bs 5
hum
an h
igh s
moo
th b
rick
wall
8.2
4.1
4.1
8.2
8.2
4.1
0.1
4.1
0.1
0.1
11.4
0.1
8.2
4.1
4.6
4.1
4.1
3.7
v41
clim
bin
g a
ids
clim
bs 5
hum
an h
igh s
mooth
bric
k w
all
and razo
r w
ire
11.4
4.1
4.1
8.2
8.2
8.2
0.1
4.1
4.1
0.1
11.4
4.1
8.2
4.1
5.7
4.1
4.1
3.6
v50
ladder cl
imbs
3 h
uman h
igh s
teel l
arg
e m
esh fe
nce
0.1
0.1
0.1
4.1
0.1
4.1
0.1
0.1
0.1
0.1
4.1
0.1
0.1
0.1
0.9
0.1
0.1
1.7
v51
ladder cl
imbs
3 h
uman h
igh s
teel s
mall
mes
h fe
nce
0.1
0.1
4.1
4.1
0.1
4.1
0.1
0.1
0.1
0.1
4.1
0.1
0.1
0.1
1.2
0.1
0.1
1.9
v49
ladder cl
imbs
3 h
uman h
igh s
moo
th b
rick
wall
0.1
0.1
4.1
4.1
4.1
8.2
0.1
0.1
0.1
0.1
4.1
0.1
4.1
0.1
2.1
0.1
0.1
2.6
v54
ladder cl
imbs
5 h
uman h
igh s
teel m
esh
fenc
e
4.1
4.1
4.1
13.3
8.2
8.2
0.1
4.1
0.1
0.1
4.1
0.1
4.1
4.1
4.2
4.1
4.1
3.8
v52
ladder cl
imbs
5 h
uman h
igh s
moo
th b
rick
wall
4.1
4.1
8.2
13.3
8.2
11.4
0.1
4.1
4.1
0.1
4.1
0.1
4.1
4.1
5.0
4.1
4.1
4.0
v53
ladder cl
imbs
5 h
uman h
igh s
moo
th b
rick
wall
and razo
r w
ire
11.4
4.1
8.2
17.3
13.3
11.4
0.1
4.1
4.1
0.1
4.1
4.1
8.2
8.2
7.0
6.2
4.1
5.0
v68
rope c
limbs
3 h
uman h
igh s
teel l
arg
e m
esh
fence
0.1
0.1
4.1
0.1
4.1
0.1
0.1
0.1
0.1
4.1
4.1
0.1
4.1
4.1
1.8
0.1
0.1
2.1
v69
rope c
limbs
3 h
uman h
igh s
teel s
mall
mes
h fe
nce
0.1
0.1
8.2
8.2
8.2
4.1
0.1
0.1
0.1
4.1
4.1
0.1
4.1
4.1
3.3
4.1
0.1
3.3
v67
rope c
limbs
3 h
uman h
igh s
mooth
bric
k w
all
4.1
0.1
8.2
8.2
8.2
4.1
0.1
4.1
0.1
4.1
8.2
0.1
8.2
4.1
4.4
4.1
4.1
3.4
v72
rope c
limbs
5 h
uman h
igh s
teel m
esh fenc
e
4.1
4.1
11.4
8.2
11.4
8.2
0.1
4.1
0.1
4.1
8.2
0.1
8.2
4.1
5.5
4.1
4.1
3.9
v70
rope c
limbs
5 h
uman h
igh s
mooth
bric
k w
all
11.4
4.1
11.4
17.3
13.3
11.4
0.1
4.1
4.1
4.1
8.2
0.1
11.4
8.2
7.8
8.2
11.4
5.2
v71
rope c
limbs
5 h
uman h
igh s
mooth
bric
k w
all
and razo
r w
ire
11.4
4.1
11.4
17.3
14.7
11.4
4.1
4.1
8.2
4.1
8.2
4.1
8.2
8.2
8.5
8.2
4.1
4.3
v56
no a
id c
limbs
3 h
uman h
igh s
teel l
arg
e m
esh fe
nce
0.1
0.1
0.1
0.1
0.1
0.1
0.1
0.1
0.1
0.1
0.1
0.1
0.1
0.1
0.1
0.1
0.1
0.0
v57
no a
id c
limbs
3 h
uman h
igh s
teel s
mall
mesh
fenc
e
8.2
8.2
8.2
8.2
8.2
8.2
8.2
8.2
8.2
8.2
8.2
8.2
8.2
8.2
8.2
8.2
8.2
0.0
v60
no a
id c
limbs
5 h
uman h
igh s
teel m
esh
fenc
e
8.2
8.2
8.2
8.2
8.2
8.2
8.2
8.2
8.2
8.2
8.2
8.2
8.2
8.2
8.2
8.2
8.2
0.0
v55
no a
id c
limbs
3 h
uman h
igh s
moo
th b
rick
wall
8.2
8.2
8.2
8.2
8.2
8.2
8.2
8.2
8.2
8.2
8.2
8.2
8.2
8.2
8.2
8.2
8.2
0.0
v58
no a
id c
limbs
5 h
uman h
igh s
moo
th b
rick
wall
17.3
17.3
17.3
17.3
17.3
17.3
17.3
17.3
17.3
17.3
17.3
17.3
17.3
17.3
17.3
17.3
17.3
0.0
v59
no a
id c
limbs
5 h
uman h
igh s
moo
th b
rick
wall
and razo
r w
ire
17.3
17.3
17.3
17.3
17.3
17.3
17.3
17.3
17.3
17.3
17.3
17.3
17.3
17.3
17.3
17.3
17.3
0.0
v93
luck
eva
des
infrare
d
0.1
0.1
0.1
0.1
0.1
0.1
0.1
0.1
0.1
0.1
0.1
0.1
0.1
0.1
0.1
0.1
0.1
0.0
v94
luck
eva
des
mic
row
ave
0.1
0.1
0.1
0.1
0.1
0.1
0.1
0.1
0.1
0.1
0.1
0.1
0.1
0.1
0.1
0.1
0.1
0.0
v96
luck
eva
des
multi
ple
sys
tem
s 0.1
0.1
0.1
0.1
0.1
0.1
0.1
0.1
0.1
0.1
0.1
0.1
0.1
0.1
0.1
0.1
0.1
0.0
v92
luck
eva
des
clo
sed c
ircuit
tv
4.1
4.1
4.1
4.1
4.1
4.1
4.1
4.1
4.1
4.1
4.1
4.1
4.1
4.1
4.1
4.1
4.1
0.0
v95
luck
eva
des
mobile
hum
an g
uard
8.2
8.2
8.2
8.2
8.2
8.2
8.2
8.2
8.2
8.2
8.2
8.2
8.2
8.2
8.2
8.2
8.2
0.0
v91
luck
eva
des
cha
nce d
ete
ctio
n
14.7
14.7
14.7
14.7
14.7
14.7
14.7
14.7
14.7
14.7
14.7
14.7
14.7
14.7
14.7
14.7
14.7
0.0
v84
crea
te fa
lse a
larm
s ev
ade
s m
ulti
ple
sys
tem
s 4.1
0.1
13.3
0.1
4.1
4.1
6.2
4.1
0.1
0.1
0.1
4.1
0.1
8.2
3.5
4.1
0.1
3.9
v81
crea
te fa
lse a
larm
s ev
ade
s in
frare
d
4.1
4.1
11.4
0.1
11.4
0.1
0.1
4.1
4.1
0.1
0.1
4.1
4.1
4.1
3.7
4.1
4.1
3.8
v82
crea
te fa
lse a
larm
s ev
ade
s m
icro
wav
e 4.1
4.1
11.4
0.1
8.2
4.1
0.1
4.1
4.1
0.1
0.1
4.1
0.1
8.2
3.8
4.1
4.1
3.6
v80
crea
te fa
lse a
larm
s ev
ade
s cl
osed
circ
uit tv
0.1
4.1
11.4
4.1
11.4
0.1
4.1
0.1
4.1
0.1
8.2
4.1
8.2
8.2
4.9
4.1
4.1
4.1
v83
crea
te fa
lse a
larm
s ev
ade
s m
obile
hum
an g
uard
4.1
0.1
17.3
14.7
13.3
4.1
4.1
8.2
4.1
0.1
11.4
4.1
13.3
8.2
7.6
6.2
4.1
5.5
v79
crea
te fa
lse a
larm
s ev
ade
s ch
anc
e d
ete
ctio
n
14.7
8.2
17.3
17.3
14.7
0.1
0.1
8.2
8.2
4.1
11.4
4.1
14.7
11.4
9.6
9.8
14.7
5.9

v102
smok
e e
vades
multi
ple
sys
tem
s 0.1
0.1
11.4
0.1
8.2
4.1
0.1
0.1
0.1
0.1
4.1
0.1
0.1
4.1
2.3
0.1
0.1
3.6
v100
smok
e e
vades
mic
row
ave
0.1
4.1
11.4
0.1
11.4
0.1
0.1
0.1
0.1
4.1
8.2
0.1
0.1
4.1
3.1
0.1
0.1
4.3
v99
smok
e e
vades
infrare
d
0.1
0.1
13.3
4.1
13.3
0.1
0.1
4.1
0.1
4.1
8.2
0.1
4.1
4.1
4.0
4.1
0.1
4.7
v98
smok
e e
vades
clo
sed c
ircuit
tv
8.2
0.1
14.7
13.3
13.3
4.1
0.1
8.2
4.1
4.1
14.7
4.1
11.4
8.2
7.8
8.2
4.1
5.1
v101
smok
e e
vades
mobile
hum
an g
uard
8.2
4.1
14.7
14.7
14.7
4.1
0.1
8.2
4.1
4.1
11.4
4.1
13.3
8.2
8.1
8.2
4.1
4.9
v97
smok
e e
vades
cha
nce d
ete
ctio
n
14.7
4.1
14.7
17.3
17.3
0.1
0.1
13.3
8.2
4.1
13.3
8.2
14.7
11.4
10.1
12.4
14.7
6.0
v76
colo
ur ca
mou
flage e
vades
mic
row
ave
0.1
17.3
0.1
0.1
4.1
0.1
0.1
0.1
0.1
0.1
0.1
0.1
0.1
8.2
2.2
0.1
0.1
4.9
v75
colo
ur ca
mou
flage e
vades
infrare
d
0.1
17.3
4.1
0.1
8.2
0.1
0.1
0.1
0.1
0.1
0.1
0.1
4.1
4.1
2.7
0.1
0.1
4.9
v78
colo
ur ca
mou
flage e
vades
multi
ple
sys
tem
s 8.2
8.2
11.4
13.3
8.2
0.1
0.1
0.1
0.1
0.1
14.7
0.1
0.1
0.1
4.6
0.1
0.1
5.7
v74
colo
ur ca
mou
flage e
vades
clo
sed c
ircuit
tv
8.2
8.2
8.2
4.1
11.4
4.1
4.1
4.1
4.1
0.1
11.4
8.2
14.7
11.4
7.3
8.2
4.1
4.0
v77
colo
ur ca
mou
flage e
vades
mobile
hum
an g
uard
8.2
4.1
8.2
11.4
13.3
4.1
6.2
8.2
8.2
8.2
13.3
8.2
13.3
13.3
9.2
8.2
8.2
3.3
v73
colo
ur ca
mou
flage e
vades
cha
nce d
ete
ctio
n
14.7
8.2
17.3
14.7
14.7
4.1
6.2
13.3
14.7
14.7
13.3
14.7
17.3
14.7
13.0
14.7
14.7
4.0
v108
syst
em k
now
ledge e
vade
s m
ulti
ple
sys
tem
s 0.1
4.1
17.3
4.1
0.1
8.2
8.2
11.4
13.3
0.1
8.2
4.1
8.2
8.2
6.8
8.2
8.2
5.1
v106
syst
em k
now
ledge e
vade
s m
icro
wav
e
4.1
0.1
17.3
8.2
0.1
8.2
8.2
13.3
13.3
0.1
8.2
4.1
8.2
8.2
7.3
8.2
8.2
5.2
v105
syst
em k
now
ledge e
vade
s in
frare
d
0.1
0.1
17.3
11.4
0.1
17.3
8.2
13.3
13.3
0.1
13.3
4.1
4.1
11.4
8.1
9.8
0.1
6.6
v107
syst
em k
now
ledge e
vade
s m
obile
hum
an g
uard
13.3
0.1
17.3
17.3
4.1
8.2
8.2
17.3
13.3
4.1
14.7
8.2
4.1
11.4
10.1
9.8
17.3
5.7
v104
syst
em k
now
ledge e
vade
s cl
osed
circ
uit
tv
8.2
0.1
17.3
14.7
4.1
17.3
8.2
14.7
13.3
0.1
13.3
8.2
0.1
11.4
9.4
9.8
8.2
6.3
v103
syst
em k
now
ledge e
vade
s ch
anc
e d
ete
ctio
n
14.7
0.1
14.7
17.3
8.2
0.1
8.2
17.3
13.3
4.1
14.7
14.7
0.1
13.3
10.1
13.3
14.7
6.5
v90
know
ledge a
nd d
ivers
ion e
vade
s m
ulti
ple
sys
tem
s 0.1
0.1
17.3
4.1
0.1
17.3
8.2
13.3
13.3
0.1
11.4
4.1
0.1
8.2
7.0
6.2
0.1
6.6
v87
know
ledge a
nd d
ivers
ion e
vade
s in
frare
d
0.1
0.1
17.3
11.4
0.1
17.3
8.2
14.7
13.3
0.1
13.3
4.1
4.1
11.4
8.2
9.8
0.1
6.7
v88
know
ledge a
nd d
ivers
ion e
vade
s m
icro
wave
4.1
0.1
17.3
8.2
4.1
17.3
8.2
14.7
13.3
0.1
13.3
4.1
0.1
11.4
8.3
8.2
4.1
6.3
v86
know
ledge a
nd d
ivers
ion e
vade
s cl
osed c
ircuit
tv
11.4
0.1
17.3
17.3
4.1
17.3
8.2
17.3
13.3
0.1
13.3
8.2
4.1
11.4
10.2
11.4
17.3
6.3
v89
know
ledge a
nd d
ivers
ion e
vade
s m
obile
hum
an g
uard
14.7
0.1
17.3
17.3
8.2
17.3
8.2
17.3
13.3
4.1
14.7
11.4
8.2
8.2
11.4
12.4
17.3
5.5
v85
know
ledge a
nd d
ivers
ion e
vade
s ch
ance
dete
ctio
n
14.7
0.1
14.7
17.3
4.1
0.1
8.2
17.3
13.3
4.1
17.3
14.7
8.2
11.4
10.4
12.4
14.7
6.3
v140
viole
nt d
estruc
tion d
isable
s cl
osed
circ
uit
tv
0.1
4.1
0.1
8.2
8.2
4.1
4.1
4.1
0.1
0.1
4.1
13.3
4.1
13.3
4.8
4.1
4.1
4.5
v142
viole
nt d
estruc
tion d
isable
s m
icro
wav
e 0.1
0.1
0.1
11.4
11.4
0.1
4.1
4.1
0.1
0.1
4.1
13.3
8.2
14.7
5.1
4.1
0.1
5.6
v141
viole
nt d
estruc
tion d
isable
s in
frare
d
0.1
4.1
0.1
11.4
8.2
0.1
4.1
8.2
0.1
0.1
4.1
13.3
8.2
13.3
5.4
4.1
0.1
5.0
v143
viole
nt d
estruc
tion d
isable
s m
obile
hum
an g
uard
0.1
0.1
8.2
17.3
8.2
0.1
4.1
8.2
0.1
0.1
6.2
4.1
4.1
14.7
5.4
4.1
0.1
5.5
v144
viole
nt d
estruc
tion d
isable
s m
ulti
ple
sys
tem
s 0.1
4.1
8.2
14.7
11.4
4.1
4.1
8.2
0.1
0.1
8.2
13.3
8.2
17.3
7.3
8.2
8.2
5.5
v139
viole
nt d
estruc
tion d
isable
s ch
ance
dete
ctio
n
11.4
4.1
11.4
17.3
4.1
17.3
4.1
8.2
0.1
0.1
13.3
4.1
4.1
14.7
8.2
6.2
4.1
6.0
v134
syst
em k
now
ledge d
isable
s cl
osed
circ
uit
tv
8.2
0.1
0.1
4.1
4.1
0.1
4.1
4.1
14.7
0.1
4.1
4.1
11.4
14.7
5.3
4.1
4.1
5.1
v135
syst
em k
now
ledge d
isable
s in
frare
d
8.2
0.1
0.1
4.1
4.1
0.1
4.1
4.1
14.7
0.1
4.1
4.1
11.4
13.3
5.2
4.1
4.1
4.9
v136
syst
em k
now
ledge d
isable
s m
icro
wav
e 8.2
0.1
0.1
4.1
8.2
0.1
4.1
4.1
14.7
0.1
4.1
4.1
13.3
13.3
5.6
4.1
4.1
5.2
v138
syst
em k
now
ledge d
isable
s m
ulti
ple
sys
tem
s 11.4
0.1
0.1
8.2
8.2
0.1
0.1
8.2
14.7
0.1
8.2
4.1
13.3
14.7
6.5
8.2
0.1
5.7
v137
syst
em k
now
ledge d
isable
s m
obile
hum
an g
uard
14.7
0.1
4.1
0.1
4.1
0.1
11.4
4.1
14.7
0.1
4.1
4.1
0.1
11.4
5.2
4.1
0.1
5.5
v133
syst
em k
now
ledge d
isable
s ch
anc
e d
ete
ctio
n
17.3
0.1
4.1
0.1
4.1
17.3
11.4
0.1
14.7
0.1
4.1
8.2
0.1
14.7
6.9
4.1
0.1
6.9
v116
cut p
ow
er dis
able
s cl
osed
circ
uit
tv
8.2
0.1
8.2
0.1
8.2
4.1
0.1
4.1
4.1
0.1
0.1
8.2
8.2
8.2
4.4
4.1
8.2
3.7
v117
cut p
ow
er dis
able
s in
frare
d
11.4
0.1
8.2
8.7
11.4
4.1
0.1
4.1
4.1
0.1
0.1
8.2
11.4
11.4
5.9
6.2
11.4
4.7
v118
cut p
ow
er dis
able
s m
icro
wave
11.4
0.1
8.2
8.7
13.3
4.1
0.1
4.1
4.1
0.1
0.1
8.2
11.4
11.4
6.1
6.2
0.1
4.9
v120
cut p
ow
er dis
able
s m
ulti
ple
sys
tem
s 11.4
0.1
11.4
8.7
13.3
4.1
0.1
8.2
4.1
0.1
0.1
8.2
11.4
14.7
6.8
8.2
0.1
5.3
v115
cut p
ow
er dis
able
s ch
anc
e d
ete
ctio
n
13.3
8.2
14.7
17.3
8.2
17.3
0.1
17.3
8.2
0.1
17.3
4.1
17.3
14.7
11.3
14.0
17.3
6.4
v119
cut p
ow
er dis
able
s m
obile
hum
an g
uard
11.4
8.2
17.3
17.3
8.2
17.3
0.1
17.3
4.1
0.1
8.2
8.2
17.3
8.2
10.2
8.2
8.2
6.3
v122
ele
ctric
al i
nte
rfere
nce
dis
able
s cl
ose
d c
ircuit
tv
0.1
4.1
8.2
0.1
4.1
0.1
0.1
8.2
4.1
0.1
4.1
8.2
4.1
13.3
4.2
4.1
0.1
4.1
v123
ele
ctric
al i
nte
rfere
nce
dis
able
s in
frare
d
0.1
4.1
8.2
0.1
8.2
4.1
0.1
8.2
4.1
0.1
4.1
8.2
8.2
13.3
5.1
4.1
8.2
4.1
v124
ele
ctric
al i
nte
rfere
nce
dis
able
s m
icro
wav
e
0.1
4.1
8.2
0.1
8.2
4.1
0.1
4.1
4.1
0.1
4.1
8.2
8.2
14.7
4.9
4.1
4.1
4.3

v126
ele
ctric
al i
nte
rfere
nce
dis
able
s m
ulti
ple
sys
tem
s 8.2
4.1
8.2
0.1
11.4
4.1
0.1
8.2
4.1
0.1
8.2
8.2
8.2
17.3
6.5
8.2
8.2
4.8
v125
ele
ctric
al i
nte
rfere
nce
dis
able
s m
obile
hum
an g
uard
17.3
0.1
8.2
17.3
4.1
17.3
17.3
14.7
0.1
4.1
17.3
0.1
17.3
0.1
9.7
11.5
17.3
7.9
v121
ele
ctric
al i
nte
rfere
nce
dis
able
s ch
ance
dete
ctio
n
17.3
8.2
8.2
17.3
4.1
17.3
4.1
14.7
0.1
4.1
17.3
4.1
17.3
13.3
10.5
10.8
17.3
6.4
v131
phys
ical i
ntim
idatio
n d
isable
s m
obile
hum
an g
uard
4.1
8.2
0.1
8.2
4.1
8.2
8.2
4.1
0.1
13.3
4.1
0.1
13.3
5.8
4.1
4.1
4.5
v127
phys
ical i
ntim
idatio
n d
isable
s ch
ance
dete
ctio
n
4.1
8.2
0.1
4.1
17.3
4.1
0.1
4.1
0.1
13.3
4.1
0.1
14.7
5.7
4.1
4.1
5.9
v128
phys
ical i
ntim
idatio
n d
isable
s cl
osed
circ
uit
tv
17.3
0.1
11.4
8.2
17.3
4.1
11.4
0.1
0.1
13.3
0.1
17.3
14.7
8.9
11.4
0.1
7.1
v129
phys
ical i
ntim
idatio
n d
isable
s in
frare
d
17.3
0.1
17.3
11.4
17.3
4.1
11.4
0.1
0.1
13.3
0.1
17.3
14.7
9.6
11.4
17.3
7.5
v130
phys
ical i
ntim
idatio
n d
isable
s m
icro
wav
e
17.3
0.1
17.3
11.4
17.3
4.1
13.3
0.1
0.1
13.3
0.1
17.3
14.7
9.7
13.3
17.3
7.6
v132
phys
ical i
ntim
idatio
n d
isable
s m
ulti
ple
sys
tem
s 17.3
4.1
13.3
17.3
11.4
17.3
4.1
13.3
0.1
0.1
14.7
0.1
17.3
17.3
10.5
13.3
17.3
7.2
v109
acc
iden
tal d
isab
les
chanc
e d
ete
ctio
n
8.2
8.2
8.2
8.2
8.2
8.2
8.2
8.2
8.2
8.2
8.2
8.2
8.2
8.2
8.2
8.2
8.2
0.0
v113
acc
iden
tal d
isab
les
mobile
hum
an g
uard
11.4
11.4
11.4
11.4
11.4
11.4
11.4
11.4
11.4
11.4
11.4
11.4
11.4
11.4
11.4
11.4
11.4
0.0
v110
acc
iden
tal d
isab
les
close
d c
ircuit
tv
13.3
13.3
13.3
13.3
13.3
13.3
13.3
13.3
13.3
13.3
13.3
13.3
13.3
13.3
13.3
13.3
13.3
0.0
v114
acc
iden
tal d
isab
les
multi
ple
sys
tem
s 11.4
11.4
11.4
11.4
11.4
17.3
17.3
17.3
17.3
17.3
17.3
17.3
17.3
17.3
15.2
17.3
17.3
2.9
v111
acc
iden
tal d
isab
les
infrare
d
17.3
17.3
17.3
17.3
17.3
17.3
17.3
17.3
17.3
17.3
17.3
17.3
17.3
17.3
17.3
17.3
17.3
0.0
v112
acc
iden
tal d
isab
les
mic
row
ave
17.3
17.3
17.3
17.3
17.3
17.3
17.3
17.3
17.3
17.3
17.3
17.3
17.3
17.3
17.3
17.3
17.3
0.0
v152
hum
an li
fe in
itial r
esp
ons
e b
y ge
nera
l public
11.4
4.1
0.1
0.1
4.1
4.1
4.1
0.1
4.1
0.1
4.1
4.1
4.1
13.3
4.1
4.1
4.1
4.0
v155
hum
an li
fe in
itial r
esp
ons
e b
y po
lice
4.1
4.1
0.1
4.1
4.1
4.1
4.1
4.1
4.1
0.1
8.2
4.1
4.1
4.1
3.8
4.1
4.1
1.9
v156
hum
an li
fe in
itial r
esp
ons
e b
y se
curit
y patrol
8.2
4.1
4.1
4.1
0.1
11.4
8.2
8.2
4.1
0.1
8.2
4.1
4.1
4.1
5.2
4.1
4.1
3.2
v151
hum
an li
fe in
itial r
esp
ons
e b
y arm
ed
4.1
4.1
0.1
8.2
4.1
17.3
4.1
8.2
4.1
0.1
17.3
6.2
4.1
8.2
6.4
4.1
4.1
5.3
v153
hum
an li
fe in
itial r
esp
ons
e b
y hig
h te
ch
4.1
17.3
4.1
11.4
4.1
17.3
4.1
11.4
0.1
0.1
17.3
8.2
0.1
4.1
7.4
4.1
4.1
6.5
v154
hum
an li
fe in
itial r
esp
ons
e b
y in
sura
nce
13.3
11.4
4.1
8.2
8.2
14.7
13.3
11.4
14.7
8.2
11.4
11.4
13.3
14.7
11.3
11.4
11.4
3.1
v162
larg
e c
ash in
itial r
esp
ons
e b
y se
curit
y patrol
8.2
4.1
4.1
4.1
8.2
11.4
8.2
8.2
4.1
4.1
8.2
4.1
4.1
8.2
6.4
6.2
4.1
2.5
v159
larg
e c
ash in
itial r
esp
ons
e b
y hig
h te
ch
4.1
4.1
4.1
17.3
8.2
17.3
4.1
13.3
0.1
0.1
4.1
17.3
0.1
4.1
7.0
4.1
4.1
6.5
v161
larg
e c
ash in
itial r
esp
ons
e b
y po
lice
8.2
8.2
4.1
8.2
8.2
4.1
8.2
8.2
4.1
4.1
8.2
4.1
4.1
8.2
6.4
8.2
8.2
2.1
v157
larg
e c
ash in
itial r
esp
ons
e b
y arm
ed
4.1
4.1
4.1
14.7
8.2
13.3
8.2
8.2
4.1
0.1
17.3
8.2
0.1
4.1
7.1
6.2
4.1
5.2
v158
larg
e c
ash in
itial r
esp
ons
e b
y ge
nera
l public
13.3
11.4
0.1
4.1
4.1
4.1
4.1
0.1
14.7
4.1
8.2
8.2
13.3
6.9
4.1
4.1
5.0
v160
larg
e c
ash in
itial r
esp
ons
e b
y in
sura
nce
13.3
8.2
8.2
8.2
8.2
14.7
13.3
11.4
8.2
8.2
11.4
11.4
13.3
11.4
10.7
11.4
8.2
2.4
v147
corp
ora
te d
ata
initi
al r
esp
ons
e b
y hig
h te
ch
8.2
0.1
4.1
17.3
13.3
13.3
0.1
14.7
0.1
0.1
11.4
17.3
0.1
4.1
7.4
6.2
0.1
6.9
v149
corp
ora
te d
ata
initi
al r
esp
ons
e b
y po
lice
11.4
8.2
8.2
8.2
8.2
4.1
8.2
11.4
14.7
4.1
11.4
8.2
8.2
8.2
8.8
8.2
8.2
2.8
v150
corp
ora
te d
ata
initi
al r
esp
ons
e b
y se
curit
y patrol
4.1
8.2
8.2
11.4
14.7
11.4
8.2
4.1
17.3
8.2
8.2
4.1
11.4
9.2
8.2
8.2
4.0
v146
corp
ora
te d
ata
initi
al r
esp
ons
e b
y ge
nera
l public
13.3
13.3
0.1
4.1
8.2
4.1
13.3
8.2
17.3
4.1
17.3
8.2
13.3
17.3
10.1
10.8
13.3
5.7
v148
corp
ora
te d
ata
initi
al r
esp
ons
e b
y in
sura
nce
13.3
11.4
4.1
11.4
11.4
13.3
13.3
11.4
13.3
8.2
13.3
12.4
13.3
11.4
11.5
11.9
13.3
2.6
v145
corp
ora
te d
ata
initi
al r
esp
ons
e b
y arm
ed
11.4
8.2
8.2
17.3
13.3
14.7
11.4
14.7
4.1
0.1
17.3
17.3
4.1
4.1
10.4
11.4
17.3
5.7
v176
small
cash
initi
al r
esp
onse
by
gen
era
l public
4.1
4.1
4.1
4.1
8.2
4.1
8.2
0.1
17.3
4.1
4.1
4.1
11.4
14.7
6.6
4.1
4.1
4.8
v180
small
cash
initi
al r
esp
onse
by
secu
rity
patrol
11.4
4.1
8.2
11.4
11.4
4.1
9.8
8.2
4.1
4.1
11.4
8.2
4.1
11.4
8.0
8.2
11.4
3.2
v179
small
cash
initi
al r
esp
onse
by
polic
e
13.3
8.2
13.3
13.3
11.4
4.1
11.4
11.4
4.1
11.4
12.4
8.2
8.2
10.1
11.4
11.4
3.2
v177
small
cash
initi
al r
esp
onse
by
hig
h te
ch
17.3
0.1
17.3
17.3
17.3
11.4
11.4
17.3
0.1
17.3
17.3
17.3
0.1
8.2
12.1
17.3
17.3
7.2
v178
small
cash
initi
al r
esp
onse
by
insu
rance
14.7
11.4
11.4
13.3
13.3
13.3
13.3
13.3
14.7
13.3
13.3
13.3
13.3
13.3
13.2
13.3
13.3
0.9
v175
small
cash
initi
al r
esp
onse
by
arm
ed
17.3
4.1
17.3
17.3
17.3
11.4
11.4
14.7
4.1
17.3
17.3
17.3
4.1
4.1
12.5
16.0
17.3
5.9
v170
pers
onal v
alu
able
s in
itial r
esp
onse
by
gene
ral p
ublic
4.1
8.2
0.1
4.1
8.2
13.3
8.2
0.1
17.3
4.1
4.1
4.1
8.2
17.3
7.2
6.2
4.1
5.5
v174
pers
onal v
alu
able
s in
itial r
esp
onse
by
secu
rity
patrol
11.4
4.1
11.4
11.4
11.4
13.3
11.4
4.1
4.1
4.1
11.4
13.3
4.1
11.4
9.1
11.4
11.4
3.9
v173
pers
onal v
alu
able
s in
itial r
esp
onse
by
polic
e
13.3
11.4
8.2
11.4
11.4
4.1
8.2
8.2
11.4
4.1
11.4
13.3
8.2
8.2
9.5
9.8
11.4
3.0
v171
pers
onal v
alu
able
s in
itial r
esp
onse
by
high te
ch
17.3
4.1
17.3
17.3
14.7
17.3
8.2
17.3
0.1
17.3
17.3
17.3
0.1
4.1
12.1
17.3
17.3
7.1
v172
pers
onal v
alu
able
s in
itial r
esp
onse
by
insu
rance
14.7
13.3
11.4
11.4
13.3
13.3
11.4
13.3
14.7
13.3
13.3
13.3
11.4
13.3
13.0
13.3
13.3
1.1
v169
pers
onal v
alu
able
s in
itial r
esp
onse
by
arm
ed
17.3
8.2
14.7
17.3
14.7
17.3
11.4
17.3
4.1
17.3
17.3
17.3
4.1
8.2
13.3
16.0
17.3
5.1

v164
low
valu
e g
ood
s in
itial r
esp
onse
by
gen
era
l public
4.1
4.1
4.1
4.1
4.1
4.1
4.1
4.1
4.1
4.1
4.1
4.1
4.1
4.1
4.1
4.1
4.1
0.0
v168
low
valu
e g
ood
s in
itial r
esp
onse
by
secu
rity
patrol
11.4
11.4
11.4
11.4
11.4
11.4
11.4
11.4
11.4
11.4
11.4
11.4
11.4
11.4
11.4
11.4
11.4
0.0
v167
low
valu
e g
ood
s in
itial r
esp
onse
by
polic
e
13.3
13.3
13.3
13.3
13.3
13.3
13.3
13.3
13.3
13.3
13.3
13.3
13.3
13.3
13.3
13.3
13.3
0.0
v166
low
valu
e g
ood
s in
itial r
esp
onse
by
insu
ranc
e
13.3
13.3
13.3
13.3
13.3
13.3
13.3
13.3
13.3
13.3
13.3
13.3
13.3
13.3
13.3
13.3
13.3
0.0
v165
low
valu
e g
ood
s in
itial r
esp
onse
by
hig
h te
ch
17.3
17.3
17.3
17.3
17.3
17.3
17.3
17.3
17.3
17.3
17.3
17.3
17.3
17.3
17.3
17.3
17.3
0.0
v163
low
valu
e g
ood
s in
itial r
esp
onse
by
arm
ed
17.3
17.3
17.3
17.3
17.3
17.3
17.3
17.3
17.3
17.3
17.3
17.3
17.3
17.3
17.3
17.3
17.3
0.0
v211
small
cash
pre
-atta
ck c
onsi
dera
tion a
ccid
enta
l 0.1
4.1
0.1
0.1
0.1
0.1
0.1
0.1
0.1
0.1
4.1
4.1
11.4
0.1
1.7
0.1
0.1
3.3
v216
small
cash
pre
-atta
ck c
onsi
dera
tion v
ery
low
motiv
atio
n
4.1
0.1
4.1
4.1
4.1
11.4
0.1
4.1
4.1
4.1
4.1
8.2
11.4
0.1
4.6
4.1
4.1
3.6
v214
small
cash
pre
-atta
ck c
onsi
dera
tion lo
w m
otiv
atio
n
8.2
0.1
8.2
4.1
8.2
0.1
8.2
4.1
8.2
4.1
8.2
11.4
0.1
5.6
8.2
8.2
3.8
v215
small
cash
pre
-atta
ck c
onsi
dera
tion m
odera
te m
otiv
atio
n
8.2
4.1
8.2
8.2
8.2
13.3
0.1
8.2
8.2
11.4
8.2
8.2
8.2
4.1
7.6
8.2
8.2
3.2
v213
small
cash
pre
-atta
ck c
onsi
dera
tion h
igh m
otiv
atio
n
11.4
4.1
11.4
11.4
11.4
4.1
0.1
13.3
8.2
11.4
11.4
11.4
4.1
4.1
8.4
11.4
11.4
4.2
v212
small
cash
pre
-atta
ck c
onsi
dera
tion e
xtre
me m
otiv
atio
n
11.4
8.2
11.4
11.4
11.4
8.2
0.1
14.7
11.4
11.4
11.4
11.4
0.1
8.2
9.3
11.4
11.4
4.3
v199
low
valu
e g
ood
s pre
-atta
ck c
onsi
dera
tion a
ccid
enta
l 0.1
0.1
0.1
0.1
0.1
0.1
0.1
0.1
0.1
0.1
0.1
0.1
0.1
0.1
0.1
0.1
0.1
0.0
v204
low
valu
e g
ood
s pre
-atta
ck c
onsi
dera
tion v
ery
low
motiv
atio
n
4.1
4.1
4.1
4.1
4.1
4.1
4.1
4.1
4.1
4.1
4.1
4.1
4.1
4.1
4.1
4.1
4.1
0.0
v202
low
valu
e g
ood
s pre
-atta
ck c
onsi
dera
tion lo
w m
otiv
atio
n
8.2
8.2
8.2
8.2
8.2
8.2
8.2
8.2
8.2
8.2
8.2
8.2
8.2
8.2
8.2
8.2
8.2
0.0
v203
low
valu
e g
ood
s pre
-atta
ck c
onsi
dera
tion m
ode
rate
motiv
atio
n
8.2
8.2
8.2
8.2
8.2
8.2
8.2
8.2
8.2
8.2
8.2
8.2
8.2
8.2
8.2
8.2
8.2
0.0
v200
low
valu
e g
ood
s pre
-atta
ck c
onsi
dera
tion e
xtre
me m
otiv
atio
n
11.4
11.4
11.4
11.4
11.4
11.4
11.4
11.4
11.4
11.4
11.4
11.4
11.4
11.4
11.4
11.4
11.4
0.0
v201
low
valu
e g
ood
s pre
-atta
ck c
onsi
dera
tion h
igh m
otiv
atio
n
11.4
11.4
11.4
11.4
11.4
11.4
11.4
11.4
11.4
11.4
11.4
11.4
11.4
11.4
11.4
11.4
11.4
0.0
v205
pers
onal v
alu
able
s pre
-atta
ck c
onsi
dera
tion a
ccid
enta
l 0.1
4.1
4.1
4.1
0.1
0.1
0.1
0.1
4.1
0.1
4.1
4.1
4.1
8.2
2.7
4.1
4.1
2.6
v210
pers
onal v
alu
able
s pre
-atta
ck c
onsi
dera
tion v
ery
low
motiv
atio
n
4.1
0.1
8.2
8.2
4.1
14.7
0.1
4.1
4.1
4.1
4.1
8.2
8.2
0.1
5.2
4.1
4.1
4.0
v208
pers
onal v
alu
able
s pre
-atta
ck c
onsi
dera
tion lo
w m
otiv
atio
n
8.2
4.1
11.4
11.4
8.2
11.4
0.1
8.2
4.1
8.2
8.2
8.2
8.2
4.1
7.4
8.2
8.2
3.3
v209
pers
onal v
alu
able
s pre
-atta
ck c
onsi
dera
tion m
odera
te m
otiv
atio
n
8.2
4.1
11.4
13.3
8.2
8.2
0.1
8.2
11.4
11.4
8.2
8.2
11.4
8.2
8.6
8.2
8.2
3.4
v207
pers
onal v
alu
able
s pre
-atta
ck c
onsi
dera
tion h
igh m
otiv
atio
n
11.4
8.2
13.3
13.3
11.4
8.2
0.1
13.3
11.4
11.4
11.4
11.4
11.4
11.4
10.5
11.4
11.4
3.4
v206
pers
onal v
alu
able
s pre
-atta
ck c
onsi
dera
tion e
xtre
me m
otiv
atio
n
11.4
8.2
13.3
14.7
11.4
8.2
0.1
14.7
11.4
11.4
11.4
11.4
13.3
11.4
10.9
11.4
11.4
3.7
v181
corp
ora
te d
ata
pre
-atta
ck c
onsi
dera
tion a
ccid
enta
l 11.4
13.3
8.2
8.2
8.2
0.1
0.1
8.2
8.2
8.2
4.1
8.2
2.0
11.4
7.1
8.2
8.2
4.1
v184
corp
ora
te d
ata
pre
-atta
ck c
onsi
dera
tion lo
w m
otiv
atio
n
13.3
13.3
13.3
11.4
11.4
13.3
0.1
8.2
14.7
11.4
8.2
11.4
8.2
8.2
10.5
11.4
13.3
3.7
v186
corp
ora
te d
ata
pre
-atta
ck c
onsi
dera
tion v
ery
low
motiv
atio
n
13.3
11.4
14.7
11.4
8.2
8.2
11.4
11.4
11.4
8.2
11.4
11.4
8.2
0.1
10.0
11.4
11.4
3.5
v185
corp
ora
te d
ata
pre
-atta
ck c
onsi
dera
tion m
ode
rate
motiv
atio
n
13.3
14.7
14.7
13.3
11.4
13.3
4.1
11.4
14.7
13.3
11.4
11.4
13.3
11.4
12.3
13.3
13.3
2.7
v183
corp
ora
te d
ata
pre
-atta
ck c
onsi
dera
tion h
igh m
otiv
atio
n
14.7
14.7
14.7
14.7
13.3
8.2
8.2
13.3
17.3
14.7
11.4
11.4
14.7
13.3
13.2
14.0
14.7
2.6
v182
corp
ora
te d
ata
pre
-atta
ck c
onsi
dera
tion e
xtre
me m
otiv
atio
n
14.7
17.3
14.7
14.7
13.3
11.4
11.4
14.7
17.3
14.7
13.3
13.3
14.7
14.7
14.3
14.7
14.7
1.7
v193
larg
e c
ash p
re-a
ttack
con
sidera
tion a
ccid
enta
l 11.4
13.3
13.3
13.3
8.2
0.1
0.1
11.4
13.3
8.2
4.1
8.2
4.1
8.2
8.4
8.2
13.3
4.7
v198
larg
e c
ash p
re-a
ttack
con
sidera
tion v
ery
low
motiv
atio
n
11.4
11.4
14.7
13.3
8.2
13.3
0.1
13.3
13.3
11.4
4.1
8.2
4.1
0.1
9.1
11.4
13.3
5.1
v196
larg
e c
ash p
re-a
ttack
con
sidera
tion lo
w m
otiv
atio
n
13.3
13.3
14.7
14.7
11.4
11.4
8.2
13.3
14.7
11.4
8.2
8.2
8.2
4.1
11.1
11.4
8.2
3.2
v197
larg
e c
ash p
re-a
ttack
con
sidera
tion m
odera
te m
otiv
atio
n
14.7
13.3
14.7
14.7
13.3
8.2
11.4
13.3
14.7
13.3
11.4
11.4
13.3
11.4
12.8
13.3
13.3
1.9
v195
larg
e c
ash p
re-a
ttack
con
sidera
tion h
igh m
otiv
atio
n
14.7
14.7
17.3
17.3
13.3
8.2
11.4
14.7
17.3
14.7
11.4
13.3
14.7
13.3
14.0
14.7
14.7
2.5
v194
larg
e c
ash p
re-a
ttack
con
sidera
tion e
xtre
me m
otiv
atio
n
17.3
14.7
17.3
17.3
14.7
8.2
11.4
17.3
17.3
14.7
13.3
13.3
17.3
14.7
14.9
14.7
17.3
2.7
v192
hum
an li
fe p
re-a
ttack
con
sidera
tion v
ery
low
motiv
atio
n
13.3
13.3
17.3
14.7
14.7
17.3
0.1
8.2
4.1
17.3
4.1
11.4
8.2
0.1
10.3
12.4
17.3
6.2
v187
hum
an li
fe p
re-a
ttack
con
sidera
tion a
ccid
enta
l 13.3
14.7
17.3
14.7
14.7
0.1
0.1
14.7
4.1
17.3
4.1
13.3
11.4
8.2
10.6
13.3
14.7
6.1
v190
hum
an li
fe p
re-a
ttack
con
sidera
tion lo
w m
otiv
atio
n
14.7
14.7
17.3
17.3
14.7
14.7
0.1
11.4
8.2
17.3
8.2
11.4
11.4
4.1
11.8
13.1
14.7
5.2
v191
hum
an li
fe p
re-a
ttack
con
sidera
tion m
odera
te m
otiv
atio
n
14.7
14.7
17.3
17.3
14.7
11.4
0.1
13.3
14.7
17.3
11.4
13.3
14.7
11.4
13.3
14.7
14.7
4.3
v189
hum
an li
fe p
re-a
ttack
con
sidera
tion h
igh m
otiv
atio
n
17.3
17.3
17.3
17.3
17.3
4.1
0.1
17.3
17.3
17.3
11.4
14.7
17.3
13.3
14.2
17.3
17.3
5.5
v188
hum
an li
fe p
re-a
ttack
con
sidera
tion e
xtre
me m
otiv
atio
n
17.3
17.3
17.3
17.3
17.3
0.1
0.1
17.3
17.3
17.3
13.3
14.7
17.3
14.7
14.2
17.3
17.3
6.1
v218
cut p
ow
er atta
ck p
re-m
edita
tion e
xtre
me m
otiv
atio
n
4.1
4.1
4.1
4.1
4.1
4.1
4.1
4.1
4.1
4.1
4.1
4.1
4.1
4.1
4.1
4.1
4.1
0.0
v219
cut p
ow
er atta
ck p
re-m
edita
tion h
igh m
otiv
atio
n
4.1
4.1
4.1
4.1
4.1
4.1
4.1
4.1
4.1
4.1
4.1
4.1
4.1
4.1
4.1
4.1
4.1
0.0
v221
cut p
ow
er atta
ck p
re-m
edita
tion m
ode
rate
motiv
atio
n
4.1
4.1
4.1
4.1
4.1
4.1
4.1
4.1
4.1
4.1
4.1
4.1
4.1
4.1
4.1
4.1
4.1
0.0

v222
cut p
ow
er atta
ck p
re-m
edita
tion v
ery
low
motiv
atio
n
4.1
4.1
4.1
4.1
8.2
8.2
8.2
8.2
8.2
8.2
8.2
8.2
8.2
8.2
7.0
8.2
8.2
1.9
v220
cut p
ow
er atta
ck p
re-m
edita
tion lo
w m
otiv
atio
n
8.2
8.2
8.2
8.2
8.2
8.2
8.2
8.2
8.2
8.2
8.2
8.2
8.2
8.2
8.2
8.2
8.2
0.0
v217
cut p
ow
er atta
ck p
re-m
edita
tion a
ccid
enta
l 8.2
8.2
8.2
8.2
8.2
8.2
8.2
8.2
8.2
8.2
8.2
8.2
8.2
8.2
8.2
8.2
8.2
0.0
v236
phys
ical i
ntim
idatio
n a
ttack
pre
-med
itatio
n e
xtre
me m
otiv
atio
n
4.1
8.2
11.4
8.2
4.1
0.1
0.1
0.1
4.1
0.1
8.2
4.1
0.1
13.3
4.7
4.1
0.1
4.5
v237
phys
ical i
ntim
idatio
n a
ttack
pre
-med
itatio
n h
igh m
otiv
atio
n
4.1
8.2
11.4
8.2
4.1
4.1
0.1
0.1
4.1
4.1
8.2
4.1
4.1
11.4
5.4
4.1
4.1
3.6
v239
phys
ical i
ntim
idatio
n a
ttack
pre
-med
itatio
n m
ode
rate
motiv
atio
n
8.2
4.1
11.4
11.4
4.1
4.1
0.1
4.1
4.1
8.2
11.4
4.1
4.1
8.2
6.3
4.1
4.1
3.5
v238
phys
ical i
ntim
idatio
n a
ttack
pre
-med
itatio
n lo
w m
otiv
atio
n
11.4
4.1
13.3
13.3
0.1
4.1
0.1
8.2
17.3
11.4
11.4
4.1
8.2
4.1
7.9
8.2
4.1
5.3
v240
phys
ical i
ntim
idatio
n a
ttack
pre
-med
itatio
n v
ery
low
motiv
atio
n
13.3
0.1
13.3
13.3
0.1
4.1
0.1
4.1
17.3
13.3
13.3
8.2
11.4
0.1
8.0
9.8
13.3
6.3
v235
phys
ical i
ntim
idatio
n a
ttack
pre
-med
itatio
n a
ccid
enta
l 14.7
4.1
13.3
14.7
4.1
0.1
0.1
4.1
17.3
17.3
13.3
8.2
13.3
8.2
9.5
10.8
4.1
6.1
v224
ele
ctric
tools
atta
ck p
re-m
edita
tion e
xtre
me m
otiv
atio
n
4.1
11.4
0.1
4.1
4.1
4.1
0.1
0.1
4.1
0.1
4.1
4.1
4.1
14.7
4.2
4.1
4.1
4.2
v225
ele
ctric
tools
atta
ck p
re-m
edita
tion h
igh
motiv
atio
n
4.1
8.2
0.1
4.1
4.1
4.1
0.1
0.1
4.1
4.1
4.1
4.1
8.2
13.3
4.5
4.1
4.1
3.6
v227
ele
ctric
tools
atta
ck p
re-m
edita
tion m
ode
rate
motiv
atio
n
8.2
8.2
0.1
8.2
4.1
8.2
0.1
4.1
4.1
8.2
8.2
4.1
8.2
11.4
6.1
8.2
8.2
3.4
v226
ele
ctric
tools
atta
ck p
re-m
edita
tion lo
w m
otiv
atio
n
11.4
4.1
4.1
8.2
4.1
8.2
0.1
11.4
8.2
11.4
8.2
8.2
11.4
8.2
7.7
8.2
8.2
3.4
v228
ele
ctric
tools
atta
ck p
re-m
edita
tion v
ery
low
motiv
atio
n
11.4
4.1
4.1
11.4
4.1
11.4
0.1
14.7
8.2
13.3
8.2
8.2
11.4
4.1
8.2
8.2
11.4
4.3
v223
ele
ctric
tools
atta
ck p
re-m
edita
tion a
ccid
enta
l 13.3
8.2
8.2
11.4
4.1
0.1
0.1
17.3
11.4
17.3
11.4
11.4
13.3
11.4
9.9
11.4
11.4
5.4
v248
viole
nt d
estruc
tion a
ttack
pre
-med
itatio
n e
xtre
me m
otiv
atio
n
4.1
11.4
13.3
11.4
4.1
8.2
0.1
8.2
0.1
0.1
4.1
4.1
4.1
17.3
6.5
4.1
4.1
5.3
v249
viole
nt d
estruc
tion a
ttack
pre
-med
itatio
n h
igh m
otiv
atio
n
4.1
11.4
13.3
11.4
4.1
8.2
0.1
8.2
0.1
4.1
8.2
4.1
4.1
14.7
6.9
6.2
4.1
4.6
v251
viole
nt d
estruc
tion a
ttack
pre
-med
itatio
n m
odera
te m
otiv
atio
n
8.2
8.2
13.3
13.3
0.1
8.2
0.1
4.1
0.1
8.2
8.2
4.1
4.1
13.3
6.7
8.2
8.2
4.8
v250
viole
nt d
estruc
tion a
ttack
pre
-med
itatio
n lo
w m
otiv
atio
n
11.4
8.2
14.7
14.7
4.1
8.2
0.1
4.1
0.1
11.4
11.4
8.2
8.2
8.2
8.1
8.2
8.2
4.6
v252
viole
nt d
estruc
tion a
ttack
pre
-med
itatio
n v
ery
low
motiv
atio
n
11.4
4.1
14.7
14.7
0.1
11.4
0.1
11.4
0.1
13.3
11.4
11.4
11.4
4.1
8.5
11.4
11.4
5.6
v247
viole
nt d
estruc
tion a
ttack
pre
-med
itatio
n a
ccid
enta
l 13.3
8.2
17.3
17.3
0.1
0.1
0.1
13.3
0.1
17.3
13.3
11.4
14.7
8.2
9.6
12.4
0.1
6.9
v230
exp
losi
ve a
ttack
pre
-medita
tion e
xtre
me m
otiv
atio
n
4.1
13.3
14.7
13.3
0.1
8.2
0.1
4.1
0.1
0.1
4.1
4.1
0.1
14.7
5.8
4.1
0.1
5.9
v231
exp
losi
ve a
ttack
pre
-medita
tion h
igh m
otiv
atio
n
4.1
13.3
14.7
13.3
0.1
8.2
0.1
8.2
0.1
4.1
4.1
4.1
0.1
13.3
6.3
4.1
4.1
5.5
v233
exp
losi
ve a
ttack
pre
-medita
tion m
ode
rate
motiv
atio
n
8.2
11.4
17.3
14.7
4.1
11.4
0.1
13.3
0.1
8.2
8.2
4.1
4.1
11.4
8.3
8.2
8.2
5.3
v232
exp
losi
ve a
ttack
pre
-medita
tion lo
w m
otiv
atio
n
11.4
8.2
17.3
14.7
0.1
13.3
0.1
14.7
0.1
11.4
8.2
8.2
4.1
8.2
8.6
8.2
8.2
5.7
v234
exp
losi
ve a
ttack
pre
-medita
tion v
ery
low
motiv
atio
n
13.3
4.1
17.3
17.3
4.1
13.3
0.1
17.3
0.1
13.3
11.4
11.4
8.2
0.1
9.4
11.4
13.3
6.6
v229
exp
losi
ve a
ttack
pre
-medita
tion a
ccid
enta
l 14.7
4.1
17.3
17.3
0.1
0.1
0.1
17.3
0.1
17.3
13.3
11.4
11.4
8.2
9.5
11.4
17.3
7.2
v242
tech
nolo
gic
al a
ttack
atta
ck p
re-m
edita
tion e
xtre
me m
otiv
atio
n
4.1
4.1
8.2
4.1
4.1
8.2
8.2
0.1
4.1
11.4
8.2
4.1
8.2
17.3
6.7
6.2
4.1
4.2
v243
tech
nolo
gic
al a
ttack
atta
ck p
re-m
edita
tion h
igh m
otiv
atio
n
8.2
4.1
8.2
4.1
4.1
11.4
8.2
4.1
4.1
11.4
8.2
4.1
8.2
14.7
7.4
8.2
4.1
3.4
v245
tech
nolo
gic
al a
ttack
atta
ck p
re-m
edita
tion m
ode
rate
motiv
atio
n
8.2
4.1
11.4
8.2
4.1
8.2
8.2
11.4
4.1
11.4
11.4
4.1
11.4
11.4
8.4
8.2
11.4
3.1
v246
tech
nolo
gic
al a
ttack
atta
ck p
re-m
edita
tion v
ery
low
motiv
atio
n
11.4
0.1
11.4
8.2
8.2
11.4
4.1
13.3
8.2
14.7
13.3
8.2
13.3
4.1
9.3
9.8
8.2
4.2
v244
tech
nolo
gic
al a
ttack
atta
ck p
re-m
edita
tion lo
w m
otiv
atio
n
11.4
8.2
11.4
8.2
8.2
11.4
4.1
11.4
8.2
13.3
11.4
8.2
14.7
8.2
9.9
9.8
8.2
2.7
v241
tech
nolo
gic
al a
ttack
atta
ck p
re-m
edita
tion a
ccid
enta
l 13.3
8.2
13.3
8.2
8.2
0.1
0.1
17.3
11.4
17.3
17.3
8.2
17.3
11.4
10.8
11.4
8.2
5.8
v273
low
valu
e g
ood
s pre
-atta
ck c
onsi
dera
tion e
xplo
sive
0.1
0.1
0.1
0.1
0.1
0.1
0.1
0.1
0.1
0.1
0.1
0.1
0.1
0.1
0.1
0.1
0.0
v275
low
valu
e g
ood
s pre
-atta
ck c
onsi
dera
tion te
chnolo
gic
al a
ttack
0.1
0.1
0.1
0.1
0.1
0.1
0.1
0.1
0.1
0.1
0.1
0.1
0.1
0.1
0.1
0.1
0.0
v274
low
valu
e g
ood
s pre
-atta
ck c
onsi
dera
tion p
hys
ical i
ntim
idatio
n
8.2
8.2
8.2
8.2
8.2
8.2
8.2
8.2
8.2
8.2
8.2
8.2
8.2
8.2
8.2
8.2
0.0
v276
low
valu
e g
ood
s pre
-atta
ck c
onsi
dera
tion v
iole
nt d
estruc
tion
8.2
8.2
8.2
8.2
8.2
8.2
8.2
8.2
8.2
8.2
8.2
8.2
8.2
8.2
8.2
8.2
0.0
v271
low
valu
e g
ood
s pre
-atta
ck c
onsi
dera
tion c
ut p
ow
er
13.3
13.3
13.3
13.3
13.3
13.3
13.3
13.3
13.3
13.3
13.3
13.3
13.3
13.3
13.3
13.3
0.0
v272
low
valu
e g
ood
s pre
-atta
ck c
onsi
dera
tion e
lect
ric to
ols
13.3
13.3
13.3
13.3
13.3
13.3
13.3
13.3
13.3
13.3
13.3
13.3
13.3
13.3
13.3
13.3
0.0
v285
small
cash
pre
-atta
ck c
onsi
dera
tion e
xplo
sive
0.1
13.3
8.2
0.1
0.1
0.1
0.1
8.2
8.2
0.1
0.1
0.1
14.7
4.1
0.1
0.1
5.6
v287
small
cash
pre
-atta
ck c
onsi
dera
tion te
chno
logic
al a
ttack
0.1
4.1
0.1
0.1
11.4
4.1
4.1
13.3
8.2
0.1
0.1
13.3
13.3
5.5
4.1
0.1
5.6
v288
small
cash
pre
-atta
ck c
onsi
dera
tion v
iole
nt de
stru
ctio
n
4.1
11.4
8.2
4.1
8.2
0.1
0.1
8.2
8.2
8.2
4.1
4.1
14.7
6.4
8.2
8.2
4.2
v286
small
cash
pre
-atta
ck c
onsi
dera
tion p
hysi
cal i
ntim
idatio
n
11.4
8.2
8.2
11.4
13.3
8.2
4.1
14.7
8.2
8.2
8.2
4.1
11.4
9.2
8.2
8.2
3.2
v284
small
cash
pre
-atta
ck c
onsi
dera
tion e
lect
ric to
ols
13.3
4.1
13.3
11.4
8.2
8.2
4.1
14.7
8.2
11.4
13.3
8.2
11.4
10.0
11.4
8.2
3.5
v283
small
cash
pre
-atta
ck c
onsi
dera
tion c
ut p
ow
er
13.3
8.2
13.3
13.3
8.2
8.2
0.1
13.3
8.2
11.4
13.3
14.7
13.3
10.7
13.3
13.3
4.0

v279
pers
onal v
alu
able
s pre
-atta
ck c
onsi
dera
tion e
xplo
sive
0.1
13.3
4.1
0.1
0.1
0.1
0.1
4.1
8.2
0.1
0.1
0.1
14.7
3.5
0.1
0.1
5.3
v281
pers
onal v
alu
able
s pre
-atta
ck c
onsi
dera
tion te
chnolo
gic
al a
ttack
4.1
11.4
0.1
13.3
11.4
0.1
0.1
8.2
8.2
0.1
0.1
11.4
13.3
6.3
8.2
0.1
5.6
v282
pers
onal v
alu
able
s pre
-atta
ck c
onsi
dera
tion v
iole
nt d
est
ruct
ion
8.2
13.3
11.4
4.1
8.2
0.1
0.1
14.7
8.2
8.2
4.1
4.1
14.7
7.6
8.2
8.2
5.0
v278
pers
onal v
alu
able
s pre
-atta
ck c
onsi
dera
tion e
lect
ric to
ols
8.2
4.1
11.4
13.3
8.2
4.1
0.1
8.2
8.2
11.4
13.3
11.4
11.4
8.7
8.2
8.2
4.0
v280
pers
onal v
alu
able
s pre
-atta
ck c
onsi
dera
tion p
hys
ical i
ntim
idatio
n
13.3
13.3
8.2
11.4
13.3
8.2
0.1
14.7
8.2
8.2
8.2
8.2
11.4
9.7
8.2
8.2
3.8
v277
pers
onal v
alu
able
s pre
-atta
ck c
onsi
dera
tion c
ut p
ow
er
13.3
4.1
8.2
14.7
13.3
4.1
4.1
8.2
8.2
11.4
13.3
13.3
13.3
10.0
11.4
13.3
4.0
v255
corp
ora
te d
ata
pre
-atta
ck c
onsi
dera
tion e
xplo
sive
14.7
17.3
13.3
4.1
11.4
11.4
0.1
8.2
8.2
13.3
4.1
0.1
14.7
9.3
11.4
14.7
5.7
v256
corp
ora
te d
ata
pre
-atta
ck c
onsi
dera
tion p
hys
ical i
ntim
idatio
n
8.2
14.7
11.4
11.4
13.3
4.1
4.1
11.4
8.2
13.3
8.2
13.3
14.7
10.5
11.4
8.2
3.6
v254
corp
ora
te d
ata
pre
-atta
ck c
onsi
dera
tion
ele
ctric
tools
11.4
13.3
11.4
14.7
14.7
13.3
4.1
13.3
8.2
13.3
8.2
8.2
14.7
11.4
13.3
13.3
3.3
v258
corp
ora
te d
ata
pre
-atta
ck c
onsi
dera
tion v
iole
nt des
truc
tion
14.7
17.3
14.7
11.4
0.1
14.7
8.2
14.7
8.2
4.1
4.1
10.2
11.4
14.7
5.6
v253
corp
ora
te d
ata
pre
-atta
ck c
onsi
dera
tion c
ut p
ow
er
14.7
14.7
14.7
14.7
13.3
17.3
4.1
11.4
8.2
14.7
13.3
14.7
14.7
13.1
14.7
14.7
3.5
v257
corp
ora
te d
ata
pre
-atta
ck c
onsi
dera
tion te
chno
logic
al a
ttack
14.7
14.7
14.7
13.3
14.7
14.7
4.1
13.3
8.2
14.7
13.3
14.7
14.7
13.1
14.7
14.7
3.2
v267
larg
e c
ash p
re-a
ttack
con
sidera
tion e
xplo
sive
17.3
14.7
14.7
8.2
13.3
0.1
0.1
14.7
8.2
13.3
8.2
0.1
17.3
10.0
13.3
14.7
6.5
v270
larg
e c
ash p
re-a
ttack
con
sidera
tion v
iole
nt d
estruct
ion
14.7
14.7
14.7
8.2
11.4
11.4
0.1
14.7
8.2
13.3
8.2
4.1
14.7
10.6
11.4
14.7
4.7
v268
larg
e c
ash p
re-a
ttack
con
sidera
tion p
hys
ical i
ntim
idatio
n
13.3
14.7
13.3
8.2
11.4
8.2
4.1
14.7
8.2
13.3
8.2
8.2
14.7
10.8
11.4
8.2
3.5
v266
larg
e c
ash p
re-a
ttack
con
sidera
tion e
lect
ric to
ols
14.7
13.3
14.7
13.3
13.3
8.2
4.1
13.3
8.2
13.3
11.4
4.1
14.7
11.3
13.3
13.3
3.8
v265
larg
e c
ash p
re-a
ttack
con
sidera
tion c
ut p
ow
er
13.3
14.7
17.3
14.7
11.4
4.1
4.1
13.3
8.2
14.7
11.4
11.4
14.7
11.8
13.3
14.7
4.1
v269
larg
e c
ash p
re-a
ttack
con
sidera
tion te
chno
logic
al a
ttack
14.7
14.7
17.3
13.3
13.3
4.1
4.1
13.3
8.2
14.7
8.2
13.3
14.7
11.8
13.3
14.7
4.3
v263
hum
an li
fe p
re-a
ttack
con
sidera
tion te
chno
logic
al a
ttack
0.1
17.3
17.3
14.7
17.3
0.1
0.1
11.4
8.2
17.3
0.1
8.2
13.3
9.6
11.4
0.1
7.3
v259
hum
an li
fe p
re-a
ttack
con
sidera
tion c
ut p
ow
er
0.1
17.3
17.3
14.7
17.3
4.1
4.1
11.4
8.2
17.3
4.1
4.1
13.3
10.3
11.4
17.3
6.4
v260
hum
an li
fe p
re-a
ttack
con
sidera
tion e
lect
ric to
ols
4.1
17.3
17.3
14.7
14.7
8.2
0.1
11.4
8.2
17.3
8.2
8.2
13.3
11.0
11.4
8.2
5.4
v262
hum
an li
fe p
re-a
ttack
con
sidera
tion p
hys
ical i
ntim
idatio
n
14.7
17.3
17.3
11.4
14.7
11.4
0.1
14.7
8.2
17.3
8.2
13.3
14.7
12.6
14.7
14.7
4.9
v261
hum
an li
fe p
re-a
ttack
con
sidera
tion e
xplo
sive
11.4
17.3
17.3
13.3
14.7
17.3
0.1
17.3
8.2
17.3
0.1
14.7
14.7
12.6
14.7
17.3
6.2
v264
hum
an li
fe p
re-a
ttack
con
sidera
tion v
iole
nt d
estruct
ion
14.7
17.3
17.3
13.3
17.3
11.4
0.1
17.3
8.2
17.3
13.3
14.7
17.3
13.8
14.7
17.3
5.0
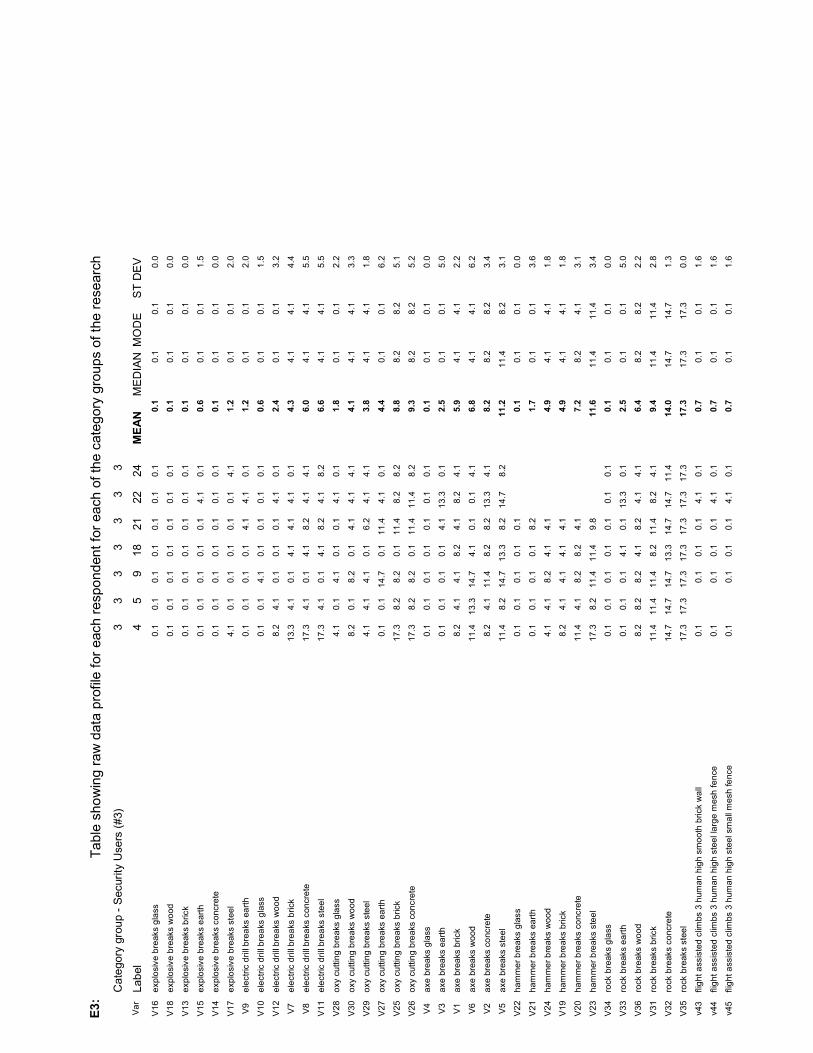
E3:
Tab
le s
how
ing
raw
dat
a pr
ofile
for
eac
h re
spon
dent
for ea
ch o
f the
cat
egor
y gr
oups
of t
he res
earc
h
Cat
ego
ry g
roup
- Sec
urity
Use
rs (#3
) 3
3 3
3 3
3 3
Var
Label
4
5 9
18
21
22
24
MEAN
MED
IAN
MO
DE
ST D
EV
V16
exp
losi
ve b
reak
s gla
ss
0.1
0.1
0.1
0.1
0.1
0.1
0.1
0.1
0.1
0.1
0.0
V18
exp
losi
ve b
reak
s w
ood
0.1
0.1
0.1
0.1
0.1
0.1
0.1
0.1
0.1
0.1
0.0
V13
exp
losi
ve b
reak
s bric
k 0.1
0.1
0.1
0.1
0.1
0.1
0.1
0.1
0.1
0.1
0.0
V15
exp
losi
ve b
reak
s earth
0.1
0.1
0.1
0.1
0.1
4.1
0.1
0.6
0.1
0.1
1.5
V14
exp
losi
ve b
reak
s co
ncre
te
0.1
0.1
0.1
0.1
0.1
0.1
0.1
0.1
0.1
0.1
0.0
V17
exp
losi
ve b
reak
s st
eel
4.1
0.1
0.1
0.1
0.1
0.1
4.1
1.2
0.1
0.1
2.0
V9
ele
ctric
dril
l bre
aks
earth
0.1
0.1
0.1
0.1
4.1
4.1
0.1
1.2
0.1
0.1
2.0
V10
ele
ctric
dril
l bre
aks
gla
ss
0.1
0.1
4.1
0.1
0.1
0.1
0.1
0.6
0.1
0.1
1.5
V12
ele
ctric
dril
l bre
aks
wood
8.2
4.1
0.1
0.1
0.1
4.1
0.1
2.4
0.1
0.1
3.2
V7
ele
ctric
dril
l bre
aks
bric
k 13.3
4.1
0.1
4.1
4.1
4.1
0.1
4.3
4.1
4.1
4.4
V8
ele
ctric
dril
l bre
aks
con
crete
17.3
4.1
0.1
4.1
8.2
4.1
4.1
6.0
4.1
4.1
5.5
V11
ele
ctric
dril
l bre
aks
ste
el
17.3
4.1
0.1
4.1
8.2
4.1
8.2
6.6
4.1
4.1
5.5
V28
oxy
cutti
ng b
reak
s gla
ss
4.1
0.1
4.1
0.1
0.1
4.1
0.1
1.8
0.1
0.1
2.2
V30
oxy
cutti
ng b
reak
s w
ood
8.2
0.1
8.2
0.1
4.1
4.1
4.1
4.1
4.1
4.1
3.3
V29
oxy
cutti
ng b
reak
s st
eel
4.1
4.1
4.1
0.1
6.2
4.1
4.1
3.8
4.1
4.1
1.8
V27
oxy
cutti
ng b
reak
s ea
rth
0.1
0.1
14.7
0.1
11.4
4.1
0.1
4.4
0.1
0.1
6.2
V25
oxy
cutti
ng b
reak
s bric
k 17.3
8.2
8.2
0.1
11.4
8.2
8.2
8.8
8.2
8.2
5.1
V26
oxy
cutti
ng b
reak
s co
ncr
ete
17.3
8.2
8.2
0.1
11.4
11.4
8.2
9.3
8.2
8.2
5.2
V4
axe
bre
aks
gla
ss
0.1
0.1
0.1
0.1
0.1
0.1
0.1
0.1
0.1
0.1
0.0
V3
axe
bre
aks
earth
0.1
0.1
0.1
0.1
4.1
13.3
0.1
2.5
0.1
0.1
5.0
V1
axe
bre
aks
bric
k 8.2
4.1
4.1
8.2
4.1
8.2
4.1
5.9
4.1
4.1
2.2
V6
axe
bre
aks
wood
11.4
13.3
14.7
4.1
0.1
0.1
4.1
6.8
4.1
4.1
6.2
V2
axe
bre
aks
conc
rete
8.2
4.1
11.4
8.2
8.2
13.3
4.1
8.2
8.2
8.2
3.4
V5
axe
bre
aks
steel
11.4
8.2
14.7
13.3
8.2
14.7
8.2
11.2
11.4
8.2
3.1
V22
ham
mer bre
aks
gla
ss
0.1
0.1
0.1
0.1
0.1
0.1
0.1
0.1
0.0
V21
ham
mer bre
aks
earth
0.1
0.1
0.1
0.1
8.2
1.7
0.1
0.1
3.6
V24
ham
mer bre
aks
wood
4.1
4.1
8.2
4.1
4.1
4.9
4.1
4.1
1.8
V19
ham
mer bre
aks
bric
k 8.2
4.1
4.1
4.1
4.1
4.9
4.1
4.1
1.8
V20
ham
mer bre
aks
conc
rete
11.4
4.1
8.2
8.2
4.1
7.2
8.2
4.1
3.1
V23
ham
mer bre
aks
ste
el
17.3
8.2
11.4
11.4
9.8
11.6
11.4
11.4
3.4
V34
rock
bre
aks
gla
ss
0.1
0.1
0.1
0.1
0.1
0.1
0.1
0.1
0.1
0.1
0.0
V33
rock
bre
aks
earth
0.1
0.1
0.1
4.1
0.1
13.3
0.1
2.5
0.1
0.1
5.0
V36
rock
bre
aks
wood
8.2
8.2
8.2
4.1
8.2
4.1
4.1
6.4
8.2
8.2
2.2
V31
rock
bre
aks
bric
k 11.4
11.4
11.4
8.2
11.4
8.2
4.1
9.4
11.4
11.4
2.8
V32
rock
bre
aks
conc
rete
14.7
14.7
14.7
13.3
14.7
14.7
11.4
14.0
14.7
14.7
1.3
V35
rock
bre
aks
stee
l 17.3
17.3
17.3
17.3
17.3
17.3
17.3
17.3
17.3
17.3
0.0
v43
flight a
ssis
ted c
limbs
3 h
uman
hig
h s
mooth
bric
k w
all
0.1
0.1
0.1
0.1
4.1
0.1
0.7
0.1
0.1
1.6
v44
flight a
ssis
ted c
limbs
3 h
uman
hig
h s
teel l
arg
e m
esh fe
nce
0.1
0.1
0.1
0.1
4.1
0.1
0.7
0.1
0.1
1.6
v45
flight a
ssis
ted c
limbs
3 h
uman
hig
h s
teel s
mall
mes
h fe
nce
0.1
0.1
0.1
0.1
4.1
0.1
0.7
0.1
0.1
1.6

v46
flight a
ssis
ted c
limbs
5 h
uman
hig
h s
mooth
bric
k w
all
0.1
0.1
0.1
0.1
4.1
0.1
0.7
0.1
0.1
1.6
v48
flight a
ssis
ted c
limbs
5 h
uman
hig
h s
teel m
esh fe
nce
0.1
0.1
0.1
0.1
4.1
0.1
0.7
0.1
0.1
1.6
v47
flight a
ssis
ted c
limbs
5 h
uman
hig
h s
mooth
bric
k w
all
and razo
r w
ire
0.1
0.1
0.1
0.1
4.1
0.1
0.7
0.1
0.1
1.6
v62
pro
ject
iles
and
wire
clim
bs 3
hum
an h
igh s
teel l
arg
e m
esh fe
nce
0.1
0.1
0.1
0.1
4.1
0.1
0.7
0.1
0.1
1.6
v63
pro
ject
iles
and
wire
clim
bs 3
hum
an h
igh s
teel s
mall
mesh
fence
0.1
0.1
0.1
0.1
4.1
0.1
0.7
0.1
0.1
1.6
v61
pro
ject
iles
and
wire
clim
bs 3
hum
an h
igh s
moo
th b
rick
wall
0.1
0.1
0.1
0.1
4.1
0.1
0.7
0.1
0.1
1.6
v66
pro
ject
iles
and
wire
clim
bs 5
hum
an h
igh s
teel m
esh fe
nce
0.1
0.1
4.1
0.1
8.2
4.1
2.8
2.1
0.1
3.3
v64
pro
ject
iles
and
wire
clim
bs 5
hum
an h
igh s
moo
th b
rick
wall
0.1
0.1
4.1
0.1
8.2
4.1
2.8
2.1
0.1
3.3
v65
pro
ject
iles
and
wire
clim
bs 5
hum
an h
igh s
moo
th b
rick
wall
and razo
r w
ire
4.1
0.1
4.1
0.1
8.2
4.1
3.4
4.1
4.1
3.1
v38
clim
bin
g a
ids
clim
bs 3
hum
an h
igh s
teel
larg
e m
esh fe
nce
0.1
0.1
4.1
0.1
4.1
0.1
1.4
0.1
0.1
2.1
v39
clim
bin
g a
ids
clim
bs 3
hum
an h
igh s
teel
sm
all
mes
h fe
nce
0.1
0.1
4.1
0.1
4.1
0.1
1.4
0.1
0.1
2.1
v37
clim
bin
g a
ids
clim
bs 3
hum
an h
igh s
moo
th b
rick
wall
0.1
4.1
13.3
0.1
8.2
4.1
5.0
4.1
0.1
5.1
v42
clim
bin
g a
ids
clim
bs 5
hum
an h
igh s
teel
mes
h fe
nce
11.4
11.4
4.1
8.2
4.1
4.1
7.2
6.2
4.1
3.6
v40
clim
bin
g a
ids
clim
bs 5
hum
an h
igh s
moo
th b
rick
wall
0.1
4.1
17.3
4.1
11.4
4.1
6.8
4.1
4.1
6.3
v41
clim
bin
g a
ids
clim
bs 5
hum
an h
igh s
moo
th b
rick
wall
and razo
r w
ire
4.1
4.1
17.3
4.1
11.4
4.1
7.5
4.1
4.1
5.6
v50
ladder cl
imbs
3 h
uman h
igh s
teel l
arg
e m
esh fe
nce
0.1
0.1
4.1
0.1
4.1
0.1
1.4
0.1
0.1
2.1
v51
ladder cl
imbs
3 h
uman h
igh s
teel s
mall
mes
h fen
ce
0.1
0.1
8.2
0.1
11.4
0.1
3.3
0.1
0.1
5.1
v49
ladder cl
imbs
3 h
uman h
igh s
moo
th b
rick
wall
0.1
0.1
13.3
0.1
11.4
0.1
4.2
0.1
0.1
6.4
v54
ladder cl
imbs
5 h
uman h
igh s
teel m
esh
fenc
e
0.1
4.1
8.2
4.1
13.3
0.1
5.0
4.1
0.1
5.1
v52
ladder cl
imbs
5 h
uman h
igh s
moo
th b
rick
wall
4.1
4.1
17.3
4.1
13.3
0.1
7.2
4.1
4.1
6.6
v53
ladder cl
imbs
5 h
uman h
igh s
moo
th b
rick
wall
and razo
r w
ire
4.1
4.1
17.3
4.1
13.3
4.1
7.8
4.1
4.1
5.9
v68
rope c
limbs
3 h
uman h
igh s
teel l
arg
e m
esh
fence
0.1
0.1
4.1
0.1
1.1
0.1
0.1
2.0
v69
rope c
limbs
3 h
uman h
igh s
teel s
mall
mes
h fe
nce
0.1
0.1
4.1
0.1
1.1
0.1
0.1
2.0
v67
rope c
limbs
3 h
uman h
igh s
mooth
bric
k w
all
0.1
0.1
4.1
0.1
1.1
0.1
0.1
2.0
v72
rope c
limbs
5 h
uman h
igh s
teel m
esh fe
nce
4.1
4.1
4.1
4.1
4.1
4.1
4.1
0.0
v70
rope c
limbs
5 h
uman h
igh s
mooth
bric
k w
all
4.1
4.1
4.1
4.1
4.1
4.1
4.1
0.0
v71
rope c
limbs
5 h
uman h
igh s
mooth
bric
k w
all
and razo
r w
ire
4.1
4.1
4.1
4.1
4.1
4.1
4.1
0.0
v56
no a
id c
limbs
3 h
uman h
igh s
teel l
arg
e m
esh fe
nce
0.1
0.1
0.1
4.1
0.1
4.1
0.1
1.2
0.1
0.1
2.0
v57
no a
id c
limbs
3 h
uman h
igh s
teel s
mall
mes
h fe
nce
8.2
8.2
8.2
8.2
8.2
13.3
0.1
7.8
8.2
8.2
3.9
v60
no a
id c
limbs
5 h
uman h
igh s
teel m
esh
fenc
e
8.2
8.2
8.2
8.2
8.2
14.7
4.1
8.5
8.2
8.2
3.1
v55
no a
id c
limbs
3 h
uman h
igh s
moo
th b
rick
wall
8.2
8.2
8.2
13.3
8.2
13.3
17.3
11.0
8.2
8.2
3.7
v58
no a
id c
limbs
5 h
uman h
igh s
moo
th b
rick
wall
17.3
17.3
17.3
17.3
17.3
14.7
17.3
16.9
17.3
17.3
1.0
v59
no a
id c
limbs
5 h
uman h
igh s
moo
th b
rick
wall
and razo
r w
ire
17.3
17.3
17.3
17.3
17.3
17.3
17.3
17.3
17.3
17.3
0.0
v93
luck
eva
des
infrare
d
0.1
0.1
0.1
0.1
0.1
4.1
11.4
2.3
0.1
0.1
4.3
v94
luck
eva
des
mic
row
ave
0.1
0.1
0.1
0.1
0.1
4.1
11.4
2.3
0.1
0.1
4.3
v96
luck
eva
des
multi
ple
sys
tem
s 0.1
0.1
0.1
0.1
0.1
4.1
17.3
3.1
0.1
0.1
6.4
v92
luck
eva
des
clo
sed c
ircuit
tv
4.1
4.1
4.1
4.1
4.1
4.1
17.3
6.0
4.1
4.1
5.0
v95
luck
eva
des
mobile
hum
an g
uard
8.2
8.2
8.2
8.2
8.2
4.1
11.5
8.1
8.2
8.2
2.1
v91
luck
eva
des
cha
nce d
ete
ctio
n
14.7
14.7
14.7
11.4
14.7
8.2
11.4
12.8
14.7
14.7
2.6
v84
crea
te fa
lse a
larm
s ev
ade
s m
ulti
ple
sys
tem
s 0.1
8.2
0.1
4.1
4.1
8.2
4.1
4.1
0.1
3.6
v81
crea
te fa
lse a
larm
s ev
ade
s in
frare
d
0.1
8.2
0.1
4.1
4.1
14.7
5.2
4.1
0.1
5.6
v82
crea
te fa
lse a
larm
s ev
ade
s m
icro
wave
0.1
8.2
0.1
4.1
4.1
13.3
5.0
4.1
0.1
5.1
v80
crea
te fa
lse a
larm
s ev
ade
s cl
osed
circ
uit tv
11.4
8.2
8.2
4.1
4.1
14.7
8.5
8.2
8.2
4.1
v83
crea
te fa
lse a
larm
s ev
ade
s m
obile
hum
an g
uard
14.7
8.2
8.2
8.2
8.2
0.1
7.9
8.2
8.2
4.6
v79
crea
te fa
lse a
larm
s ev
ade
s ch
anc
e d
ete
ctio
n
14.7
8.2
4.1
14.7
8.2
4.1
9.0
8.2
14.7
4.8

v102
smok
e e
vade
s m
ulti
ple
sys
tem
s 0.1
0.1
4.1
0.1
0.1
4.1
14.7
3.3
0.1
0.1
5.4
v100
smok
e e
vade
s m
icro
wav
e
0.1
0.1
0.1
0.1
0.1
4.1
14.7
2.7
0.1
0.1
5.5
v99
smok
e e
vade
s in
frare
d
0.1
0.1
0.1
4.1
4.1
8.2
14.7
4.5
4.1
0.1
5.4
v98
smok
e e
vade
s cl
osed
circ
uit
tv
14.7
11.4
8.2
8.2
4.1
8.2
4.1
8.4
8.2
8.2
3.8
v101
smok
e e
vade
s m
obile
hum
an g
uard
14.7
11.4
8.2
8.2
8.2
8.2
4.1
9.0
8.2
8.2
3.3
v97
smok
e e
vade
s ch
anc
e d
ete
ctio
n
14.7
11.4
8.2
8.2
14.7
8.2
4.1
9.9
8.2
8.2
3.9
v76
colo
ur ca
mou
flage e
vades
mic
row
ave
0.1
0.1
0.1
0.1
0.1
4.1
17.3
3.1
0.1
0.1
6.4
v75
colo
ur ca
mou
flage e
vades
infrare
d
0.1
0.1
0.1
0.1
0.1
4.1
17.3
3.1
0.1
0.1
6.4
v78
colo
ur ca
mou
flage e
vades
multi
ple
sys
tem
s 13.3
11.4
4.1
0.1
0.1
0.1
0.1
4.2
0.1
0.1
5.8
v74
colo
ur ca
mou
flage e
vades
clo
sed c
ircuit
tv
11.4
8.2
8.2
8.2
4.1
4.1
11.4
7.9
8.2
8.2
3.0
v77
colo
ur ca
mou
flage e
vades
mobile
hum
an g
uard
11.4
8.2
8.2
11.4
11.4
4.1
8.2
9.0
8.2
11.4
2.7
v73
colo
ur ca
mou
flage e
vades
cha
nce d
ete
ctio
n
14.7
11.4
8.2
13.3
14.7
8.2
8.2
11.2
11.4
8.2
3.1
v108
syst
em k
now
ledge e
vade
s m
ulti
ple
sys
tem
s 8.2
17.3
8.2
8.2
8.2
4.1
4.1
8.3
8.2
8.2
4.4
v106
syst
em k
now
ledge e
vade
s m
icro
wav
e
11.4
17.3
8.2
8.2
4.1
4.1
0.1
7.6
8.2
8.2
5.6
v105
syst
em k
now
ledge e
vade
s in
frare
d
11.4
17.3
8.2
8.2
4.1
4.1
0.1
7.6
8.2
8.2
5.6
v107
syst
em k
now
ledge e
vade
s m
obile
hum
an g
uard
11.4
17.3
8.2
8.2
8.2
4.1
0.1
8.2
8.2
8.2
5.4
v104
syst
em k
now
ledge e
vade
s cl
osed
circ
uit
tv
14.7
17.3
8.2
8.2
8.2
4.1
0.1
8.7
8.2
8.2
5.9
v103
syst
em k
now
ledge e
vade
s ch
anc
e d
ete
ctio
n
17.3
17.3
8.2
11.4
17.3
8.2
4.1
12.0
11.4
17.3
5.4
v90
know
ledge a
nd d
ivers
ion e
vade
s m
ulti
ple
sys
tem
s 8.2
17.3
11.4
8.2
8.2
4.1
0.1
8.2
8.2
8.2
5.4
v87
know
ledge a
nd d
ivers
ion e
vade
s in
frare
d
11.4
17.3
11.4
8.2
8.2
4.1
0.1
8.7
8.2
11.4
5.5
v88
know
ledge a
nd d
ivers
ion e
vade
s m
icro
wave
11.4
17.3
11.4
8.2
8.2
4.1
0.1
8.7
8.2
11.4
5.5
v86
know
ledge a
nd d
ivers
ion e
vade
s cl
osed
circ
uit
tv
17.3
17.3
11.4
8.2
11.4
4.1
0.1
10.0
11.4
17.3
6.4
v89
know
ledge a
nd d
ivers
ion e
vade
s m
obile
hum
an g
uard
13.3
17.3
11.4
8.2
11.4
4.1
0.1
9.4
11.4
11.4
5.8
v85
know
ledge a
nd d
ivers
ion e
vade
s ch
ance
dete
ctio
n
17.3
17.3
11.4
11.4
17.3
8.2
0.1
11.9
11.4
17.3
6.3
v140
viole
nt d
estruct
ion d
isable
s cl
osed
circ
uit
tv
11.4
13.3
0.1
8.2
0.1
8.2
0.1
5.9
8.2
0.1
5.7
v142
viole
nt d
estruct
ion d
isable
s m
icro
wav
e 14.7
13.3
0.1
17.3
0.1
11.4
0.1
8.1
11.4
0.1
7.7
v141
viole
nt d
estruct
ion d
isable
s in
frare
d
14.7
13.3
0.1
17.3
0.1
8.2
0.1
7.7
8.2
0.1
7.6
v143
viole
nt d
estruct
ion d
isable
s m
obile
hum
an g
uard
4.1
8.2
11.4
8.2
0.1
8.2
11.4
7.4
8.2
8.2
4.1
v144
viole
nt d
estruct
ion d
isable
s m
ulti
ple
sys
tem
s 17.3
13.3
0.1
17.3
0.1
13.3
0.1
8.8
13.3
0.1
8.3
v139
viole
nt d
estruct
ion d
isable
s ch
ance
dete
ctio
n
4.1
0.1
8.2
13.3
17.3
8.2
11.4
8.9
8.2
8.2
5.7
v134
syst
em k
now
ledge d
isable
s cl
osed c
ircuit
tv
4.1
17.3
0.1
8.2
4.1
8.2
4.1
6.6
4.1
4.1
5.5
v135
syst
em k
now
ledge d
isable
s in
frare
d
13.3
17.3
0.1
8.2
4.1
8.2
4.1
7.9
8.2
8.2
5.9
v136
syst
em k
now
ledge d
isable
s m
icro
wav
e 13.3
17.3
0.1
8.2
4.1
8.2
4.1
7.9
8.2
8.2
5.9
v138
syst
em k
now
ledge d
isable
s m
ulti
ple
sys
tem
s 14.7
17.3
0.1
8.2
8.2
11.4
4.1
9.1
8.2
8.2
5.9
v137
syst
em k
now
ledge d
isable
s m
obile
hum
an g
uard
4.1
8.2
14.7
8.2
11.4
8.2
11.4
9.5
8.2
8.2
3.4
v133
syst
em k
now
ledge d
isable
s ch
anc
e d
ete
ctio
n
4.1
17.3
8.2
8.2
17.3
8.2
11.4
10.7
8.2
8.2
5.0
v116
cut p
ow
er dis
able
s cl
osed
circ
uit
tv
11.4
8.2
0.1
8.2
0.1
4.1
0.1
4.6
4.1
0.1
4.7
v117
cut p
ow
er dis
able
s in
frare
d
14.7
8.2
0.1
17.3
0.1
4.1
0.1
6.4
4.1
0.1
7.3
v118
cut p
ow
er dis
able
s m
icro
wav
e
14.7
8.2
0.1
17.3
0.1
4.1
0.1
6.4
4.1
0.1
7.3
v120
cut p
ow
er dis
able
s m
ulti
ple
sys
tem
s 17.3
8.2
0.1
17.3
17.3
4.1
0.1
9.2
8.2
17.3
8.1
v115
cut p
ow
er dis
able
s ch
anc
e d
ete
ctio
n
8.2
8.2
8.2
8.2
17.3
8.2
13.3
10.2
8.2
8.2
3.7
v119
cut p
ow
er dis
able
s m
obile
hum
an g
uard
8.2
4.1
11.4
8.2
17.3
14.7
17.3
11.6
11.4
8.2
5.1
v122
ele
ctric
al i
nte
rfere
nce
dis
able
s cl
ose
d c
ircuit
tv
8.2
8.2
4.1
8.2
0.1
8.2
0.1
5.3
8.2
8.2
3.9
v123
ele
ctric
al i
nte
rfere
nce
dis
able
s in
frare
d 13.3
8.2
4.1
17.3
0.1
8.2
8.2
8.5
8.2
8.2
5.6
v124
ele
ctric
al i
nte
rfere
nce
dis
able
s m
icro
wav
e
14.7
8.2
4.1
17.3
0.1
11.4
8.2
9.1
8.2
8.2
5.9

v126
ele
ctric
al i
nte
rfere
nce
dis
able
s m
ulti
ple
sys
tem
s 14.7
8.2
4.1
17.3
4.1
13.3
8.2
10.0
8.2
8.2
5.2
v125
ele
ctric
al i
nte
rfere
nce
dis
able
s m
obile
hum
an g
uard
14.7
8.2
14.7
8.2
17.3
4.1
17.3
12.1
14.7
14.7
5.2
v121
ele
ctric
al i
nte
rfere
nce
dis
able
s ch
ance
dete
ctio
n
13.3
0.1
8.2
8.2
17.3
8.2
17.3
10.4
8.2
8.2
6.1
v131
phys
ical i
ntim
idatio
n d
isable
s m
obile
hum
an g
uard
8.2
0.1
8.2
4.1
4.1
11.4
6.0
6.2
8.2
4.0
v127
phys
ical i
ntim
idatio
n d
isable
s ch
anc
e d
ete
ctio
n
4.1
8.2
8.2
17.3
8.2
11.4
9.6
8.2
8.2
4.4
v128
phys
ical i
ntim
idatio
n d
isable
s cl
osed
circ
uit
tv
11.4
14.7
8.2
17.3
14.7
17.3
13.9
14.7
14.7
3.6
v129
phys
ical i
ntim
idatio
n d
isable
s in
frare
d
17.3
14.7
17.3
17.3
14.7
17.3
16.4
17.3
17.3
1.3
v130
phys
ical i
ntim
idatio
n d
isable
s m
icro
wav
e
17.3
14.7
17.3
17.3
14.7
17.3
16.4
17.3
17.3
1.3
v132
phys
ical i
ntim
idatio
n d
isable
s m
ulti
ple
sys
tem
s 17.3
14.7
17.3
17.3
8.2
17.3
15.4
17.3
17.3
3.7
v109
acc
iden
tal d
isab
les
chanc
e d
ete
ctio
n
8.2
8.2
8.2
8.2
8.2
4.1
11.4
8.1
8.2
8.2
2.1
v113
acc
iden
tal d
isab
les
mobile
hum
an g
uard
11.4
11.4
11.4
8.2
11.4
4.1
11.4
9.9
11.4
11.4
2.8
v110
acc
iden
tal d
isab
les
close
d c
ircuit
tv
13.3
13.3
13.3
8.2
13.3
8.2
11.4
11.6
13.3
13.3
2.4
v114
acc
iden
tal d
isab
les
multi
ple
sys
tem
s 11.4
8.2
4.1
17.3
17.3
17.3
17.3
13.3
17.3
17.3
5.5
v111
acc
iden
tal d
isab
les
infrare
d
17.3
17.3
17.3
17.3
17.3
11.4
17.3
16.5
17.3
17.3
2.2
v112
acc
iden
tal d
isab
les
mic
row
ave
17.3
17.3
17.3
17.3
17.3
11.4
17.3
16.5
17.3
17.3
2.2
v152
hum
an li
fe in
itial r
esp
onse
by
gene
ral p
ublic
0.1
0.1
4.1
4.1
4.1
4.1
8.2
3.5
4.1
4.1
2.8
v155
hum
an li
fe in
itial r
esp
onse
by
polic
e
11.4
4.1
4.1
4.1
4.1
4.1
0.1
4.6
4.1
4.1
3.4
v156
hum
an li
fe in
itial r
esp
onse
by
secu
rity
patrol
4.1
0.1
4.1
17.3
4.1
8.2
4.1
6.0
4.1
4.1
5.5
v151
hum
an li
fe in
itial r
esp
onse
by
arm
ed
8.2
4.1
8.2
4.1
4.1
8.2
0.1
5.3
4.1
8.2
3.1
v153
hum
an li
fe in
itial r
esp
onse
by
hig
h te
ch
17.3
8.2
4.1
8.2
4.1
11.4
8.9
8.2
8.2
5.0
v154
hum
an li
fe in
itial r
esp
onse
by
insu
ranc
e 4.1
13.3
13.3
17.3
14.7
13.3
13.3
12.8
13.3
13.3
4.1
v162
larg
e c
ash in
itial r
esp
onse
by
secu
rity
patrol
4.1
0.1
4.1
4.1
4.1
4.1
8.2
4.1
4.1
4.1
2.3
v159
larg
e c
ash in
itial r
esp
onse
by
hig
h te
ch
4.1
11.4
4.1
8.2
4.1
4.1
6.0
4.1
4.1
3.1
v161
larg
e c
ash in
itial r
esp
onse
by
polic
e
11.4
4.1
4.1
8.2
4.1
8.2
11.4
7.4
8.2
4.1
3.3
v157
larg
e c
ash in
itial r
esp
onse
by
arm
ed
13.3
4.1
8.2
4.1
4.1
14.7
0.1
6.9
4.1
4.1
5.4
v158
larg
e c
ash in
itial r
esp
onse
by
gene
ral p
ublic
8.2
0.1
14.7
4.1
4.1
8.2
11.4
7.3
8.2
8.2
4.9
v160
larg
e c
ash in
itial r
esp
onse
by
insu
ranc
e 4.1
13.3
11.4
8.2
8.2
11.4
11.4
9.7
11.4
11.4
3.1
v147
corp
ora
te d
ata
initi
al r
esp
ons
e b
y hig
h te
ch
11.4
0.1
11.4
0.1
8.2
0.1
5.2
4.1
0.1
5.7
v149
corp
ora
te d
ata
initi
al r
esp
ons
e b
y po
lice
13.3
8.2
13.3
8.2
11.4
11.4
11.0
11.4
13.3
2.3
v150
corp
ora
te d
ata
initi
al r
esp
ons
e b
y se
curit
y patrol
11.4
8.2
11.4
4.1
11.4
17.3
13.3
11.0
11.4
11.4
4.1
v146
corp
ora
te d
ata
initi
al r
esp
ons
e b
y ge
nera
l public
11.4
0.1
14.7
17.3
11.4
14.7
11.6
13.1
11.4
6.1
v148
corp
ora
te d
ata
initi
al r
esp
ons
e b
y in
sura
nce
11.4
17.3
13.3
17.3
13.3
13.3
14.3
13.3
13.3
2.4
v145
corp
ora
te d
ata
initi
al r
esp
ons
e b
y arm
ed
17.3
17.3
14.7
17.3
17.3
17.3
13.3
16.4
17.3
17.3
1.7
v176
small
cash
initi
al r
esp
onse
by
gen
era
l public
4.1
4.1
14.7
4.1
4.1
8.2
11.4
7.2
4.1
4.1
4.3
v180
small
cash
initi
al r
esp
onse
by
secu
rity
patrol
11.4
4.1
11.4
11.4
4.1
4.1
8.2
7.8
8.2
11.4
3.7
v179
small
cash
initi
al r
esp
onse
by
polic
e
13.3
8.2
14.7
11.4
11.4
8.2
13.3
11.5
11.4
13.3
2.5
v177
small
cash
initi
al r
esp
onse
by
hig
h te
ch
17.3
17.3
14.7
17.3
8.2
4.1
0.1
11.3
14.7
17.3
7.2
v178
small
cash
initi
al r
esp
onse
by
insu
ranc
e
11.4
17.3
13.3
13.3
13.3
13.3
13.3
13.6
13.3
13.3
1.8
v175
small
cash
initi
al r
esp
onse
by
arm
ed
17.3
17.3
11.4
17.3
17.3
17.3
11.4
15.6
17.3
17.3
2.9
v170
pers
onal v
alu
able
s in
itial r
esp
onse
by
gene
ral p
ublic
4.1
4.1
14.7
8.2
4.1
8.2
11.4
7.8
8.2
4.1
4.1
v174
pers
onal v
alu
able
s in
itial r
esp
onse
by
secu
rity
patrol
8.2
4.1
14.7
8.2
4.1
4.1
11.4
7.8
8.2
4.1
4.1
v173
pers
onal v
alu
able
s in
itial r
esp
onse
by
polic
e
13.3
8.2
14.7
13.3
11.4
8.2
11.4
11.5
11.4
13.3
2.5
v171
pers
onal v
alu
able
s in
itial r
esp
onse
by
high te
ch
17.3
13.3
17.3
17.3
4.1
11.4
13.5
15.3
17.3
5.2
v172
pers
onal v
alu
able
s in
itial r
esp
onse
by
insu
rance
8.2
13.3
13.3
13.3
13.3
13.3
13.3
12.6
13.3
13.3
1.9
v169
pers
onal v
alu
able
s in
itial r
esp
onse
by
arm
ed
17.3
17.3
14.7
17.3
17.3
17.3
11.4
16.1
17.3
17.3
2.3

v164
low
valu
e g
ood
s in
itial r
esp
ons
e b
y gen
era
l public
4.1
4.1
4.1
4.1
4.1
8.2
8.2
5.3
4.1
4.1
2.0
v168
low
valu
e g
ood
s in
itial r
esp
ons
e b
y se
curit
y patrol
11.4
11.4
11.4
11.4
11.4
4.1
8.2
9.9
11.4
11.4
2.8
v167
low
valu
e g
ood
s in
itial r
esp
ons
e b
y polic
e
13.3
13.3
13.3
11.4
13.3
8.2
13.3
12.3
13.3
13.3
1.9
v166
low
valu
e g
ood
s in
itial r
esp
ons
e b
y in
sura
nce
13.3
13.3
13.3
13.3
13.3
13.3
11.4
13.0
13.3
13.3
0.7
v165
low
valu
e g
ood
s in
itial r
esp
ons
e b
y hig
h te
ch
17.3
17.3
17.3
17.3
17.3
4.1
8.2
14.1
17.3
17.3
5.6
v163
low
valu
e g
ood
s in
itial r
esp
ons
e b
y arm
ed
17.3
17.3
17.3
17.3
17.3
17.3
8.2
16.0
17.3
17.3
3.4
v211
small
cash
pre
-atta
ck c
onsi
dera
tion a
ccid
enta
l 4.1
0.1
4.1
4.1
0.1
8.2
4.1
3.5
4.1
4.1
2.8
v216
small
cash
pre
-atta
ck c
onsi
dera
tion v
ery
low
motiv
atio
n
8.2
0.1
4.1
4.1
4.1
8.2
4.1
4.7
4.1
4.1
2.8
v214
small
cash
pre
-atta
ck c
onsi
dera
tion lo
w m
otiv
atio
n
11.4
0.1
0.1
4.1
8.2
8.2
4.1
5.2
4.1
0.1
4.3
v215
small
cash
pre
-atta
ck c
onsi
dera
tion m
odera
te m
otiv
atio
n
11.4
0.1
0.1
8.2
8.2
11.4
4.1
6.2
8.2
11.4
4.9
v213
small
cash
pre
-atta
ck c
onsi
dera
tion h
igh m
otiv
atio
n
13.3
0.1
0.1
8.2
8.2
11.4
4.1
6.5
8.2
0.1
5.2
v212
small
cash
pre
-atta
ck c
onsi
dera
tion e
xtre
me m
otiv
atio
n
13.3
0.1
0.1
8.2
8.2
11.4
4.1
6.5
8.2
0.1
5.2
v199
low
valu
e g
ood
s pre
-atta
ck c
onsi
dera
tion a
ccid
enta
l 0.1
0.1
0.1
4.1
0.1
8.2
4.1
2.4
0.1
0.1
3.2
v204
low
valu
e g
ood
s pre
-atta
ck c
onsi
dera
tion v
ery
low
motiv
atio
n
4.1
4.1
4.1
4.1
4.1
8.2
4.1
4.7
4.1
4.1
1.5
v202
low
valu
e g
ood
s pre
-atta
ck c
onsi
dera
tion lo
w m
otiv
atio
n
8.2
8.2
8.2
4.1
8.2
8.2
4.1
7.0
8.2
8.2
2.0
v203
low
valu
e g
ood
s pre
-atta
ck c
onsi
dera
tion m
ode
rate
motiv
atio
n
8.2
8.2
8.2
8.2
8.2
11.4
4.1
8.1
8.2
8.2
2.1
v200
low
valu
e g
ood
s pre
-atta
ck c
onsi
dera
tion e
xtre
me m
otiv
atio
n
11.4
11.4
11.4
8.2
11.4
11.4
4.1
9.9
11.4
11.4
2.8
v201
low
valu
e g
ood
s pre
-atta
ck c
onsi
dera
tion h
igh m
otiv
atio
n
11.4
11.4
11.4
8.2
11.4
11.4
4.1
9.9
11.4
11.4
2.8
v205
pers
onal v
alu
able
s pre
-atta
ck c
onsi
dera
tion a
ccid
enta
l 8.2
4.1
4.1
4.1
8.2
8.2
4.1
5.9
4.1
4.1
2.2
v210
pers
onal v
alu
able
s pre
-atta
ck c
onsi
dera
tion v
ery
low
motiv
atio
n
11.4
4.1
4.1
4.1
11.4
8.2
4.1
6.8
4.1
4.1
3.5
v208
pers
onal v
alu
able
s pre
-atta
ck c
onsi
dera
tion lo
w m
otiv
atio
n
11.4
4.1
4.1
4.1
13.3
8.2
4.1
7.0
4.1
4.1
4.0
v209
pers
onal v
alu
able
s pre
-atta
ck c
onsi
dera
tion m
odera
te m
otiv
atio
n
11.4
4.1
4.1
8.2
13.3
8.2
0.1
7.1
8.2
4.1
4.6
v207
pers
onal v
alu
able
s pre
-atta
ck c
onsi
dera
tion h
igh m
otiv
atio
n
13.3
0.1
4.1
8.2
14.7
11.4
0.1
7.4
8.2
0.1
6.1
v206
pers
onal v
alu
able
s pre
-atta
ck c
onsi
dera
tion e
xtre
me m
otiv
atio
n
14.7
0.1
4.1
8.2
14.7
11.4
0.1
7.6
8.2
14.7
6.3
v181
corp
ora
te d
ata
pre
-atta
ck c
ons
idera
tion
acc
iden
tal
11.4
11.4
11.4
8.2
11.4
13.3
4.1
10.2
11.4
11.4
3.1
v184
corp
ora
te d
ata
pre
-atta
ck c
ons
idera
tion
low
motiv
atio
n
13.3
11.4
11.4
11.4
13.3
13.3
4.1
11.2
11.4
13.3
3.3
v186
corp
ora
te d
ata
pre
-atta
ck c
ons
idera
tion
very
low
motiv
atio
n
11.4
11.4
14.7
13.3
11.4
13.3
4.1
11.4
11.4
11.4
3.4
v185
corp
ora
te d
ata
pre
-atta
ck c
ons
idera
tion
mode
rate
motiv
atio
n
13.3
11.4
13.3
11.4
14.7
14.7
8.2
12.4
13.3
13.3
2.3
v183
corp
ora
te d
ata
pre
-atta
ck c
ons
idera
tion
hig
h m
otiv
atio
n
14.7
11.4
13.3
13.3
14.7
14.7
8.2
12.9
13.3
14.7
2.4
v182
corp
ora
te d
ata
pre
-atta
ck c
ons
idera
tion
ext
rem
e m
otiv
atio
n
17.3
11.4
13.3
13.3
17.3
14.7
8.2
13.6
13.3
17.3
3.2
v193
larg
e c
ash p
re-a
ttack
con
sidera
tion a
ccid
enta
l 11.4
11.4
13.3
11.4
11.4
13.3
8.2
11.5
11.4
11.4
1.7
v198
larg
e c
ash p
re-a
ttack
con
sidera
tion v
ery
low
motiv
atio
n
13.3
11.4
13.3
11.4
11.4
13.3
8.2
11.8
11.4
13.3
1.8
v196
larg
e c
ash p
re-a
ttack
con
sidera
tion lo
w m
otiv
atio
n
13.3
11.4
13.3
11.4
13.3
13.3
4.1
11.4
13.3
13.3
3.4
v197
larg
e c
ash p
re-a
ttack
con
sidera
tion m
odera
te m
otiv
atio
n
14.7
11.4
14.7
13.3
13.3
13.3
4.1
12.1
13.3
13.3
3.7
v195
larg
e c
ash p
re-a
ttack
con
sidera
tion h
igh m
otiv
atio
n
14.7
11.4
14.7
13.3
14.7
13.3
0.1
11.7
13.3
14.7
5.3
v194
larg
e c
ash p
re-a
ttack
con
sidera
tion e
xtre
me m
otiv
atio
n
17.3
11.4
14.7
13.3
17.3
13.3
0.1
12.5
13.3
17.3
5.9
v192
hum
an li
fe p
re-a
ttack
con
sidera
tion v
ery
low
motiv
atio
n
13.3
11.4
14.7
11.4
11.4
14.7
0.1
11.0
11.4
11.4
5.0
v187
hum
an li
fe p
re-a
ttack
con
sidera
tion a
ccid
enta
l 8.2
11.4
14.7
11.4
11.4
14.7
8.2
11.4
11.4
11.4
2.7
v190
hum
an li
fe p
re-a
ttack
con
sidera
tion lo
w m
otiv
atio
n
14.7
11.4
14.7
11.4
13.3
14.7
0.1
11.5
13.3
14.7
5.2
v191
hum
an li
fe p
re-a
ttack
con
sidera
tion m
odera
te m
otiv
atio
n
17.3
11.4
14.7
13.3
13.3
17.3
0.1
12.5
13.3
17.3
5.9
v189
hum
an li
fe p
re-a
ttack
con
sidera
tion h
igh m
otiv
atio
n
17.3
11.4
14.7
13.3
14.7
17.3
0.1
12.7
14.7
17.3
5.9
v188
hum
an li
fe p
re-a
ttack
con
sidera
tion e
xtre
me m
otiv
atio
n
17.3
11.4
14.7
13.3
17.3
17.3
0.1
13.1
14.7
17.3
6.2
v218
cut p
ow
er atta
ck p
re-m
edita
tion e
xtre
me m
otiv
atio
n
4.1
4.1
4.1
4.1
4.1
8.2
8.2
5.3
4.1
4.1
2.0
v219
cut p
ow
er atta
ck p
re-m
edita
tion h
igh m
otiv
atio
n
4.1
4.1
4.1
4.1
4.1
8.2
8.2
5.3
4.1
4.1
2.0
v221
cut p
ow
er atta
ck p
re-m
edita
tion m
ode
rate
motiv
atio
n
4.1
4.1
4.1
4.1
4.1
11.4
8.2
5.7
4.1
4.1
2.9

v222
cut p
ow
er atta
ck p
re-m
edita
tion v
ery
low
motiv
atio
n
4.1
4.1
11.4
8.2
8.2
8.2
8.2
7.5
8.2
8.2
2.6
v220
cut p
ow
er atta
ck p
re-m
edita
tion lo
w m
otiv
atio
n
8.2
8.2
8.2
8.2
8.2
11.4
4.1
8.1
8.2
8.2
2.1
v217
cut p
ow
er atta
ck p
re-m
edita
tion a
ccid
enta
l 8.2
8.2
8.2
8.2
8.2
13.3
4.1
8.3
8.2
8.2
2.7
v236
phys
ical i
ntim
idatio
n a
ttack
pre
-med
itatio
n e
xtre
me m
otiv
atio
n
0.1
0.1
0.1
0.1
4.1
11.4
2.6
0.1
0.1
4.6
v237
phys
ical i
ntim
idatio
n a
ttack
pre
-med
itatio
n h
igh m
otiv
atio
n
0.1
0.1
4.1
0.1
4.1
11.4
3.3
2.1
0.1
4.4
v239
phys
ical i
ntim
idatio
n a
ttack
pre
-med
itatio
n m
odera
te m
otiv
atio
n
0.1
0.1
4.1
0.1
4.1
11.4
3.3
2.1
0.1
4.4
v238
phys
ical i
ntim
idatio
n a
ttack
pre
-med
itatio
n lo
w m
otiv
atio
n
4.1
0.1
4.1
4.1
8.2
8.2
4.8
4.1
4.1
3.1
v240
phys
ical i
ntim
idatio
n a
ttack
pre
-med
itatio
n v
ery
low
motiv
atio
n
8.2
0.1
8.2
8.2
8.2
8.2
6.8
8.2
8.2
3.3
v235
phys
ical i
ntim
idatio
n a
ttack
pre
-med
itatio
n a
ccid
enta
l 13.3
0.1
11.4
8.2
11.4
8.2
8.8
9.8
11.4
4.7
v224
ele
ctric
tools
atta
ck p
re-m
edita
tion e
xtre
me m
otiv
atio
n
0.1
8.2
4.1
4.1
8.2
0.1
4.1
4.1
0.1
3.6
v225
ele
ctric
tools
atta
ck p
re-m
edita
tion h
igh
motiv
atio
n
4.1
8.2
4.1
4.1
8.2
0.1
4.8
4.1
4.1
3.1
v227
ele
ctric
tools
atta
ck p
re-m
edita
tion m
ode
rate
motiv
atio
n
4.1
8.2
8.2
4.1
8.2
0.1
5.5
6.2
8.2
3.3
v226
ele
ctric
tools
atta
ck p
re-m
edita
tion lo
w m
otiv
atio
n
8.2
8.2
8.2
8.2
11.4
0.1
7.4
8.2
8.2
3.8
v228
ele
ctric
tools
atta
ck p
re-m
edita
tion v
ery
low
motiv
atio
n
8.2
8.2
8.2
8.2
11.4
0.1
7.4
8.2
8.2
3.8
v223
ele
ctric
tools
atta
ck p
re-m
edita
tion a
ccid
enta
l 11.4
8.2
11.4
8.2
13.3
0.1
8.8
9.8
11.4
4.7
v248
viole
nt d
estruct
ion a
ttack
pre
-med
itatio
n e
xtre
me m
otiv
atio
n
8.2
0.1
0.1
17.3
11.4
4.1
6.9
6.2
0.1
6.8
v249
viole
nt d
estruct
ion a
ttack
pre
-med
itatio
n h
igh m
otiv
atio
n
8.2
0.1
4.1
14.7
11.4
4.1
7.1
6.2
4.1
5.4
v251
viole
nt d
estruct
ion a
ttack
pre
-med
itatio
n m
odera
te m
otiv
atio
n
11.4
0.1
4.1
13.3
13.3
4.1
7.7
7.8
4.1
5.7
v250
viole
nt d
estruct
ion a
ttack
pre
-med
itatio
n lo
w m
otiv
atio
n
13.3
0.1
4.1
11.4
13.3
0.1
7.0
7.8
13.3
6.4
v252
viole
nt d
estruc
tion a
ttack
pre
-med
itatio
n v
ery
low
motiv
atio
n
13.3
0.1
8.2
8.2
14.7
0.1
7.4
8.2
0.1
6.3
v247
viole
nt d
estruct
ion a
ttack
pre
-med
itatio
n a
ccid
enta
l 17.3
0.1
11.4
4.1
14.7
0.1
7.9
7.8
0.1
7.5
v230
exp
losi
ve a
ttack
pre
-med
itatio
n e
xtre
me m
otiv
atio
n
4.1
13.3
0.1
13.3
13.3
4.1
8.0
8.7
13.3
6.0
v231
exp
losi
ve a
ttack
pre
-med
itatio
n h
igh m
otiv
atio
n
8.2
13.3
0.1
13.3
13.3
4.1
8.7
10.8
13.3
5.6
v233
exp
losi
ve a
ttack
pre
-med
itatio
n m
ode
rate
motiv
atio
n
8.2
13.3
4.1
13.3
14.7
4.1
9.6
10.8
13.3
4.8
v232
exp
losi
ve a
ttack
pre
-med
itatio
n lo
w m
otiv
atio
n
11.4
14.7
4.1
11.4
14.7
0.1
9.4
11.4
11.4
6.0
v234
exp
losi
ve a
ttack
pre
-med
itatio
n v
ery
low
motiv
atio
n
13.3
14.7
8.2
11.4
17.3
0.1
10.8
12.4
6.1
v229
exp
losi
ve a
ttack
pre
-med
itatio
n a
ccid
enta
l 14.7
14.7
8.2
11.4
17.3
0.1
11.1
13.1
14.7
6.2
v242
tech
nolo
gic
al a
ttack
atta
ck p
re-m
edita
tion e
xtre
me m
otiv
atio
n
4.1
13.3
4.1
17.3
14.7
8.2
10.3
10.8
4.1
5.6
v243
tech
nolo
gic
al a
ttack
atta
ck p
re-m
edita
tion h
igh m
otiv
atio
n
4.1
13.3
4.1
14.7
14.7
8.2
9.9
10.8
4.1
5.1
v245
tech
nolo
gic
al a
ttack
atta
ck p
re-m
edita
tion m
ode
rate
motiv
atio
n
8.2
13.3
8.2
13.3
14.7
8.2
11.0
10.8
8.2
3.1
v246
tech
nolo
gic
al a
ttack
atta
ck p
re-m
edita
tion v
ery
low
motiv
atio
n
11.4
14.7
8.2
4.1
13.3
8.2
10.0
9.8
8.2
3.9
v244
tech
nolo
gic
al a
ttack
atta
ck p
re-m
edita
tion lo
w m
otiv
atio
n
11.4
14.7
8.2
8.2
14.7
8.2
10.9
9.8
8.2
3.2
v241
tech
nolo
gic
al a
ttack
atta
ck p
re-m
edita
tion a
ccid
enta
l 13.3
14.7
11.4
0.1
13.3
8.2
10.2
12.4
13.3
5.4
v273
low
valu
e g
ood
s pre
-atta
ck c
onsi
dera
tion e
xplo
sive
0.1
0.1
0.1
0.1
0.1
11.4
0.1
1.7
0.1
0.1
4.3
v275
low
valu
e g
ood
s pre
-atta
ck c
onsi
dera
tion te
chno
logic
al a
ttack
0.1
0.1
0.1
0.1
0.1
11.4
0.1
1.7
0.1
0.1
4.3
v274
low
valu
e g
ood
s pre
-atta
ck c
onsi
dera
tion p
hys
ical i
ntim
idatio
n
8.2
8.2
8.2
8.2
8.2
11.4
0.1
7.5
8.2
8.2
3.5
v276
low
valu
e g
ood
s pre
-atta
ck c
onsi
dera
tion v
iole
nt d
estruc
tion
8.2
8.2
8.2
8.2
8.2
11.4
0.1
7.5
8.2
8.2
3.5
v271
low
valu
e g
ood
s pre
-atta
ck c
onsi
dera
tion c
ut p
ow
er
13.3
13.3
13.3
13.3
13.3
8.2
0.1
10.7
13.3
13.3
5.1
v272
low
valu
e g
ood
s pre
-atta
ck c
onsi
dera
tion e
lect
ric to
ols
13.3
13.3
13.3
13.3
13.3
8.2
0.1
10.7
13.3
13.3
5.1
v285
small
cash
pre
-atta
ck c
onsi
dera
tion e
xplo
sive
0.1
0.1
8.2
0.1
11.4
0.1
3.3
0.1
0.1
5.1
v287
small
cash
pre
-atta
ck c
onsi
dera
tion tec
hno
logic
al a
ttack
4.1
0.1
11.4
0.1
11.4
0.1
4.5
2.1
0.1
5.6
v288
small
cash
pre
-atta
ck c
onsi
dera
tion v
iole
nt d
est
ruct
ion
13.3
0.1
4.1
8.2
11.4
0.1
6.2
6.2
0.1
5.7
v286
small
cash
pre
-atta
ck c
onsi
dera
tion p
hysi
cal i
ntim
idatio
n
11.4
0.1
4.1
8.2
11.4
0.1
5.9
6.2
11.4
5.2
v284
small
cash
pre
-atta
ck c
onsi
dera
tion e
lect
ric tools
11.4
0.1
8.2
13.3
8.2
0.1
6.9
8.2
0.1
5.6
v283
small
cash
pre
-atta
ck c
onsi
dera
tion c
ut p
ow
er
13.3
0.1
11.4
13.3
8.2
0.1
7.7
9.8
13.3
6.2

v279
pers
onal v
alu
able
s pre
-atta
ck c
onsi
dera
tion e
xplo
sive
4.1
4.1
8.2
0.1
11.4
8.2
6.0
6.2
4.1
4.0
v281
pers
onal v
alu
able
s pre
-atta
ck c
onsi
dera
tion te
chnolo
gic
al a
ttack
4.1
4.1
11.4
8.2
13.3
8.2
8.2
8.2
4.1
3.7
v282
pers
onal v
alu
able
s pre
-atta
ck c
onsi
dera
tion v
iole
nt d
est
ruct
ion
11.4
4.1
4.1
8.2
11.4
8.2
7.9
8.2
11.4
3.3
v278
pers
onal v
alu
able
s pre
-atta
ck c
onsi
dera
tion e
lect
ric to
ols
8.2
4.1
8.2
13.3
11.4
8.2
8.9
8.2
8.2
3.2
v280
pers
onal v
alu
able
s pre
-atta
ck c
onsi
dera
tion p
hys
ical i
ntim
idatio
n
11.4
4.1
4.1
8.2
13.3
8.2
8.2
8.2
4.1
3.7
v277
pers
onal v
alu
able
s pre
-atta
ck c
onsi
dera
tion c
ut p
ow
er
13.3
4.1
11.4
13.3
11.4
8.2
10.3
11.4
13.3
3.6
v255
corp
ora
te d
ata
pre
-atta
ck c
ons
idera
tion
exp
losi
ve
4.1
13.3
11.4
13.3
13.3
0.1
9.2
12.4
13.3
5.7
v256
corp
ora
te d
ata
pre
-atta
ck c
ons
idera
tion
phys
ical i
ntim
idatio
n
4.1
13.3
4.1
13.3
13.3
0.1
8.0
8.7
13.3
6.0
v254
corp
ora
te d
ata
pre
-atta
ck c
ons
idera
tion
ele
ctric
tools
13.3
13.3
8.2
8.2
13.3
4.1
10.1
10.8
13.3
3.8
v258
corp
ora
te d
ata
pre
-atta
ck c
ons
idera
tion
viole
nt d
estruc
tion
13.3
8.2
13.3
13.3
11.4
11.4
8.2
11.3
11.4
13.3
2.3
v253
corp
ora
te d
ata
pre
-atta
ck c
ons
idera
tion
cut p
ow
er
13.3
13.3
11.4
4.1
13.3
8.2
10.6
12.4
13.3
3.8
v257
corp
ora
te d
ata
pre
-atta
ck c
ons
idera
tion
tech
nolo
gic
al a
ttack
11.4
13.3
8.2
17.3
13.3
11.4
12.5
12.4
11.4
3.0
v267
larg
e c
ash p
re-a
ttack
con
sidera
tion e
xplo
sive
11.4
14.7
8.2
13.3
14.7
4.1
11.1
12.4
14.7
4.2
v270
larg
e c
ash p
re-a
ttack
con
sidera
tion v
iole
nt d
estruct
ion
11.4
14.7
8.2
13.3
14.7
4.1
11.1
12.4
14.7
4.2
v268
larg
e c
ash p
re-a
ttack
con
sidera
tion p
hys
ical i
ntim
idatio
n
11.4
14.7
8.2
11.4
14.7
4.1
10.8
11.4
11.4
4.1
v266
larg
e c
ash p
re-a
ttack
con
sidera
tion e
lect
ric to
ols
14.7
14.7
8.2
8.2
14.7
4.1
10.8
11.5
14.7
4.6
v265
larg
e c
ash p
re-a
ttack
con
sidera
tion c
ut p
ow
er
14.7
14.7
8.2
8.2
14.7
11.4
12.0
13.1
14.7
3.2
v269
larg
e c
ash p
re-a
ttack
con
sidera
tion te
chno
logic
al a
ttac
k 8.2
14.7
8.2
14.7
14.7
11.4
12.0
13.1
14.7
3.2
v263
hum
an li
fe p
re-a
ttack
con
sidera
tion te
chno
logic
al a
ttac
k 8.2
14.7
11.4
0.1
14.7
0.1
8.2
9.8
14.7
6.7
v259
hum
an li
fe p
re-a
ttack
con
sidera
tion c
ut p
ow
er
8.2
14.7
11.4
0.1
14.7
0.1
8.2
9.8
14.7
6.7
v260
hum
an li
fe p
re-a
ttack
con
sidera
tion e
lect
ric to
ols
13.3
14.7
8.2
8.2
14.7
4.1
10.5
10.8
14.7
4.4
v262
hum
an li
fe p
re-a
ttack
con
sidera
tion p
hys
ical i
ntim
idatio
n
13.3
14.7
8.2
8.2
14.7
11.4
11.8
12.4
14.7
3.0
v261
hum
an li
fe p
re-a
ttack
con
sidera
tion e
xplo
sive
17.3
14.7
8.2
13.3
17.3
14.7
14.3
14.7
17.3
3.4
v264
hum
an li
fe p
re-a
ttack
con
sidera
tion v
iole
nt d
estruct
ion
14.7
14.7
8.2
13.3
17.3
14.7
13.8
14.7
14.7
3.0

Appendix F
F1: Table showing Questions 1, 7, 13, 19, 25, 31, 37 and 43: Statistical summary of respondents’ value assessment (n=26) of the time relationship
between Element 1 and Element 2 by conceptual scenario (Section A-H).
Element 1 Element 2 MEAN MEDIAN MODE ST DEV
Section A – considering the action “break through”
explosive glass 0.07 0.07 0.07 0.00
explosive wood 0.07 0.07 0.07 0.00
explosive brick 0.23 0.07 0.07 0.81
explosive earth 0.23 0.07 0.07 0.81
explosive concrete 0.39 0.07 0.07 1.12
explosive steel 1.04 0.07 0.07 1.76
electric drill earth 0.55 0.07 0.07 1.34
electric drill glass 0.71 0.07 0.07 1.51
electric drill wood 1.53 0.07 0.07 2.59
electric drill brick 4.04 4.10 4.10 3.63
electric drill concrete 5.39 4.10 4.10 3.79
electric drill steel 6.63 4.10 4.10 4.09
oxy cutting glass 1.68 0.07 0.07 2.02
oxy cutting wood 3.15 4.10 0.07 3.16
oxy cutting steel 3.71 4.10 4.10 2.99
oxy cutting earth 4.15 0.07 0.07 5.54
oxy cutting brick 8.51 8.20 8.20 5.04
oxy cutting concrete 9.59 8.20 8.20 5.31
axe glass 0.07 0.07 0.07 0.00
axe earth 1.08 0.07 0.07 2.87
axe brick 5.09 4.10 4.10 2.70
axe wood 5.93 4.10 0.07 5.64
axe concrete 8.07 8.20 8.20 3.42
axe steel 12.22 13.30 14.70 3.57
hammer glass 0.24 0.07 0.07 0.84
hammer earth 0.95 0.07 0.07 2.10
hammer wood 4.82 4.10 4.10 2.01
hammer brick 5.14 4.10 4.10 2.71
hammer concrete 8.59 8.20 8.20 3.13
hammer steel 13.53 14.70 17.30 3.70
rock glass 0.07 0.07 0.07 0.00
rock earth 0.76 0.07 0.07 2.73
rock wood 7.71 8.20 8.20 1.36
rock brick 10.85 11.40 11.40 1.66
rock concrete 14.51 14.70 14.70 0.71
rock steel 17.30 17.30 17.30 0.00

F2:
Element 1 Element 2 MEAN MEDIAN MODE ST DEV
Section B – considering the action “climbing over”
flight assisted 3 human high smooth brick wall 0.24 0.07 0.07 0.84
flight assisted 3 human high steel large mesh fence 0.24 0.07 0.07 0.84
flight assisted 3 human high steel small mesh fence 0.24 0.07 0.07 0.84
flight assisted 5 human high smooth brick wall 0.59 0.07 0.07 1.39
flight assisted 5 human high steel mesh fence 0.59 0.07 0.07 1.39
flight assisted 5 human high smooth brick wall and razor wire 0.77 0.07 0.07 1.56
projectiles and wire 3 human high steel large mesh fence 0.74 0.07 0.07 1.53
projectiles and wire 3 human high steel small mesh fence 1.16 0.07 0.07 1.78
projectiles and wire 3 human high smooth brick wall 1.75 0.07 0.07 2.65
projectiles and wire 5 human high steel mesh fence 2.93 4.10 4.10 2.80
projectiles and wire 5 human high smooth brick wall 3.44 4.10 4.10 3.09
projectiles and wire 5 human high smooth brick wall and razor wire 4.55 4.10 4.10 3.07
climbing aids 3 human high steel large mesh fence 0.82 0.07 0.07 1.55
climbing aids 3 human high steel small mesh fence 1.24 0.07 0.07 1.87
climbing aids 3 human high smooth brick wall 3.48 4.10 4.10 3.22
climbing aids 5 human high steel mesh fence 4.48 4.10 4.10 3.06
climbing aids 5 human high smooth brick wall 5.19 4.10 4.10 4.20
climbing aids 5 human high smooth brick wall and razor wire 6.00 4.10 4.10 3.91
ladder 3 human high steel large mesh fence 0.99 0.07 0.07 1.68
ladder 3 human high steel small mesh fence 2.22 0.07 0.07 3.04
ladder 3 human high smooth brick wall 3.11 2.08 0.07 3.86
ladder 5 human high steel mesh fence 4.89 4.10 4.10 4.10
ladder 5 human high smooth brick wall 6.21 4.10 4.10 4.79
ladder 5 human high smooth brick wall and razor wire 7.81 8.20 4.10 4.94
rope 3 human high steel large mesh fence 1.53 0.07 0.07 1.98
rope 3 human high steel small mesh fence 2.64 2.08 0.07 2.95
rope 3 human high smooth brick wall 3.75 4.10 4.10 3.30
rope 5 human high steel mesh fence 5.15 4.10 4.10 3.20
rope 5 human high smooth brick wall 7.24 4.10 4.10 4.94
rope 5 human high smooth brick wall and razor wire 7.30 6.15 4.10 3.92
no aid 3 human high steel large mesh fence 0.39 0.07 0.07 1.12
no aid 3 human high steel small mesh fence 8.08 8.20 8.20 1.96
no aid 5 human high steel mesh fence 8.30 8.20 8.20 1.57
no aid 3 human high smooth brick wall 8.97 8.20 8.20 2.24
no aid 5 human high smooth brick wall 17.20 17.30 17.30 0.52
no aid 5 human high smooth brick wall and razor wire 17.30 17.30 17.30 0.00

F3:
Element 1 Element 2 MEAN MEDIAN MODE ST DEV
Section C – considering the action “evading”
luck infrared 0.68 0.07 0.07 2.37
luck microwave 0.68 0.07 0.07 2.37
luck multiple systems 0.92 0.07 0.07 3.51
luck closed circuit tv 4.63 4.10 4.10 2.64
luck human guard 8.17 8.20 8.20 1.07
luck chance detection 14.18 14.70 14.70 1.54
create false alarms multiple systems 3.23 4.10 0.07 3.61
create false alarms infrared 4.15 4.10 4.10 4.08
create false alarms microwave 4.13 4.10 4.10 3.82
create false alarms closed circuit tv 6.72 8.20 4.10 4.34
create false alarms human guard 8.42 8.20 8.20 4.97
create false alarms chance detection 10.05 11.40 14.70 5.19
smoke multiple systems 2.73 0.07 0.07 4.06
smoke microwave 2.85 0.07 0.07 4.28
smoke infrared 3.65 4.10 0.07 4.59
smoke closed circuit tv 8.57 8.20 8.20 4.68
smoke human guard 9.15 8.20 8.20 4.48
smoke chance detection 10.64 11.40 14.70 5.15
colour camouflage microwave 2.10 0.07 0.07 4.96
colour camouflage infrared 2.58 0.07 0.07 4.93
colour camouflage multiple systems 4.99 0.07 0.07 5.69
colour camouflage closed circuit tv 7.13 8.20 4.10 3.53
colour camouflage human guard 9.08 8.20 8.20 2.82
colour camouflage chance detection 12.28 13.30 14.70 3.55
system knowledge multiple systems 7.56 8.20 8.20 4.62
system knowledge microwave 8.08 8.20 8.20 5.28
system knowledge infrared 8.50 8.20 0.07 5.94
system knowledge human guard 9.94 8.20 8.20 5.54
system knowledge closed circuit tv 9.90 11.40 8.20 5.83
system knowledge chance detection 11.30 13.30 17.30 5.82
knowledge and
diversion multiple systems 7.77 8.20 8.20 5.71
knowledge and
diversion infrared 9.18 11.40 11.40 6.02
knowledge and
diversion microwave 9.14 11.40 11.40 5.76
knowledge and
diversion closed circuit tv 10.97 11.40 17.30 6.00
knowledge and
diversion human guard 11.37 11.40 17.30 5.30
knowledge and
diversion chance detection 11.56 13.30 17.30 5.94

F4:
Element 1 Element 2 MEAN MEDIAN MODE ST DEV
Section D – considering the action “disabling”
violent destruction closed circuit tv 4.93 4.10 0.07 4.73
violent destruction microwave 5.48 4.10 0.07 6.04
violent destruction infrared 5.49 4.10 0.07 5.68
violent destruction human guard 6.26 8.20 8.20 4.99
violent destruction multiple systems 7.32 8.20 0.07 6.18
violent destruction chance detection 7.77 8.20 0.07 6.29
system knowledge closed circuit tv 5.42 4.10 4.10 5.11
system knowledge infrared 5.61 4.10 4.10 5.14
system knowledge microwave 6.01 4.10 4.10 5.13
system knowledge multiple systems 7.04 8.20 8.20 5.54
system knowledge human guard 7.57 8.20 4.10 5.71
system knowledge chance detection 8.39 8.20 0.07 6.71
cut power closed circuit tv 4.50 4.10 8.20 3.82
cut power infrared 5.69 4.10 0.07 5.30
cut power microwave 5.77 4.10 0.07 5.40
cut power multiple systems 7.03 8.20 0.07 6.19
cut power chance detection 10.58 8.20 8.20 6.26
cut power human guard 10.85 8.20 17.30 5.83
electrical interference closed circuit tv 4.57 4.10 0.07 3.81
electrical interference infrared 6.40 8.20 8.20 5.14
electrical interference microwave 5.95 4.10 4.10 4.92
electrical interference multiple systems 7.49 8.20 8.20 5.07
electrical interference human guard 11.56 14.70 17.30 6.93
electrical interference chance detection 11.57 13.30 17.30 6.20
physical intimidation human guard 5.99 4.10 4.10 4.39
physical intimidation chance detection 7.41 4.10 4.10 6.19
physical intimidation closed circuit tv 11.40 13.30 17.30 6.40
physical intimidation infrared 12.70 17.30 17.30 6.68
physical intimidation microwave 12.79 17.30 17.30 6.68
physical intimidation multiple systems 12.87 17.30 17.30 6.36
accidental chance detection 8.16 8.20 8.20 1.06
accidental human guard 10.98 11.40 11.40 1.57
accidental closed circuit tv 12.82 13.30 13.30 1.44
accidental multiple systems 14.28 17.30 17.30 3.78
accidental infrared 17.06 17.30 17.30 1.18
accidental microwave 17.06 17.30 17.30 1.18

F5:
Element 1 Element 2 MEAN MEDIAN MODE ST DEV
Section E – considering the action “response for”
human life general public 4.16 4.10 4.10 3.84
human life police 4.60 4.10 4.10 3.46
human life security patrol 5.78 4.10 4.10 4.40
human life armed 6.35 4.10 4.10 4.81
human life high tech 7.60 4.10 4.10 6.09
human life insurance 11.75 13.30 13.30 3.71
large cash security patrol 5.97 4.10 4.10 3.09
large cash high tech 6.66 4.10 4.10 5.93
large cash police 6.75 8.20 4.10 2.97
large cash armed 6.92 4.10 4.10 5.38
large cash general public 7.26 6.15 4.10 4.97
large cash insurance 10.31 11.40 8.20 2.95
corporate data high tech 7.01 6.15 0.07 6.58
corporate data police 9.33 8.20 8.20 2.90
corporate data security patrol 10.03 10.60 11.40 3.83
corporate data general public 10.27 12.35 13.30 5.94
corporate data insurance 12.23 13.30 13.30 2.70
corporate data armed 12.80 14.70 17.30 5.21
small cash general public 7.01 4.10 4.10 4.32
small cash security patrol 8.31 8.20 11.40 3.26
small cash police 10.78 11.40 11.40 2.97
small cash high tech 11.81 14.70 17.30 6.96
small cash insurance 12.74 13.30 13.30 2.90
small cash armed 13.93 17.30 17.30 4.89
personal valuables general public 7.07 4.10 4.10 4.70
personal valuables security patrol 8.78 8.20 11.40 3.70
personal valuables police 9.68 8.20 8.20 2.98
personal valuables high tech 11.77 14.70 17.30 6.65
personal valuables insurance 12.50 13.30 13.30 1.83
personal valuables armed 14.47 17.30 17.30 4.21
low value goods general public 4.43 4.10 4.10 1.14
low value goods security patrol 10.98 11.40 11.40 1.57
low value goods police 13.02 13.30 13.30 1.07
low value goods insurance 13.22 13.30 13.30 0.38
low value goods high tech 16.41 17.30 17.30 3.14
low value goods armed 16.94 17.30 17.30 1.82

F6:
Element 1 Element 2 MEAN MEDIAN MODE ST DEV
Section F – considering the concept “attack motivation”
small cash accidental 2.30 0.07 0.07 3.23
small cash very low motivation 4.21 4.10 4.10 3.46
small cash low motivation 5.54 4.10 4.10 3.76
small cash moderate motivation 6.96 8.20 8.20 3.69
small cash high motivation 8.17 8.20 11.40 4.34
small cash extreme motivation 8.81 11.40 11.40 4.47
low value goods accidental 0.72 0.07 0.07 1.92
low value goods very low motivation 4.26 4.10 4.10 0.82
low value goods low motivation 7.87 8.20 8.20 1.14
low value goods moderate motivation 8.16 8.20 8.20 1.06
low value goods extreme motivation 10.98 11.40 11.40 1.57
low value goods high motivation 10.98 11.40 11.40 1.57
personal valuables accidental 3.47 4.10 4.10 3.03
personal valuables very low motivation 5.58 4.10 4.10 3.91
personal valuables low motivation 7.08 8.20 4.10 3.42
personal valuables moderate motivation 8.27 8.20 8.20 3.76
personal valuables high motivation 9.70 11.40 11.40 4.33
personal valuables extreme motivation 9.94 11.40 11.40 4.54
corporate data accidental 7.95 8.20 8.20 4.04
corporate data low motivation 10.50 11.40 13.30 3.37
corporate data very low motivation 10.61 11.40 11.40 3.62
corporate data moderate motivation 12.30 13.30 11.40 2.36
corporate data high motivation 13.10 13.30 14.70 2.30
corporate data extreme motivation 14.01 14.70 14.70 2.10
large cash accidental 9.09 11.40 8.20 4.36
large cash very low motivation 9.94 11.40 13.30 4.18
large cash low motivation 11.11 11.40 13.30 3.13
large cash moderate motivation 12.49 13.30 13.30 2.69
large cash high motivation 13.33 14.70 14.70 3.54
large cash extreme motivation 14.11 14.70 17.30 3.82
human life very low motivation 10.87 11.40 11.40 5.32
human life accidental 10.56 11.40 11.40 5.21
human life low motivation 11.97 13.30 14.70 4.77
human life moderate motivation 13.29 14.70 14.70 4.45
human life high motivation 13.98 14.70 17.30 5.14
human life extreme motivation 14.16 17.30 17.30 5.57

F7:
Element 1 Element 2 MEAN MEDIAN MODE ST DEV
Section G – considering the concept “attack capability”
cut power extreme motivation 4.43 4.10 4.10 1.14
cut power high motivation 4.43 4.10 4.10 1.14
cut power moderate motivation 4.56 4.10 4.10 1.64
cut power very low motivation 6.85 8.20 8.20 2.20
cut power low motivation 8.16 8.20 8.20 1.06
cut power accidental 8.24 8.20 8.20 1.34
physical
intimidation extreme motivation 4.59 4.10 0.07 4.54
physical
intimidation high motivation 5.35 4.10 4.10 4.06
physical
intimidation moderate motivation 6.10 4.10 4.10 4.22
physical
intimidation low motivation 7.59 8.20 4.10 4.89
physical
intimidation very low motivation 8.42 8.20 8.20 5.56
physical
intimidation accidental 10.03 11.40 13.30 5.63
electric tools extreme motivation 4.90 4.10 4.10 4.37
electric tools high motivation 5.23 4.10 4.10 3.85
electric tools moderate motivation 6.49 8.20 8.20 3.45
electric tools low motivation 8.01 8.20 8.20 3.50
electric tools very low motivation 8.34 8.20 8.20 4.02
electric tools accidental 9.97 11.40 11.40 4.86
violent destruction extreme motivation 6.75 4.10 4.10 5.36
violent destruction high motivation 7.20 8.20 4.10 4.63
violent destruction moderate motivation 7.50 8.20 8.20 4.83
violent destruction low motivation 8.24 8.20 8.20 4.98
violent destruction very low motivation 8.96 11.40 11.40 5.68
violent destruction accidental 9.57 11.40 0.07 6.56
explosive extreme motivation 6.69 4.10 0.07 5.89
explosive high motivation 7.16 8.20 13.30 5.60
explosive moderate motivation 8.97 8.20 4.10 5.06
explosive low motivation 9.12 11.40 14.70 5.64
explosive very low motivation 10.39 11.40 17.30 6.26
explosive accidental 10.48 11.40 17.30 6.55
technological attack extreme motivation 8.30 8.20 4.10 4.75
technological attack high motivation 8.57 8.20 4.10 4.03
technological attack moderate motivation 9.55 11.40 11.40 3.22
technological attack very low motivation 9.89 11.40 8.20 4.07
technological attack low motivation 10.37 11.40 8.20 2.82
technological attack accidental 11.10 11.40 17.30 5.55

F8:
Element 1 Element 2 MEAN MEDIAN MODE ST DEV
Section H – considering the concept “attack
consideration (likelihood)”
low value goods explosive 0.52 0.07 0.07 2.27
low value goods technological attack 0.52 0.07 0.07 2.27
low value goods physical intimidation 8.00 8.20 8.20 1.77
low value goods violent destruction 8.00 8.20 8.20 1.77
low value goods cut power 12.57 13.30 13.30 2.80
low value goods electric tools 12.57 13.30 13.30 2.80
small cash explosive 4.18 0.07 0.07 5.52
small cash technological attack 5.78 4.10 0.07 5.28
small cash violent destruction 6.86 8.20 4.10 4.72
small cash physical intimidation 8.35 8.20 8.20 4.11
small cash electric tools 9.00 9.80 11.40 4.23
small cash cut power 9.68 11.40 13.30 4.53
personal valuables explosive 4.66 4.10 0.07 5.48
personal valuables technological attack 7.12 8.20 8.20 4.96
personal valuables violent destruction 7.90 8.20 8.20 4.44
personal valuables electric tools 8.74 8.20 8.20 3.67
personal valuables physical intimidation 9.23 8.20 8.20 3.86
personal valuables cut power 9.95 11.40 13.30 3.55
corporate data explosive 9.18 11.40 13.30 5.79
corporate data physical intimidation 10.09 11.40 13.30 4.30
corporate data electric tools 11.00 12.35 13.30 3.28
corporate data violent destruction 11.01 12.35 14.70 4.35
corporate data cut power 11.35 13.30 14.70 4.57
corporate data technological attack 13.00 13.30 14.70 2.89
large cash explosive 10.76 13.30 14.70 5.61
large cash violent destruction 10.95 12.35 14.70 4.65
large cash physical intimidation 11.15 11.40 8.20 3.70
large cash electric tools 11.24 13.30 14.70 4.27
large cash cut power 11.96 13.30 14.70 3.49
large cash technological attack 12.17 13.30 14.70 3.77
human life technological attack 9.24 11.40 0.07 6.66
human life cut power 10.10 12.35 13.30 6.05
human life electric tools 11.16 12.35 8.20 4.71
human life physical intimidation 12.57 14.00 14.70 4.03
human life explosive 13.30 14.70 17.30 5.11
human life violent destruction 14.02 14.70 17.30 4.24

Appendix G
G1 Section A: A Relative relationship map (in ranked order) indicating the concept continuums of force measured against
strength
force attack rock hammer axe oxy cutting electric drill explosive
material
strength
Average of
means over 6
elements
(range)
8.54
(0.07 -17.30)
5.49
(0.24 – 13.47)
5.33
(0.07 – 12.27)
4.98
(1.62 – 9.03)
3.13
(0.53 – 6.69)
0.33
(0.07 -1.00)
steel 9.05
(1.00 – 17.30)
17.30 13.47 12.27 3.57 6.69 1.00
concrete 7.65
(0.38 – 14.52)
14.52 8.58 8.07 9.03 5.34 0.38
brick 5.63
(0.22 – 10.87)
10.87 5.09 5.05 8.50 4.04 0.22
wood 3.75
(0.07 – 7.73)
7.73 4.62 5.45 3.18 1.47 0.07
earth 1.24
(0.22 – 3.99)
0.73 0.91 1.04 3.99 0.53 0.22
glass 0.46
(0.07 – 1.62)
0.07 0.24 0.07 1.62 0.69 0.07

G2 Section B: Relative relationships (rankings) for climbing attack measured against barrier delay
Climbing
Attack
no aid rope ladder climbing
aids
projectiles &
wire
flight
assisted
Height,
material,
topping
Average of
means over 6
elements
(range)
10.03
(0.38 – 17.30)
4.52
(1.47 – 7.16)
4.15
(0.96 – 7.66)
3.48
(0.79 – 5.92)
2.34
(0.71 – 4.53)
0.45
(0.24 – 0.74)
5 human
high smooth
brick wall +
razor wire
7.22
(0.74 – 17.30)
17.30 7.16 7.66 5.92 4.53 0.74
5 human
high smooth
brick wall
6.58
(0.57 – 17.20)
17.20 7.10 6.13 5.31 3.14 0.57
5 human
high - steel
small mesh
fence
4.32
(0.57 – 8.29)
8.29 5.10 4.85 4.30 2.82 0.57
3 human
high smooth
brick wall
3.52
(0.24 – 8.94)
8.94 3.77 3.15 3.34 1.69 0.24
3 human
high - steel
small mesh
fence
2.55
(0.24 – 8.08)
8.08 2.53 2.14 1.20 1.12 0.24
3 human
high - steel
large mesh
fence
0.76
(0.24 – 1.47)
0.38 1.47 0.96 0.79 0.71 0.24

G3 Section C: Relative relationships (rankings) for stealth attack measured against detection system
Stealth
Attack
luck create false
alarms
smoke colour
camouflage
system
knowledge
knowledge
& diversion
Detection
System
Average of
means over 6
elements
(range)
4.86
(0.66 – 14.20)
6.14
(3.27 – 9.92)
6.28
(2.75 – 10.74)
6.31
(2.02 – 12.32)
9.49
(8.02 – 11.53)
10.18
(7.98 – 11.59)
microwave 4.53
(0.66 – 9.35)
0.66 4.13 2.75 2.02 8.28 9.35
multiple
systems
4.62
(0.89 – 7.98)
0.89 3.27 2.62 4.96 8.02 7.98
infrared 4.84
(0.66 – 9.39)
0.66 4.15 3.67 2.48 8.68 9.39
closed
circuit tv
8.09
(4.61 – 11.22)
4.61 6.98 8.55 7.02 10.18 11.22
mobile
human
guard
9.47
(8.17 – 11.59)
8.17 8.41 9.36 9.05 10.22 11.59
chance
detection
11.71
(9.92 – 14.20)
14.20 9.92 10.74 12.32 11.53 11.53

G4 Section D: Relative relationships (rankings) for force attack measured against detection system
Force
attack
accidental physical
intimidation
electrical
interference
cut
power
system
knowledge
violent
destruction
Detection
System
Average
of
means
over 6
elements
(range)
13.42
(8.17 –
17.07)
10.41
(6.08 – 12.81)
8.05
(4.71 – 11.69)
7.41
(4.48 –
10.83)
6.57
(5.37 – 8.07)
6.18
(4.90 – 7.48)
multiple
systems
9.35
(7.07 –
14.40)
14.40 12.68 7.52 7.07 7.08 7.36
chance
detection
8.95
(7.48 –
11.69)
8.17 7.44 11.69 10.83 8.07 7.48
mobile
human
guard
8.88
(6.08 –
11.68)
11.00 6.08 11.68 10.75 7.44 6.33
microwave 8.86
(5.43 –
17.07)
17.07 12.81 6.23 5.70 5.94 5.43
infrared 8.78
(5.55 –
17.07)
17.07 12.34 6.47 5.63 5.55 5.60
closed
circuit tv
7.23
(4.48 –
12.83)
12.83 11.09 4.71 4.48 5.37 4.90
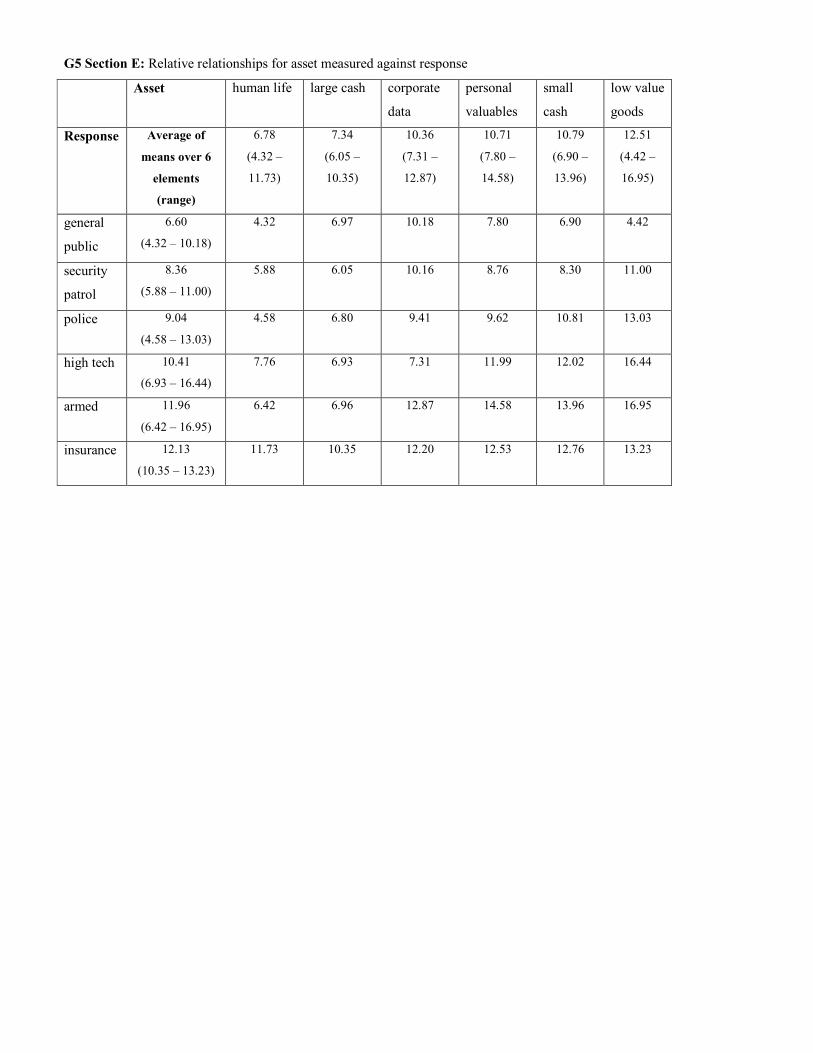
G5 Section E: Relative relationships for asset measured against response
Asset human life large cash corporate
data
personal
valuables
small
cash
low value
goods
Response Average of
means over 6
elements
(range)
6.78
(4.32 –
11.73)
7.34
(6.05 –
10.35)
10.36
(7.31 –
12.87)
10.71
(7.80 –
14.58)
10.79
(6.90 –
13.96)
12.51
(4.42 –
16.95)
general
public
6.60
(4.32 – 10.18)
4.32 6.97 10.18 7.80 6.90 4.42
security
patrol
8.36
(5.88 – 11.00)
5.88 6.05 10.16 8.76 8.30 11.00
police 9.04
(4.58 – 13.03)
4.58 6.80 9.41 9.62 10.81 13.03
high tech 10.41
(6.93 – 16.44)
7.76 6.93 7.31 11.99 12.02 16.44
armed 11.96
(6.42 – 16.95)
6.42 6.96 12.87 14.58 13.96 16.95
insurance 12.13
(10.35 – 13.23)
11.73 10.35 12.20 12.53 12.76 13.23

G6 Section F: Relative relationships (rankings) for asset measured against motivation
Asset human life large cash corporate
data
personal
valuables
low value
goods
small
cash
Motivation Average of
means over 6
elements
(range)
12.47
(10.56 –
14.16)
11.68
(9.09 –
14.12)
11.41
(7.95 –
14.01)
7.34
(3.47 –
9.94)
7.16
(0.72 –
10.98)
6.00
(2.30 –
8.81)
extreme
motivation
12.00
(8.81 –
14.16)
14.16 14.11 14.01 9.94 10.98 8.81
high
motivation
11.54
(8.17 –
13.98)
13.98 13.33 13.10 9.70 10.98 8.17
moderate
motivation
10.25
(6.96 –
13.29)
13.29 12.49 12.30 8.27 8.16 6.96
low
motivation
9.01
(5.54 –
11.97)
11.97 11.11 10.50 7.08 7.87 5.54
very low
motivation
7.58
(4.21 –
10.87)
10.87 9.94 10.61 5.58 4.26 4.21
accidental 5.68
(0.72 –
10.56)
10.56 9.09 7.95 3.47 0.72 2.30

G7 Section G: Relative relationships (rankings) for attack type against motivation
Attack technological
attack
explosive violent
destruction
electrical
tools
physical
intimidation
cut power
Motivation Average of
means over
6 elements
(range)
9.63
(8.30 – 11.10)
8.80
(6.69 –
10.48)
8.04
(6.75 –
9.58)
7.16
(4.90 –
9.97)
7.01
(4.59 – 10.03)
6.11
(4.43 –
8.24)
accidental 9.90
(8.24 –
11.10)
11.10 10.48 9.57 9.97 10.03 8.24
very low
motivation
8.81
(6.85 –
10.39)
9.89 10.39 8.96 8.34 8.42 6.85
low
motivation
8.58
(7.59 –
10.37)
10.37 9.12 8.24 8.01 7.59 8.16
moderate
motivation
7.19
(4.56 –
9.55)
9.55 8.97 7.50 6.49 6.10 4.56
high
motivation
6.32
(4.43 –
8.57)
8.57 7.16 7.20 5.23 5.35 4.43
extreme
motivation
5.94
(4.43 –
8.30)
8.30 6.69 6.75 4.90 4.59 4.43

G8 Section H: Relative relationships (rankings) for asset measured against attack type
Asset human life large cash corporate
data
personal
valuables
small
cash
low value
goods
Attack Average of
means over
6 elements
(range)
11.73
(9.24 –
14.02)
11.37
(10.76 –
12.17)
10.94
(9.18 –
13.00)
7.93
(4.66 –
9.96)
7.31
(4.18 –
9.68)
7.031
(0.52 –
12.57)
cut power 10.94
(9.68 –
12.57)
10.10 11.96 11.35 9.95 9.68 12.57
electrical
tools
10.62
(8.74 –
12.57)
11.16 11.24 11.00 8.74 9.00 12.57
physical
intimidation
9.89
(8.00 –
12.57)
12.57 11.15 10.09 9.23 8.35 8.00
violent
destruction
9.79
(6.86 –
14.02)
14.02 10.95 11.01 7.90 6.86 8.00
technological
attack
7.97
(0.52 –
13.00)
9.24 12.17 13.00 7.12 5.78 0.52

Appendix H
Group profiles using element relationships from the following
element combinations
Group
Standard
Profile
Group
Standard
Profile
Group
Standard
Profile
Group
Standard
Profile
Element 1 Element 2 Composite
Group
(mean) n=26
Group SE
(mean) n=5
Group SS
(mean) n=15
Group SU
(mean) n=6
explosive glass 0.07 0.07 0.07 0.07
explosive wood 0.07 0.07 0.07 0.07
explosive brick 0.23 1.08 0.07 0.07
explosive earth 0.23 0.07 0.07 0.64
explosive concrete 0.39 1.08 0.36 0.07
explosive steel 1.04 2.08 0.64 1.22
electric drill earth 0.55 1.08 0.07 1.22
electric drill glass 0.71 1.08 0.64 0.64
electric drill wood 1.53 2.08 0.94 2.38
electric drill brick 4.04 5.13 3.61 4.26
electric drill concrete 5.39 5.13 5.15 6.00
electric drill steel 6.63 6.95 6.55 6.58
oxy cutting glass 1.68 1.08 1.80 1.80
oxy cutting wood 3.15 3.09 2.68 4.12
oxy cutting steel 3.71 7.18 2.67 3.82
oxy cutting earth 4.15 1.08 4.92 4.35
oxy cutting brick 8.51 9.45 8.10 8.80
oxy cutting concrete 9.59 12.08 9.04 9.25
axe glass 0.07 0.07 0.07 0.07
axe earth 1.08 0.07 0.64 2.54
axe brick 5.09 5.13 4.70 5.86
axe wood 5.93 8.43 4.77 6.82
axe concrete 8.07 8.78 7.79 8.21
axe steel 12.22 13.38 12.39 11.24
hammer glass 0.24 1.08 0.07 0.07
hammer earth 0.95 0.07 0.93 1.70
hammer wood 4.82 5.13 4.69 4.92
hammer brick 5.14 7.18 4.63 4.92
hammer concrete 8.59 10.28 8.61 7.20
hammer steel 13.53 14.83 13.84 11.62
rock glass 0.07 0.07 0.07 0.07
rock earth 0.76 0.07 0.07 2.54
rock wood 7.71 8.20 8.20 6.44
rock brick 10.85 11.40 11.40 9.44
rock concrete 14.51 14.70 14.70 14.03
rock steel 17.30 17.30 17.30 17.30
flight assisted 3 human high smooth brick wall 0.24 0.07 0.07 0.74
flight assisted 3 human high steel large mesh fence 0.24 0.07 0.07 0.74
flight assisted 3 human high steel small mesh fence 0.24 0.07 0.07 0.74
flight assisted 5 human high smooth brick wall 0.59 0.07 0.69 0.74
flight assisted 5 human high steel mesh fence 0.59 0.07 0.69 0.74
flight assisted 5 human high smooth brick wall and razor wire 0.77 0.07 1.00 0.74
projectiles and wire 3 human high steel large mesh fence 0.74 0.07 0.93 0.74

projectiles and wire 3 human high steel small mesh fence 1.16 0.57 1.51 0.74
projectiles and wire 3 human high smooth brick wall 1.75 1.08 2.38 0.74
projectiles and wire 5 human high steel mesh fence 2.93 2.08 3.25 2.77
projectiles and wire 5 human high smooth brick wall 3.44 3.09 3.83 2.77
projectiles and wire 5 human high smooth brick wall and razor wire 4.55 4.10 5.15 3.44
climbing aids 3 human high steel large mesh fence 0.82 0.57 0.64 1.41
climbing aids 3 human high steel small mesh fence 1.24 1.08 1.22 1.41
climbing aids 3 human high smooth brick wall 3.48 3.09 2.95 4.97
climbing aids 5 human high steel mesh fence 4.48 4.61 3.18 7.22
climbing aids 5 human high smooth brick wall 5.19 4.61 4.64 6.84
climbing aids 5 human high smooth brick wall and razor wire 6.00 4.61 5.74 7.52
ladder 3 human high steel large mesh fence 0.99 0.57 0.93 1.41
ladder 3 human high steel small mesh fence 2.22 4.10 1.22 3.31
ladder 3 human high smooth brick wall 3.11 5.13 2.09 4.16
ladder 5 human high steel mesh fence 4.89 7.19 4.19 4.97
ladder 5 human high smooth brick wall 6.21 9.01 5.00 7.16
ladder 5 human high smooth brick wall and razor wire 7.81 10.45 7.05 7.83
rope 3 human high steel large mesh fence 1.53 1.08 1.80 1.08
rope 3 human high steel small mesh fence 2.64 2.08 3.25 1.08
rope 3 human high smooth brick wall 3.75 4.12 4.41 1.08
rope 5 human high steel mesh fence 5.15 5.13 5.45 4.10
rope 5 human high smooth brick wall 7.24 8.43 7.80 4.10
rope 5 human high smooth brick wall and razor wire 7.30 6.15 8.54 4.10
no aid 3 human high steel large mesh fence 0.39 0.07 0.07 1.22
no aid 3 human high steel small mesh fence 8.08 8.20 8.20 7.77
no aid 5 human high steel mesh fence 8.30 8.20 8.20 8.54
no aid 3 human high smooth brick wall 8.97 8.20 8.20 10.96
no aid 5 human high smooth brick wall 17.20 17.30 17.30 16.93
no aid 5 human high smooth brick wall and razor wire 17.30 17.30 17.30 17.30
luck infrared 0.68 0.07 0.07 2.26
luck microwave 0.68 0.07 0.07 2.26
luck multiple systems 0.92 0.07 0.07 3.11
luck closed circuit tv 4.63 4.10 4.10 5.99
luck human guard 8.17 8.20 8.20 8.08
luck chance detection 14.18 14.70 14.70 12.83
create false alarms multiple systems 3.23 1.08 3.47 4.12
create false alarms infrared 4.15 4.12 3.70 5.21
create false alarms microwave 4.13 4.12 3.77 4.97
create false alarms closed circuit tv 6.72 10.60 4.87 8.45
create false alarms human guard 8.42 11.88 7.65 7.93
create false alarms chance detection 10.05 13.18 9.60 9.00
smoke multiple systems 2.73 3.11 2.32 3.31
smoke microwave 2.85 2.08 3.13 2.74
smoke infrared 3.65 1.08 3.98 4.47
smoke closed circuit tv 8.57 11.68 7.75 8.41
smoke human guard 9.15 12.95 8.14 9.00
smoke chance detection 10.64 13.78 10.10 9.93
colour camouflage microwave 2.10 0.07 2.17 3.11
colour camouflage infrared 2.58 1.08 2.74 3.11
colour camouflage multiple systems 4.99 7.79 4.61 4.15

colour camouflage closed circuit tv 7.13 5.13 7.30 7.94
colour camouflage human guard 9.08 9.00 9.15 8.99
colour camouflage chance detection 12.28 11.43 13.04 11.24
system knowledge multiple systems 7.56 8.78 6.82 8.33
system knowledge microwave 8.08 11.75 7.25 7.62
system knowledge infrared 8.50 11.28 8.14 7.62
system knowledge human guard 9.94 12.35 10.11 8.21
system knowledge closed circuit tv 9.90 13.94 9.35 8.68
system knowledge chance detection 11.30 14.53 10.05 11.97
knowledge and diversion multiple systems 7.77 9.80 6.97 8.21
knowledge and diversion infrared 9.18 13.35 8.24 8.67
knowledge and diversion microwave 9.14 12.88 8.30 8.67
knowledge and diversion closed circuit tv 10.97 15.30 10.24 9.97
knowledge and diversion human guard 11.37 14.53 11.45 9.40
knowledge and diversion chance detection 11.56 15.18 10.39 11.85
violent destruction closed circuit tv 4.93 3.51 4.85 5.90
violent destruction microwave 5.48 2.08 5.12 8.13
violent destruction infrared 5.49 2.08 5.37 7.67
violent destruction human guard 6.26 7.37 5.39 7.37
violent destruction multiple systems 7.32 4.92 7.29 8.77
violent destruction chance detection 7.77 4.38 8.16 8.94
system knowledge closed circuit tv 5.42 3.91 5.28 6.58
system knowledge infrared 5.61 3.11 5.18 7.90
system knowledge microwave 6.01 4.12 5.61 7.90
system knowledge multiple systems 7.04 5.14 6.52 9.14
system knowledge human guard 7.57 12.53 5.22 9.46
system knowledge chance detection 8.39 9.69 6.87 10.67
cut power closed circuit tv 4.50 4.63 4.42 4.59
cut power infrared 5.69 3.62 5.95 6.36
cut power microwave 5.77 3.62 6.08 6.36
cut power multiple systems 7.03 3.91 6.84 9.19
cut power chance detection 10.58 8.68 11.29 10.23
cut power human guard 10.85 11.73 10.22 11.60
electrical interference closed circuit tv 4.57 4.63 4.20 5.29
electrical interference infrared 6.40 7.42 5.07 8.48
electrical interference microwave 5.95 4.12 4.88 9.14
electrical interference multiple systems 7.49 6.74 6.46 9.99
electrical interference human guard 11.56 17.30 9.66 12.07
electrical interference chance detection 11.57 17.30 10.53 10.37
physical intimidation human guard 5.99 6.42 5.85 6.01
physical intimidation chance detection 7.41 9.69 5.71 9.57
physical intimidation closed circuit tv 11.40 15.83 8.87 13.93
physical intimidation infrared 12.70 17.30 9.57 16.43
physical intimidation microwave 12.79 17.30 9.71 16.43
physical intimidation multiple systems 12.87 17.30 10.54 15.35
accidental chance detection 8.16 8.20 8.20 8.07
accidental human guard 10.98 11.40 11.40 9.90
accidental closed circuit tv 12.82 13.30 13.30 11.57
accidental multiple systems 14.28 12.88 15.19 13.27
accidental infrared 17.06 17.30 17.30 16.46
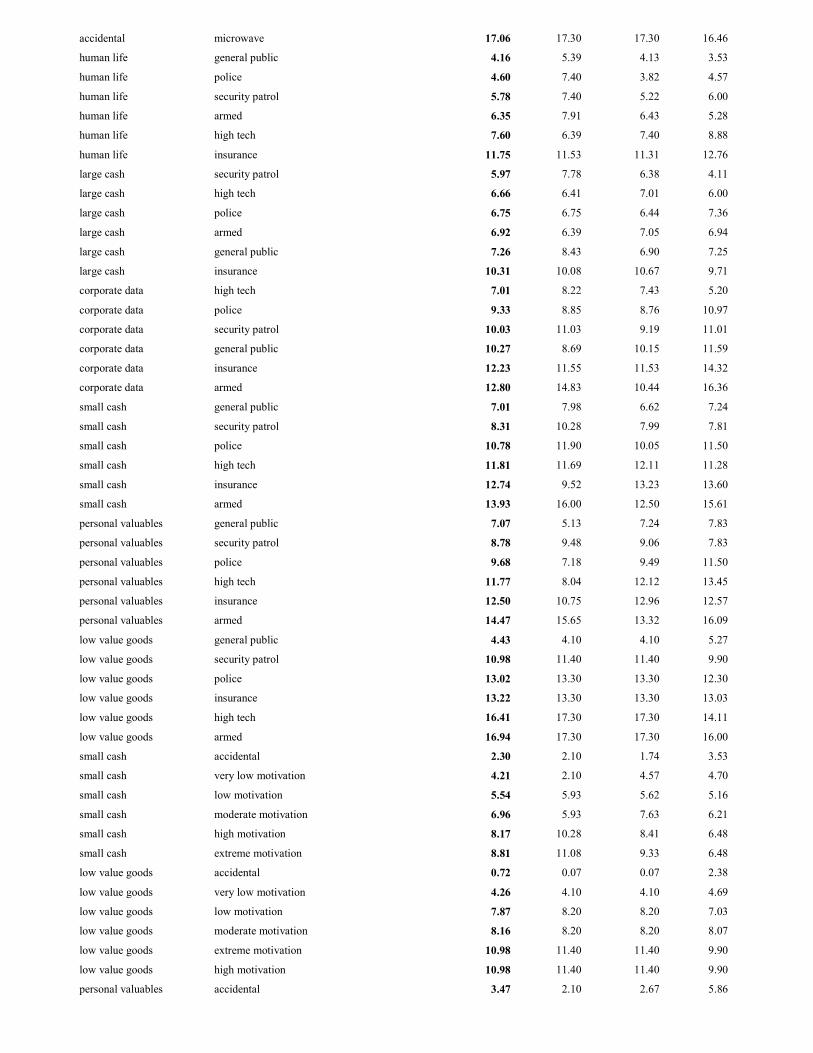
accidental microwave 17.06 17.30 17.30 16.46
human life general public 4.16 5.39 4.13 3.53
human life police 4.60 7.40 3.82 4.57
human life security patrol 5.78 7.40 5.22 6.00
human life armed 6.35 7.91 6.43 5.28
human life high tech 7.60 6.39 7.40 8.88
human life insurance 11.75 11.53 11.31 12.76
large cash security patrol 5.97 7.78 6.38 4.11
large cash high tech 6.66 6.41 7.01 6.00
large cash police 6.75 6.75 6.44 7.36
large cash armed 6.92 6.39 7.05 6.94
large cash general public 7.26 8.43 6.90 7.25
large cash insurance 10.31 10.08 10.67 9.71
corporate data high tech 7.01 8.22 7.43 5.20
corporate data police 9.33 8.85 8.76 10.97
corporate data security patrol 10.03 11.03 9.19 11.01
corporate data general public 10.27 8.69 10.15 11.59
corporate data insurance 12.23 11.55 11.53 14.32
corporate data armed 12.80 14.83 10.44 16.36
small cash general public 7.01 7.98 6.62 7.24
small cash security patrol 8.31 10.28 7.99 7.81
small cash police 10.78 11.90 10.05 11.50
small cash high tech 11.81 11.69 12.11 11.28
small cash insurance 12.74 9.52 13.23 13.60
small cash armed 13.93 16.00 12.50 15.61
personal valuables general public 7.07 5.13 7.24 7.83
personal valuables security patrol 8.78 9.48 9.06 7.83
personal valuables police 9.68 7.18 9.49 11.50
personal valuables high tech 11.77 8.04 12.12 13.45
personal valuables insurance 12.50 10.75 12.96 12.57
personal valuables armed 14.47 15.65 13.32 16.09
low value goods general public 4.43 4.10 4.10 5.27
low value goods security patrol 10.98 11.40 11.40 9.90
low value goods police 13.02 13.30 13.30 12.30
low value goods insurance 13.22 13.30 13.30 13.03
low value goods high tech 16.41 17.30 17.30 14.11
low value goods armed 16.94 17.30 17.30 16.00
small cash accidental 2.30 2.10 1.74 3.53
small cash very low motivation 4.21 2.10 4.57 4.70
small cash low motivation 5.54 5.93 5.62 5.16
small cash moderate motivation 6.96 5.93 7.63 6.21
small cash high motivation 8.17 10.28 8.41 6.48
small cash extreme motivation 8.81 11.08 9.33 6.48
low value goods accidental 0.72 0.07 0.07 2.38
low value goods very low motivation 4.26 4.10 4.10 4.69
low value goods low motivation 7.87 8.20 8.20 7.03
low value goods moderate motivation 8.16 8.20 8.20 8.07
low value goods extreme motivation 10.98 11.40 11.40 9.90
low value goods high motivation 10.98 11.40 11.40 9.90
personal valuables accidental 3.47 2.10 2.67 5.86

personal valuables very low motivation 5.58 4.92 5.16 6.77
personal valuables low motivation 7.08 5.93 7.43 7.04
personal valuables moderate motivation 8.27 9.25 8.60 7.05
personal valuables high motivation 9.70 10.75 10.54 7.41
personal valuables extreme motivation 9.94 10.75 10.88 7.61
corporate data accidental 7.95 6.97 7.12 10.17
corporate data low motivation 10.50 9.48 10.45 11.17
corporate data very low motivation 10.61 11.23 10.05 11.37
corporate data moderate motivation 12.30 12.23 12.26 12.43
corporate data high motivation 13.10 13.18 13.19 12.90
corporate data extreme motivation 14.01 13.65 14.30 13.64
large cash accidental 9.09 7.44 8.37 11.49
large cash very low motivation 9.94 9.83 9.06 11.76
large cash low motivation 11.11 10.63 11.08 11.44
large cash moderate motivation 12.49 12.08 12.79 12.11
large cash high motivation 13.33 13.70 14.02 11.74
large cash extreme motivation 14.11 14.18 14.91 12.48
human life very low motivation 10.87 12.70 10.29 11.00
human life accidental 10.56 9.04 10.57 11.43
human life low motivation 11.97 13.35 11.82 11.47
human life moderate motivation 13.29 14.65 13.30 12.48
human life high motivation 13.98 15.35 14.23 12.68
human life extreme motivation 14.16 16.00 14.18 13.05
cut power extreme motivation 4.43 4.10 4.10 5.27
cut power high motivation 4.43 4.10 4.10 5.27
cut power moderate motivation 4.56 4.10 4.10 5.73
cut power very low motivation 6.85 5.47 7.03 7.49
cut power low motivation 8.16 8.20 8.20 8.07
cut power accidental 8.24 8.20 8.20 8.34
physical intimidation extreme motivation 4.59 7.90 4.72 2.63
physical intimidation high motivation 5.35 8.97 5.45 3.30
physical intimidation moderate motivation 6.10 10.97 6.25 3.30
physical intimidation low motivation 7.59 11.60 7.93 4.79
physical intimidation very low motivation 8.42 13.60 7.99 6.84
physical intimidation accidental 10.03 15.10 9.48 8.76
electric tools extreme motivation 4.90 9.60 4.23 4.12
electric tools high motivation 5.23 9.60 4.48 4.79
electric tools moderate motivation 6.49 10.33 6.10 5.48
electric tools low motivation 8.01 10.97 7.65 7.38
electric tools very low motivation 8.34 10.97 8.19 7.38
electric tools accidental 9.97 12.67 9.92 8.76
violent destruction extreme motivation 6.75 7.90 6.46 6.86
violent destruction high motivation 7.20 8.97 6.86 7.09
violent destruction moderate motivation 7.50 10.97 6.67 7.71
violent destruction low motivation 8.24 11.43 8.07 7.04
violent destruction very low motivation 8.96 14.00 8.54 7.42
violent destruction accidental 9.57 12.67 9.61 7.94
explosive extreme motivation 6.69 8.26 5.78 8.03
explosive high motivation 7.16 8.26 6.26 8.71
explosive moderate motivation 8.97 10.70 8.32 9.62

explosive low motivation 9.12 11.17 8.56 9.39
explosive very low motivation 10.39 14.27 9.37 10.83
explosive accidental 10.48 14.00 9.47 11.06
technological attack extreme motivation 8.30 11.60 6.74 10.28
technological attack high motivation 8.57 11.60 7.36 9.85
technological attack moderate motivation 9.55 12.03 8.40 10.98
technological attack very low motivation 9.89 12.53 9.28 9.98
technological attack low motivation 10.37 11.60 9.88 10.90
technological attack accidental 11.10 14.27 10.82 10.16
low value goods explosive 0.52 0.07 0.07 1.69
low value goods technological attack 0.52 0.07 0.07 1.69
low value goods physical intimidation 8.00 8.20 8.20 7.50
low value goods violent destruction 8.00 8.20 8.20 7.50
low value goods cut power 12.57 13.30 13.30 10.68
low value goods electric tools 12.57 13.30 13.30 10.68
small cash explosive 4.18 6.29 4.09 3.31
small cash technological attack 5.78 9.27 5.55 4.52
small cash violent destruction 6.86 10.07 6.43 6.19
small cash physical intimidation 8.35 9.60 9.20 5.87
small cash electric tools 9.00 8.97 9.98 6.87
small cash cut power 9.68 9.27 10.67 7.72
personal valuables explosive 4.66 7.16 3.46 6.01
personal valuables technological attack 7.12 8.53 6.28 8.22
personal valuables violent destruction 7.90 9.00 7.64 7.90
personal valuables electric tools 8.74 8.53 8.71 8.90
personal valuables physical intimidation 9.23 9.00 9.74 8.22
personal valuables cut power 9.95 9.27 9.96 10.28
corporate data explosive 9.18 8.52 9.30 9.24
corporate data physical intimidation 10.09 12.50 10.48 8.03
corporate data electric tools 11.00 10.97 11.45 10.07
corporate data violent destruction 11.01 12.73 10.20 11.30
corporate data cut power 11.35 5.19 13.12 10.60
corporate data technological attack 13.00 13.77 13.06 12.48
large cash explosive 10.76 13.40 10.01 11.07
large cash violent destruction 10.95 12.03 10.64 11.07
large cash physical intimidation 11.15 13.40 10.81 10.75
large cash electric tools 11.24 12.03 11.28 10.77
large cash cut power 11.96 12.67 11.79 11.98
large cash technological attack 12.17 14.00 11.84 11.98
human life technological attack 9.24 9.60 9.64 8.19
human life cut power 10.10 13.30 10.25 8.19
human life electric tools 11.16 13.13 11.00 10.53
human life physical intimidation 12.57 14.23 12.56 11.75
human life explosive 13.30 14.47 12.59 14.25
human life violent destruction 14.02 15.33 13.81 13.82

Appendix I
Tab
le s
how
ing
valu
es fo
r th
e cu
rves
whe
re ta
n th
eta
(T) = m
tan
(th
eta
+ b
)
Angle theta
(in degrees)
-85.0
-80.0
-75.0
-70.0
-65.0
-60.0
-50.0
-45.0
-40.0
-30.0
-15.0
0.0
15.0
30.0
40.0
45.0
50.0
60.0
65.0
70.0
75.0
80.0
85.0
Tan theta
-11.
4 -5
.7
-3.7
-2
.7
-2.1
-1
.7
-1.2
-1
.0
-0.8
-0
.6
-0.3
0.
0 0.
3 0.
6 0.
8 1.
0 1.
2 1.
7 2.
1 2.
7 3.
7 5.
7 11
.4
5 Tan theta
-57.
2 -2
8.4
-18.
7 -1
3.7
-10.
7 -8
.7
-6.0
-5
.0
-4.2
-2
.9
-1.3
0.
0 1.
3 2.
9 4.
2 5.
0 6.
0 8.
7 10
.7
13.7
18
.7
28.4
57
.2
10 Tan theta
-114
.3
-56.
7 -3
7.3
-27.
5 -2
1.4
-17.
3 -1
1.9
-10.
0 -8
.4
-5.8
-2
.7
0.0
2.7
5.8
8.4
10.0
11
.9
17.3
21
.4
27.5
37
.3
56.7
11
4.3
5 Tan (theta + 10)
-47.
2 -1
8.4
-8.7
-3
.7
-0.7
1.
3 4.
0 5.
0 5.
8 7.
1 8.
7 10
.0
11.3
12
.9
14.2
15
.0
16.0
18
.7
20.7
23
.7
28.7
38
.4
67.2
5 Tan (theta + 50)
-7.2
21
.6
31.3
36
.3
39.3
41
.3
44.0
45
.0
45.8
47
.1
48.7
50
.0
51.3
52
.9
54.2
55
.0
56.0
58
.7
60.7
63
.7
68.7
78
.4
107.
2

Appendix J
J1: Test Case 10
Identifying a case with similarity to Test Case 9 however considering a different stronger delay for physical security
effectiveness from the knowledge matrices (considering all values over all listed attack-type elements in the orthogonal
continuum) of defensive-type universal elements we can assign values for:
1. Section A, where a high strength value is 6.69 (e.g. high percentage of steel structure considering an attack by
electric drill).
2. Section B, where a high material dimensions value is 7.66 (e.g. 5 human high steel small mesh with razor wire considering an attack by a ladder).
3. Section C, where a low detection value is 4.15 (e.g. infrared detection considering an attack creating false alarms).
4. Section D, where a high detection value is 5.55 (e.g. infrared detection considering an attack using system
knowledge).
5. Section E, where a medium response value is 8.76 (e.g. security patrol response considering personal valuables as
an asset).
These values can be considered for the model in Figure 5.17.
For Delay Probability:
m value = (Section A) + (Section B) = 14.35
b value = - (Section A) * (Section B) = -51.25
For Detection Probability:
m value = - 34.6 + (17.3 - (Section C)) + (Section D) = -15.90
b value = (17.3 - (Section C)) * (Section D) – (299.29 / 2) = -76.66
For Response Probability:
m value = - (Section A) * (Section B) * ((17.3 / (Section E)) - 1) = -49.96
b value = (17.3 - (Section C)) * (Section D) – (299.29 / 2) = -76.66
Figure 20 provides the conceptual map for Test Case 10 as tangent curves for the model showing that the delay probability
- detection probability intersection crosses at -40°. Figure 20 also presents the delay probability - response probability
intersection crosses as -21°.

Figure 20
-300
-250
-200
-150
-100
-50
0
-90 -80 -70 -60 -50 -40 -30 -20 -10 0 10 20 30 40 50 60 70 80 90
theta (degrees) - probability shared axis (P)
Tan theta - Time shared axis (T)
delay probability curve
detection probability curve
response curve
By the consideration of a stronger barrier material and barrier topping parameter inputs into the model, the resultant
intersection points of the curves have changed to significantly increase the effectiveness of the physical security
arrangement. The delay probability - detection probability intersection of approximately -40° can be compared to -64° for
Test Case 9 for the consideration of the same attacking-type parameters. Although the response input parameter is
unchanged from Test Case 9, the delay probability - response probability intersection is -21° compared to -58° for Test
Case 9. The significant increase that can be seen in both intersection points of Figure 20 is attributed to the increase in
barrier arrangement relative to Test Case 9. It follows from logical interpretation that where a stronger consideration for
delay probability is introduced to a physical security arrangement, the more likely that the response probability will
improve its suitability. This improvement in response probability occurs without any actual change to the response
parameter between these test cases.
In this example the model presents an interesting aspect to this research where it proposes that the curve for response
probability is directly related to the parameter input for delay probability. This interrelationship provides for a
demonstrated interpretation of the results of this study through use of the values out of the knowledge matrices and the
consideration of effectiveness between dissimilar conceptual entities.
Test Case 11 provides a similar consideration to Test Case 10 but in the new example the relationship between detection
probability and response probability is demonstrated. This example is presented as a direct comparison to Test Case 9
where the only altered input parameters are for a stronger detection system.

J2: Test Case 11
Identifying a case with similarity to Test Case 9 however considering a stronger detection system for physical security
effectiveness from the knowledge matrices (considering all values over all listed attack-type elements in the orthogonal
continuum) of defensive-type universal elements we can assign values for:
1. Section A, where a high strength value is 4.04 (e.g. high percentage of brick structure considering an attack by
electric drill).
2. Section B, where a high material dimensions value is 6.13 (e.g. 5 human high smooth brick wall considering an
attack by a ladder).
3. Section C, where a low detection value is 3.27 (e.g. multiple detection systems considering an attack creating false alarms).
4. Section D, where a high detection value is 7.36 (e.g. multiple detection systems considering an attack using violent
destruction). 5. Section E, where a medium response value is 8.76 (e.g. security patrol response considering personal valuables as
an asset).
These values can be considered for the model in Figure 5.17.
For Delay Probability:
m value = (Section A) + (Section B) = 10.17
b value = - (Section A) * (Section B) = -24.77
For Detection Probability:
m value = - 34.6 + (17.3 - (Section C)) + (Section D) = -13.21
b value = (17.3 - (Section C)) * (Section D) – (299.29 / 2) = -46.38
For Response Probability:
m value = - (Section A) * (Section B) * ((17.3 / (Section E)) - 1) = -24.14
b value = (17.3 - (Section C)) * (Section D) – (299.29 / 2) = -46.38
Figure 21 provides the conceptual map for Test Case 11 as tangent curves for the model showing that the delay probability
- detection probability intersection crosses at -41°. Figure 21 also presents the delay probability - response probability
intersection crosses as -32°.

Figure 21
-300
-250
-200
-150
-100
-50
0
-90 -80 -70 -60 -50 -40 -30 -20 -10 0 10 20 30 40 50 60 70 80 90
theta (degrees) - probability shared axis (P)
Tan theta - Time shared axis (T)
delay probability curve
detection probability curve
response curve
The inclusion of a stronger detection system as the only altered input parameter inputs into the model, demonstrate that the
resultant intersection points of the curves have again changed to significantly from Test Case 9. The increase the
effectiveness of the delay probability - detection probability intersection of approximately -41° can be compared to -64°
for Test Case 9 for the consideration of the same attacking-type parameters. The delay probability - response probability
intersection crosses as -32° compared to -58° for Test Case 9. It can be seen that by increasing the detection system of a
physical security arrangement the model has proposed that the effectiveness for response probability also increases.
The results from Test Case 10 and Test Case 11 are similar in effect where significant increase in the intersection point for
the response probability and delay probability curves can be attributed to the increase in either delay parameter input or
detection parameter input. The model proposes that with a relative increase in the delay probability or alternatively a
relative increase in the detection probability, a relative increase in the response probability will result.
Test Case 12 provides another example of an increase to the delay probability curve response probability curve
intersection point where the only altered input parameter is for a stronger response system.

J3: Test Case 12:
Identifying a case with similarity to Test Case 8 however considering a different slightly weaker response for physical
security effectiveness from the knowledge matrices (considering all values over all listed attack-type elements in the
orthogonal continuum) of defensive-type universal elements we can assign values for:
1. Section A, where a high strength value is 4.04 (e.g. high percentage of brick structure considering an attack by
electric drill).
2. Section B, where a high material dimensions value is 6.13 (e.g. 5 human high smooth brick wall considering an
attack by a ladder).
3. Section C, where a low detection value is 4.15 (e.g. infrared detection considering an attack creating false alarms). 4. Section D, where a high detection value is 5.55 (e.g. infrared detection considering an attack using system
knowledge).
5. Section E, where a medium response value is 6.05 (e.g. security patrol response considering large cash as an asset).
These values can be considered for the model in Figure 5.17.
For Delay Probability:
m value = (Section A) + (Section B) = 10.17
b value = - (Section A) * (Section B) = -24.77
For Detection Probability:
m value = - 34.6 + (17.3 - (Section C)) + (Section D) = -15.90
b value = (17.3 - (Section C)) * (Section D) – (299.29 / 2) = -76.66
For Response Probability:
m value = - (Section A) * (Section B) * ((17.3 / (Section E)) - 1) = -46.05
b value = (17.3 - (Section C)) * (Section D) – (299.29 / 2) = -76.66
Figure 22 provides the conceptual map for Test Case 12 as tangent curves for the model showing that the delay probability
- detection probability intersection crosses at -64°. Figure 22 also presents the delay probability - response probability
intersection crosses as -43°.
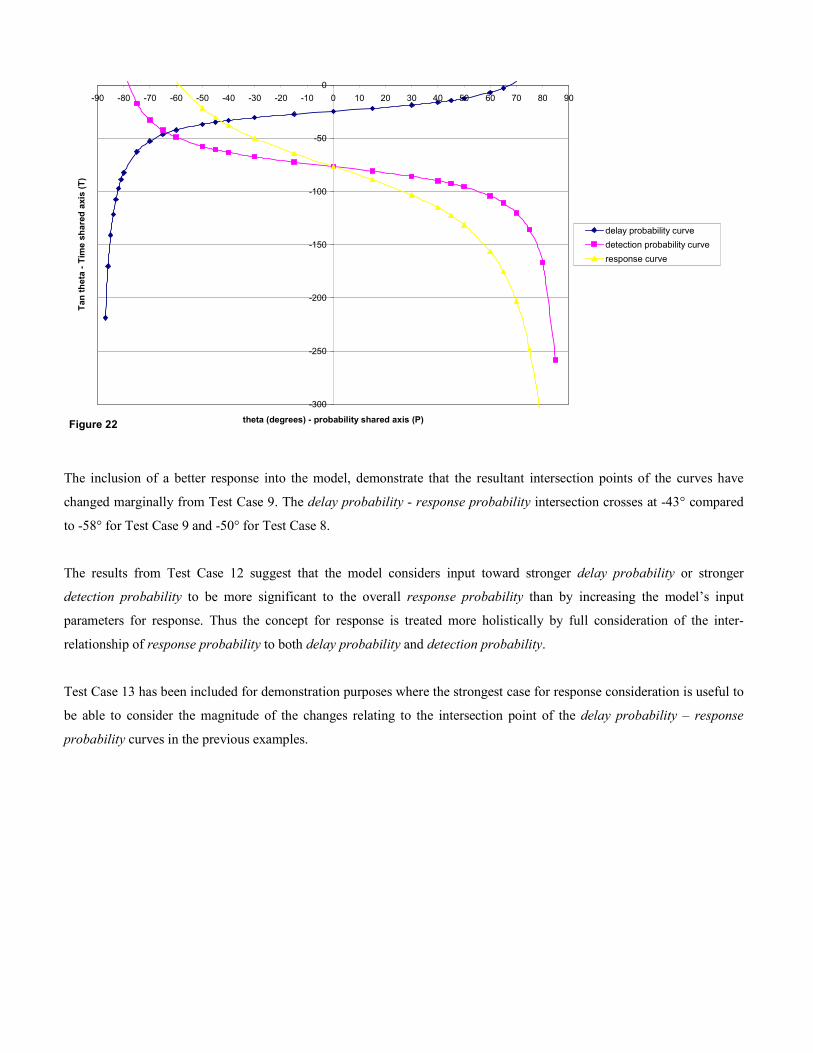
Figure 22
-300
-250
-200
-150
-100
-50
0
-90 -80 -70 -60 -50 -40 -30 -20 -10 0 10 20 30 40 50 60 70 80 90
theta (degrees) - probability shared axis (P)
Tan theta - Time shared axis (T)
delay probability curve
detection probability curve
response curve
The inclusion of a better response into the model, demonstrate that the resultant intersection points of the curves have
changed marginally from Test Case 9. The delay probability - response probability intersection crosses at -43° compared
to -58° for Test Case 9 and -50° for Test Case 8.
The results from Test Case 12 suggest that the model considers input toward stronger delay probability or stronger
detection probability to be more significant to the overall response probability than by increasing the model’s input
parameters for response. Thus the concept for response is treated more holistically by full consideration of the inter-
relationship of response probability to both delay probability and detection probability.
Test Case 13 has been included for demonstration purposes where the strongest case for response consideration is useful to
be able to consider the magnitude of the changes relating to the intersection point of the delay probability – response
probability curves in the previous examples.

J4: Test Case 13:
Identifying a case with the strongest physical security effectiveness for delay detection and response arrangements for all
Test Cases 8-12 for physical security from the knowledge matrices (considering all values over all listed attack-type
elements in the orthogonal continuum) of defensive-type universal elements we can assign values for:
1. Section A, where a high strength value is 6.69 (e.g. high percentage of steel structure considering an attack by
electric drill).
2. Section B, where a high material dimensions value is 7.66 (e.g. 5 human high steel small mesh with razor wire
considering an attack by a ladder).
3. Section C, where a low detection value is 3.27 (e.g. multiple detection systems considering an attack creating false alarms).
4. Section D, where a high detection value is 7.36 (e.g. multiple detection systems considering an attack using violent
destruction). 5. Section E, where a medium response value is 6.05 (e.g. security patrol response considering large cash as an asset).
These values can be considered for the model in Figure 5.17.
For Delay Probability:
m value = (Section A) + (Section B) = 14.35
b value = - (Section A) * (Section B) = -51.25
For Detection Probability:
m value = - 34.6 + (17.3 - (Section C)) + (Section D) = -13.21
b value = (17.3 - (Section C)) * (Section D) – (299.29 / 2) = -46.38
For Response Probability:
m value = - (Section A) * (Section B) * ((17.3 / (Section E)) - 1) = -95.29
b value = (17.3 - (Section C)) * (Section D) – (299.29 / 2) = -46.38
Figure 23 provides the conceptual map for Test Case 13 as tangent curves for the model showing that the delay probability
- detection probability intersection crosses at 10°. Figure 23 also presents the delay probability - response probability
intersection crosses as 3°.

Figure 23
-300
-250
-200
-150
-100
-50
0
-90 -80 -70 -60 -50 -40 -30 -20 -10 0 10 20 30 40 50 60 70 80 90
theta (degrees) - probability shared axis (P)
Tan theta - Time shared axis (T)
delay probability curve
detection probability curve
response curve
The results for Test Case 13 indicate the strongest case for the delay probability - response probability intersection is likely
to be in the vicinity of -10° to 10°. This is noted for reference purposes for the model and can be seen to be significantly
lower than the corresponding strongest case for the delay probability - detection probability intersection point.