Estimating Niche Width Using Stable Isotopes in the ... - PLOS
Upload
khangminh22Category
view
0download
0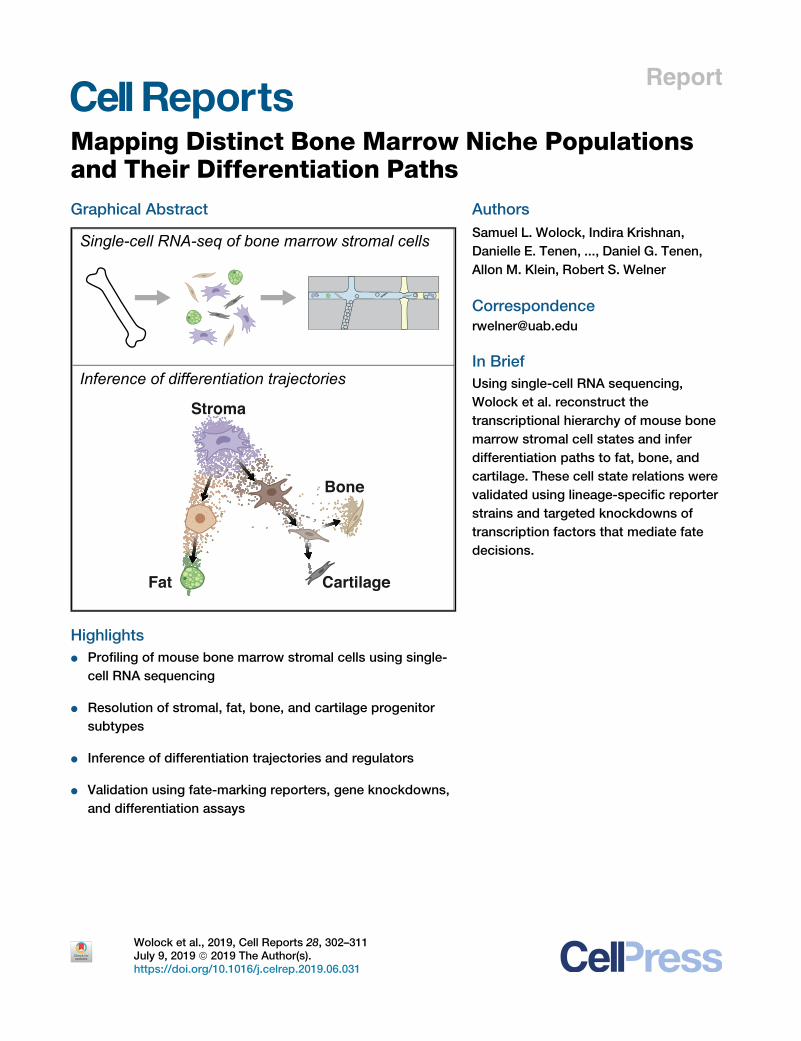
Report
Mapping Distinct Bone Ma
rrow Niche Populationsand Their Differentiation PathsGraphical Abstract
Highlights
d Profiling of mouse bone marrow stromal cells using single-
cell RNA sequencing
d Resolution of stromal, fat, bone, and cartilage progenitor
subtypes
d Inference of differentiation trajectories and regulators
d Validation using fate-marking reporters, gene knockdowns,
and differentiation assays
Wolock et al., 2019, Cell Reports 28, 302–311July 9, 2019 ª 2019 The Author(s).https://doi.org/10.1016/j.celrep.2019.06.031
Authors
Samuel L. Wolock, Indira Krishnan,
Danielle E. Tenen, ..., Daniel G. Tenen,
Allon M. Klein, Robert S. Welner
In Brief
Using single-cell RNA sequencing,
Wolock et al. reconstruct the
transcriptional hierarchy of mouse bone
marrow stromal cell states and infer
differentiation paths to fat, bone, and
cartilage. These cell state relations were
validated using lineage-specific reporter
strains and targeted knockdowns of
transcription factors that mediate fate
decisions.
Cell Reports
Report
Mapping Distinct Bone Marrow NichePopulations and Their Differentiation PathsSamuel L. Wolock,1,6 Indira Krishnan,2,6 Danielle E. Tenen,3 Victoria Matkins,4 Virginia Camacho,4 Sweta Patel,4
Puneet Agarwal,4 Ravi Bhatia,4 Daniel G. Tenen,2,5 Allon M. Klein,1 and Robert S. Welner4,7,*1Department of System Biology, Harvard Medical School, Boston, MA, USA2Harvard Stem Cell Institute, Harvard Medical School, Boston, MA, USA3Division of Endocrinology, Diabetes, and Metabolism, Beth Israel Deaconess Medical Center, Boston, MA, USA4Division of Hematology/Oncology, University of Alabama at Birmingham, Birmingham, AL, USA5Cancer Science Institute, National University of Singapore, Singapore, Singapore6These authors contributed equally7Lead Contact*Correspondence: [email protected]
https://doi.org/10.1016/j.celrep.2019.06.031
SUMMARY
The bone marrow microenvironment is composed ofheterogeneous cell populations of non-hematopoiet-ic cells with complex phenotypes and undefined tra-jectories of maturation. Among them, mesenchymalcells maintain the production of stromal, bone, fat,and cartilage cells. Resolving these unique cellularsubsets within the bone marrow remains chal-lenging. Here, we used single-cell RNA sequencingof non-hematopoietic bone marrow cells to definespecific subpopulations. Furthermore, by combiningcomputational prediction of the cell state hierarchywith the known expression of key transcription fac-tors, we mapped differentiation paths to the osteo-cyte, chondrocyte, and adipocyte lineages. Finally,we validated our findings using lineage-specific re-porter strains and targeted knockdowns. Our anal-ysis reveals differentiation hierarchies for maturingstromal cells, determines key transcription factorsalong these trajectories, and provides an under-standing of the complexity of the bone marrowmicroenvironment.
INTRODUCTION
The non-hematopoietic cells of the bone marrow microenviron-
ment include multipotent stromal and/or stem cells (MSCs),
which have been defined in culture by their capacity to differen-
tiate into osteocytes, adipocytes, and chondrocytes (Ashton
et al., 1980; Bab et al., 1986; Castro-Malaspina et al., 1980;
Dominici et al., 2006; Pittenger et al., 1999). However, it has
been difficult to resolve the subpopulations that make up stromal
progenitor and precursor cells, and identifying the transcription
factors that mediate their function and differentiation remains
challenging.
A number of methods have been used to functionally charac-
terize populations enriched for MSCs from the adult mouse bone
302 Cell Reports 28, 302–311, July 9, 2019 ª 2019 The Author(s).This is an open access article under the CC BY-NC-ND license (http://
marrow. For example, several reports have shown that MSC
potential resides within a population of platelet-derived growth
factor receptor a+ Sca-1+ (PDGFRa+ Sca-1+) cells (Mendelson
and Frenette, 2014; Mendez-Ferrer et al., 2010; Morikawa
et al., 2009; Pinho et al., 2013). Meanwhile, ablation studies
have shown that MSC populations expressing Nestin, Cxcl12,
stem cell factor (SCF), and Leptin receptor are essential for sup-
porting blood cell maintenance and differentiation (Dar et al.,
2005; Ding andMorrison, 2013; Ding et al., 2012; Mendez-Ferrer
et al., 2010; Omatsu et al., 2010; Zhou et al., 2014). Further
studies have shown that hematopoietic progenitors are predom-
inantly localized in very close proximity to MSCs secreting key
factors related to hematopoietic stem cell (HSC) maintenance
and adjacent to either small arterioles or sinusoidal endothelium
(Mendez-Ferrer et al., 2010; Morikawa et al., 2009; Silberstein
et al., 2016).
It remains difficult to establish relations and hierarchies among
bone marrow stromal cell populations. However, differential
expression of CD73 and CD90 provides some information about
their ontogeny (Nusspaumer et al., 2017) and indicates that con-
ventional PDGFRa+ Sca-1+ cells are not homogeneous but
rather comprise several populations that exhibit different func-
tions during endochondral ossification. In addition, evidence
for a common mesenchymal stem cell in the bone marrow
compartment was recently demonstrated using rigorous sin-
gle-cell analyses and lineage tracing strategies, in which skeletal
stem cells were identified in the post-natal bone marrow. More-
over, several of these distinct skeletal progenitors were defined
based on their ability to generate bone or cartilage when trans-
planted under the kidney capsule of immunodeficient mice
(Chan et al., 2015; Worthley et al., 2015). However, important
questions remain about the relation between subpopulations
and the transcription factors that mediate their differentiation.
To provide deeper insight into stromal cell differentiation, we
performed a single-cell RNA sequencing (scRNA-seq) survey of
the non-hematopoietic cells of the mouse bone marrow during
homeostasis. We identified gene signatures of unique subpop-
ulations and predicted and validated transcription factors that
mediate stromal cell differentiation. Our data suggest a simple
branching hierarchy of differentiation, and we demonstrate
creativecommons.org/licenses/by-nc-nd/4.0/).
(legend on next page)
Cell Reports 28, 302–311, July 9, 2019 303
how several transcription factors influence fate decisions to
specific bone marrow lineages. These findings were validated
using fate-marked reporter strains and by measuring differenti-
ation potential in culture.
RESULTS
Identification of Cellular Populations in the BoneMarrow MicroenvironmentSingle-cell RNA-sequencing (scRNA-seq) has become a
powerful tool for characterizing maturing hematopoietic cells
in the bone marrow (Laurenti and Gottgens, 2018), but an
extensive mapping of the differentiation paths of non-hemato-
poietic cells has not been performed. Consequently, we used
scRNA-seq to profile non-hematopoietic and non-epithelial
cells of normal 8- to 16-week-old C57BL/6 mice. Single-cell
suspensions were prepared with a combination of grinding
and collagenase-dispase treatment of long bones, followed
by sorting viable CD45�Ter119� (non-hematopoietic) and
CD31� (non-endothelial) cells. While endothelial cells represent
a significant population in the bone marrow (Mendelson and
Frenette, 2014), they were not the focus of our present study
to describe the differentiation hierarchy of the stroma. Sorted
cells were profiled by 30 droplet-based scRNA-seq (inDrops)
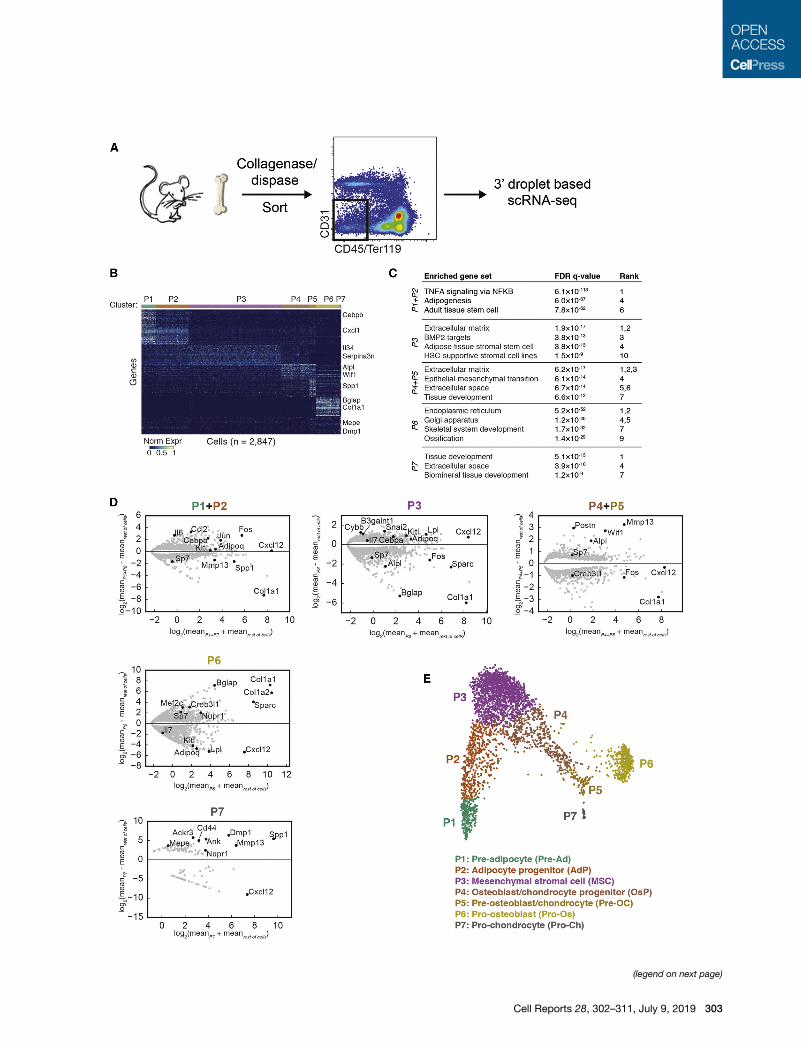
(Klein et al., 2015) (Figure 1A). Starting with 5,107 cells (median
of 1,651 molecules and 1,085 genes per cell) from duplicate
mouse samples, we observed no major differences in gene
expression or cell type abundance between the replicates
(Figures S1A and S1B). We then removed putative doublets
(Wolock et al., 2019) and contaminating hematopoietic and
endothelial cells (Figures S1C and S1D) using the remaining
2,847 cells (median of 1,394 molecules and 736 genes per
cell) for the analyses presented here. After performing spectral
clustering (7 clusters, P1–P7) and identifying genes enriched in
each cluster (Figure 1B), we used gene set enrichment analysis
to characterize the most significant gene expression signatures
from each cell state (Figure 1C). Distinct clusters expressed
genes related to cell adhesion, cytokine production, HSC sup-
port, adipogenesis, and ossification. Individual genes were also
expressed in expected patterns, with separate clusters ex-
pressing stromal (e.g., Cxcl12, Kitl) and bone-related (e.g.,
Bglap, Col1a1) genes at high levels (Figure 1D). Visualization
of the single-cell transcriptomes using SPRING (Weinreb
et al., 2018a) revealed a continuum of cell states forming two
major branches (Figure 1E), which is suggestive of a steady-
state differentiation process.
Landscape of Cellular Heterogeneity within the StromaBased on the above analyses and the expression patterns of pre-
viously characterized bone marrow stroma genes, we assigned
Figure 1. scRNA-seq Sequencing Reveals Heterogeneous Gene Expre
(A) Schematic of scRNA-seq of non-hematopoietic (CD45�/Ter119�-), non-endo(B) Heatmap of the most specific significantly enriched genes for each cell cluste
(C) Selected gene sets significantly enriched in the most highly specific genes of
(D) MA plot for genes significantly differentially expressed (permutation test, false
Selected genes of interest are highlighted in black, and all of the significant gene
(E) SPRING plot of single-cell transcriptomes. Each point is one cell, and colors
304 Cell Reports 28, 302–311, July 9, 2019
cell state labels to each cluster of our scRNA-seq dataset (Fig-
ures 1E and 2A). These include multipotent stromal cells
(MSCs), which represent the most abundant population in our
dataset, adipocyte progenitors (AdPs) and pre-adipocytes, oste-
oblast-chondrocyte progenitors, (OsPs) pre-osteoblast-chon-
drocytes (Pre-OCs), pro-osteoblasts, and pro-chondrocytes.
As our sample preparation includes treatment with collagenase
and dispase as well as cell sorting, the fat, bone, and cartilage
lineages are likely under-represented within our dataset. More-
over, collagenase dissociation has been shown to induce a
stress signature characterized by several transcription factors
(van den Brink et al., 2017), some of which are also believed to
mark adipocytes in the bone marrow (Ambrosi et al., 2017).
Therefore, we relied on additional genes (e.g., Ccl2, Ccl7,
Nr4a3, Adipoq, Icam1) that were not implicated in the stress
signature to classify the adipocyte clusters (Figures 2B and
S2A). In addition, we characterized the expression of significant
niche regulatory factors (Figure 2C), transcription factors
and other genes that map to distinct lineages (Figure 2D), previ-
ously uncharacterized gene expression specific to stromal
cells (Figure S2B), and important mediators of hematopoiesis
(Figure S2C). Of note, genes independently associated with
HSC-supportive CXCL12-abundant reticular cells were highly
expressed by a single MSC population in our data (Isern et al.,
2014; Sugiyama et al., 2006). Our data provides a landscape
for interrogating the marrow stroma.
Transcriptional Trajectories of Stromal and ProgenitorDifferentiationBefore attempting to identify transcription factors that regulate
the differentiation of stromal cell types, we first inferred the
gene expression trajectories of these cells as they differentiate.
MSCs are believed to give rise to bone, fat, and cartilage, and
this was supported by the application of Velocyto (La Manno
et al., 2018) to our data (Figure 3A). Velocyto identified MSCs
as the strongest ‘‘source’’ cell state in our dataset, with pre-
adipocytes, pro-osteoblasts, and pro-chondrocytes serving as
likely end states (Figure 3B). We then used population balance
analysis (PBA) (Weinreb et al., 2018b) to predict the average
gene expression trajectory of cells as they differentiate from
MSCs toward these end states (Figure 3C) and clustered genes
based on their expression patterns along the differentiation tra-
jectory of each lineage (Figure 3D). In addition to the expected
cell type-specific genes upregulated in the most differentiated
cells of each lineage (e.g., Sp7, Bglap, Col1a1 for osteoblasts;
Cebpb, Fosb, Junb for adipocytes), a subset of genes was
consistently downregulated as cells left the MSC compartment
(e.g., Foxc1, Cbln1, Clec2d, Snai2, Klf15). Furthermore, this
analysis revealed both established and unique transcription
factors specific to the adipogenic and osteogenic lineages
ssion in Bone Marrow Stromal Cells
thelial (CD31�) mouse bone marrow cells.
r.
each cluster.
discovery rate [FDR]-corrected p < 0.05) in each cluster versus all other cells.
s are shown in gray.
indicate graph-based cluster assignments.
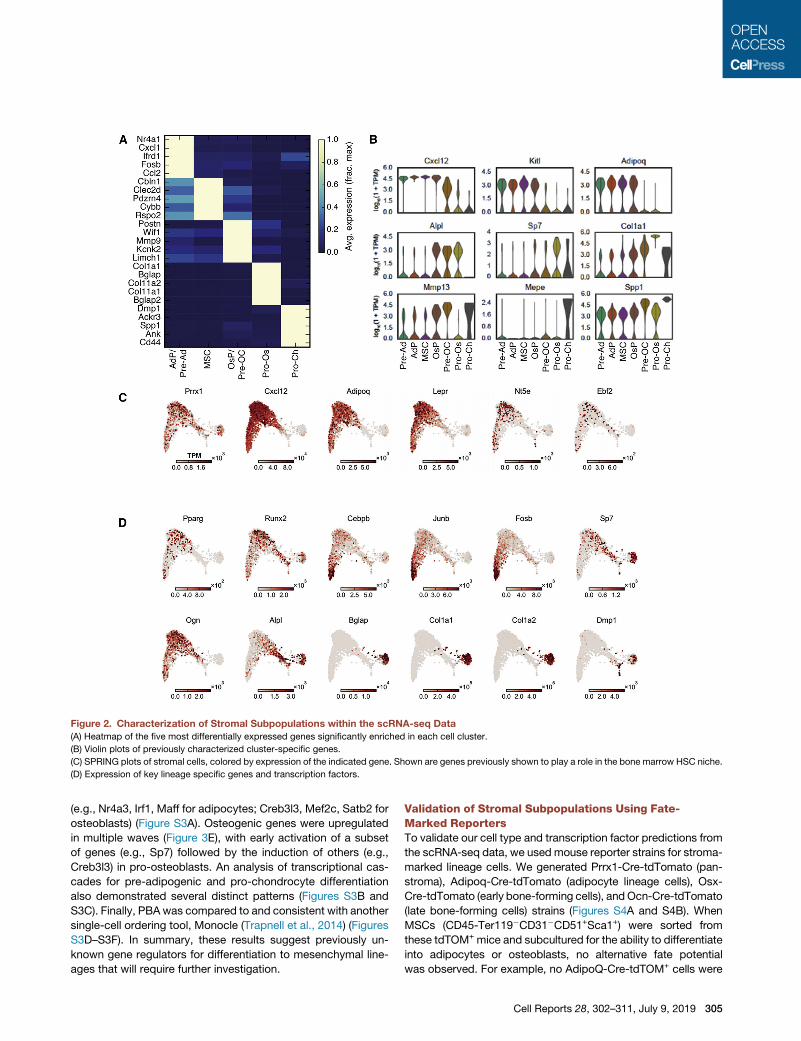
Figure 2. Characterization of Stromal Subpopulations within the scRNA-seq Data
(A) Heatmap of the five most differentially expressed genes significantly enriched in each cell cluster.
(B) Violin plots of previously characterized cluster-specific genes.
(C) SPRING plots of stromal cells, colored by expression of the indicated gene. Shown are genes previously shown to play a role in the bone marrow HSC niche.
(D) Expression of key lineage specific genes and transcription factors.
(e.g., Nr4a3, Irf1, Maff for adipocytes; Creb3l3, Mef2c, Satb2 for
osteoblasts) (Figure S3A). Osteogenic genes were upregulated
in multiple waves (Figure 3E), with early activation of a subset
of genes (e.g., Sp7) followed by the induction of others (e.g.,
Creb3l3) in pro-osteoblasts. An analysis of transcriptional cas-
cades for pre-adipogenic and pro-chondrocyte differentiation
also demonstrated several distinct patterns (Figures S3B and
S3C). Finally, PBA was compared to and consistent with another
single-cell ordering tool, Monocle (Trapnell et al., 2014) (Figures
S3D–S3F). In summary, these results suggest previously un-
known gene regulators for differentiation to mesenchymal line-
ages that will require further investigation.
Validation of Stromal Subpopulations Using Fate-Marked ReportersTo validate our cell type and transcription factor predictions from
the scRNA-seq data, we used mouse reporter strains for stroma-
marked lineage cells. We generated Prrx1-Cre-tdTomato (pan-
stroma), Adipoq-Cre-tdTomato (adipocyte lineage cells), Osx-
Cre-tdTomato (early bone-forming cells), and Ocn-Cre-tdTomato
(late bone-forming cells) strains (Figures S4A and S4B). When
MSCs (CD45-Ter119�CD31�CD51+Sca1+) were sorted from
these tdTOM+mice and subcultured for the ability to differentiate
into adipocytes or osteoblasts, no alternative fate potential
was observed. For example, no AdipoQ-Cre-tdTOM+ cells were
Cell Reports 28, 302–311, July 9, 2019 305
E
Adipocyte ChondrocyteOsteoblast
0
20
40
60
80
100
Cel
lord
erin
g(%
)
C
Dmp1Col1a1
Wif1
BglapCd44
AlplSpp1
Sp7
Mmp13
Cxcl12
Kitl
Lpl
CebpbCcl2Ccl7
Foxc1
noisserpxe.
mroN
0
max
Cell ordering (%) Cell ordering (%) Cell ordering (%)0 10050 0 10050 0 10050
DAdipocyteMSC OsteoblastMSC ChondrocyteMSC
ARNA velocity
B
PBA differentiation trajectories
Start points End pointsMSC
Ad Ch
Os
Low High
Density
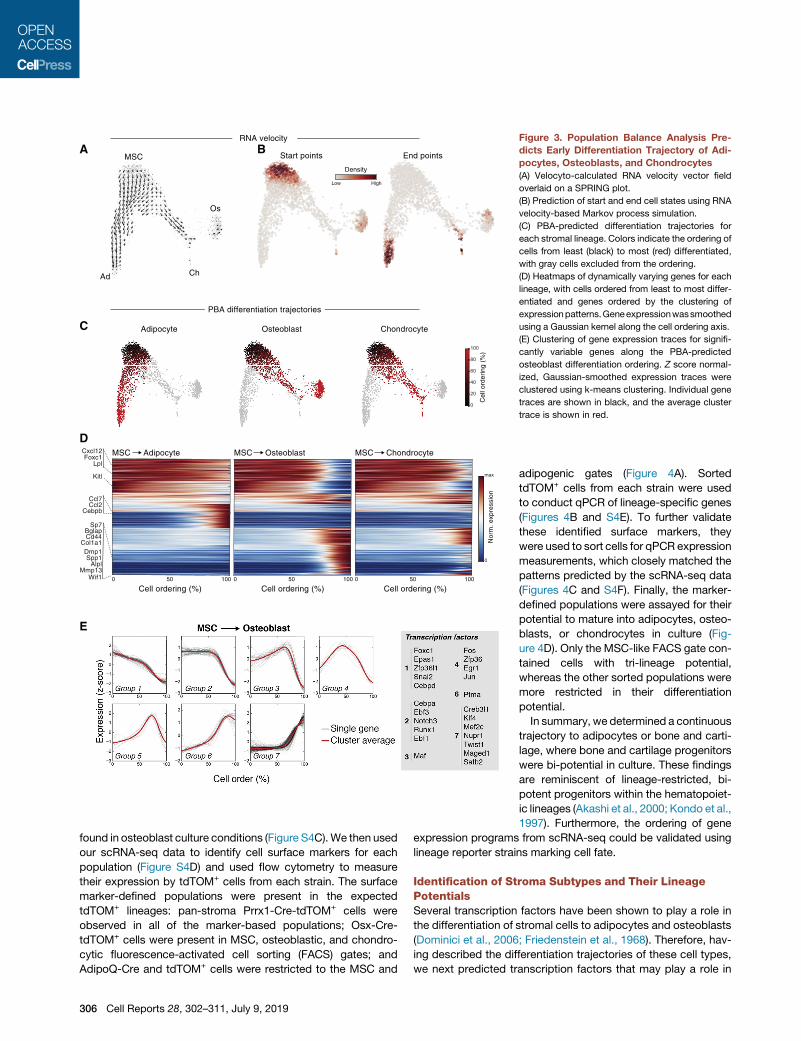
Figure 3. Population Balance Analysis Pre-
dicts Early Differentiation Trajectory of Adi-
pocytes, Osteoblasts, and Chondrocytes
(A) Velocyto-calculated RNA velocity vector field
overlaid on a SPRING plot.
(B) Prediction of start and end cell states using RNA
velocity-based Markov process simulation.
(C) PBA-predicted differentiation trajectories for
each stromal lineage. Colors indicate the ordering of
cells from least (black) to most (red) differentiated,
with gray cells excluded from the ordering.
(D) Heatmaps of dynamically varying genes for each
lineage, with cells ordered from least to most differ-
entiated and genes ordered by the clustering of
expressionpatterns.Geneexpressionwassmoothed
using a Gaussian kernel along the cell ordering axis.
(E) Clustering of gene expression traces for signifi-
cantly variable genes along the PBA-predicted
osteoblast differentiation ordering. Z score normal-
ized, Gaussian-smoothed expression traces were
clustered using k-means clustering. Individual gene
traces are shown in black, and the average cluster
trace is shown in red.
found in osteoblast culture conditions (Figure S4C).We then used
our scRNA-seq data to identify cell surface markers for each
population (Figure S4D) and used flow cytometry to measure
their expression by tdTOM+ cells from each strain. The surface
marker-defined populations were present in the expected
tdTOM+ lineages: pan-stroma Prrx1-Cre-tdTOM+ cells were
observed in all of the marker-based populations; Osx-Cre-
tdTOM+ cells were present in MSC, osteoblastic, and chondro-
cytic fluorescence-activated cell sorting (FACS) gates; and
AdipoQ-Cre and tdTOM+ cells were restricted to the MSC and
306 Cell Reports 28, 302–311, July 9, 2019
adipogenic gates (Figure 4A). Sorted
tdTOM+ cells from each strain were used
to conduct qPCR of lineage-specific genes
(Figures 4B and S4E). To further validate
these identified surface markers, they
were used to sort cells for qPCR expression
measurements, which closely matched the
patterns predicted by the scRNA-seq data
(Figures 4C and S4F). Finally, the marker-
defined populations were assayed for their
potential to mature into adipocytes, osteo-
blasts, or chondrocytes in culture (Fig-
ure 4D). Only the MSC-like FACS gate con-
tained cells with tri-lineage potential,
whereas the other sorted populations were
more restricted in their differentiation
potential.
In summary, we determined a continuous
trajectory to adipocytes or bone and carti-
lage, where bone and cartilage progenitors
were bi-potential in culture. These findings
are reminiscent of lineage-restricted, bi-
potent progenitors within the hematopoiet-
ic lineages (Akashi et al., 2000; Kondo et al.,
1997). Furthermore, the ordering of gene
expression programs from scRNA-seq could be validated using
lineage reporter strains marking cell fate.
Identification of Stroma Subtypes and Their LineagePotentialsSeveral transcription factors have been shown to play a role in
the differentiation of stromal cells to adipocytes and osteoblasts
(Dominici et al., 2006; Friedenstein et al., 1968). Therefore, hav-
ing described the differentiation trajectories of these cell types,
we next predicted transcription factors that may play a role in
A
D
B
C
0
1
2
3Pparg
Rel
ativ
eEx
pres
sion
0
500
1000
1500
2000Col1a1
Prrx1
OsxOCN
AdipoQ
0
20
40
60
80Mmp13
Rel
ativ
eEx
pres
sion
0
10
20
30
40Alpl
Prrx1
OsxOCN
AdipoQ
Prrx1-Cre/tdTOM Osx-Cre/tdTOM AdipoQ-Cre/tdTOM
ENPP1
CD140a
CX3Cl1
CD
276
CD
59a
CD
54
MSC MSC MSC
OsP OsP OsP
AdP AdP AdP
Pro-Ch Pro-Ch Pro-Ch
13%2% 0%
18%30% 37%
0%2% 14%
22%17% 1%
1%0% 0%
14%3% 0%
Pro-Os
Pro-Os
Pro-Os
Pre-Osteo/Chondrocyte
MSC Pre-Adipocyte Osteoblast Progenitor Pre-Osteoblast-Chondrocyte
FACS population:
Adi
poC
hond
roO
steo
0 10080604020Lineage potential (%)
Cul
ture
con
ditio
nFACS
Culturecondition:
0.0
0.5
1.0
1.5
2.0 Adipoq
0.0
0.5
1.0
1.5
2.0
2.5 Pparg
0
20
40
60Bglap
0
50
100
150Mmp13
MSCOsP
Pre-OC
Pro-Os
AdP
Pre-Ad
Rel
ativ
eex
pres
sion
0
1
0
1
0
500
0
25
MSCOsP
Pre-OC
Pro-Os
AdP
Pre-Ad
Adipoq
Pparg
Bglap
Mmp13
qPCRFACS scRNA-seq
Osteoblast Adipocytes Chondrocyte
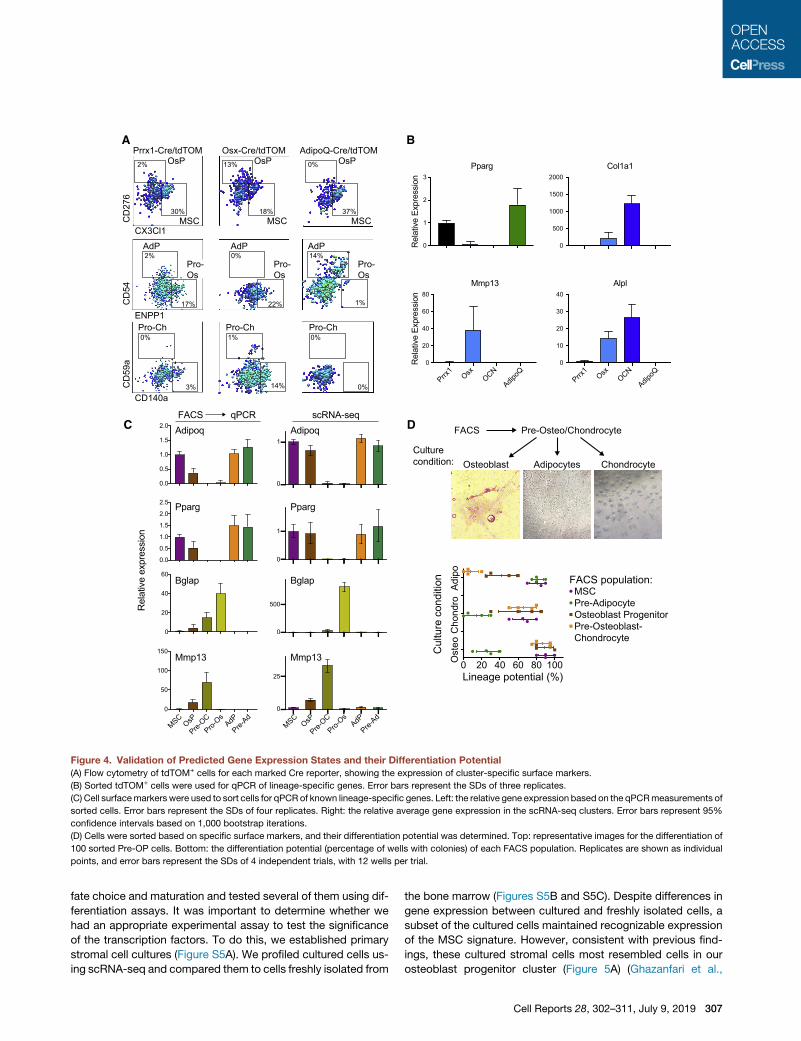
Figure 4. Validation of Predicted Gene Expression States and their Differentiation Potential
(A) Flow cytometry of tdTOM+ cells for each marked Cre reporter, showing the expression of cluster-specific surface markers.
(B) Sorted tdTOM+ cells were used for qPCR of lineage-specific genes. Error bars represent the SDs of three replicates.
(C) Cell surfacemarkers were used to sort cells for qPCR of known lineage-specific genes. Left: the relative gene expression based on the qPCRmeasurements of
sorted cells. Error bars represent the SDs of four replicates. Right: the relative average gene expression in the scRNA-seq clusters. Error bars represent 95%
confidence intervals based on 1,000 bootstrap iterations.
(D) Cells were sorted based on specific surface markers, and their differentiation potential was determined. Top: representative images for the differentiation of
100 sorted Pre-OP cells. Bottom: the differentiation potential (percentage of wells with colonies) of each FACS population. Replicates are shown as individual
points, and error bars represent the SDs of 4 independent trials, with 12 wells per trial.
fate choice and maturation and tested several of them using dif-
ferentiation assays. It was important to determine whether we
had an appropriate experimental assay to test the significance
of the transcription factors. To do this, we established primary
stromal cell cultures (Figure S5A). We profiled cultured cells us-
ing scRNA-seq and compared them to cells freshly isolated from
the bone marrow (Figures S5B and S5C). Despite differences in
gene expression between cultured and freshly isolated cells, a
subset of the cultured cells maintained recognizable expression
of the MSC signature. However, consistent with previous find-
ings, these cultured stromal cells most resembled cells in our
osteoblast progenitor cluster (Figure 5A) (Ghazanfari et al.,
Cell Reports 28, 302–311, July 9, 2019 307
Osteo Chondro Adipo0
1
2
3
4
Rel
ativ
e ar
eas
of d
iffer
entia
tion Maff
ScrSh1Sh2
Osteo Chondro Adipo0.0
0.5
1.0
1.5
Rel
ativ
e di
ffere
ntia
tion
Pparg
Osteo Chondro Adipo0.0
0.5
1.0
1.5
Rel
ativ
e di
ffere
ntia
tion
Runx2
Sh1Scr
Sh2
Osteo Chondro Adipo0.0
0.5
1.0
1.5
Rel
ativ
e di
ffere
ntia
tion
Sp7
Osteo Chondro Adipo0.0
0.5
1.0
1.5
Rel
ativ
e di
ffere
ntia
tion
Mef2c
ScrSh1Sh2
Osteo Chondro Adipo0.0
0.5
1.0
1.5
Rel
ativ
e di
ffere
ntia
tion
Creb3l3
C D
A BCollagenase
Sort3’ droplet based
scRNA-seq
Passage 2 A
dipo
cyte
Ost
eobl
ast
Cho
ndro
cyte
shControl sh1 Pparg sh2 Pparg
shControl sh1 Creb3l3 sh2 Creb3l3
shControl sh1 Runx sh2 Runx
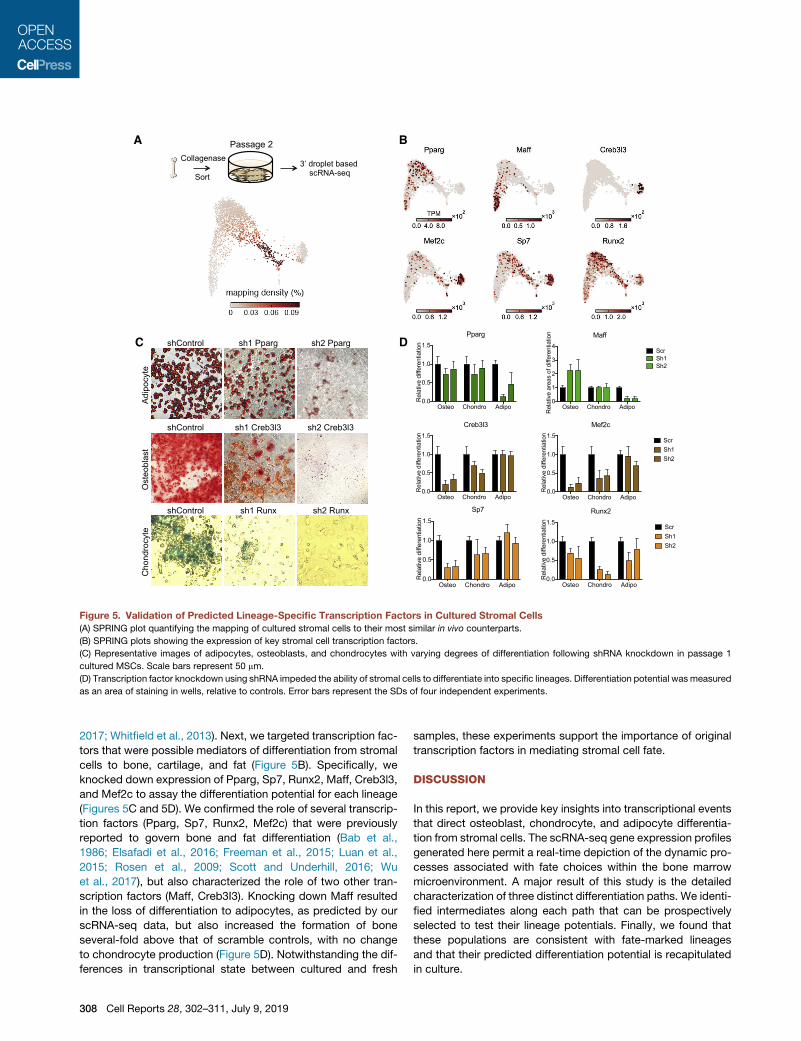
Figure 5. Validation of Predicted Lineage-Specific Transcription Factors in Cultured Stromal Cells
(A) SPRING plot quantifying the mapping of cultured stromal cells to their most similar in vivo counterparts.
(B) SPRING plots showing the expression of key stromal cell transcription factors.
(C) Representative images of adipocytes, osteoblasts, and chondrocytes with varying degrees of differentiation following shRNA knockdown in passage 1
cultured MSCs. Scale bars represent 50 mm.
(D) Transcription factor knockdown using shRNA impeded the ability of stromal cells to differentiate into specific lineages. Differentiation potential was measured
as an area of staining in wells, relative to controls. Error bars represent the SDs of four independent experiments.
2017; Whitfield et al., 2013). Next, we targeted transcription fac-
tors that were possible mediators of differentiation from stromal
cells to bone, cartilage, and fat (Figure 5B). Specifically, we
knocked down expression of Pparg, Sp7, Runx2, Maff, Creb3l3,
and Mef2c to assay the differentiation potential for each lineage
(Figures 5C and 5D). We confirmed the role of several transcrip-
tion factors (Pparg, Sp7, Runx2, Mef2c) that were previously
reported to govern bone and fat differentiation (Bab et al.,
1986; Elsafadi et al., 2016; Freeman et al., 2015; Luan et al.,
2015; Rosen et al., 2009; Scott and Underhill, 2016; Wu
et al., 2017), but also characterized the role of two other tran-
scription factors (Maff, Creb3I3). Knocking down Maff resulted
in the loss of differentiation to adipocytes, as predicted by our
scRNA-seq data, but also increased the formation of bone
several-fold above that of scramble controls, with no change
to chondrocyte production (Figure 5D). Notwithstanding the dif-
ferences in transcriptional state between cultured and fresh
308 Cell Reports 28, 302–311, July 9, 2019
samples, these experiments support the importance of original
transcription factors in mediating stromal cell fate.
DISCUSSION
In this report, we provide key insights into transcriptional events
that direct osteoblast, chondrocyte, and adipocyte differentia-
tion from stromal cells. The scRNA-seq gene expression profiles
generated here permit a real-time depiction of the dynamic pro-
cesses associated with fate choices within the bone marrow
microenvironment. A major result of this study is the detailed
characterization of three distinct differentiation paths. We identi-
fied intermediates along each path that can be prospectively
selected to test their lineage potentials. Finally, we found that
these populations are consistent with fate-marked lineages
and that their predicted differentiation potential is recapitulated
in culture.
Significant progress has been made in recent years in charac-
terizing the stroma populations during steady state and disease,
and our study provides a landscape for a better understanding of
transcriptional networks regulating the differentiation of bone
marrow microenvironment cells (Hoggatt et al., 2016; Mendez-
Ferrer et al., 2010; Mercier et al., 2011; Morrison and Scadden,
2014; Tikhonova et al., 2019; Baryawno et al., 2019). Dysregula-
tion of stromal cells has been linked to several pathophysiologic
processes, such as obesity, osteopenia, osteoporosis, cancer,
tooth loss, and aging (Engblom et al., 2017; Medyouf et al.,
2014; Mendelson and Frenette, 2014; Raaijmakers et al., 2010;
Zambetti et al., 2016). Therefore, understanding mechanisms
for regulating stromal cell differentiation could lead to improved
understanding of the pathogenesis of these disorders and even-
tually new treatments.
Our pseudotime results, as well as transcript validation, sup-
port relations between subpopulations and allowed us to explore
the transcriptional hierarchy of stromal cell phenotypes. Even
with the expansion of scRNA-seq tools and their many applica-
tions, the transcriptomic snapshot does not provide a complete
picture of the cell state (Cie�slik and Chinnaiyan, 2018; Kumar
et al., 2017). Hence, adopting a multi-modal analysis will help
yield an enhanced understanding because such technologies
hold the ability to measure multiple molecular phenotypes. More-
over, advances in understanding the fate decision of MSCs will
require more intense studies using inflammation and disease
models as well as patient samples based on our initial findings.
We show here the importance of validating the scRNA-seq data
with fate mapping and reporter strains. The same models can
be further exploited to find the significance of specific transcrip-
tion factors in lineage commitment decisions during perturbation.
In summary, this study provides important insights into the cell
composition of the bonemarrowmicroenvironment and the tran-
scriptional intermediates along differentiation paths to osteo-
blast, chondrocyte, and adipocyte fates. Moreover, despite the
differences between in vivo and cultured stromal cells, the
in vitro differentiation experiments proved useful for assaying
transcription factor relevance for different stromal fates. Our da-
taset and analysis (kleintools.hms.harvard.edu/paper_websites/
bone_marrow_stroma) will serve as a resource for future studies
investigating stromal cell differentiation.
STAR+METHODS
Detailed methods are provided in the online version of this paper
and include the following:
d KEY RESOURCES TABLE
d LEAD CONTACT AND MATERIALS AVAILABILITY
d EXPERIMENTAL MODEL AND SUBJECT DETAILS
B Mice
d METHOD DETAILS
B Cell preparation for single-cell RNA-sequencing
B scRNA-seq Analysis Method
B Quantification and Statistical Analysis of scRNA-seq
B Culture assays
d QUANTIFICATION AND STATISTICAL ANALYSIS
d DATA AND CODE AVAILABILITY
SUPPLEMENTAL INFORMATION
Supplemental Information can be found online at https://doi.org/10.1016/j.
celrep.2019.06.031.
ACKNOWLEDGMENTS
We would like to thank members of the groups of Ravi Bhatia, Allon Klein, and
Daniel Tenen for their feedback. This project was supported by NIH grants
HL131477, CA66996, CA197697, GM080177, and 5T32GM080177-07;
startup funds from the Division of Hematology/Oncology at the University of
Alabama at Birmingham (UAB); and the American Society of Hematology
Bridge Grant (2018). D.G.T. was supported by a STaR Investigator Award,
an RCE Core grant, and a Tier 3 RNA Biology Center grant MOE2014-T3-1-
006 from the National Research Foundation (NRF) and the Ministry of Educa-
tion (MOE), Singapore. V.C. was supported by UAB T32-AI007051, and V.M.
was supported by UAB T90 DART. BioRender was used for the graphical
abstract.
AUTHOR CONTRIBUTIONS
S.L.W., I.K., and R.S.W. designed and performed the experiments, assisted
with the experimental design, and wrote the manuscript; S.L.W., D.E.T.,
V.M., V.C., S.P., and P.A. performed the experiments and analyzed the data;
R.B., D.G.T., and A.M.K. supervised the study and edited the manuscript;
R.S.W. supervised the study, designed the experiments, performed the exper-
iments, and assisted with data interpretation and manuscript writing.
DECLARATION OF INTERESTS
A.M.K. is a co-founder of 1Cell-Bio.
Received: March 27, 2018
Revised: April 5, 2019
Accepted: June 7, 2019
Published: July 9, 2019
REFERENCES
Akashi, K., Traver, D., Miyamoto, T., and Weissman, I.L. (2000). A clonogenic
commonmyeloid progenitor that gives rise to all myeloid lineages. Nature 404,
193–197.
Ambrosi, T.H., Scialdone, A., Graja, A., Gohlke, S., Jank, A.M., Bocian, C.,
Woelk, L., Fan, H., Logan, D.W., Schurmann, A., et al. (2017). Adipocyte accu-
mulation in the bonemarrow during obesity and aging impairs stem cell-based
hematopoietic and bone regeneration. Cell Stem Cell 20, 771–784.e6.
Ashton, B.A., Allen, T.D., Howlett, C.R., Eaglesom, C.C., Hattori, A., andOwen,
M. (1980). Formation of bone and cartilage by marrow stromal cells in diffusion
chambers in vivo. Clin. Orthop. Relat. Res. (151), 294–307.
Bab, I., Ashton, B.A., Gazit, D., Marx, G., Williamson, M.C., and Owen, M.E.
(1986). Kinetics and differentiation of marrow stromal cells in diffusion cham-
bers in vivo. J. Cell Sci. 84, 139–151.
Baryawno, N., Przybylski, D., Kowalczyk, M.S., Kfoury, Y., Severe, N., Gus-
tafsson, K., Kokkaliaris, K.D., Mercier, F., Tabaka, M., Hofree, M., et al.
(2019). A Cellular Taxonomy of the Bone Marrow Stroma in Homeostasis
and Leukemia. Cell 177, 1915–1932.
Benjamini, Y., and Hochberg, Y. (1995). Controlling the False Discovery Rate:
A Practical and Powerful Approach to Multiple Testing. J. R. Stat. Soc. B 57,
289–300.
Castro-Malaspina, H., Gay, R.E., Resnick, G., Kapoor, N., Meyers, P., Chiar-
ieri, D., McKenzie, S., Broxmeyer, H.E., and Moore, M.A. (1980). Characteriza-
tion of human bone marrow fibroblast colony-forming cells (CFU-F) and their
progeny. Blood 56, 289–301.
Cell Reports 28, 302–311, July 9, 2019 309

Chan, C.K., Seo, E.Y., Chen, J.Y., Lo, D., McArdle, A., Sinha, R., Tevlin, R.,
Seita, J., Vincent-Tompkins, J., Wearda, T., et al. (2015). Identification and
specification of the mouse skeletal stem cell. Cell 160, 285–298.
Cie�slik, M., and Chinnaiyan, A.M. (2018). Cancer transcriptome profiling at the
juncture of clinical translation. Nat. Rev. Genet. 19, 93–109.
Dar, A., Goichberg, P., Shinder, V., Kalinkovich, A., Kollet, O., Netzer, N., Mar-
galit, R., Zsak, M., Nagler, A., Hardan, I., et al. (2005). Chemokine receptor
CXCR4-dependent internalization and resecretion of functional chemokine
SDF-1 by bone marrow endothelial and stromal cells. Nat. Immunol. 6,
1038–1046.
Ding, L., and Morrison, S.J. (2013). Haematopoietic stem cells and early
lymphoid progenitors occupy distinct bone marrow niches. Nature 495,
231–235.
Ding, L., Saunders, T.L., Enikolopov, G., and Morrison, S.J. (2012). Endothelial
and perivascular cells maintain haematopoietic stem cells. Nature 481,
457–462.
Dobin, A., Davis, C.A., Schlesinger, F., Drenkow, J., Zaleski, C., Jha, S., Batut,
P., Chaisson,M., andGingeras, T.R. (2013). STAR: ultrafast universal RNA-seq
aligner. Bioinformatics 29, 15–21.
Dominici, M., Le Blanc, K., Mueller, I., Slaper-Cortenbach, I., Marini, F.,
Krause, D., Deans, R., Keating, A., Prockop, Dj., and Horwitz, E. (2006). Mini-
mal criteria for defining multipotent mesenchymal stromal cells. The Interna-
tional Society for Cellular Therapy position statement. Cytotherapy 8,
315–317.
Elsafadi, M., Manikandan, M., Atteya, M., Hashmi, J.A., Iqbal, Z., Aldahmash,
A., Alfayez, M., Kassem, M., and Mahmood, A. (2016). Characterization of
Cellular and Molecular Heterogeneity of Bone Marrow Stromal Cells. Stem
Cells Int. 2016, 9378081.
Engblom, C., Pfirschke, C., Zilionis, R., Da Silva Martins, J., Bos, S.A., Cour-
ties, G., Rickelt, S., Severe, N., Baryawno, N., Faget, J., et al. (2017).
Osteoblasts remotely supply lung tumors with cancer-promoting SiglecFhigh
neutrophils. Science 358, eaal5081.
Freeman, B.T., Jung, J.P., and Ogle, B.M. (2015). Single-Cell RNA-Seq of
Bone Marrow-Derived Mesenchymal Stem Cells Reveals Unique Profiles of
Lineage Priming. PLoS One 10, e0136199.
Friedenstein, A.J., Petrakova, K.V., Kurolesova, A.I., and Frolova, G.P. (1968).
Heterotopic of bone marrow. Analysis of precursor cells for osteogenic and
hematopoietic tissues. Transplantation 6, 230–247.
Ghazanfari, R., Zacharaki, D., Li, H., Ching Lim, H., Soneji, S., and Scheding, S.
(2017). Human Primary Bone Marrow Mesenchymal Stromal Cells and Their
In Vitro Progenies Display Distinct Transcriptional Profile Signatures. Sci.
Rep. 7, 10338.
Hoggatt, J., Kfoury, Y., and Scadden, D.T. (2016). Hematopoietic Stem Cell
Niche in Health and Disease. Annu. Rev. Pathol. 11, 555–581.
Isern, J., Garcıa-Garcıa, A., Martın, A.M., Arranz, L., Martın-Perez, D., Torroja,
C., Sanchez-Cabo, F., and Mendez-Ferrer, S. (2014). The neural crest is a
source of mesenchymal stem cells with specialized hematopoietic stem cell
niche function. eLife 3, e03696.
Klein, A.M., Mazutis, L., Akartuna, I., Tallapragada, N., Veres, A., Li, V., Pesh-
kin, L., Weitz, D.A., and Kirschner, M.W. (2015). Droplet barcoding for single-
cell transcriptomics applied to embryonic stem cells. Cell 161, 1187–1201.
Kondo, M., Weissman, I.L., and Akashi, K. (1997). Identification of clonogenic
common lymphoid progenitors in mouse bone marrow. Cell 91, 661–672.
Kumar, P., Tan, Y., and Cahan, P. (2017). Understanding development and
stem cells using single cell-based analyses of gene expression. Development
144, 17–32.
LaManno, G., Soldatov, R., Zeisel, A., Braun, E., Hochgerner, H., Petukhov, V.,
Lidschreiber, K., Kastriti, M.E., Lonnerberg, P., Furlan, A., et al. (2018). RNA
velocity of single cells. Nature 560, 494–498.
Laurenti, E., and Gottgens, B. (2018). From haematopoietic stem cells to com-
plex differentiation landscapes. Nature 553, 418–426.
Luan, A., Paik, K.J., Li, J., Zielins, E.R., Atashroo, D.A., Spencley, A., Momeni,
A., Longaker, M.T., Wang, K.C., and Wan, D.C. (2015). RNA Sequencing for
310 Cell Reports 28, 302–311, July 9, 2019
Identification of Differentially Expressed Noncoding Transcripts during Adipo-
genic Differentiation of Adipose-Derived Stromal Cells. Plast. Reconstr. Surg.
136, 752–763.
Medyouf, H., Mossner, M., Jann, J.C., Nolte, F., Raffel, S., Herrmann, C., Lier,
A., Eisen, C., Nowak, V., Zens, B., et al. (2014). Myelodysplastic cells in pa-
tients reprogram mesenchymal stromal cells to establish a transplantable
stem cell niche disease unit. Cell Stem Cell 14, 824–837.
Mendelson, A., and Frenette, P.S. (2014). Hematopoietic stem cell nichemain-
tenance during homeostasis and regeneration. Nat. Med. 20, 833–846.
Mendez-Ferrer, S., Michurina, T.V., Ferraro, F., Mazloom, A.R., Macarthur,
B.D., Lira, S.A., Scadden, D.T., Ma’ayan, A., Enikolopov, G.N., and Frenette,
P.S. (2010). Mesenchymal and haematopoietic stem cells form a unique
bone marrow niche. Nature 466, 829–834.
Mercier, F.E., Ragu, C., and Scadden, D.T. (2011). The bone marrow at the
crossroads of blood and immunity. Nat. Rev. Immunol. 12, 49–60.
Mootha, V.K., Lindgren, C.M., Eriksson, K.F., Subramanian, A., Sihag, S., Le-
har, J., Puigserver, P., Carlsson, E., Ridderstrale, M., Laurila, E., et al. (2003).
PGC-1alpha-responsive genes involved in oxidative phosphorylation are coor-
dinately downregulated in human diabetes. Nat. Genet. 34, 267–273.
Morikawa, S., Mabuchi, Y., Kubota, Y., Nagai, Y., Niibe, K., Hiratsu, E., Suzuki,
S., Miyauchi-Hara, C., Nagoshi, N., Sunabori, T., et al. (2009). Prospective
identification, isolation, and systemic transplantation of multipotent mesen-
chymal stem cells in murine bone marrow. J. Exp. Med. 206, 2483–2496.
Morrison, S.J., and Scadden, D.T. (2014). The bone marrow niche for haema-
topoietic stem cells. Nature 505, 327–334.
Nusspaumer, G., Jaiswal, S., Barbero, A., Reinhardt, R., Ishay Ronen, D.,
Haumer, A., Lufkin, T., Martin, I., and Zeller, R. (2017). Ontogenic Identification
and Analysis of Mesenchymal Stromal Cell Populations during Mouse Limb
and Long Bone Development. Stem Cell Reports 9, 1124–1138.
Omatsu, Y., Sugiyama, T., Kohara, H., Kondoh, G., Fujii, N., Kohno, K., and
Nagasawa, T. (2010). The essential functions of adipo-osteogenic progenitors
as the hematopoietic stem and progenitor cell niche. Immunity 33, 387–399.
Petukhov, V., Guo, J., Baryawno, N., Severe, N., Scadden, D.T., Samsonova,
M.G., and Kharchenko, P.V. (2018). dropEst: pipeline for accurate estimation
of molecular counts in droplet-based single-cell RNA-seq experiments.
Genome Biol. 19, 78.
Pinho, S., Lacombe, J., Hanoun, M., Mizoguchi, T., Bruns, I., Kunisaki, Y., and
Frenette, P.S. (2013). PDGFRa and CD51mark human nestin+ sphere-forming
mesenchymal stem cells capable of hematopoietic progenitor cell expansion.
J. Exp. Med. 210, 1351–1367.
Pittenger, M.F., Mackay, A.M., Beck, S.C., Jaiswal, R.K., Douglas, R., Mosca,
J.D., Moorman, M.A., Simonetti, D.W., Craig, S., and Marshak, D.R. (1999).
Multilineage potential of adult human mesenchymal stem cells. Science 284,
143–147.
Qiu, X., Mao, Q., Tang, Y., Wang, L., Chawla, R., Pliner, H.A., and Trapnell, C.
(2017). Reversed graph embedding resolves complex single-cell trajectories.
Nat. Methods 14, 979–982.
Raaijmakers, M.H., Mukherjee, S., Guo, S., Zhang, S., Kobayashi, T., Schoon-
maker, J.A., Ebert, B.L., Al-Shahrour, F., Hasserjian, R.P., Scadden, E.O., et al.
(2010). Bone progenitor dysfunction induces myelodysplasia and secondary
leukaemia. Nature 464, 852–857.
Rosen, C.J., Ackert-Bicknell, C., Rodriguez, J.P., and Pino, A.M. (2009).
Marrow fat and the bone microenvironment: developmental, functional, and
pathological implications. Crit. Rev. Eukaryot. Gene Expr. 19, 109–124.
Scott, R.W., and Underhill, T.M. (2016). Methods and Strategies for Lineage
Tracing of Mesenchymal Progenitor Cells. Methods Mol. Biol. 1416, 171–203.
Silberstein, L., Goncalves, K.A., Kharchenko, P.V., Turcotte, R., Kfoury, Y.,
Mercier, F., Baryawno, N., Severe, N., Bachand, J., Spencer, J.A., et al.
(2016). Proximity-Based Differential Single-Cell Analysis of the Niche to Iden-
tify Stem/Progenitor Cell Regulators. Cell Stem Cell 19, 530–543.
Subramanian, A., Tamayo, P., Mootha, V.K., Mukherjee, S., Ebert, B.L., Gil-
lette, M.A., Paulovich, A., Pomeroy, S.L., Golub, T.R., Lander, E.S., and
Mesirov, J.P. (2005). Gene set enrichment analysis: a knowledge-based
approach for interpreting genome-wide expression profiles. Proc. Natl. Acad.
Sci. USA 102, 15545–15550.
Sugiyama, T., Kohara, H., Noda, M., and Nagasawa, T. (2006). Maintenance of
the hematopoietic stem cell pool by CXCL12-CXCR4 chemokine signaling in
bone marrow stromal cell niches. Immunity 25, 977–988.
Tikhonova, A.N., Dolgalev, I., Hu, H., Sivaraj, K.K., Hoxha, E., Cuesta-Domı-
nguez, A., Pinho, S., Akhmetzyanova, I., Gao, J., Witkowski, M., et al. (2019).
The bone marrow microenvironment at single-cell resolution. Nature 569,
222–228.
Trapnell, C., Cacchiarelli, D., Grimsby, J., Pokharel, P., Li, S., Morse, M., Len-
non, N.J., Livak, K.J., Mikkelsen, T.S., and Rinn, J.L. (2014). The dynamics and
regulators of cell fate decisions are revealed by pseudotemporal ordering of
single cells. Nat. Biotechnol. 32, 381–386.
van den Brink, S.C., Sage, F., Vertesy, A., Spanjaard, B., Peterson-Maduro, J.,
Baron, C.S., Robin, C., and van Oudenaarden, A. (2017). Single-cell
sequencing reveals dissociation-induced gene expression in tissue subpopu-
lations. Nat. Methods 14, 935–936.
Weinreb, C., Wolock, S., and Klein, A.M. (2018a). SPRING: a kinetic interface
for visualizing high dimensional single-cell expression data. Bioinformatics 34,
1246–1248.
Weinreb, C., Wolock, S., Tusi, B.K., Socolovsky, M., and Klein, A.M. (2018b).
Fundamental limits on dynamic inference from single-cell snapshots. Proc.
Natl. Acad. Sci. USA 115, E2467–E2476.
Whitfield, M.J., Lee, W.C., and Van Vliet, K.J. (2013). Onset of heterogeneity in
culture-expanded bone marrow stromal cells. Stem Cell Res. (Amst.) 11,
1365–1377.
Wolock, S.L., Lopez, R., and Klein, A.M. (2019). Scrublet: Computational iden-
tification of cell doublets in single-cell transcriptomic data. Cell Syst. 8, 281–
291.e9.
Worthley, D.L., Churchill, M., Compton, J.T., Tailor, Y., Rao, M., Si, Y., Levin,
D., Schwartz, M.G., Uygur, A., Hayakawa, Y., et al. (2015). Gremlin 1 identifies
a skeletal stem cell with bone, cartilage, and reticular stromal potential. Cell
160, 269–284.
Wu, H., Gordon, J.A., Whitfield, T.W., Tai, P.W., van Wijnen, A.J., Stein, J.L.,
Stein, G.S., and Lian, J.B. (2017). Chromatin dynamics regulate mesenchymal
stem cell lineage specification and differentiation to osteogenesis. Biochim.
Biophys. Acta. Gene Regul. Mech. 1860, 438–449.
Zambetti, N.A., Ping, Z., Chen, S., Kenswil, K.J.G., Mylona, M.A., Sanders,
M.A., Hoogenboezem, R.M., Bindels, E.M.J., Adisty, M.N., Van Strien,
P.M.H., et al. (2016). Mesenchymal Inflammation Drives Genotoxic Stress in
Hematopoietic Stem Cells and Predicts Disease Evolution in Human Pre-
leukemia. Cell Stem Cell 19, 613–627.
Zhou, B.O., Yue, R., Murphy, M.M., Peyer, J.G., and Morrison, S.J. (2014).
Leptin-receptor-expressing mesenchymal stromal cells represent the main
source of bone formed by adult bone marrow. Cell Stem Cell 15, 154–168.
Zilionis, R., Nainys, J., Veres, A., Savova, V., Zemmour, D., Klein, A.M., and
Mazutis, L. (2017). Single-cell barcoding and sequencing using droplet micro-
fluidics. Nat. Protoc. 12, 44–73.
Cell Reports 28, 302–311, July 9, 2019 311
STAR+METHODS
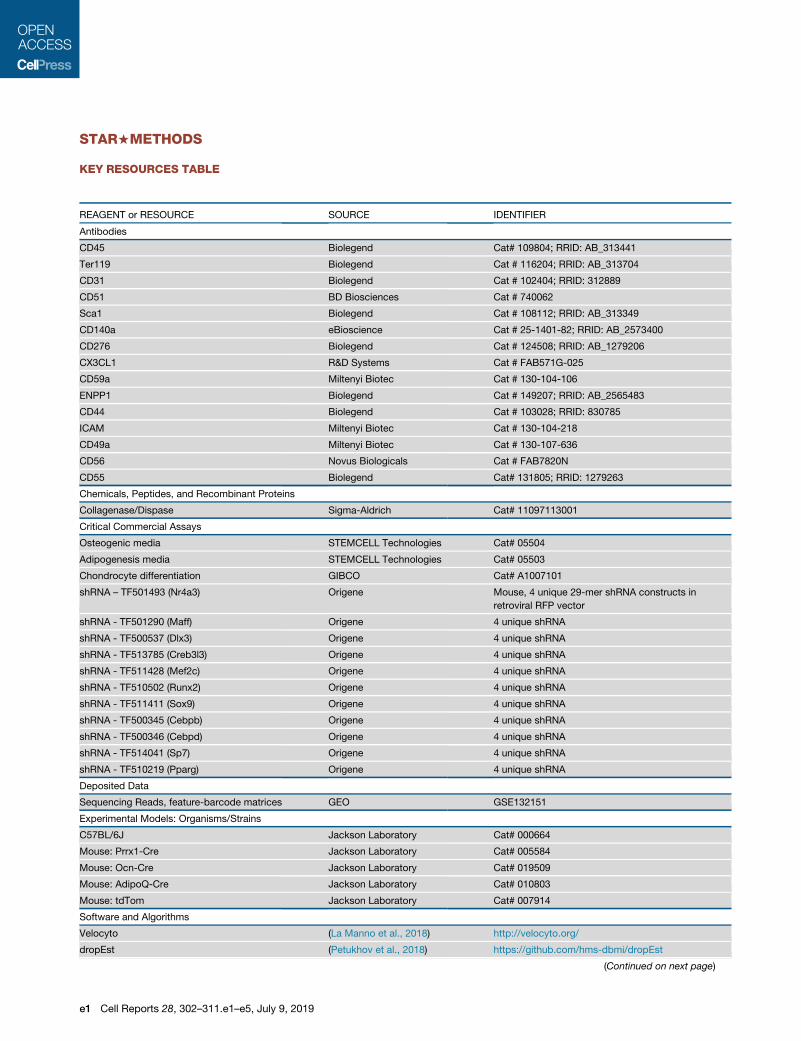
KEY RESOURCES TABLE
REAGENT or RESOURCE SOURCE IDENTIFIER
Antibodies
CD45 Biolegend Cat# 109804; RRID: AB_313441
Ter119 Biolegend Cat # 116204; RRID: AB_313704
CD31 Biolegend Cat # 102404; RRID: 312889
CD51 BD Biosciences Cat # 740062
Sca1 Biolegend Cat # 108112; RRID: AB_313349
CD140a eBioscience Cat # 25-1401-82; RRID: AB_2573400
CD276 Biolegend Cat # 124508; RRID: AB_1279206
CX3CL1 R&D Systems Cat # FAB571G-025
CD59a Miltenyi Biotec Cat # 130-104-106
ENPP1 Biolegend Cat # 149207; RRID: AB_2565483
CD44 Biolegend Cat # 103028; RRID: 830785
ICAM Miltenyi Biotec Cat # 130-104-218
CD49a Miltenyi Biotec Cat # 130-107-636
CD56 Novus Biologicals Cat # FAB7820N
CD55 Biolegend Cat# 131805; RRID: 1279263
Chemicals, Peptides, and Recombinant Proteins
Collagenase/Dispase Sigma-Aldrich Cat# 11097113001
Critical Commercial Assays
Osteogenic media STEMCELL Technologies Cat# 05504
Adipogenesis media STEMCELL Technologies Cat# 05503
Chondrocyte differentiation GIBCO Cat# A1007101
shRNA – TF501493 (Nr4a3) Origene Mouse, 4 unique 29-mer shRNA constructs in
retroviral RFP vector
shRNA - TF501290 (Maff) Origene 4 unique shRNA
shRNA - TF500537 (Dlx3) Origene 4 unique shRNA
shRNA - TF513785 (Creb3l3) Origene 4 unique shRNA
shRNA - TF511428 (Mef2c) Origene 4 unique shRNA
shRNA - TF510502 (Runx2) Origene 4 unique shRNA
shRNA - TF511411 (Sox9) Origene 4 unique shRNA
shRNA - TF500345 (Cebpb) Origene 4 unique shRNA
shRNA - TF500346 (Cebpd) Origene 4 unique shRNA
shRNA - TF514041 (Sp7) Origene 4 unique shRNA
shRNA - TF510219 (Pparg) Origene 4 unique shRNA
Deposited Data
Sequencing Reads, feature-barcode matrices GEO GSE132151
Experimental Models: Organisms/Strains
C57BL/6J Jackson Laboratory Cat# 000664
Mouse: Prrx1-Cre Jackson Laboratory Cat# 005584
Mouse: Ocn-Cre Jackson Laboratory Cat# 019509
Mouse: AdipoQ-Cre Jackson Laboratory Cat# 010803
Mouse: tdTom Jackson Laboratory Cat# 007914
Software and Algorithms
Velocyto (La Manno et al., 2018) http://velocyto.org/
dropEst (Petukhov et al., 2018) https://github.com/hms-dbmi/dropEst
(Continued on next page)
e1 Cell Reports 28, 302–311.e1–e5, July 9, 2019
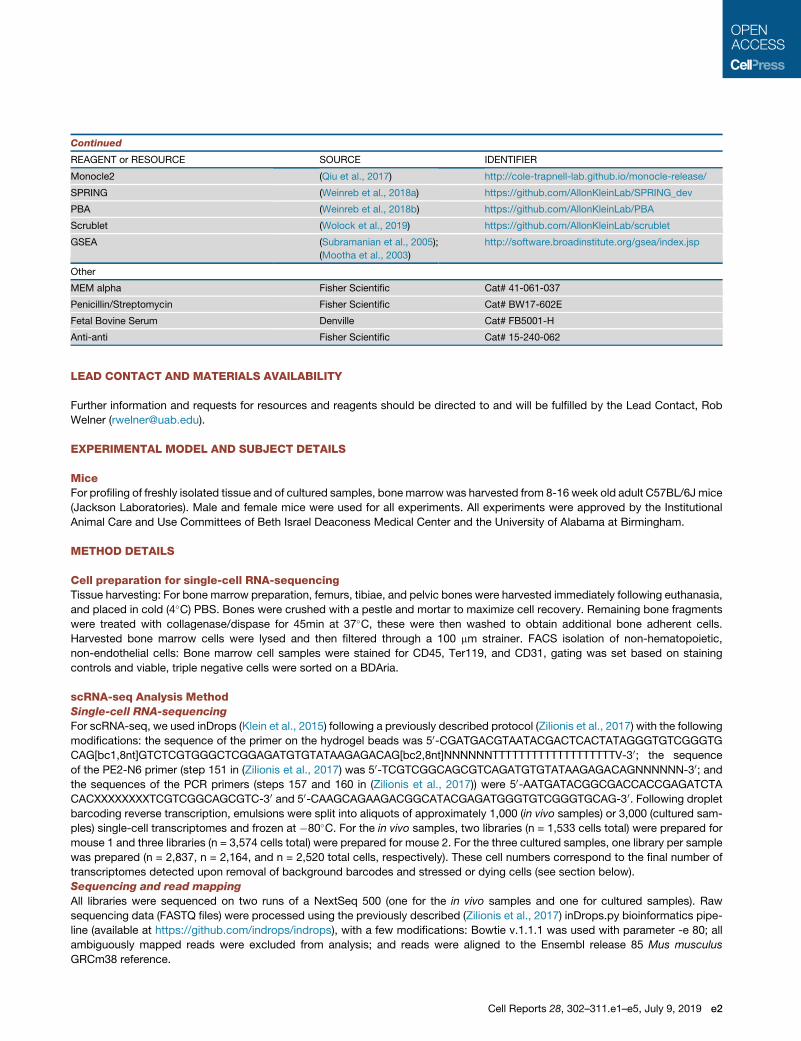
Continued
REAGENT or RESOURCE SOURCE IDENTIFIER
Monocle2 (Qiu et al., 2017) http://cole-trapnell-lab.github.io/monocle-release/
SPRING (Weinreb et al., 2018a) https://github.com/AllonKleinLab/SPRING_dev
PBA (Weinreb et al., 2018b) https://github.com/AllonKleinLab/PBA
Scrublet (Wolock et al., 2019) https://github.com/AllonKleinLab/scrublet
GSEA (Subramanian et al., 2005);
(Mootha et al., 2003)
http://software.broadinstitute.org/gsea/index.jsp
Other
MEM alpha Fisher Scientific Cat# 41-061-037
Penicillin/Streptomycin Fisher Scientific Cat# BW17-602E
Fetal Bovine Serum Denville Cat# FB5001-H
Anti-anti Fisher Scientific Cat# 15-240-062
LEAD CONTACT AND MATERIALS AVAILABILITY
Further information and requests for resources and reagents should be directed to and will be fulfilled by the Lead Contact, Rob
Welner ([email protected]).
EXPERIMENTAL MODEL AND SUBJECT DETAILS
MiceFor profiling of freshly isolated tissue and of cultured samples, bonemarrow was harvested from 8-16 week old adult C57BL/6J mice
(Jackson Laboratories). Male and female mice were used for all experiments. All experiments were approved by the Institutional
Animal Care and Use Committees of Beth Israel Deaconess Medical Center and the University of Alabama at Birmingham.
METHOD DETAILS
Cell preparation for single-cell RNA-sequencingTissue harvesting: For bone marrow preparation, femurs, tibiae, and pelvic bones were harvested immediately following euthanasia,
and placed in cold (4�C) PBS. Bones were crushed with a pestle and mortar to maximize cell recovery. Remaining bone fragments
were treated with collagenase/dispase for 45min at 37�C, these were then washed to obtain additional bone adherent cells.
Harvested bone marrow cells were lysed and then filtered through a 100 mm strainer. FACS isolation of non-hematopoietic,
non-endothelial cells: Bone marrow cell samples were stained for CD45, Ter119, and CD31, gating was set based on staining
controls and viable, triple negative cells were sorted on a BDAria.
scRNA-seq Analysis MethodSingle-cell RNA-sequencing
For scRNA-seq, we used inDrops (Klein et al., 2015) following a previously described protocol (Zilionis et al., 2017) with the following
modifications: the sequence of the primer on the hydrogel beads was 50-CGATGACGTAATACGACTCACTATAGGGTGTCGGGTG
CAG[bc1,8nt]GTCTCGTGGGCTCGGAGATGTGTATAAGAGACAG[bc2,8nt]NNNNNNTTTTTTTTTTTTTTTTTTTV-30; the sequence
of the PE2-N6 primer (step 151 in (Zilionis et al., 2017) was 50-TCGTCGGCAGCGTCAGATGTGTATAAGAGACAGNNNNNN-30; andthe sequences of the PCR primers (steps 157 and 160 in (Zilionis et al., 2017)) were 50-AATGATACGGCGACCACCGAGATCTA
CACXXXXXXXXTCGTCGGCAGCGTC-30 and 50-CAAGCAGAAGACGGCATACGAGATGGGTGTCGGGTGCAG-30. Following droplet
barcoding reverse transcription, emulsions were split into aliquots of approximately 1,000 (in vivo samples) or 3,000 (cultured sam-
ples) single-cell transcriptomes and frozen at �80�C. For the in vivo samples, two libraries (n = 1,533 cells total) were prepared for
mouse 1 and three libraries (n = 3,574 cells total) were prepared for mouse 2. For the three cultured samples, one library per sample
was prepared (n = 2,837, n = 2,164, and n = 2,520 total cells, respectively). These cell numbers correspond to the final number of
transcriptomes detected upon removal of background barcodes and stressed or dying cells (see section below).
Sequencing and read mapping
All libraries were sequenced on two runs of a NextSeq 500 (one for the in vivo samples and one for cultured samples). Raw
sequencing data (FASTQ files) were processed using the previously described (Zilionis et al., 2017) inDrops.py bioinformatics pipe-
line (available at https://github.com/indrops/indrops), with a few modifications: Bowtie v.1.1.1 was used with parameter -e 80; all
ambiguously mapped reads were excluded from analysis; and reads were aligned to the Ensembl release 85 Mus musculus
GRCm38 reference.
Cell Reports 28, 302–311.e1–e5, July 9, 2019 e2
Quantification and Statistical Analysis of scRNA-seqCell filtering and normalization
Each library was initially filtered to include only abundant barcodes (> 500 total counts for all in vivo libraries; > 800 counts for cultured
sample 1; > 1,000 counts for cultured samples 2 and 3), based on visual inspection of the histograms of total transcript counts per cell
barcode. Next, we excluded putatively stressed or dying cells with > 30% (in vivo samples) or > 20% (cultured samples) of their
transcripts coming from mitochondrial genes.
The gene expression counts of each cell were then normalized using a variant of total-count normalization that avoids distortion
from very highly expressed genes. Specifically, we calculated bxi;j, the normalized transcript counts for gene j in cell i, from the raw
counts xi;jas follows: bxi;j = xi;jX=Xi, where Xi =Pj
xi;j and X is the average of Xi over all cells. To prevent very highly expressed genes
from correspondingly decreasing the relative expression of other genes, we excluded genes comprising > 5% of the total counts of
any cell when calculating X and Xi:
Inorder to focusonheterogeneitywithin thestromalcell population,wefirstclustered thedataandexcludedhematopoieticandendo-
thelial cell clusters based on their expression of previously knownmarker genes, aswell as putative cell doublets. Specifically, we iden-
tified genes that were highly variable (top 25% by v-score (Klein et al., 2015), a measure of above-Poisson noise) and expressed at
reasonably high levels (at least 3 counts in at least 5 cells). The counts for these genes were z-score normalized and used to perform
principal components analysis (PCA), keeping the top 35 dimensions. After PCA, a k-nearest-neighbor (kNN) graph (k = 4) was con-
structed by connecting each cell to its four nearest neighbors, using Euclidean distance in the principal component space. Finally,
we applied spectral clustering (scikit-learnSpectralClustering functionwith assign_labels= ’discretize’) to the kNNgraphand visualized
the clustering by projecting the graph into two dimensions using a force-directed graph layout (SPRING(Weinreb et al., 2018a)).
We then identified enriched genes in each cluster and assigned cell type labels based on well-characterized cell type-specific
marker genes (Figure S1D). Using this approach, we excluded putative endothelial cells, granulocytes, lymphoid progenitors, mega-
karyocytes, and erythroid progenitors.
For the in vivo samples, we also used Scrublet(Wolock et al., 2019) to identify two clusters of cell doublets that co-expressed
marker genes of distinct cell types. 142 putative doublets were excluded.
Clustering and visualization of stromal cells
We repeated cell clustering and visualization using only the non-hematopoietic, non-endothelial clusters. Gene filtering, PCA, and
kNN graph construction were performed as above, except only the top 25 principal components were used, and only seven spectral
clusters were generated.
Permutation test for gene enrichment
To find significantly enriched genes in each cell cluster, we used a parameter-free permutation-based test to calculate p values, with
the difference in means as the test statistic (Engblom et al., 2017). We accounted for multiple hypotheses testing with a false discov-
ery rate of 5% using the Benjamini-Hochberg procedure (Benjamini and Hochberg, 1995). To be considered for differential gene
expression analysis, genes had to be expressed by at least 5 of the cells in the cluster of interest.
Gene set enrichment analysis (GSEA)
We used the online GSEA tool (http://software.broadinstitute.org/gsea/login.jsp)(Mootha et al., 2003; Subramanian et al., 2005) to
find terms enriched in cluster-specific genes. As input, we used significantly enriched genes with > 2-fold higher average expression
(adding a pseudocount of 0.1 transcript counts) in the cluster of interest compared to the remaining cells. The following gene set col-
lections were tested: H (hallmark), C2 (curated), and C5 (Gene Ontology).
Population balance analysis (PBA)
The PBA algorithm calculates a scalar ‘‘potential’’ for each cell that is analogous to a distance, or pseudotime, from an undifferen-
tiated source, and a vector of fate probabilities that indicate the distance to fate branch points. These fate probabilities and temporal
ordering were computed using the Python implementation of PBA (available online https://github.com/AllonKleinLab/PBA), as de-
scribed(Weinreb et al., 2018b).
The inputs to the PBA scripts are a set of comma-separated value (.csv) files encoding: the edge list of a kNN graph (k = 50) of the
cell transcriptomes (A.csv); a vector assigning a net source/sink rate to each graph node (R.csv); and a lineage-specific binary matrix
identifying the subset of graph nodes that reside at the tips of branches (S.csv). These files are provided online at http://kleintools.
hms.harvard.edu/paper_websites/bone_marrow_stroma/. PBA is then run according to the following steps:
(1) Apply the script ‘compute_Linv.py -e A.csv’, here inputting edges (flag ‘-e’) from the SPRING kNN graph (see above). This step
outputs the random-walk graph Laplacian, Linv.npy.
(2) Apply the script ‘compute_potential.py -L Linv.npy -R R.csv’, here inputting the inverse graph Laplacian (flag ‘-L’) computed in
step (1) and the net source/sink rate to each graph node (flag ‘-R’). This step outputs a potential vector (V.npy) that is used for
temporal ordering (cells ordered from high to low potential).
(3) Apply the script ‘compute_fate_probabilities.py -S S.csv -V V.npy -e A.csv -D 1’, here inputting the lineage-specific exit rate
matrix (flag ‘-S’), the potential (flag ‘-V’) computed in step (2), the same edges (flag ‘-e’) used in step (1) and a diffusion constant
(flat ‘-D’) of 1. This step outputs fate probabilities for each cell.
e3 Cell Reports 28, 302–311.e1–e5, July 9, 2019
Estimation of net source/sink rate vector R
A complete definition of the vector R in terms of biophysical quantities has been published previously(Weinreb et al., 2018b). We
assigned negative values to R for the five cells with the highest expression of marker genes for each of the three terminal lineages.
Specifically, for each lineage, we identified genes enriched in the most mature cell cluster (cluster 1 for adipocytes, cluster 6 for
osteoblasts, and cluster 7 for chondrocytes), keeping genes expressed in > 25% of cells with an average expression level
of > 0.5 transcript counts and > 2-fold higher average expression within the cluster than in the rest of the cells. We then identified
the five cells with the highest average z-score normalized expression of thesemarker genes. We used the same procedure to identify
ten starting cells (cells with highest score of cluster 3 [MSC] genes). We assigned different exit rates to each of the three lineages
using a fitting procedure that ensured that cells identified as the putative starting MSCs would have a uniform probability to become
each fate. We assigned a single positive value to all remaining cells, with the value chosen to enforce the steady-state conditionPi
Ri = 0. In the fitting procedure, all exit were initially set to one and iteratively incremented or decremented until the average
fate probabilities of the putative starting MSCs were within 1% of uniform. The separate lineage exit rates were then used to form
the lineage-specific exit rate matrix S.
Extracting and ordering cells for each lineage
To isolate the differentiation trajectory for each lineage (adipocyte, osteoblast, and chondrocyte), we ordered cells on the basis of
their graph distance from the earliest predicted MSC progenitors, keeping only cells for which the probability of the given fate
increased or remained constant with graph distance. Graph distance was measured by PBA potential, and starting with the cell
closest to the MSC origin, we added the cell with next highest potential to the trajectory if the PBA-predicted lineage probability
for cell i was at least 99.5% of the average lineage probability of the cell(s) already in the trajectory.
More formally, the procedure is as follows: order all N cells in the experiment from highest to lowest PBA potential V, with
decreasing potential corresponding to increasing distance fromMSCs. Let Ei be an indicator variable for the membership of ordered
cell i in the erythroid trajectory (Ei = 1 if cell i is in the trajectory; otherwise, Ei = 0). If Pi is the PBA-predicted lineage probability for
ordered cell i, then Ei = 1 if
Pi > 0:9953
Pk < iPk 3EkP
k < iEk
Cells on a given lineage’s trajectory were then ordered by decreasing potential. Defining tj as the index of the jth cell on a given
trajectory,
tj = 1+Xk < j
Ek
Throughout this paper, we report this cell order (akin to the ‘‘pseudotime’’ in other publications) as a percentage of ordered cells, with
the first, least differentiated cell at 0% and the most mature cell at 100%.
Significant dynamic genes
To find genes with significant changes in expression across each lineage’s cell ordering, we used a modified version of permutation
test described above (see ‘‘Permutation test for gene enrichment’’). Specifically, we applied a sliding window (n = 50 cells) to the cell
ordering and used the difference in means between the windows with the highest and lowest expression as the test statistic,
comparing the observed difference to the differences obtained after permuting the cell ordering. To be considered for analysis, genes
were required to have a mean expression of at least 0.01 transcript counts in the input cells.
Dynamic gene clustering
To find groups of genes with similar expression patterns along each lineage’s differentiation ordering, we clustered the smoothed
expression traces for all significantly variable genes (see previous section) with at least two-fold change between the windows
with minimum and maximum expression. In detail, we smoothed the gene expression traces using a Gaussian kernel (s = 10% of
cell ordering), z-score normalized the smoothed traces, and clustered the traces using k-means clustering.
Mapping cultured cell transcriptomes to freshly isolated cell data
For Figures 5A and S5B, cells from the cultured samples were projected into the same principal component space as the in vivo data,
thenmapped to their most similar in vivo neighbors. In detail, counts were first converted to TPM for all samples. Then, using only the
in vivo cells, the top 25% most variable genes (measured by v-score) with at least three transcript counts in at least five cells were
z-score normalized and used to find the top 35 principal components. Next, the cultured cells were z-score normalized using the gene
expressionmeans and s.d. from the in vivo data and transformed into the in vivo principal component space. Lastly, each cultured cell
was mapped to its closest in vivo neighbor in principal component space (Euclidean distance). In the visualization in Figure 5A, the
number of cultured cells mapping to each in vivo cell was smoothed over the kNN graph (see section ‘‘Smoothing over the kNN
graph’’). For Figure S5B, we compared cells in the in vivo MSC cluster to the cultured cells mapping to them.
Smoothing over the kNN graph
We smoothed data over the kNN graph for visualization of the density of cultured cells mapping to in vivo cells (Figure 5A).
Smoothing was performed by diffusing the number of mapped cells over the graph, as described. In brief, if G is the kNN graph,
Cell Reports 28, 302–311.e1–e5, July 9, 2019 e4
then the smoothing operator S is S = expmð� bLÞ, where L is the Laplacian matrix of G, b is the strength of smoothing ðb = 2Þ, andexpm is the matrix exponential. Then the smoothed vector X� of a vector of raw values X (number of mapped cells) is X� = SX:
RNA velocity
In order to generate the input for Velocyto (v0.17.13) (La Manno et al., 2018), which requires annotation of exons and introns for read
alignments, the raw reads were reprocessed using dropEst (v0.8.5) (Petukhov et al., 2018). We first ran droptag with the default
parameters, then aligned reads to the mouse genome (mm10) using STAR (v2.7.0a) (Dobin et al., 2013), allowing unique alignments
only (‘–outSAMmultNmax 1’). Then dropEst was run with default settings, aside from the following: ‘-m -V -b -F -L eiEIBA’. Cell
barcodes were error-corrected using the Velocyto ‘dropest-bc-correct’ command, followed by generation of Velocyto loom files
using ‘run-dropest’.
Velocyto.py was run following an example notebook (https://github.com/velocyto-team/velocyto-notebooks/blob/master/python/
DentateGyrus.ipynb). Briefly, the loom files generated by dropEst were merged and then filtered to include cell barcodes used in this
paper’s other analyses (see ‘Cell filtering and normalization’ section). Following gene filtering (3000 most variable genes with a min-
imum of 3 counts and detection in 3 cells), spliced and unspliced counts were normalized separately based on total counts per cell,
with a target size of the mean total counts across cells. PCA was run using 33 components, followed by KNN imputation with 66
neighbors. Gamma fitting, RNA velocity calculations, and Markov process simulations were conducted as in the Dentate Gyrus
example (code for the full analysis is available at kleintools.hms.harvard.edu/paper_websites/bone_marrow_stroma).
Monocle
Monocle (v2.10.1) (Qiu et al., 2017) was run on our normalized counts matrix. Using the same gene filter as in the other analyses (see
‘Cell filtering and normalization’ section), we generated an embedding using the reduceDimension() function (‘max_components = 2,
method = ’’DDRTree’’ norm_method = ’’none,’’ pseudo_expr = 0, relative_expr = FALSE, scaling = TRUE’). After generating an initial
ordering with the orderCells() function, we identified the state corresponding to MSCs and re-ran orderCells() using this state as the
root state. To compare the Monocle osteoblast cell ordering to that of PBA, we selected cells in theMSC and osteoblast states of the
Monocle embedding and then ordered cells by Monocle pseudotime.
Culture assaysStromal cell differentiation
The CD45/TER119- CD31- CD51+ Sca1+/� or tdTOM+ cells were sorted and cultured for 7-14 days. MSCs were induced toward
osteogenic and adipogenic lineages after plating to 70%–80% confluency. The cells were then cultured in differentiation induction
media for osteoblast, adipocyte and chondrocyte differentiation. The media were changed twice a week for 21 days. For osteoblast
differentiation, the cells were cultured in complete osteogenic medium from STEMCELL Technologies (05504). At day 21 after
induction, the cells were fixed with ice-cold methanol and stained with 1%Alizarin Red S for 5-10 min. The excess dye was removed,
the wells were dehydrated, and imaged. For adipogenesis, the cells were cultured in STEMCELL Technologies (05503). The cells
were fixed with 10% formalin and stained with 0.5%Oil Red O in isopropanol. Chondrocyte differentiation was induced in monolayer
culture, and the cells were cultured in 12-well plates inGIBCO (A1007101). Chondrocyte differentiation was assessed by staining with
Toluidine blue, followed by removal of the excess dye and three washes with distilled water. All images were taken using a bright field
microscope.
QUANTIFICATION AND STATISTICAL ANALYSIS
Statistical and graphical analyses was performed using Graphpad Prism and Microsoft Excel 2018. Statistical analyses were
performed depending on the spread of the variable as specified and were reported as means ± standard deviation (SD). A Sha-
piro-Wilk test was used to determine normal versus perturbed distributions, and all continuous variables were tested for mean dif-
ferences. Depending on the spread of variable both nonparametric: Mann–Whitney U test, ANOVAKruskal-Wallis test, Wilcoxon test,
and parametric: Student’s t test and ANOVA were used. For ANOVA, Tukey’s post-test was used to compare individual groups.
Depending on the spread of variable, nonparametric Mann–Whitney U test, ANOVA Kruskal-Wallis test, Wilcoxon test, and
parametric Student’s t test and ANOVA were used. For ANOVA, Tukey’s post-test was used to compare individual groups. A-priori
sample size calculation was determined based on estimates from preliminary experiments in order to provide power of > 80% to
detect a 30%differencewith an alpha error of 0.05. All flow cytometry data was obtained from at least 5mice per condition. Statistical
details, including statistical tests used, number of mice analyzed can be found in the legend for each figure.
DATA AND CODE AVAILABILITY
The accession number for the scRNA-seq data reported in this paper is GEO: GSE132151 (https://www.ncbi.nlm.nih.gov/geo/).
e5 Cell Reports 28, 302–311.e1–e5, July 9, 2019
Cell Reports, Volume 28
Supplemental Information
Mapping Distinct Bone Marrow Niche
Populations and Their Differentiation Paths
Samuel L. Wolock, Indira Krishnan, Danielle E. Tenen, Victoria Matkins, VirginiaCamacho, Sweta Patel, Puneet Agarwal, Ravi Bhatia, Daniel G. Tenen, Allon M.Klein, and Robert S. Welner
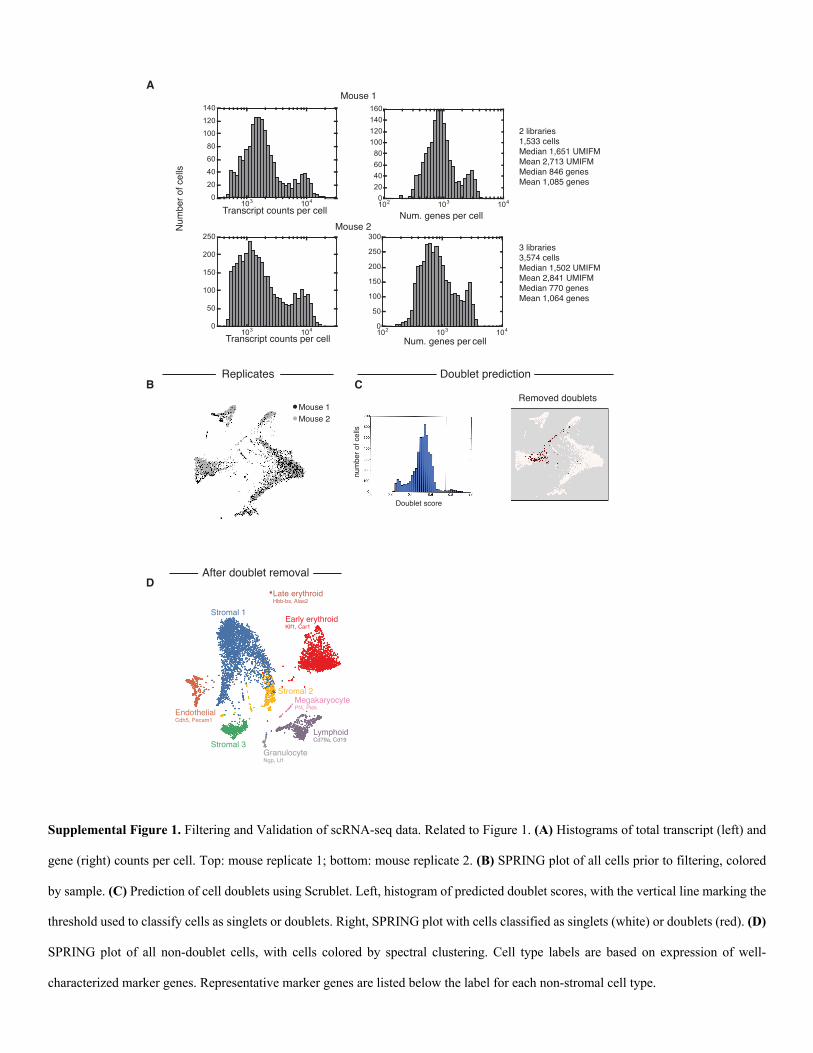
Supplemental Figure 1. Filtering and Validation of scRNA-seq data. Related to Figure 1. (A) Histograms of total transcript (left) and
gene (right) counts per cell. Top: mouse replicate 1; bottom: mouse replicate 2. (B) SPRING plot of all cells prior to filtering, colored
by sample. (C) Prediction of cell doublets using Scrublet. Left, histogram of predicted doublet scores, with the vertical line marking the
threshold used to classify cells as singlets or doublets. Right, SPRING plot with cells classified as singlets (white) or doublets (red). (D)
SPRING plot of all non-doublet cells, with cells colored by spectral clustering. Cell type labels are based on expression of well-
characterized marker genes. Representative marker genes are listed below the label for each non-stromal cell type.
Doublet prediction
Removed doubletsMouse 1Mouse 2
Stromal 1
EndothelialCdh5, Pecam1
Stromal 3GranulocyteNgp, Ltf
LymphoidCd79a, Cd19
MegakaryocytePf4, Plek
Stromal 2
Early erythroidKlf1, Car1
Late erythroidHbb-bs, Alas2
2 libraries1,533 cellsMedian 1,651 UMIFMMean 2,713 UMIFMMedian 846 genesMean 1,085 genes
3 libraries3,574 cellsMedian 1,502 UMIFMMean 2,841 UMIFMMedian 770 genesMean 1,064 genes
Num
ber o
f cel
ls
102 103 104020406080100120140160
Num. genes per cell
102 103 1040
50
100
150
200
250
300
Num. genes per cell
103 1040
20
40
60
80
100
120
140Mouse 1
Transcript counts per cell
103 1040
50
100
150
200
250
Transcript counts per cell
Mouse 2
Replicates
After doublet removal
A
B C
D
Doublet score
num
ber o
f cel
ls
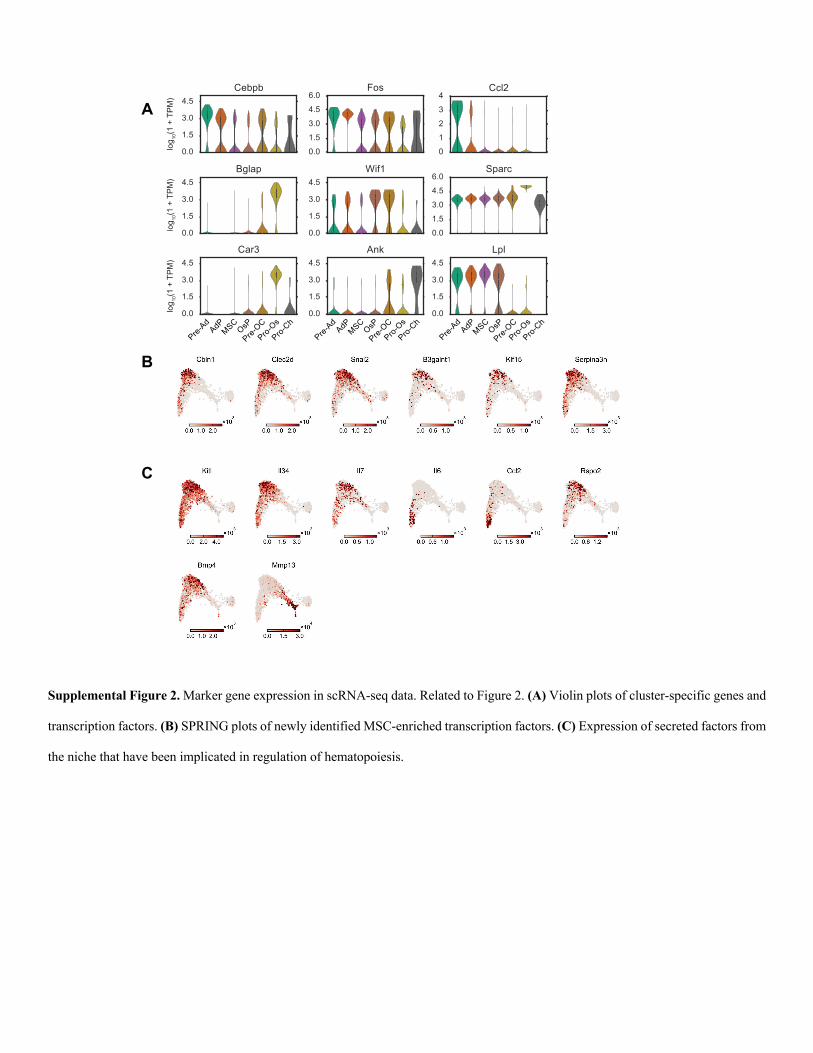
Supplemental Figure 2. Marker gene expression in scRNA-seq data. Related to Figure 2. (A) Violin plots of cluster-specific genes and
transcription factors. (B) SPRING plots of newly identified MSC-enriched transcription factors. (C) Expression of secreted factors from
the niche that have been implicated in regulation of hematopoiesis.
Supplemental Figure 2
A
B
C
0
1
2
3
4Ccl2
0.0
1.5
3.0
4.5Cebpb
0.0
1.5
3.0
4.5
6.0Fos
log 10
(1 +
TP
M)
0.0
1.5
3.0
4.5Bglap
0.0
1.5
3.0
4.5
6.0Sparc
0.0
1.5
3.0
4.5Wif1
log 10
(1 +
TP
M)
0.0
1.5
3.0
4.5Lpl
0.0
1.5
3.0
4.5Ank
0.0
1.5
3.0
4.5Car3
log 10
(1 +
TP
M)
Pre-Ad
MSCOsP
Pro-Os
Pro-Ch
AdP
Pre-OC
Pre-Ad
MSCOsP
Pro-Os
Pro-Ch
AdP
Pre-OC
Pre-Ad
MSCOsP
Pro-Os
Pro-Ch
AdP
Pre-OC
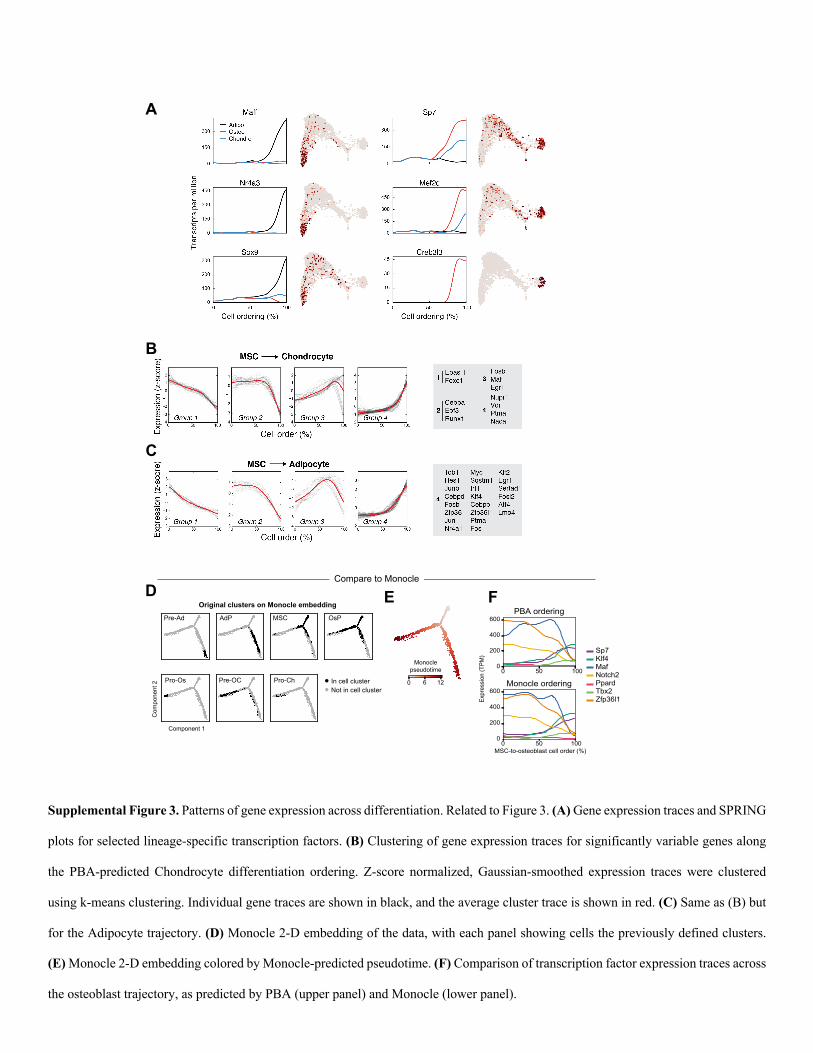
Supplemental Figure 3. Patterns of gene expression across differentiation. Related to Figure 3. (A) Gene expression traces and SPRING
plots for selected lineage-specific transcription factors. (B) Clustering of gene expression traces for significantly variable genes along
the PBA-predicted Chondrocyte differentiation ordering. Z-score normalized, Gaussian-smoothed expression traces were clustered
using k-means clustering. Individual gene traces are shown in black, and the average cluster trace is shown in red. (C) Same as (B) but
for the Adipocyte trajectory. (D) Monocle 2-D embedding of the data, with each panel showing cells the previously defined clusters.
(E) Monocle 2-D embedding colored by Monocle-predicted pseudotime. (F) Comparison of transcription factor expression traces across
the osteoblast trajectory, as predicted by PBA (upper panel) and Monocle (lower panel).
Supplemental Figure 3
B
C
D
A
0 50 1000
200
400
600
0 50 1000
200
400
600
Expr
essi
on (T
PM)
MSC-to-osteoblast cell order (%)
Sp7Klf4MafNotch2PpardTbx2Zfp36l1
PBA ordering
Monocle ordering0 6 12
Monoclepseudotime
Pre-Ad AdP MSC OsP
Pro-Os Pre-OC Pro-Ch
E FCompare to Monocle
Component 1
Com
pone
nt 2 In cell cluster
Not in cell cluster
Original clusters on Monocle embedding
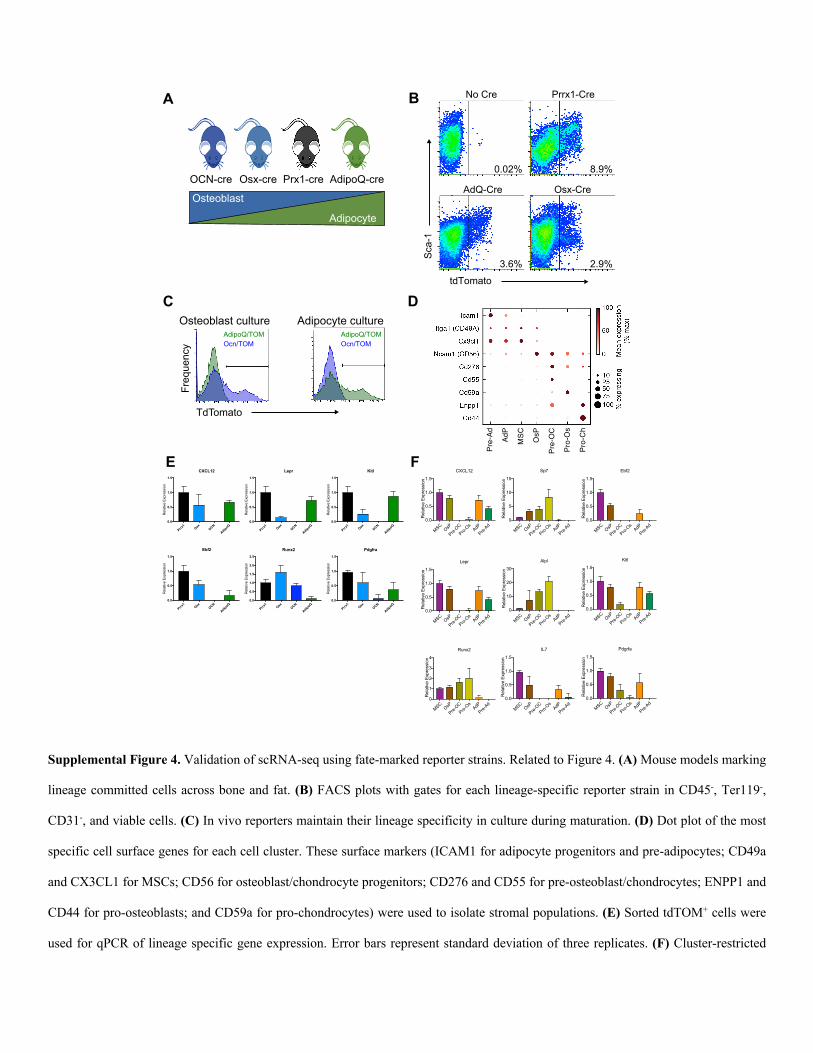
Supplemental Figure 4. Validation of scRNA-seq using fate-marked reporter strains. Related to Figure 4. (A) Mouse models marking
lineage committed cells across bone and fat. (B) FACS plots with gates for each lineage-specific reporter strain in CD45-, Ter119-,
CD31-, and viable cells. (C) In vivo reporters maintain their lineage specificity in culture during maturation. (D) Dot plot of the most
specific cell surface genes for each cell cluster. These surface markers (ICAM1 for adipocyte progenitors and pre-adipocytes; CD49a
and CX3CL1 for MSCs; CD56 for osteoblast/chondrocyte progenitors; CD276 and CD55 for pre-osteoblast/chondrocytes; ENPP1 and
CD44 for pro-osteoblasts; and CD59a for pro-chondrocytes) were used to isolate stromal populations. (E) Sorted tdTOM+ cells were
used for qPCR of lineage specific gene expression. Error bars represent standard deviation of three replicates. (F) Cluster-restricted
Supplemental Figure 4
A
C
No Cre
Prrx1
OsxOCN
AdipoQ0.0
0.5
1.0
1.5
CXCL12
Rel
ativ
e Ex
pres
sion
Prrx1
OsxOCN
AdipoQ0.0
0.5
1.0
1.5
Ebf2
Rel
ativ
e Ex
pres
sion
Prrx1
OsxOCN
AdipoQ0.0
0.5
1.0
1.5
Lepr
Rel
ativ
e Ex
pres
sion
Prrx1
OsxOCN
AdipoQ0.0
0.5
1.0
1.5
2.0
2.5
Runx2
Rel
ativ
e Ex
pres
sion
Prrx1
OsxOCN
AdipoQ0.0
0.5
1.0
1.5
Kitl
Rel
ativ
e Ex
pres
sion
Prrx1
OsxOCN
AdipoQ0.0
0.5
1.0
1.5
Pdgfra
Rel
ativ
e Ex
pres
sion
0.0
0.5
1.0
1.5
Ebf2
Rel
ativ
e Ex
pres
sion
0.0
0.5
1.0
1.5
Kitl
Rel
ativ
e Ex
pres
sion
0.0
0.5
1.0
1.5
Pdgrfa
Rel
ativ
e Ex
pres
sion
0
10
20
30
Alpl
Rel
ativ
e Ex
pres
sion
0.0
0.5
1.0
1.5
IL7
Rel
ativ
e Ex
pres
sion
0
5
10
15
Sp7
Rel
ativ
e Ex
pres
sion
0.0
0.5
1.0
1.5
CXCL12
Rel
ativ
e Ex
pres
sion
0.0
0.5
1.0
1.5
Lepr
Rel
ativ
e Ex
pres
sion
0
1
2
3
4
Runx2
Rel
ativ
e Ex
pres
sion
B
OCN-cre Prx1-cre Osx-cre AdipoQ-cre
Osteoblast
Adipocyte
D
E F Pre-Ad
MSC OsP
Pro-Os
Pro-Ch
AdP
Pre-OC
MSCOsP
Pre-OC
Pro-Os
AdP
Pre-Ad
MSCOsP
Pre-OC
Pro-Os
AdP
Pre-Ad
MSCOsP
Pre-OC
Pro-Os
AdPPre-
Ad
MSCOsP
Pre-OC
Pro-Os
AdP
Pre-Ad
MSCOsP
Pre-OC
Pro-Os
AdP
Pre-Ad
MSCOsP
Pre-OC
Pro-Os
AdP
Pre-Ad
MSCOsP
Pre-OC
Pro-Os
AdP
Pre-Ad
MSCOsP
Pre-OC
Pro-Os
AdP
Pre-Ad
MSCOsP
Pre-OC
Pro-Os
AdP
Pre-Ad
AdQ-Cre
Prrx1-Cre
Osx-Cre
0.02%
3.6%
8.9%
2.9%
tdTomato
Sca
-1
Adipocyte culture Osteoblast culture
TdTomato
Ocn/TOMAdipoQ/TOM
Ocn/TOMAdipoQ/TOM
Freq
uenc
y

surface markers were used to sort cells for qPCR measurement of lineage-specific gene expression. Error bars represent standard
deviation of four replicates.
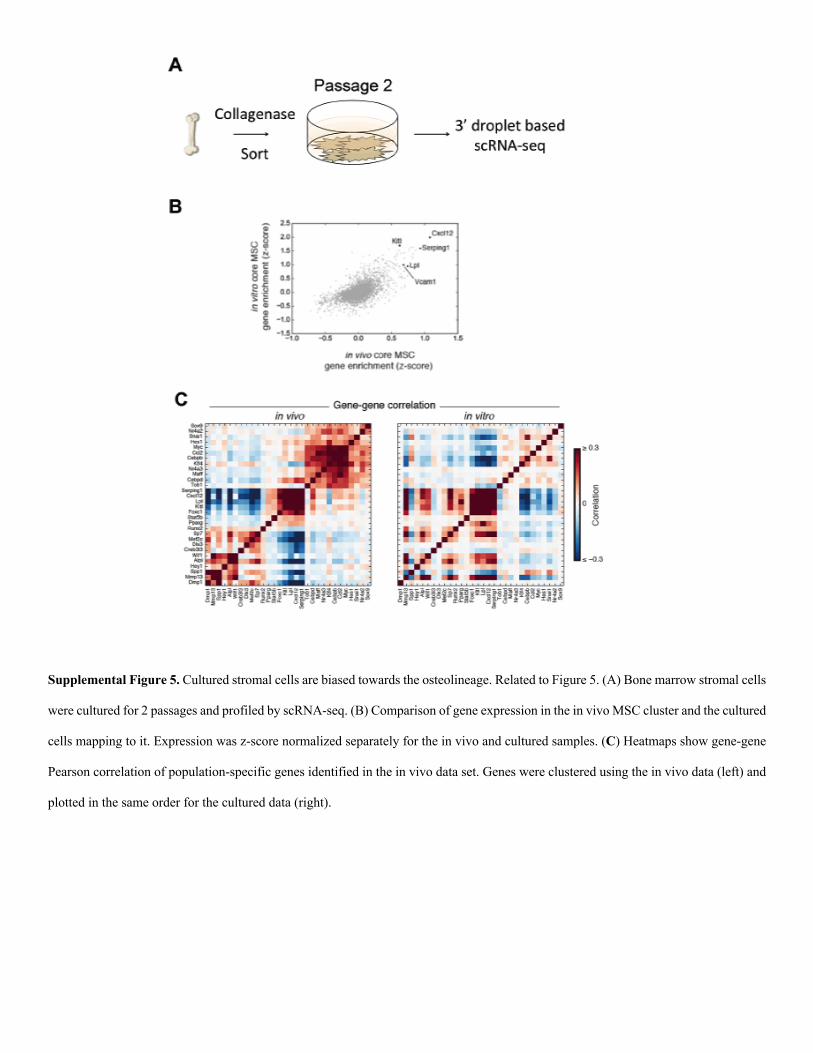
Supplemental Figure 5. Cultured stromal cells are biased towards the osteolineage. Related to Figure 5. (A) Bone marrow stromal cells
were cultured for 2 passages and profiled by scRNA-seq. (B) Comparison of gene expression in the in vivo MSC cluster and the cultured
cells mapping to it. Expression was z-score normalized separately for the in vivo and cultured samples. (C) Heatmaps show gene-gene
Pearson correlation of population-specific genes identified in the in vivo data set. Genes were clustered using the in vivo data (left) and
plotted in the same order for the cultured data (right).
Copyright © 2022 FDOKUMEN