mapping coastal exposure to climate risks in alaska's north ...
193
MAPPING COASTAL EXPOSURE TO CLIMATE RISKS IN ALASKA’S NORTH SLOPE: A COLLABORATIVE, COMMUNITY-BASED ASSESSMENT By MICHAEL BRIAN BRADY A dissertation submitted to the School of Graduate Studies Rutgers, The State University of New Jersey In partial fulfillment of the requirements For the degree of Doctor of Philosophy Graduate Program in Geography Written under the direction of Robin Leichenko And approved by New Brunswick, New Jersey January 2018
-
Upload
khangminh22 -
Category
Documents
-
view
0 -
download
0
Transcript of mapping coastal exposure to climate risks in alaska's north ...

MAPPING COASTAL EXPOSURE TO CLIMATE RISKS
IN ALASKA’S NORTH SLOPE:
A COLLABORATIVE, COMMUNITY-BASED ASSESSMENT
By
MICHAEL BRIAN BRADY
A dissertation submitted to the
School of Graduate Studies
Rutgers, The State University of New Jersey
In partial fulfillment of the requirements
For the degree of
Doctor of Philosophy
Graduate Program in Geography
Written under the direction of
Robin Leichenko
And approved by
New Brunswick, New Jersey
January 2018

ii
ABSTRACT OF THE DISSERTATION
Mapping Coastal Exposure to Climate Risks in Alaska’s North Slope:
A Collaborative, Community-Based Assessment
By MICHAEL BRIAN BRADY
Dissertation Director:
Professor Robin Leichenko
The rapidly changing Arctic is driving demand for readily usable climate research to
address the myriad of challenges and opportunities that are emerging in the region. While
the demand is forcing scientist-stakeholder collaborations to enhance usability,
scholarship on methods to effectively engage local community stakeholders in the effort
is lacking. The need for effective collaboration with local communities has been voiced
in the context of efforts to coordinate the pan-Arctic observing network to address
stakeholder needs. This dissertation addresses this need by mapping coastal exposure to
climate risks in collaboration with Alaska’s North Slope Borough and its residents. Using
a collaborative web mapping research design, this dissertation investigates three
questions: 1) Why is coastal exposure to climate risks a problem for North Slope
communities, 2) What is the land use manager usability perspective of the web map, and
3) How does the web map link to the Arctic observing network? The study identifies
coastal exposure risks using community mapping workshops organized in three North
Slope municipalities in spring 2016. Collectively, through their subsistence land uses, the
three communities observe coastal risks across the study area, which covers coastlines of
the National Petroleum Reserve – Alaska (NPR-A) and the Arctic National Wildlife

iii
Refuge (ANWR). The coastal exposure web map created for the study was used to assess
land use manager usability perspectives in an interactive workshop. Following a live
demonstration of the web map, workshop participants discussed its saliency, legitimacy,
and credibility. The study then explores web map links to the Arctic observing network
by comparing the web map process and product with the structure of the network, which
was defined using select reports on its design and activities.
Main findings include coastal exposure risks associated with Alaska Native
industrial and subsistence land uses across the study area, well beyond the small stretches
of local municipality coastlines that are the usual focus of related efforts. Land use
manager usability perspectives suggest that the web map is salient for the borough’s land
use decision-making process, credible enough to be used as a screening tool, and
legitimacy would be enhanced by including local stakeholders who observe coastal risks
where hydrocarbon development is currently concentrated between the NPR-A and
ANWR. Concerning links to the Arctic observing network, the web map process links via
the ecosystem services approach to observing network design, the web map product links
to ongoing observing activities such as sea ice monitoring, and both process and product
link to societal benefit areas that address community resilience. Study implications
include the need to account for coastal exposure risks identified in this study in efforts to
monitor coastal risks on the North Slope, potential use of the web map for land use
decision support, and the need to focus on community needs in approaches to engage
local communities in the Arctic observing network. Collectively, the findings of this
study establish the groundwork for coproduction of knowledge to address coastal
exposure risks on the North Slope using the Arctic observing network.

iv
Acknowledgements
I extend my deepest thanks to the director of this dissertation, Dr. Robin
Leichenko, and to the dissertation committee: Dr. Richard Lathrop, Dr. Åsa Rennermalm,
Dr. Kenneth Mitchell, and Dr. Hal Salzman. Dr. Leichenko tirelessly supported the
dissertation and my professional development for the past five years. I thank Dr. Salzman
for getting me interested in research in Alaska’s North Slope and mentoring me through
the years. I am also deeply appreciative of my master’s advisor, Dr. William Solecki,
who opened the door for me to engage in academic research and set me on a trajectory of
collaborative research. I also thank the numerous individuals who provided feedback and
mentorship over the years.
I also thank the employees of the North Slope Borough Planning & Community
Services Department who supported the research during 2016 fieldwork. I thank the
residents of Wainwright, Utqiaġvik, and Kaktovik for their participation in this study, and
the Cities of Wainwright and Kaktovik for providing meeting space for the community
mapping workshops. I also thank the Tuzzy Consortium Library, the Iñupiat Heritage
Center, and Iḷisaġvik College for their support during fieldwork.
I would also like to acknowledge the National Science Foundation Doctoral
Dissertation Improvement Award #1523191 and International Polar Year Award
#0903589. These two grants made fieldwork in Alaska’s North Slope possible.

v
Table of Contents
Abstract ............................................................................................................................... ii
Acknowledgements ............................................................................................................ iv
1. Introduction ..................................................................................................................... 1
1.1 Coastal Exposure to Climate Risks in the Arctic ...................................................... 3
1.2. Arctic Observing Networks and Usable Climate Science ........................................ 5
1.3. Study Site ................................................................................................................. 7
1.3.1. North Slope Land Use Management Context .................................................... 8
1.3.2. North Slope Capacity for Web Map Development ......................................... 12
1.3.3. North Slope Capacity for Collaborative Climate Change Research ............... 13
1.4. Research Questions and Dissertation Structure ..................................................... 14
2. Literature Review and Research Method ...................................................................... 18
2.1. Coastal Exposure to Climate Change ..................................................................... 18
2.2. Evaluating Climate Change Research Usability .................................................... 22
2.3. Climate Change Decision Support Using the Arctic Observing Network ............. 25
2.4. Research Questions ................................................................................................ 27
2.5. Research Method .................................................................................................... 29
3. Local Views of Coastal Exposure in Alaska’s North Slope ......................................... 34
3.1. Method ................................................................................................................... 35
3.1.1. Data Collection ................................................................................................ 36
3.1.2. Materials and Procedure .................................................................................. 39
3.1.3. Analysis ........................................................................................................... 40
3.2. Results .................................................................................................................... 41

vi
3.2.1. Distant Early Warning Line Coastal Exposure Risks...................................... 42
3.2.2. Native Corporation Land Coastal Exposure Risks .......................................... 46
3.2.3. Subsistence Hunting Camp Coastal Exposure Risks....................................... 48
3.2.4. Subsistence Boating Coastal Exposure Risks.................................................. 50
3.3. Discussion .............................................................................................................. 52
3.4. Conclusions ............................................................................................................ 54
4. Manager Usability Perspectives of the Coastal Exposure Web Map ........................... 57
4.1. Method ................................................................................................................... 59
4.1.1. Data Collection ................................................................................................ 59
4.1.2. Materials .......................................................................................................... 61
4.1.3. Analysis ........................................................................................................... 71
4.2. Results .................................................................................................................... 73
4.2.1. Web Map Saliency Perspectives ..................................................................... 74
4.2.2. Web Map Legitimacy Perspectives ................................................................. 77
4.2.3. Web Map Credibility Perspectives .................................................................. 79
4.3. Discussion .............................................................................................................. 81
4.4. Conclusions ............................................................................................................ 84
5. Linking the Coastal Exposure Web Map to the Arctic Observing Network ................ 85
5.1. Method ................................................................................................................... 85
5.1.1. Analysis ........................................................................................................... 86
5.2. Results .................................................................................................................... 88
5.2.1. Web Map Process Links to Arctic Observing Network Design Approaches .. 88
5.2.2. Web Map Product Links to Federal Arctic Observing Activities ................... 90

vii
5.2.3. Web Map Links to Arctic Observing Network Societal Benefit Areas .......... 94
5.3. Discussion .............................................................................................................. 95
5.3.1. Dual Use Arctic Observing Networks ............................................................. 95
5.3.2. Toward a North Slope Coastal Exposure Observing Network ........................ 99
5.3.3. Coastal Exposure Web Map Community Data Management........................ 102
5.4. Conclusions .......................................................................................................... 104
6. Conclusions ................................................................................................................. 105
6.1. Research Findings and Implications .................................................................... 105
6.1.1. Chapter 3 Research Findings ......................................................................... 105
6.1.2. Chapter 4 Research Findings ......................................................................... 108
6.1.3. Chapter 5 Research Findings ......................................................................... 109
6.2. Implications of the Research Findings ................................................................. 110
6.2.1. Rearticulating the North Slope Erosion Problem .......................................... 111
6.2.2. Coastal Exposure Information for North Slope Land Use Management ...... 111
6.2.3. Designing Local Engagement in the Arctic Observing Network .................. 112
6.3. Limitations of the Study and Directions for Future Research .............................. 114
Appendix A. Metadata: Local Community Verification of Coastal Exposure Risks ..... 118
Appendix B. Metadata: Shoreline Change Susceptibility Spatial Data Model .............. 120
Appendix C. Metadata: Shoreline Change Risk Spatial Data Model ............................. 122
Appendix D. Metadata: Shoreline Change Risk WebGIS Usability Workshop ............. 124
Appendix E. Wainwright and Kaktovik Research Request Letter ................................. 126
Appendix F. 2014 Fieldwork Interview Instrument ....................................................... 137
Appendix G. 2016 Fieldwork Community Mapping Instrument.................................... 143

viii
Appendix H. 2016 Usability Workshop Presentation Slides .......................................... 150
Appendix I. Methods to Create the Shoreline Change Susceptibility Data Model ........ 153
Appendix J. North Slope Borough Coastal Exposure Web Map Version 2 Updates ..... 158
References Cited ............................................................................................................. 162

ix
List of Tables
Table 4.1. Shoreline Change Susceptibility Data Description .......................................... 62
Table 4.2. Subsistence Asset Data Description ................................................................ 63
Table 4.3. Industrial Asset Data Description .................................................................... 64
Table 4.4. Municipal Asset Data Description ................................................................... 64
Table 5.1. Coastal Exposure Web Map Data Steward Network ....................................... 90
Table I.1. Shoreline Change Susceptibility Spatial Data Model Variables .................... 153
Table I.2. North Slope Land Form Type Ranked by Erodibility .................................... 155

x
List of Figures
Figure 1.1. Select North Slope Land Use ..................................................................................... 12
Figure 2.1. Collaborative Coastal Exposure Web Map Research Process ...................... 32
Figure 3.1. Data Collection Area ..................................................................................................... 38
Figure 3.2. Coastal Exposure Risks Indicated by Digitized Sticker Locations .............. 42
Figure 3.3. Cape Simpson Industrial Port ................................................................................... 45
Figure 4.1. North Slope Borough ArcGIS Portal ....................................................................... 66
Figure 4.2. DEW Line Exposure Regional Overview Map .................................................... 67
Figure 4.3. Zoomed-in Map Showing Information Query by Asset .................................. 68
Figure 4.4. Zoomed-in Map Showing Information Query by Transect ............................ 69
Figure 4.5. Zoomed-in Map Showing Information Query by Polygon ............................. 70
Figure 4.6. Barter Island DEW Line Exposure Large Scale Area of Interest Map ....... 71
Figure 4.7. Nuiqsut Subsistence Area and Oil and Gas Leases ........................................... 79
Figure 5.1. Coastal Exposure Web Map Data Steward Network........................................ 91
Figure 5.2a. Co-production and Co-Management Cycle ........................................................ 97
Figure 5.2b. Adapted Co-production and Co-Management Cycle ..................................... 97
Figure A.1 - A.2. Metadata: Local Verification of Shoreline Change Risks ................... 118
Figure B.1 - B.2. Metadata: Shoreline Change Susceptibility Data Model .................... 120
Figure C.1 - C.2. Metadata: Shoreline Change Risk Spatial Data Model ........................ 122
Figure D.1 - D.2. Metadata: WebGIS Usability Workshop .................................................. 124
Figure E.1 - E.11. Research Request Letter Send to Wainwright and Kaktovik ........ 126
Figure F.1 - F.6. 2014 Fieldwork Interview Instrument ..................................................... 137
Figure G.1 - G.7. 2016 Fieldwork Community Mapping Instrument .............................. 143

xi
Figure H.1 - H3. 2016 Usability Workshop Presentation Slides ...................................... 150
Figure J.1.a. Average September Sea Ice Extents (1979-1999) ....................................... 159
Figure J.1.b. Average September Sea Ice Extents (2000-2015) ....................................... 159

1
1. Introduction
Climate research is evolving to support decision-making in the rapidly changing Arctic,
where temperatures are rising faster than in any other region on Earth (AMAP 2017a).
Specifically, the rapid Arctic change is driving demand for readily usable climate science
and information to address the myriad of challenges and opportunities that are emerging
in the region (Knapp and Trainor 2013; NRC 2014; AMAP 2017b). This demand is
forcing scientist-stakeholder collaborations to enhance usability of climate research for
decision support (e.g. Pearce et al. 2009; Murray et al. 2012; Lovecraft et al. 2013; NRC
2014; Lee et al. 2015a; Eicken et al. 2016a; AMAP 2017b).
The decision support focus of emerging Arctic climate research has implications
for the allocation of research assets including the design and activities of the
multinational and international Arctic observing network programs. The Arctic observing
network is a pan-Arctic response to understand Arctic changes, monitor impacts, and
address stakeholder information needs (SEARCH 2005; NRC 2006; Murray et al. 2012;
Payne et al. 2013). International and national observing programs coordinate use of the
network of sensors available in the Artic, which range from local community observers to
satellite-based instruments (cf. NRC 2006; Druckenmiller et al. 2010; Huntington 2011;
Johnson et al. 2015; Lee et al. 2015a). Both science questions and stakeholder
information needs drive the network design, and network objectives to address scientific
priorities and stakeholder needs vie to influence observing activities (cf. Eicken et al.
2011, 2016a; ADI 2012; Murray et al. 2012; Lee et al. 2015a). The decision support role
of the Arctic observing network challenges network coordinators to balance science
priorities and stakeholder information needs in network design (cf. ADI 2012; Eicken et

2
al. 2016a).
Currently, science priorities dominate Arctic observing network design (cf.
SEARCH 2005; ADI 2012; Lee et al. 2015a), but collaborative research to identify
relevant stakeholder needs is emerging as a best practice to translate the network’s
science and monitoring activities into usable information products for decision support
(Pearce et al. 2009; Lovecraft et al. 2013; NRC 2014; Eicken et al. 2016a). Local
communities are among the stakeholders that the Arctic observing network is designed to
support, but effectively engaging them in the network is challenging (Lee et al. 2015a;
Eicken et al. 2016a; Johnson et al. 2013, 2015). As a result, local communities are not
making full use of the network and their needs are not fully accounted for in Arctic
observing network design. The lack of local community engagement in the network
leaves local community stakeholders to face the rapid Arctic changes with less than
optimal decision support.
Motivated by this problem, the aim of this dissertation was to initiate a “bottom-
up” collaborative research process with local communities in Alaska’s North Slope that
links to the Arctic observing network. The study was designed to engage the North Slope
in the network using a collaborative web mapping process that addresses coastal exposure
to climate risks. The web map was based on local knowledge of coastal exposure risks
and land use manager usability perspectives. The web map was installed on the borough’s
land use mapping system to facilitate the usability assessment and establish linkages to
the Arctic observing network. The specific objectives of the study were three-fold: 1)
identify coastal exposure risks from the local community perspective, 2) assess land use
manager usability perspectives of the web map, and 3) explore how the web map links to

3
the Arctic observing network. The three research objectives are closely connected in the
sustained web mapping research process described in Section 2.5. Research for objectives
1 and 2 drive web map design, and analysis of the web map process and product is used
to identify links to the Arctic observing network.
In this chapter, Sections 1.1 and 1.2 provide background information on coastal
exposure to climate risks in the Arctic and the usable science aspect of the Arctic
observing network, respectively. Section 1.3 describes the study site and Section 1.4
outlines the structure of this six-chapter dissertation.
1.1 Coastal Exposure to Climate Risks in the Arctic
Since the 1950s, Arctic air temperatures have been rising more than twice the rate of the
global average (ACIA 2004; IPCC 2013; USGCRP 2017; AMAP 2017a). Over the next
30 years, autumn and winter temperatures will increase by an average of 4 °C, and the
Arctic could be mostly free of summer sea ice as early as the 2030s (AMAP 2017a). The
Arctic scientific community is warning that the high rate of change is going to shift the
region to a new system state (AMAP 2017a). Among the dramatic changes anticipated
for the region is worsening coastal hazards as the increasing exposure of coastlines from
sea ice loss and permafrost thaw coincides with strong summer and fall storms (ACIA
2004; AMAP 2017a).
The Arctic has among the highest erosion rates in the world because of its
typically ice-rich soil exposed to strong storms during the open water season (cf.
Reimnitz et al. 1985; Overeem et al. 2011; Markon et al. 2012; Barnhart et al. 2014a,b,
2016). The average erosion rate for areas covered by the Arctic Coastal Dynamics
Database is -0.5 m yr−1 (Lantuit et al. 2012), and rates can reach up to -8.4 m yr−1 along

4
some permafrost-rich stretches of coastline (Barnhart et al. 2014b). The North Slope has
among the highest erosion rates in the Arctic. The average erosion rate for the stretch of
North Slope coastline covered by the U.S. Geological Survey’s National Assessment of
Shoreline Change Project is -1.4 m yr−1 and erosion rates range up to -18.6 m yr−1 in
some places (Gibbs and Richmond 2015).
The changing sea ice cover is a primary driver of coastal erosion in the Arctic
region because sea ice buffers the typically ice-rich Arctic coast from coastal storms
(Overeem et al. 2011; Barnhart et al. 2014a,b, 2016). The North Slope is particularly
exposed to sea ice loss. Summer-time Arctic sea ice extent has declined by an average of
10% per decade since 1979 (Stroeve et al. 2012; Mahoney et al. 2014), with pronounced
declines occurring in the Chukchi and Barents Seas adjacent to the North Slope. For
example, September sea ice extent in the Chukchi Sea has decreased by 26% per decade
(Meier et al. 2007). Arctic coastal erosion rates are rising with climate change as sea ice
decline combines with relative sea-level rise and increasing Arctic storms (cf. ACIA
2004; Manson and Solomon 2007; Overeem et al. 2011; Barnhart et al. 2014a,b, 2016).
For example, along the Beaufort Sea coast, Jones et al. (2009) estimated an increase in
mean coastal erosion rates from -8.7 m yr−1 for 1979 – 2002 to -13.6 m yr−1 for 2002 –
2007.
The rapid coastal changes have implications for the many Arctic communities that
are located near eroding coastlines (Markon et al. 2012; Larsen et al. 2014; Chapin et al.
2014; AMAP 2017a,b). Like many other villages in the state of Alaska, coastal
municipalities in the North Slope are exposed to erosion and related risks (cf. GAO
2003). In the North Slope, exposure risks experienced within or near the local

5
municipalities are well documented in government reports and academic studies.
However, the exposure risks to current local land uses that extend across the vast North
Slope coastline, beyond the local municipalities, have received much less attention in
exposure assessments.
The first objective of this dissertation addresses this information gap by mapping
local perspectives of coastal exposure risks using hard copy maps that cover vast
stretches of the North Slope coastline, beyond the local municipalities. As explained in
Section 1.3, land uses in the North Slope extend across the vast coastline, beyond where
the local municipalities are located. Addressing coastal exposure risks across the remote
stretches of North Slope coastline is important to monitor community impacts from
climate change and to support land use decisions for future coastal development (cf.
Streever et al. 2011).
1.2. Arctic Observing Networks and Usable Climate Science
As mentioned in Section 1, the Arctic observing network (AON) is a region-wide
response to understand Arctic changes, monitor impacts, and address stakeholder
information needs. The AON is composed of national and international programs that
coordinate Arctic observing activities from all available sources ranging from local
community observers to satellite-based sensors. In the United States, the National
Science Foundation has an AON program, and there are other national efforts such as the
Canadian ArcticNet Program. At the international level, the Sustaining Arctic Observing
Networks (SAON) supports the science activities of the Arctic Council including the
Arctic Monitoring and Assessment Programme (AMAP).
An important aspect held in common among the AON programs is their focus on

6
addressing both scientific priorities and stakeholder information needs in the Arctic. This
dual AON focus was supported by the Fourth International Polar Year 2007-2009 (IPY),
which bolstered both the pan-Arctic observing network and usable climate science (cf.
SEARCH 2005; NRC 2006; Kruse et al. 2011; ADI 2012; Ford et al. 2013; Lovecraft et
al. 2013; SAON 2016). The IPY was the largest international scientific program focused
on polar research with 200 research projects conducted by thousands of scientists from
over sixty countries (Hovelsrud and Krupnik 2006). The pan-Arctic engagement with
usable climate research during the IPY in the context of concurrent efforts to develop the
AON contributed to the usability aspect that continues to influence AON programs.
The usable climate science aspect of the AON is a legacy of the IPY that
continues to influence the design of Arctic climate science and monitoring programs. In
the United States, the Study of Environmental Arctic Change (SEARCH) program
defines the research areas used to prioritize Arctic observing activities. In addition to
research focused on understanding Arctic systems, the SEARCH has established a core
theme called Responding to Change, which is focused on climate science for decision
support (cf. ADI 2012). At the international scale, the Arctic Council’s AMAP
established the Adaptation Actions for a Changing Arctic initiative to promote usable
climate science across the pan-Arctic region (cf. AMAP 2017b). The usable science goals
provided by the SEARCH and the AMAP, along with their goals for scientific
understanding, drive Arctic observing activities.
However, while usable science is a common aspect of the AON, few studies
engage local communities in the AON for decision support. To address this problem, this
dissertation aimed to integrate the North Slope into the AON with a focus on locally

7
usable coastal exposure risk information for land use decision support. Research
objectives 1 and 2 were concerned with engaging the local community residents and the
North Slope Borough in the mapping process, respectively. Objective 3 was concerned
with identifying how the overall web map research process and product links to the AON.
In addition to addressing goals of the AON to support local Arctic communities
(cf. ADI 2012; Eicken et al. 2016a; IDA 2017), the research also addressed the larger
challenge to use existing AONs designed for scientific research and monitoring to
support decision-making for local communities and other stakeholders using best
available information (NRC 2014). The web map research process also addressed the
need to develop effective strategies for partnerships with the range of Arctic stakeholders
including local agencies to sustain long-standing observing activities (AON 2010).
1.3. Study Site
This section provides background information on the North Slope’s geography, unique
land use management context (Section 1.3.1), capacity for decision support web map
development (Section 1.3.2), and favorable disposition towards collaborative research
(Section 1.3.3). A key point made in this section is that the North Slope has unique local
capacity for collaborative web mapping research for such a remote Arctic place.
Alaska’s North Slope is the United States’ most northern municipality located
completely above the Arctic Circle (~66.34 N). It is defined as the low-lying land area
sloping north from the foot of the Brooks Mountain Range to the Arctic Ocean. About
half of its 10,000 residents are Alaska Native Iñupiat and about 2,000 are seasonal
workers in the oil and gas industry. Its eight municipalities vary in size from about 250 in
Kaktovik to about 5,000 in Utqiaġvik, which is the largest and seat of the North Slope

8
Borough (NSB) government. The villages are typically small, remote, and primarily
accessible by air, and separated by hundreds of kilometers of frozen or wet tundra within
its vast 231,000 km2 of land area. Five villages are located along eroding coastal bluffs,
but all eight villages rely heavily on access to coastal resources for subsistence hunting
and related cultural activities.
The North Slope has a mixed subsistence and cash economy. Primarily a maritime
subsistence culture, the Iñupiat hunt, fish, and gather to thrive in the harsh Arctic climate
as they have for millennia. During the winter, the Iñupiat scatter across the North Slope
by dogsled or snow machine to camps along the coast and up river to stage for hunting
caribou and other fish and game. Communities prepare year-round to hunt the Bowhead
Whale during their seasonal migration to and from the Arctic Ocean through the Bering
Strait. They travel by snow machine in the spring or by boat in the fall to camps across
the coast. The local wage economy is primarily supported by the public administration
sector through the North Slope Borough, which is the largest source of municipal income
and local employment on the North Slope. The North Slope Borough taxes the extractive
industry concentrated on state lands near Prudhoe Bay, the largest oil fields in the United
States.
1.3.1. North Slope Land Use Management Context
The Iñupiat-controlled North Slope Borough was established in 1972 to tax oil and gas
development after a major oil strike at Prudhoe Bay in 1968 on state lands (Figure 1.1).
While the oil and gas development has concentrated on state lands, the majority of the
North Slope has been set-aside as national energy reserves by the federal government.
Two prominent federal reserves are the National Petroleum Reserve – Alaska (NPR-A)

9
and the Arctic National Wildlife Refuge (ANWR). The NPR-A was originally established
in 1923 as an emergency fuel supply for the U.S. Navy, but in the 1970s the federal
government began leasing its lands to private oil companies. A section of the ANWR,
called the “Section 1002 Area,” holds vast petroleum reserves and development may
eventually be permitted there. However, development in the ANWR is controversial and
Congress has yet to approve it. Federal waters in the Chukchi and Beaufort Seas may
hold the largest undeveloped oil reserves in United States, and exploration there
continues. The ongoing and future energy development is a prominent economic activity
on the North Slope.
The oil and gas industry presents many challenges and opportunities for North
Slope communities to adapt to Arctic change. Relevant opportunities addressed in this
study include a well-established municipal land use geographic information system
funded by the borough through tax revenues (GIS, Section 1.3.2) and an applied research
coordinating body mandated by Congress to support North Slope land use managers – the
North Slope Science Initiative (NSSI). Chapter 4 of this dissertation addresses the
relevancy of this research for climate change and energy development scenarios research
on the North Slope. The NSSI scenarios research is one research activity occurring under
the auspices of the federal government to address the complexity of balancing energy
development with protection of natural resources and related land use management
objectives on the North Slope.
The local autonomy of the Iñupiat-controlled North Slope Borough is another
adaptation opportunity supported by energy development. The North Slope Borough has
home rule status and is withdrawn from the federal Coastal Zone Management Program.

10
This provides significant local authority and autonomy to the borough to administer its
land use management program across the North Slope. The North Slope Borough
Planning Commission reviews hundreds of coastal development land use applications
annually. Among its many objectives, the local coastal zone management program
protects its subsistence and cultural heritage resources while balancing these traditional
land uses with industrial and municipal land use needs. The North Slope Borough’s local
autonomy is one reason why collaborative web map decision support research performed
in this study could be effective in supporting adaptive local responses to change.
In addition to subsistence and related land uses, the Iñupiat also have their own
industrial land uses primarily through lands selected under the Alaska Native Claims
Settlement Act (ANCSA) of 1971. The ANCSA established regional and village native
corporations, which have limited rights to select and develop land in Alaska. The Arctic
Slope Regional Corporation (ASRC) and eight native village corporations claim lands on
the North Slope. The ASRC is one of 13 regional corporations created by the ANCSA. It
can claim surface and subsurface rights, including subsurface rights in the NPR-A if the
land is used for commercial land use and meets other conditions. The North Slope has
eight native village corporations, which selected lands at existing or reestablished
permanent settlements. The ASRC and the eight native village corporations typically
specialize in energy services and select lands strategically near hunting grounds and
national defense and oil industry sites to benefit from surface and/or subsurface rights
within the National Petroleum Reserve – Alaska (NPR-A) and the Arctic National
Wildlife Refuge (ANWR). The Iñupiat industrial land uses feature prominently in study
results on local perspectives of coastal exposure risks presented in Chapter 3.

11
In Figure 1.1 below, the native village corporation lands are symbolized in orange
and the regional corporation, i.e., the ASRC, is symbolized in brown. Most of the native
village corporation lands selected under the ANCSA are located near the eight
municipalities, which are symbolized by black dots and annotated with city name. Most
of the ASRC lands are located outside of the NPR-A with the exception of a small parcel
near Cape Halkett, east of Utqiaġvik. Four of the municipalities are located near one of
the 15 Distant Early Warning (DEW) Line sites symbolized by red rings. Most of the
North Slope is within the NPR-A or ANWR lands symbolized as light red dotted areas
lands that surround Alaska state lands symbolized by blue dotted areas. Kaktovik is the
only municipality located within the 1002 Area of the ANWR, the purple dotted area.
The Trans-Alaska Pipeline System (TAPS) starts at Prudhoe Pay and passes south
through state lands and within the subsistence use area symbolized by diagonal green
lines. The subsistence area is the combined area of all eight villages, estimated by
Pedersen (1979).

12
Figure 1.1. Select North Slope Land Use Figure 1.1 shows the North Slope’s eight municipalities, the subsistence area digitized from Pedersen (1979), regional and village
native corporation lands, Distant Early Warning (DEW) Line sites, two prominent federal land units: the National Petroleum Reserve – Alaska (NPR-A) and the Arctic National Wildlife Refuge (ANWR) including the Section 1002 Area that may be developed for oil
and gas, state lands, the Trans-Alaska Pipeline System (TAPS), and the North Slope Borough boundary (gray line). The DEW Line
was a series of radar sites with airstrips located every fifty miles across the North American coast from Alaska to Greenland. The DEW Line was installed for national defense surveillance during the Cold War, but has since been decommissioned. The DEW Line
was replaced by the North Warning System, which still operates from three legacy DEW sites. Remediated DEW sites with remaining
infrastructure are being transferred to local and state governments.
1.3.2. North Slope Capacity for Web Map Development
The North Slope has a unique capacity for collaborative web mapping for decision
support through its Iñupiat-controlled land use mapping system. In support of the local
land use management program, the North Slope Borough (NSB) established the
Department of Planning and Community Services Department and its GIS Division to
administer the borough’s land use management program, The GIS Division provides
mapping services to support borough programs (cf. Esri 1981). The borough has been
developing its geographic information system (GIS) for about four decades. In the early
1980s, with federal Coastal Zone Management funds provided by Alaska State, the NSB
contracted Esri President Jack Dangermond to investigate GIS applications in the North
Slope. The 536 page conceptual design and implementation plan (Esri 1981) was first
demonstrated for the North Slope in 1982 focusing on application in the heavily

13
developed Kuparuk region. The Environmental Information System (EIS module) of the
GIS was designed to provide access to accurate environmental data on an independent
computer under direct control of NSB personnel (Esri 1981). The EIS module was also
designed to share data between data developers and users including various state and
federal agencies and universities (Esri 1981). However, despite the recent surge in
environmental spatial data now available for the Arctic at spatial scales relevant for NSB
land use planning, to-date the intended design of the EIS module to support collaborative
environmental data share and use remains unrealized.
Recent NSB efforts to leverage Esri web-based products to facilitate data share
and borough management presents an opportunity to revisit the original NSB GIS
conceptual design and plan to reassess data share capabilities in the context of Arctic
observing networks. The NSB agreed to collaborate in this research in part because it was
viewed as a good pilot project to develop the web map and showcase the new web-based
map capabilities to local managers.
1.3.3. North Slope Capacity for Collaborative Climate Change Research
Utqiaġvik is known as a hub for climate change research in the Arctic for monitoring and
understanding the Arctic and global climate change (Norton 2001). The North Slope also
has a long history of collaborative research beginning with the installation of the Naval
Arctic Research Laboratory (NARL) in 1947 to support Navy operations where Iñupiat
were employed and often partners in collaborative research (Albert et al. 1988; Brewster
et al. 2001; Kelley and Brower 2001). The Iñupiat took greater control of Arctic research
when NARL was transferred to Ukpeagvik Iñupiat Corporation (UIC) in 1989. By the
mid-1970s, many of the local Iñupiat who had worked at NARL took decision-making

14
positions in the North Slope Borough (NSB). And the UIC, through their involvement
with NARL, helped create a positive outlook toward collaborating with scientists (Albert
1990). The collaboration legacy from NARL continues and is observed in the research
support provided by the NSB’s Department of Wildlife Management and UIC’s
commitment to the Barrow Environmental Observatory (BEO) (Brown 2001).
A formal forum for collaborative climate change research came in 2001 with the
establishment of the North Slope Science Initiative (NSSI) tasked by Congress to
coordinate applied science needs relevant for North Slope managers.1 The NSSI
coordinates applied science at the federal, state, and local level on the North Slope. The
NSB and Arctic Slope Regional Corporation (ASRC) are among the fourteen members of
the NSSI. Among its various collaborative research efforts, the NSSI coordinates a
sustained scenarios planning effort to include the perspectives of the range of North
Slope stakeholders in possible futures research in the context of global change (cf.
Streever et al. 2011).
1.4. Research Questions and Dissertation Structure
The dissertation investigated the following three research questions:
1. Why is coastal exposure to climate risks a problem for North Slope
communities?
2. What is the land use manager usability perspective of the web map?
3. How does the web map link to the Arctic observing network?
The dissertation has six chapters that address these research questions: the
introduction, a literature and methods chapter, three results chapters, and a conclusion
chapter. Each of the three results chapters has five main sections: introduction, method,
1 The NSSI was formally authorized in 2005 under the Energy Policy Act of 2005.

15
results, discussion, and conclusions. Below are brief outlines for chapters 2 through 6 of
the dissertation.
Chapter 2: Literature Review and Research Method provides a review of the
literature that the dissertation draws from and contributes to. The literature review is
grouped into three themes that correspond with the three results chapters, i.e.: 2.1:
Coastal Exposure to Climate Change, 2.2: Evaluating Climate Change Research
Usability, and 2.3: Climate Change Decision Support Using the Arctic Observing
Network. The literature review is followed by the above research questions restated in
Section 2.4 with an explanation of how the chapters contribute to the corresponding
literature areas. Section 2.5 explains the overall collaborative web mapping process based
on an Instructional Systems Design (ISD).
Chapter 3: Local Views of Coastal Exposure in Alaska’s North Slope is the first
results chapter. Section 3 introduces the first results chapter putting it in the context of
previous coastal risk research on the North Slope, and noting the lack of knowledge of
risks outside of the villages where subsistence and industrial land uses are prominent.
Section 3.1 describes the study site, collaborative mapping methods used to collect local
views of coastline risk, and analysis methods. Results provided in Section 3.2 are
organized by the two main risks found: local concern for constrained coastal access for
industrial and subsistence land uses. Section 3.3 states that the coastal exposure risks
identified in this study are relevant for the North Slope Science Initiative (NSSI), which
is Congressionally mandated to coordinate applied science on the North Slope. Section
3.4 concludes the chapter by restating the findings.

16
Chapter 4: Manager Usability Perspective of the Coastal Exposure Web Map is
the second results chapter. Section 4 introduces the second results chapter, putting it in
the context of the call in the Arctic for collaborative research to address the need for
usable climate science. Section 4.1 describes methods used to collect and analyze local
manager usability views of the coastal exposure web map. The results provided in
Section 4.2 indicate that the web map could be used as a screening tool to support the
North Slope Borough’s development permit application review process, local views from
the village of Nuiqsut should be included as well ask risks to oil and gas development on
state lands, and there is concern about the quality of underlying data. Section 4.3
discusses the unique local management context that provides good conditions for
manager uptake of the web map and next steps for enhancing its usability. Section 4.4
concludes the chapter by noting that the prominence of local management and
opportunities for uptake that emerged in the usability workshop.
Chapter 5: Linking the Coastal Exposure Web Map to the Arctic Observing
Network is the third and final results chapter. Section 5 introduces the chapter, putting the
results in the context of the challenge of engaging local communities in the Arctic
observing network (AON). Section 5.1 describes the method to analyze web map links to
the AON. Results Section 5.2.1 compares the web map research process described in
Section 2.5 with AON design approaches. Section 5.2.2 identifies the web map data
steward network based on organizations that provided the data used to create the web
map and compares results with federal Arctic observing activities. Section 5.2.3 identifies
how the web map process and product link to AON societal benefit areas. Section 5.3
discusses the significance of the results in terms of advancing “dual use” observing

17
networks by providing a method to engage local communities in the AON (5.3.1),
advancing a North Slope coastal exposure observing network by creating a community of
practice (CoP) (5.3.2), and community data management in the context of the Arctic
Spatial Data Infrastructure (ASDI) (5.3.3). Section 5.4 concludes the chapter by restating
the main findings.
Chapter 6: Conclusions summarizes the main study findings, identifies policy
implications, and recommends future research. Section 6 introduces the chapter by
restating the aim of the study and contributions to the literature. Section 6.1 summarizes
the main findings from results chapters 3, 4, and 5. Section 6.2 identifies policy
implications of the main findings, and Section 6.3 suggests future research.

18
2. Literature Review and Research Method
This chapter reviews three scholarly literature areas addressed by the dissertation: Coastal
Exposure to Climate Change (2.1), Evaluating the Usability of Climate Change Research
(2.2), and Climate Change Decision Support Using the Arctic Observing Network (2.3).
Section 2.4 explains how the three research questions contribute to their respective
literature areas, and Section 2.5 provides an overview of the collaborative web map
research process used to investigate the three questions.
2.1. Coastal Exposure to Climate Change
In the global change literature, exposure is defined the element of the concept of
vulnerability that is concerned with analyzing the nature and degree to which humans
experience social or environmental stress (Adger 2006). While the meaning of
vulnerability is contested (Cutter 1996; Liverman 1990; Dow 1992; Adger 2006), the
meaning of exposure is relatively clear and consistent in the literature. Exposure is often
equated with vulnerability in studies that emphasize the role of the environment in
causing climate risks (cf. IPCC 2012).
In the global change literature, coastal exposure is a subset of vulnerability
research concerned with the populations, economies, land use assets and activities, and
other human valuables at risk to sea-level rise and related hazards specific to the coastal
zone such as storm surge and coastal erosion. Coastal exposure studies at the global scale
coarsely take stock of populations and assets exposed. Regional and local scale coastal
exposure assessments emphasize consequences of being exposed such as economic
impacts relevant for national or regional economies. In local scale coastal exposure
research, collaboration with stakeholders is common to get stakeholder perspectives of

19
risks and impacts, and to develop decision support.
At the global scale, the concept of coastal exposure is typically used to specify the
degree to which human settlements occupy flood prone areas and are at risk (Schneider
and Chen 1980; Barth and Titus 1984; Nicholls et al. 1999, 2007; Nicholls 2002, 2004;
Pelling et al. 2004; Dilley 2005; Anthoff et al. 2006; McGranahan et al. 2006, 2007,
2008; Peduzzi et al. 2009, Peduzzi and Herold 2005; Rowley 2007; Small and Nicholls
2003; Small and Cohen 2004; Ericson et al. 2006; Nadim et al. 2009; Nicholls and
Cazenave 2010; Leichenko and Thomas 2012; Jha et al. 2012; Jogman et al. 2012;
Newmann et al. 2015). Much of the literature is devoted to the development of global
scale human geospatial data (Dobson et al. 2000; Balk et al. 2005; Vafeidis et al. 2008;
Gamba 2009) and environment geospatial data (Rabus et al. 2003; Giuliani and Peduzzi
2011) needed to analyze coastal exposure. Coastal exposure is often analyzed in terms of
the number of people exposed aggregated by country (McGranahan et al. 2006) or with a
focus on particular places or assets of interest to the international community such as
highly vulnerable dense settlements (Balk et al. 2009), world heritage cities (Bigio et al.
2014), port cities (Hansen et al. 2011), or national security assets (Hall et al. 2016). In
terms of projecting impacts, there are global estimates of exposure to sea-level rise in
terms of economic value (Hansen et al. 2011) and ecosystem services (Jarmin and
Miranda 2009). Coastal exposure research at the global level also aims to explain what
drives coastal change (Ericson 2006) and human settlement patterns (Lall and Deichmann
2010) to explain exposure outcomes.
Global climate change data are applied to regional, national, and subnational
geographies to analyze coastal exposure impacts and risks to assets and activities in

20
enough detail to be relevant at those respective scales (e.g. Neumann et al. 2010;
Dasgupa et al. 2011; Kulp and Strauss 2017). As with the global scale research, literature
is devoted to creating geospatial data to analyze coastal exposure at the larger scales (e.g.
Gornitz et al. 1991; Kopp et al. 2014). While many of the global scale coastal exposure
assessments provide an analysis by region (e.g. Anthoff et al. 2006) or country
(McGranahan et al. 2006), studies that focus on the larger scales generally emphasize
impacts from exposure such as projections of costs associated with economic losses and
adaptation (Yohe 1996, 1999; Kirshen et al. 2008; Neumann et al. 2010, 2015),
populations exposed (Gornitz et al. 2001; Strauss 2012; Martinich et al. 2013; Hauer et
al. 2016), municipal risks (Wu et al. 2002; Kulp and Strauss 2017), infrastructure risks
(Tate and Frazier 2013; Neumann et al. 2015), and loss of natural resources (Titus 1988).
Coastal exposure at these scales often detail risks to specific sectors to inform managers
such as energy (Burkett 2011), national defense (Kinner et la. 2006; Marra et al. 2015),
and national parks (Murdukhayeva et al. 2013).
Coastal exposure research at the local scale is sometimes done in collaboration
with affected stakeholders to get their perspectives of impacts and risk (e.g. Leichenko et
al. 2014; Mitchell et al. 2016), develop decision support tools (Lathrop et al. 2012, 2014,
2017), and explore management options (Frazier 2010). Consistent with the broader
climate change impacts research field, there is a call in the literature for more
collaboration with decision-makers in coastal exposure research to include their
perspectives (Vogel et al. 2007; Frazier et al. 2010; Corfee-Morlot et al. 2011; Leichenko
et al. 2014; Mitchell et al. 2016; DeLorme et al. 2016). This dissertation builds from
these stakeholder-based coastal exposure efforts and applies the approach in the Arctic.

21
While the Arctic region has received considerable attention from scientists
studying the rapidly changing coast (Hume and Schalk 1967; Walker 1991; 1998; 2001;
Lantuit 2012; Barnhart et al. 2014a,b, 2016), there is a lack the local perspectives of
coastal exposure across the vast remote stretches of the shoreline. As in other Arctic
regions, research on coastal exposure along Alaska’s northern shore mostly addresses
threats to municipal and industrial infrastructure and activity such as roads and airstrips
located in proximity to the small stretches of shoreline near Alaska native villages (cf.
Brunner and Lynch 2013; Lovecraft and Eicken 2011; Melvin et al. 2016). While these
risks are important, less is known about the rest of the vast shoreline where subsistence
and industrial activity, the two primary land uses in the region, also occur and are in some
places concentrated. Researchers that have investigated coastal exposure outside of the
villages have focused on threats to historical and archeological sites (Jones et al. 2008;
Jensen et al. 2015), but assessments of risk to current land uses along these stretches of
shoreline are lacking. With respect to efforts by the government, resource managers,
academia, and industry to understand and monitor the effects of diminishing Arctic sea
ice on local communities in the region (ACIA 2004; Streever et al. 2011; Larsen et al.
2014; Chapin et al. 2014; AMAP 2017a,b), the available literature on land use impacts
away from the villages provides an incomplete picture with most attention given to land
uses that depend directly on sea ice conditions. For example, available studies detail land
use risks associated with sea ice used as platforms to support subsistence hunting (George
et al. 2004; Hinzman et al. 2005; Eicken et al. 2009; Druckenmiller et al. 2010) and oil
and gas industry operations (Eicken et al. 2009). Less is known about the land use
impacts from shoreline change as a physical system response to sea ice loss.

22
Chapter 3 of this dissertation contributes to coastal exposure research by
collaborating with local community stakeholders to identify coastal exposure risks across
remote stretches of the North Slope coastline.
2.2. Evaluating Climate Change Research Usability
In the Arctic context where climate change is pronounced and impacts are widespread,
there is growing consensus in the scientific community that the predominant “top-down”
Arctic systems science needs to adapt to make the science more useful for resource
managers (Streever et al. 2011; Knapp and Trainor 2013; NRC 2014). The call for Arctic
science to adapt to address manager needs is driven by pressures to improve knowledge
integration with governance in the region to better respond to climate impacts and
manage risks. In Alaska where average annual temperature has increased 1.7°C (Stafford
et al. 2000), permafrost is thawing and sea-ice is diminishing (Barnhart et al. 2014a,b,
2016), climate change effects are obvious including widespread and worsening coastal
flooding and erosion impacts (GAO 2003). Usable climate information is limited in the
region in comparison with less remote places in the United States due to the lack of long-
term data and analysis expertise (Knapp and Trainor 2013). Inadequate information
combined with an understanding that access to information also requires a desire and
capacity to act (NRC 2014) demands collaborative research with information users that
address these and other usability aspects in the process.
In the global change literature, usability refers to the degree to which scientific
climate information derived by combing and interpreting multiple sources of data is
readily usable to support decision-making in policy and practice (Pielke 1995; Dilling
and Lemos 2011; Wall et al. 2017). Usable climate science in global change research is a

23
goal of coproduction of knowledge methods where researchers collaborate with
stakeholders in all phases of research to produce new scientific knowledge or refine
existing science with the goal to support decision-making (Wall et al. 2017). As the
presumed mechanism for decision-maker uptake (Cash et al. 2003, Weichselgartner and
Kasperson 2010; Lemos and Morehouse 2005; Mitchell et al. 2006; Dilling and Lemos
2011; Cutts et al. 2011; Lemos et al. 2012; Kirchhoff et al. 2013; Ford et al. 2013; Moss
2014; Meadow et al. 2015; Wall et al. 2017; Beier et al. 2017), achieving climate science
usability is the focus of emerging research on evaluating the success of coproduction of
knowledge (Fazey et al. 2014; Wall et al. 2017). Usability is a complex phenomena
determined by a range of factors including achieving stakeholder perspectives of
saliency, credibility, and legitimacy (Cash et al. 2003), mutual trust and learning, and
understanding the management context for information uptake (Wall et al. 2017). This
new area of research addresses the broad demand for publically-funded research to
support decision-making (Flyvbjerg and Sampson 2001; Cash et al. 2003; Ford and Smit
2004; Lemos and Morehouse 2005; Sarewitz and Pielke 2007; Pearce et al. 2009; Dilling
and Lemos 2011; Lemos et al. 2012, cited in Ford et al. 2013) and the problem that,
despite billions of dollars spent on research for decision support, there is little evidence of
improved decision-making (Cash et al. 2003; Ebi et al. 2009; Ford et al. 2013; Dilling
and Lemos 2011; Ford et al. 2011; Lemos et al. 2012; Wall et al. 2017).
The lack of evidence that coproduction achieves what it claims to exposes it to the
critique that the approach may be unpractical and, due to its extremely high cost, should
not be a standard method (Sutherland et al. 2017). The gravity of this critique comes into
focus when evaluating coproduction for use in sustained assessments such as the

24
International Panel on Climate Change (IPCC), which currently excludes non-peer
reviewed stakeholder knowledge. Excluding local community or other stakeholder
knowledge blocks what Cash and Moser (2000) referred to as scale-specific comparative
advantage - the value from diverse scale-specific knowledge needed for decision support.
Blocking scale-specific comparative advantage is problematic for usability because
stakeholder knowledge for science aimed to support decisions at particular locals may be
more valuable than scientific knowledge (Reid et al. 2006). For example, while state and
national institutions provide their interests and management resources such as scientific
databases, local knowledge defines locally salient impacts such as on subsistence (Berkes
et al. 2009). A failed experiment with coproduction in the Millennium Ecosystem
Assessment (MA) suggests the claimed benefits of coproduction are not achievable
systematically due to epistemological diversity preventing application of uniform
standards for credibility demanded by sustained assessments (Reid et al. 2006). However,
while balancing dimensions of information usability has proven difficult, the MA process
has yielded some evidence that both legitimacy and credibility can be established, but
only for observations of basic environmental processes where epistemological differences
to explain the processes are not invoked (Reid et al. 2006). This suggests that
coproduction should focus on answering questions that do not require agreement in
explanation such as local knowledge of values and salient impacts (Reid et al. 2014), i.e.:
“co-assessment” (Sutherland et al. 2017).
Acknowledging that knowledge about cost-effective methods for collaborative
decision support research is incomplete (DeLorme et al. 2016), much of the literature on
coastal exposure usability documents actual project experiences to provide a window into

25
the research process to evaluate effectiveness of usability methods under (collaborative)
development (Lathrop et al. 2012, 2014, 2017; Stephens et al. 2015; DeLorme et al.
2016; DeLorme et al. 2017). Analyzing the research process in terms of collaboration for
decision support is the state-of-the-art with respect to evaluating usability of climate
change research (cf. Ford et al. 2013; Wall et al. 2017).
Chapter 4 of this dissertation contributes to climate research usability literature by
assessing local land use manager usability perspectives of the coastal exposure web map
developed for the study.
2.3. Climate Change Decision Support Using the Arctic Observing Network
The approach of using the Arctic observing network (AON) to support decision-making
has emerged in the Arctic global change literature to address the high demand for usable
climate science in the region. The Arctic observing network aims to serve the dual
function of supporting decision-making and scientific research (NRC 2006; Eicken et al.
2009; Lovecraft et al. 2013; Lee et al. 2015a,b; Starkweather et al. 2016; Eicken et al.
2016a; Sommer and Fleener 2016). Arctic observing networks that include local
community input support a range of Arctic management objectives including national
security by supporting Maritime Domain Awareness (MDA) (Eicken et al. 2016a,b) and
“early warning systems” for severe social and environmental threats that emerge in the
Arctic (Alessa et al. 2013, 2016). Arctic observing networks with local community input
are also designed to support the wide-range of stakeholders operating in the region such
as the maritime and oil industries as well as the local communities themselves (Russel et
al. 2013; Eicken et al. 2016a).
Arctic observing network capacity continues to grow since the bolstering the

26
network received during the 2007-2008 International Polar Year (IPY) (see Chapter 1). A
growing number of web maps were established to make Arctic observations available to
address the range of stakeholder information and science needs such as U.S. Arctic
Observing Viewer (Manley et al. 2015). The Alaska Ocean Observing System (AOOS),
another Web-based data steward system, makes Arctic observations available and
engages stakeholders to make them accessible for use in decision-making (cf. Alessa et
al. 2016). The recently established United States Arctic Observing Network (U.S. AON)
office coordinates Arctic observing networks for the U.S. across geographic scales from
the local community level to the international scale by linking with the Sustaining Arctic
Observing Networks (SAON) program initiated by the Arctic Council (Starkweather et
al. 2016). Through SAON, the US AON links with sustained Arctic climate assessments
including the Arctic Council’s Arctic Monitoring and Assessment Programme (AMAP)
and International Arctic Science Committee (IASC).
Arctic observing network programs typically make efforts to engage stakeholders
and scientists to transform raw observations and data into usable information products
(Lovecraft et al. 2013, 2016; Timm et al. 2016; Armstrong et al. 2016). However, a major
challenge for Arctic observing networks is effectively engaging local community
stakeholders to address their information needs (Lee et al. 2015a; Eicken et al. 2016a;
Johnson et al. 2013, 2015). Though the Arctic observing network role of addressing local
community needs has been established (cf. Eicken et al. 2016a), there is no standard
approach to engage local communities for input in network (cf. Lee et al. 2015a; IARPC
2015, cited in Eicken et al. 2016a). To address this challenge, the Arctic observing
network research community is working to better align priorities of environmental

27
change monitoring efforts for science with priorities of local and regional stakeholder
information needs, but admit integrating local community stakeholder input and local
knowledge into the network is challenging (Lee et al. 2015a; Eicken et al. 2016a). Local
input in Arctic observing networks is also a major challenge for "bottom-up" approaches
such as community-based monitoring (CBM). In an assessment of CBM research
contribution to the Arctic observing network, Johnson et al. (2015) found significant
challenges with connecting CBM research with wider research and governance networks
such as resource decision-makers.
Chapter 5 of this dissertation contributes to Arctic observing network literature by
advancing methods to engage local community stakeholders in the network.
2.4. Research Questions
The review of the literature on coastal exposure to climate change, evaluating the
usability of climate change research, and climate change decision support using the
Arctic observing network has identified areas needing more research. This dissertation
addressed these literature gaps by researching the three questions described in the
following paragraphs.
Research Questions 1: Why is coastal exposure to climate risks a problem for North
Slope communities?
This research question addresses the need for more collaborative coastal exposure
risk research from the perspective of impacted stakeholders. Getting the local perspective
of exposures along the remote stretches of the North Slope coastline addresses a locally
salient information gap for resource managers that have to balance competing subsistence
and industrial land uses that occur across the vast coastline. As a front-end evaluation in

28
the overall collaborative web map research process (Figure 2.1, Step 1), the research
addressed calls to advance usable climate science by engaging with stakeholders early in
the research process, enhancing salience of coastal exposure information through a front-
end evolution effort, and building relationships and trust with local informants.
Research Question 2: What is the land use manager usability perspective of the web
map?
Answering this question contributes to collaborative research to evaluate climate
science by applying the widely used conceptual model to assess climate science
information usability: credibility, and legitimacy based on Cash et al. (2003). The
usability analysis contributes to literature specific to collaborative mapping in the Arctic
context. It also contributes to emerging collaborative web map research for coastal
exposure by providing a window into the collaborative research process, which is useful
for evaluating the research design in terms of likelihood of science being usable. In the
overall collaborative web map research design (Figure 2.1, Step 3), the research
addresses climate science by engaging stakeholders in a formative usability evaluation to
identify improvements and continue the ongoing interaction necessary to build decision
support.
Research Question 3: How does the web map link to the Arctic observing network?
Investigating this question through initiating a collaborative web map contributes
to innovative ways to interact with local communities to develop decision support. In
terms of the overall collaborative web map research design, this question addresses the
call for more research to advance usable climate science through sustained interaction
with local communities to develop land use decision support. The collaborative research
29
design used in this study is based on an Instructional Systems Design (ISD). The ISD
provides a practical method to engage local communities in the Arctic observing network
and communicate information needs.
Research questions 1, 2, and 3 are answered in chapters 3, 4, and 5, respectively.
Section 2.5 below provides an overview of the research methods used to answer the
research questions. Detailed methods are provided in each of the three results chapters.
2.5. Research Method
The three questions in Section 2.4 were investigated by initiating a coastal exposure web
map in collaboration with the North Slope Borough and its residents using an
Instructional Systems Design (instructional design) (Figure 2.1). Instructional design is a
well established and widely used collaborative research process based on systems theory
(Von Bertalanffy 1956) for developing education and training programs in a consistent,
reliable, creative, iterative, and flexible fashion (Saettler 1968; Gagné and Briggs 1974;
Gagné and Glaser 1987; Steel et al. 2017; Branch 2017). A central tenant of instructional
design is evaluation throughout the process of designing the system. Instructional design
is common in collaborative web map development in the context of the classroom (Baker
2015) or stakeholder usability workshop setting (Lathrop et al. 2012, 2014, 2017). With
respect to web-based decision support tools, the instructional design is consistent with
user-centric models for decision tool system design specified by international standard
(ISO 2010).
Evaluation through instructional design or similar interactive design is
increasingly common in collaborative coastal exposure web map development
specifically (Lathrop et al. 2012, 2014, 2017; Stephens et al. 2015; DeLorme et al. 2016;

30
DeLorme et al. 2017) including in the context of the Arctic observing network
(Eschenbach 2017; Baschek et al. 2017). With respect to connections with the global
change literature, the instructional design responds to the call for innovative approaches
for scientist-stakeholder interaction (Dilling and Lemos 2011; AMAP 2017b), iterativity
(Lemos and Morehouse 2005), and evaluation of the various phases of coproduction
(Dilling and Lemos 2011; Wall et al. 2017) to advance usable climate science.
Instructional design draws from evaluation research to enhance the ability for
instructional materials to meet defined goals. Research questions 1 and 2 in Section 2.4
correspond with the two evaluation efforts typical of an instructional design process, i.e.:
front-end and formative evaluations (cf. Gagné 1987; Dick et al. 2005). A front-end
evaluation is an effort to assess needs while a formative evaluation is done to improve
instructional materials during the development process. In the web map research process
shown in Figure 2.1, Collaborative Research Step 1 is the front-end evaluation, and
Collaborative Research Step 3 is the formative evaluation.
In Figure 2.1 below, the three collaborative research steps in bold are
distinguished from research tasks done by the researcher without interacting with the
local community. Collaborative research steps 1 through 3 are in an infinite loop, and the
North Slope Borough controls the model output through information dissemination via
the web map after the formative evaluation in Collaborative Step 3. The solid black
arrows in Figure 2.1 indicate the direction of the progression of research, and dotted
arrows indicate the direction of feedback during research phases. The front-end
evaluation in Collaborative Step 1 corresponds to the first research question addressed in
chapter 3: Why is coastal exposure to climate risks a problem for North Slope

31
communities? In the instructional design, this step consists of verifying local risks using
participatory mapping methods to collect local perspectives of coastal exposure risk.
Results from Collaborative Step 1 were used to identify the assets to represent in the web
map and understand why their exposure is a problem. While the focus of the local risk
verification was to identify at-risk assets, participants often volunteered information on
environmental drivers of shoreline change. This feedback in Collaborative Step 1 is
illustrated in Figure 2.1 as the dotted line from Step 1 to the Researcher Develop
Shoreline Change Susceptibility Data Model task. The formative evaluation in
Collaborative Step 3 corresponds with the second research question addressed in Chapter
4: What is the land use manager usability perspective of the web map? Prior to
Collaborative Step 3, the researcher collaborates with the North Slope Borough to
develop the coastal exposure web map in Collaborative Step 2. As described in more
detail in Section 4.1.2, at-risk asset data representing risk found in Step 1 were integrated
with a shoreline change susceptibility model to create coastal exposure datasets. In
Collaborative Step 2, the researcher works with the North Slope Borough to create the
coastal exposure web maps using the exposure data. In Collaborative Step 3, the dotted
arrows indicate that land use managers provide feedback for all research steps and tasks
to adapt the web map process to address manager needs.

32
Figure 2.1. Collaborative Coastal Exposure Web Map Research Process The collaborative research is based on an instructional systems design (ISD) consisting of
three collaborative research steps, two non-collaborative research tasks before Step 2, and one
North Slope Borough non-collaborative information dissemination task after Step 3.The solid
arrows indicate the direction of successive research steps, and dotted arrows indicate direction
of feedback from study participants during evaluation steps 1 and 3.
Research question 3 addressed in Chapter 5: How does the web map link to the
Arctic observing network, corresponds with the overall research process illustrated in
Figure 2.1. To identify web map links to the Arctic observing network (AON), the web
map process and product were compared with the structure of the network. To facilitate
link identification, the structure of the AON was defined using three key reports that
address important organizational aspects of the network. The three reports address AON
design approaches (ADI 2012), federal Arctic observing activities (Jeffries et al. 2007),
and societal benefit areas (IDA 2017). The method to answer research question 3 is
described in more detail in Section 5.1.
Dissertation results chapters 3, 4, and 5 each provide detailed methods that
correspond with the three research objectives. Chapter 3 describes the community
mapping workshop materials used to collect data and method to analyze the local coastal
exposure risk perspectives provided on hard copy maps. Chapter 4 describes the web map

33
materials and the method to collect and analyze land use manager usability perspectives
using the Cash et al. (2003) usable science conceptual framework. Chapter 5 describes
the method to identify web map links to the Arctic observing network, which was
summarized in the paragraph above.
The metadata for the web map datasets created for this study were submitted to
the National Science Foundation Arctic Data Center (https://arcticdata.io/). Excerpts of
the metadata are provided in Appendices A to D.

34
3. Local Views of Coastal Exposure in Alaska’s North Slope
The Arctic shoreline is changing rapidly along some stretches of the Arctic Ocean coast
and changes are likely accelerating due in part to diminishing sea ice (Overeem et al.
2011; Barnhart et al. 2014a,b, 2016). The average erosion rate for areas covered by the
Arctic Coastal Dynamics Database is 0.5 m yr−1 (Lantuit et al. 2012), and rates can reach
up to 8.4 m yr−1 along some permafrost-rich stretches of coastline (Barnhart et al.
2014b). One study found a doubling of erosion rates of a segment of the coast on the
North Slope over the last 50 years (Mars and Houseknecht 2007).
While significant research attention is being given to the environmental changes,
there is less research on how the changes are impacting coastal communities. Coastal
exposure research along Alaska’s North Slope mostly addresses threats to municipal and
industrial infrastructure such as roads and airstrips located within proximity to the small
stretches of shoreline near Alaska native villages (e.g. Brunner and Lynch 2013;
Lovecraft and Eicken 2011). While these risks are important, there has been less research
attention on the rest of the vast shoreline where subsistence and industrial activity, the
two primary land uses in the region, also occurs and is in some places concentrated.
Researchers that have investigated coastal exposure outside of the villages have focused
on threats to sites associated with historical land uses such as cultural heritage and
archeological sites (Jones et al. 2008; Jensen et al. 2015), but assessments of risk to
current land uses along these stretches of shoreline are lacking.
With respect to efforts by the government, resource managers, academia, and
industry to understand and monitor the effects of diminishing Arctic sea ice on local
communities in the region (ACIA 2004; Streever et al. 2011; Larsen et al. 2014; Chapin
35
et al. 2014), the available literature on land use impacts away from the villages provides
an incomplete picture with most attention given to land uses that depend directly on sea
ice conditions. For example, available studies detail land use risks associated with sea ice
used as platforms to support subsistence hunting (George et al. 2004; Hinzman et al.
2005; Eicken et al. 2009; Druckenmiller et al. 2010) and oil and gas industry operations
(Eicken et al. 2009). Less research attention is given to the land use impacts from coastal
exposure as a physical system response to sea ice loss.
The aim of this chapter is to address the above research gap by documenting local
views of coastal exposure to climate risk across Alaska’s North Slope coast using a
collaborative mapping research method. While this chapter focuses on the coastal
exposure research gap, it is also part of the overall study design for innovative
collaborative research explained in Chapter 2. This chapter does a “front-end” evaluation
for the coastal exposure web map created for this study. The objective of the evaluation
effort was to identify local risks from the perceptive of North Slope residents. This
research was done to identify coastal exposure risks to include in the coastal exposure
web map described in Chapter 4.
3.1. Method
The research question that guided the front-end web map evaluation is: Why is coastal
exposure to climate risks a problem for North Slope communities? The semi-directive
collaborative mapping method detailed in Section 3.1.1 was designed to collect local
views of the problem at a regional scale to avoid a focus on well-documented risks in or
near the local municipalities. Results were analyzed by identifying emergent themes from
digitized coded stickers used to spatially document participant views (Section 3.2). Of the

36
three land uses identified from toponym analysis, i.e.: industrial, subsistence, and
municipal, the first two sectors were the focus of further analysis to identify coastal
exposure risks across the vast North Slope coast outside of the local municipalities.
3.1.1. Data Collection
The primary method to collect local views of coastal exposure risks was through
community-mapping workshops in Wainwright, Utqiaġvik, and Kaktovik (Figure 3.1)
using a semi-directive interaction design and snowball sampling. The semi-directive
interview is an accepted method for collecting local information and knowledge in an
open-ended format (Briggs 1986; Pretty et al. 1995), and is common in collaborative
Arctic research (Huntington 1998). In semi-directive interviews, the researcher focuses
participant attention on the research topic, but associations made by the participant
ultimately direct the responses (Huntington 1998). This open-ended format has been used
in the Arctic as well as elsewhere in other regions of the world for community-based
investigations of climate vulnerability to leverage its strength in allowing unanticipated
and novel concepts to emerge (cf. Ford et al. 2006). The community map instrument
described in 3.1.2 served as the “boundary object” (cf. Star and Griesemer 1989; Lynch
et al. 2008; Cutts 2011) to enhance access to local knowledge by stimulating conversation
(Huntington 1998, 2011) and keeping participants focused on the research topic and
study area (Vullings et al. 2004).
The research focused on the perspectives of Arctic residents in three North Slope
municipalities: Wainwright, Utqiaġvik, and Kaktovik. Collectively, the subsistence land
use areas of the three municipalities cover the Arctic Ocean coast adjacent to the National
Petroleum Reserve – Alaska (NPR-A) and the Arctic National Wildlife Refuge (ANWR).

37
The NPR-A and ANWR coastlines are relevant for decision support research because
they are the focus of important land use decisions for large-scale onshore and offshore
hydrocarbon development. Both Wainwright and Utqiaġvik are located within the NPR-
A. Wainwright is a medium size city with about 550 residents, and Utqiaġvik is the seat
of borough government and largest city with a population of about 5,000. Kaktovik,
located in the ANWR, is the smallest city among the three with a population of about
250.
Prior to fieldwork, I sent requests to do research to the three main local authorities
in each place: the village corporations, the native village governments, and city
governments (Appendix E). The Cities of Wainwright and Kaktovik provided meeting
space for the mapping workshops in their community centers, and the Iñupiat Heritage
Center provided space in Utqiaġvik. In some cases, to include key informant elders, I was
invited to bring the maps to participant homes. To encourage participation, study
participants received a $75 credit to their local grocery store.

38
Figure 3.1. Data Collection Area The data collection focus was on the two stretches of coastlines along the National Petroleum Reserve –
Alaska (NPR-A) and the Arctic National Wildlife Refuge (ANWR) in Alaska’s North Slope indicated in
the map as light gray land areas. The locations of the three municipalities that participated in the
community mapping workshops are shown in the map as green circles annotated with the municipality
name. The green line-filled areas correspond to the estimated areal subsistence land use extent of the
municipalities annotated respectively. The subsistence extents were digitized from Pedersen (1979). The
Wainwright and Utqiaġvik subsistence areas together cover the NPR-A, and Kaktovik’s subsistence area
covers the ANWR. While the data collection focused in these three municipalities, the subsistence areas of
other North Slope municipalities (not shown) extend into the collection area, and all eight municipalities
depend on access to these coastlines for subsistence. Also, residents of communities may travel beyond
these areas including into subsistence areas of other municipalities.
With respect to the sampling strategy, the majority of the 2016 participants in
Utqiaġvik attended one large community-mapping workshop that was not audio-
recorded, but it opened the door to all community members wishing to share their
perspectives by marking directly on the maps. I conducted follow-up audio-recorded
interviews with select workshop participants in Utqiaġvik. I used purposive snowball
sampling in the two smaller villages, Wainwright and Kaktovik, to target subsistence
hunters who have knowledge about remote stretches of the shoreline.
Findings from previous fieldwork in summers 2013 and 2014 motivated the
design of the workshops to collect local views of coastal exposure risks with a geographic
focus outside of the local municipalities. Informal interviews in summer 2013 with
39
community leaders2 in Wainwright, Utqiaġvik, Nuiqsut
3, and Kaktovik identified that, in
addition to risks within the villages, coastal exposure concerns extend across the vast
shoreline from exposed industrial and subsistence-related land uses. Semi-structured
interviews in 2014 with community leaders in Utqiaġvik and Katovik4 identified rich
local knowledge and a strong willingness within the communities to share the knowledge
about specific places along the shoreline (the 2014 interview instrument is provided in
Appendix F). By identifying the local concerns across the vast shoreline and rich local
knowledge and willingness to share it, the 2013 and 2014 findings shaped and justified
the 2016 mapping workshop design to systematically collect local views of coastal
exposure risks across the coast. While the 2016 workshops were the primary data sources
in the study, transcribed interviews from the 2013 and 2014 fieldwork were used to
supplement analysis of the 2016 data by providing additional statements or perspectives
about particular exposure risks. Also, while not the data collection focus, the 2016 web
map usability workshop described in Chapter 4 was another source of coastal exposure
information.
3.1.2. Materials and Procedure
The research materials used in the 2016 community mapping workshops to document
participant views of coastal exposure risks included hard copy maps of the study area, an
instructions packet including biographical questions, coded stickers, wax pens, and an
audio-recording device (see Appendix G). The map-set consisted of three large-scale
maps at around 1:6000 (~1 cm to 60m) with imagery covering village locations, and three
medium-scale maps around 1:100,000 (~1 cm to 1km) with U.S. Geological Survey
3 Nuiqsut was excluded from data collection in 2014 and 2016 fieldwork due to limited research resources.
4 Wainwright was excluded from data collection in 2014 due to canceled flights from bad weather.

40
(USGS) topographic base maps of the coastal region surrounding each village. Recent
coastal exposure rate data provided by the USGS (Gibbs and Richmond 2015) were
overlain onto all six maps, and select asset data such as DEW Line site and camp
locations were included on the medium scale maps for additional reference.
Each participant received an instructions packet and ten numerically coded one,
quarter-inch arrow-shaped stickers to identify shoreline “problem places.” The
participants annotated the problem places by marking directly on the map near a sticker
using a wax pen or by audio-recorded oral response. Of the total 50 participants, 23 were
audio-recorded. Only 5 of the 32 participants in Utqiaġvik were audio recorded, all 8
participants in Wainwright and all 10 in Kaktovik were audio-recorded.5 The metadata
for the resulting community map dataset is provided in Appendix A.
3.1.3. Analysis
Sticker locations and written responses were digitized and oral responses were
transcribed and associated with digitized sticker points. Participant statements
corresponding to particular places were linked to the digitized point locations by sticker
codes using Esri ArcGIS software. Participant biographical information collected on the
instruction form was also attached to the points using the sticker codes. The biographical
information allowed point locations to be grouped such as by participant name to focus
analysis of digitized markings and geo-referenced audio-recorded transcriptions on
individual participants.
5 Only 5 were audio-recorded in Utqiaġvik because the door was open to all residents at the Heritage Center
for a total of four hours between two days, and most participants completed the mapping activity on the
first day. It was not possible to record each participant. The 5 that did get audio-recorded were arranged
separately from the Heritage Center community mapping event. In Wainright and Kaktovik, on the other
hand, I had unlimited access to the community center for several days, which allowed me to accommodate
each participant individually.

41
Participant statements were organized using three main land uses found using a
basic toponym analysis technique - industrial, municipal, and subsistence/ environment.6
The toponym analysis consisted of creating a 1-kilometer buffer around all digitized
sticker locations and linking them with existing land use data provided by the U.S.
Geological Survey (USGS) Board of Geographic Names.7 The Geographic Names
dataset provides place name and land use type for each location in the database. The
transcribed statements linked to digitized sticker point locations were coded with one of
the three land use types for most locations where sufficient information was available.
Subsequent qualitative analysis consisted of further grouping the statements to identify
prominent themes, and viewing associated point locations overlain with relevant spatial
layers to provide geographic context to better understand the statements. For example, if
a participant indicated that a particular subsistence hunting camp was at risk, relevant
layers were added to the map such as camp locations, native allotment parcels, cultural
heritage data, geo-referenced photographs of the coast, and recent high spatial resolution
satellite imagery.
3.2. Results
The 50 participants collectively identified 297 coastal exposure risks (Figure 3.2). The
geographic extent of the contributions along the coast correspond to the estimated
subsistence land use extents shown in Figure 3.1. The sticker points do not extend west of
the NPR-A because that is the western limit of the hard copy maps used to collect the
data. The general finding suggested by this map is that coastal exposure to climate risks
6 These results are based on a total of 118 USGS place names that were each found to be within 1km of
participant-identified places. The remaining 179 of the total 297 problem places were not within 1km of a
USGS place name. 7 https://geonames.usgs.gov/
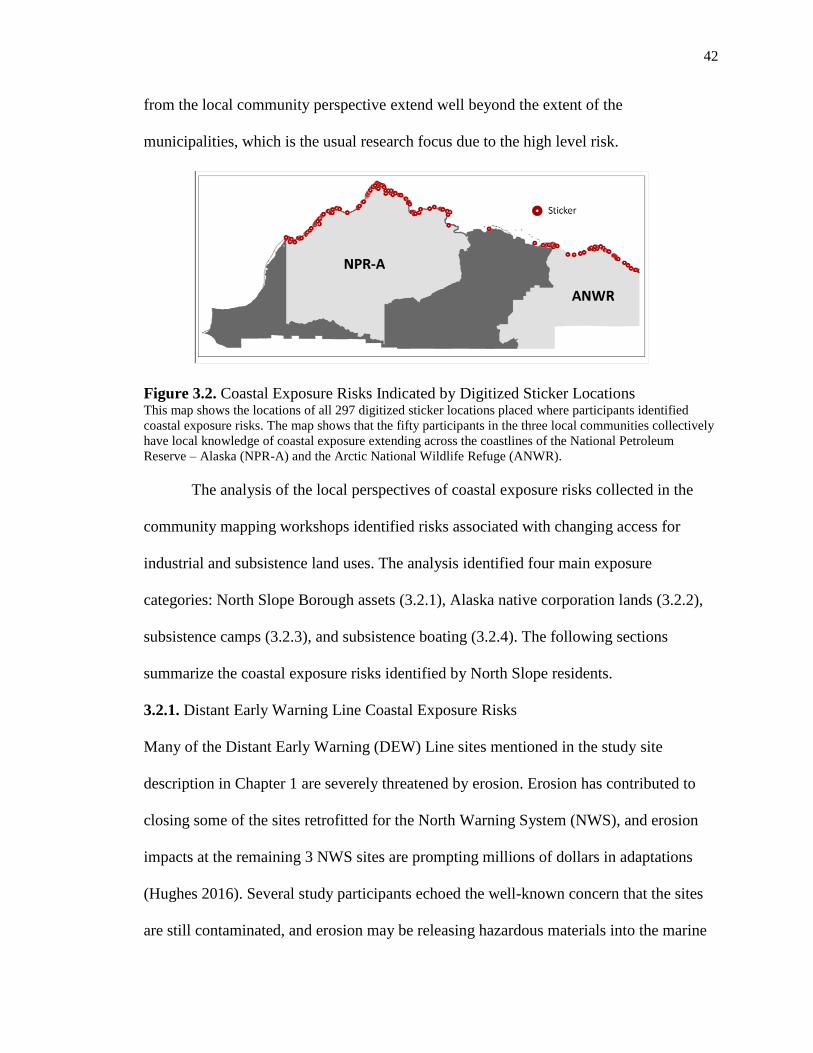
42
from the local community perspective extend well beyond the extent of the
municipalities, which is the usual research focus due to the high level risk.
Figure 3.2. Coastal Exposure Risks Indicated by Digitized Sticker Locations This map shows the locations of all 297 digitized sticker locations placed where participants identified
coastal exposure risks. The map shows that the fifty participants in the three local communities collectively
have local knowledge of coastal exposure extending across the coastlines of the National Petroleum
Reserve – Alaska (NPR-A) and the Arctic National Wildlife Refuge (ANWR).
The analysis of the local perspectives of coastal exposure risks collected in the
community mapping workshops identified risks associated with changing access for
industrial and subsistence land uses. The analysis identified four main exposure
categories: North Slope Borough assets (3.2.1), Alaska native corporation lands (3.2.2),
subsistence camps (3.2.3), and subsistence boating (3.2.4). The following sections
summarize the coastal exposure risks identified by North Slope residents.
3.2.1. Distant Early Warning Line Coastal Exposure Risks
Many of the Distant Early Warning (DEW) Line sites mentioned in the study site
description in Chapter 1 are severely threatened by erosion. Erosion has contributed to
closing some of the sites retrofitted for the North Warning System (NWS), and erosion
impacts at the remaining 3 NWS sites are prompting millions of dollars in adaptations
(Hughes 2016). Several study participants echoed the well-known concern that the sites
are still contaminated, and erosion may be releasing hazardous materials into the marine

43
environment. But one North Slope land use manager identified a potentially very
significant erosion risk that has implications for current North Slope land use planning
for industrial development.
The risk that the land use manager identified may be best summarized as
opportunity costs associated with the current and future land use roles of the DEW Line
i.e.: supporting industrial development and mitigating harmful impacts on subsistence. If
the DEW Line continues to erode into the ocean, it will take the very valuable airstrips,
building pads, and other facilities with it. Just west of the NPR-A (and west of the data
collection area in Figure 3.2) is an eroding DEW site called Point Lonely. While Point
Lonely has yet to support production in the reserve, the land use manager sees it as a
valuable asset because of its potential use by the industry, as indicated by his comment
below:
Point Lonely has got a 5,000-foot runway there - enough to land the biggest
airplane there is on earth. [It’s] [c]apable of still being used; we need to do
everything we can to preserve their use, so that continuing oil and gas
development has an opportunity to reuse them. (NSB Land Use Manager)
From the borough’s perspective, the value of keeping the assets viable is two-fold:
they are potential taxable assets if industry uses them and reusing the sites would mean
less construction elsewhere on valued subsistence lands. The land use manager addressed
both of these points when he said:
If you use them (DEW sites) and increase their value, the borough can tax it and
provide for additional revenue … If we were to protect these resources, you could
save a billion dollars in constructing new ones for the oil and gas industry to stage
out of. … And these locations happen to be where you can theoretically put a
production facility, a CPF [Central Processing Facility, which would be
economically beneficial to the borough] without having to build another one with
billions of dollars worth of gravel resources on virgin land. At the same time
minimizing these impacts [referring to subsistence impacts mentioned previously
in the interview] for the community needs of these local resources so that you

44
won't put the caribou a hundred miles off the way somewhere else when they
need them to hunt and shoot close by to provide food on the table. (NSB Land
Use Manager)
While the Point Lonely risks refer to future potential land use opportunity costs,
the borough currently leverages land use benefits from the eroding Cape Simpson DEW
site located in the NPR-A about 50 miles east of Utqiaġvik (Figures 1.1 and 3.3). The
borough owns a parcel of land at the site, called the Cape Simpson Industrial Port (CSIP).
The borough uses remaining infrastructure including an airstrip and building pads to
encourage oil and gas industry to stage from the site when exploring in the northeast
portion of the NPR-A. From the borough’s perspective, using the site to support oil and
gas exploration reduces the industry’s “footprint” on substance lands by avoiding the
need to stage somewhere not yet developed. The runway is losing upwards of ~9 meters
(~30 feet) per year, so it may become inaccessible to the industry in the foreseeable
future. From the North Slope Borough land use manager’s perspective, loss of oil and gas
industry access to the site would mean an increase in harmful impacts to subsistence
resources. Therefore, the borough may need to invest in adapting the site, as suggested by
the participant statement below:
Cape Simpson. That one actually was a DEW Line site that was transferred to the
North Slope Borough by the federal government. There was a runway there, a pad
there - all eroding away by the way. And we use it to minimize subsistence
impacts to have oil and gas explorations occur from there. So that they're not
crisscrossing where primary subsistence use areas where they were able to get to
their leased plots from there. It helped facilitate a co-existence. But it is eroding
and we need to do other things to maintain that. ... (NSB Land Use Manager)

45
Figure 3.3. Cape Simpson Industrial Port This is a picture of the Cape Simpson Industrial Port (CSIP) taken by the US Geological Survey. The CSIP
is located in the NPR-A, about 50 miles east of Utqiaġvik. The site is owned by the North Slope Borough
and used by oil and gas industry to explore in the NPR-A. The site is threatened by erosion. The North
Slope Borough is concerned that erosion of the airstrip will make the port inaccessible to the oil and gas
industry. The site mitigates oil and gas impacts on subsistence because it provides a place for the industry
to use and not have to build elsewhere on subsistence lands (US DOI 2012).
The DEW Line was constructed before there were environmental laws protecting
communities from harmful environmental and social impacts. The accounts of the harm
caused during their construction are harrowing, including bulldozed sod homes
(traditional housing prior to Quonset Huts were introduced by the military) and forced
community relocation in Kaktovik (Mikow 2010). The land use manager alluded to the
harm caused from DEW Line construction when he extended the development mitigation
benefits now realized from reuse of the CSIP to the other DEW sites in the NPR-A when
he said:
A lot of these DEW Line sites are in the NPR-A … for the federal government, and to
reuse these sites to provide environmental justice, to not repeat these things because
they're so environmentally damaging when you do it on pristine lands…”
(NSB Land Use Manager).

46
When the land use manager discussed coastal exposure risks associated with the
DEW Line, he made several references to climate change and an increasingly accessible
Arctic. For example, referring to the need for the Coast Guard to have access to the North
Slope coast to regulate increasing maritime activity in the region as the Arctic becomes
more accessible with climate change, he said: “A lot of these things need to be revisited
as the Arctic opens up and the need for presence of enforcement folks like the Coast
Guard” (NSB Land Use Manager).
3.2.2. Native Corporation Land Coastal Exposure Risks
Study participants identified coastal exposure risks on Alaska native corporation lands
that may not already be well documented.8 Two industrial risks identified are:
constrained maritime access for industrial development on Olgoonik (Wainwright’s
village corporation) lands and rapid coastal erosion at an Arctic Slope Regional
Corporation (ASRC) parcel selected for industrial development in the NPR-A.
Wainwright’s native village corporation, Olgoonik, has surface rights to a parcel
located along an eroding spit of land where the village is located (see Figure 1.1). The
parcel extends inland to the decommissioned Wainwright DEW Line site. The DEW Line
site is the planned staging area for large-scale offshore oil and gas support facilities.
Industry has proposed to reuse and expand on existing DEW Line facilities including an
airstrip and building pads in anticipation of offshore development in the Chukchi Sea. In
this development scenario, the DEW Line site would be used to support transfer of
product barged through the Wainwright Inlet to transfer facilities, and transported
through a proposed pipeline connecting from the DEW Line site, across the NPR-A to the
8 As stated earlier, this dissertation focuses on coastal exposures associated with subsistence and industrial
land uses, and not the well-documented municipal risks.

47
Trans-Alaska Pipeline System (TAPS), and ultimately to Valdez to be shipped to market
(cf. Bartholomew et al. 2014; Vargas-Moreno et al. 2016).
A critical exposure identified by one local informant is the high risk to the chain
of offshore product transportation to market in this scenario from the potential loss of
access to the Wainwright Inlet from a “blown” spit or shoaling. The participant said:
… [I]n regard to coastal erosion hazard … the key importance and sensitivity of
the geologic feature depicted here [Entrance to the Wainwright Inlet] that is the
narrow mouth of the river at the ocean entrance. If the narrow deep-water
constriction was to be lost by a general blow-out of the long sandbar bordering it
to the south, the river mouth would become a large-plain delta, impassable to all
but flat bottom skiffs. In such case, the inland Air Force base would become
unreachable by boat, an important requirement for it being an industrial base.
(NSB Land Use Manager)
Similarly, one participant identified the risk of constrained access to oil spill
response assets staged in the Wainwright Inlet. The informant explained that during a
recent oil spill response drill, boats staged near the Wainwright DEW Line site could not
pass through the mouth of the inlet because it became too shallow. For example, the
participant said:
[They’re] [h]aving a lot of problems with shoaling there [at the mouth of the
Wainwright Inlet]. Originally it was dredged because that's one of the things the
borough dredge originally did. … I have just heard recently that when they tried
to run a drill for oil spill response they couldn't get the boats out. They actually
had to put them on motors and carry them over to the ocean side, which obviously
wasn't part of their original plan. But it's the only place you can put stuff [inside
the inlet]. The ocean shoreline is eroding to the point I wouldn't put a dingy on the
beach, let alone a twenty something foot two-hundred-thousand-dollar boat.
That's why everyone keeps their boats in the lagoon, that's just where you put
your boats. (UIC Stakeholder)
The Arctic Slope Regional Corporation (ASRC) selected an important parcel of
land in the National Petroleum Reserve – Alaska (NPR-A) by the Cape Halkett area,
about 100 miles east of Utqiaġvik (US MMS 1984) (see Figure 1.1). Most of ASRC’s

48
lands are located outside of the NPR-A, just south of the reserve where there is little
potential for hydrocarbon development. This parcel is unique because it’s the only native
corporation land within the NPR-A with subsurface rights. Under the ANCSA, the
federal government has subsurface rights within the NPR-A and Arctic National Wildlife
Refuge (ANWR). However, the Alaska National Interest Lands Conservation Act of
1980 (ANILCA) permitted the ASRC to obtain subsurface rights to village corporation
lands within the NPR-A and ANWR, but such claims have to be developed for
commercial use. Development of the ASRC parcel has been denied due to historically
very high erosion rates in the Cape Halkett area, a trend that ASRC contests. For
example, a study participant said:
We're looking to do something with that property and the federal agencies were
saying 'oh no that's all eroding away, look at this USGS report' and we're saying
'no, that's wrong, yes there's erosion, there's a lot of erosion in different areas but
this area is growing rapidly; wetlands are being protected by these offshore
barrier islands and the giant spit that was formed.’ (ASRC Stakeholder)
The ASRC has also pursued lands with subsurface rights in the Section 1002 Area
of the ANWR in anticipation of it opening to leasing for energy development (see Figure
1.1). The ANILCA doubled the size of the ANWR to 19 million-acres, and designated
1.5 million-acres of the coastal plain as the Section 1002 Area, which was opened to
natural resources evaluation. However, Congress has not acted on Department of Interior
recommendations to open the Section 1002 Area to oil and gas leasing (Gallaway 2001;
US FWS 2015).
3.2.3. Subsistence Hunting Camp Coastal Exposure Risks
Participants also identified coastal exposure risks associated with camping for subsistence
hunting. Risks include loss of camps due to erosion and constrained boating access due to

49
coastal exposure along the ocean coast and up rivers. Camp impacts can be distinguished
by the number of families that depend on a site and range from single-family to sites that
entire villages depend on. However, entire communities can also depend on a single-
family camp as one whaling captain noted:
The erosion and it impacts on camps along these rivers that are community assets.
When I'm fishing I fish for the community as a whaling captain. During the dead
of winter, I'm going to travel to my camp about 75 miles east of here, and haul my
resources that I've caught back to Barrow. It's thousands and thousands of dollars
to replace some of these [camps]. Because the impact to the community is less
food, you're more dependent on store-bought things for your diet. (Utqiaġvik
Whaling Captain)
Many participants identified camps and related infrastructure such as ice cellars
used to store meat being lost to erosion. There were also numerous accounts of the
extensive chain of barrier islands that line the North Slope coast losing land and
narrowing. Erosion impacts on camps, combined with barrier island narrowing and loss
of coastal protection from diminishing sea ice, are rendering subsistence camps used for
generations unusable. Griffin Point, east of Kaktovik, is perhaps the most illustrative case
of an important camp depended on by multiple families for generations being lost to
erosion and becoming increasingly dangerous to use. For example, one participant said:
If I would point out one [an important camp being lost to erosion], the main one
we go out on is Griffin Point. Because you cut across, but the whole thing really,
is this spit, because it connects to Barter Island. We depend on this whole thing
for traveling. This is our hunting grounds - we look for the caribou. .... That's
where my grandma had her smoke house and everything. … We used to live in a
sod house when I was a little boy. Same here. We used to love to go there. And
it's all gone, it all got washed away. (Kaktovik Subsistence Hunters)
... [W]e don't hardly have Griffin Point anymore, our barrier island is what they
call it. We used to be able to land planes on there. And used to be at least a whole
football field wide, and it's only like a hundred feet wide now.
(Kaktovik Subsistence Hunter)

50
A camp used by multiple families east of Utqiaġvik is increasingly difficult to
access. One local informant said he worries that the site may become inaccessible due to
the changing shoreline. For example, the participant said:
There's this place called Smith Bay, that's where about a dozen of us families go.
... So the mouth of the Ikpikpuk River, there's only one entrance. ... The mouth of
this river, this is the only way to get into this huge river system. ... There used to
be an entrance over this way. When you know 20 years ago, now it's here. The
question is will it persist here or not? And then this mouth itself changes
gradually over time, so every year we have to nose into here into shallow water
we have to redefine the mouth. (Utqiaġvik Whaling Captain)
While Nuiqsut was not included in the community mapping, North Slope
residents mentioned that Nuiqsut is especially vulnerable due to coastal exposure
impacting access to hunting camps depended on by the entire community. One critical
threat is the diminishing Cross Island, a barrier island north of the village beyond the
Colville River Delta.
Cooper Island (corrected to: Cross Island) outside of Nuiqsut. They're a fall
whaling community only. They go out here [Cross Island] to whale in the fall
time. And they depend on it when they stage out here, far from town they have to
take everything way out there with them to reside on Cooper [corrected to: Cross
Island] Island. That island is of critical importance. Without it, Nuiqsut wouldn't
be able to successfully sustain a fall whaling exercise. It's diminishing. It's
eroding. It's losing its height, it's losing its breadth and width and length. It's
getting smaller. I can't think of any other island that is so important as that one.
(NSB Land Use Manager)
3.2.4. Subsistence Boating Coastal Exposure Risks
Study participants also identified coastal exposure risks associated with subsistence
boating during summer months along the North Slope coast. Subsistence boaters rely on
the long chain of barrier islands that run across much of the North Slope for shelter from
the ocean as they transit. They also rely on cuts in the barrier islands to access hunting

51
grounds or escape waves during stormy weather. For example, one subsistence boater
said:
Sanigaruak Pass is another deep cut between barrier islands. If all hell breaks
through in the ocean, that's a place we can rely on to get in and out for safety
behind the barrier islands. We've dragged whales through here.
(Utqiaġvik Whaling Captain)
Two main themes of boating impacts identified by participants are: 1) changing
access due to coastal exposure such as shoaling cutting off boating routes, and 2) loss of
protection from barrier islands compounded by loss of sea ice protection making boating
increasingly risky. Perhaps the most conspicuous case of the shoaling problem is the
Bernard Spit just north of Kaktovik. Bernard Spit is migrating towards the Barter Island
mainland, which threatens to cut-off the main boating route used by hunters to haul
whales into the community for processing. For example, one participant said:
[Bernard] Spit [is] getting shallower. So, I don't know if they're going to meet,
eventually hit the land and close it off, I don't know. We wouldn't be able to tow
our Bowhead Whale here to butcher it at the butchering site. Some folks are
already talking about it now being unusable in the future. Might have to go over
here to butcher it. Different spot, you know. Drag the whale. There's a road there
we could utilize. Right now, we tow the whale here, pull it onto the beach, and
butcher it there where we have a butchering shack where they cook for the
community there in the summer. (Kaktovik Native Village Stakeholder)
Participants shared numerous locations where the coastline has changed
significantly. Several boaters said that the changes have been so significant over the years
that their navigation systems, equipped with global positioning systems (GPS), indicate
that they’re transited over islands or well inland. For example, one participant said:
They're (barrier islands) moving all over the place - you don't use maps anymore.
We use a GPS to navigate in the summer months, and we're driving over mapped
islands, according to this map there should be an island there and when we see it
you know tens of yards or hundreds of yards away, so islands move around and
that's just what they do. Our job is to just keep track of it.
(Utqiaġvik Whaling Captain)

52
Participants also shared numerous locations where the rapidly changing barrier
island is cutting off access to hunting grounds, removing cuts used to escape storms, and
making boating routes between barrier islands and the mainland inaccessible. Perhaps the
best example where a diminishing barrier island is impacting boat travel is the narrowing
of Icy Reef, a barrier system that runs close to the mainland from Kaktovik to Canada.
The Icy Reef barrier island provides safe travel by boat from Egaksrak Lagoon, east of
Kaktovik, to Demarcation Bay and Canada. Hunters travel to Demarcation Bay when few
caribou are taken closer to Barter Island, or on the way to visit relatives in Canada
(Jacobson et al. 1982). For example, one participant said:
This area is really shallower, we used to go inside all the way and come out over
here to go to Demarcation - hard to do now. We have to go through the ocean.
And it's dangerous too, especially you got these reefs that go out people are
traveling and it's foggy. You get too close to the waves breaking. That's how we
lost a family about 10-15 years ago maybe. … You don't have the ice you
normally have to travel so it's calm even though it's windy."
(Kaktovik Subsistence Hunter)
3.3. Discussion
The coastal exposure risks identified in this study are relevant for efforts by the North
Slope Science Initiative (NSSI) to coordinate applied research in support of North Slope
resources management. Established by federal, state, and local governments in 2001 and
formalized in Section 348 under the Energy Policy Act of 2005, the NSSI coordinates
applied science relevant for North Slope resource managers and reports to Congress
annually (Streever et al. 2011). The NSSI has an external advisory group called the
Science Technical Advisory Panel (STAP), which is composed of 15-members including
Iñupiat elders, university and industry scientists, and non-profit organizations. The STAP
identified coastal erosion risk monitoring that includes local knowledge as an emerging

53
research need (NSSI 2014). This dissertation addressed the local knowledge aspect of this
research need.
The coastal exposure risks identified in this study suggest the need for the NSSI to
re-articulate the coastal erosion problem to address current land use exposure risks. In
addition to exposed historic infrastructure and cultural sites (cf. Jones et al. 2008), this
study identified local community exposure risks associated with current industrial and
subsistence land uses along the coastline. The identified exposure risks were summarized
in this chapter as constrained industrial and subsistence land uses due to shoreline
change. The identified coastal exposure risks based on local knowledge should be
considered by the NSSI’s efforts to coordinate erosion risk monitoring research on the
North Slope.
The coastal exposure risks to current industrial land uses identified in this study
are also relevant for the NSSI’s energy development and climate change scenarios
research. Since the Prudhoe Bay oil discovery, the government, industry, academia, and
nongovernmental organizations have made extensive efforts to understand and monitor
oil and gas development impacts on the North Slope. Understanding that the development
impacts are occurring in the context of climate change, the NSSI has taken a scenarios
research approach to assess impacts into the future (Streever et al. 2011). One reason that
the coastal exposure risks to current industrial land uses are relevant for the scenarios
research is because it provides a reason to project shoreline-dependent access at industrial
locations that become active under various energy development scenarios. For example,
under projected coastal exposure scenarios, will shoreline change at the Wainwright Inlet
allow barge traffic under a high energy development scenario (cf. Vargas-Mereno et al.

54
2016). Under the high development scenario, offshore oil in the Chukchi Sea is
transported to market through a pipeline from Wainwright through Nuiqsut to the Trans
Alaska Pipeline System (TAPS). Which DEW line sites along the NPR-A shoreline
would still be accessible under high coastal exposure scenarios? Which DEW Line sites
would need to be adapted to support offshore and onshore exploration and development
that would come with increased project feasibility in the Chukchi Sea and NPR-A from
the new pipeline?
The identified exposure risks associated with constrained subsistence land uses
contribute to public awareness of the multiple stressors that the local communities face
from development and climate change. It is well known that energy development can
have harmful impacts on subsistence and that climate change may exacerbate the problem
by impacting species habitat and other subsistence-related ecosystem services. This study
contributes to better understanding of the effects that coastal exposure under climate
scenarios may have on access for subsistence boating and camping near important
hunting grounds. These coastal exposure impacts on subsistence should be considered in
development scenarios that would also impact subsistence and related consequences such
as community health effects.
3.4. Conclusions
This chapter analyzed local views of coastal exposure to climate risks in Alaska’s North
Slope. The analysis identified risks to industrial and subsistence land uses due to
constrained access from shoreline change. This section summarizes the identified risks,
and reiterates why they are significant for future scenarios research organized by the
North Slope Science Initiative (NSSI).

55
Study participants identified locations used for industrial land uses that are
exposed to coastal risks. For example, erosion of the landing strip at the Cape Simpson
Industrial Port (CSIP) will eventually make the site inaccessible to oil and gas companies.
The North Slope Borough maintains the CSIP to avoid additional impacts on subsistence
grounds from oil companies operating elsewhere. Shoaling at the entrance to the
Wainwright Inlet makes it difficult for boats to access the Wainwright DEW Line site,
which may be used as a support base for future offshore oil and gas development. The
native village corporation, Olgoonik, owns the land, so loss of industry access from
shoaling puts the benefits Olgoonik would receive from development at risk. Lastly,
historically high erosion in the Cape Halkett area is preventing the Arctic Slope Regional
Corporation (ASRC) from developing a parcel of land in the NPR-A that they selected
for oil and gas development.
The participants also identified numerous locations where shoreline change is
causing problems for subsistence boating during summer months. For example, changes
to the chain of barrier islands that stretch across much of the North Slope coast are
creating boating hazards. One example is shoaling along the Icy Reef barrier island,
which provides protection for boaters transiting between Kaktovik and Canada. Shoaling
between the barrier island and the mainland is forcing boaters to travel outside of the
barrier island where they are exposed to the open ocean no longer buffered by sea ice.
Participants also identified many locations used to camp for subsistence hunting that are
being lost to erosion. One example is Griffin Point, a multi-family camp on a barrier
island near Kaktovik. The site has been used by multiple generations but is now being
washed into the ocean.

56
The industrial and subsistence land use risks identified in this study are relevant
for scenarios research organized by the North Slope Science Initiative (NSSI). In the
NSSI scenarios research, land use impacts are evaluated under future energy development
and climate change scenarios (Streever et al. 2011). The industrial coastal exposure risks
identified in this study are relevant for the NSSI research because access and demand of
the at-risk industrial sites will depend on climate change and energy development
scenarios. The coastal exposure risks associated with subsistence land uses are relevant
for the NSSI scenarios research inasmuch as they capture multiple stressors faced by the
local communities that warrant consideration when analyzing scenario impacts and
outcomes.

57
4. Manager Usability Perspectives of the Coastal Exposure Web Map
As social-environmental transformations occur in the Arctic with rapid environmental
changes underway, there is a need to enhance Arctic climate science usability to support
decision-making (Streever et al. 2011; Knapp and Trainor 2013; NRC 2014; V r smarty
et al. 2015). Since the 1950s, Arctic air temperatures have been rising more than twice
the rate of the global average (ACIA 2004; IPCC 2013; USGCRP 2017; AMAP 2017a).
In Alaska, the average annual temperature has increased 1.7 °C from 1949 to 1998
(Stafford et al. 2000). The warming is causing permafrost to thaw and sea-ice to melt,
which has subsequent impacts such as increasing Arctic coastline susceptibility to coastal
erosion (GAO 2003; Overeem et al. 2011; Barnhart et al. 2014a,b; 2016). Summer-time
Arctic sea ice extent has declined by an average of 10% per decade since 1979 (Stroeve
et al. 2012; Mahoney et al. 2014), with pronounced declines occurring in the Chukchi and
Barents Seas, which are adjacent to the North Slope coast. For example, September sea
ice extent in the Chukchi Sea has decreased by 26% per decade (Meier et al. 2007).
Arctic coastal erosion rates are rising with climate change as sea ice decline combines
with relative sea-level rise and increasing Arctic storms (cf. ACIA 2004; Manson and
Solomon 2007; Overeem et al. 2011; Barnhart et al. 2014a,b, 2016). For example, along
the Beaufort Sea coast, Jones et al. (2009) estimated an increase in mean coastal erosion
rates from 8.7 m yr−1 for 1979 – 2002 to 13.6 m yr−1 for 2002 – 2007.
Despite the dramatic changes, actionable climate information is limited in the
region in comparison with less remote places in the United States due in part to the lack
of long-term data and analysis expertise (Knapp and Trainor 2013). The rapid Arctic
change combined with lack of actionable information is driving efforts to create usable
58
climate science for resource managers in the region.
Motivated by the call for usable climate science in the Arctic, this dissertation
mapped coastal exposure risks in collaboration with the North Slope Borough and its
residents. As stated in Chapter 1, the three objectives of the dissertation were to: 1)
identify coastal exposure risks from the local community perspective, 2) assess land use
manager usability perspectives of the web map, and 3) engage the North Slope in a
collaborative web map research process to link them to the Arctic observing network for
decision support. Chapter 3 addressed the first objective. This chapter addresses the
second objective by conducting a collaborative web mapping effort to assess coastal
exposure risk information usability while also promoting local manager engagement in
the research. The strategy to engage the local managers was to focus the research on their
perspectives of usability. In addition to addressing usability, the research process initiated
a researcher-manager network and identified opportunities for local manager uptake of
the web map. Because the managers can address coastal exposure risks using the web
map and drive coastal observations and additional collaborative research, their
engagement is critical to link the web map research process to the Arctic observing
network. With local engagement established, the web map product is the physical object
that links the coastal risk mapping process in Chapter 3 and the usability research process
in this chapter to the Arctic observing network. Chapter 5 addresses the third research
objective by identifying how the web map process and product link to the Arctic
observing network. This chapter is primarily concerned with local usability and
establishing local manager engagement in the web mapping process.

59
In the overall study design shown in Figure 2.1, the collaborative effort addressed
in this chapter is a formative evaluation of the web map based on North Slope manager
feedback. The formative evaluation, as defined in Chapter 2, is the third collaborative
research step in the web map process. The formative evaluation occurs after the
verification of coastal risks with local residents and creation of the asset exposure web
map in Collaborative Step 2
4.1. Method
The research question that drives this formative evaluation effort is: What is the land use
manager usability perspective of the web map?
The dimensions of usability investigated in this dissertation are perspectives of
saliency, legitimacy, and credibility. These three usability dimensions are based on the
Cash et al. (2003) science and technology usability framework. The usability framework
is widely used to evaluate and advance climate science usability (e.g. Girod et al. 2009;
White et al. 2010; Kirchhoff et al. 2013; Dilling et al. 2015). Adapted for this study,
saliency is defined as relevancy of exposure information for North Slope land use
manager needs, credibility refers to information trustworthiness, and legitimacy refers to
the degree two which the exposure information is consistent with and addresses the
diverse stakeholder views in the region.
4.1.1. Data Collection
The North Slope land use manager usability perspectives were collected in a web map
usability workshop in April 2016 with sixteen prospective users. 9
The coastal exposure
web map was developed collaboratively with the North Slope Borough Planning and
9 The workshop did not include an interface usability evaluation with the land use managers. Rather, the
evaluation focused on information usability based participant responses to a live demonstration of the web
map, which was completed in a ~one-hour presentation.

60
Community Services Department in Collaborative Research Step 2 shown in Figure 2.1.
The web map product was the focus of the workshop, which was a 3-hours event
organized into three main parts. The first part was a presentation of web map
development methods, including research process and exposure data development (the
presentation research instrument is in Appendix H). The development presentation was
followed by a live demonstration of the web map. The third part of the workshop was
focused on collecting usability perspectives after users were exposed to the web map
methods and product. The participants were briefed on the purpose of the workshop to
assess usability perspectives as part of the larger collaborative web map research process.
The participants were briefed on the Rutgers University Institutional Review Board (IRB)
human subjects protection protocol and signed consent forms. It was made clear that the
approximately 1-hour long usability discussion that followed would be audio-recorded
and transcribed for use in the study.
After signing consent forms, workshop participants responded verbally to three
questions that were based on the Cash et al. (2003) usable science framework. The
questions were stated before and after the live demonstration to enhance focus on the
usability dimensions of interest. The questions stated for discussion are as follows:
1. How are the maps relevant to your responsibilities as a manager?
– What specifically could you use them for?
– What modifications would be needed to make them more useful to you?
2. What is missing?
– Thinking about your responsibilities, what other erosion risks should be
mapped?
61
– Thinking about others not in the room, what erosion risks would they want to
see included?
3. Do you trust the data and maps?
– Would U.S. Geological Survey erosion data suffice for some applications?
– What other erosion and asset data should be incorporated into the Web-maps?
The audio recording from the workshop was transcribed and stored in an Excel
file. The metadata for the usability perspectives dataset are in Appendix D
This web map usability data collection protocol described above is consistent with
human-centered design in system usability research where user perspectives are included
in system development and design to enhance usability (cf. ISO 1999; ISO 2009).
Human-centered design is widely used in development of decision support systems
including in the climate change context (cf. NRC 2009; Moss et al. 2014).
4.1.2. Materials
This section describes the coastal exposure web map evaluated in this chapter. The
metadata for all data sets described are in Appendices A through D. The data sets
described include a shoreline change susceptibility spatial data model, a coastal asset data
model, and coastal exposure risk data models created by integrating the shoreline
susceptibility and asset data. The coastal exposure risk data models consist of shoreline
change susceptibility information detailed in Table 4.1 summarized at asset locations
identified using asset spatial data described in Tables 4.2 - 4.4. Specifically, the exposure
data provides shoreline susceptibility information in the asset spatial data attribute tables.
The exposure data were used to create the coastal exposure web map described below.
Detailed metadata for the exposure data are in Appendix C.

62
Shoreline Susceptibility Data
The shoreline change susceptibility data model is based on the U.S. Geological Survey's
Coastal Vulnerability Index (CVI) adapted to the Arctic context. The model is composed
of shoreline change rates, coastline type, and wind-fetch distance based on coastal
geometry and the September 2012 sea ice extent. The model consists of coastline type
data and wind-fetch distance estimations added to coastline transects created for the U.S.
Geological Survey’s National Assessment of Shoreline Change Project, Alaska (Gibbs
and Richmond 2015). Table 4.1 below describes the shoreline data. The metadata for the
shoreline change susceptibility model are in Appendix B. The methods used to create the
shoreline model are in Appendix I.
Table 4.1. Shoreline Change Susceptibility Data Description Data Name Description Source
Historic
Shoreline
Change Rates
Much of the Arctic Slope coastline is included in the U.S. Geological
Survey's (USGS) National Assessment of Shoreline Change Project.
Motivated by erosion concerns, the project aims to provide accurate
shoreline change information on a periodic basis using consistent
methods for the U.S. region.
USGS
Landform
Types
Incorporating best available data, the ShoreZone mapping system
includes landform type information for segments of the Arctic Slope
shoreline mapped for the National Oceanic and Atmospheric
Administration's Office of Response and Restoration Environmental
Sensitivity Index (ESI) Maps.
ShoreZone
Coastlines and
Sea Ice
The shoreline susceptibility spatial data model includes wind-fetch
data consisting of distances calculated between the sea ice extent edge
to the shoreline for all wind directions at every 10 degrees. Distances
were calculated for the September 2012 record low extent. The
National Oceanic and Atmospheric Administration (NOAA) National
Center for Environmental Information maintains a high-resolution
global database of shorelines and the National Snow and Ice Data
Center (NSIDC) maintains the sea ice data used in this study.
NOAA;
NSIDC
Asset Data
The asset data set used to represent at-risk coastal assets was based on semi-structured
interviews with local managers during preliminary fieldwork in 2013 and 2014 in
Wainwright, Utqiaġvik, Kaktovik, and Nuiqsut. The assets identified were aggregated

63
into three categories: subsistence, industrial, and municipal. Risk perspectives related to
municipal land use such as threats to water utilities emerged during interviews. However,
municipal assets were not included in this relatively coarse, regional-scale coastal
exposure risk assessment. Instead, city boundaries were used to represent municipal risk
in the coastal exposure web map. What follows are descriptions of the asset data used to
create the coastal exposure risk web map. The asset data used in this study are listed in
the metadata for the exposure model in Appendix C.
Subsistence assets were defined in the dissertation as any asset that supports
subsistence hunting or related cultural activity. Traditional assets represented in the
model include built features such as camps and places with cultural ecosystem values that
do not necessarily have built features, such as important hunting grounds. Table 4.2 lists
and briefly describes the traditional land use spatial data used in the web map.
Table 4.2. Subsistence Asset Data Description Data Name Description Data Source
Subsistence
Hunting
Camps
The North Slope Borough (NSB) maintains a spatial database of around
500 camp locations and descriptive attributes such as owner, place name
location, and recent photograph. The camps are generally located away
from village centers and are used for shelter during subsistence hunting.
Many camps are located near the coast and are threatened or were lost
from erosion.
NSB
Alaska Native
Allotments
The Bureau of Land Management (BLM) manages a spatial database of
Alaska native allotments transferred under the Alaska Native Allotment
Act of 1906. Many Alaska natives selected allotments near places
important to them such as near favorable hunting sites or places that
have cultural heritage value.
BLM
Cultural
Heritage Sites
The Alaska Department of Natural Resources (DNR), Office of History
and Archeology maintains the Alaska Heritage Resources Survey
(AHRS), a spatial data base with over 45,000 cultural resources in
Alaska from prehistoric to modern time. Permission to access this
database was provided for this study. Aside from the highly restricted
Traditional Land Use Inventory (TLUI) maintained by the North Slope
Borough, the AHRS is the best available cultural heritage spatial data.
Alaska DNR
Industrial land use assets were defined as physical assets that support industrial
activities. Industrial assets represented in the model are those that relate to threats voiced
by study participants. Oil and gas assets were not included in the web map because study

64
participants did not emphasize coastal exposure of the oil and gas industry. Table 4.3 lists
and describes the industrial asset data that were used in the web map.
Table 4.3. Industrial Asset Data Description Data Name Description Data Source
Native Village
Corporation
Parcels
The BLM manages a spatial database of Alaska native land selections
under the Alaska Native Claims Settlement Act of 1971(ANCSA).
These selections include Alaska native corporation lands.
BLM
DEW Line
Sites
Spatial data for the remaining assets at Distant Early Warning (DEW)
line sites such as airstrips and solid waste sites are maintained by
separate agencies. The Alaska Department of Transportation (DOT)
maintains a database for public airstrips and the Alaska Department of
Natural Resources (DNR) maintains a database for other airstrips such
as those accessed by industry and government. The Alaska Department
of Conservations (DOC) maintains a database for solid waste sites at
DEW Line and other locations on the North Slope.
Alaska DOT;
Alaska DNR;
Alaska DOC
Military
Parcels
The BLM manages a spatial database of lands withdrawn by the
Department of Defense. These parcels are usually located near a legacy
Distant Early Warning (DEW) Line site or active North Warning
System (NWS) site.
BLM
As explained above, city boundaries were used to represent municipal exposure in
this relatively course coastal exposure risk web map (Table 4.4).
Table 4.4. Municipal Asset Data Description
Data Name Description Data Source
Village
Boundaries
The Alaska Department of Natural Resources (DNR) maintains a
database of incorporated cities having certificates with the State of
Alaska Department of Community and Economic Development. Alaska DNR
Coastal Exposure Web Map
During April 2016 fieldwork, the coastal exposure data model described in Section 4.1.2
was installed onto the North Slope Borough's Web-based ArcGIS Portal. The model was
used to create an Esri Story Map Journal (Story Maps), which is a built-in feature of the
portal. Esri Story Maps is a widely used web application designed to easily create
interactive maps with rich narrative text. In addition to being visually appealing, Story
Maps is very accessible for developers and users. Built-in GIS capabilities allow easy
display of spatial data using common display options such as "heat maps," and a simple
way to share supporting information such as permit review application comments,

65
images, and supporting documents. Anyone with an Internet connection can view a
public story map or create a map without an Esri license. Story Maps developers range
from regular citizens to federal agencies that use the application for official programs.
Developers have the option to host the data and maps on the web or on a local network as
the North Slope Borough has done to get around current limited Internet access in the
remote location. Story Maps is a communication tool designed with flexibility to be
tailored to a general audience or specific group. If a data share protocol is in place, the
data storage method allows setting-up parallel systems between the Intranet version for
local managers and Internet versions for the public and/or specific stakeholder access.
Additionally, a mobile app supports easy integration of data collected in the field and
crowd sourcing capabilities.
In the screenshot of the North Slope Borough’s ArcGIS Portal shown in Figure
4.1, the coastal exposure risk web map module created for this study is shown third from
the right, called “Coastal Erosion.”

66
Figure 4.1. North Slope Borough ArcGIS Portal Figure 4.1 is a screenshot of the North Slope Borough’s web map portal hosted on a local Intranet (not
publically accessible on the Internet). The four featured web maps and apps are Esri ArcGIS web maps
created by the borough to support land use management. The third module from the left called “Coastal
Erosion” shows the coastal exposure web map developed for this study. When selected, the Coastal Erosion
module opens a set of web maps organized thematically by exposed asset types such as Distant Early
Warning Line exposure.
Story Map Organization and Capabilities
The coastal exposure web map is organized by asset type such as Distant Early Warning
(DEW) Line exposures. The first web maps in each set of coastal exposure maps
organized by asset type are regional overview maps, which provide regional-scale
exposure information and risk summaries for each asset type (Figure 4.2). The user can
zoom and pan the screen and query more detailed information on a specific site by
selecting an asset represented by a mapped feature (Figure 4.3) or a nearby transect
(Figure 4.4).

67
Figure 4.2. DEW Line Exposure Regional Overview Map Figure 4.2 is a screenshot of an overview map of Distant Early Warning (DEW) Line coastal exposure. The
interactive map is included in the North Slope Borough ArcGIS Coastal Erosion model described in Figure
4.1. In this map, the user can pan, zoom, and click on a DEW Line site of interest. When a DEW Line site
is selected, exposure information including erosion rates will appear in a “pop-pop” window. In the left
pane on this map, the size of the circles representing the DEW Line sites correspond to rates of erosion
with high erosion represented by a large circle. The right pane lists all DEW Line sites with erosion rates,
sorted from high erosion listed at the top to low erosion at the bottom.

68
Figure 4.3. Zoomed-in DEW Line Site Map Showing Information Query by Asset Figure 4.3 is a screenshot of a close-up of the Cape Simpson DEW Line site coastal exposure map. The
interactive map is included in the North Slope Borough ArcGIS Coastal Erosion model described in Figure
4.1. In the left pane of the map, the orange circle has been selected to show exposure information derived
from the nearest 50 meter coastal transect. The 50 meter transects are symbolized by erosion rates with red
being high erosion and green being accretion. The right pane on the map shows a picture of the Cape
Simpson DEW Line site taken by the U.S. Geological Survey. Below the picture is coastal exposure
information associated with the site derived from the nearest 50 meter transect.

69
Figure 4.4. Zoomed-in DEW Line Site Map Showing Information Query by Transect Figure 4.4 is a screenshot of a close-up of the Cape Simpson DEW Line site coastal exposure map. The
interactive map is included in the North Slope Borough ArcGIS Coastal Erosion model described in Figure
4.1. In the left pane of the map, a 50 meter transect has been selected to show exposure information near
the Cape Simpson DEW Line site. The 50 meter transects are symbolized by erosion rates with red being
high erosion and green being accretion. The right pane on the map shows a picture of the Cape Simpson
DEW Line site taken by the U.S. Geological Survey. Below the picture is coastal exposure information
associated with the site derived from the nearest 50 meter transect.
Closest transects were used to attribute shoreline information for point features
(Figure 4.3) and average intersecting transect values were used to summarize exposure
for polygons (Figure 4.5).

70
Figure 4.5. Zoomed-in Native Allotment Map Showing Information Query by Polygon Figure 4.5 is a screenshot of a close-up of an Alaska native allotment coastal exposure map. The interactive
map is included in the North Slope Borough ArcGIS Coastal Erosion model described in Figure 4.1. In the
left pane of the map, an allotment parcel has been selected to show exposure information derived from the
average values of the 50-meter coastal transects that intersect the parcel. The right pane on the map is a
placeholder for an illustration of exposure at the site and a summary of exposure information.
In the coastal exposure risk web map, the larger scale maps follow asset exposure
overview maps and focus on specific assets (e.g., Figure 4.6).

71
Figure 4.6. Barter Island DEW Line Exposure Large Scale Area of Interest Map Figure 4.6 is a screenshot of a large scale DEW Line coastal exposure map. The interactive map is included
in the North Slope Borough ArcGIS Coastal Erosion model described in Figure 4.1. In the left pane of the
map, the Barter Island DEW Line site is represented as an orange circle. In this large-scale map, the 50
meter transects are symbolized by erosion rates with red being high erosion and green being accretion. The
map shows coastal exposure patterns in the area surrounding the site. The right pane on the map shows a
picture of the Barter Island DEW Line site taken by the U.S. Geological Survey. Below the picture is
coastal exposure information associated with the site derived from the nearest 50 meter transect.
4.1.3. Analysis
The usability workshop transcript was organized using the three usability categories that
correspond to the workshop questions. As explained in Section 4.1.1, the workshop
questions were based on the Cash et al. (2003) usable science conceptual framework.
This section restates the workshop questions and describes the usable science categories
used to organize the transcript and write results.
How are the maps relevant to your responsibilities as a manager? This question
addressed salience, which was defined for this study as relevance of the assessment for
the needs of North Slope land use managers. The saliency discussion was prompted by
two questions:
What specifically could you use them for?

72
What modifications would be needed to make them more useful to you?
All statements that answered questions relating to web map relevancy for North Slope
management were coded as “salience.” The salience discussion dominated, and remerged
throughout the workshop. As is explained in Section 4.2, many workshop participant
statements referred to management context. The management context statements were
also coded as “salience.”
What is missing? This question addressed legitimacy perspectives, i.e.: that the
production of the information and technology has been respectful of stakeholders'
divergent values and beliefs, unbiased in its conduct, and fair in its treatment of views
and interests. As a formative evaluation effort, asking the land use managers this question
was an effort to increase legitimacy. The discussion on legitimacy was promoted by two
questions:
Thinking about your responsibilities, what other erosion risks should be mapped?
Thinking about others not in the room, what erosion risks would they want to see
included?
All statements that answered the questions relating to perspectives on what was
missing in the web maps were coded as “legitimacy.”
Do you trust the data and maps? This question addressed credibility: the scientific
adequacy of the technical evidence and arguments. The saliency discussion was prompted
by two questions:
Would U.S. Geological Survey erosion data suffice for some applications?
What other erosion and asset data should be incorporated into the Web-maps?
All statements that answered the questions relating to trust perspectives were
73
coded as “credibility.”
As was the case for the saliency, the group discussion on legitimacy and
credibility reemerged several times during the workshop. Also, while most participants
contributed to the discussion, some community leaders in attendance were most vocal.
There were other themes that emerged in the group discussion including at-risk
assets, environmental variables of interest, planned web portal updates, and
recommended updates to the exposure maps. A summary of potential Version 2 web map
updates based, in part, on fieldwork is provided in Appendix J.
4.2. Results
While there was some mention of specific shoreline information needs in response to the
web map demonstration, the usability discussion with managers went beyond needed
environment information and focused on where decision support is needed, why, and how
specific coastal exposure information could be used to support land use decisions in the
North Slope management context. In particular, there was in-depth discussion on how the
web map could be used to support decisions through the borough's land use permit
application review program.
Discussion on legitimacy focused on the need to include energy sector risks. In
this context, participants also voiced the need to include perspectives of the village of
Nuiqsut because their traditional land use extends across the state lands where coastal
energy projects are currently concentrated around the Prudhoe Bay oil fields (Figure 4.7).
The credibility discussion focused on fitness-for-use of the web map, where
participants commented on its potential as a screening tool to better account for coastal
exposure to climate risks. The web map was perceived as salient, but participants stated

74
that they need more information to assess reliability for uses beyond initial assessment.
However, participants stated that initial coastal exposure assessments using the web map
could provide the justification for more thorough assessments. In addition to perspectives
on overall reliability, credibility was questioned at specific locations where historical
erosion rates conflict with more recent stakeholder observations. Inaccuracies in
underlying asset spatial data and the challenge of maintaining the web map such as
applying regular updates also caused credibility concerns. The metadata for the web map
usability perspectives dataset is provided in Appendix D.
The following sections expand on the summary of usability perspectives provided
above.
4.2.1. Web Map Saliency Perspectives
Workshop participant responses to the saliency questions indicate that the web map could
be used to support land use decisions for developments near the coast. Specifically, the
web map could support the borough’s development permit application review process.
The borough currently lacks shoreline change information for the region, which forces
land use managers to rely on information provided by developers in permit applications
for relevant coastal development proposals. One land use manager was particularly vocal
on this topic; he made the following statements at various times during the workshop:
I could see this as an everyday tool for the many project reviewers that we have that
have to review some 600 permits annually. It can be a desktop tool also for our
inspectors or enforcement arm and monitoring.
(NSB Land Use Manager)
... I think it's a quick reference for us when we're talking about project development,
talking about expansion or abandoning infrastructure. This gives me a tool where I can
quickly go and look to see what your thoughts would be to gathering information
produced on that area... (NSB Land Use Manager)

75
I think this is going to be useful … for future development … like ports, and the other
thing that would be useful is to make recommendations on large project reviews for
oil and gas development, where they're often looking to develop right along the
shoreline. (NSB Land Use Manager)
A lot times we often are at the mercy of the industry to provide information. We do
have the policies in place that say we need to account for erosion. … But if we had it
at our fingertips we would be able to create the dialogue more in detail about what our
policies are intended to protect. (NSB Land Use Manager)
We rely on the applicant [developer]. Our policies say we should look out for it
[erosion], but we don't have the tools right now, and perhaps this might be the tool to
help us factor that in much better.
(NSB Land Use Manager)
Coastal exposure risk information is relevant for the North Slope Borough’s land
use permitting process. Participant statements on this topic echoed the North Slope
Borough Municipal Code stipulation that the burden of proof to account for erosion risk
is on the developer. This applies to projects that have to comply with requirements to
mitigate shoreline change impact. Participant statements indicate that providing the
borough with access to coastal exposure information would support borough efforts to
require developers to account for coastal exposure risks. According to the participants,
the enhanced engagement with developers about coastal exposure risks would advance
conversations about how to manage threatened assets. Again, one land use manager was
vocal on this point:
I think it does further the conversation of: Do we get a borough asset to disappear, or
is it at a critical point where maybe we put money into it to make it a continuing
viable asset for the borough? People often hear some of this kind of information ...
They need to express their concern to advance something and the gravity of what's
going on with some assets. (NSB Land Use Manager)
Our system is not geared to deny something but geared to review something. If there
is no unmitigable adverse impacts, and that the mitigation using the tool was
warranted and the applicant met up to it, and it can go forward maybe through the
Planning Commission's approval through our conditional use. But we do have some
limitations with what the administrator can do. (The administrator being the

76
Department of Planning and Community Services Director.) It may mean that a permit
either the administrator is comfortable to review it at her level and if the tool
suggested more drastic erosion rates or a development that would be critical, it might
mean that that permit got elevated to a Planning Commission level for review, and
conditionally approved. (NSB Land Use Manager)
Participants indicated relevancy of the tool for two Alaska native-controlled assets
where there is a current need for coastal exposure information to support coastal
development decisions. One is the Cape Simpson Industrial Port (CSIP), a borough asset
at a decommissioned Cape Simpson Distant Early Warning (DEW) Line site. As
explained in Chapter 3, the North Slope Borough uses the CSIP to mitigate development
impacts on subsistence in the National Petroleum Reserve -Alaska (NPR-A). The same
land use manager that mentioned the CSIP in the local risk verification in Chapter 3
mentioned the risk during the usability workshop. In the web map workshop, the land use
manager focused on information needs that the web map could support. For example, the
manager said:
There's a point on by Cape Simpson over there, and there's a North Slope Borough
asset over there that is being inundated by erosion, there's an entire runway. It's
millions of dollars worth of an asset and the need for the borough to do something
about this is going to come to a head sometime - either to reclaim it or to enhance it
because it's a great asset. It's leased out to be able to mitigate for subsistence impact
and try to centralize oil and gas exploration where it doesn't impact the community too
much. It's a good example if the interaction is working right, we can look at the
vectors [i.e, web map exposure information], and try to anticipate what's the
anticipated useful life of that runway. We know it's getting shorter every year. That's a
30-foot zone, and hitting about 30' of runway (lost) every year. How long is it going to
be a useful landing strip? (NSB Land Use Manager)
Another asset identified in the workshop as needing coastal exposure information
is the Arctic Slope Regional Corporation (ASRC) land parcel located by Cape Halkett
(see Figure 1.1). According to the participant, the high erosion rates for the Cape Halkett
area shown in the web map do not reflect recent rates. He said that the erosion rates in the

77
area have decreased and, in some locations, the shoreline is growing (accreting). For
example, the participant said:
ASRC, within your study area, has about 8.5 miles of shoreline ... So, you're dealing
with this giant area and of course we just have this 8.5 miles of coastline, but just so
happens that that's a big area of accretion and we're just, you know someone saying
'oh no this land has little value because it's all going to be gone' and we're saying 'no,
it's stabilized, in the past it's suffered erosion, but in the past 10 or 15 years it's been
growing.’ It would be helpful for me and us to have a study or something where it
says 'no look right here is different, because on those USGS maps, it all just kind of
looks red and bad. (ASRC Stakeholder)
4.2.2. Web Map Legitimacy Perspectives
Concerning legitimacy, participants commented that a major omission of tool is the oil
and gas facilities and perspectives from the residents of Nuiqsut. Though much of the oil
and gas data needed to include the sector in the tool is difficult to access due to security
concerns, land use manager participants have extensive knowledge about the at-risk
assets as many of them are involved with regulating the industry’s development. Some
of these participants acknowledged the problem of regulating the industry without access
to coastal exposure information. One participant mentioned that the borough land use
permit application reviewers evaluate proposed projects without having erosion
information. For example, the participant said:
Every single coastal oil field facility … from the mouth of the Colville River to the
Sag River. Every single one of those is being developed annually, and our permitters
are being asked to evaluate those applications. We're doing it without erosion
information. (NSB Land Use Manager)
About 60 miles west of Prudhoe Bay, Nuiqsut is located inside the NPR-A, just
west of state lands leased for oil and gas development. The village’s subsistence use area
extends across the coastal area where petroleum development is concentrated, making
their perspective relevant for collaboratively assessing risk at oil and gas lands and

78
facilities (Figure 4.7). One participant said that he has heard Nuiqsut residents complain
that the changing coastline is impacting subsistence boating:
Nuiqsut, even though they're inland a bit, the subsistence use along that coastline is
great, those people have a lot of input, maybe add those to your query list next time.
We've heard them complaining about boating traffic to Cross Island and the water's
getting so shallow it's becoming more and more difficult. [...] [W]e're seeing some
building going on at Cross Island. (NSB Land Use Manager)
The ASRC manager who contested the coastal exposure information in the web
map (see Section 4.2.1) said that residents of Nuiqsut could attest to a decrease in erosion
rates in the Cape Halkett area. The participant’s statement suggests that the residents of
Nuiqsut are valuable sources to verify local coastal exposure risks in the region. For
example, the participant said:
And also, just off the shore there, so the wells are back about a half mile, and off the
shore, hundreds of yards of barrier islands are forming so anyway, we're kind of
battling the opposite thing. It's not so much that it's a problem, there's actually a spit
over 2 miles long that wasn't there in say 2000, and there's all kind of drift wood.
Some locals from Nuiqsut have also seen what I'm talking about and mentioned it in
another meeting. (ASRC Stakeholder)

79
Figure 4.7. Nuiqsut Subsistence Area and Oil and Gas Leases The purpose of this map is to illustrate that oil and gas activity is concentrated near Nuiqsut and within its
subsistence area. The Nuiqsut subsistence area was estimated by Pedersen (1979).
4.2.3. Web Map Credibility Perspectives
Three themes emerged when participants were asked if they trust the tool based on what
they saw in the live web map demonstration. The first theme that emerged was fitness-
for-use, or that the tool could be used as a screening tool despite unknown reliability. As
a screening tool, the web map could provide an initial assessment of coastal exposure in
an area of interest. The web map would be one source of information to decide whether
or not to pursue more detailed exposure analyses. For example, one land use manager
said:
... [We could] take a look at that information and then make a decision whether it
requires further analysis or … if we feel comfortable with the information that you
have presented is complete enough to help us with the final decision. And I don't
anticipate that to be, I mean it's going to give us a good indicator on whether we need
to dig a little deeper or not. (NSB Land Use Manager)
One land use manager said that having access to a web map for coastal exposure
screening would promote consideration of adaptations in land use decisions. As stated
above, screening with the web map could support decisions for a more detailed exposure

80
assessment. In turn, a more detailed assessment would support existing borough policy on
erosion risk. The participant said that it would be hard for developers to “push back”
against a land use decision to prevent developing in harms way if definitive exposure
information were available. The reason is, with definitive exposure information, the
borough could enforce existing policy and promote adaptation. For example, the land use
manager said:
Well once you start to get definitive information on the rate of erosion, I don't think
they can push back when your policies say you must take into account … putting
projects in harm's way unless you're going to intentionally fortify the area. That might
be a tool to help and say 'hey this should be fortified to a 200 year event factor,' or
something like that. (NSB Land Use Manager)
Another dimension of credibility that emerged in the usability workshop was the
loss of web map credibility when information in the tool is inconsistent with stakeholder
observations. As was mentioned in Section 4.2.1, the Arctic Slope Regional Corporation
(ASRC) recently proposed to develop a parcel of land they own in the Cape Halkett area.
As a condition for obtaining surface and subsurface rights, the ASRC is required to use
the parcel for commercial development. However, the ASRC’s attempts to develop the
parcel were denied due to the well-known and documented historical high erosion rates in
the area. Similar to what the same ASRC stakeholder said in Section 4.2.1, the USGS
data used in the coastal exposure web map are inconsistent with ASRC observations of
coastline changes in the Cape Halkett area. For example, the participant said:
We're looking to do something with that property and the federal agencies were saying
'oh no that's all eroding away that's all eroding away, look at this USGS report' and
we're saying 'no, that's wrong, yes there's erosion, there's a lot of erosion in different
areas but this area is growing rapidly, wetlands are being protected by these offshore
barrier islands and the giant spit that was formed.’ (ASRC Stakeholder)

81
Unknown accuracy of the asset data was another web map credibility concern that
emerged in the workshop discussion. Specifically, the ASRC participant noted that
several gas test well locations were inaccurate.
… [W]ith the red dot on map number 5, that well is about a half mile from the coast,
so I'm confused by that in particular, if that dot is referring to the WT4 test wells,
because it's showing something that I don't believe is particularly accurate.
(ASRC Stakeholder)
The asset inaccuracies result from lack of data maintenance. The credibility
concern related to web map maintenance emerged several times during the workshop. For
example, one participant said:
And I don't know what you're looking at in terms of if this is going to be updated and
what the frequency of updates is going to be, so we're not using something that's
severely outdated at times.
(NSB Land Use Manager)
4.3. Discussion
The participant responses guide next steps for collaborative research on coastal exposure
risks in the North Slope. The responses provide adequate specificity to offer new avenues
for stakeholder-driven collaborative research of coastal exposures in the region including
linking the web map with the borough’s permit application review process.
Perhaps the most significant finding with respect to web map relevancy is that the
participants saw the potential of the web map for supporting development decisions
through the borough's permit application review process for proposed developments in
the region. Integration of the web map with the permit program could be a pathway for
mainstreaming coastal exposure risk information with decisions and plans on the North
Slope. The unique North Slope management context makes this potentially very
significant for science-based land use decision support in the region for several reasons.

82
First, as with the rest of Alaska, as of 2011 the North Slope Borough does not participate
in the federal Coastal Zone Management (CZM) program. Withdrawal from the CZM
provides local autonomy for decision-making and high capacity to pursue local
management objectives. Second, the North Slope Borough is an Alaska native-controlled
territorial government with Home Rule Charter, which allows legal governmental power
over the vast region that has immense value ranging from heritage of local and national
significance to vital national defense and energy security infrastructure. Through North
Slope Borough Municipal Code (NSBMC) Title 19, the NSB created the Department of
Planning and Community Services Department (Planning Department). The Planning
Department's responsibilities include administering the borough’s planning and zoning
ordinances and the Coastal Zone Management Plan within the approximately 51,800-
sqkm coastal management zone (cf. Mitchell 1987) adjacent to the Arctic Slope's vast
3,000-km (2,000-mile) shoreline (cf. Walker 2001). The Planning Department is also
required to gather information and develop the borough's Capital Improvement Program
(CIP), which improves municipal services through infrastructure development using
borough tax revenues that primarily come from energy development on state lands. Last,
the NSBMC mandates that the Planning Department use the permitting system and
provide a geographical data base covering the entire borough along with mapping
services to support its program (NSBMC Title 19). The mapping service supports the
complicated decision process of protecting subsistence and heritage within a region
heavily developed for oil and gas production. This municipal code gives the North Slope
a uniquely high capacity to use maps to support decisions and plans through a locally-
controlled formal land use planning process for the region.

83
The web map workshop also identified coastal exposure information needs to
manage specific assets, which present opportunities for additional collaborative research.
As mentioned in Section 4.2.1, participants voiced two Alaska native-controlled
industrial assets where they need coastal exposure information to support their land use
decisions, i.e.: the eroding Cape Simpson Industrial Port (CSIP) controlled by the
borough and a land parcel in the NPR-A controlled by the Arctic Slope Regional
Corporation (ASRC). As one participant noted, the borough needs additional exposure
information to decide planning actions for the CSIP. Another participant said that the
ASRC wants to develop their parcel in the NPR-A by Cape Halkett, but they cannot get
approved because of the high erosion rates in the area. The identification of specific
coastal exposure risks where decision support is needed is significant because it could
drive future collaborative research and manager engagement in the web map research.
An important finding with respect to legitimacy is that the coverage of the coastal
exposure web map should expand into the state lands where oil and gas development is
currently concentrated. When asked whose perspectives of coastal exposure risks were
missing in the web map, the participants identified the residents of Nuiqsut. Nuiqsut’s
subsistence land use extends across the oil and gas developments on state lands (Figure
4.7). The identification of the need to include Nuiqsut in the mapping process suggests
that North Slope managers do not want to be left in the dark about coastal risks where oil
development is concentrated. Also, the borough’s mapping system plays an important
role in supporting land use decision where oil and gas development is concentrated.
Because of the relevance and import role of the mapping system there, including
Nuiqsut’s perspectives near the petroleum developments would likely encourage North

84
Slope manager engagement in the coastal exposure web mapping process.
4.4. Conclusions
This chapter provided the results of land use manager usability perspectives of the coastal
exposure web map collected in the usability workshop. An important finding with respect
to saliency perspectives is that participants indicated that the web map could support the
borough’s land use permit application review program. The borough has policies in place
to account for coastal exposure risk in development decisions, but it currently does not
have access to coastal exposure information. Workshop participants also identified two
Alaska native industrial land use sites where they need coastal exposure information to
support development decisions. With respect to web map legitimacy, workshop
participants indicated that the residents of Nuiqsut should be included in Collaborative
Research Step 1 to get their perspectives of coastal exposure risks (see Figure 2.1).
Nuiqsut’s subsistence land use area extends across the area of the coastline where oil and
gas development is concentrated, and where there are known coastal exposure risks such
as barrier islands used for whaling. With respect to web map credibility, in addition to
voicing reliability concerns such as unknown data quality, the participants discussed web
map fitness-for-use as a screening tool for initial coastal exposure risk assessments.
In summary, the land use manager perspectives suggest that the web map is
relevant for the borough’s land use decision-making process, credible enough to be used
as a screening tool, and a next step to enhance legitimacy is to include Nuiqsut’s
perspective of coastal exposure risks. Collectively, these findings inform future research
to continue the research process illustrated in Figure 2.1 and encourage local North Slope
manager engagement in the web mapping process.

85
5. Linking the Coastal Exposure Web Map to the Arctic Observing Network
A major challenge for the Arctic observing network (AON) is effectively engaging local
communities in AON activities to address their information needs (cf. Lee et al. 2015a;
Eicken et al. 2016a; Johnson et al. 2013, 2015). While local communities are among the
stakeholders that AON programs aim to support (Eicken et al. 2016a), no systematic
framework exists for local community engagement (cf. Lee et al. 2015a; IARPC 2015,
cited in Eicken et al. 2016a). Therefore, there is a need for innovative collaborative
research approaches to integrate local communities into the AON. In pursuit of this
methodological need, this chapter addresses the third research objective of the
dissertation to link local North Slope communities to the AON via the coastal exposure
web map developed for this study (see Chapter 4).
Chapter 4 addressed the second objective of the dissertation to assess land use
manager usability perspectives of the web map. As noted in Chapter 4, in addition to
assessing usability, performing the second objective also establishes local manager
engagement in the web map research, which is critical to link the North Slope to the
AON. This chapter explores answers to the question: How does the web map link to the
Arctic observing network? Answering this question is important because web map links
to the observing network would also link the North Slope Borough as the web map
owner. Answering this question therefore addresses the challenge of engaging local
communities in the AON.
5.1. Method
Web map links to the AON were identified by comparing the description of the coastal
exposure web map research process in Section 2.5 and an analysis of the web map

86
product in Section 5.2.2 with the structure of the AON defined in Section 5.1.1. Section
5.1.1 below further explains the analysis methods used to identify web map links to the
AON.
5.1.1. Analysis
This chapter presents results for three analysis steps used to identify web map links to the
AON. The first step in Section 5.2.1 analyzes web map research process links to AON
design approaches defined by the Arctic Observing Network Design and Implementation
Task Force (ADI 2012). The second step in Section 5.2.2 identifies the web map spatial
data steward network (Table 5.1 and Figure 5.1) and identifies how the data steward
network links to federal Arctic observing activities defined by the Study of
Environmental Arctic Change (SEARCH) summarized by Jeffries et al. (2007). The
network analysis was inspired by the approach of Pulsifer et al. (2014b) to identify an
emerging Arctic data management network. Finally, the third step in Section 5.2.3
analyzes web map process and product links to AON societal benefit areas defined by the
Science and Technology Policy Institute (STPI) and the Sustaining Arctic Observing
Networks (SAON) program (IDA 2017).
Below are brief descriptions of the three reports used to define the AON structure
for the purpose of exploration how the web map links to the AON.
Designing, Optimizing, and Implementing an Arctic Observing Network (ADI
2012) was the source used to identify web map process links to AON design
approaches. The Arctic Observing Network Design and Implementation Task Force
(ADI) was established in 2009 to guide the National Science Foundation (NSF), the
scientific community, and other agencies engaged in the AON on how to design

87
effective U.S. Arctic observing efforts. The ADI (2012) report focuses on the
continued development of the AON by assessing its current state, synthesizing
lessons learned, and identifying approaches for system design.
Arctic Observing Network: Toward a US Contribution to Pan-Arctic Observing
(Jeffries et al. 2007) was the source used to identify web map product links to federal
Arctic observing activities. This report by the Interagency Arctic Research and Policy
Committee (IARPC) summarizes ongoing and future federal Arctic observing
activities. The IARPC consists of 16 federal agencies established by the Arctic
Research and Policy Act of 1984 (ARPA) to enhance research and monitoring of
environmental issues in the Arctic.
International Arctic Observations Assessment Framework (IDA 2017) was the
source used to identify web map links to AON societal benefit areas (SBA). This is a
report from the IDA Science and Technology Policy Institute (STPI) and the
Sustaining Arctic Observing Networks (SAON). The STPI provides analysis support
to the White House Office of Science and Technology Policy (OSTP), the National
Science Foundation, the National Science Board, and other offices within the
executive branch of the U.S. government. The SAON was initiated by the Arctic
Council to support multinational engagement to coordinate pan-Arctic observing and
data sharing systems. The IDA (2017) report is the product of a workshop co-hosted
by the STPI and the SAON to develop an international framework for assessing
societal benefits from the AON.

88
5.2. Results
This chapter is focused on identifying how the web map process and product link to the
Arctic observing network (AON). Section 5.2.1 identifies how the web map process links
to AON design approaches. Section 5.2.2 identifies how the web map data steward
network links to federal Arctic observing activities. Finally, Section 5.2.3 identifies how
the web map process and product link to AON societal benefit areas.
5.2.1. Web Map Process Links to Arctic Observing Network Design Approaches
This section summarizes the web map research process and identifies how it links to
AON design approaches defined by the Arctic Observing Network Design and
Implementation (ADI) Task Force (ADI 2012).
As explained in Section 2.5, the web mapping process used in this dissertation is
based on an instructional system design with two evaluation phases to verify local risks
(Figure 2.1: Collaborative Step 1) and assess land use manager usability perspectives of
the coastal exposure web map (Collaborative Step 3). Collaborative Steps 1 and 3 are
focused on getting local community feedback to drive web map development. Chapter 3
provided the results of the local risk verification and Chapter 4 provided results for the
web map usability assessment. Step 1 drives the asset data used to create the exposure
web map, and Step 3 drives the design of the exposure information in the web map.
According to the AON design approaches defined by the ADI Task Force (ADI
2012), the ecosystem services component best links the coastal exposure web map
process to the AON. The Task Force defined a hierarchy of 6 approaches to design and
optimize the AON. The ecosystem services approach is one of three qualitative
approaches. The other two approaches identify observation gaps learned from previous

89
observing projects. The ecosystem services approach to AON design is to “… identify
observation parameters based on ecosystem services that are important to stakeholders at
local and regional scales” (ADI 2012: 2).
The ecosystem services approach addresses a core element of the AON structure.
Referencing the Study of Environmental Arctic Changes (SEARCH) Understanding
Change Panel (Elliot et al. 2010), the Task Force defined the current state of the AON in
terms of science questions that currently drive the network. However, the Task Force also
identified the “dual role” of the AON to address both science priorities and stakeholder
information needs. The Task Force cited the core SEARCH theme Responding to Change
as the charge of the AON dual role. With regard to the ecosystem services approach to
designing the AON and the stakeholder information support role, the Task Force found
the following:
Ecosystem services are the benefits that society derives from ecosystems. They are a
potentially useful construct for observing system design because they link the
biophysical environment to the needs of society. Thus, they can help in prioritizing
variables to measure, provide a context for communication with stakeholders, and help
integrate community-based observations. The latter in turn can inform the placement
of sensors and other aspects of system design (ADI 2012: 19).
All of the environmental information in the web map (Table 4.1) can be defined
in terms of ecosystem services that affect the North Slope and can be put in terms of
physical components to monitor quantitatively using AON resources. For example, one
of the many ecosystem services provided by sea ice extent in the Arctic is the protection
is provides to the coastline from forces that erode the coast and put people and valued
assets at risk. The sea ice can be monitored quantitatively to inform stakeholders that rely
on its ecosystem services.

90
5.2.2. Web Map Product Links to Federal Arctic Observing Activities
This section identifies the web map data steward network based on the organizations that
archive and maintain spatial data (i.e. data stewards) used to create the web map (see
Table 5.1). The description of the web map data steward network is then used to identify
how the web map product links to federal Arctic observing activities.
Stewards of the data used to create the shoreline change susceptibility model
(Table 4.1) are: the U.S. Geological Survey (USGS), the National Oceanic and
Atmospheric Administration (NOAA), the National Snow and Ice Data Center (NSIDC),
and ShoreZone. The Polar Geospatial Center (PGC) was included as a proposed
contributor of elevation data. Stewards of the data used in the asset data model (Tables
4.2 - 4.4) are: The North Slope Borough (NSB), the Bureau of Land Management (BLM),
the Alaska Department of Natural Resources (DNR), Department of Transportation and
Public Facilities (DOTPF), and the Department of Conservation (DOC). The Exchange
for Local Observations and Knowledge of the Arctic (ELOKA) was included as a
proposed steward of the local community views of coastal exposure risks identified in
Chapter 3. The NSF Arctic Data Center is the steward of data products used in the NSB
Web Portal to provide access to researchers.
Table 5.1. North Slope Borough Coastal Exposure Web Map Data Steward Network
Scale Data Steward Website
Local NSB (North Slope Borough) http://www.north-slope.org/
State/
Regional
DNR (Alaska Department of Natural
Resources). http://www.asgdc.state.ak.us/
DOTPF (Alaska Department of Transportation
and Public Facilities). http://www.dot.state.ak.us/
DOC (Alaska Department of Conservation). http://dec.alaska.gov/
ShoreZone. http://www.shorezone.org/
*ELOKA (Exchange for Local Observations
and Knowledge of the Arctic). https://eloka-arctic.org/
*PGC (Polar Geospatial Center). http://pgc.umn.edu/
National BLM (Bureau of Land Management). https://www.blm.gov/ak/st/en.html
NSF (National Science Foundation) Arctic https://arcticdata.io/

91
Data Center.
USGS (U.S. Geological Survey) National
Assessment of Shoreline Change Project.
https://coastal.er.usgs.gov/shoreline-
change/
NOAA (National Oceanic and Atmospheric
Administration) National Center for
Environmental Information.
https://www.ncei.noaa.gov/
NSIDC (National Snow and Ice Data Center). https://nsidc.org/
* Asterisks denote proposed linkages in web map version 2 described in Appendix J.
Figure 5.1. North Slope Borough Coastal Exposure Web Map Data Steward Network Figure 5.1 illustrates the network of organizations that provide the data used to create the coastal exposure
web map. Solid black lines indicate already established organizational links to the NSB Portal. Dotted
black lines indicate proposed networks where data were manually entered into the NSB Web Portal to
create the web map (Chapter 4). Dotted red lines indicate a proposed link in version 2 of the web map.
The links illustrated by dotted lines in Figure 5.1 are proposed based on the
coastal exposure web map created in this dissertation research. Dotted black lines
indicate an organization that was the source of spatial data used to create the web map.
Red dotted lines indicate data stewards that would provide data in version 2 of the web
map. The solid line indicates that the NSB data steward link to the web map is already

92
established. The NSB is currently the only organization with an established link to the
coastal exposure web map.
According to the Arctic observing activities defined by the IARPC (Jeffries et al.
2007), the categories: Ocean and Sea Ice, Terrestrial Ecosystems, Human Dimensions,
and Data and Information Management best link the web map product to AON observing
activities. The IARPC organized observing activities into seven categories defined by the
SEARCH Environmental Arctic Change Implementation Plan (SEARCH 2005). This
section follows the IARPC format by identifying and describing the observing activities
relevant for the web map based on the data steward network defined above.
Ocean and Sea Ice
The National Snow and Ice Data Center (NSIDC) archives a time series of sea ice
extent using National Aeronautical and Space Administration (NASA) passive
microwave satellites that begins in 1978. The sea ice data were used in the web
map to provide wind-fetch distances from the sea ice to places along the North
Slope shore. Also, days of open water calculated from the NSIDC sea ice data
will be added to version 2 of the web map (see Appendix J).
Terrestrial Ecosystems
Much of the Arctic Slope coastline is included in the U.S. Geological Survey's
(USGS) National Assessment of Shoreline Change Project (Gibbs and Richmond
2015). Motivated by coastal exposure risk concerns, the Shoreline Change Project
aims to provide accurate shoreline change information on a periodic basis using
consistent methods for the United States region.

93
The National Oceanic and Atmospheric Administration (NOAA) National Center
for Environmental Information (NCEI) maintains a high spatial resolution global
database of shorelines. The NCEI shorelines database was used to calculate wind-
fetch distances in the shoreline change susceptibility data model (see Appendix I).
The ShoreZone mapping system provides landform type information for segments
of the North Slope shoreline created for the National Oceanic and Atmospheric
Administration (NOAA) Office of Response and Restoration Environmental
Sensitivity Index (ESI) maps. The ESI was used to represent coastal resistance to
shoreline change in the web map.
The Polar Geospatial Center (PGC) provides high spatial resolution elevation data
for the pan-Arctic region. While the dataset is currently beta, its strength is its
ability for efficient repeat coverage. Elevation information would be added to
version 2 of the web map (see Appendix J).
Human Dimensions
The Exchange for Local Observations and Knowledge of the Arctic (ELOKA) is
an ongoing effort to archive and provide access to community observations and
knowledge data collected in the Arctic. The ELOKA archives local observations
and provides restricted access to sensitive community-based observation data sets.
In the web map network shown in Figure 5.1, ELOKA is proposed as the data
steward to manage participant observations for the coastal exposure web map
developed in this study.

94
Data and Information Management
The organizations in the web map data steward network shown in Figure 5.1
manage data and information in their own archives or support for other
organizations. For example, the NSIDC manages storage and access to NASA
remote sensing data sets such as the sea ice extent time series mentioned above.
ShoreZone stores the Environmental Sensitivity Index (ESI) created by the
NOAA. In addition to storing data, the stewards add value by creating data and
information products from data provided by other organizations. For example, the
commercial satellite company DigitalGlobe is the source of imagery used by the
Polar Geospatial Center (PGC) to create, store, and provide access to elevation
data products.
5.2.3. Web Map Links to Arctic Observing Network Societal Benefit Areas
This section identifies how the web map research process and product link to AON
societal benefit areas (SBAs) defined by IDA (2017).
According to the SBAs defined in the IDA (2017) report, the Resilient
Communities SBA best links the coastal exposure web map process and product to AON
SBAs. In a 2017 workshop co-hosted by the IDA and the SAON to evaluate the AON,
the participants defined 12 high level SBAs using a hierarchical value tree framework.
Resilient Communities, or “ … sustaining and preserving the vitality and security of
Arctic communities in a changing region” (IDA 2017: 39) is composed of three sub-
areas: Adaptation and Response of Communities, Baseline Conditions of Communities,
and Future Projections of Community Change.
The coastal exposure web map directly addresses the first two. The web map

95
supports Adaptation and Responses by the North Slope Borough by addressing sub-
components including developing capacity to adapt, improving community education on
Arctic changes and impacts, and mitigating the impacts on Arctic system changes by
providing land use decision support. The web map also supports identifying Baseline
Conditions by addressing the SBA’s subcomponent of assessing community
understanding of the threats and impacts of Arctic changes.
5.3. Discussion
The results in Section 5.2 identify ways that the North Slope Borough coastal exposure
web map research process and product link to the Arctic observing network (AON). In
this discussion, Section 5.3.1 proposes the application of the instructional systems design
web mapping research process (ISD Process) used in this study to implement the
scientist-stakeholder interaction conceptual model developed by Eicken et al. (2016a).
Section 5.3.2 proposes a North Slope coastal exposure community of practice (CoP) as a
way to influence and use Arctic observing activities. Finally, Section 5.3.3 discusses the
role of responsible data management of local community observations in collaborative
research using the AON.
5.3.1. Dual Use Arctic Observing Networks
The Arctic observing network (AONs) is intended to address both science priorities and
stakeholder information needs (Lee et al. 2015a; Eicken et al 2016a). As stated in the
introduction to this chapter, it is a challenge to engage local communities in the AON.
The instructional systems design process (ISD Process) implemented in this dissertation
offers a practical way to engage the North Slope in AON activities. In this section, the
ISD Process is presented as a method to apply the scientist-stakeholder interaction

96
conceptual model for advancing “dual use” observing systems put forward by Eicken et
al. (2016a).
Eicken et al. (2016a) proposed a conceptual framework for stakeholder-scientist
interaction called “data co-management.” The framework is based on a two-way
conversation between scientists and stakeholders to produce data and information that is
relevant for both science and stakeholder information needs (Figure 5.2a). The data co-
management framework combines co-management approaches (Berkes 2009) with
observation and data management frameworks established to support existing Arctic
observing networks. Co-management brings managers and users across scales together in
an iterative mutual learning process to better understand and manage natural resources.
The observation and data management framework is based on data management best
practices such as coproduction of data.
The notion of Arctic system services in the data co-management framework is a
key concept in the model; it translates between Arctic system variables observed for
science and Arctic system services of value to stakeholders. Arctic system services, as
described by Eicken et al. (2009), are essentially Millennium Ecosystem Assessment
ecosystem services (cf. MA 2005) specific to the Arctic. For example, coastal protection
is an Artic system service that sea ice provides (cf. Eicken et al. 2009). The role of Arctic
system services in the data co-management framework is to help identify components of
Arctic systems that are monitored and studied for science that are also relevant for
stakeholders.
In the data co-management framework, scientists and stakeholders engage in a
two-way conversation focused on identifying Arctic system variables that are of mutual

97
interest to monitor. The co-management framework establishes the two-way
conversation, which, in theory, drives scientific observations, synthesis, and information
products (Figure 5.2a). In the co-management model, the two-way conversation focuses
on collaboratively defining the Arctic system problem to research or system variable to
monitor. By communicating using the concept of Arctic system services, scientists can
identify information products to deliver to stakeholders, and stakeholders, in turn, can
provide feedback to improve information product usability (Figure 5.2a).
Figure 5.2a. Co-production and Co-
Management Cycle From Eicken et al. (2016a). Solid lines
indicate data and information product
direction, and dashed lines indicate feedback
direction.
Figure 5.2b. Adapted Co-production and Co-
Management Cycle Adapted from Eicken et al. (2016a). Solid lines
indicate data and information product direction,
and dashed lines indicate feedback direction. In
this adapted model, problem definition is
included in the ISD process in front-end
information product evaluation efforts, and
observed stakeholder outcomes is added to
desired outcomes component. Note that Arctic
system science data, modeling, and information
product activities and stakeholder feedback are
mediated by the ISD process.
However, while the data co-management framework offers a helpful theoretical
framework, it does not specify how scientist-stakeholder interactions will occur in
practice. This problem is apparent when we imagine that the stakeholders are local
resource users. Many local resource users in the Arctic, such as subsistence hunters, do
not have access to a network to voice observed or desired Arctic system service

98
outcomes. Co-management institutions would enhance such access, but, for the data co-
management model to work, the institutions would have to be linked with scientists such
as through an observing network. Lastly, even if local resource users had full access to
voice Arctic system information needs to scientists willing to provide it, generating
relevant information is not enough for stakeholder information to be usable for decision-
support. Scientist-stakeholder engagement needs to be designed to advance and balance
dimensions of scientific information usability including saliency, legitimacy, and
credibility (cf. Cash et al. 2003). A model that includes a proactive engagement with
stakeholders focused on information usability is needed to establish effective
communication between scientists and stakeholders to negotiate Arctic observing
priorities and generate usable information products.
The instructional design in this dissertation described in Section 2.5 provides a
mechanism to engage the North Slope in a two-way conversation with scientists in
practice. In Figure 5.2b, the instructional design (i.e. ISD Process) offers a social process
through which stakeholders may communicate with scientists to negotiate observing
priorities and advance coastal exposure risk information usability. For example, in
Chapter 3 of this dissertation, local residents identified coastal exposure risks in ISD
Process Collaborative Step 1 to verify local risks to include in the coastal exposure web
map. The local risk verification identified coastal exposure risks associated with Alaska
Native industrial and subsistence land uses that warrant a re-articulation of the erosion
problem for North Slope research coordinators such as the North Slope Science Initiative
(NSSI) (cf. Section 3.3). In ISD Process Collaborative Step 3 in Chapter 4, land use
managers provided usability perspectives on the coastal exposure web map. The usability

99
workshop identified relevancy of the web map to support North Slope Borough land use
decisions through the borough’s land use permit application review process. The
workshop also identified specific locations where coastal exposure information is needed
to support land use decisions. In addition, the usability workshop goes beyond mere
relevancy and provides a forum to advance credibility and legitimacy dimensions of
usability through a sustained collaborative research process. For example, the usability
workshop identified that legitimacy of the web map would be enhanced by including the
residents of Nuiqsut in the web mapping process.
5.3.2. Toward a North Slope Coastal Exposure Observing Network
The instructional systems design web map research process (ISD Process) described in
Section 2.5 provides a practical method for scientists and stakeholders to interact to
identify coastal exposure information needs and promote web map usability. However,
the method does not ensure that identified exposure information needs will be prioritized
in the Arctic observing network (AON) over other observing needs. Another social
process is needed for North Slope information needs voiced through the ISD Process to
influence and use AON activities. In this section, a North Slope coastal exposure
community of practice (CoP) is proposed as a method to influence and use AON
activities.
The observing activity prioritization framework described in Lee et al. (2015a)
offers guidance on how to influence Arctic observing activities to address North Slope
coastal exposure information needs identified in the ISD Process. The Lee et al. (2015a)
framework inserts the concept of Arctic system services mentioned in Section 5.3.1 (cf.
Eicken et al. 2009, 2016a) into the primary phase of AON coordination. The primary

100
phase described below drives the AON activities mentioned in Section 5.2.2. The
framework described in Lee et al. (2015a) is based on a hierarchy approach (ADI
Hierarchy) proposed by the Arctic Design and Implementation Task Force (ADI 2012)
mentioned in Sections 5.1.1 and 5.2.1. In the ADI Hierarchy, an Arctic change research
problem identified at the top of the hierarchy by AON coordinators such as the Study of
Environmental Arctic Change (SEARCH) in the U.S. drives observing activities. For
example, the SEARCH 5-Year Science Goals developed by the SEARCH Science
Steering Committee (SSC) with input from the broader science community and agency
representatives identified four focus areas that drive the coordination and prioritization of
public and private observing assets. The 5-Year Plan focused on understanding and
predicting the Arctic environment and analyzing the societal implications. As mentioned
in Section 5.3.1, the Arctic system services framework (cf. Eicken et al. 2009, 2016a) is
focused on identifying stakeholder-desired outcomes to drive AON observing activities
(cf. Figure 5.2a). The Lee et al. (2015a) framework works to address stakeholder
information needs by inserting the Arctic systems services concept with its focus on
outcomes desired by stakeholders into the SEARCH problem definition at the top of the
ADI Hierarchy that drives Arctic observing activities. Therefore, one way to influence
Arctic observing activities is to insert North Slope Borough coastal exposure information
needs identified in the ISD Process into the Arctic problem definition by SEARCH at the
top of the ADI Hierarchy.
However, in addition to influencing the top of the ADI Hierarchy, the Lee et al.
(2015a) framework offers another pathway for stakeholders to influence and use AON
activities. The other pathway is through exploiting flexibility in observing activities lower
101
in the hierarchy. A key goal of the ADI Hierarchy process is to build connections
between emerging and desperate networks to optimize observing (Lee et al. 2015a). A
multi-network framework described by Lee et al. (2015a) could help to balance observing
resources and integrate long-term observing that requires robust monitoring with more
flexible networks the emerge in short-term projects that can respond rapidly to
stakeholder information needs. In the ADI Hierarchy, these linkages would occur
between Problem Definition at the top and Network Implementation (i.e., observations) at
the bottom. At the Strategy Level in the hierarchy, just below the Problem Definition,
specific observation goals and information products are planned. At the Strategy Level,
the Arctic Council’s SAON, the Interagency Arctic Policy Committee (IARPC), and
SEARCH Science Steering Committee (SSC) are among the key members that determine
the strategy including funding and support strategies. The strategy is implemented at the
Tactical Level where observing protocol and data management standards are developed
and implemented. At the Tactical Level is where network integration occurs across
disciplines and projects such as sharing resources. In the ADI Hierarchy described in Lee
et al. (2015a), network integration occurs through “nodes,” or communities of practice
(CoP) that emerge from mutual interest in observing Arctic system variables such as sea
ice extent. Lee et al. (2015a) notes that SEARCH Action Teams and IARPC
Collaboration Teams may lead to nodes that result in observing network integration at the
Tactical Level.
The web map research process (ISD Process) created for this dissertation creates a
social process for a CoP, or “node” in the ADI Hierarchy framework, to form at the local
community scale. A CoP consists of three main characteristics: shared domain of interest,

102
information share and learning through interaction of a community defined by the shared
interest, and shared practice (Wegner 2011). The iterativity built into the ISD Process
(see Section 2.5) provides a mechanism at the local community scale to create a coastal
exposure CoP that includes the data steward network identified in Section 5.2.2. The ISD
Process is based on learning through interaction, and web map updates through regular
interaction would tailor information products to address manager information needs. The
regular interaction to develop the web map provides the “boundary object” that holds the
CoP together. The relevancy of coastal exposure information for a wide range of
stakeholders in the North Slope suggests a diverse shared domain of interest would likely
grow with iterations of the ISD Process.
5.3.3. Coastal Exposure Web Map Community Data Management
This chapter identified a network of data stewards based on the identification of the
organizations that manage the data used to create the North Slope coastal exposure web
map (Figure 5.1). This section discusses the need for the coordination of community data
management to share local observations and promote trust between researchers and
Arctic residents in future coastal exposure web mapping.
It is widely recognized that effective coordination of information and data
management plays an important role in realizing societal benefits from Arctic observing
networks (Jeffries et al. 2007; Johnson et al. 2011; Parsons et al. 2011; Huntington 2011;
Pulsifer et al. 2012, 2014a,b; Payne et al. 2013; Johnson et al. 2013, 2015; Lee et al
2015a; Eicken et al. 2016a). The Arctic Spatial Data Infrastructure (Arctic SDI) is an
effort to coordinate data management in the Arctic by leveraging technology, policy,
standards, and people to support Arctic geospatial data sharing in the Arctic (Arctic SDI

103
2015). Among the goals of the SDI is the application of policy and standards that make
data accessible by promoting open data and interoperability between systems to promote
access for the range of Arctic users. The National Science Foundation has taken a leading
role in the Arctic SDI by enhancing access to Arctic scientific data including establishing
data portals to centralize data storage and access (Jeffries et al. 2007). However, more
work is needed to develop interoperability of the Arctic SDI to engage local Arctic
communities in decision support observing networks.
In addition to developing technical aspects of interoperability, the coastal
exposure observing network illustrated in Figure 5.1 depends on willingness to share
information. Willingness to share is a fourth dimension of interoperability that has
received less attention in interoperability research (Pulsifer and Taylor 2005). In the
coastal exposure network in Figure 5.1, most entities are either state or federal
government and therefore are required to share their non-sensitive public data and
information. The Exchange for Local Observations of the Arctic (ELOKA), on the other
hand, is constrained by ethical considerations when sharing data and information
provided by Arctic residents (cf. Pulsifer et al. 2012). The ELOKA is a proposed actor in
the coastal exposure observing network, indicated by a red arrow connecting to the North
Slope Borough web map in Figure 5.1. The ELOKA would manage and share local
observations collected in this study with the North Slope Borough. Data management
using ELOKA would encourage local communities to share their observations in future
coastal exposure web mapping by establishing trust that the data will be handled
responsibly.

104
5.4. Conclusions
This chapter explored how the coastal exposure web map created for this study links to
the Arctic observing network (AON). To identify links, the web map process described in
Section 2.5 and a network analysis of web map data stewards in Section 5.2.2 were
compared with the structure of the AON. The structure of the AON was defined using
key reports on three important aspects of AON organization including design approaches
(ADI 2012), federal Arctic observing activities (Jeffries et al. 2007), and societal benefit
areas (SBA) (IDA 2017). The results in Section 5.2 indicate that the web map links to the
ecosystem services approach to AON design, several federal observing activities, and the
Resilient Communities SBA. Section 5.3 discusses the results with respect to advancing
“dual use” observing networks to address both science and stakeholder information
needs, establishing a coastal exposure observing network community of practice, and the
role of responsible local community data management.

105
6. Conclusions
This dissertation investigated coastal exposure to climate risks in the North Slope from
the local community perspective. It also advanced a collaborative mapping effort to
integrate the North Slope in a web mapping process that links to the Arctic observing
network. The study contributes to collaborative coastal exposure to climate change
research that includes the perspective of impacted stakeholders (Chapter 3). It also
contributes to evaluating usability of climate change research by analyzing North Slope
land use manager usability perspectives of the exposure web map created for the study
(Chapter 4). Lastly, the study contributes to advancing methods to engage local
communities in the Arctic observing network by creating a web map and map process
that links to the network (Chapter 5).
This concluding chapter summarizes the main findings of the dissertation research
(Section 6.1), identifies policy implications (Section 6.2), and suggests future research
directions (Section 6.3).
6.1. Research Findings and Implications
This section summarizes the research findings in Chapter 3 (Section 6.1.1), Chapter 4
(Section 6.1.2), and Chapter 5 (Section 6.1.3).
6.1.1. Chapter 3 Research Findings
Chapter 3 identified coastal exposure to climate risks based on the perspectives of local
communities in Alaska’s North Slope using participatory mapping methods. Analysis of
the results identified exposure risks associated with constrained coastal access for
industrial and subsistence land uses during the open water season. Many of the risks
identified are not within proximity to the municipalities, which is the usual geographic

106
focus of coastal exposure assessments on the North Slope. The dissertation grouped the
identified exposure risks into four themes based on asset type. The identified risks are
summarized by theme below:
Distant Early Warning (DEW) Line (Section 3.2.1) – Exposure of the
decommissioned DEW Line sites on the North Slope present risks associated with
current local uses of the sites. The North Slope Borough uses the remaining
infrastructure at the Cape Simpson DEW Line site including airstrips and building
pads to support oil and gas exploration in the National Petroleum Reserve – Alaska
(NPR-A). Use of the DEW site mitigates impacts on subsistence that would result
from industry building elsewhere, not yet developed, to support their operations.
Reuse of the DEW Line for industrial development also presents potential taxable
income from the assets from future development. Therefore, from the local
perspective, loss of the DEW Line from coastal exposure is a risk to current land use-
based strategies to mitigate subsistence impact and support taxable developments.
Alaska Native Corporation Lands (Section 3.2.2) – Exposure of native corporation
lands to climate risks constrains access for oil and gas and related industrial
development that would benefit the corporations. Two such risks identified include
shoaling occurring at the Wainwright Inlet near Olgoonik Corporation lands and
historical high erosion rates on Arctic Slope Regional Corporation (ASRC) lands near
Cape Halkett. Shoaling of the Wainwright Inlet would make it difficult for barges and
boats to pass, which may discourage the decision to develop an offshore oil and gas
support base at the Wainwright DEW Line site on Olgoonik Corporation lands. The

107
high erosion near Cape Halkett is preventing the ASRC from developing a parcel of
land in the NPR-A.
Subsistence Hunting Camps (Section 3.2.3) – Participants identified numerous
camps used for subsistence hunting along the North Slope coasts that are eroding into
the ocean or are becoming inaccessible by boat due to coastline changes. The camps
impacted range from single family camps to sites that support entire communities.
For example, Griffin Point, east of Kaktovik, is a multi-family camp that has been
used for millennia but is now being washed into the ocean. Multiple families depend
on the single entrance to the Ikpikpuk River in Smith Bay to access their hunting
camps. Coastal exposure changes the entrance and may one day make it inaccessible,
which would impact the multiple families that depend on it. The entire community of
Nuiqsut depends on Cross Island for whale hunting. The island is eroding away and
may not support the whale hunt, which is a critical risk to the community.
Subsistence Boating (Section 3.2.4) – In addition to affecting camp access, coastal
exposure is negatively impacting summer subsistence boating more generally. Local
boaters depend on the chain of barrier islands that stretch across much of the North
Slope coast. Participants identified numerous locations where barrier island changes
are creating problems for boating such as cutting off subsistence boating routes and
increasing risk by closing barrier island cuts used to escape stormy seas. For example,
Bernard Spit, north of Kaktovik, is moving toward the mainland, which is
constraining a boating route used to haul whales into the community. Bernard Spit
movement threatens to cut-off the route altogether. Many participants noted that
navigation devices equipped with global positioning systems (GPS) are unreliable due

108
to the rapid changes, which makes maps of the coastline inaccurate. With respect to
increasing boating risk, erosion of an important barrier island that provides protection
to boaters traveling between Kaktovik and Canada is forcing boaters to travel along
the open ocean coast exposed to seas no longer dampened by sea ice.
6.1.2. Chapter 4 Research Findings
Chapter 4 analyzed North Slope land use manager usability perspectives of the coastal
exposure web map in a usability workshop. The results were organized into the three
aspects of usability defined by Cash et al. (2003): saliency, legitimacy, and credibility.
The identified usability perspectives are summarized below:
Saliency (4.2.1) –The land use managers viewed the web map as relevant to support
the North Slope Borough’s land use permit application review program by providing
access to coastal exposure information during the review process for proposed coastal
developments. In addition to the general discussion about relevancy for the permit
program, participants also identified two places were coastal exposure information is
currently needed: the borough’s Cape Simpson Industrial Port and an Arctic Slope
Regional Corporation (ASRC) parcel within the National-Petroleum Reserve –
Alaska (NPR-A).
Legitimacy (4.2.2) – According to workshop participants, including the perspectives
of Nuiqsut residents would enhance the web map’s legitimacy. Nuiqsut’s subsistence
area covers stretches of the North Slope coastline where most oil and gas developing
is occurring. Nuiqsut’s local knowledge about coastal exposure risks would expand
the study area coverage onto state lands between the NPR-A and the Arctic National
Wildlife Refuge (ANWR). However, local knowledge of risks may also be located

109
on barrier islands where federal oil and gas activity is taking place. One barrier island
exposure risk identified in Chapter 3 is the eroding Cross Island, which the entire
community of Nuiqsut relies on for subsistence whaling.
Credibility (4.2.3) – A prominent discussion in the workshop related to credibility
was fitness-for-use of the web map. That is, even with credibility concerns, North
Slope land use managers said that the web map might be useful as a screening tool to
identify places that may need more in-depth exposure analyses. Participants also
expressed concern about accuracy of the web map data and whether or not the web
map would be maintained.
6.1.3. Chapter 5 Research Findings
Chapter 5 identified ways the coastal exposure web map links to the Arctic observing
network (AON). The web map was analyzed to identify the organizations that are the
stewards of the data used to create the web map. The web map process described in
Section 2.5 and the analysis of the web map product in Section 5.2.2 were used to
identify how the web map links to the AON. To identify the links, Sections 5.1.1 defined
the AON structure using three key reports on AON organization (i.e., ADI 2012; Jeffries
et al. 2007; IDA 2017). A summary of how the coastal exposure web map links to the
AON is provided below:
Web Map Process Links to the Arctic Observing Network Design Approaches
(5.2.1) - The web map process links to the AON via the ecosystem services
approach to designing the network described in ADI (2012). In the ecosystem
services approach to AON design, the prioritization of environmental variables
to observe using the network is based on ecosystem services that are important

110
to stakeholders. For example, coastline protection is a sea ice ecosystem service
that warrants monitoring using the AON.
Web Map Product Links to Federal Arctic Observing Activities (5.2.2) – The
coastal exposure web map links to several federal Arctic observing activities
including the National Aeronautics and Space Administration (NASA) sea ice
extent time series, which the National Snow and Ice Data Center (NSIDC)
archives. Most web map links to current observing activities described in Jeffries
et al. (2007) are associated with the data used to create the shoreline change
susceptibility spatial data model described in Section 4.1.2 and Appendix I.
Web Map Links to Arctic Observing Network Societal Benefit Areas (5.2.3) –
The web map links to the Resilient Communities societal benefit area (SBA)
described in IDA (2017). The web map is linked to the Resilient Communities
SBA because it supports Arctic community adaptive responses and assessment
of community threats and impacts from Arctic changes.
6.2. Implications of the Research Findings
This section identifies policy implications of the research findings listed above. Section
6.2.1 identifies the implications of the coastal exposure risks found in Chapter 3 for North
Slope Science Initiative (NSSI) research coordination efforts. Section 6.2.2 identifies the
implications of web map usability perspectives found in Chapter 4 for the North Slope
land use decision-making process. Finally, section 6.2.3 identifies the implications of the
web map links to the Arctic observing network (AON) found in Chapter 5 for AON
programs that are tasked with engaging local communities for decision support.

111
6.2.1. Rearticulating the North Slope Erosion Problem
The coastal exposure risks identified in this study have implications for the North Slope
Science Initiative (NSSI), which is mandated by Congress to coordinate applied science
to support North Slope resource managers. Specifically, the risks identified suggest that
the NSSI should rearticulate the erosion problem to include the risks to industrial and
subsistence land uses identified in this study. Rearticulating the erosion problem would
influence how coastal exposure to climate risks are represented in NSSI stakeholder-
driven scenarios planning activities and other research. The NSSI currently focuses on
risks to village infrastructure and historical land uses such as industrial and cultural
heritage sites (cf. Streever et al. 2011; Vargas-Moreno et al. 2016), and does not
adequately account for current land use risks identified in this study. The current NSSI
focus with respect to coastal exposure risks is based on available literature (i.e. Jones et
al. 2008), which the NSSI relied on to identify its research priorities (cf. NSSI 2014). The
current articulation of the erosion problem based on available literature limits the NSSI
erosion research priority and associated research activities to addressing the need for
accurate erosion models, asset data, and instrumentation to monitor the impacts on
municipal infrastructure and historical land uses (cf. Vargas-Moreno et al. 2016). A focus
from the NSSI on risks to current industrial and subsistence land uses from the local
community perspective would enhance relevancy for North Slope land use managers that
are actively implementing a plan for a sustainable future (cf. NSB 2015).
6.2.2. Coastal Exposure Information for North Slope Land Use Management
The finding that the coastal exposure web map could support the North Slope Borough’s
(NSB) land use permit application review program has implications for the NSB land use
112
decision-making process. As mentioned in Section 1.3.2 and Section 4.3, the NSB
established a geographic information system (GIS) to support NSB Planning Department
land use decisions. The GIS includes a module dedicated to environmental information,
and the conceptual design called for collaboration across local, state, and federal agencies
and universities to make relevant environmental information accessible to North Slope
land use managers. However, the conceptual design has not been effectively implemented
in practice and the environmental information module is not being used to its full
potential. The web mapping technologies that the borough has recently adopted provides
capabilities needed to realize the original collaborative design of the environmental
module of the boroughs mapping system. The process of engaging local managers with
coastal exposure information via the NSB GIS has implications for implementing
borough policies that aim to consider coastal exposure risks in land use management
decisions, including the borough’s land use regulations, Capital Improvement Program,
and Coastal Zone Management Plan. Continued collaborative coastal exposure web map
development could address the coastal exposure information gap in North Slope land use
planning.
6.2.3. Designing Local Community Engagement in the Arctic Observing Network
The coastal exposure web map links to the Arctic observing network (AON) identified in
this study have implications for the design of local community engagement in AON
activities. The links identified in Section 5.2 (summarized in Section 6.1.3) suggest that
local communities could be integrated with AON activities to address stakeholder
information needs with some additional effort. The community-based approach in this
study is a “bottom-up” effort that facilitates the AON in addressing local community

113
stakeholder information needs. The bottom-up effort to link the local communities to the
AON also compliments efforts of long-term scientific monitoring programs to have direct
beneficial societal impacts on communities located near monitoring sites. For example,
the National Science Foundation’s Long-Term Ecological Research (LTER) Program
broader impacts area: Translating Science for Society
(https://www.nsf.gov/pubs/2005/nsf0533/nsf0533.pdf) engages local community
stakeholders to identify local science needs that can be addressed as part of existing
LTER programs. The recently established Beaufort Sea Lagoons LTER on the North
Slope addresses coastal erosion and related environmental changes to understand
ecosystem impacts (NSF #1656026). The LTER research is designed to include
collaboration with local community stakeholders in Utqiaġvik and Kaktovik. With some
additional effort, the Beaufort Sea Lagoons LTER could address local North Slope
science needs related to coastal exposure risks as part of the larger environmental
monitoring program.
The web mapping research process created in this study could be expanded to
initiate coproduction of knowledge to address coastal exposure risks. Coproduction is
emerging as a best practice in climate change research to address stakeholder climate
science needs (cf. Lemos and Morehouse 2005; Weichselgartner and Kasperson 2012;
Rosenzweig et al. 2011; Kirchhoff 2013; Leichenko et al. 2014, 2015) including in the
Arctic context (Petrov et al. 2016). Stakeholder collaboration in all phases of research for
decision support distinguishes coproduction from other participatory methods. This
dissertation included collaboration in data collection (Figure 2.1 Collaborative Step 1),
analysis (Step 3), and dissemination of results (Figure 2.1). However, this dissertation fell

114
short of coproduction because the research questions were not defined in collaboration
with the local community stakeholders. The collaborative web map research created for
this study could be adapted to advance coproduction of knowledge to address coastal
exposure risks by integrating it with existing AON programs like the Beaufort Sea
Lagoons LTER. Application of the adapted Eicken et al. (2016a) co-production and co-
management cycle proposed in this study (Figure 5.2b) could be used to facilitate the
collaboration between LTER scientists and local community stakeholders to co-develop
coastal exposure research questions and methods to address local information needs.
Efforts to address local community climate research needs using the Arctic
observing network would be met with many benefits associated with enhanced local
community engagement in scientific research and monitoring. For example, well-
designed local community engagement would support science and monitoring goals by
providing better access to reliable and low cost in situ observations in remote and
difficult to access locations observed by local community members. Giving back to the
community in research to enhance interaction to achieve broader science goals is a well-
established strategy in collaborative mapping at the local community scale (e.g. Bryan
and Wood 2015; NOAA 2015) and in participatory research methods more generally (cf.
Cornwall and Jewkes 1995; Chambers 2006; Mercer et al. 2008; Johnson et al. 2013).
The bottom-up research process created in this dissertation presents an opportunity to
apply the well-established collaborative mapping strategy to enhance local community
interaction to support AON science goals.
6.3. Limitations of the Study and Directions for Future Research
This section addresses some study limitations that should be addressed in future research.
115
A limitation of this study is that there were geographic gaps in the coastal
exposure assessment. In particular, the assessment did not include the local community
stakeholders of Nuiqsut. Including Nuiqsut in the coastal exposure assessment would be
significant for identifying important local community risks on the North Slope while also
advancing land use manager engagement in the coastal exposure web map. Community
mapping workshop participants identified some potentially serious coastal exposure risks
for Nuiqsut including the eroding Cross Island, which is an important barrier island that
the community uses for whaling (Section 3.2.3). Usability workshop participants also
voiced the need to include Nuiqsut because of their local knowledge of coastal exposure
risks where oil and gas development is currently concentrated (Section 4.2.2). As was
noted in Section 4.3, including Nuiqsut’s coastal exposure risks would help establish
local manager engagement in the coastal exposure web map research process because of
the important role of the borough’s mapping system in supporting land use decision
where oil and gas development is concentrated.
A limitation of the coastal exposure web map usability evaluation in this study is
that it was not designed to account for tradeoffs between usability factors. Tradeoffs
between saliency, legitimacy, and credibility arise when stakeholder inclusion in the
production of science to address saliency and legitimacy negatively impacts perspectives
of scientific credibility, or when “sound science” isolated from stakeholder involvement
comes at the cost of low saliency and legitimacy (Mitchell 2006; Girod et al. 2009; White
et al. 2010). For science products to be perceived as usable by multiple stakeholders,
“boundary work” at the science-policy-practice interface is necessary to balance
perspectives of saliency, legitimacy, and credibility (Cash et al. 2003). The web map

116
created in this study provides a “boundary object” to facilitate communication to identify
and negotiate conflicts to mitigate usability tradeoffs (cf. Lynch et al. 2008; Cutts et al.
2011; Preston et al. 2011). Future research should deliberately engage the range of
stakeholders represented on the web map to collaborate in coastal exposure risk
information development. For example, the Arctic Slope Regional Corporation (ASRC)
should be included in the development of the coastal exposure information for their assets
including the ASRC parcel of land in the National Petroleum Reserve – Alaska (NPR-A)
(see Section 3.2.2). In addition to advancing usability of the web map, additional research
on usability tradeoffs with diverse stakeholders could also be designed to address the
National Science Foundation’s interest in researching effective Arctic climate science
communication for decision support (cf. V r smarty et al. 2015).
As noted in Section 6.2.3, another limitation of the dissertation is that it did not
establish coproduction because the study did not include local community stakeholders in
all research stages for decision support. That is, the web mapping research process did
involve local community stakeholders in data collection (Chapter 3), data analysis
(Chapter 4), and dissemination of study results (Figure 2.1). However, the researcher
defined the research questions without consultation with the local communities. The
research questions were based on pre-dissertation fieldwork observations of coastal
exposure risks and the academic literature on science usability evaluation and Arctic
observing networks. Future research should expand the web mapping process developed
in this dissertation by including the local community stakeholders in defining research
questions. For example, what exposure risks do the local communities want to
investigate, and what methods would they use to evaluate coastal exposure information

117
usability? The advancements made in this study including the articulation of coastal
exposure risks that are relevant for North Slope resource managers and web map
development provide the groundwork for future coproduction of knowledge to address
coastal exposure risks. The next step is to deliberately engage local communities and
Arctic observing network coordinators in coproduction of knowledge by collaboratively
defining coastal exposure research questions and further developing the web map for
decision support.

118
Appendix A
Metadata: Local Community Verification of Shoreline Change Risks Along
the Alaskan Arctic Ocean Coast (North Slope)
Figure A.1. Metadata: Local Community Verification of Shoreline Change Risks

119
Figure A.2. Metadata: Local Community Verification of Shoreline Change Risks (cont.)
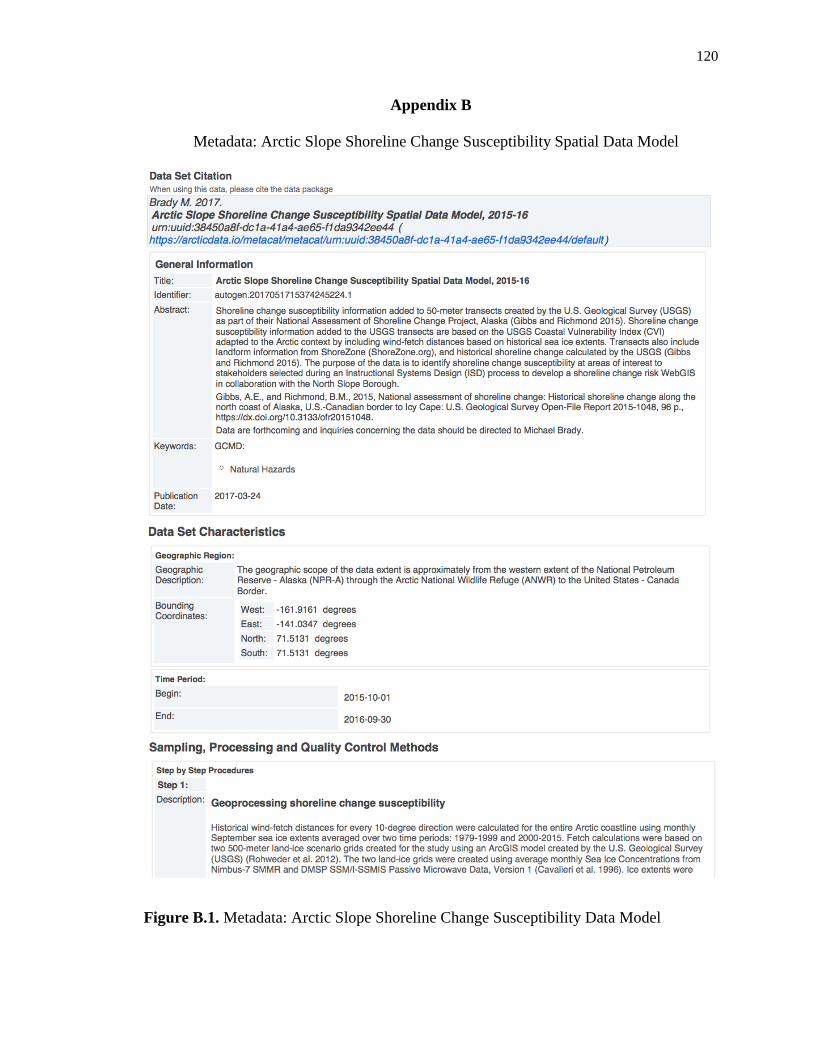
120
Appendix B
Metadata: Arctic Slope Shoreline Change Susceptibility Spatial Data Model
Figure B.1. Metadata: Arctic Slope Shoreline Change Susceptibility Data Model

121
Figure B.2. Metadata: Arctic Slope Shoreline Change Susceptibility Data Model (cont.)

122
Appendix C
Metadata: Arctic Slope Shoreline Change Risk Spatial Data Model
Figure C.1. Metadata: Arctic Slope Shoreline Change Risk Spatial Data Model

123
Figure C.2. Metadata: Arctic Slope Shoreline Change Risk Spatial Data Model (cont.)

124
Appendix D
Metadata: Shoreline Change Risk WebGIS Usability Workshop
Figure D.1. Metadata: WebGIS Usability Workshop

125
Figure D.2. Metadata: WebGIS Usability Workshop (cont.)

126
Appendix E10
Wainwright and Kaktovik Research Request Letter
Figure E.1. Research Request Letter Send to Wainwright and Kaktovik
10
This is one of six letters sent in 2016 to request permission to do research in Kaktovik and Wainwright.
Each letter was slightly modified for each recipient. Letter recipients include: Native Village of Kaktovik,
Kaktovik Iñupiat Corporation, City of Kaktovik, Native Village of Wainwright, Olgoonik Corporation, and
City of Wainwright.
March 18, 2016
Native Village of Kaktovik
P.O. Box 73
Kaktovik, AK 99747
To Whom It May Concern:
I am a doctoral student in the Geography Department at Rutgers University. My dissertation research focus is on mapping coastal erosion risk in collaboration with local communities in
Alaska's North Slope.
I am writing to respectfully request permission to visit Kaktovik from April 17 to April 21,
2016 to conduct my research. I request to show maps of erosion patterns along the North
Slope shoreline and threatened assets such as Native Allotments and buildings within the
village to local community members and ask them to share their views of erosion risk by
marking on the maps and completing a short survey. I would offer $75 credit to the local grocery store to the first ten participants.
Attached to this letter are several documents about the project including a brief description of the study by the National Science Foundation, letters of support from North Slope Borough Planning
& Community Services Department and Applied Research in Environmental Sciences Nonprofit,
letter of approval from the Rutgers University Office of Research and Regulatory Affairs, draft
study consent form, a flyer I would post prior to arrival, and a project data management plan.
Thank you for your consideration and I look forward to hearing from you soon.
Sincerely,
Michael Brady Department of Geography
Rutgers University
54 Joyce Kilmer Avenue
Piscataway, NJ 08854 (401) 578-0480

127
Figure E.2. Research Request Letter Send to Wainwright and Kaktovik (cont.)
1/12/2016 NSF Award Search: Award#1523191 - Doctoral Dissertation Research: Mapping Community Exposure to Coastal Climate Hazards in the Arctic: A Cas…
Award Abstract #1523191
Doctoral Dissertation Research: Mapping Community Exposure to Coastal Climate Hazards in
the Arctic: A Case Study in Alaska's North Slope
NSF Org: PLR Division Of Polar Programs
Initial Amendment Date: September 25, 2015
Latest Amendment Date: September 25, 2015
Award Number: 1523191
Award Instrument: Standard Grant
Program Manager: Anna Kerttula de Echave PLR Division Of Polar Programs
GEO Directorate For Geosciences
Start Date: October 1, 2015
End Date: September 30, 2016 (Estimated)
Awarded Amount to Date: $13,590.00
Investigator(s): Robin Leichenko [email protected] (Principal Investigator) Michael Brady (Co-Principal Investigator)
Sponsor: Rutgers University New Brunswick 3 RUTGERS PLAZA
NEW BRUNSWICK, NJ 08901-8559 (848)932-0150
NSF Program(s): GEOGRAPHY AND SPATIAL SCIENCES, ARCTIC SOCIAL SCIENCES
Program Reference Code(s): 1079, 1352, 5221, 9179
Program Element Code(s): 1352, 5221
ABSTRACT
This research investigates community exposure to coastal climate hazards in Alaska?s North Slope and incorporates
community assessment of the potential effects on loss of land, infrastructure, and other assets. This analysis will inform response strategies and planning by developing new methods of hazard assessment that can support community resilience in the North Slope and potentially serve as a model for advancing assessment and planning in other rural and urban
communities. This research will expand traditional assessments of financial exposure to also include non-material factors such as values and priorities of diverse social groups within a community including a diverse set of stakeholders, ranging
from multinational oil companies to individual subsistence hunters. This study surveys community views of asset importance and integrates results with a geophysical hazard data model for a coproduced community exposure map of the North Slope coast. This research will contribute to understanding the human and social dimensions of climate change impacts, including
how social, economic, political, and cultural factors shape vulnerabilities and condition response strategies. Methods and findings could enhance nation-wide efforts in the United States to map community exposure to
SEARCH
F U N D IN G
http://www.nsf.gov/awardsearch/showAward?AWD_ID=1523191
1/2
AWAR D S D ISC O VER IES
N EWS PU BLIC AT IO N S
ST AT IST IC S ABO U T N SF F AST LAN E

128
Figure E.3. Research Request Letter Send to Wainwright and Kaktovik (cont.)
1/12/2016 NSF Award Search: Award#1523191 - Doctoral Dissertation Research: Mapping Community Exposure to Coastal Climate Hazards in the Arctic: A Cas…
coastal climate hazards by demonstrating methods for, and the importance of systematically incorporating non-market values in exposure analysis.
The objectives of the proposed research include adapting the U.S. Geological Survey's (USGS) coastal vulnerability index
(CVI) to the Arctic context, and integrating results with formal asset databases and a spatial community landscape value model while working with affected communities during the process to coproduce exposure maps. Specifically, working with North Slope Alaskan communities the study will incorporate wind fetch (i.e., the open water distance over which wind can
generate near shore waves, determined by sea ice extent) into the CVI and get community feedback on the results. In addition to community input on the CVI maps, coproducing the exposure maps includes the community assigning values to traditional land use places using existing spatial datasets and mapping and investigating specific sites threatened by coastal
hazards with the aim to learn why exposed assets threaten the community.
Please report errors in award information by writing to: [email protected].
FUNDING AWARDS DISCOVERIES NEWS PUBLICATIONS STATISTICS ABOUT NSF FASTLANE
The National Science Foundation, 4201 Wilson Boulevard, Arlington, Virginia 22230, USA Tel: (703) 292-5111, FIRS: (800) 877-8339 | TDD: (800) 281-8749
http://www.nsf.gov/awardsearch/showAward?AWD_ID=1523191
2/2
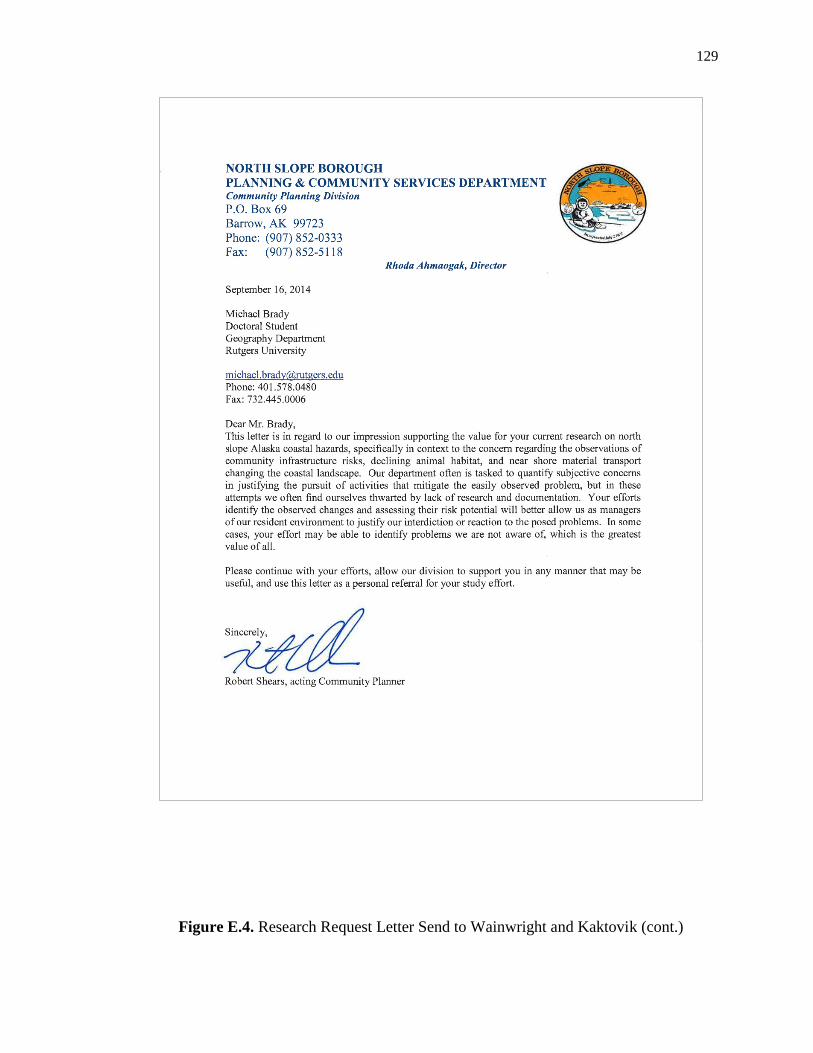
129
Figure E.4. Research Request Letter Send to Wainwright and Kaktovik (cont.)

130
Figure E.5. Research Request Letter Send to Wainwright and Kaktovik (cont.)
Email: [email protected] Website: www.ariesnonprofit.com Phone: (757)334-9568
An Illinois Nonprofit Corporation
Applied Research in Environmental Sciences Nonprofit, Inc. Mailing Address: 1042 Maple Avenue, Suite 106, Lisle, IL 60532
Principal Office: Attn: Dr. Anne Garland, 20206 Olde Towne Court, Smithfield, VA 23430
Francisco San Juan, Ph.D., President (252)335-3451 Kathleen M. Fischer, Ph.D., Treasurer (630)324-6402
Anne W. Garland, Ph.D., Secretary (757)334-9568
September 26, 2014
Michael B. Brady Department of Geography Rutgers University
Piscataway, NJ
Re.: Letter of Support for Doctoral Dissertation Research in the North Slope of Alaska
Dear Mr. Brady:
It is my pleasure to write a letter in support of your doctoral research investigating community vulnerability to coastal climate hazards in Alaska's North Slope. We are very supportive of this research as it has direct relevance to our
work on the North Slope of Alaska with indigenous coastal communities that face risks related to coastal erosion.
Applied Research in Environmental Sciences NonProfit, Inc. (ARIES) is a 501(c) (3) organization with a mission of environmental research, public education, and community outreach (www.ariesnonprofit.com). Over the past six years, ARIES has worked with tribal communities in the area of risk management.
During summer 2014, the ARIES program “Historical Ecology and Risk Management: Youth Sustainability” (HERMYS) conducted preliminary studies of the impact of coastal erosion on the North Slope communities of Barrow and Browerville, particularly with respect to critical infrastructure. Additionally, we reviewed
various options for engaging the local community in the management of risk stemming from this hazard. In conjunction with our effort, we were very fortunate to have had you collaborate with us this summer while you were performing your dissertation research. Your research goal of investigating the importance and value of a broader
range of community assets than encompassed by ARIES’ research goals both complemented and enhanced our effort.
Your dissertation research will provide essential information on two key factors in community decision-making: traditional values and knowledge, and a desire to preserve social identity and important cultural resources. As the
North Slope and other coastal communities face environmental changes, your dissertation research will provide information on factors that are determinative of successful planning of adaptation to these changes.
A guiding principle of ARIES is to collaborate with other organizations, academic institutions, and corporations to
benefit the projects we undertake. Because of our mutual interests in this work and the complementary nature of our research, ARIES will contribute support to your dissertation research by sharing data and information, assisting you in establishing local governmental and nongovernmental connections, and, where feasible, providing transportation,
lodging, field equipment, and other logistical support. Additional monetary support is a possibility as well depending on our available funds in 2015.
ARIES enthusiastically supports this research. Please feel free to contact me by phone or email.
Sincerely,
Francisco San Juan, Jr., Ph.D.
President Phone: (252) 335-3451
Email: [email protected]; [email protected]

131
Figure E.6. Research Request Letter Send to Wainwright and Kaktovik (cont.)

132
Figure E.7. Research Request Letter Send to Wainwright and Kaktovik (cont.)

133
Figure E.8. Research Request Letter Send to Wainwright and Kaktovik (cont.)
134
Figure E.9. Research Request Letter Send to Wainwright and Kaktovik (cont.)

135
Figure E.10. Research Request Letter Send to Wainwright and Kaktovik (cont.)

136
Figure E.11. Research Request Letter Send to Wainwright and Kaktovik (cont.)
Page 2
Additionally, I am currently developing a personal Website and content management system accessible publically to communicate project research and of fer downloadable data, maps,
and other products. If approval is granted by managing organizations, asset exposure data
products (derived from a-d) will be aggregated and coded in a 500 meter raster file format
including full metadata. All geospatial datasets created for this project will follow Federal
Geographic Data Committee (FGDC) standards and guidelines. Interview data (a) will be only provided in aggregated form to protect privacy. All data will be kept for at least 10
years after project completion.

137
Appendix F
2014 Fieldwork Interview Instrument
Figure F.1. 2014 Fieldwork Interview Instrument

138
Figure F.2. 2014 Fieldwork Interview Instrument (cont.)

139
Figure F.3. 2014 Fieldwork Interview Instrument (cont.)

140
Figure F.4. 2014 Fieldwork Interview Instrument (cont.)

141
Figure F.5. 2014 Fieldwork Interview Instrument (cont.)

142
Figure F.6. 2014 Fieldwork Interview Instrument (cont.)

143
Appendix G
2016 Fieldwork Community Mapping Instrument
Figure G.1. 2016 Fieldwork Community Mapping Instrument

144
Figure G.2. 2016 Fieldwork Community Mapping Instrument (cont.)
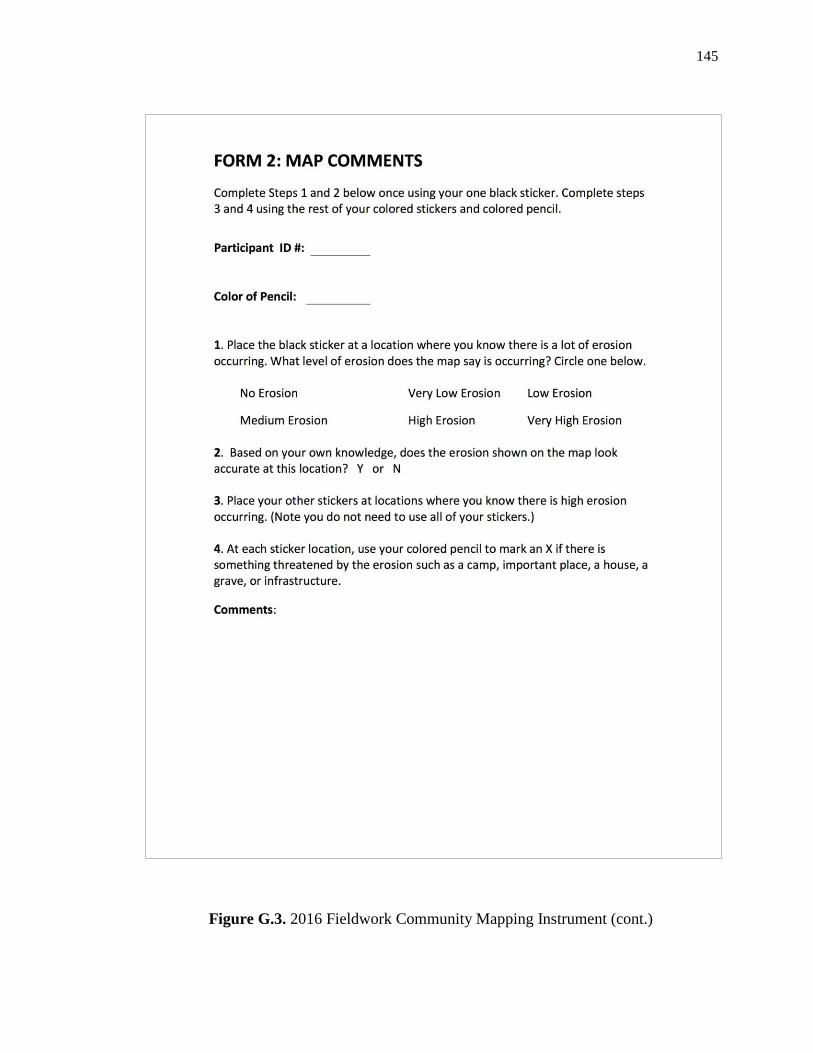
145
Figure G.3. 2016 Fieldwork Community Mapping Instrument (cont.)

146
Figure G.4. 2016 Fieldwork Community Mapping Instrument (cont.)

147
Figure G.5. 2016 Fieldwork Community Mapping Instrument (cont.)

148
Figure G.6. 2016 Fieldwork Community Mapping Instrument (cont.)

149
Figure G.7. 2016 Fieldwork Community Mapping Instrument (cont.)

150
Appendix H
2016 Usability Workshop Presentation Slides
Figure H.1. 2016 Usability Workshop Presentation Slides

151
Figure H.2. 2016 Usability Workshop Presentation Slides (cont.)

152
Figure H.3. 2016 Usability Workshop Presentation Slides (cont.)

153
Appendix I
Methods to Create the Shoreline Change Susceptibility Data Model
As explained in Chapter 4, the exposure data used in the coastal exposure web
map provides shoreline susceptibility information in the asset spatial data attribute tables.
This section explains how the shoreline change susceptibility data were created.
The Shoreline Change Susceptibility Spatial Data Model (Shoreline Model) is
based on the U.S. Geological Survey’s Coastal Vulnerability Index (CVI) (Thieler and
Hammar-Klose 1999). The CVI shows relative physical vulnerability of coastlines to sea-
level rise. It ranks coastal physical vulnerability from low to high using environmental
variables that contribute to coastline change. The variables used in the CVI for the U.S.
Atlantic Coast are: geomorphology, shoreline erosion and accretion, coastal slope,
relative sea-level rise rate, tidal range, and mean wave height. The CVI variables in
Version 1 of the Shoreline Model are: shoreline erosion and accretion and
geomorphology. Wind-fetch distance is an additional variable used in the Shoreline
Model because it is an important coastline physical vulnerability factor in the Arctic (cf.
Barnhart et al. 2014a). Table I1 below summarizes the data used in the Shoreline Model.
Table I.1. Shoreline Change Susceptibility Spatial Data Model Environmental Variables
Variable Time
Period Measurement
Source
Shoreline
change
1940s-
2010s Meters/year
USGS (Gibbs and Richmond 2015).
Geomorphology N/A Ordinal value ShoreZone (ShoreZone.org).
Wind-fetch 1979-
2015 Kilometers
Wind direction (USW00027502), sea ice extent
(NSIDC: cf. Cavalieri et al. 1996), and coastlines
(NOAA: cf. Wessel and Smith 1996).
The USGS National Assessment of Shoreline Change provided data for shoreline
change rates in the study area using 50-meter coastline transects (Gibbs and Richmond

154
2015). Version 1 of the Shoreline Model was created by attributing the USGS 50-meter
shoreline change transects with the two other variables in Table I1, i.e., geomorphology
and wind-fetch. Methods to attribute geomorphology and wind-fetch exploited the
distinction between exposed and protected coastlines in the USGS shoreline transects.
The following paragraphs explain the methods.
Geomorphology Variable
The geomorphology variable accounts for differences in coastline erodibility. In the
Shoreline Model, landform type such as sand or gravel was used as an indicator of
geomorphology. ShoreZone provided the landform data, which they acquired from
NOAA’s Environmental Sensitivity Index (ESI) (Harper et al. 2011). The ESI is widely
used in the United States to support oil spill response (cf. Jensen et al. 1998; Peterson
2002). The ESI data are linear features that represent the coastline, segmented by
landform type information collected at a scale of 1:250,000 (cf. Peterson 2002). For this
study, Ann Gibbs with the USGS ranked the landform types from 1 to 5 to specify low to
high erodibility, respectively (Table I2). The ESI linear features ranked by erodibility
were linked to the USGS transects using Spatial Join in ArcGIS ModelBuilder.

155
Table I.2. North Slope Land Form Type Ranked by Erodibility
Landform Type Protected Shore Exposed Shore Exposed Rocky Shores - 1
Exposed Solid Man made
Structures - 1
Fine to Medium grained Sand
Beaches 3 3
Tundra Cliffs 4 4
Coarse grained Sand Beaches 3 3
Mixed Sand and Gravel Beaches 2 2
Gravel Beaches 2 2
Riprap 1 1
Exposed Tidal Flats - 5
Sheltered Rocky Shores and
Sheltered Scarps in Mud or Clay 3 3
Peat Shorelines 3 5
Sheltered Tidal Flats 3 -
Sheltered Vegetated Low Banks 3 -
Salt and Brackish water marshes 3 -
Inundated Low lying Tundra 3 5
Landform rank from low to high (1-5) erodibility.
Source: Pers. comm. Ann Gibbs, USGS (October 27, 2015).
Wind Fetch Variable
In the Shoreline Model, the wind-fetch variable accounts for differences in coastline
distances to land and the September sea ice extents averaged over the satellite record.
Wind-fetch distance is relevant for assessing the level of coastal protection provided by
sea ice (cf. Barnhart et al. 2014b). Version 1 of the wind-fetch variable, which was
installed on the coastal exposure web map described in Chapter 4, is wind-fetch distances
calculated for every 10-degree wind direction using the record low September 2012 sea
ice extent. The variable was created using an ArcGIS wind-fetch model created by
Rohweder et al. (2012). The wind-fetch model calculates distances over water between
land areas for wind direction intervals specified by the user. Each land cell in a resulting
wind-fetch grid dataset is the distance between that location and the nearest cell also
coded as land in kilometers, measured from a specified wind direction. The model also
creates an average wind-fetch grid for all wind direction intervals weighted using wind

156
direction frequency. Version 1 of the wind-fetch model that was installed on the North
Slope web map (see Chapter 4) is based on the September 2012 sea ice extent for each
10-degree direction, weighted by wind-direction frequency measured at Barrow Post
Rogers weather station (USW00027502) from 1926 - 2015.
The wind-fetch model was adapted to the Arctic by treating sea ice as land, and
calculating distances between the coastline, land features, and the sea ice extent. The sea
ice extent was derived from 25-kilometer sea ice concentrations from Nimbus-7 SMMR
and DMSP SSM/I-SSMIS Passive Microwave Data, Version 1 (Cavalieri et al. 1996).
The sea ice extent data were resampled from 25-kilometers to 500-meters. The 500-meter
cells with an average value of 15% or greater were coded as land and cells less than 15%
were coded as water. A 500-meter coastline grid was created for the Arctic using
NOAA’s Global Self-consistent, Hierarchical, High-resolution Geography Database
(GSHHG) (Wessel and Smith 1996, Version 2.3.4 Jan 1, 2015) by converting the vector
shoreline data to grid. The two “land” grids based on sea ice extent and coastlines were
integrated to create the land-water dataset needed to run the wind-fetch model. Version 1
of the wind-fetch model based on the September 2012 sea ice extent includes 36 fetch
distance grids (one for each wind direction) and one averaged grid weighted by Barrow
wind direction frequency for September from 1926 - 2015.
In Version 1 of the wind-fetch variable described above, the distance values
provided by the weighted wind-fetch grid were used to attribute the USGS transects. To
overlap spatially with all transects, the 500-meter wind-fetch grid was expanded
landward. Inverse Distance Weighting (IDW) was used to expand the grid landward to
intersect USGS transects. Appropriate IDW settings such as search radius were found

157
interactively for both exposed and sheltered shorelines, and results were visually checked
for quality by comparing the resulting IDW fetch grid with the original. The resulting
expanded fetch grid was intersected with the 50-meter transects. Since multiple grid cells
from a single fetch grid often intersected with a single transect due to varying coastal
geometry, highest intersecting fetch grid values were attributed to exposed transects and
the lowest intersecting grid values were assigned to sheltered shoreline segments were
multiple grid cells intersected with a single transect.
Version 2 of the wind-fetch variable mentioned in Appendix J is based on average
sea ice extends for two time periods (1979-1999 and 2000-2015). In addition, in Version
2, fetch values associated with all wind-directions are attributed to the USGS transects.
Version 2 of the wind-fetch variable would be included in Version 2 of the coastal
exposure web map described in Appendix J.

158
Appendix J
North Slope Borough Coastal Exposure Web Map Version 2 Updates
This section describes coastal exposure updates based on local community
feedback from 2016 fieldwork.
Version 2 Shoreline Change Susceptibility Data Model Updates
While this study focused on coastal exposure risk, many of the study participants
volunteered information on environmental drivers of coastal change during both the
community mapping in Chapter 3 and web map usability workshop in Chapter 4. The
environmental variable feedback informed potential Version 2 updates to the shoreline
change susceptibility model. The paragraphs that follow detail the updates that would be
installed on Version 2 of the coastal exposure web map.
Wind-fetch – Version 1 of the fetch layer was calculated from the average sea ice
extent for September 2012. Version 2 of the fetch layer includes distance values averaged
for September extents for two time periods: 1979-1999 and 2000-2015 to show the
impact of recent recurring record breaking minimum sea ice extents since the turn of the
century. Figures I.1a and I.1b below show the change in September sea ice extents
averaged for the two time periods 1979-1999 and 2000-2015 relative to the Arctic
coastline. Some study participants noted the recent sea ice decline and increasing wind-
fetch. For example, one community mapping workshop participant said: "The larger the
ice sheet the less wave action we get. ... [B]ut over the last decade, as the ice has gone
further and further out, we've got pretty substantial fetch" (NSB Risk Manager).

159
Figure J.1.a. Average September Sea Ice
Extents (1979-1999)
Figure J.1.b. Average September Sea Ice
Extents (2000-2015)
Ice-free Days – Version 1 of the coastal exposure web map did not include spatial
data on the number of days without sea ice. The literature shows that length of the ice-
free season is an important driver of shoreline change in the Arctic (Barnhart et al. 2016).
Local managers mentioned the problem of longer ice-free seasons on coastal erosion. For
example, one community workshop participant said: "[W]e have less beach, we have
longer ice free seasons. It's a pretty bad recipe" (NSB Risk Manager). Version 2 of the
coastal exposure web map would include average number of days with open water for
1979-1999 and 2000-2015 based on a 25-kilometer resolution data set created by
researchers at the NSDIC (Barnhart et al. 2016).
Elevation - Elevation was not included in Version 1 of the shoreline change
susceptibility model because the North Slope has little relief.11
While regional coastal
slope is not an important indicator of shoreline change along the Arctic Slope coast as it
is in other regions of the world, topography is still important according to one local key
informant. For example, the local informant said:
11
Regional slope is a factor in the USGS CVI.

160
… [W]e're vulnerable to east winds and waves and ice wedge patterns that line
themselves up just right where massive roll offs of acres of land - it's strange the high
topography is the most vulnerable to erosion if the ice wedge pattern is lined up just
so, they just start sprawling off because they're broken down the back center line of
the ice wedges. If there's a line that's semi parallel to the bluff, gravity wants to take it
this way. That's a natural process, and the lowest lying topography you think would be
more vulnerable to erosion it's more immune to it because it doesn't have the ice
wedge sprawl off occurring. (Utqiaġvik Whaling Captain)
Version 2 of the coastal exposure web map would include satellite-based
elevation data product from the Polar Geospatial Center’s (PGC) ArcticDEM product
(http://pgc.umn.edu/arcticdem). While the ArcticDEM is currently beta, the recurring
collection makes it suitable for the coastal exposure web map because regular updates for
areas of interest in the vast Arctic Slope region would otherwise not be feasible.
Version 2 At-risk Asset Data Model Updates
This section describes potential Version 2 updates to the at-risk asset spatial data model
product based on 2016 fieldwork (see Chapter 3 and metadata in Appendix A).
As explained in Chapter 3, 50 study participants in three North Slope
communities collectively provided 297 shoreline change "problem places" as point
locations using coded stickers, and described the problems verbally and/or by marking
directly on maps. In many cases, specific problem places identified in the 2016
community mapping workshops corresponded with coastal exposure risks already
included in Version 1 of the web map using existing asset spatial data (see Tables 4.2 –
4.4). The transcripts from the audio-recorded verbal responses and map sketch comments
were combined with existing sources in Version 2 of the at-risk asset model. In addition
to providing local verification of risks at asset locations, many of the problem places
shared in the 2016 mapping workshop corresponded with changes in ecosystem services,
which present a variety of risks not always spatially adjacent to assets such as loss of

161
hunting camps or diminished access to them from coastal change. Version 2 of the at-risk
asset model would capture these asset network exposures.
Version 2 At-risk Asset Spatial Data Model
Version 2 of the at-risk asset data model would include important environmental
dependencies of asset access, and not just asset locations. For example, in the Version 2
at-risk asset model, an ecosystem service problem place such as a constrained river
entrance used to access camps near important hunting grounds would be included in the
model along with relationships to the relevant spatially "distant" asset locations (e.g.,
camps). Many participants in the 2016 community mapping workshops identified
numerous coastline changes that are affecting boating access to camps and/or important
hunting grounds. In most cases, individual hunters were impacted, but in some cases
several families or entire communities are being impacted such as the entrance to
Ikpikpuk River in Smith Bay noted in Section 3.2.3. Version 2 of the at-risk asset model
and derivative coastal exposure risk data sets would be included in Version 2 of the
coastal exposure web map.

162
References Cited
ACIA. (2004). Arctic climate impact assessment: Impacts of a warming Arctic.
Cambridge: Cambridge University Press.
ACRC (Alaska Climate Research Center). (2008). Monthly time series data: Barrow, AK.
http://climate.gi.alaska.edu/Climate/Location/TimeSeries/Barrow.html. Fairbanks:
Geophysical Institute, University of Alaska.
Adger, W. N. (2006). Vulnerability. Global environmental change, 16(3), 268-281.
ADI (AON Design and Implementation Task Force). (2012). Designing, Optimizing, and
Implementing an Arctic Observing Network (AON): A Report by the AON Design and
Implementation (ADI) Task Force. Study of Environmental Arctic Change (SEARCH),
Fairbanks, AK. 64 pp.
Albert, T. F. (1988). The role of the North Slope Borough in Arctic environmental
research. Arctic Research of the United States, 2, 17-23.
Albert, T. F. (1990). Impacts by science and scientists on people of Alaska’s North Slope.
Arctic Uumaruq 1990-Arctic Alive, 24-25.
Alessa, L. N., Kliskey, A., Myers, M., Veazey, P., Gray, S., Puniwai, N., ... & Anderson,
J. (2013). Community Based Observing Networks (CBONs) for Arctic Adaptation and
Security. White paper prepared for Arctic Observing Summit, Vancouver, BC.
Alessa, L., Williams, P., Kliskey, A., & Beaujean, G. (2016). Incorporating Community-
Based Observing Networks and Systems: Enhancing Community Preparedness and
Response to Arctic Critical Events. Wash. J. Envtl. L. & Pol'y, 6, 1.
AMAP (Arctic Monitoring and Assessment Programme). (2017a). Snow, Water, Ice and
Permafrost in the Arctic (SWIPA) 2017. Arctic Monitoring and Assessment Programme
(AMAP), Oslo, Norway. xiv + 269 pp.
AMAP (Arctic Monitoring and Assessment Programme). (2017b). Adaptation Actions for
a Changing Arctic (AACA) - Bering/Chukchi/Beaufort Region Overview report. Arctic
Monitoring and Assessment Programme (AMAP), Oslo, Norway. 24 pp.
Anthoff, D., Nicholls, R. J., Tol, R. S., & Vafeidis, A. T. (2006). Global and regional
exposure to large rises in sea-level: a sensitivity analysis.
AON (Arctic Observing Network). (2010). Arctic Observing Network (AON) Program
Status Report–2009. In Results from the Third AON Principal INvestigatores (PI)
Meeting (Vol. 30).

163
Arctic SDI (Arctic Spatial Data Infrastructure). (2015). Arctic Spatial Data Infrastructure
Strategic Plan 2015-2020. Arctic SDI Working Group on Strategy.
Armstrong, T., Corell, R., Reiersen, L.-O., and Fuglestad, J. (2016). Adaptation Actions
for a Changing Arctic (AACA): The Transition from Science Assessments To a Science-
Decision Making Process Founded Upon Sustained Observations and Sound Science.
Theme(s): 4, 1.
Baker, T. R. (2015). WebGIS in education. In Geospatial Technologies and Geography
Education in a Changing World (pp. 105-115). Springer Japan.
Balk, D., Pozzi, F., Yetman, G., Deichmann, U., & Nelson, A. (2005, March). The
distribution of people and the dimension of place: methodologies to improve the global
estimation of urban extents. In International Society for Photogrammetry and Remote
Sensing, Proceedings of the Urban Remote Sensing Conference (pp. 14-16).
Barnhart, K. R., Anderson, R. S., Overeem, I., Wobus, C., Clow, G. D., & Urban, F. E.
(2014a). Modeling erosion of ice‐rich permafrost bluffs along the Alaskan Beaufort Sea
coast. Journal of Geophysical Research: Earth Surface, 119(5), 1155-1179.
Barnhart, K. R., Miller, C. R., Overeem, I., & Kay, J. E. (2016). Mapping the future
expansion of Arctic open water. Nature Climate Change, 6(3), 280-285.
Barnhart, K. R., Overeem, I., & Anderson, R. S. (2014b). The effect of changing sea ice
on the physical vulnerability of Arctic coasts. Cryosphere, 8(5).
Barth, M. C., & Titus, J. G. (1984). Greenhouse effect and sea level rise: A challenge for
this generation.
Bartholomew, R., M. Brady, K. Dillon, C. Duncanson, M. Gaienne, S. Jung, K.
McKelvey, J. Wilcox. (2014). Natural Resources Development and Sustainable Arctic
Villages: Planning to avoid the natural resources curse. A report to the Ocean
Conservancy. Arctic Studio Class 2014. E.J. Bloustein School of Planning and Public
Policy, Rutgers University.
Baschek, B., Schroeder, F., Brix, H., Riethmüller, R., Badewien, T. H., Breitbach, G., ...
& Friedrich, J. (2017). The coastal observing system for northern and arctic seas
(COSYNA). Ocean Science, 13(3), 379.
Beier, P., Hansen, L. J., Helbrecht, L., & Behar, D. (2017). A How‐to Guide for
Coproduction of Actionable Science. Conservation Letters, 10(3), 288-296.
Berkes, F. (2009). Evolution of co-management: role of knowledge generation, bridging
organizations and social learning. Journal of environmental management, 90(5), 1692-
1702.

164
Bigio, A. G., Ochoa, M. C., & Amirtahmasebi, R. (2014). Climate-resilient, Climate-
friendly World Heritage Cities.
Branch, R. M. (2017). Characteristics of Foundational instructional Design
Models. Trends and Issues in Instructional Design and Technology, 23.
Brewster, K. N. (2001). Historical Perspectives on Iñupiat Contributions to Arctic
Science at NARL. Fifty more years below zero: tributes and meditations for the Naval
Arctic Research Laboratory's first half century at Barrow, Alaska, 23.
Briggs, C. L. (1986). Learning how to ask: A sociolinguistic appraisal of the role of the
interview in social science research (Vol. 1). Cambridge University Press.
Brown, J. (2001). NARL-based terrestrial bioenvironmental research including the US
IBP Tundra Biome program, 1957–1997. Fifty more years below zero: tributes and
meditations for the Naval Arctic Research Laboratory's first half century at Barrow,
Alaska, 191.
Brunner, R., & Lynch, A. (2013). Adaptive governance and climate change. Springer
Science & Business Media.
Bryan, J., & Wood, D. (2015). Weaponizing maps: Indigenous peoples and
counterinsurgency in the Americas. Guilford Publications.
Burkett, V. (2011). Global climate change implications for coastal and offshore oil and
gas development. Energy Policy, 39(12), 7719-7725.
Cash, D. W., Clark, W. C., Alcock, F., Dickson, N. M., Eckley, N., Guston, D. H., ... &
Mitchell, R. B. (2003). Knowledge systems for sustainable development. Proceedings of
the national academy of sciences, 100(14), 8086-8091.
Cash, D. W., & Moser, S. C. (2000). Linking global and local scales: designing dynamic
assessment and management processes. Global environmental change, 10(2), 109-120.
Cavalieri, D., C. Parkinson, P. Gloersen, and H. J. Zwally. (1996, updated yearly). Sea
Ice Concentrations from Nimbus-7 SMMR and DMSP SSM/I-SSMIS Passive
Microwave Data, Version 1. [NSIDC-0051]. Boulder, Colorado USA: NASA DAAC at
the National Snow and Ice Data Center. http://dx.doi.org/10.5067/8GQ8LZQVL0VL.
[Accessed in 2015].
Chambers, R. (2006). Participatory mapping and geographic information systems: Whose
map? Who is empowered and who disempowered? Who gains and who loses? The
Electronic Journal of Information Systems in Developing Countries, 25.
165
Chapin, F. S., III, S. F. Trainor, P. Cochran, H. Huntington, C. Markon, M. McCammon,
A. D. McGuire, and M. Serreze. (2014). Ch. 22: Alaska. Climate Change Impacts in the
United States: The Third National Climate Assessment, J. M. Melillo, Terese (T.C.)
Richmond, and G. W. Yohe, Eds., U.S. Global Change Research Program, 514-536.
Conrad, C. T., & Daoust, T. (2008). Community-based monitoring frameworks:
Increasing the effectiveness of environmental stewardship. Environmental
Management, 41(3), 358-366.
Corfee-Morlot, J., Cochran, I., Hallegatte, S., & Teasdale, P. J. (2011). Multilevel risk
governance and urban adaptation policy. Climatic change, 104(1), 169-197.
Cornwall, A., & Jewkes, R. (1995). What is participatory research? Social science &
medicine, 41(12), 1667-1676.
Cutter, S. L. (1996). Vulnerability to environmental hazards. Progress in human
geography, 20(4), 529-539.
Cutts, B. B., White, D. D., & Kinzig, A. P. (2011). Participatory geographic information
systems for the co-production of science and policy in an emerging boundary
organization. Environmental Science & Policy, 14(8), 977-985.
Dasgupta, S., Laplante, B., Meisner, C., Wheeler, D., & Yan, J. (2009). The impact of sea
level rise on developing countries: a comparative analysis. Climatic change, 93(3), 379-
388.
DeLorme, D. E., Kidwell, D., Hagen, S. C., & Stephens, S. H. (2016). Developing and
managing transdisciplinary and transformative research on the coastal dynamics of sea
level rise: Experiences and lessons learned. Earth's Future, 4(5), 194-209.
DeLorme, D. E., Stephens, S. H., & Hagen, S. C. (2017). Transdisciplinary sea level rise
risk communication and outreach strategies from stakeholder focus groups. Journal of
Environmental Studies and Sciences, 1-9.
Dick, W., Carey, L., & Carey, J. O. (2005). The systematic design of instruction.
Dilley, M. (2005). Natural disaster hotspots: a global risk analysis (Vol. 5). World Bank
Publications.
Dilling, L., Lackstrom, K., Haywood, B., Dow, K., Lemos, M. C., Berggren, J., &
Kalafatis, S. (2015). What stakeholder needs tell us about enabling adaptive capacity:
The intersection of context and information provision across regions in the United
States. Weather, Climate, and Society, 7(1), 5-17.

166
Dilling, L., & Lemos, M. C. (2011). Creating usable science: Opportunities and
constraints for climate knowledge use and their implications for science policy. Global
environmental change, 21(2), 680-689.
Dobson, J. E., Bright, E. A., Coleman, P. R., Durfee, R. C., & Worley, B. A. (2000).
LandScan: a global population database for estimating populations at risk.
Photogrammetric engineering and remote sensing, 66(7), 849-857.
Dow, K. (1992). Exploring differences in our common future (s): the meaning of
vulnerability to global environmental change. Geoforum, 23(3), 417-436.
Druckenmiller, M. L., Eicken, H., George, J. C., & Brower, L. (2010). Assessing the
shorefast ice: Iñupiat whaling trails off Barrow, Alaska. In SIKU: Knowing our ice (pp.
203-228). Springer Netherlands.
Ebi, K. L., Balbus, J., Kinney, P. L., Lipp, E., Mills, D., O’Neill, M. S., & Wilson, M. L.
(2009). US funding is insufficient to address the human health impacts of and public
health responses to climate variability and change. Environmental Health
Perspectives, 117(6), 857.
Eicken, H., Forbes, B., & Wiggins, H. (2011). State of the Arctic Conference 2010:
International Perspectives on Progress of Research Responsive to Decision-Makers'
Information Needs. AMBIO: A Journal of the Human Environment, 40(7), 824-827.
Eicken, H., Lee, O. A., & Lovecraft, A. L. (2016a). Evolving roles of observing systems
and data co-management in Arctic Ocean governance. In OCEANS 2016 MTS/IEEE
Monterey (pp. 1-8). IEEE.
Eicken, H., Lovecraft, A. L., & Druckenmiller, M. L. (2009). Sea-ice system services: A
framework to help identify and meet information needs relevant for Arctic observing
networks. Arctic, 119-136.
Eicken, H., Mahoney, A., Jones, J., Heinrichs, T., Bader, H., Broderson, D., ... & Merten,
A. (2016b). The Potential Contribution of Sustained, Integrated Observations to Arctic
Maritime Domain Awareness and Common Operational Picture Development in a Hybrid
Research-Operational Setting. Theme (s), 4.
Elliott, S., Schimel, J., Walsh, J., & Wiggins, H. (2010). Recommendations for
Understanding Arctic System Change: Report from a Workshop. Arctic Research
Consortium of the United States (ARCUS), Fairbanks, Alaska.
Ericson, J. P., Vörösmarty, C. J., Dingman, S. L., Ward, L. G., & Meybeck, M. (2006).
Effective sea-level rise and deltas: causes of change and human dimension implications.
Global and Planetary Change, 50(1), 63-82.

167
Eschenbach, C. A. (2017). Bridging the gap between observational oceanography and
users. Ocean Science, 13(1), 161.
Esri (Environmental Systems Research Institute). (1981). Toward a Geographically
Based Information System for the North Slope Borough Alaska Conceptual Design and
Implementation.
Fazey, I., Bunse, L., Msika, J., Pinke, M., Preedy, K., Evely, A. C., ... & Reed, M. S.
(2014). Evaluating knowledge exchange in interdisciplinary and multi-stakeholder
research. Global Environmental Change, 25, 204-220.
Flyvbjerg, B., & Sampson, S. (2001). Making social science matter: Why social inquiry
fails and how it can succeed again.
Ford, J. D., Knight, M., & Pearce, T. (2013). Assessing the ‘usability’ of climate change
research for decision-making: a case study of the Canadian International Polar Year.
Global environmental change, 23(5), 1317-1326.
Ford, J. D., & Smit, B. (2004). A framework for assessing the vulnerability of
communities in the Canadian Arctic to risks associated with climate change. Arctic, 389-
400.
Ford, J. D., Smith, T. R., & Berrang-Ford, L. (2011). Canadian Federal support for
climate change and health research compared with the risks posed. American journal of
public health, 101(5), 814-821.
Ford, J. D., Smit, B., Wandel, J., & MacDonald, J. (2006). Vulnerability to climate
change in Igloolik, Nunavut: what we can learn from the past and present. Polar
Record, 42(02), 127-138.
Frazier, T. G., Wood, N., & Yarnal, B. (2010). Stakeholder perspectives on land-use
strategies for adapting to climate-change-enhanced coastal hazards: Sarasota, Florida.
Applied Geography, 30(4), 506-517.
Gagné, R. M., & Briggs, L. J. (1974). Principles of instructional design. Holt, Rinehart &
Winston.
Gagné, R. M., & Glaser, R. (1987). Foundations in learning research. Instructional
technology: foundations, 49-83.
Gallaway, B.J. (2001). Appendix D: Historical Overview of North Slope Petroleum
Development. In: Environmental Report for Trans Alaska Pipeline System Right-of-Way
Renewal.
Gamba, P., & Herold, M. (Eds.). (2009). Global mapping of human settlement:
experiences, datasets, and prospects. CRC Press.

168
GAO (Government Accountability Office). (2003). Alaska Native Villages: Most are
affected by flooding and erosion, but few qualify for federal assistance. Report to
Congressional Committees, GAO-04-142, 83 pp.
George, J. C., Huntington, H. P., Brewster, K., Eicken, H., Norton, D. W., & Glenn, R.
(2004). Observations on shorefast ice dynamics in Arctic Alaska and the responses of the
Iñupiat hunting community. Arctic, 363-374.
Gibbs, A.E., and Richmond, B.M. (2015). National assessment of shoreline change—
Historical shoreline change along the north coast of Alaska, U.S.–Canadian border to
Icy Cape. U.S. Geological Survey Open-File Report 2015–1048, 96 p.
Girod, B., Wiek, A., Mieg, H., & Hulme, M. (2009). The evolution of the IPCC's
emissions scenarios. Environmental science & policy, 12(2), 103-118.
Giuliani, G., & Peduzzi, P. (2011). The PREVIEW Global Risk Data Platform: a
geoportal to serve and share global data on risk to natural hazards. Natural Hazards and
Earth System Science, 11(1), 53-66.
Gornitz, V., Couch, S., & Hartig, E. K. (2001). Impacts of sea level rise in the New York
City metropolitan area. Global and Planetary Change, 32(1), 61-88.
Gornitz, V., White, T. W., & Cushman, R. M. (1991). Vulnerability of the US to future
sea level rise (No. CONF-910780-1). Oak Ridge National Lab., TN (USA).
Hall, J. A., Gill, S., Obeysekera, J., Sweet, W., Knuuti, K., & Marburger, J. (2016).
Regional sea level scenarios for coastal risk management: Managing the uncertainty of
future sea level change and extreme water levels for Department of Defense coastal sites
worldwide. Strategic Environmental Research and Development Program Alexandria,
VA, Alexandria, United States.
Hanson, S., Nicholls, R., Ranger, N., Hallegatte, S., Corfee-Morlot, J., Herweijer, C., &
Chateau, J. (2011). A global ranking of port cities with high exposure to climate
extremes. Climatic change, 104(1), 89-111.
Harper, J. R., Morris, M., & Daley, S. (2011). ShoreZone Coastal Habitat Mapping
Protocol for Oregon (v. 1).
Hauer, M. E., Evans, J. M., & Mishra, D. R. (2016). Millions projected to be at risk from
sea-level rise in the continental United States. Nature Climate Change, 6(7), 691-695.
Hinzman, L. D., Bettez, N. D., Bolton, W. R., Chapin, F. S., Dyurgerov, M. B., Fastie, C.
L., ... & Jensen, A. M. (2005). Evidence and implications of recent climate change in
northern Alaska and other arctic regions. Climatic Change, 72(3), 251-298.

169
Hovelsrud, G. K., & Krupnik, I. (2006). IPY 2007-08 and social/human sciences: An
update. Arctic, 59(3), 341-348.
Hughes, Z. (2016). Erosion threat at remote military radars decades ahead of schedule.
Alaska Public Media. Internet Source, Accessed November 21, 2017
https://www.alaskapublic.org/2016/07/04/erosion-threat-at-remote-military-radars-
decades-ahead-of-schedule/
Hume, J. D., & Schalk, M. (1967). Shoreline processes near Barrow, Alaska: a
comparison of the normal and the catastrophic. Arctic, 86-103.
Huntington, H. P. (1998). Observations on the utility of the semi-directive interview for
documenting traditional ecological knowledge. Arctic, 237-242.
Huntington, H. P. (2011). Arctic science: The local perspective. Nature, 478(7368), 182-
183.
IARPC (Interagency Arctic Research Policy Committee). (2015). 2015 Biennial Report.
Committee on Environment, Natural Resources, and Sustainability, National Science and
Technology Council, Washington, D.C.
IDA Science and Technology Policy Institute and Sustaining Arctic Observing Networks.
(2017). International Arctic Observations Assessment Framework. IDA Science and
Technology Policy Institute, Washington, DC, U.S.A., and Sustaining Arctic Observing
Networks, Oslo, Norway, 73 pp.
IPCC. (2012). Managing the Risks of Extreme Events and Disasters to Advance Climate
Change Adaptation. A Special Report of Working Groups I and II of the
Intergovernmental Panel on Climate Change [Field, C.B., V. Barros, T.F. Stocker, D.
Qin, D.J. Dokken, K.L. Ebi, M.D. Mastrandrea, K.J. Mach, G.-K. Plattner, S.K. Allen,
M. Tignor, and P.M. Midgley (eds.)]. Cambridge University Press, Cambridge, UK, and
New York, NY, USA, 582 pp.
IPCC. (2013). Climate Change 2013: The Physical Science Basis. Contribution of
Working Group I to the Fifth Assessment Report of the Intergovernmental Panel on
Climate Change [Stocker, T.F., D. Qin, G.-K. Plattner, M. Tignor, S.K. Allen, J.
Boschung, A. Nauels, Y. Xia, V. Bex and P.M. Midgley (eds.)]. Cambridge University
Press, Cambridge, United Kingdom and New York, NY, USA, 1535 pp.
ISO. (2009). 9241-210: 2010. Ergonomics of human system interaction-Part 210:
Human-centred design for interactive systems. International Standardization Organization
(ISO). Switzerland.
ISO. (2010). ISO 9241-210:2010: Ergonomics of human-system interaction -- Part 210:
Human-centred design for interactive systems. Geneva: International Standards
Organization.

170
Jacobson, M. J., & Wentworth, C. (1982). Kaktovik subsistence: land use values through
time in the Arctic National Wildlife Refuge Area. US Fish and Wildlife Service, Northern
Alaska Ecological Services.
Jarmin, R. S., & Miranda, J. (2009). The impact of Hurricanes Katrina, Rita and Wilma
on business establishments. Journal of Business Valuation and Economic Loss Analysis,
4(2).
Jeffries, M. O., Korsmo, F., Calder, J., & Crane, K. (2007). Arctic observing network:
toward a US contribution to pan-Arctic observing. Arctic Research in the United
States, 21, 1-94.
Jensen, Anne M., Ben Fitzhugh, George Hambrecht, Tom Dawson, Andrew Dugmore,
Ramona Harrison, and Thomas H. McGovern. (2015). Distributed Observing Networks of
the Past: Using Archaeological Sites to Study Global Change. Poster presented at the
Society for American Archaeology Annual Meeting, San Francisco, California.
Jensen, J. R., Halls, J. N., & Michel, J. (1998). A systems approach to Environmental
Sensitivity Index (ESI) mapping for oil spill contingency planning and
response. Photogrammetric Engineering and Remote Sensing, 64, 1003-1014.
Jha, A. K., Bloch, R., & Lamond, J. (2012). Cities and flooding: a guide to integrated
urban flood risk management for the 21st century. World Bank Publications.
Johnson, N., Alessa, L., Behe, C., Danielsen, F., Gearheard, S., Gofman-Wallingford, V.,
... & Pulsifer, P. (2015). The contributions of community-based monitoring and
traditional knowledge to Arctic observing networks: Reflections on the state of the field.
Arctic, 28-40.
Johnson, N., Alessa, L., Gearheard, S., Gofman, V., Kliskey, A., Pulsifer, P., & Svoboda,
M. (2013). Strengthening community-based monitoring in the Arctic: Key challenges and
opportunities. A Community White Paper Prepared for the Arctic Observing Summit.
Johnson, G. W., Gaylord, A. G., Franco, J. C., Cody, R. P., Brady, J. J., Manley, W., ... &
Tweedie, C. E. (2011). Development of the Arctic Research Mapping Application
(ARMAP): interoperability challenges and solutions. Computers & Geosciences, 37(11),
1735-1742.
Jones, B. M., Arp, C. D., Jorgenson, M. T., Hinkel, K. M., Schmutz, J. A., & Flint, P. L.
(2009). Increase in the rate and uniformity of coastline erosion in Arctic
Alaska. Geophysical Research Letters, 36(3).
Jones, B. M., Hinkel, K. M., Arp, C. D., & Eisner, W. R. (2008). Modern erosion rates
and loss of coastal features and sites, Beaufort Sea coastline, Alaska. Arctic, 361-372.

171
Jongman, B., Ward, P. J., & Aerts, J. C. (2012). Global exposure to river and coastal
flooding: Long term trends and changes. Global Environmental Change, 22(4), 823-835.
Kelley, J. J., & Brower Sr, A. (2001). The NARL and its transition to the local
community in fifty more years below zero. Tributes and meditations for the Naval Arctic
Research Laboratory's first half century at Barrow, Alaska. Calgary and Fairbanks:
Arctic Institute of North America, 259-264.
Kinner, N. E., Lippmann, T., Ravens, T. M., & Zufelt, J. E. (2009). Climate Change
Impacts and Research Needs for DoD Assets in Alaska’s Coastal Regions. July 6-9, 2009.
Kirchhoff, C. J. (2013). Understanding and enhancing climate information use in water
management. Climatic change, 119(2), 495-509.
Kirchhoff, C. J., Lemos, M. C., & Dessai, S. (2013). Actionable knowledge for
environmental decision making: broadening the usability of climate science. Annual
review of environment and resources, 38.
Kirshen, P., Watson, C., Douglas, E., Gontz, A., Lee, J., & Tian, Y. (2008). Coastal
flooding in the Northeastern United States due to climate change. Mitigation and
Adaptation Strategies for Global Change, 13(5-6), 437-451.
Kruse, J., Lowe, M., Haley, S., Fay, G., Hamilton, L., & Berman, M. (2011). Arctic
observing network social indicators project: overview. Polar Geography, 34(1-2), 1-8.
Knapp, C.N., and Trainor, S.F., 2013, Adapting science to a warming world. Global
Environmental Change, 23(5), pp. 1296–1306.
Kopp, R. E., Horton, R. M., Little, C. M., Mitrovica, J. X., Oppenheimer, M., Rasmussen,
D. J., ... & Tebaldi, C. (2014). Probabilistic 21st and 22nd century sea‐level projections at
a global network of tide‐gauge sites. Earth's future, 2(8), 383-406.
Kulp, S., & Strauss, B. H. (2017). Rapid escalation of coastal flood exposure in US
municipalities from sea level rise. Climatic Change, 142(3-4), 477-489.
Lall, S. V., & Deichmann, U. (2010). Density and disasters: economics of urban hazard
risk. The World Bank Research Observer, 27(1), 74-105.
Lantuit, H., Overduin, P. P., Couture, N., Wetterich, S., Aré, F., Atkinson, D., ... &
Graves-Gaylord, A. (2012). The Arctic coastal dynamics database: a new classification
scheme and statistics on Arctic permafrost coastlines. Estuaries and Coasts, 35(2), 383-
400.

172
Larsen, J.N., O.A. Anisimov, A. Constable, A.B. Hollowed, N. Maynard, P. Prestrud,
T.D. Prowse, and J.M.R. Stone, 2014: Polar regions. In: Climate Change 2014: Impacts,
Adaptation, and Vulnerability. Part B: Regional Aspects. Contribution of Working Group
II to the Fifth Assessment Report of the Intergovernmental Panel on Climate Change
[Barros, V.R., C.B. Field, D.J. Dokken, M.D. Mastrandrea, K.J. Mach, T.E. Bilir, M.
Chatterjee, K.L. Ebi, Y.O. Estrada, R.C. Genova, B. Girma, E.S. Kissel, A.N. Levy, S.
MacCracken, P.R. Mastrandrea, and L.L.White (eds.)]. Cambridge University Press,
Cambridge, United Kingdom and New York, NY, USA, pp. 1567-1612.
Lathrop Jr, R. G., Auermuller, L., Haag, S., & Im, W. (2012). The Storm Water
Management and Planning Tool: Coastal water quality enhancement through the use of
an internet-based geospatial tool. Coastal Management, 40(4), 339-354.
Lathrop Jr, R. G., Auermuller, L., Herb, J., & Kaplan, M. Integrated Assessment of Risk
and Vulnerability. (2017). The Use of Online Decision-Support Tools to Communicate
Coastal Vulnerability and Promote Adaptation Planning. GI_Forum 2017, 1, 352-359.
Lathrop, R., Auermuller, L., Trimble, J., & Bognar, J. (2014). The application of
WebGIS tools for visualizing coastal flooding vulnerability and planning for resiliency:
The New Jersey experience. ISPRS International Journal of Geo-Information, 3(2), 408-
429.
Lee, C., Eicken, H., & Jakobsson, M. (2015b). The Arctic Observing Summit 2013.
Arctic, 68(5).
Lee, O., Eicken, H., Kling, G., & Lee, C. (2015a). A framework for prioritization, design
and coordination of arctic long-term observing networks: A perspective from the US
search program. Arctic, 76-88.
Leichenko, R., McDermott, M., & Bezborodko, E. (2015). Barriers, Limits and
Limitations to Resilience. Journal of Extreme Events, 2(01), 1550002.
Leichenko, R., McDermott, M., Bezborodko, E., Brady, M., & Namendorf, E. (2014).
Economic vulnerability to climate change in coastal New Jersey: A stakeholder-based
assessment. Journal of Extreme Events, 1(01), 1450003.
Leichenko, R. M., & Thomas, A. (2012). Coastal cities and regions in a changing
climate: economic impacts, risks and vulnerabilities. Geography Compass, 6(6), 327-339.
Lemos, M. C., Kirchhoff, C. J., & Ramprasad, V. (2012). Narrowing the climate
information usability gap. Nature Climate Change, 2(11), 789-794.
Lemos, M. C., & Morehouse, B. J. (2005). The co-production of science and policy in
integrated climate assessments. Global environmental change, 15(1), 57-68.

173
Liverman, D. M. (1990). Vulnerability to global environmental change. Understanding
global environmental change: The contributions of risk analysis and management, 27-44.
Lovecraft, A. L., & Eicken, H. (Eds.). (2011). North by 2020: perspectives on Alaska’s
changing social-ecological systems. University of Alaska Press.
Lovecraft, A. L., Meek, C., & Eicken, H. (2013). Connecting scientific observations to
stakeholder needs in sea ice social–environmental systems: the institutional geography of
northern Alaska. Polar Geography, 36(1-2), 105-125.
Lovecraft, A. L., Meek, C., & Eicken, H. (2016). Data Portals as Institutional Bridges:
Connecting Scientific Observations to Stakeholder Needs in Sea Ice Social-
Environmental Systems. Arctic Observing Summit, 15-18.
Lynch, A. H., Tryhorn, L., & Abramson, R. (2008). Working at the boundary: facilitating
interdisciplinarity in climate change adaptation research. Bulletin of the American
Meteorological Society, 89(2), 169-179.
MA (Millennium Ecosystem Assessment). (2005). Ecosystems and human wellbeing: a
framework for assessment. Washington, DC: Island Press.
Mahoney, A. R., Eicken, H., Gaylord, A. G., & Gens, R. (2014). Landfast sea ice extent
in the Chukchi and Beaufort Seas: The annual cycle and decadal variability. Cold
Regions Science and Technology, 103, 41-56.
Manley, W. F., Gaylord, A. G., Kassin, A., Cody, R., Copenhaver, W. A., Dover, M., ...
& Lin, D. H. (2015). The US Arctic Observing Viewer: A Web-Mapping Application for
Enhancing Environmental Observation of the Changing Arctic. Arctic, 100-110.
Manson, G. K., & Solomon, S. M. (2007). Past and future forcing of Beaufort Sea coastal
change. Atmosphere-Ocean, 45(2), 107-122.
Markon, C. J., Trainor, S. F., & Chapin III, F. S. (2012). The United States national
climate assessment-Alaska technical regional report (No. 1379). US Geological Survey.
Marra, J. J., Sweet, W., & Merrifield, M. A. (2015). Advancing Best Practices for the
Formulation of Localized Sea Level Rise/Coastal Inundation Extremes Scenarios for
Military Installations in the Pacific Islands (No. RC-2335). NOAA NESDIS National
Climate Data Center Asheville United States.
Mars, J. C., & Houseknecht, D. W. (2007). Quantitative remote sensing study indicates
doubling of coastal erosion rate in past 50 yr along a segment of the Arctic coast of
Alaska. Geology, 35(7), 583-586.

174
Martinich, J., Neumann, J., Ludwig, L., & Jantarasami, L. (2013). Risks of sea level rise
to disadvantaged communities in the United States. Mitigation and Adaptation Strategies
for Global Change, 18(2), 169-185.
McGranahan, G., Balk, D., & Anderson, B. (2006). Low coastal zone settlements.
Tiempo, 59, 23-26.
McGranahan, G., Balk, D., & Anderson, B. (2007). The rising tide: assessing the risks of
climate change and human settlements in low elevation coastal zones. Environment and
urbanization, 19(1), 17-37.
McGranahan, G., Balk, D., & Anderson, B. (2008). Risks of climate change for urban
settlements in low elevation coastal zones. The new global frontier: Urbanization,
poverty and environment in the 21st century, 165e182.
Meier, W. N., Stroeve, J., & Fetterer, F. (2007). Whither Arctic sea ice? A clear signal of
decline regionally, seasonally and extending beyond the satellite record. Annals of
Glaciology, 46(1), 428-434.
Melvin, A. M., Larsen, P., Boehlert, B., Neumann, J. E., Chinowsky, P., Espinet, X., ... &
Nicolsky, D. J. (2016). Climate change damages to Alaska public infrastructure and the
economics of proactive adaptation. Proceedings of the National Academy of Sciences,
201611056.
Mercer, J., Kelman, I., Lloyd, K., & Suchet‐Pearson, S. (2008). Reflections on use of
participatory research for disaster risk reduction. Area, 40(2), 172-183.
Mikow, E. (2010). Third Time and Counting: Remembering Past Relocations and
Discussing the Future in Kaktovik, Alaska. Alaska Journal of Anthropology, 33.
Mitchell, J. K. (1987). Coastal and Marine Area Management in the Arctic. In: Arctic
Heritage: Proceedings of a Symposium.
Mitchell, J. K., O’Neill, K., McDermott, M., & Leckner, M. (2016). Towards a
Transformative Role for Local Knowledge in Post-Disaster Recovery: Prospects for Co-
Production in the Wake of Hurricane Sandy. Journal of Extreme Events, 3(01), 1650003.
Mitchell, R. B. (2006). Global environmental assessments: information and influence.
MIT Press.
Moss, R., Scarlett, P. L., Kenney, M. A., Kunreuther, H., Lempert, R., Manning, J., ... &
Patton, L. (2014). Decision support: Connecting science, risk perspective, and
decisions. Climate change impacts in the United States: The Third National Climate
Assessment. US Global Change Research Program, Washington, DC, 620-647.

175
Murdukhayeva, A., August, P., Bradley, M., LaBash, C., & Shaw, N. (2013). Assessment
of inundation risk from sea level rise and storm surge in northeastern coastal national
parks. Journal of Coastal Research, 29(6a), 1-16.
Murray, M. S., Eicken, H., Starkweather, S., Gerlach, S. C., Evengard, B., Gearhard, S.,
... & Bock, N. (2012). Responding to Arctic Environmental Change-Translating our
Grwoing Understanding into a Research Agenda for Action. In Workshop Report
'Responding to Arctic Environmental Change' International Study for Arctic Change,
IASC.
Nadim, F., Smebye, H., Løvholt, F., Kjekstad, O., Kalsnes, B., Chen, R., ... & Muniz, M.
(2009). Natural and Conflict Related Hazards in Asia-Pacific: Risk assessment and
mitigation measures for natural and conflict related hazards in Asia-Pacific.
Neumann, J. E., Emanuel, K., Ravela, S., Ludwig, L., Kirshen, P., Bosma, K., &
Martinich, J. (2015). Joint effects of storm surge and sea-level rise on US Coasts: new
economic estimates of impacts, adaptation, and benefits of mitigation policy. Climatic
Change, 129(1-2), 337-349.
Neumann, J. E., Hudgens, D. E., Herter, J., & Martinich, J. (2010). Assessing sea-level
rise impacts: a GIS-based framework and application to coastal New Jersey. Coastal
management, 38(4), 433-455.
Nicholls, R. J. (2002). Rising sea levels: potential impacts and responses.
Nicholls, R. J. (2004). Coastal flooding and wetland loss in the 21st century: changes
under the SRES climate and socio-economic scenarios. Global Environmental Change,
14(1), 69-86.
Nicholls, R. J., & Cazenave, A. (2010). Sea-level rise and its impact on coastal zones.
science, 328(5985), 1517-1520.
Nicholls, R. J., Hoozemans, F. M., & Marchand, M. (1999). Increasing flood risk and
wetland losses due to global sea-level rise: regional and global analyses. Global
Environmental Change, 9, S69-S87.
Nicholls, R. J., Wong, P. P., Burkett, V., Codignotto, J., Hay, J., McLean, R., ... &
Brown, B. (2007). Coastal systems and low-lying areas.
NOAA (National Oceanic and Atmospheric Administration), Office for Coastal
Management. (2015). Stakeholder Engagement Strategies for Participatory Mapping.
NOAA Office for Coastal Management. Charleston, South Carolina. Accessed
December, 2016 at https://coast.noaa.gov/data/digitalcoast/pdf/participatory-mapping.pdf

176
Norton, D. W. (2001). Fifty more years below zero: tributes and meditations for the
Naval Arctic Research Laboratory's first half century at Barrow, Alaska. Univ. of Alaska
Pr.
NRC (National Research Council). (2006). Toward an integrated arctic observing
network. National Academies Press.
NRC (National Research Council). (2009). Informing decisions in a changing climate.
National Academies Press.
NRC (National Research Council). (2014). The Arctic in the Anthropocene: Emerging
Research Questions. National Academies Press.
NSB (North Slope Borough). (2015). Soaring to the Future: Barrow Comprehensive
Plan 2015-2035. Prepared for the North Slope Borough. Community Planning Division,
North Slope Borough Department of Planning & Community Services. Barrow, Alaska,
March 3, 2015.
NSSI (North Slope Science Initiative). (2014). Emerging Issues Summaries. Science
Technical Advisory Panel. Presented to the North Slope Science Initiative Oversight
Group. Barrow, Alaska, October 7-8, 2009.
Overeem, I., Anderson, R. S., Wobus, C. W., Clow, G. D., Urban, F. E., & Matell, N.
(2011). Sea ice loss enhances wave action at the Arctic coast. Geophysical Research
Letters, 38(17).
Parsons, M.A., de Bruin, T., Tomlinson, S., Campbell, H., Godøy, Ø, & LeClert, J.
(2011). The State of Polar Data: the IPY Experience. In Krupnik, I., Allison, I., Bell, R.,
Cutler, P., Hik, D. L pez-Mart nez, J., et al. (Eds.), Understanding Earth’s Polar
Challenges: Summary by the IPY Joint Committee, International Polar Year 2007–2008,
Washington, DC: National Academies Press.
Payne, J., D. Perovich, R. Shnoro, and H. Wiggins, eds. (2013). U.S. Arctic Observing
Network Coordination Workshop Report. Study of Environmental Arctic Change
(SEARCH), Fairbanks, Alaska, 52 pp.
Pearce, T. D., Ford, J. D., Laidler, G. J., Smit, B., Duerden, F., Allarut, M., ... & Goose,
A. (2009). Community collaboration and climate change research in the Canadian Arctic.
Polar Research, 28(1), 10-27.
Pedersen, S. (1979). Regional Subsistence Land Use North Slope Borough, Alaska.
Peduzzi, P., Dao, H., Herold, C., & Mouton, F. (2009). Assessing global exposure and
vulnerability towards natural hazards: the Disaster Risk Index. Natural Hazards and
Earth System Sciences, 9(4), 1149-1159.

177
Peduzzi, P., & Herold, H. D. C. (2005). Mapping disastrous natural hazards using global
datasets. Natural Hazards, 35(2), 265-289.
Pelling, M., Maskrey, A., Ruiz, P., Hall, P., Peduzzi, P., Dao, Q. H., ... & Kluser, S.
(2004). Reducing disaster risk: a challenge for development.
Peterson, J. (2002). Environmental sensitivity index guidelines: Version 3.0.
Petrov, Andrey N., Shauna BurnSilver, F. Stuart Chapin III, Gail Fondahl, Jessica
Graybill, Kathrin Keil, Annika E. Nilsson, Rudolf Riedlsperger, and Peter Schweitzer.
(2016). Arctic sustainability research: toward a new agenda. Polar Geography 39, no. 3:
165-178.
Pielke, R. A. (1995). Usable information for policy: an appraisal of the US Global
Change Research Program. Policy Sciences, 28(1), 39-77.
Preston, B. L., Yuen, E. J., & Westaway, R. M. (2011). Putting vulnerability to climate
change on the map: a review of approaches, benefits, and risks. Sustainability
Science, 6(2), 177-202.
Pretty, J. N. (1995). A trainer's guide for participatory learning and action. IIED.
Pulsifer, P., Gearheard, S., Huntington, H. P., Parsons, M. A., McNeave, C., & McCann,
H. S. (2012). The role of data management in engaging communities in Arctic research:
overview of the Exchange for Local Observations and Knowledge of the Arctic
(ELOKA). Polar Geography, 35(3-4), 271-290.
Pulsifer, P. L., Huntington, H. P., & Pecl, G. T. (2014a). Introduction: local and
traditional knowledge and data management in the Arctic.
Pulsifer, P. L., & Taylor, D. F. (2005). The cartographer as mediator: cartographic
representation from shared geographic information. Modern Cartography Series, 4, 149-
179.
Pulsifer, P. L., Yarmey, L., Godøy, Ø., Friddell, J., Parsons, M., Vincent, W. F., ... &
Nickels, S. (2014b). Towards an International Polar Data Coordination Network. Data
Science Journal, 13, PDA94-PDA102.
Rabus, B., Eineder, M., Roth, A., & Bamler, R. (2003). The shuttle radar topography
mission - a new class of digital elevation models acquired by spaceborne radar. ISPRS
journal of photogrammetry and remote sensing, 57(4), 241-262.
Reid, W. V., Berkes, F., Wilbanks, T., & Capistrano, D. (2006). Bridging scales and
knowledge systems: linking global science and local knowledge in assessments.
Millennium Ecosystem Assessment and Island, Washington.

178
Reimnitz, E., Graves, S. M., & Barnes, P. W. (1985). Beaufort Sea coastal erosion,
shoreline evolution, and sediment flux. US Department of the Interior, Geological
Survey.
Reiser, R. A. (2001). A history of instructional design and technology: Part II: A history
of instructional design. Educational technology research and development, 49(2), 57-67.
Rohweder, J., Rogala, J. T., Johnson, B. L., Anderson, D., Clark, S., Chamberlin, F., ... &
Runyon, K. (2012). Application of wind fetch and wave models for habitat rehabilitation
and enhancement projects–2012 update. US Army Corps of Engineers, Contract report.
Rosenzweig, C, Solecki W, Blake R, Bowman M, Faris C, et al. (2011). Developing
coastal adaptation to climate change in the New York City infrastructure-shed: Process,
approach, tools, and strategies. Climatic Change, 106(1): 93-127.
Rowley, R. J., Kostelnick, J. C., Braaten, D., Li, X., & Meisel, J. (2007). Risk of rising
sea level to population and land area. Eos, Transactions American Geophysical Union,
88(9), 105-107.
Russell, D. E., Svoboda, M. Y., Arokium, J., & Cooley, D. (2013). Arctic Borderlands
Ecological Knowledge Cooperative: can local knowledge inform caribou
management? Rangifer, 33(2), 71-78.
Saettler, P. (1968). A history of instructional technology.
SAON (Sustaining Arctic Observing Networks). (2016). SAON External Review: Review
Report. SAON External Review Committee. Internet source accessed in November 2016:
https://www.arcticobserving.org/publications
Sarewitz, D., & Pielke, R. A. (2007). The neglected heart of science policy: reconciling
supply of and demand for science. environmental science & policy, 10(1), 5-16.
Schneider, S. H., & Chen, R. S. (1980). Carbon dioxide warming and coastline flooding:
physical factors and climatic impact. Annual review of energy, 5(1), 107-140.
SEARCH (Study of Environmental Arctic Change). (2005). Study of Environmental
Arctic Change: Plans for Implementation During the International Polar Year and
Beyond. Fairbanks, Alaska: Arctic Research Consortium of the United States (ARCUS).
104 pp.
Seel, N. M., Lehmann, T., Blumschein, P., & Podolskiy, O. A. (2017). What is
Instructional Design? In Instructional Design for Learning (pp. 1-17). Sense Publishers.
Serreze, M. C., Holland, M. M., & Stroeve, J. (2007). Perspectives on the Arctic's
shrinking sea-ice cover. science, 315(5818), 1533-1536.

179
Small, C., & Cohen, J. (2004). Continental physiography, climate, and the global
distribution of human population. Current Anthropology, 45(2), 269-277.
Small, C., & Nicholls, R. J. (2003). A global analysis of human settlement in coastal
zones. Journal of Coastal Research, 584-599.
Sommerkorn, M., & Fleener, C. (2016). Arctic Observing Summit 2016.
Stafford, J. M., Wendler, G., & Curtis, J. (2000). Temperature and precipitation of
Alaska: 50 year trend analysis. Theoretical and Applied Climatology, 67(1), 33-44.
Star, S. L., & Griesemer, J. R. (1989). Institutional ecology, translations' and boundary
objects: Amateurs and professionals in Berkeley's Museum of Vertebrate Zoology, 1907-
39. Social studies of science, 19(3), 387-420.
Starkweather, S., Jeffries, M. O., Stephenson, S., Anderson, R. D., Jones, B. M.,
Loehman, R., & von Biela, V. R. (2016). Arctic Research Plan: FY2017-2021. National
Science and Technology Council.
Stephens, S. H., DeLorme, D. E., & Hagen, S. C. (2015). Evaluating the utility and
communicative effectiveness of an interactive sea-level rise viewer through stakeholder
engagement. Journal of Business and Technical Communication, 29(3), 314-343.
Strauss, B. H., Ziemlinski, R., Weiss, J. L., & Overpeck, J. T. (2012). Tidally adjusted
estimates of topographic vulnerability to sea level rise and flooding for the contiguous
United States. Environmental Research Letters, 7(1), 014033.
Streever, B., Suydam, R., Payne, J. F., Shuchman, R., Angliss, R. P., Balogh, G., ... &
Kelley, J. J. (2011). Environmental change and potential impacts: applied research
priorities for Alaska's North Slope. Arctic, 64(3), 390.
Stroeve, J. C., Serreze, M. C., Holland, M. M., Kay, J. E., Malanik, J., & Barrett, A. P.
(2012). The Arctic’s rapidly shrinking sea ice cover: a research synthesis. Climatic
Change, 110(3), 1005-1027.
Sutherland, W. J., Shackelford, G., & Rose, D. C. (2017). Collaborating with
communities: co-production or co-assessment? Oryx, 51(4), 569-570.
Tate, C. A., & Frazier, T. G. (2013). A GIS methodology to assess exposure of coastal
infrastructure to storm surge & sea-level rise: a case study of Sarasota County, Florida.
Journal of Geography & Natural Disasters, 1, 2167-0587.
Taylor, P.C., W. Maslowski, J. Perlwitz, and D.J. Wuebbles. (2017). Arctic changes and
their effects on Alaska and the rest of the United States. In: Climate Science Special
Report: Fourth National Climate Assessment, Volume I [Wuebbles, D.J., D.W. Fahey,
K.A. Hibbard, D.J. Dokken, B.C. Stewart, and T.K. Maycock (eds.)]. U.S. Global
Change Research Program, Washington, DC, USA, pp. 303-332.

180
Thieler, E. R., & Hammar-Klose, E. S. (1999). National assessment of coastal
vulnerability to sea-level rise; US Atlantic Coast (No. 99-593).
Timm, K., Hum, R., Druckenmiller, M. (2016). Using Communication Theory and
Strategy to Develop Researcher-Stakeholder Relationships. Theme(s): 4.
Titus, J. G. (1988). Sea level rise and wetland loss: an overview. Titus, JG Greenhouse
Effect, Sea Level Rise, and Coastal Wetlands. US Environmental Protection Agency.
Washington, DC, 186.
US DOI (U.S. Department of Interior). (2012). National Petroleum Reserve-Alaska Final
Integrated Activity Plan/Environmental Impact Statement. Vol 1: Abstract, Executive
Summary, Chap 1-3. Anchorage, Alaska.
US FWS (U.S. Fish and Wildlife Service). (2015). Chapter 4: Affected Environment. In:
Arctic National Wildlife Refuge Comprehensive Conservation Plan.
USGCRP. (2017). Climate Science Special Report: A Sustained Assessment Activity of
the U.S. Global Change Research Program [Wuebbles, D.J., D.W. Fahey, K.A. Hibbard,
D.J. Dokken, B.C. Stewart, and T.K. Maycock (eds.)]. U.S. Global Change Research
Program, Washington, DC, USA, 669 pp.
US MMS (U.S. Minerals Management Services). (1984). Barrow Arch Socioeconomic
and Sociocultural Description. The Social and Economic Studies Program, Minerals
Management Services, Alaska OCS Region. Technical Report No. 101. Prepared by
Alaska Consultants, Inc. Clyde S. Courtnage and Stephen Braund & Associates.
Vafeidis, A. T., Nicholls, R. J., McFadden, L., Tol, R. S., Hinkel, J., Spencer, T., ... &
Klein, R. J. (2008). A new global coastal database for impact and vulnerability analysis to
sea-level rise. Journal of Coastal Research, 917-924.
Vargas-Moreno, J.C., B. Fradkin, S. Emperador, O. Lee, (eds). (2016). Project Summary:
Prioritizing Science Needs Through Participatory Scenarios for Energy and
Resource Development on the North Slope and Adjacent Seas. Report to the
North Slope Science Initiative. GeoAdaptive, LLC, Boston, Massachusetts.
Vaughan, D.G., J.C. Comiso, I. Allison, J. Carrasco, G. Kaser, R. Kwok, P. Mote, T.
Murray, F. Paul, J. Ren, E. Rignot, O. Solomina, K. Steffen and T. Zhang, 2013:
Observations: Cryosphere. In: Climate Change 2013: The Physical Science Basis.
Contribution of Working Group I to the Fifth Assessment Report of the
Intergovernmental Panel on Climate Change [Stocker, T.F., D. Qin, G.-K. Plattner, M.
Tignor, S.K. Allen, J. Boschung, A. Nauels, Y. Xia, V. Bex and P.M. Midgley (eds.)].
Cambridge University Press, Cambridge, United Kingdom and New York, NY, USA.

181
Vogel, C., Moser, S. C., Kasperson, R. E., & Dabelko, G. D. (2007). Linking
vulnerability, adaptation, and resilience science to practice: Pathways, players, and
partnerships. Global environmental change, 17(3), 349-364.
Von Bertalanffy, L., & Rapoport, A. (1956). General systems. Yearbook of the society for
the Advancement of General System Theory, 1, 1-10.
V r smarty, C.J., Dav dsson, P.A., Muir, M. A. K., & Sandford, R. W. (Eds.). (2015).
Motivating Research on the Science Communications Front: Conveying the Nature and
Impacts of Rapid Change in Ice-Dominated Earth Systems to Decision Makers and the
Public.
Vullings, W., Ligtenberg, A., & Bulens, J. (2004, April). Evaluation of GIS-based design
tool to support decision making within collaborative spatial planning. In 7th AGILE
conference on Geographic Information Science, Heraklion, Greece Aalborg University,
Denmark.
Walker, H. J. (1991). Bluff erosion at Barrow and Wainwright, arctic Alaska. Zeitschrift
für Geomorphologie Supplementband, 81, 53-61.
Walker, H. J. (1998). Arctic deltas. Journal of Coastal Research, 719-738.
Walker, H. J. (2001). Coastal processes and their influences on the people of Alaska’s
North Slope. Fifty More Years Below Zero, 117-122.
Wall, T. U., Meadow, A. M., & Horganic, A. (2017). Developing evaluation indicators to
improve the process of coproducing usable climate science. Weather, Climate, and
Society, 9(1), 95-107.
Weichselgartner, J., & Kasperson, R. (2010). Barriers in the science-policy-practice
interface: Toward a knowledge-action-system in global environmental change research.
Global Environmental Change, 20(2), 266-277.
Weichselgartner, J., & Marandino, C. A. (2012). Priority knowledge for marine
environments: challenges at the science–society nexus. Current Opinion in
Environmental Sustainability, 4(3), 323-330.
Wenger, E. (2011). Communities of practice: A brief introduction.
Wessel, P., and W. H. F. Smith, A Global Self-consistent, Hierarchical, High-resolution
Shoreline Database, J. Geophys. Res., 101, #B4, pp. 8741-8743, 1996.
White, D. D., Wutich, A., Larson, K. L., Gober, P., Lant, T., & Senneville, C. (2010).
Credibility, salience, and legitimacy of boundary objects: water managers' assessment of
a simulation model in an immersive decision theater. Science and Public Policy, 37(3),
219.

182
Wu, S. Y., Yarnal, B., & Fisher, A. (2002). Vulnerability of coastal communities to sea-
level rise: a case study of Cape May County, New Jersey, USA. Climate Research, 22(3),
255-270.
Yohe, G., Neumann, J. E., & Marshall, P. (1999). The economic damage induced by sea
level rise in the United States (pp. 178-208). Cambridge University Press, Cambridge,
United Kingdom and New York, NY, USA.
Yohe, G. W., Neumann, J. E., Marshall, P., & Ameden, H. (1996). The economics costs
of sea level rise on US coastal properties. Climatic Change, 32(1), 387-410.