Calculated phase diagrams and the corrosion of die-cast Mg-Al alloys
Upload
khangminh22Category
view
0download
0

Thank you for downloading this Simon & SchustereBook.
Join our mailing list and get updates on new releases, deals, bonus content and other greatbooks from and Simon & Schuster.
CLICK HERE TO SIGN UP
or visit us online to sign up ateBookNews.SimonandSchuster.com


CONTENTS
ACKNOWLEDGMENTS
PART I DARE TO KNOW1. Uncertainty2. The Illusion of Certainty3. Innumeracy4. Insight
PART II UNDERSTANDING UNCERTAINTIES IN THE REAL WORLD5. Breast Cancer Screening6. (Un)Informed Consent7. AIDS Counseling8. Wife Battering9. Experts on Trial
10. DNA Fingerprinting11. Violent People
PART III FROM INNUMERACY TO INSIGHT12. How Innumeracy Can Be Exploited13. Fun Problems14. Teaching Clear Thinking
GLOSSARY
REFERENCES
NOTES
INDEX

For my mother

ACKNOWLEDGMENTS
Books, like human beings, have a history. They are conceived in love andwritten with perspiration. My fondness for the topic of uncertainty and risk wasinspired by Ian Hacking’s and Lorraine Daston’s writings on the ideas of chance,rationality, and statistical thinking. David M. Eddy’s work on medical diagnosis,and that of Lola L. Lopes on decision making and risk, have shown me howthese ideas flourish and shape our present world. My interest in the way medicaland legal experts think, and how one can offer them mind tools to betterunderstand uncertainties, started with Ulrich Hoffrage, once my student andnow my colleague and friend, whom I heartily thank for the fun of some tenyears of joint research. This work has continued with Ralph Hertwig, StephanKrauss, Steffi Kurzenhäuser, Sam Lindsey, Laura Martignon, and PeterSedlmeier, as well as with other researchers at the Max Planck Institute forHuman Development. Among the many people outside my research group whohave shaped my thinking on the ideas presented in this book, I would like tothank Jonathan J. Koehler and John Monahan.
Many dear friends and colleagues have read, commented on, and helpedshape the many versions of this book manuscript: Michael Birnbaum, ValerieM. Chase, Kurt Danziger, Norbert Donner-Banzhoff, George Daston, RobertM. Hamm, Ulrich Hoffrage, Max Houck, Günther Jonitz, Gary Klein,Jonathan J. Koehler, Hans-Joachim Koubenec, Steffi Kurzenhäuser, Lola L.Lopes, John Monahan, Ingrid Mühlhauser, Marianne Müller-Brettl, R. D.Nelson, Mike Redmayne, Joan Richards, Paul Slovic, Oliver Vitouch, WilliamZangwill, and Maria Zumbeel.
My special thanks go to Christine and Andy Thomson, one a lawyer and theother a psychiatrist, to whom I owe several of the case studies reported in thisbook.
Valerie M. Chase has edited the entire book manuscript and much clarity isdue to her insight. Donna Alexander helped me at all stages of the development

of the book, including the footnotes and references; she was a wonderful andcritical support. Hannes Gerhardt joined in the final stages, Wiebke Mollerhelped find literature, even in the most remote places and Dagmar Fecht clearedthe decks, making writing even possible.
Lorraine Daston, my beloved wife, gave me emotional and intellectualsupport during the four years I was gestating this book, and my daughter Thalia,always delightful and helpful, gave me valuable suggestions on improving thereadability of the text.
People are important, but so is the environment in which one works. I havehad the good fortune in the past few years to profit from the splendidintellectual atmosphere and the resources of the Max Planck Society, for which Iam thankful.

PART I
DARE TO KNOW

. . . in this world there is nothing certain but death and taxes.Benjamin Franklin
1
UNCERTAINTY
Susan’s Nightmare
During a routine medical visit at a Virginia hospital in the mid-1990s, Susan, a26-year-old single mother, was screened for HIV. She used illicit drugs, but notintravenously, and she did not consider herself at risk of having the virus. But afew weeks later the test came back positive—which at the time amounted to aterminal diagnosis. The news left Susan shocked and distraught. Word of herdiagnosis spread, her colleagues refused to touch her phone for fear of contagion,and Susan eventually lost her job. Finally, she moved into a halfway house forHIV-infected patients. While there, she had unprotected sex with anotherresident, thinking, “Why take precautions if the virus is already inside of you?”Out of concern for her 7-year-old son’s health, Susan decided to stop kissinghim and began to worry about handling his food. The physical distance she keptfrom him, intended to be protective, caused her intense emotional suffering.Months later, she developed bronchitis, and the physician who treated her for itasked her to have her blood retested for HIV. “What’s the point?” she thought.
The test came back negative. Susan’s original blood sample was then retestedand also showed a negative result. What had happened? At the time the datawere entered into a computer in the Virginia hospital, Susan’s original blood testresult seems to have been inadvertently exchanged with those of a patient who

was HIV positive. The error not only gave Susan false despair, but it gave theother patient false hope.
The fact that an HIV test could give a false positive result was news to Susan.At no point did a health care provider inform her that laboratories, which runtwo tests for HIV (the ELISA and Western blot) on each blood sample,occasionally make mistakes. Instead, she was told repeatedly that HIV testresults are absolutely conclusive—or rather, that although one test might givefalse positives, if her other, “confirmatory” test on her initial blood sample alsocame out positive, the diagnosis was absolutely certain.
By the end of her ordeal, Susan had lived for 9 months in the grip of aterminal diagnosis for no reason except that her medical counselors believedwrongly that HIV tests are infallible. She eventually filed suit against her doctorsfor making her suffer from the illusion of certainty. The result was a generoussettlement, with which she bought a house. She also stopped taking drugs andexperienced a religious conversion. The nightmare had changed her life.
Prozac’s Side Effects
A psychiatrist friend of mine prescribes Prozac to his depressive patients. Likemany drugs, Prozac has side effects. My friend used to inform each patient thathe or she had a 30 to 50 percent chance of developing a sexual problem, such asimpotence or loss of sexual interest, from taking the medication. Hearing this,many of his patients became concerned and anxious. But they did not askfurther questions, which had always surprised him. After learning about theideas presented in this book, he changed his method of communicating risks. Henow tells patients that out of every ten people to whom he prescribes Prozac,three to five experience a sexual problem. Mathematically, these numbers are thesame as the percentages he used before. Psychologically, however, they made adifference. Patients who were informed about the risk of side effects in terms offrequencies rather than percentages were less anxious about taking Prozac—andthey asked questions such as what to do if they were among the three to fivepeople. Only then did the psychiatrist realize that he had never checked how hispatients understood what “a 30 to 50 percent chance of developing a sexualproblem” meant. It turned out that many of them had thought that something

would go awry in 30 to 50 percent of their sexual encounters. For years, myfriend had simply not noticed that what he intended to say was not what hispatients heard.
The First Mammogram
When women turn 40, their gynecologists typically remind them that it is timeto undergo biennial mammography screening. Think of a family friend of yourswho has no symptoms or family history of breast cancer. On her physician’sadvice, she has her first mammogram. It is positive. You are now talking to yourfriend, who is in tears and wondering what a positive result means. Is itabsolutely certain that she has breast cancer, or is the chance 99 percent, 95percent, 90 percent, 50 percent, or something else?
I will give you the information relevant to answering this question, and I willdo it in two different ways. First I will present the information in probabilities,as is usual in medical texts.1 Don’t worry if you’re confused; many, if not most,people are. That’s the point of the demonstration. Then I will give you the sameinformation in a form that turns your confusion into insight. Ready?
The probability that a woman of age 40 has breast cancer is about 1 percent.If she has breast cancer, the probability that she tests positive on a screeningmammogram is 90 percent. If she does not have breast cancer, the probabilitythat she nevertheless tests positive is 9 percent. What are the chances that awoman who tests positive actually has breast cancer?
Most likely, the way to an answer seems foggy to you. Just let the fog sit therefor a moment and feel the confusion. Many people in your situation think thatthe probability of your friend’s having breast cancer, given that she has a positivemammogram, is about 90 percent. But they are not sure; they don’t reallyunderstand what to do with the percentages. Now I will give you the sameinformation again, this time not in probabilities but in what I call naturalfrequencies:

Think of 100 women. One has breast cancer, and she will probably testpositive. Of the 99 who do not have breast cancer, 9 will also test positive.Thus, a total of 10 women will test positive. How many of those who testpositive actually have breast cancer?
Now it is easy to see that only 1 woman out of 10 who test positive actuallyhas breast cancer. This is a chance of 10 percent, not 90 percent. The fog inyour mind should have lifted by now. A positive mammogram is not good news.But given the relevant information in natural frequencies, one can see that themajority of women who test positive in screening do not really have breastcancer.
DNA Tests
Imagine you have been accused of committing a murder and are standing beforethe court. There is only one piece of evidence against you, but it is a potentiallydamning one: Your DNA matches a trace found on the victim. What does thismatch imply? The court calls an expert witness who gives this testimony:
“The probability that this match has occurred by chance is 1 in100,000.”
You can already see yourself behind bars. However, imagine that the experthad phrased the same information differently:
“Out of every 100,000 people, 1 will show a match.”
Now this makes us ask, how many people are there who could havecommitted this murder? If you live in a city with 1 million adult inhabitants,then there should be 10 inhabitants whose DNA would match the sample onthe victim. On its own, this fact seems very unlikely to land you behind bars.
Technology Needs Psychology

Susan’s ordeal illustrates the illusion of certainty; the Prozac and DNA stories areabout risk communication; and the mammogram scenario is about drawingconclusions from numbers. This book presents tools to help people to deal withthese kinds of situations, that is, to understand and communicate uncertainties.
One simple tool is what I call “Franklin’s law”: Nothing is certain but deathand taxes.2 If Susan (or her doctors) had learned this law in school, she mighthave asked immediately for a second HIV test on a different blood sample,which most likely would have spared her the nightmare of living with adiagnosis of HIV. However, this is not to say that the results of a second testwould have been absolutely certain either. Because the error was due to theaccidental confusion of two test results, a second test would most likely haverevealed it, as later happened. If the error, instead, had been due to antibodiesthat mimic HIV antibodies in her blood, then the second test might haveconfirmed the first one. But whatever the risk of error, it was her doctor’sresponsibility to inform her that the test results were uncertain. Sadly, Susan’scase is not an exception. In this book, we will meet medical experts, legalexperts, and other professionals who continue to tell the lay public that DNAfingerprinting, HIV tests, and other modern technologies are foolproof—period.
Franklin’s law helps us to overcome the illusion of certainty by making usaware that we live in a twilight of uncertainty, but it does not tell us how to goone step further and deal with risk. Such a step is illustrated, however, in theProzac story, where a mind tool is suggested that can help people understandrisks: When thinking and talking about risks, use frequencies rather thanprobabilities. Frequencies can facilitate risk communication for several reasons, aswe will see. The psychiatrist’s statement “You have a 30 to 50 percent chance ofdeveloping a sexual problem” left the reference class unclear: Does the percentagerefer to a class of people such as patients who take Prozac, to a class of eventssuch as a given person’s sexual encounters, or to some other class? To thepsychiatrist it was clear that the statement referred to his patients who takeProzac, whereas his patients thought that the statement referred to their ownsexual encounters. Each person chose a reference class based on his or her ownperspective. Frequencies, such as “3 out of 10 patients,” in contrast, make thereference class clear, reducing the possibility of miscommunication.

My agenda is to present mind tools that can help my fellow human beings toimprove their understanding of the myriad uncertainties in our moderntechnological world. The best technology is of little value if people do notcomprehend it.

Dare to know!Kant
2
THE ILLUSION OF CERTAINTY
The creation of certainty seems to be a fundamental tendency of human minds.1The perception of simple visual objects reflects this tendency. At an unconsciouslevel, our perceptual systems automatically transform uncertainty into certainty,as depth ambiguities and depth illusions illustrate. The Necker cube, shown inFigure 2-1, has ambiguous depth because its two-dimensional lines do notindicate which face is in front and which is in back. When you look at it,however, you do not see an ambiguous figure; you see it one way or the other.After a few seconds of fixating on the cube, however, you experience a gestaltswitch—that is, you see the other cube instead, but again unambiguously.

FIGURE 2-1. The Necker cube. If you fixate on the drawing, your perceptualimpression shifts between two different cubes—one projecting into and theother out of the page.

FIGURE 2-2. Turning the tables. These two tables are of identical size andshape. This illusion was designed by Roger Shepard (1990). (Reproduced withpermission of W. H. Freeman and Company.)

Roger Shepard’s “Turning the Tables,” a depth illusion shown in Figure 2-2,illustrates how our perceptual system constructs a single, certain impression fromuncertain cues. You probably see the table on the left as having a more elongatedshape than the one on the right. The two surfaces, however, have exactly thesame shape and area, which you can verify by tracing the outlines on a piece ofpaper. I once showed this illustration in a presentation during which I hoped tomake an audience of physicians question their sense of certainty (“often wrongbut never in doubt”). One physician simply did not believe that the areas werethe same shape. I asked him how much he wanted to bet, and he offered me$250. By the end of my talk, he had disappeared.
What is going on in our minds? Unconsciously, the human perceptual systemconstructs representations of three-dimensional objects from incompleteinformation, in this case from a two-dimensional drawing. Consider the longersides of each of the two tables. Their projections on the retina have the samelength. But the perspective cues in the drawings indicate that the longer side ofthe left-hand table extends into depth, whereas that of the right-hand table doesnot (and vice versa for their shorter sides). Our perceptual systems assume that aline of a given length on the retina that extends into depth is actually longerthan one that does not and corrects for that. This correction makes the left-handtable surface appear longer and narrower.
Note that the perceptual system does not fall prey to illusory certainty— ourconscious experience does. The perceptual system analyzes incomplete andambiguous information and “sells” its best guess to conscious experience as adefinite product. Inferences about depth, orientation, and length are providedautomatically by underlying neural machinery, which means that anyunderstanding we gain about the nature of the illusion is virtually powerless toovercome the illusion itself. Look back at the two tables; they will still appear tobe different shapes. Even if one understands what is happening, the unconsciouscontinues to deliver the same perception to the conscious mind. The greatnineteenth-century scientist Hermann von Helmholtz coined the term“unconscious inference” to refer to the inferential nature of perception.2 Theillusion of certainty is already manifest in our most elementary perceptualexperiences of size and shape. Direct perceptual experience, however, is not theonly kind of belief where certainty is manufactured.

Technology and Certainty
Fingerprinting has enjoyed an impeccable reputation. The fingerprintsthemselves are unique features of an individual and persist unchanged from earlyyouth into advanced age. Even identical twins have different fingerprints despitehaving the same genes. If the fingerprints of a suspect matched those found atthe scene of the crime, what jury would acquit the suspect? Fingerprint evidenceseems absolutely certain—the great exception to Franklin’s law, it would seem.
The use of fingerprinting acquired a scientific basis through the work of SirFrancis Galton, a nineteenth-century English gentleman scientist and CharlesDarwin’s first cousin. Galton looked at the arches, whorls, and loops of whichfingerprints consist and estimated the chance that two fingerprints would matchrandomly as 1 in 64 billion.3 Galton did not look at the whole fingerprint, butat points (“points of similarity”) where the ridges in the fingerprint either end orsplit. His estimate was based on using every point, and there are typically 35 to50 such points in a fingerprint. However, current practice has been to declare amatch between the fingerprints of a suspect and those found at a crime scenewhen 8 to 16 of these points match. (This practice varies widely.) But inEngland an alternative technique is being implemented that relies on anexaminer’s overall impression of a match, not on counting the matches betweenpoints. This alternative makes the determination of a match a subjectivejudgment. The validity of neither of the two techniques—determining points ofsimilarity and overall impression—however, has been scientifically investigated.Fingerprint experts have few statistics on which they can base their conclusions.
When actual fingerprints are found at a crime scene, two complicating factorsenter: fingerprints are typically incomplete, and they are “latent.” Withincomplete fingerprints, one cannot compare whole prints, only fragments.Galton’s statistical analysis and its modern equivalents do not help much in thiscase. The second complication is that most fingerprints found at the scene arelatent; that is, they require treatment with chemicals or illumination withultraviolet light to make them visible enough to work with. How reliable is it tocompare such filtered evidence with the suspect’s clean fingerprints taken undercontrolled conditions? Given these uncertainties and differences in procedure,

how certain is fingerprint evidence? The answer is that we do not know; thereseem to be no reliable scientific studies.
Recently, however, the Federal Bureau of Investigation performed a test ofthe reliability of fingerprint evidence that had never been done before. In 1998,Byron Mitchell appealed his conviction for having driven the getaway car in arobbery in Pennsylvania in 1991. The conviction was based on two latentfingerprints, one found on the steering wheel and the other on the gearshift ofthe car. The FBI decided to test the reliability of the reported match and sentthe latent fingerprints along with Mr. Mitchell’s inked prints to the laboratoriesof 53 various state law enforcement agencies. From the 35 laboratories thatresponded, 8 failed to find a match for one of the prints, and 6 failed to find amatch for the other, making the average failure rate one in five tests. Thistroublesome result casts considerable doubt on the reliability of fingerprinting.America’s National Institute of Justice has finally provided funding to study howgood fingerprinting actually is.4
Fingerprint evidence has been accepted as certain for more than a century,following Galton’s estimate. This calculation was made for ideal conditions,which are not found in the real world of incomplete and latent prints. WhenDNA fingerprinting was introduced into the courts, almost a hundred yearsafter Galton’s seminal work, the public and many experts projected the illusionof certainty onto this new technology. As we see in Chapter 10, DNAfingerprinting has also been declared “failsafe.” The fiction that fingerprinting,DNA fingerprinting, HIV tests, or other excellent new technologies areabsolutely foolproof is like a dream that comes back night after night, fulfilling adeep unconscious wish.
Authority and Certainty
When I was a child, I was told on good authority never to drink water aftereating cherries, or I would get very sick and might even die. It never occurred tome to doubt this warning. One day I shared an ample serving of cherries with anEnglish friend who had never heard of this danger. To my horror, I saw himreach for a glass of water after eating some of the cherries. I tried to stop him,but without success; he just laughed. He took a sip, and nothing happened. Not

only did he not die; he did not even get sick. That experience cured me.5 Mybelief about cherries was groundless, as many convictions about food and dietingare. However, this is not always the case. The general disposition to uncriticallyaccept such a belief is not unfounded when beliefs involve food, health, or otherthings that directly concern survival. Here, illusory certainty seems to be anadaptive response that for ages has protected humans, especially children, fromtrying to learn first-hand about possible dangers, such as which kinds of food arepoisonous and which are not. Similarly, young children are prepared to believein values, rules, and stories without question, which facilitates their integrationinto their social group and culture. Social conventions— whether learned fromone’s family or one’s wider culture—are, like elementary perception, a source ofthe illusion of certainty.
Illusory certainty is part of our perceptual, emotional, and culturalinheritance. It can provide us with images of our environment that are useful,although not always correct, as well as with feelings of comfort and safety. Theesoterica sections in today’s bookstores attest to the idea that many people cravefast faith. Throughout history, humans have created belief systems that promisecertainty, such as religion, astrology, and divination, systems in which people—particularly those experiencing terrible suffering—can find comfort. Certaintyhas become a consumer product. It is marketed the world over—by insurancecompanies, investment advisers, election campaigns, and the medical industry.In seventeenth-century Europe, buying life insurance meant making a bet on theduration of a prominent person’s life, such as whether the mayor of Paris woulddie within three years. If he died within the period on which you had wagered,you made a small fortune. Nowadays, insurance agencies have persuaded us thatlife insurance is about safety and certainty and that it is morally responsible tobet against our own lives for the sake of our survivors’ economic security.6Political parties likewise fuel the desire for security. Before Germany’s nationalelections of 1998, streets all over the country were plastered with ChristianDemocratic campaign posters that read: “CERTAINTY, NOT RISK.” This promisewas not unique to the platform of Chancellor Helmut Kohl and his party; otherparties in the elections also advertised certainty.
The illusion of certainty can be created and exploited as a tool for politicaland economic goals. In recent years, for instance, when mad cow disease (bovine

spongiform encephalopathy, or BSE) raged in Great Britain, Ireland, Portugal,France, and Switzerland, the German government declared its country BSE-free.“German beef is safe”—this phrase was repeated again and again by thepresident of the Farmers’ Association, the minister of agriculture, and a choir ofother government officials.7 The German people liked to hear this message.English beef had been banned, and customers were advised to ask their butcherfor beef bred in Germany. In other countries, so they were told, there was amarked lack of care and control.
When, in the year 2000, the Germans finally began to actually perform asubstantial number of tests on their own herds for BSE, the disease was found,and the public was caught totally by surprise. Ministers were forced to resign,beef prices toppled, and other countries banned German beef. The governmentfinally admitted that it had clung too long to the illusion that German cattlewere entirely free of the disease.
However, the game of promising certainty did not stop; only the playerschanged. Supermarkets and butchers now put up signs and set out pamphletsreassuring their customers: “Our beef is guaranteed BSE-free.” Some explainedthat this was because their cows had, luckily, grazed on ecological meadows, andothers that their cows had actually been tested—none mentioned that these testscontain a large number of errors. When the newspapers finally reported the caseof a cow that tested negative despite, indeed, having BSE, the public was againgiven a shock. Yet another illusion of certainty disappeared. Reassurance ratherthan information concerning BSE was the primary goal of both the governmentand the butchers and supermarkets.
Political and marketing campaigns show that illusory certainty does not beginor end with the individual mind. Many parties may be involved in the creationand selling of certainty, such as members of a profession who publicly deny thepossibility that their products could be flawed, and clients who want to hear andtrust this message and surrender to social authority. The illusion is also notintended for or created in all minds; it may be conjured up for specificaudiences. For instance, the Yale Law School professor Dr. Jay Katz recounted adiscussion he had had with a surgeon friend about the uncertainties that plaguebreast cancer treatment, during which they had agreed that nobody knows whatthe single best treatment is.8 When Katz asked his friend how he advised his

patients, the surgeon recounted telling his most recent patient with breast cancerthat the single best treatment is radical surgery and impressing upon her theneed to have the operation. Katz challenged his friend about this inconsistency:How could he suddenly be so sure what the best course of action was? Althoughhe admitted that he hardly knew the patient, the surgeon insisted that hispatients—this woman included—would neither comprehend nor tolerateknowledge of the uncertainties inherent in choosing treatment. In his view,patients want the illusion of certainty, and this patient got it.
In what follows, I invite you to have a closer look at the tangled web ofmotives from which the illusion of certainty is fabricated. We will take a look atthe physician-patient relationship from the inside, from the point of view ofphysicians who discuss the pros and cons of the illusion of certainty.
Physicians on Certainty and Responsibility
In 2000, 1 attended a meeting of 60 physicians, including representatives ofphysicians’ organizations and health insurance companies. All of them wereinterested in evidence-based medicine, in which physician and patient basemedical decisions on the available evidence rather than on mere conviction,preference, or habit. These people came from several countries in Europe andthe United States to a scenic vacation spot to spend two days together. The topicof the meeting was how to improve risk communication, physician-patientinteraction, and public knowledge about medical screening. The atmosphere wascasual. The organizer’s warm personality and the beautiful setting helped us todevelop a sense of trust and a common agenda. On the second day, an intensediscussion took place on physicians’ responsibility and patients’ illusorycertainty. Here is an exchange from the middle of this discussion:9
Dr. A: We doctors are the victims of the images we have of our patients: wethink the patient is not capable of informing himself.
Representative of the World Health Organization (WHO): In the U.S., theaverage physician-patient contact is five minutes. Most of theinformation is presented in a vocabulary that is unintelligible to the

patient. Patients tend to develop views of “fate” or “Inshallah” ratherthan learning to practice informed consent. All is God’s will, or thephysician’s; why should they worry? The Institute of Medicine estimatedthat some 44,000 to 98,000 patients are killed every year in U.S.hospitals by preventable medical errors and misadventures. It’s as if onelived in a culture where death is a desirable transition from one life to abetter one.
Dr. B: Isn’t that a bit much? That’s saying more people die from hospitalaccidents than from motor vehicle accidents, or from AIDS.
WHO: It’s based on the records of hospitals in New York, Colorado, andUtah. These errors were preventable, such as when a physicianprescribed an antibiotic to a patient with a history of documentedallergic reactions without consulting the medical records. The generalproblem in medicine is that, unlike in aviation, there is no system forreporting errors without punishing the individual doctor. Pilotsanonymously report “near misses” to a central database so that otherpilots can learn from them and improve air transport safety. Aviation hasfocused on building safe systems since World War II, and U.S. airlinefatalities have decreased ever since. In 1998, there were no deaths in theUnited States in commercial aviation. Health care has no such system.
Dr. A: Women go to screening to be sure that they do not have cancer. Butmammograms don’t deliver certainty; they miss some 10 percent ofcancers. And screening has both possible benefits and harms, of whichmost women are not informed. They just don’t know.
Dr. B (after murmuring skeptically): Informed consent—that’s just apolitically correct tale. If I were to start explaining to patients thebenefits and harms of a potential treatment, they would hardlycomprehend it. And if I were, in addition, to tell them what we do notknow, they would get very nervous.

Dr. C: I agree. Sixty percent of patients, conservatively estimated, do nothave the intellectual capacity to make decisions about treatmentsthemselves.
Breast cancer specialist: Let’s talk about physicians, not patients. The majorsource of continuing education for physicians is seminars run bypharmaceutical firms. The best hotel in town, opulent dinners, partnersinvited. When we offer seminars for continuing education, with a moreunbiased view of the matter, all my institute can afford is a dull lectureroom, and there is no money for drinks or even fast food. We can attractfew physicians. Concerning the intellectual capacities of patients, I havedecided to discuss with patients the pros and cons of hormone therapy—such as less depression on the one side and higher risk, a factor of 1.4, ofbreast cancer on the other. The problem is not that women have too lowan IQ to make their own decisions. They do make them if you providethe information. My problem is that since my patients have startedmaking their own decisions, my colleagues send me fewer of theirpatients.
Dr. A: When our organizer gave a talk at our institute, women left,unnerved, in droves. Some went to natural healers, back to the promiseof certainty.
Dr. B: But how could I allow a patient to decide for herself? How can onebe a responsible physician and still allow the patient to make thedecision?
Professor O: Look, I have two sons; both attend school. In that school therule is if pupils want to go home because they feel sick, they are sent to aschool physician. This man routinely X-rays every child; that is, if a boycomplains that his hand hurts, his hand is X-rayed; if his chest hurts, hischest is X-rayed. Just to be on the safe side. Typically, the physicianconcludes that there is no fracture, only serious bruising. Some childrenjust want to cut class so they pretend to be in pain and are X-rayed. Itold my boys that they are not allowed to have these X rays, and that

they should tell the doctor that their dad is a physician. As a father, Ihave the responsibility for my children, and I should not delegate this tothe next physician.
Dr. B: I think all this talk about informed consent—benefits and costs—misses the point. The meeting between physician and patient is a ritual.False positives have no place in this ritual.
Several physicians (agitated): That’s right, rituals. That’s what it is all about.
President of a medical association: Patients want to be reassured. They wantto be relieved of their anxiety, to be in the right hands, even if they donot feel better than before. They want a label for their suffering. Aphysician who takes anxiety away from the patient is a good doctor. Onehas to do something; one cannot do nothing; the patient would bedisappointed or even angry. Most prescriptions have no proven effect,but when the patient applies the ointment, the doctor, the patient, andthe pharmaceutical company are happy.
Radiologist: It is not money that drives physicians—it is salvation. Thephysician as a hero. Heroism is self-deception and the greatest obstacletowards progress.
President: If the doctor explains to the patient the risk in terms of “numberneeded to treat,” then the placebo effect is gone. After all, “numberneeded to treat” means how many people have to suffer treatment sothat just one can be saved. A patient visits a doctor to be cured, not tolearn how many have to be harmed so that one can be cured.
Dr. C: When it comes to health, rituals are unavoidable. From an economicpoint of view, screening often does not pay; the tax dollars could bespent on other things that are more beneficial. But for the physician-patient relationship, it pays.

President: The areas where medicine has made real progress quicklydisappear from public attention. Everything concentrates on areas andtreatments of questionable value. There are too many doctors, too littlemoney, and false incentives—a situation that reminds one of ratscrowded together that do strange things. And there is the ideal ofinfallibility. Patients want to believe in a doctor who never errs, anddoctors try to foster this illusion.
WHO: Uncertainty is a threat to practitioners. It’s hard to say “I don’tknow.”
This discussion reveals physicians’ complex motives, emotions, and beliefsabout the illusion of certainty, the existence of which none of the discussantsdenied. Different physicians struggle with this conundrum in different ways.Should a physician destroy patients’ illusions and reveal to them theuncertainties involved in a treatment? Should a physician always say “I don’tknow” when she or he doesn’t know?
One group of physicians at this meeting was convinced that uncertaintiesshould not be fully disclosed. Some believed that most patients would notunderstand the uncertainties in the first place, would become more confusedupon learning of them, and might even decide to go to another healer, one whooffers certainty. Others hinted at pragmatic constraints; it is hard to fully informpatients about risks during an interaction that lasts an average of five minutes. Inthese physicians’ view, the patient wants to be reassured, not informed; they seethis interaction as a ritual for generating the feeling that the patient is beingtaken care of.
A second group of physicians, in contrast, felt strongly that authority andemotional reassurance are not all that patients need and that many patients arecapable of dealing with uncertainty. The breast cancer specialist, for instance,had little respect for his colleagues’ patronizing attitude toward the patient as anintellectual inferior. He pointed out that there is ignorance on both sides of thephysician-patient relationship and that informed patients are not alwayswelcome in physicians’ offices. In his experience, informing patients meantlosing referrals.

The president made the challenging argument that neither reassurance norinformed consent is the best choice in every situation. He used the placebo effectto illustrate his point. The placebo effect is a well-known phenomenon inmedicine and psychotherapy in which a treatment tends to have at least somepositive effect if patients believe it is beneficial. One explanation for this effect isthat a patient’s belief mobilizes forces in the immune system that have been keptin reserve, much as a distance runner can mobilize all his reserves the moment herealizes that the finish line is near.10 The president called attention to thephenomenon that the placebo effect might disappear as soon as the physicianexplained to patients the actual risks inherent in the treatment, that is, as soon asthe physician assumed a role founded on reason rather than authority. Ifillusions can sometimes cure, then there is a problem—the benefit of knowing isnot absolute; there is also the potential efficacy of faith.11
This discussion also highlights the possibility that physicians and patients canhave different or even opposing goals. The school physician routinely performsX rays; his goal is to protect himself from possible accusations of overlooking afracture. However, Professor O’s goal is to protect his sons from being harmedby the X rays. Each of the two alternatives—to X-ray or not—involves potentialbenefits and costs for his boys, but these are not the same as those for the schoolphysician. The breast cancer expert informs patients about the pros and cons ofhormone therapy so that each woman can make her own decision, depending onwhat is more important to her. For instance, a woman may prefer lowering herchance of depression over reducing her chance of developing breast cancer, orvice versa. The expert’s tutorial is in the women’s interest, but not necessarily inthat of his fellow physicians who definitely want women to receive hormonetherapy, not to reflect about it. The representative of WHO reported theshocking number of patients killed every year in U.S. hospitals by preventableerrors, but safety systems such as in commercial aviation that would be in theinterest of patients have not been set up in hospitals. In aviation, safety is in theimmediate interest of the pilot; if the passengers die in a crash, the pilot will verylikely die too. The situation for the patient vis-à-vis the doctor is different.
Because costs and benefits typically differ for physicians and patients, it isimperative that patients be informed and be in a position to choose theirtreatment on this basis. Patients’ choices will not be, and should not always be,

the same as their physician’s, and a good doctor will reveal to the patient whentheir interests diverge. The illusion of certainty—such as that treatments haveonly benefits but not any harm; that there is one and only one best treatment;that a diagnostic test is absolutely certain—is a mental obstacle toward makingup one’s own mind.
Kant’s Dream
In his essay “What Is Enlightenment?” the philosopher Immanuel Kant beginsthus:
Enlightenment is man’s emergence from his self-imposed nonage.Nonage is the inability to use one’s own understanding withoutanother’s guidance. This nonage is self-imposed if its cause lies not inlack of understanding but in indecision and lack of courage to use one’sown mind without another’s guidance. Dare to know!12
These are lucid and lovely sentiments. The key term is “courage.” Courage isnecessary because using one’s own mind can bring not only feelings of liberationand autonomy, but also punishment and pain. Kant himself had to experiencethis. A few years after he wrote these lines, he was required by the government—out of fear that his rational thinking would undermine the certainty of theChristian doctrine—to cease writing and lecturing on religious subjects. Ingeneral, overcoming nonage can mean detecting holes in stories, facts, and valuesin which one has always believed. Questioning certainties often meansquestioning social authority.
Learning to live with uncertainty is a daring task for individuals as well associeties. Much of human history has been shaped by people who wereabsolutely certain that their kin, race, or religion was the one most valued byGod or destiny, which made them believe they were entitled to get rid ofconflicting ideas along with the bodies polluted with them. Modern societieshave come a long way toward greater tolerance of uncertainty and diversity.Nevertheless, we are still far from being the courageous and informed citizens

whom Kant envisaged—a goal that can be expressed in just two Latin words:Sapere aude. Or in three English words: “Dare to know.”

Math is hard. Let’s go shopping!Barbie1
3
INNUMERACY
At the beginning of the twentieth-century, the father of modern science fiction,H. G. Wells, is reported to have predicted, “Statistical thinking will one day beas necessary for efficient citizenship as the ability to read and write.”2 At the endof the century, the mathematician John Allen Paulos investigated how far wehad—or, rather, hadn’t—come in this respect. In his best-selling book,Innumeracy, Paulos related the story of a weather forecaster on Americantelevision who reported that there was a 50 percent chance of rain on Saturdayand a 50 percent chance of rain on Sunday, from which he concluded that therewas a 100 percent chance of rain that weekend!
The inability to reason appropriately about uncertainties is by no meansstrictly an American affliction. The word “percentage” has become one of themost frequent nouns in the German media. In a survey, 1,000 Germans wereasked what “40 percent” means: (a) one-quarter, (b) 4 out of 10, or (c) every40th person. About one-third of respondents did not choose the right answer.3Political decision makers are, likewise, not immune to innumeracy. For example,commenting on the dangers of drug abuse, a Bavarian minister of the interioronce argued that because most heroin addicts have used marijuana, mostmarijuana users will become heroin addicts. Figure 3-1 shows why thisconclusion is mistaken. Most heroin addicts indeed have used marijuana, as thedark section of the small circle shows. However, this does not mean that most

marijuana users are heroin addicts—the same dark section that covers most ofthe heroin addicts covers only a small portion of the marijuana users. On thebasis of his mistaken conclusion, the minister of the interior asserted thatmarijuana should therefore remain illegal. Whatever one’s views on thelegalization of marijuana, the minister’s conclusion was based on cloudedthinking.
In Western countries, most children learn to read and write, but even inadulthood, many people do not know how to think with numbers. This is theproblem that Paulos and others have called innumeracy. I focus on the mostimportant form of innumeracy in everyday life, statistical innumeracy—that is,the inability to reason about uncertainties and risk. Henceforth, when I use theterm “innumeracy,” I mean statistical innumeracy. How is the illusion ofcertainty connected to innumeracy? Here is an overview.
• Illusion of certainty. Franklin’s law is a mind tool to overcome theillusion of certainty, to help make the transition from certainty touncertainty. For instance, when Susan, the woman introduced inChapter 1, finally learned (the hard way) that laboratory errors occurin HIV testing, she made the transition from certainty to uncertainty.

FIGURE 3-1. Marijuana users and heroin addicts. Most heroin addicts aremarijuana users (the dark part of the smaller circle). Can we conclude from thisthat most marijuana users are heroin addicts?

• Ignorance of risk. This is an elementary form of innumeracy in which aperson does not know, not even roughly, how large a personally orprofessionally relevant risk is. This differs from the illusion of certaintyin that the person is aware that there may be uncertainties, but doesnot know how great these are. The major tool for overcoming theignorance of risk consists of various forms of information search (forexample, scientific literature). For instance, Chapter 7 gives detailsabout the various risks involved in HIV testing, including falsepositives.
• Miscommunication of risk. In this form of innumeracy a person knowsthe risks but does not know how to communicate these so that othersunderstand them. The mind tool for overcoming miscommunication isrepresentations that facilitate understanding. For instance, the Prozacstory in Chapter 1 illustrates the miscommunication of risk—thefailure to communicate risk in an understandable way—and how toovercome it.
• Clouded thinking. In this form of innumeracy a person knows the risksbut not how to draw conclusions or inferences from them. Forinstance, physicians often know the error rates of a clinical test and thebase rate of a disease, but not how to infer from this information thechances that a patient with a positive test actually has the disease(Chapter 1). Representations such as natural frequencies are a mindtool that facilitate the drawing of conclusions (Chapter 4).
Innumeracy—ignorance of risk, miscommunication of risk, and cloudedthinking—becomes a problem as soon as one is driven out of the promised landof certainty into the world in which Franklin’s law reigns. Innumeracy, Iemphasize, is not simply a problem within an individual mind; ignorance andmiscommunication of specific risks can, for example, be produced andmaintained by various groups within society to their own benefit.
Risk

The term “risk” has several senses. The one I intend has to do with uncertainty,but not necessarily regarding a dangerous event, such as a plane crash, becauseone can also be uncertain about a positive outcome, such as a successful landing.Another reason not to use the term to refer exclusively to negative outcomes isthat there are situations in which a negative outcome from one perspective is apositive outcome from another. For instance, losing a month’s salary in agambling casino is a negative outcome for the gambler but a positive one for thecasino.
In this book, I call an uncertainty a risk when it can be expressed as a numbersuch as a probability or frequency on the basis of empirical data. The numberneed not be fixed—it may be updated in light of experience. In situations inwhich a lack of empirical evidence makes it impossible or undesirable to assignnumbers to the possible alternative outcomes, I use the term “uncertainty”instead of “risk.”4 Uncertainty does not imply chaos; for instance, when a curefor cancer will be found is uncertain, but this does not have anything to do withchaos.
When does an uncertainty qualify as a risk? The answer depends on one’sinterpretation of probability, of which there are three major versions: degree ofbelief, propensity, and frequency. Degrees of belief are sometimes called subjectiveprobabilities. Of the three interpretations of probability, the subjectiveinterpretation is most liberal about expressing uncertainties as quantitativeprobabilities, that is, risks. Subjective probabilities can be assigned even tounique or novel events.
Degrees of Belief. Consider the surgeon Christiaan Barnard’s account ofhis first encounter with Louis Washkansky, who was then soon tobecome the first man to have a heart transplant. Washkansky waspropped up in bed, reading a book. Barnard introduced himself andexplained that he would exchange Washkansky’s heart for a healthy oneand that “there’s a chance you can get back to normal life again.”5
Washkansky did not ask how great the chance was, how long he wouldsurvive, or what the transplant operation involved. He just said he wasready to go ahead and turned back to his book, a Western. Barnard wasdeeply disturbed that Washkansky was more interested in pulp fiction

than in this great moment in medical history and the risk it posed tohim. But Washkansky’s wife, Ann, did ask Barnard, “What chance doyou give him?” Without hesitation or further explanation, he answered,“An 80 percent chance.”6 Eighteen days after the operation, Washkanskydied. Barnard’s “80 percent” reflected a degree of belief, or subjectiveprobability. In the subjective view, uncertainties can always betransformed into risks, even in novel situations, as long as they satisfy thelaws of probability—such as that the probabilities of an exhaustive andexclusive set of alternatives such as survival and death add up to 1. Thus,according to the subjective interpretation, Barnard’s statement thatWashkansky had an 80 percent chance of survival is meaningfulprovided that the surgeon also held that there was a 20 percent chance ofhis patient not surviving. In this interpretation, Barnard’s “80 percent”would qualify as quantified uncertainty, that is, as risk.
Propensities. The possibility of translating uncertainties into risks is muchmore restricted in the propensity view. Propensities are properties of anobject, such as the physical symmetry of a die. If a die is constructed tobe perfectly symmetrical, then the probability of rolling a six is 1 in 6.The reference to a physical design, mechanism, or trait that determinesthe risk of an event is the essence of the propensity interpretation ofprobability. Note how propensity differs from the subjectiveinterpretation: It is not sufficient that someone’s subjective probabilitiesabout the outcomes of a die roll are coherent, that is, that they satisfy thelaws of probabilty. What matters is the die’s design. If the design is notknown, there are no probabilities. According to this view, Barnard’sestimate of 80 percent would not qualify as a probability, or risk, becausenot enough is known about the heart operation for its propensities to beassessed.
Frequencies. For a frequentist, a probability must be based on a largenumber of observations and is defined as the relative frequency of anevent in a specified reference class, such as the relative frequency of lungcancer in white American males who smoked cigarettes for at least 20

years. No reference class, no probability. Frequentists would not beinterested in what someone believes about the outcome of rolling a die,nor would they need to study the design of the die to determine theprobability of rolling a six. They would determine the probabilityempirically by rolling the die many times and computing the relativefrequency with which the outcome was a six. Therefore, frequentistswould declare Barnard’s estimate of 80 percent meaningless (becausethere were no comparable transplants at the time he made the estimate),and hard-line frequentists would reject altogether the notion of assigningprobabilities to a single event such as the survival of a specific man.Clearly, frequentists are cautious about moving from uncertainties torisks. For them, risks refer only to situations for which a large body ofempirical data exists. The courts, for instance, tend to adhere to thefrequentist position, admitting statements about risks as evidence onlywhen they are based on empirical frequencies rather than opinion.
These different interpretations of probability can produce drastically differentestimates of risk. A few years ago, I enjoyed a guided tour through Daimler-BenzAerospace (DASA), which produces the Ariane, a rocket that carries satellitesinto orbit. Standing with my guide in front of a large poster that listed all 94rockets launched so far (Ariane models 4 and 5), I asked him what the risk of anaccident was. He replied that the security factor is around 99.6 percent. Thatwas surprisingly high because on the poster I saw eight stars, which meant eightaccidents. To be sure, several of the stars were next to early launchings, butlaunch numbers 63, 70, and 88 were also accidents. I asked my guide how eightaccidents could translate into 99.6 percent certainty. He replied that DASA didnot count the number of accidents, but rather computed the security factor fromthe design features of the individual parts of the rocket. He added that countingaccidents would have included human errors, and pointed out that behind oneof these stars, for instance, was a misunderstanding between one worker whohad not installed a screw, and the worker on the next shift who had assumedthat his predecessor had done so. The reported risk of an Ariane accident was,hence, based on a propensity, not a frequency, interpretation.

In this book, I will focus on risks that can be quantified on the basis offrequency data. This is not to say that frequencies are the whole story inestimating risks, but—when they are available—they provide a good startingpoint.
Ignorance of Risk
Who is informed about risks? The answer depends on one’s culture and theevent or hazard in question. For instance, the weather forecast might say that thechances of rain tomorrow are 30 percent, and we at least think we understandwhat that means. Although it seems natural to express the uncertainty of weatherin terms of probabilities, this is a recent cultural phenomenon. Before 1965, theU.S. National Weather Service expressed its forecasts in all-or-none terms suchas “it will not rain tomorrow,” perhaps preceded by “it is unlikely that. . . .” InGermany, probabilities began to be reported in weather forecasts only around1990; in France, weather forecasts are still largely probability-free. Some cultureshave an insatiable appetite for numbers—batting averages, SAT scores, andmarket indices— while others are more reluctant to express uncertainties innumerical form. In general, democracies tend to have a greater desire fornumbers and a greater motivation to make risks transparent than most othersocial systems.
PROMOTING PUBLIC IGNORANCE
However, democracies also host groups that have little interest in the public’sknowing about certain risks. For instance, in the 1950s, the American tobaccoindustry began a massive campaign to convince the public that cigarette smokingwas safe. This was around the time when the American scientific communitybegan to reach a consensus that cigarettes are a major cause of illness, and theindustry invested hundreds of millions of dollars in the creation of an illusion ofcertainty.7 After the illusion crumbled following a report by the U.S. SurgeonGeneral in 1964, the tobacco industry launched a second campaign ofobfuscation to engender “doubt” about the extent of the actual risks involved.For decades, the scientific evidence concerning the hazards of smoking was rarelyif ever discussed in the leading national magazines in which the tobacco industry

advertised. Large segments of the public got the impression that the question ofthe effects of smoking on health was still open. As early as the mid-1950s,however, the American Cancer Society had evidence that people who smokedtwo packs of cigarettes a day were dying about seven years earlier, on average,than nonsmokers. Most experts today agree that tobacco is the cause of 80 to 90percent of all cases of lung cancer. Tobacco kills upward of 400,000 Americansevery year, primarily through lung cancer and heart disease; in Germany, thenumber is estimated to be 75,000. In China, the number of people who diefrom lung cancer will soon be close to 1 million a year. The case of cigarettesmoking illustrates how public awareness of a health hazard can be diluted by adouble defense line. First, the illusion of certainty is manufactured: Smoking issafe—period. When this illusion breaks down, uncertainty is acknowledged, butdoubt is spread as to whether the actual risks are known or not.
BEYOND IGNORANCE: IT’S OFTEN ONLY A SIMPLE CALCULATION
Not all ignorance is driven by trade lobbies or other parties that have an interestin keeping people ignorant of risks. There are also situations in which the factsare plainly in view and people have only to make a small mental effort to putthem together.
What is the chance of one’s dying in a motor vehicle accident over the courseof a lifetime? It does not take much time to figure this out. In an average year,40,000 to 45,000 people die on the roads in the United States.8 Given that thecountry has about 280 million inhabitants, this means that about 1 in 7,000 ofthem is killed on the road each year. Assuming that this figure remains fairlystable over time, we can also figure out the chance of dying on the road duringone’s life. Given a life span of 75 years, the result is roughly 1 in 90. That is, 1out of every 90 Americans will lose his or her life in a motor vehicle accident bythe age of 75. Most of them die in passenger car accidents.
Are Americans in greater danger of being killed on the road than people inGermany or in Great Britain? In an average year, about 8,000 people die on theroads in Germany. Given its population of about 80 million, one can calculatethat about 1 in 10,000 is killed in a motor vehicle accident. Over a life span of75 years, this is equivalent to about 1 in every 130 people. Again, the majority ofthese people are killed while driving or riding in a passenger car.9 Note that the

higher fatality rate of Americans does not imply that they drive moredangerously than Germans; they just drive more, in part because of the lack ofpublic transportation. In Great Britain (including Northern Ireland), the roadsare safer than in the United States and Germany. There, again over a life span of75 years, “only” about 1 in 220 people is killed in a motor vehicle accident.
American roads are, however, definitely not the most dangerous in theWestern world. There are two European countries that stand out from theothers, Portugal and Greece, where about 1 in 4,000 citizens is killed on theroad every year. This means that over a life span of 75 years, about 1 out of every50 people in Portugal and Greece is killed on the roads.10
All that is needed to make these estimates is the number of people who die ofthe cause in question each year and the population of the country. Both can belooked up easily for any country or state. These estimates are only rough becausethey do not take account of the possibility that driving behavior or safetytechnology might drastically change over time. I do not present the striking risksof driving to make every reader switch to public transportation. Many peoplehave heard arguments of the sort “planes are safer than cars,” yet thesearguments do not change their behavior—because of habit, fear of flying, or loveof driving. However, knowing the actual risk allows individuals to make up theirown minds, to weigh the risk against the individual benefits of driving, and toarrive at an informed decision. For instance, the terrorist attack on September11, 2001, cost the lives of some 3,000 people. The subsequent decision ofmillions to drive rather than fly may have cost the lives of many more.
PUBLIC NUMBERS
Public ignorance of risk has a historical basis. Unlike the stories, mythologies,and gossip that have been shaping our minds since the beginning of humanculture, public statistics are a recent cultural achievement. During much of theeighteenth and nineteenth centuries, statistical information was a state secretknown only by an elite and withheld from the public. The power of statisticalinformation, such as population figures, has been recognized among politicalleaders for centuries. Napoleon’s appetite for facts from his bureau de statistiquewas legendary.11 And he always wanted the numbers immediately. At theNapoleonic court, the saying was, If you want something from Napoleon, give

him statistics. Willingness to make economic and demographic figures public isa recent phenomenon. It was not until around 1830 that statistics, or at leastsome of them, became public. Since then, an “avalanche of printed numbers,” toborrow the philosopher Ian Hacking’s phrase, has turned modern life into a vastocean of information conveyed by media such as television, newspapers, and theInternet. In this sense, one can say that, although uncertainties are old, risks arerelatively new.
As already mentioned, the widening dissemination of statistical informationto the public during the nineteenth and twentieth centuries has been linked tothe rise of democracies in the Western world.12 A democracy makes lots ofinformation available to everyone, but its citizens often have very selectiveinterests. It is more likely that a young American male knows baseball statisticsthan that his chance of dying on a motorcycle trip is about 15 times higher thanhis chance of dying on a car trip of the same distance.13 Today, numbers arepublic, but the public is not generally numerate.
From Miscommunication to Risk Communication
The Prozac story in Chapter 1 illustrates the miscommunication of risk— thefailure to communicate risk in an understandable way. Some forms ofcommunication enhance understanding; others don’t. Miscommunication ofrisk is often the rule rather than the exception and can be difficult to detect, asthe ambiguous probabilities in the Prozac story illustrate. Statements about theprobabilities of single events—such as “you have a 30 to 50 percent chance ofdeveloping a sexual problem”—are fertile ground for miscommunication. Onemind tool that can overcome this problem is specifying a reference class, whichoccurs automatically when one uses statements about frequencies rather thansingle events.
There are three major forms of risk communication that invitemiscommunication: the use of single-event probabilities, relative risks, andconditional probabilities. As it happens, these seem to be the most frequently usedforms of risk communication today.
SINGLE-EVENT PROBABILITIES

To communicate risk in the form of a single-event probability means to make astatement of this type: “The probability that an event will happen is X percent.”There are two reasons why such a statement can be confusing. First, asillustrated by the Prozac case, a probability of a single event, by definition, doesnot state what the reference class is. Second, if the event is unique, that is, thereare no comparable events known, then the probability estimate itself is likely tobe nothing but a wild guess that may suggest precision where, in fact, onlyuncertainty reigns. Let me give you some examples.
The statement “there is a 30 percent chance that it will rain tomorrow” is aprobability statement about a singular event—it will either rain or not raintomorrow. In contrast, the statement that it will rain on 10 days in May is afrequency statement. The latter statement can be true or false; a single-eventprobability by itself, however, can never be proven wrong (unless the probabilityis zero or one). Single-event probabilities can lead to miscommunication becausepeople tend to fill in different reference classes. This happens even with suchfamiliar statements as “there is a 30 percent chance that it will rain tomorrow.”Some think this statement means that it will rain 30 percent of the time, othersthat it will rain in 30 percent of the area, and a third group believes it will rainon 30 percent of the days that are like tomorrow. These three interpretations areabout equally frequent.14 What weather forecasters actually have in mind is thelast interpretation. However, people should not be blamed for differentinterpretations; the statement “there is a 30 percent chance that it will raintomorrow” is ambiguous.
Dr. Barnard’s 80 percent estimate illustrates specific problems withstatements about unique events. Ann Washkansky may have gotten theimpression that this high probability offered hope, but what it meant wasambiguous. Barnard did not say to what the number referred: the probability ofWashkansky’s surviving the operation, surviving the following day or year, orsomething else. Furthermore, the probability referred to the first heart transplantin history; there were no comparable cases on which Barnard could have basedhis estimate. Barnard’s answer may have reassured, but did not inform,Washkansky’s wife.
RELATIVE RISKS

What is the benefit of a cholesterol-lowering drug on the risk of coronary heartdisease? In 1995, the results of the West of Scotland Coronary Prevention Studywere presented in a press release: “People with high cholesterol can rapidlyreduce . . . their risk of death by 22 per cent by taking a widely prescribed drugcalled pravastatin sodium. This is the conclusion of a landmark study presentedtoday at the annual meeting of the American Heart Association.”15 The benefitof this cholesterol-reducing drug, just like that of most medical treatment, wasreported by the press in the form of a relative risk reduction. What does “22percent” mean? Studies indicate that a majority of people think that out of1,000 people with high cholesterol, 220 of these people can be prevented frombecoming heart attack victims.16 This, however, is not true. Table 3-1 shows theactual result of the study: Out of 1,000 people who took pravastatin over aperiod of 5 years, 32 died, whereas of 1,000 people who did not take pravastatinbut rather a placebo, 41 died. The following three presentations of the raw result—a total mortality reduction from 41 to 32 in every 1,000 people—are allcorrect, but they suggest different amounts of benefit and can evoke differentemotional reactions in ordinary citizens.
TABLE 3-1 Reduction in total mortality for people who take a cholesterol-reducing drug (pravastatin). The people in the study had high-risk levels ofcholesterol and participated in treatment for 5 years. (From Skolbekken,1998.)
Treatment Deaths (per 1,000 people with high cholesterol)
Pravastatin (cholesterol-reducing drug) 32
Placebo 41
Three Ways to Present the Benefit
Absolute risk reduction: The absolute risk reduction is the proportion ofpatents who die without treatment (placebo) minus those who die withtreatment. Pravastatin reduces the number of people who die from 41 to32 in 1,000. That is, the absolute risk reduction is 9 in 1,000, which is0.9 percent.

Relative risk reduction: The relative risk reduction is the absolute riskreduction divided by the proportion of patients who die withouttreatment. For the present data, the relative risk reduction is 9 dividedby 41, which is 22 percent. Thus, pravastatin reduces the risk of dyingby 22 percent.
Number needed to treat: The number of people who must participate inthe treatment to save one life is the number needed to treat (NNT). Thisnumber can be easily derived from the absolute risk reduction. Thenumber of people who needed to be treated to save one life is 111,because 9 in 1,000 deaths (which is about 1 in 111) are prevented by thedrug.
The relative risk reduction looks more impressive than the absolute riskreduction. Relative risks are larger numbers than absolute risks and thereforesuggest higher benefits than really exist. Absolute risks are a mind tool thatmakes the actual benefits more understandable. Another mind tool serving as analternative to relative risks is presenting benefits in terms of the number neededto treat to save one life. With this mind tool, one can see right away that out of111 people who swallow the tablets for 5 years, 1 had the benefit, whereas theother 110 did not. The situation here is quite different from that of penicillinand other antibiotics whose positive effects when first introduced were dramatic.
CONDITIONAL PROBABILITIES
One can communicate the chances that a test will actually detect a disease invarious ways (see Chapter 1). The most frequent way is in the form of aconditional probability: If a woman has breast cancer, the probability that she willtest positive on a screening mammogram is 90 percent. Many mortals, physiciansincluded, confuse that statement with this one: If a woman tests positive on ascreening mammogram, the probability that she has breast cancer is 90 percent. Thatis, the conditional probability that an event A occurs given event B is confusedwith the conditional probability that an event B occurs given event A. This isnot the only confusion. Others mistake the probability of A given B with the

probability of A and B. One can reduce this confusion by replacing conditionalprobabilities with natural frequencies, as explained in the next chapter.
A RIGHT TO CLEAR INFORMATION
Despite the potential confusion created by single-event probabilities, relative riskreduction, and conditional probabilities, these forms of risk communication arestandard. For instance, relative risks are the prevalent way in which the press anddrug company advertising report the benefits of new treatments. There is aconsensus today that the public has a right to information. But there is not yet aconsensus that the public also has a right to get this information in a way that isclear and not misleading. I strongly urge medical, legal, and other associations tosubscribe to an ethical policy that demands reporting risks in clear terms such asabsolute risks and natural frequencies, rather than in ways that are more likely toconfuse people. In this book, I introduce various mind tools for communicatingrisk in ways people can understand.
From Clouded Thinking to Insight
Ignorance of relevant risks and miscommunication of those risks are two aspects ofinnumeracy. A third aspect of innumeracy concerns the problem of drawingincorrect inferences from statistics. This third type of innumeracy occurs wheninferences go wrong because they are clouded by certain risk representations.Such clouded thinking becomes possible only once the risks have beencommunicated. The mammography example in Chapter 1 illustrates a tool forachieving mental clarity, that is, a device for translating conditional probabilities—which impede not only risk communication but also correct inference fromrisks—into natural frequencies.
Why is it so difficult for even highly educated people to make inferences onthe basis of probabilities? One reason might be that the theory of probability,which is concerned with drawing inferences from uncertain or incompleteinformation, is a relatively recent development in human history. Ian Hacking,who is fond of precise numbers, has dated this discovery to 1654, when themathematicians Blaise Pascal and Pierre Fermat exchanged a now-famous seriesof letters about gambling. The fact that the notion of mathematical probability

developed so late—later than most key philosophical concepts—has been calledthe “scandal of philosophy.”17 The difficulty that even great thinkers had inunderstanding risk before then is best illustrated by Girolamo Cardano, asixteenth-century Italian physician and mathematician and the author of one ofthe first treatises on probability. Cardano, a notorious gambler, asserted thateach face of a die will occur exactly once in any given six rolls. This assertion,however, flew in the face of his lifelong experience at the gambling tables. Heresolved the conflict with an appeal to the intervention of luck (he was a greatbeliever in his own). Cardano’s intuition recalls that of the little girl who, as thestory goes, was scheduled to receive an injection from her pediatrician. Upsetthat her father signed a consent form stating that he understood that 1 out of10,000 children experience a serious allergic reaction, she insisted on speaking tothe doctor. “I want to know,” the little girl asked, “what number you’re on.”
The remainder of this book presents mind tools for overcoming innumeracythat are easy to learn, apply, and remember. I focus on three kinds of tools:Franklin’s law for overcoming the illusion of certainty, devices forcommunicating risk intelligibly, and the use of natural frequencies for turningclouded thinking into insight. Overcoming innumeracy is like completing athree-step program to statistical literacy. The first step is to defeat the illusion ofcertainty. The second step is to learn about the actual risks of relevant events andactions. The third step is to communicate the risks in an understandable wayand to draw inferences without falling prey to clouded thinking. The generalpoint is this: Innumeracy does not simply reside in our minds but in therepresentations of risk that we choose.

Solving a problem simply means representing it so as to make thesolution transparent.
Herbert A. Simon, The Sciences of the Artificial
4
INSIGHT
After leaving a restaurant in a charming town in Tuscany one night, I waslooking for my yellow-green Renault in the parking lot. It wasn’t there. Instead,I saw a blue Renault—the same model but the wrong color. I can still feel myfingers hesitating to put the key into the lock, but the door of the blue caropened. I drove the car home. When I looked out the window the nextmorning, I saw a yellow-green Renault standing in bright sunlight outside. Whathad happened? My color constancy system had failed in the parking lot’sartificial light but was functioning correctly under the next day’s sun. Colorconstancy, an impressive adaptation of the human perceptual system, allows usto see an object as having the same color under diverse conditions of naturalillumination—for instance, in the bluish light of day as well as in the reddishlight of sunset. Under conditions of artificial illumination, such as that producedby sodium or mercury vapor lamps, color constancy can break down.
Human color vision is adapted to the spectral properties of natural sunlight.More generally, our perceptual systems have been shaped by the environment inwhich our ancestors evolved, often referred to as the “environment ofevolutionary adaptedness.”1 These adaptations can be exquisite, though notfoolproof. The human visual system is far better than any camera at registeringconstant colors with changing illumination. Similarly, human morphology and

physiology and the human nervous and immune systems all reflect ingeniousadaptations. The tubular structure of bones, for instance, maximizes strengthand flexibility while minimizing weight; pound for pound, bones are strongerthan solid steel bars. The best manmade heart valves cannot match the waynatural heart valves open and close. Like color constancy, however, theseadaptations may break down— in the case of bones, even in the literal sense—when stable properties of the environment to which they are adapted change.2
We can understand innumeracy by using the analogy of failures of colorconstancy. Just as certain types of illumination can enhance or interfere withcolor constancy, certain numerical representations can help or hinder soundstatistical thinking. In my view, the problem of innumeracy is not essentially“inside” our minds as some have argued, allegedly because the innatearchitecture of our minds has not evolved to deal with uncertainties. Instead, Isuggest that innumeracy can be traced to external representations ofuncertainties that do not match our mind’s design—just as the breakdown ofcolor constancy can be traced to artificial illumination. This argument applies tothe two kinds of innumeracy that involve numbers: miscommunication of risksand clouded thinking. The treatment for these ills is to restore the externalrepresentation of uncertainties to a form that the human mind is adapted to.
A Physician’s Thinking
Dr. Konrad Standing3 is chief of a department in a university teaching hospital,a prominent figure in research and teaching with more than three decades ofprofessional experience. A few years ago, I asked him whether the physicians athis institution would participate in a study of diagnostic intuitions beingconducted by my colleagues and me at the Max Planck Institute for HumanDevelopment. Seeming quite interested in the subject, he agreed to encouragehis colleagues to participate. To set an example, he volunteered himself. The firstdiagnostic task he worked on concerned the routine breast cancer screening ofwomen, as described briefly in Chapter 1:
To facilitate early detection of breast cancer, starting at a particular age,women are encouraged to participate at regular intervals in routine

screening, even if they have no obvious symptoms. Imagine that youconduct such breast cancer screening using mammography in aparticular region of the country. The following information is availableabout asymptomatic women aged 40 to 50 in such a region whoparticipate in mammography screening:
The probability that one of these women has breast cancer is 0.8 percent. If awoman has breast cancer, the probability is 90 percent that she will have apositive mammogram. If a woman does not have breast cancer, theprobability is 7 percent that she will still have a positive mammogram.Imagine a woman who has a positive mammogram. What is the probabilitythat she actually has breast cancer?4
Department chiefs are not used to having their reasoning tested. Dr.Standing was visibly nervous while trying to figure out what he would tell thewoman. After mulling the numbers over, he finally estimated the woman’sprobability of having breast cancer, given that she has a positive mammogram,to be 90 percent. Nervously, he added, “Oh, what nonsense. I can’t do this. Youshould test my daughter; she is studying medicine.” He knew that his estimatewas wrong, but he did not know how to reason better. Despite the fact that hehad spent 10 minutes wringing his mind for an answer, he could not figure outhow to draw a sound inference from the probabilities.
If your mind, like Dr. Standing’s, is clouded by this problem, don’t despair.This feeling is at the crux of the point I would like to demonstrate. Innumeracy?Yes, arising from clouded thinking. Treatment? The same as for failures of colorconstancy.
When color constancy fails under sodium vapor lamps, the solution liesoutside of the mind, not inside. One needs to restore the type of input that thebrain has encountered during most of its evolution and to which the colorconstancy mechanism is therefore adapted: sunlight. In this analogy,probabilities are like sodium vapor lamps. What then corresponds to naturallight in the mammography problem? I propose that the answer is naturalfrequencies, that is, simple counts of events.

Let us try to turn Dr. Standing’s innumeracy into insight by communicatingin natural frequencies rather than probabilities:
Eight out of every 1,000 women have breast cancer. Of these 8 women withbreast cancer, 7 will have a positive mammogram. Of the remaining 992women who don’t have breast cancer, some 70 will still have a positivemammogram. Imagine a sample of women who have positive mammogramsin screening. How many of these women actually have breast cancer?
The information is the same as before (with rounding) and it leads to thesame answer. But now it is much easier to see what that answer is. Only 7 of the77 women who test positive (70 + 7) actually have breast cancer, which is 1 in11, or 9 percent—much lower than the estimate of 90 percent that Dr. Standinghad given. When he received the information in natural frequencies, hisinnumeracy turned into insight. With frequencies, he “saw” the answer,remarking with relief, “But that’s so easy” and even “That was fun.” Hisdaughter’s help was no longer needed.
How to Turn Physicians’ Innumeracy into Insight
Do natural frequencies help to clear physicians’ minds in general, as they did forDr. Standing? Ulrich Hoffrage and I tested 48 physicians with an average of 14years of professional experience from two major German cities. About two-thirdsof these physicians worked in private, public, or university hospitals, and the restin private practice. They included radiologists, gynecologists, internists, anddermatologists, among others. Their professional status ranged from being freshout of medical school to heading their respective medical departments. As withDr. Standing, we asked each physician to estimate the chances of breast cancerin a woman aged 40 to 50 given a positive mammogram in a routine screening.Half of the physicians received the relevant information in probabilities; theother half received the same information in natural frequencies.5
With probabilities, there was alarmingly little consensus, as the left side ofFigure 4-1 shows. The estimates ranged between 1 percent and 90 percent. LikeDr. Standing, one-third of the physicians (8 out of 24) concluded that the

probability of breast cancer given a positive mammogram is 90 percent. Anotherthird of physicians estimated the chances to be between 50 percent and 80percent. Another 8 thought the chance was 10 percent or less, and half of theseestimated the probability as 1 percent, which corresponds to the base rate. Themedian estimate was 70 percent. If you were a patient, you would be justlyalarmed by this diversity of medical opinion. Only 2 of the physicians reasonedcorrectly, giving estimates of about 8 percent. Another 2 estimated the chancesto be near this value, but for the wrong reasons. For instance, 1 physicianconfused the false positive rate with the probability that the patient has breastcancer given that she has a positive mammogram.

FIGURE 4-1. Estimated chances of breast cancer given a positive screeningmammogram. Of 48 physicians, half received the relevant information inconditional probabilities, the other in natural frequencies. Each point representsone physician. The ordinate shows their estimates of the probability orfrequency of breast cancer after a positive test. With probabilities, the physicianswere highly inconsistent; with natural frequencies, this inconsistency largelydisappeared—except for five “hopeless” cases—and the physicians’ estimatesclustered around the correct one. (From Gigerenzer, 1996a; Hoffrage andGigerenzer, 1998.)

When the information was presented in probabilities, the majority ofphysicians in our study grossly overestimated the risk of breast cancer given apositive mammogram, just as Dr. Standing did. They did so despite havingspent considerable time thinking about the problem. It was evident that theydidn’t take the test lightly—many of them were nervous and tense about beingtested, a situation that they rarely, if ever, encounter.
How did physicians manage with natural frequencies? The right side ofFigure 4-1 shows that the disquieting variability in responses largely disappeared.The majority of the physicians in this group responded with the correct answer,or close to it. Only five of the physicians who received the information innatural frequencies concluded that the chance of breast cancer given a positivemammogram was above 50 percent. Simply stating the information in naturalfrequencies turned much, though not all, of the physicians’ innumeracy intoinsight.
Is clouded thinking specific to the German physicians in our study? It seemsnot. David Eddy, former consultant to the Clinton administration on healthcare reform, asked a number of American physicians to estimate the probabilitythat a woman has breast cancer given that she has a positive mammogram,providing essentially the same information as we did.6 Eddy gave all thephysicians the relevant information in probabilities, not in natural frequencies.Ninety-five out of 100 of them estimated the probability of breast cancer to beabout 75 percent, about 10 times more than the realistic estimate.
I am grateful to the physicians who volunteered to participate in our study.They enabled us to demonstrate, for the first time, that frequencyrepresentations can help experienced physicians make better diagnosticinferences. The implication of this finding is not to blame physicians’ (orpatients’) inability to reason about probabilities. Rather, the lesson is torepresent risks in medical textbooks and in physician-patient interactions in away that comes naturally to the human mind. Natural frequencies are a simple,inexpensive, and effective method of improving diagnostic insight.
Insight from Outside

Why does representing information in terms of natural frequencies rather thanprobabilities or percentages foster insight? For two reasons. First, computationalsimplicity: The representation does part of the computation. And second,evolutionary and developmental primacy: Our minds are adapted to naturalfrequencies.
THE REPRESENTATION DOES PART OF THE COMPUTATION
Figure 4-2 illustrates the difference between natural frequencies andprobabilities. On the left side is a tree with natural frequencies, which representshow a person would encounter statistical information through direct experience.On the right side is the same information in probabilities, the format in whichmost information is represented for medical students in textbooks. The numbersare the same as those in the breast cancer problem that Dr. Standing struggled tosolve. The thought bubbles show the calculations needed to answer the questionwe asked in each case.

FIGURE 4-2. How natural frequencies facilitate Bayesian computations.The happy person received the relevant information in natural frequencies andhas an easy time estimating the chances of disease given a positive test (orsymptom). The reason is that she only has to pay attention to two numbers, thenumber of patients with a positive test and the disease (a = 7) and the number ofpatients with a positive test and no disease (b = 70). The person with theunhappy face has received the same information in probabilities and has a hardtime making this estimation. The structure of his equation is exactly the same asthe one the happy person used— a/(a + b)—but the natural frequencies a and bhave been transformed into conditional probabilities, making the formula forprobabilities much more complex.

Both equations are versions of Bayes’s rule,7 which is named after the Englishdissenting minister who is thought to have discovered it, Reverend ThomasBayes (1702(?)-1761).8 You can see that calculating the probability of a diseasegiven a positive test is easier when the information is in natural frequencies:
Bayes’s rule for natural frequencies
In Figure 4-2, a is the number of people who test positive and have the disease(7) and b is the number of people who test positive and do not have the disease(70).9 With probabilities, in contrast, the calculation is more demanding:
Bayes’s rule for conditional probabilities
This rule is the same as the simpler one above; both show the proportion ofcorrect positives (numerator) among all positives (denominator). The differencein this version of the rule is that each of the natural frequencies has beenreplaced by the product of two probabilities. Table 4-1 explains theseprobabilities.
In general, a test has four possible outcomes. When a person has a disease,the test can be either positive (a true positive) or negative (a false negative). Theprobability p(positive|disease) is the sensitivity of the test. The sensitivity ofmammography is the proportion of women who test positive among those whohave breast cancer. It usually ranges between 80 percent and 95 percent, withlower values among younger women. The rates of these two outcomes—thesensitivity and the false negative rate—add up to 1.
TABLE 4-1. Test outcomes. A test can have four possible outcomes: (a) a positiveresult given disease (or some other unknown condition), (b) a positive resultgiven no disease, (c) a negative result given disease, and (d) a negative resultgiven no disease. The rates with which these four results occur are called (a)sensitivity (or true positive rate), (b) false positive rate, (c) false negative rate,

and (d) specificity (true negative rate). The two shaded areas indicate the twopossible errors. The frequency of true positives and false positives are a andb, respectively, in Bayes’s rule.
Test ResultDisease
Yes No
Positive (a) sensitivity (b) false positive rate
Negative (c) false negative rate (d) specificity
When a person does not have the disease, the test can be either positive (afalse positive) or negative (a true negative). The rates of these two outcomes, thefalse positive rate and the specificity, also add up to 1. The probabilityp(positive|no disease) is the false positive rate of a test. The false positive rate ofmammography is the proportion of women who test positive among those whodo not have breast cancer. It ranges between about 5 and 10 percent, with thehigher values among younger women.
The two of the four possible outcomes that are errors are shaded in Table 4-1. The rates of the two errors are dependent on one another: Decreasing the falsepositive rate of a test increases the false negative rate, and vice versa. The fourprobabilities in Table 4-1 are called conditional probabilities, because they expressthe probability of some event (for example, a positive test) conditional on theoccurrence of some other event (for example, disease)—that is, given that thisother event has occurred. The non-conditional probability p(disease) is the baserate of having the disease. That is, the base rate is the proportion of individualswith a certain disease in a particular population at a specific point in time. Incontrast to the base rates, conditional probabilities are notoriously confusing.
We can now understand exactly why this is the case. When naturalfrequencies are transformed into conditional probabilities, the base rateinformation is taken out (this is called normalization). The benefit of thisnormalization is that the resulting values fall within the uniform range of 0 and1. The cost, however, is that when drawing inferences from probabilities (asopposed to natural frequencies), one has to put the base rates back in bymultiplying the conditional probabilities by their respective base rates.10

To summarize: Natural frequencies facilitate inferences made on the basis ofnumerical information. The representation does part of the reasoning, takingcare of the multiplication the mind would have to perform if given probabilities.In this sense, insight can come from outside the mind.
MINDS ARE ADAPTED TO NATURAL FREQUENCIES
Natural frequencies result from natural sampling, the process by which humansand animals have encountered information about risks during most of theirevolution. In contrast, probabilities, percentages, and other normalized forms ofrepresenting risk are comparatively recent. Animals can monitor the frequenciesof important events fairly accurately. Rats, for instance, are able to “count” up toabout 16, as evidenced by their ability to learn to press a lever a fixed number oftimes in order to get a dose of food.11 Humans can also monitor frequenciesfairly accurately, although not as accurately as David Hume believed when heclaimed that humans can detect the difference between an event that occurs10,000 times and one that occurs 10,001 times intuitively, that is, withoutexternally recording the number of occurrences. The human mind records thefrequencies of events, like the spatial and temporal locations of objects, withlittle effort, awareness, or interference from other processes.12 Human babies arereportedly able to discriminate between groups of one, two, or three objects(such as black dots and Mickey Mouse toys) just a few days after birth.13 Studiesof counting in children also indicate that intuitions about numbers naturallyfocus on discrete cases rather than fractions (such as conditional probabilities).For instance, if 3- or 4-year-old children are shown five forks, one of which isbroken into two parts, and are asked how many forks they can see, most saysix.14
Like children, mathematicians began by thinking in terms of frequencies andonly later turned to fractions, percentages, and probabilities. (For Pythagorasand his followers, numbers meant positive integers, not fractions or negativenumbers. According to legend, the mathematician Hip-pasus of Metapontumwas thrown off a ship for proving the existence of irrational numbers andthereby shattering the Pythagorean view that the world is ruled by integers.)15
Probabilities and percentages are historically recent representations ofuncertainty. The mathematical theory of probability emerged only in the mid-

seventeenth century. Percentages became common notations during theninteenth century after the metric system was instituted in Paris following theFrench Revolution, but were mainly used to express interest rates and taxesrather than uncertainty.16 Only in the second half of the twentieth century didprobabilities and percentages become entrenched in everyday language asexpressions of uncertainty, such as in weather reports and baseball statistics.Over the course of most of its evolution, the human mind did not learn aboutrisks from probabilities or percentages.
Representation Matters
Good numeric representation is a key to effective thinking that is not limited tounderstanding risks. Natural languages show the traces of various attempts atfinding a proper representation of numbers. For instance, English does notdenote numbers consistently in the base-10 system. Instead, it has special namesfor the numbers 1 to 12 that are vestiges of an earlier base-12 system. This base-12 system was also used for units of money and length—for example, there were12 pennies to a shilling and there are 12 inches to a foot. Children in English-speaking countries also have to learn special words for the numbers between 13and 20, such as “thirteen” and “fourteen,” which hearken back to an earlier base-20 system. French children have to deal with other remnants of the base-20system, such as quatre-vingt-dix (“four twenty ten”), which means 90. German-speaking children, like their English-speaking counterparts, have to learn asimilar hodgepodge of words for the numbers up to 20—and face an additionalchallenge. In German, the written sequence of two-digit numbers is reversedwhen spoken, for example, the word vierundzwanzig (“four and twenty”) means24. Chinese, in contrast, denotes numbers consistently in the base-10 system.For instance, the Chinese words for two-digit numbers can be generated by asimple rule: 11 is expressed as “ten one,” 12 as “ten two,” and so on; 20 isexpressed as “two ten,” 21 as “two ten one,” and so on.
Different linguistic representations of numbers can speed up or slow downlearning for speakers of different languages. The psychologist Kevin Miller andhis colleagues asked matched groups of American and Chinese children to recitethe counting sequence from the number l.17 At age four, the American children

could count up to 15, on average, whereas the Chinese children could count upto 40. One reason for the relatively poor performance of American childrenseems to be that two-digit numbers are less transparently represented in Englishthan in Chinese.
The key role of representation in thinking is often downplayed because of anideal of rationality that dictates that whenever two statements aremathematically or logically the same, representing them in different formsshould not matter. Evidence that it does matter is regarded as a sign of humanirrationality. This view ignores the fact that finding a good representation is anindispensable part of problem solving and that playing with differentrepresentations is a tool of creative thinking. The physicist Richard Feynmanobserved that different representations of the same physical law, even if they aremathematically equivalent, can evoke different mental images—and trigger newdiscoveries as a result.18
External representations are not just passive inputs to an active mind. Theycan do part of the reasoning or calculation, making relevant properties of thesame information more accessible. In an arabic-numeral representation, forinstance, one can quickly see whether a number is a power of 10, but notwhether it is a power of 2. The converse holds for binary numbers. In addition,arabic numerals are better suited to multiplication and division than romannumerals—a difference that may help to explain the superior development ofmathematics in early arabic cultures relative to Roman and early medievalEuropean culture. Imagine trying to multiply the roman numbers XIX andXXXIV. In the arabic system, one simply multiplies each of the two digits in thefirst number (19) by each digit in the second number (34) and writes the resultssuch that consecutive digits represent Is, 10s, 100s, and so on. This is impossibleusing the roman numerals—although they also constitute a base-10 system—because each digit does not denote a power of 10. As a result, the roman-numeral system does not facilitate multiplication and division.
In this chapter, I have described a tool that can help to defog minds:changing risk representations from probabilities into natural frequencies.Probabilities—or more precisely, conditional probabilities—tend to impedehuman inference, whereas natural frequencies demand less computation andhave a form in which the human mind has experienced events over most of its

evolution. As the case of Dr. Standing illustrates, natural frequencies help notonly laypeople, but experts as well. Restoring this “original” representation canturn innumeracy into insight.

PART II
UNDERSTANDING UNCERTAINTIES IN THE REALWORLD

I hope very much that pressure is not put on women to attend [breastcancer screening]. The decision must be theirs, and a truthful account ofthe facts must be available to the public and the individual patient. Itwill not be what they want to hear.
M. Maureen Roberts, Clinical director, Edinburgh Breast Cancer Screening Project
5
BREAST CANCER SCREENING
Shortly before dying of breast cancer, the clinical director of an initiative calledthe Edinburgh Breast Cancer Screening Project, Maureen Roberts, wrote ofmammography screening, “We can no longer ignore the possibility thatscreening may not reduce mortality in women of any age, however disappointingthat may be.” She went on to remark on what she called the “brainwashing” ofphysicians and the public: “There is also an air of evangelism [in the nationalscreening programs], few people questioning what is actually being done.”1 Dr.Roberts was referring to mammography screening, not to the use ofmammography per se. Mammography screening is mass screening, primarily ofhealthy women. In this situation, statistical thinking becomes of the utmostrelevance, as we will see. Mammography is also used in other situations, forinstance for patients with known symptoms of breast cancer, such as a tumormass detected in a clinical exam. The benefits and hazards of mammographyscreening cannot be directly generalized to these other situations.
Mass screening for breast cancer was first introduced in Germany in the1930s. The reason was not so much that X rays were discovered in Germany,but rather that Germans were among the first to recognize the cancer hazards of

cigarettes, asbestos, tar, and radium, prompted by the unions and politicalparties that represented the interests of the working class.2 Physicians wereexhorted to recognize the value of early detection, and those who did notperform mammography screening were accused of being complicit in the deathsof thousands of women each year. Radio and newspaper announcements urgedwomen over the age of 30 to participate in annual or biennial screening.Hundreds of thousands were screened using mammograms, and monthly breastself-examination was declared to be the moral duty of every woman. World WarII, however, put a damper on German physicians’ hopes of combating cancer.Comparable American campaigns did not get started until 30 years later.
More than 10 years after Dr. Roberts expressed her professional opinionabout screening, women in North America are still getting contradictoryrecommendations.3 The disagreements concern each of the three screening tests:mammography, clinical breast examination, and breast self-examination. Themain disagreement about mammography has to do with the age at which it has abenefit for women. The American Cancer Society and the National CancerInstitute recommend that women have mammograms and clinical breast examsannually or every one to two years, respectively, beginning at age 40. The U.S.Preventive Services Task Force and the Canadian Task Force on the PeriodHealth Exam, in contrast, recommend mammography screening every one totwo years beginning at age 50. The main disagreement about the clinical andself-exams concerns whether they should be recommended at all. The U.S.Preventive Services Task Force asserts that mammography screening may as wellbe performed without the clinical exam because, it argues, there is no evidencethat the clinical exam increases the benefit of mammography, whereas the otherthree organizations recommend the clinical breast exam as well. Finally, theAmerican Cancer Society also recommends that women perform self-examsevery month starting at age 20. None of the other organizations recommendsself-exams at any age.
Given these different recommendations, which ones, if any, should womenfollow? To answer this question, they need to be well informed about the costsand benefits of screening. And this decision can vary by individual, because thesame benefits and hazards have different values for different women.

Knowledge concerning screening is less universal than one might believe. Forexample, in surveys, more than one-third of a sample of African Americanwomen in south Florida and one-third of a sample of Hispanic women inWashington State reported never having heard of mammography. Others do notunderstand the nature of screening. In a survey of Australian women and men, 4out of 5 did not know that screening tests are for asymptomatic people.4 Five ofthe most common confusions about screening are listed below.
Clarifying Five Common Misunderstandings
• Are screening tests meant for patients with known symptoms? No,screening is for asymptomatic people. Its purpose is early detection.
• Does screening reduce the incidence of breast cancer? No, it does not.Early detection does not amount to prevention.
• Does early detection imply mortality reduction? Not in all cancers. Earlydetection can, but need not, lead to mortality reduction. For instance,if there is no effective therapy, early detection has no effect onmortality. Here, early detection does not increase life expectancy, butonly the time the patient consciously has to live with the cancer.
• Do all breast cancers progress? No. Mammography can detect a form ofbreast cancer that is called “ductal carcinoma in situ.” Most cancersfound in the screening of younger women are ductal carcinomas insitu. Although their clinical course is not well understood, half or moreof the lesions do not seem to progress.
• Is early detection always a benefit? No. For instance, when a cancer doesnot progress or progresses so slowly that it has no effect during awoman’s life, early detection does not help this woman. Rather, shewill suffer harm without benefits: Most likely she will undergo invasivetreatment, such as mastectomy or lumpectomy with radiation, and herquality of life will substantially decrease.

These basic misunderstandings aside, what are the costs and benefits, bothreal and perceived, of mammography screening?
Benefits
The goal of mammography screening is to reduce mortality from breast cancerby early detection; screening cannot prevent cancer. How can one determinewhether and when screening actually serves that goal? The best evidence comesfrom randomized trials, in which a large number of women are randomlyassigned to either a screening group or a control group. Women in the screeninggroup participate in screening at regular intervals. They are called back if theyhave a positive mammogram, and additional mammograms or biopsies areperformed. And if they are diagnosed with breast cancer, they receive treatmentssuch as a mastectomy (total removal of the breast), a lumpectomy (removal ofonly the affected tissue), and radiation therapy. Women in the control group donot participate in screening. After a fixed period, say 10 years, the two groups arecompared to determine how many lives screening actually saved. Because theparticipants are randomly assigned, any difference in mortality that is observedcan be attributed to the screening rather than to initial differences between thegroups on dimensions such as age, social status, or health.
Ten large randomized trials have been conducted to determine whetherundergoing mammography screening decreases women’s chances of dying frombreast cancer. These trials involved a total of half a million women in Canada,Scotland, Sweden, and the United States.5 What were the results?
HOW TO COMMUNICATE BENEFITS?
The results will look different, and may even be misunderstood, depending onhow they are presented. Consider first the overall benefit of mammographyscreening across all age groups (age 40 and older) covered by four Swedishrandomized trials.6 Table 5-1 shows the results of the screening.
Four Ways to Present the Risk
Relative risk reduction. One way to present the risk is to say thatmammography screening reduces the risk of dying from breast cancer by

25 percent, that is, the relative risk reduction is 25 percent. Healthorganizations favor reporting benefits in terms of relative risk, therebyopening the door to miscommunication. What does a relative riskreduction of 25 percent mean? Many believe incorrectly that this meansthat out of 100 women who participate in screening, the lives of 25 willbe saved. Yet to understand what relative risks mean, let us translatethem into the mind’s hard currency, that is, concrete cases. Consider1,000 women who did not participate in screening and another 1,000who did (Table 5-1). Within 10 years, 4 women in the first group and 3in the second group died of breast cancer.7 The decrease from 4 to 3 is arelative risk reduction of 25 percent.
Absolute risk reduction. The absolute risk reduction is 4 minus 3, that is,1 out of 1,000 (which corresponds to 0.1 percent). In other words, if1,000 women participate in screening for 10 years, one of them willprobably be saved from dying of breast cancer.
Number needed to treat. There is a third way to communicate the benefitof screening: the number needed to treat in order to save one life. Thesmaller this number is, the better the treatment. In the present case, thisnumber is 1,000, because this many women must participate in order tosave one life.
Increase in life expectancy. Finally, one can express the benefit as anincrease in life expectancy. Women who participate in screening from theage of 50 to 69 increase their life expectancy by an average of 12 days.8
TABLE 5-1: Reduction in breast cancer mortality for women (age 40 andabove) over a period of 10 years. The raw result is from four Swedishrandomized trials with some 280,000 women (numbers rounded). (Datafrom Nystrom et al., 1996, in Mühlhauser and Höldke, 1999.)
Treatment Deaths (per 1,000 women)
No mammography screening 4

Mammography screening 3
All four presentations of the raw data are correct, but they suggest differentamounts of benefits and evoke different degrees of willingness to participate inscreening and different emotional reactions in women. When risk reduction isexpressed in relative terms, misunderstanding is likely. Relative risks are biggernumbers than absolute risks—compare, for instance, a 25 percent relative riskreduction and the absolute risk reduction of 1 life in 1,000. Counting on theirclients’ innumeracy, organizations that want to impress upon clients the benefitsof a treatment generally report them in terms of relative risk reduction. Relativerisks do not carry information about the absolute benefits of a treatment: Forexample, a 25 percent reduction means many lives saved if the disease isfrequent, but only a few if the disease is rare. Transparent risk communicationcan be achieved by means of absolute risks, number needed to treat, andincreases in life expectancy. But health organizations rarely use these,communicating with the public in terms of relative risk reduction instead. InChapter 12, we will see that there are often institutional reasons for presentingbenefits in terms of relative risks; for instance, given the innumeracy of healthauthorities who evaluate proposals for medical research funding, applicants oftenfeel compelled to report relative risk reductions because they sound moreimpressive.
Transparency can also be achieved by expressing the benefit of a treatment interms of a more familiar situation. For instance, participating in annualmammography screening that affords a 25 percent risk reduction has roughlythe same effect on life expectancy as reducing the distance one drives each yearby 300 miles.9
DOES SCREENING BENEFIT WOMEN IN THEIR 40S?
None of the 10 randomized trials suggested that mammography screening ofwomen aged 40 to 49 reduces breast cancer mortality in the nine years followingthe beginning of screening. Nine out of the 10 trials also found no evidence of amortality reduction after 10 to 14 years, although one— conducted inGothenburg, Sweden—did. Why this trial found a reduction while the othersdid not remains unclear. This study was not specifically designed for women in

their 40s, whereas the Canadian National Breast Cancer Study—the only trialdesigned for this age group, and including twice as many women as theGothenburg trial—did not find a mortality reduction after 10.5 years. When theresults of all 10 randomized trials were pooled, no reduction in breast cancermortality was detectable even after 10 to 14 years.10 Thus, there is yet noevidence that mammography screening reduces mortality from breast cancer forwomen in their 40s.
Why would screening women under 50 fail to reduce mortality from breastcancer? There are some possible reasons, but no conclusive answers. Forinstance, it has been posited that breast density is generally higher in youngerwomen, making screening less likely to detect cancers at a curable stage. Analternative explanation is that, in younger women, a greater proportion ofinvasive breast cancers are aggressive and therefore grow more rapidly, whichresults in more cancers not detected between regular screening examinations. Inaddition, women under 50 are less likely to have breast cancer, which means thatfewer women in this group can benefit from screening in the first place.11
DOES SCREENING BENEFIT WOMEN 50 AND OVER?
Eight of the 10 randomized clinical trials included women who began screeningat or over age 50. Three of these studies found a significant reduction in breastcancer mortality; four found reductions that were too small to be distinguishablefrom zero; and one found no reduction at all. The reductions in mortality rates,which were computed seven to nine years after the first screening, appeared asearly as four years after the first screening. When the results of all the trials arepooled, one finds a relative risk reduction of about 27 percent. But how manylives are saved, that is, how large is the absolute risk reduction? Consider womenwho start screening at age 50 and have a mammogram every other year for thenext 20 years. For every 270 of these women, the life of one is saved. Thus, theabsolute risk reduction is 1 in 270, or about 4 in 1,000. Still, the benefits aregreater in this age group than across all age groups (Table 5-1). From age 50 on,mammography screening seems to reduce mortality from breast cancer.12
ARE CLINICAL BREAST EXAMS AND SELF-EXAMS WORTHWHILE?

Common sense suggests that using all three methods of screening for breastcancer would be better than using just one. However, this does not seem to bethe case. Among women aged 50 and older, the clinical breast exam does notcontribute to decreasing breast cancer mortality compared to mammographyalone. On the other hand, mammography contributes little to the benefit of theclinical breast exam if the exam is performed by a skilled practitioner.13
Similarly, several studies with women between the ages of 35 and 65 found thatperforming regular self-exams had no effect on breast cancer mortality, despiteincreasing the number of breast cancers detected. Yet the costs of clinical examsand self-exams can be high, because women who consult an oncologist afterfinding a suspicious change may go through months or even years of physicaland psychological strain without any benefit, as described below. Self-exams,which are recommended on a monthly rather than a yearly basis, are particularlylikely to generate a steady stream of suspicion and anxiety, and many womenobtain mammograms to gain peace of mind.14
SUMMARY OF BENEFITS
On the benefit side, the situation does not seem as bleak as Maureen Robertsdescribed it. There is evidence that mammography screening reduces mortalityfrom breast cancer in women aged 50 and older. As a consequence, earlydetection in this age group might also reduce the chance of invasive therapy andimprove quality of life. But the situation for women in their 40s is unclear.There is currently no evidence that there is a benefit before 10 years after thebeginning of screening. There is also no evidence that the clinical breast exam orself-exam has any additional benefit when performed in addition tomammography screening. These findings have led to the reversal of earlierrecommendations made by health organizations with respect to the best way toscreen for breast cancer. For instance, whereas 10 years ago health organizationsstill recommended that women between 35 and 39 have a baselinemammogram, today no responsible organization recommends baselinemammograms or screening of women in their 30s.
Finally, does annual screening for breast cancer result in a higher riskreduction than biennial screening? No. Whether women underwentmammography annually or biennially made no difference in the randomized

trials15—apparently because the length of time that must pass before manytumors become detectable by mammography is around 3.5 years, which leavesenough time for biennial screening to detect cancer.
In a recent consensus statement, the National Institutes of Health put thedecision explicitly into the hands of patients: “The available data do not warranta blanket recommendation for mammography for all women in their forties.Each woman should decide for herself whether to undergo mammography.”16
This statement has upset many people who expect firm guidelines. In the past,only a few women seem to have decided to undergo screening of their ownaccord; most followed their physician’s recommendation. When the physicianrecommended a screening mammogram, some 90 percent complied; when thephysician did not, only 10 percent of women had screening mammograms.17
How can a woman make up her own mind about screening? To make adecision independently and wisely, she needs to know mammography’s potentialcosts in addition to its benefits.
Costs
The costs of mammography screening are not as well documented as theirbenefits. These costs include physical and psychological harm and financialexpense. Three groups of women pay the costs incurred by breast cancerscreening.18
FALSE POSITIVES
The first group is made up of women who do not have breast cancer, but have apositive mammogram (that is, a false positive). Women in this group are calledback for further investigation. Almost all of them are then subjected to anothermammogram, an ultrasound, or a biopsy, and an unlucky few then undergo alumpectomy or mastectomy. For many women, mammograms are painful andupsetting. For some, mammography screening is psychologically traumatic andresults in an extended period of anxiety or depression and a loss ofconcentration. Biopsies, too, can have psychological costs, as well as physicalcosts such as wound infections, hematomas, scarring, and the loss of breasttissue. While some women might be grateful at first to find out that the result

was a false positive, the emotional shock of a positive mammogram and itsfollow-up sometimes persists even after a negative biopsy. Three months afterreceiving false positive mammograms, 1 out of 2 women reported feelingconsiderable anxiety about mammograms and breast cancer. Moreover, 1 in 4women reported that this anxiety affected their daily mood and functioning.19
How large is this group of women? In other words, how common are falsepositive mammograms?
First mammogram. In an investigation of 26,000 women who underwentmammography screening for the first time, only 1 out of 10 who testedpositive was found to have breast cancer at some point during the 13-month period thereafter.20 In other words, 9 out of 10 positive resultslater proved to be false positives. Figure 4-2 illustrates this result: Forevery 1,000 women who have their first mammogram between 40 and50 years of age, 70 of them can expect to receive false positives comparedwith only 7 true positives. Among younger women, the proportion offalse positives among all positives is even higher.21
Repeated mammograms. What about women who undergomammography regularly, that is, annually or biennially? Afterundergoing a series of 10 annual or biennial mammograms, 1 in 2women without breast cancer can expect to receive at least one falsepositive result.22 How many women pay some kind of physical andpsychological costs owing to false positives each year? In Germany, some3 million to 4 million screening mammograms are performed annually.(Although German health insurance companies do not cover screening,German physicians often contrive reports of symptoms so that thecompanies will pay for screening mammograms.)23 Out of these, some300,000 come back as false positives. As a consequence of this largenumber of false positives, an estimated 100,000 women—none of themwith breast cancer—are subjected to some form of invasive surgery everyyear. If the more than 50 million American women aged 40 or overfollowed the recommendation of the American Cancer Society toundergo annual screening, every year several million American women

would get a false positive result. Many of these would also have theirbreasts biopsied. Estimates indicate that every year more than 300,000American women who do not have breast cancer undergo a biopsy.24
Is there any way to stem this flood of false positives? Physicians in theNetherlands have attempted to do so by introducing more restrictive criteria fordefining a positive mammogram. This policy has reduced the rate of falsepositives, but at the cost of increasing the rate of false negatives. In other words,more cancers are now missed during screening.
What can be reduced easily is the emotional impact of a false positive, that is,its psychological costs. Physicians could inform women about how frequent falsepositives are—for instance, by telling them that 1 in 2 women without cancercan expect to get one or more false positive results in a series of 10mammograms. A woman who knows this will not be as shaken by a positivemammogram as a woman who does not. Nevertheless, I have met few womenwho have been informed by their physicians about how common false positivesare.
False positives take a considerable toll on women’s bodies and psyches. Abouthalf of women who participate in regular screening are affected by this cost ofmammography screening.
NONPROGRESSIVE BREAST CANCER
Eleanor was 49 years old when screening detected an early-stage breast cancer.Her surgeon removed part of her breast, and after radiation therapy, she finallygot the good news that all cancer cells had been destroyed. Joyfully, Eleanor toldall her friends that mammography and surgery had saved her and she could nowlive a carefree life. It is likely, however, that she might be mistaken and wouldhave led an equally long and even happier life without having undergone therigors of treatment.
She could have been in the second group of women who share the costs ofmammography screening: They have a type of breast cancer that would neverhave been noticed during their lifetime but for the mammogram. There are tworeasons for this phenomenon. First, there is a heterogeneous group of lesionscalled ductal carcinoma in situ, because the cancer is confined to the milk ducts

of the breast and has not spread to the surrounding tissue. It cannot be detectedby a breast exam, but it can be detected by mammography. Most breast cancersdetected by mammography in women in their 30s, and about 40 percent inwomen in their 40s, are ductal carcinomas in situ. With higher age, theincidence decreases.25 The clinical course of these cancers is not wellunderstood, but it is thought that between 1 and 5 out of 10 ductal carcinomaseventually progress, becoming invasive cancer within 20 or 30 years. The otherductal carcinomas in situ seem never to spread at all and would not be noticedduring a woman’s lifetime except for the mammogram.26 If a cancer is notinvasive, neither the cancer itself nor treatment of it will affect how long theperson lives. Physicians cannot predict which will become invasive and whichwill not. At present, almost every woman found to have a ductal carcinoma insitu is treated by lumpectomy or mastectomy. But half or more of these womenwould never have developed symptoms if left alone.
The second reason why a woman might have a cancer that would never havebeen detected in her lifetime is that some breast cancers, specifically if they arediagnosed in old age, progress so slowly that the women who have them will diebefore cancer can kill them. Like those women who have ductal carcinomas insitu that would not have proved fatal, these women typically undergo painful,traumatizing, and unnecessary therapy without the benefit of living any longer.
Most women are not aware that some cancers are nonprogressive. A survey ofa random sample of American women revealed that few had heard about ductalcarcinomas in situ, and 94 percent of the women surveyed doubted the existenceof nonprogressive breast cancer.27
Women with nonprogressive or slow-progressive cancer pay a higher price forparticipating in mammography screening than women who receive falsepositives. The therapy they usually undergo as a result of having a positivemammogram lengthens not their lives, but the period during which they mustlive with a diagnosis of cancer and suffer through the treatment. For thesewomen, early detection can decrease their quality of life.
RADIATION-INDUCED BREAST CANCER
A third group of women who bear some of the costs of screening are those whowould not have developed breast cancer were it not for radiation exposure from

mammography. The carcinogenic potential of radiation was recognized duringthe first decade of the twentieth century, when skin cancers of the hand werediscovered among X-ray technicians. The earliest evidence of X ray-inducedbreast cancer was collected by German physicians in 1919, when chest X raysbecame a common method of diagnosing tuberculosis and other lung diseases.28
The question of how large the risk is can be answered only indirectly—forexample, based on the prevalence of breast cancer among women withtuberculosis who have frequent chest X rays or of various cancers amongsurvivors of the nuclear attacks on Hiroshima and Nagasaki. Today there isgeneral agreement that mammography can induce breast cancer, but researchershave come to different conclusions about how often this happens.29
The effect of radiation increases linearly with the dose: When the dose ishalved, half as many women develop radiation-induced breast cancer; when thedose is doubled, this number also doubles, and so on. It does not seem to matterwhether the total radiation dose is received in multiple exposures or in a single,brief exposure. The risk peaks 15 years to 20 years after the time of exposure.There is no evidence that radiation-induced breast cancer develops during the 10years after the time of exposure or in women under the age of 25. The risk ofradiation-induced breast cancer is lowest among women who start menstruatinglate, have their first child at an early age, breast-feed over a long period, andexperience menopause early. Thus, the same hormonal factors that protectwomen from (nonradiation-induced) breast cancer seem also to decrease the riskof radiation-induced breast cancer.
The risk of radiation-induced breast cancer depends strongly on the age atexposure (Figure 5-1). For instance, when women in their 30s have amammogram, the risk is twice as high as that for women in their 40s. The riskpeaks around puberty and shows a sharp decline thereafter. During puberty, theusual source of radiation is not mammograms but thoracic and other types of Xrays. For women over 60, the risk of radiation-induced breast cancer appears tobe negligible, most likely because radiation-induced cancer typically takes up totwo decades to develop.
According to current estimates, out of 10,000 women, between 2 and 4 whoparticipate in mammography screening starting at age 40 will develop radiation-induced breast cancer, and one of them will die.30 It is important to keep in

mind that these figures are rough estimates that are based only on indirectevidence and can vary considerably with the imaging film used, the quality ofthe radiation, and other technical factors. For instance, the dose of radiationadministered during a mammography in the early 1970s was about 10 timeshigher than that used today.
Mammography and other sources of radiation cause breast cancer in a smallnumber of women. The best predictor of whether a woman will developradiation-induced breast cancer is her age at exposure: the older she is, the lowerthe risk.
FALSE NEGATIVES
Besides these three groups of women who pay serious costs for mammographyscreening, there is another group who are not physically harmed but are falselyassured. This group consists of women with cancer who receive a negative testresult. The false negative rate is between 5 and 20 percent, with the higher ratesin younger women. That is, out of 100 women with breast cancer, 80 to 95 willcorrectly get a positive result, but the others will be wrongly reassured by anegative result. False reassurance can result in forgoing the possibility fortherapy, but this should not be counted as a cost of screening because notparticipating in screening would have had the same consequence.

FIGURE 5-1. Deaths from radiation-induced breast cancer. The number ofwomen who die from radiation-induced breast cancer depends strongly on ageof exposure. (From Jung, 1998.)

A radiologist can try to decrease the number of false negatives, but at a price.A radiologist who wishes to minimize the possibility of missing a tumor has toclassify more of the ambiguous results as suspicious (positive), thereby increasingthe rate of false positives. There is a trade-off between false positives and falsenegatives. Radiologists who are highly accurate in detecting cancers (have fewfalse negatives) typically have high rates of false positives.
FINANCIAL COSTS
Mammography screening is most cost-effective in woman aged 50 to 69 years.Screening women in this group biennially for 20 years results in costs of $21,000per year of life saved.31 For every $100 spent on screening, an additional $33 isspent following up on false positive results.32 For breast cancer screening tobenefit women who are not affluent or covered by generous health insurance,the quality of mammography will have to be improved or more cost-effectivetechniques will have to be discovered.
SUMMARY
Mammography screening can produce both costs and benefits for women. Thereare three major types of costs. First, every second woman who does not havebreast cancer will have one or more false positive mammograms (in a series of 10mammograms), and the resulting diagnostic follow-up can cause physical andpsychological harm, such as the removal of breast tissue and increased anxiety.Second, a majority of women with a nonprogressive (or slow-progressive) breastcancer would never have noticed the existence of these abnormal cells duringtheir lifetime except for the mammogram. In these cases, where the cells wouldnever develop into invasive cancer, the treatment by lumpectomy, mastectomy,chemotherapy, and/ or radiation therapy with all their associated physical andpsychological consequences are a second cost women have to bear. Finally,roughly 2 to 4 out of 10,000 women who do not have breast cancer will developradiation-induced breast cancer because of mammography and one of them willdie.
These are the main hazards of mammography screening from the point ofview of the patient. I have not dealt here with the costs from the point of view ofthe physician. Physicians need to worry about protecting themselves against

patients and lawyers who sue them for failing to detect an instance of cancer.This reality puts misses (false negatives) rather than false positives at the top oftheir worries, because lawyers tend to zero in on misses, not false positives. Todecrease the possibility of false negatives, physicians tend to subject patients tobatteries of tests—at the price of increasing false positives.
Before age 50, mammography does not seem to have benefits, only costs.Women at age 50, however, face the question of whether the potential benefitsoutweigh the costs. Each woman must decide for herself what the answer is. Herphysician can help her understand what the benefits and costs are, but not howto weigh them. Her decision depends crucially on her goals, such as peace ofmind, keeping her body unscarred, or a willingness to take (or not to take) thechance that she is one of the few who benefit from screening.
To choose wisely, women need to be informed about the risks. Are they?
What Are the Perceived Benefits of Screening?
Recall that mammography screening cannot decrease the incidence of breastcancer, only the mortality owing to breast cancer; no mortality reduction hasbeen proven among women who participate in screening before age 50, and themortality reduction from age 50 on is about 4 in 1,000 women.
INCIDENCE
A substantial proportion of women believe that screening actually decreases theincidence of breast cancer. These women mistake early detection for prevention.This confusion is fueled by leaflets from health organizations that emphasize theincidence of breast cancer, discussed later in this chapter. An organization thathas an interest in getting as many women to participate in screening as possiblehas a conflict of interest when it attempts to inform women about the disease forwhich it offers screening. For instance, in a trial breast cancer screening programin the Swiss region of Morges (near Lake Geneva), women were informed aboutthe screening and asked to participate.33 Among these “informed” women, theproportion who mistakenly believed that screening would reduce their chance ofdeveloping breast cancer was higher than in the rest of Switzerland. As one Swisscolleague explained to me, “If we cannot get 70 to 80 percent of the women to

participate, then the results of the study will be questionable.” Therefore, healthorganizations are tempted to emphasize information that encourages women toparticipate rather than to correct their possible misunderstandings.
MORTALITY
The majority (55 percent) of more than 600 female patients who visited oneurban medical practice in Chicago answered that mammography screeningshould start at age 30-35. It is unlikely that they got this mistaken belief fromtheir physicians because, when questioned, none of the physicians in the practicestated that screening should start prior to age 40.34 In a random sample ofAmerican women, some 40 percent believed that screening should start betweenthe ages 18 and 39, and more than 80 percent believed that mammography hada proven benefit for women aged 40 to 49 years.35 These women also believedthat breast self-examination is even more beneficial than 10 years of annualmammograms.36 These results indicate a striking degree of misinformationamong American women. This is not to say that women in other countries arebetter informed; American women are just better studied.
How large is the perceived benefit of screening? In one study, 145 Americanwomen in their 40s were interviewed.37 Their education and socioeconomiclevels were above average—most had a college or postgraduate degree and afamily income over $50,000. None of these women had had breast cancer.Nevertheless, consistent with the widespread and mistaken belief that screeningbefore age 50 has proven benefits, more than 90 percent of them had had at leastone mammogram. These women were asked:
Imagine 1,000 women exactly like you. Of these women, how many doyou think would die from breast cancer during the next 10 years if theyare not screened for breast cancer by mammography or a physician’sexam?
and
Imagine 1,000 women exactly like you. Of these women, how many doyou think would die from breast cancer during the next 10 years if they

are screened every year or two for breast cancer by mammography or aphysician’s exam?
How many lives did these women think would be saved by 10 years ofscreening? Their average estimate—that is, the difference between their answersto the two questions—was 60 lives saved out of 1,000.38 Recall that screeninghas no proven effect for women in their 40s, and across all ages, the benefit in asample of 1,000 is only 1 life, not 60 lives, saved. A benefit of this size is illusory.Note that most of these well-educated women had had a mammogram. Whenthey consented to screening, we have no reason to think that this was informedconsent.
What Are the Perceived Costs of Screening?
In a survey of a random sample of American women, 92 percent said theybelieved that mammography cannot harm a woman who does not have breastcancer.39 Of the rest, 3 percent referred to exposure to radiation as a potentialhazard, 1 percent cited stress and anxiety, and an even smaller percentage raisedthe issue of false positives. Not one woman mentioned the unnecessary andtraumatic consequences of a mammogram that detects a nonprogressive cancer.
Sources of the Mammography Illusion
The picture that emerges from these studies is this: Many women ascribe almostmagical powers to mammography, and virtually none see harm in it. Where doesthis mammography illusion come from? People get their health informationfrom three main sources: the media (including television, radio, newspapers,magazines, and the Internet), physicians, and leaflets from healthorganizations.40 I will focus here on leaflets. How well do health organizationsinform women about the costs and benefits of mammography screening? In1997, Emma Slaytor and Jeanette Ward of the Central Sydney Area HealthService analyzed the information leaflets on mammography disseminated by allthe cancer organizations, health departments, and mammography screening

programs in Australia.41 Does the content of the leaflets mirror what is and whatis not in women’s minds?
TABLE 5-2: Information about mammography screening in 58 leafletsdistributed by Australian health organizations. For instance, in 60 percentof the leaflets the lifetime risk of developing breast cancer was mentioned.(Adapted from Slaytor and Ward, 1998.)
Information How oftenprovided
Lifetime risk of developing breast cancer 60%
Lifetime risk of dying from breast cancer 2%
Survival of breast cancer 5%
Relative risk reduction of death from breast cancer 22%
Absolute risk reduction of death from breast cancer Never
Number that must be screened to avert one death from breast cancer Never
Proportion of screened women who would be examined further 14%
False negative rate, or sensitivity 26%
False positive rate, or specificity Never
Proportion of women with a positive mammogram who have breast cancer(positive predictive value)
Never
The information most frequently reported in the leaflets was breast cancerincidence (Table 5-2). Sixty percent of the leaflets specified a woman’s lifetimerisk of developing breast cancer (ranging from 1 in 11 to 1 in 16 in variousleaflets). Two percent informed readers of a woman’s lifetime risk of dying frombreast cancer (which is lower). Although it is useful to know what the incidenceof breast cancer is, this information does not reveal the costs or benefits ofmammography screening. Screening cannot reduce incidence, only mortality.The leaflets’ emphasis on incidence may be one reason for many women’s beliefthat screening reduces incidence.

What did the leaflets say about mortality reduction? Only 22 percentreported mortality reduction at all. When this benefit was mentioned, it wasinvariably communicated in terms of relative risk reduction, which—asdiscussed earlier in this chapter—typically misleads laypeople intooverestimating the benefits of screening. In other words, none of the leafletsreported benefits in terms of absolute risk reduction, number needed to treat, orother easily understandable ways.
The leaflets were uniformly silent about the possible costs of screening. Forinstance, not a single one mentioned the test’s false positive rate despite the factthat about half the women undergoing repeated screening will experience one ormore false positives. One-quarter of the leaflets mentioned that the test can leadto false negatives—for example, “mammograms pick up 90 percent of breastcancers” and are “not 100 percent accurate.” Finally, how many of the leafletsinformed women that only a few women who test positive in screening—1 outof 10 among 40-year-olds—actually do have breast cancer? Not one. The moststriking feature of the leaflets is the information they left out.
This information policy does not seem to be peculiar to Australia.42 Theomissions—such as the possible costs of screening and the meaning of a positivetest—correspond closely to the “blind spots” found in studies of Americanlaypeople. The use of relative risks to report mortality reduction is consistentwith women’s overestimation of the possible benefits of screening. The omissionof information about false positives is consistent with women’s unnecessarilyexaggerated anxiety about a positive result: A woman who has never heard thatabout 9 out of 10 women with a positive screening test do not have cancer willbe unduly frightened when she has a positive result. As long as perceived benefitsand costs are grossly distorted in the public mind, informed consent will remainout of reach when it comes to mammography screening.
Upon being asked why this is so, a psychologist who had interviewedhundreds of German women and found them ignorant about breast cancer andscreening replied that many simply do not want to know any details about thedisease or screening, and that this ignorance can almost be described as acollective defense mechanism.43 Whatever the validity of this speculation, theanalysis of the information leaflets summarized here demonstrates that theproblem is not simply inside women’s minds. There are those in the health

information field who seem to prefer that potential participants inmammography screening not know too much.
From Innumeracy to Fear
It is impossible to weigh possible benefits against costs if one believes that thereare no costs in the first place. Making an informed choice about breast cancerscreening is further hindered by the specific anxiety surrounding breast cancer,fueled by the systematic exaggeration of its total incidence, of its incidencecompared to other serious diseases, and of its incidence in young women. Ofcourse, it is completely rational to fear developing a serious disease—what I amreferring to is the added and unnecessary anxiety owing to misleadinginformation provided by leaflets and the media.
“1 WOMAN IN 10”
In October 1999, the German weekly news magazine Stern ran a 13-page featureon breast cancer. In the subtitle, readers were told that every 10th womandevelops breast cancer, a message repeated in the text. This was the onlystatistical information provided. The rest of the article played on readers’emotions through personal stories of hope and despair and the obligatorysensational photos (this time of a bevy of topless women wearing blue laceunderwear and red boxing gloves—each of whom is missing a breast). The figure“1 woman in 10” (sometimes “1 woman in 9”) has become a mantra in thepopular press and breast cancer screening programs. This number has terrifiedmany. But what does it mean?
What Stern did not report is that the l-in-10 figure refers to a woman’scumulative chances of developing breast cancer by the age of 85. But mostwomen die before then, and those who contract cancer at this advanced age willmost likely die from some other cause. Table 5-3 explains how the l-in-10 figureplays out for a group of 1,000 women.44 Four women developed breast cancerin their 30s and 13 during their 40s. By age 85, the total number of cases ofbreast cancer added up to 99 cases, which corresponds to the l-in-10 figure.Thirty-three of these will have died of breast cancer. Using this naturalfrequency representation, we see that the majority of women with breast cancer

did not die of the disease; about 3 in 100 women will die of it by age 85. Andwe also see that about six times as many women die of cardiovascular disease.
TABLE 5-3. Risks of breast cancer and cardiovascular disease for 1,000women, and the meaning of the “l-in-10” figure. The data are based on theincidence and mortality rates reported in the Ontario Cancer Registry. (AfterPhillips et al., 1999.)
Age Alive atbeginning of
interval
Incidents ofbreast cancer
Deaths frombreast cancer
Deaths fromcardiovascular
causes
Deaths fromother causes
0-9 1,000 0 0 0 7
10-19
993 0 0 0 2
20-29
991 0 0 0 3
30-34
988 1 0 0 2
35-39
986 3 0 0 3
40-44
983 5 1 1 4
45-49
977 8 2 1 6
50-54
968 11 3 2 11
55-59
952 12 3 5 15
60-64
929 12 3 9 25
65-69
892 14 4 16 36

70-74
836 13 5 28 51
75-79
752 11 6 52 70
80-84
624 9 6 89 95
>85 434 5 7 224 203
Of course, the numbers in Table 5-3 need to be adjusted for differentpopulations. The goal here is simply to clarify the widely cited l-in-10 figure.The tool that fosters insight into the l-in-10 figure is the same as in Figure 4-2:Start with a population of concrete cases, and break it down into subgroups.These frequencies are easily understood.
The l-in-10 figure is rarely, if ever, explained in terms of frequencies as inTable 5-3. How do women interpret this statistic? Recall the group of well-educated American women aged 40 to 49 who had no history of breast cancer,each of whom was asked to imagine 1,000 women exactly like herself and toestimate how many of these women would die from breast cancer in the next 10years. Their average estimate was 100, that is, exactly “1 woman in 10.” 45
According to the authors of the study, this is a more than 20-fold overestimationof the actual risk of dying from breast cancer, consistent with Table 5-3. Among1,000 45-year-olds (which is the average age of the women in this study), 5 diedof breast cancer, not 100, within the next 10 years. Thus, on the assumptionthat most of these women had heard about the l-in-10 figure, they apparentlybelieved that it refers to the next 10 years rather than to the cumulative lifetimerisk at age 85, not to mention mortality rather than incidence. Each of thesemisinterpretations fuels unnecessary levels of fear. Exaggerated fears of breastcancer may serve certain interest groups, but not the interests of women.
IS BREAST CANCER THE MOST DEADLY DISEASE FOR WOMEN?
Why does breast cancer arouse more anxiety than other threatening diseases?The leading cause of death among North American women is not cancer butcardiovascular disease, which attacks the heart and blood vessels (see Table 5-3).

In a survey conducted by the American Heart Association, very few women (8percent) reported knowing this fact. Similarly, in a survey by The NationalCouncil on Aging only 9 percent of women said the disease they most feared washeart disease compared with 61 percent who most feared cancer, predominantlybreast cancer. Even among cancers, lung cancer—not breast cancer—is theleading cause of death among American women (Figure 5-2). Only 25 percentof women were aware of this fact.46
In the United States, prostate cancer is more frequent than breast cancer(Figure 5-2). It also takes almost as many lives. But there is no anxiety amongmen about prostate cancer comparable to women’s anxiety about breast cancer.Interestingly, unlike breast cancer, prostate cancer is presented in the media asan old person’s disease. However, its incidence, mortality rate, and the mean ageat diagnosis are in fact very similar to those of breast cancer.47 Colorectal canceris the third most deadly cancer among women (after lung and breast cancer).“Colorectal cancer” is an umbrella term for colon cancer and rectal cancer, coloncancer being the more common of the two. Like lung cancer, colorectal cancerrarely makes it into the headlines or onto the front pages. Consistent with whatthe media presents, relative to breast cancer the public tends to underestimatethe risk of cardiovascular disease and other cancers. A defender of the mediamight retort that it is public perception that the media coverage follows, not viceversa. There need be no contradiction—each probably follows the other.

FIGURE 5-2. Mortality (dark area) and incidence (dark plus white area) ofthe four most frequent cancers in the United States. For instance, out of100,000 men, 77 were diagnosed every year of lung cancer and 71 died from it(1990-1995, Caucasians only). (Based on the figures reported by Wingo et al.,1998).

TARGET THE YOUNG
In a 1991 issue featuring an article on breast cancer, Time ran on its front covera picture of a young woman with highlighted, bare breasts. In the years sincethen, many other magazines have followed suit, thus creating the impressionthat young women have the most to fear from breast cancer.48 In one study,some 85 percent of the case stories and anecdotes about breast cancer presentedin magazines such as Glamour, Vogue, Scientific American, Time, and Reader’sDigest were found to be about women under 50.49 When the breast cancerincidence rose dramatically in the 1980s and early 1990s, popular magazinesportrayed this increase as a mysterious epidemic targeting young, liberated,professional women.50
Age is indeed the highest risk factor for breast cancer—but it is the old, notthe young, as suggested by popular magazines, who are most at risk. The averageage at diagnosis is around 65 years (see Table 5-3). Moreover, the increase inincidence has not been observed in younger women, and the largest upsurge hasbeen among women over 60. Most, if not all, of this increase can be attributedto the increased use of mammography, which detects many cancers that maynever become clinically relevant (such as ductal carcinoma in situ).51 Consistentwith this view, mortality rates from breast cancer have remained fairly stable asincidence has increased. The incidence of breast cancer finally leveled off in theearly 1990s, after the “bubble” of increased screening had passed through thehealth system.
What has remained relatively constant over the years is the prevalence amongmen, who account for about 0.5 percent of all breast cancer diagnoses.52 Mendo not participate in screening. But if they did, we might observe an increase inincidence among them as well.
Do women’s beliefs mirror the emphasis in the media on young victims ofbreast cancer? Some 700 female patients at a Chicago academic internalmedicine practice staffed by 31 physicians were asked whether breast cancer ismore common among women aged 65 or women aged 40. Only 28 percentknew that the prevalence is higher among 65-year-olds than 40-year-olds.53
Similarly, a study of women in North Carolina found that 80 percent did notknow that older women have a higher prevalence of breast cancer.54 Yet in the

Illinois study, all the physicians in the practice correctly answered that breastcancer risk increases with age. This finding suggests that the patients did not getthis misconception from their physicians, though the physicians also failed tocorrect it. The media focus on the threat that breast cancer poses to the young isbadly misdirected. Older women have the most grounds for concern.
From Innumeracy to Prophylactic Mastectomy
A combination of innumeracy and fear can contribute to women allowingthemselves to be subjected to treatments that they would otherwise reject asneedlessly alarmist or even dangerous in themselves. The psychologist RobynDawes reported on a dramatic example involving a Michigan surgeon whom anewspaper hailed as a pioneer in the treatment of breast cancer.55 The surgeonurged all women over 30 to have an annual mammogram. Moreover, headvocated removing the breasts of healthy women and replacing them withsilicone implants. If you cannot follow his argument justifying this practice,don’t worry—but be wary.
The surgeon argued that 57 percent of women in the general population arein a group at high risk of developing breast cancer, and that 92 percent of allbreast cancers are found in this group. Furthermore, he claimed that 1 in 13women in the general population (whether at high or low risk) develops breastcancer between the ages of 40 and 59. From this he concluded that 1 in every 2or 3 women in the high-risk group will develop breast cancer between the agesof 40 and 59.
On the basis of these “estimates,” the surgeon recommended that womenwithout breast cancer who are in the high-risk group—that is, the majority ofwomen—have prophylactic (preventive) mastectomies. This measure, he argued,would save them from having to face the risk of cancer and its consequences,including the possibility of death. Over the course of two years, he removed the“high-risk” breasts of 90 cancer-free women and replaced them with siliconeimplants.
Persuaded by the surgeon’s argument, these women may have believed theywere sacrificing their breasts in a heroic exchange for the certainty of saving theirlives and protecting their loved ones from suffering and loss. None of them, and

none of their loved ones, seem to have questioned the surgeon’s numbers andreasoning.
To check whether the surgeon’s reasoning is sound, let us take a minute todraw a tree like that in Figure 5-3. Think of 1,000 women. According to thesurgeon, 570 (57 percent) of them belong to the high-risk group. According tohim, 77 of the 1,000 women (that is, 1 in 13) will develop breast cancerbetween the ages of 40 and 59, of whom 71 (that is, 92 percent) are in the high-risk group. Thus, 71 out of the 570 high-risk women will develop breast cancer,which is about 1 in 8—not 1 in 2 or 1 in 3 as the surgeon concluded.

FIGURE 5-3. A frequency representation of the risks communicated by aMichigan surgeon to his clients. The surgeon wrongly concluded that 1 out of2 or 3 women in the high risk group will develop breast cancer. When wetransform his percentages into frequencies, we can easily see that this number isabout 1 in 8 (71 in 570), not 1 in 2 or 3. When, in addition, we use realisticfigures instead of his subjective ones, this number is about 1 in 17.

Now we can see the flaw in the surgeon’s reasoning: He drew the wrongconclusions from the risks he specified. Just as alarming, the numbers he used inhis computations are themselves inflated (1 in 13 is unrealistically high forwomen between 40 and 59). In Table 5-3, we can see that in a group of 1,000women, 36 women will develop breast cancer between the ages of 40 and 59.From this more realistic figure, we would expect that only 1 in 17 high-riskwomen will develop breast cancer between the ages of 40 and 59.56 This resultindicates that out of the 90 women on whom the surgeon performedprophylactic mastectomy, some 85 would not have developed breast canceranyway. (And several of the others could most likely have been treated lessradically—for instance, by a lumpectomy.) In this case, the joint innumeracy ofthe surgeon and his patients had tragic costs—for the patients.
What is the actual benefit of prophylactic mastectomy? A recent studyfollowed up 639 women with a family history of breast cancer who hadundergone prophylactic mastectomy of both breasts at the Mayo Clinic inMinnesota.57 The women were classified as either high risk (for example,women with a mutation in the breast cancer genes BRCA1 and BRCA2; womenwith one or more first-degree relatives with breast cancer) or moderate risk; theirmedian age at mastectomy was 42 years and the median follow-up time was 14years. The result is shown in Table 5-4.
Ways to Present the Benefit
High-risk group
Absolute risk reduction. Prophylactic mastectomy reduces the number ofwomen who die from breast cancer from 5 to 1 in 100. That is, theabsolute risk reduction is 4 women in 100 (4 percent).
Relative risk reduction. Prophylactic mastectomy reduces the risk of dyingfrom breast cancer by 80 percent (because 4 saved out of 5 is 80percent). Remember that the relative risk reduction is the absolute riskreduction (4 in 100) divided by the proportion of patients who diewithout treatment (5 in 100).

Number needed to treat. The number of women who need to undergoprophylactic mastectomy to save one life is 25 because 4 in 100 (or 1 in25) deaths are prevented by prophylactic masctectomy.
Moderate-risk group
Absolute risk reduction. Prophylactic mastectomy reduces the number ofwomen who die from breast cancer from 2.4 to 0 in 100. That is, theabsolute risk reduction is 2.4 women in 100 (2.4 percent).
Relative risk reduction. Prophylactic mastectomy reduces the risk of dyingfrom breast cancer by 100 percent.
Number needed to treat. The number of women who need to undergoprophylactic mastectomy to save one life is 42.
All three presentations of the result are correct, but can suggest differentamounts of benefits and evoke different emotional reactions in women. Forinstance, for high-risk women, prophylactic mammography reduced the risk ofdying from breast cancer by 80 percent, or by 4 percent, depending on whetherthe benefit is presented as a relative or an absolute risk reduction. Moreover, interms of the number needed to treat, out of every 25 women at high risk, the lifeof one was saved, whereas the other 24 had no benefit from mastectomy(because most high-risk women do not die of breast cancer, even if they keeptheir breasts, and a few die of breast cancer even after they had both breastsremoved). In the moderate risk group, one life was saved for every 42 womenwho underwent treatment, which also means that 41 out of every 42 women losttheir breasts without a benefit.
Women who are contemplating prophylactic mastectomy should know thesenumbers in order to be able to make an informed decision. Furthermore, it isessential that they understand what the numbers mean, that is, the differencebetween the absolute risk reduction, the relative risk reduction, and the numberneeded to treat. As the cases of the 639 women at the Mayo Clinic show,prophylactic mastectomy can save lives. At the same time, however, it does notprovide absolute certainty because seven women got breast cancer even after a

prophylactic mastectomy, and for the vast majority of women treated, thetreatment led to a loss in quality of life without a prolongation of life.
TABLE 5-4: Reduction in breast cancer mortality resulting from prophylacticmastectomy (Hartmann et al., 1999).
Deaths (per 100 women)
Treatment High-risk group Moderate-risk group
Prophylactic mastectomy 1 0
Control (no mastectomy) 5 2.4
Conclusions
Breast cancer is a fairly unpredictable disease, with some tumors growing quicklyand others so slowly that they never would cause any symptoms; and there areyet others in-between. In making a decision about breast cancer screening,women face a situation in which the illusion of certainty and all three kinds ofinnumeracy interact. The illusion of certainty is fostered by physicians whoroutinely present patients with a choice between certainty and risk, although thereal choice is always between two risks, namely, the risks of screening and thoseof not screening. The illusion of certainty is fueled by leaflets distributed byhealth organizations that report the benefits of screening without mentioning itshazards. Ignorance of risks seems to be the rule rather than the exception: forinstance, the massive number of false positives is rarely remarked upon, nor isthe existence of nonprogressive cancers where early detection has no benefits,only costs. Furthermore, benefits are often communicated in terms of relativerisk reduction, which impress and mislead laypeople. As a result, knowledge ofthe benefits and costs among women is disturbingly low, and informed consentis hardly possible. Finally, the accuracy of mammography is oftencommunicated in terms of probabilities, which befuddles the minds of mostphysicians—not to mention their patients.
Of course, innumeracy is only one factor perpetuating this deplorable state ofaffairs in modern medicine. There are also institutional factors such as

physicians’ attempts to avoid being sued, conflicts of interest within healthorganizations that want both to inform patients and to get them to participate inscreening, and—last but not least—emotional reasons such as many patients’preference for reassurance over realistic information.
Of the various means capable of changing this state of affairs—legal,professional, and other—the tools for combating innumeracy are the most cost-effective and easiest to use. These tools include transparent methods of riskcommunication and mental defogging. Once insight has replaced theinnumeracy that now prevails, calls for reform may bring about the necessaryinstitutional and professional changes.

Perform all [these duties] calmly and adroitly, concealing most thingsfrom the patient while you are attending to him. Give necessary orderswith cheerfulness and serenity, turning his attention away from what isbeing done to him; sometimes reprove sharply and emphatically, andsometimes comfort with solicitude and attention, revealing nothing ofthe patient’s future or present condition.
Hippocrates
6
(UN)INFORMED CONSENT
The nineteenth century saw a struggle among three different visions of thephysician: the artist, the statistician, and the determinist. The French medicalprofessor Risueño d’Amador, for one, promoted the vision of the physician as anartist who relies on medical “tact” and his intuitions about the individualpatient. His rival Pierre-Charles-Alexandre Louis, in contrast, had little respectfor medical tact and wanted instead to see the evidence. Louis became famousfor rejecting the established doctrine of bloodletting as a medical treatment. Bycollecting data, he showed that slightly more people who were bled died thanpeople who were not, concluding: “We shall hear no more of medical tact, of akind of divining power of physicians.”1
At that time, using statistics to test the effectiveness of medical practices wasrevolutionary. The idea was inspired by the statistical methods of Pierre-SimonLaplace in astronomy and Adolphe Quetelet in social science. But statisticalevidence was frowned upon not only by medical “artists.” The Frenchphysiologist Claude Bernard rejected the images of both the physician-artist and

the physician-statistician. For Bernard, science meant certainty. He ridiculed theuse of statistical information:
A great surgeon performs operations for [kidney] stone by a singlemethod; later he makes a statistical summary of deaths and recoveries,and he concludes from these statistics that the mortality law for thisoperation is two out of five. Well, I say that this ratio means literallynothing scientifically and gives us no certainty in performing the nextoperation.2
Averages were, for Bernard, no substitute for the laws that determine eachindividual case, and a true determinist would settle for nothing less. The way todiscover these laws, in this view, was by experimentation, not the use ofstatistics. In the nineteenth century, statistical data were still consideredantithetical to the scientific method. Whereas science was about certainty,statistics was about uncertainty; therefore, statistics was not a proper scientifictool. The German-Hungarian physician Ignaz Semmel-weis’s statistical studiesof childbed fever and scurvy are as legendary as the reluctance of the relevantauthorities to enact the preventive measures that his statistics suggested. Unlikein physics, statistical thinking emerged slowly in medical diagnosis andtreatment.
The distinction that Bernard drew between statistics and experimentationwas finally closed in the 1920s and 1930s, when the English statistician SirRonald Fisher united statistics and experiment into what he called the “scientificmethod.” The medical statistician Austin Bradford Hill pioneered theapplication of Fisher’s randomized control experiments to randomized trials inmedicine and was knighted for this achievement in 1961. Praised for its“concern for the welfare of the individual,” his work reconciled medical statisticswith experimentation, thereby reconciling the aggregate with the individual.3
These visions of the physician have shaped today’s conflicting attitudes aboutwho is entitled to make medical decisions. The physician? The patient? Both?For physicians who see themselves as artistic virtuosi of medical tact, the patientis an uninitiated audience who may applaud, but not participate in, decisionmaking. After all, a conductor would not ask his audience for advice on how to

play Beethoven. Consistent with the image of the physician-artist, doctors madevirtually all the decisions; patients felt reassured and did what they were told.The patient’s body was treated as if it were the property of the doctor, whodecided whether it was to be given drugs or subjected to surgery. Somephysician-artists did not even allow patients to look at their own medicalrecords.4
Today, medical decision making is changing; patients have become more andmore involved. This change was marked by the publication of the book TheSilent World of Doctor and Patient by a Yale physician, Jay Katz. When the bookappeared in 1984, surgeons almost uniformly attacked Katz’s view that patientsshould have a say in what happens to their bodies. The magnificent vision of thephysician as an artist was at odds with the idea of an informed and maturepatient.
Bernard’s deterministic ideal has left a different mark on medical decisionmaking. Physicians who believe in this ideal see medical decisions as choicesbetween certainty and risk. The book Medical Choices, Medical Chances, writtenby a team led by Dr. Harold Bursztajn of Harvard Medical School, however, hasbeen influential in making clear that medical choices are almost never betweencertainty and risk, but rather between two risks. Tests and treatments are ofteninconclusive and can have side effects, and certainty is usually out of reach.
The book opens with the case of a 21 -month-old boy who was admitted to aleading American teaching hospital. The boy, who had an ear infection, waspale, withdrawn, and severely underweight. Though starving, he often refused toeat. The team of well-meaning doctors who treated the boy believed that itsresponsibility was to identify the cause of his illness with “certainty.” Althoughthey considered all actions not directed toward this goal to be risky, they saw noserious risk in attempting to reach certainty through relentless testing, whichrequired repeatedly drawing blood from the emaciated child. Once thediagnostic machinery was turned on, distinguished specialists performednumerous biopsies, six spinal taps, and a host of further tests—many of themdesigned to diagnose what were then untreatable diseases. The doctors felt theycouldn’t take the chance of failing to identify the cause of the boy’s illness. Whatdid the tests reveal? Nothing certain. Between each invasive test and the next,however, the little boy refused food more and more often, and after six weeks of

a struggle for certainty, he died.5 In an uncertain world, certainty can be adangerous ideal.
Louis’s vision of the physician who bases diagnostic and treatment decisionson statistics, on the other hand, lends itself to the development of a type ofdoctor-patient interaction in which both parties can discuss what to do on thebasis of the available evidence and the patient’s preferences. The moderndescendent of this vision has been termed evidence-based medicine. Fortunately,an increasing number of physicians practice evidence-based medicine. That is,they base their diagnostic and treatment decisions on the available evidencerather than on local clinical procedure and personal preference. Ideally, thephysician and the patient decide on medical care together, with the physicianbeing the expert on possible treatments and the patient the expert on what sheor he wants and needs.
Unfortunately, real medical decision making often fails to live up to thislaudable ideal. It is telling that the term “evidence-based medicine” had to becoined at all—think about a group of natural scientists in need of promotingevidence-based physics. A representative of the World Health Organizationrecently estimated that only 40 percent of medical practitioners in the UnitedStates choose treatments for their patients on the basis of scientific evidence; theothers use treatments that are possibly ineffective. One reason for the reluctancein medicine to rely on evidence—which persists today, more than 100 years afterBernard—is that many physicians still have difficulties drawing diagnosticinferences from statistics.
Informed Consent
What do physicians think about informed consent and shared decision making?Below, the second part of the discussion among the 60 physicians, introduced inChapter 2, shows that their opinions differ radically.
President: Medicine today still resembles the church in the sixteenthcentury. In surgery, it’s mostly men, they speak a strange language, andtheir clients are reassured after confession. The men wear strangewardrobes and perform ritualistic operations on the appendix. What we

need is a reformation. Martin Luther brought the Bible to the people bytranslating it from Latin into German. We have to bring the evidence tothe patients by translating relative risks and other confusing languageinto natural frequencies and transparent language.
Organizer: Let me expand. A main target of criticism for the Reformationwas the buying of indulgences, where people were made to believe thatthey could buy God’s absolution of every sin. This is what priests toldthem, and people believed it because they had no access to the Bibleitself. Today’s analogy is the medical business, where patients are madeto believe that they can buy a cure for every disease. And there is asecond parallel: new information technology. The printing press was thevehicle of the Reformation; it spread the word translated by Luther tothe people. For the first time, everyone could read the text rather thandepend on what a priest said. Today we have a second revolution ininformation technology: the Internet. The Internet allows access tomedical information that was difficult to obtain before. Noncommercialgroups of physicians, such as www.cochrane.org, distribute theinformation patients need to know over the Internet.6 Luther leveled thedisparity between priest and layperson, the initiated and the ignorant.The Internet can help us to level the disparity between the physician andthe patient, the infallible and the uninformed. This is my vision of areformation: Have doctors making decisions about treatments use thebest available evidence and consider the patients’ goals.
Gynecologist: Well, I agree with this vision, but my reality is different. I tellwomen about costs and benefits so that they can make up their minds.But few are interested in the numbers—most decide irrationally. Thiswoman’s neighbor had breast cancer—this is why she goes to bescreened.
Professor M: But we do have a responsibility to inform patients. Women arebadly informed about mammography screening. Many physicians justinvoke feelings of guilt to make them participate. “I hope you finallywent. You still didn’t?” Many women even believe that mammography

could prevent breast cancer, [the way] brushing your teeth preventscavities. Feminist groups have fought for screening. But few feministshave been informed that early detection is not always a benefit—forinstance, when a slow-growing cancer is detected that never would haveprogressed into an invasive one. The minimum a patient needs to be toldis the goal of screening, how often false positives and false negativesoccur, the benefits and costs of mammography, and the financialconsequences. A physician must reveal to a woman that he will earnmoney from performing a mammogram, but not when she declines it.
Dr. B: But patients do not like the prospect that screening can also beharmful. There are those who, in despair, fixate on mammography andthink it’s their rescue from breast cancer. It’s their hope.
Professor M: Only 1 out of 1,000 women benefits from 10 years ofscreening. In other words, 99.9 percent who participate in screeninghave no benefits, only potential harm. However, this is not the completestory. Swedish studies found that the total number of deaths— frombreast cancer or some other cause—is the same for women who arescreened and those who are not.
Dr. B: Why is this?
Dr. C: Maybe from car accidents on the way to screening.
Professor M: We don’t know. And despite excellent studies onmammography screening, we continue to live with uncertainty.
Organizer: We must learn to admit that there are different opinions, thatthere is no final answer. The question is: Go to screening and run therisk of possible costs, such as an early detection and treatment of a cancerwithout reducing mortality, resulting in a loss of quality of life? Or notgo, betting that I am among the 999 out of 1,000 who will not benefitfrom screening, as Professor M pointed out, but run the risk that I amactually the one woman whose life would be saved?

Dr. A: Physicians in Essen, Germany, amputated one or both breasts ofsome 300 women, despite most of them not having cancer. When thiswas proven, one physician set fire to his records and then himself. ASwedish study resulted in 4,000 unnecessary breast amputations. Is allthis worth the 1 in 1,000 benefit?
Dr. C: Why so many unnecessary breast amputations?
Dr. A: In the German case, shoddy diagnoses. But in general, the diagnosesof histologists are consistent with one another in only 70 percent ofcases.
(Breast cancer specialist shakes head in disagreement.)
Organizer: The pressure on women to participate in mammographyscreening is enormous. “Come back after six months, you should have afollow up mammogram . . .”
Dr. D: But why do you insist on informing? Most patients do not want tobe informed. It’s all psychology. They are anxious; they fear the worst;they want to be reassured. They do not want to see numbers.
Gynecologist: After a mammogram, it is me, the physician, who is reassured.I fear not recommending a mammogram to a woman who may latercome back with breast cancer and ask me “Why didn’t you do amammogram?” So I recommend that each of my patients be screened.Yet I believe mammography screening should not be recommended. ButI have no choice. I think this medical system is perfidious, and it makesme nervous.
Dr. A: Do you yourself participate in mammography screening?
Gynecologist: No, I don’t.
Organizer (addressing the audience): I would like to know how many of youparticipate in mammography screening. For men, the question is “If you

were a woman, would you participate?”
Organizer (seeing that no one has raised his or her hand): Hmm. How manyof you do not participate, or would not participate? How many areundecided?
Organizer (after counting hands): No one here participates herself inscreening. Fifty-five say they do not participate. Five are undecided—men, who haven’t thought about it.
President: We need to put hard evidence into patients’ minds and let theillusions out. At the same time, we need to take their anxieties and theirneed for rituals seriously. Every doctor practices a bit of voodoo andmysticism, even the star surgeon. Patients expect this. But mostimportant, we need to learn to use our brains and finally enter the age ofEnlightenment, which Kant asked us to do long ago. If not perfectlyrational, then at least enlightened.
Dr. F: Informed consent is not just prevented by the anxious patient whorefuses to think. Many physicians do not understand the risks in the firstplace, and this may affect women’s emotions and anxieties.
Breast cancer specialist: I admit that until a few years ago, I emotionallyoverestimated the power of technology. In my field, doctors focus onlyon not overlooking a cancer. When a false positive is revealed aftercutting into a breast, the patient is happy, and the doctor is too. Thepatient does not ask, “Why did you cut in the first place? Why not aneedle biopsy or other minimally invasive diagnostics?”
Organizer: The patient says to herself, “Thank God that they looked socarefully, and now everything is OK.” Invasive surgery with a benignresult relieves the patient and makes her grateful to the physician.
Decision researcher: An AIDS counselor once told me that there were neverany false positives. I asked him, “Would you actually notice a false

positive?” That made him pause, and he thought for a while andremarked, “Actually, most likely I would not.” Similarly, radiologists donot follow up on patients, do not keep statistics, and do not conductquality control studies. They don’t keep track of which positives turnout to be false positives. In addition, to talk with physicians about falsepositives often evokes anxiety and a defensive attitude on their part.
Dr. A: I sit through many a seminar for continuing education forphysicians, where we explain at length what “sensitivity” [true positiverate] and “specificity” [true negative rate] mean. Then we ask aparticipant what the probability of a positive test is called given thepresence of a disease. One physician answers “specificity.” I say, notexactly, try again. “Oh,” he corrects himself; “I wanted to say’l minusspecificity.’ ” I say, try again.
President: Few doctors are trained to judge and evaluate a scientific study. Imyself chose to be trained as a surgeon in order to avoid two things:statistics and psychology. Now I realize they are both indispensable.
The discussion reveals different views on informed consent and shareddecision making. One group of physicians perceive patients as emotional beingswho want reassurance rather than information. Others emphasize that physicianshave a moral obligation to inform their patients, and that the lack of informeddecision making is due not just to emotionally or intellectually handicappedpatients, but also to physicians’ faults, including their innumeracy. Finally, asProfessor M points out, informed consent must also entail the physician’srevealing when his or her own costs and benefits concerning a treatment differfrom those of the patient. This situation is illustrated clearly in the disturbingfact that physicians recommend screening to their patients although they do notparticipate themselves.
PHYSICIAN AND PATIENT
Is it “natural” that patients are expected to trust their doctors’ judgment withoutquestion, that they have little say in medical decision making and are badlyinformed? Although the omnipotent role that physicians play in modern society

has been defended as a long-standing tradition, there is nothing natural aboutthis form of doctor-patient relationship. For instance, records in Bologna datingfrom the late sixteenth century through the seventeenth century reveal astrikingly different doctor-patient relationship. Patients were expected to payonly if they were healed.7 The practitioners were contractually bound by “anagreement of cure” to heal the patient within a specified time and for a specifiedsum. This “horizontal” as opposed to “hierarchical” model of the physician-patient relationship empowered patients. There was a tribunal before whichpatients could sue the practitioners, licensed or unlicensed, when they broke thecure contract. By the end of the eighteenth century, however, patients no longerreceived a promise of cure but instead a promise of orthodox treatment andprotection. Payment according to results more or less disappeared with the pro-fessionalization of modern medicine. The status of American physicians today—known as “allopaths”—reflects the outcome of a century-long struggle amongcompeting groups of healers including homeopaths, mid-wives, barber-surgeons,and wise women. Well into the nineteenth century, American physicians werelittle respected and were underpaid. The twentieth century witnessed theemergence of a powerful medical monopoly and the birth of a highly respectedprofession. Jay Katz sees a link between physicians’ historical struggle fordominance and their relationship with patients today: “Physicians’ quest forpolitical power mirrors the quest for interpersonal domination of the physician-patient relationship.”8
The dominance of physicians and submission of patients in modern medicinebegan to change when, on October 22, 1957, Justice Absalom F. Bray of theCalifornia Court of Appeals coined the term “informed consent.” A man withparalyzed legs had sued his physician for failing to warn him of the risk ofparalysis inherent in the treatment for limping that he had undergone. At theend of his opinion, Justice Bray wrote: “In discussing the element of risk acertain amount of discretion must be employed consistent with the fulldisclosure of facts necessary to an informed consent.”9 His opinion marked thebeginning of the legal history of informed consent. The fact that Bray left roomfor “discretion” as well as “informed consent” reflects a tension that still existstoday. Informed consent refers to an ideal practice in which the physicianinforms the patient of the risks associated with a treatment, including its side

effects, on the basis of which the physician and the patient jointly decide what todo. Informed consent is more appropriately called “shared decision making.”The two parties bring different knowledge to the decision—the physician knowsabout diagnostic tools and treatment options, while the patient knows what hisor her goals and values are. For instance, a woman might or might not prefer tokeep her reproductive organs intact at the risk of lowering her life expectancy.Expressed in general terms, a patient might judge the possible benefits of atreatment as worth its costs, or the patient might find the costs too high and thebenefits too small to be worth the trouble.
IPHIGENIA
Consider the case of a woman whom Katz called Iphigenia (to protect heranonymity)—after the classical Greek playwright Euripides’ Iphigenia, who wassaved by the goddess Artemis from sacrifice by her father. The case illustrateshow physicians and patients can make the transition from a relationshipfounded on authority to one based on informed consent.10 Iphigenia, a 21-year-old single woman, discovered a lump in her breast, which a biopsy revealed to bea malignant lesion. She agreed to a mastectomy, the extent of which her surgeonwould determine by what he discovered during the operation. The surgeon hadnot explained the pros and cons of alternative therapies to Iphigenia because hefirmly believed that they all were inferior to surgery. As the day of the operationapproached, however, he began to doubt the wisdom of proceeding withoutgiving her details about alternatives, particularly radiation therapy. On theevening before the operation, he went to the hospital and finally told her abouthis concerns about remaining silent. After they talked for a long time, Iphigeniadecided to postpone the operation and eventually opted for a lumpectomy(excision of the tumor only) followed by radiation therapy. At a panel discussionon the treatment of breast cancer some time later, Iphigenia spokeknowledgeably about why she had made this decision and movingly expressedher joy at being able to start her impending marriage physically intact. Thediscussion was heated. The physicians defended their preferred treatment andattacked those defended by their colleagues—just as financial advisors tend tofavor their own methods. Despite the disagreements, however, the physicianswere fairly united in the belief that it was irrational of Iphigenia’s surgeon to

allow her to make the decision whether to have surgery. Even physicians havetrouble deciding which treatment is best, they reasoned, so how can a physicianallow a patient to decide?
NANCY REAGAN
Iphigenia decided for a lumpectomy over a mastectomy. Faced with early-stagebreast cancer, former First Lady Nancy Reagan weighed the pros and consdifferently and decided to have a radical mastectomy. In her words:
At the time of my operation, there were some people, including doctors,who thought I had taken too drastic a step in choosing the mastectomyinstead of a lumpectomy, which involved removing only the tumor itselfand a small amount of tissue—but also weeks of radiation. I resentedthese statements, and I still do. This is a very personal decision, one thateach woman must make for herself. This was my choice, and I don’tbelieve I should have been criticized for it. For some women, it wouldhave been wrong, but for me it was right. Perhaps, if I had been 20 yearsold and unmarried, I would have made a different decision. But I’vealready had my children and I have a wonderful, understandinghusband.11
Not only can values differ from person to person, but they can change overthe course of a lifetime. As soon as physicians agree to share information andresponsibility, patients become more knowledgeable about treatments andphysicians more aware of patients’ values. To use an analogy, the question ofhow to build a power plant is a technical one best handled by engineers. Thequestion of whether and where a power plant should be built, however, is onlypartly technical; it is also a social and political question that should not bedecided solely by engineers.
Uninformed Consent
Informed consent is a beautiful ideal, but why is it still so rare? The silent worldbetween doctor and patient is one reason: Patients often do not know what

questions to ask. The emotional world of the patient is another: Many do notdare taking an active part in the decision process. And then there is innumeracyamong physicians, which puts informed consent out of reach. The fundamentalbuilding block of the uninformed, immature patient, however, is a world ofillusionary certainty.
THE ILLUSION OF CERTAINTY
Some physicians argue that disclosing the uncertainties of diagnosis andtreatment to patients would be counterproductive because the patients wouldnot understand them, would not want to know the numbers or want to hearthat treatments have potential hazards as well as benefits— and they might seekout a physician who offered them certainty instead. In this view, the physician’smain task is to reassure the patient. According to the physician Jay Katz, untilrecently physicians have assumed an attitude of certainty toward their patients,despite a wide variety of competing treatments for the same ailment. Withoutthe tools of controlled experiments and statistics, it was difficult to evaluate theclaims of various therapies.12 Every proposed treatment, however reasonable orabsurd, found its enthusiastic adherents. These included surgery, a variety ofmedications (mineral, vegetable, and animal), dieting, bleeding, purging,exorcism, inducing perspiration, the laying on of Queen Elizabeth I’s royalhands, and applying goat dung. When one treatment fell into disrepute, it wasquickly replaced by another one, which was then touted as the single best one.Even in medieval times, surgeons removed part or all of diseased breasts, andleading surgeons accused colleagues who did not remove every bit of tissue forbeing too timid in a debate that is still going on today.
Many a physician confronts the patient with an apparent choice betweencertainty and risk rather than a choice between risks. Each alternative carries itsown uncertain consequences, which need to be compared for an informeddecision to be made. Consider, for instance, Dr. Standing’s statement that hewould not inform a patient of evidence about errors in mammography andwould perform a biopsy on a patient with a positive mammogram in any case.This course may sound harmlessly prudent, but for the patient a biopsy carriescosts. In an article in The New Yorker entitled “Whose Body Is It, Anyway?” thesurgeon Atul Gawande related the case of a woman in her 40s whose annual

mammogram revealed an area of “suspicious” calcification in her left breast onthree separate occasions.13 Each time, a surgeon took her to the operating roomand removed the tissue in question. Each time, the tissue proved to be benign.Now the woman is again confronted with a suspicious mammogram of the samebreast, and the doctor tells her that she ought to have a biopsy to exclude thepossibility of malignancy. She already has three raised scars scattered across thebreast, one of them almost 3 inches long, and so much tissue has been removedthat her left breast is markedly smaller than her right one. Should she really haveanother biopsy?
This woman’s choice is between two risks, not between certainty and a risk.To choose, she needs to know the costs and benefits of each option and toevaluate these in light of her own goals, which may differ from her physician’s.And she may have to live with a residual uncertainty, because not everything isknown as precisely as we would wish. The lifeblood of the illusion of certainty,however, is thinking in black-and-white terms rather than in shades of gray:“Either my mammogram will be normal, and I do not have to worry aboutbreast cancer, or it will not be and I will die an agonizing, horrible death.”14
Neither of these two outcomes is truly certain.
DO PATIENTS ASK QUESTIONS?
By definition, informed consent requires an informed patient, not just aconsenting one. However, many patients are poorly informed about risks—andnot only concerning breast cancer. In one study, patients in the waiting rooms ofa Colorado clinic serving army personnel and an Oklahoma clinic serving a low-income urban population were asked about the standard tests for diagnosingcommon illness and other diseases such as strep throat infection, HIV, and acutemyocardial infarction.15 Each patient judged (1) the probability that a personsuch as himself has the disease before being tested, (2) the sensitivity of the test,(3) the specificity of the test, and (4) the probability of his having the diseasegiven a positive test result. Most patients estimated these four probabilities to beessentially the same for all the diseases—whether the disease was rare or not andwhether the test was accurate or not. To find out if patients’ ignorance stemmedfrom the fact that they had no experience with these diseases, for each illness ordisease the authors looked at only those patients who had been tested or treated

for it or had attended an office visit with a family member or friend who hadbeen tested or treated for it. In the Oklahoma clinic, the estimates of patientswho had experience with the illness or disease were only slightly more accuratethan other patients’ estimates, and in the Colorado clinic, they were no moreaccurate. Even the experienced patients made very inaccurate judgments, whichsuggests that their physicians had never explained the risks to them or had doneso in a way that was hard to understand or at least hard to remember.
Do patients ask for information concerning risks that doctors fail to deliver,or do patients rarely ask for it in the first place? Audiotapes of 160 adultpatients’ visits to doctors in central North Carolina showed that in only one outof four visits did the patient and physician actually discuss risks. Risk discussionwas defined as any discussion about behavior change, tests, or treatments, andtheir future consequences (such as “You could cut your risk of getting a heartattack in half by . . .”). In the majority of these discussions, the physician statedthe risk with certainty (for example, “You will have a heart attack if you don’tlose weight”). Only a small proportion of the discussions (about one in six) wereinitiated by the patient.16 Moreover, of the 42 patients who said they haddiscussed risk with their physicians, only 3 could recall the content of thediscussion immediately after the visit. But the patients did not seem to mind.More than 90 percent felt that they had had their questions answered, hadunderstood all that was said, and had enough information.
In short, patients felt that their questions had been answered by the doctor,although they asked few questions and remembered even fewer answers. Thislack of communication between physicians and patients poses a serious threat tothe possibility of “informed” consent.
GEOGRAPHY IS DESTINY
Too often in health care, “geography is destiny.” For instance, 8 percent of thechildren in one community in Vermont had their tonsils removed, but inanother, 70 percent had. In Maine, the proportion of women who have had ahysterectomy by the age of 70 varies between communities from less than 20percent to more than 70 percent. In Iowa, the proportion of men who haveundergone prostate surgery by age 85 ranges from 15 percent to more than 60percent. The Dartmouth Atlas of Health Care documents the surprisingly wide

variability in the use of surgical treatments across all regions in the UnitedStates.17 Why do these regional differences exist? According to the physicianDavid Eddy, the tendency to follow the local pack is the single most importantexplanation for regional variations in medical practice.18 These local customs arefueled by the uncertainty about the outcomes of many surgical treatments.Unlike new drugs, which the Food and Drug Administration assures are tested,surgical procedures and medical devices are not systematically subjected toevaluation.
Aside from geography, the physician’s specialization all too frequentlydetermines treatment. The treatment of localized prostate cancer in the UnitedStates, for instance, generally depends on whom the patient visits. A study foundthat some 80 percent of urologists recommend radical surgery, whereas some 90percent of radiation oncologists recommended radiation treatment.19 Thispattern of variation suggests that patients are not generally advised about theiroptions in a way that encourages them to participate in decision making.
PROSTATE CANCER SCREENING
When the former mayor of New York, Rudolph Giuliani, was diagnosed ashaving prostate cancer, he was reported in the newspapers to make a pitch thatall men participate in prostate cancer screening. “I urge everyone to get the PSAtest,” Mr. Giuliani said, “If the PSA is normal or low, you don’t have a problem.If it’s high, then you have.”20 Screening for prostate cancer is typicallyperformed using the prostate-specific antigen (PSA) test or digital rectalexamination or both. The case of prostate cancer is a striking example of manymen’s inability to ask the right kind of questions. For example, I had thefollowing conversation with a friend who is professor of business at a leadingAmerican university:
GG: How did you decide whether or not to participate in PSA screening?
Friend: My doctor told me that I am old enough, that it’s time, so I went.
GG: Did you ask your doctor about the pros and cons of screening?

Friend: What do you mean? The pros are that the test can detect cancer inan early state.
GG: Did you ask about anything else?
Friend: Not really. The test is so simple, it’s cheap, and you can onlybenefit; it can’t hurt.
Note that my friend is an academic who knows how to get information fromlibraries and the Internet. But rather than using his brain, he displayed respectfuldocility when he consented to screening. He did not look up information, nordid he ask his doctor the relevant questions: What are the benefits and what arethe costs of prostate cancer screening? If he had looked into the relevant medicalliterature, he would have found that there is no evidence that screening reducesmortality from prostate cancer. In other words, people who take PSA tests dieequally early and equally often from prostate cancer compared to those who donot. My friend confused early detection with mortality reduction. PSA tests candetect cancer, but because there is as yet no effective treatment, it is not proventhat early detection increases life expectancy.21
“It can’t hurt,” responded my friend. He simply assumed that screening hasno costs. He erred again; there is no free lunch here. The test produces asubstantial number of false positives, and therefore, when there is a suspiciouslyhigh PSA level, in most of these cases there is no cancer. That means, many menwithout prostate cancer may go through unnecessary anxieties and often painfulfollow-up exams. Men with prostate cancer are likely to pay more substantialcosts. Many of these men undergo surgery or radiation treatment that can resultin serious, lifelong harm such as incontinence and impotence. Most prostatecancers are so slow-growing that they might never have been noticed except forthe screening. (See Figure 5-2), which shows that out of 154 people withprostate cancer, only 24 died of the disease.) Autopsies of men older than 50who die of natural causes indicate that about one in three of them has someform of prostate cancer.22 More men die with prostate cancer than from prostatecancer.
Because of the lack of benefit and the likelihood of harm, the U.S. PreventiveServices Task Force explicitly does not recommend routine screening for prostate

cancer, either using prostate-specific antigen (PSA) or digital rectalexaminations.23 There is currently no evidence that early detection reducesmortality, whereas the evidence of possible harm due to follow-up diagnosis andtreatment (including incontinence and impotence) is overwhelming. Even whenprostate cancer is detected, the prolongation of life by the available treatments is,for all stages of prostate cancer, unproven.24 Note that in cases of alreadyinvasive prostate cancer, treatment can reduce pain; but this should not beconfused with reducing mortality. Nevertheless, more and more men areparticipating in prostate cancer screening, and largely as a result, the number ofprostate cancer cases reported in the United States has more than tripled since1990.
“Doctor’s orders!” How, after our conversation, did my friend react? Heshook off his respectful docility and looked up the scientific evidence himself.Being an economist by training, he made a calculation of how much moneycould be reallocated to research effective therapies for prostate cancer if it wasnot spent on screening. He had taken the first step.
COLORECTAL CANCER SCREENING
To turn the ideal of informed consent into reality, physicians, not only patients,need specific education. Ulrich Hoffrage and I have used natural frequencies tohelp physicians understand the outcomes of standard tests for colorectal cancer,phenylketonuria, and Bechterew’s disease.25 I will only report the results for thehemoccult test here (also known as FOBT, or fecal occult blood test), which is astandard test for colorectal cancer. The same 48 physicians from Chapter 4—who had an average of 14 years of professional experience—estimated the chanceof colorectal cancer given a positive hemoccult test in routine screening. Half ofthe participants received the information in conditional probabilities, the otherhalf in natural frequencies. The two representations are given here.
Introduction—All Participants
To diagnose colorectal cancer, the hemoccult test—among others—isconducted to detect occult blood in the stool. This test is used from aparticular age on, but also in routine screening for early detection ofcolorectal cancer. Imagine you conduct a screening using the hemoccult test in

a certain region. For symptom-free people over 50 years old who participatein screening using the hemoccult test, the following information is availablefor this region:
Conditional Probabilities Format—First 24 Participants
The probability that one of these people has colorectal cancer is 0.3 percent. Ifa person has colorectal cancer, the probability is 50 percent that he will havea positive hemoccult test. If a person does not have colorectal cancer, theprobability is 3 percent that he will still have a positive hemoccult test.Imagine a person (over age 50, no symptoms) who has a positive hemocculttest in your screening. What is the probability that this person actually hascolorectal cancer? _________percent
Natural Frequencies Format—Remaining 24 Participants
Thirty out of every 10,000 people have colorectal cancer. Of these 30 peoplewith colorectal cancer, 15 will have a positive hemoccult test. Of theremaining 9,970 people without colorectal cancer, 300 will still have apositive hemoccult test. Imagine a sample of people (over age 50, nosymptoms) who have positive hemoccult tests in your screening. How many ofthese people actually have colorectal cancer? ______out______of
Figure 6-1 (left side) shows that when the information was represented inprobabilities, there was remarkable disagreement among physicians’ estimates,which ranged from 1 to 99 percent. The most frequent estimate (50 percent)was 10 times higher than the correct answer, which only 1 out of the 24physicians reached when they received the information in probabilities. A fewothers came close to it, but for the wrong reasons. For instance, one physicianconfused the false positive rate (3 percent) with the probability of colorectalcancer given a positive test, which happened to be not much larger. Thus, weobserved the same result as for breast cancer screening: When physicians try todraw a conclusion from probabilities, their minds tend to cloud over.
Did natural frequencies dispel the mental confusion and increase consensus?Again, yes. When the information was expressed in frequencies, the estimateswere less scattered, ranging from 1 percent to 10 percent (Figure 6-1, right side).

In this group, all of the physicians came up with the correct, or nearly correct,answer. As with breast cancer screening, physicians’ clouded thinking aboutwhat a positive hemoccult test means can be remedied simply by presentingstatistical information differently than it is presented in standard medicaltextbooks.
The answer to the question “What does a positive test mean?” can beillustrated by drawing a frequency tree (Figure 6-2). Out of every 315 peoplewho test positive in hemoccult screening, only 15 are expected to have colorectalcancer, which corresponds to a probability of 4.8 percent. Just as in breast cancerscreening, most hemoccult tests that are performed for purposes of screening andthat turn out positive are false positives. The reason is the same: When a diseaseis rare, as is colorectal cancer in the general population, the number of truepositives will be low and most positives will be false (the exact figures depend onthe false positive rate). For instance, one study found that between 94 and 98percent of patients with positive tests did not have colon cancer.26 Whethercolorectal cancer screening is worth the cost, given this large number of falsepositives, rests, as with breast cancer screening, in the values of the patient. Thephysician can assist the patient by explaining clearly what a positive test means.

FIGURE 6-1. The impact of representation on colorectal cancer diagnosis.Forty-eight physicians estimated the chances of colorectal cancer given a positivescreening test. Half of the physicians received the relevant information inconditional probabilities, the other in natural frequencies. Each point representsone physician. The ordinate axis shows physicians’ estimates of the probabilityor frequency of colorectal cancer given a positive test.

FIGURE 6-2. Frequency tree for colorectal cancer screening. Out of every 315people with a positive hemoccult test (shown in boldface), some 15 will havecolorectal cancer. This corresponds to a probability of 4.8 percent. (Data fromGigerenzer, 1996a; Hoffrage and Gigerenzer, 1998.)

Despite the fact that the benefit of colorectal cancer screening seems to beabout as high as that for breast cancer, this type of screening has few advocatesoutside the medical profession. Whereas the vast majority of women who areasked to participate in breast cancer screening comply,27 according to reportsfrom community screening programs, rates of compliance for the hemoccult testare only 15 to 30 percent, and even lower for sigmoidoscopy, another screeningtest experienced by patients as uncomfortable, embarrassing, and expensive. Ifroutine hemoccult and sigmoido-scopic screening of all people over the age of50 were recommended and implemented in the United States, the cost would bemore than $1 billion per year in direct charges.
ANATOMY OF THE MEDICAL MIND
How did the physicians go about solving the diagnostic tasks when they gaveincorrect answers? From their notes, estimates, and subsequent interviews, wewere able to identify most of the intuitive strategies. The reasoning wasstrikingly different with probabilities than with frequencies. The two dominantstrategies among physicians who were given probabilities were “sensitivity only”and “sensitivity minus false positives,” both of which are illustrated in Figure 6-3for the colorectal cancer task. Physicians who reasoned by the sensitivity-onlystrategy inferred that the chance of colorectal cancer given a positive test was 50percent, since 50 percent was the sensitivity of the test. Physicians who used thesensitivity-minus-false-positives strategy inferred that the chance was 47 percent,that is, the sensitivity of the test minus the false positive rate (3 percent).28 Ingeneral, these two strategies lead to gross overestimates of the actual risk ofsomeone’s having a disease given a positive test result—because both strategiesignore the disease base rate (0.3 percent) and most diseases are relatively rare.

FIGURE 6-3. How physicians reason. The arrows show which information isused by the most common diagnostic strategies. For instance, physicians whouse the strategy “sensitivity only” infer that the probability that the patient hascolorectal cancer given a positive test is 50 percent, which is the sensitivity of thetest. Note that physicians’ reasoning strategies change when the information ispresented in natural frequencies (bottom) rather than conditional probabilities(top). The analysis is based on 48 physicians. (See Hoffrage and Gigerenzer,1998.)

How consistently did physicians apply these strategies—for instance, did aphysician who used the sensitivity-only strategy to solve one diagnostic task alsouse it to solve the others? When confronted with probabilities, the physiciansshowed little consistency. For instance, one department chief added thesensitivity to the false positive rate to infer the chance of cancer given a positivetest, and in the next diagnostic task he multiplied the sensitivity by the diseasebase rate. Only 1 out of 5 physicians used the same strategy to solve bothprobability tasks that they received, such as the breast cancer and colorectalcancer tasks. With frequencies, consistency increased: More than half of thephysicians used the same strategy in both tasks.29
Although the physicians were much more likely to answer correctly in thetasks expressed in frequencies, even there their estimates were sometimesincorrect. With frequencies, the two most frequent non-Bayesian strategies were“base rate only” and “positives only.” In the colorectal cancer task, the base-rate-only strategy leads to the inference that 30 out of 10,000 people with a positivehemoccult test actually have colorectal cancer, and the positives-only strategyleads to an estimate of 315 out of 10,000. The first is an underestimation of theactual risk; the second (about 3 percent) is close to the right estimate, but for thewrong reason. The two strategies follow a common logic, however: Both focuson one of the two base rates—either that of the underlying disease or that of theobservable result (a positive hemoccult test). Thus, the use of natural frequenciesnot only fosters correct Bayesian inferences but, barring that, encourages the useof strategies that rely on base rates.
On the basis of physicians’ poor diagnostic reasoning using probabilities,previous researchers concluded that physicians confuse the two conditionalprobabilities, namely, the test sensitivity and the probability of the disease givena positive test.30 The analysis of the medical mind that Ulrich Hoffrage and Imade provides some empirical evidence for this hypothesis (the sensitivity-onlystrategy), but it also reveals that multiple inappropriate strategies—not just thisone—are sometimes used in diagnostic inference. When information ispresented in probabilities, the high variability in diagnostic judgments can betraced to the high variability in diagnostic strategies.
We also found in our studies that the younger physicians are better atthinking statistically than their older counterparts. Dr. Standing—the

department chief we met in Chapter 4—was not the only one who, despairingof his ability to make a diagnostic inference using statistical information, referredto a daughter or a son as someone who would know better. During one of theinterviews conducted for our study, the 18-year-old daughter of a 49-year-oldprivate practitioner happened to come in and asked to take the test too. Herfather had worked for 30 minutes and failed on all four diagnostic tasks, shiftingdesperately between two strategies (sensitivity-only and base-rate-only). In hiscase, even natural frequencies were no help. His daughter, in contrast, solved allfour tasks by drawing frequency trees such as those shown in Figures 4-2 and 6-2. When she discovered which strategies her father had been using, she gave herfather a quizzical look and said: “Daddy, look, the frequency problem is nothard. You couldn’t do this either?”
Are physicians aware of their innumeracy? In general, yes, but they tend notto be aware that proper representations can turn their innumeracy into insight.A few physicians even celebrate their ignorance, in an attitude reminiscent of thephysician-as-artist. For instance, a university professor who was an ear, nose, andthroat specialist—one of three physicians who declined to participate in ourstudy—declared, “This is not the way to treat patients. I throw all these journals[with statistical information] away immediately. One can’t make a diagnosis onsuch a basis. Statistical information is one big lie.” However, the majority ofphysicians in our studies who declared themselves to be mathematically illiteratehad feelings of regret: “But this is mathematics. I can’t do that. I’m too dumbfor this.” “I can’t do much with numbers. I am an intuitive being. I treat mypatients in a holistic manner and don’t use statistics.” With natural frequencies,to their own surprise, these self-diagnosed innumerate physicians reasoned aswell as those of their fellows who did not claim to suffer from innumeracy. Theirnervousness and tension turned into relief. “Now it’s different. It’s quite easy toimagine. There is a frequency; that’s more visual,” said one, and another said, “Afirst grader could do this. Wow, if someone couldn’t solve this!”
With reference to the desirability of informed consent, it must be realizedthat such consent is about more than just signing a form; it is about riskcommunication. This fact should have consequences for medical training.31
Every medical student needs to be trained in the use of mind tools that facilitatecommunication. And judging from the feedback we got from the physicians in

our studies, such training would not be unwelcome. After participating, one ofthem wrote to us: “Participating in this study and learning its results is of greatimportance to me professionally. I’m sure that from now on I will representmedical data to myself in frequencies rather than just glancing over them orbeing content with some vague idea.”
Why Informed Consent Is Not Easy to Achieve
Once I had such a stiff neck that I could hardly turn my head. My chiropractorsent me to a radiologist, Dr. Best,32 for an X ray. Dr. Best, a gentle man withempathetic eyes, ran a large radiology institute that also offered mammographyscreening. White-clad assistants whirled through the hallways, and the waitingrooms overflowed with patients. After my X ray was taken, Dr. Best mounted iton a lighted screen and explained to me what he saw. I soon realized that mychiropractor had told him on the phone that I study decision making underuncertainty. Dr. Best was overjoyed to have someone to talk to about his work:“You cannot imagine how boring my life is, the same routine every day—X raysfor 25 years.” He complained about patients’ fears of X rays, about having toperform all kinds of analyses on patients to protect himself from being sued formalpractice, and about many patients’ inclination to delegate every bit ofdecision making to the doctor.
As we discussed fear and responsibility, I took the opportunity to ask himwhat he would do in the following situation: “Imagine I were a woman in herearly 40s who came to your institute for breast cancer screening— not because Ihad any symptoms, just because my regular doctor told me to do so every otheryear. Now suppose that the mammogram came out positive, and I wanted toknow what the chances are that I actually have breast cancer. What would youtell me?” “That it looks like you have breast cancer, but it’s not certain,”answered Dr. Best, who went on to emphasize the importance of empathizingwith patients. His credo was never to deny the patient hope. I reminded him ofthe actual probabilities involved (see Chapter 4), which he knew, and explainedthat it follows that only about 1 out of 10 asymptomatic women who testpositive actually have breast cancer. He looked at me and said: “Hmm. . . . Youknow, at my university, we never learned how to think with probabilities. And

now, just look in the waiting room—I don’t have time to read professionaljournals after a 12-hour workday.” And on he went to explain how todistinguish between patients who can bear the report of a positive test and thosewith whom he has to be more sensitive about disclosing the diagnosis.
After 15 minutes of talking about patients’ personalities and physicians’empathy, I posed the question about breast cancer screening to Dr. Best again.“What would you tell a woman in this situation?” I asked. “The truth,” heanswered. “What is the truth?” I rejoined. “That it looks like she has breastcancer.” “But 15 minutes ago,” I reminded him, “we just agreed that only about1 in 10 asymptomatic women who test positive actually has breast cancer, thatis, an asymptomatic woman who tests positive is more likely not to have breastcancer than to have it.” “That is also true,” Dr. Best replied. “We physiciansshould be taught about these things. But when can I take the time? It’s all a cost-benefit question.”
The reader may ask how one could perform mammography screening for 25years and not notice that most women who test positive do not have breastcancer. Similarly, the majority of physicians in Figure 4-1 (left side) also did notseem to have noticed. If physicians and patients do not know the facts, theremay be consent, but not informed consent. The possibility of informed consentdoes not—or does not only—depend on the patient’s intelligence, maturity, andability to cope; it also depends on the constraints under which physicians work.The 12-hour workday of Dr. Best is such a constraint. What are the majorconstraints that prevent physicians such as Dr. Best from realizing that mostwomen who test positive do not have cancer? More generally, what are theinstitutional constraints that work against the ideal of informed consent?33
Division of labor. First, there is a division of labor, which can obstructthe flow of information. Radiologists who perform mammographyexaminations typically do not find out whether a patient later developscancer. Most health care systems do not monitor and disseminate follow-up information, and there is little incentive for physicians to try trackingdown the numbers themselves. This explanation applies to radiologists,such as Dr. Best, but not, however, to gynecologists, who do see therelevant information.

Legal and financial incentive structure. The second reason concernsprofessional fear and pride, and the legal and financial incentivesassociated with it. The error physicians fear most is to miss a cancer—the emotional distress at having had the power to detect a cancer andmissing the opportunity. A miss can damage their reputation; fellowphysicians may take notice. Equally important, a miss also makes themvulnerable to being sued. Erring on the side of overestimating thechances of cancer protects physicians from being sued because it meansthey will rarely miss one. At the same time, this policy brings in morerevenue to hospitals and private practices, owing to additional diagnosesand treatment. The costs of this policy—a large number of false positivesand their potential physical, psychological, and monetary costs to thepatient —vanish in the face of the physician’s fear of missing a cancer.As the organizer of the earlier discussion mentioned, female patients aregenerally grateful for false positives. However, women might be lessgrateful for what turn out to be false positives (and less terrified to beginwith) if they were informed that some 9 out of 10 women who testpositive in screening do not have breast cancer in the first place.
Conflicts of interest. The third reason is various conflicts of interest. Abreast cancer specialist told me that he no longer routinely recommendsthat women visit a radiologist just “because it is time and every womanshould go.” Instead, he decided to inform each woman about thebenefits and costs of mammography screening so that she can make areasoned decision as to whether and when to participate. When he spoketo a radiologist friend over dinner about his change in policy, the friendgot so upset that he dropped his knife and fork, stood up to leave therestaurant, and exclaimed, “Where did you get these numbers?” “Fromseveral hundred thousand women studied in America, Sweden, andother countries,” was the reply. “In America,” the radiologist exclaimedin anger, “they don’t know how to read mammograms!” But his problemin reality was not with America; it was economic. For years, he hadscreened the women whom breast cancer specialists had sent to him. Ifhalf of the women were to decide not to participate in screening or to

begin participating at a later age, the radiologist would face financialruin. I admire the breast cancer expert for his willingness to risk losingoutraged friends for the sake of informing his patients.
Innumeracy. Last but not least, there is innumeracy. Many physicians arepoorly educated in statistical thinking and have little incentive to engagein this alien form of reasoning. If patients start to look up numbers,physicians might be forced to do so too.
The first three reasons for many physicians’ failure to inform patients arisefrom institutional, professional, and economic structures that are beyond thepower of this book to change. But as for the fourth reason—innumeracy—thereis cause for hope: This book presents highly effective and inexpensive, simpletools for turning innumeracy into insight. Once a sufficient number ofphysicians and patients master these tools, the insight they gain will put pressureon the institutional, professional, and economic structures to change.

A positive result means antibodies to HIV were found in your blood.This means you have HIV infection. You are infected for life and canspread HIV to others.
Illinois Department of Public Health
I will kill myself if I test positive.
A client
7
AIDS COUNSELING
Betty
One day in November 1990, Betty’s phone rang. She lived in Florida and was45 years old and the mother of three teenage sons; their father had died. She wasasked to come to the local health clinic, where she had had a checkup for athyroid problem and a blood sample had been taken for testing. When shearrived, she was told she had AIDS. The doctors were not sure how long she hadto live. In the months that followed, she watched television constantly to blockout thoughts of the disease. But the thoughts came back during the night: Whatdress do I want to be buried in? How are my kids going to take it? How willpeople treat them?
In 1992, her doctor put her on didanosine (an anti-HIV replication drug),which caused vomiting, fatigue, and other side effects. When she joined a localgroup for AIDS patients, the counselors noted that her T-cell count hadremained consistently high. They suggested that she be retested. In November

1992, Betty’s phone rang and she was again asked to come to the clinic. Whenshe arrived, she was told, “Guess what? Your HIV test came out negative!”
Betty sued her doctor, the clinic, and the Florida Department of Health andRehabilitation Services, the agency that had performed the initial test. A juryawarded her $600,000 for two years of pain and suffering.1
David
The Chicago Tribune published the following letter and response on March 5,1993, under the headline “A False HIV Test Caused 18 Months of Hell”:
Dear Ann Landers,
In March 1991, 1 went to an anonymous testing center for a routineHIV test. In two weeks, the results came back positive. I was devastated.I was 20 years old and doomed. I became severely depressed andcontemplated a variety of ways to commit suicide. After encouragementfrom family and friends, I decided to fight back. My doctors in Dallastold me that California had the best care for HIV patients, so I packedeverything and headed west. It took three months to find a doctor Itrusted. Before this physician would treat me, he insisted on runningmore tests. Imagine my shock when the new results came back negative.The doctor tested me again, and the results were clearly negative.
I’m grateful to be healthy, but the 18 months I thought I had thevirus changed my life forever. I’m begging doctors to be more careful. Ialso want to tell your readers to be sure and get a second opinion. I willcontinue to be tested for HIV every six months, but I am no longerterrified.
David in Dallas
Dear David:
Yours is truly a nightmare with a happy ending, but don’t blame thedoctor. It’s the lab that needs to shape up. The moral of your story is

this: Get a second opinion. And a third. Never trust a single test. Ever.
Ann Landers
David does not say what, if anything, his doctors told him about the chancesthat he actually had the virus given the positive HIV (human immunodeficiencyvirus) test result. He seems to have inferred that a positive test meant that he hadthe virus, period. Betty was simply told that she had AIDS. Susan, the singlemother we met in Chapter 1, was told that a positive test meant, with absolutecertainty, that she had HIV. Susan had unprotected sex with an HIV-infectedperson, believing that it did not matter because she already had the virus; Betty’slife turned into two years of suffering; David contemplated suicide—only tolearn the hard way that HIV tests can result in false positives.
What does a positive HIV test mean? A negative result? And how can acounselor communicate this to a client, so that he or she understands the result?In this chapter, I address these questions for the testing of people who do notpractice risky behavior, such as the use of IV drugs. First, however, let us have acloser look at the test, the disease, and the social stigma attached to HIVpositives.
HIV and AIDS
When is a test result declared positive? HIV testing typically involves thefollowing sequence. The first test, called the ELISA (enzyme-linked im-munoabsorbent assay), is designed to detect antibodies against HIV in bloodsamples. It was originally used to screen donated blood, where maximizing testsensitivity (the true positive rate)—at the cost of an increased false positive rate—was imperative. If the result is negative, then the client is notified that he orshe is HIV-negative. If the result is positive, then at least one more ELISA(preferably from a different manufacturer) is conducted on the sample. If theresult is still positive, a Western blot test, which is more expensive and time-consuming to conduct than ELISA, is performed. If the Western blot is alsopositive, the client is notified that he or she is HIV-positive. In some cases, a

second blood sample is obtained and analyzed before the client is notified.2 Theexact procedure varies across institutions and countries.
AIDS (acquired immune deficiency syndrome) is defined primarily by asevere immune deficiency. Unlike other diseases, it has no constant, specificsymptoms. Once the immune system has begun to malfunction, a broadspectrum of health complications can set in, and there are some 26 opportunisticinfections known. If a person tests positive for HIV and has one or more of theseinfections, she or he is diagnosed with AIDS. AIDS is the final stage of a viralinfection caused by HIV (but individuals can express AIDS for reasons otherthan HIV). HIV is a retrovirus—that is, a virus that inserts its genetic materialinto that of the human host cell, probably for the lifetime of the host. It destroysthe T cells in the immune system. Two strains are distinguished, HIV-1,discovered in 1983 and the cause of most AIDS cases worldwide, and HIV-2,discovered in 1987 in West African women. HIV-2 is rare in the United Statesand in Europe. HIV-2 seems to be less harmful to the immune system andreproduces more slowly.3
Is there a cure? Not at present. Some of the problems associated with findinga cure can be illustrated by a comparison with the syphilis epidemic in the earlypart of the twentieth century. The syphilis campaigns closely paralleled today’sAIDS campaigns. There were educational programs to reduce high-risk sexualbehavior, scare tactics were spread through the media, and serological testing wasmade mandatory before one could obtain a marriage license in certain states inthe United States. All of these measures, however, had little effect on the spreadof the epidemic. By the 1930s, almost 1 in 10 Americans was infected withsyphilis. The syphilis epidemic was finally brought under control—not bychanges in human sexual behavior, but by the discovery of penicillin, a cheapand effective drug.
The important difference between syphilis and AIDS is that the bacteriumthat causes syphilis (a spirochete) does not mutate and change as rapidly as HIVdoes. When HIV replicates itself, it makes so many copying errors that by thetime a person is diagnosed with AIDS, that person may have a billion or moreHIV variants in his or her body. Some of these mutations will weaken HIV andexpose it to attack by the immune system; others will strengthen HIV, increasingits chances of evading the immune system. This rapid Darwinian-type evolution

of the virus seems to exceed the capacity of the immune system to recognize andrespond to it, and it helps the virus become resistant to drug therapies. Betweenthe time of the infection and the illness itself, there is an asymptomatic phase often to twelve years on average; however, this may not be a real latency phase, buta time of continuous struggle between HIV and the immune system, with thebalance slowly shifting in favor of the virus.4
There is no cure, but there is hope. Drugs that interfere with the virus’sability to replicate have been developed. Because the virus can rapidly becomeresistant to each of them, a combination of drugs is used. This so-called AIDSdrug cocktail therapy can prolong the life of an infected person, but it is not acure. It uses a mixture of drugs, including didanosine and zidovudine. Thedownside of this positive development is that these cocktails are very expensiveand are therefore more readily available to the rich than to the many in poverty;in addition, these drugs have severe to moderate side effects, including burningpains in the hands and feet, hair loss, and a dangerous swelling of the pancreas.
Screening for HIV is most important for high-risk groups. Although thepossibility of therapy is very limited because of the relentless course of thedisease, there is another reason for screening. Early detection can reduce theprevalence of HIV. Recall that mammography does not reduce prevalence, onlymortality. HIV, however, is different because it is transmitted from person toperson. Early detection can reduce the spread of the virus, and thereby itsprevalence, if the infected persons disclose their status to their sexual partnersand take precautions.
Stigma and Sexual Ethics
Ryan White was 12 years old when he was diagnosed with AIDS. He was ahemophiliac, and he lived in Kokomo, Indiana, where the disease was sociallyunacceptable. He got the virus from a blood transfusion essential to his survival.Ryan suffered from the acrimony and lies of his classmates and their parents,who accused him of spitting on them to infect them with the virus, amongother, similar fabrications. Ryan said he understood that this discrimination wasdue to ignorance, fear, and misconceptions about how the virus is transmitted.His fight to be allowed to attend school, to be able to leave his home and walk

about without being ridiculed, and to become socially acceptable gained him therespect of millions across the United States. Ryan died in 1990 at the age of 18.
The first AIDS cases in America (in 1981) were gay men. The Reverend BillyGraham said, “AIDS is a judgment of God.”5 Initial public reaction was denial:by the media, which were not ready to talk about homosexuality, needles, orcondoms, as well as by gay men, who were not ready to rethink their sexualliberation won in the 1970s. A 1988 Cosmopolitan magazine article by RobertGould assured women that there was practically no risk of AIDS with ordinaryvaginal or oral sex—even when the partner was HIV-positive.
The event that stopped the denial happened in 1985. The Hollywood starRock Hudson disclosed in public that he was suffering from AIDS. Othercelebrities followed. The pianist and entertainer Liberace died two years later ofAIDS, and the professional basketball player Magic Johnson announced in1991, “Here I am saying it can happen to anybody, even me, Magic Johnson.”
Today, the virus is spread worldwide primarily through heterosexual contact.However, this insight has not halted the stigmatization of the victims. InHinton, West Virginia, one woman was killed by three bullets and her bodydumped beside a remote road; another woman was beaten to death, run over bya car, and left in the gutter. Both had told people that they had AIDS, and theauthorities said that this was the reason they had been killed. In Ohio, a manwith a positive HIV test lost, within 12 days, his job, his home, and—almost—his wife. The day he was going to commit suicide he was notified that he hadreceived a false positive test result.
Others choose not to speak up, but rather to deceive or to lie. Many HIV-infected individuals do not disclose their status to their sexual partners. Forinstance, patients who were in primary care for HIV infection in Boston CityHospital and Rhode Island Hospital were asked whether they had disclosed theirinfection to their sexual partners. Forty percent said that they did not tell theirpartners, and most of them did not use condoms all the time.6 Women disclosedmore often than men did, and individuals with one sexual partner more oftenthan those with multiple partners. Southern California college students reportsimilar deceptive behaviors. Among some 500 sexually experienced students, 47percent of the men and 60 percent of the women reported that they had beentold a lie in order to be induced to have sex. However, only 35 percent of the

men and 10 percent of the women said that they had lied in order to have sex.That is, more report having been the victim rather than the perpetrator—whichis only consistent with the extent of lying and deception admitted. One in fivemale students said that if he were HIV-positive, he would lie and claim to have anegative HIV test in order to have sex.7 The virus can take advantage not only ofhuman lies to spread itself, but also of myths. At the 13th International AIDSconference in July 2000, Dr. Zweli Mkhize, the health minister of a SouthAfrican province, urged for education to combat false but widespread beliefs,such as that having sex with a virgin will cure AIDS, a myth that has led toviolence and rape.8 This is a contemporary version of the ancient myth of thepower of virgins: only someone so pure can absorb pollution.
The Illusion of Certainty
At a conference on AIDS held in 1987, former Senator Lawton Chiles of Floridareported that of 22 blood donors in Florida who were notified that they hadtested HIV-positive with the ELISA, 7 had committed suicide. (At that time,ELISA plus Western blot was not yet standard procedure.) The medical textdocumenting this tragedy many years later informed the reader that “even if theresults of both AIDS tests, the ELISA and WB [Western blot] are positive, thechances are only 50-50 that the individual is infected.”9 This figure applies whenpeople in a low-risk group—such as blood donors who are screened and selectedfor not having infectious diseases—test positive. The unfortunate donorsmentioned by Senator Chiles were tested only with the ELISA, which has ahigher false positive rate than the combination of the ELISA and the Westernblot. Thus, the chance that they were infected was probably even lower than the50 percent estimated by the text. If the donors had been informed of their actualrisk of having HIV given a positive test, some or all of the seven unfortunatedonors might still be alive today.
Not knowing about the possibility of false positives is one form of the illusionof certainty, but it is not the only one. The feeling “it cannot happen to me” isanother. According to several studies, half of American teenagers are not worriedabout being infected with HIV and consequently do not change their sexualbehavior. At the same time, one out of four new HIV infections occurs in people

between the ages of 13 and 20. As one teenager explained, “When you’re ateenager, your hormones are raging and you think you’re indestructible. But sexis how I got AIDS.”10 Two groups, adolescent gay men and teenage womeninfected via heterosexual contact, make up some 75 percent of all teenage HIVinfections. Both forms of the illusion of certainty—not realizing that tests canerr and not realizing that one can be vulnerable—have similar consequences:some people have contemplated suicide, some have committed suicide, andothers have turned to a fatalistic or careless lifestyle that endangered themselvesand others.
We may not be able at present to win the war against the virus withbiological weapons, but we can help people to understand the risks better. Betterunderstanding can reduce some of the toll the disease takes every year. As thecases of Susan, Betty, David, and the Florida blood donors indicate, there seemsto be a problem with counseling. I invite you to take a closer look into thecounseling room, at the counseling of people who do not practice high-riskbehavior.
Low-Risk Clients
Populations with the highest risk of HIV infection are homosexual men,intravenous drug users, heterosexual partners of intravenous drug users,hemophiliacs, and children of HIV-infected mothers. However, a largeproportion of people at high risk choose not to be tested, whereas those at lowrisk increasingly undergo HIV tests. In the United States alone, about 50million blood and plasma samples are tested each year.11 About 60 percent ofthe general population in Switzerland has had at least one HIV test.12 A largenumber of these are people engaging in low-risk behavior.
People at low HIV risk have HIV tests for various reasons: voluntarily,because they want to find out whether they are infected before starting arelationship, getting married, having children, or for other reasons; andinvoluntarily, because they are blood donors, immigrants, applicants for healthinsurance, military personnel, or members of other groups required by law totake the test. For instance, a friend of mine and her fiancé chose to be tested forHIV before they got married—just to be sure. The Swedish government has

encouraged voluntary testing to the point that “people who are unlikely to beinfected are the ones who take the test, in droves.”13
Involuntary testing is a legal possibility in several countries, and insurers canexploit this to protect themselves against losses. For instance, in 1990, BillClinton, then governor of Arkansas, had to take an HIV test to get his lifeinsurance renewed. In the late 1980s, Illinois and Louisiana required couplesapplying for marriage licenses to be tested for HIV, and disclosed the results toboth partners. These programs incurred great social and financial cost; theyfalsely identified some people as being infected with HIV, resulting in brokenengagements, aborted pregnancies, and psychological distress.14 The AmericanMedical Association has endorsed mandatory HIV testing of all pregnantwomen and newborn babies, and New York, in 1996, was the first state to passlegislation mandating HIV testing of newborns—known as the “Baby AIDS”bill.15 Compulsory testing has been forced by courts on individuals, and bygovernments on prisoners, prostitutes, and persons seeking to immigrate. Peopleat low risk may even be subjected to HIV tests without their knowledge—forinstance, large companies in Bombay reportedly tested their employees for AIDSwithout telling them; when the tests came out positive, the employees were fired.
Counseling people at low HIV risk requires giving particular attention tofalse positives, that is, to the possibility that the client may receive a positiveHIV test result despite not being infected. The reason is that the lower theprevalence (base rate) of HIV in a given group, the larger the proportion of falsepositives among the positive results. In other words, if someone with high-riskbehavior tests positive, the probability that he is actually infected with HIV isvery high, but if someone in a low-risk group tests positive, this probability isconsiderably lower.
What Does a Positive Test Mean?
A number of years ago, as a citizen of Germany, I applied for a U.S. green cardso that I could accept a professorship at the University of Chicago. The U.S.immigration office demanded that I have blood taken for an HIV test andinformed me that a positive result would mean a denial of the green card. So onemorning I drove to the U.S. consulate in Frankfurt to have the test done. On

the way, I asked myself, How likely is it that a man who tests positive for HIV(ELISA and Western blot test, one blood sample) actually has the virus? At thistime, I had the following information concerning German men with no knownrisk behavior:
About 0.01 percent of men with no known risk behavior are infected withHIV (base rate). If such a man has the virus, there is a 99.9 percent chancethat the test result will be positive (sensitivity). If a man is not infected, thereis a 99.99 percent chance that the test result will be negative (specificity).
What is the chance that a man who tests positive actually has the virus? Mostpeople think it is 99 percent or higher—however, their minds are clouded by theprobabilities. One way to find the answer is to take pencil and paper and insertthese probabilities into Bayes’s rule—but I was driving. Even on the autobahn,however, it is easy to mentally transform this information into naturalfrequencies:
Imagine 10,000 men who are not in any known risk category. One isinfected (base rate) and will test positive with practical certainty (sensitivity).Of the 9,999 men who are not infected, another one will also test positive(false positive rate). So we can expect that two men will test positive.
How many of the men who test positive are actually infected? Using thismental representation, I could easily see that my chances of having the virus—given a positive test result—would be approximately 1 in 2, or 50 percent. Thetree in Figure 7-1 illustrates this result. That is, testing positive for HIV wouldbe no reason to contemplate suicide or a move to California, nor should such aresult by itself be sufficient to bar entry to the United States. It would be areason to have another test with a new blood sample.
How could Susan, Betty, and David have been spared their nightmares? Howcould the suicides in Florida have been prevented? The answer is, by counselorsusing the same transparent risk communication as I did while driving. If a clienthad practiced risky behavior—for example, if David were homosexual andbelonged to a group with a 1.5 percent base rate of HIV infection—

transparency could be achieved in the same way. In that case, the physiciansmight have explained:

FIGURE 7-1. What does a positive HIV test mean? Out of 10,000 men withno known risk behavior, two will test positive (shown in boldface) and one ofthese will have the virus. (Data from Gigerenzer et al., 1998)

Think of 10,000 homosexual men. We expect 150 to be infected with thevirus, and most likely all of them will test positive. Of the 9,850 men whoare not infected, we expect that 1 will test positive. Thus, we have 151 menwho test positive, of whom 150 have the virus. Your chances of not havingthe virus are therefore 1 out of 151, that is, less than 1 percent.
This would be bad news—only slightly better than leaving the counselor’soffice with the belief that it is absolutely certain that one has an HIV infection.One can see that the meaning of a positive test result depends on the referenceclass, which determines the base rate of HIV. If the reference class included onlygay men who practice safe sex, the chances of not having the virus after apositive test result would be better.
What about Ann Landers’s comment? Her advice to “get a second opinion”is right to the point. But her response that David should not blame the doctorbut rather the lab overlooks the fact that whatever the reasons for false positives,doctors should inform patients that false positives occur and should say abouthow often. Some, but not all, false positives can be traced to laboratory errors,which include blood samples being confused or contaminated in the lab anderrors when entering the data into the computer (as in Susan’s case in Chapter1). False positives can also result from certain medical conditions that havenothing to do with HIV, such as rheumatological diseases, liver disease, variouscancers, malaria, and alcoholic hepatitis.16 The estimates of a sensitivity of 99.9percent and a specificity of 99.99 percent are the best I know of for combinedELISAs and Western blot (one blood sample), but they are approximations.17
Is the inadequate counseling that Susan, Betty, and David seem to havereceived an exception, or is it the rule? How do professional AIDS counselorscommunicate risks to their clients?
Inside the Counseling Room
I have been lucky in having not only smart students, but also brave ones. Tofind out firsthand how risk is communicated, a student of mine, Axel Ebert,volunteered to go undercover to 20 public health centers to have 20 HIV tests.18
The centers were located in 20 German cities, including the three largest

German cities of Berlin, Hamburg, and Munich, and they offer free HIV testsand counseling to the general public. Pretest counseling is mandatory, and thisallowed Ebert to ask the relevant questions, such as “Could I ever test positive ifI do not have the virus? And if so, how often does this happen?”
Ebert first contacted the health centers by phone and made an appointment.He was able to visit two centers in succession. Then he waited at least 2 weeks toallow the bruises from the perforation of his veins in both arms to heal. Thesepauses were necessary, because needle marks would have suggested to acounselor that Ebert was a drug addict and therefore in the high-risk category.
Of the 20 professional counselors, 14 were physicians and the others weresocial workers. Counseling before HIV testing is intended to help the clientunderstand the testing procedure, the risks of HIV infection, and the meaningsof a positive and a negative result. A report of the German government explicitlyguides counselors to perform a “quantitative and qualitative assessment of theindividual risk” and to “explain the reliability of the test result” before the test isperformed.19
Ebert asked each counselor the following questions, unless the counseloroffered the information spontaneously:
Sensitivity. If one is infected with HIV, is it possible to receive a negativetest result? How reliably does the test identify the virus if it is present?False positives. If one is not infected with HIV, is it possible to receive apositive test result? How reliable is the test with respect to false positiveresults?Prevalence in low-risk clients. How frequent is the virus in my risk group,that is, among heterosexual men between 20 and 30 years old with noknown risk factor such as intravenous drug use?Positive predictive value. What are the chances that men in my risk groupactually have HIV given a positive result?
The positive predictive value is the probability of being infected with HIVgiven a positive test. During the counseling session, Ebert never used technicalterms such as “positive predictive value” but everyday language, as illustratedabove. When the counselor gave a quantitative answer (a number or a range) or

said that he or she could not give a more precise answer, then Ebert went on toanother question. If the answer was qualitative (for example, “fairly certain”) orif the counselor misunderstood or avoided answering the question (for example,“don’t worry, the test is very reliable, trust me”), then Ebert asked for furtherclarification and, if necessary, repeated the request for clarification one moretime. If the third attempt failed, he did not push further, because somephysicians get defensive or angry when clients continue to insist on clarification.When Ebert asked about the prevalence of HIV and about the positivepredictive value, he always reminded the counselor of his low-risk status (a 25-year-old heterosexual man who does not use intravenous drugs and has no otherknown risk factors).
Ebert used a coding system to record the relevant information in shorthandduring each counseling session. After each session but three, he had an HIV testperformed. In two cases he would have had to wait several hours to have the test,and in one case the counselor suggested that he sleep on it before decidingwhether to be tested. Investigating AIDS counselors’ behavior without tellingthem that they are being studied raised ethical questions; we, therefore, obtainedthe clearance of the Ethics Committee of the German Association of Psychology.We apologize to the counselors for having employed this covert method, butbelieve that the results of this study justify it. They indicate how AIDScounseling can be improved.
COUNSELING SESSIONS
Let us first look at a few individual counseling sessions and then at the overallresults. Session 1 took place in 1994 in a public health center in a city with apopulation of about 200,000. Ebert’s questions are in italics and abbreviatedusing the technical terms. The counselor’s answers are marked in the subsequenttext. If there is more than one answer to a question, these are answers to Ebert’sclarifying questions.
Session 1: The Counselor Was a Female Social Worker
Sensitivity?

• False negatives really never occur. Although, if I think about theliterature, there were reports of such cases.
• I don’t know exactly how many.
• It happened only once or twice.
False positives?
• No, because the test is repeated; it is absolutely certain.
• If there are antibodies, the test identifies them unambiguously andwith absolute certainty.
• No, it is absolutely impossible that there are false positives; because it isrepeated, the test is absolutely certain.
Prevalence?
• I can’t tell you this exactly.
• Between about 1 in 500 and 1 in 1,000.
Positive predictive value?
• As I have now told you repeatedly, the test is absolutely certain.
The counselor was aware that HIV tests can lead to a few false negatives, butincorrectly informed Ebert that there are no false positives. Ebert asked forclarification twice, in order to make sure that he correctly understood that a falsepositive is impossible. The counselor asserted that a positive test result means,with absolute certainty, that the client has the virus; this conclusion followslogically from her (incorrect) assertion that false positives cannot occur. In thiscounseling session, Ebert was told exactly what Susan had been told by herVirginia physicians: If you test positive, it is absolutely certain that you have thevirus. Period.
The next session took place in a city with a population of about 300,000.

Session 2: Counselor Was a Male Physician
Sensitivity?
• When there are enough antibodies, then the test identifies them inevery case. Two tests [ELISA and Western blot] are performed; thefirst test is in its fourth generation and is tuned to be very specific andsensitive. Nevertheless, it is tuned in such a way that it is more likely toidentify positives than negatives.
• 99.8 percent sensitivity and specificity. But we repeat the test, andwhen it comes out positive, then the result is as solid as cast iron.
False positives?
• With certainty, they do not occur; if there are false results, then onlyfalse negatives, occurring when the antibodies have not yet formed.
• If you take the test here, including a confirmatory test, it is extremelycertain: in any case the specificity is 99.7 percent. This is as solid ascast iron. We eliminate confusion by using two tests.
Prevalence?
• The classification of individuals into risk groups is now outdated;therefore one cannot look at this that way.
• I don’t remember this. There is a trend in which the virus is spreadinginto the general public. Statistics are of no use for the individual case!
Positive predictive value?
• As I already have said: extremely certain, 99.8 percent.
This counselor initially denied the existence of false positives. Unlike thecounselor in Session 1, however, he changed his mind when the client asked forclarification and estimated the false positive rate for the combination of ELISAsand Western blot to be 0.3 percent (this follows from a specificity of 99.7

percent). This rate is much higher than the literature indicates. When thecounselor estimated the positive predictive value, he confused it with thesensitivity, as reflected by the phrase “as I already have said.” As a consequence,the information he gave is contradictory: it is internally inconsistent. We can seethrough this confusion by translating this counselor’s probabilities into naturalfrequencies, using as the base rate (which he did not specify) the medianestimate of all counselors, 1 in 1,000. Think of 1,000 low-risk male clients. Onehas the virus and will test positive with practical certainty. Of the remaining 999uninfected men, 3 will test positive. Thus we expect that out of 4 men who testpositive, only 1 has HIV. One in four is not 99.8 percent.
Unlike the first counselor, who suffered from an illusion of certainty, thesecond counselor did not deny the existence of false positives. However, he didnot know how to express the risks so that he and his clients could understandthem. His way of talking about risk was to use conditional probabilities,expressed as percentages, and his mind was clouded. This counselor did not evenrealize that his figures were impossible.
The phrase “when the antibodies have not yet formed” refers to the windowperiod, that is, the time interval between infection and the formation of asufficient number of antibodies to be detected by the tests. For instance,infection by sexual intercourse has an average window period of about 6months.20 During this period, false negatives are likely.
Session 3 took place in a city with more than 1 million inhabitants.
Session 3: The Counselor Was a Female Physician
Sensitivity?
• The test is very, very reliable, that is, about 99.98 percent.
False positives?
• The test will be repeated. After the first test, one does not speak ofpositive, only of reactive. When all tests are performed, then the resultis certain.
• It is hard to say how many false positives occur.

• How many precisely? I would have to look in the literature to see if Icould find this information there.
Prevalence?
• That depends on the region.
• Of the circa 67,000 infected people in Germany, 9 percent areheterosexual.
• In this city we have 10,000 infected people, that is, 1 percent of thepopulation. But these are only numbers that tell you nothing aboutwhether you have the virus or not.
Positive predictive value?
• As I already mentioned, the result is 99.98 percent sure. If you receivea positive result, you can trust it.
As in the previous session, the counselor at first suggested that there are nofalse positives. When Ebert asked for clarification, however, she made it clearthat false positives exist, but that she could not say how many. Like thecounselor in Session 2, she confused the sensitivity, that is, the chance that aninfected person receives a positive result, with the positive predictive value, thatis, the chance that a low-risk client who tests positive actually has HIV.
Session 4 was different. This counselor was the only one among all 20counselors who explained that the proportion of false positives among allpositive tests depends on the prevalence of HIV; that is, when low-risk clientstest positive, the proportion of false positives can be substantial. Session 4 tookplace in a public health center in a large city with a population of more than1,000,000.
Session 4: The Counselor Was a Female Social Worker
Sensitivity?
• Very, very reliable.

• No, not absolutely sure, such a thing doesn’t exist in medicine, becauseit’s possible that the virus cannot be identified.
• Close to 100 percent; I don’t know exactly.
False positives?
• They exist, but are extremely rare.
• On the order of one tenth of a percent. Probably less. However, inyour risk group, compared to high-risk groups, false positives areproportionally more frequent.
• I don’t know the exact value.
Prevalence?
• With the contacts you have had, the infection is unlikely.
• Generally, one can’t say. In our own institution, out of some 10,000tests in the last 7 years, there were only 3 or 4 heterosexuals, non-drugaddicts, or similar non-risk-group people who tested positive.
Positive predictive value?
• As mentioned, the test is not 100 percent sure. If the test confoundsthe [HIV] antibodies with others, then other methods, such asrepeated tests, do not help. And if someone like you does not have anyreal risk, then I could imagine that even 5 to 10 percent of those whoreceive a positive result will have gotten a false positive result.
The counselors in Sessions 2 and 3 had dropped remarks suggesting thatprevalence had little value for evaluating Ebert’s case. In contrast, the counselorin Session 4 understood the relationship between prevalence and the positivepredictive value: If a client who is in a group with a low prevalence tests positive,the danger of a false positive is particularly high. This counselor was also theonly one to explain that false positives cannot be completely eliminated byrepeated testing—for instance, the test may react to antibodies that it confuses

with HIV antibodies. The counselor still probably overestimated the positivepredictive value, but her estimate was on the right order of magnitude.
What information did the rest of the counselors provide, and how did theycommunicate it?
TWENTY COUNSELORS
One physician in a small Bavarian city declined to give the client anyinformation whatsoever concerning the HIV test’s sensitivity, specificity, andpositive predictive value before the result was obtained, which left us withresponses from 19 counselors. Most of the counselors gave the client realisticinformation concerning sensitivity, although 5 incorrectly claimed that falsenegatives are impossible except during the window period. The exchange of testresults in Susan’s case (Chapter 1) illustrates one source of false negatives; whileshe got a false positive, the person whose result was confused with hers got a falsenegative. The question concerning the prevalence proved to be a hard one for thecounselors; most could not find the information. Several searched in their filesand brochures for an answer, but found only irrelevant prevalences, such as thelarger number of HIV positives in West Berlin than in East Berlin. “The Wallwas the best condom East Berlin had,” one counselor joked in desperation afterfailing to find an answer.
The counselors at the public health centers were not ignorant; on thecontrary, several gave lengthy and sophisticated lectures concerning im-munodiagnostic techniques, the nature of viruses, antibodies, and proteins, andthe pathways of infection. But when it came to explaining Ebert’s risk of beinginfected if he tested positive, most counselors lacked the ability even to estimate,much less to communicate the risks.
To summarize, the principal deficits in the counseling of low-risk clientswere:
• Nontransparent risk communication. All of the counselorscommunicated information in probabilities and percentages ratherthan in a format, such as natural frequencies, that helps their clients(and themselves) attain insight. As a consequence, several counselorsdid not notice that the numbers they supplied were internally

inconsistent. For instance, one counselor told the client that theprevalence of HIV in men like the client was 0.1 percent or slightlyhigher, and that the sensitivity, specificity, and positive predictive valuewere each 99.9 percent. However, these figures are impossible, as afrequency representation can quickly demonstrate.
• Denial of false positives. The majority of the counselors (13) incorrectlyassured the client that false positives never occurred. Counselors had asimple, deterministic explanation for this: Any false positives would beeliminated through repeated testing, that is, through two ELISAs andone Western blot test. One counselor claimed that false positivesoccurred only in countries such as France, but not in Germany, whileothers acknowledged that false positives had occurred in the 1980s, butnot since. In addition to these 13 counselors, 3 others first claimed thatfalse positives would not occur (for example, Sessions 2 and 3), butthen had second thoughts.
• Failure to understand that the proportion of false positives is higher in low-risk clients. Only one counselor (Session 4) explained that the lower theprevalence, the higher the proportion of false positives among positivetests. In other words, the ratio of false positives to true positives isparticularly high among low-risk people such as Ebert.
• Illusion of certainty. Ten of the counselors asserted incorrectly that if alow-risk man tests positive, it is absolutely certain (100 percent) that heis infected with the virus (see Session 1), and 5 others told Ebert thatthe probability is 99.9 percent or higher (see Session 3). Based on thebest figures available, this probability is, in fact, around 50 percent (seeFigure 7-1). If Ebert had tested positive and trusted the informationprovided by one of these 15 counselors, he might indeed havecontemplated suicide, as had others before him. Two other counselorssuccessfully avoided answering the question concerning the positivepredictive value. Only three counselors estimated this probability to beless then 99.9 percent (all three estimates exceeded 90 percent).Counselors arrived at this prevailing illusion of certainty by one of two

routes. Some confused the positive predictive value with the sensitivity.Others assumed that there are no false positives because tests arerepeated, which implies that a positive test indicates an infection withabsolute certainty.
The lesson of this study is this: First, counselors need to be trained toovercome the illusion of certainty, and second, they need to be taught how tocommunicate the risks so that clients (and they themselves) understand them.The following model session illustrates how a counselor could communicate themeaning of a positive test transparently.
Model SessionThe counselor is trained in communicating risks in natural frequencies.
Sensitivity?
• The test will be positive for about 998 of 1,000 people infected withHIV. Depending on circumstances, such as the specific tests used, thisestimate can vary.
False positives?
• About 1 in 10,000. False positives can be reduced by repeated testing(ELISA and Western blot), but not completely eliminated. They arecaused by certain medical conditions as well as by laboratory errors.
Prevalence?
• About 1 in 10,000 heterosexual men with low-risk behavior is infectedwith HIV.
Positive predictive value?
• Think of 10,000 low-risk men like you. One is infected and will testpositive with practical certainty. Of the 9,999 noninfected men, 1 willalso test positive. Thus we expect that out of 2 men who test positive,

only 1 has HIV. This is the situation you would be in if you were totest positive; your chance of having the virus would be about 1 in 2.21
Depending on the region and risk behavior, the numbers can be adjustedaccordingly. The counselor might add that in the case of a positive result, asecond blood sample should be tested. A second sample can rule out certainsources of error, but not all. The same holds for a negative test, as one extremecase illustrates. In the VA Medical Center in Salt Lake City, a man with HIVhad 35 negative tests within a 4-year period.22 This case is unusual because theman had a strain of HIV typical to the United States, but the tests could notdetect his antibodies. We cannot expect complete certainty, but we certainly canimprove the present state of affairs with medical and psychological research, thatis, with medical weapons against the virus and with mind tools to supporthuman reasoning in understanding risks.
Information Leaflets
Do the leaflets and brochures available in public health centers help clientsunderstand what a positive test means when prevalence is low? To answer thisquestion, we analyzed 78 leaflets and brochures available on AIDS and HIVtesting in the 20 German public health centers. Some of these were given to AxelEbert by the counselors.
The strengths and weaknesses of these brochures mirrored those of thecounselors. Their strength was to provide plenty of relevant and usefulinformation on how the HIV virus is transmitted and how to live with HIV.Their blind spots concerned what a positive test means and how this meaningdepends on the risk behavior of the client. Several brochures mentioned thatfalse negatives and false positives can occur. For instance, in the newslettersedited by the Federal Center for Health Education, the reasonablerecommendation is made that people at no known risk who nevertheless testpositive should ask for a second test.23 (One wonders what those counselors whobelieve that a positive result is definitive will tell such a client.) However, noneof the leaflets and brochures gave estimates of how often false negatives and falsepositives occur. Rather, one promised that antibody tests that identify HIV-1

and HIV-2 infections with certainty will be available “in the near future.” Noneexplained that the chance of being infected given a positive test strongly dependson risk behavior. The most recent newsletter only stated, “A positive HIV testonly means that an infection with the virus has occurred. It does not necessarilymean that you have AIDS now and all is lost.”24 Reading this brochure, one getsthe impression that a positive test means being infected with HIV; there is nodistinction between high- and low-risk behavior, and no mentioning of falsepositives. A handbook for counselors, in contrast, correctly explained that thefalse positive rate is less than 1 in 1,000, but then confused the definitions ofsensitivity and specificity.25 With brochures of such mixed quality, neithercounselor nor client is likely to understand the outcomes of HIV tests.
Do Americans receive better information? An analysis of 21 AIDS leafletsdistributed at the University of Chicago Hospital, the Howard Brown MemorialClinic, and other medical institutions in Chicago would suggest not.26 Theseleaflets classified various sexual behaviors as safe, risky, or in-between and maderecommendations about how to prevent HIV infection. Some mentioned thepossibility of false negatives in the window period. Not a single one mentionedthe possibility of false positives. For instance, one leaflet “Coping with HIVDisease,” distributed by the Illinois Department of Public Health, left no roomfor uncertainty: “A person who is HIV positive has HIV disease.”
The major difference between the American and the German leaflets was thatthe former did not even mention the possibility of false positives. Not havingthis basic information makes it hard to understand that the proportion of falsepositives is particularly high among low-risk clients who test positive.
Should Anything Be Done?
Yes. Counselors need to be cured of their illusion of certainty and trained incommunicating risks transparently. This will not prevent AIDS, but it willprevent some of the avoidable consequences. These include the danger thatpeople with false positives will have unprotected sex with people infected withHIV, that they may suffer for months or years believing they are infected, andthat they think of committing suicide or actually do commit suicide. As many as

30 percent of people seeking HIV testing at a New York hospital reportedhaving suicidal thoughts during pretest counseling.27
Since the first AIDS cases were described in 1981, more manpower andmoney have been poured into researching HIV than any other disease in history.Little, in contrast, has been done to educate the general public about what anHIV test result means. An educated public that understands what a test resultmeans will be even more crucial the moment self-administered HIV testsbecome commercially available. The Food and Drug Administration had foryears opposed home-based HIV testing because of the lack of face-to-facecounseling. In 1996, however, it reversed its position and approved two self-administered test kits. One of the reasons was the hope that home-based kitscould reach those estimated 80 percent of people with high-risk behavior whoare not willing to visit HIV testing sites.28 These kits can be purchased byindividuals of any age. All one has to do is to prick one’s finger, place threedrops of blood on a card, mail it anonymously to a laboratory, and call in a weeklater and punch one’s identification number into the phone. If the test ispositive, one will be connected to a phone counselor; if negative, to anautomatic recording. Given the problems present in face-to-face counselingdocumented in this chapter, problems arising from telephone counseling arelikely to be even more serious.
As I write these lines, a friend of mine notifies me of the case of a young manwhose doctor informed him on the phone that he had tested HIV-positive. Theman immediately committed suicide—there was no post-test counseling and nosecond test with a new blood sample. If David from Dallas had committedsuicide, too, we would probably never have known that his result was a falsepositive.

The courtroom oath—“to tell the truth, the whole truth and nothingbut the truth”—is applicable only to witnesses. Defense attorneys,prosecutors, and judges don’t take this oath— they couldn’t! Indeed, it isfair to say the American justice system is built on a foundation of nottelling the whole truth.
Alan M. Dershowitz, The Best Defense
8
WIFE BATTERING
Los Angeles, USA
The verdict was to be announced at 10:00 A.M. on October 3, 1995. The LosAngeles Police Department was on full alert, and nationwide security measures,on which President Clinton had been briefed, were taken in case of rioting. Asthe hour approached, long-distance call volume dropped by 50 percent, exercisemachines in gyms stood idle, work ceased in factories, and trading volume onthe New York Stock Exchange fell by 40 percent. An estimated 100 millionpeople switched on their televisions and radios to hear what the jury had decidedin the O. J. Simpson trial. How would 12 jurors, two-thirds of whom were blackwomen, judge a black man accused of murdering his ex-wife, Nicole BrownSimpson, a white woman, and her male companion? At the appointed hour,Judge Lance Ito called the courtroom to order. Then the jury delivered theverdict: not guilty.
Images of college students watching the verdict swept across the world: youngblack women jumping up, cheering, hugging, and clapping hands; young white

women sitting, stunned into silence, chins propped on their hands. Theacquittal of the American football star divided people along racial lines. Racetrumped gender.
But the trial might as easily have turned on gender as race. The mostdangerous piece of evidence facing the Simpson defense threatened to divide thejury along gender rather than racial lines—namely, Simpson’s history of spousalabuse. There had been at least one incident in which Simpson treated his wifeviolently, and numerous other incidents that suggested that he exhibited sexualjealousy and a tendency toward violence. The prosecution argued that a historyof spousal abuse reflects a motive to kill and spent the first 10 days of the trialcalling witnesses of the 18-year relationship between Simpson and his wife to thestand. As one prosecutor put it, “a slap is a prelude to homicide.”1
Alan Dershowitz, a renowned Harvard law professor, advised the Simpsondefense team. In his best-selling book Reasonable Doubts: The Criminal JusticeSystem and the O. J. Simpson Case, Dershowitz explained the team’s success inquashing the prosecution’s argument that spousal abuse leads to murder.Dershowitz claimed repeatedly that evidence of abuse and battering should notbe admissible in a murder trial: “The reality is that a majority of women who arekilled are killed by men with whom they have a relationship, regardless of whethertheir men previously battered them. Battery, as such, is not a good independentpredictor of murder.”2
What was the evidence for Dershowitz’s claim? The defense told the courtthat some studies estimated that
as many as 4 million women are battered annually by husbands andboyfriends [in the United States]. . . . Yet in 1992, according to the FBIUniform Crime Reports, a total of 913 women were killed by theirhusbands, and 519 were killed by their boyfriends. In other words, whilethere were 212 to 4 million incidents of abuse, there were only 1,432homicides. Some of these homicides may have occurred after a history ofabuse, but obviously most abuse, presumably even most serious abuse,does not end in murder.3

From these figures Dershowitz calculated that there is less than 1 homicideper 2,500 incidents of abuse: “we were convinced from the very beginning thatthe prosecutors’ emphasis on what they called ‘domestic violence’ was a show ofweakness. We knew that we could prove, if we had to, that an infinitesimalpercentage—certainly fewer than 1 of 2,500—of men who slap or beat theirdomestic partners go on to murder them.” Dershowitz concluded: “There isnever any justification for domestic violence. But neither is there anyscientifically accepted evidence that domestic abuse— even of the sort attributedto Simpson in the worst-case scenario—is a prelude to murder.”4
Sounds convincing, doesn’t it? In the jargon of the law, Dershowitz arguedthat evidence of wife battering is more “prejudicial” than “probative.” If thiswere true, acquittals of men like O. J. Simpson, known to have battered hismurdered wife on at least one occasion, could be better justified in the future.But Dershowitz’s argument is misleading. And it may have misled the court.Given the “scientifically accepted evidence” available, if a woman has beenbattered by her partner and later murdered, the case against the batterer is in factfairly strong. Why?
Dershowitz omitted one crucial piece of evidence from his calculation: thatNicole Brown Simpson had been murdered, not just battered. The relevantpercentage is not how many men who slap or beat their domestic partners go onto murder them, as Dershowitz would have us believe. Instead, the relevantprobability is that of a man murdering his domestic partner given that hebattered her and that she was murdered.5 This probability is not 1 in 2,500.What is it?
There are two ways to estimate this probability, just as in the breast cancerand other medical examples in the previous chapters. One is to insertprobabilities into Bayes’s rule, which can cause confusion in jurors and judgesand even in experts who perform such calculations. The other is to present theinformation in more easily understandable natural frequencies. In the followingexplanation of the flaw in Dershowitz’s argument, I use his estimate that 1 in2,500 battered women is killed annually by her husband or boyfriend. Thiscorresponds to 40 in 100,000. What we need in addition is the number ofbattered women who are killed each year by someone other than their partners.Assuming that this number is about the same as for all American women

(whether battered or not), the Uniform Crime Reports for the United States and ItsPossessions (1993) estimated 5 women in 100,000 who are murdered each year.6Using frequencies, we can now easily understand how many battered andmurdered women have been murdered by their husbands or boyfriends (Figure8-1).
Think of 100,000 battered women. Within one year, we can expect about 40to be murdered by their batterers and another 5 to be murdered by someoneelse. Therefore, 40 out of every 45 murdered and battered women have beenkilled by their batterers. That is, in only 1 out of 9 cases is the murderersomeone other than the batterer.
The frequency tree makes this reasoning transparent. It is like the tree thathelped to make the chances of breast cancer after a positive mammogramtransparent. In each case, a sample of concrete cases—in this case, batteredwomen—is broken into subclasses, as would occur during natural sampling.Thus, the chances that a batterer actually murdered his partner given that shehas been killed is about 8 in 9, or approximately 90 percent. This probabilitymust not be confused with the probability that O. J. Simpson is guilty; a jurymust take into account much more evidence than battery to convict him beyonda reasonable doubt. But this probability shows that battering is a fairly goodpredictor of guilt for murder, contrary to Dershowitz’s assertions. Evidence ofbattery is probative, not prejudicial.

FIGURE 8-1. Is there a relationship between wife battering and spousalmurder in the United States? The Harvard law professor Alan Dershowitz, whoadvised the O. J. Simpson defense team, argued that battering does notconstitute evidence against the husband (or partner) when his wife has beenmurdered. If one draws a frequency tree based on Dershowitz’s numbers,however, one sees the flaw in the argument. At the time of the trial, evidencesuggested that out of every 100,000 battered women, 45 were murdered everyyear. In 40 of these cases, the murderer was the victim’s partner. Thus, wifebattering is evidence against the partner of a murdered woman.

I cannot judge whether Dershowitz confused himself with his numbers, orwhether he just confused the court, the public, and the readers of his book aboutthe Simpson case. And this may not even be an important question forDershowitz, given his baseball analogy of the legal system, according to which“most prosecutors (and defense attorneys) are as concerned about their won-lostratio as any major-league pitcher.” In his words, “nobody really wants justice.Winning is ‘the only thing’ to most participants in the criminal justice system—just as it is to professional athletes.”7 Either way, the moral is the same. Baseballgrew up from sandlots and city streets in a culture of working men and farmboys, and professionals today play the statistics as well as playing ball. Little boysare familiar with batting averages, won-lost percentages, and lots of otherstatistics. The same cannot be said of the court. Many students who spent muchof their education avoiding math and statistics become lawyers, and areunfamiliar with conditional probabilities, match probabilities, and otherstatistical evidence. Representing statistical information in natural frequenciescan help courts—and the public—win arguments and gain insight into theactual relationship between wife battering and murder.
Battering: The Larger Context
Unlike cancer and HIV, wife battering is a social disease that is manmade. Alook into its history may help us see how this phenomenon might be changed, atleast slowly. Knowing how frequent violence is against women, even today inWestern democracies, can perhaps help to expose the often hidden problem.
In 1874, Richard Oliver arrived home drunk one morning, threw a cup and acoffee pot on the floor objecting to his wife’s cooking, brought in two treebranches and whipped her, and could be stopped only after witnesses intervened.Neither of the branches was as thick as a man’s thumb. Nevertheless, Judge J.Settle affirmed that he was guilty of assault and battery, because the “rule ofthumb” doctrine was not law in North Carolina. According to this old doctrine,a husband had a right to whip his wife, provided he used a stick no thicker thanhis thumb. This court case established that, at least in North Carolina “thehusband has no right to chastise his wife under any circumstances.”8 Around thesame time, Judge Charles Pelham wrote: “The privilege, ancient though it be, to

beat her with a stick, to pull her hair, choke her, spit in her face or kick herabout the floor, or to inflict upon her like indignation, is not now acknowledgedby our law.” Some 120 years after Judge Pelham condemned this sort of wifebeating, samples of affidavits filed in U.S. courts show that the same violentbehaviors are still reported by American women.
The evolutionary psychologists Martin Daly and Margo Wilson argue thatmost cases of wife battering arise from husbands’ jealous and proprietaryresponses to their wives’ real or imagined infidelity or desertion.9 In a smallpercentage of these cases, battering “boils over” into murder. (Recall that NicoleBrown Simpson was murdered along with a male companion, whom herhusband—were he the murderer—could have viewed as a sexual competitor.)Battered women often report that their partners threaten to kill them. In fact, ofall American women murdered every year, some 30 to 40 percent are killed bytheir intimate partners.10 A recent national study of hospital emergency roomsfound that assaults by intimate partners or former partners accounted for morethan 45 percent of women’s violence-induced injuries (among all cases where anassailant could be identified).11 In a random sample of San Francisco women, 1out of 5 women reported having been beaten. Women receiving welfareassistance seem to be at greater risk than the general population; for instance, 2out of 3 Massachusetts women on welfare reported having been victims of wifebeating. Little research has been conducted among the economically privilegedin America, except by journalists. (The Pulitzer Prize-winning Seymour Hersh,for example, claimed that former President Richard Nixon beat his wife Pat andhospitalized her a number of times.)12
Physical abuse of women is not restricted to partners. Every year, about 1 in1,000 American women aged 12 and older is raped.13 This figure is the reportedforcible rape rate; because of the underreporting of rape, the actual number ishigher. Estimates are that one in five or six American women has been thevictim of a completed rape at some point in her life.14
Coercive control over women seems to have existed in all or most culturesand can still be observed. However, this does not mean that abuse cannot bedrastically reduced. Adultery laws exemplify one such change. AncientEgyptians, Syrians, Hebrews, Romans, Spartans, and other Mediterraneancultures defined adultery solely in terms of the marital status of the woman—

that is, as an affair between a married woman and a man, married or not.Adultery was seen as a kind of theft from the husband, sexual access to the wifebeing the commodity stolen. Consistent with this view, until 1974, Texas law(Texas Penal Code 1925, article 1220) allowed a husband to kill a man whomhe found in the act of adultery with his wife, without any penalty whatsoever.Texas is an extreme case in being so late to change. In 1852, Austria became thefirst country to explicitly treat male and female adultery as legally equivalent. In1996, Austria once again took the lead by passing an exceptional law againstwife battering. As a consequence of this law, battered women need not seekrefuge in homes for battered women; they need only call the police, who willinstantly turn up at the door and take the husband out of the home if the wifewishes it. The police will confiscate his keys to the house and can forbid himfrom entering the neighborhood for up to 3 months.
Men’s susceptibility to violence can shift with changes in the economic andpolitical environment. In the Soviet Union, for example, the number of womenkilled by their partners was reported to be about 1,600 in 1989, 1,900 in 1990,and 5,300 in 1991.15 After the Soviet Union’s disintegration, the RussianFederation’s National Report noted that 14,500 women were killed by malepartners in 1993 (in Russia only), a figure that rose to 15,000 and then 16,000in the following two years. The rate of spousal murder in the Russian Federationsurpassed that in every Western country, even the high rate in the United States,by an order of magnitude. The worsening economic, political, and socialconditions in Russia during the turmoil that followed the fall of the Communistregime—notably, unemployment and many Russian men’s increased flight intoalcoholism—may have fueled the growing violence.16
Wife battering is not just a Russian or an American problem. The factillustrated in Figure 8-1—that a large majority (8 out of 9) of battered womenwho are murdered are killed by their partners—seems to hold in Westerncountries generally. Men are also much more likely to kill their spouses than arewomen, a fact that also seems to hold in all countries. In the relatively few casesin which women kill their partners, the women have typically been abused andbeaten by their partners for years. An analysis of German court cases showedthat in four out of five cases in which a woman was convicted of homicide, shehad murdered her partner and that the majority of these women had been

battered by their partners.17 Rural and urban Mexican women have reportedthat most of the violence they experience comes from their partners, whetherowing to alcoholism, financial problems, jealousy, women’s true or imaginedinfidelity, or the birth of a child of the “wrong” sex (that is, a girl).18 A recentreport on domestic violence in Chile describes the commonly accepted belief inChilean culture that men may demonstrate love through violent acts. Togetherwith machismo and alcoholism, this mind-set makes violence against womenand children a “way of life.”19 Until 1989, Chile’s Civil Code legally sanctionedthe disregard of human rights for women, stating that a wife owes obedience toher husband, who protects her and has authority over her possessions andperson.
Why is there wife battering all around the world? And why do many moremen than women kill their partners? Although there are many contributingvariables, such as alcoholism, the classic explanation is paternal uncertainty.Unlike in the majority of mammalian species, in which males contributenothing to the upbringing of their offspring, in the human species males andfemales cooperate in providing parental care. Fathers face a problem thatmothers do not, and which according to evolutionary theory is so serious thatmost mammalian fathers opt out of paternal investment entirely. This problemis cuckoldry. That is, a man has to accept some degree of uncertainty aboutwhether he actually is the father of his children. A woman, in contrast, can becertain that she is the mother of her children (barring an accidental exchange ofbabies in the hospital). Paternal uncertainty can be reduced by many means, oneof which is for a man to control his partner physically to ensure that she is notconsorting with other men. According to this argument, the cost of maleparental investment brings with it male sexual jealousy, which leads men to usemethods ranging from vigilance to violence to controlling sexual access to theirmates.
How certain should human fathers be about their paternity? Probably not ascertain as is conceivably possible since the mid-1980s, when DNA fingerprintingbecame available as a highly reliable method for paternity testing. Using DNAfingerprinting, researchers found that 5 to 10 percent of children in Westerncountries who had been studied have a different biological father from the onethey thought they had.20

DNA fingerprinting has understandably played a critical role in paternitysuits, and its potential and limitations in criminal cases were also highlighted inthe O. J. Simpson trial. Interpreting a DNA match, like seeing throughDershowitz’s denial of the connection between wife battering and murder,requires clear statistical thinking. In Chapter 10, we will take a closer look atDNA technology.

. . . the theory of probabilities is at bottom only common sense reducedto calculus . . .
Pierre-Simon, Marquis de Laplace, A Philosophical Essay on Probabilities
9
EXPERTS ON TRIAL
Los Angeles, USA
On June 18, 1964, Juanita Brooks walked down an alley toward her home inthe San Pedro area of Los Angeles. With one hand she held her cane, and withthe other she pulled behind her a wicker carryall containing groceries, with herpurse on top of the packages. Suddenly, she was pushed to the ground by aperson she neither saw nor had heard approach. She managed to look up to see ayoung woman running from the scene. Mrs. Brooks’s purse, which containedbetween $35 and $40, was missing. A witness who lived at the end of the alleyreported that the running woman was blond, had a ponytail, was dressed in darkclothing, and fled from the scene in a yellow car that was driven by a black manwith a beard and a mustache.1 Armed with this description, the police arrested acouple, Janet and Malcolm Collins, who fit the description. The couple hadmarried just two weeks before, at which time they had only $12, a portion ofwhich was spent on a trip to Tijuana. Since the marriage ceremony, Malcolmhad not worked, and Janet’s earnings as a housemaid were not more than $12 aweek. During the 7-day trial, the prosecution ran into difficulties. Although heidentified Malcolm Collins in the courtroom as the driver of the getaway car, thewitness had admitted at a preliminary hearing that he was uncertain of his

identification of a beardless Mr. Collins in a police lineup. Mrs. Brooks couldnot identify either defendant.
To make a case, the prosecutor in People v. Collins called a mathematicsinstructor from a state college to the stand as an expert witness. The prosecutorprovided a chart similar to Table 9-1 to answer the following question: What isthe chance that Mr. and Mrs. Collins are innocent given that they match thedescriptions of the perpetrators on all six characteristics? The expert witnesstestified that the probability of a combination of characteristics, or their jointprobability, is given by the product of their individual probabilities. Then theprosecutor provided estimates of the probabilities of each of the sixcharacteristics and multiplied them to compute what he claimed to be theprobability that a randomly selected couple would have all six characteristics; hisanswer was 1 in 12 million.2 Based on this calculation, the prosecutor concludedthat the chance that the defendants were innocent was only 1 in 12 million. Headded that this estimate was conservative and that, in reality, “the chances ofanyone else besides these defendants being there . . . is something like 1 in abillion.”3 The jury later convicted the Collinses of second-degree robbery.
The defense appealed the verdict, and the California Supreme Court reversedthe conviction on four grounds. First, the probabilities in the prosecutor’s chartlacked evidentiary foundation; they were merely estimates. Second, multiplyingthe six probabilities requires assuming that the six characteristics areindependent, for which there was insufficient proof. Beards and mustaches, forinstance, are not independent: a man who has a beard is more likely than arandomly drawn man to have a mustache. Third, the prosecutor’s calculationassumed that the six characteristics were certain, ignoring the possibility that theperpetrators were disguised or that the witnesses inaccurately reported one ormore of the perpetrators’ characteristics. For instance, the report that the femaleperpetrator had a ponytail was actually uncertain: the victim was not able tostate whether she had one—although the victim had observed her as she ranaway—whereas the witness was sure she did. Or, the female perpetrator mighthave been a light-skinned black woman with bleached hair rather than a whitewoman. Fourth, and most important, there was a fundamental flaw in theprosecution’s reasoning. The prosecution inferred that the probability ofobserving all six characteristics in a randomly drawn couple is the probability

that Mr. and Mrs. Collins were innocent. This error is known as the prosecutor’sfallacy.4
TABLE 9-1. Probabilities provided by the prosecution in People v. Collins.These probabilities are estimated relative frequencies, such as that 1 out of 3girls have blond hair and 1 out of 10 girls have a ponytail. (Data fromKoehler, 1997, p. 215.)
Evidence Probability
Girl with blond hair 1/3
Girl with ponytail 1/10
Partly yellow automobile 1/10
Man with mustache 1/4
Negro man with beard 1/10
Interracial couple in car 1/1,000
To understand this fallacy, we need to separate two questions. First, what isthe probability that an individual (or couple) will match the perpetrator on allknown characteristics? Second, what is the probability that an individual (orcouple) is guilty, given that this individual matches the perpetrator on all knowncharacteristics? The prosecutor’s fallacy refers to the conflation of these twoprobabilities:
p(match) is mistaken for p(not guily|match) Prosecutor’s fallacy
In words, the prosecutor’s fallacy is to reason that the probability of a randommatch is the same as the probability that the defendant is not guilty, orequivalently, that the guilt probability is 1 minus the probability of a randommatch. For instance, assume that p(match) is 1 in 1,000. The person whocommits the fallacy reasons that, therefore, the chances that the defendant is notguilty are 1 in 1,000, or, equivalently, that the chances that the defendant isguilty are 999 in 1,000. In fact, however, these two probabilities are not thesame.

The probability p(match) is a random match probability of a trait orcombination of traits (for example, ponytail) in a defined population (forexample, all people in the United States). The probability p(not guilty| match),in contrast, is the probability that the defendant is not guilty given a match. Theconfusion between these two probabilities can be seen easily if we use a trait thatmatches frequently such as being male if we think about the next U.S. president.The probability p(male) that a randomly drawn American is male is about 50percent. But this probability is not the same as the probability that any randomperson will be the next U.S. president if he is male, p(president|male); the vastmajority of men never become president.
The attorney and social psychologist William Thompson and his studentEdward Schumann seem to have coined the term “prosecutor’s fallacy.” Theyused it to describe an experienced deputy district attorney’s argument that if adefendant and perpetrator match on a blood type found in 10 percent of thepopulation, there is a 10 percent probability that the defendant would have thisblood type if he were innocent, and therefore, that there is a 90 percentprobability that the defendant is guilty.5 If you find this argument confusing,that is because it is a confused argument: A random match probability does notdetermine a guilt probability. As we have seen in earlier chapters, theprosecutor’s fallacy is not specific to prosecutors. The same impeded inferencescan occur when other experts reason with probabilities. The prosecutor’s fallacyis related to the reasoning of several of the AIDS counselors in Chapter 7 whoconfused the sensitivity of the HIV test with its positive predictive value, when,in fact,6
p(positive test|HIV) is not the same as p(HIV|positive test)
The prosecutor’s fallacy is also related to the reasoning of those physicians inChapter 5 who confused the sensitivity of mammography with the probabilitythat a woman actually has breast cancer if she tests positive, when, in fact,
p(positive test|breast cancer) is not the same as p(breast cancer|positive test)
Experts who commit the prosecutor’s fallacy often use the phrase “someoneother than the defendant”:

Because the probability of a match between the defendant and the evidencesample is 1 in 10,000, the probability that someone other than the defendantis guilty is only 1 in 10,000.
How can this form of innumeracy be avoided? A simple solution would befor the courts to require that evidence be presented in frequencies rather thansingle-event probabilities. In the case of the Collinses, the confusing probabilitystatement is this:
“The probability of the defendant matching on these six characteristics is1 in 12 million.”
The probability statement looks like bad news for the defendant.Transformed into the more transparent language of frequencies, it drawsattention to other possible suspects:
“Out of every 12 million couples, we expect that 1 couple shows thesesix characteristics.”
Here one immediately asks how many couples are out there who could havecommitted the crime. Frequencies make it apparent that we need to know thenumber of couples in the relevant reference population to estimate the chancethat the Collinses are innocent. For instance, if the reference population was allcouples in California, and there were about 24 million couples in California,then the natural frequency statement reveals that we can expect two couples tohave all six characteristics. This would mean the chance that the Collinses areinnocent is 1 in 2, not 1 in 12 million.7 In the appeal, the Supreme Court ofCalifornia made a similar calculation, concluding that convicting the Collinseswas like convicting person X on the grounds that a witness saw either X or X’stwin commit the crime. The report continues with a telling remark about thestate of statistical insight in the courtroom: “Again, few defense attorneys, andcertainly few jurors, could be expected to comprehend this basic flaw in theprosecution’s analysis.”8
People v. Collins is one in a long line of legal cases in which experts, not justlaypeople, were confused by probabilities. In the notorious case in late

nineteenth-century France, for example, the conviction of Dreyfus for espionagewas ultimately reversed and the statistical arguments that had supported it werediscredited, just as in the Collins case.9 Thus, expert testimony usingprobabilities, and the confusion it can engender, has played a role in thecourtroom for more than a century now. Yet it is still common practice intoday’s courts to present statistical arguments in probabilities rather than infrequencies. This practice makes it difficult for people to spot flawed arguments.
Wuppertal, Germany
On a summer evening in Wuppertal, a city in the industrial belt of Germany, a40-year-old painter took a walk in the woods with his 37-year-old wife.Suddenly, they were attacked by a stranger who shot the man three times in thethroat and the chest. The man fell to the ground. Then the stranger attemptedto rape the woman. When she defended herself and, unexpectedly, her husbandrose to his feet to help her, the stranger shot her twice in the head and fled. Theman survived the attack; his wife did not. Three days later, a forest rangerdiscovered, 20 kilometers from the scene of the crime, a car belonging to a 25-year-old chimney sweep who used to spend his weekends in the same woods.The husband at first thought he recognized the chimney sweep in a photo,became less certain after seeing him in person, and later leaned toward believinganother suspect to be the murderer. But when the other suspect was proveninnocent, the prosecution put the chimney sweep on trial. The chimney sweep,who had no previous convictions, pled not guilty.
Among the pieces of evidence against the defendant was the blood foundunder the fingernails of the murdered woman, which matched the defendant’s.At the trial, a university lecturer testified that 17.3 percent of Germans sharethat blood type. A second piece of evidence was the blood found on the chimneysweep’s boots, which matched the murdered woman’s. The expert testified that15.7 percent of Germans share this blood type. Multiplying these twoprobabilities gives a joint probability of 2.7 percent that these two matcheswould occur by chance. Therefore, the expert witness concluded that theprobability is 97.3 percent that the chimney sweep was the murderer.10

To see why the conclusion of the expert witness does not hold water, let usassume that any of roughly the 100,000 men in Wuppertal could havecommitted the crime. One of them, the murderer, will show both matches withpractical certainty (unless the samples are confused with other samples in thelaboratory, or other errors occur). Out of the 99,999 other residents, we canexpect some 2,700 (or 2.7 percent) also to show these two matches.11 Thus, theprobability of the defendant being the murderer given the two matches is not97.3 percent, as the expert witness testified, but 1 in 2,700, that is, less thanone-tenth of 1 percent.
A second kind of evidence was textile fibers found on the clothes of both thevictim and the chimney sweep. Based on the match between these fibers, asecond expert witness, from the State Crime Department, used the samereasoning—that is, he committed the prosecutor’s fallacy— in order to computea comparably high probability that the chimney sweep was the murderer. Theseexpert calculations collapsed when the court found conclusive evidence that thedefendant was in his hometown, 100 kilometers away from the scene, at thetime of the crime.
The assumption that 100,000 men could have committed the crime wasmade here strictly for the purpose of illustration. If one has independentevidence that limits the population of potential suspects, as in the murder caseconsidered in Chapter 10, the estimate can be changed accordingly. In theWuppertal case, such evidence was not available. The assumption of a certainpopulation size generally remains an assumption. By taking upper and lowerlimits on possible population sizes (for example, all men in Europe versus allmen in Wuppertal), however, we can derive upper and lower bounds on theprobability that a defendant is the source of a forensic sample. In any case, themethod of thinking of a concrete population and breaking it down into naturalfrequencies can provide us with ballpark estimates that prevent the prosecutor’sfallacy.
The reasoning of the two expert witnesses in this case was the same as that ofthe prosecutor in People v. Collins. It is no coincidence that this type of cloudedthinking is known as the prosecutor’s fallacy rather than the defense attorney’sfallacy. This is because the fallacy usually involves inflating the probability thatthe defendant is guilty of a crime. For instance, in the Collins case, the

probability of a match was said to be 1 in 12 million, which, via the prosecutor’sfallacy, was equated with the probability of another couple being guilty of thecrime; this left the Collinses looking very guilty indeed. Thanks to theprosecutor’s fallacy, match probabilities— which are usually very small—miraculously turn into huge guilt probabilities.
Some legal scholars have argued that statistics should be excluded from courtbecause they are easily manipulated and difficult to understand.12 I believe thatstatistical evidence should not be excluded, but that professionals working incriminal law should be provided with tools to understand statistical information.In law school, students should be taught using cases such as the two in thischapter and then asked to imagine playing the two following roles. Assume youare a prosecutor and intend to confuse the court; how would you present theevidence? Now assume you are a defense attorney who hears the prosecutor’sprobability statement; how would you explain, in simple words that a juror canunderstand, what is wrong with this argument?
Prosecutors, defense attorneys, and judges need to realize that the importantquestion is not only whether evidence is admissible and true, but also whether itis presented in a way that clouds thinking or facilitates insight. Unless courts rulehow statistical information should be presented in a trial, we can expect the sameerrors to be repeated again and again. DNA fingerprinting is a case in point. Butit is also a point of hope because if there is one development that has forced thelegal profession to learn statistical thinking, it is the admissibility of DNAevidence. Appropriately understood, this new technology promotes the cause ofjustice.
The Law and Uncertainty
Many students who spent much of their life avoiding statistics and psychologybecome lawyers. Out of some 175 accredited law schools in the United States,only one requires a course in basic statistics or research methods.13 When I was avisiting professor at one of the top schools of law in the United States, I wasimpressed with how smart and rhetorically apt the students were and yet howignorant they were of basic statistical principles. The same students who excelledin critical thinking could not evaluate whether a conclusion drawn from

statistical evidence was correct or incorrect. Similarly, most students were equallyignorant of psychology, including how to communicate statistical information ina way that other minds understand it. These students, however, soon realizedthat both statistics and psychology are relevant to their careers, since many legalissues are decided on the basis of uncertain evidence. Polygraphs, fiber analysis,hair analysis, DNA fingerprinting, blood-type analysis, and handwritingidentification are all techniques that provide evidence that is uncertain and mustbe evaluated. The courts tend to call in expert witnesses, but as we have seen, theexperts that courts select can have clouded minds themselves.
How can this situation be changed? The first step is that legislators,administrators, and law professors recognize that there is a problem. The secondstep requires looking across the disciplinary boundaries to knowledge of what ishelpful in solving the problem and including it as part of law curricula andguidelines for court procedures. Until such a program is instituted, students cantry to implement a self-help program, open to any student of law and othersufferers of this problem. As one legal scholar proposed, why not “InnumeratesAnonymous”?14

Behavioral research should be carried out . . . to assess how well variousways of presenting expert testimony on DNA can reduce . . .misunderstandings.
National Research Council, The Evaluation of Forensic DNA Evidence
10
DNA FINGERPRINTING
Oldenburg, Germany
In April of 1998, more than 15,000 men between the ages of 18 and 30 went topublic schools in Oldenburg, Germany, to have their DNA fingerprints taken.These men, who came from a number of small towns in the area, took thisscreening very seriously. All were volunteers, and some even had postponed theirEaster vacation to participate. The procedure was fast and painless: their DNAwas extracted from saliva samples collected using mouth swabs. The cost of this,the largest DNA screening ever conducted in Germany, was estimated at morethan $2 million. What had impelled these men to participate was a dreadfulcrime. One evening in March of the same year, 11-year-old Christina Nytsch(“Nelly”) did not come home from swimming at the local public pool. Heralarmed parents called the police, who, after five days of searching, found thechild raped and stabbed in the woods.
The DNA traces found on Christina matched those found on another girlwho had been raped two years earlier in a neighboring town. That girl hadsurvived. From her testimony, the police were able to make a rough estimate ofthe perpetrator’s age and infer that he lived in the rural region where Christina

had lived. Thus, they hypothesized that the population group from which theperpetrator came was that of men between 18 and 30 in that region. The policedecided to screen all of them. However, they could not legally force any man toparticipate; instead, they counted on the locals’ moral outrage at the rape andmurder of Christina and on the peer pressure that would be brought to bear onanyone who refused to participate.
The police were right. On Good Friday, an unemployed 30-year-old man,married and the father of three small children, was asked by two acquaintancesto join them in going to the screening site. The man went. He may have felt hehad little choice unless he wanted to be singled out as a suspicious case. After hisDNA profile was found to match the one found at the scene of the crime, heconfessed to Christina’s rape and murder. He also confessed to the rape of theother girl two years earlier. In the case of Christina, a unique combination ofsocial peer pressure and a new technology helped the police to identify amurderer.1
In this chapter, I examine the chain of inference from an observed DNAmatch to a defendant’s guilt. This chain involves statistical reasoning that oftengoes awry. I begin with a brief history of fingerprinting and DNA evidence.
DNA Evidence
Sir Francis Galton (1822-1911), a first cousin of Charles Darwin’s, was aromantic figure in the history of statistics and perhaps the last gentlemanscientist.2 He was a man of ideas and a pioneer in diverse fields, includingmeteorology, the study of heredity, and the measurement of intelligence and theefficacy of prayer. For instance, he collected data to test whether prayer affordsany advantage to its intended beneficiaries, and found none: sovereigns forwhom whole nations prayed lived no longer than other members of theprosperous classes, nor did clergymen. He also pioneered the use of fingerprintsfor personal identification. The Galton-Henry system of fingerprintclassification was introduced at Scotland Yard in 1901 and quickly adopted inEnglish-speaking countries. In 1924, two large fingerprint collections wereconsolidated to form the basis of the FBI Identification Division’s current

database. By the late twentieth century, the division’s files contained thefingerprints of more than 90 million people.
In the early 1950s, the chemical basis of heredity was discovered: a sequenceof four bases (represented by the letters A, C, G, and T) called DNA(deoxyribonucleic acid). In the 1980s, a new “fingerprinting” technique— DNAfingerprinting, or somewhat less fashionably, DNA profiling—was developed bySir Alec Jeffreys of the University of Leicester in England. Jeffreys developed amethod for viewing fragments of DNA extracted from blood or other biologicalsamples. The fragments that interested Jeffreys were noncoding regions of thehuman genome, that is, DNA that has no known function in the cellularproduction of protein.3 Because noncoding DNA is subject to less selectionpressure than coding DNA, it shows a higher variability among individuals. Thishigher variability makes it a better tool for discriminating among people, leadingto the development of a tool with enormous potential. The fingerprint analogyis not perfect; for example, identical twins have identical DNA, but not identicalfingerprints. However, unlike fingerprints, DNA can be extracted from all kindsof biological traces, such as hair, saliva, and blood, and it lasts much longer.
DNA fingerprinting was widely hailed as the greatest breakthrough inforensic science in the twentieth century because of its evident applicability tocriminal cases and paternity suits. Because it is not possible to observe DNAdirectly using instruments such as high-powered microscopes, DNAfingerprinting typically involves the following indirect method. Forensiclaboratories break the long DNA strands into fragments by adding an enzyme tothe sample; the fragments are then separated by electrophoresis, plotted onto anylon membrane, and exposed to X-ray film. This process produces a series offuzzy lines or bands called an autoradiogram, which resembles a supermarket barcode. This pattern is the DNA profile. If the bands in the DNA profile line upwithin a specified error range with those of a particular sample, a “match” isdeclared.4 Computer-based data banks with DNA fingerprints have been, or arein the process of being, installed all over the world. For instance, one monthafter the murder of Christina, the German Federal Crime Bureau established aDNA data bank to facilitate the capture of sexual offenders.
DNA fingerprinting has a vast potential for identifying criminals. Forinstance, in the investigation of the Unabomber, the FBI obtained a DNA

sample from the saliva left on the stamp affixed to one of the bomber’s lettersand was able to demonstrate a match with Theodore Kaczynski’s DNA.5
DNA evidence is a valuable tool not only for identifying criminals, but alsofor preventing false convictions. The defense lawyers Peter Neufeld and BarryScheck, celebrated for their work on behalf of the O. J. Simpson defense team,run a program, the Innocence Project, the mission of which is the exoneration ofpeople who have been wrongly convicted of crimes. With the help of New YorkCity law student volunteers, they have used DNA fingerprinting to checkconvictions and have helped overturn the convictions of several dozen wronglyincarcerated people.6 Similarly, the London Metropolitan Police ForensicScience Laboratory has found that about 20 percent of suspects in rape cases canbe excluded by DNA fingerprinting.7 The possibilities afforded by DNAtechnology have since spread into the world of science fiction, as in the best-selling novel Jurassic Park and the movie based on it, in which extinct dinosaurspecies are resurrected with the help of as yet fictional biotechnology.
DNA fingerprinting was introduced into U.S. criminal proceedings in 1986.Ten years later, in Britain, the first court case was reported in which theprosecution relied solely on DNA evidence and charged the defendant with rape,despite contrary evidence—for example, that he was considerably older than thedescription of the assailant by the victim, that the victim did not pick him out ofa line-up, and that he had an alibi supported by his girlfriend. The number ofsuspects who are prosecuted on the basis of DNA evidence alone will possiblyincrease in the future as a consequence of the creation of national DNAdatabases, which allow the police to search the computer rather than for furtherevidence at the scene of the crime.8
DNA fingerprinting was initially received by the courts and the media as anearly foolproof means of identifying criminals who left biological traces atcrime scenes, as well as men implicated in paternity suits. However, like all newtechnologies, DNA fingerprinting depends on psychology to be understood.That is, a great technology can be foiled by a lack of understanding of theuncertainties involved. Two reports by the National Research Council haveaddressed the technical and psychological challenges posed by DNAfingerprinting. One of the recommendations in a report in 1996 was that“behavioral research should be carried out to identify any conditions that might

cause a trier of facts to misinterpret evidence on DNA profiling and to assesshow well various ways of presenting expert testimony on DNA can reduce anysuch misunderstandings.”9 I hope that this chapter helps to serve that goal.
The Chain of Inference
One would think that a match between a defendant’s DNA and the DNA foundat a crime scene would prove that the defendant is the source of the trace. But areported match does not guarantee that the defendant is guilty of the crime oreven that he or she is the source of the trace. The chain of uncertain inferencefrom a DNA match to the guilt of a specific person is depicted in Figure 10-1.First, a reported match may not be a true match because of laboratory errors,whether human or technical, that produce false positives, just as in the case ofHIV testing. Second, a defendant who provides a true match may not be thesource of the trace if the match is coincidental; even rare DNA patterns canoccur in more than one person, particularly in biological relatives. Third, adefendant who is truly the source of a DNA trace may not have been present atthe crime scene if the real perpetrator or someone else deliberately, orunintentionally for that matter, transferred the defendant’s biological material tothe scene. In the O. J. Simpson case, for instance, the defense forcefully allegedthat some of the blood evidence at the murder scene was introduced by thepolice. The defense’s success in cutting the inferential chain between “Source”and “Present at crime scene” was critical to Simpson’s acquittal. Finally, adefendant who had been present at the crime scene may not be guilty; he mayhave left the trace before or after the crime was committed.
Like the physicians, AIDS counselors, and expert witnesses we have met inprevious chapters, attorneys and DNA experts tend to talk about theuncertainties involved in DNA fingerprinting in terms of probabilities. Asdescribed in the preceding chapter, the random match probability is theprobability that a person randomly selected from a population would match thetrace evidence as closely as the suspect. The source probability, in contrast, is theprobability that the suspect is actually the source of the recovered trace evidence.The guilt probability is yet something else, because, as mentioned above, even ifthe suspect is the source of the trace, he may not have committed the crime. The

confusion of the random match probability with the other two probabilitiesleads to two errors. The source probability error occurs when someone overlooksthe first two steps of the inferential chain and wrongly infers the sourceprobability directly from the random match probability, that is:

FIGURE 10-1. The chain of uncertain inference in DNA typing: fromreported match to guilt. (After Koehler, Chia & Lindsay, 1995.)

p(match) is mistaken for p(not source|match) Source probability error
For instance, if the random match probability is 1 in 100,000, then the sourceprobability error occurs when someone infers that this is the probability that thedefendant is not the source, or, equivalently, that the probability that thedefendant is the source would be 99,999 out of 100,000. The prosecutor’sfallacy, introduced in the previous chapter, involves jumping from the firstelement of the chain to the last, that is:
p(match) is mistaken for p(not guilty|match) Prosecutor’s fallacy
The Fabrication of Certainty
Let us have a closer look at the first step in the inferential chain, “Reportedmatch.” If a match is declared, the only error that can be introduced at that stepin the inferential process is a false positive result, that is, a match is reportedalthough no true match exists. False positives do occur; unfortunately, it is hardto estimate exactly how often. One reason is that DNA laboratories prefer toconduct in-house proficiency tests rather than to submit to independent externaltests of their accuracy.
The FBI, for instance, has fought hard to prevent outsiders from seeing theresults of such in-house proficiency tests. The attorney William Thompsonreports that the “defense counsel were able to gain access to the FBI’s internalproficiency test results only after protracted litigation to overcome the FBI’sinsistence that these data were protected by a ‘self-critical evaluation privilege.’FBI memoranda . . . show that John W. Hicks, the FBI’s Assistant Director inCharge of the Laboratory Division, in 1990 unsuccessfully sought authorizationto destroy the FBI’s DNA proficiency testing data at a time when the FBI wasresisting efforts by several defense counsel (including myself) to obtain discoveryof those very data.”10 Hicks claimed that “there were no false positive or falsenegative results in any of the FBI’s proficiency tests.”11
In the few cases in which forensic laboratories agreed to external proficiencytesting, the tests were rarely blind, that is, the laboratories and technicians wereaware that they were being tested. In the first blind test reported in the

literature, three major commercial laboratories were each sent 50 DNA samples.Two of the three declared one false match; in a second test one year later, one ofthe same three laboratories declared a false match.12 From external testsconducted by the California Association of Crime Laboratory Directors, theCollaborative Testing Services, and other agencies, the psychologist JonathanKoehler and his colleagues estimated the false positive rate of DNAfingerprinting to be on the order of 1 in 100.13 Cellmark Diagnostics, one of thelaboratories that found matches between O. J. Simpson’s DNA and DNAextracted from a recovered blood stain at the murder scene, reported its ownfalse positive rate to the Simpson defense as roughly 1 in 200.14
What causes false positives? The reasons can be either technical, such asenzyme failures that produce misleading DNA banding patterns, or human,such as the contamination or mislabeling of samples and errors in patterninterpretation. There is a need for more public data on false positives andnegatives in DNA fingerprinting.
In court, several forensic scientists have been reluctant to acknowledge thepossibility of false positives. Excerpted here is an illustrative exchange betweenan attorney and a forensic expert in a 1991 trial in Texas:
Attorney: Now, you’re telling us that you can only get a result or no result; isthat correct?
Expert: That’s correct.
Attorney: And you couldn’t get a false positive?
Expert: There’s nothing like a false positive in this, no.
Attorney: How about if you use the wrong sample?
Expert: If you use the wrong sample?
(Attorney nods head.)
Expert: You either get a result, or you don’t get a result. There’s no falsepositives.15

Here the expert witness repeats his claim that there are no false positives evenafter being asked about the possibility of an inarguable human error (using thewrong sample). This expert is not alone in promising absolute certainty.American expert witnesses have testified that “there have never been any falsepositives made with DNA testing at this point”; that “a false positive finding [is]impossible because if the procedures were not correctly followed, no matchcould be obtained”; and that the accuracy rate is 100 percent and DNAfingerprinting is “failsafe.”16 In Germany, the president of the Society forForensic Medicine is reported to have publicly asserted that a DNA match“identifies a perpetrator with 100 percent certainty.”17 In other cases, forensicscientists have tried to claim certainty by excluding human error fromconsideration and reducing the meaning of a false positive to technical error. Butthis amounts to an illusion of certainty; both technical and human errorscontribute to false positives.
Clouded Thinking
Clouded thinking means drawing incorrect inferences from statistics withoutnoticing. The source probability error is one form. Here, the random matchprobability is confused with the probability that the defendant is the source ofthe evidence.
IN THE PRESS
The front page of The Boston Globe on July 5, 1995, reported on the “bignumbers” in the O. J. Simpson trial. The following three paragraphs show howthe journalist switches back and forth between confusing random matchprobabilities and source probabilities, unable to keep them straight:
As it prepares to wind up its case this week, the prosecution in O. J.Simpson’s trial wants jurors to remember the big numbers: The odds are1 in 170 million, for instance, that someone other than the defendantdripped blood on the scene of Nicole Brown Simpson’s murder.
But even figures that sound less stunning—9 percent of all Americanswear size 12 shoes; 1 in 200 people share the “genetic markers” in the

assailant’s blood; and the odds are 1 in 1,600 that the blood on thekiller’s glove came from someone other than Simpson—point in thesame direction when they’re combined.
The chance of anyone fitting all three descriptions is 1 in 3.5 million,and it soars to astronomical levels when factoring in other statistics.
The first paragraph provides a version of the source probability error: Theauthor confuses a random match probability (1 in 170 million) with the sourceprobability, p(not source|match), that someone other than the defendantdripped the blood, when, in fact,
p(match) is not the same as p(not source|match).
In the second paragraph, the first two figures are correctly presented asrandom match probabilities, but the third is phrased in the form of odds (theratio of two probabilities) and is mistaken as a source probability. In the thirdparagraph, the author switches back to referring correctly to a random matchprobability.
IN THE COURTROOM
It is not only the press that is easily confused by probabilities. In the courtroom,confusion often emerges when experts respond to attorneys’ questions. Forinstance, in a 1992 trial for aggravated sexual assault in Texas, State v. Glover,the prosecutor questioned the expert witness on direct examination. (In theUnited States, a lawyer first questions his or her own witness on directexamination; then the other side questions the witness on cross-examination;then the first side is entitled to question the witness again, and then the otherside may do so again.) The attorney first asked the expert about a random matchprobability and then restated this value as a source probability, and the expertcorroborated both statements:
Attorney: And are you able to compile all four of those probabilities anddetermine what is the likelihood of the DNA found in Billy Glover justrandomly occurring in some other DNA sample?

Expert: Yes.
Attorney: What is the likelihood of that?
Expert: The way that is done is to multiply each one of those four numbersthat I mentioned before together, because each one is separate andindependent, and the final number comes out as one in about 18 billion.
Attorney: So the likelihood that DNA belongs to someone other than BillyGlover is one in 18 billion?
Expert: That is correct.18
Here again, a random match probability is confused with a sourceprobability. The source probability error has been documented, not only inTexas, but also in other states. For instance, a court transcript from a 1991California trial involving murder and attempted robbery makes the statement“that the frequency of that DNA banding pattern in the Hispanic population isapproximately 1 in 6 billion . . . meant that the chance that anyone else but theappellant left the unknown hairs at the scene of the crime is 6 billion to 1.” Atranscript from a Kansas trial for rape and murder states that “according to theState’s three experts, there was more than a 99 percent probability that Smithwas a contributor of the semen found in the swab.”19 In these cases, randommatch probabilities were erroneously interpreted as source probabilities.
Clouded thinking does not always prevail, however. In Britain, the Court ofAppeal quashed the conviction of Andrew Deen for rape because the forensicscientist had committed the source probability error. The scientist described thematch probability as the “probability of the semen having originated fromsomeone other than Andrew Deen” and concluded that “the likelihood of this[the source] being any other man but Andrew Deen is 1 in 3 million.”20
Isn’t One in a Billion Enough?
But what if the random match probability is as low as 1 in 57 billion, perhapsthe most widely reported figure in the O. J. Simpson case and a figure with a

denominator larger than the total population of the earth? Isn’t that chancesmall enough? It is true that the discrepancy between the random matchprobability and the source probability becomes less significant with smallerrandom match probabilities. However, there are two reasons a matching suspectmight not be the source: one is a coincidental match, the likelihood of whichdecreases with smaller random match probabilities; the other is a false positive.
False positives play a role in the first link of the chain of inference shown inFigure 10-1, from “Reported match” to “True match,” whereas the randommatch probability plays a role in the second link, from “True match” to“Source.” When a false positive occurs in the first link, the second link doesn’tmatter—the chain is already broken. Specifically, when the probability of a falsepositive is many orders of magnitude larger than the random match probability,it makes little difference whether the latter is 1 in a million or 1 in a trillion.21
For instance, if the false positive rate is around 1 in 200, as Cellmark, one of thelabs involved in the O. J. Simpson trial, reported, we would expect oneerroneous match in each of 200 cases where the defendant is innocent. If amatch is false, the random match probability does not matter, however small itis. The match is still false.
One might think that the problem of miscommunicating risks could besolved if attorneys, expert witnesses, and judges understood the relevantprobabilities. But even when the prosecution carefully avoids the confusion ofthe random match and source probabilities, untrained jurors may still confusethem. In the words of one juror, “You can’t really argue with science.” TheDNA evidence “was very conclusive the way the experts explained it.”22
From Innumeracy to Insight
Does mental defogging work with legal minds as well as with medical minds? Toanswer this question, Sam Lindsey, Ralph Hertwig, and I asked 127 advancedlaw students and 27 professionals, mostly lecturers and professors of law at theFree University of Berlin, to evaluate two criminal case files.23 The files werenearly identical to those in two real rape and murder cases in Germany; the onlychanges made were those necessary for performing the experimentalmanipulation and protecting anonymity. In both cases a match was reported

between the DNA of the defendant and a trace on the victim, but aside from thematch, there was little reason to suspect that the defendant was the perpetrator.Situations in which DNA evidence is the only, or at least the major, evidenceagainst a defendant are likely to occur more and more often. In 1996, theGerman Federal Constitutional Court ruled that in serious crimes, a judge mayorder blood samples for DNA analysis even if there is no strong suspicionagainst the person from whom it is taken. Thus, screening of people for DNA ispermissible and does not constitute a violation of civil rights.
Can law students and legal scholars come to understand the uncertaintiesinvolved by using frequency representations? Does the representation affect theirverdicts, that is, their judgment of whether or not the defendant is guilty? Halfof the law students and professionals got the relevant information inprobabilities, the other half in natural frequencies. The authentic nature of thecase files was highly motivating to the participants, and they spent, on average,more than an hour and a half reading and evaluating the two cases. Sincecriminal case files are long and detailed, I summarize below the relevant passagesfor one of the two rape-and-murder cases. As mentioned above, aside from theDNA match there was little reason to suspect that the defendant was theperpetrator.
Conditional Probabilities
The expert witness testifies that there are about 10 million men who couldhave been the perpetrator. The probability of a randomly selected manhaving a DNA profile, that is identical with the trace recovered from thecrime scene is approximately 0.0001 percent. If a man has this DNA profile,it is practically certain that a DNA analysis shows a match. If a man doesnot have this DNA profile, current DNA technology leads to a reportedmatch with a probability of only 0.001 percent.
A match between the DNA of the defendant and the traces on the victimhas been reported.
Question 1. What is the probability that the reported match is a true match,that is, that the person actually has this DNA profile?
Question 2. What is the probability that the person is the source of the trace?

Question 3. Please render your verdict for this case: Guilty or not guilty?
The three questions concern three steps in the chain of inference fromreported match to guilt (see Figure 10-1). The first question is about theprobability that the reported match is a true match, the second question is aboutthe source probability, and the third about the guilt of the defendant.
Natural Frequencies
The expert witness testifies that there are about 10 million men who couldhave been the perpetrator. Approximately 10 of these men have a DNAprofile that is identical with the trace recovered from the crime scene. If aman has this DNA profile, it is practically certain that a DNA analysisshows a match. Among the men who do not have this DNA profile, currentDNA technology leads to a reported match in only 100 cases out of 10million.
A match between the DNA of the defendant and the traces on the victimhas been reported.
Question 1. How many of the men with a reported match actually do havea true match, that is, that the person actually has this DNA profile?
Question 2. How many of the men with a reported match are actually thesource of the trace?
Question 3. Please render your verdict for this case: Guilty or not guilty?
When the information was in probabilities, the legal students and expertswere lost. Consider the inference from a reported match to a true match(Question 1). The problem here is false positives. Only very few could figure outwhat to conclude from a match probability of 0.0001 percent and a false positiverate of 0.001 percent. As Figure 10-2 shows, only about 1 percent of thestudents and 10 percent of the professionals were skilled enough to do this.When the information was in natural frequencies, these numbers increased to 40percent and more than 70 percent, respectively. In terms of frequencies, it iseasier to see that there are 10 men with an identical DNA profile in the

population, and an additional 100 men where a match is reported althoughthere is no identical DNA profile. That means, only 10 of 110 men for whom amatch is reported actually have the DNA profile.
Consider now Question 2, concerning the probability that the defendant isactually the source of the trace found at the crime scene. When the informationwas in terms of probabilities, a similarly small number of students andprofessionals were able to figure out what it implied. With frequencies, however,insight emerged at the same rate as with Question 1. Many could nowunderstand that only 1 in 110 men reported to match the trace was actually thesource of the trace.

FIGURE 10-2. How the representation of uncertainties (probabilities versusfrequencies) affects the reasoning of legal students and professionals. Whenthe information about DNA evidence was presented, as usual, in terms ofconditional probabilities, few could draw the correct (Bayesian) inference; withnatural frequencies more than 40 percent of the students and the majority of theprofessionals “saw” the answer. Two questions were asked: p(Profile), whether areported match indicates that the defendant actually has the profile (a truematch); and p(Source), whether a reported match indicates that the defendant isthe source of the trace. These two questions correspond to the first two steps inthe chain of inference shown in Figure 10-1. (Adapted from Hoffrage et al.,2000.)

The final decision in a criminal trial is about the defendant’s guilt orinnocence, and it is cast in yes-no terms rather than in probabilities (Question3). Did the representation of the DNA evidence make a difference to theirverdicts? Yes. More students and professionals voted “guilty” when the evidencewas presented in terms of probabilities, that is, when their minds were clouded(Figure 10-3). This effect was slightly larger among the students, but it wasobserved in both groups. Overall, guilty verdicts increased by 50 percent whenthe law students and professionals looked at probabilities.
This study illustrates two points: the low level of understanding of theuncertainties involved in the chain of inference (Figure 10-1) by law studentsand professionals, and how an effective tool—natural frequencies— can helpovercome innumeracy in the legal profession.24

FIGURE 10-3. Does the representation of uncertainties (probabilities versusfrequencies) affect the verdict (guilty or not guilty) of legal students andprofessionals? When the information about DNA evidence was presented inconditional probabilities, more students and professionals judged “guilty.”(Adapted from Hoffrage et al., 2000.)

Paternity Uncertainty
Apart from criminal cases, the second major use of DNA testing is in paternitytesting. DNA fingerprinting is a significant improvement over the earlier ABOblood group analysis, which could sometimes exclude the possibility that a manwas the father, but never come close to proving fatherhood. Before DNA testing,court proceedings were often colored by the public humiliation of unmarriedmothers, in which the man who denied being the father and his friends tried toprove that the mother was of bad character. For instance, until the LegitimacyAct of 1959 was passed in England, hearings usually took place in open court, towhich the public and the press had a right of admission, and the evening papersprovided detailed reports including the names and addresses of the personsinvolved.25 DNA testing has helped to dispense with the humiliating characterthat court hearings had in the past. Now that DNA evidence for paternity exists,courts rarely subject mothers to cross-examinations about their sex lives. Theprospect of a DNA test can change denial into confession, as the following casein Great Britain illustrates.
Both parents were aged 18. The putative father’s mother tried to remain incourt during the initial hearing and had to be removed by the usher. On leaving,she shouted to her son “say what I’ve told you to say.” He denied paternity, andthe case was adjourned for him to arrange legal aid and consider DNA tests. Headmitted paternity immediately at the next hearing, said he had no wish to seethe baby, and was ordered to pay maintenance of £1 a week.26
My point is that the mere possibility of DNA fingerprinting can be sufficientto end denial, to spare the mother an inquisition into her sex life, and to obligethe father to pay child support. Yet this British court seems to have assumed thatbaby care is a rather low-cost proposition.
In order to estimate the probability that a man is the father of a particularchild, one needs a prior probability, or base rate, as in medical diagnoses (seeChapter 5). But what could that prior probability be? Many laboratories dealwith this problem simply by assuming that the nongenetic evidence in everypaternity case indicates that there is a prior probability of .5 that the defendantin a paternity case is the father.27 The laboratories defend this arbitrary value by

citing the principle of indifference: either the alleged father is the father or he isnot, therefore the prior probability is .5 for each possibility. This practice iscontroversial because it implies that, in every paternity case, the defendant is aslikely to be the father as all other men put together. The principle of indifferencehas a long history in the law. In the early nineteenth century, jurisprudence wasstill one of the main arenas for the application of probability theory, such as inthe evaluation of the credibility of witnesses. One issue, which then as todaydivided liberals from conservatives, was how to weigh the two possible errors ajudge can commit: to convict an innocent person or to acquit a guilty person. Ifone tries to minimize the possibility of convicting innocent defendants, one hasto pay the price of acquitting more guilty persons as well. If, however, one triesto minimize the possibility of acquitting guilty persons, one will pay the price ofimprisoning more innocent ones. The French mathematicians Denis Poissonand Pierre Laplace advocated the conservative view over the earlier liberalreforms envisaged by Condorcet, the Enlightenment philosopher and politician.Poisson emphasized societal security over individual rights even more thanLaplace, arguing that the prior probability of a defendant’s guilt should be atleast .5. In the supposed service of jurisprudence, twentieth-century DNApaternity testing assumed a similar moral stance.28
Paternity testing can also be of concern to fathers. A man can never really besure that he is the biological parent of his children, unlike mothers, who can besure, except for the possibility of babies being switched in the hospital. Aspointed out in Chapter 8, recent DNA analyses of populations in Westerncountries indicate that some 5 to 10 percent of children have a different geneticfather from the man who thinks he is the father. Despite its usually being to thebenefit of the children that such deception remain veiled, the market forpaternity testing is growing. According to the American Association of BloodBanks, 240,000 paternity tests were performed in the United States in 1997,more than three times as many as 10 years before. Above one of Chicago’sbusiest motorways, a neon-pink billboard asks “Who’s the father?” Call a certainphone number and the answer is available for $500, provided one supplies cheekswabs from mother, child, and the alleged father.29
Uncertainties Don’t Go Away with DNA

Like every new technology, DNA fingerprinting not only reduces olduncertainties, such as paternity, but poses new uncertainties as well.
WHAT IS THE POPULATION OF SUSPECTS?
In the case of Christina’s murder, described at the beginning of this chapter, thepolice had information from a former victim to generate a hypothesis about thepopulation of which the perpetrator was a member (that is, men between 18 and30 who lived in Oldenburg and its environs). This is not to say that thishypothesis was certain, as one can infer from the fact that the murderer turnedout to be 30 years old—just at the fringe of the age range that defined thesuspect population. Yet, it worked in the case of Christina. In other criminalcases the definition of a reasonable population of suspects may be less clear.However, if one wants to compute a source probability—that is, to move fromthe second to the third link in the chain of inference—one needs a base rate,that is, a population of suspects. (Courts tend not to accept a merely subjectiveprior probability.) One way to deal with this uncertainty is to make a lower andan upper estimate of the population size, that is, to start with two extreme baserates. For instance, one could consider the 18,000 men in the age range 18 to 30as the lower base rate, and the larger number of men age 16 to 50 as the upperlimit. This would allow the calculation of a lower and upper bound on thesource probability.
This problem of specifying the population of suspects exists not only incriminal cases, but also in paternity testing, as we have seen in the previoussection. Uncertainty about the population of suspects remains a fundamentalissue in making an inference from a DNA match to a source probability.
DOES THE SUSPECT HAVE BROTHERS?
The random match probability is for unrelated people. Therefore, a problem ininterpreting a match is the possibility that a defendant has close relatives. Forinstance, identical twins have the same DNA profile, and close relatives havemore similar DNA profiles than unrelated individuals. In one case in Scotland, aforensic scientist reported a DNA match probability of 1 in 49,000 for unrelatedindividuals, but a match probability of 1 in 16 for a brother of the defendant. Ithappened that the defendant had five brothers.30 Thus, if there is no further

evidence that distinguishes among the brothers, the DNA match per se is onlyweak evidence. Close relatives who could have committed a crime or parented achild need to be figured into the interpretation of a DNA match.
HOW CERTAIN IS A MATCH? A RANDOM MATCH PROBABILITY?
A further reason for caution about the DNA profiling process is that subjectivejudgments are an integral part of it. These arise both in the judgment as towhether or not there is a match and about the size of the match probability. Asmentioned earlier, a match is declared when the bands of two DNA profiles lineup with one another. However, because they do not always line up exactly, amatch is defined when two profiles line up within a specified error range. Thus,a match is not a black-and-white observation, but depends on what deviationone tolerates. This arbitrary cutoff point has the undesirable consequence thatone profile deemed not to match can be arbitrarily close to another that isdeclared a match.
Similarly, the random match probability is not just a matter of looking upthe population statistics. For instance, in 1987, Vilma Ponce and her 2-year-olddaughter were stabbed. José Castro, a Hispanic male and neighbor, wasinterrogated, and a small bloodstain from his watch was sent for analysis. Castroclaimed that the blood was his own. Lifecodes Corporation, which carried outthe test, however, reported a match between the DNA in the bloodstain and thevictim’s blood, and reported a random match probability of smaller than 1 in100 million. Harvard University and the Massachusetts Institute of Technologyexamined the same data and arrived at a probability of 1 in 24.31 Such hugediscrepancies can arise when samples are corrupted by chemical or biologicalcontaminants, or exposed to potentially harmful environmental factors such assunlight, and when laboratory practices are poor or results inadequatelyanalyzed.
A THREAT TO PRIVACY?
The biological function of DNA molecules is to provide a genetic message, thegene, encoded in a sequence of bases. Therefore, DNA databases containinformation of such a personal nature that they seem to pose a significant threatto privacy. Some people fear that if we learn to “read” DNA, then others will be

able to read our genetic future like a script. To judge the reality of this fear, weneed to keep in mind that DNA databases do not contain entire DNAsequences, only DNA profiles, which contain information about several loci(sites) rather than the entire genome. Moreover, the databases generally contain“noncoding” loci, that is, loci that are not believed to contain genes. Recall thatpart of the DNA—sometimes referred to as “junk DNA”—does not seem tohave coding functions as genes have. The reason for focusing on noncoding lociis not to protect privacy. Instead, it is to discriminate better betweenindividuals.32 Thus, given current technologies, DNA databanks afford littleinformation about any particular individual.
That said, we need to be cautious about predicting that the future will be likethe present. Historically, new technologies tend to change conceptions of civilliberty. When ordinary fingerprinting was first introduced in the United States,many courts saw its use in jurisprudence as a violation of civil rights. It is notinconceivable that, in the near future, mouth swabbing of job applicants, healthinsurance applicants, and immigrants will be considered as unproblematic asfingerprinting is now. Unlike the human genome project, which catalogues thecoding part of DNA, data banks suitable for DNA fingerprinting containsamples of noncoding DNA. There are obvious benefits from the latter forquickly identifying the perpetrator in sexual assault cases and other criminalcases. The availability of the technology supported by data banks might, in thelong run, deter some potential criminals, at least those who know they arerecorded in the data bank. Even if there were only little or no deterrence, databanks will help to determine criminals after the crime and keep them fromcommitting multiple crimes.
New Technology Can Alter the Law
The traces on O. J. Simpson’s gloves and Monica Lewinsky’s blue dress33 havemade Americans familiar with DNA evidence. At the same time, theintroduction of DNA evidence in criminal cases has put pressure on the law andnew demands on legal professionals.
The statute of limitations for rape prosecutions is one example of pressure forchange. For instance, in New York, rape cases expire after five years. That is,

there is no possibility of prosecuting a case after it is more than five years old. Asone victim, a Lower East Side student who was raped two years ago and whosecase is unsolved put it: “I don’t understand how there can be a timetable on thiscrime. Rape has completely changed my whole life.”34 The rationale for thisstatute of limitations was to give defendants a fair chance because as time goesby, evidence disappears and memories fade, and consequently, defendants willface difficulties proving where they were on a particular day or at a particularhour many years before. This historic rationale is now being strained by theavailability of DNA fingerprinting, which can give much more conclusiveevidence than any technology before. As a consequence, several states, includingFlorida, Nevada, and New Jersey, have recently abolished the time limits in casesof sexual assault. Science has revolutionized the investigation of rape cases, andthe law is catching up with the new situation.
A second law that may be put under pressure through the introduction ofDNA fingerprinting is the death penalty. Among the large democracies, only theUnited States, India, and Japan still put prisoners to death. A Gallup poll in2000 indicated that the proportion of Americans favoring the death penalty wasdecreasing (although some two-thirds are still in favor if it) and the number ofpeople who believe that innocent people are at least occasionally wronglysentenced to death is increasing. The Gallup researchers suggest that thischanging situation is linked to the advent of DNA technology, which in somecases has shown that innocent people are being sentenced to death.
DNA fingerprinting has also put new demands on the legal profession. Theseinclude overcoming the illusion of certainty and learning how to understand andcommunicate uncertainties. In this chapter, I have pointed out various sourcesof uncertainty in the chain of inference from a DNA match to a guilty verdict,and showed that the same tools that helped physicians and counselors can helplegal professionals. For instance, using natural frequencies instead ofprobabilities can greatly reduce sources of confusion, such as the prosecutor’sfallacy. Our experiments indicate that proper representation of uncertainties notonly fosters insight in legal students and professionals, but also changes thenumber of “guilty” verdicts they are willing to deliver.
Now it is up to the courts to recognize the relevance of how to representuncertainty in trials. A few attorneys and judges in Great Britain and America

have taken notice. A British Court of Appeal recently recommended that DNAevidence be presented in a frequency format.35 However, this recognition is stilloccurring in an accidental way rather than as a systematic part of legal trainingand procedures. For instance, one of my colleagues who had been writing anarticle for a legal journal on the importance of frequency representationshappened to be acquainted with an attorney who was then on the O. J. Simpsondefense team. As a consequence, the defense team asked Judge Ito not to allowthe prosecution DNA expert, Professor Bruce Weir, to testify in terms ofconditional probabilities and likelihood ratios, which are ratios of conditionalprobabilities. The team requested that the jurors hear the information infrequencies instead, arguing that they might confuse random match probabilitieswith statements about the probability that Mr. Simpson was actually the sourceof the samples.36 Judge Ito and the prosecution agreed. The prosecution expertthen used likelihood ratios anyway! Statisticians (such as Weir) are not alwaysaware of the psychology of risk communication.

Can we know the risks we face, now or in the future? No, we cannot;but yes, we must act as if we do.
Mary Douglas and Aaron Wildavsky, Risk and Culture
11
VIOLENT PEOPLE
In Chapter 1 we met a psychiatrist who told his patients that they have a 30 to50 percent chance of developing a sexual problem when taking Prozac. Thepsychiatrist and his patients understood this statement differently. For thepsychiatrist, it referred to the proportion of his patients who develop such aproblem as a result of taking the drug. For the patients, it referred to theproportion of their sexual encounters in which something would go wrong. Eachside construed the reference class from its own point of view—for thepsychiatrist, the reference class was “my patients,” whereas for the patients, itwas “my sexual encounters.” A probability of a single event leaves open what thereference class is—by definition. But people tend to assume, at least implicitly, aspecific reference class when they try to understand a single-event probability,opening the door to interpretations that contradict one another and theintended meaning. The same ambiguity can occur in legal and clinical settingsin which the aim is to predict violent behavior.
Foretelling Violence
Violence is part of our lives. People are afraid to walk in their neighborhoods atnight. Kids with guns wound and kill their peers and teachers in American

schools. Adolescents and young right-wingers attack foreigners in the formerEast Germany with knives, fists, and boots. Wife battering and the beating ofchildren are part of family life in modern Western societies. Why and when arepeople turning to violent acts?
Forecasting violent behavior is difficult. According to the AmericanPsychiatric Association in a communication to the U.S. Supreme Court, its “bestestimate is that two out of three predictions of long-term future violence madeby psychiatrists are wrong.”1 Nevertheless, the U.S. Supreme Court has ruledrepeatedly that such testimony is legally admissible as evidence. The Courtconcluded that mental health professionals’ predictions were “not alwayswrong . . . only most of the time.”2 The weakness of these forecasts illustrates alarger problem. When expertise plays a role in criminal justice, it is often insituations that are badly understood and where testimony is only marginallygrounded in scientific knowledge.
Probation officers are professionals who supervise criminal offenders whohave been granted conditional freedom, whether they are on parole, bail,probation, or weekend release. A probation officer faces the task of foretellingviolence. He or she can make either of two errors: recommend freedom forsomeone who will commit another violent act or deny freedom to someone whowill not commit such an act. An error of the first kind was committed by theexpert who recommended releasing the man who eventually murderedChristina, as related in the previous chapter.
How do experts such as probation officers advise the court about thepotential risks posed by a criminal offender? Until recently, experts have usedyes-no labels such as “dangerous” and “not dangerous.” In a Texas capitalsentencing case, for instance, Thomas Barefoot was convicted of killing a policeofficer after being stopped in an arson investigation. One of the experts whotestified at Barefoot’s sentencing hearing, a psychiatrist popularly known as Dr.Death, commented that it was “one hundred percent and absolute [ly]” certainthat Barefoot would be violent in the future.3 (The psychiatrist had neitherinterviewed nor even met Barefoot.) As in weather forecasting, however,statements that acknowledge uncertainty have since become more common inprofessional predictions concerning violent behavior. For instance, thepsychologists John Monahan and Paul Slovic and others have advocated that

mental health professionals use probability estimates, rather than verbal labels, tocommunicate the chances that violent behavior will occur.4 As a result,probation officers were asked to estimate the probability that a person wouldcommit another violent act if he were given parole or probation.
Yet these experts were reluctant to use numerical probabilities tocommunicate risk of violent behavior. They preferred categorical labels,believing that there was too much uncertainty to justify numbers and did notwant to be held accountable for being precise. In a series of seminal studies,Slovic and Monahan investigated experts’ numerical risk judgments, withstriking results.
SINGLE-EVENT PROBABILITY VERSUS FREQUENCY JUDGMENTS
In one study, Slovic, Monahan, and MacGregor tested more than 400 membersof the American Academy of Psychiatry and Law (AAPL) and more than 400members of Division 41 of the American Psychological Association, that is, theAmerican Psychology-Law Society. These experts received information aboutfour actual patients in the form of one-page abstracted discharge summariestaken from the records of patients discharged in 1996 from an acute careinpatient facility.5
What follows is the first half of one discharge summary for a womandescribed as restless, anxious, and having poor judgment and concentration.
Case 22-190 Discharge Summary
History of Present IllnessThis is a 52-year-old divorced Hispanic female with a history ofpsychiatric illness, including bipolar and schizo-affective disorders. Shehas a low level of cognitive functioning, and is borderline mentallyretarded. Her sister states that the patient struck her several times on theday of admission because the sister opened the window to let somesmoke out. The sister had to grab onto the patient’s shoulder and bringher to her room. The patient complained, “My sister grabbed my faceand hurt me.” The patient has been paranoid of her sister, and has hadauditory hallucinations. She has also had illusions of a man at herwindow and sitting in her living room, as well as illusions of lice in her

hair. She has been scratching and picking at her head, and washingherself excessively. The patient denies [feeling homicidal and suicidal],and has been compliant with medications.
Family and Social HistoryThe patient is divorced with four children. Her ex-husband is analcoholic. She currently lives in her sister’s house with her sister’shusband, sister’s father, and the patient’s brother. The brother carries adiagnosis of schizophrenia. The sister also cares for a grandson who hassevere mental retardation. The patient lived in an orphanage as a child,and has a history of being sexually abused. She was taken out of schoolin the first grade because of an inability to perform.
The second half of the discharge summary describes the medication thepatient is receiving and her family’s wish to have her return home. Is this womanlikely to harm someone other than herself during the six months followingdischarge?
One half of the experts were asked to judge the probability that this woman(or one of the other three cases) would harm someone other than herself duringthe six months following discharge, that is, would commit a violent act. Theother half were asked to judge how many out of 100 women like this womanwould commit a violent act in the same period. One might think that theanswer would be about the same because all professionals read the samedischarge summary. This was not the case. The two questions produced twosystematically different responses. The probability judgments were about 50percent higher than the frequency judgments. Figure 11-1 shows the predictionsof violent acts averaged across the four patients. The average frequency estimateof the members of the American Academy of Psychiatry and Law was 20 out of100, whereas their average probability estimate of a violent act was .30. Themembers of the American Psychology-Law Society estimated the risk of violentacts generally higher, but showed about the same difference between judgmentsof frequencies and probabilities.

FIGURE 11-1. The predicted average likelihood that a patient will commit aviolent act. More than 400 members of the American Academy of Psychiatryand Law (left) and more than 400 members of Division 41 of the AmericanPsychological Association, that is, the American Psychology-Law Society (right),predicted the likelihood that each of four patients would commit a violent act.One half of the members in each group were asked for a probability judgment,the other half for a frequency judgment. The members of the AmericanPsychology-Law Society had, in addition, received a tutorial on the definition ofharm and probability theory. Nevertheless, both groups of experts madesystematically different predictions when asked for frequency and probabilityjudgments. (After Slovic, Monahan, and MacGregor, 2000.)

It is hard to believe that professionals’ estimates of the chances of a patientharming someone would rise when they are asked to give a probability. Is therean explanation? Assume that these professionals, like many ordinary people,think of probabilities in terms of classes of concrete cases. As in the Prozac casein Chapter 1, one’s interpretation of a single-event probability depends on thereference class to which one implicitly assumes the probability refers. One maytake the reference class to be a set of events, such as the set of repeated occasionson which a particular patient leaves the hospital on weekend release and thenreturns. In that case, the question will be interpreted as being about one patientwho is repeatedly granted conditional freedom. Alternatively, one may take thereference class to be a set of patients who are granted weekend release on oneoccasion. The answers to the question “What is the probability that this personwill commit a violent act in the next six months” need not be the same given thetwo interpretations.6
In contrast, the frequency question “How many out of 100 women like thispatient would commit a violent act in the next six months?” clearly specifies onereference class: other patients like the violent patient. This argument explainswhy differences between frequency and probability judgments can arise, but notthe direction of the difference. With respect to the question of direction, that is,why probability judgments are numerically higher than frequency judgments, Ican only offer speculation, not an answer. If an expert assumes that thelikelihood of a violent act increases the more often a patient is grantedconditional freedom, such as weekend release, then it follows that the relativefrequency of violent acts of 100 patients given conditional freedom one time(that is, the first time) should be lower than that of one patient given conditionalfreedom multiple times. Because the probability question leaves open which ofthe two situations is meant, this speculation can explain why frequencyjudgments resulted in lower predicted risks.
Judgments of single-event probabilities and frequencies can differsystematically—in the case of the former, the reference class can be interpretedin many ways; in the case of the latter it is clearly specified. The ambiguityintroduced by a question such as “What is the probability that this person willcommit another violent act?” can lead to systematically different judgments onthe part of experts, as was found in the study summarized above.

DO RESPONSE CATEGORIES INFLUENCE EXPERTS’ JUDGMENTS?
Probabilities of violent behavior, like those of rain, are too imprecise to beexpressed by numbers like 31 percent. They are more readily expressed incategories, such as 5 percent, 10 percent, 20 percent, and 30 percent. Assumeyou are designing a form showing a set of categories that experts can use to judgehow dangerous a patient is. Which categories should you use? Is this choicemerely aesthetic, or would the spacing of these categories matter to the resultingjudgments? To answer this question, Slovic and his collaborators gave eachmember of the American Academy of Psychiatry and Law who participated intheir study one of the two response scales shown in Figure 11-2. Members inone group made their predictions of violent acts using response categories of 1percent, 10 percent, 20 percent, and so on in increments of 10 percentage points(“Large probabilities”); members in the other group made theirs with categoriesthat were more finely graded at the lower end (“Small probabilities”).
Does the spacing of categories influence judgments of violent acts? In anearlier study, Slovic and Monahan had found that probabilities of harm wereindeed systematically higher when people were given the scale with largeprobability categories (Figure 11-2).7 I will call this effect of the spacing ofcategory on judgment the “category effect.” However, this category effect wasreported for laypeople making predictions of harm for hypothetical personsdescribed in vignettes, not experts considering real cases. Would the choice ofcategories also influence professionals’ judgments of real cases?

FIGURE 11-2. What is the probability that the patient will harm someone?Two response scales showed different categories for probabilities. (From Slovic,Monahan, and MacGregor, 2000.)
FIGURE 11-3. Does the choice of response scale influence judgments of thepredicted probability of a violent act? Although there are differences betweenlaypeople and experts, the choice of response scales (large versus small

probabilities, see Figure 11-2) does consistently influence judgments. Themembers of the American Psychology-Law Society had in addition received atutorial on the definition of harm and probability theory. (After Slovic et al.,2000.)

As shown in Figure 11-3, the members of the American Academy ofPsychiatry and Law exhibited the same type of category effect found in lay-people. In experts, the effect was smaller but still substantial. One might suspectthat the experts did not really understand what a probability judgment is. Totest for this possibility, Slovic and his colleagues gave the members of theAmerican Psychology-Law Society a tutorial in probability theory that explainedwhat is meant by harm, what a probability is, and how probabilities are assessed.It even included an explanation of and a warning about the category effect. Yetthis tutorial made no difference: The category effect was about the same sizeamong the experts who had received the tutorial as among those who had not.When the participants were further divided into those who frequently makenumerical risk assessments in their profession and those who never or rarely doso, the category effect remained equally strong in both groups.8
Thus, the choice of response categories influences the probability judgmentsof experts as well as laypeople. A similar category effect was found when expertswere asked for judgments of frequency. However, in neither experts norlaypeople did the category effect influence the ordering of patients according tojudged harm. These results indicate that experts can reliably judge whether apatient is more dangerous than another, but their quantitative estimates areinfluenced by the categories with which they express those estimates. In otherwords, the experts can reliably give judgments about the order of patients withrespect to the probability of their doing harm but not the magnitude of theprobability of harm.
Reliability does not imply accuracy. That is, the fact that a particular orderingof patients with respect to probability of doing harm remains stable across thetwo category scales does not imply that this ordering reflects the actual orderingof the patients with respect to whether they later commit violent acts. Slovic,Monahan, and MacGregor did not report how accurate the experts’ judgmentsproved to be. However, recall the American Psychiatric Association’s estimatethat two out of three predictions are wrong; furthermore, studies of actual paroledecisions suggest that the predictive accuracy of these judgments is quite low.9
RESPONSE CATEGORIES AS CUES

The category effect is not limited to forecasting violence. It has been observed injudgments concerning events other than risks, such as in reports aboutinnocuous habits and behaviors.10 The effect seems to occur in situations thatinvolve uncertainty, such as when a person has limited knowledge and is askedto report or predict behavior. A category effect would not occur in situationswhere people have, or believe they have, definite knowledge, such as when aperson is asked “How many kids do you have?” Here, the person would simplyscan the scale in search of the right number. Situations that involve some degreeof uncertainty, however, are abundant.
One such situation is survey studies, in which respondents are asked to reporttheir behavior by selecting a category. For instance, Norbert Schwarz and hiscolleagues asked German adults how many hours a day they spend watching TVon a typical day.11 The researchers gave one group of participants a responsescale with six categories “up to V2 hour; ½ to 1 hour; 1 to 1½ hours; . . . morethan 2½ hours.” This was called the “low-category” scale. A second group wasgiven a high-category scale on which the six categories were “up to 2½ hours;2½ to 3 hours; . . . more than 4 hours.” The choice of categories influencedpeople’s reports of how much time they spent watching TV. For instance, 16percent of the participants given the low-category scale said they watched morethan 2½ hours per day. Among those given the high-category scale, 38 percentreported doing so. This is a remarkable phenomenon, and it once moredemonstrates how judgments are influenced by the choice of the category scale.Similarly, the reported frequency of sexual behaviors, of consumer behaviors,and of physical symptoms is influenced by the categories given to therespondent.12 These results highlight the dangers of taking survey data at facevalue—even when people are not lying or trying to give answers that reflectfavorably on themselves. The category effect is a quite general phenomenon thataffects judgments of risk and more.
What is the explanation for the category effect? A necessary condition seemsto be that people be uncertain about what the answer to the question really is.People do not keep records of the number of hours they watch TV. When askedto estimate this number given their incomplete knowledge, they can use theresponse categories as a clue to guide them. Someone who thinks herself anaverage TV watcher will tend to choose a category in the middle of the range,

whatever that range may be. Similarly, a psychiatrist who is uncertain about howthe risk of violent behavior is distributed in a population of patients will tend todistribute his judgments over the response categories, assuming that thecategories reflect the true range of the behavior in the population. Theprofessional, just as the TV watcher does, acts on the assumption that theresearcher knows the range in the general population and has chosen thecategories appropriately. Using their social intelligence, they both make theseemingly reasonable inference that the researcher’s choice of response categoriesis relevant to what they have been asked to do. Survey researchers or publicrelations agencies, however, who want to produce results that are favorable totheir economic, social, or political position can easily exploit the category effectand produce results in the direction they would like to see. The measurementinstrument is not a neutral mirror of an underlying belief; instead, it becomespart of the judgment.
How can the category effect be reduced in assessments of risk? There are twoways. The first is to reduce the uncertainty in the minds of risk assessors, forinstance, by providing them with statistical information about the actual violentbehavior of inmates on parole or patients on weekend release. As theirknowledge increases, their uncertainty diminishes, and the category effect willeventually disappear. A second way is to dispense with response categories anduse other tools for risk assessment, for example, an open-ended response format:“Think of 100 patients like Mr. Jones. How many will turn violent within sixmonths?______ out of 100.” In general, laypeople and experts need to take thecategory effect into account when interpreting forecasts and survey responses.
CAN A SINGLE-EVENT PROBABILITY BE WRONG?
D. A. Cloud, a 26-year-old Seattle man, was convicted of the shooting death ofhis former middle-school teacher, who had abused him and other students. Athis trial, the prosecution offered him the chance to plead guilty to second-degreemurder in exchange for a recommended sentence of 15 years (a plea bargain)rather than stand trial on first-degree murder charges with an uncertainoutcome. But according to Cloud, his lawyer— one of Seattle’s best-knowncriminal defense attorneys—told him that he had a 95 percent chance ofacquittal of the more serious charge based on an insanity plea.13 With this high

probability in mind, Cloud rejected the offer, stood trial, and was sentenced to20 years in prison for first-degree murder. The disappointed Cloud filed amotion to set aside this verdict, accusing his lawyer of having given himunrealistic probabilities. After an extraordinary 12-day hearing, the court deniedthe motion.
Note that the lawyer used a single-event probability to express Cloud’ssituation: a 95 percent chance of acquittal, which implies a 5 percent chance ofconviction. Can such a probability ever be wrong? Can it be unrealistic? It doesnot seem that it can be wrong because it refers to one case only, that of Mr.Cloud. The defendant will either be acquitted or he will not, and the probabilityestimate allows for both—unless the probability is stated to be 0 or 1, which itwas not in Mr. Cloud’s case. A frequency prediction, in contrast, can be wrong.The statement that 95 out of 100 defendants (in similar cases of homicide afterabuse) will be acquitted, for example, can be shown to be right or wrong in lightof data from legal records.
The Question Is Part of the Answer
Surveys have been designed to measure people’s perceptions of everything fromtheir risk of acquiring mad cow disease after having eaten British beef to that ofdeveloping cancer from living close to a nuclear power plant. Typically, suchsurveys use response categories to facilitate the analysis of data, and theunderlying assumption is that people have subjective risks in their minds andstraightforwardly map them onto the response categories. The response scale isseen as a neutral measurement tool, like a typewriter, which is merely a devicefor recording thoughts in the form of letters and punctuation marks. The studiesreported in this chapter show that this assumption is incorrect. When expertsestimate the risk that a violent person will do harm to another person in the nearfuture, the spacing of the categories substantially influences their judgments. Sodoes the choice of question—that is, whether it pertains to a probability or afrequency. Indeed, the question and the response categories are part of theanswer.
What can be done with fragile probabilities, that is, probability estimates thatrest on assumptions about reference classes and response categories? The effect of

response categories can be eliminated by using open-ended response formats.Concerning the ambiguity of the reference class, my recommendation is this: Ifyou want to make a single-event statement, make a frequency statement first. Thefrequency statement forces you to clarify what the reference class is and reducesthe possibility of miscommunication: “Out of every 100 inmates similar to Mr.Bold, 20 are expected to behave violently within six months if let out on parole.In other words, Mr. Bold has a 20 percent likelihood of violence.” The initialfrequency statement clarifies the reference class behind the probability statementthat follows.
Asking for a probability versus a frequency judgment and providing categoryspacing can both be used to influence predictions and estimates obtained fromlaypeople and experts. In the next chapter, I will show how variousrepresentations of benefits and costs, such as relative risk reduction, can be usedto influence policy decisions by exploiting others’ innumeracy. The power ofplaying with representations in public policy affairs is of deep concern, because itillustrates how people can be exploited without their noticing it. At the sametime, however, some of these stories also reveal a funny side, as instances ofinnumeracy often do when they are, indeed, noticed.

PART III
FROM INNUAAERACY TO INSIGHT

If an unfriendly foreign power had attempted to impose on America themediocre educational performance that exists today, we might well haveviewed it as an act of war.
The National Commission on Excellence in Education
12
HOW INNUMERACY CAN BE EXPLOITED
In front of me is a wonderful little book entitled How to Lie with Statistics.1 Itbegins with five epigraphs, the first of which reads “There are three kinds of lies:lies, damned lies, and statistics. —Disraeli.” Everyone loves this quotation,which was tentatively attributed by Mark Twain to Benjamin Disraeli, a primeminister under Queen Victoria.2 The second epigraph reads “Statistical thinkingwill one day be as necessary for efficient citizenship as the ability to read andwrite. —H. G. Wells.” Statisticians love this quotation, which has beenreproduced in statistical textbooks again and again. The author of How to Lieprovides no source for the second quotation—he simply attributes it to thescience fiction writer H. G. Wells, as do the many others who love to quote it.When I tried to find this quotation in Wells’s writings, however, I couldn’t. Inany case, How to Lie is not actually about lying, but about how to representinformation correctly yet misleadingly. Similarly, the chapter you have begun toread is not about lying but instead about choosing representations that misleadthe innumerate without being inaccurate. Given that the number of“innumerates” is supposedly legion, the opportunities to mislead them areendless. When John Q. Public does not understand relative risks, single-eventprobabilities, or conditional probabilities, it’s his own fault, isn’t it?
Why doesn’t everyone communicate risks transparently? I have asked thisquestion of myself many times. One answer is that innumerates can be

exploited. It can be to the advantage of “numerates” to be nontransparent aslong the number of innumerates is sufficiently large. As a consequence,transparent risk communication is unlikely to emerge as long as a largeproportion of people are innumerate. How do the numerate exploit others’innumeracy?
How to Get Funding
Why do researchers and health agencies continue to report the benefits oftreatments in terms of relative risks, even though this type of riskcommunication is known to mislead people about the degree of a treatment’sbenefit?
A team of British researchers studied the decision making of members of theAnglia and Oxford regional health authorities. This group included executivemembers, who are responsible for purchasing and financial and personnelmanagement, as well as nonexecutive members, who are appointed by the HomeSecretary to act as public representatives of their local populations. The memberswere asked whether they would support purchasing each of four cardiacrehabilitation programs and each of four breast cancer screening programs.3 Thealternative programs had the same benefits and differed only in the way thebenefits were described. For each program, one proposal reported relative riskreduction, the second absolute risk reduction, the third the number of patientswho need to be treated to prevent one death, and the fourth the proportion of“event-free” (that is, surviving) patients.
Table 12-1 shows data about the relative effectiveness of coronary arterybypass surgery (the cardiac rehabilitation program).
Four Ways to Present the Benefit
The absolute risk reduction of bypass surgery is 4.1 percent (404 - 350 =54; 54/1,325 = 4.1%).
The relative risk reduction of bypass surgery is 13.4 percent (4.1/ 30.5 =13.4%).

The percentages of event-free (surviving) patients are 73.6 percent and69.5 percent, respectively, for surgery and medical therapy.
The number of patients needed to be treated to save one life is 25.
Whereas the relative risk reduction with bypass surgery is 13.4 percent, theabsolute risk reduction is 4.1 percent. The number of patients who need to betreated with bypass surgery to save one more life than by medical treatment is 25(note that 1 out of 25 corresponds to 4.1 percent). In other words, out of each25 patients who receive a bypass, 1 patient’s death (within 10 years) will beprevented; the other 24 will have no benefit in terms of mortality reductionfrom the operation. Finally, the number of event-free patients (here the numberof patients who survive) is 73.6 percent for bypass surgery versus 69.5 percentfor medical treatment. All these are equivalent descriptions of one and the sameoutcome of an actual randomized trial in which the two treatments werecompared.
One might think that in deciding which treatment programs to fund, theBritish health authorities would not have been influenced by differences inrepresentations of the same outcome. As it turned out, though, they were. In thecase of both cardiac rehabilitation and breast cancer screening, the authoritiessaw the program as having the greatest merit— and were most willing to fund it—when its benefits were expressed in terms of relative risk reduction (Figure 12-1). When its benefits were expressed in terms of absolute risk reduction or theproportion of event-free patients, the authorities saw the treatments as havingthe least merit. (After all, 13.4 percent is more than 4.1 percent.) When thebenefits were reported in terms of the number of patients who needed to betreated to save one life, their willingness to fund was in-between. Given theseresults, one might wonder how many of these professionals noticed that thebenefits of the four programs were the same. In fact, only 3 out of the 140experts realized that all four reflected the same clinical results.
TABLE 12-1: What are the benefits of coronary artery bypass surgery versusmedical therapy? This table shows the actual results of a clinical study; thetext shows four ways to present the result. (After Fahey et al., 1995.)

Treatment No. of Patients Deaths
Coronary artery bypass surgery 1,325 350 (26.4%)
Medical therapy (nonsurgical) 1,324 404 (30.5%)

FIGURE 12-1. Does the willingness of members of health authorities to funda program depend on how the benefit is presented? Willingness to fund ishighest when the proposal reports benefits in terms of relative risk reduction(RRR), followed by number needed to treat (NNT), absolute risk reduction(ARR), and event-free patients (EFP). (After Fahey et al., 1995.)

How to Sell Your Treatment
In Chapter 5 we learned of a study of the information brochures on breastcancer screening distributed by Australian health organizations in which it wasfound that the benefits of screening, when they were reported at all, wereexpressed in terms of relative risks. These leaflets were written for the public, notfor professionals. In no case were the benefits of screening explained so thatlaypeople could easily understand them. Similarly, the benefits of a diet ormedical treatment are often reported in terms of a relative risk reduction orrelative risk increase. Consider a newspaper article in which it is reported thatmen with high cholesterol have a 50 percent higher risk of heart attack. Thefigure of 50 percent sounds frightening, but what does it mean? It means thatout of 100 fifty-year-old men without high cholesterol, about 4 are expected tohave a heart attack within 10 years, whereas among men with high cholesterolthis number is 6. The increase from 4 to 6 is the relative risk increase, that is, 50percent. However, if one instead compares the numbers of men in the twogroups who are not expected to have a heart attack in the next 10 years, the sameincrease in risk is from 96 to 94, that is, about 2 percent. Now the benefit ofreducing one’s cholesterol level no longer looks so great. This trick doesn’t workwith absolute risks. The absolute risk increase is 2 out of 100, or 2 percent, nomatter whether one counts those with or without heart attacks. Absolute risks donot leave room for playing with such numbers.
Consider a woman trying to decide whether or not she should have hormonereplacement therapy. Hormone therapy has potential benefits and costs. If onewants to help patients to make an informed decision, these should be reported inthe same “currency,” such as absolute risks. But some physicians would like toinfluence women’s decisions, not only inform them. One technique is to exploitpatients’ ignorance concerning risk representations. To increase the patient’swillingness to participate in therapy, one simply reports the benefits in terms ofrelative risks (which appear larger) and the costs in terms of absolute risks (whichappear smaller). To decrease the patient’s willingness, one simply does theopposite. To take an example, the following information leaflet written by 12

physicians was made available in the waiting rooms of German gynecologists.4The relevant passages are translated below.
Hormones and CancerUp-to-Date Information
Dear Patient,
The media continually report a threatening increase in cancer inconnection with the use of hormone replacement therapy duringmenopause. In what follows we give you an up-to-date review of theproven facts so that you have an objective basis for making a decision.
Breast Cancer. About 60 extensive studies on this topic have beenconducted to date. The results are not unanimous. A summary of thesestudies shows that hormone therapy may be associated with a minimalincrease in the incidence of breast cancer.
Usually, about 60 out of 1,000 women develop breast cancer in theirlifetime; after 10 years of hormone therapy, 6 more women developbreast cancer. That is, the risk may possibly increase by 0.6 percent (6 in1,000). . . .
Other Cancers. Not only does hormone therapy not increasecolorectal cancer, which is relatively frequent, but it has been proven toprotect women against colorectal cancer (by up to more than 50percent). That is, women who receive hormone therapy developcolorectal cancer only half as often. . . .
It is easy to guess in which direction these physicians were trying to influencetheir patients. The potential cost (an increased risk of breast cancer) wasreported as an absolute risk and the potential benefit (a decreased risk ofcolorectal cancer) as a relative risk, making the cost appear smaller and thebenefit larger. If these physicians had reported both the benefit and cost inrelative risks, the “minimal increase” in breast cancer would have been 10percent, not 0.6 percent. In addition, the cost was marked with the qualifier“possibly,” whereas the benefit was described as “proven.” This choice of wordsand representations is unlikely to have been accidental. Rather, these physicians

were almost certainly trying to exploit their patients’ inability to see that applesand oranges were being compared—with the aim of getting them to agree tohormone replacement therapy.
How to Raise Anxiety
Since the introduction of the contraceptive pill in the 1960s, women have gonethrough several “Pill scares.” A few years ago, information concerning side effectsof oral contraceptives was publicized in Britain. The official statement said that“combined oral contraceptives containing desogestrel and gestodene areassociated with around a two-fold increase in the risk of thromboembolism.”5
(“Thromboembolism” means blockage of a blood vessel by a clot.) The warning,which was phrased as a relative risk increase, caused great concern amongwomen and their physicians. Many women stopped taking the Pill, whichresulted in an increase in unwanted pregnancies and abortions.6
If the same information about thromboembolism had been expressed as anabsolute risk, it would have been clear how frequent this dangerous side effectactually is. The relative risk says only how much more likely thromboembolismis if one takes the Pill than if one does not take the Pill, not how oftenthromboembolism actually occurs. In terms of absolute risks, the chance ofthromboembolism increases from about 1 to 2 in 14,000 women.7 In terms ofrelative risks, the chance doubles.
Reporting relative risks can raise people’s anxieties. These anxieties, in turn,can change people’s behavior and encourage them to disregard the side effects ofnot taking the Pill, such as abortions and unwanted pregnancies, that also posehazards to their health. Note that the choice is not between risk(thromboembolism) and certainty (no thromboembolism), but between twooptions, each with its own set of risky consequences. Absolute risks help womenunderstand how often each of these consequences may occur. Once again,however, transparency helps reduce unnecessary anxieties, and abortions as well.
How to Make More Money

Assume you suffer from a serious illness and that without proper medication,you will surely die. The medication you have been taking so far reduces your riskof dying to a probability of .0006, at a cost of $185. The company that producesthis medication plans to market an improved version that would reduce yourrisk to .0003. How much would you be willing to pay for the improved version?
This question was posed to a group of Swiss university students. They saidthey were willing to pay a slightly higher price (an average of $213) for theimproved medication. Another group was given the risk reduction in absolutefrequencies, that is, the group was told that the new medication would reducethe risk of dying from 600 to 300 out of 1 million. These students were willingto pay substantially more (an average of $362) for the improved medication.8Thus, when the benefit was represented in frequencies rather than single-eventprobabilities, the perceived monetary worth of the improved medication wassubstantially higher.
Two caveats should be mentioned here. First, the possibility of increasing theperceived worth of a product by expressing risk reduction in frequencies ratherthan single-event probabilities is not boundless, especially when the hazard isextremely rare in the first place. For instance, the students’ willingness to paymore when the risks were explained in frequencies disappeared when the riskswere extremely small (for example, 3 or 6 in 1 million). Second, unlike moststudies covered in this book, this study tested students rather than experts andhypothetical illnesses rather than real ones. As a consequence, the participants’statements about their willingness to pay had no real consequences for them. Itremains to be shown whether one can use this technique to increase profits fromreal patients with real illnesses who need real medications. But expressing riskreduction in frequencies may enable businesses to charge consumers more forhealth-enhancing products.
How to Present Losses as Gains
Your firm has had quite a few ups and downs in the last three business quarters.Your eager-beaver assistant has made a plot of sales over this period (Figure 12-2) that shows that your firm experienced an overall loss in sales. Aside from yourassistant, you are the only person who has seen this graph. It is in your best

interest not to make this loss transparent because you fear it will make some ofyour stockholders nervous. What should you do?
Instead of publishing the graph, you describe it verbally. You release a pressnotice stating that between January and May, your firm suffered a 50 percentdecrease in sales, which was regrettable but consistent with the market as awhole. However, the notice says, by taking countermeasures, the firm was ableto compensate for this loss. Between May and September, the firm increased itssales by 60 percent. Overall, then, the dip in sales in the first five months wasmore than outweighed by a steeper climb in the following months. Thus,according to the notice, the overall result looks positive because 60 percent ismore than 50 percent. In actuality, the initial 50 percent loss was $500,000, andthe later increase of 60 percent amounted to only $300,000.

FIGURE 12-2. Losses and gains. The loss in sales visible in this figure can bemasked by the statement “There was a 50 percent loss in the first part of thisperiod, but this was compensated for by a 60 percent increase in the secondpart.” However, a 50 percent loss from January to May is not cancelled by a 60percent gain from May to September.

In the late 1970s, the Mexican government faced the problem of how toincrease the capacity of the Viaducto, a four-lane motorway.9 Rather thanbuilding a new highway or extending the existing one, the governmentimplemented a clever, inexpensive solution: It had the lines on the four-lanehighway repainted to make it six-lanes wide. Increasing the number of lanesfrom four to six meant a 50 percent increase in capacity. Unfortunately, themuch narrower lanes also resulted in an increase in traffic fatalities, which, aftera year, forced the government to turn the highway back into a four-lane road.Reducing the number of lanes from six to four meant a 33 percent decrease incapacity. In an effort at touting its progress in improving the country’sinfrastructure, the government subtracted the decrease from the increase andreported that its actions had increased the capacity of the road by 17 percent. Inreality, of course, the capacity returned to what it had been, resulting in no netbenefits. The net costs were the price of the paint and an increase in trafficfatalities.
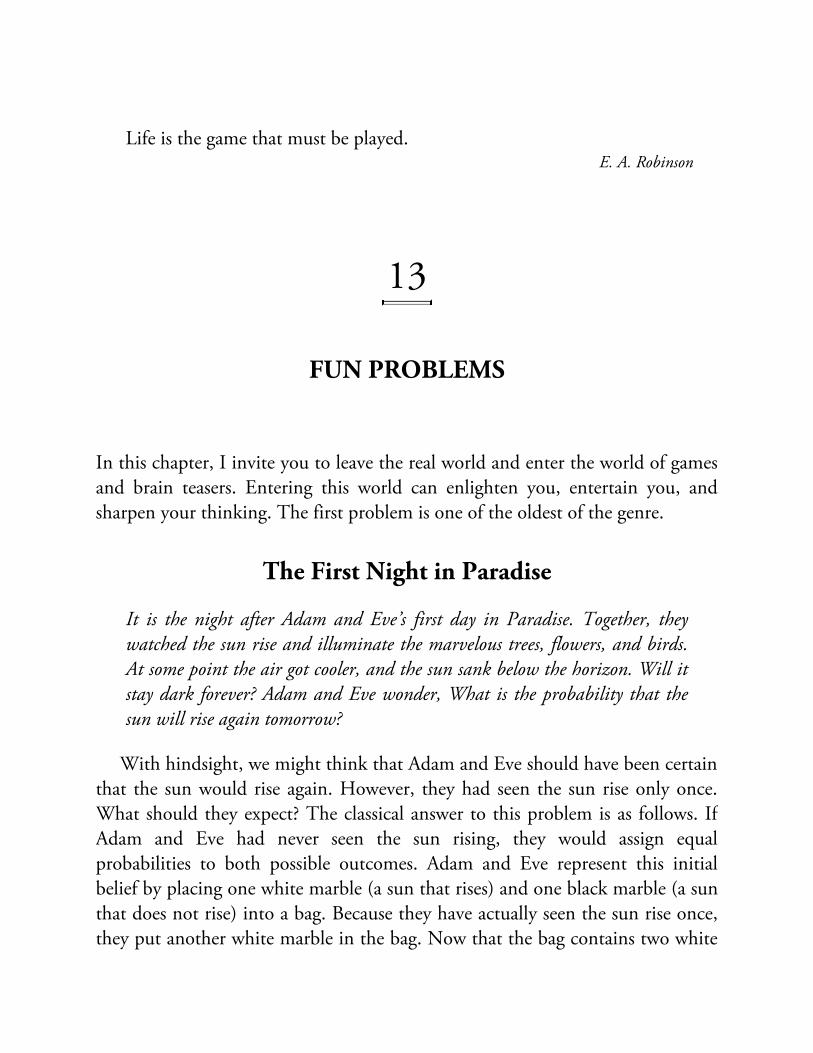
Life is the game that must be played.E. A. Robinson
13
FUN PROBLEMS
In this chapter, I invite you to leave the real world and enter the world of gamesand brain teasers. Entering this world can enlighten you, entertain you, andsharpen your thinking. The first problem is one of the oldest of the genre.
The First Night in Paradise
It is the night after Adam and Eve’s first day in Paradise. Together, theywatched the sun rise and illuminate the marvelous trees, flowers, and birds.At some point the air got cooler, and the sun sank below the horizon. Will itstay dark forever? Adam and Eve wonder, What is the probability that thesun will rise again tomorrow?
With hindsight, we might think that Adam and Eve should have been certainthat the sun would rise again. However, they had seen the sun rise only once.What should they expect? The classical answer to this problem is as follows. IfAdam and Eve had never seen the sun rising, they would assign equalprobabilities to both possible outcomes. Adam and Eve represent this initialbelief by placing one white marble (a sun that rises) and one black marble (a sunthat does not rise) into a bag. Because they have actually seen the sun rise once,they put another white marble in the bag. Now that the bag contains two white

marbles and one black marble, their degree of belief that the sun will risetomorrow has increased from 1/2 to 2/3. After observing the sunrise on thefollowing day, they add a third white marble to the bag, reflecting the fact thattheir degree of belief has increased again, this time from 2/3 to 3/4. Thus, afterhaving seen the sun rise once, Adam and Eve’s degree of belief that it will riseagain the next morning is 2/3 (Figure 13-1).
According to the rule of succession, introduced by the French mathematicianPierre-Simon Laplace in 1812, your degree of belief that the sun will rise againafter you have seen the sun rise n times should be (n +1)/ (n+2).1 When you are27 years old, the sun has risen 10,000 times in your life, so by the rule ofsuccession your confidence that it will rise again tomorrow should be10,001/10,002.
Unlike in the medical situations in the previous chapters, in which the diseasebase rates were known, Adam and Eve initially had no base rate for sunrises. Inother words, their initial assignment of one marble to each of the possibleoutcomes was not based on experience. If they had been pessimists, Adam andEve might have begun with 1 white marble and 10 black marbles in the bag; or,if they had been optimists, they might have done the opposite. The practice ofassigning equal probabilities to the possible outcomes when one has no basis onwhich to estimate their probabilities is known as the principle of indifference. Itremains controversial. Its proponents defend it by arguing that the initialassignment of probabilities to outcomes has less impact the more observationsone makes. For instance, after 10 years of sunrises, one’s estimate of theprobability that the sun will rise again tomorrow becomes practically the samewhether one was a pessimist or an optimist to begin with.2

FIGURE 13-1. The principle of indifference. This principle can be appliedwhen one does not know which of two events (the sun will rise tomorrow or itwill not) is more likely to occur. This indifference is represented by one blackand one white sun, resulting in a probability of 1/2. When Adam and Eveactually observe a sunrise, one white sun is added and the resulting probabilityincreases to 2/3, and so on.

The Base-Rate Fallacy
The story of Adam and Eve enlightens us about making predictions underconditions of almost complete ignorance. The following brain teaser was notmeant to enlighten, but to demonstrate the existence of cognitive illusions inordinary humans. It is one of the earliest demonstrations of a cognitive illusionthat later came to be called the base-rate fallacy. The psychologist M.Hammerton posed the following problem to housewives in Cambridge,England:
1. A device has been invented for screening a population for a diseaseknown as psylicrapitis. 2. The device is a very good one, but not perfect.3. If someone is a sufferer, there is a 90 percent chance that he will berecorded positively. 4. If he is not a sufferer, there is still a 1 percentchance that he will be recorded positively. 5. Roughly 1 percent of thepopulation has the disease. 6. Mr. Smith has been tested, and the resultis positive. The chance that he is in fact a sufferer is:__________3
The housewives failed. Their average estimate of the probability that Mr. Smithsuffered from the fictional disease was 85 percent, whereas the correct answer—according to Bayes’s rule (introduced in Chapter 4)—is 50 percent. Hammertonsuggested that his finding had to do with housewives’ lack of experience withmedical diagnosis. The real reason, however, may be easier to overcome. Theinformation was presented in conditional probabilities. As I have shown inearlier chapters, there is a simple way to turn innumeracy into insight in thisproblem: Translate the probabilities into natural frequencies (here thefrequencies are rounded).

FIGURE 13-2. Frequency tree for a fictional disease. A proper representationmakes it easy to see that between two people who test positive, only one has thedisease.

Think of 100 people. One has the disease psylicrapitis, and he is likely to testpositive. Of those 99 who do not have the disease, 1 will also test positive.How many of those who test positive do have the disease? ________ out of________.
The answer is clearly 1 out of 2 (Figure 13-2). The difficulty did not reside inthe housewives’ inexperience with medical diagnosis. If they had received theinformation in natural frequencies, the problem would not have clouded theirminds in the first place.4 A proper representation can help to make even themost puzzling “cognitive illusions” disappear.
Why Most Drivers Are Better Than Average
When people are asked how safe their driving is, most respond that they arebetter than average. Researchers of risk perception have argued that “it is nomore possible for most people to be safer [drivers] than average than it is formost to have above average intelligence.”5 The finding that most drivers believethey are better than average has been used as another illustration of people’scognitive illusions, much to the amusement of students of business, psychology,and beyond. It has been variously attributed to people’s overconfidence,optimism, or illusion of control—that is, over-estimation of their own power toavoid accidents.
Let us have a second look at this phenomenon. It is not possible that mostpeople have above-average IQs because the IQ distribution is, by definition,symmetric. In other words, the number of people with IQs above the average(arithmetic mean) is the same as the number below the mean. Is it possible thatmost people drive more safely than average? Yes, because safety in driving is notsymmetrically distributed around the mean. One can see this result by drawing afrequency distribution. Let me explain.
For illustration, I take the number of car accidents in which a driver isinvolved over the course of a lifetime as a measure of safety in driving. Imagine100 drivers. The average number of accidents per driver is 3. If the numbers ofaccidents were symmetrically distributed around this arithmetic mean of 3, thedistribution would look like Figure 13-3 (top). There would be 5 drivers

without accidents, 10 with one accident, and so on. The distribution would lookthe same on both sides of the mean—it would be symmetrical. (The “safe”drivers are shaded in the figure.) Assuming a symmetric distribution such as thisone, half of the drivers—and no more—can be better than average.
In reality, however, safety in driving is not symmetrically distributed.6 Aminority of drivers actually have large numbers of accidents. Figure 13-3(bottom) shows such a distribution, again with 100 drivers. There are a few veryunsafe drivers on the right side, and many safe drivers who have had noaccidents or one accident on the left side. Rather than being symmetric, thisdistribution is skewed. The average number of accidents is shifted to the right—to 4.5 accidents—because the few very bad drivers push up the mean. Now it isclear that more than 50 percent of the drivers—63 out of the total of 100—arebetter than average.7
The general point is that a graphical representation can help us to see whethera distribution is symmetric or skewed. When events are distributedsymmetrically, 50 percent of cases are above the arithmetic mean and 50 percentbelow. When a distribution is skewed, as is the case for the number of caraccidents people have, there is no longer the same number of people on bothsides of the mean. The conclusion that people overestimate their driving prowessmay be premature. A bit of statistical thinking can show that most driversactually drive more safely than “average.”

FIGURE 13-3. Can most drivers be better than average? When thedistribution of accidents is symmetrical (as in the top panel), half of the driversare better than average (shaded) and half are worse. However, when thedistribution is skewed (as in the bottom panel), most drivers can be better thanaverage. Here, the mean number of accidents per person is 4.5. Because of theskewed distribution, most drivers—63 out of 100—have fewer than the averagenumber of accidents.

The Monty Hall Problem
For about three decades, Monty Hall hosted a popular American game showcalled Let’s Make a Deal. His final contestant on each show was given the chanceto win a big prize. Here is the situation the contestant faced, as described inParade magazine by the columnist Marilyn vos Savant—allegedly the personwith the highest recorded IQ. (Figure 13-4):
Suppose you’re on a game show, and you’re given the choice of threedoors. Behind one door is a car, behind the others, goats. You pick adoor, say number 1, and the host, who knows what’s behind the doors,opens another door, say number 3, which has a goat. He says to you,“Do you want to pick door number 2?” Is it to your advantage to switchyour choice of doors?8

FIGURE 13-4. The three-doors problem. The guest on the Monty Hall showhas a choice among one of three doors. Behind one is a car, and behind theothers are goats. The guest (left) picked door 1. Monty, who knows where thecar is, opens door 3 and shows a goat. Should the guest switch to door 2 or staywith 1?

What would you do? Stay or switch? I asked a graphic designer this question.Our conversation appears below.
Designer: I would stay.
GG: Why?
Designer: You should not revise a decision you’ve made.
GG: Why?
Designer: I would feel bad if the car were behind the door I chose and then Ihad switched to one with a goat.
GG: You would feel worse if you switched from a door with a car than ifyou stayed with a door with a goat, although you would lose in bothcases?
Designer: Definitely.
GG: Now imagine there were 100 doors with 99 goats and one car. Youchoose door number 1, and Monty opens all the doors except number37, and each of the doors he opens shows a goat. Would you switch tonumber 37?
Designer: No. I would stay. There are two doors closed, and the chances are50-50. No reason to switch.
GG: The chance of choosing the right door is 1 in 100, isn’t it? So, in 99out of 100 cases, you will have picked a door with a goat, and Montywill show you all the other doors with goats, leaving the door with thecar closed. In these 99 cases, staying loses and switching wins. In onlyone case, the case in which you are lucky enough to have picked the doorwith the car, is switching to your disadvantage.
Designer: I’m getting confused. I still would not switch.

The vast majority of people think, as the graphic designer did, that switchingand staying are equally likely to win them the car—and decide to stay.9 But vosSavant recommended that the contestant switch doors. Her solution to thisbrain teaser caused a nationwide debate. The New York Times featured a front-page article that explored the fuss about switching or not switching, andthousands of opinion letters swamped Parade and other magazines.10 Theauthors of most of the letters insisted that Marilyn was wrong. A professor ofmathematics wrote the following letter:
Dear Marilyn:
Since you seem to enjoy coming straight to the point, I’ll do the same.In the following question and answer, you blew it! Let me explain. If onedoor is shown to be a loser, that information changes the probability ofeither remaining choice, neither of which has any reason to be more likely,to 1/2. As a professional mathematician, I’m very concerned with thegeneral public’s lack of mathematical skills. Please help by confessingyour error and in the future being more careful.
Another writer got down to the very essence of the problem:
You cannot correctly apply feminine logic to odds. The new situation isone of two equal chances.
In a final illustration, a college professor defends three of his colleagues whowere all of one opinion with him:
. . . As an educator, I find your . . . column reprehensible, and urge youto reconsider your future endeavors. In my opinion, you no longerprovide a useful service to your readers. . . . I am encouraging Parademagazine to drop your column. I would also encourage your publisher toprint a strong apology to the three scholars whose wisdom wasimpugned by your illogical babble. I hope they sue you!

As far as I know, the scholars never sued vos Savant, and they were welladvised not to. To switch or not to switch—that is the question. To answer it,we have to make a few assumptions that were left out of vos Savant’s version ofthe Monty Hall problem. The first assumption is that Monty always gives guestsa chance to switch, or at least that whether he gives them a chance to switch doesnot depend on which door they choose. For instance, if he offered a chance toswitch only when the guest picks the door with the car, then not switching isobviously the winning strategy. The second assumption is that Monty alwaysopens a door with a goat, never the door with the car. The third assumption isthat Monty makes all other relevant choices randomly, including the choice ofbehind which door to place the car and the choice of which door to open whenhe has a choice between two doors with goats. If the situation is clarified in thisway, then one can show that vos Savant was right: Switching increases thecontestant’s chance of winning from 1/3 to 2/3. However, as in the previousproblems, one can see the answer best with the help of a proper informationrepresentation. There are several representations that illustrate that switching isto the contestant’s advantage.11
Frequency judgments. Don’t ask whether you should switch or stay, butin how many cases switching pays. In other words, don’t ask about asingle event, but rather ask about repeated events. This frequencyquestion reveals that—at the point where you are deciding whether toswitch—there are three possible cases: (1) You have picked a door with agoat, (2) you have picked the door with the car, or (3) you have pickedthe other door with a goat. If you don’t switch, in only one out of thethree cases—the second one—will you win the car (Figure 13-5). If youswitch, you will win the car in two out of the three cases. This occurs inthe two cases in which you picked a door with a goat, Monty opened theother door with a goat, and you switched to the remaining door—theone with the car.
Perspective change. Picture yourself in the role of Monty rather than inthe role of the guest. In other words, imagine standing behind the doorsrather than in front of them. As the host, you know where the car is.

Assume the car is behind door 3 and the guest has already made her firstchoice. Three scenarios are possible. If the guest picked door 1, you areforced to open door 2. If she now switches, she will win the car. If theguest picked door 2, you are forced to open door 1. If the guest nowswitches, she will win the car. If the guest picked door 3, you willrandomly open either door 1 or door 2. Out of the three scenarios, onlyin this last one will switching result in the guest’s not winning the car. Inshort, a guest who switches will win in two out of the three cases, and aguest who stays will win in only one out of the three cases. ThroughMonty’s eyes, it is easier to see that switching increases the chance ofwinning from 1 in 3 to 2 in 3.

FIGURE 13-5. Does switching pay? The guest can choose either door 1, 2, or3. I f she stays with her choice of door 1, she will win the car in only one out ofthree cases. I f she switches, she will win the car in two out of three cases.

Repeated play. A third way to see that switching pays is to simulateplaying the game repeatedly. Take three coffee cups, turn them up-sidedown, choose one at random, and put a $10 bill underneath it. Ask acontestant to pick one cup. Then let her watch you turn over a cup withno money underneath it, and proceed as Monty Hall would. Your friendcan either stay with the cup she originally picked or switch to the othercup that has not yet been turned over. Repeat this game 100 times witha contestant who does not switch, and observe how many $10 bills shecollects. Then do the same with a contestant who switches all the time.You will observe that the person who never switches will win about $300to $350, that is, about one-third of the games. In contrast, the personwho always switches will win about $600 to $700, that is, about two-thirds of the games.
The bottom line is this: The best strategy in the Monty Hall dilemma is toswitch. Those who don’t switch leave money on the table. Lessons learned bywinning or losing money are hard to forget.
So it seems that we should advise a contestant on Let’s Make a Deal to switch.But wait a moment. Recall that this chapter is about fictional problems, notproblems in the real world or even on game shows. Switching is the best strategyin the word problem above, with the assumptions added, but the real game showmay have had different rules. Take the assumption that Monty always gave thefinal guest a chance to switch. When asked whether this was true, the realMonty Hall recalled that he rarely offered guests the switching option and couldnot say how often it was accepted. However, his longtime production assistant,Carol Andrews, asserted that Monty never offered the last guest an opportunityto switch. Barry Nalebuff, who wrote one of the first articles on the Monty Hallproblem, says that in watching the show he saw the switch option offered, buthe cannot recall whether Monty made the offer in every show or whether hismaking the offer depended on which door the guest had picked in the firstplace.12 In the real world, even game shows are uncertain. And in this case, theuncertainty is not merely a product of imperfect memory. The real game showrevolved around Monty Hall, and part of his personality was to makespontaneous decisions rather than to follow a strict protocol. In other words,

part of the suspense of the game arose from contestants’ uncertainty aboutMonty Hall’s motives and actions, and this suspense might have been lost if hehad followed the same rules in show after show.13
Three Prisoners on Death Row
In a country far away, three prisoners—Tom, Harry, and Dick—areawaiting execution in separate cells. They have just heard the news that ahealthy daughter has been born to the king and that the king has decided toexpress his gratitude to God by pardoning one of the prisoners. Because themonarch does not care which prisoner is spared, the lucky one has beenchosen by lottery. Each prisoner has a 1/3 chance of being pardoned. Thewarden, who already knows the result of the lottery, has been instructed notto let any of the prisoners know if he is the one who will be pardoned.Arguing that everyone knows for sure that either Tom or Harry will beexecuted (because only one or the other—or neither—of them will bespared), Dick persuades the warden that it would not be a violation of hisinstructions to tell Dick whether Tom or Harry will be executed. Thewarden tells Dick that Harry will be executed. Dick cheers up. Either he orTom is the one who will be pardoned, so he concludes that his chance ofsurvival has increased from 1/3 to 1/2. Is his reasoning correct?
The story of the three prisoners usually generates lively discussion.14 Listen totwo students consider the question:
Ilona: Two prisoners are left; therefore each has a 50-50 chance. It’s thatsimple.
Lara: No, Dick still has a 1/3 chance. How can Dick’s chance increase?
Ilona: Count to two! At first, there were three guys, and the chance was 1/3for everyone; now two guys are left, which makes 1/2 for each. If therewere only one guy left, his chance would be 1. It’s that simple.

Lara: No, I don’t think so. Dick has still a 1/3 chance—nothing more. Thewarden did not tell him anything about himself; he knows nothing newabout his situation. No news, no change.
Ilona: Come on, that doesn’t make sense. Just think about what you’resaying. If nothing changed, then Dick would keep his 1/3 chance, andTom his 1/3 chance, and since Harry lost his 1/3, there is somethingmissing. Just use your brain. Chances can’t disappear!
Lara: They don’t—Tom has now a 2/3 chance of being pardoned.
Ilona: You’ve got to be kidding me. That’s not fair.
Lara: Stop driving me crazy. Dick has a 1/3 and Tom a 2/3 chance. Youthink that because the warden named Harry, Dick’s chances increased to50-50. Look, if the warden had named Tom, you also would think thatDick’s chances increased to 50-50. Whatever the warden says, you thinkthat Dick’s chances increase. Dick doesn’t even have to listen to thewarden, because his chances increase anyway! The warden could be deaf!Or mute. Or Dick could just dream of the warden and his chanceswould still miraculously increase to 50-50 because the warden’s answerdoesn’t matter! You can’t believe such nonsense, can you?
Ilona: Calm down, you are getting emotional. Just use your brain. Imaginewhat would have happened if Tom had asked the warden. Whatever thewarden answers, with your argument, Tom’s chance would remain 1/3.But you can’t tell me that Tom’s chance depends on who asked thewarden. You argue that if Dick asked, Tom’s chance would be 2/3; butyou tell me that if Tom asked, Tom’s chance would be only 1/3. That’snot logical.
Lara: No, it is—the problem is in your story. You tell me that merelyasking the warden makes a prisoner’s chance of pardon increase to 1/2—whatever the warden’s answer is. You can’t make anyone believe this. IfTom, Dick, and Harry—I mean, each and every one of them—asked the

warden, then you’re telling me that each one would return to his cellthinking that his chance is 1/2. All three are happy! You’re telling methat’s logical?
Do Dick’s chances increase to 50-50 or not? To answer this question, weneed to spell out some assumptions, just as we did in the Monty Hall problem.First, the warden would not tell Dick that he is the one to be spared (just asMonty Hall would not open the door with the car); and second, if the wardenhas a choice between naming Harry or Tom—that is, in the event that Dick isthe one to be pardoned—the warden would make the choice randomly (just asMonty Hall would randomly choose which of the two doors with goats to openwhen the guest had already picked the door with the car). Given theseassumptions, Lara is right: Dick’s chance has not changed in light of what thewarden told him—it is still 1/3. The reason is the same as in the Monty Hallproblem: The probability that the car is behind the door that the contestant haschosen does not change after Monty Hall opens a door with a goat. Similarly,the probability that Dick will be pardoned does not change after the wardenreveals the name of a prisoner who will be executed.
The guest on Let’s Make a Deal corresponds to Dick, Monty Hall to thewarden, winning the car to being pardoned, and the opening of a door with agoat to the naming of a prisoner who will be executed. If Dick couldmetamorphose into one of the other men, he should chose to become Tombecause Tom has a better chance of being the lucky one. To better understandthis, let’s take a look at the same representations we used in the Monty Hallproblem.
Frequency judgments. In the Monty Hall problem, we recast the questionof whether the guest should stay or switch as how often switching pays.Similarly, in the three prisoners problem, we can recast the question ofwhether asking the warden “pays” to how often asking pays. As in theMonty Hall problem, this question focuses attention on the threepossible cases: (1) Tom has been pardoned, (2) Harry has beenpardoned, and (3) Dick has been pardoned (Figure 13-6). Initially, eachprisoner’s probability of being spared is 1/3. If Tom is to be pardoned,

the warden tells Dick that Harry will be executed. In this case, Dick willalso be executed. If Harry is to be pardoned, the warden tells Dick thatTom will be executed. In this case, Dick will also be executed. If Dick isto be pardoned, the warden tells Dick (at random) either that Harry orthat Tom will be executed. Only in this case will Dick be spared. Nowwe can see that Dick will be executed in two out of the three cases. Inother words, his probability of being pardoned remains 1/3, even afterthe warden answers his question.

FIGURE 13-6: Three prisoners on death row. Is Dick right in believing thathis chances of being spared have increased from one-third to one-half? There arethree possibilities: Either Tom, Dick, or Harry will be spared. In two of thethree cases, Dick will be executed, whatever the warden tells him. Thus, Dick’schances of being spared do not increase, but the chances of the person whom thewarden did not name increase from one-third to two-thirds.

Perspective change. Picture yourself in the role of the warden rather thanin the role of Dick. You know who is going to be freed. Now one of theprisoners asks you to name one of the prisoners who will be executed.You know that in two out of three cases, the prisoner who asks will beone of the prisoners marked for execution. For instance, assume that allthree prisoners ask you to name one of the prisoners who will beexecuted. Two of them will be marked for execution. Through thewarden’s eyes, it is easier to see that after asking the warden, theprisoner’s chance of being pardoned is still 1/3.
Repeated play. A third way to understand the problem is to play the gamerepeatedly. Take three coffee cups, each marked with the name of one ofthe three prisoners, and randomly choose one cup under which to put aslip of paper that says “Spared.” Playing the role of the warden, now turnover one of the cups that does not have the slip of paper under it—thatis, reveal that either Harry or Tom will be executed, just as describedabove. Repeat this game 100 times and see how often “Spared” isunderneath the cup marked “Dick.” You will observe that Dick is sparedin about 1/3 of the cases, not in 1/2 of the cases.
Playing with Representations
Many of us have been tricked by fun problems. In retrospect, we wonder whywe did not see the solution before. Just as with the real problems discussed in theprevious chapters, proper representations can facilitate insight. Fun problemscan be a motivating start to learning how to reckon with risk by playing withrepresentations. Because of their relative simplicity, fun problems can also easilyclarify the assumptions one needs to make to actually determine an answer. Inthe next and final chapter, I will deal with the larger issue of teaching thinking,and I now invite you to reenter our modern, technological world.

I know no safe depository of the ultimate powers of the society but thepeople themselves; and if we think them not enlightened enough toexercise their control with a wholesome discretion, the remedy is not totake it from them, but to inform their discretion.
Thomas Jefferson, Letter to William Charles Jarvis, 1820
14
TEACHING CLEAR THINKING
In the United States, an estimated 44,000 to 98,000 people die in hospitals eachyear because of documented and preventable medical errors.1 In Germany,between 8,000 and 16,000 patients in hospitals die every year because they areadministered the wrong medication or the right medication in the wrongamount, and several hundred thousand others develop serious illnesses as a resultof such errors.2 An unknown number of people who are not infected with HIVcommit suicide because they test positive in screening, not realizing that falsepositives occur. Each year, some 100,000 German women without breast cancerhave part of their breasts surgically removed in the follow-up after a positive test,and only a few of them know that most positive screening mammograms arefalse positives. As mentioned in a previous chapter, after learning of his ownprostate cancer, Mayor Rudolph Giuliani of New York is reported to have urged“everyone to get the PSA test.”3 Thousands of men have followed this advice,many of them not knowing there is no evidence that early detection of prostatecancer reduces mortality. These men can expect no benefit from treatment—only the risk of its side effects, which include incontinence and impotence.4 Inthe courts, jurors and attorneys struggle with random match probabilities, which

lead to confusion and even convictions that later had to be revised.5 The list goeson. The mind tools presented in this book can contribute to reducingunnecessary anxiety and stress and to saving lives.
How can we prepare the next generation to understand the risks it will face?Our children will live in a world with new technologies, including tests for manygenetic diseases. The information afforded by these technologies, and the risksthat their use implies, need to be understood—in terms of both benefits andcosts. At present, high school education in some countries covers only little, ifany, statistical thinking. Algebra, geometry, and calculus teach thinking in aworld of certainty—not in the real world, which is uncertain. Medical schoolsroutinely teach statistics, but focus on methods such as significance tests ratherthan the kind of statistical thinking needed for sound diagnosis and riskassessment, as the widespread innumeracy in the medical profession,documented in Chapters 5, 6, and 7, attests. Furthermore, in the medical andsocial sciences, data analysis is typically taught as a set of statistical rituals ratherthan a set of methods for statistical thinking.6 The situation in the lawprofession seems to be even worse. With one or two notable exceptions, lawschools do not teach students how to reason on the basis of uncertain evidence—although virtually all evidence is uncertain. The mind tools described in thisbook are mostly unknown in all these disciplines.
The time is ripe for an educational campaign aimed at teaching school-children, undergraduate and graduate students, ordinary citizens, andprofessionals how to reckon with risk. What would a curriculum for teachingthinking in an uncertain world look like? The three steps elaborated belowoutline an educational program that can be adapted to any specific discipline orlevel of study. The first step is to teach people to recognize types of uncertainties,including uncertainties disguised as certainties. The second step is to teachturning uncertainty into risk—that is, estimating degrees of uncertainty. Thethird step is to teach people to experiment with representations so as to discoverthe most transparent way to communicate and reason with risks. All these stepshave been described in this book; in this final chapter, they are integrated into asingle program for fostering statistical insight.
Step One: Franklin’s Law

Recall Benjamin Franklin’s aphorism “In this world nothing is certain but deathand taxes.” This statement reminds us that almost all real-world events areuncertain and that we need to learn to deal with—rather than deny—this fact.Giving up the illusion of certainty enables us to enjoy and explore thecomplexity of the world in which we live. The first step in the educationalprogram is to make people aware of Franklin’s law. The flip side of this goal is toreduce the illusion of certainty. The tools for taking the first step include (1) realstories that illustrate the uncertainty inherent in everyday situations and (2)causal understanding of uncertainties and errors. The best educational material isfound in real events, not in hypothetical examples. Described below is a truestory of an extreme instance of certainty turning into uncertainty.
35 NEGATIVE TESTS
In April 1995, a previously healthy 36-year-old American construction workersuffering from fatigue was tested for HIV.7 The ELISA, a test for HIV approvedby the U. S. Food and Drug Administration, returned a negative result. Twomonths later, the man, who had lost 27 pounds, was admitted to a hospital withshortness of breath, diarrhea, and other symptoms. A second ELISA testindicated that he was HIV-negative, and routine laboratory tests turned up noother illness. The patient was discharged without a diagnosis. In August of thesame year, the man was hospitalized again. An ELISA and a Western blotperformed by the Utah Department of Health laboratory came back negative. Atthat point, the physicians decided to interview his wife, from whom he hadseparated two years previously. She reported having had sexual contact with anHIV-infected partner before their marriage and told the doctors that this earlierpartner had recently died of AIDS. In 1994, she developed pneumonia andtested positive for HIV, a fact of which the construction worker was unaware.He reported that during their marriage, he had had sex with his wife withoutusing a condom, but he had had no sexual contact with her since theirseparation. Because of his history of exposure and the strong clinical evidencethat his immune system was compromised, the doctors performed a series ofadditional laboratory tests, which eventually revealed that he had the same strainof HIV as his ex-wife.

During his examination, the construction worker made it known that he had—in good faith—donated blood more than 30 times in the previous four years.In each case, the routine ELISA—which is used to screen all blood donations forthe HIV virus—returned a negative result. The consequences for those whoreceived the construction worker’s blood are unknown. This HIV-infected manhad tested negative for HIV no fewer than 35 times over a four-year period.
How can this incredibly long series of false negative results—which may havehad devastating consequences for recipients of the man’s donated blood—haveoccurred? To begin with, we do not know whether all the man’s negative resultswere false negatives, because the point at which he became infected is notknown. He continued to receive false negatives, however, even after hedeveloped clear signs of severe immunosuppression, including the opportunisticinfections and low lymphocyte counts characteristic of AIDS. There are twomain reasons why HIV tests sometimes return false negatives. First, there is aperiod—usually about six months— after the time of infection during whichHIV antibodies cannot be detected. But the construction worker’s test resultswere negative far beyond the usual window period. Second, new strains of HIV,which arise from the virus’s ability to mutate quickly (see Chapter 7), cannotalways be detected by routine HIV tests. But the strain of HIV carried by thispatient was practically identical to that carried by his wife, who had testedpositive.
Why the construction worker tested negative for HIV despite having beeninfected has yet to be explained. A case like this is very rare; nevertheless, it couldhappen again. The ELISA and other HIV tests are among the best antibody testsever devised, yet certainty remains out of their reach.
THE ILLUSION OF CERTAINTY
This extreme case illustrates how broadly Franklin’s law applies. Starting inChapter 1, we encounter numerous cases of illusory certainty in this book. Manypeople, of varying levels of education, believe that the results of HIV tests, DNAfingerprinting, and the growing number of genetic tests are absolutely certain.These technologies are formidable, but not foolproof. Like just about everythingelse, they are subject to Franklin’s law.8

Step Two: Beyond Ignorance of Risks
Why do American boys know the batting averages, earned-run averages, andwon-lost records of their home baseball teams, while most of their adultcounterparts are largely ignorant of the statistics that describe the world outsidethe baseball stadium, such as the number of Americans killed by handguns everyyear? How can European boys know the record of their favorite soccer team forthe last several years, while most of their adult counterparts have no idea whattheir chance is of being killed driving on the highway? Why are most womenunaware of the benefits and costs of breast cancer screening, and why are mostmen unaware of those of prostate cancer screening?
John Q. Public’s ignorance of risks is not entirely his fault; it originates notonly inside but also outside his mind. Internal sources of ignorance include apreference for distraction over information or for passivity over responsibility.But ignorance of risks is also fueled by external factors ranging from peerpressure to lobbying by trade associations. Step Two in the program of teachingthinking entails overcoming both internal and external sources of ignorance.The goal is (1) to teach people how to use tools for estimating risks, includingthe uncertainty around these estimates, and (2) to make people aware of theforces aimed at preventing them from estimating risks.
“DOUBT IS OUR PRODUCT”
The United States is home to thousands of trade associations promotingeverything from asbestos to zinc. The Beer Institute defends brewers againstclaims that drunk driving causes car accidents. The Asbestos InformationAssociation protects citizens from their “fiber phobia.” The Global ClimateCoalition represents scientists who question the evidence for global warming.Washington, D.C., alone, is home to 1,700 such trade associations. Estimatesindicate that more than $1 billion is spent by such organizations every year on“image advertising” and “issues management.” Trade associations have becomeactive in the manufacture of knowledge and ignorance. Consider, as an example,the Tobacco Institute’s “spin” on the hazards of cigarette smoking.9
At the beginning of the twentieth century, lung cancer was an exceptionallyrare type of cancer—so rare that Isaac Adler, who wrote the first book-length

medical review on lung cancer, apologized for writing about such an uncommonand insignificant disease.10 By the end of the twentieth century, lung cancer hadbecome the most frequent cause of cancer deaths worldwide. Why? At thebeginning of the century, cigarette smoking was rare; people smoked pipes andcigars. Smoking cigars causes different kinds of cancer than smoking cigarettesdoes. To take an example, Sigmund Freud developed cancer of the mouth as aresult of his heavy cigar smoking. The cancer cast a shadow over the last 16 yearsof his life, causing him continuous pain and discomfort and requiring some 30operations to remove cancerous and precancerous growths.
Cigarettes first became popular during World War I. Unlike cigar and pipesmoke, cigarette smoke is generally inhaled, exposing lung tissue to irritants. Thelink between cigarette smoking and lung cancer was first demonstrated byGerman researchers in the 1920s and 1930s but was largely ignored in America,possibly because this research was associated with the Nazis. In the early 1950s,however, a consensus developed in the American scientific community thatcigarettes are a major source of illness, including lung cancer. By the mid-1950s,there was strong evidence that a two-pack-a-day smoker lived, on average, aboutseven years fewer than a nonsmoker. Most scientists came to agree that tobaccokills about 400,000 Americans every year and that tobacco is the cause of 80percent to 90 of lung cancers.11
The Tobacco Institute was founded in 1958 as an offshoot of the Council forTobacco Research, which was established by tobacco manufacturers, growers,and warehouse owners. Since then, it has argued the case for cigarette “safety” bycreating doubt in the public mind about the hazards of smoking. In the 1960s,spokesmen tried to undermine and distract from the growing consensus in thescientific community. For instance, they asserted that the link between cigarettesand cancer was “merely statistical,” that the evidence was uncertain and theconclusions premature, and that there might be a gene that both leads tosmoking and predisposes certain people to developing cancer. In 1962, a Gallupsurvey found that only 38 percent of American adults knew that cigarettes causelung cancer. Although many physicians quit smoking after the SurgeonGeneral’s Report in 1964 made it clear that cigarettes are a major cause ofillness, many members of the public remained under the impression that thequestion about the effects of smoking on health was still open. The silence in

popular magazines about the hazards of smoking played a crucial role inmaintaining public ignorance; cigarette advertisers discouraged magazinepublishers from covering the topic of smoking hazards. A 1978 article in theColumbia Journalism Review noted that it could not find a single article in aleading national magazine that had discussed the health effects of smoking in thelast seven years. The less sophisticated, popular press was more straightforward.A headline in a 1968 National Enquirer read: “Most Medical Authorities Agree,Cigarette Lung Cancer Is Bunk: 70 Million Americans Falsely Alarmed.”12
Much later, in 1989, the Surgeon General’s Report explicitly linked the tobaccolobby’s suppression of media coverage to the general public’s ignorance of thenature and extent of the hazards of smoking.
More recently, the Tobacco Institute has tried to challenge evidence of thehazards of “passive smoking” or “secondhand smoke.” Strong evidence of thenegative health effects of breathing smoke from others’ cigarettes emerged in the1980s, when Tokyo’s National Cancer Center Research Institute showed thatlung cancer was twice as common among the nonsmoking wives of smokers asamong those of nonsmokers.13 In the 1990s, the Environmental ProtectionAgency released data indicating that secondhand smoke was responsible for 20percent of all lung cancer deaths among nonsmokers, that is, for the deaths ofabout 3,000 Americans a year. The Tobacco Institute dismissed this study as“characterized by a preference for political correctness over sound science.”14
The case of the tobacco lobby epitomizes the manufacture of ignorance andconfusion. Its efforts at obfuscation shifted constantly; as soon as one argumentfrom the tobacco lobby was discredited, new arguments were constructed toengender fresh confusion. Their arguments and slogans evolved in the followingway:
Smoking doesn’t hurt your health; it’s safe.OK, smoking may or may not hurt your health, but the scientific evidence isstill insufficient and inconclusive.OK, the evidence is conclusive that smoking does cause lung cancer, but wedidn’t know until now.OK, we knew, but we didn’t know that nicotine was addictive.OK, we knew that nicotine was addictive when we added chemicals to

cigarettes to make nicotine enter the bloodstream faster, but this waslong ago. Today we have low-tar and low-nicotine cigarettes.OK, low-tar and low-nicotine cigarettes do not actually reduce therisk of lung cancer, but this is people’s own fault because they nowsmoke more cigarettes.OK, it is in our interest that people smoke more, but they smoke more bytheir own free choice.
A similar sequence of claims has been made to cloud people’s mindsconcerning the risks of passive smoking. As the historian Robert Proctor reports,this goal was privately admitted in an internal document produced by a cigarettecompany: “Doubt is our product since it is the best means of competing withthe ‘body of facts’ that exists in the mind of the general public.”15
WHAT DOES JOHN Q. PUBLIC FEAR?
A few years ago, I booked a flight across the Alps from Munich to Florence.Entering the small Italian airplane with a boarding card labeled seat 14A, Iwalked down the narrow aisle, squinting to read the row numbers. When I hadalmost reached the end of the aisle, I saw row 12, after which there was only onemore row. I thought I was in the wrong plane. Then I noticed that the last rowwas row 14 and that there was no row 13. A light went on in my head: Theairline had skipped row 13 in deference to Europeans’ superstition that thenumber 13 is a bad omen, much as the designers of elevators in many Americanskyscrapers know to “skip” the 13th floor. In India, where this superstition isunknown, 13 is treated just like 12 and 14.16
What John Q. Public most fears is not always what threatens him most.Psychological research has identified, among others, the following three sourcesof fear.17
Preparedness. Fear of natural, recurrent threats that have endangered usthroughout our evolution is easy to learn, whereas fear of evolutionarilynovel threats is often hard to learn. This ability to learn to fear an objectfrom only one or very few observations is called preparedness. Rhesusmonkeys reared in the laboratory, for instance, show no fear of

venomous snakes. However, when a youngster watches an adultexhibiting fear of a snake, the youngster typically acquires this fear justby observing it once. The logic behind this genetic preparedness to learnsome things faster than others is obvious. If the youngster had to learnfrom experience that a snake is poisonous, its chance of survival wouldbe slim. Hence, evolutionary learning accelerates individual learning. Butpreparedness holds only for certain stimuli. For instance, when theyoungster sees another monkey exhibiting a fear reaction towards aflower, it does not acquire a fear of flowers.18 Humans show similarpreparedness for learning. It is easy to get a child to fear spiders, snakes,and tigers. All that is needed is that a parent express fear in the presenceof a spider and that the child observe the parent’s fear. It is hard to get achild to fear electrical outlets. Yet, in modern, industrialized societies,children are much more likely to be harmed by electrical outlets than byspiders. Fears and phobias tend to settle on stimuli that have beendangerous in the past. Darkness, to provide another example, issomething that we do not need to teach our children to fear. Buthumans have changed their world dramatically in the evolutionarilyrecent past. This is one reason why the things that we fear most are notnecessarily the ones most likely to hurt us.
Disasters. People tend to fear situations that can take many lives at once.Situations that cause the same number of deaths spread over time tendto be less feared.19 For instance, the causes of death that people tend tofear most, such as plane crashes and nuclear accidents, often havecatastrophic potential. Car accidents and cigarette smoking, in contrast,cause a continuous stream of deaths, and despite their having killedmany, many times more people than plane crashes or nuclear poweraccidents, they do not evoke similar levels of fear. Like preparedness forlearning, the fear of disasters has an evolutionary rationale. When agroup drops below a certain size, the group may be extinguished. Whena loss of the same size is distributed over time, however, the communityor species may be in a better position to compensate and survive.

Unknown hazards. People tend to fear dangers that are new andunknown. Examples include genetic engineering and nuclear technology,as opposed to drinking alcohol. When the new and potentiallydangerous technology is additionally perceived to be in the control ofunfamiliar people such as the rulers of a foreign country, fear tends toskyrocket.
In sum, John Q. Public does not always fear the situations that are actuallymost likely to hurt or kill him and other people. The objects and situations wetend to fear are often those that were dangerous in our evolutionary past—suchas snakes, spiders, large cats, darkness, being alone, and being exposed in anopen place—though most of them are no longer the greatest threats in ourmodern technological world.
HELPFUL SOURCES
Many sources can provide information to help us find out the risks associatedwith specific behaviors and courses of action. For instance, the National SafetyCouncil publishes an annual booklet, Accident Facts, that lists all the ways inwhich Americans die accidentally according to the frequency with which theyoccur. The National Research Council has a series of publications on matterssuch as understanding and preventing violence20 and the evaluation of DNAevidence.21 The Guide to Clinical Preventive Services by the U.S. PreventiveServices Task Force informs the public on questions about health and medicalscreening,22 and so does the Canadian Guide to Clinical Preventive Health Careby the Canadian Task Force (see www.ctfphc.org). Noncommercial groups ofphysicians, such as the Cochrane Centers (see www.cochrane.org) and Bandolierat the University of Oxford (see www.jr2.ox.ac.uk/bandolier), distribute theinformation patients need to know over the Internet. The Dartmouth Atlas ofHealth Care offers information about the puzzling variations in rates of commonsurgical procedures performed in different hospital referral regions in the UnitedStates.23 A number of other relevant sources are available in any library. A goodsource not only gives the risks, but also indicates the uncertainty involved inestimating the risk. Many potential hazards, however, such as the possible link

between brain cancer and cellular phones, are new, and scientific studies are few.With respect to these hazards, we continue to live in the twilight of uncertainty.
Step Three: Communication and Reasoning
Information needs representation. The idea that it is possible to communicateinformation in a “pure” form is fiction. Successful risk communication requiresintuitively clear representations. Playing with representations can help us notonly to understand numbers (describe phenomena) but also to draw conclusionsfrom numbers (make inferences). There is no single best representation, becausewhat is needed always depends on the minds that are doing the communicating.If you want to inform someone about false positives in screening, whatconstitutes a “good” representation depends on whether the person is astatistician, a physician, or the patient being examined.
With frustration, one of the physicians who tried in vain to determine theprobability that a person with a positive screening test actually has colorectalcancer (Chapter 6) exclaimed: “I know there is a rule; I learned it in school, butI have forgotten it.” He was referring to Bayes’s rule. In this book, we haveencountered many situations in which Bayes’s rule can help one to drawconclusions from numbers, such as how to estimate the chance of a disease givena positive diagnostic test result. And we have seen that this type of inference isdifficult for laypeople and experts to make when numbers are represented inprobabilities, yet comparatively easy when they are represented in naturalfrequencies. Representation matters to statistical thinking.
One of the goals of formal education that has been neglected in mostWestern countries is to teach people to reckon with risk, that is, to reasoneffectively in an uncertain world. One tool for reaching this goal—withoutengendering “math anxiety”—is to use intuitively understandablerepresentations of numbers. The didactic power of representations does notseem to be widely recognized in the classroom. Consider, for instance, the usualmethod of teaching Bayes’s rule in German high schools. Bayes’s rule is taughtin some, but not in all, German states. (Many of the teachers my colleagues andI have interviewed believe that Bayes’s rule is not particularly important becauseit is not part of the nationwide high school curriculum.) German-language

textbooks that include Bayes’s rule explain it exclusively in terms of probabilitiesor relative frequencies; natural frequencies, which would help studentsunderstand the problems better, are never used.24 Similarly, a survey of teachersrevealed that in the classroom almost all of them express risks in terms ofprobabilities and percentages, and very few teachers tried to foster insight byusing natural frequencies. This situation is worsened by the fact that theexamples used to introduce Bayes’s rule are usually, from a teenager’s point ofview, thoroughly boring (such as the standard problem of having to guess theprobability of there being a golden coin in a particular drawer).
I have heard adults argue that teenagers are not much interested in statisticsand that their lack of motivation accounts for our failure to educate them instatistical thinking. However, there is clear evidence to the contrary. In onestudy, German mathematics teachers reported that, when it comes to statistics,there is a striking discrepancy between students’ motivation and performance.They observed that students’ interest in statistics is considerably higher than inother mathematical topics, as is their attention and motivation. Sadly, however,the teachers also reported that students’ performance was at a considerably lowerlevel in statistics than in other areas of mathematics. This discrepancy indicatesthat what is lacking is not motivation on the part of students, but ratheradequate tools for helping students gain insight into uncertainty and risk—suchas intuitively understandable representations of numbers.
COMPUTER TUTORIALS
One class of tools for teaching thinking is computerized tutorial programs. PeterSedlmeier and I designed such a program to teach people to draw conclusionsfrom numbers. The program instructs the student to solve problems—such asthe medical and legal problems described in this book—by translatingprobabilities into natural frequencies. We call this “representation training.”25
More specifically, the tutorial teaches the student to construct frequencyrepresentations by means of trees (as in Figure 4-2). Its goals are to improvepeople’s performance in the short run and to keep them from forgetting how tosolve such problems in the long run.
We compared this representation training with traditional “rule training,” inwhich the learner is taught how to insert probabilities into Bayes’s rule. Both

types of training were implemented as computer tutorials. Each has two parts.The first part guides the learner through two training tasks step by step:inferring the presence of cancer from a positive test and inferring the presence ofsepsis from a high fever, chills, and skin lesions. The representation trainingprogram showed participants how to transform probability information into afrequency tree. The rule-training program instructed learners how to insertprobability information into Bayes’s rule. In the second part of the tutorial, thelearner is asked to solve eight additional problems with the help of step-by-stepfeedback. If participants have difficulties or make mistakes, both programsprovide immediate assistance or feedback. The help was sufficient to ensure thatall participants could complete all the steps of each problem correctly andcomplete the training.
Which was more effective: teaching people how to insert probabilities intoBayes’s rule (rule training) or teaching them how to translate probabilities intonatural frequencies (representation training)? What is effective in the short runneed not be effective in the long run. Witness the frustration of devoted teacherswho observe that, after an exam, students forget the material at a faster rate thanthey learned it. However, if natural frequencies touch a chord in the humanbrain that has been there all along, students who learn a concept in naturalfrequencies should forget it more slowly than students who learn the sameconcept in probabilities.
We evaluated the tutorials with respect to both the immediate learning effectand its stability over time. Note that all test problems were expressed inprobabilities in both types of training. Both tutorials also allowed participants towork at their own pace. Figure 14-1 shows the results of two studies, one withstudents from the University of Chicago (labeled “American students”), theother with students from the University of Munich (labeled “Germanstudents”). The American students took between one and two hours to completethe tutorials, including the tests before and after training; the German studentstook slightly more time.26
The performance of participants in both studies was very low before training.After the representation training, the percentage of correct answers in theAmerican study increased from 10 to 90 percent, whereas after the rule training,it increased from 0 to 60 percent. For the German students, who performed at a

slightly higher level before training, the effect of the representation training wasof comparable size. Overall, both tutorials showed strong immediate learningeffects, with the representation training showing a 10 to 30 percentage pointadvantage over the rule training.

FIGURE 14-1. How quickly do students forget what they have learned? Withthe traditional method of teaching people how to insert probabilities intoBayes’s rule (rule training), both groups of students tend to forget what theyhave learned. However, when they have been taught to use the mind tool ofrepresenting probabilities as natural frequencies (representation training),performance remains at a high level.

But how quickly did participants forget what they had just learned? TheAmerican students were tested with new problems one week and then five weeksafter training. Consistent with the disheartening observations of many statisticsteachers, after 1 week the performance of students who received the rule traininghad dropped to a median of 30 percent correct solutions, and after 5 weeks itwas down to only 20 percent. The performance of the students who received therepresentation training did not show any decay. Five weeks after training, themedian percentage of Bayesian inferences was still 90 percent. These studentsshowed no sign of forgetting what they had learned.
The German students were tested after one week and after three months—amore stringent test of forgetting. After one week, the students who had receivedthe rule training, unlike their American counterparts, showed no sign offorgetting what they had learned. After three months, however, the effect of ruletraining had eroded to 50 percent, a substantial drop but again a smaller onethan in the American study. The most striking result in the German study wasthis: Three months after training, the performance of the students in therepresentation training group still showed no sign of flagging. The initialtraining effect of learning did not only remain stable after three months—itincreased to 100 percent correct solutions!
The results of these training studies indicate that when students learn to useproper representations, the problem of memory decay—in this context,forgetting how to think about uncertainties—can be largely overcome. At thesame time, when students learned to play with representations—as opposed tomechanically inserting probabilities into equations—the differences between theAmerican and German students also disappeared.
TEACHING REPRESENTATIONS
These results bode well for efforts at teaching statistical thinking. Because therepresentation training takes only one to two hours including testing, it can beused, for instance, in high school curricula to teach young people how tointerpret pregnancy test results and statistics about the hazards of drug use.Similarly, it can be used in medical schools to teach physicians how to estimatethe chance of cancer given a positive test and in law schools to teach studentshow to draw conclusions on the basis of uncertain evidence such as a DNA

match. All this can be done by a computerized tutorial or a human teacher.Computerized tutorials attract the attention of all kinds of people, and theparticipants in our training studies showed a remarkable degree of involvementand motivation to succeed.
These results may be good news for instructors who design college-preparatory curricula that teach young people how to reckon with risk in atechnological world and for those heretofore unfortunate souls among us whoare charged with teaching undergraduate statistics. The struggle for statisticalliteracy is more likely to succeed if educators and students arm themselves withinformation representations suited to the human mind.
Dare to Know
Aristotle once divided our world into two realms, the heavenly world ofimmutable regularities and certain knowledge and the messy world of changeand uncertainty. In Western culture, people wanted to live in the world ofcertain knowledge, not in a world that is hard to understand and predict andwhere accidents and errors reign. For centuries, mathematicians believed theylived in the world of absolute certainty, as did theologians and their followers.The Reformation and Counter-Reformation, however, greatly eroded the empireof certainty. During the Inquisition, for instance, torture was seen as a means ofdiscovering definitive truth, and this noble goal was viewed as justifying itsignoble means. It may not be an accident that the mathematical theory ofprobability emerged only after this religious turmoil—or that as the new, moremodest standard of evidence that grew out of probability theory spread, the useof torture began to decline. By the mid-seventeenth century, a new standard ofreason had emerged, one that did not aspire to certainty but to reasonablejudgments under uncertainty.27
In our modern technological societies, Aristotle’s two realms still coexist.Most of us prefer to wander back and forth between them without muchreflection. In sports, for instance, we revel in the world of uncertainty. We knowthat the outcomes of a game are a mixture of strategy and accident. In sports, aswell as in the stock market and other competitive situations, we enjoyuncertainty; otherwise all the excitement, anticipation, and surprise would be

lost. In other aspects of our lives, however, we cherish the illusion of certaintyand turn our backs on the uncertainty we love so much in the realm ofcompetition and entertainment. For instance, when it comes to food and health,many people take an authority’s or a journalist’s opinion as definitive withoutchecking to see if it is reasonable. One goal of this book is to make you, thereader, aware of the illusion of certainty. A second goal is to provide you withtools to help you understand risks and how to communicate these effectively toothers. These tools for turning innumeracy into insight, such as replacingrelative with absolute risks and probabilities with natural frequencies, are easy tolearn.
Many have argued that sound statistical thinking is not easily turned into a“habit of mind.”28 This claim has been used by authorities ranging frompoliticians to physicians to justify withholding information from the generalpublic. I disagree with this habit-of-mind story. The central lesson of this bookis that people’s difficulties in thinking about numbers need not be accepted,because they can be overcome. These difficulties are not simply the mind’s fault.Often, the solutions can be found in the mind’s environment, that is, in the waynumerical information is presented. With the aid of intuitively understandablerepresentations, statistical thinking can become a habit of mind.
This book began with Benjamin Franklin’s declaration that in this worldnothing is certain but death and taxes and H. G. Wells’s vision of a world inwhich citizens master statistical thinking along with reading and writing. Istrongly believe that Wells’s dream is worthy of our time and effort. At the closeof the book, we see that this dream calls for two things: knowing and daring.One without the other is like a pair of scissors with only one blade; both areessential. So let me close with a reprise of Kant’s challenge: Sapere aude—dare toknow.

We hope you enjoyed reading this Simon & SchustereBook.
Join our mailing list and get updates on new releases, deals, bonus content and other greatbooks from Simon & Schuster.
CLICK HERE TO SIGN UP
or visit us online to sign up ateBookNews.SimonandSchuster.com

GLOSSARY
Absolute risk reduction. A measure of the efficacy of a treatment in terms ofthe absolute number of people saved. For instance, if a treatment reducesthe number of people who die of a disease from 6 to 4 in 1,000, then theabsolute risk reduction is 2 in 1,000, or 0.2 percent.
Average. A measure for the central tendency of a sample of observations.The term average is most often used for the arithmetic mean, butsometimes also for the median. For instance, suppose the yearly incomeof five brokers is $80,000, $90,000, $100,000, $130,000, and$600,000. The arithmetic mean is the sum of these values divided bytheir number, that is, $200,000. The median is obtained by ranking thevalues (as above) and taking the one in the middle, that is, $100,000.When the distribution is asymmetric, as it is often with income, themean and the median are not the same, and it can be the case that mostpeople earn less than the mean.
Base rate. The base rate of an attribute (or event) in a population is theproportion of individuals manifesting that attribute (at a certain point intime). A synonym for base rate is prevalence. See also incidence rate.
Bayes’s rule. A procedure for updating the probability of some hypothesis inthe light of new evidence. The origin of the rule is attributed to theReverend Thomas Bayes. For the simple case of a binary hypothesis (Hand not-H, such as cancer and not cancer) and data D (such as a positivetest), the rule is:
p(H|D) = p(H)p(D|H)/[p(H)p(D|H) + p(not-H)p(D|not-H)]

where p(D|H) is the posterior probability, p(H) is the prior probability,p(D|H) is the probability of D given H, and p(D|not-H) is theprobability of D given not-H.
Many professionals have problems understanding this rule. Theinteresting point is that the calculation of p(H|D) becomes moreintuitive and much simpler when the input is in natural frequenciesrather than probabilities. For natural frequencies, the rule is:
p(H|D) = a/(a + b)
where a is the number of D and H cases, and b is the number of D andnot-H cases.
Clouded thinking. A form of innumeracy, in which a person knows aboutthe risks but not how to draw conclusions or inferences from them. Forinstance, physicians often know the error rates of mammography and thebase rate of breast cancer, but not how to infer from this information thechances that a woman with a positive test actually has breast cancer.Mind tools for overcoming clouded thinking, such as naturalfrequencies, are representations that facilitate drawing conclusions.
Conditional probability. The probability that an event A occurs given eventB, usually written as p(A|B). An example of a conditional probability isthe probability of a positive screening mammogram given breast cancer,which is around .90. The probability p(A), for instance, is not aconditional probability. Conditional probabilities are notoriouslymisunderstood, and that in two different ways. One is to confuse theprobability of A given B with the probability of A and B; the other is toconfuse the probability of A given B with the probability of B given A.One can reduce this confusion by replacing conditional probabilitieswith natural frequencies.
Degrees of belief. One of the three major interpretations of probability(besides relative frequencies and propensities). The probability of anevent is the subjective degree of belief a person has in that event.Historically, degrees of warranted belief entered probability theory from

applications in the courtroom, such as the credibility of witnesses.Degrees of belief are constrained by the laws of probability (for example,probabilities need to add up to 1), that is, beliefs need to follow theselaws to qualify as subjective probabilities.
Early detection. Early detection of a disease is the goal of screening for it.Early detection can reduce mortality. Early detection, however, does notimply mortality reduction. For instance, if there is no effective therapy,then early detection, including treatment, will not reduce mortality.
Error. A test can result in one of two errors, a false positive or a falsenegative. These errors can result from various sources, including humanerror (for example, the laboratory assistant confuses two samples orlabels, or enters the wrong result into the computer) and medicalconditions (for example, a positive HIV test can result fromrheumatological diseases and liver diseases that have nothing to do withHIV). Errors can be reduced but not completely eliminated, and theymay even be indispensable to adaptation and survival, as the copyingerrors (mutations) in DNA illustrate.
Evidence-based medicine. To treat patients consistent with the best scientificevidence available, taking the values of the patient into consideration.
Expert witness. A person identified by the court as an expert allowed totestify before the court to facts, to draw conclusions by bringing togetherthe available data, and to testify to matters not accessible to layknowledge, such as insanity, testament capacity, and standards of care.
False negative. A test result in which the test is negative (for example, apregnancy test finds no sign of pregnancy) but the event is actually there(the woman is pregnant); also called a “miss.”
False negative rate. The proportion of negative tests among people with thedisease or condition. It is typically expressed as a conditional probabilityor a percentage. For instance, mammography screening has a false

negative rate of 5 to 20 percent depending on age, that is, 5 to 20percent of women with breast cancer receive a negative test result. Thefalse negative rate and the sensitivity (hit rate) of a test add up to 100percent. The false negative rate and the false positive rate are dependent:To decease one is to increase the other.
False positive. A test result in which the test is positive (for example, apositive pregnancy test) but the event is not extant (the woman is notpregnant); also called a “false alarm.”
False positive rate. The proportion of positive tests among people withoutthe disease or condition. It is typically expressed as a conditionalprobability or a percentage. For instance, mammography screening has afalse positive rate of 5 to 10 percent depending on age, that is, 5 to 10percent of women without breast cancer nevertheless receive a positivetest result. The false positive rate and the specificity (power) of a test addup to 100 percent. The false positive rate and the false negative rate aredependent: To decrease one is to increase the other.
Franklin’s law. “Nothing is certain but death and taxes.” A reminder that inall human conduct, uncertainty is prevalent as the result of human andtechnical errors, limited knowledge, unpredictability, deception, or othercauses.
Frequencies. A number of observations in a class of events. Frequencies canbe expressed as relative frequencies, absolute frequencies, or naturalfrequencies.
Guilt probability. The probability p(guilt|evidence) that a person is guiltygiven the evidence, such as a DNA match.
Ignorance of risks. An elementary form of innumeracy in which a persondoes not know, not even roughly, how great a relevant risk is. It differsfrom the illusion of certainty (for example, “smoking cigarettes does not

cause lung cancer”) in that the person is aware that there areuncertainties, but does not know how great they are.
Illusion of certainty. The belief that an event is absolutely certain although itmay not be. For instance, people tend to believe that the results ofmodern technologies, such as HIV testing, DNA fingerprinting,ordinary fingerprinting techniques, medical tests, or even the mechanicalvote-counting machines used in elections are certain, that is, error-free.The illusion can have benefits, such as reassurance, but also costs, such assuicide after a false positive HIV test. With respect to morals, religion,and political values, the illusion of certainty may be a requirement forbeing accepted by a social group, fostering social control.
Incidence rate. Unlike prevalence (base rate), which refers to the proportionof individuals in a population manifesting an attribute (or event) at acertain point in time, the incidence rate is the proportion of individualsin a given population developing this attribute within a specified timeinterval. For instance, the proportion of men with prostate cancer at age50 is a prevalence; the proportion of men who will develop prostatecancer between 50 and 60 is an incidence rate.
Independence. Two events are independent if knowing the outcome of onedoes not inform us about the outcome of the other. Formally, two eventsA and B are independent if the probability p(A&B) that A and B occurtogether is the product of p(A) times p(B). The concept of independenceis crucial, for instance, to evaluating a match between a defendant’sDNA and that found on the victim. Assume only 1 out of 1 million menshow such a match. If the DNA of all a country’s citizens are in a databank, and one citizen’s DNA is randomly selected, then the probabilityof a match is about 1 in a million. If the defendant, however, has anidentical twin, the probability that the twin also shows a match is 1(except for procedural errors), not 1 in 1 million. Similarly, if thedefendant has brothers, the probability that they match is considerablyhigher than for the general population. The DNA of relatives is not

independent; knowing that one matches increases the chances that therelative also matches.
Informed consent. The ideal that the patient should be informed about thepros and cons of a treatment and its alternatives, and on this basis shoulddecide whether he or she wants to enter treatment. Today’s medicalpractice has not yet generally reached this ideal, partly because patientswant to be taken care of rather than be informed, and partly becausephysicians prefer to decide what treatment to apply. The legal doctrineof informed consent deals with the voluntary consent of humans tobiomedical research and medical treatment, the question of how muchdisclosure is enough (an issue in malpractice trials), the competence ofthe patient (an issue in children and the mentally retarded), and the rightto refuse treatment.
Innumeracy. The inability to think with numbers. Statistical innumeracy isthe inability to think with numbers that represent uncertainties.Ignorance of risk, miscommunication of risk, and clouded thinking areforms of innumeracy. Like illiteracy, innumeracy is curable. Innumeracyis not simply a mental defect “inside” an unfortunate mind, but is inpart produced by inadequate “outside” representations of numbers.Innumeracy can be cured from the outside.
Life expectancy. The expected number of years remaining to be lived bypersons of a particular age.
Mind tools. Means, such as Franklin’s law and proper representations ofrisks, used to overcome the illusion of certainty and innumeracy.
Miscommunication of risks. A form of innumeracy, in which a person knowsthe risks of some event or action but does not know how tocommunicate these so that others understand them. Mind tools forovercoming miscommunication are representations that facilitateunderstanding.

Mortality reduction. A measure of the benefit of a treatment in terms of livessaved. The mortality reduction can be represented in many ways,including relative risk reduction, absolute risk reduction, and increasedlife expectancy.
Natural frequencies. Numbers that correspond to the way humansencountered information before the invention of probability theory.Unlike probabilities and relative frequencies, they are “raw” observationsthat have not been normalized with respect to the base rates of the eventin question. For instance, a physician has observed 100 persons, 10 ofwhom show a new disease. Of these 10 persons, 8 show a symptom,whereas 4 of the 90 without disease also show the symptom. Breakingthese 100 cases down into four numbers (disease and symptom: 8;disease and no symptom: 2; no disease and symptom: 4; no disease andno symptom: 86) results in four natural frequencies 8, 2, 4, and 86.Natural frequencies facilitate Bayesian inferences. For instance, if thephysician observes a new person with the symptom, the physician caneasily see that the chance that this patient also has the disease is 8/(8 +4), that is, 2/3. If the physician’s observations, however, are transformedinto conditional probabilities or relative frequencies (for example, bydividing the natural frequency 4 by the base rate 90, resulting in .044, or4.4 percent), then the computation of this probability becomes moredifficult and requires Bayes’s rule for probabilities. Natural frequencieshelp people to make sound conclusions, whereas conditionalprobabilities tend to cloud minds.
Negative test result. Typically good news. That is, no sign of a disease hasbeen found.
Number needed to treat (NNT). A measure of the efficacy of a treatment.For instance, if mammogram screening eventually saves the life of 1 in1,000 participating women, the NNT (to save one life) is 1,000. Inother words, 999 women do not benefit in terms of mortality reduction.NNT is also used to measure the harm of a treatment, such as whenabout 1 in 7,000 women who take oral contraceptives get

thromboembolism, the NNT (with oral contraceptives to cause one caseof thromboembolism) is 7,000. In other words, 6,999 do not show thisside effect.
Number of days/years gained or lost. A measure of the efficacy of a treatmentor habit in terms of increase or decrease in life expectancy. For instance,30 years of smoking one or two packs of cigarettes a day results in anaverage loss of 2,250 days, or about 6 years of life.
Number of people who match a characteristic. A transparent way to expressthe meaning of an observed match between the characteristics of adefendant and the evidence. An example is the statement “1 out of10,000 men in this population shows a match.” In contrast, thefollowing single-event statement (a random match probability) ismathematically equivalent but can easily lead to misunderstanding incourt: “The probability that this match occurred by chance is 1 in10,000, or .01 percent.”
Odds. The ratio of two probabilities (of the two possible outcomes of anevent) is called odds. For instance, the probability of getting a six bythrowing a fair die is 1/6, and the probability of not getting a six is 5/6.Thus the odds of getting a six are 1 to 5.
Percentages. There are three kinds of percentages. One is single-eventprobabilities multiplied by 100 (as in, Washkansky has an 80 percentchance of survival). With this type of statement one can produce thesame misunderstanding as with single-event probabilities. A second kindis conditional probabilities multiplied by 100. With this form ofcommunication, one can produce the same confusion as withconditional probabilities. A third kind of percentage is (unconditional)relative frequencies multiplied by 100. An example is the finding of the1962 Gallup poll that only 38 percent of adult Americans knew thatcigarettes caused lung cancer. Such a percentage is easy to comprehendas long as the reference class is clear.

Placebo effect. A placebo operates through the mind instead of the body. Forinstance, when a physician gives a patient a sugar pill or injection thatcontains no ingredients known to influence the patient’s cold symptomsor rash, but the patient nevertheless experiences relief, that is the placeboeffect. Placebo is Latin for “I shall please.” Placebos do not work all thetime or for all diseases; their effect seems to depend on how strongly thepatient believes that the treatment would actually be effective. Placebosare a challenge to the ideal of informed consent.
Positive mammogram. The result of a mammography is typically classified aspositive (suspicious) or negative. Positive results are usually distinguishedinto three levels of suspicion, such as “additional evaluation needed,”“suspicion of malignancy,” and “malignant by radiological criteria.” Thevast majority of positive screening mammograms (more than 90 percent)fall into the lowest level of suspicion.
Positive predictive value. The proportion of people among all those who testpositive who actually do have the disease (or condition): i.e. the truepositives divided by the total number who test positive.
Positive test result. Typically not good news. That is, a possible sign of adisease has been found.
Posterior probability. The probability of an event after a diagnostic result,that is, the updated prior probability. It can be calculated from the priorprobability using Bayes’s rule.
Prevalence. See base rate.
Principle of indifference. When the prior probabilities (or base rates) are notknown, the principle of indifference can be invoked. In the simplest casewith two alternatives, the principle of indifference would assign eachalternative a prior probability of one-half, for three alternatives the priorswould be one-third each, and so on.

Prior probability. The probability of an event prior to new evidence. Bayes’srule specifies how prior probabilities are updated in the light of newevidence.
Probability. A measure that quantifies the uncertainty associated with anevent. If an event A cannot happen, the probability p(A) is zero; if anevent happens with certainty, p(A) is 1; otherwise the values of p(A) arebetween zero and 1. For a set of events, A and B, which are mutuallyexclusive and exhaustive, the probabilities of the individual events addup to 1.
Proficiency tests. A method to estimate the accuracy of a diagnostic testingprocedure, such as DNA fingerprinting. For instance, a number ofsamples (say, DNA fingerprints) are sent to a large number oflaboratories, which then independently analyze the evidence anddetermine whether some of the samples match. Results can be used toestimate the false negative and false positive rates, as well as the quality ofthe individual laboratories. Proficiency tests can be blind (that is, thelaboratories and technicians do not know that they are being tested) ornot blind (they do know), and internal or external (the samples are onlyanalyzed in house or by external laboratories).
Propensities. One of the three major interpretations of probability (besidesrelative frequencies and degrees of belief). The probability of an event isdefined by physical design. Historically, propensities entered probabilitytheory from gambling, such as from the physical design of dice androulette wheels. Propensities are limited to events whose underlyingdesign or causal mechanism is known.
Prosecutor’s fallacy. The confusion of the probability p(match) that thedefendant matches the characteristics of the evidence available with theprobability p(not guilty|match) that the defendant is not guilty giventhat he or she shows a match. Because p(match) is typically very small,such as when the evidence is a DNA trace, the confusion “serves” the

prosecution because it makes the probability that the defendant isinnocent appear equally small.
Randomized trial. A method for estimating the benefits of a treatment thatuses randomization as a method of control. Participants in a randomizedtrial are randomly assigned to either a treatment (for example, prostatecancer screening) or to a control group (no prostate cancer screening).After a certain number of years, the two groups are compared on criteria,such as mortality, to determine whether the treatment has been effective.Randomization allows the control of variables—such as age, education,and health—that could be alternative explanations (besides thetreatment) for an observed difference in mortality. The randomizedclinical trial uses the same idea of control as in experiments with randomassignment to groups.
Random match probability. The relative frequency of a trait, or combinationof traits, in a population. That is, the random match probability is theprobability that a match occurs between a trait (for example, a DNApattern) found on the scene of a crime and a person randomly drawnfrom a population.
Reference class. A class of events or objects to which a probability orfrequency refers. In the frequency interpretation of the concept ofprobability, there is no probability without a specified reference class.This view excludes single-event probabilities, which, by definition,specify no reference class.
Relative frequencies. One of the three major interpretations of probability(the others are degrees of belief and propensities). The probability of anevent is defined as its relative frequency in a reference class. Historically,frequencies entered probability theory through mortality tables thatprovided the basis for calculating life insurance rates. Relativefrequencies are constrained to repeated events that can be observed inlarge numbers.

Relative risk reduction. A measure of the efficacy of a treatment in terms ofthe relative number of people saved. For instance, if a treatment reducesthe number of people who die from 6 to 4 in 1,000, then the relativerisk reduction is 33.3 percent. Reporting relative risks is popular becausethe numbers look larger than the absolute risk reduction (which wouldbe 2 in 1,000, or 0.2 percent). Relative risks do not convey how large, inabsolute terms, the risk is, and as a consequence, are oftenmisunderstood. For instance, if a treatment reduces the number ofpeople who die from 6 to 4 in 10,000, the relative risk reduction is stillthe same (33.3 percent), although the absolute risk reduction hasdecreased to 0.02 percent.
Reliability. The extent to which a test produces the same results underdifferent conditions (such as repeated measurements). High reliability isnecessary but does not guarantee high validity.
Risk. Uncertainty associated with an event that can be quantified on thebasis of empirical observations or causal knowledge. Frequencies andprobabilities are ways to express risks. Unlike in its everyday use, theterm risk need not be associated with a harm; it can refer to a positive,neutral, or negative event.
Screening. The testing of a symptomless population in order to detect casesof a disease at an early stage. The term screening is also used outside ofmedicine, for instance, when a population is screened for a DNA profile.
Sensitivity. The percentage of individuals with a disease who test positive ina test, that is, who are correctly classified as having the disease. Formally,the sensitivity is the conditional probability p(positive|disease) of apositive test result given the disease. The sensitivity and the false negativerate add up to 100 percent. The sensitivity is also called the “hit rate.”
Sensitivity of mammography. The proportion of women who test positive onmammography among those who have breast cancer. It ranges betweenabout 80 and 95 percent, with the lower values in younger women. The

sensitivity of mammography depends primarily on the ability of theradiologist to identify breast cancers and on the rate at which breastcancers double in size between screening examinations.
Single-event probabilities. A probability associated with a singular event forwhich no reference class is known or specified. For instance, thestatement “there is a 30 percent chance that it will rain tomorrow” is aprobability statement about a singular event—it either rains or does notrain tomorrow. In contrast, the statement that it will rain on 10 days inMay is a frequency statement. The latter statement can be true or false; asingle-event probability by itself can never be proven wrong (unless theprobability is zero or 1). Single-event probabilities can lead to themiscommunication because people tend to fill in different referenceclasses. For instance, people understand that the statement “there is a 30percent chance of rain tomorrow” means that it will rain for 30 percentof the time, or in 30 percent of the area, or on 30 percent of the daysthat are like tomorrow. This miscommunication can be avoided by usingfrequencies instead of single-event probabilities because frequencies spellout a reference class.
Source probability. The probability p(source|match) that a person is thesource of a trace given a match. (An example for a trace is blood found atthe scene of a crime.)
Specificity. The percentage of individuals without a disease who test negativein a test, that is, who are correctly classified as not having the disease.Formally, the specificity is the conditional probability p(negative|nodisease) of a negative test result given no disease. The specificity and thefalse positive rate add up to 100 percent. The specificity is also called the“power” of a test.
Specificity of mammography. The proportion of women who test negative onmammography among those who do not have breast cancer. It rangesbetween 90 and 95 percent, with the lower values for younger women.

Uncertainty. An event or outcome that is not certain but may or may nothappen is uncertain. When the uncertainty is quantified on the basis ofempirical observations, it is called “risk.”
Validity. The extent to which a test measures what it was intended tomeasure. High reliability is necessary but does not guarantee highvalidity.

REFERENCES
Adler, I. (1912). Primary malignant growths of lungs and bronchi. New York: Longmans,Green, and Co.
Altman, L. K. (2000, July 16). Africa’s AIDS crisis: Finding common ground. The NewYork Times, p. 4.
Antell, S. E., & Keating, D. P. (1983). Perception of numerical invariants in neonates.Child Development, 54, 695–701.
Atkinson, D. (1977). Society and sexes in the Russian past. In D. Atkinson, A. Dallin, &G. W. Lapidus (Eds.), Women in Russia (pp. 3–38). Stanford, CA: Stanford UniversityPress.
Baines, C. J. (1992). Women and breast cancer: Is it really possible for the public to bewell informed? The Canadian Medical Association Journal, 142, 2147–2148.
Balding, D. J., & Donnelly, P. (1994). How convincing is DNA evidence? Nature, 368,285–286.
Barsalou, L. W., & Ross, B. H. (1986). The roles of automatic and strategic processing insensitivity to superordinate and property frequency. Journal of Experimental Psychology:Learning, Memory, and Cognition, 12, 116–134.
Beck, U. (1986) Risikogesellschaft: Auf dem Weg in eine andere Moderne. Frankfurt amMain: Suhrkamp.
Bernard, C. (1865/1957). An introduction to the study of experimental medicine (H. C.Greene, Trans.). New York: Dover.
Berner, E. S. (1997). When to teach Bayesian reasoning (Letter to the editor). Journal ofMedical Decision Making, 17, 233.
Berry, D. A. (1991). Inferences using DNA profiling in forensic identification andpaternity cases. Statistical Science, 6, 175–205.
Berwick, D. M., Fineberg, H. V., & Weinstein, M. C. (1981). When doctors meetnumbers. American Journal of Medicine, 71, 991–998.
Black, W. C., Nease, R. F, Jr., & Tosteson, A. N. A. (1995). Perceptions of breast cancerrisk and screening effectiveness in women younger than 50 years of age. Journal of theNational Cancer Institute, 87, 720–731.
Bondy, K. (1999). Hack Barbie! [On-line]. Available:http://www.zdnet.com/zdtv/thesite/0397w4/view/iview431jump2_031797.html.

Bourguet, M.-N. (1987). Décrire, compter, calculer: The debate over statistics during theNapoleonic period. In L. Krüger, L. Daston, & M. Heidelberger (Eds.), Theprobabilistic revolution: Vol. I. Ideas in history (pp. 305–316). Cambridge, MA: MITPress.
Boyer, P. J. (2000, January 17). Annals of justice: DNA on trial. The New Yorker, 42–53.Brase, G. L., Cosmides, L., & Tooby, J. (1998). Individuation, counting, and statistical
inference: The role of frequency and whole object representations in judgment underuncertainty. Journal of Experimental Psychology: General, 127, 3–21.
Breast cancer [Cover story]. (1991). Time, 137, 42–49.Brunswik, E. (1937). Psychology as a science of objective relations. Philosophy of Science,
4, 227–260.Bundesamt für Gesundheit (BAG) in Zusammenarbeit mit der Eidgenössischen
Kommission für Aids-Fragen (EKAF). (2000). Informationen zum HIV-Test. Bern:Bundesamt für Gesundheit, Schweiz.
Bundeszentrale für gesundheitliche Aufklärung (Ed.). (1988–1993). Wissenswertes überden HIV-Test, Issues 1–10. Köln: Bundeszentrale für gesundheitliche Aufklärung.
Bundeszentrale für gesundheitliche Aufklärung (Ed.). (1993). Handbuch HIV-Test.Arbeitshilfen zur Beratung und Testdurchführung. Köln: Bundeszentrale fürgesundheitliche Aufklärung.
Bundeszentrale für gesundheitliche Aufklärung (Ed.). (2000). Leben mit HIV: Wenn derHIV-Test positiv ist. Informationen und Orientierungshilfe. Köln: Bundeszentrale fürgesundheitliche Aufklärung.
Bursztajn, H., Feinbloom, R. I., Hamm, R. M., & Brodsky, A. (1981). Medical choices,medical chances: How patients, families, and physicians can cope with uncertainty. NewYork: Delta/Seymour Lawrence.
Busch, M. P. (1994). HIV testing in blood banks. In G. Schochetman & J. R. George(Eds.), AIDS testing: A comprehensive guide to technical, medical, social, legal, andmanagement issues (pp. 224–236). New York: Springer.
Butterworth, B. (1999). The mathematical brain. London: Macmillan.Casscells, W., Schoenberger, A., & Grayboys, T. (1978). Interpretation by physicians of
clinical laboratory results. New England Journal of Medicine, 299, 999–1000.Catalan, J., & Pugh, K. (1995). Suicidal behaviour and HIV infection—is there a link?
AIDS Care, 7, S117-S121.Center for the Evaluative Clinical Sciences Staff (Ed.). (1996). The Dartmouth atlas of
health care. Chicago: American Hospital Association.Chang, K. (2000, May 4). Findings fuel debate over prostate testing. International Herald
Tribune, p. 10.Chivers, C. J. (2000, February 9). As DNA aids rape inquiries, statutory limits block
cases. The New York Times, late edition, section B, p. 1.

Cockburn, J., Redman, S., Hill, D., & Henry, E. (1995). Public understanding ofmedical screening. Journal of Medical Screening, 2, 224–227.
Coleman, W. (1987). Experimental physiology and statistical inference: The therapeutictrial in nineteenth-century Germany. In L. Krüger, G. Gigerenzer, & M. S. Morgan(Eds.), The probabilistic revolution: Vol. II. Ideas in the sciences (pp. 201–226).Cambridge, MA: MIT Press.
Collins, R., & Macleod, A. (1991). Denials of paternity: The impact of DNA tests oncourt proceedings. The Journal of Social Welfare and Family Law, 3, 209–219.
Cooper, W. S. (1989). How evolutionary biology challenges the classical theory of rationalchoice. Biology and Philosophy, 4, 457–481.
Cosmides, L., & Tooby, J. (1996). Are humans good intuitive statisticians after all?Rethinking some conclusions from the literature on judgment under uncertainty.Cognition, 58, 1–73.
Cresanta, J. L. (1992). Epidemiology of cancer in the United States. Cancer Epidemiology,Prevention, and Screening, 19, 419–441.
Daly, M., & Wilson, M. (1988). Homicide. New York: Aldine de Gruyter.Daston, L. (1981). Mathematics and the moral sciences: The rise and fall of the
probability of judgments, 1785–1840. In H. N. Jahnke & M. Otte (Eds.),Epistemological and social problems of the sciences in the early nineteenth century (pp. 287–309). Dordrecht, Holland: D. Reidel Publishing Company.
Daston, L. (1987). The domestication of risk: Mathematical probability and insurance1650–1830. In L. Kruger, L. Daston, & M. Heidelberger (Eds.), The probabilisticrevolution, Vol. 1: Ideas in history (pp. 237–260). Cambridge, MA: MIT Press.
Daston, L. (1988). Classical probability in the Enlightenment. Princeton, NJ: PrincetonUniversity Press.
Dawes, R. M. (1986). Representative thinking in clinical judgment. Clinical PsychologyReview, 6, 425–441.
Dawes, R. M. (1990). The potential nonfalsity of the false consensus effect. In R. M.Hogarth (Ed.), Insights in decision making: A tribute to Hillel J. Einhorn (pp. 179–199).Chicago: The University of Chicago Press.
Dawes, R. M. (1994). House of cards: Psychology and psychotherapy built on myth. NewYork: The Free Press.
Dawes, R. M. (2001). Everyday irrationality. Boulder, CO: Westview. Dehaene, S. (1997).The number sense: How the mind creates mathematics. New York: Oxford UniversityPress.
A delicate question. (1999, 24 April). The Economist, 26.Dershowitz, A. M. (1983). The best defense. New York: Vintage Books.Dershowitz, A. M. (1996). Reasonable doubts: The criminal justice system and the 0. J.
Simpson case. New York: Simon and Schuster.

Deutscher Bundestag (Ed.). (1990). AIDS: Fakten und Konsequenzen. Final report of theEnquete Committee of the 11th German Bundestag, 13/90. Bonn: Bonner UniversitätsBuchdruckerei.
Dolan, N. C., Lee, A. M., & McDermott, M. M. (1997). Age-related differences in breastcarcinoma knowledge, beliefs, and perceived risk among women visiting an academicgeneral medicine practice. Cancer, 80, 413–420.
Domenighetti, J. (2000). General public perception of mammography screening benefits.Paper presented at the Einsiedler Symposium, Einsiedeln, Switzerland.
Douglas, M. (1992). Risk and blame: Essays in cultural theory. London: Routledge.Douglas, M., & Wildavsky, A. (1982). Risk and culture: An essay on the selection of
technological and environmental dangers. Berkeley, CA: University of California Press.Earman, J. (1992). Bayes or bust? A critical examination of Bayesian confirmation theory.
Cambridge, MA: MIT Press.Eddy, D. M. (1982). Probabilistic reasoning in clinical medicine: Problems and
opportunities. In D. Kahneman, P. Slovic, & A. Tversky (Eds.), Judgment underuncertainty: Heuristics and biases (pp. 249–267). Cambridge: Cambridge UniversityPress.
Eddy, D. M. (1996). Clinical decision making: From theory to practice: A collection of essaysfrom the Journal of the American Medical Association. Boston: Jones and BarlettPublishers.
Ellis, G. K. (1994). Oncology update: Breast cancer. Primary Care Update for OB/ GYNS,1, 17–25.
Elmore, J. G., Barton, M. B., Moceri, V. M., Polk, S., Arena, P. J., & Fletcher, S. W.(1998). Ten-year risk of false positive screening mammograms and clinical breastexaminations. The New England Journal of Medicine, 338, 1089–1096.
Ernster, V. L., & Barclay, J. (1997). Increases in ductal carcinoma in situ (DCIS) of thebreast in relation to mammography: A dilemma. Journal of the National CancerInstitute/Monographs, 22,151–156.
Estes, W. K. (1976). The cognitive side of probability learning. Psychological Review, 83,37–64.
Evers, M., Dworschak, M., Hackenbroch, V., Jaeger, U., Leick, R., Neubacher, A.,Schmid, B., & Schreiber, S. (2000, 20 November). Deutschland—Ein BSE-Risikostaat: Seuche aus dem Trog. Der Spiegel, 47, 288–292.
Evers, M., Neubacher, A., Pützl, N., Schreiber, S., & Vehlewald, H.-J. (2000, 27November). Der deutsche Wahn: Jahrelang haben Politiker und Bauern die Bürger indem Glauben gelassen, ihr Land sei frei von der Rinderseuche BSE. Der Spiegel, 48,22–24.
Fahey, T., Griffiths, S., & Peters, T. J. (1995). Evidence based purchasing: Understandingresults of clinical trials and systematic reviews. British Medical Journal, 311, 1056–

1059.Faigman, D. L. (1999). Legal alchemy: The use and misuse of science in the law. New York:
W. H. Freeman and Company.Falk, R. (1992). A closer look at the probabilities of the notorious three prisoners.
Cognition, 43, 197–223.Fawcett, G. M., Heise, L. L., Isita-Espejel, L., & Pick, S. (1999). Changing community
responses to wife abuse: A research and demonstration project in Iztacalco, Mexico.American Psychologist, 54, 41–49.
Feynman, R. P. (1967). The character of physical law. Cambridge, MA: MIT Press.Fingering fingerprints. (2000, December 16). The Economist, 357, 103–104.Fischhoff, B. (1982). For those condemned to study the past: Heuristics and biases in
hindsight. In D. Kahneman, P. Slovic, & A. Tversky (Eds.), Judgment underuncertainty: Heuristics and biases (pp. 335–351). Cambridge: Cambridge UniversityPress.
Fischhoff, B., Lichtenstein, S., Slovic, P., Darby, S., & Keeney, R. (1981). Acceptable risk.New York: Cambridge University Press.
Fisher, R. A. (1935).The design of experiments. (5th ed., 1951; 7th ed., 1960; 8th ed.,1966). Edinburgh: Oliver & Boyd.
Franklin, B. (1987). Writings. New York: The Library of America.Friedman, D. (1998). Monty Hall’s three doors: Construction and deconstruction of a
choice anomaly. The American Economic Review, 88, 933–946.Gallistel, C. R., & Gelman, R. (1992). Preverbal and verbal counting and computation.
Cognition, 44, 43–74.Gardner, M. (1959a). Mathematical games: How three mathematicians disproved a
celebrated conjecture of Leonard Euler. Scientific American, 201, 181–188.Gardner, M. (1959b). Mathematical games: Problems involving questions of probability
and ambiguity. Scientific American, 201, 147–182.Garnick, M. B. (1994). The dilemmas of prostate cancer. Scientific American, 270, 52–59.Gawande, A. (1999, October 4). Whose body is it, anyway? What doctors should do
when patients make bad decisions. The New Yorker, 84–91.Geary, D. C. (2000). Evolution and proximate expression of human parental investment.
Psychological Bulletin, 126, 55–77.Gigerenzer, G. (1993). The superego, the ego, and the id in statistical reasoning. In G.
Keren & G. Lewis (Eds.), A handbook for data analysis in the behavioral sciences (pp.311–339). Hilsdale, NJ: Erlbaum.
Gigerenzer, G. (1996a). The psychology of good judgment: Frequency formats and simplealgorithms. Medical Decision Making, 16, 273–280.
Gigerenzer, G. (1996b). Rationality: Why social context matters. In P. B. Baltes & U. M.Staudinger (Eds.), Interactive minds: Life-span perspectives on the social foundation of

cognition (pp. 319–346). Cambridge: Cambridge University Press.Gigerenzer, G. (1998). Ecological intelligence: An adaptation for frequencies. In D. D.
Cummins & C. Allen (Eds.), Evolution of Mind (pp. 9–29). New York: OxfordUniversity Press.
Gigerenzer, G. (2000). Adaptive thinking: Rationality in the real world. New York: OxfordUniversity Press.
Gigerenzer, G., & Hoffrage, U. (1995). How to improve Bayesian reasoning withoutinstruction: Frequency formats. Psychological Review, 102, 684–704.
Gigerenzer, G., & Hoffrage, U. (1999). Overcoming difficulties in Bayesian reasoning: Areply to Lewis and Keren (1999) and Mellers and McGraw (1999). PsychologicalReview, 106, 425–430.
Gigerenzer, G., Hoffrage, U., & Ebert, A. (1998). AIDs counselling for low-risk clients.AIDS Care, 10, 197–211.
Gigerenzer, G., Hoffrage, U., & Kleinbälting, H. (1991). Probabilistic mental models: ABrunswikian theory of confidence. Psychological Review, 98, 506–528.
Gigerenzer, G., & Murray, D. J. (1987). Cognition as intuitive statistics. Hillsdale, NJ:Erlbaum.
Gigerenzer, G., Swijtink, Z., Porter, T., Daston, L., Beatty, J., & Krüger, L. (1989). Theempire of chance. How probability changed science and everyday life. Cambridge:Cambridge University Press.
Gigerenzer, G., Todd, P. M. & the ABC Research Group (1999). Simple heuristics thatmake us smart. New York: Oxford University Press.
Gillispie, C. C. (1997). Pierre-Simon Laplace, 1749–1827: A life in exact science.Princeton, NJ: Princeton University Press.
Good, I. J. (1995). When batterer turns murderer. Nature, 375, 541.Good, I. J. (1996). When batterer becomes murderer. Nature, 381, 481.Gotzsche, P. C., & Olsen, O. (2000). Is screening for breast cancer with mammography
justifiable? The Lancet, 355, 129–134.Granberg, D., & Brown, T. A. (1995). The Monty Hall dilemma. Personality and Social
Psychology Bulletin, 21, 711–723.Grisso, T., & Tomkins, A. J. (1996). Communicating violence risk assessments. American
Psychologist, 51, 928–930.Größter Massen-Gentest ist noch nicht beendet: Der Mordfall Christina / Streit unter
Rechtsmedizinern. (1998, April 14). Frankfurter Allgemeine Zeitung, p. 13.Hacking, I. (1975). The emergence of probability. Cambridge: Cambridge University Press.Hacking, I. (1990). The taming of chance. Cambridge: Cambridge University Press.Haley, N. J., & Reed, B. S. (1994). HIV testing for life insurance. In G. Schochetman &
J. R. George (Eds.), AIDS testing: A comprehensive guide to technical, medical, social,legal, and management issues (2nd ed., pp. 252–265). New York: Springer.

Hamm, R. M., Lawler, F., & Scheid, D. (1999). Prophylactic mastectomy in women witha high risk of breast cancer. New England Journal of Medicine, 340, 1837–1838.
Hamm, R. M., & Smith, S. L. (1998). The accuracy of patients' judgments of diseaseprobability and test sensitivity and specificity. The Journal of Family Practice, 47, 44–52.
Hammerton, M. (1973). A case of radical probability estimation. Journal of ExperimentalPsychology, 101, 252–254.
Hanks, G. E., & Scardino, R T. (1996). Does screening for prostate cancer make sense?Scientific American, 275, 80–81.
Hansen, M. (1996, August). Jimmy the Greek he ain't. American Bar Association Journal,30.
Harrington, A. (1997). Placebo: Conversations at the disciplinary borders. In A.Harrington (Ed.), The placebo effect: An interdisciplinary exploration (pp. 208–248).Cambridge, MA: Harvard University Press.
Harris, R. P., Fletcher, S. W., Gonzalez, J. J., Lannin, D. R., Degnan, D., Earp, J. A., &Clark, R. (1991). Mammography and age: Are we targeting the wrong women? Cancer,67, 2010–2014.
Hartmann, L. C. et al. (1999). Efficacy of bilateral prophylactic mastectomy in womenwith a family history of breast cancer. The New England Journal of Medicine, 340, 77–84.
Hasher, L., & Zacks, R. T. (1984). Automatic processing of fundamental information:The case of frequency of occurrence. American Psychologist, 39, 1372–1388.
Heilbrun, K., O'Neill, M. L., Strohman, L. K., Bowman, Q., & Philipson, J. (2000).Expert approaches to communicating violence risk. Law and Human Behavior,24,137–148.
Hicks, J. W. (1993). The facts about DNA typing. Judicature, 77, 5, 55, 57–58.Hippocrates. (1967). Decorum, Hippocrates (Vol. II, pp. 297–299). Cambridge, MA:
Harvard University Press.Hoffrage, U., & Gigerenzer, G. (1998). Using natural frequencies to improve diagnostic
inferences. Academic Medicine, 73, 538–540.Hoffrage, U., Lindsey, S., Hertwig, R., & Gigerenzer, G. (2000). Communicating
statistical information. Science, 290, 2261–2262.Horne, S. (1999). Domestic violence in Russia. American Psychologist, 54, 55–61.Huff, D. (1954/1993). How to lie with statistics. New York: W. W. Norton & Company.Humphrey, N. (2000). Great expectations: The evolutionary psychology of faith-healing and
the placebo effect [Keynote address]. Paper presented at the XXVII InternationalCongress of Psychology, Stockholm .
Illinois Department of Public Health (1992). Coping with HIV disease. San FranciscoAIDS Foundation.

Illinois Department of Public Health (1993). AIDS: Antibody testing. (Leaflet). Printed byAuthority of the State of Illinois. P.O. X302237 90,200 1/93.
Jain, B. P., McQuay, H., & Moore, A. (1998). Number needed to treat and relative riskreduction. Annals of Internal Medicine, 128, 72–73.
Jasanoff, S., & Lynch, M. (1998). Contested identities: Science, law, and forensic practice.Social Studies of Science, 28, 675–686.
Jonides, J., & Jones, C. M. (1992). Direct coding for frequency of occurrence. Journal ofExperimental Psychology: Learning, Memory, and Cognition, 18, 368–378.
Jung, H. (1998). Mammographie und Strahlenrisiko. Fortschritte auf dem Gebiet derRöntgenstrahlen, 169, 336–343.
Kahneman, D., Slovic, P., & Tversky, A. (1982). Judgment under uncertainty: Heuristicsand biases. New York: Cambridge University Press.
Kalet, A., Roberts, J. C., & Fletcher, R. (1994). How do physicians talk with theirpatients about risks? Journal of General Internal Medicine, 9, 402–404.
Kant, I. (1784). Beantwortung der Frage: Was ist Aufklärung? Berlinische Monatsschrift,Dezember-Heft, 481–494.
Katz, J. (1984). The silent world of doctor and patient. New York: The Free Press.Kerlikowske, K. (1997). Efficacy of screening mammography among women aged 40 to
49 years and 50 to 69 years: Comparison of relative and absolute benefit. Journal of theNational Cancer Institute Monographs, 22, 79–86.
Kerlikowske, K. (2000). Breast cancer screening. In M. B. Goldman & M. C. Hatch(Eds.), Women and health (pp. 895–906). New York: Academic Press.
Kerlikowske, K., Grady, D., Barclay, J., Sickles, E. A., & Ernster, V. (1996a). Effect ofage, breast density, and family history on the sensitivity of first screeningmammography. Journal of the American Medical Association, 276, 33–38.
Kerlikowske, K., Grady, D., Barclay, J., Sickles, E. A., & Ernster, V. (1996b). Likelihoodratios for modem screening mammography: Risk of breast cancer based on age andmammographic interpretation. Journal of the American Medical Association, 276, 39–43.
Kleiter, G. D. (1994). Natural sampling: Rationality without base rates. In G. H. Fischer& D. Laming (Eds.), Contributions to mathematical psychology, psychometrics, andmethodology (pp. 375–388). New York: Springer.
Knight, F. (1921). Risk, uncertainty and profit. Boston: Houghton Mifflin Co.Koehler, J. J. (1992). Probabilities in the courtroom: An evaluation of the objections and
policies. In D. K. Kagehiro, & W. S. Laufer (Eds.), Handbook of psychology and law(pp. 167–184). New York: Springer.
Koehler, J. J. (1993a). DNA matches and statistics: Important questions, surprisinganswers. Judicature, 76, 222–229.

Koehler, J. J. (1993b). Error and exaggeration in the presentation of DNA evidence attrial. Jurimetrics Journal, 34, 21–39.
Koehler, J. J. (1996). On conveying the probative value of DNA evidence: Frequencies,likelihood ratios, and error rates. University of Colorado Law Review, 67, 859–886.
Koehler, J. J. (1997). One in millions, billions, and trillions: Lessons from People vs.Collins (1968) for People vs. Simpson (1995). Journal of Legal Education, 47, 214–223.
Koehler, J. J., Chia, A., & Lindsey, S. (1995). The random match probability (RMP) inDNA evidence: Irrelevant and prejudicial? Jurimetrics Journal, 35, 201–219.
Kohn, L. T., Corrigan, J. M., & Donaldson, M. S. (Eds.). (2000). To err is human:Building a safer health system. Washington, DC: National Academy Press.
Koss, M. P., Koss, P. G., & Woodruff, J. (1991). Deleterious effects of criminalvictimization on women’s health and medical utilization. Archives of Internal Medicine,151, 342–347.
Koubenec, H.-J. (2000). Mammographie-Screening: Überschätzen wir den Nutzen?Berliner Ärzte, 8, 11–16.
Krauss, S., & Hertwig, R. (2000). Muss DNA-Evidenz schwer verständlich sein? DerAusweg aus einem Kommunikationsproblem. Monatsschrift für Kriminologie undStrafrechtsreform, 83, 155–162.
Krauss, S., Martignon, L., & Hoffrage, U. (1999). Simplifying Bayesian inference: Thegeneral case. In L. Magnani, N. Nersessian, & N. Thagard (Eds.), Model-basedreasoning in scientific discovery (pp. 165–179). New York: Plenum Press.
Krauss, S., & Wang, X. T. (2000). The psychology of the Monty Hall problem: Overcomingdifficulties in solving a tenacious brain teaser. Unpublished manuscript.
Krüger, L., Daston, L., & Heidelberger, M. (1987). The probabilistic revolution: Vol. 1.Ideas in history. Cambridge, MA: MIT Press.
Krüger, L., Gigerenzer, G., & Morgan, M. S. (Eds.). (1987). The probabilistic revolution:Vol. II. Ideas in the sciences. Cambridge, MA: MIT Press.
Kühberger, A. (1998). The influence of framing on risky decisions: A meta-analysis.Organizational Behavior and Human Decision Processes, 75, 23–55.
Lantz, P. M., & Booth, K. M. (1998). The social construction of the breast cancerepidemic. Social Science and Medicine, 46, 907–918.
Laplace, P.-S. (1814/1951). A philosophical essay on probabilities (F. W. Truscott and F. L.Emory, Trans.). New York: Dover.
Lempert, R. (1991). Some caveats concerning DNA as criminal identification evidence:With thanks to the Reverend Bayes. Cardozo Law Review, 13, 303–341.
Lerman, C., Trock, B., Rimer, B. K., Jepson, C., Brody, D., & Boyce, A. (1991).Psychological side effects of breast cancer screening. Health Psychology, 10, 259–267.
LeRoy, S. E, & Singell, L. D., Jr. (1987). Knight on risk and uncertainty. Journal ofPolitical Economy, 95, 394–406.

Lewis, C., & Keren, G. (1999). On the difficulties underlying Bayesian reasoning: Acomment on Gigerenzer and Hoffrage. Psychological Review, 106, 411–416.
Lindsey, S., Hertwig, R., & Gigerenzer, G. (2001). Communicating DNA evidence.Unpublished manuscript.
Lopes, L. L. (1981). Decision making in the short run. Journal of Experimental Psychology:Human Learning and Memory, 7, 377–385.
Lopes, L. L. (1987). Between hope and fear: The psychology of risk. In L. Berkowitz(Ed.), Advances in Experimental Social Psychology (Vol. 20, pp. 255–295). San Diego:Academic Press.
Lopes, L. L. (1992). Risk perception and the perceived public. In D. W. Bromley & K.Segerson (Eds.), The social response to environmental risk (pp. 57–73). Boston: KluwerAcademic Publishers.
Malenka, D. J., Baron, J. A., Johansen, S., Wahrenberger, J. W., & Ross, J. M. (1993).The framing effect of relative and absolute risk. Journal of General Internal Medicine, 8,543–548.
Mandel, J. S., et al. (1993). Reducing mortality from colorectal cancer by screening forfecal occult blood. New England Journal of Medicine, 328, 1365–1371.
Månsson, S. A. (1990). Psycho-social aspects of HIV testing—the Swedish case. AIDSCare, 2, 5–16.
Marr, D. (1982). Vision: A computational investigation into the human representation andprocessing of visual information. San Francisco: W.H. Freeman.
Marshall, E. (1993). Search for a killer: Focus shifts from fat to hormones. Science, 259,618–621.
Marshall, K. G. (1996). Prevention. How much harm? How much benefit? 3. Physical,psychological and social harm. Canadian Medical Association Journal, 155, 169–176.
Matthews, J. R. (1995). Quantification and the quest for medical certainty. Princeton, NJ:Princeton University Press.
Mazur, D. J., & Metz, J. F. (1994). How age, outcome severity, and scale influencegeneral medicine clinic patients' interpretations of verbal probability terms. Journal ofGeneral Internal Medicine, 9, 268–271.
McKenzie, C. R. (1994). The accuracy of intuitive judgment strategies: Covariationassessment and Bayesian inference. Cognitive Psychology, 26, 209–239.
McNeil, B. J., Pauker, S. G., Sox, H. C., & Tversky, A. (1982). On the elicitation ofpreferences for alternative theories. New England Journal of Medicine, 306, 1259–1262.
McWhirter, P. T. (1999). La violencia privada: Domestic violence in Chile. AmericanPsychologist, 54, 37–40.
Metsch, L. R., McCoy, C. B., McCoy, H.V., Pereyra, M., Trapido, E., & Miles, C.(1998). The role of the physician as an information source on mammography. CancerPractice, 6, 229–236.

Miller, K., Smith, C., Zhu, J., & Zhang, H. (1995). Preschool origins of cross-nationaldifferences in mathematical competence: The role of number-naming systems.Psychological Science, 6, 56–60.
Mineka, S., & Cook, M. (1988). Social learning and the acquisition of snake fear inmonkeys. In T. R. Zentall & B. G. Galef (Eds.), Social learning: Psychological andbiological perspectives (pp. 51–73). Hillsdale, NJ: Erlbaum.
Monahan, J. (1981). The clinical prediction of violent behavior. Washington, DC: U.S.Government Printing House.
Monahan, J., Steadman, H. J., Silver, E., Appelbaum, P. S., Robbins, P. C., Mulvey, E.P., Roth, L. H., Grisso, T., & Banks, S. (2001). Rethinking risk assessment: TheMcArthur study of mental disorder and violence. New York: Oxford University Press.
Monahan, J., & Wexler, D. B. (1978). A definite maybe: Proof and probability in civilcommitment. Law and Human Behavior, 2, 37–42.
Mosteller, F. (1965). Fifty challenging problems in probability with solutions. Reading, MA:Addison-Wesley.
Mueser, P. R., & Granberg, D. (1999). The Monty Hall dilemma revisited:Understanding the interaction of problem definition and decision making. Underrevision.
Mühlhauser, I., & Höldke, B. (1999). Übersicht: Mammographie-Screening—Darstellung der wissenschaftlichen Evidenz-Grundlage zur Kommunikation mit derFrau. Sonderbeilage arznei-telegramm, 10/99, 101–108.
Mushlin, A. I., Kouides, R. W., & Shapiro, D. E. (1998). Estimating the accuracy ofscreening mammography: A meta-analysis. American Journal of Preventive Medicine,14, 143–153.
National Academy of Sciences Committee on the biological effects of ionizing radiations.(1990). Health effects of exposure to low levels of radiations. (BEIR V ed.). Washington,DC: National Academy Press.
The National Commission on Excellence in Education. (1983). A nation at risk: Theimperative for educational reform (A Report to the Nation and the Secretary ofEducation, United States Department of Education). Washington, DC: U.S.Government Printing Office.
National Research Council. (1989). Improving risk communication. Washington, DC:National Academy Press.
National Research Council. (1996). The evaluation of forensic DNA evidence. Committee onDNA forensic science: An update. Washington, DC: National Academy of Sciences.
Nesse, R. M., & Williams, G. C. (1995). Why we get sick: The new science of Darwinianmedicine. New York: Vintage Books.
NIH Consensus Statement. (1997). Breast cancer screening for women ages 40–49. NIHConsensus Statement, 15, 1–35.

Nyström, L., Larsson, L.-G., Wall, S., Rutqvist, L., Andersson, I., Bjurstam, N.,Fagerberg, G., Frisell, J., & Tabär, L. (1996). An overview of the Swedish randomisedmammography trials: Total mortality pattern and the representativity of the studycohorts. Journal of Medical Screening, 3, 85–87.
Oberlies, D. (1997). Tötungsdelikte zwischen Männern und Frauen: Eine Untersuchunggeschlechtsspezifischer Unterschiede anhand von 174 Gerichtsurteilen. Monatsschriftfür Kriminologie und Strafrechtsreform, 80, 133–147
Olsen, O. & Gotzsche, P. C. (2001). Cochrane review on screening for breast cancer withmammography. Lancet, 358, 1340–1342.
Parducci, A. (1965). Category judgment: A range-frequency model. Psychological Review,72, 407–418.
Paulos, J. A. (1988). Innumeracy: Mathematical illiteracy and its consequences. New York:Vintage Books.
The perils of percentages. (1998, April 18). The Economist, 84.Phillips, K.-A., Glendon, G., & Knight, J. A. (1999). Putting the risk of breast cancer in
perspective. New England Journal of Medicine, 340,141–144.Politser, P. E. (1984). Explanations of statistical concepts: Can they penetrate the haze of
Bayes? Methods of Information in Medicine, 23, 99–108.Pomata, G. (1998). Contracting a cure: Patients, healers, and the law in early modern
Bologna (Translated by the author, with the assistance of Rosemarie Foy and AnnaTaraboletti-Segre, Trans.). Baltimore: The Johns Hopkins University Press.
Porter, T. (1986). The rise of statistical thinking, 1820–1900. Princeton, NJ: PrincetonUniversity Press.
Proctor, R. N. (1996). Cancer wars: How politics shapes what we know and don't knowabout cancer. New York: Basic Books.
Proctor, R. N. (1998). Tobacco testimony. Manuscript.Proctor, R. N. (1999). The Nazi war on cancer. Princeton, NJ: Princeton University Press.Ptacek, J. (1999). Battered women in the courtroom: The power of judicial responses. Boston:
Northeastern University Press.Ransohoff, D. F., & Harris, R. P. (1997). Lessons from the mammography screening
controversy: Can we improve the debate? Annals of Internal Medicine, 127, 1029–1034.
Reagan, N., & Novak, W. (1989). My turn: The memoirs of Nancy Reagan. New York:Random House.
Real, L. A. (1991). Animal choice behavior and the evolution of cognitive architecture.Science, 253, 980–986.
Redmayne, M. (1998). The DNA database: Civil liberty and evidentiary issues. CriminalLaw Review, 437–454.

Redmayne, M. (2001). Expert evidence and criminal justice. New York: Oxford UniversityPress.
Reimer, L., Mottice, S., Schable, C., Sullivan, P., Nakashima, A., Rayfield, M., Den, R.,& Brokopp, C. (1997). Absence of detectable antibody in a patient infected withhuman immunodeficiency virus. Clinical Infectious Diseases, 25, 98–100.
Reiss, A. J., Jr., & Roth, J. A. (Eds.). (1993). Understanding and preventing violence.Washington, DC: National Academy Press.
Roberts, M. M. (1989). Breast screening: Time for a rethink? British Medical Journal, 299,1153–1155.
Ross, J. F. (1999). The polar bear strategy: Reflections on risk in modern life. Reading, MA:Perseus Books.
Salzmann, P., Kerlikowske, K., & Phillips, K. (1997). Cost-effectiveness of extendingscreening mammography guidelines to include women 40 to 49 years of age. Annals ofInternal Medicine, 127, 955–965.
Schindele, E., & Stollorz, V. (2000, March 17). Vorsicht Vorsorge! Die Woche.Schmidt, J. G. (1990). The epidemiology of mass breast cancer screening—A plea for a
valid measure of benefit. Journal of Clinical Epidemiology, 43, 215–225.Schmidt, J. G. (1994). Wie gross ist der Nutzen, wie gross der Schaden der Brustkrebs-
Früherkennung? Früherkennungs-Credo gegeniiber Wirklichkeit in der Praxis. In J. G.Schmidt & R. E. Steele (Eds.), Kritik der medizinischen Vernunft: Schritte zu einerzeitgemäßen Praxis—Ein Lesebuch (pp. 63–71). Mainz: Verlag Kirchheim.
Schochetman, G., & George, J. R. (Eds.). (1994). AIDS testing: A comprehensive guide totechnical, medical, social, legal, and management issues (2nd ed.). New York: Springer.
Schönhöfer, P. S. (1999). Klinik-basierte Erfassung Arzneimittel-bedingter Erkrankungenin Pharmakovigilanz-System (ZKH Bremen). Arzneimitteltherapie, 17, 83–86.
Schräge, G. (1980). Schwierigkeiten mit stochastischer Modellbildung—Zwei Beispieleaus der Praxis. Journal für Mathematik-Didaktik, 1, 86–88.
Schwartz, L. M., Woloshin, S., Sox, H. C., Fischhoff, B., & Welch, H. G. (2000). U.S.women’s reactions to false positive mammography results and detection of ductalcarcinoma in situ: Cross-sectional survey. British Medical Journal, 320, 1635–1640.
Schwarz, N. (1999). Self-reports: How the questions shape the answers. AmericanPsychologist, 54, 93–105.
Schwarz, N., & Hippler, H.-J. (1987). What response scales may tell your respondents:Informative functions of response alternatives. In H.-J. Hippler, N. Schwarz, & S.Sudman (Eds.), Social information processing survey methodology (pp. 163–178). NewYork: Springer.
Schwarz, N., Hippler, H.-J., Deutsch, B., & Strack, F. (1985). Response categories:Effects on behavioral reports and comparative judgments. Public Opinion Quarterly,49, 388–395.

Schwing, R. C., & Kamerad, D. B. (1988). The distribution of risks: Vehicle occupantfatalities and time of week. Risk Analysis, 8, 127–133.
Sedlmeier, P. (1999). Improving statistical reasoning: Theoretical models and practicalimplications. Mahwah, NJ: Erlbaum.
Sedlmeier, P., & Gigerenzer, G. (2001). Teaching Bayesian reasoning in less than twohours. Journal of Experimental Psychology: General, 130, 380–400.
Sedlmeier, P., Hertwig, R., & Gigerenzer, G. (1998). Are judgments of the positionalfrequencies of letters systematically biased due to availability? Journal of ExperimentalPsychology: Learning, Memory, and Cognition, 24, 754–770.
Selvin, S. (1975a). A problem in probability. American Statistician, 29, 67.Selvin, S. (1975b). On the Monty Hall problem. American Statistician, 29, 134.Shaughnessy, J. M. (1992). Research on probability and statistics: Reflections and
directions. In D. A. Grouws (Ed.), Handbook of research on mathematical teaching andlearning (pp. 465–494). New York: Macmillan.
Shepard, R. N. (1987). Evolution of a mesh between principles of the mind andregularities of the world. In J. Dupré (Ed.), The latest on the best: Essays on evolution andoptimality (pp. 251–275). Cambridge, MA: MIT Press.
Shepard, R. N. (1990). Mind sights: Original visual illusions. New York: Freeman.Shepard, R. N. (1992). The perceptual organization of colors: An adaptation to
regularities of the terrestrial world? In J. H. Barkow, L. Cosmides, and J. Tooby (Eds.),The adapted mind: Evolutionary psychology and the generation of culture (pp. 495–532).New York: Oxford University Press.
Sherman, L. W. (1992). Policing domestic violence: Experiments and dilemmas. New York:The Free Press.
Siegrist, M. (1997). Communicating low risk magnitudes: Incidence rates expressed asfrequency versus rates expressed as probability. Risk Analysis, 17, 507–510.
Simon, H. A. (1969). The sciences of the artificial. Cambridge, MA: MIT Press.Sjónell, G., & Ståhle, L. (2000). Mammography screening does not significantly reduce breast
cancer mortality in Swedish daily practice [On-line].http://www.famnetdoc.com/hhot.htm.
Skolbekken, J.-A. (1998). Communicating the risk reduction achieved by cholesterolreducing drugs. British Medical Journal, 316, 1956–1958.
Slaytor, E. K., & Ward, J. E. (1998). How risks of breast cancer and benefits of screeningare communicated to women: Analysis of 58 pamphlets. British Medical Journal, 317,263–264.
Slovic, P. (1987). Perception of risk. Science, 236, 280–285.Slovic, P. (1999). Trust, emotion, sex, politics and science. Risk Analysis, 19, 689–701.Slovic, P., & Monahan, J. (1995). Probability, danger, and coercion: A study of risk
perception and decision making in mental health law. Law and Human Behavior, 19,

49–65.Slovic, P., Monahan, J., & MacGregor, D. G. (2000). Violence risk assessment and risk
communication: The effects of using actual cases, providing instruction, andemploying probability versus frequency formats. Law and Human Behavior, 24, 271–296.
Spellman, B. A. (1996, October). Degree of difficulty. American Bar Association Journal,10.
Spielberg, F., Kabeya, C. M., Ryder, R. W., Kifuani, N. K., Harris, J., Bender, T. R.,Heyward, W. L., & Quinn, T. C. (1989). Field testing and comparative evaluation ofrapid, visually read screening assays for antibody to human immunodeficiency virus.Lancet, 1, 580–584.
Statistisches Bundesamt (Federal Statistical Office) (Ed.). (2000a). Statistisches Jahrbuch2000 für dasAusland (Statistical Yearbook 2000for foreign countries). Wiesbaden:Statistisches Bundesamt.
Statistisches Bundesamt (Federal Statistical Office) (Ed.). (2000b). Statistisches Jahrbuch2000 für die Bundesrepublik Deutschland (Statistical Yearbook 2000 for the FederalRepublic of Germany). Wiesbaden: Statistisches Bundesamt.
Stein, M. D., Freedberg, K. A., Sullivan, L. M., Savetsky, J., Levenson, S. M., Hingson,R., & Samet, J. H. (1998). Sexual ethics: Disclosure of HIV-positive status to partners.Archives of Internal Medicine, 158, 253–257.
Stigler, S. M. (1980). Stigler’s law ofeponymy. Transactions of the New York Academy ofSciences, 39, 147–157.
Stigler, S. M. (1983). Who discovered Bayes’s Theorem? American Statistician, 37, 290–296.
Stigler, S. M. (1986). The history of statistics. Cambridge, MA: Bellknap Press of HarvardUniversity Press.
Stigler, S. M. (1999). Statistics on the table: The history of statistical concepts and methods.Cambridge, MA: Harvard University Press.
Stine, G. J. (1996). Acquired immune deficiency syndrome: Biological, medical, social, andlegal issues. (2nd ed.). Englewood Cliffs, NJ: Prentice Hall.
Stine, G. J. (1999). AIDS update 1999: An annual overview of acquired immune deficiencysyndrome. Upper Saddle River, NJ: Prentice-Hall.
Svenson, O., Fischhoff, B., & MacGregor, D. (1985). Perceived driving safety and seat-belt usage. Accident Analysis and Prevention, 17, 119–133.
Thinès, G., Costall, A., & Butterworth, G. (Eds.). (1991). Michotte’s experimentalphenomenology of perception. Hillsdale, NJ: Erlbaum.
Thompson, W. C. (1993). Worthwhile DNA questions. Judicature, 77, 57.Thompson, W. C., & Schumann, E. L. (1987). Interpretation of statistical evidence in
criminal trials: The prosecutor’s fallacy and the defense attorney’s fallacy. Law and

Human Behavior, 11, 167–187.Tierney, J. (1991, July 21). Behind Monty Hall’s doors: Puzzle, debate and answer? The
New York Times, p. Al.Tjaden, P., & Thoennes, N. (2000). Full report of the prevalence, incidence, and
consequences of violence against women: Findings from the National Violence AgainstWomen Survey. Washington, DC: U.S. Department of Justice.
Tooby, J. & Cosmides, L. (1992). The psychological foundations of culture. In J. Barkow,L. Cosmides & J. Tooby (Eds.), The adapted mind: Evolutionary psychology and thegeneration of culture (pp. 19–136). New York: Oxford University Press.
Tribe, L. H. (1971). Trial by mathematics: Precision and ritual in the legal process.Harvard Law Review, 84, 1329–1393.
Twain, M. (1924). Mark Twain’s Autobiography. (Vol. 1). New York: Harper andBrothers Publishers.
U.S. Department of Transportation. (1998). Traffic safety facts 1998 [On-line]. NationalCenter for Statistics and Analysis. Available: http://www.nhtsa.dot.gov.
U.S. Preventive Services Task Force Staff. (1996). Guide to clinical preventive services:Report of the U.S. preventive services task force. (2nd ed.). Baltimore, MD: Williams &Wilkins.
vos Savant, M. (1990a, September 9). Ask Marilyn (1). Parade, 15.vos Savant, M. (1990b, December 2). Ask Marilyn (2). Parade, 25.vos Savant, M. (1996). The power of logical thinking: Easy lessons in the art of reasoning . . .
and hard facts about its absence in our lives. New York: St. Martin’s Press.Ward, J. W. (1994). Testing for human retrovirus infections: Medical indications and
ethical considerations. In G. Schochetman & J. R. George (Eds.), AIDS testing: Acomprehensive guide to technical, medical, social, legal, and management issues (pp. 1–14).New York: Springer.
Was bedeutet Prozent? (1998, December 31). Süddeutsche Zeitung Magazin, p. 3.Windeler, J., & Köbberling, J. (1986). Empirische Untersuchung zur Einschätzung
diagnostischer Verfahren am Beispiel des Haemoccult-Tests [An empirical study of thejudgments about diagnostic procedures using the example of the Hemoccult test].Klinische Wochenschrift, 64, 1106–1112.
Wingo, P. A., Ries, L. A. G., Rosenberg, H. M., Miller, D. S., & Edwards, B. K. (1998).Cancer incidence and mortality, 1973–1995. Cancer, 82, 1197–1207.
Wittkowski, K. (1989). Wann ist ein HIV Test indiziert? Schlusswort. DeutschesÄrzteblatt, 86, B-138–140.
Woloshin, S., Schwartz, L. M., Byram, S. J., Sox, H. C., Fischhoff, B., & Welch, G.(2000). Women’s understanding of the mammography screening debate. Archives ofInternal Medicine, 160, 1434–1440.

Wynn, K. (1998). An evolved capacity for number. In D. D. Cummins & C. Allen(Eds.), The evolution of mind (pp. 107–126). New York: Oxford University Press.

NOTES
CHAPTER 1. UNCERTAINTY
1. For details see Chapter 5.2. Franklin (1789). In a letter, Benjamin Franklin wrote: “Our Constitution is in actual
operation; everything appears to promise that it will last; but in this world there isnothing certain but death and taxes.”
CHAPTER 2. THE ILLUSION OF CERTAINTY
1. The tendency to see certainty instead of uncertainty, structure instead of noise, and causeand effect instead of accidental contingencies has been described in other contexts byhistorians and psychologists alike (e.g., Fischhoff, 1982; Thinès, Costall, andButterworth, 1991).
2. See Gigerenzer and Murray (1987, Chapter 3).3. Stigler explains how Galton calculated this number (1999, Chapter 6).4. Fingering fingerprints. (2000, December 16) The Economist, 103-104.5. Dora Heller drew my attention to the possible origins of the alleged dangers of
consuming cherries and water at the same time. Fruit that has not been washed is coveredwith microorganisms that can lead to fermentation processes in the stomach, which inturn can cause pain. Normally, these microorganisms are destroyed by stomach acid.However, if a person drinks a large amount of liquid while eating, the acid is diluted, andis thus hindered from doing its job well, and stomach pain can result. But washing fruitbefore eating it is very likely to take care of this problem.
6. Daston (1987).7. Evers, Dworschak, et al. (2000); Evers, Neubacher, et al. (2000).8. Katz (1984, pp. 166-169).9. I have omitted details that reveal the identities of the participants, and report only their
professional status. I also have rearranged and shortened the discussion to make it easierto follow.
10. Humphrey (2000).11. Harrington (1997).12. Kant (1784).

CHAPTER 3. INNUMERACY
1. In the 1990s, the toy maker Mattel came out with a talking Barbie doll that could utter afew phrases, including the two quoted here. Feminist groups objected to the doll’sunenlightened statements, which they alleged would encourage girls to be moreconcerned with shopping than with school or careers. One group bought 500 talkingBarbie dolls and 500 talking G.I. Joe dolls just before Christmas, exchanged their voiceboxes, and returned them to the store. As a result, some little girls must have unwrappedtheir talking Barbie on Christmas morning only to hear her say, “Eat lead, Cobra!”(Bondy, 1999).
2. This statement is quoted from How to Lie with Statistics (Huff, 1954/1993), where itserves as an epigraph. No reference is given. I have searched through scores of statisticaltextbooks in which it has since been quoted and found none where a reference was given.I could not find this statement in Wells’s work either. Thus, the source of this statementremains uncertain, another example of Franklin’s law.
3. The survey was conducted by the Emnid Institute, a polling organization; see SüddeutscheZeitung Magazin (1998, December 31).
4. In the literature, the economist Frank Knight (1921) is credited with making thedistinction between risks and uncertainties, and it is almost universally claimed that hisdistinction is that between uncertainties that can and cannot be quantified. However,Knight in fact proposed a different distinction, that between objective probabilities, suchas empirical frequencies (“risk”) and subjective probabilities, such as degrees of belief(“uncertainty”). In his own words, “We can also employ the terms ‘objective’ and‘subjective’ probability to designate the risk and uncertainty respectively . . .” (p. 233). InKnight’s view, people can assign subjective quantitative probabilities to every conceivableevent, but this alone does not qualify these uncertainties as risks (see LeRoy & Singell,1987). With objective probabilities (that is, risks) Knight meant probabilities everyonewould agree on. The distinction I am making in this book is consistent with the oneKnight actually made, that is, between uncertain events where we do and do not haveempirical data to quantify (at least roughly) the uncertainties involved. The distinctionbetween “uncertainty” and “risk” is, of course, a continuum rather than an opposition,because the amount of empirical evidence available falls on a continuum. Writers such asMary Douglas (1992) and Ulrich Beck (1986) use the term “risk” in a different way, onethat explicitly includes moral and political values. Difficulties in noticing, understanding,and evaluating risks arise not only from the illusion of certainty, or from innumeracy, butfrom a multitude of emotional, social, and political factors (e.g., Slovic, 1999).
5. Cited in Katz (1984, p. 136).6. Katz (1984, p. 134).7. Proctor (1998, 1999).

8. Ross (1999, p. 40).9. Statistisches Bundesamt (Federal Statistical Office) (2000b, p. 230).
10. Statistisches Bundesamt (Federal Statistical Office) (2000a, p. 282-283).11. Bourguet (1987).12. Porter (1986). For more on Hacking’s work, see Hacking (1975; 1990).13. U.S. Department of Transportation (1998, p. 2).14. See National Research Council (1989).15. See Skolbekken (1998).16. Compare Malenka et al. (1993).17. Hacking (1975).
CHAPTER 4. INSIGHT
1. This term was originally suggested by psychiatrist John Bowlby (see Nesse and Williams,1995, p. 138). Anthropologists disagree about what conditions were like in theenvironment of evolutionary adaptedness, such as the amount of time people spentsearching for and preparing food, child-rearing customs, divisions of labor, systems ofinheritance, and social group size. Some of these conditions may have varied widely overspace and time, whereas others did not. The properties of sunlight and the 24-hournight-day cycle are examples of unvarying conditions.
2. On color constancy as an evolutionary adaptation, see Shepard (1987, 1992); on theimmune system as a collection of adaptations, see Nesse and Williams (1995); oncognitive heuristics as adaptations see Gigerenzer et al. (1999).
3. I have changed his name to protect his identity.4. The information corresponds to the results of the first screening mammography of
26,000 American women over 30 years old (Kerlikowske et al., 1996a, 1996b). Duringthe first screening, in about 0.8 percent of these women, breast cancer was identified.Among women aged 40 to 49 with breast cancer, 87 percent had a positivemammogram, and among women without breast cancer, 7 percent also had a positivemammogram. The result “positive” meant one of three conditions: Most of the positiveresults were reported as “additional evaluation needed” (93 percent); the others wereeither “suspicious for malignancy” (5 percent) or “malignant” by radiological criteria (2percent). Note that the base rate of cancer can vary with age, risk group, and country.
5. The values used in this study differed slightly from those shown in Figure 4-2. In thisstudy, the base rate, sensitivity, and false positive rate were .01, .8, and .1, respectively.The probability of breast cancer given a positive mammogram was .075, or expressed infrequencies, out of 100 persons with a positive mammogram, 7 or 8 actually had breastcancer. The details of this study can be found in Gigerenzer (1996a) and Hoffrage andGigerenzer (1998).

6. David Eddy’s informal study is reported in Eddy (1982).7. Bayes’s rule with probabilities is usually provided in today’s social science textbooks,
whereas the version with natural frequencies corresponds to Thomas Bayes’s (1763)original Proposition 5 (see Earman, 1992).
8. As Franklin’s law admonishes, however, we would be wise not to take this attribution oforigin too literally. As with most rules and laws, it is uncertain who actually discoveredBayes’s rule. According to Stigler’s law of eponymy, no scientific discovery is named afterits actual discoverer. Examples include the Pythagorean theorem, Pascal’s triangle, andthe Gaussian distribution. It remains to be discovered who actually discovered Stigler’slaw. In a gripping historical detective story, Stigler (1983) concluded that the odds are 3to 1 that Nicholas Saunderson rather than Thomas Bayes discovered Bayes’s rule.Despite being totally blind from the age of 1, Saunderson mastered all of mathematicsand natural philosophy very early in life. At 29, he held the most prestigious academicchair in England, the Lucasian chair of mathematics at Cambridge, which Newton hadheld before him. He died of scurvy, in 1739, at the age of 56. Bayes, of course, cannot beaccused of behaving in accord with the impolite but false interpretation of Stigler’s law,namely, “Every scientific discovery is named after the last individual too ungenerous togive due credit to his predecessors” (Stigler, 1980). Bayes never published his treatise, forwhich the eminent statistician R. A. Fisher (1935) congratulated him. (Fisher opposedthe use of Bayes’s rule in the sciences; see Gigerenzer et al., 1989, Chapter 3.) It waspublished posthumously by Richard Price in 1763.
9. Kleiter (1994); Gigerenzer and Hoffrage (1995, 1999).10. Why do I refer to natural frequencies as such rather than simply to frequencies? Because
there are other frequencies that are normalized just like probabilities. For instance,consider the following version of the mammography problem, which uses such“unnatural” frequencies:
Eight out of every 1,000 women have breast cancer. Of 1,000 women withbreast cancer, 900 will have a positive mammogram. Of 1,000 women withoutbreast cancer, 70 will still have a positive mammogram. Imagine a sample ofwomen who have positive mammograms in screening. How many of thesewomen actually have breast cancer?
This representation causes as much clouded thinking as probabilities do, and for thesame reasons (Gigerenzer and Hoffrage, 1999; Lewis and Keren, 1999). It does notcorrespond to the direct experience illustrated by the tree in Figure 4-2. A physician whohas seen 1,000 patients will have seen 8 with breast cancer (Figure 4-2), not 1,000 asabove. Of these 8 with cancer, 7 have a positive mammogram. However, in the aboveversion, the natural frequency 7 of 8 is normalized to 900 out of 1,000 (rounded), which

takes the information about the base rate (8 cases with cancer) out—just as .9, or 90percent, does. These frequencies are not natural frequencies because they do not carryinformation about the base rates. Similarly, it is conditional probabilities—not allprobabilities—that tend to cloud thinking. For instance, probabilities and percentagesthat express simple frequencies (that is, unconditional frequencies), such as “1 percent ofwomen have breast cancer” are easily understood. In contrast, the conditional probabilitythat a woman has breast cancer given that she tests positive is apt to be confused with theconditional probability that a woman tests positive given that she has breast cancer.
11. See Real (1991); Wynn (1998, p. 114); Dehaene (1997, p. 18).12. See, for example, Barsalou and Ross (1986), Butterworth (1999), Hasher and Zacks
(1984), Jonides and Jones (1992), and Sedlmeier, Hertwig and Gigerenzer (1998). Estes(1976) and, early in his career, Brunswik (e.g., 1937) proposed that probability learningarises from frequency learning. Their studies focused on estimations of the frequency ofletters, words, and other objects. The question of which events (out of all possible events)are automatically counted is addressed in Brase, Cosmides, and Tooby (1998).
13. Dehaene (1997, p. 50); Antell and Keating (1983).14. For an overview, see Dehaene (1997) and Gallistel and Gelman (1992).15. See Dehaene (1997, p. 87).16. The emergence of mathematical probability—and a new conception of reasonableness
that acknowledges uncertainty rather seeking certainty—is described in Daston (1988)and Hacking (1975). For more on the “probabilistic revolution,” see Kruger, Daston,and Heidelberger (1987) and Krüger, Gigerenzer, and Morgan (1987). On how notionsof chance, randomness, and probability have changed the sciences and everyday life, seeGigerenzer et al. (1989).
17. Miller, Smith, Zhu, and Zhang (1995).18. Feynman (1967, p. 53). On the distinction between an algorithm and a representation,
see Marr (1982).
CHAPTER 5. BREAST CANCER SCREENING
1. Roberts (1989, pp. 1153-1154).2. Proctor (1999). Wilhelm Conrad Röntgen, who discovered the X ray in 1895, called
these new rays “X rays” because he did not know what they were made of.3. In this section, I draw on Kerlikowske (2000).4. Cockburn (1995).5. Kerlikowske (2000).6. These trials included some 280,000 women (Nyström et al., 1996) and provided the raw
data so that the various representations of benefits could be calculated (I followMühlhauser and Höldke, 1999, here).
7. To simplify the explanation, I have rounded the numbers up (4 and 3) rather than usingthe actual raw numbers of the Swedish trials, which were 3.6 and 2.9. The actualnumbers give slightly smaller values for the benefits of mammography screening: arelative risk reduction of about 20 percent, an absolute risk reduction of 7 in 10,000, anda number needed to treat of 1,429. An important result in these trials is that the totalmortality—from breast cancer and other causes—was the same in the screening group asin the control group. That is, screening seems to reduce the number of women who diefrom breast cancer, but not the number of women who die.
8. Salzmann, Kerlikowske, and Phillips (1997). These authors found an average additionalincrease in life expectancy of 2.5 days per woman when they included 40- to 49-year oldwomen who underwent screening every 18 months.
9. Schmidt (1994, p. 69).10. Kerlikowske (2000). After 10 to 14 years there was, however, a trend toward a mortality
reduction. Does this mean that mammography screening of women in their 40s does notimmediately result in a mortality reduction, but rather only after ten or more years? Theanswer seems to be no, because almost all of this reduction occurred in those women whohad breast cancer detected at age 50 or older. In other words, if these women had startedmammography screening at age 50 years or older (rather than already in their 40s), theywould have had the same benefit (Kerlikowske, 1997, p. 83).
11. Note that all benefits are expressed in terms of mortality reduction rather than survivalstatistics. Survival statistics can be misleading. For instance, consider the general resultthat there is no mortality reduction with mammography screening in women in their40s. A woman with invasive breast cancer will die at the same age, say at age 55, whethershe had participated in mammography screening and her cancer was detected at age 43,or she had not participated and her cancer was detected at age 45, when she found alump in her breast. With screening, she would have survived 12 years after the cancer wasdetected; without screening, she would survived 10 years after detection. This exampleclarifies that the reporting of survival statistics may be misleading and make screeninglook useful when it is not. This woman only seemed to live longer with a cancerdiagnosis, because the diagnosis was earlier (Kerlikowske, 1997).
12. Kerlikowske (1997, 2000). This conclusion that mammography screening reducesmortality in women age 50 or higher, however, has been debated. Gøtzsche and Olsen(2000; see also Olsen and Gøtzsche, 2001) argue that there have been only twoadequately randomized trials for women aged 50 to 69. In the other trials, they argue,there were differences between women in the screening and control groups before thestudies began that could have confounded the results (for instance, in the Edinburgh trialthe screening group included twice as many women from the highest socioeconomicstratum as did the control group, and the New York trial excluded more women whoalready had cancer from the screening group than from the control group). What the

authors deem to be the only two adequately randomized trials found no effect ofscreening on breast cancer mortality (a relative risk reduction of 0.8 percent, which isnegligible) and an (unexplained) increase in the total number of deaths in the screeninggroup. The authors conclude that “screening for breast cancer with mammography isunjustified” (p. 129). Similarly, Sjönell and Ståhle (2000) conclude—based on theiranalysis of data from some 2 million mammograms performed in daily clinical practice(as opposed to in randomized trials)—that screening leads to no significant reduction inbreast cancer mortality in women aged 50 to 69.
13. Kerlikowske (2000, pp. 897, 901).14. Kerlikowske (2000, p. 902); see Lerman et al. (1991).15. Kerlikowske (1997, 2000).16. NIH Consensus Statement (1997).17. Metsch et al. (1998).18. Mühlhauser and Höldke (1999, pp. 105-106).19. See Elmore et al. (1998); Lerman et al. (1991).20. The University of California San Francisco Mobile Mammography Screening program
(Kerlikowske et al., 1996a; 1996b; see also Mühlhauser and Höldke, 1999, pp. 103-104). This “1 out of 10” figure is averaged across age groups. The errors reported canvary considerably depending on how the presence of cancer is measured. For instance,one meta-analysis found false positive rates as low as 1 percent to 7 percent over a one-year screening interval but as high as 29 percent over a two-year interval (Mushlin,Kouides, and Shapiro, 1998). The proportion of women with cancer among those whotest positive during routine screening also depends on the specific type of “positive”diagnosis. In the University of California San Francisco study, most positivemammograms were labeled as needing “additional evaluation” (93 percent), and theremainder as “suspicious for malignancy” or “malignant” by radiological criteria. Amongthe latter two types of cases, about 1 in 2 women who tested positive actually had breastcancer.
21. See Elmore et al. (1998); Kerlikowske et al. (1996a; 1996b).22. Elmore et al. (1998). The results are based on the records of Harvard Pilgrim Health
Care, a health maintenance organization that serves nearly 300,000 adults in and aroundBoston.
23. Koubenec (2000).24. Lerman et al. (1991, p. 259).25. Ernster and Barclay (1997).26. Kerlikowske (2000, p. 900); Mühlhauser and Höldke (1999).27. Schwartz et al. (2000).28. Proctor (1999, p. 83).

29. National Academy of Sciences Committee (1990) on the biological effects of ionizingradiations (see also Jung, 1998; Mühlhauser and Höldke, 1999, pp. 106-107). Schmidt(1990) estimated the proportion of breast cancer cases induced by radiation to be 1percent.
30. Jung (1998, p. 341); Mühlhauser and Höldke (1999, p. 106). The absolute risk in Figure5-1 refers to a dose of radiation roughly corresponding to that emitted during twoscreening mammograms. The dose is for two screening sessions, each including fourexposures, that is, two exposures of each breast.
31. Kerlikowske (2000). The costs of mammograms vary considerably. For instance, inGermany, the cost of a mammogram ranges between about $20 if it is covered by healthinsurance and $110 if it is not covered (as with screening).
32. Elmore et al. (1998).33. Domenighetti (2000).34. Dolan, Lee, and McDermott (1997).35. Woloshin et al. (2000).36. Schwartz et al. (2000).37. Black, Nease, and Tosteson (1995, p. 730). The italicized words were bold in the original
source.38. Black, Nease, and Tosteson (1995). Even by optimistic estimates, that is, if one were only
to look at those studies suggesting that mammography reduces mortality in this agegroup, the absolute risk reduction would be 0.4 (not 60) women in 1,000.
39. Schwartz et al. (2000).40. Metsch et al. (1998).41. Slaytor and Ward (1998).42. Baines (1992).43. Schindele and Stollorz (2000).44. Phillips, Glendon, and Knight (1999, p. 142).45. Black, Nease, and Tosteson (1995, p. 730). The reported average was the median
estimate.46. Admittedly, more than for other cancers, the risk of lung cancer can be strongly affected
by behavioral change: An estimated 80 to 90 percent of deaths could be prevented ifAmericans stopped smoking cigarettes (Cresanta, 1992, p. 439).
47. Hanks and Scardino (1996); Garnick (1994); Wingo et al. (1998).48. Breast cancer (cover story) (1991). Time, 137,42-49; Baines (1992).49. Lantz and Booth (1998).50. Lantz and Booth (1998).51. See Lantz and Booth (1998).52. Ellis (1994).53. Dolan, Lee, and McDermott (1997).

54. Harris et al. (1991).55. Dawes (1986; 2001).56. Think of 1,000 women. Thirty-six of them have breast cancer, and 33 of these thirty-six
(92 percent) are in the “high-risk” group. Thus, 33 out of 570 high-risk women willdevelop breast cancer, which is about 1 in 17. For information on how the risk ofdeveloping breast cancer depends on age, see Marshall (1993).
57. Hartmann et al. (1999); Hamm, Lawler, and Scheid (1999).
CHAPTER 6. (UN)INFORMED CONSENT
1. Matthews (1995; p. 19); see also Coleman (1987), on the role of statistics in thetherapeutic trial in nineteenth-century medicine.
2. Bernard (1865/1957, p. 137).3. See Matthews (1995, p. 141).4. Gawande (1999).5. Bursztajn et al. (1981, pp. 3-19).6. German-speaking readers may wish to look up www.cochrane.de7. Pomata (1998, p.xvi).8. Katz (1984, p. 46).9. Katz (1984, p. 61).
10. Katz (1984, pp. 90-100).11. Reagan and Novak (1989, cited in Eddy, 1996, p. 13).12. I rely here on Katz (1984, pp. 175-206).13. See Gawande (1999).14. Marshall (1996, p. 173).15. Hamm and Smith (1998).16. Kalet (1994).17. Center for the Evaluative Clinical Sciences Staff (1996).18. Eddy (1996, pp. 5, 319).19. See Center for the Evaluative Clinical Sciences Staff (1996, p. 135).20. Chang (2000).21. The U.S. Preventive Services Task Force Staff (1996, p. 123) writes in its report: “Even if
the need for treatment is accepted, the effectiveness of available treatments is unproven.Stage C [local extra-capsular penetration] and Stage D [metastatic] disease are oftenincurable, and the efficacy of treatment for Stage B [palpable, organ-confined cancer] isuncertain.”
22. Hanks and Scardino (1996).23. The recommendation of the U.S. Preventive Services Task Force Staff (1996, p. 119)
reads as follows: “Routine screening for prostate cancer with digital rectal examination,

serum tumor markers (e.g., prostate-specific antigen), or transrectal ultrasound is notrecommended.” The Canadian Task Force on the Periodic Health Examination (CTF)also recommends against the routine use of PSA. It concluded that the evidence was notsufficient to recommend that physicians discontinue the use of digital rectal exams inmen aged 50 to 70. The American Cancer Society, in contrast, recommends annualscreening with PSA starting at age 50, and annual screening with digital rectal examstarting at age 40.
24. This includes radical prostatectomy, radiation therapy, and hormone treatment; see U. S.Preventive Services Task Force Staff (1996). Although not a principal argument againstprostate cancer screening, the economic implications are interesting. The first year ofmass screening of all American men over the age of 50 would cost the country $12billion to $28 billion.
25. Gigerenzer (1996a); Hoffrage and Gigerenzer (1998).26. Mandel et al. (1993).27. Metsch et al. (1998).28. This strategy is also known as “delta R” and has been often proposed as the correct
strategy for estimating the degree of covariation between two dichotomous variables, suchas cause and effect or disease and symptom (McKenzie, 1994).
29. Independent evidence from experiments with laypeople confirms that there is little intra-individual consistency in diagnostic inferences with probabilities (Gigerenzer andHoffrage, 1995).
30. Eddy (1982).31. Berner (1997).32. His name has been changed.33. See also Koubenec (2000).
CHAPTER 7. AIDS COUNSELING
1. The case is reported in Stine (1999, p. 359).2. Busch (1994); Haley and Reed (1994).3. For more information on the issues discussed in this and the following paragraphs, see
Stine (1999).4. Stine (1999, p. 126).5. See Stine (1999, p. 31). The following cases are also reported in Stine, pp. 399-405.6. Stein et al. (1998).7. Cited in Stine (1999, p. 413).8. Altman (2000).9. Stine (1996, pp. 333, 338).
10. Stine (1999, p. 350).

11. Stine (1999, p. 358).12. Bundesamt für Gesundheit (BAG) in collaboration with the Eidgenössische Kommission
für Aids-Fragen (EKAF) (2000).13. Månsson (1990).14. Stine (1999, p. 388).15. Stine (1999, pp. 358, 389).16. All studies agree that false positives occur, but how often is less clear. This uncertainty has
several reasons, including: What constitutes a positive Western blot test has not beenstandardized (various agencies use different reagents, testing methods, and interpretationcriteria; see Stine, 1996, p. 335); the results of the repeated ELISAs and the Western blottest are not independent (that is, one cannot simply multiply the individual false positiverates of the tests to calculate the combined false positive rate; Spielberg et al., 1989); andthe higher the prevalence in a group, the lower the specificity seems to be for this group(Wittkowski, 1989). For instance, the German Red Cross achieved a combined (that is,ELISAs and Western blot) specificity for first-time blood donors of 99.98 percent(Wittkowski, 1989). This corresponds to a false positive rate of 2 in 10,000. From areview of the available data, Gigerenzer, Hoffrage, and Ebert (1998) estimated that thefalse positive rate is around 1 in 10,000. We also reviewed estimates of false positive rates,sensitivity, and prevalence.
The two principal methods of estimating the sensitivity and specificity of these testsare screening and blind proficiency testing. In screening tests, large numbers of serumsamples, for instance, from blood donors, are tested. Blind proficiency testing moreclosely resembles an experiment than does screening. Samples with and without HIVantibodies are sent to laboratories for analysis (the laboratories are not informed that theyare taking part in a study). Details and problems with determining the sensitivity andspecificity are reviewed in Schochetman and George (1994).
17. For the calculation of these estimates see Gigerenzer, Hoffrage, and Ebert (1998).18. This study is described in detail in Gigerenzer, Hoffrage, and Ebert (1998).19. Enquete Committee of the German Bundestag (1990); Ward (1994).20. Stine (1999, p. 177).21. The report of the Enquete Committee of the German Bundestag (1990) estimates the
positive predictive value to be less than 50 percent. See Gigerenzer, Hoffrage, and Ebert(1998).
22. See Chapter 14.23. Bundeszentrale für gesundheitliche Aufklärung (1988-1993).24. Bundeszentrale für gesundheitliche Aufklärung (2000).25. Bundeszentrale für gesundheitliche Aufklärung (1993).26. The analysis was performed by one of my students at the University of Chicago, Ken
Greif, in 1994.

27. Reported in Catalan and Pugh (1995).28. Stine (1999, pp. 378-380).
CHAPTER 8. WIFE BATTERING
1. Dershowitz (1996, p. 101).2. Dershowitz (1996, p. 105, italics in original).3. Dershowitz (1996, p. 104).4. Dershowitz (1996, pp. 101, 108).5. I. J. Good (1995, 1996), author of Good Reasoning and emeritus professor of statistics at
the Virginia Polytechnic Institute, seems to have been the first to point out the possibleconfusion between the probability that a husband will murder his wife given that he hasbattered her and the probability that a husband has murdered his wife given that he hasbattered her and that she was murdered by someone. I agree with Good’s argument, butam concerned about the way in which he represented the uncertainties. He choseprobabilities and odds, as is customary in his profession, rather than natural frequencies,which would have made it easier for readers to understand his compelling argument. Todemonstrate the difference, I summarize Good’s argument as he made it in the sixequations in his 1995 letter to Nature, using the corrected figures from his 1996 Natureletter. If you have difficulties following the argument in probabilities and odds, you areproving the very point I wish to make. So don’t be discouraged; the argument ispresented in natural frequencies in the text, where it should be straightforward enough tounderstand.
Good’s argument was that the relevant probability in the Simpson case is not p(G|Bat)but p(G|Bat and M), where G stands for “the husband is guilty” (that is, committed themurder in 1994), “Bat” means that “the husband battered his wife,” and “M” means that“the wife was actually murdered by somebody in 1994.”
Good based his calculations of p(G|Bat and M) on the odds version of Bayes’s rule:
posterior odds = prior odds × likelihood ratio,
which in the present case is
where stands for “the husband is not guilty.”Using the following six equations, marked Good-1 to Good-6, Good explained how
to estimate p(G|Bat and M). According to Dershowitz, the probability p(G|Bat) is 1 in

2,500 (Good used a slightly different estimate, 1 in 2,000, but this makes little differenceto the result):
p(G|Bat) = 1/2,500. (Good-1)
Therefore, the prior odds (O) are
O(G|Bat) = 1/2,499 ≈ 1/2,500. (Good-2)
Furthermore, the probability of a woman being murdered given that her husband hasmurdered her (whether he is a batterer or not) is unity, that is,
p(M|G and Bat) = p(M|G) = 1. (Good-3)
Because in the United States there are about 25,000 murders per year, a quarter ofthese women, and a population of about 250,000,000, Good estimated the probabilityof a woman being murdered by someone other than her husband as
p(M| and Bat) = p(M| ) ≈ 1/20,000. (Good-4)
From Equations Good-3 and Good-4 it follows that the likelihood ratio is about20,000/1; therefore the posterior odds can be calculated thus:
O(G|Bat and M) = 20,000/2,500 = 8. (Good-5)
That is, the probability that a murdered, battered wife was killed by her husband is
p(G|Bat and M) = 8/9. (Good-6)
Good added that he sent a copy of this note to both Dershowitz and the Los AngelesPolice Department and urged that Bayesian reasoning should be taught at the precollegelevel. I believe that Good’s persuasive argument could be understood more easily byexperts and ordinary people alike if the information were presented in naturalfrequencies, rather than probabilities and odds as in the six equations above.
6. Approximately one-quarter of the 25,000 people murdered in the United States each yearare female. For a population of about 250 million, half of whom are women, this meansthat about 6,250 women (one-quarter of 25,000) are murdered out of about125,000,000 women each year, which is 5 in 100,000. More precise estimates can bemade by adjusting for variables such as the woman’s age.
7. Dershowitz (1983, pp. xvi, xvii). On the relationship between baseball and statistics seeGigerenzer et al. (1989, Chapter 7).
8. See Ptacek (1999, pp. 4, 74).

9. The following discussion of facts and possible causes of spousal homicide is based in parton Daly and Wilson (1988).
10. Reiss and Roth (1993, p. 80).11. For this and the following results see Ptacek (1999, pp. 8, 24). Sherman (1992) reports
the results of randomized trials conducted by the police to discover what action—such asarrest and a night in jail for the man or simply verbal counseling for the couple—is mosteffective at reducing the chance of an assailant beating a victim after the police have leftthe scene.
12. See Ptacek (1999, p. 32).13. Reiss (1993, p. 69).14. This figure is the same for white and African American women. See the report of the
National Institute of Justice (Tjaden and Thoennes, 2000, and Koss, Koss, andWoodruff, 1991).
15. See Horne (1999).16. Violence against women increases and decreases according to changes in social and
political contexts. Before communism, Russian culture had, like many other cultures, along history and folklore in which women were believed to possess evil magical powersand to be sinful, which called for rules and punishments to control them. For instance,the Russian wedding custom in which the bride’s father passes a whip to her husbandseems to have lasted until the late nineteenth century. Atkinson (1977; cited in Horne,1999).
17. Oberlies (1997, p. 135).18. Fawcett et al. (1999).19. McWhirter (1999).20. Geary (2000, p. 65); A delicate question. (1999, 24 April). The Economist, 26.
CHAPTER 9. EXPERTS ON TRIAL
1. People v. Collins, 68 Cal.2d 319, *325; Koehler (1997).2. The reader may wonder why “dark clothing” did not appear in the chart, despite the fact
that both the victim and the witness reported this characteristic. The omission by theprosecution was not accidental; evidence had been introduced by the defense that JanetCollins wore light-colored clothing on the day of the crime. For details, see People v.Collins, 68 Cal.2d 319 and Koehler (1992).
3. People v. Collins, 68 Cal.2d 319, *325.4. Thompson and Schumann (1987); Balding and Donnelly (1994).5. Thompson and Schumann (1987).6. In the case of the AIDS counselors, the confusion is between two conditional
probabilities. However, because p(match) is practically identical with p(match|not guilty),

one can also rewrite the prosecutor’s fallacy as the confusion of two conditionalprobabilities. That is, the prosecutor’s fallacy corresponds to “p(not guilty| match) is thesame as p(match|not guilty).”
7. This is an expected value and does not mean that there are exactly two matches in thepopulation. There is some probability that there are zero, one, three, four, or morematches in the population.
8. People v. Collins, 68 Cal.2d 319, *331.9. Gigerenzer et al. (1989, Chapter 7).
10. Gigerenzer (1998); Schrage (1980).11. Both the probability and the frequency calculations assume that all people in the
population of suspects have traces of other people’s blood somewhere on their person orproperty (not necessarily on their boots). Such assumptions affect the size of thepopulation, but do not differentially affect the probability and frequency calculations.
12. Tribe, 1971 (cited in Koehler, 1997, p. 223).13. Faigman (1999).14. The term is from Faigman (1999, p. 198), who outlined 12 insights towards recovering
from innumeracy.
CHAPTER 10. DNA FINGERPRINTING
1. Later, however, the success of the police was overshadowed by one small discovery. Afterthe police had caught the murderer, they found out that he had been convicted in 1990of raping his 17-year-old sister, but was released early on probation on the basis of anexpert’s testimony that he would pose no further danger. However, the police had notentered his conviction into their computer database. If they had, the actual perpetratorwould have been a suspect in the first place, and the $2 million screening might havebeen unnecessary.
2. Stigler (1986); Porter (1986).3. See Jasanoff and Lynch (1998).4. Berry (1991).5. Faigman (1999, p. 85).6. Boyer (2000).7. Balding and Donnelly (1994).8. R. v. Adams [1996] 2 Cr. App. R. 467; see Redmayne (2001, p. 58).9. National Research Council (1996, p. 8).
10. Thompson (1993, p. 57).11. Hicks (1993, p. 55).12. Lempert (1991) reviews these and other cases of false positives in DNA matches; see also
Koehler (1993b).

13. Koehler, Chia, and Lindsey (1995).14. Koehler (1997).15. State v. Bethune (cited in Koehler, 1993b, p. 23).16. For a collection of quotations from legal transcripts see Koehler (1993a; 1993b; 1996).17. Frankfurter Allgemeine Zeitung, 14 April 1998, No. 86, p. 13.18. State v. Glover, Texas, 1992, see Koehler (1993b, p. 30).19. See Koehler (1993b, p. 28), for a collection of source probability errors in court.20. Balding and Donnelly (1994, p. 285).21. Koehler, Chia, and Lindsey (1995).22. Koehler (1993a, p. 229).23. Lindsey, Hertwig, and Gigerenzer (2001); Hoffrage et al. (2000); Krauss and Hertwig
(2000).24. Note that in the DNA literature, the term “frequentist” is often applied to frequencies
that are not natural frequencies; instead, like single-event probabilities, they refer to aparticular person or to a randomly drawn person. For instance, the law professor RichardLempert describes the reporting of the match probability in the courts thusly: “In theUnited States, experts typically give this probability in frequentist terms; for example,‘there is one chance in fifty thousand that a randomly selected Caucasian male wouldhave the same DNA profile as that found in both the evidence sample and the sampletaken from the defendant.’ ” (Lempert, 1991, pp. 305-306). Using natural frequencies, incontrast, the expert would say, “Out of every fifty thousand Caucasian males, one wouldhave the same DNA profile.” Unlike single-event statements, a statement in terms ofnatural frequencies directs one’s thoughts to the question: How many males can possiblyhave committed the crime? If we consider a city with 500,000 male inhabitants, we cansee that a DNA match by itself does not provide evidence beyond reasonable doubt: wecan expect that 10 men will have this profile.
25. Collins and Macleod (1991, p. 210).26. Collins and Macleod (1991, p. 215).27. Berry (1991). Jonathan J. Koehler (personal communication) described a Texas case
(State v. Griffith) in which the judge ruled that it was admissible to use a 50 percent priorprobability to generate posterior probabilities of paternity, even after Koehler hadtestified that to do so would mean that there were hundreds of people who could bedeemed more than 99 percent likely to be the father of a particular child. An appellatecourt upheld this judge’s ruling.
28. Daston (1981); Gigerenzer et al. (1989, Chapter 1).29. A delicate question. (1999, 24 April). The Economist, 26.30. This and the following examples are borrowed from Balding and Donnelly (1994). On
the problem of blood relatives and other sources of uncertainty, see Lempert (1991).31. See Berry (1991, p. 178) and Collins and Macleod (1991, p. 213).

32. Redmayne (1998).33. In 1998, Monica Lewinsky turned over to investigators a navy blue dress stained with
semen. DNA analysis revealed that the source of the semen was President Bill Clinton.34. Chivers (2000).35. [1997] 1 Cr. App. R. 369; cited in Redmayne (1998, p. 451) and Redmayne (2001, pp.
71-72).36. Koehler (1996, p. 877); see also Redmayne (1998, p. 451).
CHAPTER 11. VIOLENT PEOPLE
1. See Monahan (1981). This number refers to the cases in which a psychiatrist predictsfuture violent acts; that is, in only 1 out of 3 cases in which psychiatrists predict violentacts does one actually occur. The second error—to wrongly predict that there will be noviolent act—seems to occur in about 1 out of 10 cases (John Monahan, personalcommunication, 2000). The use of actuarial tools in risk assessment (see Monahan et al.,2001) may help to improve predictive accuracy.
2. See Grisso and Tomkins (1996, p. 928).3. Faigman (1999, p. 111).4. See, for example, Monahan and Wexler (1978). On communicating violence risk, see also
the work of Kirk Heilbrun (e.g., Heilbrun et al., 2000).5. Slovic, Monahan, and MacGregor (2000).6. The same effect of reference classes has been demonstrated experimentally by Gigerenzer,
Hoffrage, and Kleinbölting (1991). I would like to note that Slovic et al.’s explanationfor their fascinating results differs from mine: they try to explain the discrepancy by the“frightening images evoked by the frequency format” (p. 290), that is, by images ofharmful attacks. However, frequency judgments need not evoke more frightening imagesthan single-event judgments. The Prozac story (Chapter 1) illustrates such a case where asingle-event statement evokes more anxiety. The question of frightening images depends,I believe, on the reference class (e.g., psychiatrist’s patients versus patient’s sexualencounters) specified in the frequency judgment, not on frequency judgments per se.Frequency judgments can refer to any reference class.
7. Slovic and Monahan (1995).8. Slovic, Monahan, and MacGregor (2000). This result was replicated in a second study in
Slovic and Monahan (1995). Mazur and Merz (1994) report the same effect of responsescales in a medical judgment context, where the effect was almost as large amongexperienced clinicians as with clinically naive persons.
9. See Dawes (1994, pp. 89-90); for tools to improve accuracy see Monahan et al. (2001).10. Similar effects are known from psychophysics, see Parducci (1965).11. Schwarz, Hippler, Deutsch, and Strack (1985).

12. See Schwarz (1999); Schwarz and Hippler (1987).13. See Hansen (1996) and Spellman (1996).
CHAPTER 12. HOW INNUMERACY CAN BE EXPLOITED
1. Huff (1954/1993).2. Twain (1924, p. 246).3. Fahey, Griffiths, and Peters (1995).4. The physicians shall remain unnamed. I am grateful to Dr. Ingrid Mühlhauser for
drawing my attention to this leaflet. Another method to influence patient’s choice oftreatment is called “framing,” that is, communicating an outcome in terms of either theprobability of dying or that of surviving. For instance, McNeil et al. (1982) report thatthe preference for a therapy increased when its outcome was framed in terms of theprobability of surviving rather than dying. The size of framing effects, howerver, is notvery stable (Kühberger, 1998).
5. See Jain, McQuay, and Moore (1998). Desogestrel and gestodene are the mainingredients of many oral contraceptives.
6. Jain, McQuay, and Moore (1998).7. These numbers are themselves uncertain estimates; for instance, the risk of
thromboembolism for a woman on the pill ranges from 2 in 7,000 to 2 in 100,000 (Jain,McQuay, and Moore, 1998).
8. Siegrist (1997).9. The perils of percentages. (1998, April 18). The Economist, 84.
CHAPTER 13. FUN PROBLEMS
1. Laplace (1814/1951). On Laplace, see Gillispie (1997). The rule of succession can bederived from Bayes’s rule if one assumes that the prior probabilities are equal, as in thecase in which the two hypotheses “the sun will rise every morning” and “the sun will notrise every morning” are initially assigned equal probabilities. To illustrate, I show how theprobability of 2/3 (after one observed sunrise) can be obtained from the odds version ofBayes’s rule (see Chapter 8, footnote 5):
Here, H (for “hypothesis”) stands for “the sun will rise every morning” and not-H for“the sun will not rise every morning,” and D (data) for the observation that the sun roseonce (only one observation). Assuming uniform priors, p(H) = p(not-H) = 1/2, we get

The probability of observing the first sunrise, if H is true, is 1, that is, p(D|H) = 1. Theprobability of the same observation, if H is not true, is unknown. In order to get theresult of the law of succession, one has to make another assumption of equalprobabilities: p(D|not-H) = p(not-D|not-H) = 1/2. This results in
Because p(not-H|D) = 1 – p(H|D), we get p(H|D) = 2 – 2p(H|D), which is equivalent to
3p(H|D) = 2;
and finally p(H|D) = 2/3.2. The rule of succession can explain the false consensus effect (see Dawes, 1990). In one
study, students at Stanford University were asked to engage in activities such as walkingaround the campus wearing a big sign that said “Repent!” After each student hadcomplied or refused, he or she was asked to estimate the proportion of Stanford studentswho would comply. On average, those who had complied estimated that about 2/3 of theothers would also do so; those who refused estimated that only about 1/4 would comply.The difference between the two groups’ estimates was considered an egocentric biasbecause the students guessed what others would do on the basis of their own view of thesituation. However, a student most likely never has asked other students whether theywould be willing to walk around with this sign, but only knows what he or sheresponded. If a student’s own answer was “comply,” then the rule of succession dictatesthat she or he give a probability of 2/3 that the next student would also comply. This isabout equal to the average estimate given by the “compliers” in the study. If the student’sanswer was “refuse,” then the rule of succession dictates that she or he give a probabilityof 2/3 that the next student would also refuse, or a probability of 1/3 that the nextstudent would comply. This is in the same direction as the average estimate given by the“refusers” in the study. Thus, the false consensus effect can be seen as the product of arational process—the same used by Adam and Eve when they predicted that the sunwould rise on their second day in Paradise.
3. Hammerton (1973, p. 252).4. The irony is that Hammerton used what he called a “ ‘commonsense’ verbal argument”
(p. 252)—which was expressed in terms of natural frequencies—to explain the problemand its solution to the reader, but not the participants in his study.

5. Svenson, Fischhoff, and McGregor (1985, p. 119).6. The idea that skewed distributions can account for the fact that most drivers report that
they are better than average is developed in Lopes (1992) and Schwing and Kamerud(1988).
7. A different way to describe this phenomenon is to say that in the symmetrical distributionof Figure 13-3 (top) the average number (arithmetic mean) of accidents coincides withthe median number of accidents. (The median is the point that cuts the distribution intohalves, with 50 percent of the drivers above the median and 50 percent below.) In theasymmetrical distribution (bottom) the average and the median are different: the medianis 3 accidents, but the arithmetic mean is 4.5. This discrepancy can have puzzlingconsequences for expected utility maximization theories (which are based on thearithmetic mean rather than the median) when distributions are highly asymmetrical.Examples are the St. Petersburg paradox in humans (Lopes, 1981) and “adaptive coinflipping” in animals (Cooper, 1989; Gigerenzer, 1996b).
8. “Ask Marilyn,” Parade magazine, September 9, 1990, p. 15 (1990a), and December 2, p.25 (1990b). The Monty Hall problem was first stated in the American Statistician bySteve Selvin (1975a; 1975b).
9. See Granberg and Brown (1995); Krauss and Wang (2000).10. Tierney (1991). For the three letters quoted in the text, see vos Savant (1996). The
second letter was on the three prisoners problem, which is structurally very similar (seenext section).
11. Krauss and Wang (2000) derived these methods from the reports of successfulparticipants and showed empirically that perspective change and frequency judgmentsincreased the proportion of people who switch. There are other creative solutions. Oneperson said, “I would walk up to each door and try to smell the goat.” The answer to theMonty Hall problem can also be computed using Bayes’s rule. Assume the guest picksdoor 1. The probability p(car = 1) that the car is behind door 1 is 1/3 and is the same forthe other two doors. Now Monty opens door 3 and shows a goat. What is the probabilityp(car = 2|goat = 3) that the car is behind door 2 given that Monty opened door 3 andshowed a goat? In other words, what is the probability of winning the car if the guestswitches from door 1 to door 2? The answer can be calculated as follows: p(car = 2| goat= 3) = p(car = 2)p(goat = 3|car = 2)/[p(car = l)p(goat = 3|car = 1) + p(car = 2)p(goat =3|car = 2) +p(car = 3)p(goat = 3|car = 3)] = 1/3 × l/[l/3 × 1/2 + 1/3 × 1+1/3 × 0] = 2/3.
12. Friedman (1998).13. Mueser and Granberg (1999).14. Early versions of this problem appeared in Gardner (1959a; 1959b) and Mosteller
(1965), and Falk (1992) analyzes people’s intuitions about this problem.
CHAPTER 14. TEACHING CLEAR THINKING

1. Kohn, Corrigan, and Donaldson (2000).2. Schönhofer (1999). This means that roughly one in a thousand hospital patients is killed
by medication errors. There are more than 50,000 drugs already on the market, toomany for a physician to evaluate, plus a constant stream of new drugs. The number ofserious conditions in Germany due to medication errors is estimated at 120,000 to240,000 per year.
3. Chang (2000, p. 10).4. Chang (2000, p. 10).5. For instance, see discussion of People v. Collins (Chapter 9).6. Gigerenzer (1993, 2000).7. Reimer et al. (1997).8. In his work of science fiction, 1984, the writer George Orwell warned that Big Brother
would deprive people of their books, autonomy, and freedom. As yet there is no BigBrother to force us to believe in the illusion of certainty or ban us from reasoning aboutrisks. However, another writer of science fiction foresaw a more realistic and disturbingsociety. In Aldous Huxley’s Brave New World, no Big Brother is needed to deprive peopleof information and the ability to think; they simply have no desire to know. Instead ofwanting to understand their world, they have an almost boundless appetite for distractionand entertainment. Huxley’s work highlights one threat to the teaching of statisticalthinking: lack of awareness of uncertainty and the curiosity that comes with it.
9. In his seminal book, Cancer Wars (1996), Robert Proctor draws attention to the role oftrade associations in generating “doubt.” This section draws on his work (pp. 101-110).
10. Proctor (1999).11. Proctor (1998).12. Proctor (1998, p. 10).13. Proctor (1996, p. 107).14. Proctor (1996, p. 108).15. Proctor (1996, p. 110). The production of confusion and ignorance concerning the
health hazards of asbestos is strikingly similar (Proctor, 1996, pp. 110-122).16. Dehaene (1997, p. 115).17. E.g., Douglas and Wildavsky (1982); Fischhoff et al. (1981); Lopes (1987; 1992); Slovic
(1987); Tooby and Cosmides (1992).18. Mineka and Cook (1988).19. Hazards that have catastrophic potential, can get out of control, and have fatal
consequences are often called “dread” risks (Slovic, 1987).20. Reiss and Roth (1993).21. National Research Council (1996).22. U.S. Preventive Services Task Force Staff (1996).23. Center for the Evaluative Clinical Sciences Staff (1996).

24. Krauss, Martignon, and Hoffrage (1999).25. Sedlmeier (1999); Sedlmeier and Gigerenzer (2001)26. For details see Sedlmeier and Gigerenzer (2001).27. Daston (1988).28. See Gigerenzer (2000, Chapter 12).

INDEX
A note about the index: The pages referenced in this index refer to the page numbers in theprint edition. Clicking on a page number will take you to the ebook location that correspondsto the beginning of that page in the print edition. For a comprehensive list of locations of anyword or phrase, use your reading system’s search function.
absolute risk, absolute risk reduction, 35, 245breast cancer and, 59–60, 62, 74–75, 83–84and exploitation of innumeracy, 203–8
Accident Facts, 238adaptations, adaptiveness, 14
insight and, 45, 48–49in perceptual systems, 39–41
Adler, Isaac, 234adultery laws, 147advertising, see marketingAIDS (acquired immune deficiency syndrome), AIDS counseling, 17, 115–40, 165
comparisons between syphilis and, 118–19covert investigation of, 127–28definition of, 118financial costs of, 118–19, 139and illusion of certainty, 4, 7, 121–22, 131, 136, 139individual sessions and, 128–34information leaflets and, 138–39informed consent and, 94low-risk clients and, 123–24, 127–28, 133–39model session for, 136–38myths about, 121principal deficits in, 135–36prosecutor’s fallacy and, 154stigma of, 120–21on telephone, 140see also HIV, HIV testing

air travel, 17, 21, 31alcohol, alcoholism, 126, 238
violent behavior and, 188wife battering and, 147–48
Amador, Risueño d’, 87ambiguities:
AIDS and, 129breast cancer and, 70in illusion of certainty, 9–11and miscommunication of risks, 33–34of reference classes, 196violent behavior and, 185, 190
American Academy of Psychiatry and Law (AAPL), 187–89, 191–92American Association of Blood Banks, 178–79American Cancer Society, 30, 56, 65American Heart Association, 34, 79American Medical Association, 123American Psychiatric Association, 186, 193American Psychology-Law Society, 187–89, 192Andrews, Carol, 222arabic-numeral representations, 50–51Ariane rockets, risk of accidents for, 28–29Aristotle, 244–45Arkansas, HIV testing in, 123Asbestos Information Association, 233Australia, 57, 74–76, 205Austria, 147authority, 13–16, 20, 22averages, 214–17
Baby AIDS bill, 123Bandolier, 239Barefoot, Thomas, 186Barnard, Christiaan, 26–28, 34base-rate fallacy, 213–14base rates, see prevalencebase-10 system, 49–51base-12 system, 49base-20 system, 50

Bayes’s rule:AIDS and, 124–25colorectal cancer screening and, 108–9DNA fingerprinting and, 175in fun problems, 213and insight from outside, 45–47teaching clear thinking and, 239–42wife battering and, 143
Beer Institute, 233beliefs:
breast cancer and, 75–76, 80–82degrees of, 26–27, 212in fun problems, 212, 215and illusion of certainty, 13–14, 19–20
benefits, 83–85, 197of breast cancer screening, 55, 57–63, 70–76, 85, 91–92, 95, 99, 107, 112, 114, 205, 233of cholesterol-lowering drugs, 34–36and exploitation of innumeracy, 202–6, 208informed consent and, 91–92, 95–96, 98–99, 102, 107, 112, 114of prophylactic mastectomies, 83–84of prostate cancer screening, 102–3
Berlin, AIDS counseling in, 127, 135Bernard, Claude, 88–90Best Defense, The (Dershowitz), 141binary numbers, 50–51biopsies:
breast cancer and, 58, 64–65, 94, 96, 99informed consent and, 89, 94, 96, 99
blood samples, blood tests:expert witnesses and, 154, 156–57, 159informed consent and, 89see also specific blood tests
Bologna, Italy, 95Bombay, India, HIV testing in, 124Boston City Hospital, 121Boston Globe, The, 169–70Bray, Absalom F., 96breast cancer, breast cancer screening, 37, 55–86, 119
benefits of, 55, 57–63, 70–76, 85, 91–92, 95, 99, 107, 112, 114, 205, 233

common misunderstandings about, 57–58costs of, 55, 57, 63–71, 73–76, 85, 91–92, 95, 99, 106, 112–14, 233education and, 57, 72–73, 76, 78–79false negatives in, 47, 68–71, 74–75, 92false positives in, 5–6, 41–42, 44, 47, 64–67, 70–71, 73–75, 85, 92, 94, 105, 112–13,
229financial expense of, 63–64, 66, 70, 72, 92, 113–14goals of, 58, 92illusion of certainty in, 74–76, 82, 85, 99–100incidence of, 71–72, 74–78, 80informed consent and, 73, 76, 85, 91–100, 105–7, 109, 111–14innumeracy and, 41–44, 60, 76–86, 114, 202–6mortalities owing to, 71–73, 75, 78–80, 83–85, 92nonprogressive, 57, 66–67, 70, 73, 80, 85, 92other deadly diseases compared with, 77–80possible outcomes of, 45–48probabilities and, 5, 36–37, 41–44, 46–48, 85, 94, 109–10, 143–44, 154–55radiation-induced, 67–70Roberts on, 55–56, 62sensitivity of, 46–47, 74, 154–55specificity of, 74targeting the young for, 80–81teaching clear thinking and, 229, 233treatments for, 15–16, 18, 20–21, 58–70, 81–85, 92–99uncertainty in, 5–7, 15–17, 92for women 50and over, 61–62for women in their 40s, 61, 63–66
breast self-examinations, 56, 62–63, 72Brooks, Juanita, 151–52Bursztajn, Harold, 89
California:AIDS in, 121DNA fingerprinting in, 171expert witnesses in, 151–56wife battering in, 141–46
California Association of Crime Laboratory Directors, 167Canada, 56, 58, 61, 239

cancer, cancers, 67, 126and exploitation of innumeracy, 202–6teaching clear thinking and, 241, 244see also specific cancers
Cardano, Girolamo, 37cardiovascular disease, see heart diseaseCastro, José, 180category effect, 190–97Cellmark Diagnostics, 167, 172certainty, see illusion of certainty; uncertaintyChicago, 111.:
AIDS in, 139breast cancer and, 72–73, 80–81paternity testing in, 179
Chicago, University of, 124, 139, 242Chicago Tribune, 116–17Chile, wife battering in, 148Chiles, Lawton, 121–22China, Chinese, 30, 50cholesterol-lowering drugs, 34–36clinical breast examinations, 56, 62–63Clinton, Bill, 44, 123, 141Cloud, D.A., 195–96clouded thinking:
AIDS and, 124, 131breast cancer and, 41, 44colorectal cancer and, 105on DNA fingerprinting, 169–71, 176of expert witnesses, 158–59innumeracy and, 24–25, 37–38, 40–41teaching clear thinking and, 236
Cochrane Centers, 239cognitive illusions, 213–15Collins, Janet and Malcolm, 151–56, 158Colorado, informed consent in, 100color constancy, breakdowns of, 39–41colorectal cancer, 79, 206
false positives and, 105–6, 108–9informed consent and, 104–8

innumeracy and, 105–6, 109–10probabilities and, 104–10, 239screening for, 104–11, 239sensitivity and, 108–10
Columbia Journalism Review, 235comfort, 14, 20computational simplicity, 30–31, 45–48, 51computer tutorials, 241–44conditional probabilities, 33, 36–37, 43, 45–49, 51, 104–6, 108, 131, 145, 173–76, 183, 201,
213Condorcet, Marquis de, 178conflicts of interest, 113–14“Coping with HIV Disease,” 139coronary artery bypass surgery, 202–3Cosmopolitan, 120costs, 119, 197
of breast cancer screening, 55, 57, 63–71, 73–76, 85, 91–92, 95, 99, 106, 112–14, 233of colorectal cancer screening, 106–7and exploitation of innumeracy, 205–6, 208, 210informed consent and, 91–92, 95–96, 98–99, 102, 106–7, 112–14of prostate cancer screening, 102–3teaching clear thinking and, 233–35, 238–39, 244see also economics
Council for Tobacco Research, 234Court of Appeal, British, 171, 183Court of Appeals, Calif., 96courts of law:
DNA fingerprinting in, 158–59, 161–62, 164–65, 167–80, 182–83expert witnesses in, 151–59, 161, 165, 168, 170–77, 186frequentist position in, 28and informed consent, 96, 113and violent behavior, 186, 188, 195–96wife battering in, 141–49see also prosecutor’s fallacy
crime, crimes, crime solving:DNA fingerprinting and, 161–67, 169–77, 179–80, 182expert witnesses on, 151–58fingerprinting in, 11–13predicting violent behavior and, 185–86

wife battering and, 141–48cultures:
AIDS and, 120–21, 123DNA fingerprinting and, 178and ignorance of risks, 29, 32informed consent and, 98, 100innumeracy and, 26response categories and, 194–95social classes and, 72, 100, 146as source of illusion of certainty, 14–15, 17, 22teaching clear thinking and, 229violent behavior and, 186, 188, 194wife battering and, 146–48
Daimler-Benz Aerospace (DASA), 28Dallas, Tex., HIV testing in, 116–17, 140Daly, Martin, 146Dartmouth Atlas of Health Care, 101, 239Darwin, Charles, 12, 162Dawes, Robyn, 81death penalty, 182–83decision making:
breast cancer and, 63–71, 76, 84–85and exploitation of innumeracy, 202in fun problems, 217–22, 225and illusion of certainty, 17–18, 20–21motor vehicle accidents and, 31see also informed consent
Deen, Andrew, 171democracies:
availability of information in, 32ignorance of risks in, 29–32wife battering in, 145
depth perception, 9, 11Dershowitz, Alan M., 141–45, 149didanosine, 115, 119die, die rolls, 27–28, 37digital rectal examinations, 102–3disasters, fear of, 237–38

Disraeli, Benjamin, 201division of labor, 113DNA (deoxyribonucleic acid) fingerprinting, 161–83
chain of inference in, 162, 165–66, 171–72, 174, 179, 183clouded thinking on, 169–71, 176in courts of law, 158–59, 161–62, 164–65, 167–80, 182–83as failsafe, 13false positives in, 165, 167–69, 171–72, 174history of, 162–65innumeracy and, 169–70, 172–77insight on, 172–77in Nytsch case, 161–63, 179in paternity cases, 149, 163–64, 177–79privacy issues in, 181–82proficiency testing of, 167, 172reasonable population of suspects in, 161–62, 179–80subjective judgments in, 180teaching clear thinking and, 233, 238, 244uncertainty and, 6–7, 164–69, 173–77, 179–83in wife battering cases, 149
Douglas, Mary, 185Dreyfus, Alfred, 156drug abuse, 244
AIDS and, 3–4, 117, 120, 123, 127–28innumeracy and, 23–24
ductal carcinoma in situ, 57, 66–67, 80
ear infections, 89Ebert, Axel, 127–36, 138economics:
AIDS and, 118–19, 139breast cancer and, 63–64, 66, 70, 72, 92, 113–14colorectal cancer and, 107DNA fingerprinting and, 161and ignorance of risks, 30, 32illusion of certainty in, 14–15, 18–19informed consent and, 92, 95, 107, 111, 113–14innumeracy and, 202–5, 208–10in physician-patient interactions, 18–19

response categories and, 194–95wife battering and, 146–48see also health insurance
Eddy, David, 44, 101Edinburgh Breast Cancer Screening Project, 55education, 39, 201, 237–38
AIDS and, 118, 121, 138–40breast cancer and, 57, 72–73, 76, 78–79informed consent and, 98, 104for physicians, 17–18, 94see also teaching clear thinking
ELISAs (enzyme-linked immunoabsorbent assays), 4, 117–18, 121–22, 124, 126, 130–31,135, 137, 231–32
Elizabeth I, Queen of Great Britain, 99emotions:
AIDS and, 116breast cancer and, 60, 62, 64–65, 71, 73, 75–81, 84, 86, 91–94, 97, 113and exploitation of innumeracy, 207and illusion of certainty, 14–15, 18–20informed consent and, 91–95, 97–98, 103, 113mind tools and, 230in physician-patient interactions, 18–21relative risks and, 34see also psychology
English language, numeric representation in, 49–50Enlightenment, 94, 178Environmental Protection Agency, 235errors, 178
in breast cancer screening, 41–42, 44, 47, 99in DNA fingerprinting, 165–71, 180in fun problems, 219in HIV testing, 3–4, 7, 25, 116–17, 121–22, 124–27, 129–40and illusion of certainty, 15informed consent and, 99innumeracy and, 28–29mortalities owing to, 17, 21see also false negatives; false positives
Essen, Germany, 92–93ethics, 36, 120–21, 128

Euripides, 96evidence-based medicine, 16, 90evolutionary learning, 39, 237–38experimentation, reconciliation between statistics and, 88experts, expert witnesses:
in Collins case, 151–56, 158in courts of law, 151–59, 161, 165, 168, 170–77, 186DNA fingerprinting and, 161, 165, 168, 170–71innumeracy and, 154–55, 159, 170, 202–4teaching clear thinking and, 240uncertainty and, 153, 159violent behavior and, 186–97
false negatives, 46–47in breast cancer screening, 47, 68–71, 74–75, 92in DNA fingerprinting, 167in HIV testing, 134–35, 138–39, 231–32
false positives, 18in breast cancer screening, 5–6, 41–42, 44, 47, 64–67, 70–71, 73–75, 85, 92, 94, 105,
112–13, 229in colorectal cancer screening, 105–6, 108–9in DNA fingerprinting, 165, 167–69, 171–72, 174in HIV testing, 4, 7, 25, 94, 116–17, 121–22, 124–27, 129–40, 165, 229informed consent and, 92, 94, 103, 105–9, 112–13
fears, fears:informed consent and, 111innumeracy replaced by, 76–81sources of, 237teaching clear thinking and, 236–38
fecal occult blood tests (FOBTs), 104–9Federal Bureau of Investigation (FBI):
DNA fingerprints used by, 164, 167fingerprints used by, 12–13, 163on wife battering, 142
Federal Center for Health Education, German, 138Federal Constitutional Court, German, 172–73Federal Crime Bureau, German, 163feminists, 91–92see also women

Fermat, Pierre, 37Feynman, Richard, 50fingerprints, fingerprinting, 181
with DNA, see DNA fingerprintinghistory of, 12–13, 162–63and illusion of certainty, 11–13
First Night in Paradise problem, The, 211–13Fisher, Sir Ronald, 88Florida:
breast cancer screening in, 57DNA fingerprinting in, 182HIV testing in, 115–16, 121–22, 125
food, 13–14Food and Drug Administration, 101, 140, 231France, French, 49
expert witnesses in, 156HIV testing in, 135numeric representation in, 50weather forecasting in, 29
Franklin, Benjamin, 3, 231–33, 245Franklin’s law, 3, 7, 12, 24–25, 38
for clear thinking, 231–33, 245frequencies:
breast cancer and, 76–78, 82natural, see natural frequenciesprobabilities and, 7, 26, 28, 33–34relative, 152, 190, 240–41risks and, 7–8, 26, 28–29, 33–34, 48, 51
Freud, Sigmund, 234fun problems, 211–27
base-rate fallacy in, 213–14The First Night in Paradise, 211–13Monty Hall, 217–25playing with representations in, 227on safe driving, 214—17Three Prisoners on Death Row, 223–27
Galton, Sir Francis, 12–13, 162gambling, 37

Gawande, Atul, 99gays, 120, 122–23, 126geographical destiny, 101–2German Association of Psychology, 128Germany, German, 29–31, 91–93
AIDS in, 124, 127–36, 138–39breast cancer in, 42–44, 55–56, 65, 67, 76, 92–93DNA fingerprinting in, 161–63, 168, 172–77, 179expert witnesses in, 156–58illusion of certainty in, 14–15innumeracy in, 23–24lung cancer research in, 30, 234medical errors in, 229motor vehicle accidents in, 31numeric representation in, 50response categories and, 194spousal abuse in, 148teaching clear thinking in, 240, 242–43violent behavior in, 186weather forecasting in, 29
Giuliani, Rudolph, 102, 229Global Climate Coalition, 233–34Glover, Billy, 170Gothenburg, Sweden, 61Gould, Robert, 120Graham, Billy, 120Great Britain, 213
DNA fingerprinting in, 163–64, 171, 177, 180, 183exploitation of innumeracy in, 202–3, 207fingerprinting in, 12, 162mad cow disease in, 14–15motor vehicle accidents in, 31paternity suits in, 177
Greece, 31Guide to Clinical Preventive Services, 238–39guilt probabilities, 153–54, 158, 166
Hacking, Ian, 32, 37Hammerton, M., 213

Harvard University, 89, 142, 144, 181health care, health care system, health agencies, 16–17, 44
errors of, 17, 21, 229evidence-based, 16, 90in exploiting innumeracy, 202–7informed consent and, 113–14and ignorance of risks, 29–30teaching clear thinking and, 229–36, 238–39, 241see also informed consent; physicians, physician-patient relationships; treatments; specific
disordershealth insurance:
AIDS and, 123for breast cancer screening, 65, 70DNA fingerprinting for, 181
heart disease, 100–101and exploitation of innumeracy, 202–5informed consent and, 101linkage between smoking and, 30women’s risk of, 34–36, 77–80
heart transplants, 26–27, 34Helmholtz, Hermann von, 11heroin addicts, 23–24Hersh, Seymour, 146Hertwig, Ralph, 172Hicks, John W., 167Hill, Austin Bradford, 88Hinton, W.Va., AIDS in, 120Hippasus of Metapontum, 49Hippocrates, 87Hiroshima, cancers among survivors of, 67Hispanics, 57, 171HIV (human immunodeficiency virus), HIV testing, 13, 100, 121–40, 145, 154
drugs used for, 115, 119false positives in, 4, 7, 25, 94, 116–17, 121–22, 124–27, 129–40, 165, 229home-based, 140involuntary, 123–24meaning of positive result in, 124–26mutations and changes of, 119, 232populations with highest risk of, 123

strains of, 118, 138teaching clear thinking and, 229, 231–33transmission of, 119–20, 122–23uncertainty in, 3–4, 7, 25, 128–32, 136, 138–39voluntary, 123see also AIDS, AIDS counseling
Hoffrage, Ulrich, 42–43, 109–10homicides, 195–96
DNA fingerprinting and, 161–63, 165, 167, 169, 171–77, 179expert witnesses on, 156–58prediction of, 185–86, 188wife battering and, 141–48
hormone replacement therapy, 18, 21and exploitation of innumeracy, 205–7
How to Lie with Statistics (Huff), 201Hudson, Rock, 120Hume, David, 48
Illinois:breast cancer screening in, 72–73, 80–81HIV testing in, 115, 123, 139
illusion of certainty, 9–22and AIDS, 4, 7, 121–22, 131, 136, 139and authority, 13–16, 20, 22in breast cancer screening, 74–76, 82, 85, 99–100in DNA fingerprinting, 167–69, 172, 183and Franklin’s law, 12, 38, 231and informed consent, 17–18, 20–21, 98–100and innumeracy, 24–25and Kant, 21–22in perceptual systems and, 9–11, 14and physicians, 10, 15–21and risks, 14, 16, 18, 20, 30sources of, 14–15, 17, 22and teaching clear thinking, 231–33, 245and technology, 11–13
immune system, 118–19, 232indifference, principle of, 178, 212–13information leaflets:

AIDS counseling and, 138–39on breast cancer, 74–76, 85, 205and exploitation of innumeracy, 205–7
informed consent, 87–114and anatomy of the medical mind, 107–11asking questions for, 98, 100–102breast cancer and, 73, 76, 85, 91–100, 105–7, 109, 111–14colorectal cancer and, 104–8difficulty in achievement of, 111–14evidence-based medicine and, 90geographical destiny and, 101–2and illusion of certainty, 17–18, 20–21, 98–100innumeracy and, 94–95, 98, 105–6, 114, 205–6Iphigenia case and, 96–97law and, 96, 113prostate cancer and, 101–4rareness of, 98Reagan and, 97–98
Innocence Project, 164innumeracy, innumerates, 23–38, 40–44, 197
AIDS and, 131, 135–36breakdown of color constancy compared to, 40–41breast cancer and, 41–44, 60, 76–86, 114, 202–6clouded thinking and, 24–25, 37–38, 40–41colorectal cancer and, 105–6, 109–10DNA fingerprinting and, 169–70, 172–77expert witnesses and, 154–55, 159, 170, 202–4exploitation of, 201–10in funding issues, 202–5in fun problems, 213–14, 219increasing profits with, 208informed consent and, 94–95, 98, 105–6, 114, 205–6numeric representation and, 110physicians and, 25, 41–44, 94–95, 98, 105–6, 109–10, 114, 205–7presenting losses as gains to, 209–10raising anxiety among, 207replaced by fear, 76–81replaced by insight, 42–44, 51, 86, 114, 172–77, 214, 245risks and, 24–37, 40, 201–8

in selling treatments, 202, 205–7teaching clear thinking and, 230, 233, 240, 245
Innumeracy (Paulos), 23Inquisition, 244–45insight, 37–51
AIDS and, 135breast cancer and, 42–44, 86clouded thinking replaced by, 37–38on DNA fingerprinting, 172–77in fun problems, 214and importance of numeric representation, 49–51innumeracy replaced by, 42–44, 51, 86, 114, 172–77, 214, 245from outside, 45–49, 51teaching clear thinking and, 240, 245
Institute of Medicine, 17intelligence, 214–15International AIDS conferences, 121Iowa, informed consent in, 101Iphigenia case, 96–97Ito, Lance, 141, 183
Jarvis, William Charles, 229Jefferson, Thomas, 229Jeffreys, Sir Alec, 163Johnson, Magic, 120joint probabilities, 152, 157 Jurassic Park, 164
Kaczynski, Theodore, 164Kansas, DNA fingerprinting in, 171Kant, Immanuel, 21–22, 94, 246Katz, Jay, 15–16, 89, 95–96, 98Koehler, Jonathan, 167Kohl, Helmut, 14Kokomo, Inc., AIDS in, 120
Landers, Ann, 116–17, 126Laplace, Pierre-Simon, Marquis de, 87, 151, 178, 212law, see courts of law Legitimacy Act, 177Liberace, 120Lifecodes Corporation, 180–81

life expectancies:breast cancer and, 57, 59–60informed consent and, 96, 103
life insurance, 14, 123Lindsey, Sam, 172Los Angeles, Calif.:
expert witnesses in, 151–56wife battering in, 141–45
Louis, Pierre-Charles-Alexandre, 87, 90Louisiana, HIV testing in, 123lumpectomies, 58, 64, 66, 70, 83, 97lung cancer:
linkage between smoking and, 28, 30, 234–36mortalities owing to, 79, 235
MacGregor, D. G., 187–89, 191–93mad cow disease, 14–15, 196Maine, informed consent in, 101mammograms, see breast cancer, breast cancer screeningmarijuana users, 23–24marketing:
and exploitation of innumeracy, 208–10and ignorance of risks, 29–30illusion of certainty in, 14–15, 18and miscommunication of risks, 36response categories and, 194–95teaching clear thinking and, 233–36
Massachusetts, wife battering in, 146Massachusetts Institute of Technology, 181mastectomies, 58, 64, 66, 70, 96–99
informed consent and, 92–94, 96–97prophylactic, 81–85, 92
Max Planck Institute for Human Development, 40Mayo Clinic, 83–85media:
AIDS and, 116–118, 120, 136on breast cancer, 74, 76–77, 80–81on DNA fingerprinting, 164, 169–70and exploitation of innumeracy, 205–6

on fun problems, 217–20informed consent and, 102on prostate cancer, 79, 102teaching clear thinking and, 235on wife battering, 141young targeted by, 80–81
Medical Choices, Medical Chances (Bursztajn et al.), 89medical errors, mortalities owing to, 17, 21, 229medicine, see health care, health care system, health agencies; physicians, physician-patient
relationships; treatments; specific disordersmen, 79–80
AIDS and, 116–17, 120–23, 125–26, 130–31, 140informed consent and, 101–4in medicine, 90–91see also prostate cancer; wife battering
metric system, 49Metropolitan Police Forensic Science Laboratory, London, 164Mexico, 148, 210Michigan, breast cancer screening in, 81–82Miller, Kevin, 50mind tools, 36–38, 183
AIDS and, 138in communication of risk, 38natural frequencies and, 37–38, 111teaching clear thinking and, 230, 233, 240–41, 245see also Franklin’s law
Mitchell, Byron, 12–13Mkhize, Zweli, 121Monahan, John, 186–89, 191–93Monty Hall problem, The, 217–25Morges, Switzerland, 72motor vehicles, motor vehicle accidents:
in fun problems, 214–17and ignorance of risks, 30–32teaching clear thinking and, 233, 238
Munich, University of, 242
Nagasaki, cancers among survivors of, 67Nalebuff, Barry, 222

Napoleon I, Emperor of France, 32National Cancer Center Research Institute, 235National Cancer Institute, 56National Commission on Excellence in Education, The, 201National Council on Aging, The, 79 National Enquirer, 235National Institute of Justice, 13National Institutes of Health, 63 National Report, 147National Research Council, 161, 164–65, 238National Safety Council, 238National Weather Service, 29natural frequencies, 36–38
adaptiveness of, 45, 48–49AIDS and, 125, 131, 135, 137Bayes’s rule for, 45–46breast cancer and, 6, 37, 41–44, 144clouded thinking and, 37–38colorectal cancer and, 104–11computational simplicity of, 45–46, 48, 51DNA fingerprinting and, 173–77, 183expert witnesses and, 155–56, 158and exploitation of innumeracy, 208in fun problems, 214–16, 220, 225–26informed consent and, 91, 104–11and insight from outside, 45–46teaching clear thinking and, 240–42, 245violent behavior and, 187–90, 193, 196–97wife battering and, 143–45
natural sampling, 48Necker cubes, 9–10Netherlands, breast cancer screening in, 65Neufeld, Peter, 164New York:
AIDS in, 123, 139DNA fingerprinting in, 164rape cases in, 182
New Yorker, The, 99New York Times, The, 218–19Nixon, Richard, 146nonage, 21–22

nonprogressive breast cancer, 57, 66–67, 70, 73, 80, 85, 92normalization, 48North Carolina:
breast cancer screening in, 81informed consent in, 100–101wife battering in, 146
number needed to treat (NNT), 35–36and breast cancer, 59–60, 74–75, 84and exploitation of innumeracy, 204
numeric representation, 45–51, 192–94colorectal cancer and, 106, 110computations done by, 45–48external, 50–51importance of, 49–51response categories and, 193–94violent behavior and, 187, 190, 192–93
Nytsch, Christina "Nelly,” 161–63, 179, 186
odds, 218–27Ohio, AIDS in, 120–21Oklahoma, informed consent in, 100Oldenburg, Germany, 161–63, 179Oliver, Richard, 145–46Ontario Cancer Registry, 77open-ended response formats, 195–96oral contraceptives, 207
Parade, 217–20Pascal, Blaise, 37paternity issues:
DNA fingerprinting in, 149, 163–64, 177–79wife battering and, 148–49
patients, see physicians, physician-patient relationshipsPaulos, John Allen, 23–24Pelhem, Charles, 146penicillin, 36, 118People v. Collins, 152–56, 158percentages:
as historically recent, 49

probability of violent behavior expressedin, 190–91response categories and, 194teaching clear thinking and, 240
perception, perspectives:color constancy in, 39–41in fun problems, 220–21, 226–27in illusion of certainty, 9–11, 14
pharmaceutical firms:and exploitation of innumeracy, 208and illusion of certainty, 18–19relative risks in reporting of, 36
Philosophical Essay on Probabilities, A (Laplace), 151physicians, physician-patient relationships, 40–44, 46, 165, 183
ages of, 110AIDS and, 115–17, 126–28, 130–33, 140anatomy of minds of, 107–11breast cancer and, 15–16, 20–21, 41–44, 55–56, 63, 65–66, 71–72, 74, 81–83, 85–86,
91–95, 97, 99, 105, 109, 111–14colorectal cancer and, 104–10continuing education for, 17–18, 94different or opposing goals in, 20–21different visions of, 87–90, 110evidence-based medicine and, 90in history, 87–90, 95horizontal vs. hierarchical model of, 95illusion of certainty in, 10, 15–21informed consent and, 87–114innumeracy and, 25, 41–44, 94–95, 98, 105–6, 109–10, 114, 205–7prostate cancer and, 101–3on responsibility, 16–21risk discussions in, 16, 18–20, 44, 100–101suits against, 71, 86, 95–96, 111, 113teaching clear thinking and, 239–40, 244–5testing effectiveness of, 87–88uncertainty in, 19–20unquestioning trust in, 95
placebos, placebo effect, 19–20, 34–35points of similarity, 12

Poisson, Denis, 178politics, politicians, public policy, 197
breast cancer and, 56expert witnesses and, 159illusion of certainty in, 14–15, 17informed consent and, 96, 98innumeracy and, 23–24, 210teaching clear thinking and, 235, 245wife battering and, 147
Ponce, Vilma, 180Portugal, 31positive predictive value, 128–29, 131–37, 154pravastatin sodium, 34–35preparedness, fear and, 237–38prevalence, 48, 81
AIDS and, 124–25, 127–37DNA fingerprinting and, 178–79informed consent and, 108–9
Preventive Services Task Force, 56, 103, 238–39privacy issues, 181–82probabilities, 5–7
adaptiveness of, 45, 48–49AIDS and, 124–25, 128, 131, 135–36breast cancer and, 5, 36–37, 41–44, 46–48, 85, 94, 109–10, 143–44, 154–55colorectal cancer and, 104–10, 239computational simplicity of, 45–48, 51conditional, 33, 36–37, 43, 45–49, 51, 104–6, 108, 131, 145, 173–76, 183, 201, 213in DNA fingerprinting, 6–7, 165–66, 169–81, 183expert witnesses and, 152–58frequencies and, 7, 26, 28, 33–34in fun problems, 211–13, 219, 225guilt, 153–54, 158, 166as historically recent, 49informed consent and, 94, 100, 104–10, 112innumeracy and, 26–29, 33–34, 36–37, 208and insight from outside, 45–46joint, 152, 157prior, see prevalencerandom match, 154, 158, 165–66, 169–74, 180–81, 183, 230

risks and, 26–28, 33–34, 51single-event, 33–34, 36, 155, 185, 187–90, 195–96, 201, 208source, 166, 169–72, 174, 180subjective, 26–27teaching clear thinking and, 240–42, 244–45versions of, 26–29violent behavior and, 185, 187–93, 195–97in wife battering, 143–46
Proctor, Robert, 236propensities, 26–29prophylactic mastectomies, 81–85, 92prosecutor’s fallacy:
in Collins case, 153–55, 158DNA fingerprinting and, 166, 183in Wuppertal case, 157–58
prostate cancer, 79informed consent and, 101–4screening for, 102–4, 229, 233
prostate-specific antigen (PSA) tests, 102–3, 229Prozac, side effects of, 4–5, 7–8, 25, 32–33, 185, 189psychology, 185–87
breast cancer and, 63–71, 113in courts of law, 159DNA fingerprinting and, 164–65, 183fun problems and, 215needed by technology, 7–8in physician-patient interactions, 20and side effects of Prozac, 4–5, 7–8, 185teaching clear thinking and, 237violent behavior and, 186–87, 194see also emotions
Pythagoras, 49
Quetelet, Adolphe, 87
radiation, radiation therapy: age at time of exposure to, 68–69breast cancer and, 58, 67–70, 73, 97informed consent and, 97, 102–3for prostate cancer, 102–3

radiologists, 69–70, 94, 111–14randomized trials:
breast cancer and, 58–63, 67and exploitation of innumeracy, 203informed consent and, 88
random match probabilities, 154, 158, 165–66, 169–74, 180–81, 183, 230rape, rapes, 146–47
DNA fingerprinting and, 161–64, 170–77, 179, 182Reagan, Nancy, 97–98Reasonable Doubts (Dershowitz), 142, 145reference classes:
AIDS and, 126frequencies and, 28, 33and side effects of Prozac, 7–8, 185, 189violent behavior and, 189–90, 196–97
Reformation, 91, 244relative frequencies, 152, 190, 240–41relative risks, relative risk reduction, 33–36, 197, 201–2, 205, 245
breast cancer and, 59–62, 74–75, 83–85and exploitation of innumeracy, 202–7informed consent and, 91
reliability, 193repeated play, 221–22, 227representation training, 241–44response categories:
as cues, 193–95judgments influenced by, 190–97in predicting violent behavior, 190–96
responsibility, 16–21Rhode Island Hospital, 121Risk and Culture (Douglas and Wildavsky), 185
risks:absolute, see absolute risk, absolute risk reductionAIDS and, 25, 122–28, 130–31, 133–40breast cancer and, 37, 44, 59–62, 67–68, 71, 74–75, 77–85, 205colorectal cancer and, 109communication of, 7–8, 16, 18–20, 25–26, 32–38, 40, 59–60, 75, 86, 111, 126–27,
135–37, 139, 172, 183, 187, 196, 201–2, 230, 239

and degrees of belief, 27DNA fingerprinting and, 172, 183frequencies and, 7–8, 26, 28–29, 33–34, 48, 51in fun problems, 214, 227of heart disease, 34–36, 77–80ignorance of, 25–26, 29–32, 37, 76, 85, 205, 233–39and illusion of certainty, 14, 16, 18, 20, 30and importance of numeric representation, 49informed consent and, 89, 91, 94, 96, 99–101, 109, 111innumeracy and, 24–37, 40, 201–8in negative outcomes, 26physician-patient interactions on, 16, 18–20, 44, 100–101probabilities and, 26–28, 33–34, 51propensities and, 27relative, see relative risks, relative risk reductionresponse categories and, 196and right to clear information, 36and side effects of Prozac, 7, 25, 32–33as simple calculation, 30–31teaching clear thinking and, 230, 233–41, 244uncertainty and, 26–28violent behavior and, 186–88, 190, 192–96
rituals, 18–20, 93Roberts, M. Maureen, 55–56, 62Robinson, E. A., 211roman numerals, 51rule training, 241—43Russian Federation, 147
safety, 14, 17, 21, 31Salt Lake City, Utah, HIV testing in, 137–38San Francisco, Calif., 146scandal of philosophy, 37Scheck, Barry, 164Schumann, Edward, 154Schwarz, Norbert, 194Sciences of the Artificial, The (Simon), 39scientific method, 88Scotland:

breast cancer screening in, 55, 58DNA fingerprinting in, 180
Scotland Yard, 162Seattle, Wash., 195Sedlmeier, Peter, 241Semmelweis, Ignaz, 88sensitivity:
of breast cancer screening, 46–47, 74, 154–55of colorectal cancer screening, 108–10of HIV tests, 124–27, 129–37, 139, 154informed consent and, 94, 100, 108–10
Settle, J., 146sexual abuse, 188, 195–96sexuality, 3–5
AIDS and, 3–4, 117–18, 120–23, 126, 131, 139, 231response categories and, 194and side effects of Prozac, 4–5, 7–8, 33, 185wife battering and, 142, 147–49
shared decision making, see informed consentShepard, Roger, 10–11sigmoidoscopy, 107Silent World of Doctor and Patient, The (Katz), 89Simon, Herbert A., 39Simpson, Nicole Brown, 141–43, 146, 169Simpson, O. J., 164–65
DNA fingerprinting and, 165, 167, 169, 171–72, 182–83wife battering allegations against, 141–46, 149
single-event probabilities, 33–34, 36, 155, 185, 187–90, 195–96, 201, 208skin cancers, 67Slaytor, Emma, 74Slovic, Paul, 186–89, 191–93smoking, 28–30
breast cancer and, 56and ignorance of risks, 29–30linkage between lung cancer and, 28, 30, 234–36teaching clear thinking and, 234–36, 238
social workers, 129–30, 133–34societies, see culturesSociety for Forensic Medicine, 168

source probabilities, 166, 169–72, 174, 180South Africa, AIDS in, 121Soviet Union, spousal homicides in, 147specificity, 47
of breast cancer screening, 74of HIV tests, 124, 126–27, 130–31, 134–35, 139informed consent and, 94, 100
State v. Glover, 170statistics, statistical data:
in courts of law, 151–59informed consent and, 87–88, 90, 94, 99, 110relationship between baseball and, 145, 233
Stern, 76–77stigma, 120–21subjective probabilities, 26–27succession, rule of, 212Supreme Court, Calif., 152–53, 155–56Supreme Court, U.S., 186Surgeon General’s Report, 30, 235surgery:
and exploitation of innumeracy, 202–3informed consent and, 92–94, 96–97, 101–3teaching clear thinking and, 239see also specific procedures
Sweden, 58–62, 92, 114Switzerland, 72, 123, 208syphilis, 118–19
teaching clear thinking, 229–46communication and reasoning in, 239–41computer tutorials in, 241–44fears and, 236–38Franklin’s law in, 231–33, 245helpful sources for, 238–39representations in, 241–44risks and, 230, 233–41, 244
technology, technologies, 7–8DNA fingerprinting and, 158, 162–65, 169, 181–83and illusion of certainty, 11–13

informed consent and, 91, 94motor vehicle accidents and, 31teaching clear thinking and, 230, 233, 238, 244–45
television watching, 194terrorism, 31tests, testing:
informed consent and, 89–107, 109, 111–13teaching clear thinking and, 239, 241, 244see also specific tests
Texas:adultery laws in, 147DNA fingerprinting in, 168, 170–71predicting violent behavior in, 186
Thompson, William, 154, 167three-doors problem, 217–25Three Prisoners on Death Row problem, 223–27thromboembolisms, 207thumb, rule of, 146 Time, 80Tobacco Institute, 234–35trade associations, 233–35treatments:
AIDS and, 115–16, 119for breast cancer, 15–16, 18, 20–21, 58–70, 81–85, 92–99evidence-based medicine and, 90and exploitation of innumeracy, 202–7for heart disease, 202–3informed consent and, 88–104for prostate cancer, 101–3teaching clear thinking and, 229, 239see also number needed to treat
“Turning the Tables” (Shepard), 10–11
Unabomber, 164uncertainty, 3–28
breast cancer screening and, 5–7, 15–17, 92communication of, 7, 19–20, 183DNA fingerprinting and, 6–7, 164—69, 173–77, 179–83expert witnesses and, 153, 159external representations of, 40

in fun problems, 211, 222–23HIV and, 3–4, 7, 25, 128–32, 136, 138–39and ignorance of risks, 30, 32informed consent and, 88–90, 92, 98–101, 111innumeracy and, 23–27, 29, 33, 40law and, 159learning to live with, 22and miscommunication of risks, 33in physician-patient interactions, 19–20probabilities and, 26–27, 33, 49response categories and, 193–94risks and, 26–28and side effects of Prozac, 4–5, 7–8, 33teaching clear thinking and, 230–31, 233, 235, 239–41, 244–45as threat, 19violent behavior and, 186–87, 194–95see also illusion of certainty
unconscious, unconscious inference, 11, 13Uniform Crime Reports for the United States and Its Possessions, 143–44United States:
AIDS in, 115–18, 120, 123, 137–39breast cancer screening in, 56–58, 65, 67, 72–73, 75–76, 78, 114death penalty in, 182–83DNA fingerprinting in, 164–65, 167–71, 183evidence-based medicine in, 90expert witnesses in, 151–56, 159fingerprinting in, 12–13, 163, 181ignorance of risks in, 29–32motor vehicle accidents in, 31numeric representation in, 50paternity testing in, 179physicians in, 95–96prostate cancer in, 79, 101–2syphilis epidemic in, 118teaching clear thinking in, 242–43trade associations in, 233–35violent behavior in, 186, 195wife battering in, 141–47
unknown hazards, fear of, 238

urologists, 101–2
Vermont, informed consent in, 101Veterans Administration (VA) Medical Centers, 137–38Victoria, Queen of Great Britain, 201violent behavior, 185–97
and courts of law, 186, 188, 195–96experts and, 186–97prediction of, 185–96response categories in, 190–96see also crime, crimes, crime solving; homicides; rape, rapes; wife battering
Virginia, HIV testing in, 3–4, 130vos Savant, Marilyn, 217–20
Ward, Jeanette, 74Washington, 57, 195Washington, D.C., 234Washkansky, Louis, 26–27, 34weather forecasting:
innumeracy and, 23, 29and miscommunication of risks, 33–34probabilities in, 190uncertainty in, 186
Weir, Bruce, 183Wells, H. G., 23, 201, 245–46Western blot (WB), 4, 118, 121–22, 124, 126, 130–31, 135, 137, 231West of Scotland Coronary Prevention Study, 34“What Is Enlightenment?” (Kant), 21–22White, Ryan, 120“Whose Body Is It, Anyway?” (Gawande), 99wife battering, 141–49
in larger context, 145–49predicting violent behavior and, 186Simpson case and, 141–46, 149
Wildavsky, Aaron, 185Wilson, Margo, 146window periods, 131, 134, 139women:
AIDS and, 3–4, 7, 25, 115–16, 120–22, 125, 129–30, 132–34

cancers in, see breast cancer, breast cancerscreening heart disease risk in, 34–36, 77–80informed consent and, 91–100, 105–7, 111–13violent behavior and, 187–90see also wife battering
World Health Organization (WHO), 16–17, 19, 21, 90Wuppertal, Germany, 156–58www.cochrane.org, 91
Yale University, 15, 89

SIMON & SCHUSTERRockefeller Center1230 Avenue of the AmericasNew York, NY 10020www.SimonandSchuster.com
Copyright © 2002 by Gerd GigerenzerAll rights reserved,including the right of reproductionin whole of in part in any form.
SIMON & SCHUSTER and colophon are trademarks of Macmillan Library Research USA,license by Simon & Schuster, the publisher of this work.
Designed by Lisa Chovnick
Library of Congress Cataloging-In-Publication Data
Gigerenzer, Gerd.Calculated risks : how to know when numbers deceive you / Gerd Gigerenzer.
p. cm.Includes bibliographical references and index.
1. Probabilities—Popular works. 2. Mathematical statistics—Popular works. 3. Uncertainty—Popular works I. Title.QA273.15.G54 2002
519.2—dc21 2002017010978-0-7432-5423-6
For information regarding the special discounts for bulk purchases, please contact Simon &Schuster Special Sales at 1-800-456-6798 or [email protected]
Copyright © 2022 FDOKUMEN