
Calculated phase diagrams and the corrosion of die-cast Mg-Al alloys
18
Calculated phase diagrams and the corrosion of die-cast Mg–Al alloys Ming Liu a,b , Peter J. Uggowitzer c , A.V. Nagasekhar a , Patrik Schmutz b , Mark Easton d , Guang-Ling Song a , Andrej Atrens a,b, * a The University of Queensland, Division of Materials, ARC CoE for Design in Light Metals, St. Lucia, Brisbane, Qld 4072, Australia b Swiss Federal Laboratories for Materials Science and Technology, Uberlandstrasse 129, CH-8600 Dubendorf, Switzerland c ETH Zürich, Department of Materials, CH-8093 Zurich, Switzerland d Monash University, Department of Materials Engineering, CAST Co-operative Research Centre, Melbourne, Vic. 3800, Australia article info Article history: Received 2 October 2008 Accepted 8 December 2008 Available online 24 December 2008 Keywords: Mg–Al alloys Corrosion Impurity tolerance limit Calculated phase diagram Magnesium abstract The corrosion of commercial die-cast Mg–Al alloys was elucidated by a study, of the corrosion in 3% NaCl, of (i) high-pressure die-cast (HPDC) model Mg–Al alloys, (ii) low-purity Mg, (iii) high-purity (HP) Mg and (iv) HP Mg heat treated at 550 °C. HPDC is the most important route for the production of Mg compo- nents. The corrosion of the model alloys was dominated by the Fe impurity element. The present research identified the appearance of the Fe-rich particles in the microstructure. In high magnification (1000 to 5000) secondary electron images, they appear as small white features, typically less than 1 lm in diam- eter. In order to understand the impurity tolerance limits, (i) the appropriate corrosion literature was summarised and reviewed and (ii) Mg phase diagrams were calculated using the Pandat software pack- age. Calculated phase diagrams can explain (i) the tolerance levels for Fe and Cu and (ii) the production of high-purity castings by means of control of melt conditions; this has high significance for the production of quality castings from recycled Mg. A full analysis requires that the Mg database be extended to include Ni, Co and some RE. The Fe tolerance limit is 5–10 ppm for cast HP Mg heat treated at 550 °C. Analysis of the Mg corrosion literature indicates that several studies have been dominated by the Fe impurity con- tent and have not dealt with the stated aims; it means that the full chemical composition should be reported in all studies of the corrosion of Mg alloys. Ó 2008 Elsevier Ltd. All rights reserved. 1. Introduction 1.1. Mechanical properties of Mg–Al alloys Mg alloys are used in transport applications due to their low density and adequate strength/weight ratio. However, the relation- ship between mechanical properties (yield strength, ductility), microstructure (solute in solution, grain size, inter-metallic vol- ume fraction and morphology) and chemical composition of high-pressure die-cast (HPDC) Mg–Al alloys is still not well under- stood [1–5]. HPDC is normally used to produce thin walled castings and therefore they experience a high cooling rate and exhibit a large specific surface area, which greatly affects the scale and dis- tribution of inter-metallics, grain size, solute concentration and the skin effect [5,6]. As a result, the casting processing and the local geometry of the casting may have an overriding influence on the final mechanical properties [1,2,7]. A large number of studies have been carried out on AZ and AM series alloys aiming at assessing the effect of Al content [8–10], section thickness and casting shape, as well as assessing the effects of the skin [1,2,5–7,11], porosity [12,13], homogenisation annealing [14] and physical metallurgy [15] on the tensile behaviour. Increasing the Al content improves the castability, increases the strength, but decreases the ductility. These properties are traded off in current commercial alloys where AM50/60 are used in applications where good ductility or energy absorption is required, whilst AZ91 is used for applications that re- quire optimum castability and strength. However, detailed systematic studies of the effect of solute con- tent on the binary Mg–Al system are still lacking, even though most commercial alloys are based on this alloy system. Such stud- ies seem warranted, as HPDC is the most important route for the production of magnesium components; a detailed understanding of the microstructure – mechanical property relationship should lead to optimised alloy and component design. Thus, a research program is studying HPDC Mg–Al alloys, with Al contents between 0.5% and 12%. Nagasekhar et al. [16] will re- port the research on mechanical properties. Preliminary studies [17,18] have shown that there is an increase in strength and a reduction in ductility with Al content. It has been postulated that 0010-938X/$ - see front matter Ó 2008 Elsevier Ltd. All rights reserved. doi:10.1016/j.corsci.2008.12.015 * Corresponding author. Address: The University of Queensland, Division of Materials, ARC CoE for Design in Light Metals, St. Lucia, Brisbane, Qld 4072, Australia. Tel.: +61 733653748; fax: +61 733653888. E-mail address: [email protected] (A. Atrens). Corrosion Science 51 (2009) 602–619 Contents lists available at ScienceDirect Corrosion Science journal homepage: www.elsevier.com/locate/corsci
-
Upload
independent -
Category
Documents
-
view
3 -
download
0
Transcript of Calculated phase diagrams and the corrosion of die-cast Mg-Al alloys

Corrosion Science 51 (2009) 602–619
Contents lists available at ScienceDirect
Corrosion Science
journal homepage: www.elsevier .com/locate /corsc i
Calculated phase diagrams and the corrosion of die-cast Mg–Al alloys
Ming Liu a,b, Peter J. Uggowitzer c, A.V. Nagasekhar a, Patrik Schmutz b, Mark Easton d,Guang-Ling Song a, Andrej Atrens a,b,*
a The University of Queensland, Division of Materials, ARC CoE for Design in Light Metals, St. Lucia, Brisbane, Qld 4072, Australiab Swiss Federal Laboratories for Materials Science and Technology, Uberlandstrasse 129, CH-8600 Dubendorf, Switzerlandc ETH Zürich, Department of Materials, CH-8093 Zurich, Switzerlandd Monash University, Department of Materials Engineering, CAST Co-operative Research Centre, Melbourne, Vic. 3800, Australia
a r t i c l e i n f o
Article history:Received 2 October 2008Accepted 8 December 2008Available online 24 December 2008
Keywords:Mg–Al alloysCorrosionImpurity tolerance limitCalculated phase diagramMagnesium
0010-938X/$ - see front matter � 2008 Elsevier Ltd. Adoi:10.1016/j.corsci.2008.12.015
* Corresponding author. Address: The UniversityMaterials, ARC CoE for Design in Light Metals, StAustralia. Tel.: +61 733653748; fax: +61 733653888.
E-mail address: [email protected] (A. Atre
a b s t r a c t
The corrosion of commercial die-cast Mg–Al alloys was elucidated by a study, of the corrosion in 3% NaCl,of (i) high-pressure die-cast (HPDC) model Mg–Al alloys, (ii) low-purity Mg, (iii) high-purity (HP) Mg and(iv) HP Mg heat treated at 550 �C. HPDC is the most important route for the production of Mg compo-nents. The corrosion of the model alloys was dominated by the Fe impurity element. The present researchidentified the appearance of the Fe-rich particles in the microstructure. In high magnification (�1000� to5000�) secondary electron images, they appear as small white features, typically less than 1 lm in diam-eter. In order to understand the impurity tolerance limits, (i) the appropriate corrosion literature wassummarised and reviewed and (ii) Mg phase diagrams were calculated using the Pandat software pack-age. Calculated phase diagrams can explain (i) the tolerance levels for Fe and Cu and (ii) the production ofhigh-purity castings by means of control of melt conditions; this has high significance for the productionof quality castings from recycled Mg. A full analysis requires that the Mg database be extended to includeNi, Co and some RE. The Fe tolerance limit is �5–10 ppm for cast HP Mg heat treated at 550 �C. Analysis ofthe Mg corrosion literature indicates that several studies have been dominated by the Fe impurity con-tent and have not dealt with the stated aims; it means that the full chemical composition should bereported in all studies of the corrosion of Mg alloys.
� 2008 Elsevier Ltd. All rights reserved.
1. Introduction
1.1. Mechanical properties of Mg–Al alloys
Mg alloys are used in transport applications due to their lowdensity and adequate strength/weight ratio. However, the relation-ship between mechanical properties (yield strength, ductility),microstructure (solute in solution, grain size, inter-metallic vol-ume fraction and morphology) and chemical composition ofhigh-pressure die-cast (HPDC) Mg–Al alloys is still not well under-stood [1–5]. HPDC is normally used to produce thin walled castingsand therefore they experience a high cooling rate and exhibit alarge specific surface area, which greatly affects the scale and dis-tribution of inter-metallics, grain size, solute concentration and theskin effect [5,6]. As a result, the casting processing and the localgeometry of the casting may have an overriding influence on thefinal mechanical properties [1,2,7]. A large number of studies have
ll rights reserved.
of Queensland, Division of. Lucia, Brisbane, Qld 4072,
ns).
been carried out on AZ and AM series alloys aiming at assessing theeffect of Al content [8–10], section thickness and casting shape, aswell as assessing the effects of the skin [1,2,5–7,11], porosity[12,13], homogenisation annealing [14] and physical metallurgy[15] on the tensile behaviour. Increasing the Al content improvesthe castability, increases the strength, but decreases the ductility.These properties are traded off in current commercial alloys whereAM50/60 are used in applications where good ductility or energyabsorption is required, whilst AZ91 is used for applications that re-quire optimum castability and strength.
However, detailed systematic studies of the effect of solute con-tent on the binary Mg–Al system are still lacking, even thoughmost commercial alloys are based on this alloy system. Such stud-ies seem warranted, as HPDC is the most important route for theproduction of magnesium components; a detailed understandingof the microstructure – mechanical property relationship shouldlead to optimised alloy and component design.
Thus, a research program is studying HPDC Mg–Al alloys, withAl contents between 0.5% and 12%. Nagasekhar et al. [16] will re-port the research on mechanical properties. Preliminary studies[17,18] have shown that there is an increase in strength and areduction in ductility with Al content. It has been postulated that

M. Liu et al. / Corrosion Science 51 (2009) 602–619 603
there are step changes in both properties between 3–4% Al and 9–11% Al, which may be related to the development of an intercon-nected eutectic and the inter-metallic beta-phase, respectively.
The present paper deals with evaluation of the corrosion behav-iour, which was carried out to elucidate the corrosion behaviour ofcommercial HPDC Mg Alloys.
1.2. Corrosion of Mg alloys
A limitation to the service use of Mg alloys is their susceptibilityto corrosion [19–23] and hence there is much research to under-stand and document their corrosion behaviour [14,24–78]. Stresscorrosion cracking (SCC) occurs for frequently encountered envi-ronments [79–88]; the fact that SCC occurs in distilled water[79–84] indicates that water itself is the key environment factorcausing SCC in aqueous solutions.
The key points of the corrosion mechanism for Mg alloys[19–21] in common environments like 3% NaCl solution are as fol-lows. A partially protective (hydr)oxide film covers the surface andcorrosion occurs at the breaks in this film (i.e. at film free areas).The cathodic reaction is hydrogen evolution. The surface film onMg is not particularly protective; as a result the corrosion rate istypically more than 1 mm/y in common environments like 3% NaClsolution. No alloying element has been discovered that produces asolid solution Mg alloy with a corrosion rate less than that of pureMg in 3% NaCl solution. Consequently, it is useful to include pureMg as a standard in any comparative study of corrosion perfor-mance of Mg alloys (see e.g. [20,39,52]). Moreover, it is indeed ex-tremely important to use pure Mg as the standard for comparison;commercial purity Mg can have a corrosion rate more than 50times that of pure Mg [20,35] and so ‘‘commercial purity Mg”should be designated as ‘‘low-purity Mg” for clarity. Pure Mg inthe corrosion context means an alloy in which all the impurity ele-ments have concentrations below their tolerance limits (see Sec-tion 1.3).
Corrosion of common Mg alloys typically involves micro-gal-vanic acceleration [14,20,35,39,52,53] of the corrosion of the a-Mg matrix by the second phase(s) and corrosion rates are typicallygreater than that of pure Mg. The corrosion rate of a two phase Mgalloy can, however, be lower than that of pure Mg for an appropri-ate distribution of the second phase (or at least at the alloy sur-face): namely if the second phase is finely divided, essentiallycontinuous and, if the second phase itself has a lower corrosionrate than that of pure Mg, then the second phase can act as a cor-rosion barrier. One manifestation is the skin effect [35].
The characteristic corrosion form of Mg is typically designatedas localized corrosion [19,20,53,55] to distinguish it from the auto-catalytic pitting in stainless steels [89]. Localized corrosion in Mgtypically initiates as irregular localized corrosion, which spreadslaterally and covers the whole surface. The spread of corrosion overa typical 20 mm � 20 mm specimen takes usually several days forimmersion in 3% NaCl; the corrosion rate concomitantly increases;short term corrosion tests thus measure corrosion rates smallerthan tests that allow establishment of steady state corrosion. Theredoes not seem to be much tendency for deep pitting. The mostprobable reason is that the cathodic reaction is hydrogen evolu-tion. A by-product of that cathodic reaction is the production ofOH� ions (or equivalently the consumption of H+ ions) with a con-comitant increase of pH, a stabilization of the local magnesiumhydroxide film and a decrease in corrosion tendency. Thus local-ized corrosion in magnesium has an inherent tendency to beself-limiting. This is in marked contrast to stainless steels, wherethe occluded pit cell becomes more aggressive and acceleratesthe localized corrosion.
Corrosion of Mg has a number of seemingly strange phenom-ena. The best known may be the negative difference effect, com-
monly referred to as NDE [19–21,50,51]: the amount of hydrogenevolved increases with increasing applied anodic current (that de-creases the cathodic reaction rate and the amount of associated‘‘cathodic” hydrogen) and the amount of magnesium dissolved isgreater than expected from application of the Faraday Law; botheffects are explained by the generally accepted Mg corrosionmechanism involving the uni-positive Mg ion, Mg+. Another wellknow effect is that electrochemical measurements of the corrosionrate, based on the ‘‘corrosion current” at the free corrosion poten-tial, do not agree with direct measurements using weight loss orevaluated from the evolved hydrogen [20,48,53,57,94].
1.3. Influence of Fe on Mg corrosion
An important aspect of Mg corrosion is the extreme sensitivityto the impurity elements Fe, Ni, Cu and Co. The corrosion rate islow up to a tolerance limit; the corrosion rate is substantially high-er above the tolerance limit (the factor may be a 100�). Typicalvalues of tolerance limits are given in Table 1 [19]. Typical valuesof the corrosion rates for Mg alloys are presented in Table 2.
There are two hypotheses [19,20] for the tolerance limits of Fe,Ni, Cu and Co: (i) phase precipitation and (ii) surface deposition.The phase precipitation hypothesis is that, above the tolerancelimit, a second phase (rich in Fe, Ni, Cu or Co) is precipitated in-side the Mg alloy and that this phase supports the cathodic reac-tion (hydrogen evolution) much more effectively than does a-Mg.The surface deposition hypothesis is that there is deposition, onthe Mg alloy surface, of effective cathodes of metallic Fe, Ni, Cuor Co by means of a reaction such as Mg + Fe2+ = Fe + Mg2+, andthat there is a sufficient concentration of ions of Fe2+, Ni2+, Cu2+
or Co2+ in the solution next to the surface of the Mg alloy becauseof the dissolution of the Mg alloy containing a sufficient concen-tration of the impurity atoms. This surface deposition hypothesisis thus based on the ideas that (i) the probability of depositingsurface metallic-impurity cathodes increases with impurity con-tent and (ii) these surface metallic-impurity cathodes dominatethe corrosion behaviour above a critical surface density. Boththe phase precipitation and surface deposition hypotheses as-sume that effective hydrogen cathodes are produced above thetolerance limit, both assume that these cathodes have a composi-tion rich in the impurity element; the essential difference is thatthe phase precipitation hypothesis relates to the precipitation of anew phase inside the Mg alloy whereas the surface depositionhypothesis relates to the deposition of cathodes on the Mg alloysurface. To date there has been no successful resolution regardingwhich hypothesis is correct.
Some useful insights are gained regarding the mechanism of theFe tolerance limit for the die-cast (DC) and gravity-cast (GC) Mg al-loys AZ91-DC and AZ91-GC [24] AM60-DC [30], AS41-DC [28], andAE42-DC [31], Table 1. Fig. 1 presents the salt spray corrosion rate(measured over 10 days) as a function of the Fe content above thetolerance limit evaluated as ‘‘[Fe] – X � [Mn]”, where [Fe] is the Fecontent of the alloy, [Mn] is the Mn content of the alloy and‘‘X � [Mn]” is the alloy dependent Fe tolerance limit which dependson the Mn concentration and on the alloy (i.e. the weighting factorX is alloy dependent, particularly dependent on alloy Al content,Table 1). Fig. 1 shows:
1. The corrosion rate is low below the tolerance limit whereasthe corrosion rate is high above the tolerance limit. The corro-sion rate below the Fe tolerance limit for AZ91-GC was higherthan for AZ91-DC; this was attributed by Reichek et al. [24] toa Ni content slightly above the Ni tolerance limit.2. Above the tolerance limit, the corrosion rate increases rap-idly, in a non-linear fashion, which is alloy dependent and alsodependent on casting method.

Table 1Tolerance limits for Mg alloys [19]; ts is this study.
Alloy Condition Fe (ppm) Ni (ppm) Cu (ppm) Ref.
Pure Mg Cast 170 5 1000 [22]Pure Mg Cast 170 5 1300 [23]Pure Mg Heat treated: 1 d at 550 �C 5–10 tsAZ91 20 12 900 [23]AZ91 0.032 �Mn 50 400 [22,24]AZ91 HPDC (F) 0.032 �Mn 50 400 [25,26]AZ91 LPDC (F) 0.032 �Mn 10 400 [25]AZ91 LPDC (T4) 0.035 �Mn 10 100 [24,25]AZ91 LPDC (T6) 0.046 �Mn 10 400 [25]AZ91B <100 <2500 [27]AZ91 Die-cast 0.032 �Mn 50 400 [28]AZ91 Die-cast 50 50 700 [27]AZ91 Die-cast 0.032 �Mn 50 700 [24]AZ91 Gravity-cast 0.032 �Mn 10 400 [24]AM60 Die-cast 0.021 �Mn 30 10 [28–31]AE42 Die-cast 0.020 �Mn 40 400 [31]AS41 Die-cast 0.010 �Mn 40 200 [28,31]
604 M. Liu et al. / Corrosion Science 51 (2009) 602–619
This behaviour is consistent with the precipitation of a secondphase in each case above the Fe tolerance limit, with the precipi-tated phase in each case having somewhat different ability to actas a cathode and evolve hydrogen. The slower rate of cooling forgravity casting would allow more time for the growth of the sec-ond phase; the higher corrosion rates for gravity-cast AZ91-GCimplies that the larger second phase particles may be more effi-cient cathodes. It is hard to reconcile Fig. 1 with the second expla-nation for the tolerance limit; namely that the probability ofproducing surface Fe cathodes increases with Fe content.
1.4. High-purity castings
That the tolerance level is related to the precipitation of a sep-arate phase is also supported by the controlled casting experi-ments of Hillis and co-workers using AZ91 [24], AM60 [31] andAS41 [28]. These experiments demonstrated that high-purity al-loys could be easily produced from low purity alloy feedstock bycontrol of the casting temperature. For the AZ91 experiments, theyused �40 kg heats of high-purity AZ91-base alloys containing�9%Al, 0.5%Zn, �390 ppm Fe, <10 ppm Ni and <100 ppm Cu. Thealloy was equilibrated with 0.2%Mn (trial 1), 0.4%Mn (trial 2) or0.8%Mn (trial 3) at 750 �C; die-castings were made at 750 �C andafter equilibration for 10–15 min at the three lower nominal tem-peratures: 725, 690 and 650 �C; (in each case they measured theactual temperature of the melt at the time of casting, and these ac-tual temperatures were somewhat different to the nominal tem-peratures). Chemical analysis of the resulting die-castingsrevealed the chemical composition of the melt just before casting.Chemical analysis of the resulting die-castings of trial 1 indicated adecrease in only the Fe content as the melt temperature was de-creased from 750 to 690 �C consistent with the precipitation fromthe melt of an iron-rich phase containing little Mn. In contrast, trial3 (0.8%Mn) indicated a decrease in both the Fe content and the Mncontent between from 750 to 690 �C consistent with the precipita-tion from the melt of an iron-rich phase containing substantial Mn.Each of these die-castings had a Fe content above the Mn depen-dent tolerance limit and had a high corrosion rate in the salt spraytest. The trial 1 die-casting at 650 �C had a lower Fe compositionand a lower Mn composition indicating the precipitation of boththese elements from the melt between 690 and 650 �C; this couldbe either (i) by the precipitation of a single FeaMnb compound(which could also contain Mg or Al) or (ii) by the precipitation oftwo compounds, one Fe rich, the other Mn rich. The trial 1 650�C casting had a Fe content below the tolerance limit and a low cor-rosion rate in the salt spray test. The other trials with AZ91 [24],
and the subsequent trials with AM60 [30] and AS41 [28], revealedsimilar trends; Table 3 presents the values of the measured criticalmelt temperature, TM, at which castings were produced with mea-sured low corrosion rates and above which there was precipitationof both Fe and Mn from the melt. SEM/EDX analysis, of the sludgeof the casting trials using AZ91 [24], revealed that the precipitatefrom the Mg melt contained Fe–Mn–Al in variable amounts; theparticulates were often Fe and/or Mn rich in the core with the sur-rounding or bridging regions containing Al + Mn.
1.5. Research aims
The present study had the following aims:
� Understand the corrosion behaviour of the model HPDC Mg–Alalloys to shed light on the corrosion behaviour of commercialHPDC Mg alloys.
� Identify the microstructure features associated with the Feimpurity.
� Use calculated Mg phase diagrams to understand the metallurgyof the influence of impurity elements Fe and Cu on the corrosionof commercial Mg alloys.
� Use calculated Mg phase diagrams to explain the metallurgy ofthe production of high-purity Mg castings by controlling themelt conditions, so that the castings have excellent corrosionproperties.
2. Calculated Mg phase diagrams
2.1. Approach
In order to understand the impurity tolerance limits, Mg phasediagrams were calculated using the Pandat software package(database PanMg7) [90]. The phase diagrams so calculated usethe thermodynamic data in the latest Pandat Mg database. Thethermodynamic data has not been optimised at all for these calcu-lations. Thus, it is likely that particular numerical values may besomewhat in error, but the trends can be assumed to be valid. Fur-thermore, the database is not complete; the database includes datafor Fe and Cu, but not Ni or Co. Thus phase diagrams have been cal-culated to understand the tolerance limits for Fe and Cu. Under-standing the tolerance limits for Ni and Co needs an extension ofthe data in the database. Also the database does not include Prand La, so it has not been possible to fully explore the effect of rareearth addition as in AE42.

Table 2Typical corrosion rates of Mg alloys in solutions like 3% NaCl, NR is not recorded, ts is this study.
Year First author Alloy Al (%) Fe (ppm) Mn (ppm) Fe/Mn Solution Corrosion rate(mg cm�2 d�1)
Corrosion rate(mm/y)
Ref.
1987 Froats AZ91 160 Salt spray 7.05 14.8 [25]AZ91 19 0.0705 0.15 [25]
1987 Lunder AZ91 [26]1989 Lunder AZ91 8.6 90 1700 0.053 5% NaCl 1–2 2–4 [32]2004 Song AZ91D 9.05 100 1900 0.053 5% NaCl 1–3 2–6 [33]
Mg–Al alloys 2–9 100 100 1 125–225 260–470 [33]2002 Ambat AZ91D 9.1 10 1700 0.0059 3.5% NaCl 1.4 3 [34]1998 Song AZ91D 8.4 120 1800 0.067 1 N NaCl (pH 11) 0.3–2.6 0.6–5.5 [35]
Mg–2%Al 2.05 184 141 1.30 52 110 [35]Mg–9%Al 8.67 248 131 1.89 46 97 [35]LP Mg 0.0014 240 10 24 24 50 [35]HP Mg 0.0009 17 12 1.42 0.52 1.1 [35]HP AZ91 8.73 16 10 1.60 5.6 11.8 [35]
2005 Shi Mg1Al 1.11 150 160 0.94 5% NaCl �2.4 �5.0 [36]Mg5Al 5.08 200 100 2.00 �100 210 [36]Mg10Al 10 200 100 2.00 �130 270 [36]Mg22Al 21.6 200 80 2.50 �5 �10 [36]Mg41Al 40.9 200 <50 >4.00 �0 �0 [36]
2008 Pardo LP Mg 0.006 40 300 0.13 3.5% NaCl 310 660 [37,38]AZ31 3.1 50 2500 0.020 5.5 11 [37,38]AZ80 8.2 40 1300 0.031 0.074 0.16 [37,38]AZ91D 8.8 40 3000 0.013 0.089 0.19 [37,38]
2008 Zhao ZE41 0.004 60 200 0.3 1 N NaCl 5.9 12 [39]HP Mg 0.0066 45 86 0.52 0.44 0.92 [39]AZ91D 8.26 <20 1400 <0.01 3.1 6.5 [39]
2006 Shi CP Mg 0.007 200 150 1.33 5% NaCl 12 25 [40]HP Mg <0.01 <100 <100 3.6 7.6 [40]
2002 Song MEZu 0.42 130 1800 0.072 5% NaCl �10 �21 [41]MEZR 0.03 40 1100 0.036 �1 �2 [41]
2005 Ballerini AZ91D-DC NR 16 6100 0.003 Salt spray 0.01 0.02 [42]AZ91D-T6 NR 51 2900 0.017 Salt spray 3 6 [42]
2006 Xuehua Mg-9Al 8.87 <100 1800 <0.06 3.5% NaCl 4.4 9.2 [43]Mg9Al0.2Ho 8.60 <100 1500 <0.07 3.5% NaCl 0.3 0.6 [43]Mg9Al0.4Ho 8.79 <100 1500 <0 .07 3.5% NaCl 0.3 0.6 [43]
2007 Srinivasan AZ91 9.3 250 1800 0.14 3.5% NaCl 2.7 5.7 [45]2008 Zhang AZ91 8.2 240 1140 0.21 Salt spray 7.4 16 [46]2007 Ben-Haroush AZ89 8.3 25 1950 0.013 3.5% NaCl 0.2 0.5 [47]2005 Scharfe AZ91D 8.5–9.5 <40 <4000 ? 3.5% NaCl 2.7 5.7 [48]
AZ91D 8.5–9.5 <40 <4000 ? Salt spray 0.5 1.1 [48]2008 Hoog Pure Mg NR NR NR ? 0.1 M NaCl 0.03–0.095 0.06–0.2 [49]2008 Liu Mg–0.5Al 0.48 27 200 0.14 3% NaCl 20 40 ts
Mg–1Al 0.94 25 200 0.13 3% NaCl 20 40 tsMg–2Al 1.90 33 200 0.17 3% NaCl 40 80 tsMg–4Al 3.72 31 200 0.16 3% NaCl 40 80 tsMg–6Al 5.72 38 200 0.19 3% NaCl 40 80 tsMg–9Al 8.80 45 200 0.23 3% NaCl 40 90 tsMg–12Al 11.6 51 200 0.26 3% NaCl 50 100 tsCast HP Mg, Fig. 13a 0.007 45 8 6 3% NaCl 0.4 0.9 tsCast HP Mg, Fig. 13b 0.007 45 8 6 3% NaCl 0.8 1.8 tsHP Mg, 1 d 550 �C 0.007 45 8 6 3% NaCl 3.6 8.2 tsHP Mg, 2 d 550 �C 0.007 45 8 6 3% NaCl 4.5 10 ts
? indicates value cannot be calculated.
M. Liu et al. / Corrosion Science 51 (2009) 602–619 605
2.2. Mg–Fe
Fig. 2 presents the calculated Mg–Fe phase diagram: a eutecticphase diagram with an eutectic temperature of �650 �C, and witha-Mg having a maximum Fe solubility of �10 ppm Fe. Table 4 pre-sents details of the phases in the calculated phase diagrams.
Cooling of a Mg–Fe alloy containing more than 180 ppm causesprecipitation, from the melt, of a BCC phase. For a Fe content of180 ppm, the calculated phase diagram predicts that on cooling,the liquid Mg alloy undergoes eutectic solidification at 650 �C toform a-Mg containing about 10 ppm iron in solid solution plusthe BCC phase. However, the two-phase region (liquid Mg +a-Mg) is extremely narrow, so that it would be expected that thepre-eutectic and eutectic reactions would be suppressed duringnormal (non-equilibrium) cooling of a Mg ingot or casting, so thata Mg alloy containing less than 180 ppm Fe would solidify to a sin-gle a-Mg phase with Fe in supersaturated solid solution in the Mg
lattice. If this is indeed correct, the implication is that castings pro-duce single-phase Mg up to a critical Fe concentration of 180 ppmand that Mg-castings contain a BCC phase (rich in Fe) for iron con-tents greater than 180 ppm.
This value of 180 ppm Fe, as the Fe tolerance limit for cast Mg,should be compared with the tolerance level for Fe in pure cast Mgreported to be 170 ppm [19,22,24] or 150 ppm [25]. The calculatedphase diagram thus offers an explanation of the Fe tolerance limit:the tolerance level corresponds to the minimum content of Fe in acast Mg alloy for which a BCC phase precipitates from the melt be-fore final solidification.
The phase diagram allows estimation of how much second phaseforms for a given alloy in equilibrium. For a Mg alloy containing280 ppm Fe, the fraction of the primary BCC phase, fBCC/casting, canbe calculated using the lever rule as follows:
fBCC=casting ¼ ð0:028� 0:018Þ=ð100� 0:018Þ ¼ 0:01%

Fig. 1. For the Mg alloys AZ91, AM60, AS41 and AE42, the salt spray corrosion rate, mm/y, as a function of the alloy iron content [Fe] above the tolerance limit X � [Mn] at thealloy Mn content [Mn]. The data is replotted from Hillis and co-workers [24,28,30,31].
Table 3Values of the measured critical melt temperature, TM, measured for AZ91 [24], AM60[30] and AS41 [28]; TM is the temperature at which low corrosion rates weremeasured and above which there was precipitation of both Fe and Mn from the melt.[Mn]750�C is the Mn concentration in the starting melt at 750 �C; the die-castingstypically contained a lower Mn concentration. TC is the temperature at which thecalculated Mg–Al–Mn–Fe phase diagrams (calculated with 0.02%Fe) predict thatsolidification of a casting would lead to no BCC phase in the casting. T 0C is thecorresponding temperature from the phase diagram calculated with 0.005%Fe.
Alloy Al (wt.%) [Mn]750�C (wt.%) TM (�C) TC (�C) T 0C (�C)
AZ91 9 0.2 654 630 650AZ91 9 0.4 694 690 705AZ91 9 0.8 >750 760 755
AM60 6 0.2 640 620 630AM60 6 0.4 650 660 675AM60 6 0.8 720 720 730
AS41 4 0.2 <660 620 625AS41 4 0.4 658 630 660AS41 4 0.8 – 685 710
Fig. 2. Mg–Fe phase diagram calculated with the Pandit software [90].
606 M. Liu et al. / Corrosion Science 51 (2009) 602–619
If this BCC phase is responsible for the increasing the corrosion rateby a factor of 100 X above that of high-purity Mg, then the BCCphase evolves hydrogen 106 times faster than a-Mg.
Fig. 2 provides a further prediction regarding the Fe tolerancelimit for heat-treated Mg alloys: the Fe tolerance limit is predictedto be �5–10 ppm Fe for heat-treated pure Mg. A pure Mg castingcontaining 40 ppm Fe would be expected to have a low corrosionrate because the Fe content is below the Fe tolerance limit of�180 ppm Fe for cast Mg. What happens to the corrosion perfor-mance if this cast Mg alloy is heat-treated at just below 650 �C?Fig. 2 indicates the precipitation of some BCC phase; the volumefaction can be determined as follows.
fBCC=casting heat treated ¼ ð0:0040� 0:0010Þ=ð100� 0:001Þ ¼ 0:0031%
Is this amount of the Fe rich BCC phase sufficient to cause theheat-treated high-purity Mg to have a corrosion rate higher thanthe as-cast condition? This issue was studied experimentally; theresults are presented in Fig. 13b.
2.3. Mg–Al–Fe
Fig. 3 presents an isothermal section calculated for 651 �C,slightly above the eutectic temperature, through the Mg–Al–Fephase diagram. This section indicates that the eutectic point isshifted to lower Fe contents and thus the Fe tolerance limit de-creases rapidly with increasing Al content. The trend of decreasingFe tolerance limit with Al alloying has been previously docu-mented, Table 1. Fig. 3 provides a numerical prediction and in par-ticular indicates that there is a significant decrease with a few tensof percent of Al.
2.4. Mg–Al–Mn–Fe
Fig. 4a presents a pseudo-binary section through the Mg–Al–Mn–Fe phase diagram at 0.4%Mn and 0.02%Fe; this section was cal-culated to try to understand the controlled casting experiments(described in Section 1.4) carried out by Hillis and co-workers withAZ91 [24], AM60 [31] and AS41 [28]. Fig. 4a indicates that coolingof an alloy containing 6% Al causes initially the precipitation of aniron-rich BCC phase labelled BCC_B2. Between �675 and �660 �Cthere is a three phase region of liquid + BCC_B2 + Al8Mn5.

Table 4Details of phases in the calculated phase diagrams.
Phase diagram Phase Details
Mg–Fe, Fig. 2 BCC Essentially pure Fe containing little Mg in solid solutionHCP a-Mg containing little Fe in solid solution
Mg–Al–Fe, Fig. 3 BCC Essentially pure Fe containing some Al and little Mg in solid solution
Mg–Mn–Fe–Al, Fig. 4 BCC_B2 Fe–Mn–Al phase; the same phase as BCC in the Mg–Fe phase diagram, containing Mn and Al
Mg–0.2%Mn–Cu, Fig. 6 HCP a-Mg containing some Mn and Cu in solid solution, the same phase as HCP in the Mg–Fe phase diagramCBCC Mn rich phase
Mg–5%Al–0.2%Mn–Cu, Fig. 7 C15 60%Cu, 20%Mg, 20%AlC36_A 53%Cu, 22%Mg, 36%AlQ 37%Cu, 28%Mg, 36%Al
Mg17Al12–Fe, Fig. 8 AL13Fe4 Al13Fe4
ALMG_GAMMA Mg17Al12
Fig. 3. Calculated isothermal section through the Mg–Al–Fe phase diagram.
M. Liu et al. / Corrosion Science 51 (2009) 602–619 607
Following the experiments of Hillis and co-workers [24,28,30] it isassumed that the BCC_B2 phase settles out as the cast is slowlycooled and that the alloy as-cast at 660 �C contains no BCC_B2phase but only Mg liquid + Al8Mn5. If it is assumed that the phaseAl8Mn5 is passive (i.e. it is no more effective as a cathode than pureMg) then a 6% Al alloy cast at 660 �C has a Fe content below the Fetolerance limit and would be expected to have a low corrosion rate.Thus, Fig. 4a predicts the critical temperature to be 660 �C at whichthe alloy is cast to produce a casting with a low corrosion rate; thiscalculated critical temperature, TC, is included in Table 3. Similarly,Fig. 4 predicts critical temperatures of 690 �C for 9% Al (corre-sponding to AZ91) and 630 �C for 4% Al (corresponding to AS41).
Similarly the pseudo-binary sections were calculated throughthe Mg–Al–Mn–Fe phase diagram at 0.2%Mn + 0.02%Fe (Fig. 4b)and 0.8%Mn + 0.02%Fe (Fig. 4c) to allow comparison with theexperiments of Hillis and co-workers starting with 0.2%Mn and0.8%Mn. The critical temperatures have been included in Table 3.There is good agreement between the measured critical tempera-ture, TM, and the calculated critical temperature, TC, estimated fromthe calculated phase diagrams, indicating the phase diagrams arean extremely useful tool for the prediction of tolerance limits aswell as processing parameters.
The phase diagrams, Fig. 4a–c, were calculated using 0.02% Fe(200 ppm Fe); this value is reasonable to allow comparison withthe experiments of Hillis and co-workers; they used 390 ppm inthe starting melt for their experiments with AZ91 (the actual Fe
content was typically 200 ppm or lower in most of their castings)and 200 ppm Fe for the starting melt for their experiments withAM60 and AS41.
However, the phase diagram might be sensitive to the Fe con-tent. The phase diagram calculated for 0.4%Mn and 0.04%Fe is notincluded in this paper because it was essentially identical to theone with 0.4%Mn and 0.02%Fe, i.e. to Fig. 4a; thus there is littlechange at higher Fe contents. What about lower Fe contents?Lower Fe contents are relevant to the experiments of Hillis andco-workers and to the production of high-purity casting fromlow purity feedstock, in which case the Fe is allowed to settleout, and consequently the Fe content decreases; this situation isaddressed in Fig. 4d calculated for 0.2%Mn + 0.005%Fe. There isan influence of Fe content; the calculated temperature T 0C corre-sponding to TC, is included in Table 3; there is even better agree-ment with TM.
2.5. Mg–5%Al–Mn–Fe
Fig. 4e presents an isothermal section at 651 �C through the Mg–5%Al–Mn–Fe phase diagram. This section was calculated to under-stand how/why the Fe tolerance level depends on the Mn content.For 0%Mn, the Fe tolerance limit is �0.001% consistent with Fig. 3.Above the iron tolerance limit, say 0.002%, there is ‘‘liquid + Al2Fe”up to �0.06%Mn, thereafter there is ‘‘liquid + BCC_B2” up to�0.3%Mn, thereafter Al8Mn5. If it is assumed that both the Al2Fephase and the BCC_B2 phase is each an efficient cathode and thatAl8Mn5 is passive, then Fig. 4e predicts good corrosion behaviourfor Mn contents above �0.3%Mn and that an alloy with a greaterMn content can tolerate more Fe and still produce only the Al8Mn5
phase in equilibrium. However, the slope of the boundary of the 2phase field ‘‘liquid + Al8Mn5” does not correspond to that predictedfrom Hillis and co-workers [30] that [Fe] = 0.02 [Mn].
2.6. Phase compositions
Fig. 5a presents the compositions for BCC_B2 and Al8Mn5 calcu-lated for equilibrium cooling of an Mg alloy of composition similarto AZ91D, namely 9%Al, 0.5%Zn, 0.2%Mn and 0.02%Fe. It is assumedthat there is no settling of any of the solid phases from the melt.BCC_B2 is an Fe rich phase and contains significant Mn and Al;the Fe content decreases significantly as the temperature de-creases. This is somewhat in conflict with the trial 1 (0.02%Mn)die-castings of Hillis and co-workers [24] where it was found thatthe resulting die-castings indicated a decrease in only the Fe con-tent as the melt temperature was decreased from 750 to 690 �Cconsistent with the precipitation from the melt of an iron-richphase containing little Mn. The calculated compositions are consis-tent with trial 3 (0.8%Mn) where there was a decrease in both the

Fig. 4. (a) Calculated pseudo-binary section through the Mg–Al–Mn–Fe phase diagram at 0.4%Mn + 0.02%Fe. (b) Calculated pseudo-binary section through the Mg–Al–Mn–Fe phase diagram at 0.2%Mn + 0.02%Fe. (c) Calculated pseudo-binary section through the Mg–Al–Mn–Fe phase diagram at 0.8%Mn + 0.02%Fe. (d) Calculatedpseudo-binary section through the Mg–Al–Mn–Fe phase diagram at 0.2%Mn + 0.005%Fe. (e) Calculated isothermal section at 651 �C through the Mg–5%Al–Mn–Fephase diagram.
608 M. Liu et al. / Corrosion Science 51 (2009) 602–619

Fig. 5. (a) Compositions for BCC_B2 and Al8Mn5 calculated for equilibrium cooling of an Mg alloy of composition similar to AZ91D, namely 9%Al, 0.5%Zn, 0.2Mn and 0.02%Fe.(b) Phase fractions calculated for equilibrium cooling of an Mg alloy of composition similar to AZ91D, namely 9%Al, 0.5%Zn, 0.2Mn and 0.02%Fe. It is assumed that there is nosettling of any of the solid phases from the melt. (c) Compositions for BCC_B2 and Al8Mn5 calculated for equilibrium cooling of an Mg alloy of composition similar to AS41,namely 4%Al, 1.0%Si, 0.3%Mn and 0.02%Fe. (d) Phase fractions calculated for equilibrium cooling of an Mg alloy of composition similar to AM60, namely 6%Al, 0.3%Mn and0.02%Fe. It is assumed that there is no settling of any of the solid phases from the melt.
M. Liu et al. / Corrosion Science 51 (2009) 602–619 609
Fe content and the Mn content between 750 and 690 �C consistentwith the precipitation from the melt of an iron-rich phase contain-ing substantial Mn.
The composition of Al8Mn5, calculated for equilibrium coolingwith no settling of solid phases from the melt, indicate a composi-tion of �40%Al, �50%Mn, with up to �10%Fe at 625 �C. If there issettling of solid phases from the melt, the Fe content would bemuch lower in the melt and also in the Al8Mn5. The calculatedcomposition is consistent with the literature: there are literaturereports of Al8Mn5 containing Fe [91,92] and other reports ofAl8Mn5 containing no Fe [47,92,93].
These compositions for BCC_B2 and Al8Mn5, are consistent withthe SEM/EDX analysis of the sludge of the casting trials using AZ91[24], which revealed that the precipitate from the Mg melt con-tained Fe–Mn–Al in variable amounts; the particulates were oftenFe and/or Mn rich in the core with the surrounding or bridging re-gions containing Al + Mn.
Fig. 5b presents the phase fractions calculated for equilibriumcooling of an Mg alloy of composition similar to AZ91D, namely9%Al, 0.5%Zn, 0.2Mn and 0.02%Fe. It is assumed that there is no set-tling of any of the solid phases from the melt. There was no Zn inBCC_B2 and no Zn in Al8Mn5. The calculated compositions for
BCC_B2 and Al8Mn5 were similar for AM60; the compositions werecalculated for equilibrium cooling of a Mg alloy of compositionsimilar to AM60, namely 6%Al, 0.3Mn and 0.02%Fe.
Fig. 1 indicated that there were significant differences in corro-sion rates for AZ91-DC, AZ91-GC and AM60-DC with Fe contentsabove the tolerance limit. The above evaluations of the composi-tion of the BCC_B2 phase indicated similar compositions, andhence the differences in corrosion rate are not likely to be causedby differences in composition of the Fe rich phase precipitated inthese alloys for Fe contents above the tolerance limit.
Fig. 5c presents the compositions for BCC_B2 and Al8Mn5 calcu-lated for equilibrium cooling of an Mg alloy of composition similarto AS41, namely 4%Al, 1.0%Si, 0.3%Mn and 0.02%Fe. The composi-tions are similar to those for AZ91D and AM60, except that BCC_B2contains some Si. This Si content may cause the lower corrosionrate recorded for AS41 in Fig. 1, for Fe contents above the tolerancelimit.
Calculations were also carried out for AE42 based on 4.5%Al,2%Ce, 0.3%Mn and 0.02%Fe; the phase compositions and phase frac-tions were similar to those calculated for AZ91D. There was no Cecontained in the BCC_B2 phase. Hillis and co-workers [31] indi-cated that the RE contained 50%Ce, 25%La, 18%Nd and 7%Pr. Calcu-
610 M. Liu et al. / Corrosion Science 51 (2009) 602–619
lations with 1%Nb revealed that there was no Nb in BCC_B2. ThePandat ‘‘PanMg 7” database does not include Pr and La, so it hasnot been possible to fully explore the effect of rare earth additionas in AE42. However, the low corrosion rate for AE42-DC abovethe Fe tolerance limit indicates that this should be further explored.
Fig. 5d presents the phase fractions calculated for equilibriumcooling of an Mg alloy of composition similar to AM60, namely6%Al, 0.3%Mn and 0.02%Fe. It is assumed that there is no settlingof any of the solid phases from the melt. In contrast to AZ91,Fig. 5b, Al8Mn5 was stable to 500 �C and there is no transformationto Al11Mn4.
2.7. Mg–0.2%Mn–Cu
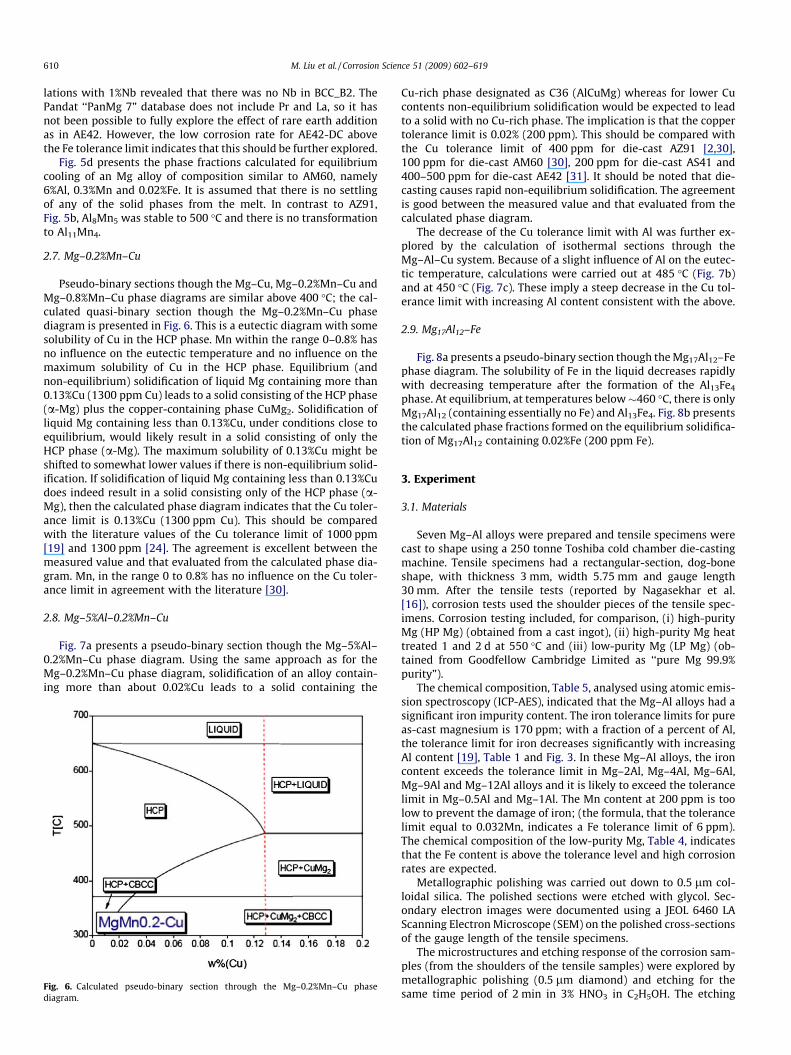
Pseudo-binary sections though the Mg–Cu, Mg–0.2%Mn–Cu andMg–0.8%Mn–Cu phase diagrams are similar above 400 �C; the cal-culated quasi-binary section though the Mg–0.2%Mn–Cu phasediagram is presented in Fig. 6. This is a eutectic diagram with somesolubility of Cu in the HCP phase. Mn within the range 0–0.8% hasno influence on the eutectic temperature and no influence on themaximum solubility of Cu in the HCP phase. Equilibrium (andnon-equilibrium) solidification of liquid Mg containing more than0.13%Cu (1300 ppm Cu) leads to a solid consisting of the HCP phase(a-Mg) plus the copper-containing phase CuMg2. Solidification ofliquid Mg containing less than 0.13%Cu, under conditions close toequilibrium, would likely result in a solid consisting of only theHCP phase (a-Mg). The maximum solubility of 0.13%Cu might beshifted to somewhat lower values if there is non-equilibrium solid-ification. If solidification of liquid Mg containing less than 0.13%Cudoes indeed result in a solid consisting only of the HCP phase (a-Mg), then the calculated phase diagram indicates that the Cu toler-ance limit is 0.13%Cu (1300 ppm Cu). This should be comparedwith the literature values of the Cu tolerance limit of 1000 ppm[19] and 1300 ppm [24]. The agreement is excellent between themeasured value and that evaluated from the calculated phase dia-gram. Mn, in the range 0 to 0.8% has no influence on the Cu toler-ance limit in agreement with the literature [30].
2.8. Mg–5%Al–0.2%Mn–Cu
Fig. 7a presents a pseudo-binary section though the Mg–5%Al–0.2%Mn–Cu phase diagram. Using the same approach as for theMg–0.2%Mn–Cu phase diagram, solidification of an alloy contain-ing more than about 0.02%Cu leads to a solid containing the
Fig. 6. Calculated pseudo-binary section through the Mg–0.2%Mn–Cu phasediagram.
Cu-rich phase designated as C36 (AlCuMg) whereas for lower Cucontents non-equilibrium solidification would be expected to leadto a solid with no Cu-rich phase. The implication is that the coppertolerance limit is 0.02% (200 ppm). This should be compared withthe Cu tolerance limit of 400 ppm for die-cast AZ91 [2,30],100 ppm for die-cast AM60 [30], 200 ppm for die-cast AS41 and400–500 ppm for die-cast AE42 [31]. It should be noted that die-casting causes rapid non-equilibrium solidification. The agreementis good between the measured value and that evaluated from thecalculated phase diagram.
The decrease of the Cu tolerance limit with Al was further ex-plored by the calculation of isothermal sections through theMg–Al–Cu system. Because of a slight influence of Al on the eutec-tic temperature, calculations were carried out at 485 �C (Fig. 7b)and at 450 �C (Fig. 7c). These imply a steep decrease in the Cu tol-erance limit with increasing Al content consistent with the above.
2.9. Mg17Al12–Fe
Fig. 8a presents a pseudo-binary section though the Mg17Al12–Fephase diagram. The solubility of Fe in the liquid decreases rapidlywith decreasing temperature after the formation of the Al13Fe4
phase. At equilibrium, at temperatures below�460 �C, there is onlyMg17Al12 (containing essentially no Fe) and Al13Fe4. Fig. 8b presentsthe calculated phase fractions formed on the equilibrium solidifica-tion of Mg17Al12 containing 0.02%Fe (200 ppm Fe).
3. Experiment
3.1. Materials
Seven Mg–Al alloys were prepared and tensile specimens werecast to shape using a 250 tonne Toshiba cold chamber die-castingmachine. Tensile specimens had a rectangular-section, dog-boneshape, with thickness 3 mm, width 5.75 mm and gauge length30 mm. After the tensile tests (reported by Nagasekhar et al.[16]), corrosion tests used the shoulder pieces of the tensile spec-imens. Corrosion testing included, for comparison, (i) high-purityMg (HP Mg) (obtained from a cast ingot), (ii) high-purity Mg heattreated 1 and 2 d at 550 �C and (iii) low-purity Mg (LP Mg) (ob-tained from Goodfellow Cambridge Limited as ‘‘pure Mg 99.9%purity”).
The chemical composition, Table 5, analysed using atomic emis-sion spectroscopy (ICP-AES), indicated that the Mg–Al alloys had asignificant iron impurity content. The iron tolerance limits for pureas-cast magnesium is 170 ppm; with a fraction of a percent of Al,the tolerance limit for iron decreases significantly with increasingAl content [19], Table 1 and Fig. 3. In these Mg–Al alloys, the ironcontent exceeds the tolerance limit in Mg–2Al, Mg–4Al, Mg–6Al,Mg–9Al and Mg–12Al alloys and it is likely to exceed the tolerancelimit in Mg–0.5Al and Mg–1Al. The Mn content at 200 ppm is toolow to prevent the damage of iron; (the formula, that the tolerancelimit equal to 0.032Mn, indicates a Fe tolerance limit of 6 ppm).The chemical composition of the low-purity Mg, Table 4, indicatesthat the Fe content is above the tolerance level and high corrosionrates are expected.
Metallographic polishing was carried out down to 0.5 lm col-loidal silica. The polished sections were etched with glycol. Sec-ondary electron images were documented using a JEOL 6460 LAScanning Electron Microscope (SEM) on the polished cross-sectionsof the gauge length of the tensile specimens.
The microstructures and etching response of the corrosion sam-ples (from the shoulders of the tensile samples) were explored bymetallographic polishing (0.5 lm diamond) and etching for thesame time period of 2 min in 3% HNO3 in C2H5OH. The etching

M. Liu et al. / Corrosion Science 51 (2009) 602–619 611
conditions were kept the same for all the Mg–Al alloys to evaluatehow the etching (in essence a corrosion process) depended on alloycontent.
Cuboid (20 � 20 � 10 mm) HP Mg samples were heat treated 24and 48 h at 550 �C in air, the surfaces polished to 1200 grit, and thecorrosion rate in 3% NaCl solution was evaluated by measuring theevolved hydrogen.
3.2. Corrosion tests
Samples for hydrogen gas collection, to characterize the corro-sion rate, were encapsulated in epoxy resin so that a surface areaof �2.5 cm2 was exposed to the 3% NaCl solution. The working sur-face was polished to 0.5 lm colloidal silica and was horizontallyimmersed in 1500 ml of the test solution. The hydrogen evolvedduring the corrosion experiment was collected in a burette abovethe corroding sample as per Song et al. [94]. The overall magne-sium corrosion reaction:
2Mgþ 2Hþ þ 2H2O ¼ 2Mg2þ þ 2OH� þ 2H2
indicates that one molecule of hydrogen is evolved for each atom ofcorroded magnesium and that the volume of hydrogen allows eval-uation of the corrosion of the magnesium alloy; previous work
Fig. 7. (a) Calculated pseudo-binary section through the Mg–5%Al–0.2%Mn–Cu phase diasection through the Mg–Al–Cu system at 450 �C.
[14,19–21,35,52,53] has indicated that this method provides anconvenient and reliable means of evaluating the corrosion rate.The hydrogen evolution volume rate, VH (ml cm�2 d�1) can be re-lated to the corrosion rate, PH (mm y�1) using the following equa-tion: PH = 2.279 VH.
4. Results
4.1. Microstructure
Figs. 9–11 present secondary electron images of alloys Mg–0.5Al,Mg–4Al and Mg–12Al at the centre of the tensile specimen gaugelength (Figs. 9a, 10a and 11a) and near the surface (Figs. 9b, 10b,11b). In Figs. 9–11, the primary a-Mg phase appears dark, the Al-en-riched eutectic a-Mg phase appears bright and the b-Mg17Al12 inter-metallic phase appears very bright. Mg–0.5Al (Figs. 9a and b) wasessentially single phase; the microstructure showed little more thangrain boundaries and twins; the small white features, typically lessthan 1 lm in diameter, correspond to the Fe rich phase BCC_B2. At4%Al there was an eutectic network and a high volume fraction ofthe inter-metallic near the surface (Fig. 10b), a microstructure typi-cal of the skin effect [5–7,35]. In the central region (Fig. 10a), therewas a smaller volume fraction of the inter-metallic and the eutectic
gram. (b) Isothermal section through the Mg–Al–Cu system at 485 �C. (c) Isothermal

Fig. 8. (a) Calculated pseudo-binary section through the Mg17Al12–Fe phasediagram. (b) Calculated phase fractions formed on the equilibrium solidificationof Mg17Al12 containing 0.02%Fe (200 ppm Fe).
612 M. Liu et al. / Corrosion Science 51 (2009) 602–619
network. At 12%Al, there was a continuous inter-metallic network atboth the centre and at the surface (Fig. 11a and b). The small whitefeatures, in Figs. 10a and b and Fig. 11b, correspond to the Fe richphase BCC_B2. Their identity was confirmed by EDS analysis whichshowed that they contained Fe.
Fig. 12 presents optical micrographs corresponding to the sam-ples used for corrosion testing. The low-purity Mg was as-polished;the Mg–Al alloys were polished and were all etched for the sametime period of 30 s in 3% HNO3 in C2H5OH. The etching conditionswere kept the same for all the Mg–Al alloys to evaluate how theetching (in essence a corrosion process) depended on alloy content.In general, the microstructure was consistent with that revealed inFigs. 9–11 by more conventional metallography; the amount andsize of second phase increased with increasing Al content; the sec-ond phase appearance is consistent with the inter-metallicMg17Al12. The amount of the second phase, however, did not in-crease smoothly with increasing Al content. For example, theamount of the second phase was greater in Mg–0.5Al than inMg–1Al; similarly for Mg–4Al and Mg–6Al, and also for Mg–9Al
and Mg–12Al. This is attributed to these samples being fromslightly different depths from the original surface of the shouldersof the tensile samples and the fact of the non-uniform distributionof the second phase in each sample, which were from the shoulderregion of the tensile samples. In addition, the surface of these spec-imens after etching had lots of pits and surface defects, the etchingwas in some locations quite significant, so that these surface etchpits are attributed to the impurity Fe content rather than to overetching. These pits may correspond to the location of Fe-richprecipitates.
4.2. Corrosion
Fig. 13a presents the corrosion behaviour, measured as hydro-gen evolution volume, for immersion in 3% NaCl for the Mg–Al al-loys, LP Mg and HP Mg. The LP Mg had the fastest corrosion rate.For the Mg–Al alloys, in the first 4 h, Mg–2Al and Mg–6Al hadthe lowest corrosion rates and Mg–0.5Al corroded fastest. Subse-quently, the corrosion rates increased in a sequence correlatedwith both the increasing Al content and the increasing Fe content.The corrosion rates have been included in Table 2. A comparisonwith the other corrosion rates in Table 2 indicates that the corro-sion rates of the Mg–Al are significantly higher than would be ex-pected for high-purity Mg alloys below the Fe tolerance; thus theincrease in corrosion rate with increasing alloying is attributed tothe increasing Fe content rather than being related to the Alcontent.
Fig. 13b presents the corrosion behaviour, measured as hydro-gen evolution volume, for (i) as-cast HP Mg, (ii) HP Mg heat treatedfor 1 d at 550 �C and (iii) HP heat treated for 2 d at 550 �C. The aver-age corrosion rate for as-cast HP Mg in Fig. 13b was 1.8 mm/y con-sistent with �0.9 mm/y from Fig. 13a, see Table 2; this givesconfidence in the experimental measurements. There was a signif-icant increase in corrosion rate after heat treatment at 550 �C, con-sistent with the precipitation of the BCC Fe rich phase as predictedin Section 2.2, Fig. 2. This indicates that the Fe tolerance limit is in-deed �5–10 ppm Fe for heat-treated pure Mg.
Fig. 14 presents the corrosion behaviour, as measured by thehydrogen evolution rate, for the model HPDC Mg–Al alloys, plot-ted against (a) the Fe content and (b) the Al content. If themicrostructure was an important factor in determining the cor-rosion rate, it would be expected that the corrosion rate wouldincrease with the %Mg17Al12 in the microstructure (listed in Ta-ble 5) for small volume fractions and then the corrosion ratewould decrease to below the corrosion rate of HP Mg whenthe Mg17Al12 became a continuous network and presented a bar-rier effect; the corrosion rate does not show such a significantdependence on the Al content. All the corrosion rates are higherthan expected for high-purity alloys with a Fe content below thetolerance limit. However, there is change in the corrosion ratesabove �1%Al. This is attributed to the Fe content being justabove the tolerance limit for Mg–0.5Al and Mg–1Al, whereasthe Fe content is significantly above the tolerance limit for theother alloys.
The high corrosion rate of the LP Mg is also attributed to itsimpurity content; the Fe content at 280 ppm significantly ex-ceeds the tolerance limit. This interpretation is confirmed by acomparison of the corrosion rates of LP Mg and HP Mg. The cor-rosion performance of pure magnesium should be that of HP Mg,rather than LP Mg with a high Fe content. The similar result isalso found in the literature [37,38]. This emphasises that in re-search on magnesium corrosion, the Fe content should alwaysbe considered as it can dominate other effects, because an Feconcentration above the tolerance limit can accelerate the corro-sion rate by 10–100 times.

Table 5The chemical composition (in wt.% or wt.ppm) of the model HPDC Mg–Al alloys, LP Mg and HP Mg, and fraction eutectic and % Mg17Al12, calculated for non-equilibrium conditionsafter Scheil.
Alloy Mg (%) Al (%) Zn (%) Mn (ppm) Fe (ppm) Be (ppm) Cu (ppm) Ni (ppm) %Eutectic %Mg17Al12
LP Mg 99.9 0.007 <0.002 170 280 20 <10 0 0HP Mg Bal 0.007 80 45 9 0 0Mg–0.5Al Bal 0.48 0.014 200 27 9 <20 <10 0.2 0.1Mg–1Al Bal 0.94 0.012 200 25 9 <20 <10 0.6 0.4Mg–2Al Bal 1.90 0.015 200 33 12 <20 <10 1.6 1.1Mg–4Al Bal 3.72 0.011 200 31 10 <20 <10 4.5 3.1Mg–6Al Bal 5.72 0.008 200 38 9 <20 <10 8.2 5.6Mg–9Al Bal 8.80 0.009 200 45 11 <20 <10 14.7 10.1Mg–12Al Bal 11.6 0.008 200 51 12 <20 <10 22.1 15.2
Fig. 9. SEM secondary electron images of HPDC Mg–0.5Al at (a) centre and (b)surface of the specimen cross-section.
Fig. 10. SEM secondary electron images of HPDC Mg–4Al at (a) centre and (b)surface of the specimen cross-section.
M. Liu et al. / Corrosion Science 51 (2009) 602–619 613
5. Discussion
5.1. Fe/Mn ratio or Fe concentration
Fig. 1 presents, for the Mg alloys AZ91, AM60, AS41 and AE42,the salt spray corrosion rate (mm/y) as a function of the alloy ironcontent ([Fe]) above the tolerance limit (X � [Mn]) at the alloy Mncontent ([Mn]). Fig. 1 is a replotting of the data from Hillis andco-workers [24,28,30,31]. Hillis and co-workers [24,28,30,31], intheir work, found that data from different trials with differentMn contents could be condensed into a single trend line by plottingtheir data against the ratio Fe/Mn; they thereby established thatthe Fe tolerance level depends on the Mn content. In Fig. 1, data
from different trials with different Mn contents also follows onetrend line for each alloy and casting condition despite the fact thatthe data is plotted against the Fe concentration is excess of the tol-erance limit and not plotted against the Fe/Mn content. The impli-cation is that the important variable above the Fe tolerance limit issimply the excess Fe concentration.
5.2. Corrosion of Mg–Al alloys (Al >4%)
The corrosion studies from the literature summarised in Table 2were carried out in similar environments so it is permissible tocompare the results of these studies. Analysis of the results inTable 2 indicates the following.

Fig. 11. SEM secondary electron images of HPDC Mg–12Al at (a) centre and (b)surface of the specimen cross-section.
614 M. Liu et al. / Corrosion Science 51 (2009) 602–619
1. If the Fe content is below 170 ppm, which is the tolerancelimit of Fe for pure as-cast Mg, and the Fe/Mn ratio is below0.032, which is the Fe tolerance limit for die-cast AZ91, thenthe corrosion rate of Mg and Mg alloys is low and below5 mg cm�2 day�1.2. If the Fe content exceeds 170 ppm and the Fe/Mn exceeds0.032, then the corrosion rate of Mg and Mg alloys is higher, usu-ally above 10 mg cm�2 day�1, in some case�100 mg cm�2 day�1.Exceptions were provided by the alloys: Mg41Al and Mg22Al;usually the addition of Al decreases the tolerance limit of iron,but this did not seem to be the case at the very high Al concentra-tions [36].3. If the Fe content is below 170 ppm and the Fe/Mn ratioexceeds 0.032, the corrosion rate of the high-purity as-castMg is below 5 mg cm�2 day�1.4. If the Fe content is below 170 ppm and the Fe/Mn ratioexceeds 0.032, the corrosion rates of Mg–Al alloys were between125 and 225 mg cm�2 day�1. The Mg–Al alloys of the presentstudy had corrosion rates between 17 and 47 mg cm�2 day�1.An exception was AZ91 in the studies of Lunder et al. [32] andSong et al. [33,35], which showed corrosion rates in the range1–6 mg cm�2 day�1; the Fe/Mn ratios were just a little bit higherthan 0.032.
These trends indicate that, if the corrosion rate is high such as�100 mg cm�2 day�1, then the corrosion is dominated by the impu-rity elements, which was the impurity element Fe for the data in
Table 2. In contrast, if the corrosion rate is below 10 mg cm�2 day�1,then the corrosion performance is controlled by the microstructure.When the corrosion rate is between 10 and 100 mg cm2 day, thecorrosion mechanism may involve (i) effects from the Fe impurityand (ii) microstructure effects. These trends lead to the followinggeneralisations.
1. If the Fe content is above the tolerance limit (e.g. 170 ppm inpure as-cast Mg) the corrosion rate is high.2. The addition of Al decreases the Fe tolerance limit. The Fe–Alcompound FeAl3 is believed to be especially harmful [19].3. Although metallic Mn is also cathodic with respect to themagnesium matrix, it does increase the tolerance limit of Fe.Mn can form an Al–Mn–Fe inter-metallic in an Mg–Al alloy,which could be passive.4. In low-purity Mg–Al alloys, the corrosion mechanism is com-plicated, especially when the corrosion rate is between 10 and100 mg cm�2 day�1.
5.3. Influence of Al
It is reported [19,20,33,34] that increasing Al concentrations inMg–Al alloys have a beneficial effect on the corrosion behaviour inchloride media, but the specific mechanism and influence of Al isstill not well understood. For instance, Song et al. [35] found thatthe corrosion rate of Mg–9%Al at 46 mg cm�2 day�1 was slightlysmaller than that of Mg–2%Al at 52 mg cm�2 day�1, however, thedifference was small and may not be significant because of the highlevel of Fe content above the tolerance limit. Similarly, Song et al.[33] found that increasing Al concentrations in the range 2–9wt.% Al in Mg–Al single phase alloys did correlate with a decreasein the corrosion rate in 5% NaCl, these alloys contained a high Fecontent and the corrosion rates were much higher than for high-purity alloys; thus the decrease in corrosion rate appears to be re-lated to a decrease in the Fe impurity level with increasing Al con-tent rather than to the Al content itself. Therefore, to investigatethe influence of Al on the corrosion of Mg, the Fe content shouldbe kept to a low concentration below the tolerance limit.
5.4. Model HPDC Mg–Al–Fe alloys
For the model HPDC Mg–Al alloys studied in the present inves-tigation, both the Fe and Al content increased, so careful analysis isneeded to distinguish the effects of either. The present investiga-tion has identified the appearance of the Fe-rich particles in themicrostructure. In high magnification (�1000� to 5000�) second-ary electron images, they appear as small white features, typicallyless than 1 lm in diameter. The relation of these microstructurefeatures to corrosion initiation would be the next step. Linking cor-rosion initiation to these locations would be an important advancefor the further study on the effect of Fe on Mg corrosion.
5.5. MEZU and MEZR
The new insights on tolerance levels from the calculated phasediagrams allow re-examination of some interesting issues raisedby prior studies. These are disused in this and the following sub-sections.
Song and StJohn [41] examined the corrosion of the sand-castmagnesium alloy MEZ with unrefined (MEZU) and Zr-grained-re-fined (MEZR) microstructures in salt spray and immersion testsusing 5% NaCl. The better performance of the Zr-grained refinedMEZR microstructure, Table 6, was attributed to the presence ofthe Zr. They did recognise that the unrefined MEZU contained a

Fig. 12. Microstructure of the HPDC Mg–Al alloys after etching for 30 s in 3% HNO3 in C2H5OH. The etching conditions were kept the same for all the Mg–Al alloys to evaluatehow the etching (in essence a corrosion process) depended on alloy content.
M. Liu et al. / Corrosion Science 51 (2009) 602–619 615
higher concentration of Al and Fe and they stated ‘‘it is not clearwhether the difference in the very small amount of aluminium inthe alloys has a significant influence on the corrosion resistance.”The above analysis in Section 2.3 on the Mg–Al–Fe phase diagramis particularly relevant to this issue; according to Section 2.3 thesmall amount of Al is indeed highly significant in decreasing theFe tolerance limit, so that the Fe content of MEZU is significantlyabove the Fe tolerance limit at 0.42%Al and so it is highly likely thatthe Fe impurity is responsible for the higher corrosion rate ofMEZU.
5.6. Influence of microstructure
Table 7 provides a summary of the data on the influence ofmicrostructure on the salt spray corrosion performance of AZ91;Table 7 is an extract from the overview by Froats et al. in theASM International Metals Handbook [25]. AZ91C has a Fe contentgreater than the tolerance limit so that the corrosion rate is highand the Fe content dominates the behaviour; the Fe content over-whelms the influence of the microstructure. AZ91E is high purity,the Fe content is below the tolerance limit, and there is a clearinfluence of the microstructure.
The Fe impurities dominate the corrosion behaviour for Mgwith a Fe content above the Fe tolerance level. Under these condi-tions the corrosion behaviour is dominated by the Fe impuritiesand the corrosion behaviour may have little relation to the intrinsiccorrosion behaviour of HP Mg. One such example is the recent ele-gant research by Williams and McMurray [78].
The influence of the microstructure has been elucidated a num-ber of studies [20,35], and is well illustrated by the recent study of
Zhao et al. [52]: Table 8 summarises the corrosion rate (mm/y)measured for 96 h immersion in 1 M NaCl solution for high-purityMg and high-purity AZ91 in various metallurgical conditions. Forthe as-cast condition the b-phase was distributed along the grainboundaries and there was an associated fine lamellar arrangementof a + b so that there was essentially a continuous network. Thisarrangement of the b phase provided a combination of corrosionbarrier effect and micro-galvanic corrosion acceleration. Thus thecorrosion rate is significantly greater than that of high-purity Mg.In the HA3805 and HA3810 conditions, there were large isolatedb phase particles so there was significant micro-galvanic corrosionacceleration. In the solid solution condition (SS), all b had been dis-solved so that there was a solid solution of a-Mg matrix containing�9% Al in solid solution. There was no second phase, so the corro-sion reflects that of a homogeneous Mg–Al alloy. The aging at200 �C for the SA205 condition produced fine b precipitates inthe a-matrix; a more protective surface film is attributed as thecause for the corrosion rate in the SA205 condition to be lowerthan that of the SS condition.
Tables 7 and 8 show the same trend in corrosion rate with heattreatment; the corrosion rates produced by solution immersion areconsiderably higher than those produced by salt spray testing. It isalso worth noting that the corrosion rate increased during theimmersion tests of Zhao et al. [52] as the corrosion spread acrossthe specimens, indicating that shorter-term tests would measurelower corrosion rates although the same trends might expect tobe measured.
Table 9 presents the corrosion rate (mm/y) measured [47] forimmersion in short-term tests (�4 h) in 3.5% NaCl solution foras-cast high-purity AZ80 and after extrusion at 250, 300 and

Fig. 13. (a) Corrosion behaviour, as revealed by hydrogen evolution measurements, for LP Mg, HP Mg and the HPDC Mg–Al alloys in 3% NaCl for 33 h. (b) Corrosion behaviourin 3% NaCl, evaluated by hydrogen evolution measurements, for cast HP Mg compared with HP Mg after heat treatment for 24 and 48 h at 550 �C.
616 M. Liu et al. / Corrosion Science 51 (2009) 602–619
350 �C. As high-purity AZ80 was used, these short-term tests mea-sured trends associated with the microstructure consistent withthose in Table 8 although the corrosion rates were lower than inthe longer-term tests of Table 8. There were long stringers of theb-phase extruded in the extrusion direction in the as-extrudedmicrostructure; these b-phase stringers caused significant micro-galvanic acceleration of the corrosion. The microstructure also con-tained an Al + Mn phase, identified as Al8Mn5; this identification isconsistent with Fig. 5d; this phase did not cause any significant mi-cro-galvanic acceleration of the corrosion in the wrought alloy.
5.7. Wrought – cast
Previous work has typically measured a corrosion rate of�1 mm/y in continuous immersion in 3% NaCl solution for high-purity as-cast Mg. The one exception is the recent work by Pradoet al. [37,38] who reported a much higher corrosion rate: a corro-sion rate of �600 mm/y [37,38] and �90 mm/y [38] for wroughthigh-purity Mg (containing 40 ppm). The material used by Pradoet al. was wrought rather than the as-cast material used in theprior studies. Figs. 2 and 13b indicate that wrought Mg has a Fe tol-erance limit �5–10 ppm; this tolerance limit for wrought or heat-treated high-purity Mg is much lower than the Fe tolerance level of170 ppm Fe for as-cast material.
Does this low Fe tolerance limit also apply to wrought Mg al-loys? The answer appears to be that wrought alloys containingMn, as do typical commercial Mg alloys, have a Fe tolerance limitthat is not too dissimilar to that of their cast counterparts. This eval-
uation is based on the work of Ben-Haroush [47] who found that ex-truded AM60 acted consistent with being high purity (thecomposition is given in Table 9) and did not show extreme sensitiv-ity to Fe as could be inferred from Fig. 2; they found that the Al8Mn5
phase did not cause any significant micro-galvanic acceleration ofthe corrosion in the wrought alloy. It is also consistent with our re-cent work with extruded AZ31 and AM30 [95]. This evaluation isalso consistent with Figs. 4a–d; which indicate that heat treatmentdoes not produce the BCC_B2 phase for Mg–Al–Mn alloys whereasheat treatment of pure Mg causes the precipitation of the BCCphase.
5.8. Production of high-purity alloys
The calculated phase diagrams can explain the controlled cast-ing experiments of Hillis and co-workers [24,30] based on theassumption that the BCC_B2 phase is allowed to settle out whenthe temperature of the melt is maintained at temperatures of725, 690 and 650 �C; there is also agreement if the Al8Mn5
phase settles from the melt. An estimate of 6.0 g/cm3
(= 0.333 � 7.84 + 0.333 � 7.44 + 0.333 � 2.7) can be made for thedensity of the BCC_B2 phase with and equal number of Fe, Mnand Al atoms on the assumption that the density is simply relatedto the mass of the constituent atoms. (The density of Fe is 7.84 g/cm3, the density of Mn is 7.44 g/cm3 and the density of Al is 2.7 g/cm3). Similarly the density is estimated to be 5.6 g/cm3 forAl8Mn5. Whilst these are rough estimations of the density ofBCC_B2 and Al8Mn5, these values are considerably in excess of

Table 7Summary of the influence of composition and microstructure on the corrosion ofAZ91 [25]. F is as-cast, T4 is solution treated (16 h at 410 �C and quenched), T6 issolution treated and aged (16 h at 410 �C and quenched, 4 h at 215 �C) and T5 is aged(4 h at 215 �C).
Alloy Mn (%) Fe/Mn Salt spray corrosion rate (mm/y)
F T4 T6 T5
AZ91C 0.18 0.087 18 15 15 –AZ91E 0.23 0.008 0.64 4 0.15 0.12
Table 8The corrosion rate (mm/y) measured for 96 h immersion in 1 M NaCl solution forhigh-purity Mg and high-purity AZ91 in the following conditions: as-cast, HA3805(homogenisation anneal for 5 h at 380 �C plus air cool), HA3810 (homogenisationanneal for 10 h at 380 �C plus air cool), SS (100 h at 410 �C plus water quench) andSA205 (SS plus age 5 h at 200 �C) [52].
As-cast HA3805 HA3810 SS SA205 High-purity Mg
16 24 43 24 6 1
M. Liu et al. / Corrosion Science 51 (2009) 602–619 617
the density of liquid Mg at 1.58 g/cm3. Thus it would indeed beexpected for there to be a tendency for both these phases to settlefrom the melt. The 0.8% trials are consistent with the settling outof the BCC_B2 phase and the calculated composition for thisphase. The 0.2%Mn trials imply that equilibrium does not occurand an Fe rich BCC_B2 phase settles out between 750 and 690 �C.
Hillis and co-workers [24,30] found experimentally usingindustrial trials that the temperature range from 750 to 650 �C isthe important temperature range in purifying the melt anddecreasing the Fe content. This temperature range corresponds tothe solidification of BCC_B2. The calculated volume fraction ofthe BCC_B2 phase at �650 �C is about 0.0005. If a 40% Fe contentis assumed, and if it assumed that all this volume fraction ofBCC_B2 settles out, then the amount of Fe settling out correspondsto 0.02%, the amount of Fe in the alloy. Thus a back-of-the-enve-lope mass balance calculation indicates that the solidification ofthe BCC_B2 phase and its settling out from the melt between 750and 650 is sufficient to purify the melt.
The SEM/EDX analysis, of the sludge of the casting trials usingAZ91 [24], revealed that the precipitate from the Mg melt con-tained Fe–Mn–Al in variable amounts; the particulates were of-ten Fe and/or Mn rich in the core with the surrounding or
Table 9The corrosion rate (mm/y) measured for immersion in short-term tests (�4 h) in 3.5%NaCl solution for as-cast AZ80 and after extrusion at 250 �C, 300 �C and 350 �C [47].The composition was 8.3%Al, 0.20%Mn, 0.40%Zn, 55 ppm Si, 2 ppm Cu, 5 ppm Ni and25 ppm Fe.
As-cast 250 �C 300 �C 350 �C
0.5 7 11 10
Fig. 14. Corrosion behaviour in 3% NaCl solution, as revealed by hydrogen volumemeasurements, as a function of (a) Fe content and (b) Al content.
Table 6Composition and average corrosion rate (2–6 d) in salt spray (SS) and salt immersion (SI)
Alloy Zr (wt.%) Al (wt.%) Zn (wt.%) Fe (ppm) Cu (ppm) Ni (ppm) Mn (
MEZU 0.005 0.42 0.54 130 <50 <20 0.18MEZR 0.6 0.03 0.42 40 <50 <20 0.11
bridging regions containing Al + Mn. A Fe or Mn rich core is con-sistent with the precipitation of the BCC_B2 phase, the surround-ing regions containing Al + Mn most probably correspond toAl8Mn5, which contained little Fe because the Fe has alreadybeen incorporated in the BCC_B2 by the time of solidificationof the Al8Mn5.
It is perhaps worth restating that the above analysis rests on theassumptions that the BCC_B2 phase is a good hydrogen cathodeand that Al8Mn5 is not.
5.9. Recycling Mg and secondary alloys
The calculated phase diagrams can explain the production ofhigh-purity castings by means of control of melt conditions; thishas significance for the production of quality castings from recy-cled Mg. As shown by the work of Hillis and co-workers [27–31]using commercial HPDC, high-purity castings can be produced bycontrol of the melt, particularly the melt temperature. The alter-native approach is to develop tailored alloys that are less sensi-tive to the impurity elements as e.g. by the research of Scharfet al. [48].
6. Conclusions
High-pressure die-cast (HPDC) model Mg–Al alloys were usedto elucidate the corrosion of commercial die-cast Mg–Al alloys.In order to understand the impurity tolerance limits, (i) the appro-priate corrosion literature was summarised and reviewed and (ii)
using 5% NaCl [41].
wt.%) Ce (wt.%) Nd (wt.%) Pr (wt.%) La (wt.%) SS (mm/y) SI (mm/y)
1.25 0.34 0.9 0.65 20 161.28 0.37 0.9 0.65 1.6 4

618 M. Liu et al. / Corrosion Science 51 (2009) 602–619
Mg phase diagrams were calculated using the Pandat softwarepackage.
1. The corrosion behaviour of the model HPDC Mg–Al alloys wasdominated by the concentration of the Fe impurity element.2. The present investigation has identified the appearance of theFe-rich particles in the microstructure. In high magnification(�1000� to 5000�) secondary electron images, they appearas small white features, typically less than 1 lm in diameter.3. The Fe tolerance limit is �5–10 ppm for heat-treated HP Mg.4. Corrosion of commercial alloys is dominated by the Fe con-tent above the tolerance limit, and high corrosion rates areexpected.5. For Fe contents below the tolerance limits, other factors caninfluence the corrosion behaviour, such as the chemical compo-sition and microstructure.6. The calculated Mg phase diagrams indicate that the impuritytolerance limits are caused by the precipitation of a distinct,iron-rich phase, either BCC or BCC_B2.7. The calculated phase diagrams provide a metallurgical expla-nation for the production of high-purity castings by means ofcontrol of pouring temperature.8. A full analysis of the tolerance limits, and the influence of REelements, requires that the Mg database be extended to includeNi, Co, Pr and La.9. Analysis of the literature indicates that several studies havebeen dominated by the Fe impurity and have not dealt withthe stated aims; it also indicates that the full chemical compo-sition should be reported in all studies of the corrosion of Mgalloys.
Acknowledgements
This work was supported by the ARC Center of Excellence De-sign of Light Alloys. CAST CRC was established under, and is sup-ported in part by, the Australian Government’s CooperativeResearch Centres scheme. Liu and Atrens would like to thankEMPA for their support that allowed them to spend considerableperiods in the EMPA laboratory. EMPA is the Swiss Federal Labo-ratories for Materials Science and Technology. Liu and Atrenswould also like to thank ENSCP for support that allowed themto spend considerable periods in the Laboratoire de Physico-Chi-mie des Surfaces, CNRS-ENSCP (UMR 7045), Ecole Nationale Supe-rieure de Chimie de Paris (ENSCP), 11 rue Pierre et Marie Curie,75005 Paris, France.
References
[1] C.H. Cáceres, W.J. Poole, A.L. Bowles, C.J. Davidson, Section thickness,macrohardness and yield strength in high-pressure diecast magnesium alloyAZ91, Mater. Sci. Engg. A 402 (2005) 269–277.
[2] C.H. Cáceres, J.R. Griffiths, A.R. Pakdel, C.J. Davidson, Microhardness mappingand the hardness-yield strength relationship in high-pressure diecastmagnesium alloy AZ91, Mater. Sci. Engg. A 402 (2005) 258–268.
[3] C.H. Cáceres, J.R. Griffiths, C.J. Davidson, C.L. Newton, Effects of solidificationrate and ageing on the microstructure and mechanical properties of AZ91alloy, Mater. Sci. Engg. A 325 (2002) 344–355.
[4] B. Johannesson, C.H. Cáceres, Effect of Si additions and heat treatment on themechanical behaviour of an Al–5Mg casting alloy, Int. J. Cast Metals Res. 17(2004) 94–98.
[5] A.L. Bowles, J.R. Griffiths, C.J. Davidson, Ductility and the skin effect in highpressure die cast Mg-Al alloys, in: J. Hryn (Ed.), Magnesium Technology, TheMinerals, Metals and Materials Society (TMS), Warrendale, PA, 2001, pp. 161–168.
[6] W.P. Sequeira, G.L. Dunlop, and M.T. Murray, Microstructure and mechanicalproperties of high pressure die cast magnesium alloy AZ91D, 3rd InternationalMagnesium Conference, London, ed. G.W. Lorimer, The Institute of Metals,London, (1997) 63–73.
[7] W.P. Sequeira, M.T. Murray, G.L. Dunlop, and D.H. StJohn, Effect of sectionthickness and gate velocity on the microstructure and mechanical properties
of high pressure die cast magnesium alloy AZ91D, TMS Symposium onautomotive alloys, The Minerals Metals and Materials Society (TMS),Warrendale, PA, (1997) 169–183.
[8] T. Aune, H. Westengen, and T. Ruden, Mechanical Properties of EnergyAbsorbing Magnesium Alloys, SAE Technical Paper 930418 (1993) 51–57.
[9] T. Aune and H. Westengen, Property Update on Magnesium Die Casting Alloys,SAE Technical Paper 950424 (1995) 332–342.
[10] T. Aune, H. Westengen, and T. Ruden, The Effects of Varying Aluminum andRare-Earth Content on the Mechanical Properties of Die Cast MagnesiumAlloys, SAE Technical Paper 940777 (1994) 553–557.
[11] P.D.D. Rodrigo and V. Ahuja, High pressure die casting simulation usingsmoothed particle hydrodynamics, Magnesium 2000, 2nd Israeli Intl. Conf. onMagnesium Science & Technology, ed. E. Aghion and D. Eliezer, Dead Sea, MRI,Beer-Sheva (2000) 97–104.
[12] T.G. Basner, M. Evans, and D.J. Sakkinen, The Effect of Extended Time Aging onthe Mechanical Properties of Vertical Vacuum Cast Aluminum-Manganese andAluminum-Rare Earth Magnesium Alloys, SAE Technical Paper 930419 (1993)59–64.
[13] A.M. Gokhale, G.R. Patel, Origins of variability in the mechanical properties ofAM60 magnesium alloy castings, in: J. Hryn (Ed.), Magnesium Technology, TheMinerals, Metals and Materials Society (TMS), Warrendale, PA, 2001, pp. 195–199.
[14] M.C. Zhao, M. Liu, G.L. Song, A. Atrens, Influence of Homogenization Annealingof AZ91 on Mechanical Properties and Corrosion Behavior, AdvancedEngineering Materials 10 (2008) 93–103.
[15] D.J. Sakkinen, Physical Metallurgy of Magnesium Die Cast Alloys, SAE TechnicalPaper 940779 (1994) 558.
[16] A.V. Nagasekhar, [email protected], C.H. Cáceres, [email protected],The University of Queensland, and Mark Easton, [email protected], Monash University, private communication (2008).
[17] A.V. Nagasekhar, C.H. Cáceres, Solute Content and the Tensile Behavior of HighPressure Die Cast Mg-Al Alloys, Materials Science Forum 561–565 (2007) 333–336.
[18] A.V. Nagasekhar, C.H. Caceres, M. Easton, Microstructure development andmechanical behaviour in high pressure die cast magnesium-aluminium binaryalloys, in: M.O. Pekguleryuz et al. (Eds.), Magnesium Technology, TheMinerals, Metals and Materials Society (TMS), Warrendale, PA, 2008, pp.343–346.
[19] G. Song, A. Atrens, Corrosion Mechanisms of Magnesium Alloys, AdvancedEngineering Materials 1 (1999) 1–33.
[20] G.L. Song, A. Atrens, Understanding Magnesium Corrosion - A Framework forImproved Alloy Performance, Advanced Engineering Materials 5 (2003) 837–858.
[21] G. Song, A. Atrens, Recent Insights into the Mechanism of MagnesiumCorrosion and Research Suggestions, Advanced Engineering Materials 9(2007) 177–183.
[22] G.L. Makar, J. Kruger, Corrosion of magnesium, International Materials Reviews38 (1993) 138.
[23] J.D. Hanawalt, C.E. Nelson, J.A. Peloubet, The effect of various alloying elementson the corrosion resistance of Mg, Transactions of AIME 147 (1942) 273–299.
[24] K.N. Reichek, K.L. Clark, J.E. Hillis, Controlling the Salt Water CorrosionPerformance of Magnesium AZ91 Alloy, SAE Technical Paper 850417 (1985).
[25] A. Froats, T.K. Aune, D. Hawke, W. Unsworth, J.E. Hillis, Corrosion ofmagnesium and magnesium alloys, Metal Handbook, Corrosion, 9th ed., vol.13, ASM International Materials Park, OH, 1987. pp. 740–754.
[26] O. Lunder, T.K. Aune, K. Nisancioglu, Effect of Mn additions on the corrosionbehavior of mould-cast magnesium ASTM AZ91, Corrosion 43 (1987) 291–295.
[27] J.E. Hillis, The Effects of Heavy Metal Contamination on Magnesium CorrosionPerformance, SAE Technical Paper 830523 (1983).
[28] J.E. Hillis, S.O. Shook, Composition and Performance of An ImprovedMagnesium AS41 Alloy, SAE Technical Paper 890205 (1989).
[29] J.E. Hillis, R.W. Murray, Finishing alternatives for high purity magnesiumalloys, SDCE 14th International Die Casting Congress and Exposition, Toronto1987, Paper No. G-T87-003.
[30] J.E. Hillis, K.N. Reichek, High Purity Magnesium AM60 Alloy: the CriticalContaminant Limits and the Salt Water Corrosion Performance, SAE TechnicalPaper 860288 (1986).
[31] W.E. Mercer, J.E. Hillis, The Critical Contaminant Limits and Salt WaterCorrosion Performance of Magnesium AE42 Alloy, SAE Technical Paper 920073(1992).
[32] O. Lunder, J.E. Lein, T.K. Aune, K. Nisancioglu, Nisancioglu, Role ofMg17Al12 phase in the corrosion of Mg alloy AZ91, Corrosion 45 (1989)741–748.
[33] G. Song, A.L. Bowles, D.H. StJohn, Corrosion resistance of aged die castmagnesium alloy AZ91D, Materials Science and Engineering A 366 (2004) 74.
[34] R. Ambat, N.N. Aung, W. Zhou, Evaluation of microstructural effects oncorrosion behaviour of AZ91D magnesium alloy, Corrosion Science 42 (2000)1433–1455.
[35] G. Song, A. Atrens, M. Dargusch, Influence of microstructure on the corrosion ofdiecast AZ91D, Corrosion Science 41 (1998) 249–273.
[36] Z. Shi, G. Song, A. Atrens, Influence of the b phase on the corrosion performanceof anodised coatings on magnesium–aluminium alloys, Corrosion Science 47(2005) 2760–2777.
[37] A. Pardo, M.C. Merino, A.E. Coy, R. Arrabal, F. Viejo, E. Matykina, Corrosionbehaviour of magnesium/aluminium alloys in 3.5 wt.% NaCl, Corrosion Science50 (2008) 823–834.

M. Liu et al. / Corrosion Science 51 (2009) 602–619 619
[38] A. Prado, M.C. Merino, A.E. Coy, F. Viejo, R. Arrabal, E. Matykina, Influence ofmicrostructure and composition on the corrosion behaviour of Mg/Al alloys inchloride media, Electrochimica Acta 53 (2008) 7890–7902.
[39] M.C. Zhao, M. Liu, G. Song, A. Atrens, Influence of Microstructure on Corrosionof As-cast ZE41, Advanced Engineering Materials 10 (2008) 104–111.
[40] Z. Shi, G. Song, A. Atrens, Corrosion resistance of anodised single-phase Mgalloys, Surface and Coatings Technology 201 (2006) 492–503.
[41] G. Song, D. StJohn, The effect of zirconium grain refinement on the corrosionbehaviour of magnesium-rare earth alloy MEZ, Journal of Light Metals 2 (2002)1–16.
[42] G. Ballerini, U. Bardi, R. Bignucolo, G. Ceraolo, About some corrosion mechanismsof AZ91D magnesium alloy, Corrosion Science 47 (2005) 2173–2184.
[43] X. Zhou, Y. Huang, Z. Wei, Q. Chen, F. Gan, Improvement of corrosion resistanceof AZ91D magnesium alloy by holmium addition, Corrosion Science 48 (2006)4223–4233.
[44] O Lunder, K Nisanccioglu, RS Hansen, Corrosion of Die Cast Magnesium–Aluminum Alloy, presented at Corrosion of Die Cast Magnesium-AluminiumAlloys, Detroit, MI (1993).
[45] A. Srinivasan, S. Ningshen, U. Kamachi Mudali, U.T.S. Pillai, B.C. Pai, Influence ofSi and Sb additions on the corrosion behavior of AZ91 magnesium alloy,Intermetallics 15 (2007) 1511–1517.
[46] J. Zhang, X. Niu, X. Qiu, K. Liu, C. Nan, D. Tang, J. Meng, Effect of yttrium-richmisch metal on the microstructures, mechanical properties and corrosionbehavior of die cast AZ91 alloy, Journal of Alloys and Compounds (2008),doi:10.1016/j.jallcom.2008.03.089.
[47] M.B. Haroush, C.B. Hamu, D. Eliezer, L. Wagner, The relation betweenmicrostructure and corrosion behavior of AZ80 Mg alloy following differentextrusion temperatures, Corrosion Science 50 (2008) 1766–1778.
[48] C. Scharf, A. Ditze, A. Shkurankov, E. Morales, C. Blawert, W. Dietzel, K.U.Kainer, Corrosion of AZ91 Secondary Magnesium Alloy, Advanced EngineeringMaterials 7 (2005) 1134–1142.
[49] C. Hoog, N. Birbilis, Y. Estrin, Corrosion of Pure Mg as a Function of Grain Sizeand Processing Route, Advanced Engineering Materials 10 (2008) 579–582.
[50] A. Atrens, W. Dietzel, The Negative Difference Effect and Unipositive Mg+,Advanced Engineering Materials 9 (2007) 292–297.
[51] S. Bender, J. Goellner, A. Atrens, Corrosion of AZ91 in 1N NaCl and theMechanism of Magnesium Corrosion, Advanced Engineering Materials 10(2008) 583–587.
[52] M.C. Zhao, M. Liu, G. Song, A. Atrens, Influence of the b-phase morphology onthe corrosion of the Mg alloy AZ91, Corrosion Science 50 (2008) 1939–1953.
[53] M.C. Zhao, M. Liu, G. Song, A. Atrens, Influence of pH and chloride ionconcentration on the corrosion of Mg alloy ZE41, Corrosion Science 50 (2008)3168–3178.
[54] G. Song, A. Atrens, D.H. StJohn, J. Nairn, Y. Lang, The electrochemical corrosionof pure magnesium in 1 N NaCl, Corrosion Science 39 (1997) 855–875.
[55] G. Song, A. Atrens, D. StJohn, X. Wu, J. Nairn, The anodic dissolution ofmagnesium in chloride and sulphate solutions, Corrosion Science 39 (1997)1981–2004.
[56] M. Liu, D. Qiu, M.C. Zhao, G. Song, A. Atrens, The effect of crystallographicorientation on the active corrosion of pure magnesium, Scripta Materialia 58(2008) 421–424.
[57] J.X. Jia, A. Atrens, G. Song, T. Muster, Simulation of galvanic corrosion ofmagnesium coupled to a steel fastener in NaCI solution, Materials andCorrosion 56 (2005) 468–474.
[58] J.X. Jia, G.L. Song, A. Atrens, Influence of geometry on galvanic corrosion ofAZ91D coupled to steel, Corrosion Science 48 (2006) 2133–2153.
[59] J.X. Jia, G. Song, A. Atrens, Experimental Measurement and ComputerSimulation of Galvanic Corrosion of Magnesium Coupled to Steel, AdvancedEngineering Materials 9 (2007) 65–74.
[60] Y. Wan, G. Xiong, H. Luo, F. He, Y. Huang, X. Zhou, Preparation andcharacterization of a new biomedical magnesium–calcium alloy, Materials &Design 29 (2008) 2034–2037.
[61] Y. Wang, M. Wei, J. Gao, J. Hu, Y. Zhang, Corrosion process of pure magnesiumin simulated body fluid, Materials Letters 62 (2008) 2181–2184.
[62] M.B. Kannan, R.K. Singh Raman, In vitro degradation and mechanical integrityof calcium-containing magnesium alloys in modified-simulated body fluid,Biomaterials 29 (2008) 2306–2314.
[63] M. Jönsson, D. Persson, C. Leygraf, Atmospheric corrosion of field-exposedmagnesium alloy AZ91D, Corrosion Science 50 (2008) 1406–1413.
[64] T. Zhang, Y. Shao, G. Meng, F. Wang, Electrochemical noise analysis of thecorrosion of AZ91D magnesium alloy in alkaline chloride solution,Electrochimica Acta 53 (2007) 561–568.
[65] G. Ben-Hamu, D. Eliezer, C.E. Cross, Th. Böllinghaus, The relation betweenmicrostructure and corrosion behavior of GTA welded AZ31B magnesiumsheet, Materials Science and Engineering A 452–453 (2007) 210–218.
[66] G. Song, Control of biodegradation of biocompatable magnesium alloys,Corrosion Science 49 (2007) 1696–1701.
[67] M. Jönsson, D. Persson, D. Thierry, Corrosion product formation during NaClinduced atmospheric corrosion of magnesium alloy AZ91D, Corrosion Science49 (2007) 1540–1558.
[68] J. Chen, J. Wang, E. Han, J. Dong, W. Ke, AC impedance spectroscopy study ofthe corrosion behavior of an AZ91 magnesium alloy in 0.1 M sodium sulfatesolution, Electrochimica Acta 52 (2007) 3299–3309.
[69] N. Hara, Y. Kobayashi, D. Kagaya, N. Akao, Formation and breakdown of surfacefilms on magnesium and its alloys in aqueous solutions, Corrosion Science 49(2007) 166–175.
[70] S. Candan, M. Unal, M. Turkmen, E. Koc, Y. Turen, E. Candan, Improvement ofmechanical and corrosion properties of magnesium alloy by lead addition,Materials Science and Engineering 501 (2009) 115–118.
[71] T. Zhang, Y. Li, F. Wang, Roles of b phase in the corrosion process of AZ91Dmagnesium alloy, Corrosion Science 48 (2006) 1249–1264.
[72] M.P. Staiger, A.M. Pietak, J. Huadmai, G. Dias, Magnesium and its alloys asorthopedic biomaterials: A review, Biomaterials 27 (2006) 1728–1734.
[73] F. Witte, J. Fischer, J. Nellesen, H.A. Crostack, V. Kaese, A. Pisch, F. Beckmann, H.Windhagen, In vitro and in vivo corrosion measurements of magnesium alloys,Biomaterials 27 (2006) 1013–1018.
[74] A.-M. Lafront, W. Zhang, S. Jin, R. Tremblay, D. Dubé, E. Ghali, Pitting corrosionof AZ91D and AJ62x magnesium alloys in alkaline chloride medium usingelectrochemical techniques, Electrochimica Acta 51 (2005) 489–501.
[75] G. Wu, Y. Fan, A. Atrens, C. Zhai, W. Ding, Electrochemical behavior ofmagnesium alloys AZ91D, AZCe2, and AZLa1 in chloride and sulfate solutions,Journal of Applied Electrochemistry 38 (2008) 251–257.
[76] J.W. Chang, X.W. Guo, P.H. Fu, A. Atrens, L.M. Peng, W.J. Ding, X.S. Wang,Comparison of the corrosion behaviour in 5% NaCl solution of Mg alloys NZ30Kand AZ91D, Journal of Applied Electrochemistry 38 (2008) 207–214.
[77] AD Südholz, N Birbilis, CJ Bettles, MA Gibson, Corrosion behaviour of Mg-alloyAZ91E with atypical alloying additions, Journal of Alloys and Compounds,(2008), doi:10.1016/j.allcom.2008.03.128.
[78] G. Williams, H.N. McMurray, Localized corrosion of magnesium in chloride-containing electrolyte studied by a scanning vibrating electrode technique,Journal of the electrochemical Society 155 (2008) C340–C349.
[79] N. Winzer, A. Atrens, G. Song, E. Ghali, W. Dietzel, K.U. Kainer, H. Hort, C.Blawert, A Critical Review of the Stress Corrosion Cracking (SCC) of MagnesiumAlloys, Advanced Engineering Materials 7 (2005) 659–693.
[80] N. Winzer, A. Atrens, W. Dietzel, V.S. Raja, G. Song, K.U. Kainer, Comparison ofthe linearly increasing stress test and the constant extension rate test in theevaluation of transgranular stress corrosion cracking of magnesium, MaterialsScience and Engineering A 472 (2008) 97–106.
[81] N. Winzer, A. Atrens, W. Dietzel, G. Song, K.U. Kainer, Fractography of stresscorrosion cracking of Mg-Al alloys, Metallurgical and Materials Transactions A39 (2008) 1157.
[82] M. Bobby Kannan, W. Dietzel, C. Blawert, A. Atrens, P. Lyon, Stress corrosioncracking of rare-earth containing magnesium alloys ZE41, QE22 and Elektron21 (EV31A) compared with AZ80, Materials Science and Engineering A 480(2008) 529–539.
[83] N. Winzer, A. Atrens, W. Dietzel, V.S. Raja, G. Song, K.U. Kainer,Characterisation of stress corrosion cracking (SCC) of Mg–Al alloys, MaterialsScience and Engineering A 488 (2008) 339–351.
[84] N. Winzer, A. Atrens, W. Dietzel, G. Song, K.U. Kainer, Stress Corrosion Cracking(SCC) in Mg-Al Alloys Studied using Compact Specimens, AdvancedEngineering Materials 10 (2008) 453–458.
[85] J. Chen, J. Wang, E. Han, W. Ke, Effect of hydrogen on stress corrosion crackingof magnesium alloy in 0.1 M Na2SO4 solution, Materials Science andEngineering A 488 (2008) 428–434.
[86] J. Chen, J. Dong, J. Wang, E. Han, W. Ke, Effect of magnesium hydride on thecorrosion behavior of an AZ91 magnesium alloy in sodium chloride solution,Electrochemistry Communications 50 (2008) 3610–3614.
[87] P. Bala Srinivasan, C. Blawert, W. Dietzel, Effect of plasma electrolyticoxidation treatment on the corrosion and stress corrosion crackingbehaviour of AM50 magnesium alloy, Materials Science and Engineering A494 (2008) 401–406.
[88] M. Bobby Kannan, W. Dietzel, R.K. Singh Raman, P. Lyon, Hydrogen-induced-cracking in magnesium alloy under cathodic polarization, Scripta Materialia 57(2007) 579–581.
[89] A. Atrens, R. Coade, J. Allison, H. Kohl, G. Hochoertler, G. Krist, Development ofa Precipitation Strengthened Duplex Stainless Steel, Materials Forum 17(1993) 263–280.
[90] Pandat is a software package for calculating phase diagrams andthermodynamic properties of multi-component alloys, http://www.computherm.com/pandat.html, CompuTherm LLC, 437 S. YellowstoneDr. Suite 217, Madison, WI 53719 USA, Phone: +1 (608) 274-1414, FAX: +1(608) 274-6045, Email: [email protected].
[91] F. Andreatta, I. Apachitei, A.A. Kodenstov, J. Dzwonczyk, Volta potential ofsecond phase particles in extruded AZ80 magnesium alloy, ElectrochemicalActa 51 (2006) 3551–3557.
[92] S.L. Sin, D. Ube, R. Tremlay, Characterisation of Al-Mn particles in AZ91Dinvestment castings, Materials Characterisation 58 (2007) 989–996.
[93] R.M. Wang, A. Elizer, E.M. Gutman, An investigation on the microstructure ofan AM50 magnesium alloy, Materials Science and Engineering A 355 (2003)201.
[94] G. Song, A. Atrens, D.H. StJohn, An hydrogen evolution method for theestimation of the corrosion rate of magnesium alloys, in: J. Hryn (Ed.),Magnesium Technology, TMS, New Orleans, PA, 2001, pp. 255–262.
[95] M.C. Zhao, P. Schmutz, S. Brunner, M. Liu, G. Song, A. Atrens, An exploratorystudy of the corrosion of Mg alloys under conditions of salt spray testing,(2008) unpublished.