Understanding and evaluating long-term environmental risks ...
243
Dissertation Understanding and evaluating long-term environmental risks from landfills Verständnis und Beurteilung langfristiger Umweltrisiken von Deponien ausgeführt zum Zwecke der Erlangung des akademischen Grades eines Doktors der technischen Wissenschaften unter der Leitung von o. Univ. Prof. Dr. Paul H. Brunner Institut für Wassergüte, Ressourcenmanagement und Abfallwirtschaft eingereicht an der Technischen Universität Wien Fakultät für Bauingenieurwesen von Dipl.-Ing. David Laner Matrikelnummer: 9740268 Wien, Juni 2011
-
Upload
khangminh22 -
Category
Documents
-
view
5 -
download
0
Transcript of Understanding and evaluating long-term environmental risks ...

Dissertation
Understanding and evaluating long-term
environmental risks from landfills
Verständnis und Beurteilung langfristiger
Umweltrisiken von Deponien
ausgeführt zum Zwecke der Erlangung des akademischen Grades eines
Doktors der technischen Wissenschaften unter der Leitung von
o. Univ. Prof. Dr. Paul H. Brunner
Institut für Wassergüte, Ressourcenmanagement und Abfallwirtschaft
eingereicht an der Technischen Universität Wien
Fakultät für Bauingenieurwesen
von
Dipl.-Ing. David Laner
Matrikelnummer: 9740268
Wien, Juni 2011

Left to themselves, things tend to go from bad to worse.
Murphy’s Law
“… we are aware of the fact that landfilling with contemporary wastes is a large scale long-term
experiment for which we have poor knowledge. We also know that in the field of production
(supply of consumer goods) we would not run chemical and biological processes under such
circumstances.”
Peter Baccini and Thomas Lichtensteiger (The Landfill, 1989)
II

Acknowledgments
I thank Paul H. Brunner for the possibility of doing my thesis under his supervision, for his
constant support during the last years, and for his constructive criticism helping me to improve my
work. I am grateful to Morton A. Barlaz, who agreed to be my co-advisor without really knowing
me or my work at that time, who hosted me as a visiting researcher at his department, and whose
comments were always thoughtful and highly appreciated.
A lot of nice people work and have worked at the Institute of Water Quality, Resources and Waste
Management, whom I want to thank for their support, on an institutional as well as on a personal
level. I owe a lot to Johann Fellner, who initiated the research project forming the basis for this
thesis, who was always available to discuss about my research and inspire new ideas, and who
became a friend during these years. Apart from the friends at the Institute, I had the chance to meet
many helpful and inspiring persons in the course of the research project “SKUDENA”, at various
scientific conferences, during my research stay in the USA, and during international PhD courses
(in particular during the Post Graduate School of Industrial Ecology). To get to know these people
was very valuable to me and I hope that many of them will pop up once in a while also in the
future.
My family is the foundation of who I am. For their unconditional affection and back up throughout
all these years of studying I am very thankful.
I am indebted the most to my beloved Monika. She motivated me when work had become tedious,
she listened to me even if I was not coming straight to the point, she broadened my perspective on
many things, and her smile made everything else secondary. Sharing my life with her is a great
fortune.
III

Abstract
After closure, landfills need to be managed (i.e. monitoring and maintenance) and controlled to avoid
adverse effects on humans and the environment. The aftercare period ends when a landfill is no longer
likely to represent a threat to human health or the environment. As quantitative criteria to determine the
state of a landfill at the end of aftercare have been missing, it was the aim of this work to develop a
methodology for evaluating the environmental compatibility of a closed landfill in view of aftercare
completion. The methodology takes into account the behavior of the deposited waste and associated
emissions, the performance of technical barriers, the potential for the migration of pollutants in the
environment, and the impact of landfill-borne pollutants on environmental media.
Landfill behavior and associated emissions were analyzed for different types of landfills. Based on
literature data and landfill data collected at sites in Austria and Switzerland, emission characteristics of
landfills and their evolution over time, remaining emission potentials, and approaches to predict future
landfill emissions were evaluated. Though organic leachate emissions and constituents such as
ammonium or chloride are of potential significance at many closed landfills, the type of pollutants and
emission levels vary from one site to another. The impact of substances mobilized from the deposited
waste on the surrounding environment is potentially mitigated by technical and natural barriers at the
landfill. The long-term efficiency of technical barriers (i.e. landfill containment) to limit and control the
interaction of the deposited waste with the surrounding environment was evaluated based on literature
data and expert surveys using a Delphi approach. Due to the large uncertainties inherent in long-term
evaluations, scenarios are used to illustrate the effect of different technical barrier performance levels on
emissions. The potential of the natural environment to attenuate adverse effects of released landfill
borne pollutants was evaluated by pollutant migration models. In general, simple and robust models
were used to describe pollutant migration in the environment, as data to establish and calibrate more
complex models are typically not available at closed landfills. Finally, scenario- and pollutant-specific
aftercare completion criteria were derived based on the combination of the different models and the
definition of an acceptable level of impact on the environment (e.g. groundwater) at the site.
The developed methodology was applied at three closed landfill sites to derive aftercare completion
criteria and estimate the duration of aftercare. For a large municipal solid waste (MSW) landfill, the
aftercare period is estimated to last from one century to several centuries, depending on the long-term
management concept at the site. At a smaller MSW landfill with high water infiltration rates (annual
precipitation of 2000 mm/yr), aftercare might be terminated within a few decades, provided that
intensified leaching of the waste is continued for another decade before final cover installation. For a
closed landfill containing building and construction (C&D) waste, aftercare completion is found to be
environmentally tolerable already after a few years, provided that the assumptions and models in the
evaluation are confirmed by further monitoring. The main reasons for the low environmental risk
associated with the C&D landfill are the small emission potential of the deposited waste, the arid
climate (and low amount of leachate), and the large dilution potential of the local groundwater stream.
The case study findings highlight the importance of site-specific factors for the evaluation of landfill
aftercare and underline the site-specific nature of the evaluation of landfill environmental compatibility.
The evaluation methodology allows for a comparison of different long-term management strategies in
view of the desired state of the landfill at the end of aftercare. Thus, it links the duration and intensity
of landfill management to the environmental risks associated with a closed landfill, which is a
prerequisite to developing cost-effective long-term landfill management concepts.
IV

Table of Contents
1 Introduction ............................................................................................................................. 1
1.1 Background and motivation ...................................................................................... 1
1.2 Objectives and scope of the work ............................................................................. 2
1.3 Structure of the thesis................................................................................................ 2
2 Aftercare completion criteria and landfill stability.............................................................. 5
2.1 Concepts for aftercare and completion ..................................................................... 5
2.1.1 General overview...................................................................................................... 5
2.1.2 Review of approaches for landfill aftercare and its completion................................ 7
2.1.3 Discussion of approaches to evaluate aftercare ...................................................... 16
2.2 Landfill stability – definition and metric ................................................................ 18
2.2.1 The notion of “landfill stability”............................................................................. 18
2.2.2 Framework to evaluate landfill PCC....................................................................... 21
3 Emission behavior of landfills .............................................................................................. 25
3.1 Emissions from MSW landfills............................................................................... 25
3.1.1 General description of emission behavior............................................................... 25
3.1.2 Emission characteristics of MSW landfills ............................................................. 30
3.1.3 Evaluation of mid- to long-term emissions............................................................. 39
3.2 Emissions from landfills containing MSWI bottom ash ......................................... 43
3.2.1 General description of emission behavior............................................................... 43
3.2.2 Emission characteristics of MSWI bottom ash landfills ......................................... 46
3.2.3 Evaluation of mid- to long-term emissions............................................................. 52
3.3 Emissions from landfills containing construction and demolition wastes .............. 54
3.3.1 General description of emission behavior............................................................... 54
3.3.2 Emission characteristics of C&D waste landfills.................................................... 55
3.3.3 Evaluation of mid- to long-term emissions............................................................. 60
3.4 Key parameters to evaluate landfill emission behavior .......................................... 62
4 Barriers – technical and natural systems............................................................................ 65
4.1 Technical barriers.................................................................................................... 65
4.1.1 Components of technical barriers ........................................................................... 67
4.1.2 Performance of landfill top cover systems.............................................................. 73
4.1.3 Performance of technical barriers at the landfill bottom......................................... 76
4.1.4 Long-term performance of technical barriers ......................................................... 79
4.1.5 Summary and discussion......................................................................................... 85
4.2 Natural systems attenuating landfill emissions ....................................................... 86
4.2.1 Overview................................................................................................................. 86
4.2.2 Leachate migration in the subsurface...................................................................... 88
4.2.3 Summary and discussion....................................................................................... 101
V
5 Evaluation method to determine aftercare completion criteria...................................... 103
5.1 Evaluation of the state of the landfill and the site................................................. 104
5.1.1 General data on the conditions at the site ............................................................. 104
5.1.2 Emission data ........................................................................................................ 105
5.1.3 Deposited waste .................................................................................................... 106
5.1.4 Containment system.............................................................................................. 108
5.1.5 Geology and hydrogeology at the site................................................................... 109
5.2 Emission models and scenario-based predictions ................................................. 109
5.2.1 Emission models ................................................................................................... 110
5.2.2 Scenario layouts .................................................................................................... 116
5.3 Pollutant migration modeling and ambient concentrations................................... 126
5.3.1 Pollutant migration model in the subsurface......................................................... 126
5.4 Determination of completion criteria .................................................................... 137
6 Case studies.......................................................................................................................... 139
6.1 Landfill A - closed MSW landfill ......................................................................... 140
6.1.1 Site description and monitoring data .................................................................... 140
6.1.2 Emission predictions............................................................................................. 143
6.1.3 Pollutant migration................................................................................................ 152
6.1.4 Completion criteria and aftercare duration ........................................................... 157
6.2 Landfill B - closed MSW landfill ......................................................................... 159
6.2.1 Site description and monitoring data .................................................................... 159
6.2.2 Emission predictions............................................................................................. 162
6.2.3 Pollutant migration................................................................................................ 168
6.2.4 Completion criteria and aftercare duration ........................................................... 172
6.3 Landfill C - closed C&D waste landfill ................................................................ 174
6.3.1 Site description and monitoring data .................................................................... 174
6.3.2 Emission predictions............................................................................................. 177
6.3.3 Pollutant migration................................................................................................ 182
6.3.4 Completion criteria and aftercare duration ........................................................... 186
6.4 Discussion of caste study results........................................................................... 187
7 Summary and conclusions .................................................................................................. 191
7.1 Summary ............................................................................................................... 191
7.1.1 Landfill emission behavior.................................................................................... 191
7.1.2 Technical and natural barriers............................................................................... 193
7.1.3 Methodology to derive aftercare completion criteria............................................ 195
7.1.4 Application of the methodology ........................................................................... 196
7.2 Conclusions and research outlook......................................................................... 198
8 Literature, Figures, and Tables.......................................................................................... 201
8.1 Literature............................................................................................................... 201
8.2 List of Figures ....................................................................................................... 217
8.3 List of Tables ........................................................................................................ 221
VI

Appendices 225
Appendix 1: Basic landfill data
Appendix 2: Expert evaluations of long-term barrier performance
VII

List of Acronyms
AF Attenuation factor
AOX Absorbable organic halides
BOD5 Biological oxygen demand in 5 days
BTEX Benzene, toluene, ethylbenzene, and xylenes
C&D Construction and demolition
COD Chemical oxygen demand
DM Dry matter
DOC Dissolved organic carbon
EC Electric conductivity
GCL Geosynthetic clay liner
HDPE High density polyethylene
HHE Human health and the environment
L/S Liquid-to-solid ratio
LDPE Low density polyethylene
LSR Landfill simulation reactor
MBT Mechanical biological treatment
MSW Municipal solid waste
MSWI Municipal solid waste incineration
PAH Polycyclic aromatic hydrocarbons
PCC Post-closure care
PVC Polyvinylchloride
QA&C Quality assurance and control
SP Service period
TKN Total Kjeldahl nitrogen
TOC Total organic carbon
VOC Volatile organic compounds
VIII

Glossary
Aftercare completion: The point in time when the authorities accept the end of aftercare, because
the landfill is no longer likely to present a threat to human health and the environment in
the absence of aftercare.
C&D waste landfill: A landfill which contains primarily construction and demolition (C&D) waste.
Contaminant: A substance, the presence of which is unwanted in a material.
De-minimus care: Low-intensity landfill management comprising levels and types of activities also
required at non-landfill sites (e.g. maintenance of a vegetation cover).
Environmental risk: The integration of the probability of occurrence of a release of pollutants from
the landfill and the damage caused by the pollutant in the environment.
Field capacity: The volumetric water content of a porous medium 2-3 days after saturation and
after gravity drainage has ceased.
Final storage quality: Expresses that a material can be deposited without containment and without
treatment of emissions into air and water.
Hydraulic conductivity: A property which describes the ease with which water can move through a
porous medium.
Landfill aftercare: The management of a closed landfill (typically monitoring, maintenance, and
treatment of emissions) until no more aftercare measures are necessary (landfill aftercare =
landfill post-closure care).
Landfill after-use: The use of a landfill site which has been released from aftercare.
Landfill closure: The point where the landfill has reached the layout according to the aftercare
requirements (i.e. installation of top cover) and is transferred to the aftercare period.
Landfill operation period: The time period during which waste is deposited at the landfill.
Landfill owner: The individual who has operated the landfill and is responsible for landfill
management (landfill owner = landfill operator).
Leachate: A liquid generated in a landfill that contains dissolved and/or suspended contaminants
from the waste.
Mobilizable substance potential: The amount of substances which can be released from the waste
via a specific emission pathway. The mobilizable substance potential depends on the
considered release mechanisms and thus, is a function of the investigation timeframe.
MSW landfill: A landfill which contains primarily municipal solid waste (MSW).
MSWI bottom ash landfill: A landfill which contains primarily bottom ash from municipal solid
waste incineration (MSWI).
IX

Natural attenuation: The reduction of mass, toxicity, mobility, volume, or concentration of pollu
tants in soil or groundwater due to naturally occurring physical, chemical, or biological
processes.
Point of compliance: The point where certain criteria defining the acceptable level of contamina
tion for the affected natural environment have to be fulfilled.
Pollutant: A substance that pollutes air, water, or soil, and is the cause of pollution.
Preferential flow: The movement of mobile water and its constituents in preferred pathways
through porous media.
Short-, mid-, and long-term: In this work, short-term periods comprise years to decades, mid-term
periods comprise decades to centuries, and long-term periods comprise centuries to
millennia.
Site surveillance: The monitoring of the landfill site to assure appropriate after-use.
Waste stabilization: A process to reduce the emission potential of the deposited waste to produce
an environmentally tolerable residue.
X

1 Introduction
1.1 Background and motivation
Of all man-made structures landfills are among those with the longest life times in the environment.
Landfills were built without containment systems until the 1970s, because the attenuation and
buffering capacity of the natural barriers (i.e. geologic conditions) was thought to be sufficient to
protect humans and the environment (e.g. Gray et al. 1974; Bagchi 1987). However, as significant
groundwater contamination was observed at such landfill sites (e.g. Andersen and Dornbusch 1967;
Zanoni 1972; Kerndorff et al. 1980), landfill regulations generally required low-permeability liners at
the base of new landfills starting from the 80s-90s (e.g. Austrian landfill directive (MoE 1996b)). In
addition to a lining system at the landfill base, a low-permeability cover is typically installed at mod
ern landfills after final closure. As a consequence of increasingly stringent regulations with respect to
the quality of the deposited waste, the level of waste containment, and landfill operations, the com
plexity and cost of landfilling has increased significantly during the last decades (e.g. Environment
Agency 2010b). An implication of this trend is the decreasing number of landfills, particularly with
respect to MSW landfills in operation, in many industrialized countries (e.g. in the U.S. the number of
MSW landfills decreased from 6300 in 1990 to 1750 in 2006 (U.S. EPA 2006); in Germany the num
ber of MSW landfills decreased from 560 in 1993 to 330 in 2000 (BMU 2006). As many of these land
fills represent a potential source of significant emissions for long time periods (cf. Belevi and Baccini
1989; Krümpelbeck 2000; Kjeldsen et al. 2002), landfill management needs to be prolonged beyond
closure to protect humans and the environment. Consequently, as the diversion of waste from landfills
to recycling, composting and combustion with energy recovery is increasing and the number of oper
ating MSW landfills is on the decline (also due to the increasing size of modern facilities (cf.
Krümpelbeck 2000)), the development of long-term management schemes for closed landfills is
necessary to prevent adverse effects on humans and the environment.
The management of closed landfills typically includes monitoring (e.g. emissions, groundwater),
treatment of emissions (e.g. leachate treatment), and maintenance (e.g. cover, leachate and gas collec
tion) of the landfill facilities and is referred to as the aftercare (or post-closure care) period. Aftercare
can be ended at a site, when the landfill is not likely to pose a threat to human health and the environ
ment (e.g. EC 1999) anymore. As there is a lack of technical criteria to evaluate landfill aftercare and
associated environmental risks (Barlaz et al. 2002; Stegmann et al. 2003; Stegmann et al. 2006), it is
difficult to develop strategies for the cost-effective protection of human health and the environment at
closed landfill sites (Morris and Barlaz 2011). The development of appropriate long-term landfill
management strategies is in the interest of both regulatory agencies and landfill owners for several
reasons. First, aftercare funding accrual mechanisms currently in place do not typically consider the
possibility of aftercare periods exceeding 30 years (minimum period of aftercare for MSW landfills in
Europe (cf. EC 1999)). If necessary, reform of the current time-based systems would be most effective
if changes were made while landfills are still in active operation and accruing funds. Second,
appropriate fiscal management of existing aftercare funds is critical to provide for the proper
protection of human health and the environment, the financial well-being of landfill owners, and to
prevent the development of landfills without aftercare funding.
Introduction 1

1.2 Objectives and scope of the work
The objective of this work is to investigate long-term landfill management with respect to environ
mental risks associated with closed landfills. The goal is to develop a methodology to define the state
of an environmentally compatible landfill at the end of aftercare. The methodological framework is
developed in consideration of typical emission profiles and emission models for different types of
landfills, the (long-tem) performance of landfill containment systems, and considerations about the
migration of pollutants in the surrounding environment. The application of the method shall provide a
basis for the comparison of different aftercare strategies with respect to the duration and intensity of
aftercare and the assessment of the environmental risks associated with a specific management
strategy.
The following questions are addressed in this work in order to attain the objectives outlined above:
• What is an appropriate method to assess the environmental compatibility of a closed landfill?
What would be suitable evaluation criteria?
• How can one investigate and analyse the emission behavior of a landfill? What are relevant
pollutants at different landfill types?
• How can landfill stability (in an environmental sense) be defined and evaluated with respect to
estimating future emission levels?
• How can technical barriers installed at the landfill and their respective service lives be taken
into account?
• How can the potential for natural attenuation processes in the subsurface in terms of envi
ronmentally compatible landfill emissions be considered?
• How can substance release from the waste body, barrier performance and reactive transport in
the surrounding environment be integrated to determine criteria for terminating landfill after
care?
The analysis in this work focuses on environmental aspects of closed landfills. Consequently, despite
their potential significance, the economic and social dimensions of long-term landfill management are
not addressed in this work.
1.3 Structure of the thesis
In chapter 1 the issue of “long-term landfill management” is briefly highlighted, the objective of the
work is described, and the structure of the thesis is outlined (see Figure 1-1). A critical review of
approaches for evaluating landfill aftercare including a discussion of their limitations and strengths is
provided in the first section of chapter 2. Based on this discussion, a framework for a new evaluation
methodology is presented and the procedure to establish the evaluation framework is described in the
last section of chapter 2. In Chapter 3 emission characteristics of municipal solid waste (MSW)
landfills, municipal solid waste incineration (MSWI) bottom ash landfills, and construction and
demolition (C&D) waste landfills are analyzed to evaluate future emission behavior at closed landfills.
Studies of the (long-term) performance of technical barriers (i.e. containment systems) are discussed in
chapter 4 in the context of estimating future landfill emissions. Chapter 4 also addresses the potentially
attenuating effect of natural barriers (i.e. (hydro)geologic conditions at the site) on the spread of
2 Introduction

Chapter 3: Landfill emission behavior
Chapter 4: Technical and natural barriers
Chapter 5: Methodology to derive landfill completion
criteria
Chapter 6: Case studies
Chapter 1: Introduction
Chapter 7: Conclusion & Outlook
Chapter 2: State of the art & Suggested framework to
evaluate landfill aftercare
Figure 1-1: Schematic illustration of thesis structure
contaminants in the environment. Based on the framework introduced in chapter 2, the analysis of
landfill emissions, and the effect of barriers on pollutant migration in chapters 3 and 4, a methodology
to derive completion criteria for landfill aftercare and to evaluate the environmental risks associated
with long-term landfill management is presented in chapter 5. The application of the methodology is
illustrated in chapter 6 for two closed MSW landfills and for a closed C&D waste landfill. Finally, the
main findings of the work are summarized and conclusions are provided in chapter 7.
The work presented in this thesis is largely based on a research project, which was conducted
primarily by the author at the Institute for Water Quality, Resources and Waste Management at the
Vienna University of Technology. Reports and articles that have been published as part of this
research project or independently by the author may contain some of the text or work included in this
thesis. Therefore, the work by Laner (2009), Laner et al. (2009), Laner et al. (2010), Laner et al.
(2011a), Laner et al. (2011b), and Laner et al. (2011c) may serve as a source of additional information.
Further data on landfill emissions (chapter 3) and for the case studies (chapter 6) can be also obtained
directly from the author.
Introduction 3

Introduction 4

Lan
dfi
ll
con
stru
ctio
n
Was
te
dis
po
sal
Po
std
isp
osa
l
Cap
pin
g
Aft
erca
re(P
os
tc
los
ure
ca
re)
Su
rvei
llan
ce
No
car
e
Postoperational care period Operational period
Figure 2-1: Different management phases throughout the existence of a MSW landfill
2 Aftercare completion criteria and landfill stability
2.1 Concepts for aftercare and completion
2.1.1 General overview
Apart from a lack of technical criteria and procedures for the evaluation of aftercare and associated
environmental risks, different terms and concepts referring to the condition of closed landfills add to
the confusion on long-term landfill management. After the operational period of a landfill, different
management phases might occur before a final cover is installed (e.g. enhanced emission reduction at
the site). In Figure 2-1 it is illustrated that while the post-operational care period starts directly after
the end of waste disposal, the aftercare period starts after the landfill has reached its final layout (i.e.
cover has been installed). Although the focus of this work is on the aftercare period (=post-closure
care period), the management of the landfill during the post operational period is addressed when this
is relevant to the approach proposed for aftercare. This would be the case, if measures for enhanced
emission reduction after the end of waste deposition are essential for the management concept during
landfill aftercare. It would be also the case, if the state of a landfill at the end of aftercare is different
from one approach to another (e.g. top cover maintenance as an afteruse activity vs. no more
maintenance of the cover). Consequently, aftercare completion may not always mean the same due to
different long-term management concepts. Therefore, aftercare completion is defined as the point
when the competent authorities accept the end of regulated aftercare, because the closed landfill is not
likely to present a threat to human health and the environment (HHE) in the absence of aftercare. In
consideration of the underlying management approach this can be a definitive endpoint (i.e. requiring
no further care) or the transformation of a closed landfill from post-closure care into a “de minimus
care” program (e.g. site surveillance and protection of top cover) (cf. Barlaz et al. 2002). Whereas the
former would also imply the end of post-operational care, the latter would leave the landfill in the
post-operational care period (cf. Figure 2-1).
Several alternatives have been discussed for the long-term management of landfills. These alternatives
include (1) termination of aftercare after a definite time period, (2) perpetual care, (3) complete waste
stabilization, (4) specific chemical criteria and (5) a performance based approach (cf. Morris and
Barlaz 2011). The first alternative describes a situation in which landfill management by the landfill
owner is terminated after specific time period. This period could be 30 years or any other time
specified by the regulator. The advantage of this alternative is that it is predictable and the owner
Aftercare completion criteria and landfill stability 5

knows what is required for what period of time. However, this alternative leaves society responsible
for problems that could arise after the owner is no longer responsible for aftercare at the site. In the
termination alternative, the biological, chemical or physical status of a landfill and its potential threat
to HHE are not addressed. If termination is at one extreme, perpetual care is considered at the other
extreme. In this alternative the owner is required to monitor and maintain the landfill forever.
Although this removes uncertainty about the duration of aftercare for owners and authorities and it
offers maximum protection of HHE, it is not necessarily cost efficient. If funds are spent to protect
against insignificant risks, this is not an optimal use of societal resources (cf. Scharff et al. 2011). In
the complete waste stabilization alternative, the landfill is managed until the waste is completely stable
with respect to chemical, biological and physical characteristics. At the point of complete stabilization,
the waste itself (i.e. without containment) does not pose a threat to HHE. While geotechnical stability
may be addressed in terms of post-closure settlement and material properties, chemical stability will
be harder to evaluate (e.g. Brunner 1992). Some issues making the evaluation of biochemical stability
a difficult task are the accumulation of ammonia in anaerobic leachate of MSW landfills (cf. Kjeldsen
et al. 2002), the presence of trace organics and persistent chemicals in the leachate (e.g. Öman and
Junestedt 2008; Weber et al. 2011), the heterogeneity of the deposited waste, the heterogeneity of
water flow and its effect on waste degradability (cf. Maloszewski et al. 1995; Fellner 2004; Rosqvist et
al. 2005), and the challenge of representatively characterizing a landfill (e.g. Chiampo et al. 1996).
The fourth alternative is to operate a landfill until specific criteria for the leachate, solids and gas are
reached. In the case of leachate from MSW landfills, a BOD5/COD ratio of less than 0.1 has been
suggested as in indicator of stable leachate (Reinhart and Townsend 1997), but it has been recognized
to be a necessary but insufficient condition for chemical stability (cf. Barlaz et al. 2002). Criteria for
landfill gas might relate to a decrease of gas production rate or a minimum fraction of the expected
total gas production has taken place at the site (e.g. Wisconsin Department of Natural Resources
2007). However, typically the lack of consistent (over time) data on landfill gas production and
varying collection efficiencies of the gas extraction system will make such evaluation difficult. For
waste quality, criteria such as the cellulose plus hemicellulose to lignin (CH/L) ratio have been
suggested as indicators for waste stability (e.g. Kelly et al. 2006), again facing challenges of
representative sampling and consistent test methods (cf. Knox et al. 2005). A limitation of many of
these criteria is that they do not consider site-specific conditions such as local climate, as the
requirements for the long-term management of landfills will probably be different in a region with arid
climate and in a humid region. The fifth alternative is to adapt post-closure management at the site
based on the actual landfill performance. The focus of this alternative is to provide specific guidance
on post-closure landfill management to achieve a sequential reduction of the necessary post-closure
care intensity. A desired state of the landfill at the end of aftercare is not defined, but aftercare
intensity is reduced as warranted by site-specific data ultimately leading to de-minimus care
requirements (e.g. activities necessary at any property such as vegetation maintenance) at the site.
Based on the general overview of management alternatives for closed landfills given above, the next
section analyzes specific approaches which have been suggested for the evaluation and potential com
pletion of aftercare at landfills with a focus on MSW landfills. Finally, the major findings from the
analysis of long-term management approaches are highlighted, an evaluation framework is developed,
and the conceptual foundation of the approach is described in section 2.2.
Aftercare completion criteria and landfill stability 6

2.1.2 Review of approaches for landfill aftercare and its completion
Given the range of alternatives for the long-term management of closed landfills, three specific types
of approaches to evaluate and manage MSW landfills after closure have been suggested: i) target value
approaches define criteria which have to be met to complete aftercare; ii) risk assessment approaches
evaluate aftercare in view of the local conditions at the landfill site to quantify risks associated with
aftercare activities and aftercare completion; iii) performance based systems for aftercare draw on site
specific data, which are used to evaluate the actual level of aftercare and to provide guidance on the
progressive reduction of aftercare intensity. A review of specific approaches suggested by different
authors (largely) adhering to one of these approaches is presented in this section.
2.1.2.1 Target values to evaluate PCC
In the target value approach, the state of the MSW landfill at which aftercare can be terminated is de
fined via generic standards. This approach could address the quality of the deposited waste, the
tolerable levels of emissions (landfill gas and leachate), and criteria such as the maximum rate of
settlement at the landfill surface. As the specified criteria are generic, they can be applied without
further evaluations.
The target values for aftercare completion suggested by Stegmann et al. (2006) are based on
approaches to significantly reduce the emission potential of a MSW landfill before the final cover is
installed at the landfill. According to investigations by the authors, a MSW landfill will require after
care for many decades to several centuries (cf. Heyer 2003; Heyer et al. 2005a), which does not
correspond with the goal of aftercare completion within one generation. The reduction of the remain
ing emission potential within the waste body is aspired to minimize potential environmental impacts
associated with a release of pollutants if containment systems fail at a later time. Controlled infiltration
of water into the waste body and the in-situ aeration of the landfill are the main strategies to achieve a
low emission potential (cf. Stegmann et al. 2003). In-situ aeration is presented as a promising
technology to reduce leachate concentrations, accelerate biochemical degradation processes within the
landfill, and complete major settlements within several years (cf. Heyer et al. 2005b).
Stegmann et al. (2006) state that at the end of aftercare the biochemical processes and other conversion
processes have to be largely completed and unlikely to be reactivated in the future due to changing
conditions at the landfill. The quantitative criteria to terminate aftercare at a site are based on the tech
nical (i.e. enhanced emission reduction technologies), the legal (primarily with respect to German reg
ulations, cf. BMU (2009)), and the economic (i.e. the costs of different aftercare strategies) conditions
concerning landfill aftercare. The suggested target values address tolerable emission levels for landfill
gas and leachate (primarily pollutant loads), the quality of the deposited waste (leaching tests and
biological degradability), and settlement rates (see Table 2-1). However, Stegmann et al. (2006)
emphasize that additional criteria need to be defined on a site-specific basis which relate to engineered
landfill elements (e.g. condition of the containment system), the potential of natural attenuation
processes taking place in the subsurface below the landfill, and potentially affected vulnerable uses in
the vicinity of the landfill. These site-specific criteria are addressed on a conceptual level and tangible
criteria or evaluation procedures are not included within the presented approach.
Similar to the above approach, Cossu et al. (2007) proposed a methodology to evaluate the “final
storage quality” of a landfill based on a combination of generic criteria and site-specific risk analysis.
A landfill is considered to have reached final storage quality when it contains materials of such quality
Aftercare completion criteria and landfill stability 7

that no further treatment of emissions into air and water is necessary (Baccini 1989). Starting from a
review of different performance parameters, emissions and waste quality, and a comparison of
attainable values for defined landfill management technologies, a set of parameters (landfill gas,
leachate, and deposited waste) was chosen to evaluate aftercare. Several quantitative criteria are pre
sented (see Table 2-1) for a screening evaluation of aftercare at a landfill. If the landfill complies with
these criteria, then a site-specific risk analysis (cf. Pivato 2003) is suggested to evaluate environmental
compatibility of the emissions at the site.
The evaluation of final storage quality was also proposed by Knox et al. (2005) for 14 year old MSW
landfill test cells. The authors state that the organic degradation of MSW is the key process with re
spect to achieving final storage quality. The criteria to assess final storage quality are likely to require
the removal of 95 to 99.5% of degradable organics, but corresponding biodegradability tests are still
rather imprecise and sometimes inconsistent with each other. The target values suggested by Knox et
al. (2005) include landfill gas emissions, leachate emissions, and tests to assess the biodegradability of
the deposited waste (Table 2-1). The criteria are defined generically based on literature data and
regulatory standards. The authors conclude, however, that criteria to assess final storage quality will
necessarily be site-specific and that current test methods are not suitable to appropriately characterize
final storage quality for a landfill. Thus, operative criteria are still to be developed and should be based
on documented cases, where MSW landfills have achieved final storage quality. A case study is pre
sented by Valencia et al. (2009), who evaluate waste from a pilot scale bioreactor test cell by applying
the waste acceptance criteria for inert waste landfills (EC 2003). They reported that the quality of the
waste did not comply with waste acceptance criteria values after two years of operation (note that this
would not be expected anyhow). However, as the waste acceptance criteria were not designed as target
values for aftercare completion at MSW landfills, as for example ammonium is ignored as a leachate
quality parameter, these criteria are not included in the discussion on target value approaches.
Krümpelbeck (2000) proposed another approach to evaluate the state of the landfill at which aftercare
might be completed using generic values. Based on an evaluation of emission data from German
MSW landfills, Krümpelbeck (2000) identifies leachate emissions as the primary long-term threat at
MSW landfills. Consequently, the suggested target values refer to the load of chemical oxygen
demand and ammonia-nitrogen in the leachate (see Table 2-1). Although the loads are suggested as the
primary indicators, critical concentration levels are also presented for these parameters. These criteria
are based on the assumption that 9% of the original emission potential of the deposited MSW,
calculated via trend extrapolations of leachate data, will be released from the landfill over 500 years.
In addition to these criteria, other values are discussed as leachate-based completion criteria, such as
water quality standards for the inflow of drinking water purification plants, and it is emphasized that
the application of the presented criteria is only suitable if the landfill base is located at least several
meters above the groundwater and emissions are compatible with the planned future use of the site.
Krümpelbeck (2000) concludes that the target values enable an initial assessment that must be
complemented by site-specific criteria to determine when completion of aftercare is possible. Hence,
the approach provides screening level indicators for leachate, but does not represent an operative
procedure to evaluate aftercare.
In general, all of the authors of target value approaches emphasize that additional site-specific evalua
tions are needed to complement the suggested values before a decision on aftercare completion can be
made. Although no specific procedure is suggested, the authors agree that a site-specific assessment
Aftercare completion criteria and landfill stability 8

needs to address the risk of environmental pollution at the site, especially with respect to groundwater.
Most of the approaches include criteria for the quality of the deposited waste with a focus on its
biodegradability. However, the issue of a representative characterization of the landfill body (cf.
Chiampo et al. 1996; Sormunen et al. 2008) and the consistency of different test methods (e.g. Laner
et al. 2011a) has not yet been handled on an operative level. In the approaches described by Stegmann
et al. (2006) and Cossu et al. (2007), the target values are derived in consideration of achievable
landfill properties (based on enhanced emission reduction measures) and they may not necessarily be
associated with environmentally compatible emissions. The latter is discussed by Ehrig (2002) who
points out the danger of specifying target values based on achievable rather than on environmentally
protective levels.
Apart from the approach suggested by Stegmann et al. (2006), the approaches presented in Table
2-1are conceptual and not specific with respect to the underlying definition of the state at which a
landfill might be released from aftercare. Although, Knox et al. (2005), Cossu et al. (2007), and
Valencia et al. (2009) use “final storage quality” to describe this desired state, it has been previously
concluded that this is not yet an operative definition and that it probably cannot be defined in a generic
way (e.g. Baccini 1989; Brunner 1992; Hjelmar and Nedenskov 2007). In conclusion, the presented
target value approaches range from specific guidance on aftercare (cf. Stegmann et al. 2006) to
screening level assessments (e.g. Knox et al. 2005). All authors acknowledge that aftercare completion
at MSW landfills is a site-specific exercise and thus supplementary evaluations to generic target values
are necessary to evaluate completion.
Aftercare completion criteria and landfill stability 9

Stegmann et al. (2006) Cossu et al. (2007) Knox et al. (2005) Krümpelbeck (2000)
Leachate COD: 5 – 20 g/m²*yr,
NH4-N: 2.5 – 10 g/m²*yr,
Cl: 10 – 20 g/m²*yr,
AOX: 0.01 – 0.05 g/m²*yr
(Emissions to subsurface)
COD: < 200 mg/l
BOD5/COD ratio & NH4-N
concentrations: mentioned as indi
cators, but no value provided.
NH4-N: ≤ 10 mg/l Concentrations & loads:
COD: ≤ 16 – 70 mg/l,
NH4-N: ≤ 9 – 20 mg/l
COD: ≤ 3 - 14 g/m²*yr,
NH4-N: ≤ 1.8 – 4 g/m²*yr
Landfill gas Methane production rate: < 25 m³
CH4/h and <0.5 liters CH4/m²*h
Hydrocarbon emissions (flame ioni-
zation detector measurements): < 25
ppm
Landfill gas generation rate: < 25
m³/h
Area-specific methane generation
rate: < 1 liter CH4/m²*h
(CO2+CH4)/N2 ratio: no value given
Landfill gas emission rate: ≤ 8.4 -
liters/m²*h
Trace gas concentrations: ≤
0.5 H2S
ppbv
Waste quality Eluate (L/S=10 l/kg):
TOC: ≤ 150 mg/l,
NH4-N ≤ 50 mg/l,
cyanide ≤ 0.1 mg/l,
AOX ≤ 0.5 mg/l (additionally: heavy
metals, organic compounds, pH, EC)
Biodegradability:
Respiratory index (RI4): ≤ 2.5 mg
O2/g dry matter (DM)
Methane generation potential in 21
days: 10 liter/kg DM
Biodegradability:
Respiratory index (RI4): ≤ 2.5 mg
O2/g DM
Methane generation potential in 21
days: 10 liter/kg DM
Biodegradability: -
Loss on Ignition (corrected for plas
tics): ≤ 25 %
Acid detergent fiber (corrected for
plastics): ≤ 2.5 %
Cellulose/lignin ratio (corrected for
plastics): < 0.2
Biochemical methane potential
(BMP): ≤ 0.2 m³ CH4/Mg DM
Landfill settlement Site-specific assessment (90
overall settlement completed)
% of - - -
Comments Site-specific criteria addressing
geotechnical stability, landfill ele
ments (e.g. base lining system), and
hydrogeology to be set.
All target values are
screening purposes
whether a subsequent
should be implemented.
intended for
to decide
risk analysis
Biodegradability tests are not precise
and site-specific assessment is
required in addition.
Concentration levels are applicable
only if leachate generation rate is
below 200 mm/yr.
Table 2-1: Completion criteria suggested within different target value approaches
Aftercare completion criteria and landfill stability 10

2.1.2.2 Environmental risk assessment to evaluate PCC
As long as a landfill represents a hazard and there is a good which can be damaged (e.g. human
health or environmental compartments), some level of risk is associated with the landfill. Risk
assessment has been applied to landfills, often with a focus on leachate emission levels and
groundwater pollution (e.g. Butt and Oduyemi 2003). With respect to landfill aftercare, an accept
able level of risk has to be defined for the state of the landfill at the end of aftercare (cf. Pivato
2003). Hence, to evaluate the risk of a closed landfill, potential negative effects on HHE and the
probability of their occurrence need to be assessed. Specific approaches which adhere to the con
cept of landfill risk assessment for evaluating aftercare are described below and summarized in
Table 2-2.
Scharff et al. (2007) state that a robust risk assessment is needed to end aftercare at landfills.
Within a pilot study on the landfilling of primarily inorganic waste, Scharff et al. (2011) developed
an approach for determining aftercare completion criteria as a part of an integrated procedure to
evaluate aftercare. Though recognizing the importance of additional evaluation criteria such as
landfill gas parameters (for landfills containing biodegradable waste) or parameters associated with
functional stability1, the work presented by Scharff et al. (2011) focuses on leachate risk
assessment. The long-term impact of leachate emissions is evaluated based on geochemical
modeling and the subsequent comparison of maximum concentration levels to water quality
criteria. The procedure is comparable to the source-pathway-receptor approach, which was applied
to determine the waste acceptance criteria within the EU landfill directive (cf. Hjelmar et al. 2001;
Hjelmar et al. 2005). The major difference is that the suggested approach employs a more
sophisticated reactive transport model to describe contaminant migration through the soil towards
the point of compliance. The modeling scenario presented in Scharff et al. (2011) is based on a
largely inorganic waste landfill with an average waste thickness of 20 meters, a net water in
filtration rate of 300 mm/yr, and an assumption that the liner system at the landfill base failed com
pletely. The application of the approach revealed chloride and sulfate as the contaminants
potentially not complying with the quality standards at the point of compliance (PoC - a
hypothetical drinking water well in the groundwater downstream of the landfill). It should be
emphasized that these results relate to leachate from largely inorganic landfills. For landfills
containing biodegradable waste, they suggest that after the organic matter has been degraded, the
behavior of the landfill body may converge towards the behavior of a largely inorganic landfill (cf.
Mathlener et al. 2006). Parameters typically important in the leachate from MSW landfills (e.g.
NH4-N, COD) have not been addressed. Scharff et al. (2011) conclude that a robust risk assessment
approach is needed to determine aftercare completion criteria in view of the conditions at the site
and that the evaluation of aftercare completion cannot be based solely on absolute numbers.
Another risk assessment approach primarily based on modeling of landfill leachate release and
forward modeling of contaminant transport processes in the subsurface has been presented by Hall
et al. (2006; 2007a). The modeling is carried out with LandSim2.5 (Environment Agency 2004),
1 defined in Morris and Barlaz (2011) as a landfill that is no longer a threat to HHE based on its performance
and data trends
Aftercare completion criteria and landfill stability 11

which is used to predict the time period until “equilibrium status” with the environment can be
reached at the landfill site, based on specific assumptions with respect to long-term liner and cap
performance. Equilibrium is defined as the state when emissions from a landfill occur at a rate that
allows sufficient natural attenuation in the surrounding environment to prevent environmental
harm, so management is no longer required (Hall et al. 2007a). Consequently, if equilibrium condi
tions are reached at a site, landfill aftercare can be terminated (Hall et al. 2007b). Within the pre
sented study, the risk assessment methodology has been primarily applied to demonstrate the effect
of waste diversion and pretreatment options (e.g. MBT residues, incineration) in the UK on the
time period until environmental equilibrium can be achieved. The authors state that aftercare
completion can only be achieved if a landfill has stabilized physically, chemically, and biologically
to a degree that the undisturbed contents are unlikely to pose a pollution risk at the site, which
implies that the presented modeling approach needs to be complemented with other criteria to form
a framework to address aftercare completion. However, this framework has not yet been proposed.
In contrast to the approaches described above, the methodology suggested by Boerboom et al.
(2003) does not assess the pollution risk emanating from a closed landfill but rather the costs of
environmental risks associated with aftercare. The methodology is designed to estimate appropriate
funding for aftercare activities, which should be based on the potential financial risks present at a
site. The risk assessment builds on expert estimates of failure probabilities for specific events (e.g.
unsatisfactory inspection of the landfill cover) that are linked to the occurrence of unwanted events
in a fault tree analysis. The investigated unwanted events do not comprise exceptional risks (e.g.
earthquake) and relate to a large and uncontrolled contamination of groundwater, damage to the
final cover, or an early need for replacement of the final cover. The probability of occurrence for an
unwanted event is calculated via Monte Carlo analysis and the sum of costs to undo the unwanted
events for a defined period is calculated as the financial risk during aftercare. Although the metho
dology is not intended to specify a procedure for landfill completion (risks are calculated for
specific aftercare durations), it may represent a valuable tool to provide appropriate funding for
aftercare activities, especially if it is widely applied and the model is parameterized from a growing
database.
Out of the risk assessment approaches summarized in Table 2-2, only the approach suggested by
Boerboom et al. (2003) directly addresses MSW landfills, however, only in terms of financial risks
during aftercare. The other approaches were developed to assess (primarily) the risk of ground
water pollution for largely inorganic landfills (Scharff et al. 2011) or for virtual landfills to analyze
different waste pretreatment options before landfilling (Hall et al. 2007), respectively. Although
these approaches might prove valuable for an assessment of environmental risks associated with
closed MSW landfills, they have not yet been integrated to form an evaluation framework for after
care. There is a high level of uncertainty involved in a risk assessment and the transparency of
modeling assumptions is significant for an understanding of the outcome. Hence, there is a need for
consistent procedures that allow for an objective evaluation of the environmental risk at a closed
landfill. This is highlighted by the work of Hall et al. (2006; 2007a), who point out the complexity
in their modeling due to assumptions on containment system performance and subsequent effects
on the interrelationships between leachate quality, release rates and concentrations at the PoC in the
groundwater. Consequently, sensitivity analysis and the handling of inherent uncertainties are
Aftercare completion criteria and landfill stability 12

Authors Modeling approach Application Comments
Scharff et al. Long-term modeling of conta- Case study on a largely inor- Suggested as a part of the
(2011) minant migration to a point of ganic landfill (Cl and SO4 iden toolbox to assess aftercare compliance and comparison to tified as critical leachate para completion specific standards meters)
Hall et al. (2007) Long-term modeling of conta- Hypothetical landfills with dif- A procedure for aftercare minant migration to a point of ferent waste qualities sited in a completion incorporating compliance and comparison to specific model environment the modeling results has not specific standard (leachate parameters at equili been suggested.
brium level are presented)
Boerboom et al. Probabilistic risk assessment to Used as a cost calculation me- No guidance on aftercare or
(2003) estimate potential costs asso thod for aftercare in several completion, but could be a
ciated with environmental risks provinces of The Netherlands basis to accrue appropriate
during aftercare aftercare funding
essential for the comprehensiveness of the modeling results. In conclusion, while the presented risk
assessment approaches could be a substantial part of an aftercare evaluation procedure, they are
expensive and uncertain. As such, the utility of risk assessments in the development of aftercare
completion remains to be determined.
Table 2-2: Methodological basis and application of risk assessment suggested to evaluate PCC
2.1.2.3 Performance-based system for PCC
As a consequence of potentially long aftercare periods for MSW landfills, performance-based eval
uations have been suggested for long-term management of closed MSW landfills (Barlaz et al.
2002). In general, such approaches are based on landfill monitoring and performance data, which
are used to evaluate the actual state of the landfill and to determine appropriate aftercare activities.
Hence, the evaluation procedures are site-specific and provide guidance on the sequential reduction
of aftercare intensity that may, if warranted by performance data, ultimately lead to aftercare com
pletion. Different approaches adhering to this concept are described in this section and summarized
in Table 2-3.
A performance-based system for evaluating aftercare requirements at MSW landfills referred to as
the evaluation of post-closure care (EPCC) methodology has been presented by Morris and Barlaz
(2011). The EPCC methodology addresses the four primary aspects of landfill aftercare monitoring
and maintenance (i.e. leachate quality and quantity, gas management, groundwater monitoring and
protection, and cover maintenance) in a user-friendly modular system. It provides long-term
stewardship of landfills by assessing their current and future impacts to the environment based on
the evaluation of “functional stability”. Functional stability is used to define a closed landfill that
does not present an unacceptable threat to HHE in the absence of aftercare, but with some remain
ing level of control to protect the cover (Solid Waste Association of North America Bioreactor
Committee (2004) cited in GeoSyntec (2006)). The methodology establishes a site-specific basis
for decisions on maintaining, extending, reducing, or modifying aftercare activities while being
protective of the environment. Logic diagrams are used for each aspect of aftercare (i.e. for each
Aftercare completion criteria and landfill stability 13

module) and the modules can be sequentially evaluated (prerequisites module, leachate module, gas
module, groundwater module, and cover module). The aspired end-use and final condition of the
landfill are defined from the outset of the evaluation. Conservative assumptions are used within the
evaluation procedure and proposals to modify an aftercare activity are driven by data. The
application of the methodology generally involves analyzing statistical trends in leachate, landfill
gas generation, and groundwater quality, as well as additional biological, chemical, and physical
data, to demonstrate that gas production is stable or decreasing and leachate quality is constant or
improving. Once a change in aftercare is implemented, the owner is expected to verify no adverse
effect by “confirmation” monitoring followed by surveillance monitoring at a decreasing
frequency. Monitoring procedures also identify high and low level “trigger” conditions requiring
immediate responsive action to be taken to resolve the condition. The system allows for multiple
outcomes in which the requirements for each aspect of aftercare may vary significantly. Three
possible levels of analysis are built into the methodology: a) in a source evaluation the compliance
with target values may be demonstrated at the source (e.g. leachate quality < drinking water
standards); b) in a point of compliance evaluation, it is demonstrated that the landfill does not pose
an unacceptable threat at the PoC; and c) in a point of exposure (PoE) evaluation it is demonstrated
that the landfill does not pose an unacceptable threat at the PoE (Morris and Barlaz 2011). The
potential for a harmful release to the environment is analyzed before any aspect of aftercare may be
reduced or discontinued. Thus, the EPCC methodology determines a level of aftercare which is
consistent with the actual state of the landfill and the sensitivity of the surrounding environment.
This is the basis for progressively reducing aftercare and finally turning the landfill into a custodial
care program (i.e. aftercare completion). The custodial care program represents a level and type of
activities which would be required at other sites and thus would not be specific for MSW
landfills (cf. Pivato and Morris 2005; ITRC 2006).
Application of some components of the EPCC methodology to evaluate appropriate aftercare at a
specific MSW landfill in Florida has been described by Sizirici (2009). A set of relevant parameters
(e.g. leachate: ammonia-nitrogen, chloride, iron, VOCs or landfill gas: remaining gas generation
potential) was identified and estimates of future emission levels were derived for the case study
landfill (cf. Sizirici and Tansel 2010). Based on a risk assessment at the site, Sizirici (2009)
concluded that landfill gas management is no longer necessary, whereas monitoring of leachate and
groundwater has to be continued. Surveillance of cap integrity also remains an integral part of
aftercare activities at the landfill. Hence, the aftercare period at the site can be reduced for some
landfill elements (e.g. gas collection) but is required for others (e.g. leachate management) to be
protective of HHE.
Recently, Sizirici et al. (2011) presented a screening procedure for a preliminary assessment of
aftercare needs at closed landfills. The procedure is based on expert evaluations (scale from 1 to
10) of site-specific parameters (e.g. climate, operational factors, leachate management, gas
management, etc.), which are combined using a ranking algorithm (i.e. by assigning weights to
different factors). The overall score from the algorithm is used to categorize the landfill conditions
as critical, acceptable, or good. “Critical condition” at a site indicates that the landfill may represent
a threat to HHE and thus, aftercare activities need to be adjusted. “Acceptable condition” as a result
of the evaluation confirms current aftercare intensity and “good condition” as an outcome of the
Aftercare completion criteria and landfill stability 14

evaluation indicates the potential for a reduction of aftercare activities. However, the suggested
aftercare evaluation procedure does not provide specific guidance on the intensity of aftercare or
the completion of aftercare activities.
A performance-based approach for aftercare based on the potential of naturally occurring or en
hanced natural attenuation (NA) processes (e.g. via waste aeration) at a landfill has been described
by van Vossen (2010). This approach aims at lasting emission reduction at closed MSW landfills
and is based on the full scale demonstration of the methodology at three case study landfills in The
Netherlands (cf. van Vossen et al. 2007; van Vossen et al. 2009a; van Vossen et al. 2009b). The
model to demonstrate the capability of natural attenuation processes to phase out unacceptable
levels of contaminants is referred to as the SANA (Sustainable Aftercare of landfills based upon
Natural Attenuation) model (van Vossen 2010). As one of the demonstration landfills has been
partly built without a base lining system, the SANA model has the capability to analyze the poten
tial for natural attenuation in the landfill body as well as in the pollution plume below the landfill
and in the groundwater. The conditions in the landfill are characterized and the model evaluates the
state of biochemical, geochemical, and hydrological processes in consideration of performance
indicators (e.g. in-situ temperature, settlements, BOD5/COD ratio, ammonia-nitrogen, gas
production rate, and CH4/CO2 ratio) that are used to describe the extent of organic matter
stabilization. The goal of enhanced emission reduction activities within the SANA model is to
replace the need for an impermeable final cover by a low emission potential of the waste, which is
expected to result in landfill emissions meeting acceptable levels and consequently allowing for
aftercare completion. If acceptable leachate emission levels cannot be achieved at a site, an
environmental risk assessment is suggested to determine the necessity of mitigation measures for
preventing inacceptable groundwater pollution. In essence, the suggested approach promotes a
specific aftercare strategy (i.e. enhanced emission reduction based on NA processes) and describes
its application to demonstration landfills, but does not yet constitute a consistent methodology to
evaluate aftercare and aftercare completion. Van Vossen (2010), states that such a methodology
will be based on the final results of the demonstration projects and is currently under development.
The performance-based evaluations of aftercare shown Table 2-3 are essentially site-specific,
allowing for long-term landfill management to be adapted to local conditions. Among the presented
approaches, the EPCC methodology represents the most tangible evaluation procedure, providing
operative assessment protocols to decide on an appropriate level of aftercare. Whereas the EPCC
methodology establishes a consistent aftercare evaluation framework, the approach suggested by
van Vossen (2010) follows a bottom-up strategy of demonstrating the performance of natural
attenuation processes to reduce emissions at full scale landfills and developing a consistent evalua
tion methodology based on the outcome of current demonstration projects. However, within the
evaluation methodology an environmental risk assessment and potential site remediation may be
necessary if admissible emission levels could not be met with the emission reduction approach. In
addition, for those landfills not equipped with a bottom liner no operative protocol to monitor NA
at MSW landfills has been suggested yet and regulators may not accept the local groundwater as a
long-term treatment filter for waste management processes (cf. Christensen et al. 2000).
Aftercare completion criteria and landfill stability 15

Authors Methodology Application Comments
EPCC methodol
ogy
(Morris and Barlaz
2011)
Modular approach for the eval
uation of environmental impacts
associated with aftercare
addressing data collection, lea
chate management, gas man
agement, groundwater moni
toring, and cover performance.
Evaluation is used as a basis to
progressively reduce aftercare,
ultimately leading to completion
while being protective of the
environment. Application was
demonstrated at a hypothetical
case study site.
Operative methodology
providing specific protocols
for long-term landfill man
agement.
Sizirici et al.
(2011)
Ranking algorithm based on ex
pert evaluations of site-specific
factors resulting in a pre
liminary assessment of appro
priate aftercare at a site.
Factor-specific ordinal scores
based on site performance as
signed by experts and then
weighted to derive an overall
landfill score. Application at
two sites was presented.
Tool is dependent on expert
judgment and qualitative
analysis.
SANA model
(van Vossen
(2010))
Demonstration of natural atten-
uation as a feasible approach for
aftercare to minimize long-term
environmental risks at MSW
landfills based on performance
data.
A natural attenuation (or bio
reactor) approach is promoted to
achieve a lasting reduction of
the emission potential at three
full-scale demonstration
landfills.
Bottom-up approach to pro-
vide guidance on aftercare.
Consistent methodology is
to be developed based on
the case study results.
Table 2-3: Methodological basis and application of performance-based systems to evaluate PCC
Another fundamental difference between the concept suggested by van Vossen (2010) and the
EPCC methodology is that the former embraces a strategy to enhance emission reduction to de
crease emissions to low levels without a long-term low-permeability cover, whereas the latter does
not require a strategy to decrease the emission potential of the waste body, as the focus lies on
actual emission levels and emission trends at the landfill. Where no steps are taken to decrease the
emission potential of the waste body, maintenance of a low-permeability top cover is expected to
be part of the custodial care program within the EPCC methodology. Indeed, regardless of the
long-term management approach at a landfill, some level of cover maintenance and associated site
care activities will always be required using the EPCC methodology.
The approach presented by Sizirici et al. (2011) does not rely on measured landfill performance
data like the other approaches listed in Table 2-3, but on expert evaluations of different factors ad-
dressing aftercare at the landfill. The procedure also does not give guidance on specific aftercare
activities or completion criteria. In general, the application at case study sites is of paramount
importance for all performance-based approaches, as this will be necessary to assess their
practicability with respect to aftercare duration and completion.
2.1.3 Discussion of approaches to evaluate aftercare
The aim of any evaluation of landfill aftercare and completion is to address the risks associated
with a closed landfill in a consistent and transparent manner and thereby allow decision makers to
comprehend underlying assumptions as well as associated residual risks. Table 2-4 summarizes the
major characteristics of the target value, risk, and performance-based approaches. As described in
16 Aftercare completion criteria and landfill stability

Characteristic Target value
approaches*
Risk assessment
approaches
Performance-based
approaches
Site specific No Yes Yes
Data collection in addition to ▪ Waste sampling and ▪ Waste sampling and ▪ More extensive moni
standard emission monitoring analysis (i.e. leaching analysis (potentially) toring
and biodegradability ▪ More extensive moni
tests) toring (potentially)
Outcome verification ▪ Not necessary ▪ Not included ▪ Included
Status of approach ▪ Conceptual to par- ▪ Partially operative ▪ Partially operative to
tially operative operative
Level of expertise ▪ Low ▪ Very high ▪ Very high
Usability of approach ▪ Mostly prescriptive ▪ Flexible ▪ Flexible
*The target value approaches acknowledge the need for additional site-specific evaluations, but do not provide
detailed guidance. Thus, the characteristics refer to generic target values only.
this section, each approach has strengths and limitations. Although target value approaches are not
site-specific per se, all of the approaches ultimately depend on site-specific data. This implies that
generic target values without site-specific assessments are not a feasible strategy for evaluating
aftercare at existing MSW landfills. In addition to the need for site specific evaluations, target
value approaches are confronted with unresolved issues of representative waste sampling and the
inconsistency of tests to estimate potential (residual) release rates. A single test is also not able to
consider the variation of substance release mechanisms dominating in a landfill over time,
highlighting the need for complementary approaches. Risk assessment approaches have been
largely presented with respect to the evaluation of specific risks (i.e. groundwater pollution), but
not as an integrated framework to allow for the confident evaluation of aftercare completion.
Although risk assessment approaches address the very core of the issue with respect to acceptable
risk and tolerable emissions (cf. Scharff et al. 2011), the evaluation requires a high level of exper
tise and comes with large uncertainties (e.g. Hall et al. 2006). The performance-based systems for
aftercare evaluation represent a more pragmatic approach, as they sequentially adjust aftercare
activities to the actual risk allowing for more confident evaluations of aftercare. However, as a de
sired state of the landfill does not consider the condition of the waste body, such as. current
emission levels and observed emission trends as a basis of the evaluation, residual environmental
risks might be neglected within such an assessment. In general, to demonstrate the feasibility of
aftercare completion based on any of these approaches case studies that lead to the completion of
aftercare need to be conducted.
In conclusion, a consistent framework to evaluate landfill aftercare and define the condition of a
closed landfill at the end of aftercare needs to integrate different aspects of the approaches
discussed above. As the evaluation of landfill environmental compatibility addresses long time
periods with potentially changing conditions, the notion of “stability” is often used in the context of
long-term landfill management. Therefore, the concept of environmental stability from a dynamic
system perspective is outlined in the next section as a basis for the evaluation of aftercare and
aftercare completion.
Table 2-4: Overview on main characteristics for different types of approaches to evaluate PCC
Aftercare completion criteria and landfill stability 17

2.2 Landfill stability – definition and metric
From the review of approaches for the long-term management of landfills in the previous section it
is apparent that the environmental compatibility of a closed landfill is often associated with the
concept of a “stable landfill” (cf. Baccini 1989). A “stable landfill” is considered not to pose a
threat to humans or the environment, and hence, it represents the state when aftercare at the landfill
can be ended. However, the specific conditions under which a landfill is called “stable” are often
not clear and rigorous definitions as well as evaluation frameworks are missing (cf. Barlaz et al.
2002). Clarity about the concept of landfill stability underlying the evaluation of post-closure care
is needed to establish an appropriate modeling framework addressing the environmental risks asso
ciated with long-term landfill management. Major aspects and the conceptual basis of the conse
quent framework to evaluate landfill long-term management developed in this work are outlined in
this section.
2.2.1 The notion of “landfill stability”
The review of existing approaches to evaluate aftercare in the previous section highlighted that an
evaluation of the environmental risk at a landfill is an integration of different aspects addressing the
condition of the landfill including biological, chemical, and physical properties, as well as the con
ditions at the site. The notion of “stability” has been used with respect to all of these landfill
properties specifically (e.g. biological stability: Barrena et al. (2009), chemical and physical stabil
ity: Boda (2002), geotechnical stability: Sabatini et al. (2002)), but not yet in an integrated way to
evaluate landfill environmental compatibility.
The complete stabilization of waste produces a material which does not represent a hazard in any
environmental setting (i.e. inert waste in Figure 2-2). For instance, this has been described as “solid
residues with properties very similar to the earth crust” (Baccini 1989). In such a case, the environ
mental compatibility of the landfill is guaranteed solely by the waste quality without additional bar
riers (e.g. containment system). Consequently, a substantial amount of work has been done to
define waste stabilization and derive indicators to evaluate the stability of deposited waste. On the
one hand, the definition of environmentally tolerable waste qualities for disposal has been sug
gested as a basis to achieve the goal of landfills not requiring any aftercare after closure (cf. criteria
to assess final storage quality of deposited wastes in Switzerland in the 1980ies (EKA 1986;
Baccini 1989; Brunner 1989; Brunner 1992). On the other hand, waste stabilization can refer to the
transformation of reactive waste in existing landfills into stabilized residues, which are deemed
environmentally compatible. Such a transformation has been intensively discussed with respect to
landfills containing organic waste. Lichtensteiger et al. (1989) discuss the transformation of sewage
sludge to ultimately achieve a final storage stage when material fluxes are no longer harmful for the
environment even on a long-term basis. In order to evaluate long-term landfill behavior they com
pare the transformation of sewage sludge to natural sediments with analogous characteristics (e.g.
sapropel, peat and organic soils). They found that about one third of the organic material in the
sewage sludge was mineralized within the first 10 to 20 years, with the remaining fraction of
organic matter to be mineralized or transformed into insoluble, refractory organic compounds over
an extended time period of thousands to hundred thousands of years. Persistent organic pollutants
are expected to be present in the landfill at least for decades to centuries. The observed mobility of
Aftercare completion criteria and landfill stability 18

heavy metals in the sewage sludge landfills is low. In similarity to the investigation of sewage
sludge landfills, it has been suggested to investigate the behavior of MSW landfills based on
processes taking place in natural analogues such as peat bogs (cf. Bozkurt et al. 2001; Döberl
2004). Bozkurt et al. (2000) concluded on such an analysis of long-term processes in MSW land
fills that, based on the alkalinity of the waste and its pH-buffering capacity, an increased mobili
zation of heavy metals might not be expected in organic waste landfills for thousands of years.
However, projections over such time periods are highly speculative and difficult to include in an
evaluation of landfill environmental compatibility.
Several criteria were suggested to evaluate waste stabilization in MSW landfills. For instance, the
evaluation of the stability of organic waste fractions (i.e. the extent of degradable organic matter
which has been already decomposed) was suggested based on biogas production tests (e.g.
Wisconsin Department of Natural Resources 2007; Barrena et al. 2009). In addition, the portion of
carbohydrates still present in organic matter and the content of lignin, which is supposed to in
crease with increasing biodegradation of the waste, were suggested as indicators (Bäumler et al.
2001). The ratio of cellulose (and hemicelluloses) to lignin (C(+H)/L) was also used to characterize
waste stability, whereby a C/L-ratio of 0.2 was proposed as an indicator for stable waste (cf. Boda
2002; Kelly et al. 2006), as C/L-ratios between 0.02 and 0.2 were observed in old landfills with
well degraded waste (Bookter and Ham 1982; Wang et al. 1994). Another method to indicate the
extent of waste stabilization is the black index (cf. Cossu and Raga 2008), which is based on the
reaction of lead acetate on a test paper with hydrogen sulfide (resulting in black lead sulfide on the
paper). Further tests and indicators to determine the stabilization of organic waste include for
example the FT-IR (Fourier Transform Infrared) spectroscopy (cf. Smidt et al. 2002), the paper
cardboard content or the SUVA index (UV absorbance to DOC ratio (see Francois et al. 2006)).
Although there are numerous tests and indicators available to evaluate waste stability, they are
often not consistent with each other (Knox et al. 2005; Wagland et al. 2009), face challenges of
representatively sampling and analyzing deposited waste (e.g. Chiampo et al. 1996; Sormunen et
al. 2008), and the parameters cannot be directly linked to actual emission levels from the waste
body (e.g. water flow heterogeneity and its implication for the emission behavior (see Fellner et al.
2009a)).
Although complete waste stabilization (i.e. the production of inert, solid residues) is desirable due
to the absence of environmental risk at such landfills (no hazard), it is hard to achieve for existing
landfills (especially with respect to landfills containing organic waste) and not yet measurable (e.g.
Brunner 1992; Knox et al. 2005). Hence, for existing landfills the conditions at the landfill site will
be of crucial importance to assess the environmental risk at a landfill. If the deposited material
represents some level of hazard to the environment, the environmental setting and its vulnerability
are essential to evaluate the environmental risk. The main elements of an evaluation of environ
mental compatibility of a landfill are the quality of the deposited waste, the level of interaction
between waste and environment, and the vulnerability of the local environment (cf. Nienhaus 2001;
Scharff et al. 2011). Thus, to assess landfill environmental compatibility in an integrated way, a
dynamic, system-based concept of landfill stability is introduced as a basis for the evaluation of the
environmental risk associated with a closed landfill. The suggested evaluation framework addresses
the landfill hazard as well as the potential damage at the site.
Aftercare completion criteria and landfill stability 19

A definition of dynamic stability has been suggested by Godoy (2000) and refers to the ability of a
system to resist a disturbance and return to an equilibrium state. The following discussion and the
underlying concept to evaluate long-term environmental compatibility of landfills is based on land
fill stability as a system property to restore the original condition of a system after it has been dis
turbed from equilibrium or steady motion. Different aspects of this definition are listed below
(adapted from Godoy (2000)):
- It is assumed that the environmental system is at equilibrium state before the landfill is
built.
- The original system is disturbed by landfill emissions (interventions).
- The environmental system responds to the disturbance (environmental media are af
fected).
- There is an assessment of the system behavior following the deposition of waste.
The list above indicates the need for an evaluation of landfill stability in view of the specific envi
ronmental situation at the landfill site. Depending on the original condition of the system and the
interactions of the waste with the surrounding environment, the landfill will cause a disturbance of
the system, controlled by the deposited material, the local climate, the applied technology (i.e.
landfill design and technical barriers), and the management of the landfill (e.g. collection and
treatment of landfill leachate). As long as the landfilled material has different properties from its
environment, there is some interaction between the landfill and its surrounding (e.g. landfill gas
emissions, deterioration of barriers) which causes a response of the surrounding environment. The
response could be a change of pollutant concentrations in different environmental media which
might be tolerable or not based on the criteria applied to evaluate the system response. Hence, the
assessment of the system response is related to a point of compliance, where certain criteria have to
be fulfilled. A system is said to be stable, when the interventions (i.e. emissions) do not cause a
response of the system which violates defined criteria at the specified point of compliance. Thus,
the point of compliance represents the boundary of the relevant environmental system. The closer
the system boundaries are placed to the landfill, the lesser buffering capacities of the surrounding
environment are taken into account and the more conservative a respective assessment would be
(provided the same criterion is applied). Apart from the spatial system boundary also a temporal
system boundary has to be specified, during which the stability of the local environmental system is
evaluated. This is the time period until the landfill does not represent a disturbance of the system
any more. In conclusion, from an environmental perspective a stable landfill disturbs the environ
mental system only to such a degree that the response of the system at any time complies with de
fined criteria at the point of compliance.
From the discussion above it is evident that the evaluation of landfill stability includes several
models which have to be established and linked to describe the system behavior over time:
− a pollutant release model of the waste to characterize the source term
− a model to describe the performance of the waste containment,
− a model to predict the substance concentrations in the affected environment
Aftercare completion criteria and landfill stability 20

The methodological framework to evaluate landfill long-term management and assess environ
mental risks at a closed landfill based on the system-based concept of landfill stability is outlined
below.
2.2.2 Framework to evaluate landfill PCC
The potential disturbance of the environmental system, as the ability to cause a response of the
system which does not meet given criteria at the point of compliance, is illustrated schematically in
Figure 2-2. It depends on the emission potential of the landfilled waste and the performance of
technical barriers, which were built to control the interaction between waste and surrounding envi
ronment. The evaluation, if a potential disturbance is acceptable or not, is carried out with respect
to the specific situation at the site (sensitivity of the system) and with respect to societal norms,
forming the basis for delineating the relevant system (i.e. defining the point of compliance) and for
specifying compliance criteria. A low disturbance will probably be acceptable in most environ
ments even if high levels of protection are aspired for environmental assets, with the extreme of the
waste itself not causing any potential disturbance (indicated in Figure 2-2 as inert waste). Medium
disturbances might be tolerable under specific circumstances, e.g. in case of an insensitive
environmental system and a lack of high valued environmental goods. However, a very high
emission potential even combined with highly reliable containment systems might hardly be
acceptable, if great societal value is assigned to environmental assets and a long-view on potential
contamination is taken. This can be observed for instance with respect to nuclear waste
repositories, as even the siting of low-level nuclear waste repositories is an intractable problem in
most societies (cf. Sjöberg 2009).
Figure 2-2: Evaluation matrix of the potential disturbance imposed on an environmental system by a
landfill
The qualitative diagram in Figure 2-2 has to be transferred into a quantitative evaluation metho
dology to assess the response of the environmental system to a specific landfill. The response is
evaluated by applying compliance criteria which depend on affected subjects of protection, the
regulatory framework for protecting environmental goods (societal value), and the intended after
use of the site. Some critical aspects within such a framework are discussed briefly below.
Aftercare completion criteria and landfill stability 21

2.2.2.1 Landfill emissions
Information on the emission behavior of a landfill can be drawn from observed emission levels at
full-scale landfills (e.g. Ehrig and Krümpelbeck 2001), experiments in the lab via landfill simu
lation reactors or waste leaching tests (e.g. Kylefors et al. 2003), physically and chemically based
mathematical models (e.g. White et al. 2004), and the analysis of the behavior of natural analogues
(e.g. Bozkurt et al. 2001). Based on this kind of data, a model for predicting the substance release
from deposited waste can be established and an emission profile for the landfill can be developed.
Whereas monitoring data of real landfills are rather limited with respect to the duration of the
observation period, lab experiments can be used to simulate longer time periods via equivalent
liquid-to-solid ratios (amount of water that passed through the waste relative to the waste mass).
However, such approaches are facing limitations with respect to the reproducibility of the extent
and rate of biochemical transformation processes, the preferential flow regime in landfills, and the
heterogeneity of the waste itself. Fellner et al. (2009a) for instance, conclude that due to the
differences in water flow and distribution between real-scale landfills and lab-scale simulations,
leachate emissions from full-scale landfills tend to decrease faster than expected from laboratory
experiments. Consequently, the stock of materials still remaining in the landfill body after a certain
period is likely to be underestimated by lab-scale landfill simulations. Hence, landfill
characterization limited to observed leachate and gas emissions is likely to underestimate the
remaining emission potential in the landfill. Gas generation is dependent on prevailing conditions
at a rather small scale, e.g. in dry zones of the landfill there might be easily degradable organic
matter present, but there will be no significant gas generation due to the lack of moisture (cf. Klink
and Ham 1982). Also leachate quality provides information only about the part of the landfill
participating in water flow. Although observed emission data are a valuable basis for simple
estimates on future emission levels as long as conditions within the landfill remain constant (e.g. by
the extrapolation of observed trends), they do not provide an appropriate basis for estimating
release rates with the prospect of potentially changing conditions such as a change of water flow
regime in the waste or the intrusion of air into the waste body.
The combination of emission models and models on the future barrier performance will allow for
determining future emission levels from a specific landfill (see Figure 2-3). The emission models
need to take into account the conditions at the site (e.g. precipitation, waste deposition height), the
pollutants of concern at the site (e.g. based on screening analysis and routine monitoring data), the
actual performance of the system (e.g. current and historic monitoring data), and the quality of the
deposited waste (e.g. mobilizable amount of substances). The models on future barrier performance
are based on the resistance built into the system and the stresses induced on the system (Inyang
2004). This includes an evaluation of the specific system installed at the landfill, the available
performance data, the system characteristics at the time of evaluation, and the potential impacts on
the system expected at the site. A schematic illustration of the extrapolation of emission trends at
the site, on the one hand, and the combination of different models within scenarios to illustrate the
effect of changing conditions on landfill emission levels, on the other hand, is shown in Figure 2-3.
Aftercare completion criteria and landfill stability 22

Figure 2-3: Combination of models to establish a disturbance term for the environmental system (the
scheme is r elated to leachate emissions)
2.2.2.2 System response and vulnerability
If leachate seeps from a landfill (i.e. no containment is 100% effective) and enters the zone below
the landfill, it potentially contaminates the groundwater underneath. Naturally occurring processes
in these environmental media can attenuate contaminants present in the leachate. Although, natural
attenuation (cf. U.S. Environmental Protection Agency 1997) has been shown to be substantial for
leachate in the subsurface at different sites and for several pollutants (e.g. Christensen et al. 1994),
there is no easy-to-use protocol available on how to assess attenuation potentials for a specific
environment (Christensen et al. 2000). Nevertheless, to evaluate the environmental risk a landfill
poses to the groundwater such processes should be included in the assessment, as they are
occurring naturally. However, due to the potentially large uncertainty associated with the
evaluation of natural attenuation processes, conservative assumptions should be used in respective
models. The part of the environmental system which is accepted as a buffering zone in the
evaluation is defined by the critical point of compliance (PoC). For instance, a PoC defined directly
outside the containment system would exclude attenuation processes potentially occurring in the
natural environment from the evaluation, whereas a PoC defined at some distance in the
groundwater downstream of the landfill, would allow for the consideration of natural attenuation in
the unsaturated and saturated zone in the evaluation. If considered, the potential for natural
attenuation needs to be demonstrated at the site and confirmed by appropriate monitoring protocols.
In addition to the release of leachate to the subsurface, the impact of leachate released to surface
waters needs to be considered. However, as collected leachate will be managed according to reg
ulatory discharge standards, the controlled discharge of leachate is considered to be compatible
with the environment.
Landfill gas emissions are an issue at sites where waste containing degradable organic matter has
been deposited (i.e. MSW landfills). Landfill gas is environmentally relevant on a global scale due
to the contained methane as a potent greenhouse gas (global warming potential of CH4 is 25 times
higher as CO2 (IPCC 2007)) and on a local scale due to potential vegetation damage, odors, and
landfill gas migration off site (i.e. explosion hazards). Oxidation of methane has been reported for
landfill cover systems in numerous studies (e.g. Oonk and Boom 1995; Huber-Humer 2004;
Aftercare completion criteria and landfill stability 23

Chanton et al. 2010) with observed reductions of methane emissions during cover passage between
0 and 99 % (cf. Oonk and Boom 1995; Huber-Humer et al. 2008; Kühle-Weidemeier and Bogon
2008; Rachor et al. 2011). At many landfills with low methane generation rates (below 48 liters of
CH4 per day), an oxidation of at least 15% of the generated methane can be expected even without
specifically designed top covers (Kühle-Weidemeier and Bogon 2008).
The vulnerability of the environmental system to the potential disturbance represented by the land
fill is dependent on actual and planned uses at the site and the aspired level of protection for
potentially affected subjects. The vulnerability of the system is reflected by the definition of the
points of compliance, where certain quality standards have to be met, and by the stringency of the
quality standards applied at these points. Hence, in order to evaluate the environmental
compatibility of a landfill, a decision about the acceptable risk at the site has to be made (cf.
Scharff et al. 2011). In essence, this decision is based on a societal consensus and expressed by the
authorities, who decide on the extent and type of long-term management at the landfill site.
2.2.2.3 Approach to evaluate landfill PCC and environmental risk
Within the concept of stability, the landfill represents a (potential) disturbance of the environmental
system. Corresponding stability criteria are applied in consideration of the response of the environ
mental system and its vulnerability. Consequently, to evaluate the environmental compatibility of a
closed landfill, models to describe the behavior of the dynamic landfill-environment system have to
be established and integrated to an evaluation method. The hypotheses underlying a respective
evaluation is that it is possible to assess the environmental risk emanating from a landfill based on
information about the deposited waste, the emission behavior of the landfill, and the current
conditions at the site. A respective methodology represents a risk-based approach which is not
limited to one functional state of the landfill, but which integrates the evolution of the landfill over
time. Clearly, there are large uncertainties associated with such an approach, as system under
standing is limited (e.g. natural variability, quality and quantity of measurements, process interac
tions, etc.) and future conditions are unknown. Among other factors, these uncertainties and the
complexity of the evaluation might have hampered the development of an integrated methodology
to evaluate long-term landfill management so far (e.g. Inyang and Lee 2005).
Aftercare completion criteria and landfill stability 24

3 Emission behavior of landfills
The emission behavior of landfills is discussed for three different landfill types based on literature
data and the analysis of data collected from landfills in Austria and Switzerland. Numerous studies
have investigated emissions from MSW landfills and the results underlined their long-term envi
ronmental significance (e.g. Belevi and Baccini 1989; Kruse 1994; Krümpelbeck 2000; Kjeldsen et
al. 2002; Heyer 2003). As many of these landfills have been closed during the last decade due to
increasingly stringent regulations in the landfill sector and the ban on landfilling untreated MSW
(EC 1999), MSW landfills are of particular interest with respect to post-closure care and long-term
management concepts. In addition to emissions from MSW landfills, the emission behavior of
municipal solid waste incineration (MSWI) bottom ash landfills is discussed in this chapter. Depo
sits of MSWI bottom ash are of growing importance due to increasing thermal waste treatment ca
pacities in many parts of the world and because of the substances contained in and potentially
emitted from these landfills (e.g. heavy metal contents of MSWI bottom ash). The third type of
landfills addressed in this chapter is construction and demolition (C&D) waste landfills. C&D
waste landfills are chosen for analysis, because approximately 25% of the waste to landfill is
deposited at this type of landfill in Austria (Lebensministerium 2006) and leachate from C&D
landfills needs to be treated during operation and potentially after landfill closure to comply with
regulatory standards for direct discharge into surface waters.
3.1 Emissions from MSW landfills
3.1.1 General description of emission behavior
The metabolism of MSW landfills during operation and in the decades after landfill closure is de
termined by the biochemical degradation of organic matter, which results in the production of
biogas (i.e. CH4 and CO2) and organically polluted leachate. In addition, the elution of soluble salts
and nitrogen compounds (i.e. ammonium) represent major substance release processes (e.g.
Farquhar and Rovers 1973; El-Fadel et al. 1997; Kjeldsen et al. 2002). One of the first schematic
descriptions of MSW landfill emission characteristics was presented by Farquhar and Rovers
(1973), see Figure 3-1. Based on the composition of landfill gas they distinguished four emission
periods: An initial phase with aerobic degradation (Aerobic phase, I) is followed by an anaerobic
phase without methane production (Acidic phase, II) after the oxygen within the deposited waste
has been depleted. In the third phase methane generation is initialized, because accumulated
organic acids are metabolized by methanogenic bacteria to CH4 and CO2. In the stable
methanogenic phase (IV) methane concentrations are typically around 50 to 60% in the landfill gas
and the concentration of easily degradable organic compounds in the leachate is low. The
schematic sequence of emission characteristics has been confirmed by various studies and extended
with respect to the long-term behavior of MSW landfills (e.g. Stegmann 1981; Ehrig 1986; Pohland
and Harper 1986; Christensen and Kjeldsen 1989; Kjeldsen et al. 2002). However, the descriptions
of emission characteristics after the stable methanogenic phase are not based on observed data at
the lab- or field-scale, but on theoretical considerations. Therefore, the subsequent descriptions of
Emission behavior of landfills 25

S
tag
bile
Ae
rob
ic
Acid
Initia
lm
eth
an
og
enic
Sta
ble
meth
an
og
enic
Meth
an
eo
xid
atio
n
Air in
tru
sio
n
Carb
on
dio
xid
e
So
il a
ir
Time
Data Speculation
I II III IV V VI VII VIII
COD
NH4 +
Heavy metals
Cl
BOD
Lea
ch
ate
com
po
sitio
n
Time
Data Speculation
I II III IV V VI VII VIII
La
nd
fill
ga
s c
om
po
sitio
n
N2
CO2 N2
O2O2
CH4
H2
phases V-VIII are hypothetical and to some degree based on speculation. Due to the continuous
decrease of degradable organic matter in the landfill, it is expected that air starts to infiltrate into
the waste body during the methane oxidation phase (phase V in Figure 3-1). Whereas air intrusion
is restricted to the landfill boundaries during the methane oxidation phase, the inner areas of the
landfill get in contact with air during the air intrusion phase (VI) too. At some point the air flow
into the landfill is sufficient to oxidize all the methane which is produced from residual anaerobic
degradation. Subsequently, the remaining degradable organic matter is oxidized during aerobic
degradation in the carbon dioxide phase (VII). In this phase the pH value might decrease causing
increased metals mobility (cf. Kjeldsen et al. 2002). Finally, the composition of the landfill gas is
equal to the composition of soil air in the last phase (soil air phase, VIII). It is speculated that it will
take many hundred to several hundred thousands of years until this phase can be observed at real
landfills, depending on the conditions at the site (e.g. waste composition, cover, degree of water
saturation, landfill relief, etc.), see Bozkurt et al. (1999).
Figure 3-1: Characteristics o f landfill gas e missions (top) and leachate emissions (bottom) for a n
idealized MSW landfill (from Kjeldsen et al. 2002 based on Farquhar a nd Rovers 1 973)
Emission behavior of landfills 26

It should be emphasized that the emission characteristics shown in Figure 3-1 and described above
simplify the conditions at real-scale landfills and, hence, are to be understood schematically. Apart
from different conditions at landfill sites (e.g. climate) and different characteristics of the landfilled
waste (e.g. composition), several emission phases will be encountered at the same time at a landfill
(cf. Ehrig 1991). This is due to the operation of landfills over an extended period of time (e.g.
sections with old, well degraded refuse and younger sections with relatively fresh MSW) and the
heterogeneity of the waste body. As the presence of mobile water is of major importance for the
degradation of organic matter in landfills (e.g. Pohland 1975; Leckie et al. 1979), the heterogeneity
of the water flow within landfills has been found to be of major importance for its emission beha
vior (cf. Öman and Rosqvist 1999; Huber et al. 2004; Rosqvist et al. 2005; Fellner et al. 2009a).
3.1.1.1 Landfill gas
Table 3-1: Selected mathematical models to estimate landfill gas generation at MSW landfills
Model formulation Author suggestions
Tabasaran and Rettenberger 1987: k= 0.04 yr-1
L0 = 1.868*TOCdeg*(0.014*T+0.28) TOCdeg = 170-200 kg C/Mg MSW
G(t) -(t*k) cum = L0*(1-10 T= 30°C
Gmax= 13.61 m³/(Mg*yr) Bundesamt für Umweltschutz (1983) (cited in Ehrig 1986):
k1= 1.1 yr (increasing trajectory) G(t) = Gmax*(1-e-(t/k ) -(t/k )
1 )*e 2 k2= 15.72 yr (decreasing trajectory)
L0= 100-180 m³/Mg MSW
Ehrig (1986): k= 0.139 yr-1
G(t) = G *e-k *(t -t) max 1 1 Gmax= (L0*k)= 13.9-25.0 m³/(Mg*yr)
G(t) = Gmax*e-k*(t-t )1 k 3 r-1
1= y (increasing trajectory)
t1= 3 yr (time of max. gas p roduction)
LandGEM (U.S. EPA 2005):
n 1 Range of k values d epending on landfill
∑∑ Mi −G(t) =
kt kL e ij
0 conditions ( e.g. wet vs. arid) i=1 j=0.1 10
Legend:
L0: Landfill gas generation potential [m³/Mg], TOCdeg: degradable organic carbon [kg C/Mg MSW], T:
Temperature [C°], G(t)cum: Cumulative amount of generated landfill gas after t years [m³/Mg], t: time
after deposition [yrs], k: first order rate [yr-1], G(t): Landfill gas generation rate [m³/(Mg*yr)], Gmax:
Maximum landfill gas generation rate [m³/(Mg*yr)], Mi: mass of waste accepted in the ith year [Mg]
The amount of landfill gas, which can be generated from municipal solid waste, depends on the
composition of the waste. Based on theoretical estimates, gas generation potentials for MSW range
between 120 and 450 liters per kg of dry MSW, whereas experimental studies indicate a range from
close to zero up to 390 liters per kg of dry MSW (cf. El-Fadel et al. 1997). Numerous models have
been presented to estimate the generation of landfill gas typically involving first order kinetics (cf.
Barlaz et al. 1990). In Table 3-1 some landfill gas generation models are shown together with au
thor suggestions on typical values for degradation rates and other model parameters. Typically,
landfill gas generation models over-estimate gas generation rates and potentials at real-scale land
fills (Fellner et al. 2004). Though such factors as the moisture content and distribution, temperature
Emission behavior of landfills 27

fluctuations, the presence of inhibitors, and pH levels are of major importance for landfill gas
generation (cf. El-Fadel et al. 1997), they are typically not addressed mechanistically by landfill
gas generation models.
The major components of landfill gas are methane (40-70% of volume) and carbon dioxide (30
60% of volume). In addition, the volumetric contents of carbon monoxide, nitrogen, oxygen,
hydrogen, hydrogen sulfide and trace gases can be in the range of several percent (cf. El-Fadel et
al. 1997). For instance, Krümpelbeck (2000) reported levels of hydrocarbons between 1.8 and 166
mg/m³, chlorofluorocarbons between 0.06 and 119 mg/m³, or xylene from 0.04 to 257 mg/m³ in the
landfill gas of closed German MSW landfills. It should be noted that the deposition of special
wastes (e.g. industrial wastes) at the site may have a strong impact on trace gases present in the
landfill gas (cf. Ehrig and Brinkmann 1999).
3.1.1.2 Landfill leachate
Leachate is generated from the preferential and transient flow of water through the deposited waste.
The water balance at a landfill is dependent on the water content of the deposited waste, the preci
pitation at the site, the potential leachate recycling, the surface runoff, the evapotranspiration at the
site, the biochemical degradation of waste, the water exported via leachate and landfill gas, and the
water storage in the landfill (cf. Baccini et al. 1987). Typically, the water losses in the landfill gas
as well as the water produced/consumed during biodegradation processes can be neglected at
closed landfills under moderate conditions (Fellner 2004). The amount of leachate generated at
closed landfills is dominated by the type and efficiency of the top cover system and the climatic
conditions at the site. For instance, at old German landfills with earthen top covers of low thickness
leachate generation amounted for 25 – 60% of the annual precipitation, at sites with thicker earthen
covers leachate generation amounted for 15 – 40% of annual precipitation, and at sites with low
permeability clay liners leachate generation was in the range of 10 – 40% (Krümpelbeck 2000).
Different top cover systems and their (long-term) effectiveness to control and minimize water in
filtration are discussed in chapter 4.1.
The quality of leachate is dependent on the chemical composition of the deposited waste, the pH
value and redox conditions, the water flow heterogeneity, as well as physical, chemical and/or bi
ological transformation of the waste material. In Table 3-2 typical concentration ranges for leachate
constituents are shown. It is apparent that concentrations vary over one to two orders of magnitude
even during the same phase of landfill evolution. The differences between individual measurements
and individual landfills may be due to the different waste compositions, different water infiltration
rates (e.g. climatic conditions), different water flow distribution in the waste, or different landfill
design (e.g. waste thickness) and management (e.g. leachate recirculation, compaction technology).
For instance, the fraction of waste participating in water flow has been observed to vary from 60%
to only 5% at different landfills (cf. Rosqvist and Bendz 1999; Döberl et al. 2005), which is highly
significant for leachate emission levels as well as long-term emission potentials of these landfills
(e.g. Rosqvist et al. 2005; Fellner et al. 2009a).
Emission behavior of landfills 28

Table 3-2: Typical concentrations of selected leachate constituents during the acidic and methano
genic phase at a MSW landfill (from: Ehrig 1980 cited in Ehrig and Brinkmann 1999)
Acidic Phase Methanogenic phase Independent from phase
Parameter Mean Range Mean Range Parameter Mean Range
pH [-] 6.1 4.5 – 7.5 8.0 7.5 – 9.0 AOX [mg/l] 2 0.32 – 3.35
BOD5 [mg/l] 13000 4000 – 40000 180 20 – 550 Cl [mg/l] 2100 100 – 5000
COD [mg/l] 22000 6000 – 60000 3000 500 – 4500 NH4-N [mg/l] 750 30 – 3000
SO4 [mg/l] 500 70 – 1750 80 10 – 420 NO3-N [mg/l] 3 0.1 – 50
Ca [mg/l] 1200 10 – 2500 60 20 – 60 NO2-N [mg/l] 0.5 0 – 25
Mg [mg/l] 470 50 – 1150 180 40 – 350 Ptot [mg/l] 6 0.1 – 30
Fe [mg/l] 780 20 – 2100 15 3 – 280 Cd [mg/l] 0.006 0.0005 – 0.14
Mn [mg/l] 25 0.3 – 65 0.7 0.03 – 45 Cr [mg/l] 0.3 0.03 – 1.6
Zn [mg/l] 5 0.1 – 120 0.6 0.03 – 4 Cu [mg/l] 0.08 0.004 – 1.4
Sr [mg/l] 7 0.5 – 15 1 0.3 – 7 Ni [mg/l] 0.2 0.02 – 2.05
Although there are large variations at individual MSW landfills, a decreasing trend of concen
trations can typically be observed for many leachate constituents with increasing landfill age, espe
cially after landfill closure (e.g. Krümpelbeck 2000; Kjeldsen et al. 2002; Gibbons et al. 2007). The
organic pollution of the leachate is often expressed as total organic carbon (TOC), dissolved
organic carbon (DOC), chemical oxygen demand (COD), and biological oxygen demand in 5 days
(BOD5). The BOD5/COD ratio has been suggested as an indicator for the extent of waste degrada
tion, with a BOD5/COD values below 0.1 indicating stabilized waste (cf. Ehrig 1989; Reinhart and
Townsend 1997). However, this is a necessary but insufficient criterion, because easily degradable
substances present in the leachate from less stable waste could be consumed while percolating
through well degraded refuse at the bottom of the landfill (cf. Bookter and Ham 1982; Barlaz et al.
2002; Youcai et al. 2002). Thus, the leachate quality at the landfill bottom does not necessarily re
flect to state of waste degradation, not even for the part of the landfill in contact with mobile water.
Apart from parameters for total organic leachate pollution, also the levels of specific organic com
pounds or groups of organic compounds have been measured for MSW landfill leachate. Fre
quently detected xenobiotic compounds include benzene, toluene, ethylbenzene, and halogenated
hydrocarbons such as trichloroethane or tetrachloroethylene (Arneth et al. 1989; Kjeldsen et al.
2002). A model of the long-term behavior of xenobiotic organic leachate constituents has been sug
gested by Kjeldsen and Christensen (2001), which indicates that these substances may persist in
landfill leachate for many decades. In general, a lot of different xenobiotic compounds have been
identified in landfills (e.g. Öman and Junestedt 2008) and as persistent organic pollutants have been
accumulated in consumer wastes, they may also be present in landfill leachate (Weber et al. 2011).
For most inorganic macrocomponents (e.g. chloride, sulfate) decreasing concentration trends can
be observed in the leachate of MSW landfills after closure (Kjeldsen et al. 2002; Gibbons et al.
2007). As the concentrations of ammonium decrease only slowly or remain in the same range for
decades, ammonium has been identified as a critical leachate constituent in terms of post-closure
care and environmental compatibility (e.g. Kruse 1994; Krümpelbeck 2000; Kjeldsen et al. 2002).
Heavy metals are typically present at very low levels in MSW landfill leachate with concentrations
in the range of or below drinking water quality standards (Kjeldsen et al. 2002). Although signif
icant quantities of heavy metals are contained in MSW, release via leachate is very low due to low
Emission behavior of landfills 29

solubility of present species, sorption, and other processes decreasing metals mobility (cf. Bozkurt
et al. 1999; Döberl et al. 2002). As a decrease of pH and a consequent increase of metals mobility
is speculated not to occur for thousands of years at MSW landfills (Belevi and Baccini 1989;
Bozkurt et al. 2000), metals are primarily mobilized due to the complexation with organic and inor
ganic compounds, and due to metal association with colloids (Kjeldsen et al. 2002). Hence, heavy
metal concentrations in leachate from MSW landfills are typically low, but may vary from one
landfill to another, as well as from one landfill phase (i.e. environmental conditions such as redox
in the waste body) to another.
3.1.2 Emission characteristics of MSW landfills
The emission profiles of the selected MSW landfills are investigated to describe the range of emis
sion levels at Austrian MSW landfills, to analyze emission trends at closed or old MSW landfills,
and to evaluate the emission potentials remaining in these landfills. The analysis is based on
reported data on existing landfills (e.g. Lebensministerium 2006; Fellner et al. 2009b) and data
available from landfill owners and authorities. Out of approximately 100 MSW landfills in Austria
(Fellner et al. 2009b), 50 sites were chosen for further investigations, because of the preference for
older landfills (age above 10 years) and for sites with a functional waste containment system (i.e.
potential availability of monitoring data). Landfill owners have been contacted and further data on
the specific landfills and emission monitoring data were gathered. Finally, 32 sites2 were chosen to
analyze emission profiles of older MSW landfills (see appendix 1). Together with landfill owners
and authorities data on deposition history, climatic conditions, landfilling technology (intermediate
covers, base liner, gas collection, etc.), and emissions (leachate and gas) were collected. All of the
investigated sites are equipped with a lining system at the landfill base to collect the leachate
percolating through the waste body. The average annual precipitation rate at the sites is 832 mm/yr
and the average age of the landfills is 24 years (in 2008), with most of the landfills (30) being
closed (see appendix 1). By 2008 the average duration of post-closure care at these landfills has
been 16 years. In Table 3-3 the mean, minimum and maximum concentrations of selected leachate
parameters are shown in comparison to current Austrian standards for leachate discharge into sur
face water bodies. Table 3-3 includes parameters, for which more than 5% of the measurements ex
ceeded the stipulated discharge limits together with information about the measured pH values, the
electric conductivities, and chloride concentrations. From Table 3-3 it is evident that the mean
values of organic leachate pollution (chemical oxygen demand (COD), biological oxygen demand
in 5 days (BOD5), and total organic carbon (TOC)) and of ammonium-nitrogen concentrations are
two orders of magnitude above the respective Austrian quality standards for direct discharge to
surface water bodies and consequently, leachate needs to be treated (either on-site or in a waste
water treatment plant off-site) before discharge. The limit values are exceeded also by the mean
concentrations of iron, absorbable organic halides (AOX), and chromium. In addition, the relatively
high chloride concentrations of 1390 mg/l should be noted. Although there is no concentration
based discharge limit, these concentrations are substantially higher than target values suggested for
the termination of leachate management during post-closure care, for example a target value of 100
2 29 MSW landfills are located in Austria, 3 in Switzerland.
Emission behavior of landfills 30

Parameter Number of
landfills
Number of
measurements Mean* Min. – Max.
Discharge limit
(surface water)**
pH [-]
EC [µS/cm]
COD [mg O2/l]
BOD5 [mg O2/l]
TOC [mg Corg /l]
NH4-N [mg N/l]
Cl [mg/l]
AOX [mg Cl/l]
Fe [mg/l]
Zn [mg/l]
As [mg/l]
Crtot [mg/l]
Ni [mg/l]
Sulfide [mg S/l]
32
32
31
30
24
32
31
27
27
30
24
28
24
4
1262
1223
1152
964
703
1284
1060
626
792
925
644
803
561
64
7.9
14055
4203
1581
1460
1045
1388
1.71
29.2
0.48
0.04
0.58
0.18
0.41
5.5 – 9.6
352 – 504000
18 – 57000
3 – 32000
0.5 – 28150
1.1 – 6200
11.7 – 9700
0.01 – 38.4
ND – 3700
ND – 14.9
ND – 0.64
ND – 9.2
ND – 8.8
ND – 4
6.5 – 8.5
50
10
20
10
Toxicity
0.5
2.0
0.5
0.1
0.5
0.5
0.5
mg Cl per liter suggested by Stegmann et al. (2006). In general, the concentration levels shown in
Table 3-3 are in accordance with the literature data discussed previously. Organic leachate
pollution and ammonium concentrations are high and most critical with respect to the
corresponding discharge limits. Leachate concentrations of chloride, AOX or iron might as well be
problematic at many sites, whereas most heavy metal concentrations are typically below the
discharge standards. However, the identification of potentially critical parameters is limited by the
range of parameters measured at the sites. On average 50 parameters were determined for leachate
samples at the sites mainly based on the regulatory requirements in Austria (see appendix 1). An
analysis of trace organics and persistent chemicals or rare metals (e.g. Rubidium) is typically not
included in routine monitoring and not covered by the analysis presented in this section. In
addition, it should be noted that the emission characteristics of an individual landfill might diverge
substantially from the data shown in Table 1, due to varying waste compositions, different
conditions at the site (e.g. climate or technology) or the co-disposal of wastes other than MSW (cf.
Gibbons et al. 1999; Slack et al. 2005).
Table 3-3: Statistical analysis of leachate characteristics of 32 MSW landfills and Austrian dis
charge limits into surface water bodies
* A non-detect (ND) is considered 0 for calculating the mean value.
** Limits according to the ordinances on waste water discharge from landfills (Leachate ordinance (MoE 2003) and
waste water discharge ordinance (MoE 1996a)).
The leachate generation rate at the investigated MSW landfills is primarily dependent on the land
fill management period. During landfill operation on average 40% of the annual precipitation was
collected as leachate, at sites with a temporary cover (typically a layer of soil) the mean leachate
generation rate accounted for 23% of annual precipitation, and after the installation of a final cover
the mean leachate generation rate decreased to 8% of annual precipitation. In general, leachate gen
eration rates were on the decrease at sites with a final cover, due to the continuing drainage of wa-
Emission behavior of landfills 31

ter stored within the waste body. However, due to different systems and conditions at the site, gen
eral statements on leachate generation rates are of limited value for the evaluation of individual
landfills.
Out of the 32 MSW landfills in the data set, monitoring data on landfill gas emissions is available
for 13 (see appendix 1). The data is of limited informative value, as time series are often incom
plete, especially during different landfill management periods, cf. Figure 2-1, and the quality of
data seems to be poor for many sites, e.g. unknown collection efficiency of the gas extraction sys
tem, suction of air into the gas extraction system. However, the mean concentrations of methane,
carbon dioxide, and oxygen in the landfill gas collected at 13 MSW landfills were 50, 40, and 2
Vol%, respectively3, which are typical values for MSW landfills during the stable methanogenic
phase (cf. Figure 3-1). The cumulative amounts of landfill gas collected at the landfill sites (by the
year 2008) range from 16 m³ of landfill gas per Mg of MSW to 162 m³ of landfill gas per Mg of
MSW. Both extremes of this range relate to old landfills (36 and 28 years, respectively), but
whereas active gas extraction started 22 years after initial waste deposition at the landfill with low
cumulative gas yield (MSW4-MSW11), gas has been collected already three years after initial
waste placement at the landfill with the highest cumulative yield (MSW1). This underlines the im
portance of a timely installation of gas collection systems to capture a large fraction of the
generated gas and highlights the large potential variation of collection efficiencies between
individual sites. In any case, landfill gas data should be handled cautiously and evaluated with
respect to representativeness and trends over time.
3.1.2.1 Evolution of emission characteristics after landfill closure
The average concentrations and concentration ranges for selected leachate parameters for specific
time periods after landfill closure are shown in Table 3-4. For most of the parameters the
concentrations decrease with increasing post-closure care duration. For instance, the mean values
of organic leachate pollution parameters (BOD5, COD, TOC, AOX) are almost by an order of
magnitude higher in the initial five-year period after closure than 20 years and more after the
landfill has been closed (cf. Table 3-4). Similar trends can be observed for ammonium, iron or
chloride. However, after more than 20 years post closure the mean values of ammonium or COD in
the data set are still an order of magnitude above the corresponding quality standards for direct dis
charge into surface waters (see Table 3-3). Only the BOD5/COD ratio does not exhibit any signifi
cant trend during the post closure care period in Table 3-4. Primarily, this is due to very high varia
tions at a few individual landfills, which do not allow for a meaningful calculation of average
BOD5/COD rations for the data set.
3 Volumetric concentrations measured at each site have been corrected for the suction of air based on the
content of Nitrogen (N2) in the landfill gas. High volumetric contents of Nitrogen infer significant suction of
air into the gas extraction system.
32 Emission behavior of landfills

Parameter Mean Min-Max Mean Min-Max
0-5 years after closure 5-10 years after closure
pH value [-]
COD [mg O2/l]
BOD5 [mg O2/l]
BOD5/COD [-]
TOC [mg Corg /l]
NH4-N [mg N/l]
Chloride [mg Cl/l]
AOX [mg Cl/l]
Fe [mg/l]
Crtot [mg/l]
8.0
3008
565
0.2
906
926
1812
3.0
6.1
0.83
6.9-8.8
182-11618
19-4157
0.01-0.58
6-2700
13-3287
140-5843
0-35
0.01-70.9
0.03-5.2
7.9
1510
251
0.2
670
571
1485
1.08
3.6
0.29
7.0-8.8
213-4680
3-1671
0.004-0.86
65-3100
5.8-2133
122-6040
0.1-3.9
0.68-8.7
0.01-1.77
10-20 years after closure >20 years after closure
pH value [-]
COD [mg O2/l]
BOD5 [mg O2/l]
BOD5/COD [-]
TOC [mg Corg /l]
NH4-N [mg N/l]
Chloride [mg Cl/l]
AOX [mg Cl/l]
Fe [mg/l]
Crtot [mg/l]
7.7
1028
140
0.2
498
369
981
0.9
4.3
0.24
6.8-8.6
18-6189
3-890
0.006-0.58
18-3000
2.8-2800
62-4500
0.05-6.3
0-45.0
0.04-1.14
7.7
642
93
0.2
-
181
537
0.39
1.03
0.13
7.0-8.6
100-2530
24-240
0.03-0.70
-
33-856
116-2980
0.08-0.79
0.33-2.31
0.02-0.80
Table 3-4: Statistical analysis of selected MSW landfill leachate parameters for consecutive time
periods after landfill closure
Figure 3-3 illustrates the concentrations of ammonium-nitrogen (left) and chloride (right) in the
leachate of closed MSW landfills with increasing post-closure period. The average concentrations
of ammonium-nitrogen gradually decrease from around 1000 mg/l subsequent to landfill closure to
less than 100 mg/l 30 years post-closure. For chloride too, concentrations decrease from 1000-2500
mg/l directly after closure to 200-300 mg/l after 30 years of post-closure monitoring. Similar trends
can be observed for BOD5, COD, Fe or AOX concentrations in the leachate, but are not shown here
(however, this is indicated by the aggregate analysis in Table 3-4). It should be noted, that the con
centration data at landfills closed for more than 20 years refer to a few landfills only and might not
be representative for each landfill included in the initial data set. Hence, although the analysis
reflects some typical emission characteristics and trends at MSW landfills, it is not directly trans
ferable to the behavior of individual landfills. For such an analysis, site-specific aspects like the
water infiltration rate (i.e. climate, level of interaction), the waste deposition thickness and
technology, and the heterogeneity of water flow need to be considered. Thus, the liquid-to-solid
Emission behavior of landfills 33

100
10000 10000
1000 1000
4 C
l [mg/l]
100
10 10
0 5 10 15 20 25 30 35 0 5 10 15 20 25 30 35
Years after closure Years after closure
NH
-N [m
g/l]
ratio4 may be better suited than landfill age as an independent variable to analyze emission
behavior of MSW landfills (see Allgaier and Stegmann 2003; Heyer 2005). The concentrations of
NH4-N and Cl in the leachate after landfill closure are plotted against the liquid-to-solid ratio of the
deposited waste in Figure 3-3. Decreasing concentrations can be observed with increasing liquid
to-solid-ratio (L/S) for both parameters. The concentrations vary across two orders of magnitude at
individual landfills with similar L/S of the deposited waste. The large bandwidth indicates that
factors such as the quality of waste, water management during landfill operation, and the
heterogeneity of water flow may have a strong influence on actual leachate quality. Therefore, to
evaluate the emission behavior of a landfill and to make meaningful predictions on leachate emis
sions, specific conditions at the site are to be considered. This is valid also for the transfer of results
from laboratory experiments to field-scale conditions based on the L/S of the deposited waste (cf.
Kylefors 2003; Fellner et al. 2009a).
Figure 3-2: Box plots5 of ammonium-nitrogen concentrations and chloride concentrations in the
leachate as a function of time after landfill closure
Landfill gas data is available for 40% of the MSW landfills (see appendix 1), whereby MSW4
MSW11 have one common system for landfill gas extraction (only aggregate data available). In
Figure 3-4 the cumulative amount of landfill gas collected per dry waste mass is shown for six gas
extraction systems. The systems have been installed at different times after landfill operation had
been started at the site and the amount of gas collected indicates strongly varying collection effi
ciencies. Whereas more than 100 m³ of landfill gas per ton of dry waste could be collected at the
sites MSW1, MSW2, and MSW3, less than 30 m³ of landfill gas per ton of dry waste have been
t4 The liquid-to-solid ratio (L/S) after t years is calculated as: L
(t) = I
, where It is the amount of water S mDM
that passed through the landfill after t years [l] and mDM is the total dry mass of waste deposited at the site
[kg] (for a closed site). 5 Box plots: The box is limited by the 25th and 75th percentile of the measurements and the median is shown
as a horizontal line within the box. The ends of the whiskers indicate the 10th and 90th percentile. The black
dots represent the 5th and 95th percentile. At least 3 values are required to calculate the box, 9 values to
display the whiskers, and 18 values to calculate 5th and 95th percentiles.
Emission behavior of landfills 34

10000 10000
1000 1000
NH
4-N
[m
g/l]
Cl [m
g/l]
100 100
10 10
<0.2 0.2-0.4 0.4-0.6 0.6-0.8 0.8-1.0 >1.0 <0.2 0.2-0.4 0.4-0.6 0.6-0.8 0.8-1.0 >1.0
L/S [litres per kg dry mass] L/S [litres per kg dry mass]
140
To
tal la
nd
fill
ga
s c
oll
ec
tio
n p
er
Mg
of d
ry w
as
te
[m³/
Mg
DM
]
120
100
80
40
60 MSW4-MSW11
MSW2
MSW18
MSW1
MSW3
MSW16
20
0
0 5 10 15 20 25
Landfill age [Years]
30 35 40
collected at MSW4-MSW11, MSW16, and MSW18. As the composition of waste at these sites is
assumed to be similar, the differences are mainly attributed to the landfill gas management at the
sites. In any case, based on a typical landfill gas generation potential at MSW landfills of 280
m³/Mg DM (cf. Krümpelbeck 2000), even at sites with high specific landfill gas yields less than
50% of the theoretical landfill gas generation potential has been collected. Although there is still
gas collected at the sites, the cumulative amount of collected landfill gas is not expected to increase
significantly in the future as gas collection rates are on the decrease and will further decrease after
final cover installation (see marked periods of the cumulative curves in Figure 3-4).
Figure 3-3: Box plots of ammonium-nitrogen concentrations and chloride concentrations in the
leachate as a function of the deposited waste’s liquid-solid-ratio (L-S) at closed landfills
Figure 3-4: Total amount of collected landfill gas per Mg of dry waste at selected MSW landfills
(collection periods after landfill closure are marked)
3.1.2.2 Emission loads and remaining substance potentials
Apart from a decrease in pollutant concentrations in landfill leachate after landfill closure, the
amount of leachate typically decreases too after the installation of a top cover. Thus, the decrease is
Emission behavior of landfills 35

1
10
100
1000
0 10 20 30 40
Lo
ad
of
Cl
[g C
l/(M
g D
m.y
r)]
Landfill age [yrs]
1
10
100
1000
0 10 20 30 40
Lo
ad
of
NH
4 -N
[g
N/(
Mg
DM
.yr)
]
Landfill age [yrs]
MSW1
MSW3
even more pronounced for substance loads in the leachate than for substance concentrations. The
annual substance load in the leachate is calculated as the product of the amount of leachate [m³/yr]
and the average concentration of the substance in the leachate [g/m³]. The specific (per ton of dry
waste) annual loads of nitrogen (primarily as ammonium-nitrogen) and chloride are plotted against
landfill age for two well documented landfills in Figure 3-5. The indicated uncertainty ranges of the
loads are based on an evaluation of the quality of data on the amount and composition of leachate.
Whereby criteria, such as the completeness of time series data, the level of variation in leachate
quality data, the number of measurements per year (for calculation of average values), or the
method to measure leachate generation have been translated to quantitative uncertainty ranges for
the available data. These estimates form the basis for the uncertainty ranges associated with the
annual loads shown in Figure 3-5. The annual loads of N and Cl decrease from around 100
g/(Mg.year) during initial landfill operation to 10-50 g/(Mg.year) after the end of waste deposition.
As both sites have been equipped with a temporary cover (soil layer of >2 meters thickness) after
closure, the leachate generation rates during the post-closure period still amounted for around 30%
of annual precipitation at MSW1 and around 15% of annual precipitation at MSW3. The installa
tion of more or less permeable covers aimed at a continuous reduction of the emission potential
remaining in the landfill before the final (low-permeability) cover is installed. After the installation
of the final cover the substance loads in the leachate are expected to decrease even faster than pre
viously observed after landfill closure. That is confirmed by significantly lower substance loads of
N and Cl around 1 g/Mg DM at landfills with a final cover already in place for several years (e.g.
MSW4 and MSW5).
Figure 3-5: Specific annual loads of nitrogen (left) and chloride (right) for two well documented
MSW landfills ( MSW1 and MSW3) plotted against landfill age
Decreasing loads, especially after landfill closure, can be observed for many substances in the
leachate (e.g. NH4-N, Cl, Corg, Fe, Cr, etc.). However, the substance potential remaining in the
landfill body after closure might be substantial even for the sites MSW1 and MSW3, where a
temporary cover has been installed to continuously decrease the emission potential of the deposited
waste after closure. To determine the remaining amount of selected substances in the landfills
MSW1 and MSW3, the methodology of material flow analysis (Brunner and Rechberger 2004;
ÖNORM 2005) is used. Substance balances are established for Corg, N, Cl, Fe, Zn, and Cd from the
Emission behavior of landfills 36

beginning of waste deposition until 2007 (last year with a complete monitoring data set). The initial
composition of the deposited waste is determined based on data for typical MSW composition in
Austria and Switzerland during the last decades (see Baccini et al. 1987; Fehringer et al. 1997;
Rolland and Scheibengraf 2003). Leachate monitoring data are available for the whole period of
landfill existence at both sites. Landfill gas collection systems have been installed three years
(MSW1) and two years (MSW3) after initial waste deposition. Apart from the amount of landfill
gas produced during the first years, also the collection efficiency of the system is estimated. The
gas generation rates before active collection are derived from a landfill gas generation model. The
efficiency of gas collection is estimated based on measurements of fugitive emissions, on the one
hand, and on collection efficiencies at other sites for those periods without fugitive emission
monitoring, on the other hand. At MSW1 between 50 and 89% of the annually generated landfill
gas have been collected with an average gas collection efficiency of 60% throughout the period of
gas extraction. At MSW3 around 50 to 80% of the generated gases have been collected annually
with an average gas collection efficiency of 52% throughout the period of gas extraction. Although
uncertainties have been considered in the substance balance calculations (cf. Figure 3-5), they are
not shown in Figure 3-6 and Figure 3-7. Nevertheless, it should be emphasized that the substance
balances for MSW1 and MSW3 are based on uncertain and incomplete data (e.g. waste composi
tion, average concentrations, data gaps in time series information, measurement errors). The results
of the analysis provide an indication of remaining substance potentials in the waste body at these
sites, but should not be regarded as exact numbers.
Figure 3-6: Substance balances for MSW1 with an average waste age of 19 years and a L/S ratio of
1.38 l/kg DM
Seven years after closure of the landfill MSW1 around 63% of the originally deposited organic
carbon is still present in the waste (see Figure 3-6). Approximately 37% of the organic carbon has
been exported via landfill gas and only a small fraction (0.2%) of Corg left the landfill in the
leachate. For the other substances, leachate was investigated as the only emission pathway. In
Figure 3-6 it is shown that 21% of the total nitrogen and 14% of the total chloride have been
extracted during the balancing period. Thus, most of these substances are still contained in the
deposited waste. Almost the whole deposited amounts of Fe, Cd, and Zn (99.98 to >99.99%)
Emission behavior of landfills 37

remain in the landfill at an average waste age of 19 years. It can be stated, that in spite of the
relatively high liquid-to-solid ratio of the deposited waste (1.38 l/kg DM) most of the substances
(more than 60% of Corg to >99.99% of Cd) originally deposited remain in the waste of landfill
MSW1 at a landfill age of 28 years.
At the landfill MSW3 a fraction of 35% of the organic carbon has been exported via landfill gas
and 0.2% of organic carbon has left the landfill in the leachate (see Figure 3-7). Consequently,
around 65% of the originally deposited organic carbon is still present in the landfill 36 years after
the first waste deposition at the site. In Figure 3-7 it is shown that leaching removed approximately
14% of the deposited amount of nitrogen and 9% of the initial amount of chloride contained in the
waste. The leached substance fractions of N and Cl at MSW3 are lower than at MSW1, which is in
accordance with the lower liquid-to-solid ratio of the waste at MSW3 (0.45 l/kg DM) relative to
MSW1 (1.38 l/kg DM). However, with respect to iron, zinc, and cadmium, the substance balances
of MSW1 and MSW3 are similar, as at least 99.98% of the deposited substances remain in each of
the landfills.
Figure 3-7: Substance balances for MSW3 with an average waste age of 23 years and L/S ratio of
0.45 l/kg DM
The substance balances in Figure 3-6 and Figure 3-7 illustrate that large fractions of the originally
deposited materials are still present in the landfills after several decades (average waste age is 19
years at MSW1 and 23 years at MSW3), even though temporary covers were installed to allow for
a further reduction of emission potentials after the end of waste deposition at these sites. After the
installation of a final, impermeable cover, in 2008 at both sites, the substance loads are expected to
decrease and the remaining substance potentials will persist for long times within the landfills.
Thus, the material stock present in a closed landfill needs to be investigated with respect to its
significance for mid- and long-term emission characteristics. A major aspect of such an assessment
is the potential of mobilizable substances in the waste, whereby the mechanism of mobilization as
well as the environmental conditions relevant to a mobilization may be different for different time
frames (e.g. Bozkurt et al. 2000; Kjeldsen et al. 2002). To estimate future emission levels, the
mobilizable substance potentials need to be related to substance release rates. Different approaches
to estimate future emissions from MSW landfills are discussed in the next section.
Emission behavior of landfills 38

3.1.3 Evaluation of mid- to long-term emissions
Different approaches can be used to evaluate the mobilizable substance potentials of deposited
MSW and consequent emissions from MSW landfills. The mobilizable substance potential is a
function of the approach and timeframe of investigation and the considered release mechanisms.
Therefore, mobilizable potentials may range from the total concentration of a substance in the
waste (e.g. long-term erosion is considered as a mechanism) to the substance fraction readily
mobile at the time of investigation (e.g. the directly leachable fraction of chloride). Approaches to
determine mobilizable substance fractions of deposited waste have been categorized by Döberl
(2004) into
- observations at existing MSW landfills (full-scale or pilot-scale),
- laboratory experiments (landfill simulation reactors, elution tests, etc.),
- mathematical models based on physical-chemical descriptions of landfill processes (differ
ent levels of complexity),
- observations of processes at analogous natural or anthropogenic systems (e.g. peat).
Monitoring data at MSW landfills (with deposited materials comparable to modern MSW) are
available for several decades. Direct observations of landfill behavior are therefore restricted to
such a timeframe (cf. Zweifel et al. 1999). Nevertheless, estimates on mid- to long-term emission
behavior have been based on extrapolations of emission trends observed at full-scale MSW land
fills (e.g. Krümpelbeck 2000; Gibbons et al. 2007). In many cases laboratory experiments have
been used as a basis to evaluate the emission behavior of MSW landfills. The transformation of
laboratory results to real-scale landfills based on the L/S ratio of the deposited waste is a possible
approach to make predictions about future landfill behavior (e.g. Stegmann 1981), whereby such
issues as the scale-dependency of water flow heterogeneity or the potential of accelerating biode
gradation processes in the laboratory reactor need to be considered in such an evaluation (cf.
Kylefors et al. 2003; Fellner et al. 2009a). Results from laboratory experiments are also used to
establish mathematical models on the emission behavior of MSW landfills. Models range from an
exponential decrease of substance concentrations in the leachate based on leachable substance
fractions determined in an elution test (e.g. Belevi and Baccini 1989) to more complex models
considering various processes in the landfill in a spatially distributed way (e.g. White et al. 2004).
In general, emission models have hardly been calibrated with field data yet and the validation of
model results is missing (also due to the prediction periods), see for example the discussion on gas
generation models shown in Table 3-1. A possibility to handle the problem of limited observation
periods or calibration and validation periods, is the analysis of old systems with a long-term
behavior similar to MSW landfills. Peat bogs have been suggested to analyze the degradation of
organic matter, because of their composition and oxygen availability (under water saturated
conditions) similar to MSW landfills (cf. Lichtensteiger et al. 1989; Bozkurt et al. 2001; Döberl
2004). However, a transfer of process characteristics from peat systems to MSW landfills is
confronted with serious limitations due to factors such as the more complex chemical composition
of MSW (chemicals, heavy metals, etc.), the heterogeneity of waste materials and water flow in the
landfill, or the influence of different initial and boundary conditions at the landfill (e.g. waste
deposition method and rate or technical barriers to separate the landfill from the environment).
Emission behavior of landfills 39

Leachate parameter Mobilizable potential [mg/kg DM] Leachate parameter Mobilizable potential [mg/kg DM]
COD 2500 – 11200 Cl 900 – 3800
NH4-N 1400 - 3400 Cd 0.0016 – 0.0062
AOX 2 – 22 Zn 0.2 – 16
c •V − ( 0 )• t
m • M0(3-1) c (t ) = c • e0
Substance Corg N P Cl Fe Cu Zn Pb Cd
m0 [mg/kg DM] 2100-7100 200-310 5-33 1000-1500 20-39 1.0-6.7 14-98 0.1-2.5 0.06-0.22
Accordingly, natural analogues have been used for qualitative statements on the degradation of
organic matter in anaerobic environments, but not to derive quantitative estimates on emission
levels from MSW landfills (cf. Lichtensteiger et al. 1989; Bozkurt et al. 2001).
The mobilizable potentials shown in Table 3-5 are based on the extrapolation of observed emission
trends at closed German MSW landfills. Krümpelbeck (2000) observed an exponential decrease of
leachate concentrations at old MSW landfills and calculated emission loads in the leachate for
10000 years based on this trend. The resulting emission potentials for leachate of MSW landfills
are shown in Table 3-5. Although an exponential decrease of leachate concentrations has been
observed for many leachate parameters after landfill closure (e.g. Zweifel et al. 1999; Gibbons et
al. 2007), it is questionable if the leachate emission potentials can be estimated based on an extra
polation of these trends over several thousands of years, as conditions at the site might change
throughout such a long period.
Table 3-5: Mobilizable substance potentials via leachate based on an extrapolation of observed
leachate emission trends at German MSW landfills (from Krümpelbeck 2000)
To evaluate the long-term emission behavior of MSW landfills, Belevi and Baccini (1989) devel
oped a model on leachate characteristics following first-order kinetics (equation 3-1) with the input
parameter m0, mobilizable substance potentials, derived from leaching tests (see Table 3-6). The
model is built on the assumptions that release mechanisms are constant throughout the modeling
period, water flow is homogenous in the landfill, and biodegradation processes after the intensive
reactor phase are insignificant. In the model formulation shown in equation 3-1 c(t) is the average
concentration of a substance in the leachate t years after the intensive reactor phase (i.e. gas gener
ation has dropped significantly and leachate concentrations exhibit a downward trend) in mg/l, c0 is
the substance concentration in the leachate directly after the intensive reactor phase in mg/l, m0 is
the mobilizable waste fraction in mg/kg of dry matter, V is the annual volume of leachate in
liters/yr, M is the waste mass in kg of dry matter, and t is the time after the intensive reactor phase
in years.
Table 3-6: Mobilizable substance potentials of landfilled MSW via leachate determined for waste
samples from landfills 11 and 14 years after waste deposition via leaching tests (see
Belevi and Baccini 1989)
The leachable amounts of substances shown in Table 3-6 were determined based on consecutive
leaching experiments with ground waste samples excavated from MSW landfills 11 years and 14
years after waste deposition, respectively. As these experiments cannot account for biodegradation
Emission behavior of landfills 40

Old MSW Old MSW Emission potentials MSW (without
landfills landfills MBT residue Parameter pretreatment)
(West) (East)
Gas generation potential [liters/kg DM] 10 - 40 n. n. 110 - 240 15 - 115
TOC (leachate) [mg/kg DM] 1800 - 8400 60 - 325 8000 - 15000 600 - 1300
Ntot (leachate) [mg/kg DM] 1200 - 4100 50 - 950 4000 - 6000 500 - 800
processes potentially mobilizing substances contained in the waste (cf. Kylefors et al. 2003), it is
not surprising that the determined mobilizable nitrogen potential is low compared to estimates by
other authors (cf. Table 3-5, Table 3-7, Table 3-8, and Table 3-9). Contrarily, organic carbon
mobilization via leachate is probably overestimated due to the neglect of the landfill gas emission
pathway. In addition to the assumption on negligible biochemical reaction rates after the intensive
reactor phase, the model assumption of homogeneous water flow in the waste hampers a realistic
evaluation of future emission levels (cf. Rosqvist et al. 2005; Fellner et al. 2009a).
In a study on residual emission potentials of old MSW landfills in Germany the mobilizable sub
stance potentials of deposited MSW for the leachate and landfill gas pathway were determined
(Ehrig and Brinkmann 1999). The corresponding data in Table 3-7 on old MSW landfills refers to
sites with landfill ages between 5 and 35 years. The emission potentials in MSW landfills in west
ern Germany were found to be significantly higher than those in Eastern Germany, due to the dif
ferent composition of the deposited waste. In the East, less organic material and a large amount of
ash from households (domestic fuel) were deposited at the sites, because of the socioeconomic dif
ferences between East and West before the German reunification. In addition to landfill simulation
reactor experiments with samples from old MSW landfills, they investigated also the emission
potentials of fresh MSW and residues from mechanical biological treatment (MBT) via landfill
simulation reactor experiments. The results in Table 3-7 illustrate that MBT may significantly
reduce the potential of mobilizable substances in the deposited waste, as landfill gas generation
potentials of MSW decreased up to 90% and the mobilizable amounts of organic carbon and nitro
gen in the leachate were up to 95% lower than without treatment.
Table 3-7: Mobilizable substance potentials via leachate and landfill gas for old MSW landfills,
fresh MSW, pretreated MSW (MBT) (source: Ehrig and Brinkmann 1999)
Kruse (1994) also used landfill simulation reactors to investigate mobilizable substance potentials
and long-term release of substances from MSW. Based on his observations, Kruse (1994)
distinguished three phases of landfill gas production: a lag phase without gas production, a growth
phase with increasing gas production, and a decay phase with decreasing gas production rates. The
total amount of methane produced in the reactors filled with fresh MSW was 103 liters CH4/kg DM
after 300 days, i.e. further gas generation could be expected after the end of the experiments. The
concentrations of COD, Cl, TKN, and AOX in the leachate of the simulation reactors were
described by exponential decrease functions. Based on the observed concentrations and exponential
trend extrapolations, Kruse (1994) estimated total mobilizable potentials for these leachate
parameters (see Table 3-8).
Emission behavior of landfills 41

Parameter Methane potential COD Cl TKN AOX
Mobilizable potential 103 liters CH4/kg DM 3 g/kg DM 2.1-2.5 g/kg DM 2.2 g/kg DM 0.6-1.2 mg Cl/kg DM
Leachate parameter Mobilizable potential [mg/kg DM] Leachate parameter Mobilizable potential [mg/kg DM]
COD 1540-1890 Cl 1560-1820
BOD5 90-150 SO4 3.1-9.4
TOC 520-620 Na 1130-1770
NH4-N 790-940 Fe 5.1-8.8
Table 3-8: Mobilizable potentials of selected parameters for MSW via landfill gas and leachate
(source: Kruse 1994)
An investigation of mobilizable substance potentials of 18 years old MSW excavated from a land
fill was carried out by Döberl et al. (2005). Waste samples were taken from an Austrian MSW
landfill and placed in landfill simulation reactors to determine the remaining mobilizable substance
potential via leachate (see Table 3-9). The experiments were terminated after 2.25 bed volumes of
water had been exchanged and the total potentials of mobilizable substances in Table 3-9 were esti
mated based on trend extrapolations.
Table 3-9: Residual amounts of substances mobilizable via the leachate pathway from 18 years old
waste excavated from an Austrian MSW landfill (source: Döberl et al. 2005)
From the review and discussion of mobilizable substance potentials and release rates above, it is
apparent that large amounts of substances are potentially mobilizable even at old (several decades)
MSW landfills. The emission potentials shown in Table 3-5, Table 3-6, Table 3-7, Table 3-8, and
Table 3-9 for fresh and aged MSW samples from landfills diverge substantially for specific
substances, due to different waste qualities, experimental settings or investigated systems, and
model assumptions. Thus, mobilizable substance potential should be determined on a case-by-case
basis for individual landfills, taking into account such factors as waste composition and
heterogeneity, water flow heterogeneity, climatic conditions, landfill operation and design. If site
specific data on the remaining mobilizable substance potentials are missing, corresponding data
from the literature may be used for screening evaluations.
In Figure 3-8 bandwidths of mobilizable substance potentials of N and Cl via leachate are com
pared to the emitted substance loads at the landfills MSW1 and MSW3 after 28 and 36 years of
landfill age, respectively (see section 3.1.2). The most probable ranges of mobilizable substance
potentials for nitrogen and chloride are assumed to be 2.0-3.4 g N/kg DM and 1.7-3.0 g Cl/kg DM
(grey areas in Figure 3-8). In addition, maximum and minimum values for mobilizable potentials
are marked by dotted lines. Figure 3-8 illustrates that only the cumulative chloride load of MSW1
lies in the range of probable values for the potential of mobilizable chloride. The cumulative loads
of nitrogen at both landfills and of chloride at MSW3 did not reach probable ranges after an
average waste age of two decades, even though both sites were equipped with a temporary cover to
allow further infiltration of water after the end of waste deposition. Despite the efforts to reduce the
remaining emission potential in the waste body at MSW1 and MSW3 after closure, a significant
amount of mobilizable substances may be present in these landfills. After the installation of a final
cover the increase of cumulative loads over time will slow down even further (cf. Figure 3-8) and
mobilizable substances will be potentially present in the landfill for long periods of time.
42 Emission behavior of landfills

Figure 3-8: Total cumulative loads of N (left) and Cl (right) in the leachate of MSW1 and MSW3
compared to estimates of corresponding mobilizable substance potentials (grey area:
most probable range of mobilizable substance fractions; dotted lines a t the bottom and at
the top: maximum and minimum mobilizable substance potentials)
In conclusion, although emissions of MSW landfills typically decrease after landfill closure, a
significant amount of mobilizable substances remains in the landfill for an extended period of time
(i.e. decades to centuries). Models to evaluate long-term emission characteristics at closed MSW
landfills need to consider the level of interaction between the deposited waste and the environment,
the mobilizable substance fraction in the waste, the water flow regime in the landfill, and a poten
tial change of the landfill conditions (e.g. changing pH, aeration, changing water flow paths, etc.).
On the short term (decades) emission trends and models based on observed emission characteristics
can be used to predict emissions. On the long term (centuries to millennia) fundamental relation
ships could be used to establish emission models, however, associated with large uncertainties due
to the long modeling periods. A procedure to establish emission models for closed MSW landfills
and derive emission estimates on a site-specific basis is presented as a part of the evaluation
methodology to derive aftercare completion criteria in chapter 5.2.
3.2 Emissions from landfills containing MSWI bottom ash
3.2.1 General description of emission behavior
From the incineration of one ton of MSW around 255 kg of bottom ash are produced. Municipal
solid waste incineration (MSWI) bottom ash typically consists of mainly ash (~ 45%) and melted
materials (~ 40%), glass (5%), metals (5%), organic components (2%), and fines (3%, mainly
stones and earth) (Baccini and Brunner 1985). Matrix components in the bottom ash are Si, Ca, Al,
and Fe, which account for 80% of dry mass and are present in oxidized form. Apart from these,
bottom ash exhibits significant concentrations (grams per kg of dry matter) of Mg, CO3, Na, K, S,
Cl, organic compounds, Cu, Pb, Zn, Mn, and Cr. Other heavy metals such as Cd, Mo, Sb, V, and W
are typically present at concentration levels of several mg per kg of dry bottom ash (cf. Johnson et
al. 1999). Organic residues, such as paper, are found in MSWI bottom ash due to incomplete
incineration processes, particularly at older waste incineration plants (e.g. Ferrari 1997). Depending
Emission behavior of landfills 43

on the quality of the incineration process the content of organic materials may still be substantial
(several mass %).
Numerous physical and chemical processes take place in MSWI bottom ash landfills, as the incine
ration residue is not in thermodynamic equilibrium at the conditions present in the landfill (temper
atures during the incineration process are around 800 – 1000 °C) (cf. Johnson et al. 1995). Due to
the contact with water, metal oxides are transformed to hydroxides in hydration reactions. Calcium
rich leachate forms minerals together with hyaline phases. The main products of this recrystalliza
tion process are clay minerals (rich in Si and Al), calcium aluminum silicate hydrate, and a crystal
line phase rich in calcium and silicate (Johnson et al. 1995). Simultaneously with these reactions,
carbonates are precipitated, as the leachate rich in calcium hydroxides gets in contact with carbon
dioxide (air constituent or from organic degradation processes). In addition, elemental substances
are involved in several reactions in the waste body (see Förstner and Grathwohl 2007). The reac
tion of aluminum and water produces aluminum hydroxide and hydrogen (Al + 3H2O � Al(OH)3 +
1.5 H2). Biochemical degradation of organic matter may be relevant in the landfill if organic matter
is present and the pH value decreases to a level allowing for microbial activity (initially, after waste
deposition, the pH is in the range of 11 to 12).
Due to the large extent of exothermic processes occurring in the deposited waste (hydration of slag
phases, corrosion of metals, and formation of calcium silicate hydrate), the temperature in the land
fill body increases. In the first years after deposition, the temperatures in the waste body may
increase up to 90°C and have been observed to remain in such ranges potentially for up two
decades (cf. AGW 1992; Turk 1996). For instance, at a 20 years old MSWI bottom ash landfill
temperatures of 60°C were measured at the landfill base (Turk 1996). However, the effect of
exothermic reactions taking place in the landfill could be drastically reduced by effective
separation of the metals contained in the bottom ash and intermediate storage of the bottom ash
before deposition (Speiser 2001).
3.2.1.1 Gaseous emissions
The main components of gas from MSWI bottom ash landfills are water vapor and hydrogen gas.
Water is transferred to the gaseous phase due to the high temperatures in the waste body and
hydrogen is a product of elemental aluminum oxidation. As 1.25 liters of hydrogen gas can be pro
duced from 1 g of elemental aluminum, approximately 25 liters of hydrogen may be generated
from 1 kg of MSWI bottom ash with 20 grams of elemental aluminum per kg of dry matter (see
Hutterer et al. 2000).
Carbon dioxide produced by anaerobic degradation of organic matter, may dissolve in the leachate
(carbonate precipitation), but may also be released in the landfill gas, depending on reaction rates
and contact with water. Methane may also be present in the landfill gas under specific
environmental conditions and if degradable organics are present in the waste body. For instance,
Speiser (2001) observed increasing methane concentrations with increasing depth at a MSWI
bottom ash landfill. At the top of the landfill methane concentrations were found to be below 100
mg CH4/m³ of gas, whereas at the landfill bottom concentrations of 1600 mg CH4/m³ were
measured. However, as many factors affect the occurrence of anaerobic degradation processes in
44 Emission behavior of landfills

bottom ash landfills, the presence of methane may vary on a case-by-case basis, but CH4
concentrations will typically be low at any site.
3.2.1.2 Leachate emissions
In the first years after waste deposition, the quality of leachate from MSWI bottom ash landfills is
dominated by high concentrations of soluble salts (e.g. chloride concentrations of 10000 mg/l, see
Hjelmar (1996), alkaline metals, and alkaline earth metals. Heavy metal concentrations in the
leachate are very low during this period and typically comply with drinking water quality stan
dards. However, the acid neutralizing capacity of the deposited material is expected to decrease
over time and increased mobilization of heavy metals may occur after long time periods (see Figure
3-9). Predictions of heavy metal mobilization rates can be based on geochemical modeling, which
may account for processes of dissolution and precipitation, sorption and complexation, cation
exchange, and incorporation of substances into the solid phase (cf. Hellweg 2000; Dijkstra et al.
2006). The expected evolution of leachate quality based on geochemical considerations is sche
matically illustrated in Figure 3-9. After the leaching of soluble substances an extended phase of
carbonate buffering keeps the pH value of the leachate above 7. During this period heavy metal
concentrations in the leachate are very low. Due to the consumption of carbonate buffer (e.g.
import of weak acids in rainwater, internal generation of acids from organic degradation, or the
export of bases), the pH may drop below 7 (this was speculated to occur over thousands of years
based on geochemical modelling). Initially increased mobilization of heavy metals takes place
primarily for zinc and nickel, but after a further drop of the pH below 5 also the concentrations of
copper and lead increase. Chromium mobilization is not expected at high rates even if the pH
reaches a level of 4 (see Förstner and Grathwohl 2007). However, large uncertainties exist with
respect to such estimates due to the very long timeframes involved .
Figure 3-9: Schematic illustration of leachate quality from MSWI bottom ash landfills over time
(source: Förstner a nd Grathwohl 2007)
As only a fraction of the deposited MSWI bottom ash gets in contact with mobile water, it is
important to consider preferential water flow within geochemical models (Hellweg 2000). For
Emission behavior of landfills 45

instance, Johnson et al. (1999) observed that 10-80% of the infiltrating water percolated through
the deposited MSWI bottom ash in preferential flow. Assuming that around 70% of the infiltrating
water is available for equilibrium reactions with the waste mass, Hellweg (2000) estimated that the
release of heavy metals will occur over tens of thousands of years with copper concentrations in the
leachate of 1.8 mg/l 100000 years after waste deposition.
3.2.2 Emission characteristics of MSWI bottom ash landfills
Although bottom ash from municipal solid waste incineration constitutes approximately half of the
material deposited at Austrian landfills for non-hazardous largely inorganic waste (“Reststoffdepo
nien” (cf. Lebensministerium 2006)), there are no mono-landfills for MSWI bottom ash in Austria.
Therefore, the analysis of typical landfill emission characteristics is based on data from Swiss
mono-landfills for MSWI bottom ash. Together with authorities and landfill owners a screening of
suitable sites to be included in the data set on emissions from MSWI bottom ash landfills was car
ried out. As data from closed mono landfills containing MSWI bottom ash had not been available
(i.e. there are no engineered sites after closure in Switzerland), data from older landfills were pri
marily included in the analysis (see appendix 1). The four investigated MSWI bottom ash landfills
have a lining system at the landfill base to collect the leachate percolating through the waste body
and monitoring data (deposition history, leachate quality and amount, precipitation data, etc.) are
available for the whole period of landfill existence. The average annual precipitation rate at the
sites is 1070 mm/yr and the average age of the landfills is 15.5 years (in 2008). None of the
investigated landfills is closed, but waste deposition has been taking place at very low rates at the
sites BA3 (no deposition from 2001 to 2007) and BA4 (no deposition from 2003).
The mean, minimum and maximum concentrations of selected leachate parameters are shown in
Table 3-10 together with the corresponding Austrian standards for leachate discharge into surface
water bodies. Table 3-10 includes parameters with at least one concentration measurement at one
of the landfills above the discharge quality standard. In addition, data are shown for electric con
ductivity, chloride, and sulfate, as these parameters are present at high levels in the leachate. The
average concentrations in the leachate of the MSWI bottom ash landfills are 6870 mg/l for chloride
and 2750 mg/l for sulfate. Apart from soluble salts, the mean concentrations of organic compounds
(COD, DOC) and ammonium-nitrogen are factors 4-8 above the corresponding discharge stan
dards. Heavy metal concentrations in the leachates are typically very low, but the maximum values
of Crtot and Cu exceed the limit values.
Although a large number of parameters is measured at the landfills (in average 34 parameters, see
appendix 1), substances not in the focus of environmental regulations might be present in the
leachate without detection. For instance, concentrations of rubidium and strontium have been
detected at levels of several mg/l during screening analysis of MSWI bottom ash leachates (Stünzi
2009), but are typically not included as monitoring parameters. Thus, the data in Table 3-10 give an
overview about general emission characteristics typically monitored at MSWI bottom ash landfills
throughout the first decades of landfill existence. However, critical leachate parameters may be
different from one site to another and vary over time.
Emission behavior of landfills 46

Parameter Number of
landfills
Number of
measurements Mean* Min. – Max.
Discharge limit
(surface water)**
pH [-]
EC [µS/cm]
COD [mg O2/l]
DOC [mg Corg/l]
NH4-N [mg N/l]
Cl [mg/l]
Sulfate [mg SO4/l]
Sulfide [mg S/l]
AOX [mg Cl/l]
As [mg As/l]
Crtot [mg Cr/l]
Cu [mg Cu/l]
4
4
1
4
4
4
4
1
2
4
4
4
274
275
45
134
139
132
138
17
64
76
91
104
8.9
2667.9
397.4
96.9
44.85
6872
2750
0.36
0.49
0.03
0.13
0.19
7.3 – 12.1
231 – 8410
67 – 1830
6.4 – 746
0.02 – 180
2260 – 27700
ND – 7920
ND – 4.1
0.01 – 4.7
ND – 0.15
0.002 – 0.67
0.01 – 2.0
6.5 - 8.5
50
20
10
Toxicity
site specific
0.1
0.5
0.1
0.5
0.5
* A non-detect (ND) is considered 0 for calculating the mean value.
** Limits according to the ordinance on waste water discharge from landfills (Leachate ordinance (MoE
2003) and waste water discharge ordinance (MoE 1996a)).
At the four MSWI bottom ash landfills on average 45-50% of the annual precipitation has been
collected as leachate during the period of landfill operation (the annual fractions range from 40
70%).
Table 3-10: Statistical analysis of leachate characteristics of 4 landfills containing waste incinera
tion bottom ash
3.2.2.1 Evolution of emission characteristics at MSWI bottom ash landfills
The leachate data of the MSWI bottom ash landfills is longitudinally analyzed with respect to the
average waste age. The liquid-to-solid ratio is not used as an independent variable to analyze
leachate quality, because of the ongoing waste deposition at the landfills which blurs the relation
ship between overall L/S (for the whole landfill) and the actual leachate quality (potentially strong
influence of substance releases from freshly deposited waste).
The box plots of DOC concentrations in the leachate of the MSWI bottom ash landfills in Figure
3-10 (left) illustrate a decreasing trend of organic leachate pollution with increasing duration of
waste deposition. The reasons may be the continuous stabilization of organic matter contained in
the waste and the decreasing content of organic matter in the deposited material due to the conti
nuous optimization of the incineration processes. The concentrations of ammonium-nitrogen on the
other hand, do not exhibit a significant trend with increasing waste age, but remain constant in the
range between 10 and 100 mg/l (cf. Figure 3-10, right). However, depending on the oxygen
availability in the landfill body and in the leachate collection system, a substantial fraction of nitro
gen may be present as nitrate in the leachate.
The concentrations of chloride decrease with increasing waste age from initially around 6000
10000 mg/l to 4000-6000 mg/l after more than 10 years of mean deposition time of the bottom ash
(Figure 3-11, left). Thus, although decreasing, the concentrations of Cl in the landfill leachate
Emission behavior of landfills 47

100
1000
1000
100
DO
C [
mg C
org
/l]
NH
4-N
[m
g N
/l]
10
1
0,1
10
0-2 2-4 4-6 6-8 8-10 10-12 12-15
0,01
0-2 2-4 4-6 6-8 8-10 10-12 12-15
Average waste age [yrs] Average waste age [yrs]
1000
100000 10000
Cl [m
g C
l/l]
10000
SO
4 [
mg S
O4l/l]
1000
100
0-2 2-4 4-6 6-8 8-10 10-12 12-15 0-2 2-4 4-6 6-8 8-10 10-12 12-15
Average waste age [yrs] Average waste age [yrs]
remain high for more than a decade. In case of sulfate, concentrations are increasing with increas
ing waste age from an average of 1900 mg/l for waste ages of a few years (0-2) to an average of
4300 mg/l for waste ages of 12-15 years (Figure 3-11, left). The reasons for increasing sulfate con
centrations in the leachate are not clear yet, as more significant analysis of the post-closure emis
sion behavior of MSWI bottom ash landfills will be possible after closure and only with respect to
individual landfill conditions.
Figure 3-10: Box plots of the concentrations of dissolved organic carbon (left) and ammonium-nitro
gen (right) in the landfill leachate plotted against average waste age
Figure 3-11: Box plots of the concentrations of chloride (left) and sulfate (right) in the landfill
leachate plotted against average waste age
The concentrations of Cr and Cu in the leachate decrease with increasing average waste age from
0.1-0.5 mg/l at the beginning to around 0.01 mg/l at an average waste age of 12-15 years (Figure
3-12). Though the concentrations of heavy metals in leachate from aged MSWI bottom ash appear
to be below drinking water quality standards, this may not hold for long time frames (millennia),
because of changing landfill conditions (i.e. decrease of pH due to the consumption of acid buffers,
cf. Figure 3-9).
In general, the longitudinal analysis of leachate characteristics will allow for more significant
extrapolations when data from closed MSWI bottom ash landfills become available. Extrapolations
may be useful for prediction periods of decades to centuries, whereas geochemical models are
Emission behavior of landfills 48

1 1
0,1 0,1
Cr to
t [m
g C
r/l]
Cu [
mg C
u/l]
0,01 0,01
0,001 0,001
0-2 2-4 4-6 6-8 8-10 10-12 12-15 0-2 2-4 4-6 6-8 8-10 10-12 12-15
Average waste age [yrs] Average waste age [yrs]
appropriate for long-term estimates on emission characteristics, especially with respect to heavy
metal mobilization.
Figure 3-12: Box plots of the concentrations of chromium (left) and copper (right) in the landfill
leachate plotted against average waste age
3.2.2.2 Emission loads and remaining substance potentials
The monitoring data on leachate quality and quantity is used to estimate loads of substances which
were exported from the landfill body from the beginning of waste deposition till 2008. The
uncertainties of the estimated annual loads are quantified based on criteria addressing the com
pleteness of the time series data, the number of measurements per year, the method to determine
leachate generation rate (e.g. climatic water balances vs. continuous discharge measurements), and
others. In Figure 3-13 the annual loads of ammonium-nitrogen and chloride are plotted against the
average waste age for the two MSWI bottom ash landfills BA1 and BA2, because a complete data
set was available for these sites only, but not for the others. The uncertainties illustrated for the
annual loads of NH4-N and Cl at BA1 and BA2 in Figure 3-13 are mainly because of the limited
amount of concentration measurements per year (1-2 values/yr) and the lack of measured leachate
generation rates specifically for the bottom ash compartments (i.e. leachate generation data were
only available in aggregate for several compartments). During the first years of waste deposition
(average waste age below 2 years) the annual loads of ammonium-nitrogen decrease from around
10 g N/Mg DM and year to around 1 g N/Mg DM and year and remain on this level afterwards,
with a slow decrease to be observed at BA2. Similarly, annual chloride loads decrease rapidly
throughout the first years of landfilling to levels of a few hundred g Cl/Mg DM and year at BA1
and of around 100 g Cl/kg DM and year at BA2. The annual chloride loads in the leachate of BA2
are then constant for the remaining observation period.
The specific annual substance loads of ammonium-nitrogen and chloride in the leachate of BA1
and BA2 shown in Figure 3-13 decrease with increasing average waste age. Similar trends can be
observed also for the other sites (BA3 and BA4) and for other substances (e.g. Corg, Cr, and Cu, for
which data are not shown). However, as MSWI bottom ash deposition is taking place at all the
investigated sites, the presented analysis provides an indication of the evolution of emission levels
after closure, but should be backed up with monitoring data from closed MSWI bottom ash
landfills in the future. Apart from that, emissions from individual landfills might vary significantly
Emission behavior of landfills 49

1
10
100 10000
0,1
BA1 BA2
Lo
ad
of
Cl
[g C
l/M
g D
M.y
r]
Lo
ad
of N
H4-N
[g
N/M
g D
M.y
r]
10
1000
100
0 2 4 6 8 10
Average waste age [yrs]
12 14 16 0 2 4 6 8 10
Average waste age [yrs]
12 14 16
due to different qualities of the deposited bottom ash (e.g. organic residues, metal separation
technology), deposition techniques (e.g. intermediate storage before landfilling), or the intensity
and extent of waste getting into contact with water (e.g. fraction of preferential flow).
Figure 3-13: Annual loads of ammonium-nitrogen (left) and chloride (right) in the leachate of BA1
and BA2 plotted against the average waste age (=mean residence of the waste in the
landfill) of the MSWI bottom ash
Based on the annual substance loads in the leachate of BA1 and BA2 (cf. Figure 3-13) and the
reported data on MSWI bottom ash composition, substance balances are established for organic
carbon, nitrogen, chlorine, chromium, and copper using material flow analysis (Brunner and
Rechberger 2004). Substance flows are investigated from initial waste deposition at the sites until
2008. The initial contents of substances in the deposited MSWI bottom ash are 10 g/kg DM of Corg,
0.4 g/kg DM of N, 2.8 g/kg DM of Cl, 1 g/kg DM of Cr, and 2g/kg DM of Cu (cf. Belevi et al.
1992; Faulstich 1993; Huber et al. 1997). Although fresh waste is deposited at the sites, the results
represent an interim balance to evaluate the emission trends shown above (see Figure 3-10 to
Figure 3-13) with respect to the actual amount of substances remaining in the landfill after some
time of waste deposition.
The fraction of substances exported from the waste body via leachate after 10 years of waste depo
sition or at an average waste age of 3.8 years, respectively, at BA1 are shown in Figure 3-14 for
Corg, N, Cl, Cr, and Cu. Whereas a substantial part of the Cl originally contained in the waste has
been leached (45%), only minor fractions of the other substances have been removed from the
landfill via leachate. More than 99.99% of the heavy metals, around 99.8% of the organic carbon,
and 97% of the deposited nitrogen are still present in the waste. However, as the initial substance
concentrations are estimated from literature data and only leachate has been included as an
emission pathway, the estimates are indicative and may deviate from the actual amounts of sub
stances present in the waste.
The transfer coefficients into the leachate of landfill BA2 in Figure 3-15 exhibit similar characteris
tics to BA1. Because of the higher liquid-to-solid ratio at BA2, the exported fractions of Cl, N, and
Corg are significantly larger than at BA1 (61% of Cl, 6% of N, and 0.4% of Corg, respectively). At an
average waste age of 14.5 years, more than 99.99% of the heavy metals remain in the landfill.
Literature data are used to determine the original waste composition and leachate is the sole
emission pathway considered for the substance balances of BA2.
Emission behavior of landfills 50

Figure 3-14: Substance balances for the MSWI bottom ash landfill BA1 with an average waste age of
3.8 years a nd L/S ratio of 0.24 l/kg DM
Figure 3-15: Substance balances for the MSWI bottom ash landfill BA2 with an average waste age of
14.5 years a nd L/S ratio of 0.37 l/kg DM
The analysis of leachate emissions and of remaining substance potentials illustrates that most of the
substances deposited at MSWI bottom ash landfills are still present in the landfill decades after the
deposition started. Although the observed concentrations in the leachate decrease with increasing
average waste age (with the exception of sulfate), it may take several decades for the leachate
quality to comply with quality standards for direct discharge into surface waters (e.g. NH4-N or
DOC). Very high concentrations of chloride in the leachate might be expected for an extended time
period, too. With respect to the short- and mid-term (decades to centuries) emission characteristics
of MSWI bottom ash landfills, data from closed sites will form a valuable basis to evaluate the
landfill emission behavior at the full scale. For estimates on the long-term evolution of emission
characteristics, geochemical modeling can be used. The buffering capacity of the deposited
materials, the amount of mobilizable substances in the waste (at different pH levels), and the
fraction of material in contact with water are major aspects to be addressed in such models (cf.
Förstner and Hirschmann 1997; Hellweg 2000).
Emission behavior of landfills 51

Mobilizable substance frac Extraction with pH = 4 for 24 hours pH = 3-4 Maximum
tion water (from (1)) (from (2)) (from (3)) (from (3))
Ca [% of total Ca] 5 - - 90
Cu [% of total Cu] 2 8 25 44.5
Cr [% of total Cr] - 0.1 7
Zn [% of total Zn] 0.4 37 70 84
Pb [% of total Pb] 0.7 3 50 23
Cd [% of total Cd] - 41 45 87.5
Hg [% of total Hg] - - 60
Cl [% of total Cl] 70 - 100
S [% of total S] 20 - 100
Corg [% of total Corg] 4 - 100
Sources: (1)Belevi et al. 1992; (2) Förstner and Grathwohl 2007; (3) Hutterer et al. 2000;
3.2.3 Evaluation of mid- to long-term emissions
As many heavy metals are present at high concentrations in MSWI bottom ash (e.g. 0.4-7.0 g
Cu/kg DM or 0.15-9.6 g Cr/kg DM, from Faulstich (1993), knowledge about the mobilizable
fraction of these substances as well as about the rate of release under different conditions (e.g.
evolution of pH) are essential to evaluate landfill emission behavior. The assumption of constant
conditions at a site allows for an extrapolation of trends observed in the monitoring data from
closed or aged MSWI bottom ash landfills. As a change of conditions (i.e. continuous consumption
and export of acid buffering capacity associated with a decrease of pH, cf. Figure 3-9) is expected
over time (many centuries to many thousands of years), laboratory experiments (e.g. elution tests,
column tests, lysimeter studies) can be used to evaluate long-term emission behavior, typically
combined with geochemical modeling.
Table 3-11: Mobilizable fraction of selected substances contained in MSWI bottom ash (shown as %
of total mass of the substance)
The fractions of mobilizable substances shown in Table 3-11 have been determined with different
experimental settings and, thus, deviate substantially from one source to another. Belevi et al.
(1992) determined the fraction of mobilizable substances based on consecutive leaching tests with
water at neutral pH, whereas the data presented by Förstner and Grathwohl (2007) and Hutterer et
al. (2000) relate to leaching experiments at significantly lower pHs. The variation of the
mobilizable fractions determined from different leaching experiments underlines that a low pH is
associated with intensified mobilization of heavy metals (e.g. Cu, Zn, Pb, and Cd). Geochemical
models can be used to estimate the evolution of the pH in the waste based on its initial composition
(mineral phases) and assumptions on the interaction of the waste with the surrounding environment
(e.g. water infiltration, acidity of the inputs).
Investigations of long-term emissions from bottom ash landfills have focused on the effect of the
continuous reduction of the acid buffering capacity on the release of heavy metals contained in the
waste (e.g. Johnson et al. 1995; Hellweg 2000; Dijkstra et al. 2006). A simplified approach for an
evaluation of long-term metal concentrations in the leachate of MSWI bottom ash landfills was
suggested by Hellweg (2000). The approach is based on the mineral phase composition of the
MSWI bottom ash and the modeling of equilibrium reactions in the landfill. In the model the
complete dissolution of a mineral phase is directly linked to a change of pH, which allows for
determining the concentrations of Mg, Cd, Zn, Ca, Pb, and Cu based on the modeling results in
Emission behavior of landfills 52

pH Mg [mol/l] Cd [mol/l] Zn [mol/l] Ca [mol/l] Pb [mol/l] Cu [mol/l]
9.11 0.4000 4.28*10-8 1.73*10-4 8.34*10-5 2.23*10-6 9.28*10-6
9.50 0.0302 1.17*10-8 6.69*10-4 8.87*10-6 7.47*10-6 1.29*10-5
8.28 1.22*10-7 1.50*10-5 4.94*10-4 5.88*10-7 9.70*10-6
6.76 5.50*10-6 2.46*10-5
6.72 2.80*10-5
Table 3-12 and the determination of mineral phases present in the landfill. The remaining mineral
phases in the deposited material are calculated from the initial amount of minerals deposited (waste
composition data) and the amount of water getting in contact with the waste for chemical
equilibrium reactions. The time until a mineral phase is depleted in a MSWI bottom ash landfill is
estimated from the equation shown in Table 3-12, whereby Hellweg (2000) assumed that 30% of
the water infiltrating the landfill does not participate in equilibrium reactions with the waste matrix,
but flows through the waste in preferential pathways. The data and the equation shown in Table
3-12 can be the basis for a rough estimate of long-term metal concentrations in the leachate of a
MSWI bottom ash landfill, provided that the composition of the waste (mineral phases) and the
water flow regime in the waste are known. Hellweg (2000) applied this procedure to a MSWI
bottom ash landfill with a deposition height of 5 meters and 275 liters per m² and year of water
flowing through the waste matrix (preferential flow has been excluded). The model results showed
that metals will be released over a period of tens of thousands of years at the site and that the
mineral content of Cu(OH)2 will be finally depleted after 125,000 years at the landfill.
Table 3-12: Dissolved concentrations of selected substances as a function of pH and arranged in the
sequence of depletion (after Hellweg 2000)
n−1
Amount initial − Water flow matrix • ∑ ti ∗ ci
i=1t = nc •Water flow n matrix
where: tn is time until the complete dissolution of a mineral [yrs], n is the number of pH changes until the dissolution
of a mineral (see above) [-],ti is the duration of period i [yrs], ci is the dissolved concentration of the substance dur
ing period i [mol/l], cn is the dissolved concentration in the last period of complete dissolution of the mineral [mol/l],
Amountinitial is the initial mass of a mineral [mol/m²], and water flowmatrix is the amount of water flowing through the
waste matrix per year [l/m² and yr]
In summary, to evaluate the long-term emission behavior of MSWI bottom ash landfills geochemi
cal models including numerous simplifications and assumptions can be used. The respective mod
eling timeframes are many thousands of years, reducing the direct significance of such model esti
mates for aftercare considerations, as aftercare strategies are not able to address such time periods.
Nevertheless, such evaluations are indicative of the long-term environmental hazards associated
with the deposition of MSWI bottom ash. While the release of heavy metals represents a long-term
threat, the immediate attention in terms of leachate quality from MSWI bottom ash landfills is more
focused on soluble salts, organic pollution, and ammonium-nitrogen. To estimate the evolution of
these parameters in the leachate over decades to centuries, trend extrapolations based on real-scale
monitoring data or results from laboratory experiments simulating current landfill conditions may
be appropriate. Estimates need to be based on the specific conditions at the site (and potential
Emission behavior of landfills 53

changes of these) and will become more assessable when aftercare monitoring data become
available at MSWI bottom ash landfills.
3.3 Emissions from landfills containing construction and demolition wastes
3.3.1 General description of emission behavior
Construction and demolition (C&D) wastes are generated during construction or demolition activi
ties and do not comprise MSW-type wastes. C&D waste going to landfill consists primarily of
concrete debris, crushed bricks, soil, metals, asphalt debris, drywall, and smaller fractions of mate
rials such as (treated and untreated) wood, cardboard, paper, plastics, tarboard, and bitumen
(Denner et al. 2005). The quality of material which can be accepted at Austrian C&D waste land
fills is defined in the Austrian landfill directive (MoE 2008), which typically requires the selective
demolition of buildings (e.g. removal of problematic or valuable materials before demolition),
sorting (e.g. recovery of pure material fractions at the source) and pretreatment (e.g. crushing and
metals separation) for C&D wastes to meet acceptance criteria. Nevertheless, as regulations have
been changing over time, the quality of the C&D waste already present in the landfill may be
different from current material qualities going to landfill. In addition, even with a high degree of
sorting and treatment a (small) fraction of potentially problematic materials (e.g. treated wood or
paint coatings containing lead, etc.) remains in the C&D waste, provided that these substances were
already present in the generated waste (cf. Roussat et al. 2008).
With respect to emissions from C&D waste landfills, investigations have focused on leachate due
to its potential for groundwater contamination (e.g. Townsend et al. 1999; Stegmann et al. 2006).
Gaseous emissions from C&D waste landfills may contain methane from anaerobic degradation of
organic materials present in the waste and hydrogen sulfide due to sulfate (present at high
concentrations in the leachate primarily due to leaching of drywall materials) reducing processes in
the landfill (i.e. anaerobic degradation of organic matter) (cf. Weber et al. 2002; Denner et al.
2005). Nevertheless, significant gas generation is not expected at landfills containing pre-sorted
C&D wastes (according to the standards of the Austrian landfill directive (MoE 2008)). Therefore,
landfill gas emissions are considered negligible with respect to the environmental impact of pure
C&D waste landfills (cf. Denner et al. 2005).
Leachate characteristics of C&D waste landfills may vary substantially between different waste
management systems (countries), because of the different qualities of the deposited materials. At
German sites the leachate of C&D waste landfills typically contains significant concentrations of
sulfate, calcium, chloride, nitrogen, and organic compounds (cf. Stegmann et al. 2006). In general,
heavy metal concentrations are low (i.e. below drinking water quality standards), but high concen
trations of zinc or iron have also been observed. Elevated levels of arsenic, chromium, and copper
in the leachate may be associated with C&D wastes containing a substantial amount of treated
wood, as this material is typically the major source of these contaminants in C&D waste (Weber et
al. 2002). Hence, based on the composition of C&D wastes different pollutants and pollutant
pathways may be significant at a landfill site.
Emission behavior of landfills 54

Parameter Number of
landfills
Number of
measurements Mean* Min. – Max.
Discharge limit
(surface water)**
pH [-]
EC [µS-cm]
COD [mg O2-l]
DOC [mg Corg-l]
NH4-N [mg N-l]
Cl [mg-l]
Sulfate [mg SO4-l]
Sulfide [mg S-l]
AOX [mg Cl-l]
Fe
Zn
12
12
4
2
3
11
10
3
11
1
11
87
87
63
48
53
59
58
21
41
14
50
7.7
3416.2
132.7
56.1
18.0
336.5
1680
0.09
0.23
0.41
0.14
5.8 – 8.9
530 – 10010
16 – 644
10 – 196
ND - 134
24 - 1760
77 - 11970
ND - 0.2
ND - 2.3
0.05 - 3.0
ND – 5.8
6.5 - 8.5
50
20
10
Toxicity
Site-specific
0.1
0.5
2.0
0.5
*A non-detect (ND) is considered 0 for calculating the mean value.
** Limits according to the ordinance on waste water discharge from landfills (Leachate ordinance (MoE 2003)
and waste water discharge ordinance (MoE 1996a)).
3.3.2 Emission characteristics of C&D waste landfills
C&D waste has been sent to landfill already for several decades in Austria. Historically, mono
landfills of this kind have not been equipped with liner systems at the landfill base and thus, time
series data from leachate monitoring over longer periods (decades) are scarce for C&D waste land
fills, due to the lack of leachate collection and treatment. Together with public authorities and land
fill owners 12 C&D waste mono landfills with data on leachate quality were identified in Austria
and Switzerland (one Swiss site was included in the study) (see appendix 1). As the amount and
quality of data varied drastically from one site to another, a large fraction of the data set is only
used for statistical analysis (cf. Table 3-13), but cannot be used for more process oriented investi
gations (e.g. evolution of leachate characteristics with increasing average waste age). For 8 sites
only punctual information about leachate characteristics (single measurements at an unknown point
in time) are available and data on the deposition history or the amount of leachate are missing. For
one more site (C&D4) monitoring data on leachate quality are available over time, but the amount
of landfilled waste, the period of landfilling, or the leachate generation rate at the site are unknown.
Consequently, detailed analysis of emission data is restricted to three sites (C&D1-C&D3), where
data on annual waste deposition and leachate quantity are available.
Table 3-13: Statistical analysis of leachate characteristics measured at 12 construction and demoli
tion (C&D) waste landfills
A statistical analysis of the data set about leachate parameters measured at 12 different C&D waste
landfills is shown in Table 3-13. 28 leachate parameters have been measured on average at the
landfills (see appendix 1), but Table 3-13 includes only parameters with at least one measurement
in the data set above the respective quality standard for direct discharge into surface waters.
Though electric conductivity and the concentrations of chloride and sulfate do not exceed discharge
limits, these parameters are listed in Table 3-13, because of their high concentrations in the
leachate of C&D waste landfills. Apart from high concentrations of sulfate in the leachate, the
Emission behavior of landfills 55

mean values of organic leachate pollution parameters such as COD and DOC, as well as of the
inorganic macro component ammonium-nitrogen are above the corresponding discharge standards
(cf. Table 3-13). Sulfide, chloride, iron or zinc concentrations may be problematic at individual
landfills or for individual measurements. The levels of other heavy metals typically comply with
drinking water quality standards. However, problematic parameters may be present but not detected
in the leachate (limited range of measured parameter), especially if the deposited C&D wastes
contain significant fractions of hazardous materials.
3.3.2.1 Evolution of emission characteristics at C&D waste landfills
The longitudinal development of leachate emissions is investigated based on the data collected at
three C&D waste landfills, because the data from the other nine sites do not allow for such an anal
ysis (i.e. no information concerning deposition history and lack of monitoring data). At the landfill
C&D1 waste has been deposited for 14 years (see appendix 1) with 120,000 m³ of occupied air
space in 2008. The landfills C&D2 and C&D3 have been in operation for a shorter period (7 and 4
years, respectively, see appendix 1) and the cumulative waste volumes in 2008 were 100,000 m³
(C&D2) and 300,000 m³ (C&D3) at these sites. All of the sites are still in operation and annual
waste deposition has been taking place during the last five years at an average rate of 9,000 tons
per year at C&D1, 20,000 tons per year at C&D2, and 90,000 tons per year at C&D3.
The concentrations of selected leachate constituents at the sites C&D1, C&D2, and C&D3 are
plotted against the average waste age in Figure 3-16. It is apparent that for many parameters, in
particular for the chemical oxygen demand, the sum of ammonium-, nitrate- and nitrite-nitrogen
(Ntot)6, chloride, and AOX, the pollution level of the leachate at C&D1 is higher throughout the
whole monitoring period. For instance, COD concentrations at C&D1 range between 100 and 350
mg O2/l, whereas COD levels at C&D2 and C&D3 are between 30 and 100 mg O2/l. Similarly,
nitrogen concentrations in the leachate of C&D1 range from 40 to 120 mg/l compared to
concentration ranges of 1 to 15 mg/l at C&D2 and C&D3. The observations could be explained by
the different composition of the C&D waste deposited at the C&D1 in the past (low intensity of
pre-sorting and higher contents of organic matter) compared to the waste composition of the
material deposited throughout the last few years (i.e. C&D2 and C&D3 are relatively young
landfills). The differences in leachate pollution levels illustrate the importance of the quality of the
deposited material for the emission behavior of the landfill. Monitoring data on sulfate concen
trations are available only for C&D1 and C&D3 and range from around 500 mg/l (first years of
waste deposition at C&D3) to around 2000 mg/l at both sites (cf. Figure 3-16). Concentrations of
AOX are all the time below 0.2 mg/l at the younger sites and follow a decreasing trend at C&D1
from initially 0.4-0.6 mg/l to values around 0.2 mg/l after the average waste age increased to 3
years and above. However, except for AOX and potentially zinc, there are no apparent trends
visible in the monitoring data. On the one hand, data series are still relatively short for C&D2 and
6 The total amount of nitrogen in the leachate is used as a parameter, because of leachate sampling from open
leachate ponds at the sites C&D2 and C&D3. As some aeration of the leachate is expected after discharge to
the pond at these sites, the nitrogen species (NH4-N, NO3-N, and NO2-N) in the leachate are aggregated to
allow for a valid comparison between the individual landfills.
56 Emission behavior of landfills

0
20
40
60
80
100
120
140
0 2 4 6 8
N to
t [m
g N
/l]
Average waste age [yrs]
0
200
400
600
800
0 2 4 6 8
Cl [
mg
Cl/l
]
Average waste age [yrs]
0
500
1000
1500
2000
2500
0 2 4 6 8
SO
4 [m
g S
O4/
l]
Average waste age [yrs]
0
0.05
0.1
0.15
0.2
0.25
0 2 4 6 8
Zn
[mg
Zn
/l]
Average waste age [yrs]
0.0
0.2
0.4
0.6
0.8
0 2 4 6 8
AO
X [
mg
Cl/l
]
Average waste age [yrs]
0
50
100
150
200
250
300
350
0 2 4 6 8
CO
D [
mg
O2
/l]
Average waste age [yrs]
C&D1 C&D2 C&D3
C&D3 and on the other hand, all of the sites are still in operation and waste is continuously
deposited, potentially blurring the evolution of emission characteristics from older waste parts.
Figure 3-16: Concentrations of COD (top left), Ntot (top right), Cl (center left), SO4 (center right),
AOX (bottom left), and Zn (bottom right) plotted against the average waste age at land
fill C&D1, C&D2, and C&D3
Based on the analysis in Figure 3-16 it may be expected that organic leachate pollution and nitro
gen levels in the leachate are more problematic at older C&D waste landfills with higher contents
of organic matter contained in the originally deposited waste than at younger deposits, where more
stringent waste acceptance criteria have been applied. Information on the evolution of leachate cha
racteristics at C&D waste landfills after closure, can be currently obtained primarily from column
leaching or lysimeter experiments (cf. Susset and Leuchs 2008), but will become increasingly
available at full-scale sites when more and more engineered (i.e. with containment system) C&D
waste landfills are turned into aftercare.
Emission behavior of landfills 57

1
100 100
10
N to
t [g
N/M
g D
M.y
r]
0.1
C&D1 C&D2 C&D3
0.1
0.01
0 2 4 6 0 2 4 6 88 Average waste age [yrs] Average waste age [yrs]
CO
D [g
O2/M
g D
M.y
r] 10
1
In general, the quality of monitoring data needs to be critically evaluated, even more so at C&D
waste landfills, as leachate samples are often taken from leachate ponds (effects on leachate qual
ity!) and complementary data such as leachate generation rates during sampling are often missing.
Landfill emissions need to be evaluated in view of site specific aspects, as the quality of the
deposited material and characteristics at the site (e.g. climate, deposition rate, and thickness) vary
from one site to another.
The multiplication of average annual concentrations in the leachate with the annual amount of
leachate generated results in annual substance loads in the leachate of the investigated C&D waste
landfills (see Figure 3-17 and Figure 3-18). The quality of the underlying data has been evaluated
and uncertainty ranges have been estimated based on specific criteria (e.g. completeness of the time
series, documentation of sampling and leachate analysis methods, method to measure or estimate
the leachate generation rate, etc.). The relatively large uncertainty ranges (expand over one to two
orders of magnitude) shown in Figure 3-17 and Figure 3-18 are primarily due to the poor quality of
data on the annual amounts of leachate, as direct discharge measurements were not carried out and
data series are incomplete.
The annual loads of chemical oxygen demand in the leachate (Figure 3-17, left) show a decreasing
trend with increasing average waste age at the investigated landfills. At C&D2 and C&D3, the ini
tial loads of approximately 30 g of COD per ton of dry waste and year decrease to less than 3 g of
COD per ton of dry waste and year at an average waste age of 2 years. At C&D1, the initial load of
55 g COD per ton of dry matter and year decreased to around 7 g of COD per ton of dry waste after
an average waste age of 5 years had been reached. Similar trends, however at lower levels, can be
observed for the annual nitrogen loads in the leachates (Figure 3-17, right). For both parameters,
COD and Ntot, the reason for the decreasing annual loads with increasing waste age is not a
decrease in concentrations (cf. Figure 3-16, top), but decreasing amounts of leachate generated at
the sites per ton of waste (e.g. increasing waste thickness through ongoing waste deposition and
constant area-specific infiltration rates result in less leachate generated per ton of waste deposited
at the site).
Figure 3-17: Specific annual substance loads of COD (left) and Ntot (right) in the leachate of C&D1,
C&D2, and C&D3 plotted against average waste age at the sites
The annual loads of chloride and sulfate in the leachate of the C&D waste landfills are shown in
Figure 3-18. In case of landfill C&D2, there is only one measurement available for the concentra
tion of Cl and SO4 has not been measured in the leachate at all (cf. Figure 3-16, center). At the
Emission behavior of landfills 58
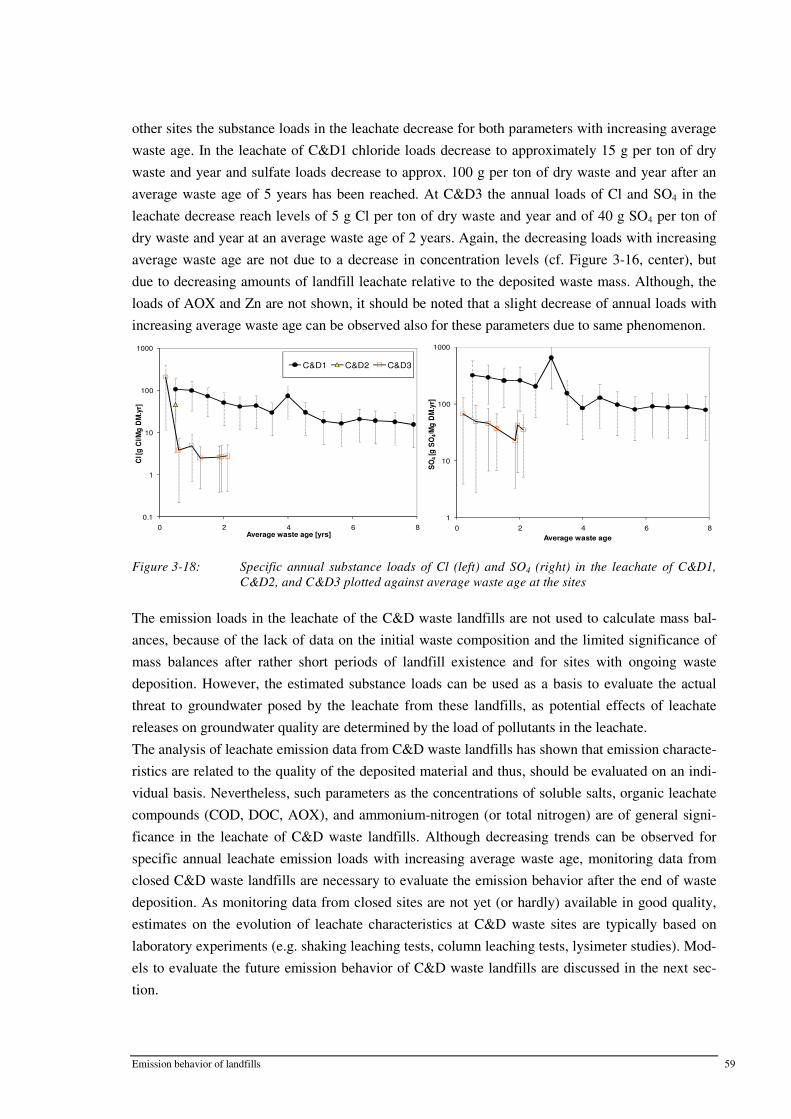
100
1000 1000
Cl [
g C
l/Mg
DM
.yr]
10
C&D1 C&D2 C&D3
1
0.1 1
0 2 4 6 Average waste age [yrs]
8 0 2 4 6 8
Average waste age
SO
4 [g
SO
4/M
g D
M.y
r]
100
10
other sites the substance loads in the leachate decrease for both parameters with increasing average
waste age. In the leachate of C&D1 chloride loads decrease to approximately 15 g per ton of dry
waste and year and sulfate loads decrease to approx. 100 g per ton of dry waste and year after an
average waste age of 5 years has been reached. At C&D3 the annual loads of Cl and SO4 in the
leachate decrease reach levels of 5 g Cl per ton of dry waste and year and of 40 g SO4 per ton of
dry waste and year at an average waste age of 2 years. Again, the decreasing loads with increasing
average waste age are not due to a decrease in concentration levels (cf. Figure 3-16, center), but
due to decreasing amounts of landfill leachate relative to the deposited waste mass. Although, the
loads of AOX and Zn are not shown, it should be noted that a slight decrease of annual loads with
increasing average waste age can be observed also for these parameters due to same phenomenon.
Figure 3-18: Specific annual substance loads of Cl (left) and SO4 (right) in the leachate of C&D1,
C&D2, and C&D3 plotted against average waste age at the sites
The emission loads in the leachate of the C&D waste landfills are not used to calculate mass bal
ances, because of the lack of data on the initial waste composition and the limited significance of
mass balances after rather short periods of landfill existence and for sites with ongoing waste
deposition. However, the estimated substance loads can be used as a basis to evaluate the actual
threat to groundwater posed by the leachate from these landfills, as potential effects of leachate
releases on groundwater quality are determined by the load of pollutants in the leachate.
The analysis of leachate emission data from C&D waste landfills has shown that emission characte
ristics are related to the quality of the deposited material and thus, should be evaluated on an indi
vidual basis. Nevertheless, such parameters as the concentrations of soluble salts, organic leachate
compounds (COD, DOC, AOX), and ammonium-nitrogen (or total nitrogen) are of general signi
ficance in the leachate of C&D waste landfills. Although decreasing trends can be observed for
specific annual leachate emission loads with increasing average waste age, monitoring data from
closed C&D waste landfills are necessary to evaluate the emission behavior after the end of waste
deposition. As monitoring data from closed sites are not yet (or hardly) available in good quality,
estimates on the evolution of leachate characteristics at C&D waste sites are typically based on
laboratory experiments (e.g. shaking leaching tests, column leaching tests, lysimeter studies). Mod
els to evaluate the future emission behavior of C&D waste landfills are discussed in the next sec
tion.
Emission behavior of landfills 59

3.3.3 Evaluation of mid- to long-term emissions
The above discussion of emission data from C&D waste landfills highlights that monitoring data
are available for a relatively short period at landfills of this type (i.e. lack of containment systems
to control emissions at older sites) with waste deposition typically still taking place at these sites.
The evolution of leachate characteristics in the mid- to long-term can therefore be assessed primar
ily on the basis of leaching experiments at different scales. Up to date, efforts to characterize and
predict leachate emission levels from C&D wastes have been made primarily to assess the risk of
recycling these wastes as fill or construction materials (e.g. van der Sloot 1996; Susset and Leuchs
2008; Susset and Grathwohl 2011). However, the results of these studies can be also used to
address the emission characteristics of formal C&D waste landfills, as they represent deposits of
the same materials.
In general, two different types of source term behavior, with transitions in between, can be dis
tinguished. The two types were referred to as “finite sources” and “virtually infinite sources” by
Susset and Leuchs (2008) or “availability-controlled substances” (= finite source) and “solubility
controlled substances” (= virtually infinite source) by van der Sloot (1996). Salts and mobile metal
fractions are typically finite sources (see concentrations of chloride and chromium shown in Figure
3-19). The leachate concentrations of such substances decrease rapidly with increasing liquid-to
solid ratio often following exponential decrease functions. The virtually unlimited type of release is
characteristic for substances showing an initial period of concentration decrease before an extended
period of constant concentrations in the leachate. This behavior is typical for some heavy metals.
The first period of decrease may be missing for organic compounds strongly sorbed to solids (e.g.
PAHs), as they exhibit constant concentration levels in the leachate from the beginning. However,
the release of PAHs from the waste can be strongly affected by biochemical degradation processes
under aerobic conditions, which could be observed during experiments accounting for such
processes (see PAHs concentrations in the leachate of column and lysimeter experiments in Figure
3-19).
The knowledge about the type of release for a substance contained in the C&D waste is a prerequi
site for the selection of appropriate experimental settings and the respective prediction of emissions
in view of potentially changing conditions (e.g. pH). In general, the transferability of results from
leaching experiments to real-scale landfills is dependent on the substance under consideration, the
material quality, the water distribution and preferential flow in the waste, the redox conditions, and
mineral solution and aging effects (Susset and Leuchs 2008). The comparison between results from
leaching experiments at column- and lysimeter-scale in Figure 3-19 illustrates, that some sub
stances are observed at very similar levels at both scales (e.g. Cl and Cr), whereas the concentra
tions of other substances may not be directly transferable from the column-scale to the field-scale.
For example, the concentrations of PAHs in the column leachate represent an upper boundary of
what can be expected at the field-scale, because biochemical degradation processes are not taking
place during the column leaching test, but potentially lower the concentration levels in the leachate
under field conditions, if regions with aerobic conditions regions exist in the landfill (cf. Figure
3-19). For some substances, such as sulfate, no relationship between concentrations observed dur
ing a column leaching test and leachate concentrations observed during field-scale experiments
could be established, due to the complex interaction of different processes. In case of sulfate,
Emission behavior of landfills 60

varying pH conditions at the micro-scale, the infiltration of air into the waste, and the heterogene
ous distribution of minerals, were identified as the main causes for the complexity of transferring
leachate concentration levels from one scale to another (cf. Susset and Leuchs 2008).
Figure 3-19: Comparison of substance concentrations in the leachate of columns and lysimeters filled
with C&D waste plotted against the liquid-to-solid ratio (adapted from Susset and
Leuchs 2008)
In conclusion, the suitability of column leaching experiments as a basis to estimate future emission
characteristics at C&D waste landfills is different from one type of substance to another. For easily
soluble salts and mobile metal fractions, the concentrations in the column leachate may be trans
ferred directly to the field-scale based on equivalent liquid-to-solid ratios. However, aspects of
waste heterogeneity (i.e. representative sampling of C&D waste) and water flow heterogeneity at
different scales (cf. Fellner et al. 2009a) are to be considered in such an endeavor. For PAHs, the
concentrations in the column leachate can be used as an estimate of maximum concentration levels
in the landfill leachate. For the type of substances without direct relationships between lab-scale
and field-scale data (e.g. SO4), emission models need to account for many different factors relevant
to the rate and extent of substance release from the waste. However, to evaluate emission
characteristics during the landfill post-closure period, monitoring data gathered at closed C&D
waste landfills will be most valuable. Direct observations at the closed site can be used to adapt an
emission model to measured data and to validate (or adapt) model predictions based on continuous
monitoring. Thus, although results from leaching experiments prove to be useful for establishing
emission models of C&D waste landfills, appropriate monitoring data at the landfill site are
necessary to calibrate and validate model estimates.
Emission behavior of landfills 61

3.4 Key parameters to evaluate landfill emission behavior
The main aspects of the emission behavior of landfills containing different types of waste have
been analyzed in the previous sections. Based on the quality of the deposited waste the emission
characteristics differ from one type of landfill to another.
The emission characteristics of MSW landfills are strongly associated with the biochemical degra
dation of organic matter contained in the waste, which results in the production of landfill gas (i.e.
CH4 and CO2) and organic leachate pollution. In addition, the elution of soluble salts and ammo
nium represent major substance release processes. The most problematic parameters in the leachate
of closed MSW landfills with respect to discharge limits (based on a statistical analysis of emission
characteristics) are NH4, TOC (or COD), Cl, and AOX. Although decreasing trends can be
observed with increasing waste age for the concentrations of most leachate parameters, the rate of
decrease is very slow for some substances (e.g. ammonium). That is why ammonium is regarded as
the most problematic long-term leachate constituent at MSW landfills (see chapter 3.1.2 or
Kjeldsen et al. (2002)). Heavy metals concentrations in the leachate are typically low, but may
exceed quality standards for discharge to surface water at individual sites or for individual
measurements. With respect to landfill gas emissions methane is of primary importance. However,
trace gases may be relevant based on the conditions at the site (e.g. odors) and the composition of
the emission source (e.g. CFC emissions from foam insulations contained in the waste).
The emissions of MSWI bottom ash landfills are dominated by the discharge of soluble substances
during operation and during the first decades after closure in the landfill leachate. The high
concentrations of soluble salts, as well as the concentrations of TOC or NH4 may be problematic
with respect to leachate discharge into surface waters. Organic leachate pollution is due to the
incomplete combustion of (degradable) organic matter contained in the fresh MSW and the
subsequent degradation of the remaining fraction in the landfill. The concentrations of heavy
metals are observed at very low levels in the leachate of MSWI bottom ash landfills, but may
increase in the long term (millennia) as pH levels are speculated to decrease.
For C&D waste landfills emissions of SO4 in the leachate are of primary interest, but also TOC,
Ntot and Cl may be present at significant levels in the leachate. This is particularly the case if the
original purity or the degree of sorting of the deposited C&D waste has been low. Metals (e.g. zinc,
iron) or specific organic pollutants (e.g. PAHs) may be of sporadic relevance in the leachate of
C&D waste landfills depending on the quality of the deposited material at a site.
The short overview of emission characteristics of different types of waste deposits has illustrated
typical emission profiles for these landfills. Nevertheless, an evaluation of the emission behavior of
a certain landfill is essentially a site-specific task. Emission models are to be established on an
individual basis and need to account for such factors as the quality of deposited waste, the waste
heterogeneity, the water flow regime and preferential flow, and the conditions at the site (e.g. water
infiltration rates, waste thickness, deposition technique, extraction systems, etc.).
The parameters listed in Table 3-14 address the required information to evaluate landfill emission
behavior. In this context, aspects of data quality management during the collection and analysis of
landfill emission data should be emphasized. In general, the quality of measurements (e.g.
documentation of leachate discharge rates during sampling, existence of sampling and analysis
Emission behavior of landfills 62

Leachate – primary parameters Leachate – secondary parameters
- Leachate quality - EC (electric conductivity)
o Ammonia (NH4), Nitrate (NO3), Nitrite
(NO2)
o COD and/or TOC, DOC, and BOD5
o Cl, SO4, Metals (Fe, Zn, Cr, etc.)
- Leachate generation
o Leachate generation rate (continuous
measurement, pumping documentation,
water balances, etc.)
- Leachate discharge during sampling
- pH value, Redox (Eh), Temperature
- BOD5/COD ratio (< 0,1 typical for methanogenic
phase leachate)*
- Trace organic compounds (BTEX, AOX,
hydrocarbons)
- Other leachate constituents
Landfill gas – primary parameters* Landfill gas – secondary parameters*
- Landfill gas generation and collection rate (meas - CH4/CO2 ratio
ured or calculated) - Trace gas compounds (e.g. H2S, CFCs)
- Landfill gas quality: CH4, CO2, O2, N2 (in % of
volume)
Deposited waste – physical factors Deposited waste – quality
- Waste materials (material heterogeneity, hydrau - Waste composition (chemical), substance bal
lic conductivity) ances
- Liquid-to-Solid ratio - Investigations:
- Heterogeneity of water flow o Soluble waste fractions (function of pH
- Settlements value),
- Bulk density o Biochemical availability of organic
waste components*
protocols, representative sampling location and procedure) is at least as important as an adequate
measurement frequency. A monitoring protocol at closed landfill sites could be based on more
extensive characterization of the leachate (and landfill gas) at longer intervals, for example
screening analysis of a broad range of parameters during periods with low leachate discharge rates
to avoid leachate dilution with preferential flow once every few (e.g. 5-10) years, combined with
routine monitoring of only a few key emission parameters (e.g. electric conductivity, ammonium)
(cf. Table 3-14). Thereby the overall intensity and costs of emission monitoring could be decreased
under stable conditions at the landfill site without a significant loss of information to assess the
landfill emission behavior.
Table 3-14: Key parameters to evaluate the emission behavior of (closed) landfills as a basis to
establish appropriate emission models
*Typically relevant only for MSW landfills.
Note:
Primary parameters are the most important emission parameters.
Secondary parameters comprise parameters which are valuable for process and/or system understanding (e.g.
Redox conditions, BOD5/COD ratio) and emission parameters of less significance, which should be included in
screening analysis.
Emission behavior of landfills 63

Emission behavior of landfills 64

Barrier orientation Typical component Functional mechanism
Low-permeability soil layers, geosynthetic clay liners, geomembranes, Resistance
asphalt-cement-liners; Top barriers
Evapotranspirative soil layers (vegetated) Capacitance
Blanket drainage layers, gas vents Extraction
Low-permeability soil layers, geosynthetic clay liners, geomembranes, Resistance
asphalt-cement-liners; Bottom barriers
Compacted soil attenuation layers Capacitance
Blanket leachate collection layers, hydraulic control layers Extraction and/or injection
Soil-bentonite and cement-bentonite walls, cement walls, jet-grouted Resistance
walls, sheet pile walls, vertical geomembranes; Lateral barriers
Low-permeability treatment walls Capacitance
Vertical wells and trenches Extraction and/or injection
Barriers – technical and natural systems 65
4 Barriers – technical and natural systems
The composition of a landfill is different from the surrounding environment, which causes flows to
balance the differences between the systems. Apart from the actual waste composition (“first bar
rier”), the impact of substances released from the waste depends on the performance of technical
barriers at the landfill (“second barrier", i.e. the containment system), on the one hand, and the
ability of the natural environment to mitigate potential negative effects of released substances on
environmental media (“third barrier”, i.e. natural attenuation potential), on the other hand. These
two barrier systems may prevent adverse effects on human health and the environment. Thus, they
need to be included in an evaluation of landfill environmental compatibility. In this chapter, basic
aspects of the long-term functioning of these systems are presented and discussed. Based on the
discussion, specific approaches to include the effect of technical and natural barriers within the
evaluation methodology are presented in chapter 5.
4.1 Technical barriers
Technical barriers are used to limit and control the interaction between the deposited waste and the
surrounding environment. Potentially hazardous emissions can be contained (e.g. low permeability
layers), collected (e.g. drainage layers), and potentially treated before they are released to the envi
ronment (cf. Table 4-1). Therefore, technical barriers are essential to prevent negative effects on
the environment from modern landfills, provided the deposited waste itself is not environmentally
compatible without containment (see Figure 2-2). As man-made buildings in general and technical
barriers in particular, are subject to aging and material deterioration, it is of crucial importance to
evaluate the long-term performance of a technical barrier system and its potential effect on the
substance flows between the landfill and the surrounding environment. The analysis in this section
focuses on the level of isolation and control technical barriers can provide over different time
periods. With respect to the environmental compatibility of closed landfills, the main question is:
How effective are technical barriers to limit interaction and for how long are they effective in the
absence of care?
Table 4-1: Components and functional mechanisms of engineered barrier systems (from National
Research Council 2007)

Different components of technical barriers and their functional mechanisms are shown in Table
4-1. Lateral barriers are of primary importance at sites which have been constructed without a bot
tom barrier and which have been enclosed due to groundwater pollution later on. The functions of
barrier components are based on different mechanisms, which are typically combined to achieve a
specific performance level of the barrier system. Components which resist diffusive/convective
flow are of central importance for technical barriers. In addition to resistance, compacted clay
layers also employ the functional mechanism of capacitance, as they may retard the breakthrough
of pollutants due to their cation exchange capacity. However, if capacitive components are not
combined with other mechanisms, for example with extraction: evapotranspirative barriers store the
infiltrating water before the flow gradient is inversed and the stored water is extracted due to
evaporation and transpiration, they will slow down pollutant migration but not prevent it. Typical
components of technical barrier systems employing extraction as a functional mechanism are gas
vents or drainage layers, where the fluid is removed due to a hydraulic gradient or pumping (cf.
National Research Council 2007).
Figure 4-1: Schematic illustration of a landfill containment system based on the requirements of the
Austrian landfill directive for landfills containing pre-treated MSW (cf. Figure 4-2 and
Figure 4-4)
A technical barrier system according to the minimum requirements of the Austrian landfill
directive (MoE 2008) for landfills containing pre-treated MSW is schematically shown in Figure
4-1. The illustrated barrier system is composed of composite liner systems with low permeability
soil liners and geomembrane liners at the top and at the bottom of the landfill. According to
Austrian regulations alternative barrier systems can be permitted if they perform equally to the
standard systems (see also Figure 4-2 and Figure 4-4). Therefore, and due to different regulations
over time and across landfill types, a large variety of technical barrier systems relying on different
functional mechanisms and components exists at landfills. Numerous studies have been carried out
to analyze and compare different barrier systems with respect to their performance and reliability.
Extensive work on the long-term performance of containment systems was presented for instance
by Rowe (2005), the National Research Council (2007), and Inyang (2004). A comprehensive
Barriers – technical and natural systems 66

Barrier system Service period
component Short-term aspects Medium- to long-term aspects
Earthen barriers Defective materials; inadequate compaction
(density and/or moisture); slope stability
Cracking due to shrink/swell, freeze/thaw, root penetration,
differential settlement, desiccation; chemical incompatibility;
waste and slope stability
Geomembranes Defective materials; physical damage due to
construction; defective seams
Puncture; global and local stability; degradation
Geosynthetic clay Defective material; seam separation Cracking due to shrink/swell, freeze/thaw, root penetration,
liners (GCLs) differential settlement, etc.; chemical incompatibility; local and
global stability; reinforcement degradation (needle-punched
reinforced GCLs); inadequate hydration (encapsulated GCLs)
Asphaltic cement
barriers
Defective material Cracking due to shrinkage or deformation, degradation of the
asphalt binder or supplemental material (e.g. crumb rubber)
Drainage layers (gra- Inadequate capacity Clogging due to soil infiltration, biological action, and mineral
nular and geosyn
thetic)
precipitation; geosynthetic drainage layers are susceptible to soil
and geosynthetics penetration and creep of the geonet core
Evapotranspirative Defective material; inadequate thickness; ina- Inadequate storage capacity for infiltration; inability to sustain
barriers bility to establish vegetation vegetation; cracking and development of other secondary per
meability features; erosion; penetration by vegetation or animals
investigation based on a large data set on the performance of engineered containment systems at
field scale has been reported by Bonaparte et al. (2002). These studies are, among others, an
important basis for the review of the long-term performance of technical barrier systems in this
section.
4.1.1 Components of technical barriers
Technical barrier systems comprise several components fulfilling different functions. Although the
effectiveness of a barrier component depends on the other system components and on local condi
tions (e.g. climate), properties and functional mechanisms of barrier components are discussed
individually below, to illustrate their reliability and use as elements of technical barrier systems. An
overview of different barrier components is given in Table 4-2 together with major performance
concerns on the short, medium, and long term.
Table 4-2: Performance concerns for barrier system components on the short, medium, and long
term (based on National Research Council 2007)
4.1.1.1 Low permeability earthen barriers
Low permeability soil liners are the best investigated components of barrier systems (Inyang 2004).
The main properties of low permeability earthen barriers with respect to pollutant transport are
hydraulic conductivity, chemical robustness, chemical transport parameters (e.g. cation exchange
capacity), and mechanical aspects (e.g. vulnerability to erosion or cracking). The major
mechanisms of pollutant transport through the low permeability soil layer are advection, under
saturated conditions described by Darcy’s law (Darcy 1856), and diffusion, described by Fick’s law
(Fick 1855)7. In general, the lower the hydraulic conductivity of a soil layer, the more important the
7 Darcy’s law: vf= kf*i (vf… filter velocity [m/s], kf… hydraulic conductivity [m/s], i… hydraulic gradient
[m/m]); Fick’s law: Jd=D0*dc/dx (Jd… diffusive flux [mol/(m².s)], D0… diffusion coefficient [m²/s], dc/dx…
concentration gradient against diffusive flux [mol/m4])
Barriers – technical and natural systems 67

diffusive flux may be for pollutant transport processes. A more detailed description of pollutant
transport processes in soil is provided in section 4.2.2.
Hydraulic conductivities below 10-9 m/s are often required for low permeability earthen barriers
and can be achieved by appropriate design and construction. Nevertheless, several factors poten
tially cause the hydraulic conductivity to increase directly after construction or in the medium to
long term (cf. Table 4-2). Field tests (e.g. double ring infiltrometer experiment) should be used to
demonstrate the hydraulic conductivities after construction, as laboratory-scale experiments do not
necessarily reflect the hydraulic conductivity in the field scale (Benson et al. 1999). A decrease of
barrier performance after construction, may be caused by crack formation (shrink/swell,
freeze/thaw, root penetration, differential settlement, desiccation), chemical or mechanical instabil
ity and can typically not be detected directly due to the lack of direct monitoring (cf. BAM 2000).
Once cracked, the hydraulic conductivity of the low permeability soil layer remains elevated even
if the crack disappears again (cf. Gray 1989; Stoffregen et al. 1999). While a significant increase in
hydraulic conductivity is not expected unless the crack reaches over more than 80 % of the soil
layer thickness, hydraulic conductivity may increase by three orders of magnitude in case of conti
nuous cracks through the whole liner (Gray 1989).
Despite inadequate design of the barrier system, e.g. insufficient thickness of protective layers on
the top of the landfill to prevent desiccation (cf. Bonaparte et al. 2002; Henken-Mellies 2006),
temperature-induced water flow may be an important factor for the desiccation of low permeability
soil liners (cf. Stoffregen et al. 1999). At the landfill base the primary factors to evaluate the
probability of temperature-induced water transport causing desiccation are the distance to ground
water and the temperature gradient (positive correlation) as well as the thickness of the liner and
the heat conductivity (negative correlation). At the top, temperature-induced water transport and
desiccation are dependent mainly on the temperature in the waste and the climatic conditions. Due
to the complex interaction of different factors, the risk of desiccation has to be evaluated on an
individual basis, whereby crack formation tendency decreases at the landfill base with increasing
overburden, i.e. waste thickness.
The chemical incompatibility of clay-rich soil layers with a liquid may be directly associated with
an increase in hydraulic conductivity (e.g. highly concentrated (> 75 vol%) organic solvents8 (cf.
Farquhar and Parker 1989)) or cause chemically induced material deterioration and a subsequent
increase of hydraulic conductivity. In general, clay-rich soil layers are more susceptible to chemical
incompatibility with liquids exhibiting higher concentrations and/or charges of dissolved ions. Clay
layers with high plasticity indices (e.g. increasing content of bentonite) are more susceptible to
chemical incompatibility than earthen barriers with low plasticity (Benson et al. 1999).
Apart from resistance to advective and/or diffusive flux of pollutants through low-permeability soil
layers, clay-rich soil layers have the capacity to retard or prevent the breakthrough of several pol
lutants (e.g. Griffin and Shimp 1975; Farquhar and Parker 1989). While anions (e.g. Cl, Br) and
organic solvents are barely retained in clay-rich soil layers, the retention of heavy metals (e.g. Pb,
Zn, Cd) and other cations is potentially high. Non polar organic compounds are primarily sorbed to
8 However, note that typical concentrations of organic solvents in the leachate of MSW landfills are in the
range of parts per million.
Barriers – technical and natural systems 68

organic carbon in the soil, making the total organic carbon content of the low permeability soil
layer the dominant indicator to evaluate the sorption of non polar organic compounds.
In summary, low permeability soil layers are an effective component of technical barrier systems
over geologic time periods, provided appropriate design and construction. Advantages of these
components are relatively low construction costs, their attenuation capacity with respect to specific
pollutants, and their robustness in view of mechanical damage. In addition, the multi-layered con
struction of such barrier components decreases their vulnerability to cracking and defective mate
rials. The main risks with respect to their effectiveness relate to potential desiccation or damage
during construction, on the one hand, and secondary desiccation processes and consequent cracking
in the medium and long term, on the other hand (cf. Table 4-2).
4.1.1.2 Geomembranes
Modern geomembranes consist of high density polyethylene (HDPE) and have been used at land
fills since the 1970s. Initially other materials such as polyvinylchloride (PVC) or low density
polyethylene (LDPE) have been also used in geomembranes, but HDPE geomembranes9 became
increasingly popular due to their higher robustness in comparison to alternative materials, as for
example softeners are leached from PVC and membranes get brittle, LDPE is more susceptible to
mechanical damage than HDPE (cf. Bräcker 2002). Without holes, geomembranes do not allow for
advective flow, roots cannot penetrate, and they are not susceptible to damage by rodents.
On the short term, geomembranes may not reach their design performance level due to poor
material quality, mechanical damage during construction and waste placement, or defective seams
(cf. Table 4-2). On the medium and long term, a decrease in performance may occur primarily due
to differential settlements and gradual material deterioration (cf. Table 4-3). The number of holes in
a geomembrane is largely dependent on the stringency of quality assurance and control (QA&C)
programs during construction. It has been demonstrated that the frequency of holes in
geomembranes decreases significantly if QA&C programs have been in place during construction
(e.g. Phaneuf and Peggs 2001; Forget et al. 2005). For instance, Forget et al. (2005) reported 0.5
holes per hectare at sites with QA&C programs during construction and 16 holes per hectare at
sites without appropriate QA&C programs. This is consistent with investigations by Rowe et al.
(2004), who reported average hole frequencies at HDPE geomembranes between 0.7 and 11 holes
per hectare, whereby 30% of the investigated liners did not have any holes and 50% had less than 5
holes per hectare. The magnitude of advective flow due to holes is dependent on the quality of
contact between the geomembrane and the low permeability soil layer in composite liners (cf.
Rowe 2005). In addition to the quality of contact between HDPE membrane and soil liner, the
presence/non-presence of wrinkles (originating from construction practice and/or thermal
expansion processes) is significant for the magnitude of advective flow through holes at
geomembranes. The higher the number of wrinkles (Rowe et al. (2004) reported a case with 1200
wrinkles per hectare), the more pronounced the effect of holes on the release of leachate and
pollutants is. Different analytical (e.g. Giroud and Bonaparte 1989) and empirical (e.g. Rowe and
9 While the thickness of HDPE geomembranes is typically 2.5 mm in Austria or Germany, 2 mm thick
HDPE liners are widely used in the USA and Canada.
Barriers – technical and natural systems 69

Temperature Stage 1* Stage 2** Stage 3** Total
[C°] [Years] [Years] [Years] [Years]
10 280 30 – 50 1380 – 2445 1690 – 2775
20 115 10 – 15 440 – 765 565 – 900
30 50 4 – 6 150 – 260 205 – 315
35 35 2 – 4 90 – 155 130 – 190
40 25 1 – 2 55 – 95 80 – 120
50 10 0.6 – 1 20 – 35 35 – 50
60 6 0.3 – 0.4 9 – 15 15 – 20
* Based on simulated liner antioxidant depletion tests
**higher values relate to experiments with water-air-interface, lower values are adjusted for the possible
effect of leachate on the rate of degradation
Booker 2000) equations are available to describe leachate flow through geomembranes with holes.
A description and discussion of these approaches is provided in Rowe (2005). However, at
undamaged HDPE geomembranes without holes, not advective but diffusive flux of pollutants
(gaseous and liquid) is of primary importance, particularly for volatile organic compounds (cf.
National Research Council 2007).
Technical lifetimes of geomembrane liners have been estimated based on laboratory data, as field
observations are not available over a sufficient time period (Rowe 2005). From Table 4-3 it is
apparent that the degradation of the liner material is strongly dependent on the temperatures at the
geomembrane, as it may take from a few decades to several thousands of years until the polymers
are deteriorated. The deterioration process can be divided into a first phase of antioxidant depletion,
a second phase of initial polymer degradation, and a third phase of polymer degradation. The
technical lifetime (=period during which design performance is reached) of HDPE geomembranes
at MSW landfills has been assumed to range from around 100 years to several hundreds of years
(e.g. Bräcker 2002; Simon and Müller 2004; Rowe 2005; Henken-Mellies 2006; Ministry of the
Environment 2010).
Table 4-3: Service lives for HDPE liners (2 mm thickness) estimated via calculations based on
laboratory experiments (Source: Rowe 2005)
In summary, HDPE geomembranes without holes/defects do not allow for advective flow and are
robust components of technical barrier systems. As proper construction of the liner and of the pro
tective layers is of high significance, appropriate QA&C programs at a site are crucial to achieve
design performance specifications. Technical lifetimes of HDPE geomembrane liners are typically
assumed to be more than 100 years, if high temperatures and extreme external stresses are not
expected to affect the geomembrane.
4.1.1.3 Geosynthetic clay liners (GCLs)
Similarly to low permeability earthen barriers, geosynthetic clay liners, i.e. geotextiles with a
bentonite filling as liner, can be functional barrier components for geologic timeframes. The major
performance concerns are similar to low permeability earthen liners with the additional aspects of
the degradation of the reinforcing geotextile and the inadequate hydration of encapsulated GCLs
(cf. Table 4-2). The permeability of a non-defective GCL is equal to the permeability of a low per
70 Barriers – technical and natural systems

meability soil liner with a thickness of 0.5 m and a hydraulic conductivity kf= 5*10-9 m/s (cf.
Bräcker 2002).
The likelihood of chemical incompatibilities of GCLs with liquids increases with increasing con
centrations of divalent ions (e.g. Ca2+ or Mg2+) in a liquid, as these cations replace the Na+ con
tained in bentonite and thereby increase the hydraulic conductivity of the GCL potentially by
several orders of magnitude (cf. Kolstad et al. 2004). Apart from the increase in hydraulic
conductivity, the substitution of sodium by higher valent cations reduces the self-healing ability of
bentonite, as the extent of clay swelling decreases. Desiccation poses a threat to the performance of
GCLs in general. In top cover systems GCLs may be also affected by root penetration, which
should be excluded via protective layers of sufficient thickness.
GCLs, similar to clay-rich low permeability soil liners, have a potential to retain pollutants and
attenuate negative effects of leachate percolating through the liner at the landfill base. However, as
GCL thickness is approximately one tenth of a compacted soil liner’s thickness, their potential to
attenuate pollutants is consequently lower.
4.1.1.4 Asphalt and asphaltic cement barriers
Asphalt and asphaltic cement liners are composed of bitumen binder and sand as mineral additive.
Typically, these liners are used as an alternative to geomembrane liners in barrier systems. They do
not allow for advective flow through the liner with technical service lives in a range of hundreds of
years (similar to geomembrane liners (cf. Bräcker 2002)). Asphalt-based liners are robust towards
mechanical and biological stresses (e.g. roots, rodents) and not vulnerable to desiccation. Negative
effects on liner performance can be caused by material incompatibilities (e.g. chemical attack of
asphalt by hydrocarbons (Simon and Müller 2004)) or vertical displacements of the liner. Neverthe
less, if properly constructed, asphalt and asphaltic cement liners represent a practically impermea
ble barrier component for a long period of time.
4.1.1.5 Drainage layers
Drainage layers are used to extract fluids from the barrier system due to the higher conductivity of
these layers compared to other barrier components (cf. Figure 4-1). The layers can be built from
mineral material (e.g. gravel) as well as from geotextiles (e.g. polyethylene or polypropylene
meshes). Drainage layers are important in a barrier system to avoid excessive head on liners and
their function is based on high hydraulic conductivities and sufficient layer thicknesses.
On the short term, the main reasons for poor performance of a drainage layer may be insufficient
hydraulic conductivity or thickness (i.e. design), poor filter stability, or a geotechnically instable
drainage layer. In the medium to long-term, the primary cause of drainage problems is the clogging
of the drainage layer due to fine particles leached from other barrier components, biological growth
in the layer (biofilms), or the precipitation of dissolved substances, like CaCO3 (cf. Table 4-2 and
Rowe (2005)). Clogging may result in a decrease of hydraulic conductivity by up to eight orders of
magnitude and thus, represents a critical process with respect to long-term drainage layer perfor
mance. In the case of granular drainage layers, the probability of clogging is lower for layers with
large grain sizes and uniform grain size distributions. Consequently, sandy drainage layers are
more likely to clog (e.g. it was observed within a few years at MSW landfills) than gravel drainage
Barriers – technical and natural systems 71

layers (cf. Rowe 2005). In the case of geotextiles, the compression of the geotextile due to
increasing overburden, the degradation of polymers, and geotextile creep can also cause
performance problems. Advantages of geotextile drainage layers are the industrial production and
quality control, the lower required thickness of the layer, and the easy handling during construction
(Simon and Müller 2004). In general, if drainage layers are properly designed, constructed, and
maintained, technical lifetimes of several decades can be expected (cf. Rowe 2005). However, as
the importance and interaction of clogging mechanisms is not fully understood, confident estimates
on the medium- to long-term performance of drainage layers are hardly possible.
4.1.1.6 Vegetative cover soil
The vegetative cover soil (=recultivation layer) is a part of the top cover to protect drainage layers
and liners against different impacts (e.g. roots, freezing) and represents the face of the closed land
fill in the landscape. Austrian regulations require a minimum thickness of the vegetative soil of 0.5
meters (cf. Figure 4-2). Based on long-term considerations, e.g. typical vegetation at the site,
thicknesses of the vegetative cover soil from 1.5 to 3.0 meters have been put forward (cf. Bräcker
2002). As a long-term component of the barrier the vegetative cover soil should have significant
water storage capacity to maintain a water balance with low water percolation rates to the lower
layers of the barrier system (Henken-Mellies and Schweizer 2011). However, top soil layer design
and required performance levels may vary from one site to another based on the aftercare and after
use concept and the local conditions (e.g. climate, vegetation).
4.1.1.7 Further barrier system components
Various components are used in barrier systems to provide specific functions. Geotextiles are used
in numerous applications as nets, meshes, or sheets. Capillary barrier layers can be used on the side
slopes of landfill top covers and consist of a capillary layer (fine grained material) above a capillary
block (larger grain sizes). Under unsaturated conditions the capillary layer has a higher hydraulic
conductivity as the capillary block and therefore drains the water to the side without releasing it to
the capillary block (cf. Simon and Müller 2004). However, although robust to desiccation, capillary
barriers are difficult to design, which makes the demonstration of field performance inevitable.
A special type of low permeability earthen liner is commercially available under the name Trisop
last and consists of 90% sand, 10% bentonite, and some polymer additives (<0.2%). The liner has a
low permeability (0.1 m of Trisoplast perform equally to 0.5 m compacted clay) and is insensitive
to desiccation as well as to differential settlements (Bräcker 2002). Apart from that, the critical
issues described for low permeability soil layers and geosynthetic clay layers are of potential signi
ficance also for the performance of Trisoplast.
The list of barrier components in this section is not complete, but comprises the most widely
applied elements of technical barrier systems. In general, it should be emphasized that performance
criteria for individual barrier components are derived from the specifications of the whole system
and its aspired performance. Thus, the performance of the whole barrier system is of primary inter
est in an evaluation and not the performance of single components.
72 Barriers – technical and natural systems

4.1.2 Performance of landfill top cover systems
The main purposes of the barrier system at the top of a landfill are to control/minimize water infil
tration into the waste, to prevent the uncontrolled release of landfill gas to the atmosphere (in case
of MSW landfills), and to allow for an appropriate after-use of the landfill site. In addition, the top
cover makes the waste inaccessible to birds and rodents, prevents wind-blown dispersal of waste,
and reduces unpleasant odors from the waste. However, as the latter factors are not of primary
importance for closed landfills, these will not be addressed in more detail below.
The minimum requirements of the Austrian landfill directive (MoE 2008) for top cover systems at
construction and demolition waste landfills (left) and landfills for pre-treated MSW (right) are
shown Figure 4-2. Although different systems can be used as long as equal performance with the
systems in Figure 4-2 can be demonstrated, the discussion in this section will mainly focus on these
“standard” top cover designs.
Figure 4-2: Minimum top cover barrier system according to the Austrian landfill directive (MoE
2008) for C&D waste landfills (left) and landfills for pretreated MSW (right)
Figure 4-3: Average leachate generation rates after closure for 11 MSW cells and 22 cells contain
ing hazardous waste (Source:Bonaparte et al. 2002)
The performance of top cover systems is typically evaluated based on the amount of water perco
lating through the top cover into the waste body. Often the corresponding criterion is the amount of
leachate generated at a landfill as a fraction of the annual precipitation at the site. For instance, the
Austrian landfill directive (MoE 2008) requires that final cover systems do not allow for leachate
generation rates above 5% of the average annual precipitation. This performance criterion needs to
Barriers – technical and natural systems 73

be reached at the latest 5 years after the installation of the final cover and demonstrated throughout
the whole period of aftercare. In Figure 4-3 the average leachate flow rate at 33 landfill cells is
shown after a final cover system had been installed at these sites (cf. Bonaparte et al. 2002). Espe
cially at hazardous waste landfills (with a composite liner system) a rapid reduction of leachate
flow rates could be observed, as the flow rates decreased by two orders of magnitude within the
first decade after cover installation. Thus, composite liner systems appear to be highly efficient
systems to minimize water infiltration into the waste, provided proper construction and design.
Mineral liner systems at the top of landfills often exhibit decreasing performance within a few
years after installation (e.g. Stoffregen et al. 1999; Benson 2001; Bonaparte et al. 2002; Melchior et
al. 2002; Henken-Mellies and Schweizer 2011). For instance, Huber et al. (2002) analyzed data on
leachate flow rates at 17 closed landfills in Bavaria (Germany) with mineral liner systems at the
top, with thicknesses of at least 0.5 m and specified hydraulic conductivies <10-8 m/s. They found
that the average leachate flow rates at the sites amounted for 10 to 20% of the average annual
precipitation. Thus, the investigated mineral liner systems were generally not able to minimize
water infiltration for more than a few years. Similarly, Bonaparte et al. (2002) and Melchior et al.
(2002) found that top cover systems based on compacted clay layer as the sole resistive layer
allowed for annual water infiltration rates above 10% of precipitation already a few years (two to
six years) after cover installation. In most cases the reason for the poor performance of single
mineral liner systems at the landfill top is the desiccation of the low permeabliliy soil liner and the
subsequent formation of cracks. The desiccation of the liner is often due to insufficient thickness of
the vegetative soil layer, clay liners with high plasticity indices, and/or root penetration and
consequent water extration by plants. In addition, differential settlements (e.g. due to significant
organic degradation processes still ongoing in the waste) may cause the formation of cracks (cf.
Simon and Müller 2004). Consequently, mineral liner systems are not suited to guarantee for a
lasting minimization of leachate generation due to their susceptibiliy to desiccation and cracking.
As cracks are preferential flow paths for liquid and gaseous emissions, they are problematic also
with respect to the collection and treatment of potentially generated landfill gas (cf. Bonaparte et al.
2002). Therefore, if a top cover system employs a sole mineral liner, it is important to protect the
liner against desiccation (i.e. through appropriate thickness of vegetative soil layer) and to assure
that settlements of the landfill surface have been largely completed.
Contrarily to mineral liner systems, composite liner systems (i.e. HDPE geomembrane above a low
permeability soil liner) have been demonstrated to be effective barriers at the top of landfills at
many sites with different climatic conditions (see Figure 4-3 and Benson 2001; Bonaparte et al.
2002). The two liners function independent from one another and, provided appropriate design and
construction, represent a system to effectively minimize interaction between waste and the
surrounding environment. The effect of holes and fissures of the geomembrane is less pronounced
if the contact between geomembrane and low permeability soil layer is intimate (i.e. water
infiltrates only locally into the low permeability soil liner). As long as the geomembrane liner is
functional, the main threat of soil liner desiccation is posed by temperature induced water transport
processes (cf. Stoffregen et al. 1999). The potential of such processes to dry out the soil liner has to
be evaluated individually and is dependent on several factors, such as waste temperatures,
fluctuations of atmospheric temperatures, and vegetative soil layer thickness. However, after the
Barriers – technical and natural systems 74

Composite liner systems Components (excluding gas vent and foundation layer)
Low permeability soil liner and > 0.5m vegetative soil, > 0.5 m drainage layer, 2.5 mm geomembrane
geomembrane liner (cf. Figure 4-2) liner, 0.6 m low permeability soil liner (construction in 3 layers)
Geosynthetic clay liner (GCL) and Same as above, but with GCL instead of low permeability soil liner
geomembrane liner
Trisoplast* and geomembrane liner 2.0 m vegetative soil, 0.3 m drainage layer, 2.5 mm geomembrane
liner, 0.07 m Trisoplast*
Capillary barrier and geomembrane 2.0 m vegetative soil, 0.4 m capillary layer, 0.25 m capillary block,
liner 2.5 mm geomembrane liner
Low permeability soil liner and 1.5 m vegetative soil, 0.3 m drainage layer, 0.075 m asphalt liner, 0.2
asphalt liner m soil foundation layer, 0.2 m capillary layer, 0.1 m capillary block
Low permeability soil liner and 2.0 m vegetative soil, 0.15 m drainage layer, 0.6 m low permeability
capillary barrier** soil layer, 0.3 m capillary layer, 0.15 m capillary block
*Trisoplast is a commercially available liner and consists of sand (90%), bentonite (10%) and polymer addi
tives (<0.2%) (see also section 4.1.1).
** In a lysimeter study this combined liner system became inefficient within a few years.
technical lifetime of the geomembrane is expired (often a few hundred years are assumed, see
section 4.1.1), the mineral liner will be the controlling resistive barrier at the landfill top. Thus, the
long-term functioning of this liner must not rely on a fully functional geomembrane liner for
protection (e.g. the geomembrane shall not be designed to protect the low permeability soil liner
against root penetration) if minimal water infiltration shall be maintained over long timeframes (cf.
Stoffregen et al. 1999; Henken-Mellies and Schweizer 2011).
Table 4-4: Examples of typical top cover barrier systems using composite liners (adapted from
Henken-Mellies 2006)
Beside the standard top cover systems, numerous alternatives exist to control/minimize the infiltra
tion of water into the waste. Some designs of composite liner systems, which have been
investigated in the field-scale (lysimeter studies or full scale landfill covers), are listed in Table 4-4.
Apart from one system (the combination of a low permeability soil liner with a capillary barrier
underneath), the observations demonstrate the appropriate performance of the top covers. However,
conclusions with respect to the medium- and log-term performance of these systems cannot be
drawn from the available data yet, as observations typically exist for a few years only.
An alternative to the minimization of water infiltration into the waste via resistive barrier compo
nents (i.e. single and composite liner systems) are landfill top covers designed as evapotranspira
tive barriers (cf. Wimmer and Reichenauer 2006). The functioning of such systems relies on the
storage of rainwater and subsequent extraction (of a large part of the water) due to evaporation and
transpiration (roots) processes. Major advantages of these systems are low maintenance require
ments and long-term functionality, provided a design appropriate for the conditions at the site.
Evapotranspirative barriers allow for some level of water infiltration, which may be comparable to
the local groundwater recharge rates of natural soils at the site.
The performance of top cover systems is typically evaluated based on leachate collection rates,
because direct monitoring data are not available for the barrier system. For instance, a direct
monitoring system would be the (area-wide) measurement of the electrical resistance in the liner to
Barriers – technical and natural systems 75

infer changes of the water content from changes in electrical resistance (cf. BAM 2000). Based on
such data, measures against decreasing barrier efficiencies could be taken before unwanted effects
of water infiltration (e.g. landfill gas and leachate generation) occur.
The performance of barrier systems at the top of landfills depends on several factors such as the
climatic conditions, the properties of the landfill body (i.e. waste characteristics and ongoing
processes), and the constitution of the barrier system. Top covers employing solely a low
permeability soil liner as a resistive component often do not perform according to design criteria
due to desiccation and subsequent cracking of the liner (leachate flow rates amounted for 10-20%
of annual precipitation a few years after cover installation). In particular, systems with mineral
liners built from fine grained material and with a protective vegetative soil layer of less than 2
meters thickness are susceptible to desiccation cracking (cf. Henken-Mellies and Schweizer 2011).
Top covers with composite liner system minimize the infiltration of water into the waste
effectively, provided that they are properly designed and constructed. While the performance of
these systems can probably rely on the combined function of the geomembrane and the mineral
liner for a few hundred years, the long-term performance of the system will be controlled by the
mineral liner. The reason is the gradual degradation of the geomembrane liner without maintenance
(100-300 years have been assumed) and the potential functionality of low permeability soil liners
over geologic timeframes.
4.1.3 Performance of technical barriers at the landfill bottom
Engineered barriers at the landfill bottom have been constructed for several decades and changed
from simple systems (e.g. peat layers) to more sophisticated systems (e.g. composite liner systems)
over time due to increasingly stringent landfill regulations (Krümpelbeck 2000). The minimum
design requirements for bottom barrier systems according to the Austrian landfill directive are
schematically illustrated in Figure 4-4 for C&D waste landfills (left) and for landfills containing
pretreated MSW (right). Though alternative systems exist and may be permitted (provided that
equal performance with the respective system in Figure 4-4 can be demonstrated), the standard
bottom barrier systems in Figure 4-4 are most widely applied and in the focus of this section.
Figure 4-4: Minimum bottom barrier system according to the Austrian landfill directive (MoE 2008)
for C&D waste landfills (left) and landfills for pretreated MSW (right)
Bottom barrier systems with a low permeability soil liner are not impermeable to advective flow,
but reduce water flow through the barrier due to low hydraulic conductivities (typically ≤10-9 m/s)
and the prevention of high hydraulic heads on the liners (i.e. drainage layer). Therefore, diffusion
may be a significant process with respect to pollutant migration through low permeability soil lin
ers (National Research Council 2007). For instance, Rowe (2005) reported diffusive transport dis-
Barriers – technical and natural systems 76

Year Value Leachate collection rate
[l/(ha*d)]
Leachate collection after
primary liner [l/(ha*d)]
Liner efficiency
[%]
1998 Average 159.1 1.0 99.2
Maximum 372.5 4.0 99.9
Minimum 27.4 0.1 98.0
1999 Average 117.4 0.8 99.1
Maximum 290.8 2.6 99.9
Minimum 16.3 0.1 97.1
Note: Data from 17 landfills in the state of New York (landfills are in operation)
tances for chloride of 0.75 m within 4.5 years and of 1.0 m within 15 years at a landfill with a min
eral liner system, respectively. He estimated typical diffusion coefficients for chloride in low per
meability soil layers to be 0.0063-0.019 m²/yr, which is in the same range as diffusion coefficients
for natural clay-rich soils under saturated conditions.
In general, the combination of two liners in a barrier system is more effective to prevent the release
of pollutants than a single liner system. For instance, Bonaparte et al. (2002) investigated the
leachate flow rates in secondary collection systems below the primary bottom barrier system at
different landfills10 and found that composite liner systems were more effective than single liner
systems with a sole geomembrane liner. The leachate percolation rate through the geomembrane
liner was by factor two higher than at composite liner systems with a geomembrane and a low per
meability soil layer and by factor 400 higher than at composite liner systems with a geomembrane
and a GCL (Note: A drainage layer below a low permeability soil liner increases the risk of liner
desiccation due to temperature-induced water transport processes (cf. Stoffregen et al. 1999)).
Another investigation of leachate percolation rates at landfills with primary and secondary bottom
liner systems was reported by Barlaz et al. (2002). The leachate collection efficiencies of the pri
mary liner system ranged from 97.1 to 99.9% (see Table 4-5), which highlights the ability of
composite liner systems to effectively contain generated leachate.
Table 4-5: Efficiency of primary bottom liner systems at 17 landfills in the years 1998 and 1999
(Source: Barlaz et al. 2002)
In a composite liner system the effect of holes or defects of the geomembrane is limited to a local
release of leachate into the mineral liner if the two layers are in intimate contact. Poor contact, for
instance due to wrinkles, may have a strong effect on the permeability of the whole system to
advective flow. Depending on the number and the location (with respect to wrinkles) of holes in the
geomembrane, the hydraulic conductivity may increase by several orders of magnitude compared
to composite liners with good contact between the geomembrane and the low permeability soil
liner (cf. Rowe 2005). In addition to the robustness against holes in the geomembrane, synergetic
effects of the combination of two liners occur with respect to diffusive transport processes through
the bottom barrier system. While geomembranes are practically impermeable to polar molecules
(e.g. salts, metals, organic acids), they have a low resistance against non polar molecules (e.g. vola
10 The investigated sites are equipped with a primary and a secondary bottom liner system. The primary liner
system lies above the secondary liner system and includes the leachate collection system. The secondary liner
system provides data on the amount of leachate percolating through the primary liner, as the percolate is
collected in a drainage layer.
Barriers – technical and natural systems 77

tile carbon compounds). As the latter can be retained by polar soil particles in the mineral liner
their concentration increases at the interface of the geomembrane and the low permeability soil
liner. Consequently, the concentration gradient along the barrier system decreases and diffuse
transport is slowed down significantly. However, as concentrations of non polar substances are
typically low in landfill leachate, the importance of diffusive transport may be rather limited for
composite liner systems with a functional geomembrane liner (National Research Council 2007).
A decrease in the performance of the low permeability soil liner after the construction of the
composite liner system can be caused by temperature-induced water transport processes. The
higher the temperature at the landfill base, the more water is transported downwards from the liner
interface. Thus, if the liner can drain to a layer with higher hydraulic conductivity, the low permea
bility soil layer may desiccate and cracks can form (Stoffregen et al. 1999). Whether temperature
induced water transport poses a threat to a mineral liner depends on several factors (e.g. overbur
den, heat conductivity of the liner, distance to groundwater, etc.) and is difficult to evaluate.
Apart from liners, drainage layers represent important components for the functioning of bottom
barrier systems. Drainage layers are used to avoid the build-up of excessive hydraulic heads on
liners by collecting and extracting the leachate at the bottom of the landfill. The leachate typically
drains into collection pipes directing it to a storage tank. The performance of a drainage layer
depends on appropriate dimensions (i.e. thickness) and sufficient hydraulic conductivity. Several
processes can contribute to the deterioration of a drainage system, eventually causing the build-up
of significant hydraulic heads in the landfill. Technical lifetimes of drainage systems vary from one
system to another, but are supposed to be less than 100 years in the absence of maintenance (cf.
Rowe 2005; Ministry of the Environment 2010).
In summary, composite liner systems represent an effective technical barrier to prevent the release
of pollutants to the subsurface at landfills. Synergetic effects of the liner combination are the
increased robustness of the system with respect to geomembrane defects (holes, fissures) and the
complementary barrier effects against diffusive transport of pollutants. Provided appropriate design
and construction, technical lifetimes of such systems may expand over long time periods, with the
long-term performance controlled by the low permeability soil liner or the geosynthetic clay liner,
respectively. Though, models of different complexity are available to describe pollutant transport
processes (i.e. empirical, analytical, and numerical models, see Rowe 2005) through composite
liner system, the interaction of various processes, and the potential change of material properties
represent unresolved issues with respect to modeling. In addition, data to calibrate and validate
such models are hardly available, as direct monitoring (i.e. primary and secondary liner systems) is
often not possible at bottom barrier systems. Typically, the performance of bottom barrier systems
is monitored indirectly via groundwater wells downstream of the landfill. However, as observation
wells may potentially miss an existing pollutant plume and/or pollutant travel times (time period
between actual release of a pollutant and the detection at the monitoring well) may be very long (cf.
Inyang 2004), the direct monitoring of bottom barrier system performance represents the best way
to increase system understanding based on field-scale monitoring data.
Barriers – technical and natural systems 78

Containment system (component) Significance*
(%)
Dominant human factor
Design** Construction** Operation**
Bottom liner system – construction
Bottom liner system – degradation
Bottom liner system – stability
Bottom liner system – displacement
Leachate drainage system – construction
Leachate drainage system – degradation
Leachate drainage system – malfunction
Leachate drainage system – operation
Top cover system – construction
Top cover system – degradation
Top cover system – stability
Top cover system – displacement
18
9
15
5
8
6
5
5
2
2
23
2
1
3
9
4
0
2
2
1
0
2
16
1
11
3
0
0
6
3
0
0
2
0
2
1
2
1
3
0
0
0
2
3
0
0
0
0
* Overall 69 landfills have been investigated – percentages relate to the frequency of the problems occurred at these sites
** In total 80 problems have been reported at the 69 landfills
4.1.4 Long-term performance of technical barriers
4.1.4.1 Performance evaluation and modeling
The performance of technical barriers can be evaluated based on different criteria. Top covers are
often evaluated based on the amount of water infiltrating into the waste approximated by the flow
rate in the leachate collection system. Direct performance evaluations of bottom barrier systems are
not possible at many sites, as monitoring often focuses on potentially affected environmental media
and not on the barrier system itself (e.g. concentrations of pollutants detected at groundwater
monitoring wells). In addition to performance indicators of the whole system, criteria can be
defined also for single components. Such criteria are, for instance, the hydraulic conductivity of a
low permeability soil liner or the thickness of a geomembrane liner or the maximum build-up of
hydraulic head in a drainage layer. It should be noted though that these criteria can be addressed
primarily during and immediately after construction and therefore, secondary effects on per
formance levels can typically not be evaluated directly any more.
Table 4-6: Observed problems at landfill containment systems, their significance, and the dominant
human factor contributing to the problem (based on Bonaparte et al. 2002)
Table 4-6 shows some results of an investigation by Bonaparte et al. (2002) including 69 landfills
in the USA, where problems concerning the containment system were reported. The reported
problems were distinguished based on the barrier system elements (top cover, leachate collection,
and bottom liner), and on the dominant human factor contributing to the failure of the containment
system. Based on the data in Table 4-6, 47% of the reported problems related to the bottom liner
system, 29% related to the top cover, and 24% related to the leachate collection system. The most
important failure mechanism was the loss of geotechnical stability, which accounted for 38% of all
the reported problems, followed by inappropriate construction, responsible for 28% of the reported
problems. Among the human factors poor design was the prior reason for containment failure in
more than half of cases, 35% of the problems were due to poor construction quality and control,
and 14% of the problems were caused by improper operation of the landfill. This analysis
highlights the importance of stringent quality assurance mechanisms during the design and
Barriers – technical and natural systems 79

construction of technical barriers. However, the analysis is based exclusively on reported (i.e.
detected) problems and the age of the landfills is rather low compared to the time period with
significant emissions potentially expected from the waste.
Models describing the efficiency of a technical barrier system are based on the behavior of the bar
rier components and their interaction within the system. A widely applied model describing the
performance of top cover systems is the HELP model (Schroeder et al. 1984), which is based on a
layer concept and calculates water flow from one layer of the top cover system to the next layer in
the downwards direction. The simplicity of the model does not allow for a mechanistic description
of the complex hydrodynamic processes in a top cover system. The HELP model is used primarily
as a screening assessment tool to estimate leachate generation (cf. National Research Council
2007). More complex models, such as Hydrus-1D (Šimůnek et al. 1998), use the Richards equation
(Richards 1931) and water retention curves to express the relationship between the water content
and the soil water potential to describe water flow in top cover systems (e.g. Mallants et al. 1999;
Scanlon et al. 2002). The application of such models requires more and better input data, more
calculation capacity, and expertise in using numerical simulation models. Nevertheless, also these
models face limitations with respect to the consideration of preferential flow in top cover systems
or in view of changing material properties over time (e.g. material degradation, biological
processes, external stresses, etc.).
The modeling of water flow through bottom barrier systems with a sole low permeability soil liner
employs the same models used in soil physics to describe the water flow through saturated (Darcy
equation) and unsaturated (Richards equation) media (see also section 4.2.2). Pollutant transport
can be described via advection-diffusion equations, which allow for various transport processes
such as advective transport, diffusive transport, sorption, and degradation or transformation.
Though one dimensional models (e.g. Hydrus 1D) may be sufficient to describe pollutant transport
through bottom liners, multi-dimensional models are widely applied, too (Rowe 1998). While well
established and widely applied models exist to describe water and pollutant flow through single
mineral liner systems at the landfill base, the modeling of composite liner systems is more
nebulous. As advective flow is bound to the presence of holes or defects of the geomembrane liner,
corresponding models are based on assumptions about hole frequency, the presence of wrinkles,
and the quality of liner contact (cf. Rowe and Booker 2000; Rowe 2005). Based on a review of
leakage rates at U.S. landfills, the National Research Council (2007) concluded that the observed
flow rates cannot be explained in a plausible way without assuming wrinkles and increased head on
the geomembrane liner. The lack of direct observations (e.g. measurements of the number and size
of holes or the location and extent of wrinkles) introduces high model uncertainties and makes the
estimation of advective flow through geomembrane liners a challenging task. In addition to the
incomplete knowledge about the condition of the current system, the change of system properties
over time, such as decreasing effectiveness of drainage system and increased build-up of hydraulic
head, polymer degradation of the geomembrane liner, and local or global geotechnical instability
due to changing mechanical properties, cannot be accounted for within the transport models.
Barriers – technical and natural systems 80

Figure 4-5: Models of deterioration patterns at landfill containment systems and resulting source
concentrations (adapted from Inyang( 2004)): a) constant pollutant release from the
waste and constant barrier strength; b) constant pollutant release from the waste and
exponentially decreasing barrier strength; c) limited pollutant release from the waste
and exponentially decreasing barrier strength after some time; d) unlimited pollutant
release from the waste and exponentially decreasing barrier strength after some time;
An approach to tackle the problem of changing properties of the technical barrier system over time
is the definition of different service periods, associated with a defined condition of the system
during the respective service period. Based on this concept, Inyang (2004) distinguished between
an initial period (=technical barrier is mostly intact), an intermediate period (=flaws are generated),
and an extended period (=behavior of the barrier is dominated by flaws). For each period, different
models and/or model parameters are appropriate to describe water and pollutant transport.
Subsequently, the period-specific models can be aligned along the time axis to derive a continuous
estimate of technical barrier performance. Apart from the assumptions during model development,
the level of complexity in such estimates is exacerbated by the interrelationship between the
performance of the top cover system and the stresses (i.e. leachate generation) working on the
bottom barrier system. Although this procedure allows for a consideration of changing system
properties over time, the uncertainty inherent in such estimates needs to be emphasized. The effect
of different barrier deterioration models and different source characteristics over time on the source
concentration (=pollutant concentration directly outside the containment) is schematically
illustrated in Figure 4-5. The curves in Figure 4-5a) show the model assumption of constant barrier
strength and constant pollutant release from the waste resulting in constant source strength. The
assumption concerning barrier strength could be justified for continuously maintained and repaired
systems, but is incorrect for barrier systems in the absence of maintenance. Figure 4-5b) illustrates
the case of exponential barrier deterioration with a constantly high release of pollutants from the
waste resulting in high source concentrations after an initial increase in pollution. The effect of
exponential deterioration of the barrier in combination with limited substance release from the
waste on source concentrations is shown in Figure 4-5c). Finally, Figure 4-5d) illustrates the case
of exponential barrier deterioration after an initial lag phase (e.g. maintenance period) with an
inexhaustible release of pollutants from the waste resulting in increasing source concentrations.
Inyang (2004) concluded, based on the analysis of the effect of different model assumptions, that
the choice of deterioration model is of crucial importance for the evaluation of future pollutant
release from landfills and thus, model choice and application need to be scientifically based and
critically discussed.
Barriers – technical and natural systems 81

The discussion above highlights that statements about the long-term efficiency of technical barrier
systems are associated with substantial uncertainties. On the one hand, field data on the
performance of these systems have been collected for several decades, which is a rather short time
period compared to the time period over which many landfills contain a significant pollution
potential. On the other hand, monitoring data are typically not collected to gain an increased system
understanding of the technical barriers but to evaluate the effect of a landfill on potentially affected
systems (e.g. groundwater monitoring). To gain better insight into the processes and mechanisms
significant for the performance of technical barriers, more direct monitoring data need to be
collected and made available (cf. National Research Council 2007), and estimates about the
development of system performance need to be based on longer observation periods at the field
scale. As the latter cannot be achieved in a short time, the statement made by Farquhar and Parker
(1989) more than 20 years ago is still valid today: „Yet we must work with systems whose per
formance we do not fully understand and cannot adequately predict. This dilemma requires that we
be conservative in our judgments and vigilant in assessing their impact“.
4.1.4.2 Expert survey to evaluate long-term performance of technical barriers
The large uncertainties inherent in the evaluation of long-term barrier performance are primarily
due to a lack of appropriate field performance data (monitoring periods and data quality), the com
plex interaction of different processes contributing to a decrease in barrier performance, and the
inability to determine future conditions encountered in and around the landfill. As estimates on
future barrier performance cannot be verified, they are often based on assumptions which have a
significant effect on the outcome (Inyang 2004). Therefore, experts were invited to participate in a
survey to evaluate the significance of different factors for the performance of technical barrier
systems typically installed at Austrian landfills (cf. Figure 4-2 and Figure 4-4). 23 experts in
landfill geotechnics from Austria and Germany were asked to create a list of relevant factors in a
first step and subsequently evaluate the importance of these factors for different time periods (=
service periods) and barrier systems in a second step (see also appendix 2 and Laner et al. 2011c).
13 of the invited experts (approximately 57%) participated in the survey (see Table A-4 of
appendix 2). Based on a suggestion by the author, the experts agreed on a list of factors potentially
important to evaluate long-term system performance (see Table 4-7). The factors address the
resistance built into the barrier system (e.g. thickness of the vegetative cover) and the stresses
induced on the barrier system (e.g. climatic conditions, heat production in the waste). Then, the
experts assigned scores to each of the factors for different service periods (see appendix 2: Table
A-5 – Table A-8), based on the importance of this factor for the performance of the barrier system.
The evaluation scores ranged from 1 (insignificant) to 5 (highly significance). For instance, a score
of 5 for the factor “observed barrier performance” in service period 1 means that the system
performance at the time of evaluation is of very high significance for the expected system
performance during the first service period. Based on the expert evaluation, factors of high
significance for barrier performance during a specific time period can be identified (cf. appendix 2
and Table 4-8) and the expected importance of different factors over time can be analyzed (see
Figure 4-6 and Figure 4-7). Figure 4-6 and Figure 4-7 illustrate some trends in factor importance
over time for composite liner systems at the top and at the bottom of a landfill. For top covers (cf.
82 Barriers – technical and natural systems

0.5
1.0
1.5
SP 1 SP 2 SP 3
Evalu
ati
on
sco
re f
or
the
serv
ice
peri
od
/Evalu
ati
on
sco
refo
r all
peri
od
s
1 2 3 4 5
6 7 8 9 10
Figure 4-6), the importance of “heat production in the waste”, “observed barrier performance”,
“expected settlements”, “drainage system”, and “construction and design quality assurance
program” decreases with increasing service period, while the importance of “climate” and
“vegetation & after-use” increases with time. For bottom barriers (cf. Figure 4-7), the importance
of factors such as “heat production in the waste”, “observed barrier performance” or “leachate
drainage system” decreases strongly with time, while the significance of factors such as “landfill
geometry” or “distance to groundwater level” increases or remains similar over time. Note that the
mean evaluation scores in Figure 4-6 and Figure 4-7 are normalized. Therefore, they do not reveal
the absolute significance assigned to a factor by the experts, but illustrate the individual trends of
expected factor importance over time (service periods: several decades, around a century, several
centuries). An overview about the score assignments by the experts is provided in appendix 2.
Table 4-7: List of significant factors for the performance of engineered barrier systems
# Bottom barrier system Top cover barrier system
1
2
3
4
5
6
7
8
9
10
11
Observed barrier performance
Construction & design quality assurance program
Climate (e.g. temperature, precipitation)
Heat production in the waste
Distance to groundwater surface level
Overburden pressure
Leachate quality
Monitoring (e.g. groundwater monitoring)
Leachate drainage system
Stability of foundation
Landfill geometry (heap vs. cavity)
Observed barrier performance
Construction & design quality assurance program
Recultivation layer (vegetative cover thickness)
Heat production in the waste
Climate (e.g. temperature, precipitation)
Vegetation and projected after-use
Relief
Expected settlements
Lining control systems (direct monitoring)
Drainage system
Figure 4-6: Normalized evaluation scores (mean evaluation score for the service period/mean
evaluation score for all service periods) for the factors in Table 4-5 to illustrate the trend
of factor significance over time (i.e. over the service periods) for a top cover system with
a composite liner
The most important factors (i.e. number of rankings among the top three factors by an expert) are
shown in Table 4-8 for each period and barrier system. It is apparent that construction & design
Barriers – technical and natural systems 83

0.5
1.0
1.5
SP 1 SP 2 SP 3
Evalu
ati
on
sco
re f
or
the
serv
ice
peri
od
/Evalu
ati
on
sco
refo
r all
peri
od
s
1 2 3 4 5 6
7 8 9 10 11
Barrier system Service period 1
(< 50 yrs )
Service period 2
(50 - >100 yrs)
Service period 3
(several centuries)
Construction quality assurance (12) Vegetative soil layer (10) Vegetation & after-use (12)
Top cover: Local settlements (11) Vegetation & after-use (10) Vegetative soil layer (11)
Composite liner Vegetative soil layer (8) Construction quality assurance (10) Climate (10)
Observed performance (7*)
Local settlements (13) Vegetative soil layer (11) Vegetative soil layer (10) Top cover:
Low permeability soil
liner
Construction quality assurance (12)
Vegetative soil layer (11)
Vegetation & after-use (9)
Climate (9)
Climate (9)
Vegetation & after-use (9)
Construction quality assurance (6*) Construction quality assurance ((7*)
Construction quality assurance (13) Construction quality assurance (11) Landfill geometry (9)
Bottom barrier: Leachate drainage (13) Foundation stability (9) Construction quality assurance (9)
Composite liner Observed performance (8) Landfill geometry (8) Foundation stability (8)
Construction quality assurance (12) Construction quality assurance (11) Landfill geometry (9) Bottom barrier:
Leachate drainage (11) Foundation stability (11) Foundation stability (9) Low permeability soil
liner Observed performance (9) Landfill geometry (8) Construction quality assurance (8)
Leachate drainage (8*)
Notes:
*A fourth factor is included in the list, if the experts ranked the factor on the top as often as the third factor. For instance, for composite liner sys
tem at the top the factor “Observed performance” was ranked 6 times on top, which is equal to the number of top rankings for “Vegetative soil
layer”, with “vegetative soil layer being ranked more often on the 2nd or 3rd spot.
quality assurance is regarded as a very important factor for barriers at the top and at the bottom of a
landfill in general and in particular during the first service period. On the longer view, vegetation
and after-use, the thickness of the vegetative soil layer, and climate become the dominant factors
for top cover performance and landfill geometry as well as foundation stability get increasingly
important for bottom barrier performance.
Figure 4-7: Normalized evaluation scores for the factors in Table 4-5 to illustrate the trend of factor
significance over time for a bottom barrier system with a composite liner
Table 4-8: List of the top factors influencing the performance of the barrier systems throughout
different time periods (in brackets: number of experts ranking the factor among the top
three factors during the service period)
Barriers – technical and natural systems 84

Technical barrier system
-
-
-
Design: Layers, extraction systems, design specifications, similar systems
Construction: Quality assurance (protocols, field testing, documentation), local and global proof of geotech
nical stability
Observed performance: Monitoring data (leachate generation rate, efficiency of base lining system)
Waste properties
- Settlements: Overall settlements and differential settlements
-
-
Temperatures: Areas of different temperatures in the waste body
Emissions: Leachate composition (e.g. substances increasing the risk of drainage system clogging)
Landfill site
-
-
-
Climate and water balance: Precipitation, temperatures, groundwater recharge, prevailing winds
After-use: Proposed after-use, projected vegetation cover/typical vegetation at the site
Other factors: Hydrogeology, potential exposure to natural hazards (e.g. flood plain)
Although subjective, the expert evaluations provide a basis to rank the importance of different fac
tors with respect to their (expected) effect on barrier system performance. The expert evaluations
are subsequently used to determine weighting factors and develop a scenario of gradually decreas
ing barrier performance (see chapter 5.2), which forms the basis to illustrate the effect of decreas
ing barrier performance on the release of substances from the landfill. The different scenarios to
address long-term barrier performance are described in chapter 5.2 as a part of the methodology for
evaluating the environmental compatibility of closed landfills.
4.1.5 Summary and discussion
Technical barriers control and limit the interaction between the deposited waste and the surround
ing environment. Technical barriers typically consist of several components with low-permeability
mineral layers (e.g. clay liners), geomembranes (e.g. HDPE liners), geosynthetic clay layers, drai
nage layers, and vegetative soil layers being among the most important ones. The long-term per
formance of different barrier components (in the absence of maintenance and repair) is estimated to
range from several decades for leachate drainage systems to geologic time periods (thousands of
years) for low permeability mineral liners. Although several models exist to describe barrier per
formance, the lack of appropriate field data to calibrate and validate models, the complex interac
tion of different processes relevant to water and pollutant transport, and the potential change of
material properties over time introduce substantial uncertainties into the modeling. As subjective
assumptions may dominate model outcomes (cf. Inyang 2004), experts were invited to assess the
importance of different factors for the performance of barrier systems over specific time periods
(=service periods). Existing studies and the expert evaluations were used to outline basic indicators
for developing models of long-term barrier performance (see Table 4-9). The indicators listed in
Table 4-9 relate to the resistance built into a system (e.g. components of the barrier system, quality
assurance), the stresses induced on the system (e.g. settlements, climate, natural hazards), and the
currently (i.e. during the aftercare period) observed performance of the system. This information is
used to estimate future barrier performance as a part of the evaluation of landfill environmental
compatibility. In this work a scenario-based approach is used, which is described in chapter 5.2 and
illustrated in the case studies presented in chapter 6.
Table 4-9: Basic information to evaluate long-term barrier performance at closed landfills
Barriers – technical and natural systems 85

Operation period Containment period Deterioration period (largely isolation) (increasing interaction)
Time
Solid waste Solid waste Solid waste
4.2 Natural systems attenuating landfill emissions
4.2.1 Overview
Until 50 years ago, landfills were built with the belief that the buffering capacity of the local envi
ronmental system (i.e. the geological conditions at the site) is sufficient to prevent negative effects
on human health and the environment from landfill emissions. The potential of naturally occurring
processes (e.g. degradation, transformation, retardation, dispersion, and dilution) to mitigate pollu
tion from landfills was highlighted in several studies (e.g. Gray et al. 1974; Bagchi 1983). The
concept of “natural attenuation landfills” was often applied at sites with inappropriate geologic and
hydrologic conditions, so groundwater pollution became a problem at many of these landfill sites
(e.g. Zanoni 1972; Christensen et al. 1994; Kjeldsen and Christophersen 2001). As a consequence,
modern landfills are typically equipped with a containment system (=technical barrier system, see
previous section) to separate the deposited waste from the environment and limit/control two-way
substance flows (cf. European landfill directive (EC 1999)). The technical barrier system at the
bottom of the landfills is constructed before waste placement and a final cover, typically with low
permeability, is installed some time after the end of waste deposition (cf. Figure 2-1). Thus, the
waste is largely isolated from the surrounding environment implying minimal substance flows into
and out of the landfill (=containment period in Figure 4-8). Due to the limited resistance built into
the containment system and the continuous stresses induced on the system, the containment
deteriorates and the waste may increasingly interact with the surrounding environment
(=deterioration period in Figure 4-8). The landfill evolution illustrated in Figure 4-8 can be
expected in the absence of maintenance and repair/replacement of the containment system, but note
that also a functional containment system allows for some residual level of interaction between the
waste and the environment. Therefore, the evaluation of the environment’s capability to mitigate
negative effects of pollutants released from a landfill is a major element of the assessment of the
environmental compatibility of a closed landfill, particularly in the long term.
Figure 4-8: Interaction period at a containment-type landfill with decreasing performance of the
technical barriers in the absence of maintenance and repair
The main focus of this chapter is on the release of leachate to the subsurface and the subsequent
migration of leachate constituents in the environment, as landfill leachate is the most significant
long-term emission (cf. chapter 3 or Krümpelbeck 2000) and because of the potential pathway
associated with limited or decreasing technical barrier performance (cf. Figure 4-8). Apart from
leachate migration in the subsurface, the migration of landfill gas through top cover systems and
the discharge of collected leachate to surface waters are briefly addressed below.
Barriers – technical and natural systems 86

4.2.1.1 Landfill gas migration and methane oxidation
Modern top cover systems at MSW landfills include a landfill gas collection system, but many old
landfills are not equipped with such a system. In either case a (potentially small) fraction of the
landfill gas will migrate through the top cover. During the passage of the top layers of the cover,
methane can be oxidized under the presence of oxygen (at least 2% of volume) to carbon dioxide
and water (Huber-Humer et al. 2008). Methane oxidation has been demonstrated at landfills with
and without gas collection systems as well as for cover soils designed as biologically active covers
(i.e. compost amended soils) and for conventional vegetative top soil layers (e.g. Oonk and Boom
1995; Barlaz et al. 2004; Chanton et al. 2010; Chanton et al. 2011). While biologically active
covers oxidize a higher fraction of the methane entering the cover system in general (cf. Barlaz et
al. 2004; Huber-Humer 2004; Chanton et al. 2010), the actual rate of methane oxidation in a cover
is dependent on numerous factors. Important factors are the availability of oxygen, the methane
flux (=flow rate per area), the temperature, the water content, the presence of inhibitors (e.g.
ammonium), the content of humified organic matter, the root penetration, and the aging (=duration
of methane application) of the biologically active soil layer. The optimum temperatures for
methane oxidation processes are between 25 and 38°C (cf. Scheutz and Kjeldsen 2004), thus
fluctuations of atmospheric temperature throughout the year may also have a significant effect on
methane oxidation rates in a cover. Although higher methane fluxes into the cover system have
been demonstrated to increase the absolute rate of methane oxidation, the fraction of oxidized
methane tends to decrease with increasing flux (cf. Chanton et al. 2011; Rachor et al. 2011).
Methane oxidation rates in landfill covers have been reported between 0 and more than 100 g
CH4/m2.d, corresponding to fractions of oxidized methane between 0 and 99% (e.g. Huber-Humer
et al. 2008; Kühle-Weidemeier and Bogon 2008; Chanton et al. 2010; Scheutz et al. 2011). The
highest oxidation rates have been observed at biologically active covers with mature compost11 and
adapted microbiology. For instance, Huber-Humer et al. (2008) showed that optimized cover
systems could completely oxidize methane fluxes into the top cover of up to 4 l CH4/m².hour. For
low methane flux rates (below 2 l CH4/m².hour) high oxidation rates can be expected also at covers
not specifically designed to optimize methane oxidation (Kühle-Weidemeier and Bogon 2008).
The defininition of a constant fraction of the input flux for estimating methane oxidation does not
account for the effect of various factors such as CH4 flux into the cover or climatic conditions on
methane oxidation rates (cf. Chanton et al. 2011). Nevertheless, constant values are often suggested
as a first screening evaluation of the fraction of methane which can be oxidized in a cover system.
While the suggestion of 10% for the average annual fraction of oxidized methane by the IPCC
(2007) is rather conservative and very simplistic, the suggestions in Table 4-10 consider different
cover types and methane fluxes. It should be emphasized that methane oxidation processes are
influenced by many factors and that, particularly high, methane oxidation rates need to be
demonstrated in the field-scale over an extended period of time before they are used to assess
methane emissions to the atmosphere.
11 Compost with a significant fraction of readily biodegradable organics will reduce oxygen availability for
methane oxidation, cf. Scheutz et al. 2011.
Barriers – technical and natural systems 87

Top cover system Methane flux
> 2 l CH4/m².hour
Methane flux
< 2 l CH4/m².hour
Cohesive soil (silty sand or sandy silt) 0.10 0.15
Vegetative soil rich in humus 0.15 0.30
Biologically active methane oxidation layer
(during aftercare with monitoring/maintenance ) 0.60 0.70
Biologically active methane oxidation layer
(long-term without monitoring) 0.40 0.50
Table 4-10: Fraction of oxidized methane during the migration through the top cover (oxidized frac
tion relates to the methane released into the cover) for different cover systems and
methane fluxes (based on Kühle-Weidemeier and Bogon 2008)
4.2.1.2 Leachate discharge to surface waters
In Austria the controlled discharge of leachate to surface waters is regulated by emission-related
ordinances12 (leachate ordinance (MoE 2003) and waste water discharge ordinance (MoE 1996a),
see Hefler (2003) for further details). If the quality of landfill leachate does not comply with these
regulations at the point of leachate discharge (i.e. the outlet to the surface water body), the leachate
has to be treated before discharge. Though the authorities can specify differing criteria based on the
vulnerability of the potentially affected water body, this has been hardly exercised yet. Conse
quently, as generic limit values are used to evaluate the release of collected leachate to surface
waters, the effect of these (controlled) emissions on environmental media is not addressed in more
detail.
Apart from controlled discharge of leachate, leachate-polluted groundwater could have an impact
on water quality in affected surface waters. This emission pathway is included in the analysis of
pollutant migration in the subsurface. Another possible way of uncontrolled leachate-induced pol
lution of surface water bodies is the flooding of landfills, as a significant proportion of landfills in
Austria are located in flood-prone areas (cf. Laner et al. 2009). The erosion of deposited waste
and/or the leaching of pollutants contained in the waste are potential sources of surface water pol
lution. However, due to the large dilution potential during a flood event, a flooded landfill will be
typically one among many sources of pollution of similar magnitude during a flood event (Laner et
al. 2009).
4.2.2 Leachate migration in the subsurface
The migration of pollutants in the subsurface has been intensively investigated (e.g. Christensen et
al. 1994; Christensen et al. 2000; National Research Council 2000; Luckner 2010) with the aim to
evaluate the potential of natural environments to mitigate negative effects of a release of landfill
leachate. Naturally occurring physical, chemical, or biological processes that, under favorable
conditions, reduce the mass, toxicity, mobility, volume, or concentration of pollutants in soil or
groundwater are called “natural attenuation processes”. They include biodegradation, dispersion,
dilution, sorption, volatilization, radioactive decay, and chemical or biological stabilization,
transformation, or destruction of pollutants (U.S. Environmental Protection Agency 1997). It has
12 The discharge quality standards for several landfill leachate parameters are shown in Table 3-3, Table
3-10, and Table 3-13
Barriers – technical and natural systems 88

been suggested that only retardation (i.e. transformation of substances from mobile, liquid phases
to immobile phases) and degradation (i.e. transformation of substances into less harmful or
harmless substances) should be considered in remediation strategies for contaminated sites (cf.
Luckner et al. 2008; Luckner 2010). However, processes causing a sole decrease in pollutant
concentrations (i.e. dispersion, dilution) naturally take place in the subsurface environment and are
subsequently considered in the evaluation of environmental impacts due to leachate emissions.
4.2.2.1 Landfills as a threat to groundwater
Landfill leachate emissions are a significant threat to the groundwater quality in Europe (cf.
Europäische Umweltagentur 2004). In the USA landfills are reported to be one of the most impor
tant sources of groundwater pollution (3rd rank among reported sources of groundwater pollution in
Figure 4-9). In the past, landfills have often been constructed with inadequate technical barrier sys
tems at sites where the geology and hydrogeology could not prevent groundwater pollution.
Although modern landfills are typically equipped with technical barrier systems, they represent a
potential source of groundwater pollution, particularly on the long term (cf. Figure 4-8).
Figure 4-9: Major sources of groundwater pollution in the USA (Source: U.S. EPA 2000)
Despite the fact that indivdual landfills differ with respect to waste composition and local
conditions, typical impacts of released landfill leachate on the groundwater quality can be
illustrated via statistical analysis of measurements in contaminated and uncontaminated
groundwater (cf. Arneth et al. 1989; Kerndorff et al. 1993; Voigt and Wippermann 1998). In Table
4-11 and Table 4-12 measurements of groundwater quality at 126 drinking water extraction plants
(=uncontaminated groundwater) and at 205 leachate plumes from old landfills (=affected by waste
deposit) are analyzed and compared. The mean and median values of each data set in Table 4-11
Barriers – technical and natural systems 89

and Table 4-12 show that pollution by landfill leachates is typically associated with increased
concentrations of substances in the groundwater13. To evaluate the importance of indivdual
pollutants, two indices are calculated: The emission detection frequency (EDF) is the percentage of
the “affected by waste deposit” data set above the mean value calculated for the “uncontaminated
groundwater” data set. The influence factor (IF) expresses the strength of pollution by multiplying
the EDF with the quotient of the mean values of the two data sets (see Table 4-11 and Table 4-12).
Table 4-11 and Table 4-12 also show the marginal effect levels (MEL) for different substances
(=threshold levels to identify groundwater damage (cf. LAWA 2004)) and the Austrian drinking
water quality standards (MoE 2001) for comparisons.
Among inorganic groundwater constituents, the concentrations of ammonium, arsenic, chromium,
boron, and chloride differ the most between the contaminated and the uncontaminated groundwater
data set, based on the calculated influence factors (see Table 4-11). Emission detection frequencies
above 75% can be observed for hydrogen carbonate, boron, sodium, chloride, and magnesium.
Boron has been suggested as an indicator for landfill-borne groundwater pollution, due to its low
geogenic concentrations and its typical presence in groundwater leachate plumes from landfills (cf.
Voigt and Wippermann 1998). However, in terms of leachate quality it should be emphasized, that
a substance may well be present in the landfill leachate but not be detected in the groundwater, due
to high retardation or low persistence (i.e. short degradation half-life). Therefore, the substance
concentrations of a groundwater leachate plume depend on the composition of the released
leachate, the geochemical mobility and persistence of the leachate constituents, the redox condi
tions, and the range of parameters measured in the groundwater.
The mean values of most of the organic groundwater constituents listed in Table 4-12 are below the
respective detection limits for the uncontaminated groundwater data set. While most of the organic
compounds in landfill leachate plumes are (rather harmless) organic acids (e.g. humic acids), more
hazardous organic compounds are present, too (cf. Öman and Junestedt 2008; Weber et al. 2011).
Among the most important are BTEX, halogenated hydrocarbons and various pesticides (cf. Table
4-12; Baun et al. 2004; Europäische Umweltagentur 2004). However, the extent of leachate plumes
with organic pollutants in the groundwater has been observed to be quite limited at many landfills
due to relatively fast degradation and dilution/dispersion of the pollutants in the groundwater (cf.
Christensen et al. 1994). This is illustrated by Table 4-13, as reported lengths of groundwater
plumes downstream of old MSW landfills are typically in the range of several hundreds of meters.
However, pollutant plumes in coarse sand aquifers were reported to impact the groundwater over
several kilometers, particularly with respect to conservative, inorganic pollutants such as chloride
(cf. Table 4-13).
13 Some substance concentrations could be also reduced due to the influence of landfill leachate (e.g. sulfate
reduction in an anaerobic pollutant plume, cf. Figure 4-10).
Barriers – technical and natural systems 90

Parameter Affected by waste
deposit1
Uncontaminated
groundwater1 EDF2
DW
limit3 MEL4 IF5
Unit Mean Median Mean Median [%] [-]
Major anions
Hydrogen carbonate mg/l 519 408 83 78.7 85.8% 5.4
Chloride mg/l 202 74.2 14 11.9 79.2% 200 250 11.4
Sulfate mg/l 194 122 18 12.7 64.5% 250 240 7.0
Nitrate mg/l 25.6 2.5 3 2.2 50.7% 50 - 4.3
Major cations
Calcium mg/l 175 156 83 78.7 74.5% - - 1.6
Magnesium mg/l 38.1 22 14 11.9 76.0% - - 2.1
Sodium mg/l 128 45.6 18 12.7 83.4% 200 - 5.9
Ammonium mg/l 11 0.4 0.17 0.07 53.6% 0.5 - 34.7
Iron mg/l 9.6 2 2 0.93 40.6% 0.2 - 1.9
Manganese mg/l 1.5 0.43 0.18 0.12 62.2% 0.05 - 5.2
Trace components
Aluminum µg/l 596 80 50 <10 33.9% 200 - 4.0
Lead µg/l 6.3 <0.05 1.4 <0.5 38.3% 10 7 1.7
Cadmium µg/l 1.5 <0.05 0.13 <0.1 14.9% 5 0.5 1.7
Chromium (total) µg/l 21.2 <10 0.58 <0.5 56.3% 50 7 20.6
Copper µg/l 24.5 <10 7 4.5 52.4% 2000 14 1.8
Nickel µg/l 22.9 13 2.8 <1 64.3% 20 14 5.3
Mercury µg/l <0.2 <0.2 <0.1 <0.1 14.7% 1 0.2 -
Strontium µg/l 580 399 240 200 74.1% - - 1.8
Zinc µg/l 410 64.5 117 30.2 41.2% - 58 1.4
Arsenic µg/l 45.4 1.3 1.2 <0.5 61.3% 10 10 23.2
Nitrite µg/l 0.49 <0.1 <0.01 <0.01 35.4% 100 - -
Selenium µg/l 0.1 <0.2 0.55 <0.1 22.3% 10 7 0.0
Boron (total) µg/l 832 181 34.8 26 85.7% 1000 740 20.5
Fluoride µg/l <0.5 <0.5 <0.1 <0.1 52.6% 1.5 0.75 -
Cyanide (total) µg/l - - <1 <1 - 50 5 (50) -
Phosphate (total) µg/l 1.8 0.1 0.14 0.08 41.5% - - 5.3 1 Measured data at 205 groundwater wells downstream of waste deposits (=affected groundwater) and data from water quality monitoring at
126 drinking water extraction plants (=uncontaminated groundwater) (cf. Kerndorff et al. 1993) 2 EDF = Emission detection frequency (=fraction of measurements in the affected groundwater above the mean value of the uncontaminated
groundwater data set) based on Voigt and Wippermann (1998) 3 Quality standards for drinking water (Austrian drinking water quality directive, MoE (2001)) 4 Marginal effect levels (MEL) according to LAWA (2004) 5 Influence factor (IF): IF= (mean valueaffectedt/mean valueuncontaminated)*emission detection frequency
Table 4-11: Comparison of inorganic groundwater constituent concentrations in groundwater
affected by waste deposits and uncontaminated groundwater (based on Voigt and
Wippermann 1998; Luckner et al. 2008)
Barriers – technical and natural systems 91

Parameter
Unit
Affected by waste 1 deposit
Mean Median
Uncontaminated 1 groundwater
Mean Median
EDF2
[%]
DW 3 limit
MEL4
IF5
Aggregate parameters
DOC
AOX
Volatile halogenated
hydrocarbons
Trichloromethane
1.2-Dichloroethane
cis-1.2-Dichloroethylene
Chloroethylene
Trichloroethylene
Tetrachloroethylene
BTEX
Benzene
Toluene
o-Xylene
m/p-Xylene
Ethylbenzene
PAH
Naphtaline
mg/l
µg/l
µg/l
µg/l
µg/l
µg/l
µg/l
µg/l
µg/l
µg/l
µg/l
µg/l
µg/l
µg/l
-
-
76.2
107
22100
1690
11.5
56.1
141
4.1
13.8
3.4
6.6
1.5
-
-
1.4
<5
166
99.5
2.3
1.4
13.5
3.5
4.7
2.8
4.4
1.1
1.6
2.7
0.12
-
-
-
0.21
0.34
<0.1
<0.1
<0.1
<0.1
<0.1
-
1.2
<2
<0.1
-
-
-
<0.1
<0.1
<0.1
<0.1
<0.1
<0.1
<0.1
-
-
-
22.0%
18.8%
30.1%
17.7%
40.8%
46.2%
29.1%
16.5%
9.5%
22.8%
11.3%
12.1%
-
-
-
3
-
0.5
10*
1
-
-
-
-
0.1**
-
20
-
2
0.5
10*
1
-
-
-
-
0.2**
1
-
-
139.9
-
-
-
22.3
76.2
-
-
-
-
-
-
-
1 Measured data at 205 groundwater wells downstream of waste deposits (=affected groundwater) and data from water quality monitoring at 126 drinking water extraction plants (=uncontaminated groundwater) (cf. Kerndorff et al. 1993)
2 EDF = Emission detection frequency (=fraction of measurements in the affected groundwater above the mean value of the uncontaminated
groundwater data set) based on Voigt and Wippermann (1998)
3 Quality standards for drinking water (Austrian drinking water quality directive, MoE (2001)) 4 Marginal effect levels (MEL) according to LAWA (2004)
5 Influence factor (IF): IF= (mean valueaffectedt/mean valueuncontaminated)*emission detection frequency
* Values relate to the sum of tetrachloroethylene and trichloroethylene
** Values relate to the sum of PAH without naphtaline
Landfill Area Dimensions (longitudinal/lateral) Geological
stratum Investigated parameters* [m²] [m]
Borden, CAN
North Bay, CAN
Woolwich, CAN
Grindsted, DEN
Vejen, DEN
Unknown, GER
Noordwijk, NED
Army Creek, USA
Babylon, USA
Islip, USA
KL Avenue, USA
Sjoelund, DEN
45,000
280,000
35,000
100,000
60,000
150,000
60,000
240,000
100,000
70,000
270,000
6,300
700 \ 600
400 \ 100
600 \
400 \ < 400
400 \ 100
3000 \ 500
- \ -
700 \
3000 \ 600
1500 \ 400
1600 \
100
Sand
Silt
-
Sand
Sand
Coarse sand
Coarse sand
Sand
Coarse sand
Coarse sand
Sand
Fine sand
1, 2, 3
1, 2, 3, 4
1, 3, 4
1, 2, 3, 4
1, 2, 3, 4, 5
1, 3
1, 4
1, 2, 3, 4
1
1
1, 2, 3, 4
2, 3, 4
*Parameters: 1… Inorganic parameters, 2… Redox pairs, 3… DOC, 4… XOC, 5… Heavy metals
Table 4-12: Comparison of organic groundwater constituent concentrations in groundwater affected
by waste deposits and uncontaminated groundwater (based on Voigt and Wippermann
1998; Luckner et al. 2 008)
Table 4-13: Dimensions of pollutant plumes downstream of old MSW landfills (based on Christensen
et al. 2000 and Bjerg et al. 2009)
Barriers – technical and natural systems 92

Due to the organic pollution of leachate from old MSW landfills, typical redox zones can be
observed in groundwater pollution plumes downstream of such landfills (cf. Figure 4-10). The
sequence of redox zones is based on the available electron acceptors during the microbial degrada
tion of organic matter and the amount of chemical energy released during the reactions (cf. Zobrist
1999). Ranked by the amount of chemical energy released, the sequence of reactions is: 1.) Aerobic respiration: Corg + O2 � CO2 + H2O
2.) Denitrification: Corg + NO3-
� N2 + HCO3- + CO2
-3.) Manganese reduction: Corg + MnO2 � Mn2+ + HCO3
-4.) Iron reduction: Corg + FeOOH � Fe2+ + HCO3
5.) Sulfate reduction: Corg + SO42-
� HS- + HCO3- + CO2
6.) Methane generation: Corg + CO2 � CH4 + CO2
At a site where leachate with strong organic pollution is released to the groundwater, the zone of
methane generation below the landfill is surrounded by a sulfate reduction zone, provided that
some sulfate is present in the leachate (see Figure 4-10). Further downstream, oxides of iron and
manganese are still available as electron acceptors and corresponding zones can be identified in the
leachate plume. In addition, nitrate is often leached to the groundwater from the surface (e.g. agri
cultural activities) and a denitrification zone forms at the fringe of the pollutant plume. Also at the
end of the organic pollutant plume nitrate is available as an oxidant and denitrification takes place
before the groundwater turns aerobic again further downstream (see Figure 4-10). A detailed
discussion of the biogeochemistry of landfill leachate plumes in the groundwater can be found for
instance in Christensen et al. (2001) or Fetter (2008).
Figure 4-10: Redox zonation in groundwater polluted by landfill leachate based on investigations at
the landfill „Grindstet“ by Ludvigsen et al. (1998)
While there is a general understanding of pollutant migration in the subsurface, an evaluation of
substance transport is possible only in view of the local environmental conditions and for specific
pollutants. Major attenuation mechanisms of different pollutants in a clay-rich soil are listed in
Table 4-14 and are meant to qualitatively illustrate the most important processes potentially
mitigating negative effects of the pollutants on the groundwater. Evaluations of landfill-borne pol
lutant migration for a specific system are typically associated with substantial uncertainties due to
various reasons. Firstly, investigations of natural attenuation potentials have focused mainly on
Barriers – technical and natural systems 93

Leachate parameter Major attenuation mechanisms Mobility in clayey soil
Ammonium Exchange, biological uptake Moderate
Arsenic Precipitation, adsorption Moderate
Boron Adsorption, precipitation High
Cadmium Precipitation, adsorption Moderate
Calcium Precipitation, exchange High
COD Biological uptake, filtration Moderate
Chloride Dilution High
Chromium Precipitation, exchange, adsorption Low (Cr3+), high (Cr6-)
Cyanide Biotransformation, Adsorption High
Iron Precipitation, exchange, adsorption Moderate
Lead, zinc, copper Adsorption, exchange, precipitation Low
Magnesium Exchange, precipitation Moderate
Manganese Precipitation, exchange High
Mercury Adsorption, precipitation High
Nickel Adsorption, precipitation Moderate
Nitrate Biological uptake, dilution High
Sodium Exchange, dilution Low to high
Sulfate Exchange, dilution High
hydrocarbons (i.e. petroleum hydrocarbons) and chlorinated solvents in the past, and not on typical
landfill leachate constituents (e.g. National Research Council 2000). As a consequence, marginal
effect levels have not been proposed for typical leachate constituents such as ammonium (cf. Table
4-11 and Table 4-12). Secondly, leachate is a complex mixture of different substances mutually
influencing each others’ migration behavior. Thirdly, the heterogeneity of the emission source
(heterogeneous waste body, preferential water flow) and the dimensions of the source area (pollu
tant fluxes, points of release, groundwater flow directions) make the evaluation of natural attenua
tion difficult. Finally, natural variations in environmental system properties (e.g. soil properties)
and incomplete system understanding also represent a source of uncertainty.
Table 4-14: Major attenuation mechanisms for landfill leachate constituents in clayey soil (Source:
Bagchi 1987)
Substance migration in the soil and groundwater zone is dependent on the mixture and concentra
tion of the substances in the leachate as well as on the local environmental setting. To evaluate the
impact of released landfill leachate on the subsurface environment, dominant substance transport
mechanisms are incorporated into mathematical models, which can be used to determine substance
concentrations along the transport pathway. The mathematical descriptions of important substance
transport processes and selected transport models are presented below.
4.2.2.2 Models of substance transport in the subsurface
The subsurface environment under investigation comprises the vadose zone above the groundwater
(provided the landfill bottom is not located in the groundwater zone) and the potentially affected
groundwater zone. The landfill represents the pollutant source with the release rate and the compo
sition of the leachate as the major parameters of interest. The dominant substance migration
processes are advection, dispersion and diffusion, as well as sorption and transformation (degrada
tion and volatilization). While these processes are only addressed briefly below, more elaborate
descriptions of the individual migration processes can be found for instance in Luckner and
Schestakow (1991), Hillel (1998) or Fetter (2008).
94 Barriers – technical and natural systems

Description of major migration processes
Advection is the transport of a solute due to the movement of a liquid in the subsurface. If a liquid
is in motion, advection14 takes place. The movement of water in an unsaturated porous media is
described by Richards equation (Richards 1931), which is based on Darcy’s equation (Darcy 1856)
and the continuity equation (law of mass conservation), see equation 4-1. Consequently, to describe
advective transport, information about the porous medion (e.g. hydraulic conductivity, effective
porosity) and about the hydraulic gradient causing water flow is necessary under water saturated
conditions. Under unsaturated conditions, additional knowledge of the water content and the water
retention curve is needed to describe advective transport.
∂θ ∂ ∂h k(θ ) ⋅ +1 − S(z, t)(4-1) =
∂t ∂ ∂z z
where θ is the water content [m³/m³], h is the hydraulic head or hydraulic potential [m], k(θ) is the
hydraulic conductivity as a function of the water content [m/s], t is the time [s], z is the depth [m],
and S is the source/sink term [s-1].
Hydrodynamic dispersion causes solute transport relative to the advective flow of the fluid. Hydro
dynamic dispersion is dependent on advective flow (no dispersion without advection). The extent
of hydrodynamic dispersion is related to the scale of investigation, as the dominant factors causing
hydrodynamic dispersion differ from micro- to macro-scale. At the micro-scale, hydrodynamic
dispersion is primarily caused by the variability of flow velocities across pore cross-sections,
varying pore widths causing different flow velocities, diverse flow paths due to pore structure
(tortuosity), and transversal pollutant spreading due to pore ramifications (cf. Luckner and
Schestakow 1991). At the large scale, factors such as geologic stratification of the subsurface or the
presence of local layers with different properties (e.g. soil lenses with low permeability in a gravel
aquifer) have a dominant effect on hydrodynamic dispersion.
Molecular diffusion is mainly caused by the Brownian motion of particles, but also due to osmotic
forces, heat diffusion, and electro-osmosis. Diffusion is described by Fick’s law (Fick 1855), which
establishes a direct relationship between the substance flux in static liquids and the concentration
gradient of a substance in the liquids, see equation 4-2. In the unsaturated zone, the diffusion
coefficient is strongly dependent on the water content and the tortuosity (cf. Hillel 1998). Although
molecular diffusion is included in the dispersion coefficient in many substance migration models, it
should be emphasized that molecular diffusion is related to another physical mechanism than
hydrodynamic dispersion and it would also occur without advection, which is not the case for
hydrodynamic dispersion.
(4-2) J d = −D0 ⋅ dc / dx
where Jd is the diffusive flux [mol/(m².s)], D0 is the diffusion coefficient [m²/s], and dc/dx is the
concentration gradient against the direction of diffusive flux [mol/m4].
The substance transport processes described above are combined to the advection-dispersion equa
tion, which is given by equation 4-3 for unsaturated conditions.
14 Advection is also referred to as convection.
Barriers – technical and natural systems 95

∂(Bd ⋅ C*) ∂(θ ⋅ C) ∂
∂C + ∑(4-3) D ⋅θ ⋅ − q ⋅ C Yi+ = s
∂ ∂ ∂ ∂zt t z i
where Bd is the bulk density of the soil [kg/m³], C* is the substance concentration bound to the
solid phase [kg/kg], t is the time [s], θ is the water content [m³/m³], C is the substance concentration
in the liquid phase [kg/m³], Ds is the substance-specific dispersion coefficient (including diffusion)
[m²/s], z is the spatial coordinate in the flow direction [m], q is the advective water flow velocity
[m/s], and Yi is the source/sink term to consider transformation, release, and extraction processes
[s-1]. If the variables Bd, Ds, θ and q in equation 4-3 are constant, the equation resembles the
advection-dispersion equation for the groundwater zone.
The first part of equation 4-3 describes the distribution of a substance between the liquid and the
solid phase. Equilibrium reactions are often assumed, which means that thermodynamic equili
brium is reached in a short time between the substance concentration in the liquid and in the solid
phase. Sorption isotherms adhering to this concept are the linear sorption isotherm, the Freundlich
sorption isotherm, or the Langmuir sorption isotherm. The linear sorption isotherm is widely
applied due to its simplicity (C*= kd · C; with kd being the distribution coefficient in kg/m³). But it
is based on the assumption of unlimited sorption capacity of the soil, which is unrealistic in general
and problematic in case of high substance loads in the liquid phase. Sorption processes are consi
dered reversible, which means that substances accumulated in the solid phase can be released to the
liquid phase again after a decrease of the concentrations in the liquid phase.
The last term of the advection-dispersion equation (4-3) considers source or sink processes taking
place in the subsurface (cf. Luckner et al. 2008). Sinks for substances are, for instance,
bioaccumulation processes (e.g. substance is metabolized for microbial growth), transformation
processes, and substance extraction via roots. Transformation processes can be also a source
process for daughter products from the degradation of pollutants originally present in the leachate
(e.g. trichloroethane degradation is typically associated with the accumulation of vinyl chloride).
However, the immobilization and transformation of pollutants is the product of many different
processes and the modeling of these processes is confronted with limited knowledge and complex
interactions. Therefore, while advection, hydrodynamic dispersion and diffusion are well
understood, the description of substance immobilization and transformation is more uncertain (cf.
National Research Council 2000).
The effects of different substance transport processes on the break-through curves in a column flow
experiment are schematically illustrated in Figure 4-11. Ideal plug flow could be observed if sub
stance transport was solely based on advection (i.e. the substance traveled at the same velocity as
the liquid). Dispersion processes cause a stretching of the break-through curve (some solutes travel
faster and others slower relative to advective flow), but do not decrease the overall substance
concentration (in case of continuous application at the top). Adsorption and dispersion processes
cause a retardation of substance break through, but only a minor reduction in the final substance
concentration at the outlet. Thus, the only process significantly reducing the substance
concentrations at the outlet of the experimental column is biodegradation, as a part of the applied
substances is transformed into other substances and mass reduction of the applied substance takes
place.
Barriers – technical and natural systems 96

1.0
C C0
00 2 3
Ideal plug flow
Dispersion Adsorption and dispersion
Biodegradation and dispersion
1 Time relative to mean residence time of water
Figure 4-11: Schematic tracer break through curves to illustrate the effect of dispersion, sorption, and
degradation processes on solute transport (according to Fetter 2008 based on Roberts et
al. (1980))
Analytical and numerical transport models
The complexity of models to describe substance migration in the subsurface varies from simple
screening tables to sophisticated numerical models. In general, the model choice depends on the
processes of interest and on the available data. It should be emphasized that the most sophisticated
model will not be available to describe processes realistically without appropriate input data. In
many cases, a simple model based on conservative assumptions may be a good starting point to
derive first estimates and potentially establish a more complex model with higher data and resource
requirements in a subsequent step. In any case, the model complexity should directly relate to the
quality and quantity of data to calibrate and validate the model.
Several analytical and numerical models to estimate substance transport in the vadose and/or
groundwater zone are discussed briefly below. While there are numerous transport models availa
ble, the models presented here shall provide an overview about different model complexities and
capabilities.
Analytical models
Analytical models are based on mathematical equations which are continuous in space and time
and can be solved without iterations. They typically include assumptions on regular geometries and
homogenous properties. The major advantages of such models are (cf. Foster Wheeler Env. Corp.
1998) that
- they are quick to set up and easy to use,
- they may be used to validate numerical models for a defined set of input data,
- they deliver stable solutions,
- they may be used to quickly derive conservative estimates before more complex models
are used, and
- they can partly consider anisotropic conditions.
Apart from the advantages of ease of use, the simplifications and assumptions present in analytical
models may cause the models to ignore significant migration processes occurring in the real sys
tem, for example due to the ignorance of heterogeneous soil properties or of the temporal variabil-
Barriers – technical and natural systems 97

ity of boundary conditions. As examples, two analytical models for the unsaturated zone (AF
model and Altex-1D) and one analytical model for the saturated zone (DOMENICO) are briefly
discussed below.
Altex-1D
The model Altex-1D (LABO 2008) is based on the analytical solution of the advection-dispersion
equation (cf. equation 4-3) for the one-dimensional case according to van Genuchten (1982). The
model assumes homogeneous soil properties (equivalent soil properties can be calculated for a soil
profile with different layers based on an empirical formula) and a stationary, one-dimensional
downward flow field (transversal dispersion can be considered in the model making it three-dimen
sional (symmetric)). Two functions are available in the model to consider the pollutant source: a)
constant source term strength for a limited period of time or b) exponential decrease of source term
strength. The Altex-1D model assumes no pre-contamination of the transport pathway. Sorption
processes are described via linear sorption isotherms. Degradation processes can be considered at a
first order rate, i.e. the degradation rate is directly proportional to the concentration of the sub
stance, in the model. The Altex-1D model has been developed for forecasting leachate con
centrations from waste-derived material deposits in and on the soil. Case studies to illustrate the
application of Altex-1D, including a description of the spread sheet calculations, are presented in
the report by LABO (2008).
AF model
The AF model (Schneider and Stöfen 2004 and 2006) is also based on the analytical solution of the
advection-dispersion equation (cf. equation 4-3) for the one-dimensional case (van Genuchten
1982). A continuous, stationary and downward flow field in the unsaturated zone is assumed
without initial pollution of the transport pathway. Processes considered in the model include
advection, dispersion, diffusion in soil liquid and gas, linear sorption, and degradation at a first
order rate. Multiple soil layers can be specified in the transport model. Two source term functions
are available in the model: The release of pollutants for a finite time and at a constant level on the
one hand, and the release of pollutants at an exponentially decreasing rate on the other hand. Based
on the comparison of average substance residence times in the unsaturated zone and the
decreasing/limited source term strength, an attenuation factor is calculated. The relationships of
substance residence times, finite or decreasing source term strength, and the resulting attenuation
factors are expressed in nomograms (cf. Figure 5-12 and Figure 5-13), which were derived from
numerous solutions of the advection-dispersion equation for a range of input parameters (Schneider
and Stöfen 2004). The AF model does not determine a pollutant concentration over time, but
calculates the maximum pollutant concentration above the groundwater surface. Like Altex-1D, the
AF model has been developed to estimate the impact of pollutants from deposited waste-derived
materials and it has been demonstrated to be a robust and conservative approach for estimating
substance migration in the vadose zone (Schneider and Stöfen 2006).
DOMENICO
The DOMENICO model provides an analytical solution of the advection-dispersion equation under
water saturated conditions (Domenico 1987). The solution is approximate. Further simplifications
are the assumption of substance transport along the direct line between the source and the point of
interest, homogenous concentrations in the source zone, and no pre-contamination of the aquifer.
Barriers – technical and natural systems 98

Pollutant migration is three dimensional (symmetric around the flow path) due to the consideration
of transversal dispersion. Apart from dispersion, further processes potentially decreasing substance
concentrations in the model are sorption (linear sorption isotherms) and substance degradation at a
first order rate. Input parameters to establish the model are the source concentration of the
investigated substance, the dimensions of the source, the advective groundwater flow, and the
dispersivity. Due to its simplicity and ease of use the DOMENICO model is frequently
implemented in groundwater models to consider solute transport (e.g. BIOSCREEN).
Numerical models
Partial differential equations are used within numerical models to describe substance transport dis
cretely in time and space. The system of differential equations can be solved iteratively (method of
finite differences or method of finite elements) based on the definition of boundary conditions.
Numerical models can simulate substance transport in heterogeneous systems with varying system
properties over space and time. Major advantages of numerical models are (cf. Foster Wheeler Env.
Corp. 1998) that
- they can describe the complex interaction of different processes,
- they allow for the simulation of multidimensional systems,
- they can consider different boundary conditions as well as the spatial variability of system
properties,
- they can simulate stationary and dynamic flow conditions,
- they deliver temporally and spatially discrete results for the whole system.
The advantages of numerical models listed above are confronted by increased requirements with
respect to the quality and quantity of input data, the higher resource-demand to establish and apply
such models, and the possibility of numerical instabilities in the calculation. If appropriate data are
available to apply numerical models, they represent a powerful tool to describe substance migration
processes and their interaction in the subsurface. Out of the numerical models briefly described
below, Hydrus and BIOF&T2D can simulate substance transport in variably saturated media and
MODFLOW has been developed to model transport processes in the saturated zone.
Hydrus (1D, HP1, 2D/3D)
Hydrus 1D (Šimůnek et al. 2008) can simulate vertical water, heat and solute transport in variably
saturated porous media. Water flow is modeled based on the Richards equation (cf. equation 4-1)
with the van Genuchten soil parameters. Different hydraulic boundary conditions can be specified
and potentially vary over time. While Hydrus 1D is restricted to one-dimensional transport
processes, the Hydrus 2D/3D (Šimůnek et al. 2007) model allows for modeling the migration of
water, heat, and substances in variably saturated porous media in two or three dimensions.
Substance transport in Hydrus is based on the advection-dispersion equation (cf. equation 4-3). The
model can consider up to six substances, which may migrate independently from each other or can
be interreleated by chemical reactions. Transformation processes can occur at a first or zero order
rate, whereby reaction rates can be defined explicitly for the solid, liquid, and gas phase.
Equilibrium and non-equilibrium sorption processes can be considered in the model. In addition,
Hydrus 1D has been coupled with PHREEQC-2 within the HP1 model (cf. Jacques and Šimůnek
2005) to geochemically model reactive substance transport in the subsurface (interaction of the soil
matrix with the liquid phase).
Barriers – technical and natural systems 99

The various Hydrus models can be applied to a variety of problems relating to migration processes
in porous media. While the detailed modeling of water flow has been the primary focus of the
Hydrus models, the integrated HP1 model also allows geochemical modeling at a highly sophisti
cated level. Hydrus represents a powerful tool to model migration processes in the subsurface.
BIOF&T2D
The bio flow and transport (BIOF&T) model was developed as a two-dimensional (2D) model to
evaluate the effect of remediation activities at contaminated sites (Resources & Systems
International 1995-2000). Water flow in variably saturated media is described by the Richards
equation (cf. equation 4-1) with limited possibilities of defining boundary conditions in the model.
Substance migration processes are expressed via the advection-dispersion equation (cf. equation 4
3) and based on a dual porosity approach (cf. van Genuchten and Wierenga 1976), which assumes
advective flow in larger pores and sole diffusive substance transport in small pores. The focus of
BIOF&T2D is on biological degradation processes, which can be described by aerobic or anaerobic
degradation following a first order rate or Monod kinetics. In case of anaerobic degradation, the
sequential degradation of a substance and the formation of daughter products can also be consi
dered. However, to realistically model the degradation of organic compounds in the subsurface, the
model needs to be based on empirically determined reaction rates under site-specific conditions
(e.g. leachate composition, soil properties, redox conditions, etc.).
MODFLOW
MODFLOW was developed by the geological survey of the USA to simulate three-dimensional
groundwater transport (McDonald and Harbaugh 1988). The numerical solution of the water flow
equations is based on the method of finite differences. Stationary as well as non-stationary water
flow through heterogeneous, anisotropic porous media can be modeled. While the initial focus of
MODFLOW was primarily on the description of groundwater flow, additional modules have been
continuously integrated into the model to consider various migration processes. Apart from sub
stance transport, density flow or aquifer compression, there are also modules allowing to model
water flow in variably saturated media.
Evaluation of transport models
Apart from analytical or numerical models, simple screening tables or mass balance approaches can
provide a basis to evaluate pollutant migration in the subsurface, too. Screening tables may be use
ful for a first assessment of the situation at a site, but cannot be adapted to site-specific conditions
to a high degree and are not able to consider the effect of various mechanisms on substance
migration. Mass balance approaches, without the consideration of processes reducing substance
concentrations apart from dilution (i.e. assuming plug flow), can provide a quick, conservative
estimate on substance migration. In general, the choice of a model to describe substance migration
processes in the subsurface, depends on several factors:
- the type and quality of information which is expected from the model (e.g. screening
assessment vs. detailed risk assessment)
- the migration processes and pathways of interest
- the complexity of different models and data requirements to establish the models
- the availability of data to establish and apply a model
- the expected level of detail in the modeling outcomes
Barriers – technical and natural systems 100

- the experience of modelers and decision-makers with a specific model
In summary, the complexity of the modeling approach should reflect the quality and availability of
data on the investigated system, the expertise available for establishing and adapting the model, and
the required level of detail in the results to provide decision-support. As the source term function
(i.e. quality and quantity of landfill leachate) is associated with substantial uncertainty and the
amount and quality of site-specific data to establish transport models is typically limited (e.g.
hydrogeologic investigations before/during landfill construction, data from groundwater
monitoring wells), simpler models are often more appropriate to describe substance transport below
closed landfills. However, as simple models are based on various assumptions, the limitations of
the models need to be discussed in view of the accuracy and usefulness of model outcomes. Monte
Carlo simulations can be used to outline inherent uncertainties and the sensitivity of the results with
respect to the variation of specific parameters by assigning probability density functions to
uncertain input parameters. Such an approach has been implemented in the groundwater risk
assessment software “LandSim”, which was developed to evaluate the impact of a landfill on
groundwater quality (Environment Agency 2004). The software combines a source term function
(exponential decrease of pollutant concentrations), estimates on the effectiveness of the
containment system, and pollutant transport models for the unsaturated and saturated zone to
evaluate the impact of a landfill on groundwater quality (cf. Hall et al. 2003). While the software is
not flexible with respect to different source term functions or other transport models, it allows for a
probabilistic evaluation of the modeling results, which is valuable to understand the reliability of
model outcomes.
Although complex models enable the detailed simulation of substance migration in the subsurface,
simple models are more appropriate to evaluate substance migration at most landfills due to
reduced input data requirements, easier handling and application of the models, and the possibility
of using simple models as a basis to adapt a higher tier model in a consecutive evaluation. There
fore, the AF model is suggested for the modeling of transport processes in the vadose zone and a
mass balance approach is suggested to describe substance migration in the groundwater within the
evaluation methodology. The models and their application within the evaluation methodology are
described in chapter 5.2.
4.2.3 Summary and discussion
The potential of natural systems to mitigate negative effects of released substances on environ
mental media is based on naturally occurring processes reducing the mass, toxicity, extent, mobility
or concentration of pollutants in the environment. Landfill-borne pollutants may migrate through a
top cover in the landfill gas, may be released to surface waters in collected leachate or surface run
off, or may be released to the subsurface via leachate migrating through the landfill bottom. The
latter was in the focus of this section, due to landfill leachate as a potential long-term threat to
groundwater quality. Pollutant migration in the subsurface can be mathematically described via the
advection-dispersion equation, addressing the processes of advection, hydrodynamic dispersion,
diffusion, sorption, and transformation. While advective transport and dispersion/diffusion
processes are well understood, knowledge of substance immobilization and transfer in the subsur
face is still incomplete and respective models are associated with substantial uncertainty. As the
Barriers – technical and natural systems 101

Source term (scenario-based emission estimates)
- Flow rate: Leachate release rate to the subsurface
- Pollutant levels: Concentrations of critical leachate constituents (current and future development)
- Geometry: Contaminated area, dimensions in relation to the groundwater flow direction
Unsaturated (vadose) zone
- Layers: Soil layers (including low permeability soil layer at the landfill base)
For each layer: Thickness and soil properties (grain size distribution, bulk density, Corg, hydraulic
conductivity, etc.)
- Pollutant-specific transport parameters: Diffusion coefficients (water and air), degradation rates (half lives)
For each layer: Sorption coefficients
Groundwater
- Flow characteristics: Flow direction and hydraulic gradient
- Aquifer characteristics: Hydraulic conductivity, thickness, geologic strata
- Groundwater quality: Concentrations up- and downstream (existing pollution, dissolved oxygen, Redox
conditions)
quality and quantity of data to establish substance migration models is typically rather limited at
landfills, a simple modeling approach (combining the AF model in the vadose zone with a mass
balance approach in the groundwater zone) is suggested to evaluate transport processes in the
subsurface. The data requirements to establish and adapt the chosen, relatively simple, approach at
a landfill are listed in Table 4-15. As the required information to model substance migration shown
in Table 4-15 probably exceeds actual data availability at many closed landfills, complementary
data from the literature and/or from empirical estimation formulas may be necessary to establish
the models. Nevertheless, at landfills where more and better data are available or can be collected,
the evaluation of substance migration processes in the subsurface may build on more sophisticated
models (e.g. numerical models).
Table 4-15: Basic information to establish a simple model on the subsurface migration of leachate
constituents
Barriers – technical and natural systems 102

5 Evaluation method to determine aftercare completion criteria
The evaluation methodology consists of four elements: a) models on emission characteristics, b)
models on the performance of the containment system, c) substance migration models in the envi
ronment (i.e. subsurface environment), and d) points of compliance (PoC), where certain criteria
(e.g. groundwater quality criteria) have to be met, which are combined to derive site-specific
aftercare completion criteria. The scenario layout underlying these completion criteria may imply
additional criteria to be considered during the evaluation of landfill environmental compatibility
(e.g. geotechnical stability). The procedure to derive completion criteria for a closed landfill is
schematically illustrated in Figure 5-1.
Figure 5-1: Schematic illustration of the procedure to evaluate landfill environmental
compatibility and determine post-closure care completion criteria
To evaluate any system, data need to be collected on the system itself and the boundary conditions
relevant to the evaluation. Hence, as a first step, data on the landfilled waste (e.g. amount and com
position of the deposited material over time, state of waste degradation, hydraulic regime), the
containment system (e.g. design and construction, field tests and performance data), the emission
monitoring (e.g. quality and amount of landfill gas and landfill leachate over time), and the site
characteristics (e.g. climatic conditions, geologic and hydrogeologic conditions, vulnerable uses in
the vicinity, natural hazards) need to be collected. Subsequently, based on an analysis of this data
Evaluation method to determine aftercare completion criteria 103

(especially with respect to landfill monitoring), relevant emission parameters are identified and
emission scenarios are developed to estimate potential emission levels of the landfill associated
with specific landfill conditions. The scenario-based emission estimates form the input for model
ing pollutant migration in the surrounding environment during step 3 (see Figure 1). The effect of
released landfill pollutants is evaluated at defined PoCs located along the migration pathways. In
the fourth step, the calculated concentrations at the PoCs are compared to quality criteria. If the
effect of the scenario emissions complies with the quality criteria applied at the PoCs, the scenario
can be considered environmentally tolerable. If not, the tolerable scenario emission levels at the
source can be determined based on the acceptable quality criteria at critical PoCs and the
attenuation factors derived from the transport modeling. The reverse calculation starting from the
PoC in the direction of the source (landfill) results in a tolerable emission level for a specific
substance and a specific scenario. The tolerable emission levels at the source are calculated for the
most probable long-term emission scenario and the critical point of compliance. In addition, there
might be criteria addressing geotechnical stability, containment system performance, after-use,
further care, etc. In any case, a period of monitoring will be necessary at the site after the
evaluation in order to validate the underlying models and to confirm/increase the reliability of the
evaluation results (cf. Figure 5-1). Specific elements of the evaluation procedure are described in
more detail below.
5.1 Evaluation of the state of the landfill and the site
The analysis of the landfill state includes current and historic emission levels, a characterization of
the waste body (direct or indirect), information about the performance of the landfill containment
system (i.e. top cover and base lining system), and data addressing the climatic, hydrogeologic, and
topographic conditions at the site.
5.1.1 General data on the conditions at the site
The climatic conditions at the site are a major factor to estimate the (potential) infiltration of water
into the waste and to evaluate the influence of temperature fluctuations on the landfill containment
system. Some landfills are equipped with monitoring stations, whereas for others data will be
available only from nearby measurement stations operated, for instance, by the meteorological
service. The current use, post-closure care strategy and planned after-use are of interest, as the use
of the site needs to be assessed in view of its impact on the landfill conditions. Information about
the geology at the site, properties adjacent to the landfill, potentially affected uses in the vicinity of
the site (e.g. groundwater resources, residential areas), and potential exposure to natural hazards
can be obtained from landfill application documents, official notifications and permits, plans on the
design and construction of the site, investigation of site geology and hydrogeology prior to and
during landfill construction, etc. The rate of waste deposition (quantity and quality over time)
should be available from annual reports on landfill operations and topographic documentations of
the used landfill space. For sites with incomplete data, aerial photographs taken at different times
or interviews with neighbors might provide an indication of the deposition history (Ehrig and
Brinkmann 1999). In general, collected data should be verified by involved personnel (e.g. landfill
staff, public authorities) and site inspections should be carried out by the evaluator. If data are
104 Evaluation method to determine aftercare completion criteria

missing for the site, it may be possible to gather this information from regional information ser
vices (e.g. flood risk zoning and other hydrologic data, geologic maps and surveys, maps of sensi
tive ecosystems, etc.).
5.1.2 Emission data
5.1.2.1 Leachate
Before monitoring data can be used to describe the state of the landfill, they should be subject to
critical review with respect to accuracy and representativeness. This includes the identification and
appropriate treatment of outliers (e.g. transcription errors, data coding, calibration errors, etc.), the
evaluation of potential interferences at the sampling location (e.g. leachate collection pipe vs.
leachate tank), or the check of plausibility via related parameters (e.g. comparison of ammonium
concentrations to nitrate concentrations in anaerobic leachate). If the data suggest the presence of
outliers after a visual inspection, statistical tests can be applied to identify outliers and potentially
remove them from the monitoring data set. Dixon’s Test (Dixon 1953) has been recommended by
Gibbons and Coleman (2001) to test for outliers in data sets addressing environmental
contamination. However, cross checks with other parameters will be necessary to assess outliers in
a leachate parameter data set, as factors such as the leachate discharge rate might have a strong
effect on substance concentrations in the leachate (cf. Johnson et al. 1999; Zweifel et al. 1999).
Consequently, the measurement of leachate discharge rates, when leachate samples are taken,
might prove valuable to understand natural variations in the monitoring data set of some parameters
(e.g. soluble salts). After the evaluation of the data quality, statistical analysis can be used to
estimate representative current and maximum values, establish trends evident from the emission
data, or determine levels of confidence for exceeding given standard values (cf. Gibbons and Bull
2006). A visual assessment might indicate a trend, which can be statistically tested. With respect to
landfill leachate, Sen’s Test (Sen 1968) has been recommended, because it is a rather simple, non
parametric test which can be used to test for trend hypotheses as well as to determine the average
slope of a trend (Gibbons and Bull 2006). In addition, statistical relationships between different
emission parameters can be used to retain information about parameters with a reduced number of
measurements (cf. Kylefors 2003). For instance, the electric conductivity of leachate might be
strongly dependent on the actual discharge rate and well correlated with the concentration of
chloride in the effluent. In such a case, the availability of continuous electric conductivity
measurements would also allow for statements on chloride concentrations in the same temporal
resolution without specific chloride measurements (cf. Laner et al. 2011b).
As hydrologic boundary conditions of the waste body are generally altered in the post-closure
phase of a landfill (due to top cover installation), it is useful to relate emission data to the liquid-to
solid ratio (L/S), which is the amount of water (in liters) percolating through a given waste mass (in
kg dry matter of waste). The L/S can be used to compare field-scale data to results from laboratory
experiments (cf. Kylefors et al. 2003) and it can provide an indication of the remaining pollution
potential in a landfill (cf. Allgaier and Stegmann 2003). Water flow patterns in landfills are highly
heterogeneous and thus, the remaining stock of mobilizable substances in the landfill cannot be
assessed solely on the basis of observed emission levels (cf. Fellner et al. 2009a). Emission data
Evaluation method to determine aftercare completion criteria 105

will provide information restricted to the fraction of the landfill body which is in contact with
water, where leaching and organic degradation processes take place (cf. Huber et al. 2004).
Therefore, an evaluation of the remaining emission potential within a landfill needs to include
hydraulic heterogeneity of a landfill, e.g. wet as well as dry landfill parts, the persistence of dry
regions in the landfill, and preferential pathways for leachates (Rosqvist et al. 2005).
5.1.2.2 Landfill gas
The discussion of representativeness and reliability of leachate data is, in general, equally valid for
landfill gas data. However, collection rates are typically much lower for landfill gas than for
leachate prior to final capping. Depending on the duration of landfill operation, the landfilled
waste, the intermediate and final covers, and the gas extraction system, the collected fraction of
landfill gas may be between a few percent and 2/3 of the total amount of produced landfill gas (cf.
Krümpelbeck 2000). In general, the collection efficiency will increase after a cover is installed at
the site and might well be 85% or above at sites with low-permeability final cover systems (cf.
Spokas et al. 2006). Landfill gas generation can be estimated based on theoretical gas generation
models (cf. chapter 3.1.1.1) or measurements of fugitive emissions at the landfill surface can be
used to complement gas collection data. Theoretical gas generation models typically overestimate
the amount of landfill gas, as the conditions within the waste body deviate from model
assumptions. Heterogeneous waste composition, different micro-climates, non-availability of
water, presence of inhibitors, etc. cause actual gas generation to be below model estimates
(Krümpelbeck 2000). Based on the analysis of monitoring data sets (including the measurement of
fugitive emissions) at various MSW landfills, Fellner et al. (2004) concluded that annual methane
emission loads estimated by theoretic gas generation models are on average 100 % higher than the
actual loads. Fugitive gas monitoring techniques (e.g. box or chamber systems, tracer gas methods)
could provide site-specific data to complement gas flow rates in a collection system and estimate
gas generation trends. In addition, trend analysis can provide insights with respect to landfill gas
generation, as the collected fraction of generated landfill gas is typically nearly constant after final
capping. However, as landfill gas data are of poor quality at many sites landfill (e.g. short period of
gas collection, suction of air into the system, no measurements of fugitive emissions), statements
based thereon should be made with caution.
5.1.3 Deposited waste
Generally, the waste body of a MSW landfill is highly heterogeneous. On the one hand, this is due
to diverse compositions of the deposited material, waste placement practices (stratified waste lay
ers), and operation of landfill compartments (e.g. leachate re-infiltration). On the other hand, this is
due to different micro-climates established within the waste body, most notably because of the
presence or non-presence of mobile water (Rosqvist and Bendz 1999). The latter is of primary
importance, as substances in landfill zones not taking part in the water flow regime remain largely
unaltered and therefore, could be responsible for increased emission levels in the future if water
flow and moisture increase due to a change in water distribution. Apart from tracer experiments
(e.g. Rosqvist and Bendz 1999; Fellner 2004), geophysical investigation methods might be suitable
to map the distribution of water and its dynamics in a landfill body (e.g. Bernstone et al. 2000;
106 Evaluation method to determine aftercare completion criteria

Method of analysis Parameter Unit Sample size
Waste sorting Paper and cardboard content kg/kg kg - Mg
Landfill simulation reactor (LSR) Leachate and gas emissions, settlements, temperature, various kg - Mg
analysis of solid samples (before – after)
Biological tests Biochemical methane potential (anaerobic), respira various g
tion activity (aerobic), self-heating tests
Leaching tests Leached concentrations (e.g. NH4-N, DOC) kg/m³ g
Fourier transform infrared spec- Presence or absence of specific bands is used to gain cm -1 (wave mg – g
troscopy (FT-IR) information about the decomposition status number)
Chemical analysis e.g. fiber analysis (ratio of cellulose (+ hemicellulose) kg/kg mg - g
to lignin), cellulose content, TOC, N, loss on ignition
Hoekstra et al. 2009). Such non intrusive characterization methods can provide cost-effective tools
to obtain information about the hydraulic characteristics of the landfill. However, the achievable
resolution of measured data and the need of additional information to interpret the measurements
limit the informative value of such investigations. Therefore, in most cases a detailed investigation
of the landfill body will include intrusive techniques to characterize the landfilled waste. Sampling
of deposited waste is a difficult task due to initial waste heterogeneity and different states of
degradation, so a large number of samples is necessary to characterize the landfill body.
Nevertheless, high resolution sampling of waste bodies was proven to be useful to characterize the
landfilled waste and its state of biochemical degradation (e.g. Sormunen et al. 2008). As the
emission characteristics of a MSW landfill are largely determined by the biochemical degradation
of organic matter, numerous methods have been developed to investigate the biological reactivity
of deposited waste samples (see Table 5-1). The amount of material used for the analysis is usually
smaller than the amount extracted. Hence, in addition to the original heterogeneity of the waste
body, the necessary reduction of sample mass for analysis introduces further errors. The smaller the
sample size for analysis, the more care has to be taken to maintain the representativeness of the
reduced sample (cf. Gy 2004).
Table 5-1: Methods for determining the extent of biological degradation of organic matter con
tained in waste samples
In Table 5-1 methods to determine the state of biodegradation are shown together with sample sizes
typically used to measure the parameters of interest. The largest amount of material can be ana
lyzed by waste sorting, as all the extracted waste can theoretically be sorted, with the content of
paper and cardboard often used to characterize the state of waste decomposition (e.g. Sormunen et
al. 2008). However, as the initial composition of the extracted waste is generally unknown, in most
cases the paper and cardboard content would be one among several indicators to describe the extent
of waste transformation. Another option to determine the state of degradation of waste samples is
to observe their behavior in landfill simulation reactors (LSR) (e.g. Kruse 1994; Fellner et al.
2009a). At a smaller scale, biological tests like the biochemical methane potential test might be
used to quantify the biochemical stability of landfilled waste. Apart from the test duration (e.g. 100
days), the results of these experiments vary due to different inoculates, container volumes, and
sample sizes (e.g. Kelly et al. 2006). Waste samples can also be used in leaching experiments to
determine mobilizable substance fractions. However, as these experiments cannot take into account
biochemical degradation processes, they are of limited value for estimating remaining emission
Evaluation method to determine aftercare completion criteria 107

potentials related to the degradation of organic matter (Kylefors et al. 2003). Further methods to
investigate the degree of waste decomposition are infrared spectroscopy (e.g. Smidt et al. 2002),
fiber analysis (cellulose, hemicelluloses, and lignin) of waste samples (e.g. Kelly et al. 2006), or
direct chemical analysis of solid waste samples (e.g. content of total organic carbon). Provided that
the limitations of the individual approaches are considered, the analysis of waste samples
represents a valuable source of information about the characteristics of the landfill body. However,
apart from scientific endeavors, intensive waste sampling and analysis has not been used to monitor
and evaluate the waste quality in existing landfills yet.
5.1.4 Containment system
Landfill containment systems serve the purpose of separating the waste body from the surrounding
environment and controlling the interaction between these compartments. A review of the state of
knowledge about the performance of different containment systems and single elements is provided
in chapter 4.1. Functional mechanisms of the components making up the barrier system are
resistance (e.g. clay liners, geomembranes), capacitance (e.g. evapotranspirative soil layers,
attenuation layers), and extraction/injection (e.g. drainage layers, gas vents) (National Research
Council 2007). The performance of barrier systems is commonly expressed as acceptable mass
flow rates through top covers or bottom liners. The “status quo” can be evaluated based on direct
monitoring data (e.g. leachate generation), investigations of the integrity of single barrier
components (e.g. visual inspection of leachate collection pipes), and indirect monitoring data (e.g.
observation of groundwater wells, settlement measurements). A survey by Bonaparte et al. (2002)
on reported failures of landfill containment systems showed that in 86 % of the cases the principal
factor causing a system to fail was barrier design or construction. This is an indication of the
crucial importance of appropriate design and the enforcement of construction quality standards in
order to achieve specified barrier performance. Due the limited observation periods (a few decades
at the maximum), the importance of other factors might increase with ongoing deterioration of the
barriers. With respect to contaminant migration through the base liner, groundwater monitoring
does not necessarily provide a reliable and timely indication of leachate emissions (cf. Christensen
et al. 2000; Inyang 2004).
Barrier system components have limited technical life times and are likely to fail at different times.
For instance, the service life of a HDPE geomembrane in a MSW landfill with a temperature of
35°C at the liner has been estimated to be about 160 years (cf. Rowe 2005 and Table 4-3).
However, as the duration of service periods and respective efficiencies are dependent on the actual
state of the barriers (=resistance built into the system) and the stresses induced on the system
components (cf. Inyang 2004), a consequent evaluation has to be site specific. In any case, as long
term monitoring data on the performance of waste containment systems do not exist and
predictions cannot be verified yet, future barrier performance should be judged with caution, but
also in view of synergetic effects occurring in composite liner systems (cf. chapter 4.1).
108 Evaluation method to determine aftercare completion criteria

5.1.5 Geology and hydrogeology at the site
Information about the geology and the hydrogeology can be obtained from investigations at the site
associated with the permit or the construction of the landfill. Typically a landfill permit includes
the operation of monitoring wells upstream and downstream of the landfill, to evaluate potential
adverse effects on the local groundwater quality. In addition, data on the groundwater situation as
well as the geologic strata are available from official maps and potentially from online platforms of
central information services15. Although, site-specific information is preferred to regional infor
mation, the latter is useful to check plausibility of site data, describe the landfill surrounding, and
as a basis to evaluate potential adverse effects of landfill emissions off the site.
5.2 Emission models and scenario-based predictions
The method to evaluate potential future emission levels builds on a detailed analysis of monitoring
data, investigations and predictions of the behavior of the deposited waste, an evaluation of the
long-term functionality of landfill facilities (i.e. containment systems), and an evaluation of site
specific factors such as climate or potential exposure to extreme events. The procedure to derive
site-specific emission estimates is schematically illustrated in Figure 5-2. Emission levels are pre
dicted by using an emission model under the assumption of constant release mechanisms (i.e. water
flow pattern and mobilizable waste fraction) on the one hand, and potentially, adapted models for
scenarios investigating a change of water flow pattern or a change of dominant release mechan
isms, on the other hand. In any case, future emission characteristics are related to the change of the
liquid-to-solid ratio of the deposited waste and the mobilizable waste fraction. Previous models on
future leachate emissions (e.g. Belevi and Baccini 1989; Kruse 1994; Krümpelbeck 2000) were
generally based on the assumption of stable boundary conditions at the landfill site and did not take
into account the heterogeneity of water flow through the landfill body. Due to the investigation of
different emission scenarios (i.e. analyzing different site conditions, such as levels of barrier perfor
mance, and emission models, for example a change of water flow paths) this methodology allows
for a more comprehensive analysis of potential emission levels at a landfill (cf. Figure 5-2).
Scenarios are established based on the current situation at the site and estimates of changes of
specific conditions in the future. The scenario-based emission estimates are subsequently used to
model pollutant migration in the surrounding environment and evaluate the impact of landfill
emissions at defined points of compliance (PoC).
15 For example, the Austrian hydrographic service: http://gis.lebensministerium.at/eHYD/ or the
geological survey of Austria: http://geomap.geolba.ac.at/GEO/
Evaluation method to determine aftercare completion criteria 109

Emission models
Leachate
Model parameters: mobilizable substance fractions, time series data
���� Liquid-to-Solid ratio in relation to parameter concentrations
Landfill gas
Model parameters: gas generation potential, time series data
���� trend extrapolations & gas generation models
Scenario analysis
A) Status Quo
Constant barrier performance & unchanged release mechanisms
B) Gradual decrease of barrier performance
Increasing leachate generation & unchanged release mechanisms
C) Barrier failure and redistribution of water flow paths
„Worst Case“ in case of barrier performance & changed release mechanisms
…..
„Source term“ for pollutant migration
Figure 5-2: Schematic procedure to derive estimates on potential future emissions at the landfill
5.2.1 Emission models
5.2.1.1 Leachate emission models
Models to estimate future leachate emissions can be based on the extrapolation of observed emis
sion behavior, both in full- and lab-scale (e.g. Krümpelbeck 2000), simple mathematical models
(e.g. Belevi and Baccini 1989), complex biogeochemical models considering various processes in a
spatially distributed way (e.g. White et al. 2004). As the former are not based on physical
parameters relating to the landfill and the latter have not been able to cope with the complexity of
processes occurring simultaneously and interacting with each other in a landfill yet, a simple "grey
box" model is introduced to estimate future leachate emissions. The model is developed for the
period after gas generation levels have dropped significantly and a decreasing concentration trend
can be observed in the leachate (i.e. typically some time after landfill closure). Future leachate
characteristics are estimated based on the mobilizable substance potential of the waste, the
heterogeneity of water flow, and the observed emission levels at the site. The model is built under
the assumption that the landfill conditions after closure remain constant. This means no change of
the water flow pattern will occur within the landfill and the dominant mechanisms of substance
mobilization will remain the same (e.g. stable pH, anaerobic environment). Hence, provided that a
statistically significant trend is observable in the post-closure emission data, which has been
reported for many parameters in the leachate of MSW landfills after site closure (cf. Krümpelbeck
2000; Gibbons et al. 2007; Laner et al. 2010), this trend can be extrapolated to the future. The
adaptation of an emission model to a data set on leachate concentrations is schematically illustrated
in Figure 5-3. As a first approximation, an exponential decrease with a first order rate has been
used for several leachate constituents (e.g. Belevi and Baccini 1989; Krümpelbeck 2000; Kruse
1994), assuming that leachate concentration depends on the mobilizable substance concentration of
110 Evaluation method to determine aftercare completion criteria

Prediction period
La
nd
fill
clo
su
re
C le
ach
ate
[m
g/l]
Calibration period
Time Now
the waste. The emission model described below addresses leachate from MSW landfills, but could
be applied also to other landfill types if appropriate data are available and release mechanisms are
comparable. A discussion of emission profiles for different landfill types (i.e. municipal solid waste
incineration ash and construction & demolition waste) and possible approaches to predict future
emissions is provided in chapter 3.
Figure 5-3: Adaptation of the emission model to the post-closure monitoring data at the site (includ
ing model validation)
The basic model formulation to estimate the mean leachate concentration of a specific substance as
a function of time after landfill closure (c(t) in mg/l) is given in equation (5-1). The formulation is
based on the model suggested by Belevi and Baccini (1989), but modified as follows: heterogeneity
of the water flow regime is included via a heterogeneity factor (h) and different release rates are
considered for processes dominated by leaching mechanisms (first term) as well as for processes
associated with the degradation of slowly degradable organic matter are taken into account (second
term): cc0 ,leach L 0 ,org L
− ( •Δ •h )•t − ( •Δ •h )•t m S m S0 ,leach 0 ,org c (t ) = c • e + c • e(5-1) 0 ,leach 0 ,org
In equation 5-1, c0,leach denotes the substance concentration readily leachable after the intensive
reactor phase (mg/l). m0,leach is the leachable fraction of mobilizable substances (mg/kg DM). h is a
heterogeneity factor accounting for the fraction of the landfill taking part in the water flow regime
(dimensionless). ΔL/S is the change of the deposited waste’s liquid-to-solid ratio per year (l/kg DM
and year), and t is the time after intensive reactor phase, i.e. when gas generation has dropped
significantly and leachate concentrations exhibit a downward trend (cf. Belevi and Baccini 1989),
in years. The second term in equation 5-1 is used to describe the slow release of substances due to
the degradation of slowly degradable organic matter. c0,org is the concentration of the substance
made available for leaching via slow organic degradation processes directly after the intensive
reactor phase (mg/l). m0,org is the fraction of mobilizable substances which is still being made
available via organic degradation processes (mg/kg DM). This term is negligible for readily soluble
salts (e.g. chloride) or the soluble fraction of metals contained in the waste, whereas it needs to be
considered for substances associated with the degradation of organic matter (e.g. organic leachate
pollution, ammonium). The heterogeneity factor h is calculated as the total volume of the waste
Evaluation method to determine aftercare completion criteria 111

body divided by the volume taking part in water flow and contributing to leachate emissions.
Typical values for h range from two to six (cf. Döberl et al. 2005; Rosqvist and Bendz 1999), but
may vary significantly between individual landfills. As a first guess for the fraction of mobilizable
substances (m0), values can be taken from the literature. Some literature data on the potential of
mobilizable substances in deposited MSW are given in Table 5-2. However, site investigations
should confirm the parameters on mobilizable substances to establish a reliable emission model.
The potentially mobilizable fraction is split into readily available substances (m0,leach) and
substances which are made available via slow organic degradation processes (m0,org). The
distinction between these fractions can be based on different experimental settings, investigating
readily leachable substance concentrations (e.g. leaching tests), on the one hand, and slowly
releasable waste fractions (e.g. landfill simulation reactors) associated with organic degradation
processes, on the other hand. However, model parameters need to be validated using observed
emission characteristics (landfill monitoring data) and should be checked for plausibility via
literature data (see Table 5-2). The initial leachate concentration due to slow organic degradation
processes (c0,org) can be estimated using decay rates of the slowly degradable organic matter
published for landfill gas generation models (cf. Krümpelbeck 2000). Based on the estimated half
life, the decay constant is calculated. This equals the value of the power term in brackets (equation
1, second term) and thus allows to estimate c0,org. For instance, a decay constant of 0.0173
(corresponds to a half-life of 40 years of the organic matter), a change of liquid-to-solid-ratio of
0.01 l/kg DM per year, a water flow heterogeneity factor of 2, and a m0,org of 400 mg/kg DM result
in a c0,org of 346.5 mg/l16. The readily leachable substance concentration after the intensive reactor
phase (c0,leach) results from subtracting c0,org from concentrations at the site observed after the
intensive reactor phase. Monitoring data is necessary to check the plausibility of the model
parameters and fit the model estimates to the observed leachate characteristics.
The model includes several parameters for which a range of probable values should be assigned
based on site investigations. The effect of the variation of mobilizable substance fractions of chlo
ride in the waste between 1.5 g/kg DM at the minimum and 3.0 g/kg DM at the maximum (cf.
Table 5-2) and a range of heterogeneity factors between 2 and 6 result in the minimum model curve
(=m0�min, h�max) and the maximum model curve (=m0�max, h�min) shown in Figure 5-4.
The minimum and maximum estimates are compared to all the chloride measurements at 30 MSW
landfills after closure (see chapter 3.1.2 and appendix 1, Table A-1). The average annual change of
the liquid-to-solid ratio was calculated from the data of the 30 sites and the initial chloride
concentrations (c0) of the model curves were chosen based on the measured minimum and
maximum concentrations. The comparison of model curves and chloride measurements during the
aftercare period, illustrates that the range of parameters allows for a description of the observations
at the sites. The large bandwidth of potential model estimates highlights the need for site-specific
data to calibrate and subsequently validate the emission model.
c0,org L 400 •0.0173 • h = 0.0173 → c = → c = 346.5 mg / l16 Compare to equation 5-1, second term: • Δ
m S 0,org • 0,org 0.01 20,org
Evaluation method to determine aftercare completion criteria 112

Parameter
[mg/kg
DM]
Extrapolation of land
fill monitoring data [1]
Leaching tests with
landfilled waste A
(age 11-14 yrs) [2]
Extrapolation based on
LSR experiments with
MSW [3]
LSR experiments with
landfilled waste
(age 18 yrs) [4]
CSB 2500 - 11200 - 3000 1538-1885
BSB5 - - - 90 – 150
TOC - 2100 – 7100 - 515 – 616
Cl 900 – 3800 1000 - 1500 2100 - 2500 1563 – 1818
SO4 - - - 3.1 – 9.4
NH4-N 1400 – 3400 200 – 310 2200 794 – 991
Fe - 20 – 39 - 5.1 – 8.8
Pb - 0.1 – 2.5 - -
Cu - 1.0 – 6.7 - -
AOX 2 – 22 - 0.6 – 1.2 -
Cd 0.002 – 0.006 0.06 – 0.22 - -
Zn 0.2 – 16 14 – 98 - -
Notes: LSR… Landfill Simulation Reactor
Sources: [1] Krümpelbeck 2000, [2] Belevi and Baccini 1989, [3] Kruse 1994, [4] Döberl et al. 2005
Table 5-2: Data on mobilizable substance fractions of landfilled MSW via leachate from various
literature sources, in mg/kg dry matter (DM) of MSW
0
1000
2000
3000
4000
5000
6000
0 20 40 60 80 100
Cl [m
g/l
]
Time after landfill closure [yrs]
Cl concentrations (measured)
Model (maximum)
Model (minimum)
Figure 5-4: Minimum and maximum model estimates for chloride based on the variation of the model
parameters m0 and h in a plausible range in comparison to chloride measurements at 30
closed MSW landfills
In similarity to chloride, the minimum and maximum model curves are estimated for ammonium
nitrogen based on a plausible range of mobilizable substance fractions between 1.0 and 4.0 g/kg
DM (the fraction of slowly mobilizable nitrogen is assumed between 20 and 90%) and for a water
flow heterogeneity factor from 2 to 6. The minimum and maximum model curves are compared to
the NH4-N measurements at 30 closed MSW landfills (cf. chapter 3.1.2 and appendix 1, Table A-1)
in Figure 5-5. Again, the model curves envelop the measured concentrations, which underlines the
ability of the range of model parameters to describe NH4-N concentrations in the leachate of closed
MSW landfills. However, the large margin between minimum and maximum curves also highlights
Evaluation method to determine aftercare completion criteria 113

0
500
1000
1500
2000
2500
3000
3500
0 10 20 30 40 50 60 70 80 90 100
NH
4 -N
[m
g/l]
Time after landfill closure [yrs]
NH4-N concenrations (measured)
Model (maximum)
Model (minimum)
the need for appropriate data. Apart from monitoring data (model calibration and validation), direct
investigations of mobilizable substance potentials or water flow heterogeneity may be necessary to
derive reliable model estimates for a specific landfill. In any case, it should be noted that the
mobilizable fraction used in the model is not static, but will vary with the period of investigation
and the considered substance mobilization processes. However, under the assumption of stable
conditions (=no change of water flow paths, constant dominant release mechanisms) the parameters
are to be specified in a way that the model fits the emission data at the site. The model estimates
need to be verified by future monitoring to gain confidence into the model. Without validation, the
model remains more or less speculative, depending on the amount of site-specific data (e.g. water
flow heterogeneity, mobilizable substance fractions) available to build the model.
Figure 5-5: Minimum and maximum model estimates for ammonium-nitrogen based on the variation
of the model parameters m0 and h in a plausible range in comparison to NH4-N mea
surements at 30 closed MSW landfills
The emission model described above is based on the assumption that the mechanisms of substance
release from the waste and the water flow distribution in the waste are stable. If an emission scena
rio involves a change of these processes, a different emission model will be needed as a basis for
such a scenario. For instance, a redistribution of the water flow paths in the waste will most likely
be associated with an increase in leachate concentrations due to the leaching of substances from
previously dry areas (cf. Laner et al. 2011b). The new water flow pattern might include some parts
of the waste body which were not previously taking part in the water flow regime. Thus, in these
previously “dry” zones, biochemical processes might be restored and leachable substances will
concentrate in the leachate. Such processes might occur as a consequence of human intrusion into
the landfill or because of the water saturation of the waste body (e.g. flooding or pooling of
leachate in the landfill).
Based on the extent of change of the hydraulic flow pattern assumed within the scenario and the
original heterogeneity of water flow (parameter h in equation 5-1: the higher it is, the larger is the
fraction of mobilizable substances in previously dry zones), the mobilizable waste fraction of the
adapted emission model can be calculated. For instance, if a scenario occurs after the mobilizable
substances in the waste originally taking part in the water flow regime have been leached, the
remaining mobilizable substance potential for the scenario emission model would be m0,scenario= m0
Evaluation method to determine aftercare completion criteria 114

C lea
chate
[m
g/l]
C lea
chate[m
g/l] b) Water flow redistribution a) Stable conditions
Status Scenario L/S [l/kg DM] L/S [l/kg DM] Quo occurence
- m0/h (cf. equation 5-1). Neglecting a potentially occurring initial “reactor phase” and defining the
water flow heterogeneity in the scenario, the emission model for this scenario can be estimated (c0
can be calculated using a constant ratio of c0/m0 from the calibrated emission model during post
closure monitoring). With all the assumptions stated above, the model formulation of equation 5-1
can be used to estimate leachate characteristics during the scenario. A comparison of the emission
model based on unchanged conditions and an emission model according to the description above
(complete redistribution of water flow paths) is schematically illustrated in Figure 5-6. The
concentrations of the emission model based on stable conditions are lower in Figure 5-6, as they
have been decreasing already during the post-closure period until the time of evaluation. From the
discussion above it is apparent that scenario emission models are often highly speculative and that
they could be established in many different ways. For instance, a possible emission model for a
scenario to illustrate the effect of a redistribution of water flow in the waste on the emissions of a
MSW landfill has been described in Laner et al. (2011a). Again, for other scenarios different
models might be appropriate. Accordingly, the formulation of the emission model has to be
described in the scenario layout and be consistent with the investigated effects. In general, the
emission model based on the post-closure monitoring data may provide a valuable basis for the
establishment of scenario emission models, too.
Figure 5-6: Schematic illustration of different emission models (concentration of a substance in the
leachate as a function of the waste’s liquid-to-solid ratio) based on scenario conditions
5.2.1.2 Landfill gas generation models
It is of crucial importance that landfill gas generation models are applied and validated with site
specific data (cf. Barlaz et al. 1990). Validation is imperative, since actual gas generation is depen
dent on waste characteristics, moisture content and distribution, temperature, pH, microbial com
munities, nutrient availability, and the presence of inhibitors. Due to the assumption of optimal
conditions many landfill gas generation models drastically overestimate the amount of gas pro
duced (Fellner et al. 2004). Depending on the investigated landfill conditions, different models
might be appropriate to estimate landfill gas generation. Under stable conditions at the site, the
extrapolation of observed gas generation trends or the adaptation of a specific model (cf. Table 3-1)
to observed generation rates may be used to estimate future gas generation rates. At closed MSW
landfills low levels of landfill gas generation have been observed already a few decades after land
fill closure. For instance, Krümpelbeck (2000) reported gas collection rates at German MSW land-
Evaluation method to determine aftercare completion criteria 115

fills below 2 liters per kg of dry waste matter and year already 10 to 15 years after closure. Never
theless, within specific scenarios, a landfill gas generation model could be used to estimate an
increase of landfill gas generation even at old MSW landfills due to a reactivation of biochemical
processes based on the remaining fraction of degradable organics in the waste.
Several models have been suggested to estimate gas generation rates at MSW landfills. Models dif
fer with respect to their complexity and with respect to basic assumptions on the biodegradability
of organic matter (i.e. degradation rate or half life values for refuse components). For instance,
models which have been widely applied are the LandGEM model by the U.S. EPA (2005), the
GasSim model by Golder Associates (e.g. Attenborough et al. 2002), or the model by Tabasaran
and Rettenberger (1987). However, the resulting gas generation rates and yields are rough
estimates and should be treated accordingly.
5.2.2 Scenario layouts
Scenarios are used within the evaluation methodology to illustrate the effect of specific landfill
conditions on emission levels. The layout and the number of investigated emission scenarios is
dependent on the current conditions, the potential future conditions (e.g. site in a flood plain), and
the long-term management strategy (e.g. whether human intrusion is to be included in a scenario
analysis) at the site. Comprehensible scenario analysis is based on the description of scenario
design and underlying emission models, the discussion of sensitive assumptions, and reasoning for
the inclusion/exclusion of specific scenarios. A basic procedure to derive scenarios addressing
potential future conditions has been suggested by Schwartz (1991) and includes six steps of scena
rio creation (adapted to long-term landfill management):
1. Identify critical decision criterion
Why are the scenarios created and which questions shall be answered based on scenario
analysis?
2. Significant landfill processes and mechanisms for the emission behavior
Identify and describe dominant processes with respect to the release of substances from the
landfill.
3. Stress induced on the landfill system at the site
Connect site-specific conditions to processes associated with the release of substances from
the landfill.
4. Rank different factors (stresses) based on importance and uncertainty
Identify the most important factors and those with the highest uncertainties for further
investigation.
5. Describe scenario logics
Define the relationship between stresses (site-specific conditions) and processes in the
landfill leading to emissions.
6. Establish scenarios for analysis
Define scenarios to evaluate the effect of different site-specific conditions on landfill emis
sions.
116 Evaluation method to determine aftercare completion criteria
The procedure described above represents a general guidance to establish consistent scenarios.
With respect to long-term landfill management, substantial uncertainties due to the long time
frames and the limited knowledge about the current and future landfill system have to be tackled.
To foster understanding of the potential significance of an event with respect to possible emissions,
it is recommended to analyze best and worst case scenarios associated with specific conditions (e.g.
level of containment), before more complex scenarios are investigated.
Apart from the persistence of the status quo, continuous changes of landfill conditions (e.g. deteri
oration of technical barriers, intrusion of air into the waste body), and extraordinary events, like
earthquakes or flooding, might be relevant for scenario development. Flooding has been shown to
be of potential significance for many older landfill sites in Austria with consequences for landfill
emissions in the short and in the long-term (cf. Laner et al. 2009). The intrusion of air into the
waste body and consequent changes of redox-conditions and pH may be associated with a signifi
cant release of heavy metals. However, the aeration of a MSW landfill is expected not to occur
naturally within many centuries, for an unsaturated, uncovered landfill, to several hundred
thousands of years, for a covered, water-saturated landfill (cf. Bozkurt et al., 1999). Consequently,
such a scenario may be of interest primarily for long-term considerations and subsequent emission
rates might be rather low due to the extended duration of the aeration period in most cases.
5.2.2.1 Scenarios addressing containment system performance
Although existing observations confirm that modern landfill containment systems are principally
able to separate the waste body from the environment and control landfill emissions (cf. National
Research Council 2007), these data relate to a few decades only. The technical life times of barrier
systems in field-scale applications are largely unknown. Models of deterioration patterns range
from constant barrier strength (or no barrier) to exponential deterioration of the barrier, with the
choice of model having a dominant impact on predicted emission levels. Despite the assumption of
constant strength being incorrect without maintenance, it can be used to describe the lack of an
engineered barrier (constantly zero) or a system which is fully serviceable and forever maintained
(Inyang 2004). Without maintenance, an exponential deterioration pattern has been suggested to be
the most suitable to assess long-term performance of containment systems. Such degradation is
associated with a gradual increase of percolation rates through the barrier systems. As field data to
evaluate the long-term performance of containment systems is missing, a set of scenarios is used to
illustrate the effect of different containment system performance levels on potential landfill
emissions. The persistence of the status quo (constant conditions at the landfill including
unchanged performance of the containment system) is used as a “best case scenario” within the
scenario analysis. Further scenarios might address the slow deterioration of the technical barriers
associated with a gradual decrease of barrier performance levels, and a “worst case scenario” may
assume a total failure of the containment system. The specification of containment system
performance levels for these scenarios is described below. A description of the different
containment systems and the basics to evaluate long-term performance is provided in chapter 4.1.
Evaluation method to determine aftercare completion criteria 117

Constant performance – persistence of the status quo
As the scenarios are used to evaluate the effect of the termination of post-closure care at the land
fill, constant performance levels of the containment system resemble the “best case” with respect to
landfill isolation. The best performance level is based on the final layout of the landfill. Hence, at
landfills, where the final cover has not been installed yet, performance levels of the final system
might be estimated from monitoring of similar final cover systems at comparable sites (i.e. climatic
conditions), as site-specific data are not yet available. Austrian regulations require a final cover to
limit infiltration into the landfill to less than 5% of annual precipitation (Austrian landfill directive,
MoE (2008)). However, at most closed landfills the final cover will be in place at the time of
evaluation and leachate generation rates can be used as a basis to assess the top cover performance
after gravity drainage of the waste body.
The performance of the base lining system is harder to assess, because direct monitoring data on
leachate percolation rates (i.e. secondary liner system) are typically not available. Performance data
for composite liner systems at landfills show that leachate collection efficiencies greater than 99%
can be achieved (e.g. Barlaz et al. 2002), especially if a rigid quality assurance program has been
followed during construction. However, collection efficiencies as low as 90% of the generated
leachate have been reported for geomembrane bottom liners at landfills (Bonaparte et al., 2002),
too. In some cases groundwater monitoring data can give an indication of containment system
performance, but leachate plumes might not be detected at all (spatial resolution) or with a
substantial time delay due to long travel times from the landfill to the monitoring well (cf. Inyang
2004).
Complete failure of the containment system
The complete failure of the barrier system is the “worst case” with respect to the interaction level
between the waste body and the surrounding environment. The failure of the top cover system (i.e.
the low permeability elements of the cover are ineffective) is typically assumed to result in infiltra
tion rates similar to the local groundwater recharge rate. However, higher infiltration rates might be
justified under specific conditions. For example, the failure of a top cover with a low top soil layer
thickness (< 0.5 m) or a low fraction of surface runoff (e.g. depression or insignificant slope) may
be associated with infiltration rates above the natural groundwater recharge rate at the site. The
efficiency of the base lining system within this scenario is assumed to be zero. As no leachate is
collected, all the generated leachate is released to the subsurface below the landfill during the worst
case of complete containment failure.
Gradual decrease of containment system performance
Factors and mechanisms relevant for the performance of barrier systems or single components are
described in chapter 4.1. In general, the future performance of the containment system is a function
of the resistance built into the system and the stresses induced on the system. Long-term
performance predictions are speculative in nature, with future performance levels expected to be
between the current service level (at best) and the complete inefficiency of the containment (at
worst). The evaluation of long-term performance is based on the analysis of the current state of the
system and the expected impacts on the system at the site. To determine the rate and extent of a
gradual decrease in containment system performance the modeling period is split into three service
Evaluation method to determine aftercare completion criteria 118

periods and performance levels are estimated for each period. Performance is delimited by the
current system performance (the best possible service level provided there is no future
maintenance) and the complete inefficiency of the liner elements (the worst service level). The
predicted service levels of the containment system are based on the evaluation of different
performance factors and their importance in a specific service period. The list of factors to assess
system performance is shown in Table 5-3 and Table 5-4 for a top cover and a base lining system
including a composite liner (for more details on barrier system evaluation see chapter 4.1). An
evaluation score between 1 (good) to 3 (bad) is assigned to each factor in Table 5-4 based on the
criteria in Table 5-3, which refer to the conditions at the landfill site. Table 5-3 provides some
suggestions for criteria in consideration of Austrian conditions, which may be modified within the
evaluation process to consider different conditions or different sensitivities of the barrier system at
other sites. For instance, a score of one for “barrier performance at the time of evaluation” means
that the barrier has performed according to its design specifications, whereas a score of three means
that it has not achieved its intended service level at the time of evaluation. After the scores have
been assigned by the evaluator, they are multiplied with specified weighting factors and a total is
calculated for each service period (cf. Table 5-4). Because the weighting factors for a specific
service period add up to two, the evaluation result is between two (i.e. if all factor scores were one)
and six (i.e. if all factor scores were three). A score of two is equivalent to the best service level in
the service period (i.e. the system performance at the time of evaluation or during the previous
service period) and a score of six is equivalent to the worst service level in this period (i.e.
complete inefficiency). The overall evaluation results (between two and six) are linearly translated
into respective performance levels. The corresponding procedure is illustrated in Figure 5-7 for top
cover performance during a modeling period of 300 years. The resulting infiltration levels are also
shown in Table 5-4. Within these illustrative calculations a local groundwater recharge rate of 158
mm/yr is assumed (worst case performance) and the top cover currently allows for a water
infiltration of 3.2 mm/yr (initial performance level). For the bottom lining system an evaluation
result of two equals a barrier efficiency of 99% (actual and best future performance) and a result of
six equals a barrier efficiency of 0% (worst performance level).
Evaluation method to determine aftercare completion criteria 119

Period 1 Current: Local groundwater recharge 3.2 mm/yr rate: 158 mm/yr
2 4 6
2.74
�3.2+((158-3.2)/4)*(2.74-2)
= 32 mm/yr
Period 1: 32 mm/yr
Local groundwater recharge rate: 158 mm/yr
2 4 6
3.44
�32+((158-32)/4)*(3.44-2)
= 77 mm/yr
Period 2: 77 mm/yr
Local groundwater recharge rate: 158 mm/yr
2 4 6
3.46
�77+((158-77)/4)*(3.46-2)
= 107 mm/yr
Period 2
Period 3
Figure 5-7: Schematic illustration of the procedure to translate the evaluation results in Table 5-3
into corresponding infiltration rates for the top cover system (annual precipitation at this
site is 630 mm/yr)
The whole procedure to estimate a gradual decrease of barrier performance levels is highly
speculative. It should be emphasized that these are assumptions within a scenario to illustrate the
effect of decreasing barrier performance on landfill emissions and not deterministic predictions of
future barrier performance levels. The performance levels estimated for each service period are
reached at the end of the respective period. Hence, for the example in Table 5-4 the rate of water
infiltration into the waste would have increased from 3.2 mm initially to 32 mm/yr after 100 years.
Evaluation method to determine aftercare completion criteria 120

Table 5-3: Basic criteria for the evaluation of relevant factors to estimate future barrier performance levels suggested for Austrian conditions (see Table 5-4)
SCORE GOOD (1) MEDIUM (2) POOR (3)
Top cover (composite liner)
Barrier performance at time of evaluation Monitoring verifies design specifications Monitoring data is not available (yet), but design specifications are probably met
Minimum design requirements are not met
Construction quality program Appropriate documentation of quality assurance is available Quality assurance has been reported, but protocols/test results do not exist No quality assurance program during landfill construction
Recultivation layer (cover) Thickness: >1.5 m (in any case above higher than root or frost penetration depths)
Thickness: 0.5 - 1.5 m (recultivation + drainage > 1 m) Thickness: > 0.5 m
Heat production within waste Low reaction levels in the waste (< 35 °C) Waste temperatures measured/expected: 35 - 60 °C Strongly exothermic reactions (i.e. MSWI landfills with > 60 °C)
Climate Moderate Austrian climate Moderate climate with very cold winter or high annual precipitation (> 1400 mm/yr)
Extreme climate with very high fluctuations in temperature
Typical vegetation and projected after use
Planned after-use does not threaten top cover Vegtation with high root penetration depths (compare to thickness of recultivation layer)
Plants at the site typically have root penetration depths above 1.5 m
Relief Heap with moderate slopes Landfill in a depression, but slopes in place to guarentee stormwater runoff Flat surface or depression not facilitating surface runoff
Expected settlements Low settlement expected: differential settlements within 1.5 m radius below 0.1 m
Some settlments expected, but at least 90 % of total settlement has been completed
Stronger settlements have to be expected with differential settlements above 0.3 m
Lining control systems (direct monitoring)
Direct monitoring system exists Only indirect monitoring of performance No monitoring
Drainage system Appropriate design and materials Drainage layer from alternative materials without proof of equival performance to standards
No drainage layer
Base liner (composite liner)
Barrier performance at time of evaluation Direct or indirect monitoring verifies design specifications No monitoring, but design specifications are probably met Minimum design requirements are not met
Construction quality program Appropriate documentation of quality assurance is available Quality assurance has been reported, but protocols/test results do not exist No quality assurance progrm during landfill construction
Climate Moderate Austrian climate Moderate climate with high annual precipitation (> 1400 mm/yr) Extreme climate with high annual precipitation and frequent high intensity rainfalls
Heat production within waste Leachate temperature is typically below < 30 °C (at the outflow) Leachate temperature between 30 °C and 40 °C Leachate with temperatures above 40 °C
Distance to groundwater Groundwater surface (max.) is more than 1 m below the landfill base Groundwater surface (max.) is just below the landfill base Groundwater surface might rise into the landfill
Overburden pressure Maximum landfill thickness (incl. base liner and top cover system) > 20 m Maximum landfill thickness (incl. base liner and top cover system) 10 - 20 m
Maximum landfill thickness (incl. base liner and top cover system) < 10 m
Leachate quality Low load of organic substances and of potentially precipitating constitutents Leachate with higher loads (organic, precipitating), but decreasing trend Leachate with high loads (organic, precipitating) and chemically aggressive
Monitoring (e.g. groundwater monitoring)
Direct monitoring system exists Only indirect monitoring of performance No monitoring
Drainage system Appropriate design and materials Drainage layer from alternative materials without proof of equivalent performance to standards
No drainage layer
Stability of foundation Geotechnical stability has been proven (global and local) Geotechnical stability might decrease (e.g. slope stability) Landfill is not geotechnically stable or there is a high risk of extreme events (e.g. earthquakes)
Landfill geometry (heap vs. cavity) Heap with gravitational drainage Lanfill in a depression, but with gravitational drainage Landfill in a depression without gravitational drainage
Evaluation method to determine aftercare completion criteria 121

Factors – top cover (composite liner) Evaluation score Weighting factors*
1good–3bad 0–100 yrs 100–200 yrs 200–300 yrs
Barrier performance at time of evaluation 1 0.36 0.08 0.065
Construction quality program 1 0.38 0.44 0.12
Recultivation layer (cover) 3 0.33 0.48 0.487
Heat production within waste 1 0.09 0.06 0.04
Climate 1 0.08 0.12 0.487
Typical vegetation and projected after-use 2 0.09 0.48 0.487
Relief 1 0.08 0.1 0.12
Expected settlements 1 0.38 0.09 0.065
Lining control systems (direct monitoring) 1 0.1 0.06 0.05
Drainage system 1 0.1 0.09 0.08
Evaluation results: 2.74 3.44 3.46
Leachate generation rates [mm/yr]: 32 77 107
Factors – bottom liner (composite liner)
Barrier performance at time of evaluation 1 0.44 0.08 0.07
Construction quality program 2 0.46 0.49 0.44
Climate 1 0.07 0.08 0.09
Heat production within waste 1 0.09 0.06 0.05
Distance to groundwater 1 0.08 0.08 0.09
Overburden pressure 1 0.08 0.08 0.08
Leachate quality 2 0.08 0.08 0.08
Monitoring (e.g. groundwater monitoring) 3 0.08 0.07 0.07
Drainage system 2 0.46 0.11 0.10
Stability of foundation 1 0.10 0.44 0.46
Landfill geometry (heap vs. cavity) 1 0.08 0.43 0.48
Evaluation results: 3.18 2.82 2.77
Leachate percolating through landfill base [mm/yr]: 10 34 59
* Weighting factors were derived based on expert interviews:
Table 5-4: Example of an evaluation chart to determine future barrier performance levels of a top
cover and base lining system at a specific site
The survey involved 23 experts from Austria and Germany and was conducted in two steps. In the first step,
23 experts were invited to create a list of relevant factors for barrier performance based on a suggestion by
the author. 13 of the 23 invited experts accepted the invitation and participated in the list of relevant factors
(see above). In the second step, the 13 experts were asked to evaluate the importance of each factor for two
standard (according to the Austrian Landfilling Directive) top cover and base lining systems at a landfill site
with average Austrian climate (e.g. precipitation around 1000 mm/yr). For three different time periods each
factor had to be evaluated with scores ranging from 1 to 5 (1 being insignificant and 5 being very important
for the performance of the barrier system). Based on the evaluations relative weights are calculated of each
factor and time period (average score for a specific factor divided by the sum of average scores for all fac
tors). In addition, the factors most often ranked among the top three factors in a specific period by the experts
are given additional weights (the sum of additional weights of the top factors is equal to the sum of the
weights of all factors). The final weighting factors for a composite lining system at the top and the bottom of
a landfill are shown above (see also chapter 4.1 and appendix 2).
Evaluation method to determine aftercare completion criteria 122

5.2.2.2 Scenarios addressing a change of emission behavior
In many cases the persistence of anaerobic conditions and the stability of water flow patterns in the
landfill will be a valid assumption to build emission scenarios. For such scenarios the emission
model based on post-closure monitoring data can be used. These scenarios will be useful primarily
for modeling timeframes of several decades to a few centuries. However, for long-term modeling
(e.g. natural aeration of MSW landfills, dissolution of mineral phases releasing heavy metals from
MSW incineration ash landfills due to a decrease of pH) or for externally induced, sudden changes
of landfill conditions (e.g. flooding, human intrusion), a change of emission behavior can be
expected.
The persistence of preferential water flow paths has not been studied in landfills. However, such
investigations have been carried out for natural soils with little dissolution and degradation
processes (compared to waste), where preferential flow paths appear to be stable at least for many
decades to centuries (Bundt et al. 2000; Hagedorn and Bundt 2002). The invasion into the waste
body or the remodeling of the waste body will have an impact on the water flow pattern and
consequently change the emission characteristics of the landfill. The latter has been observed
during the installation of a final top cover system at a MSW landfill (cf. Laner et al. 2011b), where
the reorganization of top waste layers to guarantee an appropriate cover slope, caused pollutant
levels in the leachate (e.g. NH4-N, Cl) to increase substantially. The potential increase of emission
levels due to a redistribution of water flow paths is directly correlated with the heterogeneity of
water flow in the landfill and the total amount of mobilizable substances remaining within the
waste body. These relationships have been illustrated in Figure 5-8 for the amount of degradable
organic matter in a landfill and the hydraulic regimes in the waste body (see van Vossen 2010).
Consequently, the smaller the fraction of waste taking part in the water flow regime, the higher is
the remaining emission potential within the landfill (as long as the water flow pattern does not
change).
The flooding of a landfill has a substantial impact on landfill emission behavior (cf. Laner et al.
2009). Given the long time period a landfill may present a potential threat to the humans or the
environment, and the practice of locating landfills close to rivers in the past, landfill flooding could
be a significant emission scenario for many closed landfills. For instance, in Austria around one
third of closed MSW landfills are located in flood risk zones (Laner et al. 2009). Scenarios to
estimate landfill emissions due to flooding can range from a complete erosion of the landfill to a
reactivation of biochemical degradation processes after the flood event. The associated risks have
to be evaluated on a site-specific basis and in view of other potential sources of pollution adjacent
to the river (Laner et al. 2009).
In the long view, the aeration of MSW landfills could be associated with changing emission cha
racteristics (cf. Kjeldsen et al. 2002). As this is speculated to occur over an extended time period of
thousands of years for most landfills (Bozkurt et al. 1999), the associated mobilization processes,
for example with respect to metals mobility, will occur at a slow rate. Due to the very long view of
such a scenario, predictions are difficult and the importance of different factors such as pH value,
redox conditions, humic substances, or the sorption capacity of the waste is hard to evaluate.
Evaluation method to determine aftercare completion criteria 123

Another long-term scenario at MSW incineration ash landfills might look at the release of metals
due to a decrease of pH within the landfill after the acid buffering capacity has been consumed,
which is expected to occur over many thousands of years (cf. Förstner and Hirschmann 1997).
Geochemical modeling has been suggested to evaluate the effect of mineral dissolution on the con
centrations of heavy metals in the landfill leachate (cf. Hellweg 2000; Dijkstra et al. 2006). Based
on equilibrium modeling, Hellweg (2000) presented an approach to estimate the sequential disso
lution of different mineral phases and associated metal concentrations in the leachate over time (see
also chapter 3.2). As modeling periods are typically in the area of a hundred thousand years,
practical consequences can hardly be expected for the management of closed landfills from such
modeling.
Figure 5-8: Conceptual illustration of the distribution of degradable organic matter and of water
flow regimes within a MSW landfill with respect to the effect on the remaining emission
potential (Source: van Vossen 2010)
The discussion about a change of landfill emission behavior illustrates the speculative nature of
such scenarios, as they are either associated with an extreme, specific change of conditions at the
site (e.g. flooding, human intrusion) or refer to very long time periods (e.g. release of heavy metals
due to aeration or mineral dissolution). In general, scenario layouts will differ from one site to
another. The range of scenarios considered at a specific site depends on the modeling timeframe of
the analysis and assumptions on potential future conditions at the site. Relevant aspects are the
location of the site with respect to nearby rivers (and potentially flood protection measures), the
planned after-use at the landfill, and the danger of invasive activities at the site.
Evaluation method to determine aftercare completion criteria 124

(1) Emission model
+
(2) Top cover performance level
(3) Scenario emission characteristics
�
5.2.2.3 Scenario selection
The choice and layout of emission scenarios is based on potential conditions at the site and the pur
pose of scenario analysis.
Figure 5-9: Composition of emission scenarios to investigate different top cover performance levels
assuming stable conditions for the emission model
Although the set of scenarios might differ from one landfill to another, the persistence of the “sta
tus quo” will typically be among the investigated scenarios, as this scenario reflects the final state
of the landfill during post-closure care. The scenario can be used to evaluate the current environ
mental impact of the landfill and, with respect to long-term management, represents a scenario of
perpetual care at the site. Additional scenarios based on an emission model assuming stable condi
tions within the landfill (i.e. anaerobic conditions and no change of water flow pattern) could
address the effect of decreasing barrier efficiency on emission levels. If the end of aftercare is asso
ciated with the end of maintenance and control of the containment system, deterioration of the
Evaluation method to determine aftercare completion criteria 125
containment system over time is expected. Consequently, an evaluation of the associated emissions
will be necessary to analyze long-term environmental risks. A schematic illustration of different
elements and their combination within scenarios to investigate the effect of different top cover per
formance levels is given in Figure 5-9. Although Figure 5-9 refers to scenarios on containment sys
tem performance, the combination of the basic elements (a) an emission model and b) an estimate
on the level of interaction between the landfill and the surrounding environment) would be similar
for any other emission scenario.
In the case of long-term landfill management, different scenarios are established to support deci
sions on aftercare and to evaluate the associated environmental risk. As thousands of years are
hardly a manageable time period, scenario modeling will typically extend over centuries. However,
for scenarios investigating the effect of a sudden, extreme change of conditions on emissions the
time of occurrence is not of primary importance anyway, provided that the remaining emission
potential is conserved within the landfill after final closure (cf. Allen 2001; Laner et al. 2011a).
Consequently, whether to include such scenarios in the analysis or not, depends on the probability
of their occurrence and not on the time when they occur.
5.3 Pollutant migration modeling and ambient concentrations
The emission scenarios established for a specific landfill form the input for pollutant migration
modeling. In general, several pollutant pathways might be relevant within an evaluation of landfill
environmental compatibility. If direct exposure to the deposited waste is excluded (i.e. a top cover
has been installed at the site), pollutants migrate as constituents of landfill gas or contaminated
waters. Landfill gas can migrate through the top cover and in the subsurface. Surface runoff waters
might be contaminated if erosion has led to the exposure of deposited waste. The direct discharge
of collected leachate may affect water quality in receiving surface waters and leachate may perco
late through the landfill base and release pollutants to the subsurface below the landfill.
The migration of pollutants in the landfill environment has been discussed in chapter 4.2 with the
focus on the migration of leachate constituents in the subsurface. In this section, only the migration
of leachate in the subsurface will be addressed as a part of the evaluation methodology. Neverthe
less, it should be noted, that each of the pathways mentioned above could represent an environ
mental hazard.
5.3.1 Pollutant migration model in the subsurface
5.3.1.1 Overview
Leachate seeping from a landfill enters the zone below the landfill and potentially contaminates the
groundwater underneath. Different processes occurring during the passage of these environmental
media might, to a certain degree, mitigate negative effects of a release of leachate. Although, it has
been shown that natural attenuation of many pollutants present in landfill leachate can be substan
tial, there is no easy-to-use protocol available on how to assess attenuation potentials for a specific
environment (Christensen et al. 2000).
126 Evaluation method to determine aftercare completion criteria

Characterization of transport pathways
Subsurface
Geology (soil layers) & groundwater
Surface and surface water bodies Cover and after-use, potentially affected uses, discharge and quality of surface waters
Calculation of concentrations at PoCs
Migration modeling
Concentrations at the source & transport parameters
� scenario-und pollutant-specific attenuation factors
Determination of completion criteria
Acceptable influence levels at PoCs
Criteria applied at PoCs
Limit values, threshold values, upstream-downstream difference values, consideration of additional sources
� criteria applied according to sensitivty of environmental compartment/use
Figure 5-10: Schematic procedure to evaluate pollutant migration in the subsurface due to the release
of leachate from the landfill
The procedure of evaluating the migration of leachate constituents in the subsurface is illustrated in
Figure 5-10. The landfill-environment system is defined based on site characteristics (containment
system, geology, hydrogeology, climate, etc.). The properties of the environmental system
surrounding the landfill are outlined and points of compliance are defined for the evaluation. The
characterization of transport pathways (cf. Figure 5-10 and Table 4-15) in the subsurface will
typically comprise information about
- the low permeability soil layer at the landfill base (e.g. bulk density, grain size distribution,
hydraulic conductivity, etc.),
- the soil layers in the vadose zone below the landfill (e.g. bulk density, grain size distribu
tion, content of organic matter, hydraulic conductivity, field capacity, etc.),
- the position of the groundwater surface, the groundwater flow direction and velocity, the
quality of the groundwater,
- the properties of the aquifer (e.g. hydraulic conductivity, thickness, etc.),
- and potentially affected surface waters (e.g. water quality, habitats, water discharge, etc.).
The data requirements of the transport model need to take into account the amount and quality of
data available for the site. For simple, empirically-based models the data available from geological
surveys before and during landfill construction and from existing monitoring sites may be
sufficient to set up a model. Whereas for the application of more complex, spatially discretized
models, it will be typically necessary to gather additional information about the site based on field
(e.g. groundwater pumping testes, additional monitoring wells, drillings, etc.) and lab-scale (e.g.
cation-exchange-capacity tests, hydraulic conductivity tests, etc.) investigations.
Evaluation method to determine aftercare completion criteria 127

After an appropriate conceptual model of the site has been built and a model to estimate pollutant
migration has been established, pollutant concentrations can be calculated at the points of com
pliance. For each emission scenario (source concentration and release rates) and for each pollutant
of potential concern (e.g. leachate constituents which have been observed above drinking water
quality standards) the concentrations are determined. The attenuation factors are defined as the
maximum concentration at the source divided by the maximum concentration at the respective
point of compliance (AF = Cmax,source/Cmax, PoC). Hence, based on the transport modeling for each
pollutant, scenario, and PoC, the attenuation factors can be calculated.
Finally, the maximum concentration at the PoC is compared to environmental quality standards (cf.
Figure 5-10). The standards can refer to drinking water quality (e.g. Drinking water directive (MoE
2001), marginal effect levels (e.g. LAWA 2004), background concentrations, or any other accepted
level of impact. In any case the standards should be assigned in consideration of the vulnerability
of the environmental system and the potential use of these resources (e.g. groundwater as a source
of drinking water). Based on the assigned standard, which has to be met at the PoC, and the attenu
ation factors calculated from the transport modeling, scenario- and pollutant-specific completion
criteria for landfill aftercare can be derived.
5.3.1.2 Approach for migration modeling
To establish an appropriate reactive transport model for the unsaturated and saturated zone below
the landfill, substance- and site-specific data need to be gathered. The complexity of the model
should reflect the quantity and quality of data, which are available for establishing and applying the
model. The more one needs to rely on literature data instead of site-specific measurements, the
simpler and more conservative the modeling approach should be. Hence, within the evaluation
methodology rather simple and robust models are used to describe pollutant migration processes in
the landfill surrounding. On the one hand, this is in accordance with the data generally available at
closed landfill sites and on the other hand, the simpler model can be replaced by a more complex
model in a higher tier evaluation, provided that additional data are collected at the site.
Modeling migration processes in the vadose zone
The pollutant migration in the vadose zone below the landfill is evaluated with the so called “AF
model” (Schneider and Stöfen, 2004), which is a one dimensional model based on the analytical
solution of the advection-dispersion-equation (cf. equation 4-3). The model assumes stationary,
one-dimensional downward flow and no pre-contamination of the transport pathway. Processes
which can be considered within the migration model are advection, dispersion and diffusion, linear
sorption, and first order degradation. Based on the comparison of average pollutant travel times in
the vadose zone and the decreasing/limited source term strength, an attenuation factor is calculated.
The model can consider the effect of multiple soil layers, but instead of a concentration over time
as an output, it produces an estimate on the maximum concentration above the groundwater
surface. The AF model has been shown to be a robust and conservative approach to describe
potential attenuation in the vadose zone based on comparative analysis with the more complex
Hydrus-1D model (Schneider and Stöfen 2006). Within the evaluation methodology only
longitudinal dispersion processes (i.e. the decrease in concentrations above the groundwater is due
128 Evaluation method to determine aftercare completion criteria

to decreasing source term strength) are considered, as the model might be sensitive with respect to
the inclusion of transversal dispersion processes.
The AF model has been designed for constant leachate generation rates. Therefore, for scenarios
with varying leachate generation rates (e.g. gradual decrease in barrier performance), a mass bal
ance approach is used in addition to the AF model. The mass balance calculations address the time
when the maximum load is released to the subsurface. Note that with a decreasing source strength
but increasing leachate generation rates, this is not necessarily the time of maximum concentrations
at the source: Load(t) [g/yr]= Cleachate(t) [g/l] * Leachate generation(t) [l/yr]. The concentration in
the leachate at the time of maximum load is consequently used as the concentration above the
groundwater table within these calculations. The concentration is compared to the result of the AF
model (with an averaged leachate generation over the emission period) and the more conservative
estimate is used to quantify pollutant migration. A mass balance approach is also applied to
describe the mixing of leachate with the groundwater and pollutant migration in the groundwater
within the evaluation methodology.
As described above, the AF model builds on the analytical solution of the advection-dispersion
equation (see chapter 4.2, equation 4-3). As linear sorption of pollutants is assumed in the AF
model, the advection-dispersion-equation can be written as 2∂C ∂ C ∂C
(5-2) R + = Ds ⋅ 2 − v ⋅ − λ ⋅ C
∂t ∂z ∂z
where R is the retardation factor [-], C is the concentration in the liquid phase [kg/m³], t is time
[years], Ds is the longitudinal hydrodynamic dispersion coefficient [m²/year], z is the depth [m], v
is the seepage velocity [m/year], and λ is the first order degradation coefficient [1/year].
Some of the expressions used in equation 5-2 are converted to the formulations in equations 5-3 to
5-5. Whereby qs is the leachate release rate [m/year], θw is the water content [m³/m³], ρd is the dry
bulk density of the soil [kg/m³], kd is the distribution coefficient between liquid and solid phase
[m³/kg], αL is the longitudinal dispersivity [m], Dw is the diffusion coefficient in water [m²/year], τw
is the tortuosity for soil water [-], H is Henry’s constant [-], Dg is the diffusion coefficient in gas
[m²/year], θg is the air content [m³/m³], and τg is the tortuosity for soil air [-]. For some of these
parameters empirical relationships have been established to allow for their estimation from other
soil properties (cf. Schneider and Stöfen 2004).
q ρd ⋅ kd H (5-3) v = (5-4) R = 1+ (5-5) D =α ⋅v+D ⋅θ ⋅τ + ⋅D ⋅θ ⋅τ s L w w w g g g
θ θ θ w w w
Based on the equations above (5-2 to 5-5) an estimate on the average travel time of a pollutant
through the vadose zone can be derived. Main input data requirements to establish and run the AF
model are briefly illustrated below.
Evaluation method to determine aftercare completion criteria 129
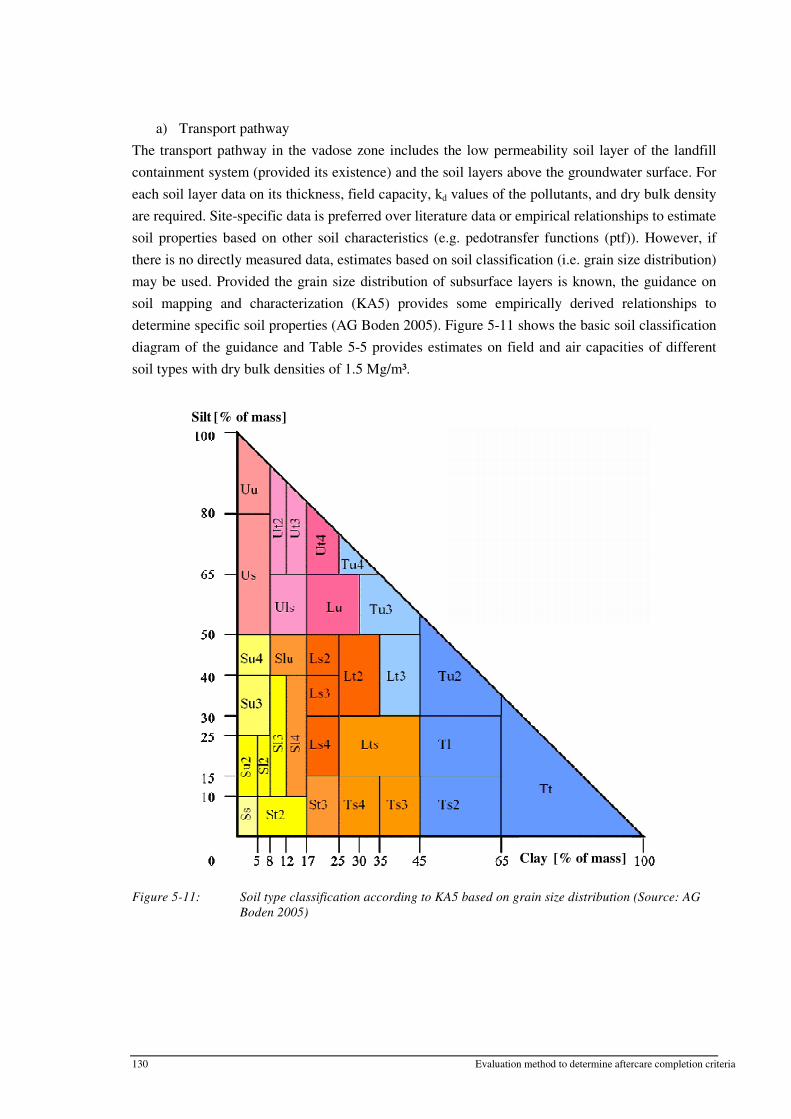
Silt [% of mass]
Clay [% of mass]
a) Transport pathway
The transport pathway in the vadose zone includes the low permeability soil layer of the landfill
containment system (provided its existence) and the soil layers above the groundwater surface. For
each soil layer data on its thickness, field capacity, kd values of the pollutants, and dry bulk density
are required. Site-specific data is preferred over literature data or empirical relationships to estimate
soil properties based on other soil characteristics (e.g. pedotransfer functions (ptf)). However, if
there is no directly measured data, estimates based on soil classification (i.e. grain size distribution)
may be used. Provided the grain size distribution of subsurface layers is known, the guidance on
soil mapping and characterization (KA5) provides some empirically derived relationships to
determine specific soil properties (AG Boden 2005). Figure 5-11 shows the basic soil classification
diagram of the guidance and Table 5-5 provides estimates on field and air capacities of different
soil types with dry bulk densities of 1.5 Mg/m³.
Figure 5-11: Soil type classification according to KA5 based on grain size distribution (Source: AG
Boden 2005)
Evaluation method to determine aftercare completion criteria 130

Dry density Field Air Dry density Field Air
Soil type [Mg/m³] capacity* capacity* Soil type [Mg/m³] capacity* capacity*
[% vol] [% vol] [% vol] [% vol]
Ss
Sl2
Sl3
Sl4
Slu
St2
St3
Su2
Su3
Su4
Ls2
Ls3
Ls4
1.5
1.5
1.5
1.5
1.5
1.5
1.5
1.5
1.5
1.5
1.5
1.5
1.5
11
25
27
30
33
22
30
23
29
32
34
33
32
32
18
15
12
10
20
14
21
14
11
9
9
11
Uls
Us
Ut2
Ut3
Ut4
Tt
Tl
Tu2
Tu3
Tu4
Ts2
Ts3
Ts4
1.5
1.5
1.5
1.5
1.5
1.5
1.5
1.5
1.5
1.5
1.5
1.5
1.5
35
35
37
37
37
43
41
42
38
37
39
37
32
8
9
6
6
7
3
4
4
6
6
4
6
10
Lt2
Lt3
1.5
1.5
36
39
7
5 Sand
Lts
Lu
Uu
1.5
1.5
1.5
37
36
38
6
7
7
fS, fSms, fSgs
mS, mSfs, mSgs
gS
1.5
1.5
1.5
14
10
8
31
32
33
*Estimated values are based on the dry density given in the table.
Correction factors can be used to consider coarse soil fractions and the organic content of the (Table 15 and Table 72 of KA55)
Table 5-5: Empirical estimates on the field and air capacity of different soil types (see Figure 5-11)
according to the soil classification KA 5 (AG Boden 2005)
b) Leachate constituents and specific soil parameters
The pollutants of concern in the landfill leachate may differ from one site to another. Knowledge
about the migration behavior in the subsurface is still scarce for many landfill pollutants (Luckner
et al. 2008), especially because pollutants are mixed with other substances in the leachate mutually
influencing each others migration behavior. Hence, data should be gathered based on site-specific
investigations with local soil types and representative leachates. If such data are not available,
literature data reported for comparable conditions can be used. Some reported values for substance
specific parameters are shown in Table 5-6 for selected leachate parameters. The sorption of
ammonium to the soil matrix should be only considered in low-permeability soils with some clay
content. For low-permeability soil liners a kd value of 0.5 is regarded as a conservative estimate (cf.
Buss et al. 2004). The degradation of pollutants is primarily relevant for well degradable organic
compounds (e.g. petroleum hydrocarbons) and can be considered within the AF model at a first
order rate. Again, half lives should be determined specifically for the conditions at the site, but are
also available in various databases on subsurface pollutant degradation (e.g. CalTOX), which can
be used to provide a first estimate.
Evaluation method to determine aftercare completion criteria 131

Linear sorption Diffusion in water [2] Parameter Reference soil
kd [l/kg] Dw [m²/yr] [1] Ammonium 0 – 5 (0.5) Low permeability soil liner 0.0378
Chloride 0 - 0.0315
Sulfate 0 - 0.0189
Organic pollutants Parameters depend strongly on the type of organic substances and the content of
organic matter in the soil (Kd = Corg * KOC))
Heavy metals Varies for different metals and soils. Approaches to estimate metal sorption in different
soils are described in Utermann et al. 2005.
Source: [1] Buss et al. 2004; [2] Furrer and Wehrli 1996
Table 5-6: Examples of substance-specific transport parameters for selected leachate constituents
c) Seepage velocity and hydrodynamic dispersion
The seepage velocity is calculated from the leachate release rate (emission scenario output) and the
volumetric water content of the soil layer (cf. equation 5-3). Within the model calculations the field
capacity (=the volumetric water content a porous media can hold against gravitation) is used for the
determination of the seepage velocity.
The formula to calculate longitudinal hydrodynamic dispersion is shown in equation 5-5. In case of
non-volatile substances longitudinal dispersion causes a decrease of the maximum pollutant con
centrations if source strength is decreasing with time or finite. The decrease of maximum
concentration is dependent on the average travel time of the pollutant in relation to the emission
strength of the source term. Hydrodynamic dispersion is strongly dependent on the scale (see
chapter 4.2). In the AF model longitudinal dispersivity is by default set to one tenth of the travel
distance.
d) Source term behavior
Pollutant migration modeling builds on the outcomes of the emission scenarios. Hence, the source
term is defined by the results of the emission scenarios during the previous step of the evaluation
method. The AF model distinguishes two basic cases of source term strength: a) constant source
term strength (pollutant concentration) for a limited time period, C(t)= C0 for t < tsource (cf. Figure
5-12); b) exponential decrease of source strength, C(t)= C0 exp(-ks.t) (cf. Figure 5-13). The emis
sion levels estimated within the scenarios are approximated by one of these basic cases and the
emission period is determined. For exponentially decreasing concentrations, the emission period is
calculated as the inverse of the first order rate of decrease (=ks), tsource= 1/ks.
The basic cases of source term behavior within the AF model assume constant leachate release
rates. However, for some emission scenarios this assumption will not be appropriate (e.g.
decreasing barrier performance). Although an average leachate release rate could be used for the
emission time period, it is hard to approximate the varying rate of concentration decrease at the
source within such an approach. Therefore, it is suggested to estimate maximum concentrations at
the groundwater surface also based on a mass balance approach for the time the maximum load is
released from the landfill. Within the latter approach, no decrease of the pollutant concentrations in
the leachate at the time of maximum load is considered while it is traveling through the vadose
zone. Hence, the leachate concentration at the source at the time of maximum load is the same as
Evaluation method to determine aftercare completion criteria 132

the leachate concentration arriving at the groundwater surface. For reasons of conservativeness, the
approach (AF model or mass balance at the time of maximum emission load) which results in
higher maximum concentrations at the groundwater surface will be used to evaluate pollutant
migration.
e) Determination of attenuation factors
The attenuation factor (AF) is the quotient of the maximum concentration at the source (C0) and the
maximum concentration at the bottom of the vadose zone (Cmax,vz): AF = C0/Cmax,vz. AF is
calculated based on the pollutant travel time in the vadose zone and the lifetime of the source
(tsource). The AF increases with increasing travel time and decreasing lifetime of the source,
respectively. To determine the relationship between travel time and source lifetime so called
“nomograms” have been developed (Schneider and Stöfen 2004). The nomograms (see Figure 5-12
and Figure 5-13) are based on analytical solutions of the advection-dispersion equation and can be
used to visually determine the AF for a given pollutant travel time (see equation 5-6) and a specific
lifetime of the source. The effective dispersivity has been set to 10 % of the transport distance
within the calculations. However, different dispersivities could be considered via a correction
factor to calculate the equivalent travel time (see equation 5-7). The same correction factor can be
used to consider first order pollutant degradation in the model. However, if degradation is
considered, effective dispersivity is fixed at the value of 0.1 times the travel distance. For a more
elaborate discussion on correction factors and the analytical solutions see Schneider and Stöfen
(2004). N
i i i∑M ⋅θ fieldc ⋅ R i=1(5-6) tt =
q
The formula to determine the average travel time of a pollutant in the vadose zone is given in equ
ation 5-6. Whereby tt is the average travel time of the pollutant [years], N is the number of soil lay
ers [-], Mi is the thickness of soil layer i [m], θifieldc is the water content of layer i at field capacity
[m³/m³], Ri is the retardation factor of soil layer i [-], and q is the leachate release rate. The equiva
lent travel (taae) time is calculated after equation 5-7 to potentially consider a correction factor (tc)
due to different longitudinal dispersivity or pollutant degradation processes together with the cal
culated average pollutant travel time (tt).
(5-7) log tae = log tt + log tc
The nomograms in Figure 5-12 (basic case: limited constant source strength) and Figure 5-13
(basic case: exponential decrease of source strength) can be used to determine the attenuation factor
after the equivalent travel time and the lifetime of the source have been determined. In case of an
AF above 10, the formulas in equation 5-8 can be used to calculate the AF directly without the aid
of nomograms.
t t ae ae (5-8) AF = or AF = t 1/ k source s
Evaluation method to determine aftercare completion criteria 133

Equivalent average travel time log tae [yrs]
Em
issi
on
per
iod
of
the
sou
rce
tso
urc
e [y
rs] Co
nc.
Time
Limited duration of constant
source term strength
Equivalent average travel time log tae [yrs]
Ra
te o
f co
nce
ntr
ati
on
dec
rea
se 1
/ks [y
rs]
Con
c.
Time
Exponential decrease of
source term strength
Figure 5-12: Nomogram to determine the AF value for the case of constant source term strength for a
limited emission period (Source: Schneider and Stöfen 2004)
Figure 5-13: Nomogram to determine the AF value for the case of exponentially decreasing source
term strength (Source: Schneider and Stöfen 2004)
Pollutant migration in the groundwater
The mixing of leachate and groundwater causes a decrease of pollutant concentrations (i.e. pro
vided that background groundwater levels are below the levels in the leachate). Sophisticated
models can be applied to describe pollutant migration in groundwater systems, but within the
Evaluation method to determine aftercare completion criteria 134
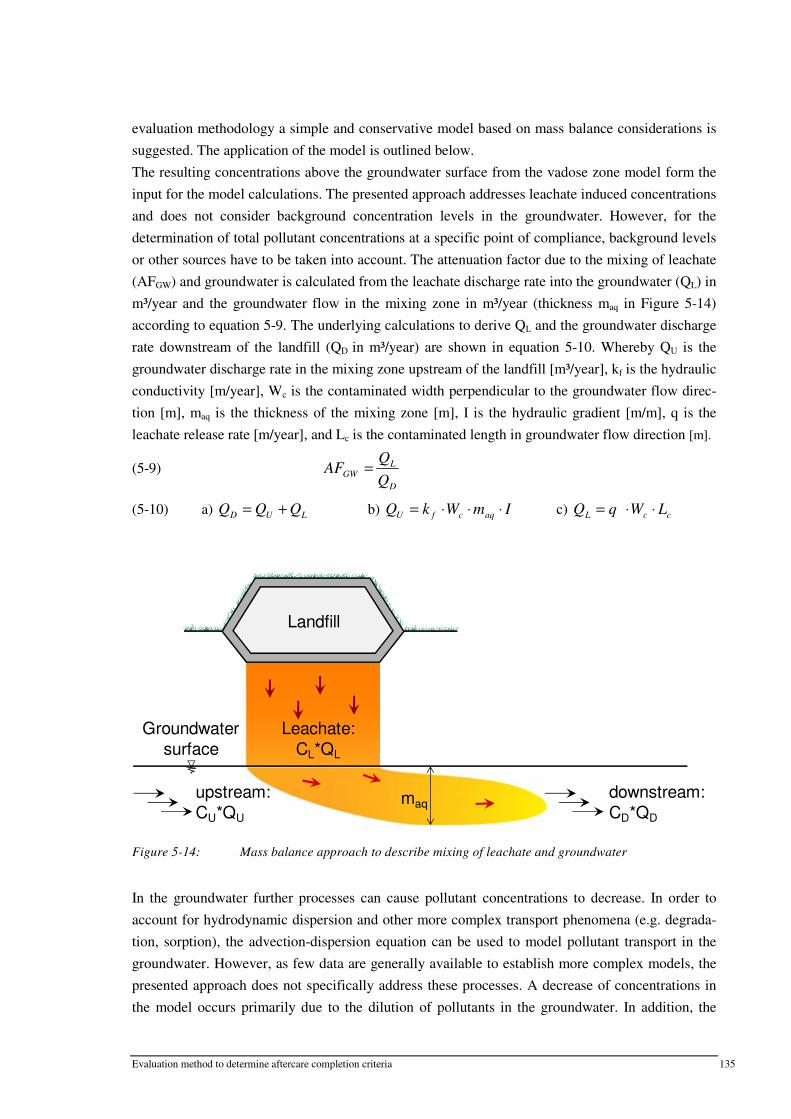
Landfill
upstream:
CU*QU
Leachate:
CL*QL
downstream:
CD*QD
maq
Groundwater
surface
evaluation methodology a simple and conservative model based on mass balance considerations is
suggested. The application of the model is outlined below.
The resulting concentrations above the groundwater surface from the vadose zone model form the
input for the model calculations. The presented approach addresses leachate induced concentrations
and does not consider background concentration levels in the groundwater. However, for the
determination of total pollutant concentrations at a specific point of compliance, background levels
or other sources have to be taken into account. The attenuation factor due to the mixing of leachate
(AFGW) and groundwater is calculated from the leachate discharge rate into the groundwater (QL) in
m³/year and the groundwater flow in the mixing zone in m³/year (thickness maq in Figure 5-14)
according to equation 5-9. The underlying calculations to derive QL and the groundwater discharge
rate downstream of the landfill (QD in m³/year) are shown in equation 5-10. Whereby QU is the
groundwater discharge rate in the mixing zone upstream of the landfill [m³/year], kf is the hydraulic
conductivity [m/year], Wc is the contaminated width perpendicular to the groundwater flow direc
tion [m], maq is the thickness of the mixing zone [m], I is the hydraulic gradient [m/m], q is the
leachate release rate [m/year], and Lc is the contaminated length in groundwater flow direction [m].
QL(5-9) AFGW = QD
(5-10) a) Q = Q + Q b) Q = k ⋅W ⋅ m ⋅ I c) Q = q ⋅W ⋅ LD U L U f c aq L c c
Figure 5-14: Mass balance approach to describe mixing of leachate and groundwater
In the groundwater further processes can cause pollutant concentrations to decrease. In order to
account for hydrodynamic dispersion and other more complex transport phenomena (e.g. degrada
tion, sorption), the advection-dispersion equation can be used to model pollutant transport in the
groundwater. However, as few data are generally available to establish more complex models, the
presented approach does not specifically address these processes. A decrease of concentrations in
the model occurs primarily due to the dilution of pollutants in the groundwater. In addition, the
Evaluation method to determine aftercare completion criteria 135

simple approach represents a robust framework for reverse calculations to determine maximum
acceptable concentrations at the source based on the attenuation factors.
5.3.1.3 Discussion
In general, the complexity of a modeling approach should reflect the amount and quality of data
available to establish and calibrate a model. As available data at closed MSW landfills do typically
not allow for sophisticated models to be adapted to the site in a meaningful way (without additional
site investigations), simple approaches are suggested to describe pollutant migration in the
unsaturated and saturated zone below the landfill. The AF model (Schneider and Stöfen 2004) is
used to estimate pollutant transport in the vadose zone (complemented with a mass balance
approach for emission scenarios with varying leachate release rates) and a robust mass balance
approach is used to estimate pollutant spreading in the groundwater.
Although the limitations of these approaches were discussed before, some main aspects are
highlighted below:
- Only linear distribution coefficients (kd) can be considered within the AF model. They
assume unlimited sorption capacity of the soil, which is unrealistic in general, but
especially if high pollutant concentrations are encountered in the leachate. Sorption
isotherms following a different behavior can be linearized (cf. Utermann et al. 2005), but
should be cautiously handled in any case. Ideally, kd values are based on specific
experiments reflecting the actual conditions at the site (e.g. leachate composition and soil
materials). For ammonium some suggestions for appropriate kd values were presented by
Buss et al. (2004).
- Homogeneous flow is assumed in the unsaturated zone in the AF model. Nevertheless,
preferential flow could be considered by lowering the volumetric water content available
for pollutant transport processes.
- Degradation of pollutants can be modeled only with a first order rate in the AF model
together with a dispersivity of 0.1 times the transport distance. To describe these processes
in different ways or combinations, more complex analytical or numerical need to be used.
- Varying leachate release rates can only be approximated (average rate over emission
period) in the AF model. Therefore, a mass balance approach to complement the AF model
is suggested to deal with such source terms.
- The flux of pollutants is assumed to be constant throughout the whole area of the landfill
base. This assumption underestimates the seepage velocity in the vadose zone as the hete
rogeneity of the release pattern is neglected. If degradation and sorption processes are not
considered for the transport evaluation, this does not have any effect on the load of
pollutants reaching the groundwater. However, the travel time would be shorter due to the
higher seepage velocity. Irregular release of leachate throughout the base could be
considered by assuming a smaller contaminated area below the landfill than the area of the
landfill base. Nevertheless, estimates on heterogeneous release patterns will be highly
speculative, but probably closer to the real situation (e.g. base liners with a geomembrane
layer will mainly release leachate at hot spots like holes or flaws).
136 Evaluation method to determine aftercare completion criteria

In addition to the factors listed above, the input data and parameters are associated with uncertain
ties. Reasons are the natural variability of site characteristics, incomplete knowledge of current and
future conditions, as well as wrong or inadequate measurements. To account for the effect of
different parameters/inputs on the results of the modeling, the sensitivity of outcomes needs to be
assessed. Monte Carlo analysis can be used to evaluate the robustness of the results with respect to
the variation of input and parameter values.
5.4 Determination of completion criteria
In general, completion criteria are determined based on a critical point of compliance, tolerable
concentration levels at this point, the choice of the most probable or most relevant long-term emis
sion scenario, and the calculated attenuation factors for substances released to the surrounding
environment during this scenario. With respect to landfill leachate site-specific completion criteria
can be determined based on the combination of the models presented in this chapter. The critical
point of compliance (PoC) is chosen in consideration of the vulnerability of different
environmental media and the current, planned, and potential uses at the site, respectively. A quality
standard is applied at the PoC to define the maximum acceptable level of influence due to a release
of leachate from the landfill. A reverse calculation, based on the pollutant- and scenario-specific
attenuation factors determined during the pollutant migration modeling, is subsequently used to
define tolerable emission levels at the source (i.e. in the landfill leachate). Hence, from specifying
maximum acceptable impacts on groundwater quality at a certain point corresponding leachate
quality criteria for a specific emission scenario can be derived. For instance, a quality standard of
10 mg Cl/l at PoC3 (defined as the critical point of compliance) in Figure 5-15 would result in a
tolerable concentration of Cl in the landfill leachate of 200 mg/l (= 10*2*2*5). Thus, if the Cl
concentration in the leachate decreases to and remains below 200 mg/l, future leachate emissions
will be environmentally tolerable, provided that the conditions of the underlying emission scenario
are met. In this way, aftercare completion criteria for leachate are determined for a landfill based on
a defined long-term emission scenario. As completion criteria are associated with an expected
future behavior of the landfill and specific conditions at the site (i.e. conditions within the emission
scenario), criteria relating to the underlying long-term emission scenario are to be included. For
instance, as the emission model used within the emission scenario must be validated, confirmation
monitoring to verify model assumptions will be required as a completion criterion. This could be
similar to the monitoring and action matrices for natural attenuation at closed landfill sites, which
have been suggested as an element of corresponding remediation strategies (cf. Luckner et al.
2008). Another example would be the assumption of an undisturbed waste body in the emission
scenario, which would imply criteria to prevent invasive activities at the site. The assumption of
optimal containment system performance in the underlying long-term emission scenario would
include the maintenance and repair of the containment system as an aftercare completion criterion.
However, one might doubt if authorities accepted the latter as a de-minimus care actvitity.
Evaluation method to determine aftercare completion criteria 137

Landfill
Emission AF=5
x PoC 1
GW-stream AF=2
x PoC 2 x PoC 3
AF=2
Figure 5-15: Scheme of the landfill-environment system with scenario- and substance-specific
attenuation factors between the different PoCs
Aftercare completion criteria for landfill gas can be based on a minimum of cumulative gas gen
eration demonstrated at the site complemented with target values for maximum gas emission rates
specified in technical guidances (e.g. Fellner et al. 2008) or regulations (e.g. Wisconsin Department
of Natural Resources 2007). Attenuation of methane concentrations in the landfill cover may be
considered if it can be demonstrated that methane entering the cover is oxidized during cover
passage. Criteria addressing subsurface migration of landfill gas and associated risks (e.g.
explosion hazards in buildings) have not been included in the evaluation methodology. However, if
there is a potential for gas migration at the site, landfill gas risk assessment to derive acceptable
emission levels and surveillance monitoring in the landfill surrounding are necessary to evaluate
the end of post-closure care.
In summary, completion criteria addressing landfill emissions are typically complemented by crite
ria associated with the emission scenario underlying the evaluation. Such additional criteria may
comprise geotechnical aspects, the functionality of landfill elements (e.g. containment system),
surveillance and maintenance activities at the site, restrictions of use, etc. The only emission scena
rio with no additional criteria (to completion criteria addressing emissions), would be one where
the tolerable emission levels relate to a scenario of waste without any containment and fully
exposed to external conditions at the site (e.g. precipitation). For all the other emission scenarios
some additional completion criteria will be necessary to assure environmental compatibility of the
closed landfill. Because the procedure of deriving completion criteria requires emission scenario
conditions to be addressed as additional completion criteria, it is expected that the basic long-term
management concept will be better understood by decision makers and that a consequent
evaluation will be comprehensible to them.
Emission scenarios investigated but not used as a basis for completion criteria, provide a basis to
evaluate residual environmental risks at the site. For instance, the potential effects of a complete
failure of the containment system or the effects of landfill flooding on the environmental system
can be evaluated if such scenarios have been included in the analysis. If the emission scenario
“complete failure of the containment” is used as a basis to derive completion criteria, residual risks
might be low, whereas if the emission scenario “constant containment level” is used to derive
completion criteria, residual risks might be higher. In any case, the decision on the completion of
aftercare will be one about acceptable risks, as long as there is some hazard associated with the
deposited waste.
Evaluation method to determine aftercare completion criteria 138

6 Case studies
To test the developed methodology with respect to applicability and practicality, it is applied at
three landfills. Aftercare completion criteria are determined at each site and consequent aftercare
periods are discussed. The selection of the case study landfills is based mainly on three criteria:
a) Sufficient quality and availability of data: Emission monitoring (time series data on quan
tity and quality), waste deposition (time series data on composition and amount of depo
sited waste), landfill engineering (deposition techniques, containment system), information
about local climate, geology, hydrogeology, etc.
b) Site characteristics: Waste type and emission potential, level of interaction between waste
and environment, vulnerability of the local environment, etc.
c) Cooperative attitude of the landfill owner or the one responsible for aftercare: Access to
archives and support with data collection, interest in the evaluation of the site and the
proposed aftercare strategy, etc.
The selection of landfills with different waste types, engineering systems and environmental con
ditions is intended to highlight the importance of site-specific factors with respect to the evaluation
of landfill environmental compatibility and to illustrate the applicability of the methodology to
landfill sites with varying characteristics.
Due to the environmental significance and the comparatively large number of closed MSW land
fills in Austria17, two of the three case study sites are closed MSW landfills. Based on the informa
tion and contacts during data collection to establish typical landfill emission profiles (cf. chapter 3),
a pre-selection of suitable sites was made based on the criteria listed above. After additional
inquiries and site visits, a large, closed MSW landfill (closed in 2005 with a waste volume of 1.7
million m³) in the centre of Austria with temperate, continental climate (precipitation: 960 mm/yr,
potential evaporation: 630 mm/yr) was chosen (Landfill A) together with a smaller MSW landfill
(Landfill B) in the West of Austria (closed in 2004 with a waste volume of 135,000 m³) at a site
with humid, continental climate (precipitation: 1960 mm/yr; potential evaporation: 550 mm/yr).
The third case study site (Landfill C) is situated in the East of Austria (arid climate with 610 mm/yr
precipitation and 630 mm/yr potential evaporation). It was closed in 2008, and contains around
400,000 m³ of construction and demolition (C&D) waste. A C&D waste landfill is chosen because
of the quantitative significance of this landfill type and because of the different emission potential
of the waste relative to MSW. A landfill containing municipal solid waste incineration residues has
not been included as a case study site, as there is no mono landfill of this kind in Austria (data
presented in chapter 3.2 are from Swiss landfills). However, the methodology could be applied in a
similar way to such a landfill site.
17 Since 2004 the landfilling of MSW without pre-treatment is prohibited in Austria. Therefore, many MSW
landfills have been closed during the last decade and are now in the post-closure care period.
Case studies 139
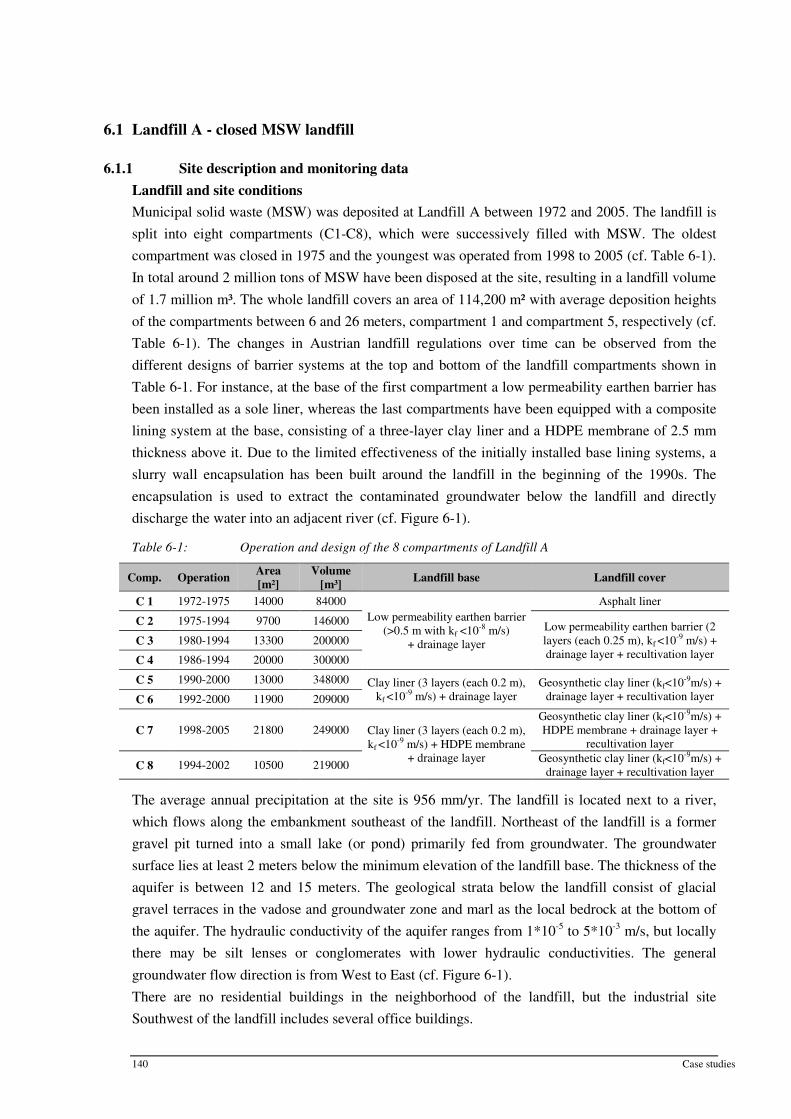
Area Volume Comp. Operation Landfill base Landfill cover
[m²] [m³]
C 1 1972-1975 14000 84000 Asphalt liner Low permeability earthen barrier C 2 1975-1994 9700 146000 Low permeability earthen barrier (2 (>0.5 m with kf <10-8 m/s)
C 3 1980-1994 13300 200000 layers (each 0.25 m), kf <10-9 m/s) + + drainage layer
drainage layer + recultivation layer C 4 1986-1994 20000 300000
C 5 1990-2000 13000 348000 Clay liner (3 layers (each 0.2 m), Geosynthetic clay liner (kf<10-9 m/s) + kf <10-9 m/s) + drainage layer drainage layer + recultivation layer C 6 1992-2000 11900 209000
Geosynthetic clay liner (kf<10-9 m/s) + C 7 1998-2005 21800 249000 Clay liner (3 layers (each 0.2 m), HDPE membrane + drainage layer +
kf <10-9 m/s) + HDPE membrane recultivation layer
+ drainage layer Geosynthetic clay liner (kf<10-9 m/s) + C 8 1994-2002 10500 219000
drainage layer + recultivation layer
6.1 Landfill A - closed MSW landfill
6.1.1 Site description and monitoring data
Landfill and site conditions
Municipal solid waste (MSW) was deposited at Landfill A between 1972 and 2005. The landfill is
split into eight compartments (C1-C8), which were successively filled with MSW. The oldest
compartment was closed in 1975 and the youngest was operated from 1998 to 2005 (cf. Table 6-1).
In total around 2 million tons of MSW have been disposed at the site, resulting in a landfill volume
of 1.7 million m³. The whole landfill covers an area of 114,200 m² with average deposition heights
of the compartments between 6 and 26 meters, compartment 1 and compartment 5, respectively (cf.
Table 6-1). The changes in Austrian landfill regulations over time can be observed from the
different designs of barrier systems at the top and bottom of the landfill compartments shown in
Table 6-1. For instance, at the base of the first compartment a low permeability earthen barrier has
been installed as a sole liner, whereas the last compartments have been equipped with a composite
lining system at the base, consisting of a three-layer clay liner and a HDPE membrane of 2.5 mm
thickness above it. Due to the limited effectiveness of the initially installed base lining systems, a
slurry wall encapsulation has been built around the landfill in the beginning of the 1990s. The
encapsulation is used to extract the contaminated groundwater below the landfill and directly
discharge the water into an adjacent river (cf. Figure 6-1).
Table 6-1: Operation and design of the 8 compartments of Landfill A
The average annual precipitation at the site is 956 mm/yr. The landfill is located next to a river,
which flows along the embankment southeast of the landfill. Northeast of the landfill is a former
gravel pit turned into a small lake (or pond) primarily fed from groundwater. The groundwater
surface lies at least 2 meters below the minimum elevation of the landfill base. The thickness of the
aquifer is between 12 and 15 meters. The geological strata below the landfill consist of glacial
gravel terraces in the vadose and groundwater zone and marl as the local bedrock at the bottom of
the aquifer. The hydraulic conductivity of the aquifer ranges from 1*10-5 to 5*10-3 m/s, but locally
there may be silt lenses or conglomerates with lower hydraulic conductivities. The general
groundwater flow direction is from West to East (cf. Figure 6-1).
There are no residential buildings in the neighborhood of the landfill, but the industrial site
Southwest of the landfill includes several office buildings.
140 Case studies

Figure 6-1: Aerial photograph of Landfill A and surroundings
Monitoring data
The leachate collection system consists of the gravel drainage layers at the landfill base, a network
of leachate collection pipes to transport the leachate to underground storage basins outside the
landfill body, and a pumping system to transport the leachate from the basins to a storage tank on
the surface, from where the leachate is transferred to a treatment plant. The composition of the
leachate is analyzed separately for each compartment twice a year (see Table 6-2). The leachate
generation rate is calculated from the extracted amount of leachate from the different basins. As the
compartments 1 to 4 drain into the same basin, their specific leachate generation rates are estimated
based on the relative surface area of each compartment and the cover systems of each individual
compartment (e.g. open system, temporary cover, and final cover). Overall, leachate generation
rates strongly decreased after compartment closure. For the older compartments, around 3% of the
annual precipitation is currently collected as leachate at the landfill base. For the younger
compartments, the amount of leachate equals approximately 20% of the annual precipitation a few
years after closure. However, according to the design parameters of the installed top cover systems,
future leachate generation rates should be much lower, as the gravity drainage of water stored in
the landfilled waste is expected to become insignificant.
From Table 6-2 it is visible that, after their closure, the younger landfill compartments (e.g. C7 or
C8) produce leachate, which is still strongly polluted with organic compounds, nitrogen and
soluble salts (see Table 6-2). Leachate collected from older compartments (e.g. C1 or C2) exhibits
significantly lower concentrations of degradable organics (BOD), organic compounds in general
(COD), nitrogen (especially ammonia), and easily soluble salts (e.g. chloride). Nevertheless, even
the latter concentrations are still above the maximum concentration levels for direct leachate dis
charge into rivers (cf. Table 6-2).
The most problematic leachate parameters in view of the limit values for direct discharge are the
organic compounds (COD, BOD, AOX), ammonia-nitrogen, chloride, phosphorus, and the metals
Fe and Crtot (cf. Table 6-2). Based on the available data and the observable leachate quality trends,
Case studies 141

Parameter C1 C2 C3 C4 C5 C6 C7 C8 Limit*
pH value 7,86 7,78 7,92 7,85 8,24 7,84 7,87 8,00 6,5–8,5
EC [µS/cm] 5434 4216 13444 11739 26170 14514 18000 10003
NH4-N [mg/l] 150 146 786 681 2133 1072 996 634 10
NO2 [mg/l]: 5,6 2,0 9,2 8,7 2,5 0,9 0,5 17,7 2,0
NO3 [mg/l]: 89,9 45,4 9,9 17,8 20,0 12,9 <5 272,0
Fluorides [mg F/l]: 0,4 0,4 1,0 0,9 1,3 0,9 0,9 0,7 10
Cl [mg/l]: 495 478 1625 1573 4037 1713 2020 1125 Toxicity
Cyanideges [mg/l]: 0,02 0,03 0,01 0,00 0,22 0,07 - <0,05
SO4 [mg/l]: 646 71 87 136 1011 339 87 380
P [mg/l]: 1,7 0,8 5,9 5,6 11,5 7,1 7,7 3,7 2,0
COD [mg O2/l]: 633 352 2437 2318 7680 3922 4470 1217 50
BOD5 [mg O2/l]: 82 80 251 286 902 744 560 145 10
Hydrocarbons [mg/l] 0,04 0,03 0,11 0,62 0,14 0,21 0,20 0,17 5,0
BTEX [mg/l]: 0,01 0,02 0,05 0,02 0,04 0,05 0,00 0,01 0,1
AOX [mg Cl/l]: 0,25 0,31 1,37 1,06 7,48 0,93 0,95 0,45 0,5
Fe [mg/l]: 3,04 1,99 4,84 4,95 2,22 3,17 - 1,40 2,0
Mn [mg/l]: 0,12 0,31 0,21 0,31 0,67 0,52 - 0,30
Zn [mg/l]: 0,46 0,08 0,27 0,18 0,13 0,14 0,06 0,11 0,5
Ni [mg/l]: 0,08 0,02 0,16 0,15 0,39 0,17 0,07 0,12 0,5
Co [mg/l]: 0,01 <0,05 <0,05 <0,05 0,01 <0,05 - <0,05
Cu [mg/l]: 0,03 <0,05 0,02 0,02 0,03 0,04 <0,05 0,01 0,5
Cd [mg/l]: <0,01 <0,01 <0,01 <0,01 <0,01 <0,01 <0,01 <0,01 0,1
Sn [mg/l]: 0,02 0,01 0,15 0,19 0,10 0,05 0,00 0,00 2,0
Pb [mg/l]: <0,05 <0,05 <0,05 <0,05 <0,05 <0,05 0,01 <0,05 0,5l
Crtot [mg Cr/l]: 0,15 0,09 0,64 0,60 2,50 0,86 0,47 0,24 0,5
Al [mg/l]: 0,35 0,21 0,53 0,54 1,40 1,13 - <0,2 2,0
Ag [mg/l]: <0,02 <0,02 <0,02 <0,02 <0,02 <0,02 - <0,02 0,1
As [mg/l]: 0,01 0,00 0,03 0,03 0,13 0,04 <0,01 0,02 0,1
Hg [mg/l]: 0,002 <0,001 <0,001 <0,001 0,0002 <0,001 <0,001 <0,001 0,01
*Limit values for direct discharge into rivers according to the Austrian directive on leachate discharge (MoE 2003) and the Austrian directive
on waste water discharge (MoE 1996), respectively.
the parameters COD, NH4-N, Cl, and Crtot are chosen as parameters for emission modeling.
However, it should be noted that a screening analysis of organic leachate pollution would be neces
sary to identify hazardous components potentially present in the leachate at low levels.
Table 6-2: Mean values of selected leachate parameters measured after waste deposition has been
completed at the respective landfill compartment (bold: mean values above discharge
limits and chloride)
In contrast to emission data on leachate composition and amount, data on landfill gas emissions are
available only to a limited degree. The gas collection system at the landfill was installed in 1994
with an extraction system for all landfill compartments. The amount and composition (measured
continuously since 2000 for methane, carbon dioxide, and oxygen) of the captured landfill gas are
shown in Figure 6-2. Based on the collected amount of landfill gas, the specific gas generation rates
are 1.4 m³ per ton of dry matter and year directly after final closure of the landfill. However,
because of the restricted gas collection efficiency in general and the belated installation of the gas
collection system at the site, it can be assumed that the actual gas generation rate is higher than the
one calculated from the collected amount of landfill gas (cf. Krümpelbeck 2000).
Methane is chosen as the parameter of interest for landfill gas emission modeling, as it is of major
environmental significance (globally: 25-fold global warming potential of CO2, locally: explosion
hazards) and typically present at high concentrations in landfill gas.
142 Case studies

0
0,5
1
1,5
2
2,5
1994 1996 1998 2000 2002 2004 2006 2008
Year
Ca
ptu
red
lan
dfi
ll g
as
[m
illio
n m
³/y
ea
r]
0
10
20
30
40
50
60
Co
nc
en
tra
tio
n o
f g
as
co
mp
ou
nd
[V
ol%
]
Landfill gas
CH4
CO2
O2
Figure 6-2: Collected amount of landfill gas and gas composition at Landfill A (common collection
of gas for all landfill compartments)
Containment system
The containment system of Landfill A includes different designs at the compartment level (see
Table 6-1). Information about the performance of the top cover systems is available from the
leachate generation rates of the compartments. However, as the amount of leachate collected at the
base of younger compartments is still rather high (approximately 20% of annual precipitation), the
current cover performance will be measureable after the “bleeding out” of the waste body is
completed. For now, the performance level of recently installed cover systems is estimated based
on the design parameters of the systems and the performance levels observed at similar systems.
Therefore, the fraction of precipitation infiltrating into the waste body is estimated to be 5 % for the
compartments 1 to 4, 1 % for the compartments 5, 6, and 8, and 0.5 % for the compartment 7.
These performance levels represent the best possible function of the covers, provided that the
systems are not reconfigured in the future.
No direct observations of barrier performance are available for the systems at the landfill base.
Although the contamination level of the extracted groundwater from the slurry wall encapsulation
proves that there is leachate released to the subsurface below the landfill, it is not possible to
quantify the performance of the bottom barrier systems with these data. The fraction of leachate
percolating through the landfill base is estimated to be between 3 and 10 % for the compartments 1
to 4, 1 % for the compartments 5 and 6, and 0.5 % for the compartments 7 and 8. As these values
are not based on direct measurements, they should be treated as assumptions rather than true
system parameters.
6.1.2 Emission predictions
Emission models for leachate and landfill gas are used to estimate future substance releases from
the landfill into the surrounding environment based on scenario analysis. The scenarios are built on
the same emission model for each compartment (fraction of mobilizable substances, water flow
heterogeneity, release mechanisms), but differ with respect to the level of interaction between the
Case studies 143

Scenario Technical barrier at the top Technical barrier at the base
Status quo Best performance Best performance
Status quo* Best performance Ineffective
Scenario A Gradual decrease of barrier performance Gradual decrease of barrier performance
Scenario A* Gradual decrease of barrier performance Ineffective
Scenario B Ineffective Ineffective
Note: “*” designates scenario variations of the status quo and Scenario A which assume a total release of the generated leachate to the subsurface.
landfilled waste and the surrounding environment (i.e. water infiltration rates and release rates to
the subsurface). The scenarios are designed to illustrate potential emissions after post-closure care
has been terminated. Hence, it is assumed that there is no repair or maintenance of the containment
system taking place after the time of evaluation. The time of evaluation for Landfill A is the year
2007, as this is the last year with a complete set of monitoring data.
Table 6-3: Scenario layouts to investigate potential emission levels of Landfill A
The scenario layouts to investigate potential future emissions of the landfill are shown in Table 6-3.
Within the status quo constant barrier function at the top and at the bottom of the landfill is
assumed, showing the effect of continuous optimal barrier performance. Scenario A considers a
gradual deterioration of the barrier systems and a consequent decrease of barrier function in the
future. Scenario B investigates the complete failure of the technical barriers, thereby illustrating the
“worst case” with respect to barrier performance. In addition, modified versions of the status quo
and Scenario A are analyzed to account for the fact that there is no free drainage to remove the
leachate from the leachate collection tanks. After the termination of post-closure care, leachate
might not be extracted from the landfill anymore and percolate through the landfill base. Therefore,
the complete release of leachate into the subsurface is investigated in the status quo* and in the
Scenario A*. The modeling period for all scenarios is 300 years.
As described above, all scenarios assume constant release mechanisms and water flow patterns in
the deposited waste and are designed to analyze the effect of changing hydraulic boundary condi
tions (infiltration at the top and percolation rates at the bottom) on landfill emissions. Other scena
rios could be established to investigate the effect of landfill flooding (i.e. full water saturation of
the waste body), of changing water flow patterns within the landfill, or of the aeration of the waste
body on future emission levels. However, landfill flooding is improbable within the next centuries,
as hydraulic simulations showed no inundation of the landfill area even in case of a 1000 year
recurrence interval flood. A change of the water flow pattern in the waste is not investigated,
because an abrupt change is not to be expected in an undisturbed landfill. As the aeration of the
undisturbed waste body is expected to take place over several thousand years at a slow rate (cf.
Bozkurt et al. 1999), such a scenario is not included in the analysis.
6.1.2.1 Leachate emissions
Emission model
For each landfill compartment an emission model is established based on the monitoring data at the
site and data from the literature on mobilizable waste fractions (see Table 6-5 and Table 6-4). The
144 Case studies

Compart-Parameter
c0 ms h c0,org morg
ment [mg/l] [mg/kg] [-] [mg/l] [mg/kg]
Cl [mg/l] 1050 1500 -
C1 NH4-N [mg/l] 800 300 5 76,7 500
COD [mg/l] 1200 800 429 2800
C2
Cl [mg/l]
NH4-N [mg/l]
COD [mg/l]
2500
1000
4500
1800
500
1600
3
-
125
416,7
-
600
2000
C3
Cl [mg/l]
NH4-N [mg/l]
COD [mg/l]
1800
500
3000
2000
500
2000
2
-
402
804
-
1000
2000
C4
Cl [mg/l]
NH4-N [mg/l]
COD [mg/l]
2000
450
2600
1750
400
800
2
-
345
1035
-
600
1800
C5
Cl [mg/l]
NH4-N [mg/l]
COD [mg/l]
6000
3500
10000
1500
600
3000
3
-
429
675
-
1400
2200
C6
Cl [mg/l]
NH4-N [mg/l]
COD [mg/l]
2000
2000
10000
1800
400
2200
2
-
230
632,5
-
800
2200
C7
Cl [mg/l]
NH4-N [mg/l]
COD [mg/l]
2200
1000
8000
1800
600
2000
3
-
255,6
511
-
1000
2000
C8
Cl [mg/l]
NH4-N [mg/l]
COD [mg/l]
1400
1000
1500
1500
200
500
3
-
230
287,6
-
800
1000
Model formulation: c t( ) = c0
th S
L
m
c
se ••• Δ−
• )( 0
+ org c0,
th S
L
m
c
org
org
e •••Δ−
• )
,( 0
concentrations of Cl, NH4-N, and COD in the leachate after compartment closure are shown in
Table 6-5 as a function of the liquid-to-solid ratio of the waste. In general, a decreasing trend can
be observed for leachate concentration levels, but for younger compartments additional monitoring
data would be necessary to allow for reliable statements. The parameters of the calibrated emission
models are shown in Table 6-4. The mobilizable waste fractions (ms and morg) as well as the water
flow heterogeneity (h) are chosen in a plausible bandwidth (cf. Table 5-2) and the models are fitted
to the measured leachate concentrations after compartment closure.
Table 6-4: Model parameters to estimate the concentrations of Cl, NH4-N, and COD in the leachate
of the landfill compartments (c0 refers to the time of compartment closure)
Case studies 145

10000
Compartment 1 Compartment 2
Compartment 3 Compartment 4 8000
Compartment 5 Compartment 6
Compartment 7 Compartment 8
6000
NH
4-N
[m
g/
l]
Cl [
mg
/l]
4000
2000
0
0.00 0.10 0.20 0.30 0.40 0.50 0.60 L/S after closure [l/kg DM]
5000
Compartment 1 Compartment 2
Compartment 3 Compartment 4 4000
Compartment 5 Compartment 6
Compartment 7 Compartment 8
3000
2000
1000
0
0.00 0.10 0.20 0.30 0.40 0.50 0.60 L/S after closure [l/kg DM]
15000 Compartment 5: Compartment 1 Compartment 2 max. 35000 mg/l
Compartment 3 Compartment 4
Compartment 5 Compartment 6
Compartment 7 Compartment 8 10000
CO
D [
mg
/l]
5000
0
0.00 0.10 0.20 0.30 0.40 L/S after closure [l/kg DM]
0.50 0.60
Table 6-5: Concentrations of Cl, NH4-N, and COD in the leachate after compartment closure
146 Case studies

The concentrations of Cr in the leachate are not included in Table 6-5 and Table 6-4, as they do not
exhibit a significant trend and estimates on the mobilizable fractions of chromium in MSW are
hardly available in the literature and highly uncertain. Therefore, the mean concentration values are
extrapolated for the whole modeling period. The assumption of constant chromium levels in the
leachate is conservative, as long as there is no increased release of chromium due to a change in
ambient conditions in the waste or pH decrease.
Status quo
The status quo is based on the persistence of the best containment system performance at the site.
In addition to the constant function of the technical barriers, the substance release mechanisms and
water flow patterns in the waste remain unchanged. Depending on the investigated compartment,
the top cover systems prevent between 95 and 99.5 % of the annual precipitation from infiltration
into the waste and the efficiencies of the base lining systems (fraction of leachate captured within
the landfill) lie between 90 and 99.5 %.
Figure 6-3: Leachate emissions for the Status quo (constant barrier performance) at Landfill A (left:
total leachate emissions, right: leachate emission to subsurface)
The emission estimates for the status quo (see Figure 6-3) are based on the emission models in
Table 6-4 and the barrier efficiencies described above. In Figure 6-3 the emissions of each
compartment have been integrated for the whole landfill due to reasons of brevity. The concentra
tions of chloride, ammonia-nitrogen, and chemical oxygen demand (COD) in the leachate decrease
slowly, because of the relatively low level of water infiltration into the waste body. Chloride con
centrations fall from 870 mg/l to 150 mg/l, ammonia-nitrogen from 410 mg/l to 110 mg/l, and COD
from 1350 mg/l to 270 mg/l within 300 years (see Figure 6-3, left). Similarly, the loads of Cl, NH4
N, and COD decrease slowly from several thousand kg/yr to several hundred kg/yr after 300 years.
Case studies 147

The concentrations and loads of chromium are constant during the whole modeling period at a level
of 0.5 mg/l and 1.6 kg/yr, respectively. The concentrations in the leachate released to the subsur
face (Figure 6-3, right) differ from the total leachate emissions (Figure 6-3, left), because of differ
ent efficiencies of the technical barriers at the landfill base on the compartment level. Concentra
tions in the released leachate are slightly lower, as the older compartments produce less polluted
leachate and have lower barrier efficiencies. The annual emission loads of Crtot to the subsurface
are lower by a factor 30 than the total loads in the leachate (see Figure 6-3, right).
The modified status quo* assumes the complete inefficiency of the technical barrier at the landfill
base. Hence, the total leachate emissions in Figure 6-3 (left) and the emissions released to the
subsurface are the same for this scenario.
Scenario A
This scenario is designed to investigate the effect of gradual barrier deterioration and decreasing
barrier performance levels on landfill emissions. The conditions within the waste body remain
stable (e.g. dominant release mechanisms, water flow pattern) and the hydraulic boundary condi
tions change over time (gradual increase of infiltration rates and percolation rates through the land
fill base).
The future barrier performance is estimated for three service periods and performance levels are
derived for each period (cf. Table 6-6). Barrier efficiency is delimited by the actual system perfor
mance (the best possible service level provided there is no future maintenance) and the complete
inefficiency of landfill liners (the worst service level). The inefficiency of the final top cover is
approximated by the local groundwater recharge rate of 27% of annual precipitation. Regarding
bottom liner failure, all the generated leachate is released to the vadose zone below the landfill. The
predicted service levels of the containment system are based on evaluating different performance
factors and their importance in a specific service period. The evaluation scores and the translation
of the scores into respective performance levels are shown in Table 6-6 for the technical barriers of
compartment 1. The calculated performance levels in Table 6-6 (leachate generation rates and lea
chate percolation through landfill base) are reached at the end of each respective service period.
The evaluation procedure is described in detail in chapter 5.2.
The calculated emissions for Scenario A are based on the emission models in Table 6-4 and the
predictions on future barrier efficiencies of the compartments (e.g. Table 6-6). The total leachate
emissions and the leachate emissions to the landfill subsurface are shown in Figure 6-4. The
concentrations of chloride in the leachate decrease from 870 mg/l at the beginning to approximately
10 mg/l after 300 years, those of ammonia-nitrogen from 410 mg/l to 50 mg/l, and those of COD
from 1350 mg/l to 100 mg/l (see Figure 6-4, left). The corresponding annual loads in the leachate
peak after 30 to 60 years at 3420 kg Cl/yr, 1840 kg NH4-N/yr, and 5350 kg COD/yr, respectively.
Due to the constant chromium concentrations during the modeling period (0.6 mg/l)18, the
chromium loads increase steadily to a level of 9.1 kg Cr/yr after 300 years.
18 Chromium concentrations are 0.6 mg/l for Scenario A relative to 0.5 mg/l for the staus quo, because of
decreasing barrier performance at compartments with higher chromium concentrations in the leachate. The
average concentration over the whole modeling period in the leachate is 0.6 mg/l and is kept constant
(conservative assumption) for the leachte released to the subsurface.
148 Case studies

Factors – top cover Evaluation score*
1good–3bad
Weighting factors**
0–100 yrs 100–200 yrs 200–300 yrs Barrier performance at time of evaluation
Construction quality program
Recultivation layer (cover)
Heat production within waste
Climate
2
1
2
1
1
0.36
0.38
0.33
0.09
0.08
0.08
0.44
0.48
0.06
0.12
0.065
0.12
0.487
0.04
0.487
Typical vegetation and projection after use
Relief
1
1
0.09
0.08
0.48
0.1
0.487
0.12
Expected settlements
Lining control systems (direct monitoring)
Drainage system
1
3
2
0.38
0.1
0.1
0.09
0.06
0.09
0.065
0.05
0.08
Evaluation results: 2.98 2.77 2.73
Leachate generation rates [mm/yr]: 98.6 128.7 151.9
Factors – bottom lining system
Barrier performance at time of evaluation
Construction quality program
Climate
2
1
1
0.44
0.46
0.07
0.08
0.49
0.08
0.07
0.44
0.09
Heat production within waste
Distance to groundwater
Overburden pressure
Leachate quality
Monitoring (e.g. groundwater monitoring)
Drainage system
Stability of foundation
Landfill geometry (heap vs. cavity)
1
1
2
1
1
1
1
2
0.09
0.08
0.08
0.08
0.08
0.46
0.10
0.08
0.06
0.08
0.08
0.08
0.07
0.11
0.44
0.43
0.05
0.09
0.08
0.08
0.07
0.10
0.46
0.48
Evaluation results: 2.62 2.59 2.64
Leachate percolating through landfill base [mm/yr]: 23.6 45.3 69.2
*Specific criteria are used to derive evaluation scores: For instance, a score of 1 for “barrier performance at the time of evaluation”
means that the barrier has performed according to its design specifications, a score of 2 is awarded if there is no direct monitoring of the
barrier function, but it is probably performing according to the design specifications, whereas a score of 3 means that it has not achieved
its intended service level at the time of evaluation.
**Weighting factors were derived from expert evaluations during a survey on the importance of different factors for barrier performance
during different service periods (cf. chapter 4.1.4, chapter 5.2, and appendix 2).
Table 6-6: Evaluation of the containment system of compartment 1 of Landfill A to estimate future
service levels within Scenario A
In the leachate released to the subsurface concentration levels of the emission parameters are lower
than in the generated leachate at the beginning of the modeling period (except for Cr). However,
these concentrations are increasing during the first decade due to the decreasing efficiency of the
base lining system at compartments with strongly polluted leachate. After a few years the concen
trations reach maxima of 664 mg Cl/l, 308 mg NH4-N/l, and 996 mg COD/l (cf. Figure 6-4, right).
The corresponding loads increase to levels of 330 kg Cl/yr after 130 years, 278 kg NH4-N/yr after
225 years, and 578 kg COD/yr also after 225 years. Due to the constant chromium concentrations
in the leachate, the chromium loads increase to 3.4 kg/yr at the end of the modeling period.
The modified scenario “Scenario A*” assumes the complete inefficiency of the technical barrier at
the landfill base. Hence, the total leachate emissions in Figure 6-4 (left) and the emissions released
to the subsurface are the same for Scenario A*.
Case studies 149
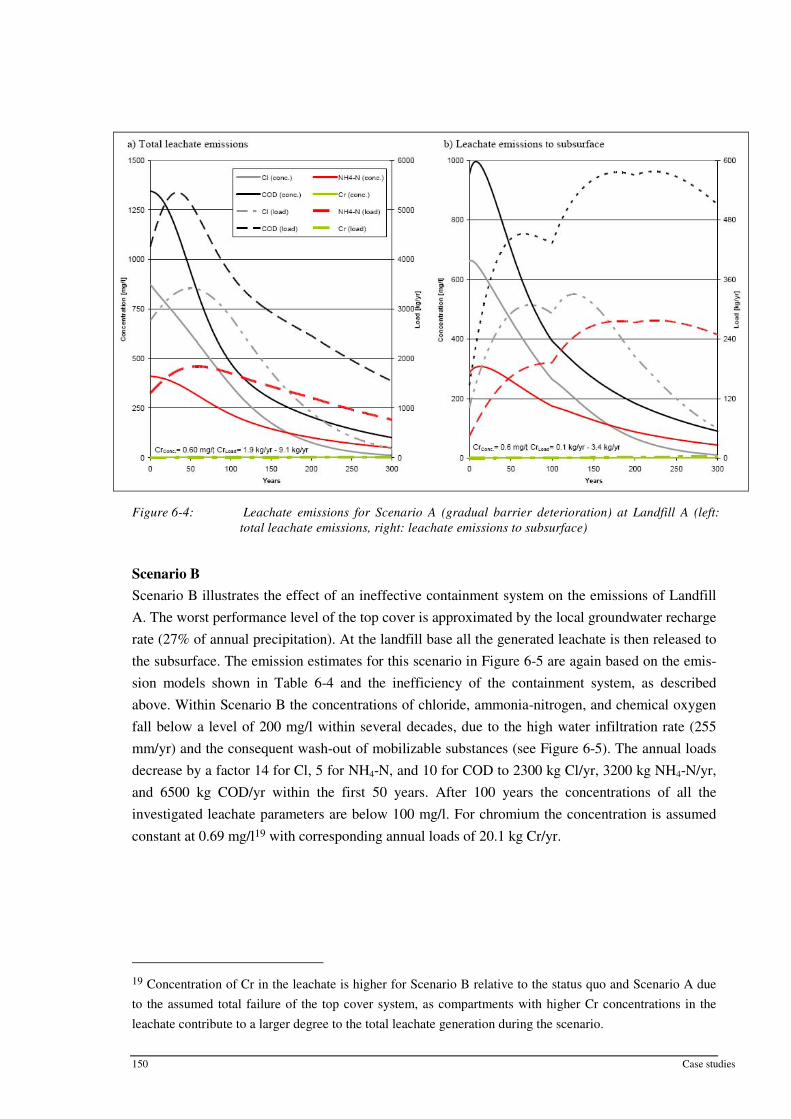
Figure 6-4: Leachate emissions for Scenario A (gradual barrier deterioration) at Landfill A (left:
total leachate emissions, right: leachate emissions to subsurface)
Scenario B
Scenario B illustrates the effect of an ineffective containment system on the emissions of Landfill
A. The worst performance level of the top cover is approximated by the local groundwater recharge
rate (27% of annual precipitation). At the landfill base all the generated leachate is then released to
the subsurface. The emission estimates for this scenario in Figure 6-5 are again based on the emis
sion models shown in Table 6-4 and the inefficiency of the containment system, as described
above. Within Scenario B the concentrations of chloride, ammonia-nitrogen, and chemical oxygen
fall below a level of 200 mg/l within several decades, due to the high water infiltration rate (255
mm/yr) and the consequent wash-out of mobilizable substances (see Figure 6-5). The annual loads
decrease by a factor 14 for Cl, 5 for NH4-N, and 10 for COD to 2300 kg Cl/yr, 3200 kg NH4-N/yr,
and 6500 kg COD/yr within the first 50 years. After 100 years the concentrations of all the
investigated leachate parameters are below 100 mg/l. For chromium the concentration is assumed
constant at 0.69 mg/l19 with corresponding annual loads of 20.1 kg Cr/yr.
19 Concentration of Cr in the leachate is higher for Scenario B relative to the status quo and Scenario A due
to the assumed total failure of the top cover system, as compartments with higher Cr concentrations in the
leachate contribute to a larger degree to the total leachate generation during the scenario.
150 Case studies

2000
2400
Cl (conc.)
COD (conc.)
Cl (load)
COD (load)
NH4-N (conc.)
Cr (conc.)
NH4-N (load)
Cr (load)
100000
1600 1000
Co
ncen
trati
on
[m
g/l]
1200
800 10
400
0
0 50 100 150
Years
200 250 300
0,1
CrConc.= 0.69 mg/l
Lo
ad
[kg
/yr]
Figure 6-5: Leachate emissions for Scenario B (complete failure of barriers) at Landfill A
6.1.2.2 Landfill gas emissions
Due to the low quality of available landfill gas monitoring data, different models and model para
meters are used to estimate potential landfill gas emissions. Thereby, a bandwidth of possible emis
sion levels is illustrated. The landfill gas emission models are not adapted to the scenarios
described above, but only extrapolated to the future based on the past conditions within the landfill.
The reason for this is twofold: a) no relationship between the amount of water infiltration and the
gas production rate at Landfill A can be established, and b) the large bandwidth of possible emis
sion model parameters and resulting estimates do not allow for meaningful scenario analysis. In
any case, it is probable that the scenarios investigating the effect of limited water infiltration into
the waste body would be associated with relatively low gas generation rates, as the availability of
mobile water is of primary importance for anaerobic degradation processes (cf. Klink and Ham
1982; Bogner and Spokas 1993; Christensen et al. 1996).
Emission model and predictions
In order to adjust a theoretical gas production model to the measured gas collection data at the site,
several assumptions are necessary. First, the fraction of biodegradable organics contained within
the deposited MSW must be estimated. Second, the fraction of landfill gas collected needs to be
assumed. Based on data presented by Krümpelbeck (2000) for German landfills and the fact that
gas collection was installed two decades after the operation of the landfill was started, a collection
efficiency of 35 percent is assumed for Landfill A. The gas production rates calculated from the
measured amount of collected landfill gas are shown in Figure 6-6. Two landfill gas production
models are adjusted to the estimated (35 % collection efficiency) gas production rate. The model by
Tabasaran and Rettenberger (Tabasaran and Rettenberger 1987) with a gas production potential of
187 m³ per ton of dry waste and the LandGEM model published by the U.S. EPA (U.S. EPA 2005)
Case studies 151

La
nd
fill g
as [
millio
n m
³/y
ea
r]
10
8
6
4
2
0
1970 1980 1990 2000 2010 2020 2030 2040 2050
Gas generation (Tabasaran & Rettenberger)
Gas generation (LandGEM)
Gas generation (35% captured)
Captured landfill gas
Year
with a gas production potential of 200 m³ per ton of dry waste (the moisture content of the
deposited waste was 30% by weight). Typical degradation rates for conventional landfills (cf.
Table 3-1) are chosen. For the Tabasaran & Rettenberger model the k-value is 0.035 per year and
for the LandGEM model the k-value is 0.04 per year. The consequent gas production curves for
these two models are shown in Figure 6-6. The Tabasaran & Rettenberger model calculates the
highest gas generation rates, but also predicts a faster decrease of gas generation than the
LandGEM model. Both models are rather conservative (overestimate actual gas generation)
compared to the gas generation rates estimated from measured data with an assumed collection
efficiency of 35% of total landfill gas. However, as the poor monitoring data and the large
uncertainties (i.e. collection efficiency, degradable amount of organic matter) do not allow for more
confident estimates on gas generation, the model estimates in Figure 6-6 are used to evaluate a
bandwidth of potential future landfill emissions. The concentration of methane in the landfill gas is
estimated to be 50 % of volume, which is confirmed by the monitoring data (cf. Figure 6-2).
Figure 6-6: Comparison of measured data on captured landfill gas at Landfill A with estimates of
different models about landfill gas generation
6.1.3 Pollutant migration
Based on the emission estimates developed above, the migration of released pollutants and their
ambient concentrations in the affected environmental media (i.e. soil, groundwater, surface waters,
and atmosphere) are evaluated.
Leachate migration
A scheme of the migration pathway through the vadose zone and the aquifer below Landfill A is
shown in Table 6-7 together with the soil properties of the different layers. The design parameters
of the landfill liner system of the compartments 1 to 4 are used for the whole landfill, although
there might be thicker earthen barriers or composite liner systems at the base of other compart
ments (cf. Table 6-1). The earthen barrier is included in the pollutant migration modeling. The
natural subsurface system is mainly built up from gravel with the groundwater surface
approximately 2 meters below the lowest point of the landfill base. The slurry wall system around
152 Case studies
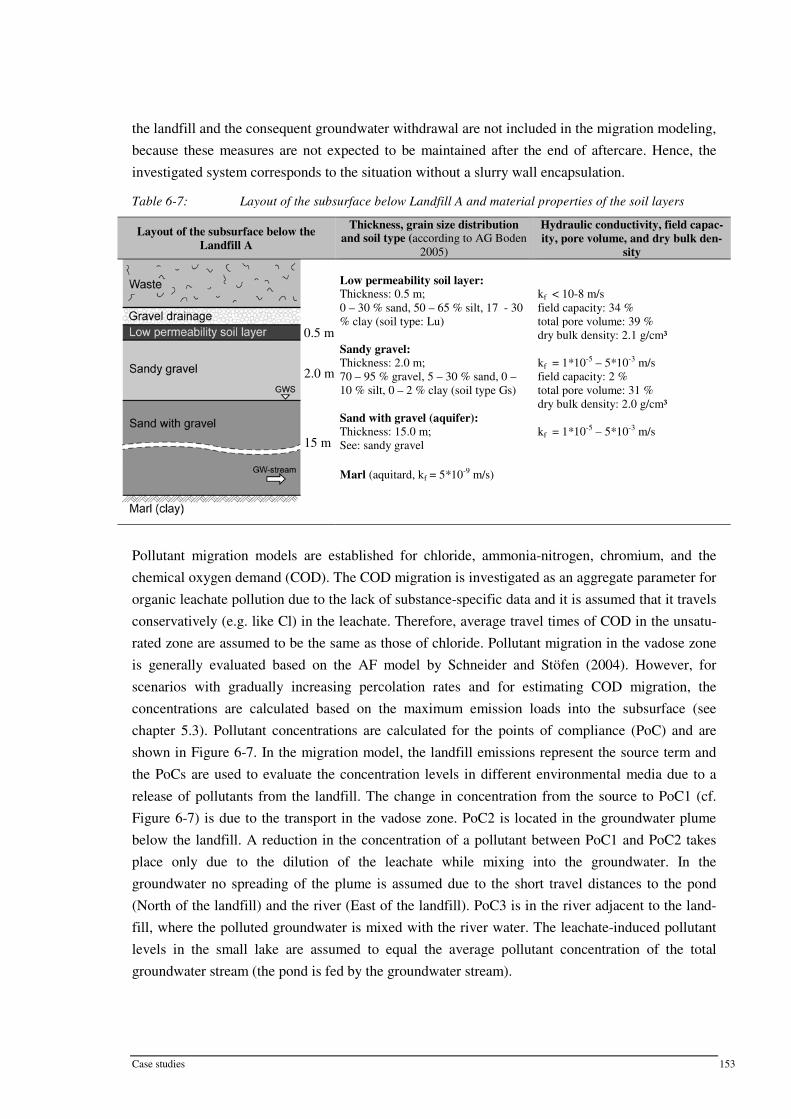
Layout of the subsurface below the
Landfill A
Thickness, grain size distribution and soil type (according to AG Boden
2005)
Hydraulic conductivity, field capac
ity, pore volume, and dry bulk den
sity
0.5 m
2.0 m
15 m
Low permeability soil layer: Thickness: 0.5 m; 0 – 30 % sand, 50 – 65 % silt, 17 - 30 % clay (soil type: Lu)
Sandy gravel:
Thickness: 2.0 m; 70 – 95 % gravel, 5 – 30 % sand, 0 – 10 % silt, 0 – 2 % clay (soil type Gs)
Sand with gravel (aquifer):
Thickness: 15.0 m; See: sandy gravel
Marl (aquitard, kf = 5*10-9 m/s)
kf < 10-8 m/s field capacity: 34 % total pore volume: 39 % dry bulk density: 2.1 g/cm³
kf = 1*10-5 – 5*10-3 m/s field capacity: 2 % total pore volume: 31 % dry bulk density: 2.0 g/cm³
kf = 1*10-5 – 5*10-3 m/s
the landfill and the consequent groundwater withdrawal are not included in the migration modeling,
because these measures are not expected to be maintained after the end of aftercare. Hence, the
investigated system corresponds to the situation without a slurry wall encapsulation.
Table 6-7: Layout of the subsurface below Landfill A and material properties of the soil layers
Pollutant migration models are established for chloride, ammonia-nitrogen, chromium, and the
chemical oxygen demand (COD). The COD migration is investigated as an aggregate parameter for
organic leachate pollution due to the lack of substance-specific data and it is assumed that it travels
conservatively (e.g. like Cl) in the leachate. Therefore, average travel times of COD in the unsatu
rated zone are assumed to be the same as those of chloride. Pollutant migration in the vadose zone
is generally evaluated based on the AF model by Schneider and Stöfen (2004). However, for
scenarios with gradually increasing percolation rates and for estimating COD migration, the
concentrations are calculated based on the maximum emission loads into the subsurface (see
chapter 5.3). Pollutant concentrations are calculated for the points of compliance (PoC) and are
shown in Figure 6-7. In the migration model, the landfill emissions represent the source term and
the PoCs are used to evaluate the concentration levels in different environmental media due to a
release of pollutants from the landfill. The change in concentration from the source to PoC1 (cf.
Figure 6-7) is due to the transport in the vadose zone. PoC2 is located in the groundwater plume
below the landfill. A reduction in the concentration of a pollutant between PoC1 and PoC2 takes
place only due to the dilution of the leachate while mixing into the groundwater. In the
groundwater no spreading of the plume is assumed due to the short travel distances to the pond
(North of the landfill) and the river (East of the landfill). PoC3 is in the river adjacent to the land
fill, where the polluted groundwater is mixed with the river water. The leachate-induced pollutant
levels in the small lake are assumed to equal the average pollutant concentration of the total
groundwater stream (the pond is fed by the groundwater stream).
Case studies 153

Diffusion coefficient in kd-value [l/kg] kd-value [l/kg] Vadose zone Comments
water [m²/yr] (low perm. soil layer) (gravel & sand)
Cl 0.0315 0 0 No degradation
NH4-N 0.0378 0.5 0 No degradation
Crges Unknown (0) 400 400 No degradation
Groundwater velocity Groundwater Mixing depth [m] Contaminated width [m] Comments
[m/yr]
General parameters 150 0,5 250 No degradation*
* The dissolved oxygen content in the groundwater is used as an indicator to estimate the potential for aerobic degradation of
organic substances and the nitrification of ammonia.
Figure 6-7: Scheme of the landfill-environment system and relevant points of compliance (PoC) at
Landfill A (cross-section along the ground water flow direction)
Different transport parameters and assumptions within the pollutant migration modeling are listed
in Table 6-8. As the distribution coefficients of the linear sorption isotherm (kd) relate to a single
substance and not to a complex mixture of substances like landfill leachate, the values in Table 6-8
were chosen conservatively (see also chapter 4.2)
Table 6-8: Parameters used for pollutant migration modeling in the subsurface below Landfill A
The attenuation factors in Figure 6-8 represent a first estimate of concentration reductions due to
transport processes in the subsurface for the different emission scenarios. Some basic figures of the
calculations to derive the attenuation factors for the selected pollutants and the different scenarios
are given in Table 6-9 and Table 6-10.
The concentrations of Cl, NH4-N, and Cr at the PoC1 are calculated with the AF model (Schneider
and Stöfen 2004) for scenarios with constant leachate release rates (see Table 6-9). Migration
processes considered within the model are longitudinal dispersion, diffusion and potentially
sorption. The concentrations at PoC1 are then reduced due to the mixing with groundwater:
dilution factor = (leachate flow rate [m³/yr] + groundwater flow in the mixing zone [m³/yr]) /
leachate flow rate [m³/yr]. The concentrations in the groundwater remain unaltered, as there is no
spreading of the plume, sorption, or degradation considered. Subsequently, the contaminated
groundwater exfiltrates into the adjacent surface water bodies.
The concentrations of COD at PoC1 are calculated based on the released emission loads to the
subsurface. In case of constant leachate release rates, the travel time of Cl (calculated in the AF
model) is used to calculate the average COD load over this time period and the COD
concentrations at PoC1. In case of varying leachate release rates, the leachate concentration at the
154 Case studies

time when the maximum substance load is released to the subsurface is equal to the concentration
at PoC1. This load-based approach is used for scenarios with varying leachate release rates, except
in case of Cr, for which the concentrations are calculated according to the AF model with the
average leachate release rate over the whole modeling period (see Table 6-10). The concentrations
in the groundwater and in the surface waters are calculated based on a mass balance approach using
maximum substance loads, too. The migration modeling represents a screening analysis with rather
conservative assumptions about the environmental setup and the transport parameters. However, a
more realistic pollutant migration modeling is only warranted, if more data are collected at the site
to adapt more complex models to the conditions at Landfill A.
Landfill
PoC1
PoC2
Groundwater
q = 1.4 mm/yr
AFCl
AFNH4-N
AFCOD
AFCr
AFGW
3,0
5,5
1,8
4850,0
129
Status Quo
AFriver
PoC3
31752
Landfill
AFCl 1,0
AFNH4-N 1,0
AFCOD 1,0
PoC1 AFCr 242,0
PoC2 AFGW 7,2 AFriver 27570
PoC3
Status Quo*
Groundwater
q = 28.1 mm/yr
Scenario A Scenario A*
Landfill
PoC1
PoC2
Groundwater
q = 14 - 33 mm/yr
AFCl
AFNH4-N
AFCOD
AFCr
AFGW, Cl
AFGW, NH4-N
AFGW, COD
AFGW, Cr
3,2
4,1
6,3
1230,0
13
6,3
6,4
9,3
AFriver
PoC3
27000-30000
Landfill
AFCl 1,4
AFNH4-N 1,3
AFCOD 1,2
PoC1 AFCr 80,2
PoC2 AFGW, Cl 4,6 AFriver 21000-26000
AFGW, NH4-N 4,4 PoC3
AFGW, COD 5,2
AFGW, Cr 3,0
Groundwater
q = 41 - 85 mm/yr
Landfill
PoC1
PoC2
Groundwater
q = 255 mm/yr
AFCl
AFNH4-N
AFCOD
AFCr
AFGW
1,0
1,0
1,0
26,6
1,7
Scenario B
AFriver
PoC3
12911
Grey cells indicate that the calculated attenuation factor is based on the maximum or
average load in the leachate. For scenarios with varying leachate release rates over
time the maximum loads result in higher concentrations in the subsurface than the
calculations based on initial concentrations in the leachate.
In case of COD all calculations are based on substance loads into the subsurface.
For constant leachate release rates the COD load is averaged over the average
transport duration in the vadose zone (the same as for Cl).
The dilution in the river water is calculated based on the mean annual discharge of the
river (MQ). For a time increment of one year, the use of mean discharge seems
appropriate, while for shoter time increments low flow values would be more suitable.
Comments
Attenuation factors refer to the maximum concentration in the leachate. For instance,
for Scenario A the leachate-induced chloride cocentration at PoC3 would be (see
values in the left box in the middle): cPoC3 = c0/(3.2*13*27000)
Figure 6-8: Attenuation factors to estimate the concentrations at relevant PoCs due to a release of
leachate from Landfill A for the different scenarios
The pollutant migration modeling for Landfill A does not include any degradation processes which
might take place in the soil and groundwater zone. However, the concentration of oxygen in the
groundwater upstream of the landfill is around 7 – 9 mg/l, which results in an annual oxygen load
in the groundwater mixing zone below the landfill of 140 kg O2 per year. For the whole
groundwater stream the oxygen load amounts to approximately 4200 kg O2 per year. The oxygen
demands (COD and nitrification of ammonia) induced on the groundwater during the emission
scenarios status quo*, Scenario A*, and Scenario B exceed this load and therefore also affect the
Case studies 155

Scenario Parameter c0,max Release rate AF Travel time cPoC1 GW flow AFGW cPoC2
[mg/l] [mm/yr] [-] tm [yrs] [mg/l] [m³/yr] [-] [mg/l]
Status quo Cl 662 1.4 3.0 150 221 19710 129 1.7
Status quo NH4-N 287 1.4 5.5 525 52 19710 129 0.4
Status quo Cr 0.35 1.4 4850 > 1 Mio. 0.00 19710 129 0.0
Scenario B Cl 1083 255.2 1.0 0.8 1083 19710 1.7 637.1
Scenario B NH4-N 551 255.2 1.0 2.8 551 19710 1.7 324.1
Scenario B Cr 0.69 255.2 26.6 7900 0.03 19710 1.7 0.02
Status quo* Cl 873 28.0 1.0 7.5 874 19710 7.2 120.9
Status quo* NH4-N 411 28.0 1.0 26.0 411 19710 7.2 56.9
Status quo* Cr 0.5 28.0 242 71900 0.00 19710 7.2 0.0
Scenario A Cr 0.6 20.7 1230 367000 0.0 19710 9.3 0.0
Scenario A* Cr 0.6 84.5 80 23850 0.0 19710 3.0 0.0
Scenario Parameter C0,max Release rate Load Travel time cPoC1 AF AFGW CPoC2
[mg/l] [mm/yr] [kg/yr] tm [yrs] [mg/l] [-] [-] [mg/l]
Status quo COD 953 1.4 81.0 150 a 526 1.8 129 4.1
Scenario A Cl 662 14.3 329 14.0 204 3.2 13.0 15.7
Scenario A NH4-N 310 32.8 278 23.7 75 4.1 6.3 11.9
Scenario A COD 1000 32.0 578 6.6 158 6.3 8.3 19.1
Scenario B COD 2126 255.2 61950 0.8 a 2126 1.0 1.7 1251
Status quo* COD 1345 28.0 4110 7.5 a 1298 1.0 7.2 180
Scenario A* Cl 874 48.6 3420 4.0 625 1.4 4.6 137
Scenario A* NH4-N 411 51.2 1843 14.0 316 1.3 4.4 72
Scenario A* COD 1345 41.3 5348 5.0a 1142 1.2 5.2 220 a Average travel time of COD in the vadose zone is assumed the same as for Cl.
oxygen levels in the adjacent surface waters (especially in the pond). However, reaeration will take
place in the surface waters depending, among other factors, on the mixing rate.
Table 6-9: Data for the AF-model calculations to estimate concentrations at PoC1 and PoC2
Table 6-10: Data for the calculations based on maximum emission loads into the subsurface to esti
mate concentrations at PoC1 and PoC2
The attenuation factors in Figure 6-8 can be used to determine the concentration levels at the PoCs
due to the release of leachate from the landfill. Thus, the model outcomes do not reveal the total
pollutant concentration in the groundwater, but the influence of landfill leachate on the
groundwater. To calculate total concentrations, the pollutant concentrations in the groundwater
upstream of Landfill A would have to be considered.
Landfill gas migration
The area-specific methane generation rates illustrated in Figure 6-9 are based on the landfill gas
models for Landfill A shown in Figure 6-6. The generated methane is assumed to be released from
the waste body and to migrate through the top cover, as landfill gas is not collected any more. The
generated methane may be fully released to the atmosphere or some fraction may be subject to
methane oxidation processes taking place in the recultivation layer of the top cover system (cf.
chapter 4.2). A fraction of 15% of methane oxidation in the landfill top cover was suggested to
156 Case studies

0
5
10
15
20
25
0 10 20 30 40 50 60 70 80 90 100
Me
tha
ne g
en
era
tio
n [
kg
/(m
².y
ea
r)]
Year
Methane generation (T&R)
Methane generation (LandGEM)
estimate methane emissions from sites with methane generation rates below 17 kg of CH4 per m²
and year (cf. Table 4-10). Without considering methane oxidation, methane emissions are expected
to drop below 10 kg CH4 per m² and year within 20 years and below 5 kg CH4 per m² and year
within 40 years.
Figure 6-9: Methane generation rates per m² of landfill surface for the two gas generation models
applied to Landfill A
The migration of landfill gas in the subsurface is not included in the analysis, as the landfill is hill
shaped and no vulnerable uses (e.g. cellars of residential buildings) are located in the vicinity of the
landfill.
6.1.4 Completion criteria and aftercare duration
Based on the developed emission scenarios, the pollutant migration modeling, and acceptable con
centration levels at the points of compliance, tolerable emission levels at the source (Landfill A) are
derived. The resulting scenario-specific substance concentrations in the leachate, at which aftercare
can be terminated, are shown in Table 6-11. Because there is no gravity drainage of the leachate
collected in the leachate basins, the status quo* and Scenario A* are considered as most relevant to
assess the environmental risk for Landfill A. Due to the expected decrease in top cover
performance after maintenance and repair activities are terminated, Scenario A* is used to assess
tolerable emission levels, at which aftercare can be terminated. The maximum concentration levels
in the leachate given in Table 6-11 allow for pollutant levels as high as the drinking water quality
standards at PoC2 or in the pond, respectively. The limits applied for ammonia-nitrogen assume a
nitrification of the ammonia to nitrate in the groundwater and COD levels at PoC2 are not
evaluated. Hence, the limits set in Table 6-11 would allow for contamination of the groundwater
below the landfill and assume this environmental compartment to be a kind of treatment filter for
the released leachate. Nevertheless, the derived tolerable leachate concentrations of NH4-N and
COD would be below the current leachate concentrations. The acceptable concentration of Cl in the
leachate would be in the range of current concentrations. The acceptable concentrations are
determined without considering other potential pollutant sources or pollutant levels already present
in the groundwater upstream of the landfill. Therefore, even if the groundwater is accepted as a
Case studies 157

- - -
Parameter PoC2 Status quo* Scenario A* Pond Status quo* Scenario A*
climit [mg/l] c0 [mg/l] c0 [mg/l] climit [mg/l] c0 [mg/l] c0 [mg/l]
Cla) 200 1445 1286 200 43341 38584
11.3 82 64 11.3 2449 1932 NH4-Na)
5 1123 920 CODa)
Cra) 0.01 17 2 0.01 524 73
a) Limit values for leachate induced concentrations at PoC equal Austrian drinking water quality standards (MoE 2001). In case of
ammonia-nitrogen limit values for nitrate are applied. COD limits are only applied to subsurface waters.
treatment filter and without looking at total concentration levels, the current levels of NH4-N and
COD are too high to meet the quality standards set in Table 6-11 for the groundwater and the pond.
Table 6-11: Tolerable leachate concentrations (c0) at the source to comply with the specified limit
values at PoC2 and in the pond
To estimate the time until acceptable leachate quality can be reached at Landfill A and the landfill
can be released from aftercare, it is necessary to specify an aftercare strategy for the landfill. In
Table 6-12 potential aftercare durations are given for each of the critical leachate parameters (NH4
N and COD) based on three different (hypothetic) aftercare strategies. The first strategy is based on
constantly low water infiltration rates (current performance level remains constant during the after
care period). The second strategy is based on a gradual increase of water infiltration rates (as
described for top cover performance in Scenario A). The third strategy is based on the intensified
infiltration of water into the waste body (infiltration rate equals the local groundwater recharge
rate). The consequent aftercare durations are between 80 (intensive infiltration) and 450 (minimum
infiltration) years with ammonia-nitrogen, as the critical parameter for the environmental compati
bility of the leachate. Hence, even intensive water infiltration will not allow for the termination of
aftercare at Landfill A within the next decades. The leachate management period required at
Landfill A will be probably in the range of several centuries.
Table 6-12: Duration of aftercare for leachate emissions of Landfill A in consideration of different
aftercare strategies
Parameter Sealing at the top Sealing at the top Intensive water infiltration
through the cover (constant performance) (decrease of performance)
NH4-N 450 yrs 270 yrs 80 yrs
COD 100 yrs 50 yrs 7 yrs
If all the generated methane in the landfill is released to the atmosphere, it would take 60 to 110
years until the methane emissions drop below a value of 0.3 kg CH4 per m² and year (see Figure
6-9), which was suggested as a threshold level for insignificant methane emissions (cf. Fellner et al.
2008). The oxidation of 15% of the generated methane in the top cover would slightly shorten the
period of significant landfill gas emissions to 50 - 100 years. Thus, the aftercare duration at
Landfill A is probably determined by the necessary leachate management periods (cf. Table 6-12)
and not by landfill gas management. In addition, methane emissions may decrease at a faster rate in
reality than predicted by the landfill gas models, due to the conservative assumptions in the models.
Provided that monitoring data of sufficient quality are collected at the site in the future, more
realistic predictions on gas generation ratesa at the site could be derived.
158 Case studies

Although the presented evaluation is based on many (conservative) assumptions, inaccurate data,
and rather simplistic models, it has been illustrated that the developed methodology can be used to
define the desired state of the landfill at the end of aftercare and that different management
strategies can be evaluated with respect to achieving this state of the landfill. The emission models,
scenario layouts, and migration models used for the evaluation at Landfill A need to be verified
with future monitoring data or potentially adjusted to correspond with the observed developments
at the site. In any case, additional data need to be collected, as a basis for a more realistic
evaluation of the environmental compatibility of Landfill A, which can be used to optimize long
term landfill management at the site.
6.2 Landfill B - closed MSW landfill
6.2.1 Site description and monitoring data
Landfill and site conditions
During the years 1988 and 2003 approximately 135,000 tons of municipal solid wastes were
disposed at Landfill B. The waste was deposited in two sections, which were filled in succession.
The waste deposition took place from 199220 to 2000 in the first section and from 2000 to 2003 in
the second section. The two sections are only separated by a dam at the landfill base, the technical
systems of both sections are identical, and emissions are collected for the whole landfill.
Figure 6-10: Aerial photograph of Landfill B and surroundings
The landfill is situated on a hillslope with a road passing nearby the Western boundary of the pre
mises (see Figure 6-1). The direction of groundwater flow is West to Northwest. A river is located
in the valley approximately 250 m from the landfill. The leachate collection tanks are situated
20 Landfilling began at the site in 1988, but the waste disposed of between 1988 and 1992 was excavated in
1992 and then put into the upgraded landfill. Hence, although waste has been deposited since 1988 the
landfill containment at the base was finished in 1992.
Case studies 159

underground outside the landfill on the other side of the road, to enable gravity drainage and
collection of the landfill leachate.
The climate at the landfill site is humid with an average annual precipitation of 1960 mm. The
geologic strata below the landfill are composed of glacial gravel with high carbonate content. The
fluctuation of groundwater surface levels below the landfill is high with a typically low thickness
of the groundwater body. The distance between the lowest point of the landfill containment system
and groundwater surface is not less than 1.2 m. The groundwater body in the valley is more
voluminous than the groundwater along the hillslope below the landfill and has been investigated
as a potential drinking water resource of a village located 2 km North of the landfill.
Monitoring data
The waste volumes deposited at Landfill B were rather low during the first 10 years of landfill
operation. From 1988 to 1998 approximately 5000 tons of MSW have been disposed at the site
annually. Afterwards the amount of MSW landfilled increased to peak at 32,700 tons per year in
2002. In consequence, the second landfill section was filled within 3 years although its volume is
higher than the volume of the first section. In 2003, the landfill was closed and a temporary cover
consisting of a soil layer and a compost layer at the top (cf. Table 6-14) has been installed. The
temporary cover is planned as an aftercare measure until 2020, when a final cover shall be installed
at the landfill site.
The generated leachate is collected at the bottom of the landfill in a gravel drainage layer with
embedded leachate collection pipes. The pipes transport the leachate to the landfill bottom below
the middle dam, which separates the two landfill sections. The collected leachate of both landfill
sections is then directed to a leachate storage tank outside the landfill. The leachate generation rate
is evaluated based on the removal of leachate from the storage tank for treatment in a nearby waste
water treatment plant. The amount of leachate was continuously high at the landfill. During
operation the annual leachate generation rate was 50 to 90% of the annual precipitation. After the
installation of the temporary cover, the amount of leachate ranged between 60 and 80% of the
average annual precipitation, which corresponds to 13,500 and 18,000 m³ per year, respectively.
The samples for leachate analysis are taken at the inflow of the leachate storage tank. Samples are
taken twice a year and typically analyzed for 22 parameters. Some data for selected leachate
constituents are presented in Table 6-13 for the period during landfill operation and the period after
landfill closure. From the table it is evident that decreasing concentrations can be observed for
many leachate parameters after closure, but that some parameters still range far above the specified
quality standards for direct discharge of the leachate into a river. The mean values of post-closure
measurements in the leachate for COD, BOD5, TOC, NH4-N, and Cl are above the limit values.
The other leachate parameters generally comply with the discharge standards, with only the
maximum concentrations of AOX and Cr being above the limits. Therefore, NH4-N, COD, and Cl
(as conservative migrant with elevated concentrations in the leachate) are selected as leachate
parameters for the emission modeling at Landfill B.
160 Case studies

1000 50
Ca
ptu
red
me
tha
ne
[m
³/d
ay]
Methane amount
Methane concentration
800 40
600 30
400 20
200 10
0 0
9-Nov-04 5-Sep-05 2-Jul-06 Date 28-Apr-07 22-Feb-08
Me
tha
ne
co
nc
en
tra
tio
n in
la
nd
fill g
as
[V
ol%
]
Table 6-13: Statistical parameters of selected leachate properties of Landfill B during operation and
after closure of the Landfill
Parameter Operation period Post closure
Limit* Mean Median
Min. Max. Mean Median Min. Max.
pH 7.90 7.90 7.30 8.40
EC [µS/cm] 8542 7020 3220 16530
COD [mg O2/l] 1986 1453 445 6450
BOD [mg O2/l] 445 327 43 13500
TOC [mg/l] 460 242 22 1500
TNb [mg/l] - - - -
NH4-N [mg/l] 629 427 38 1800
NO3-N [mg/l] 42.0 16.2 0.1 324.4
Sulfate [mg/l] 349.3 317.5 31.7 1230.0
Chloride [mg/l] 431 364 71 1060
AOX [µg/l] 594 570 1 1806
Zn [mg/l] 0.22 0.13 0.05 0.85
Cr [mg/l] - - - -
Cu [mg/l] - - - -
Ni [mg/l] - - - -
Cd [mg/l] - - - -
Pb [mg/l] - - - -
Potassium [mg/l] 513 480 200 948
Sodium [mg/l] 1474 478 5 13800
7.71 7.80 6.40 8.20 6.5-8.5
6308 5790 3560 12600 -
965 720 220 2700 50
94.9 72.5 25.0 360.0 10
459 445 160 1100 25
500 460 220 1100
482 420 220 1100 10
3.9 3.5 1.1 16.0 -
148.4 120.0 25.0 480.0 -
301 210 84 940 Toxicity
330 300 120 1100 500
0.08 0.04 0.02 0.28 0.50
0.19 0.12 0.06 0.60 0.50
0.05 0.02 0.01 0.49 0.50
0.04 0.04 0.02 0.11 0.50
<0.001 <0.001 <0.001 <0.001 0.10
<0.01 <0.01 <0.01 <0.01 0.50
172 155 97 350 -
212 190 140 420 -
*Limit values for direct discharge into rivers
waste water discharge (1996), respectively.
according to the Austrian directive on leachate discharge (2003) and the Austrian directive on
Figure 6-11: Landfill gas monitoring data for the amount of methane collected and the methane
concentrations
In contrast to the good quality of available leachate data, landfill gas monitoring was carried out
only over a comparatively short period and the collected data are associated with high uncertainties
(e.g. fraction of landfill gas captured, amount of air sucked into the gas collection system).
Although there has been a gas collection system with a flare in operation since the mid of the
1990s, data on the amount and composition of the landfill gas are available only for the period after
the installation of the temporary cover. The measurements of the captured amount of methane and
its concentration in the landfill gas are shown in Figure 6-11. A decreasing trend of the amount and
Case studies 161

Area [m²] Volume [m³] Landfill base Landfill cover
Temporary cover: Soil layer (1.2 m) + Compost layer
Clay liner (3 layers (each 0.2 m), (0.25 m as recultivation layer)
kf <10-9 m/s) + HDPE membrane (2 12200 135000 Final cover: mm) + Geotextile + Gravel drainage
Low permeability soil layer (kf<10-9
layer (0.5 m) + Geotextile m/s) + HDPE membrane + Drainage layer + Recultivation layer
the concentration of methane in the landfill gas can be observed and the influence of different
climatic conditions throughout the year is indicated by the presented landfill gas data in Figure
6-11. Nevertheless, the limited data availability makes it difficult to estimate the landfill gas
generation rates for Landfill B.
Containment system
The landfill containment system is currently made up of the barrier system at the landfill base and
the temporary cover system at the top of the landfill (see Table 6-14). The temporary cover allows
on average 62% of the precipitation to infiltrate into the landfill body, which corresponds to an
infiltration rate of 1221 mm per year. It is planned to install a final cover at the site in 2020, which
includes a composite lining system (cf. Table 6-14) and is supposed to reduce the fraction of
precipitation infiltrating into the waste to 1 % (observed performance of similar systems, see chap
ter 4.1). No data are available on the efficiency of the base lining system. However, as there are no
indications of poor barrier performance at the monitoring wells downstream of the landfill, it is
assumed that currently 99 % of the generated leachate is contained within the landfill, collected,
and treated.
Table 6-14: Area and waste volume of Landfill B and design of the containment system
6.2.2 Emission predictions
To estimate potential future emissions of landfill leachate and landfill gas, several scenarios are
developed. The scenarios are used to illustrate the effect of different barrier performance levels
after the end of landfill aftercare on landfill emission levels. The basic emission model (leachate
quality as a function of liquid-to-solid ratio) is the same for all the investigated scenarios (i.e. no
change of water flow pattern and constant release mechanisms). The scenario layouts are the same
as for Landfill A (see Table 6-3), but with different infiltration rates corresponding to the described
barrier performance levels at Landfill B. The status quo assumes constant barrier function at the top
and at the bottom of the landfill. Scenario A considers the gradual decrease of barrier function at
the top and bottom of the landfill due to the slow deterioration of the barriers. Scenario B is
designed to illustrate the effect of complete barrier failure on landfill emission levels, which
represents the “worst case” with respect to technical barrier performance. In addition, modified
versions of the status quo and Scenario A are analyzed to investigate the effect of an inefficient
technical barrier at the landfill base. Under the assumption that leachate collection is impeded (e.g.
through clogging of drainage system) and liner systems fail, all the generated leachate is released to
the subsurface below Landfill B. The corresponding scenarios are the status quo* and Scenario A*
(see also Table 6-3). The modeling period for all scenarios is 300 years.
162 Case studies

0
400
800
1200
1600
2000
2400
2800
3200
3600
0.00 0.20 0.40 0.60 0.80 1.00 1.20
Co
ncen
trati
on
[m
g/l]
L/S after closure [l/kg DM]
Cl (measured) NH4-N (measured) COD (measured)
Cl (model) NH4-N (model) COD (model)
All the investigated scenarios assume constant release mechanisms and water flow patterns in the
deposited waste and are designed to analyze emission levels for different infiltration rates at the top
and percolation rates at the bottom of the landfill. Although the installation of a top cover might
have an effect on the water flow pattern in the waste (cf. Laner et al. 2011b), this is not expected
for Landfill B, as the final cover will be placed above the temporary cover without removing the
latter. Obviously, further scenarios could be evaluated with respect to potential landfill emission
levels. However, a flooding of the landfill can be ruled out due to its location on the hillside, an
aeration of the landfill is not expected within many centuries, and unintentional invasion should be
forestalled by appropriate after-use of the site.
The time of evaluation for Landfill B is the year 2010, as this is the last year for which monitoring
data is available. Although the scenario-based emission estimates include the time of temporary
cover (which is an aftercare measure), emission estimates are shown and discussed from year 10.
Hence, the estimated emission levels correspond to the (planned) final state of the landfill, after the
final top cover has been installed21.
6.2.2.1 Leachate emissions
Emission model
Figure 6-12: Concentrations of Cl, NH4-N, and COD in the leachate of Landfill B after closure as a
function of liquid-to-solid-ratio
Leachate emissions of ammonia-nitrogen, chemical oxygen demand, and chloride are estimated.
The emission model is based on literature data for mobilizable waste fractions and initial
concentrations as well as water flow heterogeneity estimated based on the available monitoring
data after landfill closure (see Figure 6-12 and Table 6-15). Due to the high water throughput (L/S
ratio increased by 1.15 liters per kg of dry waste within 5 years after closure), the concentrations in
the leachate have been decreasing rapidly and are currently (2010) in the range of 100 mg/l for Cl
21 The “bleeding out” of the landfill after final cover installation due to water stored in the waste
and slow drainage is not considered in the modeling, as this of minor importance in view of the
long modeling period.
Case studies 163

150 40 Cl (conc.) NH4-N (conc.) COD (conc.)
Cl (load) NH4-N (load) COD (load)
120
Co
ncen
trati
on
[m
g/l] 30
90
20
60
10 30
0 0
10 155 300 Years
Lo
ad
[kg
/yr]
and 220 mg/l for NH4-N and COD. The model functions shown in Figure 6-12 are based on the
model parameters listed in Table 6-15. The emission models form the basis for the emission
scenarios discussed below.
Table 6-15: Model parameters to estimate concentrations of Cl, NH4-N, and COD in the leachate of
Landfill B (c0 refers to the time of closure)
Parameter c0
[mg/l]
ms
[mg/kg]
h
[-]
c0,org
[mg/l]
morg
[mg/kg]
Cl [mg/l]
NH4-N [mg/l]
COD [mg/l]
1000 1600 - -
1100 1400 3 154 1000
3000 1800 385 2500
Model formulation:
c 0 L 0 , c org L
− ( • Δ • h ) • t −( •Δ •h)•t m s S morg S
c (t ) = e • e c0 • + c0,org
Status quo
Within the status quo the fraction of precipitation entering the waste body is 0.62 during the period
of temporary cover and 0.01 after the final cover has been installed (after year 10). At the base of
the landfill 99 % of the generated leachate is constantly removed via the collection system, the rest
percolates through the technical barrier to the subsurface.
Figure 6-13: Leachate emissions for the status quo (constant barrier performance) at Landfill B
The total leachate emissions resulting from the models in Table 6-15 and the barrier performance
levels described above, are shown in Figure 6-13. The emission projections start after year 10, as
the period of temporary cover is not relevant with respect to the termination of aftercare (it is only a
temporary measure). Because of the permanently low water infiltration rate, the concentrations of
the leachate parameters decrease slowly and fall from 9 mg Cl/l, 50 mg NH4-N/l, and 120 mg
COD/l after 10 years to 2 mg Cl/l, 34 mg NH4-N/l, and 85 mg COD/l at the end of the modeling
period. Similarly, the emission loads decrease from 2 kg Cl/yr, 12 kg NH4-N/yr, and 29 kg COD/yr
to 0.5 kg Cl/yr, 8 kg NH4-N/yr, and 20 kg COD/yr after 300 years. The emission levels to the sub
surface are constantly 1 % of these loads due to the assumption of constant barrier performance.
164 Case studies

0
25
50
75
100
125
0
25
50
75
100
125
10 155 300
Lo
ad
(to
tal)
[kg
/yr]
Co
ncen
trati
on
[m
g/l]
Years
0
5
10
15
20
10 155 300
Lo
ad
(to
su
bsu
rface)
[kg
/yr]
Years
a) Total leachate emissions b) Leachate emissions to subsurface
Cl (conc.) NH4-N (conc.)
COD (conc.) Cl (load)
NH4-N (load) COD (load)
The emissions into the subsurface for the status quo* are the same as the total leachate emissions
for the status quo in Figure 6-13, as the complete inefficiency of the barrier system at the landfill
base is assumed during the status quo*.
Scenario A
Scenario A is based on the gradual deterioration of the technical barrier systems and the consequent
decrease in performance levels. Nevertheless, during the first ten years (temporary cover) a
constant infiltration rate of 1221 mm/yr and constant barrier efficiency at the landfill base are
assumed. After the installation of the final cover, a slow decrease in barrier performance is
assumed. The evaluation of the final containment system (see Table 6-14) is carried out based on
the same criteria as for Landfill A, with evaluation scores according to the conditions at the site and
the design of the final containment system shown in Table 6-16. The initial infiltration rate after
final cover installation (year 10) is 19.57 mm/yr, then it increases to 100 mm/yr within 100 years
and to 323 mm/yr after 300 years (the modeling period ends 290 years after top cover installation
due to 10 years of temporary cover in the modeling period). The corresponding percolation rates at
the landfill base are 0.2 mm/yr initially (after final cover installation), 5.2 mm/yr 100 years later,
and 95 mm/yr after 300 years.
The leachate emissions associated with this evolution of the technical barrier performance levels
are shown in Figure 6-14. Cl, NH4-N, and COD concentrations decrease faster with increasing
duration of the scenario due to the increasing water infiltration rates. The substance loads in the
generated leachate reach the maximum levels after 60 years for Cl, after 110 years for NH4-N, and
after 125 years for COD (see Figure 6-14, left). With respect to the emission loads into the
subsurface it takes 85 years for Cl and 240 years for NH4-N and COD to reach the maximum levels
(see Figure 6-14, right). The annual loads released to the subsurface peak at 0.16 kg Cl/yr, 6.1 kg
NH4-N/yr, and 15.2 kg COD/yr.
Figure 6-14: Leachate emissions for Scenario A (gradual barrier deterioration) at Landfill B (left:
total leachate emissions, right: leachate emissions to subsurface)
Case studies 165

Factors – top cover Evaluation score*
1good–3bad 0–100 yrs
Weighting factors
100–200 yrs 200–300 yrs Barrier performance at time of evaluation
Construction quality program
Recultivation layer (cover)
Heat production within waste
Climate
Typical vegetation and projection after use
Relief
Expected settlements
Lining control systems (direct monitoring)
Drainage system
1
1
1
1
2
1
1
1
3
1
0.36
0.38
0.33
0.09
0.08
0.09
0.08
0.38
0.1
0.1
0.08
0.44
0.48
0.06
0.12
0.48
0.1
0.09
0.06
0.09
0.065
0.12
0.487
0.04
0.487
0.487
0.12
0.065
0.05
0.08
Evaluation results:
Leachate generation rates [mm/yr]:
2.27
100.7
2.24
167.9
2.59
322.7
Factors – bottom lining system
Barrier performance at time of evaluation
Construction quality program
Climate
1
1
2
0.44
0.46
0.07
0.08
0.49
0.08
0.07
0.44
0.09
Heat production within waste
Distance to groundwater
Overburden pressure
Leachate quality
Monitoring (e.g. groundwater monitoring)
Drainage system
Stability of foundation
Landfill geometry (heap vs. cavity)
1
1
1
1
1
1
1
2
0.09
0.08
0.08
0.08
0.08
0.46
0.1
0.08
0.06
0.08
0.08
0.08
0.07
0.11
0.44
0.43
0.05
0.09
0.08
0.08
0.07
0.1
0.46
0.48
Evaluation results: 2.17 2.51 2.58
Leachate percolating through landfill base [mm/yr]: 5.2 29.0 94.5
*Specific criteria are used to derive evaluation scores: for instance, a score of 1 for “barrier performance at the time of evaluation”
means that the barrier has performed according to its design specifications, a score of 2 is awarded if there is no direct monitoring of the
barrier function, but it is probably performing according to the design specifications, whereas a score of 3 means that it has not achieved
its intended service level at the time of evaluation.
**Weighting factors were derived from expert evaluations during a survey on the importance of different factors for barrier performance
during different service periods (cf. chapter 4.1.4, chapter 5.2, and appendix 2).
Table 6-16: Evaluation of the containment system of Landfill B to estimate future service levels
within Scenario A
In case of Scenario A*, the total leachate emissions of Scenario A, see Figure 6-14 on the left,
equal the leachate emissions to the subsurface. Scenario A* is used to illustrate the effect of a gra
dual decrease of the cover performance together with the complete inefficiency of the technical
barrier system at the landfill base on landfill emissions.
Scenario B
Within Scenario B the top lining system and the bottom lining system fail to provide containment
of the waste. The “worst case” infiltration rate at the top is 1221 mm/yr, which is the rate observed
during the period of temporary cover. At the bottom of the landfill all the leachate is released to the
subsurface during this scenario.
The emission estimates for Scenario B are shown in Figure 6-15. Due to the high water throughput,
the concentrations and annual loads of the leachate parameters decrease rapidly and all of them
range below 10 mg/l already after less than 50 years. The modeling period is 300 years for this sce
166 Case studies

0
400
800
1200
1600
2000
0
30
60
90
120
150
10 60 110
Lo
ad
[k
g/y
r]
Co
nc
en
tra
tio
n [m
g/l]
Years
Cl (conc.) NH4-N (conc.) COD (conc.)
Cl (load) NH4-N (load) COD (load)
nario, but results are only shown until year 110, as the emissions decrease to very low levels within
a few decades.
Figure 6-15: Leachate emissions for Scenario B (complete failure of barriers) at Landfill B
6.2.2.2 Landfill gas emissions
Emission model and predictions
Monitoring data on landfill gas emissions are available only for a short period of time and asso
ciated with large uncertainties due to the unknown collection efficiency at the site, the lack of data
to estimate the amount of air sucked into the landfill gas collection system, and the lack of
information about the amount of degradable organic matter in the waste. Thus, two gas generation
models with different parameters are used to estimate future gas generation rates. Both models
result in landfill gas generation rates, which are above the observed amounts of landfill gas, even if
a collection efficiency of 35% is assumed at the site (see Figure 6-16). Hence, the model estimates
are rather conservative, whereby the LandGEM model estimates are derived from typical
parameters of wet landfills (k-value of 0.7 and gas generation potential 192 m³ per Mg of wet
waste) and the model by Tabasaran and Rettenberger (1987) (=T&R model) is calculated based on
a k-value of 0.1 and a potential gas generation potential of 196 m³ per Mg of wet waste (cf. Table
3-1). The future gas generation rate is supposed to range somewhere between the model estimates.
Even after final cover installation, when water infiltration has been minimized, there should be
sufficient water for continued gas generation in the landfill for some time. According to Figure
6-16, it can be expected that the gas generation rates at the landfill will drop to very low levels
within a few decades. Based on the T&R model gas generation would be around 60,000 m³ of
landfill gas/yr by the year 2020 and below 6,000 m³ of landfill gas/year by 2030.
Case studies 167

0
1
2
3
4
5
1988 1998 2008 2018 2028 2038 2048
Lan
dfi
ll g
as [
10
6 m
³/year]
Year
Captured gas
Gas production (35 % collected)
Gas generation (LandGEM, wet)
Gas generation (T&R model)
Figure 6-16: Captured landfill gas data at Landfill B and estimates on future landfill gas generation
based on different gas generation models
6.2.3 Pollutant migration
Leachate migration
The investigated migration pathway for leachate in the subsurface includes the earthen barrier at
the bottom of the landfill, the vadose zone below the landfill, the local groundwater, and the river,
which is also fed with groundwater potentially affected by leachate emissions. An outline of the
soil properties of the vadose zone and the aquifer below Landfill B is provided in Table 6-17. The
soil below the landfill consists mainly of gravel, mixed with varying portions of fine particles.
Stones and silty soil have been used to create a plain before the construction of the bottom liner at
the site. As these materials have been mixed with the natural ground, the foundation layer is
approximated as the layer “Stones, gravel, and sand” in Table 6-17. The low permeability soil layer
of the base lining system is included in the substance migration modeling, because it is supposed to
function over long time periods and may slow down the transport of pollutants in the subsurface.
The geomembrane is not included in the transport modeling, as its function is evaluated in the
emission scenarios. The minimum distance from the clay liner to the groundwater surface is 1.2
meters. However, due to the large fluctuations in groundwater surface levels, the thickness of the
unsaturated zone will be higher at most times. The thickness of the groundwater below the landfill
is only a few meters and the groundwater surface has a strong gradient downhill (see Figure 6-17).
The average groundwater velocity is estimated to be 300 meters per year, which is probably at the
lower range of realistic velocities due to the high hydraulic gradient of the groundwater (> 0.1
m/m). In the valley the groundwater thickness increases (PoC3 in Figure 6-17). This groundwater
body is of potential significance as a source of drinking water for a nearby village and it is partially
draining into the river located in the valley (PoC4 in Figure 6-17).
168 Case studies

Layout of the subsurface below the
Landfill B
Thickness, grain size distribution and soil type (according to AG Boden
2005)
Hydraulic conductivity, field capac
ity, pore volume, and dry bulk den
sity
Clay layer: Thickness: 0.6 m;
40 – 60 % sand, 30 – 40% silt, 8 - 15% clay (soil type: Sl3)
Stones, gravel, and sand:
Thickness: 1.2 m; (soil type gS);
Gravel and sand (aquifer):
Thickness: < 5 m; Carbonatic material (lenses of fine
grained material possible);
< 10-10 kf m/s
field capacity: 25 % total pore volume: 35 %
dry bulk density: 2.1 g/cm³
10-5 kf ≈ m/s
field capacity: 6 % total pore volume: 35 %
dry bulk density: 1.6 g/cm³
10-4 kf ≈ m/s
Table 6-17: Layout of the subsurface below Landfill B and material properties of the soil layers
The points of compliance where the pollutant concentrations are determined, are shown in Figure
6-17. After the release of the leachate, the resulting maximum concentrations are calculated above
the groundwater surface (PoC1), in the mixing zone of leachate and groundwater (PoC2) with an
average thickness of 0.25 meters, in the groundwater body in the valley after a transport distance of
100 meters (PoC3), and in the affected river water (PoC4). The corresponding transport parameters
for the leachate pollutants and some data on the groundwater conditions are shown in Table 6-18.
The contaminated width of the groundwater body is assumed to equal the width of the landfill
perpendicular to the groundwater stream. However, in reality a release of leachate will probably not
occur at the same rate all over the landfill base, but there will be some “hot spots” were leachate
escapes from the containment systems through cracks and flaws. Therefore, it is emphasized that
the model calculations illustrate the effect of emissions on the environmental compartment “local
groundwater”. Clearly, higher concentrations could be encountered at specific points due to
heterogeneous release patterns. For a screening evaluation, this approach seems justified, especially
in view of the generally conservative assumptions within the migration modeling (e.g. vadose zone
thickness and composition, groundwater velocity and transport distances, no degradation included
in the modeling, etc.).
Figure 6-17: Scheme of the landfill-environment system and relevant points of compliance (PoC) at
Landfill B (cross-section along the ground water flow direction)
Case studies 169

Diffusion coefficient in kd-value [l/kg] kd-value [l/kg] Vadose zone Comments
water [m²/yr] (clay layer) (stones, gravel & sand)
Cl 0.0315 0 0 No degradation
NH4-N 0.0378 0.5 0 No degradation
COD* 0.0315 0 0 No degradation
Groundwater velocity Groundwater Mixing depth [m] Contaminated width [m] Comments
[m/yr]
General parameters 300 0.25 100 No degradation **
* Transport parameters for COD are the same as for Cl.
** The dissolved oxygen content in the groundwater is used as an indicator to estimate the potential for aerobic degradation of
organic substances and for the nitrification of ammonia.
Scenario
(after final cover) Parameter
c0,max Release rate AF Travel time cPoC1 GW flow AFGW cPoC2
[mg/l] [mm/yr] [-] tm [yrs] [mg/l] [m³/yr] [-] [mg/l]
Status quo
Status quo
Cl
NH4-N
9
50.5
0.2
0.2
8.0
8.4
1110
4260
1.1
6.0
7500
7500
3080
3080
0.0
0.0
Scenario B Cl 9 1221 1.0 0.2 9.0 7500 1.5 6.0
Scenario B NH4-N 50.5 1221 1.0 0.7 50.5 7500 1.5 33.6
Status quo*
Status quo*
Cl
NH4-N
9
50.5
19.6
19.6
1.0
1.0
11.0
43.5
9.0
50.5
7500
7500
32.5
32.5
0.3
1.6
Table 6-18: Parameters used for pollutant migration modeling in the subsurface of Landfill B
The emission scenario estimates are investigated after the installation of the final cover (starting
from year 10). The polltuant migration modeling for Cl and NH4-N is based on the AF model
(Schneider and Stöfen 2004) for scenarios with constant leachate generation and release rates (see
Table 6-19). For scenarios with varying leachate generation rates (Scenario A and A*), the
maximum emission load to the subsurface is used to evaluate pollutant migration according to a
mass balance apporach (see Table 6-20). The mass balance approach using maximum loads is also
employed to estimate COD22 migration, whereby the maximum loads into the subsurface are
averaged over the estimated travel times in the vadose zone for scenarios with constant leachate
generation rates. The concentrations in the leachate at the time of maximum emission loads equal
the concentrations in the vadose zone above the groundwater surface (PoC1). In Table 6-19 and
Table 6-20 maximum concentrations at PoC1 and PoC2 (groundwater mixing zone) are shown
together with major calculation parameters. The migration modeling does not include degradation
processes and considers sorption only to a very limited extent (ammonia cations are exchanged in
the clay layer). Hence, concentration reductions are mainly caused by hydrodynamic dispersion and
dilution processes.
Table 6-19: Data for the AF-model calculations to estimate concentrations at PoC1 and PoC2
22 For more specific modeling of COD, migration data on the composition of organic leachate pollution
would be necessary. As such information is not available, COD is modeled with the same parameters as Cl (it
is conservatively assumed that COD transport is not retarded).
170 Case studies

Scenario
(after final cover) Parameter
C0,max Release rate Load Travel time cPoC1 AF AFGW CPoC2
[mg/l] [mm/yr] [kg/yr] tm [yrs] [mg/l] [-] [-] [mg/l]
Status quo COD 121.0 0.2 0.2 1110 100 1.2 3080 0.03
Scenario A Cl 9.0 5.6 0.2 111 2.3 3.9 112 0.02
Scenario A NH4-N 50.5 43.6 6.1 25 11.5 4.4 15.1 0.8
Scenario A COD 121.0 47.7 15.2 5.0 26.2 4.6 13.9 1.9
Scenario B COD 121.0 1221 1800 0.2 121 1.0 1.5 80
Status quo* COD 121.0 19.6 28.5 10 120 1.0 32.5 3.7
Scenario A* Cl 9.0 65.4 3.9 3.4 4.9 1.8 10.4 0.5
Scenario A* NH4-N 50.5 102.7 41.5 7.8 33.2 1.5 7.0 4.8
Scenario A* COD 121.0 110.8 102.7 2.0 76.1 1.6 6.6 11.6
a Average travel time of COD in the vadose zone is assumed the same as for Cl.
Table 6-20: Data for the calculations based on maximum emission loads into the subsurface to esti
mate concentrations at PoC1 and PoC2
Figure 6-18: Attenuation factors to estimate the concentrations at relevant PoCs due to a release of
leachate from Landfill B for the different scenarios
The calculations shown in Table 6-19 and Table 6-20 are used to estimate attenuation factors to
determine the reduction of pollutant concentrations along the transport pathway. The attenuation
factors to evaluate the migration of the leachate contaminants (Cl, NH4-N, and COD) in the
subsurface are shown in Figure 6-18. To calculate the concentrations at PoC3 (100 m downstream
the landfill in the groundwater) the following assumptions are met: no spreading of the leachate
plume (width 100 m and thickness 0.25 m) and dilution in the groundwater is caused solely by the
groundwater recharge rate of 250 mm/year (the low recharge rate of 13% of the precipitation is
Case studies 171

0
5
10
15
20
0 10 20 30 40 50
Meh
tan
e g
en
era
tio
n [
kg
CH
4 /m
².year]
Years
Gas generation (LandGEM, wet)
Gas generation (T&R)
Fin
al c
ov
er
inst
all
ati
on
because of the surface slope and the partly sealed area). The concentration at PoC4 is calculated
under the assumption that all the contaminated groundwater exfiltrates into the river and fully
mixes with the river water (the calculations are based on the mean annual discharge). In case of
varying leachate release rates, the lowest dilution factor is used as an attenuation factor in Figure
6-18.
Landfill gas migration
The predicted landfill gas emissions for Landfill B are associated with substantial uncertainties.
Therefore, the bandwidth of potential emissions in Figure 6-16 is large. Based on the adapted
landfill gas generation models, potential methane emissions are evaluated for the Landfill B. The
resulting methane emission rates per m² of landfill surface (assuming 50 vol% methane content in
the landfill gas and a complete release of all the generated methane through the top cover) are
shown in Figure 6-19. According to these calculations, even the maximum estimates for methane
emissions drop below 1 kg CH4 per m² and year within 13 years or within 3 years after final cover
installation, respectively. 8 years after final cover installation methane emissions will be below 0.3
kg CH4/(m²*year). Hence, it is expected that methane emissions will decrease to insignificant
levels within a few decades at the site even without considering any attenuating effects during gas
migration through the top cover (methane oxidation can substantially reduce methane emissions, cf.
Table 4-10). The migration of landfill gas in the subsurface is not evaluated, due to a lack of
migration pathways (hillside terrain) and receptors (residential areas, basements) in the landfill
surroundings.
Figure 6-19: Methane generation rates per m² of landfill surface for the two gas generation models
applied to Landfill B
6.2.4 Completion criteria and aftercare duration
The migration of leachate pollutants at Landfill B was evaluated with respect to the vadose zone
below the site, the groundwater below and downstream of the landfill, and the river in the valley.
To evaluate the environmental compatibility of the emissions the groundwater downstream of the
landfill is chosen as the critical point of compliance, as the groundwater body in the valley has been
identified as a potential source of drinking water for a nearby village. Therefore, the quality
172 Case studies
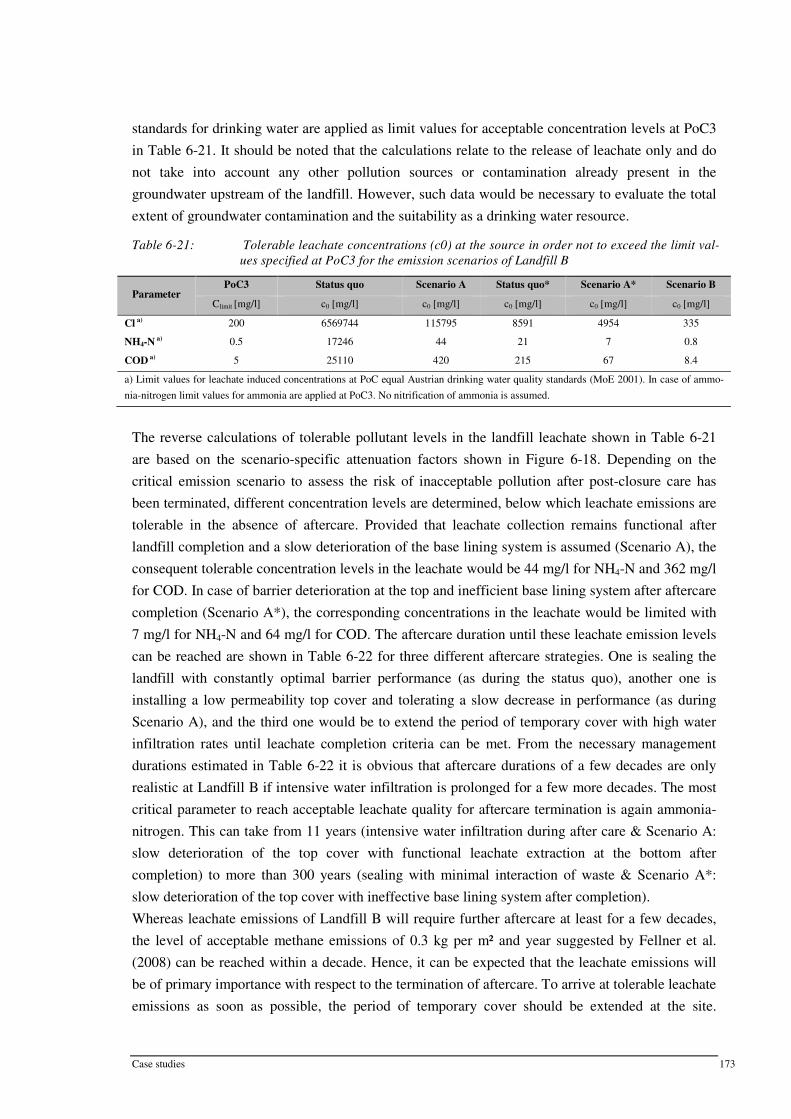
Parameter PoC3 Status quo Scenario A Status quo* Scenario A* Scenario B
Climit [mg/l] c0 [mg/l] c0 [mg/l] c0 [mg/l] c0 [mg/l] c0 [mg/l]
Cl a) 200 6569744 115795 8591 4954 335
NH4-N a) 0.5 17246 44 21 7 0.8
COD a) 5 25110 420 215 67 8.4
a) Limit values for leachate induced concentrations at PoC equal Austrian drinking water quality standards (MoE 2001). In case of ammo
nia-nitrogen limit values for ammonia are applied at PoC3. No nitrification of ammonia is assumed.
standards for drinking water are applied as limit values for acceptable concentration levels at PoC3
in Table 6-21. It should be noted that the calculations relate to the release of leachate only and do
not take into account any other pollution sources or contamination already present in the
groundwater upstream of the landfill. However, such data would be necessary to evaluate the total
extent of groundwater contamination and the suitability as a drinking water resource.
Table 6-21: Tolerable leachate concentrations (c0) at the source in order not to exceed the limit val
ues specified at PoC3 for the emission scenarios of Landfill B
The reverse calculations of tolerable pollutant levels in the landfill leachate shown in Table 6-21
are based on the scenario-specific attenuation factors shown in Figure 6-18. Depending on the
critical emission scenario to assess the risk of inacceptable pollution after post-closure care has
been terminated, different concentration levels are determined, below which leachate emissions are
tolerable in the absence of aftercare. Provided that leachate collection remains functional after
landfill completion and a slow deterioration of the base lining system is assumed (Scenario A), the
consequent tolerable concentration levels in the leachate would be 44 mg/l for NH4-N and 362 mg/l
for COD. In case of barrier deterioration at the top and inefficient base lining system after aftercare
completion (Scenario A*), the corresponding concentrations in the leachate would be limited with
7 mg/l for NH4-N and 64 mg/l for COD. The aftercare duration until these leachate emission levels
can be reached are shown in Table 6-22 for three different aftercare strategies. One is sealing the
landfill with constantly optimal barrier performance (as during the status quo), another one is
installing a low permeability top cover and tolerating a slow decrease in performance (as during
Scenario A), and the third one would be to extend the period of temporary cover with high water
infiltration rates until leachate completion criteria can be met. From the necessary management
durations estimated in Table 6-22 it is obvious that aftercare durations of a few decades are only
realistic at Landfill B if intensive water infiltration is prolonged for a few more decades. The most
critical parameter to reach acceptable leachate quality for aftercare termination is again ammonia
nitrogen. This can take from 11 years (intensive water infiltration during after care & Scenario A:
slow deterioration of the top cover with functional leachate extraction at the bottom after
completion) to more than 300 years (sealing with minimal interaction of waste & Scenario A*:
slow deterioration of the top cover with ineffective base lining system after completion).
Whereas leachate emissions of Landfill B will require further aftercare at least for a few decades,
the level of acceptable methane emissions of 0.3 kg per m² and year suggested by Fellner et al.
(2008) can be reached within a decade. Hence, it can be expected that the leachate emissions will
be of primary importance with respect to the termination of aftercare. To arrive at tolerable leachate
emissions as soon as possible, the period of temporary cover should be extended at the site.
Case studies 173

Parameter Sealing at the top
(constant performance)
Sealing at the top
(decrease of performance)
Temporary cover remains
(high infiltration)
NH4-N
COD
110 - >> 300 yrs
0 - > 300 yrs
60 - 270 yrs
0 – 60 yrs
11 – 35 yrs
0 – 20 yrs
Depending on the underlying long-term emission scenario different activities will be necessary at
the site after the end of aftercare. In any case, further extensive monitoring will be necessary at the
landfill (e.g. geotechnical stability, diffuse gas emissions, recultivation layer, etc.) and in the
potentially affected environmental media (e.g. groundwater wells) in order to verify model
estimates and scenario assumptions.
Table 6-22: Duration of aftercare for leachate emissions of Landfill B in consideration of different
aftercare strategies
In this case study many (conservative) assumptions have been made to evaluate the environmental
compatibility of potential landfill emissions. Therefore, the evaluation was carried out on a
screening level associated with large inherent uncertainties. This evaluation can be the basis for
future monitoring efforts and investigations to fill existing data gaps. Monitoring data can be used
to validate the predictions of the emission model and investigate the extent of preferential water
flow for different hydraulic boundary conditions. Additional investigations of the mobilizable
substance potentials present in the waste should be conducted to gain further confidence into the
emission models (leachate and gas). In consequence, based on more reliable model estimates, after
care activities could be optimized to minimize actual and remaining environmental risks at the
landfill site.
6.3 Landfill C - closed C&D waste landfill
6.3.1 Site description and monitoring data
Landfill and site conditions
At Landfill C waste was deposited between 1992 and 2008. The material disposed at the site was
mainly construction and demolition (C&D) waste and, to a smaller extent, other mineral wastes and
contaminated soils. Landfill operation was completed in 2009 and a final cover was installed at the
site. The approximate waste volume is 400,000 m³ corresponding to 700,000 tons of waste (density
around 1.8 g/cm³) with an average deposition height of 13 meters.
In the vicinity of the landfill are several other landfills including a closed non-organic waste land
fill (e.g. deposition of mineral sludges and incineration residues), a closed landfill for contaminated
soil, and an operating landfill receiving residues from mechanical biological treatment of MSW. A
main road is passing the landfill property in the North and the river Danube is flowing several hun
dred meters further in the North (see Figure 6-20). The only buildings in the neighborhood of the
landfill are located on the property next to the landfill site in the East.
Landfill C is located above a groundwater body of high thickness, which is strongly influenced by
the hydraulic regime of the Danube. The groundwater flows in a Northeastern direction towards the
Danube river and exhibits significant nitrate pollution levels (agricultural activities in the region).
174 Case studies

The local climate is arid with an average annual precipitation of 613 mm/yr and a potential
evaporation of 630 mm/yr. The geologic stratum below the landfill consists primarily of sand with
varying fractions of gravel, silt, and clay.
Figure 6-20: Aerial photograph of Landfill C and surroundings
Monitoring data
Landfill C was operated for 16 years. From 1992 to 2000 around 500,000 tons of construction and
demolition waste were deposited at the site. In 2001 and 2002 there was almost no deposition of
materials and afterwards the rate of landfilling increased again to 20,000 – 50,000 tons per year
until 2008.
During the whole operation and after closure of the landfill, leachate was collected at the landfill
base. The leachate is pumped out of storage tanks at the landfill bottom into a leachate collection
basin on the surface next to the landfill. From the basin the leachate is directed to a leachate
treatment facility. Leachate generation rates are estimated from data on pump operation times to
pump the leachate from the storage tanks at the base to the collection basin on the surface. As there
was leachate recirculated from the basin back into the waste body and as pumping data is not
available for all the years, the data on leachate generation rates are associated with large
uncertainties. Available data on the leachate levels in the basin (on the surface) are not reliable,
because surface runoff could be collected in the basin and evaporation is an important factor.
During landfill operation around 16 % of the annual precipitation has been collected as leachate at
the landfill base. After closure the leachate generation dropped to approximately 1 % of annual
precipitation, but due to the short period (1 year) and the uncertainties mentioned above
(measurement of leachate levels in the basin on the surface) this value needs to be verified with
future monitoring data.
Leachate samples for chemical analysis were taken from the open leachate basin at the surface once
a year and analyzed for 21 parameters. Statistical data on the measurements at Landfill C are
shown in Table 6-23. As the leachate quality in the basin might be affected by different factors (e.g.
surface runoff diluting leachate in the basin, evaporation concentrating leachate constituents,
Case studies 175

Parameter Mean Median Min. Max. 75-percentile Limit*
pH [-] 8.04 7.96 7.10 9.20 8.46 6.5–8.5
EC [µS/cm] 2506 2830 100 3680 3510
NH4-N [mg/l] 0.2 0.1 0.02 1.2 0.2 10
NO2-N [mg/l] 0.02 0.01 0.00 0.1 0.03 2.0
NO3–N [mg/l] 3.8 1.2 >1 15.6 6.1
SO4 [mg/l] 784 860 137 1719 1327
Sulfide [mg/l] <0.1 <0.1 <0.01 <0.5 <0.1 0.5
COD [mg O2/l] 26.2 29.5 18.0 93.0 44.0 50
TOC [mg/l] 8.3 9.4 2.1 16.9 14.7 25
Hydrocarbons [mg/l] <0.01 <0.01 <0.01 0.25 0.25 5.0
PAH [mg/l] 0.00 0.02 0.02 0.02 0.02
Fe [mg/l] 0.07 0.25 0.03 0.42 0.37 2.0
Mn [mg/l] 0.07 0.19 0.06 0.74 0.42
Zn [mg/l] 0.10 0.04 0.01 1.40 0.15 0.5
Ni [mg/l] 0.01 0.09 0.08 0.09 0.09 0.5
Cu [mg/l] <0.01 <0.01 <0.01 0.01 0.01 0.5
Cd [mg/l] <0.01 <0.01 <0.01 0.01 <0.01 0.1
Sn [mg/l] <0.1 <0.1 <0.01 <0.5 <0.1 2.0
Pb [mg/l] 0.01 0.04 0.04 0.04 0.04 0.5
Al [mg/l] 0.4 0.1 0.1 0.8 0.2 2.0
Cl [mg/l] 86.6 115.2 4.0 211.0 209.0 Toxicity
*Limit values for direct discharge into rivers according to the Austrian directive on leachate discharge (2003) and the Austrian direc
tive on waste water discharge (1996), respectively.
aerobic conditions enabling ammonia nitrification, etc.), the measured parameters may not be
representative for the leachate quality at the bottom of the landfill. Consequently, the nitrogen
compounds are analyzed in aggregate and it is assumed that all the nitrogen in the landfill leachate
is present as ammonia-nitrogen in the landfill. Apart from representativeness issues, the monitoring
data have also been corrected for outliers. In particular, one Cl measurement was excluded as
concentrations were 10 times higher than Cl concentrations at all other times although electric
conductivity of the same sample was normal to low. The data in Table 6-23 show that the mean
values of all leachate parameters comply with the quality standards for direct discharge into surface
waters. Only the maximum concentrations of COD and total nitrogen (sum of NH4-N, NO2-N, and
NO3-N) are above the limit values. Therefore, these two parameters will be included in the
emission modeling together with sulfate23 and chloride, as their concentrations are partly above
drinking water quality standards, too.
Table 6-23: Statistical parameters for selected leachate properties of Landfill C
The landfill was not equipped with a gas collection system, because no significant gas generation is
expected from the deposited waste (cf. chapter 3.3).
Containment system
The landfill containment system consists of a top cover with a low permeability soil liner and a
technical barrier at the landfill base also with a low permeability soil liner (see Table 6-24). The
current performance level of the top cover cannot be assessed, as there is no reliable monitoring
23The deposited waste has a high content of soluble sulfate. Sulfate is potentially highly mobile in the
subsurface.
176 Case studies

Area [m²] Volume [m³] Landfill base Landfill cover
30000 400000
Loamy soil (thickness of 1 m) + low permeability earthen barrier (2 layers
(each 0.2 m), <10-9 m/S) + drainage layer (0.3 m)
Layer of excavated soil (thickness of 1 m) + low permeability soil layer (0.3
m) + recultivation layer (0.3 m)
data available at present (see above). Therefore, the top cover system is assumed to allow for an
infiltration rate of 5 % of the average annual precipitation (legal requirement), although current
monitoring data indicate very low infiltration levels (around 1 % of annual precipitation). No data
are available on the efficiency of the base lining system (no direct monitoring or monitoring wells).
Hence, instead of measured data, the design performance of 99% leachate collection efficiency is
used as the current (and the best) performance level of the base lining system. For both systems, at
the top and the base of the landfill, further monitoring data are necessary to assess their actual
performance. In particular for the top cover system, future data will show if a fast decrease of
barrier performance occurs (e.g. cracks due to desiccation) or if the very low leachate generation
rates will persist for a longer period.
Table 6-24: Design of Landfill C and its containment system
6.3.2 Emission predictions
In case of Landfill C, potential future emissions are estimated for landfill leachate only, as there is
no significant landfill gas generation at the site. Based on different scenarios, the effects of
different interaction levels between the landfilled waste and the surrounding environment on
leachate emissions are illustrated. The investigated scenario layouts are identical to those presented
for Landfill A (see Table 6-3), but different performance levels of the technical barriers are applied
according to the conditions at Landfill C. Therefore, all the scenarios are again based on one
emission model (leachate quality as a function of liquid-to-solid ratio), which means that constant
conditions are assumed within the landfill body (i.e. no change of water flow pattern and release
mechanisms). The status quo is based on the persistence of optimal barrier performance at the top
and at the bottom of the landfill. Scenario A assumes a gradual decrease of barrier performance at
the top and at the bottom of the landfill due to continuous barrier deterioration. Scenario B is used
to illustrate the effect of complete barrier failure on landfill emissions, representing the “worst
case” with respect to technical barrier performance. In addition, modified versions of the status quo
and Scenario A are investigated to illustrate the effect of an inefficient technical barrier at the
landfill base on emission levels to the subsurface. As the leachate generated at Landfill C cannot
gravity drain to the leachate collection basin, it is assumed that after aftercare completion (without
further pumping) all the generated leachate is released to the subsurface. The corresponding
scenarios are the status quo* and Scenario A* (see also Table 6-3). The modeling period for all
scenarios is 300 years. The beginning of the modeling period is 2009, as this is the last year for
which monitoring data is available.
Landfill flooding is improbable at the site due to area wide flood protection (designed for 1000 year
recurrence interval flood), the water flow pattern of the waste body is expected to be stable (soil
like material) if the landfill remains undisturbed (i.e. no invasion), and a scenario of landfill erosion
will not be significant within manageable post-closure care periods. Therefore, the analysis of
Case studies 177
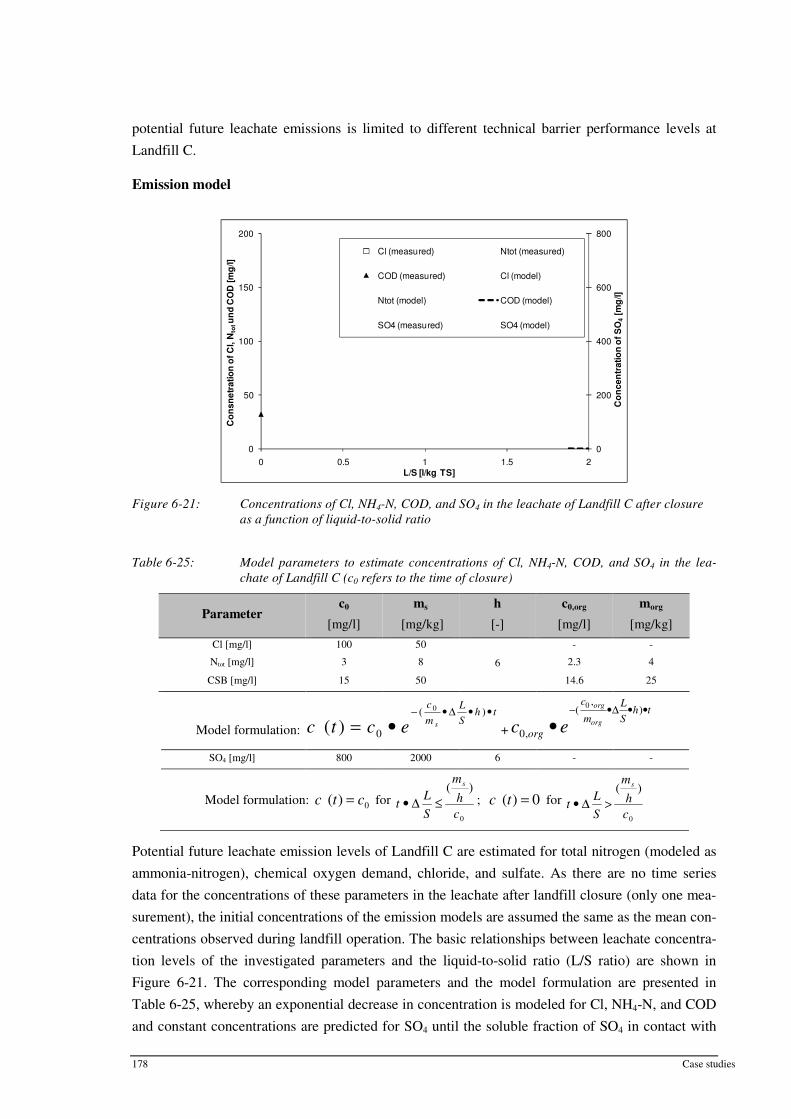
0
200
400
600
800
0
50
100
150
200
0 0.5 1 1.5 2
Co
ncen
tratio
n o
f S
O4 [
mg
/l]
Co
nsn
etr
ati
on
of C
l, N
tot u
nd
CO
D [
mg
/l]
L/S [l/kg TS]
Cl (measured) Ntot (measured)
COD (measured) Cl (model)
Ntot (model) COD (model)
SO4 (measured) SO4 (model)
Parameter c0 ms h c0,org morg
[mg/l] [mg/kg] [-] [mg/l] [mg/kg]
Cl [mg/l] 100 50 - -
Ntot [mg/l] 3 8 6 2.3 4
CSB [mg/l] 15 50 14.6 25
c L c0 ,org L − ( 0 • Δ • h ) • t −( •Δ •h)•t
m S org m S s
Model formulation: c (t ) = c0 • e + c0,org • e
SO4 [mg/l] 800 2000 6 -
m m( s ) ( s )
L LModel formulation: c (t) = c for h ; c (t) = 0 for h0 t • Δ ≤ t • Δ >
S c S c0 0
potential future leachate emissions is limited to different technical barrier performance levels at
Landfill C.
Emission model
Figure 6-21: Concentrations of Cl, NH4-N, COD, and SO4 in the leachate of Landfill C after closure
as a function of liquid-to-solid ratio
Table 6-25: Model parameters to estimate concentrations of Cl, NH4-N, COD, and SO4 in the lea
chate of Landfill C (c0 refers to the time of closure)
Potential future leachate emission levels of Landfill C are estimated for total nitrogen (modeled as
ammonia-nitrogen), chemical oxygen demand, chloride, and sulfate. As there are no time series
data for the concentrations of these parameters in the leachate after landfill closure (only one mea
surement), the initial concentrations of the emission models are assumed the same as the mean con
centrations observed during landfill operation. The basic relationships between leachate concentra
tion levels of the investigated parameters and the liquid-to-solid ratio (L/S ratio) are shown in
Figure 6-21. The corresponding model parameters and the model formulation are presented in
Table 6-25, whereby an exponential decrease in concentration is modeled for Cl, NH4-N, and COD
and constant concentrations are predicted for SO4 until the soluble fraction of SO4 in contact with
178 Case studies

0
25
50
75
100
125
0
30
60
90
120
150
0 50 100 150 200 250 300
Lo
ad
[kg
/yr]
Co
ncen
trati
on
[m
g/l]
Years
Cl (conc.) Ntot (conc.) COD (conc.)
Cl (load) Ntot (load) COD (load)
SO4 (conc.) = 800 mg/l, SO4 (load) =736 kg/yr
mobile water has been emitted. The mobilizable substance fractions in Table 6-25 have been
derived from leaching tests with the deposited material at the site (waste acceptance procedures).
The high heterogeneity of the water flow (h=6 in Table 6-25) could be due to the low hydraulic
conductivity of the deposited waste and the highly heterogeneous waste structure (i.e. large
variance of grain sizes). However, it should be noted that the heterogeneity of water flow is an
assumption (in accordance with monitoring data during operation) and that the hydraulic regime in
the waste should be investigated to collect site-specific data.
Status quo
The best performance level of the top cover system allows for an infiltration of 5 % of the average
annual precipitation into the waste body. Thus, the current infiltration rate is around 31 mm/yr and
constant throughout the whole modeling period, assuming no degradation of the technical barrier at
the top. Similarly, the base lining system constantly retains 99 % of the generated leachate, which
is directed to the leachate collection basin. Therefore, the leachate release rate to the subsurface is
0.31 mm/yr.
The emission levels at Landfill for the status quo are shown in Figure 6-22. The initial
concentrations comply with the direct discharge quality standards (cf. Table 6-23) and are
continuously decreasing for Cl, NH4-N, and COD until the end of the modeling period. For SO4,
the concentrations remain at 800 mg/l until the mobilizable sulfate is emitted and then, after 295
years, the concentrations drop to 0 mg/l. The corresponding annual sulfate loads in the leachate are
756 kg/yr during most of the modeling period and 0 kg/yr during the last 5 years. The loads of the
other leachate parameters are 92 kg Cl/yr, 5 kg N/yr, and 27 kg COD/yr at the beginning and
decrease to 0.6 kg Cl/yr, 1.5 kg N/yr, and 9.4 kg COD/yr after 300 years. The leachate emissions to
the subsurface during the status quo are the same as in Figure 6-22 in terms of concentrations, but
only 1 % of the substance loads.
The status quo* is established to investigate the effect of the complete inefficiency of the base
lining system on the emissions to the subsurface. Hence, the total emission levels for the status quo,
shown in Figure 6-22, are identical to the emissions into the subsurface throughout the status quo*.
Figure 6-22: Leachate emissions for the status quo (constant barrier performance) at Landfill C
Case studies 179

Factors – top cover Evaluation score*
1good–3bad
Weighting factors**
0–100 yrs 100–200 yrs 200–300 yrs Barrier performance at time of evaluation
Construction quality program
Recultivation layer (cover)
Heat production within waste
Climate
2
1
3
1
1
0.36
0.38
0.33
0.09
0.08
0.08
0.44
0.48
0.06
0.12
0.07
0.12
0.49
0.04
0.49
Typical vegetation and projection after use
Relief
1
2
0.09
0.08
0.48
0.10
0.49
0.12
Expected settlements
Lining control systems (direct monitoring)
Drainage system
1
2
3
0.38
0.10
0.10
0.09
0.06
0.09
0.07
0.05
0.08
Evaluation results: 3.39 3.38 3.37
Leachate generation rates [mm/yr]: 54.4 69.8 79.8
Factors – bottom lining system
Barrier performance at time of evaluation
Construction quality program
Climate
2
1
1
0.44
0.46
0.07
0.08
0.49
0.08
0.07
0.44
0.09
Heat production within waste
Distance to groundwater
Overburden pressure
Leachate quality
Monitoring (e.g. groundwater monitoring)
Drainage system
Stability of foundation
Landfill geometry (heap vs. cavity)
1
1
1
1
3
1
1
3
0.09
0.08
0.08
0.08
0.08
0.46
0.1
0.08
0.06
0.08
0.08
0.08
0.07
0.11
0.44
0.43
0.05
0.09
0.08
0.08
0.07
0.1
0.46
0.48
Evaluation results: 2.78 3.08 3.18
Leachate percolating through landfill base [mm/yr]: 11.0 29.2 47.1
*Specific criteria are used to derive evaluation scores: for instance, a score of 1 for “barrier performance at the time of evaluation”
means that the barrier has performed according to its design specifications, a score of 2 is awarded if there is no direct monitoring of the
barrier function, but it is probably performing according to the design specifications, whereas a score of 3 means that it has not achieved
its intended service level at the time of evaluation.
**Weighting factors were derived from expert evaluations during a survey on the importance of different factors for barrier performance
during different service periods (cf. chapter 4.1.4, chapter 5.2, and appendix 2).
Scenario A
Scenario A illustrates the effect of gradually decreasing barrier performance on landfill emission
levels. Barrier efficiency is delimited by the actual system performance (the best possible service
level without future maintenance) and the complete inefficiency of landfill liners (the worst service
level). Thus, the initial infiltration rate through the top cover is 30.6 mm/yr and is expected to
increase within 100 years to 54.4 mm/yr, based on the evaluation of future barrier performance
summarized in Table 6-26. At the end of the modeling period, the infiltration rate is estimated to be
around 80 mm/yr, which is close to the worst possible barrier function of approximately 100
mm/yr. However, as top cover systems with a sole low permeability soil liner often show a rapid
decrease of barrier performance within the first years after cover installation (e.g. Bonaparte et al.
2002; Henken-Mellies and Schweizer 2011 or chapter 4.2), future monitoring data will be essential
to evaluate the rate and extent of barrier deterioration at Landfill C.
Table 6-26: Evaluation of the containment system of Landfill C to estimate future service levels
within Scenario A
180 Case studies

The evaluation of the base lining system results in an increase of the leachate release rate to the
subsurface from 0.3 mm/yr initially to 11 mm/yr after 100 years, and 47 mm/yr at the end of the
modeling period (see Table 6-26). Thus, the leachate collection efficiency will drop to around 41%
after 300 years from 99% at the beginning.
The leachate emissions for Scenario A are based on the emission models in Table 6-25 and on the
decrease of barrier performance illustrated in Table 6-26. The resulting emission estimates are
shown in Figure 6-23. The concentrations of nitrogen and COD slowly decrease from 5.3 mg N/l
and 30 mg COD/l to around 1 mg N/l and 6.4 mg COD/l after 300 years. Chloride concentration
levels drop faster and halve within 70 years from 100 mg/l to 50 mg/l (see Figure 6-23, left).
Sulfate concentrations remain at 800 mg/l for 180 years and then fall to 0 mg/l. The corresponding
loads of sulfate in the leachate continuously increase to reach approximately 1590 kg/yr after 180
years and subsequently drop to zero. The loads of the other leachate parameters also increase from
the beginning, but reach their respective maximum levels of 96 kg Cl/yr, 6.6 kg N/yr, and 37 kg
COD/yr at an earlier time (after 20 years for Cl, after 90 years for N, and after 100 years for COD).
Figure 6-23: Leachate emissions for Scenario A (gradual decrease of barrier performance) at Landfill
C (left: total leachate emissions, right: leachate emissions to subsurface)
The substance loads released into the subsurface below the landfill increase for all parameters from
the beginning to reach their maxima after 80 years (10.6 kg Cl /a), after 180 years (590 kg SO4/yr),
and after 200 years (1.9 kg N/yr and 11.3 kg COD/yr), respectively. Afterwards, the loads decrease
(instantaneously in case of SO4) to 0 kg SO4/yr, to almost 0 kg Cl/yr, to 1.4 kg N/yr, and to 9 kg
COD/yr, respectively (see Figure 6-23, right).
With respect to Scenario A* the total leachate emission levels of Scenario A (see Figure 6-23, left)
are the emission levels to the subsurface, as the Scenario A* assumes the inefficiency of base lining
and leachate collection after the termination of aftercare.
Case studies 181
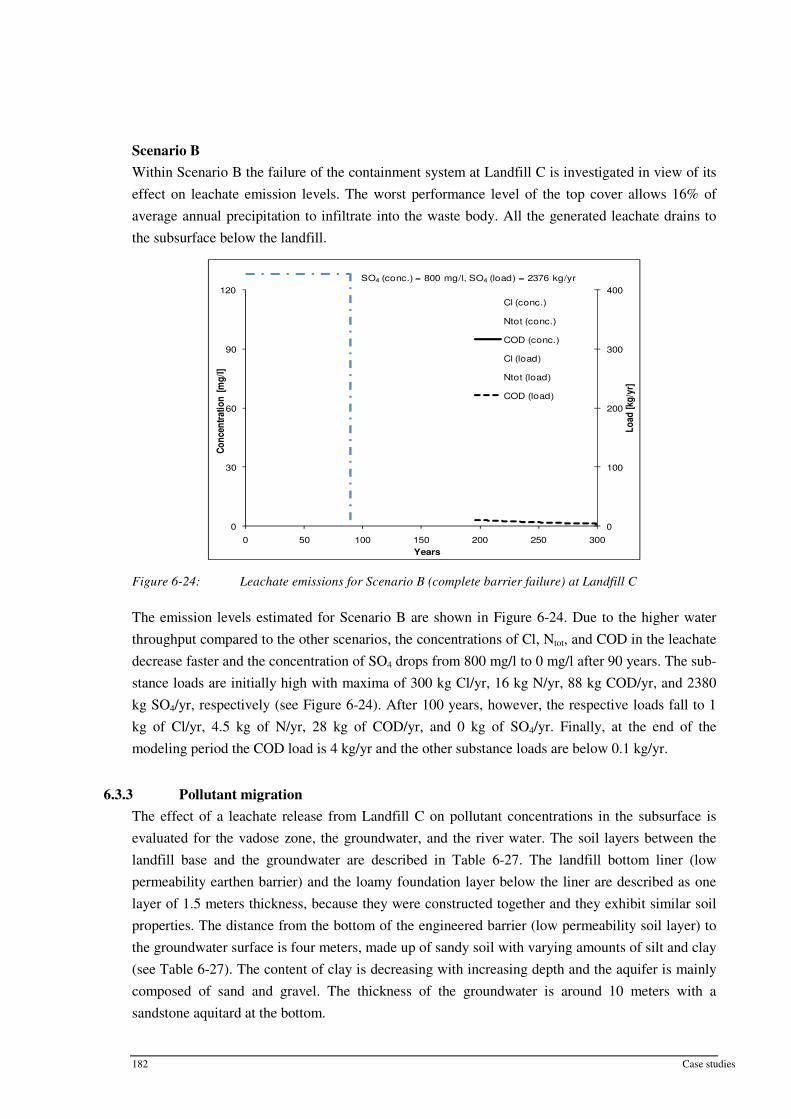
0
100
200
300
400
0
30
60
90
120
0 50 100 150 200 250 300
Lo
ad [
kg/y
r]
Co
nce
ntr
atio
n [
mg
/l]
Years
Cl (conc.)
Ntot (conc.)
COD (conc.)
Cl (load)
Ntot (load)
COD (load)
SO4 (conc.) = 800 mg/l, SO4 (load) = 2376 kg/yr
Scenario B
Within Scenario B the failure of the containment system at Landfill C is investigated in view of its
effect on leachate emission levels. The worst performance level of the top cover allows 16% of
average annual precipitation to infiltrate into the waste body. All the generated leachate drains to
the subsurface below the landfill.
Figure 6-24: Leachate emissions for Scenario B (complete barrier failure) at Landfill C
The emission levels estimated for Scenario B are shown in Figure 6-24. Due to the higher water
throughput compared to the other scenarios, the concentrations of Cl, Ntot, and COD in the leachate
decrease faster and the concentration of SO4 drops from 800 mg/l to 0 mg/l after 90 years. The sub
stance loads are initially high with maxima of 300 kg Cl/yr, 16 kg N/yr, 88 kg COD/yr, and 2380
kg SO4/yr, respectively (see Figure 6-24). After 100 years, however, the respective loads fall to 1
kg of Cl/yr, 4.5 kg of N/yr, 28 kg of COD/yr, and 0 kg of SO4/yr. Finally, at the end of the
modeling period the COD load is 4 kg/yr and the other substance loads are below 0.1 kg/yr.
6.3.3 Pollutant migration
The effect of a leachate release from Landfill C on pollutant concentrations in the subsurface is
evaluated for the vadose zone, the groundwater, and the river water. The soil layers between the
landfill base and the groundwater are described in Table 6-27. The landfill bottom liner (low
permeability earthen barrier) and the loamy foundation layer below the liner are described as one
layer of 1.5 meters thickness, because they were constructed together and they exhibit similar soil
properties. The distance from the bottom of the engineered barrier (low permeability soil layer) to
the groundwater surface is four meters, made up of sandy soil with varying amounts of silt and clay
(see Table 6-27). The content of clay is decreasing with increasing depth and the aquifer is mainly
composed of sand and gravel. The thickness of the groundwater is around 10 meters with a
sandstone aquitard at the bottom.
182 Case studies

Layout of the subsurface below the
Landfill C
Thickness, grain size distribution and soil type (according to AG Boden
2005)
Hydraulic conductivity, field capac
ity, pore volume, and dry bulk den
sity
Low permeability soil layer: Thickness: 1.5 m; 30 – 40 % sand, 40 – 50 % silt, 17 – 25 % clay (soil type: Ls2)
Silty and clayey fine sand: Thickness: 2.0 m; 40 – 60 % sand, 30 – 50 % silt, 10 – 20 % clay (soil type: Slu)
Silty fine sand: Thickness: 2.0 m; 50 – 75 % sand, 25 – 40 % silt, 0 – 10 % clay (soil type: Su3)
Fine sand with gravel (aquifer): Thickness ≈ 10 m
Bedrock: Sandstone
kf < 10-9 – 10-8 m/s field capacity: 34 % total pore volume: 43 % dry bulk density: 1.8 g/cm³
kf ≈ 10-8 m/s field capacity: 33 % total pore volume: 43 % dry bulk density: 1.5 g/cm³
kf ≈ 10-8 – 10-7 m/s field capacity: 29 % total pore volume: 43 % dry bulk density: 1.5 g/cm³
Average groundwater velocity ≈ 500 m/yr
Table 6-27: Layout of the subsurface below Landfill C and material properties of the soil layers
The points of compliance to evaluate pollutant migration in the subsurface are the vadose zone just
above the groundwater surface (PoC1), the mixing zone of leachate and groundwater (PoC2), the
groundwater 100 m downstream of the landfill (PoC3), and the river Danube (PoC4). A scheme of
the landfill-environment system is shown in Figure 6-25. The local groundwater quality is strongly
affected by agricultural activities in the region. Nitrate concentrations in the groundwater are
around 50 mg/l, ammonia concentrations are below 0.1 mg/l, and concentrations of dissolved oxy
gen range between 8 and 12 mg/l. Chloride concentrations vary seasonally from 10 to 15 mg/l
(peaks in winter due to road de-icing salts) and sulfate concentrations are typically around 30 mg/l
in the groundwater24. In addition, there are several other landfill sites in the vicinity of Landfill C
which could potentially affect the groundwater. Although the subsequent transport modeling does
not include any other pollutant sources or consider the upstream pollutant levels already present in
the groundwater, it should be noted that cumulative effects of several pollutant sources or
background pollutant levels might be significanct for determining acceptable pollution levels of the
environmental media.
24 As an example, the calculation of total concentration levels is illustrated for PoC2:
Total concentration at PoC2 (ctot in mg/l) = background concentration (cback in mg/l) * leachate dilution factor
(DF)a) + concentration because of leachate release at PoC2 (cPoC2 in mg/l) � ctot = cback * DF + cPoC2 a)DF = affected groundwater flow [m³/yr] / (leachate flow [m³/yr] + affected groundwater flow [m³/yr])
Case studies 183

Vadose zone Diffusion coefficient in
water [m²/yr]
kd-value [l/kg]
(low perm. soil layer)
kd-value [l/kg]
(stones, gravel & sand) Comments
Cl 0.0315 0 0 No degradation
NH4-N 0.0378 0.5 0 No degradation
SO4 0.0189 0 0 No degradation
Groundwater Groundwater velocity
[m/yr] Mixing depth [m] Contaminated width [m] Comments
General parameters 500 0.25 100 No degradation *
* The dissolved oxygen content in the groundwater is used as an indicator to estimate the potential for aerobic degradation of
organic substances and the nitrification of ammonia.
Figure 6-25: Scheme of the landfill-environment system and relevant points of compliance (PoC) at
Landfill C (cross-section along the ground water flow direction)
Table 6-28: Parameters used for pollutant migration modeling in the subsurface of Landfill C
The migration of Cl, SO4, and Ntot (modeled as NH4-N) in the vadose zone is estimated based on
the AF model (Schneider and Stöfen 2004) for scenarios with constant leachate generation rates.
For scenarios with varying leachate generation rates and for COD in general, pollutant migration in
the vadose zone is evaluated based on a mass balance approach using the maximum loads released
into the subsurface. The concentration in the leachate at the time of maximum load is equal to the
concentration at PoC125. Main parameters for pollutant migration modeling in the subsurface are
given in Table 6-28. The release of contaminants is assumed throughout the landfill width
perpendicular to the groundwater flow direction. The assumed mixing depth is 0.25 meters and the
average groundwater velocity is 500 m/yr. In the vadose zone, sorption is only considered in the
low permeability soil layer at the landfill base for ammonia-nitrogen. As potential degradation is
not considered in the modeling, a reduction of pollutant concentration occurs mainly due to
hydrodynamic dispersion (including diffusion) and dilution processes.
25 In case of COD concentrations for scenarios with constant leachate generation rate, the maximum loads
are averaged over the travel time in the vadose zone (the travel time of Cl from the AF model calculations is
used for COD).
184 Case studies

Scenario Parameter c0,max Release rate AF Travel time cPoC1 GW flow AFGW cPoC2
[mg/l] [mm/yr] [-] tm [yrs] [mg/l] [m³/yr] [-] [mg/l]
Status quo
Status quo
Status quo
Cl
NH4-N
SO4
100
5.3
800
0.3
0.3
0.3
166
58
30
5710
8350
5710
0.6
0.1
26.7
12500
12500
12500
1360
1360
1360
0.0
0.0
0.0
Scenario B Cl 100 99.0 1.8 18 55.6 12500 5.2 10.7
Scenario B NH4-N 5.3 99.0 1.0 26 5.3 12500 5.2 1.0
Scenario B SO4 800 99.0 1.0 18 800 12500 5.2 154
Status quo*
Status quo*
Status quo*
Cl
NH4-N
SO4
100
5.3
800
30.7
30.7
30.7
2.0
1.4
1.0
57
84
57
50.0
3.8
800
12500
12500
12500
14.6
14.6
14.6
3.4
0.3
55
Scenario Parameter C0,max Release rate Load Travel time cPoC1 AF AFGW CPoC2
[mg/l] [mm/yr] [kg/yr] tm [yrs] [mg/l] [-] [-] [mg/l]
Status quo COD 30 0.3 0.3 5710 29.6 1.0 1360 0.0
Scenario A Cl 100 7.6 10.6 230 46.3 2.2 55.6 0.8
Scenario A NH4-N 5.3 29.0 1.9 90 2.2 2.4 15.4 0.1
Scenario A COD 29.6 29.0 11.3 60 13.0 2.3 15.4 0.9
Scenario A SO4 800 24.4 591 71 800 1.0 18.1 44.7
Scenario B COD 29.6 99.0 79.0 18 26.6 1.1 5.2 5.1
Status quo* COD 29.6 30.7 27.2 57 29.6 1.0 14.6 2.0
Scenario A* Cl 100 36.4 86.0 48 78.8 1.3 12.4 6.3
Scenario A* NH4-N 5.3 52.0 6.6 50 4.2 1.3 9.0 0.5
Scenario A* COD 29.6 53.2 37.0 33 23.2 1.3 8.8 2.6
Scenario A* SO4 800 66.3 1594 28 800 1.0 7.3 110 a Average travel time of COD in the vadose zone is assumed the same as for Cl.
Table 6-29: Data for the AF model calculations to estimate concentrations at PoC1 and PoC2at
Landfill C
Table 6-30: Data for the calculations based on maximum emission loads into the subsurface to esti
mate concentrations at PoC1 and PoC2 at Landfill C
The calculation results and data for the evaluation of pollutant concentrations at PoC1 (vadose zone
above groundwater surface) and PoC2 (mixing zone in the groundwater) based on the AF model
are shown in Table 6-29. The calculations based on a mass balance approach using the maximum
substance loads released to the subsurface to estimate pollutant concentrations at PoC1 and PoC2
for COD and scenarios with varying leachate generation rates are shown in Table 6-30.
After the mixing of leachate and groundwater (PoC2), pollutants travel at the same velocity as the
groundwater, as no retardation and no degradation of pollutants are assumed in the groundwater.
However, between PoC2 and PoC3 the pollutant concentrations decrease due to the spreading of
the plume in the groundwater, which amounts for 1 percent of the travel distance. Hence, the
thickness of the plume increases by 1 meter between PoC2 and PoC3. No further dispersion of the
plume is assumed afterwards and the concentration in the contaminated groundwater remains
constant until the groundwater mixes with the river water at PoC4. Because of the very high
discharge volume of the river Danube, the concentrations in the river resulting from a release of
leachate into the subsurface are very low. The corresponding attenuation factors for the
investigated pollutants between the different points of compliance are shown in Figure 6-26. The
Case studies 185

scenario- and pollutant-specific attenuation factors in Figure 6-26 are the basis for the reverse
calculation of tolerable pollutant levels in the landfill leachate and are used to derive completion
criteria with respect to leachate quality.
Status Quo Status Quo*
Landfill Landfill
q = 0.3 mm/yr
AFCl
AFN 58.0
166.0 AFCl 2.0
q = 30.7 mm/yr
AFN 1.4
PoC1
PoC2
Groundwater
AFCOD
AFSO4
AFGW
1.0
30.0
1360 AFGW
PoC3
5.0 AFriver > 100.000
PoC4
AFCOD 1.0
PoC1 AFSO4 1.0
PoC2 AFGW 14.6 AFGW 4.7 AFriver > 100.000
PoC3 PoC4 Groundwater
Scenario A Scenario A*
Landfill Landfill
q = 4.9 - 10.4 mm/yr
AFCl 2.2 AFCl 1.3
q = 43.6 - 50.3 mm/yr
PoC1
PoC2
AFCOD
AFSO4
AFGW, Cl
AFN 2.4
2.3
1.0
55.6 AFGW, Cl 4.9 AFriver > 100.000
AFCSB 1.3
PoC1 AFSO4 1.0
PoC2 AFGW, Cl 12.4 AFGW, Cl 4.7 AFriver > 100.000
AFN 1.3
Groundwater AFGW, N
AFGW, COD 15.4
15.4 AFGW, N
AFGW, COD
AFGW, SO4
4.7
4.7
4.8
PoC4 AFGW, N 9.0 AFGW, N 4.6 PoC4 Groundwater
AFGW, COD 8.8 AFGW, COD 4.5
AFGW, SO4 7.3 AFGW, SO4 4.5 AFGW, SO4 18.1
Scenario B
PoC3
Comments
PoC3
Attenuation factors refer to the maximum concentration in the leachate. For instance, for Scenario A Landfill the leachate-induced chloride cocentration at PoC3 would be calculated like this:
q = 99 mm/yr cPoC3 = c0/(2.2*55.6*4.9)
PoC1
PoC2
AFCl
AFN
AFCOD
AFSO4
AFGW
1.8
1.0
1.1
1.0
5.2 AFGW 4.2 AFriver > 100.000
Grey cells indicate that the calculated attenuation factor is based on the maximum or average load in
the leachate. For scenarios with varying leachate release rates over time the maximum loads result in
higher concentrations in the subsurface than the calculations based on initial concentrations in the
leachate.
In case of COD all calculations are based on substance loads into the subsurface. For constant Groundwater PoC3 PoC4 leachate release rates the COD load is averaged over the average transport duration in the vadose
zone (the same as for Cl).
The dilution in the river water is calculated based on the mean annual discharge of the river (MQ).
Figure 6-26: Attenuation factors to estimate the concentrations at relevant PoCs due to a release of
leachate from Landfill C for the different scenarios
6.3.4 Completion criteria and aftercare duration
The leachate generated at Landfill C has to be extracted at the landfill base with pumps. As the
functionality of this pumping system may not be guaranteed after the termination of aftercare, it is
assumed that the generated leachate will percolate through the base lining system of the landfill and
pollutants will be released to the subsurface. Hence, at Landfill C the status quo*, Scenario A*, and
Scenario B are regarded as most relevant to evaluate the effect of potential future leachate
emissions on the local groundwater (see Table 6-31). As the groundwater at the site is already
polluted and further degradation should be prevented (authorities aim at improving groundwater
quality for the affected groundwater body), the PoC2 (leachate mixing zone in the groundwater) is
defined as the critical point of compliance, where drinking water quality standards have to be met.
Thus, the limit values are applied at PoC2 and the reverse calculation of the maximum leachate
concentration (based on the attenuation factors shown in Figure 6-26) results in the tolerable
pollutant concentrations in the landfill leachate at the end of aftercare shown in Table 6-31. The
tolerable concentrations at the source are generally above the current levels in the leachate, only in
case of complete barrier failure (Scenario B) the current concentrations of nitrogen in the leachate
186 Case studies

Parameter PoC2 Status quo* Scenario A* Scenario B
Climit [mg/l] C0 [mg/l] C0 [mg/l] C0 [mg/l]
Cl a) 100 2919 1580 938
NH4-N a) 0.5 10 6 3
COD a) 5 73 56 29
SO4 a) 250 3649 1822 1302
a) Limit values for leachate induced concentrations at PoC equal Austrian drinking water quality standards (MoE 2001). In
case of ammonia-nitrogen limit values for ammonia are applied at PoC3. No nitrification of ammonia is assumed.
would be too high26. As a sudden failure of technical barriers is not expected, Scenario A* (a
gradual decrease of top cover performance and the complete inefficiency of the base lining system)
is regarded as the most relevant scenario to evaluate the aftercare completion. Consequently, the
leachate of Landfill C can be considered tolerable in the local environment and the operator could
be released from aftercare obligations. However, due to the very short monitoring period and the
poor quality of leachate data at Landfill C, further aftercare (especially representative monitoring)
will be necessary to provide additional data as a basis for validating the models underlying the
emission scenarios. Emphasis should be primarily put on observations to confirm the parameters of
the emission model and the assumptions on the performance level of the final top cover during the
next decade (e.g. desiccation cracks).
Table 6-31: Tolerable leachate concentrations (C0) at the source in order not to exceed the limit val
ues specified at PoC2 for relevant emission scenarios of Landfill C
In conclusion, post-closure care at Landfill C needs to be prolonged to gather appropriate monitor
ing data to back up specific model parameters and assumptions. If the model results are verified by
future monitoring, landfill completion could be achieved within the next decade at the site. If
monitoring data do not support the model estimates, models need to be adjusted to the collected
data and the evaluation of landfill environmental compatibility needs to be repeated based on the
adapted models and scenarios.
6.4 Discussion of caste study results
In general, the evaluation of aftercare and environmental risks at the case study landfills is
associated with substantial uncertainties. Apart from the fact that future conditions are unknown,
the quality of available data is often quite limited (e.g. landfill gas data for Landfill A, data to esti
mate subsurface transport processes at all sites, and leachate generation rates for Landfill C) and
the monitoring periods to establish appropriate models are rather short (e.g. post-closure data for
Landfill C is available for one year only). Therefore, it should be emphasized that the purpose of
the evaluation is primarily to illustrate the applicability of the developed methodology. In order to
use the evaluation within a regulatory procedure for evaluating aftercare completion, further
investigations and monitoring data would be necessary at the sites. While the range of parameters
measured at short intervals (i.e. less than two years) could be reduced, some parameters (e.g.
26 Note the assumption that all the nitrogen is released as ammonia-nitrogen and no nitrification takes place
in the subsurface.
Case studies 187

leachate generation rates, electric conductivity) should be measured frequently, under different
hydraulic conditions, and over an extended period of time. Apart from the continuous gathering of
information about the landfill and associated emissions, the investigation of specific properties (e.g.
mobilizable substance fractions) may be necessary to establish more reliable estimates on future
emission levels. In general, the evaluation of environmental compatibility of a closed landfill is
probably associated with additional investigations of the landfill-environment system (e.g. waste
properties or subsurface conditions) and is only possible if appropriate monitoring data time series
exist.
A summary of basic data and the results of the case study evaluations are shown in Table 6-32. The
evaluations differ with respect to various aspects, such as the conditions at the site, the deposited
waste material, the relevant points of compliance, or the most probable emission scenario after
aftercare completion, which was used to derive completion criteria.
Different points of compliance are defined at the different sites to show the relevance of the
location of the definitive point of compliance, on the one hand, and to reflect the level of protection
assigned to a specific environmental compartment, on the other hand. However, within a regulatory
procedure the pollutant levels already present in the affected environmental media, potential addi
tional sources, and the intended use at and around the site would probably be factors significant for
the choice of the critical PoC and the associated environmental quality standards. During the case
study evaluations drinking water quality standards (MoE 2001) were used to specify an acceptable
level of landfill-borne pollution at the PoCs in the subsurface. Nevertheless, other quality standards
could be chosen in view of the vulnerability of the affected environment and the intended level of
protection (e.g. marginal effect levels (LAWA 2004) or limit values elative to background levels
and fluctuations (cf. Bräcker et al. 2004)). Nonetheless, the methodology illustrated here can be
used with alternate input assumptions and constraints.
The emission estimates, which were used to evaluate the release of leachate at the points of
compliance, relate to Scenario A* (gradual decrease of top cover performance and complete
inefficiency of the base lining system) for Landfill A and Landfill C and to Scenario A (gradual
decrease of top cover and base lining system performance) for Landfill B, see Table 6-32. While
the extraction of collected leachate at the base of Landfill A and Landfill C depends on functional
pumping systems, which cannot be guaranteed in the absence of aftercare, gravity drainage of
collected leachate at Landfill B can be expected also after the end of regulated aftercare. This
implies that at Landfill B the appropriate management of the collected leachate needs to be assured
also in the absence of aftercare. It should be noted that conditions assumed within the relevant
emission scenarios represent specific criteria, which need to be fulfilled. For instance, geotechnical
stability of the case study landfills is assumed within all scenarios, which implies that this is an
inherent criterion for aftercare completion. Also the persistence of water flow patterns in the
landfill and constant release mechanisms are assumed for all scenarios, for instance requiring
protection from human intrusion. In general, to complete aftercare it has to be demonstrated that
the scenario models are appropriate for the site and that the landfill conditions of the emission
scenario underlying the evaluation can be expected at the site (i.e. after-use concepts and custodial
care program).
188 Case studies

Table 6-32: Overview on the evaluation of the case study landfills and the estimated remaining
aftercare periods
Landfill A Landfill B Landfill C
Closed MSW landfill Closed MSW landfill Closed C&D landfill
General landfill data
Precipitation: 956 mm/yr
Pot. evaporation: 633 mm/ yr
Operation period: 1972-2005
Waste volume: 1700000 m³
Average deposition height: 15 m
Precipitation: 1960 mm/ yr
Pot. evaporation: 550 mm/ yr
Operation period: 1988-2003
Waste volume: 135000 m³
Average deposition height: 11 m
Precipitation: 613 mm/ yr
Pot. evaporation: 630 mm/ yr
Operation period: 1992-2008
Waste volume: 400000 m³
Average deposition height: 13 m
Emission parameters Leachate: Cl, COD, NH4-N,
Crtot; Landfill gas: CH4
Leachate: Cl, COD, NH4-N;
Landfill gas: CH4 Leachate: Cl, COD, Ntot, SO4
Most probable emission
scenario after termina
tion of aftercare
Gradual decrease of top cover
performance and complete ineffi
ciency of base lining system
(Scenario A*)
Gradual decrease of top cover
and base lining system efficiency
(partial collection and manage
ment of leachate required – Sce
nario A)
Gradual decrease of top cover
performance and complete ineffi
ciency of base lining system
(Scenario A*)
Leachate generation
years after
years after
Initial level
300
100
yr mm
yr mm
yr mm
/150
/100
/30
yr mm
yr mm
yr mm
/320
/100
/20
yr mm
yr mm
yr mm
/80
/50
/30
Leachate release rate to
subsurface
years after
years after
Initial level
300
100
yr mm
yr mm
yr mm
/150
/100
/30
yr mm
yr mm
yr mm
/95
/5.0
/0.2
yr mm
yr mm
yr mm
/80
/50
/30
Definitive point of com
pliance (PoC) in the sub
surface
Groundwater (GW) plume GW 100 m downstream landfill Leachate mixing zone in the GW
Acceptable level at PoC Drinking water quality Drinking water quality Drinking water quality
Critical parameter
(leachate)
Ammonia-nitrogen
(Nitrification considered)1
Ammonia-nitrogen
(No nitrification) -
Aftercare duration2 Minimum: 80 years
Maximum: 450 years
Minimum: 11 years
Maximum: 110 years
Most probable scenario is envi
ronmentally tolerable
Additional criteria
a) Undisturbed landfill body (e.g.
geotechnical stability); b) Per
formance of top cover decreases
gradually;
a) Collection and management of
leachate is guaranteed for; b)
Undisturbed landfill body (e.g.
geotechnical stability); c) Per
formance of top cover decreases
gradually;
a) Undisturbed landfill body (e.g.
geotechnical stability); b) Per
formance of top cover decreases
gradually; c) Aftercare necessary
to collect representative moni
toring data; 1 It is assumed that the ammonia is nitrified before or after the exfiltration into the adjacent surface water systems (Limit values for nitrate
nitrogen are used to evaluate groundwater contamination). 2 Minimum aftercare duration: Water infiltration rate equals the local groundwater recharge rate. Maximum aftercare duration: Water infil
tration rate under the assumption of constant optimal top cover performance.
Case studies 189

The estimated aftercare durations for the three case study landfills are shown in Table 6-32.
Depending on the assumed aftercare strategy at the site, the time periods to reach the completion
criteria (in all cases ammonia-nitrogen in the leachate constitutes the critical parameter) are differ
ent. For Landfill A the aftercare duration is 80 years at the minimum (intensive water infiltration
during aftercare) and more than 450 years at the maximum (continuous optimal function of the top
cover system). For Landfill B the equivalent durations are 11 years at the minimum to 110 years at
the maximum provided that (partial) collection and treatment of the leachate can be assured after
the termination of aftercare. In case of Landfill C, it would be not necessary to maintain aftercare
based on the criteria addressing tolerable emission levels. Nevertheless, further aftercare is
necessary to confirm the models and assumptions within the evaluation due to the poor quantity
(only one year post-closure monitoring) and quality of monitoring data. However, if future
monitoring supports the established models and scenarios, it may be possible to terminate aftercare
within the next decade without unacceptable environmental risks at the Landfill C.
The case studies illustrate that the developed aftercare completion criteria can be used to estimate
the duration of aftercare for different long-term management concepts. The comparison of
strategies in view of the desired state of the landfill in the absence of aftercare represents a basis to
link the duration and intensity of long-term management to the environmental risks associated with
the closed landfill. Therefore, the case study evaluations can be the foundation to develop cost
effective long-term management concepts for the investigated landfills.
190 Case studies

7 Summary and conclusions
7.1 Summary
Landfills are key elements in modern waste management, as they represent sinks for substances
which cannot be recovered due to economic or ecologic reasons. In general, landfills need to be
managed after closure to assure the long-term protection of humans and the environment. This
period of “aftercare” or “post-closure care” typically comprises the monitoring and control of land
fill emissions, the maintenance and control of landfill facilities, as well as site surveillance. It can
be brought to an end when the authorities consider the landfill to no longer pose a threat to humans
and the environment. While simple qualitative criteria are often used as a basis to evaluate
aftercare, rigorous methodologies and data to evaluate aftercare and aftercare completion are
difficult to build and hardly available. Different approaches have been suggested to evaluate
landfill aftercare and its completion (e.g. Stegmann et al. 2006; Environment Agency 2010a;
Morris and Barlaz 2011; Scharff et al. 2011), but a consistent methodology to derive aftercare
completion criteria in view of long-term environmental risks associated with a closed landfill has
not yet been established. However, such a methodology is needed to support the authorities’
decision on appropriate management strategies and completion criteria for aftercare. Therefore, in
this thesis the long-term landfill management was investigated in view of the associated
environmental risks. The goal was to develop a methodology for defining an environmentally
compatible closed landfill at the end of aftercare. The methodological framework to evaluate
landfill environmental compatibility included assessments of landfill emission behavior, estimates
on containment system performance, and evaluations of pollutant migration in the environment.
7.1.1 Landfill emission behavior
Landfill behavior and associated emissions were analyzed for different types of landfills containing
municipal solid waste (MSW), municipal solid waste incineration (MSWI) ash, and construction
and demolition (C&D) waste, respectively. Based on literature data and landfill data gathered at
sites in Austria and Switzerland, emission characteristics of different landfills and their evolution
over time, remaining emission potentials, and possible approaches to predict future landfill emis
sions were evaluated.
MSW landfills
The emission behavior of closed MSW landfills is dominated by the degradation of organic matter
(landfill gas and organic leachate pollution) and the leaching of soluble salts and inorganic macro
components (cf. Farquhar and Rovers 1973; Bookter and Ham 1982; El-Fadel et al. 1997; Kjeldsen
et al. 2002). While landfill gas emissions typically drop to very low levels within a few decades
after landfill closure (e.g. Krümpelbeck 2000), in the leachate several substances are present at high
concentrations even several decades after the end of waste deposition. The concentrations of
ammonium and organic pollutants (i.e. COD, TOC, BOD5) in the leachate of Austrian MSW land
fills were shown to be, on average, one order of magnitude above the corresponding limits for
direct discharge into surface waters even 20 years after landfill closure (see Table 3-4). In addition,
Summary and conclusions 191

average concentrations of chloride, despite an observed decreasing trend, are still high (>500 mg/l)
in the leachate. Apart from the leachate parameters mentioned above, Fe, AOX, and Crtot are of
significance at some sites. Heavy metal concentrations are typically low in the leachate of closed
MSW landfills. Although emissions from MSW landfills decrease after closure (concentrations and
loads), a large fraction of mobilizable substances remains in the landfill for an extended period of
time, especially if waste leaching and waste degradation is minimized by an impermeable cover on
top of the landfill. Thus, models to evaluate long-term emission characteristics at closed MSW
landfills need to consider the level of interaction between the deposited waste and the environment,
the mobilizable potential of substances remaining in the landfill, the water flow regime in the
waste, and potentially changing conditions at the landfill. On the short term (decades) emission
trends and models based on observed emission characteristics can be used to predict emissions. On
the long term (centuries to millennia) fundamental relationships could be used to establish emission
models. However, due to long modeling periods and limited process understanding such models are
associated with large uncertainties. Emission models always need to be adapted to the specific
situation of a particular landfill, as emission characteristics vary substantially from one landfill to
another.
MSWI bottom ash landfills
Numerous reactions, which are partly associated with environmentally relevant emissions, take
place in landfills containing bottom ash from the incineration of municipal solid waste27. High
temperatures may occur in the waste body due to exothermic reactions potentially affecting the
landfill containment system. Landfill gas consists primarily of water vapor, hydrogen (from the
reaction of metallic aluminum and water to aluminum oxide and hydrogen gas), and possibly
methane as a product of the anaerobic degradation of residual organic matter contained in the bot
tom ash. The analysis of leachate at Swiss MSWI ash landfills showed that the concentrations of
soluble salts (i.e. chloride) in the leachate are in the range of several thousand mg/l during the first
decades of landfill existence. In addition organic leachate pollution (e.g. TOC) and ammonium
nitrogen concentrations might be significant in view of the corresponding discharge standards,
whereas heavy metal concentrations in the leachate typically comply with drinking water quality
standards. However, the release of heavy metals represents a long-term threat with respect to lea
chate emissions, as increased mobilization might occur as a consequence of decreasing pH in the
landfill over a period of many thousands of years (e.g. Förstner and Grathwohl 2007). The long
term emission behavior of MSWI ash landfills can be addressed by geochemical models, though
the results may be of limited significance for aftercare decisions due to the long timeframes (cf.
Hellweg 2000). The immediate attention in terms of leachate quality is therefore focused on soluble
salts, organic pollution, and ammonium-nitrogen. Trend extrapolations based on real-scale
monitoring data or results from laboratory experiments simulating current landfill conditions can be
used to evaluate the evolution of these parameters in the leachate over time periods from decades to
centuries. In all cases, estimates of landfill emissions need to be based on the specific conditions at
27 It should be noted, that the quality of residues from thermal processes depends also on process parameters,
which are continuously optimized. Therefore, the composition and properties of future MSWI bottom ash
might well be different from currently deposited material.
Summary and conclusions 192

the site (and potential changes of these), with the significance of trend extrapolations strongly
depending on the availability of appropriate aftercare monitoring data.
C&D waste landfills
The composition of construction and demolition (C&D) waste is of major importance for the emis
sion characteristics observed at C&D waste landfills. At older sites, where waste containing higher
amounts of organic matter has been deposited, organic leachate pollution as well as the concentra
tions of nitrogen and soluble salts in the leachate are substantially higher than at sites where strin
gent waste acceptance criteria have been in place all the time. Consequently, landfill emission cha
racteristics differ from one site to another. However, parameters such as the concentrations of
soluble salts, organic leachate compounds (COD, DOC, AOX), and ammonium-nitrogen (or total
nitrogen) may be significant at many C&D waste landfills. As the analyzed monitoring data stem
from landfills with ongoing waste deposition, data on emission characteristics during the post
closure period of C&D waste landfills will prove valuable to evaluate future emissions. Typically,
models on the evolution of leachate characteristics at C&D waste sites are based on laboratory
experiments (e.g. shaking leaching tests, column leaching tests, lysimeter studies) and direct obser
vations at the closed site used for model calibration and validation. Although comparisons of
results from leaching experiments to larger systems (lysimeters) allow one to infer that
experimental data are valuable to evaluate emissions from C&D waste landfills (e.g. Susset and
Grathwohl 2011), appropriate monitoring data from closed landfills will be necessary to transfer
laboratory-scale results to real-scale landfill situations.
7.1.2 Technical and natural barriers
A landfill is not in thermodynamic equilibrium with its surrounding environment due to its differ
ent composition. This induces two-way substance and energy flows, balancing the differences
between these systems. Substance flows to air, soil, surface waters, and groundwater may be of
environmental concern. The impact of substances mobilized from the deposited waste is dependent
on the performance of technical barriers at the landfill to limit and control the interaction of the
deposited waste with the surrounding environment, on the one hand, and the ability of the natural
environment to mitigate potential negative effects of released substances on environmental media,
on the other hand. The two systems represent barriers for pollutants and may prevent adverse
effects on human health and the environment.
Technical barriers
Technical barriers typically consist of several components with low-permeability mineral layers
(e.g. clay liners), geomembranes (e.g. HDPE liners), geosynthetic clay layers, drainage layers, and
recultivation layers being among the most important ones. The performance of the technical barrier
system is the product of the interaction of the different elements. In the short term the most
important factors with respect to barrier performance are proper design and construction of the
system and geotechnical stability issues (cf. Bonaparte et al. 2002), while the long-term perfor
mance is primarily dependent on the stresses induced on the system at the site compared to the
resistance built into the system (cf. Inyang 2004). The elements of a technical barrier system have
different service lives. Estimates on the long-term performance of different barrier components
(under the assumption that no maintenance and repair is taking place) range from several decades
Summary and conclusions 193

for leachate drainage systems to geologic time periods (thousands of years) for low-permeability
mineral liners (e.g. Rowe 2005). However, due to the very limited period of field observations for
technical barrier systems (several decades) and the complex interactions within the system and at
the boundaries of the system, the evaluation of long-term barrier performance is associated with
substantial uncertainty. Therefore, a scenario-based approach was implemented to evaluate future
barrier performance. A best and a worst case scenario investigate the effect of constant barrier
performance (best case) and complete barrier failure (worst case). A scenario of gradual barrier
deterioration is based on an evaluation of different factors to address the conditions at the landfill
site and the resistance built into the system. The weighting of the factors for different service
periods was based on evaluations of experts on landfill geotechnics who had been invited to list
important factors with respect to the performance of technical barriers at landfills and subsequently
evaluate the importance of these factors for the performance of the system for different time
periods (e.g. 0-50 yrs, 50-100 yrs, above 100 yrs). These evaluations were related to the best and
the worst barrier performance levels and the scenario of gradually decreasing barrier performance
could be estimated for the specific system at a particular site.
Natural barriers
The potential of natural systems to attenuate negative effects of landfill-borne pollutants is based
on naturally occurring processes reducing the mass, toxicity, extent, mobility or concentration of
pollutants in the environment. As the release of landfill leachate is of potential concern with respect
to groundwater contamination for long periods of time, the focus of evaluating natural attenuation
potentials in the environment is placed on the release of leachate from the landfill and the
corresponding subsurface migration pathways. Although natural attenuation potentials have been in
the focus of contaminated site management and remediation for some time (e.g. Christensen et al.
2000; National Research Council 2000), knowledge about the migration of typical leachate
constituents such as ammonium-nitrogen or with respect to aggregate parameters on organic
leachate pollution is still rather limited (cf. Luckner 2010). Apart from the mixture of a multitude
of substances in the leachate, also the lack of site-specific data on the characteristics of the
subsurface system and the relevant boundary conditions render the evaluation of natural attenuation
potentials a challenging task. Therefore, although there is evidence of such processes limiting
groundwater pollutant plumes of unlined landfills to several hundreds of meters (cf. Table 4-13),
conservative models are preferred to assess the migration of landfill-borne pollutants and their
impact on specific environmental media. In general, convective transport and dispersion/diffusion
processes in the vadose and groundwater zone are well investigated and understood, whereas large
knowledge gaps exist with respect to processes of substance immobilization and transfer (cf.
National Research Council 2000; Luckner et al. 2008). In essence, the complexity of the modeling
approach should reflect the quality and availability of data on the investigated system. While
simplifications and assumptions in simple models can cause the ignorance of significant processes
in the real system, the advantages of such models are the limited amount of spatially distributed
input data required to establish the model, the easier handling and application of the model, the
robustness of the model with respect to reverse calculations of tolerable emission levels, and the
possibility of using the simple model as a basis to adapt a higher tier model in a consecutive
evaluation. Therefore, a comparatively simple analytical model (one-dimensional solution of the
Summary and conclusions 194
advection-dispersion equation) is suggested to evaluate substance transport processes in the vadose
zone within the evaluation methodology. Substance transport in the groundwater is described based
on a mass balance approach taking into account primarily dilution of the leachate plume in the
groundwater. However, provided that appropriate data are available to establish and calibrate more
complex migration models (e.g. numerical models), the evaluation of attenuation potentials along
the subsurface migration pathway may be also based on such models.
7.1.3 Methodology to derive aftercare completion criteria
The method to derive aftercare completion criteria forms the basis for evaluating environmental
risks associated with the closed landfill. Within the evaluation, models about the emission behavior
of the deposited waste, the performance of technical barriers, and the potential attenuation of pollu
tants in the environment are combined to derive aftercare completion criteria (cf. Figure 7-1).
The basis of the evaluation is the collection of data and information about the conditions at a site
(e.g. climate, geology, topographic location), the containment system (=technical barriers), and the
deposited waste and associated emissions (see Figure 7-1, 1.). In general, data need to be critically
evaluated. For monitoring data this means, for instance, checking for representativeness of the sam
pling location, measurement protocols, collection efficiencies (with respect to landfill gas) or lea
chate discharge rates during sampling (with respect to landfill leachate). Monitoring at closed land
fills could be optimized by gathering information in view of the situation at the site and the signi
ficance of the data for modeling purposes (e.g. Zweifel et al. 1999). For instance, measurements
including a wide range of parameters could be done once every few years, whereas routine moni
toring could be restricted to a few parameters (e.g. electric conductivity, leachate discharge rate,
ammonium, and TOC) measured at a higher frequency/resolution to gain system understanding for
model development. Provided that conditions at the site are constant (e.g. after top cover installa
tion) the observation of a few parameters can also allow for statements about the behavior of other
parameters for which correlations have been established (e.g. Kylefors 2003; Laner et al. 2011b). In
all cases, input data and models are uncertain, at least due to natural variability, and should be
treated accordingly.
The relevant emission parameters are identified based on the observations at the site and emission
models are established to predict future emission characteristics (Figure 7-1, 2.). The substance
concentrations in the leachate of a closed landfill were described by a model which depends on the
mobilizable amount of substances in the waste, the heterogeneity of water flow in the landfill, the
observed concentrations of the substance, and the rate of water infiltration. The effects of different
or changing conditions at the landfill were illustrated via emission scenarios. For instance, scenario
analysis typically included scenarios investigating the effect of different future performance levels
of technical barriers. The layout and choice of the investigated scenarios depended on the range of
potentially occurring conditions at the site with a significant effect on landfill emission behavior as
well as on the scope of the evaluation (e.g. management periods in the focus of the evaluation). For
instance, emissions associated with landfill flooding might be a relevant emission scenario at some
sites, while insignificant at others (cf. Laner et al. 2009). The estimates on future emission levels
derived from the individual scenarios formed the input for the pollutant migration modeling in the
third step (Figure 7-1, 3.). Pollutant migration models were used to evaluate the concentrations of
Summary and conclusions 195

selected pollutants in the affected environmental media. Scenario- and pollutant-specific attenua
tion factors were calculated along the migration pathways at defined points of compliance (PoC).
Based on the attenuation factors, the quality criteria to be met at the designated point of
compliance, and the choice of the critical long-term emission scenario, aftercare completion criteria
were determined for the landfill in the fourth step (Figure 7-1, 4.). As the derived emission-related
criteria were based on a specific long-term emission scenario, additional completion criteria could
relate to the scenario-conditions underlying the evaluation. Such additional criteria may comprise
geotechnical aspects (e.g. geotechnical stability of the landfill body), the functionality of landfill
elements (e.g. containment system), surveillance and maintenance activities at the site, or
restrictions of use. Finally, the models used as a basis of the emission scenario need to be
confirmed by future monitoring and site observations (Figure 7-1, 5.). If model estimates and
scenario assumptions are supported by the observations, the evaluation results and the
corresponding completion criteria are validated. In case emissions and/or conditions at the site
develop differently, the evaluation needs to be adapted or repeated to account for the observed
landfill behavior. Thus, at many sites the application of the evaluation methodology and the
determination of completion criteria resemble iterative processes.
Figure 7-1: Schematic illustration of the procedure to derive aftercare completion criteria at a
closed landfill site
7.1.4 Application of the methodology
The developed methodology was applied at three closed landfill sites to derive aftercare completion
criteria. The case study landfills were chosen based on three factors: the availability of data, differ
ent waste types and varying environmental settings, and a positive attitude towards the evaluation
by the landfill owner. At two landfill sites, municipal solid waste (Landfill A and Landfill B) was
deposited and one landfill contains primarily construction and demolition waste (Landfill C). The
volume of Landfill A is 1.7 million m³ with the deposition period from 1972 to 2005. The different
196 Summary and conclusions

compartments of the landfill are equipped with different technical barrier systems ranging from
mineral liner systems to composite liner systems at the landfill base. The climate at the site is
temperate with an average annual precipitation of 956 mm/yr. Landfill B contains approximately
135000 m³ of MSW which was deposited at the site between 1988 and 2003. The landfill is
equipped with a temporary cover (i.e. soil layer) at the top and a composite liner system at the bot
tom. The climate at the site is humid with an average annual precipitation of 1960 mm/yr. Landfill
C was operated from 1992 to 2008 and contains 400000 m³ of construction and demolition waste.
Mineral liner systems are installed at the top and bottom of the landfill. The climate at Landfill C is
arid with 613 mm/yr of annual precipitation and 630 mm/r of annual potential evaporation.
At Landfill A and Landfill C the emission scenario assuming the gradual decrease of top cover per
formance and a total failure of the base lining system after the end of aftercare was used to derive
aftercare completion criteria (= Scenario A*), because of the lack of gravity leachate drainage at
these sites. At Landfill B leachate can gravity drain to a storage tank outside the landfill. Therefore,
the scenario of gradual barrier performance decrease at the top and the bottom of the landfill (=
Scenario A) was chosen as a basis to derive completion criteria for Landfill B (cf. Table 6-32)28. At
Landfill A and Landfill C, the mixing zone of leachate and groundwater was the relevant point of
compliance where drinking water quality standards had to be met. At Landfill B these quality
standards had to be met 100 m downstream of the landfill in the groundwater. At all the case study
landfills, ammonium-nitrogen was the most problematic leachate parameter with respect to the
quality standards at the point of compliance (cf. Table 6-32). The time until the calculated
completion criteria could be met at a landfill was estimated for different aftercare strategies. One
strategy was to allow for high rainwater infiltration rates (i.e. minimum aftercare durations due to
intensified leaching) and another strategy was to minimize rainwater infiltration effectively (i.e.
maximum aftercare duration due to very slow decrease of mobilizable substance potentials).
Consequently, for Landfill A the minimum aftercare duration was estimated to be another 80 years
at the minimum (intensive water infiltration during aftercare) and more than 450 years at the
maximum (continuous optimal function of the top cover system) until the completion criteria
would be reached. For Landfill B, the equivalent durations were 11 years at the minimum to 110
years at the maximum, provided that (partial) collection and treatment of the leachate could be
assured in the absence of aftercare. In the case of Landfill C, it would not be necessary to maintain
aftercare based on the determined tolerable leachate emissions, but due to the poor quantity (only
one year post-closure monitoring) and quality of monitoring data, further aftercare is necessary to
confirm the underlying models and scenario assumptions. If future monitoring supports the
evaluation, aftercare could be ended at Landfill C within the next decade without unacceptable
environmental risks. A general finding was that high water infiltration rates flush out contaminants
faster and thereby shorten necessary aftercare periods. However, at all case study sites additional
completion criteria have to be fulfilled based on the emission scenarios underlying the evaluation
28 Apart from Scenario A and A*, three more scenarios on barrier performance were investigated for the case
study landfills: Status quo: constant barrier performance at the top and bottom of the landfill; status quo*:
constant barrier performance at the top and failure at the bottom; Scenario B: total barrier failure at the top
and at the bottom of the landfill.
Summary and conclusions 197

(e.g. undisturbed content or gradual decrease of top cover performance in the absence of aftercare).
Finally, it should be highlighted that the case study evaluations were meant to illustrate the appli
cability and flexibility of the developed evaluation method. An application of the methodology as a
decision support tool for aftercare completion by the authorities may well be different with respect
to the underlying emission scenarios, points of compliance, or quality standards.
7.2 Conclusions and research outlook
The evaluation of landfill environmental compatibility needs to address different aspects significant
to the environmental risk associated with a landfill. This includes the behavior of the deposited
waste and associated emissions, the (long-term) performance of the technical barrier system, and
the migration of pollutants in the surrounding environment and potential adverse effects on envi
ronmental media. The evaluation of long-term landfill management and aftercare completion is
based on the environmental risks associated with a closed landfill at the end of aftercare. Thus, the
evaluation of aftercare resembles a site-specific endeavor about acceptable risks (cf. Scharff et al.
2011). As data available to characterize the system are limited, system understanding is incomplete,
and future conditions are unknown, there is substantial uncertainty inherent in the evaluation. Con
sequently, the developed methodology builds on scenario-based assessments to determine the envi
ronmentally tolerable state of the landfill at the end of aftercare. Aftercare completion criteria are
derived based on the combination of different models and include tolerable emission levels at the
site as well as criteria associated with the long-term emission scenario underlying the evaluation.
The methodology was applied to three closed landfills to illustrate the determination of aftercare
completion criteria. For the two closed MSW landfills the evaluation showed, that aftercare periods
of hundreds of years have to be expected until leachate emissions become environmentally tolera
ble, if the landfills are equipped with (constantly) impermeable top covers after closure. If higher
water infiltration is maintained after landfill closure to intensify contaminant leaching, management
periods could be shortened. However, for the relatively large Landfill A aftercare would still have
to be maintained at least for a period of 80 years from now. For Landfill B, a site with humid
climate and high groundwater recharge rates, the minimum duration of aftercare was estimated to
be a few decades, provided a cover allowing for high water infiltration rates would be maintained
at the site. The evaluation of Landfill C (closed construction and demolition waste landfill) showed
that aftercare may be terminated within the next decade(s), provided that the underlying models
and scenario assumptions can be verified by future monitoring. The low emission potential of the
waste, the arid climate at the site, and the high dilution potential in the groundwater below the land
fill are the main factors enabling the completion of aftercare without inacceptable environmental
risks at this site.
The presented methodology allows for defining the desired state of a landfill at the end of aftercare,
which is a crucial element to optimize aftercare strategies in view of environmental risks associated
with a closed landfill. The costs for aftercare can be determined for different long-term manage
ment concepts ranging from the encapsulation of the waste to additional efforts (e.g. enhanced
emission reduction) to accelerate the transition of the landfill into an environmentally tolerable
state in the absence of aftercare. Therefore, the evaluation methodology may present the basis to
198 Summary and conclusions

optimize the use of available financial resources to assure cost-effective protection of humans and
the environment at closed landfills. Overall, a consistent and transparent evaluation of aftercare is a
prerequisite for estimating the full cost of landfilling including long-term care obligations at the
landfill sites.
The evaluation framework presented in this work is intended to be used by authorities to decide on
appropriate aftercare strategies and aftercare completion at a site. However, experience with
implementing the developed approach is yet to be gathered. Well documented case studies that
include regulatory review and acceptance are needed to evaluate the utility of the evaluation
methodology as a decision support tool on landfill aftercare and its completion. In addition to the
assessment of the method’s practicability, the increasing availability of data from case study land
fills will provide further insights about the emission behavior of closed landfills, the performance
of barriers at the field scale, and the environmental conditions encountered at closed landfills. The
experience and data gathered during the application of the methodology at different sites and by
different stakeholders should be subject to critical discussion in order to arrive at a regulatory
procedure for assessing the environmental significance of closed landfills and the associated
aftercare requirements.
The importance of site-specific conditions for the evaluation of landfill aftercare completion is
highlighted by the results of the case study applications. The climatic conditions, the geologic and
hydrogeologic setting, and the vicinity of vulnerable uses are important factors with respect to the
determination of environmentally tolerable emission levels. Particularly in view of mid- to long
term environmental compatibility, the significance of site specific-conditions should be emphasized
during site selection for new landfills. An insensitive environmental setting (e.g. large thickness of
clayey soil layer above the groundwater, high dilution potential in the groundwater stream, absence
of sensitive (current and future) uses, etc.) facilitates the maintenance of a low level of
environmental risk at a closed landfill and is potentially associated with a reduced intensity of long
term management relative to landfills at sites with less favorable conditions (e.g. gravel layer of
low thickness between landfill base and groundwater). However, for many existing, closed landfills
the accrued funding might be insufficient to fulfill the required aftercare obligations (e.g. in Austria
funding has been accrued for 40 years of aftercare at MSW landfills). Thus, concerted efforts of
landfill owners and authorities are needed to develop integrated concepts for the long-term
management of these sites as well as for landfills which are currently building up their financial
aftercare provisions.
While the evaluation of environmental risks associated with a closed landfill is the basis for cost
effective protection of humans and the environment, the significant uncertainties present in the
evaluation results counteract their use for decision-support. Long-term estimates are particularly
confronted with large knowledge gaps with respect to dominant release processes and process rates,
the potential degradation of materials (waste and containment), and the variation of external forces
at the site (e.g. climate change, extreme events, human intrusion, etc.). Further research is needed
to increase the understanding of the landfill emission behavior as well as the interaction of
emissions with technical and natural barriers. For instance, the effect of water flow heterogeneity
and its potential change on landfill emissions is of major importance to understand the evolution of
the mobilizable substance potential accessible to mobile water. Investigations focusing on different
Summary and conclusions 199

hydraulic regimes in the waste body and the associated fractions of preferential flow are essential
to understand the influence of different water infiltration rates on substance concentrations in the
leachate. Research about the lasting effect of enhanced emission reduction measures (e.g. aeration
and flushing) is necessary to evaluate the effect of such measures on mobilizable substance poten
tials and future emission rates. Due to the long periods of time over which residual emission levels
may persist at landfills, the investigation of low-intensity technologies to manage these emissions
(e.g. methane oxidation in bio-active covers or extensive leachate treatment) is important to
optimize landfill management. Research efforts to define mobilizable substance potentials in the
waste in view of different release mechanisms, time frames, and environmental conditions would
be valuable for long-term emission estimates, but need to cope with substantial uncertainty due to
the extended timeframes involved in such evaluations. In addition, research in the field of geotech
nical landfill engineering (e.g. performance levels of technical barrier systems over time) or geohy
draulics (e.g. natural attenuation of typical leachate constituents) can increase the understanding of
the landfill-environment system. However, due to the long time frames and the complex interaction
of system components, uncertainty is inherent in an evaluation of risks associated with landfilling.
Apart from increasing the reliability of the evaluation of environmental compatibility, a joint effort
involving all stakeholders in waste management will be necessary to optimize long-term landfill
management.
Summary and conclusions 200

8 Literature, Figures, and Tables
8.1 Literature
AG Boden (2005): Bodenkundliche Kartieranleitung (KA5) - 5. Auflage. Hannover, Bundesanstalt
für Geowissenschaften und Rohstoffe und Niedersächsisches Landesamt für Bodenfor
schung.
AGW (1992): Emmisionsabschätzung für Kehrichtschlacke. Zürich, Amt für Gewässerschutz und
Wasserbau des Kantons Zürich
Allen, A. (2001): Containment landfills: the myth of sustainability. Engineering Geology 60(1-4):
3-19.
Allgaier, G. and R. Stegmann (2003): Development of a new risk assessment model for small old
landfills. Sardinia Waste Management and Landfill Symposium 2003, S. Margarita di Pula,
Cafgliari, Italy, CISA.
Andersen, J. R. and J. N. Dornbusch (1967): Influence of Sanitary landfill on Ground Water Qual
ity. Journal of American Water Works Association 59: 457-470.
Arneth, J. D., G. Milde, H. Kerndorff and R. Schleyer (1989): Waste deposit influences on
groundwater quality as a tool for waste type and site selection for final storage quality. The
Landfill - Reactor and Final Storage. P. Baccini. Berlin Heidelberg New York, Springer-
Verlag. 20: 438.
Attenborough, G. M., R. G. Gregory, D. H. Hall and L. McGoochan (2002): Development of a
landfill gas risk assessment model: GasSim. 25th Annual Landfill Gas Symposium 2002 of
the Solid Waste Association of North America, Monterey, California.
Baccini, P., Ed. (1989): The Landfill - Reactor and Final Storage. Lecture Notes in Earth Sciences.
Berlin Heidelberg New York, Springer-Verlag.
Baccini, P. and P. H. Brunner (1985): Behandlung und Endlagerung von Reststoffen aus Kehricht
verbrennungsanlagen. Gas, Wasser, Abwasser 65: 403-409.
Baccini, P., G. Henseler, R. Figi and H. Belevi (1987): Water and Element Balances of Municipal
Solid Waste Landfills. Waste Management Research 5(1): 483-499.
Bagchi, A. (1983): Design of Natural Attenuation Landfills. Journal of environmental engineering
109(4): 800-811.
Bagchi, A. (1987): Natural Attenuation Mechanisms of Landfill Leachate and Effects of Various
Factors On the Mechanisms. Waste Management Research 5(1): 453-463.
BAM (2000): Anforderungen an Dichtungskontrollsysteme in Oberflächenabdichtungen von
Deponien. Berlin, Bundesanstalt für Materialforschung und –prüfung (BAM),: 46.
Barlaz, M. A., R. B. Green, J. P. Chanton, C. D. Goldsmith and G. R. Hater (2004): Evaluation of a
Biologically Active Cover for Mitigation of Landfill Gas Emissions. Environmental
Science & Technology 38(18): 4891-4899.
Barlaz, M. A., R. K. Ham, D. M. Schaefer and R. Isaacson (1990): Methane production from
municipal refuse: A review of enhancement techniques and microbial dynamics. Critical
Reviews in Environmental Control 19(6): 557-584.
Literature, Figures, and Tables 201

Barlaz, M. A., A. P. Rooker, P. Kjeldsen, M. A. Gabr and R. C. Borden (2002): Critical Evaluation
of Factors Required To Terminate the Postclosure Monitoring Period at Solid Waste Land
fills. Environmental Science & Technology 36(16): 3457-3464.
Barrena, R., G. d'Imporzano, S. Ponsá, T. Gea, A. Artola, F. Vázquez, A. Sánchez and F. Adani
(2009): In search of a reliable technique for the determination of the biological stability of
the organic matter in the mechanical-biological treated waste. Journal of Hazardous Mate
rials 162(2-3): 1065-1072.
Bäumler, R., S. Lindel, H. Knicker and I. Kögel-Knabner (2001): Stability of organic matter in an
old landfill site - a case study in northern Bavaria (Germany). Sardinia International Waste
Management and Landfill Symposium, S. Margeritha di Pula, Cagliari, Italy, CISA.
Baun, A., A. Ledin, L. A. Reitzel, P. L. Bjerg and T. H. Christensen (2004): Xenobiotic organic
compounds in leachates from ten Danish MSW landfills--chemical analysis and toxicity
tests. Water Research 38(18): 3845-3858.
Belevi, H. and P. Baccini (1989): Long-Term Behavior of Municipal Solid Waste Landfills. Waste
Management Research 7(1): 43-56.
Belevi, H., D. M. Stampfli and P. Baccini (1992): Chemical Behaviour of Municipal Solid Waste
Incinerator Bottom Ash in Monofills. Waste Management Research 10(2): 153-167.
Benson, C. (2001): Waste Containment: Strategies and Performance. Australian Geomechanics
36(4): 1-25.
Benson, C. H., D. E. Daniel and G. P. Boutwell (1999): Field Performance of Compacted Clay
Liners. Journal of Geotechnical and Geoenvironmental Engineering 125(5): 390-403.
Bernstone, C., T. Dahlin, T. Ohlsson and H. Hogland (2000): DC-resistivity mapping of internal
landfill structures: two pre-excavation surveys. Environmental Geology 39(3): 360-371.
Bjerg, P. L., N. Tuxen, L. A. Reitzel, H.-J. Albrechtsen and P. Kjeldsen (2009): Natural Attenua
tion Processes in Landfill Leachate Plumes at Three Danish Sites. Ground Water: publis
hed online ahead of print.
BMU (2006): Siedlungsabfallentsorgung in Deutschland. Berlin, Bundesministerium für Umwelt,
Naturschutz und Reaktorsicherheit: 47.
BMU (2009): Verordnung über Deponien und Langzeitlager (Directive on landfills and long-term
deposits). BGBl. I S. 900.
Boda, B. (2002): Evaluation of Stability Parameters for Landfills. Civil and Environmental Engi
neering. Blacksburg, Virginia Polytechnic Institute and State University: 48.
Boerboom, A. A. M., E. Foppen and O. van Leeuwen (2003): Risk assessment methodology for
after-care of landfills based on the probabilistic approach. Sardinia Waste Management and
Landfill Symposium 2003, S. Margarita di Pula, Cafgliari, Italy, CISA.
Bogner, J. and K. Spokas (1993): Landfill CH4: rates, fates, and role in global carbon cycle. Che
mosphere 26: 369-386.
Bonaparte, R., D. E. Daniel and R. M. Koerner (2002): Assessment and Recommendations for
Improving the Performance of Waste Containment Systems. Cincinnati, OH, US EPA:
1039.
Bookter, T. J. and R. K. Ham (1982): Stabilization of Solid Waste in Landfills. Journal of the Envi
ronmental Engineering Division 108(6): 1089-1100
Literature, Figures, and Tables 202

Bozkurt, S., M. Lucisano, L. Moreno and I. Neretnieks (2001): Peat as a potential analogue for the
long-term evolution in landfills. Earth-Science Reviews 53(1-2): 95-147.
Bozkurt, S., L. Moreno and I. Neretnieks (1999): Long-term fate of organics in waste deposits and
its effect on metal release. The Science of The Total Environment 228(2-3): 135-152.
Bozkurt, S., L. Moreno and I. Neretnieks (2000): Long-term processes in waste deposits. The
Science of The Total Environment 250(1-3): 101-121.
Bräcker, W. (2002): Oberflächenabdeckungen und -abdichtungen. Hildesheim, Niedersächsisches
Landesamt: 34.
Bräcker, W., G. Gerdes and B. Engeser (2004): Umsetzung der Deponieverordnung: Leitfaden mit
Arbeitsanleitung zur Festlegung von Auslöseschwellen sowie zur Gestaltung von Maß
nahmenplänen nach § 9 Deponieverordnung (DepV). Hannofer, Landesamt Niedersachsen.
Brunner, P. H. (1989): Die Herstellung von umweltverträglichen Reststoffen als neues Ziel der
Müllverbrennung. Müll und Abfall 1989(4): 171-178.
Brunner, P. H. (1992): Wo stehen wir auf dem Weg zur “Endlagerqualität”? Österreichische Was
serwirtschaft 44(9/10).
Brunner, P. H. and H. Rechberger (2004): Practical Handbook of Material Flow Analysis. Boca
Raton, . Lewis Publishers,.
Bundt, M., A. Albrecht, P. Froidevaux, P. Blaser and H. Fluhler (2000): Impact of Preferential
Flow on Radionuclide Distribution in Soil. Environmental Science & Technology 34(18):
3895-3899.
Buss, S. R., A. W. Herbert, P. Morgan, S. F. Thornton and J. W. N. Smith (2004): A review of
ammonium attenuation in soil and groundwater. Quarterly Journal of Engineering Geology
and Hydrogeology 37(4): 347-359.
Butt, T. E. and K. O. K. Oduyemi (2003): A holistic approach to Concentration Assessment of
hazards in the risk assessment of landfill leachate. Environment International 28(7): 597
608.
Chanton, J., T. Abichou, C. Langford, G. Hater, R. Green, D. Goldsmith and N. Swan (2010):
Landfill Methane Oxidation Across Climate Types in the U.S. Environmental Science &
Technology: null-null.
Chanton, J., T. Abichou, C. Langford, K. Spokas, G. Hater, R. Green, D. Goldsmith and M. A.
Barlaz (2011): Observations on the methane oxidation capacity of landfill soils. Waste
Management 31(5): 914-925.
Chiampo, F., R. Conti and D. Cometto (1996): Morphological characterisation of MSW landfills.
Resources, Conservation and Recycling 17(1): 37-45.
Christensen, T. H., P. H. Bjerg and P. Kjeldsen (2000): Natural attenuation: A feasible approach to
remediation of groundwater pollution at landfills? Ground Water Monitoring and Remedi
ation 20(1): 69-77.
Christensen, T. H. and P. Kjeldsen (1989): Basic biochemical Processes in Landfills. Sanitary
Landfill Process, Technology and Environmental Impact '89. T. H. Christensen, R. Cossu
and R. Stegmann, Academic Press.
Literature, Figures, and Tables 203

Christensen, T. H., P. Kjeldsen, H.-J. r. Albrechtsen, G. Heron, P. H. Nielsen, P. L. Bjerg and P. E.
Holm (1994): Attenuation of landfill leachate pollutants in aquifers. Critical Reviews in
Environmental Science and Technology 24(2): 119 - 202.
Christensen, T. H., P. Kjeldsen, P. L. Bjerg, D. L. Jensen, J. B. Christensen, A. Baun, H.-J.
Albrechtsen and G. Heron (2001): Biogeochemistry of landfill leachate plumes. Applied
Geochemistry 16(7-8): 659-718.
Christensen, T. H., P. Kjeldsen and B. Lindhardt (1996): Gas-generating processes in landfills.
Landfilling of waste: biogas. T. H. Christensen. London, E&FN Spon: p. 27-44.
Cossu, R., T. Lai and E. Piovesan (2007): Proposal of a methodology for assessing the final storage
quality of a landfill. Sardinia 2007 - Eleventh International Waste Management and Land
fill Symposium, S. Margherita di Pula, Cagliari, Italy, CISA.
Cossu, R. and R. Raga (2008): Test methods for assessing the biological stability of biodegradable
waste. Waste Management 28(2): 381-388.
Darcy, H. (1856): Les Fontaines Publiques de la Ville de Dijon. Dalmont, Paris.
Denner, M., E. Schachermayer and M. Scheibengraf (2005): Baurestmassen - Grundlagen zur Cha
rakterisierung und Beurteilung des potenziellen Risikos bei der Ablagerung. Wien,
Umweltbundesamt GmbH: 66.
Dijkstra, J. J., H. A. van der Sloot and R. N. J. Comans (2006): The leaching of major and trace
elements from MSWI bottom ash as a function of pH and time. Applied Geochemistry
21(2): 335-351.
Dixon, W. J. (1953): Processing data for outliers. Biometrics 9: 74-89.
Döberl, G. (2004): Evaluierung von Modellen zur Bestimmung des langfristigen Verhaltens von
Hausmülldeponien - Wissensdefizite und neue Ansätze. Institut für Wassergüte und
Abfallwirtschaft. Wien, Technische Universität Wien: 199.
Döberl, G., J. Fellner, G. Allgaier, P. H. Brunner and R. Stegmann (2005): Eine neue Methode zur
Charakterisierung des Stabilisierungsgrades großer Altablagerungen (EMSA). Wien, Tech
nische Universität Wien, Institut für Wassergüte und Abfallwirtschaft: 178.
Döberl, G., R. Huber, J. Fellner, O. Cencic and P. H. Brunner (2002): Neue Strategien zur Nach
sorge von Deponien und zur Sanierung von Altlasten (STRANDEZA). Wien, Technische
Universität Wien, Institut für Wassergüte und Abfallwirtschaft: 268.
Domenico, P. A. (1987): An analytical model for multidimensional transport of a decaying conta
minant species. Journal of Hydrology 91(1-2): 49-58.
EC (1999): Richtlinie des Rates über Abfalldeponien (European landfill directive) 1999/31/EG.
EC (2003): Establishing criteria and procedures for the acceptance of waste at landfills pursuant to
Article 16 of and Annex II to Directive 1999/31/EC. C. o. t. E. Union, Official Journal of
the European Communities. L 11/27.
Ehrig, H.-J. (1986): Untersuchungen zur Gasproduktion aus Hausmüll. Müll und Abfall 5: 173
183.
Ehrig, H.-J. and I. Krümpelbeck (2001): The emission behaviour of old landfills in the aftercare
phase. Sardinia Waste Management and Landfill Symposium, S. margarita di Pula, Cag
liari, Italy, CISA.
Literature, Figures, and Tables 204

Ehrig, H. J. (1989): Water and Element Balances of Landfills. The Landfill - Reactor and Final Sto
rage. P. Baccini. Berlin Heidelberg New York, Springer-Verlag. 20: 438.
Ehrig, H. J. (1991): Gasprognosen bei Restmülldeponien. Trierer Berichte zur Abfallwirtschaft. G.
S. Rettenberger, R. Trier. 2: 61 - 88.
Ehrig, H. J. (2002): Inwieweit bestimmen Sickerwasser- und Deponiegasemissionen die Dauer der
Nachsorge? Retrieved 03.04.2009.
Ehrig, H. J. and U. Brinkmann (1999): Verbundvorhaben Deponiekörper - Zusammenfassender
Abschlussbericht zum Arbeitsgebiet Siedlungsabfälle. Wuppertal, BUGH Wuppertal: 110.
EKA (1986): Leitbild für die schweizerische Abfallwirtschaft. Bern, Eidgenössische Kommission
für Abfallwirtschaft.
El-Fadel, M., A. N. Findikakis and J. O. Leckie (1997): Environmental Impacts of Solid Waste
Landfilling. Journal of Environmental Management 50(1): 1-25.
Environment Agency (2004): LandSim 2.5 - groundwater risk assessment tool for landfill design.
Bristol, Environment Agency: 6.
Environment Agency (2010a): The surrender of permits for the permanent deposit of waste. Bris
tol, UK, Environment Agency. Version 1: 24.
Environment Agency (2010b): Waste Information 2009: A summary of the types and quantities of
waste handled by permitted waste management facilities in 2009 in England and Wales. .
Bristol, UK., UK Environment Agency.
Europäische Umweltagentur (2004): Qualität und Quantität von Grundwasser in Europa. Wien,
Umweltbundesamt: 161.
Farquhar, G. J. and W. Parker (1989): Interactions of Leachates with Natural and Synthetic Enve
lopes. The Landfill - Reactor and Final Storage. P. Baccini. Berlin Heidelberg New York,
Springer-Verlag. 20: 145-175.
Farquhar, G. J. and F. A. Rovers (1973): Gas production during refuse decomposition. Water, Air,
& Soil Pollution 2(4): 483-495.
Faulstich, M. (1993): Schmelzen von Rückständen aus der Müllverbrennung - Integrieren oder
Nachschalten? Reaktoren zur thermischen Abfallbehandlung. K. J. Thomé-Kozmiensky,
EF Verlag: 175-188.
Fehringer, R., H. Rechberger, H.-L. Pesonen and P. H. Brunner (1997): Auswirkungen unter
schiedlicher Szenarien der thermischen Verwertung von Abfällen in Österreich (Projekt:
ASTRA). Wien, Institute for Water Quality, Resources and Waste Management, TU
Vienna.
Fellner, J. (2004): A New Method for Modeling Water Flow and Water Storage in Municipal Solid
Waste Landfills. Institut für Wassergüte und Abfallwirtschaft. Wien, Technische Univer
sität Wien: 296.
Fellner, J., G. Döberl, G. Allgaier and P. H. Brunner (2009a): Comparing field investigations with
laboratory models to predict landfill leachate emissions. Waste Management 29(6): 1844
1851.
Fellner, J. et al. (2008): Konzeptionelle Überlegungen zur Entlassung aus der Deponienachsorge.
Wien, Österreichischer Wasser- und Abfallwirtschaftsverband.
Literature, Figures, and Tables 205

Fellner, J., D. Laner, P. H. Brunner, H. P. Nachtnebel, H. Holzmann, C. Neuhold, U. Haberl, B.
Kahl, A. Bichler, B. Dengler and U. Schmock (2009b): Gefährdung durch Deponien und
Altablagerungen im Hochwasserfall – Risikoanalyse und Minimierung (GEDES). Wien,
KIRAS - Sicherheitsforschungsprogramm: 193.
Fellner, J., P. Schöngrundner and P. H. Brunner (2004): Methanemissionen aus Deponien
Bewertung von Messdaten. Wien, Institut für Wassergüte und Abfallwirtschaft, TU Wien.
Ferrari, S. (1997): Chemische Charakterisierung des Kohlenstoffes in Rückständen von Müll
verbrennungsanlagen Zürich, ETH Zürich.
Fetter, C. W. (2008): Contaminant Hydrogeology Edition. Long Grove, Illinois, Waveland Press,
Inc.
Fick, A. (1855): Ueber Diffusion. Annalen der Physik 170(1): 59-86.
Forget, B., A. L. Rollin and T. Jacquelin (2005): Lessons learned from 10 years of leak detection
surveys on geomembranes. Tenth International Waste Management and Landfilling Sym
posium. T. Christensen, Cossu, R., Stegmann, R.,. St. Margarita di Pula, CISA: 9.
Förstner, U. and P. Grathwohl (2007): Ingenieurgeochemie. Berlin Heidelberg, Springer-Verlag.
Förstner, U. and G. Hirschmann (1997): Langfristiges Deponieverhalten von Müllverbrennungs
schlacken. Hamburg, Technische Universität Hamburg-Harburg: 259.
Foster Wheeler Env. Corp. (1998): RBCA Fate and Transport Models: Compendium and Selection
Guidance. Norcross, GA, American Society for Testing and Materials (ASTM)
Francois, V., G. Feuillade, N. Skhiri, T. Lagier and G. Matejka (2006): Indicating the parameters of
the state of degradation of municipal solid waste. Journal of Hazardous Materials 137(2):
1008-1015.
Furrer, G. and B. Wehrli (1996): Microbial reactions, chemical speciation, and multicomponent
diffusion in porewaters of a eutrophic lake. Geochimica et Cosmochimica Acta 60(13):
2333-2346.
GeoSyntec (2006): Performance-Based System for Post-Closure Care at MSW Landfills: A Proce
dure for Providing Long-Term Stewardship under RCRA Subtitle D. Columbia, Maryland,
U.S., Environmental Research and Education Foundation: 302.
Gibbons, R. and L. Bull (2006): Statistically-Based Data Evaluation Methodologies for Municipal
Solid Waste (MSW) Leachate. Waste Tech Landfill Technology Conference. Phoenix.
Gibbons, R. D. and D. E. Coleman (2001): Statistical methods for the detection and quantification
of environmental contamination. New
York/Chichester/Weinheim/Brisbane/Singapore/Toronto, John Wiley & Sons, Inc.
Gibbons, R. D., D. G. Dolan, H. May, K. O'Leary and R. O'Hara (1999): Statistical Comparison of
Leachate from Hazardous, Codisposal, and Municipal Solid Waste Landfills. Ground
Water Monitoring & Remediation 19(4): 57-72.
Gibbons, R. D., D. D. Slaine and J. W. F. Morris (2007): Municipal Solid Waste Landfill Leachate
Characterization Study. Alexandria, Environmental Research and Education Foundation
(EREF): 50.
Giroud, J. P. and R. Bonaparte (1989): Leakage through liners constructed with geomembranes.
Part II: Composite liners. Geotextiles and Geomembranes 8(2): 71–111.
Godoy, L. A. (2000): Theory of Elastic Stability: Analysis and Sensitivity, Taylor & Francis.
Literature, Figures, and Tables 206

Gray, D. A., J. D. Mather and I. B. Harrison (1974): Review of groundwater pollution from waste
disposal sites in England and Wales, with provisional guidelines for future site selection.
Quarterly Journal of Engineering Geology 1: 181-196.
Gray, D. H. (1989): Geotechnical Engineering of Land Disposal Systems. The Landfill - Reactor
and Final Storage. P. Baccini. Berlin Heidelberg New York, Springer-Verlag. 20: 145-175.
Griffin, R. A. and N. F. Shimp (1975): Interaction of clay minerals and pollutants in municipal
leachate. Water Reuse 2: 801-811.
Gy, P. (2004): Sampling of discrete materials--a new introduction to the theory of sampling: I.
Qualitative approach. Chemometrics and Intelligent Laboratory Systems 74(1): 7-24.
Hagedorn, F. and M. Bundt (2002): The age of preferential flow paths. Geoderma 108(1-2): 119
132.
Hall, D. H., D. Drury, J. R. Gronow, S. J. T. Pollard and R. Smith (2007a): Estimating Pollutant
Removal Requirements for Landfills in the UK: III. Policy Analysis and Operational
Implications. Environmental Technology 28(1): 25-32.
Hall, D. H., D. Drury, J. R. Gronow, A. Rosevear, S. J. T. Pollard and R. Smith (2006): Estimating
Pollutant Removal Requirements for Landfills in the UK: II. Model Development. Envi
ronmental Technology 27(12): 1323 - 1333.
Hall, D. H., D. Drury, J. W. N. Smith, H. A. B. Potter and J. R. Gronow (2003): Predicting the
groundwater impact of modern landfills: major developments of the approach to landfill
risk assessment in the UK (LandSim 2.5). Sardinia International Waste Management and
Landfill Symposium, S. Margeritha di Pula, Cagliari, Italy, CISA.
Hall, D. H., J. McDougall, D. Drury, N. Blakey, P. Braithwaite and A. Rosevear (2007b): Sustain
able landfill: the role of fail-safe engineering for landfill aftercare. Sardinia 2007 - Eleventh
International Waste Management and Landfill Symposium, S. Margherita di Pula, Cagliari,
Italy, CISA.
Hefler, F. (2003): Erläuterungen zur Abwasseremissionsverordnung "Deponiesickerwasser"
Gesetzliche Begrenzung von Sickerwasseremissionen aus Abfalldeponien. Wien,
BMLFUW: 35.
Hellweg, S. (2000): Time- and Site-Dependent Life-Cycle Assessment of Thermal Waste Treat
ment Processes. Zürich, Swiss Federal Institute of Technology: 192.
Henken-Mellies, U. (2006): Kombinationsabdichtungen in Oberflächenabdichtungssystemen.
Anforderungen an Deponie-Oberflächenabdichtungssysteme, Höxter, DGGT.
Henken-Mellies, W.-U. and A. Schweizer (2011): Long-term performance of landfill covers
results of lysimeter test fields in Bavaria (Germany). Waste Management & Research
29(1): 59-68.
Heyer, K.-U. (2003): Emissionsreduzierung in der Nachsorge. Stuttgart, Deutschland, Verlag
Abfall aktuell.
Heyer, K.-U. (2005): Evaluation and Preliminary Assessment of Old Deposits. St. Pölten, Nie
derösterreichische Landesakademie: 225.
Heyer, K.-U., K. Hupe and R. Stegmann (2005a): Landfill aftercare - scope for actions, duration,
costs and quantitative criteria for the completion. Sardinia 2005 Tenth International Waste
Management and Landfill Symposium, S. Margherita di Pula, Cagliari, Italy, CISA.
Literature, Figures, and Tables 207

Heyer, K. U., K. Hupe, M. Ritzkowski and R. Stegmann (2005b): Pollutant release and pollutant
reduction - Impact of the aeration of landfills. Waste Management 25(4): 353-359.
Hillel, D. (1998): Environmental Soil Physics. San Diego, California, Academic Press.
Hjelmar, O. (1996): Disposal strategies for municipal solid waste incineration residues. Journal of
Hazardous Materials 47(1-3): 345-368.
Hjelmar, O., J. Holm, J. Gudbjerg, D. Bendz, P. Suèr, H. Rosquvist, M. Wahlström and J. Laine-
Ylijoki (2005): Development of criteria for acceptance of monolithic waste at landfills
Nordic Council of Ministers, NMR Landfill Group.
Hjelmar, O. and J. Nedenskov (2007): Prediction and reduction of the duration of landfill aftercare.
Sardinia 2007 - Eleventh International Waste Management and Landfill Symposium, S.
Margherita di Pula, Cagliari, Italy, CISA.
Hjelmar, O., H. A. van der Sloot, D. Guyonnet, R. P. J. J. Rietra, A. Brun and D. Hall (2001):
Development of acceptance criteria for landfilling of waste: an approach based on impact
modelling and scenario calculations. Sardinia Waste Management and Landfill Sympo
sium, S. margarita di Pula, Cagliari, Italy, CISA.
Hoekstra, N., P. Kruiver, H. Kers, W. J. van Vossen, H. Woelders and H. Oonk (2009): Throwing
light into black boxes: using new characterisation tools for risk assessment of abandoned
landfills. Sardinia 2009 - Twelfth International Waste Management and Landfill Sympo
sium. R. Cossu, Diaz, L., Stegmann, R. S. Margherita di Pula, Cagliari, Italy, CISA: 13.
Huber-Humer et al. (2008): Technischer Leitfaden - Methanoxidationsschichten. Wien, Österrei
chischer Verein für Altlastensanierung: 43.
Huber-Humer, M. (2004): Abatement of landfill methane emissions by microbial oxidation in bio
covers made of compost. Institut für Abfallwirtschaft. Wien, Universität für Bodenkultur
Wien: 377.
Huber, H., M. Jaros and P. Lechner (1997): Auswirkungen der künstlichen Alterung von
MVASchlacke auf deren Emissionsverhalten. 2. Statusdeponieseminar „Deponiekörper".
Wuppertal. 2.
Huber, R., J. Fellner, G. Döberl and P. H. Brunner (2004): Water Flows of MSW Landfills and
Implications for Long-Term Emissions. Journal of Environmental Science and Health, Part
A: Toxic/Hazardous Substances and Environmental Engineering 39(4): 885 - 900.
Huber, W., S. Schatz and A. Quentin (2002): Statistische Auswertung des Sickerwasseranfalls auf
bayerischen Deponien. Augsburg, LfU Bayerisches Landesamt für Umweltschutz: 37.
Hutterer, H., P. H. Brunner, W. Schönbäck, W. Frühwirth, H. Wöginger, G. Döberl, M. Eder and
R. Pierrard (2000): Bewertung abfallwirtschaftlicher Maßnahmen mit dem Ziel der nach
sorgefreien Deponie. Wien, Umweltbundesamt: 406.
Inyang, H. and G. F. Lee (2005): Response | Models are not the answer to improved landfilling.
Environmental Science & Technology 39(2): 31A-32A.
Inyang, H. I. (2004): Peer Reviewed: Modeling the Long-Term Performance of Waste Containment
Systems. Environmental Science & Technology 38(17): 328A-334A.
IPCC (2007): Climate Change 2007: The Physical Science Basis. Contribution of Working Group I
to the Fourth Assessment Report of the Intergovernmental Panel on Climate Change. .
Literature, Figures, and Tables 208

Cambridge, United Kingdom and New York, NY, USA., Cambridge University Press.
ITRC (Interstate Technology & Regulatory Council) (2006): Evaluating, Optimizing, or Ending
Post-Closure Care at Municipal Solid Waste Landfills Based on Site-Specific Data Evalua
tions. Washington, D.C., Interstate Technology & Regulatory Council, Alternative Landfill
Technologies Team.
Jacques, D. and J. Šimůnek (2005): User Manual of the Multicomponent Variably-Saturated Flow
and Transport Model HP1 - Description, Verification, and Examples. Mol, Belgium, SCK
CEN: 79.
Johnson, C. A., S. Brandenberger and P. Baccini (1995): Acid Neutralizing Capacity of Municipal
Waste Incinerator Bottom Ash. Environmental Science & Technology 29(1): 142-147.
Johnson, C. A., M. Kaeppeli, S. Brandenberger, A. Ulrich and W. Baumann (1999): Hydrological
and geochemical factors affecting leachate composition in municipal solid waste incinera
tor bottom ash: Part II. The geochemistry of leachate from Landfill Lostorf, Switzerland.
Journal of Contaminant Hydrology 40(3): 239-259.
Kelly, R. J., B. D. Shearer, J. Kim, C. D. Goldsmith, G. R. Hater and J. T. Novak (2006): Relation
ships between analytical methods utilized as tools in the evaluation of landfill waste stabil
ity. Waste Management 26(12): 1349-1356.
Kerndorff, H., V. Brill, R. Schleyer, P. Friesel and G. Milde (1980): Erfassung grundwassergefähr
dender Altablagerungen - Ergebnisse hydrogeochemischer Untersuchungen. WaBoLu-
Hefte 5(1985).
Kerndorff, H., R. Schleyer and H. H. Dieter (1993): Bewertung der Grundwassergefährdung von
Altablagerungen - Standardisierte Methoden und Maßstäbe. Berlin, Institut für Wasser-,
Boden- und Lufthygiene des Bundesgesundheitsamtes: 145.
Kjeldsen, P., M. A. Barlaz, A. P. Rooker, A. Baun, A. Ledin and T. H. Christensen (2002): Present
and Long-Term Composition of MSW Landfill Leachate: A Review. Critical Reviews in
Environmental Science and Technology 32(4): 297 - 336.
Kjeldsen, P. and T. H. Christensen (2001): A simple model for the distribution and fate of organic
chemicals in a landfill: MOCLA. Waste Management Research 19(3): 201-216.
Kjeldsen, P. and M. Christophersen (2001): Composition of leachate from old landfills in Den
mark. Waste Management Research 19(3): 249-256.
Klink, R. E. and R. K. Ham (1982): Effects of moisture movement on methane production in solid
waste landfill samples. Resources and Conservation 8(1): 29-41.
Knox, K., P. Braithwaite, M. Caine and B. Croft (2005): Brogborough landfill test cells: The final
chapter. A study of landfill completion in relation to final storage quality (FSQ) criteria.
Sardinia 2005 Tenth International Waste Management and Landfill Symposium, S. Marg
herita di Pula, Cagliari, Italy, CISA.
Kolstad, D. C., C. H. Benson and T. B. Edil (2004): Hydraulic Conductivity and Swell of Nonpre
hydrated Geosynthetic Clay Liners Permeated with Multispecies Inorganic Solutions. Jour
nal of Geotechnical and Geoenvironmental Engineering 130(12): 1236-1249.
Literature, Figures, and Tables 209

Krümpelbeck, I. (2000): Untersuchungen zum langfristigen Verhalten von Siedlungsabfalldepo
nien. Fachbereich Bauingenieurwesen. Wuppertal, Bergische Universität - Gesamthoch
schule Wuppertal: 216.
Kruse, K. (1994): Langfristiges Emissionsverhalten von Siedlungsabfalldeponien. Fachbereich für
Bauingenieur- und Vermessungswesen. Braunschweig, Technische Universität Carolo-
Wilhelmina zu Braunschweig: 228.
Kühle-Weidemeier, M. and H. Bogon (2008): Wirksamkeit von biologischen Methanoxidations
schichten auf Deponien. Praxistagung Deponie 2008. Hannover, WasteConsult.
Kylefors, K. (2003): Evaluation of leachate composition by multivariate data analysis (MVDA).
Journal of Environmental Management 68(4): 367-376.
Kylefors, K., L. Andreas and A. Lagerkvist (2003): A comparison of small-scale, pilot-scale and
large-scale tests for predicting leaching behaviour of landfilled wastes. Waste Management
23(1): 45-59.
LABO (2008): Arbeitshilfe "Sickerwasserprognose bei Detailuntersuchungen", Bund
/Länderarbeitsgemeinschaft Bodenschutz (LABO) - Altlastenausschuss (Unterausschuss
"Sickerwasserprognose"): 137.
Laner, D. (2009): The consideration of long-term emissions from landfills within life-cycle assess
ment. Waste Management Research 27(5): 463-470.
Laner, D., J. Fellner and P. H. Brunner (2009): Flooding of municipal solid waste landfills -- An
environmental hazard? Science of The Total Environment 407(12): 3674-3680.
Laner, D., J. Fellner and P. H. Brunner (2010): Die Umweltverträglichkeit von Deponieemissionen
unter dem Aspekt der Nachsorgedauer. Österreichische Wasser- und Abfallwirtschaft
2010(7-8): 2-11.
Laner, D., J. Fellner and P. H. Brunner (2011a): Environmental Compatibility of Closed Landfills –
Assessing Future Pollution Hazards. Waste Management and Research 29(1): 89–98.
Laner, D., J. Fellner and P. H. Brunner (2011b): Future landfill emissions and the effect of final
cover installation - A case study. Waste Management 31(7): 1522-1531.
Laner, D., J. Fellner and P. H. Brunner (2011c): Standortbezogene Kriterien zur Beurteilung der
Umweltverträglichkeit von Deponieemissionen unter dem Aspekt der Nachsorgedauer
(Projekt SKUDENA). Vienna, Institute for Water Quality, Resources and Waste Manage
ment, Vienna University of Technology: 452.
LAWA (2004): Ableitung von Geringfügigkeitsschwellenwerten für das Grundwasser. L. Wasser.
Düsseldorf, Kulturbuch-Verlag GmbH.
Lebensministerium (2006): Bundes-Abfallwirtschaftsplan 2006 (Austrian Waste Management
Plan). Wien, Bundesministerium für Land- und Forstwirtschaft, Umwelt und Wasserwirt
schaft,: 332.
Leckie, J. O., C. Halvadakis and J. G. Pacey (1979): Landfill Management with Moisture Control.
Journal of the Environmental Engineering Division 105(2): 337 - 355.
Lichtensteiger, T., P. H. Brunner and M. Langmeier (1989): Transformation of sewage sludge in
landfills. Thermophilic Aerobic Digestion and Processing Requirements for Landfilling. A.
M. Bruce, F. Colin and P. G. Newman. London, Elsevier Applied Science.
Literature, Figures, and Tables 210

Luckner et al. (2008): Leitfaden des KORA-Themenverbund 4 "Deponien, Altablagerungen".
Dresden, Dresdner Grundwasserforschungszentrum e.V.: 337.
Luckner, L. and W. M. Schestakow (1991): Migration Processes in the Soil & Groundwater Zone.
Chelsea, Michigan, Lewis Publishers, Inc.
Luckner, T. (2010): Stilllegung und Nachsorge von Deponien und Altablagerungen in Deutschland
– FuE-Ergebnisse des BMBF-Förderschwerpunkts KORA-TV4. Österreichische Wasser-
und Abfallwirtschaft 62(7): 149-154.
Ludvigsen, L., H. J. Albrechtsen, G. Heron, P. L. Bjerg and T. H. Christensen (1998): Anaerobic
microbial redox processes in a landfill leachate contaminated aquifer (Grindsted, Den
mark). Journal of Contaminant Hydrology 33(3-4): 273-291.
Mallants, D., G. Volckaert and J. Marivoet (1999): Sensitivity of protective barrier performance to
changes in rainfall rate. Waste Management 19(7-8): 467-475.
Maloszewski, P., H. Moser, W. Stichler and P. Trimborn (1995): Isotope hydrology investigations
in large refuse lysimeters. Journal of Hydrology 167(1-4): 149-166.
Mathlener, R. A., T. Heimovaara, H. Oonk, L. Luning, H. A. van der Sloot and A. van Zomeren
(2006): Opening the Black Box - Process-Based Design Criteria to Eliminate Aftercare of
Landfills. Hertogenbosch, The Netherlands, Dutch Sustainable Landfill Foundation.
McDonald, M. G. and A. W. Harbaugh (1988): A modular three-dimensional finite-difference
ground-water flow model. Reston, U.S. Geological Survey: 528.
Melchior, S., K. Berger, B. Vielhaber and G. Miehlich (2002): Großlysimeter Deponie Hamburg-
Georgswerder: Wasserhaushalt und Wirksamkeit von Oberflächenabdichtungssystemen mit
bindigen mineralischen Dichtungen. Status-Workshop: Austrocknungsverhalten von mine
ralischen Abdichtungsschichten in Deponie- Oberflächenabdichtungssystemen. H.-G.
RAMKE, W. LÜKEWILLE and B. VIELHABER. Höxter.
Ministry of the Environment (2010): Landfill standards: a guideline on the regulatory and approval
requirements for new and expanding landfilling sites. Ministry of the Environment.
Toronto, Government of Ontario. Revised version of the 1998 document: 110.
MoE (Austrian Ministry of Environment) (1996a): Allgemeine Begrenzung von Abwasseremissio
nen in Fließgewässer und öffentliche Kanalisationen (Austrian ordinance on waste water
discharge ordinance). BGBl. Nr. 186.
MoE (Austrian Ministry of Environment) (1996b): Deponieverordnung (Austrian Landfill Direc
tive). Directive.
MoE (Austrian Ministry of Environment) (2001): Verordnung über die Qualität von Wasser für den
menschlichen Gebrauch (Trinkwasserverordnung – TWV) (Austrian ordinance on drinking
water quality). BGBl. II Nr.304: 18.
MoE (Austrian Ministry of Environment) (2003): Abwasseremissionsverordnung – Deponiesi
ckerwasser (Austrian ordinance on leachate emissions). BGBl. II Nr. 263.
MoE (Austrian Ministry of Environment) (2008): Deponieverordnung (Austrian Landfill Direc
tive). BGBl. II Nr. 39.
Morris, J. W. F. and M. A. Barlaz (2011): A performance-based system for the long-term manage
ment of municipal waste landfills. Waste Management 31(4): 649-662.
Literature, Figures, and Tables 211

National Research Council (2000): Natural Attenuation for groundwater remediation. Washington,
D.C., National Academy Press.
National Research Council (2007): Assessment of the performance of engineered waste contain
ment barriers. Washington, D.C., The National Academy of Sciences: 121.
Nienhaus, U. (2001): Bewertungshilfe für Deponien. Landesumweltamt NRW. Essen, Deutschland.
Öman, C. and H. Rosqvist (1999): Transport fate of organic compounds with water through land
fills. Water Research 33(10): 2247-2254.
Öman, C. B. and C. Junestedt (2008): Chemical characterization of landfill leachates - 400 para
meters and compounds. Waste Management 28(10): 1876-1891.
ÖNORM (2005): Stoffflussanalyse – Teil 2: Anwendung in der Abfallwirtschaft – Methodik.
Wien, Österreichisches Normungsinstitut.
Oonk, J. and A. Boom (1995): Landfill gas formation, recovery and emissions. Apeldoorn,
NOVEM Programme Energy Generation from Waste and Biomass (EWAB).
Phaneuf, R. and I. Peggs (2001): Landfill construction quality: Lessons Learned from Electrical
Resistivity Testing of Geomembrane Liners. GFR Magazine. 19.
Pivato, A. (2003): An overview of the fundamentals of risk assessment applied to the aftercare
landfill impact. Sardinia International Waste Management and Landfill Symposium, S.
Margeritha di Pula, Cagliari, Italy, CISA.
Pivato, A. and J. W. F. Morris (2005): Performance-based methodology for assessing the aftercare
endpoint of landfills. Sardinia 2005 Tenth International Waste Management and Landfill
Symposium, S. Margherita di Pula, Cagliari, Italy, CISA.
Pohland, F. G. (1975): Sanitary landfill stabilization with leachate recycle and residual treatment.
Cincinnati, USEPA.
Pohland, F. G. and S. A. Harper (1986): Critical review and summary of leachate and gas produc
tion from landfills. Washington D.C., US EPA.
Rachor, I., J. Gebert, A. Gröngröft and E.-M. Pfeiffer (2011): Assessment of the methane oxidation
capacity of compacted soils intended for use as landfill cover materials. Waste Manage
ment 31(5): 833-842.
Reinhart, D. R. and T. G. Townsend (1997): Landfill Bioreactor Design & Operation. Boca Raton
London - New York - Washington, D.C., CRC Press LLC.
Resources & Systems International (1995-2000): BIOF&T – Flow and Transport in the Saturated
and Unsaturated Zone in 2- or 3-Dimensions. Blacksburg, Resources & Systems Interna
tional,.
Richards, L. A. (1931): Capillary conduction of liquids through porous media. Physics 1: 318-333.
Rolland, C. and M. Scheibengraf (2003): Biologisch abbaubarer Kohlenstoff im Restmüll. Wien,
Umweltbundesamt: 22.
Rosqvist, H. and D. Bendz (1999): An experimental evaluation of the solute transport volume in
biodegraded municipal solid waste. Journal of Hydrology and Earth System Sciences 3(3):
429-438.
Rosqvist, N. H., L. H. Dollar and A. B. Fourie (2005): Preferential flow in municipal solid waste
and implications for long-term leachate quality: valuation of laboratory-scale experiments.
Waste Management Research 23(4): 367-380.
Literature, Figures, and Tables 212

Roussat, N., J. Méhu, M. Abdelghafour and P. Brula (2008): Leaching behaviour of hazardous
demolition waste. Waste Management 28(11): 2032-2040.
Rowe, R. K. (1998): Geosynthetics and the minimization of contaminant migration through barrier
systems beneath solid waste. Sixth International Conference on Geosynthetics. Atlanta,
Industrial Fabrics Association International. 1: 27-103.
Rowe, R. K. (2005): Long-term performance of contaminant barrier systems. Geotechnique 55(9):
631-678.
Rowe, R. K. and J. R. Booker (2000): Theoretical solutions for calculating leakage through compo
site liner systems. . The John Booker Memorial Symposium - Developments in theoretical
geomechanics, Sydney.
Rowe, R. K., R. M. Quigley, R. W. I. Brachman and J. R. Booker (2004): Barrier Systems for
Waste Disposal Facilities. London, Taylor & Francis.
Sabatini, P. J., L. M. Griffin, R. Bonaparte, R. D. Espinoza and J. P. Giroud (2002): Reliability of
state of practice for selection of shear strength parameters for waste containment system
stability analyses. Geotextiles and Geomembranes 20(4): 241-262.
Scanlon, B. R., M. Christman, R. C. Reedy, I. Porro, J. Simunek and G. N. Flerchinger (2002):
Intercode comparisons for simulating water balance of surficial sediments in semiarid
regions. Water Resour. Res. 38.
Scharff, H., J. Jacobs, H. A. van der Sloot and A. van Zomeren (2007): Inorganic waste landfill and
final storage quality. Sardinia 2007 - Eleventh International Waste Management and Land
fill Symposium, S. Margherita di Pula, Cagliari, Italy, CISA.
Scharff, H., A. van Zomeren and H. A. van der Sloot (2011): Landfill sustainability and aftercare
completion criteria. Waste Management & Research 29 ((1)): 30-40.
Scheutz, C. and P. Kjeldsen (2004): Environmental Factors Influencing Attenuation of Methane
and Hydrochlorofluorocarbons in Landfill Cover Soils. J. Environ. Qual. 33(1): 72-79.
Scheutz, C., A. Pedicone, G. B. Pedersen and P. Kjeldsen (2011): Evaluation of respiration in com
post landfill biocovers intended for methane oxidation. Waste Management 31(5): 895-902.
Schneider, W. and H. Stöfen (2004): Nomogramme der Sickerwasserprognose. Grundwasser
2004(1): 54-66.
Schneider, W. and H. Stöfen (2006): Entwicklung und Erprobung eines in der Verwaltungspraxis
tauglichen Verfahrens für verlässliche Sickerwasserprognosen in Baden-Württemberg.
Hamburg-Harburg, Technische Universität Hamburg-Harburg: 33.
Schroeder, P. R., J. M. Morgan, T. M. Walski and A. C. Gibson (1984): The hydrologic evaluation
of landfill Performance (HELP) model, volume I, user's guide for version 1. Cincinnati, US
EPA.
Schwartz, P. (1991): The Art of the Long View. New York, Bantam Doubleday Dell Publishing
Group.
Sen, P. K. (1968): Estimates of the regression coefficient based on Kendall's tau. Journal of the
American Statistics Association 63: 1379-1389.
Simon, F.-G. and W. W. Müller (2004): Standard and alternative landfill capping design in Ger
many. Environmental Science & Policy 7(4): 277-290.
Literature, Figures, and Tables 213

Šimůnek, J., K. Huang and M. T. van Genuchten (1998): The HYDRUS code for simulating the
one-dimensional movement of water, heat, and multiple solutes in variably saturated
media. Riverside, U.S. Salinity Laboratory.
Šimůnek, J., M. Šejna, H. Saito, M. Sakai and M. T. van Genuchten (2008): The HYDRUS-1D
Software Package for Simulating the One-Dimensional Movement of Water, Heat, and
Multiple Solutes in Variably-Saturated Media. Riverside, CA, University of California
Riverside: 315.
Šimůnek, J., M. Šejna and M. T. van Genuchten (2007): The HYDRUS Software Package for
Simulating the Two- and Three-Dimensional Movement of Water, Heat, and Multiple
Solutes in Variably-Saturated Media. Prague, CR, PC Progress: 203.
Sizirici, B. and B. Tansel (2010): Projection of landfill stabilization period by time series analysis
of leachate quality and transformation trends of VOCs. Waste Management 30(1): 82-91.
Sizirici, B., B. Tansel and V. Kumar (2011): Knowledge based ranking algorithm for comparative
assessment of post-closure care needs of closed landfills. Waste Management 31(6): 1232
1238.
Sizirici, B. (2009): Risk Based Post Closure Care Analysis for Florida Landfills. College of
Engineering and Computing. Miami, Florida Inernational University. PhD: 157.
Sjöberg, L. (2009): Precautionary attitudes and the acceptance of a local nuclear waste repository.
Safety Science 47(4): 542-546.
Slack, R. J., J. R. Gronow and N. Voulvoulis (2005): Household hazardous waste in municipal
landfills: contaminants in leachate. Science of The Total Environment 337(1-3): 119-137.
Smidt, E., P. Lechner, M. Schwanninger, G. Haberhauer and M. H. Gerzabek (2002): Characteri
zation of Waste Organic Matter by FT-IR Spectroscopy: Application in Waste Science.
Applied Spectroscopy 56: 1170-1175.
Sormunen, K., M. Ettala and J. Rintala (2008): Detailed internal characterisation of two Finnish
landfills by waste sampling. Waste Management 28(1): 151-163.
Speiser, C. (2001): Exothermer Stoffumsatz in MVA-Schlackedeponien: Mineralogische und geo
chemische Charakterisierung von Müllverbrennungsschlacken, Stoff- und Wärmebilanz.
Fakultät für Chemie. München, Technische Universität München: 261.
Spokas, K., J. Bogner, J. P. Chanton, M. Morcet, C. Aran, C. Graff, Y. M.-L. Golvan and I. Hebe
(2006): Methane mass balance at three landfill sites: What is the efficiency of capture by
gas collection systems? Waste Management 26(5): 516-525.
Stegmann, R. (1981): Beschreibung eines Verfahrens zur Untersuchung anaerober Umsetzungspro
zesse von festen Abfallstoffen im Labormaßstab. Müll und Abfall 2: 35 - 39.
Stegmann, R., K.-U. Heyer, K. Hupe and M. Ritzkowski (2003): Discussion of criteria for the
completion of landfill aftercare. Sardinia International Waste Management and Landfill
Symposium, S. Margeritha di Pula, Cagliari, Italy, CISA.
Stegmann, R., K.-U. Heyer, K. Hupe and A. Willand (2006): Deponienachsorge - Handlungsoptio
nen, Dauer, Kosten und quantitative kriterien für die Entlassung aus der Nachsorge. Des
sau, Umweltbundesamt: 172.
Stoffregen, H., P. Döll, G. Wessolek, S. Melchior, V. Beate, U. Holzlöhner, R. Horn, T. Baumgartl,
W. Gräsle, K. Bohne and M. Schmidt (1999): Rissgefährdung von Kombinationsdichtun-
Literature, Figures, and Tables 214

gen durch temperaturabhängige Austrocknung - Bedeutung für Deponieplanung und Depo
niebau. Müll und Abfall 1: 29-35.
Stünzi, J. (2009): Sickerwasservollanalysen der Schlackekompartimente der Deponie Riet. Personal
communication with D. Laner.
Susset, B. and P. Grathwohl (2011): Leaching standards for mineral recycling materials - A harmo
nized regulatory concept for the upcoming German Recycling Decree. Waste Management
31(2): 201-214.
Susset, B. and W. Leuchs (2008): Ableitung von Materialwerten im Eluat und Einbaumöglichkei
ten mineralischer Ersatzbaustoffe. Dessau, Umweltbundesamt: 117.
Tabasaran, O. and G. Rettenberger (1987): Grundlage zur Planung von Entgasungsanlagen. Berlin,
Erich Schmidt Verlag.
Townsend, T. G., Y. Jang and L. G. Thurn (1999): Simulation of Construction and Demolition
Waste Leachate. Journal of environmental engineering 125(11): 1071-1081.
Turk, M. (1996): Inkrustationen in Entwässerungssystemen von MVA-Schlacke- und Klär
schlammproben. Müll und Abfall 9: 587-594.
U.S. Environmental Protection Agency (1997): Use of Monitoring Natural Attenuation at Super
fund, RCRA Corrective Action, and Underground Storage Tank Sites. Washington D.C.,
U.S. Environmental Protection Agency.
U.S. EPA (2000): National Water Quality Inventory - Ground Water and Drinking Water Chapters.
Washington, D.C., United States Environmental Protection Agency: 99.
U.S. EPA (2005): Landfill Gas Emissions Model (LandGEM) Version 3.02 User’s Guide. Wash
ington, DC, U.S. Environmental Protection Agency. 2005: 56.
U.S. EPA (2006): Municipal Solid Waste Generation, Recycling, and Disposal in the United States:
Facts and Figures for 2006. Washington, DC, U.S. Environmental Protection Agency.
2006: 11.
Utermann, J., G. Meyenburg, S. Altfelder, H.-E. Gäbler, W. H. M. Duijnisveld, A. Bahr and T.
Streck (2005): Entwicklung eines Verfahrens zur Quantifizierung von
Stoffkonzentrationen im Sickerwasser auf der Grundlage
chemischer und physikalischer Pedotransferfunktionen. Hannover, Bundesanstalt für Geowissen
schaften und Rohstoffe: 217.
Valencia, R., W. van der Zon, H. Woelders, H. J. Lubberding and H. J. Gijzen (2009): Achieving
"Final Storage Quality" of municipal solid waste in pilot scale bioreactor landfills. Waste
Management 29(1): 78-85.
van der Sloot, H. A. (1996): Developments in evaluating environmental impact from utilization of
bulk inert wastes using laboratory leaching tests and field verification. Waste Management
16(1-3): 65-81.
van Genuchten, M. T. (1982): Analytical Solutions of the one-dimensional convectivedispersive
solute transport equation. Washington DC, Agricultural Research Service, United States
Department of Agriculture.
van Genuchten, M. T. and P. J. Wierenga (1976): Mass Transfer Studies in Sorbing Porous Media
I. Analytical Solutions. Soil Science Society of America Journal 40(4): 473-480.
Literature, Figures, and Tables 215
van Vossen, W. J. (2010): Sustainable landfilling in The Netherlands: developments, methodolo
gies and experiences. Österreichische Wasser- und Abfallwirtschaft Volume 62(7-8): 141
148.
van Vossen, W. J., M. de Jong and D. T. Folmer (2007): New strategy for sustainable and cost
saving aftercare of closed landfills based on natural biochemical processes, a full scale
demonstration project at the landfill Vlagheide in Schijndel (NL). Sardinia 2007 - Eleventh
International Waste Management and Landfill Symposium, S. Margherita di Pula, Cagliari,
Italy, CISA.
van Vossen, W. J., K. U. Heyer and H. Woelders (2009a): Feasibility study of sustainable emission
reduction at the existing landfills Wieringermeer and Kragge in the Netherlands: processes
in the waste body and design and costs of enhancing measures (infiltration/aeration). Sar
dinia 2009 - Twelfth International Waste Management and Landfill Symposium. R. Cossu,
Diaz, L., Stegmann, R. S. Margherita di Pula, Cagliari, Italy, CISA: 25.
van Vossen, W. J., F. Olie, H. Peperkamp and D. T. Folmer (2009b): New and practical approach
for sustainable emission reduction of closed landfills based on natural biochemical
processes: results of a full scale bioreactor project at the landfill Vlagheide in Schinjndel
(NL). Sardinia 2009 - Twelfth International Waste Management and Landfill Symposium.
R. Cossu, Diaz, L., Stegmann, R. S. Margherita di Pula, Cagliari, Italy, CISA: 22.
Voigt, H.-J. and T. Wippermann (1998): Geochemie. Berlin Heidelberg New York, Springer.
Wagland, S. T., S. F. Tyrrel, A. R. Godley and R. Smith (2009): Test methods to aid in the evalua
tion of the diversion of biodegradable municipal waste (BMW) from landfill. Waste Man
agement In Press, Corrected Proof.
Wang, Y.-S., C. S. Byrd and M. A. Barlaz (1994): Anaerobic biodegradability of cellulose and he
micellulose in excavated refuse samples using a biochemical methane potential assay.
Journal of Industrial Microbiology & Biotechnology 13(3): 147-153.
Weber, R., A. Watson, M. Forter and F. Oliaei (2011): Review Article: Persistent organic pollu
tants and landfills - a review of past experiences and future challenges. Waste Management
& Research 29(1): 107-121.
Weber, W. J., Y.-C. Jang, T. G. Townsend and S. Laux (2002): Leachate from Land Disposed
Residential Construction Waste. Journal of environmental engineering 128(3): 237-245.
White, J., J. Robinson and Q. Ren (2004): Modelling the biochemical degradation of solid waste in
landfills. Waste Management 24(3): 227-240.
Wimmer, B. and T. Reichenauer (2006): Evapotranspirationsschichten zur Sicherung/Sanierung
von Altablagerungen. Seibersdorf, ARC Seibersdorf research GmbH: 24.
Wisconsin Department of Natural Resources (2007): Guidance for Landfill Organic Stability Plans.
W. D. o. N. Resources. Madison, Wisconsin Department of Natural Resources. Publication
WA-1125: 19.
Youcai, Z., L. Hua, W. Jun and G. Guowei (2002): Treatment of Leachate by Aged-Refuse-based
Biofilter. Journal of environmental engineering 128(7): 662-668.
Zanoni, A. E. (1972): Ground-Water Pollution and Sanitary Landfills—A Critical Reviewa.
Ground Water 10(1): 3-16.
Literature, Figures, and Tables 216

Zobrist, J. (1999): Die Qualität von Grundwasser - Resultat biogeochmischer Prozesse. EAWG
News 48(November): 15 - 17.
Zweifel, H.-R., C. A. Johnson and E. Hoehn (1999): Langzeitanalysen der Hauptelemente von
Sickerwässern aus Altdeponien. Müll und Abfall 12(1999): 727-732.
8.2 List of Figures
Figure 1-1: Schematic illustration of thesis structure ................................................................. 3
Figure 3-10: Box plots of the concentrations of dissolved organic carbon (left) and ammonium-
Figure 3-11: Box plots of the concentrations of chloride (left) and sulfate (right) in the landfill
Figure 3-12: Box plots of the concentrations of chromium (left) and copper (right) in the landfill
Figure 2-1: Different management phases throughout the existence of a MSW landfill........... 5
Figure 2-2: Evaluation matrix of the potential disturbance imposed on an environmental
system by a landfill ................................................................................................ 21
Figure 2-3: Combination of models to establish a disturbance term for the environmental
system (the scheme is related to leachate emissions)............................................. 23
Figure 3-1: Characteristics of landfill gas emissions (top) and leachate emissions (bottom) for
an idealized MSW landfill (from Kjeldsen et al. 2002 based on Farquhar and
Rovers 1973).......................................................................................................... 26
Figure 3-2: Box plots of ammonium-nitrogen concentrations and chloride concentrations in the
leachate as a function of time after landfill closure ............................................... 34
Figure 3-3: Box plots of ammonium-nitrogen concentrations and chloride concentrations in the
leachate as a function of the deposited waste’s liquid-solid-ratio (L-S) at closed
landfills .................................................................................................................. 35
Figure 3-4: Total amount of collected landfill gas per Mg of dry waste at selected MSW
landfills (collection periods after landfill closure are marked) .............................. 35
Figure 3-5: Specific annual loads of nitrogen (left) and chloride (right) for two well
documented MSW landfills (MSW1 and MSW3) plotted against landfill age...... 36
Figure 3-6: Substance balances for MSW1 with an average waste age of 19 years and a L/S
ratio of 1.38 l/kg DM ............................................................................................. 37
Figure 3-7: Substance balances for MSW3 with an average waste age of 23 years and L/S ratio
of 0.45 l/kg DM...................................................................................................... 38
Figure 3-8: Total cumulative loads of N (left) and Cl (right) in the leachate of MSW1 and
MSW3 compared to estimates of corresponding mobilizable substance potentials
(grey area: most probable range of mobilizable substance fractions; dotted lines at
the bottom and at the top: maximum and minimum mobilizable substance
potentials)............................................................................................................... 43
Figure 3-9: Schematic illustration of leachate quality from MSWI bottom ash landfills over
time (source: Förstner and Grathwohl 2007) ......................................................... 45
nitrogen (right) in the landfill leachate plotted against average waste age ............ 48
leachate plotted against average waste age ............................................................ 48
leachate plotted against average waste age ............................................................ 49
Literature, Figures, and Tables 217

Figure 3-13: Annual loads of ammonium-nitrogen (left) and chloride (right) in the leachate of
BA1 and BA2 plotted against the average waste age (=mean residence of the waste
in the landfill) of the MSWI bottom ash ................................................................ 50
Figure 3-14: Substance balances for the MSWI bottom ash landfill BA1 with an average waste
age of 3.8 years and L/S ratio of 0.24 l/kg DM...................................................... 51
Figure 3-15: Substance balances for the MSWI bottom ash landfill BA2 with an average waste
age of 14.5 years and L/S ratio of 0.37 l/kg DM .................................................... 51
Figure 3-16: Concentrations of COD (top left), Ntot (top right), Cl (center left), SO4 (center
right), AOX (bottom left), and Zn (bottom right) plotted against the average waste
age at landfill C&D1, C&D2, and C&D3 .............................................................. 57
Figure 3-17: Specific annual substance loads of COD (left) and Ntot (right) in the leachate of
C&D1, C&D2, and C&D3 plotted against average waste age at the sites ............. 58
Figure 3-18: Specific annual substance loads of Cl (left) and SO4 (right) in the leachate of
C&D1, C&D2, and C&D3 plotted against average waste age at the sites ............. 59
Figure 3-19: Comparison of substance concentrations in the leachate of columns and lysimeters
filled with C&D waste plotted against the liquid-to-solid ratio (adapted from
Susset and Leuchs 2008) ........................................................................................ 61
Figure 4-1: Schematic illustration of a landfill containment system based on the requirements
of the Austrian landfill directive for landfills containing pre-treated MSW (cf.
Figure 4-2 and Figure 4-4) ..................................................................................... 66
Figure 4-2: Minimum top cover barrier system according to the Austrian landfill directive
(MoE 2008) for C&D waste landfills (left) and landfills for pretreated MSW (right)
............................................................................................................................... 73
Figure 4-3: Average leachate generation rates after closure for 11 MSW cells and 22 cells
containing hazardous waste (Source:Bonaparte et al. 2002).................................. 73
Figure 4-4: Minimum bottom barrier system according to the Austrian landfill directive (MoE
2008) for C&D waste landfills (left) and landfills for pretreated MSW (right) ..... 76
Figure 4-5: Models of deterioration patterns at landfill containment systems and resulting
source concentrations (adapted from Inyang( 2004)): a) constant pollutant release
from the waste and constant barrier strength; b) constant pollutant release from the
waste and exponentially decreasing barrier strength; c) limited pollutant release
from the waste and exponentially decreasing barrier strength after some time; d)
unlimited pollutant release from the waste and exponentially decreasing barrier
strength after some time; ........................................................................................ 81
Figure 4-6: Normalized evaluation scores (mean evaluation score for the service period/mean
evaluation score for all service periods) for the factors in Table 4-5 to illustrate the
trend of factor significance over time (i.e. over the service periods) for a top cover
system with a composite liner ................................................................................ 83
Figure 4-7: Normalized evaluation scores for the factors in Table 4-5 to illustrate the trend of
factor significance over time for a bottom barrier system with a composite liner . 84
Figure 4-8: Interaction period at a containment-type landfill with decreasing performance of
the technical barriers in the absence of maintenance and repair ............................ 86
218 Literature, Figures, and Tables

Figure 4-9: Major sources of groundwater pollution in the USA (Source: U.S. EPA 2000) .... 89
Figure 4-10: Redox zonation in groundwater polluted by landfill leachate based on
investigations at the landfill „Grindstet“ by Ludvigsen et al. (1998) ..................... 93
Figure 4-11: Schematic tracer break through curves to illustrate the effect of dispersion,
sorption, and degradation processes on solute transport (according to Fetter 2008
based on Roberts et al. (1980)) .............................................................................. 97
Figure 5-1: Schematic illustration of the procedure to evaluate landfill environmental
compatibility and determine post-closure care completion criteria ..................... 103
Figure 5-2: Schematic procedure to derive estimates on potential future emissions at the
landfill .................................................................................................................. 110
Figure 5-3: Adaptation of the emission model to the post-closure monitoring data at the site
(including model validation) ................................................................................ 111
Figure 5-4: Minimum and maximum model estimates for chloride based on the variation of the
model parameters m0 and h in a plausible range in comparison to chloride
measurements at 30 closed MSW landfills .......................................................... 113
Figure 5-5: Minimum and maximum model estimates for ammonium-nitrogen based on the
variation of the model parameters m0 and h in a plausible range in comparison to
NH4-N measurements at 30 closed MSW landfills ............................................. 114
Figure 5-6: Schematic illustration of different emission models (concentration of a substance
in the leachate as a function of the waste’s liquid-to-solid ratio) based on scenario
conditions ............................................................................................................. 115
Figure 5-7: Schematic illustration of the procedure to translate the evaluation results in Table
5-3 into corresponding infiltration rates for the top cover system (annual
precipitation at this site is 630 mm/yr) ................................................................. 120
Figure 5-8: Conceptual illustration of the distribution of degradable organic matter and of
water flow regimes within a MSW landfill with respect to the effect on the
remaining emission potential (Source: van Vossen 2010) ................................... 124
Figure 5-9: Composition of emission scenarios to investigate different top cover performance
levels assuming stable conditions for the emission model ................................... 125
Figure 5-10: Schematic procedure to evaluate pollutant migration in the subsurface due to the
release of leachate from the landfill ..................................................................... 127
Figure 5-11: Soil type classification according to KA5 based on grain size distribution (Source:
AG Boden 2005) .................................................................................................. 130
Figure 5-12: Nomogram to determine the AF value for the case of constant source term strength
for a limited emission period (Source: Schneider and Stöfen 2004) .................... 134
Figure 5-13: Nomogram to determine the AF value for the case of exponentially decreasing
source term strength (Source: Schneider and Stöfen 2004) ................................. 134
Figure 5-14: Mass balance approach to describe mixing of leachate and groundwater ........... 135
Figure 5-15: Scheme of the landfill-environment system with scenario- and substance-specific
attenuation factors between the different PoCs .................................................... 138
Figure 6-1: Aerial photograph of Landfill A and surroundings .............................................. 141
Literature, Figures, and Tables 219

Figure 6-2: Collected amount of landfill gas and gas composition at Landfill A (common
collection of gas for all landfill compartments) ................................................... 143
Figure 6-11: Landfill gas monitoring data for the amount of methane collected and the methane
Figure 6-12: Concentrations of Cl, NH4-N, and COD in the leachate of Landfill B after closure
Figure 6-13: Leachate emissions for the status quo (constant barrier performance) at Landfill B
Figure 6-14: Leachate emissions for Scenario A (gradual barrier deterioration) at Landfill B
Figure 6-16: Captured landfill gas data at Landfill B and estimates on future landfill gas
Figure 6-17: Scheme of the landfill-environment system and relevant points of compliance
Figure 6-18: Attenuation factors to estimate the concentrations at relevant PoCs due to a release
Figure 6-19: Methane generation rates per m² of landfill surface for the two gas generation
Figure 6-21: Concentrations of Cl, NH4-N, COD, and SO4 in the leachate of Landfill C after
Figure 6-22: Leachate emissions for the status quo (constant barrier performance) at Landfill C
Figure 6-23: Leachate emissions for Scenario A (gradual decrease of barrier performance) at
Landfill C (left: total leachate emissions, right: leachate emissions to subsurface)
Figure 6-3: Leachate emissions for the Status quo (constant barrier performance) at Landfill A
(left: total leachate emissions, right: leachate emission to subsurface)................ 147
Figure 6-4: Leachate emissions for Scenario A (gradual barrier deterioration) at Landfill A
(left: total leachate emissions, right: leachate emissions to subsurface) .............. 150
Figure 6-5: Leachate emissions for Scenario B (complete failure of barriers) at Landfill A . 151
Figure 6-6: Comparison of measured data on captured landfill gas at Landfill A with estimates
of different models about landfill gas generation ................................................ 152
Figure 6-7: Scheme of the landfill-environment system and relevant points of compliance
(PoC) at Landfill A (cross-section along the ground water flow direction)......... 154
Figure 6-8: Attenuation factors to estimate the concentrations at relevant PoCs due to a release
of leachate from Landfill A for the different scenarios........................................ 155
Figure 6-9: Methane generation rates per m² of landfill surface for the two gas generation
models applied to Landfill A ............................................................................... 157
Figure 6-10: Aerial photograph of Landfill B and surroundings .............................................. 159
concentrations ...................................................................................................... 161
as a function of liquid-to-solid-ratio .................................................................... 163
............................................................................................................................. 164
(left: total leachate emissions, right: leachate emissions to subsurface) .............. 165
Figure 6-15: Leachate emissions for Scenario B (complete failure of barriers) at Landfill B.. 167
generation based on different gas generation models .......................................... 168
(PoC) at Landfill B (cross-section along the ground water flow direction)......... 169
of leachate from Landfill B for the different scenarios........................................ 171
models applied to Landfill B................................................................................ 172
Figure 6-20: Aerial photograph of Landfill C and surroundings .............................................. 175
closure as a function of liquid-to-solid ratio ........................................................ 178
............................................................................................................................. 179
............................................................................................................................. 181
Figure 6-24: Leachate emissions for Scenario B (complete barrier failure) at Landfill C........ 182
Literature, Figures, and Tables 220

Figure 6-25: Scheme of the landfill-environment system and relevant points of compliance
(PoC) at Landfill C (cross-section along the ground water flow direction)......... 184
Figure 6-26: Attenuation factors to estimate the concentrations at relevant PoCs due to a release
of leachate from Landfill C for the different scenarios........................................ 186
Figure 7-1: Schematic illustration of the procedure to derive aftercare completion criteria at a
closed landfill site ................................................................................................ 196
8.3 List of Tables
Table 2-1: Completion criteria suggested within different target value approaches ............... 10
Table 2-2: Methodological basis and application of risk assessment suggested to evaluate
PCC........................................................................................................................ 13
Table 2-3: Methodological basis and application of performance-based systems to evaluate
PCC........................................................................................................................ 16
Table 2-4: Overview on main characteristics for different types of approaches to evaluate
PCC........................................................................................................................ 17
Table 3-1: Selected mathematical models to estimate landfill gas generation at MSW landfills
............................................................................................................................... 27
Table 3-2: Typical concentrations of selected leachate constituents during the acidic and
methanogenic phase at a MSW landfill (from: Ehrig 1980 cited in Ehrig and
Brinkmann 1999) ................................................................................................... 29
Table 3-3: Statistical analysis of leachate characteristics of 32 MSW landfills and Austrian
discharge limits into surface water bodies ............................................................. 31
Table 3-4: Statistical analysis of selected MSW landfill leachate parameters for consecutive
time periods after landfill closure .......................................................................... 33
Table 3-5: Mobilizable substance potentials via leachate based on an extrapolation of
observed leachate emission trends at German MSW landfills (from Krümpelbeck
2000) ...................................................................................................................... 40
Table 3-6: Mobilizable substance potentials of landfilled MSW via leachate determined for
waste samples from landfills 11 and 14 years after waste deposition via leaching
tests (see Belevi and Baccini 1989) ....................................................................... 40
Table 3-7: Mobilizable substance potentials via leachate and landfill gas for old MSW
landfills, fresh MSW, pretreated MSW (MBT) (source: Ehrig and Brinkmann
1999) ...................................................................................................................... 41
Table 3-8: Mobilizable potentials of selected parameters for MSW via landfill gas and
leachate (source: Kruse 1994)................................................................................ 42
Table 3-9: Residual amounts of substances mobilizable via the leachate pathway from 18
years old waste excavated from an Austrian MSW landfill (source: Döberl et al.
2005) ...................................................................................................................... 42
Table 3-10: Statistical analysis of leachate characteristics of 4 landfills containing waste
incineration bottom ash .......................................................................................... 47
Literature, Figures, and Tables 221

Table 3-11: Mobilizable fraction of selected substances contained in MSWI bottom ash (shown
as % of total mass of the substance) ...................................................................... 52
Table 3-12: Dissolved concentrations of selected substances as a function of pH and arranged
in the sequence of depletion (after Hellweg 2000) ................................................ 53
Table 3-13: Statistical analysis of leachate characteristics measured at 12 construction and
demolition (C&D) waste landfills .......................................................................... 55
Table 3-14: Key parameters to evaluate the emission behavior of (closed) landfills as a basis to
establish appropriate emission models ................................................................... 63
Table 4-1: Components and functional mechanisms of engineered barrier systems (from
National Research Council 2007) .......................................................................... 65
Table 4-2: Performance concerns for barrier system components on the short, medium, and
long term (based on National Research Council 2007) ......................................... 67
Table 4-3: Service lives for HDPE liners (2 mm thickness) estimated via calculations based
on laboratory experiments (Source: Rowe 2005)................................................... 70
Table 4-4: Examples of typical top cover barrier systems using composite liners (adapted
from Henken-Mellies 2006) ................................................................................... 75
Table 4-5: Efficiency of primary bottom liner systems at 17 landfills in the years 1998 and
1999 (Source: Barlaz et al. 2002) ........................................................................... 77
Table 4-6: Observed problems at landfill containment systems, their significance, and the
dominant human factor contributing to the problem (based on Bonaparte et al.
2002) ...................................................................................................................... 79
Table 4-7: List of significant factors for the performance of engineered barrier systems ....... 83
Table 4-8: List of the top factors influencing the performance of the barrier systems
throughout different time periods (in brackets: number of experts ranking the
factor among the top three factors during the service period)................................ 84
Table 4-9: Basic information to evaluate long-term barrier performance at closed landfills .. 85
Table 4-10: Fraction of oxidized methane during the migration through the top cover (oxidized
fraction relates to the methane released into the cover) for different cover systems
and methane fluxes (based on Kühle-Weidemeier and Bogon 2008) .................... 88
Table 4-11: Comparison of inorganic groundwater constituent concentrations in groundwater
affected by waste deposits and uncontaminated groundwater (based on Voigt and
Wippermann 1998; Luckner et al. 2008) ............................................................... 91
Table 4-12: Comparison of organic groundwater constituent concentrations in groundwater
affected by waste deposits and uncontaminated groundwater (based on Voigt and
Wippermann 1998; Luckner et al. 2008) ............................................................... 92
Table 4-13: Dimensions of pollutant plumes downstream of old MSW landfills (based on
Christensen et al. 2000 and Bjerg et al. 2009) ....................................................... 92
Table 4-14: Major attenuation mechanisms for landfill leachate constituents in clayey soil
(Source: Bagchi 1987) ........................................................................................... 94
Table 4-15: Basic information to establish a simple model on the subsurface migration of
leachate constituents ............................................................................................ 102
222 Literature, Figures, and Tables

Table 5-1: Methods for determining the extent of biological degradation of organic matter
contained in waste samples .................................................................................. 107
Table 5-2: Data on mobilizable substance fractions of landfilled MSW via leachate from
various literature sources, in mg/kg dry matter (DM) of MSW........................... 113
Table 5-3: Basic criteria for the evaluation of relevant factors to estimate future barrier
performance levels suggested for Austrian conditions (see Table 5-4) ............... 121
Table 5-4: Example of an evaluation chart to determine future barrier performance levels of a
top cover and base lining system at a specific site............................................... 122
Table 5-5: Empirical estimates on the field and air capacity of different soil types (see Figure
5-11) according to the soil classification KA 5 (AG Boden 2005)...................... 131
Table 5-6: Examples of substance-specific transport parameters for selected leachate
constituents .......................................................................................................... 132
Table 6-1: Operation and design of the 8 compartments of Landfill A................................. 140
Table 6-2: Mean values of selected leachate parameters measured after waste deposition has
been completed at the respective landfill compartment (bold: mean values above
discharge limits and chloride) .............................................................................. 142
Table 6-3: Scenario layouts to investigate potential emission levels of Landfill A ............. 144
Table 6-4: Model parameters to estimate the concentrations of Cl, NH4-N, and COD in the
leachate of the landfill compartments (c0 refers to the time of compartment
closure)................................................................................................................. 145
Table 6-5: Concentrations of Cl, NH4-N, and COD in the leachate after compartment closure
............................................................................................................................. 146
Table 6-6: Evaluation of the containment system of compartment 1 of Landfill A to estimate
future service levels within Scenario A ............................................................... 149
Table 6-7: Layout of the subsurface below Landfill A and material properties of the soil
layers .................................................................................................................... 153
Table 6-8: Parameters used for pollutant migration modeling in the subsurface below Landfill
A........................................................................................................................... 154
Table 6-9: Data for the AF-model calculations to estimate concentrations at PoC1 and PoC2
............................................................................................................................. 156
Table 6-10: Data for the calculations based on maximum emission loads into the subsurface to
estimate concentrations at PoC1 and PoC2.......................................................... 156
Table 6-11: Tolerable leachate concentrations (c0) at the source to comply with the specified
limit values at PoC2 and in the pond ................................................................... 158
Table 6-12: Duration of aftercare for leachate emissions of Landfill A in consideration of
different aftercare strategies................................................................................. 158
Table 6-13: Statistical parameters of selected leachate properties of Landfill B during operation
and after closure of the Landfill ........................................................................... 161
Table 6-14: Area and waste volume of Landfill B and design of the containment system..... 162
Table 6-15: Model parameters to estimate concentrations of Cl, NH4-N, and COD in the
leachate of Landfill B (c0 refers to the time of closure) ..................................... 164
Literature, Figures, and Tables 223

Table 6-16: Evaluation of the containment system of Landfill B to estimate future service
levels within Scenario A ...................................................................................... 166
Table 6-17: Layout of the subsurface below Landfill B and material properties of the soil layers
............................................................................................................................. 169
Table 6-18: Parameters used for pollutant migration modeling in the subsurface of Landfill B
............................................................................................................................. 170
Table 6-19: Data for the AF-model calculations to estimate concentrations at PoC1 and PoC2
............................................................................................................................. 170
Table 6-20: Data for the calculations based on maximum emission loads into the subsurface to
estimate concentrations at PoC1 and PoC2.......................................................... 171
Table 6-21: Tolerable leachate concentrations (c0) at the source in order not to exceed the limit
values specified at PoC3 for the emission scenarios of Landfill B...................... 173
Table 6-22: Duration of aftercare for leachate emissions of Landfill B in consideration of
different aftercare strategies................................................................................. 174
Table 6-23: Statistical parameters for selected leachate properties of Landfill C................... 176
Table 6-24: Design of Landfill C and its containment system ................................................ 177
Table 6-25: Model parameters to estimate concentrations of Cl, NH4-N, COD, and SO4 in the
leachate of Landfill C (c0 refers to the time of closure) ...................................... 178
Table 6-26: Evaluation of the containment system of Landfill C to estimate future service
levels within Scenario A ...................................................................................... 180
Table 6-27: Layout of the subsurface below Landfill C and material properties of the soil layers
............................................................................................................................. 183
Table 6-28: Parameters used for pollutant migration modeling in the subsurface of Landfill C
............................................................................................................................. 184
Table 6-29: Data for the AF model calculations to estimate concentrations at PoC1 and PoC2at
Landfill C............................................................................................................. 185
Table 6-30: Data for the calculations based on maximum emission loads into the subsurface to
estimate concentrations at PoC1 and PoC2 at Landfill C .................................... 185
Table 6-31: Tolerable leachate concentrations (C0) at the source in order not to exceed the
limit values specified at PoC2 for relevant emission scenarios of Landfill C ..... 187
Table 6-32: Overview on the evaluation of the case study landfills and the estimated remaining
aftercare periods................................................................................................... 189
Literature, Figures, and Tables 224

Appendix
Appendix 1
Basic landfill data (2 pages)
Appendix 2
Expert evaluations of long-term barrier performance (5 pages)
Appendix 225

Table A-1: General characteristics of the sites included in the data set on MSW landfills
# Landfill age*
[yrs] Years after closure*
[yrs] Precipitation
[mm/yr] Leachate quality
(Param./Sampling times) Gas data
MSW1 MSW2 MSW3 MSW4 MSW5 MSW6 MSW7 MSW8 MSW9
MSW10 MSW11 MSW12 MSW13 MSW14 MSW15 MSW16 MSW17 MSW18 MSW19 MSW20 MSW21 MSW22 MSW23 MSW24 MSW25 MSW26 MSW27 MSW28 MSW29 MSW30 MSW31 MSW32
Mean
28 18 36 36 32 28 23 18 19 11 14 22 22 22 25 20 24 17 26 28 16 16 23 32 31 32 26 26 22 31 23 25 24
7 -
9 32 29 23 19
8 8 3 6
20 20 20 13
-9 0
20 17
8 4 4 4
12 19 19 19 11
4 6 9
13
1485 1150 1150 956 956 956 956 956 956 956 956 633 633 633 1300 923 926 1220 658 525 525 520 562 490 500 547 810 810 840 770 710 660 832
21 / 85 21 / 69 21 / 85 52 / 53 52 / 52 52 / 49 52 / 40 52 / 29 52 / 31 52 / 16 52 / 22 21 / 72 21 / 72 21 / 72 18 / 43 24 / 37 10 / 43 11 / 194 25 / 22 75 / 10 75 / 10 75 / 10 75 / 16 75 / 10 75 / 16 75 / 16 75 / 10 75 / 10 75 / 10 75 / 20 75 / 10 75 / 14 50 / 39
yes yes yes
yes** yes** yes** yes** yes** yes** yes** yes**
no no no no
yes no
yes no no no no no no no no no no no no no no
-* Data on the landfill age and PCC duration refer to the year 2008.
** For the landfill compartments MSW4 to MSW11 gas data is available only in aggregate (for the whole landfill site).
Appendix 1: Basic landfill data
a) Municipal solid waste (MSW) landfills
A-1 Appendix 1

Table A-2: General characteristics of the sites included in the data set on MSWI bottom ash landfills
# Landfill age*
[yrs] Average waste age
[yrs] Closure Precipitation
[mm/yr] Leachate quality
(Param./Sampling times) BA1 10 3.8 no 1100 43 / 32 BA2 22 14.5 no 1117 37 / 52 BA3 18 9.5 no 1035 28 / 98 BA4 12 7.7 no 1035 28 / 96
Mean 15.5 8.9 - 1070 34/70 * Data on the landfill age and PCC duration refer to the year 2008.
Table A-3: General characteristics of the sites included in the data set on C&D waste landfills
# Landfill age*
[yrs] Average waste age
[yrs] Closure Precipitation
[mm/yr] Leachate quality
(Param./Sampling times) C&D1 14 7.9 no 1155 37/34
22/673/17
4/98/18
C&D2 7 2.5 no 900 C&D3 4 2.1 no 1179 C&D4 ? ? no 620 C&D5 Leachate quality monitoring data from 8 C&D waste landfills (no additional information)
b) Municipal solid waste incineration (MSWI) bottom ash landfills
c) Construction and demolition (C&D) waste landfills
Appendix 1 A-2

Affiliation Authorities* Consulting and
engineering companies Research and
academic institutions Number of experts 4 4 5
*Authorities: Environmental Protection Agency, Ministries, and Provincial governments
Note: 8 experts have their primary background in geotechnical engineering, 5 experts in waste management.
Appendix 2: Expert evaluations of technical barrier systems
A survey was conducted in two steps during the year 2010 and involved 23 experts on landfill geotechnics from Austria and Germany. In the first step, 23 experts were invited to create a list of relevant factors for barrier performance based on a suggestion by the author. 13 of the 23 invited experts accepted the invitation and participated in the list of relevant factors. In the second step, the 13 experts were asked to evaluate the importance of each factor for the standard top cover and base lining systems shown in Figure 4-2 and Figure 4-4 at a landfill site with typical Austrian climate (e.g. precipitation around 1000 mm/yr). For three different time periods (several decades, around a century, and several centuries) each factor had to be evaluated with scores ranging from 1 to 5 (1 being insignificant and 5 being highly significant for the performance of the barrier system). The histograms of the expert evaluations are shown for each factor and period below for the two bottom barrier and the two top cover systems (cf. Table A-5 to Table A-8). More information about the expert survey, the original survey forms, and more extensive analysis of the expert evaluations can be obtained from the report published by Laner et al. (2011)1.
Table A-4: Affiliations of the 13 experts involved in the evaluation of factors determining the performance of technical barrier systems
Note: The percentages do not add up to 100% for some histograms in the Tables A-5 to A-8 due to missing score assignments for the respective factor and period by the experts.
Laner, D., J. Fellner, Brunner, P.H. (2011): Standortbezogene Kriterien zur Beurteilung der Umweltverträglichkeit von Deponieemissionen unter dem Aspekt der Nachsorgedauer (Projekt SKUDENA). Final report of the research project SKUDENA. Institute for Water Quality, Resources and Waste Management, Vienna University of Technology, Vienna. 452 pages + appendices.
A-3 Appendix 2
1

Criterion 1insignificant – 5very high significance
0-50 yrs 50- >100 yrs >> 100 yrs
Observed barrier performance
0%
20%
40%
60%
1 2 3 4 5
0%
20%
40%
60%
1 2 3 4 5
0%
20%
40%
60%
1 2 3 4 5
Construction & design quality assurance program
0%
20%
40%
60%
80%
1 2 3 4 5
0%
20%
40%
60%
80%
1 2 3 4 5
0%
20%
40%
60%
80%
1 2 3 4 5
Recultivation layer (vegetative cover thickness)
0%
20%
40%
60%
1 2 3 4 5
0%
20%
40%
60%
1 2 3 4 5
0%
20%
40%
60%
1 2 3 4 5
Heat production in the waste
0%
20%
40%
60%
1 2 3 4 5
0%
20%
40%
60%
1 2 3 4 5
0%
20%
40%
60%
1 2 3 4 5
Climate (e.g. temperature, precipitation)
0%
20%
40%
60%
1 2 3 4 5
0%
20%
40%
60%
1 2 3 4 5
0%
20%
40%
60%
1 2 3 4 5
Vegetation and projected after-use
0%
20%
40%
60%
1 2 3 4 5
0%
20%
40%
60%
1 2 3 4 5
0%
20%
40%
60%
1 2 3 4 5
Relief
0%
20%
40%
60%
1 2 3 4 5
0%
20%
40%
60%
1 2 3 4 5
0%
20%
40%
60%
1 2 3 4 5
Expected settlements
0%
20%
40%
60%
80%
1 2 3 4 5
0%
20%
40%
60%
80%
1 2 3 4 5
0%
20%
40%
60%
80%
1 2 3 4 5
Lining control systems (direct monitoring)
0%
20%
40%
60%
1 2 3 4 5
0%
20%
40%
60%
1 2 3 4 5
0%
20%
40%
60%
1 2 3 4 5
Drainage system
0%
20%
40%
60%
80%
1 2 3 4 5
0%
20%
40%
60%
80%
1 2 3 4 5
0%
20%
40%
60%
80%
1 2 3 4 5
Table A-5: Histograms of expert scores to evaluate the importance of a factor for the performance of a top cover system with a composite liner (cf. Figure 4-2) during different service periods
Appendix 1 A-4

Table A-6: Histograms of expert scores to evaluate the importance of a factor for the performance of a top cover system with a mineral liner (cf. Figure 4-2) during different service periods
Criterion 1insignificant – 5very high significance
0-50 yrs 50- >100 yrs >> 100 yrs
Observed barrier performance
0%
20%
40%
60%
1 2 3 4 5
0%
20%
40%
60%
1 2 3 4 5
0%
20%
40%
60%
1 2 3 4 5
Construction & design quality assurance program
0%
20%
40%
60%
80%
1 2 3 4 5
0%
20%
40%
60%
80%
1 2 3 4 5
0%
20%
40%
60%
80%
1 2 3 4 5
Recultivation layer (vegetative cover thickness)
0%
20%
40%
60%
80%
1 2 3 4 5
0%
20%
40%
60%
80%
1 2 3 4 5
0%
20%
40%
60%
80%
1 2 3 4 5
Heat production in the waste
0%
20%
40%
60%
1 2 3 4 5
0%
20%
40%
60%
1 2 3 4 5
0%
20%
40%
60%
1 2 3 4 5
Climate (e.g. temperature, precipitation)
0%
20%
40%
60%
1 2 3 4 5
0%
20%
40%
60%
1 2 3 4 5
0%
20%
40%
60%
1 2 3 4 5
Vegetation and projected after-use
0%
20%
40%
60%
1 2 3 4 5
0%
20%
40%
60%
1 2 3 4 5
0%
20%
40%
60%
1 2 3 4 5
Relief
0%
20%
40%
60%
1 2 3 4 5
0%
20%
40%
60%
1 2 3 4 5
0%
20%
40%
60%
1 2 3 4 5
Expected settlements
0%
20%
40%
60%
1 2 3 4 5
0%
20%
40%
60%
1 2 3 4 5
0%
20%
40%
60%
1 2 3 4 5
Lining control systems (direct monitoring)
0%
20%
40%
60%
80%
1 2 3 4 5
0%
20%
40%
60%
80%
1 2 3 4 5
0%
20%
40%
60%
80%
1 2 3 4 5
Drainage system
0%
20%
40%
60%
1 2 3 4 5
0%
20%
40%
60%
1 2 3 4 5
0%
20%
40%
60%
1 2 3 4 5
A-5 Appendix 2

Criterion 1insignificant – 5very high significance
0-50 yrs 50- >100 yrs >> 100 yrs
Observed barrier performance
0%
20%
40%
60%
80%
1 2 3 4 5
0%
20%
40%
60%
80%
1 2 3 4 5
0%
20%
40%
60%
80%
1 2 3 4 5
Construction & design quality assurance program 0%
20%
40%
60%
80%
100%
1 2 3 4 5
0%
20%
40%
60%
80%
100%
1 2 3 4 5
0%
20%
40%
60%
80%
100%
1 2 3 4 5
Climate (e.g. temperature, precipitation)
0%
20%
40%
1 2 3 4 5
0%
20%
40%
1 2 3 4 5
0%
20%
40%
1 2 3 4 5
Heat production in the waste
0%
20%
40%
60%
1 2 3 4 5
0%
20%
40%
60%
1 2 3 4 5
0%
20%
40%
60%
1 2 3 4 5
Distance to groundwater surface
0%
20%
40%
1 2 3 4 5
0%
20%
40%
1 2 3 4 5
0%
20%
40%
1 2 3 4 5
Overburden pressure
0%
20%
40%
60%
1 2 3 4 5
0%
20%
40%
60%
1 2 3 4 5
0%
20%
40%
60%
1 2 3 4 5
Leachate quality
0%
20%
40%
60%
80%
1 2 3 4 5
0%
20%
40%
60%
80%
1 2 3 4 5
0%
20%
40%
60%
80%
1 2 3 4 5
Monitoring (e.g. groundwater monitoring)
0%
20%
40%
60%
1 2 3 4 5
0%
20%
40%
60%
1 2 3 4 5
0%
20%
40%
60%
1 2 3 4 5
Leachate drainage system
0%
20%
40%
60%
80%
100%
1 2 3 4 5
0%
20%
40%
60%
80%
100%
1 2 3 4 5
0%
20%
40%
60%
80%
100%
1 2 3 4 5
Stability of foundation
0%
20%
40%
1 2 3 4 5
0%
20%
40%
1 2 3 4 5
0%
20%
40%
1 2 3 4 5
Landfill geometry (heap vs. cavity)
0%
20%
40%
60%
1 2 3 4 5
0%
20%
40%
60%
1 2 3 4 5
0%
20%
40%
60%
1 2 3 4 5
Table A-7: Histograms of expert scores to evaluate the importance of a factor for the performance of a bottom barrier with a composite liner (cf. Figure 4-4) during different service periods
Appendix 1 A-6

Table A-8: Histograms of expert scores to evaluate the importance of a factor for the performance of a bottom barrier with a mineral liner (cf. Figure 4-4) during different service periods
Criterion 1insignificant – 5very high significance
0-50 yrs 50- >100 yrs >> 100 yrs
Observed barrier performance
0%
20%
40%
60%
80%
1 2 3 4 5
0%
20%
40%
60%
80%
1 2 3 4 5
0%
20%
40%
60%
80%
1 2 3 4 5
Construction & design quality assurance program 0%
20%
40%
60%
80%
100%
1 2 3 4 5
0%
20%
40%
60%
80%
100%
1 2 3 4 5
0%
20%
40%
60%
80%
100%
1 2 3 4 5
Climate (e.g. temperature, precipitation)
0%
20%
40%
1 2 3 4 5
0%
20%
40%
1 2 3 4 5
0%
20%
40%
1 2 3 4 5
Heat production in the waste
0%
20%
40%
1 2 3 4 5
0%
20%
40%
1 2 3 4 5
0%
20%
40%
1 2 3 4 5
Distance to groundwater surface
0%
20%
40%
1 2 3 4 5
0%
20%
40%
1 2 3 4 5
0%
20%
40%
1 2 3 4 5
Overburden pressure
0%
20%
40%
60%
1 2 3 4 5
0%
20%
40%
60%
1 2 3 4 5
0%
20%
40%
60%
1 2 3 4 5
Leachate quality
0%
20%
40%
60%
80%
1 2 3 4 5
0%
20%
40%
60%
80%
1 2 3 4 5
0%
20%
40%
60%
80%
1 2 3 4 5
Monitoring (e.g. groundwater monitoring)
0%
20%
40%
60%
1 2 3 4 5
0%
20%
40%
60%
1 2 3 4 5
0%
20%
40%
60%
1 2 3 4 5
Leachate drainage system
0%
20%
40%
60%
80%
1 2 3 4 5
0%
20%
40%
60%
80%
1 2 3 4 5
0%
20%
40%
60%
80%
1 2 3 4 5
Stability of foundation
0%
20%
40%
60%
1 2 3 4 5
0%
20%
40%
60%
1 2 3 4 5
0%
20%
40%
60%
1 2 3 4 5
Landfill geometry (heap vs. cavity)
0%
20%
40%
60%
1 2 3 4 5
0%
20%
40%
60%
1 2 3 4 5
0%
20%
40%
60%
1 2 3 4 5
A-7 Appendix 2

Curriculum Vitae of David Laner
Vital statistics
Date of birth: 25.04.1979 Place of birth: Schärding Nationality: Austrian
Education
X. 2006 – VI. 2011 Dotoral studies at the Vienna University of Technology, Faculty of Civil Engineering.
II. 2011 – III. 2011 Visiting researcher at the North Carolina State University, Department of Civil, Construction, and Environmental Engineering.
X. 2006 – IX. 2008 Participation in the Post Graduate School of Industrial Ecology, Norwegian University of Science and Technology (Marie Curie Program).
X. 1999 – XI. 2005 Master studies of “Land and Water Management and Engineering” at the University of Natural Resources and Applied Life Sciences, Vienna.
X.1997 – IX. 1998 Master studies of “Land and Water Management and Engineering” at the University of Natural Resources and Applied Life Sciences, Vienna.
VI. 1997 ALevels at the grammar school (Bundesrealgymnasium) in Schärding, Upper Austria.
Professional experience
IV. 2006 Research associate, Vienna University of Technology, Institute for Water Quality, Resources and Waste Management
XII. 2005 III. 2006 Research associate, Groundwater Research Center Dresden (Scholarship of the foundation: “Stiftung zur Förderung der wissenschaftlichen Schule ZunkerBuschLuckner”)
2003 2005 Employment as a student worker at the consulting engineers „Büro Dr. Lengyel” for 34 months each year
1994 2003 Various jobs for a few months per year during summer vacations (e.g. City of Vienna, Department for the sewer system (MA 30): internship; Gesta Fertighäuser: construction site worker).
X. 1998 – IX.1999 Civil service at the Lebenshilfe Oberösterreich (Tagesheimstätte Münzkirchen)
CV David Laner 1/1