MANDYA DISTRICT HUMAN DEVELOPMENT REPORT 2014
337
MANDYA DISTRICT HUMAN DEVELOPMENT REPORT 2014 Mandya Zilla Panchayat and Planning, Programme Monitoring and Statistics Department Government of Karnataka
-
Upload
khangminh22 -
Category
Documents
-
view
0 -
download
0
Transcript of MANDYA DISTRICT HUMAN DEVELOPMENT REPORT 2014
MANDYA DISTRICT HUMAN DEVELOPMENT REPORT 2014
Mandya Zilla Panchayatand
Planning, Programme Monitoring and Statistics Department Government of Karnataka
COPY RIGHTS
Mandya District Human Development Report 2014
Copyright : Planning, Programme Monitoring and Statistics Department Government of Karnataka
Published by : Mandya Zilla Panchayat, Government of Karnataka
First Published : 2014
All rights reserved. No part of this publication may be reproduced, stored or transmitted in any form by any means without the prior permission by Zilla Panchayat and Planning, Programme Monitoring and Statistics Department, Government of Karnataka
Printed by : KAMAL IMPRESSION # 54, Sri Beereshwara Trust Camplex, SJCE Road, T.K. Layout, Mysore - 570023. Mobile : 9886789747
While every care has been taken to reproduce the accurate data, oversights / errors may occur. If found convey it to the CEO, Zilla Panchayat and Planning, Programme Monitoring and Statistics Department, Government of Karnataka
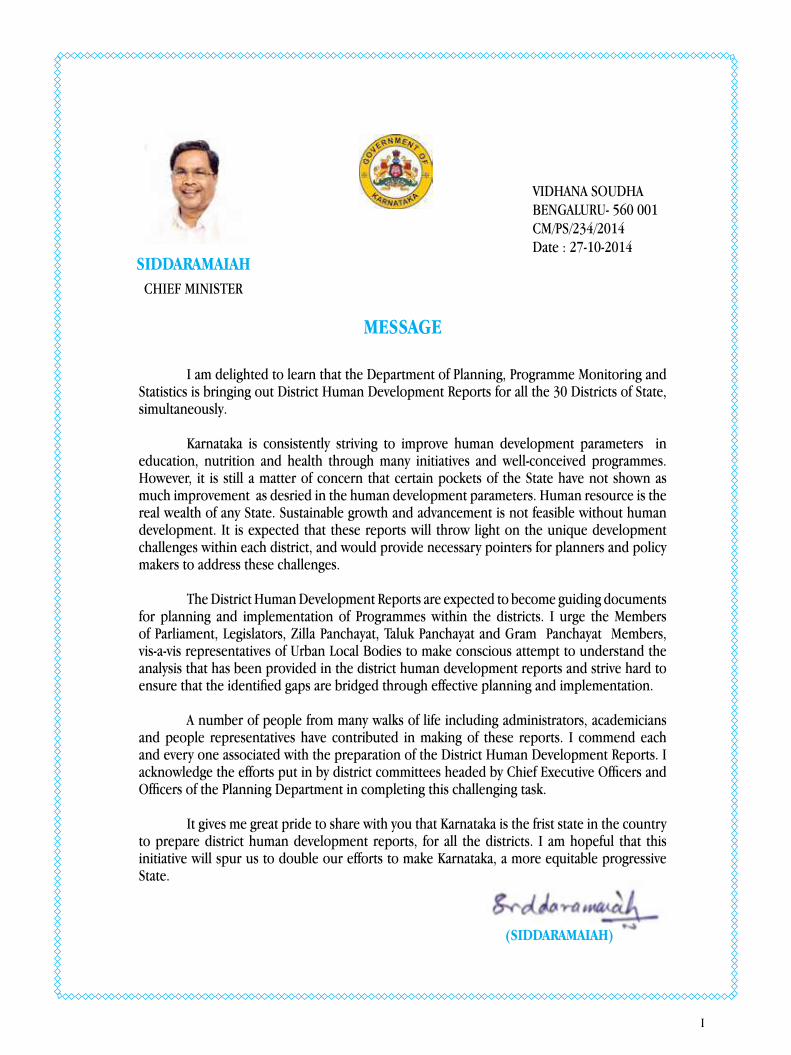
I am delighted to learn that the Department of Planning, Programme Monitoring and Statistics is bringing out District Human Development Reports for all the 30 Districts of State, simultaneously.
Karnataka is consistently striving to improve human development parameters in education, nutrition and health through many initiatives and well-conceived programmes. However, it is still a matter of concern that certain pockets of the State have not shown as much improvement as desried in the human development parameters. Human resource is the real wealth of any State. Sustainable growth and advancement is not feasible without human development. It is expected that these reports will throw light on the unique development challenges within each district, and would provide necessary pointers for planners and policy makers to address these challenges.
The District Human Development Reports are expected to become guiding documents for planning and implementation of Programmes within the districts. I urge the Members of Parliament, Legislators, Zilla Panchayat, Taluk Panchayat and Gram Panchayat Members, vis-a-vis representatives of Urban Local Bodies to make conscious attempt to understand the analysis that has been provided in the district human development reports and strive hard to ensure that the identified gaps are bridged through effective planning and implementation.
A number of people from many walks of life including administrators, academicians and people representatives have contributed in making of these reports. I commend each and every one associated with the preparation of the District Human Development Reports. I acknowledge the efforts put in by district committees headed by Chief Executive Officers and Officers of the Planning Department in completing this challenging task.
It gives me great pride to share with you that Karnataka is the frist state in the country to prepare district human development reports, for all the districts. I am hopeful that this initiative will spur us to double our efforts to make Karnataka, a more equitable progressive State.
MESSAGE
VIDHANA SOUDHABENGALURU- 560 001CM/PS/234/2014Date : 27-10-2014
SIDDARAMAIAHCHIEF MINISTER
(SIDDARAMAIAH)
I
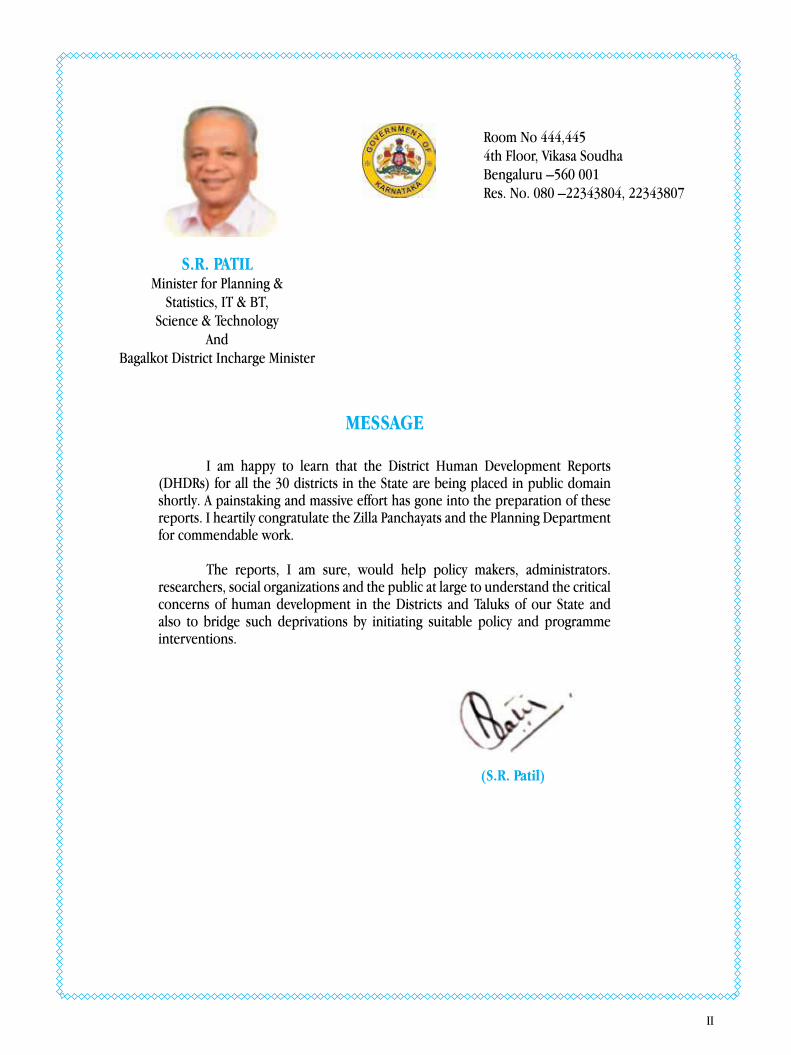
I am happy to learn that the District Human Development Reports (DHDRs) for all the 30 districts in the State are being placed in public domain shortly. A painstaking and massive effort has gone into the preparation of these reports. I heartily congratulate the Zilla Panchayats and the Planning Department for commendable work.
The reports, I am sure, would help policy makers, administrators. researchers, social organizations and the public at large to understand the critical concerns of human development in the Districts and Taluks of our State and also to bridge such deprivations by initiating suitable policy and programme interventions.
MESSAGE
Room No 444,4454th Floor, Vikasa Soudha Bengaluru –560 001Res. No. 080 –22343804, 22343807
S.R. PATILMinister for Planning &
Statistics, IT & BT,Science & Technology
And Bagalkot District Incharge Minister
(S.R. Patil)
II
III
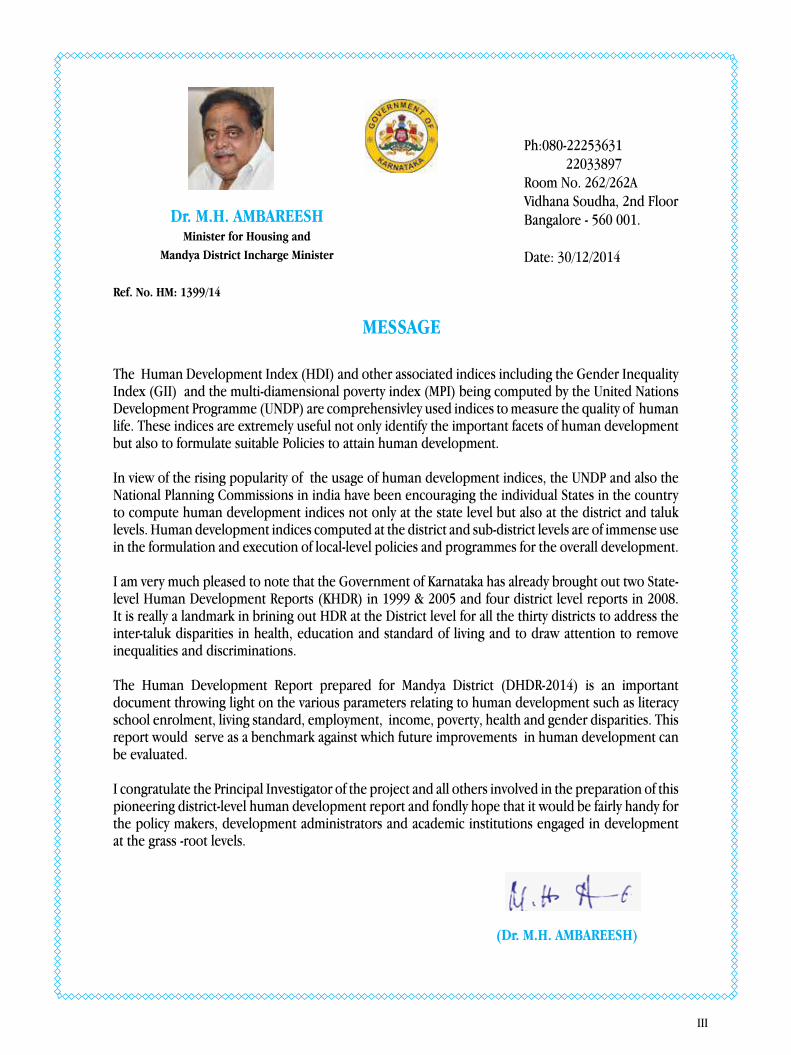
The Human Development Index (HDI) and other associated indices including the Gender Inequality Index (GII) and the multi-diamensional poverty index (MPI) being computed by the United Nations Development Programme (UNDP) are comprehensivley used indices to measure the quality of human life. These indices are extremely useful not only identify the important facets of human development but also to formulate suitable Policies to attain human development.
In view of the rising popularity of the usage of human development indices, the UNDP and also the National Planning Commissions in india have been encouraging the individual States in the country to compute human development indices not only at the state level but also at the district and taluk levels. Human development indices computed at the district and sub-district levels are of immense use in the formulation and execution of local-level policies and programmes for the overall development.
I am very much pleased to note that the Government of Karnataka has already brought out two State-level Human Development Reports (KHDR) in 1999 & 2005 and four district level reports in 2008. It is really a landmark in brining out HDR at the District level for all the thirty districts to address the inter-taluk disparities in health, education and standard of living and to draw attention to remove inequalities and discriminations.
The Human Development Report prepared for Mandya District (DHDR-2014) is an important document throwing light on the various parameters relating to human development such as literacy school enrolment, living standard, employment, income, poverty, health and gender disparities. This report would serve as a benchmark against which future improvements in human development can be evaluated.
I congratulate the Principal Investigator of the project and all others involved in the preparation of this pioneering district-level human development report and fondly hope that it would be fairly handy for the policy makers, development administrators and academic institutions engaged in development at the grass -root levels.
MESSAGE
Ph:080-22253631 22033897Room No. 262/262AVidhana Soudha, 2nd FloorBangalore - 560 001.
Date: 30/12/2014
Dr. M.H. AMBAREESH Minister for Housing and
Mandya District Incharge Minister
Ref. No. HM: 1399/14
(Dr. M.H. AMBAREESH)

IV
PREFACE
That the quality of human life in a poor country like India cannot be improved simply by increasing the incomes of people or by enhancing the quantity and range of goods and services these incomes can buy, has long been established. The development specialists and policy makers have been relentlessly in quest of new and more comprehensive indicators of development encompassing the different facets of human well-being. A result of this search is the concept of human development index evolved by the UNDP in the nineteen-nineties.
Most developing countries which embarked on a programme of rapid economic development during the post-Second World War period were given to understand that economic growth which, through a steady rise in incomes, would automatically fetch everything required for all-round human prosperity. The growth experience of the poor countries in the latter half of the 20th century belied this hope. Development is a multi-faceted process involving concerted, all-round efforts to improve the quality of human life in its myriad dimensions, while economic growth is a uni-directional one which only leads to a rise in the number of goods and services available per person, and fails to bring about complete human development.
It was gradually realized by the development pandits and policy makers that the aim of development should be not merely to increase the real income per capita but to enhance the quality of human life, by not only enlarging the people’s choices/ command over the ‘material requisites of well-being’ but also by freeing them from poverty, unemployment, hunger and mal-nutrition, squalor, ignorance, ill-health, premature death and debilitating physical environment. The ultimate objective of every development effort is attainment of human self-esteem which can only be accomplished through a sustained rise in real incomes accompanied by gainful employment to all, alleviation of poverty with particular stress on the need to fight feminine poverty, bring about all-round empowerment of women and remove economic and social discrimination among different classes in the society.
Human Development Index (HDI) is a commendable conceptual-cum-policy effort to achieve the above-mentioned objectives of development. It is a composite index incorporating the major traits of the quality of human life namely, life expectancy at birth, adult literacy ratio, combined school enrolment ratio and income adjusted for purchasing power parity. The saga of human development reports brought out regularly every year by the UNDP since 1990, is replete with continuous attempts to refine the methods of incorporating the different components of the HDI along with a sustained commitment and drive to extend the task of preparation of HDI into the constituent states within every country, into the districts within a state and also into every taluk/block within every district. The ultimate goal of this movement is to be able to prepare human development indices for every village and perhaps, for every household therein. As far as India is concerned, there is a realization, albeit belatedly, on the part of the planners and policy makers that more meaningful and effective formulation and implementation of programmes for development would require a status report on the different facets/components of human development at the grassroots level.
The present report, the District Human Development Report (DHDR-2014) of Mandya district, it is fondly hoped, would serve not only as a data base for development planning at the taluk and district levels but also as a status report on the key dimensions of human development in different taluks in the district. The HDR of Mandya district makes a sincere attempt to compare different taluks in the district in terms of the major components of human development index and also to compare the human development indicators of the district as such, with those of the State of Karnataka.
Thus the Human Development Report (HDR) of Mandya district helps usher in and facilitate a process of development at the grass-root level. The report would be extremely useful not only as a data base for local-level planning but also as a guide for the grass-root level development functionaries - both government and non-government – to implement various development programmes more meaningfully and effectively, besides being useful for academicians/researchers in the field of development.
This report was made possible by the encouragement and help I received from several individuals, officers and institutions. The report benefited particularly from the interactions in the workshops and experts’ meetings held at the State, District and Taluk levels from time to time. It is my pleasant duty to thank all of them although the space does not permit me to make a mention of every one of them here. First of all, I am grateful to the authorities of the University of Mysore for their kind permission and encouragement in carrying out this project.
V
This project was funded by the Government of Karnataka, Department of Planning, Bengaluru. In this context, I am deeply indebted to Sri. Sanjeev Kumar, IAS., Formerly Principal Secretary to the Government of Karnataka (GoK), Department of Planning for his constant encouragement, kind help and guidance in the process of preparation of the report. I thankful to Smt. Anita Kaul, IAS (Rtd.), Formerly Additional Chief Secretary and Principal Secretary, Planning Department, GoK, Bengaluru for her committed support for the preparation of HDRs at the district level.
I must be thankful to Ms. V. Manjula, IAS, Principal Secretary to the GoK, Department of Planning, Bengaluru for her learned comments and guidance at every stage of preparation of this report. I am thankful to Sri Rajeev Ranjan, IFS, Former Secretary, Department of Planning, Bengaluru. I am thankful to Sri. A.K. Singh, IFS, Secretary, Department of Planning, Bengaluru. Thanks are due to Dr. H. Shashidhar, IAS (Rtd.), State Level Consultant and Coordinator, Human Development Division, Department of Planning, Bengaluru, for his continuous support and valuable suggestions & guidance in preparing the report. I am thankful to Sri. H.S. Ashokananda, QMG, Member, for his support and guidance for the completion of the report.
I place on record my heartfelt thanks to Mrs. Rohini Sindhuri, I.A.S, CEO, Zilla Panchayat, Mandya for sponsoring this study and also for extending the necessary support in this regard from Zilla Panchayat. Thanks are due to Sri.G.Jayarm and Sri.P.C.Jayanna former Chief Executive Officers of Mandya Zilla Panchayat, for their support and cooperation in the preparation of this report. I must be thankful to Sri. B.N.Kendagannappa, Former CPO, Zilla Panchayat, Mandya for his unstinted co-operation and help right from the inception of the project. My thanks are also due to the members of the Mandya District Planning Committee as well as to the President and Members of Mandya Zilla Panchayat for their encouragement and suggestions. My thanks are also due to all the members of the Core committee, officers of Zilla Panchayat, Mandya, and line Departments in Zilla Panchayat, NGO’s and urban local bodies in Mandya district for their kind help in the course of this study.
I am thankful to my colleague Dr. H.S. Kumara, Assistant Professor & Co-Investigator of the project for his continuous support in the preparation of the report. I thank Dr. M.V.Srinivasagowda, Honorary Professor, National Institute of Advanced Studies, Bengaluru, for his erudite insights into several vital topics discussed in the report. Besides relentlessly suggesting quite a few ideas in the format of the report, he has written Chapter 6 titled: Income, Employment and Poverty, and made meticulous and strenuous language scrutiny for this report.
I am thankful to Prof. R.N.Achutha, Former Director, IDS, Dr. Ganesh Prasad, SIRD, Mysuru, Prof. O.D.Hegde, Prof. D.S Leelavathi, Prof. K.S.Arunkumar, Prof. M.G. Basavaraja, Prof. Yashodhara, Dr. Navitha Thimmiah, Dr. Meera Mundayat, and Dr. M. Komala for their co-operation and involvement in the preparation of this report.
In the Project Team, Mr. Sandeep, Mr. Lokesh, Mr. Suresh, Dr. Ramakrishna, Dr. Sathyanarayana, and others at IDS, Mysuru, have rendered yeoman service in various forms: collecting, processing and analyzing the massive data for the project and computer-drafting of this report. I thank them profusely for their unstinted help. I thank Mr. M.S. Karthik, NRDMS, Chamarajanagar district, for preparation of cartographic maps.
I admit here that while the suggestions and help I have received from all these people and institutions have helped to make this report immensely better than it would otherwise have been, I am alone responsible for the flaws that may still lurk in it.
M. Devaraj
Director and Professor (Lead Agency)Institute of Development Studies, University of Mysore
Mysuru
VI
Smt. Rohini Sinduri, IAS, Chief Executive Officer
Zilla Panchayat, Mandya
ACKNOWLEDGEMENTS
The Human Development Report (HDR-2014) for Mandya District serves as an important official data base and a document useful for development administrators and academicians engaged in improving the quality of human life in the District. The HDR is the result of the efforts put in by several institutions, officials, elected representatives and experts for over a year. I am happy to acknowledge the help and support they have rendered in bringing out this report. This report serves as a benchmark for local-level institutions such as Gram Panchayats, Taluk Panchayats and the Zilla Panchayat, with reference to which they can plan for future development.
First of all I thank the Government of Karnataka not only for having chosen Mandya District for preparation of Human Development Report (HDR) at the grass-root level, but also for funding this project.
The success of this project is largely due to the unstinted efforts of Dr. M. Devaraj, Director and Professor, Institute of Development Studies, University of Mysore, Mysuru, Principal Investigator of this project and Dr. H.S.Kumara, Assistant Professor, Co-Investigator of the project. I am thankful to them and their team for the commendable work done by them.
I am thankful to the President, Vice-President and Members of Mandya Zilla Panchayat and the members of the District Planning Committee (DPC) for their interaction at the district workshops and their valuable suggestions to enhance the quality of this DHDR – Mandya.
My thanks are also due to all my District officers and officers of the Zilla Panchayat, Mandya, particularly Sri.B.N. Kendagannappa, Former Chief Planning Officer and Nodal Officer, Project Director, Deputy Secretaries for their co-operation for the preparation of the report.
I must be thankful to all the Chairpersons and the Members of the Technical Committees, who have rendered yeoman service in various stages of the preparation of the HDR of Mandya District by providing necessary data and other technical support.
I also thank the District Officials of Departments of Agriculture, Women and Child Welfare, Social Welfare, Education, Health, Food & Civil supplies, DUDC, Police Department, Slum Board, DSO, PWD, Forest Department, Electricity Board, Railways, Banks, NGOs and urban local bodies in Mandya district for their kind help in collecting the necessary data for the report.
My thanks are due to Presidents, Vice-presidents and Members of the Gram Panchayats and Taluk Panchayats, Executive Officers and other officials for their interactions and for providing useful data for the preparation of the HDR-Mandya District.
I am thankful to Sri. H.S. Ashokananda, QMG, Member, Prof. R.N.Achutha, Former Director, IDS, Dr. Ganesh Prasad, SIRD, Mysuru, Dr. M.V.Srinivasagowda, Honorary Professor, National Institute of Advanced Studies, Bengaluru, Prof. O.D.Hegde, Prof. D.S. Leelavathi, Prof. K.S. Arunkumar, Prof. M.G. Basavaraja, Prof. Yashodhara, Dr. Navitha Thimmiah, Dr. Meera Mundayat and Dr. M. Komala for their co-operation and involvement in the preparation of this report.
The Project staff, including Mr. Sandeep, Mr. Karthik, Mr. Lokesh, Mr. Suresh, Dr. Ramakrishna, Dr. Sathyanarayana, the research team and others at IDS, Mysuru, have rendered yeoman service in the preparation of this report, I thank them profusely.
Mandya
VII
MANDYA DISTRICT
HUMAN DEVELOPMENT REPORT 2014
EXPERT GROUP
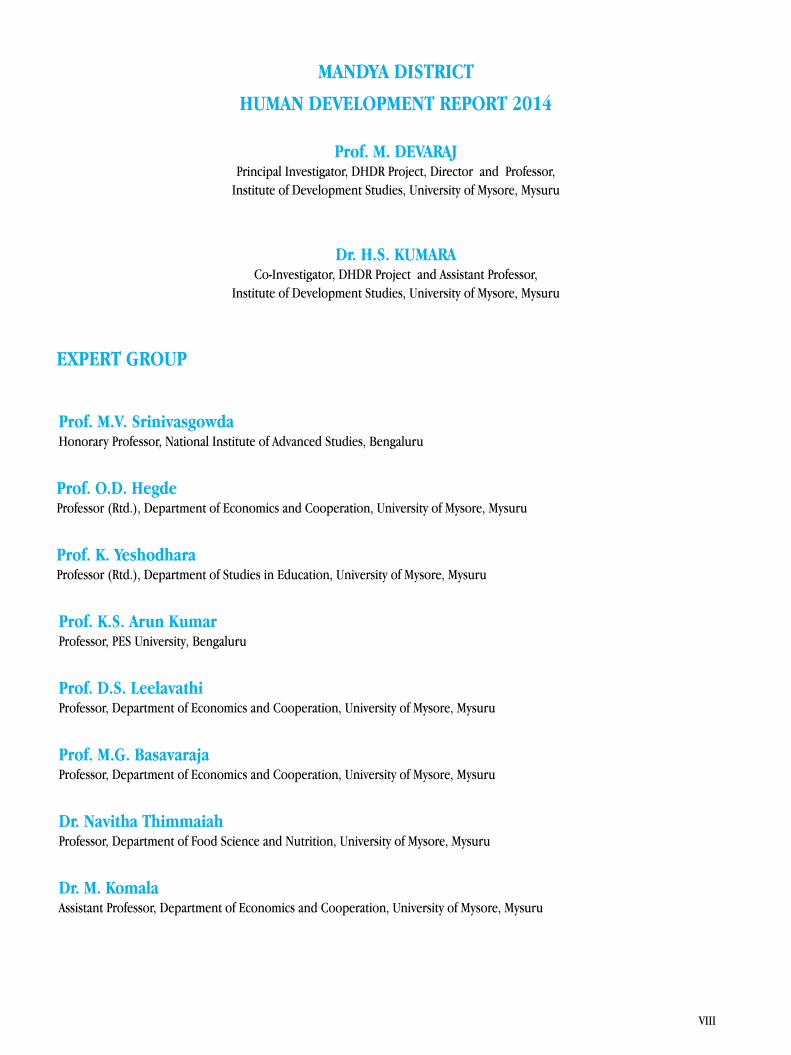
Prof. M. DEVARAJPrincipal Investigator, DHDR Project, Director and Professor,
Institute of Development Studies, University of Mysore, Mysuru
Dr. H.S. KUMARACo-Investigator, DHDR Project and Assistant Professor,
Institute of Development Studies, University of Mysore, Mysuru
Prof. M.V. SrinivasgowdaHonorary Professor, National Institute of Advanced Studies, Bengaluru
Prof. O.D. HegdeProfessor (Rtd.), Department of Economics and Cooperation, University of Mysore, Mysuru
Prof. K. YeshodharaProfessor (Rtd.), Department of Studies in Education, University of Mysore, Mysuru
Prof. K.S. Arun Kumar Professor, PES University, Bengaluru
Prof. D.S. Leelavathi Professor, Department of Economics and Cooperation, University of Mysore, Mysuru
Prof. M.G. BasavarajaProfessor, Department of Economics and Cooperation, University of Mysore, Mysuru
Dr. Navitha Thimmaiah Professor, Department of Food Science and Nutrition, University of Mysore, Mysuru
Dr. M. KomalaAssistant Professor, Department of Economics and Cooperation, University of Mysore, Mysuru
VIII

MANDYA DISTRICT HUMAN DEVELOPMENT REPORT 2014
CORE COMMITTEE
Chairperson Chief Executive Officer
Sri. G. Jayaram (May 2010 -June 2012)
Sri. P.C. Jayanna ( June 2012 – June 2014)
Smt. Rohini Sindhuri (From June 2014)
Member Secretary Chief Planning Officer and
Nodal Officer of the DHDR - Mandya
Sri. B.N. Kendagannappa
Members Prof. M. Devaraj
Principal Investigator, DHDR Project
Dr. H.S. Kumara
Co-Investigator, DHDR Project
Joint Director, Dept. of Agriculture
Deputy Secretary (Development), ZP, Mandya
Deputy Secretary (Administration), ZP, Mandya
Deputy Director, Food and Civil Supplies
District Health Officer
Deputy Director, Dept. of Public Instruction
Deputy Director, Dept. of Women and Child
Project Director, District Urban Development Cell
District Social Welfare Officer
District Statistical Officer
IX
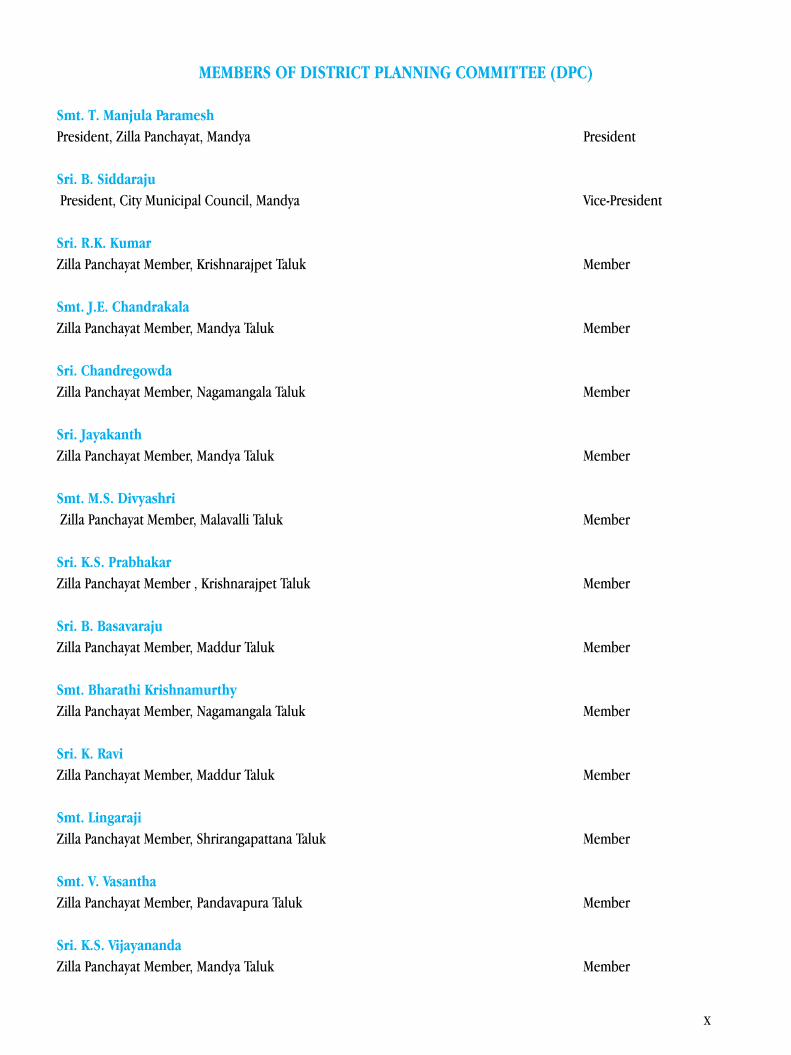
MEMBERS OF DISTRICT PLANNING COMMITTEE (DPC)
Smt. T. Manjula ParameshPresident, Zilla Panchayat, Mandya President
Sri. B. Siddaraju President, City Municipal Council, Mandya Vice-President
Sri. R.K. KumarZilla Panchayat Member, Krishnarajpet Taluk Member
Smt. J.E. ChandrakalaZilla Panchayat Member, Mandya Taluk Member
Sri. ChandregowdaZilla Panchayat Member, Nagamangala Taluk Member
Sri. JayakanthZilla Panchayat Member, Mandya Taluk Member
Smt. M.S. Divyashri Zilla Panchayat Member, Malavalli Taluk Member
Sri. K.S. PrabhakarZilla Panchayat Member , Krishnarajpet Taluk Member
Sri. B. BasavarajuZilla Panchayat Member, Maddur Taluk Member
Smt. Bharathi Krishnamurthy Zilla Panchayat Member, Nagamangala Taluk Member
Sri. K. Ravi Zilla Panchayat Member, Maddur Taluk Member
Smt. LingarajiZilla Panchayat Member, Shrirangapattana Taluk Member
Smt. V. VasanthaZilla Panchayat Member, Pandavapura Taluk Member
Sri. K.S. VijayanandaZilla Panchayat Member, Mandya Taluk Member
X

Sri. R.N. Viswash Zilla Panchayat Member, Malavalli Taluk Member
Dr. S.C. ShankaregowdaZilla Panchayat Member, Mandya Taluk Member
Sri. C.M. SatishZilla Panchayat Member, Malavalli Taluk Member
Smt. SarvamangalaZilla Panchayat Member, Malavalli Taluk Member
Sri. H.K. AshokaCouncilor, TMC, Krishnarajpet Member
Sri. M. Mahesh Councilor, CMC, Mandya Member
Sri. Somashekar KeragoduCouncilor, CMC, Mandya Member
Sri. C.S. PuttarajuMember of Parliament, Mandya District Permanent Invitee
Dr. M.H. AmbareeshMLA, Mandya Permanent Invitee
Sri. D.C. ThammannaMLA, Maddur Permanent Invitee
Sri. A.B. Ramesh Babu BandisiddegowdaMLA, Shrirangapattana Permanent Invitee
Sri. P.M. NarendraswamyMLA, Malavalli Permanent Invitee
Sri. K.C. NarayanagowdaMLA, Krishnarajpet Permanent Invitee
Sri. K.S. PuttannaiahMLA, Melkote Permanent Invitee
Sri. N. ChaluvarayaswamyMLA, Nagamangala Permanent Invitee
XI
Sri. B. RamakrishnaMLC Permanent Invitee
Sri. G. MadhusudanMLC Permanent Invitee
Sri. MarithibbegowdaMLC Permanent Invitee
Deputy Commissioner, Mandya District Permanent Invitee
Chief Executive Officer, Zilla Panchayat, Mandya Member Secretary
XII
CONTENTS
MESSAGE III - VFOREWORD VIPREFACE VII-VIIIACKNOWLEDGEMENTS IX-XPART I: EXECUTIVE SUMMARY 1-8PART II: ALL CHAPTERS 9-257
CHAPTER 1: INTRODUCTION 11-181.1. Concept and Methodology 91.2. Factors contributing to Human Development 121.3. Data Collection, Compilation and Validation 131.4. Measurement of Indices 171.5. Concluding Remarks 19 CHAPTER 2: DISTRICT OVERVIEW 21-322.1. Introduction 212.2. Background and Brief Regional History 222.3. Physiographic Divisions of the District 232.4. Land, Soil and Natural Resource Endowments 252.5. Demography 262.6. Literacy 272.7. Industry 272.8. Irrigation 282.9. Infrastructure 292.10. Regional Perspectives and Backwardness 302.11. An Overview 32
CHAPTER 3. COMPUTATION OF INDICES 31-523.1. Introduction 333.2. Human Development Index 343.3. Gender Inequality Index 423.4. Child Development Index 483.5. Food Security Index 54 3.6. Composite Taluk Development Index 603.7. Urban Development Index 663.8. Concluding Remarks 68
XIII
CHAPTER 4: LITERACY AND EDUCATION 70-964.1. Introduction 704.2. Literacy Profile of the District 704.3. Enrollment -Elementary School 734.4. Attendance, Dropout and Dropout Children Mainstreamed 754.5. Transition Index for Children enrolled at 6th Class as compared to the children enrolled at 5th Class as well as 8th and 7th in a particular year 784.6. Secondary School Enrollment and Dropout Rate 794.7. Pupil –Teacher Ratio 814.8. Infrastructure and Access 834.9. Eight Basic facilities – Infrastructure Index (SSA Method) 854.10. School Completion Ratio, Pass Rate in 5th and 7th Classes, Percentage of Children passing with 60% and above and SSLC / PUC Results 864.11. Post-Secondary Education including Professional (Engineering/Medicine/ Dental/Nursing) and General Degree Colleges, ITI/Polytechnic and other Skill Development Institutions 904.12. Schemes for Promotion of Literacy Level 904.13. Per-capita Expenditure Analysis 914.14. Radar Analysis for Education 924.15. Small area study: Female Drop-outs in Lower and Higher Primary and Secondary education – A study in three GPs of Nagamangala Taluk 924.16. An Overview and persisting educational gaps in the District 934.17. Recommendations 96
CHAPTER 5: HEALTH AND NUTRITION 97-1155.1. Introduction 975.2. Demography, Population by Place of Residence, Sex, and Social Groups, Sex Ratio 985.3. IMR, CMR and MMR 1005.4. Couple Protection Issues and Family Welfare 1025.5. Infrastructure and Health Personnel Facility 1035.6. ANC Coverage and Anaemia among Pregnant Women 1065.7. Institutional Delivery 1075.8. Immunization of Children 1085.9. Under-weight Children and BMI Ratio 1085.10. Communicable Diseases 1095.11. Performance of various Health Schemes 1105.12. Per-capita Expenditure Analysis on Health Sector 1105.13. Radar Analysis for Health 1125.14. Small area study: Efficacy of Health Care Services for Pregnant Women – A study in K. Honnalagere GP of Maddur Taluk. 1125.15. An Overview: Performance and Inadequacies of Health Care System 115
XIV
CHAPTER 6: INCOME, POVERTY AND EMPLOYMENT 116-1336.1. Introduction 1166.2. District and Taluk Income 1166.3. Agriculture: Cropping Pattern, Irrigation, and Livestock 1236.4. Poverty, BPL Households and MGNREGA 1276.5. Employment and Unemployment 1296.6. Main and Marginal Workers 1296.7. Work Participation Rate 1296.8. Occupation Pattern 1306.9. Child Labour 1306.10. Radar Analysis for Living Standard 1326.11. Concluding Remarks 132
CHAPTER 7: STANDARD OF LIVING 134-1497.1. Introduction 1347.2. Housing Status 1357.3. Site-less Households 1357.4. Households with Pucca Houses 1357.5. Households without Proper Houses 1367.6. Households and Asset Status 1377.7. Schemes for Housing Facilities 1407.8. Drinking Water 1427.9. Electricity 1447.10. Traditional Fuel and Modern Fuel 1447.11. Sanitation 1497.12. Small area study: Construction and the Use of Rural Toilets – A study in Manikyanahalli GP of Pandavapura Taluk 1477.13. Concluding Remarks 148
CHAPTER 8: GENDER AND DEVELOPMENT 150-1708.1. Introduction – Gender as Concept 1508.2. Gender Differentials in the District 1568.3. Patterns of Literacy and Enrollment 1568.4. Work Participation Trends 1598.5. Marginalization of Women’s Works 1618.6. Trends in Political Participation 1628.7. Community Attitudes and Social Prejudices, if any, affecting Women and Girl Children 1658.8. Crime against Women: Crime Data at District and Taluk Levels 1668.9. Role of Women’s Groups and SHGs 1678.10. Small area study: Community attitudes and social prejudices, affecting women and girl children in Shrirangapattana & Mandya taluks - A study in K. Shettihalli and Tubinakere GPs. 1688.11. Concluding Remarks 169
XV
CHAPTER 9: STATUS OF SCHEDULED CASTES AND SCHEDULED TRIBES 171-1969.1. Introduction 1719.2. A Demographic Profile of SCs and STs 1729.3. Education Profile and Levels of Enrollment and Education and Dropout Rate 1779.4. Health Awareness and Institutional Delivery Rate 1859.5. Occupational Pattern – Income and Employment – Livelihood opportunities and Development Programmes 1869.6. Housing, Sanitation, and Drinking Water facilities 1889.7. Composite Dalit Development Index (CDDI) – A Case Study 1929.8. Concluding remarks 196
CHAPTER 10: GOVERNANCE ISSUES – GOVERNANCE AND HUMAN DEVELOPMENT 197-21910.1. Introduction 19710.2. Local Governance Structure 19910.3. Panchayat Raj Institutions: Structure and Process 20110.4. Urban Local Bodies: Structure, Issues and Processes 20810.5. Improving Service Delivery Mechanisms: e – Initiatives, Capacity Building, Good Governance Practices 21210.6. Role of NGOs and Other Voluntary Groups 21410.7. Representation of Women and Marginalized Sections of Society in Governance 21610.8. Concluding Remarks 218
CHAPTER 11: URBAN ISSUES IN HUMAN DEVELOPMENT 220-24211.1. Introduction 22011.2. Service Delivery Issues 22111.3. Water Supply and Sanitation 22811.4. Solid and Liquid Waste management 23011.5. Radar Analysis 23811.6. Small area study: Socio-economic status of slum dwellers in Malavalli Town of Mandya District 23911.7. Concluding Remarks 242
CHAPTER 12: WAY FORWARD 243-25712.1. Introduction 24312.2. Discussion and Analysis on: Outline of HD and its Measurement as indicated by different indicators • Educational Component • Health Component • Livelihood and Quality of Living Indicators like Drinking Water, Housing and Sanitation Components • Combined HD Analysis of the District • Regional Disparity of the present HD situation in the District
XVI
The way Ahead: • Future HD Strategy for the Education Sector • Future HD strategy for Health Sector • Future HD Strategy for Livelihood Sector • Future HD Strategy for Dalits, Tribals, and Minorities • Future HD Strategy for Gender Development • Future HD Strategy for other sectors 243
12.3. Concluding Remarks 256
ANNEXURES 258-333
REFERANCES 333
XVII
LIST OF TABLES
2.1. Percentage of forest area to total geographical area of Mandya District -2011-12 258
2.2. Decadal population growth rate in Mandya District - 2001 and 2011 258
2.3. Urban Population to Total Population in Mandya District- 2011 258
2.4. Proportion of urban and rural population in Mandya vis-a -vis Karnataka and India 259
2.5. Sex ratio in Mandya District by Taluk -2011 259
2.6. Width-wise details of first three classes of roads (in km) in Mandya districts (up to end of March 2002) 259
2.7. Distance covered in Mandya district (up to end of March 2002) 259
2.8. Classification of Taluks in Mandya District as per Composite Taluk Development Indices -
Comparison of DHDR’s and Prof. D.M. Nanjundappa Committee’s classifications 260
3.1. Human Development Index (HDI) Value and Rank 36
3.2. Gender Inequality Index (GII) Value and Rank 44
3.3. Child Development Index (CDI) Value and Rank 49
3.4. Food Security Index (FSI) Value and Rank 56
3.5. Composite Taluk Development Index (CTDI) Value and Rank 65
3.6. Urban Development Index (UDI) Value and Rank 67
4.1. Literacy Rate in Mandya district -2001 and 2011 260
4.2. Taluk-wise Male and Female literacy rates in Mandya District-2011 260
4.3. Gender gap in Literacy rate between 2001 and 2011 in Mandya District 261
4.4. Gross Enrolment Rate (Elementary School) in Mandya District by Taluks -2011 261
4.5. Net Enrolment Rate (Elementary School) in Mandya District by Taluk - 2010-11 and 2011-12 261
4.6. Dropout rate (Elementary School) in Mandya District by Taluks 2009-10, 2010-11, 2011-12 262
4.7. Taluk wise Dropout Children Mainstreamed (Primary and Secondary Schools) in
Mandya District by Taluks 2009-10, 2010-11 and 2011-12 262
4.8. Transition Rate at Elementary School level in Mandya District: 2009-10, 2011-12 (%) 263
4.9. Secondary School Gross Enrolment Rate (15-16 years) 263
4.10. Drop-out rate in Secondary School 263
4.11. Details of sanctioned posts and working teachers in schools in Mandya District in 2011-12 264
4.12. Details of Male and Female working teachers in schools 264
4.13. Pupil-Teacher Ratio (Elementary School) in Mandya District by Taluk -2009-10, 2010-11 & 2011-12 264
4.14. Pupil-Teacher Ratio (Secondary School) in Mandya District in 2009-10, 2010-11 & 2011-12 265
4.15. Building status and Condition of classrooms in Elementary and Secondary schools
(Education Department Schools) – Mandya District 265
4.16. Percentage of villages having a Primary School within 1 km distance in Mandya District 2011-12 265
4.17. Taluk-wise School Infrastructure Index in Mandya District in 2009-10, 2010-11 and 2011-12 266
4.18. Taluk-wise School Infrastructure Index in Mandya District in 2011-12 266
4.19. Educational Performance of Mandya District -2006 267
4.20. Educational Performance of Mandya District -2010 267
XVIII
4.21. SSLC pass percentage in Mandya district and its taluks during 2009-10,2010-11 and 2011-12 267
4.22. PUC pass percentage in Mandya District and its Taluks in 2009-10, 2010-11, 2011-12 267
4.23. Particulars of Higher Education Institutions in Mandya District 268
4.24. Details of Enrolment in different Higher Education Institutions 2009-10, 2010-11, 2011-12 268
4.25 (a). Per- capita Expenditure on Education-2011-12 268
4.25 (b). Break-up of Expenditure by Dept. of Education in Mandya District for the Year 2011-12 269
4.26. Social Composition of the Sample School dropouts 269
4.27. Level of schooling and Class-wise Distribution of the Sample dropout (No. of Dropouts 37) 270
4.28. Education Level of Parents of Dropouts Childern 270
4.29. Reasons for Female Dropouts 271
4.30. Percentage of Dropouts resumed back to school 271
5.1. Status of Health Indicators in Mandya District 271
5.2. Sex Ratio and Child Sex Ratio between 2001 and 2011 271
5.3. Major Health Indicators in Taluks of Mandya District 272
5.4. Eligible couples protected by contraceptive methods in Mandya District by Taluks 272
5.5. Sub-centers in Mandya District by Taluk -2011 272
5.6. Primary Health Centers in Mandya District by Taluk-2011 272
5.7. Doctors availability in Mandya District by Taluk- 2011 273
5.8. Nurses Availability in Mandya District by Taluk- 2011 273
5.9. Sub-centers, Primary Health Centers and Doctors availability in
Mandya District by Taluk 2009-2011(No’s) 273
5.10. ANC Coverage and Anaemia among pregnant women in Mandya District by Taluk: 2009-10 (%) 273
5.11. Taluk- wise Institutional deliveries in Mandya District -2011 274
5.12. ANC and Institutional Delivery in 2009-10 and 2010-11 in Mandya District 274
5.13. Children fully Immunized in Mandya District by Taluks 274
5.14. Percentage of Children born under-weight in Mandya District by Taluk in 2011-12 274
5.15. Malnourished Children (Excluding Normal) in Mandya District by Taluk (%) 275
5.16. Percentage of fully Immunized Children in Mandya by Taluk 275
5.17. Percentage of people affected by major communicable diseases-2011-12 275
5.18. Number of people affected by Communicable Diseases during 2009-2012 276
5.19. Number of Jana Swashthya Yojana ( JSY ) Beneficiaries in Mandya District and its Taluk (2011-12) 276
5.20. Per-capita Health Expenditure in 2008-09 (at Current Prices) 276
5.21. Trends in Per-Capita Health Expenditure from 2009 to 2012 277
5.22. Place of Delivery 277
5.23. Birth Weight of the children (in kg’s) 277
5.24. Vaccinations administered to the baby 277
6.1. Growth of DDP at 2004-05 prices in Mandya District: (Rs. Lakh) 277
6.2. Taluk-wise Economic Growth Rates at 2004-05 prices in Mandya District (In lakh Rs.) 278
6.3. Growth Rate of Per capita income in Mandya District vis-a-vis Karnataka State at 2004-05
prices during the period from 2004-05 to 2008-09 278
XIX
6.4. Taluk-wise Gross Per- capita Income (in rupees) for the year 2008-09 at current prices 278
6.5. Taluk-wise Sectoral Distribution of DDP in Mandya District in 2008-09 at Current Prices –
Aggregates for all sectors (In lakh Rs. & %) 279
6.6. Taluk-wise Sectoral Distribution of DDP in Mandya District in 2008-09 at Current Prices –
Primary Sector (In lakh Rs. & %) 279
6.7. Taluk-wise Sectoral Distribution of DDP in Mandya District in 2008-09 at Current Prices –
Secondary Sector (In lakh Rs. & %) 280
6.8. Taluk-wise Sectoral Distribution of DDP in Mandya District in 2008-09 at Current Prices –
Tertiary Sector (In lakh Rs. & %) 281
6.9 (a). Land Use Pattern in Mandya District in 2011-12 (in Ha.) 282
6.9 (b). Percentage Change in Net Sown Area (NSA) in Mandya District (2001 – 2011) 282
6.9 (c). Percentage of area degraded to TGA in Mandya District in 2011-12 283
6.9 (d). Taluk- wise Average size of holdings in Mandya District - 2011-12 (In hectares) 283
6.10 (a). Cropping Intensity in Mandya District by Taluks -2011-12 283
6.10 (b). Cropping Intensity in Mandya District by Taluks – 2012-13 284
6.11. Cropping Pattern in Mandya District 2011-12 284
6.12. Percentage of Area under leguminous crops to the GCA in Mandya District 2011-12 284
6.13. Per capita food grain production in Mandya District In 2011-12 (in kgs) 285
6.14. Irrigation in Mandya District 2011-12: Net Area Irrigated by Different Sources (Area in Ha) 285
6.15. Irrigation Intensity in Mandya District by Taluks -2011-12 285
6.16. Livestock In Mandya District (As per 2007 Livestock Census) 286
6.17. Taluk-wise Poverty Head Count Ratio in Mandya District 286
6.18. Shows the details of the total number of ration cards including BPL cards issued by
State Food and Civil Supplies Dept in Mandya District. 286
6.19. Percentage of Households provided employment to total number of households in
Mandya District registered under MGNREGS 287
6.20. Decadal Growth Rate of Workforce in Mandya District by Taluks between 2001 and 2011 287
6.21. Percentage of main workers to total workers in Mandya District by Taluks - 2011 287
6.22. Work Participation Rate (WPR) in Mandya District by Taluks -2011 288
6.23. Male Work Participation Rate (WPRM) in Mandya District by Taluks -2011 288
6.24. Female Work Participation Rate (WPRF) in Mandya District by Taluks -2011 288
6.25. Cultivators to Total Workers in Mandya District by Taluks -2011 288
6.26. Percentage of Agricultural labourers to total workers in Mandya District -2011 289
6.27. Percentage of workers in Household Industries in Mandya District - 2011 289
6.28. Share of female workers in the non-agricultural sector in Mandya District -2011 289
6.29. Female Agricultural wage rate in Mandya District - 2011 289
6.30. Male Agricultural wage rate in Mandya District - 2011 290
6.31. Ratio of average agricultural wage prevalent in Mandya District to Minimum
wages prescribed by the State 290
XX
6.32. Occupation Pattern in Mandya District 2011-12 290
7.1. Taluk-wise Site-less Households in Mandya District 2011 291
7.2. Number of Households with Pucca Houses in Mandya District by Taluks-2011 291
7.3. Number of Households without Own Houses in Urban Local Bodies -2011 291
7.4. Percentage of Slum Population to total urban population -2011 292
7.5. Sewerage/ Drainage Facilities in Urban Local Bodies -2011 292
7.6. Gram Panchayats selected for Nirmal Gram Puraskar Award in Mandya District, 2011 292
7.7. Number of Households with Bicycles in Mandya District in 2001 & 2011 293
7.8. Number of Households having with two-wheelers during 2001 & 2011 293
7.9. Number of households with no assets (Telephone, Computer, TV,
2 Wheelers and 4 Wheelers) in Mandya District during 2001 & 2011 294
7.10 (a). Progress of Indira Awas Yojana in Mandya District -Physical Progress, 2009-2010 294
7.10 (b).Progress of Indira Awas Yojana in Mandya District-Physical Progress, 2011-2012. 294
7.10 (c). Progress of Indira Awas Yojana in Mandya District-Physical Progress, 2012-13 295
7.10 (d). Progress of Rural Ambedkar Housing Scheme in Mandya Physical Progress, 2009-12. 295
7.10 (e). Progress of Basava Housing Scheme in Mandya District Physical Progress 2010-11 296
7.11. Number of Households having access to drinking water during 2001 & 2011 297
7.12. Number of Households in Mandya district having access to electricity in 2001 and 2011 298
7.13. Number of Households having access to Modern Cooking fuel during 2001 & 2011 298
7.14. Number of Households having access to latrine facility within their premises in 2001 & 2011 299
7.15. Percentage of Households Selected for Rural Sanitation within Manikyanahalli Gram Panchayat Area 299
8.1. Taluk-wise Sex ratio in Mandya District 299
8.2. Distribution of Child Sex ratio in Mandya district by taluk 300
8.3 (a). Taluk-wise health indicators among women in Mandya District 300
8.3 (b). Taluk wise health indicators among children in Mandya District 300
8.3 (c). Population Served by Anganwadi Centers in Mandya District by Taluks 301
8.4. Taluk wise Female Literacy Rate in Mandya District 301
8.5. Taluk-wise female and male work participation rates in Mandya District 301
8.6. Percentage of female workers in non-agricultural sector (NAGF) to Total female workers 302
8.7. Taluk-wise female and male wage rates in Mandya District 302
8.8. Elected Women Representatives in Urban Local Bodies 302
8.9. Elected Women Representatives in Rural Local Bodies 303
8.10. Women-headed Households in Mandya District 303
8.11. Crime against Women in Mandya District 2009-12 303
8.12. Active Self-Help Groups (SHGs) 304
9.1. Decadal Growth of SC & ST Population in Mandya District 304
9.2. Taluk-wise Growth of SC and ST Population in the District 1991-2011 305
9.3. Percentage of SC-ST Population to the total Population by Taluk 305
9.4. SC-ST Population in Rural & Urban Areas 2001 & 2011 306
XXI
9.5. Sex Ratio among SC, ST and Other Groups 306
9.6. Gross Enrollment in Primary School in Mandya District in 2011-12 307
9.7. Gross Enrollment in Upper Primary School in Mandya District 2011-12 307
9.8. Gross Enrollment in Elementary School in Mandya District in 2011-12 307
9.9. Transition Rate from 5th Standard to 6th Standard in Mandya District 2011-12 308
9.10. Transition Rate from 8th Standard to 9th Standard in Mandya District 2011-12 308
9.11. Drop-out rate in Primary Schools for SCs and STs 2011-12 308
9.12. Drop-out rate in Upper Primary Schools for SCs and STs 2011-12 309
9.13. SSLC Results for SC and ST in Mandya district 2011-12 & 2012-13 309
9.14. Land Holding among SCs and STs (In numbers) 309
9.15. Land Owned by Different Groups (In hectares) 310
9.16. Houses Constructed Under Ashraya Scheme Year: 2011-12 310
9.17. Houses Constructed Under Dr. B.R. Ambedkar Scheme Year: 2011-12 310
9.18. Indira Awas Houses Year: 2011-12 311
9.19. Ambedkar Housing Scheme for SC’s and ST’s in Mandya district Year 2009-12 311
9.20. Details of sanitation facilities for SC’s and ST’s in Mandya district Year: 2009-11 311
9.21. Scheduled Caste HH’s access to basic services 311
9.22. Scheduled Tribes HHs with access to basic services 312
9.23. Composite Dalit Development Index 312
10.1. Details of SHGs in Mandya District - 2011-12 312
10.2. Details of SCs/STs elected representatives in rural local bodies 313
10.3. SCs/STs elected representatives in urban local bodies in Mandya District in 2011-12 313
10.4. Gram Panchayats Selected for Nirmal Gram Puraskar Awards in the District 313
11.1. Category-wise ULBs in Mandya District 313
11.2. Trends in Urban Population in Mandya District 314
11.3. Trends in urban slum population in Mandya District during 2001-2011 314
11.4. Household’s Access to Drinking Water in ULBs in Mandya District 2001-2011 315
11.5. Households having access to toilet facility within the premises in Mandya District ULBs (2001 -2011) 315
11.6. Solid Waste Generated in ULBs of Mandya District 316
11.7. Manpower deployed for collection and disposal of Solid waste in ULBs 316
11.8. HHs having access to Sewerage /Drainage in Mandya District ULBs 317
11.9. Roads (Length in kms) in ULBs 318
11.10. Percentage of Own resources to Total receipts of ULBs wise 318
11.11. Per-capita expenditure on Development Works in ULBs 319
11.12. Households without own house in ULBs in 2011-12 319
11.13. Crime Rate per 10,000 Populations in Urban local bodies 319
11.14. Road accidents per 10, 000 Populations in ULBs 320
11.15. Number of Hospital Beds per 1,000 population in ULBs in 2011 320
11.16. Urban Development Index (UDI) for Mandya District ULBs 320
XXII
LIST OF FIGURES
2.1. Month –wise actual and normal rainfall in 2012 (mms) in Mandya District 23
2.2. Actual annual rainfall from 2001-2012 (mms) in Mandya District 24
3.1. Radar diagram for Taluk-wise HDI 37
3.2. Comparison of HDI – 2011 37
3.3. HDI of Mandya District in 1991, 2001 & 2011 38
3.4. Radar Diagram for Living Standard Index in Mandya District. 39
3.5. Radar diagram for Taluk-wise Health Index, in Mandya District 40
3.6. Radar diagram for Taluk-wise Education Index in Mandya District 40
3.7. Taluk-wise comparison of LSI, HI and EI in Mandya District 41
3.8. Gender Inequality Index 44
3.9. Reproductive Health Index 45
3.10. Empowerment Index 46
3.11. Labour Market Index 47
3.12. Taluk-wise comparison of Gender Inequality Indices in Mandya District 48
3.13. Radar diagram for Child Development Index. 50
3.14. Health Index 51
3.15. Nutrition Index 52
3.16. Education Index 53
3.17. Comparison between Child Development Indices 54
3.18. Food Security Index (FSI) 56
3.19. Food Availability Index (FAI) 57
3.20. Food Accessibility Index (FAcI) 58
3.21. Food Absorption Index (FAbI) 59
3.22. Taluk-wise Comparison of Food Security Indices in Mandya district 60
3.23: Living Standard/Livelihood Index 61
3.24: Health Index 62
3.25: Education Index 63
3.26. Composite Taluk Development Index 64
3.27. Urban Development Index 68
4.1. Literacy Rate in Mandya district -2001 and 2011 71
4.2. Taluk-wise male and female literacy rates in Mandya District-2011 72
4.3. Gross Enrolment Rate (Elementary School) in Mandya District by Taluks-2011 74
4.4. Net Enrolment Rate (Elementary School) in Mandya District by Taluk – 2010-11 and 2011-12 75
4.5. Dropout Rate (Elementary School) in Mandya District by Taluks 2009-10, 2010-11, 2011-12 76
4.6. Taluk wise Dropout Children Mainstreamed (Primary and Secondary Schools) in Mandya District-2011 77
4.7. Transition Rate at Elementary School level in Mandya District: 2009-10, 2011-12 (%) 79
4.8. Secondary School Gross Enrolment Rate (15-16 years) 80
XXIII
4.9. Drop-out rate in Secondary School 81
4.10. School Infrastructure Index Number 85
4.11. Radar diagram of Education Index 92
5.1. Changes in Sex Ratio and Child Sex Ratio between 2001 and 2011 100
5.2. Status of Major Health Indicators in taluks of Mandya District 101
5.3. Eligible couples protected by contraceptive methods in Mandya District by Taluks 103
5.4. Per -capita Health Expenditure from 2009-2012 111
5.5. Radar Diagram of Health 112
5.6. Incidence of Anaemia among sample respondents 114
6.1. Percentage of Taluk-wise Sectoral Distribution of DDP in Mandya District in 2008-09
at Current Prices - Aggregates for all sectors 121
6.2. Percentage of Taluk-wise Sectoral Distribution of DDP in Mandya District in 2008-09
at Current Prices -Primary Sector 122
6.3. Percentage of Taluk-wise Sectoral Distribution of DDP in Mandya District in 2008-09
at Current Prices -Secondary Sector 122
6.4. Percentage of Taluk-wise Sectoral Distribution of DDP in Mandya District in 2008-09
at Current Prices - Tertiary Sector 123
6.5. Radar Diagram for Living Standard Index in Mandya District 132
7.1. Percentage of Households with Bicycles in Mandya District in 2001 & 2011 138
7.2. Percentage of Households having with two-wheelers during 2001 & 2011 139
7.3. Percentage of households with no assets (Telephone, Computer, TV,
2 Wheelers and 4 Wheelers) in Mandya District during 2001 & 2011 140
7.4. Percentage of Households having access to drinking water during 2001 & 2011 143
7.5. Percentage of Households in Mandya District having access to electricity in 2001 & 2011 144
7.6. Percentage of Households having access to Modern Cooking fuel during 2001 & 2011 145
7.7. Percentage of Households having access to latrine facility within the premises during 2001 & 2011 146
8.1. Taluk-wise Sex ratio in Mandya District 152
8.2. Distribution of Child Sex ratio in Mandya district by taluk 153
8.3. Taluk-wise health indicators among women in Mandya District 154
8.4. Population Served by Anganwadi Centers in Mandya District by Taluks 155
8.5. Taluk-wise female and male work participation rates in Mandya District 159
8.6. Percentage of female workers in non-agricultural sector (NAGF) to Total female workers 160
8.7. Taluk-wise female and male wage rates in Mandya District 161
8.8. Percentage of Elected Women Representatives in Urban Local Bodies 163
8.9. Percentage of elected women representatives in rural local bodies 163
8.10. Percentage of Women-headed Households in Mandya District 164
8.11. Crime against Women in Mandya District 2009-12 166
8.12. Percentage of active and registered SHGs 167
9.1. Taluk-wise Growth of SC and ST Population in the District 1991-2011 173
XXIV
9.2. SC-ST Population in Rural & Urban Areas 2001 & 2011 175
9.3. Sex Ratio among SC, ST and Other Groups 177
9.4. Gross Enrollment in Primary School among SC and ST in Mandya District in 2011-12 178
9.5. Gross Enrollment in Upper Primary School among SC and ST in Mandya District 2011-12 179
9.6. Gross Enrollment in Elementary School among SC and ST in Mandya District in 2011-12 180
9.7. Transition Rate from 5th Standard to 6th Standard among SC and ST in Mandya District 2011-12 181
9.8. Transition Rate from 8th Standard to 9th Standard among SC and ST in Mandya District 2011-12 182
9.9. Drop-out rate in Primary Schools for SCs and STs 2011-12 183
9.10. Drop-out rate in Upper Primary Schools for SCs and STs 2011-12 184
9.11. SSLC Results for SC and ST in Mandya district 2011-12 & 2012-13 185
9.12. Land Holdings among SC and ST (In numbers 186
9.13. Land Owned by SC, ST and General Groups (In hectares) 187
9.14. Houses Constructed Under Ashraya Scheme Year: 2011-12 188
9.15. Houses Constructed Under Dr. B.R. Ambedkar Scheme Year: 2011-12 189
9.16. Indira Awas Houses Year: 2011-12 190
9.17. Percentage of Scheduled Caste Households with access to basic services 191
9.18. Percentage of Scheduled Tribes Households with access to basic services 192
9.19. Radar Diagram of Composite Dalit Development Index 195
10.1. Details of SHGs in Mandya District - 2011-12 215
10.2. SCs/STs elected representatives in rural local bodies 216
10.3. SCs/STs elected representatives in urban local bodies in Mandya District in 2011-12 217
10.4. Gram Panchayats Selected for Nirmal Gram Puraskar Awards in the District 218
11.1. Percentage of Households having access to four basic services provided by
Urban Local Bodies (ULBs), Mandya district -2011 222
11.2. Trends in Urbanisation in Mandya District 227
11.3. Trends in urban slum population in Mandya District 228
11.4. Percentage of urban households having access to water supply in Mandya District ULBs (2001-2011) 229
11.5. Percentage of urban households in Mandya District ULBs having access to toilet facility
within the premises (2001-2011) 230
11.6. Per-capita waste generated (gm/day) 231
11.7. Percentage of Households having access to Sewerage /Drainage in Mandya District ULBs 232
11.8. Percentage of own resources to total receipts of ULBs during 2011-12 233
11.9. Trends in percentage of own resources to total receipts of ULBs 234
11.10. Per- capita expenditure on development works in ULBs 235
11.11. Percentage of Households without own house in ULBs in 2011-12 236
11.12. Crime rate per 10, 000 populations in ULBs 236
11.13. Roads accidents per 10000 populations in ULBs 237
11.14. Radar analysis 238
11.15. Age group of the respondents 239
XXV
LIST OF CHARTS
LIST OF BOXES
LIST OF THEMATIC MAPS
3.1. Indicators for three dimensions of HDI 35
3.2. Indicators for Gender Inequality Index 43
3.3 Indicators for Child Development Index 49
3.4 Indicators for Food Security Index 55
3.5 Indicators for Urban Development Index 67
10.1. District Level – Zilla Panchayat 205
10.2. Intermediate Level – Taluk Panchayat 205
10.3. Lower Level – Grama Panchayat 206
10.4. Existing Planning Process of Three Tier System in Karnataka 207
10.5. Elected wing in City Municipal Council and Town Municipal Councils 210
10.6. Structure of City Municipal Councils (CMCs) 211
10.7. Structure of Town Municipal Councils (TMCs) 211
2.1. Summary Statistics of Mandya District (2011) 22
4.1. Provision for Children with Special Needs 78
4.2. Two Model schools in Mandya District 84
4.3. Quality concern in Education in Mandya District 87
4.4. Capacity Building 88
4.5. Nali kali Satellite Programme 91
4.6. Reading corners 95
6.1. Maddur – A Unique Terminal Market for Tender Coconut 124
6.2. National Child Labour Project (NCLP) in Karnataka 131
7.1. Self investment in Housing-model villages show the way 136
8.1. Why Gender Segregated Analysis? 150
10.1. UNDP- Five Principles of Good Governance 198
11.1. Initiatives for improving urban Governance 223
11.2. Glimpse of Public Grievance and Redressal Module (PGR) 224
1.1. Human Development Index
2.1. Gender Inequality Index
3.1. Child Development Index
4.1. Food Security Index
5.1. Composite Taluk Development Index
6.1. Urban Development Index
XXVI
LIST OF ABBREVIATIONS
AAY Anthyodaya Anna Yojana
ACGR Annual Compound Growth Rate
AEH All Electric Homes
AEZ Agricultural Export Zone
ANC Antenatal Care
APL Above Poverty Line
ASHAs Accredited Social Health Activists
ASER Annual States of Education Report
AVY Ambedkar Vasathi Yojana
BEO Block Education Officer
BMIC Bangalore-Mysore Infrastructure Corridor
BRS Bank Reconciliation Statement
BVY Basava Vasathi Yojana
CBO Community Based Organization
CBR Crude Birth Rate
CD Communicable Diseases
CDDI Composite Dalit Development Index
CDI Child Development Index
CCDI Comprehensive Composite Development Index
CFTRI Central Food Technological Research Institute
CIPET Central Institute of Plastic Engineering Technology
CMC City Municipal Council
CMR Child Mortality Rate
CP Cerebral Palsied
CPHEEO Central Public Health and Environmental Engineer Organisation
CPM Capability Poverty Measure
CPO Chief Planning Officer
CSO Central Statistical Organization
CSR Child Sex Ratio
CTDI Composite Taluk Development Index
CWSN Children With Special Needs
DDI Dalit Deprivation Index
DDP District Domestic Product
DDPI Deputy Director of Public Instruction
DFRL Defence Food Research Laboratory
DHDR District Human Development Report
DIET District Institute of Education and Training
DISE District Information System for Education
XXVII
DPC District Planning Committee
DPEP District Primary Education Programme
DPGR Decadal Population Growth Rate
DUDC District Urban Development Cell
EI Education Index
EMI Empowerment Index
ESA Employment Standards Act
ETR Educational Transition Rates
FSI Food Security Index
GAD Gender and Development
GCA Gross Cropped Area
GDP Gross Domestic Product
GEM Gender Empowerment Measure
GER Gross Enrolment rate
GII Gender Inequality Index
GIS Geographic Information System
GNP Gross National Product
GoK Government of Karnataka
GP Gram Panchayath
GSDP Gross State Domestic Product
HBE Home Based Education
HCR Head Count Ratio
HDI Human Development Index
HDPE High-Density Polyethylene
HDRs Human Development Reports
HHs House Holds
HI Hearing Impaired
HI Health Index
HPS Higher Primary School
HS High School
IAY Indira Awas Yojana
ICT Information and Communication Technology
ID Institutional Deliveries
IEDSS Inclusive Education for Disabled at Secondary Stage
IMR Infant Mortality Rate
IPM Income Poverty Measure
ITI Industrial Training Institute
KIADB Karnataka Industrial Area Development Board
KM Karnataka Municipalities
KMABR Karnataka Municipal Accounting & Budgeting Rules
XXVIII
KMC Karnataka Municipal Corporations Act
KRS Krishna Raj Sagar
KSCB Karnataka Slum Clearance Board
KSSIDC Karnataka Small Scale Industries Development Corporation
KUWS & DB Karnataka Urban Water Supply and Drainage Board
LD Learning Disabled
LMI Labour Market Index
LPS Lower Primary School
LSI Living Standard Index
MDGs Millennium Development Goals
MEW Measure of Economic Welfare
MGNREGS Mahatma Gandhi National Rural Employment Guarantee Scheme
MHRD Ministry of Human Resource Development
MLA Member of Legislative Assembly
MLC Members of the Legislative Council
MLD Million Liters per Day
MMR Maternal Mortality Rate
MPCE Monthly Per -Capita Consumption Expenditure
MPI Multidimensional Poverty Index
MR Mentally Retarded
MRP Municipal Reforms Project
NBA Nirmal Bharat Abhiyan
NER Net Enrollment Rate
NEW Net Economic Welfare
NGOs Non-Governmental Organizations
NHDR National Human Development Report
NICNET National Informatics Center Network
NREGS National Rural Employment Scheme
NSA Net Sown Area
NTR Non-Tax Revenues
OBB Operation Black Board
OBC Other Backward Class
ODC Overseas Development Council
OI Orthopedically Impaired
OOSC Out of School Children
PANE Pregnant Women with Anaemia
PCHE Per Capita Health Expenditure
PCI Per Capita Income
PGR Public Grievance and Redressal Module
PHC Primary Health Centre
XXIX
PPP Purchasing Power Parity
PQLI Physical Quality of Life Index
PRI Panchayat Raj Institutions
RDI Reproductive Health Index
RLBs Rural Local Bodies
RMSA Rashtriya Madyamika Shikshana Abhiyana
ROW Right of Way
RTE Right To Education
RUSA Rashtriya Uchchatar Shiksha Abhiyan
SCs Scheduled Castes
SCSP Schedule Caste Sub-Plan
SDMC School Development and Management Committee
SDP State’s Domestic Product
SEZ Special Economic Zone
SH State Highway
SHGs Self Help Groups
SI Speech Impaired
SNA System of National Accounts
SSA Sarva Shikshana Abhiyana
STEP Support to Training and Employment Programme for Women
STs Scheduled Tribes
TDP Taluk Domestic Product
TFR Total Fertility Rate
TGA Total Geographical Area
TMC Town Municipal Councils
TPs Town Panchayats
UDI Urban Development Index
ULBs Urban Local Bodies
UNDP United Nations Development Programme
UNICEF United Nations International Children’s Emergency Fund
UNO United Nation Organisation
VC Visweswarayya Canal
VI Visually Impaired
WAD Women and Development
WHO World Health Organization
WID Women in Development
WPR Work Participation Rate
WTP Water Treatment Plant
ZP Zilla Panchayath
XXX
1
The conventional concept of development focused on the expansion of production of goods and services and the consequent growth in per capita income was used as an indicator of prosperity. As economic prosperity measured in terms of per capita income does not always ensure enrichment in quality of life reflected in broader dimensions of well-being, it needs to be measured using unconventional indicators such as Human Development Index (HDI) and the incidence of poverty, the indicators that are more appropriate in reflecting changes in the attainment levels during different periods of time.
Human Development is about much more than the rise in national incomes. It is about creating an environment in which people can develop their full potential and lead productive, creative lives in accordance with their needs and interests. People are the real wealth of a nation. Thus development is about expanding the choices people have to make to lead their lives the way they value. And it is thus much more than economic growth which is only a means, albeit a very important one, of enlarging people’s choices. Fundamental to enlarging these choices is building human capabilities – the range of things that people can do in life. The most basic capabilities for human development are to lead a long and healthy life, to be knowledgeable to have access to the resources needed for a decent standard of living and to be able to participate in the life of the community. Without these, many choices are simply not available and many opportunities in life remain inaccessible.
The most important purpose of the Human development Report (HDR) for Mandya District is to provide a yardstick against which future attainments on the human development front can be judged. Another major purpose is to sensitize the State planners and policy makers to the significance of the human development perspective for promoting social well-being along with equitable and sustainable growth. Thus, human development can be an ideal instrument for increasing the pace of poverty reduction. This report also spells out the challenges that the local government faces in different areas of human development, and outlines the policy initiatives for meeting these challenges. The HDR provides a noteworthy assessment of key components of human development in the district highlights the achievements made hitherto
and provides what else needs to be done to consolidate and accelerate the gains. In fact the 73rd and 74th Constitutional Amendments mandate the preparation of district-level plans. So, the District has been and will continue to be a very important unit for planning and its implementation for human development.
Among other things, the availability of district-level human development indicators would facilitate planning and resource mapping. Easy public access to current information of this type could serve as a ‘gauge’ to measure the performance and progress of various districts. The Human Development Report of Mandya District specifically focuses on :to draw at a ‘rich picture’ of Human development in the district of Mandya by focusing specifically on the dimensions and indicators of human development as manifested in the district over space and time; to critically examine human development of the district by taking into account the temporal and spatial variations in social, economic, cultural and political aspects of people’s life with special reference to demography, literacy and education, sanitation, health and nutrition, employment, income and poverty, socio-economic infrastructures such as housing, water supply, irrigation, power, transport and communication, gender issues and disparities in development among the poor and rich and the local governance with regard to Panchayat raj institutions; to bring out reasons for disparities in the development levels in all aspects mentioned above, and to develop strategies for bringing about equitable, sustainable, productive and empowered human development and to identify the needs and priorities of backward taluks and find solutions to reduce the development gaps between them and the developed taluks by making appropriate provisions in the resource allocations.
The concept of human development as propounded in the UNDP’s Human Development reports is multifaceted and still evolving. The range and dimensions of the choices have been expanding with successive Global HDRs. Nevertheless, the three choices, viz., to lead a long life, to acquire knowledge and to have resources needed for a decent living which are central to the notion of human development have remained constant.
PART - I
EXECUTIVE SUMMARY
2
The HDI is an outline of human development. It measures the average achievement in a country in three basic dimensions of human development. The Global Human Development Report-2010 prepared by the UNDP has used an improved methodology for computing HDI, GII and MPI. The measurement of human development is now broad-based and it considers several additional indicators. Accordingly, eleven indicators have been used for measuring the three dimensions of HDI viz. Living standard, health and education. HDI is the geometric mean of the three-dimensional indices. Albeit Human Development Index (HDI) has been used as the prime indicator of human development in Mandya district, other complementary indices have also been computed to comprehensively understand the overall development of the district through different dimensions. These additional indices are: Gender Inequality Index (GII); Child Development Index (CDI); Food Security Index (FSI); Composite Taluk Development Index (CTDI); Urban Development Index (UDI) and Composite Dalit Development Index (CDDI).
Overall 126 Indicators have been used for computing the above-mentioned indices. These indicators are chosen taking into account demographic factors, livelihood and employment related factors, household assets, factors empowering the community, health factors including water supply and sanitation, and education factors HDI is computed by using 11 indicators, Gender Inequality Index (GII) is computed by using 15 indicators, Child Development Index (CDI) is computed using 3 indicators, FSI by using 18 indicators, CTDI by using 68 indicators, UDI by using 11 indicators.To work out the HDI the study has used the well-known and time-tested UNDP methodology. For computing Composite Dalit Development Index (CDDI), 10 indicators have been used and the data were gathered from a village to compute CDDI.
The human development index (HDI) for all the taluks in the district ranges between 0.493 and 0.758. HDI for Shrirangapattana, Mandya and Maddur taluks is higher than the district average (0.663), while HDI for Malavalli, Pandavapura, Nagamangala and Krishnarajpet taluks is lower than that of district. Shrirangapattana taluk ranks number one in HDI ranking followed by Mandya taluk in the 2nd rank and Maddur taluk in the 3rd rank. Krishnarajpet taluk ranks last i.e. 7th, with a HDI of 0.493. Shrirangapattana taluk has highest HDI (0.758) because of the better values in health index (0.920), living standard index (0.696) and 0.682 for education index.
Though Mandya taluk ranks first in education index (1.0) and living standard index (0.754), it ranks seventh in health index (0.441). Due to poor performance in health index, Mandya taluk moved to the 2nd rank in the district. Krishnarajpet taluk ranks 7th in HDI in the district because of the low index value in living standard (0.204).
The living standard index (LSI), one of the three components of HDI is computed using seven sub-indicators namely: access to cooking fuel, toilet, water, electricity, pucca house, percentage of non-agricultural workers and per capita income. Mandya district has a moderate LSI of 0.588. The highest LSI (0.754) is found for Mandya taluk which is in the 1st rank and the Lowest LSI (0.204) is for Krishnarajpet taluk which is in the 7th rank. Mandya and Shrirangapattana taluks have better LSI value than the district’s average of 0.588, while Krishnarajpet, Nagamangala, Malavalli, Pandavapura and Maddur taluks have lower LSI than the district average. Thus, there is a significant gap in the LSI between the taluks of Mandya district.
Two vital health indicators namely child mortality rate and maternal mortality rate are used as sub-indicators to compute the health index (HI). The HI of taluks in the district ranges from 0.441 to 0.953 and there is a striking gap between lowest and highest in health index. Mandya taluk has least (0.441) HI which is lesser than the district average of 0.726, while all other taluks have higher health index than that of the district. Nagamangala taluk ranks number one with highest HI of 0.953.
Education index is computed using two sub-indicators namely literacy rate and gross enrollment rate at primary and secondary schools. Mandya district has an average EI of 0.681 which shows the moderate education development. EI for taluks ranges from 0.428 to 1.000 showing wide gap between taluks. Mandya taluk ranks first with an EI of 1.0, while Malavalli taluk has least EI of 0.428.
The gender inequality index (GII) is one of the other indices computed for assessing the overall development of the district. Gender inequality index encompasses unequal rights, responsibilities, and opportunities for female and translates to poor health status, low educational attainment, and poor economic and political status compared to male. GII is computed based on three dimensions relating to: reproductive health, empowerment and labour market. The GII for
3
Mandya district is 0.070 indicating that gender inequality in Mandya district is very low. Taluk-wise GII values indicate that Maddur taluk rank 1st with the lowest value (0.046) followed by Krishnarajpet in the 2nd Rank (0.052), Shrirangapattana in the 3rd Rank (0.053) and Nagamangala in the 4th Rank (0.0.61). Mandya taluk has GII of 0.075 which is nearly equal to that of GII of the district. Malavalli and Pandavapura taluks have higher GII of 0.087 and 0.104 with 6th and 7th ranks respectively.
Child Development Index (CDI) is a composite index worked out based on child mortality rate (Health Index), percentage of mal-nourished children, babies born under-weight (Nutritional index) and percentage of drop-out children in primary and secondary school main-streamed (Education index). The CDI for Mandya district is 0.338. For taluks CDI ranges from 0.208 to 0.978. The CDI for Pandavapura taluk is the highest (0.978) followed by Shrirangapattana taluk with CDI of 0.681. Malavalli taluk is in the 3rd rank with 0.584, Maddur taluk ranks 4th with 0.533 and Nagamangala taluk ranks 5th with 0.448. Krishnarajpet (0.302) and Mandya taluks (0.208) are in the 6th and 7th place respectively.
Food Security Index (FSI) is computed based on three dimensions namely food availability, accessibility and absorption. Food Security index of a nation helps to find out whether a nation is able to give food to the people and keep them healthy all the times. The FSI for Mandya district is 0.398. The FSI for the taluks ranges from 0.365 in the case of Malavalli (7th rank) to 0.605 in the case of Shrirangapattana taluk (1st rank). This considerable gap in FSI indicates wide variation with regard to food security, between taluks which is to be essentially addressed by the district administration.
Composite Taluk Development Index (CTDI) is a comprehensive index covering a wide range of critical development indicators in a taluk. It helps not only to assess the over-all development of a taluk but also to compare taluks in terms of overall development. CTDI is computed by using three broad parameters related to education, health and standard of living. In all 68 indicators have been used for computing CTDI. The average Composite Development Index for Mandya district is 0.506 which shows modest development. Mandya taluk with a CTDI value of 0.611 ranks first. The CTDI for Maddur taluk is 0.535 which is slightly higher than the district CTDI. Nagamangala taluk is in the 3rd place with a CTDI of 0.507. The CTDI of Shrirangapattana (0.491), Krishnarajpet (0.473) and Malavalli (0.425)
taluks are below the district average.Urban Development Index (UDI) is also one of the important indices for assessing human development of an urban area. The UDI is computed using the indicators which are important for urban development and altogether 11 indicators have been used to compute the UDI. The UDI for urban local bodies ranges from 0.383 to 0.756. Mandya CMC has highest UDI of 0.756 followed by Krishnarajpet TMC with UDI of 0.648 and Shrirangapattana with UDI of 0.629. The UDI for Malavalli TMC is 0.497, for Nagamangala TP 0.467, for Pandavapura TP 0.442 and for Maddur TMC 0.383.
In addition to constructing the above-mentioned index, a Composite Dalit Development Index (CDDI) is also computed based on a small area study in a village to understand the Dalit development problems. CDDI is a composite index of 10 indicators relating the life of Dalits. In the sample study in a village of Mandya district the CDDI worked out to be 0.573 which indicates “average Dalit development” in the scale range specified for the purpose. The Dalit Deprivation Index (DDI) is 1-CDDI (0.573), thus in the present case the DDI is 0.427.
In addition to the computation of Human Development Index and other indices namely GII, CDI, FSI, CTDI, UDI and CDDI the report also throws light on issues relating to literacy and education, health & nutrition, standard of living, status of Scheduled Castes and Scheduled Tribes and Urban issues to understand the gamut of human development in the district.
Literacy Rate is the common indicator used for educational development in any district and it is calculated by considering the population above seven years. The total population above seven years of the district is 16.33 lakh and the literacy rate is 70.40 per cent. But it is less than the average literacy rate of the state (75.60%) and the district is placed in the 20th position in the literacy rate. The district in total has made some improvement in Literacy rate in the last decade from 2001 (61.05%) to 2011 (70.40%). The GER at elementary level in all the seven taluks is fairly high and it ranges between the lowest 85.76% (Nagamangala taluk) and the highest 107.34% (Mandya taluk). Three taluks -Mandya, Pandavapura and Maddur - have recorded a GER of greater than 100 per cent, whereas the other four taluks have recorded less than 100%. Pupil-Teacher Ratio at the elementary level in the district is 20:1 which means there are 20 pupils attached to one teacher. Considerable variation in Pupil-Teacher Ratio is noticed across the seven taluks, ranging between
4
13:1in Nagamangala taluk and 37:1 in Shrirangapattana taluk in 2011-12; while little variation is found across the taluks in 2009-10 and some variation in 2010-11. About 99% of the schools possess own buildings.
In respect of health and nutrition the core indicators like IMR, CMR, MMR and per capita expenditure on health are discussed in the report. The IMR for Mandya District is 26 which is much below the Karnataka and India’s IMR of 35 and 42 respectively. Krishnarajpet has highest rate of IMR with (27) is followed by Nagamangala and Malavalli with 26 each. The least IMR is found in four taluks namely Pandavapura, Shrirangapattana, Mandya and Maddur with IMR of 25. The Child Mortality Ratio (CMR) is the number of children who die in the age group of 0-5 years per 1000 live births. The CMR is 30 in Mandya district. Highest CMR of 31 is found in Mandya taluk followed by Krishnarajpet and Maddur with 29 apiece. On the other hand, the remaining four taluks namely Nagamangala, Pandavapura, Shrirangapattana and Malavalli recorded CMR of 28. The CMR for the district and the taluk is much below CMR for India (55) and Karnataka (54).Maternal Mortality Ratio (MMR) is the number of women who die during pregnancy and child birth, per 1, 00,000 live births. MMR is highest for Mandya with 124 followed by Pandavapura and Malavalli with 113 apiece. Lowest MMR of 104 is recorded for Krishnarajpet taluk followed by Maddur (105) and Nagamangala (107). The MMR of 111 for the district is below 144 for Karnataka and 178 for India. In terms of the number of children born under-weight (CUW), Nagamangala Taluk has the highest percentage (13.80%) followed by Mandya with 13.04 percent. Shrirangapattana taluk has the lowest CUW with 6.13 percent. Krishnarajpet Taluk has the highest percentage (26.07 %) of malnourished children (CMN) followed by Nagamangala (29.45%) and Shrirangapattana (20.95%). Pandavapura Taluk has the lowest CMN with 18.73 percent followed by Malavalli taluk with 21.7 percent. The highest per capita health expenditure (PCHE) of Rs. 2177.98 is incurred in Mandya taluk followed by Rs. 2149.62 in Krishnarajpet taluk. Pandavapura taluk has the least PCHE of Rs.1156.68. The district records PCHE of Rs.1782.95.
The Standard of Living in a broad sense reflects the quality of Life of the people. It includes basic needs as well as other happiness-enhancing goods and services. They are food, shelter/housing, clothing, personal vehicle ownership, luxury goods at home, etc. Their adequate quantity and good quality are very essential. In Mandya district, 6.61% of the households are without
house sites. Out of 73,354 urban households, 10,331 urban households do not have own houses. About 56.46 percent of the households owned pucca houses in Mandya district in 2011. Except Krishnarajpet taluk the remaining 6 taluks of the district have more than 50 percent households with pucca houses.
About 80.24% households in Mandya district are having access to potable drinking water supply by 2001; the percentage has gone up to 85.09 by 2011.In 2001, 77.66% of the households in the district had electricity connection; this has risen to 91.67% by 2011. Regarding sanitation, only 14.31% of the households were having toilets in 2001, the percentage went up to 37.47% by 2011. About 19.56% of the households have access to modern cooking fuel like LPG/PNG, electricity and biogas. There is more than doubling of the number of households using modern cooking fuel (like LPG), from 9.31% to 19.56%, between 2001 and 2011.
With regard to status of SCs and SCs in the district the data indicates that, about 54.93 percent of SC households lived in pucca houses; 81.31 percent of their houses were connected with drinking water; 85.06 percent of the houses were provided with electricity; 25.90 percent these households were built with toilets and only 10.41 percent were using modern cooking fuel. 53.24 percent of ST households had pucca houses; drinking water facilities was available for 78.75 percent of the houses while only 34.51 percent of the houses had toilets. About 83.53 percent of the houses were provided with electricity and 16.08 percent were using modern cooking fuel.
In respect of urban issues, about 17.49% of urban people in the district live in slums. Malavalli town has the highest percentage of the population living in slums while Shrirangapattana town has the lowest percentage (9.13%) of slum population. With regard to the percentage of households having access to four basic services in Mandya ULBs, the highest percentage (95.83%) had access to electricity, followed by 86.06% of the households having access to latrine facilities within the premises, 74.81% having access to water supply within the premises and 44.94% having closed drainage. Combining the four important basic services of availability of water within the premises, electricity, latrine facilities and closed drainage, only 75.41 per cent had access to all the four services.
The HDR also discusses on the growth of Mandya District’s Economy. Between 2004-05 and 2008-09, the Mandya district domestic product (DDP) grew at the
5
annual compound growth rate of 8.43% per annum. However, this growth rate was less than state average of 9.81%. Among the different sectors, Primary Sector grew at the rate of 11.41%, while the Secondary Sector grew at the rate of 8.83%, Contrary to the general trend witnessed during the growth process of a region, Mandya District’s Service Sector growth rate was the lowest (5.69%) during the period under reference. Obviously the District’s Per Capita Income (PCI) for the year 2008-09 was about half of the state Per Capita Income. The district’s Per Capita Income at 2004-05 prices was Rs.23, 635 as against the state average of Rs.41, 751. The compound growth rate of Mandya District’s PCI was 7.19% as against the State’s PCI growth rate of 8.56%.The Primary Sector in Mandya District still continues to contribute a high percentage of DDP (36.75%) while this sector contributes hardly 17.8% at the state level. The district is industrially backward in relation to the State’s industrial situation because the secondary sector of the district contributes hardly 22.89% as against the state average of 29.2%. The tertiary sector contributes 43.36% of the DDP whereas the State’s tertiary sector contributes 52.99% of the SDP.
In spite of being located on the Bengaluru -Mysuru Highway and having over 50 percent its land under irrigation, the per capita income of Mandya district is quite lower than that of the State and India. Although agricultural prosperous, the industrial development of the district is below the state average. There are large inter-taluk differences in the human development indicators. Krishnarajpet, Malavalli and Nagamangala taluks are less developed in respect of all three dimensions of human development namely living standard, health and education. Even Dr. Nanjundappa Committee had classified these three taluks under more backward taluks. Therefore, the development departments of the government would do well to focus attention on these backward taluks without of course neglecting future development potential of the other taluks. Removal of this human development gap among the taluks requires not only allocation of more funds to the critical factors influencing human development but also good governance at all levels of administration.

6

7

8
9

10
11
1.1. Concept and Methodolog y
The traditional concept of development focused on the expansion of production of goods and services and the consequent growth in per capita income was used as an indicator of prosperity. As economic prosperity measured in terms of per capita income does not always ensure enrichment in quality of life reflected in broader dimensions of well-being, it needs to be measured using alternative indicators such as Human Development Index (HDI) and the incidence of poverty, the indicators that are more appropriate in reflecting changes in the attainment levels during different periods of time.
Human Development is about much more than the rise in national incomes. It is about creating an environment in which people can develop their full potential and lead productive, creative lives in accordance with their needs and interests. People are the real wealth of a nation. Thus development is about expanding the choices people have to make to lead their lives the way they value. And it is thus much more than economic growth which is only a means, albeit a very important one, of enlarging people’s choices.
Fundamental to enlarging these choices is building human capabilities – the range of things that people can do in life. The most basic capabilities for human development are to lead a long and healthy life, to be knowledgeable to have access to the resources needed for a decent standard of living and to be able to participate in the life of the community. Without these, many choices are simply not available and many opportunities in life remain inaccessible.
Human Development as a DiscourseFrom an exclusive, income-centered paradigm for a very long time, development thinking has slowly but surely turned into an inclusive people-centered paradigm in the 1990s (UNDP, 1997; UNDP, 2007). This shift has ushered in a concern for inclusive human development, from what had until then been a concern for exclusive development. The architects of this shift are Amartya Sen and Mahabub-Ul-Haq (UNDP, 1997; and also Paul Streeten in a foreword to Haq. 1996).
CHAPTER 1
INTRODUCTION
The idea of human development had been evolving continuously and, in the process, its nature and scope had been widened in application as well as in understanding. Sen’s and Haq’s systematic exposition of the concept of human development is manifest in various reports, notably in the Human Development Reports (HDRs) of the United Nations Development Programme (UNDP), the national HDRs of the Indian Planning Commission and also the HDRs of the Government of Karnataka and other States, in letter and spirit.
Since its launch in 1990, the Human Development Report has defined human development as the process of enlarging the choices of people. The most critical of those choices are those of long and healthy life, education and a decent standard of living. There are, of course, other choices as well, viz., political freedom, human rights and self respect. These are choices that are essential and that bring further opportunities for people. Hence, human development is a process of widening people’s choices as well as raising the level of well-being. In his reflections on human development, Prof. Sen brings out the difference between growth-centered and people-centered development as that focusing on the choice of expanding income (growth-centered) and on the enlarging of all human choices, whether economic, social, cultural or political (people-centered).
The RationaleThe main purpose of the Human development Report for Mandya District is to provide a benchmark against which future attainments on the human development front can be judged. Another major purpose is to sensitize the State planners and policy makers to the significance of the human development perspective for promoting social well-being along with equitable and sustainable growth. Thus, human development can be an ideal instrument for increasing the pace of poverty reduction. This report also spells out the challenges that the local government faces in different areas of human development, and outlines the policy initiatives for meeting these challenges.
This report provides a critical examination of certain key components of human development in the district, highlights the achievements to date and describes what else needs to be done to consolidate and accelerate
12
the gains. In fact the 73rd and 74th Constitutional Amendments mandate the preparation of district-level plans. So, the District has been and will continue to be a very important unit for planning and its implementation for human development.
Among other things, the availability of district-level human development indicators would facilitate planning and resource mapping. Easy public access to current information of this type could serve as a ‘gauge’ to measure the performance and progress of various districts.
Objectives of the ReportThe specific objectives of the Human Development Report of Mandya District are: 1. To draw at a ‘rich picture’ of Human development in the district of Mandya by focusing specifically on the dimensions and indicators of human development as manifested in the district over space and time.
2. To critically examine human development of the district by taking into account the temporal and spatial variations in social, economic, cultural and political aspects of people’s life with special reference to demography, literacy and education, sanitation, health and nutrition, employment, income and poverty, socio-economic infrastructures such as housing, water supply, irrigation, power, transport and communication, gender issues and disparities in development among the poor and rich and the local governance with regard to panchayat raj institutions. 3. To bring out reasons for disparities in the development levels in all aspects mentioned above, and to develop strategies for bringing about equitable, sustainable, productive and empowered human development.
4. To identify the needs and priorities of backward taluks and find solutions to reduce the development gaps between them and the developed taluks by making appropriate provisions in the resource allocations.
Human Development Index Methodolog yBeing central to the concerns of human development, it is this index which ranks the taluks in the order of their progress, in the annual reports on human development.
HDI is valuable in bringing forth the correspondence or lack of it between economic growth and human development. The greater the gap in the two rankings, greater is the absence of convergence between two vital indicators of development. Either way, it is undesirable. If human development lags behind economic growth, it indicates flaws in the pattern of growth and existence of significant distributive imbalances in incomes and assets. The other way too, it is undesirable as long-term human development cannot be sustained without a reasonable rate of economic growth.
The concept of human development as propounded in the UNDP’s Human Development reports is multifaceted and still evolving. The range and dimensions of the choices have been expanding with successive Global HDRs. Nevertheless, the three choices, viz., to lead a long life, to acquire knowledge and to have resources needed for a decent living which are central to the notion of human development have remained constant.
The HDI is indeed a summary measure of human development. It measures the average achievement in a country in three basic dimensions of human development. The Global Human Development Report-2010 prepared by the UNDP has used an improved methodology for computing HDI, GII and MPI. The measurement of human development is now broad-based and it considers several additional indicators. Accordingly, eleven indicators have been used for measuring the three dimensions of HDI.
HDI is the geometric mean of the three-dimensional indices. Besides HDI, additional indices have been constructed by the India Human Development Report 2011 making the understanding of the levels of human development even better through computing inequality-adjusted Human Development Index (IHDI), Gender inequality Index (GII) and Multidimensional Poverty Index (MPI). In this report only HDI and GII are covered as the other index, MPI, has not been constructed owing to certain data constraints.
Gender Inequality Index (GII)GII measures the loss in the potential of human development due to inequality between female and male achievements. As it reflects an inequality situation, a value of zero represents no gender inequality and a value of one represents highest level of gender inequality in the society. The UNDP Report for 2010 measures GII, using three dimensions, namely reproductive health; empowerment and labour market.
13
In addition to the HDI and GII, the DHDR presents indices on various Human Development issues, namely: Child Development Index (CDI), Food Security Index (FSI), Urban Development Index (UDI) Composite Taluk Development Index (CTDI) and Composite Dalit Development Index (CDDI).
1.2. Factors contributing to Human Development
Human development is inextricably linked with human freedom. Human development emphasizes enhancement of human capabilities, which reflect the freedom to achieve different things that people value. In this sense, human development is freedom. However, this freedom, the ability to achieve things that people value, cannot be used if opportunities to exercise this freedom do not exist. Such opportunities are ensured through the existence of various key institutions namely the community, the society, and the state. Human development and human rights are common denominators in achieving human freedom. Human development, by enhancing human capabilities, creates the ability to exercise freedom, while human rights, by providing the necessary framework, creates the opportunities to exercise it. Freedom is both the guarantor and the goal of both facets of human development.
Poverty as well as tyranny, limited economic opportunities as well as systematic social deprivation, neglect of public facilities as well as intolerance or state repression are major sources of human deprivation and thus diminution of human development. Overcoming these deprivations is central to the process of development. In the context of this broader approach to well-being and for empirical purposes, five distinct types of individual freedom have been identified as being of special importance for policy purposes on the grounds that they contribute directly to the general capability of a person and that they complement one another in achieving human development as a whole. The important factors are:
• Political freedom, which relates to the opportunities that people have to determine who should govern and on what principles, and also includes the possibility to scrutinize and criticize authorities and to have freedom of political expression and a liberal press. • Economic facilities, which can be understood as the ways in which economies function to create income opportunities and promote equitable distribution of wealth.
• Social opportunities, which refer to the arrangements that society makes for education and health care, both of which influence the individual’s substantive self-determination to live better. • Protective security, which deals with the provision of the relevant social safety nets for vulnerable groups in society.
Thus, human development, by encompassing all these aspects, represents a more holistic approach to development. It is for these reasons that the Human Development has four pillars often referred to as components, namely equity ( for example equitable access to opportunities), sustainability (sustaining development over generations and opportunities for development), productivity (increasing human skills for enabling their participation in income generation) and empowerment (enabling people to participate in decision making processes that shape their lives), without which any chartering of human development will not come out with productive results.
1.3. Data Collection, Data sources, Compilation and Validation
The study has used the well-known and time-tested UNDP methodology. The experience gained from the Human Development reports prepared at the National, State and district levels is brought to bear on the preparation of Human Development Report for Mandya district. The UNDP methods are not paraphrased here for they are available in the appendices of the HDRs of several Indian states and the districts and the modifications are considered in the light of data sets and that become available for use in the preparation of the present report.
It was necessary to mobilize logistic support from the Local Governments in the compilation of data for computing the HDI, GII and so on. It was equally important to make organized efforts at collecting, analyzing data and computing the indices using data on various aspects for several years (temporal) and taluks (spatial). The year-long effort at preparing the Human Development report for the District actually started with a series of three workshops organized at the district and sub-district levels for preparing a work plan and creating awareness among stakeholders. Deliberations were held on various dimensions of human development with the local government officials and people, NGOs and Community Based Organisation (CBO) who were useful
14
in adding perspectives to the preparation of DHDR and to gather reliable and accurate data for the construction of human development indices.
Selection of Indicators The assessment of human development in any study is accomplished through certain indicators which are measurable and quantifiable. But, often the direct indicators reflecting human development are not available at the sub-district level. Hence, it is important to go for proxy indicators to understand the position of human development.
For the preparation of DHDRs, a set of 126 indicators affecting human development have been identified and selected based on the availability and reliability of data at the taluk level. These data are used in the relevant chapters for understanding the position of the taluk in the respective districts.
HDI is calculated by using three broad parameters related to education, health, and standard of living. The set of 126 indicators influence the three broad parameters of human development. These indicators are chosen taking into account demographic factors, livelihood and employment related factors, household assets, factors empowering the community, health factors including water supply and sanitation, and education factors.
The DHDR for Mandya has made use of several data sources for constructing 126 indicators. Two broad types of data sources were used namely government sources and private sources. The government sources included Census of India, 2001 & 2011, the data from the departments of education, health, women and child, agriculture, urban development, social welfare, food & civil supplies, industries and commerce, public administration, rural development and so on. Census data were used particularly for demographic, health and educational indicators. The data were also gathered from other published and unpublished reports of Central & State governments, Research reports, ZP, TPs and GPs. The data published by DES, particularly on income estimates were used.
For obtaining reliable data from several departments at the district level, consultations were held with the department officials. In the first stage we had supplied a data format for all the line departments of ZP for filling up the data in the formats individually and send the same to the lead agency. Upon looking into the information
obtained on various indicators from the departments in the first data format, we had observed that there were some data discrepancies regarding IMR, MMR, and CMR given by the Health Department and also Women and Child Welfare Department. The Health department data on these indicators did not match with the data given by the Women and Child Welfare Department. Similarly the data given by the other departments on several indicators had shown discrepancies. After verifying these, we had another meeting with all the line departments to discuss the data differences on the same indicators between the departments. We had asked them to rectify such data by sitting together and finalizing a consistent data to be forwarded to the lead agency. In the second step we had prepared another data format which was being circulated among all the departments for collection of basic information from the line departments coming under the ZP.
The Human Development Division, Planning Department, Government of Karnataka had supplied a list of 126 indicators for the collection of data from concerned departments for computing various indices and to prepare the DHDR. The data format was prepared and sent to the concerned departments to provide the data on these 126 indicators for the years 2009-10, 2010-11 and 2011-12. A meeting was conducted inviting all the line departments in the ZP under the chairmanship of Chief Executive Officer to discuss the method of compiling various data. In order to collect the data from several departments, we had deputed our investigators. The data given by them on 126 indicators were verified by the lead agency which found that data were not reliable on a good number of indicators relating to health, education, agriculture, women and children etc. So, the lead agency realised that without reliable data it would be difficult to prepare a good quality Human Development Report. Hence we decided to call upon all the line departments of ZP to have a serious re- look into the quality of the data.
Some of the 126 indicators given by the Human Development Division are Census data and the remaining is drawn from the line departments of ZP. The data pertaining to the Census were verified by looking into the Census of India 2001 and 2011 reports, and then the data were validated. In order to get quality data on non-census indicators given by the departments, the lead agency called for the original absolute form of the data given by the line departments in the form of numbers, percentages, ratios etc. The line departments furnished
15
their original data (absolute data) and sat with the lead agency again to verify the percentages, numbers, ratios, etc. They found that there were still some mistakes in computing these ratios, percentages etc. After looking into the absolute data and thoroughly verifying the data furnished on various indicators, some consistency of data on these indicators was ensured. These data pertained to years 2009-10, 2010-11 and 2011-12.
The Human Development Division, Planning Department, Government of Karnataka also looked into such data given by lead agencies for all the 30 districts and found that the data given on health indicators were not realistic. The Human Development Division verified these data from the concerned departments and validated the same and supplied to concerned lead agencies with a caution to use only these data on health indicators such as MMR, IMR, CMR, malnourished children and pregnant women with anemia while computing indicators for their respective districts.
The other method used to overcome the problem of poor and unreliable data was small area surveys. The small area surveys were being identified by the lead agencies to support/complement the data on important indicators/issues of the district. The surveys could give some input to the lead agency to complement the poor quality data on the indicators with the help of which the lead agency could verify such data given by line departments. For this purpose, five such small area surveys were been conducted in Mandya district on the following issues:
1) Female Drop-outs in Lower and Higher Primary and Secondary education – A study in three GPs of Nagamangala Taluk 2) Socio-economic status of slum dwellers in Malavalli Town of Mandya District 3) Construction and the Use of Rural Toilets – A study in Manikyanahalli GP of Pandavapura Taluk 4) Efficacy of Health Care Services for Pregnant Women – A study in K. Honnalagere GP of Maddur Taluk. 5) Community attitudes and social prejudices, affecting women and girl children in Shrirangapattana & Mandya taluks - A study in K. Shettihalli and Tubinakere GPs. 6) A Study on Dalit Development Index in Chikkadiganahalli village, Vittalapura GP of Krishnarajpet Taluk
Core committee and technical committee Nine technical committees were formed on health, livelihood opportunity, women and children, rural development, agriculture, housing, water, sanitation and gender issues. These committees comprised the district officers and taluk level functionaries from various government agencies, and met periodically to discuss various human development issues, data discrepancies, progress of the report etc. The matters discussed in the technical committees used to be brought to the notice of the core committee by the chairpersons of respective technical committees. The chairpersons of the technical committees were the members of the core committee under the chairmanship of Chief Executive Officer of ZP. The issues discussed in the core committee along with the lead agencies were meant to sort out the data and other constraints, and to find solutions for the same in order to improve the quality of preparation of DHDR. The final report of DHDR is the outcome of the efforts of both the core committee and technical committees.
The issues raised by lead agencies used to be discussed in the core committee, which used to meet periodically to discuss the various issues such as data collection, data validation and other factors on human development. The district officers of all the line departments had taken initiatives in providing required information to lead agency. They not only furnished data to the investigators, but also voluntarily visited the office of lead agency to clarify the latter’s doubts and validates the data from time to time under the leadership of Chief Executive Officer, ZP, Mandya. The Chief Planning Officer (CPO) also used to respond positively and give instructions to the officers of line departments from time to time for preparation of DHDR Mandya. Not only the officials but also the elected representatives contributed to the preparation of the report by way of interactions with the District Planning Committee (DPC).
District and Taluk level workshopsTwo district-level and three Taluk-level workshops were conducted to deliberate on all human development issues and also to create awareness among Government officials and elected representatives about the significance of the DHDR. For the district level workshops all the ZP and DPC members used to be invited along with the district officers, NGOs and members mass media to discuss the issues on education, health, drinking water and sanitation, employment etc., The officials of the Government departments and members of NGOs gave suitable suggestions for including issue-based matters
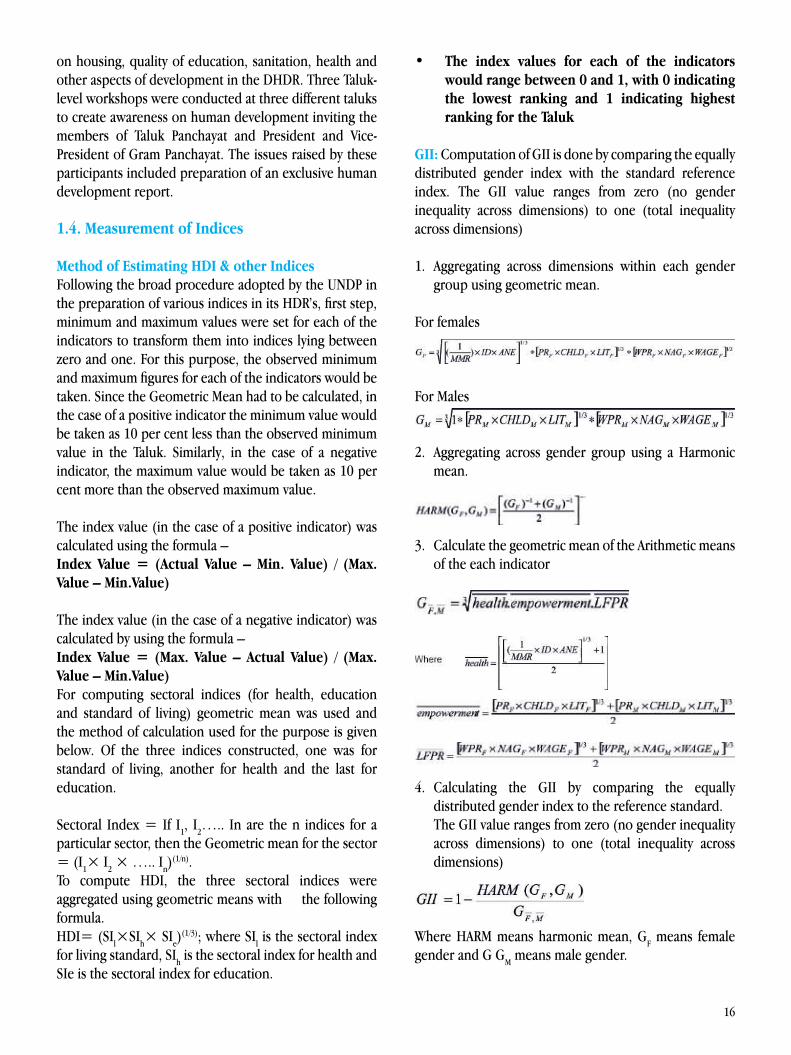
16
on housing, quality of education, sanitation, health and other aspects of development in the DHDR. Three Taluk-level workshops were conducted at three different taluks to create awareness on human development inviting the members of Taluk Panchayat and President and Vice-President of Gram Panchayat. The issues raised by these participants included preparation of an exclusive human development report.
1.4. Measurement of Indices
Method of Estimating HDI & other IndicesFollowing the broad procedure adopted by the UNDP in the preparation of various indices in its HDR’s, first step, minimum and maximum values were set for each of the indicators to transform them into indices lying between zero and one. For this purpose, the observed minimum and maximum figures for each of the indicators would be taken. Since the Geometric Mean had to be calculated, in the case of a positive indicator the minimum value would be taken as 10 per cent less than the observed minimum value in the Taluk. Similarly, in the case of a negative indicator, the maximum value would be taken as 10 per cent more than the observed maximum value.
The index value (in the case of a positive indicator) was calculated using the formula –Index Value = (Actual Value – Min. Value) / (Max.Value – Min.Value)
The index value (in the case of a negative indicator) was calculated by using the formula –Index Value = (Max. Value – Actual Value) / (Max.Value – Min.Value)For computing sectoral indices (for health, education and standard of living) geometric mean was used and the method of calculation used for the purpose is given below. Of the three indices constructed, one was for standard of living, another for health and the last for education.
Sectoral Index = If I1, I2….. In are the n indices for a particular sector, then the Geometric mean for the sector = (I1× I2 × ….. In)
(1/n).To compute HDI, the three sectoral indices were aggregated using geometric means with the following formula.HDI= (SIl×SIh× SIe)
(1/3); where SIl is the sectoral index for living standard, SIh is the sectoral index for health and SIe is the sectoral index for education.
• The index values for each of the indicators would range between 0 and 1, with 0 indicating the lowest ranking and 1 indicating highest ranking for the Taluk
GII: Computation of GII is done by comparing the equally distributed gender index with the standard reference index. The GII value ranges from zero (no gender inequality across dimensions) to one (total inequality across dimensions)
1. Aggregating across dimensions within each gender group using geometric mean.
For females
For Males
2. Aggregating across gender group using a Harmonic mean.
3. Calculate the geometric mean of the Arithmetic means of the each indicator
4. Calculating the GII by comparing the equally distributed gender index to the reference standard. The GII value ranges from zero (no gender inequality across dimensions) to one (total inequality across dimensions)
Where HARM means harmonic mean, GF means female gender and G GM means male gender.
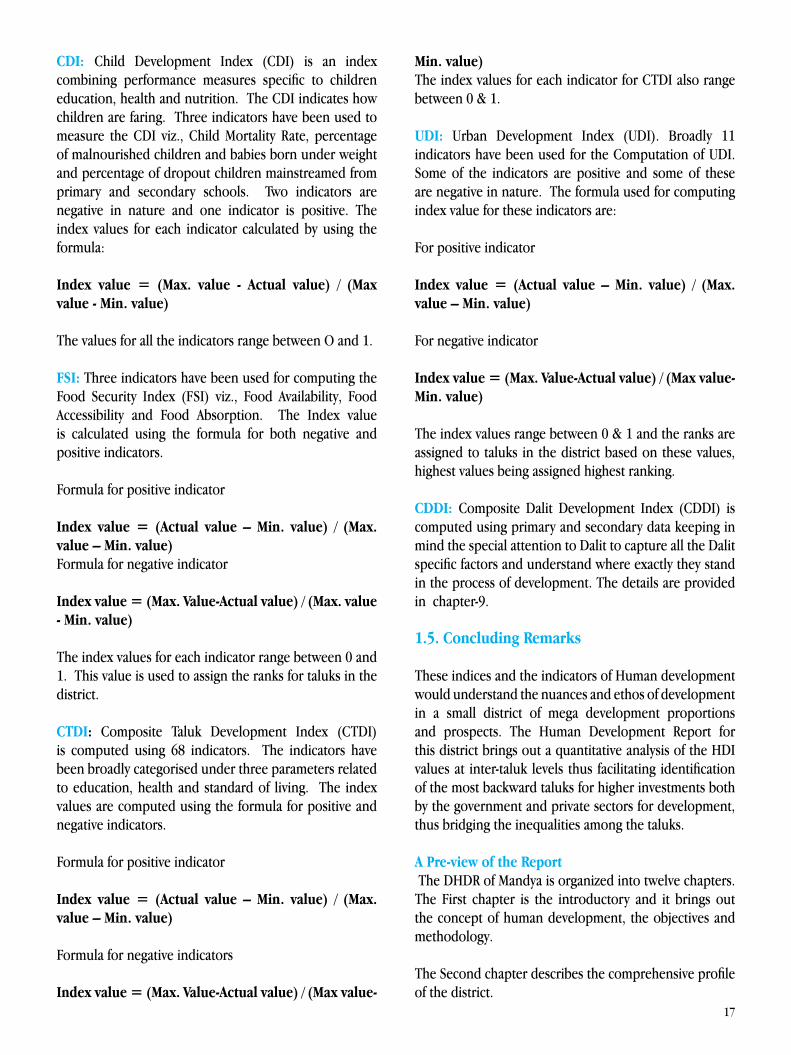
17
CDI: Child Development Index (CDI) is an index combining performance measures specific to children education, health and nutrition. The CDI indicates how children are faring. Three indicators have been used to measure the CDI viz., Child Mortality Rate, percentage of malnourished children and babies born under weight and percentage of dropout children mainstreamed from primary and secondary schools. Two indicators are negative in nature and one indicator is positive. The index values for each indicator calculated by using the formula:
Index value = (Max. value - Actual value) / (Max value - Min. value)
The values for all the indicators range between O and 1.
FSI: Three indicators have been used for computing the Food Security Index (FSI) viz., Food Availability, Food Accessibility and Food Absorption. The Index value is calculated using the formula for both negative and positive indicators.
Formula for positive indicator
Index value = (Actual value – Min. value) / (Max. value – Min. value)Formula for negative indicator
Index value = (Max. Value-Actual value) / (Max. value - Min. value)
The index values for each indicator range between 0 and 1. This value is used to assign the ranks for taluks in the district.
CTDI: Composite Taluk Development Index (CTDI) is computed using 68 indicators. The indicators have been broadly categorised under three parameters related to education, health and standard of living. The index values are computed using the formula for positive and negative indicators.
Formula for positive indicator
Index value = (Actual value – Min. value) / (Max. value – Min. value)
Formula for negative indicators
Index value = (Max. Value-Actual value) / (Max value-
Min. value) The index values for each indicator for CTDI also range between 0 & 1.
UDI: Urban Development Index (UDI). Broadly 11 indicators have been used for the Computation of UDI. Some of the indicators are positive and some of these are negative in nature. The formula used for computing index value for these indicators are:
For positive indicator
Index value = (Actual value – Min. value) / (Max. value – Min. value)
For negative indicator
Index value = (Max. Value-Actual value) / (Max value- Min. value)
The index values range between 0 & 1 and the ranks are assigned to taluks in the district based on these values, highest values being assigned highest ranking.
CDDI: Composite Dalit Development Index (CDDI) is computed using primary and secondary data keeping in mind the special attention to Dalit to capture all the Dalit specific factors and understand where exactly they stand in the process of development. The details are provided in chapter-9.
1.5. Concluding Remarks
These indices and the indicators of Human development would understand the nuances and ethos of development in a small district of mega development proportions and prospects. The Human Development Report for this district brings out a quantitative analysis of the HDI values at inter-taluk levels thus facilitating identification of the most backward taluks for higher investments both by the government and private sectors for development, thus bridging the inequalities among the taluks.
A Pre-view of the Report The DHDR of Mandya is organized into twelve chapters. The First chapter is the introductory and it brings out the concept of human development, the objectives and methodology.
The Second chapter describes the comprehensive profile of the district.
18
The Third chapter is on computation of indices. It elaborates the methods of computing Human Development Index, Gender Inequality Index, Child Development Index, Food Security Index, Urban Development Index, Composite Taluk Development Index and Composite Dalit Development Index.
The Fourth chapter brings out the literacy and education profile of the district covering literacy ratio, educational infrastructure school enrollment, school dropouts, Teacher-Pupil ratio and educational programmes.
The Fifth chapter deals with health and nutrition and also demographic features including IMR and MMR, institutional delivery, performance of various health schemes and inadequacies of health care system.
The Sixth chapter examines income, employment and poverty in the district. This chapter also focuses on the work-participation rate, occupation pattern and child labour.
The Seventh chapter deals with the standard of living comprising housing status, drinking water, electricity and sanitation.
The Eighth chapter examines gender and development issues comprising gender differentials in the district, pattern of literacy and enrollment, community attitudes and social prejudices effecting women and girl children and crime against women. The chapter also focuses on the role of women’s groups in development.
The Ninth chapter analyses the status of scheduled castes and scheduled tribes covering demographic profile, education profile, occupational pattern, housing, sanitation and drinking water facilities for SCs and STs.
The Tenth chapter deals with governance and human development, highlighting the role of good governance and NGOs in human development programmes.
The Eleventh chapter focuses on urban issues in human development in the district. This chapter discusses service delivery issues, water supply, sanitation and solid and liquid waste management.
The Twelfth chapter, the last one, covers The Way Forward for human development in Mandya district. This chapter discusses limitations relating to measurement of indices, education, health, regional disparities and the way ahead for overcoming them for preparation of future human development reports.
NOTE 1: Since the number of tables in each chapter is quite large, they have been shifted to Annexure –I except chapter -3. For easy table identification with respect to each chapter, the tables serial number is digitalized, with the first digit showing the chapter no. and the second showing the serial no. of the table in that chapter.
19
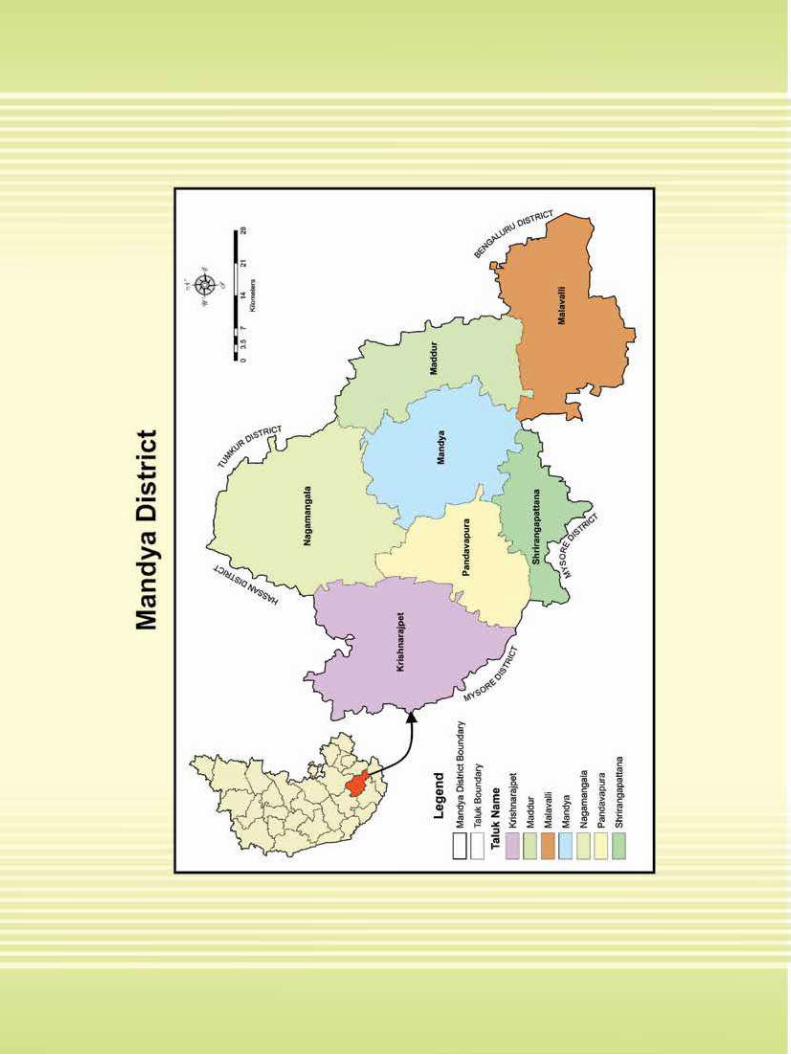
20
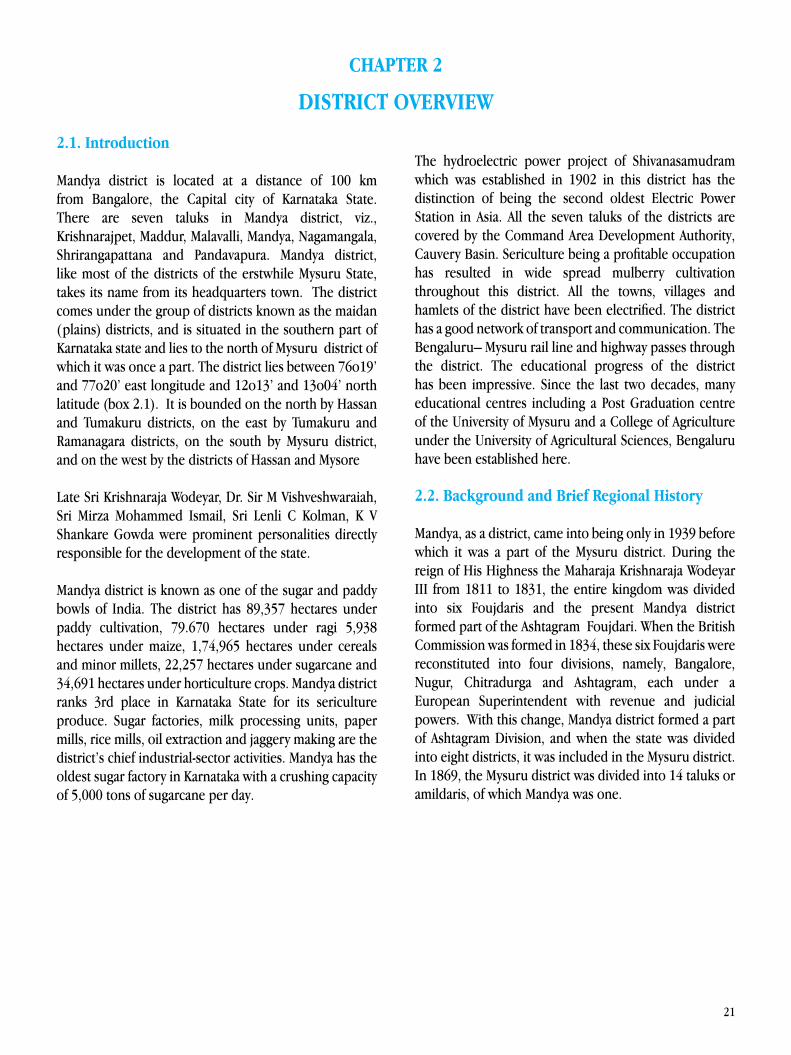
21
2.1. Introduction
Mandya district is located at a distance of 100 km from Bangalore, the Capital city of Karnataka State. There are seven taluks in Mandya district, viz., Krishnarajpet, Maddur, Malavalli, Mandya, Nagamangala, Shrirangapattana and Pandavapura. Mandya district, like most of the districts of the erstwhile Mysuru State, takes its name from its headquarters town. The district comes under the group of districts known as the maidan (plains) districts, and is situated in the southern part of Karnataka state and lies to the north of Mysuru district of which it was once a part. The district lies between 76o19’ and 77o20’ east longitude and 12o13’ and 13o04’ north latitude (box 2.1). It is bounded on the north by Hassan and Tumakuru districts, on the east by Tumakuru and Ramanagara districts, on the south by Mysuru district, and on the west by the districts of Hassan and Mysore
Late Sri Krishnaraja Wodeyar, Dr. Sir M Vishveshwaraiah, Sri Mirza Mohammed Ismail, Sri Lenli C Kolman, K V Shankare Gowda were prominent personalities directly responsible for the development of the state.
Mandya district is known as one of the sugar and paddy bowls of India. The district has 89,357 hectares under paddy cultivation, 79.670 hectares under ragi 5,938 hectares under maize, 1,74,965 hectares under cereals and minor millets, 22,257 hectares under sugarcane and 34,691 hectares under horticulture crops. Mandya district ranks 3rd place in Karnataka State for its sericulture produce. Sugar factories, milk processing units, paper mills, rice mills, oil extraction and jaggery making are the district’s chief industrial-sector activities. Mandya has the oldest sugar factory in Karnataka with a crushing capacity of 5,000 tons of sugarcane per day.
CHAPTER 2
DISTRICT OVERVIEW
The hydroelectric power project of Shivanasamudram which was established in 1902 in this district has the distinction of being the second oldest Electric Power Station in Asia. All the seven taluks of the districts are covered by the Command Area Development Authority, Cauvery Basin. Sericulture being a profitable occupation has resulted in wide spread mulberry cultivation throughout this district. All the towns, villages and hamlets of the district have been electrified. The district has a good network of transport and communication. The Bengaluru– Mysuru rail line and highway passes through the district. The educational progress of the district has been impressive. Since the last two decades, many educational centres including a Post Graduation centre of the University of Mysuru and a College of Agriculture under the University of Agricultural Sciences, Bengaluru have been established here.
2.2. Background and Brief Regional History
Mandya, as a district, came into being only in 1939 before which it was a part of the Mysuru district. During the reign of His Highness the Maharaja Krishnaraja Wodeyar III from 1811 to 1831, the entire kingdom was divided into six Foujdaris and the present Mandya district formed part of the Ashtagram Foujdari. When the British Commission was formed in 1834, these six Foujdaris were reconstituted into four divisions, namely, Bangalore, Nugur, Chitradurga and Ashtagram, each under a European Superintendent with revenue and judicial powers. With this change, Mandya district formed a part of Ashtagram Division, and when the state was divided into eight districts, it was included in the Mysuru district. In 1869, the Mysuru district was divided into 14 taluks or amildaris, of which Mandya was one.

22
Box 2.1: Summary Statistics of Mandya District (2011)
1. Height (MSL) 760 to 920 meters above MSL
2. Latitude 76° 19'–77° 07'
3. Longitude 12° 11' N – 13° 00'
4. Population:
Male 905,085
Female 900,684
Total 1,805,769
5. Population Growth rate (%) 2.38
6. Sex Ratio 995
7. 0-6 Sex Ratio 939
8. Density (Persons per sq.km) 364
9. Literacy rate (%) 70.40
10. Male (%) 78.27
11. Female (%) 62.54
12. SC Population to total Population (%) 14.69
13. ST Population to total Population (%) 1.24
14. Workforce Participation Rate (%) 48.36
15. Main workers to total workers (%) 82.04
16. Cultivators to total workers (%) 44.64
17. Urban Population to Total population (%) 17.08
18. Slum population to urban population (%) 17.49
Source: Census of India, 2011
2.3. Physiographic features of the District
Most of the land is flat, interspersed with hilly regions and sparsely vegetated by thorns and boshes. The district is situated at a height of 762 to 914 meters from the sea level. The district has fertile land with red soil mixed with sand, red clay-soil and red soil mixed with stones. Mandya, Maddur, Nagamangala blocks have red soil mixed stone and iron content which has less water holding capacity. Malavalli, Shrirangapattana and Pandavapura blocks have
clay-soil mixed red soil. Mandya district is popularly known as the belt of sugar.
2.3.1. Rainfall
The average rainfall in the district is 691.2 mm. The rainfall is generally uniform in the district except in the western border where the rainfall is a little higher. The rainfall varies from 742 mm at Krishnarajpet to 670.6 mm at Shrirangapattana. The rainy season is mostly confined
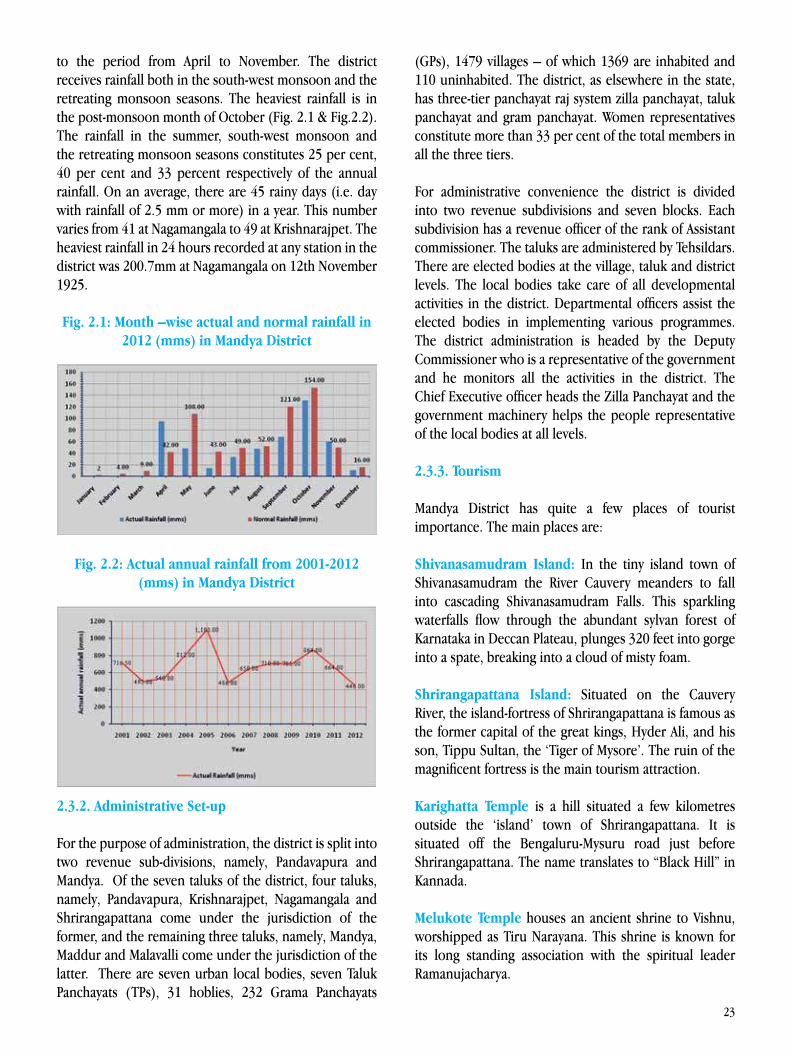
23
to the period from April to November. The district receives rainfall both in the south-west monsoon and the retreating monsoon seasons. The heaviest rainfall is in the post-monsoon month of October (Fig. 2.1 & Fig.2.2). The rainfall in the summer, south-west monsoon and the retreating monsoon seasons constitutes 25 per cent, 40 per cent and 33 percent respectively of the annual rainfall. On an average, there are 45 rainy days (i.e. day with rainfall of 2.5 mm or more) in a year. This number varies from 41 at Nagamangala to 49 at Krishnarajpet. The heaviest rainfall in 24 hours recorded at any station in the district was 200.7mm at Nagamangala on 12th November 1925.
Fig. 2.1: Month –wise actual and normal rainfall in 2012 (mms) in Mandya District
Fig. 2.2: Actual annual rainfall from 2001-2012 (mms) in Mandya District
2.3.2. Administrative Set-up
For the purpose of administration, the district is split into two revenue sub-divisions, namely, Pandavapura and Mandya. Of the seven taluks of the district, four taluks, namely, Pandavapura, Krishnarajpet, Nagamangala and Shrirangapattana come under the jurisdiction of the former, and the remaining three taluks, namely, Mandya, Maddur and Malavalli come under the jurisdiction of the latter. There are seven urban local bodies, seven Taluk Panchayats (TPs), 31 hoblies, 232 Grama Panchayats
(GPs), 1479 villages – of which 1369 are inhabited and 110 uninhabited. The district, as elsewhere in the state, has three-tier panchayat raj system zilla panchayat, taluk panchayat and gram panchayat. Women representatives constitute more than 33 per cent of the total members in all the three tiers.
For administrative convenience the district is divided into two revenue subdivisions and seven blocks. Each subdivision has a revenue officer of the rank of Assistant commissioner. The taluks are administered by Tehsildars. There are elected bodies at the village, taluk and district levels. The local bodies take care of all developmental activities in the district. Departmental officers assist the elected bodies in implementing various programmes. The district administration is headed by the Deputy Commissioner who is a representative of the government and he monitors all the activities in the district. The Chief Executive officer heads the Zilla Panchayat and the government machinery helps the people representative of the local bodies at all levels.
2.3.3. Tourism
Mandya District has quite a few places of tourist importance. The main places are:
Shivanasamudram Island: In the tiny island town of Shivanasamudram the River Cauvery meanders to fall into cascading Shivanasamudram Falls. This sparkling waterfalls flow through the abundant sylvan forest of Karnataka in Deccan Plateau, plunges 320 feet into gorge into a spate, breaking into a cloud of misty foam.
Shrirangapattana Island: Situated on the Cauvery River, the island-fortress of Shrirangapattana is famous as the former capital of the great kings, Hyder Ali, and his son, Tippu Sultan, the ‘Tiger of Mysore’. The ruin of the magnificent fortress is the main tourism attraction.
Karighatta Temple is a hill situated a few kilometres outside the ‘island’ town of Shrirangapattana. It is situated off the Bengaluru-Mysuru road just before Shrirangapattana. The name translates to “Black Hill” in Kannada.
Melukote Temple houses an ancient shrine to Vishnu, worshipped as Tiru Narayana. This shrine is known for its long standing association with the spiritual leader Ramanujacharya.
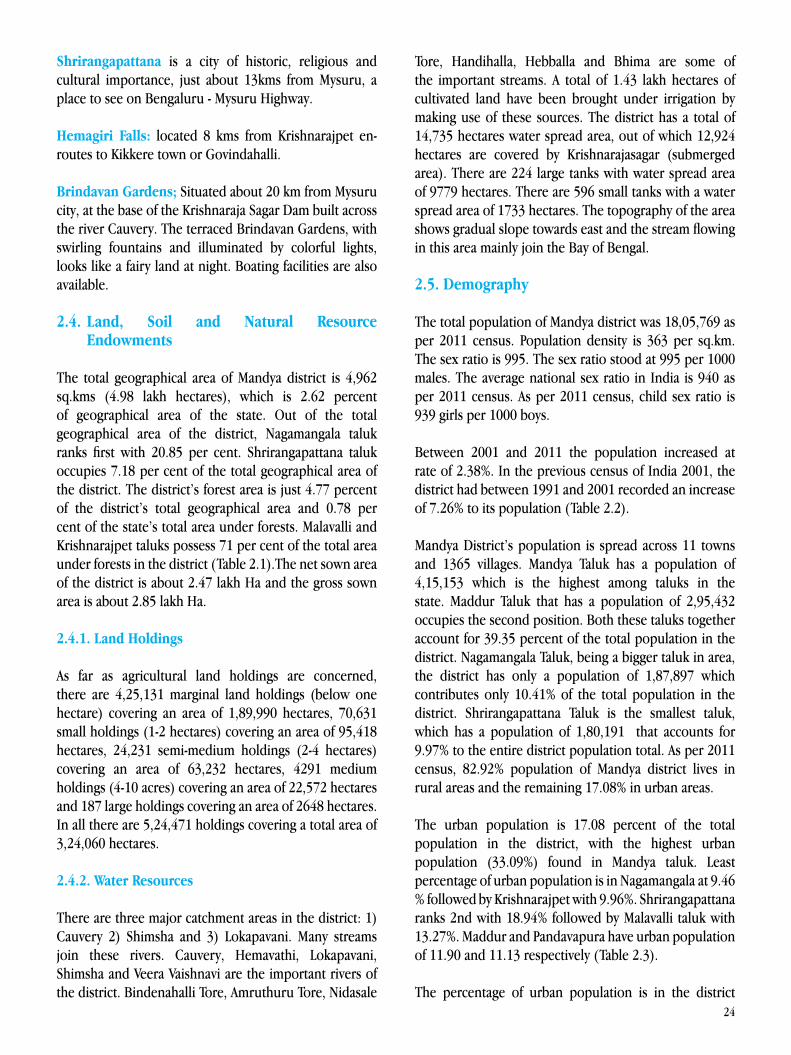
24
Shrirangapattana is a city of historic, religious and cultural importance, just about 13kms from Mysuru, a place to see on Bengaluru - Mysuru Highway.
Hemagiri Falls: located 8 kms from Krishnarajpet en-routes to Kikkere town or Govindahalli.
Brindavan Gardens; Situated about 20 km from Mysuru city, at the base of the Krishnaraja Sagar Dam built across the river Cauvery. The terraced Brindavan Gardens, with swirling fountains and illuminated by colorful lights, looks like a fairy land at night. Boating facilities are also available.
2.4. Land, Soil and Natural Resource Endowments
The total geographical area of Mandya district is 4,962 sq.kms (4.98 lakh hectares), which is 2.62 percent of geographical area of the state. Out of the total geographical area of the district, Nagamangala taluk ranks first with 20.85 per cent. Shrirangapattana taluk occupies 7.18 per cent of the total geographical area of the district. The district’s forest area is just 4.77 percent of the district’s total geographical area and 0.78 per cent of the state’s total area under forests. Malavalli and Krishnarajpet taluks possess 71 per cent of the total area under forests in the district (Table 2.1).The net sown area of the district is about 2.47 lakh Ha and the gross sown area is about 2.85 lakh Ha.
2.4.1. Land Holdings As far as agricultural land holdings are concerned, there are 4,25,131 marginal land holdings (below one hectare) covering an area of 1,89,990 hectares, 70,631 small holdings (1-2 hectares) covering an area of 95,418 hectares, 24,231 semi-medium holdings (2-4 hectares) covering an area of 63,232 hectares, 4291 medium holdings (4-10 acres) covering an area of 22,572 hectares and 187 large holdings covering an area of 2648 hectares. In all there are 5,24,471 holdings covering a total area of 3,24,060 hectares.
2.4.2. Water Resources
There are three major catchment areas in the district: 1) Cauvery 2) Shimsha and 3) Lokapavani. Many streams join these rivers. Cauvery, Hemavathi, Lokapavani, Shimsha and Veera Vaishnavi are the important rivers of the district. Bindenahalli Tore, Amruthuru Tore, Nidasale
Tore, Handihalla, Hebballa and Bhima are some of the important streams. A total of 1.43 lakh hectares of cultivated land have been brought under irrigation by making use of these sources. The district has a total of 14,735 hectares water spread area, out of which 12,924 hectares are covered by Krishnarajasagar (submerged area). There are 224 large tanks with water spread area of 9779 hectares. There are 596 small tanks with a water spread area of 1733 hectares. The topography of the area shows gradual slope towards east and the stream flowing in this area mainly join the Bay of Bengal.
2.5. Demography
The total population of Mandya district was 18,05,769 as per 2011 census. Population density is 363 per sq.km. The sex ratio is 995. The sex ratio stood at 995 per 1000 males. The average national sex ratio in India is 940 as per 2011 census. As per 2011 census, child sex ratio is 939 girls per 1000 boys.
Between 2001 and 2011 the population increased at rate of 2.38%. In the previous census of India 2001, the district had between 1991 and 2001 recorded an increase of 7.26% to its population (Table 2.2).
Mandya District’s population is spread across 11 towns and 1365 villages. Mandya Taluk has a population of 4,15,153 which is the highest among taluks in the state. Maddur Taluk that has a population of 2,95,432 occupies the second position. Both these taluks together account for 39.35 percent of the total population in the district. Nagamangala Taluk, being a bigger taluk in area, the district has only a population of 1,87,897 which contributes only 10.41% of the total population in the district. Shrirangapattana Taluk is the smallest taluk, which has a population of 1,80,191 that accounts for 9.97% to the entire district population total. As per 2011 census, 82.92% population of Mandya district lives in rural areas and the remaining 17.08% in urban areas.
The urban population is 17.08 percent of the total population in the district, with the highest urban population (33.09%) found in Mandya taluk. Least percentage of urban population is in Nagamangala at 9.46 % followed by Krishnarajpet with 9.96%. Shrirangapattana ranks 2nd with 18.94% followed by Malavalli taluk with 13.27%. Maddur and Pandavapura have urban population of 11.90 and 11.13 respectively (Table 2.3).
The percentage of urban population is in the district
25
rather very low when compared to Karnataka (38.57%) and India (31.16%). The percentage of rural population is very high in Mandya district when compared with Karnataka and India. There is a very slight decrease of 1.05% in rural population from 2001 to 2011 for Mandya whereas the decreases are 4% and 5% for Karnataka and India respectively (Table 2.4).
Sex ratio is 993 for rural areas and 995 for urban areas. The child population comprises 9.69% of total rural population of Mandya district (Table 2.5).
2.6. Literacy
The literacy rate in different communities of the district is rising year after year. The district’s average literacy rate was 70.40 % in 2011 compared to 66.64% in 2001. Even after 6 decades of the independence, the literacy rate among SCs, STs, backward classes and Muslim community is still low. Literacy is considered as an important facet of human development.
2.7. Industry Having one engineering college and three Polytechnics with different disciplines, educational institutions provide a good source of technical manpower for industrialization. Mandya is located within 50 km radius from various research organisations like CFTRI, DFRL, CIPET, and STEP-SJCE which helps in better industrialisation of the district.
The District has two KIADB industrial areas - one at Tubinakere near Mandya and another at Somanahalli near Maddur. There are KSSIDC industrial estates located at Mandya town, Ganjam (Shrirangapattana), Somanahalli (Maddur), Harohalli (Pandavapura), Nagamangala. Recently a substation of 220 KVA was operationalised at Tubinakere. However, in spite of being strategically located, Mandya district is considered as one among the industrially developing districts of Karnataka.
By the end of March 2002, the district had 14 large and medium scale industries. Of these 3 belonged to government, 2 belonged to the co-operative sector and the remaining 9 were under the control of the private sector. The total capital investment made in this sector amounted to Rs. 28,272.20 lakh. It had created jobs for 5,653 workers. These industries manufactured sugar, milk, dairy products; edible oils electrical generators, fertilizers, paper, dry cells etc. Among them five have not
been functioning at present. There are 674 registered small industry units in the district, with a total capital investment of Rs 10,784 lakh. These provided jobs for 31,864 workers. Under the District Khadi and Gramodyog Board there were 325 functional units and had created jobs for 1,738 workers.
There is a handlooms cluster in Melkote taluk. Providing a strong ecosystem for textiles with presence of large organizations like Welpun Gokaldas, Shashi exports etc. From 1995 to 1997 a census of Handlooms and power looms was undertaken. As per this census 310 families were engaged in handloom and 17 households were operating power looms. In the district there were 238 handlooms which had created jobs for 472 workers. Out of the 32 power looms in the district, 16 were defunct.
Sericulture industry is an agro-based activity in the district. Out of the Kotis (grainages) 7 were government and 100 private of the supplied disease free laying to the farmers. Three government-owned mulberry growing centres are engaged in cultivation, quality maintenance and standards in mulberry production. Free mulberry stems are being distributed among farmers by the government which is also providing technical training for raring silk firms.
There are very few large scale industries that have Capital investment of Rs.100 crore and above as well as those industries that have cent percent export-oriented production. As the district is predominantly agriculture-oriented, naturally it has the industries that are more agro-based such as rice mills, Jaggery manufacturing, furnaces, sugar factories, oil mills and such others. The crushed cane sugar pulps generated from the Mysuru Sugar Company and four other Sugar factories have been used till recently in the manufacturing of paper by the Mandya National Paper Mills at Belgola. This Paper Mills has been closed recently, because it turned severely sick for long. Similar was the fate of Mysuru Acetate Factory.
Distilleries industries operating in the district are using the by-products obtained from the manufacture of sugar. Minerals and other natural resources that are necessary for the development of industries are not available in the district. Internal infrastructure facilities such as transport, communication, finance, electricity, industrial area, industrial training, which are essential for industrial development are not inadequate in the district.
26
2.8. Irrigation Before the irrigation water was made available, the farmers in Mandya District used to grow crops only under rain fed conditions. During those days, the major crops being grown were Ragi, Paddy and Horse gram. The district started glowing with greenery only after the Krishnarajasagar Dam’s water was made available to farmers for irrigation purpose. The district comes under the river Cauvery basin. The gross irrigated area from various sources is 1,67,002 hectares. Of the total, net irrigated area from varies sources is 1,35,290 hectares.2.8.1. Agriculture
With almost fifty percent of its area getting assured irrigation water, Mandya district naturally was the focus of agricultural development programmes in the State during the post-independence period especially the Green Revolution era. The prosperity of the district is tied to the irrigated agriculture in general and two irrigated crops namely paddy and sugarcane in particular. However, there are dry land taluks in the district which still continue to depend on rainfall, with the major crop being ragi. For the development of these areas in particular, the thrust programs in the agricultural sector of the district are: expansion of area under vegetables, composite orchards/dry land horticulture, micro and conjunctive irrigation, crop intensification in coconut gardens and organic farming.
The agricultural development plan of Mandya district is formulated, by and large in accordance with the panchasutra laid out in the New Agriculture Policy (2006) of the Government of Karnataka, of course, keeping in view the situation obtaining at the end of the Tenth Plan period. The district intends to accord priority to the following aspects which have direct or indirect bearing on the development of agriculture. 1. Protection and improvement of soil health 2. Water management and micro irrigation 3. Supply of quality seeds 4. Integrated approach to production, processing and value addition 5. Reducing the gap between lab and land.
2.9. Infrastructure
Located between two major centers of Karnataka namely Bengaluru and Mysuru, Mandya District enjoys a good rail, road and communication network. Broad-gauge railway line and four-line road with median connecting
Bengaluru and Mysuru ensures easy and speedy transportation of people and goods. The district has fairly good infrastructural facilities coming as it is within the ambit of Bangalore-Mysuru Infrastructure Corridor (BMIC).
The district also consists of Mysuru– Bengaluru and Mysuru– Hassan broad gauge railway lines providing rapid transport facilities. The national highway 48 passes through Nagamangala in the district for a distance of 29 km and the National Highway 17 Bengaluru- Ooty passes through the taluks of Maddur, Mandya and Shrirangapattana. Yet another national highway (209) Bangalore–Coimbatore passes through Malavalli taluk (44 kms) of the district. These national highways along with state, district and taluk roads actively connect all taluk centers and major towns and cities of the district. The district comprises 8,309 km of roads. Among these 5,753 kms roads are high quality and the remaining 2,556 kms roads are termed as Kacha roads. From the tourist point of view the road which runs between Bidar and Shrirangapattana (SH-19) which is a state highway connecting 19 districts of the state assumes crucial importance. Of late the tourism department has taken up the development of this road or war footing (Tables 2.6 and 2.7).
The first railway line passes through Maddur, Mandya, Pandavapura, Shrirangapattana taluk, while the second railway line passes through the taluks of Shrirangapattana and Krishnarajpet. The total railway distance of 83kms is available for fast transport. The Mandya taluk alone consists of 25 km of railway line. The district does not have airstrips; it depends on Bengaluru international airport located 140 km away. The Mysuru airport is nearer than Bengaluru but it cannot be depended as it is not functioning.
Mandya district has fairly good number power stations. The Shivanasamudram hydro electric power generates about 42 mega watts of electric power. The Shimsha hydro electric power project generates about 17.2 mega watts of electric power. The Keelara power private limited which is located at Keelara village of Mandya taluk is commissioned and functioning with 2 mega watt capacity. The Malavalli power plant private limited which is an agro-based project, has a generating capacity of 4.5 mega watts. Atria Power Corporation limited has obtained clearances for many hydro-electric power projects at Shimsha which has a power generating capacity of 12 mega watt.
27
Mandya district has a big land bank, 145 commercial bank branches, 364 post offices and 65 telephone exchanges.
2.10. Regional Perspectives and Backwardness
Balanced development of infrastructure as well as investment for development is not a matter that can be achieved in one stroke. Development is a continuous process. Imbalances may get reduced with planning but can again surface due to changes in exogenous factors. It is possible that even at a higher stage of development; there can be imbalances in different areas in so far as perfectly balanced development is elusive.
Thus, imbalances and backwardness can exist together. Similarly, developed areas may have imbalances. Reduction of imbalances in different regions or areas of the State is one of the means for achieving the goal of re-distributive justice in different parts of the State or the country. Formulating plans and their implementation in the public sector assumes greater importance at the grassroots level. The State can also act as a facilitator for private investment to go into a backward region which has imbalances. Certain areas which are totally lacking in access may have to depend entirely on public investment directed towards such areas in which case the cost of development and the burden to the State exchequer would be higher. Further, imbalances of any form can hold back the development process.
Generally, four types of imbalances are seen in the development process. (1) Inter-sectoral imbalance, (2) Inter-regional imbalances, (3) Intra-sectoral imbalance and (4) Intra-regional imbalances. Though planning one expects to bring about a co-ordinated and balanced expansion of various sectors in such a way as to ensure a balance between demand and supply, a task which is better realized under market mechanism. Inter-sectoral and intra-sectoral balance is crucial for achieving proper utilization of capacities. It is expected that this balance will ensure growth with stability.
Imbalances and BackwardnessSolutions to the problem of regional disparities and backwardness cannot be found solely from resource distribution and special schemes. What is important is a systematic attempt to identify barriers to development and concentrate on resources and efforts towards breaking these barriers. In the context of redressing regional disparities in
development in Karnataka, Prof. D.M. Nanjundappa Committee had classified all the 175 Taluks of the State into 3 broad categories based on what it called a comprehensive composite development index (CCDI) in 2011. As per this classification the 3 broad categories of taluks were – 1) Backward taluks (with CCDI value ranging from 0-89 to 0.99) 2) More backward taluks (with index CCDI value ranging from 0.80 to 0.88) and 3) Most backward taluks (with CCDI value ranging from 0.53 TO 0.79).
As per Nanjundappa Committee’s criteria Shrirangapattana, Maddur Pandavapura taluks were classified as backward taluks (see Table 2.8) while Malavalli, Nagamangala, and Krishnarajpet Taluks were listed as more backward taluks. Interestingly, none of the taluks in Mandya district figured in the most backward taluks’ category. Further,Mandya Taluk does not figure in any of the 3 categories of backward taluks as per Nanjundappa Committee’s criteria.
However, as per the Composite Taluk Development Index (CTDI) prepared in connection with the present District Human Development Report classifies the taluks rather differently and ranks of the taluks are based on the value of CTDI. The average value for Mandya District is 0.506 but there are wide inter-taluk differences in the CTDI. Four taluks namely Malavalli, Pandavapura and Krishnarajpet, Shrirangapattana Taluks have CTDI less than the District average with CTDI values 0.425, 0.451, 0.473 and 0.491 respectively, while the other three taluks namely Mandya, Maddur and Nagamangala have CTDI greater than the district average their respective CTDI being 0.611, 0.535 and 0.507. Apparently the criteria used by the present DHDR and D. M. Nanjundappa committee’s criteria differ from one another. Obviously the policy imperatives emerging from these two sets of criteria may also be different.
2.11. An overview
Mandya District is basically dependent on agriculture and a few agro-based industries such as sugar for income and employment of the people. The land use pattern of the district indicates very small percentage of the geographical area under forest. The district has about half of the cultivated land under irrigation, thanks to the Cauvery and Hemavathi rivers as also their tributaries which provide year–long assured irrigation for crops. Paddy and sugarcane are dominant crops grown in almost the entire canal-irrigated area, while ragi and horse gram
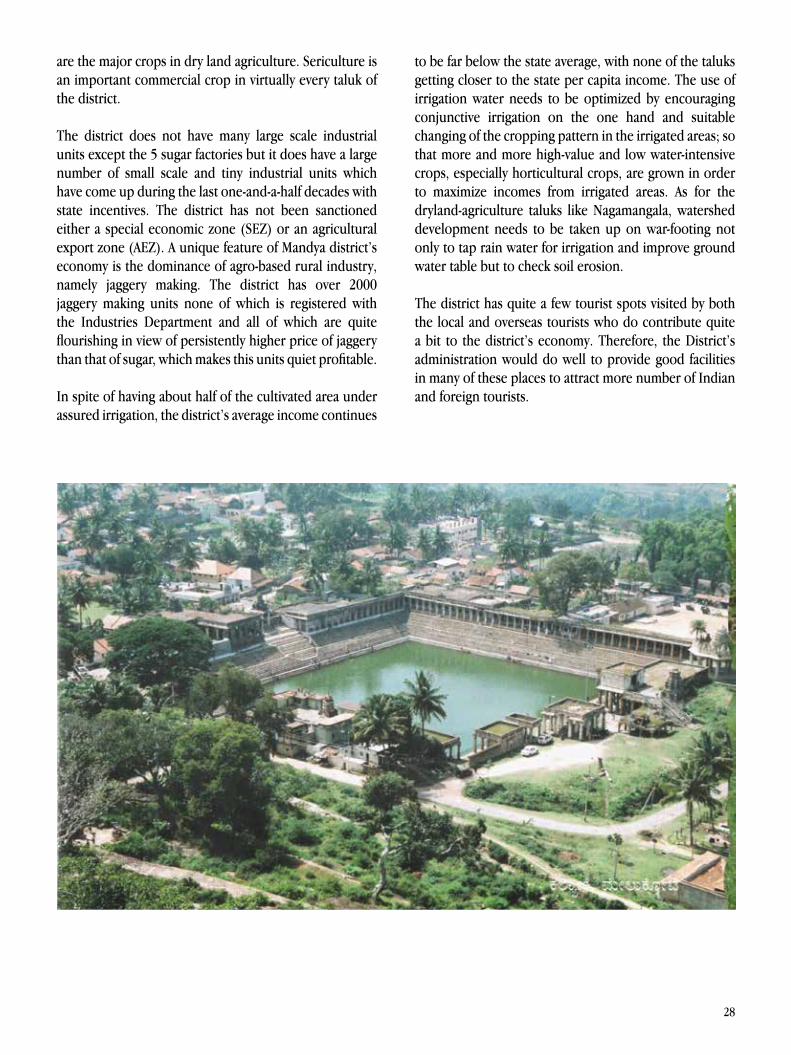
28
are the major crops in dry land agriculture. Sericulture is an important commercial crop in virtually every taluk of the district.
The district does not have many large scale industrial units except the 5 sugar factories but it does have a large number of small scale and tiny industrial units which have come up during the last one-and-a-half decades with state incentives. The district has not been sanctioned either a special economic zone (SEZ) or an agricultural export zone (AEZ). A unique feature of Mandya district’s economy is the dominance of agro-based rural industry, namely jaggery making. The district has over 2000 jaggery making units none of which is registered with the Industries Department and all of which are quite flourishing in view of persistently higher price of jaggery than that of sugar, which makes this units quiet profitable.
In spite of having about half of the cultivated area under assured irrigation, the district’s average income continues
to be far below the state average, with none of the taluks getting closer to the state per capita income. The use of irrigation water needs to be optimized by encouraging conjunctive irrigation on the one hand and suitable changing of the cropping pattern in the irrigated areas; so that more and more high-value and low water-intensive crops, especially horticultural crops, are grown in order to maximize incomes from irrigated areas. As for the dryland-agriculture taluks like Nagamangala, watershed development needs to be taken up on war-footing not only to tap rain water for irrigation and improve ground water table but to check soil erosion.
The district has quite a few tourist spots visited by both the local and overseas tourists who do contribute quite a bit to the district’s economy. Therefore, the District’s administration would do well to provide good facilities in many of these places to attract more number of Indian and foreign tourists.
29
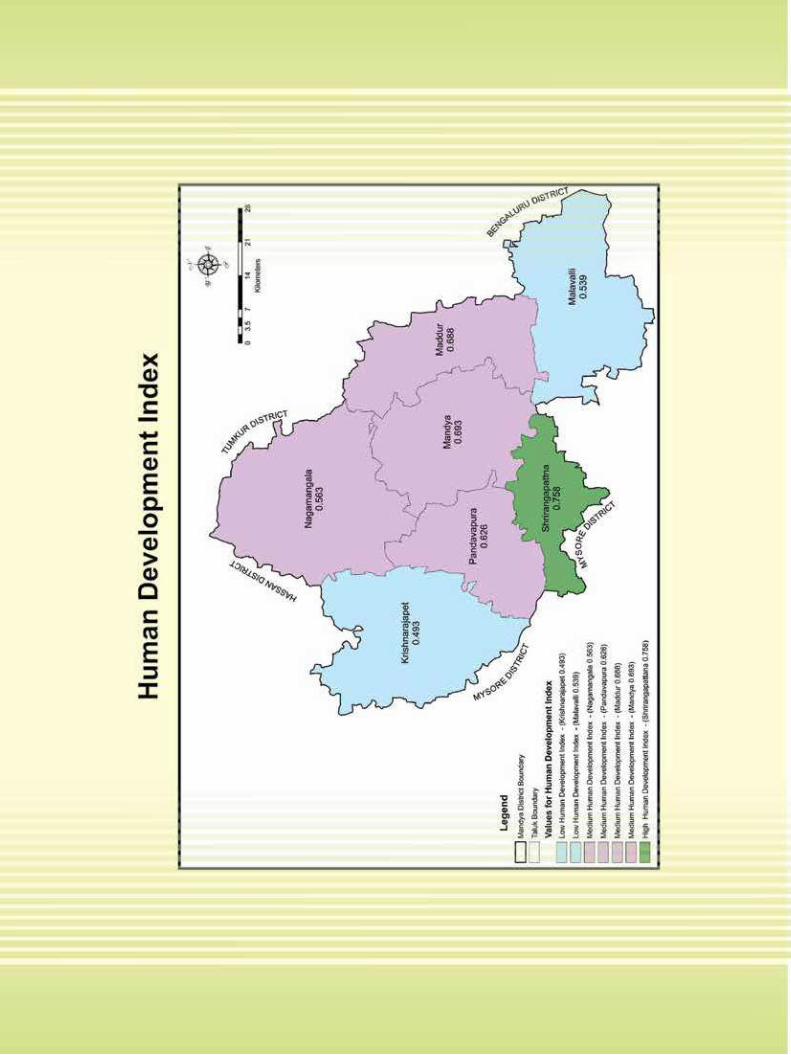
30

31
3.1. Introduction
The first Human Development Report was published in 1990 by the UNDP and the concept of human development has now been accepted as a basic goal of development throughout the world. Development approach was earlier an income-centred approach and now the focus has been shifted to people-centred approach. The human development approach attempts to measure the all-round achievement of a nation with reference to development programmes and policies that are implemented to fulfil the basic needs of the people and enable them to lead quality life.
Gender inequality persists in every society and it is especially more pronounced in developing and under-developed countries. Research evidences have revealed that gender discrimination is a prominent factor on influencing health and educational status of people. Therefore, the 2010 Human Development Report of the UNDP has started assessing the loss of human development by computing Gender Inequality Index (GII) which measures the loss in potential human development due to inequality between female and male achievements.
Children are the most valuable resource for a nation and are recognized for their future roles in constructing families, strengthening communities and building a nation. Well-being of children is one of the significant factors in a nation’s development. Child Development Index measures the specific issues associated with children such as education, health and nutrition that are indicative of child’s well-being.
Food Security situation of a country indicates the building of emergency grain reserves and ensuring availability of
CHAPTER 3
COMPUTATION OF INDICES
nutritious food in the society at an affordable price. It is related to the ability to provide food for the people and keeping them healthy all the time. Food security index is computed based on three major parameters - Availability, Accessibility and Absorption indicators.
In this chapter, an attempt is made to portray the status of Human Development in Mandya district by computing Human Development Index (HDI) while certain other indices have been computed to understand the efficacy of overall development of the district through different dimensions. These indices are: • Human Development Index (HDI) • Gender Inequality Index (GII) • Child Development Index (CDI) • Food Security Index (FSI) • Composite Taluk Development Index (CTDI) • Urban Development Index (UDI) and • Composite Dalit Development Index (CDDI)As many as 126 Indicators have been used for computing the above mentioned indices. The Human Development Index (HDI) is computed using 11 indicators, 15 indicators have been used for computing Gender Inequality Index (GII), Child Development Index (CDI) is computed using 3 indicators, 18 indicators for FSI, 11 indicators for UDI and 68 indicators are used for computing CTDI.
3.2. Human Development Index
The Human Development Index (HDI, for short) is used to measure a country’s overall achievement especially in relation to the social and economic dimensions of people’s life. The social and economic dimensions comprise the health of people, their level of educational attainment and their standard of living. HDI is a composite index of different dimensions of human life with a focus on three facets namely living standard, Health and Education.
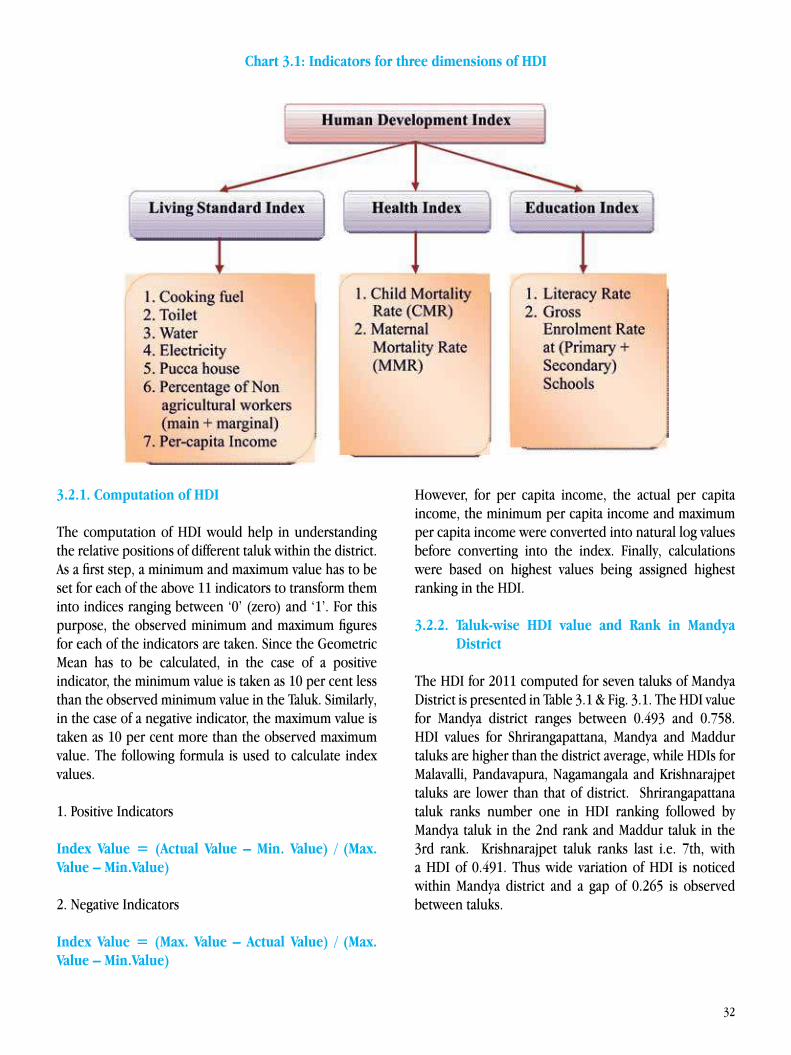
32
Chart 3.1: Indicators for three dimensions of HDI
3.2.1. Computation of HDI
The computation of HDI would help in understanding the relative positions of different taluk within the district. As a first step, a minimum and maximum value has to be set for each of the above 11 indicators to transform them into indices ranging between ‘0’ (zero) and ‘1’. For this purpose, the observed minimum and maximum figures for each of the indicators are taken. Since the Geometric Mean has to be calculated, in the case of a positive indicator, the minimum value is taken as 10 per cent less than the observed minimum value in the Taluk. Similarly, in the case of a negative indicator, the maximum value is taken as 10 per cent more than the observed maximum value. The following formula is used to calculate index values.
1. Positive Indicators
Index Value = (Actual Value – Min. Value) / (Max.Value – Min.Value)
2. Negative Indicators
Index Value = (Max. Value – Actual Value) / (Max.Value – Min.Value)
However, for per capita income, the actual per capita income, the minimum per capita income and maximum per capita income were converted into natural log values before converting into the index. Finally, calculations were based on highest values being assigned highest ranking in the HDI.
3.2.2. Taluk-wise HDI value and Rank in Mandya District
The HDI for 2011 computed for seven taluks of Mandya District is presented in Table 3.1 & Fig. 3.1. The HDI value for Mandya district ranges between 0.493 and 0.758. HDI values for Shrirangapattana, Mandya and Maddur taluks are higher than the district average, while HDIs for Malavalli, Pandavapura, Nagamangala and Krishnarajpet taluks are lower than that of district. Shrirangapattana taluk ranks number one in HDI ranking followed by Mandya taluk in the 2nd rank and Maddur taluk in the 3rd rank. Krishnarajpet taluk ranks last i.e. 7th, with a HDI of 0.491. Thus wide variation of HDI is noticed within Mandya district and a gap of 0.265 is observed between taluks.
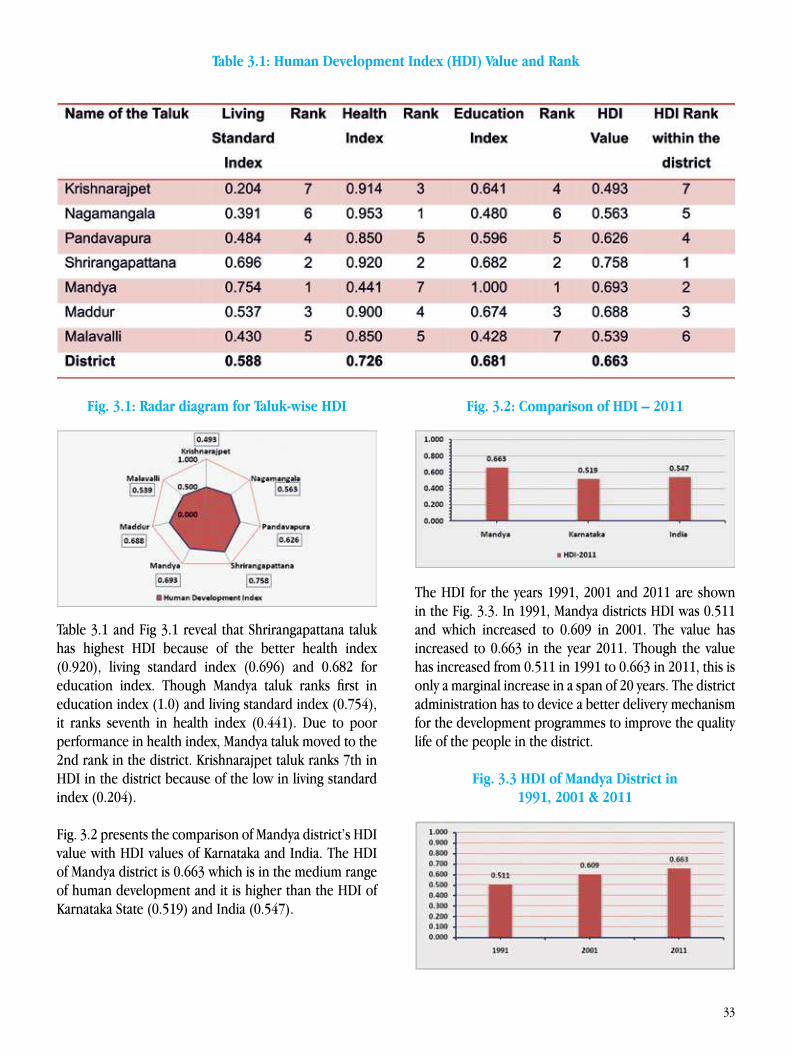
33
Table 3.1: Human Development Index (HDI) Value and Rank
Fig. 3.1: Radar diagram for Taluk-wise HDI
Table 3.1 and Fig 3.1 reveal that Shrirangapattana taluk has highest HDI because of the better health index (0.920), living standard index (0.696) and 0.682 for education index. Though Mandya taluk ranks first in education index (1.0) and living standard index (0.754), it ranks seventh in health index (0.441). Due to poor performance in health index, Mandya taluk moved to the 2nd rank in the district. Krishnarajpet taluk ranks 7th in HDI in the district because of the low in living standard index (0.204).
Fig. 3.2 presents the comparison of Mandya district’s HDI value with HDI values of Karnataka and India. The HDI of Mandya district is 0.663 which is in the medium range of human development and it is higher than the HDI of Karnataka State (0.519) and India (0.547).
Fig. 3.2: Comparison of HDI – 2011
The HDI for the years 1991, 2001 and 2011 are shown in the Fig. 3.3. In 1991, Mandya districts HDI was 0.511 and which increased to 0.609 in 2001. The value has increased to 0.663 in the year 2011. Though the value has increased from 0.511 in 1991 to 0.663 in 2011, this is only a marginal increase in a span of 20 years. The district administration has to device a better delivery mechanism for the development programmes to improve the quality life of the people in the district.
Fig. 3.3 HDI of Mandya District in 1991, 2001 & 2011

34
The relative positions of the taluks in human development index and their comparative rankings in the three dimensions of HDI are discussed in the following paragraphs. This would facilitate understanding of the disparities in the dimensions and indicators of Human development in the district.
Living Standard Index (LSI)The living standard index (LSI) is computed using seven sub- indicators namely: access to cooking fuel, toilet, water, electricity, pucca house, percentage of non-agricultural workers and per capita income. The LSI for Mandya district and its taluks is presented in Table 3.1 & Fig. 3.4. Mandya district has a moderate an LSI of 0.588. The highest LSI (0.754) is found for Mandya taluk which is in the 1st rank and the Lowest LSI (0.204) is for Krishnarajpet taluk which is in the 7th rank. Mandya and Shrirangapattana taluks have better LSI value than the district’s average of 0.588, while Krishnarajpet, Nagamangala, Malavalli, Pandavapura and Maddur taluks have lower LSI than the district average. Thus, there is a significant gap in the LSI between the taluks of Mandya district. Mandya Taluk has the first rank in LSI since the values of the sub-indicators such as percentage of households having toilets is 52.52, access to pucca houses is 62.65 percent, the percentage of houses connected with Electricity is 91.89 and the share of non-agriculture workers in the total accounted has 42.41 percent are comparatively higher for the district. In contrast, Krishnarajpet taluk the values for LSI sub- indicators namely households with toilets being 21.67 percent, and access to pucca houses being hardly 43.69 percent are relatively lower compared to those for taluks in the district and LSI value is obviously lesser for this taluk. Households with modern cooking fuel (10.80) percent and share of non-agricultural workers (20.17) percent are the other contributing factors for low LSI in Krishnarajpet taluk. The taluks such as Nagamangala, Malavalli, Pandavapura and Maddur having LSI value lesser than the district average had low LSI.
Fig 3.4: Radar Diagram for Living Standard Index
Health Index (HI)The child mortality rate and maternal mortality rate are used as sub-indicators to compute the HI. The HI for Mandya district and its taluks is depicted in Fig. 3.5. HI for Mandya district is 0.726 which shows that the overall health service is good in the district. The HI of taluks ranges from 0.441 to 0.953 and there is a noteworthy gap between lowest and highest HI. Mandya taluk has least (0.441) HI which is lesser than the district average, of 0.726, while all other taluks have higher health index than that of the district. Nagamangala taluk ranks number one with highest HI of 0.953. While Mandya taluk is in the 7th rank with the lowest HI. This is really puzzling in view of the fact that Mandya Town, being the district and taluk headquarters, has quite a good number of public and private hospitals and nursing homes. The main reasons for low health index in Mandya taluk are high Child Mortality Rate (31) and Maternal Mortality Rate (124). It is fact that for the taluks which have lower CMR and MMR apparently the HI value is higher. In Nagamangala taluk CMR (28) and MMR (107) is lower compared to all other taluks in the district and obviously its HI is higher (0.953). The radar diagram (3.5) clearly indicates the taluk wise position of HI in the district. Fig. 3.5: Radar diagram for Taluk-wise Health Index
Education Index (EI)Education index is computed using two sub- indicators namely literacy rate and gross enrollment rate at primary and secondary schools. Education index for Mandya district and its taluks is presented in Fig. 3.6. Mandya district has an average EI of 0.681 which shows the moderate education development. EI for taluks ranges from 0.428 to 1.000 showing significant gap between taluks. Mandya taluk ranks first with an EI of 1.0, while Malavalli taluk has least EI of 0.428.

35
Fig. 3.6: Radar diagram for Taluk-wiseEducation Index
The Fig. 3.6 shows that the EI for Maddur, Krishnarajpet, Pandavapura, Nagamangala and Malavalli taluks is lesser
than the district average. The main cause for the lower EI is low literacy rate and lower gross enrollment in some of the taluks. Mandya taluk has 74.75 percent literacy and 107.48 percent of gross enrollment rate which significantly contributed to higher EI.
Taluk-wise comparison of LSI, HI and EI in Mandya DistrictFig 3.7 presents the taluk-wise comparison of LSI, HI and EI. Though Krishnarajpet taluk has lowest HDI value (0.493) it performs better in HI (0.914) and EI (0.641), but its LSI is low. The low values of LSI sub -indicators such as households with toilets, access to pucca houses, households with modern cooking fuel and share of non-agricultural workers are the other contributing factors for the lower LSI for Krishnarajpet taluk.
Fig. 3.7: Taluk-wise comparison of LSI, HI and EI in Mandya District
36
Nagamangala taluk has highest HI (0.953) in the district but is in the 6th place in both EI and LSI with values of 0.480 and 0.391 respectively. The main contributing factors for low EI and LSI are lower gross enrolment rate (88.35 percent), low percentage of households having access to modern cooking fuel (12.94%) and toilet (28.44%) facilities and smaller number of non-agricultural workers (21.96%).
Pandavapura taluk has 4th place both in HDI and LSI with the index value of 0.626 and 0.484 respectively. The taluk ranks 5th both in HI (0.850) and EI (0.596). The taluk has lower LSI, EI and HDI than the district.
Shrirangapattana taluk ranks 2nd in LSI, HI and EI with the index values 0.696, 0.920 and 0.682 respectively. Despite these modest sub-indices, the taluk ranks first in HDI (0.758).
Mandya taluk ranks 1st both in LSI and EI with values of 0.754 and 1.000 respectively. The taluk has the least rank in HI (0.441) because of the high CMR (31) and MMR (124). The CMR and MMR were high for Mandya taluk compared to all other taluks in the district. Because of the low value of HI, the taluk moved to 2nd place in the HDI (0.693) in the ranking.
The relative performance of Maddur taluk in all indices is fairly good. The taluk has the 3rd place in HDI (0.688), EI (0.674) and LSI (0.537). But, it slipped to the 4th position in the HI (0.900) in the district. The major tasks for the improvement in human development in the taluk are raising the literacy rate and per-capita income,
improvement in the work participation rate in non-agricultural activities and increase in the percentage of households with toilets.
3.3. Gender Inequality Index
Gender inequality is a socially constructed difference between male and female individuals. It generally refers to discrimination among individuals based on gender that systematically empower one group to the detriment of the other. Gender inequality is very complex and diversified in nature because it is present in every corner of world. It is manifested in many ways and in many fields. Gender inequality is more pronounced in developing and under-developed countries than in developed countries. Gender inequality encompasses unequal rights, responsibilities, and opportunities for female and translates to poor health status, low educational attainment, and poor economic and political status compared to male. Gender inequality is a major threat for a nation’s development. Therefore the latest HDR of UNDP has started assessing human development by computing Gender inequality Index which measures the loss in potential of human development due to inequality between female and male achievements. Developing countries like India face huge gender inequalities, which have a direct bearing on their human development. According to the UNDP’s Human Development Report 2013, GII of India was 0.610 and it ranks 132 out of 187 countries. According to the National HDR 2001, Karnataka state had higher GDI (0.637) than the Country (0.609) while Mandya district had lower GDI (0.593) than the state.
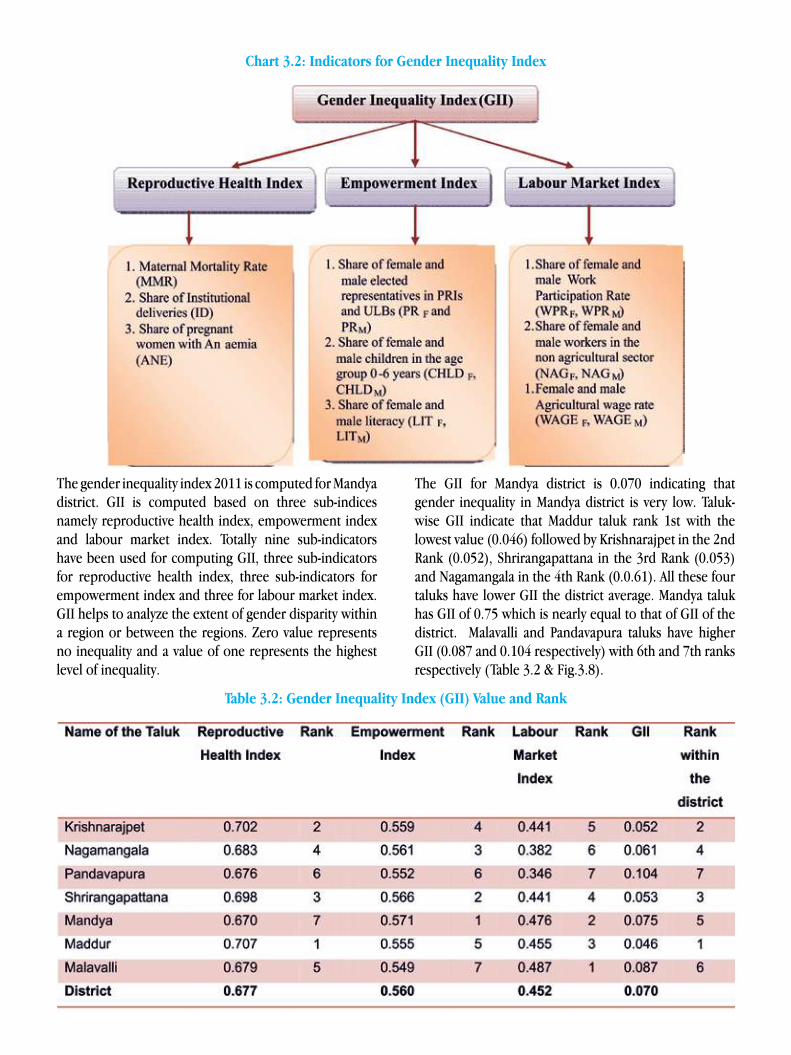
37
Chart 3.2: Indicators for Gender Inequality Index
The gender inequality index 2011 is computed for Mandya district. GII is computed based on three sub-indices namely reproductive health index, empowerment index and labour market index. Totally nine sub-indicators have been used for computing GII, three sub-indicators for reproductive health index, three sub-indicators for empowerment index and three for labour market index. GII helps to analyze the extent of gender disparity within a region or between the regions. Zero value represents no inequality and a value of one represents the highest level of inequality.
The GII for Mandya district is 0.070 indicating that gender inequality in Mandya district is very low. Taluk-wise GII indicate that Maddur taluk rank 1st with the lowest value (0.046) followed by Krishnarajpet in the 2nd Rank (0.052), Shrirangapattana in the 3rd Rank (0.053) and Nagamangala in the 4th Rank (0.0.61). All these four taluks have lower GII the district average. Mandya taluk has GII of 0.75 which is nearly equal to that of GII of the district. Malavalli and Pandavapura taluks have higher GII (0.087 and 0.104 respectively) with 6th and 7th ranks respectively (Table 3.2 & Fig.3.8).
Table 3.2: Gender Inequality Index (GII) Value and Rank
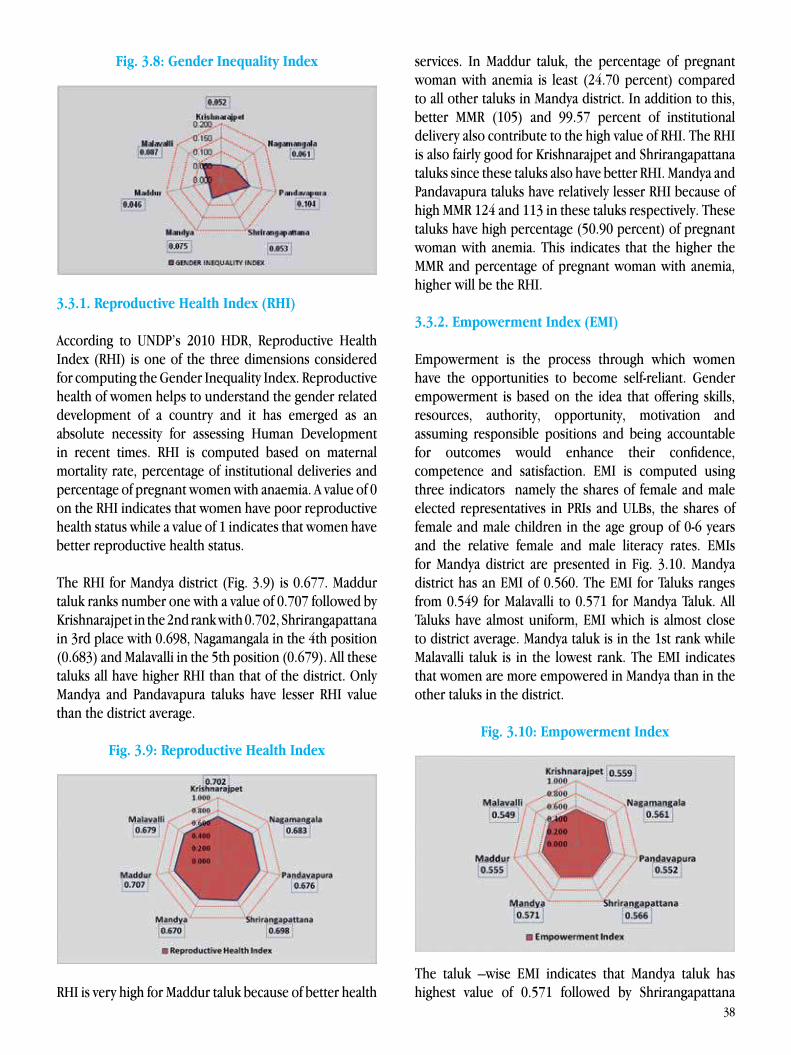
38
Fig. 3.8: Gender Inequality Index
3.3.1. Reproductive Health Index (RHI)
According to UNDP’s 2010 HDR, Reproductive Health Index (RHI) is one of the three dimensions considered for computing the Gender Inequality Index. Reproductive health of women helps to understand the gender related development of a country and it has emerged as an absolute necessity for assessing Human Development in recent times. RHI is computed based on maternal mortality rate, percentage of institutional deliveries and percentage of pregnant women with anaemia. A value of 0 on the RHI indicates that women have poor reproductive health status while a value of 1 indicates that women have better reproductive health status.
The RHI for Mandya district (Fig. 3.9) is 0.677. Maddur taluk ranks number one with a value of 0.707 followed by Krishnarajpet in the 2nd rank with 0.702, Shrirangapattana in 3rd place with 0.698, Nagamangala in the 4th position (0.683) and Malavalli in the 5th position (0.679). All these taluks all have higher RHI than that of the district. Only Mandya and Pandavapura taluks have lesser RHI value than the district average.
Fig. 3.9: Reproductive Health Index
RHI is very high for Maddur taluk because of better health
services. In Maddur taluk, the percentage of pregnant woman with anemia is least (24.70 percent) compared to all other taluks in Mandya district. In addition to this, better MMR (105) and 99.57 percent of institutional delivery also contribute to the high value of RHI. The RHI is also fairly good for Krishnarajpet and Shrirangapattana taluks since these taluks also have better RHI. Mandya and Pandavapura taluks have relatively lesser RHI because of high MMR 124 and 113 in these taluks respectively. These taluks have high percentage (50.90 percent) of pregnant woman with anemia. This indicates that the higher the MMR and percentage of pregnant woman with anemia, higher will be the RHI.
3.3.2. Empowerment Index (EMI)
Empowerment is the process through which women have the opportunities to become self-reliant. Gender empowerment is based on the idea that offering skills, resources, authority, opportunity, motivation and assuming responsible positions and being accountable for outcomes would enhance their confidence, competence and satisfaction. EMI is computed using three indicators namely the shares of female and male elected representatives in PRIs and ULBs, the shares of female and male children in the age group of 0-6 years and the relative female and male literacy rates. EMIs for Mandya district are presented in Fig. 3.10. Mandya district has an EMI of 0.560. The EMI for Taluks ranges from 0.549 for Malavalli to 0.571 for Mandya Taluk. All Taluks have almost uniform, EMI which is almost close to district average. Mandya taluk is in the 1st rank while Malavalli taluk is in the lowest rank. The EMI indicates that women are more empowered in Mandya than in the other taluks in the district.
Fig. 3.10: Empowerment Index
The taluk –wise EMI indicates that Mandya taluk has highest value of 0.571 followed by Shrirangapattana
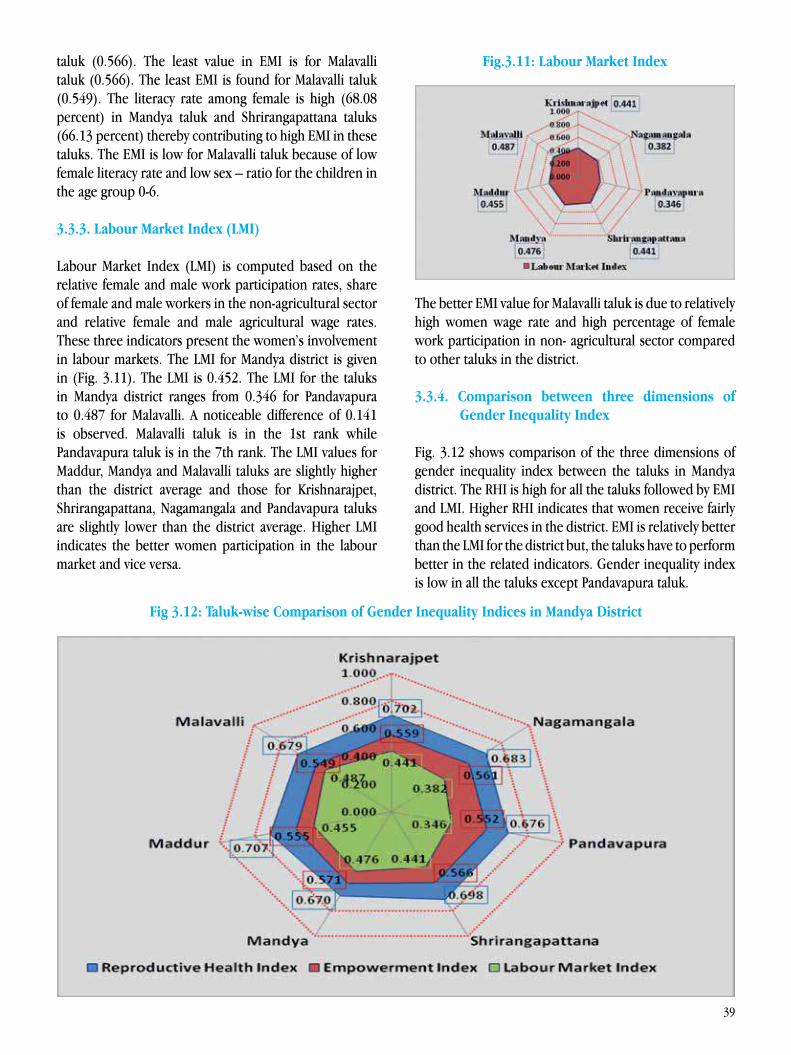
39
taluk (0.566). The least value in EMI is for Malavalli taluk (0.566). The least EMI is found for Malavalli taluk (0.549). The literacy rate among female is high (68.08 percent) in Mandya taluk and Shrirangapattana taluks (66.13 percent) thereby contributing to high EMI in these taluks. The EMI is low for Malavalli taluk because of low female literacy rate and low sex – ratio for the children in the age group 0-6.
3.3.3. Labour Market Index (LMI)
Labour Market Index (LMI) is computed based on the relative female and male work participation rates, share of female and male workers in the non-agricultural sector and relative female and male agricultural wage rates. These three indicators present the women’s involvement in labour markets. The LMI for Mandya district is given in (Fig. 3.11). The LMI is 0.452. The LMI for the taluks in Mandya district ranges from 0.346 for Pandavapura to 0.487 for Malavalli. A noticeable difference of 0.141 is observed. Malavalli taluk is in the 1st rank while Pandavapura taluk is in the 7th rank. The LMI values for Maddur, Mandya and Malavalli taluks are slightly higher than the district average and those for Krishnarajpet, Shrirangapattana, Nagamangala and Pandavapura taluks are slightly lower than the district average. Higher LMI indicates the better women participation in the labour market and vice versa.
Fig.3.11: Labour Market Index
The better EMI value for Malavalli taluk is due to relatively high women wage rate and high percentage of female work participation in non- agricultural sector compared to other taluks in the district.
3.3.4. Comparison between three dimensions of Gender Inequality Index
Fig. 3.12 shows comparison of the three dimensions of gender inequality index between the taluks in Mandya district. The RHI is high for all the taluks followed by EMI and LMI. Higher RHI indicates that women receive fairly good health services in the district. EMI is relatively better than the LMI for the district but, the taluks have to perform better in the related indicators. Gender inequality index is low in all the taluks except Pandavapura taluk.
Fig 3.12: Taluk-wise Comparison of Gender Inequality Indices in Mandya District
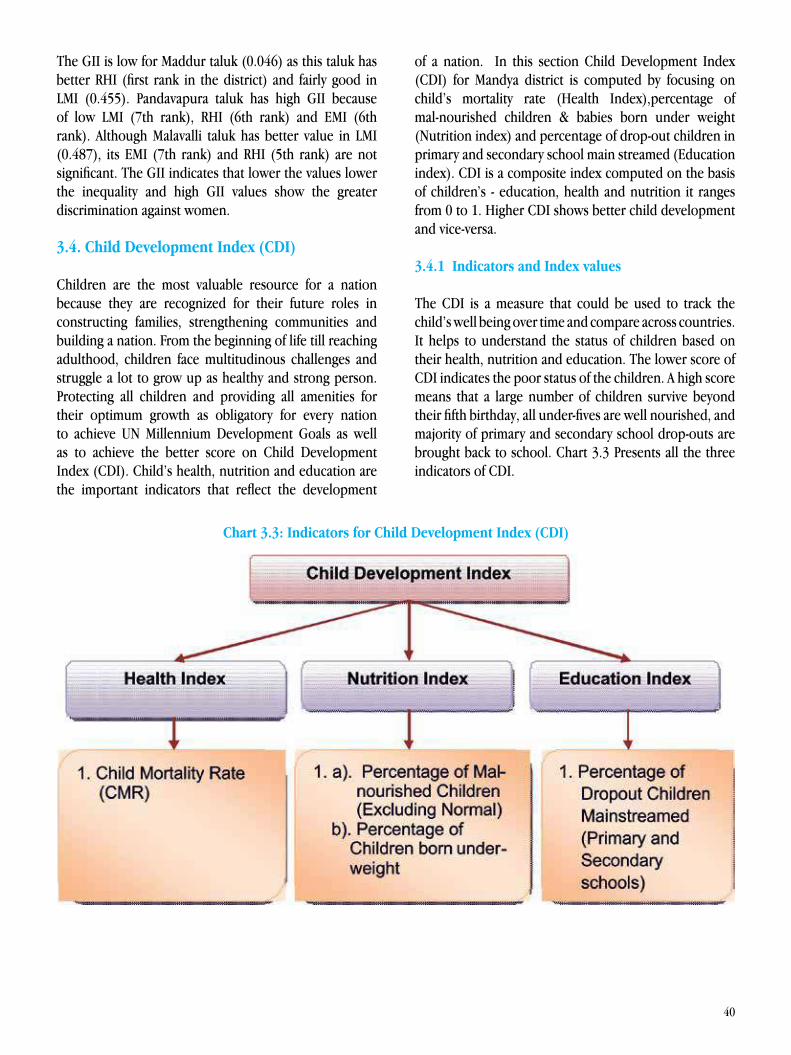
40
The GII is low for Maddur taluk (0.046) as this taluk has better RHI (first rank in the district) and fairly good in LMI (0.455). Pandavapura taluk has high GII because of low LMI (7th rank), RHI (6th rank) and EMI (6th rank). Although Malavalli taluk has better value in LMI (0.487), its EMI (7th rank) and RHI (5th rank) are not significant. The GII indicates that lower the values lower the inequality and high GII values show the greater discrimination against women.
3.4. Child Development Index (CDI)
Children are the most valuable resource for a nation because they are recognized for their future roles in constructing families, strengthening communities and building a nation. From the beginning of life till reaching adulthood, children face multitudinous challenges and struggle a lot to grow up as healthy and strong person. Protecting all children and providing all amenities for their optimum growth as obligatory for every nation to achieve UN Millennium Development Goals as well as to achieve the better score on Child Development Index (CDI). Child’s health, nutrition and education are the important indicators that reflect the development
of a nation. In this section Child Development Index (CDI) for Mandya district is computed by focusing on child’s mortality rate (Health Index),percentage of mal-nourished children & babies born under weight (Nutrition index) and percentage of drop-out children in primary and secondary school main streamed (Education index). CDI is a composite index computed on the basis of children’s - education, health and nutrition it ranges from 0 to 1. Higher CDI shows better child development and vice-versa.
3.4.1 Indicators and Index values
The CDI is a measure that could be used to track the child’s well being over time and compare across countries. It helps to understand the status of children based on their health, nutrition and education. The lower score of CDI indicates the poor status of the children. A high score means that a large number of children survive beyond their fifth birthday, all under-fives are well nourished, and majority of primary and secondary school drop-outs are brought back to school. Chart 3.3 Presents all the three indicators of CDI.
Chart 3.3: Indicators for Child Development Index (CDI)
41
Table 3.3: Child Development Index (CDI) Value and Rank
The CDI computed for Mandya district (Table 3.3 & Fig 3.13.) ranges from 0.208 to 0.978. The CDI for Pandavapura taluk is the highest (0.978) followed by Shrirangapattana taluk with CDI of 0.681. Malavalli taluk is in the 3rd rank with 0.584, Maddur taluk ranks 4th with 0.533 and Nagamangala taluk ranks 5th with 0.448. All these taluks have higher CDI than the district. Krishnarajpet (0.302) and Mandya taluk (0.208) are in the 6th and 7th ranks and both taluks have lower CDI than that of the district. Significant difference between the taluks (0.208 to 0.978) indicates the imbalance in taluks with respect to Child’s well being. Higher the CDI, higher would be the child’s development and lower CDI indicates the low child development.
The taluk-wise indices show that Pandavapura taluk ranks first in CDI because of the high HI (1.0), NI (1.0) and EI (1.0). A Shrirangapattana taluk rank 2nd in CDI with 0.681 since it has better HI (1.0) and NI (0.849). Malavalli taluk also has fairly good HI (1.0); NI (0.580) and EI (0.174) compared to other taluks and hence moved to the 3rd place. Mandya taluk occupies last place in CDI (0.208) because of the low HI (0.0) and EI (0.0). For Mandya taluk CMR is high (31) and the percentage of drop-out children main–streamed is as low as 6.85 percent, obviously the CDI is low.
Fig. 3.13: Radar diagram for Child Development Index.
Health Index (HI)The studies on children indicated that growth and development of children aged less than five years is crucial and it lays the foundation for their future adult health. According to World Health Organization (WHO) “health is a state of complete physical, mental and social well being and not merely the absence of diseases and infirmity”. Enjoyment of highest attainable standard of health is one of the fundamental rights of every human being. Children’s health is the extent to which individual children or groups of children are able or enabled to (a) develop and realize their potential, (b) satisfy their needs, and (c) develop the capacities that allow them to interact successfully with their biological, physical, and social environments. Infant and child mortality rates are sensitive indicators of children’s health as well as of the
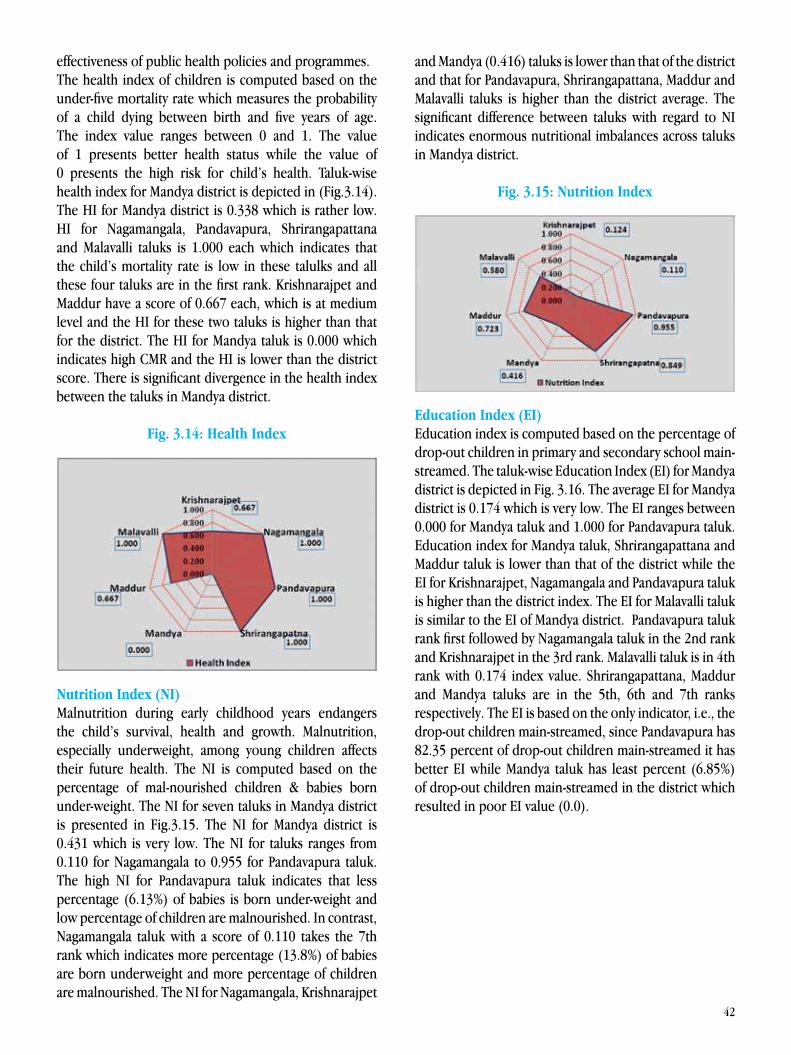
42
effectiveness of public health policies and programmes. The health index of children is computed based on the under-five mortality rate which measures the probability of a child dying between birth and five years of age. The index value ranges between 0 and 1. The value of 1 presents better health status while the value of 0 presents the high risk for child’s health. Taluk-wise health index for Mandya district is depicted in (Fig.3.14). The HI for Mandya district is 0.338 which is rather low. HI for Nagamangala, Pandavapura, Shrirangapattana and Malavalli taluks is 1.000 each which indicates that the child’s mortality rate is low in these talulks and all these four taluks are in the first rank. Krishnarajpet and Maddur have a score of 0.667 each, which is at medium level and the HI for these two taluks is higher than that for the district. The HI for Mandya taluk is 0.000 which indicates high CMR and the HI is lower than the district score. There is significant divergence in the health index between the taluks in Mandya district.
Fig. 3.14: Health Index
Nutrition Index (NI)Malnutrition during early childhood years endangers the child’s survival, health and growth. Malnutrition, especially underweight, among young children affects their future health. The NI is computed based on the percentage of mal-nourished children & babies born under-weight. The NI for seven taluks in Mandya district is presented in Fig.3.15. The NI for Mandya district is 0.431 which is very low. The NI for taluks ranges from 0.110 for Nagamangala to 0.955 for Pandavapura taluk. The high NI for Pandavapura taluk indicates that less percentage (6.13%) of babies is born under-weight and low percentage of children are malnourished. In contrast, Nagamangala taluk with a score of 0.110 takes the 7th rank which indicates more percentage (13.8%) of babies are born underweight and more percentage of children are malnourished. The NI for Nagamangala, Krishnarajpet
and Mandya (0.416) taluks is lower than that of the district and that for Pandavapura, Shrirangapattana, Maddur and Malavalli taluks is higher than the district average. The significant difference between taluks with regard to NI indicates enormous nutritional imbalances across taluks in Mandya district.
Fig. 3.15: Nutrition Index
Education Index (EI)Education index is computed based on the percentage of drop-out children in primary and secondary school main- streamed. The taluk-wise Education Index (EI) for Mandya district is depicted in Fig. 3.16. The average EI for Mandya district is 0.174 which is very low. The EI ranges between 0.000 for Mandya taluk and 1.000 for Pandavapura taluk. Education index for Mandya taluk, Shrirangapattana and Maddur taluk is lower than that of the district while the EI for Krishnarajpet, Nagamangala and Pandavapura taluk is higher than the district index. The EI for Malavalli taluk is similar to the EI of Mandya district. Pandavapura taluk rank first followed by Nagamangala taluk in the 2nd rank and Krishnarajpet in the 3rd rank. Malavalli taluk is in 4th rank with 0.174 index value. Shrirangapattana, Maddur and Mandya taluks are in the 5th, 6th and 7th ranks respectively. The EI is based on the only indicator, i.e., the drop-out children main-streamed, since Pandavapura has 82.35 percent of drop-out children main-streamed it has better EI while Mandya taluk has least percent (6.85%) of drop-out children main-streamed in the district which resulted in poor EI value (0.0).
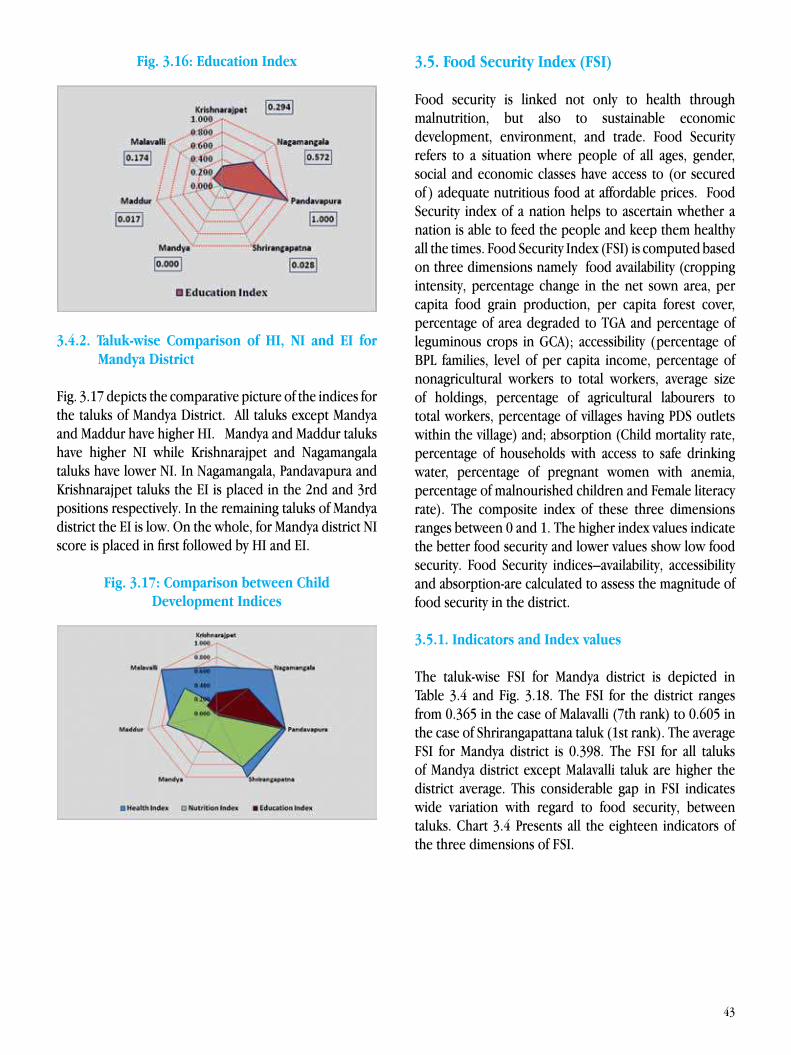
43
Fig. 3.16: Education Index
3.4.2. Taluk-wise Comparison of HI, NI and EI for Mandya District
Fig. 3.17 depicts the comparative picture of the indices for the taluks of Mandya District. All taluks except Mandya and Maddur have higher HI. Mandya and Maddur taluks have higher NI while Krishnarajpet and Nagamangala taluks have lower NI. In Nagamangala, Pandavapura and Krishnarajpet taluks the EI is placed in the 2nd and 3rd positions respectively. In the remaining taluks of Mandya district the EI is low. On the whole, for Mandya district NI score is placed in first followed by HI and EI.
Fig. 3.17: Comparison between Child Development Indices
3.5. Food Security Index (FSI)
Food security is linked not only to health through malnutrition, but also to sustainable economic development, environment, and trade. Food Security refers to a situation where people of all ages, gender, social and economic classes have access to (or secured of ) adequate nutritious food at affordable prices. Food Security index of a nation helps to ascertain whether a nation is able to feed the people and keep them healthy all the times. Food Security Index (FSI) is computed based on three dimensions namely food availability (cropping intensity, percentage change in the net sown area, per capita food grain production, per capita forest cover, percentage of area degraded to TGA and percentage of leguminous crops in GCA); accessibility (percentage of BPL families, level of per capita income, percentage of nonagricultural workers to total workers, average size of holdings, percentage of agricultural labourers to total workers, percentage of villages having PDS outlets within the village) and; absorption (Child mortality rate, percentage of households with access to safe drinking water, percentage of pregnant women with anemia, percentage of malnourished children and Female literacy rate). The composite index of these three dimensions ranges between 0 and 1. The higher index values indicate the better food security and lower values show low food security. Food Security indices–availability, accessibility and absorption-are calculated to assess the magnitude of food security in the district.
3.5.1. Indicators and Index values
The taluk-wise FSI for Mandya district is depicted in Table 3.4 and Fig. 3.18. The FSI for the district ranges from 0.365 in the case of Malavalli (7th rank) to 0.605 in the case of Shrirangapattana taluk (1st rank). The average FSI for Mandya district is 0.398. The FSI for all taluks of Mandya district except Malavalli taluk are higher the district average. This considerable gap in FSI indicates wide variation with regard to food security, between taluks. Chart 3.4 Presents all the eighteen indicators of the three dimensions of FSI.
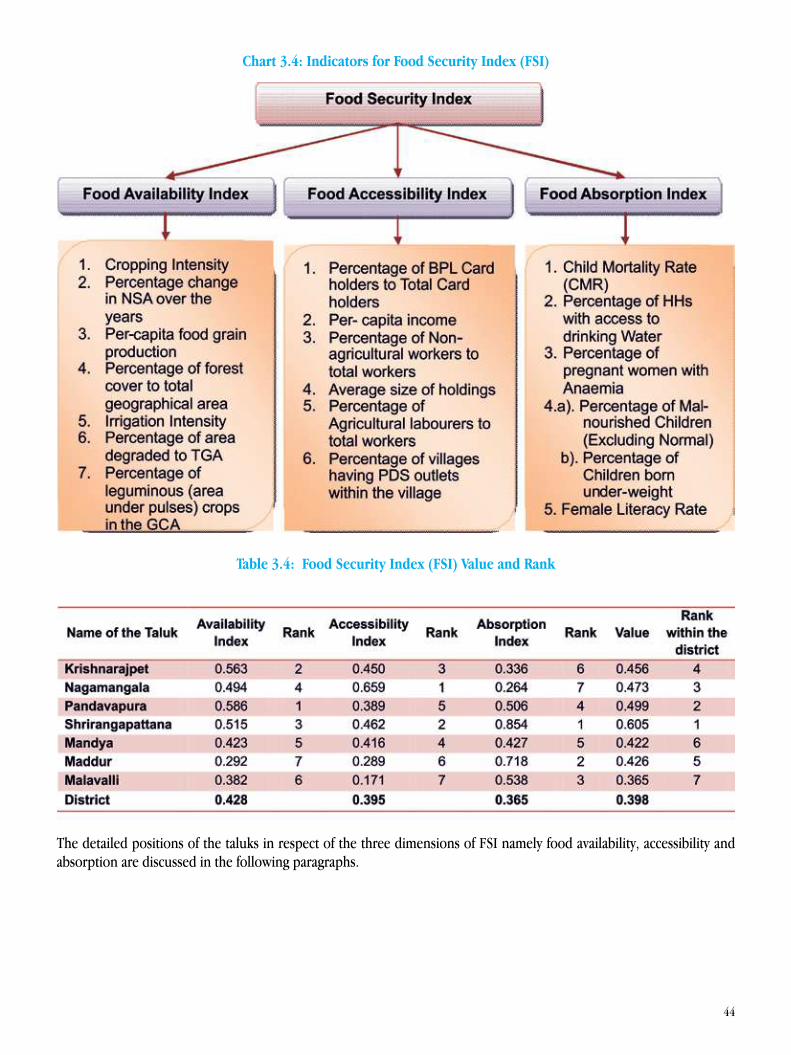
44
Chart 3.4: Indicators for Food Security Index (FSI)
Table 3.4: Food Security Index (FSI) Value and Rank
The detailed positions of the taluks in respect of the three dimensions of FSI namely food availability, accessibility and absorption are discussed in the following paragraphs.

45
Fig. 3.18: Food Security Index (FSI)
Food Availability Index (FAI)Food availability index is computed using seven indicators. The Food availability index for Mandya district is 0.428 (Fig.3.19.). Pandavapura taluk ranks first with FAI of 0.586 followed by Krishnarajpet taluk in the 2nd rank with 0.563, Shrirangapattana taluk in the 3rd rank with 0.515 and Nagamangala taluk ranks 4th place with 0.494. All these four taluks have higher FAI than the district average. Mandya, Malavalli and Maddur taluks have lower FAI than that of the district and they are in the 5th, 6th and 7th ranks respectively.
Fig. 3.19: Food Availability Index (FAI)
Pandavapura taluk has better food availability index (0.586) as it has higher percentage change in net area sown (44.84%), large percentage of area under pulses crops (27.50%) and per-capita food grain production of 210 kgs. Krishnarajpet taluk also has better performance in per-capita food grain production (236 kgs), area under pulses (22.00%) and irrigation intensity (127.58). Maddur taluk ranks last in FAI because of low percentage change in net area sown (-20.18%) low percentage area under pulses (80%) and low irrigation intensity (110.47%).
Food Accessibility Index (FAcI)Food accessibility index (FAcI) is computed using six
indicators (Fig.3.20). Nagamangala taluk has the highest FAcI (0.659) and ranks first. Malavalli taluk has lowest FAcI (0.171) and ranks 7th.Thus a significant gap in the FAcI (0.171 to 0.659) between the taluks is observed. FAcI for the district is 0.395 which reflects rather lower. All taluks except Malavalli, Maddur and Pandavapura taluks have higher FAcI than the district.
Fig. 3.20: Food Accessibility Index (FAcI)
The table 3.4 reveals that Nagamangala taluk stand first in FAcI (0.659) as it has better values for indicators used for computing this index such as lower percentage of agricultural labourers to total workers (12.92%) high per capita income (Rs. 35,473) and more number of village having PDS outlets (85.80%). On the contrary, in Malavalli taluk the per capita income is low (Rs.25,316) compared to other taluks in the district, high percentage of agricultural labourers (34.84%) to total workers and low average size of land holdings (0.68 ha) all of which depress FAcI (0.171).
Food Absorption Index (FAbI) Six indicators have been used for calculating FAbI index. The FAbI for the district is 0.365 which is rather low (Fig.3.21). The FAbI for taluks of Mandya district ranges from 0.264 in the case of Nagamangala taluk to 0.854 in the case of Shrirangapattana taluk. Shrirangapattana is in 1st rank followed by Maddur taluk in the 2nd place, Malavalli taluk in the 3rd rank, Pandavapura in the 4th rank and Mandya taluk is in the 5th rank. All these five taluks have higher FAbI than district average. Krishnarajpet and Nagamangala taluks have lower FAbI than the district’s index and they are in the 6th and 7th ranks. The large FAbI gap between the taluks indicates great difference between taluks with regard to food absorption.
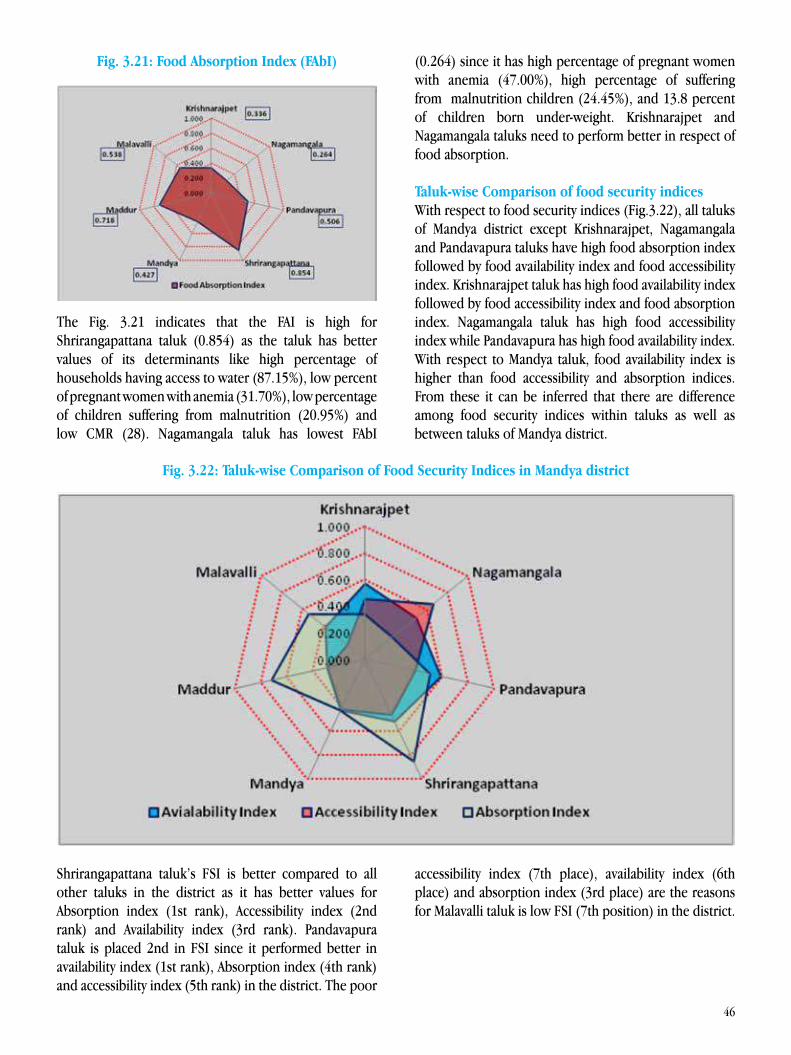
46
Fig. 3.21: Food Absorption Index (FAbI)
The Fig. 3.21 indicates that the FAI is high for Shrirangapattana taluk (0.854) as the taluk has better values of its determinants like high percentage of households having access to water (87.15%), low percent of pregnant women with anemia (31.70%), low percentage of children suffering from malnutrition (20.95%) and low CMR (28). Nagamangala taluk has lowest FAbI
(0.264) since it has high percentage of pregnant women with anemia (47.00%), high percentage of suffering from malnutrition children (24.45%), and 13.8 percent of children born under-weight. Krishnarajpet and Nagamangala taluks need to perform better in respect of food absorption.
Taluk-wise Comparison of food security indicesWith respect to food security indices (Fig.3.22), all taluks of Mandya district except Krishnarajpet, Nagamangala and Pandavapura taluks have high food absorption index followed by food availability index and food accessibility index. Krishnarajpet taluk has high food availability index followed by food accessibility index and food absorption index. Nagamangala taluk has high food accessibility index while Pandavapura has high food availability index. With respect to Mandya taluk, food availability index is higher than food accessibility and absorption indices. From these it can be inferred that there are difference among food security indices within taluks as well as between taluks of Mandya district.
Fig. 3.22: Taluk-wise Comparison of Food Security Indices in Mandya district
Shrirangapattana taluk’s FSI is better compared to all other taluks in the district as it has better values for Absorption index (1st rank), Accessibility index (2nd rank) and Availability index (3rd rank). Pandavapura taluk is placed 2nd in FSI since it performed better in availability index (1st rank), Absorption index (4th rank) and accessibility index (5th rank) in the district. The poor
accessibility index (7th place), availability index (6th place) and absorption index (3rd place) are the reasons for Malavalli taluk is low FSI (7th position) in the district.

47
3.6. Composite Taluk Development Index (CTDI)
CTDI is comprehensive index covering a wide range of critical development indicators in a taluk. It helps not only to assess the over-all development of a taluk but also to compare taluks in terms of overall development. CTDI is computed by using the three broad parameters related to education, health and standard of living. These indicators are related to demographic factors, livelihood and employment factors, household assets, empowerment of the community, health factors including drinking water supply, sanitation, and education factors. In all 68 indicators have been used for calculating CTDI. These indictors help to understand the position of taluks and district from the human development perspective. The value for each of these indicators ranges between 0 and 1, zero value indicating the lowest ranking for the taluk and 1 indicating the highest ranking of the taluk.
3.6.1. Living Standard Index (LSI):
The Living Standard Index(LSI) is a composite index computed by taking into account four dimensions namely i) Demography, ii) Livelihood and Employment, iii) Housing and Assets and iv) Participation Indices. The LSI for the taluks of Mandya district is portrayed in Radar diagram 3.23. The average LSI for Mandya district is 0.420 which is rather low. Mandya taluk has the highest living standard index (0.535) in the district while Pandavapura taluk has the lowest (0.416). Mandya, Nagamangala, Maddur, Shrirangapattana, and Krishnarajpet taluks have higher LSI than the district average. Pandavapura taluk has lower score than the district average.
Fig. 3.23: Living Standard/Livelihood Index
Mandya taluk has the highest rank in LSI (0.535) because of the high decadal growth of employment (9.51%), high
percentage of Households with two wheelers (23.39%) and high percentage of women elected representatives to local bodies (45.36%). In contrast, Pandavapura taluk ranks last since it has lowest decadal growth of employment (1.08%), high percentage of siteless households (9.6%) low percentage of BPL households provided with employment under MGNREGS and low percentage of active SHGs (66.19%).
3.6.2. Health Index (HI):
The HI for the taluks of Mandya district is presented in Fig. 3.24. The HI for Mandya district is 0.474. The HI for the taluks of Mandya district ranges from 0.439 to 0.743 and there is a noticeable gap between taluks. The highest gap of 0.304 is observed between Mandya and Nagamangala taluks. The HI of Mandya taluk is 0.743 and it is in the 1st rank followed by Maddur taluk in the 2nd rank with an HI of 0.599, Shrirangapattana taluk is in the 3rd rank 0.549 and Krishnarajpet taluk is in the 4thrank with 0.478. All these four taluks have higher HI than the district. The HI for Malavalli taluk is identical to the district average. The average HI for Pandavapura and Nagamangala taluks is 0.454 and 0.439 respectively, they are in the last two ranks. On the whole, the health care in the taluks as well as in Mandya district requires greater attention by the Health Department and Zilla Panchayath to improve the health situation.
Fig. 3.24: Health Index
The factors contributing to high HI for Mandya taluk are 100 percent pregnant women receiving full ANC, less percentage of people affected by communicable diseases (0.34%), a good number of people (9260) were served by PHCs, availability of doctors and nurses per 1000 population is fairly good, and fairly high per-capita health expenditure (Rs. 2178). On the other hand, Nagamangala
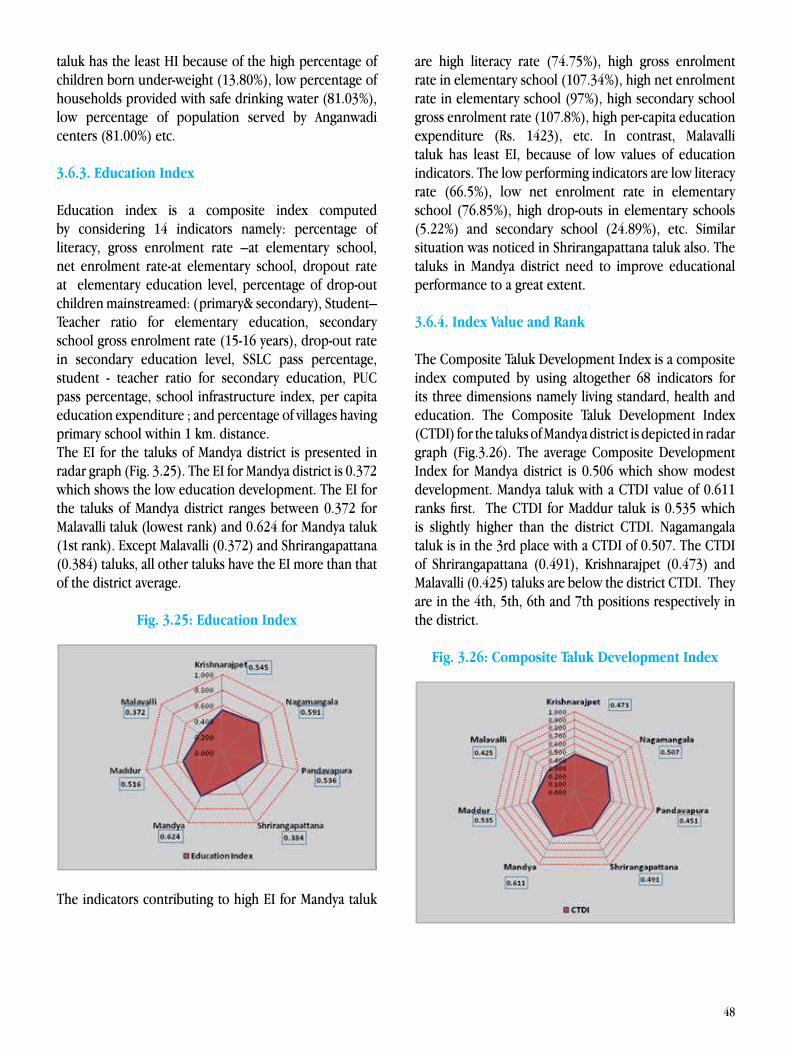
48
taluk has the least HI because of the high percentage of children born under-weight (13.80%), low percentage of households provided with safe drinking water (81.03%), low percentage of population served by Anganwadi centers (81.00%) etc.
3.6.3. Education Index
Education index is a composite index computed by considering 14 indicators namely: percentage of literacy, gross enrolment rate –at elementary school, net enrolment rate-at elementary school, dropout rate at elementary education level, percentage of drop-out children mainstreamed: (primary& secondary), Student–Teacher ratio for elementary education, secondary school gross enrolment rate (15-16 years), drop-out rate in secondary education level, SSLC pass percentage, student - teacher ratio for secondary education, PUC pass percentage, school infrastructure index, per capita education expenditure ; and percentage of villages having primary school within 1 km. distance. The EI for the taluks of Mandya district is presented in radar graph (Fig. 3.25). The EI for Mandya district is 0.372 which shows the low education development. The EI for the taluks of Mandya district ranges between 0.372 for Malavalli taluk (lowest rank) and 0.624 for Mandya taluk (1st rank). Except Malavalli (0.372) and Shrirangapattana (0.384) taluks, all other taluks have the EI more than that of the district average.
Fig. 3.25: Education Index
The indicators contributing to high EI for Mandya taluk
are high literacy rate (74.75%), high gross enrolment rate in elementary school (107.34%), high net enrolment rate in elementary school (97%), high secondary school gross enrolment rate (107.8%), high per-capita education expenditure (Rs. 1423), etc. In contrast, Malavalli taluk has least EI, because of low values of education indicators. The low performing indicators are low literacy rate (66.5%), low net enrolment rate in elementary school (76.85%), high drop-outs in elementary schools (5.22%) and secondary school (24.89%), etc. Similar situation was noticed in Shrirangapattana taluk also. The taluks in Mandya district need to improve educational performance to a great extent.
3.6.4. Index Value and Rank
The Composite Taluk Development Index is a composite index computed by using altogether 68 indicators for its three dimensions namely living standard, health and education. The Composite Taluk Development Index (CTDI) for the taluks of Mandya district is depicted in radar graph (Fig.3.26). The average Composite Development Index for Mandya district is 0.506 which show modest development. Mandya taluk with a CTDI value of 0.611 ranks first. The CTDI for Maddur taluk is 0.535 which is slightly higher than the district CTDI. Nagamangala taluk is in the 3rd place with a CTDI of 0.507. The CTDI of Shrirangapattana (0.491), Krishnarajpet (0.473) and Malavalli (0.425) taluks are below the district CTDI. They are in the 4th, 5th, 6th and 7th positions respectively in the district.
Fig. 3.26: Composite Taluk Development Index
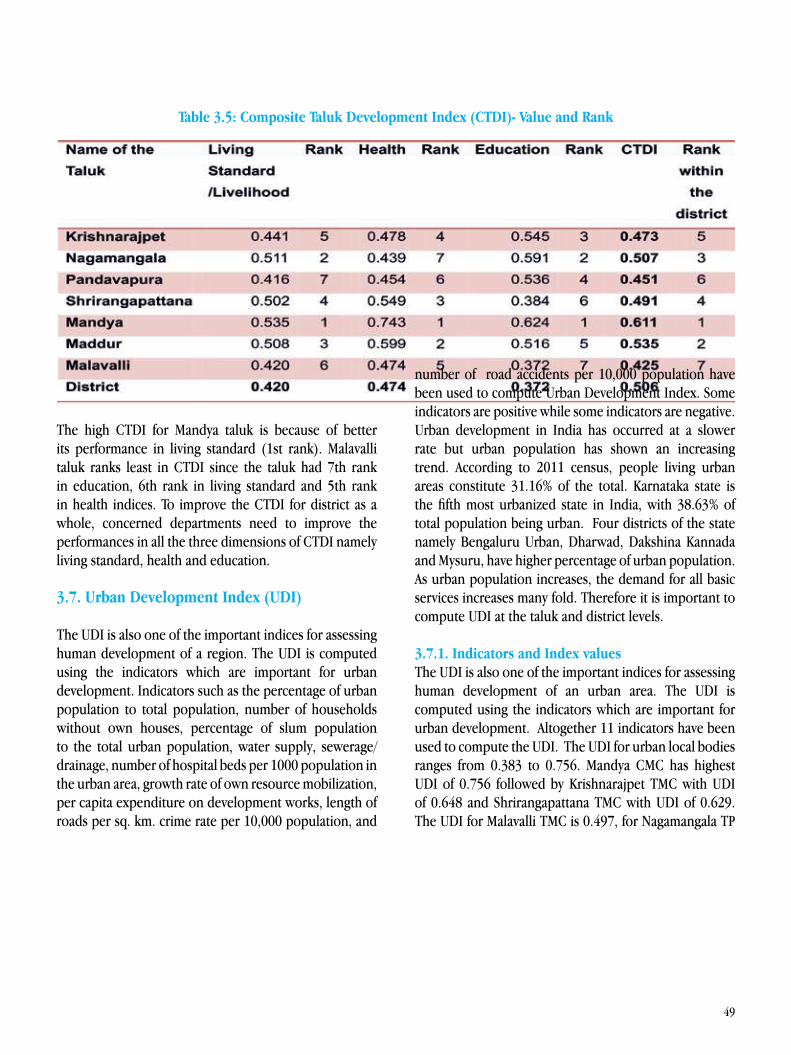
49
Table 3.5: Composite Taluk Development Index (CTDI)- Value and Rank
The high CTDI for Mandya taluk is because of better its performance in living standard (1st rank). Malavalli taluk ranks least in CTDI since the taluk had 7th rank in education, 6th rank in living standard and 5th rank in health indices. To improve the CTDI for district as a whole, concerned departments need to improve the performances in all the three dimensions of CTDI namely living standard, health and education. 3.7. Urban Development Index (UDI)
The UDI is also one of the important indices for assessing human development of a region. The UDI is computed using the indicators which are important for urban development. Indicators such as the percentage of urban population to total population, number of households without own houses, percentage of slum population to the total urban population, water supply, sewerage/ drainage, number of hospital beds per 1000 population in the urban area, growth rate of own resource mobilization, per capita expenditure on development works, length of roads per sq. km. crime rate per 10,000 population, and
number of road accidents per 10,000 population have been used to compute Urban Development Index. Some indicators are positive while some indicators are negative. Urban development in India has occurred at a slower rate but urban population has shown an increasing trend. According to 2011 census, people living urban areas constitute 31.16% of the total. Karnataka state is the fifth most urbanized state in India, with 38.63% of total population being urban. Four districts of the state namely Bengaluru Urban, Dharwad, Dakshina Kannada and Mysuru, have higher percentage of urban population. As urban population increases, the demand for all basic services increases many fold. Therefore it is important to compute UDI at the taluk and district levels.
3.7.1. Indicators and Index values The UDI is also one of the important indices for assessing human development of an urban area. The UDI is computed using the indicators which are important for urban development. Altogether 11 indicators have been used to compute the UDI. The UDI for urban local bodies ranges from 0.383 to 0.756. Mandya CMC has highest UDI of 0.756 followed by Krishnarajpet TMC with UDI of 0.648 and Shrirangapattana TMC with UDI of 0.629. The UDI for Malavalli TMC is 0.497, for Nagamangala TP
50
0.467, for Pandavapura TP 0.442 and for Maddur TMC 0.383 (Table 3.6 and Fig. 3.27). Chart 3.5: Presents all the eleven indicators of UDI.
Chart 3.5: Indicators for Urban Development Index (UDI)
Table 3.6: Urban Development Index (UDI) Value and Rank
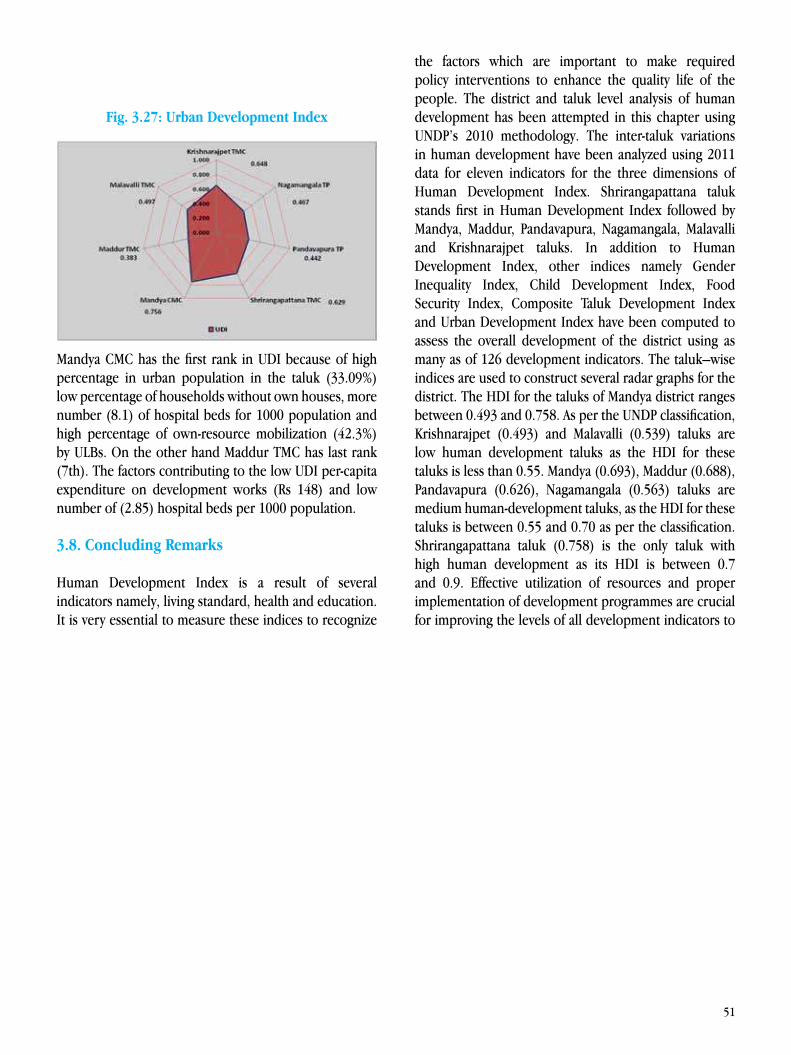
51
Fig. 3.27: Urban Development Index
Mandya CMC has the first rank in UDI because of high percentage in urban population in the taluk (33.09%) low percentage of households without own houses, more number (8.1) of hospital beds for 1000 population and high percentage of own-resource mobilization (42.3%)by ULBs. On the other hand Maddur TMC has last rank (7th). The factors contributing to the low UDI per-capita expenditure on development works (Rs 148) and low number of (2.85) hospital beds per 1000 population.
3.8. Concluding Remarks
Human Development Index is a result of several indicators namely, living standard, health and education. It is very essential to measure these indices to recognize
the factors which are important to make required policy interventions to enhance the quality life of the people. The district and taluk level analysis of human development has been attempted in this chapter using UNDP’s 2010 methodology. The inter-taluk variations in human development have been analyzed using 2011 data for eleven indicators for the three dimensions of Human Development Index. Shrirangapattana taluk stands first in Human Development Index followed by Mandya, Maddur, Pandavapura, Nagamangala, Malavalli and Krishnarajpet taluks. In addition to Human Development Index, other indices namely Gender Inequality Index, Child Development Index, Food Security Index, Composite Taluk Development Index and Urban Development Index have been computed to assess the overall development of the district using as many as of 126 development indicators. The taluk–wise indices are used to construct several radar graphs for the district. The HDI for the taluks of Mandya district ranges between 0.493 and 0.758. As per the UNDP classification, Krishnarajpet (0.493) and Malavalli (0.539) taluks are low human development taluks as the HDI for these taluks is less than 0.55. Mandya (0.693), Maddur (0.688), Pandavapura (0.626), Nagamangala (0.563) taluks are medium human-development taluks, as the HDI for these taluks is between 0.55 and 0.70 as per the classification. Shrirangapattana taluk (0.758) is the only taluk with high human development as its HDI is between 0.7 and 0.9. Effective utilization of resources and proper implementation of development programmes are crucial for improving the levels of all development indicators to

52

53

54
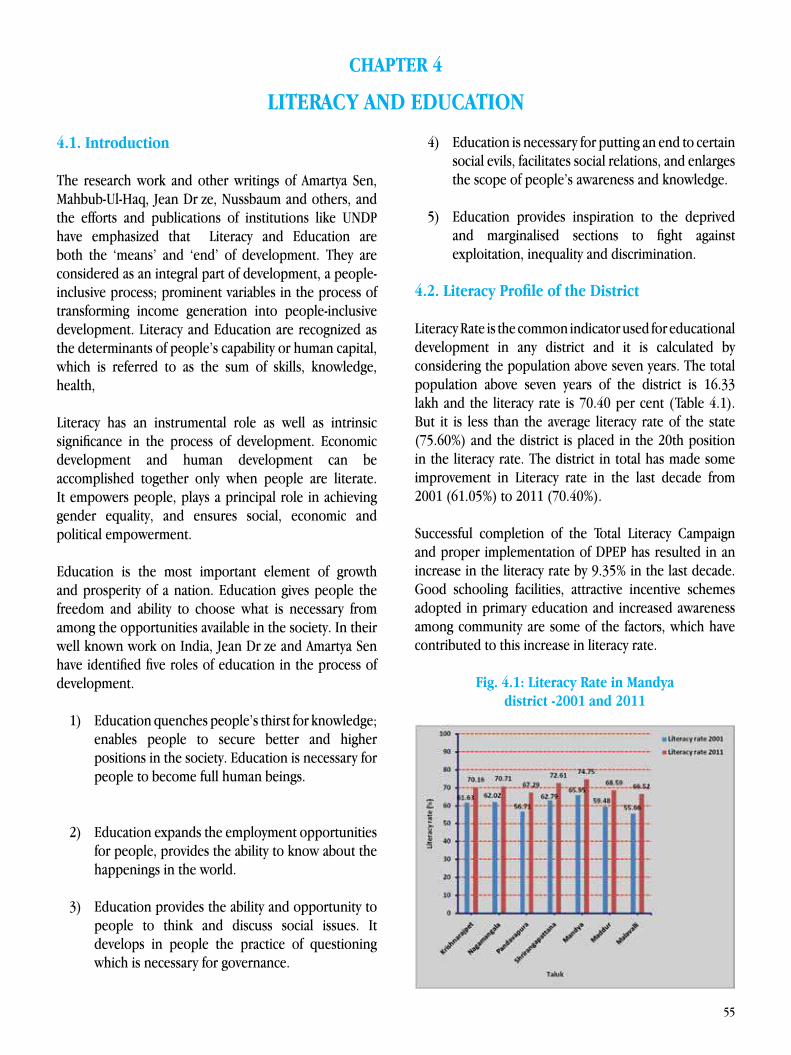
55
4.1. Introduction
The research work and other writings of Amartya Sen, Mahbub-Ul-Haq, Jean Drềze, Nussbaum and others, and the efforts and publications of institutions like UNDP have emphasized that Literacy and Education are both the ‘means’ and ‘end’ of development. They are considered as an integral part of development, a people-inclusive process; prominent variables in the process of transforming income generation into people-inclusive development. Literacy and Education are recognized as the determinants of people’s capability or human capital, which is referred to as the sum of skills, knowledge, health,
Literacy has an instrumental role as well as intrinsic significance in the process of development. Economic development and human development can be accomplished together only when people are literate. It empowers people, plays a principal role in achieving gender equality, and ensures social, economic and political empowerment.
Education is the most important element of growth and prosperity of a nation. Education gives people the freedom and ability to choose what is necessary from among the opportunities available in the society. In their well known work on India, Jean Drềze and Amartya Sen have identified five roles of education in the process of development.
1) Education quenches people’s thirst for knowledge; enables people to secure better and higher positions in the society. Education is necessary for people to become full human beings.
2) Education expands the employment opportunities for people, provides the ability to know about the happenings in the world.
3) Education provides the ability and opportunity to people to think and discuss social issues. It develops in people the practice of questioning which is necessary for governance.
CHAPTER 4
LITERACY AND EDUCATION
4) Education is necessary for putting an end to certain social evils, facilitates social relations, and enlarges the scope of people’s awareness and knowledge.
5) Education provides inspiration to the deprived and marginalised sections to fight against exploitation, inequality and discrimination.
4.2. Literacy Profile of the District
Literacy Rate is the common indicator used for educational development in any district and it is calculated by considering the population above seven years. The total population above seven years of the district is 16.33 lakh and the literacy rate is 70.40 per cent (Table 4.1). But it is less than the average literacy rate of the state (75.60%) and the district is placed in the 20th position in the literacy rate. The district in total has made some improvement in Literacy rate in the last decade from 2001 (61.05%) to 2011 (70.40%).
Successful completion of the Total Literacy Campaign and proper implementation of DPEP has resulted in an increase in the literacy rate by 9.35% in the last decade. Good schooling facilities, attractive incentive schemes adopted in primary education and increased awareness among community are some of the factors, which have contributed to this increase in literacy rate.
Fig. 4.1: Literacy Rate in Mandya district -2001 and 2011
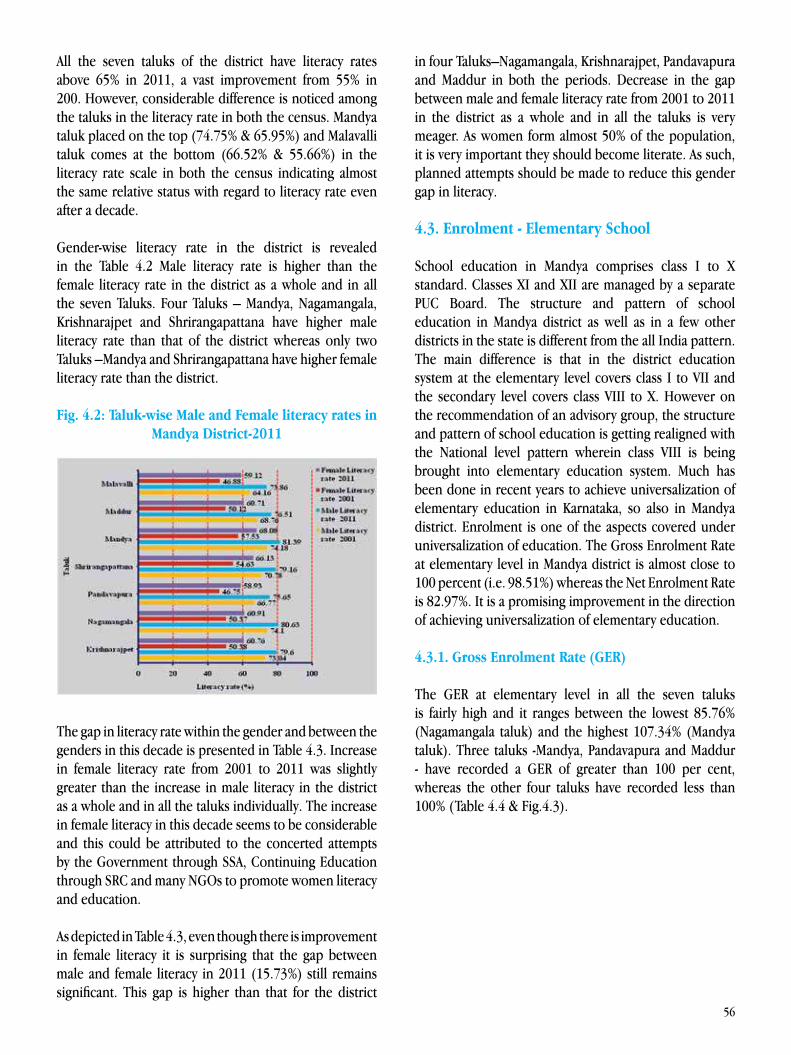
56
All the seven taluks of the district have literacy rates above 65% in 2011, a vast improvement from 55% in 200. However, considerable difference is noticed among the taluks in the literacy rate in both the census. Mandya taluk placed on the top (74.75% & 65.95%) and Malavalli taluk comes at the bottom (66.52% & 55.66%) in the literacy rate scale in both the census indicating almost the same relative status with regard to literacy rate even after a decade.
Gender-wise literacy rate in the district is revealed in the Table 4.2 Male literacy rate is higher than the female literacy rate in the district as a whole and in all the seven Taluks. Four Taluks – Mandya, Nagamangala, Krishnarajpet and Shrirangapattana have higher male literacy rate than that of the district whereas only two Taluks –Mandya and Shrirangapattana have higher female literacy rate than the district.
Fig. 4.2: Taluk-wise Male and Female literacy rates in Mandya District-2011
The gap in literacy rate within the gender and between the genders in this decade is presented in Table 4.3. Increase in female literacy rate from 2001 to 2011 was slightly greater than the increase in male literacy in the district as a whole and in all the taluks individually. The increase in female literacy in this decade seems to be considerable and this could be attributed to the concerted attempts by the Government through SSA, Continuing Education through SRC and many NGOs to promote women literacy and education.
As depicted in Table 4.3, even though there is improvement in female literacy it is surprising that the gap between male and female literacy in 2011 (15.73%) still remains significant. This gap is higher than that for the district
in four Taluks–Nagamangala, Krishnarajpet, Pandavapura and Maddur in both the periods. Decrease in the gap between male and female literacy rate from 2001 to 2011 in the district as a whole and in all the taluks is very meager. As women form almost 50% of the population, it is very important they should become literate. As such, planned attempts should be made to reduce this gender gap in literacy.
4.3. Enrolment - Elementary School
School education in Mandya comprises class I to X standard. Classes XI and XII are managed by a separate PUC Board. The structure and pattern of school education in Mandya district as well as in a few other districts in the state is different from the all India pattern. The main difference is that in the district education system at the elementary level covers class I to VII and the secondary level covers class VIII to X. However on the recommendation of an advisory group, the structure and pattern of school education is getting realigned with the National level pattern wherein class VIII is being brought into elementary education system. Much has been done in recent years to achieve universalization of elementary education in Karnataka, so also in Mandya district. Enrolment is one of the aspects covered under universalization of education. The Gross Enrolment Rate at elementary level in Mandya district is almost close to 100 percent (i.e. 98.51%) whereas the Net Enrolment Rate is 82.97%. It is a promising improvement in the direction of achieving universalization of elementary education.
4.3.1. Gross Enrolment Rate (GER)
The GER at elementary level in all the seven taluks is fairly high and it ranges between the lowest 85.76% (Nagamangala taluk) and the highest 107.34% (Mandya taluk). Three taluks -Mandya, Pandavapura and Maddur - have recorded a GER of greater than 100 per cent, whereas the other four taluks have recorded less than 100% (Table 4.4 & Fig.4.3).
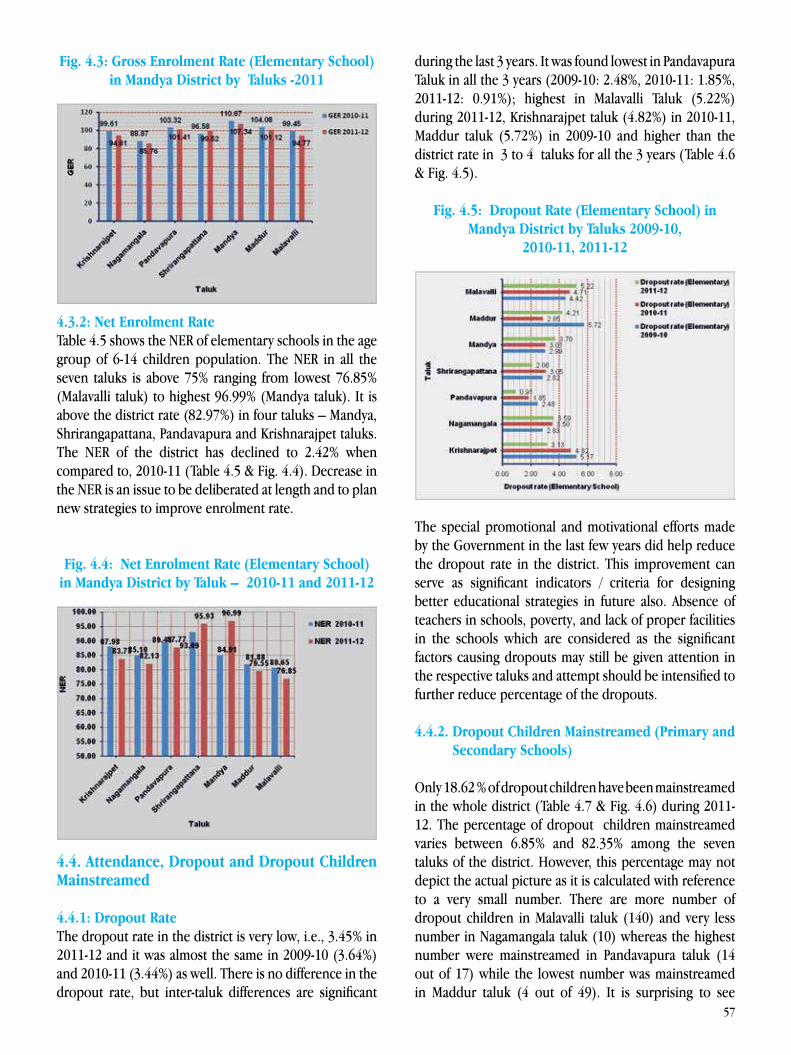
57
Fig. 4.3: Gross Enrolment Rate (Elementary School) in Mandya District by Taluks -2011
4.3.2: Net Enrolment RateTable 4.5 shows the NER of elementary schools in the age group of 6-14 children population. The NER in all the seven taluks is above 75% ranging from lowest 76.85% (Malavalli taluk) to highest 96.99% (Mandya taluk). It is above the district rate (82.97%) in four taluks – Mandya, Shrirangapattana, Pandavapura and Krishnarajpet taluks. The NER of the district has declined to 2.42% when compared to, 2010-11 (Table 4.5 & Fig. 4.4). Decrease in the NER is an issue to be deliberated at length and to plan new strategies to improve enrolment rate.
Fig. 4.4: Net Enrolment Rate (Elementary School)
in Mandya District by Taluk – 2010-11 and 2011-12
4.4. Attendance, Dropout and Dropout Children Mainstreamed
4.4.1: Dropout RateThe dropout rate in the district is very low, i.e., 3.45% in 2011-12 and it was almost the same in 2009-10 (3.64%) and 2010-11 (3.44%) as well. There is no difference in the dropout rate, but inter-taluk differences are significant
during the last 3 years. It was found lowest in Pandavapura Taluk in all the 3 years (2009-10: 2.48%, 2010-11: 1.85%, 2011-12: 0.91%); highest in Malavalli Taluk (5.22%) during 2011-12, Krishnarajpet taluk (4.82%) in 2010-11, Maddur taluk (5.72%) in 2009-10 and higher than the district rate in 3 to 4 taluks for all the 3 years (Table 4.6 & Fig. 4.5).
Fig. 4.5: Dropout Rate (Elementary School) in Mandya District by Taluks 2009-10,
2010-11, 2011-12
The special promotional and motivational efforts made by the Government in the last few years did help reduce the dropout rate in the district. This improvement can serve as significant indicators / criteria for designing better educational strategies in future also. Absence of teachers in schools, poverty, and lack of proper facilities in the schools which are considered as the significant factors causing dropouts may still be given attention in the respective taluks and attempt should be intensified to further reduce percentage of the dropouts. 4.4.2. Dropout Children Mainstreamed (Primary and Secondary Schools)
Only 18.62 % of dropout children have been mainstreamed in the whole district (Table 4.7 & Fig. 4.6) during 2011-12. The percentage of dropout children mainstreamed varies between 6.85% and 82.35% among the seven taluks of the district. However, this percentage may not depict the actual picture as it is calculated with reference to a very small number. There are more number of dropout children in Malavalli taluk (140) and very less number in Nagamangala taluk (10) whereas the highest number were mainstreamed in Pandavapura taluk (14 out of 17) while the lowest number was mainstreamed in Maddur taluk (4 out of 49). It is surprising to see
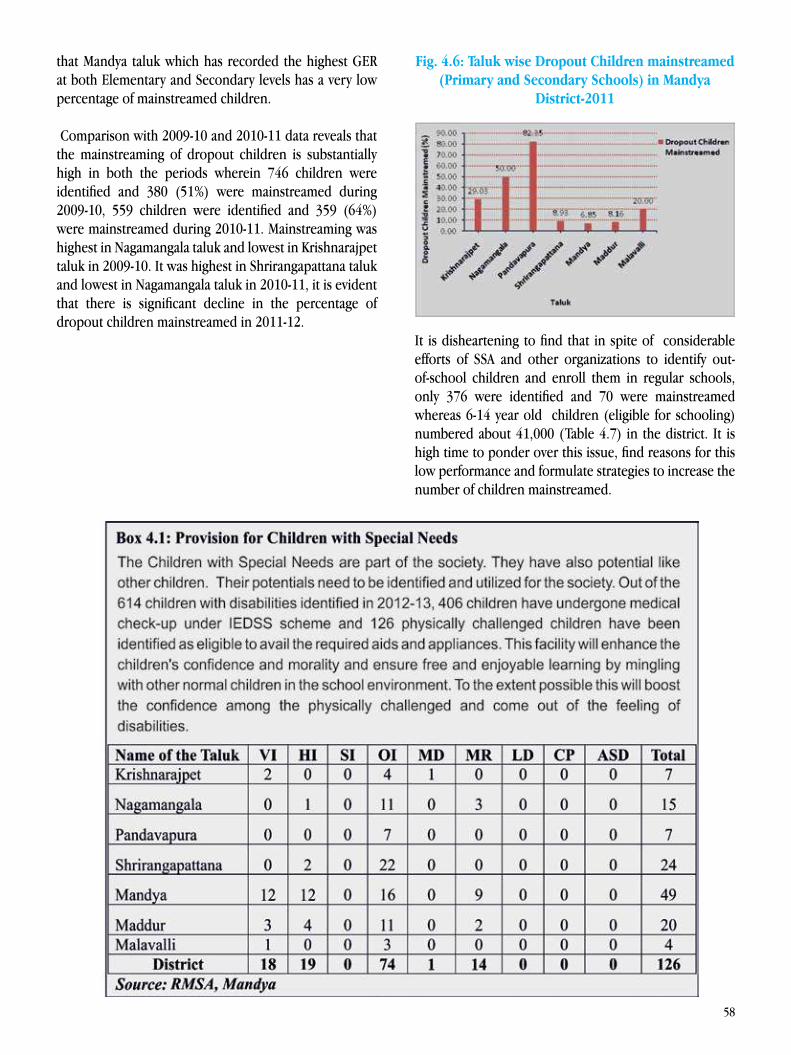
58
that Mandya taluk which has recorded the highest GER at both Elementary and Secondary levels has a very low percentage of mainstreamed children.
Comparison with 2009-10 and 2010-11 data reveals that the mainstreaming of dropout children is substantially high in both the periods wherein 746 children were identified and 380 (51%) were mainstreamed during 2009-10, 559 children were identified and 359 (64%) were mainstreamed during 2010-11. Mainstreaming was highest in Nagamangala taluk and lowest in Krishnarajpet taluk in 2009-10. It was highest in Shrirangapattana taluk and lowest in Nagamangala taluk in 2010-11, it is evident that there is significant decline in the percentage of dropout children mainstreamed in 2011-12.
Fig. 4.6: Taluk wise Dropout Children mainstreamed (Primary and Secondary Schools) in Mandya
District-2011
It is disheartening to find that in spite of considerable efforts of SSA and other organizations to identify out-of-school children and enroll them in regular schools, only 376 were identified and 70 were mainstreamed whereas 6-14 year old children (eligible for schooling) numbered about 41,000 (Table 4.7) in the district. It is high time to ponder over this issue, find reasons for this low performance and formulate strategies to increase the number of children mainstreamed.
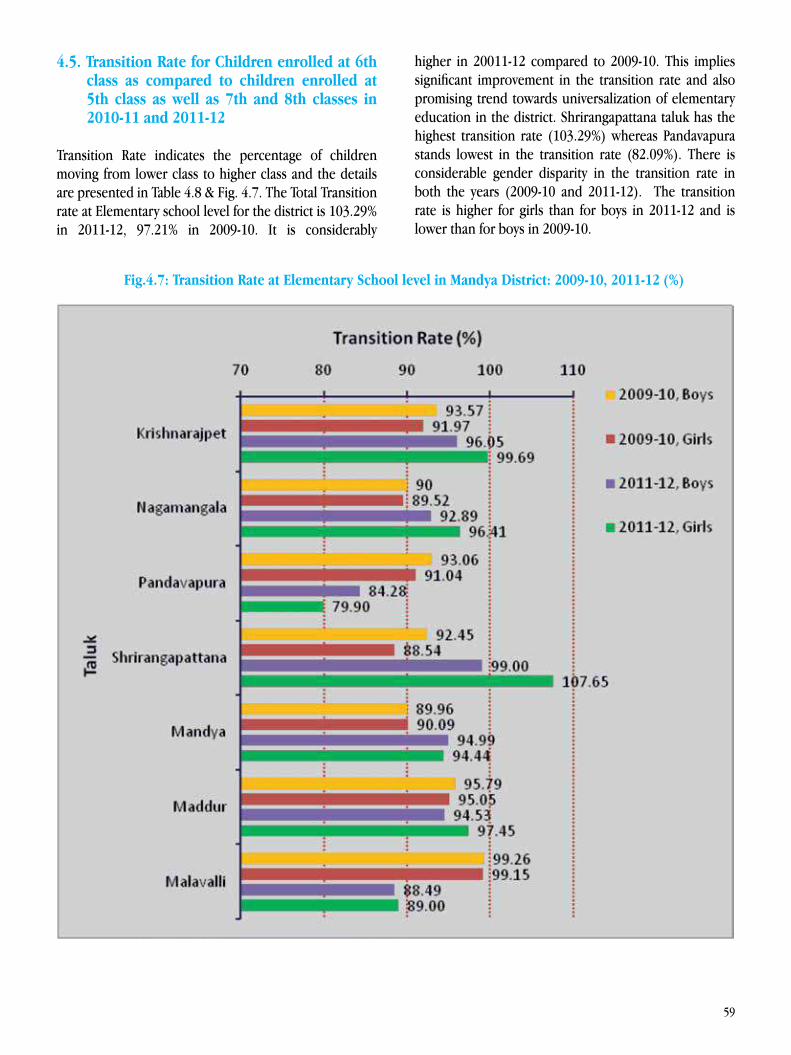
59
4.5. Transition Rate for Children enrolled at 6th class as compared to children enrolled at 5th class as well as 7th and 8th classes in 2010-11 and 2011-12
Transition Rate indicates the percentage of children moving from lower class to higher class and the details are presented in Table 4.8 & Fig. 4.7. The Total Transition rate at Elementary school level for the district is 103.29% in 2011-12, 97.21% in 2009-10. It is considerably
higher in 20011-12 compared to 2009-10. This implies significant improvement in the transition rate and also promising trend towards universalization of elementary education in the district. Shrirangapattana taluk has the highest transition rate (103.29%) whereas Pandavapura stands lowest in the transition rate (82.09%). There is considerable gender disparity in the transition rate in both the years (2009-10 and 2011-12). The transition rate is higher for girls than for boys in 2011-12 and is lower than for boys in 2009-10.
Fig.4.7: Transition Rate at Elementary School level in Mandya District: 2009-10, 2011-12 (%)
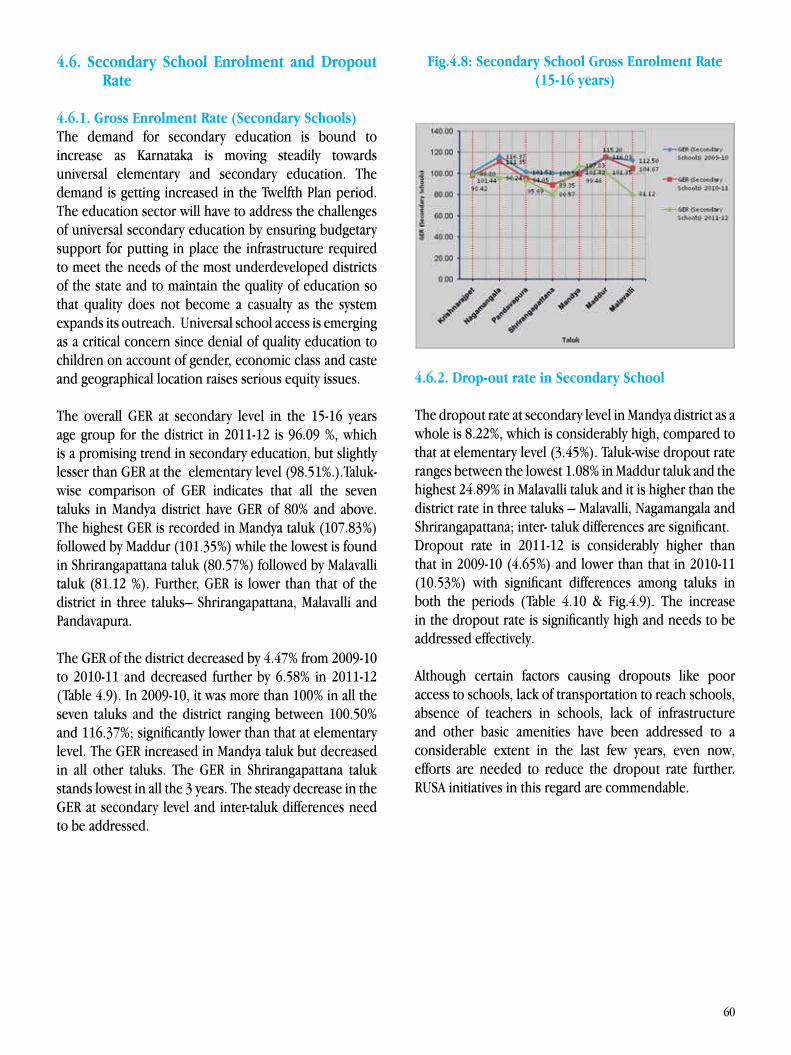
60
4.6. Secondary School Enrolment and Dropout Rate
4.6.1. Gross Enrolment Rate (Secondary Schools)The demand for secondary education is bound to increase as Karnataka is moving steadily towards universal elementary and secondary education. The demand is getting increased in the Twelfth Plan period. The education sector will have to address the challenges of universal secondary education by ensuring budgetary support for putting in place the infrastructure required to meet the needs of the most underdeveloped districts of the state and to maintain the quality of education so that quality does not become a casualty as the system expands its outreach. Universal school access is emerging as a critical concern since denial of quality education to children on account of gender, economic class and caste and geographical location raises serious equity issues.
The overall GER at secondary level in the 15-16 years age group for the district in 2011-12 is 96.09 %, which is a promising trend in secondary education, but slightly lesser than GER at the elementary level (98.51%.).Taluk-wise comparison of GER indicates that all the seven taluks in Mandya district have GER of 80% and above. The highest GER is recorded in Mandya taluk (107.83%) followed by Maddur (101.35%) while the lowest is found in Shrirangapattana taluk (80.57%) followed by Malavalli taluk (81.12 %). Further, GER is lower than that of the district in three taluks– Shrirangapattana, Malavalli and Pandavapura.
The GER of the district decreased by 4.47% from 2009-10 to 2010-11 and decreased further by 6.58% in 2011-12 (Table 4.9). In 2009-10, it was more than 100% in all the seven taluks and the district ranging between 100.50% and 116.37%; significantly lower than that at elementary level. The GER increased in Mandya taluk but decreased in all other taluks. The GER in Shrirangapattana taluk stands lowest in all the 3 years. The steady decrease in the GER at secondary level and inter-taluk differences need to be addressed.
Fig.4.8: Secondary School Gross Enrolment Rate (15-16 years)
4.6.2. Drop-out rate in Secondary School
The dropout rate at secondary level in Mandya district as a whole is 8.22%, which is considerably high, compared to that at elementary level (3.45%). Taluk-wise dropout rate ranges between the lowest 1.08% in Maddur taluk and the highest 24.89% in Malavalli taluk and it is higher than the district rate in three taluks – Malavalli, Nagamangala and Shrirangapattana; inter- taluk differences are significant.Dropout rate in 2011-12 is considerably higher than that in 2009-10 (4.65%) and lower than that in 2010-11 (10.53%) with significant differences among taluks in both the periods (Table 4.10 & Fig.4.9). The increase in the dropout rate is significantly high and needs to be addressed effectively.
Although certain factors causing dropouts like poor access to schools, lack of transportation to reach schools, absence of teachers in schools, lack of infrastructure and other basic amenities have been addressed to a considerable extent in the last few years, even now, efforts are needed to reduce the dropout rate further. RUSA initiatives in this regard are commendable.

61
Fig.4.9: Drop-out rate in Secondary School
4.7. Pupil -Teacher Ratio
Teachers are the pivot of any education system as any change or improvement in the quality of education depends on the availability and quality of teachers. Hence it is imperative to analyse the strength of teachers in school education. The details of sanctioned posts and working teachers in elementary and secondary schools are presented in Table 4.11.
Totally 92.5% and 88% of sanctioned teachers were working at elementary and secondary schools respectively in 2011-12. It is evident that the number of teacher’s posts sanctioned and working is not proportionately adequate to the number of students enrolled. Attention should be given to recruit teachers against all the sanctioned posts and more number of teachers post need to be increased in accordance with the enrolment of students.
The percentage of female teachers is low in lower primary and secondary schools compared to higher primary schools. In order to encourage girl’s education, it is recommended to have more number of female teachers at the school level in general and at elementary level in particular. But, this is not fulfilled even after considerably a long period. This needs immediate attention.
One of the important indicators which add to the quality of education and literacy is the Pupil-Teacher Ratio. This ratio indicates the number of pupils enrolled per teacher and is calculated considering the total number of pupils enrolled to the 7th class in Government schools and the number of teachers working in those schools separately for elementary and secondary education level.
4.7.1. Pupil -Teacher Ratio (Elementary School)
Pupil-Teacher Ratio at the elementary level in the district is 20:1 (Table 4.13), which means there are 20 pupils attached to one teacher. It is surprising, this ratio is higher, when compared to that of in 2010-11 (19:1) and in 2009-10 (12:1 vide Table 4.13). Considerable variation in Pupil-Teacher Ratio is noticed across the seven taluks, ranging between 13:1in Nagamangala taluk and 37:1 in Shrirangapattana taluk in 2011-12; while little variation is found across the taluks in 2009-10 and some variation in 2010-11.
It is commonly admitted that if a teacher is responsible for less number of pupils, it is possible to give individual attention to pupils and promote effective learning. Hence, it is recommended to have a lower pupil-teacher ratio. But it is painful to observe that a ratio of less than 10 is not found in any of the taluks in Mandya district. Further, it is disheartening to find pupil-teacher ratio of 37:1 in one of the seven taluks (Shrirangapattana). This ratio is calculated only for Government schools. But, it is commonly observed that Pupil-Teacher ratio is much higher in private schools. Thus, it is very imperative to address this problem very seriously and bring down the Pupil-Teacher Ratio, which goes a long way in ensuring quality education.
4.7.2. Pupil -Teacher Ratio (Secondary School)
As per Table 4.14, Pupil-Teacher Ratio at the secondary education level is 23:1 and is slightly higher than the P-T ratio at elementary education level (20:1). Variation in Pupil-Teacher Ratio across the taluks of the district is considerable. This Ratio is more than 20:1 in all the taluks except in Malavalli taluk where it is less than 20:1 (14:1). However, highest ratio (43:1) is found in Shrirangapattana, where nearly 43 pupils are attached to one teacher. Further, Teacher-Pupil Ratio for the district is 26:1 in 2009-10 and 24:1 in 2010-11 with significant variation among taluks (lowest in Malavalli taluk and highest in Shrirangapattana taluk) in both the periods. As there is inadequate number of teachers in secondary schools, quality has emerged as a great concern to be addressed seriously. More number of qualified teachers needs to be recruited to bring down the Pupil - Teacher Ratio appropriately.
62
4.8. Infrastructure and Access
Sarva Shiksha Abhiyan accorded special significance and weightage for the provision of infrastructure facilities in schools. School buildings, additional classrooms, maintenance and repairs of school buildings are included in the programme. The details of the building status and conditions of classrooms are presented in Table 4.15.
Out of 1801 Elementary schools of Education Department in the district, 99% (1788) of the schools possess own buildings, rent need not be paid to 7 schools owned by the Department, 2 schools are in rented buildings and 4 schools are in private buildings. There are 213 Secondary schools in the district, about 90% (187) of schools have own buildings, 21 are in rent-free buildings, 1 in private building and 4 are in the buildings which are in a dilapidated condition.
At elementary level, 61% of the classrooms are in good condition, 15% of classrooms need major repairs and 24% of classrooms need minor repairs. At secondary level, 62% of classrooms are in good condition, 8% of classrooms need major repairs and 30% of classrooms need minor repairs.
However, Mandya district is placed in the 7th place regarding the building status, 30th regarding the condition of classrooms at Elementary level; placed 14th regarding the building status and 29th regarding the condition of classrooms at secondary level in the state .
Regarding school facilities, the Government has identified the following 9 facilities, which include most of the basic facilities identified by MHRD , required for a school as per RTE – Drinking water, Boys toilet, Girls toilet, Compound wall, Library, Play ground, Ramps, Teachers and Rooms. In Mandya district, 36.26% of elementary schools have all the 9 facilities and 97.83% of elementary schools have only 7 facilities. There are 1045 LPS, 1107 HPS and 632 HS in the district. Out of which 978 LPS, 850 HPS and 232 HS are run by the Government and 67 LPS, 256 HPS and 199 HS are private aided /unaided schools. There is only one Central Govt. HPS and HS each, 21 HPS with class 8 out of which 20 are Government and one is unaided ( Source: DISE 2011-12 as on 30th September 2011).
Table 4.16 shows the distribution of primary schools among the villages of the seven taluks of Mandya district having the primary schools within one km distance.
The data indicates that 98.47% of the villages in Mandya district have the Primary School within 1 km distance which is the clear indicator for the assurance of education to all the children and for the easy access to the Primary Education which is also a promising note for the increase in the enrolment in Primary Education. In general, there is a very good access for education. In almost all habitations there are primary schools and there is an easy access to schooling facilities for all the children within their reach.

63
4.9. Eight Basic Facilities –Infrastructure Index (SSA Method)
As per MHRD specifications, SSA has given importance to the following 8 facilities as basic facilities to be insisted upon for improvement in school education - common toilets, girls’ toilets, electricity, play ground, ramps, library, compound and drinking water. The details of the School Infrastructure Index for different taluks are given in Table 4.17. The details of basic facilities for the year 2011-12 are presented in Table 4.18.
Fig.4.10 School Infrastructure Index
64
The School Infrastructure Index for Mandya district as a whole is 0.89 and it remains almost same in all the seven taluks, ranging between 0.88 and 0.92, which shows uniform distribution of school infrastructure facilities in all the schools of Mandya district (Table 4.17 & Fig.4.10). This indicated that majority of schools in the district have the required facilities listed by SSA. There is considerable improvement in the index from 2009-10 (0.70) and 2010-11 (0.77) to 2011-12 (0.89) and it is inferred that attempts have been made to improve the basic facilities in the schools from time to time, thus moving towards quality education.
Nagamangala taluk has the highest number of schools (361) followed closely by Krishnarajpet taluk with the next highest number of schools (341). Shrirangapattana taluk has the lowest number of schools (125). As far as the facilities in all the schools in the seven taluks of Mandya district are concerned, toilets for both boys and girls are available in almost all the schools, except 3 schools without boys’ toilet and 8 schools without girls’ toilet, where as Malavalli and Mandya taluks have 100 % toilet facility for both boys and girls.
Electricity is available in 99.80% of the schools in the district (1798 out of 1801 schools Malavalli, Pandavapura and Shrirangapattana taluks have electricity facility in all the schools (100%) followed by Mandya and Nagamangala taluks with electricity facility in 99.60% of the schools.
Play ground in the school premises is a very important component of school plan as play activities provide physical, mental, social and emotional wellbeing of children. But unfortunately in all the seven taluks of Mandya district (Table 4.18) more than 50% of the schools do not have the play ground facility. In the whole district, playground facility is available only in 895 out of 1801 schools.
Ramps are a necessary requirement in all the schools as many of the schools do have the special and disabled children. But only 12.60% of the schools in the district have these ramps facility. Shrirangapattana and Maddur taluks have very less number of schools without ramps whereas the number of schools without ramps is more in Mandya and Nagamangala taluks.
Library facility is very important to develop reading habit among the students and also to enrich their knowledge about different subjects. As far as Mandya district is concerned, the library facility is available in almost all
the schools, except in 6 schools. Krishnarajpet, Mandya and Shrirangapattana taluks have library facility in 100 percent of the schools and all the other taluks have the library facility in 99 percent of the schools which is a very good sign of the improvement in the field of education in Mandya district.
About 80.80% of the schools have compound and almost all the taluks have certain number of schools without compounds. Drinking water is available in all the schools in the district. This shows that Government has taken measures to provide all the schools with basic facilities like drinking water.
There is remarkable improvement in the provision of basic facilities from 2009-10 to 2011-12, 19.65% in the case of the elementary schools and 12.93% in the case of secondary schools in the district and correspondingly the district is placed in the 13th and 19th positions in the State regarding basic facilities for elementary and secondary schools respectively . A review of progress of schooling in the light of infrastructural facilities to schools reveals that there have been notable improvements, enrolment ratios, retention ratios, student-classroom ratios, pupil – teacher ratios, transition rates and gender parity in enrolment.
4.10. School Completion Ratio, Percentage of children passing S.S.L.C and PUC Examinations
Mandya district is on a higher side in comparison with Karnataka state regarding 3 aspects of education: i) Standard 1-2 children who can read letters, words or more; ii).Standard 1-2 children who can recognize Nos. 1-9 or more; iii) Standard 3-5 children who can read level-1 text or more and on lower side in one aspect – Standard 3-5 children who can do subtraction or more. It is evident that there is considerable improvement in the educational performance of children at elementary level from 2006 to 2010 in 3 aspects of performance: i). Standard 1-2 Children who can read letters, words or more, ii). Standard 1-2 Children who can recognize numbers 1-9 or more, and iii). Standard 3-5 Children who can read level 1 text or more decline in the performance of Standard 3-5 Children who can do subtraction or more is very remarkable. The reasons for this decline are to be explored and addressed immediately. This implies that achievement in the quantitative aspects like the number of schools and classrooms, other infrastructural facilities is remarkable, but achievement in the qualitative aspects of
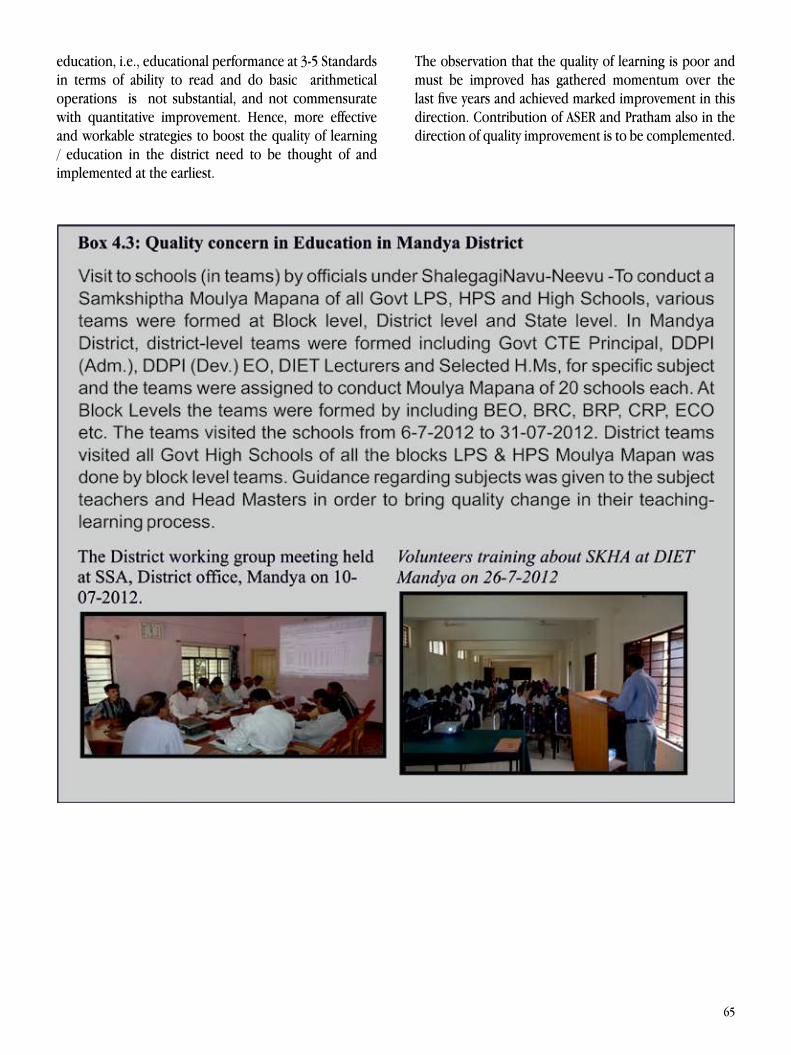
65
education, i.e., educational performance at 3-5 Standards in terms of ability to read and do basic arithmetical operations is not substantial, and not commensurate with quantitative improvement. Hence, more effective and workable strategies to boost the quality of learning / education in the district need to be thought of and implemented at the earliest.
The observation that the quality of learning is poor and must be improved has gathered momentum over the last five years and achieved marked improvement in this direction. Contribution of ASER and Pratham also in the direction of quality improvement is to be complemented.
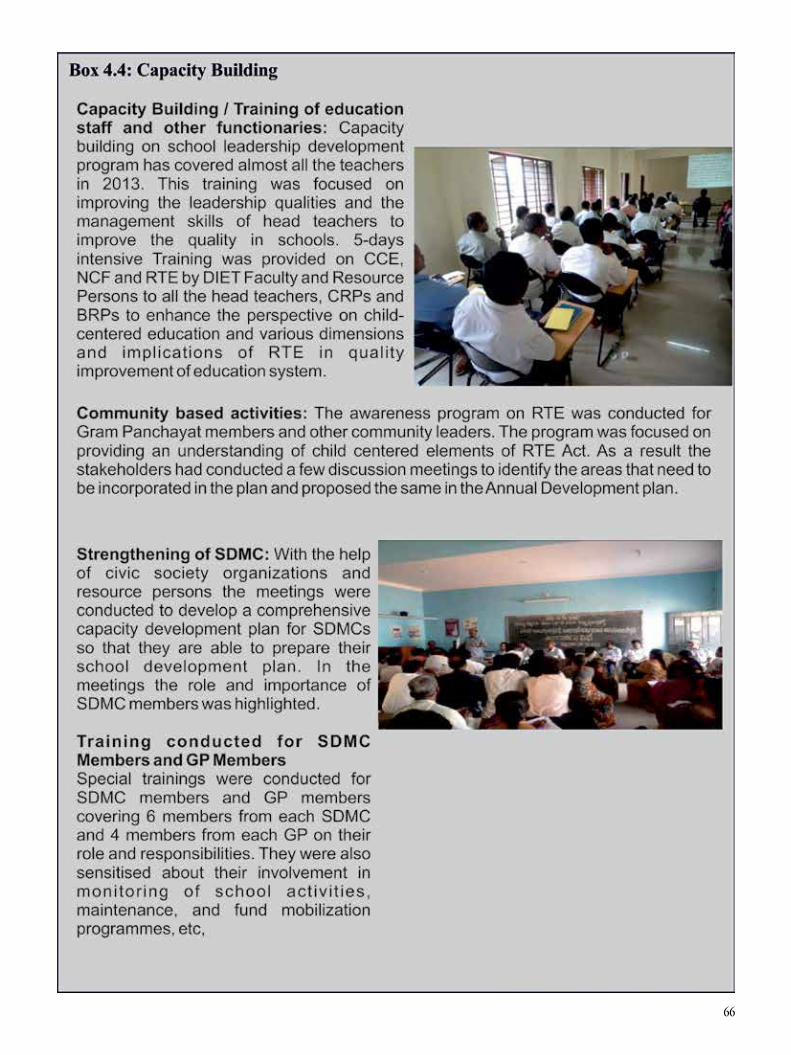
66
67
Tables 4.21 and 4.22 show the pass percentage of the students in SSLC and PUC examinations respectively in Mandya district. As it is evident from the tables, the pass percentage in SSLC examination is 84.09 in 2011-12, but it is only 54.51 in PUC examination.
Taluk-wise comparison with regard to SSLC pass percentage indicates that all the taluks have achieved more than 85% pass except in one taluk Malavalli which achieved 79.96%. Moderate differences across the taluks are noticed with highest pass percentage (92.76) in Maddur taluk followed by next highest percentage (90.81) in Krishnarajpet taluk. It is evident that Mandya taluk has reported highest GER (107.83), but SSLC pass percentage (84.09) is not that encouraging compared to GER.
When the results of 2010-11 are compared with the results of 2011-12, about 2% decline is found in 2011-12. This decline from 2010-11 to 2011-12 is a serious matter. This matter needs to be considered on priority and address immediately. Taluk-wise comparison also indicates decline in S.S.L.C results in all the taluks except in Malavalli taluk As such sincere efforts need to be made to improve SSLC results in different taluks of Mandya district.
Earnest efforts to achieve 100% result in SSLC examination by certain schools in the district are laudable. Govt. High School in Hariyellamma Temple, Chittanahalli, Pandavapura Taluk has achieved 100% result in SSLC in all the three years – 2009-10, 2010-11, and 2011-12 with 9, 12 and 17 students respectively. The action plan of the school for this achievement included the following – regular special classes, group activities, teachers and parents meeting, use of TV and Radio, home visit by teachers, varied activities to encourage student participation, and maintenance of separate individual files for students etc. Another Govt. High School in Alisandra in Nagamangala taluk got 100% result in 2011-12 and continued to get this result in coming years also i.e., 2012-13 and 2013-14. In addition to this, 6 more schools i.e., Govt. High Schools in Malavalli taluk, Kittur Rani Chennamma Residential School, Shrirangapattana, Chikkanayakanahally, Maddur taluk, Maduvina Kodi in Krishnarajpet taluk, Yelechakanahally and Shivapura in Mandya taluk have obtained 100% result in SSLC Examination 2013-14. The district has reported very low pass percentage (54.51%) in PUC and this percentage in all the taluks is
still lower than that of the district except in Nagamangala and Pandavapura taluks. The low pass percentage in PUC emphasises the need for proper attention to +2 level education in the district. It also indicates the needs for adequate training to teachers to impart quality education. It is very interesting to note that the teachers of +2 levels with CBSE and other Central Government schemes are compulsorily trained and this has resulted in achieving better results at this level. It is high time that the significance of proper training for teachers of +2 level is recognized and the State Government has taken initiatives to make teacher training (B.Ed.) mandatory for them along with Master degree in the respective subjects.
4.11.Post-Secondary Education including Professional, General, ITIs and Polytechnics
There are different types of institutions at higher education level catering to varied interests and requirements of students. But, the types of institutions considered for this report are Medical Colleges, Govt. Engineering Colleges, Post-Graduate Colleges, Degree Colleges, ITI s and Govt. Polytechnics only.
Degree colleges and ITIs are found in all the seven taluks while Government Poly-techniques and Teacher Education Colleges in are found five taluks, Engineering Colleges in three taluks, PG Colleges in two taluks while Medical College is in only one Taluk i.e. Mandya. It is surprising that there are no Polytechnics in Mandya, the most urbanised Taluk in the district. But there is a PG centre of University of Mysuru where many PG courses have been started.
4.11.1 Enrolment in different higher educational Institutions: 2009-10, 2010-11 and 2011-12
Enrolment at higher education in the district is low. However, there is continuous enrolment improvement from 2009-10 to 2011-12 in all types of institutions mentioned above, except in ITIs where it is constant during these three years. It is interesting to note that, there is decline in the enrolment of boys in Medical College. As usual, the enrolment of girls at higher education level is less than that of boys. This demands more effective and workable strategies to improve enrolment at higher education level.
4.12. Schemes for Promotion of Literacy Level
In order to promote literacy level in schools, the
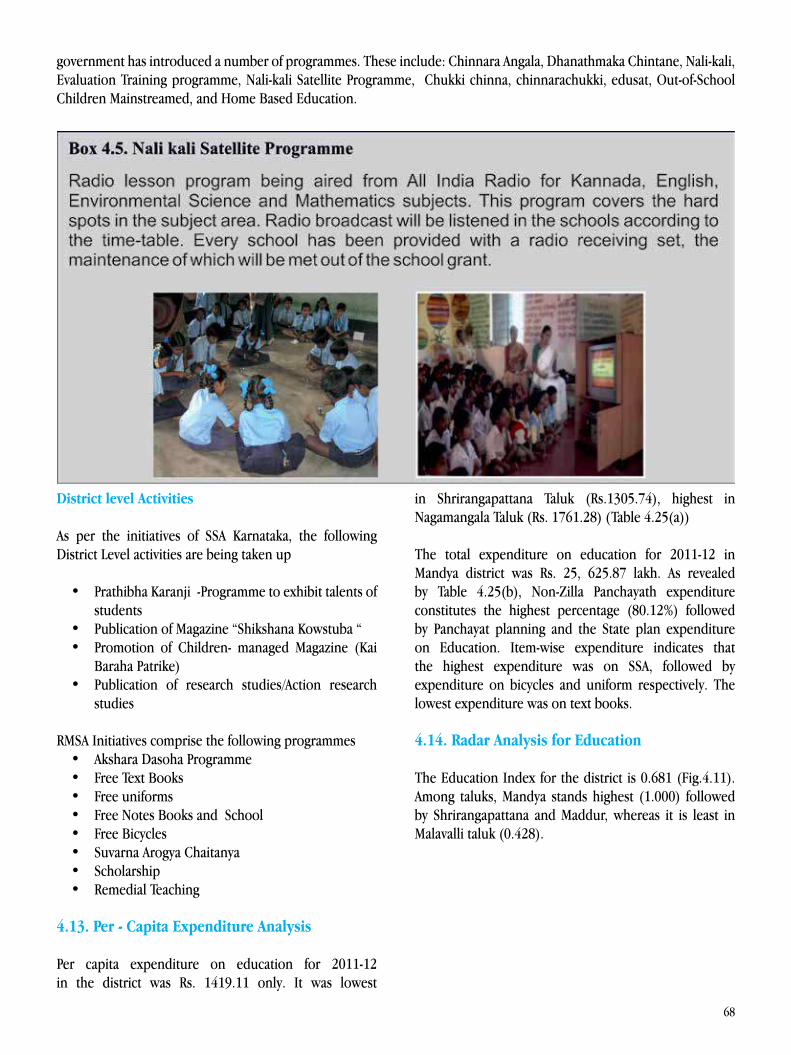
68
government has introduced a number of programmes. These include: Chinnara Angala, Dhanathmaka Chintane, Nali-kali, Evaluation Training programme, Nali-kali Satellite Programme, Chukki chinna, chinnarachukki, edusat, Out-of-School Children Mainstreamed, and Home Based Education.
District level Activities
As per the initiatives of SSA Karnataka, the following District Level activities are being taken up
• Prathibha Karanji -Programme to exhibit talents of students • Publication of Magazine “Shikshana Kowstuba “ • Promotion of Children- managed Magazine (Kai Baraha Patrike) • Publication of research studies/Action research studies
RMSA Initiatives comprise the following programmes • Akshara Dasoha Programme • Free Text Books • Free uniforms • Free Notes Books and School • Free Bicycles • Suvarna Arogya Chaitanya • Scholarship • Remedial Teaching
4.13. Per - Capita Expenditure Analysis
Per capita expenditure on education for 2011-12 in the district was Rs. 1419.11 only. It was lowest
in Shrirangapattana Taluk (Rs.1305.74), highest in Nagamangala Taluk (Rs. 1761.28) (Table 4.25(a))
The total expenditure on education for 2011-12 in Mandya district was Rs. 25, 625.87 lakh. As revealed by Table 4.25(b), Non-Zilla Panchayath expenditure constitutes the highest percentage (80.12%) followed by Panchayat planning and the State plan expenditure on Education. Item-wise expenditure indicates that the highest expenditure was on SSA, followed by expenditure on bicycles and uniform respectively. The lowest expenditure was on text books.
4.14. Radar Analysis for Education
The Education Index for the district is 0.681 (Fig.4.11). Among taluks, Mandya stands highest (1.000) followed by Shrirangapattana and Maddur, whereas it is least in Malavalli taluk (0.428).
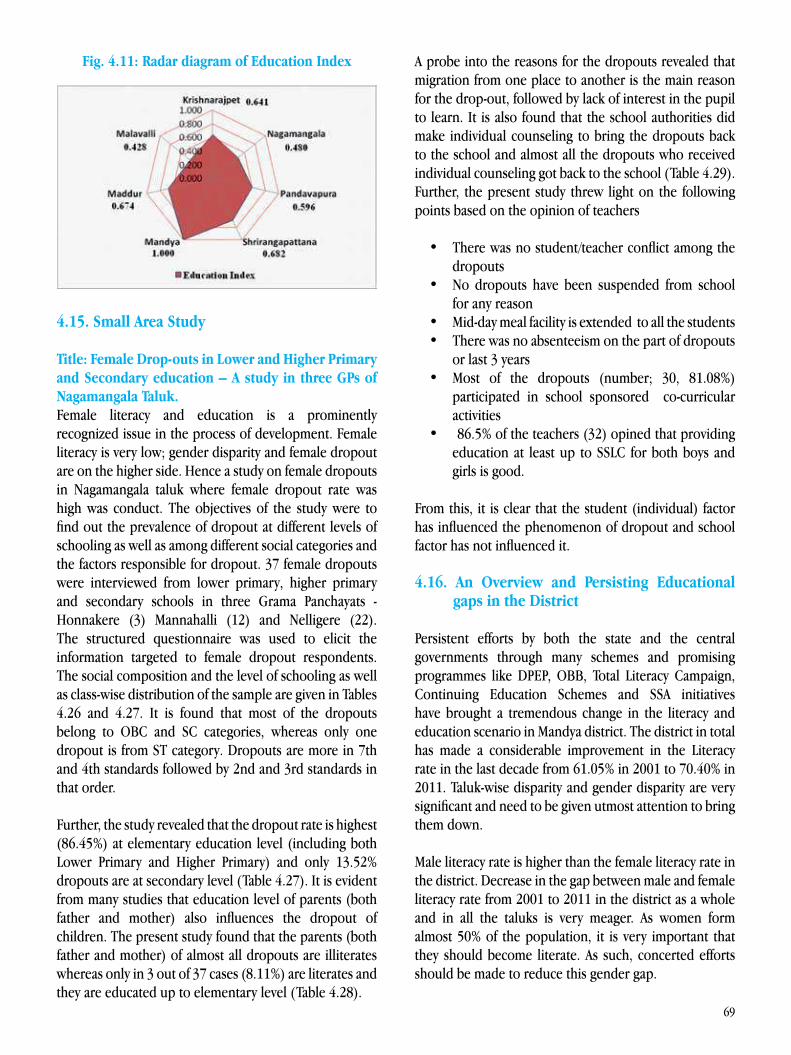
69
Fig. 4.11: Radar diagram of Education Index
4.15. Small Area Study
Title: Female Drop-outs in Lower and Higher Primary and Secondary education – A study in three GPs of Nagamangala Taluk. Female literacy and education is a prominently recognized issue in the process of development. Female literacy is very low; gender disparity and female dropout are on the higher side. Hence a study on female dropouts in Nagamangala taluk where female dropout rate was high was conduct. The objectives of the study were to find out the prevalence of dropout at different levels of schooling as well as among different social categories and the factors responsible for dropout. 37 female dropouts were interviewed from lower primary, higher primary and secondary schools in three Grama Panchayats - Honnakere (3) Mannahalli (12) and Nelligere (22). The structured questionnaire was used to elicit the information targeted to female dropout respondents. The social composition and the level of schooling as well as class-wise distribution of the sample are given in Tables 4.26 and 4.27. It is found that most of the dropouts belong to OBC and SC categories, whereas only one dropout is from ST category. Dropouts are more in 7th and 4th standards followed by 2nd and 3rd standards in that order.
Further, the study revealed that the dropout rate is highest (86.45%) at elementary education level (including both Lower Primary and Higher Primary) and only 13.52% dropouts are at secondary level (Table 4.27). It is evident from many studies that education level of parents (both father and mother) also influences the dropout of children. The present study found that the parents (both father and mother) of almost all dropouts are illiterates whereas only in 3 out of 37 cases (8.11%) are literates and they are educated up to elementary level (Table 4.28).
A probe into the reasons for the dropouts revealed that migration from one place to another is the main reason for the drop-out, followed by lack of interest in the pupil to learn. It is also found that the school authorities did make individual counseling to bring the dropouts back to the school and almost all the dropouts who received individual counseling got back to the school (Table 4.29).Further, the present study threw light on the following points based on the opinion of teachers
• There was no student/teacher conflict among the dropouts • No dropouts have been suspended from school for any reason • Mid-day meal facility is extended to all the students • There was no absenteeism on the part of dropouts or last 3 years • Most of the dropouts (number; 30, 81.08%) participated in school sponsored co-curricular activities • 86.5% of the teachers (32) opined that providing education at least up to SSLC for both boys and girls is good.
From this, it is clear that the student (individual) factor has influenced the phenomenon of dropout and school factor has not influenced it.
4.16. An Overview and Persisting Educational gaps in the District
Persistent efforts by both the state and the central governments through many schemes and promising programmes like DPEP, OBB, Total Literacy Campaign, Continuing Education Schemes and SSA initiatives have brought a tremendous change in the literacy and education scenario in Mandya district. The district in total has made a considerable improvement in the Literacy rate in the last decade from 61.05% in 2001 to 70.40% in 2011. Taluk-wise disparity and gender disparity are very significant and need to be given utmost attention to bring them down.
Male literacy rate is higher than the female literacy rate in the district. Decrease in the gap between male and female literacy rate from 2001 to 2011 in the district as a whole and in all the taluks is very meager. As women form almost 50% of the population, it is very important that they should become literate. As such, concerted efforts should be made to reduce this gender gap.
70
ASER 2006 has highlighted the relationship between the education of mothers and the children. The survey results indicated that many children of mothers with no schooling are not enrolled or have dropped out and more importantly the gender gap in families where the mother never went to school is wider. Researchers have long known that educated mothers are more likely to send their children to school and to have healthier and better educated children. UNICEF’s State of the World’s Children Report 2007 also highlights the correlation between educated mothers and their children. ASER 2006 confirms that children of mothers who have not been to school are five times as likely to be out of school: 6-8 year olds of mothers who have not been to school are three times not likely to be able to read the alphabet than children of mothers who have at least completed grade 5.This implies powerful arguments in favour of increasing the coverage and quality of adult literacy programmes (instead of closing them down as has been suggested in some quarter), and targeting their efforts on women, particularly young mothers, in recognition of the fact that an educated mother serves as a multiplier when it comes to educating her children. As we take steps to improve the quality of education in schoolrooms, educating the mothers of enrolled and out-of-school children could lead to surprisingly valuable results in terms of the enrolment and learning of our children.
This further implied that children from households with no literate parents are in the greatest need of pre-school education. Simple pre-school education material in the hands of a dedicated pre-school teacher would make a big difference for retention and learning in school.
ASER 2006 rightly turns the spotlight on two critical elements in the learning continuum – education status of mothers (and fathers) and pre-school education opportunities for children. It is time that the Govt. reconsiders the policy of keeping all under 6 out of the education system and introduces a pre-school / nursery section in all primary schools with a full time teacher and mid-day meal.
The fact that there are more number of children who cannot either read or comprehend simple passages or complete simple divisions at the upper end of primary education implies that we need to be seriously concerned about reaching these children. For them and also for those who have not been to the school, it may be suggested to have an accelerated learning programme that allows them to complete the elementary level in
four years instead of the usual 8 years , with an emphasis on reading, comprehension and simple arithmetic or a short term (2 year) programme that enables acquisition of higher primary competencies for children of 12 to 16 age group.
Although certain factors causing dropouts at secondary level like poor access to schools, lack of transportation to reach schools, absence of teachers in schools, lack of infrastructures and other basic amenities have been addressed to a considerable extent in the last few years, still need to be addressed to reduce the dropout rate. RUSA initiatives in this regard are commendable.
In the direction of achieving universalization of school education, mainstreaming of children who are out of school, drop outs, children with special needs are of paramount importance. Attempts have been made to identify OOS children and mainstream them. But the percentage of children mainstreamed in the district is not substantial. Thus, suitable measures need to be taken in this regard.
The significance of teachers in the education system is a very well established fact. Commendable efforts have been and are being made to train and empower teachers to promote quality education. It is evident from the survey that required number of teachers posts are not there in the district commensurate with students’ enrolment. Many sanctioned posts have not been filled up and the number of teachers working at present is not adequate to meet the requirement of students. Pupil-Teacher Ratio is not satisfactory. This ratio is calculated only for Government schools. But, it is commonly observed that Pupil-Teacher Ratio is much higher in private schools. Thus, it is very imperative to address this problem very seriously and bring down the Pupil-Teacher Ratio, which goes a long way in ensuring quality education. As there are no adequate number of teachers in secondary schools, quality concern has emerged as a great issue to be addressed seriously. More number of teacher posts need to be created, qualified teachers need to be recruited to bring down the Pupil-Teacher Ratio appropriately.
The pass percentage in SSLC examination is 86.76 and the district has to go a long way to reach 100% result in SSLC As such sincere efforts need to be made to improve SSLC results in different taluks of Mandya district. The district has reported very low pass percentage (54.70%) in PUC and this point to the urgent need for proper attention to +2 level educations in the district and it also
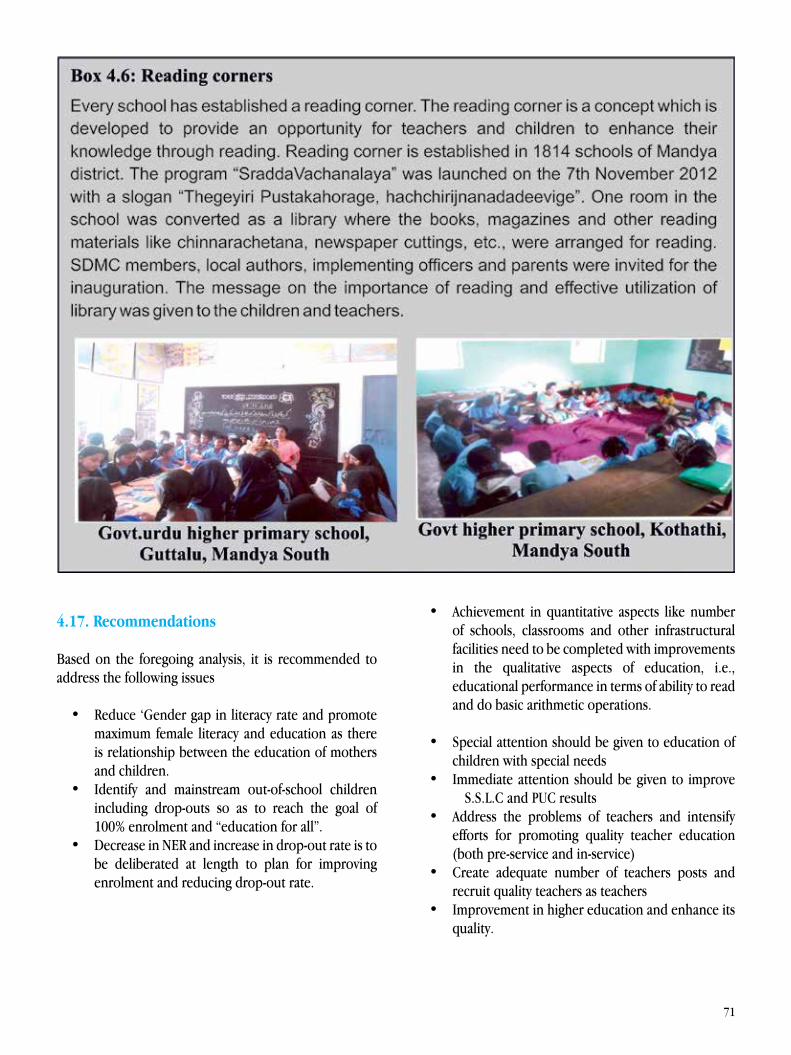
71
indicates the need for adequate training to teachers to impart quality education.
4.17. Recommendations
Based on the foregoing analysis, it is recommended to address the following issues
• Reduce ‘Gender gap in literacy rate and promote maximum female literacy and education as there is relationship between the education of mothers and children. • Identify and mainstream out-of-school children including drop-outs so as to reach the goal of 100% enrolment and “education for all”. • Decrease in NER and increase in drop-out rate is to be deliberated at length to plan for improving enrolment and reducing drop-out rate.
• Achievement in quantitative aspects like number of schools, classrooms and other infrastructural facilities need to be completed with improvements in the qualitative aspects of education, i.e., educational performance in terms of ability to read and do basic arithmetic operations. • Special attention should be given to education of children with special needs • Immediate attention should be given to improve S.S.L.C and PUC results • Address the problems of teachers and intensify efforts for promoting quality teacher education (both pre-service and in-service) • Create adequate number of teachers posts and recruit quality teachers as teachers • Improvement in higher education and enhance its quality.

72
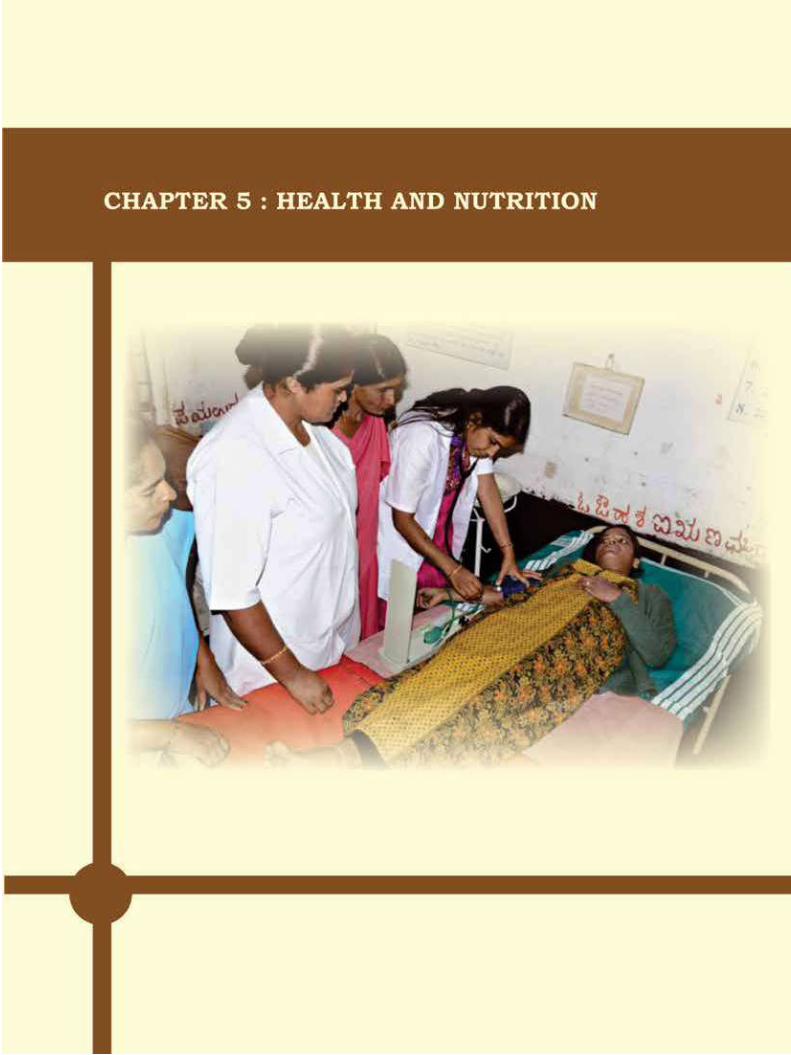
73
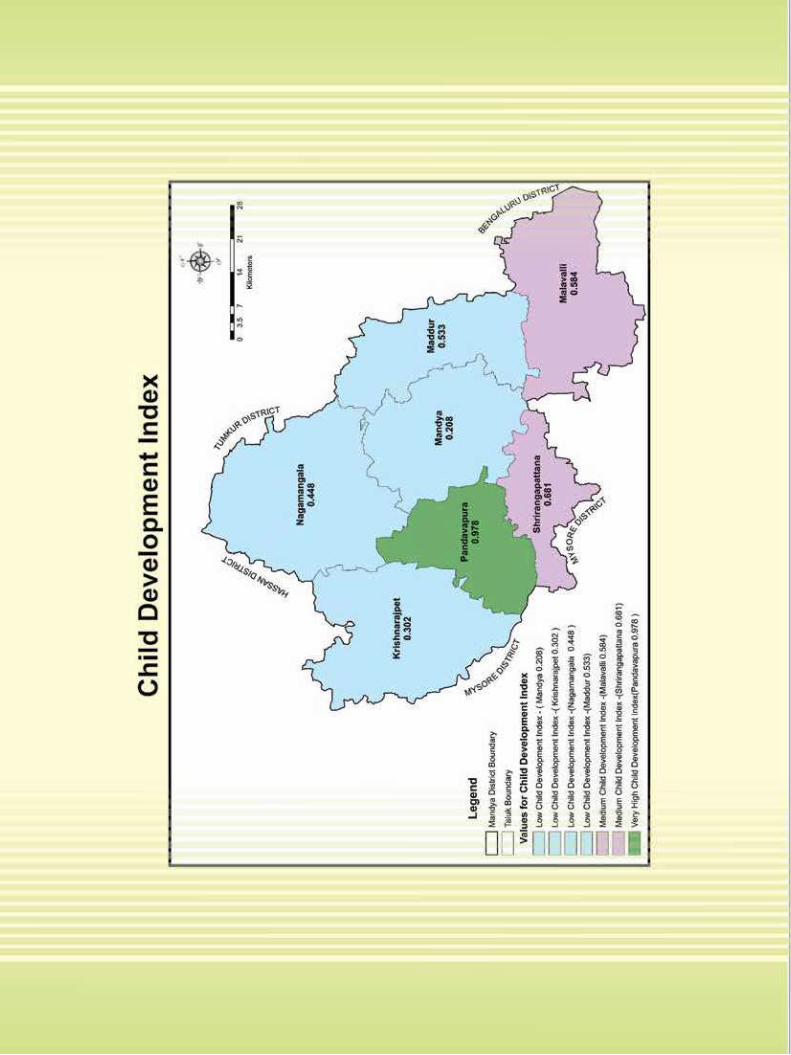
74
75
5.1. Introduction
Health is described as the state of complete physical, mental and social well being (WHO). According to Dorland’s Medical Dictionary: Health is “an optimal state of physical, mental and social wellbeing, not merely the absence of disease or infirmity”.
Health is significant from the point of view of individual and also of society. Good health is important because it makes our lives more productive, socially strong and physically bearable. Poor health, in the form of injuries, disabilities, chronic pain, mental illness or disease, prevents millions of people from supporting, caring for or expressing themselves effectively. Healthy population is a predominant aspect of any economy. It is premised that healthy person can contribute towards economic growth and development by taking up economically productive activities. It is about human population serving as human capital or human resources. Thus, health is a public good when health services are provided by government and merit good when people avail health services by paying for it in the society.
The overall health of an individual is a composite of multiple variables to which he/ she is exposed, nutrition being one of the important determinants of body size, growth and development, functional capacity and cognitive performance. The nutritional status of child is influenced by the dietary intakes, the amount and type of food eaten as well as the living environs.
Health and nutrition security are interrelated with health services and food and nutrition security being the prime determinants and education, income, gender equality and social environment being the secondary determinants. While the key elements of health security can be described by three ‘A’s and U, availability, approachability, affordability and utilization, the motivational factors in the context of Indian population emerge as equally important causes of insecurities. Access to quality foods in adequate quantities at affordable prices determine the nutritional status while living environs subscribe to the extent of exposure to various morbidities, specifically to infectious diseases.
CHAPTER 5
HEALTH AND NUTRITION
India is experiencing unique, demographic, epidemiologic and nutritional transitions which necessitate policy makers, health care providers and researchers to visualize and interpret the challenges pertaining to these areas in a most insightful way and design the strategies to overcome them. Health indicator is one of the key components of human development index which was first used in UNDP’s human development report of 1990 along with education and income. The importance of health is reflected in MDGs of UNO where out of the 8 goals, 18 targets and 48 indicators, six goals, 8 targets and 18 indicators are directly related to health.
Various demographic and health indicators indicate the health status of the population in any given region. Important demographic indicators are growth rates of population, population density, sex ratio, child sex ratio etc. Important health indicators are life expectancy at birth, infant mortality ratio, child mortality ratio, maternal mortality ratio, prevalence of communicable diseases and; indicators relating to nutrition like percentage of malnourished children, BMI ratio, children born under-weight and so on. The present chapter provides an in-depth scenario of the health sector and health status in Mandya district.
As per the data released by WHO on the eve of Mothers Day on May 10th 2014, India tops the global list of countries for maternal death with an estimated 50,000 deaths of pregnant women every year. One-third of global maternal deaths are accounted for by India (17 percent), followed by Nigeria (14 percent). Though the MMR has declined in India to 178 from 560 in 1990, an improvement of 65%, still it is above the stipulated levels. Kerala has the lowest MMR at 66 and Assam the highest at 328. Kerala, Tamil Nadu (90), Maharashtra (87) have MMR below 100. Karnataka’s MMR is 144, highest among south Indian states though a slight fall was observed from 2010 to 2012. The sex ratio in India as per 2011 census is 940 with much worse number of 914 for 0-6 year’s population. The sex ratio and child sex ratio in the state are 968 and 943 respectively.
5.2. Demography
Table 5.1 gives information on the status of various demographic and health indicators for Mandya district
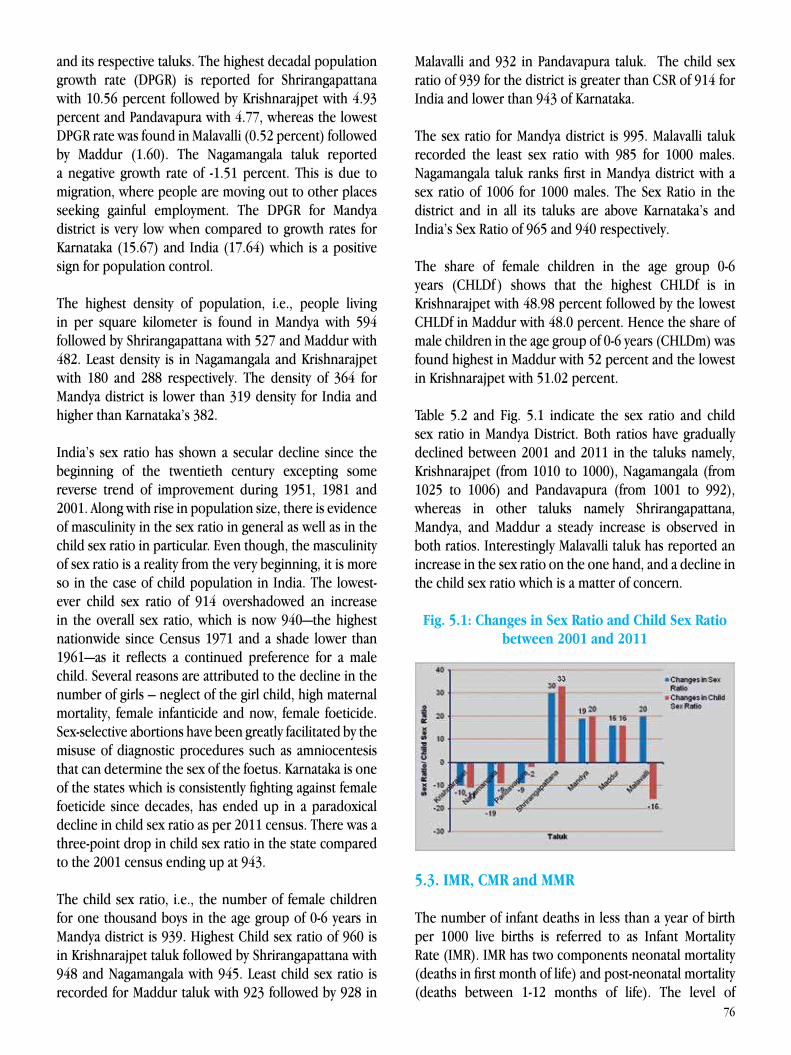
76
and its respective taluks. The highest decadal population growth rate (DPGR) is reported for Shrirangapattana with 10.56 percent followed by Krishnarajpet with 4.93 percent and Pandavapura with 4.77, whereas the lowest DPGR rate was found in Malavalli (0.52 percent) followed by Maddur (1.60). The Nagamangala taluk reported a negative growth rate of -1.51 percent. This is due to migration, where people are moving out to other places seeking gainful employment. The DPGR for Mandya district is very low when compared to growth rates for Karnataka (15.67) and India (17.64) which is a positive sign for population control.
The highest density of population, i.e., people living in per square kilometer is found in Mandya with 594 followed by Shrirangapattana with 527 and Maddur with 482. Least density is in Nagamangala and Krishnarajpet with 180 and 288 respectively. The density of 364 for Mandya district is lower than 319 density for India and higher than Karnataka’s 382.
India’s sex ratio has shown a secular decline since the beginning of the twentieth century excepting some reverse trend of improvement during 1951, 1981 and 2001. Along with rise in population size, there is evidence of masculinity in the sex ratio in general as well as in the child sex ratio in particular. Even though, the masculinity of sex ratio is a reality from the very beginning, it is more so in the case of child population in India. The lowest-ever child sex ratio of 914 overshadowed an increase in the overall sex ratio, which is now 940—the highest nationwide since Census 1971 and a shade lower than 1961—as it reflects a continued preference for a male child. Several reasons are attributed to the decline in the number of girls – neglect of the girl child, high maternal mortality, female infanticide and now, female foeticide. Sex-selective abortions have been greatly facilitated by the misuse of diagnostic procedures such as amniocentesis that can determine the sex of the foetus. Karnataka is one of the states which is consistently fighting against female foeticide since decades, has ended up in a paradoxical decline in child sex ratio as per 2011 census. There was a three-point drop in child sex ratio in the state compared to the 2001 census ending up at 943.
The child sex ratio, i.e., the number of female children for one thousand boys in the age group of 0-6 years in Mandya district is 939. Highest Child sex ratio of 960 is in Krishnarajpet taluk followed by Shrirangapattana with 948 and Nagamangala with 945. Least child sex ratio is recorded for Maddur taluk with 923 followed by 928 in
Malavalli and 932 in Pandavapura taluk. The child sex ratio of 939 for the district is greater than CSR of 914 for India and lower than 943 of Karnataka.
The sex ratio for Mandya district is 995. Malavalli taluk recorded the least sex ratio with 985 for 1000 males. Nagamangala taluk ranks first in Mandya district with a sex ratio of 1006 for 1000 males. The Sex Ratio in the district and in all its taluks are above Karnataka’s and India’s Sex Ratio of 965 and 940 respectively.
The share of female children in the age group 0-6 years (CHLDf ) shows that the highest CHLDf is in Krishnarajpet with 48.98 percent followed by the lowest CHLDf in Maddur with 48.0 percent. Hence the share of male children in the age group of 0-6 years (CHLDm) was found highest in Maddur with 52 percent and the lowest in Krishnarajpet with 51.02 percent.
Table 5.2 and Fig. 5.1 indicate the sex ratio and child sex ratio in Mandya District. Both ratios have gradually declined between 2001 and 2011 in the taluks namely, Krishnarajpet (from 1010 to 1000), Nagamangala (from 1025 to 1006) and Pandavapura (from 1001 to 992), whereas in other taluks namely Shrirangapattana, Mandya, and Maddur a steady increase is observed in both ratios. Interestingly Malavalli taluk has reported an increase in the sex ratio on the one hand, and a decline in the child sex ratio which is a matter of concern.
Fig. 5.1: Changes in Sex Ratio and Child Sex Ratio between 2001 and 2011
5.3. IMR, CMR and MMR
The number of infant deaths in less than a year of birth per 1000 live births is referred to as Infant Mortality Rate (IMR). IMR has two components neonatal mortality (deaths in first month of life) and post-neonatal mortality (deaths between 1-12 months of life). The level of
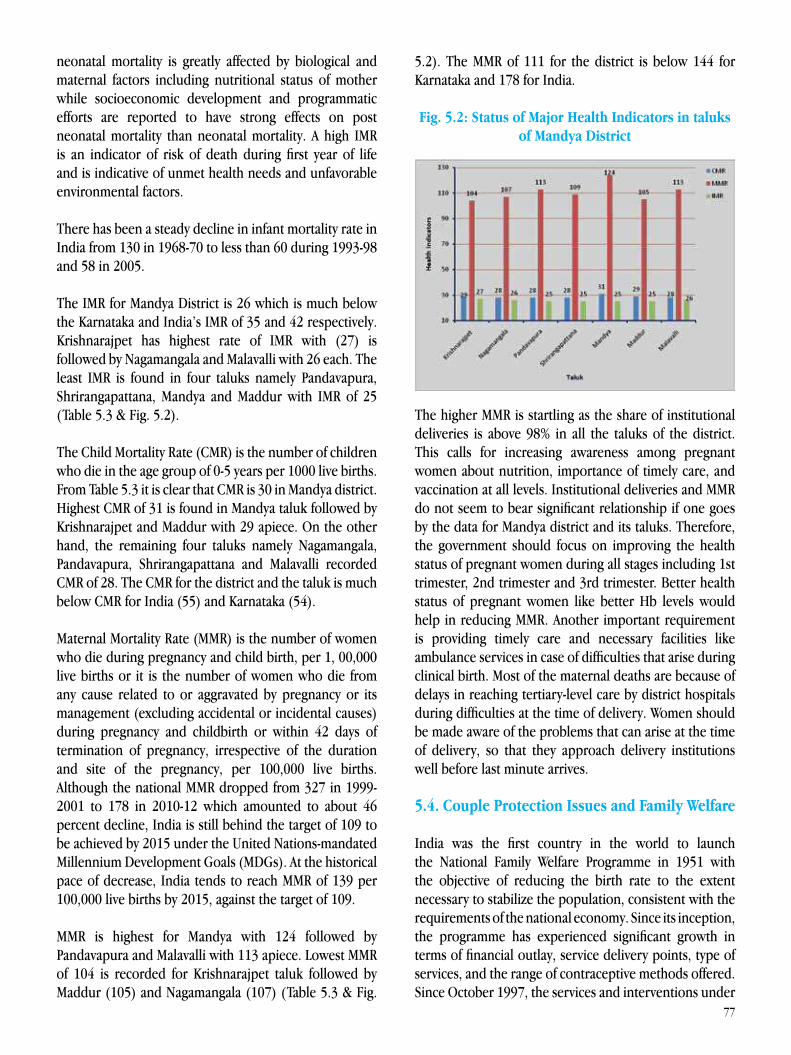
77
neonatal mortality is greatly affected by biological and maternal factors including nutritional status of mother while socioeconomic development and programmatic efforts are reported to have strong effects on post neonatal mortality than neonatal mortality. A high IMR is an indicator of risk of death during first year of life and is indicative of unmet health needs and unfavorable environmental factors.
There has been a steady decline in infant mortality rate in India from 130 in 1968-70 to less than 60 during 1993-98 and 58 in 2005.
The IMR for Mandya District is 26 which is much below the Karnataka and India’s IMR of 35 and 42 respectively. Krishnarajpet has highest rate of IMR with (27) is followed by Nagamangala and Malavalli with 26 each. The least IMR is found in four taluks namely Pandavapura, Shrirangapattana, Mandya and Maddur with IMR of 25 (Table 5.3 & Fig. 5.2).
The Child Mortality Rate (CMR) is the number of children who die in the age group of 0-5 years per 1000 live births. From Table 5.3 it is clear that CMR is 30 in Mandya district. Highest CMR of 31 is found in Mandya taluk followed by Krishnarajpet and Maddur with 29 apiece. On the other hand, the remaining four taluks namely Nagamangala, Pandavapura, Shrirangapattana and Malavalli recorded CMR of 28. The CMR for the district and the taluk is much below CMR for India (55) and Karnataka (54).
Maternal Mortality Rate (MMR) is the number of women who die during pregnancy and child birth, per 1, 00,000 live births or it is the number of women who die from any cause related to or aggravated by pregnancy or its management (excluding accidental or incidental causes) during pregnancy and childbirth or within 42 days of termination of pregnancy, irrespective of the duration and site of the pregnancy, per 100,000 live births. Although the national MMR dropped from 327 in 1999-2001 to 178 in 2010-12 which amounted to about 46 percent decline, India is still behind the target of 109 to be achieved by 2015 under the United Nations-mandated Millennium Development Goals (MDGs). At the historical pace of decrease, India tends to reach MMR of 139 per 100,000 live births by 2015, against the target of 109.
MMR is highest for Mandya with 124 followed by Pandavapura and Malavalli with 113 apiece. Lowest MMR of 104 is recorded for Krishnarajpet taluk followed by Maddur (105) and Nagamangala (107) (Table 5.3 & Fig.
5.2). The MMR of 111 for the district is below 144 for Karnataka and 178 for India.
Fig. 5.2: Status of Major Health Indicators in taluks of Mandya District
The higher MMR is startling as the share of institutional deliveries is above 98% in all the taluks of the district. This calls for increasing awareness among pregnant women about nutrition, importance of timely care, and vaccination at all levels. Institutional deliveries and MMR do not seem to bear significant relationship if one goes by the data for Mandya district and its taluks. Therefore, the government should focus on improving the health status of pregnant women during all stages including 1st trimester, 2nd trimester and 3rd trimester. Better health status of pregnant women like better Hb levels would help in reducing MMR. Another important requirement is providing timely care and necessary facilities like ambulance services in case of difficulties that arise during clinical birth. Most of the maternal deaths are because of delays in reaching tertiary-level care by district hospitals during difficulties at the time of delivery. Women should be made aware of the problems that can arise at the time of delivery, so that they approach delivery institutions well before last minute arrives.
5.4. Couple Protection Issues and Family Welfare
India was the first country in the world to launch the National Family Welfare Programme in 1951 with the objective of reducing the birth rate to the extent necessary to stabilize the population, consistent with the requirements of the national economy. Since its inception, the programme has experienced significant growth in terms of financial outlay, service delivery points, type of services, and the range of contraceptive methods offered. Since October 1997, the services and interventions under
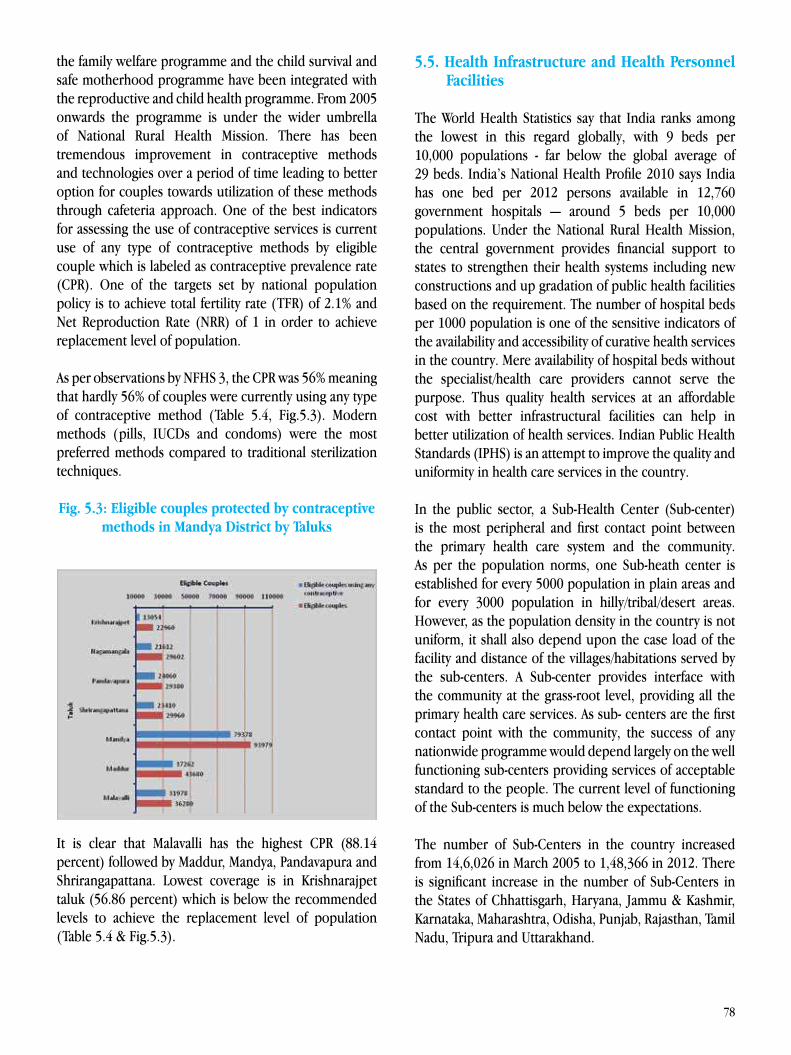
78
the family welfare programme and the child survival and safe motherhood programme have been integrated with the reproductive and child health programme. From 2005 onwards the programme is under the wider umbrella of National Rural Health Mission. There has been tremendous improvement in contraceptive methods and technologies over a period of time leading to better option for couples towards utilization of these methods through cafeteria approach. One of the best indicators for assessing the use of contraceptive services is current use of any type of contraceptive methods by eligible couple which is labeled as contraceptive prevalence rate (CPR). One of the targets set by national population policy is to achieve total fertility rate (TFR) of 2.1% and Net Reproduction Rate (NRR) of 1 in order to achieve replacement level of population.
As per observations by NFHS 3, the CPR was 56% meaning that hardly 56% of couples were currently using any type of contraceptive method (Table 5.4, Fig.5.3). Modern methods (pills, IUCDs and condoms) were the most preferred methods compared to traditional sterilization techniques.
Fig. 5.3: Eligible couples protected by contraceptive methods in Mandya District by Taluks
It is clear that Malavalli has the highest CPR (88.14 percent) followed by Maddur, Mandya, Pandavapura and Shrirangapattana. Lowest coverage is in Krishnarajpet taluk (56.86 percent) which is below the recommended levels to achieve the replacement level of population (Table 5.4 & Fig.5.3).
5.5. Health Infrastructure and Health Personnel Facilities
The World Health Statistics say that India ranks among the lowest in this regard globally, with 9 beds per 10,000 populations - far below the global average of 29 beds. India’s National Health Profile 2010 says India has one bed per 2012 persons available in 12,760 government hospitals — around 5 beds per 10,000 populations. Under the National Rural Health Mission, the central government provides financial support to states to strengthen their health systems including new constructions and up gradation of public health facilities based on the requirement. The number of hospital beds per 1000 population is one of the sensitive indicators of the availability and accessibility of curative health services in the country. Mere availability of hospital beds without the specialist/health care providers cannot serve the purpose. Thus quality health services at an affordable cost with better infrastructural facilities can help in better utilization of health services. Indian Public Health Standards (IPHS) is an attempt to improve the quality and uniformity in health care services in the country.
In the public sector, a Sub-Health Center (Sub-center) is the most peripheral and first contact point between the primary health care system and the community. As per the population norms, one Sub-heath center is established for every 5000 population in plain areas and for every 3000 population in hilly/tribal/desert areas. However, as the population density in the country is not uniform, it shall also depend upon the case load of the facility and distance of the villages/habitations served by the sub-centers. A Sub-center provides interface with the community at the grass-root level, providing all the primary health care services. As sub- centers are the first contact point with the community, the success of any nationwide programme would depend largely on the well functioning sub-centers providing services of acceptable standard to the people. The current level of functioning of the Sub-centers is much below the expectations.
The number of Sub-Centers in the country increased from 14,6,026 in March 2005 to 1,48,366 in 2012. There is significant increase in the number of Sub-Centers in the States of Chhattisgarh, Haryana, Jammu & Kashmir, Karnataka, Maharashtra, Odisha, Punjab, Rajasthan, Tamil Nadu, Tripura and Uttarakhand.
79
Sub-center is staffed with a junior health assistant (female previously designated as ANM) and a junior health assistant (male). They will provide a blend of preventive, promotive, curative and rehabilitative services to the community. The basic thrust is on maternal and child health services, implementation of relevant national health programme, awareness programmes pertaining to health in the area they serve. They will also coordinate with the local-level health functionaries like Anganwadi workers and ASHAs to ensure adequate utilization of health services in the community.
Table 5.5 presents taluk-wise sub-health centers in Mandya District. It is clear that Mandya taluk has the maximum number of Sub-Centers with 81 followed by Maddur with 66, Krishnarajpet with 63 and Malavalli taluk with 58. Pandavapura and Shrirangapattana taluk have the least number of Sub-Centers with 43 each.
Primary Health Center is the cornerstone of rural health services - the first port of call to a qualified doctor of the public sector health services in rural areas for the sick and those who directly report or are referred from Sub-Centers for curative, preventive and promotive health care. A typical Primary Health Center covers a population of 20,000 in hilly, tribal, or difficult areas and 30,000 populations in plain areas with 6 indoor/observation beds. It acts as a referral unit for 6 Sub-Centers and refer out-cases to the Community Health Center (CHC) (30-bedded hospital) and higher order public hospitals located at sub-district and district level. However, as the population density in the country is not uniform, the number of PHCs would depend upon the case load. The basic functions of primary health center are to provide medical care, ensuring nutritional and safe water supply, health education, maternal and child health services including childhood immunization, health education, implementation of relevant national health programmes, supply of essential drugs, maintenance of vital statistics in the area, basic laboratory facilities and training and supervision of health care workers.
In Mandya district, Mandya taluk has the highest number of PHCs with 30 followed by Malavalli and Krishnarajpet taluks with 21 and 20 PHCs respectively. Shrirangapattana has the lowest number of PHCs with just 8 PHCs (Table 5.6).At the time of independence, the total number of physicians in India was 47,524, with doctor - population ratio of 1 to 6300. Today, the number of registered medical practitioners is 8,40,130 (a 17-fold increase). Despite the
population explosion (population has tripled) the overall doctor population ratio is now 1:1700 which reflects a 3.5 fold improvement. Although India remained a major supplier of doctors and nurses to the developed countries over the years, the domestic scenario looked bleak with the country ranking 67th among the developing nations in the case of doctor-population ratio. Doctor population ratio is crucial for improving availability, accessibility, affordability and utilization of health services. In India doctors from both the Government and private sectors serve the health needs and problems of the community. This doctor-population ratio gives a composite figure of health care delivered by both these sectors.As Table 5.7 shows, Shrirangapattana taluk has the lowest number of doctors (20) with 0.12 of the doctors per 1000 population. On the other hand, Mandya taluk has the highest number of doctors (128) with 0.31 doctors per 1000 population.
Nurses constitute a larger group of health care providers in almost all the countries. Their services are essential to provide safe and effective care to the community. Their proportion to number of doctors and population are vital in achieving health-related goals. Thus nurse- population ratio is considered as one of the important health-service related indicators in a country. Heath workers are the major channels for providing primary health care to the general population. They generally cater to a population of 5000 in plains and 3000 in hilly and tribal areas. They provide curative services at the sub-center by treating minor ailments, preventive services through house-to-house visits, ensuring environmental sanitation, assist Anganwadi worker in supplementary nutrition, antenatal care, post natal care, childhood immunization, health education activities etc. Apart from this they maintain vital statistics, conduct community- need assessment surveys, implement national health programmes in the community, collect, compile and analyze health-related data. Thus they act as the backbone in Indian health care delivery system. A cadre of health workers named staff nurses will concentrate only on curative and MCH services. They act as skilled birth attendants in conducting deliveries, immunization and family planning services. With regard to nurse availability per 1000 population among the taluks, Mandya taluk has the highest number of nurses with 0.36 and Krishnarajpet has lowest number of nurses with 0.11 (Table 5.8). All the taluks of the Mandya District have 100 percent Anganawadi facilities in all villages. Highest numbers of Anganawadis are found in Mandya taluk (500) and the least in Shrirangapattana taluk (197).
80
From Table 5.9, it is clear that the number of health institutions were same in 2009-10 and 2011-12 in all the taluks of Mandya district. There is no increase in the number of SCs, PHCs and doctors in the district as well as in its taluks between 2009-10 and 2011-12.
5.6. ANC Coverage and Anaemia among Pregnant Women
Care provided to women during pregnancy is called as antenatal care. This includes preventive, promotive and curative health services blended together. Many health problems in pregnant women can be prevented, detected and treated during antenatal care visits with trained health workers. Antenatal care (ANC) services are considered to be the key element in the primary health care delivery system of a country, which aims for a healthy society. Minimum three antenatal visits are recommended for achieving healthy mother and healthy child as outcome of pregnancy. Antenatal care visits by pregnant women provides an opportunity to identify and manage risk cases, provide awareness on breast and infant feeding, motivating towards acceptance of family planning services and also to mentally prepare an expectant women for delivery. Various studies conducted across the globe have shown clear cut inverse relationship between antenatal care visits on the one hand and IMR, CMR and MMR on the other. That means, greater the number of ANC visits, lesser IMR, CMR and MMR, and vice versa. Thus in order to achieve the Millennium Development Goals (MDGs), it is recommended that each pregnant woman should receive at least three ANC visits and hundred percent institutional deliveries. Greater human resource and institutional arrangements are made under Reproductive and Child Health Programme and National Rural Health Mission in the form of creating a new cadre of workers called Accredited Social Health Activists (ASHAs), who ensure registration of pregnancy in the first trimester, minimum three antenatal visits and 100 percent institutional deliveries.
As per NFHS – III, overall 77% pregnant women had paid at least one antenatal visit. However, there is huge disparity between urban and rural pregnant women in that 91% of the urban women make at least one ANC visit while only 72% of rural women do so.
Mandya taluk has highest number of ANC coverage with 100 percent and Shrirangapattana has lowest number of ANC with 56.31 percent. In case of Pregnant Women with Anaemia (PANE), Pandavapura and Mandya taluk have
highest percentage of 50.90 percent while Maddur taluk has lowest percentage of PANE with 24.70 percent (Table 5.10).
5.7. Institutional Delivery
Institutional deliveries or facility-based births are often promoted for reducing maternal and neo-natal mortality. About half of all births in India in 2007-2008 occurred at home without skilled attendance (District Level Household Survey (DLHS-3)). Institutional deliveries in India range from about 35% in Chhattisgarh to 76% in Madhya Pradesh. Of the 284 districts in nine high-focus states which account for 62% of maternal deaths in the country, institutional delivery is less than 60% in 170 districts (Annual Health Survey AHS 2011). Besides reducing maternal and neo-natal mortality, institutional deliveries are also believed to improve health-seeking behavior and practices in the period following childbirth. Children born at a health facility are more likely to be vaccinated and breastfed, which are the predominant factors contributing to the adequate growth and development of children in physical, mental, social and academic domains. Therefore, institutional delivery can also be deemed as an investment in human capital and can play an important contributory role in the development process of the economy.
Realizing the fact that promotion of institutional deliveries can act as a stepping stone towards achieving Millennium development goals for both mother and child health, Government of India has brought about Janani Suraksha Yojana ( JSY ) under National Rural Health Mission (NRHM). Various studies across the country have documented significant positive impact of JSY on the percentage of institutional deliveries and has acted as one of the most important factors in bringing down maternal and infant mortality.
Krishnarajpet taluk accounted for the highest percentage of institutional deliveries among the taluks with 99.90 percent followed by Mandya and Shrirangapattana taluks with 99.88 and 99.79 percent respectively. The least rate of institutional delivery was recorded in Malavalli with 99.44 percent (Table 5.11). Deliveries at home have declined from 10.3 percent in 2006-07 to 0.06% in 2013-14 (DHO, Mandya). Although the rate of institutional delivery is above 99 percent in all the taluks of Mandya, the high IMR rates are surprising. This means that either there is poor pre-natal care of the pregnant women or the records/reports showing the percentages of institutional
81
deliveries by Health Department are not reliable, since most rural pregnant women are taken to the maternity hospitals just before delivery.
As per the data presented in Table 5.12, all the taluks have recorded marginal increase in institutional deliveries from 2009-10 to 2011-12 moving towards 100 percent coverage.
In Krishnarajpet, Malavalli and Mandya taluks the increase is greater than 1 percent, whereas in Maddur and Shrirangapattana it is an increase of 0.93% and 0.77% respectively. Least percentage increase is noticed in the case of Nagamangala and Pandavapura taluks with 0.42% and 0.43%.
5.8. Immunization of Children
Immunization is one of the most cost-effective public health interventions since it provides direct and effective protection against preventable morbidity and mortality. It has been a major contributor in the decline of under-5 mortality in last five decades in India. However, vaccine preventable diseases (VPDs) are still responsible for over 5 lakh deaths annually in India. This underlines the need for further improvement. As a modification of Extended Programme for Immunization (EPI) of WHO, India implemented Universal Immunization Programme in the year 1985. Under this programme six major VPDs viz. childhood tuberculosis, poliomyelitis, diphtheria, pertussis, tetanus and measles were addressed. Later on vaccines against Hepatitis B and H Influenza were also added. In spite of this, India along with many developing countries is lagging behind in sufficient coverage of Routine Immunization.
According to the most recent Coverage Evaluation Survey (CES), a nationwide survey covering all States and Union Territories of India, conducted during November 2009 to January 2010 by UNICEF, the national fully immunized (FI) coverage against the six vaccines included in UIP in the age-group of 12-23 month old children is 61% whereas it was 54.1% and 47.3% as reported by District Level Household and Facility Survey (DLHS-3) (2007-08) and NFHS-III (2005-06), respectively. The main reasons for poor coverage of routine immunization are, lack of awareness about immunization and its benefits, lack/poor supply of vaccines, untrained health workers, fear of adverse events, lack of access to health centers, loopholes in monitoring and evaluation services etc.
Maddur Taluk has highest coverage of child immunization with 289.84 percent followed by Shrirangapattana and Malavalli with 240.16 percent and 237.54 percent. The least coverage in child immunization is recorded in Mandya Taluk with 58.82 percent (Table 5.13). This is very puzzling because Mandya taluk with Mandya town has the best immunization facility among all the taluks in the district. Perhaps this may be due to large number of pregnant women coming from other taluks for delivery in Mandya but getting their babies immunized in their respective taluks.
5.9. Under-weight Children and BMI Ratio
Low birth weight is associated with high neonatal and infant mortality, lower trajectory of growth during childhood and adolescence, and increased risk of non-communicable diseases during adult life. Birth weight is influenced by the nutritional and health status of the mother. Numerous studies have clearly established that there is a strong correlation between birth weights and maternal weight; poor pregnancy weight gain and maternal under-nutrition are also associated with low birth weight. There has not been any substantial decline in LBW deliveries over the last three decades.
Low birth-weight can be a sequential outcome of compromised food and nutrition security. The lifecycle approach to nutrition demonstrates the relationship between the nutritional status of women prior to pregnancy, during pregnancy and after child birth to that of offspring affecting the whole lifespan of next generation thereon. It is imperative to prevent foetal and early childhood under-nutrition. Nutrition interventions in pregnancy and early childhood can result in improvements in body size and composition in adolescents and in young adults.
The National Rural Health Mission attempts to improve the coverage, content and quality of antenatal care and bring about a convergence with the efforts of the ICDS system to provide food supplements to improve maternal nutrition. Effective implementation of these interventions could result in some reduction in low birth-weight rates.The prevalence of low birth-weight babies (less than 2.5 kg at birth) is 22.5% as estimated by NFHS- III, but In NFHS - III birth weight was reported only in 34.1% of cases of live births (60% of urban and 25% of rural). There is the wide range of variation in the prevalence of LBW amongst Indian states; where 7.6% was reported in Mizoram and 32.7 % in Haryana. Proportion of the LBW
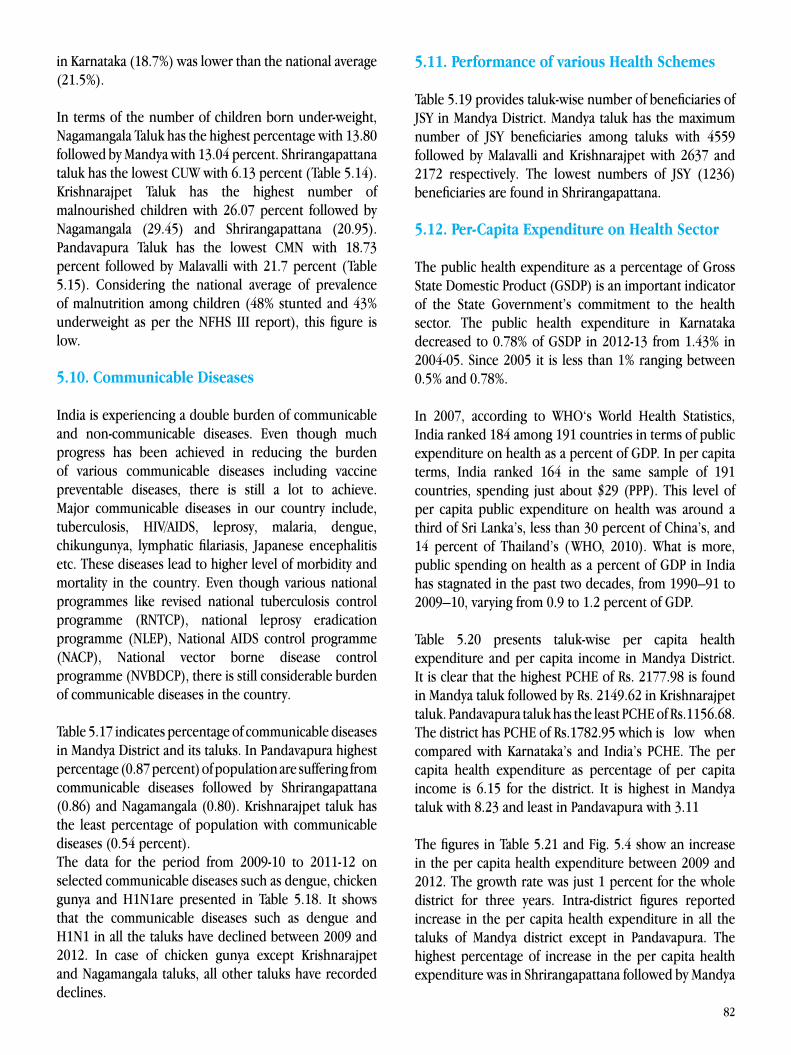
82
in Karnataka (18.7%) was lower than the national average (21.5%).
In terms of the number of children born under-weight, Nagamangala Taluk has the highest percentage with 13.80 followed by Mandya with 13.04 percent. Shrirangapattana taluk has the lowest CUW with 6.13 percent (Table 5.14). Krishnarajpet Taluk has the highest number of malnourished children with 26.07 percent followed by Nagamangala (29.45) and Shrirangapattana (20.95). Pandavapura Taluk has the lowest CMN with 18.73 percent followed by Malavalli with 21.7 percent (Table 5.15). Considering the national average of prevalence of malnutrition among children (48% stunted and 43% underweight as per the NFHS III report), this figure is low.
5.10. Communicable Diseases
India is experiencing a double burden of communicable and non-communicable diseases. Even though much progress has been achieved in reducing the burden of various communicable diseases including vaccine preventable diseases, there is still a lot to achieve. Major communicable diseases in our country include, tuberculosis, HIV/AIDS, leprosy, malaria, dengue, chikungunya, lymphatic filariasis, Japanese encephalitis etc. These diseases lead to higher level of morbidity and mortality in the country. Even though various national programmes like revised national tuberculosis control programme (RNTCP), national leprosy eradication programme (NLEP), National AIDS control programme (NACP), National vector borne disease control programme (NVBDCP), there is still considerable burden of communicable diseases in the country.
Table 5.17 indicates percentage of communicable diseases in Mandya District and its taluks. In Pandavapura highest percentage (0.87 percent) of population are suffering from communicable diseases followed by Shrirangapattana (0.86) and Nagamangala (0.80). Krishnarajpet taluk has the least percentage of population with communicable diseases (0.54 percent).The data for the period from 2009-10 to 2011-12 on selected communicable diseases such as dengue, chicken gunya and H1N1are presented in Table 5.18. It shows that the communicable diseases such as dengue and H1N1 in all the taluks have declined between 2009 and 2012. In case of chicken gunya except Krishnarajpet and Nagamangala taluks, all other taluks have recorded declines.
5.11. Performance of various Health Schemes
Table 5.19 provides taluk-wise number of beneficiaries of JSY in Mandya District. Mandya taluk has the maximum number of JSY beneficiaries among taluks with 4559 followed by Malavalli and Krishnarajpet with 2637 and 2172 respectively. The lowest numbers of JSY (1236) beneficiaries are found in Shrirangapattana.
5.12. Per-Capita Expenditure on Health Sector
The public health expenditure as a percentage of Gross State Domestic Product (GSDP) is an important indicator of the State Government’s commitment to the health sector. The public health expenditure in Karnataka decreased to 0.78% of GSDP in 2012-13 from 1.43% in 2004-05. Since 2005 it is less than 1% ranging between 0.5% and 0.78%.
In 2007, according to WHO‘s World Health Statistics, India ranked 184 among 191 countries in terms of public expenditure on health as a percent of GDP. In per capita terms, India ranked 164 in the same sample of 191 countries, spending just about $29 (PPP). This level of per capita public expenditure on health was around a third of Sri Lanka’s, less than 30 percent of China’s, and 14 percent of Thailand’s (WHO, 2010). What is more, public spending on health as a percent of GDP in India has stagnated in the past two decades, from 1990–91 to 2009–10, varying from 0.9 to 1.2 percent of GDP.
Table 5.20 presents taluk-wise per capita health expenditure and per capita income in Mandya District. It is clear that the highest PCHE of Rs. 2177.98 is found in Mandya taluk followed by Rs. 2149.62 in Krishnarajpet taluk. Pandavapura taluk has the least PCHE of Rs.1156.68. The district has PCHE of Rs.1782.95 which is low when compared with Karnataka’s and India’s PCHE. The per capita health expenditure as percentage of per capita income is 6.15 for the district. It is highest in Mandya taluk with 8.23 and least in Pandavapura with 3.11
The figures in Table 5.21 and Fig. 5.4 show an increase in the per capita health expenditure between 2009 and 2012. The growth rate was just 1 percent for the whole district for three years. Intra-district figures reported increase in the per capita health expenditure in all the taluks of Mandya district except in Pandavapura. The highest percentage of increase in the per capita health expenditure was in Shrirangapattana followed by Mandya
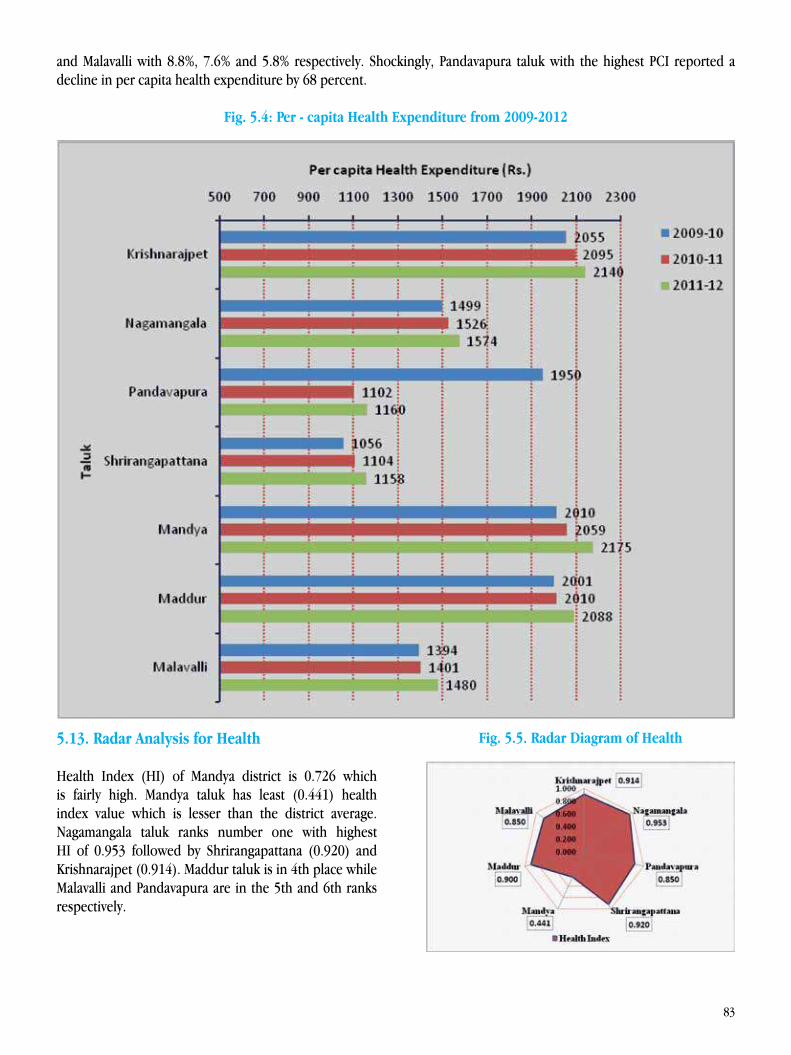
83
and Malavalli with 8.8%, 7.6% and 5.8% respectively. Shockingly, Pandavapura taluk with the highest PCI reported a decline in per capita health expenditure by 68 percent.
Fig. 5.4: Per - capita Health Expenditure from 2009-2012
5.13. Radar Analysis for Health
Health Index (HI) of Mandya district is 0.726 which is fairly high. Mandya taluk has least (0.441) health index value which is lesser than the district average. Nagamangala taluk ranks number one with highest HI of 0.953 followed by Shrirangapattana (0.920) and Krishnarajpet (0.914). Maddur taluk is in 4th place while Malavalli and Pandavapura are in the 5th and 6th ranks respectively.
Fig. 5.5. Radar Diagram of Health
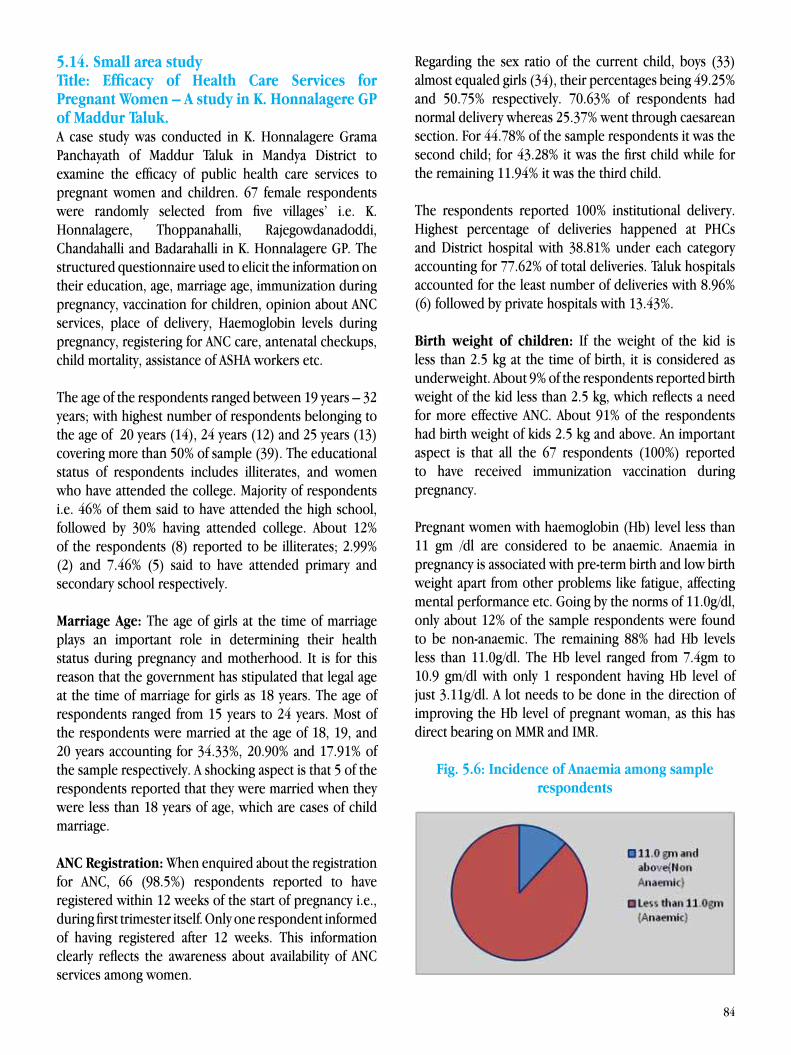
84
5.14. Small area studyTitle: Efficacy of Health Care Services for Pregnant Women – A study in K. Honnalagere GP of Maddur Taluk.A case study was conducted in K. Honnalagere Grama Panchayath of Maddur Taluk in Mandya District to examine the efficacy of public health care services to pregnant women and children. 67 female respondents were randomly selected from five villages’ i.e. K. Honnalagere, Thoppanahalli, Rajegowdanadoddi, Chandahalli and Badarahalli in K. Honnalagere GP. The structured questionnaire used to elicit the information on their education, age, marriage age, immunization during pregnancy, vaccination for children, opinion about ANC services, place of delivery, Haemoglobin levels during pregnancy, registering for ANC care, antenatal checkups, child mortality, assistance of ASHA workers etc.
The age of the respondents ranged between 19 years – 32 years; with highest number of respondents belonging to the age of 20 years (14), 24 years (12) and 25 years (13) covering more than 50% of sample (39). The educational status of respondents includes illiterates, and women who have attended the college. Majority of respondents i.e. 46% of them said to have attended the high school, followed by 30% having attended college. About 12% of the respondents (8) reported to be illiterates; 2.99% (2) and 7.46% (5) said to have attended primary and secondary school respectively.
Marriage Age: The age of girls at the time of marriage plays an important role in determining their health status during pregnancy and motherhood. It is for this reason that the government has stipulated that legal age at the time of marriage for girls as 18 years. The age of respondents ranged from 15 years to 24 years. Most of the respondents were married at the age of 18, 19, and 20 years accounting for 34.33%, 20.90% and 17.91% of the sample respectively. A shocking aspect is that 5 of the respondents reported that they were married when they were less than 18 years of age, which are cases of child marriage.
ANC Registration: When enquired about the registration for ANC, 66 (98.5%) respondents reported to have registered within 12 weeks of the start of pregnancy i.e., during first trimester itself. Only one respondent informed of having registered after 12 weeks. This information clearly reflects the awareness about availability of ANC services among women.
Regarding the sex ratio of the current child, boys (33) almost equaled girls (34), their percentages being 49.25% and 50.75% respectively. 70.63% of respondents had normal delivery whereas 25.37% went through caesarean section. For 44.78% of the sample respondents it was the second child; for 43.28% it was the first child while for the remaining 11.94% it was the third child.
The respondents reported 100% institutional delivery. Highest percentage of deliveries happened at PHCs and District hospital with 38.81% under each category accounting for 77.62% of total deliveries. Taluk hospitals accounted for the least number of deliveries with 8.96% (6) followed by private hospitals with 13.43%.
Birth weight of children: If the weight of the kid is less than 2.5 kg at the time of birth, it is considered as underweight. About 9% of the respondents reported birth weight of the kid less than 2.5 kg, which reflects a need for more effective ANC. About 91% of the respondents had birth weight of kids 2.5 kg and above. An important aspect is that all the 67 respondents (100%) reported to have received immunization vaccination during pregnancy.
Pregnant women with haemoglobin (Hb) level less than 11 gm /dl are considered to be anaemic. Anaemia in pregnancy is associated with pre-term birth and low birth weight apart from other problems like fatigue, affecting mental performance etc. Going by the norms of 11.0g/dl, only about 12% of the sample respondents were found to be non-anaemic. The remaining 88% had Hb levels less than 11.0g/dl. The Hb level ranged from 7.4gm to 10.9 gm/dl with only 1 respondent having Hb level of just 3.11g/dl. A lot needs to be done in the direction of improving the Hb level of pregnant woman, as this has direct bearing on MMR and IMR.
Fig. 5.6: Incidence of Anaemia among sample respondents

85
The services of ANM and ASHA workers were found to be satisfactory in the sample survey. All the 67 respondents reported that ANM visited them regularly. 91.04% of the respondents have received assistance of ASHA during delivery while 7. 46% of the respondents mentioned that they were not informed. For 1 respondent there was no ASHA assistance. The gap of 9% in receiving assistance of ASHA emphasizes the need for increasing awareness about public health care services available and also accessibility to ASHA.
About 71.64% of the respondents have gone through antenatal checkups 4 times and above, and the remaining 28.36% respondents reported to have had antenatal checkups less than 3 times. As this has a direct bearing on IMR and MMR, ASHA workers have to be more effective in reaching out to pregnant women in first trimester itself.
Child / Infant HealthRegarding child mortality and infant mortality, one child death of 3 years of age was reported by the sample. The, sex of deceased child was not mentioned. No infant (below 1 year) death has been reported by the sample. About 94.03% respondents reported to have had baby vaccinated and 5.97% of the respondents have not administered any vaccinations which is a matter of concern.
Even though the state and central governments have implemented many programmes to improve the health status of pregnant women especially in rural areas, there are still many gaps. The efficacy in health care can be
improved by increasing awareness about nutrition, immunization of pregnant women, timely care, going for antenatal checkups, approaching delivery institutions before time at the time of delivery, importance of iron and folic acid intake and so on. 5.15. An Overview and Performance inadequacies of health care system
Considering the MDG targets for 2015 Mandya district’s achievement in the health sector is fairly good except for the maternal mortality rate. Institutional Deliveries are about to reach 100%. Nevertheless, the district needs strive to achieve better health status in the near future moving well ahead of the MDG targets.
The 2015 Millennium Development Goal for CMR is 42 and Mandya District has moved ahead with a CMR of 30. Even the highest CMR of 31 in Mandya taluk, which is well below the MDG target of 42 is a matter of achievement in the health scenario of the district. The IMR target of 27 set in MDGs is achieved in the district. The district IMR is 26 and highest IMR of 27 which is the target rate is found in Krishnarajpet taluk. As mentioned earlier the only matter of concern is the MMR rate of 111 which is marginally above the MDG target of 109. The highest MMR of 127 in Mandya taluk is of serious concern. The district administration has to focus on issues of child marriage which is still existent as indicated by the small area study and reach out to beneficiaries of projects relating to maternal and child health.

86

87
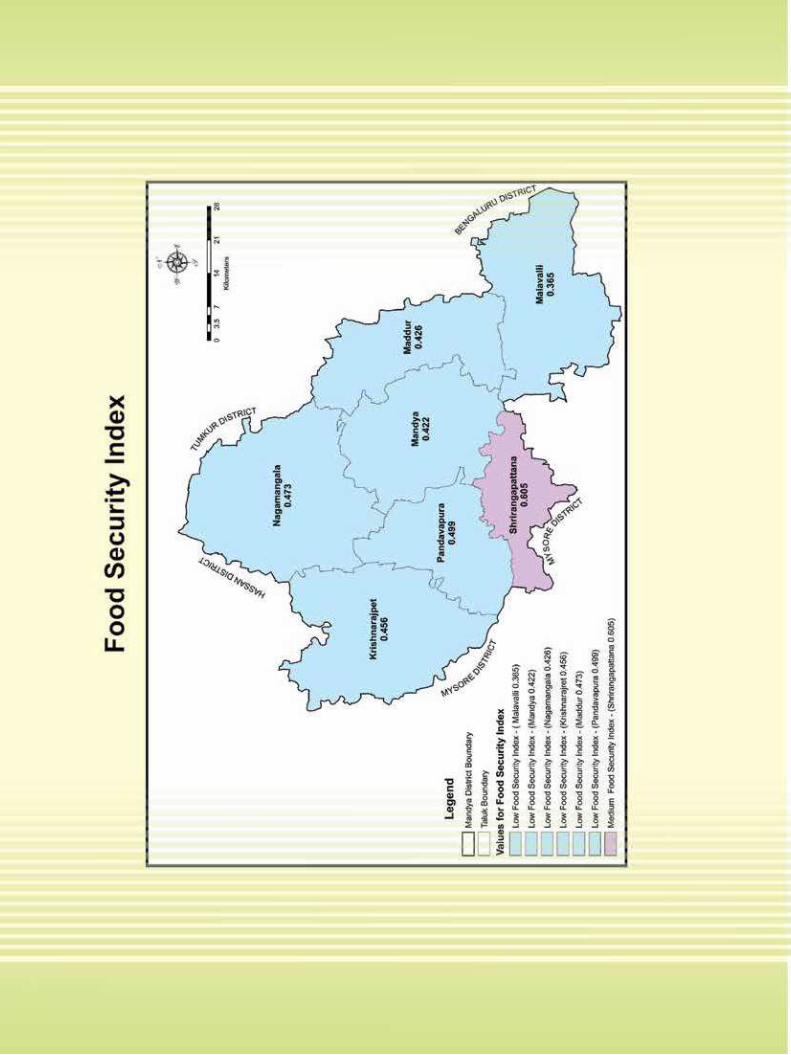
88
89
6.1. Introduction
This Chapter deals basically with the economy of Mandya District since income, employment, standard of living and poverty are all integral aspects of the economy of any Region. The levels of income and standard of living in a region depend upon several factors, the important of them being land and other natural resources, the quantity and quality of work force and, employment opportunities. The availability of entrepreneurial talent and financial resources in the region determines the extent which the natural and human resources are put to use in production. The following sections give a brief account of the natural and human resource situation of Mandya District.
Economy of Mandya District – An OverviewThe land of sugar and rice, Mandya is a prominent agricultural district, blessed with the irrigation waters of rivers Cauvery and Hemavathi. About half of the agricultural land in the district receives assured irrigation from the Krishnaraja Sagar (KRS) and the Hemavathi reservoirs.
The other half is dependent on the South-West Monsoons. Paddy and Sugarcane are the main crops of the irrigated region. Ragi and Horse gram are the major crops of dry land agriculture. Agriculture is the main occupation of people in the district. Most of the industries in the district agro-processing depending on agriculture produce as their raw material. Sugar Mills, Jaggery making units, Rice Mills are the prominent industries of this district.
6.2. District and Taluk Income
Evolution of Income as an Indicator of DevelopmentIncome is the remuneration earned in cash or kind by an individual or household for turning out certain production. Income represents production in the economy and hence it confers on the individual the command or purchasing power over goods and services. It was Prof. Arthur Cecil Pigou, a famous British Economist who first used the concept of income to measure the economic welfare of people. Accordingly the concepts such as GNP, GDP and per capita income came into use. Income continues to
CHAPTER 6
INCOME, EMPLOYMENT AND POVERT Y
be an important conventional indicator of development although development specialists of late find flaws in it as an indicator of human prosperity.
Differences in the concepts and techniques used in the measurement of income add to the problems in using income as the sole indicator of development. Several refinements were attempted to purge the flaws. Accordingly, from time to time, economists have come up with new concepts such as MEW (Measure of Economic Welfare) coined by Prof. P.A. Samuelson and NEW (Net Economic Welfare) coined by Prof. James Tobin and Philip Nordhous. Basically MEW and NEW are similar in that they take income net of demerit goods (like narcotics, etc.) harmful to human health but to add the income generated in the form of (or rather the expenditure saved from) housewives’ unpaid household jobs, etc, to the total income.
A further attempt is made by the UN Organizations such as the UNEP (UN Environment Program) to purge out the flaws in the conventional measurement of income which does not deduct the depreciation of natural resources that takes place every year while producing the GNP. In this context, the concept green GNP has come into vogue. So, green GNP is the conventionally computed GNP minus the depletion of the natural capital stock occurring in that year. Since the depletion of the natural capital stock every year jeopardizes the prospects for future growth, the green GNP concept marks the emergence of what is called green accounting in the national income analysis. The Scandinavian countries have already started green GNP accounting as part of their regular national income accounting exercise.
The World Bank introduced the concept of purchasing power parity (PPP) to take into account the differences in the prices of goods and services across the countries. Income adjusted for PPP is a better indicator of the development differences among countries. An altogether new approach to measuring the quality of human life was first made by Morris D. Morrisof the Overseas Development Council (ODC), a private non-profit organization in the USA. Morris introduced the concept of physical quality of life index (PQLI), which became a precursor to the now famous concept of human
90
development index (HDI) developed by the UNDP. The differences between the PQLI and HDI are that the former had used only three indicators namely the life expectancy at birth, adult literacy ratio and infant mortality ratio, entirely disregarding income as a requirement for improving the quality of human life. But the HDI concept has incorporated income adjusted for purchasing power parity (PPP) as a component.
Thus, irrespective of the way it is computed and the components included, income continues to be reckoned with as an important indicator of human development. Income can be regarded as a ‘catch-all’ variable in that it provides the purchasing power to an individual or household. Since human development is conventionally defined as nothing but enlarging human choices and capabilities, income is the means to enhance these choices and capabilities. And hence income continues to be a crucial parameter in computing human development indices.
Poverty is measured in two ways. The first one uses income as the sole indicator, and hence is called the income poverty measure (IPM). This is the conventional measure of poverty, according to which a person becomes poor if he/she fails to earn an income required to buy the essential things in life. In India the Planning Commission’s concept of poverty line is based on income as the sole criterion for measuring poverty.
The other measure is the capability poverty measure (CPM) popularized by the UNDP. It takes into account the human capabilities- capability to live longer and with good health, capability to be knowledgeable and the capability to buy goods and services including food, shelter and clothing. But all these capabilities (or lack of them, which is otherwise called deprivation) are directly or indirectly determined by the income of the person in question. So, the so-called capability measure of poverty is just the other side of the same coin, the income measure. Rich people have great capabilities while poor do not have. Hence, the need to study income.
Significance, Scope and Coverage of Income Estimates: Income estimates help: in measuring the growth in the economy, building the Human Development Indices, in assessing the relative contribution of different sectors of the economy to the income of the State/District/Taluk, and in understanding the nature and extent of inter-sectoral and inter-regional imbalances in the economy. SDP / DDP excludes: Defence personnel and other Para-
military forces, Govt. offices abroad, Foreign offices of LIC & GIC, Bombay Offshore activities and Deep sea fishing.
Estimation of IncomeIn India the Central Statistical Organization (CSO) is the chief government agency that estimates and publishes the national income data every year. Its national income estimates cover all the conventional concepts of income such as the GNP, NNP, GDP, GNP at market prices, GNP at factor cost, GNP at current prices, GNP at constant prices, per capita income, etc., and also the other related aspects such as consumption, saving, capital formation, sector-wise distribution of income, etc. Late Prof. V.K.R.V. Rao did a monumental work in improving the national income accounting methods for India, which enabled the CSO to refine its techniques in estimating national income and its components in the country.
However, all these estimates of the CSO are available only at the National and State levels. The CSO’s estimates do not get down to the district and taluka levels. In this regard Karnataka has been a pioneer State in starting district-level estimates of income as early as in 1960-61. Since then, the district estimates used to be made at an interval of ten years till 1990-91, but thereafter estimates are being made every year. The district domestic product (DDP) estimates are, however, derived from the State-level GDP estimates. The State Directorate of Economics and Statistics which collects and publishes these data, has so far not made systematic attempts to estimate the GDP at the grassroots levels. The present study has attempted to estimate the GDP for Mandya district at the taluka-level using the data gathered from the official records of the Mandya District Office of the State Directorate of Economics and Statistics. Continuous time series data on GDP at the taluk-level are not available for longer periods to examine the trends in taluk-level income. However, the annual compound growth rates were computed by using the data available for four years 2004-05 and 2008-09.
For estimating the taluk-level GDP (called TDP), identical conventional classifications are adopted by the CSO and the State Directorate of Economics and Statistics. Accordingly the taluk economy is classified into three sectors namely 1) primary, 2) secondary and 3) tertiary sectors. The primary sector covers agriculture, animal husbandry, forestry, fishing, mining and quarrying. The secondary sector includes both registered and unregistered manufacturing, construction, electricity, gas and water supply. The tertiary or service sector comprises
91
transport; communication; trade, hotels and restaurants; banking and insurance; real estates, ownership of dwellings and business services, public administrations and other services.
A serious lacuna in respect of the tertiary-sector data at the district and taluk levels is lack of separate data on income generated from the service sub-sectors namely education and health. The income from these sub-sectors is clubbed perhaps with either ‘Business Services’ sub-sector or ‘Other Services’ sub-sector. Separate data on education and health sub-sectors are of vital importance for the purpose of meaningful planning for human development.
Growth of Mandya District’s EconomyJust as the growth of the Indian economy is measured in terms of the GDP at constant prices, the growth of Karnataka’s economy is measured in terms of the State’s Domestic Product (SDP) at constant prices. Accordingly, we can measure the growth of the economy of Mandya district and the taluks thereof, in terms of the District Domestic Product (DDP) and Taluk Domestic Product (TDP) respectively at constant prices. Comparable taluk-level data were available only for a short period of four recent years, i.e., from 2004-05 to 2008-09. The growth of the DDP in Mandya district during the period 2004-05 to 2008-09 is depicted in Table 6.1.
Between 2004-05 and 2008-09, the Mandya district DDP grew at the annual compound growth rate of 8.43% per annum. However, this growth rate was less than state average of 9.81%. (Table 6.1) Among the different sectors, Primary Sector grew at the rate of 11.41%, while the Secondary Sector grew at the rate of 8.83%, Contrary to the general trend witnessed during the growth process of a region, Mandya District’s Service Sector growth rate was the lowest (5.69%) during the period under reference.
Obviously the District’s per capita income (PCI) for the year 2008-09 was about half of the state’s per capita income. The district’s per capita income at 2004-05 prices was Rs.23635 as against the state average of Rs.41751. The compound growth rate of Mandya District’s PCI was 7.19% as against the State’s PCI growth rate of 8.56% (Table 6.2).
There were considerable inter-taluk differences with regard to the growth rates of TDP. Nagamangala taluk, although a dry region depending entirely on rainfall, has registered the highest rate of growth of TDP
between 2004-05 and 2008-09 (Table 6.3). The TDP of Shrirangapattana taluk grew at the lowest rate of 2.13% followed by Maddur taluk, which experienced a TDP growth rate hardly 3.88%.
The District’s PCI at current prices in 2008-09, was just Rs 28,987 as against the state PCI of Rs.53,101 (Table 6.4). Taluk-wise, Pandavapura talus’s PCI (Rs. 37,182) was the highest, followed by Nagamangala (Rupees 35,473).
Sectoral Distribution of IncomeThe Primary Sector in Mandya District still continues to contribute a high percentage of DDP (36.75%) while this sector contributes hardly 17.8% at the state level. The district is industrially backward in relation to the State’s industrial situation because the Secondary Sector of the district contributes hardly 22.89% as against the state average of 29.2%. The Tertiary Sector contributes 43.36% of the DDP whereas the State’s Tertiary Sector contributes 52.99% of the SDP (Table 6.5 & Fig. 6.1).
Taluk-wise, Nagamangala taluk, although one of the rich taluks in the District in terms of PCI, interestingly continues to depend heavily on the Primary Sector including agriculture. This taluka’s Primary Sector contributes as high as 49.32% of the TDP, followed by Krishnarajpet taluk (42.30%). Industrially speaking, the Secondary Sector contribution to TDP is highest in Maddur (32.5%) while it is lowest in Nagamangala taluk (11.61%). The Tertiary Sector of Shrirangapattana taluk contributes as high as 51.79% of the TDP and the lowest Tertiary sector contribution to TDP is found in K R Pet taluk (Table 6.5 & Fig. 6.1).
Sub Sector-wise distribution of DDP and TDP presents some interesting features in Mandya District. Agriculture and animal husbandry contribute 81.2% of the Primary Sector DDP in the District, with Mandya taluk topping the list in which agriculture and animal husbandry contribute as high as 87.82% of the Primary Sector DDP (Table 6.6 & Fig. 6.2). The Mining Sub-sector is negligible in the district, accounting for hardly 6.61% of the district’s DDP. Construction industry contributes more than half (55.35%) of the Secondary Sector DDP in the district, whereas Manufacturing (both registered & unregistered) contributes roughly one-third (33.85%, vide Table 6.7 & Fig. 6.3). The construction sub-sector accounts for over 70% of the respective Secondary Sector TDP’s of Krishnarajpet, Malavalli and Pandavapura taluks. The Manufacturing sub-sector (Registered & Unregistered) is dominant only in Maddur taluk, accounting for 68.87%,
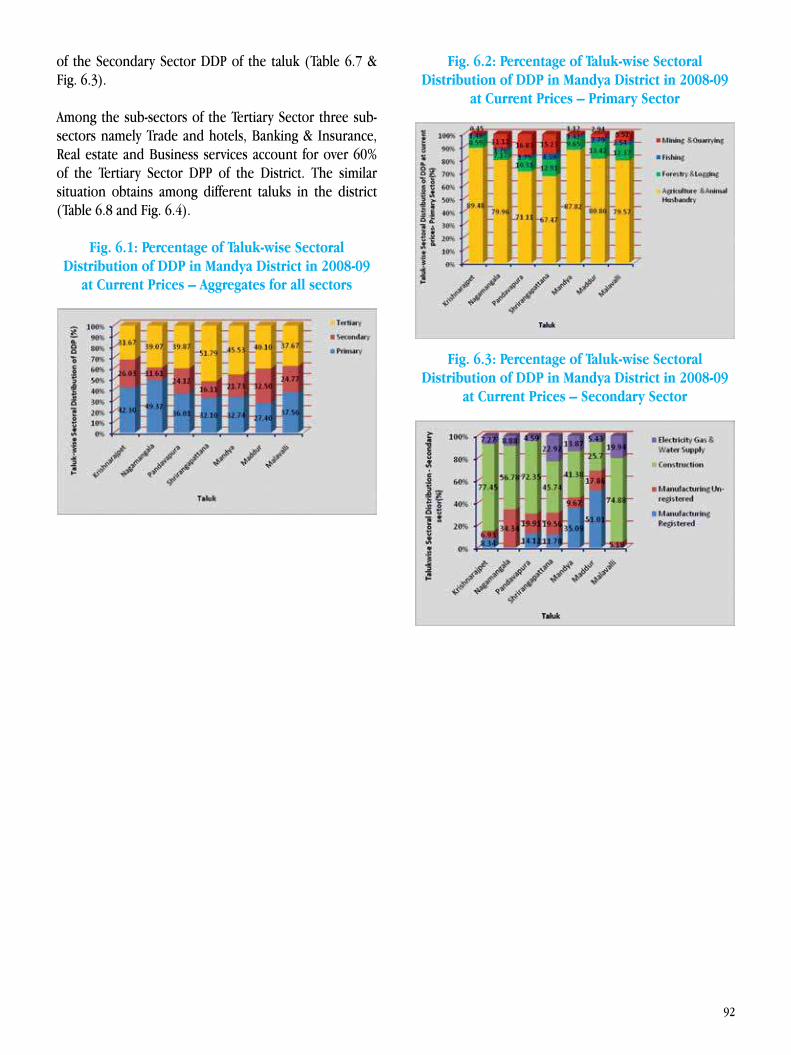
92
of the Secondary Sector DDP of the taluk (Table 6.7 & Fig. 6.3).
Among the sub-sectors of the Tertiary Sector three sub-sectors namely Trade and hotels, Banking & Insurance, Real estate and Business services account for over 60% of the Tertiary Sector DPP of the District. The similar situation obtains among different taluks in the district (Table 6.8 and Fig. 6.4).
Fig. 6.1: Percentage of Taluk-wise Sectoral Distribution of DDP in Mandya District in 2008-09
at Current Prices – Aggregates for all sectors
Fig. 6.2: Percentage of Taluk-wise Sectoral Distribution of DDP in Mandya District in 2008-09
at Current Prices – Primary Sector
Fig. 6.3: Percentage of Taluk-wise Sectoral Distribution of DDP in Mandya District in 2008-09
at Current Prices – Secondary Sector
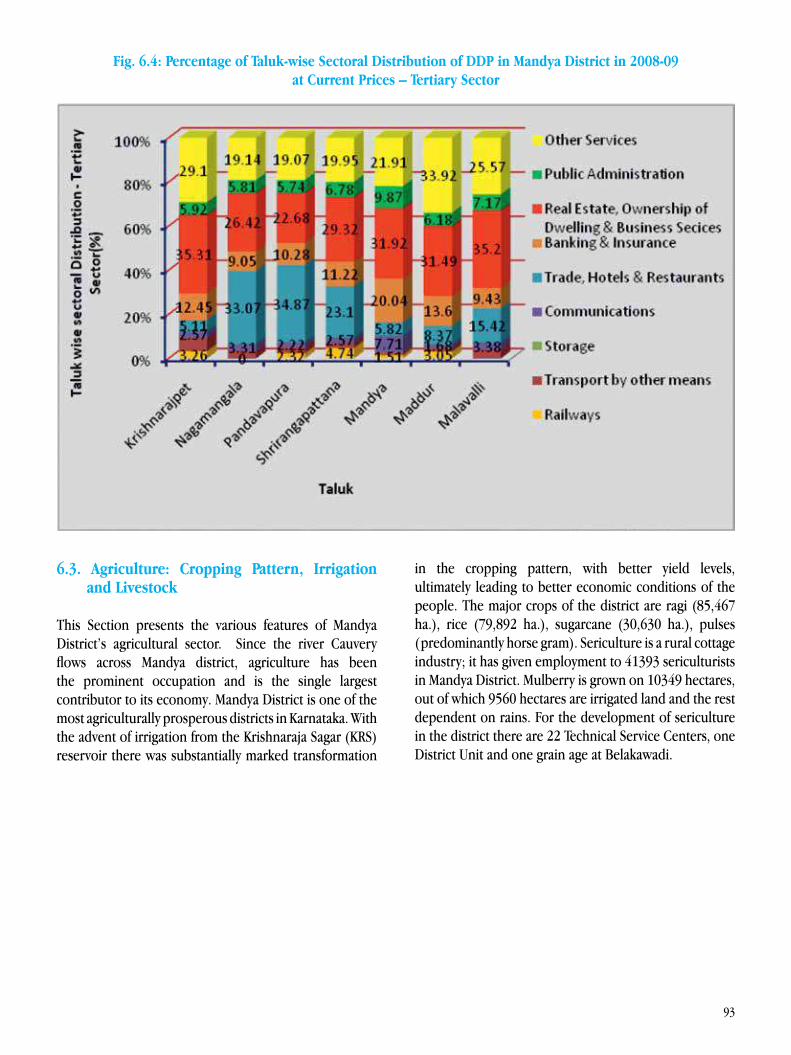
93
Fig. 6.4: Percentage of Taluk-wise Sectoral Distribution of DDP in Mandya District in 2008-09 at Current Prices – Tertiary Sector
6.3. Agriculture: Cropping Pattern, Irrigation and Livestock
This Section presents the various features of Mandya District’s agricultural sector. Since the river Cauvery flows across Mandya district, agriculture has been the prominent occupation and is the single largest contributor to its economy. Mandya District is one of the most agriculturally prosperous districts in Karnataka. With the advent of irrigation from the Krishnaraja Sagar (KRS) reservoir there was substantially marked transformation
in the cropping pattern, with better yield levels, ultimately leading to better economic conditions of the people. The major crops of the district are ragi (85,467 ha.), rice (79,892 ha.), sugarcane (30,630 ha.), pulses (predominantly horse gram). Sericulture is a rural cottage industry; it has given employment to 41393 sericulturists in Mandya District. Mulberry is grown on 10349 hectares, out of which 9560 hectares are irrigated land and the rest dependent on rains. For the development of sericulture in the district there are 22 Technical Service Centers, one District Unit and one grain age at Belakawadi.
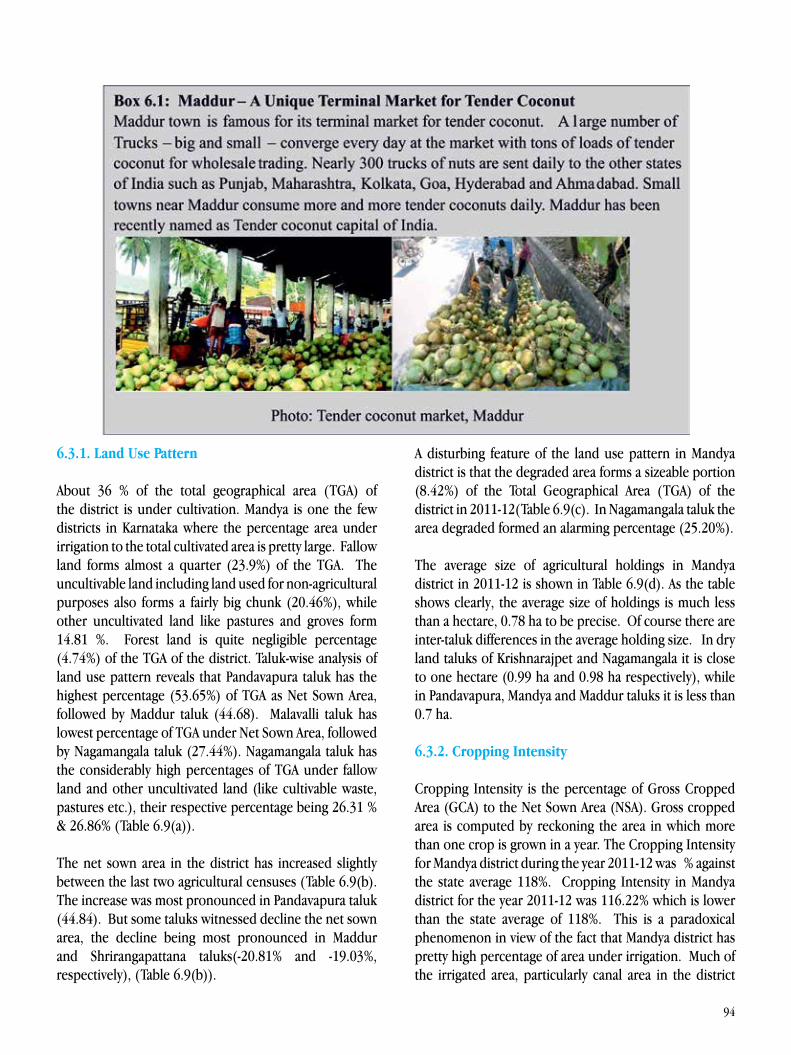
94
6.3.1. Land Use Pattern
About 36 % of the total geographical area (TGA) of the district is under cultivation. Mandya is one the few districts in Karnataka where the percentage area under irrigation to the total cultivated area is pretty large. Fallow land forms almost a quarter (23.9%) of the TGA. The uncultivable land including land used for non-agricultural purposes also forms a fairly big chunk (20.46%), while other uncultivated land like pastures and groves form 14.81 %. Forest land is quite negligible percentage (4.74%) of the TGA of the district. Taluk-wise analysis of land use pattern reveals that Pandavapura taluk has the highest percentage (53.65%) of TGA as Net Sown Area, followed by Maddur taluk (44.68). Malavalli taluk has lowest percentage of TGA under Net Sown Area, followed by Nagamangala taluk (27.44%). Nagamangala taluk has the considerably high percentages of TGA under fallow land and other uncultivated land (like cultivable waste, pastures etc.), their respective percentage being 26.31 % & 26.86% (Table 6.9(a)).
The net sown area in the district has increased slightly between the last two agricultural censuses (Table 6.9(b). The increase was most pronounced in Pandavapura taluk (44.84). But some taluks witnessed decline the net sown area, the decline being most pronounced in Maddur and Shrirangapattana taluks(-20.81% and -19.03%, respectively), (Table 6.9(b)).
A disturbing feature of the land use pattern in Mandya district is that the degraded area forms a sizeable portion (8.42%) of the Total Geographical Area (TGA) of the district in 2011-12(Table 6.9(c). In Nagamangala taluk the area degraded formed an alarming percentage (25.20%).
The average size of agricultural holdings in Mandya district in 2011-12 is shown in Table 6.9(d). As the table shows clearly, the average size of holdings is much less than a hectare, 0.78 ha to be precise. Of course there are inter-taluk differences in the average holding size. In dry land taluks of Krishnarajpet and Nagamangala it is close to one hectare (0.99 ha and 0.98 ha respectively), while in Pandavapura, Mandya and Maddur taluks it is less than 0.7 ha.
6.3.2. Cropping Intensity
Cropping Intensity is the percentage of Gross Cropped Area (GCA) to the Net Sown Area (NSA). Gross cropped area is computed by reckoning the area in which more than one crop is grown in a year. The Cropping Intensity for Mandya district during the year 2011-12 was % against the state average 118%. Cropping Intensity in Mandya district for the year 2011-12 was 116.22% which is lower than the state average of 118%. This is a paradoxical phenomenon in view of the fact that Mandya district has pretty high percentage of area under irrigation. Much of the irrigated area, particularly canal area in the district
95
is for sugar cane production which spans over a year. Hence, long duration crops such as sugar cane, tend to reduce cropping intensity. Taluk-wise analysis reveals that, in Shrirangapattana taluk cropping intensity is the highest (144.49%), while in other taluks it hovers around the district average (Table 6.10(a)). Table 6.10(b) shows that there was a slight improvement in the cropping intensity in 2012-13.
6.3.3. Cropping Pattern
Mandya district’s cropping pattern is depicted in Table 6.11.The cropping pattern of the district as a whole is dominated by food grain crops, especially paddy and ragi. Cereals and minor millets occupy over half of the total crop area. Commercial crops occupy a quarter of the total cropped area and sugarcane accounts for bulk of the commercial crops. Fruits and vegetables and oil seeds together account for hardly 8.32 % of the cropped area. Taluk – wise analysis of the cropping pattern reveals dominance of the irrigation intensive crops namely paddy and sugarcane in the irrigated taluks expect Nagamangala and Krishnarajpet. Cereals and millets are the prominent items of food crops in Shrirangapattana, Mandya, & Malavalli (with 63.12 %, 52.23% and 63.88%% respectively of the total cropped area). Nagamangala, Krishnarajpet and Pandavapura taluks have about a quarter of their respective total cropped areas under pulses. There are no major inter-taluks differences regarding the percentage area under fruit and vegetables as also under oil seeds. Sugarcane area occupies over 80 percent of the commercial crops areas in three taluks namely Pandavapura, Mandya and Shrirangapattana (with 89.36 %, 82.4% and 81.55% respectively). On the contrary, sericulture is a prominent commercial crop in two taluks namely Malavalli and Maddur, respective shares of this crop in the two taluks being 49.39 % and 34.79 % of the total commercial crops area. Leguminous crops like pulses and groundnut in Mandya district account for a small percentage of the GCA (13.6%, vide Table 6.12).
The per capita food grain production in the district in 2011-12 was 181 kegs with wide inter-taluk variations; Krishnarajpettaluk having the least production (236 kgs) and Malavalli taluk having the lowest production (166 kgs, vide Table 6.13).
6.3.4. Irrigation
Nearly, 65.37% of cultivated area is irrigated by different sources. Almost three quarters of the area under irrigation
in Mandya district comes under canal command. Canals accounted for Bulk of the irrigated area (74.32%), followed by tanks (15.84%). The area irrigated by wells and tube wells forms a negligible portion of the irrigated area (9.52%). Canals account for high percentage of irrigated area in all the taluks except Nagamangala where tanks, wells & tube wells together irrigate more than half (53.21%) of the irrigated area (Table 6.14).
Irrigation intensityIrrigation intensity is the percentage of gross irrigated are to the net irrigated area. Irrigation intensity in Mandya district for the year 2011-12 was 123.44% which is slightly higher than cropping intensity (116.22%). This means that the irrigated area is more intensively cultivated than the un-irrigated area in Mandya district (Table. 6.15). Taluk-wise analysis interestingly reveals that in the taluks where well irrigation tapping the ground water is dominant, for example Nagamangala, Krishnarajpet Taluk, the irrigation intensity is higher (136.75% and 127.78%, respectively). Since well irrigation happens to be private investment by farmers, they tend to utilize the available land to grow as many crops as possible in a year, thereby leading to higher irrigation intensity (Table. 6.15).
6.3.5. Livestock Economy
Table 6.16 depicts the Livestock situation in Mandya district based on 2007 Livestock census. Barring a few taluks, livestock activity is relative less significant in the rural economy of Mandya district compared to many other districts in the state. Table 6.16 shows the composition and number of livestock in the district as per 2007 live stock census. Generally speaking, in the canal-irrigated areas producing paddy, sugarcane, and other commercial crops, there is dearth of grazing lands on the one hand and lack of adequate fodder for animals, thanks to dominance of commercial crops in the cropping pattern, on the other. Therefore, livestock enterprises fail to develop as a supplementary activity in irrigated areas. However, the taluks of Krishnarajpet and Malavalli are an exception to this trend. They have a high percentage of cattle and buffaloes of the district. On the contrary, Pandavapura and Shrirangapattana have very low percentage of all types of livestock in the district (Table 6.16).
96
6.4. Poverty: BPL Households and MGNREGS
6.4.1. Poverty – Conceptual and methodological constraintsA Household below poverty line is one which is unable to satisfy even the basic needs of life including food, shelter, clothing, transport, health, and education & transport. However the Government of India and the State Governments had for long stuck to the minimum daily food calorie requirement to compute the poverty line. In recent years, however monthly per capita consumption expenditure (MPCE) is being used by the erstwhile Planning Commission to calculate the poverty line. Even this method came in for wide criticism in view of the reworking of the poverty head count ration by Suresh Tendulkar Committee. Since the Tendulkar Committee’s re-calculation of the Poverty line was also questioned, the erstwhile Planning Commission had appointed another committee under the Chairmanship of Prof. C. Rangarajan in May 2013 to come up with a more realistic conceptualization and methodology for the poverty line. This Committee which submitted its report on July 1, 2014, has hiked the poverty limit to Rs. 47 per day in urban areas, stating that people spending below that would be considered poor. The Tendulkar committee report had fixed the poverty line at Rs 33 per day for urban areas. The Rangarajan report also states that those spending less than Rs 32 per day in rural areas would be considered poor. The Tendulkar committee had estimated the poverty line at Rs 27 a day for rural India. As per the report the poverty head count ratio stood at 38.2 per cent in 2009-10 and declined to 29.5 per cent in 2011-12.
Notwithstanding the anomalies in the currently used concepts and methodology for poverty estimation, data on current estimates on poverty are available only at the State and National levels. There are no regular and comparable poverty estimates at the taluk and district levels. As far as Karnataka State is concerned, taluk-level percentages of the population below poverty line were estimated by Household survey conducted by GOI, (2002) (Table 6.17). Otherwise, the only source of data for identifying for the BPL households is the number of BPL Cards issued at the grassroots level. The number of Ration Cards issued under two categories of BPL households namely Anthyodaya Anna Yojana (AAY ), and BPL households which are together treated as BPL households by the State Government are presented.
The Table 6.17 shows an interesting fact that the poverty head count ratio in agriculturally rich taluks like Pandavapura and Mandya is higher than the district average of 30 %, while relatively poorer districts of Nagamangala and Krishnarajpet have lower than district-average poverty head count ratios. It is pertinent to mention here that in Nagamangala and Krishnarajpet taluks, widespread poverty in the yester years forced poorer households tended to move out, some people even to Gulf countries, in search of better employment and income opportunities. Such migrated persons from these taluks continue to transfer part of the income they have been earning outside to their kin left behind at home. This also partly explains why the PCI, especially in Nagamangala taluk, is the highest in the district.
In view of the massive increase in the number applicants for BPL cards, recentlythe State Government, which launched the Anna Bhagya scheme to provide rice at Re. 1 per kg to BPL families, has now decided to put a stringent cap on eligibility. A recent circular directs Food and Civil Supplies officers to ensure that no more than 70 per cent households in rural areas and 50 per cent in urban areas are brought under the food security umbrella.
This revision drive is being termed as an exercise to weed out “ineligible” beneficiaries. As per the guidelines issued by the Department, the first phase of revision of fresh applications should end by October 31, 2013. The verification has to be done as per the Government Order issued in August, 2013, which lists 14 criteria to identify those ineligible under the scheme. However, attempts to fix a cap on the number of cards has in the past been controversial, with many arguing that it often results in errors of exclusion.
At present, over 75 per cent of families in the State have BPL cards, with some districts above the average. For instance, in Hassan district, 80 per cent of families have ration cards. As per the number of BPL cards issued, about 95 per cent of rural families and 64 per cent of urban families in this district fall below the poverty line!
6.4.2. Poverty alleviation programms
Both the central and state Governments have operationalized several programmes to uplift poor people and also effect development in the rural areas. The State Government in effect expects the Zilla Panchayats to implement the programmes in the decentralised system. The programmes are Indira Awas Yojana (IAY ),
97
Ambedkar Housing Scheme, Nava Gram Yojana, National Rural Employment Guarantee Scheme (NREGS), Western Ghats Development Programme, Nirmala Grama Yojana, Swatcha Grama Yojana, Suvarna Grama Yojana, Yashaswini, Akshara Dasoha, are some of the important State Government rural development programmes implemented in the district.
The Government’s Policy and Programmes have laid emphasis on poverty alleviation, generation of employment and income opportunities, provision of infrastructure and basic facilities to meet the needs of the rural poor. The major employment generation-cum-poverty alleviation programs briefly presented as under.
MGNREG SchemeDuring the lien period of agricultural operations the agricultural labourers are left without any employment. Hence the programme provides minimum 100 days work at Rs 100 per day and women below poverty line who are above 18 years of age and below 60 years. Out of Rs 363.38 lakh allocation, Rs 100 lakh have been spent during 2008-09, creating 74,217 man-hours in the district; and 91434 job cards are issued during 2010-11 and created 59956 man-hour employments in the district. Table 6.19 depicts the summary picture on NREGS in the district.
6.5. Employment and Unemployment
Trends in workforce growthTable 6.20 depicts the decadal growth rate of workforce in Mandya District between 2001 and 2011.Over the last census decade, the workforce of Mandya District has increased by 4.05.%. The rate of increase was highest in Nagamangala taluk (7.86%) followed by Krishnarajpet Taluk (7.34 %) and least in Pandavapura taluk (1.08 %). Interestingly Maddur and Shrirangapattana taluks recorded negative growth rates (1.79 % and 1.26 % respectively).
6.6. Main and Marginal Workers
Table 6.21 presents the percentage of main workers to total workers at the taluk level in Mandya District. Main workers (those who work for 183 days or more in a year) form 82.04 percent of the total work force in the district. At the taluk level, main workers represent the highest percentage (87.75%) of the workforce in Pandavapura taluk, and their percentage is least (76.46 %) in Nagamangala taluk.
6.7. Work Participation Rate
Table 6.22 shows Work Participation Rate (WPR) in Mandya District by Taluks according to 2011 census. It shows that the WPR for the district as a whole is 53.36 as against the national average of 36%. Interestingly Nagamangala taluk recorded the highest WPR (61.31%), while the WPR for other taluks except Krishnarajpet and Pandavapura taluks is below the district average.
Table 6.23 shows the Male WPR in the district. The WPR among male workers was 70.49% and there was virtually little difference in the WPR across the taluks. Table 6.24 shows female WPR in the district. The district average female WPR was 36.25%. Interestingly Nagamangala taluk recorded the highest female WPR (52.08%), while Mandya taluk recorded the lowest WPR (31.45%).
As regards the occupational composition of the labour force, cultivators form fairly high percentage (44.64 %) of the total number of workers (Table 6.25). Agricultural labourers form slightly less than a quarter (24.81 %) of the total labour force, with very vides differences across the taluks (Table 6.26). In Nagamangala taluk agricultural labourers account for hardly 12.92 % of the workforce while it is highest for Malavalli taluk (3.84 %)
Table 6.27 reveals that according to 2011 census, workers in Household Industries form a negligible percentage (2.05 %) of the total workforce in Mandya District. The share of female workers in the non-agricultural sector in the district is 26.44 % (Table 6.28), while it is highest in Mandya taluk (37.52 %), followed by Shrirangapattana taluk (36.08 %).
The average daily wage rate for female agricultural workers in the district is Rs 130, the wage rate being higher (Rs 145) in Krishnarajpet and Maddur taluks and lowest (Rs 125) in Shrirangapattana taluk (Table 6.29). The average daily wage rate for male agricultural workers in the district is Rs 240, the wage rate being highest (Rs 275) in Malavalli taluk and lowest (Rs.225) in Shrirangapattana and Nagamangala taluks (Table 6.30).
It is interesting to note that while the minimum daily wage rate under NREGS in the district is uniformly fixed at Rs. 155 uniformly in the all the taluks of Mandya district, the daily wage rates for agricultural labourers (average for male and female) prevailing in all taluks in Mandya district are much above the NREGS wage rate
98
(Table 6.31), although there are inter-taluk differences in agricultural wage rate.
6.8. Occupational Pattern
The occupational pattern in Mandya District is given in Table 6.32. Over two-fifths (44.64%) of the district’s total work force consists of cultivators while agricultural labourers account for about a quarter (24.81%). Thus, in the district as a whole 69.45% of the workforce depends on agriculture, while hardly 30.55% of the district’s workforce depends on non-agricultural occupations. Taluk-wise analysis reveals inter-taluk differences in the occupational pattern. In Nagamangala taluk, cultivators form the largest percentage (65.13%) of the total workforce of the taluk and agricultural labourers form the lowest percentage (12.92%) among all the taluks in the district. This is perhaps a testimony to the phenomenon of extensive migration of illiterate or poorly educated persons from this taluk to other places for better employment and income. Non-agricultural workers account for the highest percentage (42.41%) of the total workforce in Mandya taluk, followed by Shrirangapattana (40.36%). This is obviously due to the respective taluk headquarters having large urban population engaged in
non-agricultural activities, located along the Bengaluru-Mysuru infrastructure corridor (Table 6.32).
6. 9. Child Labour
Child labour continues to be an ugly social evil in India. In spite of laws prohibiting child labour, children are still being put to work overtly or covertly in all sorts of jobs. These jobs include beedi making, construction work, domestic work, brick kilns, tile making, dhabas, hotels, restaurants, auto repair shops and detergent making, etc. There are no authentic data on child labour. But the provisional estimates by 2011 census indicate that there are at least 2.5 lakh child labourers Karnataka in the age group of 5 to 14, out of the national total of 43.5 lakh. There are no district/taluk level estimates of child labour.
Among the measures taken to eradicate child labour is the Child Labour (Prohibition & Regulation) Act 1986 to prohibit the engagement of children in certain employments and to regulate the conditions of work of children in certain other employments. Government of India is implementing National Child Labour Project (NCLP) scheme in 266 child labour endemic districts in 20 states.
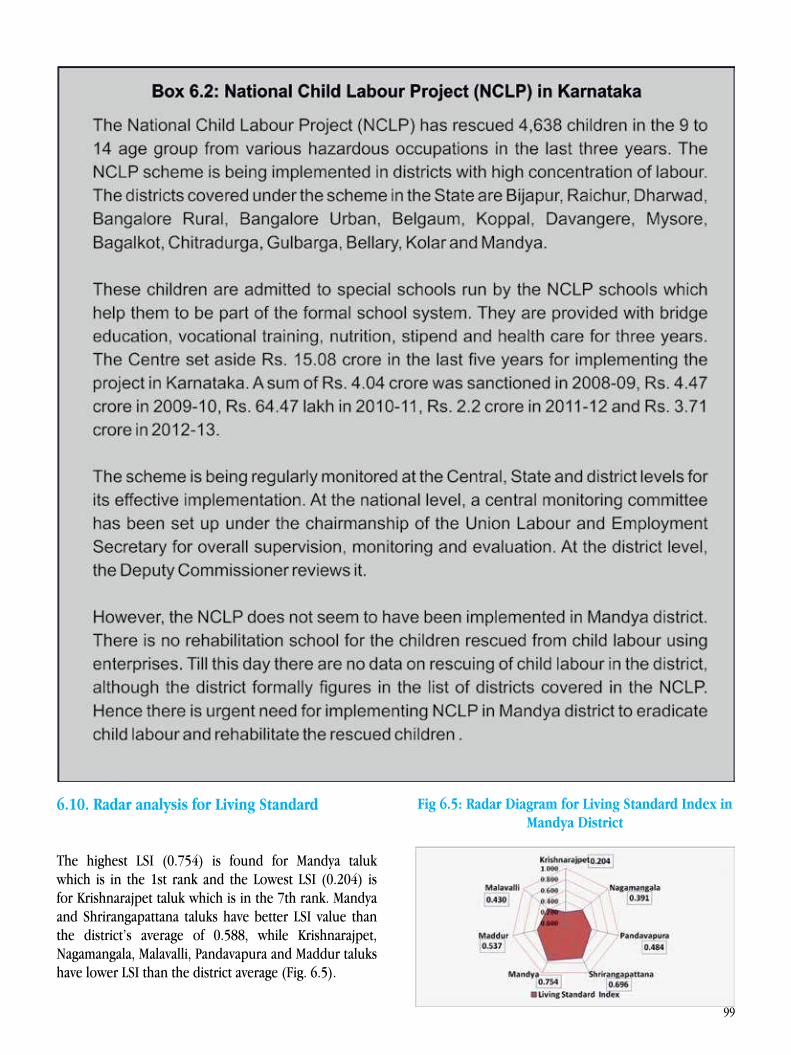
99
6.10. Radar analysis for Living Standard
The highest LSI (0.754) is found for Mandya taluk which is in the 1st rank and the Lowest LSI (0.204) is for Krishnarajpet taluk which is in the 7th rank. Mandya and Shrirangapattana taluks have better LSI value than the district’s average of 0.588, while Krishnarajpet, Nagamangala, Malavalli, Pandavapura and Maddur taluks have lower LSI than the district average (Fig. 6.5).
Fig 6.5: Radar Diagram for Living Standard Index in Mandya District
100
6.11. Concluding Remarks
Income continues to be an important conventional indicator of development although development specialists of late find flaws in it as a reflection of human development. Since human development is conventionally defined as nothing but enlarging human choices and capabilities, income is the means to enhance these choices and capabilities. Thus income continues to be a crucial parameter in computing human development indices.
Economic growth of a nation or a region therein is usually measured in terms of the GDP at constant prices. Accordingly, the growth of Karnataka’s economy is measured in terms of the State’s Gross Domestic Product (SDP, for short). while the growth of the economies of districts and the taluks thereof is measured in terms of the Gross District Domestic Product (DDP, for short) and Gross Taluk Domestic Product (TDP, for short), respectively at constant prices.
The overall rate of economic growth Mandya district has been lower than that of the State in recent years, although the primary sector including agriculture in the district has registered quite higher growth rate than in the state. The district depends heavily on agriculture with over half the cultivated area under irrigation, mostly by canal. There is need to hasten the development of secondary sector, particularly the manufacturing sub-sector not only to generate non-farm employment opportunities but also to exploit the available industrial resources to eradicate poverty.
The district-level development agencies such as agriculture and industry departments and also institutional credit agencies need to serve as pro-active agents in hastening the rate of growth of the district’s economy. Through effective implementation of various development programmes, they can enhance employment opportunities in the district and through them, try and eradicate both unemployment and poverty.

101
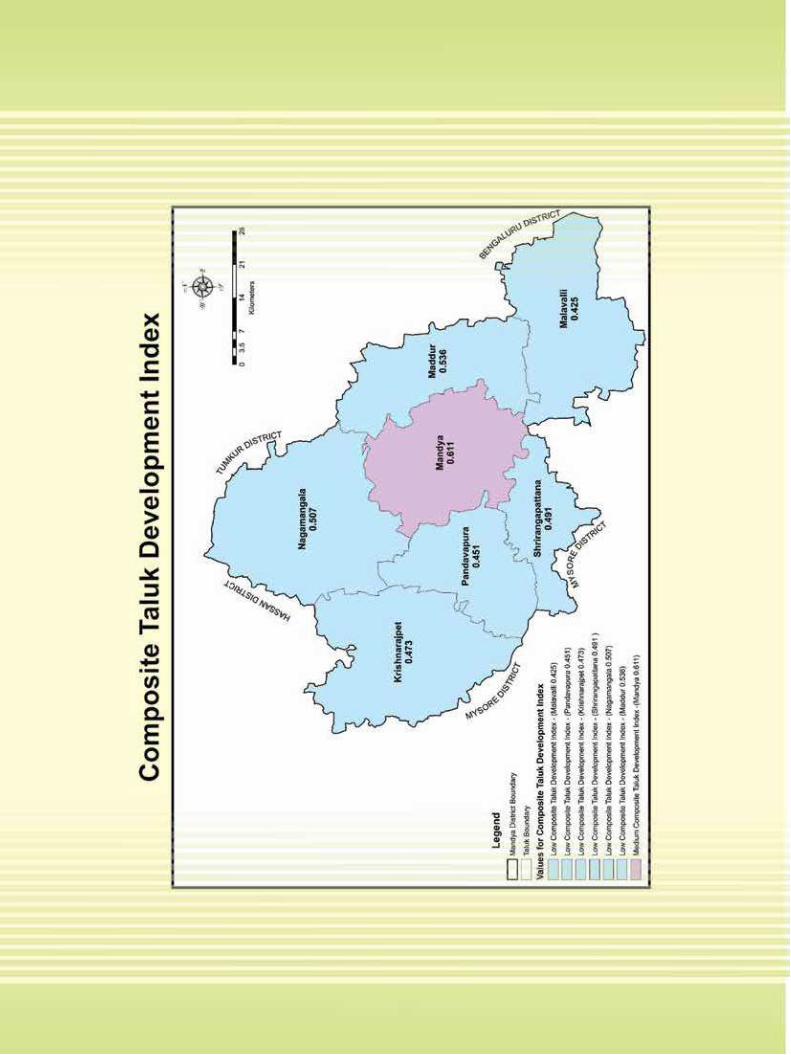
102
103
7.1. Introduction
The Standard of Living in a broad sense reflects the quality of Life of the people. It includes basic needs as well as other happiness enhancing goods and services. They are food, shelter/housing, clothing, personal vehicle ownership, luxury goods at home, etc. Their adequate quantity and good quality are very essential. These different kinds of life-sustaining goods shall be available to all people in a country.
Housing is an important indicator of the standard of living of the people. Housing provides safety, essential conveniences/comforts and privacy for an individual’s life. Thus, housing provides physical, social, mental/psychological base for a happy human life. Thus, housing is basic as well as essential good for leading a good healthy and hygienic life.
A good house contributes to maximise the following:
• It improves in the quality of life of the members of the household and help fulfil their aspirations;
• Helps total development of the personality and the family;
• Facilitates provision of all basic amenities, which have a direct impact on the family health, vigour and efficiency;
• Women and Children in particular would be able to maintain good health and well being and be inspired to pursue economic and social activities.
The following trends and policy initiatives are found in the National Housing and Housing Finance Market in India since 1985:
(a) A National Housing policy was announced in 1985 by the Government of India. Accordingly the State Governments were advised to devise and incorporate housing schemes into their five year plans. This paved the way for State participation in Housing and Housing Finance Market in India.
CHAPTER 7
STANDARD OF LIVING
(b) Private sector participation in urban housing was encouraged in view of increasing demand for housing in urban areas. This was further facilitated by the emergence of housing finance markets.
(c) Housing subsidies are provided by the Central and State Governments to the poor to support and promote the people’s initiatives in house building activity.
The factors like (a) and (c) have affected widely the rural housing schemes in India. This trend has affected housing schemes at the district level.
7.2. Housing Status
The concept of ‘Housing status’ indicates the extent of fairly pucca (good quality) houses the number houseless and site-less households as well as households without basic social amenities in a region like a village city/district. All these dimensions of the housing status of the Mandya district are explained in detail elsewhere.
7.3. Site-less Households
Housing shortage is very acute in rural areas of Mandya district. For instance Table 7.1 shows that out of 426,578 households, 28,188 (6.61%) households are without house sites. Out of 73,354 urban households, 10,331 urban households do not have own houses. There is also slum dwellers’ housing problem in the Mandya district. On the whole 3.58 lakh BPL families are identified in the Mandya district. These population groups being vulnerable do normally represent the houseless category.A large number of site-less households are concentrated in Malavalli (8,848; 13.43%), Maddur (6246; 8.80%), Shrirangapattana (4724; 10.92%), Pandavapura (4100; 9.60%) and Krishnarajpet (3452; 5.68%) taluks. In Mandya taluk only 34 households and in Nagamangala taluk 784 households are site-less. Investment in housing and residential land by the people of Mandya district is rather low.
7.4. Households with Pucca Houses
Pucca houses denote tiles roof/RCC houses of

104
varying size. The dimensions of buildup area may be, modestly, 400-600 square feet. Nearly 56.46 percent of the households (2,39,734) own pucca houses in relation to a total number of 4,24,640 households in Mandya district by 2011. Except Krishnarajpet taluk the remaining 6 taluks of the Mandya district have more than 50 percent (up to 66%) households with pucca houses (Table 7.2). The pucca houses are in more number in Shrirangapattana, Mandya, Maddur and Malavalli taluks. Except Malavalli taluk the remaining three taluks are highly irrigated and thus, are agriculturally prosperous.
Therefore the people’s investment in housing is better in Shrirangapattana, Mandya and Maddur taluks. In the case of Malavalli taluk a good number of new generation young people work in Bengaluru and Mysuru cities. This has brought remittances to Malavalli taluk.
Still, however, 44% of the households in Mandya district need Pucca houses. That means underdevelopment and underinvestment in housing sector continues in Mandya district.
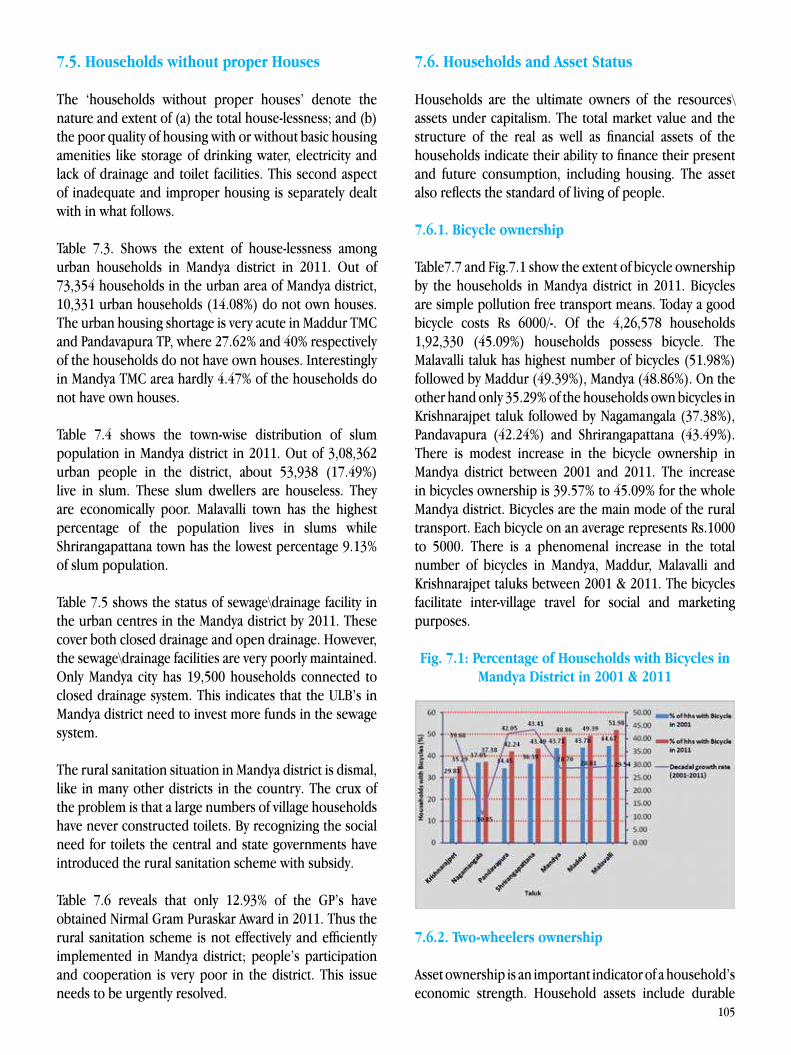
105
7.5. Households without proper Houses
The ‘households without proper houses’ denote the nature and extent of (a) the total house-lessness; and (b) the poor quality of housing with or without basic housing amenities like storage of drinking water, electricity and lack of drainage and toilet facilities. This second aspect of inadequate and improper housing is separately dealt with in what follows.
Table 7.3. Shows the extent of house-lessness among urban households in Mandya district in 2011. Out of 73,354 households in the urban area of Mandya district, 10,331 urban households (14.08%) do not own houses. The urban housing shortage is very acute in Maddur TMC and Pandavapura TP, where 27.62% and 40% respectively of the households do not have own houses. Interestingly in Mandya TMC area hardly 4.47% of the households do not have own houses.
Table 7.4 shows the town-wise distribution of slum population in Mandya district in 2011. Out of 3,08,362 urban people in the district, about 53,938 (17.49%) live in slum. These slum dwellers are houseless. They are economically poor. Malavalli town has the highest percentage of the population lives in slums while Shrirangapattana town has the lowest percentage 9.13% of slum population.
Table 7.5 shows the status of sewage\drainage facility in the urban centres in the Mandya district by 2011. These cover both closed drainage and open drainage. However, the sewage\drainage facilities are very poorly maintained. Only Mandya city has 19,500 households connected to closed drainage system. This indicates that the ULB’s in Mandya district need to invest more funds in the sewage system.
The rural sanitation situation in Mandya district is dismal, like in many other districts in the country. The crux of the problem is that a large numbers of village households have never constructed toilets. By recognizing the social need for toilets the central and state governments have introduced the rural sanitation scheme with subsidy.
Table 7.6 reveals that only 12.93% of the GP’s have obtained Nirmal Gram Puraskar Award in 2011. Thus the rural sanitation scheme is not effectively and efficiently implemented in Mandya district; people’s participation and cooperation is very poor in the district. This issue needs to be urgently resolved.
7.6. Households and Asset Status
Households are the ultimate owners of the resources\assets under capitalism. The total market value and the structure of the real as well as financial assets of the households indicate their ability to finance their present and future consumption, including housing. The asset also reflects the standard of living of people.
7.6.1. Bicycle ownership
Table7.7 and Fig.7.1 show the extent of bicycle ownership by the households in Mandya district in 2011. Bicycles are simple pollution free transport means. Today a good bicycle costs Rs 6000/-. Of the 4,26,578 households 1,92,330 (45.09%) households possess bicycle. The Malavalli taluk has highest number of bicycles (51.98%) followed by Maddur (49.39%), Mandya (48.86%). On the other hand only 35.29% of the households own bicycles in Krishnarajpet taluk followed by Nagamangala (37.38%), Pandavapura (42.24%) and Shrirangapattana (43.49%). There is modest increase in the bicycle ownership in Mandya district between 2001 and 2011. The increase in bicycles ownership is 39.57% to 45.09% for the whole Mandya district. Bicycles are the main mode of the rural transport. Each bicycle on an average represents Rs.1000 to 5000. There is a phenomenal increase in the total number of bicycles in Mandya, Maddur, Malavalli and Krishnarajpet taluks between 2001 & 2011. The bicycles facilitate inter-village travel for social and marketing purposes.
Fig. 7.1: Percentage of Households with Bicycles in Mandya District in 2001 & 2011
7.6.2. Two-wheelers ownership
Asset ownership is an important indicator of a household’s economic strength. Household assets include durable
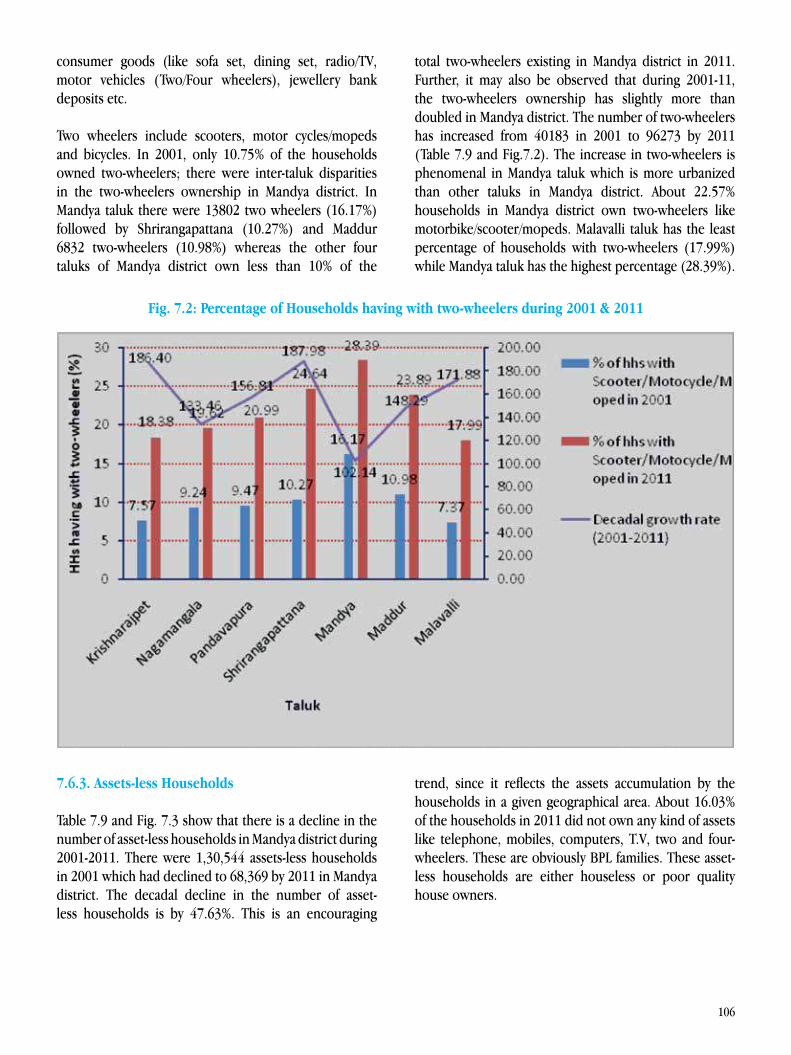
106
consumer goods (like sofa set, dining set, radio/TV, motor vehicles (Two/Four wheelers), jewellery bank deposits etc.
Two wheelers include scooters, motor cycles/mopeds and bicycles. In 2001, only 10.75% of the households owned two-wheelers; there were inter-taluk disparities in the two-wheelers ownership in Mandya district. In Mandya taluk there were 13802 two wheelers (16.17%) followed by Shrirangapattana (10.27%) and Maddur 6832 two-wheelers (10.98%) whereas the other four taluks of Mandya district own less than 10% of the
total two-wheelers existing in Mandya district in 2011. Further, it may also be observed that during 2001-11, the two-wheelers ownership has slightly more than doubled in Mandya district. The number of two-wheelers has increased from 40183 in 2001 to 96273 by 2011 (Table 7.9 and Fig.7.2). The increase in two-wheelers is phenomenal in Mandya taluk which is more urbanized than other taluks in Mandya district. About 22.57% households in Mandya district own two-wheelers like motorbike/scooter/mopeds. Malavalli taluk has the least percentage of households with two-wheelers (17.99%) while Mandya taluk has the highest percentage (28.39%).
Fig. 7.2: Percentage of Households having with two-wheelers during 2001 & 2011
7.6.3. Assets-less Households
Table 7.9 and Fig. 7.3 show that there is a decline in the number of asset-less households in Mandya district during 2001-2011. There were 1,30,544 assets-less households in 2001 which had declined to 68,369 by 2011 in Mandya district. The decadal decline in the number of asset-less households is by 47.63%. This is an encouraging
trend, since it reflects the assets accumulation by the households in a given geographical area. About 16.03% of the households in 2011 did not own any kind of assets like telephone, mobiles, computers, T.V, two and four-wheelers. These are obviously BPL families. These asset-less households are either houseless or poor quality house owners.
107
Fig. 7.3: Percentage of households with no assets (Telephone, Computer, TV, 2 Wheelers and 4 Wheelers) in Mandya District during 2001 & 2011
7.7. Schemes for Housing Facilities
The provision of shelter / housing is included under the basket of basic needs/ minimum needs/ primary goods. The concept of basic needs is viewed as a poverty alleviation requirement by the World Bank in the early 1970’s.
The Government of India has included the provision of shelter / housing under the minimum needs approach to alleviate poverty since 1969 (from the 4th Five-year Plan onwards). It was also included for the economic empowerment of the poor. This was the beginning of the Central and State Government involvement in housing / shelter programmes.
In Karnataka the following housing programmes are being implemented at present: • Indira Awas Yojana • Rural Ashraya Yojana • Rural Ambedkar Housing Scheme, and • Basava Vasathi Yojana
The housing programmes are implemented through the ZPs by involving Gram Panchayats.
The total number of site-less households has increased from 2009-10 to 2001-12 by over 25% percent. It appears that there are mistakes in the procedure adopted to collect and document data on site-less poor households in Mandya district. However, construction of houses and their allotment to poorer households is better in Mandya district. It may be observed that the government constructed 2,222 new houses in 2009-10, 15062 in 2010-11 and 6263 new houses in 2011-12 and allotted them to the rural poor. This is a good progress in the rural housing sector under IAY, Rural Ambedkar and Basava Housing Schemes in Mandya district.
The Indira Awas Yojana is a rural shelter scheme launched for the benefit of rural poor implemented since mid-1990 in India. The IAY is a major rural housing scheme funded by GOI.
a) Both central and state Governments are participating in planning, financing and implementing the rural housing schemes ;
b) The likely beneficiaries are selected in the GP meetings held for purpose openly once is six months every year. The concerned officials of TP/ ZP are also present is such meetings at the ZP level.
108
In Mandya district the task of beneficiary selection is done democratically. There are no reported favoritism and violence / group clashes in the selection of beneficiaries for housing.
c) The norm of ‘social justice’ is well incorporated into selection and allotment of houses subsidised by the State. Fair representation is given to SC and ST, General population groups and also religious minorities; allotment of houses for STs in Mandya district is meager since ST population itself is in small number.
d) Adequate representation is given for physically challenged, male and female poor in the allotment of subsidised houses.
It may be observed from Table 7.10(a) and (b) that (i) more than 75% of the public houses constructed were completed in the given financial year in Mandya district; (ii) a good number of SC and general category beneficiaries are identified under the IAY Scheme; and (iii) there is no large time lag between beneficiary selection, actual house completion and its allotment in Mandya district under IAY during 2009-10 and 2011-12.Some of the other vital features of the IAY Scheme include the following:
• During 2012-13, largest share in the new houses constructed and allotted under IAY has gone in favour of SC households as against the general category households (Table 7.10(c)). This is a welcome change. Highest number of IAY houses was allotted to SC households in Mandya, Maddur and Malavalli taluks.
• The share of minorities (like Jains and Muslims) in IAY houses during 2009-13 is very negligible. The poor and houseless among the minorities need to be considered in the future.
• The rural Ambedkar Housing Scheme is essentially meant for the SC and ST population. It may be observed that (a) the rural Ambedkar Housing Scheme has not benefitted ST population in Mandya district. This is perhaps because the ST population is very small. The progress of rural Ambedkar Housing Scheme is very slow in Mandya district (Table 7.10(d)). Rural Ambedkar Housing Scheme is really yet to take-off in Mandya district.
The Basava Vasathi (Housing) scheme is a major pro–poor programme implemented by the government of Karnataka through PRI network. Table 7.10(e) gives details of Basava Housing Scheme for the two-year period viz. 2010-11 and 2013-14 in Mandya district. Some of the important features of Basava Housing Scheme include:Basava Housing Scheme is meant for providing subsidised houses for all the categories of the rural poor. About 36,471 beneficiaries were identified in Mandya district in 2010-11, the highest number being in Maddur, Mandya and Nagamangala taluks. Adequate representation is given for SC’s and ST’s under Basava Vasathi Yojana (2010-11).
The implementation of Basava Housing Scheme is however not satisfactory in Mandya district. For 36,471 beneficiaries identified, only 11,696 houses are completed. Construction of SC and ST houses was less than 30%.In Mandya district the housing implementation machinery at ZP and GP levels needs to be sensitized and improved.
The Basava Housing Scheme for 2013-14 had modest targets. That is the reason for a small number of beneficiaries identified for the project.
Housing is an important social good to promote and raise the level of human development in Mandya district. It is necessary to increase the housing investment; increase social awareness to construct toilets and to speed up the process of implementation of State housing schemes.
7.8. Drinking Water
A good quality potable water supply is very essential for promoting human health. Thus the supply of drinking water for rural and urban population is considered to be an important social sector programme under the five years plans in India. The supply of drinking water is very essential for ensuring and promoting standard of living of the people. The households’ access to water for drinking and other domestic use in Mandya district by 2011. The drinking water is drawn from major rivers like Cauvery, Hemavathi and Shimsha; village tanks, bore-wells and open wells in Mandya district. About 80.24% households in Mandya district were having access to potable drinking water supply by 2001; this has gone up to 85.09% by 2011 (Table 7.11 and Fig.7.4). This is a fairly good coverage of safe drinking water supply in an agricultural district like Mandya. However, Krishnarajpet, Pandavapura and Nagamangala taluks lag behind other taluks in regard to
109
drinking water supply. Krishnarajpet, Pandavapura, Nagamangala and Malavalli taluks lag behind in respect of quite a few indicators of housing services. Thus more concerted efforts need to be made to implement the government sponsored drinking water supply house/toilet construction, electricity supply, etc. This needs to take place at ZP and TP and GP levels in Mandya district.
Fig. 7.4: Percentage of Households having access to drinking water during 2001 & 2011
7.9. Electricity
The households’ access to electricity for lighting and cooking purposes is a good indicator of the modern standard of living. Electricity connection to households is essential for better and safe living. It can be used to heat water for bathing, toilets cooking and lighting and entertainment (TV/Radio) purposes. Table 7.12 and Fig.7.5 show the extent of households’ access to electricity in
Mandya district by 2011. About 91.67% of the households in Mandya district have access to electricity. There are no wide inter-taluk disparities in the availability of domestic electricity. There is very impressive improvement in the households, electrification in Mandya district. In 2001, in the whole Mandya district 77.66% of the households had electricity connection, which has risen to 91.67% by 2011.
110
Fig. 7.5: Percentage of Households in Mandya District having access to electricity in 2001 & 2011
7.10. Traditional Fuel and Modern Fuel
Kerosene and fuel woods were the traditional fuels in the households. Cow dung, cakes were also used as fuel for cooking purpose.
Since 1992 there has been a gradual switch over from traditional fuels to modern fuels in many parts of rural India, including Mandya district. About 19.56% of the households have access to modern cooking fuel like LPG/PNG, Electricity and Biogas (Table 7.13 and Fig 7.6). Highest numbers of modern fuel users are found in Mandya taluk, followed by Shrirangapattana and Maddur taluks. These three taluks are agriculturally prosperous and educationally developed in Mandya district. There is an increase in the percentage of households having access to modern cooking fuel during the recent decade 2001-2011. The data reveal a few interesting trends in modern cooking fuel use by the households: (a) There is more than double increase in the number of households using
modern cooking fuel (like LPG) from 9.31% to 19.56% between 2001 and 2011; Thus the decadal growth rate of cooking fuel using households in Mandya district is 139.99% during 2001-2011; (b) The agriculturally prosperous taluks like Shrirangapattana, Pandavapura and Mandya have achieved a higher number of gas connections than the other four taluks in Mandya district. Further, the greater access to cities like Mysuruand participation in higher education prompt people purchase modern housing services like gas connection, water supply, electricity, etc. This is observed in Shrirangapattana, Mandya and Pandavapura taluks. Still, however, over 80% of the households in Mandya district still have no access to modern cooking fuel. Electricity and biogas are not popular household fuels in Mandya district. Frequent power-cuts may be an important reason for not using electric stoves by the households. Thus, there is enormous scope for promoting biogas plants in the rural areas of Mandya district.
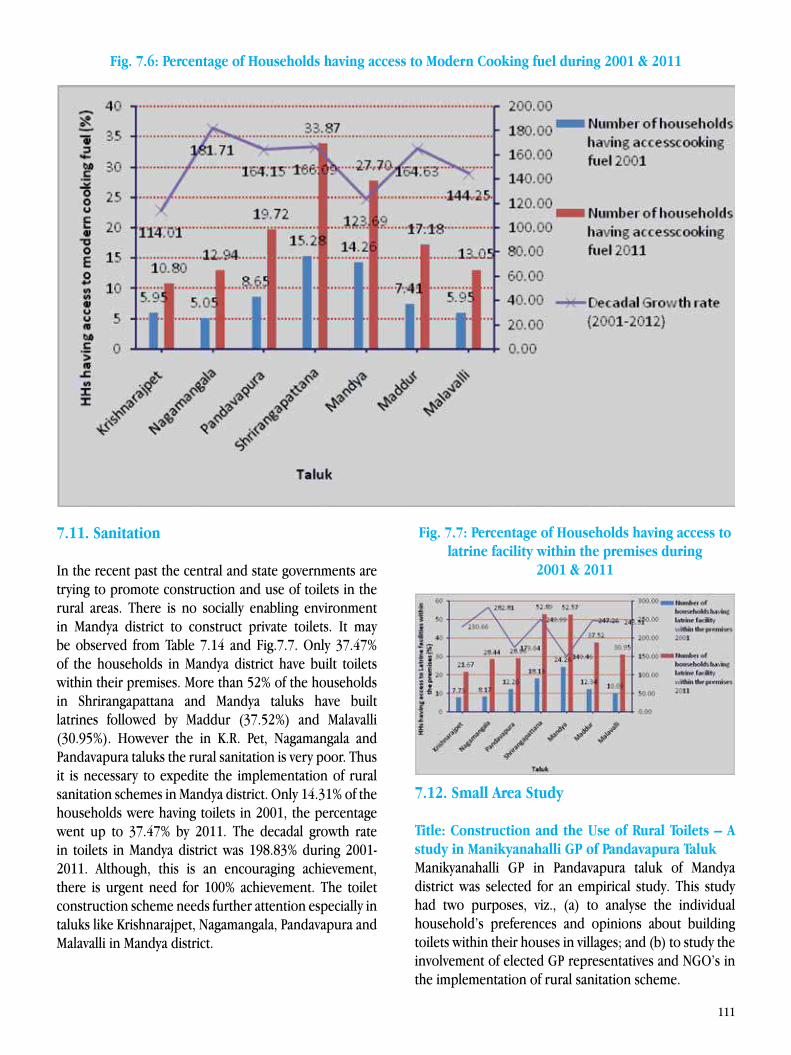
111
Fig. 7.6: Percentage of Households having access to Modern Cooking fuel during 2001 & 2011
7.11. Sanitation
In the recent past the central and state governments are trying to promote construction and use of toilets in the rural areas. There is no socially enabling environment in Mandya district to construct private toilets. It may be observed from Table 7.14 and Fig.7.7. Only 37.47% of the households in Mandya district have built toilets within their premises. More than 52% of the households in Shrirangapattana and Mandya taluks have built latrines followed by Maddur (37.52%) and Malavalli (30.95%). However the in K.R. Pet, Nagamangala and Pandavapura taluks the rural sanitation is very poor. Thus it is necessary to expedite the implementation of rural sanitation schemes in Mandya district. Only 14.31% of the households were having toilets in 2001, the percentage went up to 37.47% by 2011. The decadal growth rate in toilets in Mandya district was 198.83% during 2001-2011. Although, this is an encouraging achievement, there is urgent need for 100% achievement. The toilet construction scheme needs further attention especially in taluks like Krishnarajpet, Nagamangala, Pandavapura and Malavalli in Mandya district.
Fig. 7.7: Percentage of Households having access to latrine facility within the premises during
2001 & 2011
7.12. Small Area Study
Title: Construction and the Use of Rural Toilets – A study in Manikyanahalli GP of Pandavapura TalukManikyanahalli GP in Pandavapura taluk of Mandya district was selected for an empirical study. This study had two purposes, viz., (a) to analyse the individual household’s preferences and opinions about building toilets within their houses in villages; and (b) to study the involvement of elected GP representatives and NGO’s in the implementation of rural sanitation scheme.
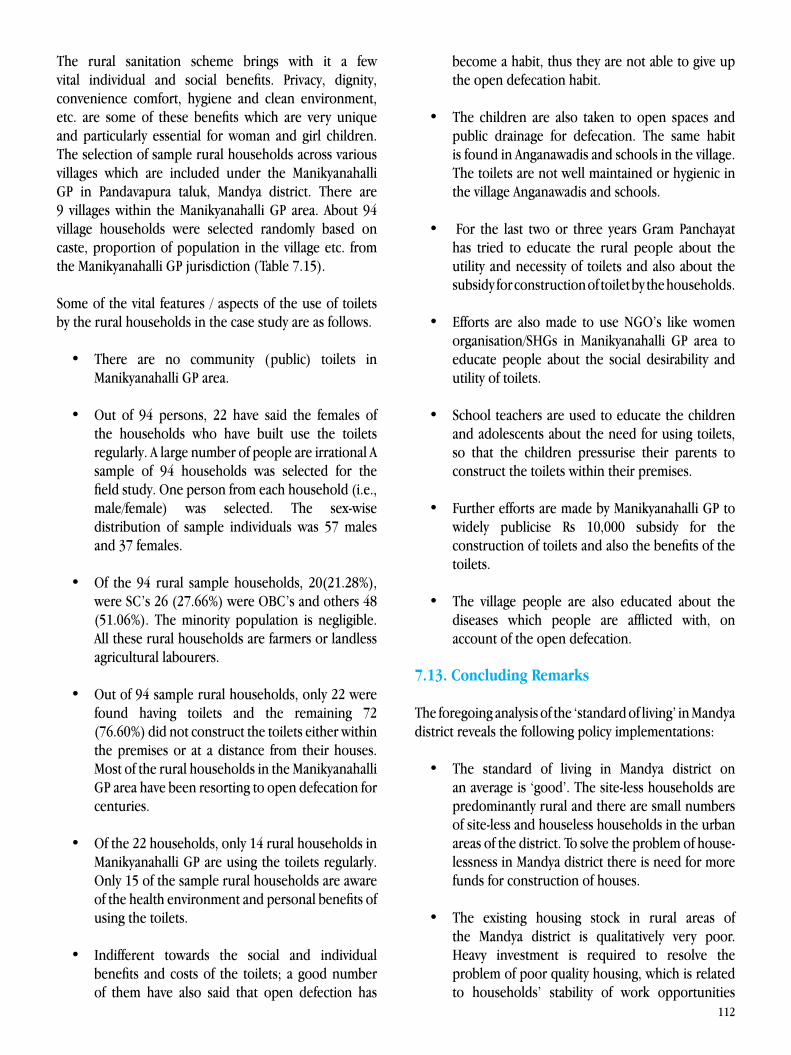
112
The rural sanitation scheme brings with it a few vital individual and social benefits. Privacy, dignity, convenience comfort, hygiene and clean environment, etc. are some of these benefits which are very unique and particularly essential for woman and girl children. The selection of sample rural households across various villages which are included under the Manikyanahalli GP in Pandavapura taluk, Mandya district. There are 9 villages within the Manikyanahalli GP area. About 94 village households were selected randomly based on caste, proportion of population in the village etc. from the Manikyanahalli GP jurisdiction (Table 7.15).
Some of the vital features / aspects of the use of toilets by the rural households in the case study are as follows.
• There are no community (public) toilets in Manikyanahalli GP area.
• Out of 94 persons, 22 have said the females of the households who have built use the toilets regularly. A large number of people are irrational A sample of 94 households was selected for the field study. One person from each household (i.e., male/female) was selected. The sex-wise distribution of sample individuals was 57 males and 37 females.
• Of the 94 rural sample households, 20(21.28%), were SC’s 26 (27.66%) were OBC’s and others 48 (51.06%). The minority population is negligible. All these rural households are farmers or landless agricultural labourers.
• Out of 94 sample rural households, only 22 were found having toilets and the remaining 72 (76.60%) did not construct the toilets either within the premises or at a distance from their houses. Most of the rural households in the Manikyanahalli GP area have been resorting to open defecation for centuries.
• Of the 22 households, only 14 rural households in Manikyanahalli GP are using the toilets regularly. Only 15 of the sample rural households are aware of the health environment and personal benefits of using the toilets.
• Indifferent towards the social and individual benefits and costs of the toilets; a good number of them have also said that open defection has
become a habit, thus they are not able to give up the open defecation habit.
• The children are also taken to open spaces and public drainage for defecation. The same habit is found in Anganawadis and schools in the village. The toilets are not well maintained or hygienic in the village Anganawadis and schools.
• For the last two or three years Gram Panchayat has tried to educate the rural people about the utility and necessity of toilets and also about the subsidy for construction of toilet by the households.
• Efforts are also made to use NGO’s like women organisation/SHGs in Manikyanahalli GP area to educate people about the social desirability and utility of toilets.
• School teachers are used to educate the children and adolescents about the need for using toilets, so that the children pressurise their parents to construct the toilets within their premises.
• Further efforts are made by Manikyanahalli GP to widely publicise Rs 10,000 subsidy for the construction of toilets and also the benefits of the toilets.
• The village people are also educated about the diseases which people are afflicted with, on account of the open defecation.
7.13. Concluding Remarks
The foregoing analysis of the ‘standard of living’ in Mandya district reveals the following policy implementations:
• The standard of living in Mandya district on an average is ‘good’. The site-less households are predominantly rural and there are small numbers of site-less and houseless households in the urban areas of the district. To solve the problem of house- lessness in Mandya district there is need for more funds for construction of houses.
• The existing housing stock in rural areas of the Mandya district is qualitatively very poor. Heavy investment is required to resolve the problem of poor quality housing, which is related to households’ stability of work opportunities
113
and income. Thus there is need for searching for ways and means to promote and expand the rate of economic growth in Mandya district.
• The housing conditions in Krishnarajpet, Pandavapura, Malavalli and Nagamangala taluks are rather poor. These are backward taluks of the Mandya district. Therefore more funds need to be allocated for Government sponsored subsidised housing schemes in Mandya district.
• There are certain complex and critical challenges for ZP’s and GP’s in Mandya. One such major problem is convincing and motivating rural people to accept the sanitation scheme. The people of Mandya district fail to appreciate social and individual benefits of constructing toilets within their premises. A mass campaign about the benefits of the toilets is essential. The services and advice from the heads of the religions mutts may also be availed. This would be more effective in popularising the rural sanitation scheme.
• In Mandya district more than 93% of the households have access to drinking water supply and domestic electrification. The only problem is frequent power-cuts. This problem has to be solved early.
• Indira Awas Yojana, Rural Ambedkar Housing scheme and Basava Vasathi Yojana are implemented in Karnataka including the Mandya district. Of these three housing schemes, the IAY and Basava Vasathi Scheme are large-scale housing/ shelter programmes. The IAY is centrally sponsored scheme which is the more systematically implemented. But Rural Ambedkar Housing Scheme meant for SC’s and ST’s needs to be made more effective.
• The allotment of dwelling units under various housing schemes for ST’s, SC’s and minorities is inadequate in Mandya district. In fact the housing needs of these poor groups have not been adequately met by the district administration/ZP in Mandya.

114
115
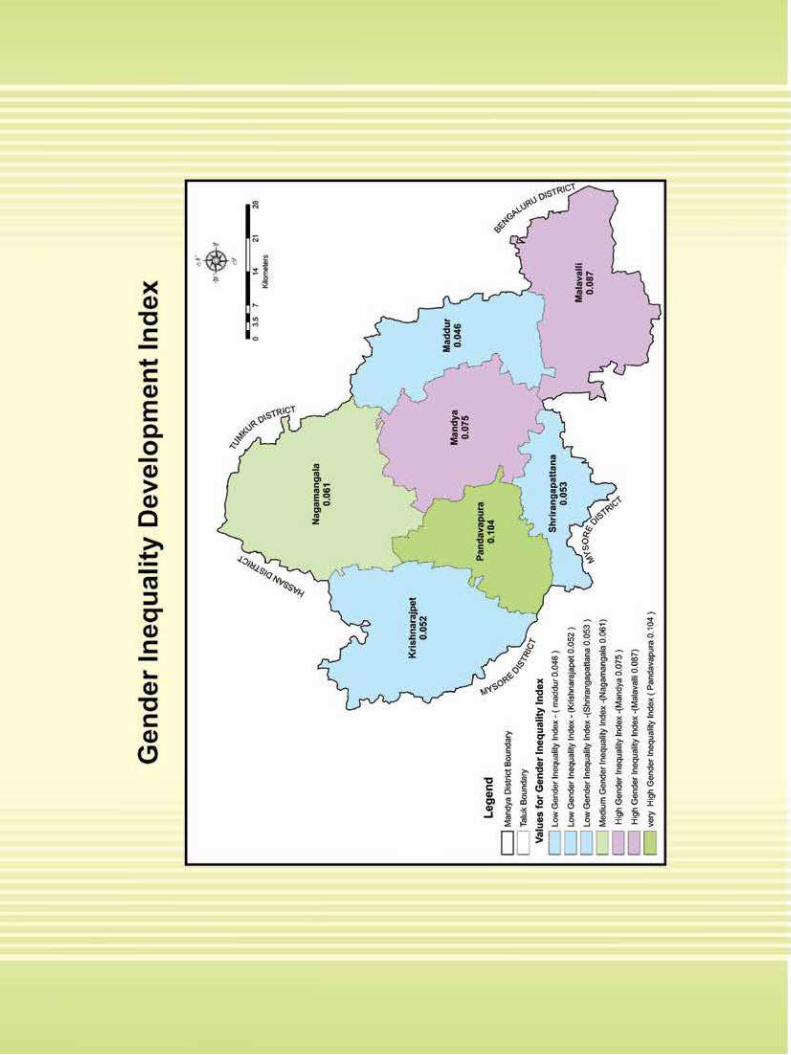
116
117
8.1. Introduction
“Development if not Engendered is Endangered” says the Human Development Report (1995).
CHAPTER 8
GENDER AND HUMAN DEVELOPMENT
Triggered by the phenomenal increase in the attention to gender disparities in development, in recent years there has been a significant change in the approach to human development in general and gender development in particular. The declaration of the International Decade for Women (1975 to 1985) signified the new visibility of Women in Development (WID) in international forums. WID approach is rooted in modernisation theory and liberal feminist ideas of equality. WID approach is based on the fact that women’s contribution to development is not recognised by the policy makers and women are treated as beneficiaries of development, not as the active agents of development. WID approach calls for gender attention to women in development policy and practice
and emphasises the need to integrate them into the development process. It was a reaction to women being seen as passive beneficiaries of development.
Contrary to this WID assertion, Women and Development (WAD) notion is rooted in the dependency theory and advocated no real policy change about involving women in the development process. WAD assumes that women are already integrated in development process and it also demanded affirmative action by the state since laissez fair worsened the already existing inequalities. The proponents of WAD approach are mainly activists and theorists who saw the limitations of WID and argued that women would never get their equal share of development unless patriarchy and global inequality problems are addressed.
Similarly the emerging approach, that is Gender and Development (GAD), is a way of determining how best to structure development projects and programs based on an analysis of gender relationships. It was developed in the 80s as an alternative to the women in development approach that was common until then. Unlike WID, GAD approach is not concerned specifically with woman, but with the way in which a society assigns roles and responsibilities and expectations to both women and men. GAD applies gender analysis to uncover the way in which men and women work together. GAD emerged from a frustration with the lack of progress of WID policy in changing women’s lives. It also does not consider women as a uniform group. It maintains that women should be seen in the context of socio- economic,
There is considerable evidence thatWomen’s education and literacy
tend to reducethe mortality rates of children
-Amartya SenDevelopment as Freedom, 2000, pg. 195
118
racial and other factors that shape a particular society. It is in this background that gender mainstreaming in development, gender budget and gender auditing has emerged as the most feasible approaches for ensuring gender-sensitised development. Gender bias affects not only women’s access to and control over resources, her active and productive participation in society and her ability to exercise her rights but also reduces the tempo of economic development. The gender differentials and gender gaps would distort the development process and would also denote under utilisation of the most potential human factor of production. Gender concerns and issues, therefore need to be mainstreamed in the human development approach and through policy interventions.
It is in this background that UNDP has made GDI and GEM as permanent features of its annual reports on Human Development Since 1995. Further in 2010 Gender Inequalities Index was introduced based on reproductive health (MMR and adolescent fertility), empowerment (parliamentary seats and high educational attainments) and labour market participation (women in work force).
Gender related Development Index refers to a distribution-sensitive measure that accounts for human development impact of the existing gender gaps in three components of Human development namely – longevity, literacy and level of income. It is a gender sensitive extension of HDI and, on its own, is not an independent measure of gender gap.
Gender Empowerment Measure (GEM) is the United Nations Development Programme’s (UNDP) attempt to measure the extent of gender inequality across the globe’s countries, based on estimates of women’s relative economic income, participations in high-paying positions with economic power, and access to professional and parliamentary positions. It is designed to measure whether both men and women are able to actively participate in economic and political life and take part in decision making. It is logically agency focused, that is, what people are actually able to do. The Gender Empowerment Index for Mandya district is 0.560 and Malavalli taluk ranks first in GEM, followed by Shrirangapattana and Maddur. Mandya taluk stands least among 7 taluks of Mandya district.
Gender Inequality Index (GII)/ Gender Gap – it is a new index to measure gender disparity discussed in 2010 Human Development Report in its 20th anniversary edition. According to UNDP, GII is the composite measure
which captures the loss of achievement within a country due to gender inequality and uses three dimensions mentioned earlier.
Recognising its importance at the smaller regional level, the Karnataka HDRs in 1999 and 2005 have made an attempt to constitute gender development indices at the district and at taluk levels. The focus is on highlighting the status of gender development and also to showcase the gender differentials across the taluks to understand the grass-root realities and formulate micro policies to ensure gender equality. The GII for Mandya district is (0.070) within the district, Maddur taluk has the highest gender inequality followed by Krishnarajpet & Shrirangapattana respectively.
Mandya district comprising of seven taluks has a HDI score of 0.663 & Shrirangapattana taluk stands first in HDI, followed by Mandya & Maddur respectively. The least HDI taluk is Krishnarajpet in the district.
8.1.1. Demographic Features of Women Population
The distribution of female and male population by taluks reveals the sex ratio and the gap in the gender composition of the population across the district. According to 2011 Census, at the district level the sex ratio is 995 which is higher than the state and national average of 973 and 943 respectively. Nagamangala taluk with 1006 females per male stands highest in sex ratio and Malavalli taluk with 985 females per 1000 males stands lowest in the district as per Table 8.1 and Fig. 8.1. The variations among the taluks are quite discernible from the table. However, it needs to be noted that the sex ratio across the taluks are higher than the sex ratio at the State level. In comparison with the Census 2001 sex ratio has seen an improvement; however at individual taluk levels ups and downs are evident from the Table 8.1 and Fig.8.1.
Fig. 8.1: Taluk-wise Sex ratio in Mandya District
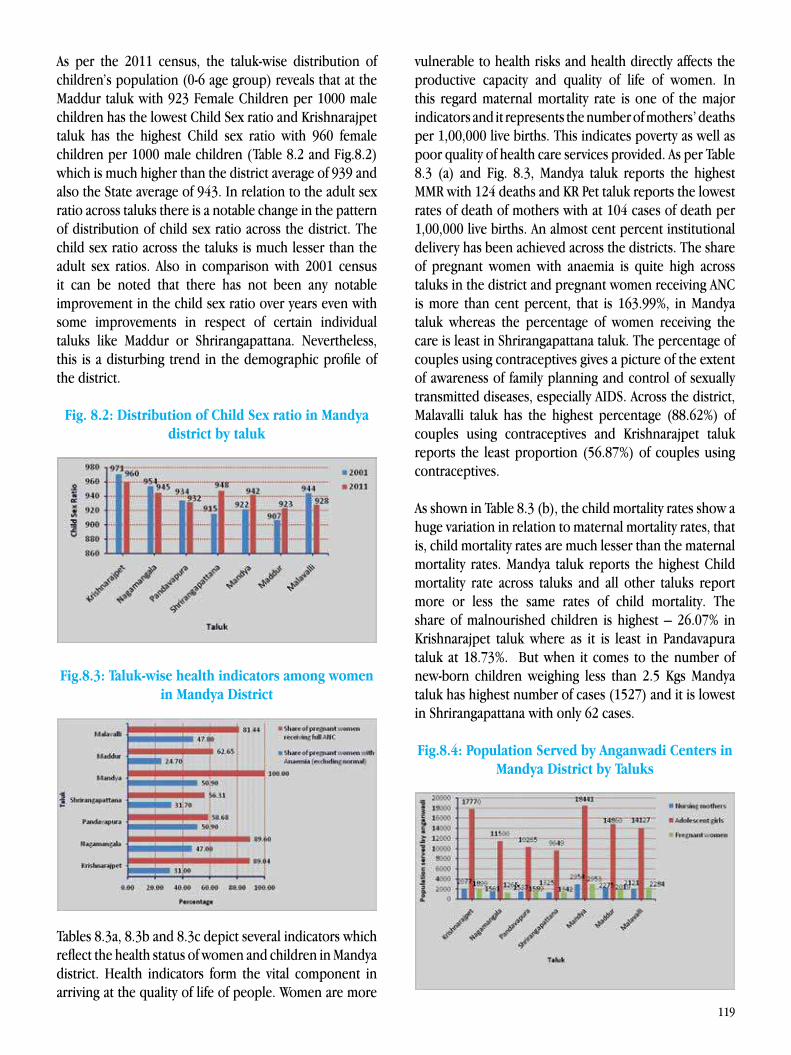
119
As per the 2011 census, the taluk-wise distribution of children’s population (0-6 age group) reveals that at the Maddur taluk with 923 Female Children per 1000 male children has the lowest Child Sex ratio and Krishnarajpet taluk has the highest Child sex ratio with 960 female children per 1000 male children (Table 8.2 and Fig.8.2) which is much higher than the district average of 939 and also the State average of 943. In relation to the adult sex ratio across taluks there is a notable change in the pattern of distribution of child sex ratio across the district. The child sex ratio across the taluks is much lesser than the adult sex ratios. Also in comparison with 2001 census it can be noted that there has not been any notable improvement in the child sex ratio over years even with some improvements in respect of certain individual taluks like Maddur or Shrirangapattana. Nevertheless, this is a disturbing trend in the demographic profile of the district.
Fig. 8.2: Distribution of Child Sex ratio in Mandya district by taluk
Fig.8.3: Taluk-wise health indicators among women in Mandya District
Tables 8.3a, 8.3b and 8.3c depict several indicators which reflect the health status of women and children in Mandya district. Health indicators form the vital component in arriving at the quality of life of people. Women are more
vulnerable to health risks and health directly affects the productive capacity and quality of life of women. In this regard maternal mortality rate is one of the major indicators and it represents the number of mothers’ deaths per 1,00,000 live births. This indicates poverty as well as poor quality of health care services provided. As per Table 8.3 (a) and Fig. 8.3, Mandya taluk reports the highest MMR with 124 deaths and KR Pet taluk reports the lowest rates of death of mothers with at 104 cases of death per 1,00,000 live births. An almost cent percent institutional delivery has been achieved across the districts. The share of pregnant women with anaemia is quite high across taluks in the district and pregnant women receiving ANC is more than cent percent, that is 163.99%, in Mandya taluk whereas the percentage of women receiving the care is least in Shrirangapattana taluk. The percentage of couples using contraceptives gives a picture of the extent of awareness of family planning and control of sexually transmitted diseases, especially AIDS. Across the district, Malavalli taluk has the highest percentage (88.62%) of couples using contraceptives and Krishnarajpet taluk reports the least proportion (56.87%) of couples using contraceptives.
As shown in Table 8.3 (b), the child mortality rates show a huge variation in relation to maternal mortality rates, that is, child mortality rates are much lesser than the maternal mortality rates. Mandya taluk reports the highest Child mortality rate across taluks and all other taluks report more or less the same rates of child mortality. The share of malnourished children is highest – 26.07% in Krishnarajpet taluk where as it is least in Pandavapura taluk at 18.73%. But when it comes to the number of new-born children weighing less than 2.5 Kgs Mandya taluk has highest number of cases (1527) and it is lowest in Shrirangapattana with only 62 cases.
Fig.8.4: Population Served by Anganwadi Centers in Mandya District by Taluks
120
Anganwadi centres play a crucial role in the life of rural women and children; in fact they serve as a via media to ensure that all the State-sponsored schemes for women are rightfully delivered if not all the vast majority of schemes. Popularly known as Asha workers, they serve the rural women. In Mandya district the details of population served by these Asha workers are depicted in Table 8.3(c) and Fig.8.4. Mandya taluk receives the highest number of services from these workers for all the groups, be it for nursing mothers or for adolescent girls or for pregnant women. Whereas the number of nursing mothers and adolescent girls was being served by Asha workers is lowest in Shrirangapattana taluks. The number of pregnant women population receiving the service of Asha workers in Nagamangala taluk is lowest in relation to other taluks in the district.8.2. Gender Differentials in the District
8.2.1. Sex and Gender
Sex is biological and gender is cultural. Although quite often sex and gender are used interchangeably they are two different concepts for gender economists and feminists. ‘sex’ refers to the biological make up of an individual’s productive anatomy which is natural, ‘gender’ refers to the social and cultural roles assigned to women by the society.
According to WHO “Sex” refers to the biological and psychological change that defines men and women. Similarly gender refers to the socially constructed roles,
behaviors and attributes that a given society considers appropriate for men and women and that masculine and feminine are gender categories.
Gender issues focus on women and on the relationship between men and women, their roles, access to control over resources, division of labour, interests and needs. Gender relations affect household security, family and well being, planning of production and many other aspects of life. Gender differences are social constructs, inculcated on the basis of a specific society’s particular perceptions of the physical differences and the assumed tastes, tendencies and capabilities of men and women. Gender differences, unlike the immutable characteristics of sex, are universally conceded in historical and comparative social analyses to be variants that are transformed over time and from one culture to the next, as societies change and evolve. Gender relations are accordingly defined as the specific mechanisms whereby different cultures determine the functions and responsibilities of each sex. They also determine the access to material resources, such as land, credit and training, and more ephemeral resources, such as power. The implications for everyday life are many, and include division of labour, responsibilities of family members inside and outside the home, education and opportunities for professional advancement and a voice in policy-making. So the various fields or areas of life where Gender differentials are quite visible are discussed in the subsequent separate sections in the chapter.
8.3. Patterns of Literacy and Enrollment
Literacy rate is one of the important indicators of human development. The female literacy rate across taluks of the Mandya district as per census 2011 provides a dismal picture in this regard (Table 8.4). All the taluks except for Mandya with 68.08% and Shrirangapattana with 66.13% percent stand lesser than the State average of 66.1%. Pandavapura taluk reports the lowest rates of female literacy at 58.93%. Female literacy levels in relation to the male literacy levels are much lesser and the actual difference in terms of absolute numbers may be even more steep. However in relation to 2001 census there has been a significant increase in literacy levels of both female and male population.
121
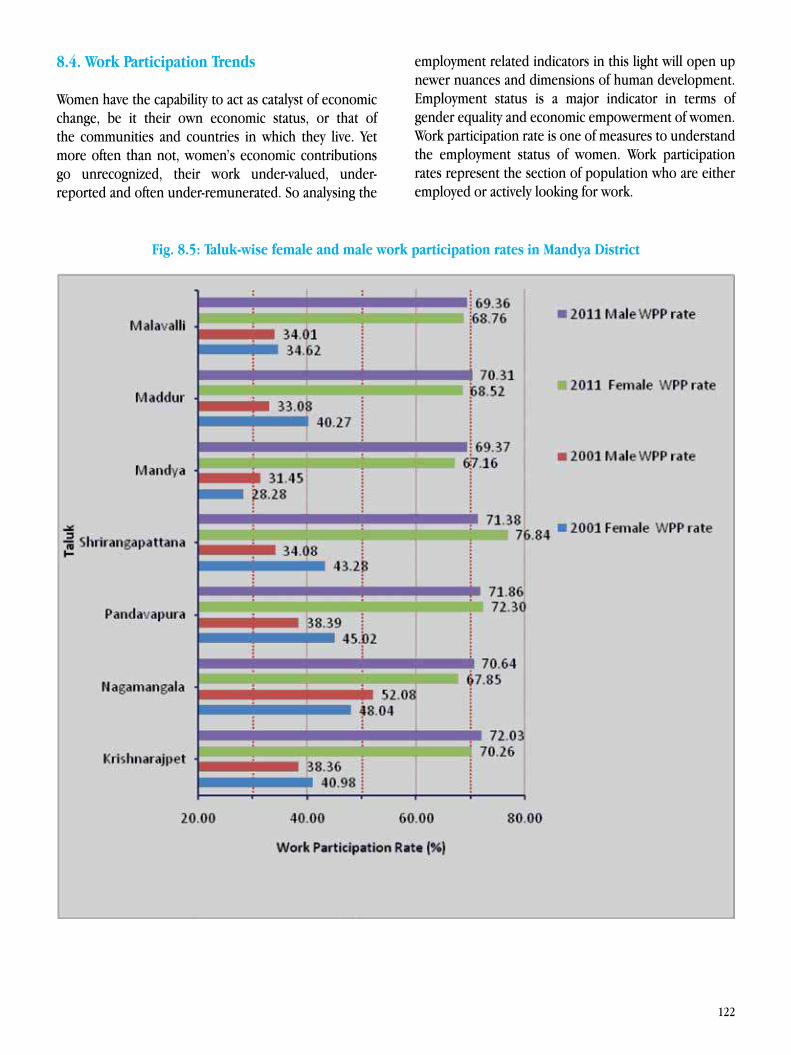
122
8.4. Work Participation Trends
Women have the capability to act as catalyst of economic change, be it their own economic status, or that of the communities and countries in which they live. Yet more often than not, women’s economic contributions go unrecognized, their work under-valued, under-reported and often under-remunerated. So analysing the
employment related indicators in this light will open up newer nuances and dimensions of human development. Employment status is a major indicator in terms of gender equality and economic empowerment of women. Work participation rate is one of measures to understand the employment status of women. Work participation rates represent the section of population who are either employed or actively looking for work.
Fig. 8.5: Taluk-wise female and male work participation rates in Mandya District
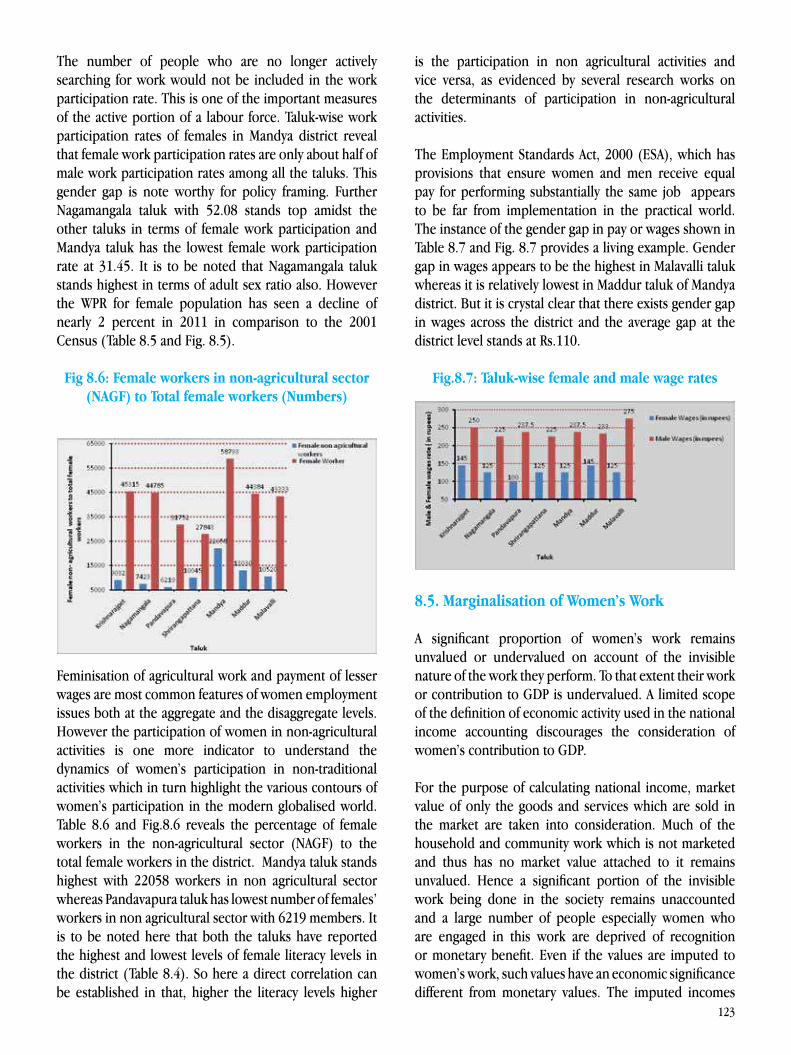
123
The number of people who are no longer actively searching for work would not be included in the work participation rate. This is one of the important measures of the active portion of a labour force. Taluk-wise work participation rates of females in Mandya district reveal that female work participation rates are only about half of male work participation rates among all the taluks. This gender gap is note worthy for policy framing. Further Nagamangala taluk with 52.08 stands top amidst the other taluks in terms of female work participation and Mandya taluk has the lowest female work participation rate at 31.45. It is to be noted that Nagamangala taluk stands highest in terms of adult sex ratio also. However the WPR for female population has seen a decline of nearly 2 percent in 2011 in comparison to the 2001 Census (Table 8.5 and Fig. 8.5).
Fig 8.6: Female workers in non-agricultural sector (NAGF) to Total female workers (Numbers)
Feminisation of agricultural work and payment of lesser wages are most common features of women employment issues both at the aggregate and the disaggregate levels. However the participation of women in non-agricultural activities is one more indicator to understand the dynamics of women’s participation in non-traditional activities which in turn highlight the various contours of women’s participation in the modern globalised world. Table 8.6 and Fig.8.6 reveals the percentage of female workers in the non-agricultural sector (NAGF) to the total female workers in the district. Mandya taluk stands highest with 22058 workers in non agricultural sector whereas Pandavapura taluk has lowest number of females’ workers in non agricultural sector with 6219 members. It is to be noted here that both the taluks have reported the highest and lowest levels of female literacy levels in the district (Table 8.4). So here a direct correlation can be established in that, higher the literacy levels higher
is the participation in non agricultural activities and vice versa, as evidenced by several research works on the determinants of participation in non-agricultural activities.
The Employment Standards Act, 2000 (ESA), which has provisions that ensure women and men receive equal pay for performing substantially the same job appears to be far from implementation in the practical world. The instance of the gender gap in pay or wages shown in Table 8.7 and Fig. 8.7 provides a living example. Gender gap in wages appears to be the highest in Malavalli taluk whereas it is relatively lowest in Maddur taluk of Mandya district. But it is crystal clear that there exists gender gap in wages across the district and the average gap at the district level stands at Rs.110.
Fig.8.7: Taluk-wise female and male wage rates
8.5. Marginalisation of Women’s Work
A significant proportion of women’s work remains unvalued or undervalued on account of the invisible nature of the work they perform. To that extent their work or contribution to GDP is undervalued. A limited scope of the definition of economic activity used in the national income accounting discourages the consideration of women’s contribution to GDP.
For the purpose of calculating national income, market value of only the goods and services which are sold in the market are taken into consideration. Much of the household and community work which is not marketed and thus has no market value attached to it remains unvalued. Hence a significant portion of the invisible work being done in the society remains unaccounted and a large number of people especially women who are engaged in this work are deprived of recognition or monetary benefit. Even if the values are imputed to women’s work, such values have an economic significance different from monetary values. The imputed incomes
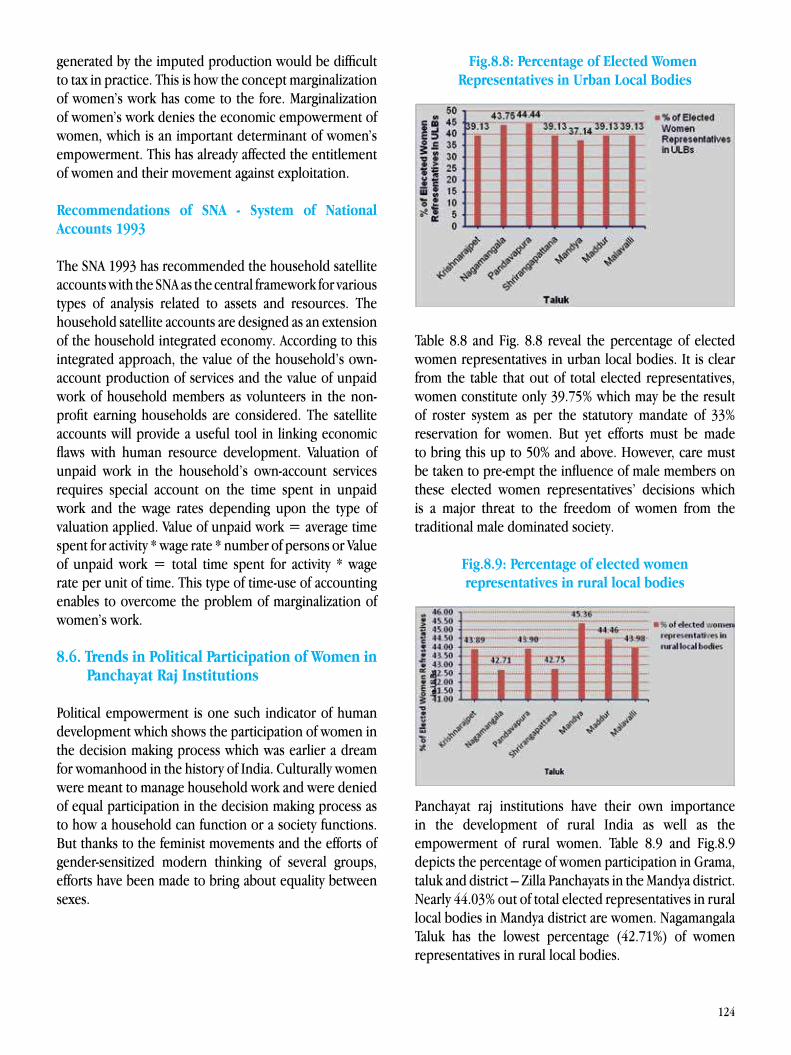
124
generated by the imputed production would be difficult to tax in practice. This is how the concept marginalization of women’s work has come to the fore. Marginalization of women’s work denies the economic empowerment of women, which is an important determinant of women’s empowerment. This has already affected the entitlement of women and their movement against exploitation.
Recommendations of SNA - System of National Accounts 1993
The SNA 1993 has recommended the household satellite accounts with the SNA as the central framework for various types of analysis related to assets and resources. The household satellite accounts are designed as an extension of the household integrated economy. According to this integrated approach, the value of the household’s own-account production of services and the value of unpaid work of household members as volunteers in the non-profit earning households are considered. The satellite accounts will provide a useful tool in linking economic flaws with human resource development. Valuation of unpaid work in the household’s own-account services requires special account on the time spent in unpaid work and the wage rates depending upon the type of valuation applied. Value of unpaid work = average time spent for activity * wage rate * number of persons or Value of unpaid work = total time spent for activity * wage rate per unit of time. This type of time-use of accounting enables to overcome the problem of marginalization of women’s work.
8.6. Trends in Political Participation of Women in Panchayat Raj Institutions
Political empowerment is one such indicator of human development which shows the participation of women in the decision making process which was earlier a dream for womanhood in the history of India. Culturally women were meant to manage household work and were denied of equal participation in the decision making process as to how a household can function or a society functions. But thanks to the feminist movements and the efforts of gender-sensitized modern thinking of several groups, efforts have been made to bring about equality between sexes.
Fig.8.8: Percentage of Elected Women Representatives in Urban Local Bodies
Table 8.8 and Fig. 8.8 reveal the percentage of elected women representatives in urban local bodies. It is clear from the table that out of total elected representatives, women constitute only 39.75% which may be the result of roster system as per the statutory mandate of 33% reservation for women. But yet efforts must be made to bring this up to 50% and above. However, care must be taken to pre-empt the influence of male members on these elected women representatives’ decisions which is a major threat to the freedom of women from the traditional male dominated society.
Fig.8.9: Percentage of elected women representatives in rural local bodies
Panchayat raj institutions have their own importance in the development of rural India as well as the empowerment of rural women. Table 8.9 and Fig.8.9 depicts the percentage of women participation in Grama, taluk and district – Zilla Panchayats in the Mandya district. Nearly 44.03% out of total elected representatives in rural local bodies in Mandya district are women. Nagamangala Taluk has the lowest percentage (42.71%) of women representatives in rural local bodies.
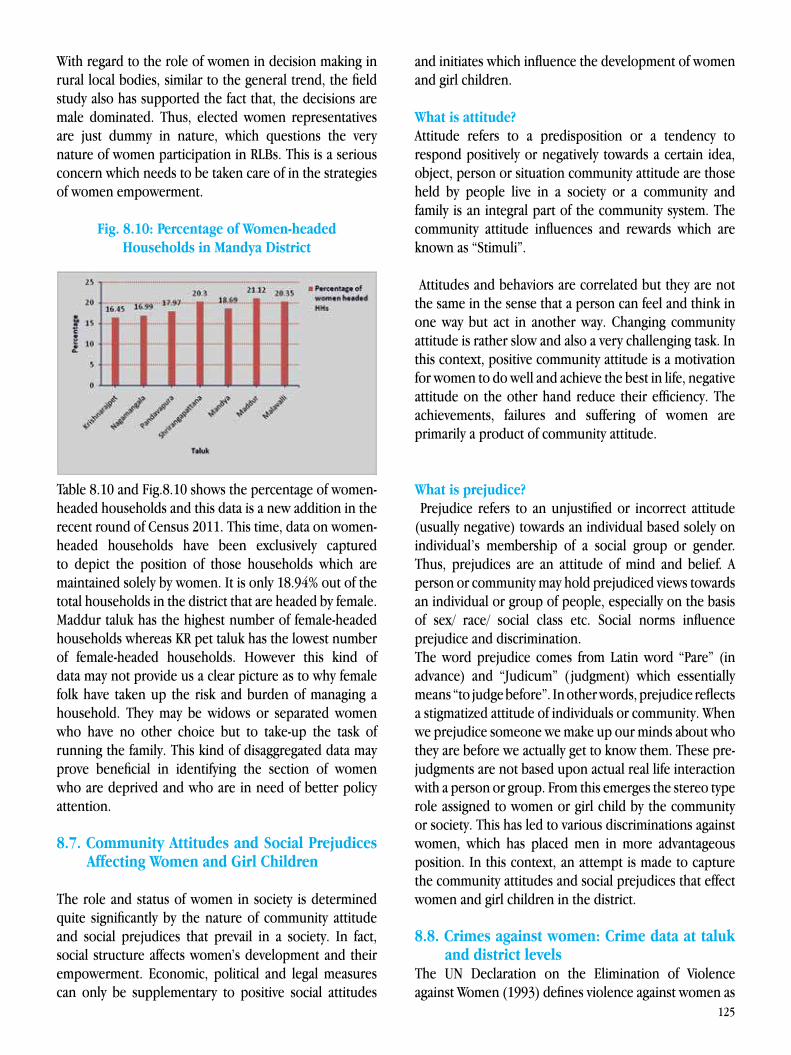
125
With regard to the role of women in decision making in rural local bodies, similar to the general trend, the field study also has supported the fact that, the decisions are male dominated. Thus, elected women representatives are just dummy in nature, which questions the very nature of women participation in RLBs. This is a serious concern which needs to be taken care of in the strategies of women empowerment.
Fig. 8.10: Percentage of Women-headed Households in Mandya District
Table 8.10 and Fig.8.10 shows the percentage of women-headed households and this data is a new addition in the recent round of Census 2011. This time, data on women-headed households have been exclusively captured to depict the position of those households which are maintained solely by women. It is only 18.94% out of the total households in the district that are headed by female. Maddur taluk has the highest number of female-headed households whereas KR pet taluk has the lowest number of female-headed households. However this kind of data may not provide us a clear picture as to why female folk have taken up the risk and burden of managing a household. They may be widows or separated women who have no other choice but to take-up the task of running the family. This kind of disaggregated data may prove beneficial in identifying the section of women who are deprived and who are in need of better policy attention.
8.7. Community Attitudes and Social Prejudices Affecting Women and Girl Children
The role and status of women in society is determined quite significantly by the nature of community attitude and social prejudices that prevail in a society. In fact, social structure affects women’s development and their empowerment. Economic, political and legal measures can only be supplementary to positive social attitudes
and initiates which influence the development of women and girl children.
What is attitude? Attitude refers to a predisposition or a tendency to respond positively or negatively towards a certain idea, object, person or situation community attitude are those held by people live in a society or a community and family is an integral part of the community system. The community attitude influences and rewards which are known as “Stimuli”.
Attitudes and behaviors are correlated but they are not the same in the sense that a person can feel and think in one way but act in another way. Changing community attitude is rather slow and also a very challenging task. In this context, positive community attitude is a motivation for women to do well and achieve the best in life, negative attitude on the other hand reduce their efficiency. The achievements, failures and suffering of women are primarily a product of community attitude.
What is prejudice? Prejudice refers to an unjustified or incorrect attitude (usually negative) towards an individual based solely on individual’s membership of a social group or gender. Thus, prejudices are an attitude of mind and belief. A person or community may hold prejudiced views towards an individual or group of people, especially on the basis of sex/ race/ social class etc. Social norms influence prejudice and discrimination.The word prejudice comes from Latin word “Pare” (in advance) and “Judicum” ( judgment) which essentially means “to judge before”. In other words, prejudice reflects a stigmatized attitude of individuals or community. When we prejudice someone we make up our minds about who they are before we actually get to know them. These pre-judgments are not based upon actual real life interaction with a person or group. From this emerges the stereo type role assigned to women or girl child by the community or society. This has led to various discriminations against women, which has placed men in more advantageous position. In this context, an attempt is made to capture the community attitudes and social prejudices that effect women and girl children in the district.
8.8. Crimes against women: Crime data at taluk and district levelsThe UN Declaration on the Elimination of Violence against Women (1993) defines violence against women as
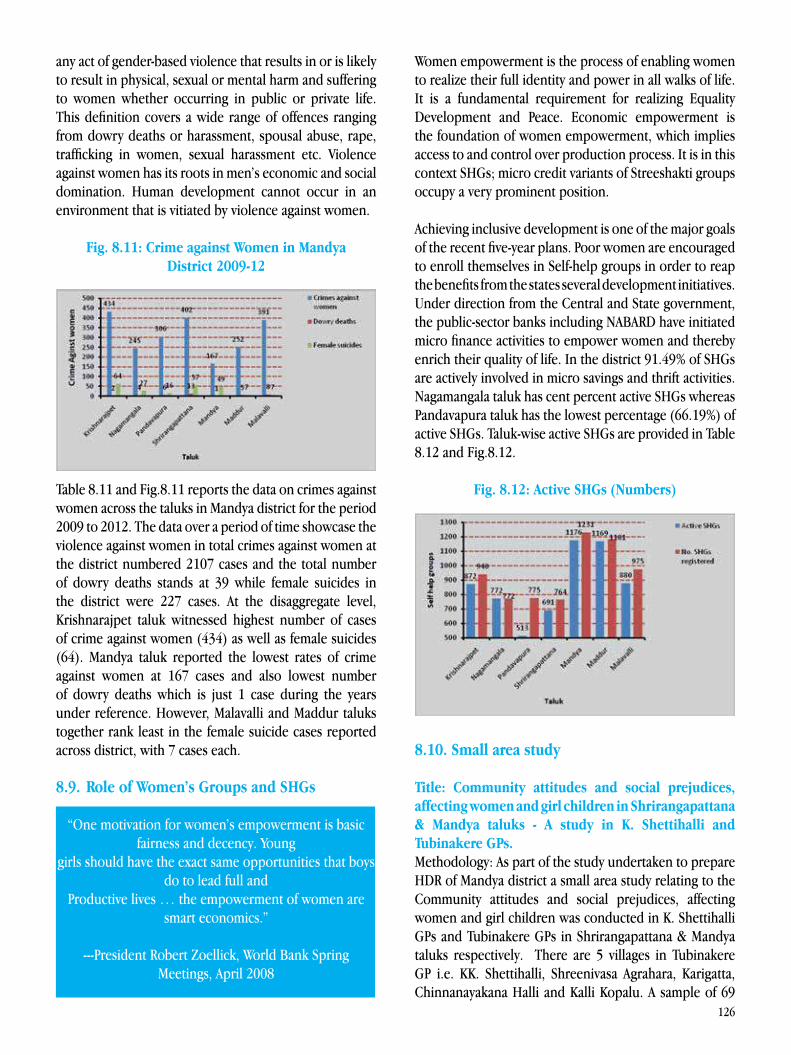
126
any act of gender-based violence that results in or is likely to result in physical, sexual or mental harm and suffering to women whether occurring in public or private life. This definition covers a wide range of offences ranging from dowry deaths or harassment, spousal abuse, rape, trafficking in women, sexual harassment etc. Violence against women has its roots in men’s economic and social domination. Human development cannot occur in an environment that is vitiated by violence against women.
Fig. 8.11: Crime against Women in Mandya District 2009-12
Table 8.11 and Fig.8.11 reports the data on crimes against women across the taluks in Mandya district for the period 2009 to 2012. The data over a period of time showcase the violence against women in total crimes against women at the district numbered 2107 cases and the total number of dowry deaths stands at 39 while female suicides in the district were 227 cases. At the disaggregate level, Krishnarajpet taluk witnessed highest number of cases of crime against women (434) as well as female suicides (64). Mandya taluk reported the lowest rates of crime against women at 167 cases and also lowest number of dowry deaths which is just 1 case during the years under reference. However, Malavalli and Maddur taluks together rank least in the female suicide cases reported across district, with 7 cases each.
8.9. Role of Women’s Groups and SHGs
“One motivation for women’s empowerment is basic fairness and decency. Young
girls should have the exact same opportunities that boys do to lead full and
Productive lives … the empowerment of women are smart economics.”
---President Robert Zoellick, World Bank Spring Meetings, April 2008
Women empowerment is the process of enabling women to realize their full identity and power in all walks of life. It is a fundamental requirement for realizing Equality Development and Peace. Economic empowerment is the foundation of women empowerment, which implies access to and control over production process. It is in this context SHGs; micro credit variants of Streeshakti groups occupy a very prominent position.
Achieving inclusive development is one of the major goals of the recent five-year plans. Poor women are encouraged to enroll themselves in Self-help groups in order to reap the benefits from the states several development initiatives. Under direction from the Central and State government, the public-sector banks including NABARD have initiated micro finance activities to empower women and thereby enrich their quality of life. In the district 91.49% of SHGs are actively involved in micro savings and thrift activities. Nagamangala taluk has cent percent active SHGs whereas Pandavapura taluk has the lowest percentage (66.19%) of active SHGs. Taluk-wise active SHGs are provided in Table 8.12 and Fig.8.12.
Fig. 8.12: Active SHGs (Numbers)
8.10. Small area study
Title: Community attitudes and social prejudices, affecting women and girl children in Shrirangapattana & Mandya taluks - A study in K. Shettihalli and Tubinakere GPs.Methodology: As part of the study undertaken to prepare HDR of Mandya district a small area study relating to the Community attitudes and social prejudices, affecting women and girl children was conducted in K. Shettihalli GPs and Tubinakere GPs in Shrirangapattana & Mandya taluks respectively. There are 5 villages in Tubinakere GP i.e. KK. Shettihalli, Shreenivasa Agrahara, Karigatta, Chinnanayakana Halli and Kalli Kopalu. A sample of 69
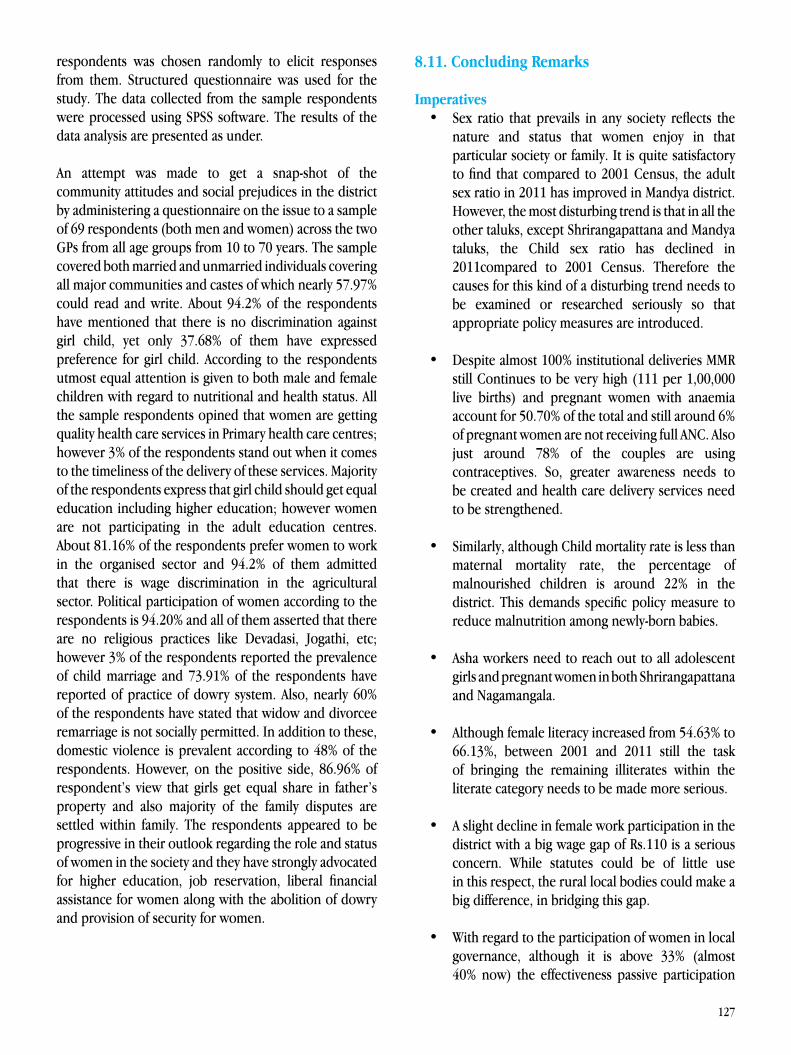
127
respondents was chosen randomly to elicit responses from them. Structured questionnaire was used for the study. The data collected from the sample respondents were processed using SPSS software. The results of the data analysis are presented as under.
An attempt was made to get a snap-shot of the community attitudes and social prejudices in the district by administering a questionnaire on the issue to a sample of 69 respondents (both men and women) across the two GPs from all age groups from 10 to 70 years. The sample covered both married and unmarried individuals covering all major communities and castes of which nearly 57.97% could read and write. About 94.2% of the respondents have mentioned that there is no discrimination against girl child, yet only 37.68% of them have expressed preference for girl child. According to the respondents utmost equal attention is given to both male and female children with regard to nutritional and health status. All the sample respondents opined that women are getting quality health care services in Primary health care centres; however 3% of the respondents stand out when it comes to the timeliness of the delivery of these services. Majority of the respondents express that girl child should get equal education including higher education; however women are not participating in the adult education centres. About 81.16% of the respondents prefer women to work in the organised sector and 94.2% of them admitted that there is wage discrimination in the agricultural sector. Political participation of women according to the respondents is 94.20% and all of them asserted that there are no religious practices like Devadasi, Jogathi, etc; however 3% of the respondents reported the prevalence of child marriage and 73.91% of the respondents have reported of practice of dowry system. Also, nearly 60% of the respondents have stated that widow and divorcee remarriage is not socially permitted. In addition to these, domestic violence is prevalent according to 48% of the respondents. However, on the positive side, 86.96% of respondent’s view that girls get equal share in father’s property and also majority of the family disputes are settled within family. The respondents appeared to be progressive in their outlook regarding the role and status of women in the society and they have strongly advocated for higher education, job reservation, liberal financial assistance for women along with the abolition of dowry and provision of security for women.
8.11. Concluding Remarks
Imperatives • Sex ratio that prevails in any society reflects the nature and status that women enjoy in that particular society or family. It is quite satisfactory to find that compared to 2001 Census, the adult sex ratio in 2011 has improved in Mandya district. However, the most disturbing trend is that in all the other taluks, except Shrirangapattana and Mandya taluks, the Child sex ratio has declined in 2011compared to 2001 Census. Therefore the causes for this kind of a disturbing trend needs to be examined or researched seriously so that appropriate policy measures are introduced.
• Despite almost 100% institutional deliveries MMR still Continues to be very high (111 per 1,00,000 live births) and pregnant women with anaemia account for 50.70% of the total and still around 6% of pregnant women are not receiving full ANC. Also just around 78% of the couples are using contraceptives. So, greater awareness needs to be created and health care delivery services need to be strengthened.
• Similarly, although Child mortality rate is less than maternal mortality rate, the percentage of malnourished children is around 22% in the district. This demands specific policy measure to reduce malnutrition among newly-born babies.
• Asha workers need to reach out to all adolescent girls and pregnant women in both Shrirangapattana and Nagamangala.
• Although female literacy increased from 54.63% to 66.13%, between 2001 and 2011 still the task of bringing the remaining illiterates within the literate category needs to be made more serious.
• A slight decline in female work participation in the district with a big wage gap of Rs.110 is a serious concern. While statutes could be of little use in this respect, the rural local bodies could make a big difference, in bridging this gap.
• With regard to the participation of women in local governance, although it is above 33% (almost 40% now) the effectiveness passive participation
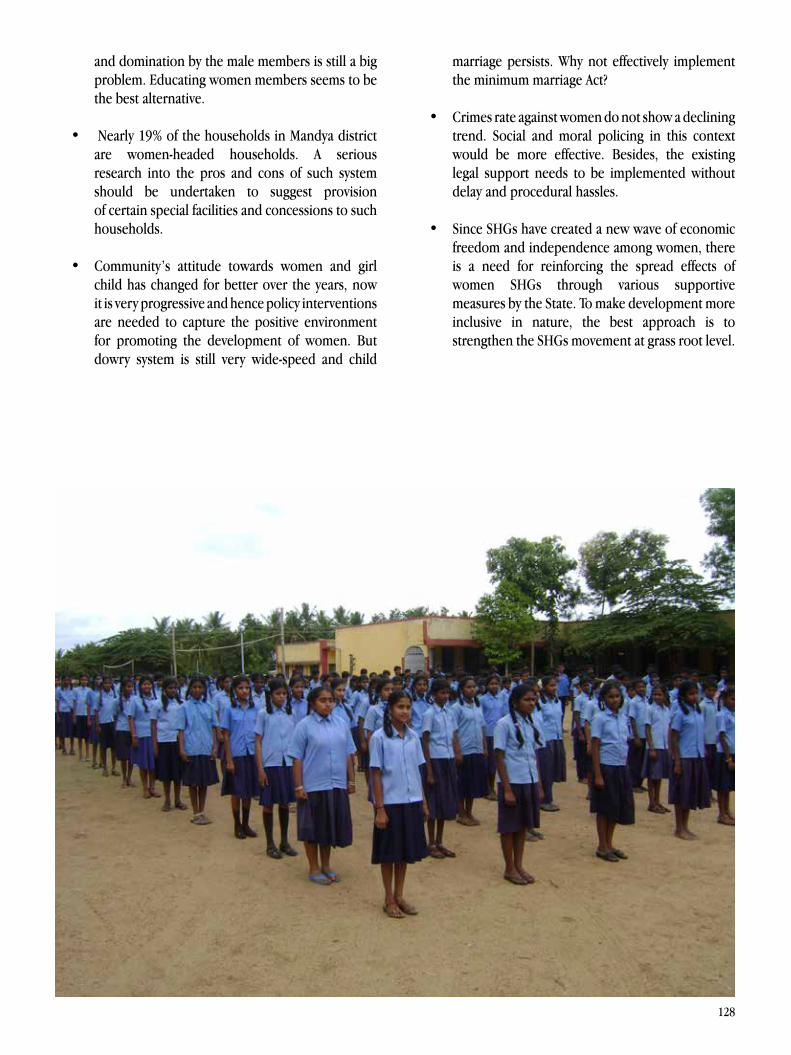
128
and domination by the male members is still a big problem. Educating women members seems to be the best alternative.
• Nearly 19% of the households in Mandya district are women-headed households. A serious research into the pros and cons of such system should be undertaken to suggest provision of certain special facilities and concessions to such households.
• Community’s attitude towards women and girl child has changed for better over the years, now it is very progressive and hence policy interventions are needed to capture the positive environment for promoting the development of women. But dowry system is still very wide-speed and child
marriage persists. Why not effectively implement the minimum marriage Act?
• Crimes rate against women do not show a declining trend. Social and moral policing in this context would be more effective. Besides, the existing legal support needs to be implemented without delay and procedural hassles.
• Since SHGs have created a new wave of economic freedom and independence among women, there is a need for reinforcing the spread effects of women SHGs through various supportive measures by the State. To make development more inclusive in nature, the best approach is to strengthen the SHGs movement at grass root level.
129

130
131
9.1. Introduction
The Scheduled Castes (SCs) and Scheduled Tribes (STs) socially marginalized groups in the society and they are looked at from the point of view of deprivation, oppression and suppression. SCs & STs are two groups of historically disadvantaged people recognised in the Constitution of India. Since the 1850s these communities were loosely referred to as Depressed Classes. These groups had traditionally been subjected to the most menial labour with no scope for upward mobility and subjected to extensive social disadvantages and exclusion, in comparison to the other communities. The scheduled castes were unable to participate in the community life of the Indian Society and they were thus deprived of any opportunity for integration with the rest of the society and corresponding opportunities for social and economic development.
In 1935, the British Rule passed the Government of India Act 1935, designed to give the Indian provinces greater self-rule and set up a federal structure for the country. Reservation of seats for the depressed classes was incorporated into the Act, which went into force in 1937. The Act brought the term “scheduled castes” into use, and defined the group as including “such castes, races or tribes or parts of groups within castes, races or tribes, which appeared to His Majesty in the Council to correspond to the classes of persons formerly known as the ‘depressed classes’, as His Majesty in the Council may prefer.” This, the vague definition was clarified in The Government of India (Scheduled Castes) Order, 1936 which contained a list, or schedule of castes, throughout the British provinces.
After Independence, the Constituent Assembly accepted the extant definition of Scheduled Castes and Tribes, and gave (via Articles 341, 342) the President and Governors the responsibility to compile a full listing of castes and tribes, and also the power to edit it later as required. The actual / complete listing of castes and tribes was made via two orders The Constitution (Scheduled Castes) Order, 1950, and The Constitution (Scheduled Tribes) Order, 1950 respectively. Since Independence, the SCs and STs are being given reservation in various fields.
CHAPTER 9
STATUS OF SCHEDULED CASTES AND SCHEDULED TRIBES
The Governments have taken initiatives to improve the conditions of SCs & STs such as protective measures required to enforce equality, preferential treatment in allotment of jobs and access to higher education as a means to accelerate the integration of the SCs and STs with the mainstream Society and also to provide resources and benefits to bridge the socio-economic gap between the SCs & STs and other communities.
The Schedule Caste Sub-plan (SCSP) of 1979 mandated a planning process for the social, economic and educational development of SC’s and improvement in their working and living conditions.
In India, the SC’s and ST’s together comprise over 24 per cent of India’s Population, with SCs over 16 per cent and ST over 8 per cent as per the 2001 Census; this proportion has remained fairly stable in the 2011 Census according to which SC and ST population constitutes 16.6 and 8.6 percent respectively. In view of the fact that the SC-ST Population forms comparatively large share of the total, the overall human development in the country or in a region/ state would depend upon the nature of development policies implemented for these marginalised sections. It is very important to throw focused light on the major components of human development in respect of these groups.
9.2. Demographic Profile of SCs and STs in Mandya District
According to the Census of India 2011, the total Population of Mandya district was 18.06 lakh, out of which 9.05 lakh were males and 9.0 lakh were females. In 2001, the total Population of Mandya district was 17.64 lakh out of which 8.88 were males and 8.75 females. Of the total population of 18.06 lakh in 2011, rural and urban Population was 14.97lakh (82.92%) and 3.08 lakh (17.08%), respectively. The percentage of female Population in the rural and urban areas was 49.83 per cent and 50.1 per cent, respectively.
Population of SCs and STsThe total SC population in Mandya district was 2, 26,626 in 1991 constituting 13.78 percent of the total population. Between 1991 and 2001, the SC population

132
was increased by 8.33 percent and 6.81 percent between 2001 and 2011. As per the 2011 census, the districts’ SC population was 2, 65,294 constituting 14.69 percent to the total population. The decadal growth of Population decreased by 1.52 percent between 2001 and 2011(Table 9.1).
In Mandya district, the total ST Population was 11,936 in 1991 constituting 0.73 percent of the total population of the district. The population has increased by 30.58 percent between 1991 and 2001 and it by 23.25 percent between 2001 and 2011. The total ST population was 22,402 in 2011 constituting 1.24 Percent of the total population of the district. The decadal growth rate between 2001 and 2011 was declined by 7.33 percent
Fig. 9.1: Taluk-wise Growth of SC and ST Population in the District 1991-2011
133
The SC-ST Population distribution in Mandya district varies from one taluk to another. Malavalli taluk had highest percentage of SC population in the district (23.42 percent) followed by Mandya taluk (22.38%), Maddur taluk (16.27%) and the least SC Population was recorded in Pandavapura taluk with 8.45 percent. The similar trend was revealed in 2001 and 2011 census.
In respect of ST Population in 1991, Krishnarajpet taluk was recorded highest percentage with 22.42 percent followed by Mandya (16.98%), Shrirangapattana (13.68%) and the least percentage was observed in Nagamangala with 8.38 percent. Krishnarajpet taluk showed the similar trend in 2001 and 2011, it had highest percentage (30.13 and 27.01%) of ST Population in the district. Mandya, Shrirangapattana also had second and third places in 2001 and 2011. In 2001, Maddur taluk has lowest share of Population whereas Malavalli taluk had 6.89 Percent of the total ST Population in the district in 2011. This small variation between the taluks may be attributed to continued migration from one taluk to another and also from one district to another for employment purpose.
In Mandya district, the SC-ST Population showed an increasing trend in the decadal growth from 1991 census to 2011 census.
The SC Population in Mandya district has increased from 2.47 lakh in 2001 to 2.65 lakh in 2011 presenting a decadal increase of 6.81 percent. The share of SC Population in the total Population in 1991 was 13.78 percent which has marginally increased to 14.02 percent in 2001 and to 14.69 percent in 2011.The taluk-wise percentage of SC Population in the district show that Malavalli taluk
had highest share of SC Population with 20.10 percent in 1991 followed by Shrirangapattana (14.26%), and Mandya (13.24%) taluks. The least percentage (10.72%) of Population was recorded in Nagamangala taluk. The similar distribution of Population was observed in the census years 2001 and 2011 also.
According to census 1991, the ST Population in Mandya district was 11,936 which increased to 17,193 in 2001 to 2,402 in 2011 with a decadal percentage growth of 23.25%. The share of ST Population in the total Population of the district was 0.73 percent in 1991 and increased to 0.97 percent and 1.24 percent in 2001 and 2011 censuses respectively. Regarding ratio of ST Population among Taluks to the total Population of the district, Shrirangapattana taluk had highest percentage ST Population with 1.23 percent followed by Krishnarajpet (1.21%), and Pandavapura (0.73%). The least percentage of Population of ST was recorded in Mandya taluk (0.53%). But, in 2001 census, Krishnarajpet recorded highest percentage of ST Population with 2.09 percent followed by Shrirangapattana (1.56%) and Pandavapura taluk with 1.04 percent. The least percent of ST population was in Maddur taluk with 0.51 percent. In 2011, Shrirangapattana had highest percentage of ST Population to the total Population with 2.41 percent followed by Krishnarajpet taluk with a value of 2.32 percent, Pandavapura (1.14%) and least percentage was in Malavalli taluk (0.54%).
The SC and ST Population in the district are more or less evenly distributed. The SC Population is a little higher in Malavalli taluk and ST Population a little higher in Krishnarajpet taluk.
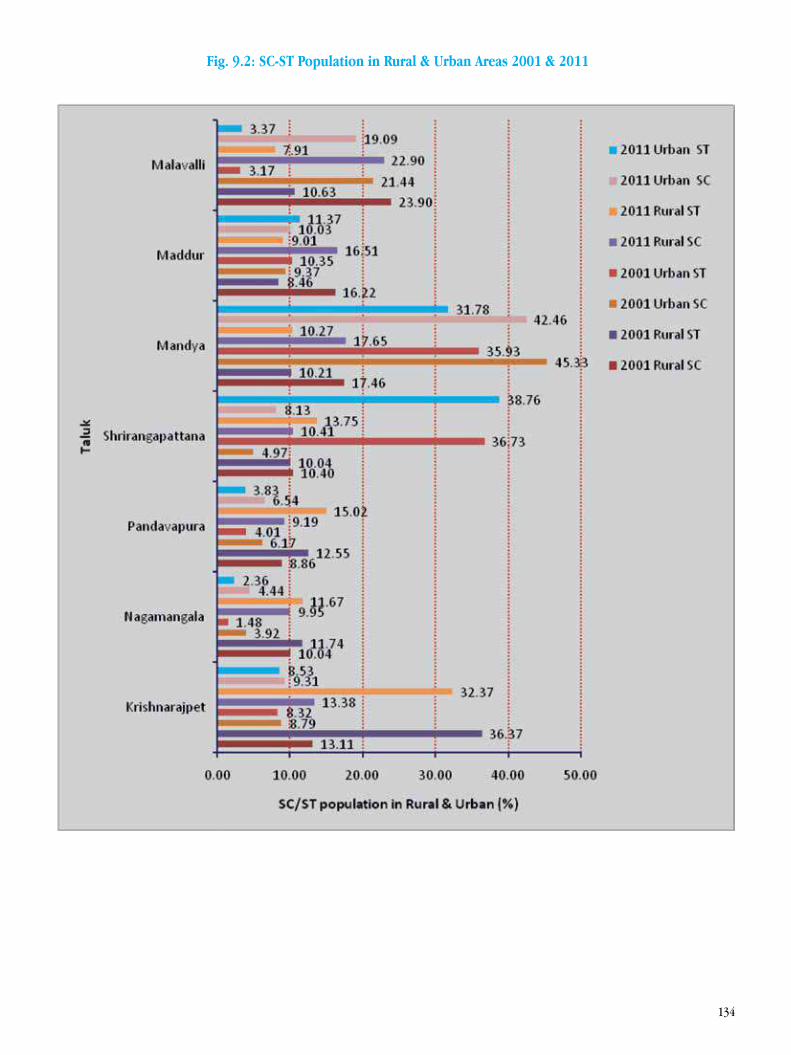
134
Fig. 9.2: SC-ST Population in Rural & Urban Areas 2001 & 2011

135
About 83 percent of the SC Population in Mandya district was in rural area and 17 percent in urban area, in 200. In 2011 the rural SC population was 83.66 percent and urban Population recorded 16.34 percent. The ST Population in rural area was 80.62 percent and in urban area it was 19.38 percent. As per 2011 census the rural population was 77.50 percent and urban population was 22.50 percent.
The taluk wise distribution of SC population among the taluks shows that in Mandya taluk the urban SC population was more with 45.33 percent followed by Malavalli (21.44%), Maddur taluk (9.37%) Krishnarajpet (8.79%) and least share of urban SC Population was in Nagamangala taluk with 3.92 percent. Similar situation in rural SC population distribution was observed in 2011. Malavalli taluk had highest rural SC population with 23.90 percent followed by Mandya (17.46%), and Maddur (16.22%), the least percentage share of SC population in rural area was in Pandavapura (8.86%) in 2001 census. The urban population of ST was highest in Shrirangapattana taluk with 36.73 percent followed by Mandya taluk (35.93%), Krishnarajpet (8.32%) and the least in the district was in Nagamangala taluk with 1.48 percent. Similar situation was observed in 2011 census.
As per 2001 census, the sex ratio (number of females per 1000 males) of the SC population was highest in Pandavapura Taluk with 1028 followed by Nagamangala Taluk with 1025 and, Shrirangapattana Taluk with 1006. The least sex ratio was reported in Malavalli taluk with 985. In 2011 census, Shrirangapattana showed the highest sex ratio with 1033, Nagamangala taluk (1024), Pandavapura (1023) while Malavalli has the lowest sex ratio of 1003.
Regarding the sex ratio among ST population, Shrirangapattana had highest sex ratio of 1022 in 2001 followed by Maddur with 1011, and Pandavapura taluk with 1000 while the least sex ratio was in Nagamangala taluk with 903. But, the general population sex ratio in Nagamangala was 1027 in 2001 census; there was a huge difference of 124 between the taluks. As per the 2011 census, this sex ratio was high in Pandavapura taluk with 1017, followed by Shrirangapattana taluk (1013).The lowest sex ratio for ST population in the district was in Nagamangala with 885, whereas the general population sex ratio in the taluk was 1005 which was the highest for the entire district.
Fig 9.3: Sex Ratio among SC, ST and Other Groups - 2011
9.3. Education Profile and Levels of Enrollment and Education and Dropout Rate
The literacy rate in Karnataka as per 2011 census is 75.36 percent. The urban literacy rate is more than rural literacy rate. Female literacy is still on lower side compared to male literacy. This is also factual in respect of SC and ST Population, the literacy rate among SC and ST in 2001 was 56 percent and it has marginally increased in 2011. Literacy plays an important role in improving the socio-economic status of people. Education improves people’s productive efficiency by strengthening their knowledge, and skills which in turn increase their income. The literacy rate among SCs and STs is quite low compared to other social groups in the state. In order to increase the literacy levels and to educate the socially marginalized groups the Government of Karnataka was implemented several education schemes such as Nursery-cum-woman welfare schemes, residential schools, Navodaya and Morarji Desai residential schools etc. In order to extend good facilities to the students and to discourage dropouts and to empower SC-ST boys and girls, the government is running several pre-metric and post-metric hostels throughout the state. Several incentives such as scholarship, cash price , Book Bank schemes, financial assistance, extra study tour are provided by the state government to improve the level of education and literacy among SC’s and ST’s in the state.A number of schemes are also introduced by the state to bring the school dropout children back to school. Such schemes directly address the constraints faced by the students particularly girl students and their parents. The initiatives are chinnara angala, Coolienda shalege, Flexi School, mobile schools; beediyinda shalege, baa bale shalege etc. are some of the programs which are really encouraging children particularly SCs and STs.
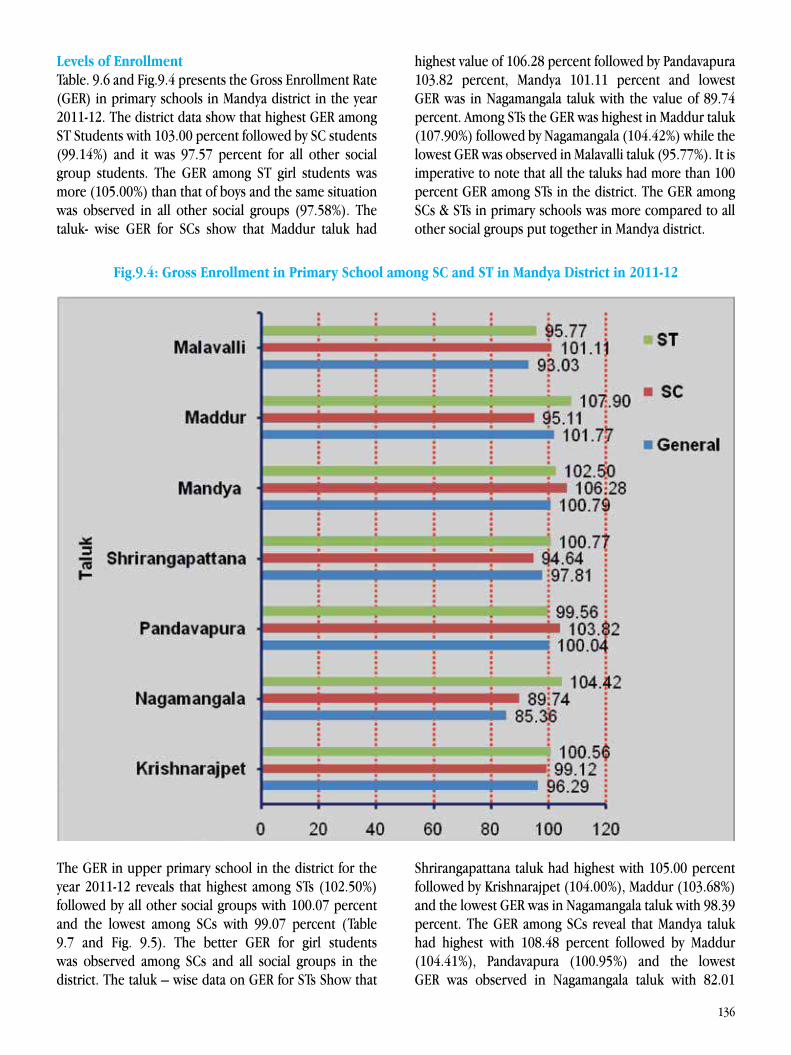
136
Levels of EnrollmentTable. 9.6 and Fig.9.4 presents the Gross Enrollment Rate (GER) in primary schools in Mandya district in the year 2011-12. The district data show that highest GER among ST Students with 103.00 percent followed by SC students (99.14%) and it was 97.57 percent for all other social group students. The GER among ST girl students was more (105.00%) than that of boys and the same situation was observed in all other social groups (97.58%). The taluk- wise GER for SCs show that Maddur taluk had
highest value of 106.28 percent followed by Pandavapura 103.82 percent, Mandya 101.11 percent and lowest GER was in Nagamangala taluk with the value of 89.74 percent. Among STs the GER was highest in Maddur taluk (107.90%) followed by Nagamangala (104.42%) while the lowest GER was observed in Malavalli taluk (95.77%). It is imperative to note that all the taluks had more than 100 percent GER among STs in the district. The GER among SCs & STs in primary schools was more compared to all other social groups put together in Mandya district.
Fig.9.4: Gross Enrollment in Primary School among SC and ST in Mandya District in 2011-12
The GER in upper primary school in the district for the year 2011-12 reveals that highest among STs (102.50%) followed by all other social groups with 100.07 percent and the lowest among SCs with 99.07 percent (Table 9.7 and Fig. 9.5). The better GER for girl students was observed among SCs and all social groups in the district. The taluk – wise data on GER for STs Show that
Shrirangapattana taluk had highest with 105.00 percent followed by Krishnarajpet (104.00%), Maddur (103.68%) and the lowest GER was in Nagamangala taluk with 98.39 percent. The GER among SCs reveal that Mandya taluk had highest with 108.48 percent followed by Maddur (104.41%), Pandavapura (100.95%) and the lowest GER was observed in Nagamangala taluk with 82.01
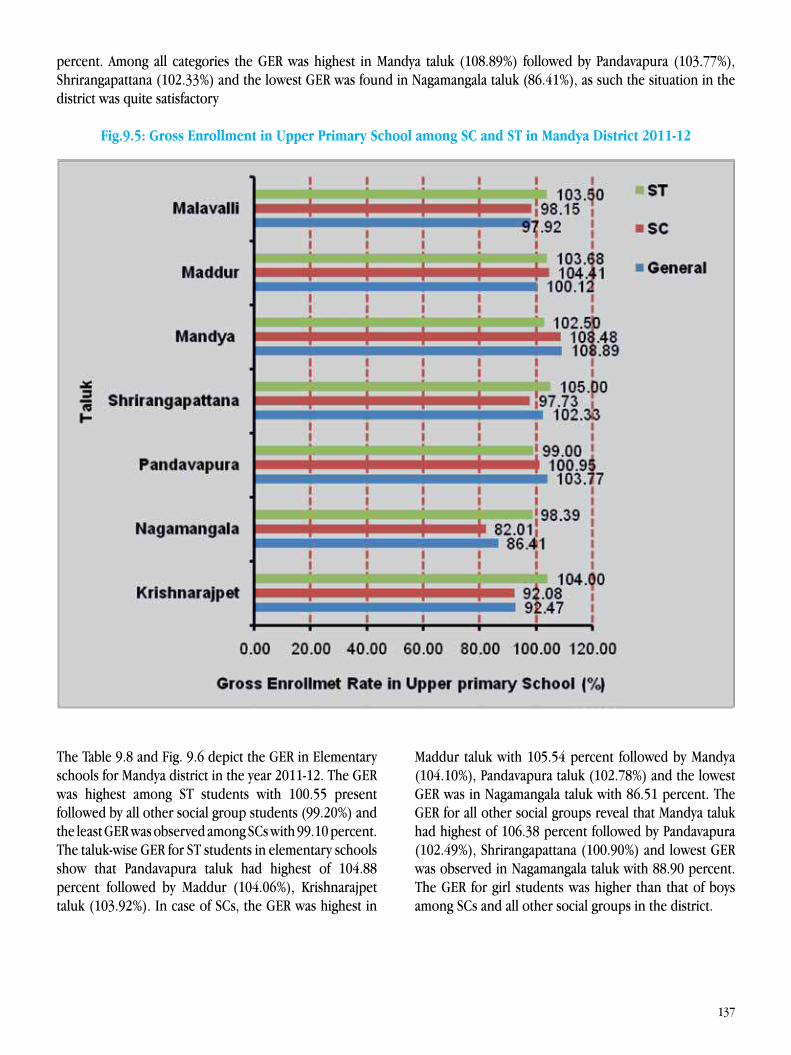
137
percent. Among all categories the GER was highest in Mandya taluk (108.89%) followed by Pandavapura (103.77%), Shrirangapattana (102.33%) and the lowest GER was found in Nagamangala taluk (86.41%), as such the situation in the district was quite satisfactory
Fig.9.5: Gross Enrollment in Upper Primary School among SC and ST in Mandya District 2011-12
The Table 9.8 and Fig. 9.6 depict the GER in Elementary schools for Mandya district in the year 2011-12. The GER was highest among ST students with 100.55 present followed by all other social group students (99.20%) and the least GER was observed among SCs with 99.10 percent. The taluk-wise GER for ST students in elementary schools show that Pandavapura taluk had highest of 104.88 percent followed by Maddur (104.06%), Krishnarajpet taluk (103.92%). In case of SCs, the GER was highest in
Maddur taluk with 105.54 percent followed by Mandya (104.10%), Pandavapura taluk (102.78%) and the lowest GER was in Nagamangala taluk with 86.51 percent. The GER for all other social groups reveal that Mandya taluk had highest of 106.38 percent followed by Pandavapura (102.49%), Shrirangapattana (100.90%) and lowest GER was observed in Nagamangala taluk with 88.90 percent. The GER for girl students was higher than that of boys among SCs and all other social groups in the district.
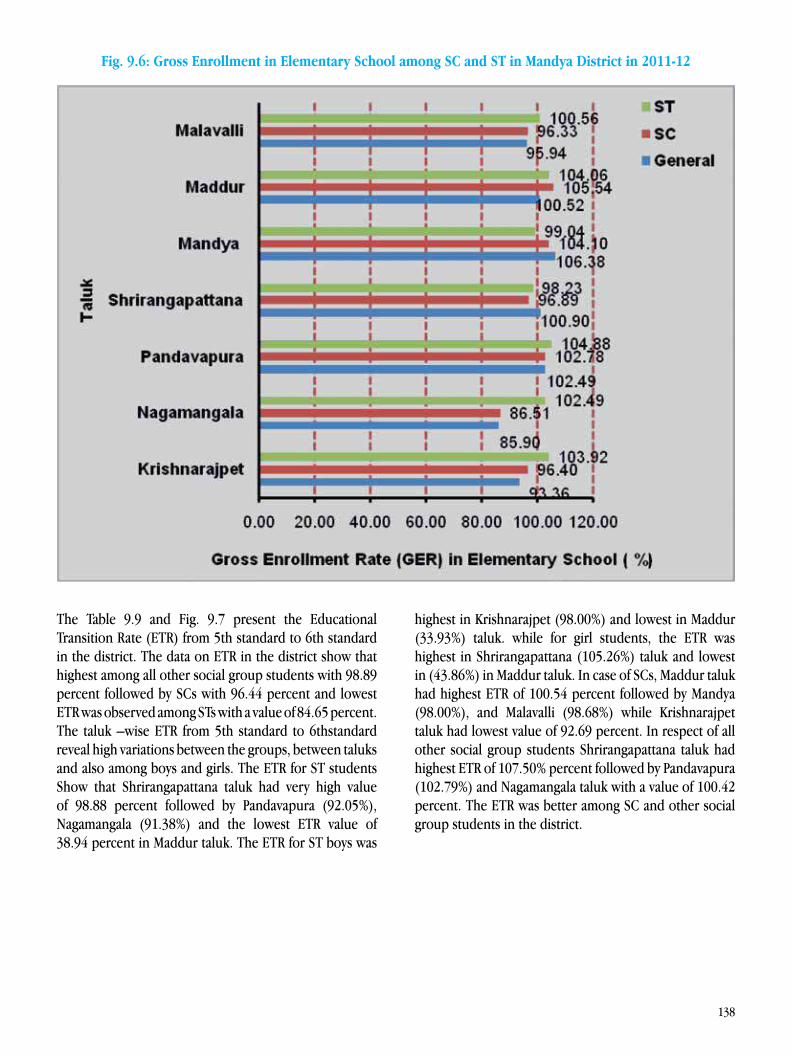
138
Fig. 9.6: Gross Enrollment in Elementary School among SC and ST in Mandya District in 2011-12
The Table 9.9 and Fig. 9.7 present the Educational Transition Rate (ETR) from 5th standard to 6th standard in the district. The data on ETR in the district show that highest among all other social group students with 98.89 percent followed by SCs with 96.44 percent and lowest ETR was observed among STs with a value of 84.65 percent. The taluk –wise ETR from 5th standard to 6thstandard reveal high variations between the groups, between taluks and also among boys and girls. The ETR for ST students Show that Shrirangapattana taluk had very high value of 98.88 percent followed by Pandavapura (92.05%), Nagamangala (91.38%) and the lowest ETR value of 38.94 percent in Maddur taluk. The ETR for ST boys was
highest in Krishnarajpet (98.00%) and lowest in Maddur (33.93%) taluk. while for girl students, the ETR was highest in Shrirangapattana (105.26%) taluk and lowest in (43.86%) in Maddur taluk. In case of SCs, Maddur taluk had highest ETR of 100.54 percent followed by Mandya (98.00%), and Malavalli (98.68%) while Krishnarajpet taluk had lowest value of 92.69 percent. In respect of all other social group students Shrirangapattana taluk had highest ETR of 107.50% percent followed by Pandavapura (102.79%) and Nagamangala taluk with a value of 100.42 percent. The ETR was better among SC and other social group students in the district.
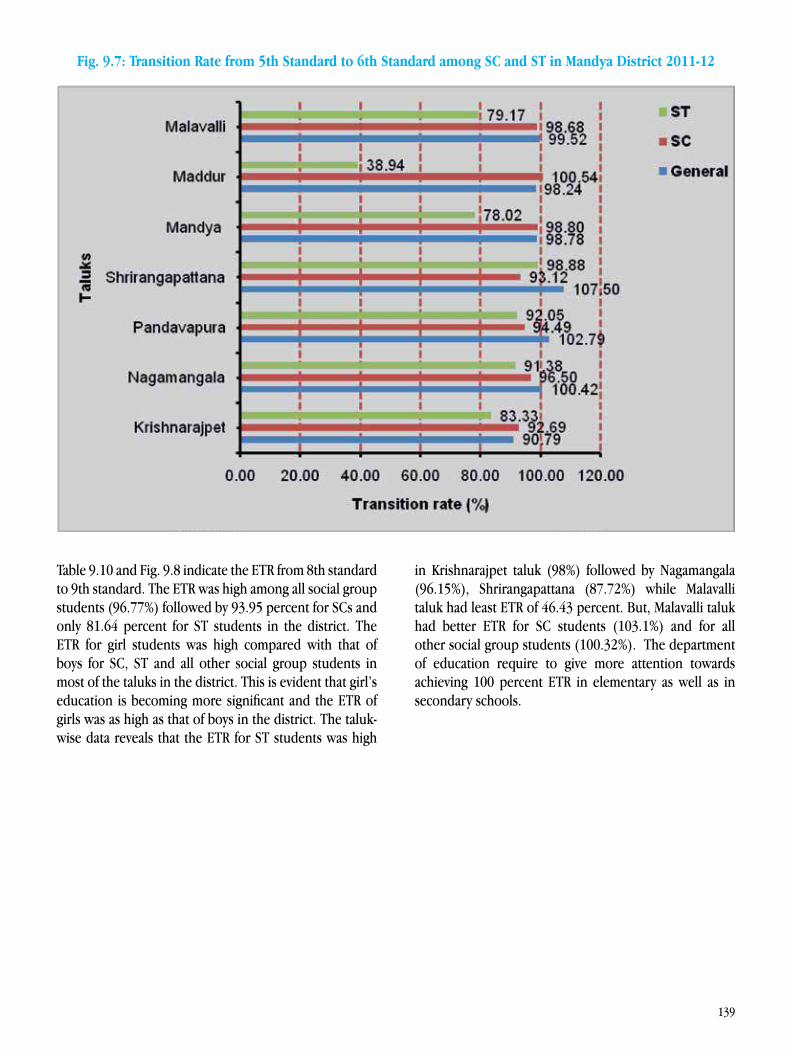
139
Fig. 9.7: Transition Rate from 5th Standard to 6th Standard among SC and ST in Mandya District 2011-12
Table 9.10 and Fig. 9.8 indicate the ETR from 8th standard to 9th standard. The ETR was high among all social group students (96.77%) followed by 93.95 percent for SCs and only 81.64 percent for ST students in the district. The ETR for girl students was high compared with that of boys for SC, ST and all other social group students in most of the taluks in the district. This is evident that girl’s education is becoming more significant and the ETR of girls was as high as that of boys in the district. The taluk-wise data reveals that the ETR for ST students was high
in Krishnarajpet taluk (98%) followed by Nagamangala (96.15%), Shrirangapattana (87.72%) while Malavalli taluk had least ETR of 46.43 percent. But, Malavalli taluk had better ETR for SC students (103.1%) and for all other social group students (100.32%). The department of education require to give more attention towards achieving 100 percent ETR in elementary as well as in secondary schools.

140
Fig. 9.8. Transition Rate from 8th Standard to 9th Standard among SC and ST in Mandya District 2011-12
Fig. 9.9: Drop-out rate in Primary Schools for SCs and STs 2011-12
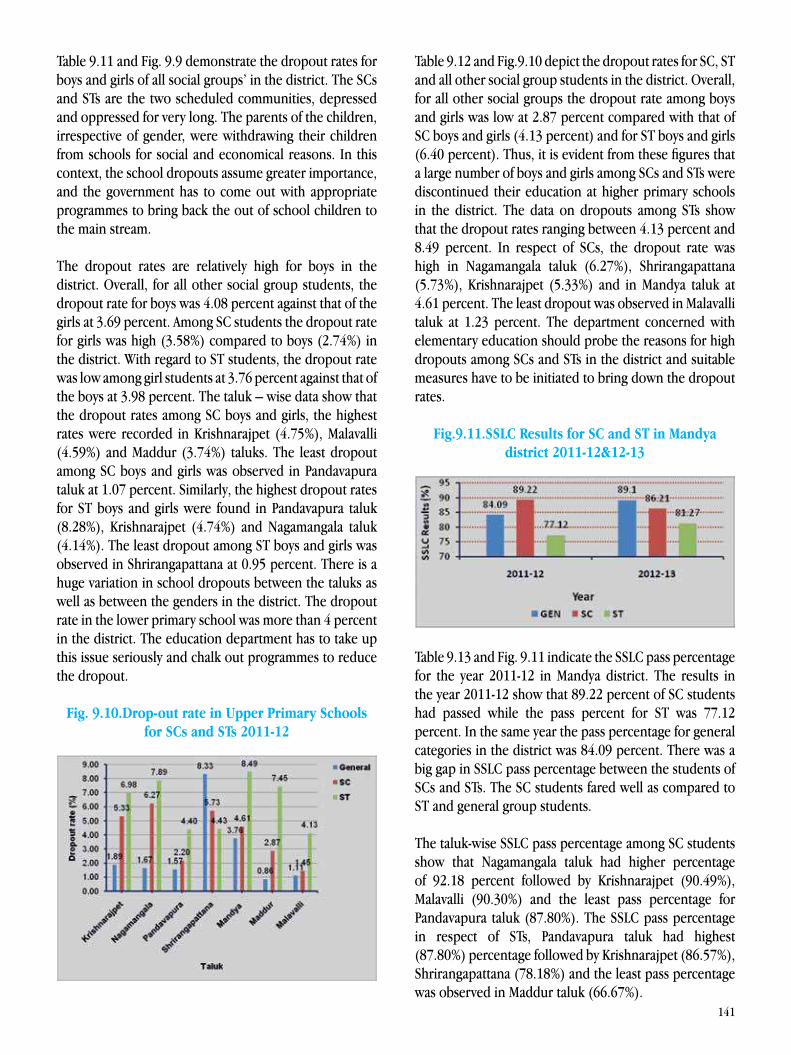
141
Table 9.11 and Fig. 9.9 demonstrate the dropout rates for boys and girls of all social groups’ in the district. The SCs and STs are the two scheduled communities, depressed and oppressed for very long. The parents of the children, irrespective of gender, were withdrawing their children from schools for social and economical reasons. In this context, the school dropouts assume greater importance, and the government has to come out with appropriate programmes to bring back the out of school children to the main stream.
The dropout rates are relatively high for boys in the district. Overall, for all other social group students, the dropout rate for boys was 4.08 percent against that of the girls at 3.69 percent. Among SC students the dropout rate for girls was high (3.58%) compared to boys (2.74%) in the district. With regard to ST students, the dropout rate was low among girl students at 3.76 percent against that of the boys at 3.98 percent. The taluk – wise data show that the dropout rates among SC boys and girls, the highest rates were recorded in Krishnarajpet (4.75%), Malavalli (4.59%) and Maddur (3.74%) taluks. The least dropout among SC boys and girls was observed in Pandavapura taluk at 1.07 percent. Similarly, the highest dropout rates for ST boys and girls were found in Pandavapura taluk (8.28%), Krishnarajpet (4.74%) and Nagamangala taluk (4.14%). The least dropout among ST boys and girls was observed in Shrirangapattana at 0.95 percent. There is a huge variation in school dropouts between the taluks as well as between the genders in the district. The dropout rate in the lower primary school was more than 4 percent in the district. The education department has to take up this issue seriously and chalk out programmes to reduce the dropout.
Fig. 9.10.Drop-out rate in Upper Primary Schools for SCs and STs 2011-12
Table 9.12 and Fig.9.10 depict the dropout rates for SC, ST and all other social group students in the district. Overall, for all other social groups the dropout rate among boys and girls was low at 2.87 percent compared with that of SC boys and girls (4.13 percent) and for ST boys and girls (6.40 percent). Thus, it is evident from these figures that a large number of boys and girls among SCs and STs were discontinued their education at higher primary schools in the district. The data on dropouts among STs show that the dropout rates ranging between 4.13 percent and 8.49 percent. In respect of SCs, the dropout rate was high in Nagamangala taluk (6.27%), Shrirangapattana (5.73%), Krishnarajpet (5.33%) and in Mandya taluk at 4.61 percent. The least dropout was observed in Malavalli taluk at 1.23 percent. The department concerned with elementary education should probe the reasons for high dropouts among SCs and STs in the district and suitable measures have to be initiated to bring down the dropout rates.
Fig.9.11.SSLC Results for SC and ST in Mandya district 2011-12&12-13
Table 9.13 and Fig. 9.11 indicate the SSLC pass percentage for the year 2011-12 in Mandya district. The results in the year 2011-12 show that 89.22 percent of SC students had passed while the pass percent for ST was 77.12 percent. In the same year the pass percentage for general categories in the district was 84.09 percent. There was a big gap in SSLC pass percentage between the students of SCs and STs. The SC students fared well as compared to ST and general group students.
The taluk-wise SSLC pass percentage among SC students show that Nagamangala taluk had higher percentage of 92.18 percent followed by Krishnarajpet (90.49%), Malavalli (90.30%) and the least pass percentage for Pandavapura taluk (87.80%). The SSLC pass percentage in respect of STs, Pandavapura taluk had highest (87.80%) percentage followed by Krishnarajpet (86.57%), Shrirangapattana (78.18%) and the least pass percentage was observed in Maddur taluk (66.67%).

142
The SSLC pass percentage in the year 2012-13, reveals that 86.21 percent of SC students had passed which was lower than the previous year results. The pass percentage for ST was 81.27 percent which was increased by about 4 percent from the previous year results. In respect of general students, the pass percentage was 89.10 percent which was better than the year 2011-12.
The taluk-wise SSLC results among SC students show that Maddur taluk had higher pass (92.07%) percentage followed by Shrirangapattana (90.03%), Krishnarajpet (88.62%) taluk and the lowest pass percentage was observed in Mandya taluk(79.49%). The pass percentage in respect of STs, Krishnarajpet had highest pass percentage (89.87%) followed by Pandavapura (89.19%) while the least pass percentage observed in Mandya (67.80%) taluk. Though the SSLC pass percentage in all the groups is higher than that of the state average of 81.05 percent, still the primary and secondary education department can do well to achieve cent percent results in the district.
9.4. Health Awareness and Institutional Delivery RateJanani Suraksha Yojana – Helping the poor pregnant women after delivery – under this scheme pregnant women belonging to BPL families and SC-ST families will get an amount of Rs. 500 for delivery at home, Rs 600 for urban institutional delivery, Rs 700 for delivery in health center in rural areas and Rs 1500 for caesarian delivery. The payment is made to the government hospitals and recognized private hospitals for conducting delivery. The SCs and STs are aware about this scheme and are benefiting from the programme. This has led to high percentage of institutional deliveries among SCs and STs. 9.5. Occupational Pattern - Income and Employment-Livelihood opportunities and Development ProgrammesIncome and employment are the two important indicators of the living standard of people. Disaggregated data on work participation ratio, occupational pattern and per capital income are not available for SC’s and ST’s. Since the data on these indicators were not available, it is not possible to analyse the livelihood opportunities for these marginalised groups in the district. However an attempt was made to compare the SC and ST households owning cultivable agricultural land with other groups of population who owned agriculture land. Access to basic facilities such as pucca house, drinking water, sanitation, electricity, modern cooking fuel etc by the SC’s and ST’s was also analysed. The schemes providing houses for these are also discussed in this section.
Fig. 9.12: Land Holdings among SC and ST (In numbers)
The data on land holdings in the district for the agricultural census 2011 show that, out of the total land holdings of 3,93,412 (by all groups), 36,365 (9.24%) land holdings belonged to SCs, 2,383 (0.61%) to ST’s and 3,54,664 (90.15%) to other groups of people. The taluk-wise distribution of land holders indicates taluk the highest percentage for SCs in Malavalli taluk with 28.31 percent, followed by Krishnarajpet taluk(17.94%), Nagamangala taluk (17.15%) while the lowest percentage was found in Shrirangapattana taluk (7.09%). Regarding the ST population, the highest percentage was in Nagamangala taluk with 24.63 percent followed by Maddur (23.29%) Pandavapura (22.03%) while the lowest percentage was in Shrirangapattana (1.88%). The land holdings data for general population show uniform distribution between the Taluks except for Pandavapura (8.48%) and Shrirangapattana (8.12%) taluks.
Fig. 9.13: Land Owned by SC, ST and General Groups (In hectares)
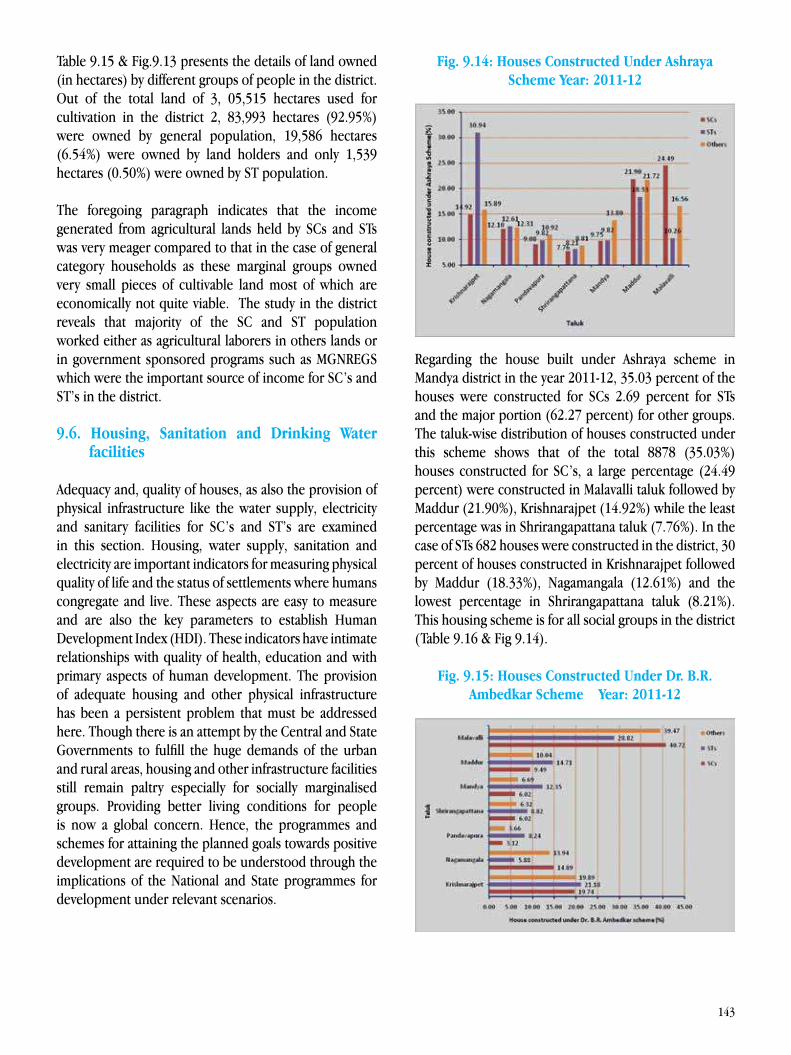
143
Table 9.15 & Fig.9.13 presents the details of land owned (in hectares) by different groups of people in the district. Out of the total land of 3, 05,515 hectares used for cultivation in the district 2, 83,993 hectares (92.95%) were owned by general population, 19,586 hectares (6.54%) were owned by land holders and only 1,539 hectares (0.50%) were owned by ST population.
The foregoing paragraph indicates that the income generated from agricultural lands held by SCs and STs was very meager compared to that in the case of general category households as these marginal groups owned very small pieces of cultivable land most of which are economically not quite viable. The study in the district reveals that majority of the SC and ST population worked either as agricultural laborers in others lands or in government sponsored programs such as MGNREGS which were the important source of income for SC’s and ST’s in the district.
9.6. Housing, Sanitation and Drinking Water facilities
Adequacy and, quality of houses, as also the provision of physical infrastructure like the water supply, electricity and sanitary facilities for SC’s and ST’s are examined in this section. Housing, water supply, sanitation and electricity are important indicators for measuring physical quality of life and the status of settlements where humans congregate and live. These aspects are easy to measure and are also the key parameters to establish Human Development Index (HDI). These indicators have intimate relationships with quality of health, education and with primary aspects of human development. The provision of adequate housing and other physical infrastructure has been a persistent problem that must be addressed here. Though there is an attempt by the Central and State Governments to fulfill the huge demands of the urban and rural areas, housing and other infrastructure facilities still remain paltry especially for socially marginalised groups. Providing better living conditions for people is now a global concern. Hence, the programmes and schemes for attaining the planned goals towards positive development are required to be understood through the implications of the National and State programmes for development under relevant scenarios.
Fig. 9.14: Houses Constructed Under Ashraya Scheme Year: 2011-12
Regarding the house built under Ashraya scheme in Mandya district in the year 2011-12, 35.03 percent of the houses were constructed for SCs 2.69 percent for STs and the major portion (62.27 percent) for other groups. The taluk-wise distribution of houses constructed under this scheme shows that of the total 8878 (35.03%) houses constructed for SC’s, a large percentage (24.49 percent) were constructed in Malavalli taluk followed by Maddur (21.90%), Krishnarajpet (14.92%) while the least percentage was in Shrirangapattana taluk (7.76%). In the case of STs 682 houses were constructed in the district, 30 percent of houses constructed in Krishnarajpet followed by Maddur (18.33%), Nagamangala (12.61%) and the lowest percentage in Shrirangapattana taluk (8.21%). This housing scheme is for all social groups in the district (Table 9.16 & Fig 9.14).
Fig. 9.15: Houses Constructed Under Dr. B.R. Ambedkar Scheme Year: 2011-12
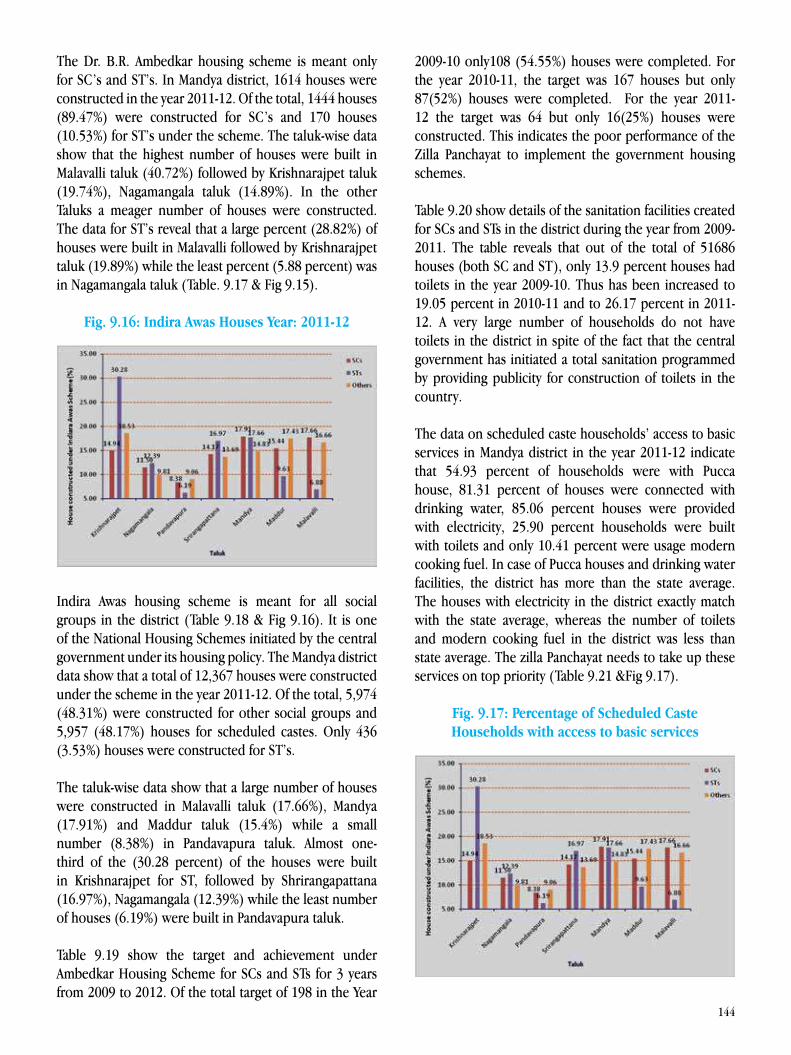
144
The Dr. B.R. Ambedkar housing scheme is meant only for SC’s and ST’s. In Mandya district, 1614 houses were constructed in the year 2011-12. Of the total, 1444 houses (89.47%) were constructed for SC’s and 170 houses (10.53%) for ST’s under the scheme. The taluk-wise data show that the highest number of houses were built in Malavalli taluk (40.72%) followed by Krishnarajpet taluk (19.74%), Nagamangala taluk (14.89%). In the other Taluks a meager number of houses were constructed. The data for ST’s reveal that a large percent (28.82%) of houses were built in Malavalli followed by Krishnarajpet taluk (19.89%) while the least percent (5.88 percent) was in Nagamangala taluk (Table. 9.17 & Fig 9.15).
Fig. 9.16: Indira Awas Houses Year: 2011-12
Indira Awas housing scheme is meant for all social groups in the district (Table 9.18 & Fig 9.16). It is one of the National Housing Schemes initiated by the central government under its housing policy. The Mandya district data show that a total of 12,367 houses were constructed under the scheme in the year 2011-12. Of the total, 5,974 (48.31%) were constructed for other social groups and 5,957 (48.17%) houses for scheduled castes. Only 436 (3.53%) houses were constructed for ST’s.
The taluk-wise data show that a large number of houses were constructed in Malavalli taluk (17.66%), Mandya (17.91%) and Maddur taluk (15.4%) while a small number (8.38%) in Pandavapura taluk. Almost one-third of the (30.28 percent) of the houses were built in Krishnarajpet for ST, followed by Shrirangapattana (16.97%), Nagamangala (12.39%) while the least number of houses (6.19%) were built in Pandavapura taluk.
Table 9.19 show the target and achievement under Ambedkar Housing Scheme for SCs and STs for 3 years from 2009 to 2012. Of the total target of 198 in the Year
2009-10 only108 (54.55%) houses were completed. For the year 2010-11, the target was 167 houses but only 87(52%) houses were completed. For the year 2011-12 the target was 64 but only 16(25%) houses were constructed. This indicates the poor performance of the Zilla Panchayat to implement the government housing schemes.
Table 9.20 show details of the sanitation facilities created for SCs and STs in the district during the year from 2009-2011. The table reveals that out of the total of 51686 houses (both SC and ST), only 13.9 percent houses had toilets in the year 2009-10. Thus has been increased to 19.05 percent in 2010-11 and to 26.17 percent in 2011-12. A very large number of households do not have toilets in the district in spite of the fact that the central government has initiated a total sanitation programmed by providing publicity for construction of toilets in the country.
The data on scheduled caste households’ access to basic services in Mandya district in the year 2011-12 indicate that 54.93 percent of households were with Pucca house, 81.31 percent of houses were connected with drinking water, 85.06 percent houses were provided with electricity, 25.90 percent households were built with toilets and only 10.41 percent were usage modern cooking fuel. In case of Pucca houses and drinking water facilities, the district has more than the state average. The houses with electricity in the district exactly match with the state average, whereas the number of toilets and modern cooking fuel in the district was less than state average. The zilla Panchayat needs to take up these services on top priority (Table 9.21 &Fig 9.17).
Fig. 9.17: Percentage of Scheduled Caste Households with access to basic services
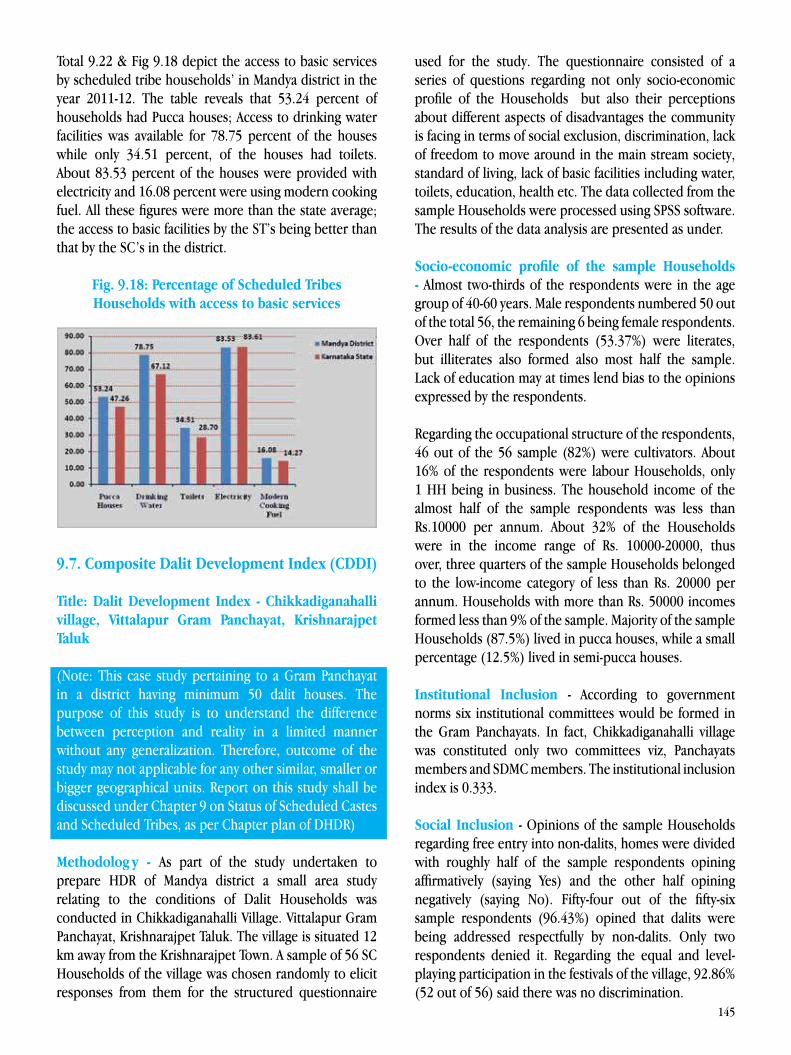
145
Total 9.22 & Fig 9.18 depict the access to basic services by scheduled tribe households’ in Mandya district in the year 2011-12. The table reveals that 53.24 percent of households had Pucca houses; Access to drinking water facilities was available for 78.75 percent of the houses while only 34.51 percent, of the houses had toilets. About 83.53 percent of the houses were provided with electricity and 16.08 percent were using modern cooking fuel. All these figures were more than the state average; the access to basic facilities by the ST’s being better than that by the SC’s in the district.
Fig. 9.18: Percentage of Scheduled Tribes Households with access to basic services
9.7. Composite Dalit Development Index (CDDI)
Title: Dalit Development Index - Chikkadiganahalli village, Vittalapur Gram Panchayat, Krishnarajpet Taluk
(Note: This case study pertaining to a Gram Panchayat in a district having minimum 50 dalit houses. The purpose of this study is to understand the difference between perception and reality in a limited manner without any generalization. Therefore, outcome of the study may not applicable for any other similar, smaller or bigger geographical units. Report on this study shall be discussed under Chapter 9 on Status of Scheduled Castes and Scheduled Tribes, as per Chapter plan of DHDR)
Methodolog y - As part of the study undertaken to prepare HDR of Mandya district a small area study relating to the conditions of Dalit Households was conducted in Chikkadiganahalli Village. Vittalapur Gram Panchayat, Krishnarajpet Taluk. The village is situated 12 km away from the Krishnarajpet Town. A sample of 56 SC Households of the village was chosen randomly to elicit responses from them for the structured questionnaire
used for the study. The questionnaire consisted of a series of questions regarding not only socio-economic profile of the Households but also their perceptions about different aspects of disadvantages the community is facing in terms of social exclusion, discrimination, lack of freedom to move around in the main stream society, standard of living, lack of basic facilities including water, toilets, education, health etc. The data collected from the sample Households were processed using SPSS software. The results of the data analysis are presented as under.
Socio-economic profile of the sample Households - Almost two-thirds of the respondents were in the age group of 40-60 years. Male respondents numbered 50 out of the total 56, the remaining 6 being female respondents. Over half of the respondents (53.37%) were literates, but illiterates also formed also most half the sample. Lack of education may at times lend bias to the opinions expressed by the respondents.
Regarding the occupational structure of the respondents, 46 out of the 56 sample (82%) were cultivators. About 16% of the respondents were labour Households, only 1 HH being in business. The household income of the almost half of the sample respondents was less than Rs.10000 per annum. About 32% of the Households were in the income range of Rs. 10000-20000, thus over, three quarters of the sample Households belonged to the low-income category of less than Rs. 20000 per annum. Households with more than Rs. 50000 incomes formed less than 9% of the sample. Majority of the sample Households (87.5%) lived in pucca houses, while a small percentage (12.5%) lived in semi-pucca houses.
Institutional Inclusion - According to government norms six institutional committees would be formed in the Gram Panchayats. In fact, Chikkadiganahalli village was constituted only two committees viz, Panchayats members and SDMC members. The institutional inclusion index is 0.333.
Social Inclusion - Opinions of the sample Households regarding free entry into non-dalits, homes were divided with roughly half of the sample respondents opining affirmatively (saying Yes) and the other half opining negatively (saying No). Fifty-four out of the fifty-six sample respondents (96.43%) opined that dalits were being addressed respectfully by non-dalits. Only two respondents denied it. Regarding the equal and level-playing participation in the festivals of the village, 92.86% (52 out of 56) said there was no discrimination.
146
Relating to entry into village temples there were divided opinions. Thirty respondents out of fifty six (53.57%) reported that they were allowed into the temples, but 46.43% said no.
Perception of discrimination - Fifty-three out of fifty-six respondents perceived that they had access to all sources of drinking water in the village to which non-dalits also have access; just 3 respondents (5.36%) said they had no access.
Regarding the treatment to be meted out to the Dalit children on par with non-dalits children in matters such as class room seating, plates for mid-day meals and participation in curricular and extracurricular activities in the school, 75% of the respondents reported that there was no discrimination and 25% said there was discrimination.
Pertaining to the delivery of health services by the health personnel in matters such as frequency of visits, paying proper attention, disbursement of drugs, provision of emergency services and prompt passing on cash benefits, fifty-five out of fifty-six respondents there was no discrimination.
Concerning the treatment meted out to dalits in respect of entry and food supplies in hotels, the seating arrangements, disposal of the used plates and glasses etc. and also participation in religious functions, the opinions were starkly divided, with fifty percent saying yes and the other fifty percent saying no.
In matters such as partaking temple and festival works, community cooking, renting-in and renting-out houses, about two-thirds of the respondents (64.29%) reported there was no discrimination but 35.71% opined there was discrimination.
Protest against discrimination - Forty-one out of the fifty-six respondents affirmed that they have protested against water discrimination in the village while 26.79% said they did not protest. About 73.21% of the respondents reported that they protested against educational discrimination, health discrimination and social discrimination. About 75% of the respondents reported that they protested against economic discrimination.
Conflict resolution - Fifty-three out of the fifty-six respondents (94.64%) reported that water discrimination in the village had been satisfactorily resolved. All the
100% respondents opined that discrimination regarding health, water, social and economic discrimination have been satisfactorily resolved.
Perception of freedom - Seventy-five percent of the respondents think that they can question the various injustices meted out them, about 82% of the respondents think they can protest against any sort of discrimination meted out them. Regarding freedom to move around in any part of the village where non-dalits also move around, fifty-five out of the fifty-six sample respondents said ‘yes’, they can and do move around. Regarding freedom of employment opportunities, fifty out of the fifty-six dalits opined that they can get any job opportunity which non-dalits also get. Regarding participation in all cultural activities taking place in the village, fifty-four out of the fifty-six opined that they have freedom to participate like non-dalits do.
Gender dimensions of dalits development - Regarding the number of days of rest taken by pregnant Dalit women prior to delivery, 21.43% of the respondents indicated that their women less than three months rest, 33.93% indicated more than three months rest and remaining 44.64% reported that the Dalit pregnant women would take precisely three months rest. Regarding number of visits to the dalits, homes by health visitors in a month, there were widely different opinions. However majority of them (55.36%) opined that health visitors would visit four times in a month, while another 35.71% of the respondents opined that the health visitors would visit twice in a month. As regards the place of delivery by Dalit women, 73.21% of the dalit respondent’s opined that delivery would take place in the hospital, while remaining 26.79% said that delivery would take place at home. About whether Dalit women would get reproductive health support, fifty-five out of the fifty-six said yes. Regarding the frequency of drinking water supplied by the local body in the dalits locality, 75% of the respondents said that water would be supplied twice a week, while remaining 25% reported thrice a week.
Composite Dalit Development Index - Assigning specific scores for the opinions in respect of all the above mentioned items of Dalit Development Indicators and aggregating all these scores, a Composite Dalit Development Index (CDDI) with a minimum value of 0 and maximum value of 1 was computed. In the case of the study under reference the total CDDI worked out to be 0.573 which indicates “average dalit development” in the scale range specified for the purpose. The Dalit
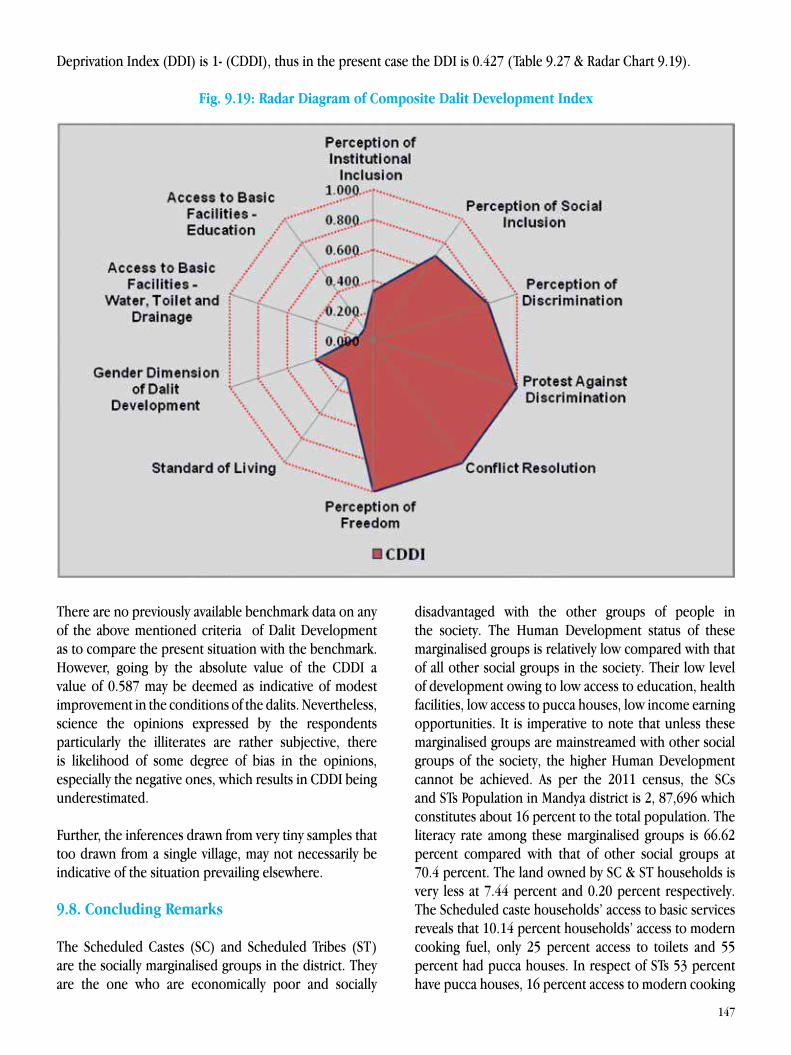
147
Deprivation Index (DDI) is 1- (CDDI), thus in the present case the DDI is 0.427 (Table 9.27 & Radar Chart 9.19).
Fig. 9.19: Radar Diagram of Composite Dalit Development Index
There are no previously available benchmark data on any of the above mentioned criteria of Dalit Development as to compare the present situation with the benchmark. However, going by the absolute value of the CDDI a value of 0.587 may be deemed as indicative of modest improvement in the conditions of the dalits. Nevertheless, science the opinions expressed by the respondents particularly the illiterates are rather subjective, there is likelihood of some degree of bias in the opinions, especially the negative ones, which results in CDDI being underestimated.
Further, the inferences drawn from very tiny samples that too drawn from a single village, may not necessarily be indicative of the situation prevailing elsewhere.
9.8. Concluding Remarks
The Scheduled Castes (SC) and Scheduled Tribes (ST) are the socially marginalised groups in the district. They are the one who are economically poor and socially
disadvantaged with the other groups of people in the society. The Human Development status of these marginalised groups is relatively low compared with that of all other social groups in the society. Their low level of development owing to low access to education, health facilities, low access to pucca houses, low income earning opportunities. It is imperative to note that unless these marginalised groups are mainstreamed with other social groups of the society, the higher Human Development cannot be achieved. As per the 2011 census, the SCs and STs Population in Mandya district is 2, 87,696 which constitutes about 16 percent to the total population. The literacy rate among these marginalised groups is 66.62 percent compared with that of other social groups at 70.4 percent. The land owned by SC & ST households is very less at 7.44 percent and 0.20 percent respectively. The Scheduled caste households’ access to basic services reveals that 10.14 percent households’ access to modern cooking fuel, only 25 percent access to toilets and 55 percent had pucca houses. In respect of STs 53 percent have pucca houses, 16 percent access to modern cooking
148
fuel and only 34 percent of house-holds access to toilets. Most of these families work as agricultural labourers. The government should encourage the socially marginalised groups through special programmes for education, health, housing and sanitation, more opportunities for generating income through adequate guarantee of employment etc., to enhance their quality of life which ultimately led to high level of Human Development in the district.
149

150
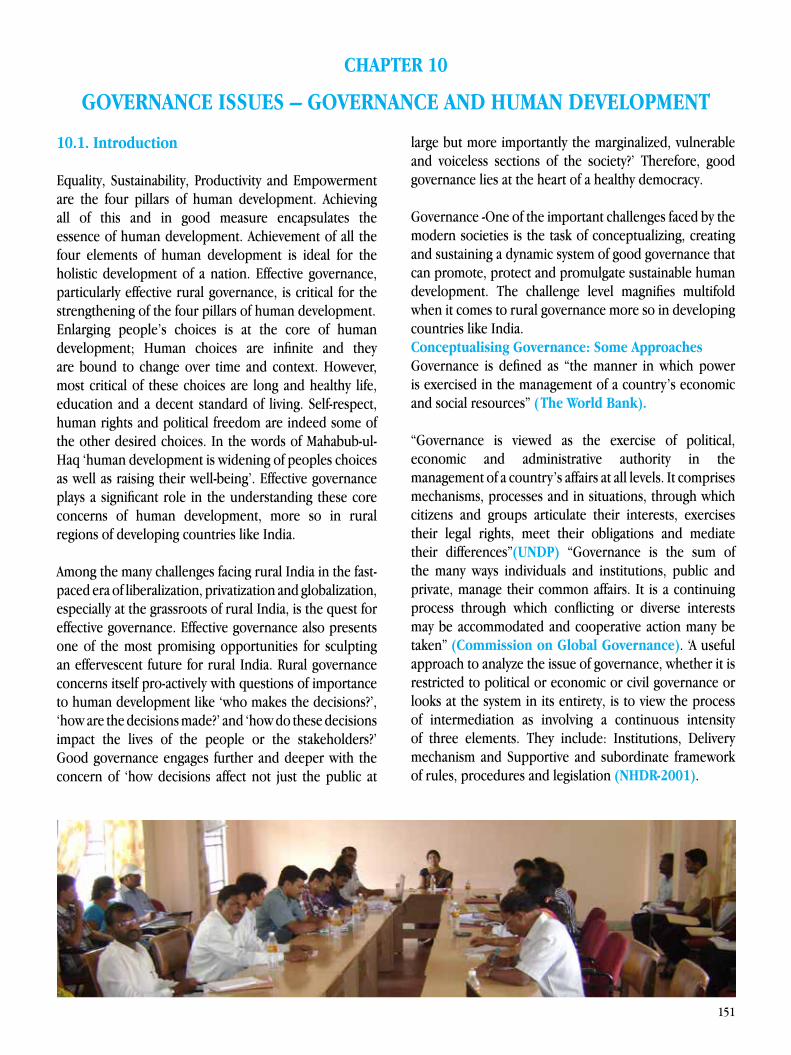
151
10.1. Introduction
Equality, Sustainability, Productivity and Empowerment are the four pillars of human development. Achieving all of this and in good measure encapsulates the essence of human development. Achievement of all the four elements of human development is ideal for the holistic development of a nation. Effective governance, particularly effective rural governance, is critical for the strengthening of the four pillars of human development. Enlarging people’s choices is at the core of human development; Human choices are infinite and they are bound to change over time and context. However, most critical of these choices are long and healthy life, education and a decent standard of living. Self-respect, human rights and political freedom are indeed some of the other desired choices. In the words of Mahabub-ul-Haq ‘human development is widening of peoples choices as well as raising their well-being’. Effective governance plays a significant role in the understanding these core concerns of human development, more so in rural regions of developing countries like India.
Among the many challenges facing rural India in the fast-paced era of liberalization, privatization and globalization, especially at the grassroots of rural India, is the quest for effective governance. Effective governance also presents one of the most promising opportunities for sculpting an effervescent future for rural India. Rural governance concerns itself pro-actively with questions of importance to human development like ‘who makes the decisions?’, ‘how are the decisions made?’ and ‘how do these decisions impact the lives of the people or the stakeholders?’ Good governance engages further and deeper with the concern of ‘how decisions affect not just the public at
CHAPTER 10
GOVERNANCE ISSUES – GOVERNANCE AND HUMAN DEVELOPMENT
large but more importantly the marginalized, vulnerable and voiceless sections of the society?’ Therefore, good governance lies at the heart of a healthy democracy.
Governance -One of the important challenges faced by the modern societies is the task of conceptualizing, creating and sustaining a dynamic system of good governance that can promote, protect and promulgate sustainable human development. The challenge level magnifies multifold when it comes to rural governance more so in developing countries like India.Conceptualising Governance: Some ApproachesGovernance is defined as “the manner in which power is exercised in the management of a country’s economic and social resources” (The World Bank).
“Governance is viewed as the exercise of political, economic and administrative authority in the management of a country’s affairs at all levels. It comprises mechanisms, processes and in situations, through which citizens and groups articulate their interests, exercises their legal rights, meet their obligations and mediate their differences”(UNDP) “Governance is the sum of the many ways individuals and institutions, public and private, manage their common affairs. It is a continuing process through which conflicting or diverse interests may be accommodated and cooperative action many be taken” (Commission on Global Governance). ‘A useful approach to analyze the issue of governance, whether it is restricted to political or economic or civil governance or looks at the system in its entirety, is to view the process of intermediation as involving a continuous intensity of three elements. They include: Institutions, Delivery mechanism and Supportive and subordinate framework of rules, procedures and legislation (NHDR-2001).
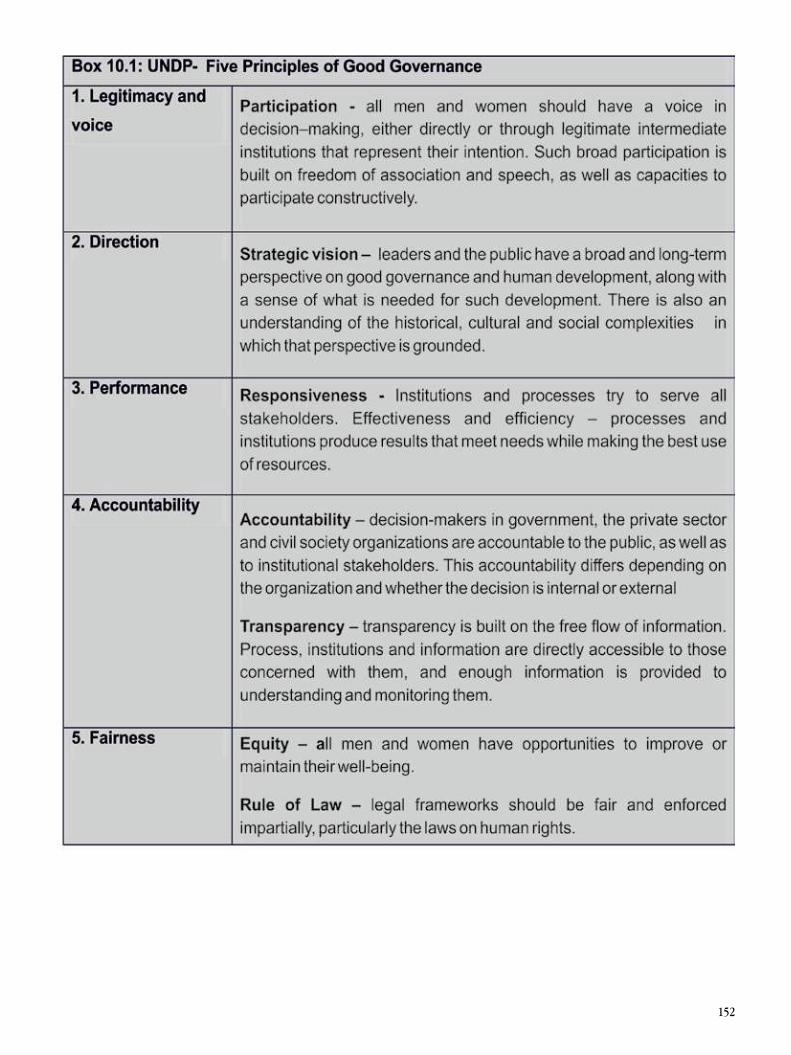
152
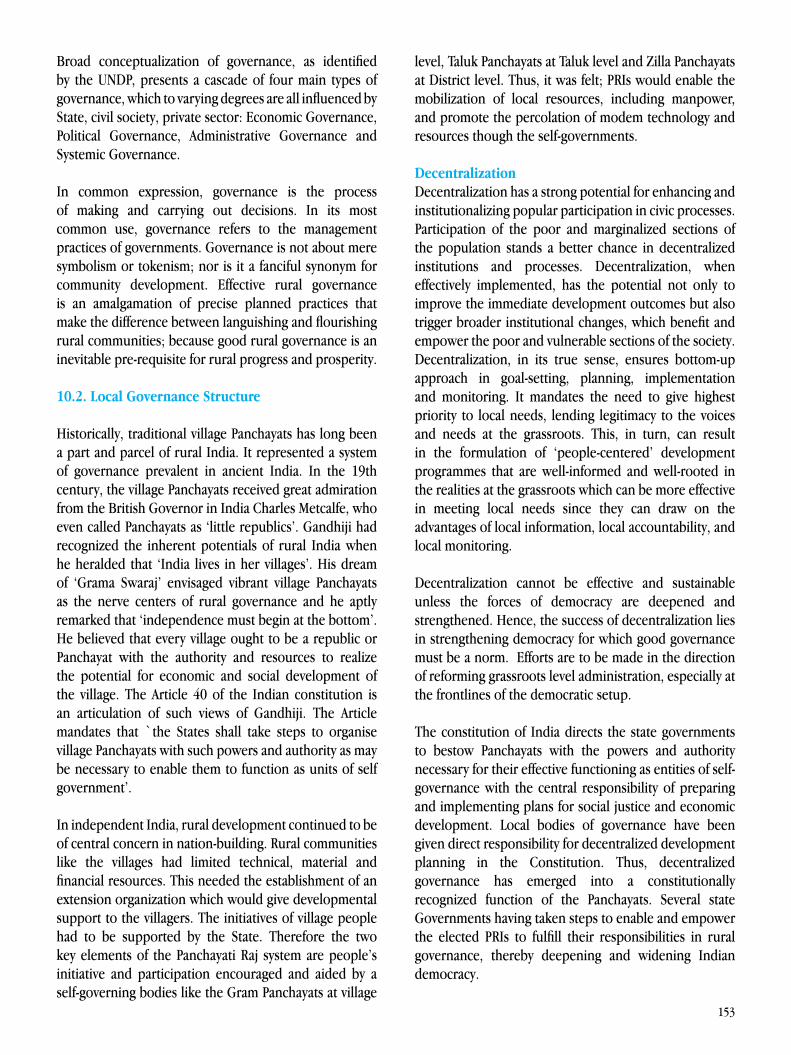
153
Broad conceptualization of governance, as identified by the UNDP, presents a cascade of four main types of governance, which to varying degrees are all influenced by State, civil society, private sector: Economic Governance, Political Governance, Administrative Governance and Systemic Governance.
In common expression, governance is the process of making and carrying out decisions. In its most common use, governance refers to the management practices of governments. Governance is not about mere symbolism or tokenism; nor is it a fanciful synonym for community development. Effective rural governance is an amalgamation of precise planned practices that make the difference between languishing and flourishing rural communities; because good rural governance is an inevitable pre-requisite for rural progress and prosperity.
10.2. Local Governance Structure
Historically, traditional village Panchayats has long been a part and parcel of rural India. It represented a system of governance prevalent in ancient India. In the 19th century, the village Panchayats received great admiration from the British Governor in India Charles Metcalfe, who even called Panchayats as ‘little republics’. Gandhiji had recognized the inherent potentials of rural India when he heralded that ‘India lives in her villages’. His dream of ‘Grama Swaraj’ envisaged vibrant village Panchayats as the nerve centers of rural governance and he aptly remarked that ‘independence must begin at the bottom’. He believed that every village ought to be a republic or Panchayat with the authority and resources to realize the potential for economic and social development of the village. The Article 40 of the Indian constitution is an articulation of such views of Gandhiji. The Article mandates that `the States shall take steps to organise village Panchayats with such powers and authority as may be necessary to enable them to function as units of self government’.
In independent India, rural development continued to be of central concern in nation-building. Rural communities like the villages had limited technical, material and financial resources. This needed the establishment of an extension organization which would give developmental support to the villagers. The initiatives of village people had to be supported by the State. Therefore the two key elements of the Panchayati Raj system are people’s initiative and participation encouraged and aided by a self-governing bodies like the Gram Panchayats at village
level, Taluk Panchayats at Taluk level and Zilla Panchayats at District level. Thus, it was felt; PRIs would enable the mobilization of local resources, including manpower, and promote the percolation of modem technology and resources though the self-governments.
DecentralizationDecentralization has a strong potential for enhancing and institutionalizing popular participation in civic processes. Participation of the poor and marginalized sections of the population stands a better chance in decentralized institutions and processes. Decentralization, when effectively implemented, has the potential not only to improve the immediate development outcomes but also trigger broader institutional changes, which benefit and empower the poor and vulnerable sections of the society. Decentralization, in its true sense, ensures bottom-up approach in goal-setting, planning, implementation and monitoring. It mandates the need to give highest priority to local needs, lending legitimacy to the voices and needs at the grassroots. This, in turn, can result in the formulation of ‘people-centered’ development programmes that are well-informed and well-rooted in the realities at the grassroots which can be more effective in meeting local needs since they can draw on the advantages of local information, local accountability, and local monitoring.
Decentralization cannot be effective and sustainable unless the forces of democracy are deepened and strengthened. Hence, the success of decentralization lies in strengthening democracy for which good governance must be a norm. Efforts are to be made in the direction of reforming grassroots level administration, especially at the frontlines of the democratic setup.
The constitution of India directs the state governments to bestow Panchayats with the powers and authority necessary for their effective functioning as entities of self-governance with the central responsibility of preparing and implementing plans for social justice and economic development. Local bodies of governance have been given direct responsibility for decentralized development planning in the Constitution. Thus, decentralized governance has emerged into a constitutionally recognized function of the Panchayats. Several state Governments having taken steps to enable and empower the elected PRIs to fulfill their responsibilities in rural governance, thereby deepening and widening Indian democracy.
154
For the first time in 1959, Karnataka passed the Grama Panchayat and local Governments Act (Panchayat and Local Board Act). Thereafter, in 1960, laws were passed for Grama and Taluk Panchayats, and outlined membership in Zilla Panchayats. This situation was in force till 1983; during which time, elections were not held regularly and resulting in a scenario where Gram Panchayats were predominantly under the control of appointed administrators.
Strengthening Panchayati Raj System, in Karnataka, was the dream child of late Abdul Nazir Sab, the then Rural Development Minister and Sri. Ramakrishna Hegde, the then Chief Minister of Karnataka, shared this vision and enacted the first independent legislation on PRIs in 1983 and was brought into effect from 1987.
The 73rd Constitutional Amendment bill came into force in 1993. It exclusively deals with rural governance through Panchayat Raj Institutions and clearly mandated that states with a population of 20 Lakhs and above should introduce a three-tier system of Panchayat Raj. The Karnataka Panchayati Raj Act of 1993 incorporates the decentralized institutional structure set out by the 73rd Amendment. It has established the Gram Panchayat at the village level, Taluka Panchayat at the intermediate level and Zilla Panchayat at the district level.
10.3. Panchayat Raj Institutions: Structure and Process
A new wind of change was ushered in at the frontlines of democracy through the rural local bodies by the 73rd Amendment to the Constitution. Some of the important characteristics brought about by the 73rd Amendment to the Constitution and the Karnataka Panchayats Act 1993 are listed below.
• Establishment of three-tier system namely, Gram Panchayat at Village level, Taluk Panchayat at Taluk level and Zilla Panchayat at district level.
• Mandatory local body election every five years.
• Reservation of seats and offices for SCs/STs in proportion to their population in every local body with provision for rotation of the reserved seats and offices.
• Reservation of seats and offices for women.
• Constitution of State Election Commission as an independent body to conduct elections to both rural and urban local bodies periodically.
• Establishment of State Finance Commission to recommend devolution of resources from the State Government to the rural and urban local bodies.
• Constitution of a District Planning Committee to consolidate the plans prepared by the rural local bodies in the district with a view to preparing a comprehensive development plan for the district.
• Introduction of the concept of Grama Sabha comprising all registered voters in a Grama Panchayat.
As part of the decentralization process, wide-ranging development activities have been assigned to PRIs through the Eleventh Schedule affixed to the Constitution of India. These development activities include:
• Productive activities like agriculture, irrigation, animal husbandry, poultry, fishery, fuel and fodder, cottage industries and small-scale industries including food processing and;
• Land development programmes namely, soil conservation, land reforms, water management and watershed development, minor irrigation, social forestry and grazing lands, wasteland development;
• Education and Cultural activities namely primary schools, adult education, technical education and libraries;
• Social welfare activities like family welfare, women and child development, care of people with physical and mental disabilities;
• Social and economic advancement of the weaker sections through poverty alleviation and allied programmes;
• Provisions for civic amenities namely rural housing and health, drinking water, rural electrification, rural roads, non-conventional sources of energy, bridges, culverts, waterways, sanitation;
155
• Public distribution system and maintenance of community assets and;
• Organization of rural markets, village fairs and its control.
Devolution At the three tiers of the Panchayat Raj Institutions, various committees have been constituted for devolution of functions in their respective spheres of development work. The process of decentralization and delegation of powers and functions in Panchayats is planned to be a continuous and dynamic process. The present system has been formulated in such a way that delegating even more powers and functions to the rural local bodies especially the Grama Panchayats is possible.
Pyramidal Structure of PRIsPanchayat Raj Institutions have a pyramidal structure. The Grama Panchayat at the lower level, the Taluk Panchayat at the intermediate level and Zilla Panchayat at the district level.
Gram Panchayat Section 4 of the PRI Act provides for constituting Panchayat for the area comprising of a village or group of villages having a population of 5,000 and not more than 7,000. The functions of the Gram Panchayat are mentioned in Section 58 and comprise 32 functions with three Standing Committees: 1. Production Committee, 2. Social Justice Committee, and 3. Amenities Committee. Functions of Gram PanchayatBeing the basic unit of the democratic set up in India, Gram Panchayats is entrusted with several important functions of rural governance. They are:
• Providing sanitary latrines to the households and constructing adequate number of community latrines for the use of men and women and maintaining them;
• Maintaining water supply works either on its own or by annual contract by generating adequate resources;
• Revising and collecting taxes, rates and fees periodically as per the Act;
• Ensuring universal enrolment of children in primary school;
• Achieving universal immunization of children;
• Ensuring prompt registration and reporting of births and deaths;
• Providing sanitation and proper drainage;
• Construction, repair and maintenance of public streets;
• Removing encroachments on public streets or public places;
• Providing adequate number of street lights and paying electricity charges regularly;
• Filling-up insanitary depressions and reclaiming unhealthy localities;
• Destruction of rabid and ownerless dogs;
• Maintenance of all community assets vested in it;
• Maintenance of records relating to population census crop census, cattle census, census of unemployed persons and persons below poverty line;
• Earmarking places away from the dwelling houses for dumping refuse and manure.
Taluk PanchayatsThe next higher tier is the Taluk Panchayat (TP), constituted for each taluk and consists of members directly elected through election by all the residents in the non-urban areas of the taluk. The strength of the TP varies depending on the population; taluks with population of less than one lakh can have 15 members and those having more than one lakh, can elect 19 members. Seats are reserved for scheduled castes on the basis of their population and for women, the number being not more than two. Members of Legislative Assembly (MLA) whose constituencies lie within the taluk and members of the Legislative Council (MLCs) are entitled to take part in the proceedings and also vote in the meetings. The presidents and vice-presidents of TPs would be elected from among members only. The term of all directly elected members is five years. The MLAs and MLCs hold office till the end
156
of their tenure in the state legislature. Section 145 of the Act lists four main functions with 28 detailed functions to be performed by the Panchayat. The functions are mainly supervisory and to monitor the progress of the schemes. There are three Standing Committees like, the General Standing Committee, Finance, Auditing and Planning Committee and Social Justice Committee.
Functions Taluk Panchayat is at the intermediate level of PRI. It predominantly has a supervisory role with specific responsibilities of monitoring the progress of various development schemes. Some of its major functions are:
• Construction and augmentation of water supply works;
• Filing half-yearly report regarding the activities of Grama Panchayats within the taluk regarding:
- Holding of Grama Sabha; - Maintenance of water supply works; - Construction of individual and community latrines - Collection and revision of taxes, rates and fees; - Payment of electricity charges; - Enrolment in schools; and - Progress of immunization.
• Providing adequate number of classrooms and maintaining primary school buildings in proper condition, including water supply and sanitation;
• Acquiring land for locating the manure pits away from the dwelling houses in the villages.
Standing Committees: Standing Committees under the Taluk Panchayat are as follows: • General Standing Committee;
• Finance, Audit and Planning Committee; • Social Justice Committee
Zilla PanchayatZilla Panchayat (ZP) is a body constituted under the Karnataka Panchayat Raj Act, 1993.Section 184 of the Act lists four main functions and 29 detailed functions are given in Schedule III. There are 5 Standing Committees: General Standing Committee, Finance, Audit and Planning Committee, Social Justice Committee, Education & Health Committee and Agriculture & Industries Committee.
FunctionsZilla Panchayat is entrusted with several major functions as follows:
• Establishment of health centers including maternity centers so as to cover the entire population within five years, as per the norms laid down by the Government;
• Construction of underground water recharge structures to ensure availability of water in the drinking water wells;
• Prevention of drilling of irrigation bore wells in the vicinity of drinking water wells to ensure adequate drinking water, especially in lean season; and
• Drawing up a plan for social forestry development in each taluk and spending not less than such percentage of the District Plan allocation every year as may be specified by the Government from time to time.
The organizational structure of the three Institutions is given in the following Charts 10.1, 10.2 and 10.3.
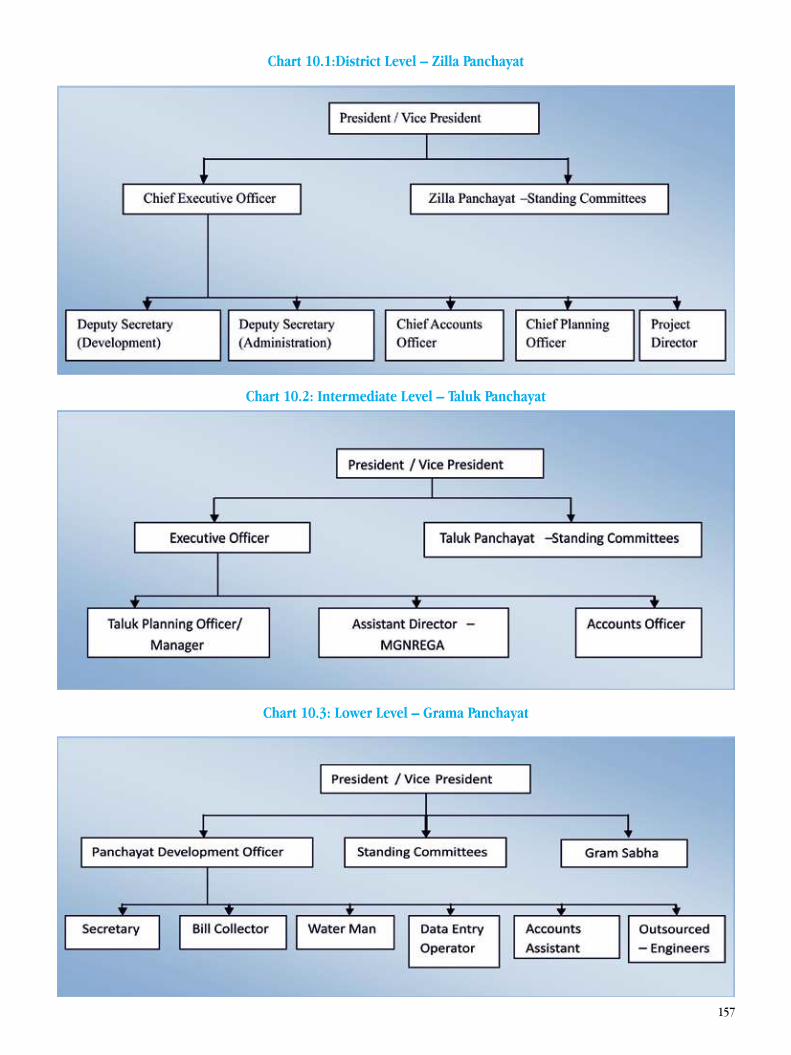
157
Chart 10.1:District Level – Zilla Panchayat
Chart 10.2: Intermediate Level – Taluk Panchayat
Chart 10.3: Lower Level – Grama Panchayat
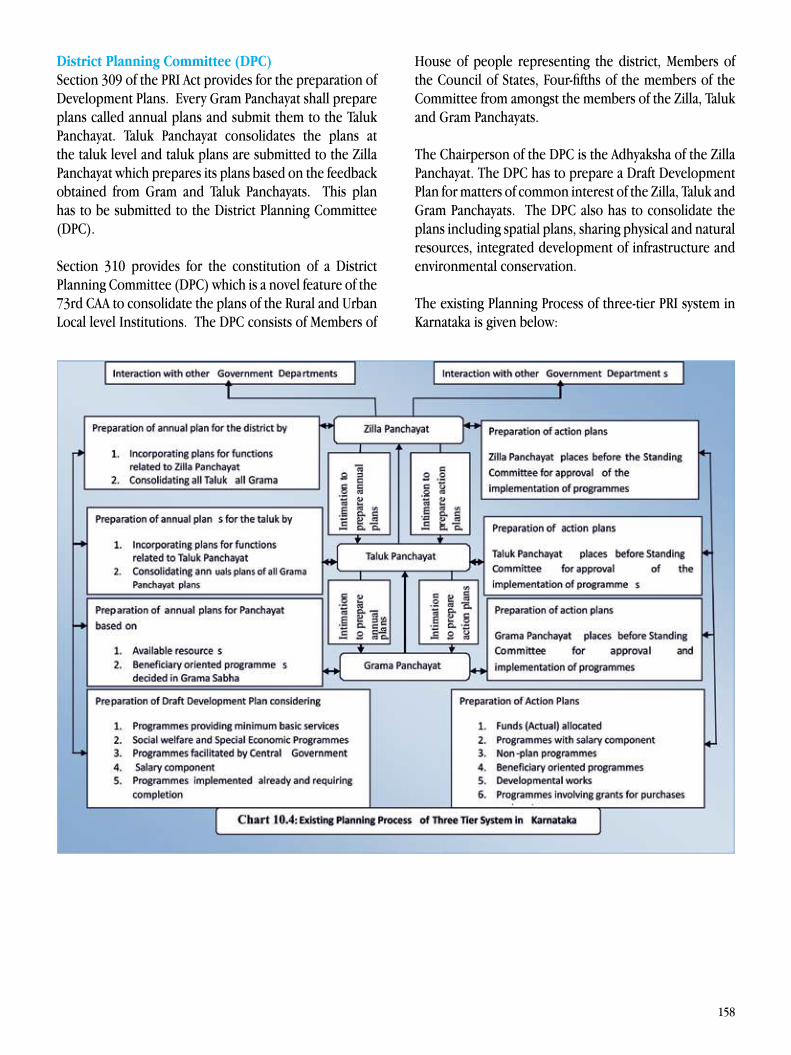
158
District Planning Committee (DPC)Section 309 of the PRI Act provides for the preparation of Development Plans. Every Gram Panchayat shall prepare plans called annual plans and submit them to the Taluk Panchayat. Taluk Panchayat consolidates the plans at the taluk level and taluk plans are submitted to the Zilla Panchayat which prepares its plans based on the feedback obtained from Gram and Taluk Panchayats. This plan has to be submitted to the District Planning Committee (DPC).
Section 310 provides for the constitution of a District Planning Committee (DPC) which is a novel feature of the 73rd CAA to consolidate the plans of the Rural and Urban Local level Institutions. The DPC consists of Members of
House of people representing the district, Members of the Council of States, Four-fifths of the members of the Committee from amongst the members of the Zilla, Taluk and Gram Panchayats.
The Chairperson of the DPC is the Adhyaksha of the Zilla Panchayat. The DPC has to prepare a Draft Development Plan for matters of common interest of the Zilla, Taluk and Gram Panchayats. The DPC also has to consolidate the plans including spatial plans, sharing physical and natural resources, integrated development of infrastructure and environmental conservation.
The existing Planning Process of three-tier PRI system in Karnataka is given below:
159
The District Plan has to concentrate on the following:
1. Document and analyze district economy based on the detailed resources inventory and establish levels of development of sub-districts/Taluks 2. Formulate District Sector schemes 3. Prepare Integrated Spatial Development Plans to direct investment on infrastructure and district service networks system for social and economic development. 4. Prepare employment budgeting and plans 5. Prepare urban and rural sectoral development plans 6. Identify overall finances available for annual and five year plans and disaggregate finances under national, State and district sector schemes and prepare perspective five year and annual integrated development plan for the district. 7. Monitor and evaluate projects implemented at the district level. 8. Building a District Vision.
The Planning Commission is also of the view that the local self Governments should also undertake a stock-taking exercise to assess the human conditions and also the availability of natural, social and financial resources, and infrastructures. This requires a good data base at all three levels to be consolidated at the Zilla level. The Planning Commission is insisting all the States to prepare Human Development Report at the State and the district levels and to use these reports as “Development Radars”. Development Radars are a pictorial depiction of the performance of a unit of planning in respect of various sectors such as health, education, poverty alleviation, drinking water and housing. Development Radars could also be used as a report card that can measure progress on the development parameters that comprise it.
10.4. Urban Local Bodies: Structure, Issues and Processes
The 74th Amendment has given a constitutional recognition to a third-tier local government. Structurally, the Amendment has provided for an elected body, with 1/3rd of seats reserved for women, formation of ward committees, setting up of a State Finance Commission, Election Commission and a Planning Body. The Amendment was passed by Parliament in the year 1992 and received the President’s assent on June 3 1993. By June 1994, the Act became operational in all the States. The Constitution provides that the legislature of
any State may, by law, endow the Panchayats and the Municipalities, with such powers and authority as may be necessary to enable them to function as institutions of self-government and such law may contain provisions for the devolution of powers and responsibilities upon Panchayat and Municipalities at the appropriate level.
The structureMunicipal areas are specified based on the Population, density of Population, revenue generated, economic importance and such other viability. There are five categories of ULBs in Karnataka: 1. The Municipal Corporation 2. The City Municipal Councils 3. Town Municipal Councils 4. Town Panchayats 5. Notified Area Committees
The Corporations cover a Population of 3 lakh and above with more than 30 and less than one hundred councilors, 23 to 35 councilors from a Population range of 20,000 to 3 lakhs comprise the Municipal Councils, the Town Panchayats comprises of a Population ranging from 10 to 25 thousand, with not less than 50 % of the Population being in non-agricultural activities. Also for specified areas like industrial areas where municipal services are required to be provided, the government has created Notified Area Committees . About 1/3rd seats are reserved for SCs/STs depending on their Population.1/3rd of the seats are reserved for the OBCs and half of the seats reserved for women. Ward Committees and Ward Sabhas are also urban governance mechanisms introduced by the Corporation and the Municipality Act. Ward Committee are constituted in cities with more than three Lakhs or more Population, with the Councilors of the Corporation as members and five knowledgeable persons of the area as nominated members. Ward Committees and Sabhas form important forums which seek citizen’s participation.
The State has devolved 16 out of the 18 functions specified by the 12th Schedule of the Indian Constitution to the ULBs (excluding Urban Planning and Fire services). The ULBs are expected to perform discretionary and obligatory functions as per KMC Act such as sanitation and public health, establishment, maintenance and regulation of public amenities, education, water supply and drainage, and regulation of building activities etc. Under the jurisdiction of Mandya District, seven elected ULBs including City Municipal Council of Mandya are functioning. All the Urban Local Bodies have elected and
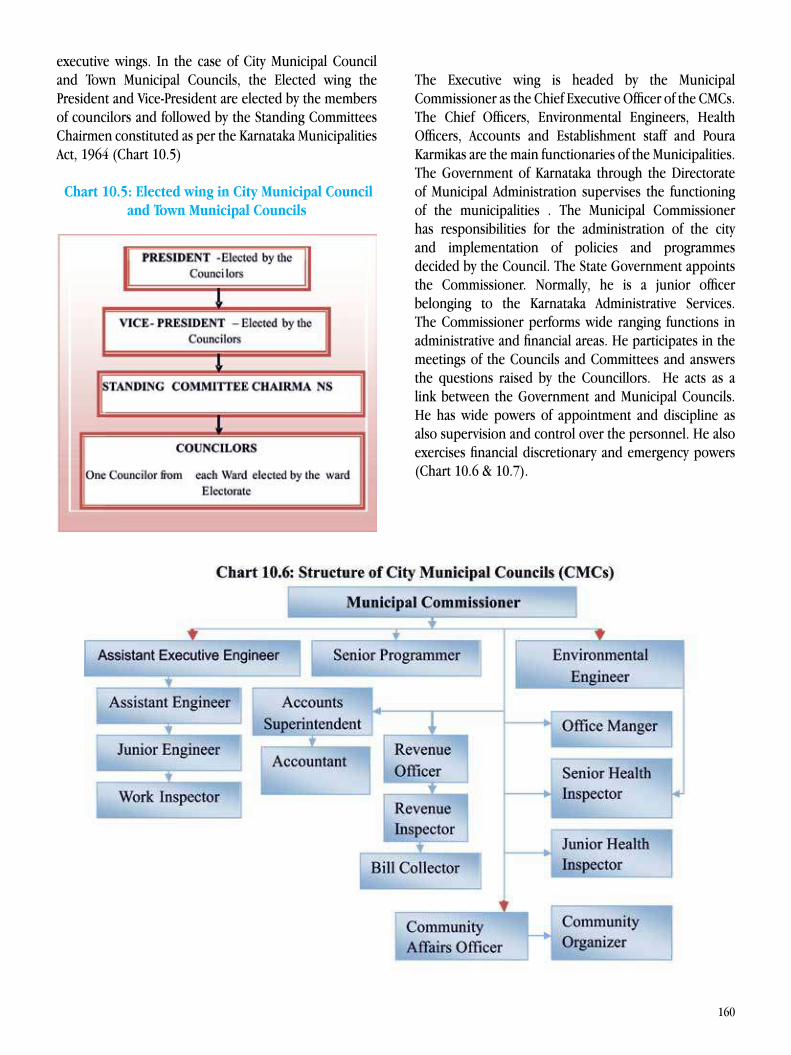
160
executive wings. In the case of City Municipal Council and Town Municipal Councils, the Elected wing the President and Vice-President are elected by the members of councilors and followed by the Standing Committees Chairmen constituted as per the Karnataka Municipalities Act, 1964 (Chart 10.5) Chart 10.5: Elected wing in City Municipal Council
and Town Municipal Councils
The Executive wing is headed by the Municipal Commissioner as the Chief Executive Officer of the CMCs. The Chief Officers, Environmental Engineers, Health Officers, Accounts and Establishment staff and Poura Karmikas are the main functionaries of the Municipalities. The Government of Karnataka through the Directorate of Municipal Administration supervises the functioning of the municipalities . The Municipal Commissioner has responsibilities for the administration of the city and implementation of policies and programmes decided by the Council. The State Government appoints the Commissioner. Normally, he is a junior officer belonging to the Karnataka Administrative Services. The Commissioner performs wide ranging functions in administrative and financial areas. He participates in the meetings of the Councils and Committees and answers the questions raised by the Councillors. He acts as a link between the Government and Municipal Councils. He has wide powers of appointment and discipline as also supervision and control over the personnel. He also exercises financial discretionary and emergency powers (Chart 10.6 & 10.7).
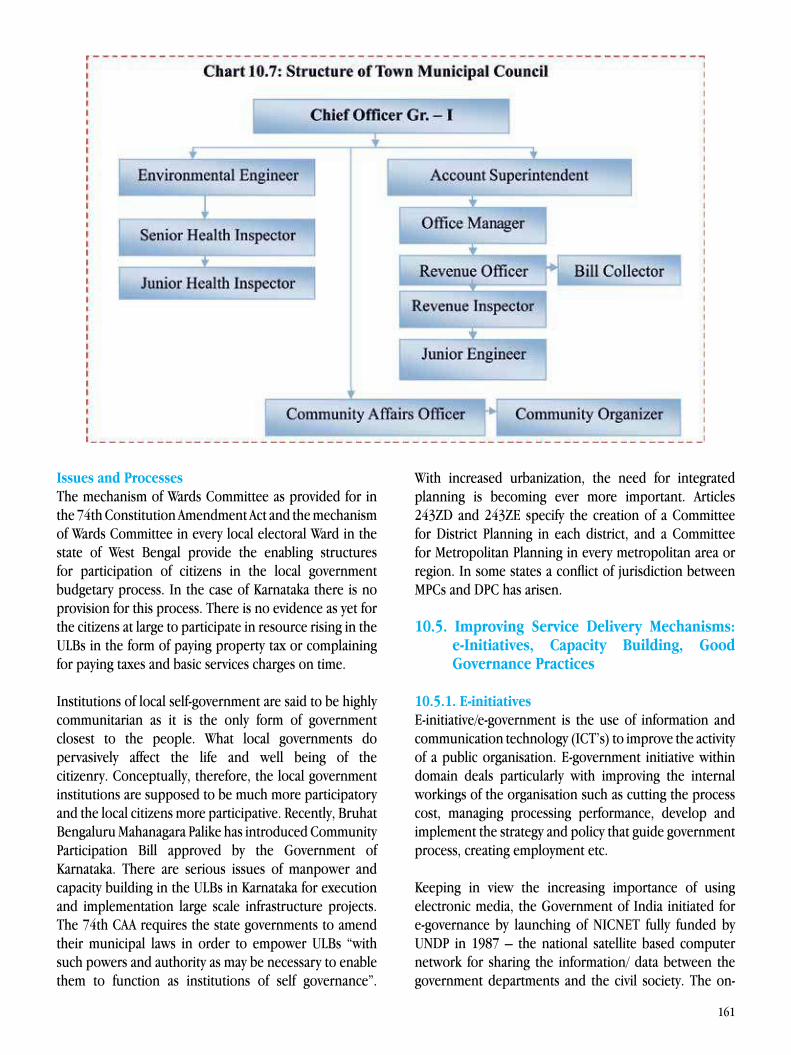
161
Issues and ProcessesThe mechanism of Wards Committee as provided for in the 74th Constitution Amendment Act and the mechanism of Wards Committee in every local electoral Ward in the state of West Bengal provide the enabling structures for participation of citizens in the local government budgetary process. In the case of Karnataka there is no provision for this process. There is no evidence as yet for the citizens at large to participate in resource rising in the ULBs in the form of paying property tax or complaining for paying taxes and basic services charges on time.
Institutions of local self-government are said to be highly communitarian as it is the only form of government closest to the people. What local governments do pervasively affect the life and well being of the citizenry. Conceptually, therefore, the local government institutions are supposed to be much more participatory and the local citizens more participative. Recently, Bruhat Bengaluru Mahanagara Palike has introduced Community Participation Bill approved by the Government of Karnataka. There are serious issues of manpower and capacity building in the ULBs in Karnataka for execution and implementation large scale infrastructure projects. The 74th CAA requires the state governments to amend their municipal laws in order to empower ULBs “with such powers and authority as may be necessary to enable them to function as institutions of self governance”.
With increased urbanization, the need for integrated planning is becoming ever more important. Articles 243ZD and 243ZE specify the creation of a Committee for District Planning in each district, and a Committee for Metropolitan Planning in every metropolitan area or region. In some states a conflict of jurisdiction between MPCs and DPC has arisen.
10.5. Improving Service Delivery Mechanisms: e-Initiatives, Capacity Building, Good Governance Practices
10.5.1. E-initiativesE-initiative/e-government is the use of information and communication technology (ICT’s) to improve the activity of a public organisation. E-government initiative within domain deals particularly with improving the internal workings of the organisation such as cutting the process cost, managing processing performance, develop and implement the strategy and policy that guide government process, creating employment etc.
Keeping in view the increasing importance of using electronic media, the Government of India initiated for e-governance by launching of NICNET fully funded by UNDP in 1987 – the national satellite based computer network for sharing the information/ data between the government departments and the civil society. The on-
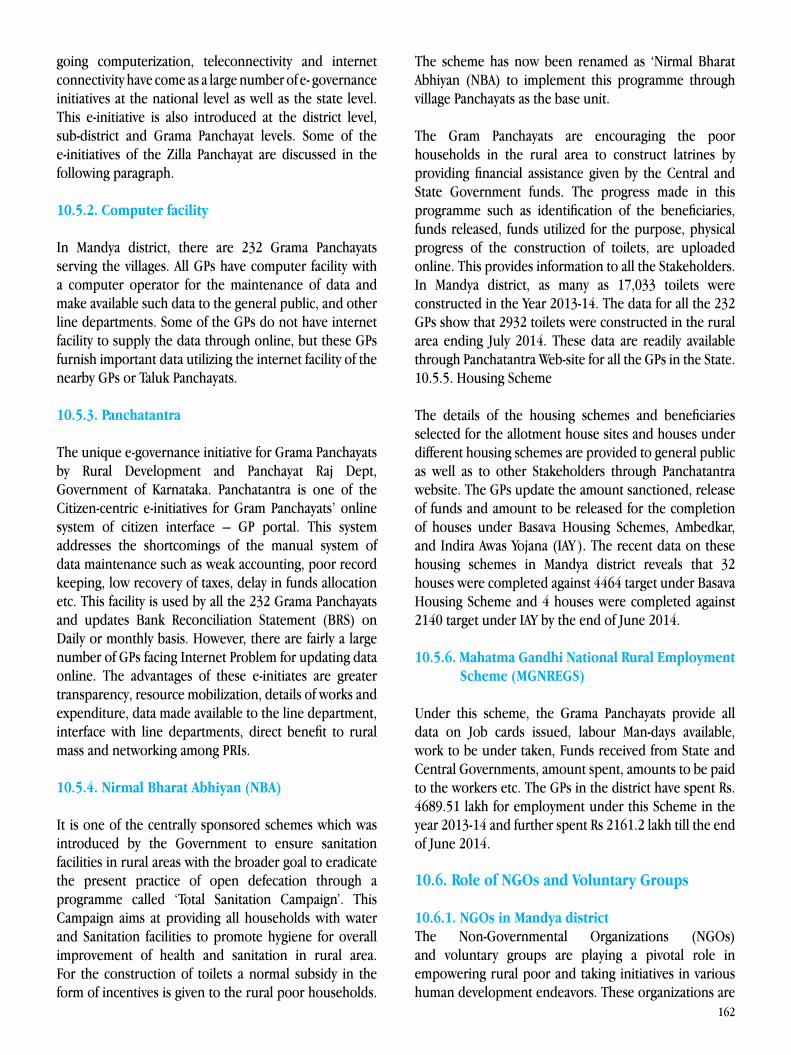
162
going computerization, teleconnectivity and internet connectivity have come as a large number of e- governance initiatives at the national level as well as the state level. This e-initiative is also introduced at the district level, sub-district and Grama Panchayat levels. Some of the e-initiatives of the Zilla Panchayat are discussed in the following paragraph.
10.5.2. Computer facility
In Mandya district, there are 232 Grama Panchayats serving the villages. All GPs have computer facility with a computer operator for the maintenance of data and make available such data to the general public, and other line departments. Some of the GPs do not have internet facility to supply the data through online, but these GPs furnish important data utilizing the internet facility of the nearby GPs or Taluk Panchayats.
10.5.3. Panchatantra
The unique e-governance initiative for Grama Panchayats by Rural Development and Panchayat Raj Dept, Government of Karnataka. Panchatantra is one of the Citizen-centric e-initiatives for Gram Panchayats’ online system of citizen interface – GP portal. This system addresses the shortcomings of the manual system of data maintenance such as weak accounting, poor record keeping, low recovery of taxes, delay in funds allocation etc. This facility is used by all the 232 Grama Panchayats and updates Bank Reconciliation Statement (BRS) on Daily or monthly basis. However, there are fairly a large number of GPs facing Internet Problem for updating data online. The advantages of these e-initiates are greater transparency, resource mobilization, details of works and expenditure, data made available to the line department, interface with line departments, direct benefit to rural mass and networking among PRIs.
10.5.4. Nirmal Bharat Abhiyan (NBA)
It is one of the centrally sponsored schemes which was introduced by the Government to ensure sanitation facilities in rural areas with the broader goal to eradicate the present practice of open defecation through a programme called ‘Total Sanitation Campaign’. This Campaign aims at providing all households with water and Sanitation facilities to promote hygiene for overall improvement of health and sanitation in rural area. For the construction of toilets a normal subsidy in the form of incentives is given to the rural poor households.
The scheme has now been renamed as ‘Nirmal Bharat Abhiyan (NBA) to implement this programme through village Panchayats as the base unit.
The Gram Panchayats are encouraging the poor households in the rural area to construct latrines by providing financial assistance given by the Central and State Government funds. The progress made in this programme such as identification of the beneficiaries, funds released, funds utilized for the purpose, physical progress of the construction of toilets, are uploaded online. This provides information to all the Stakeholders.In Mandya district, as many as 17,033 toilets were constructed in the Year 2013-14. The data for all the 232 GPs show that 2932 toilets were constructed in the rural area ending July 2014. These data are readily available through Panchatantra Web-site for all the GPs in the State.10.5.5. Housing Scheme
The details of the housing schemes and beneficiaries selected for the allotment house sites and houses under different housing schemes are provided to general public as well as to other Stakeholders through Panchatantra website. The GPs update the amount sanctioned, release of funds and amount to be released for the completion of houses under Basava Housing Schemes, Ambedkar, and Indira Awas Yojana (IAY ). The recent data on these housing schemes in Mandya district reveals that 32 houses were completed against 4464 target under Basava Housing Scheme and 4 houses were completed against 2140 target under IAY by the end of June 2014.
10.5.6. Mahatma Gandhi National Rural Employment Scheme (MGNREGS)
Under this scheme, the Grama Panchayats provide all data on Job cards issued, labour Man-days available, work to be under taken, Funds received from State and Central Governments, amount spent, amounts to be paid to the workers etc. The GPs in the district have spent Rs. 4689.51 lakh for employment under this Scheme in the year 2013-14 and further spent Rs 2161.2 lakh till the end of June 2014.
10.6. Role of NGOs and Voluntary Groups
10.6.1. NGOs in Mandya districtThe Non-Governmental Organizations (NGOs) and voluntary groups are playing a pivotal role in empowering rural poor and taking initiatives in various human development endeavors. These organizations are
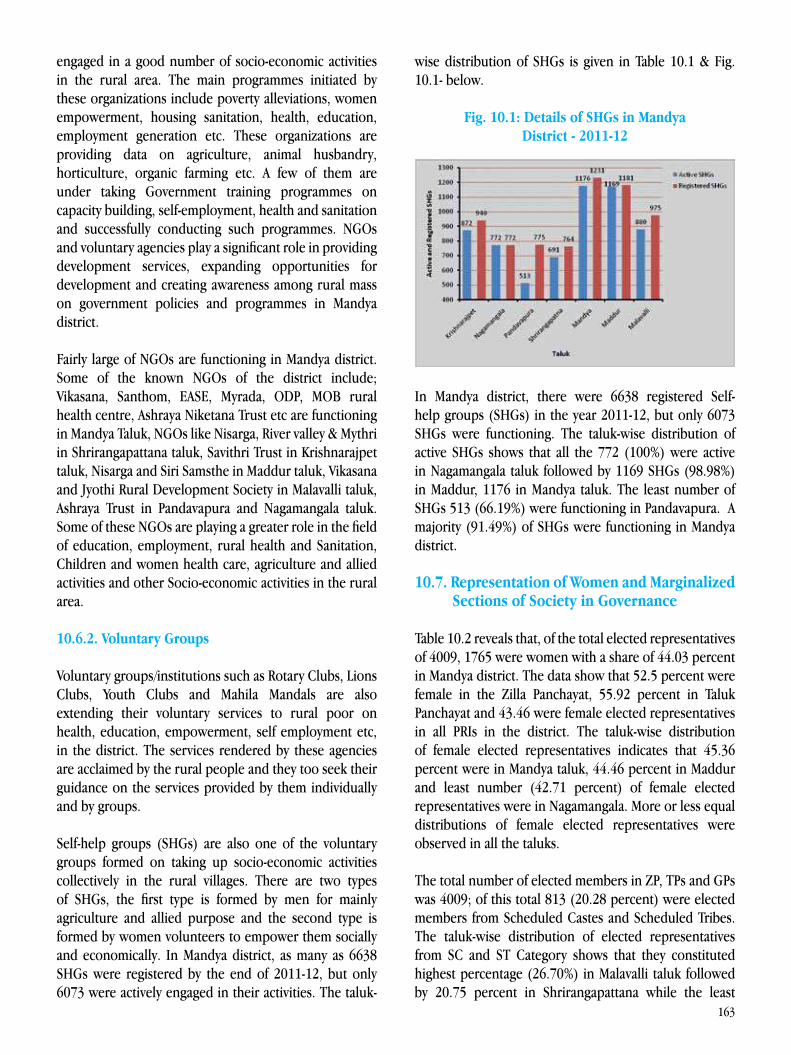
163
engaged in a good number of socio-economic activities in the rural area. The main programmes initiated by these organizations include poverty alleviations, women empowerment, housing sanitation, health, education, employment generation etc. These organizations are providing data on agriculture, animal husbandry, horticulture, organic farming etc. A few of them are under taking Government training programmes on capacity building, self-employment, health and sanitation and successfully conducting such programmes. NGOs and voluntary agencies play a significant role in providing development services, expanding opportunities for development and creating awareness among rural mass on government policies and programmes in Mandya district.
Fairly large of NGOs are functioning in Mandya district. Some of the known NGOs of the district include; Vikasana, Santhom, EASE, Myrada, ODP, MOB rural health centre, Ashraya Niketana Trust etc are functioning in Mandya Taluk, NGOs like Nisarga, River valley & Mythri in Shrirangapattana taluk, Savithri Trust in Krishnarajpet taluk, Nisarga and Siri Samsthe in Maddur taluk, Vikasana and Jyothi Rural Development Society in Malavalli taluk, Ashraya Trust in Pandavapura and Nagamangala taluk. Some of these NGOs are playing a greater role in the field of education, employment, rural health and Sanitation, Children and women health care, agriculture and allied activities and other Socio-economic activities in the rural area.
10.6.2. Voluntary Groups
Voluntary groups/institutions such as Rotary Clubs, Lions Clubs, Youth Clubs and Mahila Mandals are also extending their voluntary services to rural poor on health, education, empowerment, self employment etc, in the district. The services rendered by these agencies are acclaimed by the rural people and they too seek their guidance on the services provided by them individually and by groups.
Self-help groups (SHGs) are also one of the voluntary groups formed on taking up socio-economic activities collectively in the rural villages. There are two types of SHGs, the first type is formed by men for mainly agriculture and allied purpose and the second type is formed by women volunteers to empower them socially and economically. In Mandya district, as many as 6638 SHGs were registered by the end of 2011-12, but only 6073 were actively engaged in their activities. The taluk-
wise distribution of SHGs is given in Table 10.1 & Fig. 10.1- below.
Fig. 10.1: Details of SHGs in Mandya District - 2011-12
In Mandya district, there were 6638 registered Self-help groups (SHGs) in the year 2011-12, but only 6073 SHGs were functioning. The taluk-wise distribution of active SHGs shows that all the 772 (100%) were active in Nagamangala taluk followed by 1169 SHGs (98.98%) in Maddur, 1176 in Mandya taluk. The least number of SHGs 513 (66.19%) were functioning in Pandavapura. A majority (91.49%) of SHGs were functioning in Mandya district.
10.7. Representation of Women and Marginalized Sections of Society in Governance
Table 10.2 reveals that, of the total elected representatives of 4009, 1765 were women with a share of 44.03 percent in Mandya district. The data show that 52.5 percent were female in the Zilla Panchayat, 55.92 percent in Taluk Panchayat and 43.46 were female elected representatives in all PRIs in the district. The taluk-wise distribution of female elected representatives indicates that 45.36 percent were in Mandya taluk, 44.46 percent in Maddur and least number (42.71 percent) of female elected representatives were in Nagamangala. More or less equal distributions of female elected representatives were observed in all the taluks.
The total number of elected members in ZP, TPs and GPs was 4009; of this total 813 (20.28 percent) were elected members from Scheduled Castes and Scheduled Tribes. The taluk-wise distribution of elected representatives from SC and ST Category shows that they constituted highest percentage (26.70%) in Malavalli taluk followed by 20.75 percent in Shrirangapattana while the least
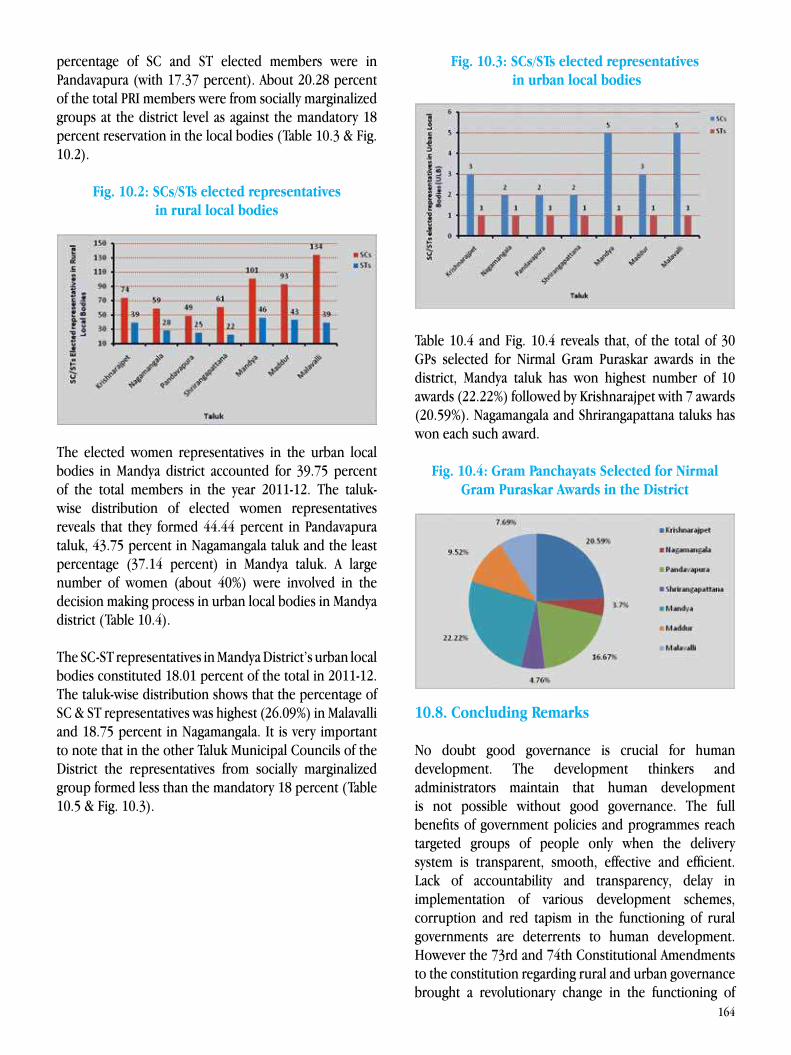
164
percentage of SC and ST elected members were in Pandavapura (with 17.37 percent). About 20.28 percent of the total PRI members were from socially marginalized groups at the district level as against the mandatory 18 percent reservation in the local bodies (Table 10.3 & Fig. 10.2).
Fig. 10.2: SCs/STs elected representatives in rural local bodies
The elected women representatives in the urban local bodies in Mandya district accounted for 39.75 percent of the total members in the year 2011-12. The taluk-wise distribution of elected women representatives reveals that they formed 44.44 percent in Pandavapura taluk, 43.75 percent in Nagamangala taluk and the least percentage (37.14 percent) in Mandya taluk. A large number of women (about 40%) were involved in the decision making process in urban local bodies in Mandya district (Table 10.4).
The SC-ST representatives in Mandya District’s urban local bodies constituted 18.01 percent of the total in 2011-12. The taluk-wise distribution shows that the percentage of SC & ST representatives was highest (26.09%) in Malavalli and 18.75 percent in Nagamangala. It is very important to note that in the other Taluk Municipal Councils of the District the representatives from socially marginalized group formed less than the mandatory 18 percent (Table 10.5 & Fig. 10.3).
Fig. 10.3: SCs/STs elected representatives in urban local bodies
Table 10.4 and Fig. 10.4 reveals that, of the total of 30 GPs selected for Nirmal Gram Puraskar awards in the district, Mandya taluk has won highest number of 10 awards (22.22%) followed by Krishnarajpet with 7 awards (20.59%). Nagamangala and Shrirangapattana taluks has won each such award.
Fig. 10.4: Gram Panchayats Selected for Nirmal Gram Puraskar Awards in the District
10.8. Concluding Remarks
No doubt good governance is crucial for human development. The development thinkers and administrators maintain that human development is not possible without good governance. The full benefits of government policies and programmes reach targeted groups of people only when the delivery system is transparent, smooth, effective and efficient. Lack of accountability and transparency, delay in implementation of various development schemes, corruption and red tapism in the functioning of rural governments are deterrents to human development. However the 73rd and 74th Constitutional Amendments to the constitution regarding rural and urban governance brought a revolutionary change in the functioning of
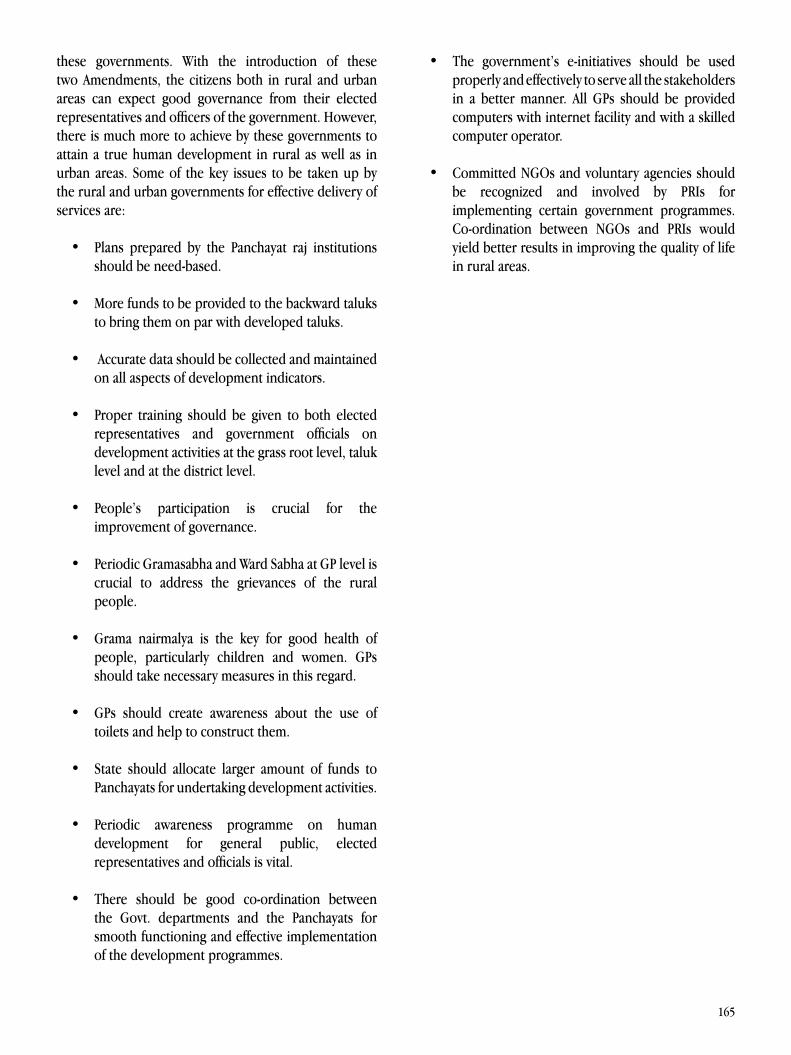
165
these governments. With the introduction of these two Amendments, the citizens both in rural and urban areas can expect good governance from their elected representatives and officers of the government. However, there is much more to achieve by these governments to attain a true human development in rural as well as in urban areas. Some of the key issues to be taken up by the rural and urban governments for effective delivery of services are:
• Plans prepared by the Panchayat raj institutions should be need-based.
• More funds to be provided to the backward taluks to bring them on par with developed taluks.
• Accurate data should be collected and maintained on all aspects of development indicators.
• Proper training should be given to both elected representatives and government officials on development activities at the grass root level, taluk level and at the district level.
• People’s participation is crucial for the improvement of governance.
• Periodic Gramasabha and Ward Sabha at GP level is crucial to address the grievances of the rural people.
• Grama nairmalya is the key for good health of people, particularly children and women. GPs should take necessary measures in this regard.
• GPs should create awareness about the use of toilets and help to construct them.
• State should allocate larger amount of funds to Panchayats for undertaking development activities.
• Periodic awareness programme on human development for general public, elected representatives and officials is vital.
• There should be good co-ordination between the Govt. departments and the Panchayats for smooth functioning and effective implementation of the development programmes.
• The government’s e-initiatives should be used properly and effectively to serve all the stakeholders in a better manner. All GPs should be provided computers with internet facility and with a skilled computer operator.
• Committed NGOs and voluntary agencies should be recognized and involved by PRIs for implementing certain government programmes. Co-ordination between NGOs and PRIs would yield better results in improving the quality of life in rural areas.

166
167
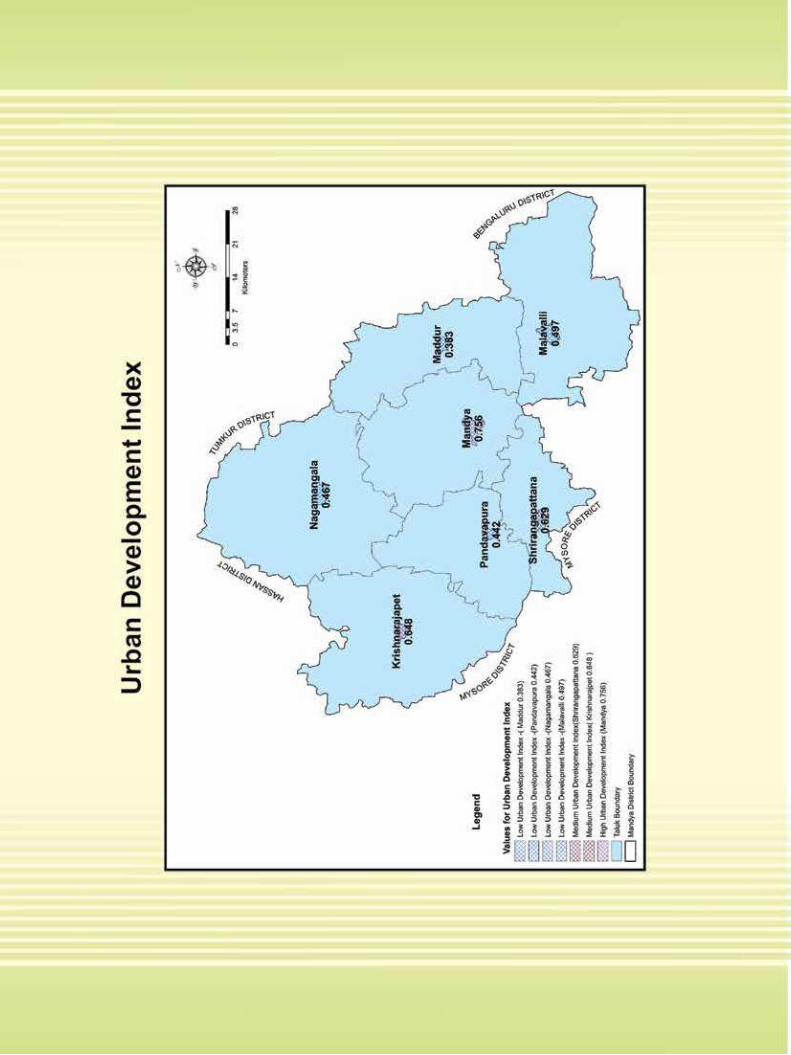
168
169
CHAPTER 11
URBAN ISSUES IN HUMAN DEVELOPMENT
International Airport at Bengaluru and 36 Km to Mysuru Airport. The nearest sea port is at Mangalore which is at a distance of 220 kms (Box 1). 11.2. Service Delivery Issues
One of the duties of the State Government is to provide all its citizens with adequate access to basic services such as water, sanitation, electricity and transport etc. Water, for instance, is an extremely precious natural resource, which must be used judiciously for there to be enough to go around, not just for the present generation, but also for those to come. However, as the 2006 Global HDR points out, access to this resource is also controlled by other factors such as poverty, inequality and government failures, due to which the poor and vulnerable segments of society can be ‘locked out’ .
The 74th Constitutional amendment enacted in 1992 envisioned creation of local self-governments for the urban population wherein municipalities were provided with the constitutional status for governance. The amendment empowered Urban Local Bodies (ULBs) to function efficiently and effectively as autonomous entities to deliver services for economic development and social justice with regard to 18 subjects listed in XII Schedule of the Constitution. The amendment introduced certain uniformity in the fundamental structure of the ULBs at the national level. However since ULBs are a State subject, State Legislative Acts govern these bodies and set out their powers, responsibilities, service delivery mandates and obligations with regard to accounting, audit and supervision. The Municipalities have been entrusted with the implementation of schemes for economic development and social justice including those in relation to the matters listed in the Twelfth schedule.
These, responsibilities among others are: - Urban planning and town planning -Regulation of land-use and construction of buildings -Planning for social and economic development -Slum improvement and up gradation -Provision of urban amenities and facilities such as parks, gardens, playgrounds -Public amenities including street lighting, parking lots, bus stops and public conveniences etc.
11.1. Introduction
“Human development, as an approach, is concerned with what I take to be the basic development idea: namely, advancing the richness of human life, rather than the richness of the economy in which human beings live, which is only a part of it.”—Amartya Sen .
The Urban Development Indicators and the index thereof indicate impart report analysis the issues regarding the status of human development in Mandya district. Urban Local Bodies (ULBs) are looked at two perspectives: first, the objective facts on the ground based data/information provided by the concerned departments; and second, people’s perceptions about the services in slums. The latter is based on the findings of a small area study conducted in Malavalli town slum areas, with a representative sample of around 51 households. This study probes how people rate various developmental issues as well as what their own aspirations are as the citizens of Malavalli Town.
The Karnataka State has a population of 61.13 million (Census of India, 2011), and ranks by ninth among states in respect of total population. Karnataka is one of the fastest growing and urbanizing states of the country, with more than 1/3rd of its inhabitants or 33.98 per cent of its population residing in urban areas, well above the National average . In terms of urbanization, the State has witnessed an increase of 4.68 per cent in the proportion of urban population in the last decade. Karnataka’s urban population has grown by 31.27% between 2001 and 2011, compared with 28.85% in the previous decade. Karnataka has emerged as a key state with knowledge-based industries such as IT, Biotechnology and Engineering.
The Mandya district has seven Urban Local Bodies (ULBs), out of which one is City Municipal Council (CMC) viz, Mandya, four are Town Municipal Councils (TMCs) such as Krishnarajpet, Shrirangapattana, Maddur, Malavalli and two are Town Panchayats (TPs) of Nagamangala and Pandavapura. The Mandya City is connected by National Highways 48 and National Highway 209 with a railway route, the city is situated 98 Km from Bengaluru city, the Capital of Karnataka. Mandya city has good connectivity having the proximity of 130 km to KempeGowda
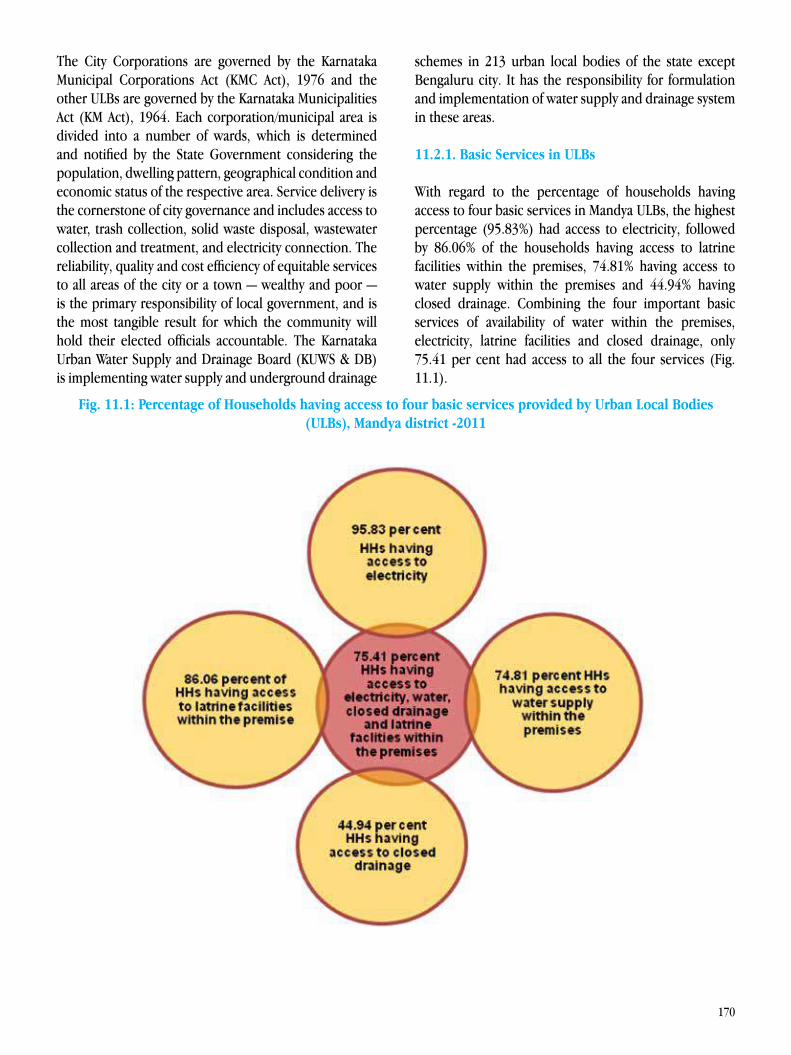
170
The City Corporations are governed by the Karnataka Municipal Corporations Act (KMC Act), 1976 and the other ULBs are governed by the Karnataka Municipalities Act (KM Act), 1964. Each corporation/municipal area is divided into a number of wards, which is determined and notified by the State Government considering the population, dwelling pattern, geographical condition and economic status of the respective area. Service delivery is the cornerstone of city governance and includes access to water, trash collection, solid waste disposal, wastewater collection and treatment, and electricity connection. The reliability, quality and cost efficiency of equitable services to all areas of the city or a town — wealthy and poor — is the primary responsibility of local government, and is the most tangible result for which the community will hold their elected officials accountable. The Karnataka Urban Water Supply and Drainage Board (KUWS & DB) is implementing water supply and underground drainage
schemes in 213 urban local bodies of the state except Bengaluru city. It has the responsibility for formulation and implementation of water supply and drainage system in these areas.
11.2.1. Basic Services in ULBs
With regard to the percentage of households having access to four basic services in Mandya ULBs, the highest percentage (95.83%) had access to electricity, followed by 86.06% of the households having access to latrine facilities within the premises, 74.81% having access to water supply within the premises and 44.94% having closed drainage. Combining the four important basic services of availability of water within the premises, electricity, latrine facilities and closed drainage, only 75.41 per cent had access to all the four services (Fig. 11.1).
Fig. 11.1: Percentage of Households having access to four basic services provided by Urban Local Bodies (ULBs), Mandya district -2011
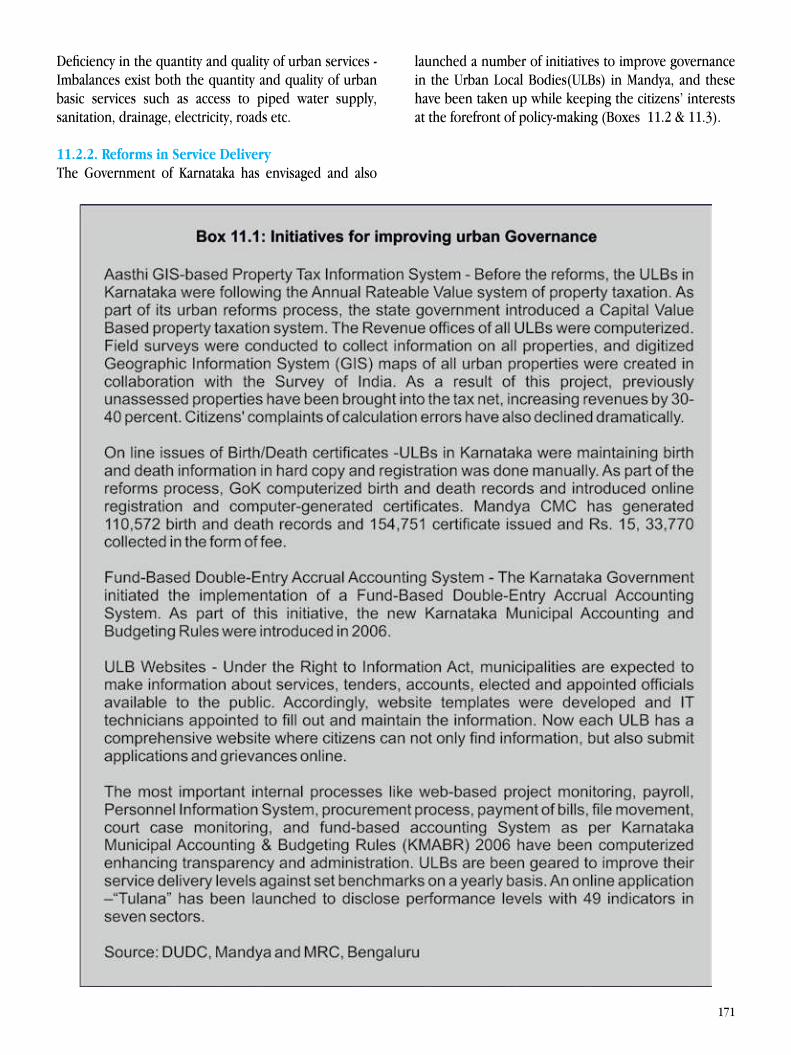
171
Deficiency in the quantity and quality of urban services - Imbalances exist both the quantity and quality of urban basic services such as access to piped water supply, sanitation, drainage, electricity, roads etc.
11.2.2. Reforms in Service DeliveryThe Government of Karnataka has envisaged and also
launched a number of initiatives to improve governance in the Urban Local Bodies(ULBs) in Mandya, and these have been taken up while keeping the citizens’ interests at the forefront of policy-making (Boxes 11.2 & 11.3).
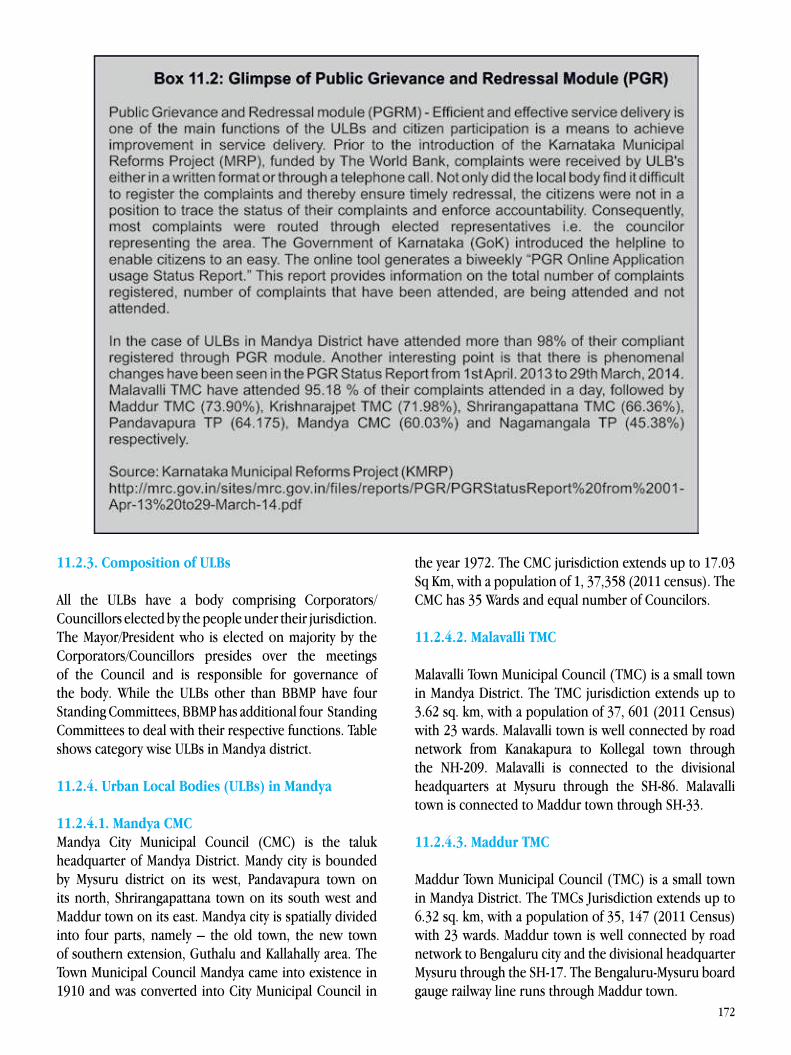
172
11.2.3. Composition of ULBs
All the ULBs have a body comprising Corporators/Councillors elected by the people under their jurisdiction. The Mayor/President who is elected on majority by the Corporators/Councillors presides over the meetings of the Council and is responsible for governance of the body. While the ULBs other than BBMP have four Standing Committees, BBMP has additional four Standing Committees to deal with their respective functions. Table shows category wise ULBs in Mandya district.
11.2.4. Urban Local Bodies (ULBs) in Mandya
11.2.4.1. Mandya CMCMandya City Municipal Council (CMC) is the taluk headquarter of Mandya District. Mandy city is bounded by Mysuru district on its west, Pandavapura town on its north, Shrirangapattana town on its south west and Maddur town on its east. Mandya city is spatially divided into four parts, namely – the old town, the new town of southern extension, Guthalu and Kallahally area. The Town Municipal Council Mandya came into existence in 1910 and was converted into City Municipal Council in
the year 1972. The CMC jurisdiction extends up to 17.03 Sq Km, with a population of 1, 37,358 (2011 census). The CMC has 35 Wards and equal number of Councilors. 11.2.4.2. Malavalli TMC
Malavalli Town Municipal Council (TMC) is a small town in Mandya District. The TMC jurisdiction extends up to 3.62 sq. km, with a population of 37, 601 (2011 Census) with 23 wards. Malavalli town is well connected by road network from Kanakapura to Kollegal town through the NH-209. Malavalli is connected to the divisional headquarters at Mysuru through the SH-86. Malavalli town is connected to Maddur town through SH-33.
11.2.4.3. Maddur TMC
Maddur Town Municipal Council (TMC) is a small town in Mandya District. The TMCs Jurisdiction extends up to 6.32 sq. km, with a population of 35, 147 (2011 Census) with 23 wards. Maddur town is well connected by road network to Bengaluru city and the divisional headquarter Mysuru through the SH-17. The Bengaluru-Mysuru board gauge railway line runs through Maddur town.
173
11.2.4.4. Shrirangapattana TMC
Shrirangapattana Town Municipal Council (TMC) is a small town in Mandya District. The unique feature of this town is the island created by river Cauvery on its eastern and western (Paschima Vaahini) side. Shrirangapattana town is well connected by road network to Bengaluru and Mysuru cities through SH-17. The Bangalore-Mysuru board gauge railway line runs through Shrirangapattana town. Shrirangapattana (10 km from Mysuru city, 128 km from Bengaluru city) is a place of pilgrimage. The TMC jurisdiction extends up to 8.6 sq km, with a population of 34, 153 (2011 Census) within 23 wards. 11.2.4.5. Krishnarajpet TMC
Krishnarajpet Town Municipal Council (TMC) is a small town and taluk headquarters in Mandya District. Krishnarajpet town is well connected by road network through SH-16. The TMC jurisdiction extends up to 4.26 sq km, with a population of 25, 946 (2011 Census). The TMC has 18 Wards and equal number of Councilors.
11.2.4.6. Pandavapura TP
Pandavapura Town Panchayat (TP) is small town in Mandya District. The Visweswarayya Canal (VC Canal) flows through the heart of the town, dividing the town into two parts. Pandavapura town is well connected by road network from through Shrirangapattana town and Mysuru city on SH-19. Pandavapura town is connected to Krishnarajpet and Mandya town through major roads. Pandavapura railway station is located at a distance of 4 km from the towns. The TP jurisdiction extends up to 2.5 sq. km, with a population of 20399 (2011 Census) within 17 wards.
11.2.4.7. Nagamangala TP
Nagamangala Town Panchayat (TP) is small town in Mandya District. Nagamangala was also known as base for
temple architecture and manufacturing of temple jewels and other ornaments. The TP jurisdiction extends up to 2.5 sq. km, with a population of 17, 776 (2011 Census) within 16 wards.
11.2.5. Demographic Profile of Urban Local Bodies (ULBs)
11.2.5.1. General population and growth rateThe percentage of urban population to total population is highest in Mandya CMC jurisdiction it comprises about 33.09 of the total population of Mandya Taluk. This is less than the Karnataka State average of (38%). Percentage of urban population is formed in Nagamangala TP. As the consequence of the percent of rapid urbanization, the total population in urban areas has grown rapidly from 2001 to 2011 censuses. Shrirangapattana TMC has registered highest growth rate (43.85 percent), followed by Maddur TMC (32.53 percent), Krishnarajpet TMC (14.91 percent) and rest of the ULBs having moderate growth rate (Table 2 & Figure 2). The main reason for high growth rate of population in Shrirangapattana TMC is due to its proximity to Mysore; the town is situated along the Mysuru-Bengaluru corridor and it is a focal point for Mandya and Mysore. In the same time the growth rate of slum population has doubled during 2001-2011 Census. In the case of Maddur town since it is located along the Mysuru–Bengaluru Corridor, the phenomenal growth of industrial sector in and around the town has directly contributed to heavy influx population to the town (Table 11.2 & Fig. 11.2). Regarding the level of urbanization, Bengaluru is the most urbanised district with 90.94 per cent of its population residing in urban areas followed by Mysuru district (41.50 per cent) and Mandya district itself is (17.08 per cent), Chamarajanagar district (17.14 per cent) etc. Mandya, Chamarajanagar and Koppal being the least urbanized districts in Karnataka (Census of India, 2011).
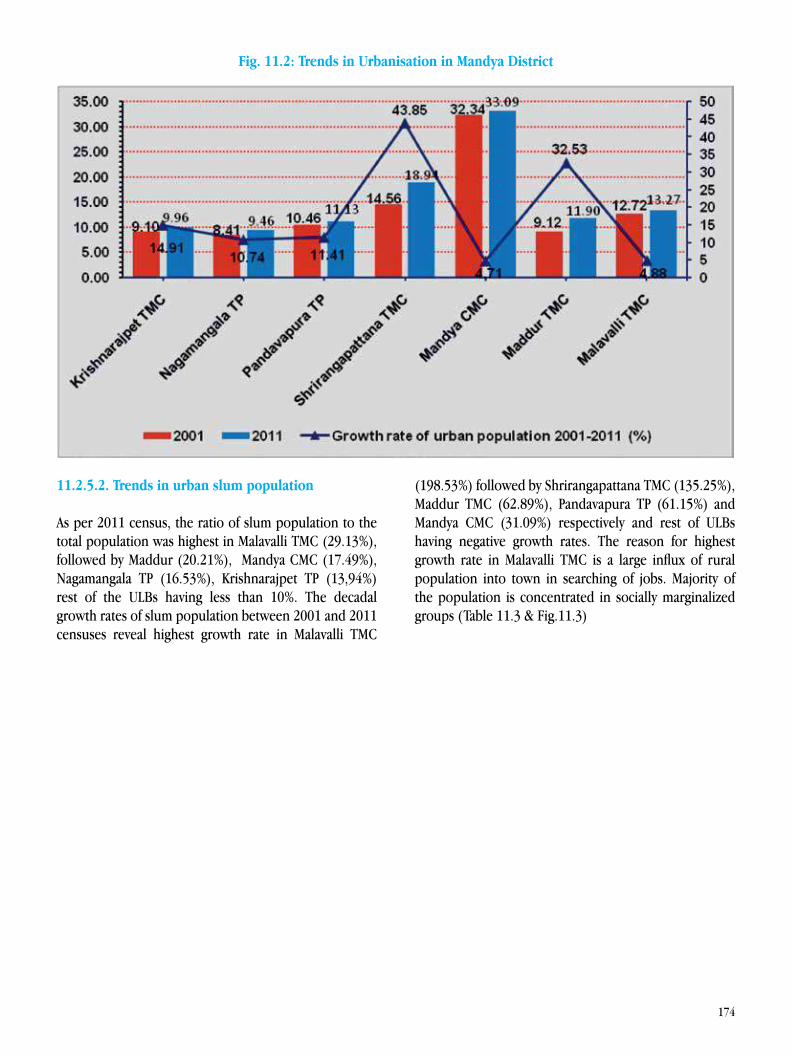
174
Fig. 11.2: Trends in Urbanisation in Mandya District
11.2.5.2. Trends in urban slum population
As per 2011 census, the ratio of slum population to the total population was highest in Malavalli TMC (29.13%), followed by Maddur (20.21%), Mandya CMC (17.49%), Nagamangala TP (16.53%), Krishnarajpet TP (13,94%) rest of the ULBs having less than 10%. The decadal growth rates of slum population between 2001 and 2011 censuses reveal highest growth rate in Malavalli TMC
(198.53%) followed by Shrirangapattana TMC (135.25%), Maddur TMC (62.89%), Pandavapura TP (61.15%) and Mandya CMC (31.09%) respectively and rest of ULBs having negative growth rates. The reason for highest growth rate in Malavalli TMC is a large influx of rural population into town in searching of jobs. Majority of the population is concentrated in socially marginalized groups (Table 11.3 & Fig.11.3)
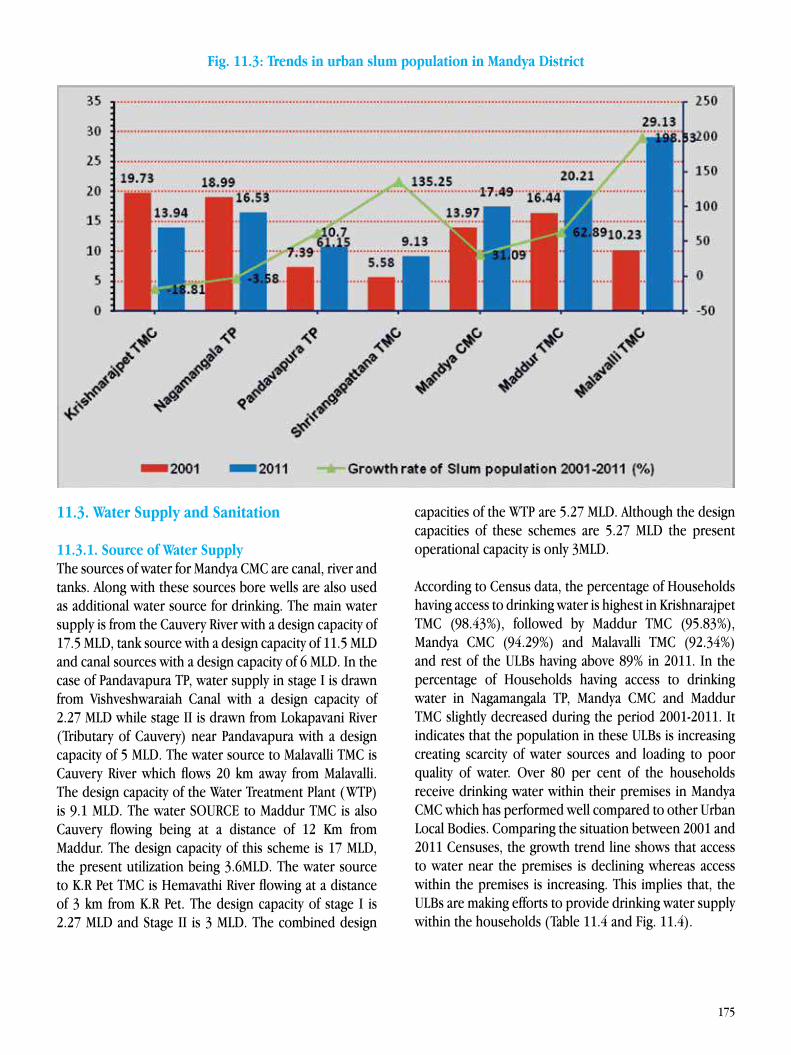
175
Fig. 11.3: Trends in urban slum population in Mandya District
11.3. Water Supply and Sanitation
11.3.1. Source of Water Supply The sources of water for Mandya CMC are canal, river and tanks. Along with these sources bore wells are also used as additional water source for drinking. The main water supply is from the Cauvery River with a design capacity of 17.5 MLD, tank source with a design capacity of 11.5 MLD and canal sources with a design capacity of 6 MLD. In the case of Pandavapura TP, water supply in stage I is drawn from Vishveshwaraiah Canal with a design capacity of 2.27 MLD while stage II is drawn from Lokapavani River (Tributary of Cauvery) near Pandavapura with a design capacity of 5 MLD. The water source to Malavalli TMC is Cauvery River which flows 20 km away from Malavalli. The design capacity of the Water Treatment Plant (WTP) is 9.1 MLD. The water SOURCE to Maddur TMC is also Cauvery flowing being at a distance of 12 Km from Maddur. The design capacity of this scheme is 17 MLD, the present utilization being 3.6MLD. The water source to K.R Pet TMC is Hemavathi River flowing at a distance of 3 km from K.R Pet. The design capacity of stage I is 2.27 MLD and Stage II is 3 MLD. The combined design
capacities of the WTP are 5.27 MLD. Although the design capacities of these schemes are 5.27 MLD the present operational capacity is only 3MLD.
According to Census data, the percentage of Households having access to drinking water is highest in Krishnarajpet TMC (98.43%), followed by Maddur TMC (95.83%), Mandya CMC (94.29%) and Malavalli TMC (92.34%) and rest of the ULBs having above 89% in 2011. In the percentage of Households having access to drinking water in Nagamangala TP, Mandya CMC and Maddur TMC slightly decreased during the period 2001-2011. It indicates that the population in these ULBs is increasing creating scarcity of water sources and loading to poor quality of water. Over 80 per cent of the households receive drinking water within their premises in Mandya CMC which has performed well compared to other Urban Local Bodies. Comparing the situation between 2001 and 2011 Censuses, the growth trend line shows that access to water near the premises is declining whereas access within the premises is increasing. This implies that, the ULBs are making efforts to provide drinking water supply within the households (Table 11.4 and Fig. 11.4).
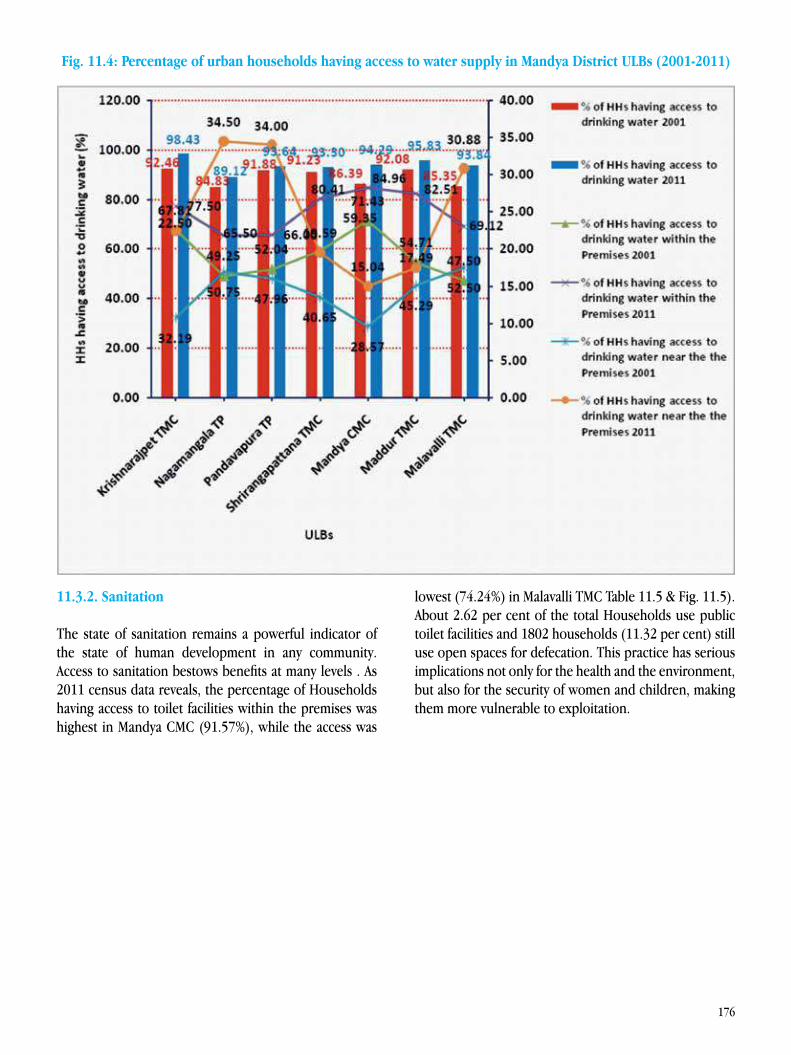
176
Fig. 11.4: Percentage of urban households having access to water supply in Mandya District ULBs (2001-2011)
11.3.2. Sanitation
The state of sanitation remains a powerful indicator of the state of human development in any community. Access to sanitation bestows benefits at many levels . As 2011 census data reveals, the percentage of Households having access to toilet facilities within the premises was highest in Mandya CMC (91.57%), while the access was
lowest (74.24%) in Malavalli TMC Table 11.5 & Fig. 11.5). About 2.62 per cent of the total Households use public toilet facilities and 1802 households (11.32 per cent) still use open spaces for defecation. This practice has serious implications not only for the health and the environment, but also for the security of women and children, making them more vulnerable to exploitation.
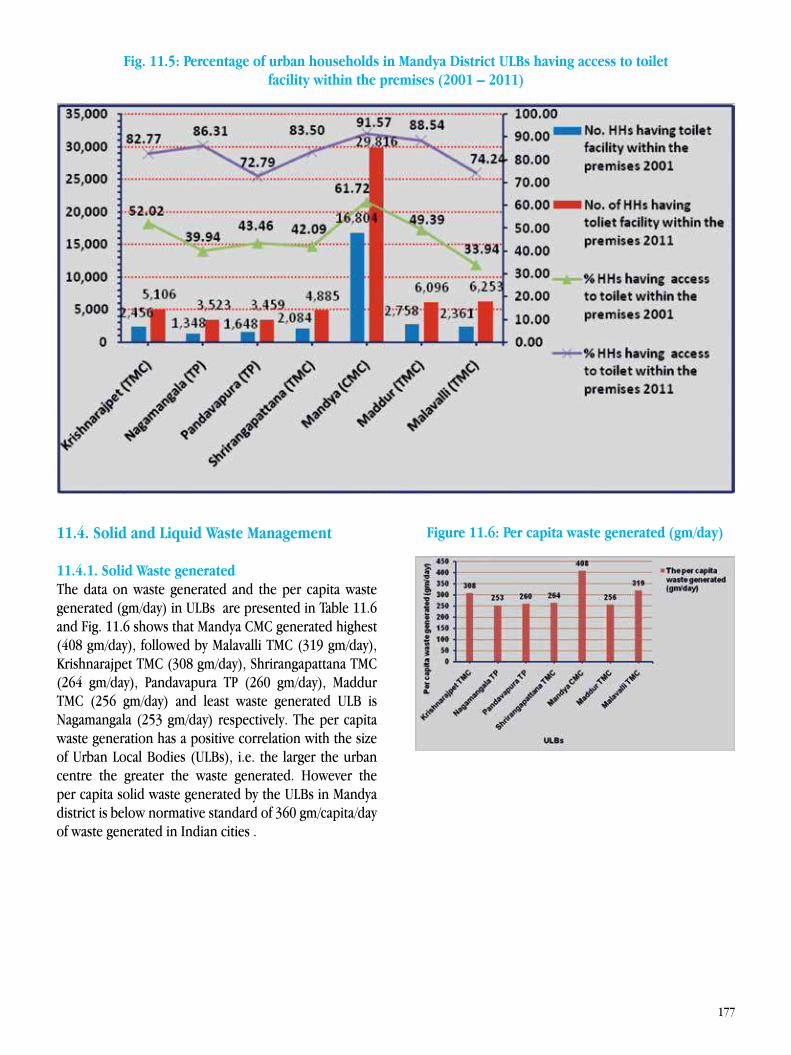
177
Fig. 11.5: Percentage of urban households in Mandya District ULBs having access to toilet facility within the premises (2001 – 2011)
11.4. Solid and Liquid Waste Management
11.4.1. Solid Waste generatedThe data on waste generated and the per capita waste generated (gm/day) in ULBs are presented in Table 11.6 and Fig. 11.6 shows that Mandya CMC generated highest (408 gm/day), followed by Malavalli TMC (319 gm/day), Krishnarajpet TMC (308 gm/day), Shrirangapattana TMC (264 gm/day), Pandavapura TP (260 gm/day), Maddur TMC (256 gm/day) and least waste generated ULB is Nagamangala (253 gm/day) respectively. The per capita waste generation has a positive correlation with the size of Urban Local Bodies (ULBs), i.e. the larger the urban centre the greater the waste generated. However the per capita solid waste generated by the ULBs in Mandya district is below normative standard of 360 gm/capita/day of waste generated in Indian cities .
Figure 11.6: Per capita waste generated (gm/day)
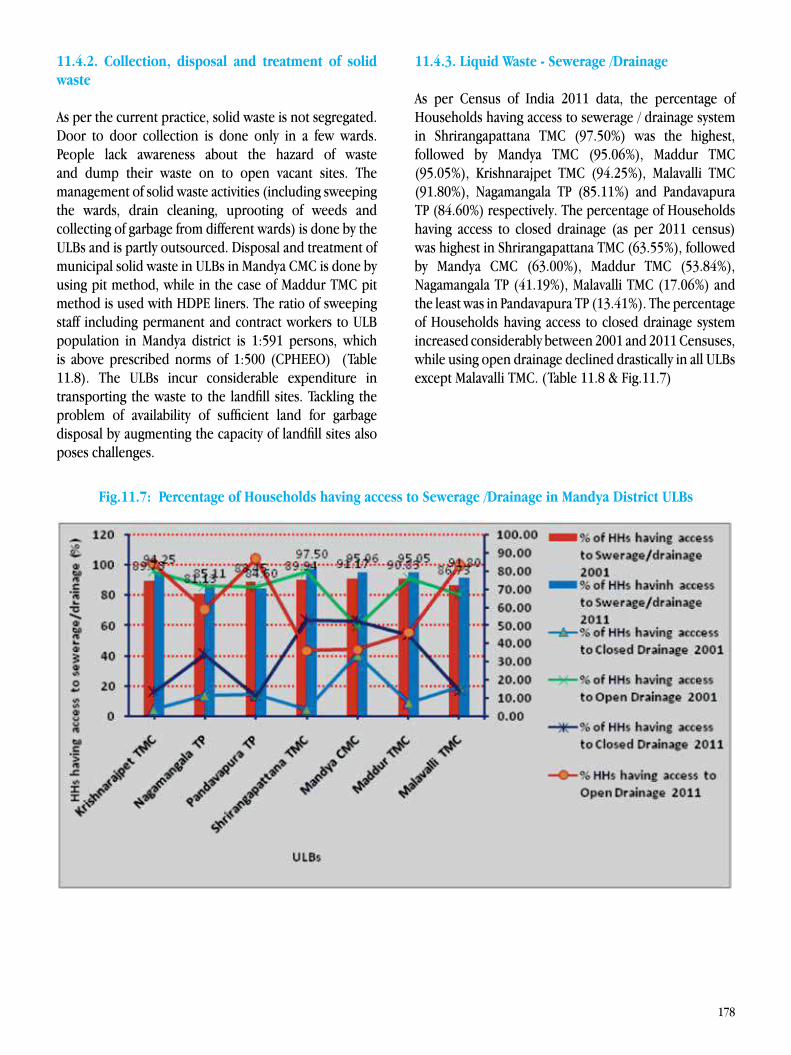
178
11.4.2. Collection, disposal and treatment of solid waste
As per the current practice, solid waste is not segregated. Door to door collection is done only in a few wards. People lack awareness about the hazard of waste and dump their waste on to open vacant sites. The management of solid waste activities (including sweeping the wards, drain cleaning, uprooting of weeds and collecting of garbage from different wards) is done by the ULBs and is partly outsourced. Disposal and treatment of municipal solid waste in ULBs in Mandya CMC is done by using pit method, while in the case of Maddur TMC pit method is used with HDPE liners. The ratio of sweeping staff including permanent and contract workers to ULB population in Mandya district is 1:591 persons, which is above prescribed norms of 1:500 (CPHEEO) (Table 11.8). The ULBs incur considerable expenditure in transporting the waste to the landfill sites. Tackling the problem of availability of sufficient land for garbage disposal by augmenting the capacity of landfill sites also poses challenges.
11.4.3. Liquid Waste - Sewerage /Drainage
As per Census of India 2011 data, the percentage of Households having access to sewerage / drainage system in Shrirangapattana TMC (97.50%) was the highest, followed by Mandya TMC (95.06%), Maddur TMC (95.05%), Krishnarajpet TMC (94.25%), Malavalli TMC (91.80%), Nagamangala TP (85.11%) and Pandavapura TP (84.60%) respectively. The percentage of Households having access to closed drainage (as per 2011 census) was highest in Shrirangapattana TMC (63.55%), followed by Mandya CMC (63.00%), Maddur TMC (53.84%), Nagamangala TP (41.19%), Malavalli TMC (17.06%) and the least was in Pandavapura TP (13.41%). The percentage of Households having access to closed drainage system increased considerably between 2001 and 2011 Censuses, while using open drainage declined drastically in all ULBs except Malavalli TMC. (Table 11.8 & Fig.11.7)
Fig.11.7: Percentage of Households having access to Sewerage /Drainage in Mandya District ULBs
179
11.4.4. Traffic and Transport
Nagamangala TP has the highest length of roads (19.31 km) per sq.km of geographical area, followed by Malavalli TMC (17.40 km), Pandavapura TP (16.80 km), Mandya CMC (16.80 km), Krishnarajpet TMC (15.03 km), Maddur TMC (8.86 km) and Shrirangapattana TMC (6.63 km) respectively (Table 11.9). Roads are maintained by the PWD and rests are maintained by other parastatal agencies. The major issues regarding roads are undivided carriageways, narrowed carriageways due to parking and other informal activities and Right of Way (ROW) violations found to be common across the town. The town roads lack signals, signage and footpaths. Two -wheelers form major part of traffic on all the roads in ULBs.
11.4.5. Resource Mobilisation
The receipts of ULBs are broadly classified as (a) Tax and Non-Tax Revenues (NTR) and (b) Grants and Loans. The State laws empower the ULBs, being local self-governments, to impose taxes and collect fees for various services rendered by them, but the powers pertaining to the rates and revision thereof, procedure of collection, ceilings, method of assessment, exemptions and concessions etc., are vested with the State Government. As Fig. 11. 8 depicts, the highest percentage of ULBs own resources during 2011-12 was found in Mandya CMC (42.34%), followed by Shrirangapattana TMC (28.88%), Krishnarajpet TMC (20.49%), Maddur TMC (20.05%), Pandavapura TP (17.64%), Nagamangala TP (14.88%) and Malavalli TMC (11.16%) respectively. The reason for Mandya CMC getting percentage of own revenues highest is that property tax is the most important source of revenue constituting more than 40% of the total own resources. Recently, Mandya CMC has approves Rs. 2.97 crore surplus budgets . Malavalli TMC owns resources are least due to collection of property tax being minimal. The percentage of own resources to the total receipts is marginally increasing in Mandya CMC, while as declining in other. The reasons for the decline are collection of property tax is minimal and revenue from other sources is also very meager (Table 11.10 & Fig. 11.9).
Fig. 11.8: Percentage of own resources to total receipts of ULBs during 2011-12
Fig. 11.9: Trends in percentage of own resources to total receipts of ULBs
11.4.6. Expenditure on Development works
With the physical infrastructure and services failing to keep pace with the needs of the rapidly growing urban population, the quality of urban life would be jeopardized especially for the urban poor who are particularly affected by inadequate infrastructure and other basic services. The data on per capita expenditure made on development works of ULBs in Mandya districts during 2011-12 reveal that, Krishnarajpet TMC spent the highest, followed by Pandavapura TP, Malavalli TMC, Shrirangapattana TMC, Mandya CMC, Nagamangala TMC and least is Maddur TMC (Table 11.11 & Fig. 11.10). The least per capita expenditure on development was made in Maddur TMC, due to lowest allocation of grants from the government for development works in the ULB.
180
Fig. 11.10: Per -capita expenditure on development works in ULBs
11.4.7. Households without own house in ULBs
The data on the percentage of households without own house during the year 2011-12 reveal that, Pandavapura TP had highest percentage (40.74%), followed by Maddur TMC (34.63%), Nagamangala TP (22.32%), Krishnarajpet TMC (21.02%), Shrirangapattana TMC (16.85%), Malavalli TMC (16.03%) and Mandya CMC (4.51%) respectively (Table 11.12 & Fig. 11.11). The reasons for lower percentage households without own houses in Mandya CMC and Malavalli TMC is various schemes for housing implemented in these ULBs. Fig. 11.11: Percentage of Households without own
house in ULBs in 2011-12
11.4.8. Crime rate in ULBs
The data indicate that, the crime rate per 10000 population was highest in Maddur TMC (6.80), followed by Nagamangala TP (5.23), Mandya CMC (5.12), Malavalli TMC (4.63), Pandavapura TP (4.61), Krishnarajpet TMC (4.20) and Shrirangapattana TMC (3.93) respectively (Table 11.13 & Fig. 11.12).
Fig. 11.12: Crime rate per 10, 000 populations in ULBs
11.4.9. Road Accident
The data indicate that, the number road accidents per 10, 000 populations highest in Pandavapura TMC (48.04), followed by Maddur TMC (28.74), Nagamangala TP (20.81), Malavalli TMC (10.11), Mandya CMC (9.54), Krishnarajpet YMC (7.71) and lowest is Shrirangapattana TMC (4.69) respectively. Reasons for high incidence road accidents TP area including narrow and curved roads with poor traffic signals.
Fig. 11.13: Roads accidents per 10000 populations in ULBs
11.4.10. Health Facilities
The number of hospital beds per 1000 population in the urban areas of Mandya district was highest in Mandya CMC (8.19), followed by Nagamangala TP (5.63), Pandavapura TP (4.90), Krishnarajpet TMC (3.85), Shrirangapattana TMC (2.93), Maddur TMC (2.85) and Malavalli TMC (2.66) respectively (table 11.15). The National Urban Renewal Mission norm is one urban primary health centre for every 50,000 population . The central government provides financial support to states to
181
strengthen their health systems including constructions of new and up gradation of public health facilities based on the requirement. The number of hospital beds per 1000 population is one of the crucial indicators of the availability and accessibility of curative health services in the country. Mere availability of hospital beds without the specialist / health care providers cannot serve the purpose. Providing quality health services at affordable cost with better infrastructural facilities is an urgent need.
11.5. Radar Analysis
The diagram relating to radar analysis shows that, Mandya CMC (0.756) has highest Urban Development Index (UDI) and rank first among the ULBs in the District, followed by Krishnarajpet TMC (0.648), Shrirangapattana TMC (0.629), Malavalli TMC (0.497), Nagamangala TP (0.467), Pandavapura TP (0.442), and Maddur TMC has the lowest rank (Table 16 & Fig. 11.14). The contributors to highest urban development index in respect of Mandya CMC are high percentage of own resource mobilization to total receipts, no. of hospital beds per 1000 population and concentration of urban population to total population. On the contrary, the contributing factors for lowest UDI for Maddur TMC are low Per capita expenditure on Development Works and poor length of roads (in Km) per Sq. Km of urban geographical area.
Fig. 11.14: Radar Diagram of Urban Development Index
11.6. Small area study
Title: Socio -Economic Status of Slum Dwellers in Malavalli TownMethodology: As part of the study undertaken to prepare HDR of Mandya district a small area study relating to the socio-economic status of slum Households was conducted in Malavalli Town. Malavalli town has a slum population
of 10, 953 as per 2011 Census, and constituting 29.13% of the total urban population. There are 6 declared slums and 2 undeclared slums as per KSCB data. A sample of 51 Households from declared slums of the town was chosen randomly to elicit responses from them. Structured questionnaire was used for the study. The questionnaire consisted of a series of questions regarding not only socio-economic profile of the slum Households but also their perceptions about different aspects such as access to basic services including drinking water, toilets, drainage, education and health etc. The data collected from the sample slum Households were processed using SPSS software. The results of the data analysis are presented as under.
Socio-Economic Profile of the Sample Households: Nineteen out of fifty one (37.25%) respondents were in the age-group of 40-50 years and twelve out of fifty one (23.53%) respondents were in the age group of 30-40 years and rests of the respondents were having different age group. Male respondents numbered 48 out of the total 51, the remaining 3 being female respondents. Less than half of the sample respondents (45.10%) were literates, but illiterates also formed more than half the sample (54.90%). Lack of education may at times lend bias to the opinions expressed by the respondents.
Figure 11.15: Age group of the respondents
Regarding the occupational structure of the respondents, 38 out of the 51 (74.51%) sample respondents had temporary occupation and 25.49% of the respondents had permanent occupation. Out of 38 Households having temporary occupation, 54.90% worked as daily labourers and rest had different occupation such as agriculture, auto driving, own business, laundry, barber shop, beedi works in the house, provision store and silk filatures etc. Regarding the structure of the social groups of the sample of slum Households, data for Malavalli town show that, 45.10% of the respondents belonged to SCs, 7.84%
182
to STs, 25.49% to OBC and the rest were others. Forty six out of Fifty one (90.20%) respondents were native and the rest were migrants. About 88.24% of the sample respondents residing in the slum area were BPL card holders and 11.76% were not having the BPL cards.
Basic ServicesHousing: Fourteen out of fifty one (27.45%) sample respondents lived in pucca houses, 15.69% in somewhat good houses, 43.14% dilapidated houses and 13.73% in very poor condition tenements. More than one tenth of the slum population lived in dilapidated tenements houses due to low incomes and they were unaware of various housing schemes available for poor (Table 11.25). In the case of ownership of the houses, about 88.24% of the sample respondents lived in own houses and 11.76% lived in rented houses. About 47.06% of the sample respondents lived in one room tenements, 27.45% lived in two rooms, 25.49% Households lived in no separate rooms in their houses. Hardly 15.69% of the sample respondent’s houses were constructed under the different schemes and 84.31% of the sample respondent’s houses were constructed outside the schemes. The schemes under which houses were constructed covers these launched by Fishery Dept., Karnataka Slum Clearance Board, other state government bodies etc. About 90.20% of the sample respondents’ houses had electricity.
Access to Water Supply: Thirty six out of fifty one (70.59%) sample respondents were having access to drinking water through individual tap connections in their houses, about 21.57% having access to public tap and rest of the Households having access through bore well hand pump. As regards the frequency of water availability in their locality, 72.55% of the Households said it was available daily, about 15.69% said it was supplied on alternate days and rest of the Households said they get it once in a week. Majority of the sample Households opined that they got sufficient water. In the case of water quality, majority of the sample Households said it was poor and only a few respondents complained about for smell in the water.
About 52.94% Households did not have access to toilet facility in their house and 47.06% Households were access to toilet facilities. Regarding the modes of sewerage disposal having toilet facilities within their houses, about 43.14% connected the water closet to sewer line, 41.18% connected to septic tank, 1.96% connected to pit latrine and rest of the sample Households other modes of disposal. About 45.10% of the sample Households still
use open spaces for defecation and 7.84% were using public toilets. The open defecation practice has serious implications not only for health and environment, but also for the security of women and children.
Solid Waste Management: Thirty two out of fifty one (62.75%) sample respondents were disposing of household waste into garbage bin provided by the Malavalli TMC, about 17.65% disposing in front of the house, 11.76% disposing it in the open space and rest of the Households had waste collected at door by the Malavalli TMC. Regarding waste cleared/collected from the TMC workers, 70.59% of the respondents opining affirmatively (saying Yes) and other 29.41% opining negatively (saying no). About 98.04% of the respondents said that they are not paying money for waste clearance to TMC and only one HH said Yes.
Education Facilities: Forty out of fifty one (78.43%) sample respondents said that lower primary school is located within the locality and rest of the respondents said No. About 70.59% of the respondents said that they are not spending money to their children’s education and 29.41% of slum Households reported they were spending money for their children education.
These Households said that they were spending money for books and fees. Twenty nine out of fifty one (56.86%) sample respondents opined that they were not getting financial assistance from the government for their children’s education and rest of the Households said Yes. About 41.18% of the respondents said that they are getting government scholarship for their children’s education, 1.96% said have got money for uniform and rest of the Households said that No. Cent percent sample respondents said that they had no problems in their children’s school.
Health Facilities: Twenty six out of fifty one (50.98%) sample respondents said that they are getting health care facilities in the government hospital located within the proximity of 1.5km and 1.96% of the Households said they were getting healthcare in private hospitals and rest of the Households said No. About 27.45% of the respondents said affirmatively (saying Yes) for health assistants to visit their locality and rest of the respondents said No. Further, 1.96% Households opined that health assistant visits once in a week, 3.92% said once in fifteen days, 3.92% said once in a monthly, 21.57% said that health assistant visits once more than one month once and rest of the respondents did not specify. About 56.86% of the
183
sample respondents were satisfied with health facilities available near their place and rest of the respondents reported they were not satisfied. Twenty two out of fifty one respondents specified the problems in the health center, mentioning that doctors are demanding money for treatment, treatment for the diseases no effective and doctors are not attending the patients in time, etc.
Ownership of Assets: Thirty two out of fifty one (62.75%) of the sample respondent said that, their present income was sufficient to meet their household expenditure and the rest of the respondents said not sufficient. Further, Nineteen out of fifty one respondents manage their household expenditure from other sources such as business, loan from money lenders and petty shops etc. Forty eight out of fifty one (94.12%) sample respondents said that they were getting sufficient food grains from the fair price shops and remaining 3 said that they were not getting sufficient food grains. The reasons quoted area are they were demanding high prices.
Regarding the assets owed by the sample Households in the slum area 50.98% owned phone, two wheeler, TV, Cycle, LPG etc, 23.53% owned phone, TV, grinder/mixer and LPG and 7.84% Households is owned phone, TV, Grinder/mixer, LPG, Cycle, Tape recorder, 13.73% owned phone, TV, Grinder//mixer, LPG, Cycle, Auto rickshaw, refrigerator and two-wheeler and rest of the sample respondents said that they were not having any assets. About 23.53% of the sample respondents reported having problem of drainage and toilet facilities within their locality, 37.25% reported about the problem of drinking water, street lighting, road and electricity etc, and remaining 39.22% said they had problem regarding dwelling houses and ration cards.
11.7. Concluding Remarks
The Households access to basic service in Mandya ULBs is comparatively good. However, there is a need for improvement especially in the households’ access to water supply and toilet facilities within the premises and also in their access to closed drainage system. Another interesting point is Shrirangapattana TMC registered highest population growth rate (43.85%) and Malavalli TMC registered highest slum population growth rate (198.53%) during 2001- 2011 census. These are all indications of faster urbanization. For addressing the present and future problems in the Mandya ULBs there is a need for more funds and manpower for execution of developmental projects and providing efficient service delivery to urban households. In the case of solid waste management, except Mandya CMC, all other ULBs are having above the normative standard for manpower requirement to collect and dispose of solid waste. Expenditure on developmental works is very low in Maddur TMC. There is need for strengthening its financial position. A time has come for adopting a pragmatic strategy to dispose of solid waste by recycling it rather than dumping it in land-fills. The only long term and environment-friendly solution to solid waste management is recycling it by using modern methods. This not only saves precious land used for dumping unprocessed waste but also prevents the resultant environment pollution and health hazards.

184

185

186
187
12.1. Introduction
This chapter attempts to analyse the various issues identified in the foregoing chapters and offer certain significant policy guidelines and strategies essential for sustainable human development in Mandya district. An attempt is made to focus on the appropriate human development determinants and parameters which would enable the governments, general public, NGOs and other stake holders to participate, co-ordinate and initiate action at the district and sub-district levels to produce better outcomes in the implementation of various development programmes.
This chapter also provides a detailed account of development indicators used for the measurement of HDI. There are other measures of human development apart from HDI, viz., GII, FSI, CDI, CTD, CDDI and UDI. These indices help the policies makers to chalk-out an appropriate plans and policies to address the low human development regions and to bring them on par with high human development regions.
Human development is a process of enlarging people’s choices to improve the quality of human life. The most important choices are good health, education and decent standard of living. The human development approach attempts to measure the overall development of the district with regard to development programmes and policies implemented by the government to fulfill the requirements of the people to lead a quality of life. Before we turn to the analysis of various human development indices for Mandya district, let us take a quick look at certain general features of this district.
Mandya is basically an agriculture-dependent District with a few agro-based industries such as sugar and jaggery for income and employment of the people. A very small percentage of the geographical area of the district is under forest. The district has about half of the cultivated land under irrigation, thanks to the Cauvery and Hemavathi rivers as also their tributaries which provide year–long assured irrigation for crops. Paddy and sugarcane are dominant crops grown in almost the entire canal-irrigated area, while ragi and horse gram are the major crops in dry land agriculture. Sericulture is an
CHAPTER 12
WAY FORWARD
important commercial crop in virtually every taluk of the district.In spite of having about half of the cultivated area under assured irrigation, the district’s average income continues to be far below the state average, with none of the taluks getting closer to the state per capita income.
12.2. Discussions and analysis on:
Outline of Human Development and its measurement as indicated by different indicators It is well accepted by the development thinkers that human development is much more than income-centered development. Thus, there has been a shift from income-centered development paradigms to the people- centered development paradigms which is popularly recognized as ‘Human Development’ (HD) paradigm. The major difference between economic growth and human development in that former focuses on the enlargement of one option (income or product), while the focus of the latter is on enlarging all human options. Human development may be defined as a process of enlarging people’s choices. At all levels of development, the three essential choices for people are: to live a long and healthy life, to acquire better knowledge and to have access to resources needed for a decent standard of living. If these essential choices are not available, many other opportunities to improve the quality of life will remain inaccessible.
(i) Human Development Index (HDI)HDI is a composite index of different dimensions of human life with a focus on three facets critical for human development, viz., to lead long and healthy lives (health), to be knowledgeable (education) and to have access to the resources needed for a decent life (standard of living). Altogether eleven indicators have been used for measuring these three dimensions of HDI. In addition to HDI, other indices namely Gender Inequality Index, Child Development Index, Food Security Index, Composite Taluk Development Index, Urban Development Index and Composite Dalit Development Index have been computed to assess the overall development of the district using as many as of 126 development indicators.
The HDI for Mandya district is 0.663. For different taluks in the district it ranges between 0.493 and
188
0.758. HDI for Shrirangapattana, Mandya and Maddur taluks is higher than the district average, while HDI for Malavalli, Pandavapura, Nagamangala and Krishnarajpet taluks is lower than that of district. Shrirangapattana taluk ranks number one in HDI ranking followed by Mandya taluk in the 2nd rank and Maddur taluk in the 3rd rank. Krishnarajpet taluk ranks last, i.e.7th rank with a HDI value of 0.493. Shrirangapattana taluk has the highest HDI value because of the better values in health index (0.920), living standard index (0.696) and education index (0.682). Though Mandya taluk ranks first in education index (1.000) and living standard index (0.754), it ranks seventh in health index (0.441). Due to poor performance in health index, Mandya taluk moved to the 2nd rank in the district. Krishnarajpet taluk ranks 7th in HDI in the district because of the low in living standard index (0.204).
As per the UNDP classification, Krishnarajpet (0.493) and Malavalli (0.539) taluks are low human-development taluks as the HDI for these taluks is less than 0.55. Mandya (0.693), Maddur (0.688), Pandavapura (0.626), Nagamangala (0.563) taluks are medium human-development taluks, as the HDI for these taluks is between 0.55 and 0.70 as per the classification. Shrirangapattana taluk (0.758) is the only taluk with high human development as its HDI is between 0.7 and 0.9. Effective utilization of resources and proper implementation of development programmes are essential for improving the levels of all development indicators to achieve higher level of human development in all the taluks of the district.
(ii) Living Standard Index (LSI)The living standard index (LSI) is computed using seven sub-indicators namely: access to cooking fuel, toilet, water, electricity, pucca house, percentage of non-agricultural workers and per capita income. Mandya district has a moderate LSI of 0.588. The highest LSI (0.754) is found for Mandya taluk which is in the 1st rank and the Lowest LSI (0.204) is for Krishnarajpet taluk which is in the 7th rank. Mandya and Shrirangapattana taluks have better LSI than the district’s average of 0.588, while Krishnarajpet, Nagamangala, Malavalli, Pandavapura and Maddur taluks have lower LSI than the district. Thus, there is a significant gap in the LSI between the taluks of Mandya district. The high LSI for Mandya Taluk is because of the high values of sub-indicators such as high percentage of households (52.52%) having toilets, high percentage (62.65%) having pucca houses, high percentage of
houses (91.89%)connected with electricity and high percentage share (42.41%)of non-agriculture workers in the total accounted. In contrast, for Krishnarajpet taluk the values for LSI sub-indicators namely households with toilets is 21.67 percent, access to pucca houses is hardly 43.69 percent, low percentage (10.80%)of households with modern cooking fuel and low percentage (20.17%)of non-agricultural workers are the contributing factors for low LSI in Krishnarajpet taluk.
(iii) Health Index (HI)The child mortality rate and maternal mortality rate are used as sub-indicators to compute the HI. HI of Mandya district is 0.726 which shows that the overall health service in the districtis fairly good. The HI of taluks ranges from 0.441 to 0.953 and there is a noteworthy gap between lowest and highest HI. Mandya taluk has least HI (0.441) while all other taluks have higher health index than that of the district. Nagamangala taluk ranks number one with the highest HI of 0.953. This is really puzzling in view of the fact that Mandya Town, being the district and taluk headquarters, has quite a good number of public and private hospitals. The main reasons for low health index in Mandya taluk are high Child Mortality Rate (31) and Maternal Mortality Rate (124). It is a fact that for the taluks which have lowers CMR and MMR apparently the HI value is higher. In Nagamangala taluk CMR (28) and MMR (107) is lower compared to all other taluks in the district and evidently its HI is high (0.953).
(iv) Education Index (EI)Education index is worked out using two sub- indicators namely literacy rate and gross enrollment rate at primary and secondary schools. Mandya district has EI of 0.681 which shows the moderate education development. The EI for taluks ranges from 0.428 to 1.000 showing significant gap between taluks. Mandya taluk ranks first with an EI of 1.000, while Malavalli taluk has least EI of 0.428. The EI for Maddur, Krishnarajpet, Pandavapura, Nagamangala and Malavalli taluks is lesser than the district average. The main cause for the lower EI is low literacy rate and lower gross enrollment in schools in some of the taluks. Mandya taluk has 74.75 percent literacy and 107.48 percent of gross enrollment rate which significantly contribute to the higher education index.
(v) Gender Inequality IndexThe GII for Mandya district is 0.070 indicating that gender inequality in Mandya district is rather low. Taluk-wise GII values indicate that Maddur taluk ranks 1st with the lowest value (0.046) followed by Krishnarajpet in the 2nd
189
Rank (0.052), Shrirangapattana in the 3rd Rank (0.053) and Nagamangala in the 4th Rank (0.061). All these four taluks have lower GII the district average. Mandya taluk has GII of 0.075 which is nearly equal to that of GII of the district. Malavalli and Pandavapura taluks have higher GII (0.087 and 0.104 respectively) with 6th and 7th ranks respectively.
(vi) Child Development Index (CDI)The CDI for Mandya district is computed by focusing on child’s mortality rate (Health Index), percentage of mal-nourished children and babies born under- weight (Nutrition index) and percentage of drop-out children in primary and secondary schools main-streamed (Education index). The CDI for taluks in Mandya district ranges from 0.208 to 0.978. The CDI for Pandavapura taluk is the highest (0.978) followed by Shrirangapattana taluk with CDI of 0.681. Malavalli taluk is in the 3rd rank with 0.584, Maddur taluk ranks 4th with 0.533 and Nagamangala taluk ranks 5th with 0.448. All these taluks have higher CDI than the district average. Krishnarajpet (0.302) and Mandya taluk (0.208) are in the 6th and 7th ranks and both taluks have lower CDI than that of the district. Significant difference between the taluks (0.208 to 0.978) reflects imbalance between taluks with respect to Child’s well-being. Higher the CDI, higher would be the child’s development and lower CDI indicates the low child development.
(vii) Food Security Index (FSI)Food Security index of a region/district helps to ascertain whether a region/district is able to feed the people and keep them healthy all the times. Food Security Index (FSI) is computed based on three dimensions namely food availability, accessibility and absorption. The average FSI for Mandya district is 0.398. The FSI for the taluks ranges from 0.365 in the case of Malavalli (7th rank) to 0.605 in the case of Shrirangapattana taluk (1st rank). The FSI for all taluks of Mandya district except Malavalli taluk are higher than the district average. This substantial gap in FSI indicates wide differences with regard to food security, between taluks.
(viii) Composite Taluk Development Index (CTDI)68 indicators have been used for calculating CTDI. CTDI for Mandya district is 0.506 which shows modest development. Mandya taluk with a CTDI value of 0.611 ranks first. The CTDI for Maddur taluk is 0.535 which is slightly higher than the district CTDI. Nagamangala taluk is in the 3rd place with a CTDI of 0.507. The CTDI of Shrirangapattana (0.491), Krishnarajpet (0.473) and
Malavalli (0.425) taluks are below the district CTDI.
(ix) Urban Development Index (UDI)The UDI is also one of the important indices for assessing human development of a region. The UDI is computed using 11 indicators which are important for urban development. The UDI for urban local bodies (ULBs) ranges from 0.383 to 0.756. Mandya TMC is in the 1st rank with UDI of 0.756 followed by Krishnarajpet TP in the 2nd Rank with UDI of 0.648 and Shrirangapattana ULB in the 3rd Rank with a UDI of 0.629. The UDI for Malavalli ULB is 0.497, 0.467 for Nagamangala TP, 0.442 for Pandavapura ULB and 0.383 for Maddur TMC.
(x) Composite Dalit Development Index (CD DI) As part of the study undertaken for analyzing the human development of Mandya district, in addition to constructing the above-mentioned indices, a Composite Dalit Development Index (CDDI) was also computed based on a small area (sample) study. The CDDI is a composite index of 10 indicators relating the life of Dalits. In the sample study conducted in a village of Mandya district the CDDI worked out to be 0.573 which indicates “average Dalit development” in the scale range specified for the purpose. The Dalit Deprivation Index (DDI) is 1-CDDI. Thus in the present case the DDI is 0.427, which means there is still a lot to be done to ameliorate the conditions of Dalits.
Education component The special promotional and motivational efforts made by the Government in the last few years did help reduce the school dropout rate in the district. This improvement can serve as a significant indicator / criterion for designing better educational strategies in future. Absence of teachers in schools, poverty, and lack of proper facilities in the schools which are considered as the significant factors causing dropouts may still be given attention in the respective taluks and efforts should be intensified to further reduce percentage of the dropouts. The percentage of female teachers is low in lower primary and secondary schools compared to higher primary schools. In order to encourage girl’s education, it is necessary to recruit more number of female teachers at the school level in general and at elementary level in particular. But, this is not fulfilled even after considerably a long period. This needs immediate attention.
190
One of the important indicators which add to the quality of education and literacy is the Pupil-Teacher Ratio. This ratio indicates the number of pupils enrolled per teacher and is calculated considering the total number of pupils enrolled to the 7th class in Government schools and the number of teachers working in those schools separately for elementary and secondary education level.
At the elementary level, 61% of the classrooms are in good condition, 15% of classrooms need major repairs and 24% of the classrooms need minor repairs. At the secondary level, 62% of the classrooms are in good condition, 30% need minor repairs and 8%need major repairs.
A state level analysis has placed Mandya district in the 7th place regarding the building status 30th regarding the condition of classrooms at elementary level; 14th regarding the building status and 29th regarding the condition of classrooms at secondary level in the state.Regarding school facilities, the Government has identified the following 9 facilities, which include most of the basic facilities identified by MHRD, required for a school as per RTE – Drinking water, boys’ toilet, girls’ toilet, compound wall, library, playground, ramps, teachers and rooms. In Mandya district, 36.26% of elementary schools have all the 9 facilities and 97.83% of elementary schools have only 7 facilities. Health Component The health indicators for Mandya district show some positive trends. A redeeming feature of the health situation is that the IMR for Mandya District is 26 which is much below the Karnataka and India’s IMR of 35 and 42 respectively. Krishnarajpet has highest rate of IMR with (27) is followed by Nagamangala and Malavalli with 26 each. The least IMR is found in four taluks namely Pandavapura, Shrirangapattana, Mandya and Maddur with IMR of 25.
Even the Child Mortality Ratio (CMR) is low (30) in Mandya district. The highest CMR of 31 is found in Mandya taluk followed by Krishnarajpet and Maddur with 29 apiece. On the other hand, the remaining four taluks namely Nagamangala, Pandavapura, Shrirangapattana and Malavalli recorded CMR of 28. Thus the CMR for the district and the taluks is much below CMR for India (55) and Karnataka (54).
Maternal Mortality Ratio (MMR), which is the number of women who die during pregnancy and child birth, per 1, 00,000 live births, is 111 for Mandya district and
is below that for Karnataka (144) and also that for India (178).MMR is highest for Mandya with 124 followed by Pandavapura and Malavalli with 113 apiece. Lowest MMR of 104 is recorded for Krishnarajpet taluk followed by Maddur (105) and Nagamangala (107).
As per the findings of National Family Health Surway-3 (NFHS-3), the contraceptive prevalence ratio (CPR) was 56% meaning that hardly 56% of couples were currently using any type of contraceptive method. Modern methods (pills, IUCDs and condoms) were the most preferred methods compared to traditional sterilization techniques.
Livelihood and Quality of Living indicatorsDrinking water, housing and Sanitation are some of the important indicators of the standard of living of the People. A good quality of potable water supply is very essential for promoting human health. The supply of drinking water is very essential for ensuring and promoting standard of living of the people. About 85 percent of the households in Mandya district were having access to potable drinking water in 2011. In Nagamangala taluk, 81 percent of the households having access to drinking water and in Maddur taluk as many as 88 percent of households having access to potable drinking water. The data on potable drinking water in the district indicates that more than 81 percent of households were having access to water in the year 2011. This is a fairly good coverage of safe drinking water supply in the district.
Housing is an important indicator of the standard of living of the people. Housing provides physical, social, mental base for human life. The Government of India has introduced a National Housing Policy in 1985 to provide houses for the poor through housing subsidies. About 56 percent of the households own pucca houses in Mandya district in the year 2011. The pucca houses are more in numbers in Shrirangapattana, Mandya, Maddur and Malavalli taluks. However, 44 percent of the households in the district require to be covered with pucca houses.
Sanitation is also one of the important indicators of standard of living. The Government of India has initiated a ‘total sanitation programme’ to eradicate the present practice of open defecation in rural areas. This programme aims at providing all houses with water and sanitation facilities to promote hygiene for overall improvement of health and sanitation in rural areas. About 37 percent of households in the districts have toilet facilities within the premises. More than 52 percent of households have toilets only in Mandya and Shrirangapattana taluks
191
remaining taluks lagging behind in construction of toilets within the premises. There is an urgent need for cent percent achievements in the construction of toilets in the district to improve the living standard of the people.
Combined H.D analysis of the district One of the objectives of the preparation of the Human Development Report (HDR) for Mandya district is to understand the HD positions of the taluks by focusing on the three dimensions of human development. Human Development Index (HDI) is the summary measure of the human development which measures the average achievement of human development in the district. As we already discussed in the introductory chapter, HDI is the average value of three dimensions of human development namely living standard, health and education. HDI provides the relative positions and achievements of the taluks in the district in human development. The HDI value for Mandya district is 0.663. Shrirangapattana taluk ranks first with the value of 0.758 followed by Mandya taluk (0.693), Maddur ranks third (0.688) and these taluks HDI values are higher than the district average. Pandavapura taluk ranks number 4th with the value of 0. 626 and Nagamangala (0.563), Malavalli (0.539) and Krishnarajpet (0.493) ranks 5th, 6th and 7th respectively wide variation of 0.265 is observed between this taluks.Regional disparity of the Present HD Situation in the district.
The Human Development Report - 2014 for Mandya district attempts to bring out the differences in human development through an analysis of data on various development indicators through HDI values computed for the purpose. This is meant to address imbalances in the areas of concern in human development more importantly the achievements in the three dimensions of human development namely living standard, health and education.
In order to identify the regional imbalances in development and to suggest addressing the regional imbalances, the Government of Karnataka constituted a committee under the chairmanship of Dr. D. M. Nanjundappa in 2000. The committee constructed a Comprehensive Composite Development Index (CCDI), Comprising of 35 indicators for each of the 175 taluks. According to the CCDI Values, taluks whose values are less than 1.0 are regarded as backward taluks. As per this classification, the taluks in Mandya district also ranked with other 175 taluks in the State. The following table gives the ranking of the taluks based on the HDR-2014 for Mandya district and CCDI Values computed by Dr. Nanjundappa committee.
Comparison of HDI & CCDI Values in Mandya District
Taluks HDI Value Rank CCDI Value
Krishnarajpet 0.493 7 0.80
Nagamangala 0.563 5 0.83
Pandavapura 0. 626 4 0.94
Shrirangapattana 0.758 1 0.98
Mandya 0.693 2 1.00
Maddur 0.688 3 0.95
Malavalli 0.539 6 0.84
District 0.663 - -
Source: DHDR – 2014, Mandya and Dr. Nanjundappa Report – 2002
192
The higher HDI Values Indicates the higher achievements in human development indicators and lower values show the lesser achievements. Thus, these values show the disparity in development between the taluks. Shrirangapattana has highest HDI value (0.758) which indicates the higher average achievements in the three dimensions of human development. On the other hand, Krishnarajpet has 0.493 HDI value which is far behind in the achievement level of human development. The regional imbalances in human development in Krishnarajpet, Malavalli and Nagamangala taluks have to be addressed by the government not only by allocating more funds but also effective utilization of funds allotted for housing, sanitation, drinking water, and health and education. Even in the Dr. Nanjundappa report these taluks were identified as more backward (the taluks whose CCDI value is between 0.8 and 0.88are more backward) taluks of the district in respect of development. As per the CCDI values, Shrirangapattana, Maddur and Pandavapura taluks were considered as backward taluks (the taluks whose CCDI value is between 0.89 & 0.99 were considered as back ward).
The local governments have to take note of these regional imbalances and address properly by formulating plans and implementing them effectively to reduce the imbalances between the taluks/regions in the district.
The Way Ahead Future HD strateg y for Education SectorLiteracy and education play a significant role in human development. Economic development and human development can be accomplished together only when people are literate. It empowers people, plays a principal role in achieving gender equality and ensures both social empowerment and people’s empowerment. Therefore it is very important to provide quality education to empower people in the society. The following are the few suggestions to improve the education system in Mandya district.
• Reduce gender gap in the literacy rate and promote maximum female literacy as there is a strong positive relationship between the education of mothers and children.
• Identify and mainstream out-of-school children including drop-outs so as to reach the goal of 100% enrolment and “education for all”.
• Decrease in NER and increase in drop-out rate is to be probed at length to plan for improving enrolment and reducing drop-out rate.
• Quantitative aspects like number of schools, classrooms and other infrastructural facilities need to be looked into along with improvements in the qualitative aspects of education, i.e., educational performance in terms of ability to read and do basic arithmetic operations.
• Basic facilities like toilets, drinking water, electricity etc. are very essential and need to be provided by the education department.
• Special attention should be given to education of children with special needs.
• Immediate attention should be given to improve SSLC and PUC results
• There is urgent need for promoting quality teacher education (both pre-service and in-service).
• Adequate number of quality teachers need to be recruited.
• Improvement in the quality of higher education is necessary.
• More number of female teachers in lower primary and upper primary schools to be appointed as this would encourage female students to continue their education
Future HD Strateg y for the Health SectorGood health is necessary for the well-being of human beings. Therefore, it is considered as one of the vital dimensions of human development index. The most important determinants of health status are IMR, CMR, MMR, percentage of mal-nourished children, percentage of pregnant women with anemia, percentage of population served by health centers etc. The health sector in Mandya district has to initiate the following strategy/ policy measures to enhance the quality of health services.
• Though the IMR & CMR are fairly good in Mandya district, it is very important to reduce the present MMR of 124 to fulfill the target of Millennium Development Goals of 109.
193
• Percentage of low birth weight babies in Mandya district was lesser (11.5%) than both national average (21.5%) and state average (18.7%) In 2011-12, highest proportion of LBW babies was reported in Nagamangala taluk (13.80%) and least in Shrirangapattana Taluk (6.13%). The health department still reduce the percentage of babies born under weight by providing good health services to the pregnant women.
• The health department has to meet the inadequate number of PHCs/ health centers. The vacant posts of doctors and nurses to be filled up by the Government immediately.
• Private initiatives in health services need to be encouraged by the government to provide good health services in rural areas.
• NGOs services in health sector should be encouraged by the Zilla Panchayats. Health awareness and Government programmes on healthcare is vital in Mandya district.
• Regular ANC visit to the rural areas in the district is crucial.
• The district’s per-capita health expenditure (PCHE) is Rs.1782.95 which is low when compared with Karnataka’s and India’s PCHE. The highest PCHE of Rs. 2177.98 is incurred in Mandya taluk followed by Rs. 2149.62 in Krishnarajpet taluk. Pandavapura taluk has the least PCHE of Rs.1156.68. There is need for increasing the PCHE, and this has to come largely in the form of public health expenditure to enhance the quality of health service.
Future HD Strateg y for the Livelihood Sector The district’s economy is the basic source of livelihood for the people. To what extent the poverty in the district is alleviated and the standard of living is improved depends primarily on the rate of growth of the district’s economy. The overall rate of economic growth Mandya district has been lower than that of the State in recent years, although the primary sector including agriculture in the district has registered quite higher growth rate than in the state .The district-level development agencies such as agriculture and industry departments and also institutional credit agencies need to serve as pro-active agents in hastening the rate of growth of the district’s economy.
• The development of social sector is vital in the district particularly the social indicators viz. housing and sanitation, electricity and potable drinking water.
• More than 40 percent of the households in the district do not have pucca house structure, housing schemes/programmes of the State and Central governments should be used by Zilla Panchayats.
• Marginal farmers (about 23 %) and agricultural labourers (24%) in the district should be encouraged to take up income generating subsidiary occupations such as dairying, sheep rearing, poultry farming etc. by providing subsidised institutional credit.
• Artificial recharge structures should be constructed in feasible areas for augmenting ground water resource and to improve ground water quality especially in areas of Krishnarajpet, Nagamangala and Malavalli taluks where fluoride problem exists to a limited extent.
• Through effective implementation of various employment/income generating programmes like MGNREGS, this can enhance employment opportunities and improve the income level of the poor in the district.
• “Total Sanitation programme “should be implemented effectively in schools, anganawadis and in individual houses as there is close relation between health and sanitation.
• There is need to hasten the development of secondary sector, particularly the manufacturing sub-sector not only to generate non-farm employment opportunities but also to exploit the available industrial resources to eradicate poverty.
HD Strateg y for Dalits, Tribals and MinoritiesThe Scheduled Castes (SCs), Scheduled Tribes (STs) and some minorities are the socially marginalised groups in the district. They are economically poor and socially disadvantaged compared to the other groups of people in the society. The Human Development status of these marginalised groups is relatively low compared with that of all other social groups in the society. Their low level of development owing to low access to education, health
194
facilities, low access to pucca houses, low income earning opportunities. It is imperative to note that unless these marginalised groups are mainstreamed with other social groups of the society, the higher Human Development cannot be achieved.
• 16 percent of the SCs & STs population constitute the total population in Mandya district. It is important to bring them par with other social groups in the district.
• The literacy rate among these marginalised groups is less compared to other social groups in the district. The education department has to initiate special programmes to improve the literacy rate among these marginalised groups.
• The land owned by SC & ST households is very less; most of these families work as agricultural labourers. These families have to be encouraged by the Zilla Panchayats to take up self-employment activities to improve their living standard.
• Only few SC & ST households’ access to modern cooking fuel in the district, it is important to provide cooking fuel to all the families as most of them lives in remote areas in the district.
• About 30 percent of the households have access to toilets; this should be addressed immediately by the district administration.
• Nearly 50 percent of the marginalised groups do not pucca houses, they should be provided pucca houses under IAY, Ambedkar Awas Yojana, Basava Vasathi Yojana etc. on priority basis.
• The government should encourage the socially marginalised groups through special programmes for education, health, housing and sanitation, more opportunities for generating income through adequate guarantee of employment etc., to enhance their quality of life which would ultimately led to high level of Human Development in the district.
Future HD strateg y for Gender DevelopmentAlthough gender inequality in Mandya district is not marked, as evidenced by fairly low Gender Inequality Index of 0.070, there are still problems to be attended to regarding gender development in the district.
• The Child sex ratio has declined in 2011compared to 2001 Census, hence the causes for this trend needs to be examined and appropriate policy measures need to be introduced on war footing.
• Around 78% of the couples are using contraceptives, better awareness needs to be created and health care delivery services need to be strengthened.
• Even though Child mortality rate is less than maternal mortality rate, the percentage of malnourished children is around 22% in the district. This demands specific policy measure to reduce malnutrition among newly-born babies.
• ASHA workers need to reach out to all adolescent girls and pregnant women in both Shrirangapattana and Nagamangala.
• A slight decline in female work participation in the district coupled with a big wage gap of Rs.110 is a serious concern; the rural local bodies could make a big difference, in bridging this gap.
• SHGs have created a new wave of economic freedom and independence among women in the district, there is a need for strengthening the SHGs movement at grass root level.
Future HD Strateg y for other sectorsFuture HD Strateg y for tackling Urban Problems:
• The households’ access to basic services in Mandya CMC is comparatively better. However, there is a need for improvement especially in the households’ access to water supply and toilet facilities within the premises and also in their access to closed drainage system. The future strategy is to provide basic services to rest of the ULBs.
• The ULBs are struggling to meet the basic urban services like street lighting, water supply, drainage system, clearance of garbage, health services, housing and education especially to the poorer sections. There is an urgent need for recruiting anpower to execute the developmental projects.
• Lack of adequate own sources of funds to establish and maintain urban facilities, insufficient state allocation to ULBs and poor management of the
195
available funds. The ULBs should mobilize their own resources to meet the expenditure on basic services on priority.
Future HD strateg y for Good Governance: Good governance is crucial for human development. The development thinkers and administrators maintain that human development is not possible without good governance. The full benefits of government policies and programmes reach targeted groups of people only when the delivery system is transparent, smooth, effective and efficient. There is much more to achieve by these governments to attain a true human development in rural as well as in urban areas. Some of the key issues to be taken up by the rural and urban governments for effective delivery of services are:
• Plans prepared by the Panchayat raj institutions should be need-based.
• More funds to be allotted to the backward taluks to bring them on par with developed taluks.
• Accurate data should be collected and maintained on all aspects of development indicators.
• Proper training should be given to both elected representatives and government officials on development activities at the grass root level, taluk level and at the district level.
• People’s participation is crucial for the improvement of governance.
• Periodic Gramasabha and Ward Sabha at GP level are crucial to address the grievances of the rural people.
• Grama nairmalya is the key for good health of people, particularly children and women. GPs should take necessary measures in this regard.
• GPs should create awareness among people about the use of toilets and help to construct them.
• State should allocate larger amount of funds to Panchayats for undertaking development activities.
• Periodic awareness programme on human development for general public, elected representatives and officials is vital.
• Committed NGOs and voluntary agencies should be recognized and involved by PRIs for implementing certain government programmes. Co-ordination between NGOs and PRIs would yield better results in improving the quality of life in rural areas.
• There should be good co-ordination between the Govt. departments and the Panchayats for smooth functioning and effective implementation of the development programmes.
• The government’s e-initiatives should be used properly and effectively to serve all the stakeholders in a better manner. All GPs should be provided computers with internet facility and with a skilled computer operator.
12.3. Concluding Remarks
Human development at the grassroots level can be achieved not merely by allocating large amounts of funds but by the honest and judicious deployment of these funds on various development projects coupled with constant monitoring of their progress at the local level. The local governments consisting of both the elected representatives and bureaucracy need to play a pro-active and sincere role to make human development inclusive and sustainable. Transparency in local administration and checking pilferage of development funds is the need of the hour which need be accomplished not just by the routine departmental auditing but also an effective social auditing at the local level. It is an open secret that the local governments have often turned out to be hot-beds of factional politics and vested interests to which many a well-meaning human development project becomes the victim. There are always people at the local level to point out the irregularities in the micro level development administration. But what protection does the State Government give to such trumpet blowers!!

196
197
ANNEXURE – I: TABLES
Table 2.1: Percentage of forest area to total geographical area of Mandya District - 2011-12
Taluk Forest area (ha) Total Geographical area (ha) Percentage
Krishnarajpet 5767 91551 6.30
Nagamangala 2516 103885 2.42
Pandavapura 2051 52743 3.89
Shrirangapattana 725 35758 2.03
Mandya 1507 71512 2.11
Maddur 20 61846 0.03
Malavalli 12179 80949 15.05
District 24765 498244 4.97
Source: JD, Agriculture, Mandya
Table 2.2: Decadal population growth rate in Mandya District - 2001 and 2011
Taluk
Population Decadal Growth rate (2001-2011) 2001 2011
Total Rural Urban Total Rural Urban Total Rural Urban
Krishnarajpet 248245 225665 22580 260479 234533 25946 4.93 3.93 14.91
Nagamangala 190770 174718 16052 187897 170121 17776 -1.51 -2.63 10.74
Pandavapura 175009 156699 18310 183352 162953 20399 4.77 3.99 11.41
Shrirangapat-tana
162984 139255 23729 180191 146056 34135 10.56 4.88 43.85
Mandya 405612 274433 131179 415153 277795 137358 2.35 1.23 4.71
Maddur 290783 264262 26521 295432 260285 35147 1.60 -1.50 32.53
Malavalli 281809 245958 35851 283265 245664 37601 0.52 -0.12 4.88
District 1763705 1480990 282715 1805769 1497407 308362 2.38 1.11 9.07
Source: Census of India, 2001 & 2011
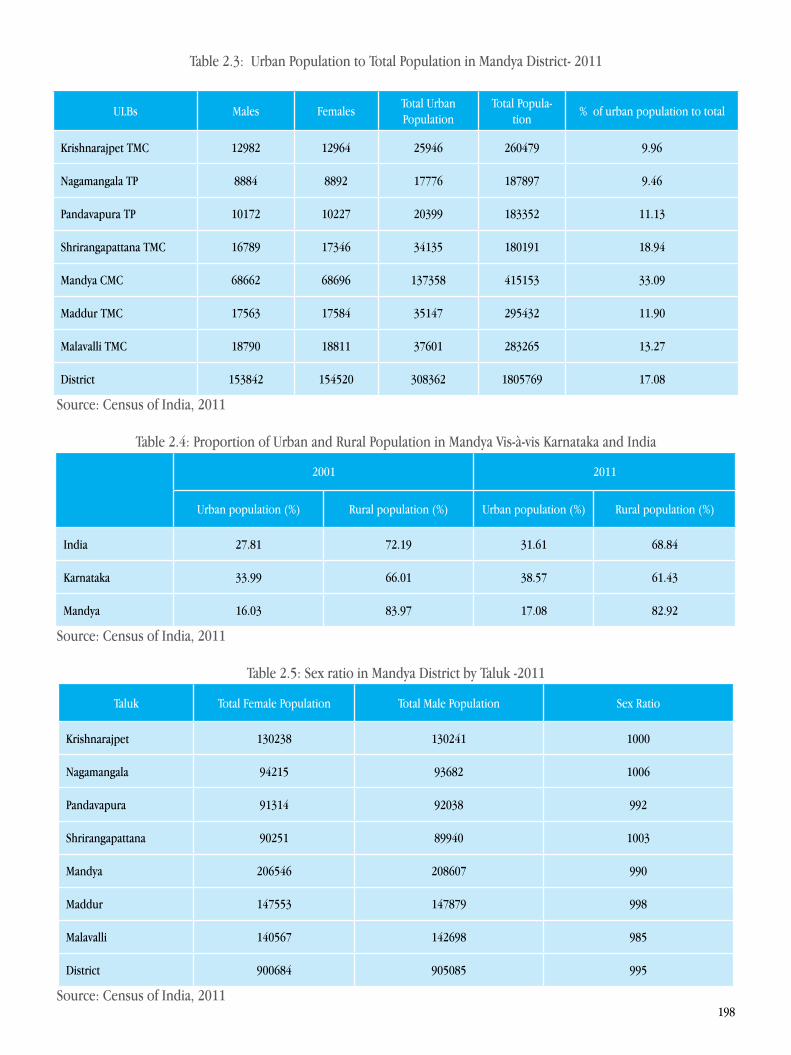
198
Table 2.3: Urban Population to Total Population in Mandya District- 2011
ULBs Males FemalesTotal Urban Population
Total Popula-tion
% of urban population to total
Krishnarajpet TMC 12982 12964 25946 260479 9.96
Nagamangala TP 8884 8892 17776 187897 9.46
Pandavapura TP 10172 10227 20399 183352 11.13
Shrirangapattana TMC 16789 17346 34135 180191 18.94
Mandya CMC 68662 68696 137358 415153 33.09
Maddur TMC 17563 17584 35147 295432 11.90
Malavalli TMC 18790 18811 37601 283265 13.27
District 153842 154520 308362 1805769 17.08
Source: Census of India, 2011
Table 2.4: Proportion of Urban and Rural Population in Mandya Vis-à-vis Karnataka and India
2001 2011
Urban population (%) Rural population (%) Urban population (%) Rural population (%)
India 27.81 72.19 31.61 68.84
Karnataka 33.99 66.01 38.57 61.43
Mandya 16.03 83.97 17.08 82.92
Source: Census of India, 2011
Table 2.5: Sex ratio in Mandya District by Taluk -2011
Taluk Total Female Population Total Male Population Sex Ratio
Krishnarajpet 130238 130241 1000
Nagamangala 94215 93682 1006
Pandavapura 91314 92038 992
Shrirangapattana 90251 89940 1003
Mandya 206546 208607 990
Maddur 147553 147879 998
Malavalli 140567 142698 985
District 900684 905085 995
Source: Census of India, 2011
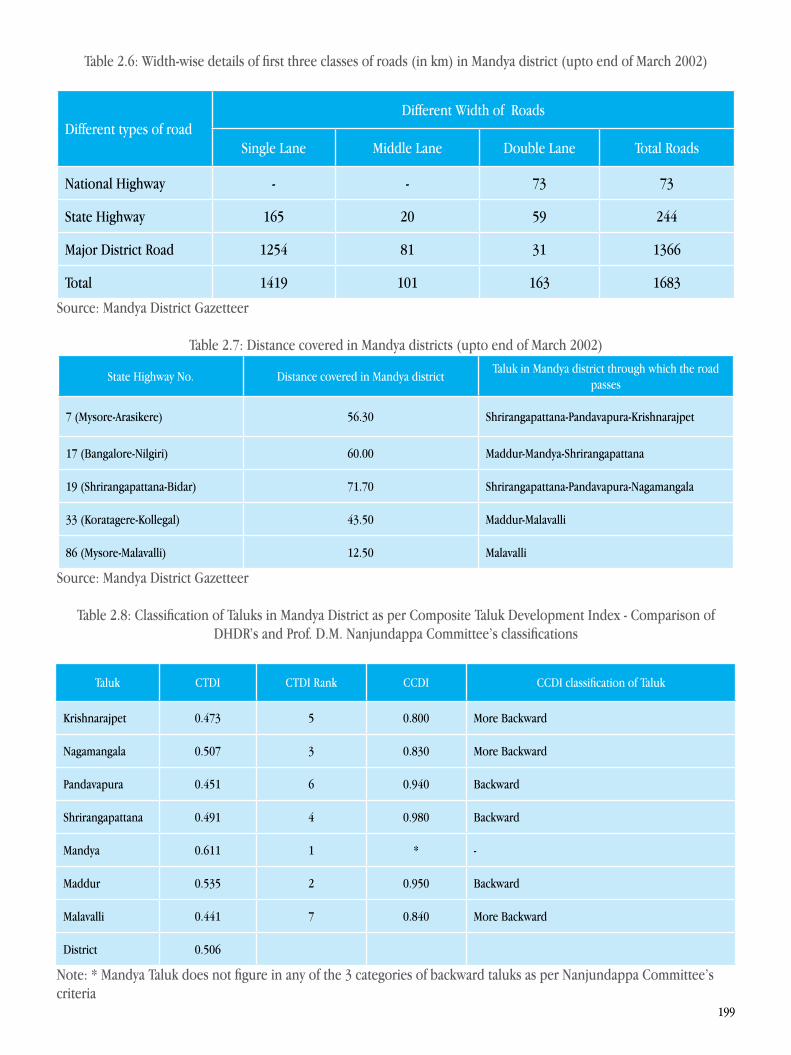
199
Table 2.6: Width-wise details of first three classes of roads (in km) in Mandya district (upto end of March 2002)
Different types of roadDifferent Width of Roads
Single Lane Middle Lane Double Lane Total Roads
National Highway - - 73 73
State Highway 165 20 59 244
Major District Road 1254 81 31 1366
Total 1419 101 163 1683
Source: Mandya District Gazetteer
Table 2.7: Distance covered in Mandya districts (upto end of March 2002)
State Highway No. Distance covered in Mandya districtTaluk in Mandya district through which the road
passes
7 (Mysore-Arasikere) 56.30 Shrirangapattana-Pandavapura-Krishnarajpet
17 (Bangalore-Nilgiri) 60.00 Maddur-Mandya-Shrirangapattana
19 (Shrirangapattana-Bidar) 71.70 Shrirangapattana-Pandavapura-Nagamangala
33 (Koratagere-Kollegal) 43.50 Maddur-Malavalli
86 (Mysore-Malavalli) 12.50 Malavalli
Source: Mandya District Gazetteer
Table 2.8: Classification of Taluks in Mandya District as per Composite Taluk Development Index - Comparison of DHDR’s and Prof. D.M. Nanjundappa Committee’s classifications
Taluk CTDI CTDI Rank CCDI CCDI classification of Taluk
Krishnarajpet 0.473 5 0.800 More Backward
Nagamangala 0.507 3 0.830 More Backward
Pandavapura 0.451 6 0.940 Backward
Shrirangapattana 0.491 4 0.980 Backward
Mandya 0.611 1 * -
Maddur 0.535 2 0.950 Backward
Malavalli 0.441 7 0.840 More Backward
District 0.506
Note: * Mandya Taluk does not figure in any of the 3 categories of backward taluks as per Nanjundappa Committee’s criteria
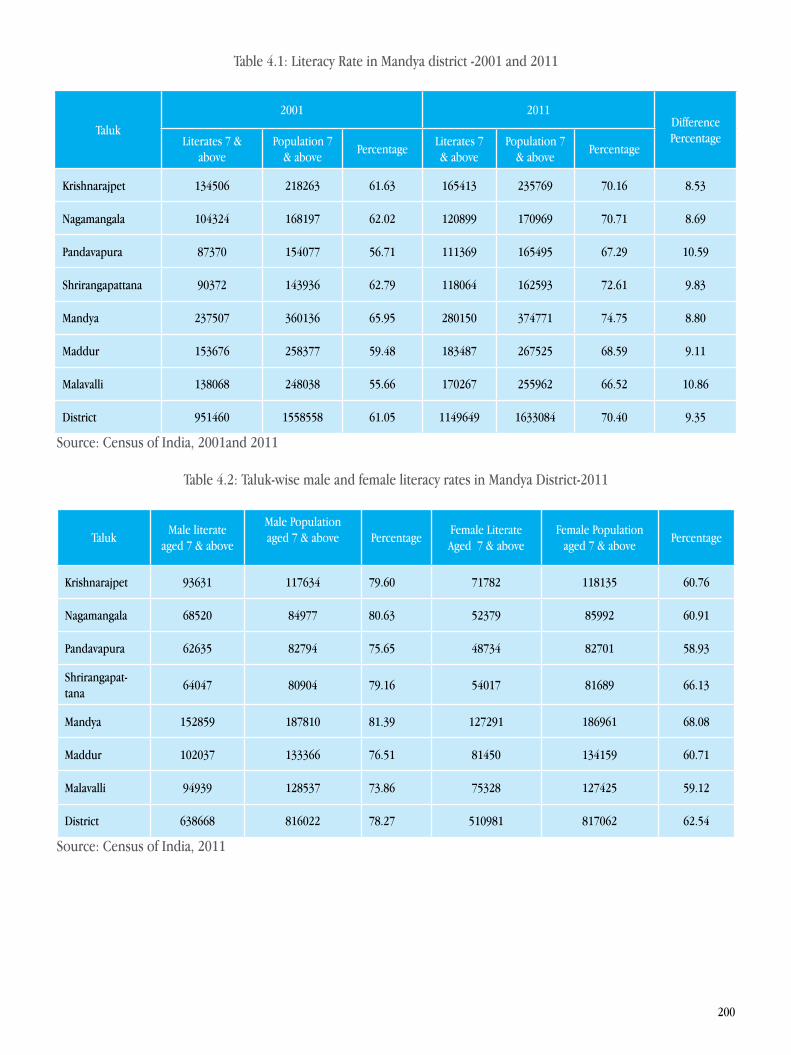
200
Table 4.1: Literacy Rate in Mandya district -2001 and 2011
Taluk
2001 2011Difference Percentage Literates 7 &
abovePopulation 7
& abovePercentage
Literates 7 & above
Population 7 & above
Percentage
Krishnarajpet 134506 218263 61.63 165413 235769 70.16 8.53
Nagamangala 104324 168197 62.02 120899 170969 70.71 8.69
Pandavapura 87370 154077 56.71 111369 165495 67.29 10.59
Shrirangapattana 90372 143936 62.79 118064 162593 72.61 9.83
Mandya 237507 360136 65.95 280150 374771 74.75 8.80
Maddur 153676 258377 59.48 183487 267525 68.59 9.11
Malavalli 138068 248038 55.66 170267 255962 66.52 10.86
District 951460 1558558 61.05 1149649 1633084 70.40 9.35
Source: Census of India, 2001and 2011
Table 4.2: Taluk-wise male and female literacy rates in Mandya District-2011
TalukMale literate
aged 7 & above
Male Populationaged 7 & above Percentage
Female LiterateAged 7 & above
Female Populationaged 7 & above
Percentage
Krishnarajpet 93631 117634 79.60 71782 118135 60.76
Nagamangala 68520 84977 80.63 52379 85992 60.91
Pandavapura 62635 82794 75.65 48734 82701 58.93
Shrirangapat-tana
64047 80904 79.16 54017 81689 66.13
Mandya 152859 187810 81.39 127291 186961 68.08
Maddur 102037 133366 76.51 81450 134159 60.71
Malavalli 94939 128537 73.86 75328 127425 59.12
District 638668 816022 78.27 510981 817062 62.54
Source: Census of India, 2011
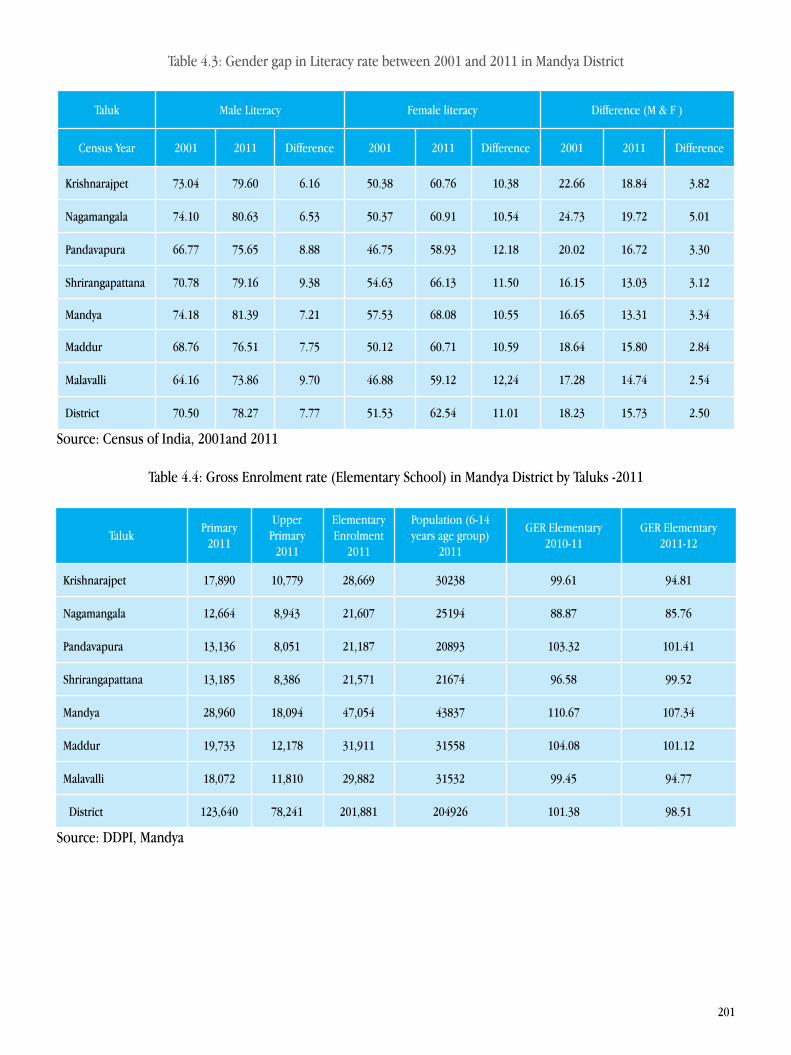
201
Table 4.3: Gender gap in Literacy rate between 2001 and 2011 in Mandya District
Taluk Male Literacy Female literacy Difference (M & F )
Census Year 2001 2011 Difference 2001 2011 Difference 2001 2011 Difference
Krishnarajpet 73.04 79.60 6.16 50.38 60.76 10.38 22.66 18.84 3.82
Nagamangala 74.10 80.63 6.53 50.37 60.91 10.54 24.73 19.72 5.01
Pandavapura 66.77 75.65 8.88 46.75 58.93 12.18 20.02 16.72 3.30
Shrirangapattana 70.78 79.16 9.38 54.63 66.13 11.50 16.15 13.03 3.12
Mandya 74.18 81.39 7.21 57.53 68.08 10.55 16.65 13.31 3.34
Maddur 68.76 76.51 7.75 50.12 60.71 10.59 18.64 15.80 2.84
Malavalli 64.16 73.86 9.70 46.88 59.12 12,24 17.28 14.74 2.54
District 70.50 78.27 7.77 51.53 62.54 11.01 18.23 15.73 2.50
Source: Census of India, 2001and 2011
Table 4.4: Gross Enrolment rate (Elementary School) in Mandya District by Taluks -2011
TalukPrimary
2011
Upper Primary
2011
Elementary Enrolment
2011
Population (6-14 years age group)
2011
GER Elementary 2010-11
GER Elementary 2011-12
Krishnarajpet 17,890 10,779 28,669 30238 99.61 94.81
Nagamangala 12,664 8,943 21,607 25194 88.87 85.76
Pandavapura 13,136 8,051 21,187 20893 103.32 101.41
Shrirangapattana 13,185 8,386 21,571 21674 96.58 99.52
Mandya 28,960 18,094 47,054 43837 110.67 107.34
Maddur 19,733 12,178 31,911 31558 104.08 101.12
Malavalli 18,072 11,810 29,882 31532 99.45 94.77
District 123,640 78,241 201,881 204926 101.38 98.51
Source: DDPI, Mandya
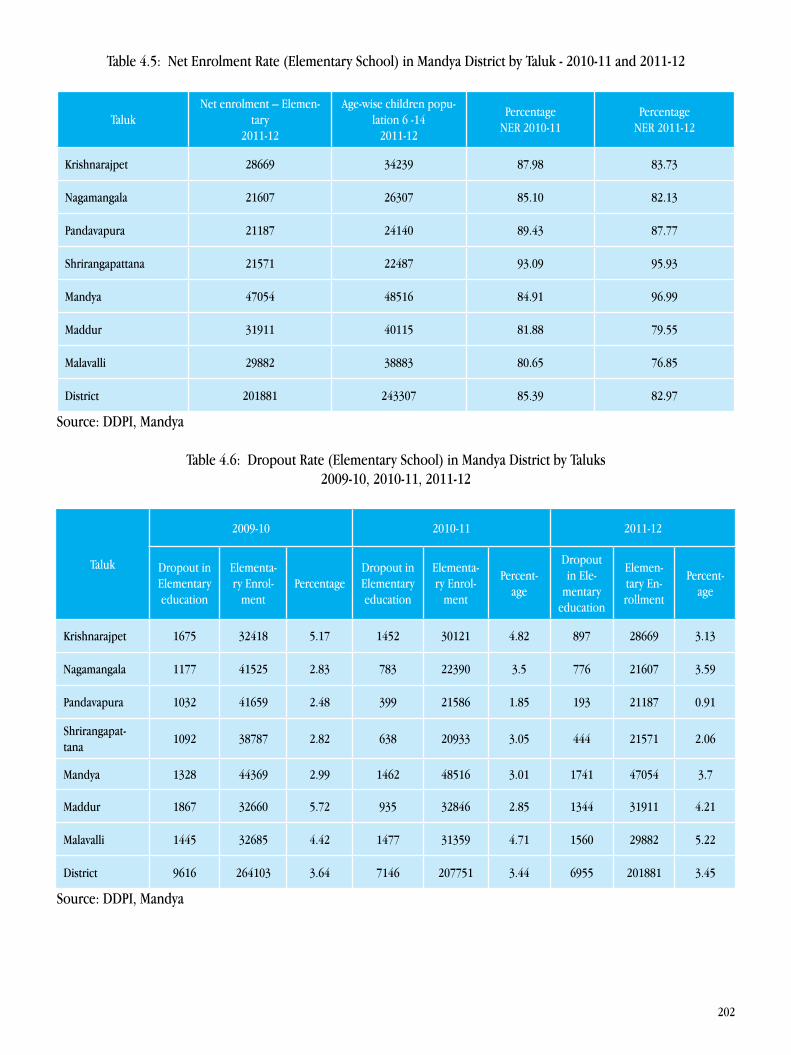
202
Table 4.5: Net Enrolment Rate (Elementary School) in Mandya District by Taluk - 2010-11 and 2011-12
TalukNet enrolment – Elemen-
tary2011-12
Age-wise children popu-lation 6 -14
2011-12
PercentageNER 2010-11
PercentageNER 2011-12
Krishnarajpet 28669 34239 87.98 83.73
Nagamangala 21607 26307 85.10 82.13
Pandavapura 21187 24140 89.43 87.77
Shrirangapattana 21571 22487 93.09 95.93
Mandya 47054 48516 84.91 96.99
Maddur 31911 40115 81.88 79.55
Malavalli 29882 38883 80.65 76.85
District 201881 243307 85.39 82.97
Source: DDPI, Mandya
Table 4.6: Dropout Rate (Elementary School) in Mandya District by Taluks 2009-10, 2010-11, 2011-12
Taluk
2009-10 2010-11 2011-12
Dropout in Elementary education
Elementa-ry Enrol-
mentPercentage
Dropout in Elementary education
Elementa-ry Enrol-
ment
Percent-age
Dropout in Ele-
mentary education
Elemen-tary En-rollment
Percent-age
Krishnarajpet 1675 32418 5.17 1452 30121 4.82 897 28669 3.13
Nagamangala 1177 41525 2.83 783 22390 3.5 776 21607 3.59
Pandavapura 1032 41659 2.48 399 21586 1.85 193 21187 0.91
Shrirangapat-tana
1092 38787 2.82 638 20933 3.05 444 21571 2.06
Mandya 1328 44369 2.99 1462 48516 3.01 1741 47054 3.7
Maddur 1867 32660 5.72 935 32846 2.85 1344 31911 4.21
Malavalli 1445 32685 4.42 1477 31359 4.71 1560 29882 5.22
District 9616 264103 3.64 7146 207751 3.44 6955 201881 3.45
Source: DDPI, Mandya

203
Table 4.7: Taluk wise Dropout Children Mainstreamed (Primary and Secondary Schools) in Mandya District by Taluks 2009-10, 2010-11 and 2011-12
Taluk
2009-10 2010-11 2011-12
Dropout Children
Mainstreamed
Dropout Children
PercentageDropout Children
Mainstreamed
Drop-out
Chil-dren
Percent-age
Dropout Children
Mainstreamed
Drop-out
Chil-dren
Percent-age
Krishnarajpet 20 56 35.71 25 42 59.52 9 31 29.03
Nagamangala 20 27 74.07 18 55 32.73 5 10 50.00
Pandavapura 61 118 51.69 8 11 72.73 14 17 82.35
Shrirangapat-tana
34 66 51.52 69 83 83.13 5 56 8.93
Mandya 102 191 53.40 55 71 77.46 5 73 6.85
Maddur 38 80 47.50 44 83 53.01 4 49 8.16
Malavalli 105 208 50.48 140 214 65.42 28 140 20.00
District 380 746 50.94 359 559 64.22 70 376 18.62
Source: DDPI, Mandya
Table 4.8: Transition Rate at Elementary School level in Mandya District: 2009-10, 2011-12 (%)
Taluk
2009-10 2011-12
All community All community
Boys Girls Total Boys Girls Total
Krishnarajpet 93.57 91.97 92.48 96.05 99.69 97.87
Nagamangala 90.00 89.52 90.14 92.89 96.41 94.65
Pandavapura 93.06 91.04 98.58 84.28 79.90 82.09
Shrirangapattana 92.45 88.54 90.38 99.00 107.65 103.32
Mandya 89.96 90.09 96.28 94.99 94.44 94.72
Maddur 95.79 95.05 99.15 94.53 97.45 95.99
Malavalli 99.26 99.15 97.65 88.49 89.00 88.75
District 93.42 91.93 97.21 101.32 105.27 103.29
Source: DDPI, Mandya
204
Table 4.9: Secondary School Gross Enrolment Rate (15-16 years)
Taluk
2009-10 2010-11 2011-12
Secondary school
Enrolment
Popula-tion in
15-16 age group
GER Per-centages
Secondary school En-rolment
Popula-tion in
15-16 age group
GER Percent-ages
Secondary school En-rolment
Population in 15-16
age group
GER Per-centages
Krishnara-jpet
10893 10738 101.44 10568 10738 98.42 10717 10738 99.80
Nagaman-gala
9604 8253 116.37 9190 8253 111.35 7943 8253 96.24
Pandavapura 7683 7569 101.51 7243 7569 95.69 7119 7569 94.05
Shriranga-pattana
7452 7415 100.50 6625 7415 89.35 5974 7415 80.57
Mandya 17788 17539 101.42 17444 17539 99.46 18912 17539 107.83
Maddur 14591 12575 116.03 14487 12575 115.2 12745 12575 101.35
Malavalli 13708 12185 112.5 12754 12185 104.67 9885 12185 81.12
District 81719 76274 107.14 78311 76274 102.67 73,295 76274 96.09
Source: DDPI, Mandya
Table 4.10: Drop-out rate in Secondary School
Taluk
2009-10 2010-11 2011-12
Drop out in Second-
ary
Secondary enrolment
PercentageDrop out
in Sec-ondary
Secondary enrolment
PercentageDrop out
in Sec-ondary
Secondary enrolment
Percentages
Krishnara-jpet
325 10717 3.03 149 10568 1.41 432 10717 4.03
Nagaman-gala
414 7943 5.21 1247 9190 13.57 1105 7943 13.91
Pandavapura 440 7119 6.18 124 7243 1.71 391 7119 5.49
Shriranga-pattana
827 5974 13.84 651 6625 9.83 756 5974 12.65
Mandya 344 18912 1.82 1468 17444 8.42 741 18912 3.92
Maddur 104 12745 0.82 1742 14487 12.02 138 12745 1.08
Malavalli 954 9885 9.65 2869 12754 22.49 2460 9885 24.89
District 3408 73295 4.65 8250 78311 10.53 6023 73,295 8.22
Source: DDPI, Mandya
205
Table 4.11: Details of sanctioned posts and working teachers in schools in Mandya District in 2011-12
Level
Dept. ofEducation
Social Welfare Aided Unaided Total
S W S W S W S W S W
Primary 1848 1690 05 04 09 08 293 284 2155 1986
Higher Primary 4170 3789 158 150 257 216 2155 2087 6740 6242
Elementary 6018 5479 163 154 266 224 2448 2371 8895 8228
Secondary 2048 1729 133 125 679 548 1329 1279 4189 3681
Source: DISE 2011-12 Note: S-Sanctioned W- Working
Table 4.12: Details of Male and Female working teachers in schools
Level
Dept. ofEducation
Social Welfare Aided Unaided Total
M F M F M F M F M F
Primary 1066 626 02 04 00 08 24 267 1092 905
Higher Primary 2045 1746 101 76 79 137 511 1691 2736 3650
Elementary 3111 2372 103 80 79 145 535 1958 3826 4555
Secondary 1093 636 85 61 403 148 556 825 2137 1670
Source: DISE 2011-12 Note: M – Male F -Female
206
Table 4.13: Pupil-Teacher Ratio (Elementary School) in Mandya District by Taluk -2009-10, 2010-11 & 2011-12
Taluk
2009-10 2010-11 2011-12
Govt. Enrol-ment 1to 7
class
Govt. Teacher Working
Pupil- Teacher
Ratio
Govt. Enrol-ment to 7
class
Govt. Teacher Working
Pupil- Teacher
Ratio
Govt. Enrol-ment 1to 7
class
Govt. Teacher Work-
ing
Pupil- Teacher
Ratio
Krishnarajpet 12,961 1041 12:1 18,436 1012 18:1 16087 978 16:1
Nagamangala 9,401 819 11:1 13,523 830 16:1 10077 759 13:1
Pandavapura 7,824 612 13:1 11,449 612 19:1 10158 573 18:1
Shrirangapat-tana
6,765 530 13:1 10,158 490 21:1 18436 499 37:1
Mandya 13714 1079 13:1 20202 1049 19:1 21455 1013 21:1
Maddur 10,870 888 12:1 16,087 853 19:1 17783 799 22:1
Malavalli 11,784 936 13:1 17,783 897 20:1 13550 858 16:1
District 73,319 5,905 12:1 107,638 5,743 19:1 107546 5479 20:1
Source: DDPI, Mandya
Table 4.14: Pupil-Teacher Ratio (Secondary School) in Mandya District in2009-10, 2010-11 & 2011-12
Taluk
2009-10 2010-11 2011-12
Enrolment in 8 to
10 Stds. in (Govt. Schools)
Teacher Govt.
PT Ratio
Enrolment in 8 to
10 Stds. in (Govt. Schools)
Teacher Govt.
PT Ratio
Enrolment in 8 to 10 Stds.
in (Govt. Schools)
Teacher Govt.
PT Ratio
Krishnarajpet 6367 236 27:1 6367 227 28:1 6367 230 28:1
Nagamangala 4030 165 24:1 4030 179 23:1 4030 174 23:1
Pandavapura 4032 157 26:1 4032 165 24:1 4032 186 22:1
Shrirangapat-tana
7101 139 51:1 7101 170 42:1 7101 167 43:1
Mandya 7323 232 32:1 7323 342 21:1 7323 362 20:1
Maddur 6992 313 22:1 6992 320 22:1 6992 304 23:1
Malavalli 4150 293 14:1 4150 281 15:1 4150 306 14:1
District 39995 1535 26:1 39995 1684 24:1 39995 1729 23:1
Source: DDPI, Mandya
207
Table 4.15: Building status and Condition of classrooms in Elementary and Secondary schools (Education Department Schools) – Mandya District
(A)Status of School Building
Level Schools Private Rented Govt Rent Free DilapidatedUnder Construc-
tionNo Building
Elementary 1801 04 02 1788 07 00 00 00
Secondary 213 01 00 187 21 04 00 00
(B) Condition of Classrooms
Level
Class rooms Other rooms
Good RoomsNeed major
repair
Need minor repair
Total rooms Good roomsNeed ma-jor repair
Need minor repair
Total rooms
Elementary 4101 978 1632 6711 1119 422 531 2072
Secondary 656 84 316 1056 447 79 322 848
Source: DISE 2011-12
Table 4.16: Percentage of Villages having a Primary School within 1 km distance in Mandya District 2011-12
TalukVillages having a primary school within 1 km
distanceTotal no of habitation Percentages
Krishnarajpet 419 419 100.00
Nagamangala 547 577 94.80
Pandavapura 238 239 99.58
Shrirangapattana 156 157 99.36
Mandya 337 341 98.83
Maddur 291 291 100.00
Malavalli 327 327 100.00
District 2315 2351 98.47
Source: DDPI, Mandya

208
Tabl
e 4.
17: T
aluk
-wise
Sch
ool I
nfra
stru
ctur
e In
dex
in M
andy
a D
istric
t in
2009
-10,
201
0-11
and
201
1-12
Talu
k
2009
-10
2010
-11
2011
-12
Tota
l Sch
ools
Faci
litie
sSc
hool
s in
dex
Tota
l Sch
ools
Faci
litie
sSc
hool
sIn
dex
Tota
l Sch
ools
Faci
litie
sSc
hool
sIn
dex
Krish
nara
jpet
344
1790
2752
0.65
342
2054
2736
0.75
341
2463
2728
0.90
Nag
aman
gala
373
1934
2984
0.65
370
2151
2960
0.73
361
2532
2888
0.88
Pand
avap
ura
182
1050
1456
0.72
182
1130
1456
0.78
182
1311
1456
0.90
Shrir
anga
patta
na12
672
810
080.
7212
579
410
000.
7912
589
710
000.
90
Man
dya
295
1761
2360
0.75
294
1836
2352
0.78
290
2074
2320
0.89
Mad
dur
246
1511
1968
0.77
247
1706
1976
0.86
246
1805
1968
0.92
Mal
aval
li26
314
2021
040.
6726
115
5920
880.
7525
617
9820
480.
88
Dist
rict
1829
1019
414
632
0.70
1821
1123
014
568
0.77
1801
1288
014
408
0.89
Sour
ce: D
DPI
, Man
dya
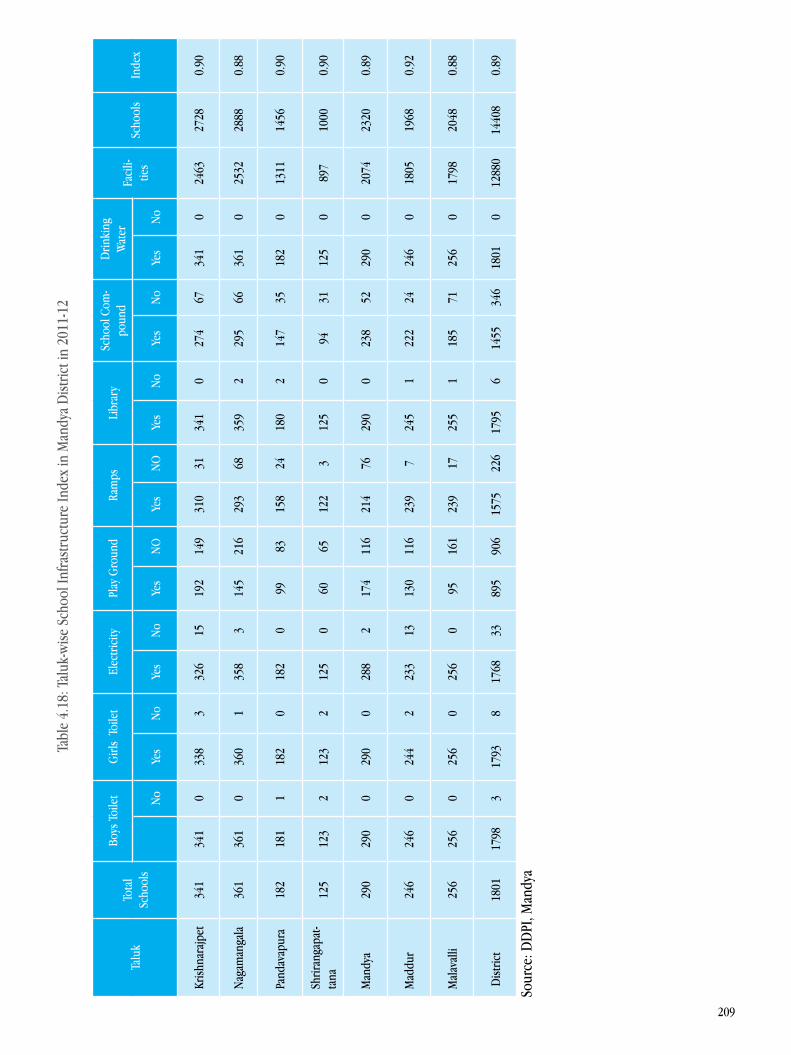
209
Tabl
e 4.
18: T
aluk
-wise
Sch
ool I
nfra
stru
ctur
e In
dex
in M
andy
a D
istric
t in
2011
-12
Talu
kTo
tal
Scho
ols
Boys
Toi
let
Girl
s To
ilet
Elec
trici
tyPl
ay G
roun
dRa
mps
Libr
ary
Scho
ol C
om-
poun
dD
rinki
ng
Wat
erFa
cili-
ties
Scho
ols
Inde
x
No
Yes
No
Yes
No
Yes
NO
Yes
NO
Yes
No
Yes
No
Yes
No
Krish
nara
jpet
341
341
033
83
326
1519
214
931
031
341
027
467
341
024
6327
280.
90
Nag
aman
gala
361
361
036
01
358
314
521
629
368
359
229
566
361
025
3228
880.
88
Pand
avap
ura
182
181
118
20
182
099
8315
824
180
214
735
182
013
1114
560.
90
Shrir
anga
pat-
tana
125
123
212
32
125
060
6512
23
125
094
3112
50
897
1000
0.90
Man
dya
290
290
029
00
288
217
411
621
476
290
023
852
290
020
7423
200.
89
Mad
dur
246
246
024
42
233
1313
011
623
97
245
122
224
246
018
0519
680.
92
Mal
aval
li25
625
60
256
025
60
9516
123
917
255
118
571
256
017
9820
480.
88
Dist
rict
1801
1798
317
938
1768
3389
590
615
7522
617
956
1455
346
1801
012
880
1440
80.
89
Sour
ce: D
DPI
, Man
dya
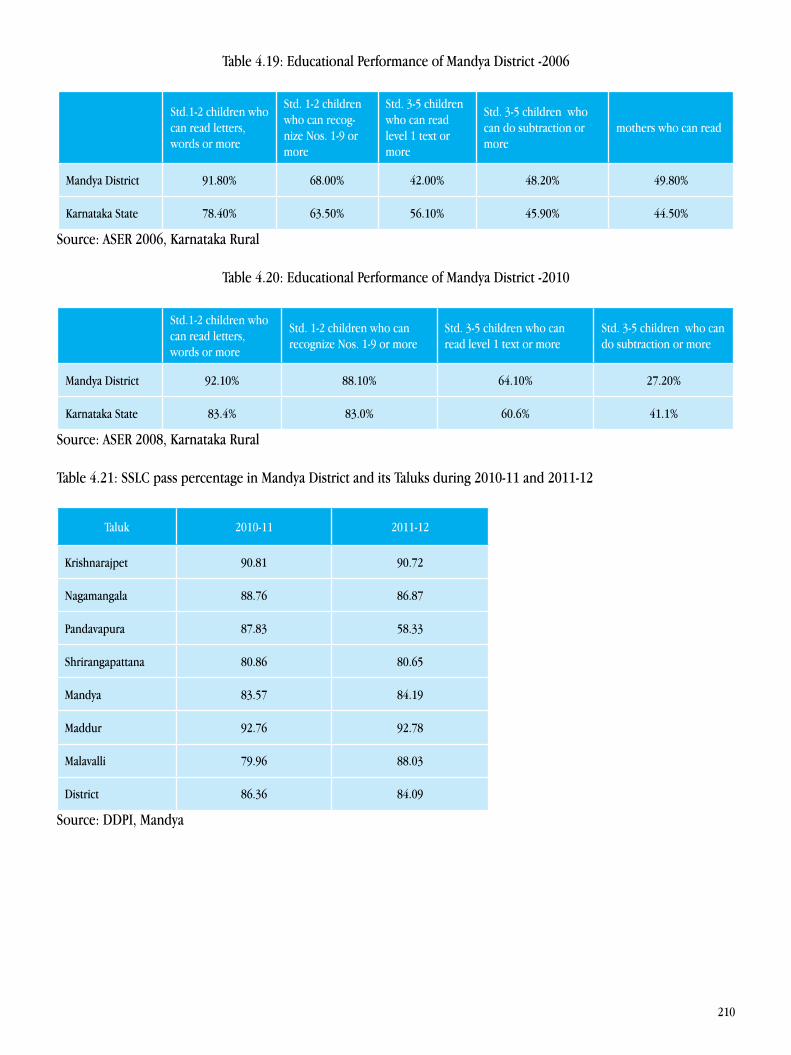
210
Table 4.19: Educational Performance of Mandya District -2006
Std.1-2 children who can read letters, words or more
Std. 1-2 children who can recog-nize Nos. 1-9 or more
Std. 3-5 children who can read level 1 text or more
Std. 3-5 children who can do subtraction or more
mothers who can read
Mandya District 91.80% 68.00% 42.00% 48.20% 49.80%
Karnataka State 78.40% 63.50% 56.10% 45.90% 44.50%
Source: ASER 2006, Karnataka Rural
Table 4.20: Educational Performance of Mandya District -2010
Std.1-2 children who can read letters, words or more
Std. 1-2 children who can recognize Nos. 1-9 or more
Std. 3-5 children who can read level 1 text or more
Std. 3-5 children who can do subtraction or more
Mandya District 92.10% 88.10% 64.10% 27.20%
Karnataka State 83.4% 83.0% 60.6% 41.1%
Source: ASER 2008, Karnataka Rural
Table 4.21: SSLC pass percentage in Mandya District and its Taluks during 2010-11 and 2011-12
Taluk 2010-11 2011-12
Krishnarajpet 90.81 90.72
Nagamangala 88.76 86.87
Pandavapura 87.83 58.33
Shrirangapattana 80.86 80.65
Mandya 83.57 84.19
Maddur 92.76 92.78
Malavalli 79.96 88.03
District 86.36 84.09
Source: DDPI, Mandya
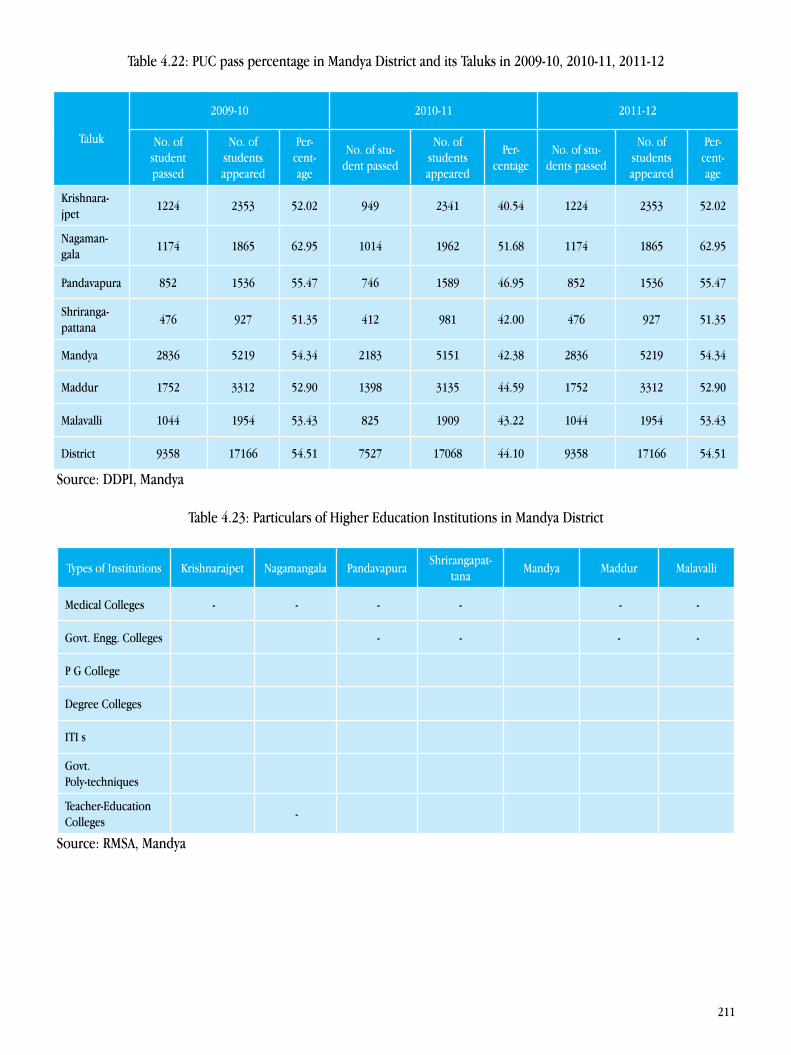
211
Table 4.22: PUC pass percentage in Mandya District and its Taluks in 2009-10, 2010-11, 2011-12
Taluk
2009-10 2010-11 2011-12
No. of student passed
No. of students appeared
Per-cent-age
No. of stu-dent passed
No. of students appeared
Per-centage
No. of stu-dents passed
No. of students appeared
Per-cent-age
Krishnara-jpet
1224 2353 52.02 949 2341 40.54 1224 2353 52.02
Nagaman-gala
1174 1865 62.95 1014 1962 51.68 1174 1865 62.95
Pandavapura 852 1536 55.47 746 1589 46.95 852 1536 55.47
Shriranga-pattana
476 927 51.35 412 981 42.00 476 927 51.35
Mandya 2836 5219 54.34 2183 5151 42.38 2836 5219 54.34
Maddur 1752 3312 52.90 1398 3135 44.59 1752 3312 52.90
Malavalli 1044 1954 53.43 825 1909 43.22 1044 1954 53.43
District 9358 17166 54.51 7527 17068 44.10 9358 17166 54.51
Source: DDPI, Mandya
Table 4.23: Particulars of Higher Education Institutions in Mandya District
Types of Institutions Krishnarajpet Nagamangala PandavapuraShrirangapat-
tanaMandya Maddur Malavalli
Medical Colleges - - - - ề - -
Govt. Engg. Colleges ề ề - - ề - -
P G College ề ề
Degree Colleges ề ề ề ề ề ề ề
ITI s ề ề ề ề ề ề ề
Govt. Poly-techniques
ề ề ề ề ề
Teacher-Education Colleges
ề - ề ề ề ề ề
Source: RMSA, Mandya
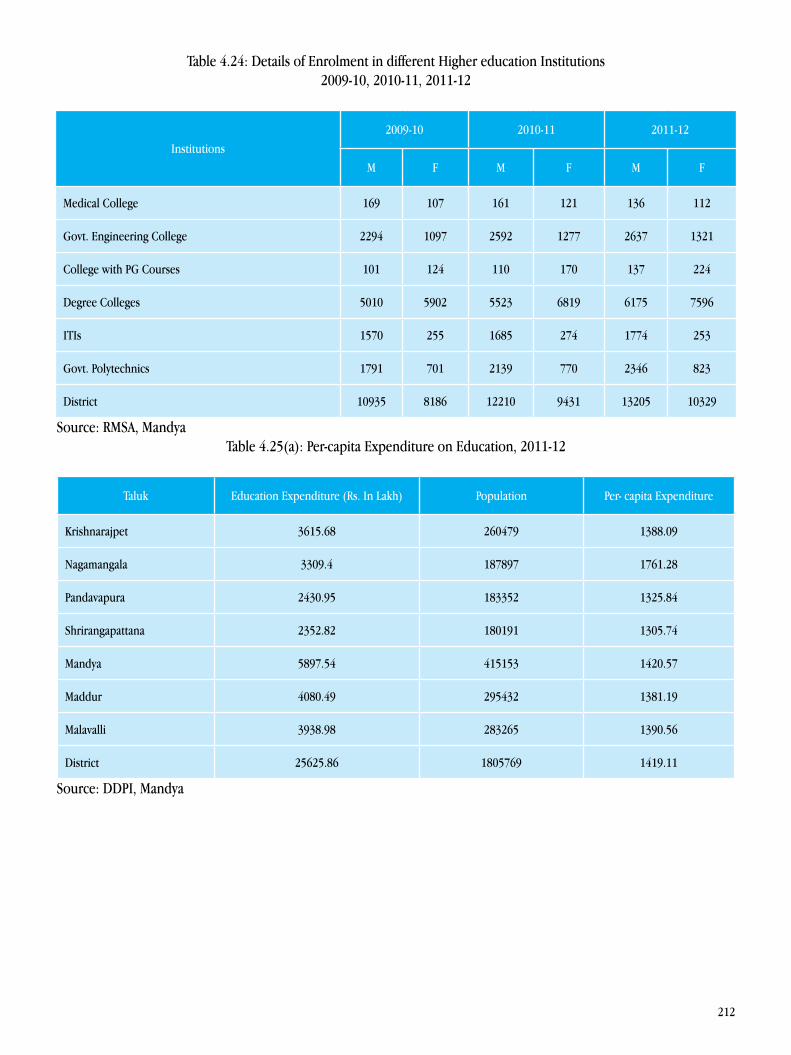
212
Table 4.24: Details of Enrolment in different Higher education Institutions2009-10, 2010-11, 2011-12
Institutions2009-10 2010-11 2011-12
M F M F M F
Medical College 169 107 161 121 136 112
Govt. Engineering College 2294 1097 2592 1277 2637 1321
College with PG Courses 101 124 110 170 137 224
Degree Colleges 5010 5902 5523 6819 6175 7596
ITIs 1570 255 1685 274 1774 253
Govt. Polytechnics 1791 701 2139 770 2346 823
District 10935 8186 12210 9431 13205 10329
Source: RMSA, MandyaTable 4.25(a): Per-capita Expenditure on Education, 2011-12
Taluk Education Expenditure (Rs. In Lakh) Population Per- capita Expenditure
Krishnarajpet 3615.68 260479 1388.09
Nagamangala 3309.4 187897 1761.28
Pandavapura 2430.95 183352 1325.84
Shrirangapattana 2352.82 180191 1305.74
Mandya 5897.54 415153 1420.57
Maddur 4080.49 295432 1381.19
Malavalli 3938.98 283265 1390.56
District 25625.86 1805769 1419.11
Source: DDPI, Mandya
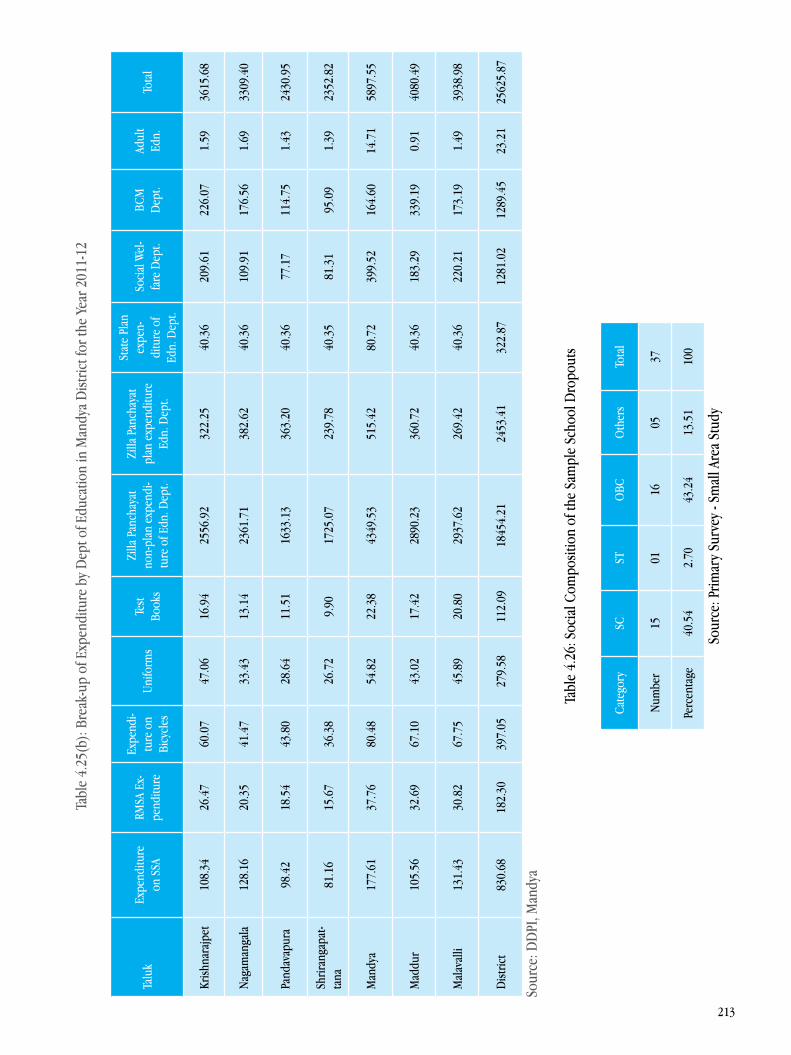
213
Tabl
e 4.
25(b
): Br
eak-
up o
f Exp
endi
ture
by
Dep
t of E
duca
tion
in M
andy
a D
istric
t for
the
Year
201
1-12
Talu
k Ex
pend
iture
on
SSA
RM
SA E
x-pe
nditu
re
Expe
ndi-
ture
on
Bicy
cles
Un
iform
sTe
st
Book
s
Zilla
Pan
chay
at
non-
plan
exp
endi
-tu
re o
f Edn
. Dep
t.
Zilla
Pan
chay
at
plan
exp
endi
ture
Ed
n. D
ept.
Stat
e Pl
an
expe
n-di
ture
of
Edn.
Dep
t.
Soci
al W
el-
fare
Dep
t.
BCM
D
ept.
Adul
t Ed
n.
Tota
l
Krish
nara
jpet
108.
3426
.47
60.0
747
.06
16.9
425
56.9
232
2.25
40.3
620
9.61
226.
071.
5936
15.6
8
Nag
aman
gala
128.
1620
.35
41.4
733
.43
13.1
423
61.7
138
2.62
40.3
610
9.91
176.
561.
6933
09.4
0
Pand
avap
ura
98.4
218
.54
43.8
028
.64
11.5
116
33.1
336
3.20
40.3
677
.17
114.
751.
4324
30.9
5
Shrir
anga
pat-
tana
81.1
615
.67
36.3
826
.72
9.90
1725
.07
239.
7840
.35
81.3
195
.09
1.39
2352
.82
Man
dya
177.
6137
.76
80.4
854
.82
22.3
843
49.5
351
5.42
80.7
239
9.52
164.
6014
.71
5897
.55
Mad
dur
105.
5632
.69
67.1
043
.02
17.4
228
90.2
336
0.72
40.3
618
3.29
339.
190.
9140
80.4
9
Mal
aval
li13
1.43
30.8
267
.75
45.8
920
.80
2937
.62
269.
4240
.36
220.
2117
3.19
1.49
3938
.98
Dist
rict
830.
6818
2.30
397.
0527
9.58
112.
0918
454.
2124
53.4
132
2.87
1281
.02
1289
.45
23.2
125
625.
87
Sour
ce: D
DPI
, Man
dya
Tabl
e 4.
26: S
ocia
l Com
posit
ion
of th
e Sa
mpl
e Sc
hool
Dro
pout
s
Cate
gory
SCST
OBC
Oth
ers
Tota
l
Num
ber
1501
1605
37
Perc
enta
ge40
.54
2.70
43.2
413
.51
100
Sour
ce: P
rimar
y Su
rvey
- Sm
all A
rea
Stud
y
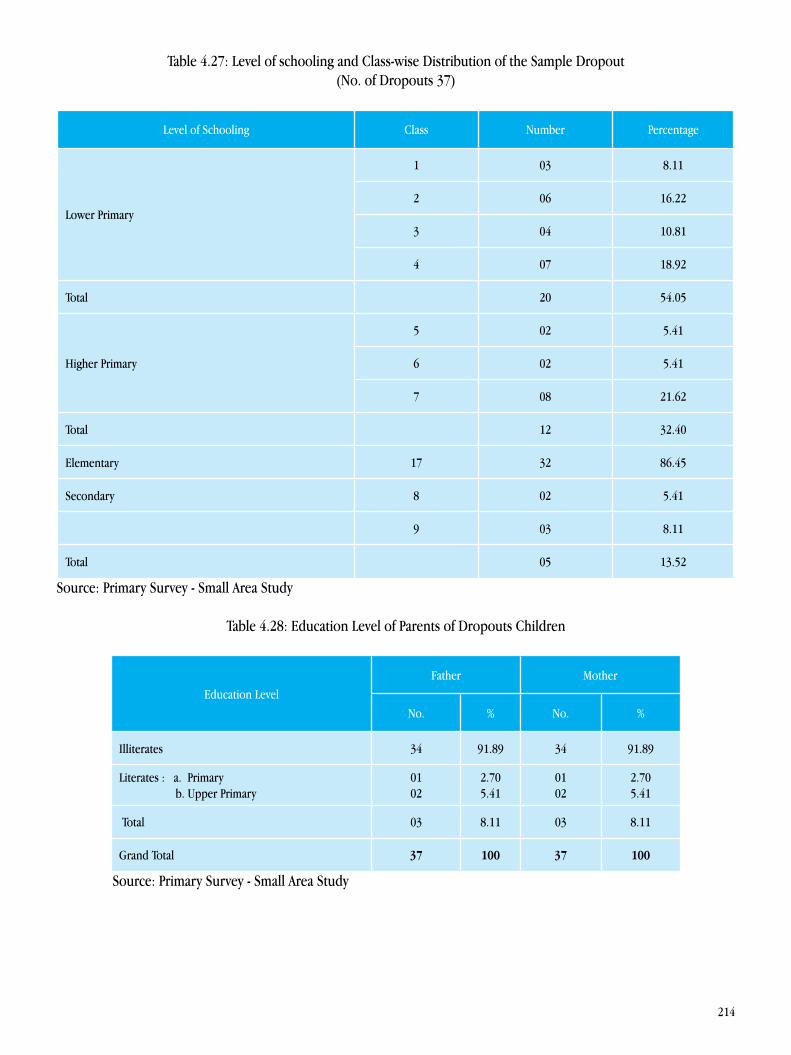
214
Table 4.27: Level of schooling and Class-wise Distribution of the Sample Dropout (No. of Dropouts 37)
Level of Schooling Class Number Percentage
Lower Primary
1 03 8.11
2 06 16.22
3 04 10.81
4 07 18.92
Total 20 54.05
Higher Primary
5 02 5.41
6 02 5.41
7 08 21.62
Total 12 32.40
Elementary 17 32 86.45
Secondary 8 02 5.41
9 03 8.11
Total 05 13.52
Source: Primary Survey - Small Area Study
Table 4.28: Education Level of Parents of Dropouts Children
Education LevelFather Mother
No. % No. %
Illiterates 34 91.89 34 91.89
Literates : a. Primary b. Upper Primary
0102
2.705.41
0102
2.705.41
Total 03 8.11 03 8.11
Grand Total 37 100 37 100
Source: Primary Survey - Small Area Study
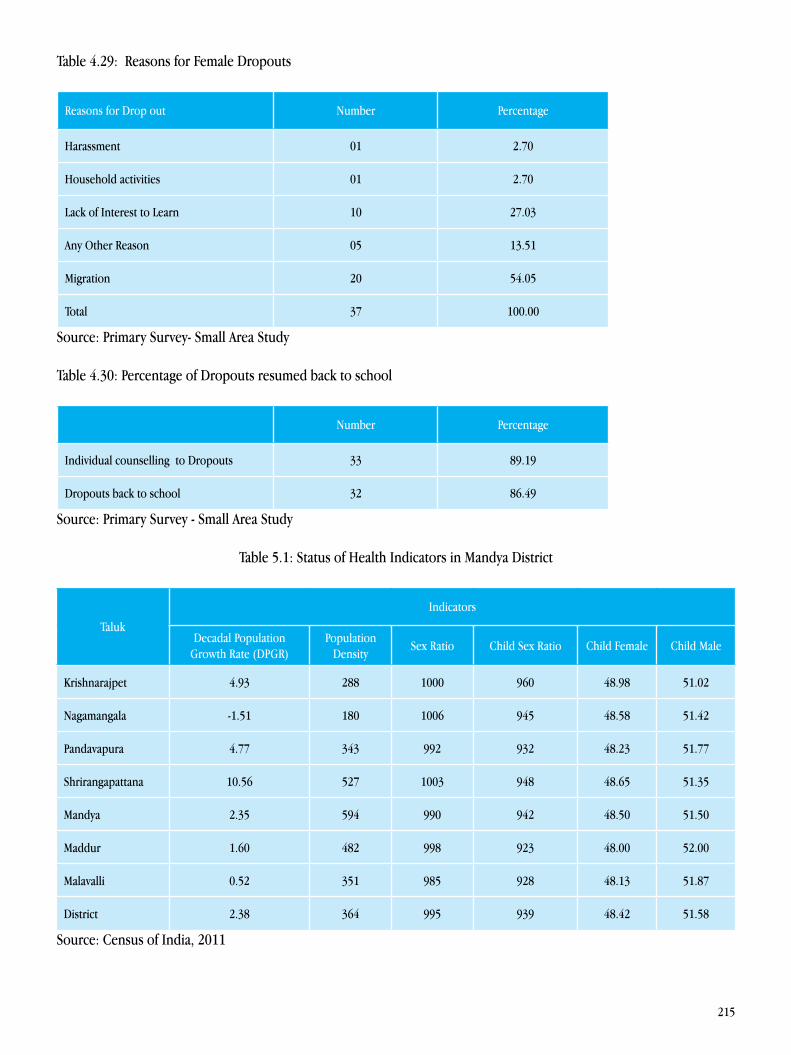
215
Table 4.29: Reasons for Female Dropouts
Reasons for Drop out Number Percentage
Harassment 01 2.70
Household activities 01 2.70
Lack of Interest to Learn 10 27.03
Any Other Reason 05 13.51
Migration 20 54.05
Total 37 100.00
Source: Primary Survey- Small Area Study
Table 4.30: Percentage of Dropouts resumed back to school
Number Percentage
Individual counselling to Dropouts 33 89.19
Dropouts back to school 32 86.49
Source: Primary Survey - Small Area Study
Table 5.1: Status of Health Indicators in Mandya District
Taluk
Indicators
Decadal Population Growth Rate (DPGR)
Population Density
Sex Ratio Child Sex Ratio Child Female Child Male
Krishnarajpet 4.93 288 1000 960 48.98 51.02
Nagamangala -1.51 180 1006 945 48.58 51.42
Pandavapura 4.77 343 992 932 48.23 51.77
Shrirangapattana 10.56 527 1003 948 48.65 51.35
Mandya 2.35 594 990 942 48.50 51.50
Maddur 1.60 482 998 923 48.00 52.00
Malavalli 0.52 351 985 928 48.13 51.87
District 2.38 364 995 939 48.42 51.58
Source: Census of India, 2011
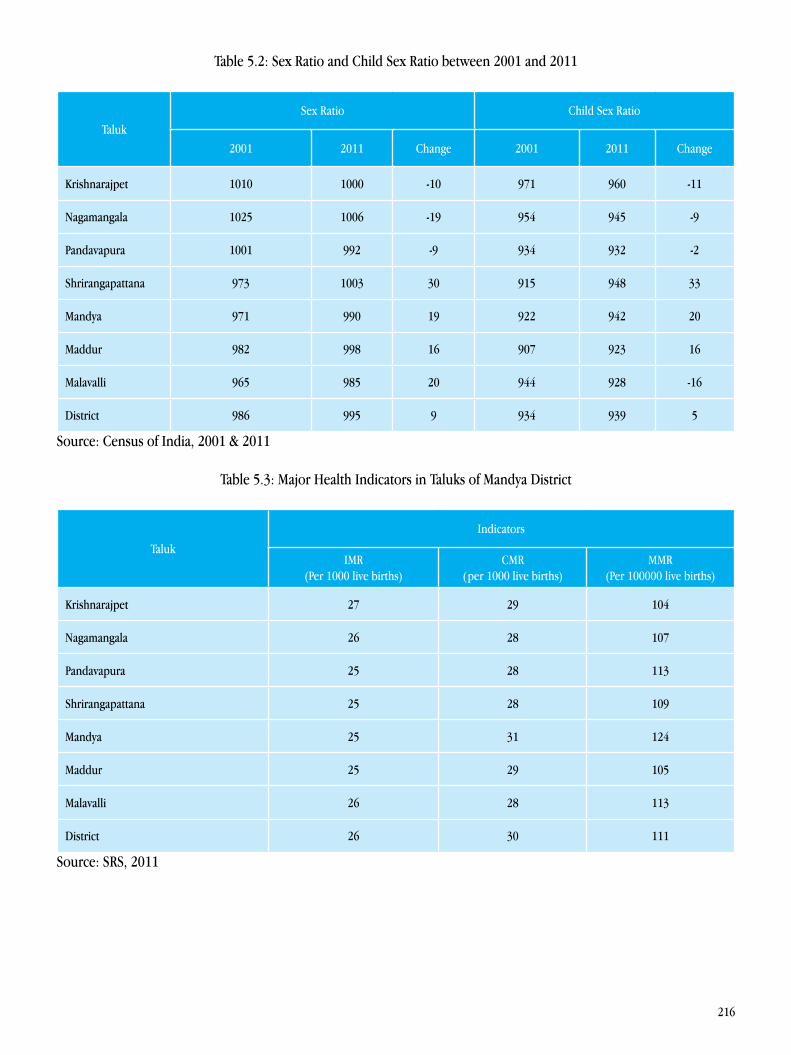
216
Table 5.2: Sex Ratio and Child Sex Ratio between 2001 and 2011
TalukSex Ratio Child Sex Ratio
2001 2011 Change 2001 2011 Change
Krishnarajpet 1010 1000 -10 971 960 -11
Nagamangala 1025 1006 -19 954 945 -9
Pandavapura 1001 992 -9 934 932 -2
Shrirangapattana 973 1003 30 915 948 33
Mandya 971 990 19 922 942 20
Maddur 982 998 16 907 923 16
Malavalli 965 985 20 944 928 -16
District 986 995 9 934 939 5
Source: Census of India, 2001 & 2011
Table 5.3: Major Health Indicators in Taluks of Mandya District
Taluk
Indicators
IMR(Per 1000 live births)
CMR (per 1000 live births)
MMR(Per 100000 live births)
Krishnarajpet 27 29 104
Nagamangala 26 28 107
Pandavapura 25 28 113
Shrirangapattana 25 28 109
Mandya 25 31 124
Maddur 25 29 105
Malavalli 26 28 113
District 26 30 111
Source: SRS, 2011
217
Table 5.4: Eligible couples protected by contraceptive methods in Mandya District by Taluks -2011
TalukNo. of eligible couples using any contraceptive (both
temporary and permanent)Total no. of eligible
couplesPercentage
Krishnarajpet 13054 22960 56.86
Nagamangala 21612 29602 73.01
Pandavapura 24060 29380 81.89
Shrirangapattana 23410 29960 78.14
Mandya 79378 93979 84.46
Maddur 37262 43680 85.31
Malavalli 31978 36280 88.14
District 230754 285841 80.73
Source: DHO, Mandya
Table 5.5: Sub-Centers in Mandya District by Taluk -2011
Taluk No. of sub-centers
Krishnarajpet 63
Nagamangala 53
Pandavapura 43
Shrirangapattana 43
Mandya 81
Maddur 66
Malavalli 58
District 407
Source: DHO, Mandya
218
Table 5.6: Primary Health Centers in Mandya District by Taluk-2011
Taluk No. of primary health centers
Krishnarajpet 20
Nagamangala 14
Pandavapura 8
Shrirangapattana 8
Mandya 30
Maddur 18
Malavalli 21
District 119
Source: DHO, Mandya
Table 5.7: Doctors availability in Mandya District by Taluk- 2011
Taluk No. of doctors
Krishnarajpet 30(0.12)
Nagamangala 27(0.14)
Pandavapura 30(0.16)
Shrirangapattana 20(0.11)
Mandya 128(0.31)
Maddur 35(0.12)
Malavalli 34(0.12)
District 304(0.17)
Source: DHO, MandyaFigures in Parantheses indicate doctors per 1000 population
219
Table 5.8: Nurses Availability in Mandya District by Taluk- 2011
Taluk No. of Nurses
Krishnarajpet 29 (0.11)
Nagamangala 46 (0.24)
Pandavapura 37 (0.20)
Shrirangapattana 48 (0.27)
Mandya 148 (0.36)
Maddur 53 (0.18)
Malavalli 41 (0.14)
District 402 (0.22)
Source: DHO, Mandya Note: Figures in parantheses are number of nurses per 1000 population.
Table 5.9: Sub-centers, Primary Health Centers and Doctors availability in Mandya District by Taluk 2009-2011(No’s)
TalukSub-center PHCs Doctors
2009-10 2011-12 2009-10 2011-12 2009-10 2011-12
Krishnarajpet 63 63 20 20 30 30
Nagamangala 53 53 14 14 27 27
Pandavapura 43 43 8 8 30 30
Shrirangapattana 43 43 8 8 620 20
Mandya 81 81 30 30 128 128
Maddur 66 66 18 18 35 35
Malavalli 58 58 21 21 34 34
District 407 407 119 119 304 304
Source: DHO, Mandya
220
Table 5.10: ANC Coverage and Anaemia among pregnant women in Mandya District by Taluk: 2011 (%)
Taluk ANC PANE
Krishnarajpet 89.04 31.00
Nagamangala 89.60 47.00
Pandavapura 58.68 50.90
Shrirangapattana 56.31 31.70
Mandya 163.99* 50.90
Maddur 62.65 24.70
Malavalli 81.44 47.80
District 94.49 50.90
Source: DHO, Mandya and SRS, 2011
Table 5.11: Taluk- wise Institutional deliveries in Mandya District -2011
TalukPercentage of institutional
deliveries
Krishnarajpet 99.90
Nagamangala 99.69
Pandavapura 99.75
Shrirangapattana 99.79
Mandya 99.88
Maddur 99.57
Malavalli 99.44
District 99.72
Source: DHO, Mandya
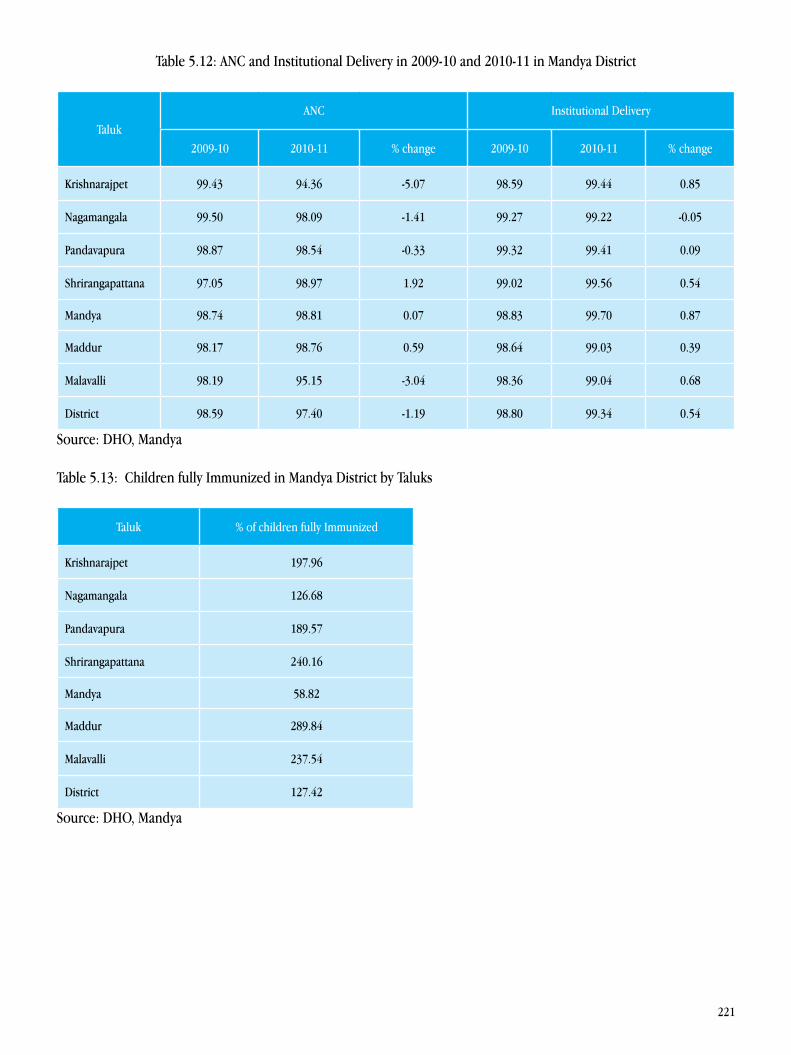
221
Table 5.12: ANC and Institutional Delivery in 2009-10 and 2010-11 in Mandya District
TalukANC Institutional Delivery
2009-10 2010-11 % change 2009-10 2010-11 % change
Krishnarajpet 99.43 94.36 -5.07 98.59 99.44 0.85
Nagamangala 99.50 98.09 -1.41 99.27 99.22 -0.05
Pandavapura 98.87 98.54 -0.33 99.32 99.41 0.09
Shrirangapattana 97.05 98.97 1.92 99.02 99.56 0.54
Mandya 98.74 98.81 0.07 98.83 99.70 0.87
Maddur 98.17 98.76 0.59 98.64 99.03 0.39
Malavalli 98.19 95.15 -3.04 98.36 99.04 0.68
District 98.59 97.40 -1.19 98.80 99.34 0.54
Source: DHO, Mandya
Table 5.13: Children fully Immunized in Mandya District by Taluks
Taluk % of children fully Immunized
Krishnarajpet 197.96
Nagamangala 126.68
Pandavapura 189.57
Shrirangapattana 240.16
Mandya 58.82
Maddur 289.84
Malavalli 237.54
District 127.42
Source: DHO, Mandya
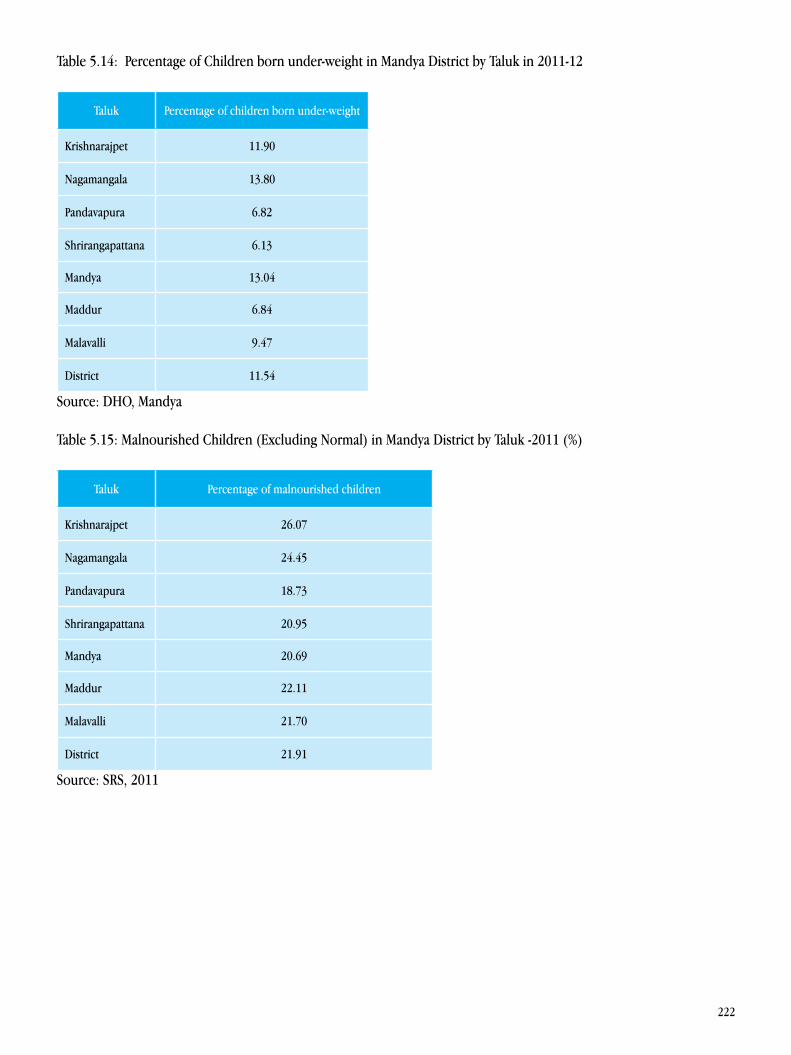
222
Table 5.14: Percentage of Children born under-weight in Mandya District by Taluk in 2011-12
Taluk Percentage of children born under-weight
Krishnarajpet 11.90
Nagamangala 13.80
Pandavapura 6.82
Shrirangapattana 6.13
Mandya 13.04
Maddur 6.84
Malavalli 9.47
District 11.54
Source: DHO, Mandya
Table 5.15: Malnourished Children (Excluding Normal) in Mandya District by Taluk -2011 (%)
Taluk Percentage of malnourished children
Krishnarajpet 26.07
Nagamangala 24.45
Pandavapura 18.73
Shrirangapattana 20.95
Mandya 20.69
Maddur 22.11
Malavalli 21.70
District 21.91
Source: SRS, 2011
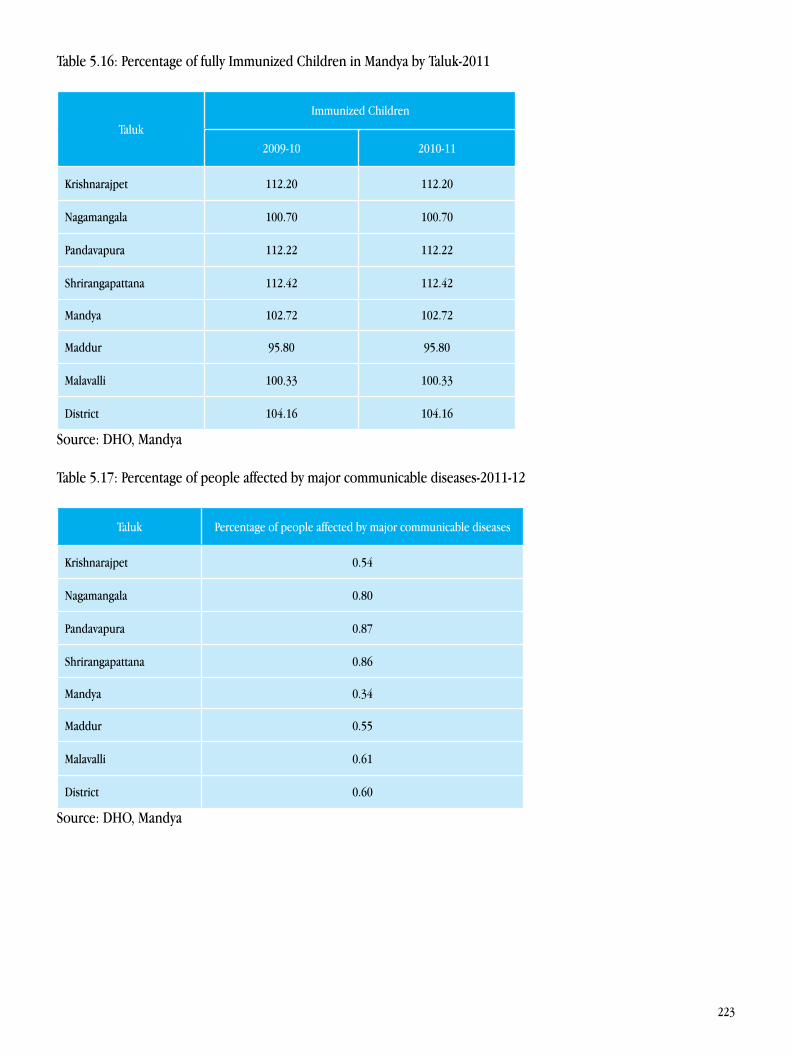
223
Table 5.16: Percentage of fully Immunized Children in Mandya by Taluk-2011
TalukImmunized Children
2009-10 2010-11
Krishnarajpet 112.20 112.20
Nagamangala 100.70 100.70
Pandavapura 112.22 112.22
Shrirangapattana 112.42 112.42
Mandya 102.72 102.72
Maddur 95.80 95.80
Malavalli 100.33 100.33
District 104.16 104.16
Source: DHO, Mandya
Table 5.17: Percentage of people affected by major communicable diseases-2011-12
Taluk Percentage of people affected by major communicable diseases
Krishnarajpet 0.54
Nagamangala 0.80
Pandavapura 0.87
Shrirangapattana 0.86
Mandya 0.34
Maddur 0.55
Malavalli 0.61
District 0.60
Source: DHO, Mandya
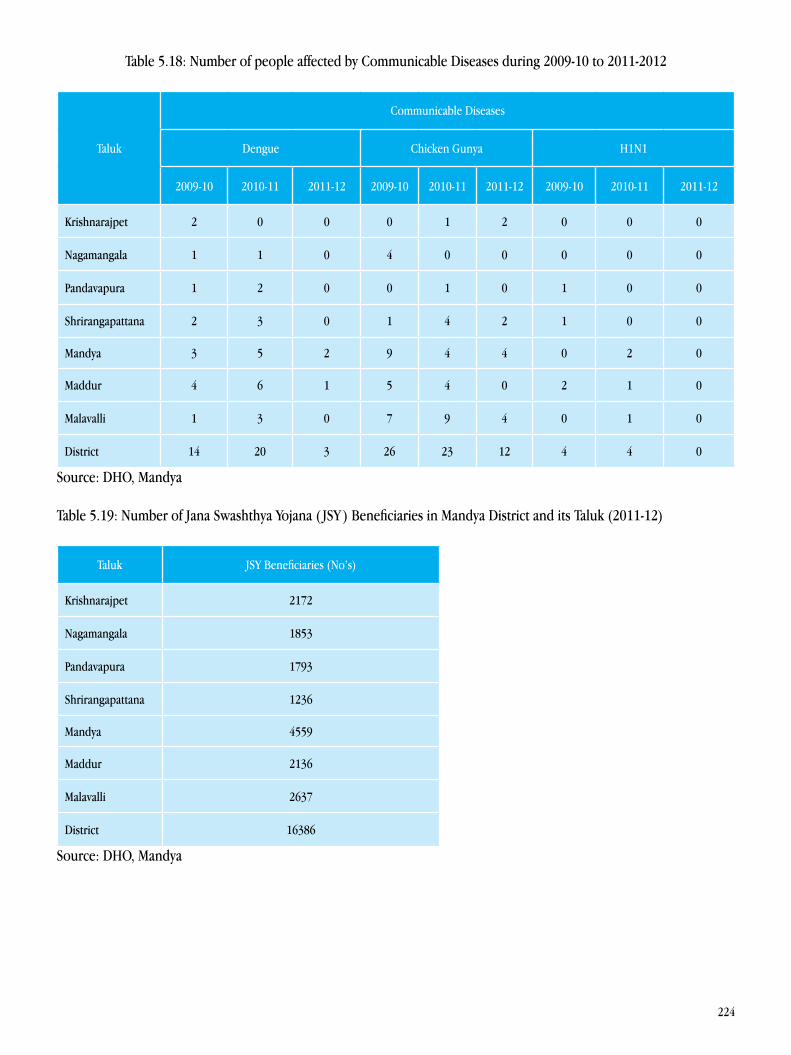
224
Table 5.18: Number of people affected by Communicable Diseases during 2009-10 to 2011-2012
Taluk
Communicable Diseases
Dengue Chicken Gunya H1N1
2009-10 2010-11 2011-12 2009-10 2010-11 2011-12 2009-10 2010-11 2011-12
Krishnarajpet 2 0 0 0 1 2 0 0 0
Nagamangala 1 1 0 4 0 0 0 0 0
Pandavapura 1 2 0 0 1 0 1 0 0
Shrirangapattana 2 3 0 1 4 2 1 0 0
Mandya 3 5 2 9 4 4 0 2 0
Maddur 4 6 1 5 4 0 2 1 0
Malavalli 1 3 0 7 9 4 0 1 0
District 14 20 3 26 23 12 4 4 0
Source: DHO, Mandya
Table 5.19: Number of Jana Swashthya Yojana ( JSY ) Beneficiaries in Mandya District and its Taluk (2011-12)
Taluk JSY Beneficiaries (No’s)
Krishnarajpet 2172
Nagamangala 1853
Pandavapura 1793
Shrirangapattana 1236
Mandya 4559
Maddur 2136
Malavalli 2637
District 16386
Source: DHO, Mandya
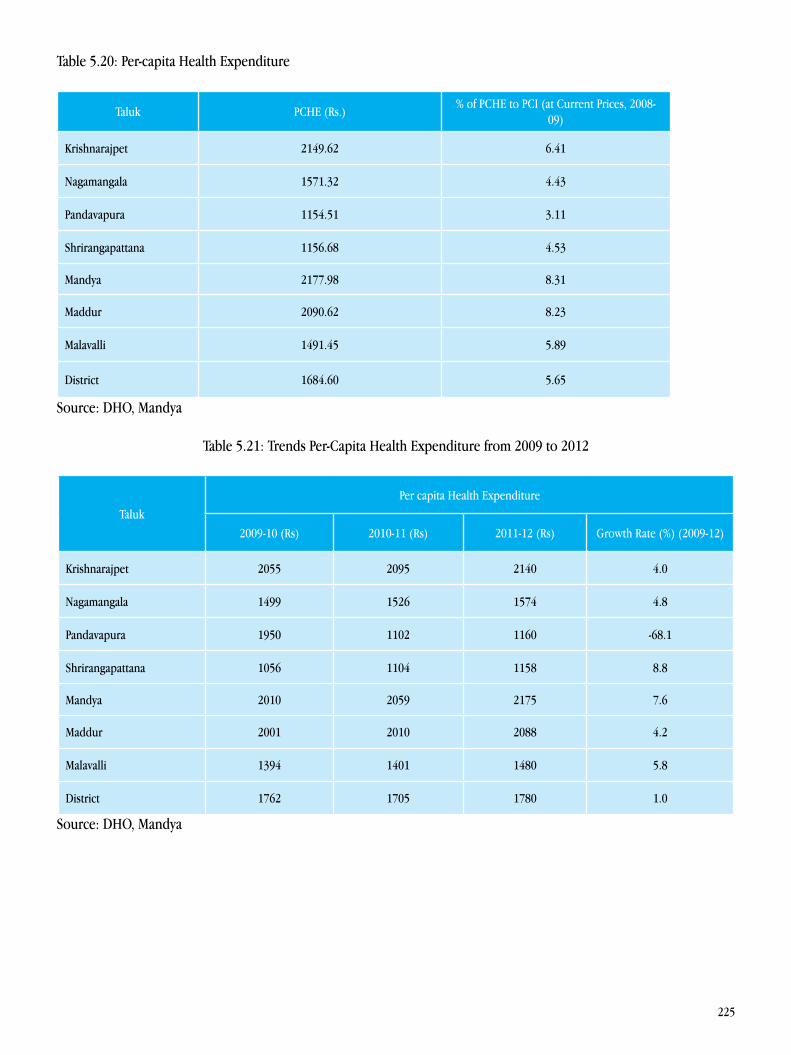
225
Table 5.20: Per-capita Health Expenditure
Taluk PCHE (Rs.)% of PCHE to PCI (at Current Prices, 2008-
09)
Krishnarajpet 2149.62 6.41
Nagamangala 1571.32 4.43
Pandavapura 1154.51 3.11
Shrirangapattana 1156.68 4.53
Mandya 2177.98 8.31
Maddur 2090.62 8.23
Malavalli 1491.45 5.89
District 1684.60 5.65
Source: DHO, Mandya
Table 5.21: Trends Per-Capita Health Expenditure from 2009 to 2012
TalukPer capita Health Expenditure
2009-10 (Rs) 2010-11 (Rs) 2011-12 (Rs) Growth Rate (%) (2009-12)
Krishnarajpet 2055 2095 2140 4.0
Nagamangala 1499 1526 1574 4.8
Pandavapura 1950 1102 1160 -68.1
Shrirangapattana 1056 1104 1158 8.8
Mandya 2010 2059 2175 7.6
Maddur 2001 2010 2088 4.2
Malavalli 1394 1401 1480 5.8
District 1762 1705 1780 1.0
Source: DHO, Mandya
226
Table 5.22: Place of Delivery
Place No. of respondents Percentage
Home Nil Nil
Primary Health Center 26 38.81
Taluk Level Hospital 6 8.96
District Hospital 26 38.81
Private Hospital 9 13.43
Total 67 100
Source: Primary Survey - Small Area Study
Table 5.23: Birth Weight of the children (in kg’s)
Birth Weight Number Percentage
Less than 2.5 Kg (Underweight) 6 8.95
2.5 Kg and within 3 52 77.61
3 Kg and above 9 13.43
Total 67 100
Source: Primary Survey - Small Area Study
Table 5.24: Vaccinations administered to the baby
Number Percentage
NIL 4 5.97
YES 63 94.03
Total 67 100
Source: Primary Survey - Small Area Study
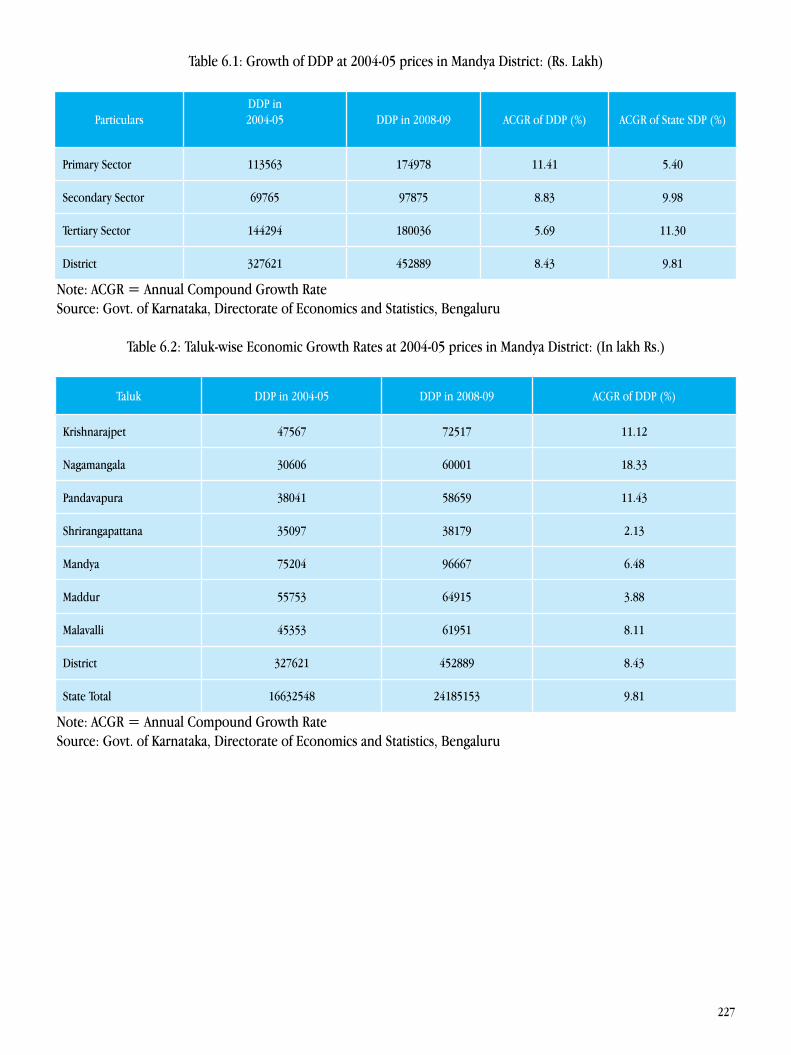
227
Table 6.1: Growth of DDP at 2004-05 prices in Mandya District: (Rs. Lakh)
ParticularsDDP in2004-05 DDP in 2008-09 ACGR of DDP (%) ACGR of State SDP (%)
Primary Sector 113563 174978 11.41 5.40
Secondary Sector 69765 97875 8.83 9.98
Tertiary Sector 144294 180036 5.69 11.30
District 327621 452889 8.43 9.81
Note: ACGR = Annual Compound Growth RateSource: Govt. of Karnataka, Directorate of Economics and Statistics, Bengaluru
Table 6.2: Taluk-wise Economic Growth Rates at 2004-05 prices in Mandya District: (In lakh Rs.)
Taluk DDP in 2004-05 DDP in 2008-09 ACGR of DDP (%)
Krishnarajpet 47567 72517 11.12
Nagamangala 30606 60001 18.33
Pandavapura 38041 58659 11.43
Shrirangapattana 35097 38179 2.13
Mandya 75204 96667 6.48
Maddur 55753 64915 3.88
Malavalli 45353 61951 8.11
District 327621 452889 8.43
State Total 16632548 24185153 9.81
Note: ACGR = Annual Compound Growth RateSource: Govt. of Karnataka, Directorate of Economics and Statistics, Bengaluru
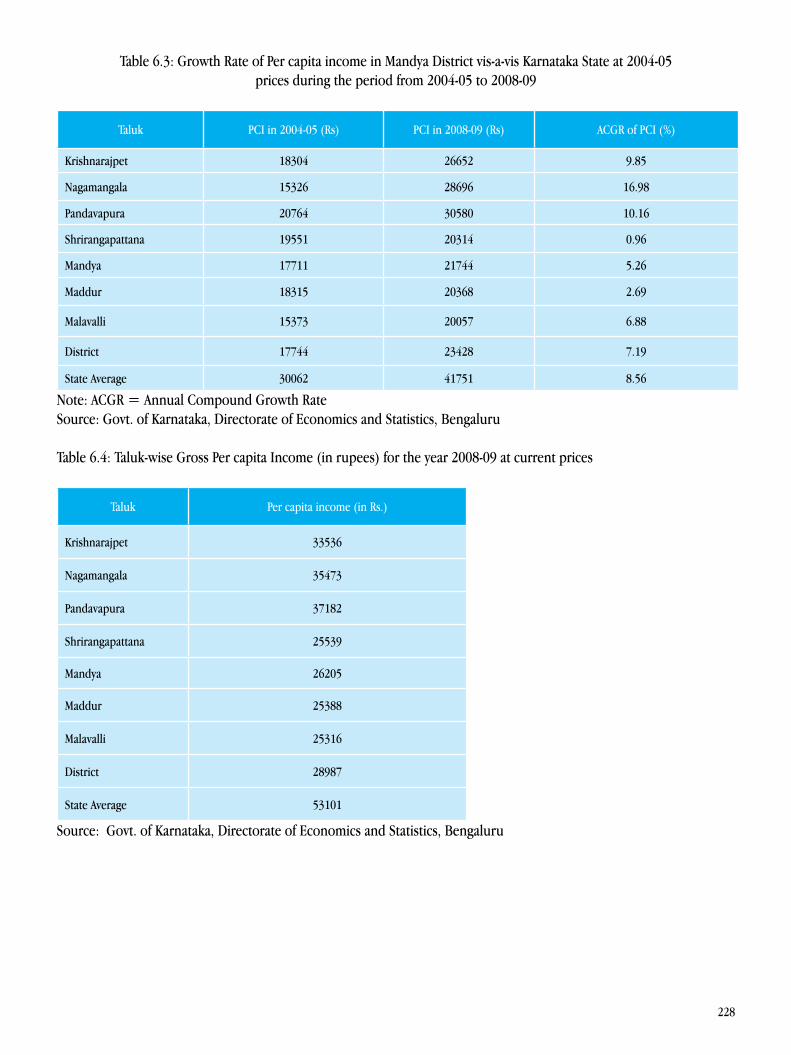
228
Table 6.3: Growth Rate of Per capita income in Mandya District vis-a-vis Karnataka State at 2004-05 prices during the period from 2004-05 to 2008-09
Taluk PCI in 2004-05 (Rs) PCI in 2008-09 (Rs) ACGR of PCI (%)
Krishnarajpet 18304 26652 9.85
Nagamangala 15326 28696 16.98
Pandavapura 20764 30580 10.16
Shrirangapattana 19551 20314 0.96
Mandya 17711 21744 5.26
Maddur 18315 20368 2.69
Malavalli 15373 20057 6.88
District 17744 23428 7.19
State Average 30062 41751 8.56
Note: ACGR = Annual Compound Growth Rate Source: Govt. of Karnataka, Directorate of Economics and Statistics, Bengaluru
Table 6.4: Taluk-wise Gross Per capita Income (in rupees) for the year 2008-09 at current prices
Taluk Per capita income (in Rs.)
Krishnarajpet 33536
Nagamangala 35473
Pandavapura 37182
Shrirangapattana 25539
Mandya 26205
Maddur 25388
Malavalli 25316
District 28987
State Average 53101
Source: Govt. of Karnataka, Directorate of Economics and Statistics, Bengaluru
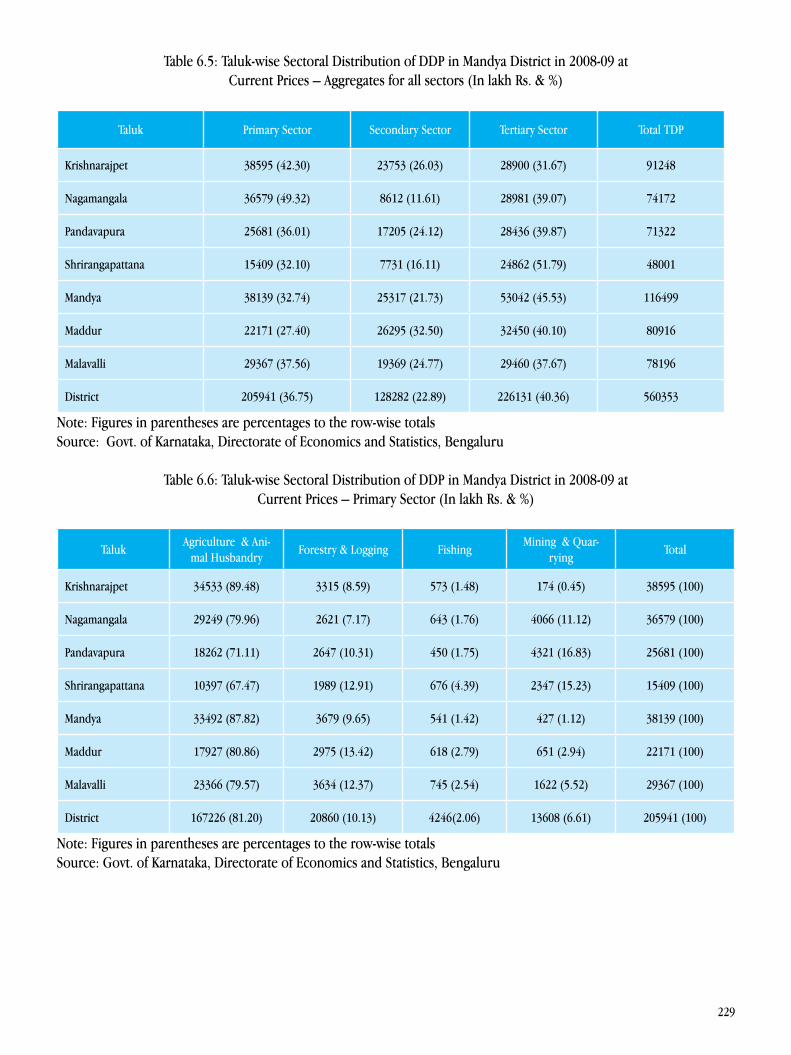
229
Table 6.5: Taluk-wise Sectoral Distribution of DDP in Mandya District in 2008-09 at Current Prices – Aggregates for all sectors (In lakh Rs. & %)
Taluk Primary Sector Secondary Sector Tertiary Sector Total TDP
Krishnarajpet 38595 (42.30) 23753 (26.03) 28900 (31.67) 91248
Nagamangala 36579 (49.32) 8612 (11.61) 28981 (39.07) 74172
Pandavapura 25681 (36.01) 17205 (24.12) 28436 (39.87) 71322
Shrirangapattana 15409 (32.10) 7731 (16.11) 24862 (51.79) 48001
Mandya 38139 (32.74) 25317 (21.73) 53042 (45.53) 116499
Maddur 22171 (27.40) 26295 (32.50) 32450 (40.10) 80916
Malavalli 29367 (37.56) 19369 (24.77) 29460 (37.67) 78196
District 205941 (36.75) 128282 (22.89) 226131 (40.36) 560353
Note: Figures in parentheses are percentages to the row-wise totalsSource: Govt. of Karnataka, Directorate of Economics and Statistics, Bengaluru
Table 6.6: Taluk-wise Sectoral Distribution of DDP in Mandya District in 2008-09 at Current Prices – Primary Sector (In lakh Rs. & %)
Taluk Agriculture & Ani-
mal HusbandryForestry & Logging Fishing
Mining & Quar-rying
Total
Krishnarajpet 34533 (89.48) 3315 (8.59) 573 (1.48) 174 (0.45) 38595 (100)
Nagamangala 29249 (79.96) 2621 (7.17) 643 (1.76) 4066 (11.12) 36579 (100)
Pandavapura 18262 (71.11) 2647 (10.31) 450 (1.75) 4321 (16.83) 25681 (100)
Shrirangapattana 10397 (67.47) 1989 (12.91) 676 (4.39) 2347 (15.23) 15409 (100)
Mandya 33492 (87.82) 3679 (9.65) 541 (1.42) 427 (1.12) 38139 (100)
Maddur 17927 (80.86) 2975 (13.42) 618 (2.79) 651 (2.94) 22171 (100)
Malavalli 23366 (79.57) 3634 (12.37) 745 (2.54) 1622 (5.52) 29367 (100)
District 167226 (81.20) 20860 (10.13) 4246(2.06) 13608 (6.61) 205941 (100)
Note: Figures in parentheses are percentages to the row-wise totalsSource: Govt. of Karnataka, Directorate of Economics and Statistics, Bengaluru
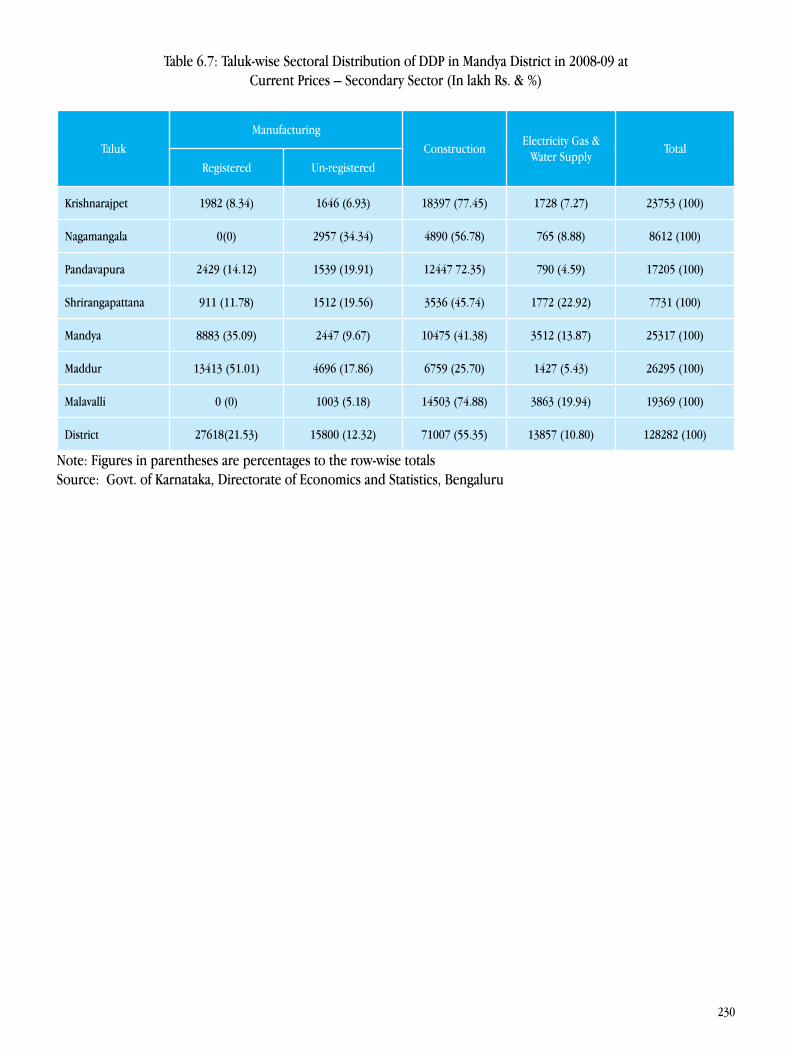
230
Table 6.7: Taluk-wise Sectoral Distribution of DDP in Mandya District in 2008-09 at Current Prices – Secondary Sector (In lakh Rs. & %)
TalukManufacturing
ConstructionElectricity Gas &
Water SupplyTotal
Registered Un-registered
Krishnarajpet 1982 (8.34) 1646 (6.93) 18397 (77.45) 1728 (7.27) 23753 (100)
Nagamangala 0(0) 2957 (34.34) 4890 (56.78) 765 (8.88) 8612 (100)
Pandavapura 2429 (14.12) 1539 (19.91) 12447 72.35) 790 (4.59) 17205 (100)
Shrirangapattana 911 (11.78) 1512 (19.56) 3536 (45.74) 1772 (22.92) 7731 (100)
Mandya 8883 (35.09) 2447 (9.67) 10475 (41.38) 3512 (13.87) 25317 (100)
Maddur 13413 (51.01) 4696 (17.86) 6759 (25.70) 1427 (5.43) 26295 (100)
Malavalli 0 (0) 1003 (5.18) 14503 (74.88) 3863 (19.94) 19369 (100)
District 27618(21.53) 15800 (12.32) 71007 (55.35) 13857 (10.80) 128282 (100)
Note: Figures in parentheses are percentages to the row-wise totals Source: Govt. of Karnataka, Directorate of Economics and Statistics, Bengaluru
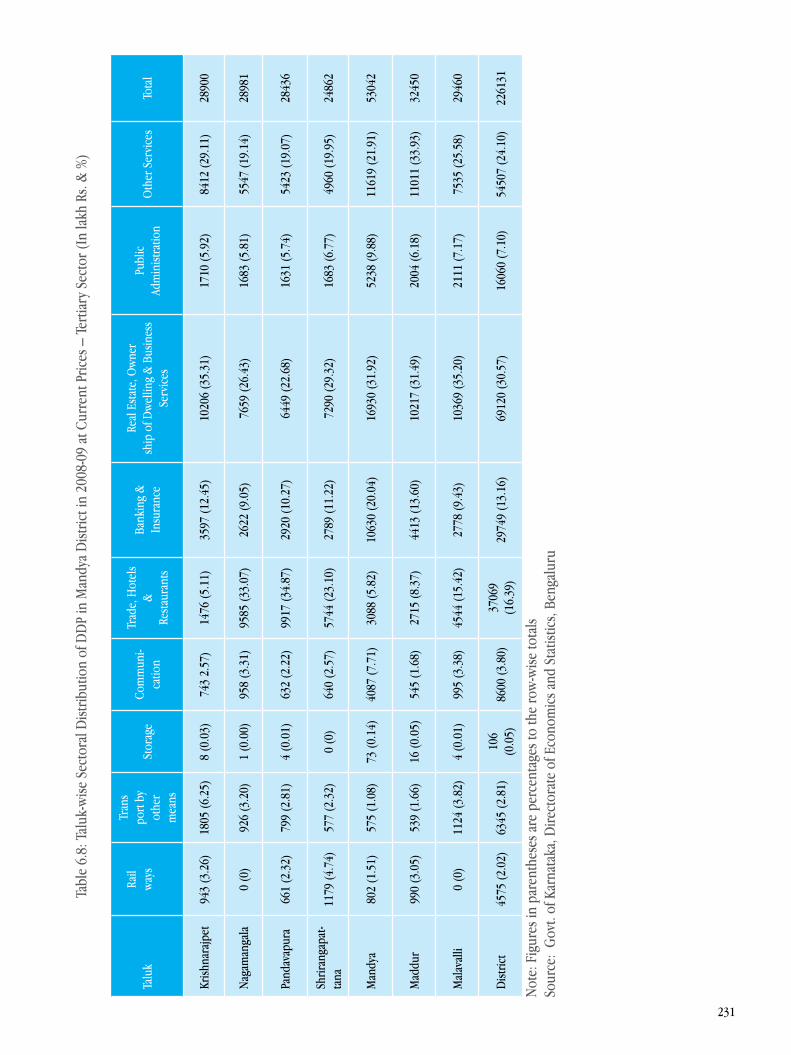
231
Tabl
e 6.
8: T
aluk
-wise
Sec
tora
l Dist
ribut
ion
of D
DP
in M
andy
a D
istric
t in
2008
-09
at C
urre
nt P
rices
– T
ertia
ry S
ecto
r (In
lakh
Rs.
& %
)
Talu
kRa
ilw
ays
Tran
spo
rt by
othe
r m
eans
Stor
age
Com
mun
i-ca
tion
Trad
e, H
otel
s &
Rest
aura
nts
Bank
ing
&In
sura
nce
Real
Est
ate,
Ow
ner
ship
of D
wel
ling
& B
usin
ess
Serv
ices
Publ
ic
Adm
inist
ratio
nO
ther
Ser
vice
sTo
tal
Krish
nara
jpet
94
3 (3
.26)
1805
(6.2
5)8
(0.0
3)74
3 2.
57)
1476
(5.1
1)35
97 (1
2.45
)10
206
(35.
31)
1710
(5.9
2)84
12 (2
9.11
)28
900
Nag
aman
gala
0 (0
)92
6 (3
.20)
1 (0
.00)
958
(3.3
1)95
85 (3
3.07
)26
22 (9
.05)
7659
(26.
43)
1683
(5.8
1)55
47 (1
9.14
)28
981
Pand
avap
ura
661
(2.3
2)79
9 (2
.81)
4 (0
.01)
632
(2.2
2)99
17 (3
4.87
)29
20 (1
0.27
)64
49 (2
2.68
)16
31 (5
.74)
5423
(19.
07)
2843
6
Shrir
anga
pat-
tana
1179
(4.7
4)57
7 (2
.32)
0 (0
)64
0 (2
.57)
5744
(23.
10)
2789
(11.
22)
7290
(29.
32)
1683
(6.7
7)49
60 (1
9.95
)24
862
Man
dya
802
(1.5
1)57
5 (1
.08)
73 (0
.14)
4087
(7.7
1)30
88 (5
.82)
1063
0 (2
0.04
)16
930
(31.
92)
5238
(9.8
8)11
619
(21.
91)
5304
2
Mad
dur
990
(3.0
5)53
9 (1
.66)
16 (0
.05)
545
(1.6
8)27
15 (8
.37)
4413
(13.
60)
1021
7 (3
1.49
)20
04 (6
.18)
1101
1 (3
3.93
)32
450
Mal
aval
li 0
(0)
1124
(3.8
2)4
(0.0
1)99
5 (3
.38)
4544
(15.
42)
2778
(9.4
3)10
369
(35.
20)
2111
(7.1
7)75
35 (2
5.58
)29
460
Dist
rict
4575
(2.0
2)63
45 (2
.81)
106
(0.0
5)86
00 (3
.80)
3706
9 (1
6.39
)29
749
(13.
16)
6912
0 (3
0.57
)16
060
(7.1
0)54
507
(24.
10)
2261
31
Not
e: F
igur
es in
par
enth
eses
are
per
cent
ages
to th
e ro
w-w
ise to
tals
Sour
ce:
Gov
t. of
Kar
nata
ka, D
irect
orat
e of
Eco
nom
ics a
nd S
tatis
tics,
Beng
alur
u
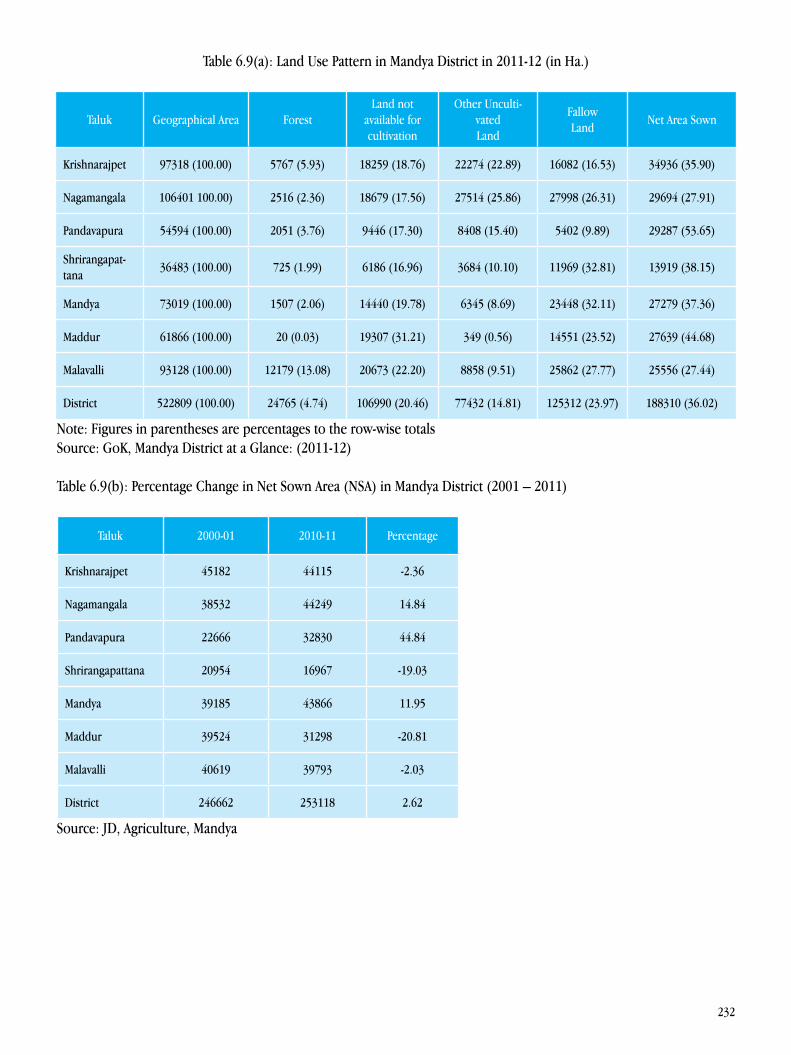
232
Table 6.9(a): Land Use Pattern in Mandya District in 2011-12 (in Ha.)
Taluk Geographical Area ForestLand not
available for cultivation
Other Unculti-vatedLand
FallowLand
Net Area Sown
Krishnarajpet 97318 (100.00) 5767 (5.93) 18259 (18.76) 22274 (22.89) 16082 (16.53) 34936 (35.90)
Nagamangala 106401 100.00) 2516 (2.36) 18679 (17.56) 27514 (25.86) 27998 (26.31) 29694 (27.91)
Pandavapura 54594 (100.00) 2051 (3.76) 9446 (17.30) 8408 (15.40) 5402 (9.89) 29287 (53.65)
Shrirangapat-tana
36483 (100.00) 725 (1.99) 6186 (16.96) 3684 (10.10) 11969 (32.81) 13919 (38.15)
Mandya 73019 (100.00) 1507 (2.06) 14440 (19.78) 6345 (8.69) 23448 (32.11) 27279 (37.36)
Maddur 61866 (100.00) 20 (0.03) 19307 (31.21) 349 (0.56) 14551 (23.52) 27639 (44.68)
Malavalli 93128 (100.00) 12179 (13.08) 20673 (22.20) 8858 (9.51) 25862 (27.77) 25556 (27.44)
District 522809 (100.00) 24765 (4.74) 106990 (20.46) 77432 (14.81) 125312 (23.97) 188310 (36.02)
Note: Figures in parentheses are percentages to the row-wise totals Source: GoK, Mandya District at a Glance: (2011-12)
Table 6.9(b): Percentage Change in Net Sown Area (NSA) in Mandya District (2001 – 2011)
Taluk 2000-01 2010-11 Percentage
Krishnarajpet 45182 44115 -2.36
Nagamangala 38532 44249 14.84
Pandavapura 22666 32830 44.84
Shrirangapattana 20954 16967 -19.03
Mandya 39185 43866 11.95
Maddur 39524 31298 -20.81
Malavalli 40619 39793 -2.03
District 246662 253118 2.62
Source: JD, Agriculture, Mandya
233
Table 6.9(c): Percentage of area degraded to TGA in MandyaDistrict in 2011-12
Taluk Cultivable waste (ha) Total geographical area (ha) Percentage
Krishnarajpet 6510 91551 7.11
Nagamangala 26178 10385 25.2
Pandavapura 3900 52743 7.39
Shrirangapattana 500 35758 1.4
Mandya 2319 71512 3.24
Maddur 128 61846 0.21
Malavalli 2420 80949 2.99
District 41955 498244 8.42
Source: JD, Agriculture, Mandya
Table 6.9(d): Taluk- wise Average size of holdings in Mandya District - 2011-12 (In hectares)
Taluk Total Area of holdings (Ha) Total No. of Holdings Average Size of Holdings
Krishnarajpet 55176 55493 0.99
Nagamangala 60966 62320 0.98
Pandavapura 26243 37916 0.69
Shrirangapattana 24686 34794 0.71
Mandya 50521 74904 0.67
Maddur 42745 62416 0.68
Malavalli 49094 67923 0.72
District 309431 395766 0.78
Source: JD, Agriculture, 2011-12
234
Table 6.10(a): Cropping Intensity in Mandya District by Taluks -2011-12
Taluk Gross sown area (in ha) Net sown area (in ha) Percentage
Krishnarajpet 41135 37663 109.22
Nagamangala 39246 37618 104.33
Pandavapura 31028 28322 109.55
Shrirangapattana 24946 17265 144.49
Mandya 45727 36741 124.46
Maddur 41384 32765 126.31
Malavalli 43995 39753 110.67
District 267461 230127 116.22
Source: JD, Agriculture, Mandya
Table 6.10(b): Cropping Intensity in Mandya District by Taluks – 2012-13
Taluk Gross Cropped Area (ha) Net Area Sown (ha)Cropping
Intensity (%)
Krishnarajpet 39801 34936 113.93
Nagamangala 33096 29694 111.46
Pandavapura 32819 29287 112.06
Shrirangapattana 20767 13919 149.20
Mandya 36924 27279 135.36
Maddur 30557 27639 110.56
Malavalli 30266 25556 118.43
District 224230 188310 119.07
Source: District at a Glance: Mandya (2012-13)
235
Table 6.11: Cropping Pattern in Mandya District 2011-12
Taluk Cereals & Millets PulsesTotal food
grainsFruits &
VegetablesOil seeds
CommercialCrops
Total
Krishnarajpet 19881 (52.50) 9068 23.95) 28949 (76.45) 2268 (5.99) 1620 (4.28) 5028 (13.28)37865 (100)
Nagamangala 15628 (48.01) 8746 26.87) 24374 (74.88) 2753 (8.46) 2597 (7.98) 2828 (8.69)32552 (100)
Pandavapura 13274 (39.23) 8546 25.25) 21820 (64.48) 858 (2.54) 984 (2.91)10178 (30.08)
33840 (100)
Shrirangapattana 15853 (63.12) 1609 (6.41) 17762 (70.72) 1128 (4.49) 443 (1.76) 5783 (23.03)25116 (100)
Mandya 22123 (52.23) 2666 (6.29) 24789 (58.53) 2249 (5.31) 909 (2.15)14407 (34.02)
42354 (100)
Maddur 19932 (47.24) 3291 (7.80) 23223 (55.04) 875 (2.07) 1099 (2.60)16996 (40.28)
42193 (100)
Malavalli 28291 (63.88) 2482 (5.60) 30773 (69.48) 1403 (3.17) 2289 (5.17) 9825 (22.18)44290 (100)
District 134982 (52.28)36408 (14.10)
171690 (66.49)
11534 (4.47) 9941 (3.85)65045 (25.19)
258210 (100)
Note: Figures in parentheses are percentages to the row-wise totalsSource: District at a Glance: Mandya (2012-13)
Table 6.12: Percentage of Area under leguminous crops to the GCA in Mandya District 2011-12
Taluk Percentage of Leguminous Crops
Krishnarajpet 22
Nagamangala 22.3
Pandavapura 27.5
Shrirangapattana 6.4
Mandya 5.8
Maddur 8
Malavalli 5.6
District 13.6
Source: JD, Agriculture, Mandya
236
Table 6.13: Per - capita food grain production in Mandya District in 2011-12 (in kgs)
Taluk Per capita food grain production (In Kgs)
Krishnarajpet 236.00
Nagamangala 235.00
Pandavapura 210.00
Shrirangapattana 179.00
Mandya 130.00
Maddur 171.00
Malavalli 166.00
District 181.00
Source: JD, Agriculture, Mandya
Table 6.14: Irrigation in Mandya District 2011-12: Net Area Irrigated by Different Sources (Area in Ha)
Taluk Canal Tanks Well Tube wellLift
IrrigationTotal
Krishnarajpet 12034 (61.07%)5314 (26.97%)
984 (4.99%) 1234 (6.26%) 138 (0.70%) 19704 (100%)
Nagamangala 4314 (46.78%)2894 (31.38%)
894 (9.69%) 1120 (12.14%) - 9222 (100%)
Pandavapura 12341 (68.68%)3669 (20.42%)
1534 (8.54%) 270 (1.50%) 154 (0.86%) 17968 (100%)
Shrirangapattana 12800 (87.10%) 438 (2.98%) 497 (3.38%) 960 (6.53%) - 14695 (100%)
Mandya 21421 (77.92%)4150 (15.10%)
1357 (4.94%) 564 (2.05%) - 27492 (100%)
Maddur 18670 (79.55%)3215 (13.70%)
1121 (4.78%) 380 (1.62%) 84 (0.36%) 23470 (100%)
Malavalli 18970 (83.42%) 1748 (7.69%) 1248 (5.49%) 720 (3.17%) 53 (0.23%) 22739 (100%)
District 100550 (74.32%)21428 (15.84%)
7635 (5.64%) 5248 (3.88%) 429 (0.32%) 135290 (100%)
Note: Figures in parentheses are percentages to the row-wise totals Source: District at a Glance: Mandya (2012-13)
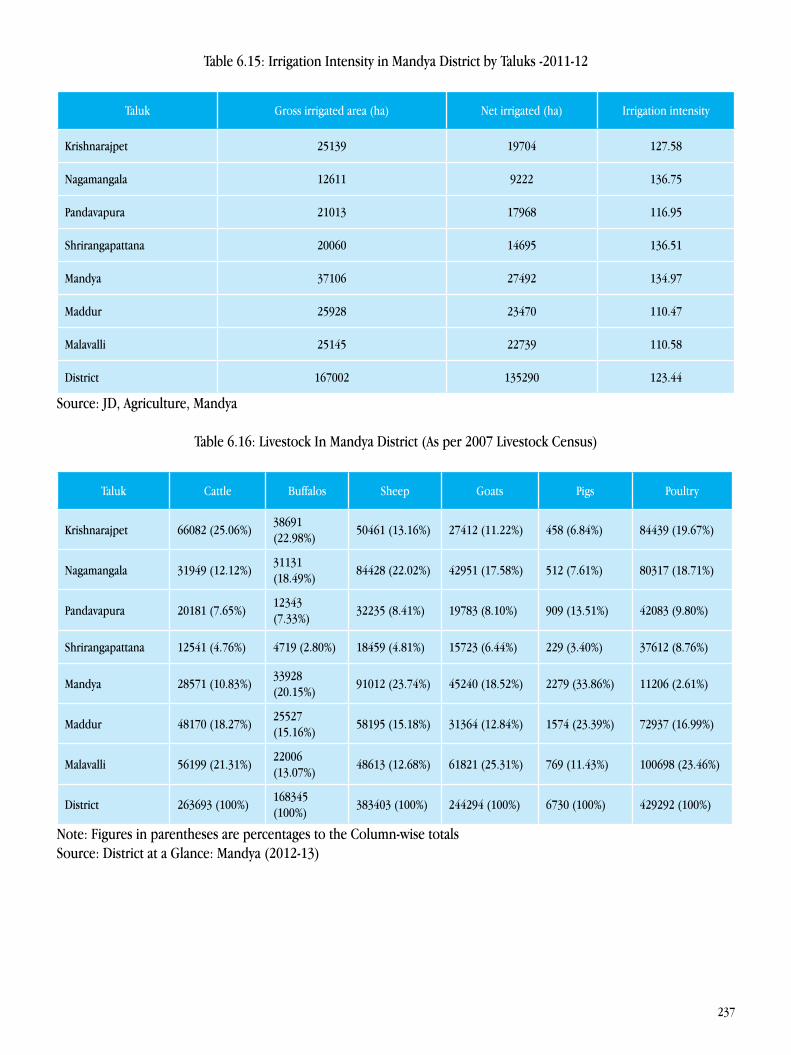
237
Table 6.15: Irrigation Intensity in Mandya District by Taluks -2011-12
Taluk Gross irrigated area (ha) Net irrigated (ha) Irrigation intensity
Krishnarajpet 25139 19704 127.58
Nagamangala 12611 9222 136.75
Pandavapura 21013 17968 116.95
Shrirangapattana 20060 14695 136.51
Mandya 37106 27492 134.97
Maddur 25928 23470 110.47
Malavalli 25145 22739 110.58
District 167002 135290 123.44
Source: JD, Agriculture, Mandya
Table 6.16: Livestock In Mandya District (As per 2007 Livestock Census)
Taluk Cattle Buffalos Sheep Goats Pigs Poultry
Krishnarajpet 66082 (25.06%)38691 (22.98%)
50461 (13.16%) 27412 (11.22%) 458 (6.84%) 84439 (19.67%)
Nagamangala 31949 (12.12%)31131 (18.49%)
84428 (22.02%) 42951 (17.58%) 512 (7.61%) 80317 (18.71%)
Pandavapura 20181 (7.65%)12343 (7.33%)
32235 (8.41%) 19783 (8.10%) 909 (13.51%) 42083 (9.80%)
Shrirangapattana 12541 (4.76%) 4719 (2.80%) 18459 (4.81%) 15723 (6.44%) 229 (3.40%) 37612 (8.76%)
Mandya 28571 (10.83%)33928 (20.15%)
91012 (23.74%) 45240 (18.52%) 2279 (33.86%) 11206 (2.61%)
Maddur 48170 (18.27%)25527 (15.16%)
58195 (15.18%) 31364 (12.84%) 1574 (23.39%) 72937 (16.99%)
Malavalli 56199 (21.31%)22006 (13.07%)
48613 (12.68%) 61821 (25.31%) 769 (11.43%) 100698 (23.46%)
District 263693 (100%)168345 (100%)
383403 (100%) 244294 (100%) 6730 (100%) 429292 (100%)
Note: Figures in parentheses are percentages to the Column-wise totals Source: District at a Glance: Mandya (2012-13)
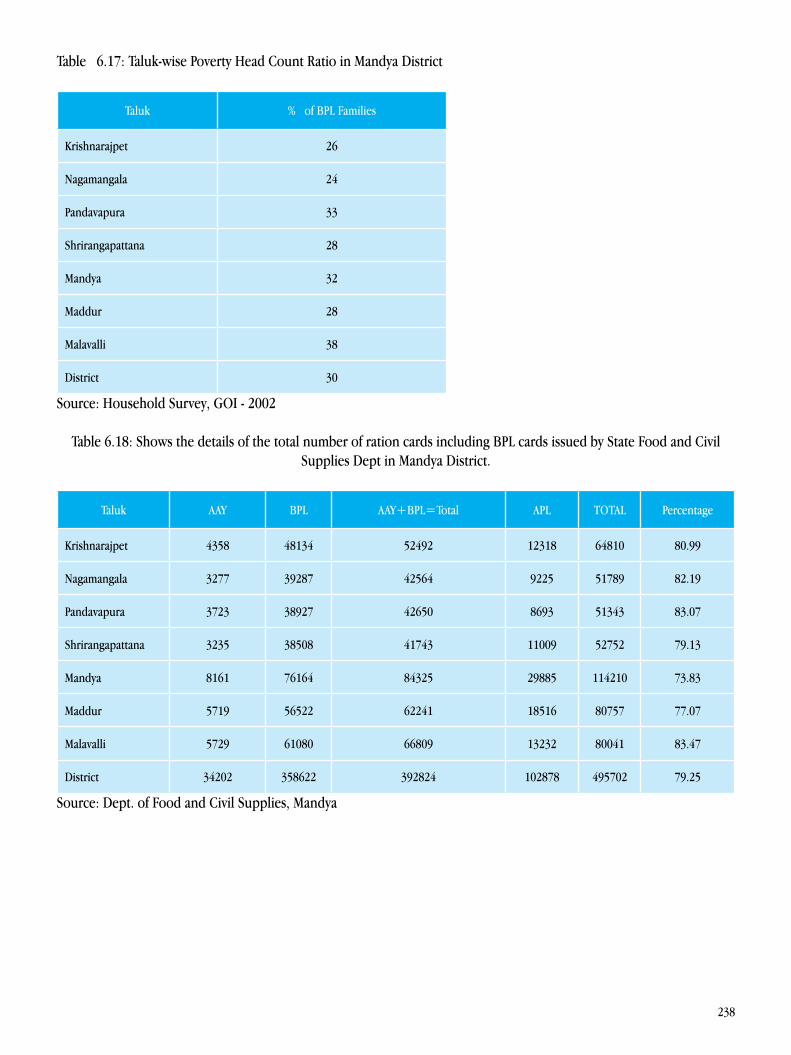
238
Table 6.17: Taluk-wise Poverty Head Count Ratio in Mandya District
Taluk % of BPL Families
Krishnarajpet 26
Nagamangala 24
Pandavapura 33
Shrirangapattana 28
Mandya 32
Maddur 28
Malavalli 38
District 30
Source: Household Survey, GOI - 2002
Table 6.18: Shows the details of the total number of ration cards including BPL cards issued by State Food and Civil Supplies Dept in Mandya District.
Taluk AAY BPL AAY+BPL=Total APL TOTAL Percentage
Krishnarajpet 4358 48134 52492 12318 64810 80.99
Nagamangala 3277 39287 42564 9225 51789 82.19
Pandavapura 3723 38927 42650 8693 51343 83.07
Shrirangapattana 3235 38508 41743 11009 52752 79.13
Mandya 8161 76164 84325 29885 114210 73.83
Maddur 5719 56522 62241 18516 80757 77.07
Malavalli 5729 61080 66809 13232 80041 83.47
District 34202 358622 392824 102878 495702 79.25
Source: Dept. of Food and Civil Supplies, Mandya
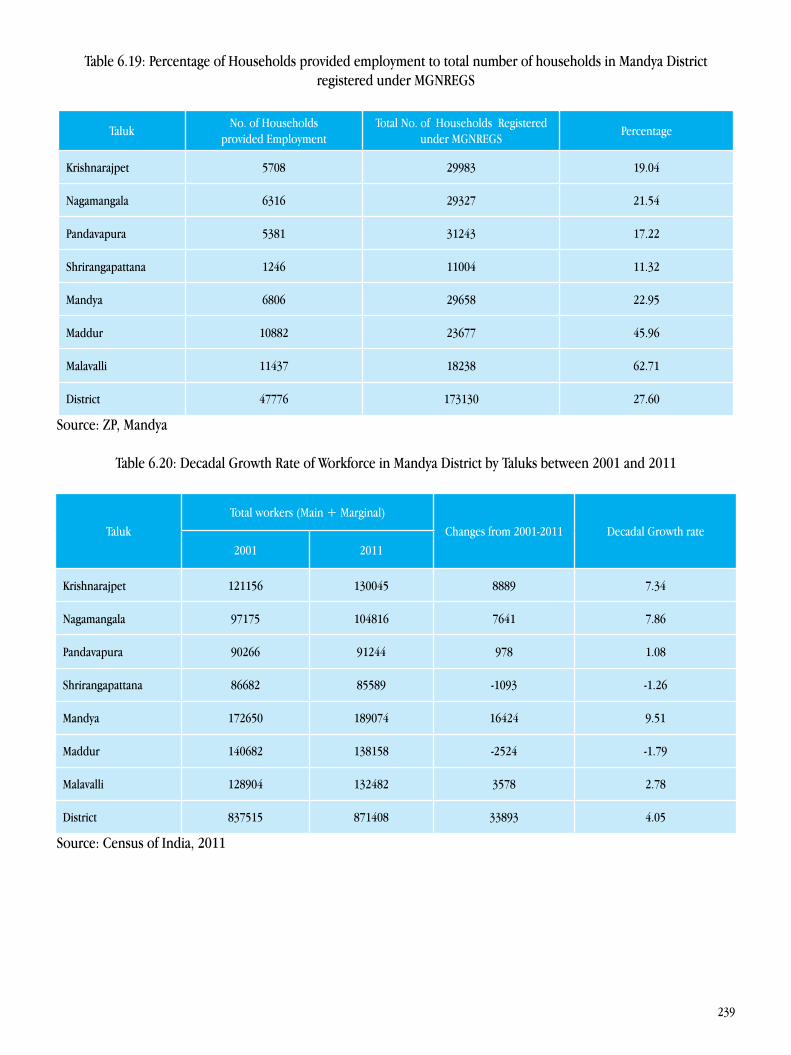
239
Table 6.19: Percentage of Households provided employment to total number of households in Mandya District registered under MGNREGS
TalukNo. of Households
provided EmploymentTotal No. of Households Registered
under MGNREGSPercentage
Krishnarajpet 5708 29983 19.04
Nagamangala 6316 29327 21.54
Pandavapura 5381 31243 17.22
Shrirangapattana 1246 11004 11.32
Mandya 6806 29658 22.95
Maddur 10882 23677 45.96
Malavalli 11437 18238 62.71
District 47776 173130 27.60
Source: ZP, Mandya
Table 6.20: Decadal Growth Rate of Workforce in Mandya District by Taluks between 2001 and 2011
TalukTotal workers (Main + Marginal)
Changes from 2001-2011 Decadal Growth rate2001 2011
Krishnarajpet 121156 130045 8889 7.34
Nagamangala 97175 104816 7641 7.86
Pandavapura 90266 91244 978 1.08
Shrirangapattana 86682 85589 -1093 -1.26
Mandya 172650 189074 16424 9.51
Maddur 140682 138158 -2524 -1.79
Malavalli 128904 132482 3578 2.78
District 837515 871408 33893 4.05
Source: Census of India, 2011

240
Table 6.21: Percentage of main workers to total workers in Mandya District by Taluks - 2011
Taluk Total Main Workers Total Workers Percentage
Krishnarajpet 103225 130045 79.38
Nagamangala 80144 104816 76.46
Pandavapura 80064 91244 87.75
Shrirangapattana 69307 85589 80.98
Mandya 159472 189074 84.34
Maddur 119503 138158 86.50
Malavalli 103186 132482 77.89
District 714901 871408 82.04
Source: Census of India, 2011
Table 6.22: Work Participation Rate (WPR) in Mandya District by Taluks -2011
Taluk Total Work force Total working Population Percentage
Krishnarajpet 130045 235769 55.16
Nagamangala 104816 170969 61.31
Pandavapura 91244 165495 55.13
Shrirangapattana 85589 162593 52.64
Mandya 189074 374771 50.45
Maddur 138158 267525 51.64
Malavalli 132482 255962 51.76
District 871408 1633084 53.36
Source: Census of India, 2011
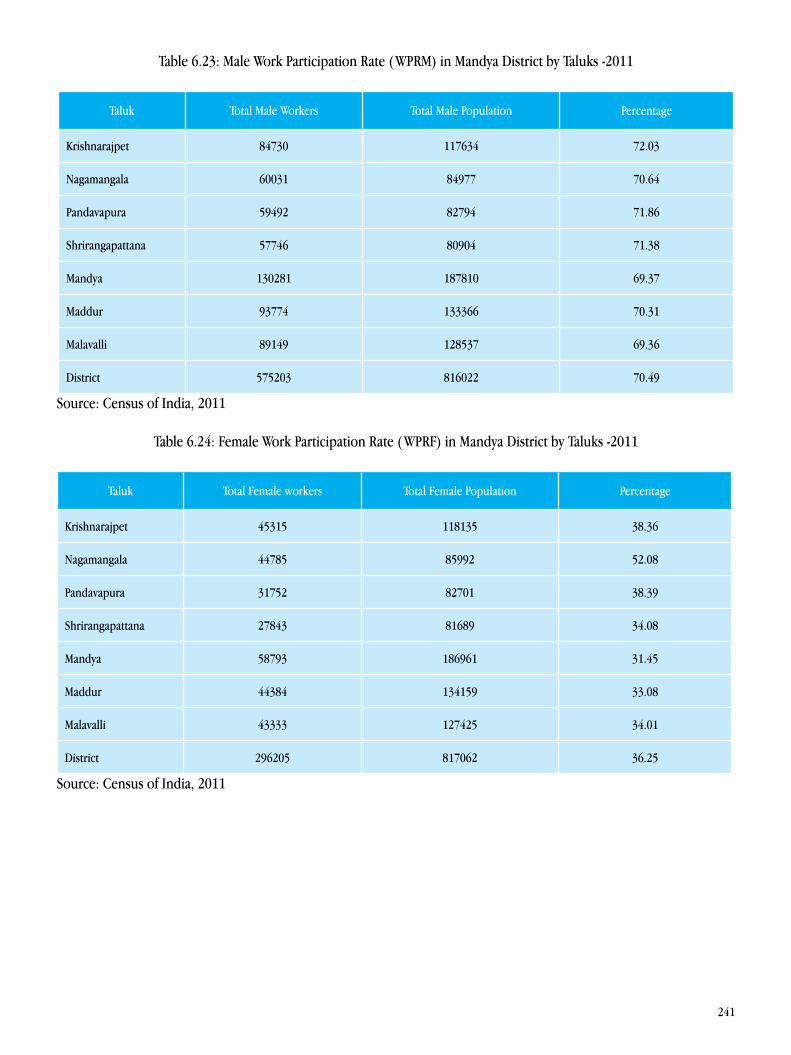
241
Table 6.23: Male Work Participation Rate (WPRM) in Mandya District by Taluks -2011
Taluk Total Male Workers Total Male Population Percentage
Krishnarajpet 84730 117634 72.03
Nagamangala 60031 84977 70.64
Pandavapura 59492 82794 71.86
Shrirangapattana 57746 80904 71.38
Mandya 130281 187810 69.37
Maddur 93774 133366 70.31
Malavalli 89149 128537 69.36
District 575203 816022 70.49
Source: Census of India, 2011
Table 6.24: Female Work Participation Rate (WPRF) in Mandya District by Taluks -2011
Taluk Total Female workers Total Female Population Percentage
Krishnarajpet 45315 118135 38.36
Nagamangala 44785 85992 52.08
Pandavapura 31752 82701 38.39
Shrirangapattana 27843 81689 34.08
Mandya 58793 186961 31.45
Maddur 44384 134159 33.08
Malavalli 43333 127425 34.01
District 296205 817062 36.25
Source: Census of India, 2011

242
Table 6.25: Cultivators to Total Workers in Mandya District by Taluks -2011
TalukTotal Cultivators
(Main +Marginal)Total Workers Percentage
Krishnarajpet 77427 130045 59.54
Nagamangala 68266 104816 65.13
Pandavapura 48292 91244 52.93
Shrirangapattana 26273 85589 30.70
Mandya 60476 189074 31.99
Maddur 60063 138158 43.47
Malavalli 48184 132482 36.37
District 388981 871408 44.64
Source: Census of India, 2011
Table 6.26: Percentage of Agricultural labourers to total workers in Mandya District -2011
Taluk Total Agricultural Labour (Main+ Marginal) Total Workers Percentage
Krishnarajpet 26387 130045 20.29
Nagamangala 13537 104816 12.92
Pandavapura 20732 91244 22.72
Shrirangapattana 24775 85589 28.95
Mandya 48412 189074 25.60
Maddur 36158 138158 26.17
Malavalli 46158 132482 34.84
District 216159 871408 24.81
Source:Census of India, 2011
243
Table 6.27: Percentage of workers in Household Industries in Mandya District - 2011
Taluk Total HH Industries workers Total Workers Percentage
Krishnarajpet 2581 130045 1.98
Nagamangala 1556 104816 1.48
Pandavapura 1690 91244 1.85
Shrirangapattana 2649 85589 3.10
Mandya 4485 189074 2.37
Maddur 2347 138158 1.70
Malavalli 2526 132482 1.91
District 17834 871408 2.05
Source: Census of India, 2011
Table 6.28: Share of female workers in the non-agricultural sector in Mandya District -2011
TalukTotal Female non agricultural
workersTotal Female Worker Percentage
Krishnarajpet 9032 45315 19.93
Nagamangala 7423 44785 16.57
Pandavapura 6219 31752 19.59
Shrirangapattana 10045 27843 36.08
Mandya 22058 58793 37.52
Maddur 13030 44384 29.36
Malavalli 10520 43333 24.28
District 78327 296205 26.44
Source: Census of India, 2011
244
Table 6.29: Female Agricultural wage rate in Mandya District - 2011
Taluk Wages (in rupees)
Krishnarajpet 145.00
Nagamangala 125.00
Pandavapura 100.00
Shrirangapattana 125.00
Mandya 125.00
Maddur 145.00
Malavalli 125.00
District 130.00
Source: District Statistical Dept. & JD, Agriculture
Table 6.30: Male Agricultural wage rate in Mandya District - 2011
Taluk Wages (in rupees)
Krishnarajpet 250
Nagamangala 225
Pandavapura 237.50
Shrirangapattana 225
Mandya 237.50
Maddur 233
Malavalli 275
District 240
Source: District Statistical Dept. & JD, Agriculture
245
Table 6.31: Ratio of average agricultural wage prevalent in Mandya District to Minimum wages prescribed by the State
TalukAverage agricultural wage in a day
(Male + Female)Minimum Wage under MGNREGS
Ratio of agricultural wage to MGNREGS Wage
Krishnarajpet 196 155 1.27
Nagamangala 175 155 1.13
Pandavapura 169 155 1.09
Shrirangapattana 175 155 1.13
Mandya 182 155 1.17
Maddur 188 155 1.22
Malavalli 200 155 1.29
District 183 155 1.19
Source: ZP, Mandya
Table 6.32: Occupation Pattern in Mandya District 2011-12
Taluk Cultivators Agriculture Labourers Non-Agriculture Workers Total Workers
Krishnarajpet 77427 (59.54%) 26387 (20.29%) 26231 (20.17%) 130045 (100%)
Nagamangala 68266 (65.13%) 13537 (12.92%) 23013 (21.96%) 104816 (100%)
Pandavapura 48292 (52.93%) 20732 (22.72%) 22220 (24.35%) 91244 (100%)
Shrirangapattana 26273 (30.70%) 24775 (28.95%) 34541 (40.36%) 85589 (100%)
Mandya 60476 (31.99%) 48412 (25.60%) 80186 (42.41%) 189074 (100%)
Maddur 60063 (43.47%) 36158 (26.17%) 41937 (30.35%) 138158 (100%)
Malavalli 48184 (36.37%) 46158 (34.84%) 38140 (28.79%) 132482 (100%)
District 388981 (44.64%) 216159 (24.81%) 266268 (30.56%) 871408 (100%)
Note: Figures in parentheses are percentages to the row-wise totalsSource: Census of India, 2011
246
Table 7.1: Taluk-wise Site-less Households in Mandya District 2011
TalukNo. of households without house sites
Total No. of Households Percentage
Krishnarajpet 3452 60,817 5.68
Nagamangala 784 44,628 1.76
Pandavapura 4100 42,695 9.60
Shrirangapattana 4724 43,274 10.92
Mandya 34 98,271 0.03
Maddur 6246 71,017 8.80
Malavalli 8848 65,876 13.43
District 28188 426,578 6.61
Source: ZP, Mandya
Table 7.2: Number of Households with Pucca Houses in Mandya District by Taluk-2011
TalukTotal No. of Pucca houses
(Material roof & wall)Number of census houses used as resi-
dence and residence-cum-other usePercentage
Krishnarajpet 26,446 60,530 43.69
Nagamangala 23,590 44,561 52.94
Pandavapura 21,237 42,602 49.85
Shrirangapattana 21,594 43,182 50.01
Mandya 61,289 97,831 62.65
Maddur 46,991 70,965 66.22
Malavalli 38,587 64,969 59.39
District 239,734 424,640 56.46
Source: Census of India, 2011
247
Table 7.3: Number of Households without Own Houses in Urban Local Bodies -2011
ULBs Households without own house Total Households Percentage
Krishnarajpet TMC 1297 6269 20.69
Nagamangala TP 911 4164 21.88
Pandavapura TP 1936 4840 40.00
Shrirangapattana TMC 986 8081 12.20
Mandya CMC 1467 32839 4.47
Maddur TMC 2384 8630 27.62
Malavalli TMC 1350 8531 15.82
District 10331 73354 14.08
Source: DUDC, Mandya
Table 7.4: Percentage of Slum Population to total urban population -2011
ULBs Slum Population Urban Population Percentage
Krishnarajpet TMC 3618 25946 13.94
Nagamangala TP 2939 17776 16.53
Pandavapura TP 2182 20399 10.70
Shrirangapattana TMC 3117 34135 9.13
Mandya CMC 24027 137358 17.49
Maddur TMC 7102 35147 20.21
Malavalli TMC 10953 37601 29.13
District 53938 308362 17.49
Source: Census of India, 2011
248
Table 7.5: Sewerage/ Drainage Facilities in Urban Local Bodies -2011
ULBsWaste water outlet connected to Total no. of Households
access to sewerage/drainage facilities
Total Households PercentageClosed Drainage Open Drainage
Krishnarajpet TMC 948 4,866 5,814 6,169 94.25
Nagamangala TP 1,431 2,043 3,474 4,082 85.11
Pandavapura TP 539 3,481 4,020 4,752 84.60
Shrirangapattana TMC 3,625 2,079 5,704 5,850 97.50
Mandya CMC 19,500 11,451 30,951 32,560 95.06
Maddur TMC 3,523 3,021 6,544 6,885 95.05
Malavalli TMC 1,319 6,413 7,732 8,423 91.80
District 30,885 33,354 64,239 68,721 93.48
Source: Census of India, 2011
Table 7.6: Gram Panchayats selected for Nirmal Gram Puraskar Award in Mandya District, 2011
TalukTotal no of Nirmal Gram Puraskar
AwardTotal number of Gram Panchayat Percentage
Krishnarajpet 7 34 20.59
Nagamangala 1 27 3.70
Pandavapura 4 24 16.67
Shrirangapattana 1 21 4.76
Mandya 10 45 22.22
Maddur 4 42 9.52
Malavalli 3 39 7.69
District 30 232 12.93
Source: ZP, Mandya.
249
Table 7.7: Number of Households with Bicycles in Mandya District in 2001 & 2011
Taluk
2001 2011
Decadal growth rate (2001-2011)
BicycleTotal
number of households
% of House-holds with Bicycle in
2001
BicycleTotal
number of households
% of House-holds with Bicycle in
2011
Krishnarajpet 15367 51544 29.81 21,465 60,817 35.29 39.68
Nagamangala 15047 40608 37.05 16,680 44,628 37.38 10.85
Pandavapura 12695 36846 34.45 18,033 42,695 42.24 42.05
Shrirangapattana 13123 36061 36.39 18,820 43,274 43.49 43.41
Mandya 37310 85351 43.71 48,018 98,271 48.86 28.70
Maddur 27230 62202 43.78 35,074 71,017 49.39 28.81
Malavalli 26433 59169 44.67 34,240 65,876 51.98 29.54
District 147868 373672 39.57 192,330 426,578 45.09 30.07
Source: Census of India, 2001 & 2011
Table 7.8: Number of Households having with two-wheelers during 2001 & 2011
Taluk
2001 2011
Decadal growth rate (2001-2011)Scooter/
Motorcycle/Moped
Total number of households
% of House-holds with
Scooter/Motocycle/Moped in
2001
Scooter/ Motorcycle/
Moped
Total number of households
% of House-holds with
Scooter/Motocycle/Moped in
2011
Krishnarajpet 3903 51544 7.57 11,178 60,817 18.38 186.395
Nagamangala 3751 40608 9.24 8,757 44,628 19.62 133.458
Pandavapura 3489 36846 9.47 8,960 42,695 20.99 156.807
Shrirangapattana 3702 36061 10.27 10,661 43,274 24.64 187.979
Mandya 13802 85351 16.17 27,900 98,271 28.39 102.145
Maddur 6832 62202 10.98 16,963 71,017 23.89 148.287
Malavalli 4360 59169 7.37 11,854 65,876 17.99 171.881
District 40183 373672 10.75 96,273 426,578 22.57 139.586
Source: Census of India, 2001 & 2011
250
Table 7.9: Number of households with no assets (Telephone, Computer, TV, 2 Wheelers and 4 Wheelers) in Mandya District during 2001 & 2011
Taluk
2001 2011
Decadal growth rate (2001-2011)Assets –less
Households
Total number of households
%Assets –less Households
Total number of households
%
Krishnarajpet 20242 51544 39.27 11,105 60,817 18.26 - 45.14
Nagamangala 13254 40608 32.64 7,585 44,628 17.00 - 42.77
Pandavapura 14112 36846 38.30 6,816 42,695 15.96 - 51.70
Shrirangapattana 12292 36061 34.09 5,598 43,274 12.94 - 54.46
Mandya 26284 85351 30.80 13,335 98,271 13.57 - 49.27
Maddur 21898 62202 35.20 11,944 71,017 16.82 - 45.46
Malavalli 21984 59169 37.15 11,986 65,876 18.19 - 45.48
District 130544 373672 34.94 68,369 426,578 16.03 - 47.63
Source: Census of India, 2001 & 2011
Table 7.10(a) Progress of Indira Awas Yojana in Mandya District-Physical Progress, 2009-2010.
Taluk TargetBeneficiary Selected Houses Completed
Under Construction
SC ST Gen Total SC ST Gen Total
Krishnara-jpet
428 199 22 207 428 142 12 142 296 132
Nagaman-gala
165 65 6 94 165 47 4 71 122 43
Pandavapura 268 75 2 191 268 57 2 154 213 55
Shriranga-pattana
266 117 10 139 266 80 6 95 181 85
Mandya 458 173 13 272 458 137 12 240 389 69
Maddur 555 111 6 438 555 87 6 372 465 90
Malavalli 525 184 6 335 525 110 5 248 363 162
District 2665 924 65 1676 2665 660 47 1322 2029 636
Source: ZP, Mandya
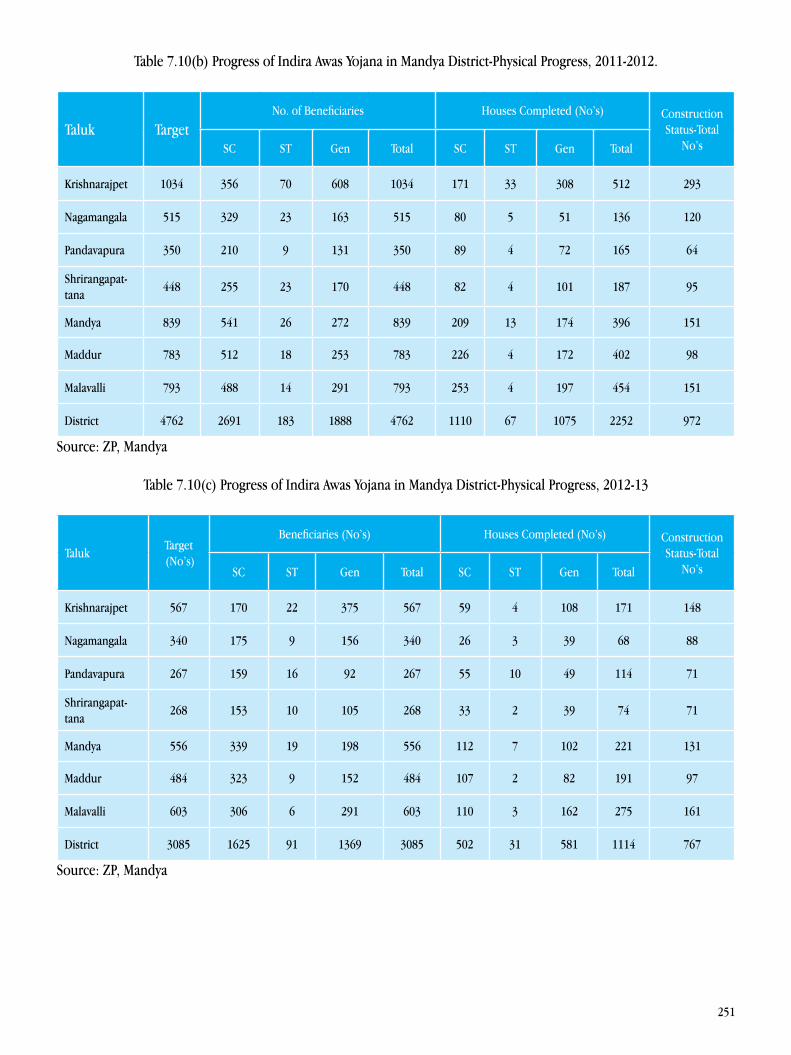
251
Table 7.10(b) Progress of Indira Awas Yojana in Mandya District-Physical Progress, 2011-2012.
Taluk TargetNo. of Beneficiaries Houses Completed (No’s) Construction
Status-Total No’sSC ST Gen Total SC ST Gen Total
Krishnarajpet 1034 356 70 608 1034 171 33 308 512 293
Nagamangala 515 329 23 163 515 80 5 51 136 120
Pandavapura 350 210 9 131 350 89 4 72 165 64
Shrirangapat-tana
448 255 23 170 448 82 4 101 187 95
Mandya 839 541 26 272 839 209 13 174 396 151
Maddur 783 512 18 253 783 226 4 172 402 98
Malavalli 793 488 14 291 793 253 4 197 454 151
District 4762 2691 183 1888 4762 1110 67 1075 2252 972
Source: ZP, Mandya
Table 7.10(c) Progress of Indira Awas Yojana in Mandya District-Physical Progress, 2012-13
TalukTarget (No’s)
Beneficiaries (No’s) Houses Completed (No’s) Construction Status-Total
No’sSC ST Gen Total SC ST Gen Total
Krishnarajpet 567 170 22 375 567 59 4 108 171 148
Nagamangala 340 175 9 156 340 26 3 39 68 88
Pandavapura 267 159 16 92 267 55 10 49 114 71
Shrirangapat-tana
268 153 10 105 268 33 2 39 74 71
Mandya 556 339 19 198 556 112 7 102 221 131
Maddur 484 323 9 152 484 107 2 82 191 97
Malavalli 603 306 6 291 603 110 3 162 275 161
District 3085 1625 91 1369 3085 502 31 581 1114 767
Source: ZP, Mandya
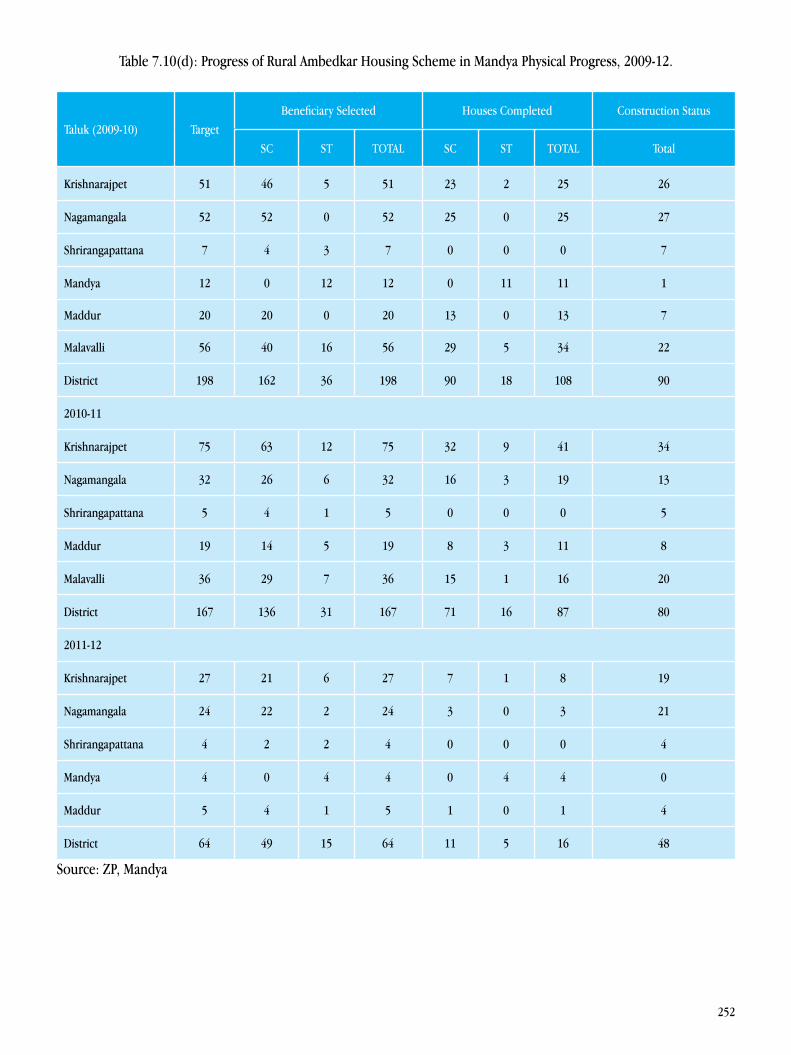
252
Table 7.10(d): Progress of Rural Ambedkar Housing Scheme in Mandya Physical Progress, 2009-12.
Taluk (2009-10) TargetBeneficiary Selected Houses Completed Construction Status
SC ST TOTAL SC ST TOTAL Total
Krishnarajpet 51 46 5 51 23 2 25 26
Nagamangala 52 52 0 52 25 0 25 27
Shrirangapattana 7 4 3 7 0 0 0 7
Mandya 12 0 12 12 0 11 11 1
Maddur 20 20 0 20 13 0 13 7
Malavalli 56 40 16 56 29 5 34 22
District 198 162 36 198 90 18 108 90
2010-11
Krishnarajpet 75 63 12 75 32 9 41 34
Nagamangala 32 26 6 32 16 3 19 13
Shrirangapattana 5 4 1 5 0 0 0 5
Maddur 19 14 5 19 8 3 11 8
Malavalli 36 29 7 36 15 1 16 20
District 167 136 31 167 71 16 87 80
2011-12
Krishnarajpet 27 21 6 27 7 1 8 19
Nagamangala 24 22 2 24 3 0 3 21
Shrirangapattana 4 2 2 4 0 0 0 4
Mandya 4 0 4 4 0 4 4 0
Maddur 5 4 1 5 1 0 1 4
District 64 49 15 64 11 5 16 48
Source: ZP, Mandya
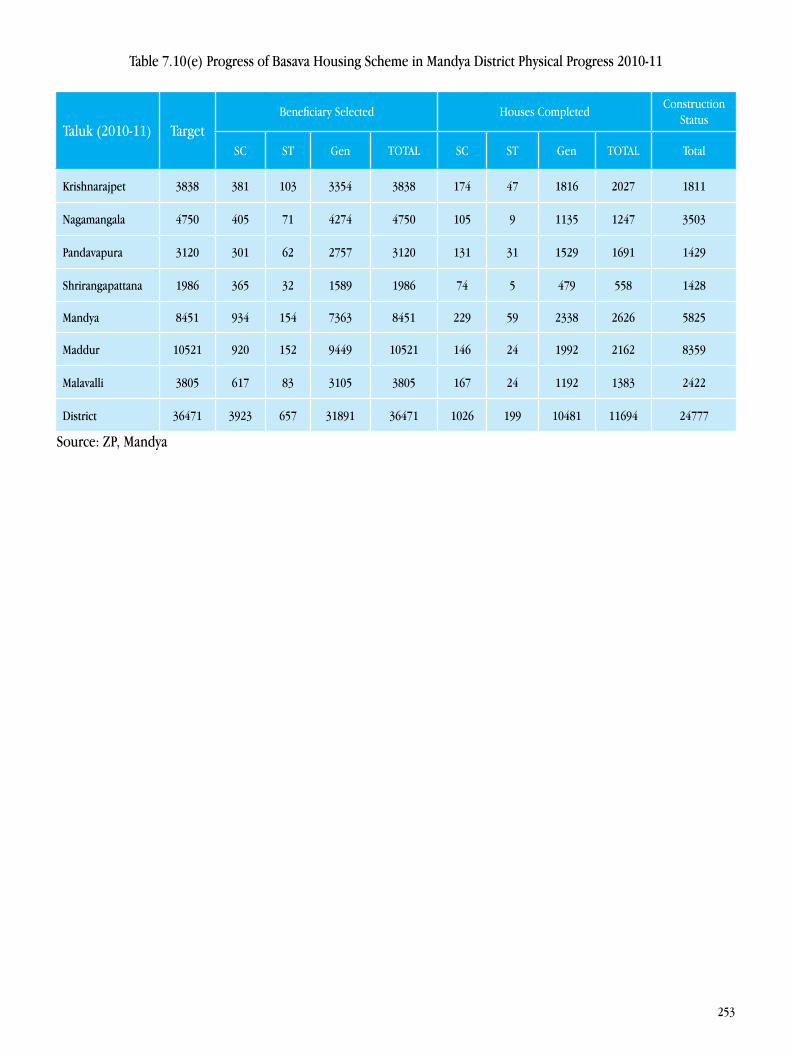
253
Table 7.10(e) Progress of Basava Housing Scheme in Mandya District Physical Progress 2010-11
Taluk (2010-11) TargetBeneficiary Selected Houses Completed
Construction Status
SC ST Gen TOTAL SC ST Gen TOTAL Total
Krishnarajpet 3838 381 103 3354 3838 174 47 1816 2027 1811
Nagamangala 4750 405 71 4274 4750 105 9 1135 1247 3503
Pandavapura 3120 301 62 2757 3120 131 31 1529 1691 1429
Shrirangapattana 1986 365 32 1589 1986 74 5 479 558 1428
Mandya 8451 934 154 7363 8451 229 59 2338 2626 5825
Maddur 10521 920 152 9449 10521 146 24 1992 2162 8359
Malavalli 3805 617 83 3105 3805 167 24 1192 1383 2422
District 36471 3923 657 31891 36471 1026 199 10481 11694 24777
Source: ZP, Mandya
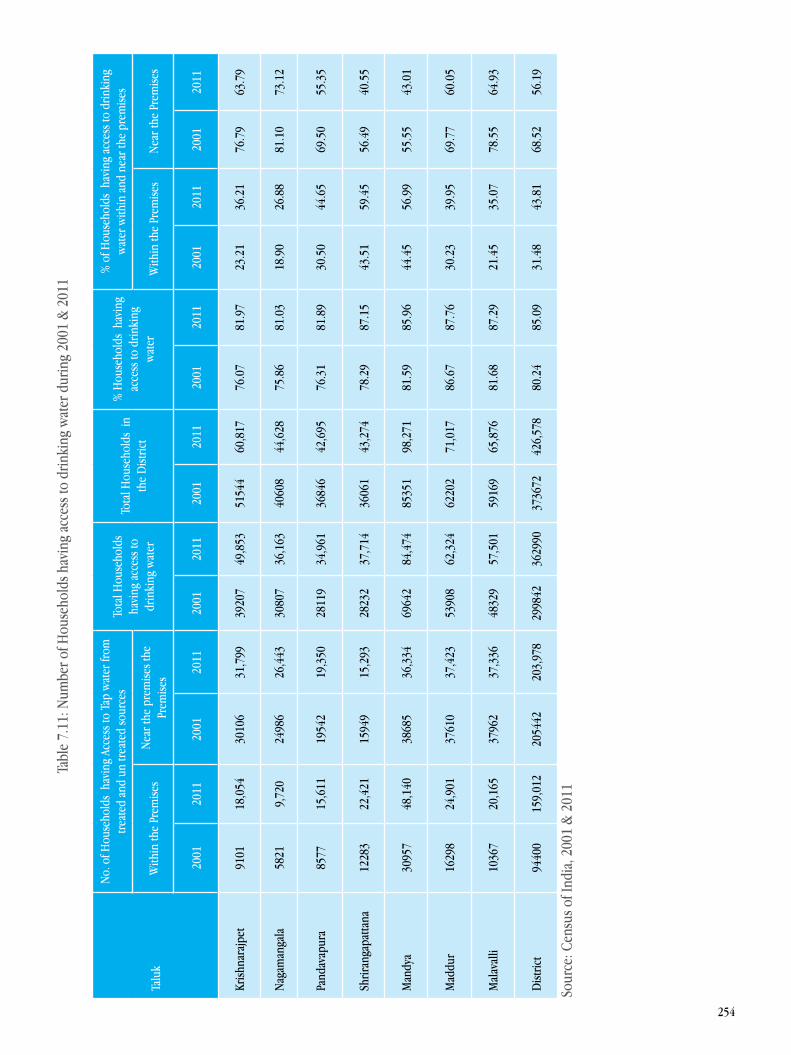
254
Tabl
e 7.
11: N
umbe
r of H
ouse
hold
s hav
ing
acce
ss to
drin
king
wat
er d
urin
g 20
01 &
201
1
Talu
k
No.
of H
ouse
hold
s ha
ving
Acc
ess t
o Ta
p w
ater
from
tre
ated
and
un
treat
ed so
urce
sTo
tal H
ouse
hold
s ha
ving
acc
ess t
o dr
inki
ng w
ater
Tota
l Hou
seho
lds
in
the
Dist
rict
% H
ouse
hold
s ha
ving
ac
cess
to d
rinki
ng
wat
er
% o
f Hou
seho
lds
havi
ng a
cces
s to
drin
king
w
ater
with
in a
nd n
ear t
he p
rem
ises
With
in th
e Pr
emise
sN
ear t
he p
rem
ises t
he
Prem
ises
With
in th
e Pr
emise
sN
ear t
he P
rem
ises
2001
2011
2001
2011
2001
2011
2001
2011
2001
2011
2001
2011
2001
2011
Krish
nara
jpet
91
0118
,054
3010
631
,799
3920
749
,853
5154
460
,817
76.0
781
.97
23.2
136
.21
76.7
963
.79
Nag
aman
gala
5821
9,72
024
986
26,4
4330
807
36,1
6340
608
44,6
2875
.86
81.0
318
.90
26.8
881
.10
73.1
2
Pand
avap
ura
8577
15,6
1119
542
19,3
5028
119
34,9
6136
846
42,6
9576
.31
81.8
930
.50
44.6
569
.50
55.3
5
Shrir
anga
patta
na12
283
22,4
2115
949
15,2
9328
232
37,7
1436
061
43,2
7478
.29
87.1
543
.51
59.4
556
.49
40.5
5
Man
dya
3095
748
,140
3868
536
,334
6964
284
,474
8535
198
,271
81.5
985
.96
44.4
556
.99
55.5
543
.01
Mad
dur
1629
824
,901
3761
037
,423
5390
862
,324
6220
271
,017
86.6
787
.76
30.2
339
.95
69.7
760
.05
Mal
aval
li 10
367
20,1
6537
962
37,3
3648
329
57,5
0159
169
65,8
7681
.68
87.2
921
.45
35.0
778
.55
64.9
3
Dist
rict
9440
015
9,01
220
5442
203,
978
2998
4236
2990
3736
7242
6,57
880
.24
85.0
931
.48
43.8
168
.52
56.1
9
Sour
ce: C
ensu
s of I
ndia
, 200
1 &
201
1

255
Tabl
e 7.
12: N
umbe
r of H
ouse
hold
s in
Man
dya
dist
rict h
avin
g ac
cess
to e
lect
ricity
in
2001
and
201
1
Talu
k
2001
2011
Dec
adal
gro
wth
rate
(2
001-
2011
)El
ectri
city
Con
nect
ed
Hou
seho
lds
Tota
l No.
of H
ouse
-ho
lds
Perc
enta
geEl
ectri
city
Con
nect
-ed
Hou
seho
lds
Tota
l No.
of H
ouse
-ho
lds
Perc
enta
ge
Krish
nara
jpet
41
690
5154
480
.88
55,2
4760
,817
90.8
432
.52
Nag
aman
gala
3456
440
608
85.1
241
,784
44,6
2893
.63
20.8
9
Pand
avap
ura
2966
636
846
80.5
139
,306
42,6
9592
.06
32.5
0
Shrir
anga
patta
na29
463
3606
181
.70
40,3
7343
,274
93.3
37.0
3
Man
dya
6635
885
351
77.7
590
,300
98,2
7191
.89
36.0
8
Mad
dur
4505
362
202
72.4
363
,700
71,0
1789
.741
.39
Mal
aval
li 41
802
5916
970
.65
60,3
2365
,876
91.5
744
.31
Dist
rict
2901
9437
3672
77.6
639
1,03
342
6,57
891
.67
34.7
5
Sour
ce: C
ensu
s of I
ndia
, 200
1 &
201
1
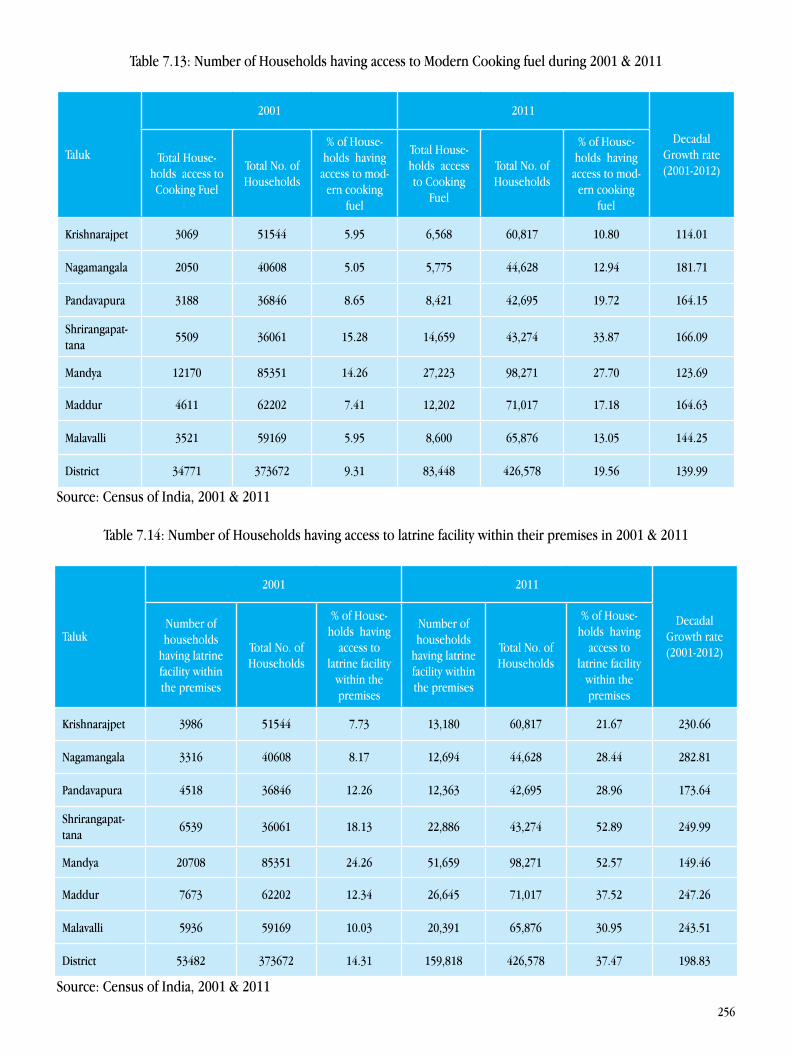
256
Table 7.13: Number of Households having access to Modern Cooking fuel during 2001 & 2011
Taluk
2001 2011
Decadal Growth rate (2001-2012)
Total House-holds access to Cooking Fuel
Total No. of Households
% of House-holds having
access to mod-ern cooking
fuel
Total House-holds access to Cooking
Fuel
Total No. of Households
% of House-holds having
access to mod-ern cooking
fuel
Krishnarajpet 3069 51544 5.95 6,568 60,817 10.80 114.01
Nagamangala 2050 40608 5.05 5,775 44,628 12.94 181.71
Pandavapura 3188 36846 8.65 8,421 42,695 19.72 164.15
Shrirangapat-tana
5509 36061 15.28 14,659 43,274 33.87 166.09
Mandya 12170 85351 14.26 27,223 98,271 27.70 123.69
Maddur 4611 62202 7.41 12,202 71,017 17.18 164.63
Malavalli 3521 59169 5.95 8,600 65,876 13.05 144.25
District 34771 373672 9.31 83,448 426,578 19.56 139.99
Source: Census of India, 2001 & 2011
Table 7.14: Number of Households having access to latrine facility within their premises in 2001 & 2011
Taluk
2001 2011
Decadal Growth rate (2001-2012)
Number of households
having latrine facility within the premises
Total No. of Households
% of House-holds having
access to latrine facility
within the premises
Number of households
having latrine facility within the premises
Total No. of Households
% of House-holds having
access to latrine facility
within the premises
Krishnarajpet 3986 51544 7.73 13,180 60,817 21.67 230.66
Nagamangala 3316 40608 8.17 12,694 44,628 28.44 282.81
Pandavapura 4518 36846 12.26 12,363 42,695 28.96 173.64
Shrirangapat-tana
6539 36061 18.13 22,886 43,274 52.89 249.99
Mandya 20708 85351 24.26 51,659 98,271 52.57 149.46
Maddur 7673 62202 12.34 26,645 71,017 37.52 247.26
Malavalli 5936 59169 10.03 20,391 65,876 30.95 243.51
District 53482 373672 14.31 159,818 426,578 37.47 198.83
Source: Census of India, 2001 & 2011
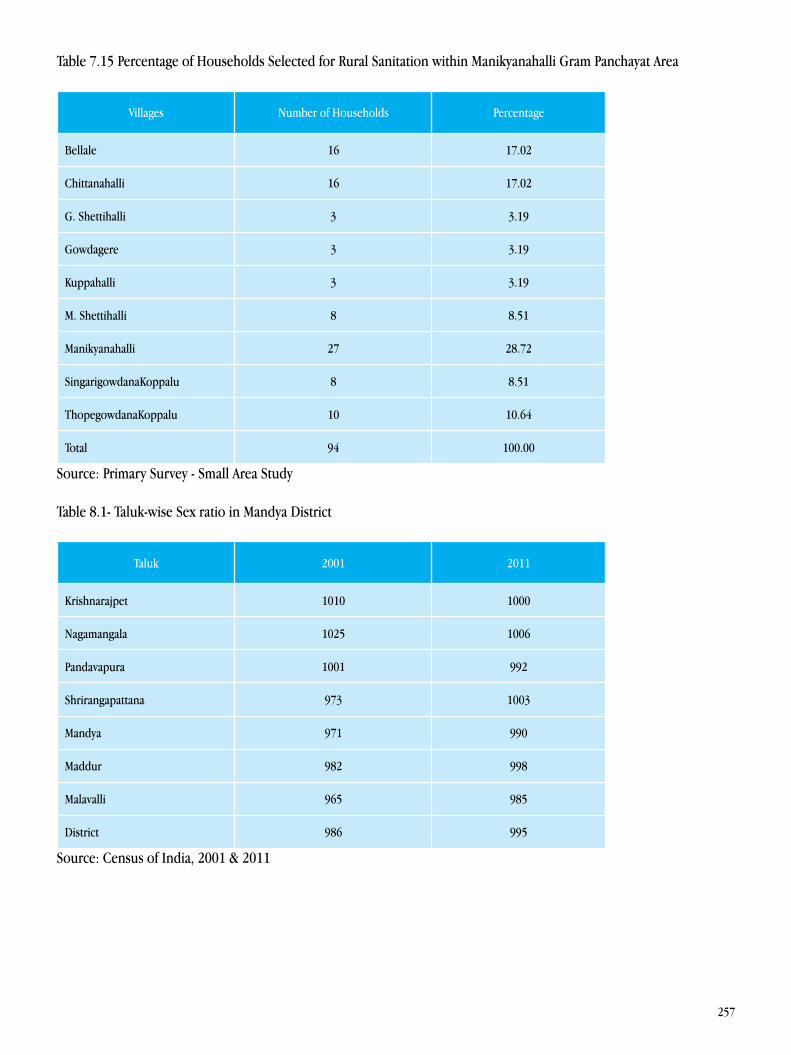
257
Table 7.15 Percentage of Households Selected for Rural Sanitation within Manikyanahalli Gram Panchayat Area
Villages Number of Households Percentage
Bellale 16 17.02
Chittanahalli 16 17.02
G. Shettihalli 3 3.19
Gowdagere 3 3.19
Kuppahalli 3 3.19
M. Shettihalli 8 8.51
Manikyanahalli 27 28.72
SingarigowdanaKoppalu 8 8.51
ThopegowdanaKoppalu 10 10.64
Total 94 100.00
Source: Primary Survey - Small Area Study
Table 8.1- Taluk-wise Sex ratio in Mandya District
Taluk 2001 2011
Krishnarajpet 1010 1000
Nagamangala 1025 1006
Pandavapura 1001 992
Shrirangapattana 973 1003
Mandya 971 990
Maddur 982 998
Malavalli 965 985
District 986 995
Source: Census of India, 2001 & 2011
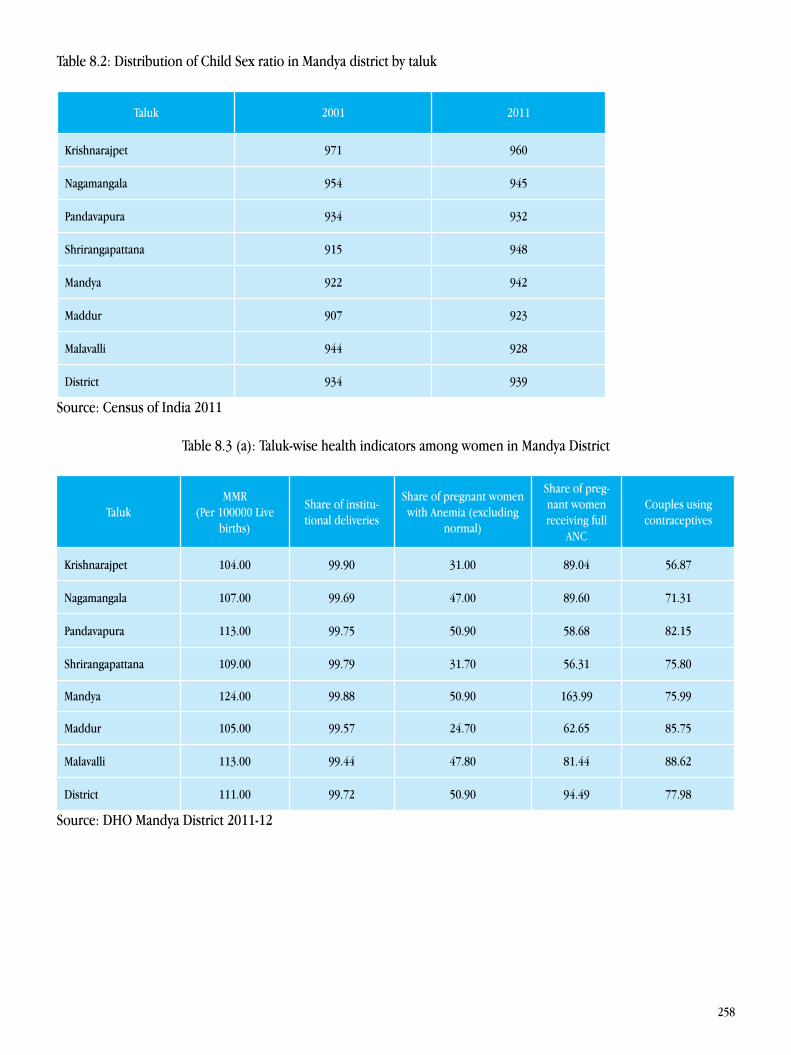
258
Table 8.2: Distribution of Child Sex ratio in Mandya district by taluk
Taluk 2001 2011
Krishnarajpet 971 960
Nagamangala 954 945
Pandavapura 934 932
Shrirangapattana 915 948
Mandya 922 942
Maddur 907 923
Malavalli 944 928
District 934 939
Source: Census of India 2011
Table 8.3 (a): Taluk-wise health indicators among women in Mandya District
TalukMMR
(Per 100000 Live births)
Share of institu-tional deliveries
Share of pregnant women with Anemia (excluding
normal)
Share of preg-nant women receiving full
ANC
Couples using contraceptives
Krishnarajpet 104.00 99.90 31.00 89.04 56.87
Nagamangala 107.00 99.69 47.00 89.60 71.31
Pandavapura 113.00 99.75 50.90 58.68 82.15
Shrirangapattana 109.00 99.79 31.70 56.31 75.80
Mandya 124.00 99.88 50.90 163.99 75.99
Maddur 105.00 99.57 24.70 62.65 85.75
Malavalli 113.00 99.44 47.80 81.44 88.62
District 111.00 99.72 50.90 94.49 77.98
Source: DHO Mandya District 2011-12
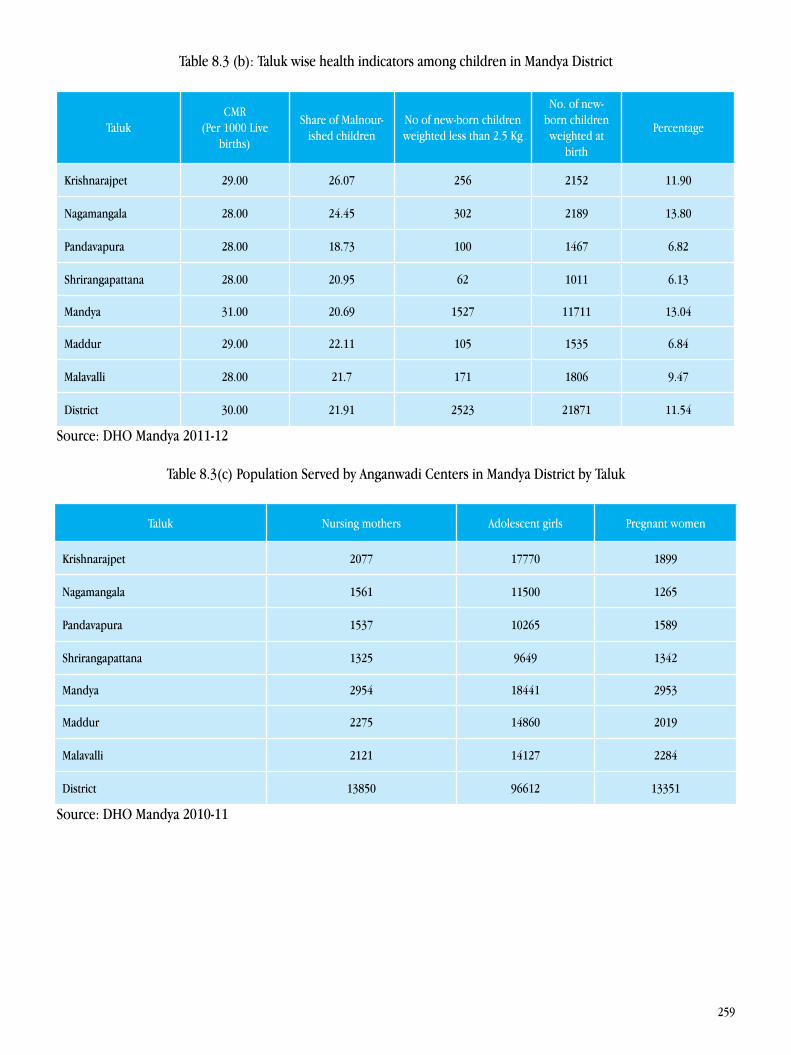
259
Table 8.3 (b): Taluk wise health indicators among children in Mandya District
TalukCMR
(Per 1000 Live births)
Share of Malnour-ished children
No of new-born children weighted less than 2.5 Kg
No. of new-born children weighted at
birth
Percentage
Krishnarajpet 29.00 26.07 256 2152 11.90
Nagamangala 28.00 24.45 302 2189 13.80
Pandavapura 28.00 18.73 100 1467 6.82
Shrirangapattana 28.00 20.95 62 1011 6.13
Mandya 31.00 20.69 1527 11711 13.04
Maddur 29.00 22.11 105 1535 6.84
Malavalli 28.00 21.7 171 1806 9.47
District 30.00 21.91 2523 21871 11.54
Source: DHO Mandya 2011-12
Table 8.3(c) Population Served by Anganwadi Centers in Mandya District by Taluk
Taluk Nursing mothers Adolescent girls Pregnant women
Krishnarajpet 2077 17770 1899
Nagamangala 1561 11500 1265
Pandavapura 1537 10265 1589
Shrirangapattana 1325 9649 1342
Mandya 2954 18441 2953
Maddur 2275 14860 2019
Malavalli 2121 14127 2284
District 13850 96612 13351
Source: DHO Mandya 2010-11
260
Table 8.4: Taluk wise Female Literacy Rate in Mandya District
TalukPercentage of female literacy Percentage of male literacy Total literacy rate
2001 2011 2001 2011 2001 2011
Krishnarajpet 50.38 60.76 73.04 79.60 61.63 70.16
Nagamangala 50.37 60.91 74.10 80.63 62.02 70.71
Pandavapura 46.75 58.93 66.77 75.65 56.71 67.29
Shrirangapattana 54.63 66.13 70.78 79.16 62.79 72.61
Mandya 57.53 68.08 74.18 81.39 65.95 74.75
Maddur 50.12 60.71 68.76 76.51 59.48 68.59
Malavalli 46.88 59.12 64.16 73.86 55.66 66.52
District 51.53 62.54 70.50 78.27 61.05 70.40
Source: DHO Mandya 2010-11
Table 8.5: Taluk-wise female and male work participation rates in Mandya District
TalukShare of female Work Participation Rate Share of male Work Participation Rate
2001 2011 2001 2011
Krishnarajpet 40.98 38.36 70.26 72.03
Nagamangala 48.04 52.08 67.85 70.64
Pandavapura 45.02 38.39 72.30 71.86
Shrirangapattana 43.28 34.08 76.84 71.38
Mandya 28.28 31.45 67.16 69.37
Maddur 40.27 33.08 68.52 70.31
Malavalli 34.62 34.01 68.76 69.36
District 38.22 36.25 69.52 70.49
Source: Census of India, 2001 & 2011
261
Table 8.6: Percentage of female workers in non-agricultural sector (NAGF) to Total female workers
TalukTotal Female non agricultural
workersTotal Female Worker Percentage
Krishnarajpet 9032 45315 19.93
Nagamangala 7423 44785 16.57
Pandavapura 6219 31752 19.59
Shrirangapattana 10045 27843 36.08
Mandya 22058 58793 37.52
Maddur 13030 44384 29.36
Malavalli 10520 43333 24.28
District 78327 296205 26.44
Source: Census of India, 2011
Table 8.7: Taluk-wise female and male wage rates in Mandya District
Taluk Female Wages (in rupees) Male Wages (in rupees) Wage gap
Krishnarajpet 145 250 108
Nagamangala 125 225 100
Pandavapura 100 237.50 137.50
Shrirangapattana 125 225 100
Mandya 125 237.50 112.50
Maddur 145 233 91
Malavalli 125 275 150
District 130 240 110
Source: Mandya District Statistical Dept. & JD, Agriculture 2011-12
262
Table 8.8: Elected Women Representatives in Urban Local Bodies
ULBs Women Total Percentage
Krishnarajpet 9 23 39.13
Nagamangala 7 16 43.75
Pandavapura 8 18 44.44
Shrirangapattana 9 23 39.13
Mandya 13 35 37.14
Maddur 9 23 39.13
Malavalli 9 23 39.13
District 64 161 39.75
Source: DUDC, Mandya 2011-12
Table 8.9: Elected Women Representatives in Rural Local Bodies
TalukZP TP GP
Total Female TotalPercent-
ageFemale Total Female Total Female Total
Krishnarajpet 3 6 13 23 250 577 266 606 43.89
Nagamangala 2 5 10 18 190 450 202 473 42.71
Pandavapura 3 4 9 16 175 406 187 426 43.90
Shrirangapat-tana
2 4 8 15 161 381 171 400 42.75
Mandya 4 7 15 28 318 708 337 743 45.36
Maddur 3 7 16 27 298 679 317 713 44.46
Malavalli 4 7 14 25 267 616 285 648 43.98
District 21 40 85 152 1659 3817 1765 4009 44.03
Source: ZP, Mandya 2011-12
263
Table 8.10: Women-headed Households in Mandya District
Taluk Female headed Households No. of Households Percentage of women headed
Households
Krishnarajpet 10,038 61035 16.45
Nagamangala 7,636 44954 16.99
Pandavapura 7,775 43262 17.97
Shrirangapattana 8,809 43402 20.30
Mandya 18,511 99024 18.69
Maddur 15,001 71028 21.12
Malavalli 13,418 65920 20.35
District 81,188 428625 18.94
Source: Census of India, 2011
Table 8.11: Crime against Women in Mandya District 2009-12
Taluk Crimes against women Dowry deaths Female suicides
Krishnarajpet 434 2 64
Nagamangala 245 4 27
Pandavapura 306 6 16
Shrirangapattana 402 13 57
Mandya 167 1 49
Maddur 252 5 7
Malavalli 391 8 7
District 2107 39 227
Source: Records of Police Superintendent, Mandya District- 2013
264
Table 8.12: Active Self-Help Groups (SHGs)
Taluk Active SHGs No. SHGs registered Percentage
Krishnarajpet 872 940 92.77
Nagamangala 772 772 100.00
Pandavapura 513 775 66.19
Shrirangapattana 691 764 90.45
Mandya 1176 1231 95.53
Maddur 1169 1181 98.98
Malavalli 880 975 90.26
District 6073 6638 91.49
Source: Department of Women and Child, Mandya 2011-12
Table 9.1: Decadal Growth of SC&ST Population in Mandya
YearScheduled Caste (SC) Scheduled Tribe (ST)
Population Decadal growth rate Population Decadal growth rate
1991 226626 - 11936 -
2001 247213 8.33 17193 30.58
2011 265294 6.81 22402 23.25
Source: District Census hand book1991-2011
265
Table 9.2: Taluk-wise Growth of SC and ST Population in the District 1991-2011
Taluk1991 2001 2011
SC % ST % SC % ST % SC % ST %
Krishnarajpet 26357 11.63 2676 22.42 30604 12.38 5180 30.13 33726 12.71 6050 27.01
Nagamangala 19161 8.45 1000 8.38 22357 9.04 1633 9.50 23998 9.05 2145 9.58
Pandavapura 18412 8.12 1172 9.82 20770 8.40 1824 10.61 23241 8.76 2801 12.50
Shrirangapat-tana
22043 9.73 1901 15.93 23512 9.51 2548 14.82 26631 10.04 4341 19.38
Mandya 50712 22.38 2027 16.98 53666 21.71 2545 14.80 57586 21.71 3385 15.11
Maddur 36864 16.27 1527 12.79 37279 15.08 1478 8.60 41001 15.45 2137 9.54
Malavalli 53077 23.42 1633 13.68 57867 23.41 1538 8.95 59111 22.28 1543 6.89
District 226626 100.00 11936 100.00 247213 100.00 17193 100.00 265294 100.00 22402 100.00
Source: District Census hand book1991-2011
Table 9.3: Percentage of SC-ST Population to the total Population by Taluk
Taluk
Percent of SC Population to total Population of the Taluk
Percent of ST Population to total Population of the Taluk
1991 2001 2011 1991 2001 2011
Krishnarajpet 11.92 12.33 12.95 1.21 2.09 2.32
Nagamangala 10.72 11.72 12.77 0.56 0.86 1.14
Pandavapura 11.50 11.87 12.68 0.73 1.04 1.53
Shrirangapattana 14.26 14.43 14.78 1.23 1.56 2.41
Mandya 13.24 13.23 13.87 0.53 0.63 0.82
Maddur 13.04 12.82 13.88 0.54 0.51 0.72
Malavalli 20.10 20.53 20.87 0.62 0.55 0.54
District 13.78 14.02 14.69 0.73 0.97 1.24
Source: District Census hand book1991-2011
266
Tabl
e 9.
4: S
C-ST
Pop
ulat
ion
in R
ural
& U
rban
Are
as 2
001
& 2
011
Talu
k
2001
20
11
Rura
l
Urba
n
Rura
l Ur
ban
SC%
ST%
SC%
ST%
SC%
ST%
SC%
ST%
Krish
nara
jpet
2722
513
.11
4910
36.3
733
798.
7927
08.
3229
691
13.3
856
2032
.37
4035
9.31
430
8.53
Nag
aman
gala
2084
910
.04
1585
11.7
415
083.
9248
1.48
2207
59.
9520
2611
.67
1923
4.44
119
2.36
Pand
avap
ura
1839
78.
8616
9412
.55
2373
6.17
130
4.01
2040
79.
1926
0815
.02
2834
6.54
193
3.83
Shrir
anga
pat-
tana
2160
110
.40
1356
10.0
419
114.
9711
9236
.73
2310
510
.41
2387
13.7
535
268.
1319
5438
.76
Man
dya
3624
117
.46
1379
10.2
117
425
45.3
311
6635
.93
3917
817
.65
1783
10.2
718
408
42.4
616
0231
.78
Mad
dur
3367
616
.22
1142
8.46
3603
9.37
336
10.3
536
651
16.5
115
649.
0143
5010
.03
573
11.3
7
Mal
aval
li49
625
23.9
014
3510
.63
8242
21.4
410
33.
1750
836
22.9
013
737.
9182
7519
.09
170
3.37
Dist
rict
2076
1410
0.00
1350
110
0.00
3844
110
0.00
3245
100.
0022
1943
100.
0017
361
100.
0043
351
100.
0050
4110
0.00
Sour
ce: D
istric
t Cen
sus h
and
book
2001
-201
1
267
Table 9.5: Sex Ratio among SC, ST and Other Groups
Taluk2001 2011
SC ST General SC ST General
Krishnarajpet 11.92 12.33 12.95 1.21 2.09 2.32
Nagamangala 10.72 11.72 12.77 0.56 0.86 1.14
Pandavapura 11.50 11.87 12.68 0.73 1.04 1.53
Shrirangapattana 14.26 14.43 14.78 1.23 1.56 2.41
Mandya 13.24 13.23 13.87 0.53 0.63 0.82
Maddur 13.04 12.82 13.88 0.54 0.51 0.72
Malavalli 20.10 20.53 20.87 0.62 0.55 0.54
District 13.78 14.02 14.69 0.73 0.97 1.24
Source: District Census hand book2001-2011
Table 9.6: Gross Enrollment in Primary School in Mandya District in 2011-12
TalukGeneral SC ST
Boys Girls Total Boys Girls Total Boys Girls Total
Krishnarajpet 96.44 96.15 96.29 93.32 104.93 99.12 101.00 100.11 100.56
Nagamangala 85.10 85.63 85.36 90.53 88.95 89.74 107.53 101.30 104.42
Pandavapura 99.09 100.99 100.04 107.53 100.11 103.82 99.00 100.12 99.56
Shrirangapattana 98.00 97.62 97.81 97.23 92.23 94.64 100.00 101.53 100.77
Mandya 101.51 100.06 100.79 103.72 99.56 106.28 102.00 103.00 102.50
Maddur 101.42 102.13 101.77 106.79 105.78 95.11 100.12 115.67 107.90
Malavalli 92.41 93.66 93.03 93.98 96.23 101.11 108.48 83.06 95.77
District 97.56 97.58 97.57 99.31 98.97 99.14 101.00 105.00 103.00
Source: DDPI, Mandya
268
Table 9.7: Gross Enrollment in Upper Primary School in Mandya District 2011-12
TalukGeneral SC ST
Boys Girls Total Boys Girls Total Boys Girls Total
Krishnarajpet 90.84 94.11 92.47 90.50 93.66 92.08 103.00 105.00 104.00
Nagamangala 85.84 86.91 86.41 83.06 80.96 82.01 103.77 93.00 98.39
Pandavapura 104.84 102.69 103.77 101.53 100.26 100.95 104.00 94.00 99.00
Shrirangapattana 101.94 102.72 102.33 91.21 104.26 97.73 108.00 102.00 105.00
Mandya 108.89 108.88 108.89 101.30 115.67 108.48 101.00 104.00 102.50
Maddur 100.14 100.10 100.12 100.11 108.70 104.41 104.12 103.23 103.68
Malavalli 97.30 97.92 97.12 98.84 97.46 98.15 106.00 101.00 103.50
District 99.63 100.50 100.07 96.42 101.72 99.07 104.00 101.00 102.50
Source: DDPI, Mandya
Table 9.8: Gross Enrollment in Elementary School in Mandya District in 2011-12
TalukGeneral SC ST
Boys Girls Total Boys Girls Total Boys Girls Total
Krishnarajpet 92.44 94.28 93.36 92.24 100.57 96.40 102.49 105.35 103.92
Nagamangala 86.36 85.44 85.90 87.32 85.70 86.51 101.19 103.79 102.49
Pandavapura 103.79 101.19 102.49 105.35 100.21 102.78 108.83 100.93 104.88
Shrirangapattana 102.32 98.00 100.90 94.92 96.85 96.89 100.52 95.94 98.23
Mandya 108.83 103.93 106.38 102.68 105.52 104.10 103.79 94.28 99.04
Maddur 100.12 100.93 100.52 104.17 106.90 105.54 104.12 104.00 104.06
Malavalli 97.60 94.27 95.94 95.93 96.72 96.33 101.00 102.12 100.56
District 97.32 98.35 99.20 98.16 100.03 99.10 102.12 98.98 100.55
Source: DDPI, Mandya
269
Table 9.9: Transition Rate from 5th Standard to 6th Standard in Mandya District 2011-
TalukGeneral SC ST
Boys Girls Total Boys Girls Total Boys Girls Total
Krishnarajpet 91.04 90.54 90.79 91.00 94.50 92.69 98.00 69.23 83.33
Nagamangala 104.69 95.81 100.42 98.06 94.85 96.50 96.43 86.67 91.38
Pandavapura 100.49 105.46 102.79 94.77 94.22 94.49 88.24 97.30 92.05
Shrirangapattana 108.51 106.40 107.50 92.86 93.40 93.12 94.12 105.26 98.88
Mandya 98.50 99.10 98.78 98.99 98.61 98.80 74.47 81.82 78.02
Maddur 99.28 97.13 98.24 99.61 101.36 100.54 33.93 43.86 38.94
Malavalli 99.12 99.95 99.52 98.59 98.77 98.68 65.79 94.12 79.17
District 99.50 98.25 98.89 96.66 96.22 96.44 84.64 84.67 84.65
Source: DDPI, Mandya
Table 9.10: Transition Rate from 8th Standard to 9th Standard in Mandya District 2011-12
TalukGeneral SC ST
Boys Girls Total Boys Girls Total Boys Girls Total
Krishnarajpet 92.30 94.82 93.53 87.32 100.77 93.76 102.08 94.23 98.00
Nagamangala 98.87 95.50 97.36 97.56 99.01 98.21 94.12 94.44 96.15
Pandavapura 92.57 95.20 93.88 92.61 99.01 96.04 95.45 88.89 92.50
Shrirangapattana 97.36 102.67 99.87 71.56 94.95 82.51 84.85 91.67 87.72
Mandya 94.36 99.07 96.61 94.32 97.85 96.11 80.00 96.00 86.67
Maddur 97.78 97.89 97.83 80.47 80.91 80.69 56.10 152.94 84.48
Malavalli 100.05 100.59 100.32 108.93 105.13 107.01 96.43 29.76 46.43
District 96.20 97.38 96.77 91.36 96.60 93.95 82.41 80.77 81.64
Source: DDPI, Mandya

270
Table 9.11: Drop-out rate in Primary Schools for SCs and STs 2011-12
TalukGeneral SCs STs
Boys Girls Total Boys Girls Total Boys Girls Total
Krishnarajpet 6.68 5.91 6.30 3.97 6.11 4.75 5.86 3.54 4.74
Nagamangala 4.51 4.41 4.16 3.03 2.51 2.54 1.32 7.19 4.14
Pandavapura 2.59 2.34 2.38 2.16 0.34 1.07 8.30 8.25 8.28
Shrirangapattana 2.36 2.15 2.26 1.57 4.01 2.20 1.11 0.78 0.95
Mandya 4.49 4.19 4.35 1.00 3.74 2.24 5.36 4.05 3.74
Maddur 3.32 3.41 3.37 4.67 3.16 3.74 3.95 4.35 4.14
Malavalli 4.21 2.96 3.62 4.54 5.07 4.59 2.46 4.88 3.68
District 4.08 3.69 3.85 2.74 3.58 2.92 3.98 3.76 3.88
Source: DDPI, Mandya
Table 9.12: Drop-out rate in Upper Primary Schools for SCs and STs 2011-12
TalukGeneral SC ST
Boys Girls Total Boys Girls Total Boys Girls Total
Krishnarajpet 1.08 2.67 1.89 3.57 7.28 5.33 8.15 6.11 6.98
Nagamangala 2.13 2.04 1.67 7.51 5.45 6.27 7.45 8.62 7.89
Pandavapura 0.98 2.28 1.57 1.20 3.22 2.20 3.70 5.13 4.40
Shrirangapattana 8.09 8.59 8.33 3.78 7.71 5.73 2.80 6.25 4.43
Mandya 4.02 3.50 3.76 4.54 5.14 4.61 12.25 2.72 8.49
Maddur 1.11 0.66 0.86 2.22 4.84 2.87 7.77 7.05 7.45
Malavalli 0.98 1.24 1.11 2.43 1.23 1.45 3.70 4.35 4.13
District 2.80 3.06 2.87 3.72 5.00 4.13 6.95 5.86 6.40
Source: DDPI, Mandya
271
Table 9.13: SSLC Results for SC and ST in Mandya district 2011-12 & 2012-13
Taluk2011-12 2012-13
GEN SC ST GEN SC ST
Krishnarajpet 90.72 90.49 86.57 91.50 88.62 89.87
Nagamangala 86.87 92.18 74.42 90.19 87.93 86.00
Pandavapura 58.33 87.50 87.80 90.18 87.68 89.19
Shrirangapattana 80.65 89.97 78.18 87.35 90.03 77.14
Mandya 84.19 86.80 70.83 84.95 79.49 67.80
Maddur 92.78 88.56 66.67 93.66 92.07 85.00
Malavalli 88.02 90.30 70.69 87.31 86.89 74.15
District 84.09 89.22 77.12 89.10 86.21 81.27
Source: DDPI, Mandya
Table 9.14 Land Holding among SCs and STs (In numbers)
Taluk SC % ST % General % Total %
Krishnarajpet 5894 16.21 548 23.00 56834 16.02 63276 16.08
Nagamangala 5047 13.88 399 16.74 56396 15.90 61842 15.72
Pandavapura 2323 6.39 337 14.14 28874 8.14 31534 8.02
Shrirangapattana 2304 6.34 63 2.64 30329 8.55 32696 8.31
Mandya 5134 14.12 131 5.50 68888 19.42 74153 18.85
Maddur 4747 13.05 812 34.07 56696 15.99 62255 15.82
Malavalli 10916 30.02 93 3.90 56647 15.97 67656 17.20
District 36365 100.00 2383 100.00 354664 100.00 393412 100.00
Source: Agricultural Census Year 2010-11, DSO, Mandya,N.B. Figures in the first parentheses are percentage to the row-wise totals while those in the second parentheses are percentage to the Colum-wise totals.

272
Table 9.15: Land Owned by Different Groups (In hectares)
Taluk SC % ST % General % Total %
Krishnarajpet 3585 17.94 320 20.79 50548 17.80 54453 17.82
Nagamangala 3428 17.15 379 24.63 56554 19.91 60361 19.76
Pandavapura 1523 7.62 339 22.03 24079 8.48 25941 8.49
Shrirangapattana 1417 7.09 29 1.88 23047 8.12 24493 8.02
Mandya 2412 12.07 51 3.31 46706 16.45 49169 16.09
Maddur 1963 9.82 360 23.39 40213 14.16 42536 13.92
Malavalli 5658 28.31 61 3.96 42846 15.09 48565 15.90
District 19986 100.00 1539 100.00 283993 100.00 305518 100.00
Source: DSO, Mandya Census Year 2010-11
Table 9.16: Houses Constructed Under Ashraya Scheme Year: 2011-12
TalukScheduled
Castes%
Scheduled Tribes
% Others % Total %
Krishnarajpet 1325 14.92 211 30.94 2507 15.89 4043 15.95
Nagamangala 1074 12.10 86 12.61 1943 12.31 3103 12.24
Pandavapura 806 9.08 67 9.82 1723 10.92 2596 10.24
Shrirangapattana 689 7.76 56 8.21 1390 8.81 2135 8.43
Mandya 866 9.75 67 9.82 2177 13.80 3110 12.27
Maddur 1944 21.90 125 18.33 3427 21.72 5496 21.69
Malavalli 2174 24.49 70 10.26 2614 16.56 4858 19.17
District 8878 100.00 682 100.00 15781 100.00 25341 100.00
Source: ZP, Mandya
273
Table 9.17: Houses Constructed Under Dr. B.R. Ambedkar Scheme Year: 2011-12
Taluk Schedule Caste %Scheduled
Tribe% Total %
Krishnarajpet 285 19.74 36 21.18 321 19.89
Nagamangala 215 14.89 10 5.88 225 13.94
Pandavapura 45 3.12 14 8.24 59 3.66
Shrirangapattana 87 6.02 15 8.82 102 6.32
Mandya 87 6.02 21 12.35 108 6.69
Maddur 137 9.49 25 14.71 162 10.04
Malavalli 588 40.72 49 28.82 637 39.47
District 1444 100.00 170 100.00 1614 100.00
Source: ZP, Mandya
Table 9.18: Indira Awas Houses Year: 2011-12
TalukSchedule
Caste%
Scheduled Tribe
% Others % Total %
Krishnarajpet 890 14.94 132 30.28 1107 18.53 2129 17.22
Nagamangala 685 11.50 54 12.39 586 9.81 1325 10.71
Pandavapura 499 8.38 27 6.19 541 9.06 1067 8.63
Shrirangapattana 844 14.17 74 16.97 818 13.69 1736 14.04
Mandya 1067 17.91 77 17.66 886 14.83 2030 16.41
Maddur 920 15.44 42 9.63 1041 17.43 2003 16.20
Malavalli 1052 17.66 30 6.88 995 16.66 2077 16.79
District 5957 100.00 436 100.00 5974 100.00 12367 100.00
Source: ZP, MandyaN.B. Figures in parentheses are percentage to the targeted totals.
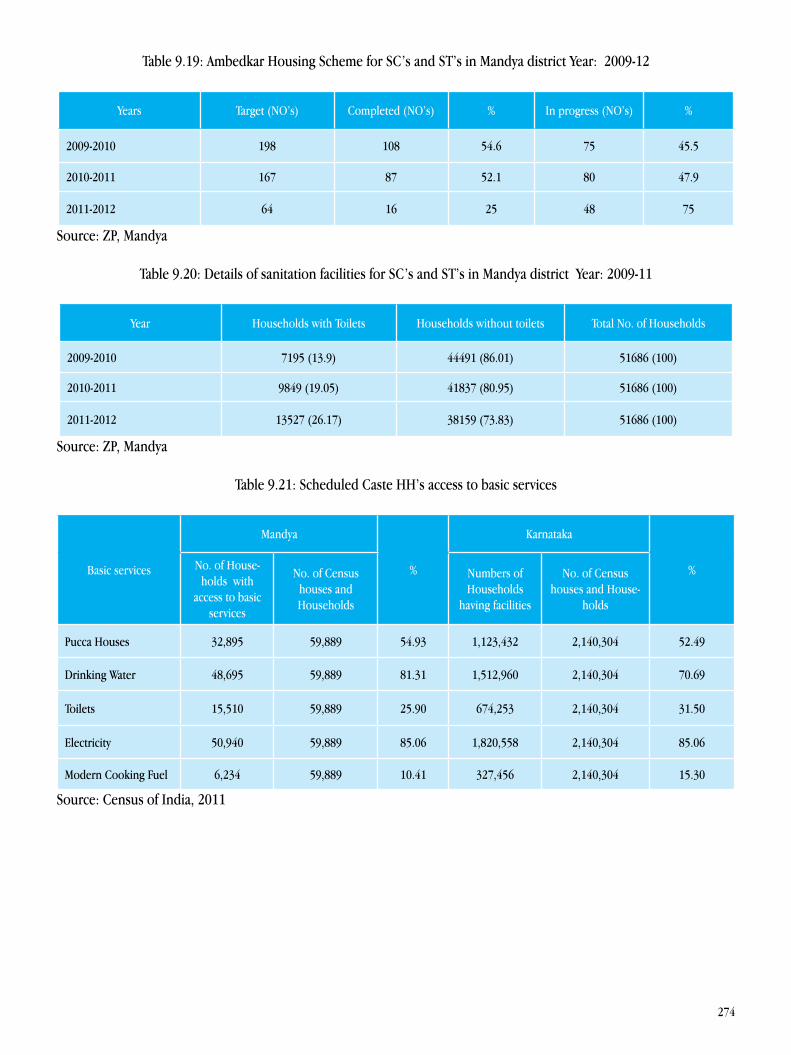
274
Table 9.19: Ambedkar Housing Scheme for SC’s and ST’s in Mandya district Year: 2009-12
Years Target (NO’s) Completed (NO’s) % In progress (NO’s) %
2009-2010 198 108 54.6 75 45.5
2010-2011 167 87 52.1 80 47.9
2011-2012 64 16 25 48 75
Source: ZP, Mandya
Table 9.20: Details of sanitation facilities for SC’s and ST’s in Mandya district Year: 2009-11
Year Households with Toilets Households without toilets Total No. of Households
2009-2010 7195 (13.9) 44491 (86.01) 51686 (100)
2010-2011 9849 (19.05) 41837 (80.95) 51686 (100)
2011-2012 13527 (26.17) 38159 (73.83) 51686 (100)
Source: ZP, Mandya
Table 9.21: Scheduled Caste HH’s access to basic services
Basic services
Mandya
%
Karnataka
%No. of House-holds with
access to basic services
No. of Census houses and Households
Numbers of Households
having facilities
No. of Census houses and House-
holds
Pucca Houses 32,895 59,889 54.93 1,123,432 2,140,304 52.49
Drinking Water 48,695 59,889 81.31 1,512,960 2,140,304 70.69
Toilets 15,510 59,889 25.90 674,253 2,140,304 31.50
Electricity 50,940 59,889 85.06 1,820,558 2,140,304 85.06
Modern Cooking Fuel 6,234 59,889 10.41 327,456 2,140,304 15.30
Source: Census of India, 2011
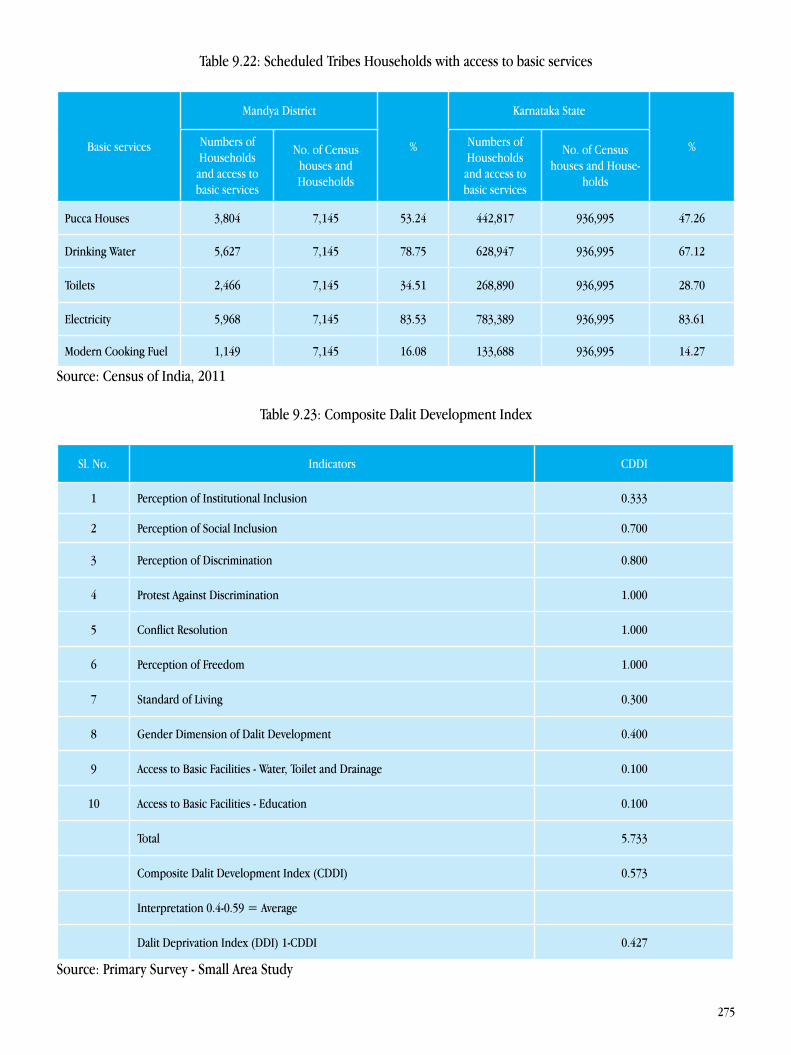
275
Table 9.22: Scheduled Tribes Households with access to basic services
Basic services
Mandya District
%
Karnataka State
%Numbers of Households and access to basic services
No. of Census houses and Households
Numbers of Households and access to basic services
No. of Census houses and House-
holds
Pucca Houses 3,804 7,145 53.24 442,817 936,995 47.26
Drinking Water 5,627 7,145 78.75 628,947 936,995 67.12
Toilets 2,466 7,145 34.51 268,890 936,995 28.70
Electricity 5,968 7,145 83.53 783,389 936,995 83.61
Modern Cooking Fuel 1,149 7,145 16.08 133,688 936,995 14.27
Source: Census of India, 2011
Table 9.23: Composite Dalit Development Index
Sl. No. Indicators CDDI
1 Perception of Institutional Inclusion 0.333
2 Perception of Social Inclusion 0.700
3 Perception of Discrimination 0.800
4 Protest Against Discrimination 1.000
5 Conflict Resolution 1.000
6 Perception of Freedom 1.000
7 Standard of Living 0.300
8 Gender Dimension of Dalit Development 0.400
9 Access to Basic Facilities - Water, Toilet and Drainage 0.100
10 Access to Basic Facilities - Education 0.100
Total 5.733
Composite Dalit Development Index (CDDI) 0.573
Interpretation 0.4-0.59 = Average
Dalit Deprivation Index (DDI) 1-CDDI 0.427
Source: Primary Survey - Small Area Study
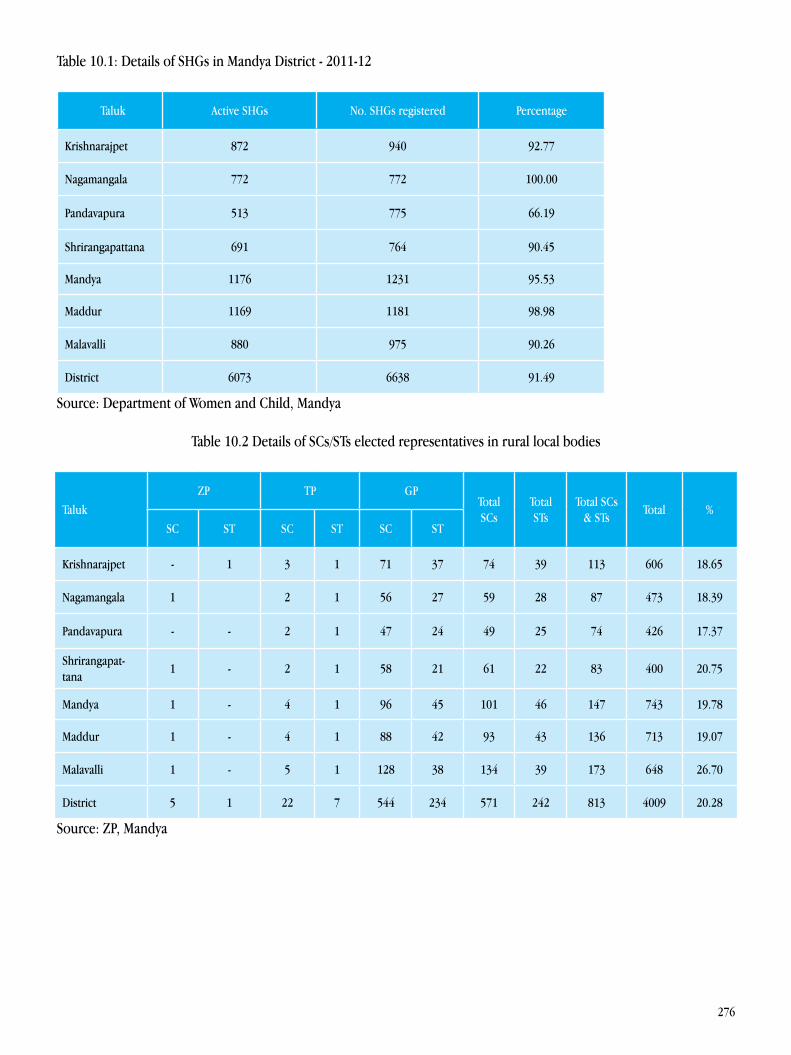
276
Table 10.1: Details of SHGs in Mandya District - 2011-12
Taluk Active SHGs No. SHGs registered Percentage
Krishnarajpet 872 940 92.77
Nagamangala 772 772 100.00
Pandavapura 513 775 66.19
Shrirangapattana 691 764 90.45
Mandya 1176 1231 95.53
Maddur 1169 1181 98.98
Malavalli 880 975 90.26
District 6073 6638 91.49
Source: Department of Women and Child, Mandya
Table 10.2 Details of SCs/STs elected representatives in rural local bodies
Taluk ZP TP GP
Total SCs
Total STs
Total SCs & STs
Total %SC ST SC ST SC ST
Krishnarajpet - 1 3 1 71 37 74 39 113 606 18.65
Nagamangala 1 2 1 56 27 59 28 87 473 18.39
Pandavapura - - 2 1 47 24 49 25 74 426 17.37
Shrirangapat-tana
1 - 2 1 58 21 61 22 83 400 20.75
Mandya 1 - 4 1 96 45 101 46 147 743 19.78
Maddur 1 - 4 1 88 42 93 43 136 713 19.07
Malavalli 1 - 5 1 128 38 134 39 173 648 26.70
District 5 1 22 7 544 234 571 242 813 4009 20.28
Source: ZP, Mandya
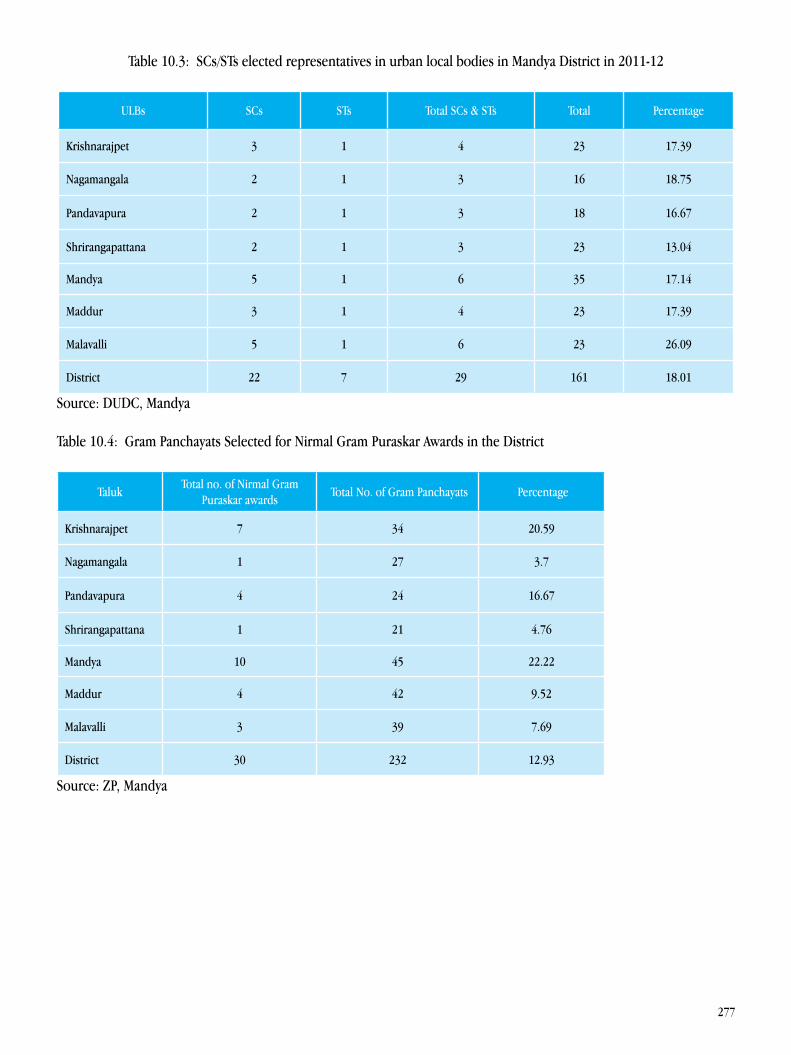
277
Table 10.3: SCs/STs elected representatives in urban local bodies in Mandya District in 2011-12
ULBs SCs STs Total SCs & STs Total Percentage
Krishnarajpet 3 1 4 23 17.39
Nagamangala 2 1 3 16 18.75
Pandavapura 2 1 3 18 16.67
Shrirangapattana 2 1 3 23 13.04
Mandya 5 1 6 35 17.14
Maddur 3 1 4 23 17.39
Malavalli 5 1 6 23 26.09
District 22 7 29 161 18.01
Source: DUDC, Mandya
Table 10.4: Gram Panchayats Selected for Nirmal Gram Puraskar Awards in the District
TalukTotal no. of Nirmal Gram
Puraskar awards Total No. of Gram Panchayats Percentage
Krishnarajpet 7 34 20.59
Nagamangala 1 27 3.7
Pandavapura 4 24 16.67
Shrirangapattana 1 21 4.76
Mandya 10 45 22.22
Maddur 4 42 9.52
Malavalli 3 39 7.69
District 30 232 12.93
Source: ZP, Mandya
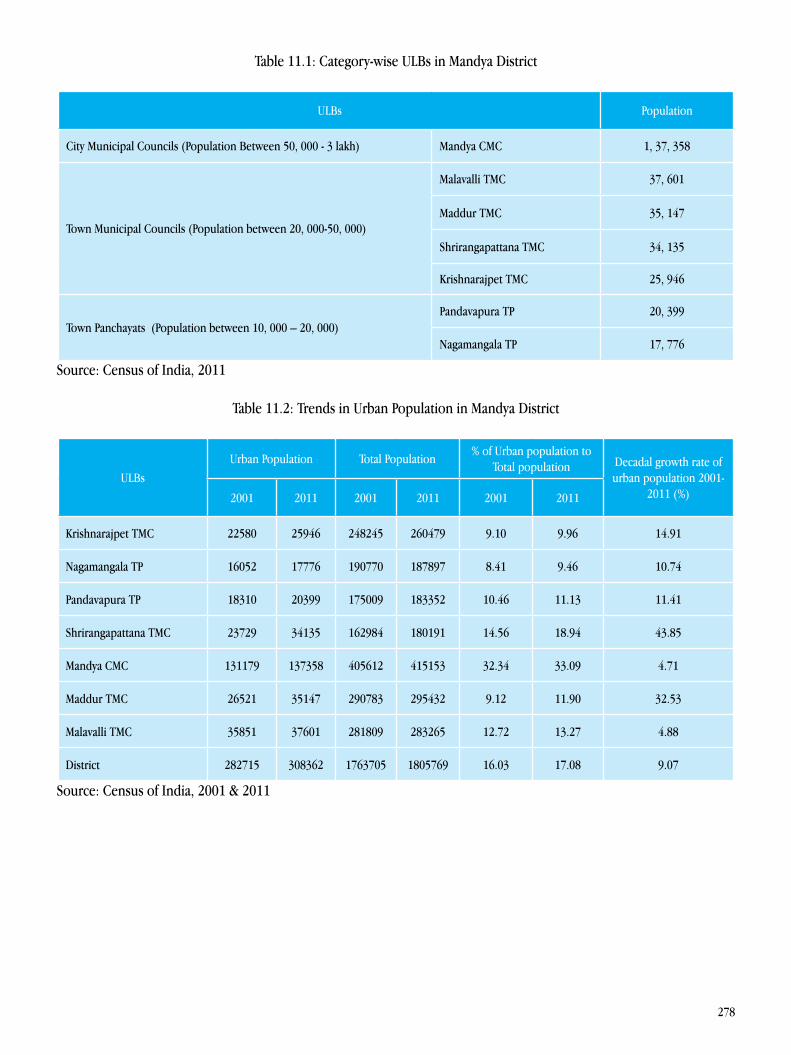
278
Table 11.1: Category-wise ULBs in Mandya District
ULBs Population
City Municipal Councils (Population Between 50, 000 - 3 lakh) Mandya CMC 1, 37, 358
Town Municipal Councils (Population between 20, 000-50, 000)
Malavalli TMC 37, 601
Maddur TMC 35, 147
Shrirangapattana TMC 34, 135
Krishnarajpet TMC 25, 946
Town Panchayats (Population between 10, 000 – 20, 000)Pandavapura TP 20, 399
Nagamangala TP 17, 776
Source: Census of India, 2011
Table 11.2: Trends in Urban Population in Mandya District
ULBs Urban Population Total Population
% of Urban population to Total population Decadal growth rate of
urban population 2001-2011 (%)2001 2011 2001 2011 2001 2011
Krishnarajpet TMC 22580 25946 248245 260479 9.10 9.96 14.91
Nagamangala TP 16052 17776 190770 187897 8.41 9.46 10.74
Pandavapura TP 18310 20399 175009 183352 10.46 11.13 11.41
Shrirangapattana TMC 23729 34135 162984 180191 14.56 18.94 43.85
Mandya CMC 131179 137358 405612 415153 32.34 33.09 4.71
Maddur TMC 26521 35147 290783 295432 9.12 11.90 32.53
Malavalli TMC 35851 37601 281809 283265 12.72 13.27 4.88
District 282715 308362 1763705 1805769 16.03 17.08 9.07
Source: Census of India, 2001 & 2011
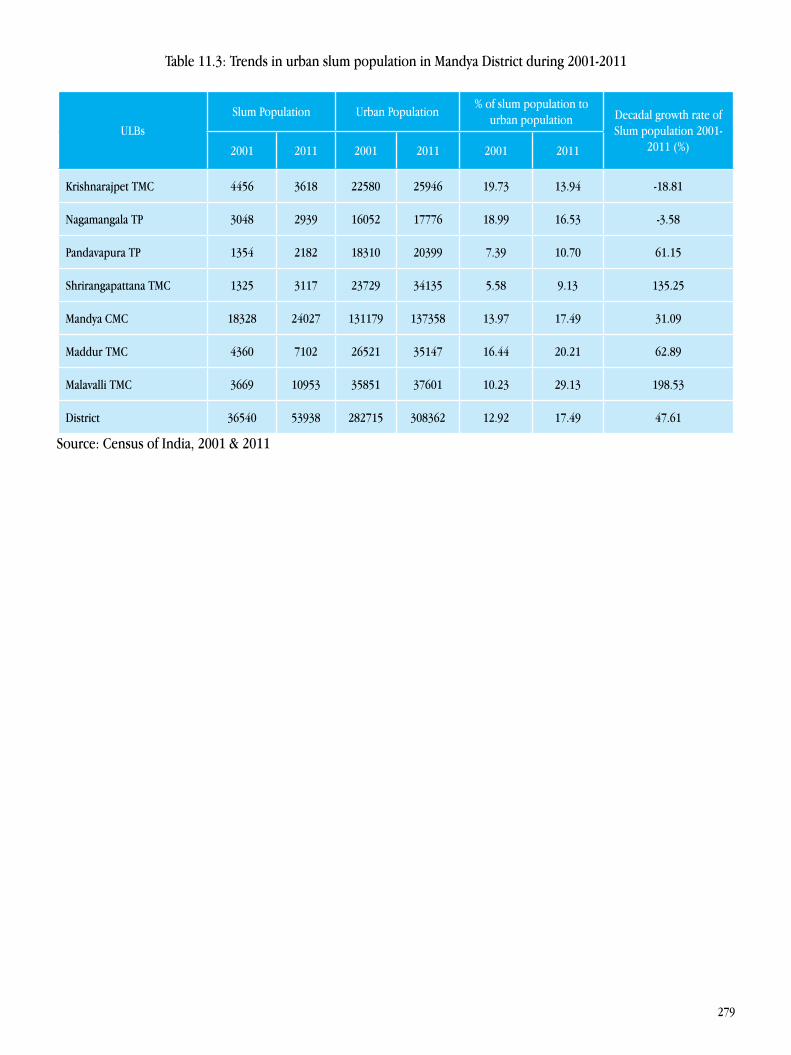
279
Table 11.3: Trends in urban slum population in Mandya District during 2001-2011
ULBsSlum Population Urban Population
% of slum population to urban population Decadal growth rate of
Slum population 2001-2011 (%)2001 2011 2001 2011 2001 2011
Krishnarajpet TMC 4456 3618 22580 25946 19.73 13.94 -18.81
Nagamangala TP 3048 2939 16052 17776 18.99 16.53 -3.58
Pandavapura TP 1354 2182 18310 20399 7.39 10.70 61.15
Shrirangapattana TMC 1325 3117 23729 34135 5.58 9.13 135.25
Mandya CMC 18328 24027 131179 137358 13.97 17.49 31.09
Maddur TMC 4360 7102 26521 35147 16.44 20.21 62.89
Malavalli TMC 3669 10953 35851 37601 10.23 29.13 198.53
District 36540 53938 282715 308362 12.92 17.49 47.61
Source: Census of India, 2001 & 2011
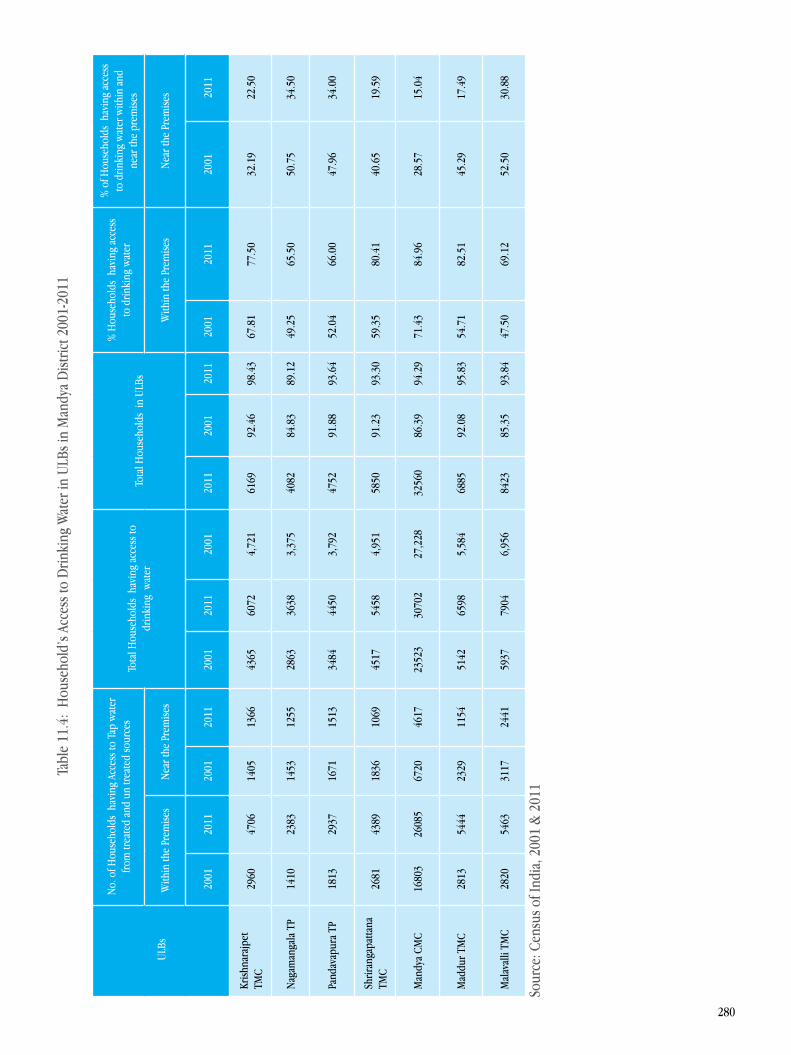
280
Tabl
e 11
.4:
Hou
seho
ld’s
Acce
ss to
Drin
king
Wat
er in
ULB
s in
Man
dya
Dist
rict 2
001-
2011
ULB
s
No.
of H
ouse
hold
s ha
ving
Acc
ess t
o Ta
p w
ater
fro
m tr
eate
d an
d un
trea
ted
sour
ces
Tota
l Hou
seho
lds
havi
ng a
cces
s to
drin
king
wat
erTo
tal H
ouse
hold
s in
ULB
s
% H
ouse
hold
s ha
ving
acc
ess
to d
rinki
ng w
ater
% o
f Hou
seho
lds
havi
ng a
cces
s to
drin
king
wat
er w
ithin
and
ne
ar th
e pr
emise
s
With
in th
e Pr
emise
s N
ear t
he P
rem
ises
With
in th
e Pr
emise
s N
ear t
he P
rem
ises
2001
2011
2001
2011
2001
2011
2001
2011
2001
2011
2001
2011
2001
2011
Krish
nara
jpet
TM
C29
6047
0614
0513
6643
6560
724,
721
6169
92.4
698
.43
67.8
177
.50
32.1
922
.50
Nag
aman
gala
TP
1410
2383
1453
1255
2863
3638
3,37
540
8284
.83
89.1
249
.25
65.5
050
.75
34.5
0
Pand
avap
ura
TP18
1329
3716
7115
1334
8444
503,
792
4752
91.8
893
.64
52.0
466
.00
47.9
634
.00
Shrir
anga
patta
na
TMC
2681
4389
1836
1069
4517
5458
4,95
158
5091
.23
93.3
059
.35
80.4
140
.65
19.5
9
Man
dya
CMC
1680
326
085
6720
4617
2352
330
702
27,2
2832
560
86.3
994
.29
71.4
384
.96
28.5
715
.04
Mad
dur T
MC
2813
5444
2329
1154
5142
6598
5,58
468
8592
.08
95.8
354
.71
82.5
145
.29
17.4
9
Mal
aval
li TM
C28
2054
6331
1724
4159
3779
046,
956
8423
85.3
593
.84
47.5
069
.12
52.5
030
.88
Sour
ce: C
ensu
s of I
ndia
, 200
1 &
201
1
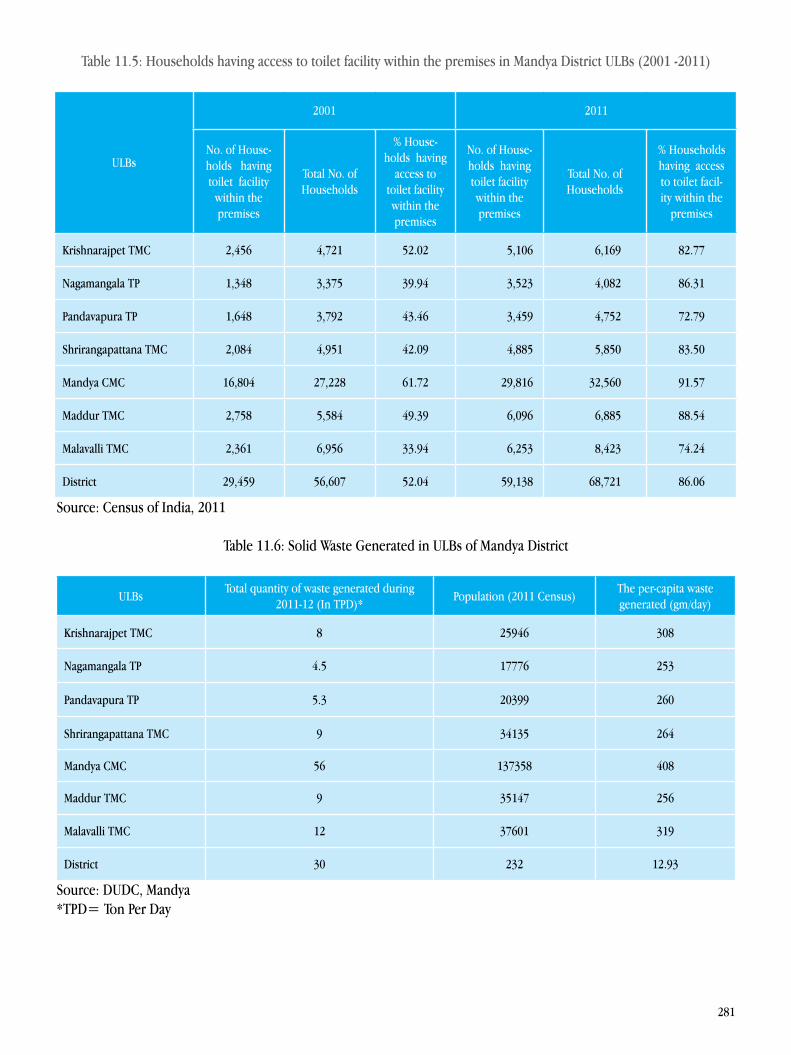
281
Table 11.5: Households having access to toilet facility within the premises in Mandya District ULBs (2001 -2011)
ULBs
2001 2011
No. of House-holds having toilet facility
within the premises
Total No. of Households
% House-holds having
access to toilet facility within the premises
No. of House-holds having toilet facility within the premises
Total No. of Households
% Households having access to toilet facil-ity within the
premises
Krishnarajpet TMC 2,456 4,721 52.02 5,106 6,169 82.77
Nagamangala TP 1,348 3,375 39.94 3,523 4,082 86.31
Pandavapura TP 1,648 3,792 43.46 3,459 4,752 72.79
Shrirangapattana TMC 2,084 4,951 42.09 4,885 5,850 83.50
Mandya CMC 16,804 27,228 61.72 29,816 32,560 91.57
Maddur TMC 2,758 5,584 49.39 6,096 6,885 88.54
Malavalli TMC 2,361 6,956 33.94 6,253 8,423 74.24
District 29,459 56,607 52.04 59,138 68,721 86.06
Source: Census of India, 2011
Table 11.6: Solid Waste Generated in ULBs of Mandya District
ULBs Total quantity of waste generated during
2011-12 (In TPD)*Population (2011 Census)
The per-capita waste generated (gm/day)
Krishnarajpet TMC 8 25946 308
Nagamangala TP 4.5 17776 253
Pandavapura TP 5.3 20399 260
Shrirangapattana TMC 9 34135 264
Mandya CMC 56 137358 408
Maddur TMC 9 35147 256
Malavalli TMC 12 37601 319
District 30 232 12.93
Source: DUDC, Mandya *TPD= Ton Per Day
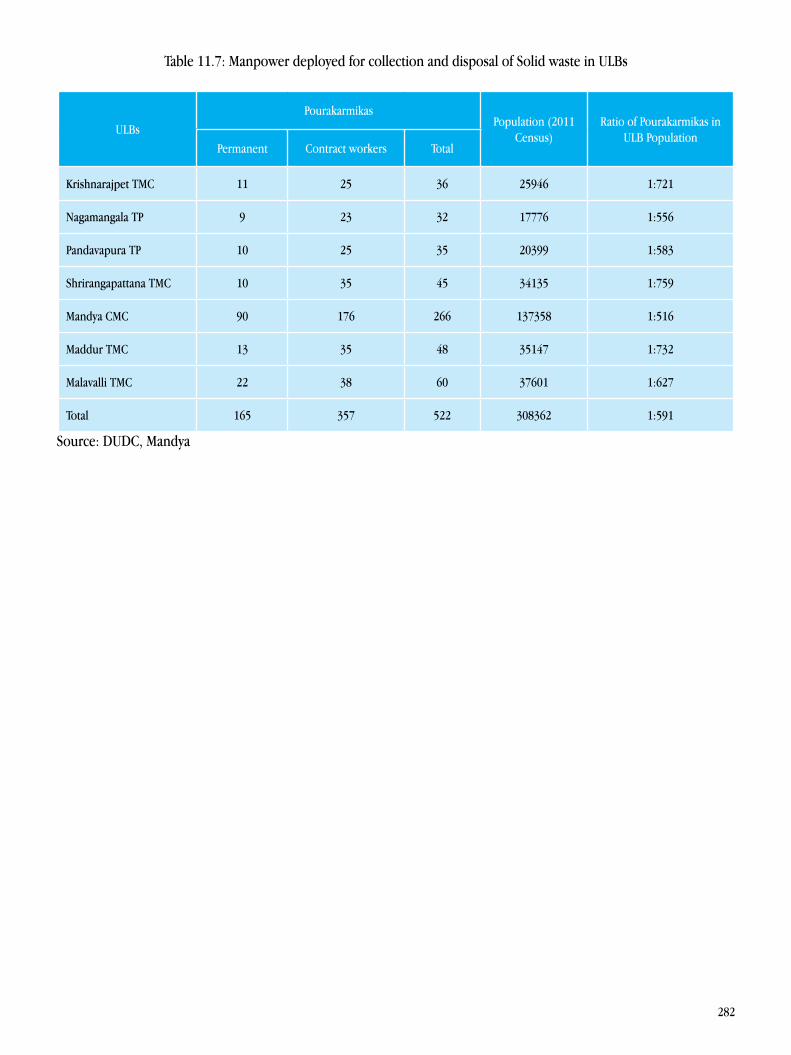
282
Table 11.7: Manpower deployed for collection and disposal of Solid waste in ULBs
ULBsPourakarmikas
Population (2011 Census)
Ratio of Pourakarmikas in ULB Population
Permanent Contract workers Total
Krishnarajpet TMC 11 25 36 25946 1:721
Nagamangala TP 9 23 32 17776 1:556
Pandavapura TP 10 25 35 20399 1:583
Shrirangapattana TMC 10 35 45 34135 1:759
Mandya CMC 90 176 266 137358 1:516
Maddur TMC 13 35 48 35147 1:732
Malavalli TMC 22 38 60 37601 1:627
Total 165 357 522 308362 1:591
Source: DUDC, Mandya
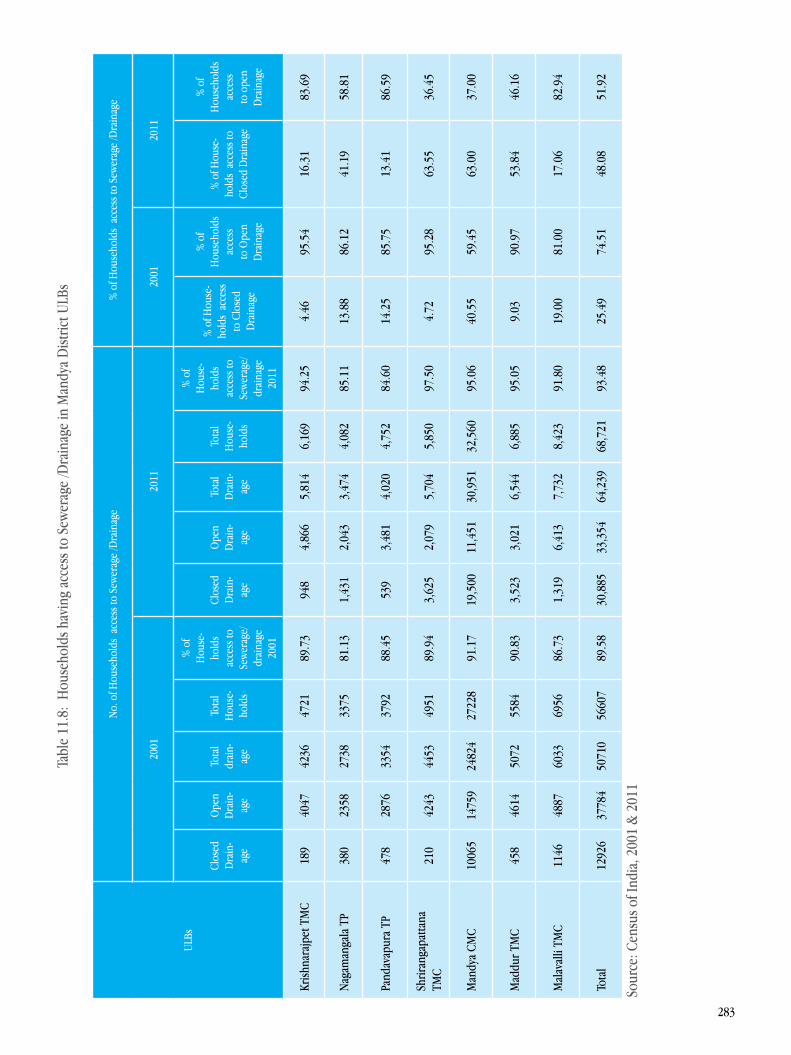
283
Tabl
e 11
.8:
Hou
seho
lds h
avin
g ac
cess
to S
ewer
age
/Dra
inag
e in
Man
dya
Dist
rict U
LBs
ULBs
No.
of H
ouse
hold
s ac
cess
to S
ewer
age
/Dra
inag
e%
of H
ouse
hold
s ac
cess
to S
ewer
age
/Dra
inag
e
2001
2011
2001
2011
Clos
ed
Dra
in-
age
Ope
n D
rain
-ag
e
Tota
l dr
ain-
age
Tota
l H
ouse
-ho
lds
% o
f H
ouse
-ho
lds
acce
ss to
Se
wer
age/
drai
nage
20
01
Clos
ed
Dra
in-
age
Ope
n D
rain
-ag
e
Tota
l D
rain
-ag
e
Tota
l H
ouse
-ho
lds
% o
f H
ouse
-ho
lds
acce
ss to
Se
wer
age/
drai
nage
20
11
% o
f Hou
se-
hold
s ac
cess
to
Clo
sed
Dra
inag
e
% o
f H
ouse
hold
s ac
cess
to
Ope
n D
rain
age
% o
f Hou
se-
hold
s ac
cess
to
Clos
ed D
rain
age
% o
f H
ouse
hold
s ac
cess
to
ope
n D
rain
age
Krish
nara
jpet
TM
C18
940
4742
3647
2189
.73
948
4,86
65,
814
6,16
994
.25
4.46
95.5
416
.31
83.6
9
Nag
aman
gala
TP
380
2358
2738
3375
81.1
31,
431
2,04
33,
474
4,08
285
.11
13.8
886
.12
41.1
958
.81
Pand
avap
ura
TP47
828
7633
5437
9288
.45
539
3,48
14,
020
4,75
284
.60
14.2
585
.75
13.4
186
.59
Shrir
anga
patta
na
TMC
210
4243
4453
4951
89.9
43,
625
2,07
95,
704
5,85
097
.50
4.72
95.2
863
.55
36.4
5
Man
dya
CMC
1006
514
759
2482
427
228
91.1
719
,500
11,4
5130
,951
32,5
6095
.06
40.5
559
.45
63.0
037
.00
Mad
dur T
MC
458
4614
5072
5584
90.8
33,
523
3,02
16,
544
6,88
595
.05
9.03
90.9
753
.84
46.1
6
Mal
aval
li TM
C11
4648
8760
3369
5686
.73
1,31
96,
413
7,73
28,
423
91.8
019
.00
81.0
017
.06
82.9
4
Tota
l 12
926
3778
450
710
5660
789
.58
30,8
8533
,354
64,2
3968
,721
93.4
825
.49
74.5
148
.08
51.9
2
Sour
ce: C
ensu
s of I
ndia
, 200
1 &
201
1
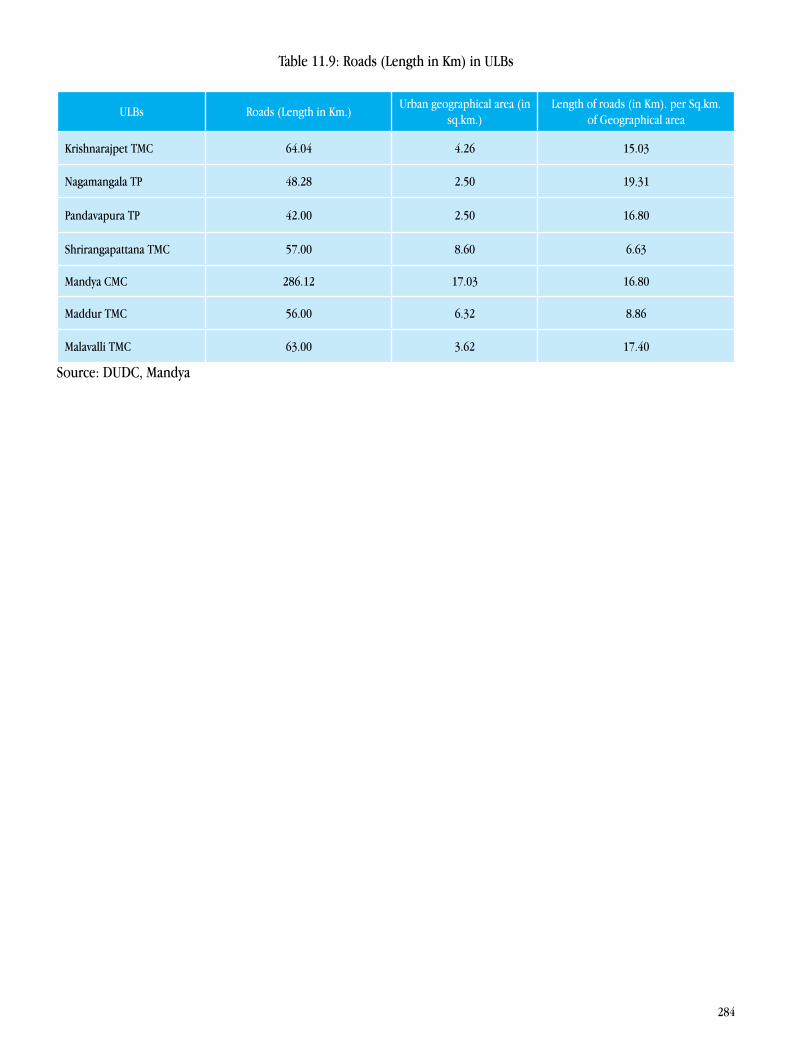
284
Table 11.9: Roads (Length in Km) in ULBs
ULBs Roads (Length in Km.)Urban geographical area (in
sq.km.) Length of roads (in Km). per Sq.km.
of Geographical area
Krishnarajpet TMC 64.04 4.26 15.03
Nagamangala TP 48.28 2.50 19.31
Pandavapura TP 42.00 2.50 16.80
Shrirangapattana TMC 57.00 8.60 6.63
Mandya CMC 286.12 17.03 16.80
Maddur TMC 56.00 6.32 8.86
Malavalli TMC 63.00 3.62 17.40
Source: DUDC, Mandya
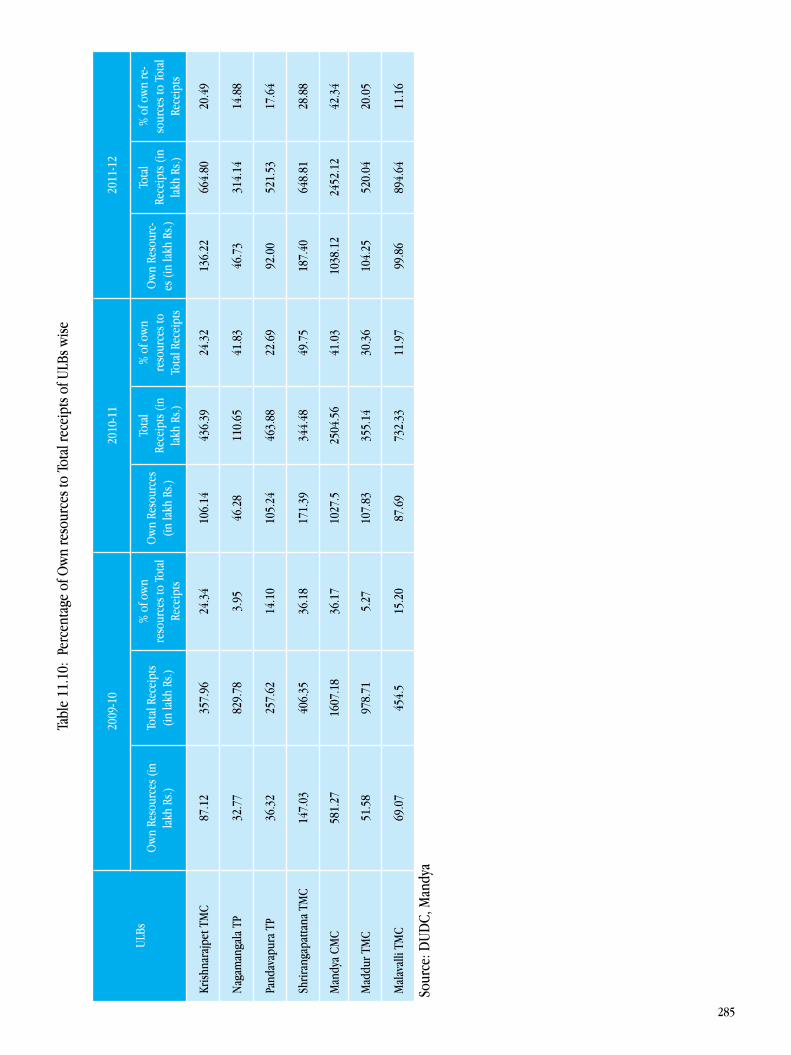
285
Tabl
e 11
.10:
Per
cent
age
of O
wn
reso
urce
s to
Tota
l rec
eipt
s of U
LBs w
ise
ULBs
2009
-10
2010
-11
2011
-12
Ow
n Re
sour
ces (
in
lakh
Rs.)
To
tal R
ecei
pts
(in la
kh R
s.)
% o
f ow
n re
sour
ces t
o To
tal
Rece
ipts
Ow
n Re
sour
ces
(in la
kh R
s.)
Tota
l Re
ceip
ts (i
n la
kh R
s.)
% o
f ow
n re
sour
ces t
o To
tal R
ecei
pts
Ow
n Re
sour
c-es
(in
lakh
Rs.)
Tota
l Re
ceip
ts (i
n la
kh R
s.)
% o
f ow
n re
-so
urce
s to
Tota
l Re
ceip
ts
Krish
nara
jpet
TM
C87
.12
357.
9624
.34
106.
1443
6.39
24.3
213
6.22
664.
8020
.49
Nag
aman
gala
TP
32.7
782
9.78
3.95
46.2
811
0.65
41.8
346
.73
314.
1414
.88
Pand
avap
ura
TP36
.32
257.
6214
.10
105.
2446
3.88
22.6
992
.00
521.
5317
.64
Shrir
anga
patta
na T
MC
147.
0340
6.35
36.1
817
1.39
344.
4849
.75
187.
4064
8.81
28.8
8
Man
dya
CMC
581.
2716
07.1
836
.17
1027
.525
04.5
641
.03
1038
.12
2452
.12
42.3
4
Mad
dur T
MC
51.5
897
8.71
5.27
107.
8335
5.14
30.3
610
4.25
520.
0420
.05
Mal
aval
li TM
C69
.07
454.
515
.20
87.6
973
2.33
11.9
799
.86
894.
6411
.16
Sour
ce: D
UDC,
Man
dya
286
Tabl
e 11
.11:
Per
- cap
ita e
xpen
ditu
re o
n D
evel
opm
ent W
orks
in U
LBs
ULB
s
2009
-10
2010
-11
2011
-12
Expe
nditu
re o
n D
evel
opm
ent w
orks
(in
mill
ion
Rs.)
Urba
n Po
pu-
latio
n (N
o’s.)
Per c
apita
ex
pend
iture
(R
s.)
Expe
nditu
re o
n D
evel
opm
ent w
orks
(in
mill
ion
Rs.)
Urba
n Po
pula
tion
(No’
s)
Per c
apita
ex
pend
iture
(R
s.)
Expe
nditu
re o
n D
e-ve
lopm
ent w
orks
(in
mill
ion
Rs.)
Urba
n Po
pula
tion
(No’
s)
Per c
apita
exp
en-
ditu
re (R
s.)
Krish
nara
jpet
TM
C35
.796
2258
015
8543
.639
2258
019
3366
.480
2594
625
62
Nag
aman
gala
TP
82.9
7816
052
5169
11.0
6516
052
689
31.4
1417
776
1767
Pand
avap
ura
TP25
.762
1823
614
1346
.388
1823
625
4452
.153
2039
925
57
Shrir
anga
patta
na T
MC
40.6
3523
729
1712
34.4
4823
729
1452
64.8
8134
135
1901
Man
dya
CMC
160.
718
1311
7912
2525
0.45
613
1179
1909
245.
212
1373
5817
85
Mad
dur T
MC
97.8
7126
521
3690
35.5
1426
521
1339
52.0
4035
147
148
Mal
aval
li TM
C45
.450
3585
112
6873
.233
3585
120
4389
.464
3760
123
79
Sour
ce: D
UDC,
Man
dya
287
Table 11.12: Households without own house in ULBs in 2011-12
ULBs Households without own house Total Households in ULBs Percentage
Krishnarajpet TMC 1297 6,169 21.02
Nagamangala TP 911 4,082 22.32
Pandavapura TP 1936 4,752 40.74
Shrirangapattana TMC 986 5,850 16.85
Mandya CMC 1467 32,560 4.51
Maddur TMC 2384 6,885 34.63
Malavalli TMC 1350 8,423 16.03
Source: DUDC, Mandya
Table 11.13: Crime Rate per 10000 Populations in Urban local bodies
ULBs Total No. of Crimes Urban Population (No’s) Crime rate per 10000
population (No’s)
Krishnarajpet TMC 109 25946 4.20
Nagamangala TP 93 17776 5.23
Pandavapura TP 94 20399 4.61
Shrirangapattana TMC 134 34135 3.93
Mandya CMC 703 137358 5.12
Maddur TMC 239 35147 6.80
Malavalli TMC 174 37601 4.63
Source: SP Office, Mandya
288
Table 11.14: Road accidents per 10, 000 Populations in ULBs
ULBs Total Road Accident Urban Population Road accidents per 10, 000
population
Krishnarajpet TMC 20 25946 7.71
Nagamangala TP 37 17776 20.81
Pandavapura TP 98 20399 48.04
Shrirangapattana TMC 16 34135 4.69
Mandya CMC 131 137358 9.54
Maddur TMC 101 35147 28.74
Malavalli TMC 38 37601 10.11
Source: SP Office, Mandya
Table 11.15: Number of Hospital Beds per 1000 population in ULBs in 2011
ULBs No. of Hospital Beds Urban Population Beds per 1000 in Urban area
Krishnarajpet TMC 100 25946 3.85
Nagamangala TP 100 17776 5.63
Pandavapura TP 100 20399 4.90
Shrirangapattana TMC 100 34135 2.93
Mandya CMC 1125 137358 8.19
Maddur TMC 100 35147 2.85
Malavalli TMC 100 37601 2.66
Source: DHO, Mandya
289
Table 11.16: Urban Development Index (UDI) for Mandya District ULBs
ULBs ValuesRank of ULBs within the
district
Krishnarajpet TMC 0.648 2
Nagamangala TP 0.467 5
Pandavapura TP 0.442 6
Shrirangapattana TMC 0.629 3
Mandya CMC 0.756 1
Maddur TMC 0.383 7
Malavalli TMC 0.497 4
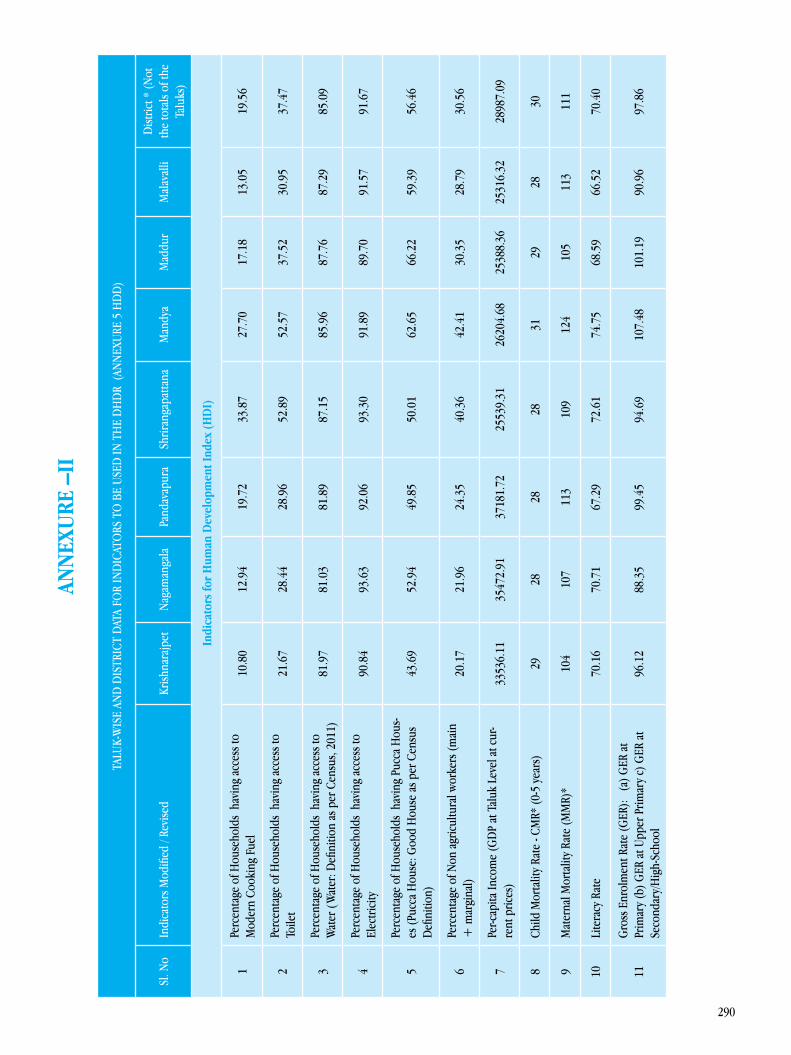
290
ANN
EXU
RE –
II
TALU
K-W
ISE
AND
DIS
TRIC
T DA
TA F
OR
IND
ICAT
ORS
TO
BE
USED
IN T
HE
DH
DR
(AN
NEX
URE
5 H
DD
)
Sl. N
oIn
dica
tors
Mod
ified
/ Re
vise
dKr
ishna
rajp
etN
agam
anga
laPa
ndav
apur
aSh
riran
gapa
ttana
Man
dya
Mad
dur
Mal
aval
liD
istric
t * (N
ot
the
tota
ls of
the
Talu
ks)
Ind
icat
ors
for
Hum
an D
evel
opm
ent I
ndex
(HD
I)
1Pe
rcen
tage
of H
ouse
hold
s ha
ving
acc
ess t
o M
oder
n Co
okin
g Fu
el10
.80
12.9
419
.72
33.8
727
.70
17.1
813
.05
19.5
6
2Pe
rcen
tage
of H
ouse
hold
s ha
ving
acc
ess t
o To
ilet
21.6
728
.44
28.9
652
.89
52.5
737
.52
30.9
537
.47
3Pe
rcen
tage
of H
ouse
hold
s ha
ving
acc
ess t
o W
ater
(W
ater
: Defi
nitio
n as
per
Cen
sus,
2011
)81
.97
81.0
381
.89
87.1
585
.96
87.7
687
.29
85.0
9
4Pe
rcen
tage
of H
ouse
hold
s ha
ving
acc
ess t
o El
ectri
city
90.8
493
.63
92.0
693
.30
91.8
989
.70
91.5
791
.67
5Pe
rcen
tage
of H
ouse
hold
s ha
ving
Puc
ca H
ous-
es (P
ucca
Hou
se: G
ood
Hou
se a
s per
Cen
sus
Defi
nitio
n)43
.69
52.9
449
.85
50.0
162
.65
66.2
259
.39
56.4
6
6Pe
rcen
tage
of N
on a
gric
ultu
ral w
orke
rs (m
ain
+ m
argi
nal)
20.1
721
.96
24.3
540
.36
42.4
130
.35
28.7
930
.56
7Pe
r-cap
ita In
com
e (G
DP
at T
aluk
Lev
el a
t cur
-re
nt p
rices
)33
536.
1135
472.
9137
181.
7225
539.
3126
204.
6825
388.
3625
316.
3228
987.
09
8Ch
ild M
orta
lity
Rate
- CM
R* (0
-5 y
ears
)29
2828
2831
2928
30
9M
ater
nal M
orta
lity
Rate
(MM
R)*
104
107
113
109
124
105
113
111
10Li
tera
cy R
ate
70.1
670
.71
67.2
972
.61
74.7
568
.59
66.5
270
.40
11G
ross
Enr
olm
ent R
ate
(GER
): (
a) G
ER a
t Pr
imar
y (b
) GER
at U
pper
Prim
ary
c) G
ER a
t Se
cond
ary/
Hig
h-Sc
hool
96.1
288
.35
99.4
594
.69
107.
4810
1.19
90.9
697
.86
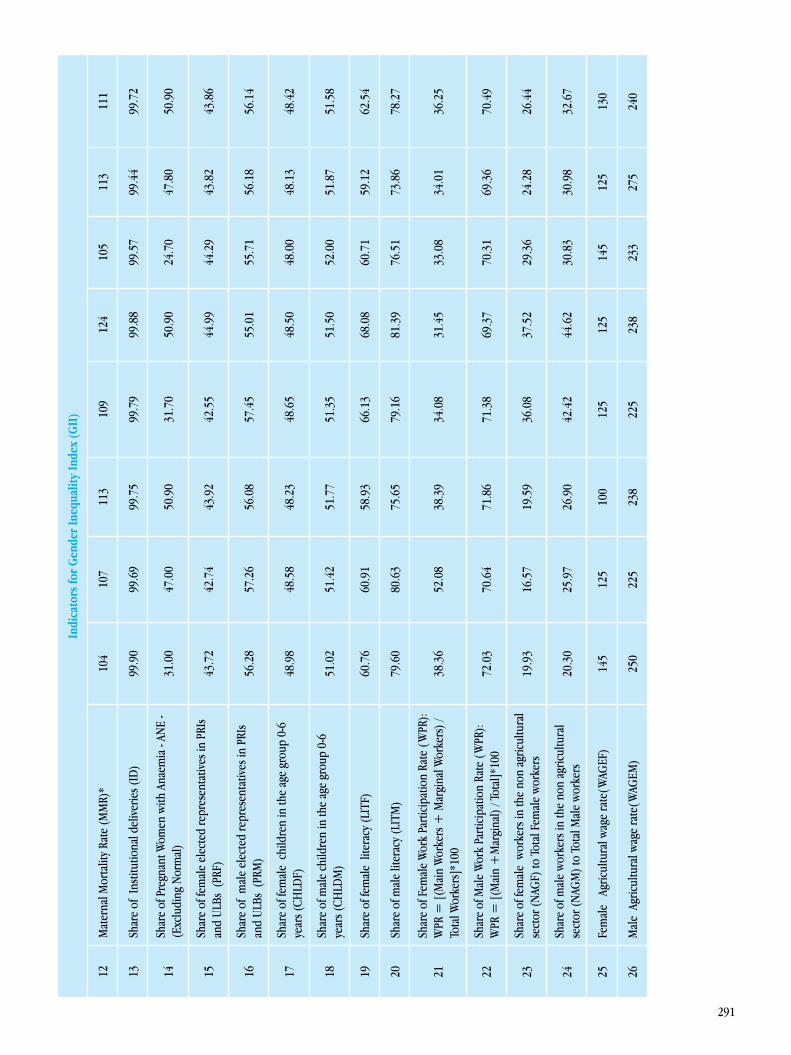
291
Indi
cato
rs fo
r G
ende
r In
equa
lity
Inde
x (G
II)
12M
ater
nal M
orta
lity
Rate
(MM
R)*
104
107
113
109
124
105
113
111
13Sh
are
of I
nstit
utio
nal d
eliv
erie
s (ID
)99
.90
99.6
999
.75
99.7
999
.88
99.5
799
.44
99.7
2
14Sh
are
of P
regn
ant W
omen
with
Ana
emia
- AN
E -
(Exc
ludi
ng N
orm
al)
31.0
047
.00
50.9
031
.70
50.9
024
.70
47.8
050
.90
15Sh
are
of fe
mal
e el
ecte
d re
pres
enta
tives
in P
RIs
and
ULBs
(PR
F)
43.7
242
.74
43.9
242
.55
44.9
944
.29
43.8
243
.86
16Sh
are
of m
ale
elec
ted
repr
esen
tativ
es in
PRI
s an
d UL
Bs (
PRM
) 56
.28
57.2
656
.08
57.4
555
.01
55.7
156
.18
56.1
4
17Sh
are
of fe
mal
e c
hild
ren
in th
e ag
e gr
oup
0-6
year
s (CH
LDF)
48
.98
48.5
848
.23
48.6
548
.50
48.0
048
.13
48.4
2
18Sh
are
of m
ale
child
ren
in th
e ag
e gr
oup
0-6
year
s (CH
LDM
) 51
.02
51.4
251
.77
51.3
551
.50
52.0
051
.87
51.5
8
19Sh
are
of fe
mal
e li
tera
cy (L
ITF)
60
.76
60.9
158
.93
66.1
368
.08
60.7
159
.12
62.5
4
20Sh
are
of m
ale
liter
acy
(LIT
M)
79.6
080
.63
75.6
579
.16
81.3
976
.51
73.8
678
.27
21Sh
are
of F
emal
e W
ork
Parti
cipa
tion
Rate
(W
PR):
WPR
= [(
Mai
n W
orke
rs +
Mar
gina
l Wor
kers
) /
Tota
l Wor
kers
]*10
038
.36
52.0
838
.39
34.0
831
.45
33.0
834
.01
36.2
5
22Sh
are
of M
ale
Wor
k Pa
rtici
patio
n Ra
te (
WPR
):
WPR
= [(
Mai
n +
Mar
gina
l) / T
otal
]*10
072
.03
70.6
471
.86
71.3
869
.37
70.3
169
.36
70.4
9
23Sh
are
of fe
mal
e w
orke
rs in
the
non
agric
ultu
ral
sect
or (N
AGF)
to T
otal
Fem
ale
wor
kers
19
.93
16.5
719
.59
36.0
837
.52
29.3
624
.28
26.4
4
24Sh
are
of m
ale
wor
kers
in th
e no
n ag
ricul
tura
l se
ctor
(NAG
M) t
o To
tal M
ale
wor
kers
20
.30
25.9
726
.90
42.4
244
.62
30.8
330
.98
32.6
7
25Fe
mal
e A
gric
ultu
ral w
age
rate
(WAG
EF)
145
125
100
125
125
145
125
130
26M
ale
Agr
icul
tura
l wag
e ra
te(W
AGEM
) 25
022
523
822
523
823
327
524
0

292
Indi
cato
rs fo
r Ch
ild D
evel
opm
ent I
ndex
(CD
I)
27Ch
ild M
orta
lity
Rate
– C
MR
(0-5
yea
rs)
2928
2828
3129
2830
28(a
) Per
cent
age
of M
al-n
ouris
hed
Child
ren
(Exc
ludi
ng N
orm
al)
26
.07
24.4
518
.73
20.9
520
.69
22.1
121
.70
21.9
1
(b
) Per
cent
age
of C
hild
ren
born
und
er-w
eigh
t11
.90
13.8
06.
826.
1313
.04
6.84
9.47
11.5
4
29Pe
rcen
tage
of D
rop-
out C
hild
ren
Mai
n-st
ream
ed:
(a) P
rimar
y (b
) Sec
onda
ry29
.03
50.0
082
.35
8.93
6.85
8.16
20.0
018
.62
Indi
cato
rs fo
r Fo
od S
ecur
ity In
dex
(FSI
)
30Cr
oppi
ng In
tens
ity10
9.22
104.
3310
9.55
144.
4912
4.46
126.
3111
0.67
116.
22
31Pe
rcen
tage
Cha
nge
in N
SA(N
et S
own
Area
) ove
r th
e ye
ars (
2001
– 2
011)
-2.3
614
.84
44.8
4-1
9.03
11.9
5-2
0.81
-2.0
32.
62
32Pe
r cap
ita fo
od g
rain
pro
duct
ion
(in K
gs)
236.
0023
5.00
210.
0017
9.00
130.
0017
1.00
166.
0018
1.00
33Pe
rcen
tage
of f
ores
t cov
er to
tota
l geo
grap
hica
l ar
ea6.
302.
423.
892.
032.
110.
0315
.05
4.97
34Ir
rigat
ion
Inte
nsity
127.
5813
6.75
116.
9513
6.51
134.
9711
0.47
110.
5812
3.44
35Pe
rcen
tage
of a
rea
degr
aded
(cul
tivab
le w
aste
) to
Tot
al G
eogr
aphi
cal A
rea
(TGA
)7.
1125
.20
7.39
1.40
3.24
0.21
2.99
8.42
36Pe
rcen
tage
of l
egum
inou
s (ar
ea u
nder
pul
ses)
cr
ops i
n th
e G
ross
Cro
pped
Are
a (G
CA)
22.0
022
.30
27.5
06.
405.
808.
005.
6013
.60
37 P
erce
ntag
e of
BPL
Car
d ho
lder
s to
Tota
l Car
d ho
lder
s80
.99
82.1
983
.07
79.1
373
.83
77.0
783
.47
79.2
5
38Pe
r cap
ita in
com
e (G
DP
at c
urre
nt p
rices
in th
e Ta
luk)
3353
6.11
3547
2.91
3718
1.72
2553
9.31
2620
4.68
2538
8.36
2531
6.32
2898
7.09
39Pe
rcen
tage
of N
on-a
gric
ultu
ral w
orke
rs to
tota
l w
orke
rs20
.17
21.9
624
.35
40.3
642
.41
30.3
528
.79
30.5
6
40Av
erag
e siz
e of
hol
ding
s (To
tal a
rea
of h
oldi
ngs
/ Tot
al N
o. o
f hol
ding
s)0.
990.
980.
690.
710.
670.
680.
720.
78
41Pe
rcen
tage
of A
gric
ultu
ral l
abou
rers
to to
tal
wor
kers
20.2
912
.92
22.7
228
.95
25.6
026
.17
34.8
424
.81
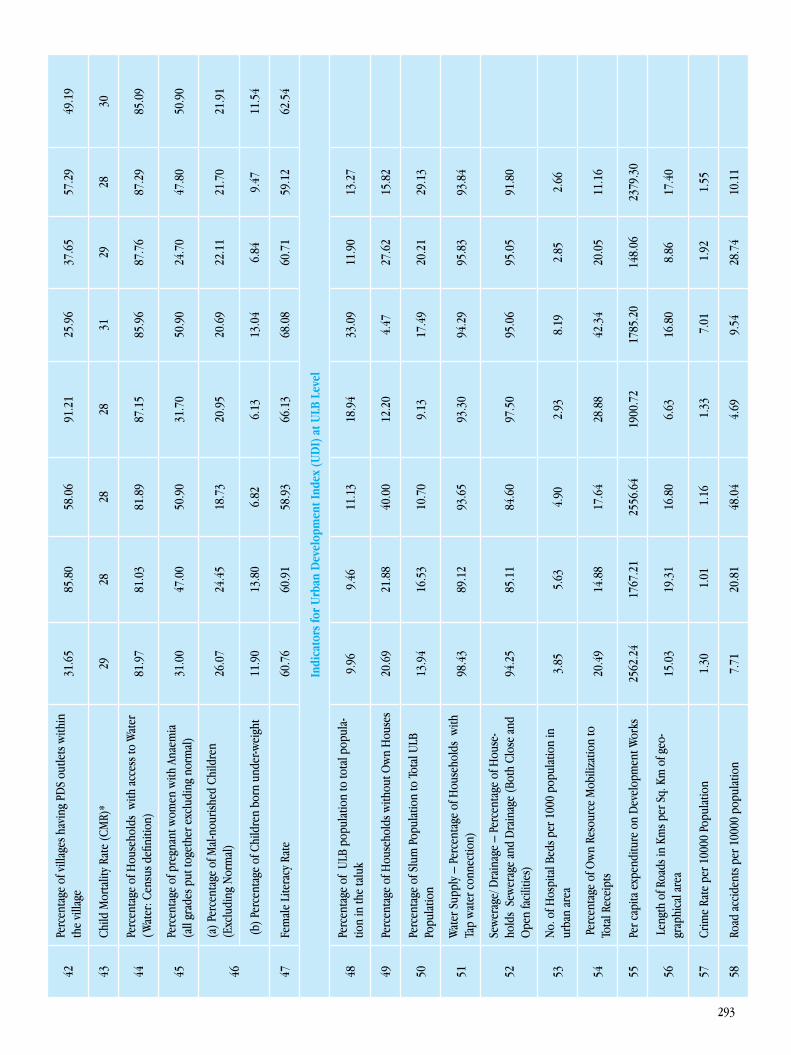
293
42Pe
rcen
tage
of v
illag
es h
avin
g PD
S ou
tlets
with
in
the
villa
ge31
.65
85.8
058
.06
91.2
125
.96
37.6
557
.29
49.1
9
43Ch
ild M
orta
lity
Rate
(CM
R)*
2928
2828
3129
2830
44Pe
rcen
tage
of H
ouse
hold
s w
ith a
cces
s to
Wat
er
(Wat
er: C
ensu
s defi
nitio
n)81
.97
81.0
381
.89
87.1
585
.96
87.7
687
.29
85.0
9
45Pe
rcen
tage
of p
regn
ant w
omen
with
Ana
emia
(a
ll gr
ades
put
toge
ther
exc
ludi
ng n
orm
al)
31.0
047
.00
50.9
031
.70
50.9
024
.70
47.8
050
.90
46
(a) P
erce
ntag
e of
Mal
-nou
rishe
d Ch
ildre
n (E
xclu
ding
Nor
mal
)
26.0
724
.45
18.7
320
.95
20.6
922
.11
21.7
021
.91
(b) P
erce
ntag
e of
Chi
ldre
n bo
rn u
nder
-wei
ght
11.9
013
.80
6.82
6.13
13.0
46.
849.
4711
.54
47Fe
mal
e Li
tera
cy R
ate
60.7
660
.91
58.9
366
.13
68.0
860
.71
59.1
262
.54
Indi
cato
rs fo
r U
rban
Dev
elop
men
t Ind
ex (U
DI)
at U
LB L
evel
48Pe
rcen
tage
of
ULB
popu
latio
n to
tota
l pop
ula-
tion
in th
e ta
luk
9.96
9.46
11.1
318
.94
33.0
911
.90
13.2
7
49Pe
rcen
tage
of H
ouse
hold
s with
out O
wn
Hou
ses
20.6
921
.88
40.0
012
.20
4.47
27.6
215
.82
50Pe
rcen
tage
of S
lum
Pop
ulat
ion
to T
otal
ULB
Po
pula
tion
13.9
416
.53
10.7
09.
1317
.49
20.2
129
.13
51W
ater
Sup
ply
– Pe
rcen
tage
of H
ouse
hold
s w
ith
Tap
wat
er c
onne
ctio
n)98
.43
89.1
293
.65
93.3
094
.29
95.8
393
.84
52Se
wer
age/
Dra
inag
e –
Perc
enta
ge o
f Hou
se-
hold
s Se
wer
age
and
Dra
inag
e (B
oth
Clos
e an
d O
pen
faci
litie
s)94
.25
85.1
184
.60
97.5
095
.06
95.0
591
.80
53N
o. o
f Hos
pita
l Bed
s per
100
0 po
pula
tion
in
urba
n ar
ea3.
855.
634.
902.
938.
192.
852.
66
54 P
erce
ntag
e of
Ow
n Re
sour
ce M
obili
zatio
n to
To
tal R
ecei
pts
20.4
914
.88
17.6
428
.88
42.3
420
.05
11.1
6
55Pe
r cap
ita e
xpen
ditu
re o
n D
evel
opm
ent W
orks
2562
.24
1767
.21
2556
.64
1900
.72
1785
.20
148.
0623
79.3
0
56 L
engt
h of
Roa
ds in
Km
s per
Sq.
Km
of g
eo-
grap
hica
l are
a15
.03
19.3
116
.80
6.63
16.8
08.
8617
.40
57Cr
ime
Rate
per
100
00 P
opul
atio
n1.
30 1
.01
1.1
6 1
.33
7.0
1 1
.92
1.55
58Ro
ad a
ccid
ents
per
100
00 p
opul
atio
n7.
7120
.81
48.0
44.
699.
5428
.74
10.1
1
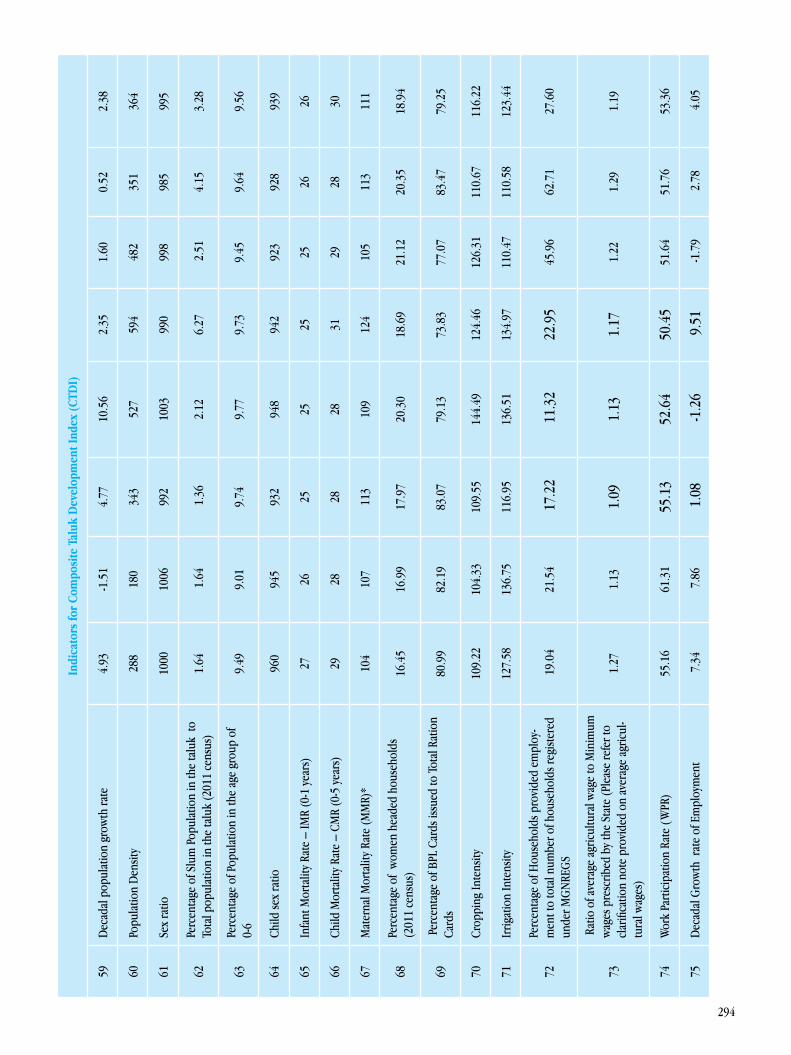
294
Indi
cato
rs fo
r Co
mpo
site
Tal
uk D
evel
opm
ent I
ndex
(CTD
I)
59D
ecad
al p
opul
atio
n gr
owth
rate
4.93
-1.5
14.
7710
.56
2.35
1.60
0.52
2.38
60Po
pula
tion
Den
sity
288
180
343
527
594
482
351
364
61Se
x ra
tio10
0010
0699
210
0399
099
898
599
5
62Pe
rcen
tage
of S
lum
Pop
ulat
ion
in th
e ta
luk
to
Tota
l pop
ulat
ion
in th
e ta
luk
(201
1 ce
nsus
)1.
64 1
.64
1.3
6 2.
126.
27 2
.51
4.15
3.28
63Pe
rcen
tage
of P
opul
atio
n in
the
age
grou
p of
0-
6 9.
499.
019.
749.
779.
739.
459.
649.
56
64Ch
ild se
x ra
tio
960
945
932
948
942
923
928
939
65In
fant
Mor
talit
y Ra
te –
IMR
(0-1
yea
rs)
2726
2525
2525
2626
66Ch
ild M
orta
lity
Rate
– C
MR
(0-5
yea
rs)
2928
2828
3129
2830
67M
ater
nal M
orta
lity
Rate
(MM
R)*
104
107
113
109
124
105
113
111
68Pe
rcen
tage
of
wom
en h
eade
d ho
useh
olds
(2
011
cens
us)
16.4
516
.99
17.9
720
.30
18.6
921
.12
20.3
518
.94
69 P
erce
ntag
e of
BPL
Car
ds is
sued
to T
otal
Rat
ion
Card
s80
.99
82.1
983
.07
79.1
373
.83
77.0
783
.47
79.2
5
70Cr
oppi
ng In
tens
ity10
9.22
104.
3310
9.55
144.
4912
4.46
126.
3111
0.67
116.
22
71Ir
rigat
ion
Inte
nsity
127.
5813
6.75
116.
9513
6.51
134.
9711
0.47
110.
5812
3.44
72Pe
rcen
tage
of H
ouse
hold
s pro
vide
d em
ploy
-m
ent t
o to
tal n
umbe
r of h
ouse
hold
s reg
ister
ed
unde
r MG
NRE
GS
19.
04
21.5
4 1
7.22
11.
3222
.95
45.9
662
.71
27.6
0
73
Rat
io o
f ave
rage
agr
icul
tura
l wag
e to
Min
imum
w
ages
pre
scrib
ed b
y th
e St
ate
(Ple
ase
refe
r to
clar
ifica
tion
note
pro
vide
d on
ave
rage
agr
icul
-tu
ral w
ages
)
1.27
1.13
1.09
1.13
1.17
1.22
1.29
1.19
74W
ork
Parti
cipa
tion
Rate
(W
PR)
55.1
661
.31
55.1
352
.64
50.4
551
.64
51.7
653
.36
75D
ecad
al G
row
th r
ate
of E
mpl
oym
ent
7.3
4 7
.86
1.0
8 -1
.26
9.5
1 -1
.79
2.7
8 4
.05
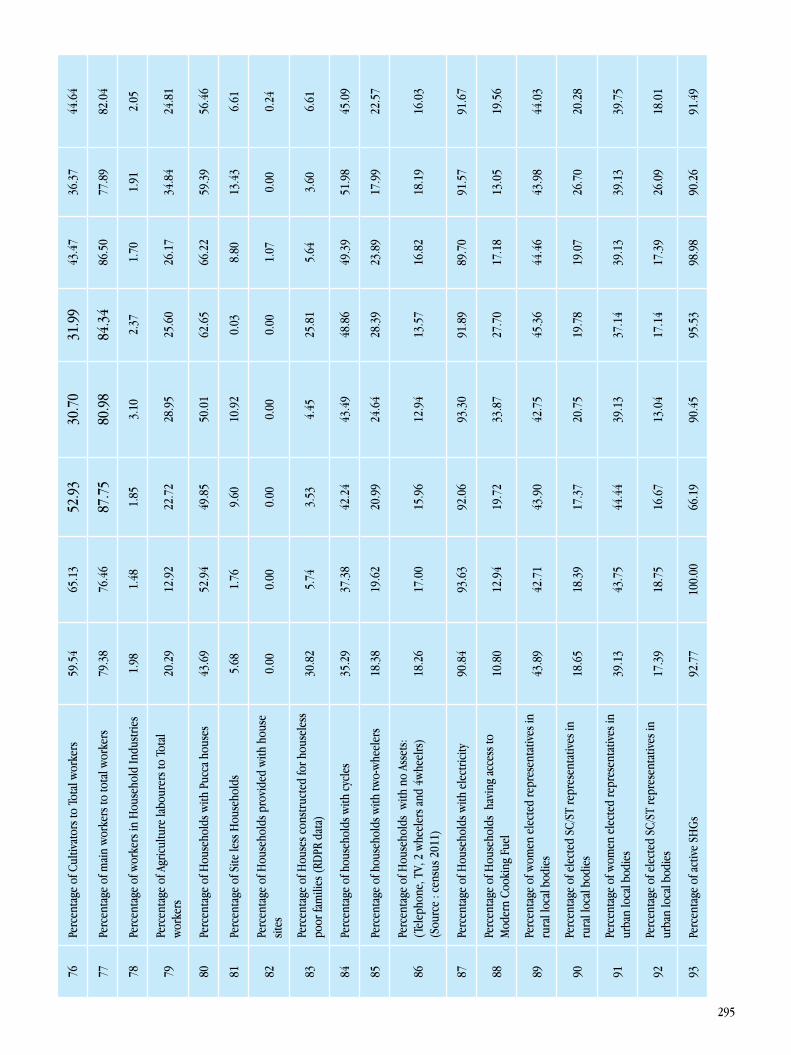
295
76Pe
rcen
tage
of C
ultiv
ator
s to
Tota
l wor
kers
59.5
465
.13
52.9
330
.70
31.9
943
.47
36.3
744
.64
77Pe
rcen
tage
of m
ain
wor
kers
to to
tal w
orke
rs79
.38
76.4
687
.75
80.9
884
.34
86.5
077
.89
82.0
4
78Pe
rcen
tage
of w
orke
rs in
Hou
seho
ld In
dust
ries
1.98
1.48
1.85
3.10
2.37
1.70
1.91
2.05
79Pe
rcen
tage
of A
gric
ultu
re la
bour
ers t
o To
tal
wor
kers
20.2
912
.92
22.7
228
.95
25.6
026
.17
34.8
424
.81
80Pe
rcen
tage
of H
ouse
hold
s with
Puc
ca h
ouse
s43
.69
52.9
449
.85
50.0
162
.65
66.2
259
.39
56.4
6
81Pe
rcen
tage
of S
ite le
ss H
ouse
hold
s5.
681.
769.
6010
.92
0.03
8.80
13.4
36.
61
82Pe
rcen
tage
of H
ouse
hold
s pro
vide
d w
ith h
ouse
sit
es0.
000.
000.
000.
000.
001.
070.
000.
24
83Pe
rcen
tage
of H
ouse
s con
stru
cted
for h
ouse
less
po
or fa
mili
es (R
DPR
dat
a)30
.82
5.74
3.53
4.45
25.8
15.
643.
606.
61
84Pe
rcen
tage
of h
ouse
hold
s with
cyc
les
35.2
937
.38
42.2
443
.49
48.8
649
.39
51.9
845
.09
85Pe
rcen
tage
of h
ouse
hold
s with
two-
whe
eler
s18
.38
19.6
220
.99
24.6
428
.39
23.8
917
.99
22.5
7
86Pe
rcen
tage
of H
ouse
hold
s w
ith n
o As
sets
: (T
elep
hone
, TV,
2 w
heel
ers a
nd 4
whe
elrs
) (S
ourc
e : c
ensu
s 201
1)18
.26
17.0
015
.96
12.9
413
.57
16.8
218
.19
16.0
3
87Pe
rcen
tage
of H
ouse
hold
s with
ele
ctric
ity90
.84
93.6
392
.06
93.3
091
.89
89.7
091
.57
91.6
7
88Pe
rcen
tage
of H
ouse
hold
s ha
ving
acc
ess t
o M
oder
n Co
okin
g Fu
el10
.80
12.9
419
.72
33.8
727
.70
17.1
813
.05
19.5
6
89Pe
rcen
tage
of w
omen
ele
cted
repr
esen
tativ
es in
ru
ral l
ocal
bod
ies
43.8
942
.71
43.9
042
.75
45.3
644
.46
43.9
844
.03
90Pe
rcen
tage
of e
lect
ed S
C/ST
repr
esen
tativ
es in
ru
ral l
ocal
bod
ies
18.6
518
.39
17.3
720
.75
19.7
819
.07
26.7
020
.28
91Pe
rcen
tage
of w
omen
ele
cted
repr
esen
tativ
es in
ur
ban
loca
l bod
ies
39.1
343
.75
44.4
439
.13
37.1
439
.13
39.1
339
.75
92Pe
rcen
tage
of e
lect
ed S
C/ST
repr
esen
tativ
es in
ur
ban
loca
l bod
ies
17.3
918
.75
16.6
713
.04
17.1
417
.39
26.0
918
.01
93Pe
rcen
tage
of a
ctiv
e SH
Gs
92.7
710
0.00
66.1
990
.45
95.5
398
.98
90.2
691
.49
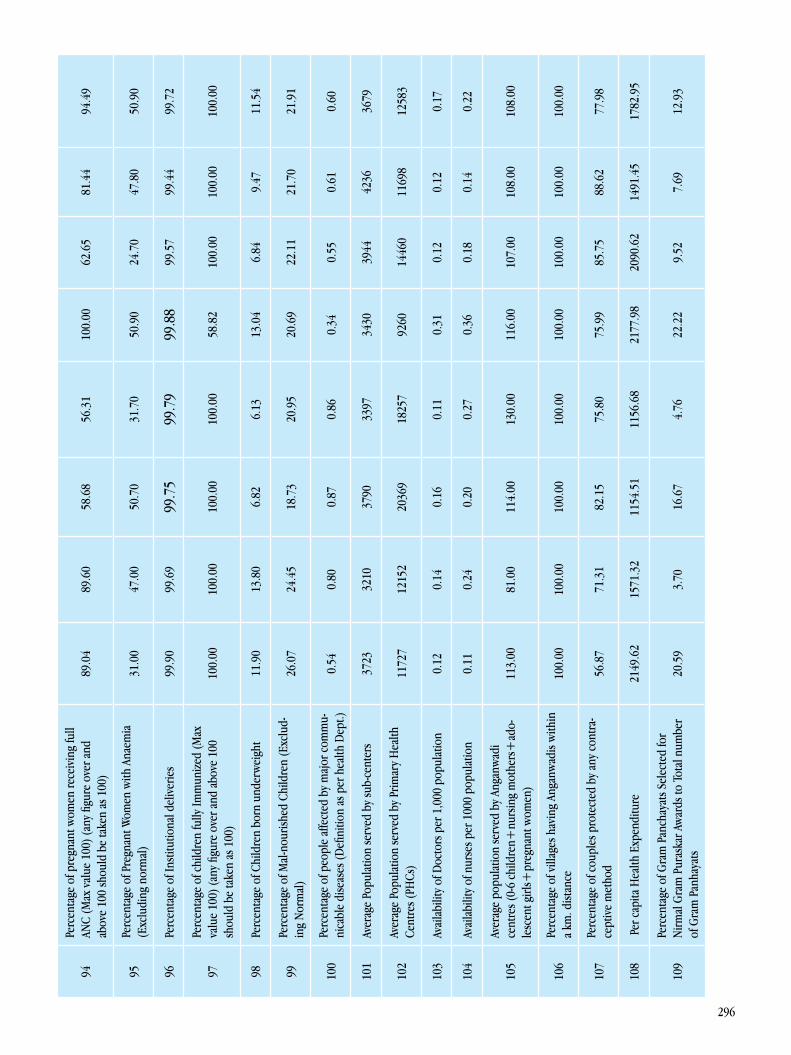
296
94Pe
rcen
tage
of p
regn
ant w
omen
rece
ivin
g fu
ll AN
C (M
ax v
alue
100
) (an
y fig
ure
over
and
ab
ove
100
shou
ld b
e ta
ken
as 1
00)
89.0
489
.60
58.6
856
.31
100.
0062
.65
81.4
494
.49
95Pe
rcen
tage
of P
regn
ant W
omen
with
Ana
emia
(E
xclu
ding
nor
mal
)31
.00
47.0
050
.70
31.7
050
.90
24.7
047
.80
50.9
0
96Pe
rcen
tage
of I
nstit
utio
nal d
eliv
erie
s 99
.90
99.6
999
.75
99.7
999
.88
99.5
799
.44
99.7
2
97Pe
rcen
tage
of c
hild
ren
fully
Imm
uniz
ed (M
ax
valu
e 10
0) (a
ny fi
gure
ove
r and
abo
ve 1
00
shou
ld b
e ta
ken
as 1
00)
100.
0010
0.00
100.
0010
0.00
58.8
210
0.00
100.
0010
0.00
98Pe
rcen
tage
of C
hild
ren
born
und
erw
eigh
t 11
.90
13.8
06.
826.
1313
.04
6.84
9.47
11.5
4
99Pe
rcen
tage
of M
al-n
ouris
hed
Child
ren
(Exc
lud-
ing
Nor
mal
)26
.07
24.4
518
.73
20.9
520
.69
22.1
121
.70
21.9
1
100
Perc
enta
ge o
f peo
ple
affe
cted
by
maj
or c
omm
u-ni
cabl
e di
seas
es (D
efini
tion
as p
er h
ealth
Dep
t.)0.
540.
800.
870.
860.
340.
550.
610.
60
101
Aver
age
Popu
latio
n se
rved
by
sub-
cent
ers
3723
3210
3790
3397
3430
3944
4236
3679
102
Aver
age
Popu
latio
n se
rved
by
Prim
ary
Hea
lth
Cent
res (
PHCs
)11
727
1215
220
369
1825
792
6014
460
1169
812
583
103
Avai
labi
lity
of D
octo
rs p
er 1
,000
pop
ulat
ion
0.12
0.14
0.16
0.11
0.31
0.12
0.12
0.17
104
Avai
labi
lity
of n
urse
s per
100
0 po
pula
tion
0.11
0.24
0.20
0.27
0.36
0.18
0.14
0.22
105
Aver
age
popu
latio
n se
rved
by
Anga
nwad
i ce
ntre
s (0-
6 ch
ildre
n+nu
rsin
g m
othe
rs+
ado-
lesc
ent g
irls+
preg
nant
wom
en)
113.
0081
.00
114.
0013
0.00
116.
0010
7.00
108.
0010
8.00
106
Perc
enta
ge o
f vill
ages
hav
ing
Anga
nwad
is w
ithin
a
km. d
istan
ce10
0.00
100.
0010
0.00
100.
0010
0.00
100.
0010
0.00
100.
00
107
Perc
enta
ge o
f cou
ples
pro
tect
ed b
y an
y co
ntra
-ce
ptiv
e m
etho
d56
.87
71.3
182
.15
75.8
075
.99
85.7
588
.62
77.9
8
108
Per
cap
ita H
ealth
Exp
endi
ture
2149
.62
1571
.32
1154
.51
1156
.68
2177
.98
2090
.62
1491
.45
1782
.95
109
Perc
enta
ge o
f Gra
m P
anch
ayat
s Sel
ecte
d fo
r N
irmal
Gra
m P
uras
kar A
war
ds to
Tot
al n
umbe
r of
Gra
m P
anha
yats
20.5
93.
7016
.67
4.76
22.2
29.
527.
6912
.93
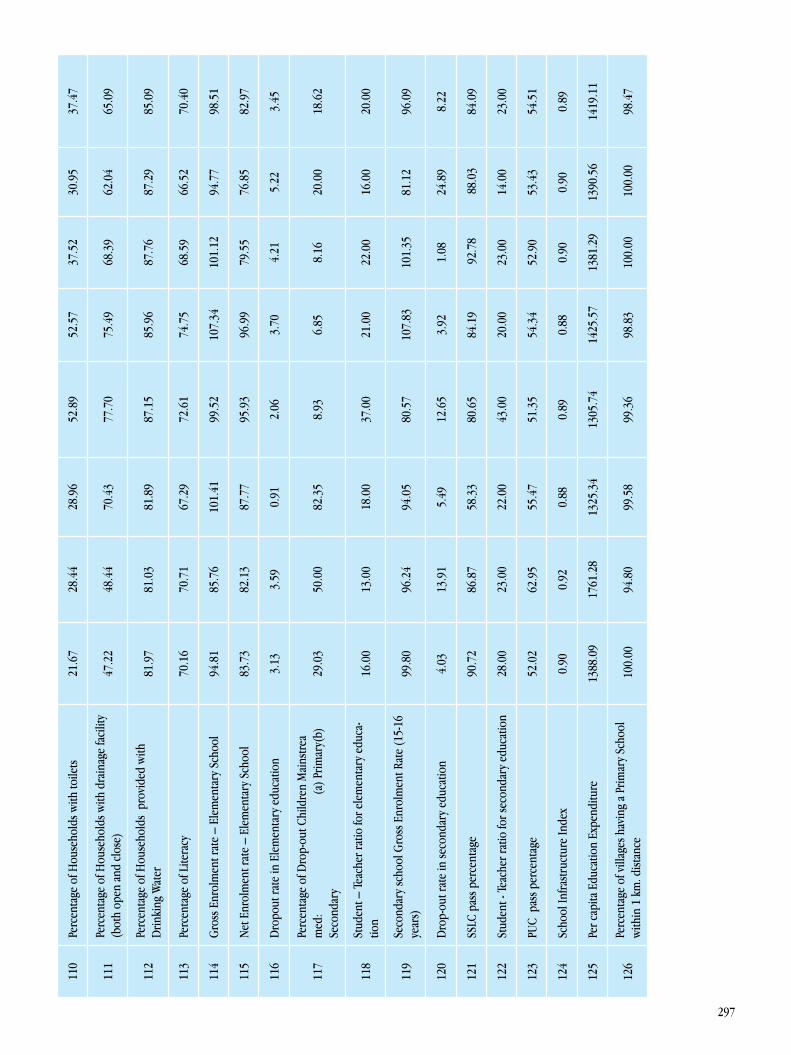
297
110
Perc
enta
ge o
f Hou
seho
lds w
ith to
ilets
21
.67
28.4
428
.96
52.8
952
.57
37.5
230
.95
37.4
7
111
Perc
enta
ge o
f Hou
seho
lds w
ith d
rain
age
faci
lity
(bot
h op
en a
nd c
lose
)47
.22
48.4
470
.43
77.7
075
.49
68.3
962
.04
65.0
9
112
Perc
enta
ge o
f Hou
seho
lds
prov
ided
with
D
rinki
ng W
ater
81.9
781
.03
81.8
987
.15
85.9
687
.76
87.2
985
.09
113
Perc
enta
ge o
f Lite
racy
70
.16
70.7
167
.29
72.6
174
.75
68.5
966
.52
70.4
0
114
Gro
ss E
nrol
men
t rat
e –
Elem
enta
ry S
choo
l 94
.81
85.7
610
1.41
99.5
210
7.34
101.
1294
.77
98.5
1
115
Net
Enr
olm
ent r
ate
– El
emen
tary
Sch
ool
83.7
382
.13
87.7
795
.93
96.9
979
.55
76.8
582
.97
116
Dro
pout
rate
in E
lem
enta
ry e
duca
tion
3.13
3.59
0.91
2.06
3.70
4.21
5.22
3.45
117
Perc
enta
ge o
f Dro
p-ou
t Chi
ldre
n M
ains
trea
med
:
(a) P
rimar
y(b)
Se
cond
ary
29.0
350
.00
82.3
58.
936.
858.
1620
.00
18.6
2
118
Stud
ent –
Tea
cher
ratio
for e
lem
enta
ry e
duca
-tio
n16
.00
13.0
018
.00
37.0
021
.00
22.0
016
.00
20.0
0
119
Seco
ndar
y sc
hool
Gro
ss E
nrol
men
t Rat
e (1
5-16
ye
ars)
99
.80
96.2
494
.05
80.5
710
7.83
101.
3581
.12
96.0
9
120
Dro
p-ou
t rat
e in
seco
ndar
y ed
ucat
ion
4.03
13.9
15.
4912
.65
3.92
1.08
24.8
98.
22
121
SSLC
pas
s per
cent
age
90.7
286
.87
58.3
380
.65
84.1
9 9
2.78
88.
0384
.09
122
Stud
ent -
Tea
cher
ratio
for s
econ
dary
edu
catio
n28
.00
23.0
022
.00
43.0
020
.00
23.0
014
.00
23.0
0
123
PUC
pas
s per
cent
age
52.0
262
.95
55.4
751
.35
54.3
452
.90
53.4
354
.51
124
Scho
ol In
frast
ruct
ure
Inde
x0.
900.
920.
880.
890.
880.
900.
900.
89
125
Per c
apita
Edu
catio
n Ex
pend
iture
1388
.09
1761
.28
1325
.34
1305
.74
1425
.57
1381
.29
1390
.56
1419
.11
126
Perc
enta
ge o
f vill
ages
hav
ing
a Pr
imar
y Sc
hool
w
ithin
1 k
m. d
istan
ce 1
00.0
094
.80
99.5
899
.36
98.8
310
0.00
100
.00
98.4
7
298
ANNEXURE III: NOTE ON PROCESS OF DHDR PREPARATION, DATA AVAILABILIT Y, LIMITATIONS AND QUALIT Y OF DATA
Note on process of DHDR preparation The preparation of the Human Development Report for Mandya district is to provide a benchmark against which future attainments on the human development can be Judged and to Create awareness among the Stakeholders on the importance of the human development for promoting social well-being of the people at the district and sub-district levels. The Human Development Index (HDI) and other indices viz. GII, CDI, FSI, CTDI and UDI are computed to understand the achievement level of human development at the district and at the inter-taluk levels. In order to compute index values for the above said indices as many as 126 indicators have been used. Of these 126 indicators, data for 41 indicators were obtained from the Census Sources; data on per capita income was provided by the Directorate of Economics and Statistics, GOK, Bangalore. The data on IMR, CMR, MMR, pregnant woman with anemia and Malnourished children were obtained from the SRS data. The data on remaining indicators were gathered from the departments such as education, health, rural development agriculture, women and child, police department, urban development, social welfare department etc. In addition to this, data were also obtained from the published Sources. The Secondary Sources of data for the preparation DHDR-Mandya are well supported by the primary Sources. The primary sources for the report are (i)district and taluk level interaction with the elected representatives and district officials at work shops and (ii) small area survey on important aspects of human development at GP levels. The outcome of these discussions and G P level surveys are used to enhance the quality of the report. The data collected have been analysed in the form of tables and graphs to draw the conclusion on human development issues. Core committee and technical committees have been formed and committees met periodically to ensure the progress of the report. All the members of the core committee and Technical Committees contributed to the report in their fields. Several deliberations were held in the core committee to finalize the report. In addition to this, the expert group committee has been formed Comprising of experts from different areas of human development and the committee also met periodically and discussed the discrepancies in data and other issues on human development. The human development division, planning department, GOK, also organized several DHDRs review meetings and provided inputs on the preparation of the report. The report is the outcome of the efforts of core committees, technical committee and expert group. Data validationThe data given in the form of percentages, ratios, and numbers by the line departments of ZP such as education, health, agriculture etc have been verified by the lead agency looking into the original (Absolute) data. Some of such data were also validated convening the meeting of the officials to deliberate on data discrepancies by the lead agency. The data obtained by these departments on about 80 human development indicators have been scrutinized and consistency and quality of these indicators were ensured. These validated data were used to prepare the final tables for discussion in the report.
Data limitationsThe data obtained from Census and non-Census sources were used for the preparation of the report. These data are confined only to Mandya district. The taluk-wise data on these indicators provided by the line departments of ZP were used to fix the maximum and minimum value for all the 126 indicators for computing various indices values. These maximum and minimum values are limited only to Mandya district. These maximum and minimum values may not much with the Max-Minimum values of any other districts/ sub-districts in the state. The values computed for several indices are based on the Max-Min values of 126 indicators. The indices value computed for several taluks in the district are comparable between the taluks of Mandya district, where as these index values cannot be compared with the other districts/sub districts value of indices as these values are based on the district’s Max-Min values. Therefore the disparities in different dimensions of human development can be measured only at district and at the inter-taluk levels for Mandya district.
299
ANNEXURE IV: CONSULTATIONS AND LOCAL SUBJECT EXPERTS
EXPERT GROUP
Prof. M.V. Srinivasgowda Honorary Professor, National Institute of Advanced Studies, Bengaluru
Prof. O.D. HegdeProfessor (Rtd.), Department of Economics and Cooperation, University of Mysore, Mysuru
Prof. K. YeshodharaProfessor (Rtd.), Department of Studies in Education, University of Mysore, Mysuru
Prof. K.S. Arun Kumar Professor, PES University, Bengaluru
Prof. D.S. Leelavathi Professor, Department of Economics and Cooperation, University of Mysore, Mysuru
Prof. M.G. BasavarajaProfessor, Department of Economics and Cooperation, University of Mysore, Mysuru
Dr. Navitha Thimmaiah Assistant Professor, Department of Economics and Cooperation, University of Mysore, Mysuru
Dr. M. KomalaAssistant Professor, Department of Food Science and Nutrition, University of Mysore, Mysuru
300
ANNEXURE V: DETAILS ON MEETINGS AND WORKSHOPS
A. District Core Committee Meetings
1. 31-01-2013 19 (DCC Members and other officers)
2. 08-04-2013 19 (DCC Members and other officers)
3. 15-04-2013 19 (DCC Members and other officers)
4. 15-07-2013 19 (DCC Members and other officers)
5. 13-08-2013 13 (DCC Members & other officers)
6. 05-10-2013 20 (DCC Members and other officers)
7. 16-11-2013 12 (DCC Members & other officers)
8. 20-01-2014 12 (DCC Members & other officers)
9. 01-03-2014 13 (DCC Members & other officers)
10. 20-05-2014 13 (DCC Members & other officers)
11. 22-07-2014 13 (DCC Members & other officers)
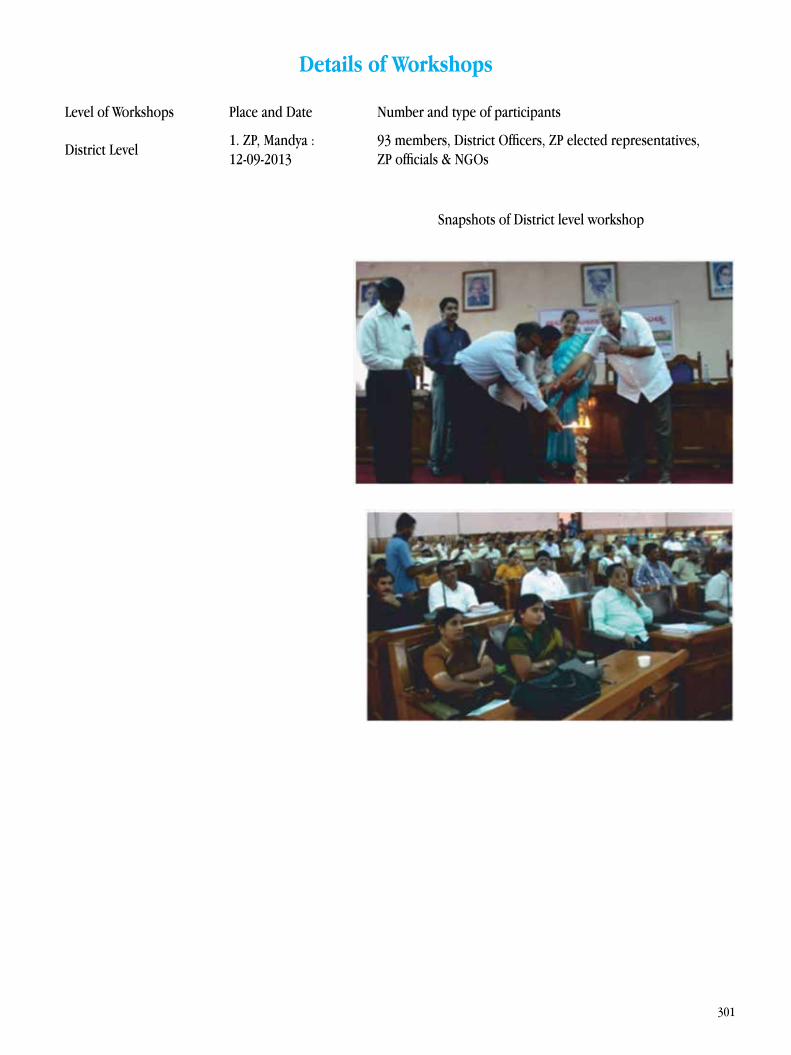
301
Details of Workshops
Level of Workshops Place and Date Number and type of participants
District Level 1. ZP, Mandya :12-09-2013
93 members, District Officers, ZP elected representatives, ZP officials & NGOs
Snapshots of District level workshop
302
DPC2. ZP, Mandya: 06-08-2014
82 members, DPC Members, District Officers, ZP officials & NGOs
Taluk Level 1. Krishnarajpet 27-09-2013 About 120 members, Taluk level officers, Panchayath Develop-ment Officers/Secretaries, Taluk Panchayat elected Representa-tives, President & vice president of GPs
Snapshots of DPC workshop
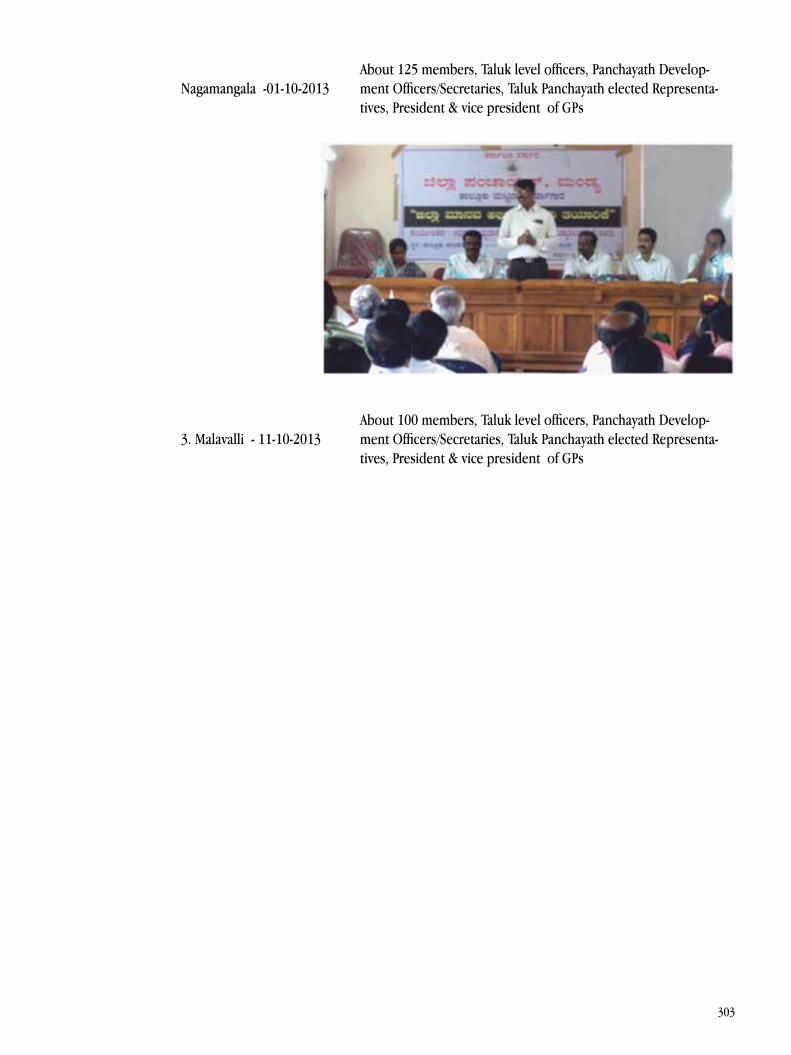
303
Nagamangala -01-10-2013 About 125 members, Taluk level officers, Panchayath Develop-ment Officers/Secretaries, Taluk Panchayath elected Representa-tives, President & vice president of GPs
3. Malavalli - 11-10-2013 About 100 members, Taluk level officers, Panchayath Develop-ment Officers/Secretaries, Taluk Panchayath elected Representa-tives, President & vice president of GPs
304
REFERENCES
Annual States of Education Report (Rural) 2006, Pratham Resource Centre, Mumbai, 2007
Annual States of Education Report (Rural) 2010, Pratham Resource Centre, Mumbai, 2011.Census of India 2001, 2011
Dabson, Brian (2006), “Eight Principles for Effective Rural Governance and How Communities Put them into Practice”, RUPRI, Columbia-Missouri.
Educations in Karnataka 2011-12. An Analytical Report, Sarva Shikshana Abhiyana, Bangalore.
Food and Agriculture Organization (2002), “A Handbook for Trainers on Participatory Local Development: The Panchayat Raj Institutions”, Regional Office for Asia and Pacific, http://www.fao.org/docrep/006/ad346e/ad346e03.htm, accessed on 19 April 2014.
Government of India Ministry of Water Resources, Central Ground Water Board, Ground Water Information Booklet Mandya District, Karnataka, South Western Region, Bangalore, July 2008.
Government of Karnataka (2005), StateHuman Development Report: Karnataka
Government of Karnataka (2008), District Human Development Report: Mysore
Narayanaswamy C. (2011),”History of Panchayati Raj in Karnataka”, Concerned for Working Children, Bangalore, www.concernedforworkingchildren.org, accessed 20 April 2014.
Planning and Statistical Department, Government of Karnataka.
Planning Commission (2001), “Report of the Task Force on Panchayati Raj Institutions (PRIs)”, Government of India, New Delhi, http://planningcommission.nic.in/aboutus/taskforce/tsk_pri.pdf, accessed 12 April 2014.
Planning, Programme Monitoring and Statistics Department, Bangalore.
Puliani, Sathpal (ed.) (2006), The Karnataka Panchayat Raj Act 1993: Manual, Karnataka Law Journal Publications, Bangalore.
SSA & RMSA Annual Reports
www.rupri.org, accessed 14 April 2014.
305
END NOTES
i) Change of names - Mysore to Mysuru as per Gazette Notification No.669, dated 31.10.2014
ii) Education in Karnataka 2011-12 – An Analytical Report by SSA- Karnataka Table 29-30 and 31-32
iii) Education in Karnataka 2011-12. An Analytical Report by SSA- Karnataka. Table 33 and 34
iv) According to the ESA, a woman cannot be paid less than a man if she is doing “equal work.” This also applies in reverse; a man cannot receive less pay than a woman if he is doing “equal work.”
v) Total Number of ULBs in Karnataka: 218 (Corporations 8, City Municipal Councils 43, Town Municipal Councils 94, Town Panchayats 68 and Notified Area Committees 5).
v) Director of Municipal Administration see: http://municipaladministration.kar.nic.in
vi) http://hdr.undp.org/en/humandev/originsAccessed on 13 March 2014
vii) Census of India, 2001
viii) http://www.bounteouskarnataka.com/DP-PDF/DistrictProfile-Mandya.pdf
ix) Delhi Human Development Report, 2006, “Beyond Scarcity, Power, Poverty and the Global Water Crisis’, Available at: http://hdr.undp.org/en/reports/global/hdr2006/, Accessed on 16 May 2013.
x) Classified as City Corporations, City Municipal Councils, Town Municipal Councils, Town Panchayats and Notified Area Committees, etc. based on the population
xi) 1) Taxation, Finance and Appeals 2) Public Health, Education and Social Justice 3) Town Planning and Improvement 4) Accounts.
xii) 1) Public Works 2) Education and Social Justice 3) Appeal 4) Horticulture
xiii) Infrastructure Development & Investment Plan for Mandya City
xiv) http://www.un.org/waterforlifedecade/sanitation.shtml Accessed on 11 June, 2014.
xv) City Sanitation Plan Mysore, Karnataka, Draft Report | December 2011, Directorate of Municipal Administration Government of Karnataka Administrative Staff College of India, Hyderabad, Ministry of Urban Development Department, Government of India and City Managers Association Karnataka. http://urbanindia.nic.in/programme/ uwss/CSP/Draft_CSP/Mysore_CSP.pdf
xvi) Central Public Health and Environmental Engineer Organisation (CPHEEO) Manual, 2000, Ministry of Urban Development, Government of India.
xvii) Article on The Hindu newspaper:http://www.thehindu.com/todays-paper/tp-national/tp-karnataka/mandya-cmc- approves-rs-297crore-surplus-budget/article5742217.eceAccessed on 17th May, 2014
xvii) National Urban Health Mission Framework for implementation, Government of India, Ministry of Health & Family Welfare, Department of Health & Family Welfare, http://www.pbhealth.gov.in/nuhm_framework.pdf