Managing Data in Digital Marketing - Resolve a DOI Name
104
-
Upload
khangminh22 -
Category
Documents
-
view
0 -
download
0
Transcript of Managing Data in Digital Marketing - Resolve a DOI Name

Andrzej Szymkowiak
Managing Data in Digital Marketing
Bogucki Wydawnictwo NaukowePoznań 2019

ISBN 978-83-7986-278-8
DOI: 10.12657/9788379862788
Bogucki Wydawnictwo NaukoweGórna Wilda 9061-576 Poznań[email protected]
Copyright © Andrzej Szymkowiak, Poznań 2019
Publication co-financed by the European Union from the European Social Fund under the Operational Programme Knowledge Education Development 2014–2020.
Reviewers: Barbara Borusiak Robert Romanowski
Cover design: Julia Bogucka
Author: Andrzej Szymkowiak Department of Commerce and Marketing Laboratory Manager ConsumerLab.pl Poznań University of Economics and Business [email protected]
https://orcid.org/0000-0001-5673-7093

Contents
Introduction . . . . . . . . . . . . . . . . . . . . . . . . . . . . . . . . . . . . . . . . . . . . . . . . . . . . . . . . . . 4
The importance of data in business . . . . . . . . . . . . . . . . . . . . . . . . . . . . . . . . . . . 71. Data in the digital world . . . . . . . . . . . . . . . . . . . . . . . . . . . . . . . . . . . . . . . . 72. User data and their protection . . . . . . . . . . . . . . . . . . . . . . . . . . . . . . . . . . 16
Discovering knowledge from data . . . . . . . . . . . . . . . . . . . . . . . . . . . . . . . . . . . . 273. The importance of data in knowledge discovery . . . . . . . . . . . . . . . . . 274. The process of discovering knowledge from data . . . . . . . . . . . . . . . . 46
Data in digital marketing . . . . . . . . . . . . . . . . . . . . . . . . . . . . . . . . . . . . . . . . . . . . . 645. Mapping e-customer journey in purchasing decisions . . . . . . . . . . . 646. Model of data management in marketing . . . . . . . . . . . . . . . . . . . . . . . 77
Conclusion . . . . . . . . . . . . . . . . . . . . . . . . . . . . . . . . . . . . . . . . . . . . . . . . . . . . . . . . . . . 86
Bibliography . . . . . . . . . . . . . . . . . . . . . . . . . . . . . . . . . . . . . . . . . . . . . . . . . . . . . . . . . 87
Appendix 1 . . . . . . . . . . . . . . . . . . . . . . . . . . . . . . . . . . . . . . . . . . . . . . . . . . . . . . . . . . . 101
Appendix 2 . . . . . . . . . . . . . . . . . . . . . . . . . . . . . . . . . . . . . . . . . . . . . . . . . . . . . . . . . . . 103
IntroductionDiscovering knowledge from data is a process that takes on a special meaning in the digital world and applies to companies that actively use the Internet in marketing and sales activities. In this case, the technical possibilities for collect-ing and processing data far exceed those of the past as every consumer activity on the Internet today can be tracked and codified. Data obtained in this way may form the basis for analysis in order to better understand the consumer. What is important to remember, however is that this opportunity for business-es can be a privacy threat for consumers and this is reflected in this work. The monograph indicates technical possibilities, potential benefits for business, but also legal restrictions, which are obligatory for every entity that acquires and processes personal data.
The monograph refers to structured and unstructured data that an en-terprise can access and use to make business decisions. These data relate to the purchasing behaviour of recipients, related to activity on the company’s website and as a response to marketing content that is presented outside the company’s own website. This applies to promotional materials that are distrib-uted in the form of e-mail marketing, social media, contextual advertising, on blogs or banner advertising. Regardless of the choice of promotion method, each action taken is associated with financial outlays, including the time spent on work. Proper data analysis will allow not only the assessment of the effec-tiveness of the measures taken, but also their effectiveness in relation to the expenditure incurred.
Due to the multitude of different types of data available, it becomes crucial to choose the element that defines the achievement of the intended goal in both the short and long term. Diversity of data types and access to a wide range of information, which can be counted in millions of rows or terabites, is one of the basic problems of efficient use of these resources. The previous studies were mainly oriented towards the technical aspects related to data management in the context of information technologies or on measuring and analysing the effects of marketing activities. The lack of a coherent study regarding the possi-bilities of collecting, processing, analysing and using data for managerial needs in digital marketing, is a gap that the author bridges with this study. The book discusses issues related to data management in digital marketing and the main aim is to create a descriptive model of the data management process. The five specific objectives of this work, therefore, are ontological, epistemological and
Introduction 5
axiological data characterization, description of technological and legal possi-bilities of collecting and processing consumer data, discussion of data-driven approach in the context of the data science and the analysis of existing data mining models. The last objective concerns the characteristics of the heter-ogeneous online purchasing process and help determine cause-effect rela-tionships in various situational contexts in the decision-making process. This translates into the choice of data and measures used in the data management model in digital marketing.
The book consists of 6 chapters grouped in 3 areas. The first area concerns the importance of data in business and indicates the changes that contributed to the codification of Internet users’ activity on an unprecedented scale. The considerations were based on trends related to the development of technolog-ical equipment and the perception of available data as a source of value. Data characteristics which vary depending on the level of structuring, type or data sources are also discussed. Next, data attributes and the concept of big data are presented to help in the identification of components conditioning a compa-ny’s ability to create value based on big data.
The considerations carried out in the second chapter were focused on the methods of collecting enterprise data and the possibilities of their use. This is followed by a review of the legal conditions determining the manner in which an enterprise may use the acquired data, including personal data, and how it is obliged to inform the interested parties. In addition to the descriptive charac-ter, the results of own research on the method and purposefulness of process-ing user data by online stores are presented. In the next area entitled Discover-ing knowledge from data, the author focused on determining the importance of data in modern science and on the process of discovering knowledge from data.
In Chapter 3, a discussion was undertaken about the merits of distinguish-ing data science as an area of science and the perception of data science due to the progress of computational possibilities. The historical outline of data sci-ence was discussed, along with a reference to the data-driven approach. An additional problem raised in this chapter relates to determining the role of the scientist in the process of knowledge discovery. Moreover, in the context of the development of the tooling and methodological apparatus based on analytical autonomous operation. Various areas of data science were characterized, and traditional and modern methods were compared in the process of knowledge discovery, also showing the relationship between individual elements based on the knowledge pyramid. In addition, areas of marketing where data mining
Introduction 6
is of particular interest were identified and described. This chapter also discuss-es solutions based on artificial intelligence that benefit from today’s technol-ogies and data collection and processing capabilities. The second part of this chapter focuses on the process approach to the problem of data management. Selected models relating to big data analysis were characterized. The individual stages were discussed in detail, identifying the main challenges and possible difficulties.
The last area directly refers to the main problem discussed in the book. The first part maps the e-customer journey in making purchasing decisions. The results of the authors research was presented, on the basis of which a gener-alization was made regarding the stages of searching for information on the Internet and making purchase decisions by users. The differences resulting from heterogeneity in consumer behaviour as well as business consequences significant at the stage of data collection and analysis will then be described. The circumstances conditioning the online purchasing process, which act as a mediator and moderator for the analysed variables, are also indicated. The last chapter presents selected measures used in the analysis of marketing data on the Internet and discusses in detail the data management model in digital marketing with the characteristics of individual elements and the relationships between them.

The importance of data in businessThe terms data science (DS), data mining (DM), business intelligence (BI), big data (BD), machine learning (ML) or artificial intelligence (AI) in the context of social sciences are a contemporary approach to analysing the surrounding eco-nomic reality with the progressive digitization of life. These concepts refer to changes that have taken place in the area of all human activity and can be cod-ified in various ways. This is due to the ability to collect and process diverse data to better understand human behaviour and the consumer. It is also important in a descriptive and predictive approach, in order to predict the response to stimuli and adapt the content to the expected goals. These considerations will be preceded by a discussion of issues related to the collection, processing and heterogeneity of data on the Internet, which is of key importance due to the topics discussed in the work.
1. Data in the digital worldTechnological progress has affected the ease of collecting, accessing and ana-lysing data. Data collection is carried out even in a situation where there is no clear purpose for their use in the near future and can be characterized as data greed (Kathuria, 2019). Lack of knowledge on how to directly use the data does not limit their motivation to collect. This is due not only to the technological possibilities of obtaining them, but also due to the possibility of their storage. The aim of the chapter is to systematize the concepts associated with digital data. It will discuss key issues related to data, technological changes that have contributed to the possibility of their collection and processing, their classifica-tion, characteristics and possibilities in using and creating value.
The development of the latest technological systems in the scope of data storage options, such as Optical data storage, DNA data storage or Holographic data storage is progressing exponentially (Bhat, 2018). This applies not only to the maximum available capacities, but what to do when working on data rates of data transfer and response speed. In Table 1 average values for selected tech-nologies that illustrate this progress have been shown.
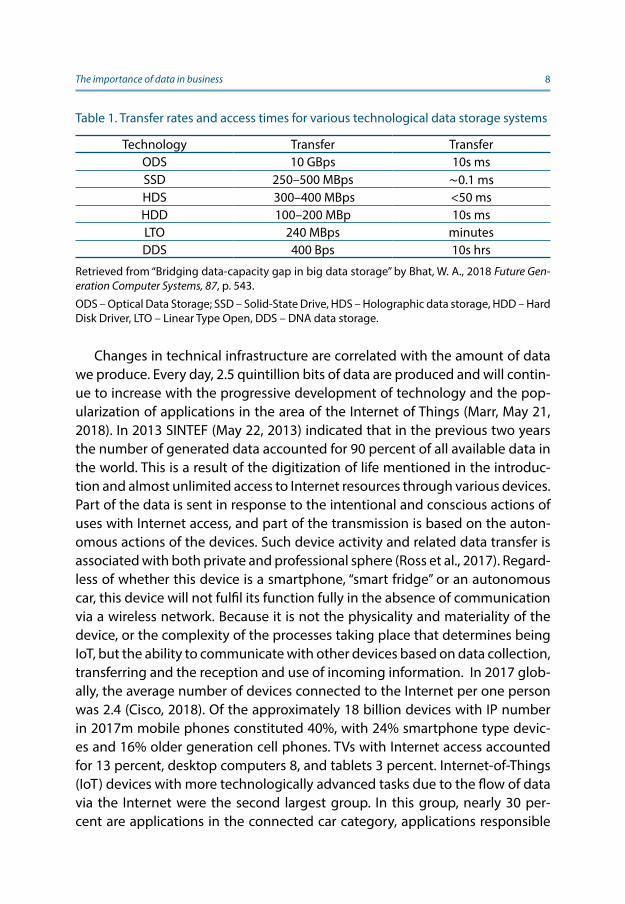
The importance of data in business 8
Table 1. Transfer rates and access times for various technological data storage systems
Technology Transfer TransferODS 10 GBps 10s ms SSD 250–500 MBps ∼0.1 ms HDS 300–400 MBps <50 ms HDD 100–200 MBp 10s ms LTO 240 MBps minutesDDS 400 Bps 10s hrs
Retrieved from “Bridging data-capacity gap in big data storage” by Bhat, W. A., 2018 Future Gen-eration Computer Systems, 87, p. 543.
ODS – Optical Data Storage; SSD – Solid-State Drive, HDS – Holographic data storage, HDD – Hard Disk Driver, LTO – Linear Type Open, DDS – DNA data storage.
Changes in technical infrastructure are correlated with the amount of data we produce. Every day, 2.5 quintillion bits of data are produced and will contin-ue to increase with the progressive development of technology and the pop-ularization of applications in the area of the Internet of Things (Marr, May 21, 2018). In 2013 SINTEF (May 22, 2013) indicated that in the previous two years the number of generated data accounted for 90 percent of all available data in the world. This is a result of the digitization of life mentioned in the introduc-tion and almost unlimited access to Internet resources through various devices. Part of the data is sent in response to the intentional and conscious actions of uses with Internet access, and part of the transmission is based on the auton-omous actions of the devices. Such device activity and related data transfer is associated with both private and professional sphere (Ross et al., 2017). Regard-less of whether this device is a smartphone, “smart fridge” or an autonomous car, this device will not fulfil its function fully in the absence of communication via a wireless network. Because it is not the physicality and materiality of the device, or the complexity of the processes taking place that determines being IoT, but the ability to communicate with other devices based on data collection, transferring and the reception and use of incoming information. In 2017 glob-ally, the average number of devices connected to the Internet per one person was 2.4 (Cisco, 2018). Of the approximately 18 billion devices with IP number in 2017m mobile phones constituted 40%, with 24% smartphone type devic-es and 16% older generation cell phones. TVs with Internet access accounted for 13 percent, desktop computers 8, and tablets 3 percent. Internet-of-Things (IoT) devices with more technologically advanced tasks due to the flow of data via the Internet were the second largest group. In this group, nearly 30 per-cent are applications in the connected car category, applications responsible
The importance of data in business 9
for fleet management, in-vehicle entertainment and Internet access, roadside assistance, vehicle diagnostics and navigation (Cisco, 2018).
Regardless of the popularity of individual types M. Chen et al. (2014) pro-posed to categorize data into three main groups: Internet of Things data, bio-medical data and, what is particularly important from the perspective of this work: enterprise data. In the case of IoT as a source of large data sets, these data can come from various areas such as agriculture, industry, automotive and transport. Due to the specificity of processes in device communication, the net-work architecture can be divided into a layer, based on sensors, responsible for data acquisition and another layer responsible for processing information and transmission with the central unit via the Internet or at a close distance with other devices using additional sensors.
The last application layer is responsible for analysing information and han-dling application processes. The characteristic feature of this type of data is its diversity due to the heterogeneous nature of the sensors and the variety of devices aggregating all data, including the time and place of collection. The device is placed in given locations, and each transmitted data has a specific time stamp which is used in the analysis (Chen M. et al., 2014). If the acquisition and related data transmission is based on continuous monitoring of the meas-ured phenomenon, the scale of the collected data is very large. The analysis is also partly based on historical data, which causes the need to store information about past events, contributing to data collection without prior selection. The result is that data efficiency understood as the usefulness and usefulness of all data plummets to low. A large part of the data in this situation is treated as information noise, which must be identified and separated.
The other category by M. Chen et al. (2014) is biomedical data gathered via the development of biosensors and innovative enterprises in the field of med-icine and genetics. In 2014, there were officially 1750 banks that collected 7.4 billion information in the area of medical data of hundreds of thousands of patients, genotypes, biological samples (Lusty et al., 2014). The largest gene bank has 40 different databases covering data on 118 million people, diseases, animals and plants (China National Genebank, 2018). The last separate group are the previously referenced internal data of enterprises, which are collected on the basis of codification of conducted activity and based on possessed re-sources such as production data, sales volume, financial data, customer base and effects of marketing activities.
George et al. (2014) provide a different 5 group breakdown of data sources: public and private data, side data, social data and individually shared. Public
The importance of data in business 10
data is data collected by and for the needs of governments at international, national and local levels via dedicated websites or multimedia applications. This type of data often relates to the macroeconomic situation and can be suc-cessfully used by business. Data collected and distributed by state institutions are an important source of information, as they allow a single enterprise to es-timate the country level of unemployment, the value of disposable income and other metrics related to health care or energy industry. This type of data can illustrate the market situation, which will be an important reference point for understanding the changes that are taking place in a given enterprise. Pri-vate data refers to data held by individuals, enterprises or non-profit organiza-tions and relate to activities only known to them, illustrating their actions and actions taken. An example of such data may be a record of employee activity on company devices or a statement of physical activity of an individual user, including e.g. duration, time and place, user’s pulse recorded throughout the entire activity. Such data can serve to better understand the situation in a mi-croeconomic perspective. They are not made public in a structured and organ-ized way. Side data (data exhaust) refers to data that is somehow a by-product and is passively collected while performing other activities. They have no value in themselves, but can be combined with other data, contributing to the cre-ation of new value by using them in a different context. An example would be the use of social media activity with the geolocation function among tourists. Posting by users on social media content including photos during foreign visits has enabled to analyse the popularity of attractions (Mukhina et al., 2017). It is possible through social media activity and analysis of available content to an-alyse drug addiction (Yakushev & Mityagin, 2014) or to identify depression by analysing what they publish, write, behave and what content they react to (Li A. et al., 2018). Social data is data of a heterogeneous shape and profile, resulting from the activity of members of a given community on the Internet. These are content published as a form of product or service reviews, responses to content published by other content, or discussions held within thematic forums. This type of data offers insight into the lives of millions of people over time, which increases the interest in this type of analysis in academia and business, espe-cially in commerce and marketing (Halford & Savage, 2017). The use of this data in marketing activities can be diverse, but also limited to their unstructured qualitative nature. The last group consists of data provided independently by individuals.
Data that can be used to create value can be classified into structured and unstructured (Kietzmann et al., 2018). Structured data refers to traditional data,
The importance of data in business 11
which is obtained and saved according to a adopted procedure. Each opera-tion, e.g. related to the purchase of products according to generally accepted standards, is archived, which not only enables the execution of the order, but is also stored for the purposes of any complaints or returns. Data on a single order as well as in aggregate form can be exported and to be used in analyses. For more complex databases, it is possible to extract data on all operations for a given user. Available data in such a statement can refer to the number and type of products purchased, date and value of the order. Similarly, structured data can be obtained in relation to website traffic (number of users for each day, duration of the session) or regarding activity within the company profile in social media (number of people tracking separately for each day, number of people who were redirected from content on social media per product page).
Unstructured data have a different nature. Obviously, the key aspect is the lack of structuring, which raises a problem in their understanding and analysis. Meeting notes, e-mail content, annotations in paper calendars, employee ob-servations, customer comments transmitted orally are only selected examples of data, which, due to their unstructured nature, constraints the management of knowledge and the possibility of efficient use of resources. For example, structuring an e-mail message would allow the company to prepare message templates, which would reduce the time it took to prepare it, and eliminate ty-pos. In the case of sales emails sent by employees comparing them with order data, the effectiveness of individual actions could be determined. Moreover, the choice of template, customer status could identify the stages of the sales process, and be an authoritative tool for analysing the effectiveness of individ-ual sales departments. This type of enterprise data accounts for up to 80 per-cent of all available data (Rizkallah, June 5, 2017) and indicates the scale of the problem and the need for more complex processes to reduce this ratio. Cogni-tive value will be reduced if, for example, in accepted analyses, instead of the semantic content of information published on the Internet, only its presence at the binary level will be taken into account.
The changes described and the progressing digitization have contributed to the perception of data and, in a sense, their magnitude, in a new approach. This is related to the concept of big data as a source of competitive advantage on the market, which is a development of the concept of Business Intelligence (Ross et al., 2017). Business Intelligence is based on making conclusions from available data, and not on the basis of experience and intuition. In the original design, the term big data referred to a set of large amounts of data that ex-ceeded the capacity to store and process them using publicly available utility
The importance of data in business 12
computers (Manovich, 2012). However, his modern understanding is not limit-ed to data sizes. Gartner (2012), described big data as “high-volume, high-ve-locity and/or high-variety information assets that demand cost-effective, inno-vative forms of information processing that enable enhanced insight, decision making, and process automation”. An attempt to define big data, often refers to the characteristics of the main attributes: called as 3V (Gartner, 2012), together with their subsequent evaluations of 4 and 5Vs: Volume, Velocity, Value, Variety, and Veracity.
The first element that constituted the basis for adopting an adequate name is size, and more precisely, significant volume. The reference point to assess the size as significant was the technical possibilities of the devices used. This means that this parameter is not constant. On the one hand, there are significant differ-ences between the performance of various devices and an increase in the effi-ciency of the produced equipment. Furthermore, two aspects should be distin-guished: data collection and processing. The mere possibility of collecting data is not enough. In the situation, when there will be insufficient cache to perform operations on the collected empirical material, its usefulness is levelled. Having millions of data lines with historical transactions is not a value in itself when it is not possible to determine, for example, the average order value, identify trends or key customers. A standard spreadsheet can store up to 1,048,576 rows for 16,384 columns. A larger database of collected data requires more specialized programs. This can be seen as a prerequisite to be able to speak of a large-scale database. However, this is not a sufficient condition to interpret it as big data.
According to the author, despite the historical significance of this attribute, this is not the most important element. It is worth pointing out that in an anal-ysis of data on user activity on a website with 100,000 visits a day, each analysis based on time series would exceed the value of a million, The number of portals through which terabytes of data are created is increasing (Zhao et al., 2013). As the number of analysed events increases, the number of operations performed on these data increases and requires more digital memory. Such a demand for efficiency influenced the popularization of the so-called cloud where the user has access to the interface whilst all calculations are performed on an external server, in order to not burden the user computer. The results are sent in elec-tronic form and available via a browser or sent via the interface of programmed applications. This form can also be used to transfer data between where one of the pages is a social networking server or a portal providing services related to website traffic analysis.
The importance of data in business 13
The indicated challenges posed by the size of the data are associated not only with their storage and analysis, but with accessibility, the speed of access. Operations on large data sets must not only be possible but efficiently carried out. A long response time not only affects the comfort of work but also prevents the implementation of other operations at the same time. Low work speed lim-its the ability to process and store data while extended data recording time may cause the loss of data that is queued up for interception. Regardless of the idea that accompanies the analysis of available data, the system must be able to process it, perform calculations and present the results (Vasarhelyi et al., 2015). In some cases, it may be necessary to conduct analyses on a continuous basis, based on updated data, requiring a fast and efficient system.
What constitutes a special feature and challenge of big data in relation to databases is diversity (Labrinidis & Jagadish, 2012). This means that different types of data and sources are used within the analysed databases, affecting the complexity of the whole process and forcing the use of technological solutions adapted to heterogeneous variables, to allow better insight and acquisition of knowledge. Data diversity is related to their unstructured nature. In this case, the possibilities to categorize and frame raw data in tables are limited and pose a challenge for modern technological solutions. Performing operations on uni-fied and structured data, is not new. Operationalization of data of heterogene-ous nature is a bigger challenge. It is challenge to use all available sources and types of data that apply to digital marketing media: image files, audio and vid-eo files, content, response to content, logs, data on individual clicks, behaviour on the website, response to advertising (Chen H. et al., 2012; Halford & Savage, 2017).
Another element characterizing big data is data reliability. The increasing complexity of data structures in connection with anonymity and inaccuracy will force consideration of the reliability of individual data sources. This can be interpreted as the quality of the data (Zicari, 2013) and is particularly impor-tant for digital marketing as the actions performed may not reflect the actual state. Opinions expressed on the Internet may be insincere, accidental or false as a sense of anonymity can affect the emotional character of actions caused by social interactions (Sivarajah et al., 2017). These types of factors create a need to assess the suitability of individual data as they affect business decisions.
Credibility in the context of an increasingly complex data structure, ano-nymity, inaccuracy or inconsistency in large data sets translates into their quality and accuracy. Truth is particularly important in the event of discrep-ancies in the data collected. IBM has indicated genuineness as a data feature
The importance of data in business 14
that represents inaccuracy inherent in many structural and unstructured data sources. Akerkar (2013) and Zicari (2013) refer credibility to truthfulness as dealing with prejudices, doubts, imprecision, fabrication, clutter and incorrect evidence in the data. The Veracity function measures the accuracy of the data and its potential use for analysis (Vasarhelyi et al., 2015). Drawing conclusions based on false data leads to wrong decisions. Therefore, not only attention but prudence is needed, which will allow to question the legitimacy of using the in-dicated data. For example, a customer’s opinion about various social networks is different and unclear by nature because it is interpersonal (Sivarajah et al., 2017). Moreover, the ease of publishing opinions necessitates the need for an effective method of isolating true, qualitative data during presentation. Thus, the need to deal with inaccurate and ambiguous data is another aspect of BD (Gandomi & Haider, 2015).
The last of the features characterizing big data is their value. The purpose of data-driven activities is to discover knowledge that is not available without conducting complex analyses using a variety of data sources that map reality as accurately as possible. The data set is to lead to the achievement of intended business goals via the creation of a better offer to clients, a deeper understand-ing of business processes and development of an effective marketing commu-nication strategy. Simply having data does not create value as it is only a pre-requisite for using big data in creating a competitive advantage. Value of big date refers to the value that big data gathering, managing and analysing gives to business (Al Nuaimi et al., 2015).
The indicated characteristics of big data go beyond the perception of this term only as large data sets. It refers to the perception of differentiated data as a source of discovering the non-obvious regularities using adequate research methods based on understanding the data and the values that they bring to achieve the set goals. Therefore, the goal of big data is not collecting and struc-turing data but creating values that result from its analysis. The ability to analyse data is therefore based not only on available data in a codified form. Gupta and George (2016) proposed the division of sources affecting the ability to analyse big data into 3 equivalent categories: tangible, intangible and human. The first category relates to data, technology and resources), the second to organiza-tional culture and the organization’s ability to learn, the third to the manager’s cuteness and his technical skills. The big data characteristic described earlier indicates the relational character of individual categories.
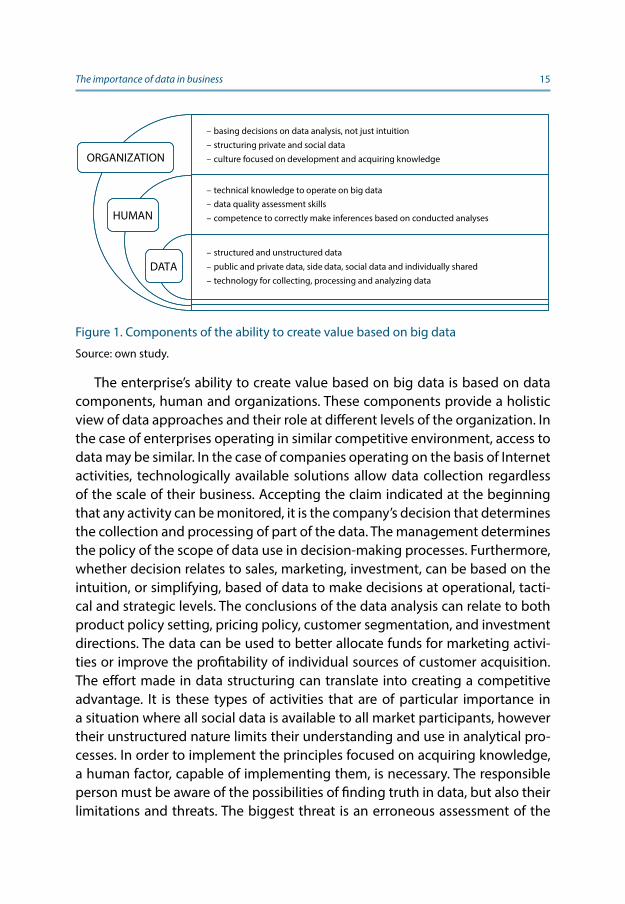
The importance of data in business 15
The enterprise’s ability to create value based on big data is based on data components, human and organizations. These components provide a holistic view of data approaches and their role at different levels of the organization. In the case of enterprises operating in similar competitive environment, access to data may be similar. In the case of companies operating on the basis of Internet activities, technologically available solutions allow data collection regardless of the scale of their business. Accepting the claim indicated at the beginning that any activity can be monitored, it is the company’s decision that determines the collection and processing of part of the data. The management determines the policy of the scope of data use in decision-making processes. Furthermore, whether decision relates to sales, marketing, investment, can be based on the intuition, or simplifying, based of data to make decisions at operational, tacti-cal and strategic levels. The conclusions of the data analysis can relate to both product policy setting, pricing policy, customer segmentation, and investment directions. The data can be used to better allocate funds for marketing activi-ties or improve the profitability of individual sources of customer acquisition. The effort made in data structuring can translate into creating a competitive advantage. It is these types of activities that are of particular importance in a situation where all social data is available to all market participants, however their unstructured nature limits their understanding and use in analytical pro-cesses. In order to implement the principles focused on acquiring knowledge, a human factor, capable of implementing them, is necessary. The responsible person must be aware of the possibilities of finding truth in data, but also their limitations and threats. The biggest threat is an erroneous assessment of the
–
basing decisions on data analysis, not just intuition
–
structuring private and social data
–
culture focused on development and acquiring knowledge
–
technical knowledge to operate on big data
–
data quality assessment skills
–
competence to correctly make inferences based on conducted analyses
–
structured and unstructured data – public and private data, side data, social data and individually shared
– technology for collecting, processing and analyzing data
ORGANIZATION
HUMAN
DATA
Figure 1. Components of the ability to create value based on big data
Source: own study.
The importance of data in business 16
reliability and usefulness of data, which may lead to erroneous conclusions. The analysis process is mainly based on the implementation of complex calcula-tions, however, it is the person who decides to indicate their scope. In addition to this type of sensitivity, skills are needed to operate on large and diverse data sets. Data is the foundation of any analysis and it is necessary to be aware of various methods that can be used in a given situation, and which methods will allow it to be visualized and understood. The challenge in the modern digital economy is not access to data, but the proper collection, structuring and use of data in the analysis process.
In the digital world, data is not only its basis, but also the main if not the only component. Each transmitted information is a form of data and each dis-played element on the consumer monitor is the result of data transfer in re-sponse to user activity, understood as clicking on a hyperlink or entering the website address in the browser bar. Any such activity can be recorded, stored, analysed and help understand the cause-effect relationship between the dis-played information and the reaction of users. This type of data in quantitative terms, allows to verify hypotheses regarding consumer behaviour in the digital world. Therefore, it is crucial to understand the individual data collected, while respecting consumer rights arising from adopted legal norms.
2. User data and their protection Data on user online activity is the basis for analysing and assessing the effects of marketing activities. However, consumer knowledge of what constitutes val-ue for an enterprise may be a violation of individual consumer rights. The issue of consumer rights protection is an important aspect, as legislative changes may limit the possibility of collecting, storing and analysing data. The aim of the chapter is to define the scope of data that can be collected and processed by enterprises. This chapter discusses applicable legal regulations, the appli-cation of which imposes an information obligation on companies, giving in-sight into what data and for what purpose they are collected. This chapter also discusses own research based on text mining regarding privacy policy at the largest online stores in Poland.
Any activity in the digital world leaves a trail related to all actions that a user, using the resources of the Internet, generates. This is particularly important from both a consumer and business perspective. For the consumer, this simply means no anonymity (Gold, 2013; Misoch, 2015). At the enterprise level, they

The importance of data in business 17
can be aggregated, generalized and anonymized, which limits the possibility of identifying a particular user or the device from which the action was carried out. Any activity can be monitored and such data is stored. The data may relate to both activities understood as actions within a web browser and situational context for such activity and such a user, informing among others who, when, from what place in the world, from what IP address, using what device entered the analysed website. In the case of actions as part of the browser, an example can be clicking on a hyperlink, searching for a phrase in an Internet search en-gine, adding a product to the basket, completing the purchasing process or using the Internet application. This means that every action that is associated with a change in the content presented on the monitor is codified, which re-quires data transmission.
In addition to this type of information, additional data is collected that mod-erates data processing. Examples of such variables include, the type of device on which data is processed, the size of the display, the time and place of call-ing the query to the server, in response to which the data presented on the monitor is sent, the type of web browser through which the content is viewed, the length of the display content, or more precisely the time interval between displaying different content. By comparing this data, one can get a preview of consumer activity on the website. This can be aggregated quantitative data or take the form of a recording that takes into account the movement of a single user cursor (Leiva & Huang, 2015), presenting the recipient’s behaviour in qual-itative terms. From the enterprise perspective, the above data can be analysed in order to achieve business goals, by better adapting to the recipient or elimi-nating errors in the reception of content. Such activities result from the analysis of the data held, which is why entrepreneurs are interested in collecting them for future analysis and inference. This approach is illustrated by the hierarchical model in the shape of the vertical pyramid data-information-knowledge-wis-dom (DIKW), which indicates that data is the basic element that goes into in-formation and penetrate into wisdom (Frické, 2008; Rowley, 2007). Data stored and analysed can have a dual nature. The first type is anonymized data that allows a generalized interpretation in relation to the problem being analysed. An example of such data is the total number of visits to the site in a given time horizon, the number of transitions from the main page to the contact tab or the number of views of a promotional video placed on social media. The second type refers to direct relations between a particular customer and the company, e.g. within the CRM system – customer relationship management (Dalla Poz-za et al., 2018). The information collected may refer to purchase history, their

The importance of data in business 18
frequency and value, information about sales emails opened and clicks on spe-cific marketing content. These data are collected individually for a particular customer, who can be identified by name or email address.
Legal and ethical dilemmas are emerging at the intersection of these per-spectives. The companies have access to data, which somehow directly be-longs to them, via their own website or social media portals. This gives one the opportunity to shape the content. Most often this is also related to the desire to learn about how many people this content has reached and whether it has translated into any action. However, to obtain this type of knowledge, it is nec-essary to monitor users’ activity, which reduces their right to privacy. In each country, regulations regarding the protection of personal data may differ. For example, the General Data Protection Regulation adopted in 2016 within the European Union (Tan, Lee, Hew, Ooi, Wong, 2018), came into force in the mem-ber countries on the basis of detailed regulations after a two-year transition period.
Regarding the security of storage and processing of personal data (Mans-field-Devine, 2017; Perry, 2019; Politou et al., 2018; Wilson, 2018) for business purposes such as marketing, the applicable law has defined a number of in-formation obligations on entities collecting and processing data, which has an impact on awareness (Presthus & Sørum, 2018; Steppe, 2017; van Bavel et al., 2019). In connection with applicable legal regulations, the user has access to information about which data about him are stored, by whom, for what pur-pose, were and will be used.
In the case of collecting personal data, the user must explicitly consent to the entity that wants to process his data. In the case of anonymized data, one must have access to information in which it is indicated what type of data is collected during activity on the website, by whom and for what purpose. In the case of websites, regardless of whether it is a thematic portal or online store, in which access to information does not require the creation of an account, the user must have direct access to the described privacy policy.
As part of the privacy policy, it characterizes the use of cookies which are a type of data stored on users’ devices. As a rule, they do not collect person-al data, but enable customer profiling, which the user must also be informed about. Default web browser settings allow cookies to be stored on the user’s device and gather data regarding the frequency of visits, content viewed or products. So the data is assigned to the device, not the user. In the case of web pages where access to part of the content or implementation of expected ac-tivities requires the creation of an account, the user at the registration stage
The importance of data in business 19
is informed about the methods of processing and use of data, which he must agree to. This applies to both online stores and social networking sites. The le-gal aspects discussed burden the companies that collect them with responsi-bility for the protection of personal data. The key intention here is to reduce the risk of processing by unauthorized companies in a manner that may harm personal rights.
The issue of personal data is even more problematic because the user only has one apparent choice (Woo, 2016). The alternative is based on the possibil-ity of not using the website or service (Aïmeur et al., 2016). The rules regarding user data are posted on websites as a privacy policy, which is akin to a mani-festo of how the service provider will use the information provided (Awad & Krishnan, 2006). It is a statement that allows a person using a particular ap-plication or website to learn how data will be collected, used, disclosed and managed (Prichard & Mentzer, 2017). This is to raise consumer awareness of the company’s practices in handling data (Jensen & Potts, 2004) and can be consid-ered as a form of social contract between the client and the company (Ginosar & Ariel, 2017). It takes on a legal nature that defines boundaries, as part of this is based on trust (Culnan & Williams, 2009; Earp et al., 2005) and any violation is associated with negative consequences (Earp et al., 2005). As Steinfeld (2016) indicates, a privacy policy is a text regulating the possibility of using data while providing users with control over the way it is collected and processed.
The information obligation is an important contribution to the users’ under-standing of their rights. It minimizes the asymmetry of information between the entity that has full knowledge of what data is collected, how and for what purpose. The regulations also include the obligation to indicate a legal entity which implements it, irrespective of the brand name or name of the page un-der which the page appears. Non-fulfilment of obligations results in fines in the form of a fine or imprisonment. The financial dimension of penalties and their severe nature shows the importance of this area for the legal regulator. Two levels of penalty can be specified (Stępniewski, Feb 7, 2018):
● a fine of up to EUR 10 million or 2 percent of the annual turnover of the enterprise for such deficiencies as: processing of personal data of minors without the consent of their parents or guardians, non-compliance with the principle of privacy by design, no record of processing activities, not containing information such as data controller data, not mentioning the purpose of processing and/or not neglecting the security of personal data processing.
The importance of data in business 20
● a fine of up to EUR 20 million or 4%. the annual turnover of the company is granted for deficiencies such as non-compliance with the basic princi-ples of personal data processing, lack of legal basis allowing for the col-lection and processing of personal data, failure to obtain the consent of the person to process his data or preventing his withdrawal at any time, processing specific categories of personal data – e.g. racial, ethnic origin, religious beliefs, political and other views, concealing information about the purpose of data processing, the fact of transferring them to other entities, failure to comply with the information obligation towards the person whose data is processed, preventing the use of “the right to be forgotten“ – the right to request the deletion of all personal data stored by the administrator, violations in the transfer of personal data to third countries or international organizations, violations in the processing of personal data and freedom of expression, access to official documents, recruitment, etc.
Incorrectly prepared regulations refer to problems that relate to higher penalties. The amount of 4% trading and not profit is prohibitive and has an important preventive function. In practice, it means that the content of the regulations is prepared by lawyers (Earp et al., 2005) and sometimes the doc-uments contain difficult legal jargon (Ermakova et al., 2016). This affects the willingness to become acquainted with it and the possibility of its understand-ing by the general public (Das et al., 2018). The willingness to read the privacy policy is low (Aïmeur et al., 2016). Most users prefer to opt out of reading pri-vacy policies if this is possible (Steinfeld, 2016) and the mere information that the site has a privacy policy is, for many, the basis for recognizing that there is no problem with privacy protection on a given site (Turow, 2006), which can be dangerous (Robillard et al., 2019). Therefore, there is a tendency to accept the privacy policy by default, due to its difficult nature (Chua et al., 2017; Zhou et al., 2015). This is also associated with the time taken to read the text as stud-ies have shown that the average policy needs 8–12 minutes (McDonald & Cra-nor, 2008), and 20 minutes for one with 5,000 words (Kienle et al., 2009). The length of sentences also affects the level of understanding the content (Chua et al., 2017) and avoiding the use of difficult and complex sentences (Vail et al., 2008). This has a demotivating effect on the willingness to read the document that concerns users’ rights (Milne & Culnan, 2004), who see it as vague, incom-prehensible (O’Loughlin et al., 2019), creating a routine response to the need for consent (Robillard et al., 2019). This problem may get worse because legal changes in Europe in connection with the introduction of the GDPR have led
The importance of data in business 21
to an extension of the content of privacy policies by about 23 percent (Linden T. et al., 2018).
The basis of new legal solutions is transparency, which is particularly impor-tant in a situation where data on users’ online activity can be the basis for cre-ating psychological profiles and the basis for psychological targeting (Kosin ski et al., 2013; Matz et al., 2020; Matz et al., 2017). Regulation (European Parliament and of the Council, 2016) outside the scope of the information obligation, in art. 12 obliges the administrator to take all measures so that it is written transpar-ently, in a comprehensible and easily accessible form, and in a concise manner. This problem matters because it involves access to information about who, why and how processes data collected during website activity. In order to verify the implementation of the abovementioned statutory assumptions, a qualitative and quantitative research on the content and presentation of privacy policies was carried out among 50 online stores providing services in Poland. The selec-tion was based on the 2018 Online Stores Ranking report (Anagnostopulu, Feb 19, 2019) based on consumer feedback after the transaction. The ranking was based on the value of revenues, online sales, volume of website traffic, number of stationary stores and customer recognition. In order to carry out the compar-ative analysis, the study included only the pages of the regulations available in English. The survey was conducted in 10 top-rated stores in categories such as: appliances / electronics, medical and zoological articles, products for children, home and interior. The diversification of the range of products in the analysed stores was aimed at eliminating the possible specificity of individual categories of assortment. Based on the list of online stores, a search was made on the website for a reference or link to the privacy policy or content regarding the protection of personal data to which the store is legally obliged. The list of an-alysed stores, along with the addresses at which the privacy policy is available, has been attached at the end of the study. In two of the 50 cases content was not available. In the case of the Naszzoo.pl store, the hyperlink takes the user to a page that does not exist. In the store can not be found (at 20/03/2019) infor-mation on the privacy policy, and the store’s regulations contain information related to the outdated law regulations. In the case of other online stores, the privacy policy published on websites were the basis for further quantitative and qualitative analysis.
How data is collected, processed, for what purpose and by whom must be not only written, but also written in a concise, clear and transparent way. This was indicated directly in art. 12. To evaluate this, the study adopted the total number of characters, number of words, and number of sentences as a change
The importance of data in business 22
(Soemer & Schiefele, 2019). In addition to the basic variables in the assessment of the difficulty of the text, the average number of syllables per text was calcu-lated, (Cholin et al., 2004; Rello et al., 2013). The value of syllables informs the use of longer and more complex words that affect the perception of the text as difficult and reduce the desire to read it, which is also related to the level of education. Another measure used is the number of words per sentence, which indicates its length and complexity. The ease of understanding the text can be measured by the number of unique words (Rello et al., 2013), which means that texts based on repetitive words require less effort at the cognitive level to interpret it. The study took into account that in sixteen enterprises, detailed information on cookies was extracted into a separate document. The quanti-tative study included the total value of both documents. In other cases they constituted an integral whole.
The research results showed a large variation in the length of the descrip-tion of the privacy policy. This is despite the fact that in the analysed cases, the privacy policy refers to a similar scope of business operations- the func-tion of an online store. The average length of the full privacy policy described available on the website of the surveyed online stores was 19,580.19 characters (sd = 10,085.77). The range was 52,200 characters, where the lowest value re-corded was 4,340 (Diabetyk24.pl) and the maximum value was 56,540 charac-ters (Zooplus.pl). While the subject of the research is not the analysis of compli-ance with the regulation, a difference of more than 12 times raises questions. The provisions in the first extreme regulations indicate, for example, “every person, to the extent resulting from legal provisions, has the right to: access to their data and rectification, deletion or limitation of processing [...]”, however, there is no information about the time or method of seeking their rights, or any exclusions such as Scandinavianbaby.pl. The number of characters does not al-ways translate into the accuracy of the data, as one might think. As part of the privacy policy, the user must also receive information onto whom his data is transferred and for what purposes. In connection with their remote trade activ-ities, such entities include:
● carriers, freight forwarders, courier brokers, entities servicing electronic payments or by payment card,
● lending entities / lessors,
● opinion poll system suppliers,
● service providers providing the Administrator with technical, IT and or-ganizational solutions,
The importance of data in business 23
● providers of accounting, legal and consulting services.
These groups were, for example on the Manito.pl website, without indicat-ing specific entities and mentioned that data “may be” transferred. Data is col-lected for the purposes of order processing and processing, but also for the needs of marketing activities. In some cases, it is written explicitly that the data is also collected for marketing purposes. A good example of this is – “i.e. match-ing the marketing offer to the abovementioned preferences. “ by Meblobranie.pl. The scope of data use, especially on the basis of cookies, applies to such mar-keting purposes as those specified by 3xk.pl. Data collected during user activity is collected for the purposes of the following marketing purposes:
● Website configuration, including adapting the content of websites to user preferences and optimizing the use of websites, recognizing the website user’s device and its location and properly displaying the web-site, tailored to his individual needs, remembering the settings selected by the user and personalizing the user interface, remembering the his-tory of pages visited on the website for the purpose of recommending content, font size, website appearance, etc., authenticating the user on the website and providing the user’s session on the website, including maintaining the Website user’s session (after logging in), thanks to which the user does not have to re-enter the login and password on each sub-page of the website, correct configuration of selected website functions- enabling the verification of the authenticity of the browser session and optimizing and increasing the efficiency of services provided by the ad-ministrator.
● Implementation of processes necessary for the full functionality of web-sites, including adapting the content of website pages to user preferenc-es and optimizing the use of website pages. In particular, these files allow to recognize the basic parameters of the user’s device and properly dis-play the website, tailored to his individual needs; correct operation of the partner program, enabling in particular verification of sources of users’ redirection to the website’s websites.
● Remembering the user’s location, including the correct configuration of selected website functions, enabling in particular the adjustment of the information provided to the user, taking into account his location.
● Analyse, research and audience audit via anonymous statistics that help understand how users use website pages, to improve their structure and content.

The importance of data in business 24
● Provision of advertising services by adapting third-party services and products presented through the website.
The data administrator is the company that collects and processes this data. As indicated in the last point, the provision of advertising services may be car-ried out by external companies. An example of this relationship is the pres-entation of graphic advertising materials in social media based on the products viewed or not bought in the online store. This shows how strong the integration of various media influencing consumers can be. All the more, there is a need for a full understanding of the possibilities, including legal ones, that an enterprise has in collecting and using data.
Access to knowledge about who data is transferred for marketing purposes is an important aspect to eliminate information asymmetry between the user and the company. It should be noted that knowledge in this field may also be important from the perspective of other entities, in order to identify compet-itive advantages and promotional activities used by the enterprise, but also entities that carry out various activities for the company. For example, as part of the privacy policy at Feedo.pl, a list of 51 entities is presented along with their addresses to which data is transferred. On the Agdmaster.com website, the administrator informs that “personal data left on the website will not be sold or made available to third parties in accordance with the provisions of the Personal Data Protection Act.” Such a record may raise doubts when, as a result of analysing the source code of the page, the author has found scripts of ex-ternal entities, such as Facebook, Google or Opineo, which is not mentioned in the content of the privacy policy. There are legal problems, whether there is a “transfer” of data in this case, and whether, for example, exclusive browsing of content on the website exhausts the hallmarks of “leaving data”. Regardless of the assessment, research indicates that all companies use or create technical conditions to collected data.
The distribution illustrating the length of the privacy policy documents indi-cates right-sided asymmetry. If, assuming that the length of the text translates into their detail, it is worth recalling the study Tsai et al. (2011) indicating that consumers are more likely to trust when they know more precisely how their data can be use. Concerns about the way data is processed also result in less willingness to use the given administrator’s services (Nofer et al., 2014). In ad-dition to the cognitive aspect, it is worth paying attention to the length of the document that may discourage a user from reading it, which diminishes the purpose that was imposed on administrators. The time needed to read a text
The importance of data in business 25
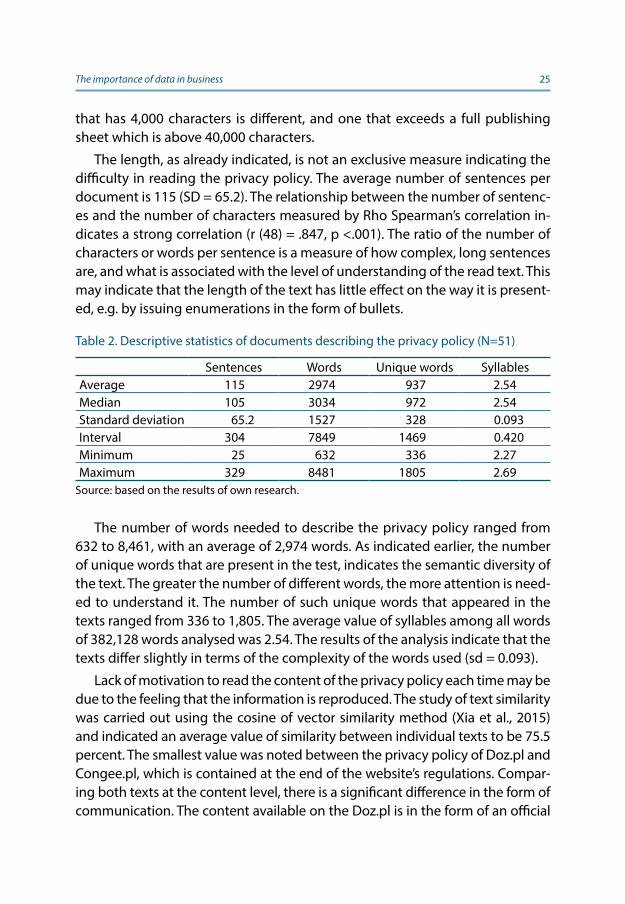
that has 4,000 characters is different, and one that exceeds a full publishing sheet which is above 40,000 characters.
The length, as already indicated, is not an exclusive measure indicating the difficulty in reading the privacy policy. The average number of sentences per document is 115 (SD = 65.2). The relationship between the number of sentenc-es and the number of characters measured by Rho Spearman’s correlation in-dicates a strong correlation (r (48) = .847, p <.001). The ratio of the number of characters or words per sentence is a measure of how complex, long sentences are, and what is associated with the level of understanding of the read text. This may indicate that the length of the text has little effect on the way it is present-ed, e.g. by issuing enumerations in the form of bullets.
Table 2. Descriptive statistics of documents describing the privacy policy (N=51)
Sentences Words Unique words SyllablesAverage 115 2974 937 2.54Median 105 3034 972 2.54Standard deviation 65.2 1527 328 0.093Interval 304 7849 1469 0.420Minimum 25 632 336 2.27Maximum 329 8481 1805 2.69
Source: based on the results of own research.
The number of words needed to describe the privacy policy ranged from 632 to 8,461, with an average of 2,974 words. As indicated earlier, the number of unique words that are present in the test, indicates the semantic diversity of the text. The greater the number of different words, the more attention is need-ed to understand it. The number of such unique words that appeared in the texts ranged from 336 to 1,805. The average value of syllables among all words of 382,128 words analysed was 2.54. The results of the analysis indicate that the texts differ slightly in terms of the complexity of the words used (sd = 0.093).
Lack of motivation to read the content of the privacy policy each time may be due to the feeling that the information is reproduced. The study of text similarity was carried out using the cosine of vector similarity method (Xia et al., 2015) and indicated an average value of similarity between individual texts to be 75.5 percent. The smallest value was noted between the privacy policy of Doz.pl and Congee.pl, which is contained at the end of the website’s regulations. Compar-ing both texts at the content level, there is a significant difference in the form of communication. The content available on the Doz.pl is in the form of an official
The importance of data in business 26
document that only presents the facts required by law whereas the content on Congee.pl is presented in the form of questions and answers. Active speech is used and there is a direct reference to the user: “For what purpose and on what legal basis can we process your data personal? We process your personal data in order to perform the contract concluded with you [...]. Full compliance between privacy policies has been detected between Morele.net and Hulahop.pl. The ad-ministrator’s data was similar, indicating that both brands belong to one owner. It justifies the adoption of a similar privacy policy, however, it also shows how universal content can be and that there is no need to make any changes even when it concerns different online stores with different products. A full Table of similarities is attached to the study (Appendix 2).
The use of data can also be useful from the user’s perspective, because it limits the time needed to find the product one is looking for and speeds up the entire process (Aïmeur et al., 2016), whilst improving the efficiency of market-ing expenses of enterprises (Linden G. et al., 2003; Spiekermann et al., 2015).
It should be noted, however, that regardless of the risk posed by the col-lection of data by enterprises, the users themselves publish data that can be used for various purposes by various entities. A special example is social media. The ambivalent attitude of some users towards privacy should be noted. On the one hand, they are thoroughly familiar with the privacy policy, and on the other hand, they publish their own image, inform about their shopping behav-iour or share content not only about themselves but others too, e.g. relatives or families.
Legal regulations require transparency from organisations who should in-form how, for what purpose and by whom data is collected and processed. Pub-lication of information about partners whose marketing services the company uses may also prove to be a source of knowledge in itself for other companies. Current regulations, with indicated restrictions, allow processing of collected data in order to achieve competitive advantage. This competitive advantage is gained via a better understanding of the consumer and gearing company activities to cater to the consumer insights obtained (Kosinski et al., 2016; Matz & Kosinski, 2019).
Discovering knowledge from dataAccess to data is a necessary condition, but not sufficient, to obtain the addi-tional knowledge needed in the decision-making process. Discovering knowl-edge from data is a process that requires a series of actions to be carried out to answer the questions at a certain level of risk of error. In this chapter, the first part refers to data science and historical considerations that shape the per-ception of data science in modern science. The second part discusses big data analysis models along with an overview of individual elements.
3. The importance of data in knowledge discoveryIf data is the hallmark of modern times, then understanding the data becomes a key issue. The aim of the chapter is to determine the importance of data in the process of knowledge discovery. The chapter discusses the relationship be-tween data, information and knowledge. The chapter refers to the data science and characterizes the changes caused by methodological progress in the area of data analysis.
In 1960, P. Naur pointed to data science as a novelty that is part of computer science, but suggested the need to separate datology or data science as a sepa-rate science (Ratner, 2017). Naur (1974) stated that “Data science is the science of dealing with data, [...] while the relation of data to what they represent is delegated to other fields and sciences [...]”. At the beginning, data science was meaningfully close to data processing. Then in the 70s the aspect of statisti-cal analysis of data was more and more intensively discussed, an example was the speech by Jeff Wu entitled “Statistics = Data Science?"(Sundaresan, 2017). Sundaresan (2017) in his article on the history of data science, points to Bill Cleveland in the International Statistical Review, as an important turning point, calling for the establishment of data science as an area that covers but extends the scope of the area of statistics. After more than 50 years from the beginning of the discussion on the possibility of self-determination in the field of science, the votes are divided (Ceri, 2018; Gibert et al., 2018; Olhede & Wolfe, 2018; Reid, 2018; Shi, 2018; Smirnova et al., 2018; Zhu & Xiong, 2015). On the pages of the Data Science Journal Zhu and Xiong (2015) state “A new discipline called Data Science is coming. It provides a type of novel research method (a data-intensive method) for natural and social sciences and goes beyond computer science in researching data”. According to Reid (2018), it currently seems reasonable to
Discovering knowledge from data 28
consider the field of data research as a combination of statistical modeling and inference, data management, large-scale calculations, their optimization, com-munication and visualization. Data Science is characterized by a new approach to data and their understanding. In 1997, Turkey pointed to a new approach to statistics, where more emphasis was put on using data as a source of hypoth-esis for testing (Gibert et al., 2018). Agarwal and Dhar (2014) suggest that the current development of research tools with unprecedented access to diverse data and taking into account their numbers, promotes the creation of oppor-tunities in which computers are sufficient not only to test hypotheses but also to suggest theories. This controversial approach reduces the role of the scien-tist to an attempt to understand and describe them in the form of generalized conclusions.
Data science in a narrow sense can be understood as research seeking to extract knowledge from generalizable data (Dhar, 2013). In broad terms, data science is a concept emerging from the applications of existing research on measurement, representation, interpretation and management in relation to problems in various areas of the economy and social life (Marchionini, 2016), however, the pure science is omitted in this definition. Provost and Fawcett (2013) show that “data science involves principles, processes, and techniques for under- standing phenomena via the (automated) analysis of data”. Such characteristics contain important elements of data science (Song & Zhu, 2016). While the methodological progress resulting from the development of science and the available tools and computing power used in the analysis of large data sets is indisputable, it does not change the approach and knowledge of the sur-rounding world, but only provides opportunities to better and more accurately understand it.
As it is a fashionable term nowadays, various definitions appear and is iden-tified with knowledge discovery, machine learning, predictive analytics, and data exploration or data mining (Gibert et al., 2018; Kotu & Deshpande, 2019). Although the increase in popularity in the academic and business community of these issues can be noted, the range of techniques and methods for some issues has been known for decades.
The impact on interest is also caused by the availability of technological solutions and software that increasingly supports or even replaces people. As indicated Kotu and Deshpande (2018) “so, who uses data science today? Al-most every organization and business. Sure, we didn’t call the methods that are now under data science as “Data Science.” The use of the term science in data science indicates that the methods are evidence based, and are built on

Discovering knowledge from data 29
empirical knowledge, more specifically historical observations”. The Fourth Par-adigm. Data-Intensive scientific discovery (2009) it significantly raises the chang-es that technological development.
Instead of judging it in terms of alternatives, it should be seen as an oppor-tunity. Just as deduction and induction can be seen as phases of the iterative knowledge acquisition cycle, (Mazzocchi, 2015), the machine can be treated as technological support and complement in the generation, evaluation and hierarchy of hypotheses (Mazzocchi, 2015). Ceri (2018) describes the evolu-tion described in the Fourth Paradigm book as phases that lead to a data-driven approach. This term already appears in many works and forms the basis of re-search and inference methodology (Arunachalam & Kumar, 2018; Hu K. et al., 2019; Huang et al., 2018; Meng et al. 2018), based on the achievements of work in the field of data science. This approach intentionally raises the rank of data throughout the entire research process.
The characteristics of the data-driven approach can be visualized on the basis of autonomous vehicle analogues. Apart from all environmental issues, let’s assume that data is fuel and our goal is to reach places not yet discovered. The more fuel available, the greater the distance one can travel. The larger the radius, the larger the total surface area available. Therefore, the number of un-discovered places is increasing. Importantly, not always “the furthest” means the best solution because it is associated with uncertainty as to whether it will be possible the goal in the event of unplanned events. Sufficient fuel supply allows you to increase the likelihood of making no mistake. This does not mean that they are not in the immediate vicinity. It is not the amount of data and thus the range that determines the chance, but the driver (researcher). Modern methods, like cars, can be used in various conditions and their selection should not be accidental or conditioned only by personal preferences. Some are more advanced, more sophisticated and others less so.
In all cases, one should take the time to understand and master them. What if the car has no driver? Years ago, we would say that such a car will not drive. Today, autonomous cars already exist and arouse extreme emotions (Romero, Dec 31, 2018). In this case, autonomy lies in the lack of need for a person to drive a car, but it is the man who sets the goals and route. The methods used allow optimization of operations, based on imposed guidelines. It is therefore safe to assume that autonomy allows one to traverse the indicated areas, piece by piece. This happens for methods that analyse hundreds of thousands of possi-ble associations to identify the best solution. However, this is not possible with-out human intervention as without the right path and understanding of the
Discovering knowledge from data 30
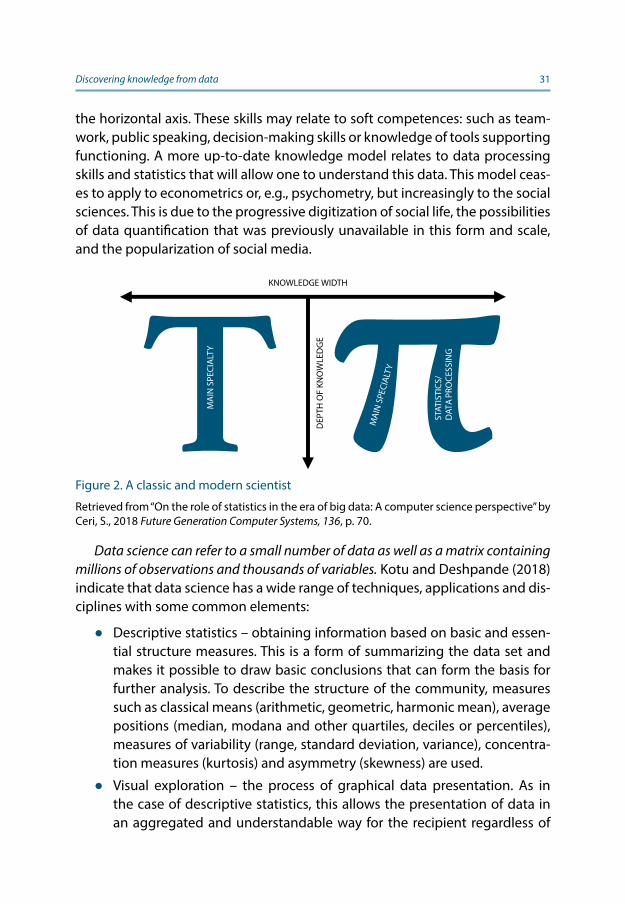
results of the analysis, the whole data process does not matter. The data-driven approach in the current situation is not only possible but necessary. Wider ac-cess to empirical data and methods gives opportunities that were previously unavailable. Regardless of the subdued methodological solutions regarding data collection or analysis, human participation remains the foundation of dis-covering the truth. Data science translates into quality in scientific research, and knowledge in this area becomes an indispensable tool for the scientist. Ceri (2018) aptly illustrated this account in article On the role of statistics in the era of big data (Figure 2). The work of a scientist requires the development of various skills and competences that allow not only to conduct research, but is in accordance with the rule of art to describe, publish, present, popularize and most often also pass as part of teaching. Knowledge of research methodology is acquired most intensively during studies, including doctoral studies. The dis-sertation and its public defense prove the scientist’s ability to conduct research independently, and thus the tool. At a later stage of professional development and work, it is developed incidentally depending on currently conducted re-search. Increasingly complex research procedures and data analysis methods are a challenge for people who have not used them before. This can affect the motivation for continuous learning, but also cause a deepening specialization both in the area of scientific research and applied methods.
The traditional competences of the researcher are based on development in various areas. Knowledge, however, is deepened in one discipline, area or specialty. Emerging interdisciplinary problems constitute an important prem-ise for cooperation with other scientists. This lack of sufficient knowledge forc-es cooperation with people who complement each other. The newer science model is increasingly based on quantitative data as well as in the quest to quantify qualitative data. This approach is to guarantee the objectivity of the conclusions drawn and affect the transparency of research. Transcription from in-depth interviews can be the basis for sentiment analysis, and based on the video recording it is possible to identify the respondent’s emotions. Skills in data processing and analysis are becoming an elementary part of the scientist’s work. One can recall analogies to the skills of using editor programs, the basics of a spreadsheet or the use of e-mail, which today constitute the core curricu-lum in early school and school age, and were once only available to a few.
Figure 2 shows the transition from the T-shape to the Pi-shape of the knowl-edge model (Ceri, 2018). Ceri (2018) in his work refers to this model of acquir-ing knowledge and approach to student education. Specialization in the main-stream (vertical axis) is complemented by various skills, which are illustrated on
Discovering knowledge from data 31
the horizontal axis. These skills may relate to soft competences: such as team-work, public speaking, decision-making skills or knowledge of tools supporting functioning. A more up-to-date knowledge model relates to data processing skills and statistics that will allow one to understand this data. This model ceas-es to apply to econometrics or, e.g., psychometry, but increasingly to the social sciences. This is due to the progressive digitization of social life, the possibilities of data quantification that was previously unavailable in this form and scale, and the popularization of social media.
Data science can refer to a small number of data as well as a matrix containing millions of observations and thousands of variables. Kotu and Deshpande (2018) indicate that data science has a wide range of techniques, applications and dis-ciplines with some common elements:
● Descriptive statistics – obtaining information based on basic and essen-tial structure measures. This is a form of summarizing the data set and makes it possible to draw basic conclusions that can form the basis for further analysis. To describe the structure of the community, measures such as classical means (arithmetic, geometric, harmonic mean), average positions (median, modana and other quartiles, deciles or percentiles), measures of variability (range, standard deviation, variance), concentra-tion measures (kurtosis) and asymmetry (skewness) are used.
● Visual exploration – the process of graphical data presentation. As in the case of descriptive statistics, this allows the presentation of data in an aggregated and understandable way for the recipient regardless of
KNOWLEDGE WIDTH
DEP
TH O
F KN
OW
LED
GE
STAT
ISTI
CS/
DAT
A P
ROCE
SSIN
G
MA
IN S
PECI
ALT
Y
MAI
N S
PECI
ALTY
Figure 2. A classic and modern scientist
Retrieved from “On the role of statistics in the era of big data: A computer science perspective” by Ceri, S., 2018 Future Generation Computer Systems, 136, p. 70.

Discovering knowledge from data 32
the number of observations. This allows one to see certain patterns and anomalies that will be a clue. It is an alternative to independent brows-ing of raw data saved in the form of a string of values. Charts that are the foundation of the graphical form of data retrieval can take various forms adapted to the nature of the data and the scales used. Among the graphical methods of data presentation, the following should be men-tioned: linear methods (the value is marked on the chart in a coordinate system), surface (the volume of the value is presented as the total surface of the figure or part of it), quantitative-pictorial (the value is presented by means of an appropriate number of images with a known unit of one image). The most common types are histograms, pie charts, cartograms and diagrams.
● Extracting dimensions – understanding the structure and differences within the structure allows one to separately analyse the phenomena occurring in given groups. An example of a computational method that allows users to easily and selectively extract and search data for analysis from various points of view is the OLAP (OnLine Analytical Processing) system. This enables data analysis in the form of multidimensional views and are used in the initial phase of the data set review and analysis.
● Hypothesis testing – experimental data is collected in confirmatory data analysis to assess whether the hypothesis has enough evidence to sup-port it or not. There are many types of statistical tests that are directly ap-plicable in business. In general, data science is a process in which many hypotheses are generated and tested based on observational data. Be-cause data learning algorithms are iterative, solutions can be improved at every step (Kotu & Deshpande, 2018).
● Data engineering – the area of data science, associated with the acqui-sition, organization, storage, and organization of data for its effective analysis. Data engineering is responsible for the construction and main-tenance of the organization’s pipeline data system as well as cleaning and bringing the data to a usable state (Furbush, Jun 16, 2018). Working on increasingly complex data requires skills that go beyond handling a standard spreadsheet or statistical programs. Recommended skills in-clude knowledge of, programming in, R, Python or Scale / Java, knowl-edge of SQL, and knowledge of the pros and cons of various ecosystems for receiving (e.g. Kafka Kinesis), processing (e.g. Spark, Flink) and data storage (e.g. S3, HDFS, HBase, Kudu).
Discovering knowledge from data 33
● Business intelligence – responsible for providing results of analysis, indi-cators and reports based on collected data to support managerial deci-sions. One can define BI as a process covering all previous elements or as a product constituting the final stage of the process that helps the organ-ization survive and prosper. It can also be pointed out as a product that allows one to better understand his/her organization and predict the be-ahviour of competitors, suppliers, customers, technologies, acquisitions, markets, products, services, and the overall business environment (Casei-ro & Coelho, 2018).
The DIKW hierarchy mentioned earlier, the original of which was proposed by (Ackoff, 1989) consists of 5 components: data, information, knowledge and understanding. The questioned legitimacy of isolating “understanding” influ-enced the formation of the widespread version known as: pyramid of knowl-edge, information hierarchy, knowledge hierarchy, bypassing understanding and sometimes wisdom. Sometimes modifications to the original go even further and information is treated synonymously as knowledge (Almeida & Soares, 2014). It is worth recalling A. Einstein’s warning that information is not knowledge. Each subsequent element is the basis of the next, each subse-quent element is transformed into another. There can also be no knowledge without information, and information without data. Data is defined as symbols representing the properties of objects, events and their environment. They are observation products, but they are worthless without the right context. The difference between data and information is functional, not structural (Rowley, 2007). The information is contained in descriptions, answers to questions that start with words such as who, what, when and how much.
Information systems generate, store, retrieve and process data. Knowledge makes it possible to transform information into instructions and can be ob-tained either through transmission from who has it or experience. Wisdom is the ability to increase effectiveness and requires one to exercise judgment. The ethical and aesthetic values are inseparable from the actor and are unique and personal (Rowley, 2007). The individual levels refer to the knowledge man-agement concept defined by Zeleny (1987), where they assume the nature of know-nothing, information: know-what, knowledge: know-how, and wisdom : know-why. This combination in a simplified way illustrates the differences be-tween levels.
The first level refers to data that gives nothing but possession itself and is an ordered and unstructured set of observations. Data understood in this way is an elementary record of events, phenomena or actions. Any structuring according
Discovering knowledge from data 34
to any criterion indicates the context of the analysis and makes it possible to interpret and understand the meaning of a given record. Information is there-fore processed data that takes on a useful character. Know-what refers to the possibility of understanding values, which, without it, constitute a worthless re-cord. Knowledge is a combination of data and information, to which expertise, skills and experience have been added to obtain a valuable resource that can be used to support decision making (Rowley, 2007). Apart from the anamnesis thread, Platon (2017), pointed out that knowledge is transmitted to us from the outside or that it results from experience and is identified with deductive sciences. Popper (1979) indicates that knowledge has many shades and is nev-er fully verifiable due to the finite number of possible studies with an infinite number of predictions arising from theories. Wisdom as the highest level of abstraction refers to understanding the source of truth, even in the situation of insufficient data that can shape knowledge.
In the context of the development of science, Allen (2004) proposed a divi-sion of the level of knowledge into theories, area and type. Taking into account the author’s definition of meaning and nomenclature used in Poland, it should be defined as about theory, discipline and field. Theory gathers consistent in-formation about the phenomenon and are connected with each other logically (Gibson, 1993). The transition from information to theory has an intermediate stage, called proto-theory, where the theory is not well-established, but during some period binding on individuals or groups work to create a coherent theory (Boardman, 1997). It may also include many, but differing, proto-theories, each of which does not have sufficient consensus or evidence of a fully accepted theory (Allen, 2004). Theories can be divided based on different areas or disci-plines, and there are common areas where theory from one discipline is a com-ponent of another discipline. The next level of knowledge aggregation is based on the field of science. Knowledge understood in this way is synonymous with science.
Figure 3 presents an illustration of the relationship between the DIKW model and the possibility of automation in discovering knowledge that is the source of wisdom. Two additional dimensions are indicated. The first refers to the possibility of automation through the use of algorithms and programma-ble solutions to perform tasks that allow to acquire, collect and process data to become useful in acquiring knowledge. The second dimension refers to the possibility of performing individual tasks by a human or a machine. To-day, machines based on programmed algorithms perform actions that allow a person to understand the essence of things. The increase in the advancement
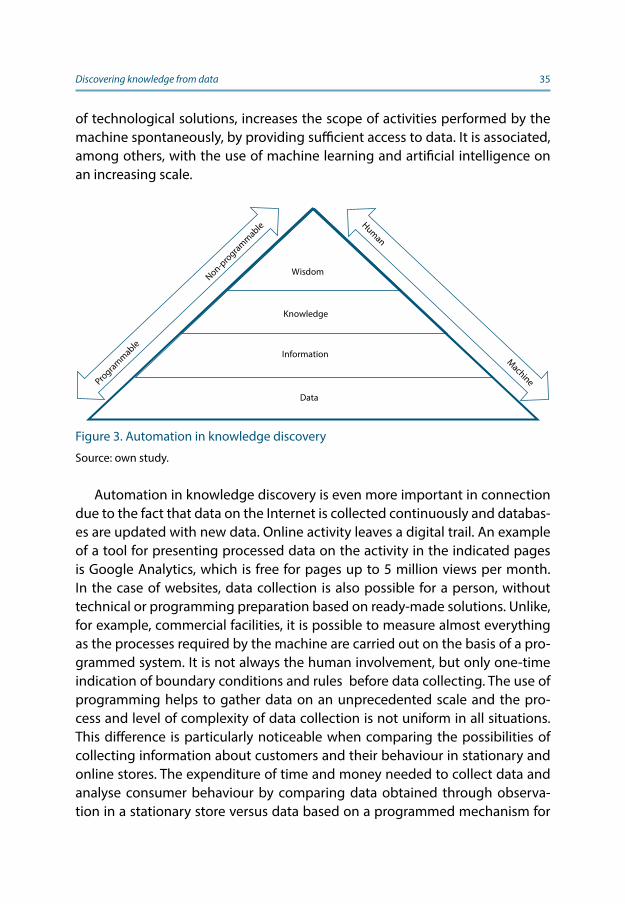
Discovering knowledge from data 35
of technological solutions, increases the scope of activities performed by the machine spontaneously, by providing sufficient access to data. It is associated, among others, with the use of machine learning and artificial intelligence on an increasing scale.
Automation in knowledge discovery is even more important in connection due to the fact that data on the Internet is collected continuously and databas-es are updated with new data. Online activity leaves a digital trail. An example of a tool for presenting processed data on the activity in the indicated pages is Google Analytics, which is free for pages up to 5 million views per month. In the case of websites, data collection is also possible for a person, without technical or programming preparation based on ready-made solutions. Unlike, for example, commercial facilities, it is possible to measure almost everything as the processes required by the machine are carried out on the basis of a pro-grammed system. It is not always the human involvement, but only one-time indication of boundary conditions and rules before data collecting. The use of programming helps to gather data on an unprecedented scale and the pro-cess and level of complexity of data collection is not uniform in all situations. This difference is particularly noticeable when comparing the possibilities of collecting information about customers and their behaviour in stationary and online stores. The expenditure of time and money needed to collect data and analyse consumer behaviour by comparing data obtained through observa-tion in a stationary store versus data based on a programmed mechanism for
Data
Information
Knowledge
Wisdom
Programmable
Non-program
mable
Human
Machine
Figure 3. Automation in knowledge discovery
Source: own study.
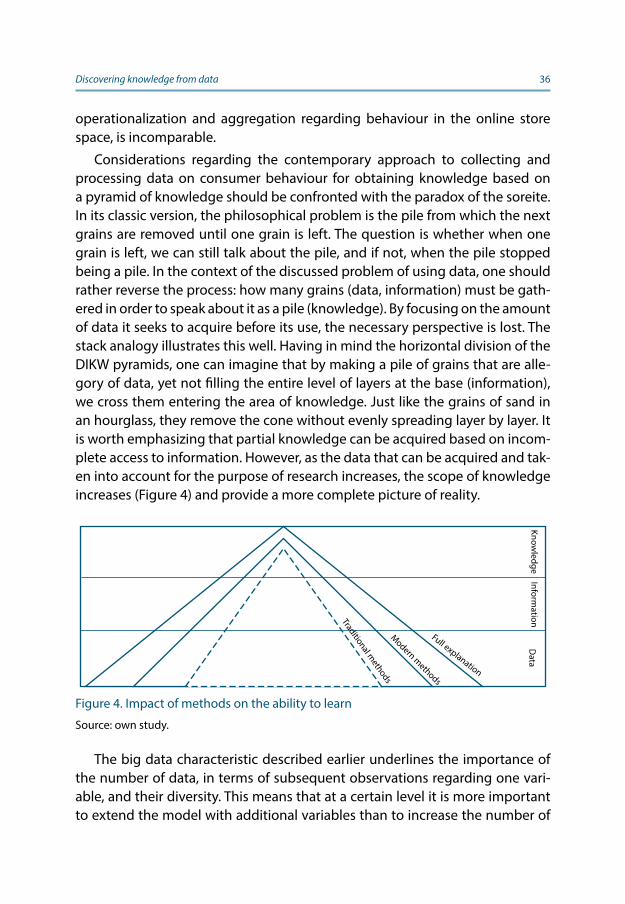
Discovering knowledge from data 36
operationalization and aggregation regarding behaviour in the online store space, is incomparable.
Considerations regarding the contemporary approach to collecting and processing data on consumer behaviour for obtaining knowledge based on a pyramid of knowledge should be confronted with the paradox of the soreite. In its classic version, the philosophical problem is the pile from which the next grains are removed until one grain is left. The question is whether when one grain is left, we can still talk about the pile, and if not, when the pile stopped being a pile. In the context of the discussed problem of using data, one should rather reverse the process: how many grains (data, information) must be gath-ered in order to speak about it as a pile (knowledge). By focusing on the amount of data it seeks to acquire before its use, the necessary perspective is lost. The stack analogy illustrates this well. Having in mind the horizontal division of the DIKW pyramids, one can imagine that by making a pile of grains that are alle-gory of data, yet not filling the entire level of layers at the base (information), we cross them entering the area of knowledge. Just like the grains of sand in an hourglass, they remove the cone without evenly spreading layer by layer. It is worth emphasizing that partial knowledge can be acquired based on incom-plete access to information. However, as the data that can be acquired and tak-en into account for the purpose of research increases, the scope of knowledge increases (Figure 4) and provide a more complete picture of reality.
The big data characteristic described earlier underlines the importance of the number of data, in terms of subsequent observations regarding one vari-able, and their diversity. This means that at a certain level it is more important to extend the model with additional variables than to increase the number of
Data
Information
Knowledge
Full explanation
Modern methods
Traditional methods
Figure 4. Impact of methods on the ability to learn
Source: own study.
Discovering knowledge from data 37
observations from e.g. 250,000 to 270,000. This level determines the maximum acceptable probability of making a type I error, i.e. the maximum risk of error that is acceptable and in rejecting the null hypothesis, which is not actually false. The increase in the number of observations minimizes this error. There-fore, if the admissible error was assumed at the level of α = 0.05 or with a less liberal approach α = 0.01 or α = 0.001, then the increase in number will not significantly affect the cognitive value of the studied phenomenon, but on the validity of the conclusions drawn. The adopted limit values are a guide, and sometimes a determinant that determines the acceptance of the hypothesis in the falsification process. Each subsequent observation will have less and less impact on the results of analysis, which results from its unit participation in the entire sample assuming homogeneity of weights every observation. Each econometric model analysing the impact of the explanatory variable on the explanatory variable estimates the extent to which the given model explains the studied phenomenon. The increase in this value is related to the number of variables included in the model, whose inclusion has theoretical foundations. The researcher strives for full explanation as the aim of the research is to un-derstand the phenomenon under study as best as possible. This approach is idealistic and impossible in social sciences, where the subject of research is the consumer, which, however, does not limit the possibility of desire to pursue him. This is influenced by the choice of appropriate methods in both collecting and analysing data.
In the problem raised in understanding consumer behaviour online, there are very different methods of collecting qualitative and quantitative data. It is possible for the user to obtain answers to questions on a given page and these declarative answers could be in the form of in-depth interviews, participating observations, research based on think aloud techniques, or data collected us-ing the questionnaire method or using the knob motion analysis eye in the context of the presented website or mouse movement on the website.
These are only selected examples illustrating how different data methods can be used at the data collection stage. The choice is always based on the specific goals of the research, the researcher’s limitations and preferences. Lack of access to research tools or lack of knowledge about the possibilities of their use is a barrier that sometimes has a decisive impact on the adopted research scheme. A separate issue is the need to use triangulation of qualitative and quantitative methods, which ensures the highest quality of the research pro-cess, reducing measurement error and identifying hidden consumer behaviour.
Discovering knowledge from data 38
The border between traditional and modern methods is not clear, as illustrat-ed in Figure 4 by the broken line. The modern approach to data collection relies on greater emphasis on operationalizing data and reducing everything to nu-merical values. This also applies to qualitative methods. Thanks to audio-visual recording of interviews, it is possible to isolate, for example, the respondent’s statements (Koretzky, 2019), whilst preparing their transcription (Aichinger & Schoentgen, 2018), to form the basis in the analysis of sentiment (Liu et al., 2019), and image analysis and micro expression for emotional intensity of ex-pression (Benini et al., 2019). This approach increases the scale of research, as the effort necessary to prepare the decomposition procedure for qualitative ma-terial is the same for both 10 and 1000 interviews. The time needed to gather empirical material in this example increases proportionally. This problem, how-ever, becomes marginal when analysing materials published on the Internet.
Digitized content such as website content, user activity within the website, reactions and comments or reviews published by individual customers are open access. In order to aggregate them for the needs of future analysis, it is possible to manually perform actions or use mechanisms to automate work. The use of a machine programmed for a given task is justified in every situation when the time needed for the task to be completed by a person will be longer than the time needed to prepare the appropriate system and do it by the pro-gram. It is related to the skills and experience of the researcher, which can be a source of pre-defined solutions in the form of ready-made algorithm code.
The possibility of collecting all data gives access to various variables with which the researcher can try to explain the studied phenomenon. The increase in the number of variables is not linearly correlated with the level of the ex-plained variable. This is due to the fact that various factors affect the variable in different ways, but if the variable is theoretically justified, it will reduce the value of the unexplained variable. Performing the analysis, the researcher is limited by his knowledge or technology. Available solutions in the field of data analysis far exceed the coded functions of spreadsheets or in popular statistical programs. The criterion for differentiating available program solutions can be their functional simplicity or place of data processing. In the case of simplicity of functionality, some programs are based on the user interface, which the user through the mouse activity can indicate data for the fields defined by default. The user is somehow guided through the entire analysis process. This limits the available options, thus limiting the possibility of making a mistake, but not their elimination. An example of such programs that are based on this form of anal-ysis is SPSS, Statistica, JASP, Jamovi. To a limited extent, it is possible to enter
Discovering knowledge from data 39
commands in the form of code. It is based on other programming languages that alone constitute tools used in analysing data. The most popular languages are R and Python, especially popular in the context of machine learning and ar-tificial intelligence. Another division may concern the place of data processing. Part of the operation can be performed locally on the investigator’s stationary device. Other solutions are based on performing operations in the so-called cloud, which means that this has eliminated the hardware limitations of central units used in offices, because the computing power is not based on desktop computers or internal servers. This translates into the complexity of possible operations and their implementation time. The biggest limitation of this type of statistical programs is reliance on solutions provided on a commercial basis. These types of programs allow the use of a closed number of functions, with-out the possibility of independent development or modification, despite the newer solutions in Journal of Statistical Software (Hamilton & Ferry, 2018; Hyun et al., 2018; Jing & Oliveira, 2015; Korzeń & Jaroszewicz, 2014; Panse, 2018) or Statistics and Computing (Berger et al., 2018; Kosmidis et al., 2019; Li Z. & Wood, 2019; Nomura, 2018; Picheny et al. 2018). It is thanks to the use of computers for calculations that it is possible to carry out thousands of simulations or use the recommended bootstrap method (DiCiccio, et al., 1992) at 10,000 repeat. Modern methods in the field of data analysis, just like it was in the area of data collection and processing, allow better insight into the studied phenomenon and gain more knowledge. Modern methods of data analysis are an extension of traditional methods as analysing more variables and finding connections would not be possible without IT solutions. Thus, the concepts of artificial in-telligence, machine learning and data science are often interchangeable in the media (Kotu & Deshpande, 2018). These are heterogeneous concepts, and their general relationship is depicted on Figure 5.
Artificial intelligence is a broader concept than machine learning. Solutions attributed to machine learning can be used to create artificial intelligence al-gorithms. The machine learning process imposes techniques used in the anal-ysis process, while artificial intelligence autonomously selects the techniques learned, depending on the situation. Artificial Intelligence (AI) is a science emerging from the mid-twentieth century, associated mainly with technology and the development of intelligent products, to perform activities and expand human intelligence (Zhang & Dahu, 2019). Artificial intelligence is indicated as the most advanced technology to date in human history (Zhang & Dahu, 2019) and can help or replace a person in complex activities, including not only per-forming manual activities.
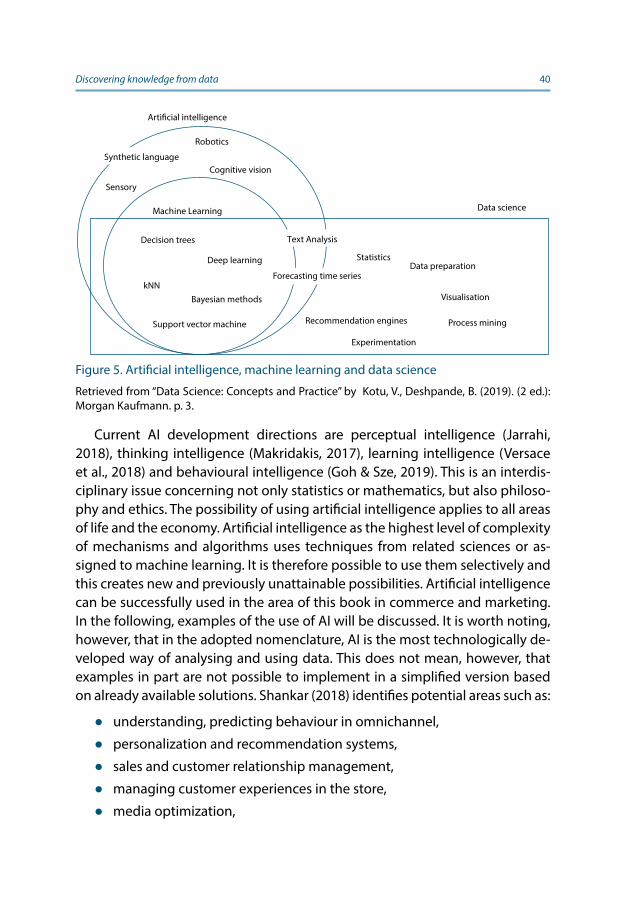
Discovering knowledge from data 40
Current AI development directions are perceptual intelligence (Jarrahi, 2018), thinking intelligence (Makridakis, 2017), learning intelligence (Versace et al., 2018) and behavioural intelligence (Goh & Sze, 2019). This is an interdis-ciplinary issue concerning not only statistics or mathematics, but also philoso-phy and ethics. The possibility of using artificial intelligence applies to all areas of life and the economy. Artificial intelligence as the highest level of complexity of mechanisms and algorithms uses techniques from related sciences or as-signed to machine learning. It is therefore possible to use them selectively and this creates new and previously unattainable possibilities. Artificial intelligence can be successfully used in the area of this book in commerce and marketing. In the following, examples of the use of AI will be discussed. It is worth noting, however, that in the adopted nomenclature, AI is the most technologically de-veloped way of analysing and using data. This does not mean, however, that examples in part are not possible to implement in a simplified version based on already available solutions. Shankar (2018) identifies potential areas such as:
● understanding, predicting behaviour in omnichannel,
● personalization and recommendation systems,
● sales and customer relationship management,
● managing customer experiences in the store,
● media optimization,
Articial intelligence
Data scienceMachine Learning
Cognitive vision
Robotics
Synthetic language
Sensory
Decision trees Text Analysis
Forecasting time series
Recommendation engines
Deep learning
kNN Bayesian methods
Support vector machine
Data preparation Statistics
Visualisation
Experimentation
Process mining
Figure 5. Artificial intelligence, machine learning and data science
Retrieved from “Data Science: Concepts and Practice” by Kotu, V., Deshpande, B. (2019). (2 ed.): Morgan Kaufmann. p. 3.
Discovering knowledge from data 41
● inventory optimization,
● customer service and payment management,
● logistics, transport and supply management.
Thanks to artificial intelligence it is possible to understand customer behav-iour at key moments in the decision-making process. The key aspect for AI is its fuel and its understanding. Data sources can be of various types: manually entered, various sensors, cameras based on historical databases. An important source of such data are cellular devices that can collect and transfer data relat-ed to the user’s activity not only about his activity within mobile web browsers but as a sensor for store location or based on a camera image. The increase in the number of mobile devices and the use of mobile applications in commerce gives additional insight into the path followed by the customer.
The challenge of today’s trade is to find solutions that will allow one to an-alyse the customer and all information that can be collected: whether he uses a mobile application, website or is physically in the store. Today, each format is analysed separately due to the low possibility of data binding. This option exists if the customer has an account and is logged in during browsing. In the case of presence in the store, registration of purchases is possible using a loy-alty card. However, the data in this case will only apply to the time, place and products purchased. Therefore, if the customer’s path runs from browsing in an online store to buying in a stationary store, then the analysis of the whole buying process is possible.
In a situation where the customer got acquainted with the offer in the store, but did not make the purchase, the seller will not have this knowledge. He will not know what the prospect was interested in and how much time he spent. Using traditional methods, the seller will not know what problems were en-countered in the transaction not being finalized and other important details.
Artificial intelligence allows to solve these problems in theory. Why in theo-ry only? Because the implementation of such tasks would involve the need to inform consumers, obtain appropriate approvals and adapt the privacy policy to a level that is not currently acceptable. Technical solutions already exist, but their scope of use goes beyond accepted social norms. This is illegal and social-ly unacceptable. A hypothetical model would assume, for example, an analysis of the image from the front camera phone when using the application, a com-puter camera while browsing a given website and the camera system in the store. This type of audiovisual data would allow to identify people using a given
Discovering knowledge from data 42
page or application regardless of the device or account they use, as well as peo-ple in the store and to link activity data in various trade formats.
The ability to identify a person regardless of where they come into contact with the company is one of the most important bases for implementing the omnichannel assumptions (Lee et al., 2019; von Briel, 2018), Today it is imple-mented using traditional methods or using substitute tools such as beacons (Caro & Sadr, 2019; Sturari et al., 2016). Identifying customers is the first step and the use of audiovisual material could be used by artificial intelligence to analyse consumer behaviour based on eyeball movements: what they paid at-tention to, what they were looking for (Otterbring et al., 2016) or for microex-pression and analysis of emotions (Walsh et al., 2011).
The technology can support the personalization and recommendation sys-tem by indicating solutions based on the provided information. Based on the accumulated knowledge about the consumer, as a result of conducted analysis, the system can predict the needs, based on discovered patterns. This may ap-ply to information on historical transactions or those that have not been paid for. Knowledge about what products the consumer viewed (measured by the number of viewed product cards), what he paid attention to (individual actions such as clicking and viewing photos, mouse movement, exposure time of a se-lected area of the page) and in what order, can be the basis for analysing pref-erences and provide guidance for future recommendations. Predictive models uncover patterns that may relate to repetition of purchases or preferences in this case. Preferences can also be determined based on information about re-jected products and thus propose a product that will meet the expectations of the recipient.
Recommendation systems may also apply to complementary products. The behaviour of other consumers is an important reference point. By conducting a comparative analysis, it is possible to determine the relationships that will be used for subsequent customers. Such a system applies not only to the purchase of products (Razia Sulthana & Ramasamy, 2019) but also content made availa-ble online (Zihayat et al., 2019). This applies to watched on-demand movies, books, articles, and online videos. This is due to the possibility of collecting not only declarative data, but information on actual activity. Consumer demand for these types of systems is growing for two main reasons linked to each other: the increase in the number of content available on the Internet and the desire to best use time. Recommendations are based on generally available options, which the recipient can also access independently. The system indicates which movie, music or content of the post on social media may interest the user and

Discovering knowledge from data 43
affect satisfaction by adapting content to the recipient and extend the time spent in a given medium.
Managed sales and customer relations as key areas of business can also be supported by solutions in the field of artificial intelligence or individual modern methods image or text processing, web scrapping, content generation. Sales understood as a transaction are preceded by a decision-making process. Oth-erwise one can characterize the decision-making process for purchases on the B2B and B2C market. Sales management on the B2B market include searching for potential contractors, preparation of offers, negotiations, preparation and confirmation of orders, execution of transactions and handling of documenta-tion, including legal and accounting documentation. The length and complex-ity of the process is related to the level of possible product offer modifications, order value, and is relevant to the recipient. Automation possible at every such stage. Anatomy understood not only as the ability to search, collect and pro-cess data, but also to indicate solutions based on them. In some cases, a person as a company representative is not involved in the process. This happens in the case of recommendations for movies, posts, online content or scientific arti-cles suggested based on previous customer feedback. In some cases, human participation is still important for control purposes. Another scope of activity is searching for potential customers based on search results for a given phrase, finding email addresses. Analysis of the content on the website of a potential customer in order to adjust the offer including the price is another thing. It also illustrates the difference between artificial intelligence and modern methods that artificial intelligence uses. The highest level would be not to indicate ways of searching for customers, but only to present all the theoretical solutions based on e.g. CRM system and the use of virtual voice advisers acting as sell-ers. Indeed, pointing to one specific path is already a limitation which in reality does not have to be the best. It is increasingly common to provide information to users based on the question they have written, what is stylized as a con-versation. This form of chatbots analyses the written content and adjusts the answer to it. Transferring this to a verbal level, like a telephone conversation, is the next step. It is possible that bots’ conversations were not only text-based via a website, but using a speech synthesizer to initiate conversations, i.e. cold call-ing. If the answer is positive, the contact would be continued by the employee. Therefore, it is possible to use telephone calls not only to reproduce previously recorded messages, but to interact and answer emerging questions. However, we are entering the field of futurology.

Discovering knowledge from data 44
AI assumes process automation, i.e. their implementation in a repetitive manner with changing available data resources without the need for human intervention. What’s more, it is possible to use the experience gained to im-prove developed solutions. Pointing to previously defined and imposed only one specific customer acquisition path is already a limitation which in reality does not have to be the best. The use of automation in customer service is not a new phenomenon. Today’s standard is generating emails when confirming transactions or changing its status. Virtual advisors are available via websites on the websites of banks or telecommunications companies. Their use is based on the choice of one of the available topics by the “interlocutor” and clarifying the problem on the principle of a decision tree and obtaining answers in the form of text or audio or redirecting to the appropriate subpage. The user can manually enter the content of the question or problem. The system at this level does not understand the question, but only through basic operations in the field of text analysis finds keywords and associates them with the previously programmed answer that is displayed. The tendency to use this type of com-munication, or rather to obtain information, is associated with other alternative forms available. With the contact tab being able to choose to send an email, phone contact, leave a number to call back, a database of frequently asked questions or a virtual advisor with a humanoid shape, the consumer chooses the best form for him.
Habits are also important, as users who shaped theirs during the period of unavailability of virtual assistants, would find it more natural to use more natu-ral communication. Studies have shown that the reception of communication is also influenced by giving it a human character by adding a photo of a human (Go & Shyam Sundar, 2019). This is different in the case of social media, where the basic form of two-way communication is the text form. In the case of Face-book, conversations was moved to a separate application in 2016 called Face-book Messenger. This enabled programming within the application and creat-ing so-called virtual avatars. Chatbot is a program inside the messenger that interacts with users by providing information, answering questions. It plays the role of support, sales and has the ability to initiate contact within the company profile, i.e. in relation to potential customers browsing the content. Extracting the application enabled its use and implication in external services such as the company website or online store. The functions that chatbots can perform are very broad and can be used in the process of verifying the availability of goods, information about opening hours, booking a table at a restaurant, at the hair-dresser’s or a cinema ticket for the indicated film screening. This goes beyond

Discovering knowledge from data 45
the information function by becoming an integral part of the sales process without employee involvement. The number of entities that use them is grow-ing, exceeding 300,000 in 2018 (Nealon, Jun 4, 2018).
The role of a virtual advisor may not be limited to the interactions described above as they can provide real support throughout the entire decision-mak-ing process. This type of assistant can accompany the customer from when they were entering the website, through familiarizing with the offer, until the finalization of the purchase. In a situation where such a communication chan-nel would be an integral part of each tab, it would be possible to collect and present information based on an analysis of consumer behaviour. In the event that the system would know about the preferences or boundary conditions set by the consumer, the assistant could indicate whether the product meets the expectations or recommend another. Implementation goes beyond the basic methods currently used and would require the use of artificial intelligence. In the real world, humanoid assistants also occur (Cuthbertson, Oct 9, 2018). Their role results from the assigned goals, appropriate programming and may relate to directions, settlement of transactions or providing additional information about the product and offer.
The use of data by artificial intelligence in the process of data analysis to achieve benefits goes beyond activities aimed at increasing revenues and can help in risk management, minimization of potential frauds (Lunden, Jun 21, 2018), detection of anomalies by raising data on Internet payments and micro-payments to support both entrepreneurs and customers. Data analysis can support logistics, transport and optimization of delivery costs. Uber, as an ap-plication associating drivers and potential passengers, uses machine learning to predict potential routes, optimizing the time used inefficiently by drivers (Turakhia, Nov 10, 2017).
Optimization of costs and improvement of efficiency of expenses applies specially to marketing activities. Spending on advertising in traditional media is associated with limited ability to assess their impact on final purchasing de-cisions. Advertising on the radio, television or in the printed press influences brand recognition and propensity to buy, which is supported by numerous studies (D’Alessio et al., 2009; Davtyan & Cunningham, 2017). However, the pa-rameterization of financial results assigned to a given promotional campaign is limited. This is due to the time interval that occurs between the display of ad-vertising content and observable shopping behaviour, such as placing an order or visiting the store. In the case of Internet advertising, evaluation is much more possible by tracking the consumer and his behaviour to assess its effectiveness.
Discovering knowledge from data 46
This efficiency in social media can be measured with many variables, which will be discussed in the following chapters. Each action and reaction can be measured. These types of values are a source to understand what influences consumer behaviour and how to optimize results based on both generalized data and personalizing marketing messages based on information collected about the user.
All the activities described are aimed at making the best use of consumer knowledge to optimize costs or improve effects, while supporting customer service, which can be important and helps the recipient. The examples de-scribed can be implemented using artificial intelligence, giving the “machine” autonomy, access to data and equipping it with appropriate mechanisms. These mechanisms can also be selectively used in created models in the process of knowledge discovery. Knowledge of methods creates a spectrum of available options and can be crucial when making decisions about how to process data, analyse them, and as a consequence may be crucial for the results obtained. The relationship between data, information and knowledge indicated in this chapter is the foundation for understanding the possibilities offered by the proper use of differentiated data sources. The described possibilities are only selected examples showing the spectrum of their application. However, their use requires a thoughtful implementation process.
4. The process of discovering knowledge from dataPotential access to data becomes a temptation to use them. This use cannot be an intent in itself. The purpose of this chapter is to present the most important data processing models. This chapter presents their characteristics and analy-ses individual components in the context of digital marketing. Metamodel in data science assumes: understanding the problem, data preparation, model preparation, and its subsequent implementation and maintenance (Kotu & Deshpande, 2019). This is the most general look that can be adapted to every problem that arises. A model with a similar degree of generality is the DMAIC model (Srinivasan et al., 2014) based on the six-sigma method: Define-Meas-ure-Analyze-Improve-Control which is based on the desire to improve quali-ty, to excellence based on the data obtained. Originally, it was determined to improve quality in the production process, but was successfully adapted to various problems (de Mast & Lokkerbol, 2012). DMAIC is an important starting point to understand how data can be used to improve existing results. The pro-

Discovering knowledge from data 47
cess including the elements that make up its name – Define, Measure, Analyse, Improve, Control and indicate general steps that assume purposefulness in ac-tion. It consists of 5 stages (Smętkowska & Mrugalska, 2018):
1. Definition of goals and guidelines- definition of the resources and respon-sibilities needed, defining the structure capable of achieving the intended goal, defining the time frame of the entire project and obtaining approval and support of the board.
2. Measurement of the process – the identification and validation of key vari-ables, determining the scope of data and assessing the possibilities of their use, determining the current state and measuring the current efficiency and conducting comparative tests.
3. Analysis of the results of previous studies and identification of sources of imperfections – assessment, determination of possible causes of differenc-es between the assumed performance and the current state, estimation of resources required to achieve the goal, identification of possible obstacles.
4. Process improvement – implementing changes that eliminates imperfec-tions by developing and testing possible solutions, choosing the best, de-signing an implementation plan.
5. Control of the improved process through continuous monitoring of results- preparation of documentation for the standardization plan and process im-provement through and its confirmation through comparative analysis.
Knowledge Discovery in Databases (KDD) is another model based on the search for knowledge from data and refers to the process of all work needed to understand and extract knowledge from data. It goes beyond the narrowly understood data mining (Tavani, 1999) used to achieve the goals of KDD (Kah-raman & Yanık, 2016). Shikhli and Hammad (2018) develops the abbreviation KDD as “Knowledge Discovery and Datamining” which illustrates the relation-ship between these concepts. KDD is likewise defined in the Encyclopedia of Computer Science and Engineering as Knowledge Discovery and Data Mining (Wu et al., 2009). Discovering knowledge from databases is based on data that must be collected and decoded, which can be used. If we assume that KDD is a process, then DM is its focal point and consists of 4 stages (Wu et al., 2009): data acquisition and integration, data marking and inspection, interference elimination and data cleaning,
Discovering useful patterns and models depicting reality is a common goal of data mining (DM) and knowledge discovery from databases. KDD also relates to the stages preceding the selection of data, based on previous knowledge
Discovering knowledge from data 48
and activities following the discovery of patterns (Talia et al., 2015). Aggarwal (2015) in his book emphasizes that although data mining evokes associations and the analytical approach and algorithms, the vast majority of work concerns the process of data preparation. Raw data can be unstructured or in a format that is not immediately suitable for automatic processing.
A separate problem is the issue of data selection decisions and obtaining the corresponding raw data. DM applies more to technical matters of data pro-cessing, which is part of the KDD (Tsironis, 2018). Thanks to KDD, it is possible to find patterns that would not be possible through the use of traditional methods of data processing and analysis. Identifying any pattern is not enough. Tsironis (2018) defines an interesting pattern as one that is easy to understand, impor-tant, potentially useful and innovative. In addition, a pattern is also considered interesting if it confirms the hypothesis that the user is trying to confirm.
Cross Industry Standard Process for Data Mining (CRISP-DM) is another pop-ular model acquiring knowledge from data (Chiang & Yang, 2018; Marbán et al., 2008), which similarly describes the test procedure in 5 stages (Fernandes et al., 2019):
1. business understanding,
2. understanding of data,
3. data preparation,
4. modeling,
5. implementation.
The model which has data mining in its name, goes beyond the narrowly understood concept of data mining. Both the first and last stages give meaning to the whole action, which is the same as discovering knowledge from data. Despite being indicated more than 20 years ago by Fayyad et al. (1996) the distinction that DM refers to the use of mathematical algorithms in the extrac-tion of patterns, and covers its scope includes both preceding and following, DM is treated interchangeably in understanding data analysis as well as the whole process, and moreover interchangeably for predictive analytics (PA) (Nis-bet et al., 2018). It can therefore be assumed that the narrow meaning of both PA and DM is an element of KDD, however, in a broad sense, all these elements relate to the process of understanding, collecting and analysing data in order to discover discovered relationships. In the further work, these terms will be treated synonymously, unless there is any indication of a narrow understand-ing of any of them.
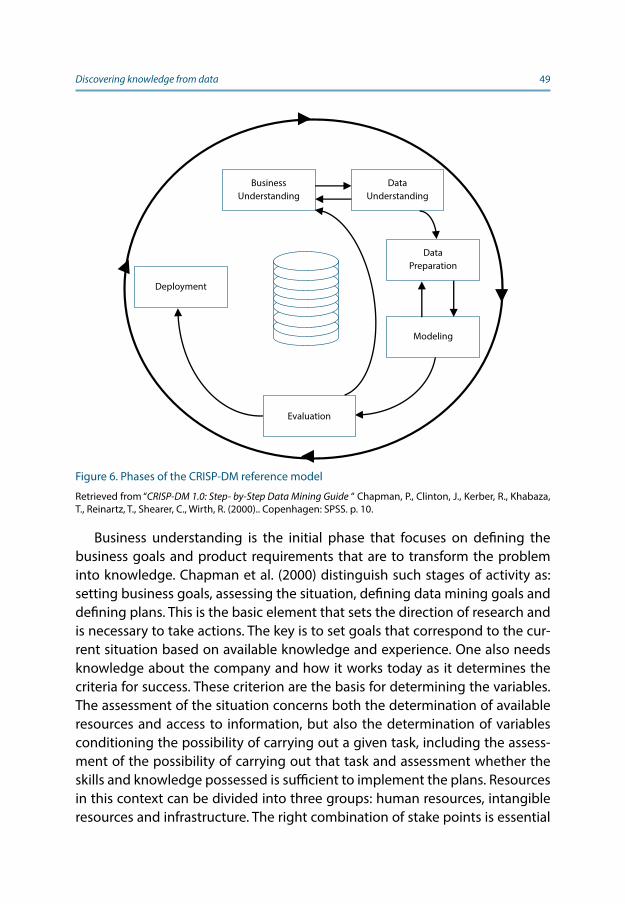
Discovering knowledge from data 49
Business understanding is the initial phase that focuses on defining the business goals and product requirements that are to transform the problem into knowledge. Chapman et al. (2000) distinguish such stages of activity as: setting business goals, assessing the situation, defining data mining goals and defining plans. This is the basic element that sets the direction of research and is necessary to take actions. The key is to set goals that correspond to the cur-rent situation based on available knowledge and experience. One also needs knowledge about the company and how it works today as it determines the criteria for success. These criterion are the basis for determining the variables. The assessment of the situation concerns both the determination of available resources and access to information, but also the determination of variables conditioning the possibility of carrying out a given task, including the assess-ment of the possibility of carrying out that task and assessment whether the skills and knowledge possessed is sufficient to implement the plans. Resources in this context can be divided into three groups: human resources, intangible resources and infrastructure. The right combination of stake points is essential
Business Understanding
Data Understanding
Data Preparation
Modeling
Evaluation
Deployment
Figure 6. Phases of the CRISP-DM reference model
Retrieved from “CRISP-DM 1.0: Step- by-Step Data Mining Guide “ Chapman, P., Clinton, J., Kerber, R., Khabaza, T., Reinartz, T., Shearer, C., Wirth, R. (2000).. Copenhagen: SPSS. p. 10.
Discovering knowledge from data 50
for success. Intangible resources mainly concern access to data that will be-come the basis for analysis. In the case of infrastructure, we are talking about tools that will enable the collection, processing and management of data. At this stage, the effectiveness of the actions taken is assessed, making it possible to determine the costs and indicate the level of expected benefits that have a positive impact on the company’s value or profit. Therefore, the company’s general goals should be combined with measurable variables that correspond. This forms the basis for future model design. The holistic approach to business objectives with the model’s objectives while simultaneously characterized re-sources enables the definition of a full plan and schedule of activities.
Understanding the data is the second step in the CRISP-DM model. Misun-derstanding of data will lead to erroneous conclusions. If the value depicting the number of visits to the page is the number of page launches, this can not be identified as the number of people who visited the site, because one per-son can perform a given action multiple-page at different intervals. The use of this value in further analyses modified the perception of e.g. the effectiveness of various promotional campaigns. This is the stage that starts with collecting data and giving the right context to understand the information they contain. Acquiring data, in the case of companies optimizing operations, in the larg-est measure related to their databases based on the company’s history. This can apply to both the revenue side, i.e. the price and quantity of sales, date of orders, customer data and cost side: production costs, costs of marketing activities. The data referred to as raw are the best representation of reality and allow one to familiarize themselves with the entire material. It is necessary to assess the quality of the collected material and to make its full characteristics. The reliability of the data indicates the possibility of using them in the analysis process as a source of knowledge.
The preparation of the data is of a technical nature, inseparable from the researcher’s work. Based on the available data sets, together with their char-acteristics, variables that match the tasks given are selected. The data cleans-ing process that improve data quality then follows. Data quality in the narrow sense is a way of preparing data suitable for further analysis. In a broader sense, it is achieved data potential that can be used through the applied empirical models. Data understood in this way must meet 8 assumptions (Kenett R. et al., 2017). First, the scale of the variables and the amount of data must correspond to the complexity of the problem. This remains a subjective issue, however, as information noise can drown out the image, just as it may contribute to erro-neous conclusions as a lack of sufficient data range. The data structure must
Discovering knowledge from data 51
also enable the combination of structured quantitative data and unstructured semantic data. In the case of different data sources, it is important to integrate them properly. This process must be based on data relevant to the problem. This significance is not only measured by the adequacy of the data but also by its timeliness. The more turbulent the conditions, the greater the weight of this factor: time. A homogeneous criterion determining the fulfilment of this condition cannot be indicated, which makes the researcher responsible for cor-rectly made decisions. In the event of permanent monitoring, the data must be updated. In the case of using solutions based on appropriate infrastructure, the implementation of cyclical activities can take place without the need for a con-stant effort of the researcher, limiting his role to the control function. Including a time stamp allows one to make trend analyses that will illustrate changes both before and after making changes resulting from the implementation of milestones based on the analysis. This makes it possible to assess the effective-ness of the proposed solutions. R.S. Kenett et al. (2018) also indicates that data quality is manifested in the ability to generalize data at the statistical level, i.e. the possibility of inference on a sample and scientific basis, as the possibility of application based on a specific target population to other populations. The study based on good quality data gives the opportunity to operationalize the information provided as a result of the study. The last qualitative criterion for perceiving data quality is providing clear and comprehensible information to the right people at the right time (Kenett R. et al., 2017).
At the technical level, data processing requires action to be taken to enable its use. Knowledge in this area has a more operational nature as it is necessary for the proper conduct of the process and is used to avoid errors and prob-lems at the stage of analysis. The interested reader is encouraged to deepen the problems of data processing based on books focusing on the subject that will only be highlighted in this chapter (Grus, 2019; O’Reilly, 2016). The first stage is the aforementioned data cleaning which involves actions as filling in missing values, smoothing noise resulting from the identification of outliers and im-proving inconsistencies in the data. To this end, techniques such as estimating missing values, manual supplementing of missing values and determining the most likely value by means of regression or tools using Bayensian formalism or decision trees are used (Han et al., 2012).
The choice of technique should be justified by the nature of the data and the share of missing values in the entire set. Noise reduction applies to both so-called, label noise (class noise) where the problem relates to incorrect classifi-cation of markings for input values, and attribute noise resulting from incorrect
Discovering knowledge from data 52
or incomplete values (García-Gil et al., 2019). Noise smoothing is based on an attempt to capture patterns by modifying individual points to reduce uneven-ness (Xu & Jasra, 2019; Ylioinas et al., 2016). At the data cleaning stage, less spectacular and statistically advanced operations are carried out to improve the process. As part of this process, data formatting, according to the adopted scheme, which will also be understandable for the machine at the stage of data analysis. The entry “19/03/2019” is a date, same with 19-03-2019 or 19.03.19. This string of characters is understandable when the context is clear. The dif-ferences in the notation may be a limitation that will transform the date under-stood in this way into a numerical value. It is therefore necessary to unify this type of records or to “teach” the system what a particular value means. A similar problem may arise from the use of a non-uniform decimal separator. Descrip-tive analysis is often sufficient to identify this type of interference. However, these are activities that require a lot of attention as they might cause a critical problem.
The next stage of data preparation is the integration of data that comes from various sources. The goal of data integration is to collect data so that one can get full insight into the problem being analysed. Such aggregation allows the unification of data related to sales, costs, employee activity measured by the number of phone calls made, the volume of traffic to websites and the number of clicks on advertisements in the form of online banners. Such access makes it possible to identify connections and cause-effect relationships. This example relates to linking data from different departments in a company, to get a com-plete picture of the company.
Employee activity can be measured by the number of phone calls made to the recipient’s number, date and length of the call. Variables in this case may not be limited to quantitative values like frequency, but also qualitative, based on an automated analysis of the nature of the message and the relationship. Communication can also take place directly during the meeting. Data on this may result from data related to glocalization. Each of these examples can be an element of a separate database, but only their integration associated with the connecting factor can give knowledge that will influence the understand-ing of the client’s decision-making process and the choice of the form of the appropriate form of communication. This database concerns customer infor-mation such as his contact details, order history, office location. All these data are characterized by the previously described big data features and only their proper integration will allow to identify valuable patterns. Integration does not mean copying data to one common base. Without clear relationships and
Discovering knowledge from data 53
connections, with the wrong data format, these will only be numeric entries with no additional value.
Integration also involves the unification of data labels, so that, for example, the system will understand the name “client_id” will be the same as the name of the “id-client” variables used in another database. The appearing system term refers to the assumption of the conditions in which activities have been pro-grammed and implemented without the need for manual operation by a hu-man. Such a system ensures continuity of task implementation, when updating the database with new observations. The goal of integration is not only to put data in one database, but to do it optimally. Optimizing the size of databases without losing any data can include, among others, eliminating duplicate data held in various configurations.
Storing the same information in several places may temporarily increase their transparency, e.g. all customer data is in the order history database, in the employee activity database. Extracting the customer base, assigning them an identification number, will allow using only a series of digits with different types of cancellations without the need, loading data that will be unnecessary in individual analyses (headquarters zip code, level of discount). Another good practice, when the models and size of the database is advanced, is to define the data types for the values stored in it. In a situation where the system has indicated that there is text in a given column, more memory in the database is reserved than if the indicated value was saved in accordance with its type.
We can distinguish several types of data: logical values in a binary system, integers, numerics and characters. In each case, by predefining the type, the range that is expected to be introduced is defined. The correct determination of the data type is helpful when performing analyses, as the system may indi-cate an error or warning. If the variable were to be defined as text, the system will indicate that the text cannot be a divisor, regardless of the value entered being an integer. This organization of data can therefore help in the next stages of the data exploitation process, but also improve the efficiency and speed of calculations performed by the system. Of course, the difference in performing simple operations on 1,000 variables will be unnoticeable for the observer but doing so with many years of data will not.
Compression, which does not cause data loss is therefore recommended to complex databases. The preparation of the database for future analyses is based, among others, on the selection of data that is or may be related to the problem being analysed. This reduces resources, including the time it takes to process and perform calculations. What’s more, it reduces the risk of making

Discovering knowledge from data 54
a mistake, because the database structure will be simpler. In this case, we are talking about data reduction which may be based on the reduction of replace-ment, elimination of selected columns (assuming that in accordance with the rule of art, rows correspond to observations), or reduction of dimensions. Di-mension reduction is based on transforming data as intended by the research-er. Each reduction diminishes the cognitive value and facilitates interpretation, making the data more transparent.
Transformation can also be used as an additional variable. In the case of marketing activities in the form of sponsored ads on Facebook, the result may be the number of people who have used the promoted offer. This value can be expressed on a continuous scale in the number of people who used it or trans-formed into an ordinal variable. The value of cash flows assigned to the custom-er can be expressed in the value of money, or as a result of the transformation of numerical values on a nominal scale, each customer will be assigned a label, e.g. a standard customer, key customer. Of course, the presented simplifica-tions illustrate the possibilities, the decision is made by the researcher because he is the architect of the base. A properly prepared database is complete when it is at the same time as small and consistent as possible, and the assigned data types of variables correspond to their content. This will enable optimization of resources: especially the time and required technical infrastructure, and thus the money needed to perform operations on such a prepared database.
In the case when we integrate data from an enterprise, numerous restric-tions can be levelled by systematizing the way of entering new data and col-lecting it. In this situation, the enterprise is responsible for the default shape of the database, which will be used in the analysis. The enterprise increasing-ly uses social or economic data that it obtains from outside the enterprise. Blazquez and Domenech (2018) proposed the division of non-traditional data sources according to the purpose of seeking information, conducting financial and non-financial transactions, the purpose of data dissemination, the purpose of social interaction and sources of non-purpose nature. These types of sources rely on the transfer of data via a computer and makes it possible to access for better understanding.
A basic example for the data on the information sought the data stored by search engines. Some of them provide anonymous information illustrating the changes that have taken place over time – Google Trends. Data of a similar but much narrower range can be obtained by analysing search engines inside the website. Search results can also be information in itself, as it can be a source of activity for competitors. Knowing what pages are presented outside of

Discovering knowledge from data 55
a specific query within the Internet search engine gives one the opportunity to conduct a comparative analysis and create a competitive advantage.
Appropriate query structure may indicate pages within which the page is promoted, assuming that the given page has redirection in the form of hyper-links. Evaluation of search results can illustrate the context in which a given phrase is presented. Transaction history is also an important source of knowl-edge from the point of view of finalizing the purchase. On some websites such
Data cleaning
Data integration
Data reductionAttributes Attributes
Tran
sact
ions
Tran
sact
ions
A1 A2 A3 ... A126 A1 A3 ... A115
T1
T2
T3
T4...
T2000
T1
T4...
T1456
Data transformation –2, 32, 100, 59, 48 –0.02, 0.32, 1.00, 0.59, 0.48
Figure 7. Data Preparation
Retrieved from “Data Preprocessing. In Data Mining” by an, J., Kamber, M., Pei, J. 2012.

Discovering knowledge from data 56
as Ebay, Allegro and Aliexpress, information is available regarding the number of products purchased. Such a policy may result from the auction nature of the store and can be an important source of information about the demand for individual products at different prices. Cash flows are also recorded in the case of payment for services such as means of transport or using electronic banking. Blazquez and Domenech (2018) indicate that transactions may also involve non-financial aspects in which the user provides the counterparty with the required information to obtain a product or service, such as e-office or e-re-cruitment. The spread of information is the result of user activity aimed at its popularization or promotion. To achieve this, various activities are undertaken to lead to the publication of content on the Internet. That is why websites, mo-bile applications are created or annotated in already available Internet resourc-es such as Wikipedia. While the owner has access to the full data, an outsider can rely on the estimated values. Companies today, provide estimated infor-mation about website traffic, its sources, and time spent on the site. Alexa and Similarweb are examples of such global brands. Data is determined based on method triangulation. As Similarweb reports on its website (SimilarWeb, 2019) these are panel data from hundreds of millions of stationary and mobile devic-es, data from Internet service providers, public data sources from over a billion websites and application pages, and direct measurement data from hundreds of thousands of websites and applications. Other companies specialize in pro-viding information about keywords for which a competitor is positioned, about a given brand in electronic media.
Another of the indicated types of data is information that users get as part of online social networks. This applies to content generated by them, made available, commented, reviewed as well as reactions to the content of other users published within a given network. The last source of data is information collected while completing another main purpose. These are data that refer to device activity in the area of an open WIFI network and globalization data. The cited division illustrates the diversity of data sources that can be used in the process of knowledge discovery.
According to the author, what determines the level of complexity is the abil-ity to integrate data. If we assume that the base is our own collected and stored data, then all independent sources will have to be adapted to this. This is due to the fact that only integration allows full use of all resources. The integra-tion problem may arise from either limited access or the unstructured nature of the data. The purposefulness of data integration is based on the possibility of including them in one study. Simultaneous research provides only limited
Discovering knowledge from data 57
insight, ignoring the relationships, cause and effect relationships that occur be-tween them. Integration is the effort that an organization must make to com-prehend phenomena in a competitive environment as comprehensively as possible. The basis for integration is its own data, which it collects intentionally. The structure of the database results from the adopted internal regulations and the tools used to codify information and process it.
In addition to this type of data, the company has access to data that can be distributed, unencoded or unstructured. An example of this type of data are findings and knowledge obtained on the basis of personal contacts, telephone conversations or e-mails, or the lack of aggregation of information about pro-jects rejected by clients, which could be used to identify factors limiting the level of acceptance. The source of data for the company can be collected by external entities, making it difficult to determine who is the owner of such data. Even if one assume that the entity does not only administer this data, it has full access to it.
Some data can be exported in the form of databases or integrated with the company’s internal system. Possible solutions depend on the technical infra-structure used in enterprises but also from the technical skills of personnel. The analyses also use data from government institutions that provide aggregated data in the form of databases. A separate case is the data provided by business intelligence services, whose form may be more or less adapted to expectations. The last group of digital data is the data available in the browser level. In this case, the biggest problem is the possibility of obtaining them in an organized way, as they need to be structured to be integrated into one coherent whole. An example of this is the content posted by users on the company profile on so-cial media or on any website. The aforementioned characteristics illustrate the diversity in access and the possibilities of using data in conducted analyses. The effort put in collecting comprehensive data can translate into finding the pat-terns sought, drawing conclusions that will provide a competitive advantage.
After the stage of preparation of the base, the modelling stage follows. This stage, is increasingly performed by the machines and requires knowledge of modelling methods to eliminate unnecessary problems. The sentence “the program will count everything” may refer, on the one hand, to the fact that programs with a graphical interface are designed so that analysis can be per-formed in a very intuitive way. The step-by-step procedure often used is sup-posed to lead the researcher. As a result, the selected analysis will be carried out efficiently. On the other hand, this also leads to a situation in which the role of the researcher is reduced to clicking on the appropriate field. This approach
Discovering knowledge from data 58
is somehow consistent with the indicated earlier need for scientists to develop competences in the field of data mining, however it can be mistakenly inter-preted as the ability to use the program. Without full or at least partial knowl-edge of the processes taking place at the stage of analysis according to the adopted model, the program will be able to count almost anything, regardless of the incorrect assumptions of the researcher. The result is a certain numerical value or set of values whose interpretation belongs to the researcher. To be aware of whether a given value is the answer to a given question, one should be aware of the techniques used, their assumptions and conditions. However, this is not the main area of interest in this study, which is why interested readers are encouraged to familiarize themselves with relevant compact items. Data mining is a process that the researcher implements to find answers to the ques-tions. Among the most common types of tasks carried out under data mining, the following can be identified (Talia et al., 2016):
● Classification – the goal is to assign observations based on the classifica-tion of variables to identify the group based on predefined classes. Clas-sification is an example of pattern recognition and each case is grouped based on one or more variables. Traditional procedures are based on the assumption of a normative variable distribution and are based on Fish-er’s work on a linear discriminant function. However, Bayensian proce-dures assume that the attribute values in the classes are independent. In this case, belonging to a given group is determined on the basis of the probability of belonging to the group on the basis of calculated condi-tional probabilities. Regardless of the procedure, the classification allows to assign cases to defined groups, which can be used in many areas such as customer segmentation, text mining, and analysis of social networks.
● Clustering – occurs when we do not have specific predefined groups. As a result of using the appropriate model, objects are grouped on the basis of the best characterizing set of features. Lack of a prior determi-nation causes the system to automatically assesses individual variables and compares inter-object similarities, identifying the set of features that best characterizes all objects classified into a group, while simultaneous-ly differentiating groups as much as possible.
● Regression – used as a predictive technique, predicting the value of an independent variable based on observable variables. Forecasted values should not exceed the range of values taken into account at the stage of determining the values of the equation parameters. This is due to the uncertainty that the variable will assume forecasted values, also in the
Discovering knowledge from data 59
event of significant exceeding of the values analysed so far. For example, a change in demand for a linear price increase will be distributed non-lin-early. A 100-fold increase in spending on social media advertising may not result in a 100-fold increase in the number of customers. Attempting to linearize variables may also be applicable to functions with a sinusoi-dal shape.
● Descriptive statistics – result of the data analysis may be the summary of the sample. Activities do not only relate to quantitative data, when these types of tasks are the basic activity verifying assumptions enabling e.g. use in statistical parametric tests. The use of descriptive statistics gives a general view of the collected data, which is often the starting point for further analysis. Sometimes obtaining basic measures such as mean, median, fashion, standard deviation is the goal and the last stage of anal-ysis. An example would be text analysis. An example of an analysis whose purpose in itself was to define variables was the study described in Chap-ter 2, when the subject of the analysis was to assess the complexity of the content of the privacy policy on online store websites. With the example of the analysis, whose purpose in itself was to determine the cited vari-ables, the reader had the opportunity to read in earlier passages, when the subject of the analysis was to assess the complexity of the content of the privacy policy on the websites of online stores. The determination of these values was preceded by a series of actions. This constituted the data cleansing stage that was previously discussed in detail. As with text mining, descriptive statistics are important for image recognition-based operations. The process of reaching the desired values is complex, but the decomposition of content allows the identification of data that is hid-den, which is the essence of data exploitation.
● Outlier detection – purpose of the analysis is to identify cases that are clearly different from the others that constitute the reference base. The identification of such situations is often the starting point for understand-ing its source. Outliers can be both positive and negative in terms of or-ganization. On the example of social media, the observable variable may be the number of comments posted by users. The increased number of comments relative to the average number based on historical data is not information in itself. Analysis of the content and sentiment of comments may indicate their extremely negative characterization or have a positive characterization. Identification of sources can contribute to levelling po-tential threats or, one can use this knowledge to repeat success.

Discovering knowledge from data 60
● Discovering or predicting events over episodes or prediction time series – based on identifying the relationship between the event and the time stamp. This is based on the assumption that there are event sequences that are related in time.
● Detection of association rules – this task is to find sets of elements that occur together in data sets and relationships between these elements to obtain many correlations that meet certain thresholds. It aims to identify strong rules detected in large data sets using different measures.
● Dependency modelling – identification of a model that describes signif-icant relationships between variables. The goal is to discover how some data values depend on other data values. Dependency models are at two levels: the structural level of the model determines which variables are dependent locally, while the quantitative level determines the power of dependence using a numerical scale.
The methods discussed above are the final stage of the narrowly under-stood date mining. Obtaining numerical values regardless of the form of their visualization or lack is not an end in itself. The evaluation stage is a comparison of the results obtained with the objectives that were defined at the beginning. At this stage, the context of the obtained values is given, which leads to the interpretation of the results and evaluation of the model used. The assessment of the results must be based on the researcher’s experience and knowledge. However, this cannot determine the perception of the study, because the con-clusions obtained as a result of the research may be in contradiction with the current theory. This approach is important because it is the last opportunity to verify the results and eliminate previously unidentified problems. In the analy-sis of privacy policy text discussed earlier, an example of a situation that could be detected only after the analysis was a problem regarding the length of indi-vidual words and the associated syllable issue that would not appear in a text published as part of a blog, press article or novel. As a result of the descriptive analysis, the results indicated that the text contains words consisting of several syllables. The system carried out all the tasks specified earlier, thus from the system perspective there was no error. The reason was hidden among 382,128 words, and for the record it was only 48 texts. Performing several operations indicated that the problem concerns email addresses and websites repeated in the text with references to individual tabs. No error was made at the stage of the first analysis, but it would be a mistake if such a situation were not iden-tified and after eliminating the whole process was not carried out again. This example demonstrates how the role of system programs is still limited and man
Discovering knowledge from data 61
plays an important role in the whole process. Of course, it can be pointed out that knowledge and experience may result in the fact that in every future study this element will be eliminated at the first attempt. And it is impossible to dis-agree, but it is always limited to what the authors knows as the system must be learned. Another similar example in the area of text mining is a study on the sentiment of headlines for press articles in the United States. The operation from a technical point of view is based on assigning to each word a value corre-sponding to sentiment based on available sentiment libraries. The research was carried out in accordance with the methodology described in the literature, however, the results were at least puzzling. They pointed out that most of the headlines had a positive characteristic, which did not confirm the hypothesis and was not consistent with the assessment of selective titles. The reason was the double meaning of the words Trump, which in the dictionary appeared in the context of playing cards with a positive mark. This word was the most fre-quently appearing noun out of 926,258 words analysed, which directly affected the results. After analysing 100 random titles with this word, it was found that they all refer to a person, hence the analysis was again carried out omitting it, indicating in restrictions. The cited example illustrates that the implementation of the analysis in accordance with the guidelines may not be sufficient in in-dividual cases. If the analysis is properly programmed, performing the whole process again is incomparably less time consuming, which translates into the quality of the analysis. Therefore, adequate sensitivity to results is needed, be-cause at the stage of model evaluation, the researcher accepts the model and results based on a subjective assessment. If it is accepted, one should decide what to do with the results of the analysis. A list of options is created based on which one make decisions.
The examples indicated indicate that the analysis and the results obtained most often give rise to further questions, which leads to further studies. This is the same as conducting scientific research, the results of which are published in the form of scientific articles. Going through a certain process, gives new expe-rience and opens new paths leading to the deepening of knowledge, which are written off in the final part of the work. The results obtained show the legitima-cy of further research and indicate possible directions. Therefore, the exploita-tion of data included in the CRISP-DM model is a cycle.
The process carried out in this way provides the company with knowledge that can be the basis for introducing changes, improvements or taking actions to improve the situation of the company. Numerical values, which are the oper-ational result of numerical results, form the basis for making business decisions.
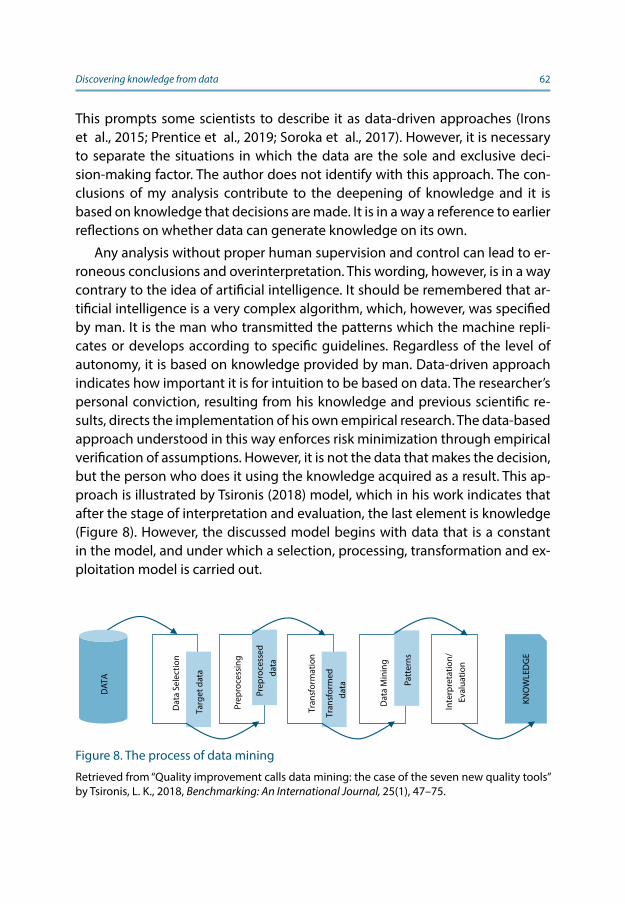
Discovering knowledge from data 62
This prompts some scientists to describe it as data-driven approaches (Irons et al., 2015; Prentice et al., 2019; Soroka et al., 2017). However, it is necessary to separate the situations in which the data are the sole and exclusive deci-sion-making factor. The author does not identify with this approach. The con-clusions of my analysis contribute to the deepening of knowledge and it is based on knowledge that decisions are made. It is in a way a reference to earlier reflections on whether data can generate knowledge on its own.
Any analysis without proper human supervision and control can lead to er-roneous conclusions and overinterpretation. This wording, however, is in a way contrary to the idea of artificial intelligence. It should be remembered that ar-tificial intelligence is a very complex algorithm, which, however, was specified by man. It is the man who transmitted the patterns which the machine repli-cates or develops according to specific guidelines. Regardless of the level of autonomy, it is based on knowledge provided by man. Data-driven approach indicates how important it is for intuition to be based on data. The researcher’s personal conviction, resulting from his knowledge and previous scientific re-sults, directs the implementation of his own empirical research. The data-based approach understood in this way enforces risk minimization through empirical verification of assumptions. However, it is not the data that makes the decision, but the person who does it using the knowledge acquired as a result. This ap-proach is illustrated by Tsironis (2018) model, which in his work indicates that after the stage of interpretation and evaluation, the last element is knowledge (Figure 8). However, the discussed model begins with data that is a constant in the model, and under which a selection, processing, transformation and ex-ploitation model is carried out.
DAT
A
Dat
a Se
lect
ion
Prep
roce
ssin
g
Tran
sfor
mat
ion
Dat
a M
inin
g
Inte
rpre
tatio
n/
Eval
uatio
n
KNO
WLE
DG
E
Targ
et d
ata
Prep
roce
ssed
da
ta
Tran
sfor
med
da
ta Pa
tter
ns
Figure 8. The process of data mining
Retrieved from “Quality improvement calls data mining: the case of the seven new quality tools” by Tsironis, L. K., 2018, Benchmarking: An International Journal, 25(1), 47–75.
Discovering knowledge from data 63
Each individual stage and each action taken has a specific goal. The purpose of selection is to indicate the data used in the next stage. The initial process-ing of data is intended for its purification. The transformation in this model is a separate processing element in which the data is operationalized, the data are brought into a form that can be used in the model. In the case of the de-scribed model called “The process of data mining” Tsironis (2018) indicates that the data mining stage is part of the data mining process. This can be identified as an idem per idem error, or adopted, identified earlier in the study equat-ing knowledge exploration with discovering knowledge from data. In a narrow sense, this stage is to discover patterns that describe and enable a better un-derstanding of repetitive consumer behaviour.
Data in digital marketingThe use of technology in everyday life by users and the time that consumers spend with access to the Internet has prompted businesses to intensify their online marketing activities. This chapter will discuss the ways companies can use to promote, sell, and build responses to customers on the Internet. The In-ternet significantly influenced the way a company/brand communicates with its recipients. Knowledge of how to influence consumers on the Internet is the basis for a well-known selection of tools and the form of their use. Any form of activity is a means of fighting for the consumer‘s attention. However, in the case of marketing communications, this is simplified wording. The time that a consumer devotes and within which he is exposed to, e.g. advertising, is not synonymous with a purchasing decision. Marketing communication goes be-yond influencing the recipient and efficiency becomes a key element. Effective-ness is understood as the implementation of the action desired by the compa-ny. If the goal is sales, the number of transactions can be used as a measure. The adoption of an appropriate metric is crucial and may affect all business decisions made. In the context of sales, other measures of a different semantic nature are- repeatability of purchases by a particular customer, profitability of individual products, the total value of the order or the perception of a given re-cipient as key. This forces decision-makers to be careful in determining the two sides of the equation, where there is revenue on one side and costs and loss or profit on the other. The first part focuses on various forms of communication, using various Internet marketing tools and describes the path of the customer when obtaining information. The second, discusses the problem of a holistic approach to the problem of using data in Internet marketing to optimize busi-ness operations.
5. Mapping e-customer journey in purchasing decisions
The Internet has created new opportunities, inaccessible or limited in non-dig-ital marketing. A characteristic feature particularly highlighted in this work is the possibility of codification of customer data and behaviour, decisions to form a database. The digital trail discussed in the previous chapter, which leaves information about user activity, can be used to better understand it, and the knowledge thus acquired to optimize marketing activities and become an

Data in digital marketing 65
important element in the decision-making process. The aim of the chapter is to describe the online customer journey, taking into account the distinctness of places of seeking information and making purchasing decisions. This chapter describes the results of qualitative research related to the purpose of the chap-ter, on the basis of which the model was formulated. The chapter also presents the factors conditioning the path. The progressive change in the perception and use of data is due to the desire to better allocate resources. Efficiency in marketing activities is important because the spending options are wide and the budgets limited. Parameterization conducted marketing activities and re-lated effects to a greater extent allows obtaining the answer to the question whether the indicated marketing activity paid off. This is an enigmatic term, but it reflects the characteristics of the problem that managers have to face. This problem becomes more important the longer the customer‘s path is from the first contact with the product or brand to buy. The longer the path, the greater the problem with identifying the factor that determines consumer behaviour. In order to illustrate the problem, let‘s consider several variants of the shopping path of a customer who is choosing a place to stay and planning to buy a prod-uct from the household appliances category.
Determining the actual path is important for both scientists and business practitioners, however, misinterpretation of touch points can result in errone-ous conviction of their effectiveness (Rosenbaum et al., 2017). Mapping is used in various markets and industries (Farah et al., 2019; Harris et al., 2018; Hu T.-I. & Tracogna, 2020; Rudkowski et al.; Witell et al., 2019). Qualitative methodolo-gy was conducted due to the exploratory nature of this research. The author was particularly interested in developing a deeper understanding the path that customers take when making purchasing decisions. The choice of the method is motivated by the need to better understand how the client thinks, what he is paying attention to and what he is guiding when assessing the product. This methodical approach in an example of Participatory Action Research (PAR) that gives the opportunity to discover knowledge by assuming that the consumer is not only a research object but also a research subject that can contribute a lot as an engaged participant (Ozanne & Saatcioglu, 2008). The descriptions are the result of participant observation in research conducted by the author in January 2019 on 32 active Internet users, aged 22–29 years, where 59 percent were female. In this age group, Internet use is common at 99–100%, and they constitute the largest group among Internet users. In addition, this age group has the largest percentage of people making purchases online and the most time using the Internet daily (CBOS, 2019). The adopted sample is larger than
Data in digital marketing 66
used in previous publications concerning mapping the e-customer journey (Vakulenko et al., 2019).
The first part of the study, participants were asked to choose a place to sleep for two on the dates indicated (Jun 22–23, 2019) in Frankfurt in a suggested budget of EUR 100. Having their own devices at their disposal, their cell phone or computer had to indicate the location where they would make the reserva-tion. The use of own equipment improved realism, because it was related, for example, to individual preferences and predefined settings that determined the decision-making process.
The study used the technique of think out loud during which participants are asked to verbalize their thoughts and actions out loud, focusing on the mo-tives of individual actions and decision criteria. From the perspective of this chapter, the most important conclusion concerns the complexity of decision paths. Regardless of the final selection of places, the key in the study was the process that took place from indicating the task to its completion, i.e. making a decision. The study also verified the assumption about the lack of own expe-rience in finding accommodation in the indicated city, which could distort the search and decision-making process. As a result of the study, 4 leading paths were identified by clients in the decision-making process:
● through organic search results for query related phrases. In this case, ex-amples of phrases entered by participants were: hotel Frankfurt, accom-modation in Frankfurt, double room Frankfurt price.
● through contextual advertising in search results for phrases related to the query. This type of advertisement is presented in a similar way as or-ganic results in search results. It is tailored to the query, so one can as-sume that it is relatively related to the product one is looking for.
● by directly accessing the website aggregating accommodation offers. The participant, apart from the Internet search engine, entered a direct address in the browser window and went to a page he knew earlier. In the case of people using a smartphone, access was via dedicated appli-cations.
● through search results for phrases related to the names of portals aggre-gating accommodation offers. The name entered appeared from the first search results in which the link was clicked by the respondent.

Data in digital marketing 67
Each of the identified paths at the search stage is based on various elements that condition the possibility of generalization of identified attitudes. In the case of search results, the heterogeneous wording of the query generates het-erogeneous results, e.g. in Google or Bing search. This refers to positioning, i.e. deliberate action aimed at displaying the page as part of search results in the highest positions possible. While the exact way in which search engine mech-anisms work is a strictly protected secret, certain universal principles can be identified based on business recommendations and experience. All activities can be generalized to three groups related to the substantive side, technical side and recommendation page. The substantive page concerns the adequacy of the content sought by users and the content available on the website. This refers to the extent to which the content of the page contains the information the user is looking for.
Of course, this mechanism is extremely complex, using, among others, data on the behaviour of other users in the same situation, the consistency of the
Search stage
Selection stage
Purchase stage
DecisionFamiliarizing
with the offer
Organic
results
Advertising in
search results
Access the
site directly
Access the
site indirectly
Figure 9. A one-level search stage in the decision-making process regarding the selec-tion of an offer on the Internet
Source: Own study.

Data in digital marketing 68
query category with the landing page, or the content context. In the event of a majority of other users leaving the page within a few seconds of arrival (high bounce rate) it may be a signal that despite the previous indications the site does not contain the desired content. The content published as the theme of a given subpage may have a different meaning than the word or phrase ap-pearing in the commentary to a random article. It is among others proper cod-ing of the page can contribute to better, i.e. proper and adequate reading of content by so-called bots, analyse and index website content.
Marking a given part of the text as a title or subtitle, not only by manually increasing the font, but using appropriate markup in HTML, is a clear indication that the content within a given section will deepen a given thread, just like the table of contents is a preview of what will be on individual pages. Errors in the coding of the page reduce its value, and cause problems arising from the long time needed to load the page, or non-adaptability of content to mobile devices and issues related to the size of the monitor, lack of support for some technol-ogies used in the presentation of content and the lack of indicators which is replaced by a finger. The last point concerns systemic recommendations and in a simplified way refers to the principle that if important pages are mentioned (by placing a hyperlink), it indicates that such a page is also important. Knowl-edge of the mechanism can contribute to the desire to achieve a high position through unacceptable means that will contribute to achieving the opposite ef-fects. Such unacceptable means include:
● theft of content from other sites, which limits the unique content,
● hiding content or links in the page content by covering it with graphics or consistency with the background
● unnatural density of links to external pages or words important from the point of view of typed phrases, i.e. keywords including the preparation of visible texts that do not add value to the reader but are only constructed for the bot.
For readers interested in positioning issues, refer to specialized and cur-rent positions, in which guidelines for prepared and published content and principles related to website construction, including meta tags, html rules, website weight, etc. (Enge et al., 2015; Williams, 2019). The current challenge for search engines is speed indexing pages and content on social media with timeliness, credibility, as well as analysing the content published in the form of photos or videos, to allow vision recognition mechanisms to index the pre-sented content.
Data in digital marketing 69
The actions taken by companies to achieve a high position in search re-sults are based on a long-term strategy. Depending on the level of competitive phrase, visible effects can be achieved in a period of 3–6 months. In the case of phrases that apply to very competitive markets and are short, this time may be significantly longer, with the lack of certainty about reaching the first positions. Such phrases are e.g. work, credit, hotel. However, theoretically, all actions can be carried out without cost based on one‘s own work time. The expenditure of time needed for this type of activity with the changing algorithm and the growing awareness of competition prompts us to entrust search engine opti-mization to an external entity.
An action that can bring the desired results right away is paid advertising in search results. A contextual text ad is displayed when the advertiser‘s require-ments match the given ad. This customization can be based on a list of phrases for which the ad is displayed and can be refined with contextual exclusion. In the case of the hotel in question, one can promote the phrase hotel Frankfurt, but at the same time indicate that in the case of cheap hotel Frankfurt the ad-vertisement will not be displayed. These types of activities are aimed at opti-mizing expenses that are based on this CPC (cost-per-click) ad. If the advertiser finds that the offer of his property will be inappropriate for a person looking for cheap accommodation, then including these types of exclusions, he will limit paid traffic that will not bring the expected benefits. Such traffic can be adapted and conditioned according to criteria such as device, location and time interval. All these additional restrictions are conditioned by cost optimization. Greater precision in selecting the message for the recipient and for the situation can translate into better results measured by the level of conversion.
Another situation occurs when the user, in search of the service, directly enters the landing page by entering the address in the browser bar or using a previously installed application on a mobile device. Adopting a full exper-imental model in the study, which bypasses the possibility of using own de-vices, would make it impossible to identify certain shopping behaviours. Such an example was the launch of a mobile application prepared by some service providers (Booking.com, Airbnb) without delay. In this path, based on our own experience, the search stage was skipped as the users went directly to the home page to continue their search, therefore, not searching for any page, but finding a page known to the user.
From the perspective of the discussed model, in a single purchasing deci-sion making process, the possibility of a competitive struggle due to consum-er loyalty to a given platform is limited. Installation of the application is an

Data in digital marketing 70
expression of a higher level of loyalty but not customer involvement. The con-sumer is aware of the brand, shows a habitual approach resulting from habits and does not look for alternatives unless the situation forces him. Such a situa-tion may be a technical problem with the application or website or an offer that does not meet basic expectations. While in the context of the discussed single purchase process it is the first and only element of the search phase, it should be noted that achieving this level of brand awareness required building rela-tionships. These types of activities are of a long-term nature, so the challenge is to take into account the previously incurred financial outlays in estimating their profitability, measured by the level of conversion, but also by the level of repeatability of purchases and the length of the customer‘s life cycle.
An alternative scheme for the search stage is indirect behaviour for the ex-amples indicated earlier. Some users after launching the browser, entered the name of the target page they are looking for and omitted the reference to the name of the organization type (gov., Com., Edu.) and / or the abbreviation of the country name (uk, pl, de). While the protocol name (https, http) or the web-site designation (www) is added by default by the browser, the lack of required elements prevents one from going to the destination page. In this case, even entering the brand name directly starts the search process and the results are presented in a browser window, in the same way as if a user had used the Inter-net search engine.
If one enter the brand name precisely, the search results will display the name, description and address of the page one was looking for first. Users point-ed out that such behaviour, which somewhat extends the process of searching for the target page, is conditioned by the fear that the address entered will prove to be incorrect either because of a typo in the name or by entering an in-appropriate extension. They do not recognize the need to remember the exact address, further emphasizing that they “trust Google”. Such “trust” creates con-sequences that are important from a competitive perspective but also for data analysis. Regardless of the scheme used to access search results, it consists of elements that are not all dependent on the destination address. The structure of results presentation can be divided into 3 areas of results, of which only the last is stable and the first two depend on the content sought.
The last area is organic results, i.e. the content presented on the basis of an analysis of the content of the page for which presence is not charged. The first element is the previously characterized paid advertising. Some content can also be visualized by showing the results on a map (searching for places or objects in a given geographical area) or in tabular form (flight search results).
Data in digital marketing 71
This structure results in the situation that when searching for a specific domain within the search results, it may be displayed first as part of the organic search results. The occurrence of ads depends on the supply and is subject to bounda-ry conditions. This means that it may happen that during the search for a given phrase, no ads will be displayed, and at other times they will be presented.
The advertising algorithm based on the behaviour of recipients, displays ads a limited number of times depending on their effectiveness. The practice, which was questioned years ago on an ethical and legal level, is to target advertising of competing brand names. The decision in this case followed the judgment of the Court of Justice of the EU (First Chamber) of 22 September 2011. Interflora Inc. and Interflora British Unit v Marks, Spencer plc et Flowers Direct Online Ltd. The court indicated (High Court of Justice (England, Wales) Chancery Division – United Kingdom, Sep 22, 2011) that Internet advertising based on keywords corresponding to trademarks can offer alternatives to the goods or services of the owners of the trademarks. An important element of the judgment was that it could not be considered that the proprietor of the trade mark could be opposed to a competitor, in fair competition conditions respecting the trade mark‘s function of origin, making use of a sign identical with the trade mark for goods and services identical to those for which the mark is registered where the sole effect of that use is to force the proprietor of that trade mark to adjust his efforts to obtain or maintain a reputation that is likely to attract consumers. In the same way, the proprietor of the trademark cannot validly rely on the fact that the said use results in some consumers turning away from the goods and services bearing the trademark.
On Figure 10 the search results for the selected brand were presented. This is important because it clearly indicates that the competition is conscious and intentional. The name entered in the search engine is the brand name. Thus, it can be assumed with a high degree of certainty that the user entering it in the Google search engine is looking for it. In this context, advertisements promot-ing business entities were set up. It is worth noting that the advertiser, in ad-dition to other targeting options, determines as part of the Google Ads ad for which phrases the ad should be displayed and for which it should not. There-fore, the action is intentional. In the case of search results for another phrase, e.g. booking, one could indicate that it does not refer to a particular brand but to activities. In the example shown, the search results first have paid ads. When the first position is a reference to the searched phrase (Vrbo) and the second is to the competitive offer (Airbnb). The ads are marked with an “Ad” in front of the website address. It should be clarified that the main factor determining
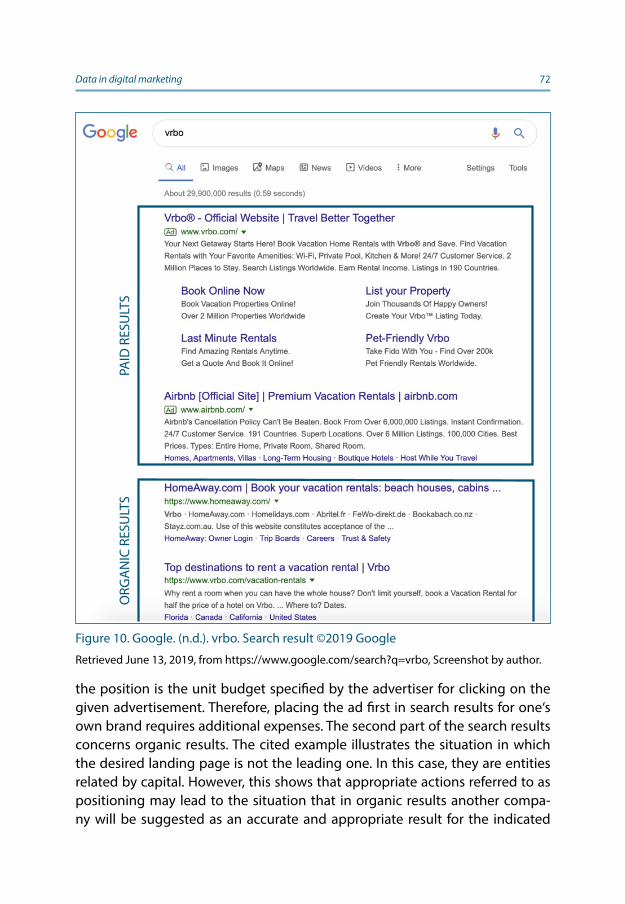
Data in digital marketing 72
the position is the unit budget specified by the advertiser for clicking on the given advertisement. Therefore, placing the ad first in search results for one‘s own brand requires additional expenses. The second part of the search results concerns organic results. The cited example illustrates the situation in which the desired landing page is not the leading one. In this case, they are entities related by capital. However, this shows that appropriate actions referred to as positioning may lead to the situation that in organic results another compa-ny will be suggested as an accurate and appropriate result for the indicated
PAID
RES
ULT
SO
RGA
NIC
RES
ULT
S
Figure 10. Google. (n.d.). vrbo. Search result ©2019 Google
Retrieved June 13, 2019, from https://www.google.com/search?q=vrbo, Screenshot by author.
Data in digital marketing 73
query. As a result, in the case of indirect methods of entering the website, some users may use the offer of a competitive website. The importance of position in organic results has an additional two dimensions that are indirectly relat-ed to each other. As a result of research, the attitudes of some consumers to contextual advertising have been revealed. They deliberately and intentionally ignored search results marked as ads. This was due to the fact that they are ads. This was the only justification for his own actions. Such blindness on contextual advertising occurs despite the blurring of the visual border between organic and paid results. In earlier versions, the ads were marked with an additional background colour or an indication that they were sponsored promotional links. At the moment, ads are marked subtly by the website address indicating that they are ads. Historically, this area was marked, the background colour was different and the word “advertisement” was more prominent. Currently, the boundary between paid and organic results is not visually blurred as indicated in the Figure 10. Another situation, which is a kind of mechanical version of blindness is the installation of additional extensions within the browser, which limit the display of advertising content. The number of users using this type of solutions varies from country to country, e.g. Greece 42%, USA 27%, Korea 13%, reaching 27% globally (Statistica, 2019).
This is particularly important from the perspective of data analysis, because such actions work on the recipient‘s website, and more precisely browsers, pre-venting the display of part of the code, despite its download from the server. This means a big limitation in the possibility of determining the number of peo-ple whose ad was displayed, which is the basis for determining its effectiveness. In addition, simply having an ad blocking extension installed will not mean that it will be used in this case. Contextual advertising is not blocked by adblockers as they are not considered intrusive. However, these are the default settings that are easily changed. The search results listed below ads, marked in Figure 10, as organic results are a search engine recommendation. These results are of an organic nature, i.e. they are www addresses indicated by the search results, according to the algorithm results they are the answer to the user‘s search que-ry. But also in this case the page directly referring to the entered phrase “vrbo” appears as the second result. The first result refers to the parent brand. This is influenced by the activities, page structure, content, page structure, references to the searched phrase and its relevance, which was mentioned in the previous part of this chapter.
The cited example of the purchasing process was based on a straightfor-ward purchasing path, which was implemented along four parallel roads. Each
Data in digital marketing 74
of them was independent, but the awareness of alternative routes is crucial for understanding the data and reducing errors in their interpretation.
Another more complex process is the assumption of an n-level search stage. In this model, the search process is not limited to one element. This will be illustrated based on the second in-depth quasi-experiment. In this case, the participants‘ task was to buy a coffee machine as a gift for a loved one. In the discussed case, the process was more complex and was not limited to search-ing for a specific model, except for one person who defined himself as an ex-pert in this field. In other cases, the process of finalizing the purchase itself was preceded by the stage of seeking additional information that enabled making a “thoughtful” decision.
A proper understanding of the nature and consumer decision making pro-cess, is necessary to understand the data from the perspective of the entire en-terprise. It is worth referring to the modified EKB model. The basic model con-sists of awareness of needs, searching for information, assessing alternatives, purchasing and post-purchase behaviour (Engel et al., 1986; Engel et al., 1978). Mącik (2013) pointed out that before choosing a purchase, there is an addition-al stage of choosing a seller. Another approach based on a similar observation is to distinguish two phases referring separately to the decision to choose the product itself and to choose the place of purchase, i.e. the seller (Szymkowiak, 2016). In both cases, alternatives are assessed.
The stage of searching for information was multilevel. Wide access to the of-fer, diversified product range and limited knowledge limited the use of a flat process, where the decision to compare the offer and selection was based on in-formation on one page. The desire to make the right choice came down to Her-bart Simon‘s limited rationality. The consumer makes the best decision accord-ing to his own individual criteria, based on the limited information available. Additional searches enrich the consumer‘s knowledge, expanding his limited knowledge. The process of seeking information began heterogeneously among participants and some people used the Internet search engine for phrases such as “coffee espresso rankings”, “coffee maker, what to look for”, some searched for video materials, e.g. “what automatic coffee machine should I buy?”. Another case was direct access to a forum in under which related themes were sought. Some people pointed to social media, and the opinion of their friends, who based on their own experience would indicate what to look for, what to buy or what not to buy. Each subsequent information began a new cycle, indicating the choice of type, functions needed, brand or type preferences, familiarization with opinions. With the selection of the product, one process ends, starting another
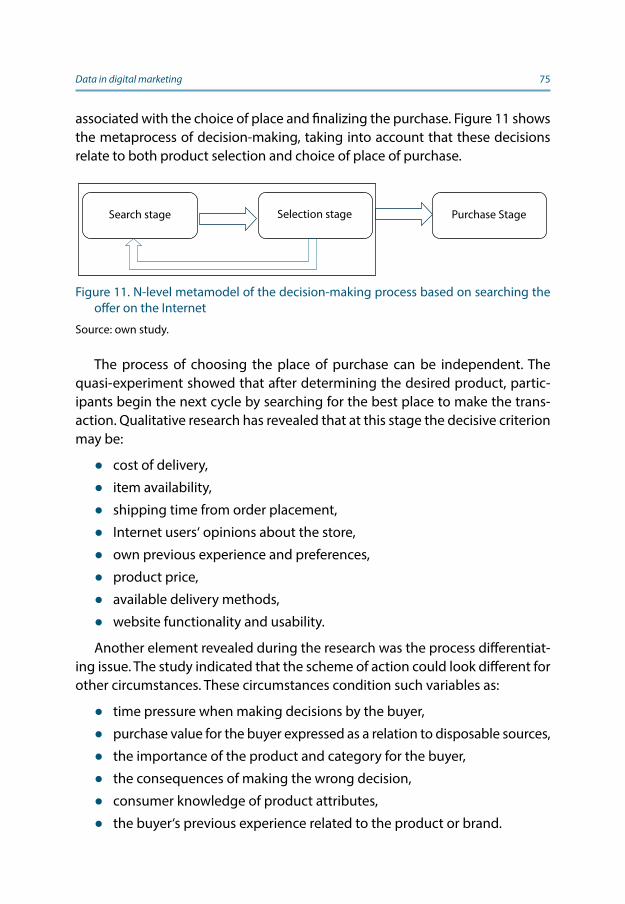
Data in digital marketing 75
associated with the choice of place and finalizing the purchase. Figure 11 shows the metaprocess of decision-making, taking into account that these decisions relate to both product selection and choice of place of purchase.
The process of choosing the place of purchase can be independent. The quasi-experiment showed that after determining the desired product, partic-ipants begin the next cycle by searching for the best place to make the trans-action. Qualitative research has revealed that at this stage the decisive criterion may be:
● cost of delivery,
● item availability,
● shipping time from order placement,
● Internet users‘ opinions about the store,
● own previous experience and preferences,
● product price,
● available delivery methods,
● website functionality and usability.
Another element revealed during the research was the process differentiat-ing issue. The study indicated that the scheme of action could look different for other circumstances. These circumstances condition such variables as:
● time pressure when making decisions by the buyer,
● purchase value for the buyer expressed as a relation to disposable sources,
● the importance of the product and category for the buyer,
● the consequences of making the wrong decision,
● consumer knowledge of product attributes,
● the buyer‘s previous experience related to the product or brand.
Purchase StageSearch stage Selection stage
Figure 11. N-level metamodel of the decision-making process based on searching the offer on the Internet
Source: own study.
Data in digital marketing 76
In case of greater time pressure, the user becomes familiar with the con-tent currently available on the Internet and only to a limited extent. He looks for problems analogous to his situation, which were previously discussed, and some solutions indicated. In the case of less time pressure, the user can return to the community, be it by formulating a question in a thematic forum or in social media describing the given situation and asking for advice. This situation extends the process of collecting information and is based directly on the re-cipient‘s indications or boundary conditions and the current knowledge of the participants. The purchase value refers to the price that the buyer must bear, taking into account his material situation and the means at his disposal. The higher the value, the longer the working time needed to obtain the necessary funds and the cost of any wrong decision. The related but not identical issue is the significance of the product purchased by the recipient. The financial dimen-sion is only one of the areas determining the level of significance for the buyer. When purchasing products that cost a small share, the buyer may pay special attention to other aspects. For example, when choosing food products, the con-sumer may familiarize himself with the offer in detail, verifying the composition, country of origin, presence of allergens, GMOs, the use of reusable raw materi-als or the aesthetics of the packaging. Consumer knowledge is the same as his awareness of the aspects to which attention should be paid. Lack of knowledge may lead to more superficial decisions in connection with basic attribution er-rors, e.g. resulting from the relationship between quality and price, attractive-ness of the packaging and the value of the content. Lack of knowledge may also result in the need for more time needed for further training in a given field. Whether the buyer makes an additional effort depends on the other conditions listed above. The final condition of the decision-making process is the buy-er‘s personal experience regarding the product or brand. This is related to the halo effect described in the literature (Nisbett & Wilson, 1977). If the buyer has strong positive or negative experience with a given product or brand, it will de-termine his choices. Each of the above mentioned conditions occur separately, however, it is only each combination that takes into account all its elements can contribute to understanding the differences in the decision-making process of individual users for the same goods. The discussed differences illustrating the purchasing process based on heterogeneous user paths force entrepreneurs to get a better understanding of the consumer. A better understanding of the consumer will allow operations to be operationalized and measured from the point of view of the results achieved. This diversity and complexity of all ele-ments that lead the customer from the first contact with the brand or product
Data in digital marketing 77
to its purchase on the Internet generate a need for a generalized model that will be adaptable in various industries and sales funnels.
6. Model of data management in marketingThe heterogeneous decision-making process indicated in the previous chapter is associated with the need to take into account various data in the analysis. These data relate to the interaction that occurred between the presented con-tent and the consumer. Each marketing activity focused on potential custom-ers is intended to bring them closer to making a purchasing decision. There-fore, it becomes justified to ask whether the actions taken contribute to the achievement of business goals. The operationalization of data and their use in the decision-making process is a challenge in the modern digitized world and the purpose of the data management model described in this chapter. The pur-pose of this chapter is to create a data management model in digital marketing. In this chapter, the data management cycle will be illustrated graphically, and all its elements will be discussed, along with the relations between them.
Like all tools in the common understanding, the same way for marketing tools, their use can be different and adapted to current needs. The purposeful-ness of their use is based, however, on understanding the mechanisms of their functioning. This diversity makes it possible to modify the message to achieve better results. Modifications can be based on manager‘s intuition or based on acquired knowledge. The source of knowledge can be a theory. It helps to bet-ter understand the surrounding reality and predict the effects of actions taken. Theory-based knowledge can be the basis for specific actions. However, there is a risk arising from the diversity of consumers but also the specifics of each enterprise and its competitive environment. The effectiveness of marketing ac-tivities undertaken in one enterprise may not bring the assumed results in an-other. However, in order for such an assertion to be possible, the company must first have specific goals, secondly it must collect the necessary data and, thirdly, the analysis will allow for such an assessment to be carried out, minimizing the risk of error.
In Internet marketing, the traces left by the user enable codification of his activities and thus measurement by different tools. This approach allows one to determine the level of implementation of the objectives that are both short and long term. In the short term, perception and assessment can only be limited to assessing performance using measures directly related to a single marketing
Data in digital marketing 78
activity. In the case of email marketing, this measure can be the openness of the email, in the case of a post promoted on social media, click-throughs on advertising. In a longer perspective, it should be realized that it is not the type of reactions performed by the user that count, but whether the more impor-tant from the perspective of the company‘s goal, i.e. transaction finalization, is met. Flashy advertising can trigger interest measured by the number of people who clicked on it, but these people may not be interested in buying. In the case of advertising focused on the benefits of the product, it can achieve less click-through but generate more revenue, because the ratio of people who bought the product after switching to the website of the promoted store was higher. It can be the implementation of an order, repeatability of purchases, achieving a certain sum of order values, switching the user to the subscription model or placing an order from the referral link as the result of a recommendation. Each of the examples listed may be indicated as the final element of the so-called sales funnel. This funnel illustrates the next levels in the decision-making pro-cess, during which some users do not go through the stages.
In terms of the entire sales funnel as well as individual marketing activities, various measures are used to illustrate the differently defined effectiveness of the actions taken. Commonly toned down measures in Internet marketing are:
● Cost per click (CPC) – a model for settling promotional activities, other-wise known as Pay Per Click (PPC) based on determining the price of one action (clicks on an advertisement), based on a top-down or bid rate.
● Cost per impressions (CPM) – a measure of the number of clicks per thou-sand impressions. It defines how some of the recipients became inter-ested in the presented advertisement, which took a measurable effect in the form of clicking on it, moving the user to the landing page. It is a measure expressed in the unit, taking into account the number of clicks and the cost incurred to display the advertisement among thousands of recipients.
● Cost per thousand (CPT) – a measure that determines the cost of adver-tising exposure per one thousand recipients.
● Cost per ratio (CPR) – a measure that measures the ratio of the total num-ber of clicks on a promoted ad to the total number of impressions. Please note that the value does not refer to the number of dorms but to the number of views. This is particularly important when no additional set-tings limit the multiple exposure of the same ad to the user.

Data in digital marketing 79
● Cost per action / cost per acquisition (CPA) or cost per lead (CPL) – a meas-ure determining the cost per single sales lead, that is, a person or com-pany potentially interested in a given product or service. Most often it is related to the implementation of an additional action such as sending an inquiry on the basis of the form, leaving contact details to discuss the offer or signing up for a product webinar.
● Lead volume (LV) – total value of acquired sales leads as a direct result of a given advertising campaign. It is an absolute measure that does not take into account incurred costs and expenditure of working time.
● Frequency of exposure – a measure presenting the average number of views of a single campaign for a particular user, i.e. indicating the aver-age number of times an ad was viewed by an user.
● Social media pages viewers – the number of users who visited the site based on hyperlinks available on social media. In the narrow sense, this can only apply to ads and redirections available as part of advertising content, and in a broad sense, any automatic transition (by clicking a hy-perlink) in content published by the company as part of advertising, posts, profile descriptions and content published by other users
● Impressions / views – a measure of the total number of views that has been presented to users on the Internet. Specifies the times the ad has been viewed, not including the number of users.
The referenced indicators are selected measures enabling a better under-standing of the data. However, this is a form of data transformation, which in-volves the risk of not seeing dependencies or patterns. Certain regularities may not be disclosed when considering individual indicators. It is connected with making generalizations, during which important factors determining the dis-persion of values can be unknowingly omitted. This means that the ability to identify situations or events that determine the effectiveness of actions taken will be limited. To be able to consider the impact of a given factor on a vari-able, one needs to allow this possibility. This possibility is manifested in the collection of relevant data that will be used at the analysis stage. In the case of questionnaire surveys, this forces the survey to be adapted and the item to be included in the question. In the case of marketing research based on user activity on the Internet, this data is codified by default. This increases the ease of determining research questions and seeking answers to them, as there is ac-cess to data, however only apparently. This apparent appearance results from the fact that merely having access to data is not enough. It is the scope of the
Data in digital marketing 80
data that is collected that can contribute to a superficial examination of avail-able information. Despite the fact that aggregation and data structuring tools are available, which are possible to present in a visual form, the use of this is not without errors, which will be discussed later in this chapter.
Access to this amount of data taking into account information about their behaviour and response to various marketing content creates the ability to precisely describe recipients. Such amount of data is supposedly a digitized multi-volume encyclopaedia regarding users‘ behaviour on the website. This analogy refers not only to the volume but also to the way it is used. Access to such a huge resource of information only makes sense when we are looking for precise information. Lack of purposefulness in reading the data will prove time consuming and may not have any effect. In addition, only by familiarizing oneself with the various issues and linking the information that results from them will one be able discover the knowledge needed to achieve the result. Similarly, reviewing the webpage analytics software panel like Google Analyt-ics or Adobe Analytics, as well as browsing encyclopaedia pages, will make us learn something new but it may not matter to us except for the cognitive value. In the case of business, such value is the improvement of its business efficien-cy. Information about the average time spent on the site was 4.5 min remains only information. The knowledge could result from the fact of asking yourself a question whether the change made to the site affected the length of the vis-it. However, the change in time may result either from problems with finding the information sought by the user, which extends the time needed or from increased interest, which remains a separate question.
Figure 12 presents the author‘s model of data management in digital mar-keting It is a cycle that consists of three related phases. The first phase, which can be described as conceptual, is based on the knowledge and experience of the researcher, who imposes perspective and defines the problem that is the subject of further consideration. The use of data must be intentional, i.e. it is necessary to define the goal to be achieved. Defining the goal of market-ing activity is crucial for the whole process, because it determines each subse-quent element. The goal must be measurable and specific. An indication of an increase in a company‘s profit is insufficient, because it can be achieved, e.g. by influencing the cost side, by increasing the margin at a fixed price or by affect-ing the increase in the number of customers, the average value of the shopping basket or repeatability of purchases by current customers.

Data in digital marketing 81
Improving any indicator requires knowledge of the current purchasing pro-cess as well as purchasing behaviour and factors that may affect it. The theo-retical foundations allow quick identification of areas that will be analysed in subsequent phases, and conclusions used to improve the entire process. Deter-mining the business goal is akin to determining the destination, which is the ba-sis for determining the current path to then sketch other, new solutions. Goals can apply to all marketing areas. However, one should consider what measures will be used to determine the effectiveness of each activity. In the case of e-mail marketing, a change in title can result in a higher rate of mail openings, with a larger number of people who have requested unsubscribing from the mail-ing database or fewer visits to the website and fewer orders. A similar situation may occur if the day of the week or the time of sending the email are changed.
Figure 12. Model of data usage cycle in digital marketing
Source: own study.
Data in digital marketing 82
Promotional content published on the company blog can be very readable and shareable, however, this may not translate into a sales result. When using paid external systems to send newsletters, the standard is information on the num-ber of people who have opened the email. Information about the number of users who clicked hyperlinks in the body of the email is also often available. As-sociating this information with the actions performed on the website already, requires data consolidation and may be based on granting access to an exter-nal system for analysing activities. The longer the sales funnel is to be analysed as a whole, the more data sources must be integrated.
Wanting to use both internal and external activity data requires access to information in a form that can be obtained and integrated. Presentation of data in external systems in already processed form, e.g. in aggregated graphic form without access to source data, limits the possibility of their use and connection with other data. For example, if an advertisement of an article about the pros and cons of a given product category appeared on a social blog on a social networking site, and as part of the articles there were redirects to product cards in the store, this transition of one user from one page to another leaves a trace in two places. On the first page, it concerns the numerical value of actions per-formed by the Internet user, in this case clicking on the article‘s advertisement. On the next page, as the number of entries, indicating the source of the en-try. Similarly, when the user goes from the blog of the external partner to the store. This assumption is model because it assumes consistency in these values. Values that form the basis for assessing effectiveness. Comparison of values in practice may indicate an underestimation on one side. This may be due to ran-dom situations, e.g. after clicking on the page, the website was not displayed due to server problems, as a result of bot activity or other noise mistakenly treated as real traffic. Other reasons may be that the click is not being treated as an action.
Other issues may relate to the analysis period, date range taking into ac-count time zone differences or data availability in one day delay. Therefore, one should be aware of the threats and the additional work needed to integrate data from various sources. All this is related to the data preparation phase. Data acquisition is a static activity in which a researcher acquires data from a select-ed time period. Data processing from own databases can be based on current data for a given hour or even a minute.
When obtaining data from external sources, one should assume a certain delay, which depends on the level of integration but also system assumptions, under which synchronization was adopted due to the transfer capacity. Both

Data in digital marketing 83
raw data records from own server in the form of logs as well as data processed by an external entity require full knowledge of the importance of individual values. The previously mentioned example measures are already a form of pro-cessing primary data.
Understanding data refers to a full understanding of the conditions under which a given value is included in the result. An example would be the problem in the graphic regarding the number of clicks on advertising on social media. One should make sure how the click is defined in a given case: whether it is only clicking on the offer link available in the post or also any other form of interac-tion such as clicking on the name of the profile, which moves to its home page. The adopted model assumes obtaining data from selected sources, directly related to the research area. This reduces information noise while making the considerations more readable and transparent. This means that each data set is crucial for the given study and is especially important for the resulting values.
This is due to the approach to considering the sales process in Internet mar-keting based on sales funnels. The data determines the numbers at each stage. This approach is based on the assumption that a smaller proportion of users go to each subsequent stage. The analysis of differences between individual stag-es illustrates the percentage losses. This type of data can be seen from many perspectives, especially as a measure of success and failure. However, what is particularly important, this assumption has the effect that if the number of us-ers at each subsequent stage is smaller, then each individual unit has a greater share of the given stage, because the total number of users is smaller.
It is therefore crucial to properly understand the data that is intended to illustrate success. For example, if the goal is to improve the effectiveness of actions aimed at the number of people who have agreed to send marketing content electronically. The main question is “how to measure it?” This value may be different if the number of people who subscribed to the newsletter and who confirmed it by clicking on the confirmation email is taken as a reference point. Enigmatic name of the column in the database as “number of people subscribed to the newsletter” does not explain whether it is the number of peo-ple who have signed up to the database or confirmed it by clicking the activa-tion link in the confirmation email. Even if it is assumed that this is the value of people who have finally agreed, the lack of consideration of the earlier stage limits the cognitive value of the analysis. It may turn out that in the extreme case the lack of confirmation of consent results from the form and content of the confirmation e-mail (no clear call to action, which in this case is to click the confirmation link) or that this e-mail does not reach the addressee because

Data in digital marketing 84
these e-mails are blocked by the anti-spam system. The data preparation phase is not only data structuring or data integration in certain situations, but most importantly, obtaining data that is adequate and as fully as possible to under-stand or predict customer behaviour.
The analytical phase applies to the entire process that directly enables knowledge discovery from data. As part of this phase, all activities related to the use of data to discover certain regularities can be carried out. One should be aware that the choice of method is based on the knowledge and skills of the researcher. Based on the portfolio of available methods, the researcher uses the tools and solutions most relevant to a given problem, which were described in the previous chapter Based on the developed models, statistical inference is carried out, which is based on quantitative data. Such a procedure allows statistical inference and results analysis by drawing conclusions and making business recommendations.
The central element of the model is the data collection process itself. This process in the cycle of using data in digital marketing is not obligatory directly for the enterprise or the first. This unequivocal statement is justified by two possibilities. First, by using external databases, an enterprise may have access to data without delay or the necessary data has already been collected by the enterprise. This refers to the phrase “greed for data” indicated at the beginning of the first chapter, which causes the company to collect data, even without a clearly defined purpose. Data collection in process terms is a possible option in several cases:
● determining the data sources as the stage after stage- applies to situa-tions when internal and external databases lack data that are important from the perspective of a given problem and the company must start collecting such information, e.g. by adding an exit-popup mechanism, collecting data related to satisfaction or assessment of website usability by users. This type of decision to collect additional data is associated with the extension of the entire process by the time needed to obtain data, which in this case will be related to the number of visits to the site and the willingness to respond.
● as the stage following the stage of understanding the data- when the results of the attempt to operationalize data or integrate data from differ-ent sources arise the need to obtain data that is better or more accurately depict the analysed phenomenon.
Data in digital marketing 85
● as a stage resulting from the stage of model development- in the dis-cussed situation, this is related to the need to perform A / B tests and the associated analysis of variance. Testing two or more variants will allow one to identify differences in the solutions used. The choice of such an approach will be related to the need to carry out research under qua-si-experimental conditions that will enable the collection of data needed for comparative analysis.
● as a stage resulting from the inference stage- in the case where, e.g. as a result of the analysis, the results obtained are characterized by an unac-ceptable level of error of the first type, but the variables are explained to the extent unsatisfactory for the researcher, this requires additional data and implementation of the entire process again.
● as a stage following the stage of data recommendations and implemen-tation- the model form of the cycle has two dimensions, one illustrating the constant desire to improve results and the endless process of setting further goals. The second dimension is related to the variability of the environment. The basic process implemented is static. This means that the process is based on data available at the time, which are subject to analysis. On their basis, conclusions are drawn that shape further busi-ness. However, one should take into account the lack of timelessness of some of the conclusions drawn. This is due to changes taking place, among others in consumer behaviour, their changing preferences, com-petitive activity, and technological changes. Understanding this is the key to adapting to new conditions. This requires taking into account the data management model in Internet marketing and the transition from static to dynamic data analysis. This means the need to monitor whether previous decisions based on previously collected data are still valid or should not be revised. Going through the entire cycle creates opportu-nities to take actions to automate parts from the stage of data collec-tion through their structuring based on a previously developed model of analysis. Thanks to this, an internal autonomous cycle is created, which is programmed to notify hazards when the boundary values are exceeded.

ConclusionAt a time when the activity of consumers is increasing on the Internet and more and more decisions are made by clicking the appropriate fields with the mouse pointer or finger, observing customers in a stationary store is enriched by an electronic record of Internet actions taken on the website. This new reality cre-ates new ways to understand how customers make decisions, who are custom-ers or why they left the site without a transaction. The answers to these and other questions are based on drawing conclusions, based on the data that the consumer left either in the form of an electronic questionnaire or by analysing his shopping path on the website. Any such information is based on the data collected and may be unstructured in nature, contain informational noise, and have different types. It was therefore necessary to create a model that would illustrate the pattern of knowledge discovery from data.
This is especially important in the case of Internet marketing activities. First of all, it results from the technical possibilities offered by the Internet and cod-ification of all activities. On the other hand, it results from the need to obtain knowledge on the effectiveness and efficiency of promotional activities and determining further directions of marketing expenses. Technical solutions in Internet marketing give the opportunity to carry out multiple A / B tests, which creates a special space for analysis and searching for optimal solutions. Atten-tion, however, should be returned to understanding the data and the choice of criteria determining the choice. In addition, the key issue raised in the book is the lack of timelessness of the conclusions drawn, which determines the need for a systematic approach to data collection and analysis.
The book discusses issues regarding data, their sources, and legal options for their processing. In addition, ways of acquiring and analysing data to discover knowledge were characterized. The problem raised at work concerned the mod-el approach to the data management process in the area of Internet marketing. The author's model of the cycle of using data in digital marketing described in the work, is based on previous scientific studies related to big data. The present-ed model is a generalized illustration of the process that allows efficient use of data in accordance with the principles of profitability, efficiency, and economy. Adaptation of the model in business will allow consideration of potential threats and limitations. It will also create the opportunity to make better business deci-sions by better understanding clients’ behaviour, preferences and discovering knowledge about patterns. This will in turn, help allocate the right amount of funds spent on various digital marketing activities based on available data.
BibliographyAckoff, R. (1989). From data to wisdom. Journal of Applied Systems Analysis, 16, 3–6.
Agarwal, R., & Dhar, V. (2014). Big Data, Data Science, and Analytics: The Opportunity and Challenge for IS Research. Information Systems Research, 25(3), 443–448. https://doi.org/10.1287/isre.2014.0546
Aggarwal, C., C. (2015). Data Mining: The Textbook. New York, NY: Springer Publishing Company.
Aichinger, P., & Schoentgen, J. (2018). Detection of Diplophonation in Audio Record-ings of German Standard Text Readings. Journal of Voice. https://doi.org/10.1016/j.jvoice.2018.06.009
Aïmeur, E., Lawani, O., & Dalkir, K. (2016). When changing the look of privacy policies af-fects user trust: An experimental study. Computers in Human Behavior, 58, 368–379. https://doi.org/10.1016/j.chb.2015.11.014
Akerkar, R. (2013). Big Data Computing: Taylor & Francis Group & Hall/CRC
Al Nuaimi, E., Al Neyadi, H., Mohamed, N., & Al-Jaroodi, J. (2015). Applications of big data to smart cities. Journal of Internet Services and Applications, 6(1). https://doi.org/10.1186/s13174-015-0041-5
Allen, G. D. (2004). Hierarchy of Knowledge – from Data to Wisdom. International Jour-nal of Current Research in Multidisciplinary 2(1), 15–23.
Almeida, M. V., & Soares, A. L. (2014). Knowledge sharing in project-based organizations: Overcoming the informational limbo. International Journal of Information Manage-ment, 34(6), 770–779. https://doi.org/10.1016/j.ijinfomgt.2014.07.003
Anagnostopulu, A. (Feb 19, 2019). Ranking Sklepów Internetowych Opineo 2018. Re-trieved from Wrocław: https://www.opineo.pl/i/aktualnosci/ranking-2018
Arunachalam, D., & Kumar, N. (2018). Benefit-based consumer segmentation and per-formance evaluation of clustering approaches: An evidence of data-driven deci-sion-making. Expert Systems with Applications, 111, 11–34. https://doi.org/10.1016/j.eswa.2018.03.007
Awad, N., & Krishnan, M. (2006). The Personalization Privacy Paradox: An Empirical Eval-uation of Information Transparency and the Willingness to Be Profiled Online for Personalization. MIS Quarterly, 30(1), 13–28. https://doi.org/10.2307/25148715
Benini, S., Khan, K., Leonardi, R., Mauro, M., & Migliorati, P. (2019). Face analysis through semantic face segmentation. Signal Processing: Image Communication, 74, 21–31. https://doi.org/10.1016/j.image.2019.01.005
Berger, M., Tutz, G., & Schmid, M. (2018). Tree-structured modelling of varying coeffi-cients. Statistics and Computing, 29(2), 217–229. https://doi.org/10.1007/s11222-018-9804-8
Bibliography 88
Bhat, W. A. (2018). Bridging data-capacity gap in big data storage. Future Generation Computer Systems, 87, 538–548. https://doi.org/10.1016/j.future.2017.12.066
Blazquez, D., & Domenech, J. (2018). Big Data sources and methods for social and eco-nomic analyses. Technological Forecasting and Social Change, 130, 99–113. https://doi.org/10.1016/j.techfore.2017.07.027
Boardman, R. (1997). Environmental discourse and international relations the-ory: Towards a proto‐theory of ecosation 1. 11(1), 31–44. https://doi.org/10.1080/13600829708443120
Caro, F., & Sadr, R. (2019). The Internet of Things (IoT) in retail: Bridging supply and de-mand. Business Horizons, 62(1), 47–54. https://doi.org/10.1016/j.bushor.2018.08.002
Caseiro, N., & Coelho, A. (2018). The influence of Business Intelligence capacity, net-work learning and innovativeness on startups performance. Journal of Innovation & Knowledge. https://doi.org/10.1016/j.jik.2018.03.009
CBOS. (2019). Korzystanie z Internetu [Press release].
Ceri, S. (2018). On the role of statistics in the era of big data: A computer science perspective. Statistics & Probability Letters, 136, 68–72. https://doi.org/10.1016/j.spl.2018.02.019
Chapman, P., Clinton, J., Kerber, R., Khabaza, T., Reinartz, T., Shearer, C., & Wirth, R. (2000). CRISP-DM 1.0: Step-by-Step Data Mining Guide. Copenhagen: SPSS.
Chen, H., Chiang, R. H. L., & Storey, V. C. (2012). Business Intelligence and Analyt-ics: From Big Data to Big Impact. MIS Quarterly, 36(4), 1165–1188. https://doi.org/10.2307/41703503
Chen, M., Mao, S., & Liu, Y. (2014). Big Data: A Survey. Mobile Networks and Applications, 19(2), 171–209. https://doi.org/10.1007/s11036-013-0489-0
Chiang, L.-L., & Yang, C.-S. (2018). Does country-of-origin brand personality generate re-tail customer lifetime value? A Big Data analytics approach. Technological Forecast-ing and Social Change, 130, 177–187. https://doi.org/10.1016/j.techfore.2017.06.034
China National Genebank. (2018). Bio-informatics Data Center. Retrieved from https://www.cngb.org/database.html
Cholin, J., Schiller, N. O., & Levelt, W. J. M. (2004). The preparation of syllables in speech production. Journal of Memory and Language, 50(1), 47–61. https://doi.org/10.1016/j.jml.2003.08.003
Chua, H. N., Herbland, A., Wong, S. F., & Chang, Y. (2017). Compliance to personal data pro-tection principles: A study of how organizations frame privacy policy notices. Telem-atics and Informatics, 34(4), 157–170. https://doi.org/10.1016/j.tele.2017.01.008
Cisco. (2018). Cisco Visual Networking Index: Forecast and Trends, 2017–2022. White paper. Retrieved from https://www.cisco.com/c/en/us/solutions/collateral/ser-vice-provider/visual-networking-index-vni/white-paper-c11-741490.pdf
Bibliography 89
Culnan, M., & Williams, C. (2009). How Ethics Can Enhance Organizational Privacy: Les-sons from the Choicepoint and TJX Data Breaches. MIS Quarterly, 33(4), 673–687. https://doi.org/10.2307/20650322
Cuthbertson, A. (Oct 9, 2018). MPS invite robot to give evidence on AI. Retrieved from https://www.independent.co.uk/life-style/gadgets-and-tech/news/uk-robot-pep-per-commons-ai-select-committee-fourth-industrial-revolution-a8575741.html
D'Alessio, M., Laghi, F., & Baiocco, R. (2009). Attitudes toward TV advertising: A measure for children. Journal of Applied Developmental Psychology, 30(4), 409–418. https://doi.org/10.1016/j.appdev.2008.12.026
Dalla Pozza, I., Goetz, O., & Sahut, J. M. (2018). Implementation effects in the relation-ship between CRM and its performance. Journal of Business Research, 89, 391–403. https://doi.org/10.1016/j.jbusres.2018.02.004
Das, G., Cheung, C., Nebeker, C., Bietz, M., & Bloss, C. (2018). Privacy Policies for Apps Targeted Toward Youth: Descriptive Analysis of Readability. JMIR Mhealth Uhealth, 6(1), e3. https://doi.org/10.2196/mhealth.7626
Davtyan, D., & Cunningham, I. (2017). An investigation of brand placement effects on brand attitudes and purchase intentions: Brand placements versus TV com-mercials. Journal of Business Research, 70, 160–167. https://doi.org/10.1016/j.jbus-res.2016.08.023
de Mast, J., & Lokkerbol, J. (2012). An analysis of the Six Sigma DMAIC method from the perspective of problem solving. International Journal of Production Economics, 139(2), 604–614. https://doi.org/10.1016/j.ijpe.2012.05.035
Dhar, V. (2013). Data Science and Prediction. Communications of the ACM, 56(12), 64–73. https://doi.org/10.1145/2500499
DiCiccio, T., Martin, M., & Young, G. (1992). Analytical approximationsfor iterated boot-strap confidenceintervals. Statistics and Computing, 2, 161–171.
Earp, J. B., Anton, A. I., Aiman-Smith, L., & Stufflebeam, W. H. (2005). Examining Internet Privacy Policies Within the Context of User Privacy Values. IEEE Transactions on En-gineering Management, 52(2), 227–237. https://doi.org/10.1109/tem.2005.844927
Enge, E., Spencer, S., & Stricchiola, J. (2015). The Art of SEO (3 ed.). Sebastopol, United States: O'Reilly Media.
Engel, J. F., Blackwell, R. D., & Miniard, P. W. (1986). Consumer behavior, (5 ed.). Hinsdale, IL: Dryden.
Engel, J. F., Kollat, D. T., & Blackwell, R. D. (1978). Consumer behavior (3 ed.). Hinsdale, IL: Dryden.
Ermakova, T., Krasnova, H., & Fabian, B. (2016). Exploring the impact of readability of privacy policies on users’ trust. Research Papers, 20.
Bibliography 90
Regulation (EU) 2016/679 of the European Parliament and of the Council of 27 April 2016 on the protection of natural persons with regard to the processing of person-al data and on the free movement of such data, and repealing Directive 95/46/EC (General Data Protection Regulation) (2016).
Farah, M. F., Ramadan, Z. B., & Harb, D. H. (2019). The examination of virtual reality at the intersection of consumer experience, shopping journey and physical retailing. Journal of Retailing and Consumer Services, 48, 136–143. https://doi.org/10.1016/j.jretconser.2019.02.016
Fayyad, U., Piatetsky-Shapiro, G., Smyth, P., & Uthurusamy, R. (1996). Advances in Knowl-edge Discovery and Data Mining: The MIT Press.
Fernandes, E., Holanda, M., Victorino, M., Borges, V., Carvalho, R., & Erven, G. V. (2019). Educational data mining: Predictive analysis of academic performance of public school students in the capital of Brazil. Journal of Business Research, 94, 335–343. https://doi.org/10.1016/j.jbusres.2018.02.012
The Fourth Paradigm. Data-Intensive scientific discovery. (2009). (T. Hey, S. Tansley, & K. Tolle Eds.). Redmond, Washington: Microsoft research.
Frické, M. (2008). The knowledge pyramid: a critique of the DIKW hierarchy. Journal of Information Science, 35(2), 131–142. https://doi.org/10.1177/0165551508094050
Furbush, J. (Jun 16, 2018). Data engineering: A quick and simple definition. Retrieved from https://www.oreilly.com/ideas/data-engineering-a-quick-and-simple-defini-tion
Gandomi, A., & Haider, M. (2015). Beyond the hype: Big data concepts, methods, and analytics. International Journal of Information Management, 35(2), 137–144. https://doi.org/10.1016/j.ijinfomgt.2014.10.007
García-Gil, D., Luengo, J., García, S., & Herrera, F. (2019). Enabling Smart Data: Noise filtering in Big Data classification. Information Sciences, 479, 135–152. https://doi.org/10.1016/j.ins.2018.12.002
Gartner. (2012). The Importance of ‘Big Data’: A Definition.
George, G., Haas, M. R., & Pentland, A. (2014). Big Data and Management. Academy of Management Journal, 57(2), 321–326. https://doi.org/10.5465/amj.2014.4002
Gibert, K., Horsburgh, J. S., Athanasiadis, I. N., & Holmes, G. (2018). Environmental Data Science. Environmental Modelling & Software, 106, 4–12. https://doi.org/10.1016/j.envsoft.2018.04.005
Gibson, R. F. (1993). Katz on Indeterminacy and the Proto-Theory. Philosophical Issues, 4(167). https://doi.org/10.2307/1522838
Ginosar, A., & Ariel, Y. (2017). An analytical framework for online privacy research: What is missing? Information & Management, 54(7), 948–957. https://doi.org/10.1016/j.im.2017.02.004
Bibliography 91
Go, E., & Shyam Sundar, S. (2019). Humanizing Chatbots: The effects of visual, identity and conversational cues on humanness perceptions. Computers in Human Behavior. https://doi.org/10.1016/j.chb.2019.01.020
Goh, W. W. B., & Sze, C. C. (2019). AI Paradigms for Teaching Biotechnology. Trends Bio-technol, 37(1), 1–5. https://doi.org/10.1016/j.tibtech.2018.09.009
Gold, S. (2013). Getting lost on the Internet: the problem with anonymity. Network Secu-rity, 2013(6), 10–13. https://doi.org/10.1016/s1353-4858(13)70069-2
Grus, J. (2019). Data Science from Scratch: First Principles with Python (2 ed.): O’Reilly Me-dia.
Gupta, M., & George, J. F. (2016). Toward the development of a big data analytics ca-pability. Information & Management, 53(8), 1049–1064. https://doi.org/10.1016/j.im.2016.07.004
Halford, S., & Savage, M. (2017). Speaking Sociologically with Big Data: Symphon-ic Social Science and the Future for Big Data Research. Sociology. https://doi.org/10.1177/0038038517698639
Hamilton, N. E., & Ferry, M. (2018). ggtern: Ternary Diagrams Using ggplot2. Journal of Statistical Software, 87(Code Snippet 3). https://doi.org/10.18637/jss.v087.c03
Han, J., Kamber, M., & Pei, J. (2012). Data Preprocessing. In Data Mining (pp. 83–124).
Harris, P., Dall’Olmo Riley, F., & Hand, C. (2018). Understanding multichannel shopper journey configuration: An application of goal theory. Journal of Retailing and Con-sumer Services, 44, 108–117. https://doi.org/10.1016/j.jretconser.2018.06.005
Interflora Inc. and Interflora British Unit v Marks & Spencer plc and Flowers Direct On-line Ltd., (Sep 22, 2011).
Hu, K., Liu, J., Li, B., Liu, L., Gharibzahedi, S. M. T., Su, Y., Guo, Y. (2019). Global research trends in food safety in agriculture and industry from 1991 to 2018: A data-driven analysis. Trends in Food Science & Technology, 85, 262–276. https://doi.org/10.1016/j.tifs.2019.01.011
Hu, T.-I., & Tracogna, A. (2020). Multichannel customer journeys and their determinants: Evidence from motor insurance. Journal of Retailing and Consumer Services, 54. https://doi.org/10.1016/j.jretconser.2019.102022
Huang, L., Wu, C., Wang, B., & Ouyang, Q. (2018). Big-data-driven safety decision-mak-ing: A conceptual framework and its influencing factors. Safety Science, 109, 46–56. https://doi.org/10.1016/j.ssci.2018.05.012
Hyun, S. W., Wong, W. K., & Yang, Y. (2018). VNM: An R Package for Finding Multiple-Ob-jective Optimal Designs for the 4-Parameter Logistic Model. Journal of Statistical Software, 83(5). https://doi.org/10.18637/jss.v083.i05

Bibliography 92
Irons, L. M., Boxall, J., Speight, V., Holden, B., & Tam, B. (2015). Data driven analy-sis of customer flow meter data. Procedia Engineering, 119, 834–843. https://doi.org/10.1016/j.proeng.2015.08.947
Jarrahi, M. H. (2018). Artificial intelligence and the future of work: Human-AI symbio-sis in organizational decision making. Business Horizons, 61(4), 577–586. https://doi.org/10.1016/j.bushor.2018.03.007
Jensen, C., & Potts, C. (2004). Privacy policies as decision-making tools: an evaluation of online privacy notices. Paper presented at the Proceedings of the SIGCHI Conference on Human Factors in Computing Systems, Vienna, Austria.
Jing, L., & Oliveira, D. V. (2015). geoCount: An R Package for the Analysis of Geostatistical Count Data. Journal of Statistical Software, 68(11).
Kahraman, C., & Yanık, S. (2016). Intelligent Decision Making Techniques in Quality Man-agement: A Literature Review. In C. Kahraman & S. Yanik (Eds.), Intelligent Decision Making in Quality Management: Theory and Applications (pp. 1–22). Cham: Springer International Publishing.
Kathuria, V. (2019). Greed for data and exclusionary conduct in data-driven markets. Computer Law & Security Review. https://doi.org/10.1016/j.clsr.2018.12.001
Kenett, R., Zonnenshain, A., & Fortuna, G. (2017). A road map for applied data sciences supporting sustainability advanced manufacturing: the information quality dimen-sions. Paper presented at the 15th Global Conference on Sustainable Manufactur-ing.
Kenett, R. S., Zonnenshain, A., & Fortuna, G. (2018). A road map for applied data scienc-es supporting sustainability in advanced manufacturing: the information quali-ty dimensions. Procedia Manufacturing, 21, 141–148. https://doi.org/https://doi.org/10.1016/j.promfg.2018.02.104
Kienle, H., Lober, A., Vasiliu, C., & Muller, H. A. (2009). Complexity of Virtual Worlds’ Terms of Service. In F. Lehmann-Grube & J. Sablatnig (Eds.), Facets of Virtual Environments (pp. 79–90). Germany: Springer.
Kietzmann, J., Paschen, J., & Treen, E. (2018). Artificial Intelligence in Advertising. Journal of Advertising Research, 58(3), 263–267. https://doi.org/10.2501/jar-2018-035
Koretzky, A. (2019). Audio AI: isolating vocals from stereo music using Convolutional Neu-ral Networks. Retrieved from https://towardsdatascience.com/audio-ai-isolating-vo-cals-from-stereo-music-using-convolutional-neural-networks-210532383785
Korzeń, M., & Jaroszewicz, S. (2014). PaCAL: A Python Package for Arithmetic Computa-tions with Random Variables. Journal of Statistical Software, 57(10).
Kosinski, M., Stillwell, D., & Graepel, T. (2013). Private traits and attributes are predicta-ble from digital records of human behavior. Proceedings of the National Academy of Sciences, 110(15), 5802–5805. https://doi.org/10.1073/pnas.1218772110
Bibliography 93
Kosinski, M., Wang, Y., Lakkaraju, H., & Leskovec, J. (2016). Mining big data to extract pat-terns and predict real-life outcomes. Psychol Methods, 21(4), 493–506. https://doi.org/10.1037/met0000105
Kosmidis, I., Kenne Pagui, E. C., & Sartori, N. (2019). Mean and median bias reduction in generalized linear models. Statistics and Computing. https://doi.org/10.1007/s11222-019-09860-6
Kotu, V., & Deshpande, B. (2018). Data Science: Concepts and Practice (2 ed.): Morgan Kaufmann.
Kotu, V., & Deshpande, B. (2019). Data Science Process. In Data Science (pp. 19–37).
Labrinidis, A., & Jagadish, H. V. (2012). Challenges and opportunities with big data. Proc. VLDB Endow., 5(12), 2032–2033. https://doi.org/10.14778/2367502.2367572
Lee, Z. W. Y., Chan, T. K. H., Chong, A. Y.-L., & Thadani, D. R. (2019). Customer engage-ment through omnichannel retailing: The effects of channel integration quality. Industrial Marketing Management, 77, 90–101. https://doi.org/10.1016/j.indmar-man.2018.12.004
Leiva, L. A., & Huang, J. (2015). Building a better mousetrap: Compressing mouse cur-sor activity for web analytics. Information Processing & Management, 51(2), 114–129. https://doi.org/10.1016/j.ipm.2014.10.005
Li, A., Jiao, D., & Zhu, T. (2018). Detecting depression stigma on social media: A linguistic analysis. J Affect Disord, 232, 358–362. https://doi.org/10.1016/j.jad.2018.02.087
Li, Z., & Wood, S. N. (2019). Faster model matrix crossproducts for large generalized linear models with discretized covariates. Statistics and Computing. https://doi.org/10.1007/s11222-019-09864-2
Linden, G., Smith, B., & Yotk, J. (2003). Item-to-Item Collaborative Filtering.
Linden, T., Khandelwal, R., Harkous, H., & Fawaz, K. (2018). The Privacy Policy Land-scape After the GDPR. arXiv e-prints. Retrieved from https://ui.adsabs.harvard.edu/\#abs/2018arXiv180908396L
Liu, Y., Huang, K., Bao, J., & Chen, K. (2019). Listen to the voices from home: An analysis of Chinese tourists’ sentiments regarding Australian destinations. Tourism Manage-ment, 71, 337–347. https://doi.org/10.1016/j.tourman.2018.10.004
Lunden, I. (Jun 21, 2018). PayPal to buy Simility, a specialist in AI-based fraud and risk management, for $120M. Retrieved from https://techcrunch.com/2018/06/21/pay-pal-to-buy-simility-a-specialist-in-ai-based-fraud-and-risk-management-for-120m/
Lusty, C., Guarino, L., Toll, J., & Lainoff, B. (2014). Genebanks: Past, Present, and Optimis-tic Future. In N. K. Van Alfen (Ed.), Encyclopedia of Agriculture and Food Systems (pp. 417–432). Oxford: Academic Press.
Mącik, R. (2013). Technologie informacyjne i komunikacyjne jako moderator procesów podejmowania decyzji zakupowych przez konsumentów. Lublin: UMCS.

Bibliography 94
Makridakis, S. (2017). The forthcoming Artificial Intelligence (AI) revolution: Its impact on society and firms. Futures, 90, 46–60. https://doi.org/10.1016/j.futures.2017.03.006
Manovich, L. (2012). Trending: The Promises and the Challenges of Big Social Data. In M. K. Gold (Ed.), Debates in the Digital Humanities: Minnesota Scholarship Online.
Mansfield-Devine, S. (2017). Meeting the needs of GDPR with encryption. Computer Fraud & Security, 2017(9), 16–20. https://doi.org/10.1016/s1361-3723(17)30100-8
Marbán, O., Menasalvas, E., & Fernández-Baizán, C. (2008). A cost model to estimate the effort of data mining projects (DMCoMo). Information Systems, 33(1), 133–150. https://doi.org/10.1016/j.is.2007.07.004
Marchionini, G. (2016). Information Science Roles in the Emerging Field of Data Sci-ence. Journal of Data and Information Science, 1(2), 1–6. https://doi.org/10.20309/jdis.201609
Marr, B. (May 21, 2018). How Much Data Do We Create Every Day? The Mind-Blowing Stats Everyone Should Read. Retrieved from https://www.forbes.com/sites/ber-nardmarr/2018/05/21/how-much-data-do-we-create-every-day-the-mind-blow-ing-stats-everyone-should-read
Matz, S., & Kosinski, M. (2019). Using Consumers’ Digital Footprints for More Persuasive Mass Communication. NIM Marketing Intelligence Review, 11(2).
Matz, S. C., Appel, R. E., & Kosinski, M. (2020). Privacy in the age of psychological tar-geting. Current Opinion in Psychology, 31, 116–121. https://doi.org/10.1016/j.copsyc.2019.08.010
Matz, S. C., Kosinski, M., Nave, G., & Stillwell, D. J. (2017). Psychological targeting as an effective approach to digital mass persuasion. Proceedings of the National Academy of Sciences, 114(48), 12714–12719. https://doi.org/10.1073/pnas.1710966114
Mazzocchi, F. (2015). Could Big Data be the end of theory in science?: A few remarks on the epistemology of data-driven science. EMBO reports, 16(10), 1250–1255. https://doi.org/10.15252/embr.201541001
McDonald, A., & Cranor, L. (2008). The Cost of Reading Privacy Policies. I/S: A Journal of Law and Policy for the Information Society, 4(3), 543–568.
Meng, H., Zamudio, C., & Jewell, R. D. (2018). Unlocking competitiveness through scent names: A data-driven approach. Business Horizons, 61(3), 385–395. https://doi.org/10.1016/j.bushor.2018.01.004
Milne, G. R., & Culnan, M. J. (2004). Strategies for reducing online privacy risks: Why con-sumers read (or don’t read) online privacy notices. Journal of Interactive Marketing, 18(3), 15–29. https://doi.org/10.1002/dir.20009
Misoch, S. (2015). Stranger on the internet: Online self-disclosure and the role of visual anonymity. Computers in Human Behavior, 48, 535–541. https://doi.org/10.1016/j.chb.2015.02.027
Bibliography 95
Mukhina, K. D., Rakitin, S. V., & Visheratin, A. A. (2017). Detection of tourists attraction points using Instagram profiles. Procedia Computer Science, 108, 2378–2382. https://doi.org/https://doi.org/10.1016/j.procs.2017.05.131
Naur, P. (1974). Concise survey of computer methods. Lund, Sweden: Studentlitteratur.
Nealon, G. (Jun 4, 2018). Using Facebook Messenger And Chatbots To Grow Your Audience. Retrieved from https://www.forbes.com/sites/forbesagencycoun-cil/2018/06/04/using-facebook-messenger-and-chatbots-to-grow-your-audience/
Nisbet, R., Miner, G., & Yale, K. (2018). The Data Mining and Predictive Analytic Process. In Handbook of Statistical Analysis and Data Mining Applications (pp. 39–54).
Nisbett, R. E., & Wilson, T. D. (1977). The halo effect: Evidence for unconscious alteration of judgments. Journal of Personality and Social Psychology, 35(4), 250–256. https://doi.org/10.1037/0022-3514.35.4.250
Nofer, M., Hinz, O., Muntermann, J., & Roßnagel, H. (2014). The Economic Impact of Pri-vacy Violations and Security Breaches. Business & Information Systems Engineering, 6(6), 339–348. https://doi.org/10.1007/s12599-014-0351-3
Nomura, N. (2018). Orthant probabilities of elliptical distributions from orthogonal projections to subspaces. Statistics and Computing, 29(2), 289–300. https://doi.org/10.1007/s11222-018-9808-4
O'Loughlin, K., Neary, M., Adkins, E. C., & Schueller, S. M. (2019). Reviewing the data security and privacy policies of mobile apps for depression. Internet Interv, 15, 110–115. https://doi.org/10.1016/j.invent.2018.12.001
O'Reilly, J. (2016). Network Storage: Tools and Technologies for Storing Your Company’s Data: Elsevier Science.
Olhede, S. C., & Wolfe, P. J. (2018). The future of statistics and data science. Statistics & Probability Letters, 136, 46–50. https://doi.org/10.1016/j.spl.2018.02.042
Otterbring, T., Wästlund, E., & Gustafsson, A. (2016). Eye-tracking customers' visual at-tention in the wild: Dynamic gaze behavior moderates the effect of store familiari-ty on navigational fluency. Journal of Retailing and Consumer Services, 28, 165–170. https://doi.org/10.1016/j.jretconser.2015.09.004
Ozanne, J. L., & Saatcioglu, B. (2008). Participatory Action Research. Journal of Consumer Research, 35(3), 423–439. https://doi.org/10.1086/586911
Panse, C. (2018). Rectangular Statistical Cartograms in R: The recmap Package. Journal of Statistical Software, 86(Code Snippet 1). https://doi.org/10.18637/jss.v086.c01
Perry, R. (2019). GDPR – project or permanent reality? Computer Fraud & Security, 2019(1), 9–11. https://doi.org/10.1016/s1361-3723(19)30007-7
Picheny, V., Servien, R., & Villa-Vialaneix, N. (2018). Interpretable sparse SIR for functional data. Statistics and Computing, 29(2), 255–267. https://doi.org/10.1007/s11222-018-9806-6

Bibliography 96
Platon. (2017). Fedon: Teologia Polityczna.
Politou, E., Michota, A., Alepis, E., Pocs, M., & Patsakis, C. (2018). Backups and the right to be forgotten in the GDPR: An uneasy relationship. Computer Law & Security Review, 34(6), 1247–1257. https://doi.org/10.1016/j.clsr.2018.08.006
Popper, K. (1979). Objective knowledge: an evolutionary approach: Clarendon Press.
Prentice, C., Han, X. Y., Hua, L.-L., & Hu, L. (2019). The influence of identity-driven cus-tomer engagement on purchase intention. Journal of Retailing and Consumer Servic-es, 47, 339–347. https://doi.org/10.1016/j.jretconser.2018.12.014
Presthus, W., & Sørum, H. (2018). Are Consumers Concerned About Privacy? An Online Survey Emphasizing the General Data Protection Regulation. Procedia Computer Sci-ence, 138, 603–611. https://doi.org/10.1016/j.procs.2018.10.081
Prichard, J., & Mentzer, K. (2017). An analysis of app privacy statements. Issues in Infor-mation Systems, 18(4), 179–188.
Provost, F., & Fawcett, T. (2013). Data Science and its Relationship to Big Data and Data-Driven Decision Making. Big Data, 1(1), 51–59. https://doi.org/10.1089/big.2013.1508
Ratner, B. (2017). Statistical and Machine-Learning Data Mining: : Techniques for Better Predictive Modeling and Analysis of Big Data. Portland, United States: Taylor & Francis Inc.
Razia Sulthana, A., & Ramasamy, S. (2019). Ontology and context based recommenda-tion system using Neuro-Fuzzy Classification. Computers & Electrical Engineering, 74, 498–510. https://doi.org/10.1016/j.compeleceng.2018.01.034
Reid, N. (2018). Statistical science in the world of big data. Statistics & Probability Letters, 136, 42–45. https://doi.org/10.1016/j.spl.2018.02.049
Rello, L., Baeza-Yates, R., Dempere-Marco, L., & Saggion, H. (2013, 2013//). Frequent Words Improve Readability and Short Words Improve Understandability for People with Dyslexia. Paper presented at the Human-Computer Interaction – INTERACT 2013, Berlin, Heidelberg.
Rizkallah, J. (June 5, 2017). The Big (Unstructured) Data Problem. Retrieved from www.forbes.com/sites/forbestechcouncil/2017/06/05/the-big-unstructured-data-prob-lem/
Robillard, J. M., Feng, T. L., Sporn, A. B., Lai, J.-A., Lo, C., Ta, M., & Nadler, R. (2019). Availa-bility, readability, and content of privacy policies and terms of agreements of mental health apps. Internet Interventions, 17. https://doi.org/10.1016/j.invent.2019.100243
Romero, S. (Dec 31, 2018). Wielding Rocks and Knives, Arizonans Attack Self-Driving Cars. The New York Times. Retrieved from https://www.nytimes.com/2018/12/31/us/waymo-self-driving-cars-arizona-attacks.html
Bibliography 97
Rosenbaum, M. S., Otalora, M. L., & Ramírez, G. C. (2017). How to create a realistic cus-tomer journey map. Business Horizons, 60(1), 143–150. https://doi.org/10.1016/j.bushor.2016.09.010
Ross, P. K., Ressia, S., & Sander, E. J. (2017). Work in the 21st Century.
Rowley, J. (2007). The wisdom hierarchy: representations of the DIKW hierarchy. Journal of Information Science, 33(2), 163–180. https://doi.org/10.1177/0165551506070706
Rudkowski, J., Heney, C., Yu, H., Sedlezky, S., & Gunn, F. (2019). Here Today, Gone Tomor-row? Mapping and modeling the pop-up retail customer journey. Journal of Retail-ing and Consumer Services. https://doi.org/10.1016/j.jretconser.2018.11.003
Shankar, V. (2018). How Artificial Intelligence (AI) is Reshaping Retailing. Journal of Re-tailing, 94(4), vi-xi. https://doi.org/10.1016/s0022-4359(18)30076-9
Shi, J. Q. (2018). How do statisticians analyse big data – Our story. Statistics & Probability Letters, 136, 130–133. https://doi.org/10.1016/j.spl.2018.02.043
Shikhli, M. S. E., & Hammad, A. M. (2018). Data acquisition model for analyzing sched-ule delays using KDD (Knowledge Discovery and Datamining). Paper presented at the ACM International Conference Proceeding Series.
SimilarWeb. (2019). Our Data. Retrieved from https://www.similarweb.com/ourdata
SINTEF. (May 22, 2013). Big Data, for better or worse: 90% of world's data gen-erated over last two years. Retrieved from www.sciencedaily.com/releas-es/2013/05/130522085217.htm
Sivarajah, U., Kamal, M. M., Irani, Z., & Weerakkody, V. (2017). Critical analysis of Big Data challenges and analytical methods. Journal of Business Research, 70, 263–286. https://doi.org/10.1016/j.jbusres.2016.08.001
Smętkowska, M., & Mrugalska, B. (2018). Using Six Sigma DMAIC to Improve the Quality of the Production Process: A Case Study. Procedia – Social and Behavioral Sciences, 238, 590–596. https://doi.org/10.1016/j.sbspro.2018.04.039
Smirnova, E., Ivanescu, A., Bai, J., & Crainiceanu, C. M. (2018). A practical guide to big data. Statistics & Probability Letters, 136, 25–29. https://doi.org/10.1016/j.spl.2018.02.014
Soemer, A., & Schiefele, U. (2019). Text difficulty, topic interest, and mind wandering during reading. Learning and Instruction, 61, 12–22. https://doi.org/10.1016/j.learn-instruc.2018.12.006
Song, I.-Y., & Zhu, Y. (2016). Big data and data science: what should we teach? Expert Systems, 33(4), 364–373. https://doi.org/10.1111/exsy.12130
Soroka, A., Liu, Y., Han, L., & Haleem, M. S. (2017). Big Data Driven Customer Insights for SMEs in Redistributed Manufacturing. Procedia CIRP, 63, 692–697. https://doi.org/10.1016/j.procir.2017.03.319
Bibliography 98
Spiekermann, S., Acquisti, A., Böhme, R., & Hui, K.-L. (2015). The challenges of per-sonal data markets and privacy. Electronic Markets, 25(2), 161–167. https://doi.org/10.1007/s12525-015-0191-0
Srinivasan, K., Muthu, S., Devadasan, S. R., & Sugumaran, C. (2014). Enhancing Effective-ness of Shell and Tube Heat Exchanger through Six Sigma DMAIC Phases. Procedia Engineering, 97, 2064–2071. https://doi.org/10.1016/j.proeng.2014.12.449
Statistica. (2019). Adblocking penetration rate in selected countries worldwide as of February 2018. Retrieved from https://www.statista.com/statistics/351862/ad-blocking-usage/
Steinfeld, N. (2016). “I agree to the terms and conditions”: (How) do users read priva-cy policies online? An eye-tracking experiment. Computers in Human Behavior, 55, 992–1000. https://doi.org/10.1016/j.chb.2015.09.038
Stępniewski, R. (Feb 7, 2018). Naruszenia ochrony danych osobowych a kary pieniężne. Retrieved from https://www.politykabezpieczenstwa.pl/pl/a/naruszenia-ochrony-danych-osobowych-a-kary-pieniezne
Steppe, R. (2017). Online price discrimination and personal data: A General Data Pro-tection Regulation perspective. Computer Law & Security Review, 33(6), 768–785. https://doi.org/10.1016/j.clsr.2017.05.008
Sturari, M., Liciotti, D., Pierdicca, R., Frontoni, E., Mancini, A., Contigiani, M., & Zingaretti, P. (2016). Robust and affordable retail customer profiling by vision and radio bea-con sensor fusion. Pattern Recognition Letters, 81, 30–40. https://doi.org/10.1016/j.patrec.2016.02.010
Sundaresan, N. (2017). The History of Data Science. Retrieved from https://www.huffing-tonpost.com/quora/the-history-of-data-scien_b_10116442.html?guccounter=1
Szymkowiak, A. (2016). Zachowania konsumentów korzystających z portali zakupów grupowych i ich uwarunkowania (1 ed.). Poznań: PTE.
Talia, D., Trunfio, P., & Marozzo, F. (2015). Data Analysis in the Cloud: Elsevier.
Talia, D., Trunfio, P., & Marozzo, F. (2016). Introduction to Data Mining. In Data Analysis in the Cloud (pp. 1–25).
Tan, G. W.-H., Lee, V.-H., Hew, J.-J., Ooi, K.-B., & Wong, L.-W. (2018). The interactive mobile social media advertising: An imminent approach to advertise tourism products and services? Telematics and Informatics, 35(8), 2270–2288. https://doi.org/https://doi.org/10.1016/j.tele.2018.09.005
Tavani, H. (1999). KDD, data mining, and the challenge for normative privacy. Ethics and Information Technology, 1, 65–273.
Tsai, J., Egelman, S., Cranor, L., & Acquisti, A. (2011). The Effect of Online Privacy Informa-tion on Purchasing Behavior: An Experimental Study. Information Systems Research, 22(2), 254–268.
Bibliography 99
Tsironis, L. K. (2018). Quality improvement calls data mining: the case of the seven new quality tools. Benchmarking: An International Journal, 25(1), 47–75. https://doi.org/10.1108/bij-06-2016-0093
Turakhia, C. (Nov 10, 2017). Engineering More Reliable Transportation with Machine Learning and AI at Uber. Retrieved from https://eng.uber.com/machine-learning/
Turow, J. (2006). Americans Online Privacy: The System Is Broken. The Annenberg Public Policy Center of the University of Pennsylvania.
Vail, M. W., Earp, J. B., & AntÓn, A. I. (2008). An Empirical Study of Consumer Perceptions and Comprehension of Web Site Privacy Policies. IEEE Transactions on Engineering Management, 55(3), 442–454. https://doi.org/10.1109/tem.2008.922634
Vakulenko, Y., Shams, P., Hellström, D., & Hjort, K. (2019). Service innovation in e-com-merce last mile delivery: Mapping the e-customer journey. Journal of Business Re-search, 101, 461–468. https://doi.org/10.1016/j.jbusres.2019.01.016
van Bavel, R., Rodríguez-Priego, N., Vila, J., & Briggs, P. (2019). Using protection moti-vation theory in the design of nudges to improve online security behavior. Inter-national Journal of Human-Computer Studies, 123, 29–39. https://doi.org/10.1016/j.ijhcs.2018.11.003
Vasarhelyi, M. A., Kogan, A., & Tuttle, B. M. (2015). Big Data in Accounting: An Overview. Accounting Horizons, 29(2), 381–396. https://doi.org/10.2308/acch-51071
Versace, E., Martinho-Truswell, A., Kacelnik, A., & Vallortigara, G. (2018). Priors in Ani-mal and Artificial Intelligence: Where Does Learning Begin? Trends Cogn Sci, 22(11), 963–965. https://doi.org/10.1016/j.tics.2018.07.005
von Briel, F. (2018). The future of omnichannel retail: A four-stage Delphi study. Techno-logical Forecasting and Social Change, 132, 217–229. https://doi.org/10.1016/j.tech-fore.2018.02.004
Walsh, G., Shiu, E., Hassan, L. M., Michaelidou, N., & Beatty, S. E. (2011). Emotions, store-environmental cues, store-choice criteria, and marketing outcomes. Journal of Business Research, 64(7), 737–744. https://doi.org/10.1016/j.jbusres.2010.07.008
Williams, A. (2019). Seo 2019: Actionable, Hands-On Seo, Including a Full Site Audit (1 ed.): Independently Published.
Wilson, S. (2018). A framework for security technology cohesion in the era of the GDPR. Computer Fraud & Security, 2018(12), 8–11. https://doi.org/10.1016/s1361-3723(18)30119-2
Witell, L., Kowalkowski, C., Perks, H., Raddats, C., Schwabe, M., Benedettini, O., & Burton, J. (2019). Characterizing customer experience management in business markets. Journal of Business Research. https://doi.org/10.1016/j.jbusres.2019.08.050
Woo, J. (2016). The right not to be identified: privacy and anonymity in the inter-active media environment. New Media & Society, 8(6), 949–967. https://doi.org/10.1177/1461444806069650
Bibliography 100
Wu, X., Zhang, Y., & Zhu, X. (2009). Data Mining. In B. Wah (Ed.), Wiley Encyclopedia of Computer Science and Engineering: Wiley.
Xia, P., Zhang, L., & Li, F. (2015). Learning similarity with cosine similarity ensemble. Infor-mation Sciences, 307, 39–52. https://doi.org/10.1016/j.ins.2015.02.024
Xu, Y., & Jasra, A. (2019). A method for high-dimensional smoothing. Journal of the Kore-an Statistical Society, 48(1), 50–67. https://doi.org/10.1016/j.jkss.2018.08.004
Yakushev, A., & Mityagin, S. (2014). Social Networks Mining for Analysis and Modeling Drugs Usage. Procedia Computer Science, 29, 2462–2471. https://doi.org/10.1016/j.procs.2014.05.230
Ylioinas, J., Poh, N., Holappa, J., & Pietikäinen, M. (2016). Data-driven techniques for smoothing histograms of local binary patterns. Pattern Recognition, 60, 734–747. https://doi.org/10.1016/j.patcog.2016.06.029
Zeleny, M. (1987). Management support systems: towards integrated knowledge man-agement,. Human Systems Management, 7(1), 59–70.
Zhang, X., & Dahu, W. (2019). Application of Artificial Intelligence Algorithms in Image Processing. Journal of Visual Communication and Image Representation. https://doi.org/10.1016/j.jvcir.2019.03.004
Zhao, Z., Zhang, R., Cox, J., Duling, D., & Sarle, W. (2013). Massively parallel feature se-lection: an approach based on variance preservation. Machine Learning, 92(1), 195–220. https://doi.org/10.1007/s10994-013-5373-4
Zhou, X., Xu, C., & Kimmons, B. (2015). Detecting tourism destinations using scalable geospatial analysis based on cloud computing platform. Computers, Environment and Urban Systems, 54, 144–153. https://doi.org/https://doi.org/10.1016/j.compen-vurbsys.2015.07.006
Zhu, Y., & Xiong, Y. (2015). Towards Data Science. Data Science Journal, 14(0). https://doi.org/10.5334/dsj-2015-008
Zicari, R. (2013). Big Data: Challanges and Opportunities. In R. Akerkar (Ed.), Big Data Computing: CRC Press.
Zihayat, M., Ayanso, A., Zhao, X., Davoudi, H., & An, A. (2019). A utility-based news recom-mendation system. Decision Support Systems, 117, 14–27. https://doi.org/10.1016/j.dss.2018.12.001

Appendix 1 101
Appendix 1List of analysed stores, along with the addresses at which the privacy policy is available
Category Brand Link
AGD/RTV north.pl https://north.pl/polityka-prywatnosci.html
AGD/RTV morele.net https://www.morele.net/
AGD/RTV X-kom.pl https://www.x-kom.pl/polityka-prywatnosci
AGD/RTV Oleole.pl https://www.oleole.pl/cms/polityka-prywatnosci.bhtml
AGD/RTV agdmaster.com https://www.agdmaster.com/polityka-prywatnosci
AGD/RTV Neo24.pl https://www.neo24.pl/polityka-prywatnosci
AGD/RTV Zadowolenie.pl https://www.zadowolenie.pl/polityka-prywatnosci
AGD/RTV AVANS.PL https://www.avans.pl/s,zasady-przetwarzania-danych
AGD/RTV ELECTRO.PL https://www.electro.pl/s,zasady-przetwarzania-danych#przetwarzamy_rowniez
AGD/RTV Neonet.pl https://www.neonet.pl/polityka-prywatnosci
Medical articles Apteka-melissa.pl https://www.apteka-melissa.pl/strona/polityka-prywatnosci.html
Medical articles Aptekagemini.pl https://www.aptekagemini.pl/webpage/polityka-prywatnosci.html
Medical articles Wapteka.pl https://www.wapteka.pl/strona/polityka-prywatnosci.html
Medical articles Diabetyk24.pl https://diabetyk24.pl/polityka-prywatnosci
Medical articles Bezokularow.pl https://www.bezokularow.pl/polityka-prywatnosci
Medical articles DOZ.pl https://www.doz.pl/info/Doz.pl_-_regulamin
Medical articles Aptekaflora.pl https://www.aptekaflora.pl/page/polityka_prywatnosci/17
Medical articles aptekazawiszy.PL https://aptekazawiszy.pl/strony/polityka.html
Medical articles Aptekapomocna24.pl https://aptekapomocna24.pl/Regulamin-cterms-pol-29.html
Medical articles Szkla.com https://www.szkla.com/privacy_policy.html
Zoological articles Zooart.com.pl https://zooart.com.pl/Polityka-Prywatnosci-cabout-pol-10.html
Zoological articles Fera.pl https://fera.pl/polityka-prywatnosci.html
Zoological articles krakvet.pl https://www.krakvet.pl/Polityka-prywatnosci-cterms-chy-63.html
Zoological articles Telekarma.pl https://www.telekarma.pl/s239/ochrona.prywatnosci.htm
Zoological articles Zooplus.pl https://www.zooplus.pl/content/privacy
Zoological articles Naszezoo.pl https://www.naszezoo.pl/%22/pl/i/Regulamin/2/%22
Zoological articles Apetete.pl https://apetete.pl/polityka_prywatnosci.html
Zoological articles e-sklep.kakadu.pl https://e-sklep.kakadu.pl/s243/polityka.prywatnosci.htm
Zoological articles Swiatkarm.pl https://www.swiatkarm.pl/Polityka-prywatnosci-clinks-zul-73.html
Zoological articles petkarma.PL https://petkarma.pl/ochrona-danych-osobowych
Children's products Feedo.pl https://www.feedo.pl/regulamin-sklepu-archiwum/warunki-przetwarzania-danych-osobowych/
Children's products congee.pl https://congee.pl/Regulamin-cterms-pol-43.html
Children's products kucmar.pl https://kucmar.pl/Polityka-Prywatnosci-cterms-pol-20.html
Children's products 3xk.pl https://3xk.pl/Polityka-Prywatnosci-cterms-pol-20.html
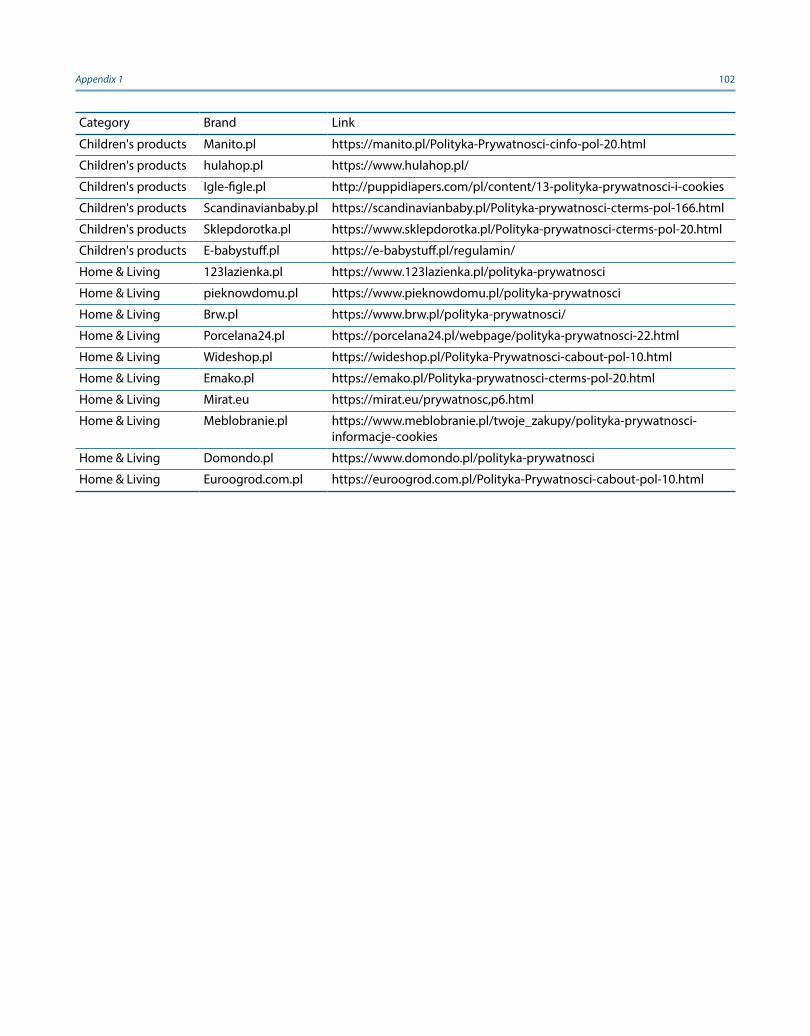
Appendix 1 102
Category Brand Link
Children's products Manito.pl https://manito.pl/Polityka-Prywatnosci-cinfo-pol-20.html
Children's products hulahop.pl https://www.hulahop.pl/
Children's products Igle-figle.pl http://puppidiapers.com/pl/content/13-polityka-prywatnosci-i-cookies
Children's products Scandinavianbaby.pl https://scandinavianbaby.pl/Polityka-prywatnosci-cterms-pol-166.html
Children's products Sklepdorotka.pl https://www.sklepdorotka.pl/Polityka-prywatnosci-cterms-pol-20.html
Children's products E-babystuff.pl https://e-babystuff.pl/regulamin/
Home & Living 123lazienka.pl https://www.123lazienka.pl/polityka-prywatnosci
Home & Living pieknowdomu.pl https://www.pieknowdomu.pl/polityka-prywatnosci
Home & Living Brw.pl https://www.brw.pl/polityka-prywatnosci/
Home & Living Porcelana24.pl https://porcelana24.pl/webpage/polityka-prywatnosci-22.html
Home & Living Wideshop.pl https://wideshop.pl/Polityka-Prywatnosci-cabout-pol-10.html
Home & Living Emako.pl https://emako.pl/Polityka-prywatnosci-cterms-pol-20.html
Home & Living Mirat.eu https://mirat.eu/prywatnosc,p6.html
Home & Living Meblobranie.pl https://www.meblobranie.pl/twoje_zakupy/polityka-prywatnosci-informacje-cookies
Home & Living Domondo.pl https://www.domondo.pl/polityka-prywatnosci
Home & Living Euroogrod.com.pl https://euroogrod.com.pl/Polityka-Prywatnosci-cabout-pol-10.html
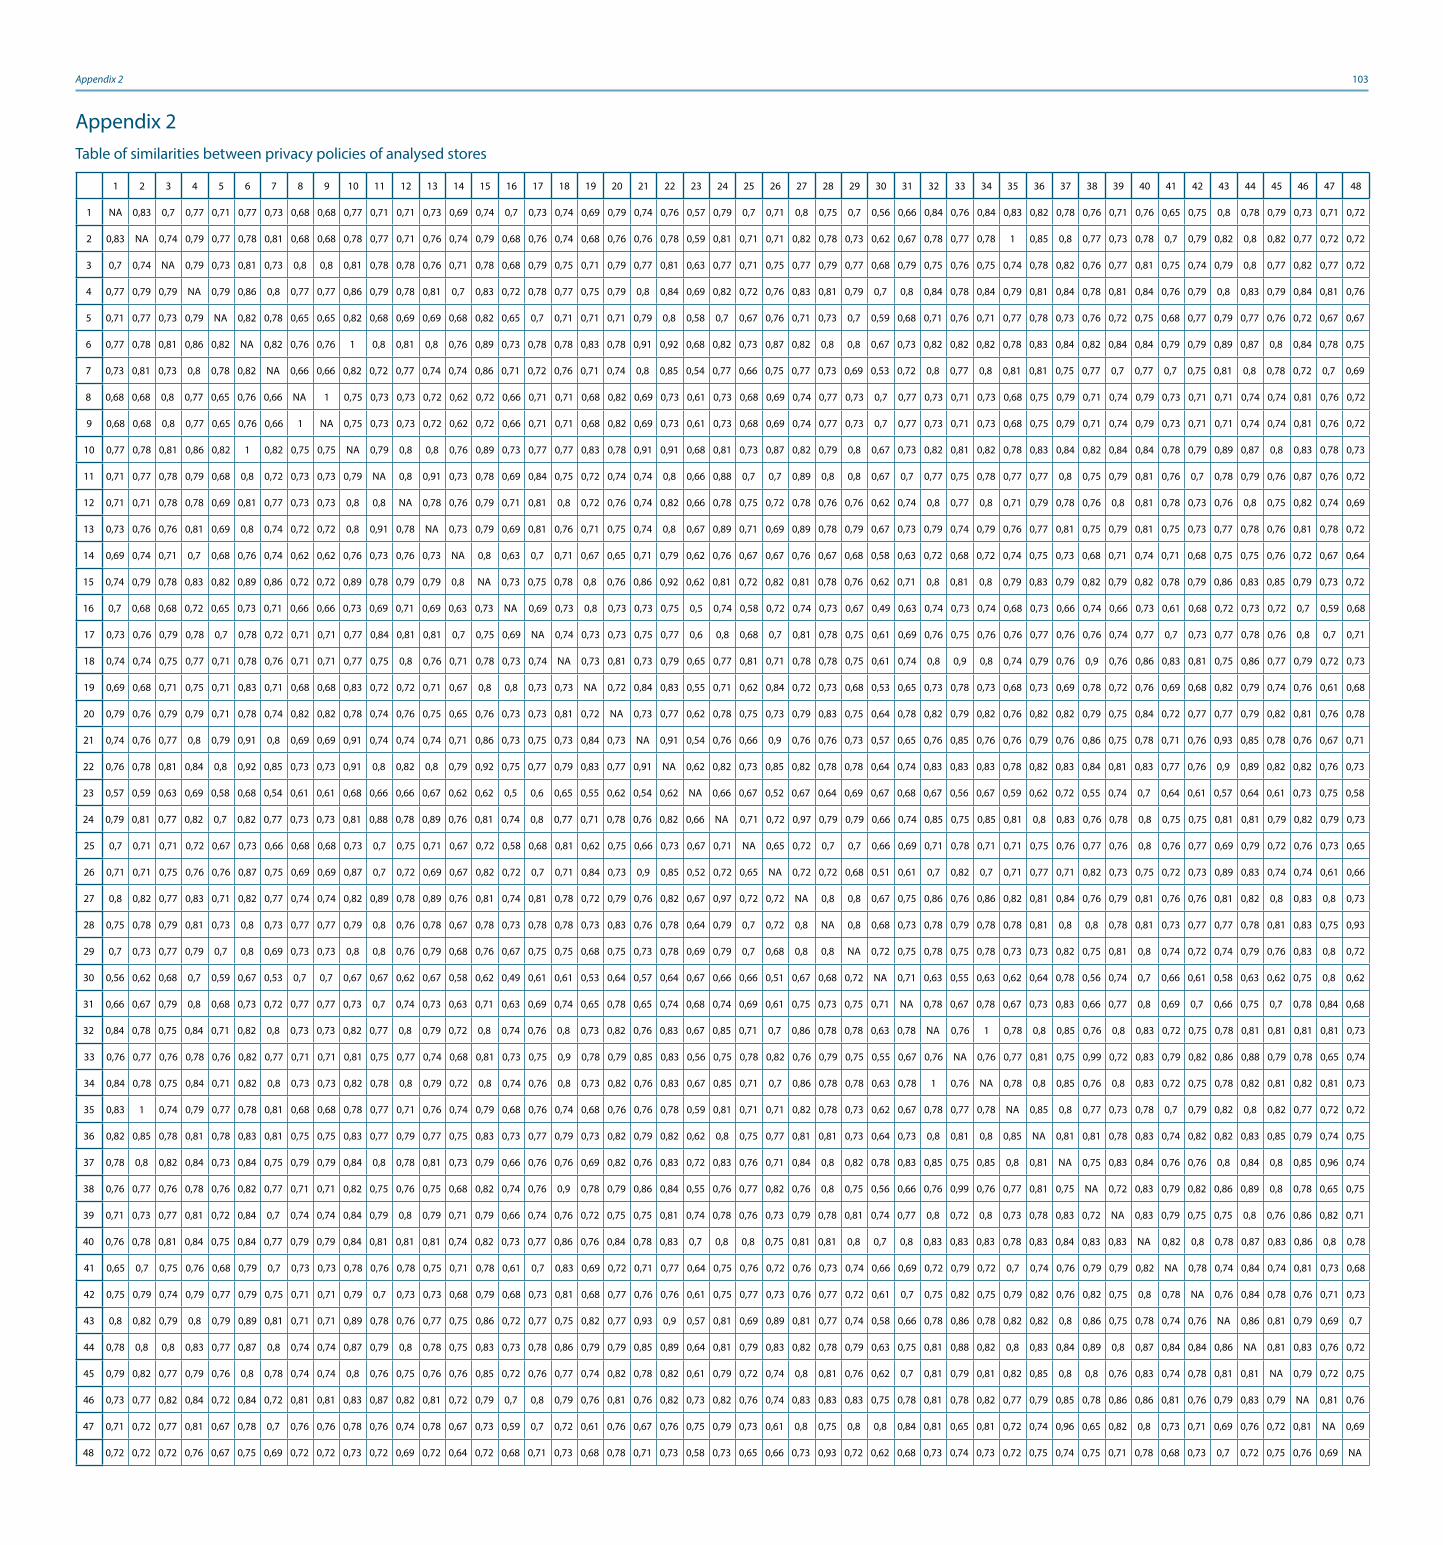
Appendix 2 103
Appendix 2Table of similarities between privacy policies of analysed stores
1 2 3 4 5 6 7 8 9 10 11 12 13 14 15 16 17 18 19 20 21 22 23 24 25 26 27 28 29 30 31 32 33 34 35 36 37 38 39 40 41 42 43 44 45 46 47 48
1 NA 0,83 0,7 0,77 0,71 0,77 0,73 0,68 0,68 0,77 0,71 0,71 0,73 0,69 0,74 0,7 0,73 0,74 0,69 0,79 0,74 0,76 0,57 0,79 0,7 0,71 0,8 0,75 0,7 0,56 0,66 0,84 0,76 0,84 0,83 0,82 0,78 0,76 0,71 0,76 0,65 0,75 0,8 0,78 0,79 0,73 0,71 0,72
2 0,83 NA 0,74 0,79 0,77 0,78 0,81 0,68 0,68 0,78 0,77 0,71 0,76 0,74 0,79 0,68 0,76 0,74 0,68 0,76 0,76 0,78 0,59 0,81 0,71 0,71 0,82 0,78 0,73 0,62 0,67 0,78 0,77 0,78 1 0,85 0,8 0,77 0,73 0,78 0,7 0,79 0,82 0,8 0,82 0,77 0,72 0,72
3 0,7 0,74 NA 0,79 0,73 0,81 0,73 0,8 0,8 0,81 0,78 0,78 0,76 0,71 0,78 0,68 0,79 0,75 0,71 0,79 0,77 0,81 0,63 0,77 0,71 0,75 0,77 0,79 0,77 0,68 0,79 0,75 0,76 0,75 0,74 0,78 0,82 0,76 0,77 0,81 0,75 0,74 0,79 0,8 0,77 0,82 0,77 0,72
4 0,77 0,79 0,79 NA 0,79 0,86 0,8 0,77 0,77 0,86 0,79 0,78 0,81 0,7 0,83 0,72 0,78 0,77 0,75 0,79 0,8 0,84 0,69 0,82 0,72 0,76 0,83 0,81 0,79 0,7 0,8 0,84 0,78 0,84 0,79 0,81 0,84 0,78 0,81 0,84 0,76 0,79 0,8 0,83 0,79 0,84 0,81 0,76
5 0,71 0,77 0,73 0,79 NA 0,82 0,78 0,65 0,65 0,82 0,68 0,69 0,69 0,68 0,82 0,65 0,7 0,71 0,71 0,71 0,79 0,8 0,58 0,7 0,67 0,76 0,71 0,73 0,7 0,59 0,68 0,71 0,76 0,71 0,77 0,78 0,73 0,76 0,72 0,75 0,68 0,77 0,79 0,77 0,76 0,72 0,67 0,67
6 0,77 0,78 0,81 0,86 0,82 NA 0,82 0,76 0,76 1 0,8 0,81 0,8 0,76 0,89 0,73 0,78 0,78 0,83 0,78 0,91 0,92 0,68 0,82 0,73 0,87 0,82 0,8 0,8 0,67 0,73 0,82 0,82 0,82 0,78 0,83 0,84 0,82 0,84 0,84 0,79 0,79 0,89 0,87 0,8 0,84 0,78 0,75
7 0,73 0,81 0,73 0,8 0,78 0,82 NA 0,66 0,66 0,82 0,72 0,77 0,74 0,74 0,86 0,71 0,72 0,76 0,71 0,74 0,8 0,85 0,54 0,77 0,66 0,75 0,77 0,73 0,69 0,53 0,72 0,8 0,77 0,8 0,81 0,81 0,75 0,77 0,7 0,77 0,7 0,75 0,81 0,8 0,78 0,72 0,7 0,69
8 0,68 0,68 0,8 0,77 0,65 0,76 0,66 NA 1 0,75 0,73 0,73 0,72 0,62 0,72 0,66 0,71 0,71 0,68 0,82 0,69 0,73 0,61 0,73 0,68 0,69 0,74 0,77 0,73 0,7 0,77 0,73 0,71 0,73 0,68 0,75 0,79 0,71 0,74 0,79 0,73 0,71 0,71 0,74 0,74 0,81 0,76 0,72
9 0,68 0,68 0,8 0,77 0,65 0,76 0,66 1 NA 0,75 0,73 0,73 0,72 0,62 0,72 0,66 0,71 0,71 0,68 0,82 0,69 0,73 0,61 0,73 0,68 0,69 0,74 0,77 0,73 0,7 0,77 0,73 0,71 0,73 0,68 0,75 0,79 0,71 0,74 0,79 0,73 0,71 0,71 0,74 0,74 0,81 0,76 0,72
10 0,77 0,78 0,81 0,86 0,82 1 0,82 0,75 0,75 NA 0,79 0,8 0,8 0,76 0,89 0,73 0,77 0,77 0,83 0,78 0,91 0,91 0,68 0,81 0,73 0,87 0,82 0,79 0,8 0,67 0,73 0,82 0,81 0,82 0,78 0,83 0,84 0,82 0,84 0,84 0,78 0,79 0,89 0,87 0,8 0,83 0,78 0,73
11 0,71 0,77 0,78 0,79 0,68 0,8 0,72 0,73 0,73 0,79 NA 0,8 0,91 0,73 0,78 0,69 0,84 0,75 0,72 0,74 0,74 0,8 0,66 0,88 0,7 0,7 0,89 0,8 0,8 0,67 0,7 0,77 0,75 0,78 0,77 0,77 0,8 0,75 0,79 0,81 0,76 0,7 0,78 0,79 0,76 0,87 0,76 0,72
12 0,71 0,71 0,78 0,78 0,69 0,81 0,77 0,73 0,73 0,8 0,8 NA 0,78 0,76 0,79 0,71 0,81 0,8 0,72 0,76 0,74 0,82 0,66 0,78 0,75 0,72 0,78 0,76 0,76 0,62 0,74 0,8 0,77 0,8 0,71 0,79 0,78 0,76 0,8 0,81 0,78 0,73 0,76 0,8 0,75 0,82 0,74 0,69
13 0,73 0,76 0,76 0,81 0,69 0,8 0,74 0,72 0,72 0,8 0,91 0,78 NA 0,73 0,79 0,69 0,81 0,76 0,71 0,75 0,74 0,8 0,67 0,89 0,71 0,69 0,89 0,78 0,79 0,67 0,73 0,79 0,74 0,79 0,76 0,77 0,81 0,75 0,79 0,81 0,75 0,73 0,77 0,78 0,76 0,81 0,78 0,72
14 0,69 0,74 0,71 0,7 0,68 0,76 0,74 0,62 0,62 0,76 0,73 0,76 0,73 NA 0,8 0,63 0,7 0,71 0,67 0,65 0,71 0,79 0,62 0,76 0,67 0,67 0,76 0,67 0,68 0,58 0,63 0,72 0,68 0,72 0,74 0,75 0,73 0,68 0,71 0,74 0,71 0,68 0,75 0,75 0,76 0,72 0,67 0,64
15 0,74 0,79 0,78 0,83 0,82 0,89 0,86 0,72 0,72 0,89 0,78 0,79 0,79 0,8 NA 0,73 0,75 0,78 0,8 0,76 0,86 0,92 0,62 0,81 0,72 0,82 0,81 0,78 0,76 0,62 0,71 0,8 0,81 0,8 0,79 0,83 0,79 0,82 0,79 0,82 0,78 0,79 0,86 0,83 0,85 0,79 0,73 0,72
16 0,7 0,68 0,68 0,72 0,65 0,73 0,71 0,66 0,66 0,73 0,69 0,71 0,69 0,63 0,73 NA 0,69 0,73 0,8 0,73 0,73 0,75 0,5 0,74 0,58 0,72 0,74 0,73 0,67 0,49 0,63 0,74 0,73 0,74 0,68 0,73 0,66 0,74 0,66 0,73 0,61 0,68 0,72 0,73 0,72 0,7 0,59 0,68
17 0,73 0,76 0,79 0,78 0,7 0,78 0,72 0,71 0,71 0,77 0,84 0,81 0,81 0,7 0,75 0,69 NA 0,74 0,73 0,73 0,75 0,77 0,6 0,8 0,68 0,7 0,81 0,78 0,75 0,61 0,69 0,76 0,75 0,76 0,76 0,77 0,76 0,76 0,74 0,77 0,7 0,73 0,77 0,78 0,76 0,8 0,7 0,71
18 0,74 0,74 0,75 0,77 0,71 0,78 0,76 0,71 0,71 0,77 0,75 0,8 0,76 0,71 0,78 0,73 0,74 NA 0,73 0,81 0,73 0,79 0,65 0,77 0,81 0,71 0,78 0,78 0,75 0,61 0,74 0,8 0,9 0,8 0,74 0,79 0,76 0,9 0,76 0,86 0,83 0,81 0,75 0,86 0,77 0,79 0,72 0,73
19 0,69 0,68 0,71 0,75 0,71 0,83 0,71 0,68 0,68 0,83 0,72 0,72 0,71 0,67 0,8 0,8 0,73 0,73 NA 0,72 0,84 0,83 0,55 0,71 0,62 0,84 0,72 0,73 0,68 0,53 0,65 0,73 0,78 0,73 0,68 0,73 0,69 0,78 0,72 0,76 0,69 0,68 0,82 0,79 0,74 0,76 0,61 0,68
20 0,79 0,76 0,79 0,79 0,71 0,78 0,74 0,82 0,82 0,78 0,74 0,76 0,75 0,65 0,76 0,73 0,73 0,81 0,72 NA 0,73 0,77 0,62 0,78 0,75 0,73 0,79 0,83 0,75 0,64 0,78 0,82 0,79 0,82 0,76 0,82 0,82 0,79 0,75 0,84 0,72 0,77 0,77 0,79 0,82 0,81 0,76 0,78
21 0,74 0,76 0,77 0,8 0,79 0,91 0,8 0,69 0,69 0,91 0,74 0,74 0,74 0,71 0,86 0,73 0,75 0,73 0,84 0,73 NA 0,91 0,54 0,76 0,66 0,9 0,76 0,76 0,73 0,57 0,65 0,76 0,85 0,76 0,76 0,79 0,76 0,86 0,75 0,78 0,71 0,76 0,93 0,85 0,78 0,76 0,67 0,71
22 0,76 0,78 0,81 0,84 0,8 0,92 0,85 0,73 0,73 0,91 0,8 0,82 0,8 0,79 0,92 0,75 0,77 0,79 0,83 0,77 0,91 NA 0,62 0,82 0,73 0,85 0,82 0,78 0,78 0,64 0,74 0,83 0,83 0,83 0,78 0,82 0,83 0,84 0,81 0,83 0,77 0,76 0,9 0,89 0,82 0,82 0,76 0,73
23 0,57 0,59 0,63 0,69 0,58 0,68 0,54 0,61 0,61 0,68 0,66 0,66 0,67 0,62 0,62 0,5 0,6 0,65 0,55 0,62 0,54 0,62 NA 0,66 0,67 0,52 0,67 0,64 0,69 0,67 0,68 0,67 0,56 0,67 0,59 0,62 0,72 0,55 0,74 0,7 0,64 0,61 0,57 0,64 0,61 0,73 0,75 0,58
24 0,79 0,81 0,77 0,82 0,7 0,82 0,77 0,73 0,73 0,81 0,88 0,78 0,89 0,76 0,81 0,74 0,8 0,77 0,71 0,78 0,76 0,82 0,66 NA 0,71 0,72 0,97 0,79 0,79 0,66 0,74 0,85 0,75 0,85 0,81 0,8 0,83 0,76 0,78 0,8 0,75 0,75 0,81 0,81 0,79 0,82 0,79 0,73
25 0,7 0,71 0,71 0,72 0,67 0,73 0,66 0,68 0,68 0,73 0,7 0,75 0,71 0,67 0,72 0,58 0,68 0,81 0,62 0,75 0,66 0,73 0,67 0,71 NA 0,65 0,72 0,7 0,7 0,66 0,69 0,71 0,78 0,71 0,71 0,75 0,76 0,77 0,76 0,8 0,76 0,77 0,69 0,79 0,72 0,76 0,73 0,65
26 0,71 0,71 0,75 0,76 0,76 0,87 0,75 0,69 0,69 0,87 0,7 0,72 0,69 0,67 0,82 0,72 0,7 0,71 0,84 0,73 0,9 0,85 0,52 0,72 0,65 NA 0,72 0,72 0,68 0,51 0,61 0,7 0,82 0,7 0,71 0,77 0,71 0,82 0,73 0,75 0,72 0,73 0,89 0,83 0,74 0,74 0,61 0,66
27 0,8 0,82 0,77 0,83 0,71 0,82 0,77 0,74 0,74 0,82 0,89 0,78 0,89 0,76 0,81 0,74 0,81 0,78 0,72 0,79 0,76 0,82 0,67 0,97 0,72 0,72 NA 0,8 0,8 0,67 0,75 0,86 0,76 0,86 0,82 0,81 0,84 0,76 0,79 0,81 0,76 0,76 0,81 0,82 0,8 0,83 0,8 0,73
28 0,75 0,78 0,79 0,81 0,73 0,8 0,73 0,77 0,77 0,79 0,8 0,76 0,78 0,67 0,78 0,73 0,78 0,78 0,73 0,83 0,76 0,78 0,64 0,79 0,7 0,72 0,8 NA 0,8 0,68 0,73 0,78 0,79 0,78 0,78 0,81 0,8 0,8 0,78 0,81 0,73 0,77 0,77 0,78 0,81 0,83 0,75 0,93
29 0,7 0,73 0,77 0,79 0,7 0,8 0,69 0,73 0,73 0,8 0,8 0,76 0,79 0,68 0,76 0,67 0,75 0,75 0,68 0,75 0,73 0,78 0,69 0,79 0,7 0,68 0,8 0,8 NA 0,72 0,75 0,78 0,75 0,78 0,73 0,73 0,82 0,75 0,81 0,8 0,74 0,72 0,74 0,79 0,76 0,83 0,8 0,72
30 0,56 0,62 0,68 0,7 0,59 0,67 0,53 0,7 0,7 0,67 0,67 0,62 0,67 0,58 0,62 0,49 0,61 0,61 0,53 0,64 0,57 0,64 0,67 0,66 0,66 0,51 0,67 0,68 0,72 NA 0,71 0,63 0,55 0,63 0,62 0,64 0,78 0,56 0,74 0,7 0,66 0,61 0,58 0,63 0,62 0,75 0,8 0,62
31 0,66 0,67 0,79 0,8 0,68 0,73 0,72 0,77 0,77 0,73 0,7 0,74 0,73 0,63 0,71 0,63 0,69 0,74 0,65 0,78 0,65 0,74 0,68 0,74 0,69 0,61 0,75 0,73 0,75 0,71 NA 0,78 0,67 0,78 0,67 0,73 0,83 0,66 0,77 0,8 0,69 0,7 0,66 0,75 0,7 0,78 0,84 0,68
32 0,84 0,78 0,75 0,84 0,71 0,82 0,8 0,73 0,73 0,82 0,77 0,8 0,79 0,72 0,8 0,74 0,76 0,8 0,73 0,82 0,76 0,83 0,67 0,85 0,71 0,7 0,86 0,78 0,78 0,63 0,78 NA 0,76 1 0,78 0,8 0,85 0,76 0,8 0,83 0,72 0,75 0,78 0,81 0,81 0,81 0,81 0,73
33 0,76 0,77 0,76 0,78 0,76 0,82 0,77 0,71 0,71 0,81 0,75 0,77 0,74 0,68 0,81 0,73 0,75 0,9 0,78 0,79 0,85 0,83 0,56 0,75 0,78 0,82 0,76 0,79 0,75 0,55 0,67 0,76 NA 0,76 0,77 0,81 0,75 0,99 0,72 0,83 0,79 0,82 0,86 0,88 0,79 0,78 0,65 0,74
34 0,84 0,78 0,75 0,84 0,71 0,82 0,8 0,73 0,73 0,82 0,78 0,8 0,79 0,72 0,8 0,74 0,76 0,8 0,73 0,82 0,76 0,83 0,67 0,85 0,71 0,7 0,86 0,78 0,78 0,63 0,78 1 0,76 NA 0,78 0,8 0,85 0,76 0,8 0,83 0,72 0,75 0,78 0,82 0,81 0,82 0,81 0,73
35 0,83 1 0,74 0,79 0,77 0,78 0,81 0,68 0,68 0,78 0,77 0,71 0,76 0,74 0,79 0,68 0,76 0,74 0,68 0,76 0,76 0,78 0,59 0,81 0,71 0,71 0,82 0,78 0,73 0,62 0,67 0,78 0,77 0,78 NA 0,85 0,8 0,77 0,73 0,78 0,7 0,79 0,82 0,8 0,82 0,77 0,72 0,72
36 0,82 0,85 0,78 0,81 0,78 0,83 0,81 0,75 0,75 0,83 0,77 0,79 0,77 0,75 0,83 0,73 0,77 0,79 0,73 0,82 0,79 0,82 0,62 0,8 0,75 0,77 0,81 0,81 0,73 0,64 0,73 0,8 0,81 0,8 0,85 NA 0,81 0,81 0,78 0,83 0,74 0,82 0,82 0,83 0,85 0,79 0,74 0,75
37 0,78 0,8 0,82 0,84 0,73 0,84 0,75 0,79 0,79 0,84 0,8 0,78 0,81 0,73 0,79 0,66 0,76 0,76 0,69 0,82 0,76 0,83 0,72 0,83 0,76 0,71 0,84 0,8 0,82 0,78 0,83 0,85 0,75 0,85 0,8 0,81 NA 0,75 0,83 0,84 0,76 0,76 0,8 0,84 0,8 0,85 0,96 0,74
38 0,76 0,77 0,76 0,78 0,76 0,82 0,77 0,71 0,71 0,82 0,75 0,76 0,75 0,68 0,82 0,74 0,76 0,9 0,78 0,79 0,86 0,84 0,55 0,76 0,77 0,82 0,76 0,8 0,75 0,56 0,66 0,76 0,99 0,76 0,77 0,81 0,75 NA 0,72 0,83 0,79 0,82 0,86 0,89 0,8 0,78 0,65 0,75
39 0,71 0,73 0,77 0,81 0,72 0,84 0,7 0,74 0,74 0,84 0,79 0,8 0,79 0,71 0,79 0,66 0,74 0,76 0,72 0,75 0,75 0,81 0,74 0,78 0,76 0,73 0,79 0,78 0,81 0,74 0,77 0,8 0,72 0,8 0,73 0,78 0,83 0,72 NA 0,83 0,79 0,75 0,75 0,8 0,76 0,86 0,82 0,71
40 0,76 0,78 0,81 0,84 0,75 0,84 0,77 0,79 0,79 0,84 0,81 0,81 0,81 0,74 0,82 0,73 0,77 0,86 0,76 0,84 0,78 0,83 0,7 0,8 0,8 0,75 0,81 0,81 0,8 0,7 0,8 0,83 0,83 0,83 0,78 0,83 0,84 0,83 0,83 NA 0,82 0,8 0,78 0,87 0,83 0,86 0,8 0,78
41 0,65 0,7 0,75 0,76 0,68 0,79 0,7 0,73 0,73 0,78 0,76 0,78 0,75 0,71 0,78 0,61 0,7 0,83 0,69 0,72 0,71 0,77 0,64 0,75 0,76 0,72 0,76 0,73 0,74 0,66 0,69 0,72 0,79 0,72 0,7 0,74 0,76 0,79 0,79 0,82 NA 0,78 0,74 0,84 0,74 0,81 0,73 0,68
42 0,75 0,79 0,74 0,79 0,77 0,79 0,75 0,71 0,71 0,79 0,7 0,73 0,73 0,68 0,79 0,68 0,73 0,81 0,68 0,77 0,76 0,76 0,61 0,75 0,77 0,73 0,76 0,77 0,72 0,61 0,7 0,75 0,82 0,75 0,79 0,82 0,76 0,82 0,75 0,8 0,78 NA 0,76 0,84 0,78 0,76 0,71 0,73
43 0,8 0,82 0,79 0,8 0,79 0,89 0,81 0,71 0,71 0,89 0,78 0,76 0,77 0,75 0,86 0,72 0,77 0,75 0,82 0,77 0,93 0,9 0,57 0,81 0,69 0,89 0,81 0,77 0,74 0,58 0,66 0,78 0,86 0,78 0,82 0,82 0,8 0,86 0,75 0,78 0,74 0,76 NA 0,86 0,81 0,79 0,69 0,7
44 0,78 0,8 0,8 0,83 0,77 0,87 0,8 0,74 0,74 0,87 0,79 0,8 0,78 0,75 0,83 0,73 0,78 0,86 0,79 0,79 0,85 0,89 0,64 0,81 0,79 0,83 0,82 0,78 0,79 0,63 0,75 0,81 0,88 0,82 0,8 0,83 0,84 0,89 0,8 0,87 0,84 0,84 0,86 NA 0,81 0,83 0,76 0,72
45 0,79 0,82 0,77 0,79 0,76 0,8 0,78 0,74 0,74 0,8 0,76 0,75 0,76 0,76 0,85 0,72 0,76 0,77 0,74 0,82 0,78 0,82 0,61 0,79 0,72 0,74 0,8 0,81 0,76 0,62 0,7 0,81 0,79 0,81 0,82 0,85 0,8 0,8 0,76 0,83 0,74 0,78 0,81 0,81 NA 0,79 0,72 0,75
46 0,73 0,77 0,82 0,84 0,72 0,84 0,72 0,81 0,81 0,83 0,87 0,82 0,81 0,72 0,79 0,7 0,8 0,79 0,76 0,81 0,76 0,82 0,73 0,82 0,76 0,74 0,83 0,83 0,83 0,75 0,78 0,81 0,78 0,82 0,77 0,79 0,85 0,78 0,86 0,86 0,81 0,76 0,79 0,83 0,79 NA 0,81 0,76
47 0,71 0,72 0,77 0,81 0,67 0,78 0,7 0,76 0,76 0,78 0,76 0,74 0,78 0,67 0,73 0,59 0,7 0,72 0,61 0,76 0,67 0,76 0,75 0,79 0,73 0,61 0,8 0,75 0,8 0,8 0,84 0,81 0,65 0,81 0,72 0,74 0,96 0,65 0,82 0,8 0,73 0,71 0,69 0,76 0,72 0,81 NA 0,69
48 0,72 0,72 0,72 0,76 0,67 0,75 0,69 0,72 0,72 0,73 0,72 0,69 0,72 0,64 0,72 0,68 0,71 0,73 0,68 0,78 0,71 0,73 0,58 0,73 0,65 0,66 0,73 0,93 0,72 0,62 0,68 0,73 0,74 0,73 0,72 0,75 0,74 0,75 0,71 0,78 0,68 0,73 0,7 0,72 0,75 0,76 0,69 NA