Managing Capital Flows: The Case of the Philippines - Asian ...
54
Managing Capital Flows: The Case of the Philippines Josef T. Yap February 2008 ADB Institute Discussion Paper No. 91
-
Upload
khangminh22 -
Category
Documents
-
view
2 -
download
0
Transcript of Managing Capital Flows: The Case of the Philippines - Asian ...

Managing Capital Flows: The Case of the Philippines
Josef T. Yap
February 2008
ADB Institute Discussion Paper No. 91
ADBI’s discussion papers reflect initial ideas on a topic, and are posted online for discussion. ADBI encourages readers to post their comments on the main page for each discussion paper (given in the citation below). Some discussion papers may develop into research papers or other forms of publication. This discussion paper is part of the “Managing Capital Flows: Search for a Model” project.
Suggested citation:
Yap, Josef T. 2008. Managing Capital Flows: The Case of the Philippines. ADBI Discussion Paper 91. Tokyo: Asian Development Bank Institute. Available: http://www.adbi.org/discussion-paper/2008/03/05/2496.managing.capital.flows.philippines/
Asian Development Bank Institute Kasumigaseki Building 8F 3-2-5 Kasumigaseki, Chiyoda-ku Tokyo 100-6008, Japan Tel: +81-3-3593-5500 Fax: +81-3-3593-5571 URL: www.adbi.org E-mail: [email protected] © 2008 Asian Development Bank Institute
Josef T. Yap is President of the Philippine Institute for Development Studies (PIDS). The author would like to acknowledge the contribution of Ms. Racquel A. Claveria, Acting Bank Officer V, Economic and Financial Forecasting Group, Department of Economic Research, Bangko Sentral ng Pilipinas (BSP), who did the VAR analysis. The author also gratefully acknowledges the excellent research assistance of Ms. Fatima Lourdes E. del Prado and Mr. Michael R. Cabalfin. This paper was prepared in conjunction with the project on “Managing Capital Flows: Search for Model” under the auspices of the Asian Development Bank Institute.
The views expressed in this paper are the views of the author and do not necessarily reflect the views or policies of ADBI, the Asian Development Bank (ADB), its Board of Directors, or the governments they represent. ADBI does not guarantee the accuracy of the data included in this paper and accepts no responsibility for any consequences of their use. Terminology used may not necessarily be consistent with ADB official terms.
ADBI Discussion Paper 91 Josef T. Yap
Abstract During the past five years or so, most East Asian economies including the Philippines experienced a rising level of foreign exchange reserves and rapidly appreciating currencies both in nominal and real terms. One cause has been the resurgence of capital flows, which makes the issue of how to manage them relevant. However, the experience with regard to capital flows among East Asian economies is mixed and the level of capital flows to the region is proportionally less than that prior to the 1997 crisis. Another reason is the rise in current account surpluses. The Philippines has experienced both a return of capital inflows and a more favorable current account balance, with the latter largely due to remittances from overseas workers. However, like many other regional currencies, the appreciation of the peso is not commensurate to movements of the BOP accounts. Currencies in the region are reacting primarily to the general weakness of the US dollar, and global uncertainties have contributed to weak investment which in turn is another major reason behind the current account surplus of several economies including the Philippines. Policy measures at the domestic level can focus on reviving private investment, particularly channeling overseas remittances to more productive investment. Meanwhile, East Asian financial and monetary cooperation can also result in a unified front aimed at overhauling the unipolar global financial system.
JEL Classification: F31, F32, F37
ADBI Discussion Paper 91 Josef T. Yap
Contents
I. Introduction 3
II. Managing Capital Flows: Key Issues 4
Determinants of Capital Flows 4 Advantages of Greater Capital Mobility 5 Drawbacks of Greater Capital Mobility 6 Some Empirical Evidence 7 Trends and Composition 8 Impact on the Macroeconomy: Econometric Results 9 Real Sector 15 What is driving the exchange rate? 16 Dollarization and De-Dollarization 17 Stock Prices 18
V. Policy Responses 18
1987–1997 18 1998–2007 19 A Closer Look at BSP Intervention 21
VI. Evaluation of Policy Responses 22
Has Intervention Worked? 22 Has Inflation-Targeting been Undermined by Foreign Exchange Inflows? 24 Reserve Accumulation: Another Interpretation 25
VII. The Way Forward 27
Measures to Increase Private Investment 27 The Heart of the Matter 28 Regional Monetary and Financial Cooperation 29
References 31
ADBI Discussion Paper 91 Josef T. Yap
3
I. INTRODUCTION
The global financial instability that was spawned by the 1997 East Asian financial crisis generated a broad consensus that the international financial architecture (IFA) had to be reformed. The proposed reforms had two wide-ranging objectives (Griffith-Jones and Ocampo, 2003): (i) to prevent currency and banking crises and better manage them when they occur; and (ii) to support adequate provision of net private and public flows to developing countries, particularly low-income ones. Much progress has been made in terms of reforming the IFA during the past ten years. However, the progress has been uneven and asymmetric and in certain areas patchy (Griffith-Jones and Ocampo, 2003; Wang, 2004; Kawai, 2005; World Bank, 2005; and Kawai and Houser, 2007).
For example, there have been many advances in terms of regional financial and monetary cooperation in East Asia. Just last 5 May 2007, the ASEAN+3 nations agreed to pool the region’s vast foreign currency reserves. However, the urgency of architectural reform in the G-7 countries has receded considerably (Wang, 2004). This was echoed by Sakakibara (2003) when he argued that the lack of global governance, including a global lender of last resort and international financial regulation, is not likely to be remedied anytime soon. As long as the structural problems on the supply side of international capital such as volatile capital movements and G-3 exchange rate gyrations persist, the East Asian countries will remain as vulnerable to future crises.
There are many indications of the inadequacies in the reform of the IFA. For example, Table 1 shows that in 2006 aggregate net resource flows into developing countries reached $566 billion, the bulk of which comprised foreign direct investment (FDI) and portfolio equity. This $94 billion in “hot money” that poured into developing countries in 2006 is three times the peak reached in 1997. The development is largely brought about by a situation of excess global liquidity, which in turn is related to the problem of global macroeconomic imbalances. With the abundance of global liquidity, investors are lured into emerging markets which offer higher returns. The resulting inflow of capital has created “important challenges for policymakers because of their potential to generate overheating, loss of competitiveness, and increased vulnerability to crisis” (IMF, 2007a).
The macroeconomic difficulties spawned by the surge in capital inflows have elicited various policy responses (IMF, 2007a):
“Whereas some countries have let exchange rates move upward, in many cases the monetary authorities have intervened heavily in foreign exchange markets to resist heavy currency appreciation. To varying degrees, they have sought to neutralize the monetary impact of intervention through sterilization, with a view to forestalling an excessively rapid expansion of domestic demand. Controls on capital inflows have been introduced or tightened, and controls on outflows eased, to relieve upward pressure on exchange rates. Fiscal policies have also responded—in some cases, stronger revenue growth from buoyant activity has been harnessed to achieve better fiscal outcomes, although in many countries rising revenues have led to higher government spending.”
ADBI Discussion Paper 91 Josef T. Yap
4
The chart in Figure 1 shows that recently real effective exchange rates in four of the five countries hardest hit by the 1997 crisis are generally following the same pattern observed prior to July 1997.1 Meanwhile, many economies in emerging East Asia are accumulating reserves beyond the optimal level, either to self-insure against financial crises or to prevent nominal and/or real appreciation of their currencies in the face of increasing capital flows (see Figure 2). The stock of foreign exchange reserves in these economies rose from an average of $289.5 billion in 1990–95 to $2.1 trillion at the end of 2006.
In this paper, the experience of the Philippines with regard to managing capital inflows—or more generally foreign exchange inflows—from 1987–2007 is reviewed, with focus on the post–1997 period since earlier work (Lamberte, 1995) has adequately analyzed the experienced prior to the crisis. The impact of foreign exchange inflows will be analyzed and the policy responses, particularly those initiated by the BSP will be evaluated. The findings of this paper will be input into a cross-country study of managing capital flows in Asia.
II. MANAGING CAPITAL FLOWS: KEY ISSUES
Determinants of Capital Flows
The surge in capital flows to emerging market economies in the past 20 years or so is a reflection of the rapid expansion and integration of international capital markets that had been driven by economic policy and structural changes, and technological factors. The latter refer to revolutionary advances in handling of information and telecommunications and the emergence of increasingly sophisticated financial engineering. These factors have increased the speed and complexity of capital account transactions. Meanwhile, economic policy and structural changes from the standpoint of developing economies can be categorized into two broad groups: those that are country-specific, or “pull” factors; and those that are external to the country and beyond its control, or “push” factors.
One set of “pull” factors were policies that improved the relations of heavily indebted countries with external creditors. A key element was the role of debt-equity swaps in increasing the expected rate of return on domestic investment projects, thereby encouraging FDI (Calvo et al., 1994). Successful price stabilization programs that were accompanied by improved fiscal policy fundamentals and greater macroeconomic stability were also major pull factors. Lastly, institutional reforms such as the liberalization of the capital account played a significant role in attracting capital flows. Indeed, the right to repatriate dividends and capital may have been the most important factor in the surge of foreign equity flows to emerging market economies (Taylor and Sarno, 1997).
Among the prominent “push” factors were the decline in international interest rates and economic recessions in industrialized countries. These factors reduced profit opportunities in world financial centers and drove international capital to emerging market economies. Another type of push factor was in the mode of contagion effects. 1 The underlying factors are quite different, however. The sharp appreciation of REER prior to the crisis was
due largely to the depreciation of the yen. The recent appreciation of REER is due more to nominal currency appreciation as a result of foreign exchange inflows and general weakness of the dollar.
ADBI Discussion Paper 91 Josef T. Yap
5
Large shifts in capital flows to one or two large countries in a region may have generated externalities for the smaller neighboring countries (Calvo et al., 1996).
In terms of actual policy adjustments, regulatory changes in the US and Europe made it easier for foreign firms to place their equity and bonds under more attractive conditions to investors. This facilitated the trend towards international portfolio diversification. Meanwhile, competition and rising labor costs in industrialized countries, along with falling transport and communications costs, induced firms to seek opportunities to increase efficiency and returns by producing abroad (Rana, 1998). The realignment of major currencies contributed to this process. The result has been a progressive globalization of production and the growth of FDI flows.
A crucial debate has been on the relative importance of “pull” and “push” factors in the evolution of capital flows. If “pull” factors were the primary determinants of capital flows into emerging market economies, this would support the optimistic view that the sustainability of these flows is to a large extent a function of domestic policies under the control of developing countries. On the other hand, if the surge in capital flows was mostly a result of “push” factors, particularly interest rate movements, this would support the view that the capital flows are highly volatile because they are subject to factors beyond the control of policymakers (Fernandez-Arias, 1996).
The empirical evidence has generally been mixed. Some analysts argue that the weight of the evidence favors the push view—that falling US interest rates have played a dominant role in driving capital flows to developing countries (Fernandez-Arias and Montiel, 1996). Other studies have shown that country specific factors—e.g. the domestic credit rating and black market exchange premium—have been as important in influencing capital flows, particularly portfolio flows (Taylor and Sarno, 1997). The primacy of “pull” factors, however, can be questioned on several counts. Although it is true that not all countries have been recipients of the new inflows, it is also true that flows have not been restricted to countries with well-established track records of macroeconomic and structural adjustment. Second, country creditworthiness depends not only on domestic factors but also on the international interest rate. Third, the significant role of contagion in the 1997 Asian financial crisis points to the relative strength of “push” factors.
Knowledge of the determinants of capital flows has profound implications in terms of appropriate policy responses. In this context, the overriding objective of economic managers is to maximize the benefits of capital flows and minimize their costs.
Advantages of Greater Capital Mobility
Greater capital mobility is generally viewed to be advantageous to the process of economic development. Capital flows to emerging market economies have eased the domestic savings constraint, which in turn has increased investment, thereby boosting economic growth. To the extent that real returns to marginal investment are lower in capital-rich countries than those in capital-scarce countries, the movement of capital from developed economies to emerging market economies improves the efficiency of world resource allocation (Devlin, Ffrench-Davis and Griffith-Jones, 1995).
Instead of raising the investment rate indirectly by providing more resources, capital flows may do so directly in the form of FDI. This type of inflow usually brings a range of
ADBI Discussion Paper 91 Josef T. Yap
6
dynamic benefits such as technology, improved management practices and greater access to international markets.
The availability of international capital also provides an economy the ability to smooth expenditures especially in the advent of adverse exogenous shocks. Meanwhile, an open capital account for both developed and emerging market economies allows for greater portfolio diversification and better management of risk on the part of investors. This is one of the more common arguments at the microeconomic level for capital account liberalization (Devlin et al., 1995).
Drawbacks of Greater Capital Mobility
The Asian financial crisis was a painful reminder of the risks associated with more open capital accounts. Foreign capital flows may cause imbalances that threaten macroeconomic stability. This situation becomes likely if the absorptive capacity of the economy falls below the level of the capital inflows. Such a disparity arises because of policy arbitrage, where capital flows are attracted by the sound fundamentals of an economy causing financial markets to allocate too much or too little capital to some recipients at a given moment (Guitian, 1998).
If an economy has a flexible exchange rate regime, capital inflows will lead to an appreciation of the nominal and real exchange rates. This will have an adverse impact on the competitiveness of exports and import-substituting industries and result in a deterioration of the current account balance. The resource allocation effects of a real exchange rate appreciation may also spawn asset price bubbles and rapid credit expansion that could jeopardize the stability of the financial system.
In a fixed-exchange rate regime, capital inflows lead to a real exchange rate appreciation via inflationary pressure brought about by the increase in money supply and domestic credit. However, a fixed-exchange rate regime is more vulnerable when there is a net capital outflow. Unless it has adequate foreign exchange reserves, the monetary authority would have to raise interest rates to protect the peg. The likely outcome would be an economic recession.
Many factors could also undermine the efficacy of the capital inflows. The host economy may experience a mere substitution of domestic savings by foreign savings, which would only facilitate a consumption boom. In order to avoid this situation, a relatively high saving rate must be attained in order to generate a trade surplus that will be used to service the foreign debt incurred. But even if this saving rate is attained, an insufficient amount of investment may be channeled to the tradable goods sector (most likely because of the appreciation of the real exchange rate), which would reduce the convertibility of the surplus to foreign currency needed to service the foreign debt. Some analysts have argued that even if capital inflows are channeled completely to investment, the resulting improvement in the growth rate is only short-term in nature unless it is accompanied by a significant improvement in the economy’s technology (Reisen, 1998).
Since capital account inflows inherently entail financial transactions, they are also susceptible to market imperfections associated with asymmetric information and moral hazard. These microeconomic distortions normally result in an inappropriate assessment of risk exposure and cause over-borrowing, making the financial system vulnerable to
ADBI Discussion Paper 91 Josef T. Yap
7
exogenous shocks. The problem becomes particularly acute when banks are the main intermediaries of capital flows. The situation is even more precarious in emerging markets where the risk-management practices of the private sector are underdeveloped, the capacity of regulators to supervise the financial sector are limited, and the financial markets are thin.
Another potential microeconomic distortion arises from the real sector where aspects such as imperfect competition, externalities or wage rigidity, may result in inappropriate private sector adjustment even if the financial sector is functioning well (Fernandez-Arias and Montiel, 1996). Such static distortions may lead to the choice of a wrong technology and access to foreign capital will magnify the problem (Calvo et al., 1994). Meanwhile, in the event of a sudden capital outflow, these distortions would induce exchange rate overshooting, making the economic adjustment more difficult.
Some Empirical Evidence
Despite the theoretical and intuitive arguments in favor of greater capital mobility, some studies have questioned the benefits of capital flows on empirical grounds. In one study, an indicator of capital account liberalization was included as an explanatory variable for economic growth (Rodrik, 1998). The conclusion reached was that the data provided no evidence that countries without capital controls have grown faster, invested more, or experienced lower inflation.
A more recent study used capital flows directly as an explanatory variable (Levine and Carkovic, 1999). The authors applied more sophisticated econometric techniques to account for simultaneity, country-specific effects and the inclusion of lagged dependent variables as regressors. The study found that the exogenous components of FDI flows and portfolio flows did not exert a positive influence on economic growth. The conclusion is consistent with microeconomic studies that generally suggest that FDI does not boost economic growth primarily because of the absence of evidence of positive spillovers running from foreign-owned to domestic-owned firms.
The study of Levine and Carkovic also looked at the effect of capital flows on productivity growth, which is an important determinant of the variation in long-term growth across economies. This data, too, did not show evidence of a link. However, a separate study by Levine (1999) presented evidence that the entry of foreign banks—a form of direct investment—enhanced the efficiency of the domestic financial system. Meanwhile, international portfolio equity flows were shown to have enhanced domestic stock market liquidity. Other studies have confirmed the positive effects of both financial system efficiency and stock market liquidity on productivity and economic growth. Hence, the study of Levine provided evidence of a transmission mechanism between foreign capital flows, on the one hand, and economic growth, on the other.
The study of Rodrik was criticized by Eichengreen (1998) as being biased. Variables that are negatively associated with growth but positively associated with the decision to open the capital account were inadvertently omitted. The study of Levine and Carkovic and the study of Levine indicate that the evidence on the impact of capital flows is generally mixed. Finally, it is widely accepted by economic analysts that the spectacular growth of several East Asian economies (e.g. Singapore and People’s Republic of China) was due in no small measure to FDI.
ADBI Discussion Paper 91 Josef T. Yap
8
An analysis of the macroeconomic impact of capital flows can determine whether the aforementioned drawbacks have materialized. In one study, key economic variables for selected Asian and Latin American economies were monitored using data from 1988–1994 (Calvo, Leiderman and Reinhart, 1996). Some stylized facts were documented from these observations. First, a substantial portion of the surge in capital inflows was channeled to accumulation of foreign exchange reserves. Second, in most countries the capital inflows were associated with widening current account deficits. Third, there was a rise in consumption spending, which was usually driven by rising imports of durable goods. Fourth, in almost all countries examined, there was rapid growth in the money supply both in nominal and real terms. Fifth, the surge in portfolio flows was accompanied by sharp increases in stock and real estate prices. Lastly, the evidence on the real exchange rate presents a mixed picture. The data indicate that real exchange rate appreciation was more prevalent in Latin America than in Asia.
The stylized facts suggest that the disadvantages associated with capital flows (e.g. increased consumption and real exchange rate appreciation) are likely outcomes. Given the potential benefits of capital flows, it is thus imperative for policymakers to adopt measures that minimize their costs. Strategies for capital flow management can be developed at the domestic, regional and international levels. Policy options that exist in the domestic front can further be classified into macroeconomic and microeconomic responses.
III. CAPITAL INFLOWS INTO THE PHILIPPINES: 1987–2007
Trends and Composition
Net capital flows to the Philippines have been fairly steady from 1989–1997, except for a blip in 1996 when net capital flows jumped to $14.7 billion (Table 2). FDI was a constant contributor although the level was much lower compared with neighboring countries with a similar level of development, i.e. Malaysia, Thailand and Indonesia (Table 3). Portfolio investment surged in 1995 and 1996 following the global trend during this period. Meanwhile, transactions classified as “other investments” were the largest source of flows during this period, and this category largely explains the jump in capital inflows in 1996. Data indicate that this was attributable mainly to the increase in net foreign assets of commercial banks.
Between 1998 and 2007, which is the period after the East Asian financial crisis, net capital flows to the Philippines fell sharply (Table 4). The only exceptions were in 1999 when there was a fairly large amount of foreign investment in debt securities, and in 2005 when there was a surge in portfolio investment. In 1999, there was an increase in borrowers availing themselves of medium and long-term loans largely in response to the adverse effects of the crisis. The category “other investments” also increased sharply in 2005 although this was followed by a turnaround in 2006.
Despite the slowdown in capital inflows after the crisis, foreign exchange inflows remained strong. This was largely due to remittances of Filipinos working abroad, which are the main component of current transfers. Net current transfers in 2006 amounted to $13.2 billion which was 11.3% of GDP (Table 4). Given the dominance of current transfers, the analysis in this study should not be limited to capital flows but extended to cover inflows of foreign exchange. Historical comparison should be approached with caution, however, since adjustments to Philippine BOP data have been applied only
ADBI Discussion Paper 91 Josef T. Yap
9
from 1999 to the present. While capital account data are still loosely comparable, the same is not true for data on current transfers.
As a percentage of GDP, there was a jump in current transfers in 2001. This level increased steadily until 2006. This implies that while remittances are relatively high, it would be difficult to attribute the sharp rise in the peso’s value in 2006–2007 to a “surge” in remittances. This issue will be discussed in more detail in Section IV.
Capital inflows to the Philippines are largely due to “push” factors. The ebb and flow generally follow global patterns, particularly in the case of portfolio flows. If “pull” factors were dominant, FDI would have been much higher. Table 1 indicates a sharp rise in FDI flows to developing countries from 2004 to 2006. However, the direct investments of non-residents in the Philippines amounted to $2,086 million in 2006, which ranks only sixth among ASEAN member countries in absolute terms and eighth as a ratio GDP, and is even lower than the peak of $2,287 million in 1998 (Table 3 and Table 4).
Meanwhile, remittances respond to both pull and push factors. Studies have shown that remittances are largely pro-cyclical and driven by investment motives (Tuaño-Amador et al., 2007). Hence, a more conducive business environment will attract more remittances. The peso appreciation could also be considered a pull factor, wherein larger dollar remittances are required to sustain a specific standard of living. On the other hand, the main push factor would be more employment opportunities and higher remuneration abroad. In this context, it should be noted that there has been an increase in demand for overseas workers particularly for nurses and caregivers.
Impact on the Macroeconomy: Econometric Results
As discussed in Section II, large inflows of capital can lead to accumulation of reserves, real appreciation of the local currency, expansion in domestic liquidity, increase in the price level, and reduction in the domestic interest rate, which, in turn, affect consumption, investment and government spending. On the other hand, some of these variables constitute the host of “pull” factors that determine capital flows—such as improved macroeconomic performance and exchange rate regime—that attract investor confidence and encourage capital inflows. Hence, the apparent endogeneity of capital inflows and other macroeconomic variables, i.e. the tendency to appear in both the left and right side of the equation, warrants the use of a non-structural multi-equation approach to analyze the impact of inflows of capital on the macroeconomy. Possible methodologies toward this end include estimation through a vector autoregression (VAR) model in case of absence of cointegration relationship among the chosen variables or a vector error correction model (VECM) in case such relationship exists among the variables.
Before proceeding with the choice of estimation methodology, the time series properties of the variables were first checked since estimations of the nonstationary series are known to be spurious. Given the expected impact of capital inflows in the economy, as discussed above, we include, apart from the measure of capital inflows—using net capital and financial account of the Balance of Payments—reserves, 91-day Treasury (T-bill) rate, real effective exchange rate (REER), M3, consumption, investment and government expenditures in the set of variables. The results of the augmented Dickey-Fuller tests (ADF) indicate that all the variables are stationary in levels except for M3 and consumption which are integrated of order two.
ADBI Discussion Paper 91 Josef T. Yap
10
The nonstationarity of M3 and consumption implies that it is legitimate to search for a cointegration relationship among the variables. In performing cointegration tests using the approach of Johansen (1991), we consider the foregoing set of macroeconomic variables. Results of the Johansen cointegration tests provide evidence that a unique cointegrating vector exists among the abovementioned set of variables. The existence of cointegration relationship among the four groupings of variables warrants the use of a VECM, in lieu of an unrestricted VAR.2
The impulse response functions (IRF) derived from the various versions of the VECM could provide indications of the impact of capital flows on the macroeconomic variables included in the groupings. However, IRF results using Cholesky decomposition could be sensitive to the ordering of the variables in VECM. Since our analysis focuses on the impact of capital flows on the macroeconomy, the measure of capital flows is placed first in the ordering. The surge of capital flows could lead to accumulation of reserves so the reserves are placed second in the ordering. Meanwhile, the central bank is expected to respond to capital inflow shocks using its policy instruments such as the policy rate which could, in turn, influence market rates (Berument and Dincer, 2004). Hence, the 91-day T-bill rate enters the VECM as the third variable. Moreover, exchange rates could respond to the increase in the market rates via the interest parity condition.
In addition, exchange rates could react to capital inflows because the latter could increase reserves, as argued above, and the money supply as well. Therefore, the real exchange rate and M3 follow the 91-day T-bill rate. Meanwhile, the resulting expansion in money supply could lead to an increase in the price level, hence, the consumer price index (CPI) is placed next. Finally, other variables in the real and fiscal sectors react to changes in the market rate and the real exchange rate so that consumption, investment and government expenditures are placed at the end of the ordering. Although frowned upon by practitioners, a dummy variable was added to temper the impact of the 1997 financial crisis.
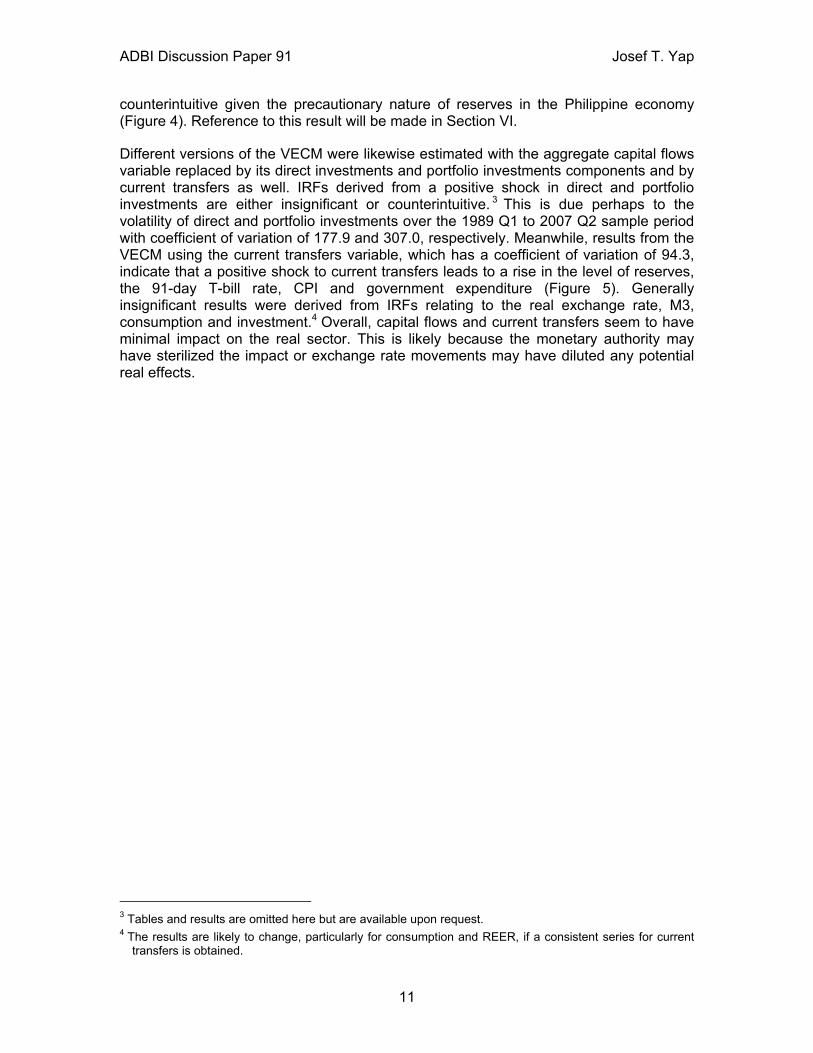
IRF results from the VECM indicate that capital inflows, in aggregate, could lead to an increase in reserves, with the impact reaching its highest magnitude in the second quarter after the capital inflow shock (Figure 3). However, the impact of a positive capital flow on the 91-day T-bill rate appears insignificant. Meanwhile, capital inflows tend to lead to a real appreciation of the peso against the basket of major trading partners’ (MTP) currencies. Nevertheless, the positive impact of the capital inflow shock seems to dissipate in the second quarter after the shock so that the real exchange rate reverts to its pre-shock value in the seventh quarter but appears to appreciate again thereafter. The broadly positive results from the impulse response functions relating to M3 and CPI indicate the capital inflows could lead to an expansion in domestic liquidity and an increase in inflation. Meanwhile, the impact of capital flows on consumption, investment and government expenditure appear insignificant.
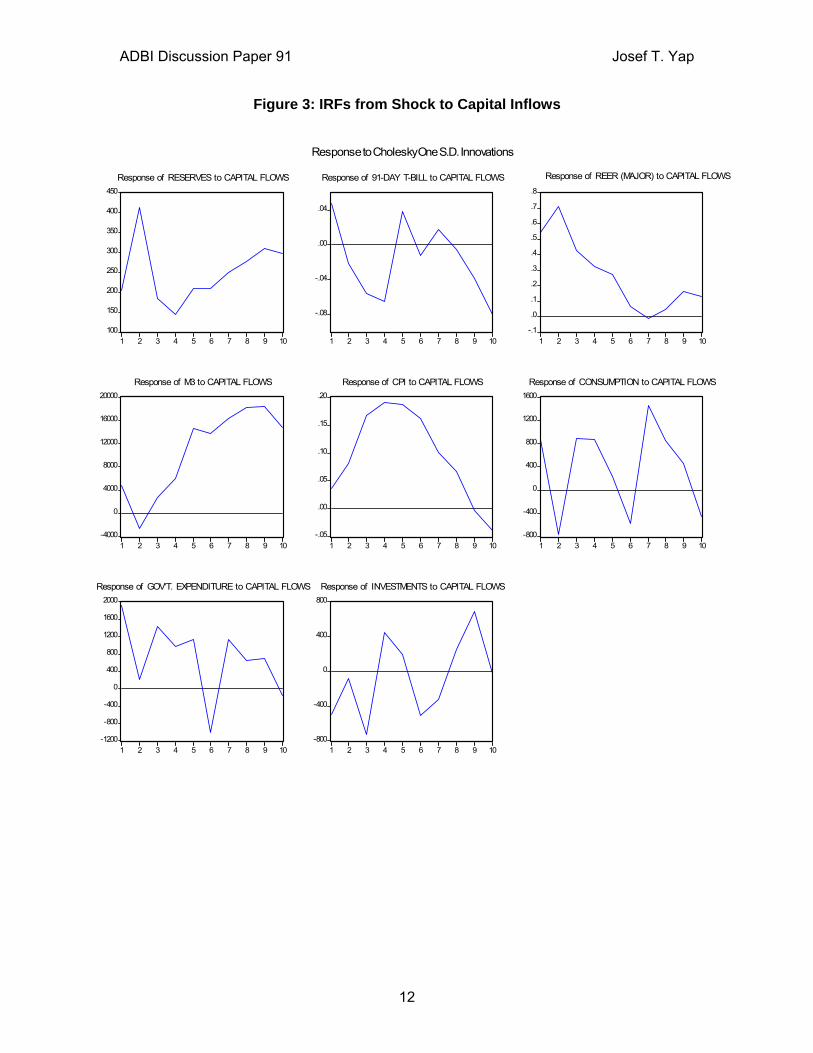
The estimated VECM was likewise utilized to generate IRFs resulting from a positive shock to reserves. An interesting result is that the reserves shock leads to a real appreciation of the peso against the basket of MTP currencies, which appears to be
2 The empirical results are available upon request. The four groupings refer to the types of capital flows used
in the estimation. One is a combination of FDI and portfolio investment. The second and third are FDI and portfolio investment, respectively. And the fourth is remittances.
ADBI Discussion Paper 91 Josef T. Yap
11
counterintuitive given the precautionary nature of reserves in the Philippine economy (Figure 4). Reference to this result will be made in Section VI.
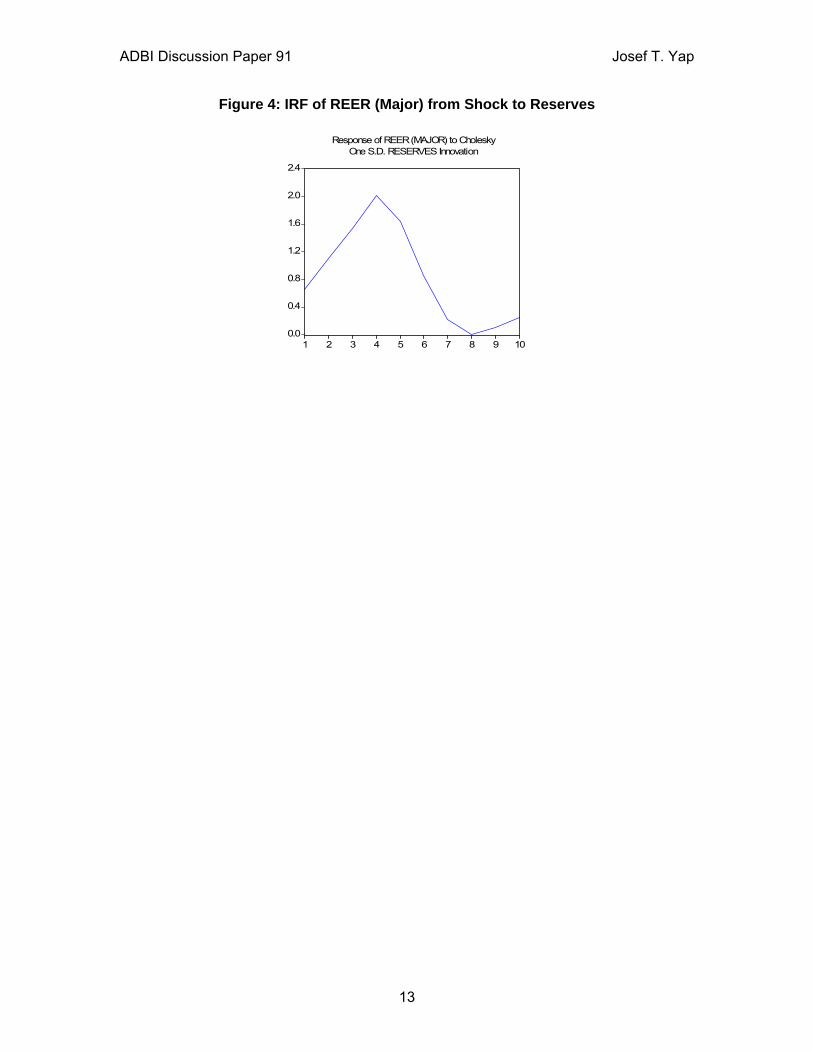
Different versions of the VECM were likewise estimated with the aggregate capital flows variable replaced by its direct investments and portfolio investments components and by current transfers as well. IRFs derived from a positive shock in direct and portfolio investments are either insignificant or counterintuitive. 3 This is due perhaps to the volatility of direct and portfolio investments over the 1989 Q1 to 2007 Q2 sample period with coefficient of variation of 177.9 and 307.0, respectively. Meanwhile, results from the VECM using the current transfers variable, which has a coefficient of variation of 94.3, indicate that a positive shock to current transfers leads to a rise in the level of reserves, the 91-day T-bill rate, CPI and government expenditure (Figure 5). Generally insignificant results were derived from IRFs relating to the real exchange rate, M3, consumption and investment.4 Overall, capital flows and current transfers seem to have minimal impact on the real sector. This is likely because the monetary authority may have sterilized the impact or exchange rate movements may have diluted any potential real effects.
3 Tables and results are omitted here but are available upon request. 4 The results are likely to change, particularly for consumption and REER, if a consistent series for current
transfers is obtained.
ADBI Discussion Paper 91 Josef T. Yap
12
Figure 3: IRFs from Shock to Capital Inflows
100
150
200
250
300
350
400
450
1 2 3 4 5 6 7 8 9 10
Response of RESERVES to CAPITAL FLOWS
-.08
-.04
.00
.04
1 2 3 4 5 6 7 8 9 10
Response of 91-DAY T-BILL to CAPITAL FLOWS
-.1
.0
.1
.2
.3
.4
.5
.6
.7
.8
1 2 3 4 5 6 7 8 9 10
Response of REER (MAJOR) to CAPITAL FLOWS
-4000
0
4000
8000
12000
16000
20000
1 2 3 4 5 6 7 8 9 10
Response of M3 to CAPITAL FLOWS
-.05
.00
.05
.10
.15
.20
1 2 3 4 5 6 7 8 9 10
Response of CPI to CAPITAL FLOWS
-800
-400
0
400
800
1200
1600
1 2 3 4 5 6 7 8 9 10
Response of CONSUMPTION to CAPITAL FLOWS
-1200
-800
-400
0
400
800
1200
1600
2000
1 2 3 4 5 6 7 8 9 10
Response of GOV'T. EXPENDITURE to CAPITAL FLOWS
-800
-400
0
400
800
1 2 3 4 5 6 7 8 9 10
Response of INVESTMENTS to CAPITAL FLOWS
Response to Cholesky One S.D. Innovations
ADBI Discussion Paper 91 Josef T. Yap
13
Figure 4: IRF of REER (Major) from Shock to Reserves
0.0
0.4
0.8
1.2
1.6
2.0
2.4
1 2 3 4 5 6 7 8 9 10
Response of REER (MAJOR) to CholeskyOne S.D. RESERVES Innovation
ADBI Discussion Paper 91 Josef T. Yap
14
Figure 5: IRFs from Shock to Transfers
120
140
160
180
200
220
240
260
1 2 3 4 5 6 7 8 9 10
Response of RESERVES to TRANSFERS
.0
.1
.2
.3
.4
.5
.6
1 2 3 4 5 6 7 8 9 10
Response of 91-day T-BILL to TRANSFERS
-.2
-.1
.0
.1
.2
.3
.4
.5
1 2 3 4 5 6 7 8 9 10
Response of REER (MAJOR) to TRANSFERS
-8000
-6000
-4000
-2000
0
2000
4000
1 2 3 4 5 6 7 8 9 10
Response of M3 to TRANSFERS
.00
.04
.08
.12
.16
.20
.24
1 2 3 4 5 6 7 8 9 10
Response of CPI to TRANSFERS
-800
-400
0
400
800
1200
1 2 3 4 5 6 7 8 9 10
Response of CONSUMPTION to TRANSFERS
1500
2000
2500
3000
3500
4000
1 2 3 4 5 6 7 8 9 10
Response of GOV'T EXPENDITURE to TRANSFERS
-800
-400
0
400
800
1 2 3 4 5 6 7 8 9 10
Response of INVESTMENTS to TRANSFERS
Response to Cholesky One S.D. Innovations
IV. IMPACT OF CAPITAL INFLOWS IN THE PHILIPPINES The drawbacks of capital inflows—which can be extended to foreign exchange inflows in general—were discussed in Section II. These include (i) imbalances that threaten macroeconomic stability become likely if the absorptive capacity of the economy falls below the level of the foreign exchange inflows; (ii) a rapid appreciation of the nominal and real exchange rates if the economy has a flexible exchange regime; a substitution of domestic savings by foreign savings, which would only facilitate a consumption boom; (iii) microeconomic distortions such as asymmetric information that normally result in an inappropriate assessment of risk exposure and cause over-borrowing; and (iv) distortions from the real sector where aspects such as imperfect competition, externalities or wage rigidity, may result in inappropriate private sector adjustment such as wrong choice of technology even if the financial sector is functioning well. Meanwhile, in the event of a sudden capital outflow, these distortions would induce exchange rate overshooting, making the economic adjustment more difficult.
ADBI Discussion Paper 91 Josef T. Yap
15
This section looks at the experience of the Philippines from 1987–2007 and determines whether the possible adverse outcomes of surges of foreign exchange inflows were realized. The analysis refers to the econometric results in the previous section when relevant. Basic macroeconomic indicators of the Philippines are shown in Table 5. This investigation will help in the analysis of the impact of foreign exchange inflows on the economy and also in the evaluation of selected policy responses.
Real Sector
Knowledge of the range of impacts of current transfers and capital flows on the real sector will aid policymakers in crafting measures that will optimize their use. The results of the VAR analysis indicate that foreign exchange flows have limited impact on the real sector. The negligible impact on investment is not unexpected. The level of FDI investment in the Philippines has been historically low, reaching a maximum of 3.4% in 1998, which can even be considered an abnormal year. Moreover, the literature review pointed out that the beneficial impact of FDI is dependent on a significant improvement in the economy’s technology (Reisen, 1998) and some microeconomic studies generally suggest that FDI does not boost economic growth primarily because of the absence of evidence of positive spillovers running from foreign-owned to domestic-owned firms (Levine and Carkovic, 1999). A later study indicated that in several Southeast Asian economies including the Philippines, FDI had only direct effects while spillover effects in terms of technology transfer were minimal (Mirza and Giroud, 2004).
However, the negligible impact of current transfers on investment and consumption is not consistent with earlier studies. Using a seemingly unrelated regression technique, Lamberte (1995) finds remittances to be a significant determinant of personal consumption but not of investment. A modified form of his regressions was estimated using data from 1999–2006 (Table 6). The results show that remittances significantly affect both investment and personal consumption, but both FDI and portfolio investment are insignificant. The reason for the difference with Lamberte’s study in terms of the impact on investment may be the size of the remittances and the behavior of households. The latter may have become sophisticated over time in managing remittances, thereby using them more productively.
A study based on the 2003 Family Income and Expenditure Survey (FIES) finds evidence that households receiving remittances tend to spend more conspicuously in terms of consumer items but also invest more on education, housing, medical care and durable goods (Tabuga, 2007). The study shows no clear relationship between remittances and tobacco and alcohol. Unfortunately, FIES data do not include capital outlays, hence the impact on investment was not considered.
Meanwhile, a study by Yang (2005) also used FIES data but focuses on the impact of exchange rate shocks on migrant income on a range of investment outcomes in Philippine households such as child schooling, child labor, and entrepreneurial activity. However, the latter does not cover capital outlays. The study finds that favorable exchange rate movements—from the perspective of the overseas worker—lead to greater child schooling, reduced child labor, and increased educational expenditure in Philippine households. Favorable exchange rate shocks also lead to differentially more hours worked in self-employment, and to differential entry into relatively capital-intensive enterprises by households receiving remittances.
ADBI Discussion Paper 91 Josef T. Yap
16
The empirical results in Table 6 are consistent with the BSP study (Tuaño-Amador et al., 2007) that shows remittances to be pro-cyclical and dominated by investment motives. The analysis indicates that remittances have the potential to be a more robust source of sustainable economic growth if they are channeled to productive investments. More micro-level studies should be conducted to determine the factors that can bring this about. What would be suspect, though, is the negligible impact of remittances on consumption based on the VAR analysis. This can be considered inconclusive until such time that a consistent data series on current transfers will be extended to years prior to 1999.
What is driving the exchange rate?
The most controversial aspect of foreign exchange inflows, arguably, has been the sharp appreciation of many Asian currencies in nominal and real terms from 2004 up to the present (Table 7 and Figure 1).5 The peso started appreciating sharply vis-à-vis the US dollar only in December 2005 and even then it was the Asian currency with the most rapid appreciation during the period 2003–07 (Table 7). As a matter of fact, the peso had the fastest nominal appreciation in 2007. Based on the literature review and econometric evidence, the knee-jerk reaction would attribute this phenomenon to a surge in foreign exchange inflows.
Closer scrutiny of the data indicates, however, that foreign exchange inflows may have a less prominent role in the appreciation of Asian currencies than assumed. Data in Table 8 show the ratio of balance-of-payments components to GDP during the period 2004–06 for various Asian countries. There is no indication of a surge in current transfers among them except for the Philippines. However, Singapore and Malaysia do have substantial current account surpluses but the Singapore dollar and ringgit have significantly lower rates of appreciation.
Meanwhile, the balance in the capital and financial accounts were fairly moderate except for relatively large surpluses in the Philippines and Thailand in 2005. Moreover, as indicated in the earlier section, there has been no jump in remittances into the Philippines compared to its historical trend and even then the resulting current account surplus was much lower than that of Malaysia and Singapore. Hence, while important, it would be incorrect to cite a surge in foreign exchange inflows as the primary cause of the peso’s recent sharp appreciation.
Instead, the following factors can be considered in the context of the Philippines:
1. At the “lowest” points of the various regional currencies, the peso experienced the second largest depreciation in both nominal and real terms. Hence it is but natural to expect it to have a faster appreciation during the recovery period after the crisis. This argument, however, is tempered by the experience of Indonesia, which had the sharpest depreciation as a result of the crisis, yet experienced a net nominal depreciation of the rupiah during the period 2003–07.
5 An empirical study on the effects of the peso appreciation is beyond the scope of this paper. Tuaño-
Amador, et al. (2007) allude to evidence of Dutch Disease in the Philippines, which is also manifest in the deceleration of the manufacturing sector simultaneously with the rapid growth of GDP. Manufacturing sector growth fell to 3.3% in 2007 from 4.6% a year before whereas GDP growth surged to 7.3% in 2007 compared to 5.4% in 2006. However, a more important undertaking would be to determine whether the peso is overvalued at the current exchange rate.
ADBI Discussion Paper 91 Josef T. Yap
17
2. Instead of a drawn out process, the peso’s recovery was bunched up over the period December 2005 to the present. This is largely explained by the prevailing fiscal difficulties up to that time. The Philippine government implemented stringent and decisive fiscal reforms beginning in 2005 and their success boosted investor confidence which was reflected in the peso’s strong appreciation in 2006–07.
3. Compared to other central banks in the region, the BSP did not intervene as much in terms of accumulating foreign exchange reserves. Hence it should be expected that the peso’s appreciation should be faster. This can be gleaned from Figure 2 which is Graph 2 of Ho and McCauley (2007). The ratio of the change in foreign exchange reserves to GDP was extended to October 2007 (Figure 2A) and while the Philippines moved up in rankings, the extent of intervention was still comparable to the past five years. However, this argument is also tempered by Indonesia’s experience where the degree of intervention was even lower.
4. A prevailing current account surplus since 2003 has also pushed up the peso’s value. From a current account deficit equal to 5.3% of GDP in 1998, the Philippine economy recorded a surplus of 4.5% of GDP in 2006 and 4.4% in 2007 (Table 5). This is largely due to a fall in the investment rate and reflected in a drop in the ratio of imports to GDP from 63% in 1997 to only 45.3% in 2007 (Table 5). The issue of the fall in the investment rate and its relation to the accumulation of reserves will be discussed in Section VI.
Rather than surges in foreign exchange inflows, the strength of Asian currencies vis-à-vis the US dollar is largely attributable to the latter’s overall weakness. Data in Table 7 show that the US dollar depreciated by 38% against the euro during the period 2003–07. This is about 10 percentage points higher than the peso’s appreciation against the dollar. However, the concept of “dollar weakness” has to be translated into foreign exchange flows that affect the region’s exchange rates. One possible explanation relates to the concepts of “dollarization” and “de-dollarization.”
Dollarization and De-Dollarization
Dollar denominated assets held by residents has been increasing over time consistent with the liberalization of the economy. The relative magnitude of these assets reflects the degree of dollarization, which increased between 1990 and 2000 following the surge of foreign exchange inflows (Table 9). Using the IMF standard, an economy is considered highly dollarized if the ratio of foreign currency deposits (FCDs) to money supply is greater than 30%. The data show that the Philippines was on its way to becoming a highly dollarized economy, but, after reaching 41% in 2000, the ratio fell to 29.9% in 2006 and 26.4% in October 2007.
The trend towards de-dollarization can be partly explained by the general decline in capital inflows after the crisis. However, at a certain point the fall in the FCD/M3 ratio is driven largely by the peso appreciation. In this context, making FCD/M3 an indicator of de-dollarization becomes an exercise in tautology. Data show that in 2006 and 2007 there was a jump in withdrawals in FCDs (Table 9), which is a more reliable indicator of de-dollarization. The jump can be attributed to expectations of a peso appreciation which become self-fulfilling. Another indication of de-dollarization is the ratio of FCDs to foreign exchange reserves, which has fallen sharply between 2004 and 2007. The logic is that

ADBI Discussion Paper 91 Josef T. Yap
18
perceptions of weakness in the US dollar has prompted economic agents to withdraw from their FCDs and convert their dollar holdings to pesos in anticipation of its appreciation. This action in itself has contributed to the peso’s appreciation.
Stock Prices
Foreign portfolio investment has been the main driver of the local stock market. Hence, it is not surprising that the surge in stock prices since 2003 has been accompanied by the resurgence of non-residents’ investment in equity securities (Table 4 and Figure 6). The results of the VECM analysis and regressions in Table 6 indicate, however, that portfolio flows have had an insignificant impact on investment and consumption.
V. POLICY RESPONSES
The role of policymakers is to implement measures that will mitigate the adverse impact of foreign exchange inflows. This section provides an inventory of such measures with emphasis on the role of the BSP.
1987–1997
The surge in the capital account that lasted between 1993 and 1997 led to a persistent appreciation of the peso, in nominal terms between October 1993 and November 1994, and in real terms between April 1995 and June 1997 (see Figure 1 and Figure 6). Inflation, interest rates and money supply growth were generally higher prior to the crisis (Table 5). In response, the government implemented measures that can be classified into four categories: reducing the supply of foreign exchange inflows; increasing the demand for foreign exchange; strengthening prudential regulations; and reducing the cost of production for exporters.
To reduce the supply of foreign exchange in the country, the government cut back on its requests for loan rescheduling under the Paris debt program. Between 1994 and 1997, the government pre-paid a total of $1.41 billion of external debt. Meanwhile, the BSP lifted the restriction on the repatriation of foreign investments made under the debt-to-equity conversion program, as well as on the remittance of dividends, profits and earnings that are derived from such investments. It also increased the allowable outward investments that can be sourced from the banking system from $1 million to $6 million per investor per year.
To increase the demand for foreign exchange, the BSP intervened in the foreign exchange market by buying dollars. In some cases the BSP engaged in sterilized intervention by buying dollars in the market while concurrently engaged in mopping up operations by selling government securities in its portfolio to prevent the money supply from increasing. For its part, the national government advanced the phasedown of the forward exchange cover extended to oil firms to add to demand for foreign exchange.
The BSP instituted several measures to reduce the costs of production to exporters to maintain their competitiveness. Direct and indirect exporters were allowed access to foreign currency loans offered by foreign currency deposit units (FCDUs). This led to large savings in interest payments on the part of exporters since interest rate differentials between FCDU loans and peso denominated loans from commercial banks at that time ranged from 5.5–7 percentage points.
ADBI Discussion Paper 91 Josef T. Yap
19
Monetary Board Resolution No. 1197 dated December 1, 1994 established an Exporters Dollar Facility (EDF), and the BSP subsequently issued Circular No. 57 dated December 19, 1994. Under Circular No. 57, qualified banks could avail themselves of the EDF against the eligible dollar-denominated loans of their exporter-borrowers (both direct and indirect), including service exporters who were engaged in rendering technical, professional, and other services. On April 27, 1999, the BSP issued Circular No. 199 whereby the EDF was renamed Exporters Dollar and Yen Rediscount Facility (EDYRF). Qualified banks could avail themselves of the EDYRF against the eligible dollar-denominated or yen-denominated loans of their exporter-borrowers.
The BSP also added more loanable funds to the system by gradually reducing the reserve requirement on all deposit liabilities from 24% in January 1993 to 17% in August 1994. This contributed to the decline in domestic interest rates.
To prevent banks from unduly speculating in the foreign exchange markets, the BSP reduced the oversold position of banks from 15% of its unimpaired capital to 5%. To weed out the speculative component of portfolio investment, the BSP imposed a prior approval requirement on all forward transactions with nonresidents.
1998–2007
After the crisis, the BSP embarked on an “aggressive and wide-ranging reform process” of the domestic financial system (Tetangco, 2005). One of the objectives was to increase the resilience of the domestic financial to volatility of capital flows and enable it to allocate capital flows more efficiently. The BSP “adopted changes in the regulatory and supervisory framework to be able to effectively meet the demands and challenges of globally integrated financial markets and the growing sophistication of financial products and services. This process of reform is geared towards greater commitment to risk management, strengthening of the regulatory framework and supervision techniques, promotion of transparency and good corporate governance, and putting in place the necessary infrastructure requirements. The BSP, working closely with the banking sector, has made important progress on these fronts.”6
Measures to improve monitoring and transparency of capital flows were also introduced. The Philippines started subscribing to the IMF’s Special Data Dissemination Standards (SDDS) in 1996. By January 2001, the Philippines was in full compliance with the SDDS in the dissemination of the relevant data through the internet in accordance with prescribed timeliness and frequency.
To facilitate the adoption of international norms, the Philippines has also been participating in the formulation of Reports on the Observance of Standards and Codes (ROSCs). These reports assess the extent to which the Philippines conforms to various key international standards and codes that are relevant to the effective functioning of its economic and financial system. Resulting gains in transparency are expected to enable market participants to formulate better analysis, forecasts and investment decisions, thus reducing uncertainty and helping investors price risk on a sounder basis. To complement the activities under ROSCs, the Philippines has also been participating in the IMF-World Bank Financial Sector Assessment Program (FSAP), which is aimed at
6 Quoted from Tetangco (2005), pages 253-254. The details of the reforms are contained in the same paper.
ADBI Discussion Paper 91 Josef T. Yap
20
providing a comprehensive assessment of the strengths, risks and vulnerabilities of the financial system.
Apart from its effort at reforming the domestic financial system, the BSP also followed measures similar to those in 1987–1997, particularly reducing the supply of foreign exchange inflows and increasing the demand for foreign exchange. The BSP's main approach has been to liberalize private sector capital outflows in order to reduce the inflows and reserve accumulation. This involved the following:7
1. Encouraging investments by overseas Filipinos, initially by facilitating remittances.
• Promoting transparency and competition in remittances through Circular no. 534 (remittance charges disclosure).
• Improving payment and settlement systems by approving setting up of local bank’s remittance centers and branches abroad, authorizing rural banks to accept FCDs, approving interconnection of three (3) ATM networks, and approving use of new technologies as mode of remittance (e.g. internet and SMS).
• Promoting financial literacy campaigns among OFs/families.
2. Encouraging private sector capital outflows through further liberalization of foreign exchange transactions:
• Phase 1: BSP Circular 561 which involves a symmetrical limit of 20% of unimpaired capital (Oversold/Overbought positions) and increased limit of outward investment by Philippine residents to $12 million/year; and BSP Circular 565 allowing thrift banks to invest in FCD debt instruments.
• Phase 2: Policy reforms contemplated under this area cover the expanded use of foreign exchange swaps; transactions in which FCDUs of thrift banks/rural banks/cooperatives may engage; increase in the allowed foreign exchange purchases by residents from banks for non-trade current account purposes and outward investments; and streamlining of documentation and reporting requirements to further facilitate the purchase of foreign exchange from the banking system for legitimate trade and non-trade transactions.
3. On other capital account transactions, the allowable outward investments by residents without prior BSP approval and registration was increased from US$6 million per investor per year to US$12 million. For purposes of purchasing foreign exchange from banks, outward investments will now include residents’ investments in foreign currency-denominated bonds issued by the National Government and other Philippine entities. The increase in the allowable limit on outward investments is expected to allow greater portfolio and risk diversification and facilitate integration with global markets.
4. On current account transactions, the limit on allowable foreign exchange purchases by residents from banks to cover payments to foreign beneficiaries for non-trade purposes (excluding those related to foreign loans/foreign currency loans and foreign investments) without supporting documents was increased
7 Information was sourced from the BSP.
ADBI Discussion Paper 91 Josef T. Yap
21
from US$5,000 to US$10,000. Furthermore, the “no-splitting” restriction and notarization requirement for applications to purchase foreign exchange were also lifted. These measures are expected to facilitate the rising demand by residents for foreign exchange to service non-trade transactions (such as education of dependents abroad, medical care and payment of service fees) which have risen as a result of globalization. Lower transaction costs for bank clients, including retail customers, are expected as a result. While the documentary requirements are being relaxed, these transactions will continue to be covered by existing provisions under the Anti-Money Laundering regulations.
5. There have also been initiatives aimed at improving the BSP’s ability to offset the effects of inflows through proposals to amend the BSP Charter, the most important of which is the proposal to allow the BSP to issue its own instruments like other central banks. The BSP has also made representations with the National Government on its subscription to the P40 billion remaining capitalization of the BSP.
A Closer Look at BSP Intervention
During the period 1998–2007, the BSP continued to intervene in the foreign exchange market. The latter involves the purchase of foreign currency with domestic currency, which changes the monetary liabilities of the monetary authority, and thus the monetary stance. Typically, intervention aims at the following (IMF, 2007b): a) Influencing the level of the exchange rate; b) Dampening exchange rate changes; c) Smoothing exchange rate flexibility; and d) Accumulating reserves.
While not as heavy as in other countries (Figure 2), based on a calculated exchange market pressure (EMP) index, the intervention was heavier after the crisis (Figure 7 and Figure 8).8 The bars in the figure divide the exchange market pressure on the positive axis into the need to allow the currency to appreciate and a rise in reserves to prevent the appreciation. A useful comparison is the behavior of EMP during the surge of capital flows in 1996 and the surge in 2005.
In 1996, the maximum value of EMP was only 1.3 (August), while in 2005 the maximum value was 4.7 (February), even reaching 9.1 in January 2006. The chart clearly shows that positive changes in international reserves contributed substantially to exchange market pressure.
Not only has the BSP intervened more heavily after the crisis, sterilization has apparently been more pronounced (Table 10). The sterilization coefficient for the period 1998–2007 is much higher compared to the coefficient between 1987 and 1997.9 The coefficient has also been steadily increasing, which can be observed by comparing the
8 The EMP is calculated as tres
ert reser Δ+Δ
Δ
Δ
σσ %% . The exchange rate is defined as $/peso, and %er
and res are the percentage month-on-month change of the exchange rate and international reserves, respectively. The EMP normalizes the size of the intervention, therefore making comparisons across time valid.
9 The sterilization coefficient is the coefficient from a regression on the contribution of net domestic assets to reserve money growth on the contribution of net foreign assets to reserve money growth.
ADBI Discussion Paper 91 Josef T. Yap
22
regressions for the period 2002.1–2004.12, which is the period when inflation targeting was initiated, 2005.1–2007.8, which covers a period of heavy capital inflows, and 1998.1–2007.8.
An important tool for sterilization beginning in 2006 was the special deposit account (SDA) facility. Established in 1998, SDA is BSP’s alternative to open market operations. Banks can place funds with the BSP under the SDA facility which is subject to interest rates depending on the term of the placements. Interest rates have been generally higher than those in the money or interbank markets. For example, when the SDA was first opened to state firms and banks’ trust units in the second quarter of 2007, it offered as much as 8% for the three-month tenor while the overnight placements facility stood at 7.5%. Data in Table 5 show that the 91-day Treasury Bill rate averaged only 5.3 percent in 2007.
Data from 2004 onward show that the SDA was hardly used until 2006 (Figure 9). In April 2006 the amount in the SDA jumped to P19.3 billion from just P2.5 billion in February and P9.6 billion in March. Then in September 2006 the amount in the SDA facility increased to P49.7 billion.
In May 2007, the BSP allowed banks’ placements in the SDA to be an alternative way to comply with the liquidity floor requirements for government deposits. Access to the SDA was likewise widened to include trust units and state firms. According to some analysts, this was done to mop up excess liquidity and maintain inflation within the target levels. In that same month the SDA increased sharply to P222.9 billion from only P54.2 billion in April, 2007. The amount in the SDA stood at P583.3 billion as of February, 2008.
Because of the surge in the size of the SDA, the BSP decided in March 2008 to implement immediately the following refinements in the facility: (1) the closure of existing windows for the two-, three-, and six-month tenors; and (2) the reduction of the interest rates on the remaining tenors. There was concern that the SDA was siphoning off funds from investment activity.
VI. EVALUATION OF POLICY RESPONSES
Has Intervention Worked?
As described earlier, the BSP has engaged in both sterilized and unsterilized intervention. A simple correlation analysis indicates that intervention, as measured by the percentage of international reserves, has limited impact on the exchange rate’s level, percentage change, and volatility (Table 11).10 The results indicate that intervention had a modicum of success in reducing exchange rate volatility in the Philippines between 1993 and 1996. Meanwhile, intervention prevented a rise in the exchange rate (measured in US$/peso) after the crisis, particularly during the period 2003–2007. In many instances the results are counter-intuitive, i.e. the correlation coefficient is positive, similar to the result of the impulse response function that was presented in Section III (Figure 4).
10 The correlation results were supported by regression analysis using the two-stage least squares
procedures applied by the IMF (2007b) as described in Box 3.2 “The Effectiveness of Intervention: Additional Tests,” page 39.
ADBI Discussion Paper 91 Josef T. Yap
23
The empirical results differ from those reported by the IMF (2007b) for the Philippines. However, the IMF study does find limited evidence of systematic links between sterilized intervention and exchange rates in the Philippines, Indonesia, India, Republic of Korea, and Thailand. The general result is somewhat unexpected given the low degree of substitutability of emerging market assets and the large size of interventions relative to currency market turnover in emerging markets. The IMF explains the results as follows:
“First, persistent structural factors may be driving the appreciation of the currency, obscuring any effect of intervention beyond a short period. Second, to the extent that sterilized intervention prevents the domestic interest rate from adjusting (especially downwards), it would have limited effects on capital flows driven by interest rate differentials, thereby failing to alleviate upward pressure on the currency.”
Some studies (e.g. Lamberte, 1995) support the relatively large offset coefficient of sterilized intervention in the Philippines. In 2007, the rate of appreciation of the peso increased significantly after access to the SDA was expanded in May (Figure 9). However, as noted earlier, the persistent appreciation of the Philippine peso after 2005 should also be viewed in the general context of the weak US dollar.
On its part, the BSP argues that its intervention policy cannot be judged by the size alone. The size and nature of the shocks and the economy’s financial vulnerability should also be considered. Amid higher volatility of capital flows, BSP intervention needs to be commensurately large to maintain orderly market conditions. The Philippine foreign exchange market has expanded considerably in the past decade—by more than fivefold in terms of the daily turnover in the foreign exchange market—and the gross foreign exchange flows through the financial system have correspondingly also grown in magnitude.11
Moreover, the BSP has been accumulating reserves as a form of self-insurance or precautionary reserves balance, as a first line of defense against future financial crises. This becomes more important in light of the debt burden of the Philippines which remains high relative to its comparators. Intervention should therefore be adjusted for passive intervention.12 The BSP argues that the analysis should therefore distinguish between more permanent flows such as exports and remittances and those driven by cyclical trends (e.g., higher cross-border flows) as a result, for instance, of diversification by central banks and sovereign wealth funds (SWFs) in Asia and the Middle East, and structural portfolio adjustments in the private sector, as home bias declines worldwide. If cyclical factors are driving the trends in the inflows, intervention may be necessary to moderate the macroeconomic imbalances that could result from such large inflows. 11 The views of the BSP, as contained in this paragraph and the next two, were expressed by Dr. Cyd
Tuaño-Amador, Managing Director for Research of the BSP, during the ADBI workshop in Tokyo on December 11-12.
12 Dr. Tuaño-Amador cited the fact that the IMF mission recognizes that BSP needs to build up reserves. In the 2006 Article IV consultation report, IMF staff noted that “…reserve cover remains low compared to other emerging markets… Some further intervention to build reserves therefore seems justified.” Former IMF Managing Director Rodrigo De Rato in a speech in Thailand in 2007 stated that “There is a place in managing capital inflows for intervention, especially where inflows of capital appear to be a short-term surge rather than a long-term trend”…and that “the Fund recognizes that intervention can be an appropriate tool of macroeconomic management.”
ADBI Discussion Paper 91 Josef T. Yap
24
While the Philippines’ international reserves have risen significantly in the past two years, the relative size of the stock of reserves remains considerably smaller compared to other countries in the region classified as independent floaters. This is the same observation made by Ho and McCauley (2007). The BSP cites the IMF (2007b) study which shows that for 2000–2007 the BSP’s intervention has been effective in tempering the volatility of exchange rate movements. This is precisely the principle behind the BSP’s intervention policy: reducing volatilities rather than swaying the exchange rate in one direction or changing the path of the exchange rate.
It should also be noted that money supply growth in the third quarter of 2007 fell to 12.4% without any significant rise in interest rates (Table 5). Inflation in 2007 was only 2.8%, below the target range of 4-5%. These data indicate the effectives of sterilized intervention, particularly the use of the SDA. However, intervention and the subsequent sterilization have financial costs and other central banks are facing similar circumstances. This is another reason that the BSP has built up its capital reserves. These accumulated surpluses now serve as a buffer for losses that the BSP is incurring in its stabilization efforts.
Has Inflation-Targeting been Undermined by Foreign Exchange Inflows?
In January 2002, the BSP formally shifted to an inflation targeting framework from a monetary aggregating targeting approach in formulating monetary policy. The shift in the BSP’s policy framework from a monetary aggregate targeting approach to inflation targeting was prompted by the observation that the historical relationship between inflation and money supply had weakened, thus undermining the effectiveness of the policy of targeting monetary aggregates. Innovations in financial products and financial markets, and greater financial liberalization have altered the link between money supply and inflation.
With more open capital accounts, many countries—including the Philippines—decided that a flexible exchange rate framework is better suited to cushioning domestic economic performance from external disturbances than fixed nominal exchange rates. In this context, the inflation target, rather than the fixed exchange rate, performs the role of a nominal anchor. The BSP is expected to intervene less in the foreign exchange market, allowing the exchange rate to absorb shocks induced by capital flows.
The empirical results discussed indicate that the BSP may be having difficulty in implementing the inflation-targeting framework. Surges in foreign exchange inflows—both from the current and capital accounts—seem to have compelled the BSP to intervene in the exchange rate market and revert to targeting monetary aggregates. Whether this has reduced the effectiveness of inflation-targeting is an issue that has to be analyzed and discussed carefully.
A recent study by Ho and McCauley (2007) analyzes whether the policy of countering foreign exchange inflows with sterilized intervention will result in unintended adverse domestic consequences, particularly in three areas: monetary control, financial stability, and central bank profitability and balance sheet risk. In the case of monetary control, foreign reserve accumulation may lead to a “technical” sterilization problem wherein the central banks are not able to achieve their operating targets whether they be in terms of a quantity or price. Otherwise, foreign reserve accumulation may “compromise the
ADBI Discussion Paper 91 Josef T. Yap
25
goals” of central banks by inducing them to adopt a more accommodative monetary policy stance than that required by their inflation objective.
Ho and McCauley conclude that, with perhaps the very recent and short-lived exceptions of India and the Philippines, it is difficult to argue that Asian central banks have technical difficulties with sterilization as a result of large-scale foreign exchange purchases. Evidence from interest rate targeting central banks suggests technically effective sterilization. Meanwhile, during the period 2002–06, Asia did not provide evidence that large-scale reserve accumulation would be inflationary. The Philippines did over-shoot its inflation targets during this period but its intervention was not as heavy as the other countries. Moreover, the relatively high inflation was attributed to supply side factors.
The BSP argues that attention is given to monetary aggregates because they have important information content. Monetary and credit aggregates are some of the many variables that are examined in the conduct of monetary policy under an inflation targeting framework, which is information intensive in its consideration of the factors that should underpin policy action. There is a large, although not undisputed, body of evidence which suggests that persistently high growth of money and credit aggregates may provide useful “early warnings” of emerging financial imbalances and may serve as leading indicators of pressures on aggregate demand and on inflation expectations that matter for overall underlying price stability. The growth of monetary aggregates that are beyond the requirements of the economy will tell in the long run on the future evolution of prices.13
Meanwhile, an accurate representation of BSP’s treatment of the exchange rate in the IT framework is one where there is willingness to tolerate a significant degree of variability in the exchange rate and to be sufficiently disciplined to participate in the foreign exchange market only in well-defined circumstances. As noted earlier, the BSP intervenes in the market only to temper wide swings in the exchange rate that can lead to disorderly market conditions. However, it is important to underscore that in responding to capital flows, the BSP follows a package of policy measures. This policy mix includes, apart from exchange rate stability, the build-up of international reserves and the prepayment of external obligations. It was pointed out in Section V that the BSP has been encouraging the shift in the borrowing mix of the government in favor of domestic borrowing. Capital account liberalization, specifically through easing of regulations on non-trade transactions and outward capital investments, continues to be pursued, not for the sake of supporting the peso, but because of the economic gains it can bring by way of portfolio diversification and improved risk management.
Reserve Accumulation: Another Interpretation
The relatively benign effects of reserve accumulation—or central bank intervention in the foreign exchange market—have contributed to the favorable assessment of the BSP, particularly with regard to inflation-targeting. However, economic slack and consequently low domestic interest rates in Asia, including the Philippines, contributed largely to the non-manifestation of the usual effects of reserve accumulation (Ho and McCauley, 2007). In this context, Ho and McCauley suggest that reserve accumulation should not be viewed as an exogenous policy with consequences, but rather as a consequence of
13 The views in this paragraph and the next were also expressed by Dr. Tuaño-Amador during the ADBI
workshop on December 11-12, 2007.
ADBI Discussion Paper 91 Josef T. Yap
26
particular economic circumstances. In particular, the strong efforts to resist currency appreciation in Asia can be seen as a response to weak post-crisis recovery in investment (Table 12).
A related view is that the accumulation of reserves is largely a consequence of the low investment rate which in turn is a direct result of the uncertainty spawned by the 1997 financial crisis. For example, Genberg et al. (2005) argue that:
“Although it may sound paradoxical, reforms that have contributed to liberalizing and opening domestic financial markets appear to have weakened investment demand throughout East Asia. Banks and other financial institutions have become much more reluctant to finance long-term and risky investment projects out of concern for the quality of their asset portfolios…Financial institutions, corporations, and governments themselves have all been preoccupied with strengthening their financial positions to insulate themselves against external financial shocks and speculative attacks.”
Asian Development Bank (2007) cites the favorable conditions for a recovery in investment in East Asia: strong profits, easy credit availability, rebound in prices of physical assets, reductions in debt, and elimination of excess capacity. The sluggish investment performance as shown in Table 12 is therefore rather surprising and ADB attributes this to increased uncertainty and risk. Consistent with the argument of Genberg et al., the accumulation of reserves is a response to the increase in risk and uncertainty, which ultimately has an adverse impact on fixed investment.
The sharp fall of the investment rate can partly explain the present Philippine macroeconomic situation wherein the rapid inflow of foreign exchange is accompanied by an accumulation of reserves, an appreciating currency in nominal and real terms, a current account surplus, rising money supply growth, stable interest rates and inflation, and an improving fiscal balance. The situation is markedly different from the one prior to the crisis when the inflow of foreign exchange was accompanied by less exchange market intervention, a large current account deficit, a fairly stable nominal exchange rate, relatively high inflation, interest rates and money supply growth, and a fiscal surplus. In this context, the following arguments can be made:
• The proposal of the IMF (2007a) to stem currency appreciation through fiscal restraint is not applicable to the Philippines for two reasons. First, the fiscal situation in the Philippines, while still vulnerable, has improved markedly in the past two years. And second, the recommendation of the IMF for fiscal restraint was in the context of correcting a current account deficit.
• The more relevant issue for the Philippines is stimulating private investment. This will lead to higher growth of imports and a deterioration of the current account balance which will then check the appreciation of the peso.
• The accumulation of reserves and subsequent sterilization has not undermined the policy of inflation targeting. However, as indicated earlier the rise in reserves is not necessarily an “intervention” on the part of the BSP and may not even be a result of precautionary motives on the part of economic agents. Rather, reserve accumulation is a direct result of weak investment growth, which is reflected in a
ADBI Discussion Paper 91 Josef T. Yap
27
current account surplus. A weak investment rate puts a cap on interest rates by lowering the demand for credit. The low interest rate cum low credit growth scenario then provides leeway for the BSP to successfully sterilize the rise in foreign exchange reserves. Nevertheless, the scenario may change dramatically once private investment recovers and central banks have to adjust their policy stance accordingly.
VII. THE WAY FORWARD
Measures to Increase Private Investment
The first set of policy recommendations should deal with stimulating private investment in the Philippines. This problem has been the subject of many studies. The recent ADB study gives a succinct description of the main issues:14
“For Indonesia and the Philippines, where improvements have already taken place in the macroeconomic policy environment, the key to sustaining growth is likely to lie in improving the quality and performance of key institutions that influence investor perceptions about uncertainties, risks, and the costs of doing business…In the Philippines (too), governance issues are to the fore. Contract enforcement, corruption, and crime and security are of particular concern…Poor infrastructure, particularly in power and transportation, add most to costs. Generally, the institutions of government are weak and this has slowed the pace of progress. Complex rules and regulations do not adequately address competition issues and continue to create fertile ground for rent seeking. In a variety of dimensions, prospects for raising investment and accelerated growth will depend on the capacity of institutions to move ahead and implement the changes that are required to reduce uncertainty and risk.”
A more direct mechanism to ease pressure on the current account would be to channel workers’ remittances to more productive investment projects. The econometric evidence clearly shows a link between remittances and investment but the latter should go beyond housing and small-scale transportation which are the more popular options at present. To facilitate more productive investment, the BSP has adopted measures to encourage overseas Filipinos to remit through the financial system, such as enhancing transparency and promoting competition in the remittance market; improving the country’s payment and settlement systems and the access to financial services; encouraging overseas Filipinos and their families to increase savings and investments; and cultivating financial literacy among overseas Filipinos and their families.
14 A recent World Bank Study explains the dilemma of rising economic growth and declining investment. See
A. M. Bocchi, “Rising growth, declining investment: the puzzle of the Philippines.” Manuscript, November 1, 2007.
ADBI Discussion Paper 91 Josef T. Yap
28
The Heart of the Matter
Earlier it was mentioned that the progress in reforming the IFA has been uneven and asymmetric. This can gleaned from the Philippine case wherein emphasis has been on reforming the domestic financial system. Despite the substantial progress that has been made, the economy is still having difficulty coping with a rapidly appreciating peso. The latter is argued to be largely a result of the weak US dollar, the volatility of which over the past four years is a manifestation of problems in the IFA.
The uneven and asymmetric progress in the reform of the IFA—particularly the inability “to guarantee a more coherent macroeconomic policy approach at the global level”— is a manifestation of the unipolar world of finance which has been characterized as unjust and unsustainable.15 This is an extension of Triffin’s dilemma. In the present global financial system most of the international trade is denominated in US dollars, most of the international reserves are held in US dollars, and the US can pay for its external deficits by printing dollars which it does not expect to be redeemed in the foreseeable future. The US-led private financial institutions intermediate a major part of international savings and investments and the US-led international financial institutions now play a decisive role in determining the macroeconomic policies of many developing countries.
Under the unipolar financial system, the US has been appropriating seigniorage that is created by expanding world trade and cross-border capital flows. Because the US gets tremendous benefits in terms of financial gain and ideological hegemony, it cannot be expected to surrender these gains voluntarily through a meaningful reform of the IFA. In the unipolar world of finance, the US has had a soft budget constraint in terms of its external deficit. The US has been able to combine a widening current account deficit with an appreciation in the real effective exchange rate—or at least one that is relatively stable—because of huge capital inflows. This has led to what has been referred to as the trans-Pacific macroeconomic imbalance.
However, the US current account deficit reached $857 billion in 2006, equivalent to a historical high of 6.5% of GDP. As a point of comparison, the combined GDP of the ASEAN member countries was $884 billion in 2005 and approximately $1 trillion in 2006. Largely because of its soft budget constraint, the US has become the world’s largest debtor nation with a net foreign debt of $2.7 trillion as of 2005. Another major cause for concern is that the annual balance of net income on domestic and foreign investments in the US was –$1 billion in 2006, making it the first year on record with a negative net income flow. If “net investment income” continues to deteriorate, it will add to the current account deficit and increase the risk of a major reduction or reversal in the capital inflows into the US.
In this context, fixed investment in East Asia may actually be constrained by the need to support the trans-Pacific macroeconomic imbalance and prevent the sharp fall of the dollar. The sustainability of the trans-Pacific macroeconomic imbalance has been a subject of debate and there is still no consensus.16 However, the sharp depreciation of 15 A large part of this section is lifted from Agarwala (2004). 16 The more appropriate term is “global macroeconomic imbalances” since the US has a deficit also with the
EU. This issue and the possibility of East Asian investment being constrained by the need to support the US dollar is discussed thoroughly in the following recently published books Global Imbalances and the US Debt Problem – Should Developing Countries Support the US Dollar? Edited by J. J. Teunissen. Fondad, The Hague, December 2006; and Global Imbalances and Developing Countries: Remedies for a Failing
ADBI Discussion Paper 91 Josef T. Yap
29
the US dollar, particularly since March 2006 and a pending US economic recession may be an indication of a difficult adjustment process.
In order to partly address the inequity caused by a unipolar financial system, the expanded use of Special Drawing Rights (SDRs) was recommended. The introduction of SDRs in 1969 created a truly global money to be used exclusively as a reserve asset, thus generating a more balanced distribution of seigniorage powers. Unfortunately, this proposal has not been implemented. A recommendation for a third allocation of SDRs, though approved by 77% voting majority of the IMF in 1997, did not come into effect because of opposition by the US Congress.
Other recommendations include an international currency (Mundell, 2003) and an international clearing agency (ICA) (D’Arista, 2006). This ICA could be based on a proposal by John Maynard Keynes revised to serve as the institutional platform for a new global payments system that would foster egalitarian interactions and more balanced outcomes. The new ICA would clear transactions denominated in members’ accounts. These clearing accounts would, in fact, constitute the international reserves of the system, held for the member countries by the ICA and valued using a trade-weighted basket of all members’ currencies.
Regional Monetary and Financial Cooperation
Regional financial and monetary cooperation in East Asia is at a critical juncture. The way forward has tremendous implications for the IFA. The “easy” phase of the reform process in East Asia is at its tail end. Policymakers in the region now have to agree to a blueprint for financial sector development in the foreseeable future, the long-term objective of which Kuroda (2004) succinctly identified as the establishment of a single currency in East Asia. This would cover the need to channel more East Asian savings to infrastructure and investment projects in the region.
The main elements of the blueprint are: (i) the structure of regional financial cooperation in terms of reserve pooling and exchange rate coordination; (ii) the relationship between regional cooperation and the domestic financial system, including required domestic economic reforms; (iii) the institutional set-up in the region that will underpin implementation of the blueprint; and (iv) the non-economic objectives of regional financial cooperation.
The last two elements have important political economy considerations. More specifically, they involve establishing a political consensus which is difficult in East Asia due to differences in political systems, “history” issues and the lack of mutual trust (Kawai, 2005). No single economic power plays a dominant role in East Asia similar to that of the US in the Western Hemisphere, nor does any bipolar relationship exist similar to the Franco-German alliance in Western Europe. Japan has been mired in economic stagnation over the last decade and the People’s Republic of China, while recently emerging as an economic power, has yet to achieve full transition to a market economy and, more fundamentally, political transition.
International Financial System. Edited by J. J. Teunissen. Fondad, The Hague, June 2007. The books contain relevant policy recommendations on how to address the unipolar financial system.
ADBI Discussion Paper 91 Josef T. Yap
30
Promoting non-economic objectives highlights the political economy issues that are involved. In light of the European experience, an important consideration in evaluating the trade-off between the potential benefits to be reaped from exchange rate coordination and the potential costs associated with the loss of macroeconomic policy independence arising from the implied need for broader macroeconomic cooperation, is whether the ultimate goals of financial cooperation in East Asia are wholly economic or also partly political. The goal could ultimately be political if the objective of fostering increased regional economic integration is paramount, and that objective is itself an instrumental one designed to achieve political goals. These could include, as in the European case:
(i) The desire to defuse potential regional political conflicts. An important assumption driving European integration was that enhanced economic interdependence would induce European countries to focus on common interests.
(ii) Allowing the region to speak more effectively with one voice in international affairs. This was also an important motive in Europe, and has played a role in other regional integration initiatives. As the world economy becomes increasingly globalized and international negotiations on financial and commercial issues intensify, its importance may be increasing over time.
Grenville (2003) similarly points out that:
“Regional groupings are the principal way of addressing this ‘democratic deficit’. There seems little room for debate that this region is inadequately represented in many of the forums which determine the important issues of globalization. There seems little doubt, also, that the region pays a price for this. East Asia, with an IMF quota of less than 15 percent, accounts for more than 20 percent of world GDP, almost a quarter of world trade, and almost half of world foreign exchange reserves.”
In other words, the process of institutionalizing East Asian regional cooperation should be a venue where common interests of the countries can be articulated. Subsequently, it can be a vehicle by which these interests are pushed in the global setting.
The inability of East Asia to effectively speak with one voice, particularly with regard to the IFA, is one major reason why reform of the latter has become uneven, asymmetric, and patchy. A case in point is the proposed measures to address the trans-Pacific macroeconomic imbalance. Currently, policy proposals that are played up in the media are focused on revaluing East Asian currencies, particularly the yuan. However, the People’s Republic of China is not large enough an economy to be responsible for the US deficits or to be able to correct them. Between 1997 and 2004, the US current account deficit deteriorated by $529 billion, and, over the same period, the People’s Republic of China’s current account position improved by only $35.6 billion (Genberg et al., 2005). A united East Asian front could throw its weight towards a solution that emphasizes fiscal consolidation by the US, which makes more economic sense.
Another important issue is that of capital controls, which have proven be effective in several economies (see for example Epstein et al., 2004). This is evident with the
ADBI Discussion Paper 91 Josef T. Yap
31
behavior of the Malaysian ringgit compared to other currencies in the region (Figure 1 and Table 7). However, with the advent of greater financial integration, capital controls, particularly on inflows, have to be endorsed at the international level in order to be effective (Grenville, 2007). Given that this would require IMF endorsement, international backing of any form of capital controls is unlikely. Hence, endorsement at the regional level would be a second best solution. A united East Asian front could subsequently advocate for fundamental reform of the IFA, particularly with regard to its current unipolar structure.
References
Agarwala, R. (2004): “Reserve Bank of Asia: An Institutional Framework for Regional and Monetary Cooperation in Asia” in Towards an Asian Economic Community: Vision of a New Asia, edited by Nagesh Kumar. Singapore: Institute of Southeast Asian Studies.
Asian Development Bank (2007): “Ten Years After the Crisis: The facts about investment and growth” in Beyond the Crisis: Emerging Trends and Challenges, Mandaluyong City: Asian Development Bank.
Berument, H. and N. N. Dincer (2004): “Do Capital Flows Improve Macroeconomic Performance in Emerging Markets? The Turkish Experience.” Emerging Markets and Trade (July and August).
Calvo, G. A., L. Leiderman and C. M. Reinhart (1996): “Inflows of Capital to Developing Countries in the 1990s: Causes and Effects” Journal of Economic Perspectives 10 (2).
Calvo, G. A., L. Leiderman and C. M. Reinhart (1994): “The Capital Inflows Problem: Concepts and Issues” Contemporary Economic Policy XII, July.
D’Arista, J. (2007): “A More Balanced International Monetary System” in Global Imbalances and Developing Countries: Remedies for a Failing International Financial System. Edited by J. J. Teunissen. Fondad, The Hague.
Devlin, R., R. Ffrench-Davis and S. Griffith Jones (1995): “Surges in Capital Flows and
Development: An Overview of Policy Issues” in R. Ffrench- Davis and S. Griffith-Jones (eds.) Coping with Capital Surges: The Return of Finance to Latin America. Ottawa: International Development Research Centre.
Eichengreen, B. (1998): “Capital Controls: Capital Idea or Capital Folly?” Manuscript. (http://www.stern.nyu.edu/~nroubini/asia/AsiaHomepage.html)
Eichengreen, B. (1999): Toward a New International Financial Architecture: A Practical Post-Asia Agenda. Washington DC: Institute for International Economics.
ADBI Discussion Paper 91 Josef T. Yap
32
Epstein, G., I. Grabel, and K. S. Jomo (2004): “Capital Management Techniques in Developing Countries: An Assessment of Experiences from the 1990s and Lessons for the Future”. UNCTAD G-24 Discussion Paper Series No. 27 (March).
Fernandez-Arias, E. (1996): “The New Wave of Capital Inflows: Push or Pull?” Journal of Development Economics 48 (March).
Fernandez-Arias, E. and P. Montiel (1996): “The Surge in Capital Inflows to Developing Countries: An Analytical Overview” World Bank Economic Review 10 (March).
Genberg, H., R. McCauley, Y. C. Park, and A. Persaud (2005): Official Reserves and Currency Management in Asia: Myth, Reality and the Future. Geneva: International Center for Monetary and Banking Studies.
Grenville, S. (2003): “Policy Dialogue in East Asia: Principles for Success.” Chapter 2 of Financial Governance in East Asia edited by G. de Brouwer and Y. Wang. London: Routledge.
Grenville, S. (2007): “Globalization and Capital Flows: Unfinished Business in the International Financial Architecture.” Lowry Institute for International Policy Perspectives (February).
Griffith-Jones, S. and J. A. Ocampo (2003): “What Progress on International Reform? Why so Limited?” Paper prepared for the Expert Group on Development Issues, downloaded from http://www.un.org/esa/desa/ousg/presentations/2002_finref.pdf.
Guitian, M. (1998): “The Challenge of Managing Global Capital Flows” IMF Finance and Development 35, 2, June.
Ho, C. and R. N. McCauley (2007): “Resisting appreciation and accumulating reserves in Asia: examining the domestic financial consequences.” Bank of International Settlements, manuscript (27 December).
International Monetary Fund (2007a): “Managing Large Capital Inflows” Chapter 3 of World Economic Outlook, Washington (October).
International Monetary Fund (2007b): “Sterilized Intervention in Emerging Asia: Is it Effective?” Chapter III of Regional Economic Outlook, Asia and the Pacific (October).
Johansen, S. (1991): “Estimation and Hypothesis Testing of Co-integration Vectors in Gaussian Vector Autoregressive Models.” Econometrica 59.
Kawai, M. (2005): “East Asian Economic Regionalism: Progress and Challenges.” Journal of Asian Economics 16.
Kawai M., and C. Houser (2007): Evolving ASEAN+3 ERPD: From Peer Reviews to Due Diligence. Paper presented at the international conference The First OECD-Southeast Asia Regional Forum: Peer review Mechanism for Policy Reform, organized by OECD with the ASEAN Secretariat and ADB, Jakarta, 23–24 January.
ADBI Discussion Paper 91 Josef T. Yap
33
Kuroda, H. 2004. “Transitional Steps in the Road to a Single Currency in East Asia.” Statement at the seminar on “A Single Currency for East Asia—Lessons from Europe” organized by Asian Development Bank, Jeju, May 14.
Lamberte, M. B. (1995): “Managing Surges in Capital Inflows: The Philippine Case.” Journal of Philippine Development, XXII, No. 1 (First Semester).
Levine, R. (1999): “Foreign Bank Entry and Capital Control Liberalization: Effects on Growth and Stability” Manuscript (October).
Levine, R. and M. Carkovic (1999): “Do Foreign Investment and Portfolio Inflows Accelerate Economic Growth?” Manuscript (December).
Mirza, H. and A. Giroud (2004): “Regionalization, Foreign Direct Investment and Poverty Reduction: Lessons From Viet Nam in ASEAN.” Journal of the Asia Pacific Economy 9 (2).
Mundell, R. A. (2003): “The International Monetary System and the Case for a World Currency.” Distinguished Lecture Series No. 12, Leon Koźmiński Academy of Entrepreneurship and Management, October 23.
Rana P. B. (1998): “Surges and Volatility of Private Capital Flows to Asian Developing
Countries: Implications for Multilateral Development Banks.” Asian Development Bank Occasional Papers Number 19.
Reisen, H. (1998): “Net capital inflows: How much to accept, how much to resist?” in R.
Glick (ed.) Managing Capital Flows and Exchange Rates: Perspectives from the Pacific Basin. Cambridge University Press.
Rodrik, D. (1998): “Who Needs Capital-Account Convertibility?” in Should the IMF
Pursue Capital-Account Convertibility? Essays in International Finance No. 207, International Finance Section, Princeton University (May).
Sakakibara, E. 2003. “Asian Cooperation and the End of Pax Americana” in Jan Joost Teunissen and Mark Teunissen (eds.) Financial Stability and Growth in Emerging Economies: The Role of the Financial Sector. FONDAD: The Hague.
Tabuga, A. D. (2007): “International Remittances and Household Expenditures: The Philippines Case.” Philippine Institute for Development Studies Discussion Paper 2007-18.
Taylor, M. P. and L. Sarno (1997): “Capital Flows to Developing Countries: Long and Short-Term Determinants” World Bank Economic Review 11 (3).
Tetangco, A. M. Jr. (2005): “The composition and management of capital flows in the Philippines” in Globalisation and Monetary Policy in Emerging Markets, BIS Papers 23, May.
ADBI Discussion Paper 91 Josef T. Yap
34
Tuaño-Amador, M. C. N., R. A. Claveria, V. K. Delloro and F. S. Co (2007): “Philippine Overseas Workers and Migrants’ Remittances: The Dutch Disease Phenomenon and the Cyclicality Issue.” Paper presented at the 45th Philippine Economic Society (PES) Meeting, 14 November.
Wang, Y. (2004): “Prospects for Financial and Monetary Cooperation in Asia” and Monetary Cooperation in Asia” in Towards an Asian Economic Community: Vision of a New Asia, edited by Nagesh Kumar. Singapore: Institute of Southeast Asian Studies.
Yang, D. (2005): “International Migration, Human Capital, and Entrepreneurship: Evidence from Philippine Migrants' Exchange Rate Shocks.” World Bank Policy Research Working Paper Series No. 3578 (February). Retrieved August 6, 2007, from: http://ssrn.com/abstract=546483.
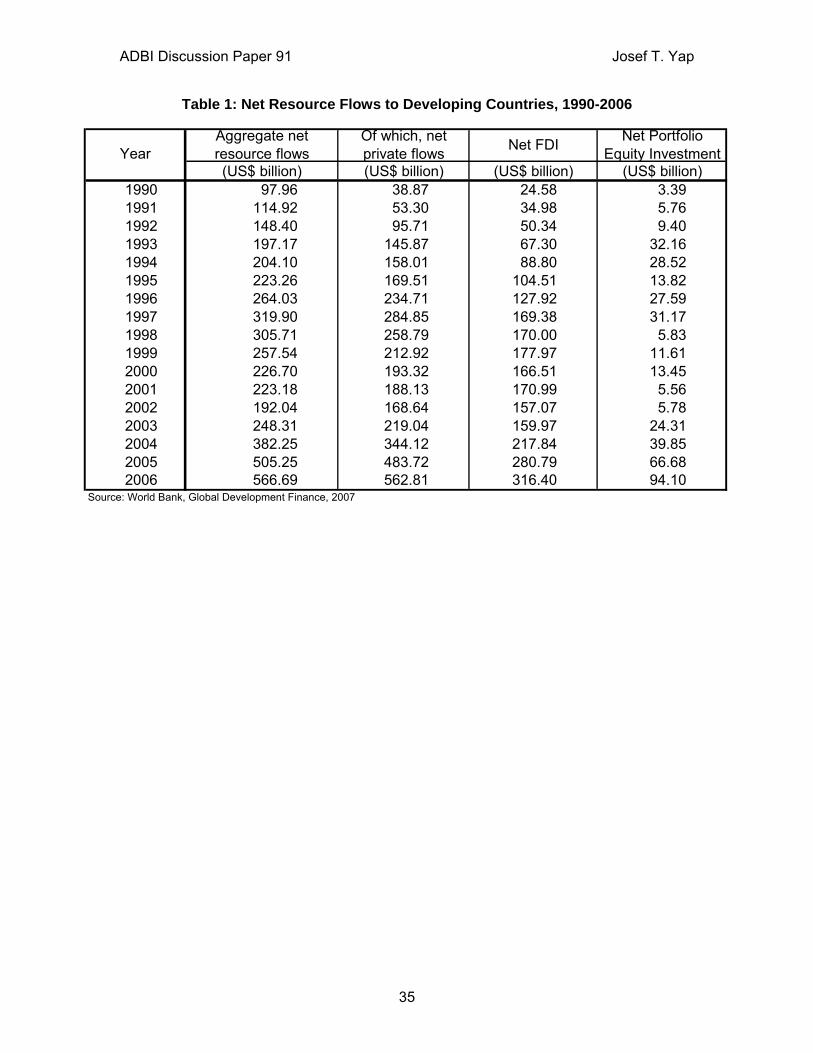
ADBI Discussion Paper 91 Josef T. Yap
35
Table 1: Net Resource Flows to Developing Countries, 1990-2006
(US$ billion) (US$ billion) (US$ billion) (US$ billion)1990 97.96 38.87 24.58 3.391991 114.92 53.30 34.98 5.761992 148.40 95.71 50.34 9.401993 197.17 145.87 67.30 32.161994 204.10 158.01 88.80 28.521995 223.26 169.51 104.51 13.821996 264.03 234.71 127.92 27.591997 319.90 284.85 169.38 31.171998 305.71 258.79 170.00 5.831999 257.54 212.92 177.97 11.612000 226.70 193.32 166.51 13.452001 223.18 188.13 170.99 5.562002 192.04 168.64 157.07 5.782003 248.31 219.04 159.97 24.312004 382.25 344.12 217.84 39.852005 505.25 483.72 280.79 66.682006 566.69 562.81 316.40 94.10
YearAggregate net resource flows
Of which, net private flows
Net Portfolio Equity InvestmentNet FDI
Source: World Bank, Global Development Finance, 2007
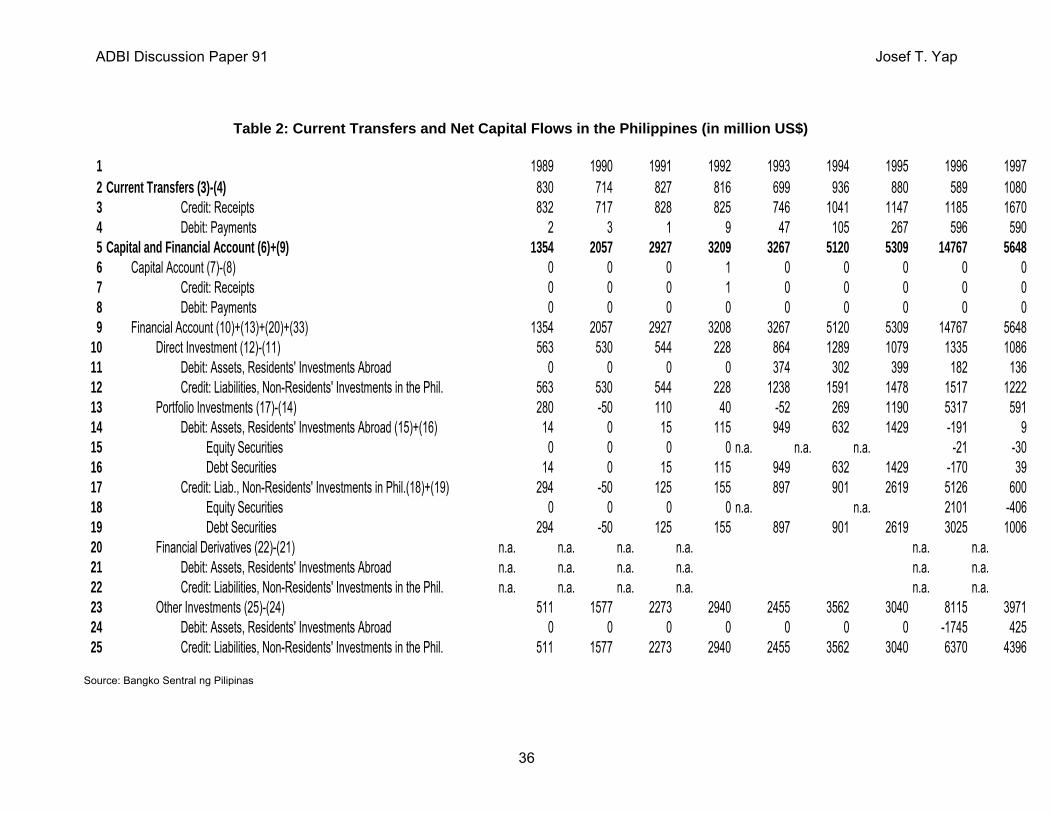
ADBI Discussion Paper 91 Josef T. Yap
36
Table 2: Current Transfers and Net Capital Flows in the Philippines (in million US$)
1 1989 1990 1991 1992 1993 1994 1995 1996 19972 Current Transfers (3)-(4) 830 714 827 816 699 936 880 589 10803 Credit: Receipts 832 717 828 825 746 1041 1147 1185 16704 Debit: Payments 2 3 1 9 47 105 267 596 5905 Capital and Financial Account (6)+(9) 1354 2057 2927 3209 3267 5120 5309 14767 56486 Capital Account (7)-(8) 0 0 0 1 0 0 0 0 07 Credit: Receipts 0 0 0 1 0 0 0 0 08 Debit: Payments 0 0 0 0 0 0 0 0 09 Financial Account (10)+(13)+(20)+(33) 1354 2057 2927 3208 3267 5120 5309 14767 5648
10 Direct Investment (12)-(11) 563 530 544 228 864 1289 1079 1335 108611 Debit: Assets, Residents' Investments Abroad 0 0 0 0 374 302 399 182 13612 Credit: Liabilities, Non-Residents' Investments in the Phil. 563 530 544 228 1238 1591 1478 1517 122213 Portfolio Investments (17)-(14) 280 -50 110 40 -52 269 1190 5317 59114 Debit: Assets, Residents' Investments Abroad (15)+(16) 14 0 15 115 949 632 1429 -191 915 Equity Securities 0 0 0 0 n.a. n.a. n.a. -21 -3016 Debt Securities 14 0 15 115 949 632 1429 -170 3917 Credit: Liab., Non-Residents' Investments in Phil.(18)+(19) 294 -50 125 155 897 901 2619 5126 60018 Equity Securities 0 0 0 0 n.a. n.a. 2101 -40619 Debt Securities 294 -50 125 155 897 901 2619 3025 100620 Financial Derivatives (22)-(21) n.a. n.a. n.a. n.a. n.a. n.a.21 Debit: Assets, Residents' Investments Abroad n.a. n.a. n.a. n.a. n.a. n.a.22 Credit: Liabilities, Non-Residents' Investments in the Phil. n.a. n.a. n.a. n.a. n.a. n.a.23 Other Investments (25)-(24) 511 1577 2273 2940 2455 3562 3040 8115 397124 Debit: Assets, Residents' Investments Abroad 0 0 0 0 0 0 0 -1745 42525 Credit: Liabilities, Non-Residents' Investments in the Phil. 511 1577 2273 2940 2455 3562 3040 6370 4396
Source: Bangko Sentral ng Pilipinas
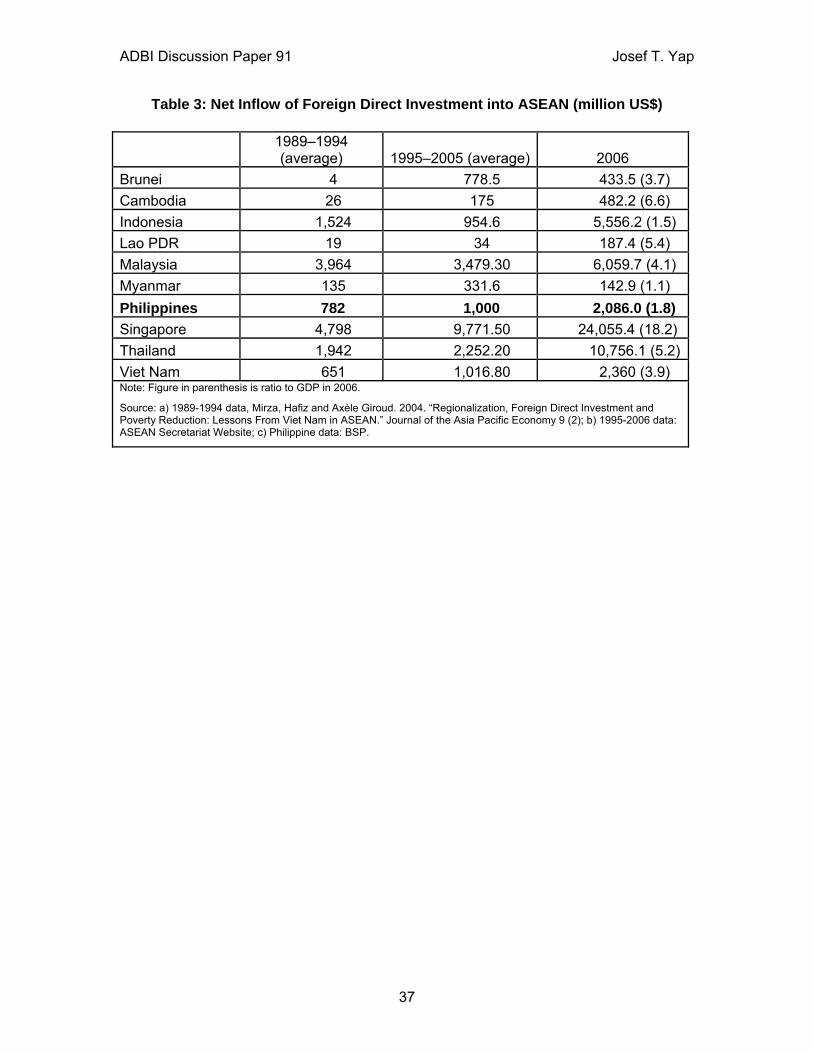
ADBI Discussion Paper 91 Josef T. Yap
37
Table 3: Net Inflow of Foreign Direct Investment into ASEAN (million US$)
1989–1994 (average) 1995–2005 (average) 2006
Brunei 4 778.5 433.5 (3.7) Cambodia 26 175 482.2 (6.6) Indonesia 1,524 954.6 5,556.2 (1.5)Lao PDR 19 34 187.4 (5.4) Malaysia 3,964 3,479.30 6,059.7 (4.1) Myanmar 135 331.6 142.9 (1.1)Philippines 782 1,000 2,086.0 (1.8) Singapore 4,798 9,771.50 24,055.4 (18.2) Thailand 1,942 2,252.20 10,756.1 (5.2)Viet Nam 651 1,016.80 2,360 (3.9) Note: Figure in parenthesis is ratio to GDP in 2006.
Source: a) 1989-1994 data, Mirza, Hafiz and Axèle Giroud. 2004. “Regionalization, Foreign Direct Investment and Poverty Reduction: Lessons From Viet Nam in ASEAN.” Journal of the Asia Pacific Economy 9 (2); b) 1995-2006 data: ASEAN Secretariat Website; c) Philippine data: BSP.
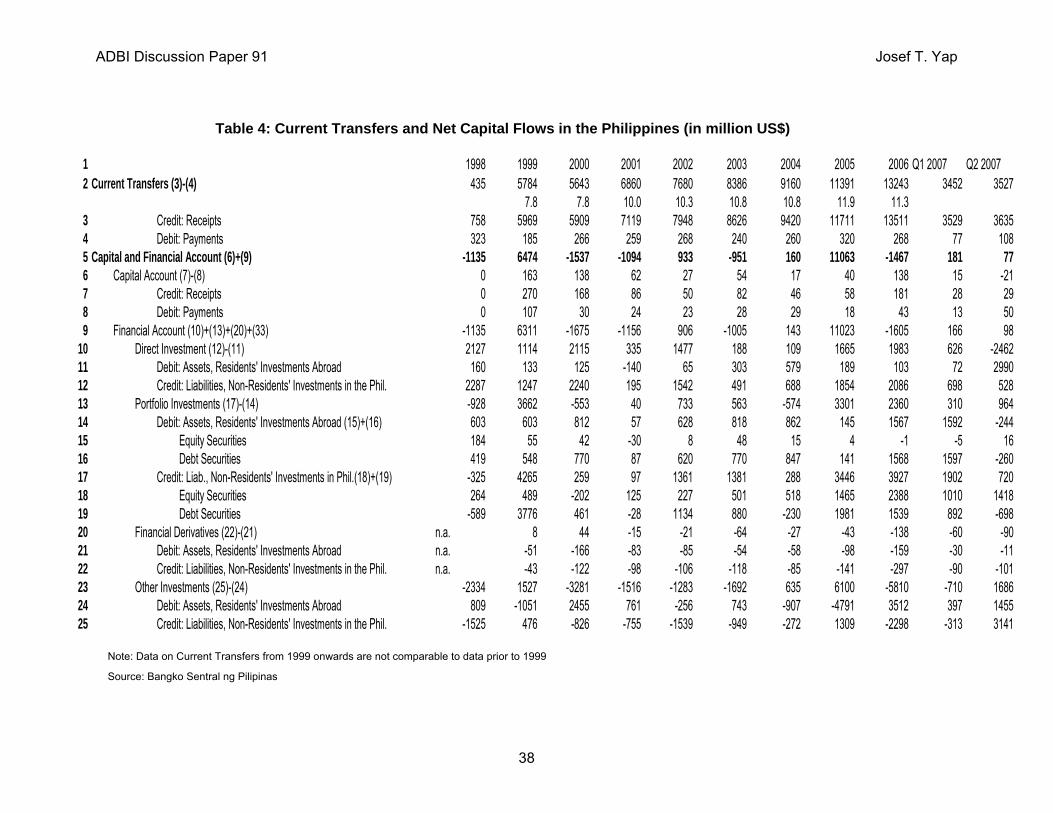
ADBI Discussion Paper 91 Josef T. Yap
38
Table 4: Current Transfers and Net Capital Flows in the Philippines (in million US$)
1 1998 1999 2000 2001 2002 2003 2004 2005 2006 Q1 2007 Q2 20072 Current Transfers (3)-(4) 435 5784 5643 6860 7680 8386 9160 11391 13243 3452 3527
7.8 7.8 10.0 10.3 10.8 10.8 11.9 11.33 Credit: Receipts 758 5969 5909 7119 7948 8626 9420 11711 13511 3529 36354 Debit: Payments 323 185 266 259 268 240 260 320 268 77 1085 Capital and Financial Account (6)+(9) -1135 6474 -1537 -1094 933 -951 160 11063 -1467 181 776 Capital Account (7)-(8) 0 163 138 62 27 54 17 40 138 15 -217 Credit: Receipts 0 270 168 86 50 82 46 58 181 28 298 Debit: Payments 0 107 30 24 23 28 29 18 43 13 509 Financial Account (10)+(13)+(20)+(33) -1135 6311 -1675 -1156 906 -1005 143 11023 -1605 166 98
10 Direct Investment (12)-(11) 2127 1114 2115 335 1477 188 109 1665 1983 626 -246211 Debit: Assets, Residents' Investments Abroad 160 133 125 -140 65 303 579 189 103 72 299012 Credit: Liabilities, Non-Residents' Investments in the Phil. 2287 1247 2240 195 1542 491 688 1854 2086 698 52813 Portfolio Investments (17)-(14) -928 3662 -553 40 733 563 -574 3301 2360 310 96414 Debit: Assets, Residents' Investments Abroad (15)+(16) 603 603 812 57 628 818 862 145 1567 1592 -24415 Equity Securities 184 55 42 -30 8 48 15 4 -1 -5 1616 Debt Securities 419 548 770 87 620 770 847 141 1568 1597 -26017 Credit: Liab., Non-Residents' Investments in Phil.(18)+(19) -325 4265 259 97 1361 1381 288 3446 3927 1902 72018 Equity Securities 264 489 -202 125 227 501 518 1465 2388 1010 141819 Debt Securities -589 3776 461 -28 1134 880 -230 1981 1539 892 -69820 Financial Derivatives (22)-(21) n.a. 8 44 -15 -21 -64 -27 -43 -138 -60 -9021 Debit: Assets, Residents' Investments Abroad n.a. -51 -166 -83 -85 -54 -58 -98 -159 -30 -1122 Credit: Liabilities, Non-Residents' Investments in the Phil. n.a. -43 -122 -98 -106 -118 -85 -141 -297 -90 -10123 Other Investments (25)-(24) -2334 1527 -3281 -1516 -1283 -1692 635 6100 -5810 -710 168624 Debit: Assets, Residents' Investments Abroad 809 -1051 2455 761 -256 743 -907 -4791 3512 397 145525 Credit: Liabilities, Non-Residents' Investments in the Phil. -1525 476 -826 -755 -1539 -949 -272 1309 -2298 -313 3141
Note: Data on Current Transfers from 1999 onwards are not comparable to data prior to 1999
Source: Bangko Sentral ng Pilipinas
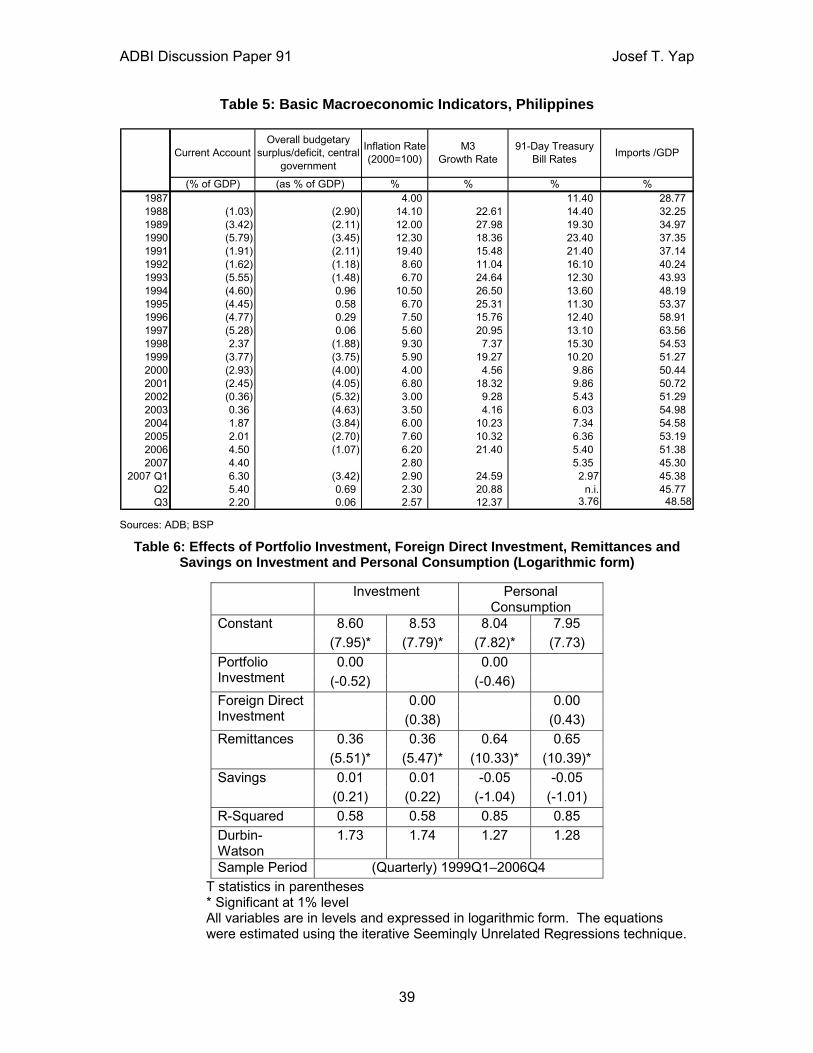
ADBI Discussion Paper 91 Josef T. Yap
39
Table 5: Basic Macroeconomic Indicators, Philippines
(% of GDP) (as % of GDP) % % % %1987 4.00 11.40 28.77 1988 (1.03) (2.90) 14.10 22.61 14.40 32.25 1989 (3.42) (2.11) 12.00 27.98 19.30 34.97 1990 (5.79) (3.45) 12.30 18.36 23.40 37.35 1991 (1.91) (2.11) 19.40 15.48 21.40 37.14 1992 (1.62) (1.18) 8.60 11.04 16.10 40.24 1993 (5.55) (1.48) 6.70 24.64 12.30 43.93 1994 (4.60) 0.96 10.50 26.50 13.60 48.19 1995 (4.45) 0.58 6.70 25.31 11.30 53.37 1996 (4.77) 0.29 7.50 15.76 12.40 58.91 1997 (5.28) 0.06 5.60 20.95 13.10 63.56 1998 2.37 (1.88) 9.30 7.37 15.30 54.53 1999 (3.77) (3.75) 5.90 19.27 10.20 51.27 2000 (2.93) (4.00) 4.00 4.56 9.86 50.44 2001 (2.45) (4.05) 6.80 18.32 9.86 50.72 2002 (0.36) (5.32) 3.00 9.28 5.43 51.29 2003 0.36 (4.63) 3.50 4.16 6.03 54.98 2004 1.87 (3.84) 6.00 10.23 7.34 54.58 2005 2.01 (2.70) 7.60 10.32 6.36 53.19 2006 4.50 (1.07) 6.20 21.40 5.40 51.38 2007 4.40 2.80 5.35 45.30
2007 Q1 6.30 (3.42) 2.90 24.59 2.97 45.38 Q2 5.40 0.69 2.30 20.88 n.i. 45.77 Q3 2.20 0.06 2.57 12.37 3.76 48.58
M3 Growth Rate
91-Day Treasury Bill RatesCurrent Account
Overall budgetary surplus/deficit, central
government
Inflation Rate (2000=100) Imports /GDP
Sources: ADB; BSP
Table 6: Effects of Portfolio Investment, Foreign Direct Investment, Remittances and Savings on Investment and Personal Consumption (Logarithmic form)
Investment Personal Consumption
Constant 8.60 8.53 8.04 7.95 (7.95)* (7.79)* (7.82)* (7.73)
Portfolio Investment
0.00 0.00 (-0.52) (-0.46)
Foreign Direct Investment
0.00 0.00 (0.38) (0.43)
Remittances 0.36 0.36 0.64 0.65 (5.51)* (5.47)* (10.33)* (10.39)*
Savings 0.01 0.01 -0.05 -0.05 (0.21) (0.22) (-1.04) (-1.01)
R-Squared 0.58 0.58 0.85 0.85 Durbin-Watson
1.73 1.74 1.27 1.28
Sample Period (Quarterly) 1999Q1–2006Q4 T statistics in parentheses * Significant at 1% level All variables are in levels and expressed in logarithmic form. The equations were estimated using the iterative Seemingly Unrelated Regressions technique.
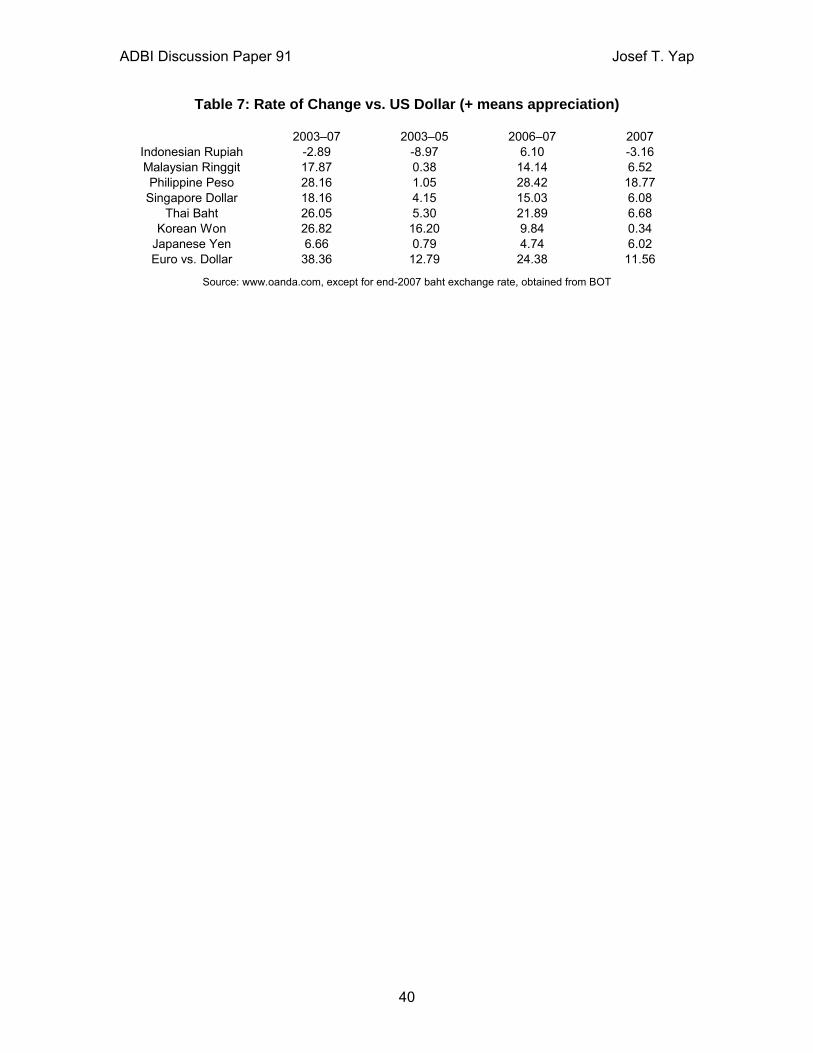
ADBI Discussion Paper 91 Josef T. Yap
40
Table 7: Rate of Change vs. US Dollar (+ means appreciation)
2003–07 2003–05 2006–07 2007Indonesian Rupiah -2.89 -8.97 6.10 -3.16Malaysian Ringgit 17.87 0.38 14.14 6.52Philippine Peso 28.16 1.05 28.42 18.77
Singapore Dollar 18.16 4.15 15.03 6.08Thai Baht 26.05 5.30 21.89 6.68
Korean Won 26.82 16.20 9.84 0.34Japanese Yen 6.66 0.79 4.74 6.02Euro vs. Dollar 38.36 12.79 24.38 11.56
Source: www.oanda.com, except for end-2007 baht exchange rate, obtained from BOT
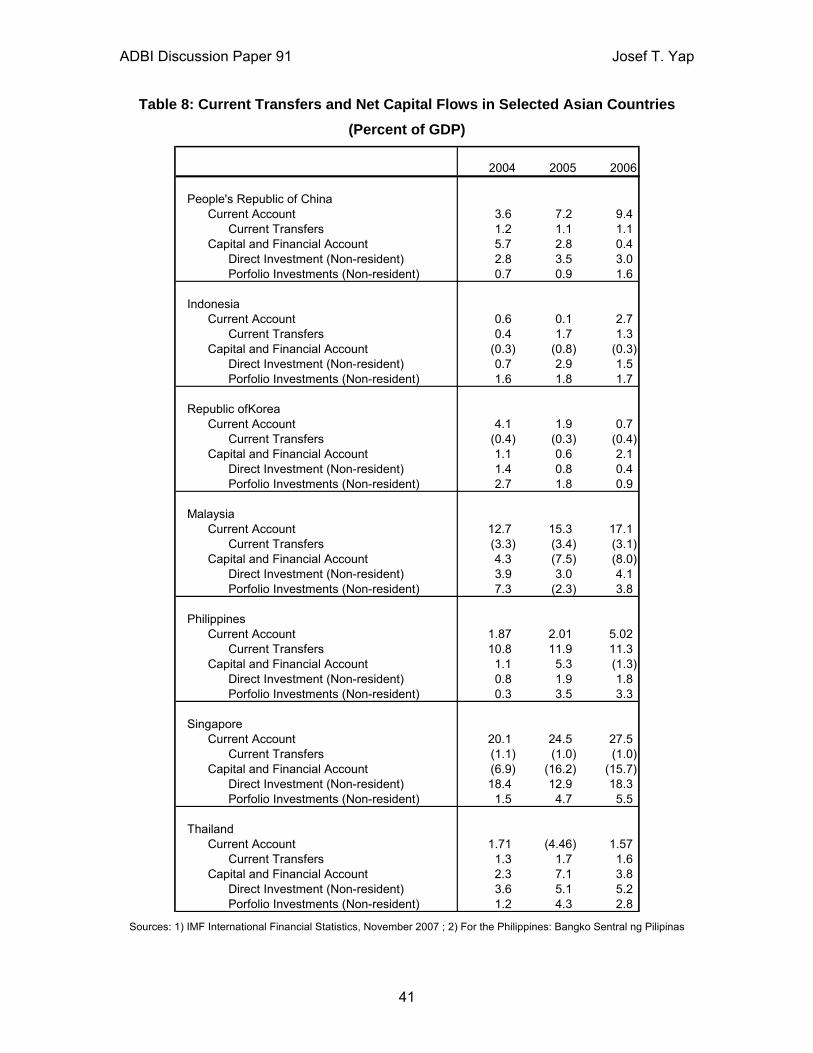
ADBI Discussion Paper 91 Josef T. Yap
41
Table 8: Current Transfers and Net Capital Flows in Selected Asian Countries (Percent of GDP)
2004 2005 2006
People's Republic of ChinaCurrent Account 3.6 7.2 9.4
Current Transfers 1.2 1.1 1.1 Capital and Financial Account 5.7 2.8 0.4
Direct Investment (Non-resident) 2.8 3.5 3.0 Porfolio Investments (Non-resident) 0.7 0.9 1.6
IndonesiaCurrent Account 0.6 0.1 2.7
Current Transfers 0.4 1.7 1.3 Capital and Financial Account (0.3) (0.8) (0.3)
Direct Investment (Non-resident) 0.7 2.9 1.5 Porfolio Investments (Non-resident) 1.6 1.8 1.7
Republic ofKoreaCurrent Account 4.1 1.9 0.7
Current Transfers (0.4) (0.3) (0.4) Capital and Financial Account 1.1 0.6 2.1
Direct Investment (Non-resident) 1.4 0.8 0.4 Porfolio Investments (Non-resident) 2.7 1.8 0.9
MalaysiaCurrent Account 12.7 15.3 17.1
Current Transfers (3.3) (3.4) (3.1) Capital and Financial Account 4.3 (7.5) (8.0)
Direct Investment (Non-resident) 3.9 3.0 4.1 Porfolio Investments (Non-resident) 7.3 (2.3) 3.8
PhilippinesCurrent Account 1.87 2.01 5.02
Current Transfers 10.8 11.9 11.3 Capital and Financial Account 1.1 5.3 (1.3)
Direct Investment (Non-resident) 0.8 1.9 1.8 Porfolio Investments (Non-resident) 0.3 3.5 3.3
SingaporeCurrent Account 20.1 24.5 27.5
Current Transfers (1.1) (1.0) (1.0) Capital and Financial Account (6.9) (16.2) (15.7)
Direct Investment (Non-resident) 18.4 12.9 18.3 Porfolio Investments (Non-resident) 1.5 4.7 5.5
ThailandCurrent Account 1.71 (4.46) 1.57
Current Transfers 1.3 1.7 1.6 Capital and Financial Account 2.3 7.1 3.8
Direct Investment (Non-resident) 3.6 5.1 5.2 Porfolio Investments (Non-resident) 1.2 4.3 2.8
Sources: 1) IMF International Financial Statistics, November 2007 ; 2) For the Philippines: Bangko Sentral ng Pilipinas
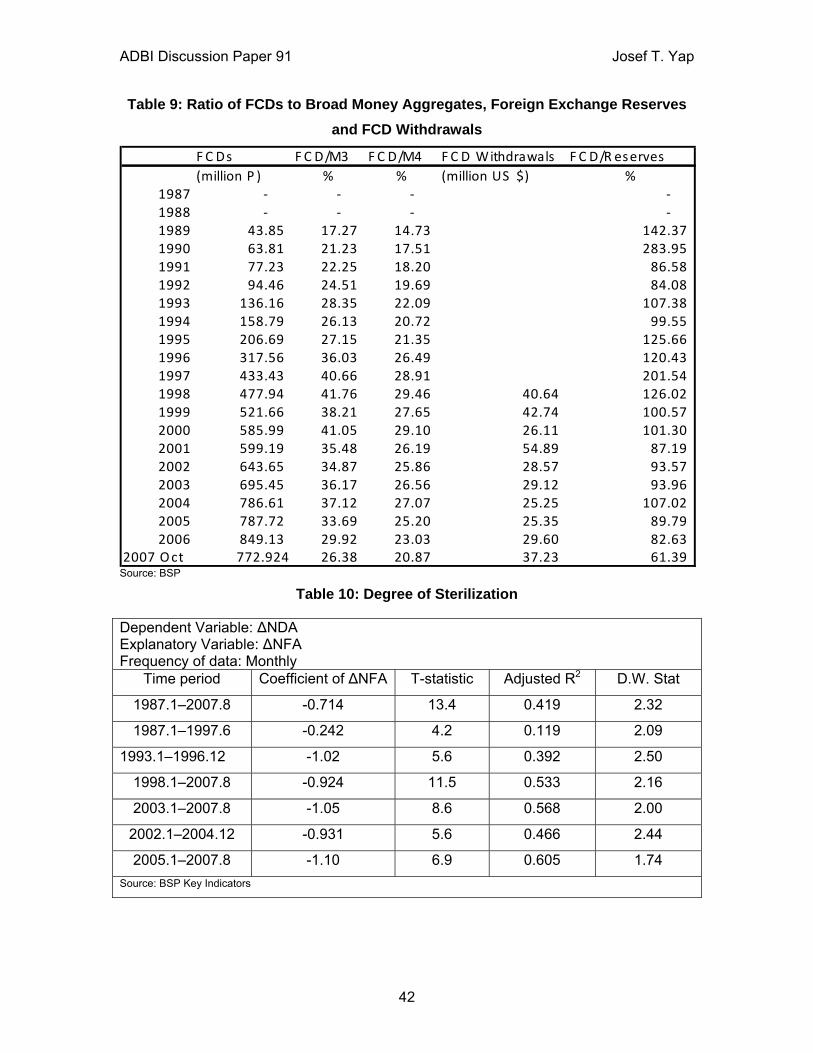
ADBI Discussion Paper 91 Josef T. Yap
42
Table 9: Ratio of FCDs to Broad Money Aggregates, Foreign Exchange Reserves and FCD Withdrawals
F C Ds F C D/M3 FC D/M4 FC D Withdrawals F C D/R eserves(million P ) % % (million US $) %
1987 ‐ ‐ ‐ ‐ 1988 ‐ ‐ ‐ ‐ 1989 43.85 17.27 14.73 142.37 1990 63.81 21.23 17.51 283.95 1991 77.23 22.25 18.20 86.58 1992 94.46 24.51 19.69 84.08 1993 136.16 28.35 22.09 107.38 1994 158.79 26.13 20.72 99.55 1995 206.69 27.15 21.35 125.66 1996 317.56 36.03 26.49 120.43 1997 433.43 40.66 28.91 201.54 1998 477.94 41.76 29.46 40.64 126.02 1999 521.66 38.21 27.65 42.74 100.57 2000 585.99 41.05 29.10 26.11 101.30 2001 599.19 35.48 26.19 54.89 87.19 2002 643.65 34.87 25.86 28.57 93.57 2003 695.45 36.17 26.56 29.12 93.96 2004 786.61 37.12 27.07 25.25 107.02 2005 787.72 33.69 25.20 25.35 89.79 2006 849.13 29.92 23.03 29.60 82.63
2007 Oct 772.924 26.38 20.87 37.23 61.39 Source: BSP
Table 10: Degree of Sterilization
Dependent Variable: ΔNDA Explanatory Variable: ΔNFA Frequency of data: Monthly
Time period Coefficient of ΔNFA T-statistic Adjusted R2 D.W. Stat
1987.1–2007.8 -0.714 13.4 0.419 2.32
1987.1–1997.6 -0.242 4.2 0.119 2.09
1993.1–1996.12 -1.02 5.6 0.392 2.50
1998.1–2007.8 -0.924 11.5 0.533 2.16
2003.1–2007.8 -1.05 8.6 0.568 2.00
2002.1–2004.12 -0.931 5.6 0.466 2.44
2005.1–2007.8 -1.10 6.9 0.605 1.74 Source: BSP Key Indicators
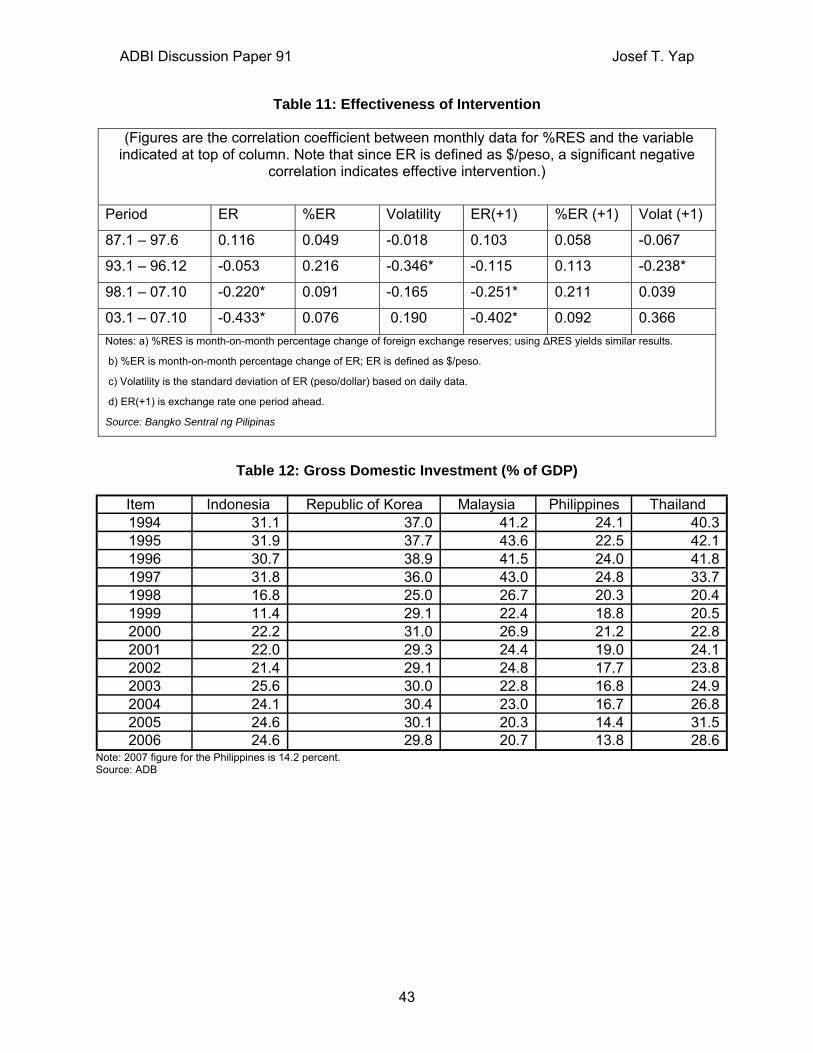
ADBI Discussion Paper 91 Josef T. Yap
43
Table 11: Effectiveness of Intervention
(Figures are the correlation coefficient between monthly data for %RES and the variable indicated at top of column. Note that since ER is defined as $/peso, a significant negative
correlation indicates effective intervention.)
Period ER %ER Volatility ER(+1) %ER (+1) Volat (+1)
87.1 – 97.6 0.116 0.049 -0.018 0.103 0.058 -0.067
93.1 – 96.12 -0.053 0.216 -0.346* -0.115 0.113 -0.238*
98.1 – 07.10 -0.220* 0.091 -0.165 -0.251* 0.211 0.039
03.1 – 07.10 -0.433* 0.076 0.190 -0.402* 0.092 0.366 Notes: a) %RES is month-on-month percentage change of foreign exchange reserves; using ΔRES yields similar results.
b) %ER is month-on-month percentage change of ER; ER is defined as $/peso.
c) Volatility is the standard deviation of ER (peso/dollar) based on daily data.
d) ER(+1) is exchange rate one period ahead.
Source: Bangko Sentral ng Pilipinas
Table 12: Gross Domestic Investment (% of GDP)
Item Indonesia Republic of Korea Malaysia Philippines Thailand 1994 31.1 37.0 41.2 24.1 40.3 1995 31.9 37.7 43.6 22.5 42.1 1996 30.7 38.9 41.5 24.0 41.8 1997 31.8 36.0 43.0 24.8 33.7 1998 16.8 25.0 26.7 20.3 20.4 1999 11.4 29.1 22.4 18.8 20.5 2000 22.2 31.0 26.9 21.2 22.8 2001 22.0 29.3 24.4 19.0 24.1 2002 21.4 29.1 24.8 17.7 23.8 2003 25.6 30.0 22.8 16.8 24.9 2004 24.1 30.4 23.0 16.7 26.8 2005 24.6 30.1 20.3 14.4 31.5 2006 24.6 29.8 20.7 13.8 28.6
Note: 2007 figure for the Philippines is 14.2 percent. Source: ADB
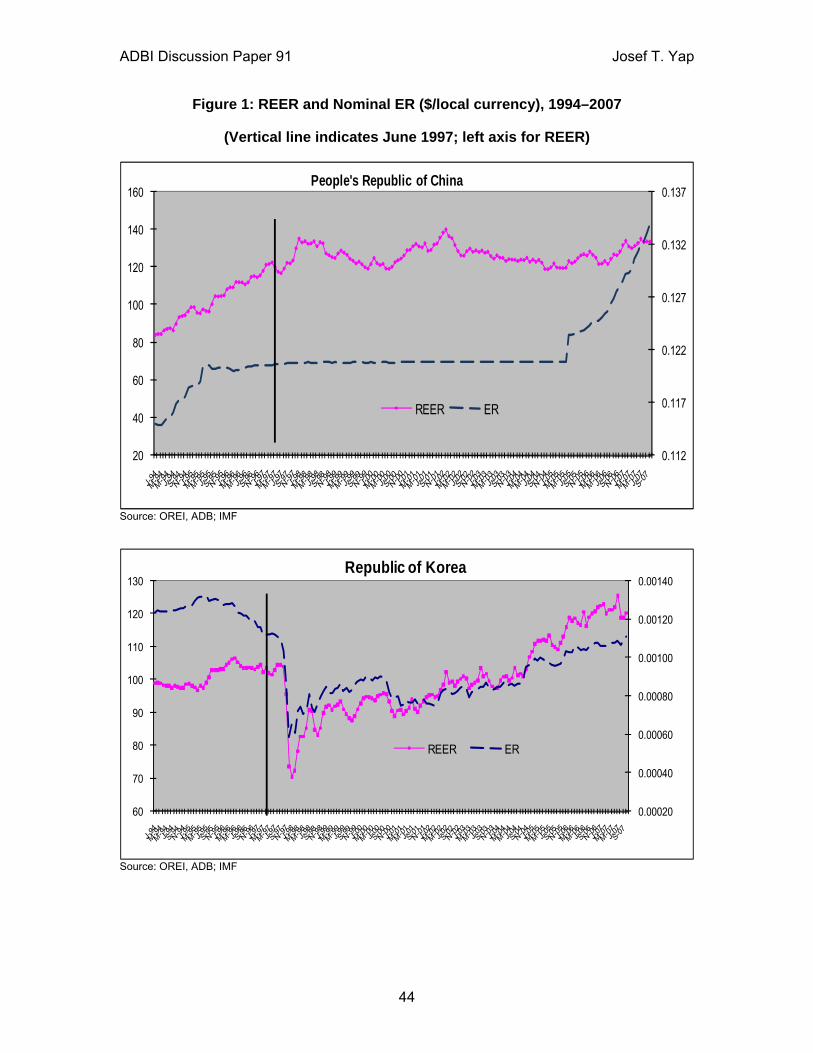
ADBI Discussion Paper 91 Josef T. Yap
44
Figure 1: REER and Nominal ER ($/local currency), 1994–2007
(Vertical line indicates June 1997; left axis for REER)
0.112
0.117
0.122
0.127
0.132
0.137
20
40
60
80
100
120
140
160People's Republic of China
REER ER
Source: OREI, ADB; IMF
0.00020
0.00040
0.00060
0.00080
0.00100
0.00120
0.00140
60
70
80
90
100
110
120
130Republic of Korea
REER ER
Source: OREI, ADB; IMF
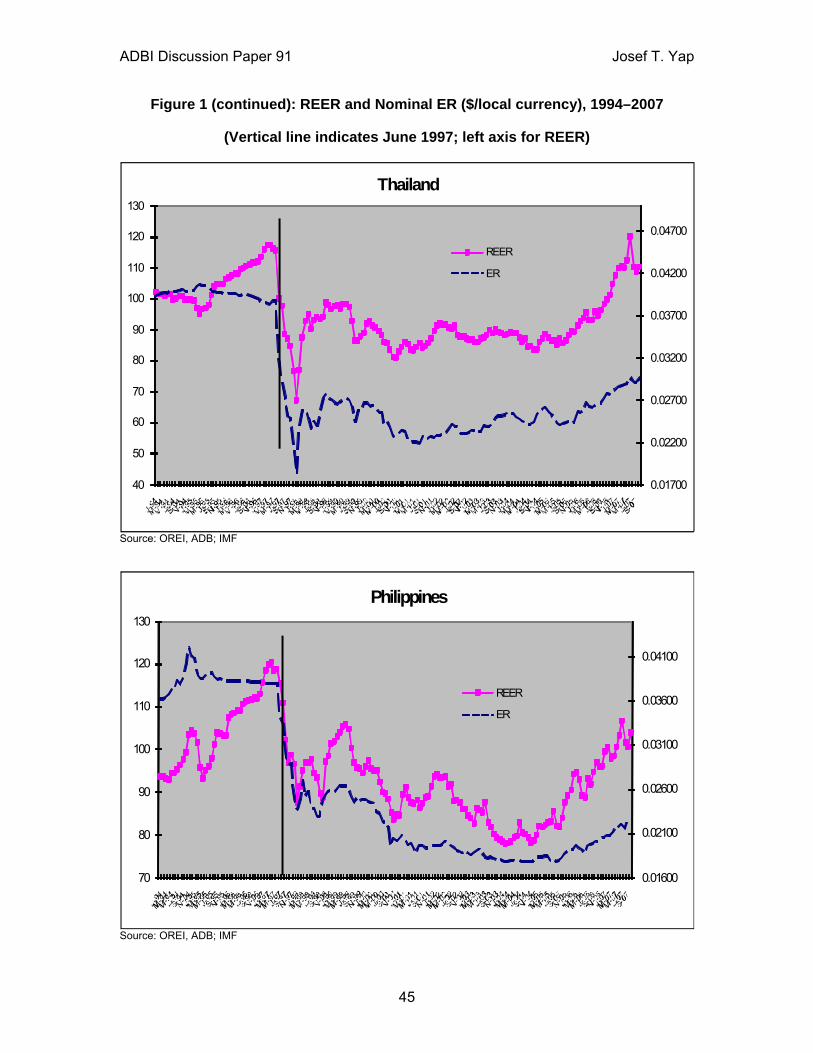
ADBI Discussion Paper 91 Josef T. Yap
45
Figure 1 (continued): REER and Nominal ER ($/local currency), 1994–2007
(Vertical line indicates June 1997; left axis for REER)
0.01700
0.02200
0.02700
0.03200
0.03700
0.04200
0.04700
40
50
60
70
80
90
100
110
120
130Thailand
REER
ER
Source: OREI, ADB; IMF
0.01600
0.02100
0.02600
0.03100
0.03600
0.04100
70
80
90
100
110
120
130
Philippines
REER
ER
Source: OREI, ADB; IMF
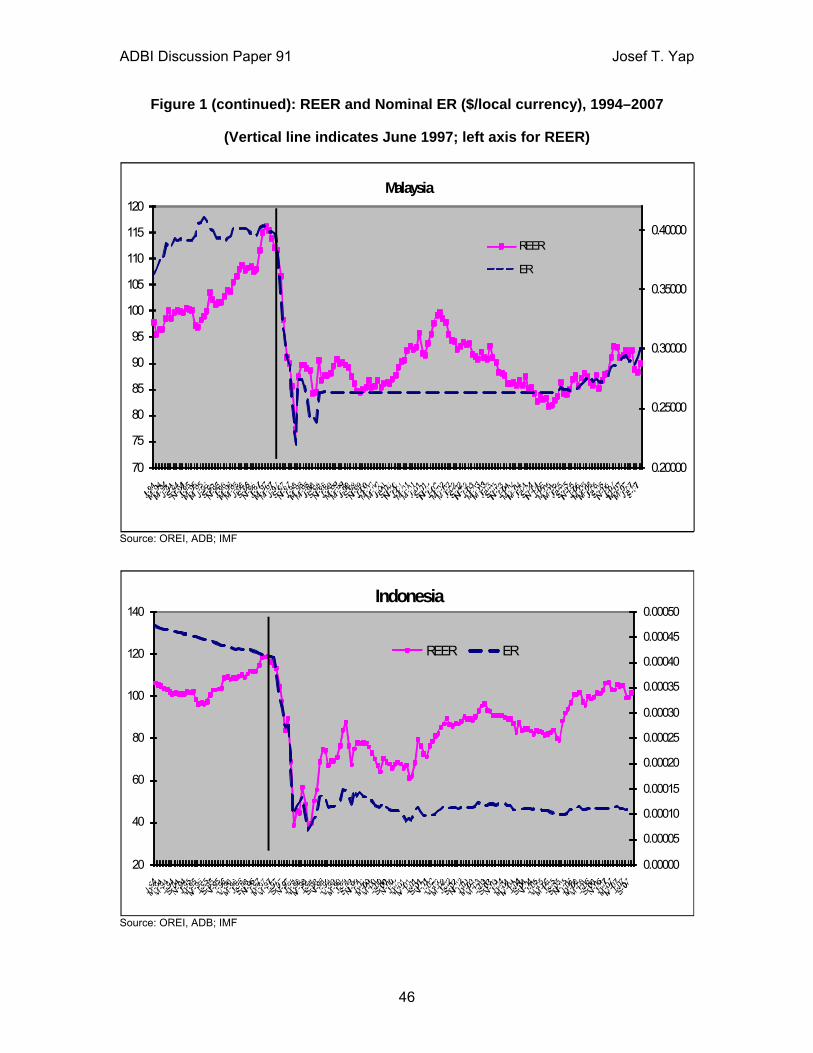
ADBI Discussion Paper 91 Josef T. Yap
46
Figure 1 (continued): REER and Nominal ER ($/local currency), 1994–2007
(Vertical line indicates June 1997; left axis for REER)
0.20000
0.25000
0.30000
0.35000
0.40000
70
75
80
85
90
95
100
105
110
115
120Malaysia
REER
ER
Source: OREI, ADB; IMF
0.00000
0.00005
0.00010
0.00015
0.00020
0.00025
0.00030
0.00035
0.00040
0.00045
0.00050
20
40
60
80
100
120
140Indonesia
REER ER
Source: OREI, ADB; IMF
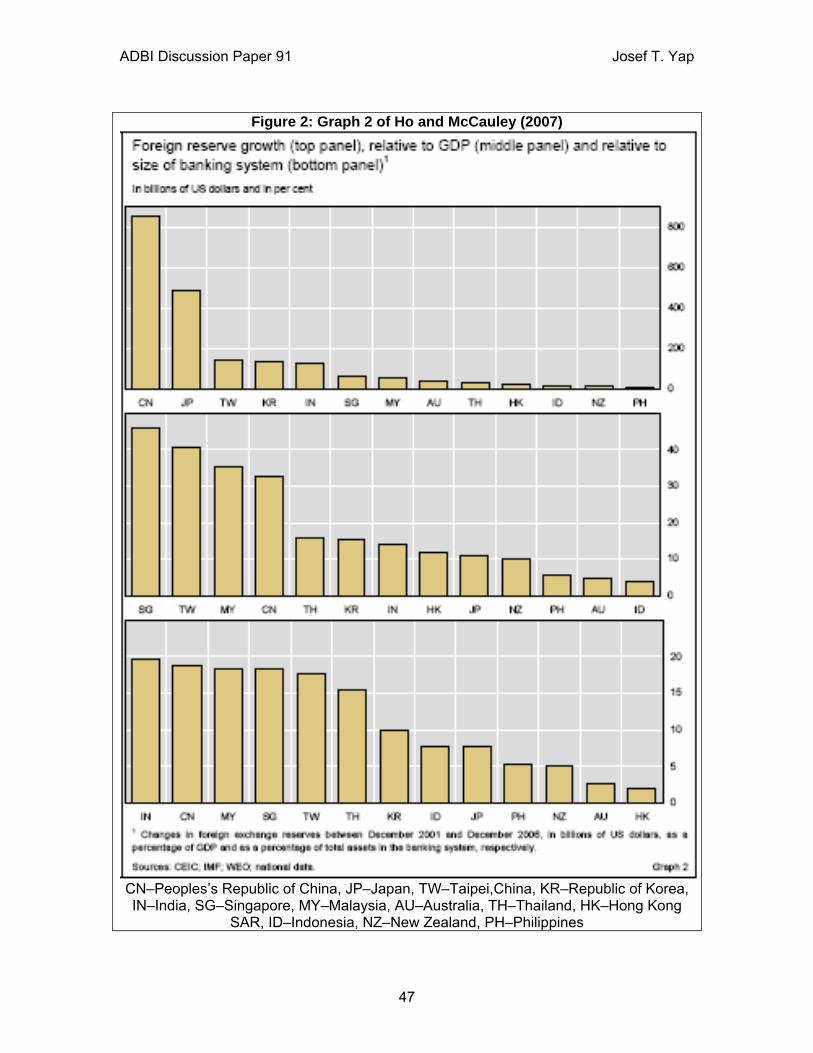
ADBI Discussion Paper 91 Josef T. Yap
47
Figure 2: Graph 2 of Ho and McCauley (2007)
CN–Peoples’s Republic of China, JP–Japan, TW–Taipei,China, KR–Republic of Korea, IN–India, SG–Singapore, MY–Malaysia, AU–Australia, TH–Thailand, HK–Hong Kong
SAR, ID–Indonesia, NZ–New Zealand, PH–Philippines
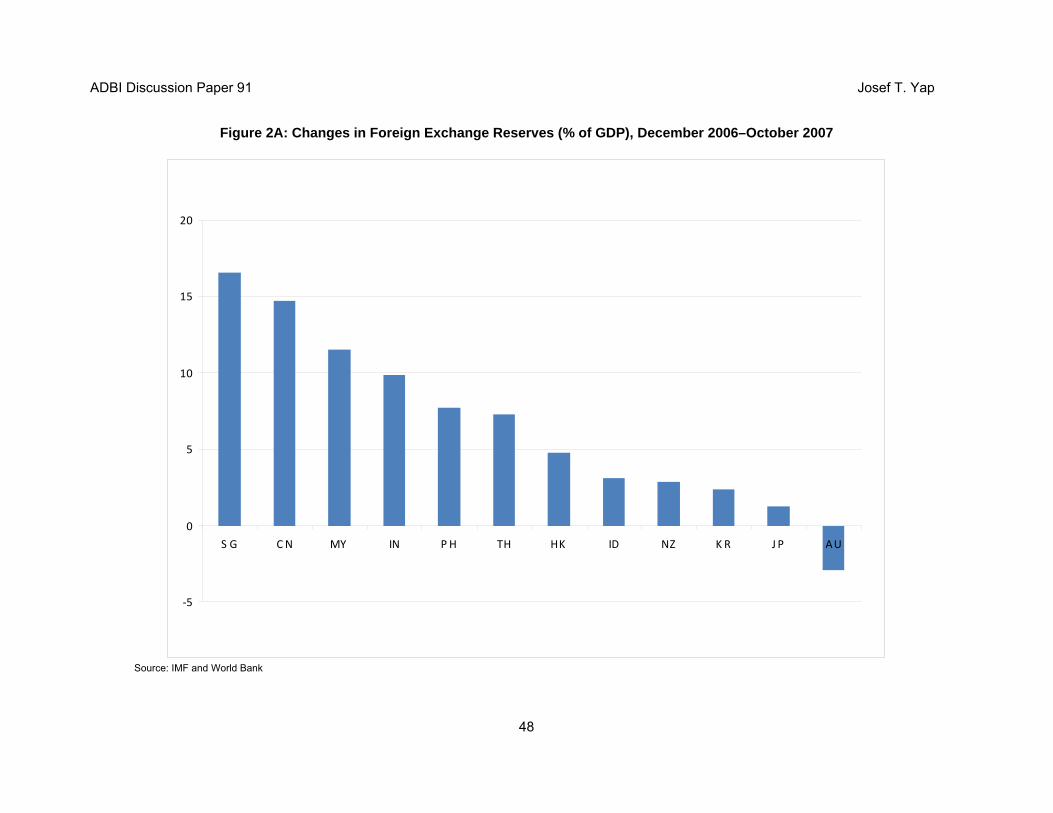
ADBI Discussion Paper 91 Josef T. Yap
48
Figure 2A: Changes in Foreign Exchange Reserves (% of GDP), December 2006–October 2007
‐5
0
5
10
15
20
S G CN MY IN PH TH HK ID NZ K R J P AU
Source: IMF and World Bank
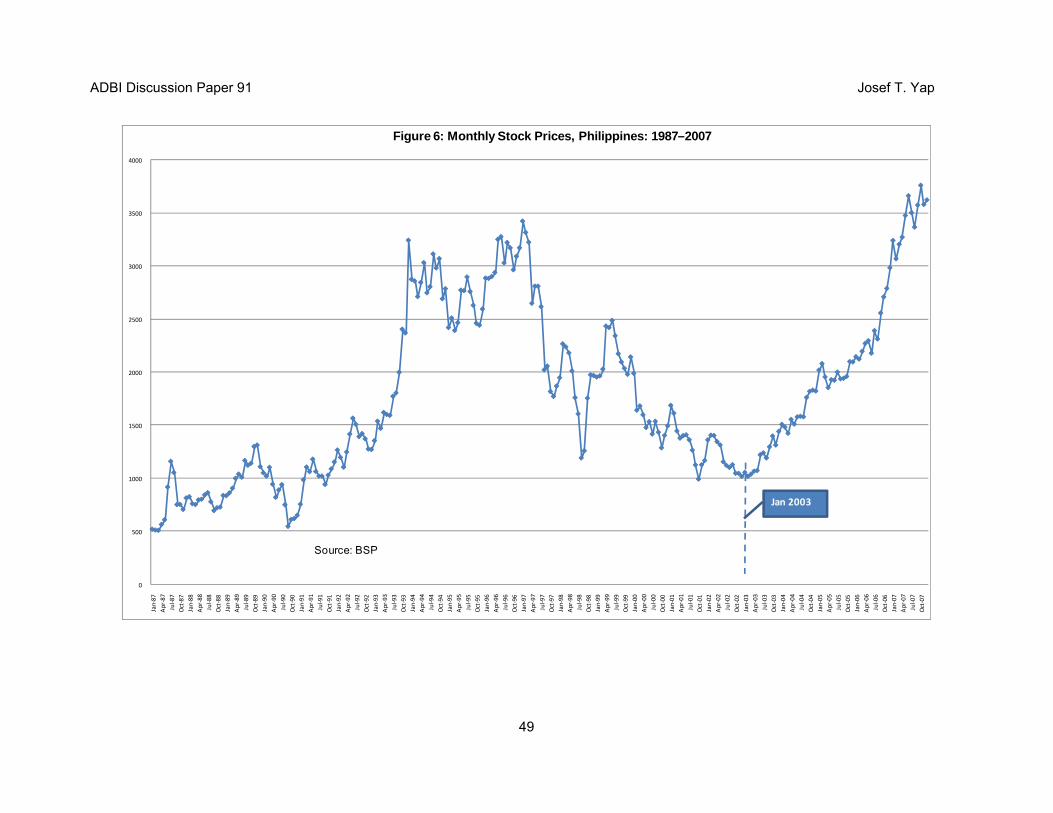
ADBI Discussion Paper 91 Josef T. Yap
49
0
500
1000
1500
2000
2500
3000
3500
4000Jan‐87
Apr‐87
Jul‐87
Oct‐87
Jan‐88
Apr‐88
Jul‐88
Oct‐88
Jan‐89
Apr‐89
Jul‐89
Oct‐89
Jan‐90
Apr‐90
Jul‐90
Oct‐90
Jan‐91
Apr‐91
Jul‐91
Oct‐91
Jan‐92
Apr‐92
Jul‐92
Oct‐92
Jan‐93
Apr‐93
Jul‐93
Oct‐93
Jan‐94
Apr‐94
Jul‐94
Oct‐94
Jan‐95
Apr‐ 95
Jul‐95
Oct‐95
Jan‐96
Apr‐96
Jul‐96
Oct‐96
Jan‐97
Apr‐97
Jul‐97
Oct‐97
Jan‐98
Apr‐98
Jul‐98
Oct‐98
Jan‐99
Apr‐99
Jul‐99
Oct‐99
Jan‐00
Apr‐00
Jul‐00
Oct‐00
Jan‐01
Apr‐01
Jul‐01
Oct‐01
Jan‐02
Apr‐02
Jul‐02
Oct‐02
Jan‐03
Apr‐03
Jul‐03
Oct‐03
Jan‐04
Apr‐04
Jul‐04
Oct‐04
Jan‐05
Apr‐05
Jul‐05
Oct‐05
Jan‐06
Apr‐06
Jul‐06
Oct‐06
Jan‐07
Apr‐07
Jul‐07
Oct‐07
Figure 6: Monthly Stock Prices, Philippines: 1987–2007
Jan 2003
Source: BSP
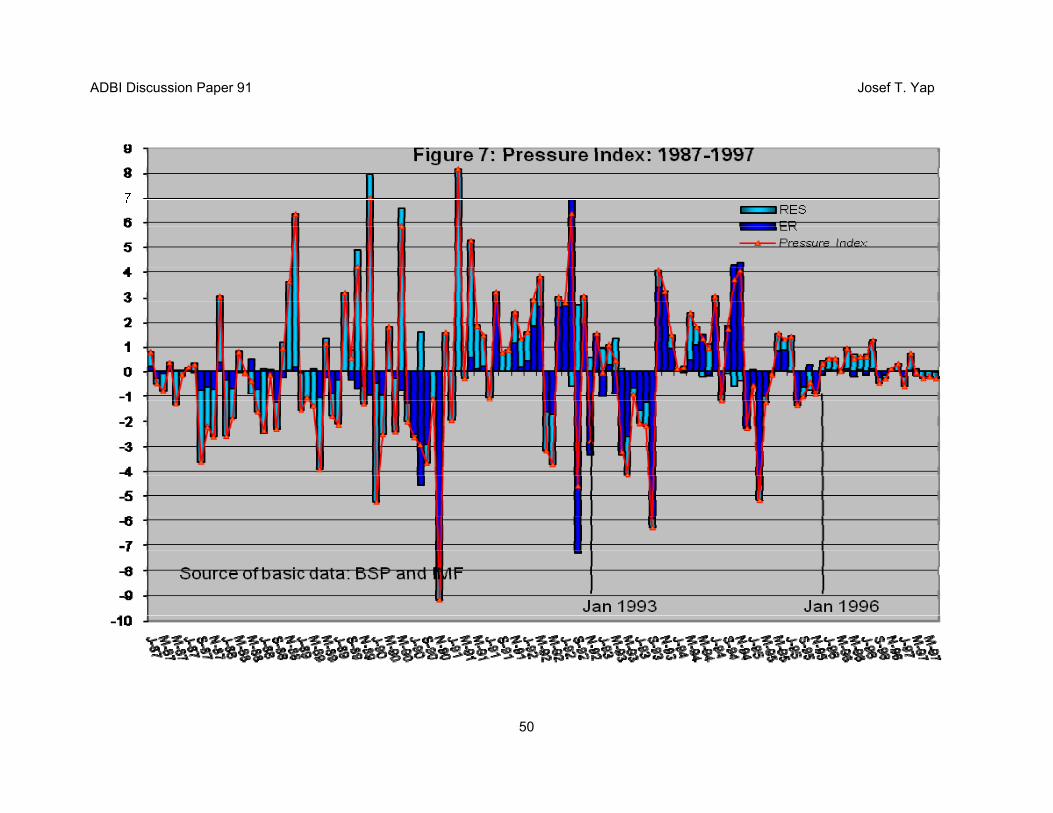
ADBI Discussion Paper 91 Josef T. Yap
50
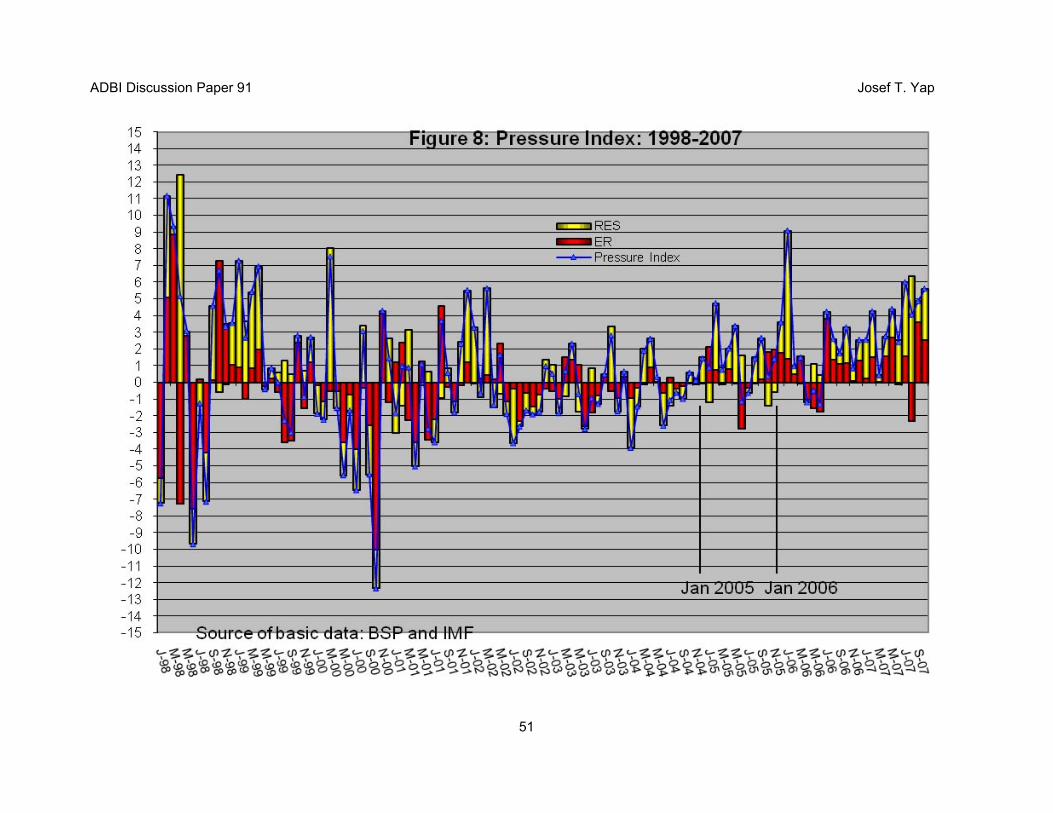
ADBI Discussion Paper 91 Josef T. Yap
51
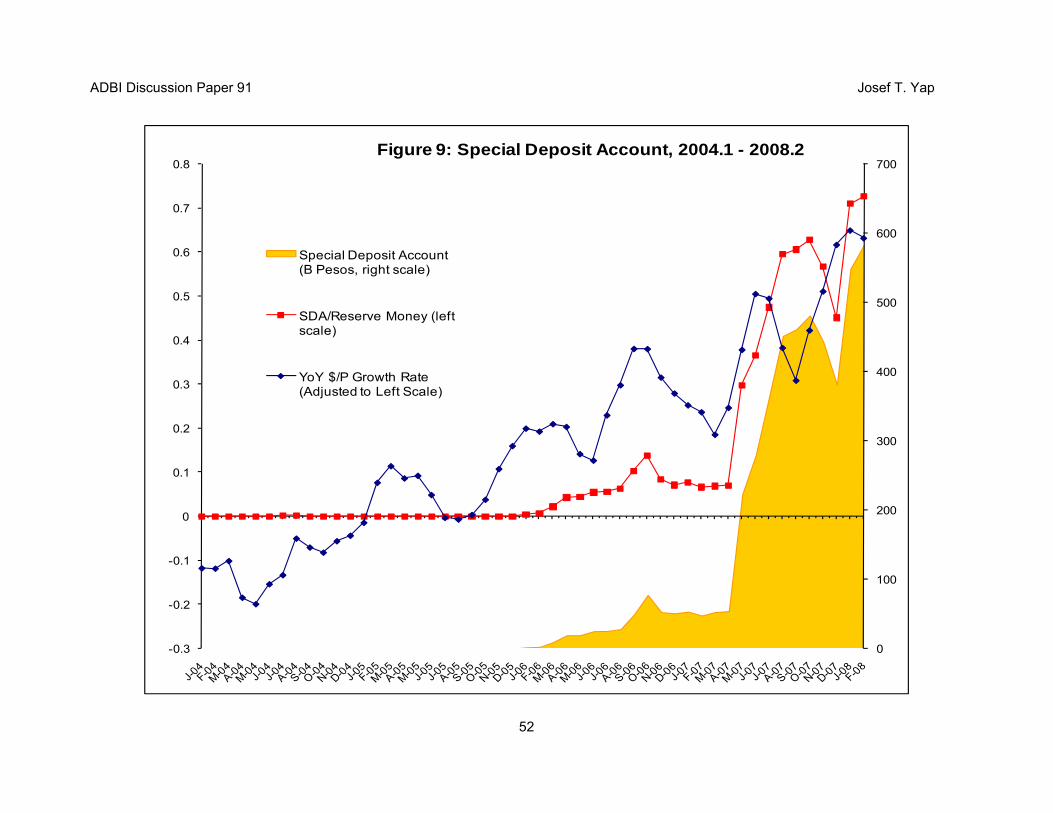
ADBI Discussion Paper 91 Josef T. Yap
52
0
100
200
300
400
500
600
700
-0.3
-0.2
-0.1
0
0.1
0.2
0.3
0.4
0.5
0.6
0.7
0.8Figure 9: Special Deposit Account, 2004.1 - 2008.2
Special Deposit Account (B Pesos, right scale)
SDA/Reserve Money (left scale)
YoY $/P Growth Rate (Adjusted to Left Scale)