Doctor Who Classics / Doctor Who 2005 - renouveau et continuité
Upload
khangminh22Category
view
0download
0
GATS|Philippines
Global Adult Tobacco Survey: Country Report 2015
ii

2 Global Adult Tobacco Survey : Philippines Country Report, 2015

Foreword
3 Global Adult Tobacco Survey : Philippines Country Report, 2015

Foreword
4 Global Adult Tobacco Survey : Philippines Country Report, 2015

Message
First, let me congratulate the Department of Health (DOH) and the Philippine Statistics Authority on the outstanding results of the Global Adult Tobacco Survey (GATS). The Philippines have seen a relative reduction in tobacco use by 20% in the past six years – this is one of the biggest drops in Asia in the past decade. This result is proof that partnerships, determination, leadership and strong advocacy – particularly among our civil society organizations – work. GATS is a nationally representative survey that helps countries design, implement and evaluate their tobacco control programmes, in fulfilment of their obligations under the WHO Framework Convention on Tobacco Control (FCTC). As the survey uses consistent and standard protocols across countries, it also allows us to objectively compare accomplishments and identify best practices. Clearly, the Philippines has made great strides. But there is still much to do: though much lower than before, smoking prevalence among Filipinos – at close to 23% – is still just above the global average. The Philippines and other countries have shown that there is no magic solution; a range of tobacco control measures are needed. The more measures we implement, the more lives we save. The WHO FCTC clearly lays out tobacco control interventions. No less than 180 countries have ratified the Convention since 2003, making it the most widely embraced treaty in UN history. With the 2030 Agenda for Sustainable Development, strengthening FCTC implementation is more important than ever – to protect people from the harms of tobacco use and reduce the burden of tobacco-related illness on national economies. Tobacco control is key to achieve Sustainable Development Goal target 3.4 of a one-third reduction of premature deaths from noncommunicable diseases (NCDs) by 2030. The greatest burden of NCDs lies in vulnerable populations including women, children and the poor. We must enhance our collaboration to ensure that no one is left behind. WHO applauds the high level of commitment of the Government to tobacco control and we assure our full support to the DOH and its partners to implement measures that will save the lives of thousands of Filipinos.
5 Global Adult Tobacco Survey : Philippines Country Report, 2015

On behalf of the US Centers for Disease Control and Prevention’s Office on Smoking and Health, we congratulate the Philippines on the successful completion of its second Global Adult Tobacco Survey (GATS). The Philippines is to be commended for this significant achievement, which demonstrates its commitment to tracking adult tobacco use and key tobacco control indicators using surveillance data collected using global standards. This report has great potential to further improve tobacco prevention and control efforts in the country, which is supported by the World Health Organization Framework Convention on Tobacco Control (WHO FCTC) and MPOWER measures— Monitor tobacco use and prevention policies; Protect people from tobacco smoke; Offer help to quit tobacco use; Warn about the dangers of tobacco; Enforce bans on tobacco advertising, promotion and sponsorship; and Raise taxes on tobacco.
Philippines ratified the WHO FCTC in 2005 and has since worked on MPOWER implementation for all six measures. Since 2012, the Philippines passed a landmark tobacco tax reform called Sin Tax Law, which increased taxes on tobacco products aiming to curb the tobacco epidemic and at the same time create additional revenue for public health programs. Philippines has also attained the highest MPOWER implementation scores for monitoring the epidemic and health warnings. The first GATS was conducted by the Philippines in 2009 and the second GATS in 2015, to measure change over this time period in tobacco prevention and control. Results from Philippine’s 2015 GATS demonstrate the impact of these measures— Tobacco use prevalence significantly decreased among adults from 29.7% in 2009 to 23.8% in 2015 (from 49.5% to 41.9% among males; from 10.1% to 5.8% among females). Additionally, the percentage of current smokers who thought of quitting smoking because of health warnings on cigarette packages increased significantly (37.4% in 2009 compared to 44.6% in 2015). Opportunities remain to accelerate high-level achievement of MPOWER implementation, especially around cessation advice from health providers given that the proportion of current smokers who were advised to quit by health care providers and the proportion of smokers who successfully quit in the past 12 months remained level from 2009 to 2015.
Tobacco use still remains one of the biggest challenges our world faces in public health. As the largest preventable risk factor for four major non-communicable diseases (cancer, cardiovascular disease, diabetes and chronic lung disease), tobacco use contributes greatly to rising health care costs and the loss of economic productivity. Continuous monitoring of tobacco use can help countries track progress toward the goals of WHO FCTC and the WHO Global Monitoring Framework, which includes a specific tobacco target—a 30% relative reduction in current tobacco use by 2025. Continuous engagement and vigilance through monitoring and managing the epidemic can lead to significant reductions in tobacco-related disease and death. With the GATS findings, the Philippines is now well positioned to inform, support, and scale up tobacco control measures and policies that improve the health of its citizens. The Philippines has the opportunity to take bold steps in combating the tobacco epidemic by continuing to accelerate tobacco control programs and interventions.
The Philippines Department of Health, the Philippine Statistics Authority, and WHO are to be commended for their roles in making the 2015 GATS a success. The U.S. Centers for Disease Control and Prevention thanks you for your leadership and looks forward to continued collaboration in tobacco prevention and control efforts.
Message
6 Global Adult Tobacco Survey : Philippines Country Report, 2015

CONTENTS
Foreword ........................................................................................................................................... 3
Foreword ........................................................................................................................................... 4
Message ............................................................................................................................................ 5
Message ............................................................................................................................................ 6
Executive Summary ......................................................................................................................... 16
1. Introduction .............................................................................................................................. 20 1.1 Burden of Tobacco in the Philippines ............................................................................................ 21 1.2 Current Tobacco Control Policies in the Philippines ...................................................................... 23 1.3 Survey Objectives ........................................................................................................................... 28
2. Methodology ............................................................................................................................. 29
2.1 Study Population ............................................................................................................................ 29 2.2 Eligibility Criteria ............................................................................................................................ 29 2.3 Sampling Design ............................................................................................................................. 29 2.4 Questionnaires ............................................................................................................................... 32 2.5 Recruitment, Training and Fieldwork ............................................................................................ 33 2.6 Statistical Analysis .......................................................................................................................... 36
3. Sample and Population Characteristics ....................................................................................... 37 4. Tobacco Use .............................................................................................................................. 39 5. Electronic Cigarette .................................................................................................................... 47 6. Smoking Cessation ..................................................................................................................... 49 7. Secondhand Smoke .................................................................................................................... 53 8. Economics of Tobacco Smoking .................................................................................................. 57 9. Tobacco Advertising, promotion and Sponsorship ....................................................................... 61 10. Knowledge, Attitudes and Perceptions on Tobacco Smoking ....................................................... 64 11. Change Over Time: Comparison of 2009 and 2015 ...................................................................... 69 12. Conclusion and Recommendations ............................................................................................. 77
References ....................................................................................................................................... 82
Appendix A: Country Report Tables .................................................................................................. 83
Appendix B: 2015 Philippine GATS Questionnaire ........................................................................... 150
Appendix C: Estimation of Sampling Errors ..................................................................................... 192
Appendix D: Sample Design ............................................................................................................ 200
Appendix E: Technical and Survey Staff .......................................................................................... 203
Appendix F: MPOWER Summary Indicators .................................................................................... 224
Appendix G: Glossary of Terms ..................................................................................................... 226
Appendix H: Indicator Definition ................................................................................................... 227
7 Global Adult Tobacco Survey : Philippines Country Report, 2015
TABLES
Table No. Title Page
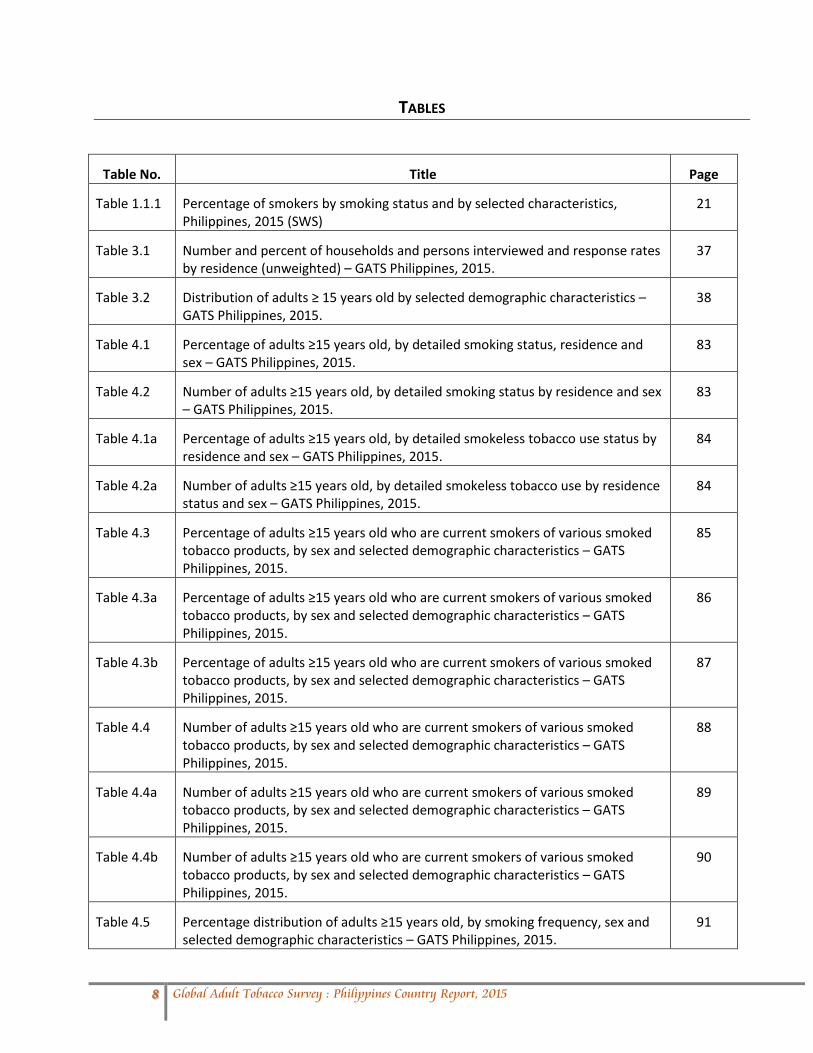
Table 1.1.1 Percentage of smokers by smoking status and by selected characteristics, Philippines, 2015 (SWS)
21
Table 3.1 Number and percent of households and persons interviewed and response rates by residence (unweighted) – GATS Philippines, 2015.
37
Table 3.2 Distribution of adults ≥ 15 years old by selected demographic characteristics – GATS Philippines, 2015.
38
Table 4.1 Percentage of adults ≥15 years old, by detailed smoking status, residence and sex – GATS Philippines, 2015.
83
Table 4.2 Number of adults ≥15 years old, by detailed smoking status by residence and sex – GATS Philippines, 2015.
83
Table 4.1a Percentage of adults ≥15 years old, by detailed smokeless tobacco use status by residence and sex – GATS Philippines, 2015.
84
Table 4.2a Number of adults ≥15 years old, by detailed smokeless tobacco use by residence status and sex – GATS Philippines, 2015.
84
Table 4.3 Percentage of adults ≥15 years old who are current smokers of various smoked tobacco products, by sex and selected demographic characteristics – GATS Philippines, 2015.
85
Table 4.3a Percentage of adults ≥15 years old who are current smokers of various smoked tobacco products, by sex and selected demographic characteristics – GATS Philippines, 2015.
86
Table 4.3b Percentage of adults ≥15 years old who are current smokers of various smoked tobacco products, by sex and selected demographic characteristics – GATS Philippines, 2015.
87
Table 4.4 Number of adults ≥15 years old who are current smokers of various smoked tobacco products, by sex and selected demographic characteristics – GATS Philippines, 2015.
88
Table 4.4a Number of adults ≥15 years old who are current smokers of various smoked tobacco products, by sex and selected demographic characteristics – GATS Philippines, 2015.
89
Table 4.4b Number of adults ≥15 years old who are current smokers of various smoked tobacco products, by sex and selected demographic characteristics – GATS Philippines, 2015.
90
Table 4.5 Percentage distribution of adults ≥15 years old, by smoking frequency, sex and selected demographic characteristics – GATS Philippines, 2015.
91
8 Global Adult Tobacco Survey : Philippines Country Report, 2015

Table 4.5a Percentage distribution of adults ≥15 years old, by cigarette frequency, sex and selected demographic characteristics – GATS Philippines, 2015.
92
Table 4.5b Percentage distribution of adults ≥15 years old, by waterpipe frequency, sex and selected demographic characteristics – GATS Philippines, 2015.
94
Table 4.6 Average number and percentage distribution of cigarettes smoked per day among daily cigarette smokers ≥15 years old, by sex and selected demographic characteristics – GATS Philippines, 2015.
95
Table 4.7 Percentage distribution of ever daily smokers 15-34 years old by age at daily smoking initiation, sex and residence.– GATS Philippines, 2015.
96
Table 4.7a Percentage distribution of ever daily smokers 15-17 years old by age at daily smoking initiation, sex and residence.– GATS Philippines, 2015.
97
Table 4.8 Percentage of all adults and ever daily smokers ≥15 years old who are former daily smokers, by selected demographic characteristics – GATS Philippines, 2015.
98
Table 4.9 Percentage distribution of former daily smokers ≥15 years old, by time since quitting smoking and selected demographic characteristics – GATS Philippines, 2015.
99
Table 4.10 Percentage distribution of current tobacco users ≥15 years old, by tobacco use pattern and selected demographic characteristics – GATS Philippines, 2015.
100
Table 4.11 Percentage distribution of daily smokers ≥15 years old, by time to first smoke upon waking and selected demographic characteristics – GATS Philippines, 2015.
101
Table 4.12 Prevalence of knowledge and use of e-cigarettes, by demographic characteristics- GATS Philippines, 2015
102
Table 5.1 Percentage of smokers ≥15 years old who made a quit attempt and received health care provider advice in the past 12 months, by selected demographic characteristics – GATS Philippines, 2015.
103
Table 5.2 Percentage of smokers ≥15 years old who attempted to quit smoking in the past 12 months, by cessation methods used and selected demographic characteristics – GATS Philippines, 2015.
104
Table 5.2a Percentage of current smokers ≥15 years old who attempted to quit smoking in the past 12 months, by reasons for quitting and selected demographic characteristics – GATS Philippines, 2015.
105
Table 5.3 Percentage distribution of current smokers ≥15 years old by interest in quitting smoking and selected demographic characteristics – GATS Philippines, 2015.
106
Table 6.1 Percentage and number of adults ≥15 years old who work indoors and are exposed to tobacco smoke at work, by smoking status and selected demographic characteristics – GATS Philippines, 2015.
107
Table 6.1a Percentage distribution of current smokers ≥15 years old who work indoors or outdoors with an enclosed area, by the policy they have at work and selected demographic characteristics – GATS Philippines, 2015.
108
9 Global Adult Tobacco Survey : Philippines Country Report, 2015

Table 6.1b Percentage of all adults ≥15 years old who work indoors or outdoors with an enclosed area and are exposed to tobacco smoke at work, by the policy they have at work and selected demographic characteristics – GATS Philippines, 2015.
109
Table 6.2 Percentage of adults ≥15 years old who are exposed to tobacco smoke at home, by smoking status and selected demographic characteristics – GATS Philippines, 2015.
110
Table 6.3 Percentage of adults ≥15 years old who were exposed to tobacco smoke in various public places in the past 30 days, by smoking status and selected demographic characteristics – GATS Philippines, 2015.
111
Table 6.3a Percentage of non-smokers ≥15 years old who were exposed to tobacco smoke in various public places in the past 30 days, by smoking status and selected demographic characteristics – GATS Philippines, 2015.
112
Table 6.4 Percentage of adults ≥15 years old who visited various public places in the past 30 days and were exposed to tobacco smoke, by smoking status and selected demographic characteristics – GATS Philippines, 2015.
113
Table 6.4a Percentage of non-smokers ≥15 years old who visited various public places in the past 30 days and were exposed to tobacco smoke, by smoking status and selected demographic characteristics – GATS Philippines, 2015.
114
Table 7.1 Percentage of current manufactured cigarette smokers ≥15 years old, by last brand purchased and selected demographic characteristics – GATS Philippines, 2015.
115
Table 7.2 Percentage distribution of manufactured cigarette smokers ≥15 years old, by the source of last purchase of cigarettes and selected demographic characteristics – GATS Philippines, 2015.
116
Table 7.3 Average cigarette expenditure per month among manufactured cigarette smokers ≥15 years old, by selected demographic characteristics – GATS Philippines, 2015.
117
Table 7.4 Percentage of current manufactured cigarette smokers ≥15 years old, who purchased various types of cigarettes by selected demographic characteristics – GATS Philippines, 2015.
118
Table 7.5 Percentage distribution of manufactured cigarette smokers ≥15 years old, by the packaging type of last purchase of cigarettes selected demographic characteristics – GATS Philippines, 2015.
119
Table 7.6 Percentage of manufactured cigarette smokers ≥15 years old, who consider that the tax increases since 2013 affected their smoking, by the types of influence and selected demographic characteristics – GATS Philippines, 2015.
120
Table 8.1 Percentage of adults ≥15 years old who noticed anti-cigarette smoking information during the last 30 days in various places, by smoking status and selected demographic characteristics – GATS Philippines, 2015.
121
10 Global Adult Tobacco Survey : Philippines Country Report, 2015

Table 8.2 Percentage of current smokers ≥15 years old who noticed health warnings on cigarette packages and considered quitting because of the warning labels during the last 30 days, by selected demographic characteristics – GATS Philippines, 2015.
122
Table 8.3 Percentage of adults ≥15 years old who noticed cigarette marketing during the last 30 days in various places, by selected demographic characteristics – GATS Philippines, 2015.
123
Table 8.4 Percentage of current smokers ≥15 years old who noticed cigarette marketing during the last 30 days in various places, by selected demographic characteristics – GATS Philippines, 2015.
125
Table 8.5 Percentage of non-smokers ≥15 years old who noticed cigarette marketing during the last 30 days in various places, by selected demographic characteristics – GATS Philippines, 2015.
128
Table 9.1 Percentage of adults ≥15 years old who believe that smoking causes serious illness and various diseases, by smoking status and selected demographic characteristics – GATS Philippines, 2015.
130
Table 9.2 Percentage of adults ≥ 15 years old who believe that breathing other people's smoke causes serious illness in Non-smokers, by smoking status and selected demographic characteristics – GATS Philippines, 2015.
132
Table 9.3 Percentage of adults ≥15 years old who believe that using smokeless tobacco causes serious illness, by smoking status and selected demographic characteristics – GATS Philippines, 2015.
133
Table 9.4 Percentage distribution of current tobacco smokers ≥15 years old, by their perception of the harmfulness of their current brand and selected demographic characteristics – GATS Philippines, 2015.
134
Table 9.5 Percentage of adults ≥15 years old by their perception of the harmfulness of cigarettes and selected demographic characteristics – GATS Philippines, 2015.
135
Table 9.6 Percentage of adults ≥15 years old who support complete ban of smoking in indoor workplaces and public policies, by selected demographic characteristics – GATS Philippines, 2015.
136
Table 10.0 Percentage distribution of adults ≥15 years old by selected demographic characteristics – GATS Philippines 2009 and 2015
137
Table 10.1 Percentage of adults ≥15 years old, by detailed smoking status and Sex – GATS Philippines 2009 and 2015
138
Table 10.2 Percentage of adults ≥15 years old who are current smokers of various smoked tobacco products, by selected demographic characteristics – GATS Philippine 2009 and 2015
139
Table 10.3 Average number of cigarettes smoked per day for daily cigarette smokers, by selected demographic characteristics – GATS Philippines 2009 and 2015
140
11 Global Adult Tobacco Survey : Philippines Country Report, 2015

Table 10.4 Average age at initiation among ever daily smokers 15-34 years old, by selected demographic characteristics - GATS Philippines 2009 and 2015
140
Table 10.5 Smoking Cessation Status of adults 15 years and older by sex – GATS Philippines 2009 and 2015
141
Table 10.6 Percentage of adults ≥15 years old who visited that place in the past 30 days by selected demographic characteristics – GATS Philippines 2009 and 2015
142
Table 10.7 Percentage of adults ≥15 years old and the smoking rules inside the home, by smoking status and selected demographic characteristics – GATS PHILIPPINES, 2009 and 2015.
143
Table 10.8 Cigarette expenditures among manufactured cigarette smokers ≥ 15 years, by selected demographic characteristics - GATS, Philippines 2009 and 2015
144
Table 10.9 Percentage of adults ≥15 who use single sticks, by selected demographic characteristics – GATS Philippines 2009 and 2015
145
Table 10.10 Percentage of adults ≥15 years old who noticed anti-cigarette smoking information during the last 30 days in various places, by selected demographic characteristics – GATS Philippines 2009 and 2015
146
Table 10.11 Percentage of current smokers ≥15 years old who noticed health warnings on cigarette packages and considered quitting because of the warning label on cigarette packages during the last 30 days, by selected demographics - GATS Philippines 2009 and 2015
147
Table 10.12 Percentage of adults ≥15 years old who noticed cigarette marketing during the last 30 days in various places, by selected demographic characteristics – GATS Philippines 2009 and 2015
148
Table 10.13 Percentage of adults ≥ 15 years who believe that smoking causes serious illness and that second hand smoke causes serious illness, by selected demographic characteristics - GATS Philippines 2009 and 2015
149
Table C1 List of Indicators for Sampling Errors, GATS, Philippines 2015 194
Table C2 Sampling Errors – Overall, GATS, Philippines, 2015 195
Table C3 Sampling Errors – Males, GATS, Philippines, 2015 196
Table C4 Sampling Errors – Females, GATS, Philippines, 2015 197
Table C5 Sampling Errors – Urban, GATS, Philippines, 2015 198
Table C6 Sampling Errors – Rural, GATS, Philippines, 2015 199
Table F1 MPOWER Summary Indicators, GATS, Philippines, 2015 224
Table F2 MPOWER Summary Indicators, GATS, Philippines, 2009 and 2015 225
12 Global Adult Tobacco Survey : Philippines Country Report, 2015

FIGURES
Figure No. Title Page
Figure 4.1 Percentage of current tobacco users by sex and age group- GATS Philippines, 2015
40
Figure 4.2 Percentage distribution of current tobacco users by pattern of tobacco use, sex and age group - GATS Philippines, 2015
40
Figure 4.3 Percentage of current tobacco smokers by smoking status and sex - GATS Philippines, 2015
41
Figure 4.4 Percentage of current smokeless tobacco user by status and sex - GATS Philippines, 2015
41
Figure 4.5 Percentage distribution of adults by cigarette smoking frequency, sex and age group - GATS Philippines, 2015
42
Figure 4.6 Percentage of current cigarette smokers by sex and age group - GATS Philippines, 2015
42
Figure 4.7 Average number of cigarettes smoked per day among daily cigarette smokers by sex and age group – GATS, Philippines, 2015
43
Figure 4.8 Percentage distribution of cigarettes smoked per day among daily cigarette smokers- GATS Philippines, 2015
43
Figure 4.9 Percentage distribution of daily smokers by time to first smoke upon waking - GATS Philippines, 2015
44
Figure 4.10 Percentage of daily smokers by time to first smoke after waking by sex - GATS Philippines, 2015
44
Figure 4.11 Percentage distribution of ever daily smokers 15-17 years old by age at daily smoking initiation - GATS Philippines, 2015
45
Figure 4.12 Percentage distribution of ever daily smokers 15-34 years old by age at daily smoking initiation - GATS Philippines, 2015
45
Figure 4.13 Percentage of ever daily smokers who are former daily smokers by sex and age group - GATS Philippines, 2015
46
Figure 4.14 Percentage of former daily smokers by time since quitting smoking - GATS Philippines, 2015
46
Figure 5.1 Percentage of adults old who ever heard of electronic cigarettes by sex and age group - GATS Philippines, 2015
47
Figure 5.2 Percentage of adults by use of electronic cigarette, sex and age group – GATS, Philippines, 2015
47
Figure 6.1 Percentage distribution of current smokers by interest in quitting smoking – GATS, Philippines, 2015
49
13 Global Adult Tobacco Survey : Philippines Country Report, 2015
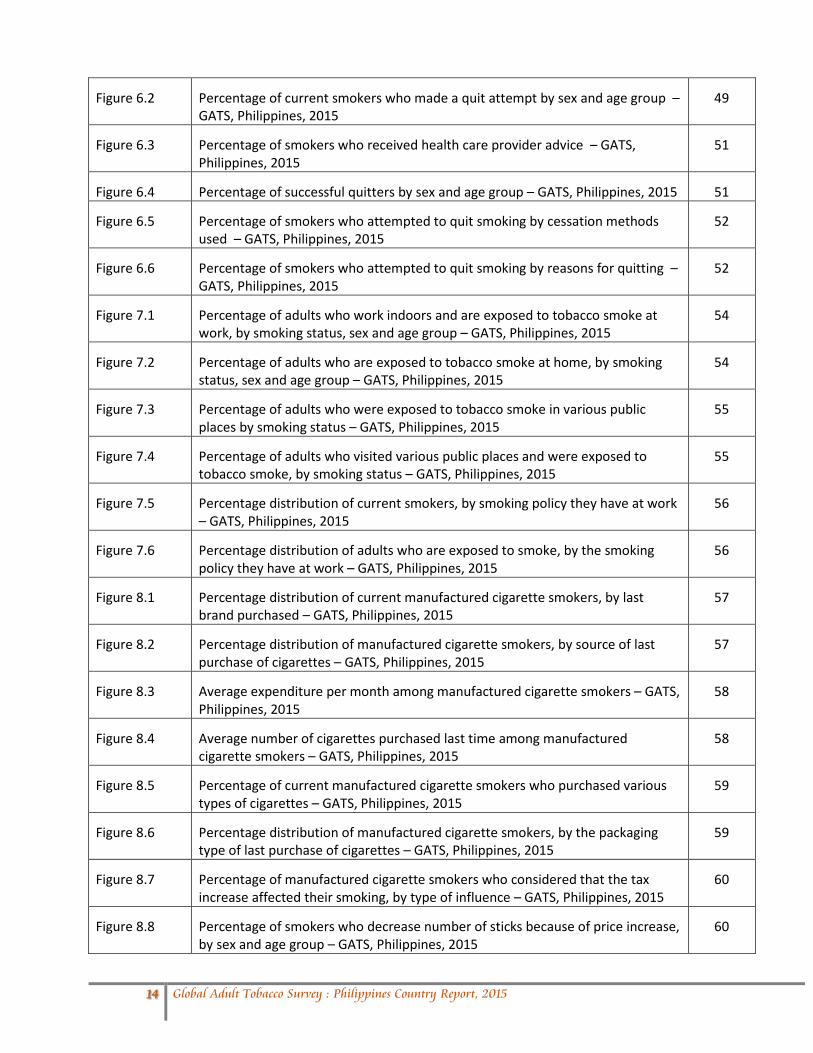
Figure 6.2 Percentage of current smokers who made a quit attempt by sex and age group – GATS, Philippines, 2015
49
Figure 6.3 Percentage of smokers who received health care provider advice – GATS, Philippines, 2015
51
Figure 6.4 Percentage of successful quitters by sex and age group – GATS, Philippines, 2015 51
Figure 6.5 Percentage of smokers who attempted to quit smoking by cessation methods used – GATS, Philippines, 2015
52
Figure 6.6 Percentage of smokers who attempted to quit smoking by reasons for quitting – GATS, Philippines, 2015
52
Figure 7.1 Percentage of adults who work indoors and are exposed to tobacco smoke at work, by smoking status, sex and age group – GATS, Philippines, 2015
54
Figure 7.2 Percentage of adults who are exposed to tobacco smoke at home, by smoking status, sex and age group – GATS, Philippines, 2015
54
Figure 7.3 Percentage of adults who were exposed to tobacco smoke in various public places by smoking status – GATS, Philippines, 2015
55
Figure 7.4 Percentage of adults who visited various public places and were exposed to tobacco smoke, by smoking status – GATS, Philippines, 2015
55
Figure 7.5 Percentage distribution of current smokers, by smoking policy they have at work – GATS, Philippines, 2015
56
Figure 7.6 Percentage distribution of adults who are exposed to smoke, by the smoking policy they have at work – GATS, Philippines, 2015
56
Figure 8.1 Percentage distribution of current manufactured cigarette smokers, by last brand purchased – GATS, Philippines, 2015
57
Figure 8.2 Percentage distribution of manufactured cigarette smokers, by source of last purchase of cigarettes – GATS, Philippines, 2015
57
Figure 8.3 Average expenditure per month among manufactured cigarette smokers – GATS, Philippines, 2015
58
Figure 8.4 Average number of cigarettes purchased last time among manufactured cigarette smokers – GATS, Philippines, 2015
58
Figure 8.5 Percentage of current manufactured cigarette smokers who purchased various types of cigarettes – GATS, Philippines, 2015
59
Figure 8.6 Percentage distribution of manufactured cigarette smokers, by the packaging type of last purchase of cigarettes – GATS, Philippines, 2015
59
Figure 8.7 Percentage of manufactured cigarette smokers who considered that the tax increase affected their smoking, by type of influence – GATS, Philippines, 2015
60
Figure 8.8 Percentage of smokers who decrease number of sticks because of price increase, by sex and age group – GATS, Philippines, 2015
60
14 Global Adult Tobacco Survey : Philippines Country Report, 2015

Figure 9.1 Percentage of adults who noticed anti-cigarette smoking information in various places – GATS, Philippines, 2015
62
Figure 9.2 Percentage of adults who noticed cigarette marketing in various places – GATS, Philippines, 2015
62
Figure 9.3 Percentage of current cigarette smokers who noticed health warnings on cigarette packages and who thought of quitting, by sex and age group – GATS Philippines, 2015
63
Figure 10.1 Percentage of adults who believed that smoking causes serious illness by smoking status and education level – GATS, Philippines, 2015
65
Figure 10.2 Percentage of adults who believed that secondhand smoke exposure causes serious illness in non-smokers, by smoking status and education level – GATS, Philippines, 2015
65
Figure 10.3 Percentage of adults who believed that smoking causes serious various diseases – GATS, Philippines, 2015
66
Figure 10.4 Percentage of adults who believed that breathing other people’s smoke causes serious illness in non-smokers, by smoking status, sex and age group – GATS, Philippines, 2015
66
Figure 10.5 Percentage distribution of adults, by their perception of the harmfulness of cigarettes – GATs, Philippines, 2015
67
Figure 10.6 Percentage distribution of current tobacco smokers, by their perception of the harmfulness of their current brand of cigarette – GATS, Philippines, 2015
67
Figure 10.7 Percentage of adults who support complete ban of smoking in indoor workplaces and public places, by smoking status, sex and age group – GATS, Philippines, 2015
68
Figure 11.1.1 Prevalence of current tobacco use by sex, Philippines 2009 and 2015 70
Figure 11.1.2 Prevalence of current cigarette smoking by sex, Philippines 2009 and 2015 70
Figure 11.1.3 Prevalence of current smokeless tobacco use by sex, Philippines 2009 and 2015 71
Figure 11.1.4 Prevalence of smokeless tobacco use by type of user, Philippines 2009 and 2015 71
Figure 11.2.1 Exposure to secondhand smoke in the past 30 days, Philippines 2009 and 2015 72
Figure 11.3.1 Quit successes, quit attempts and interest in quitting, Philippines 2009 and 2015 73
Figure 11.4.1 Thought about quitting because of warning labels and anti-cigarette advertisements, Philippines 2009 and 2015
74
Figure 11.5.1 Noticed any promotion, advertisements and sponsorship in the past 30 days and point of sale in stores, Philippines 2009 and 2015
75
Figure 11.6.1 Average cost of 20 manufactured cigarettes and monthly expenditure, Philippines 2009 and 2015
76
15 Global Adult Tobacco Survey : Philippines Country Report, 2015
EXECUTIVE SUMMARY
Introduction
Tobacco use is a major preventable cause of premature death and disease worldwide.1 Globally, approximately 6 million people die each year from tobacco-related illnesses, and if current trends continue, this number is expected to increase to more than 8 million a year by 2030.2 An efficient and systematic surveillance system is important to monitor tobacco use and evaluate tobacco prevention and control interventions.3 The Global Adult Tobacco Survey (GATS) is a nationally representative household survey used to monitor adult tobacco use (smoking and smokeless) and track key tobacco control indicators across countries. GATS was launched as part of the Global Tobacco Surveillance System (GTSS) and it was first implemented in the Philippines in 2009, and repeated in 2015. During the six year period between the two GATS surveys, the Philippines has made significant progress in reducing tobacco use and implementing various tobacco control initiatives, including: restructure of excise taxes to increase the tax on tobacco products on an incremental basis; development and implementation by local government units of tobacco ordinances compliant with the Framework Convention on Tobacco Control (FCTC); development of a recognition system “Red Orchid Awards for 100% Tobacco Free Environment” for local government units, government agencies and hospitals complying with FCTC obligations; placement of graphic health information on billboards, tarpaulins, and posters; development and implementation of the National Tobacco Control Strategy (2011-2016) to accelerate implementation of FCTC; implementation of 100% smoke free policies on the premises of government agencies, health facilities, educational institutions, public terminals, public conveyances and public places; and, implementation of the total prohibition of tobacco advertising, promotion, and sponsorship by local government units. The Department of Health (DOH) and the Philippine Statistics Authority (PSA) collaborated in administering the 2009 and 2015 GATS surveys. The PSA was the lead agency in implementing the survey, while the DOH funded and coordinated the analyses and writing of the final report. Technical assistance was provided by the U.S. Centers for Disease Control and Prevention (CDC), the World Health Organization (WHO), and RTI International. For the 2009 GATS, the Bloomberg Initiative to Reduce Tobacco Use provided the financial support. In 2015, financial support was provided by the Epidemiology Bureau of the Department of Health, Philippines and the Bloomberg Initiative to Reduce Tobacco Use through the CDC Foundation with a grant from the Bill & Melinda Gates Foundation.
Methodology Similar to 2009, the 2015 GATS used a multistage geographically clustered sample design to collect nationally representative data on Filipinos aged 15 years or older. One individual was randomly chosen from each selected household to participate in the survey. In 2009, there were a total of 9,701 completed individual interviews, with an overall response rates of 88.4%. In 2015, there were a total of 11,644 completed individual interviews with an overall response rate of 92.1%.
GATS provides information on respondents’ background characteristics, tobacco use (smoking and smokeless), cessation, secondhand smoke exposure, economics, media, and knowledge, attitudes and perceptions towards tobacco use. GATS enhances countries’ capacity to design, implement and evaluate tobacco control programs. It will also assist countries to fulfill their obligations under the WHO FCTC to
16 Global Adult Tobacco Survey : Philippines Country Report, 2015

generate comparable data within and across countries. WHO developed MPOWER4, a technical assistance package of six evidence-based tobacco demand reduction measures contained in the FCTC that includes:
Key Findings
GATS 2015
Tobacco Use: In 2015, 23.8% of all adults reported current tobacco use in any form [41.9% among men and 5.8% among women]. The prevalence of current tobacco use among all adults in urban areas was 22.1% and 25.3% in rural areas. Overall, 22.7% (15.9 million) of adults currently smoke tobacco [40.3% among men and 5.1% among women]. Overall, 18.7% (13.1 million) of adults currently smoke tobacco daily [33.9% among men and 3.6% among women].
Overall, daily cigarette smokers smoked an average of 11.0 cigarettes per day [11.2 among men and 8.6 among women]. The overall average age of initiating daily cigarette smoking among ever daily smokers aged 15-34 was 17.5 years old [17.5 years old among men and 18.3 years old among women].
Overall, 1.7% of adults reported current smokeless tobacco use [2.7% among men and 0.7% among women]. Overall, 21.5% of adults, or about 15 million, reported currently smoking manufactured cigarettes in 2015 [38.9% among men and 4.2% among women]. The overall proportion of former daily smokers among ever daily smokers was 19.3% [17.7% among men and 31.0% among women].
Smoking Cessation: In 2015, 7 in 10 (76.7%) current tobacco smokers were interested or planned to quit smoking tobacco. Among ever daily smokers, 19.3% quit smoking while 4.0% of those who smoked in the past 12 months recently quit smoking.
Exposure to Secondhand Smoke: An estimated 21.5% of adults (3.6 million adults) were exposed to tobacco smoke in enclosed areas at the workplace in the past month. In the past month, 34.7% of adults (24.0 million adults) were exposed to tobacco smoke at home. Among those who visited public places in the past 30 days,
Team which conducted the pretest Training of enumerators Data collection
Photos courtesy of Department of Health and Philippine Statistics Authority, Philippines.
17 Global Adult Tobacco Survey : Philippines Country Report, 2015

21.9% of adults visiting restaurants; and 37.6% of adults using public transportation reported being exposed to secondhand smoke.
Economics of Tobacco Smoking: Among daily cigarette smokers, average monthly cigarette expenditures were PhP 678.4 [PhP 696.1 among men and PhP 515.8 among women].
Advertising, Promotion, and Sponsorship: Among adults, 40.5% noticed cigarette marketing in stores where cigarettes are sold; 9.6% of adults noticed logos that promote cigarettes on clothing or other items.
Overall, 83.2% of adults noticed anti-cigarette smoking information at any location, with 39.1% of adults having noticed anti-cigarette smoking information on radio and 63.7% of adults having noticed anti-cigarette smoking information on TV.
Among current cigarette smokers, 44.6% thought about quitting smoking because of warning labels on cigarette packages.
Knowledge, Attitudes, and Perceptions: Among all adults, 95.0% believed that smoking causes serious illnesses: lung cancer (96.4%), tuberculosis (95.4%), heart attack (85.7%), and stroke (79.6%).
Similarly, 93.5% of all adults believed that breathing other people’s smoke causes serious illness in non-smokers [90.3% among smokers and 94.5% among non-smokers].
Nearly all (97.2%) adults favored a complete prohibition of smoking in indoor workplaces and public places, with 98.0% of non-smokers and 94.5% of current smokers favoring the ban.
GATS 2009 to 2015
• Tobacco use prevalence significantly decreased among adults from 29.7% in 2009 to 23.8% in 2015 [from
49.5% to 41.9% among males; from 10.1% to 5.8% among females]. This represents a 19.9% relative decline in tobacco use prevalence [15.3% decline for males; 42.8% decline for females].
• The prevalence of current cigarette smoking among adults significantly decreased from 27.9% in 2009 to
22.5% in 2015 [from 47.2% to 40.1% among men and from 8.8% to 4.9% among women]. • The percentage of current smokers who are interested in quitting (60.4% in 2009 to 76.7% in 2015) and
the percentage of smokers who made quit attempts in the last 12 months (47.9% in 2009 to 52.2% in 2015) both increased significantly. However, the proportion of smokers who successfully quit in the past 12 months largely remained unchanged from 2009 (4.5%) to 2015 (4.0%).
• The percentage of current cigarette smokers who thought of quitting smoking because of health
warnings on cigarette packages increased significantly from 37.4% in 2009 to 44.6% in 2015. • There was a significant increase in the percentage of adults who noticed anti-cigarette smoking
information at any location (80.1% in 2009 to 83.2% in 2015). • Exposure to secondhand smoke (SHS) in homes (54.4% in 2009 to 34.7% in 2015) and in the workplace
(32.6% in 2009 to 21.5% in 2015) declined significantly. Among all public places for which data were collected, the largest decline in exposure to SHS occurred in government buildings (25.5% in 2009 to 13.6% in 2015).
18 Global Adult Tobacco Survey : Philippines Country Report, 2015

• Among daily smokers, average cigarette expenditures per month increased from PhP 336.3 in 2009 to PhP 678.4 in 2015, after adjusting for inflation. The average price of a pack of 20 manufactured cigarettes almost doubled, increasing from PhP 24.9 in 2009 to PhP 48.0 in 2015.
• Exposure to any cigarette advertising, promotion, or sponsorship in the past 30 days declined significantly
from 74.3% in 2009 to 58.6% in 2015. Similarly, it declined significantly at the point of sale, from 53.7% in 2009 to 40.5% in 2015.
Conclusions1 Between 2009 and 2015, the Philippines has made progress in protecting the public from exposure to SHS, reducing exposure to tobacco advertisements, promotion, and sponsorship, and increasing the price of tobacco products. The “Red Orchid Awards for 100% Tobacco Free Environment” (ROA), which was given to local government agencies, provided the impetus to implement FCTC at subnational levels. Over this period, average monthly cigarette expenditures and the average cost of a pack of manufactured cigarettes nearly doubled.
While the Philippines has reduced tobacco use since 2009, nearly a quarter of Filipinos continued to use tobacco in 2015. The MPOWER package outlines steps that can be taken to help end the tobacco epidemic. Periodic monitoring of tobacco use, evaluation of tobacco control interventions and continued vigilance on tobacco industry interference are important components in reducing tobacco use and tobacco related morbidity and mortality.
1The findings and conclusion in this executive summary are those of the author(s) and do not necessarily represent the official position of the U.S. Centers for Disease Control and Prevention
19 Global Adult Tobacco Survey : Philippines Country Report, 2015

1. INTRODUCTION
Tobacco use is a major preventable cause of premature death and disease, presently causing over 6 million deaths each year and is expected to cause over 8 million deaths yearly by 2030. Unless current trends change, the vast majority of these deaths are projected to occur in the developing world. An efficient and systematic surveillance mechanism to monitor the epidemic is one of the essential components of a comprehensive tobacco control program.5
The World Health Organization (WHO) aims to reduce the global burden of disease and death caused by tobacco, thereby protecting present and future generations from the devastating health, social, environmental and economic consequences of tobacco consumption and exposure to tobacco smoke. This is accomplished through providing global policy leadership—promoting the WHO Framework Convention on Tobacco Control (FCTC) and the MPOWER package of tobacco policies as a key entry point to the FCTC. MPOWER includes the following policies: Monitor tobacco use and prevention policies; Protect people from tobacco smoke; Offer help to quit tobacco use; Warn about the dangers of tobacco; Enforce bans on tobacco advertising, promotion, and sponsorship; and Raise taxes on tobacco. The FCTC encourages countries to adhere to its principles, and WHO supports countries in their efforts to implement provisions of the FCTC and MPOWER.
In August 2006, WHO and the U.S. Centers for Disease Control and Prevention (CDC) convened an expert consultation to discuss adult tobacco surveillance and made recommendations for the development of a standard survey protocol. The expert consultation also recognized the challenges of limited funding and methodological complexities when conducting systematic adult tobacco surveys and identified a lack of comparability in ongoing national surveys.
The Bloomberg Initiative to Reduce Tobacco Use offers resources to fill the data gap for measuring adult tobacco use globally and to optimize the reach and results of the ongoing Global Tobacco Surveillance System (GTSS). The GTSS is a global standard to monitor youth and adult tobacco use and key tobacco control policies. GTSS comprises Global Youth Tobacco Survey (GYTS), Global Adult Tobacco Survey (GATS) and Tobacco Questions for Surveys: A Subset of Key Questions from GATS (TQS).
GATS, a component of GTSS, was launched in February 2007 and enables countries to collect data on key tobacco control indicators in the adult population. Results from GATS assist countries in the planning, implementation and evaluation of effective tobacco control interventions, along with allowing countries to compare the results of their survey with results from other countries that have conducted GATS.
The CDC, CDC Foundation, Johns Hopkins Bloomberg School of Public Health (JHSPH), RTI International, WHO and countries throughout the world are working together to implement GATS.
20 Global Adult Tobacco Survey : Philippines Country Report, 2015

1.1 Burden of Tobacco in the Philippines The prevalence of noncommunicable diseases (NCD) continues to rise in the Philippines and promoting a healthy lifestyle is necessary and as relevant as ever. More than half (55%) of total deaths in the country in 2013 were caused by NCDs. Diseases of the heart and vascular system made up more than one-third (35%) of all deaths.6
The most recent (8th) National Nutrition Survey (NNS) was conducted by the Food and Nutrition Research Institute of the Department of Science and Technology (FNRI-DOST) from June 2013 to April 2014, and covered all 17 regions of the country, 79 provinces, 45,047 households and 172,323 individuals. Results from the survey indicated that the prevalence of current smokers has decreased from 31.0% in 2008 to 25.4%; never-smokers increased from 54.3% to 59.1%; and former smokers increased from 14.7% to 15.4%.
The prevalence of smoking was higher among adults aged 40–49 years, and among those from lower economic class, the poorest quintiles still have the highest rates of smoking.
The second round of GATS was conducted in2015, the same year the Department of Health (DOH) commissioned the Social Weather Station (SWS) to conduct the “National Survey to Monitor the Impact of the Sin Tax Law.” The results of this survey are presented below (Table 1.1.1).
Table 1.1.1 Percentage of smokers by smoking status and by selected characteristics, Philippines, 2015
Smoking Status
PHILS.
Locale Economic Class Age-Group
Urban Rural ABC D E 18-24 25-34 35-44 45-54 55 & above
Current Smokers
25 25 25 14 26 27 22 29 30 26 17
Former Smokers
16 17 15 22 17 13 8 12 10 22 27
Non-smokers
59 57 60 64 58 60 70 58 60 52 56
The following were also the results of the survey:
• Average age at initiation of smoking: overall=19 years; male=19 years; female=19 years
• Median age at initiation of smoking: overall=18 years; male=19 years; female=19 years
• Median number of cigarettes smoked by current smokers: overall=9 sticks; daily smoker=10 sticks
• 55% of the respondents reported exposure to secondhand smoke; and 48% reported exposure to secondhand smoke at home.
• 34% of current smokers who tried to stop smoking reported that the main reason for deciding to try to stop smoking cigarettes was to improve health
• 71% of current smokers who changed their brand of cigarette stated that the main reason for changing the brand of cigarette was due to an increase in price of the previous brand.
21 Global Adult Tobacco Survey : Philippines Country Report, 2015

Teenage and Young Adult Smoking
Adolescents (young people between the ages of 10 and 19 years) are often thought of as a healthy group. Nevertheless, many adolescents die prematurely due to accidents, suicide, violence, pregnancy-related complications and other illnesses that are either preventable or treatable. Many more suffer chronic ill-health and disability. In addition, many serious diseases in adulthood have their roots in adolescence. For example, tobacco use, sexually transmitted infections including HIV, and poor eating and exercise habits lead to illness or premature death later in life. 7
Most young people are healthy. However, in 2009 more than 2.6 million young people aged 10–24 worldwide died mostly due to preventable causes. A much greater number of young people suffer from illnesses which hinder their ability to grow and develop to their full potential. A greater number still engage in behaviors that jeopardize not only their current state of health, but often their health for years to come.
Nearly two-thirds of premature deaths and one-third of the total disease burden in adults is associated with conditions or behaviors that began in their youth, including: tobacco use, a lack of physical activity, unprotected sex or exposure to violence.
In the Philippines, five out of ten leading causes of deaths among youth and young adults aged 10–24 are noncommunicable in nature, and these are mostly attributable to risk behaviors. Accidents are the leading cause of death, followed by diseases of the heart, cancer, and chronic diseases of the lower respiratory and vascular systems. Collectively, they account for 54.7% (12,909) of total deaths (23,588) in the age group 10–24 in 2013.6
The Philippines is a country in the Western Pacific Region with a moderate-to-high burden of tobacco use among its youth and adult population. The 2015 Philippines Global Youth Tobacco Survey (GYTS), a component of the Global Tobacco Surveillance System (GTSS) which systematically monitors youth tobacco use, highlighted the following:8
• 16.0% of students, 22.2% of boys and 10.4% of girls, currently use any tobacco products • 14.5% of students, 20.5% of boys and 9.1% of girls, currently smoke tobacco • 12.0% of students, 17.6% of boys and 7.0% of girls, currently smoke cigarettes • 2.5% of students, 2.9% of boys and 2.1% of girls, currently use smokeless tobacco • 79.4% of students who currently smoke cigarettes bought cigarettes from a store, shop, street
vendor or kiosk • 47.5% of students who currently smoke cigarettes were not prevented from buying cigarettes
because of their age • 10.9% current cigarette smokers reported that their usual smoking place is in school • 35.9% of current smokers showed signs of smoking dependence.
Further, the results of the Philippines’ 2015 Global School-Based Student Health Survey (GSHS), a collaborative surveillance project designed to help countries measure and assess the behavioral risk factors and protective factors in 10 key areas among young people aged 13–15 years old, revealed the following:7
22 Global Adult Tobacco Survey : Philippines Country Report, 2015
• A total of 14.6% of high school students aged 13–15 years were current users of any tobacco product. Males (18.4%) were more likely to use any tobacco product than females (11.0%)
• About 12.1% of high school students aged 13–15 years were current cigarette smokers. Males (15.8%) were almost twice as likely to smoke cigarettes as females (8.6%)
• Among the students who currently smoked cigarettes, almost 9 out of 10 (88.0%) tried to quit smoking. The same proportion was reported for both males and females (88.2%)
• One in every two high school students aged 13–15 is exposed to cigarette smoke. More than half (50.8%) of the students reported that people smoked in their presence in the past seven days before the survey. Males (53.9%) were more likely to be exposed to secondhand smoke than females (47.9%).
1.2 Current Tobacco Control Policies in the Philippines The World Health Organization Framework Convention on Tobacco Control (WHO FCTC) was adopted by the 56th World Health Assembly in May 2003 and became international law on February 27, 2005. The Philippines ratified the WHO FCTC on June 6, 2005 and became a party to the WHO FCTC on September 4, 2005.9
The WHO FCTC calls for countries to establish programs for national, regional, and global tobacco surveillance. The WHO FCTC also encourages countries to develop and implement tobacco control action plans to include public policies such as bans on direct and indirect tobacco advertising; tobacco taxes and price increases; promoting smoke-free public places and workplaces; and including health messages on tobacco packaging.
As of 2015, the Philippines was reported to have the following tobacco control policies:9
Smoke-free environments - Complete smoking ban on: Healthcare facilities Primary and secondary schools Universities Government facilities Bans on tobacco advertising, promotion and sponsorship in and including: Domestic TV and radio Domestic magazines and newspapers Internet advertising Paid placement in media Health warnings on smoked tobacco product packaging: Text warnings written in the principal language describing health impacts Warnings including a picture or graphic 50% of principal display areas covered (50% front and 50% back) 12 published warnings displayed at any given time Health warnings are required to rotate Health warnings are written in the principal language Health warnings displayed on smokeless tobacco products
23 Global Adult Tobacco Survey : Philippines Country Report, 2015

Tobacco taxation and prices: A pack of 20 cigarettes of the most-sold brand sells for Philippine Pesos (PhP) 26.75; in U.S. Dollars (USD),0.62).
The total tax on the most-sold brand is 74% of retail price. The total excise tax on the most-sold brand is 64% of retail price.
Tobacco Control Interventions in the Philippines There have been several tobacco control initiatives and interventions at the national and subnational levels which involve government and non-government organizations. Descriptions of these laws and policies follow. Republic Act 9211, or the Tobacco Regulation Act of 2003 In June 2003, Republic Act 9211, also known as the Tobacco Regulation Act of 2003, became a law in the Philippines. The Tobacco Regulatory Act included landmark legislation with provisions on effective tobacco control in the country, including: 1. Promotion of a healthful environment 2. Provision of information to the public on health risks associated with cigarette smoking and tobacco use 3. Regulation and subsequent banning of all tobacco advertisements and sponsorships 4. Regulation of placing health warning labels on tobacco products 5. Prohibition of the sale of tobacco products to minors 6. Provision of assistance and encouragement for Filipino tobacco farmers to cultivate alternative agricultural crops to prevent economic dislocation 7. Creation of an Interagency Committee on Tobacco (IAC-Tobacco) to oversee the implementation of the provisions of this Act.
Republic Act 10351, or the Sin Tax Reform Law This law is one of the landmark legislations under the Aquino administration. It is primarily a health measure with revenue implications, but more fundamentally, it is a good governance measure. The Sin Tax Reform Law helps finance the Universal Health Care program of the government, simplifies the current excise tax system on alcohol and tobacco products and fixes long-standing structural weaknesses, and addresses public health issues relating to alcohol and tobacco consumption. It was signed into law on December 12, 2012 in Malacañang.
Fifteen percent of the incremental revenue collected from the excise tax on tobacco products under R. A. No. 8240 will be allocated and divided among the provinces producing burley and native tobacco, in accordance with the volume of tobacco leaf production. Eighty-five percent of the Sin Tax revenue will be given to the DOH.
Eighty percent of the 85% derived from this act will be allocated for the Universal Health Care under the National Health Insurance Program; the attainment of the millennium development goals; and health awareness programs. The remaining 20% will be allocated nationwide, based on political and district subdivisions, for medical assistance and health enhancement facilities program, the annual requirements of which shall be determined by the DOH.
24 Global Adult Tobacco Survey : Philippines Country Report, 2015

Republic Act 10643, or The Graphic Health Warnings Law The Graphic Health Warnings Law or Republic Act 10643 was signed into law on July 15, 2014. The purposes of the law are to:
1. Include graphic health warnings that effectively warn of the devastating effects of tobacco use and exposure to second-hand smoke
2. Remove misleading or deceptive numbers or descriptors like “low tar”, “light”, “ultralights” or “mild” which convey or tend to convey that a product or variant is healthier, less harmful or safer
3. Further promote the right to health and information of the people.
This Act requires cigarette and other tobacco product packages, including package inserts and onserts, and any outside packaging and labeling withdrawn from the manufacturing facilities or imported into the Philippine customs territory, to bear a highly visible, full-color photographic image which accurately depicts the hazards of tobacco use accompanied by textual warning related to the picture. One year after the issuance of the templates by the DOH, cigarette packages and other tobacco product packages, including package inserts and onserts, and any outside packaging and labelling, withdrawn from the manufacturing facilities, or imported into the Philippine customs territory shall bear the prescribed highly visible full-color graphic health warnings that shall have two components: a photographic picture warning and an accompanying textual warning that is related to the picture. The graphic health warnings shall be printed on 50% of the principal display surfaces of any tobacco package; they shall occupy 50% of the front and 50% of the back panel of the packaging. Civil Service Commission (CSC) Memorandum Circular No.17 s 2009 Smoking Prohibition Based on 100% Smoke-free Environment Policy The CSC adopts and promulgates a 100% smoke-free policy and a smoking prohibition in all areas of government premises, buildings and grounds, except for open spaces designated as smoking areas, in order to ensure a healthy and productive workforce. This policy finds legal basis from the Tobacco Regulation Act of 2003 (Republic Act 9211) and the World Health Organization (WHO) Framework Convention on Tobacco Control (FCTC), Article 8 and its guidelines. Civil Service Commission and Department of Health Joint Memorandum Circular No. 2010 -01, or the Protection of the Bureaucracy Against Tobacco Industry Interference Pursuant to the WHO FCTC, specifically under the title General Obligations, Article 5.3, the parties, in setting and implementing their public health policies with respect to tobacco control, shall act to protect these policies from commercial and vested interests of the tobacco industry. The CSC and the DOH promulgated the policy on Protection of the Bureaucracy against Tobacco Industry Interference. The following are the prohibitions under this policy:
1. Unnecessary interaction with the tobacco industry 2. Preferential treatment to the tobacco industry 3. Accepting gifts, donations and sponsorship 4. Financial interest in the tobacco industry 5. Conflict of interest with the tobacco industry.
25 Global Adult Tobacco Survey : Philippines Country Report, 2015

In 2009, the DOH-NCHP (Department of Health - National Center for Health Promotion) launched the Red Orchid Award, which aims to search for the national, regional and local offices that implement a 100% tobacco-free environment. The NCHP also joined the planning meeting of the ASEAN (Association of Southeast Asian Nations) Focal Points on Tobacco Control (AFPTC), which has the goal of ensuring that effective tobacco control measures are in conformity with the ASEAN Social Cultural Blueprint.
In the same year, the DOH started implementing the Bloomberg Initiative entitled, “Moving to the Next Level in the Philippines: Complete Implementation of the WHO-Framework Convention on Tobacco Control (WHO-FCTC).” The project is tasked to supplement the country's tobacco prevention efforts, in congruence with the DOH-NCHP, and to enforce WHO-FCTC effectively.
The key initiatives of the project include the development of a comprehensive National Tobacco Control Strategy (2011-2016) and Medium-Term Plan (2011-2013); creation of the National Tobacco Control Coordinating Office (NTCCO) within the DOH; and formation of the DOH Tobacco Control Team (TCT) and 11 Sector-Wide Anti-Tobacco (SWAT) subcommittees for the implementation of WHO-FCTC provisions. The NTCCO is in charge of working with other sectors of the DOH to synchronize tobacco control efforts, and facilitated the development of the National Tobacco Control Strategy (NTCS) for 2011–2016.
Other DOH tobacco control initiatives include: (1) the passage of FDA Law (RA 9711) in 2009 and (2) issuance of DOH AO 2014-0037 on Graphic Health Warning Templates and Guidelines.
Through its regional offices, the DOH conducted tobacco control activities, including conducting advocacy activities for the adoption of the national laws, providing technical assistance and conducting capability building activities focusing on WHO MPOWER strategy.
Food and Drug Administration Administrative Order No. 2014-0008 Rules and Regulations on Electronic Nicotine Delivery System (ENDS) or Electronic Cigarettes Consistent with the policy of the state to promote the right to health of all people and instill health consciousness among them, this administrative order is being issued with the following objectives:
• To ensure the safety, efficacy and quality of electronic cigarettes or ENDS as a health product or consumer product, and
• To serve as guidelines for electronic cigarette or ENDS manufacturers and distributors in securing a Food and Drug Administration (FDA) license to operate and a Certificate of Product Registration (CPR).
Office of the Ombudsman – Office Circular No. 34 s. 2010 This policy prohibits smoking within the premises of the Office of Ombudsman and implements a smoking cessation program for affected employees
26 Global Adult Tobacco Survey : Philippines Country Report, 2015

Commission on Higher Education Memorandum on Compliance with the Guidelines Implementing Article 5.3 of WHO FCTC This memorandum directs all central and regional directors and officers-in-charge to reject any contribution from the tobacco industry in order to avoid partnership with them and thereby promote a healthy environment and protect people from the hazards of tobacco smoke. Department of Education Memorandum No. 124 s. 2011 on Integrating the Anti-smoking Campaign in the Oplan Balik Eskwela Program This memorandum integrates the Anti-Smoking Campaign as stipulated in Sections 5 and 10 of the RA 9211 [an interagency project of the Department of Education (DepEd), the Department of the Interior and Local Government (DILG), the Philippine National Police (PNP), the Department of Health (DOH), and the Department of Trade and Industry (DTI)] into its Oplan Balik-Eskwela Program. Department of Education Department Order No. 33 s 2003 Youth Smoking Prevention Program Aligning with the Republic Act 8749, known as Philippine Clean Air Act of 1999, this order prohibits smoking and the sale of cigarettes and other tobacco products inside public and private school campuses, buildings, offices, including the premises and buildings of the division, regional and national offices. Said campuses, premises, buildings and offices shall be declared as “No Smoking Areas” or "Zones of Health.” According to this order, the DepEd, acting through the Center for Students and Co-Curricular Affairs (CSCA) and the School Health and Nutrition Center (SHNC), will spearhead the Youth Smoking Prevention (YSP) Program and direct its implementation in all public and private schools and divisional and regional offices. Topics related to smoking prevention will be integrated into health education as well as into the student council agenda and other school-related activities. Department of Education Order No. 6 s. 2012 Guidelines on the Adoption and Implementation of Public Health Policies on Tobacco Control and Protection Against Tobacco Industry Interference These guidelines aim to raise public awareness, in particular that of students, of the adverse effects of cigarette smoking on health and productivity as well as its negative impact on the cost of health service and the economy. They also work to discourage all forms of cooperation or partnership with the tobacco industry, and to ensure tobacco control and protection from commercial and other vested interests of the tobacco industry.
Department of Education Order No. 48 s. 2016 on Policy and Guidelines on Comprehensive Tobacco Control The policy specifically aims to:
1. Educate and inform all students as well as both teaching and non-teaching personnel and staff on the hazards of tobacco use and exposure to secondhand smoke; the adverse socioeconomic and environmental consequences of tobacco production and consumption; and the tobacco control policies and tactics of the tobacco industry
2. Make effective cessation intervention services available and accessible to all learners, teachers and non-teaching personnel in need of such services
3. Facilitate enforcement of tobacco control policies in schools and offices, including absolute smoking bans; restriction to access; ban on sponsorship; ban on outdoor advertising; ban on promotional items for minors and sampling restrictions as well as Corporate Social Responsibility
27 Global Adult Tobacco Survey : Philippines Country Report, 2015

(CSR) activities of the tobacco industry; and protection against tobacco industry interference 4. Ensure strict implementation of policies on the protection against tobacco industry interference in
the department The DepEd prescribes rules on how parents, teachers and school officials of private and public schools can facilitate enforcement of the ban on selling and advertising tobacco within 100 meter perimeter of schools and prevent tobacco sponsorships. According to the policy, enforcement will be facilitated with the assistance of Parent Teacher Associations, and through the monitoring and reporting mechanisms of the Child Protection Committee, a committee established to prevent child abuses under the DepEd's Child Protection Policy. Among others, school officials are required to monitor for violations and report to local governments accordingly to ensure that school children are not exposed to the lethal product, its ads, and the tobacco industry's so-called CSR, as these may lure them into a lifelong addiction. Land Transportation Franchising & Regulatory Board (LTFRB) Memorandum Circular No. 2009-036 100% Smoke Free Public Utility Vehicles (PUVs) and Public Land Transportation Terminals This memorandum requires all holders of Certificates of Public Convenience to observe the smoking prohibition in all public utility vehicles and public land transportation terminals as well as to prominently post no smoking signs in their authorized units and premises.
1.3 Survey Objectives
The objectives of GATS are to:
• Systematically monitor adult tobacco use (smoking and smokeless) and track key tobacco control indicators in a nationally representative sample of the Philippines.
• Track implementation of FCTC recommended policies outlined in the MPOWER package of tobacco demand reduction measures.
28 Global Adult Tobacco Survey : Philippines Country Report, 2015

2. METHODOLOGY
Adhering to the global standard protocol for systematically monitoring adult tobacco use and tracking key tobacco control indicators, the GATS Philippines 2015 was a cross-sectional household survey that aimed to produce national level estimates by residence and gender. The design also allowed estimates of indicators of interest at an acceptable level of precision by age group, education, and residence by wealth index.
2.1 Study population The target population for the survey included all male and female household members in the Philippines aged 15 years and over who considered the country to be their primary place of residence. A household, as defined in the survey, refers to a person or a group of persons who usually sleep in the same housing unit and have a common arrangement for the preparation and consumption of food. 2.2 Eligibility Criteria The eligible respondents were all persons in the household aged 15 years and over who resided in the country and consider the Philippines to be their usual place of residence. Background information about each respondent such as age, marital status, residence, education, and employment status was also gathered. 2.3 Sampling Design The GATS Philippines 2015 used the Philippine 2003 Master Sample (MS) created for the Philippines Statistical Authority (PSA)’s household-based surveys with some modifications to conform to GATS protocol on sampling design. One of the four replicates of the MS was used for GATS. Stratification Within each region, the first level of stratification was by province, highly urbanized cities (HUCs) and independent component cities (ICCs). This stratification is helpful for making separate design-based estimates for provinces, HUCs and ICCs. However, the estimates at this level generally will have low reliability. Implicit stratification was also applied within the final explicit strata using the following variables: proportion of strong houses; agricultural indicators; and per capita income (i.e. total income of the municipality divided by its total population).
Stages of Selection The 2003 MS was based on a three-staged sample design with barangays or combination of small contiguous barangays within the same municipality as primary sampling units (PSU). The average PSU size or the average number of households in a PSU is 923. For the GATS Philippines 2015, an additional stage of selection was added to select one eligible respondent per household.
29 Global Adult Tobacco Survey : Philippines Country Report, 2015

At the first stage of selection, where there were 16,579 primary sampling units (PSUs) across the country, a sample of 2,826 PSUs was drawn using probability proportional to the estimated size (PPES), the measure of size being the number of households from the 2000 Census of Population and Housing. From the full set of 2,826 sampled PSUs, four replicates are formed by randomly assigning any number from one to four to each PSU. PSUs with the same number were grouped together to form one replicate. For the 2015 Philippine GATS, replicate four is selected. In the second stage of selection, within each selected PSU, enumeration areas (EAs) were selected with probability proportional to the number of households in the EA. An EA was defined as an area with discernible boundaries consisting of approximately 350 contiguous households. For the GATS Philippines 2015, there were 794 sample EAs in replicate four. In the third stage, within each sampled EA, 16 to 18 housing units (HUs) on the average were selected using systematic sampling. For operational considerations, at most 30 HUs were selected per sample EA. All households in the sample HUs were interviewed except for HUs with more than three households. In those cases, only three households were selected. For the GATS Philippines 2015, all households listed in the sample HU were interviewed. However, if additional households were found during the actual visit, random selection process was applied to reselect a sample household within the sample housing unit. Finally, from each sampled household, one eligible respondent from the household members 15 years old and over, regardless of sex, was randomly selected for interview using the GATS Individual Questionnaire.
30 Global Adult Tobacco Survey : Philippines Country Report, 2015

Base weights In general, the base weight for a sampled unit was given by the inverse of that unit’s probability of selection for the sample. Thus, selection probabilities were computed.
In the 2003 MS, the probability that a HU was included in the sample varied across domains/regions but was designed to be constant within each region. In nearly all cases, all households in sampled housing units were included in the sample. In these cases, the selection probability for a household was the same as that for its HU. If the selection probability for a housing unit in region/domain d was then the base weight for a sampled household in domain d in a HU in which all households are included was
If a survey collects data on all persons in sampled households, the selection probabilities of persons and households are the same. Hence the household base weights also apply to persons. However, for the 2015 Philippine GATS, only one eligible respondent was randomly selected from all eligible members within the household. Thus, person base weights were computed.
Nonresponse adjustments
Adjustments were also made to the base weights to compensate for nonresponse by sampled units eligible for the survey. The adjustment inflates the base weights of “similar” responding units to compensate for nonresponding units using weighting class adjustment. Population weighting adjustment Generally, weighted sample distributions do not conform to known population distributions (e.g. projected population counts). Here, the nonresponse adjusted person weights were further adjusted so that the weighted survey estimates of the national sex/age distribution and of the regional total population distribution produced the corresponding population projection distributions.
Final weights The final survey weight assigned to each responding unit was computed as the product of the base weight, the nonresponse adjustment, and the population weighting adjustment. The final weights were then used to produce valid estimates of population parameters. The final weights were used in the estimation procedure.
Estimation Procedure Most of the estimates generated from surveys that utilized the 2003 MS design were in the form of totals, means, proportions, or ratios. The survey estimate of the population total for variable y, denoted
by Y, was then ˆi iY w y= Σ ., where iwΣ estimates the total number of units in the population, N.
The extension to estimating a population mean for y, /Y Y N= , is straightforward. With Y estimating Y and iwΣ estimating N, Y may be estimated by /i i iy w y w= Σ Σ . Letting 1iy = if respondent i has a
given characteristic and 0iy = if not, then y estimates the proportion with the characteristic.
df ′
1/d dw f ′=
31 Global Adult Tobacco Survey : Philippines Country Report, 2015

Furthermore, the population ratio in the form /R Y X= , where X is the population total for another variable denoted by x, may be estimated by the ratio estimator /i i i ir w y w x= Σ Σ . A mean or
proportion is the special case with 1ix = for all units in the population. 2.4 Questionnaires The GATS Philippines 2015 used two types of questionnaires: the Household Questionnaire and the Individual Questionnaire. The questionnaires were based on a core set of questions designed for all GATS participating countries. Country-specific questions, which were recommended by the DOH, PSA, CDC and WHO to address relevant issues in the country and approved by the CDC Questionnaire Review Committee, were added to the core set of questions. The questionnaires, which are in English, were translated into six popular local languages—Tagalog, Ilokano, Bikol, Waray, Hiligaynon and Cebuano—to facilitate the field data-gathering in the sample households. The translated questionnaires were back-translated into English to check the quality of the translations. The Household Questionnaire was used to collect information on the number of persons in the sampled household who are 15 years and older and who consider the selected housing unit as their primary place of residence the night prior to the survey date. These persons are whom the survey considers to be eligible respondents in the household. Information on age, sex, and current use of smoked and smokeless tobacco was collected for all eligible respondents. The information on age was used to identify an eligible random respondent for the Individual Questionnaire. The Individual Questionnaire was used to collect information from each selected eligible respondent. The questionnaire consists of ten sections:
1. Section A. Background Characteristics. Included questions on sex, age, education, work status, possessions of household items and monthly income.
2. Section B. Tobacco Smoking. Questions covered patterns of use (daily consumption, less than daily consumption, not at all), former/past tobacco consumption, age of initiation of daily smoking, consumption of different tobacco products (cigarettes, pipes, cigars and other smoked tobacco), nicotine dependence, and frequency of consultations with a healthcare provider.
3. Section EC-WP. Electronic Cigarettes and Waterpipes. Included questions about electronic cigarettes or e-cigarettes to determine if the respondents ever used electronic cigarettes or waterpipes to smoke tobacco.
4. Section C. Smokeless Tobacco. Questions covered pattern use (daily consumption, less than daily consumption, not at all), former/past use of smokeless tobacco, age of initiation of daily use of smokeless tobacco, and consumption of different smokeless tobacco products (chewing tobacco, betel quid, etc.).
5. Section D1. Cessation – Tobacco Smoking. Included questions related to smoking cessation advice from healthcare providers, and methods for quitting smoking.
6. Section E. Secondhand Smoke. Included questions about smoking in the home; exposure to secondhand smoke at home; indoor smoking policy at workplace; exposure within the last 30 days at: workplace, government buildings/offices, healthcare facilities, restaurants, educational institutions, and public transportation. Additional question about knowledge of serious illness in nonsmokers due to secondhand smoke was also included.
7. Section F. Economics – Manufactured Cigarettes. Included questions pertaining to the brand, quantity, cost and source of manufactured cigarettes.
32 Global Adult Tobacco Survey : Philippines Country Report, 2015

8. Section G. Media. Questions addressed exposure to: pro- and anti-tobacco advertisement on television, radio, billboards, posters, newspapers/magazines, cinema, Internet, public transportation, and public walls; sporting events connected with tobacco; music, art or fashion events connected with tobacco; tobacco promotion activities; information on dangers of smoking; and reactions to health warning labels on cigarette packages. The reference period for the questions in this section is the last 30 days.
9. Section H. Knowledge, Attitudes, and Perceptions. Included questions about knowledge of health effects of both smoking and smokeless tobacco.
10. Section CP. Cigarette Packs. This section determines the compliance of cigarette manufacturers to RA 9211 Section 13, “Warnings on Cigarette Packages.”
Information on the ownership of various household items and durable goods (e.g., electricity, flush toilet, fixed telephone, cellular phone, television, radio/radio cassette) obtained from Section A were used in the computation of a wealth index. A wealth index is a proxy measure of the long-term standard of living of the household, and is based on household ownership of household items and durable goods related to the household’s socioeconomic status. A wealth index for GATS was constructed by assigning a weight or factor score to each household asset through principal component analysis. These scores were summed by household, and individuals were ranked according to the total score of the household in which they reside. The sample individuals were then divided into quintiles—five groups, each with the same number of individuals. 2.5 Recruitment, training and fieldwork 2.5.1 Implementing Agencies The PSA was the implementing agency responsible for the 2015 Philippines GATS data collection. Financial support was provided by the Epidemiology Bureau of the Department of Health, Philippines, and the Bloomberg Initiative to Reduce Tobacco Use through the CDC Foundation with a grant from the Bill & Melinda Gates Foundation. Technical assistance was provided by the DOH, CDC, WHO, and RTI International. The National Statistician, through the Deputy National Statistician and the Assistant National Statistician of the Social Sector Statistics Services (SSSS), provided the overall direction on the conduct of the survey. The 17 Regional Directors (RDs) of PSA served as the overall field coordinators in their respective regions while the 81 Provincial Statistics Officers (PSOs) supervised the overall field activities in their respective provinces. On the more technical aspects of the survey, the Regional Supervisors (RSs), one for each region, were responsible for providing assistance on survey concepts, questionnaire items, and field operation procedures and on monitoring the progress of enumeration in the region by the interviewing teams in their region. The Regional IT Personnel, one for each region, were responsible for providing assistance pertaining to the use of handheld computers (tablet) in the administration of GATS questionnaire in data gathering. Provincial Supervisors (PSs), one for each province, were primarily responsible for the management of the work plan for the team, solving fieldwork problems with Team Supervisors (TSs), ensuring the timely completion of data collection, maintenance of the tablets, collection of data files from the TSs, and timely transmission of data files to the central office. The TS, who generally was in charge of two to three Field Interviewers (FIs), was responsible for the performance of his/her team.
33 Global Adult Tobacco Survey : Philippines Country Report, 2015

The TS ensured that the interviewers in his/her team strictly adopt the prescribed procedures in interviewing the sample household and the sample male/female individual. There were a total of 81 teams nationwide. 2.5.2 Pretest The PSA conducted the pretest for the GATS in one urban and one rural barangay of Castillejos in the province of Zambales on July 13–15, 2015. In general, the objective of the pretest was to test all the survey materials and the planned operational model for field data collection and management of the full survey implementation. In specific terms, the pretest aimed to ensure the applicability of the questionnaire in the Philippines in terms of clarity of the questions, logical flow or sequence of the questions, adequacy and appropriateness of response categories, and clarity and correctness of translations. The pretest also aimed to determine if the respondent’s attitude, interest, and motivation to answer the questions would be sustained; to establish average interview time to set a reasonable quota per day; and to assess issues and challenges that would likely be encountered during the actual GATS operations and identify solutions for such issues. Another important objective of the pretest was to test the use of the handheld computers (Samsung Tab 4) in data collection. Two trainings/briefings were carried out in preparation for the actual pretest; the IT briefing was conducted on July 6–8, 2015 and the pretest training on July 9–11, 2015. The IT briefing focused on the features of the tablet, installation of the GATS system, program tools, loading and editing of the questionnaires in local languages, troubleshooting, loading of training and pretest case files, and data management. The IT briefing included IT focal persons from the PSA-ITDS (Information Technology Dissemination Service), PSA-DHSD (Demographic and Health Statistics Division), and the DOH. Resource persons at the IT briefing included handheld technology experts from the RTI and CDC. The pretest training consisted of discussion about survey concepts and definitions, how to ask questions, and how to use the handheld computers, and included participants from PSA-DHSD, ITDS, and DOH. Resource persons at the pretest training included core members of GATS Philippine team from the PSA and the DOH. The pretest field work involved four interview teams with each team comprising one observer and three interviewers. A resource person from the WHO Regional Office and an IT officer from the CDC Foundation also participated in the pretest. A total of 119 households and individuals were successfully interviewed for the pretest. The pretest for the questionnaires in five (5) other local languages was conducted at the PSA Central Office on July 20–21, 2015. For each translated questionnaire (Bicolano, Cebuano. Hiligaynon, Ilocano, and Waray), three respondents who speak the local language were interviewed. PSA staff who spoke the local languages conducted the interviews. 2.5.3 Training In order to prepare PSA Central Office statisticians and regional IT personnel, two trainings were held prior to the training on field operations, including: a training of regional IT personnel and a training of trainers. The IT training for the regional IT personnel provided instructions on the initialization/configuration, use, care, and troubleshooting of the Android tablets, as well as loading of
34 Global Adult Tobacco Survey : Philippines Country Report, 2015

case files for the training and enumeration. The IT training also discussed innovations such as the Share It Application for addressing compatibility issues on transferring of files from Samsung Tab 4 used by statistical researchers to the ASUS tablets used by the supervisors. Meanwhile, the trainers’ training focused on identifying which particular items and instructions needed extra emphasis in order to preempt issues that might arise during the training of field staff. The PSA GATS core team who participated in the pretest and finalization of questionnaires and manuals also took part in the trainers’ training. Training for conducting the full 2015 GATS was conducted at the Makati Palace Hotel, Makati City. Designated regional IT personnel from 17 regions were trained on October 29–30, 2015 and the Task Force (TF) level training for 17 Regional Supervisors (RS) followed on November 2–7, 2015. Core GATS team from PSA Central Office served as trainers, while the GATS team from WHO, CDC, and DOH served as resource persons. The second-level training was held simultaneously at each of the 17 regions from November 9–14, 2015 with TASK Force training participants functioning as trainers and with the 81 Provincial Supervisors (PSs), 81 Team Supervisors (TSs), and 148 hired field interviewers (FIs) participating. Each level of training consisted of lectures on survey concepts and definitions, questionnaire administration using the Android tablet, as well as other field operation procedures. Both levels also included classroom lectures, written exercises, demonstration interviews, role playing, mock interviews and field practices. 2.5.4 Fieldwork For the 2015 Philippines GATS, PSA employed a total of 148 interviewers distributed to 81 teams nationwide. A team supervisor was responsible for one to three interviewers and ensured that the team strictly followed the protocol or the prescribed procedures in interviewing the sample household and the sample individual. In each province, a PSA field personnel was designated as Provincial Supervisor to monitor the progress of each team in his/her province and ascertain completion of the workload within the survey period. Regional Supervisors were assigned to supervise the conduct of the survey in their respective regions and provide technical assistance on survey concepts, questionnaire items and field operation procedures. A technical staff person from the PSA Regional/Provincial Office was designated to provide technical assistance on the use of the Android tablets. RDs, PSOs and members of the GATS team from the PSA Central Office also supervised the GATS interview teams. All supervisors conducted spot checks and short verification interviews. They also accomplished re-interviews while observing the conduct of the interviews by the FIs. The fieldwork for the 2015 Philippine GATS started on November 23, 2015 and was completed on December 23, 2015. Fieldwork included Saturdays (Sundays and holidays, if necessary). The enumeration was completed on time in all sample areas within the 27-day enumeration period. Output per day was pegged at 4–5 sample households, with an average of around 16 sample housing units and sample households in a sample area. On average, it took about 4–5 days for one interviewer to complete the fieldwork in an area of 15–18 sample housing units and sample households.
35 Global Adult Tobacco Survey : Philippines Country Report, 2015

2.5.5 Confidentiality/Informed Consent Parental consent was required for participants aged 15–17. Their verbal consent to participate was obtained in the presence of his or her parents. Section 26 of Republic Act No. 10625 stipulates that individual data furnished by a respondent to statistical inquiries, surveys, and censuses of the PSA shall be considered privileged communication and as such shall be inadmissible as evidence in any proceeding. The PSA may release data gathered from censuses only in the form of summaries or statistical tables, in which no reference to an individual, corporation, association, partnership, institution or business enterprise shall appear. 2.6 Statistical Analysis Complex survey data analysis was performed to obtain population estimates and their related confidence intervals (CIs). The sample weights were calculated for each respondent. For each respondent, a sample weight was computed using a weighting process (see details in Appendix A) that included the following three main steps: (1) creation of the base weight or design weight, calculated from all steps of random selection in the sample design; (2) an adjustment for non-response by sample households and sample individuals eligible for the survey; and (3) a post-stratification calibration adjustment of sample totals to projection of the population aged 15 years and above by region, area, gender and age group. The final weights attached to each respondent were computed as the product of the base weights, the non-response adjustment and post-stratification calibration adjustment. The final weights were used in all analyses to produce estimates of population parameters and their CIs. All weighting computations, estimates and their CIs were calculated using the Statistical Package for the Social Sciences (SPSS) 23 complex samples module. A 95% confidence interval (95% CI) was used to indicate the precision of the estimate. The relative change (𝑅𝑅�) of the two estimates is calculated as a percentage and is defined as 𝑅𝑅� = ��𝑟2−��𝑟1
��𝑟1 × 100, where
��𝑟1 is the estimate from GATS 2009, and ��𝑟2 is the estimate from GATS 2015. For example, if the estimate of current smoking prevalence among males aged 25-34 were 20.0% in GATS 2009 and 18.0% in GATS 2015, then the relative change would be 10% from 2009 to 2015. This can be interpreted as a relative decline of 10% in current smoking rates from 2009 to 2015. A Z-test was used to measure statistical significance of the relative change between the 2009 and 2015 data and relative change (either decrease or increase) is considered significant if p<0.05. Details of the reporting measures of comparison are provided in the GATS Analysis and Reporting Package.
36 Global Adult Tobacco Survey : Philippines Country Report, 2015

3. SAMPLE AND POPULATION CHARACTERISTICS
There were 11,644 interviews conducted during the 2015 GATS, which represents an estimated 70 million Filipino adults aged 15 years and older. The respondents were 49.9% men (34.9 million) and 50.1% women (35.1 million). The majority of the respondents were 25–44 years old (41.7 % or 29.1 million). (Table 3.2)
More than half lived in rural areas (53.4% or 37.4 million), and the majority of them (14.4%) were from middle-income families. Overall, the majority (70.6% or 49.4 million) of the respondents were highly educated. At least two out of five respondents (41.7% or 29.1 million) finished secondary school and three out of ten (28.9%) finished college or above. (Table 3.2)
n % n % n %
Completed, person selected for interview (HC) 4,785 85.6 7,311 87.3 12,096 86.6Completed, none eligible for interview (HCNE) 14 0.3 23 0.3 37 0.3Incomplete (HINC) 5 0.1 1 0.0 6 0.0No screening respondent (HNS) 12 0.2 7 0.1 19 0.1Nobody home (HNH) 72 1.3 121 1.4 193 1.4Refused (HR) 6 0.1 1 0.0 7 0.1Unoccupied (HUO) 463 8.3 746 8.9 1,209 8.7Address not a dwelling (HAND) 48 0.9 18 0.2 66 0.5Other (HO)1,* 186 3.3 144 1.7 330 2.4Total Households Selected 5,591 100 8,372 100 13,963 100Household Response Rate2
Completed (PC) 4,610 96.3 7,034 96.2 11,644 96.3Incomplete (PINC) 2 0.0 1 0.0 3 0.0Not eligible (PNE) 2 0.0 7 0.1 9 0.1Not at home (PNAH) 116 2.4 150 2.1 266 2.2Refused (PR) 6 0.1 5 0.1 11 0.1Incapacitated (PI) 41 0.9 84 1.1 125 1.0Other1 8 0.2 30 0.4 38 0.3Total Eligible Persons 4,785 100 7,311 100 12,096 100Person-level Response Rate3
Total Response Rate4
2 The Household Response Rate (HRR) is calculated as: PC + PINC + PNH + PR + PI + PO
HC * 100 4 The Total Response Rate (TRR) is calculated as: (HRR x PRR) / 100HC + HINC + HNS + HNH + HR + HO
96.4% 95.6%
96.3%96.4% 96.3%
Selected person
1 Other includes any other result not listed. 3 The Person-level Response Rate (PRR) is calculated as:
PC *100
Table 3.1: Number and percent of households and persons interviewed and response rates by residence (unweighted) – GATS Philippines, 2015.
Selected household
94.5%
ResidenceTotalUrban Rural
91.1% 92.8% 92.1%
37 Global Adult Tobacco Survey : Philippines Country Report, 2015

Table 3.2: Distribution of adults ≥ 15 years old by selected demographic characteristics – GATS Philippines, 2015.
Demographic Characteristics
Weighted
Unweighted Number of Adults Percentage Number of
Adults
(95% CI1) (in thousands)
Overall 100.0
70,064 11,644 Sex
Male 49.9 (48.9, 50.8) 34,936 5,781 Female 50.1 (49.2, 51.1) 35,128 5,863 Age (years)
15-24 29.4 (28.4, 30.4) 20,599 2,338 25-44 41.7 (40.7, 42.7) 29,193 4,967 45-64 22.4 (21.6, 23.2) 15,699 3,210 65+ 6.5 (6.1, 7.0) 4,573 1,129
Education Level2
No Formal 1.7 (1.3, 2.1) 1,160 273 Elementary 24.4 (23.2, 25.7) 17,123 3,430 Secondary 41.7 (40.5, 42.8) 29,189 4,623 Post-Secondary 3.4 (2.9, 3.8) 2,351 361 College or above 28.9 (27.6, 30.1) 20,225 2,953
Residence x wealth index quintile3
Urban 46.6 (43.0, 50.2) 32,629 4,610 Lowest 0.7 (0.5, 1.0) 489 115 Second 5.1 (4.4, 6.0) 3,605 667 Middle 9.5 (8.5, 10.5) 6,633 1,024 Fourth 11.9 (10.9, 13.1) 8,368 1,159 Highest 19.3 (17.7, 21.0) 13,535 1,645 Rural 53.4 (49.8, 57.0) 37,434 7,034 Lowest 2.5 (2.0, 3.1) 1,738 452 Second 13.3 (12.0, 14.7) 9,332 2,073 Middle 14.4 (13.2, 15.8) 10,119 1,874 Fourth 13.2 (12.0, 14.5) 9,216 1,555 Highest 10 (8.9, 11.4) 7,031 1,080
Note: The following observations were missing: 0 for age, 0 for gender, 0 for residence, and 4 for education. 1 95 % Confidence Interval 2 Education Level: No Formal = No formal schooling; Elementary = Elementary undergraduate or elementary graduate; Secondary = High school undergraduate or high school graduate; Post-Secondary = Post-secondary years 1, 2 or 3; College or Higher = College undergraduate, college graduate, or post graduate degree completed
3National Statistics Office (NSO) [Philippines], and ICF Macro. 2009. National Demographic and Health Survey 2008. Calverton, Maryland: NSO and ICF Macro.
38 Global Adult Tobacco Survey : Philippines Country Report, 2015

4. TOBACCO USE
This chapter presents prevalence of tobacco use among adults in the Philippines. Tobacco use includes both smoking and smokeless tobacco use. The data describes smoking behavior with respect to the status and pattern of tobacco use; use of tobacco products; number and frequency of tobacco use; age of initiation; and indicators of tobacco dependence by selected demographic characteristics.
Key Findings in 2015: Tobacco Use
• Overall 23.8% (16.5 million adults) currently use tobacco; men: 41.9% and women: 5.8%. • Overall 22.7% (15.9 million adults) currently smoke tobacco; men: 40.3% and women: 5.1%. • Overall 18.7% (13.1 million adults) currently smoke tobacco daily; men: 33.9% and women: 3.6%. • Overall 21.5% (15.0 million adults) currently smoke manufactured cigarettes; men: 38.9% and
women: 4.2%. • Overall, 1.7% (1.1 million adults) currently use smokeless tobacco; men: 2.7% and women: 0.7%. • Overall, the average age of initiation of cigarette smoking among ever daily smokers aged 15-34, is
17.5 years old; men: 17.5 years old and women: 18.3 years old. • On the average, daily cigarette smokers smoke 11.0 cigarettes per day; men smoke 11.2 cigarettes
per day and women smoke 8.6 cigarettes per day.
39 Global Adult Tobacco Survey : Philippines Country Report, 2015

4.1 Prevalence of current tobacco use
Both of the above figures present prevalence of current tobacco use by selected demographic characteristics. Figure 4.1 shows the overall prevalence across all age groups and sexes, while Figure 4.2 shows prevalence by type of current tobacco use.
The overall prevalence of current tobacco use among adults was 23.8% (16.5 million); men: 41.9% and women: 5.8%. Approximately 14.6 million men and 2.0 million women were current tobacco users. Three out of 10 adults from age group 25–44 (27.0%) or age group 45–64 (28.3%) were current tobacco users.
In the Philippines, there are two types of tobacco according to pattern-of-use (i.e. whether they smoke tobacco or use smokeless tobacco). The majority of current tobacco users are tobacco smokers, across ages (15 years and over) and sexes. Overall, 92.8% of current tobacco users smoked tobacco only; 4.4% use smokeless tobacco only; and 2.7% used both smoked and smokeless tobacco. More women (10.6%) were users of smokeless tobacco than men (3.6%). Also, more adults aged 65 and above (13.4%) used smokeless tobacco as compared to younger adults. (Table 4.10)
23.8
41.9
5.8
16.7
27.0 28.3 20.6
0
20
40
60
80
100
Percent
Figure 4.1: Percentage of current tobacco users by sex and age group - GATS, Philippines, 2015
92.8 93.5 88 94.1 93.6 92.8 82.1
4.4 3.6 10.6 3.7 3.2 5.2 13.4
2.7 2.9 1.4 2.3 3.2 1.9 4.4
0%
20%
40%
60%
80%
100%
Figure 4.2: Percentage distribution of current tobacco users by pattern of tobacco use, sex and age group - GATS, Philippines, 2015
Both smoked and smokeless Smokeless onlySmoked only
40 Global Adult Tobacco Survey : Philippines Country Report, 2015

Figures 4.3 and 4.4 show the tobacco use status of current tobacco smokers and current smokeless tobacco users respectively. Current tobacco use (smoked and smokeless) was categorized as daily or occasional.
Among adults aged 15 years and older, 22.7 % were current tobacco smokers, representing 15.9 million adults. There were 40.3% or 14.0 million men, and 5.1% or 1.8 million women, who currently smoke tobacco.
Of the 22.7% current tobacco smokers, 18.7% (13.1 million adults) were daily smokers and 4.0% (2.7 million adults) were occasional smokers. Among the daily smokers, 33.9% were men and 3.6% were women. More adults aged 45-64 (22.5%) smoked daily than adults of other ages. One in four daily smokers (24.7%) had an elementary level education. The proportion of daily smokers who lived in urban areas and rural areas was equal (18.5%). (Tables 4.1, 4.2 and 4.5)
Among those who were occasional smokers, 6.4% were men and 1.5% were women. Among occasional smokers, adults aged 25–44 (4.5%), and those with elementary level of education (5.0%) formed the largest groups in their respective groups. More occasional smokers lived in rural areas (4.7%) than in urban areas (3.1%). (Tables 4.1, 4.2 and 4.5)
Overall, the highest prevalence of current smokers was among adults aged 45–64 years (26.8%) and with an educational level of up to elementary (30.1%). Current smokers from rural areas accounted for 23.5% and 21.7%in urban areas. Results show that in both urban and rural areas, current smoking was inversely related to the household wealth index. Current smoking was more prevalent among those who belonged to the lowest quintile of the household wealth index (lowest urban: 41.1%; lowest rural: 29.4%) as compared to those who belonged to the highest quintile (highest urban: 17.0%; highest rural: 15.7%). (Table 4.3)
22.7 18.7
4.0
40.3 33.9
6.4 5.1 3.6 1.5 0
10
20
30
40
50
Currenttobaccosmoker
Dailysmoker
Occasionalsmoker
Percent
Figure 4.3: Percentage of current tobacco smokers by smoking status and sex - GATS, Philippines, 2015
Overall Men Women
1.7 1.0 0.7
2.7 1.5 1.2 0.7 0.5 0.2
0
2
4
6
8
10
Currentsmokeless
tobaccouser
Daily user Occasionaluser
Percent
Figure 4.4: Percentage of current smokeless tobacco user by status and sex - GATS, Philippines, 2015
Overall Men Women
41 Global Adult Tobacco Survey : Philippines Country Report, 2015
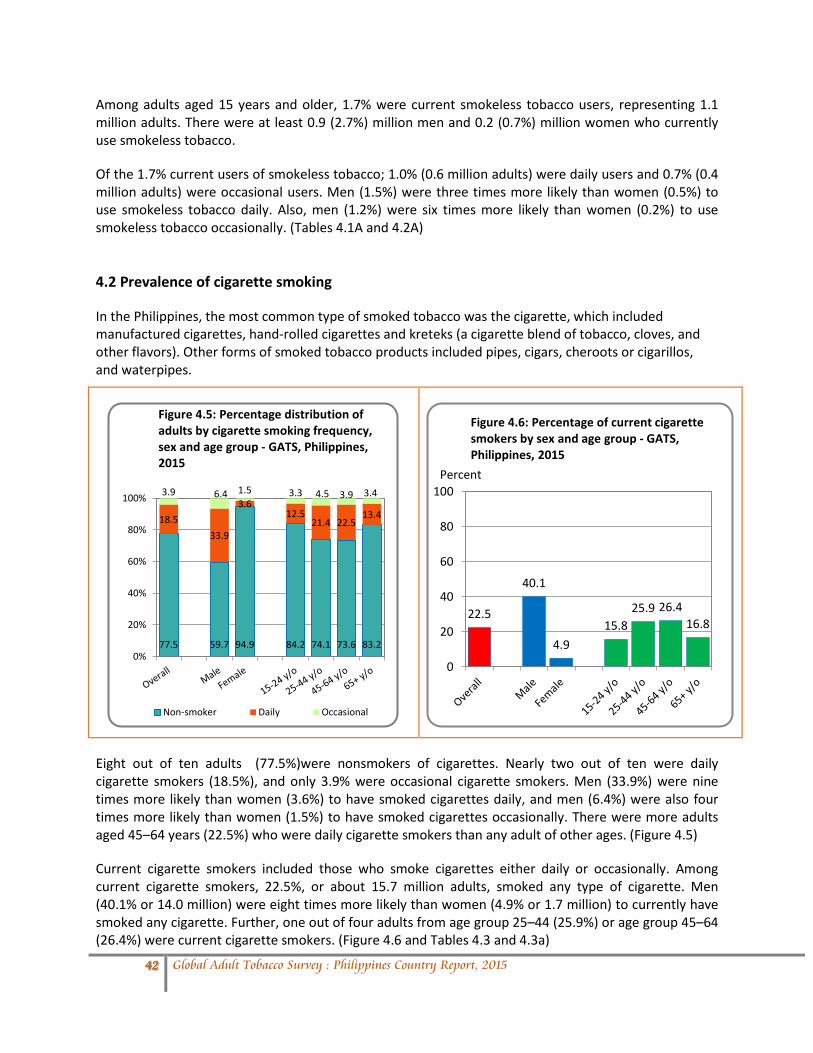
Among adults aged 15 years and older, 1.7% were current smokeless tobacco users, representing 1.1 million adults. There were at least 0.9 (2.7%) million men and 0.2 (0.7%) million women who currently use smokeless tobacco.
Of the 1.7% current users of smokeless tobacco; 1.0% (0.6 million adults) were daily users and 0.7% (0.4 million adults) were occasional users. Men (1.5%) were three times more likely than women (0.5%) to use smokeless tobacco daily. Also, men (1.2%) were six times more likely than women (0.2%) to use smokeless tobacco occasionally. (Tables 4.1A and 4.2A)
4.2 Prevalence of cigarette smoking
In the Philippines, the most common type of smoked tobacco was the cigarette, which included manufactured cigarettes, hand-rolled cigarettes and kreteks (a cigarette blend of tobacco, cloves, and other flavors). Other forms of smoked tobacco products included pipes, cigars, cheroots or cigarillos, and waterpipes.
Eight out of ten adults (77.5%)were nonsmokers of cigarettes. Nearly two out of ten were daily cigarette smokers (18.5%), and only 3.9% were occasional cigarette smokers. Men (33.9%) were nine times more likely than women (3.6%) to have smoked cigarettes daily, and men (6.4%) were also four times more likely than women (1.5%) to have smoked cigarettes occasionally. There were more adults aged 45–64 years (22.5%) who were daily cigarette smokers than any adult of other ages. (Figure 4.5)
Current cigarette smokers included those who smoke cigarettes either daily or occasionally. Among current cigarette smokers, 22.5%, or about 15.7 million adults, smoked any type of cigarette. Men (40.1% or 14.0 million) were eight times more likely than women (4.9% or 1.7 million) to currently have smoked any cigarette. Further, one out of four adults from age group 25–44 (25.9%) or age group 45–64 (26.4%) were current cigarette smokers. (Figure 4.6 and Tables 4.3 and 4.3a)
77.5 59.7 94.9 84.2 74.1 73.6 83.2
18.5 33.9
3.6 12.5
21.4 22.5 13.4
3.9 6.4 1.5 3.3 4.5 3.9 3.4
0%
20%
40%
60%
80%
100%
Figure 4.5: Percentage distribution of adults by cigarette smoking frequency, sex and age group - GATS, Philippines, 2015
Non-smoker Daily Occasional
22.5
40.1
4.9 15.8
25.9 26.4 16.8
0
20
40
60
80
100Percent
Figure 4.6: Percentage of current cigarette smokers by sex and age group - GATS, Philippines, 2015
42 Global Adult Tobacco Survey : Philippines Country Report, 2015

The prevalence of smoking any type of cigarette in both urban (21.7%) and rural areas (23.2%) was almost the same. (Table 4.3)
Manufactured cigarettes were the most commonly used type of smoked tobacco in the Philippines. The use of manufactured cigarettes (21.5%) was significantly higher than the use of hand-rolled cigarettes (2.5%) or kreteks (0.4%). Of the 15.9 million adults who currently smoked tobacco, 15million smoked manufactured cigarettes. Men (38.9%) were nine times more likely than women (4.2%) to have currently smoked manufactured cigarettes. The prevalence of smoking manufactured cigarettes in both urban (21.3%) and rural areas (21.7%) was almost the same. (Table 4.3 and 4.4)
Other tobacco products smoked by current smokers included pipes (0.4%), cigars, cheroots or cigarillos (0.8%), and waterpipes (0.4%). (Table 4.3)
4.3 Number of cigarettes smoked daily and time-to-first-smoke after waking
The number of cigarettes smoked per day and the interval of time-to-first-smoke after waking are indicators for nicotine dependence of current cigarette smokers.
Overall, the average number of cigarettes smoked per day by daily cigarette smokers was 11 sticks. Men smoked more than the average (11.2 sticks), while women smoked less than the average (8.6 sticks). Across all ages, adults aged 45–64 years old smoked the largest number of cigarettes (12.2 sticks). Further, those who with the highest education level (college or above) were the heaviest smokers. Adults from rural areas consumed slightly more cigarettes a day (11.0) than adults who were from urban areas (10.9). (Table 4.6)
11.0 11.2
8.6 8.8
11.2 12.2
10.6
0.0
3.0
6.0
9.0
12.0
15.0Number
Figure 4.7: Average number of cigarettes smoked per day among daily cigarette smokers by sex and age group - GATS, Philippines, 2015
33.7 34.8
7.6
1.2 22.7
Figure 4.8: Percentage distribution of number of cigarettes smoked on average per day among daily cigarette smokers - GATS, Philippines, 2015
1-5 6-10 11-15 16-20 >20
43 Global Adult Tobacco Survey : Philippines Country Report, 2015

One-third (33.7%) of daily cigarette smokers smoked 1–5 cigarettes per day, and 34.8% smoked 6–10 cigarettes per day. One out of five of daily cigarette smokers (22.7%) smoked heavily, consuming more than 20 cigarettes per day. More men (23.5%) had smoked more than 20 cigarettes a day than women (14.4%). Heavy smoking was common among adults belonging to age group 45–64 years old (26.4%) and to adults with educational level of elementary (24.1%). The proportion of adults who smoked more than 20 cigarettes per day from urban areas (21.8%) and rural areas (23.5%) was almost the same. (Table 4.6)
About 17.4% of the daily smokers reported that they smoke within five minutes or less after waking in the morning. More than one-third (35.3%) of daily smokers smoked within 6 to 30 minutes and almost 3 out of 10 (29.5%) daily smokers smoked more than an hour upon waking. (Table 4.11)
Figure 4.10 shows that men tend to smoke earlier than women during the first hour in the morning. Consequently, more women (39.9%) than men (28.3%) deferred their smoking for more than an hour after waking in the morning. (Table 4.11)
17.4
35.3 17.8
29.5
Figure 4.9: Percentage distribution of daily smokers by time to first smoke upon waking - GATS, Philippines, 2015
<=5 minutes 6 to 30 minutes31 to 60 minutes >60 minutes
17.9
35.6
18.1
28.3
12.8
32.2
15.1
39.9
0
10
20
30
40
50
<=15minutes
6 to 30minutes
31 to 60minutes
>60minutes
Percent
Figure 4.10: Percentage of daily smokers by time to first smoke after waking by sex - GATS, Philippines, 2015
Male Female
44 Global Adult Tobacco Survey : Philippines Country Report, 2015

4.4 Age at smoking initiation
In the Philippines, sale of cigarettes to minors (<18 years old) is prohibited. The figures above show the percentage distribution of ever daily smokers by age when they started to smoke daily.
Among respondents 15–17 years of age who have ever been daily smokers, 39.1% reported that they started to smoke daily when they were 14 or 15 years old and 36.1% reported that they just recently started (16–17 years old) the habit of daily smoking. However, about one out of five (21.4%) started daily smoking at a very young age of 12 or 13 years old. (Table 4.7a)
The average age at daily smoking initiation among respondents aged 15–34 years was 17.5 years. Men started to smoke daily earlier (17.5 years) than women (18.3 years). Across educational levels, respondents with post-secondary education were older when they started to smoke daily, about 19.4 years old. There was no difference in age at daily smoking initiation of respondents from either urban or rural areas (17.5 years). (Table 4.7)
Overall, 36.4% of respondents aged 15–34 years old who have ever smoked daily reported that they initiated daily smoking when they were 17–19 years old. More than one-quarter (26.1%) started the habit at age 20 or older. Almost the same percentage of respondents (25.2%) initiated daily smoking at the very young age of 15 or 16 years old. (Table 4.7)
0.8 2.6
21.4
39.1
36.1
Figure 4.11: Percentage distribution of ever daily smokers 15-17 years old by age at daily smoking initiation - GATS, Philippines, 2015
<10 y/o 10-11 y/o 12-13 y/o14-15 y/o 16-17 y/o
12.3
25.2
36.4
26.1
Figure 4.12: Percentage distribution of ever daily smokers 15-34 years old by age at daily smoking initiation - GATS, Philippines, 2015
<15 y/o 15-16 y/o 17-19 y/o 20+ y/o
45 Global Adult Tobacco Survey : Philippines Country Report, 2015

4.5 Quit Rate
Quit rate is a key indicator in measuring the success of efforts to encourage cessation among former daily smokers. Former daily smokers include current nonsmokers. Quit rate is the percentage of ever daily smokers who currently do not smoke.
Figure 4.13 shows the quit rate among ever daily smokers. The overall quit rate was 19.3%, or almost one–fifth of ever daily smokers. Data suggests that 31.0% of women have quit smoking as compared to 17.7% of men. Data also suggests that as age increases, the quit rate also increases. This suggests that ever daily smokers become more successful in qutting smoking as they get older. The quit rate of ever daily smokers who were 65 years and older (49.2%) was more than twice that of those 45–64 years (24.3%); more than three times that of those 25–44 years old (14.5%); and five times higher than adults aged 15–24 years (8.9%). (Table 4.8)
Figure 4.14 presents the percentage distribution of former daily smokers who have quit smoking for less than one year; from one to less than five years; from five years to less than ten years; and for ten years or more. Those in the group who had quit for 10 or more had an overall prevalence of 49.3%, with women at a higher prevalence (53.3%) than men (48.4%). (Table 4.9)
19.3 17.7
31.0
8.9 14.5
24.3
49.2
0
10
20
30
40
50Percent
Figure 4.13: Percentage of ever daily smokers who are former daily smokers by sex and age group - GATS, Philippines, 2015
14.1
24.0
12.6
49.3
13.6
24.3
13.8
48.4
16.4 23.0
7.4
53.3
0
20
40
60
80
<1 year 1 to <5years
5 to <10years
>=10 years
Percent
Figure 4.14: Percentage of former daily smokers by time since quitting smoking- GATS, Philippines, 2015
Overall Male Female
46 Global Adult Tobacco Survey : Philippines Country Report, 2015

5. ELECTRONIC CIGARETTES
5.1 Prevalence of knowledge and use of e-cigarettes
Electronic nicotine delivery system (ENDS), of which electronic cigarettes are the most common prototype, are the subject of a public health dispute among bona fide tobacco-control advocates that has become more divisive as their use has increased. Whereas some experts welcome e-cigarettes as a pathway to the reduction of tobacco smoking, others characterize them as products that could undermine efforts to denormalize tobacco use. ENDS, or e-cigarettes, therefore, represent an evolving frontier, filled with promise and threat for tobacco control. 10
An electronic cigarette or e-cigarette is a handheld electronic device that vaporizes a flavored liquid. The user inhales the vapor. Using e-cigarettes is often called vaping. The fluid in the e-cigarette, called e-liquid, is usually made of nicotine, propylene glycol, glycerine, and flavorings. 11
In the Philippines, about 3 out of 10 adults (31.7%) had heard of electronic cigarettes or e-cigarettes. Significantly more males (36.4%) than females (27.1%) had heard of e-cigarettes. E-cigarettes were more popular among younger adults, including those aged 15–24 years (36.3%), than among older age groups. Adults who were 65 years old and older (11.3%) were less aware of e-cigarettes. Across educational levels, survey results showed that awareness of e-cigarettes increased with the educational level of respondents. Respondents from urban areas (43.8%) were more than twice as likely to have heard about e-cigarettes as were respondents from rural areas (21.1%). (Table 4.12)
The overall prevalence of ever-used and current use of e-cigarettes among all adults was 2.8% and 0.8%, respectively. A higher prevalence of e-cigarette use among men than women was evident in Figure 4.16. Men were three times and five times more likely than women to have ever used an e-cigarette or to currently use e-cigarettes, respectively.
31.7 36.4
27.1
36.3 34.5
26.4
11.3
0
10
20
30
40
50Percent
Figure 5.1: Percentage of adults who ever heard of electronic cigarettes by sex and age group - GATS, Philippines, 2015
2.8
4.5
1.1
4.3
1.5 0.8
1.3
0.2
1.3
0.2 0
1
2
3
4
5
Overall MaleFemale Urban Rural
Percent
Figure 5.2: Percentage of adults by use of electronic cigarette, sex and age group - GATS, Philippines, 2015
Ever used an e-cigarette
Current user of e- cigarette
47 Global Adult Tobacco Survey : Philippines Country Report, 2015

Because knowledge of e-cigarettes was higher in urban areas than in rural areas, the percentage use of e-cigarettes was accordingly higher in urban areas (4.3% for ever used and 1.3% for current use) than in rural areas (1.5 % for ever-used and 0.2% for current use). (Table 4.12)
48 Global Adult Tobacco Survey : Philippines Country Report, 2015

6. SMOKING CESSATION
This section presents findings from the 2015 GATS on smoking cessation among adults who reported they were either current or former tobacco smokers. Its findings report attempts to quit smoking; the health-seeking behavior of smokers; interest in quitting tobacco use; and cessation methods.
Key Findings in 2015: Smoking Cessation
• 76.7% of current smokers planned to or were thinking about quitting smoking. • 3.9% of ever daily smokers quit smoking during the past year. • 4.0% of those who smoked in the past 12 months successfully quit. • 56.5% of smokers who visited a healthcare provider in the past 12 months were advised to quit
smoking.
6.1 Interest in quitting smoking and quit attempts
10.3
8.5
57.9
19.1
4.2
Figure 6.1: Percentage distribution of current smokers by interest in quitting smoking - GATS, Philippines, 2015
Planning to quit within the next month
Thinking about quitting within next 12 months
Will quit someday but not in the next 12 months
Not interested in quitting
Don’t know
52.2 51.5 57.1 54.4 51.6 52.7
46.1
0
20
40
60
80
100Percent
Figure 6.2: Percentage of current smokers who made a quit attempt by sex and age group - GATS, Philippines, 2015
49 Global Adult Tobacco Survey : Philippines Country Report, 2015

Interest in quitting smoking among current smokers is defined as planning to quit or thinking about quitting smoking within the next month, 12 months, or someday. The interest in quitting was categorized as planning to quit within the next month; thinking about quitting within the next 12 months; planning to quit someday but not in the next 12 months; not interested in quitting; or not knowing if they will quit or not.
Overall, 76.7% of current smokers (current daily or occasional smokers) were interested in quitting; 10.3% were planning to quit within next month, 8.5% were thinking about quitting smoking within the next 12 months, 8.5% were thinking about quitting within 12 months, and 57.9% were planning to quit someday.(Table 5.3)
More female current smokers planned to quit smoking within the next month (17.6%) than males (9.4%). But, there was no significant difference in proportion of respondents who planned to quit smoking within the next month across all educational levels and residence types. (Table 5.3)
More than half of current smokers (57.9%) had plans to quit smoking someday but not in the next 12 months. This proportion was significantly higher than any other response recorded regarding the interest of current smokers in quitting smoking. However, the differences reported were not significant across sex, educational levels and residence. (Table 5.3)
Quit attempts were measured among current smokers and former smokers who have been abstinent for less than 12 months. About one in five current smokers (19.1%) were not interested in quitting. Only 8.5% were thinking about quitting within the next 12 months, and 4.2% were unsure whether they will quit smoking or not. (Table 5.3)
More than half (52.2%) of the smokers made a quit attempt. The proportion of men (51.5%) who made a quit attempt was not so different from the proportion of women (57.1%). Smokers who were younger or who were in the 15–24 year age group had the highest percentage of quit attempts (54.4%). Across educational levels, those who attained post-secondary education (61.6%) reported the highest percentage of quit attempts. There was no difference in the quit attempt percentage of smokers who were from either urban (50.2%) or rural (53.8%) areas. (Table 5.1)
50 Global Adult Tobacco Survey : Philippines Country Report, 2015

Overall, one-quarter(26.5%) of smokers visited a healthcare provider (HCP), and more female smokers (40.0%) visited a HCP than male smokers (24.7%). The HCP asked 70.5% overall if they were smokers, and advised more than half (56.5%) to quit smoking. The percentage asked by a HCP if they smoked was 72.8% for men and 60.2% for women ;while HCPs advised 58.1% of men and 48.8% of women to quit smoking. (Table 5.1)
About 4.0% of smokers were successful quitters, and women (6.9%) were more likely than men (3.6%) to quit successfully. Young smokers quit smoking more successfully than older smokers. Notably, 7.0% of smokers aged 15–24 years were able to quit, while only 3.3% of smokers aged 25-44 and 2.5% of smokers aged 45–64 (2.5%) quit successfully. (Table 5.1)
26.5 24.7
40.0
70.5 72.8 60.2 56.5 58.1
48.8
0
20
40
60
80
100
Overall Male Female
Percent
Figure 6.3: Percentage of smokers who received health care provider advice - GATS, Philippines, 2015
Visited a HCPAsked by HCP if a smokerAdvised to quit by HCP
4.0 3.6
6.9 7.0
3.3 2.5
5.3
0
2
4
6
8
10Percent
Figure 6.4: Percentage of successful quitters by sex and age group - GATS, Philippines, 2015
51 Global Adult Tobacco Survey : Philippines Country Report, 2015

6.2 Smoking cessation methods and reasons to quit
The above figures show the percentages of smokers who attempted to quit smoking according to the cessation methods used and their reasons for quitting.
The 2015 GATS identified several methods of cessation such as pharmacotherapy, which includes nicotine replacement therapy and prescription medications; counseling, which includes counseling at cessation clinics and via telephone quit line/help lines; the use of e-cigarettes; switching to smokeless tobacco; traditional medicines; and self-education materials. However, despite the availability of multiple cessation methods, 7 out of 10 smokers (68.5%) reported that they attempted to quit smoking without using any of these methods. The same number of respondents (13.6%) used counseling and self-education materials, and the use of pharmacotherapy was less prevalent at 12.4%. The use of e-cigarettes (2.1%), traditional medicines (1.3%), and switching to smokeless tobacco (1.7%) as cessation methods were relatively unpopular among smokers. There was no significant difference in the percentage of use of various cessation methods across sexes, age groups, educational levels and residence, except that e-cigarettes were used more frequently by smokers in urban areas (4.2%) to quit than in rural areas (0.6%). Further, switching to smokeless tobacco as a cessation method was more popular in rural areas (2.8%) than in urban areas (0.2%). (Table 5.2)
Reason for attempting to quit smoking varied. The most common response was for health reasons (83.1%). Seven out of ten smokers (67.2%) wanted to quit because their families wanted them to stop smoking, and more than half cited financially-related reasons, including to save money (58.1%) and the high price of cigarettes (55.5%). Others were mindful of antismoking policies (34.8%), or reported a no-smoking policy at work (26.7%). (Table 5.2a)
68.5
13.6 13.6 12.4 5.7 2.1 1.3 1.7 0
20406080
100Percent
Figure 6.5: Percentage of smokers who attempted to quit smoking by cessation methods used - GATS, Philippines, 2015
83.1 67.2
58.1 55.5
34.8 26.7
6.0 0
20
40
60
80
100Percent
Figure 6.6: Percentage of smokers who attempted to quit smoking by reasons for quitting - GATS, Philippines, 2015
52 Global Adult Tobacco Survey : Philippines Country Report, 2015

7. SECONDHAND SMOKE
Nonsmokers exposed to second-hand smoke breathe in toxic chemicals from tobacco smoke as the smokers do, with similar, although smaller effects. Secondhand smoke (SHS), and the process of breathing smoke from tobacco is also called involuntary smoking or passive smoking.12
SHS is one of the most important and widespread exposures in the indoor environment. The link between SHS and several health outcomes, including respiratory infections, ischaemic heart disease, lung cancer and asthma, has long been established.13 SHS consists of smoke released from a smoldering cigarette or other smoking device (e.g. cigar, pipe, bidi) and diluted with ambient air.14
Key Findings in 2015: Exposure to Secondhand Smoke
• 21.5% of adults who worked indoors (3.6 million adults) were exposed to tobacco smoke in enclosed areas at their workplace in the past month.
• 34.7% of adults (24.0 million adults) were exposed to tobacco smoke at home at least monthly. • 86.3% of adults (32.6 million adults) were exposed to tobacco smoke when visiting bars and
nightclubs. • 37.6% of adults (20.2 million adults) were exposed to tobacco smoke when using public
transportation. • 11.6% of adults (8.1 million) were exposed to tobacco smoke in restaurants. • 29.0% of adults (20.2 million) were exposed to tobacco smoke in public transportation.
53 Global Adult Tobacco Survey : Philippines Country Report, 2015

7.1 Exposure to secondhand smoke at workplace or at home
Overall, one out of five (21.5%) adults who work outside of the home (i.e. work indoors, or both indoors and outdoors) were exposed to tobacco smoke at work. This is equal to more than 3.6 million adult workers, and out of these workers, about 2.3 million or 17.8% were nonsmokers and were also exposed to tobacco smoke in their workplaces. Men, regardless of smoking status, were exposed to SHS at work more frequently than women. Data show that exposure to tobacco smoke at work was common among the elderly, or those aged 65 and older (among all elderly adults: 30.6%; among nonsmokers: 20.3%). Across all educational levels, the prevalence of exposure among those with elementary level education was significantly higher (overall: 38.5%; nonsmokers: 31.9%) as compared with adults with higher educational attainment. (Table 6.1)
Among all adults, 34.7% were exposed to tobacco smoke at home, while 27.3% of adult nonsmokers were exposed to SHS at home. Overall, males (39.0%) were exposed more frequently than females (30.3%). Among nonsmokers, females (28.6%) were exposed more frequently to SHS than males (25.2%).
Younger age groups had higher risk of exposure than the older age groups. While 29.0% of adults aged 65 and older were exposed to SHS, exposure was higher in the younger age groups, including 36% for ages 15–24 years; 35% for ages 25–44 years; and 34.1% for ages 45–64 years. Similarly, among nonsmokers, the exposure of younger adults (ages 15–24 years: 31.6%; ages 25–44 years: 26.4%) was significantly higher than the older adults aged 65 and older (20.9%). (Table 6.2)
21.5 26.4
16.4 17.9 22.0 23.2
30.6
17.8 21.0
15.7 15.5 18.1 19.6 20.3
0
10
20
30
40
50Percent
Figure 7.1: Percentage of adults who work indoors and are exposed to tobacco smoke at work, by smoking status,sex and age group - GATS, Philippines, 2015
Overall Non-smokers
34.7 39.0
30.3 36.0 35.0 34.1
29.0
27.3 25.2 28.6
31.6 26.4 24.5
20.9
0
10
20
30
40
50
Percent
Figure 7.2: Percentage of adults who are exposed to tobacco smoke at home, by smoking status,sex and age group - GATS, Philippines, 2015
Overall Non-smokers
54 Global Adult Tobacco Survey : Philippines Country Report, 2015

7.2. Exposure to secondhand smoke exposure at various public places
Public places where people could be exposed to SHS included public transportation, restaurants, government buildings, healthcare facilities, schools, universities, and bars or nightclubs.
It was reported that the percentage of adults who were exposed to SHS was significantly highest in public transportation (29.0%) and in restaurants (11.6%) among any other public places. The exposure was lowest in healthcare facilities (1.7%), followed by universities (2.2%), schools (4.3%), bars or night clubs (4.7%) and government buildings (5.6%). Percentage of SHS exposure among nonsmokers in the same public places was more or less the same. (Tables 6.3 and 6.3a)
On the other hand, the percentage of adults who visited the same public places identified above and who were exposed to SHS was significantly highest in bars or night clubs (86.3%) and public transportation (37.6%). The lowest was still in healthcare facilities (4.2%), followed by the schools (10.9%), government buildings (13.6%), universities (15.1%), and in restaurants (21.9%). The percentage of SHS exposure among nonsmokers who visited the same public places was more or less the same. (Tables 6.4 and 6.4a)
29.0
11.6 5.6 4.3 4.7 2.2 1.7
28.9
10.9 5.0 4.6 3.1 2.4 1.7 0
10
20
30
40
50
Perc
ent
Figure 7.3: Percentage of adults who were exposed to tobacco smoke in various public places by smoking status - GATS, Philippines, 2015
Overall
Non-smokers
86.3
37.6
21.9 15.1 13.6 10.9
4.2
80.7
37.2
20.3 14.9 12.2 10.9 3.8 0
20
40
60
80
100
Perc
ent
Figure 7.4: Percentage of adults who visited various public places and were exposed to tobacco smoke, by smoking status - GATS, Philippines, 2015
Overall
Non-smokers
55 Global Adult Tobacco Survey : Philippines Country Report, 2015

7.3. Smoking policy at work
The above figures show the percentage distribution of current smokers (Figure 7.5) and adults who were exposed to smoke who work either indoors or outdoors with an enclosed area, according to the smoking policy they have at work. (Figure 7.6)
The majority of current smokers who work either indoors or outdoors with an enclosed area reported that smoking was allowed everywhere in their workplace (65.2%). About 13.6% of respondents reported that smoking was not allowed in any enclosed area of their workplace; 15.1% responded that smoking was allowed only in some enclosed areas; and 5.2% responded that their workplace did not have a smoking policy.
Among those who work in areas where smoking was not allowed in any area, male current smokers (14.7%) were significantly higher than female (3.4%). Among those who work in places where there was no smoking policy, current smokers aged 65 and older (16.5%), were significantly more than the current smokers who belonged to younger age groups. Across, education levels those who finished college or above were significantly less than current smokers with lower educational attainment (elementary 7.0%; no formal 5.9%) among those who work in places where there was no smoking policy. (Table 6.1a)
Among all adults who work either indoors or outdoors with an enclosed area and are exposed to tobacco smoke at work, one-third (35.7%) reported that smoking was allowed everywhere in their workplaces. Females (42.3%) were more exposed to smoke than males (31.7%), and those living in rural areas (38.0%) were more exposed to smoke than those in urban areas (33.6%). (Table 6.1b)
One in four adults reported that smoking was not allowed in any enclosed area in their work (24.4%) or that smoking was allowed only in some enclosed areas (27.4%). One in ten adults (12.3%) reported that there was no smoking policy in their places of work. (Table 6.1b)
13.6
65.2
15.1
5.2
0.8
Figure 7.5: Percentage distribution of current smokers, by the smoking policy they have at work - GATS, Philippines, 2015
Not allowed inany enclosedareaAllowedeverywhere
Allowed only insome enclosedareasNo policy
Don't know
24.4
35.7
27.4
12.3
0.3
Figure 7.6: Percentage distribution of adults who are exposed to smoke, by the smoking policy they have at work - GATS, Philippines, 2015
Not allowed inany enclosedareaAllowedeverywhere
Allowed only insome enclosedareasNo policy
Don't know
56 Global Adult Tobacco Survey : Philippines Country Report, 2015

8. ECONOMICS OF TOBACCO SMOKING
Raising taxes on tobacco is the most effective way to reduce tobacco use. However, the tobacco industry will do whatever it can to keep taxes low.
Price and tax measures to reduce the demand for tobacco are one of the core demand reduction strategies that the WHO FCTC requires its parties to implement. According to Article 6, parties recognize that, “price and tax measures are an effective and important means of reducing tobacco consumption.” Further, the WHO FCTC calls on the parties to adopt and maintain tax and price policies that will, “contribute to the health objectives aimed at reducing tobacco consumption.”1
Key Findings in 2015: Economics of Tobacco Smoking
• The average monthly expenditure for manufactured cigarettes was PhP 678.40 (Philippine Pesos).
• Males had higher expenditure at PhP 696.10 than females at PhP 515.80.
• The average cost of 100 packs of manufactured cigarettes was 3.5% of per capita Gross Domestic Product (GDP).
• 63.8% of adults who attempted to quit smoking in the past 12 months did so because of high cigarette cost.
8.1 Brand and source of manufactured cigarette last purchased
23.3
22.3
16.4
9.9
7.6
20.5
Figure 8.1: Percentage distribution of current manufactured cigarette smokers, by last brand purchased - GATS, Philippines, 2015
Fortune
Marlboro
Mighty
Marvel
Jackpot
All others96.4
0.8 2.3 0.1
0.5
Figure 8.2: Percentage distribution of manufactured cigarette smokers, by source of last purchase of cigarettes - GATS, Philippines, 2015
Store
Street vendor
ConveniencestoreFrom anotherpersonOther
57 Global Adult Tobacco Survey : Philippines Country Report, 2015

Among those who currently smoke manufactured cigarettes, Fortune (23.3%) was the most popular brand. The other four of the top five most popular cigarette brands were Marlboro (22.3%), Mighty (16.4%), Marvel (9.9%) and Jackpot (7.6%). The most popular brand among males was Fortune (23.5%), while the most popular among females was Marlboro (25.5%). Fortune and Marlboro were the cigarette brands commonly smoked by younger adults (aged 15–44), while Fortune and Mighty were commonly smoked by older adults (aged 45 and older). Cigarette smokers from urban areas commonly smoked Marlboro (32.0%), while those from rural areas commonly smoked Fortune (21.6%). (Table 7.1)
Almost all these manufactured cigarettes were bought in stores (96.4%), and only a few were bought in convenience stores (2.3%) and from street vendors (0.8%). There was no significant difference in the percentage of respondents across sex, age, education level and residence with respect to the source of their last purchase of cigarettes. (Table 7.2)
8.2 Expenditure on manufactured cigarettes and number of cigarettes last purchased
The figures above show a comparison of the average expenditure on cigarettes per month of smokers and the average number of cigarettes last purchased by smokers in terms of the mean and median.
Overall, the average monthly amount spent by smokers for their cigarettes was PhP 678.40 (PhP=Philippine peso), while, half of the respondents spent more than PhP 531.00. Males (PhP 696.10), spent significantly more for their cigarettes than females (PhP 515.80). Those aged 45–64 (PhP 725.60) and those with highest educational attainment (college or above) spent the most amount per month for their cigarettes (PhP 741.80). Smokers from urban areas spent about PhP 736.60, significantly more than those in rural areas (PhP 627.10). (Table 7.3)
678.4 696.1
515.8 577.7
707.6 725.6
552.6
531.0 569.3
278.9
397.4
534.6 595.1
265.2
0
200
400
600
800
1000
Amount in pesos
Figure 8.3: Average expenditure per month among manufactured cigarette smokers - GATS, Philippines, 2015
Mean Median
19.7 20.5
11.4 7.7
17.4
31.4 36.6
3.6 3.7 2.4 2.0 3.7 4.7 6.1 0
10
20
30
40
50
Number
Figure 8.4 Average number of cigarettes purchased last time among manufactured cigarette smokers - GATS, Philippines, 2015
Mean Median
58 Global Adult Tobacco Survey : Philippines Country Report, 2015

The last purchase of manufactured cigarettes by smokers averaged more than 19 sticks. Males (20.5 sticks) bought almost more than twice what females bought (11.4 sticks). Smokers aged 65 or older bought more than 36 cigarettes during their last purchase, more than four times than young smokers aged 15–24. (7.7). However, the type of residence had no effect in the number of cigarettes last purchased by smokers. (Table 7.3)
8.3 Types of cigarette and packaging of last purchased
The survey revealed that almost all current manufactured cigarette smokers (97.6%) preferred filtered cigarettes, and more than half (51.9%) chose the menthol type of cigarette. Low-tar cigarettes were the least popular (2.5%) among the cigarette types.
Four out of five (80.4%) smokers bought cigarettes by single stick. Across all sexes, educational levels and types of residence, manufactured cigarette smokers usually bought cigarettes by sticks, followed by packs of 20 (16.4%), packs of 10 (1.4%) and by ream, with each ream consisting of 10 packs of 20 cigarettes each (0.5%). (Table 7.5)
97.6
51.9 47.5
17.9
2.5 0
20
40
60
80
100
Filtered Menthol Light Mild Low tar
Percent
Figure 8.5: Percentage of current manufactured cigarette smokers who purchased various types of cigarettes - GATS, Philippines, 2015
80.4
16.4
1.4 0.8 0.5
Figure 8.6: Percentage distribution of manufactured cigarette smokers, by the packaging type of last purchase of cigarettes - GATS, Philippines, 2015
Single stick
Pack of 20
Pack of 10
Otherquantities
Ream (200sticks)
59 Global Adult Tobacco Survey : Philippines Country Report, 2015

8.4 Influence of cigarette price increase in smoking
The survey enumerated several effects of higher cigarette taxes on smokers. Four out of five (82.3%) smokers reported that the number of cigarettes they smoked decreased because of the increased price. Seven out of ten smokers (69.4%) considered quitting smoking, and almost the same percentage of respondents (63.8%) attempted to quit smoking. Two out of five smokers (39.4%) switched to a cheaper brand or simply resorted to asking others for cigarettes (37.5%). A small portion (6.6%) of respondents preferred to buy cigarettes in bulk.
After the implementation of the Sin Tax Law on the sale of cigarettes, smokers decreased their cigarette consumption, with females decreasing their consumption more (86.5%) than males (81.9%). The highest percentage of smokers decreasing the number of sticks smoked due to higher taxes occurred among smokers who were aged 65 years and older (84.2%), possessed an elementary education level (85.2%), and who lived in rural areas (82.5%). (Table 7.6)
82.3 69.4 63.8
39.4 37.5
6.6
0
20
40
60
80
100
Decreasethe
numberof sticks
Thinkabout
quitting
Make anattemptto quit
Switch tocheaperbrand
Ask forcigarettes
fromother
Buycigarettein bulk
Percent
Figure 8.7: Percentage of manufactured cigarette smokers who consider that the tax increases affected their smoking, by type of influence- GATS, Philippines, 2015
82.3 81.9 86.5 81.1 83.5 80.6 84.2
0
20
40
60
80
100Percent
Figure 8.8: Percentage of smokers who decrease number of sticks because of price increase, by sex and age group - GATS, Philippines, 2015
60 Global Adult Tobacco Survey : Philippines Country Report, 2015

9. TOBACCO ADVERTISING, PROMOTION AND SPONSORSHIP
The WHO Report on the Global Tobacco Epidemic, 2013, described the tens of billions of dollars that tobacco companies spend each year on tobacco advertising, promotion and sponsorship and reported that one-third of youth experimentation with tobacco occurs as a result of exposure to tobacco advertising, promotion and sponsorship. According to the report, bans on tobacco advertising, promotion and sponsorship are highly effective in decreasing tobacco use.16
Key Findings in 2015: Advertising, Promotion and Sponsorship
• 40.5% of adults noticed cigarette marketing in stores where cigarettes were sold.
• 9.6% of adults noticed cigarette promotions on clothing or other items with cigarette brand name or logo.
• 39.1% of adults heard anti-cigarette information on the radio.
• 63.7% of adults noticed anti-cigarette information on television.
• 44.6% of current smokers thought about quitting because of warning labels on cigarette packages.
61 Global Adult Tobacco Survey : Philippines Country Report, 2015

The survey reported that overall, and in any location, more adults (83.2%) had noticed anti-cigarette smoking information than had noticed cigarette marketing (58.6%) during the 30 days prior to the survey. Specifically, anti-cigarette smoking information was most visible on television (63.7%) and in healthcare facilities (57.9%). Cigarette marketing was commonly seen in stores (40.5%) and in posters, leaflets and calendars (20.7%).
62 Global Adult Tobacco Survey : Philippines Country Report, 2015
83.2
63.7 57.9
39.1 35.9 30.5
23.8
7.1 6.7
0
20
40
60
80
100Percent
Figure 9.1: Percentage of adults who noticed anti-cigarettes smoking information in various places - GATS Philippines, 2015
58.6
40.5
20.7 12.9 12.8 10.6 7.6 7.4 6.1 6.0
0.9 0
20
40
60
80
100Percent
Figure 9.2: Percentage of adults who noticed cigarette marketing in various places - GATS Philippines, 2015
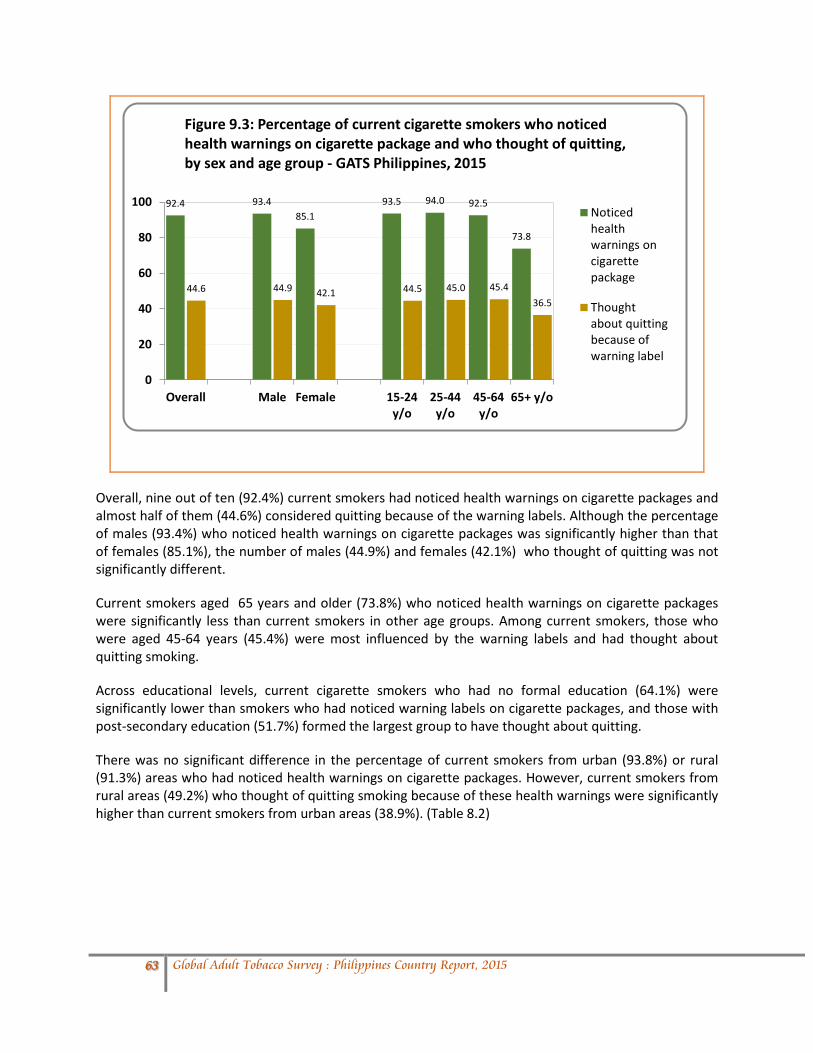
Overall, nine out of ten (92.4%) current smokers had noticed health warnings on cigarette packages and almost half of them (44.6%) considered quitting because of the warning labels. Although the percentage of males (93.4%) who noticed health warnings on cigarette packages was significantly higher than that of females (85.1%), the number of males (44.9%) and females (42.1%) who thought of quitting was not significantly different.
Current smokers aged 65 years and older (73.8%) who noticed health warnings on cigarette packages were significantly less than current smokers in other age groups. Among current smokers, those who were aged 45-64 years (45.4%) were most influenced by the warning labels and had thought about quitting smoking.
Across educational levels, current cigarette smokers who had no formal education (64.1%) were significantly lower than smokers who had noticed warning labels on cigarette packages, and those with post-secondary education (51.7%) formed the largest group to have thought about quitting.
There was no significant difference in the percentage of current smokers from urban (93.8%) or rural (91.3%) areas who had noticed health warnings on cigarette packages. However, current smokers from rural areas (49.2%) who thought of quitting smoking because of these health warnings were significantly higher than current smokers from urban areas (38.9%). (Table 8.2)
63 Global Adult Tobacco Survey : Philippines Country Report, 2015
92.4 93.4 85.1
93.5 94.0 92.5
73.8
44.6 44.9 42.1 44.5 45.0 45.4 36.5
0
20
40
60
80
100
Overall Male Female 15-24y/o
25-44y/o
45-64y/o
65+ y/o
Figure 9.3: Percentage of current cigarette smokers who noticed health warnings on cigarette package and who thought of quitting, by sex and age group - GATS Philippines, 2015
Noticedhealthwarnings oncigarettepackage
Thoughtabout quittingbecause ofwarning label

10. KNOWLEDGE, ATTITUDES AND PERCEPTIONS ABOUT TOBACCO SMOKING
Key Findings in 2015: Knowledge, Attitudes and Perceptions
Overall (All adults):
• 95.0% believed that smoking causes serious illness. • 96.4% believed that smoking causes lung cancer. • 85.7% believed that smoking causes heart attack. • 79.6% believed that smoking causes stroke. • 95.4% believed that smoking causes tuberculosis. • 90.8% believed that cigarettes are addictive. • 93.5% believed breathing other peoples’ smoke causes serious illness in nonsmokers.
Current Smokers:
• 92.7% believed that smoking causes serious illness. • 94.2% believed that smoking causes lung cancer. • 82.0% believed that smoking causes heart attack. • 74.4% believed that smoking causes stroke. • 93.6% believed that smoking causes tuberculosis. • 88.8% believed that cigarettes are addictive. • 90.3% believed breathing other peoples’ smoke causes serious illness in nonsmokers.
Non-Smokers:
• 95.7% believed that smoking causes serious illness. • 97.0% believed that smoking causes lung cancer. • 86.8% believed that smoking causes heart attack. • 81.1% believed that smoking causes stroke. • 96.0% believed that smoking causes tuberculosis. • 91.3% believed that cigarettes are addictive. • 94.5% believed breathing other peoples’ smoke causes serious illness in nonsmokers.
64 Global Adult Tobacco Survey : Philippines Country Report, 2015

10.1 Knowledge of the effects of smoking and secondhand smoke in health
Many tobacco users are unaware of the harms caused by tobacco use. Up to half of all tobacco users will die from a tobacco-related disease.2
The majority of respondents believed that smoking and exposure to secondhand smoke could cause serious and various illnesses. In general, across educational levels, the graphs show that as the respondent becomes educated, the more they believe that smoking and secondhand smoke adversely affect health.
82.7 89.5
94.3 98.4 95.8 78.6 86.0 91.7
93.4 95.1
84.2 91.1 95.2 99.5 95.9
0
20
40
60
80
100
Percent
Figure 10.2: Percentage of adults who believe that secondhand smoke exposure causes serious illness in non-smokers, by smoking status and education level - GATS Philippines, 2015
Overall Current smokers Non-smokers
65 Global Adult Tobacco Survey : Philippines Country Report, 2015
88.3 93.1 95.3 96.3 96.4 90.1 94.6 95.6 97.4 96.7
0
20
40
60
80
100
Percent
Figure 10.1: Percentage of adults who believe that smoking causes serious illness by smoking status and education level - GATS Philippines, 2015
Overall Non-smokers
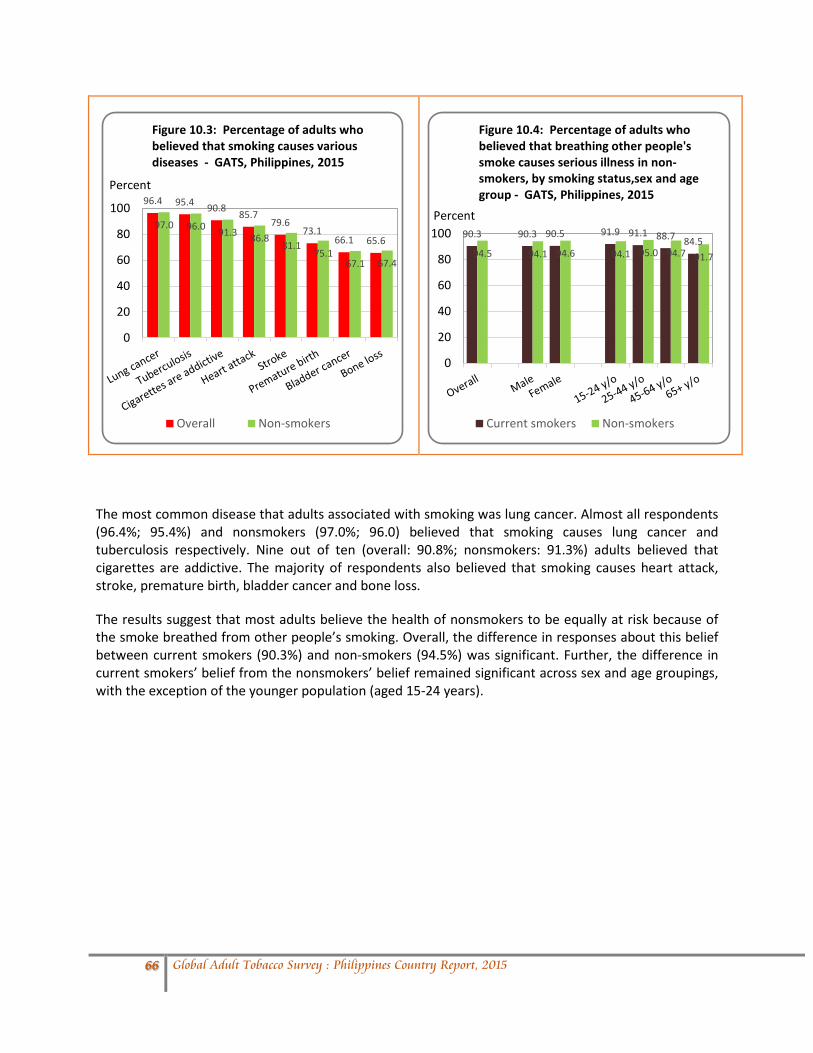
The most common disease that adults associated with smoking was lung cancer. Almost all respondents (96.4%; 95.4%) and nonsmokers (97.0%; 96.0) believed that smoking causes lung cancer and tuberculosis respectively. Nine out of ten (overall: 90.8%; nonsmokers: 91.3%) adults believed that cigarettes are addictive. The majority of respondents also believed that smoking causes heart attack, stroke, premature birth, bladder cancer and bone loss.
The results suggest that most adults believe the health of nonsmokers to be equally at risk because of the smoke breathed from other people’s smoking. Overall, the difference in responses about this belief between current smokers (90.3%) and non-smokers (94.5%) was significant. Further, the difference in current smokers’ belief from the nonsmokers’ belief remained significant across sex and age groupings, with the exception of the younger population (aged 15-24 years).
96.4 95.4 90.8 85.7 79.6
73.1 66.1 65.6
97.0 96.0 91.3 86.8 81.1
75.1 67.1 67.4
0
20
40
60
80
100
Percent
Figure 10.3: Percentage of adults who believed that smoking causes various diseases - GATS, Philippines, 2015
Overall Non-smokers
90.3 90.3 90.5 91.9 91.1 88.7 84.5 94.5 94.1 94.6 94.1 95.0 94.7 91.7
0
20
40
60
80
100Percent
Figure 10.4: Percentage of adults who believed that breathing other people's smoke causes serious illness in non-smokers, by smoking status,sex and age group - GATS, Philippines, 2015
Current smokers Non-smokers
66 Global Adult Tobacco Survey : Philippines Country Report, 2015

10.2 Perception of the harmfulness of cigarettes
Nine out of ten adults (88.9%) perceived all cigarettes to be equally harmful. Males (88.9%) agreed equally with females (88.9%) that all cigarettes are harmful, and the perception about the harmfulness of cigarettes was the same across all age groups and educational levels. However, the percentage of this perception was significantly higher in adults in urban areas (90.9%) than those in rural areas (87.1%) (Table 9.5)
Three out of four (74.8%) current smokers admitted that the cigarette brand they preferred was equally harmful with any other brands. However, about 15.1% believed that their cigarette brand was a little less harmful. About 6.3% recognized that the cigarette they smoked was a little more harmful than other brands.
88.9
6.8 4.3
Figure 10.5: Percentage distribution of adults, by their perception of the harmfulness of cigarettes - GATS, Philippines, 2015
All equallyharmful
Lessharmful
Don’t know 74.8
15.1
6.3
3.9
Figure 10.6: Percentage distribution of current tobacco smokers, by their perception of the harmfulness of their current brand of cigarette- GATS, Philippines, 2015
Nodifference
A little lessharmful
A littlemoreharmfulDon’t know
67 Global Adult Tobacco Survey : Philippines Country Report, 2015

10.3 Support for complete ban on smoking
A high percentage of adults supported a complete ban on smoking in indoor workplaces and public places. Responses were analyzed separately for current smokers and nonsmokers. Overall, the percentage of nonsmokers (98.0%) who favored the complete ban on smoking was significantly higher than that of current smokers (94.5%). Within smoking status, the difference in sex and age did not significantly affect the decision to support a complete ban in smoking.
94.5 94.4 95.8 93.4 94.1 96.5 93.8
98.0 97.7 98.2 97.3 98.4 98.5 97.4
0
20
40
60
80
100Percent
Figure 10.7: Percentage of adults who support complete ban of smoking in indoor workplaces and public places, by smoking status,sex and age group - GATS, Philippines, 2015
Current smokers Non-smokers
68 Global Adult Tobacco Survey : Philippines Country Report, 2015

11. CHANGE OVER TIME : COMPARISON OF 2009 AND 2015
The Philippines first implemented the Global Adult Tobacco Survey (GATS) in 2009, and it was repeated in 2015. The following were the relative changes computed from the two survey rounds.
11.1 Comparative change between 2009 and 2015: Tobacco Use
• Tobacco use prevalence significantly decreased among adults from 29.7% in 2009 to 23.8% in
2015 (from 49.5% to 41.9% among males; from 10.1% to 5.8% among females). This represents a 19.9% relative decline of the tobacco use prevalence (15.3% decline for males; 42.8% decline for females).
• Current cigarette smoking prevalence significantly decreased among adults from 27.9% in 2009 to 22.5% in 2015. This represents a 19.6% relative decline of current cigarette smoking prevalence (15.1% decline for males; 43.9% decline for females).
• Current use of smokeless tobacco decreased among adults from 2.0% in 2009 to 1.7% in
2015. This represents a 15.0% relative decline of current smokeless tobacco use (3.5% decline for males; 41.7% decline for females).
• Average age at daily smoking initiation did not significantly change from 17.3 years in 2009 to
17.5 years in 2015. This represents a 1.4% relative decline in the age of daily smoking initiation (1.8% increase for males; 2.4% decline for females).
• Prevalence of former smokers among ever daily smokers significantly decreased among
adults from 21.5% in 2009 to 19.3% in 2015. This represents a 10.2% relative decline of former smoker prevalence (14.9% significant decline for males; 24.1% increase for females).
69 Global Adult Tobacco Survey : Philippines Country Report, 2015

Overall, there was a significant decrease in the prevalence of current cigarette smokers from 2009 (27.9%) to 2015 (22.5%). The decrease constitutes a decline from one in every four adult current cigarette smokers in 2009, to one in every five adults in 2015. Prevalence of female cigarette smokers in 2009 declined by almost half (43.9%) in 2015.
Across all age groups, the decline in prevalence was also significant. The highest reduction in prevalence was reported for current cigarette smokers aged 65 and older (35.0%). A significant decline in prevalence was also reported among those with no formal education (28.6%); with elementary education (18.8%); and with secondary education (10.4%) only. The number of current cigarette smokers did not significantly change for those with a higher level of education.
In both surveys, the percentage of current cigarette smokers was higher in rural areas than in urban areas, and the decline was significantly higher in rural (25.6%) than in urban areas (12.5%).
Among the different types of cigarettes, the significant decline in prevalence of use was in the manufactured cigarettes (20.3%). There was an increase in the use of hand-rolled cigarettes (28.1%). (Table 10.2)
70 Global Adult Tobacco Survey : Philippines Country Report, 2015
29.7
49.5
10.1
23.8 41.9
5.8
0
20
40
60
80
100
Overall Male Female
Percent
Figure 11.1.1 Prevalence of current tobacco use by sex, Philippines 2009 and 2015
2009 2015
27.9
47.2
8.8
22.5 40.1
4.9
0
20
40
60
80
100
Overall Male Female
Percent
Figure 11.1.2 Prevalence of current cigarette smoking by sex, Philippines 2009 and 2015
2009 2015
29.7
49.5
10.1
0
20
40
60
80
100
Overall Male Female
Percent
Figure 10.1.1 Prevalence of current tobacco use by sex, Philippines 2009 and 2015
2009
27.9
47.2
8.8
22.5 40.1
4.9
0
20
40
60
80
100
Overall Male Female
Percent
Figure 10.1.2 Prevalence of current cigarette smoking by sex, Philippines 2009 and 2015
2009 2015
29.7
49.5
10.1
23.8 41.9
5.8
0
20
40
60
80
100
Overall Male Female
Percent
Figure 10.1.1 Prevalence of current tobacco use by sex, Philippines 2009 and 2015
2009 2015
27.9
47.2
8.8
22.5 40.1
4.9
0
20
40
60
80
100
Overall Male Female
Percent
Figure 10.1.2 Prevalence of current cigarette smoking by sex, Philippines 2009 and 2015
2009 2015
29.7
49.5
10.1
23.8 41.9
5.8
0
20
40
60
80
100
Overall Male Female
Percent
Figure 11.1.1 Prevalence of current tobacco use by sex, Philippines 2009 and 2015
2009 2015
27.9
47.2
8.8
22.5 40.1
4.9
0
20
40
60
80
100
Overall Male Female
Percent
Figure 11.1.2 Prevalence of current cigarette smoking by sex, Philippines 2009 and 2015
2009 2015

The current use of smokeless tobacco among adults reflected a relative decline of 15.0% between the two rounds of the survey. Current use of smokeless tobacco decreased among adults from 2.0% in 2009 to 1.7% in 2015. The decline in the use of smokeless tobacco was twelve times higher in women (41.7%) than in men (3.5%).
11.2 Comparative change between 2009 and 2015: Exposure to Secondhand Smoke (SHS)
• Exposure to SHS in public places significantly declined. The largest drop in exposure to SHS
occurred in government buildings, decreasing from 25.5% in 2009 to 13.6% in 2015. This represents a relative decline of 46.7%.
• In homes, the exposure significantly declined from 54.4% in 2009 to 34.7% in 2015. This is a
36.2% relative decline. • At workplaces, the exposure significantly declined from 32.6% in 2009 to 21.5% in 2015. This
is a 34.3% relative decline.
71 Global Adult Tobacco Survey : Philippines Country Report, 2015
2.0
2.8
1.2
1.7
2.7
0.7
0
1
2
3
4
5
Overall Male Female
Percent
Figure 11.1.3 Prevalence of current smokeless tobacco use by sex, Philippines 2009 and 2015
2009 2015
2.0 1.4
0.6
1.7
1.0 0.7
0
1
2
3
4
5
Currentsmokeless
tobaccouser
Daily user Occasionaluser
Percent
Figure 11.1.4 Prevalence of smokeless tobacco use by type of user, Philippines 2009 and 2015
2009 2015

Overall, across sexes and areas of residence, there was a significant decline in the percentage of adults exposed to SHS in places they visited in the past 30 days preceding the survey. The highest relative decline was in government buildings (46.7%), followed by healthcare facilities (44.4%) and homes (36.2%). (Table 1: MPOWER)
11.3 Comparative change between 2009 and 2015: Smoking Cessation
• The percentage of current smokers who were interested in quitting significantly increased from 60.4% in 2009 to 76.7% in 2015. This represents a relative increase of 27.0%.
• The percentage of smokers who made quit attempts in the last 12 months significantly increased from 47.9% in 2009 to 52.2% in 2015. This is 9.0% relative increase.
• However, the proportion of current smokers who were advised to quit by healthcare providers and the proportion of smokers who successfully quit in the past 12 months did not significantly change from 2009 to 2015.
72 Global Adult Tobacco Survey : Philippines Country Report, 2015
55.3 54.4
33.6 32.6 25.5
7.6
37.6 34.7 21.9 21.5
13.6 4.2
0
20
40
60
80
100
PublicTransportation
Homes Restaurants Workplace GovernmentBuildings
Health CareFacilities
Percent
Figure 11.2.1 Exposure to secondhand smoke in the past 30 days, Philippines 2009 and 2015
2009
2015

The relative increase in percentage of smokers interested in or planning to quit smoking was significant for both sexes, but was higher among females (28.0%) than males (26.9%). Results showed that females were more successful in quitting smoking, with a relative increase of 8.9%; the percentage of male quitters significantly declined by 14.3%. (Table 10.5)
11.4 Comparative change between 2009 and 2015: Knowledge, Attitude and Perception
• The belief that tobacco smoking causes serious illness remains high (94.0% in 2009 and 95.0%
in 2015).
• The percentage of current smokers who thought about quitting smoking because of health warnings on cigarette packages increased significantly (37.4% in 2009 compared to 44.6% in 2015) with a relative change of 19.4%.
• The percentage of adults who noticed anti-cigarette smoking information at any location
increased significantly by 3.9% (80.1% in 2009 to 83.2% in 2015).
73 Global Adult Tobacco Survey : Philippines Country Report, 2015
60.4 51.5 47.9
4.5
76.7
56.5 52.2
4.0 0
20
40
60
80
100
Interest in quitting Advised to quit byhealth care provider
Made a quit attempt Successfully quit*
Percent
Figure 11.3.1 Quit successes, quit attempts and interest in quitting, Philippines 2009 and 2015
2009
2015

Overall, there was a significant increase in the prevalence of current smokers who noticed health warnings on cigarette packages (4.2%) and who thought about quitting because of these warning labels (19.4%). These relative increases were more evident in females than in males and were significant for current smokers from rural areas than in urban areas. (Table 10.11)
11.5 Comparative change between 2009 and 2015: Advertising , Promotion and Sponsorship
• Exposure to any tobacco advertising, promotion and sponsorship in the past 30 days
decreased significantly from 74.3% in 2009 to 58.6% in 2015.
• Similarly, the exposure decreased significantly at points of sale from 53.7% in 2009 to 40.5% in 2015.
74 Global Adult Tobacco Survey : Philippines Country Report, 2015
88.7
37.4
80.1 92.4
44.6
83.2
0
20
40
60
80
100
Noticed health warningson cigarette packages
Thought about quittingbecause of warning labels
on cigarette packages
Noticed anti-cigaretteinformation
Percent
Figure 11.4.1 Thought about quitting because of warning labels and anti -cigarette advertisements, Philippines 2009 and 2015
2009
2015

Survey results suggests that there was a significant decline in the percentages of adults who noticed tobacco advertisements in stores (24.7%), or who noticed any advertisement, sponsorship or promotion of tobacco products (21.2%). The decrease in the percentage of adults who noticed tobacco advertisements in stores was greater among males (25.8%) than among females (23.4%), and greater among those in urban areas (30.9%) than in rural areas (18.1%). The decrease in the percentage of adults noticing tobacco advertisements in stores was greatest among lower age groups (29.8%) and among those with no formal education (54.4%). (Table 10.12)
11.6 Comparative change between 2009 and 2015: Economics of Tobacco Smoking
• Among manufactured cigarette smokers, the average cigarette expenditure per month increased from PhP 336.30 in 2009 to PhP 678.40 in 2015.
• Likewise, the average cost of a pack of 20 manufactured cigarettes almost doubled during the same period.
74.3
53.7 58.6
40.5
0
20
40
60
80
100
Anyadvertisement/Promotions
Noticed tobaccoadvertisements in stores
Percent
Figure 11.5.1 Noticed any promotion, advertisements and sponsorship in the past 30 days and point of sale in stores, Philippines 2009 and 2015
2009
2015
75 Global Adult Tobacco Survey : Philippines Country Report, 2015

The average cost of 20 manufactured cigarettes significantly increased from PhP 24.90 in 2009 to PhP 48.00 in 2015; this represents a relative increase of 92.4%. Consequently, the cigarette expenditure per month of manufactured cigarette smokers significantly increased from PhP 336.30 in 2009 to PhP 678.40 in 2015. This is more than a double increase (101.7%) in cigarette expenditure. Overall, and across all demographic characteristics such as sex, age, residence and selected educational levels, cigarette expenditures per month among manufactured cigarette smokers significantly increased. (Table 10.8)
24.9
336.3
48.0
678.4
0
200
400
600
800
Average cost of 20 manufacturedcigarettes
Average monthly expenditure
Pesos
Figure 11.6.1 Average cost of 20 manufactured cigarettes and monthly expenditure, Philippines 2009 and 2015 (in pesos)
2009
2015
76 Global Adult Tobacco Survey : Philippines Country Report, 2015

12.* CONCLUSION AND RECOMMENDATIONS
During the six-year period between the two rounds of the GATS surveys, the Philippines achieved remarkable tobacco control successes most notably in the area of taxation. Generally, there was a relative reduction in current tobacco use of 19.3% since the 2009 survey was conducted, and a reduction of 19.4% in current cigarette smokers. Secondhand smoke exposure significantly decreased in public places. More Filipinos are making quit attempts and the demand for smoking cessation services is expected to rise as more Filipinos are interested in quitting. There also was a decline in respondents noticing any cigarette advertisement, promotion or sponsorship. More smokers are thinking of quitting because of health warnings on cigarette packages reinforced by anti-smoking campaigns, which include graphical illustration of the health effects of tobacco smoke in various media. The two-fold increase in both the average monthly cigarette expenditure and the average cost of a pack of manufactured cigarettes can be largely attributed to the implementation of Republic Act No. 10351. Although the Philippines achieved great advances towards curbing the tobacco epidemic, challenges remain and opportunities abound for implementing effective tobacco control initiatives. Republic Act No. 9211 or Tobacco Regulations Act of 2003 has many loopholes and these serve as points of entry for the tobacco industry to assert its influence in policy-making processes. It is high time for this law to be amended to make it compliant with the obligations under the Framework Convention on Tobacco Control (FCTC). The tobacco industry should be excluded from the Inter-Agency Committee on Tobacco, and there should be a total ban on tobacco advertisements, promotions and sponsorship. Despite the high level of awareness of Filipinos on the health effects of smoking and exposure to secondhand smoke, many are still hooked on smoking due to the addictive nature of nicotine. The DOH could recommend to the Philippine Drug Enforcement Agency that nicotine be included in the list of dangerous drugs paving the way for cigarettes to be declared as an illegal consumer product in the coming years. Success stories on FCTC implementation are coming from the local government units and in order for their initiatives to be sustained, they might need to be supported by the DOH. The Red Orchid Awards (ROA) recognition system for local government units with 100% tobacco-free environments remains one of the best practices being emulated by other countries and this serves as a driving force to implement the FCTC at the subnational level. The ROA Hall of Famers can be tapped as a resource who can mentor and coach other local government units so they can also comply with FCTC obligations. The national cessation infrastructure of the country remains to be established. All health workers should be trained on giving brief advice on smoking cessation so that all smokers at initial point of contact are able to receive brief advice. A national quitline will be timely, and mobile cessation services can supplement the quitline. Pharmacotherapies should be given to those who will benefit from these, as specified in the clinical practical guidelines on treatment of tobacco dependence.
The Graphic Health Warning Law (Republic Act No. 10643) is a long overdue law and has to be implemented at the level of local government units. Multisectoral collaboration is crucial in the enforcement of this law and, as in other tobacco control policies, implementation is not solely the role of the health sector.
77 Global Adult Tobacco Survey : Philippines Country Report, 2015

The gains from Republic Act No. 10351 (or the Sin Tax Reform Law) need to be periodically monitored especially since a unitary excise tax rate will be implemented in 2017. This law should be shielded from tobacco industry interference as well as other policies that emanate from government agencies. We must heighten awareness of Filipinos that there is no such thing as corporate social responsibility (CSR) by the tobacco industry and that any alleged CSR by the industry should be considered CSR-washing or fake CSR.
Therefore, the following were also recommended to strengthen tobacco control policies and programs in the Philippines as outlined in MPOWER measures.
M: Monitor tobacco use and prevention policies
• Sustain the Global Tobacco Surveillance System (GTSS) in the Philippines; implement a single system for epidemiological surveillance of tobacco in the country, which allows monitoring of the epidemic behavior in adolescents, adults, vulnerable groups and interest groups (e.g. health professionals) at the national and local levels and determines trends in order to monitor and assess the effectiveness of tobacco control policies, initiatives and measures and obtains comparable data globally;
• Sustain the system for conducting component surveys of the Global Tobacco Surveillance System (GTSS); the Global Youth Tobacco Survey (GYTS); the Global Adult Tobacco Survey(GATS); and the Global Health Professions Student Survey (GHPSS); and continue to ensure funding support with the General Appropriations Act (GAA) counterpart allocation for the repeat of GTSS surveys on a regular basis;
• Introduce core indicators of GATS in other national surveys and as a part of regular political
polling on knowledge, attitudes and behaviors in relation to tobacco use;
• Develop a national tobacco control research agenda and establish a clearinghouse for release of official data through a consortium of research institutions that have agreed to reject all funding from the tobacco industry and its network;
• Work closely with non-governmental organizations (NGOs) and the tobacco control community
to monitor tobacco industry interference as provided for in Article 5.3 guidelines of the FCTC and expose violations;
• Build capacity of local governments, including chief executives and mayors, to appreciate the
economic and health benefits of good tobacco control programs and strong surveillance systems to monitor progress of interventions within their jurisdictions.
P: Protect people from tobacco smoke
At the national level,
• Amend national legislation to abolish the clause allowing designated smoking rooms in indoor public places;
78 Global Adult Tobacco Survey : Philippines Country Report, 2015

• Enact and enforce the guidelines of Article 8, which requires the adoption of effective measures to protect people from SHS in (1) indoor workplaces, (2) indoor public places, (3) public transport, and (4) “as appropriate” in “other public places.” This creates an obligation to provide universal protection by ensuring that all of the above are 100% free from SHS. No exemptions are allowed on the basis of health or law arguments;
• Make reduction of adult exposure to SHS in enclosed workplaces and buildings to 0% a national objective for health in collaboration with the Trade Union Congress of the Philippines, the Occupational Health and Safety Centre and other stakeholders that protect the right to health of workers in the Philippines;
• Highlight the harm caused by SHS to children and sustain efforts to educate parents on smoking
at home through public messages of the Secretary of Health and through the national program for health of preschool children as well as other initiatives for children;
• Revive the national campaign on tobacco control, "Yosi Kadiri," to continue to educate the
public on the danger and damage caused by SHS. At the local jurisdictions,
• Advocate to Local Government Units (LGUs) to strictly implement existing smoke-free ordinances;
• Advocate to LGUs to pass 100% smoke-free ordinances in their jurisdictions;
• Prompt the DOH to provide incentives and support to LGUs that would like to implement
100% smoke-free indoor policies and programs.
O: Offer help to quit tobacco use
At the national level, • Develop a comprehensive national program on treatment of tobacco dependence with a range
of interventions including the following:
o Training of primary healthcare workers, midwives, barangay health workers and other frontline health staff to provide brief advice to smokers;
o Establish referral networks and more advanced programs for treatment of tobacco dependence in secondary and tertiary hospitals so that heavy smokers can be referred for treatment, counseling and motivational interviewing;
o Implement financing for treatment and counseling by doctors and other health workers through the Philippine Health Insurance Corporation (PHIC) Develop Clinical Practice Guidelines (CPGs) which include Nicotine Replacement Therapy (NRT) and other drugs as reimbursable items under the PHIC program;
o Conduct trainings for healthcare professionals/providers to treat tobacco dependence
79 Global Adult Tobacco Survey : Philippines Country Report, 2015

through networks of pediatricians, pulmonologists, cardiologists and other specialists;
o Establish quitline services to improve access to information and referral systems;
o Integrate tobacco control in the national tuberculosis control program and include brief advice and referral in DOTS treatment.
At the local jurisdictions,
• Develop local programs on treatment of tobacco dependence;
• Conduct trainings and capacity building for community-based approaches to cessation, including support groups.
W: Warn about the dangers of tobacco
At the national level,
• Strictly implement and monitor Republic Act 10643, or The Graphic Health Warnings Law;
• Use graphic health warnings to educate the public on quitlines and referral centres for treatment of tobacco dependence;
• Create greater visibility of the dangers of tobacco through posters and warnings in health
centers and health facilities;
• Develop counter advertisements to SHS.
E: Enforce bans on tobacco advertising, promotion and advertising
At the national level,
• Expose violations and abuses of point-of-sale advertising through statements of the Secretary of Health, NGOs and other stakeholders;
• Amend the law to remove point-of-sale advertising;
• Develop strategies to report violations of RA 9211 and publicize this;
• Enable health workers and NGOs to play a lead role in monitoring violations;
• Advocate to the Movie Television Review Classification Board (MTRCB) the removal of scenes depicting smoking, and the re-classification of movies & TV shows;
• Advocate for showing of anti-smoking scenes prior to movie screening in movie houses;
• Advocate for a total ban on the import of promotional materials with tobacco company logo
(e.g.in t-shirts, bags).
80 Global Adult Tobacco Survey : Philippines Country Report, 2015

At the local jurisdictions,
• Advocate that LGUs and law enforcers, implement anti-smoking laws and ordinances where there would be apprehension of violations and imposition of corresponding penalties;
• Monitor the systematization and synchronicity of guidelines and evaluation tools of enforcement status.
R: Raise taxes on tobacco
• Advocate for and legislate a uniform scheme of taxation on all cigarettes using an inflation-rate-based tax index;
• Legislate the creation of a health promotion foundation or board that can use earmarked revenues from excise tobacco taxes intended for health promotion and tobacco control as well as treatment of tobacco dependence;
• Work toward establishing that60% of retail price comes from excise tax, and increasing this
when that level has been achieved;
• Ban the sale of “kiddie packs” and single sticks;
• Ensure taxes for “kiddie packs”;
• Collaborate with other partners, especially NGOs and media, to gain support for tobacco tax measures;
• Advocate that all tobacco products be subject to excise taxation.
* The findings and conclusion in this report are those of the author(s) and do not necessarily represent the official position of the U.S. Centers for Disease Control and Prevention
81 Global Adult Tobacco Survey : Philippines Country Report, 2015

REFERENCES
1. WHO report on the global tobacco epidemic, 2015. Raising taxes on tobacco. WHO, Geneva. Accessible at: http://www.who.int/tobacco/global_report/2015/report/en/.
2. WHO report on the global tobacco Epidemic, 2011: Warning about the dangers of tobacco. Accessible at: http://apps.who.int/iris/bitstream/10665/44616/1/9789240687813_eng.pdf.
3. Frieden, Thomas R, Bloomberg, Michael R. How to prevent 100 million deaths from tobacco. The Lancet, Vol. 369, Issue 9574, 1758-1761. Accessible at: http://www.thelancet.com/pdfs/journals/lancet/PIIS0140-6736(07)60782-X.pdf.
4. WHO MPOWER. Tobacco Free Initiative, WHO, Geneva. Accessible at: www.who.int/tobacco/mpower/en/.
5. World Health Organization. WHO report on the global tobacco epidemic, 2011: The MPOWER Package. WHO, Geneva. (accessed 2017 March 28) Accessible at: http://www.who.int/tobacco/mpower/mpower_report_forward_summary_2011.pdf
6. The 2013 Philippine Health Statistics. Epidemiology Bureau, DOH, Manila 7. Global School-Based Student Health Survey, Philippines 2015, Country Report. Epidemiology
Bureau, DOH, Manila 8. Global Youth Tobacco Survey, Philippines 2015, Country Report. Epidemiology Bureau, DOH,
Manila 9. Campaign for Tobacco-Free Kids Legal Website. Accessible at: www.tobaccocontrollaws.org 10. Conference of the Parties to the WHO FCTC, Sixth Session, Moscow , Russian Federation 13-18
October 2014. Provisional Agenda item 14.4.2 FCTC/COP/6/10Rev.1, 01 Sept. 2014 11. Accessible at: https://en.m.wikipedia.org/wiki/Electronic_cigarette#Construction … 11/16/2016 12. Retrieve from: www.who.int/tobacco/research/secondhand_smoke/about/en 13. Retrieve from: www.who.int/gho/phe/secondhand_smoke/en/ 14. Retrieve from : www.who.int/tobacco/research/secondhand_smoke/en/ 15. Retrieve from:
http://apps.who.int/iris/bitstream/10665/178574/1/9789240694606_eng.pdf?ua=1&ua=1 16. Retrieve from:
http://apps.who.int/iris/bitstream/10665/85380/1/9789241505871_eng.pdf?ua=1
Cover photos copied from:
1. Palawan Underground River: www.gopalawan.travel 2. Philippine Flag: Philippine Flag Archives Blog Watch Citizen Media; 448 335;
blogwatch.tv/tag/philippine-flag/ 3. Banaue Rice Terraces: www.alamy.com - BOH BB6 ; alamy 368 320; alamy stock photo 4. Boracay island: www.castpel.com 5. Vigan: Arnel Paolo Tejada (the Philippine Star) Updated May 9, 2015- 12:00 nn; Philstar 600
410 145 2765/vigan-declared-wonder-city; www.philstar.com/headlines/2015/05/15 6. Bohol Chocolate Hills: 810 541 Touropia.com ; Touropia Travel Experts
82 Global Adult Tobacco Survey : Philippines Country Report, 2015

APPENDIX A: COUNTRY REPORT TABLES
Table 4.1: Percentage of adults ≥15 years old, by detailed smoking status, residence and sex – GATS Philippines, 2015. Smoking Status
Current tobacco smoker 22.7 (21.7, 23.6) 40.3 (38.7, 41.9) 5.1 (4.5, 5.8) 21.7 (20.5, 23.0) 23.5 (22.1, 24.9)Daily smoker 18.7 (17.8, 19.6) 33.9 (32.3, 35.5) 3.6 (3.1, 4.1) 18.6 (17.4, 19.8) 18.8 (17.5, 20.1)Occasional smoker 4.0 (3.5, 4.5) 6.4 (5.6, 7.4) 1.5 (1.2, 1.9) 3.1 (2.6, 3.7) 4.7 (4.0, 5.5)
Occasional smoker, formerly daily 1.7 (1.5, 2.0) 2.9 (2.5, 3.5) 0.5 (0.4, 0.7) 1.4 (1.1, 1.7) 2.0 (1.6, 2.5)Occasional smoker, never daily 2.2 (1.9, 2.6) 3.5 (2.9, 4.2) 1.0 (0.7, 1.3) 1.7 (1.3, 2.2) 2.7 (2.2, 3.3)
Non-smoker 77.3 (76.4, 78.3) 59.7 (58.1, 61.3) 94.9 (94.2, 95.5) 78.3 (77.0, 79.5) 76.5 (75.1, 77.9)Former daily smoker 4.9 (4.4, 5.4) 7.9 (7.2, 8.8) 1.9 (1.5, 2.3) 4.3 (3.6, 5.1) 5.4 (4.8, 6.1)Never daily smoker 72.5 (71.4, 73.5) 51.8 (50.0, 53.5) 93.0 (92.2, 93.8) 74.0 (72.7, 75.3) 71.1 (69.5, 72.6)
Former occasional smoker 3.0 (2.5, 3.5) 4.2 (3.6, 5.0) 1.7 (1.3, 2.2) 2.9 (2.3, 3.8) 3.0 (2.5, 3.6)Never smoker 69.5 (68.4, 70.6) 47.5 (45.7, 49.4) 91.4 (90.5, 92.2) 71.1 (69.5, 72.6) 68.1 (66.5, 69.7)
Note: Current use includes both daily and occasional (less than daily) use.
Urban RuralOverall Male Female
Percentage (95% CI)
Smoking Status Overall Male Female Urban Rural
Current tobacco smoker 15,874 14,079 1,795 7,085 8,790Daily smoker 13,102 11,836 1,266 6,070 7,033Occasional smoker 2,772 2,244 529 1,015 1,757
Occasional smoker, formerly daily 1,212 1,027 186 458 754Occasional smoker, never daily 1,560 1,217 343 557 1,003
Non-smoker 54,189 20,857 33,333 25,545 28,645Former daily smoker 3,425 2,773 651 1,391 2,033Never daily smoker 50,765 18,083 32,682 24,153 26,612
Former occasional smoker 2,068 1,479 589 959 1,109Never smoker 48,697 16,605 32,092 23,194 25,503
Note: Current use includes both daily and occasional (less than daily) use.
Number in thousands
Table 4.2: Number of adults ≥15 years old, by detailed smoking status by residence and sex – GATS Philippines, 2015.
83 Global Adult Tobacco Survey : Philippines Country Report, 2015

Smokeless Tobacco Use Status
Current smokeless tobacco user 1.7 (1.3, 2.2) 2.7 (2.0, 3.6) 0.7 (0.5, 1.0) 0.6 (0.4, 0.9) 2.6 (1.9, 3.6)Daily user 1.0 (0.7, 1.4) 1.5 (1.0, 2.2) 0.5 (0.3, 0.7) 0.3 (0.2, 0.5) 1.5 (1.0, 2.3)Occasional user 0.7 (0.5, 1.0) 1.2 (0.8, 1.9) 0.2 (0.1, 0.3) 0.3 (0.1, 0.5) 1.1 (0.7, 1.7)
Occasional user, formerly daily 0.3 (0.2, 0.4) 0.4 (0.2, 0.7) 0.1 (0.1, 0.2) 0.1 (0.0, 0.3) 0.4 (0.2, 0.7)Occasional user, never daily 0.5 (0.3, 0.8) 0.8 (0.5, 1.4) 0.1 (0.0, 0.2) 0.1 (0.1, 0.3) 0.7 (0.4, 1.3)
Non-user of smokeless tobacco 98.3 (97.8, 98.7) 97.3 (96.4, 98.0) 99.3 (99.0, 99.5) 99.4 (99.1, 99.6) 97.4 (96.4, 98.1)Former daily user 0.2 (0.1, 0.3) 0.2 (0.1, 0.4) 0.1 (0.1, 0.2) 0.1 (0.1, 0.3) 0.2 (0.1, 0.4)Never daily user 98.2 (97.6, 98.6) 97.1 (96.1, 97.8) 99.2 (98.9, 99.4) 99.3 (99.0, 99.5) 97.2 (96.2, 97.9)
Former occasional user 0.5 (0.4, 0.7) 0.7 (0.5, 1.0) 0.3 (0.2, 0.4) 0.4 (0.2, 0.6) 0.6 (0.5, 0.9)Never user 97.6 (97.1, 98.1) 96.3 (95.4, 97.1) 98.9 (98.6, 99.2) 98.9 (98.6, 99.2) 96.5 (95.5, 97.3)
Table 4.1A: Percentage of adults ≥15 years old, by detailed smokeless tobacco use status by residence and sex – GATS Philippines, 2015.
Note: Current use includes both daily and occasional (less than daily) use.
Urban RuralOverall Male Female
Percentage (95% CI)
Smokeless Tobacco Use Status Overall Male Female Urban Rural
Current smokeless tobacco user 1,173 935 238 191 982Daily user 682 511 171 106 576Occasional user 491 424 67 86 406
Occasional user, formerly daily 178 138 39 38 140Occasional user, never daily 314 286 28 48 266
Non-user of smokeless tobacco 68,258 33,685 34,573 32,063 36,196Former daily user 110 75 35 38 72Never daily user 68,148 33,610 34,538 32,024 36,124
Former occasional user 351 254 97 115 236Never user 67,797 33,356 34,441 31,910 35,888
Note: Current use includes both daily and occasional (less than daily) use.
Number in thousands
Table 4.2A: Number of adults ≥15 years old, by detailed smokeless tobacco use by residence status and sex – GATS Philippines, 2015.
84 Global Adult Tobacco Survey : Philippines Country Report, 2015

Table 4.3: Percentage of adults ≥15 years old who are current smokers of various smoked tobacco products, by sex and selected demographic characteristics – GATS Philippines, 2015.
Overall 22.7 (21.7, 23.6) 22.5 (21.5, 23.4) 21.5 (20.6, 22.5) 2.5 (2.0, 3.1) 0.4 (0.2, 0.9) 0.4 (0.2, 0.8) 0.8 (0.5, 1.2) 0.4 (0.2, 0.9) 0.4 (0.2, 0.9)Age (years)
15-24 15.9 (14.4, 17.6) 15.8 (14.3, 17.5) 15.8 (14.3, 17.5) 0.9 (0.5, 1.7) 0.2 (0.1, 0.7) 0.2 (0.1, 0.7) 0.4 (0.2, 0.9) 0.2 (0.1, 0.5) 0.2 (0.1, 0.7)25-44 26.0 (24.6, 27.4) 25.9 (24.5, 27.3) 25.1 (23.7, 26.5) 2.5 (1.9, 3.3) 0.6 (0.2, 1.3) 0.5 (0.2, 1.2) 0.8 (0.4, 1.5) 0.6 (0.3, 1.3) 0.6 (0.2, 1.3)45-64 26.8 (25.2, 28.4) 26.4 (24.8, 28.1) 24.9 (23.4, 26.6) 3.6 (2.9, 4.5) 0.3 (0.1, 0.8) 0.4 (0.2, 0.8) 1.0 (0.6, 1.6) 0.4 (0.2, 0.9) 0.3 (0.1, 0.8)65+ 17.7 (15.2, 20.5) 16.8 (14.4, 19.6) 12.6 (10.6, 14.9) 5.7 (4.2, 7.5) 0.0 N/A 0.1 (0.0, 0.5) 1.1 (0.5, 2.0) 0.4 (0.1, 1.3) 0.0 N/A
Education Level
No Formal 27.5 (21.1, 35.0) 26.2 (19.9, 33.7) 18.4 (13.1, 25.4) 9.1 (6.1, 13.5) 0.0 N/A 0.2 (0.0, 1.7) 0.8 (0.2, 2.6) 0.3 (0.0, 2.2) 0.2 (0.0, 1.2)Elementary 30.1 (28.0, 32.3) 29.7 (27.6, 31.9) 26.7 (24.6, 28.8) 6.1 (5.0, 7.4) 0.4 (0.1, 1.3) 0.4 (0.1, 1.3) 1.4 (0.8, 2.3) 0.6 (0.2, 1.3) 0.5 (0.2, 1.3)Secondary 23.8 (22.4, 25.3) 23.7 (22.3, 25.2) 23.5 (22.1, 25.0) 1.6 (1.0, 2.5) 0.5 (0.2, 1.2) 0.5 (0.2, 1.2) 0.8 (0.4, 1.5) 0.5 (0.2, 1.1) 0.4 (0.1, 1.3)Post-Secondary 18.4 (14.0, 23.8) 18.4 (14.0, 23.8) 18.4 (14.0, 23.8) 0.3 (0.3, 0.4) 0.0 N/A 0.4 (0.1, 2.9) 0.0 N/A 0.0 N/A 0.0 N/ACollege or above 14.9 (13.6, 16.3) 14.8 (13.5, 16.2) 14.8 (13.5, 16.2) 0.7 (0.4, 1.3) 0.3 (0.1, 0.9) 0.2 (0.1, 0.6) 0.3 (0.1, 0.7) 0.3 (0.1, 0.7) 0.2 (0.1, 1.0)
Residence x wealth index quintile
Urban 21.7 (20.5, 23.0) 21.7 (20.4, 22.9) 21.3 (20.1, 22.6) 0.8 (0.6, 1.1) 0.1 (0.0, 0.3) 0.1 (0.0, 0.2) 0.2 (0.1, 0.4) 0.2 (0.1, 0.4) 0.1 (0.0, 0.2) Lowest 41.1 (30.5, 52.6) 41.1 (30.5, 52.6) 37.2 (27.0, 48.7) 9.7 (4.6, 19.5) 0.0 N/A 0.0 N/A 0.0 N/A 0.0 N/A 0.0 N/A Second 33.9 (30.1, 38.0) 33.9 (30.1, 38.0) 31.8 (27.6, 36.3) 3.2 (2.0, 5.1) 0.3 (0.1, 1.0) 0.0 N/A 0.3 (0.1, 1.0) 0.3 (0.0, 1.8) 0.5 (0.1, 1.9) Middle 23.2 (20.7, 25.9) 23.0 (20.5, 25.7) 23.0 (20.5, 25.7) 0.6 (0.3, 1.1) 0.0 (0.0, 0.3) 0.2 (0.1, 0.5) 0.2 (0.1, 0.6) 0.1 (0.0, 0.6) 0.1 (0.0, 0.5) Fourth 21.7 (19.7, 23.9) 21.6 (19.6, 23.8) 21.6 (19.5, 23.8) 0.3 (0.2, 0.6) 0.1 (0.0, 0.8) 0.1 (0.0, 0.8) 0.2 (0.1, 0.7) 0.2 (0.1, 0.7) 0.0 (0.0, 0.1) Highest 17.0 (15.5, 18.6) 17.0 (15.5, 18.6) 17.0 (15.5, 18.6) 0.2 (0.1, 0.6) 0.1 (0.0, 0.8) 0.1 (0.0, 0.1) 0.2 (0.0, 0.6) 0.3 (0.1, 0.7) 0.0 N/ARural 23.5 (22.1, 24.9) 23.2 (21.8, 24.6) 21.7 (20.4, 23.1) 4.0 (3.1, 5.0) 0.6 (0.2, 1.6) 0.6 (0.2, 1.5) 1.2 (0.7, 2.1) 0.6 (0.3, 1.4) 0.6 (0.3, 1.6) Lowest 29.4 (24.3, 35.2) 29.0 (23.7, 34.8) 24.0 (19.2, 29.5) 9.3 (6.5, 13.2) 0.1 (0.0, 0.4) 0.3 (0.1, 1.6) 0.3 (0.1, 1.1) 0.7 (0.2, 1.9) 0.5 (0.1, 1.7) Second 27.3 (24.9, 30.0) 27.0 (24.5, 29.6) 23.9 (21.7, 26.3) 6.4 (5.1, 7.9) 0.7 (0.3, 1.6) 0.7 (0.3, 1.6) 1.5 (0.9, 2.5) 0.8 (0.4, 1.6) 0.7 (0.3, 1.6) Middle 24.9 (22.3, 27.6) 24.6 (22.1, 27.3) 23.9 (21.4, 26.6) 3.6 (2.2, 5.7) 1.2 (0.4, 3.9) 1.2 (0.3, 3.8) 1.7 (0.7, 4.0) 1.1 (0.3, 3.5) 1.3 (0.4, 4.0) Fourth 22.9 (20.1, 25.9) 22.5 (19.8, 25.5) 21.3 (18.7, 24.1) 3.4 (2.3, 5.2) 0.2 (0.1, 0.7) 0.2 (0.1, 0.7) 1.2 (0.7, 2.2) 0.2 (0.1, 0.7) 0.2 (0.1, 0.7) Highest 15.7 (13.4, 18.3) 15.3 (13.1, 17.9) 15.3 (13.1, 17.9) 0.8 (0.3, 2.1) 0.3 (0.1, 1.2) 0.4 (0.1, 1.1) 0.5 (0.2, 1.3) 0.3 (0.1, 1.2) 0.2 (0.0, 1.6)
Other smoked tobacco2
N/A- The estimate is "0.0"
Any smoked tobacco product Any cigarette1
1 Includes manufactured ,hand rolled cigarettes and kreteks.2 Includes any other reported smoking tobacco products.
Percentage (95% CI)
Manufactured Hand-rolled
Note: Current use includes both daily and occasional (less than daily) use.
Demographic Characteristics
Type of Cigarette
Kretek PipesCigars, cheroots, or
cigarillos Waterpipe
85 Global Adult Tobacco Survey : Philippines Country Report, 2015

Table 4.3a: Percentage of adults ≥15 years old who are current smokers of various smoked tobacco products, by sex and selected demographic characteristics – GATS Philippines, 2015.
Male 40.3 (38.7, 41.9) 40.1 (38.5, 41.7) 38.9 (37.3, 40.5) 4.1 (3.2, 5.1) 0.6 (0.3, 1.5) 0.6 (0.3, 1.4) 1.3 (0.8, 2.1) 0.7 (0.4, 1.5) 0.4 (0.2, 0.9)Age (years)
15-24 29.7 (26.9, 32.6) 29.6 (26.8, 32.5) 29.5 (26.8, 32.4) 1.8 (1.0, 3.3) 0.4 (0.2, 1.3) 0.4 (0.1, 1.3) 0.8 (0.4, 1.7) 0.4 (0.1, 1.0) 0.2 (0.1, 0.7)25-44 46.5 (44.2, 48.8) 46.3 (44.0, 48.6) 45.1 (42.8, 47.4) 4.5 (3.4, 5.9) 1.0 (0.4, 2.2) 0.9 (0.4, 2.2) 1.5 (0.8, 2.7) 1.1 (0.5, 2.3) 0.6 (0.2, 1.3)45-64 45.7 (43.0, 48.4) 45.4 (42.8, 48.1) 43.8 (41.1, 46.4) 5.4 (4.2, 6.9) 0.4 (0.1, 1.1) 0.4 (0.2, 1.1) 1.5 (0.9, 2.5) 0.6 (0.3, 1.2) 0.3 (0.1, 0.8)65+ 28.4 (24.0, 33.2) 27.8 (23.4, 32.7) 23.0 (19.1, 27.4) 7.4 (5.0, 10.9) 0.0 N/A 0.2 (0.1, 0.9) 0.8 (0.3, 2.3) 0.3 (0.1, 1.5) 0.0 N/A
Education Level
No Formal 44.3 (33.4, 55.9) 43.8 (32.8, 55.4) 37.0 (26.7, 48.7) 8.2 (4.4, 14.6) 0.0 N/A 0.0 N/A 0.9 (0.1, 6.4) 0.0 N/A 0.2 (0.0, 1.2)Elementary 47.3 (44.3, 50.3) 47.0 (44.0, 50.0) 43.3 (40.2, 46.4) 8.6 (6.9, 10.6) 0.6 (0.2, 1.8) 0.6 (0.2, 1.8) 1.9 (1.1, 3.4) 0.7 (0.3, 1.9) 0.5 (0.2, 1.3)Secondary 42.7 (40.3, 45.1) 42.6 (40.2, 45.1) 42.5 (40.1, 44.9) 2.9 (1.8, 4.6) 0.8 (0.3, 2.3) 0.8 (0.3, 2.2) 1.3 (0.7, 2.6) 0.9 (0.4, 2.0) 0.4 (0.1, 1.3)Post-Secondary 32.6 (25.3, 40.9) 32.6 (25.3, 40.9) 32.6 (25.3, 40.9) 0.7 (0.6, 0.8) 0.0 N/A 0.9 (0.1, 6.1) 0.0 N/A 0.0 N/A 0.0 N/ACollege or above 29.7 (27.2, 32.3) 29.4 (26.9, 32.1) 29.4 (26.9, 32.1) 1.4 (0.7, 2.5) 0.4 (0.1, 1.5) 0.4 (0.1, 1.3) 0.6 (0.2, 1.6) 0.6 (0.2, 1.6) 0.2 (0.1, 1.0)
Residence x wealth index quintile
Urban 38.9 (36.7, 41.0) 38.8 (36.7, 41.0) 38.3 (36.2, 40.5) 1.4 (0.9, 2.0) 0.1 (0.0, 0.6) 0.1 (0.0, 0.1) 0.4 (0.2, 0.8) 0.4 (0.2, 0.9) 0.1 (0.0, 0.2) Lowest 58.5 (41.3, 73.9) 58.5 (41.3, 73.9) 57.2 (39.4, 73.3) 11.1 (3.9, 27.6) 0.0 N/A 0.0 N/A 0.0 N/A 0.0 N/A 0.0 N/A Second 54.2 (48.7, 59.5) 54.2 (48.7, 59.5) 50.6 (44.4, 56.8) 5.4 (3.2, 8.9) 0.3 (0.0, 1.8) 0.0 N/A 0.4 (0.1, 1.7) 0.5 (0.1, 3.3) 0.5 (0.1, 1.9) Middle 39.4 (35.2, 43.7) 39.4 (35.2, 43.7) 39.3 (35.2, 43.6) 1.0 (0.5, 2.0) 0.1 (0.0, 0.6) 0.2 (0.1, 0.3) 0.5 (0.2, 1.1) 0.3 (0.1, 1.3) 0.1 (0.0, 0.5) Fourth 40.5 (36.7, 44.5) 40.3 (36.5, 44.4) 40.3 (36.5, 44.4) 0.4 (0.2, 0.8) 0.0 N/A 0.0 N/A 0.4 (0.1, 1.4) 0.5 (0.1, 1.4) 0.0 N/A Highest 31.9 (28.8, 35.1) 31.9 (28.8, 35.1) 31.9 (28.8, 35.1) 0.5 (0.2, 1.3) 0.2 (0.0, 1.6) 0.1 (0.0, 0.3) 0.3 (0.1, 1.3) 0.4 (0.1, 1.7) 0.0 N/ARural 41.5 (39.2, 43.9) 41.2 (38.8, 43.6) 39.4 (37.1, 41.7) 6.3 (4.9, 8.1) 1.0 (0.4, 2.6) 1.1 (0.4, 2.6) 2.0 (1.1, 3.5) 1.0 (0.4, 2.4) 0.6 (0.3, 1.6) Lowest 43.8 (35.1, 52.8) 43.2 (34.5, 52.5) 39.4 (31.1, 48.3) 10.2 (6.4, 15.8) 0.1 (0.0, 0.7) 0.5 (0.1, 2.9) 0.1 (0.0, 0.7) 0.8 (0.2, 2.9) 0.5 (0.1, 1.7) Second 48.4 (44.5, 52.4) 48.1 (44.1, 52.1) 44.1 (40.3, 47.9) 10.0 (7.9, 12.7) 1.3 (0.5, 3.0) 1.1 (0.4, 2.9) 2.5 (1.4, 4.5) 1.2 (0.5, 2.9) 0.7 (0.3, 1.6) Middle 43.1 (39.0, 47.3) 42.7 (38.6, 47.0) 41.9 (37.8, 46.1) 5.8 (3.6, 9.3) 1.9 (0.6, 6.0) 1.9 (0.6, 6.0) 2.9 (1.3, 6.4) 1.6 (0.5, 5.3) 1.3 (0.4, 4.0) Fourth 41.3 (36.4, 46.3) 41.1 (36.3, 46.1) 39.6 (35.1, 44.3) 5.7 (3.5, 9.0) 0.4 (0.1, 1.3) 0.4 (0.1, 1.3) 1.8 (0.9, 3.7) 0.5 (0.2, 1.3) 0.2 (0.1, 0.7) Highest 29.2 (24.7, 34.1) 28.7 (24.3, 33.6) 28.7 (24.3, 33.6) 1.6 (0.6, 4.3) 0.5 (0.1, 2.4) 0.7 (0.2, 2.3) 0.8 (0.3, 2.4) 0.5 (0.1, 2.4) 0.2 (0.0, 1.6)
Percentage (95% CI)
Note: Current use includes both daily and occasional (less than daily) use.1 Includes manufactured ,hand rolled cigarettes and kreteks.2 Includes any other reported smoking tobacco products.N/A- The estimate is "0.0"
Manufactured Hand-rolledDemographic Characteristics Other smoked tobacco2Pipes
Cigars, cheroots, or cigarillos WaterpipeAny smoked tobacco product Any cigarette1
Type of Cigarette
Kretek
86 Global Adult Tobacco Survey : Philippines Country Report, 2015

Table 4.3b: Percentage of adults ≥15 years old who are current smokers of various smoked tobacco products, by sex and selected demographic characteristics – GATS Philippines, 2015.
Female 5.1 (4.5, 5.8) 4.9 (4.3, 5.6) 4.2 (3.7, 4.8) 0.9 (0.7, 1.3) 0.1 (0.0, 0.3) 0.1 (0.1, 0.3) 0.3 (0.1, 0.5) 0.2 (0.1, 0.3) 0.1 (0.0, 0.3)Age (years)
15-24 1.8 (1.2, 2.7) 1.7 (1.1, 2.6) 1.7 (1.1, 2.6) 0.0 N/A 0.0 N/A 0.0 N/A 0.0 N/A 0.1 (0.1, 0.1) 0.0 N/A25-44 4.9 (4.0, 6.0) 4.9 (4.0, 6.0) 4.7 (3.8, 5.7) 0.5 (0.3, 0.9) 0.1 (0.0, 0.5) 0.1 (0.0, 0.5) 0.1 (0.0, 0.4) 0.1 (0.0, 0.4) 0.2 (0.1, 0.6)45-64 8.1 (6.8, 9.6) 7.7 (6.4, 9.2) 6.4 (5.3, 7.7) 1.8 (1.2, 2.8) 0.3 (0.1, 0.9) 0.3 (0.1, 0.7) 0.5 (0.3, 1.1) 0.2 (0.1, 0.7) 0.2 (0.1, 0.6)65+ 9.9 (7.6, 12.8) 8.8 (6.7, 11.6) 5.0 (3.5, 7.1) 4.4 (3.0, 6.4) 0.0 N/A 0.1 (0.0, 0.7) 1.2 (0.5, 2.8) 0.5 (0.1, 2.2) 0.0 N/A
Education Level
No Formal 13.9 (9.0, 21.0) 12.1 (7.6, 18.7) 3.6 (1.6, 7.8) 9.8 (5.9, 15.9) 0.0 N/A 0.4 (0.1, 3.0) 0.6 (0.1, 2.5) 0.6 (0.1, 3.9) 0.0 N/AElementary 8.5 (7.0, 10.2) 8.0 (6.6, 9.7) 5.8 (4.6, 7.2) 2.9 (2.1, 4.0) 0.1 (0.0, 0.6) 0.2 (0.1, 0.7) 0.7 (0.4, 1.4) 0.3 (0.1, 0.9) 0.2 (0.1, 0.8)Secondary 4.6 (3.8, 5.5) 4.4 (3.6, 5.4) 4.3 (3.5, 5.2) 0.2 (0.1, 0.5) 0.1 (0.0, 0.4) 0.2 (0.0, 0.5) 0.2 (0.1, 0.6) 0.1 (0.0, 0.4) 0.1 (0.0, 0.4)Post-Secondary 6.4 (2.6, 14.6) 6.4 (2.6, 14.6) 6.4 (2.6, 14.6) 0.0 N/A 0.0 N/A 0.0 N/A 0.0 N/A 0.0 N/A 0.0 N/ACollege or above 2.9 (2.3, 3.7) 2.9 (2.3, 3.7) 2.9 (2.2, 3.7) 0.1 (0.0, 0.6) 0.2 (0.1, 0.6) 0.0 N/A 0.0 N/A 0.1 (0.1, 0.1) 0.1 (0.0, 0.7)
Residence x wealth index quintile
Urban 5.3 (4.5, 6.4) 5.3 (4.4, 6.3) 5.1 (4.2, 6.1) 0.2 (0.1, 0.5) 0.1 (0.0, 0.3) 0.1 (0.0, 0.4) 0.0 (0.0, 0.1) 0.1 (0.1, 0.1) 0.0 (0.0, 0.3) Lowest 15.4 (8.0, 27.7) 15.4 (8.0, 27.7) 7.8 (3.4, 16.8) 7.6 (3.1, 17.9) 0.0 N/A 0.0 N/A 0.0 N/A 0.0 N/A 0.0 N/A Second 9.3 (6.5, 13.1) 9.3 (6.5, 13.1) 8.9 (6.2, 12.6) 0.6 (0.2, 1.8) 0.2 (0.0, 1.7) 0.0 N/A 0.2 (0.0, 1.4) 0.0 N/A 0.5 (0.1, 3.4) Middle 7.9 (5.7, 11.0) 7.6 (5.4, 10.6) 7.5 (5.3, 10.5) 0.2 (0.0, 0.8) 0.0 N/A 0.2 (0.0, 1.3) 0.0 N/A 0.0 N/A 0.0 N/A Fourth 3.9 (2.6, 5.8) 3.9 (2.6, 5.8) 3.8 (2.5, 5.8) 0.2 (0.1, 0.7) 0.2 (0.0, 1.5) 0.2 (0.0, 1.6) 0.0 N/A 0.0 N/A 0.0 N/A Highest 3.8 (3.0, 4.9) 3.8 (3.0, 4.9) 3.8 (3.0, 4.9) 0.0 N/A 0.0 N/A 0.1 (0.0, 0.1) 0.0 (0.0, 0.0) 0.2 (0.1, 0.2) 0.0 N/ARural 4.9 (4.1, 5.8) 4.6 (3.8, 5.5) 3.4 (2.8, 4.1) 1.6 (1.1, 2.2) 0.2 (0.1, 0.6) 0.1 (0.0, 0.5) 0.5 (0.2, 0.9) 0.2 (0.1, 0.6) 0.2 (0.1, 0.6) Lowest 10.4 (6.6, 16.1) 10.1 (6.3, 15.7) 3.6 (1.8, 7.1) 8.1 (4.8, 13.3) 0.0 N/A 0.0 N/A 0.6 (0.2, 2.4) 0.4 (0.1, 3.1) 0.0 N/A Second 5.7 (4.3, 7.6) 5.4 (4.0, 7.1) 3.3 (2.3, 4.6) 2.6 (1.7, 3.9) 0.1 (0.0, 0.6) 0.1 (0.0, 0.6) 0.5 (0.2, 1.0) 0.3 (0.1, 0.8) 0.1 (0.0, 0.6) Middle 5.5 (4.0, 7.5) 5.3 (3.8, 7.4) 4.9 (3.4, 6.9) 1.1 (0.5, 2.5) 0.5 (0.1, 2.2) 0.4 (0.1, 2.2) 0.4 (0.1, 2.2) 0.5 (0.1, 2.3) 0.6 (0.1, 2.3) Fourth 4.1 (2.6, 6.3) 3.5 (2.2, 5.6) 2.5 (1.5, 4.1) 1.1 (0.5, 2.3) 0.0 N/A 0.0 N/A 0.7 (0.2, 1.7) 0.0 N/A 0.0 N/A Highest 3.0 (1.8, 4.8) 2.7 (1.7, 4.3) 2.7 (1.7, 4.3) 0.0 N/A 0.0 N/A 0.0 N/A 0.2 (0.0, 1.6) 0.0 N/A 0.0 N/A
N/A- The estimate is "0.0"
Other smoked tobacco2
2 Includes any other reported smoking tobacco products.
Note: Current use includes both daily and occasional (less than daily) use.
Cigars, cheroots, or cigarillos WaterpipeManufactured Hand-rolled Kretek
1 Includes manufactured ,hand rolled cigarettes and kreteks.
Demographic Characteristics Any smoked tobacco product Any cigarette1
Type of Cigarette
Pipes
Percentage (95% CI)
87 Global Adult Tobacco Survey : Philippines Country Report, 2015

Manufactured Hand-rolled Kretek
Overall 15,874 15,733 15,075 1,746 264 263 260 532 309Age (years)
15-24 3,281 3,260 3,255 188 47 49 40 88 5125-44 7,582 7,554 7,327 734 164 161 154 238 17745-64 4,203 4,149 3,916 565 54 53 59 158 6365+ 810 770 577 259 -- -- 7 48 19
Education Level
No Formal 319 304 214 106 -- 2 3 9 4Elementary 5,156 5,087 4,566 1,038 70 89 71 239 95Secondary 6,948 6,915 6,870 457 139 125 137 230 149Post-Secondary 433 433 433 8 -- -- 10 -- --College or above 3,016 2,991 2,989 138 56 47 39 54 61
Residence x wealth index quintile
Urban 7,085 7,066 6,961 257 36 24 31 65 76 Lowest 201 201 182 47 -- -- -- -- -- Second 1,223 1,223 1,146 117 9 17 . 12 9 Middle 1,540 1,528 1,522 38 3 5 13 16 10 Fourth 1,817 1,809 1,806 26 9 2 10 17 18 Highest 2,305 2,305 2,305 29 15 -- 8 21 38Rural 8,790 8,667 8,114 1,488 229 239 228 467 233 Lowest 511 504 417 161 1 8 5 6 11 Second 2,551 2,519 2,234 595 67 66 61 141 71 Middle 2,515 2,490 2,423 360 124 132 117 171 111 Fourth 2,111 2,077 1,962 316 18 18 20 114 21 Highest 1,102 1,078 1,078 56 18 16 25 35 18
Table 4.4: Number of adults ≥15 years old who are current smokers of various smoked tobacco products, by sex and selected demographic characteristics – GATS PHILIPPINES, 2015.
--Indicates estimates based on less than 25 unweighted cases and has been suppressed.
Cigars, cheroots, or cigarollos Waterpipe
Number in Thousands
Note: Current use includes both daily and occasional (less than daily) use.1 Includes manufactured, hand rolled cigarettes and kreteks.
Other smoked tobacco2 Pipes
2 Includes any other reported smoking tobacco products.
Demographic Characteristics
Any smoked tobacco product Any cigarette1
Type of Cigarette
88 Global Adult Tobacco Survey : Philippines Country Report, 2015

Table 4.4a: Number of adults ≥15 years old who are current smokers of various smoked tobacco products, by sex and selected demographic characteristics – GATS Philippines, 2015.
Manufactured Hand-rolled Kretek Pipes
Male 14,079 14,008 13,593 1,416 220 213 441 254 578Age (years)
15-24 3,097 3,087 3,082 188 47 40 88 40 10525-44 6,870 6,842 6,654 662 142 135 222 164 30645-64 3,565 3,542 3,412 423 31 34 116 45 14365+ 548 537 444 143 0 4 16 6 24
Education Level
No Formal 229 226 191 42 0 0 5 0 7Elementary 4,515 4,483 4,130 821 59 54 184 72 233Secondary 6,288 6,277 6,250 422 125 114 198 133 254Post-Secondary 352 352 352 8 0 10 0 0 10College or above 2,693 2,668 2,668 124 36 35 54 50 74
Residence x wealth index quintile
Urban 6,192 6,185 6,109 216 23 12 60 65 141 Lowest 170 170 166 32 0 0 0 0 0 Second 1,072 1,072 1,002 107 5 0 9 9 18 Middle 1,269 1,269 1,267 32 3 7 16 10 38 Fourth 1,650 1,643 1,643 16 0 0 17 18 35 Highest 2,031 2,031 2,031 29 15 5 19 27 50Rural 7,887 7,824 7,484 1,200 197 201 382 190 437 Lowest 434 429 390 101 1 5 1 8 20 Second 2,288 2,272 2,083 475 60 54 120 58 131 Middle 2,247 2,229 2,185 305 100 97 149 85 157 Fourth 1,925 1,917 1,848 265 18 20 84 21 90 Highest 994 978 978 56 18 25 27 18 40
Other smoked tobacco2
Cigars, cheroots, or cigarillos Waterpipe
Number in Thousands
Demographic Characteristics
Any smoked tobacco product Any cigarette1
Type of Cigarette
1 Includes manufactured, hand rolled cigarettes and kreteks.2 Includes any other reported smoking tobacco products.
89 Global Adult Tobacco Survey : Philippines Country Report, 2015

Table 4.4b: Number of adults ≥15 years old who are current smokers of various smoked tobacco products, by sex and selected demographic characteristics – GATS Philippines, 2015.
Manufactured Hand-rolled Kretek Pipes
Female 1,795 1,725 1,481 329 45 47 90 54 159Age (years)
15-24 184 173 173 0 0 0 0 11 1125-44 712 712 672 72 21 19 16 13 4445-64 638 607 504 142 23 25 42 18 5665+ 261 233 133 115 0 3 33 13 48
Education Level
No Formal 90 78 23 63 0 3 4 4 10Elementary 641 605 436 217 11 17 55 23 81Secondary 660 638 620 35 14 23 32 16 42Post-Secondary 81 81 81 0 0 0 0 0 0College or above 323 323 322 14 20 4 0 11 25
Residence x wealth index quintile
Urban 893 881 852 41 13 20 5 11 44 Lowest 31 31 15 15 0 0 0 0 0 Second 151 151 144 10 4 0 3 0 11 Middle 271 260 256 6 0 6 0 0 6 Fourth 167 167 163 10 9 10 0 0 10 Highest 274 274 274 0 0 4 2 11 17Rural 903 844 629 288 32 27 85 43 114 Lowest 78 75 27 61 0 0 5 3 8 Second 264 247 151 120 7 7 21 13 25 Middle 268 261 238 56 25 20 21 27 44 Fourth 185 161 114 51 0 0 30 0 30 Highest 108 100 100 0 0 0 8 0 8
Other smoked tobacco2
Cigars, cheroots, or cigarillos Waterpipe
Number in Thousands
Demographic Characteristics
Any smoked tobacco product Any cigarette1
Type of Cigarette
1 Includes manufactured, hand rolled cigarettes and kreteks.2 Includes any other reported smoking tobacco products.
90 Global Adult Tobacco Survey : Philippines Country Report, 2015

Table 4.5: Percentage distribution of adults ≥15 years old, by smoking frequency, sex and selected demographic characteristics – GATS Philippines, 2015.
Overall 18.7 (17.8, 19.6) 4.0 (3.5, 4.5) 77.3 (76.4, 78.3) 100Sex
Male 33.9 (32.3, 35.5) 6.4 (5.6, 7.4) 59.7 (58.1, 61.3) 100 Female 3.6 (3.1, 4.1) 1.5 (1.2, 1.9) 94.9 (94.2, 95.5) 100Age (years)
15-24 12.6 (11.2, 14.1) 3.3 (2.6, 4.2) 84.1 (82.4, 85.6) 10025-44 21.5 (20.2, 22.8) 4.5 (3.8, 5.3) 74.0 (72.6, 75.4) 10045-64 22.9 (21.4, 24.4) 3.9 (3.3, 4.7) 73.2 (71.6, 74.8) 10065+ 14.1 (12.0, 16.5) 3.6 (2.6, 5.0) 82.3 (79.5, 84.8) 100
Education Level
No Formal 23.1 (17.1, 30.6) 4.3 (2.5, 7.4) 72.5 (65.0, 78.9) 100Elementary 25.0 (23.1, 27.1) 5.1 (4.2, 6.1) 69.9 (67.7, 72.0) 100Secondary 19.8 (18.5, 21.3) 4.0 (3.3, 4.8) 76.2 (74.7, 77.6) 100Post-Secondary 13.7 (10.4, 17.8) 4.7 (2.4, 9.0) 81.6 (76.2, 86.0) 100College or above 12.0 (10.8, 13.3) 2.9 (2.4, 3.5) 85.1 (83.7, 86.4) 100
Residence x wealth index quintile
Urban 18.6 (17.4, 19.8) 3.1 (2.6, 3.7) 78.3 (77.0, 79.5) 100 Lowest 31.5 (22.6, 42.0) 9.6 (4.4, 19.5) 58.9 (47.4, 69.5) 100 Second 28.4 (24.7, 32.3) 5.6 (3.9, 7.9) 66.1 (62.0, 69.9) 100 Middle 19.9 (17.4, 22.6) 3.3 (2.3, 4.7) 76.8 (74.1, 79.3) 100 Fourth 19.4 (17.4, 21.5) 2.3 (1.6, 3.3) 78.3 (76.1, 80.3) 100 Highest 14.4 (13.0, 15.9) 2.6 (2.0, 3.4) 83.0 (81.4, 84.5) 100Rural 18.8 (17.5, 20.1) 4.7 (4.0, 5.5) 76.5 (75.1, 77.9) 100 Lowest 25.8 (20.9, 31.4) 3.6 (2.2, 5.8) 70.6 (64.8, 75.7) 100 Second 21.2 (19.1, 23.4) 6.2 (4.8, 7.9) 72.7 (70.0, 75.1) 100 Middle 19.3 (17.1, 21.6) 5.6 (4.2, 7.4) 75.1 (72.4, 77.7) 100 Fourth 19.1 (16.5, 22.1) 3.8 (2.8, 4.9) 77.1 (74.1, 79.9) 100 Highest 12.7 (10.7, 15.0) 2.9 (2.0, 4.2) 84.3 (81.7, 86.6) 100
1 Occasional refers to less than daily use.
Cigarette Smoking FrequencyTotal
Daily Occasional1 Non-smoker
Percentage (95% CI)
Demographic Characteristics
91 Global Adult Tobacco Survey : Philippines Country Report, 2015

Table 4.5a: Percentage distribution of adults ≥15 years old, by cigarette frequency, sex and selected demographic characteristics – GATS Philippines, 2015.
Overall 18.5 (17.6, 19.5) 3.9 (3.5, 4.5) 77.5 (76.5, 78.6) 100Age (years)
15-24 12.5 (11.0, 14.2) 3.3 (2.6, 4.2) 84.2 (82.3, 85.9) 10025-44 21.4 (20.0, 22.9) 4.5 (3.7, 5.4) 74.1 (72.6, 75.6) 10045-64 22.5 (20.8, 24.3) 3.9 (3.2, 4.7) 73.6 (71.7, 75.4) 10065+ 13.4 (11.2, 16.0) 3.4 (2.4, 5.0) 83.2 (80.2, 85.7) 100
Education Level
No Formal 21.9 (15.9, 29.3) 4.3 (2.5, 7.4) 73.8 (66.3, 80.1) 100Elementary 24.7 (22.6, 26.8) 5.0 (4.2, 6.1) 70.3 (68.0, 72.5) 100
Secondary 19.7 (18.2, 21.3) 4.0 (3.2, 4.8) 76.3 (74.7, 77.9) 100
Post-Secondary 13.7 (10.2, 18.1) 4.7 (2.4, 9.2) 81.6 (76.0, 86.2) 100
College or above 11.9 (10.5, 13.5) 2.9 (2.3, 3.6) 85.2 (83.6, 86.7) 100
Residence x wealth index quintile
Urban 18.5 (17.2, 20.0) 3.1 (2.5, 3.8) 78.3 (76.8, 79.8) 100 Lowest 31.5 (22.2, 42.5) 9.6 (4.4, 19.7) 58.9 (47.0, 69.9) 100 Second 28.4 (24.4, 32.7) 5.6 (3.8, 8.2) 66.1 (61.5, 70.3) 100 Middle 19.8 (16.8, 23.1) 3.3 (2.1, 5.0) 77.0 (73.5, 80.1) 100 Fourth 19.3 (16.9, 22.0) 2.3 (1.5, 3.6) 78.4 (75.6, 80.9) 100 Highest 14.4 (12.5, 16.6) 2.6 (1.9, 3.5) 83.0 (80.7, 85.0) 100Rural 18.5 (17.2, 19.9) 4.7 (3.9, 5.5) 76.8 (75.4, 78.2) 100 Lowest 25.4 (20.4, 31.1) 3.6 (2.2, 5.9) 71.0 (65.1, 76.3) 100 Second 20.8 (18.7, 23.1) 6.2 (4.8, 7.9) 73.0 (70.4, 75.5) 100 Middle 19.0 (16.9, 21.4) 5.6 (4.2, 7.4) 75.4 (72.7, 77.9) 100 Fourth 18.9 (16.2, 21.8) 3.7 (2.8, 4.9) 77.5 (74.4, 80.2) 100 Highest 12.4 (10.4, 14.7) 2.9 (2.0, 4.3) 84.7 (82.1, 86.9) 100
Percentage (95% CI)
1 Occasional refers to less than daily use.
Demographic Characteristics
Cigarette Smoking FrequencyTotal
Daily Occasional1 Non-smoker
92 Global Adult Tobacco Survey : Philippines Country Report, 2015

Male 33.9 (32.1, 35.7) 6.4 (5.6, 7.4) 59.7 (57.9, 61.5) 100Age (years)
15-24 23.5 (20.6, 26.5) 6.2 (4.8, 8.0) 70.3 (67.0, 73.4) 10025-44 39.6 (37.0, 42.1) 7.0 (5.7, 8.5) 53.5 (51.0, 56.0) 10045-64 39.5 (36.7, 42.3) 6.3 (5.1, 7.7) 54.3 (51.3, 57.2) 10065+ 24.2 (20.0, 29.0) 4.1 (2.5, 6.7) 71.6 (66.4, 76.3) 100
Education Level
No Formal 37.0 (26.1, 49.5) 7.3 (3.9, 13.4) 55.7 (44.1, 66.7) 100Elementary 40.0 (36.9, 43.1) 7.3 (5.9, 9.0) 52.7 (49.5, 55.8) 100Secondary 36.1 (33.4, 38.8) 6.6 (5.3, 8.2) 57.3 (54.6, 60.0) 100Post-Secondary 27.3 (20.1, 35.9) 5.3 (2.7, 10.2) 67.4 (58.4, 75.3) 100College or above 24.5 (21.6, 27.6) 5.2 (4.1, 6.7) 70.3 (67.1, 73.3) 100
Residence x wealth index quintile
Urban 34.2 (31.6, 36.9) 4.7 (3.8, 5.7) 61.1 (58.4, 63.8) 100 Lowest 47.6 (32.5, 63.2) 10.9 (3.8, 27.6) 41.5 (26.0, 58.9) 100 Second 46.8 (41.0, 52.7) 7.4 (4.6, 11.5) 45.8 (39.9, 51.9) 100 Middle 35.1 (30.1, 40.5) 4.2 (2.8, 6.4) 60.6 (55.2, 65.8) 100 Fourth 36.9 (32.4, 41.7) 3.6 (2.1, 6.0) 59.5 (54.7, 64.1) 100 Highest 27.5 (23.6, 31.6) 4.4 (3.2, 6.2) 68.1 (63.8, 72.2) 100Rural 33.6 (31.2, 36.1) 7.9 (6.6, 9.5) 58.5 (56.1, 60.9) 100 Lowest 39.2 (30.7, 48.4) 4.6 (2.6, 7.8) 56.2 (47.0, 65.0) 100 Second 37.9 (34.2, 41.7) 10.5 (8.1, 13.5) 51.6 (47.6, 55.6) 100 Middle 33.8 (29.9, 38.0) 9.3 (6.8, 12.4) 56.9 (52.6, 61.1) 100 Fourth 35.1 (30.2, 40.3) 6.2 (4.5, 8.4) 58.7 (53.7, 63.6) 100 Highest 23.7 (19.7, 28.2) 5.5 (3.7, 8.1) 70.8 (65.9, 75.3) 100
Female 3.6 (3.1, 4.2) 1.5 (1.2, 1.9) 94.9 (94.1, 95.5) 100Age (years)
15-24 1.5 (0.9, 2.5) 0.3 (0.1, 0.8) 98.2 (97.1, 98.9) 10025-44 3.0 (2.2, 3.9) 2.0 (1.4, 2.8) 95.1 (93.9, 96.0) 10045-64 6.5 (5.2, 8.1) 1.6 (1.1, 2.4) 91.9 (90.2, 93.4) 10065+ 6.7 (4.8, 9.1) 3.2 (2.0, 5.2) 90.1 (87.1, 92.5) 100
Education Level
No Formal 12.0 (7.5, 18.7) 2.0 (0.7, 5.5) 86.1 (78.9, 91.1) 100Elementary 6.2 (4.9, 7.8) 2.3 (1.6, 3.3) 91.5 (89.7, 93.1) 100Secondary 3.3 (2.6, 4.3) 1.2 (0.8, 1.8) 95.4 (94.3, 96.3) 100Post-Secondary 2.1 (0.9, 5.2) 4.2 (1.2, 14.3) 93.6 (85.1, 97.4) 100College or above 1.9 (1.3, 2.8) 1.0 (0.6, 1.7) 97.1 (96.0, 97.9) 100
Residence x wealth index quintile
Urban 3.7 (2.9, 4.7) 1.6 (1.1, 2.5) 94.7 (93.4, 95.7) 100 Lowest 7.7 (3.1, 18.2) 7.7 (3.1, 17.7) 84.6 (71.6, 92.2) 100 Second 5.9 (3.7, 9.3) 3.4 (1.6, 7.0) 90.7 (86.3, 93.8) 100 Middle 5.5 (3.6, 8.3) 2.4 (1.0, 5.7) 92.1 (88.6, 94.5) 100 Fourth 2.8 (1.6, 4.8) 1.1 (0.5, 2.4) 96.1 (93.9, 97.5) 100 Highest 2.8 (1.7, 4.5) 1.0 (0.5, 2.0) 96.2 (94.3, 97.4) 100Rural 3.5 (2.9, 4.3) 1.4 (1.0, 1.9) 95.1 (94.2, 95.9) 100 Lowest 8.1 (4.9, 13.0) 2.3 (0.9, 6.0) 89.6 (83.8, 93.5) 100 Second 4.0 (2.8, 5.6) 1.7 (1.1, 2.7) 94.3 (92.4, 95.7) 100 Middle 3.8 (2.6, 5.6) 1.7 (1.0, 2.8) 94.5 (92.5, 96.1) 100 Fourth 2.8 (1.7, 4.5) 1.3 (0.6, 2.5) 95.9 (93.7, 97.4) 100 Highest 2.4 (1.4, 4.3) 0.5 (0.2, 1.3) 97.0 (95.2, 98.2) 100
Table 4.5a (cont.): Percentage distribution of adults ≥15 years old, by cigarette frequency, sex and selected demographic characteristics – GATS Philippines, 2015.
Percentage (95% CI)
1 Occasional refers to less than daily use.
Demographic Characteristics
Cigarette Smoking FrequencyTotal
Daily Occasional1 Non-smoker
93 Global Adult Tobacco Survey : Philippines Country Report, 2015

Overall 0.1 (0.0, 0.1) 0.4 (0.2, 0.8) 99.6 (99.1, 99.8) 100Sex
Male 0.1 (0.1, 0.3) 0.6 (0.3, 1.4) 99.3 (98.5, 99.6) 100 Female 0.1 (0.0, 0.1) 0.1 (0.0, 0.3) 99.8 (99.7, 99.9) 100Age (years)
15-24 0.1 (0.0, 0.2) 0.2 (0.1, 0.4) 99.8 (99.5, 99.9) 10025-44 0.1 (0.0, 0.2) 0.5 (0.2, 1.3) 99.4 (98.7, 99.7) 10045-64 0.1 (0.0, 0.3) 0.3 (0.1, 0.8) 99.6 (99.1, 99.8) 10065+ 0.2 (0.1, 0.7) 0.2 (0.0, 1.4) 99.6 (98.7, 99.9) 100
Education Level
No Formal 0.3 (0.0, 2.2) 0.0 N/A 99.7 (97.8, 100.0) 100Elementary 0.2 (0.1, 0.4) 0.4 (0.1, 1.3) 99.4 (98.7, 99.8) 100Secondary 0.1 (0.0, 0.2) 0.4 (0.2, 1.1) 99.5 (98.9, 99.8) 100Post-Secondary 0.0 N/A 0.0 N/A 100.0 100College or above 0.1 (0.1, 0.1) 0.2 (0.1, 0.7) 99.7 (99.3, 99.9) 100
Residence x wealth index quintile
Urban 0.1 (0.1, 0.3) 0.1 (0.0, 0.3) 99.8 (99.6, 99.9) 100 Lowest 0.0 N/A 0.0 N/A 100.0 N/A 100 Second 0.3 (0.0, 1.8) 0.0 N/A 99.7 (98.2, 100.0) 100 Middle 0.1 (0.0, 0.6) 0.0 N/A 99.9 (99.4, 100.0) 100 Fourth 0.2 (0.0, 0.7) 0.1 (0.0, 0.4) 99.8 (99.3, 99.9) 100 Highest 0.1 (0.1, 0.1) 0.2 (0.0, 0.8) 99.7 (99.3, 99.9) 100Rural 0.0 (0.0, 0.1) 0.6 (0.2, 1.4) 99.4 (98.6, 99.7) 100 Lowest 0.4 (0.1, 1.6) 0.2 (0.0, 1.5) 99.3 (98.1, 99.8) 100 Second 0.1 (0.0, 0.2) 0.7 (0.3, 1.6) 99.2 (98.4, 99.6) 100 Middle 0.0 N/A 1.1 (0.3, 3.5) 98.9 (96.5, 99.7) 100 Fourth 0.0 (0.0, 0.3) 0.2 (0.1, 0.7) 99.8 (99.3, 99.9) 100 Highest 0.0 N/A 0.3 (0.1, 1.2) 99.7 (98.8, 99.9) 100
Table 4.5b: Percentage distribution of adults ≥15 years old, by waterpipe frequency, sex and selected demographic characteristics – GATS Philippines, 2015.
N/A- The estimate is "0.0" or "100.0"
Percentage (95% CI)
1 Occasional refers to less than daily use.
Demographic Characteristics
Waterpipe FrequencyTotal
Daily Occasional1 Non-smoker
94 Global Adult Tobacco Survey : Philippines Country Report, 2015

Table 4.6: Average number and percentage distribution of cigarettes smoked per day among daily cigarette smokers ≥15 years old, by sex and selected demographic characteristics – GATS Philippines, 2015.
Total
Overall 11.0 (10.5, 11.5) 33.7 (31.0, 36.5) 34.8 (32.4, 37.3) 7.6 (6.3, 9.1) 1.2 (0.6, 2.2) 22.7 (20.3, 25.2) 100Sex
Male 11.2 (10.7, 11.7) 32.2 (29.4, 35.1) 35.1 (32.5, 37.7) 7.9 (6.6, 9.5) 1.3 (0.7, 2.4) 23.5 (21.0, 26.2) 100 Female 8.6 (6.9, 10.2) 48.7 (41.1, 56.4) 32.3 (25.2, 40.3) 4.7 (2.3, 9.3) 0.0 N/A 14.4 (9.5, 21.1) 100Age (years)
15-24 8.8 (7.9, 9.7) 42.9 (36.2, 50.0) 38.6 (31.8, 45.8) 3.8 (1.9, 7.3) 0.4 (0.1, 2.0) 14.3 (10.1, 19.8) 10025-44 11.2 (10.4, 11.9) 33.3 (29.5, 37.3) 33.8 (30.6, 37.2) 7.6 (5.8, 10.0) 1.4 (0.7, 2.8) 23.9 (20.5, 27.7) 10045-64 12.2 (11.5, 12.9) 25.8 (22.0, 30.1) 35.7 (31.4, 40.3) 10.5 (7.8, 14.0) 1.5 (0.7, 3.3) 26.4 (22.6, 30.6) 10065+ 10.6 (8.5, 12.7) 44.3 (35.5, 53.5) 24.1 (17.1, 32.8) 7.2 (3.5, 14.1) 0.7 (0.1, 5.0) 23.6 (16.5, 32.6) 100
Education Level
No Formal 9.3 (6.7, 12.0) 48.6 (32.8, 64.7) 25.1 (13.8, 41.4) 1.6 (0.4, 6.5) 1.7 (0.2, 11.4) 23 (11.8, 40.0) 100Elementary 11.0 (10.3, 11.7) 34.9 (30.7, 39.2) 31.9 (28.0, 36.1) 7.0 (5.3, 9.2) 2.1 (0.9, 4.9) 24.1 (20.6, 27.9) 100Secondary 10.9 (10.2, 11.6) 34.4 (30.2, 38.8) 35.4 (31.5, 39.4) 6.3 (4.8, 8.3) 0.9 (0.5, 1.8) 23 (19.6, 26.8) 100Post-Secondary 10.0 (8.5, 11.4) 23.2 (13.5, 36.9) 52.6 (38.6, 66.3) 11.5 (4.6, 26.0) 1.8 (0.4, 7.2) 10.8 (5.4, 20.6) 100College or above 11.4 (10.2, 12.6) 29.8 (23.6, 36.8) 37.2 (31.3, 43.5) 11.9 (7.8, 17.7) 0.1 (0.0, 0.8) 21 (16.0, 27.1) 100
Residence x wealth index quintile
Urban 10.9 (10.3, 11.5) 32.2 (28.5, 36.2) 36.7 (33.1, 40.4) 8.0 (6.0, 10.6) 1.3 (0.4, 3.8) 21.8 (18.6, 25.3) 100 Lowest 10.3 (7.1, 13.5) 40.5 (22.5, 61.4) 27.5 (12.3, 50.7) 3.0 (0.7, 11.6) 2.2 (0.3, 14.0) 26.8 (11.0, 52.0) 100 Second 11.2 (9.4, 13.1) 32.3 (24.0, 41.7) 36.6 (28.8, 45.0) 7.7 (3.7, 15.1) 2.8 (0.7, 10.6) 20.7 (14.4, 28.9) 100 Middle 10.1 (9.2, 11.0) 34.3 (27.4, 42.0) 38.9 (31.6, 46.7) 3.7 (1.8, 7.7) 2.8 (0.8, 9.6) 20.2 (14.7, 27.3) 100 Fourth 10.9 (9.6, 12.2) 34.9 (28.2, 42.4) 35.0 (28.6, 41.9) 9.8 (6.5, 14.3) 0.5 (0.1, 1.8) 19.9 (14.5, 26.7) 100 Highest 11.3 (10.3, 12.2) 27.9 (21.7, 35.0) 37.4 (30.5, 44.8) 10.0 (6.0, 16.3) 0.2 (0.0, 1.6) 24.5 (18.8, 31.3) 100Rural 11.0 (10.2, 11.8) 35.0 (31.2, 39.0) 33.2 (30.1, 36.4) 7.3 (5.8, 9.1) 1.1 (0.6, 1.9) 23.5 (20.1, 27.2) 100 Lowest 10.3 (8.5, 12.0) 34.6 (24.3, 46.5) 34.1 (24.0, 45.8) 10.0 (5.6, 17.2) 2.0 (0.3, 11.7) 19.4 (10.1, 34.0) 100 Second 10.0 (9.1, 10.9) 39.0 (33.4, 44.8) 33.2 (28.4, 38.3) 7.0 (4.8, 10.0) 1.8 (0.9, 3.6) 19.1 (15.1, 23.8) 100 Middle 10.9 (9.7, 12.2) 37.9 (31.3, 45.0) 30.8 (24.9, 37.4) 5.1 (3.2, 8.1) 0.5 (0.1, 2.1) 25.7 (19.6, 32.9) 100 Fourth 11.4 (10.1, 12.6) 32.2 (25.4, 39.8) 35.5 (29.0, 42.6) 7.0 (4.4, 11.0) 0.9 (0.2, 3.7) 24.4 (19.1, 30.6) 100 Highest 13.2 (10.8, 15.6) 25.7 (18.2, 34.9) 33.4 (24.8, 43.3) 11.9 (6.3, 21.4) 0.7 (0.1, 4.6) 28.3 (20.2, 38.3) 100
1 Among daily cigarette smokers. Cigarettes include manufactured and Hand-rolled.N/A- The estimate is "0.0"
Demographic Characteristics
Distribution of number of cigarettes smoked on average per day1
Average number of cigarettes smoked per day1
Percentage (95% CI)
1-5 6-10 11-15 16-20 ≥20
95 Global Adult Tobacco Survey : Philippines Country Report, 2015

Table 4.7: Percentage distribution of ever daily smokers 15-34 years old by age at daily smoking initiation, sex and residence.– GATS PHILIPPINES, 2015.
Overall 17.5 (17.3, 17.8) 12.3 (10.1, 14.9) 25.2 (21.7 , 28.7) 36.4 (32.6 , 40.2) 26.1 (23.1 , 29.1) 100Sex
Male 17.5 (17.2, 17.7) 12.8 (10.3 , 15.4) 24.9 (21.2 , 28.5) 36.7 (32.6 , 40.8) 25.6 (22.5 , 28.7) 100 Female 18.3 (17.3, 19.4) 6.3 (0.4 , 12.1) 28.7 (15.1 , 42.2) 33.2 (22.4 , 44.1) 31.8 (20.0 , 43.7) 100Education Level
No Formal 17.3 (15.5, 19.0) -- -- -- -- -- -- -- --Elementary 17.1 (16.7, 17.5) 13.1 (8.7 , 17.4) 29.5 (22.3 , 36.7) 35.4 (28.8 , 42.1) 22.0 (16.9 , 27.1) 100Secondary 17.3 (16.8, 17.6) 14.2 (10.5 , 18.0) 26.4 (21.4 , 31.3) 36.5 (31.5 , 41.6) 22.9 (18.9 , 26.9) 100Post,Secondary 19.4 (17.9, 20.9) 3.4 (0.0 , 8.8) 8.7 (0.1 , 17.4) 50.3 (28.3 , 72.2) 37.5 (16.3 , 58.7) 100College or above 18.6 (18.0, 19.0) 7.8 (3.7 , 12.0) 19.1 (13.3 , 24.8) 35.2 (27.0 , 43.4) 37.9 (30.5 , 45.3) 100
Residence x wealth index quintile
Urban 17.5 (17.2, 17.9) 13.9 (10.7 , 17.0) 23.4 (18.1 , 28.6) 35.2 (30.4 , 40.0) 27.6 (23.2 , 31.9) 100 Lowest 16.2 (15.4, 17.0) -- -- -- -- -- -- -- -- Second 17.0 (16.3, 17.6) 21.7 (11.4 , 32.0) 30.6 (15.5 , 45.7) 31.0 (19.8 , 42.2) 16.7 (8.9 , 24.6) 100 Middle 17.6 (16.8, 18.3) 15.8 (8.8 , 22.8) 24.5 (16.9 , 32.1) 36.3 (28.2 , 44.4) 23.4 (14.6 , 32.2) 100 Fourth 18.2 (17.6, 18.8) 10.8 (6.8 , 14.9) 14.6 (7.5 , 21.7) 37.6 (29.3 , 45.9) 37.0 (28.7 , 45.2) 100 Highest 17.8 (16.8, 18.6) 10.1 (5.1 , 15.1) 28.4 (18.2 , 38.6) 35.2 (26.7 , 43.7) 26.3 (19.0 , 33.7) 100Rural 17.5 (17.2, 17.9) 10.9 (7.3 , 14.6) 26.8 (22.0 , 31.6) 37.5 (31.7 , 43.3) 24.7 (20.5 , 28.9) 100 Lowest 17.9 (17.4, 18.4) 14.7 (4.1 , 25.3) 27.8 (12.2 , 43.3) 29.5 (15.9 , 43.1) 28.0 (13.9 , 42.2) 100 Second 17.1 (16.5, 17.6) 7.9 (4.0 , 11.7) 22.8 (16.7 , 28.9) 39.9 (32.3 , 47.5) 29.5 (22.6 , 36.3) 100 Middle 17.7 (16.6, 18.6) 12.2 (4.7 , 19.6) 31.5 (21.9 , 41.1) 33.5 (25.0 , 42.1) 22.9 (14.1 , 31.6) 100 Fourth 17.4 (16.6, 18.1) 12.7 (3.1 , 22.3) 27.7 (16.8 , 38.6) 37.1 (23.0 , 51.3) 22.5 (13.9 , 31.0) 100 Highest 17.8 (16.8, 18.6) 9.9 (2.3 , 17.5) 24.2 (11.6 , 36.7) 43.7 (29.4 , 58.0) 22.2 (11.5 , 33.0) 100
-- Indicates estimates based on less than 25 unweighted cases and has been suppressed.
Percentage (95% CI)
1 Among respondents 15-34 years of age who are ever daily smokers.
Demographic Characteristics
Age at Daily Smoking Initiation (years)1
Total<15 15-16 17-19 20+Average age of Initiation
96 Global Adult Tobacco Survey : Philippines Country Report, 2015

Table 4.7a: Percentage distribution of ever daily smokers 15-17 years old by age at daily smoking initiation and sex.– GATS Philippines, 2015.
Overall 0.8 (0.1, 5.5) 2.6 (0.4, 16.9) 21.4 (9.6, 41.1) 39.1 (21.7, 59.8) 36.1 (16.6, 61.7) Sex
Male 0.8 (0.1, 6.0) 2.8 (0.4, 18.1) 18.4 (7.6, 38.0) 39.0 (20.9, 60.7) 39.0 (18.2, 64.7) Female -- -- -- -- -- -- -- -- -- --1 Among respondents 15-17 years of age who are ever daily smokers.
Age at Daily Smoking Initiation (years)1
<10 10-11 12-13 14-15
--Indicates estimates based on less than 25 unweighted cases and has been suppressed.
Percentage (95% CI)
16-17Demographic Characteristics
97 Global Adult Tobacco Survey : Philippines Country Report, 2015

Overall 4.9 (4.4, 5.4) 19.3 (17.6, 21.1)Sex
Male 7.9 (7.2, 8.8) 17.7 (16.1, 19.5)Female 1.9 (1.5, 2.3) 31.0 (25.9, 36.6)
15-24 1.3 (0.9, 2.0) 8.9 (5.9, 13.1)25-44 3.9 (3.4, 4.6) 14.5 (12.5, 16.7)45-64 8.1 (7.1, 9.3) 24.3 (21.5, 27.3)65+ 15.9 (13.6, 18.5) 49.2 (43.5, 55.0)
No Formal 5.9 (3.7, 9.4) 18.5 (11.7, 27.9)Elementary 8.4 (7.4, 9.6) 23.1 (20.5, 26.0)Secondary 3.9 (3.3, 4.5) 15.3 (13.0, 17.9)Post-Secondary 4.3 (2.4, 7.5) 22.4 (12.9, 36.0)College or above 3.4 (2.7, 4.2) 20.7 (17.2, 24.6)
Urban 4.3 (3.6, 5.1) 17.6 (14.9, 20.6) Lowest 1.9 (0.8, 4.6) 5.0 (1.9, 12.2) Second 3.1 (1.9, 4.8) 8.8 (5.7, 13.5) Middle 6.0 (4.7, 7.6) 22.1 (17.6, 27.5) Fourth 3.9 (2.9, 5.3) 16.0 (11.9, 21.1) Highest 4.0 (3.1, 5.3) 20.8 (16.3, 26.1)Rural 5.4 (4.8, 6.1) 20.7 (18.6, 23.0) Lowest 3.4 (2.1, 5.5) 10.9 (6.9, 16.9) Second 5.1 (4.2, 6.3) 17.7 (14.7, 21.2) Middle 4.8 (3.8, 6.0) 18.3 (14.7, 22.6) Fourth 5.6 (4.5, 7.0) 20.7 (16.7, 25.4) Highest 7.1 (5.4, 9.2) 34.3 (27.1, 42.3)
Table 4.8: Percentage of all adults and ever daily smokers ≥15 years old who are former daily smokers, by selected demographic characteristics – GATS Philippines, 2015.
Residence x wealth index quintile
Education Level
Age (years)
Former Daily Smokers1
(Among All Adults) Former Daily Smokers1 (Among
Ever Daily Smokers)2
Percentage (95% CI)
1 Current Non-smokers.2 Also known as the quit ratio for daily smoking.
Demographic Characteristics
98 Global Adult Tobacco Survey : Philippines Country Report, 2015

Overall 14.1 (10.9, 18.0) 24.0 (20.2, 28.4) 12.6 (10.2, 15.4) 49.3 (45.1, 53.6) 100Sex
Male 13.6 (10.5, 17.3) 24.3 (20.2, 28.9) 13.8 (11.0, 17.1) 48.4 (43.7, 53.1) 100Female 16.4 (8.4, 29.5) 23.0 (14.9, 33.6) 7.4 (4.5, 12.0) 53.3 (43.0, 63.3) 100
Age (years)
15-24 59.6 (39.1, 77.2) 31.9 (16.7, 52.1) 8.6 (2.4, 26.2) -- -- 10025-44 16.0 (11.2, 22.2) 30.5 (23.5, 38.5) 19.3 (14.1, 25.8) 34.2 (27.4, 41.8) 10045-64 7.3 (4.8, 10.9) 21.5 (16.5, 27.5) 10.8 (7.5, 15.3) 60.4 (53.9, 66.6) 10065+ 6.2 (3.5, 10.8) 15.5 (10.5, 22.2) 6.4 (3.5, 11.6) 71.9 (64.5, 78.3) 100
Education Level
No Formal -- -- 1.6 (0.6, 4.0) 0.3 (0.0, 2.2) 2.7 (1.2, 5.9)Elementary 14.8 (10.8, 19.9) 21.9 (17.2, 27.4) 11.0 (7.7, 15.5) 52.3 (46.3, 58.2) 100Secondary 18.4 (12.4, 26.3) 23.9 (17.6, 31.5) 13.7 (9.3, 19.7) 44.0 (36.9, 51.4) 100Post-Secondary -- -- 1.3 (0.4, 3.9) 0.2 (0.0, 1.5) 2.7 (1.3, 5.7) 100College or above 6.7 (2.8, 15.1) 27.7 (19.7, 37.3) 15.7 (10.3, 23.1) 49.9 (40.4, 59.5) 100
Residence x wealth index quintile
Urban 11.2 (6.3, 19.1) 22.6 (16.8, 29.6) 14.8 (10.8, 20.0) 51.4 (45.1, 57.6) 100 Lowest -- -- 0.3 (0.1, 2.0) 0.0 N/A 1.6 (0.5, 5.0) Second 15.7 (5.6, 36.9) 9.8 (3.4, 25.4) 25.8 (12.3, 46.4) 48.7 (27.5, 70.3) 100 Middle 12.6 (7.1, 21.4) 19.4 (9.5, 35.4) 12.5 (6.2, 23.5) 55.5 (43.7, 66.8) 100 Fourth 2.8 (0.9, 8.7) 23.0 (12.9, 37.7) 20.6 (12.2, 32.6) 53.6 (41.7, 65.1) 100 Highest 14.6 (6.3, 30.3) 27.3 (18.4, 38.5) 11.1 (6.1, 19.1) 47.0 (36.7, 57.6) 100Rural 16.1 (12.2, 20.8) 25.1 (20.2, 30.7) 11 (8.3, 14.3) 47.9 (42.2, 53.7) 100 Lowest -- -- 1.3 (0.6, 2.6) 0.3 (0.1, 1.4) 1.2 (0.6, 2.7) Second 13.7 (7.9, 22.7) 21.0 (14.6, 29.2) 12.3 (7.6, 19.4) 53.0 (43.0, 62.8) 100 Middle 19.3 (11.0, 31.5) 26.7 (17.2, 39.0) 14.5 (9.1, 22.4) 39.5 (29.1, 51.0) 100 Fourth 24.8 (16.7, 35.2) 22.3 (14.0, 33.5) 8.6 (4.3, 16.4) 44.4 (33.4, 56.0) 100 Highest 5.9 (1.9, 16.5) 28.9 (18.1, 42.8) 9.1 (3.8, 20.2) 56.2 (43.6, 68.0) 100
Table 4.9: Percentage distribution of former daily smokers ≥15 years old, by time since quitting smoking and selected demographic characteristics – GATS Philippines, 2015.
N/A- The estimate is "0.0"
Percentage (95% CI)
--Indicates estimates based on less than 25 unweighted cases and has been suppressed.
1 Among former daily smokers (current Non-smokers).
Demographic Characteristics
Time since quitting smoking (years)1
Total<1 1 to <5 5 to <10 ≥10
99 Global Adult Tobacco Survey : Philippines Country Report, 2015

Table 4.10: Percentage distribution of current tobacco users ≥15 years old, by tobacco use pattern and selected demographic characteristics – GATS Philippines, 2015.
Total
Overall 23.8 (22.9, 24.8) 92.8 (90.7, 94.5) 4.4 (3.2, 6.2) 2.7 (1.9, 4.0) 100Sex
Male 41.9 (40.3, 43.6) 93.5 (91.4, 95.1) 3.6 (2.4, 5.2) 2.9 (2.0, 4.3) 100Female 5.8 (5.1, 6.5) 88.0 (83.4, 91.4) 10.6 (7.3, 15.1) 1.4 (0.6, 3.3) 100
Age (years)
15-24 16.7 (15.1, 18.4) 94.1 (90.1, 96.5) 3.7 (2.1, 6.5) 2.3 (0.9, 5.4) 10025-44 27.0 (25.6, 28.4) 93.6 (90.9, 95.5) 3.2 (1.9, 5.4) 3.2 (2.0, 5.1) 10045-64 28.3 (26.7, 30.1) 92.8 (90.0, 94.9) 5.2 (3.6, 7.7) 1.9 (1.0, 3.5) 10065+ 20.6 (17.9, 23.5) 82.1 (76.8, 86.5) 13.4 (9.6, 18.4) 4.4 (2.5, 7.9) 100
Education Level
No Formal 33.3 (26.5, 40.8) 77.0 (65.2, 85.7) 17.4 (9.8, 29.1) 5.5 (2.2, 13.2) 100Elementary 32.9 (30.8, 35.1) 88.0 (84.6, 90.7) 8.0 (5.8, 11.0) 4.0 (2.7, 5.8) 100Secondary 24.6 (23.1, 26.1) 95.2 (92.6, 96.9) 2.5 (1.5, 4.3) 2.3 (1.2, 4.5) 100Post-Secondary 18.8 (14.4, 24.2) 98.9 (95.2, 99.8) 1.1 (0.2, 4.8) 0.0 N/A 100College or above 15.1 (13.8, 16.6) 97.6 (95.1, 98.8) 1.0 (0.5, 2.0) 1.5 (0.5, 4.2) 100
Residence x wealth index quintile
Urban 22.1 (20.9, 23.4) 97.3 (95.9, 98.2) 0.9 (0.6, 1.6) 1.8 (1.0, 3.0) 100 Lowest 43.2 (32.5, 54.7) 86.7 (61.9, 96.3) 3.9 (0.6, 21.9) 9.4 (1.7, 38.4) 100 Second 34.6 (30.7, 38.7) 93.1 (88.4, 96.0) 1.8 (1.1, 2.8) 5.1 (2.5, 10.3) 100 Middle 23.9 (21.4, 26.6) 97.1 (94.7, 98.4) 1.9 (1.0, 3.6) 1.0 (0.3, 3.4) 100 Fourth 21.9 (19.8, 24.1) 99.2 (97.7, 99.7) 0.2 (0.0, 1.7) 0.5 (0.1, 2.1) 100 Highest 17.2 (15.7, 18.9) 99.0 (98.1, 99.4) 0.2 (0.0, 1.3) 0.9 (0.5, 1.6) 100Rural 25.3 (23.9, 26.9) 89.5 (86.0, 92.2) 7.0 (4.9, 10.0) 3.5 (2.1, 5.5) 100 Lowest 39.3 (31.4, 47.7) 69.3 (46.9, 85.3) 25.5 (10.8, 49.1 5.2 (2.7, 9.7) 100 Second 30.6 (28.0, 33.3) 87.5 (82.3, 91.3) 10.2 (6.8, 14.9) 2.3 (1.3, 4.1) 100 Middle 26.3 (23.6, 29.1) 88.3 (81.2, 93.0) 4.9 (3.3, 7.4) 6.7 (3.2, 13.6) 100 Fourth 23.5 (20.8, 26.5) 96.1 (92.9, 97.9) 2.4 (1.2, 4.7) 1.5 (0.5, 4.8) 100 Highest 16.0 (13.7, 18.6) 96.8 (93.1, 98.5) 1.8 (0.7, 5.0) 1.4 (0.4, 4.5) 100
N/A- The estimate is "0.0"
Percentage (95% CI)
1 Includes daily and occasional (less than daily) smokers or smokeless users.
Type of Current Tobacco Use
Smoked only Smokeless only Both smoked and smokelessCurrent Tobacco Users1Demographic
Characteristics
100 Global Adult Tobacco Survey : Philippines Country Report, 2015
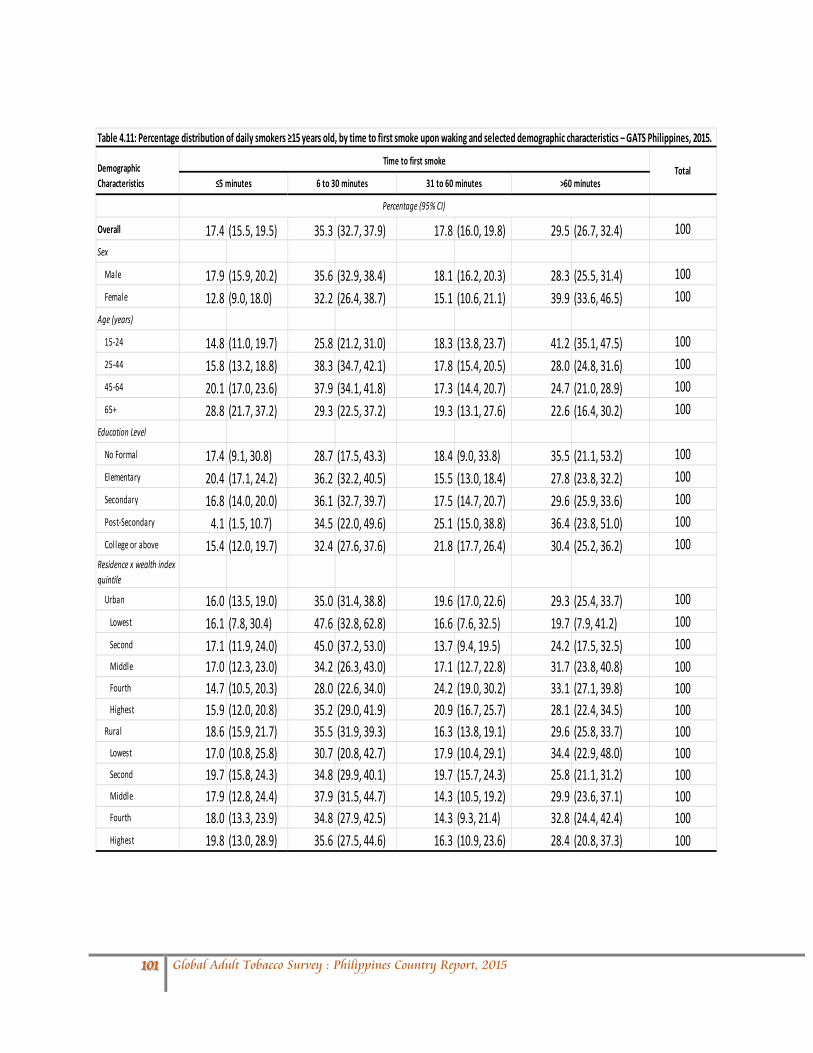
Table 4.11: Percentage distribution of daily smokers ≥15 years old, by time to first smoke upon waking and selected demographic characteristics – GATS Philippines, 2015.
Overall 17.4 (15.5, 19.5) 35.3 (32.7, 37.9) 17.8 (16.0, 19.8) 29.5 (26.7, 32.4) 100Sex
Male 17.9 (15.9, 20.2) 35.6 (32.9, 38.4) 18.1 (16.2, 20.3) 28.3 (25.5, 31.4) 100Female 12.8 (9.0, 18.0) 32.2 (26.4, 38.7) 15.1 (10.6, 21.1) 39.9 (33.6, 46.5) 100
Age (years)
15-24 14.8 (11.0, 19.7) 25.8 (21.2, 31.0) 18.3 (13.8, 23.7) 41.2 (35.1, 47.5) 10025-44 15.8 (13.2, 18.8) 38.3 (34.7, 42.1) 17.8 (15.4, 20.5) 28.0 (24.8, 31.6) 10045-64 20.1 (17.0, 23.6) 37.9 (34.1, 41.8) 17.3 (14.4, 20.7) 24.7 (21.0, 28.9) 10065+ 28.8 (21.7, 37.2) 29.3 (22.5, 37.2) 19.3 (13.1, 27.6) 22.6 (16.4, 30.2) 100
Education Level
No Formal 17.4 (9.1, 30.8) 28.7 (17.5, 43.3) 18.4 (9.0, 33.8) 35.5 (21.1, 53.2) 100Elementary 20.4 (17.1, 24.2) 36.2 (32.2, 40.5) 15.5 (13.0, 18.4) 27.8 (23.8, 32.2) 100Secondary 16.8 (14.0, 20.0) 36.1 (32.7, 39.7) 17.5 (14.7, 20.7) 29.6 (25.9, 33.6) 100Post-Secondary 4.1 (1.5, 10.7) 34.5 (22.0, 49.6) 25.1 (15.0, 38.8) 36.4 (23.8, 51.0) 100College or above 15.4 (12.0, 19.7) 32.4 (27.6, 37.6) 21.8 (17.7, 26.4) 30.4 (25.2, 36.2) 100
Residence x wealth index quintile
Urban 16.0 (13.5, 19.0) 35.0 (31.4, 38.8) 19.6 (17.0, 22.6) 29.3 (25.4, 33.7) 100 Lowest 16.1 (7.8, 30.4) 47.6 (32.8, 62.8) 16.6 (7.6, 32.5) 19.7 (7.9, 41.2) 100 Second 17.1 (11.9, 24.0) 45.0 (37.2, 53.0) 13.7 (9.4, 19.5) 24.2 (17.5, 32.5) 100 Middle 17.0 (12.3, 23.0) 34.2 (26.3, 43.0) 17.1 (12.7, 22.8) 31.7 (23.8, 40.8) 100 Fourth 14.7 (10.5, 20.3) 28.0 (22.6, 34.0) 24.2 (19.0, 30.2) 33.1 (27.1, 39.8) 100 Highest 15.9 (12.0, 20.8) 35.2 (29.0, 41.9) 20.9 (16.7, 25.7) 28.1 (22.4, 34.5) 100Rural 18.6 (15.9, 21.7) 35.5 (31.9, 39.3) 16.3 (13.8, 19.1) 29.6 (25.8, 33.7) 100 Lowest 17.0 (10.8, 25.8) 30.7 (20.8, 42.7) 17.9 (10.4, 29.1) 34.4 (22.9, 48.0) 100 Second 19.7 (15.8, 24.3) 34.8 (29.9, 40.1) 19.7 (15.7, 24.3) 25.8 (21.1, 31.2) 100 Middle 17.9 (12.8, 24.4) 37.9 (31.5, 44.7) 14.3 (10.5, 19.2) 29.9 (23.6, 37.1) 100 Fourth 18.0 (13.3, 23.9) 34.8 (27.9, 42.5) 14.3 (9.3, 21.4) 32.8 (24.4, 42.4) 100 Highest 19.8 (13.0, 28.9) 35.6 (27.5, 44.6) 16.3 (10.9, 23.6) 28.4 (20.8, 37.3) 100
Percentage (95% CI)
Demographic Characteristics
Time to first smokeTotal
≤5 minutes 6 to 30 minutes 31 to 60 minutes >60 minutes
101 Global Adult Tobacco Survey : Philippines Country Report, 2015

Table 4.12: Prevalence of knowledge and use of e-cigarettes, by demographic characteristics- GATS Philippines, 2015
Demographic Characteristics
Overall 31.7 (30.0, 33.5) 2.8 (2.4, 3.3) 0.8 (0.6, 0.9)
Male 36.4 (34.1, 38.6) 4.5 (3.8, 5.3) 1.3 (1.1, 1.7)Female 27.1 (25.3, 29.0) 1.1 (0.8, 1.5) 0.2 (0.1, 0.3)
15-24 36.3 (33.8, 39.0) 3.1 (2.3, 4.1) 0.6 (0.4, 1.0)25-44 34.5 (32.4, 36.7) 3.1 (2.6, 3.8) 1.0 (0.7, 1.3)45-64 26.4 (24.5, 28.4) 2.5 (1.9, 3.2) 0.7 (0.4, 1.0)65+ 11.3 (9.5, 13.4) 0.5 (0.2, 1.1) 0.2 (0.1, 0.2)
No Formal 13.6 (7.0, 24.6) 0.4 (0.1, 2.8) 0.0 N/A
Elementary 12.8 (11.3, 14.6) 1.0 (0.6, 1.6) 0.3 (0.2, 0.7) Secondary 29.1 (27.2, 31.2) 2.3 (1.8, 2.9) 0.6 (0.4, 0.9)
Post-Secondary 45.4 (39.7, 51.2) 3.0 (1.4, 6.2) 0.0 N/A College or above 50.9 (48.4, 53.3) 5.1 (4.2, 6.2) 1.4 (1.0, 1.9)
Urban 43.8 (41.3, 46.5) 4.3 (3.6, 5.1) 1.3 (1.1, 1.7) Lowest 13.7 (7.5, 23.7) 0.0 N/A 0.0 N/A Second 19.2 (15.7, 23.2) 1.0 (0.5, 2.1) 0.3 (0.2, 0.7) Middle 33.9 (30.1, 37.9) 2.3 (1.5, 3.4) 0.5 (0.3, 1.1) Fourth 44.2 (40.8, 47.7) 4.2 (3.1, 5.8) 1.5 (0.9, 2.4) Highest 56.2 (53.4, 58.8) 6.4 (5.2, 7.8) 2.0 (1.4, 2.7)Rural 21.1 (19.2, 23.2) 1.5 (1.1, 2.1) 0.2 (0.1, 0.4) Lowest 5.6 (3.4, 8.9) 0.0 N/A 0.0 N/A Second 12.2 (10.0, 14.8) 0.5 (0.2, 1.1) 0.0 (0.0, 0.2) Middle 17.4 (15.1, 20.1) 1.1 (0.6, 2.1) 0.3 (0.1, 0.9) Fourth 24.0 (20.8, 27.4) 1.7 (0.9, 3.3) 0.2 (0.1, 0.6) Highest 38.2 (34.0, 42.6) 3.5 (2.4, 5.0) 0.4 (0.2, 1.1)1 Among all adults.2 Current use includes daily or less than daily use.
Percentage (95% CI)
Current user of electronic cigarettes1,2
Ever heard of electronic cigarettes1Ever used an electronic
cigarette1
N/A- The estimate is "0.0"
Residence x wealth index quintile
Education Level
Age (years)
Sex
102 Global Adult Tobacco Survey : Philippines Country Report, 2015

Table 5.1: Percentage of smokers ≥15 years old who made a quit attempt and received health care provider advice in the past 12 months, by selected demographic characteristics – GATS Philippines, 2015.
Demographic Characteristics
Overall 52.2 (49.7, 54.6) 26.5 (24.5, 28.6) 70.5 (66.4, 74.4) 56.5 (52.0, 60.8) 4.0 (3.2, 5.0)Sex
Male 51.5 (48.9, 54.2) 24.7 (22.7, 26.8) 72.8 (68.2, 76.9) 58.1 (53.5, 62.6) 3.6 (2.9, 4.5)Female 57.1 (51.4, 62.6) 40.0 (34.1, 46.3) 60.2 (48.7, 70.7) 48.8 (37.8, 59.9) 6.9 (3.8, 12.2)
Age (years)15-24 54.4 (48.8, 59.9) 20.3 (16.5, 24.8) 57.4 (46.3, 67.9) 42.9 (32.1, 54.4) 7.0 (4.5, 10.6)25-44 51.6 (48.3, 54.8) 24.8 (22.0, 27.8) 72.8 (66.6, 78.2) 55.4 (48.5, 62.2) 3.3 (2.4, 4.4)45-64 52.7 (49.0, 56.3) 32.5 (29.1, 36.1) 74.1 (68.0, 79.4) 63.8 (57.7, 69.5) 2.5 (1.6, 3.7)65+ 46.1 (38.9, 53.4) 37.0 (30.2, 44.4) 70.5 (59.9, 79.3) 61.2 (50.4, 71.0) 5.3 (3.0, 9.1)
Education LevelNo Formal 30.1 (19.5, 43.4) 17.2 (10.7, 26.5) -- -- -- -- 5.2 (1.6, 15.9)Elementary 49.7 (45.6, 53.7) 23.9 (21.0, 27.0) 64.6 (57.7, 70.9) 53.7 (47.0, 60.3) 4.8 (3.5, 6.4)Secondary 53.7 (50.4, 56.9) 23.3 (20.5, 26.3) 71.1 (65.0, 76.5) 56.9 (50.0, 63.6) 4.0 (2.8, 5.8)Post-Secondary 61.6 (47.1, 74.3) 38.2 (26.6, 51.4) 63.1 (32.8, 85.7) 47.2 (24.2, 71.4) 0.9 (0.1, 6.4)College or above 54.2 (49.4, 58.9) 38.0 (33.2, 43.0) 77.5 (70.1, 83.6) 60.0 (52.0, 67.5) 2.7 (1.6, 4.5)
Urban 50.2 (46.1, 54.2) 28.1 (24.7, 31.7) 71.5 (65.1, 77.1) 55.2 (48.7, 61.6) 3.4 (2.2, 5.2) Lowest 45.9 (29.4, 63.5) 5.6 (2.1, 13.9) -- -- -- -- 2.7 (1.8, 4.0) Second 35.5 (28.5, 43.1) 19.6 (14.2, 26.4) 59.9 (44.4, 73.6) 38.5 (24.2, 55.1) 1.4 (0.5, 4.2) Middle 50.2 (42.8, 57.5) 28.9 (23.8, 34.6) 64.3 (50.4, 76.1) 50.6 (39.0, 62.2) 4.4 (2.7, 7.1) Fourth 54.1 (47.5, 60.6) 33.0 (27.2, 39.3) 70.8 (60.9, 79.0) 61.8 (51.5, 71.0) 2.9 (1.3, 6.1) Highest 55.1 (49.5, 60.4) 30.0 (24.8, 35.9) 81.3 (71.2, 88.5) 58.7 (49.0, 67.8) 4.2 (2.0, 8.9)Rural 53.8 (50.7, 56.9) 25.2 (22.8, 27.8) 69.7 (64.0, 74.8) 57.7 (51.5, 63.6) 4.4 (3.4, 5.7) Lowest 42.6 (31.9, 54.0) 16.5 (11.1, 23.9) 47.8 (28.9, 67.3) 47.8 (28.9, 67.3) 2.1 (0.7, 5.8) Second 52.8 (47.3, 58.2) 25.0 (20.8, 29.8) 67.5 (58.7, 75.3) 57.5 (48.7, 65.8) 3.1 (1.9, 5.1) Middle 54.0 (48.0, 59.8) 22.1 (18.2, 26.5) 75.4 (65.6, 83.1) 61.1 (50.5, 70.7) 5.0 (2.9, 8.4) Fourth 57.4 (51.4, 63.2) 28.5 (23.6, 34.0) 68.0 (56.5, 77.7) 54.6 (42.5, 66.2) 6.1 (4.0, 9.3) Highest 53.7 (45.0, 62.1) 30.2 (22.9, 38.6) 72.9 (58.3, 83.8) 60.3 (44.9, 73.9) 3.8 (1.7, 8.4)
1 Among current smokers and former smokers who have been abstinent for less than 12 months.
2 HCP = health care provider. 3 Among current smokers and former smokers who have been abstinent for less than 12 months, and who visited a HCP during the past 12 months.4 Among all past year smokers (current and those that quit<12 months ago).
Percentage (95% CI)
-- Indicates estimates based on less than 25 unweighted cases and has been suppressed.
Successful Quitters4Made quit attempt1 Visited a HCP1,2 Asked by HCP if a smoker2,3 Advised to quit by HCP2,3
Residence x wealth index quintile
103 Global Adult Tobacco Survey : Philippines Country Report, 2015

Table 5.2: Percentage of smokers ≥15 years old who attempted to quit smoking in the past 12 months, by cessation methods used and selected demographic characteristics – GATS Philippines, 2015.
Overall 12.4 (9.9, 15.3) 13.6 (11.4, 16.2) 2.1 (1.5, 3.1) 1.7 (1.0, 2.7) 68.5 (64.5, 72.2) 1.3 (0.8, 2.3) 13.6 (11.3, 16.2) 5.7 (4.3, 7.6)Sex
Male 13.1 (10.4, 16.3) 13.4 (11.1, 16.1) 2.3 (1.5, 3.4) 1.8 (1.1, 3.0) 68.6 (64.4, 72.5) 1.3 (0.7, 2.3) 13.9 (11.5, 16.8) 6.0 (4.4, 8.1)Female 7.5 (4.5, 12.3) 15.1 (10.4, 21.5) 1.3 (0.9, 1.9) 0.7 (0.2, 3.0) 68.1 (59.4, 75.6) 1.9 (0.6, 5.8) 11.3 (7.4, 16.9) 3.8 (1.6, 8.5)
Age (years)15-24 14.1 (10.1, 19.5) 8.7 (5.9, 12.6) 1.4 (0.4, 4.6) 2.4 (1.0, 5.8) 73.0 (64.8, 80.0) 2.6 (1.0, 6.4) 13.0 (9.2, 18.0) 7.5 (4.4, 12.5)25-44 12.5 (9.6, 16.0) 14.2 (11.2, 18.0) 2.6 (1.6, 4.2) 1.1 (0.5, 2.3) 71.2 (66.1, 75.7) 0.7 (0.2, 2.0) 13.9 (11.1, 17.3) 4.1 (2.6, 6.4)45-64 10.7 (7.2, 15.7) 16.3 (12.9, 20.3) 2.3 (1.6, 3.3) 2.2 (1.1, 4.3) 62.2 (57.0, 67.1) 1.3 (0.5, 3.0) 15.0 (11.4, 19.3) 7.0 (4.8, 10.2)65+ 12.5 (6.9, 21.6) 16.3 (10.0, 25.5) 0.0 N/A 1.3 (0.2, 8.7) 55.9 (44.6, 66.5) 2.4 (0.7, 7.3) 6.0 (2.7, 12.5) 5.7 (2.7, 11.9)
Education LevelNo Formal 19.6 (6.5, 46.1) 8.2 (2.2, 26.2) 0.0 N/A 2.6 (0.4, 15.5) 71.4 (51.0, 85.7) 0.0 N/A 16.2 (4.3, 45.3) 0.0 N/AElementary 12.9 (9.2, 17.8) 14.6 (11.2, 18.7) 0.5 (0.1, 1.9) 2.2 (1.3, 3.9) 64.8 (59.1, 70.0) 0.8 (0.3, 2.2) 8.4 (6.0, 11.7) 6.7 (4.3, 10.3)Secondary 11.3 (8.4, 15.0) 14.5 (11.4, 18.3) 1.8 (1.0, 3.4) 1.5 (0.7, 3.2) 69.3 (63.6, 74.4) 1.5 (0.7, 3.2) 15.1 (12.0, 18.9) 6.0 (3.9, 9.0)Post-Secondary 14.7 (6.5, 30.1) 11.4 (4.6, 25.6) 0.9 (0.1, 6.4) 0.0 N/A 76.8 (59.2, 88.3) 0.0 N/A 11.1 (3.8, 28.5) 2.2 (0.3, 14.5)College or above 13.3 (9.8, 17.7) 10.8 (6.1, 18.3) 5.9 (3.9, 9.0) 1.5 (0.5, 4.6) 71.2 (64.2, 77.3) 2.1 (0.7, 5.7) 18.7 (13.1, 25.8) 4.5 (3.0, 6.7)
Urban 10.5 (6.9, 15.7) 11.1 (8.3, 14.8) 4.2 (2.8, 6.2) 0.2 (0.0, 1.1) 70.6 (64.4, 76.1) 1.4 (0.6, 3.1) 13.5 (10.2, 17.6) 6.0 (4.0, 8.8) Lowest -- -- -- -- -- -- -- -- -- -- -- -- -- -- -- -- Second 10.7 (5.7, 19.2) 13.7 (7.0, 25.0) 1.2 (0.2, 7.7) 0.0 N/A 66.2 (53.7, 76.8) 0.0 N/A 17.0 (9.1, 29.3) 8.3 (3.3, 19.8) Middle 12.6 (5.2, 27.5) 9.3 (5.8, 14.5) 0.4 (0.1, 2.8) 0.7 (0.1, 5.1) 65.6 (54.2, 75.5) 2.3 (0.6, 8.9) 12.1 (4.2, 30.1) 5.9 (3.0, 11.5) Fourth 9.3 (6.0, 14.1) 12.8 (8.7, 18.4) 5.7 (3.4, 9.3) 0.0 N/A 74.7 (65.2, 82.3) 3.3 (1.3, 8.4) 15.9 (10.7, 22.9) 5.4 (2.4, 11.7) Highest 9.1 (5.5, 14.7) 10.5 (5.8, 18.5) 6.7 (4.1, 10.7) 0.0 N/A 71.9 (64.0, 78.6) 0.0 N/A 12.1 (8.6, 16.9) 6.0 (3.5, 10.2)Rural 13.8 (10.7, 17.5) 15.5 (12.5, 19.1) 0.6 (0.2, 1.6) 2.8 (1.7, 4.5) 66.9 (61.4, 71.9) 1.3 (0.6, 2.6) 13.7 (10.7, 17.4) 5.5 (3.7, 8.3) Lowest 11.3 (5.2, 22.7) 14.1 (7.7, 24.4) 0.0 N/A 1.8 (0.2, 12.1) 73.5 (57.9, 84.8) 0.0 N/A 7.1 (3.0, 15.8) 2.5 (0.5, 11.7) Second 15.2 (10.5, 21.4) 14.9 (10.5, 20.6) 0.0 N/A 3.2 (1.5, 6.7) 65.6 (57.9, 72.6) 1.6 (0.4, 5.8) 9.9 (6.9, 14.0) 6.1 (3.5, 10.4) Middle 12.3 (8.4, 17.6) 12.9 (9.0, 18.1) 0.8 (0.1, 5.7) 4.2 (2.0, 8.9) 64.8 (56.7, 72.1) 1 (0.3, 3.0) 10.8 (6.8, 16.6) 5.8 (2.9, 11.2) Fourth 14.1 (9.4, 20.5) 21.5 (15.5, 29.1) 0.8 (0.2, 3.3) 1.5 (0.4, 5.2) 65.9 (54.2, 76.0) 0.4 (0.1, 1.8) 19.4 (13.5, 27.0) 6.1 (2.9, 12.1) Highest 14.4 (8.5, 23.2) 10.9 (5.5, 20.7) 1.1 (0.3, 4.4) 1.8 (0.5, 6.5) 74.0 (64.4, 81.8) 3.4 (0.9, 12.1) 19.3 (11.7, 30.2) 3.7 (1.0, 12.4)
Demographic Characteristics
Residence x wealth index quintile
Use of Cessation Method1
N/A- The estimate is "0.0"
--Indicates estimates based on less than 25 unweighted cases and has been suppressed.
Switching to Smokeless Tobacco
Attempt to quit without assistance Other4Traditional Medicines Self-education Materials
2 Pharmacotherapy includes nicotine replacement therapy and prescription medications.
Pharmacotherapy2 Counseling/Advice3 Electronic Cigarettes
1 Among current smokers who made a quit attempt in the past 12 months and former smokers who have been abstinen for less than 12 months.
Percentage (95% CI)
3 Includes counseling at a cessation clinic and a telephone quit line/helpline.4 Any other reported methods.
104 Global Adult Tobacco Survey : Philippines Country Report, 2015

Table 5.2a: Percentage of current smokers ≥15 years old who attempted to quit smoking in the past 12 months, by reasons for quitting and selected demographic characteristics – GATS Philippines, 2015.
Overall 83.1 (80.4, 85.5) 58.1 (54.7, 61.5) 55.5 (52.1, 58.8) 34.8 (31.2, 38.6) 67.2 (63.8, 70.4) 26.7 (23.8, 29.9) 6.0 (4.2, 8.4)Sex
Male 82.6 (79.7, 85.2) 58.8 (55.1, 62.4) 56.3 (52.7, 59.9) 34.9 (31.1, 39.0) 68.5 (65.0, 71.8) 27.3 (24.4, 30.5) 5.8 (3.9, 8.6)Female 86.6 (80.9, 90.8) 53.5 (44.5, 62.2) 49.7 (40.6, 58.8) 34.3 (26.4, 43.3) 57.5 (48.1, 66.3) 22.6 (15.5, 31.6) 7.2 (3.7, 13.6)
Age (years)
15-24 79.9 (72.6, 85.7) 54.5 (46.3, 62.5) 55.7 (47.7, 63.5) 36.4 (28.8, 44.6) 68.7 (59.9, 76.4) 23.0 (17.1, 30.2) 9.8 (5.1, 17.9)25-44 82.7 (79.2, 85.6) 58.8 (54.3, 63.2) 55.7 (51.2, 60.1) 34.9 (30.6, 39.4) 68.8 (64.2, 73.1) 30.7 (26.0, 35.8) 6.4 (4.3, 9.4)45-64 85.6 (80.4, 89.6) 60.6 (55.6, 65.4) 55.9 (50.7, 61.0) 34.6 (29.6, 39.9) 62.1 (57.0, 66.9) 24.9 (20.9, 29.5) 2.9 (2.0, 4.1)65+ 87.8 (77.2, 93.8) 53.0 (41.8, 63.9) 49.5 (38.6, 60.5) 29.1 (20.1, 40.1) 73.1 (61.5, 82.2) 13.3 (7.1, 23.5) 3.2 (1.1, 9.0)
Education Level
No Formal -- -- -- -- -- -- -- -- -- -- -- -- -- --Elementary 83.7 (79.8, 87.0) 64.7 (59.7, 69.4) 64.3 (59.4, 68.8) 32.6 (27.4, 38.2) 66.1 (60.3, 71.4) 19.2 (15.5, 23.5) 3.7 (2.2, 6.2)Secondary 85.9 (81.7, 89.2) 58.7 (53.5, 63.6) 57.0 (52.0, 61.9) 35.9 (31.2, 41.0) 67.9 (62.9, 72.5) 28.4 (24.5, 32.7) 7.5 (4.7, 11.8)Post-Secondary 78.8 (64.1, 88.5) 40.6 (28.0, 54.5) 41.1 (27.2, 56.6) 28.0 (16.5, 43.2) 67.4 (47.9, 82.3) 42.2 (21.7, 65.7) 1.6 (0.4, 6.4)College or above 77.3 (71.7, 82.1) 49.6 (42.9, 56.2) 40.4 (33.9, 47.3) 36.9 (30.2, 44.2) 66.0 (59.7, 71.7) 31.7 (25.0, 39.3) 7.0 (4.2, 11.5)
Residence x wealth index quintile
Urban 85.7 (82.2, 88.6) 48.8 (44.3, 53.4) 44.8 (40.4, 49.2) 34.2 (29.3, 39.5) 64.8 (60.2, 69.1) 30.4 (25.9, 35.3) 4.9 (3.4, 7.0) Lowest -- -- -- -- -- -- -- -- -- -- -- -- -- -- Second 85.7 (77.2, 91.3) 66.4 (54.8, 76.3) 66.1 (54.7, 75.9) 46.0 (34.7, 57.8) 64.1 (52.9, 74.0) 28.1 (19.5, 38.5) 8.6 (4.4, 16.1) Middle 87.8 (78.0, 93.6) 52.8 (41.3, 64.0) 52.7 (43.5, 61.8) 27.4 (19.1, 37.6) 68.3 (58.0, 77.1) 32.3 (22.5, 43.9) 1.0 (0.2, 4.2) Fourth 92.1 (86.3, 95.5) 47.5 (39.3, 55.8) 44.3 (36.0, 52.8) 36.3 (28.8, 44.5) 66.7 (59.1, 73.5) 37.8 (29.9, 46.3) 5.2 (2.6, 10.1) Highest 80.6 (76.3, 84.3) 41.3 (33.9, 49.0) 33.0 (25.9, 40.9) 33.2 (26.0, 41.2) 62.5 (54.2, 70.2) 24.2 (18.8, 30.6) 5.7 (3.4, 9.4)Rural 81.1 (77.0, 84.7) 65.3 (60.6, 69.7) 63.6 (59.0, 68.0) 35.3 (30.2, 40.7) 69.0 (64.1, 73.4) 24.0 (20.2, 28.2) 6.8 (4.1, 11.1) Lowest 67.4 (47.0, 82.8) 69.7 (52.7, 82.6) 66.5 (49.8, 79.9) 19.1 (11.3, 30.4) 50.9 (33.0, 68.5) 11.4 (5.1, 23.7) 8.1 (2.7, 21.7) Second 80.9 (74.8, 85.8) 72.0 (65.3, 77.9) 71.1 (64.5, 76.9) 39.0 (31.4, 47.1) 68.1 (60.7, 74.7) 24.2 (18.4, 31.1) 5.6 (3.0, 10.0) Middle 82.5 (76.3, 87.4) 66.7 (59.1, 73.5) 66.7 (59.3, 73.3) 30.7 (23.4, 39.1) 73.4 (66.0, 79.6) 22.8 (17.5, 29.2) 6.2 (3.1, 12.0) Fourth 83.9 (73.6, 90.7) 61.4 (50.9, 71.0) 59.2 (48.4, 69.1) 40.5 (31.7, 49.9) 67.2 (56.5, 76.3) 24.6 (16.4, 35.2) 9.5 (3.9, 21.3) Highest 78.2 (67.5, 86.1) 52.8 (42.0, 63.3) 47.9 (37.0, 59.0) 32.8 (22.7, 44.7) 71.4 (60.0, 80.7) 29.4 (19.8, 41.3) 5.3 (1.7, 15.0)
--Indicates estimates based on less than 25 unweighted cases and has been suppressed.
1 Any other reported reasons.
No smoking policy at workFamily
Percentage (95% CI)
Other Reasons1Demographic Characteristics
Health reasons To save money High Price of Cigarettes Anti-Smoking policies/laws
Reasons of trying to quit smoking tobacco
105 Global Adult Tobacco Survey : Philippines Country Report, 2015

Table 5.3: Percentage distribution of current smokers ≥15 years old by interest in quitting smoking and selected demographic characteristics – GATS Philippines, 2015.
Overall 10.3 (9.1, 11.8) 8.5 (7.0, 10.2) 57.9 (55.0,60.6) 19.1 (17.4,21.1) 4.2 (3.1, 5.5) 100Sex
Male 9.4 (8.2, 10.8) 8.3 (6.8, 10.2) 58.9 (55.8,61.8) 19.4 (17.5,21.4) 4.1 (3.0, 5.5) 100Female 17.6 (13.4,22.7) 9.8 (7.2, 13.2) 50.0 (44.1,56.0) 17.4 (13.6,22.0) 5.2 (3.0, 8.7) 100
Age (years)15-24 12.4 (9.4, 16.2) 8.2 (5.9, 11.3) 58.6 (53.0,64.0) 17.1 (13.0,22.2) 3.6 (2.1, 6.1) 10025-44 9.8 (8.0, 11.8) 7.8 (6.0, 10.0) 59.5 (55.6,63.3) 18.0 (15.8,20.5) 4.9 (3.4, 7.1) 10045-64 9.6 (7.6, 11.9) 9.5 (7.2, 12.5) 56.6 (52.5,60.7) 21.0 (18.0,24.4) 3.2 (2.2, 4.8) 10065+ 11.3 (6.8, 18.3) 10.5 (6.9, 15.8) 45.8 (38.4,53.4) 28.2 (21.8,35.6) 4.2 (1.7, 9.6) 100
Education LevelNo Formal 9.5 (3.9, 21.1) 11.8 (4.4, 27.9) 40.8 (28.7,54.1) 34.0 (22.8,47.3) 4.0 (1.0, 14.7) 100Elementary 8.2 (6.5, 10.4) 7.8 (6.1, 9.8) 55.7 (51.5,59.9) 23.7 (20.6,27.1) 4.6 (3.0, 7.0) 100Secondary 11.3 (9.3, 13.6) 8.3 (6.6, 10.4) 59.4 (55.8,62.8) 16.8 (14.3,19.5) 4.3 (3.0, 6.1) 100Post-Secondary 12.4 (6.2, 23.4) 9.5 (4.2, 19.8) 63.6 (49.2,75.8) 10.9 (5.2, 21.6) 3.6 (0.7, 17.5) 100College or above 11.6 (8.8, 15.2) 9.6 (6.6, 13.8) 59.0 (53.6,64.2) 16.5 (13.4,20.2) 3.3 (1.8, 5.9) 100
Urban 9.0 (7.4, 10.9) 7.5 (6.2, 9.1) 59.8 (56.0,63.4) 19.3 (16.7,22.2) 4.4 (2.9, 6.7) 100 Lowest 6.1 (4.0, 9.3) 5.6 (3.2, 9.8) 63.3 (55.1,70.8) 21.1 (15.4,28.2) 3.8 (1.0, 13.4) 100 Second 7.0 (4.0, 12.0) 4.1 (2.1, 7.6) 58.4 (49.2,67.0) 23.1 (16.2,31.7) 7.5 (4.4, 12.5) 100 Middle 9.6 (7.3, 12.4) 7.9 (4.6, 13.4) 63.5 (56.4,70.0) 14.8 (10.8,19.8) 4.3 (1.8, 10.0) 100 Fourth 11.3 (7.7, 16.3) 11.1 (8.2, 14.8) 54.5 (48.0,60.9) 19.7 (15.3,25.0) 3.4 (1.4, 7.9) 100 Highest 9.3 (6.8, 12.7) 7.2 (5.2, 10.1) 60.5 (54.7,66.0) 18.9 (15.0,23.7) 4.0 (1.9, 8.2) 100Rural 11.4 (9.6, 13.6) 9.3 (7.0, 12.2) 56.3 (52.2,60.3) 19.0 (16.6,21.7) 4.0 (2.7, 5.8) 100 Lowest 11.9 (8.8, 15.9) 8.7 (6.3, 12.0) 55.8 (49.6,61.8) 21.5 (17.4,26.2) 2.1 (1.2, 3.8) 100 Second 10.7 (7.7, 14.8) 8.0 (5.5, 11.4) 54.4 (48.0,60.6) 21.3 (16.4,27.1) 5.6 (3.2, 9.6) 100 Middle 15.3 (11.3,20.5) 8.3 (5.4, 12.7) 56.2 (49.4,62.7) 16.9 (12.6,22.3) 3.3 (1.7, 6.3) 100 Fourth 8.4 (5.4, 13.1) 14.9 (7.5, 27.5) 56.4 (48.3,64.2) 15.2 (10.3,21.8) 5.0 (2.5, 9.5) 100 Highest 9.4 (5.4, 15.7) 5.4 (2.6, 10.8) 61.9 (52.7,70.4) 18.4 (12.1,27.0) 4.9 (1.9, 11.9) 100
1 Among current daily or less than daily smokers.
Percentage (95% CI)
Interest in Quitting Smoking1
TotalPlanning to Quit Within Next Month
Thinking About Quitting Within Next 12 Months
Will Quit Someday, But Not in the Next 12 Months
Not Interested in Quitting Don’t KnowDemographic Characteristics
Residence x wealth index quintile
106 Global Adult Tobacco Survey : Philippines Country Report, 2015

Number in thousands
Number in thousands
Overall 21.5 (19.5, 23.6) 3,619 17.8 (16.0, 19.9) 2,340Sex
Male 26.4 (23.6, 29.5) 2,253 21.0 (18.1, 24.2) 1,100Female 16.4 (14.4, 18.5) 1,366 15.7 (13.8, 17.9) 1,240
Age (years)
15-24 17.9 (14.7, 21.7) 714 15.5 (12.4, 19.3) 50925-44 22.0 (19.4, 24.8) 1,967 18.1 (15.6, 20.8) 1,23445-64 23.2 (20.0, 26.7) 841 19.6 (16.5, 23.2) 54865+ 30.6 (21.2, 41.9) 98 20.3 (11.3, 33.8) 49
Education Level
No Formal -- -- 23 -- -- 2Elementary 38.5 (32.7, 44.6) 761 31.9 (26.0, 38.5) 404Secondary 24.3 (21.1, 27.8) 1,364 21.7 (18.2, 25.5) 899Post-Secondary 14.6 (10.1, 20.6) 150 12.6 (8.0, 19.4) 105College or above 16.2 (13.9, 18.8) 1,321 13.7 (11.6, 16.1) 930
Residence x wealth index quintile
Urban 18.2 (15.9, 20.8) 1,928 21.8 (14.9, 30.8) 199 Lowest 26.8 (23.4, 30.6) 1,692 -- -- 1 Second 40.4 (31.6, 50.0) 302 32.5 (24.4, 41.8) 147 Middle 18.9 (14.5, 24.2) 343 14.6 (10.8, 19.3) 193 Fourth 16.0 (12.7, 20.0) 410 14.0 (11.1, 17.4) 259 Highest 15.7 (13.0, 18.8) 844 14.4 (11.9, 17.4) 645Rural
Lowest -- -- 27 -- -- 26 Second 31.3 (23.9, 39.8) 298 25.8 (18.3, 35.1) 178 Middle 28.5 (22.4, 35.4) 409 20.5 (15.1, 27.2) 229 Fourth 29.6 (23.7, 36.2) 537 24.5 (18.7, 31.3) 357 Highest 21.1 (16.3, 27.0) 420 17.5 (12.8, 23.5) 287
Table 6.1: Percentage and number of adults ≥15 years old who work indoors and are exposed to tobacco smoke at work, by smoking status and selected demographic characteristics – GATS Philippines, 2015.
--Indicates estimates based on less than 25 unweighted cases and has been suppressed.
1 In the past 30 days. Among those respondents who work outside of the home who usually work indoors or both indoors an outdoors.
Demographic Characteristics
Adults Exposed to Tobacco Smoke at Work1
Overall Non-smokers
Percentage (95% CI) Percentage (95% CI)
107 Global Adult Tobacco Survey : Philippines Country Report, 2015

Overall 65.2 (60.6, 69.5) 15.1 (12.3, 18.4) 13.6 (10.8, 17.0) 5.2 (3.3, 8.1) 0.8 (0.3, 2.7) 100Sex
Male 64.8 (59.9, 69.3) 14.9 (11.9, 18.4) 14.7 (11.6, 18.4) 4.9 (3.0, 8.0) 0.7 (0.2, 3.1) 100Female 69.3 (57.4, 79.1) 17.4 (9.8, 28.9) 3.4 (1.2, 9.3) 8.2 (3.2, 19.5) 1.8 (0.6, 5.1) 100
Age (years)15-24 67.8 (57.0, 77.0) 10.4 (5.8, 18.1) 13.7 (7.7, 23.3) 6.7 (2.6, 16.1) 1.3 (0.2, 8.9) 10025-44 67.6 (61.6, 73.0) 14.3 (10.9, 18.6) 13.4 (9.8, 17.9) 3.9 (2.1, 7.2) 0.8 (0.1, 4.8) 10045-64 60.3 (52.2, 67.8) 18.8 (13.2, 26.1) 14.2 (9.8, 20.1) 6.3 (3.8, 10.4) 0.4 (0.1, 2.0) 10065+ 36.6 (20.1, 57.1) 33.6 (18.5, 52.9) 12.1 (3.9, 31.8) 16.5 (6.1, 37.5) 1.2 (0.2, 8.6) 100
Education LevelNo Formal -- -- -- -- -- -- -- -- -- --Elementary 50.8 (41.6, 60.0) 27.6 (20.5, 36.1) 15.2 (9.6, 23.1) 5.9 (2.8, 11.9) 0.5 (0.2, 1.6) 100Secondary 64.1 (57.2, 70.4) 15.5 (11.3, 21.0) 12.4 (8.9, 16.9) 7.0 (3.5, 13.6) 1.1 (0.3, 3.6) 100Post-Secondary 76.3 (57.7, 88.4) 13.3 (4.8, 32.0) 7.8 (2.7, 20.4) 2.5 (0.6, 10.0) 0.0 N/A 100College or above 75.0 (67.4, 81.3) 6.0 (3.5, 10.1) 15.2 (10.1, 22.1) 3.0 (1.5, 5.8) 0.9 (0.1, 6.0) 100
Urban 73.0 (67.3, 78.1) 10.9 (7.8, 14.9) 12.1 (8.7, 16.7) 2.8 (1.5, 5.1) 1.2 (0.3, 4.5) 100 Lowest 51.2 (33.3, 68.8) 22.8 (11.5, 40.2) 21.0 (10.5, 37.5) 0.4 (0.1, 3.0) 4.6 (0.6, 26.9) 100 Second 56.9 (42.9, 69.8) 18.3 (10.2, 30.6) 17.3 (7.6, 34.7) 7.5 (3.2, 16.7) 0.0 N/A 100 Middle 73.5 (60.3, 83.5) 11.6 (5.9, 21.5) 8.9 (3.8, 19.3) 1.8 (0.2, 11.8) 4.2 (0.7, 21.2) 100 Fourth 76.7 (66.3, 84.7) 12.3 (6.4, 22.3) 9.6 (5.0, 17.6) 1.3 (0.3, 5.3) 0.0 N/A 100 Highest 81.6 (72.8, 88.1) 3.4 (1.4, 8.1) 11.7 (6.6, 19.9) 3.3 (1.1, 9.6) 0.0 N/A 100Rural 53.2 (45.9, 60.3) 21.7 (16.8, 27.5) 15.8 (11.6, 21.3) 9.0 (5.0, 15.7) 0.3 (0.1, 1.2) 100 Lowest 54.8 (38.6, 70.1) 16.9 (8.9, 29.7) 11.3 (4.3, 26.8) 16.1 (5.2, 40.1) 0.9 (0.2, 3.4) 100 Second 47.3 (34.9, 60.1) 29.0 (18.8, 42.0) 18.9 (10.3, 32.2) 3.6 (1.1, 11.0) 1.0 (0.1, 7.1) 100 Middle 50.6 (37.6, 63.5) 27.1 (17.2, 39.9) 17.1 (9.5, 28.7) 5.3 (2.3, 11.5) 0.0 N/A 100 Fourth 56.1 (42.6, 68.7) 20.6 (11.9, 33.2) 12.6 (7.3, 20.7) 10.8 (4.9, 22.0) 0.0 N/A 100 Highest 57.6 (41.5, 72.2) 11.8 (5.0, 25.5) 19.2 (9.1, 36.1) 11.4 (3.9, 28.6) 0.0 N/A 100
Table 6.1a: Percentage distribution of current smokers ≥15 years old who work indoors or outdoors with an enclosed area, by the policy they have at work and selected demographic characteristics – GATS Philippines, 2015.
Residence x wealth index quintile
N/A- The estimate is "0.0"
--Indicates estimates based on less than 25 unweighted cases and has been suppressed.
Percentage (95% CI)
Demographic Characteristics
TotalAllowed only in some enclosed areas
Not allowed in any enclosed area No policy Don’t Know
Smoking policy at work
Allowed everywhere
108 Global Adult Tobacco Survey : Philippines Country Report, 2015

Overall 35.7 (30.7, 40.9 27.4 (22.2, 33.3) 24.4 (19.4, 30.1) 12.3 (8.8, 16.9) 0.3 (0.1, 0.9) 100Sex
Male 31.7 (26.1, 37.8 29.8 (23.9, 36.5) 26.5 (20.8, 33.1) 12.0 (8.3, 17.0) 0.0 N/A 100Female 42.3 (34.6, 50.3 23.3 (15.8, 33.1) 20.9 (12.5, 32.8) 12.8 (8.1, 19.6) 0.7 (0.2, 2.5) 100
Age (years)15-24 39.0 (27.6, 51.8 26.3 (16.4, 39.4) 25.3 (14.3, 40.8) 8.8 (3.6, 20.0) 0.6 (0.1, 4.0) 10025-44 35.1 (28.7, 42.1 26.7 (20.6, 33.7) 26.3 (20.1, 33.6) 11.7 (7.8, 17.2) 0.2 (0.0, 1.7) 10045-64 36.1 (27.7, 45.5 29.0 (21.0, 38.4) 20.6 (14.3, 28.7) 14.2 (8.8, 22.3) 0.2 (0.0, 1.1) 10065+ 19.1 (7.3, 41.3) 35.3 (18.7, 56.4) 13.1 (4.5, 32.6) 32.5 (15.1, 56.6 0.0 N/A 100
Education LevelNo Formal -- -- -- -- -- -- -- -- -- -- 100Elementary 25.3 (17.7, 34.7 40.0 (30.2, 50.6) 18.2 (11.8, 27.1) 15.8 (9.6, 24.9) 0.8 (0.2, 3.8) 100Secondary 31.4 (24.7, 38.9 31.2 (22.9, 40.8) 19.8 (14.1, 27.1) 17.6 (11.8, 25.5 0.0 N/A 100Post-Secondary 35.8 (16.4, 61.4 26.6 (11.2, 51.1) 27.8 (12.7, 50.5) 9.7 (3.4, 25.1) 0.0 N/A 100
College or above46.5 (37.5, 55.7 15.5 (9.6, 24.0) 32.6 (23.7, 42.9) 5.2 (2.7, 9.5) 0.3 (0.0, 2.2) 100
Urban 33.6 (27.1, 40.7 26.1 (18.6, 35.3) 29.6 (21.9, 38.6) 10.5 (5.9, 17.8) 0.2 (0.0, 1.5) 100 Lowest 26.1 (11.1, 49.9) 38.7 (22.7, 57.7) 31.3 (18.0, 48.6) 3.9 (1.1, 12.8) 0.0 N/A 100 Second 29.7 (19.2, 42.9 23.2 (12.5, 39.2) 30.2 (14.3, 53.0) 15.7 (6.6, 32.8) 1.1 (0.2, 7.4) 100 Middle 31.2 (15.4, 53.1 30.9 (15.2, 52.5) 23.0 (10.3, 43.6) 14.9 (5.3, 35.5) 0.0 N/A 100 Fourth 31.9 (19.7, 47.1 34.5 (20.6, 51.7) 22.2 (12.9, 35.6) 11.4 (5.4, 22.3) 0.0 N/A 100 Highest 38.8 (28.5, 50.2 18.6 (10.5, 30.6) 34.5 (23.1, 48.1) 8.1 (3.4, 18.1) 0.0 N/A 100Rural 38 (30.8, 45.8 28.8 (22.3, 36.4) 18.5 (14.0, 24.0) 14.4 (9.8, 20.5) 0.4 (0.1, 1.7) 100 Lowest 24.3 (14.1, 38.5 34.3 (20.7, 51.2) 14.7 (7.5, 26.8) 26.1 (13.6, 44.2 0.6 (0.1, 4.2) 100 Second 26.8 (14.8, 43.5 42.6 (26.2, 60.8) 19.4 (9.3, 36.1) 11.2 (4.5, 25.4) 0.0 N/A 100 Middle 41.3 (29.5, 54.2 29.2 (17.2, 45.2) 18.5 (11.1, 29.2) 9.9 (5.1, 18.5) 1.0 (0.1, 7.0) 100 Fourth 38.9 (25.2, 54.6 28.3 (16.8, 43.5) 15.5 (8.9, 25.6) 17.4 (9.7, 29.3) 0.0 N/A 100 Highest 49.8 (32.9, 66.8 15.2 (6.3, 32.3) 23.5 (12.3, 40.2) 11.5 (3.7, 30.2) 0.0 N/A 100
Table 6.1b: Percentage of all adults ≥15 years old who work indoors or outdoors with an enclosed area and are exposed to tobacco smoke at work, by the policy they have at work and selected demographic characteristics – GATS Philippines, 2015.
Residence x wealth index quintile
N/A- The estimate is "0.0"
Total
--Indicates estimates based on less than 25 unweighted cases and has been suppressed.
Demographic Characteristics
Allowed everywhere Allowed only in some enclosed areas
Not allowed in any enclosed area
No policy Don't Know
Adults exposed to tobacco smoke at work
Percentage (95% CI)
109 Global Adult Tobacco Survey : Philippines Country Report, 2015

Overall 34.7 (33.0, 36.4) 27.3 (25.6, 29.0)Sex
Male 39.0 (37.0, 41.2) 25.2 (23.1, 27.4)Female 30.3 (28.5, 32.2) 28.6 (26.7, 30.5)
Age (years)15-24 36.0 (33.4, 38.7) 31.6 (29.0, 34.3)25-44 35.0 (32.9, 37.1) 26.4 (24.3, 28.5)45-64 34.1 (31.9, 36.2) 24.5 (22.4, 26.8)65+ 29.0 (25.9, 32.3) 20.9 (18.0, 24.1)
Education LevelNo Formal 52.9 (42.6, 62.9) 40.4 (28.9, 53.0)Elementary 44.0 (41.2, 46.9) 33.3 (30.4, 36.3)Secondary 36.9 (34.7, 39.1) 30.3 (28.1, 32.8)Post-Secondary 25.8 (20.9, 31.4) 20.7 (15.6, 26.9)College or above 23.5 (21.7, 25.5) 19.2 (17.4, 21.2)
Urban 29.5 (27.2, 31.8) 22.3 (20.3, 24.3) Lowest 50.9 (34.4, 67.2) 43.1 (23.5, 65.2) Second 43.5 (38.0, 49.2) 31.6 (25.8, 38.0) Middle 35.2 (31.3, 39.3) 28.0 (24.3, 32.0) Fourth 30.4 (27.1, 33.9) 23.1 (19.8, 26.7) Highest 21.6 (19.4, 23.9) 16.7 (14.6, 19.1)Rural 39.3 (36.8, 41.8) 31.8 (29.2, 34.5) Lowest 57.9 (48.1, 67.2) 51.1 (39.8, 62.4) Second 47.4 (43.5, 51.4) 40.0 (35.5, 44.7) Middle 40.2 (36.8, 43.7) 32.2 (28.6, 36.0) Fourth 36.4 (33.0, 40.0) 28.4 (24.9, 32.1) Highest 26.4 (23.0, 30.2) 22.2 (18.8, 25.9)
Table 6.2: Percentage of adults ≥15 years old who are exposed to tobacco smoke at home, by smoking status and selected demographic characteristics – GATS Philippines, 2015.
Demographic Characteristics
Residence x wealth index quintile
1 Among all adults in the past 30 days.
Someone smokes at least monthly inside the home
Overall Non-smokers
Someone smokes at least monthly inside the home
Adults exposed to tobacco at home1
Percentage (95% CI)
110 Global Adult Tobacco Survey : Philippines Country Report, 2015

Table 6.3: Percentage of adults ≥15 years old who were exposed to tobacco smoke in various public places in the past 30 days, by smoking status and selected demographic characteristics – GATS Philippines, 2015.
Overall 5.6 (4.9, 6.4) 1.7 (1.5, 2.0) 4.3 (3.8, 4.9) 2.2 (1.9, 2.7) 11.6 (10.7, 12.6) 4.7 (4.2, 5.3) 29.0 (27.4, 30.6)Sex
Male 6.2 (5.3, 7.3) 1.6 (1.3, 2.0) 4.3 (3.7, 5.1) 2.2 (1.8, 2.8) 14.3 (13.0, 15.8) 7.2 (6.4, 8.1) 29.6 (27.7, 31.5)Female 4.9 (4.2, 5.8) 1.8 (1.5, 2.2) 4.4 (3.7, 5.1) 2.2 (1.8, 2.9) 8.9 (8.0, 9.9) 2.2 (1.8, 2.8) 28.4 (26.7, 30.1)
Age (years)15-24 4.5 (3.6, 5.6) 1.3 (0.9, 1.8) 7.3 (6.2, 8.6) 4.6 (3.6, 5.7) 11.3 (9.9, 13.0) 5.5 (4.7, 6.5) 31.4 (29.1, 33.8)25-44 5.7 (4.7, 6.8) 1.9 (1.5, 2.3) 3.5 (2.9, 4.2) 1.6 (1.2, 2.1) 12.9 (11.6, 14.3) 5.9 (5.1, 6.8) 30.1 (28.2, 32.1)45-64 6.9 (5.8, 8.2) 1.9 (1.5, 2.5) 2.9 (2.3, 3.8) 0.9 (0.6, 1.4) 11.2 (9.9, 12.5) 2.5 (2.0, 3.2) 26.6 (24.6, 28.7)65+ 5.1 (3.5, 7.4) 2.1 (1.4, 3.1) 1.3 (0.8, 2.1) 0.2 (0.1, 0.3) 6.1 (4.7, 7.8) 0.6 (0.3, 1.1) 19.0 (16.6, 21.6)
Education LevelNo Formal 5.6 (2.9, 10.8) 2.6 (0.9, 7.0) 2.9 (1.1, 7.5) 0.0 N/A 4.8 (1.7, 13.1) 1.0 (0.2, 4.3) 23.5 (16.8, 31.7)Elementary 5.4 (4.5, 6.6) 1.8 (1.3, 2.4) 3.0 (2.3, 3.9) 0.6 (0.3, 1.1) 9.0 (7.7, 10.5) 1.9 (1.4, 2.6) 23.3 (21.3, 25.6)Secondary 5.3 (4.3, 6.7) 1.7 (1.3, 2.2) 5.5 (4.7, 6.4) 1.5 (1.2, 1.9) 10.9 (9.9, 12.1) 4.0 (3.4, 4.8) 29.4 (27.5, 31.4)Post-Secondary 6.1 (4.0, 9.2) 0.7 (0.4, 1.5) 2.2 (1.2, 3.8) 2.5 (1.5, 4.1) 13.9 (9.8, 19.4) 7.6 (4.7, 11.9) 34.6 (29.2, 40.3)College or above 6.0 (5.0, 7.1) 1.7 (1.3, 2.2) 4.2 (3.4, 5.3) 4.8 (3.8, 6.0) 14.9 (13.4, 16.5) 7.9 (6.8, 9.1) 32.8 (30.5, 35.1)
Urban 5.3 (4.2, 6.7) 1.5 (1.2, 1.8) 3.7 (3.1, 4.5) 2.3 (1.8, 3.0) 11.7 (10.4, 13.1) 6.5 (5.7, 7.3) 33.9 (31.8, 36.1) Lowest 6.5 (3.0, 13.4) 4.3 (1.1, 14.8) 1.7 (0.3, 10.3) 0.0 N/A 15.6 (7.9, 28.5) 0.0 N/A 22.2 (10.4, 41.1) Second 4.6 (2.6, 8.1) 1.1 (0.5, 2.4) 6.0 (4.4, 8.2) 1.4 (0.8, 2.6) 10.5 (8.2, 13.4) 4.3 (3.1, 6.0) 25.5 (20.8, 30.8) Middle 4.7 (3.0, 7.3) 1.4 (0.8, 2.4) 3.1 (2.1, 4.4) 1.3 (0.9, 2.0) 11.3 (9.0, 14.0) 4.7 (3.4, 6.4) 32.4 (29.3, 35.7) Fourth 6.0 (4.0, 8.9) 1.7 (1.2, 2.5) 3.7 (2.7, 5.1) 2.0 (1.2, 3.3) 10.1 (8.2, 12.3) 5.6 (4.3, 7.2) 36.1 (33.0, 39.4) Highest 5.4 (4.1, 7.0) 1.3 (1.0, 1.7) 3.5 (2.7, 4.5) 3.3 (2.4, 4.5) 13.0 (11.3, 15.0) 8.7 (7.3, 10.2) 36.0 (33.2, 38.8)Rural 5.8 (5.0, 6.7) 1.9 (1.6, 2.4) 4.9 (4.1, 5.8) 2.2 (1.7, 2.8) 11.5 (10.3, 12.9) 3.2 (2.6, 3.9) 24.6 (22.6, 26.7) Lowest 4.1 (2.3, 7.3) 0.4 (0.1, 1.4) 1.5 (0.6, 3.3) 0.8 (0.2, 3.1) 3.8 (2.2, 6.6) 1.9 (0.9, 3.6) 21.1 (15.6, 27.9) Second 5.3 (4.1, 6.9) 2.0 (1.4, 2.8) 3.7 (2.8, 4.9) 1.1 (0.6, 2.1) 7.6 (6.2, 9.3) 2.3 (1.5, 3.5) 21.2 (18.6, 24.2) Middle 5.6 (4.3, 7.1) 2.3 (1.6, 3.4) 5.0 (3.8, 6.6) 1.3 (0.8, 2.0) 11.5 (9.5, 13.7) 2.7 (1.9, 3.9) 24.6 (21.6, 27.8) Fourth 5.6 (4.4, 7.0) 1.8 (1.2, 2.7) 5.8 (4.3, 7.7) 2.3 (1.5, 3.6) 13.4 (11.4, 15.7) 2.8 (2.1, 3.9) 25.2 (22.2, 28.4) Highest 7.4 (5.8, 9.4) 1.9 (1.2, 3.0) 6.0 (4.4, 8.1) 5.0 (3.5, 7.1) 16.3 (13.5, 19.5) 5.7 (4.1, 7.8) 29.3 (25.8, 33.2)
N/A- The estimate is "0.0"
1 Among all adults in the past 30 days.
Adults Exposed to Tobacco Smoke1 in…
Government buildingsHealth care
facilities Restaurants Public transportation
Percentage (95% CI)
Demographic Characteristics
Schools Universities Bars, night clubs
Residence x wealth index quintile
111 Global Adult Tobacco Survey : Philippines Country Report, 2015

Table 6.3a: Percentage of non-smokers ≥15 years old who were exposed to tobacco smoke in various public places in the past 30 days, by smoking status and selected demographic characteristics – GATS Philippines, 2015.
Non-smokers 5.0 (4.4, 5.8) 1.7 (1.4, 2.0) 4.6 (4.0, 5.3) 2.4 (2.0, 3.0) 10.9 (10.0, 11.8 3.1 (2.7, 3.6) 28.9 (27.3, 30.6)Sex
Male 5.2 (4.3, 6.4) 1.5 (1.1, 2.1) 4.8 (3.9, 5.8) 2.7 (2.0, 3.6) 14.2 (12.7, 15.9 5.1 (4.3, 6.0) 29.7 (27.6, 31.8)Female 4.9 (4.2, 5.8) 1.8 (1.4, 2.2) 4.5 (3.8, 5.3) 2.3 (1.8, 2.9) 8.7 (7.8, 9.7) 1.9 (1.5, 2.4) 28.5 (26.8, 30.3)
Age (years)15-24 3.8 (2.9, 4.8) 0.9 (0.6, 1.4) 7.8 (6.5, 9.3) 5.0 (3.9, 6.3) 10.9 (9.4, 12.5) 3.8 (3.1, 4.7) 31.1 (28.6, 33.7)25-44 5.4 (4.4, 6.6) 1.9 (1.5, 2.5) 3.4 (2.8, 4.2) 1.5 (1.1, 2.1) 11.9 (10.6, 13.3 3.7 (3.0, 4.6) 29.9 (27.9, 32.0)45-64 6.7 (5.5, 8.1) 2.2 (1.6, 2.9) 3.0 (2.2, 4.1) 1.0 (0.5, 1.7) 10.5 (9.2, 12.0) 1.7 (1.2, 2.4) 26.7 (24.4, 29.1)65+ 3.8 (2.4, 5.8) 2.1 (1.3, 3.1) 1.3 (0.8, 2.2) 0.2 (0.1, 0.4) 5.9 (4.6, 7.7) 0.7 (0.4, 1.3) 20.2 (17.6, 23.1)
Education LevelNo Formal 4.8 (2.4, 9.4) 2.9 (0.8, 9.5) 3.6 (1.3, 10.0) 0.0 N/A 5.0 (1.5, 15.2) 0.3 (0.1, 2.2) 22.7 (15.4, 32.2)Elementary 5.3 (4.3, 6.6) 1.8 (1.3, 2.6) 3.0 (2.2, 4.0) 0.6 (0.3, 1.2) 7.9 (6.5, 9.5) 1.1 (0.7, 1.6) 22.5 (20.3, 25.0)Secondary 5.0 (3.8, 6.4) 1.7 (1.3, 2.2) 6.0 (5.0, 7.1) 1.4 (1.0, 2.0) 10.4 (9.2, 11.7) 2.0 (1.5, 2.5) 29.1 (27.0, 31.2)Post-Secondary 6.4 (4.0, 10.0) 0.7 (0.4, 1.6) 2.3 (1.3, 4.1) 1.9 (1.1, 3.3) 12.0 (8.7, 16.5) 3.1 (1.6, 5.7) 34.9 (29.4, 40.8)College or above 4.8 (3.9, 5.8) 1.6 (1.1, 2.1) 4.3 (3.3, 5.5) 5.2 (4.1, 6.5) 13.7 (12.2, 15.3 6.2 (5.1, 7.5) 32.9 (30.5, 35.4)
Urban 4.8 (3.7, 6.2) 1.5 (1.1, 1.9) 3.8 (3.0, 4.8) 2.5 (1.8, 3.3) 11.0 (9.8, 12.3) 4.5 (3.7, 5.4) 33.4 (31.1, 35.7) Lowest 10.4 (4.8, 21.0) 7.3 (2.0, 23.5) 1.4 (0.2, 8.6) 0.0 N/A 15.7 (6.6, 32.7) 0.0 N/A 22.7 (8.4, 48.4) Second 4.3 (1.9, 9.3) 0.6 (0.2, 1.7) 7.0 (4.8, 10.0) 1.3 (0.5, 3.3) 8.5 (6.0, 12.0) 1.7 (1.0, 2.9) 26.8 (21.3, 33.2) Middle 4.0 (2.5, 6.2) 1.9 (1.1, 3.2) 3.5 (2.4, 5.0) 1.1 (0.6, 2.0) 10.1 (8.0, 12.6) 3.2 (2.2, 4.5) 31.0 (27.6, 34.6) Fourth 5.3 (3.5, 7.9) 1.2 (0.7, 2.1) 4.1 (2.8, 5.8) 2.2 (1.2, 3.9) 9.7 (7.7, 12.0) 3.4 (2.3, 5.0) 35.2 (31.9, 38.6) Highest 4.9 (3.6, 6.5) 1.5 (1.1, 2.0) 3.2 (2.4, 4.3) 3.6 (2.6, 5.0) 12.5 (10.8, 14.6 6.4 (5.2, 8.0) 35.1 (32.2, 38.0)Rural 5.3 (4.5, 6.2) 1.8 (1.4, 2.4) 5.3 (4.4, 6.3) 2.4 (1.8, 3.1) 10.8 (9.5, 12.2) 1.9 (1.5, 2.5) 25 (22.9, 27.2) Lowest 4.8 (2.6, 9.0) 0.6 (0.2, 2.0) 1.9 (0.8, 4.6) 0.7 (0.1, 4.4) 2.2 (1.0, 4.9) 0.8 (0.3, 2.3) 21.8 (15.9, 29.3) Second 5.1 (3.8, 6.7) 2.1 (1.4, 3.2) 3.8 (2.7, 5.3) 1.1 (0.5, 2.2) 7.1 (5.4, 9.1) 1.3 (0.8, 2.2) 20.2 (17.3, 23.4) Middle 4.9 (3.8, 6.4) 1.7 (1.1, 2.7) 5.6 (4.1, 7.5) 1.2 (0.7, 2.2) 10.7 (8.7, 13.1) 1.4 (0.8, 2.4) 25.0 (21.7, 28.7) Fourth 5.4 (4.2, 7.0) 2.0 (1.3, 3.0) 6.5 (4.8, 8.8) 2.6 (1.6, 4.1) 12.4 (10.3, 14.8 1.6 (1.0, 2.5) 25.3 (22.2, 28.7) Highest 5.8 (4.3, 7.7) 1.8 (1.1, 2.9) 5.8 (4.1, 8.2) 5.5 (3.8, 7.9) 14.8 (12.1, 18.1 3.8 (2.6, 5.6) 30.6 (26.6, 34.9)
N/A- The estimate is "0.0"
Percentage (95% CI)
1 Among all adults in the past 30 days.
Demographic Characteristics
Adults Exposed to Tobacco Smoke1 in…
Government buildingsHealth care
facilities Schools Universities Restaurants Bars, night clubs Public transportation
Residence x wealth index quintile
112 Global Adult Tobacco Survey : Philippines Country Report, 2015

Table 6.4: Percentage of adults ≥15 years old who visited various public places in the past 30 days and were exposed to tobacco smoke, by smoking status and selected demographic characteristics – GATS Philippines, 2015.
Overall 13.6 (11.9, 15.5) 4.2 (3.6, 4.9) 10.9 (9.7, 12.3) 15.1 (12.7, 17.9) 21.9 (20.3, 23.6) 86.3 (82.6, 89.3) 37.6 (35.8, 39.5)Sex
Male 15.6 (13.5, 18.1) 4.9 (3.9, 6.2) 12.7 (10.9, 14.7) 15.8 (12.7, 19.5) 26.8 (24.6, 29.2) 88.9 (84.9, 91.9) 39.9 (37.6, 42.3)Female 11.7 (10.0, 13.6) 3.8 (3.1, 4.6) 9.6 (8.2, 11.3) 14.5 (11.5, 18.1) 17.0 (15.3, 18.8) 78.9 (70.3, 85.6) 35.5 (33.5, 37.5)
Age (years)15-24 12.3 (10.0, 15.1) 3.8 (2.7, 5.4) 16.3 (13.8, 19.1) 17.2 (13.7, 21.2) 20.0 (17.6, 22.7) 84.3 (75.2, 90.5) 38.1 (35.4, 40.9)25-44 13.5 (11.3, 16.1) 4.2 (3.4, 5.2) 8.2 (6.9, 9.7) 14.3 (11.2, 18.2) 23.2 (21.0, 25.5) 87.4 (83.2, 90.6) 39.3 (37.0, 41.6)45-64 14.5 (12.4, 16.9) 4.5 (3.5, 5.8) 8.5 (6.6, 10.9) 9.9 (6.3, 15.3) 22.9 (20.5, 25.4) 87.2 (79.0, 92.5) 35.4 (33.0, 37.9)65+ 15.9 (11.4, 21.9) 5.3 (3.6, 7.8) 8.1 (5.2, 12.6) 6.5 (3.4, 12.2) 18.4 (14.4, 23.3) -- -- 30.8 (27.3, 34.6)
Education LevelNo Formal 13.5 (6.9, 24.8) 5.4 (1.9, 14.2) 11.0 (4.4, 25.1) -- -- 15.7 (5.4, 37.6) -- -- 40.3 (29.6, 51.9)Elementary 15.7 (13.0, 18.8) 4.8 (3.5, 6.5) 8.8 (6.8, 11.2) 12.0 (6.7, 20.5) 26.5 (23.1, 30.1) 91.2 (84.2, 95.2) 33.3 (30.4, 36.3)Secondary 14.0 (11.3, 17.2) 4.5 (3.5, 5.7) 12.4 (10.7, 14.5) 13.1 (10.2, 16.6) 22.5 (20.5, 24.7) 91.2 (82.0, 95.9) 37.5 (35.2, 39.9)Post-Secondary 14.4 (9.7, 20.7) 2.0 (1.0, 4.1) 6.2 (3.5, 10.8) 18.5 (10.9, 29.6) 21.4 (15.2, 29.2) 86.0 (65.3, 95.2) 44.2 (37.4, 51.2)College or above 11.8 (10.0, 13.9) 3.7 (2.9, 4.8) 10.6 (8.4, 13.2) 16.7 (13.5, 20.5) 19.8 (17.9, 22.0) 82.4 (77.4, 86.4) 40.0 (37.4, 42.7)
Urban 13.7 (10.9, 17.2) 3.7 (2.9, 4.6) 10.1 (8.4, 12.2) 13.0 (10.2, 16.4) 19.2 (17.2, 21.4) 84.1 (78.9, 88.2) 40.6 (38.1, 43.1) Lowest 19.6 (9.7, 35.5) 12.0 (3.1, 37.0) 6.3 (0.8, 34.3) -- -- 53.8 (33.3, 73.1) -- -- 35.4 (17.9, 58.0) Second 15.8 (9.1, 26.1) 3.4 (1.6, 7.2) 15.4 (11.1, 20.9) 16.2 (9.6, 26.0) 25.1 (19.6, 31.6) 87.1 (60.6, 96.7) 33.3 (27.2, 40.0) Middle 13.7 (9.0, 20.2) 3.8 (2.2, 6.5) 8.6 (6.0, 12.4) 11.1 (7.4, 16.3) 23.7 (19.3, 28.7) 96.5 (88.8, 99.0) 38.2 (34.7, 42.0) Fourth 15.3 (10.4, 22.0) 4.3 (3.0, 6.2) 9.5 (6.9, 12.9) 12.7 (7.7, 20.2) 17.3 (14.3, 20.7) 87.6 (79.8, 92.7) 41.6 (38.1, 45.1) Highest 12.3 (9.6, 15.7) 3.0 (2.2, 4.0) 9.9 (7.8, 12.4) 13.4 (9.9, 17.8) 17.4 (15.2, 19.9) 79.9 (73.5, 85.1) 43.1 (40.1, 46.2)Rural 13.5 (11.6, 15.6) 4.7 (3.8, 5.8) 11.5 (9.8, 13.5) 17.8 (13.9, 22.6) 25.1 (22.5, 27.8) 90.5 (85.6, 93.9) 34.5 (31.9, 37.2) Lowest 12.3 (6.1, 23.0) 1.3 (0.4, 4.0) 4.7 (2.0, 10.3) -- -- 17.2 (9.6, 28.8) -- -- 39.4 (28.4, 51.7) Second 13.2 (10.3, 16.8) 4.7 (3.3, 6.7) 9.0 (6.9, 11.8) 19.3 (10.4, 33.1) 21.7 (17.7, 26.4) 91.0 (82.5, 95.6) 30.4 (26.8, 34.3) Middle 13.6 (10.6, 17.2) 5.8 (4.0, 8.5) 12.2 (9.4, 15.8) 12.7 (8.0, 19.7) 27.7 (23.6, 32.2) 89.1 (77.9, 95.0) 34.3 (30.4, 38.3) Fourth 12.4 (9.8, 15.6) 4.3 (2.8, 6.3) 13.5 (10.2, 17.7) 15.9 (10.2, 24.0) 26.1 (22.1, 30.5) 87.3 (70.8, 95.1) 34.5 (30.7, 38.5) Highest 15.2 (12.0, 18.9) 4.5 (3.0, 6.8) 12.2 (9.1, 16.2) 21.6 (15.4, 29.5) 24.6 (20.7, 29.1) 92.9 (84.1, 97.0) 39.1 (34.5, 43.9)
*Indicates estimates based on less than 25 unweighted cases and has been suppressed.
1 Among those that visited the place in the past 30 days.
Demographic Characteristics
Government buildingsHealth care
facilities Schools
Percentage (95% CI)
Restaurants Bars, night clubs Public transportationUniversities
Adults Exposed to Tobacco Smoke1 in…
Residence x wealth index quintile
113 Global Adult Tobacco Survey : Philippines Country Report, 2015

Table 6.4a: Percentage of non-smokers ≥15 years old who visited various public places in the past 30 days and were exposed to tobacco smoke, by smoking status and selected demographic characteristics – GATS Philippines, 2
Non-smokers 12.2 (10.6, 14.0) 3.8 (3.2, 4.6) 10.9 (9.5, 12.5) 14.9 (12.4, 17.9) 20.3 (18.7, 22.0) 80.7 (75.0, 85.4) 37.2 (35.3, 39.2)Sex
Male 13.1 (10.8, 15.7) 4.3 (3.2, 5.9) 13.3 (10.9, 16.1) 15.6 (11.9, 20.4) 26.1 (23.6, 28.7) 83.6 (76.4, 89.0) 40.1 (37.6, 42.8)Female 11.7 (10.0, 13.6) 3.6 (3.0, 4.4) 9.8 (8.3, 11.5) 14.4 (11.3, 18.1) 16.6 (14.9, 18.4) 76.3 (66.5, 83.8) 35.5 (33.5, 37.6)
Age (years)15-24 10.4 (8.2, 13.1) 2.7 (1.8, 4.1) 16.6 (13.9, 19.7) 17.1 (13.6, 21.2) 19.3 (16.8, 22.0) 78.4 (65.7, 87.3) 37.8 (34.9, 40.7)25-44 12.6 (10.3, 15.2) 3.9 (3.0, 5.0) 7.4 (6.1, 9.0) 13.2 (9.8, 17.7) 21.1 (18.9, 23.5) 82.1 (75.4, 87.3) 38.3 (36.0, 40.8)45-64 13.5 (11.2, 16.1) 4.7 (3.6, 6.1) 8.4 (6.3, 11.3) 9.7 (5.5, 16.6) 20.9 (18.5, 23.6) 82.2 (70.7, 89.9) 35.3 (32.5, 38.1)65+ 12.5 (8.4, 18.4) 5.0 (3.3, 7.6) 8.5 (5.2, 13.5) -- -- 18.0 (14.0, 22.7) -- -- 32.6 (28.8, 36.7)
Education LevelNo Formal 10.9 (5.3, 20.9) 5.1 (1.5, 15.8) 12.2 (4.5, 29.2) -- -- 15.8 (4.6, 42.3) -- -- 40.5 (27.8, 54.6)Elementary 15.5 (12.7, 18.7) 4.6 (3.2, 6.4) 8.3 (6.2, 11.0) 11.5 (6.4, 19.8) 23.8 (20.1, 28.0) 90.4 (80.0, 95.7) 32.3 (29.2, 35.6)Secondary 13.0 (10.2, 16.4) 4.1 (3.1, 5.3) 12.6 (10.6, 15.0) 11.6 (8.4, 15.9) 21.6 (19.4, 24.0) 82.6 (63.7, 92.8) 36.8 (34.3, 39.3)Post-Secondary 14.6 (9.4, 22.0) 1.9 (0.9, 3.9) 6.5 (3.6, 11.4) 15.3 (8.5, 26.1) 18.8 (13.5, 25.5) -- -- 45.2 (38.5, 52.0)College or above
9.7 (8.0, 11.7) 3.3 (2.4, 4.5) 10.4 (8.1, 13.3) 17.1 (13.6, 21.2) 18.4 (16.5, 20.5) 80.0 (73.4, 85.3) 39.6 (36.9, 42.4)
Urban 12.5 (9.8, 15.9) 3.5 (2.7, 4.5) 9.9 (7.9, 12.4) 12.6 (9.5, 16.5) 17.8 (15.9, 19.8) 78.4 (70.9, 84.3) 39.6 (37.2, 42.2) Lowest -- -- 17.5 (4.7, 47.6) -- -- -- -- -- -- -- -- 44.7 (19.4, 73.1) Second 13.9 (6.4, 27.5) 1.6 (0.6, 4.4) 16.2 (11.0, 23.1) 14.8 (6.5, 30.2) 21.7 (15.2, 29.9) -- -- 34.7 (27.8, 42.2) Middle 11.9 (7.7, 18.1) 4.8 (2.8, 8.1) 9.4 (6.4, 13.5) 8.8 (4.8, 15.5) 21.8 (17.8, 26.5) -- -- 36.4 (32.7, 40.4) Fourth 13.6 (9.2, 19.7) 3.0 (1.7, 5.1) 9.9 (6.9, 14.0) 13.3 (7.6, 22.1) 16.5 (13.3, 20.3) 87.9 (76.9, 94.1) 40.3 (36.6, 44.1) Highest 11.5 (8.7, 15.0) 3.3 (2.4, 4.4) 8.7 (6.5, 11.6) 13.1 (9.5, 17.7) 16.5 (14.2, 19.0) 73.8 (65.3, 80.8) 41.6 (38.4, 44.9)Rural 12.0 (10.2, 14.0) 4.1 (3.2, 5.3) 11.7 (9.8, 13.9) 17.9 (13.8, 22.8) 23.3 (20.6, 26.3) 86.3 (77.8, 91.9) 34.7 (31.9, 37.6) Lowest 14.2 (6.6, 28.1) 1.6 (0.5, 4.9) 5.5 (2.3, 12.7) -- -- 10.5 (4.3, 23.6) 100.0 40.2 (27.9, 53.8) Second 12.3 (9.3, 16.0) 4.5 (3.0, 6.7) 8.8 (6.4, 11.9) 17.7 (8.4, 33.5) 20.9 (16.0, 26.8) 89.1 (78.1, 95.0) 29.5 (25.5, 33.8) Middle 11.7 (9.0, 15.1) 4.0 (2.5, 6.2) 12.5 (9.3, 16.7) 11.5 (6.5, 19.6) 25.5 (21.1, 30.6) 81.2 (58.9, 92.8) 33.9 (29.7, 38.3) Fourth 12.2 (9.4, 15.7) 4.5 (2.9, 6.8) 14.8 (11.1, 19.6) 16.6 (10.8, 24.7) 24.6 (20.5, 29.2) 74.5 (50.3, 89.4) 34.5 (30.5, 38.8) Highest 11.5 (8.5, 15.3) 3.9 (2.4, 6.2) 11.4 (8.1, 15.8) 22.1 (15.5, 30.4) 22.7 (18.6, 27.3) 94.9 (84.5, 98.4) 40.3 (35.3, 45.6)
--Indicates estimates based on less than 25 unweighted cases and has been suppressed.
Restaurants Bars, night clubs Public transportation
Percentage (95% CI)
1 Among those that visited the place in the past 30 days.
Demographic Characteristics
Adults Exposed to Tobacco Smoke1 in…
Government buildings Health care facilities
Schools Universities
Residence x wealth index quintile
114 Global Adult Tobacco Survey : Philippines Country Report, 2015

Overall 23.3 (21.1 , 25.5) 22.3 (19.9 , 24.6) 16.4 (14.1 , 18.8) 9.9 (8.1 , 11.7) 7.6 (6.1 , 9.1) 20.5 (18.3 , 22.7) 100Gender
Male 23.5 (21.2 , 25.7) 21.9 (19.5 , 24.3) 16.6 (14.1 , 19.2) 10.2 (8.2 , 12.1) 7.7 (6.1 , 9.3) 20.1 (17.9 , 22.4) 100Female 22.1 (16.8 , 27.4) 25.5 (18.7 , 32.3) 14.5 (10.1 , 19.0) 7.6 (4.2 , 10.9) 6.4 (3.7 , 9.2) 23.9 (18.6 , 29.3) 100
Age (years)15,24 26.9 (21.9 , 31.9) 26.8 (21.5 , 32.1) 13.8 (9.5 , 18.2) 7.4 (4.4 , 10.3) 5.6 (2.5 , 8.8) 19.5 (15.2 , 23.7) 10025,44 22.9 (19.9 , 25.9) 26.4 (23.2 , 29.6) 14.4 (11.4 , 17.4) 9.2 (7.1 , 11.3) 7.3 (5.6 , 9.0) 19.8 (17.0 , 22.5) 10045,64 22.3 (18.9 , 25.8) 12.8 (9.9 , 15.8) 21.6 (18.1 , 25.1) 11.4 (8.5 , 14.2) 9.6 (7.1 , 12.1) 22.3 (19.0 , 25.6) 10065+ 15.6 (8.7 , 22.4) 6.9 (2.2 , 11.5) 22.3 (14.4 , 30.1) 23.7 (16.2 , 31.3) 7.9 (3.9 , 12.0) 23.6 (17.0 , 30.2) 100
Education LevelNo Formal 5.7 (0.0 , 13.6) 8.8 (0.2 , 17.4) 15.1 (1.6 , 28.6) 14.3 (0.0 , 28.7) 18.5 (2.3 , 34.6) 37.6 (19.9 , 55.4) 100Elementary 18.1 (14.5 , 21.7) 6.9 (4.6 , 9.1) 21.2 (17.5 , 24.9) 17.7 (14.1 , 21.4) 11.9 (8.8 , 15.0) 24.2 (20.4 , 28.0) 100Secondary 27.2 (23.9 , 30.6) 22.2 (19.3 , 25.0) 16.8 (13.6 , 19.9) 8.6 (6.5 , 10.8) 6.9 (5.1 , 8.7) 18.3 (15.6 , 20.9) 100Post,Secondary 24.8 (13.0 , 36.5) 38.5 (21.5 , 55.5) 10.3 (2.9 , 17.6) 2.8 (0.0 , 6.0) 0.6 (0.0 , 1.7) 23.1 (12.3 , 33.9) 100College or above 23.4 (19.6 , 27.1) 44.7 (39.8 , 49.7) 9.3 (5.7 , 13.0) 1.6 (0.6 , 2.6) 2.6 (1.1 , 4.0) 18.4 (15.1 , 21.8) 100
Urban 25.3 (22.0 , 28.6) 32.0 (28.4 , 35.6) 13.2 (11.0 , 15.5) 3.2 (2.1 , 4.4) 4.9 (2.7 , 7.0) 21.4 (18.3 , 24.5) 100 Lowest 27.2 (11.8 , 42.7) 0.0 14.5 (1.8 , 27.2) 4.7 (0.0 , 10.2) 25.3 (6.3 , 44.3) 28.2 (10.0 , 46.4) 100 Second 25.4 (18.6 , 32.2) 12.9 (8.1 , 17.6) 20.9 (13.8 , 28.1) 9.1 (4.7 , 13.5) 9.1 (3.8 , 14.4) 22.6 (15.2 , 30.0) 100 Middle 30.3 (22.0 , 38.6) 24.1 (17.3 , 30.8) 12.6 (8.9 , 16.4) 2.9 (0.9 , 4.9) 6.4 (2.5 , 10.2) 23.8 (18.3 , 29.3) 100 Fourth 24.0 (19.3 , 28.6) 38.9 (32.3 , 45.5) 14.6 (9.9 , 19.4) 1.6 (0.3 , 2.9) 2.6 (1.2 , 4.0) 18.2 (13.2 , 23.3) 100 Highest 22.8 (17.5 , 28.1) 43.8 (38.3 , 49.3) 8.5 (6.6 , 10.5) 1.7 (0.8 , 2.6) 2.0 (0.1 , 3.9) 21.2 (17.6 , 24.8) 100Rural 21.6 (18.6 , 24.7) 13.9 (11.4 , 16.5) 19.2 (15.3 , 23.1) 15.6 (12.6 , 18.6) 9.9 (7.7 , 12.0) 19.7 (16.7 , 22.8) 100 Lowest 11.1 (4.5 , 17.8) 7.2 (1.3 , 13.2) 13.9 (7.3 , 20.5) 23.7 (14.0 , 33.4) 16.6 (4.8 , 28.4) 27.4 (16.9 , 37.9) 100 Second 16.2 (12.0 , 20.4) 5.7 (2.9 , 8.5) 19.3 (14.1 , 24.6) 17.1 (12.9 , 21.3) 13.3 (9.8 , 16.8) 28.4 (23.0 , 33.7) 100
Middle 23.0 (17.6 , 28.3) 10.0 (6.5 , 13.4) 24.5 (18.0 , 31.1) 17.5 (12.6 , 22.5) 7.5 (5.0 , 10.1) 17.5 (13.0 , 22.0) 100
Fourth 25.6 (19.3 , 31.9) 17.0 (10.8 , 23.2) 19.9 (12.3 , 27.5) 14.2 (9.3 , 19.0) 10.9 (6.4 , 15.5) 12.4 (8.1 , 16.6) 100 Highest 26.8 (20.0 , 33.7) 37.0 (28.8 , 45.3) 7.8 (2.8 , 12.8) 7.8 (3.7 , 12.0) 3.3 (0.5 , 6.1) 17.3 (10.6 , 23.9) 100
Table 7.1: Percentage of current manufactured cigarette smokers ≥15 years old, by last brand purchased and selected demographic characteristics – GATS PHILIPPINES, 2015.
Residence x wealth index quintile
Note: Current manufactured cigarette smokers includes daily and occasional (less than daily) use. The top five reported brands last purchased among all manufactured cigarette smokers are shown here.
TotalAll others1
1Example of all others: Winsboro, Pentagon, D&B and Chelsea
Percentage (95% CI)
Demographic Characteristics Fortune Marvel JackpotMarlboro Mighty
Last cigarette brand purchased
115 Global Adult Tobacco Survey : Philippines Country Report, 2015

Overall 96.4 (95.4, 97.2) 2.3 (1.8, 2.9) 0.8 (0.4, 1.4) 0.1 (0.0, 0.2) 0.5 (0.3, 0.9) 100Sex
Male 96.6 (95.6, 97.4) 2.1 (1.6, 2.8) 0.8 (0.4, 1.4) 0.0 N/A 0.5 (0.3, 1.0) 100Female 94.7 (89.8, 97.3) 3.7 (2.3, 5.7) 1.0 (0.2, 4.0) 0.4 (0.1, 2.6) 0.3 (0.0, 1.9) 100
Age (years)
15-24 97.2 (94.3, 98.7) 1.1 (0.5, 2.1) 1.2 (0.4, 4.1) 0.0 N/A 0.5 (0.1, 3.5) 10025-44 96.9 (95.5, 97.8) 2.1 (1.5, 3.1) 0.8 (0.4, 1.6) 0.1 (0.0, 0.4) 0.0 (0.0, 0.3) 10045-64 94.8 (92.1, 96.6) 3.3 (2.2, 5.0) 0.5 (0.2, 1.3) 0.0 N/A 1.4 (0.8, 2.5) 10065+ 96.6 (90.1, 98.9) 3.4 (1.1, 9.9) 0.0 N/A 0.0 N/A 0.0 N/A 100
Education Level
No Formal 99.1 (93.7, 99.9) 0.9 (0.1, 6.3) 0.0 N/A 0.0 N/A 0.0 N/A 100Elementary 97.7 (96.2, 98.6) 1.4 (0.8, 2.5) 0.5 (0.1, 1.9) 0.0 N/A 0.3 (0.1, 1.1) 100Secondary 97.1 (95.5, 98.2) 1.1 (0.9, 1.5) 1.0 (0.5, 2.3) 0.1 N/A 0.7 (0.3, 1.6) 100Post-Secondary 92.0 (80.3, 97.0) 8.0 (3.8, 16.2) 0.0 N/A 0.0 N/A 0.0 N/A 100College or above 93.2 (90.0, 95.5) 5.4 (3.6, 8.1) 0.8 (0.4, 1.8) 0.2 (0.0, 1.3) 0.4 (0.1, 1.0) 100
Residence x wealth index quintile
Urban 95.4 (93.6, 96.8) 3.6 (2.7, 4.7) 0.4 (0.2, 0.9) 0.0 N/A 0.6 (0.2, 1.4) 100 Lowest 100.0 N/A 0.0 N/A 0.0 N/A 0.0 N/A 0.0 N/A 100 Second 98.6 (96.2, 99.5) 1.0 (0.3, 3.1) 0.0 N/A 0.0 N/A 0.4 (0.1, 3.1) 100 Middle 96.3 (91.9, 98.4) 1.2 (0.4, 3.5) 0.6 (0.1, 4.0) 0.2 (0.2, 0.3) 1.7 (0.5, 5.6) 100 Fourth 96.7 (93.2, 98.4) 2.4 (1.6, 3.6) 0.8 (0.4, 1.6) 0.0 N/A 0.1 (0.0, 0.7) 100 Highest 91.9 (87.5, 94.9) 7.6 (5.4, 10.8) 0.1 (0.0, 0.5) 0.0 N/A 0.3 (0.0, 2.3) 100Rural 97.2 (96.0, 98.1) 1.1 (0.7, 1.9) 1.2 (0.6, 2.3) 0.1 (0.0, 0.5) 0.4 (0.2, 0.9) 100 Lowest 98.6 (90.6, 99.8) 0.0 N/A 1.4 (0.2, 9.3) 0.0 N/A 0.0 N/A 100 Second 98.4 (96.3, 99.4) 0.6 (0.1, 2.1) 0.9 (0.2, 3.0) 0.0 N/A 0.1 (0.1, 0.2) 100 Middle 97.5 (94.5, 98.9) 0.5 (0.1, 2.3) 1.7 (0.6, 4.8) 0.0 N/A 0.3 (0.0, 2.0) 100 Fourth 97.4 (94.9, 98.7) 1.3 (0.5, 3.2) 0.9 (0.3, 2.9) 0.0 N/A 0.4 (0.1, 1.4) 100 Highest 93.3 (88.3, 96.3) 4.0 (1.9, 8.5) 0.9 (0.2, 3.9) 0.5 (0.1, 3.5) 1.2 (0.3, 5.2) 100
Table 7.2: Percentage distribution of manufactured cigarette smokers ≥15 years old, by the source of last purchase of cigarettes and selected demographic characteristics – GATS Philippines, 2015.
N/A- The estimate is "0.0" or "100.0"
1Examples of other last purchase location include: public market,factory &store owner
SourceTotal
Other1From another personStoreStreet vendor
(TAKATAK)
Percentage (95% CI)
Convenience Store/Supermarket
116 Global Adult Tobacco Survey : Philippines Country Report, 2015
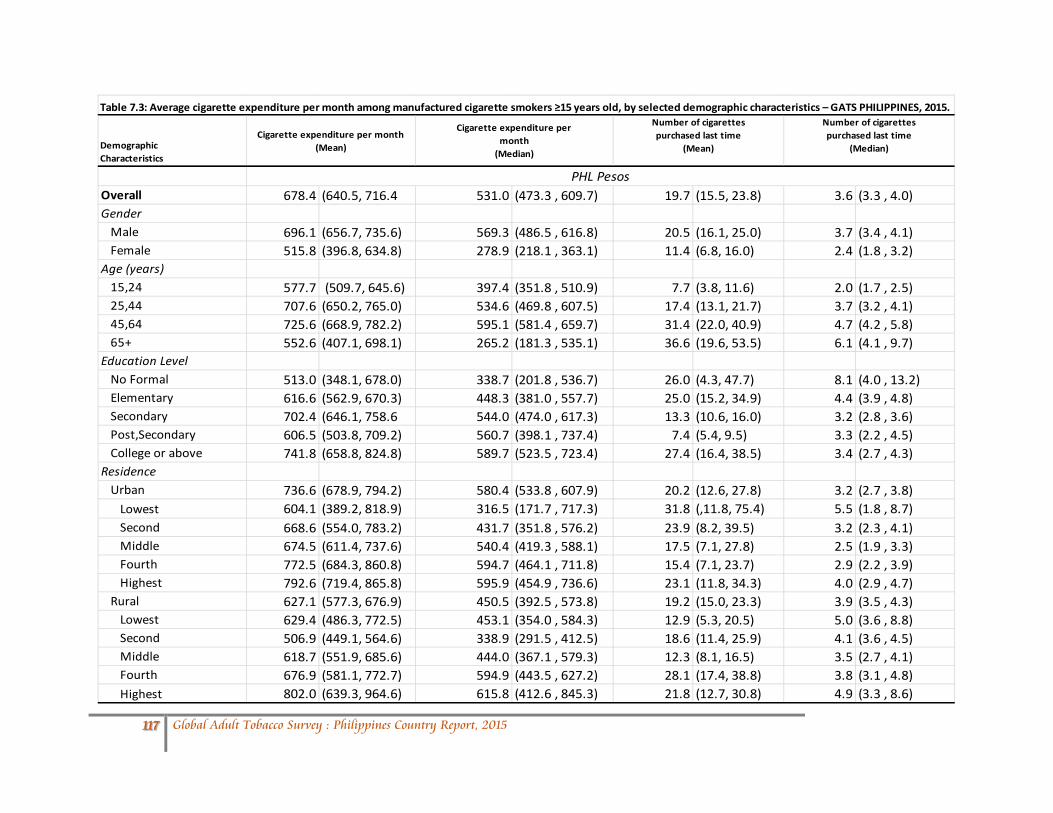
Table 7.3: Average cigarette expenditure per month among manufactured cigarette smokers ≥15 years old, by selected demographic characteristics – GATS PHILIPPINES, 2015.
Overall 678.4 (640.5, 716.4 531.0 (473.3 , 609.7) 19.7 (15.5, 23.8) 3.6 (3.3 , 4.0)Gender
Male 696.1 (656.7, 735.6) 569.3 (486.5 , 616.8) 20.5 (16.1, 25.0) 3.7 (3.4 , 4.1)Female 515.8 (396.8, 634.8) 278.9 (218.1 , 363.1) 11.4 (6.8, 16.0) 2.4 (1.8 , 3.2)
Age (years)15,24 577.7 (509.7, 645.6) 397.4 (351.8 , 510.9) 7.7 (3.8, 11.6) 2.0 (1.7 , 2.5)25,44 707.6 (650.2, 765.0) 534.6 (469.8 , 607.5) 17.4 (13.1, 21.7) 3.7 (3.2 , 4.1)45,64 725.6 (668.9, 782.2) 595.1 (581.4 , 659.7) 31.4 (22.0, 40.9) 4.7 (4.2 , 5.8)65+ 552.6 (407.1, 698.1) 265.2 (181.3 , 535.1) 36.6 (19.6, 53.5) 6.1 (4.1 , 9.7)
Education LevelNo Formal 513.0 (348.1, 678.0) 338.7 (201.8 , 536.7) 26.0 (4.3, 47.7) 8.1 (4.0 , 13.2)Elementary 616.6 (562.9, 670.3) 448.3 (381.0 , 557.7) 25.0 (15.2, 34.9) 4.4 (3.9 , 4.8)Secondary 702.4 (646.1, 758.6 544.0 (474.0 , 617.3) 13.3 (10.6, 16.0) 3.2 (2.8 , 3.6)Post,Secondary 606.5 (503.8, 709.2) 560.7 (398.1 , 737.4) 7.4 (5.4, 9.5) 3.3 (2.2 , 4.5)College or above 741.8 (658.8, 824.8) 589.7 (523.5 , 723.4) 27.4 (16.4, 38.5) 3.4 (2.7 , 4.3)
ResidenceUrban 736.6 (678.9, 794.2) 580.4 (533.8 , 607.9) 20.2 (12.6, 27.8) 3.2 (2.7 , 3.8) Lowest 604.1 (389.2, 818.9) 316.5 (171.7 , 717.3) 31.8 (,11.8, 75.4) 5.5 (1.8 , 8.7) Second 668.6 (554.0, 783.2) 431.7 (351.8 , 576.2) 23.9 (8.2, 39.5) 3.2 (2.3 , 4.1) Middle 674.5 (611.4, 737.6) 540.4 (419.3 , 588.1) 17.5 (7.1, 27.8) 2.5 (1.9 , 3.3) Fourth 772.5 (684.3, 860.8) 594.7 (464.1 , 711.8) 15.4 (7.1, 23.7) 2.9 (2.2 , 3.9) Highest 792.6 (719.4, 865.8) 595.9 (454.9 , 736.6) 23.1 (11.8, 34.3) 4.0 (2.9 , 4.7)Rural 627.1 (577.3, 676.9) 450.5 (392.5 , 573.8) 19.2 (15.0, 23.3) 3.9 (3.5 , 4.3) Lowest 629.4 (486.3, 772.5) 453.1 (354.0 , 584.3) 12.9 (5.3, 20.5) 5.0 (3.6 , 8.8) Second 506.9 (449.1, 564.6) 338.9 (291.5 , 412.5) 18.6 (11.4, 25.9) 4.1 (3.6 , 4.5) Middle 618.7 (551.9, 685.6) 444.0 (367.1 , 579.3) 12.3 (8.1, 16.5) 3.5 (2.7 , 4.1) Fourth 676.9 (581.1, 772.7) 594.9 (443.5 , 627.2) 28.1 (17.4, 38.8) 3.8 (3.1 , 4.8) Highest 802.0 (639.3, 964.6) 615.8 (412.6 , 845.3) 21.8 (12.7, 30.8) 4.9 (3.3 , 8.6)
Number of cigarettespurchased last time
(Mean)
Number of cigarettespurchased last time
(Median)Demographic Characteristics
Cigarette expenditure per month
(Median)
Cigarette expenditure per month (Mean)
PHL Pesos
117 Global Adult Tobacco Survey : Philippines Country Report, 2015
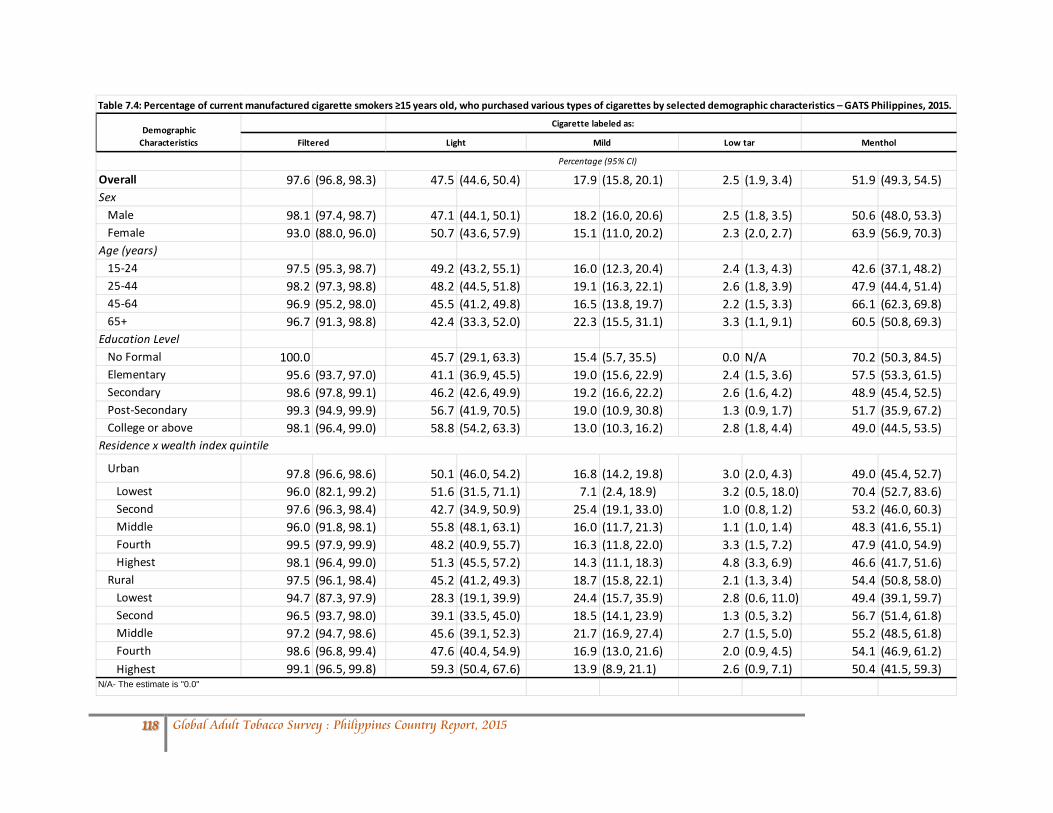
Table 7.4: Percentage of current manufactured cigarette smokers ≥15 years old, who purchased various types of cigarettes by selected demographic characteristics – GATS Philippines, 2015.
Overall 97.6 (96.8, 98.3) 47.5 (44.6, 50.4) 17.9 (15.8, 20.1) 2.5 (1.9, 3.4) 51.9 (49.3, 54.5)Sex
Male 98.1 (97.4, 98.7) 47.1 (44.1, 50.1) 18.2 (16.0, 20.6) 2.5 (1.8, 3.5) 50.6 (48.0, 53.3)Female 93.0 (88.0, 96.0) 50.7 (43.6, 57.9) 15.1 (11.0, 20.2) 2.3 (2.0, 2.7) 63.9 (56.9, 70.3)
Age (years)15-24 97.5 (95.3, 98.7) 49.2 (43.2, 55.1) 16.0 (12.3, 20.4) 2.4 (1.3, 4.3) 42.6 (37.1, 48.2)25-44 98.2 (97.3, 98.8) 48.2 (44.5, 51.8) 19.1 (16.3, 22.1) 2.6 (1.8, 3.9) 47.9 (44.4, 51.4)45-64 96.9 (95.2, 98.0) 45.5 (41.2, 49.8) 16.5 (13.8, 19.7) 2.2 (1.5, 3.3) 66.1 (62.3, 69.8)65+ 96.7 (91.3, 98.8) 42.4 (33.3, 52.0) 22.3 (15.5, 31.1) 3.3 (1.1, 9.1) 60.5 (50.8, 69.3)
Education LevelNo Formal 100.0 45.7 (29.1, 63.3) 15.4 (5.7, 35.5) 0.0 N/A 70.2 (50.3, 84.5)Elementary 95.6 (93.7, 97.0) 41.1 (36.9, 45.5) 19.0 (15.6, 22.9) 2.4 (1.5, 3.6) 57.5 (53.3, 61.5)Secondary 98.6 (97.8, 99.1) 46.2 (42.6, 49.9) 19.2 (16.6, 22.2) 2.6 (1.6, 4.2) 48.9 (45.4, 52.5)Post-Secondary 99.3 (94.9, 99.9) 56.7 (41.9, 70.5) 19.0 (10.9, 30.8) 1.3 (0.9, 1.7) 51.7 (35.9, 67.2)College or above 98.1 (96.4, 99.0) 58.8 (54.2, 63.3) 13.0 (10.3, 16.2) 2.8 (1.8, 4.4) 49.0 (44.5, 53.5)
Urban 97.8 (96.6, 98.6) 50.1 (46.0, 54.2) 16.8 (14.2, 19.8) 3.0 (2.0, 4.3) 49.0 (45.4, 52.7) Lowest 96.0 (82.1, 99.2) 51.6 (31.5, 71.1) 7.1 (2.4, 18.9) 3.2 (0.5, 18.0) 70.4 (52.7, 83.6) Second 97.6 (96.3, 98.4) 42.7 (34.9, 50.9) 25.4 (19.1, 33.0) 1.0 (0.8, 1.2) 53.2 (46.0, 60.3) Middle 96.0 (91.8, 98.1) 55.8 (48.1, 63.1) 16.0 (11.7, 21.3) 1.1 (1.0, 1.4) 48.3 (41.6, 55.1) Fourth 99.5 (97.9, 99.9) 48.2 (40.9, 55.7) 16.3 (11.8, 22.0) 3.3 (1.5, 7.2) 47.9 (41.0, 54.9) Highest 98.1 (96.4, 99.0) 51.3 (45.5, 57.2) 14.3 (11.1, 18.3) 4.8 (3.3, 6.9) 46.6 (41.7, 51.6)Rural 97.5 (96.1, 98.4) 45.2 (41.2, 49.3) 18.7 (15.8, 22.1) 2.1 (1.3, 3.4) 54.4 (50.8, 58.0) Lowest 94.7 (87.3, 97.9) 28.3 (19.1, 39.9) 24.4 (15.7, 35.9) 2.8 (0.6, 11.0) 49.4 (39.1, 59.7) Second 96.5 (93.7, 98.0) 39.1 (33.5, 45.0) 18.5 (14.1, 23.9) 1.3 (0.5, 3.2) 56.7 (51.4, 61.8) Middle 97.2 (94.7, 98.6) 45.6 (39.1, 52.3) 21.7 (16.9, 27.4) 2.7 (1.5, 5.0) 55.2 (48.5, 61.8) Fourth 98.6 (96.8, 99.4) 47.6 (40.4, 54.9) 16.9 (13.0, 21.6) 2.0 (0.9, 4.5) 54.1 (46.9, 61.2) Highest 99.1 (96.5, 99.8) 59.3 (50.4, 67.6) 13.9 (8.9, 21.1) 2.6 (0.9, 7.1) 50.4 (41.5, 59.3)
N/A- The estimate is "0.0"
Demographic Characteristics
Cigarette labeled as:
Percentage (95% CI)
Filtered Light Mild Low tar Menthol
Residence x wealth index quintile
118 Global Adult Tobacco Survey : Philippines Country Report, 2015

Table 7.5: Percentage distribution of manufactured cigarette smokers ≥15 years old, by the packaging type of last purchase of cigarettes selected demographic characteristics – GATS Philippines, 2015.
Overall 80.4 (78.0, 82.5) 1.4 (1.0, 2.1) 16.4 (14.6, 18.3) 0.5 (0.3, 0.8) 0.8 (0.4, 1.4) 100Sex
Male 80.0 (77.6, 82.3) 1.5 (1.0, 2.2) 16.8 (14.9, 18.9) 0.5 (0.3, 0.8) 0.6 (0.3, 1.3) 100Female 83.3 (78.2, 87.4) 1.2 (0.4, 3.3) 12.5 (9.2, 16.8) 0.5 (0.4, 0.7) 2.2 (0.9, 5.3) 100
Age (years)15-24 89.7 (85.4, 92.9) 1.5 (0.5, 4.4) 8.2 (5.8, 11.5) 0.0 N/A 0.5 (0.1, 2.0) 10025-44 81.5 (78.5, 84.1) 1.7 (1.1, 2.8) 15.9 (13.5, 18.7) 0.0 (0.0, 0.3) 0.5 (0.2, 1.2) 10045-64 72.4 (68.6, 75.9) 1.0 (0.5, 2.0) 22.2 (19.1, 25.7) 1.6 (1.1, 2.5) 1.3 (0.6, 2.9) 10065+ 67.1 (58.1, 74.9) 0.0 N/A 28.4 (20.8, 37.4) 1.9 (0.5, 7.1) 2.0 (0.7, 5.7) 100
Education LevelNo Formal 61.1 (42.7, 76.9) 8.4 (3.0, 21.4) 28.5 (14.0, 49.4) 0.0 N/A 2.0 (0.3, 13.3) 100Elementary 76.5 (72.0, 80.4) 1.3 (0.5, 3.2) 20.2 (16.9, 23.9) 0.4 (0.1, 1.0) 1.2 (0.5, 2.7) 100Secondary 84.8 (82.1, 87.1) 1.0 (0.5, 2.0) 12.9 (10.9, 15.3) 0.7 (0.4, 1.1) 0.2 (0.1, 0.9) 100Post-Secondary 81.9 (71.1, 89.3) 0.0 N/A 18.1 (10.7, 28.9) 0.0 N/A 0.0 N/A 100College or above 77.3 (73.4, 80.9) 2.4 (1.5, 4.0) 17.3 (14.3, 20.8) 0.4 (0.2, 1.2) 1.4 (0.5, 3.9) 100
Urban 83.5 (79.9, 86.5) 1.5 (0.8, 2.6) 13.5 (11.0, 16.4) 0.6 (0.4, 0.8) 0.5 (0.2, 1.5) 100 Lowest 78.6 (54.9, 91.7) 1.3 (0.2, 9.2) 19.2 (6.8, 43.9) 0.0 N/A 0.9 (0.1, 6.3) 100 Second 87.0 (78.2, 92.6) 0.7 (0.4, 1.4) 11.3 (5.9, 20.3) 0.2 (0.0, 1.2) 0.9 (0.1, 6.0) 100 Middle 88.4 (81.8, 92.8) 0.0 N/A 10.9 (6.6, 17.7) 0.7 (0.6, 0.8) 0.0 N/A 100 Fourth 86.1 (81.6, 89.7) 1.6 (0.4, 7.0) 11.1 (8.3, 14.7) 0.0 N/A 0.4 (0.1, 2.0) 100 Highest 76.8 (72.6, 80.5) 2.7 (1.5, 5.0) 17.6 (14.6, 21.0) 1.3 (0.9, 1.9) 0.7 (0.1, 4.9) 100Rural 77.7 (74.5, 80.6) 1.4 (0.8, 2.5) 18.8 (16.3, 21.6) 0.4 (0.2, 1.0) 1 (0.5, 2.1) 100 Lowest 78.6 (62.8, 88.9) 6.3 (2.1, 17.3) 13.6 (7.1, 24.4) 0.0 N/A 1.5 (0.4, 5.2) 100 Second 79.4 (74.4, 83.6) 0.9 (0.2, 3.5) 17.0 (13.3, 21.4) 0.0 N/A 1.8 (0.8, 4.0) 100 Middle 80.8 (75.8, 84.9) 1.3 (0.4, 3.5) 17.2 (13.4, 21.7) 0.1 (0.0, 1.0) 0.3 (0.1, 1.3) 100 Fourth 76.0 (69.3, 81.5) 0.9 (0.2, 3.4) 20.7 (15.8, 26.6) 0.8 (0.3, 2.3) 1.2 (0.3, 3.9) 100 Highest 70.2 (61.5, 77.6) 1.8 (0.6, 5.0) 25.1 (18.1, 33.7) 1.5 (0.4, 5.6) 0.4 (0.1, 2.7) 100
Note: There are no ream with 100 sticksN/A- The estimate is "0.0"
TotalOther Quantities
Percentage (95% CI)
Demographic Characteristics
Cigarette Type
Single Stick Pack of 20 Ream(200) sticksPack of 10
Residence x wealth index quintile
119 Global Adult Tobacco Survey : Philippines Country Report, 2015

Table 7.6: Percentage of manufactured cigarette smokers ≥15 years old, who consider that the tax increases since 2013 affected their smoking, by the types of influence and selected demographic characteristics – GATS Philippines, 2015.
Overall 63.8 (60.5, 67.0) 69.4 (66.3, 72.4) 82.3 (79.6, 84.6) 39.4 (36.1, 42.7) 6.6 (5.3, 8.3) 37.5 (33.5, 41.7) 1.0 (0.4, 2.4)Sex
Male 62.6 (59.0, 66.0) 68.2 (64.8, 71.4) 81.9 (79.1, 84.4) 40.2 (36.8, 43.7) 6.9 (5.4, 8.7) 38.1 (33.9, 42.4) 1.1 (0.5, 2.6)Female 78.3 (70.4, 84.6) 84.7 (77.2, 90.1) 86.5 (79.6, 91.3) 29.3 (21.5, 38.5) 3.7 (1.8, 7.4) 31.0 (22.9, 40.5) 0.0 N/A
Age (years)15-24 69.5 (63.2, 75.2) 71.1 (64.5, 76.9) 81.1 (74.3, 86.5) 39.8 (32.8, 47.3) 8.0 (5.0, 12.5) 56.1 (48.7, 63.2) 0.9 (0.3, 3.2)25-44 60.8 (56.2, 65.3) 68.8 (64.6, 72.7) 83.5 (80.2, 86.3) 37.9 (33.4, 42.6) 4.6 (3.2, 6.6) 34.7 (29.8, 40.0) 0.8 (0.3, 2.4)45-64 63.7 (58.7, 68.5) 69.2 (64.2, 73.9) 80.6 (75.9, 84.6) 41.0 (36.4, 45.7) 8.8 (6.4, 11.9) 30.4 (25.5, 35.8) 1.5 (0.2, 8.4)65+ 70.8 (60.1, 79.6) 70.3 (58.5, 79.9) 84.2 (75.6, 90.2) 43.6 (34.2, 53.6) 9.4 (4.8, 17.6) 26.4 (18.1, 37.0) 0.4 (0.1, 2.9)
Education LevelNo Formal 66.4 (44.1, 83.2) 73.1 (54.6, 86.0) 70.0 (43.8, 87.4) 49.9 (27.6, 72.2) 4.2 (0.8, 19.4) 41.4 (22.3, 63.5) 0.0 N/AElementary 65.6 (60.9, 70.0) 71.6 (67.0, 75.8) 85.2 (81.3, 88.5) 40.1 (34.9, 45.5) 6.6 (4.6, 9.2) 36.4 (31.6, 41.5) 0.4 (0.1, 1.9)Secondary 63.3 (58.4, 67.8) 68.4 (63.6, 72.7) 82.0 (78.1, 85.4) 39.8 (35.6, 44.2) 5.1 (3.6, 7.2) 39.7 (34.3, 45.3) 0.6 (0.2, 1.9)Post-Secondary 69.6 (52.3, 82.8) 66.1 (49.0, 79.8) 77.8 (63.3, 87.7) 45.3 (29.3, 62.3) 4.6 (1.2, 15.5) 24.9 (12.7, 43.1) 0.0 N/ACollege or above 60.8 (53.9, 67.3) 68.3 (62.0, 74.1) 79.0 (73.3, 83.8) 35.2 (29.0, 41.8) 11.3 (7.8, 16.3) 35.2 (27.8, 43.3) 3.3 (0.9, 12.0)
Urban 57.3 (52.4, 62.1) 63.5 (58.8, 68.0) 81.9 (77.9, 85.4) 38.3 (34.0, 42.8) 7.7 (5.7, 10.3) 36.8 (31.8, 42.0) 1.7 (0.5, 5.2) Lowest 72.6 (50.7, 87.2) 71.7 (52.6, 85.2) 84.2 (66.6, 93.4) 43.8 (21.1, 69.5) 0.0 (0., 0. ) 53.7 (32.6, 73.6) 0.0 N/A Second 57.1 (47.7, 66.0) 65.4 (56.4, 73.4) 83.8 (76.5, 89.1) 36.1 (27.4, 45.8) 4.7 (1.6, 13.3) 45.5 (36.2, 55.1) 1.2 (0.2, 8.1) Middle 58.9 (50.0, 67.3) 66.4 (56.9, 74.6) 86.7 (77.1, 92.7) 36.5 (27.1, 47.0) 7.0 (4.1, 11.6) 41.0 (32.0, 50.5) 2.3 (0.7, 6.8) Fourth 61.7 (52.7, 70.0) 65.8 (57.2, 73.4) 86.2 (79.8, 90.7) 42.9 (34.9, 51.2) 9.0 (5.8, 13.9) 35.8 (27.4, 45.0) 0.0 N/A Highest 51.1 (42.7, 59.4) 57.6 (50.3, 64.6) 73.6 (64.9, 80.7) 36.6 (29.3, 44.6) 9.5 (5.9, 15.1) 27.7 (20.9, 35.6) 3.0 (0.4, 18.2)Rural 68.3 (63.9, 72.3) 73.5 (69.4, 77.3) 82.5 (78.9, 85.6) 40.1 (35.6, 44.8) 5.9 (4.2, 8.3) 38.0 (32.4, 44.1) 0.6 (0.2, 1.8) Lowest 52.0 (36.7, 67.0) 71.1 (59.9, 80.2) 83.3 (73.3, 90.1) 41.6 (28.5, 56.0) 4.7 (2.1, 9.8) 34.6 (23.4, 47.8) 0.0 N/A Second 67.1 (61.1, 72.6) 72.5 (66.6, 77.6) 85.0 (79.8, 89.1) 37.2 (31.1, 43.7) 5.4 (3.2, 9.2) 34.9 (28.7, 41.7) 0.0 N/A Middle 72.1 (65.1, 78.1) 78.0 (71.1, 83.6) 81.3 (74.1, 87.0) 44.7 (37.1, 52.6) 5.8 (3.3, 9.9) 42.5 (34.4, 51.1) 1.1 (0.3, 4.1) Fourth 72.0 (63.4, 79.3) 75.4 (67.3, 82.0) 82.0 (74.6, 87.7) 40.5 (33.2, 48.2) 4.6 (2.4, 8.8) 42.8 (31.7, 54.7) 0.0 N/A Highest 61.6 (50.3, 71.8) 61.7 (49.3, 72.7) 79.0 (69.7, 86.1) 33.7 (23.6, 45.5) 11.1 (6.1, 19.4) 25.9 (17.3, 37.0) 2.3 (0.3, 14.0)
N/A- The estimate is "0.0"
1 Among current daily or less than daily smokers.
Influence anything elseInfluence to buy cigarettes in
bulkInfluence to ask for cigarettes
from others
Percentage (95% CI)
Residence x wealth index quintile
Cigarette price increase influence1
Demographic Characteristics
Influence to make an attempt to quit Influence to think about quitting
Influence to decrease the number of sticks
Influence to switch to a cheaper brand
120 Global Adult Tobacco Survey : Philippines Country Report, 2015
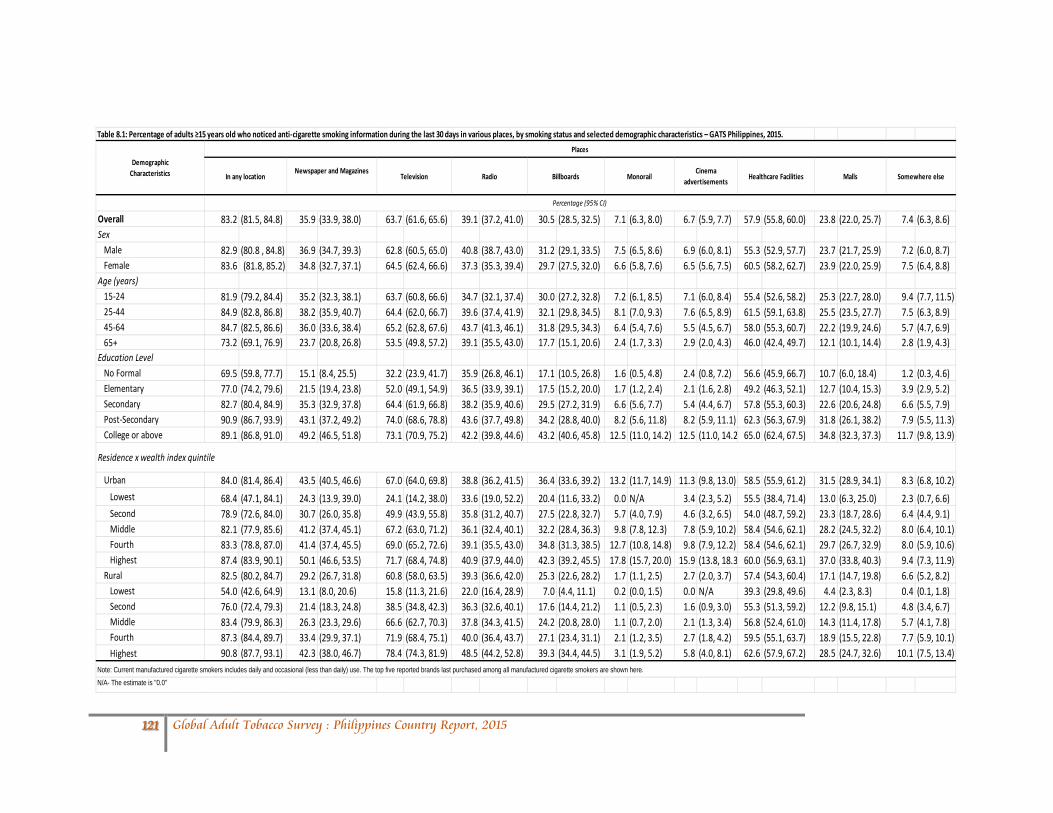
Table 8.1: Percentage of adults ≥15 years old who noticed anti-cigarette smoking information during the last 30 days in various places, by smoking status and selected demographic characteristics – GATS Philippines, 2015.
Overall 83.2 (81.5, 84.8) 35.9 (33.9, 38.0) 63.7 (61.6, 65.6) 39.1 (37.2, 41.0) 30.5 (28.5, 32.5) 7.1 (6.3, 8.0) 6.7 (5.9, 7.7) 57.9 (55.8, 60.0) 23.8 (22.0, 25.7) 7.4 (6.3, 8.6)Sex
Male 82.9 (80.8 , 84.8) 36.9 (34.7, 39.3) 62.8 (60.5, 65.0) 40.8 (38.7, 43.0) 31.2 (29.1, 33.5) 7.5 (6.5, 8.6) 6.9 (6.0, 8.1) 55.3 (52.9, 57.7) 23.7 (21.7, 25.9) 7.2 (6.0, 8.7)Female 83.6 (81.8, 85.2) 34.8 (32.7, 37.1) 64.5 (62.4, 66.6) 37.3 (35.3, 39.4) 29.7 (27.5, 32.0) 6.6 (5.8, 7.6) 6.5 (5.6, 7.5) 60.5 (58.2, 62.7) 23.9 (22.0, 25.9) 7.5 (6.4, 8.8)
Age (years)15-24 81.9 (79.2, 84.4) 35.2 (32.3, 38.1) 63.7 (60.8, 66.6) 34.7 (32.1, 37.4) 30.0 (27.2, 32.8) 7.2 (6.1, 8.5) 7.1 (6.0, 8.4) 55.4 (52.6, 58.2) 25.3 (22.7, 28.0) 9.4 (7.7, 11.5)25-44 84.9 (82.8, 86.8) 38.2 (35.9, 40.7) 64.4 (62.0, 66.7) 39.6 (37.4, 41.9) 32.1 (29.8, 34.5) 8.1 (7.0, 9.3) 7.6 (6.5, 8.9) 61.5 (59.1, 63.8) 25.5 (23.5, 27.7) 7.5 (6.3, 8.9)45-64 84.7 (82.5, 86.6) 36.0 (33.6, 38.4) 65.2 (62.8, 67.6) 43.7 (41.3, 46.1) 31.8 (29.5, 34.3) 6.4 (5.4, 7.6) 5.5 (4.5, 6.7) 58.0 (55.3, 60.7) 22.2 (19.9, 24.6) 5.7 (4.7, 6.9)65+ 73.2 (69.1, 76.9) 23.7 (20.8, 26.8) 53.5 (49.8, 57.2) 39.1 (35.5, 43.0) 17.7 (15.1, 20.6) 2.4 (1.7, 3.3) 2.9 (2.0, 4.3) 46.0 (42.4, 49.7) 12.1 (10.1, 14.4) 2.8 (1.9, 4.3)
Education LevelNo Formal 69.5 (59.8, 77.7) 15.1 (8.4, 25.5) 32.2 (23.9, 41.7) 35.9 (26.8, 46.1) 17.1 (10.5, 26.8) 1.6 (0.5, 4.8) 2.4 (0.8, 7.2) 56.6 (45.9, 66.7) 10.7 (6.0, 18.4) 1.2 (0.3, 4.6)Elementary 77.0 (74.2, 79.6) 21.5 (19.4, 23.8) 52.0 (49.1, 54.9) 36.5 (33.9, 39.1) 17.5 (15.2, 20.0) 1.7 (1.2, 2.4) 2.1 (1.6, 2.8) 49.2 (46.3, 52.1) 12.7 (10.4, 15.3) 3.9 (2.9, 5.2)Secondary 82.7 (80.4, 84.9) 35.3 (32.9, 37.8) 64.4 (61.9, 66.8) 38.2 (35.9, 40.6) 29.5 (27.2, 31.9) 6.6 (5.6, 7.7) 5.4 (4.4, 6.7) 57.8 (55.3, 60.3) 22.6 (20.6, 24.8) 6.6 (5.5, 7.9)Post-Secondary 90.9 (86.7, 93.9) 43.1 (37.2, 49.2) 74.0 (68.6, 78.8) 43.6 (37.7, 49.8) 34.2 (28.8, 40.0) 8.2 (5.6, 11.8) 8.2 (5.9, 11.1) 62.3 (56.3, 67.9) 31.8 (26.1, 38.2) 7.9 (5.5, 11.3)College or above 89.1 (86.8, 91.0) 49.2 (46.5, 51.8) 73.1 (70.9, 75.2) 42.2 (39.8, 44.6) 43.2 (40.6, 45.8) 12.5 (11.0, 14.2) 12.5 (11.0, 14.2 65.0 (62.4, 67.5) 34.8 (32.3, 37.3) 11.7 (9.8, 13.9)
Urban 84.0 (81.4, 86.4) 43.5 (40.5, 46.6) 67.0 (64.0, 69.8) 38.8 (36.2, 41.5) 36.4 (33.6, 39.2) 13.2 (11.7, 14.9) 11.3 (9.8, 13.0) 58.5 (55.9, 61.2) 31.5 (28.9, 34.1) 8.3 (6.8, 10.2) Lowest 68.4 (47.1, 84.1) 24.3 (13.9, 39.0) 24.1 (14.2, 38.0) 33.6 (19.0, 52.2) 20.4 (11.6, 33.2) 0.0 N/A 3.4 (2.3, 5.2) 55.5 (38.4, 71.4) 13.0 (6.3, 25.0) 2.3 (0.7, 6.6) Second 78.9 (72.6, 84.0) 30.7 (26.0, 35.8) 49.9 (43.9, 55.8) 35.8 (31.2, 40.7) 27.5 (22.8, 32.7) 5.7 (4.0, 7.9) 4.6 (3.2, 6.5) 54.0 (48.7, 59.2) 23.3 (18.7, 28.6) 6.4 (4.4, 9.1) Middle 82.1 (77.9, 85.6) 41.2 (37.4, 45.1) 67.2 (63.0, 71.2) 36.1 (32.4, 40.1) 32.2 (28.4, 36.3) 9.8 (7.8, 12.3) 7.8 (5.9, 10.2) 58.4 (54.6, 62.1) 28.2 (24.5, 32.2) 8.0 (6.4, 10.1) Fourth 83.3 (78.8, 87.0) 41.4 (37.4, 45.5) 69.0 (65.2, 72.6) 39.1 (35.5, 43.0) 34.8 (31.3, 38.5) 12.7 (10.8, 14.8) 9.8 (7.9, 12.2) 58.4 (54.6, 62.1) 29.7 (26.7, 32.9) 8.0 (5.9, 10.6) Highest 87.4 (83.9, 90.1) 50.1 (46.6, 53.5) 71.7 (68.4, 74.8) 40.9 (37.9, 44.0) 42.3 (39.2, 45.5) 17.8 (15.7, 20.0) 15.9 (13.8, 18.3 60.0 (56.9, 63.1) 37.0 (33.8, 40.3) 9.4 (7.3, 11.9)Rural 82.5 (80.2, 84.7) 29.2 (26.7, 31.8) 60.8 (58.0, 63.5) 39.3 (36.6, 42.0) 25.3 (22.6, 28.2) 1.7 (1.1, 2.5) 2.7 (2.0, 3.7) 57.4 (54.3, 60.4) 17.1 (14.7, 19.8) 6.6 (5.2, 8.2) Lowest 54.0 (42.6, 64.9) 13.1 (8.0, 20.6) 15.8 (11.3, 21.6) 22.0 (16.4, 28.9) 7.0 (4.4, 11.1) 0.2 (0.0, 1.5) 0.0 N/A 39.3 (29.8, 49.6) 4.4 (2.3, 8.3) 0.4 (0.1, 1.8) Second 76.0 (72.4, 79.3) 21.4 (18.3, 24.8) 38.5 (34.8, 42.3) 36.3 (32.6, 40.1) 17.6 (14.4, 21.2) 1.1 (0.5, 2.3) 1.6 (0.9, 3.0) 55.3 (51.3, 59.2) 12.2 (9.8, 15.1) 4.8 (3.4, 6.7) Middle 83.4 (79.9, 86.3) 26.3 (23.3, 29.6) 66.6 (62.7, 70.3) 37.8 (34.3, 41.5) 24.2 (20.8, 28.0) 1.1 (0.7, 2.0) 2.1 (1.3, 3.4) 56.8 (52.4, 61.0) 14.3 (11.4, 17.8) 5.7 (4.1, 7.8) Fourth 87.3 (84.4, 89.7) 33.4 (29.9, 37.1) 71.9 (68.4, 75.1) 40.0 (36.4, 43.7) 27.1 (23.4, 31.1) 2.1 (1.2, 3.5) 2.7 (1.8, 4.2) 59.5 (55.1, 63.7) 18.9 (15.5, 22.8) 7.7 (5.9, 10.1) Highest 90.8 (87.7, 93.1) 42.3 (38.0, 46.7) 78.4 (74.3, 81.9) 48.5 (44.2, 52.8) 39.3 (34.4, 44.5) 3.1 (1.9, 5.2) 5.8 (4.0, 8.1) 62.6 (57.9, 67.2) 28.5 (24.7, 32.6) 10.1 (7.5, 13.4)
Note: Current manufactured cigarette smokers includes daily and occasional (less than daily) use. The top five reported brands last purchased among all manufactured cigarette smokers are shown here.
N/A- The estimate is "0.0"
In any location
Demographic Characteristics Newspaper and Magazines
Television Radio Billboards
Places
Percentage (95% CI)
MonorailCinema
advertisements Healthcare Facilities Malls Somewhere else
Residence x wealth index quintile
121 Global Adult Tobacco Survey : Philippines Country Report, 2015

Overall 92.4 (91.0, 93.6) 44.6 (41.8, 47.4)Sex
Male 93.4 (92.0, 94.5) 44.9 (41.9, 47.9)Female 85.1 (81.2, 88.3) 42.1 (36.1, 48.3)
Age (years)15-24 93.5 (89.7, 95.9) 44.5 (39.1, 50.1)25-44 94.0 (92.0, 95.4) 45.0 (41.4, 48.6)45-64 92.5 (90.5, 94.1) 45.4 (41.2, 49.7)65+ 73.8 (66.7, 79.8) 36.5 (29.4, 44.1)
Education LevelNo Formal 64.1 (50.6, 75.7) 23.9 (14.6, 36.5)Elementary 86.7 (83.9, 89.1) 43.9 (39.7, 48.2)Secondary 95.3 (93.4, 96.7) 46.4 (42.9, 49.9)Post-Secondary 97.5 (93.4, 99.1) 51.7 (37.6, 65.5)College or above 97.8 (96.0, 98.9) 42.9 (37.7, 48.2)
Urban 93.8 (91.8, 95.3) 38.9 (34.9, 43.1) Lowest 81.5 (60.2, 92.8) 42.7 (26.4, 60.6) Second 87.5 (81.3, 91.9) 41.2 (32.9, 50.0) Middle 95.6 (91.5, 97.8) 39.9 (32.2, 48.1) Fourth 93.9 (90.9, 95.9) 40.0 (33.6, 46.7) Highest 96.9 (91.7, 98.9) 35.9 (30.4, 42.0)Rural 91.3 (89.3, 93.0) 49.2 (45.4, 52.9) Lowest 79.2 (71.1, 85.5) 42.0 (32.3, 52.5) Second 88.7 (85.5, 91.2) 46.0 (41.4, 50.7) Middle 91.9 (87.6, 94.8) 54.0 (47.3, 60.7) Fourth 94.2 (90.4, 96.6) 50.8 (44.0, 57.6) Highest 96.2 (91.4, 98.3) 45.9 (37.4, 54.6)
Table 8.2: Percentage of current smokers ≥15 years old who noticed health warnings on cigarette packages and considered quitting because of the warning labels during the last 30 days, by selected demographic characteristics – GATS Philippines, 2015.
Current smokers1 who…
Noticed health warnings on cigarette package2
Thought about quitting because of warning label2
Percentage (95% CI)
Demographic Characteristics
1 Includes daily and occasional (less than daily) smokers.2 During the last 30 days.
Residence x wealth index quintile
122 Global Adult Tobacco Survey : Philippines Country Report, 2015

Table 8.3: Percentage of adults ≥15 years old who noticed cigarette marketing during the last 30 days in various places, by selected demographic characteristics – GATS Philippines, 2015.
Overall 58.6 (56.2, 61.0) 40.5 (38.2, 42.8) 12.8 (11.4, 14.3) 7.4 (6.6, 8.4) 7.6 (6.6, 8.6) 20.7 (18.8, 22.7) 6.1 (5.4, 6.8) 0.9 (0.7, 1.2) 6.0 (5.2, 6.9) 10.6 (9.5, 11.8) 12.9 (11.6, 14.3) 1.2 (0.8, 1.8)Sex
Male 61.7 (59.0, 64.4) 43.2 (40.6, 45.8) 13.5 (11.9, 15.2) 8.0 (7.0, 9.2) 8.6 (7.5, 9.9) 22.5 (20.2, 25.0) 6.3 (5.5, 7.1) 1.0 (0.7, 1.4) 5.8 (4.9, 6.8) 11.6 (10.3, 13.1) 13.8 (12.1, 15.6) 1.1 (0.7, 1.7)Female 55.5 (52.9, 58.1) 37.8 (35.4, 40.2) 12.0 (10.6, 13.6) 6.8 (5.8, 7.9) 6.5 (5.6, 7.6) 18.9 (17.1, 20.8) 5.8 (5.1, 6.7) 0.9 (0.6, 1.2) 6.2 (5.3, 7.3) 9.6 (8.5, 10.8) 12.1 (10.7, 13.5) 1.2 (0.8, 2.0)
Age (years)15-24 61.0 (57.9, 64.0) 41.7 (38.6, 44.8) 13.0 (11.2, 15.0) 6.5 (5.3, 7.8) 7.9 (6.6, 9.4) 23.1 (20.6, 25.7) 6.9 (5.8, 8.3) 0.9 (0.6, 1.5) 10.4 (8.8, 12.3) 12.1 (10.5, 14.1) 16.6 (14.6, 18.7) 1.4 (0.8, 2.4)25-44 60.4 (57.7, 63.1) 42.4 (39.8, 45.0) 13.3 (11.8, 15.0) 7.6 (6.6, 8.8) 7.8 (6.8, 9.0) 20.8 (18.7, 23.0) 6.1 (5.3, 7.0) 1.1 (0.8, 1.5) 5.9 (5.0, 6.9) 11.2 (9.9, 12.6) 13.0 (11.4, 14.7) 1.2 (0.8, 1.9)45-64 56.1 (53.3, 59.0) 38.3 (35.6, 41.0) 12.4 (10.8, 14.1) 8.4 (7.2, 9.8) 7.6 (6.2, 9.4) 19.5 (17.2, 22.1) 5.6 (4.5, 6.8) 0.6 (0.4, 1.0) 2.1 (1.6, 2.9) 8.8 (7.5, 10.3) 9.9 (8.4, 11.5) 1.1 (0.8, 1.6)65+ 44.5 (41.0, 48.1) 30.3 (27.0, 33.8) 9.6 (7.6, 11.9) 6.8 (5.2, 8.8) 4.2 (3.2, 5.5) 13.6 (11.3, 16.3) 3.5 (2.3, 5.3) 0.9 (0.4, 2.0) 0.4 (0.2, 0.7) 6.2 (4.7, 8.0) 6.6 (5.0, 8.7) 0.6 (0.3, 1.3)
Education LevelNo Formal 32.0 (22.9, 42.7) 14.3 (9.2, 21.5) 2.2 (0.8, 5.9) 3.6 (1.8, 7.2) 1.2 (0.3, 3.9) 7.3 (4.3, 12.0) 0.0 N/A 0.9 (0.1, 6.4) 0.0 N/A 3.3 (1.3, 8.4) 3.1 (1.2, 7.8) 0.0 N/AElementary 53.8 (50.4, 57.2) 36.8 (33.8, 39.8) 11.0 (9.5, 12.8) 8.1 (6.8, 9.7) 4.4 (3.4, 5.5) 17.1 (14.7, 19.9) 3.3 (2.6, 4.1) 0.4 (0.2, 0.8) 1.2 (0.8, 1.8) 8.0 (6.6, 9.5) 9.6 (8.1, 11.3) 0.7 (0.4, 1.2)Secondary 60.6 (57.8, 63.4) 42.6 (39.9, 45.3) 12.4 (10.9, 14.0) 7.1 (6.1, 8.2) 7.4 (6.3, 8.8) 21.0 (18.8, 23.3) 5.4 (4.7, 6.3) 0.6 (0.4, 0.9) 5.1 (4.2, 6.3) 11.2 (9.8, 12.7) 13.2 (11.7, 14.9) 1.1 (0.7, 1.8)
Post-Secondary 58.3 (51.8, 64.6) 41.8 (35.8, 48.2) 14.0 (9.9, 19.4) 7.0 (4.6, 10.5) 10.4 (7.3, 14.4) 24.8 (19.7, 30.8) 9.8 (7.2, 13.2) 1.6 (0.8, 3.4) 10.5 (7.4, 14.5) 13.4 (9.7, 18.1) 15.5 (11.6, 20.5) 1.4 (0.6, 3.0)College or above 61.3 (58.4, 64.1) 42.0 (39.3, 44.7) 15.2 (13.1, 17.7) 7.6 (6.4, 9.0) 10.5 (9.1, 12.2) 23.6 (21.1, 26.3) 9.2 (8.0, 10.5) 1.7 (1.3, 2.4) 11.1 (9.7, 12.8) 12.1 (10.6, 13.8) 15.6 (13.8, 17.6) 1.7 (1.1, 2.7)
Urban 58.0 (54.6, 61.4) 39.2 (36.4, 42.2) 12.3 (10.4, 14.5) 6.5 (5.4, 7.9) 9.1 (7.6, 10.9) 20.0 (17.9, 22.4) 7.0 (6.2, 8.0) 1.3 (0.9, 1.8) 8.7 (7.5, 10.2) 12.1 (10.6, 13.8) 13.4 (11.8, 15.2) 1.7 (0.9, 3.0) Lowest 41.4 (26.7, 57.7) 30.1 (19.4, 43.6) 9.0 (3.9, 19.4) 7.6 (3.0, 18.3) 10.8 (4.7, 23.0) 17.2 (9.1, 30.2) 5.9 (1.9, 16.8) 2.3 (1.5, 3.5) 5.5 (1.7, 16.7) 10.9 (5.5, 20.7) 10.9 (5.3, 21.0) 3.6 (0.6, 18.8) Second 55.0 (48.5, 61.3) 36.1 (30.8, 41.9) 12.5 (9.1, 17.0) 7.1 (5.1, 9.9) 8.3 (5.8, 11.7) 19.8 (15.6, 24.8) 4.2 (2.7, 6.5) 0.4 (0.1, 1.4) 3.3 (2.0, 5.5) 13.3 (10.1, 17.4) 14.7 (11.1, 19.2) 1.9 (0.7, 5.1) Middle 58.4 (54.1, 62.6) 41.8 (37.6, 46.2) 11.1 (8.7, 14.0) 5.1 (3.7, 7.0) 7.0 (5.1, 9.7) 19.2 (16.2, 22.6) 5.3 (4.1, 6.8) 0.5 (0.3, 1.0) 5.9 (3.9, 9.0) 9.8 (7.8, 12.2) 11.8 (9.5, 14.4) 1.3 (0.5, 3.3) Fourth 62.5 (58.2, 66.5) 43.9 (40.0, 47.9) 13.8 (11.0, 17.1) 8.0 (6.1, 10.6) 9.9 (8.0, 12.2) 21.3 (18.4, 24.6) 6.5 (5.1, 8.2) 1.1 (0.6, 1.9) 7.2 (5.7, 9.0) 11.8 (9.6, 14.3) 12.2 (10.1, 14.7) 1.4 (0.8, 2.5) Highest 56.6 (52.8, 60.2) 36.2 (33.1, 39.4) 12.0 (9.7, 14.8) 6.1 (4.7, 7.9) 9.8 (8.3, 11.6) 19.9 (17.3, 22.7) 9.0 (7.6, 10.6) 1.9 (1.3, 2.9) 12.7 (10.8, 14.7) 13.1 (11.2, 15.3) 14.7 (12.6, 17.0) 1.9 (1.1, 3.3)Rural 59.1 (55.6, 62.5) 41.6 (38.2, 45.1) 13.2 (11.3, 15.3) 8.2 (6.9, 9.6) 6.2 (5.1, 7.5) 21.3 (18.4, 24.5) 5.2 (4.3, 6.2) 0.6 (0.4, 1.0) 3.6 (2.8, 4.5) 9.3 (7.9, 11.0) 12.5 (10.6, 14.7) 0.8 (0.5, 1.2) Lowest 35.3 (26.7, 45.0) 22.5 (16.6, 29.7) 3.2 (1.7, 6.2) 5.7 (3.6, 9.0) 2.2 (0.8, 5.9) 11.9 (8.0, 17.4) 1.7 (0.6, 4.8) 0.0 N/A 0.0 N/A 3.9 (2.3, 6.6) 4.0 (2.2, 7.2) 0.4 (0.1, 3.0) Second 54.0 (49.3, 58.6) 36.1 (31.9, 40.6) 8.3 (6.7, 10.3) 7.7 (6.1, 9.7) 4.6 (3.4, 6.2) 17.9 (14.9, 21.3) 3.7 (2.8, 5.0) 0.5 (0.3, 1.1) 1.0 (0.6, 1.8) 6.9 (5.3, 8.8) 8.9 (7.0, 11.3) 0.5 (0.2, 1.0) Middle 60.1 (55.8, 64.2) 42.4 (38.5, 46.5) 14.2 (11.9, 17.0) 7.0 (5.6, 8.8) 5.2 (3.9, 6.9) 22.2 (18.4, 26.5) 3.7 (2.7, 5.1) 0.2 (0.1, 0.7) 2.2 (1.3, 3.5) 9.9 (7.9, 12.3) 12.4 (10.1, 15.2) 0.8 (0.4, 1.5) Fourth 61.0 (56.8, 65.0) 43.7 (39.4, 48.1) 15.2 (12.6, 18.2) 8.8 (7.0, 10.9) 6.1 (4.6, 8.1) 21.2 (17.6, 25.3) 6.6 (5.1, 8.4) 0.6 (0.3, 1.3) 3.7 (2.7, 5.1) 9.5 (7.5, 12.1) 14.4 (11.7, 17.5) 0.9 (0.4, 1.7) Highest 67.8 (62.6, 72.6) 49.6 (44.2, 55.0) 17.9 (14.2, 22.3) 10.3 (8.1, 13.0) 10.8 (8.3, 14.0) 27.0 (22.7, 31.8) 8.3 (6.4, 10.6) 1.6 (0.9, 3.0) 9.8 (7.4, 12.9) 12.8 (10.1, 16.1) 17.1 (13.5, 21.3) 1.1 (0.5, 2.3)
Residence x wealth index quintile
N/A- The estimate is "0.0"
Percentage (95% CI)
In any location
Advertisement, sponsorship and promotion
Public WallsDemographic Characteristics
Stores Television Radio Billboards Anywhere ElsePosters, leaflets & calendars
Newspapers Cinemas Internet Public Transportation
123 Global Adult Tobacco Survey : Philippines Country Report, 2015

Table 8.3 (cont.): Percentage of adults ≥15 years old who noticed cigarette marketing during the last 30 days in various places, by selected demographic characteristics – GATS Philippines, 2015.
Overall 1.6 (1.3, 1.9) 6.3 (5.7, 7.1) 5.4 (4.8, 6.1) 2.5 (2.1, 2.9) 6.3 (5.5, 7.2) 9.6 (8.6, 10.8) 0.7 (0.5, 0.9) 1.1 (0.9, 1.3)Sex
Male 2.1 (1.7, 2.7) 7.9 (7.1, 8.9) 6.4 (5.5, 7.4) 2.8 (2.3, 3.4) 6.7 (5.8, 7.8) 10.6 (9.3, 12.0) 0.6 (0.4, 0.9) 1.1 (0.8, 1.5)Female 1.1 (0.8, 1.4) 4.7 (4.1, 5.5) 4.5 (3.9, 5.2) 2.1 (1.7, 2.7) 5.9 (5.1, 7.0) 8.7 (7.6, 10.0) 0.7 (0.5, 1.0) 1.0 (0.7, 1.4)
Age (years)15-24 1.4 (1.1, 1.9) 6.1 (5.2, 7.1) 5.6 (4.6, 6.7) 2.5 (1.9, 3.3) 6.4 (5.2, 7.9) 10.6 (9.1, 12.3) 0.8 (0.5, 1.3) 1.1 (0.7, 1.7)25-44 1.8 (1.4, 2.3) 6.4 (5.6, 7.4) 5.9 (5.1, 6.9) 2.7 (2.2, 3.4) 7.2 (6.2, 8.4) 10.0 (8.7, 11.4) 0.7 (0.5, 1.0) 1.2 (1.0, 1.6)45-64 1.8 (1.3, 2.4) 6.9 (5.9, 8.1) 5.2 (4.2, 6.4) 2.3 (1.8, 3.0) 5.3 (4.3, 6.4) 8.3 (7.1, 9.6) 0.5 (0.2, 0.8) 0.8 (0.5, 1.3)65+ 0.6 (0.2, 1.2) 4.9 (3.7, 6.6) 2.5 (1.8, 3.4) 1.0 (0.5, 2.1) 3.7 (2.8, 4.8) 7.6 (5.9, 9.8) 0.5 (0.2, 1.1) 0.6 (0.4, 0.9)
Education LevelNo Formal 1.5 (0.5, 4.8) 1.3 (0.3, 4.7) 0.7 (0.2, 2.2) 1.1 (0.8, 1.5) 1.4 (0.5, 3.5) 10.5 (4.4, 23.1) 0.0 N/A 0.0 N/AElementary 0.9 (0.6, 1.4) 6.0 (5.1, 7.2) 4.7 (3.8, 5.6) 1.8 (1.3, 2.5) 5.9 (4.7, 7.4) 8.5 (7.0, 10.3) 0.3 (0.2, 0.7) 0.5 (0.2, 0.9)Secondary 1.2 (0.9, 1.7) 6.7 (5.9, 7.7) 5.9 (5.1, 6.8) 2.7 (2.1, 3.3) 6.3 (5.3, 7.4) 9.4 (8.2, 10.8) 0.7 (0.4, 1.0) 1.0 (0.7, 1.5)Post-Secondary 1.0 (0.4, 2.6) 6.6 (4.4, 9.7) 7.3 (4.6, 11.4) 2.9 (1.3, 6.3) 7.4 (4.9, 11.1) 8.1 (5.7, 11.5) 0.5 (0.1, 2.1) 1.0 (0.3, 3.8)College or above 2.8 (2.3, 3.6) 6.3 (5.4, 7.3) 5.6 (4.6, 6.8) 2.7 (2.2, 3.4) 6.9 (5.8, 8.2) 11.0 (9.5, 12.6) 1.0 (0.7, 1.4) 1.7 (1.3, 2.3)
Urban 2.1 (1.6, 2.7) 7.6 (6.6, 8.8) 6.4 (5.5, 7.5) 2.9 (2.4, 3.5) 5.3 (4.5, 6.2) 9.1 (7.9, 10.5) 0.9 (0.6, 1.2) 1.5 (1.2, 2.0) Lowest 1.1 (0.8, 1.7) 3.3 (1.9, 5.9) 5.0 (1.4, 16.9) 2.6 (1.7, 4.0) 2.9 (1.8, 4.6) 8.0 (3.6, 16.9) 2.3 (1.5, 3.5) 0.0 N/A Second 2.5 (1.3, 4.5) 9.5 (7.0, 12.6) 7.1 (5.2, 9.6) 1.5 (0.8, 2.9) 4.7 (3.2, 7.0) 7.8 (5.3, 11.5) 0.5 (0.2, 1.7) 1.3 (0.9, 2.1) Middle 1.7 (1.0, 2.8) 7.1 (5.5, 9.2) 6.4 (4.7, 8.7) 2.7 (1.8, 3.9) 4.4 (3.2, 6.0) 9.5 (7.5, 11.9) 0.4 (0.1, 1.4) 0.8 (0.4, 1.7) Fourth 2.0 (1.5, 2.9) 8.5 (7.0, 10.3) 6.0 (4.9, 7.4) 3.4 (2.6, 4.5) 5.9 (4.4, 7.9) 9.3 (7.6, 11.4) 0.7 (0.5, 1.0) 1.5 (1.1, 2.0) Highest 2.2 (1.7, 3.0) 6.9 (5.8, 8.3) 6.5 (5.2, 8.1) 3.0 (2.3, 4.0) 5.6 (4.6, 6.9) 9.1 (7.7, 10.7) 1.3 (0.8, 1.9) 2.0 (1.5, 2.8)Rural 1.2 (0.9, 1.6) 5.2 (4.5, 6.1) 4.6 (3.9, 5.5) 2.1 (1.6, 2.7) 7.2 (5.9, 8.7) 10.1 (8.5, 12.0) 0.5 (0.3, 0.7) 0.6 (0.4, 1.0) Lowest 0.2 (0.0, 1.6) 2.1 (0.9, 4.7) 1.9 (0.8, 4.8) 0.5 (0.1, 2.5) 1.9 (0.9, 4.0) 8.4 (3.9, 17.3) 0.7 (0.1, 4.8) 0.0 N/A Second 1.2 (0.8, 1.9) 5.2 (4.0, 6.7) 4.0 (3.0, 5.1) 1.6 (1.0, 2.4) 6.4 (4.9, 8.3) 11.1 (8.2, 14.9) 0.3 (0.1, 0.8) 1.0 (0.5, 1.8) Middle 1.0 (0.6, 1.7) 5.9 (4.7, 7.5) 4.8 (3.6, 6.5) 1.9 (1.3, 2.9) 8.0 (6.3, 10.1) 8.9 (7.2, 10.9) 0.5 (0.2, 1.2) 0.4 (0.1, 0.9) Fourth 1.1 (0.7, 1.8) 5.1 (3.9, 6.6) 5.3 (4.1, 6.9) 2.4 (1.6, 3.4) 7.4 (5.8, 9.5) 9.2 (7.4, 11.4) 0.7 (0.3, 1.5) 0.6 (0.3, 1.3) Highest 2.0 (1.1, 3.5) 5.2 (3.8, 7.0) 5.0 (3.6, 6.8) 3.1 (2.0, 4.8) 8.3 (6.3, 10.8) 12.1 (9.3, 15.5) 0.2 (0.1, 0.8) 0.9 (0.3, 2.6)
N/A- The estimate is "0.0"
Percentage (95% CI)
Advertisement, sponsorship and promotion
Cigarette Promotion in Mail
Fashion EventsDemographic Characteristics
Sponsorship or Sporting Event
Free Samples Raffle Tickets Free Gifts LogosSales
Residence x wealth index quintile
124 Global Adult Tobacco Survey : Philippines Country Report, 2015

Table 8.4: Percentage of current smokers ≥15 years old who noticed cigarette marketing during the last 30 days in various places, by selected demographic characteristics – GATS Philippines, 2015.
Overall 63.4 (60.3, 66.4) 44.0 (40.9, 47.1) 13.9 (12.0, 16.1) 9.7 (8.2, 11.6) 9.0 (7.6, 10.7) 22.7 (19.9, 25.6) 6.3 (5.3, 7.5) 1.0 (0.7, 1.6) 4.5 (3.6, 5.7) 12.0 (10.4, 13.8) 14.4 (12.4, 16.7) 0.9 (0.6, 1.4)Sex
Male 64.7 (61.4, 67.9) 45.0 (41.8, 48.3) 14.4 (12.3, 16.7) 9.8 (8.1, 11.7) 9.5 (8.0, 11.2) 23.3 (20.4, 26.5) 6.5 (5.4, 7.8) 1.2 (0.8, 1.8) 4.2 (3.3, 5.5) 12.5 (10.7, 14.4) 15.0 (12.7, 17.5) 1.0 (0.7, 1.6)Female 53.1 (46.8, 59.3) 35.7 (30.2, 41.5) 10.5 (7.2, 15.1) 9.6 (6.4, 14.1) 5.6 (3.5, 8.9) 17.5 (13.6, 22.2) 4.8 (2.8, 8.2) 0.0 6.6 (4.5, 9.5) 8.7 (6.0, 12.5) 9.8 (6.9, 13.8) 0.0
Age (years)
15-24 65.6 (59.5, 71.3) 46.0 (40.1, 52.0) 14.5 (11.0, 19.0) 10.2 (7.2, 14.1) 10.9 (8.1, 14.4) 25.0 (20.5, 30.2) 6.8 (4.8, 9.6) 0.8 (0.2, 3.1) 7.0 (4.9, 9.8) 12.8 (9.7, 16.7) 17.3 (12.7, 23.2) 0.2 (0.2, 0.3)25-44 65.4 (61.4, 69.1) 44.5 (40.7, 48.4) 14.6 (12.2, 17.4) 9.0 (7.2, 11.1) 8.3 (6.6, 10.4) 22.2 (19.1, 25.8) 6.7 (5.4, 8.4) 1.8 (1.1, 2.8) 5.5 (4.1, 7.4) 13.0 (10.7, 15.7) 15.3 (12.7, 18.2) 0.9 (0.5, 1.7)45-64 61.0 (56.8, 65.0) 43.6 (39.4, 47.9) 13.4 (10.9, 16.4) 10.8 (8.5, 13.7) 9.2 (6.7, 12.5) 22.9 (19.2, 27.0) 6.0 (4.3, 8.2) 0.2 (0.0, 0.7) 1.4 (0.7, 2.6) 10.5 (8.4, 13.1) 11.1 (8.5, 14.4) 1.6 (1.0, 2.7)65+ 49.1 (41.0, 57.2) 32.7 (25.5, 40.9) 7.9 (5.1, 11.9) 9.4 (5.9, 14.7) 7.2 (4.4, 11.6) 15.8 (10.4, 23.3) 1.9 (0.8, 4.4) 0.0 1.3 (0.2, 8.3) 8.2 (4.6, 14.2) 11.5 (7.0, 18.1) 0.0
Education Level
No Formal 31.9 (20.4, 46.0) 22.7 (12.8, 37.1) 2.6 (0.9, 7.0) 7.3 (2.6, 18.5) 0.0 11.4 (4.6, 25.5) 0.0 3.3 (0.5, 20.2) 0.0 (0., 0. ) 8.7 (2.6, 25.2) 5.3 (1.4, 18.6) 0.0Elementary 58.6 (53.6, 63.5) 41.9 (37.4, 46.6) 13.3 (10.6, 16.4) 9.2 (7.1, 12.0) 4.9 (3.5, 6.8) 19.3 (15.9, 23.1) 3.8 (2.6, 5.4) 0.2 (0.1, 0.6) 0.9 (0.3, 2.2) 9.5 (7.5, 12.0) 11.8 (9.1, 15.3) 0.7 (0.3, 1.8)Secondary 65.5 (61.6, 69.1) 44.4 (40.6, 48.3) 14.3 (12.0, 17.1) 11.4 (9.0, 14.5) 10.8 (8.7, 13.4) 24.2 (20.6, 28.1) 6.7 (5.2, 8.5) 1.3 (0.7, 2.5) 5.2 (3.6, 7.3) 14.0 (11.6, 16.8) 14.2 (11.7, 17.2) 0.8 (0.4, 1.7)Post-Secondary 54.2 (38.2, 69.5) 43.2 (29.6, 58.0) 11.2 (5.0, 22.9) 7.0 (2.4, 18.5) 9.1 (4.4, 17.9) 22.5 (13.4, 35.2) 1.5 (0.5, 4.7) 0.6 (0.5, 0.8) 3.8 (1.2, 11.4) 9.8 (3.8, 23.2) 8.6 (3.3, 20.6) 0.0College or above 71.6 (66.8, 75.9) 48.9 (43.4, 54.4) 15.8 (11.9, 20.6) 7.4 (5.1, 10.6) 13.0 (10.1, 16.8) 26.2 (21.3, 31.8) 11.2 (8.4, 14.7) 1.7 (1.0, 3.1) 9.8 (7.3, 13.0) 12.4 (9.3, 16.3) 21.1 (16.3, 26.8) 1.9 (1.4, 2.5)
Residence x wealth index quintile
Urban 63.0 (58.4, 67.3) 43.2 (39.1, 47.3) 12.7 (10.1, 15.8) 8.2 (6.1, 10.9) 11.5 (9.1, 14.4) 22.3 (19.0, 26.1) 7.3 (5.8, 9.2) 1.8 (1.1, 2.9) 7.4 (5.7, 9.4) 14.1 (11.8, 16.7) 14.4 (12.0, 17.2) 1.1 (0.7, 1.7) Lowest 46.9 (28.4, 66.3) 34.7 (19.0, 54.6) 10.6 (2.3, 37.1) 7.9 (1.1, 39.0) 10.3 (2.3, 36.3) 11.3 (4.8, 24.2) 7.9 (1.1, 39.0) 0.0 7.9 (1.1, 39.0) 11.8 (3.2, 35.1) 12.6 (3.6, 35.5) 8.8 (1.5, 37.4) Second 55.6 (46.3, 64.5) 37.1 (29.3, 45.6) 10.2 (6.1, 16.4) 8.8 (5.4, 14.0) 7.2 (4.0, 12.4) 22.2 (16.2, 29.6) 5.0 (2.6, 9.4) 0.6 (0.2, 1.9) 2.9 (1.3, 6.3) 11.2 (7.5, 16.4) 12.6 (8.3, 18.7) 0.4 (0.0, 2.5) Middle 61.9 (54.3, 69.0) 41.0 (34.9, 47.3) 9.8 (6.6, 14.3) 3.6 (2.1, 6.1) 11.3 (7.2, 17.3) 20.7 (15.5, 27.0) 4.6 (3.4, 6.3) 0.6 (0.2, 1.8) 4.0 (2.5, 6.4) 14.0 (9.9, 19.5) 12.3 (8.4, 17.6) 0.0 Fourth 67.7 (61.2, 73.6) 51.4 (45.4, 57.5) 15.9 (11.8, 20.9) 8.6 (5.5, 13.0) 14.2 (9.8, 20.0) 26.8 (20.6, 33.9) 9.1 (5.6, 14.4) 2.1 (0.9, 4.9) 7.1 (4.2, 11.7) 15.4 (11.1, 20.9) 14.6 (10.5, 19.9) 1.1 (0.8, 1.6) Highest 65.2 (60.0, 70.1) 42.1 (36.3, 48.2) 13.7 (9.4, 19.5) 10.6 (6.6, 16.6) 12.0 (9.0, 15.8) 21.0 (16.7, 26.1) 8.9 (6.2, 12.7) 3.2 (1.6, 6.0) 12.1 (8.5, 17.0) 14.8 (10.9, 19.8) 16.7 (12.4, 22.1) 1.6 (1.4, 1.9)Rural 63.8 (59.4, 67.9) 44.6 (40.2, 49.2) 14.9 (12.3, 18.0) 11.0 (8.8, 13.6) 7.0 (5.5, 8.9) 22.9 (18.9, 27.5) 5.5 (4.2, 7.2) 0.4 (0.2, 1.1) 2.2 (1.4, 3.5) 10.3 (8.3, 12.8) 14.4 (11.4, 18.1) 0.7 (0.3, 1.6) Lowest 36.5 (27.0, 47.2) 26.7 (18.8, 36.5) 4.0 (1.9, 7.9) 8.7 (5.0, 14.6) 1.9 (0.6, 5.9) 14.6 (8.9, 22.9) 1.9 (0.6, 5.8) 0.0 0.0 3.8 (1.8, 7.9) 4.7 (2.0, 10.3) 1.4 (0.2, 9.5) Second 63.6 (57.8, 69.0) 44.0 (38.4, 49.9) 11.4 (8.3, 15.5) 11.0 (7.8, 15.2) 6.5 (4.2, 9.9) 20.8 (16.4, 25.9) 5.0 (3.2, 7.6) 0.5 (0.1, 2.6) 0.9 (0.5, 1.9) 8.9 (6.1, 13.0) 11.7 (8.5, 15.8) 0.4 (0.1, 1.2) Middle 64.9 (58.6, 70.8) 44.4 (37.8, 51.2) 17.0 (12.8, 22.1) 11.3 (8.0, 15.6) 5.5 (3.7, 8.3) 23.1 (17.6, 29.8) 4.5 (2.5, 7.8) 0.1 (0.0, 0.7) 1.3 (0.4, 3.7) 12.2 (8.7, 16.9) 15.7 (11.6, 20.9) 0.8 (0.2, 2.9) Fourth 66.0 (59.1, 72.3) 46.7 (39.8, 53.7) 15.7 (11.4, 21.2) 10.9 (7.4, 15.7) 9.5 (6.4, 13.8) 24.7 (17.7, 33.3) 7.4 (4.8, 11.3) 0.8 (0.2, 3.8) 3.5 (1.8, 6.8) 9.1 (6.0, 13.6) 15.4 (10.2, 22.6) 0.8 (0.2, 3.2) Highest 70.2 (61.1, 78.0) 50.9 (42.0, 59.8) 22.3 (15.7, 30.7) 11.9 (7.5, 18.2) 9.2 (5.1, 16.0) 27.9 (20.3, 37.1) 6.9 (4.0, 11.6) 0.5 (0.1, 3.4) 5.6 (2.3, 13.2) 14.9 (9.2, 23.2) 20.5 (13.7, 29.5) 1.0 (0.1, 6.8)
Percentage (95% CI)
Public Walls Anywhere ElseDemographic Characteristics
Stores Television Radio BillboardsIn any location
Advertisement, sponsorship and promotion
Posters Newspapers Cinemas Internet Public Transportation
125 Global Adult Tobacco Survey : Philippines Country Report, 2015

Table 8.4: Percentage of current smokers ≥15 years old who noticed cigarette marketing during the last 30 days in various places, by selected demographic characteristics – GATS Philippines, 2015.
Overall 63.4 (60.3, 66.4) 44.0 (40.9, 47.1) 13.9 (12.0, 16.1) 9.7 (8.2, 11.6) 9.0 (7.6, 10.7) 22.7 (19.9, 25.6) 6.3 (5.3, 7.5) 1.0 (0.7, 1.6) 4.5 (3.6, 5.7) 12.0 (10.4, 13.8) 14.4 (12.4, 16.7) 0.9 (0.6, 1.4)Sex
Male 64.7 (61.4, 67.9) 45.0 (41.8, 48.3) 14.4 (12.3, 16.7) 9.8 (8.1, 11.7) 9.5 (8.0, 11.2) 23.3 (20.4, 26.5) 6.5 (5.4, 7.8) 1.2 (0.8, 1.8) 4.2 (3.3, 5.5) 12.5 (10.7, 14.4) 15.0 (12.7, 17.5) 1.0 (0.7, 1.6)Female 53.1 (46.8, 59.3) 35.7 (30.2, 41.5) 10.5 (7.2, 15.1) 9.6 (6.4, 14.1) 5.6 (3.5, 8.9) 17.5 (13.6, 22.2) 4.8 (2.8, 8.2) 0.0 N/A 6.6 (4.5, 9.5) 8.7 (6.0, 12.5) 9.8 (6.9, 13.8) 0.0 N/A
Age (years)15-24 65.6 (59.5, 71.3) 46.0 (40.1, 52.0) 14.5 (11.0, 19.0) 10.2 (7.2, 14.1) 10.9 (8.1, 14.4) 25.0 (20.5, 30.2) 6.8 (4.8, 9.6) 0.8 (0.2, 3.1) 7.0 (4.9, 9.8) 12.8 (9.7, 16.7) 17.3 (12.7, 23.2) 0.2 (0.2, 0.3)25-44 65.4 (61.4, 69.1) 44.5 (40.7, 48.4) 14.6 (12.2, 17.4) 9.0 (7.2, 11.1) 8.3 (6.6, 10.4) 22.2 (19.1, 25.8) 6.7 (5.4, 8.4) 1.8 (1.1, 2.8) 5.5 (4.1, 7.4) 13.0 (10.7, 15.7) 15.3 (12.7, 18.2) 0.9 (0.5, 1.7)45-64 61.0 (56.8, 65.0) 43.6 (39.4, 47.9) 13.4 (10.9, 16.4) 10.8 (8.5, 13.7) 9.2 (6.7, 12.5) 22.9 (19.2, 27.0) 6.0 (4.3, 8.2) 0.2 (0.0, 0.7) 1.4 (0.7, 2.6) 10.5 (8.4, 13.1) 11.1 (8.5, 14.4) 1.6 (1.0, 2.7)65+ 49.1 (41.0, 57.2) 32.7 (25.5, 40.9) 7.9 (5.1, 11.9) 9.4 (5.9, 14.7) 7.2 (4.4, 11.6) 15.8 (10.4, 23.3) 1.9 (0.8, 4.4) 0.0 N/A 1.3 (0.2, 8.3) 8.2 (4.6, 14.2) 11.5 (7.0, 18.1) 0.0 N/A
Education LevelNo Formal 31.9 (20.4, 46.0) 22.7 (12.8, 37.1) 2.6 (0.9, 7.0) 7.3 (2.6, 18.5) 0.0 N/A 11.4 (4.6, 25.5) 0.0 N/A 3.3 (0.5, 20.2) 0.0 N/A 8.7 (2.6, 25.2) 5.3 (1.4, 18.6) 0.0 N/AElementary 58.6 (53.6, 63.5) 41.9 (37.4, 46.6) 13.3 (10.6, 16.4) 9.2 (7.1, 12.0) 4.9 (3.5, 6.8) 19.3 (15.9, 23.1) 3.8 (2.6, 5.4) 0.2 (0.1, 0.6) 0.9 (0.3, 2.2) 9.5 (7.5, 12.0) 11.8 (9.1, 15.3) 0.7 (0.3, 1.8)Secondary 65.5 (61.6, 69.1) 44.4 (40.6, 48.3) 14.3 (12.0, 17.1) 11.4 (9.0, 14.5) 10.8 (8.7, 13.4) 24.2 (20.6, 28.1) 6.7 (5.2, 8.5) 1.3 (0.7, 2.5) 5.2 (3.6, 7.3) 14.0 (11.6, 16.8) 14.2 (11.7, 17.2) 0.8 (0.4, 1.7)Post-Secondary 54.2 (38.2, 69.5) 43.2 (29.6, 58.0) 11.2 (5.0, 22.9) 7.0 (2.4, 18.5) 9.1 (4.4, 17.9) 22.5 (13.4, 35.2) 1.5 (0.5, 4.7) 0.6 (0.5, 0.8) 3.8 (1.2, 11.4) 9.8 (3.8, 23.2) 8.6 (3.3, 20.6) 0.0 N/ACollege or above 71.6 (66.8, 75.9) 48.9 (43.4, 54.4) 15.8 (11.9, 20.6) 7.4 (5.1, 10.6) 13.0 (10.1, 16.8) 26.2 (21.3, 31.8) 11.2 (8.4, 14.7) 1.7 (1.0, 3.1) 9.8 (7.3, 13.0) 12.4 (9.3, 16.3) 21.1 (16.3, 26.8) 1.9 (1.4, 2.5)
Urban 63.0 (58.4, 67.3) 43.2 (39.1, 47.3) 12.7 (10.1, 15.8) 8.2 (6.1, 10.9) 11.5 (9.1, 14.4) 22.3 (19.0, 26.1) 7.3 (5.8, 9.2) 1.8 (1.1, 2.9) 7.4 (5.7, 9.4) 14.1 (11.8, 16.7) 14.4 (12.0, 17.2) 1.1 (0.7, 1.7) Lowest 46.9 (28.4, 66.3) 34.7 (19.0, 54.6) 10.6 (2.3, 37.1) 7.9 (1.1, 39.0) 10.3 (2.3, 36.3) 11.3 (4.8, 24.2) 7.9 (1.1, 39.0) 0.0 N/A 7.9 (1.1, 39.0) 11.8 (3.2, 35.1) 12.6 (3.6, 35.5) 8.8 (1.5, 37.4) Second 55.6 (46.3, 64.5) 37.1 (29.3, 45.6) 10.2 (6.1, 16.4) 8.8 (5.4, 14.0) 7.2 (4.0, 12.4) 22.2 (16.2, 29.6) 5.0 (2.6, 9.4) 0.6 (0.2, 1.9) 2.9 (1.3, 6.3) 11.2 (7.5, 16.4) 12.6 (8.3, 18.7) 0.4 (0.0, 2.5) Middle 61.9 (54.3, 69.0) 41.0 (34.9, 47.3) 9.8 (6.6, 14.3) 3.6 (2.1, 6.1) 11.3 (7.2, 17.3) 20.7 (15.5, 27.0) 4.6 (3.4, 6.3) 0.6 (0.2, 1.8) 4.0 (2.5, 6.4) 14.0 (9.9, 19.5) 12.3 (8.4, 17.6) 0.0 N/A Fourth 67.7 (61.2, 73.6) 51.4 (45.4, 57.5) 15.9 (11.8, 20.9) 8.6 (5.5, 13.0) 14.2 (9.8, 20.0) 26.8 (20.6, 33.9) 9.1 (5.6, 14.4) 2.1 (0.9, 4.9) 7.1 (4.2, 11.7) 15.4 (11.1, 20.9) 14.6 (10.5, 19.9) 1.1 (0.8, 1.6) Highest 65.2 (60.0, 70.1) 42.1 (36.3, 48.2) 13.7 (9.4, 19.5) 10.6 (6.6, 16.6) 12.0 (9.0, 15.8) 21.0 (16.7, 26.1) 8.9 (6.2, 12.7) 3.2 (1.6, 6.0) 12.1 (8.5, 17.0) 14.8 (10.9, 19.8) 16.7 (12.4, 22.1) 1.6 (1.4, 1.9)Rural 63.8 (59.4, 67.9) 44.6 (40.2, 49.2) 14.9 (12.3, 18.0) 11.0 (8.8, 13.6) 7.0 (5.5, 8.9) 22.9 (18.9, 27.5) 5.5 (4.2, 7.2) 0.4 (0.2, 1.1) 2.2 (1.4, 3.5) 10.3 (8.3, 12.8) 14.4 (11.4, 18.1) 0.7 (0.3, 1.6) Lowest 36.5 (27.0, 47.2) 26.7 (18.8, 36.5) 4.0 (1.9, 7.9) 8.7 (5.0, 14.6) 1.9 (0.6, 5.9) 14.6 (8.9, 22.9) 1.9 (0.6, 5.8) 0.0 N/A 0.0 N/A 3.8 (1.8, 7.9) 4.7 (2.0, 10.3) 1.4 (0.2, 9.5) Second 63.6 (57.8, 69.0) 44.0 (38.4, 49.9) 11.4 (8.3, 15.5) 11.0 (7.8, 15.2) 6.5 (4.2, 9.9) 20.8 (16.4, 25.9) 5.0 (3.2, 7.6) 0.5 (0.1, 2.6) 0.9 (0.5, 1.9) 8.9 (6.1, 13.0) 11.7 (8.5, 15.8) 0.4 (0.1, 1.2) Middle 64.9 (58.6, 70.8) 44.4 (37.8, 51.2) 17.0 (12.8, 22.1) 11.3 (8.0, 15.6) 5.5 (3.7, 8.3) 23.1 (17.6, 29.8) 4.5 (2.5, 7.8) 0.1 (0.0, 0.7) 1.3 (0.4, 3.7) 12.2 (8.7, 16.9) 15.7 (11.6, 20.9) 0.8 (0.2, 2.9) Fourth 66.0 (59.1, 72.3) 46.7 (39.8, 53.7) 15.7 (11.4, 21.2) 10.9 (7.4, 15.7) 9.5 (6.4, 13.8) 24.7 (17.7, 33.3) 7.4 (4.8, 11.3) 0.8 (0.2, 3.8) 3.5 (1.8, 6.8) 9.1 (6.0, 13.6) 15.4 (10.2, 22.6) 0.8 (0.2, 3.2) Highest 70.2 (61.1, 78.0) 50.9 (42.0, 59.8) 22.3 (15.7, 30.7) 11.9 (7.5, 18.2) 9.2 (5.1, 16.0) 27.9 (20.3, 37.1) 6.9 (4.0, 11.6) 0.5 (0.1, 3.4) 5.6 (2.3, 13.2) 14.9 (9.2, 23.2) 20.5 (13.7, 29.5) 1.0 (0.1, 6.8)
Residence x wealth index quintile
N/A- The estimate is "0.0"
Percentage (95% CI)
Public Walls Anywhere Else
Demographic Characteristics Stores Television Radio BillboardsIn any location
Advertisement, sponsorship and promotion
Posters Newspapers Cinemas Internet Public Transportation
126 Global Adult Tobacco Survey : Philippines Country Report, 2015

Table 8.4 (cont.): Percentage of current smokers ≥15 years old who noticed cigarette marketing during the last 30 days in various places, by selected demographic characteristics – GATS Philippines, 2015.
Overall 2.2 (1.6, 3.1) 10.1 (8.8, 11.5) 7.7 (6.6, 9.0) 3.4 (2.6, 4.5) 8.2 (6.9, 9.7) 11.3 (9.7, 13.1) 0.7 (0.3, 1.5) 1.2 (0.7, 2.0)Sex
Male 2.5 (1.7, 3.5) 10.7 (9.3, 12.2) 7.8 (6.6, 9.1) 3.2 (2.4, 4.3) 8.2 (6.8, 9.8) 11.2 (9.5, 13.2) 0.8 (0.3, 1.6) 1.2 (0.7, 2.1)Female 0.1 (0.0, 0.4) 5.5 (3.9, 7.7) 7.3 (4.7, 11.3) 5.2 (2.7, 9.8) 8.4 (6.2, 11.3) 11.7 (8.5, 15.9) 0.3 (0.0, 2.1) 1.1 (0.5, 2.7)
Age (years)15-24 2.2 (1.2, 4.0) 12.8 (9.9, 16.4) 8.4 (6.2, 11.4) 3.9 (2.2, 6.9) 8.4 (6.0, 11.7) 12.7 (9.4, 16.9) 0.9 (0.2, 3.4) 0.9 (0.2, 3.1)25-44 2.6 (1.7, 3.9) 9.9 (8.2, 11.8) 8.0 (6.5, 9.8) 3.8 (2.6, 5.5) 9.5 (7.6, 11.7) 11.9 (9.7, 14.4) 0.9 (0.4, 1.9) 1.3 (0.7, 2.5)45-64 1.8 (1.0, 3.1) 9.5 (7.4, 12.1) 7.7 (5.7, 10.3) 2.7 (1.7, 4.1) 6.8 (5.1, 9.1) 10.2 (8.0, 12.9) 0.4 (0.1, 1.6) 1.4 (0.7, 2.8)65+ 0.0 (0., 0. ) 3.9 (2.0, 7.4) 2.4 (1.3, 4.7) 1.9 (0.8, 4.5) 2.9 (1.6, 5.2) 5.6 (3.0, 10.3) 0.0 N/A 0.2 (0.2, 0.2)
Education LevelNo Formal 0.0 N/A 0.0 N/A 0.4 (0.1, 3.1) 1.5 (0.8, 2.8) 2.4 (1.1, 5.4) 1.8 (0.6, 5.5) 0.0 N/A 0.0 N/AElementary 1.2 (0.6, 2.2) 8.4 (6.5, 10.9) 6.8 (5.1, 9.0) 2.3 (1.5, 3.5) 7.5 (5.6, 10.0) 8.8 (6.8, 11.4) 0.2 (0.0, 0.6) 0.5 (0.1, 1.7)Secondary 2.0 (1.2, 3.6) 11.6 (9.5, 14.0) 8.4 (6.8, 10.3) 4.5 (3.1, 6.4) 8.9 (7.1, 11.1) 12.0 (9.8, 14.8) 1.3 (0.5, 3.1) 1.6 (0.7, 3.4)Post-Secondary 2.4 (0.8, 6.6) 5.6 (2.4, 12.4) 2.5 (0.7, 8.1) 1.5 (0.2, 9.8) 2.2 (0.5, 9.2) 4.7 (1.3, 15.9) 0.0 (0., 0. ) 0.0 (0., 0. )College or above 4.5 (2.8, 7.0) 11.1 (8.7, 14.2) 9.2 (6.8, 12.4) 3.5 (1.9, 6.3) 9.4 (7.3, 12.0) 15.6 (12.0, 20.0 0.5 (0.1, 2.1) 1.7 (0.9, 3.2)
Urban 2.8 (1.7, 4.6) 11.1 (9.1, 13.4) 9.2 (7.5, 11.2) 4.3 (3.0, 6.1) 7.3 (5.8, 9.1) 11.0 (8.6, 14.0) 1.0 (0.3, 2.8) 1.8 (0.9, 3.6) Lowest 2.8 (1.8, 4.2) 2.5 (0.6, 9.7) 12.3 (3.5, 35.0) 0.7 (0.1, 4.8) 1.4 (0.3, 5.4) 5.8 (2.2, 14.6) 0.0 N/A 0.0 N/A Second 2.6 (0.8, 8.5) 12.5 (8.3, 18.5) 10.1 (6.8, 14.7) 1.5 (0.6, 3.9) 5.3 (3.0, 9.3) 9.4 (5.5, 15.6) 0.0 N/A 1.2 (0.5, 2.8) Middle 3.2 (1.4, 7.1) 11.8 (8.7, 15.8) 8.2 (5.5, 12.0) 3.6 (1.7, 7.2) 8.0 (5.2, 12.1) 9.1 (6.1, 13.3) 1.6 (0.4, 6.1) 2.2 (0.7, 6.3) Fourth 4.2 (2.5, 6.7) 12.8 (9.6, 16.7) 8.4 (5.6, 12.3) 7.1 (4.6, 10.7) 9.9 (6.4, 14.9) 13.0 (8.8, 18.9) 0.6 (0.1, 2.4) 2.7 (1.0, 7.4) Highest 1.5 (0.4, 6.2) 9.3 (6.7, 12.7) 9.7 (6.9, 13.7) 4.3 (2.2, 8.2) 6.4 (4.9, 8.3) 12.1 (8.5, 16.9) 1.5 (0.4, 5.0) 1.5 (0.5, 4.6)Rural 1.7 (1.1, 2.6) 9.3 (7.7, 11.1) 6.5 (5.2, 8.2) 2.7 (1.8, 4.1) 9.0 (7.0, 11.4) 11.5 (9.4, 13.8) 0.5 (0.2, 1.1) 0.6 (0.3, 1.3) Lowest 0.0 N/A 3.5 (1.3, 9.2) 1.0 (0.3, 3.2) 0.2 (0.2, 0.3) 4.1 (1.7, 9.8) 6.9 (4.0, 11.6) 0.0 N/A 0.0 N/A Second 1.3 (0.7, 2.5) 8.9 (6.4, 12.2) 6.7 (4.6, 9.5) 2.3 (1.2, 4.4) 8.2 (5.7, 11.7) 10.7 (7.7, 14.8) 0.5 (0.2, 1.6) 1.1 (0.4, 3.0) Middle 1.9 (0.9, 3.9) 10.2 (7.4, 13.8) 6.5 (4.6, 9.0) 2.6 (1.3, 5.2) 11.0 (7.7, 15.6) 13.1 (9.5, 17.9) 0.5 (0.1, 3.3) 0.4 (0.1, 1.6) Fourth 0.3 (0.2, 0.3) 9.7 (6.7, 13.7) 7.8 (5.1, 11.7) 2.9 (1.4, 5.6) 7.4 (4.7, 11.3) 8.3 (5.5, 12.2) 0.5 (0.1, 3.3) 0.4 (0.1, 2.6) Highest 5.6 (2.4, 12.6) 9.9 (5.5, 17.2) 6.5 (3.6, 11.5) 4.9 (1.9, 12.3) 11.2 (7.1, 17.1) 17.6 (11.7, 25.5 0.7 (0.2, 2.8) 1.0 (0.2, 4.2)
N/A- The estimate is "0.0"
Percentage (95% CI)
Demographic Characteristics
Advertisement, sponsorship and promotion
Sponsorship or Sporting Event Free Samples Raffle Tickets Free Gifts Logos
Cigarette Promotion in Mail Fashion EventsSales
Residence x wealth index quintile
127 Global Adult Tobacco Survey : Philippines Country Report, 2015

Table 8.5: Percentage of non-smokers ≥15 years old who noticed cigarette marketing during the last 30 days in various places, by selected demographic characteristics – GATS Philippines, 2015.
Percentage (95% CI)
Overall 57.2 (54.7, 59.7) 39.5 (37.2, 41.8) 12.4 (11.0, 13.9) 6.7 (5.9, 7.7) 7.1 (6.2, 8.2) 20.1 (18.3, 22.1) 6.0 (5.3, 6.7) 0.9 (0.7, 1.2) 6.4 (5.6, 7.4) 10.2 (9.1, 11.4) 12.5 (11.2, 13.9) 1.3 (0.8, 2.0)Sex
Male 59.7 (56.8, 62.5) 42.0 (39.3, 44.7) 12.9 (11.2, 14.8) 6.9 (5.8, 8.1) 8.0 (6.7, 9.5) 22.0 (19.6, 24.5) 6.2 (5.2, 7.2) 0.9 (0.6, 1.4) 6.8 (5.6, 8.2) 11.1 (9.5, 12.9) 13.0 (11.2, 15.0) 1.2 (0.7, 2.1)Female 55.6 (52.9, 58.2) 37.9 (35.4, 40.4) 12.1 (10.6, 13.7) 6.6 (5.7, 7.7) 6.6 (5.6, 7.7) 19.0 (17.2, 21.0) 5.9 (5.1, 6.8) 0.9 (0.6, 1.3) 6.2 (5.2, 7.4) 9.6 (8.5, 10.9) 12.2 (10.8, 13.7) 1.3 (0.8, 2.1)
Age (years)15-24 60.1 (56.9, 63.2) 40.9 (37.7, 44.1) 12.7 (10.8, 14.8) 5.8 (4.6, 7.1) 7.3 (6.0, 8.9) 22.7 (20.2, 25.4) 7.0 (5.8, 8.4) 1.0 (0.6, 1.6) 11.0 (9.2, 13.1) 12.0 (10.2, 14.1) 16.4 (14.5, 18.6) 1.6 (0.9, 2.8)25-44 58.7 (55.8, 61.5) 41.7 (39.0, 44.5) 12.9 (11.3, 14.6) 7.2 (6.2, 8.3) 7.7 (6.5, 9.0) 20.2 (18.1, 22.5) 5.9 (5.0, 6.9) 0.9 (0.6, 1.3) 6.0 (5.1, 7.1) 10.5 (9.2, 12.1) 12.2 (10.6, 14.0) 1.3 (0.8, 2.1)45-64 54.4 (51.5, 57.3) 36.4 (33.6, 39.2) 12.0 (10.4, 13.8) 7.5 (6.3, 9.0) 7.1 (5.7, 8.7) 18.3 (16.0, 20.8) 5.4 (4.4, 6.7) 0.8 (0.5, 1.4) 2.4 (1.7, 3.3) 8.2 (6.8, 9.8) 9.4 (7.9, 11.2) 0.9 (0.5, 1.5)65+ 43.5 (39.7, 47.5) 29.8 (26.3, 33.5) 9.9 (7.7, 12.6) 6.2 (4.6, 8.4) 3.6 (2.6, 4.9) 13.1 (10.6, 16.2) 3.9 (2.5, 6.0) 1.1 (0.5, 2.4) 0.2 (0.1, 0.8) 5.7 (4.2, 7.7) 5.5 (4.0, 7.7) 0.7 (0.3, 1.6)
Education LevelNo Formal 32.1 (21.4, 45.1) 11.1 (6.6, 18.1) 2.0 (0.5, 8.1) 2.2 (1.0, 5.2) 1.6 (0.5, 5.4) 5.7 (3.1, 10.1) 0.0 N/A 0.0 N/A 0.0 N/A 1.3 (0.3, 4.8) 2.2 (0.7, 6.7) 0.0 N/AElementary 51.8 (48.1, 55.4) 34.5 (31.5, 37.7) 10.1 (8.4, 12.0) 7.6 (6.2, 9.3) 4.2 (3.1, 5.5) 16.2 (13.6, 19.2) 3.1 (2.4, 4.0) 0.6 (0.3, 1.1) 1.4 (0.8, 2.2) 7.3 (5.9, 9.0) 8.6 (7.1, 10.3) 0.7 (0.4, 1.4)Secondary 59.1 (56.1, 62.1) 42.0 (39.2, 44.9) 11.7 (10.2, 13.5) 5.7 (4.8, 6.8) 6.4 (5.2, 7.7) 20.0 (17.9, 22.2) 5.0 (4.2, 6.1) 0.4 (0.3, 0.6) 5.1 (4.1, 6.3) 10.3 (8.9, 11.9) 12.9 (11.3, 14.7) 1.3 (0.7, 2.2)Post-Secondary 59.2 (52.1, 66.0) 41.5 (34.7, 48.7) 14.7 (10.2, 20.6) 7.0 (4.5, 10.8) 10.6 (7.3, 15.2) 25.4 (19.8, 31.9) 11.6 (8.5, 15.7) 1.9 (0.8, 4.1) 11.9 (8.5, 16.6) 14.2 (10.2, 19.3) 17.1 (12.7, 22.5) 1.7 (0.8, 3.6)College or above 59.5 (56.5, 62.4) 40.8 (38.0, 43.6) 15.2 (13.0, 17.5) 7.6 (6.4, 9.0) 10.1 (8.6, 11.9) 23.2 (20.8, 25.8) 8.9 (7.7, 10.2) 1.7 (1.2, 2.5) 11.4 (9.8, 13.2) 12.0 (10.5, 13.8) 14.6 (12.8, 16.7) 1.7 (1.0, 2.8)
Urban 56.7 (53.2, 60.1) 38.1 (35.2, 41.1) 12.2 (10.2, 14.5) 6.1 (5.0, 7.4) 8.5 (7.0, 10.2) 19.4 (17.2, 21.8) 7.0 (6.0, 8.1) 1.1 (0.8, 1.7) 9.1 (7.8, 10.7) 11.5 (9.9, 13.3) 13.1 (11.4, 15.0) 1.8 (0.9, 3.5) Lowest 37.5 (21.0, 57.6) 26.9 (14.4, 44.6) 7.9 (3.7, 15.9) 7.5 (3.4, 15.5) 11.2 (4.9, 23.4) 21.4 (10.9, 37.8) 4.5 (2.6, 7.8) 3.9 (2.4, 6.4) 3.9 (2.4, 6.4) 10.4 (5.2, 19.5) 9.7 (4.7, 18.9) 0.0 N/A Second 54.7 (48.2, 61.1) 35.7 (30.2, 41.6) 13.8 (9.7, 19.1) 6.3 (4.1, 9.6) 8.9 (6.1, 12.9) 18.5 (13.9, 24.2) 3.8 (2.2, 6.6) 0.3 (0.0, 2.4) 3.5 (1.8, 6.6) 14.4 (10.4, 19.6) 15.8 (11.7, 20.9) 2.7 (1.0, 6.8) Middle 57.3 (52.8, 61.8) 42.1 (37.2, 47.1) 11.4 (8.7, 14.9) 5.6 (3.9, 7.9) 5.7 (4.1, 8.1) 18.7 (15.6, 22.3) 5.4 (3.9, 7.5) 0.5 (0.2, 1.1) 6.5 (4.0, 10.5) 8.5 (6.5, 11.1) 11.6 (9.2, 14.5) 1.7 (0.7, 4.3) Fourth 61.0 (56.6, 65.2) 41.8 (37.8, 45.9) 13.2 (10.3, 16.8) 7.9 (5.8, 10.6) 8.7 (6.7, 11.3) 19.8 (16.8, 23.2) 5.8 (4.4, 7.6) 0.8 (0.4, 1.7) 7.2 (5.6, 9.3) 10.8 (8.6, 13.4) 11.5 (9.2, 14.3) 1.4 (0.7, 2.9) Highest 54.8 (50.9, 58.6) 35.0 (31.8, 38.3) 11.7 (9.4, 14.4) 5.2 (3.9, 6.9) 9.3 (7.7, 11.3) 19.6 (17.0, 22.5) 9.1 (7.6, 10.8) 1.7 (1.1, 2.6) 12.8 (10.9, 14.9 12.8 (10.8, 15.0) 14.3 (12.2, 16.7) 2.0 (1.0, 3.8)Rural 57.7 (54.0, 61.2) 40.7 (37.2, 44.2) 12.6 (10.8, 14.8) 7.3 (6.1, 8.7) 6.0 (4.8, 7.3) 20.8 (18.0, 23.9) 5.1 (4.2, 6.2) 0.7 (0.5, 1.1) 4.0 (3.1, 5.2) 9.0 (7.5, 10.7) 11.9 (10.1, 14.1) 0.8 (0.5, 1.2) Lowest 34.9 (24.7, 46.6) 20.7 (14.3, 28.9) 2.9 (1.2, 7.0) 4.4 (2.5, 7.7) 2.3 (0.7, 6.7) 10.8 (6.8, 16.7) 1.7 (0.5, 5.1) 0.0 N/A 0.0 N/A 3.9 (2.0, 7.6) 3.7 (1.8, 7.7) 0.0 N/A Second 50.3 (45.2, 55.4) 33.1 (28.6, 38.1) 7.1 (5.6, 9.1) 6.5 (5.0, 8.4) 3.9 (2.8, 5.5) 16.8 (13.6, 20.6) 3.2 (2.3, 4.5) 0.6 (0.2, 1.3) 1.1 (0.5, 2.2) 6.1 (4.6, 8.1) 7.9 (6.0, 10.2) 0.5 (0.2, 1.3) Middle 58.5 (53.9, 63.0) 41.8 (37.7, 46.0) 13.3 (11.0, 16.1) 5.6 (4.2, 7.4) 5.1 (3.7, 7.1) 21.9 (18.0, 26.2) 3.5 (2.5, 4.9) 0.2 (0.1, 0.9) 2.5 (1.5, 4.1) 9.1 (7.1, 11.6) 11.4 (9.1, 14.0) 0.8 (0.4, 1.4) Fourth 59.5 (54.9, 63.8) 42.8 (38.3, 47.4) 15.0 (12.4, 18.1) 8.1 (6.4, 10.3) 5.1 (3.8, 6.9) 20.2 (16.9, 23.9) 6.3 (4.7, 8.4) 0.5 (0.2, 1.2) 3.8 (2.6, 5.4) 9.7 (7.4, 12.5) 14.0 (11.2, 17.5) 0.9 (0.4, 1.8) Highest 67.4 (61.9, 72.5) 49.4 (43.8, 54.9) 17.1 (13.2, 21.8) 10.0 (7.7, 12.8) 11.1 (8.4, 14.6) 26.8 (22.3, 31.8) 8.5 (6.5, 11.2) 1.9 (1.0, 3.5) 10.6 (7.9, 14.0) 12.4 (9.7, 15.7) 16.4 (12.9, 20.7) 1.1 (0.4, 2.5)
Residence x wealth index quintile
N/A- The estimate is "0.0"
Public Transportation Public Walls Anywhere Else
Demographic Characteristics Stores Television Radio BillboardsIn any location
Advertisement, sponsorship and promotion
Posters Newspapers Cinemas Internet
128 Global Adult Tobacco Survey : Philippines Country Report, 2015

Table 8.5 (cont.): Percentage of non-smokers ≥15 years old who noticed cigarette marketing during the last 30 days in various places, by selected demographic characteristics – GATS Philippines, 2015.
Overall 1.4 (1.2, 1.8) 5.2 (4.6, 6.0) 4.8 (4.2, 5.5) 2.2 (1.8, 2.6) 5.8 (5.0, 6.7) 9.2 (8.0, 10.4) 0.6 (0.5, 0.8) 1.0 (0.8, 1.3)Sex
Male 1.9 (1.5, 2.5) 6.1 (5.2, 7.2) 5.5 (4.5, 6.7) 2.6 (2.1, 3.2) 5.7 (4.8, 6.8) 10.1 (8.7, 11.7) 0.5 (0.3, 0.8) 1.1 (0.8, 1.5)Female 1.2 (0.9, 1.5) 4.7 (4.0, 5.4) 4.3 (3.7, 5.1) 1.9 (1.5, 2.5) 5.8 (4.9, 6.9) 8.5 (7.4, 9.8) 0.7 (0.5, 1.0) 1.0 (0.7, 1.4)
Age (years)15-24 1.3 (0.9, 1.8) 4.8 (3.9, 5.9) 5.1 (4.1, 6.3) 2.2 (1.7, 3.0) 6.0 (4.8, 7.6) 10.2 (8.7, 12.0) 0.8 (0.5, 1.3) 1.1 (0.7, 1.8)25-44 1.5 (1.1, 2.1) 5.2 (4.4, 6.2) 5.2 (4.3, 6.3) 2.3 (1.8, 3.0) 6.4 (5.5, 7.6) 9.3 (8.0, 10.9) 0.6 (0.4, 0.9) 1.2 (0.9, 1.7)45-64 1.8 (1.2, 2.5) 5.9 (4.8, 7.2) 4.3 (3.3, 5.5) 2.2 (1.7, 2.9) 4.7 (3.8, 5.9) 7.6 (6.4, 9.0) 0.5 (0.2, 0.9) 0.6 (0.4, 1.1)65+ 0.7 (0.3, 1.5) 5.2 (3.7, 7.1) 2.5 (1.8, 3.5) 0.9 (0.3, 2.1) 3.8 (2.8, 5.2) 8.1 (6.1, 10.6) 0.6 (0.2, 1.3) 0.7 (0.4, 1.1)
Education LevelNo Formal 2.1 (0.7, 6.5) 1.8 (0.5, 6.5) 0.8 (0.2, 3.0) 1.0 (0.7, 1.3) 1.0 (0.2, 4.8) 13.8 (5.7, 29.9) 0.0 N/A 0.0 N/AElementary 0.8 (0.5, 1.3) 5.0 (4.0, 6.2) 3.7 (2.9, 4.7) 1.6 (1.1, 2.4) 5.2 (4.0, 6.7) 8.4 (6.7, 10.5) 0.4 (0.2, 1.0) 0.5 (0.2, 0.9)Secondary 1.0 (0.7, 1.4) 5.2 (4.4, 6.2) 5.1 (4.2, 6.1) 2.1 (1.6, 2.7) 5.4 (4.5, 6.6) 8.6 (7.4, 10.1) 0.5 (0.3, 0.7) 0.8 (0.5, 1.3)Post-Secondary 0.7 (0.2, 2.9) 6.8 (4.4, 10.4) 8.4 (5.2, 13.3) 3.2 (1.4, 7.3) 8.6 (5.7, 12.8) 8.9 (6.2, 12.7) 0.6 (0.1, 2.6) 1.2 (0.3, 4.7)College or above 2.6 (2.0, 3.3) 5.5 (4.5, 6.6) 4.9 (3.9, 6.2) 2.6 (2.1, 3.3) 6.5 (5.3, 7.8) 10.2 (8.7, 11.8) 1.1 (0.7, 1.6) 1.7 (1.2, 2.4)
Urban 1.9 (1.4, 2.5) 6.6 (5.5, 7.9) 5.6 (4.7, 6.8) 2.5 (2.0, 3.1) 4.8 (3.9, 5.7) 8.6 (7.3, 9.9) 0.8 (0.6, 1.1) 1.5 (1.1, 1.9) Lowest 0.0 N/A 3.9 (2.4, 6.4) 0.0 N/A 3.9 (2.4, 6.4) 3.9 (2.4, 6.4) 9.6 (4.1, 20.7) 3.9 (2.4, 6.4) 0.0 N/A Second 2.4 (1.2, 4.7) 7.9 (5.4, 11.4) 5.6 (3.7, 8.3) 1.5 (0.6, 3.7) 4.4 (2.6, 7.3) 7.1 (4.1, 11.9) 0.8 (0.2, 2.5) 1.4 (0.9, 2.3) Middle 1.2 (0.6, 2.4) 5.7 (4.1, 8.0) 5.9 (4.0, 8.6) 2.4 (1.6, 3.6) 3.3 (2.1, 5.0) 9.6 (7.3, 12.6) 0.0 (0., 0. ) 0.4 (0.2, 0.9) Fourth 1.5 (0.9, 2.3) 7.3 (5.7, 9.3) 5.3 (4.2, 6.8) 2.4 (1.6, 3.6) 4.8 (3.4, 6.7) 8.3 (6.7, 10.3) 0.7 (0.5, 1.0) 1.1 (0.6, 2.2) Highest 2.4 (1.8, 3.1) 6.5 (5.3, 7.8) 5.8 (4.5, 7.5) 2.8 (2.1, 3.7) 5.5 (4.3, 6.9) 8.5 (7.1, 10.1) 1.2 (0.8, 1.9) 2.2 (1.6, 3.0)Rural 1.1 (0.8, 1.5) 4.0 (3.3, 4.9) 4.0 (3.3, 4.9) 1.9 (1.4, 2.5) 6.7 (5.4, 8.2) 9.7 (8.0, 11.7) 0.5 (0.3, 0.8) 0.6 (0.4, 1.1) Lowest 0.3 (0.0, 2.3) 1.6 (0.5, 4.5) 2.3 (0.8, 6.6) 0.6 (0.1, 4.0) 1.0 (0.3, 3.5) 9.0 (3.3, 22.3) 1.0 (0.1, 6.7) 0.0 N/A Second 1.1 (0.6, 2.0) 3.8 (2.7, 5.5) 2.9 (2.1, 4.1) 1.3 (0.8, 2.1) 5.7 (4.2, 7.7) 11.2 (7.9, 15.8) 0.2 (0.1, 0.9) 0.9 (0.4, 1.9) Middle 0.7 (0.3, 1.3) 4.5 (3.4, 6.1) 4.3 (2.9, 6.2) 1.7 (1.0, 2.7) 6.9 (5.3, 9.1) 7.5 (5.8, 9.7) 0.6 (0.2, 1.4) 0.4 (0.1, 1.0) Fourth 1.4 (0.8, 2.3) 3.7 (2.7, 5.1) 4.6 (3.4, 6.2) 2.2 (1.4, 3.4) 7.4 (5.7, 9.6) 9.5 (7.4, 12.0) 0.7 (0.3, 1.7) 0.7 (0.3, 1.5) Highest 1.3 (0.6, 2.8) 4.3 (3.0, 6.1) 4.7 (3.2, 6.7) 2.8 (1.7, 4.5) 7.7 (5.7, 10.4) 11.1 (8.4, 14.5) 0.1 (0.0, 1.0) 0.8 (0.2, 3.1)
N/A- The estimate is "0.0"
Percentage (95% CI)
Demographic Characteristics
Advertisement, sponsorship and promotion
Sponsorship or Sporting Event
Free Samples Raffle Tickets Free Gifts Logos Cigarette Promotion in Mail
Fashion EventsSales
Residence x wealth index quintile
129 Global Adult Tobacco Survey : Philippines Country Report, 2015

Overall 95.0 (94.1, 95.8) 79.6 (78.0, 81.1) 85.7 (84.2, 87.1) 96.4 (95.7, 96.9) 66.1 (64.2, 68.0) 95.4 (94.8, 96.0) 73.1 (71.4, 74.8) 65.6 (63.7, 67.5) 90.8 (89.8, 91.6)Sex
Male 94.8 (93.8, 95.7) 78.2 (76.2, 80.1) 85.0 (83.2, 86.5) 96.0 (95.2, 96.6) 66.5 (64.3, 68.6) 95.0 (94.2, 95.7) 70.2 (68.1, 72.3) 64.3 (62.1, 66.5) 90.0 (88.9, 91.0)Female 95.2 (94.2, 96.0) 81.0 (79.3, 82.5) 86.5 (84.9, 87.9) 96.7 (96.0, 97.3) 65.7 (63.7, 67.8) 95.9 (95.0, 96.6) 76.0 (74.2, 77.8) 66.9 (64.9, 68.8) 91.5 (90.3, 92.5)
Age (years)15-24 95.5 (94.5, 96.4) 75.7 (73.1, 78.1) 83.9 (81.4, 86.0) 95.9 (94.6, 96.8) 63.6 (60.9, 66.2) 94.4 (93.0, 95.5) 71.0 (68.4, 73.5) 62.5 (59.7, 65.2) 88.9 (87.3, 90.4)25-44 94.8 (93.4, 95.9) 81.3 (79.3, 83.1) 86.9 (85.1, 88.5) 97.3 (96.5, 97.8) 68.3 (66.1, 70.4) 96.4 (95.7, 97.1) 74.9 (72.8, 76.9) 68.8 (66.6, 70.9) 91.2 (90.0, 92.3)45-64 95.1 (94.0, 96.0) 81.6 (79.9, 83.3) 87.0 (85.5, 88.4) 96.5 (95.7, 97.1) 66.3 (63.8, 68.7) 96.0 (95.2, 96.7) 74.7 (72.6, 76.6) 65.7 (63.4, 68.0) 91.9 (90.6, 93.0)65+ 94.0 (91.8, 95.6) 79.0 (76.0, 81.6) 82.2 (79.0, 85.0) 92.5 (90.6, 94.1) 62.5 (58.7, 66.2) 91.6 (89.6, 93.3) 66.4 (62.7, 69.9) 59.2 (55.5, 62.7) 92.3 (90.4, 93.9)
Education LevelNo Formal 88.3 (81.9, 92.6) 58.2 (48.2, 67.6) 61.5 (51.2, 70.9) 83.5 (76.4, 88.8) 51.9 (42.9, 60.7) 88.9 (82.7, 93.1) 62.3 (52.2, 71.5) 61.2 (51.6, 69.9) 86.5 (79.9, 91.2)Elementary 93.1 (91.4, 94.5) 73.9 (71.3, 76.4) 80.1 (77.4, 82.5) 93.8 (92.6, 94.8) 62.0 (59.2, 64.7) 94.0 (92.9, 94.9) 65.1 (62.1, 67.9) 59.1 (56.3, 61.9) 89.9 (88.4, 91.2)Secondary 95.3 (94.2, 96.2) 79.0 (76.9, 80.9) 85.9 (84.2, 87.5) 96.6 (95.8, 97.3) 65.2 (62.7, 67.6) 95.4 (94.4, 96.3) 71.7 (69.5, 73.9) 63.7 (61.3, 66.1) 90.6 (89.3, 91.8)Post-Secondary 96.3 (93.7, 97.9) 80.3 (75.4, 84.5) 86.1 (82.1, 89.2) 99.1 (97.5, 99.6) 62.9 (57.0, 68.5) 97.7 (95.8, 98.7) 75.0 (69.1, 80.0) 65.8 (59.4, 71.7) 89.8 (85.0, 93.2)College or above 96.4 (95.4, 97.2) 86.3 (84.8, 87.8) 91.6 (90.4, 92.8) 98.6 (98.0, 99.0) 72.1 (69.9, 74.3) 96.7 (95.9, 97.4) 82.4 (80.8, 84.0) 74.1 (72.0, 76.1) 92.1 (90.8, 93.2)
Urban 94.6 (92.9, 95.9) 82.0 (79.9, 84.0) 88.7 (86.8, 90.4) 97.1 (96.2, 97.8) 67.3 (64.7, 69.8) 95.5 (94.6, 96.3) 76.3 (74.0, 78.5) 67.8 (65.3, 70.2) 91.1 (89.8, 92.2) Lowest 87.3 (65.9, 96.0) 80.3 (63.5, 90.6) 83.4 (64.2, 93.3) 89.0 (66.1, 97.1) 74.7 (56.7, 86.9) 94.0 (86.7, 97.4) 67.2 (52.5, 79.1) 63.4 (49.2, 75.6) 87.4 (68.5, 95.7) Second 91.4 (86.0, 94.9) 74.6 (68.9, 79.6) 83.1 (77.7, 87.5) 95.7 (93.7, 97.0) 69.2 (63.0, 74.8) 95.7 (93.0, 97.4) 71.5 (65.6, 76.7) 65.8 (60.2, 71.0) 89.2 (85.9, 91.8) Middle 94.8 (93.2, 96.1) 82.8 (79.9, 85.4) 88.2 (85.6, 90.4) 96.8 (95.7, 97.6) 67.6 (63.1, 71.8) 94.3 (92.0, 96.0) 74.5 (70.9, 77.8) 66.6 (62.4, 70.5) 90.3 (88.2, 92.0) Fourth 95.4 (93.7, 96.7) 79.4 (76.2, 82.3) 88.0 (84.8, 90.5) 97.4 (96.0, 98.4) 64.7 (61.0, 68.2) 95.9 (94.1, 97.1) 76.5 (73.0, 79.7) 68.4 (65.1, 71.4) 90.7 (88.6, 92.4) Highest 95.1 (93.2, 96.4) 85.2 (83.1, 87.2) 91.1 (89.4, 92.6) 97.7 (96.4, 98.5) 68.6 (65.6, 71.6) 95.9 (94.5, 97.0) 78.8 (76.6, 80.8) 68.7 (65.9, 71.3) 92.3 (90.7, 93.6)Rural 95.4 (94.4, 96.2) 77.5 (75.0, 79.7) 83.1 (80.9, 85.1) 95.7 (94.8, 96.5) 65.1 (62.2, 67.8) 95.3 (94.5, 96.0) 70.3 (67.8, 72.8) 63.7 (60.9, 66.5) 90.5 (89.2, 91.7) Lowest 85.4 (78.9, 90.2) 65.2 (57.4, 72.2) 70.9 (62.9, 77.8) 88.7 (83.6, 92.4) 60.4 (51.3, 68.8) 93.8 (91.0, 95.8) 59.0 (48.5, 68.8) 54.9 (45.5, 64.0) 84.0 (77.7, 88.7) Second 94.9 (93.3, 96.1) 72.2 (68.3, 75.8) 77.0 (72.9, 80.6) 93.7 (91.7, 95.3) 61.4 (56.5, 66.0) 94.6 (92.9, 95.9) 65.9 (62.1, 69.6) 60.1 (55.9, 64.1) 88.7 (86.1, 90.9) Middle 95.9 (94.4, 97.0) 79.2 (75.9, 82.1) 84.7 (81.6, 87.5) 96.4 (95.1, 97.3) 70.0 (66.0, 73.8) 96.3 (95.1, 97.2) 70.9 (66.8, 74.7) 63.3 (59.1, 67.3) 92.1 (89.9, 93.8) Fourth 96.5 (95.4, 97.3) 78.1 (74.3, 81.5) 84.7 (81.6, 87.4) 96.7 (95.2, 97.8) 68.6 (64.9, 72.1) 94.9 (93.1, 96.3) 70.6 (67.2, 73.8) 66.1 (62.2, 69.8) 91.8 (89.9, 93.3) Highest 96.3 (94.5, 97.5) 84.2 (81.0, 86.9) 89.8 (87.3, 91.8) 97.9 (96.7, 98.7) 68.0 (63.3, 72.3) 95.8 (94.2, 97.0) 77.9 (74.3, 81.1) 68.3 (64.3, 72.1) 90.6 (88.1, 92.7)
Residence x wealth index quintile
Table 9.1: Percentage of adults ≥15 years old who believe that smoking causes serious illness and various diseases, by smoking status and selected demographic characteristics – GATS Philippines, 2015.Adults who believe that smoking causes…Demographic
Characteristics Serious illness Stroke Heart attack Lung cancer
Percentage (95% CI)
Cigarettes are addictiveTuberculosis Premature Birth Bone lossBladder Cancer
130 Global Adult Tobacco Survey : Philippines Country Report, 2015

Non-smokers1 95.7 (94.8, 96.4) 81.1 (79.5, 82.6) 86.8 (85.4, 88.1) 97.0 (96.3, 97.5) 67.1 (65.2, 69.0) 96.0 (95.3, 96.6) 75.1 (73.3, 76.8) 67.4 (65.5, 69.2) 91.3 (90.3, 92.3)Sex
Male 96.0 (95.0, 96.7) 80.7 (78.8, 82.5) 87.0 (85.3, 88.5) 97.0 (96.3, 97.6) 69.0 (66.7, 71.2) 95.9 (95.0, 96.7) 72.5 (70.3, 74.6) 67.0 (64.6, 69.3) 90.7 (89.4, 91.8)Female 95.5 (94.5, 96.4) 81.3 (79.6, 82.9) 86.7 (85.1, 88.2) 97.0 (96.2, 97.6) 66.0 (63.9, 68.0) 96.0 (95.1, 96.7) 76.7 (74.8, 78.5) 67.6 (65.6, 69.6) 91.8 (90.6, 92.8)
Age (years)15-24 95.7 (94.5, 96.6) 77.1 (74.5, 79.6) 84.8 (82.4, 87.0) 96.4 (95.3, 97.3) 64.7 (61.8, 67.4) 94.7 (93.3, 95.9) 72.2 (69.5, 74.8) 64.5 (61.7, 67.2) 89.2 (87.5, 90.7)25-44 95.3 (94.0, 96.4) 83.0 (81.2, 84.7) 87.9 (86.2, 89.4) 97.5 (96.7, 98.1) 69.6 (67.3, 71.7) 96.7 (95.7, 97.4) 77.4 (75.4, 79.3) 71.1 (68.8, 73.2) 91.8 (90.5, 92.9)45-64 96.5 (95.4, 97.4) 83.9 (82.0, 85.6) 89.0 (87.4, 90.3) 97.9 (97.1, 98.4) 67.8 (65.1, 70.4) 97.7 (96.9, 98.2) 77.4 (75.3, 79.4) 67.5 (64.9, 70.0) 93.3 (92.0, 94.4)65+ 95.3 (92.8, 97.0) 79.7 (76.4, 82.6) 83.3 (79.7, 86.4) 93.8 (91.8, 95.4) 62.5 (58.3, 66.6) 92.7 (90.6, 94.4) 67.9 (63.7, 71.8) 59.4 (55.2, 63.5) 92.5 (90.4, 94.1)
Education LevelNo Formal 90.1 (83.3, 94.3) 56.6 (45.8, 66.7) 61.4 (50.0, 71.6) 86.3 (78.8, 91.4) 53.5 (43.9, 62.9) 91.2 (84.1, 95.3) 65.9 (54.8, 75.6) 64.8 (54.8, 73.7) 86.8 (79.2, 91.9)Elementary 94.6 (93.2, 95.8) 76.2 (73.6, 78.6) 81.9 (79.4, 84.3) 94.7 (93.4, 95.8) 63.5 (60.6, 66.3) 94.6 (93.4, 95.6) 67.5 (64.3, 70.5) 61.4 (58.4, 64.4) 90.8 (88.9, 92.3)Secondary 95.6 (94.4, 96.5) 80.0 (77.8, 81.9) 86.7 (84.7, 88.4) 97.0 (96.2, 97.7) 66.1 (63.4, 68.7) 95.9 (94.9, 96.8) 73.2 (70.8, 75.5) 65.3 (62.7, 67.8) 91.3 (89.8, 92.5)Post-Secondary 97.4 (94.3, 98.8) 80.8 (75.3, 85.3) 85.3 (80.9, 88.9) 99.9 (99.5, 100.0) 61.0 (54.7, 67.0) 98.9 (97.7, 99.5) 75.5 (69.1, 81.0) 65.2 (58.3, 71.6) 89.7 (84.0, 93.5)College or above 96.7 (95.6, 97.5) 87.2 (85.6, 88.7) 91.9 (90.5, 93.0) 98.7 (98.1, 99.1) 72.4 (70.2, 74.6) 96.9 (95.9, 97.6) 83.2 (81.5, 84.8) 74.6 (72.5, 76.7) 92.3 (91.0, 93.5)
Urban 95.1 (93.5, 96.3) 83.0 (81.0, 84.8) 89.4 (87.6, 90.9) 97.5 (96.5, 98.2) 67.5 (64.9, 70.1) 95.8 (94.7, 96.7) 78.0 (75.7, 80.1) 69.0 (66.5, 71.4) 91.7 (90.4, 92.8) Lowest 86.6 (66.1, 95.5) 83.8 (66.3, 93.2) 85.7 (65.9, 94.9) 90.2 (67.9, 97.6) 74.7 (56.7, 86.9) 98.1 (94.0, 99.4) 73.9 (57.1, 85.8) 74.3 (59.2, 85.3) 88.2 (72.6, 95.4) Second 93.2 (89.4, 95.6) 75.7 (69.8, 80.8) 85.9 (80.9, 89.8) 96.8 (94.9, 98.0) 69.2 (63.0, 74.8) 95.9 (92.1, 98.0) 73.4 (67.6, 78.6) 69.4 (63.9, 74.4) 90.9 (87.5, 93.4) Middle 95.5 (94.1, 96.5) 83.6 (80.4, 86.3) 88.6 (85.9, 90.9) 97.2 (96.3, 97.9) 67.6 (63.1, 71.8) 93.9 (90.9, 96.0) 75.9 (72.0, 79.4) 67.7 (63.0, 72.2) 92.2 (90.6, 93.5) Fourth 95.9 (93.8, 97.3) 79.7 (76.4, 82.7) 88.1 (84.8, 90.8) 97.7 (96.2, 98.7) 64.7 (61.0, 68.2) 96.6 (94.7, 97.8) 77.8 (74.0, 81.1) 69.0 (65.4, 72.4) 90.5 (88.1, 92.5) Highest 95.1 (92.8, 96.6) 86.1 (83.7, 88.2) 91.2 (89.4, 92.8) 97.8 (96.2, 98.7) 68.6 (65.6, 71.6) 96.1 (94.4, 97.3) 80.1 (77.7, 82.3) 69.3 (66.4, 72.1) 92.4 (90.6, 93.8)Rural 96.2 (95.3, 97.0) 79.4 (77.0, 81.6) 84.6 (82.3, 86.6) 96.6 (95.6, 97.3) 66.8 (64.0, 69.5) 96.1 (95.3, 96.8) 72.5 (69.9, 75.0) 66.0 (63.2, 68.6) 91.0 (89.5, 92.4) Lowest 86.4 (77.9, 92.0) 66.0 (57.2, 73.9) 69.9 (60.4, 77.9) 88.0 (81.6, 92.4) 60.4 (51.3, 68.8) 94.8 (91.8, 96.7) 61.7 (50.3, 72.0) 59.0 (48.6, 68.7) 84.1 (76.0, 89.9) Second 95.2 (93.4, 96.6) 72.7 (68.3, 76.8) 77.1 (72.3, 81.3) 94.1 (91.8, 95.8) 61.4 (56.5, 66.0) 95.1 (93.0, 96.6) 68.6 (64.3, 72.6) 62.2 (57.6, 66.6) 88.5 (85.1, 91.2) Middle 97.0 (95.4, 98.0) 81.3 (77.9, 84.3) 86.2 (83.2, 88.8) 96.7 (95.3, 97.7) 70.0 (66.0, 73.8) 97.0 (95.6, 97.9) 72.2 (68.0, 76.0) 65.5 (61.3, 69.4) 93.1 (90.8, 94.8) Fourth 97.7 (96.7, 98.4) 81.8 (78.3, 84.8) 87.6 (84.7, 90.0) 98.5 (97.6, 99.1) 68.6 (64.9, 72.1) 96.0 (94.4, 97.2) 73.5 (69.6, 77.1) 68.3 (64.3, 72.0) 92.1 (90.0, 93.8) Highest 96.8 (94.9, 98.0) 84.6 (81.2, 87.5) 90.4 (87.8, 92.4) 98.6 (97.2, 99.3) 68.0 (63.3, 72.3) 96.5 (94.9, 97.7) 78.5 (74.7, 81.9) 69.6 (65.4, 73.5) 91.6 (88.9, 93.6)
1 Includes former and never smokers.
Table 9.1(cont.): Percentage of adults ≥15 years old who believe that smoking causes serious illness and various diseases, by smoking status and selected demographic characteristics – GATS Philippines, 2015.
Cigarettes are addictiveDemographic Characteristics Serious illness Stroke Heart attack Lung cancer
Adults who believe that smoking causes…
Tuberculosis Premature Birth Bone lossBladder Cancer
Percentage (95% CI)
Residence x wealth index quintile
131 Global Adult Tobacco Survey : Philippines Country Report, 2015

Overall 93.5 (92.5, 94.4) 90.3 (88.2, 92.1) 94.5 (93.5, 95.3)Sex
Male 92.6 (91.2, 93.8) 90.3 (87.9, 92.2) 94.1 (93.0, 95.1)Female 94.5 (93.4, 95.3) 90.5 (86.9, 93.2) 94.6 (93.6, 95.5)
Age (years)15-24 93.8 (92.5, 94.9) 91.9 (88.2, 94.5) 94.1 (92.7, 95.3)25-44 94.0 (92.6, 95.2) 91.1 (88.2, 93.4) 95.0 (93.8, 96.1)45-64 93.1 (91.9, 94.1) 88.7 (86.3, 90.7) 94.7 (93.5, 95.7)65+ 90.4 (88.2, 92.2) 84.5 (78.7, 88.9) 91.7 (89.3, 93.6)
Education LevelNo Formal 82.7 (75.0, 88.4) 78.6 (65.2, 87.8) 84.2 (76.2, 89.9)Elementary 89.5 (87.5, 91.3) 86.0 (81.7, 89.4) 91.1 (89.3, 92.5)Secondary 94.3 (93.2, 95.3) 91.7 (89.6, 93.4) 95.2 (93.9, 96.2)Post-Secondary 98.4 (96.8, 99.2) 93.4 (85.8, 97.0) 99.5 (97.9, 99.9)College or above 95.8 (94.7, 96.7) 95.1 (92.7, 96.8) 95.9 (94.7, 96.8)
Urban 94.4 (92.5, 95.8) 91.1 (86.7, 94.2) 95.2 (93.7, 96.4) Lowest 81.4 (65.1, 91.1) 79.9 (59.0, 91.7) 82.5 (67.1, 91.6) Second 91.2 (86.0, 94.6) 87.1 (75.8, 93.5) 93.4 (89.5, 95.9) Middle 94.7 (93.1, 96.0) 90.3 (84.4, 94.1) 96.1 (94.8, 97.0) Fourth 94.9 (92.0, 96.8) 92.1 (86.8, 95.4) 95.7 (92.9, 97.5) Highest 95.1 (93.2, 96.5) 94.0 (91.7, 95.8) 95.3 (93.2, 96.8)Rural 92.8 (91.6, 93.8) 89.6 (87.6, 91.3) 93.7 (92.5, 94.8) Lowest 77.6 (67.5, 85.3) 75.6 (62.2, 85.3) 78.5 (67.4, 86.5) Second 89.2 (87.2, 91.0) 86.9 (83.7, 89.5) 90.1 (87.7, 92.1) Middle 94.1 (92.4, 95.5) 91.5 (88.1, 93.9) 95.0 (93.1, 96.4) Fourth 94.8 (93.4, 95.9) 90.8 (86.8, 93.6) 96.0 (94.4, 97.1) Highest 96.6 (95.2, 97.6) 96.0 (93.0, 97.8) 96.7 (95.1, 97.8)
Table 9.2: Percentage of adults ≥ 15 years old who believe that breathing other people's smoke causes serious illness in Non-smokers, by smoking status and selected demographic characteristics – GATS Philippines, 2015.
Residence x wealth index quintile
1 Includes daily and occasional (less than daily) smokers2 Includes former and never smokers.
Percentage (95% CI)
Non-smokers2
Believe that breathing other people’s smoke causes
serious illness in Non-smokersDemographic Characteristics
Overall Current smokers1
132 Global Adult Tobacco Survey : Philippines Country Report, 2015

Overall 56.1 (54.2, 58.0) 57.5 (46.3, 67.9) 56.1 (54.1, 58.0)Sex
Male 54.7 (52.5, 56.8) 57.6 (45.2, 69.1) 54.6 (52.4, 56.7)Female 57.5 (55.4, 59.7) 56.9 (39.9, 72.3) 57.6 (55.4, 59.7)
Age (years)15-24 56.2 (53.3, 59.2) 58.5 (36.2, 77.8) 56.2 (53.3, 59.2)25-44 55.9 (53.7, 58.1) 63.8 (48.9, 76.5) 55.8 (53.5, 58.0)45-64 56.8 (54.5, 59.1) 48.7 (34.5, 63.2) 57.0 (54.7, 59.3)65+ 54.1 (50.7, 57.6) 53.6 (38.8, 67.9) 54.2 (50.6, 57.7)
Education LevelNo Formal 61.1 (51.1, 70.3) -- -- 61.9 (51.4, 71.4)Elementary 53.6 (50.8, 56.4) 51.0 (40.0, 61.8) 53.7 (50.9, 56.5)Secondary 55.6 (53.1, 58.1) 68.1 (48.9, 82.6) 55.5 (52.9, 58.0)Post-Secondary 55.7 (49.1, 62.1) 100.0 55.6 (49.0, 62.0)College or above 58.7 (56.2, 61.1) -- -- 58.7 (56.2, 61.1)
Urban 56.0 (53.3, 58.7) 53.9 (38.4, 68.7) 56.0 (53.2, 58.7) Lowest 60.8 (43.8, 75.6) -- -- 63.1 (45.5, 77.8) Second 53.9 (49.2, 58.6) -- -- 53.6 (48.7, 58.4) Middle 51.1 (47.3, 54.9) -- -- 51.1 (47.3, 54.9) Fourth 56.6 (52.9, 60.2) -- -- 56.6 (52.9, 60.3) Highest 58.4 (55.2, 61.5) -- -- 58.4 (55.2, 61.5)Rural 56.2 (53.4, 58.9) 58.1 (45.2, 70.0) 56.2 (53.4, 58.9) Lowest 50.6 (39.6, 61.6) 74.5 (43.8, 91.6) 47.4 (37.1, 57.9) Second 55.1 (51.2, 59.0) 48.8 (38.8, 58.9) 55.4 (51.3, 59.4) Middle 57.7 (54.0, 61.4) 61.4 (37.5, 80.9) 57.6 (54.0, 61.2) Fourth 56.4 (52.6, 60.2) -- -- 56.5 (52.6, 60.3) Highest 56.6 (51.7, 61.3) -- -- 56.6 (51.7, 61.3)
Table 9.3: Percentage of adults ≥15 years old who believe that using smokeless tobacco causes serious illness, by smoking status and selected demographic characteristics – GATS Philippines, 2015.
-- Indicates estimates based on less than 25 unweighted cases and has been suppressed.
Percentage (95% CI)
Demographic Characteristics
Believe that using smokeless tobacco causes serious illness
OverallCurrent smokeless
tobacco users Non-users
Residence x wealth index quintile
133 Global Adult Tobacco Survey : Philippines Country Report, 2015

Total
Overall 15.1 (12.6, 17.9) 74.8 (71.4, 78.0) 6.3 (4.7, 8.3) 3.9 (2.6, 5.6) 100Sex
Male 15.4 (12.7, 18.5) 75.0 (71.4, 78.4) 5.9 (4.2, 8.2) 3.7 (2.4, 5.6) 100Female 12.6 (7.6, 20.1) 73.2 (64.7, 80.2) 8.9 (5.3, 14.6) 5.4 (2.3, 11.8) 100
Age (years)15-24 8.3 (4.3, 15.5) 86.6 (78.3, 92.0) 3.1 (1.1, 8.3) 2.0 (0.5, 6.9) 10025-44 15.7 (12.2, 19.9) 72.5 (67.6, 76.9) 7.8 (5.3, 11.4) 4.0 (2.5, 6.5) 10045-64 18.1 (14.1, 23.1) 71.6 (66.2, 76.5) 6.1 (4.1, 9.1) 4.1 (2.2, 7.6) 10065+ 12.7 (6.8, 22.5) 77.3 (62.9, 87.3) 2.8 (0.4, 17.3) 7.2 (2.0, 22.4) 100
Education LevelNo Formal -- -- -- -- -- -- -- --Elementary 18.8 (14.1, 24.7) 69.6 (63.0, 75.4) 6.4 (3.6, 11.3) 5.2 (2.9, 8.9) 100Secondary 13.4 (10.2, 17.5) 77.4 (72.6, 81.6) 5.7 (3.8, 8.4) 3.5 (2.0, 6.0) 100Post-Secondary 19.6 (8.8, 38.1) 73.7 (55.3, 86.4) 3.7 (0.5, 22.2) 2.9 (0.4, 18.0) 100College or above 12.3 (8.2, 18.2) 78.1 (71.6, 83.5) 7.6 (4.3, 13.3) 1.9 (0.8, 4.3) 100
Urban 15.0 (11.5, 19.2) 76.4 (71.9, 80.4) 5.6 (3.7, 8.5) 3.0 (1.5, 5.8) Lowest -- -- -- -- -- -- -- -- Second 27.5 (16.9, 41.4) 68.0 (54.4, 79.2) 2.9 (1.1, 7.3) 1.6 (0.2, 10.7) 100 Middle 13.3 (7.5, 22.5) 76.1 (66.5, 83.7) 1.8 (0.4, 7.6) 8.7 (4.1, 17.3) 100 Fourth 11.7 (6.5, 20.2) 77.3 (68.2, 84.4) 9.7 (5.7, 16.0) 1.4 (0.2, 9.1) 100 Highest 11.6 (7.0, 18.6) 81.1 (73.1, 87.1) 6.9 (3.5, 13.1) 0.4 (0.1, 2.8) 100Rural 15.1 (11.8, 19.2) 73.5 (68.3, 78.2) 6.8 (4.5, 10.0) 4.6 (2.8, 7.3) Lowest 20.5 (10.7, 35.7) 61.4 (42.1, 77.7) 9.5 (3.2, 24.8) 8.6 (1.3, 41.4) 100 Second 18.0 (11.7, 26.7) 70.1 (60.9, 77.9) 6.8 (3.5, 12.9) 5.1 (2.3, 10.7) 100 Middle 15.4 (10.3, 22.4) 71.8 (63.0, 79.2) 6.7 (3.4, 12.7) 6.1 (2.8, 12.7) 100 Fourth 10.1 (5.6, 17.7) 79.9 (70.5, 86.8) 6.6 (2.6, 15.9) 3.4 (1.4, 7.8) 100 Highest 16.2 (8.2, 29.7) 76.4 (62.5, 86.2) 6.2 (2.2, 16.5) 1.1 (0.2, 7.7) 100
Table 9.4: Percentage distribution of current tobacco smokers ≥15 years old, by their perception of the harmfulness of their current brand and selected demographic characteristics – GATS Philippines, 2015.
Residence x wealth index quintile
--Indicates estimates based on less than 25 unweighted cases and has been suppressed.
Don't Know
Think that your current brand might be..Demographic Characteristics A little less harmful No different A little more harmful
Percentage (95% CI)
134 Global Adult Tobacco Survey : Philippines Country Report, 2015
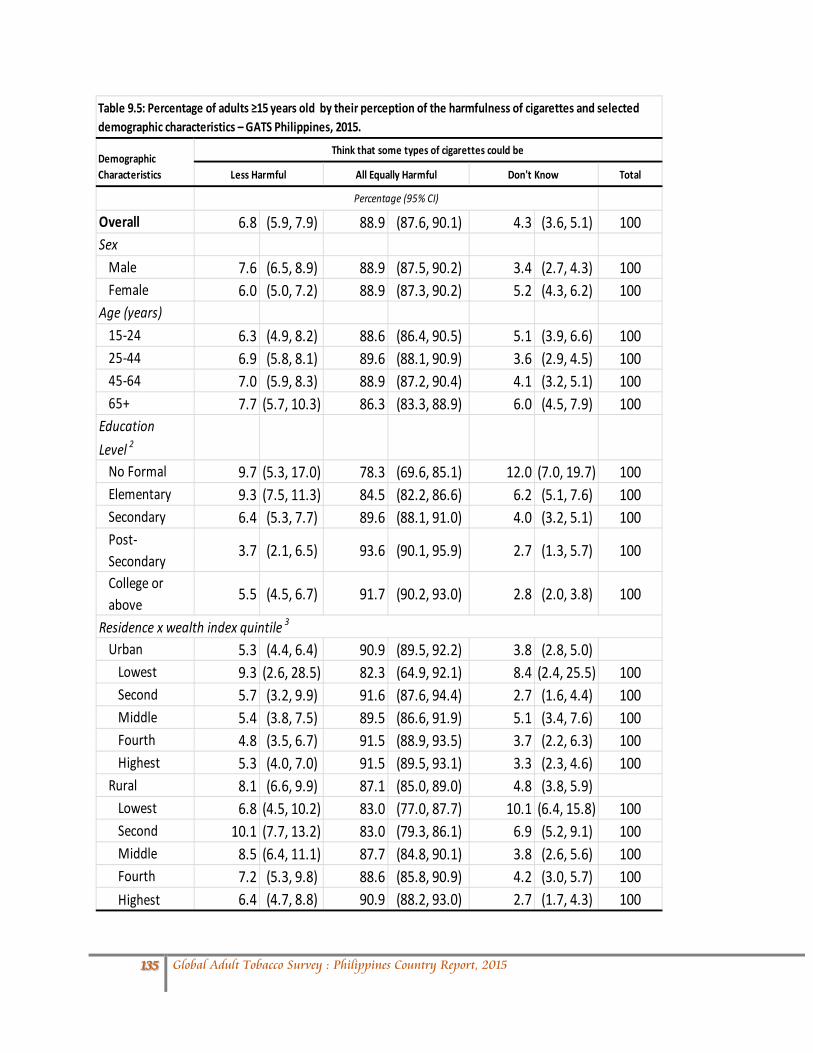
Total
Overall 6.8 (5.9, 7.9) 88.9 (87.6, 90.1) 4.3 (3.6, 5.1) 100Sex
Male 7.6 (6.5, 8.9) 88.9 (87.5, 90.2) 3.4 (2.7, 4.3) 100Female 6.0 (5.0, 7.2) 88.9 (87.3, 90.2) 5.2 (4.3, 6.2) 100
Age (years)15-24 6.3 (4.9, 8.2) 88.6 (86.4, 90.5) 5.1 (3.9, 6.6) 10025-44 6.9 (5.8, 8.1) 89.6 (88.1, 90.9) 3.6 (2.9, 4.5) 10045-64 7.0 (5.9, 8.3) 88.9 (87.2, 90.4) 4.1 (3.2, 5.1) 10065+ 7.7 (5.7, 10.3) 86.3 (83.3, 88.9) 6.0 (4.5, 7.9) 100
Education Level 2
No Formal 9.7 (5.3, 17.0) 78.3 (69.6, 85.1) 12.0 (7.0, 19.7) 100Elementary 9.3 (7.5, 11.3) 84.5 (82.2, 86.6) 6.2 (5.1, 7.6) 100Secondary 6.4 (5.3, 7.7) 89.6 (88.1, 91.0) 4.0 (3.2, 5.1) 100Post-Secondary
3.7 (2.1, 6.5) 93.6 (90.1, 95.9) 2.7 (1.3, 5.7) 100
College or above
5.5 (4.5, 6.7) 91.7 (90.2, 93.0) 2.8 (2.0, 3.8) 100
Urban 5.3 (4.4, 6.4) 90.9 (89.5, 92.2) 3.8 (2.8, 5.0) Lowest 9.3 (2.6, 28.5) 82.3 (64.9, 92.1) 8.4 (2.4, 25.5) 100 Second 5.7 (3.2, 9.9) 91.6 (87.6, 94.4) 2.7 (1.6, 4.4) 100 Middle 5.4 (3.8, 7.5) 89.5 (86.6, 91.9) 5.1 (3.4, 7.6) 100 Fourth 4.8 (3.5, 6.7) 91.5 (88.9, 93.5) 3.7 (2.2, 6.3) 100 Highest 5.3 (4.0, 7.0) 91.5 (89.5, 93.1) 3.3 (2.3, 4.6) 100Rural 8.1 (6.6, 9.9) 87.1 (85.0, 89.0) 4.8 (3.8, 5.9) Lowest 6.8 (4.5, 10.2) 83.0 (77.0, 87.7) 10.1 (6.4, 15.8) 100 Second 10.1 (7.7, 13.2) 83.0 (79.3, 86.1) 6.9 (5.2, 9.1) 100 Middle 8.5 (6.4, 11.1) 87.7 (84.8, 90.1) 3.8 (2.6, 5.6) 100 Fourth 7.2 (5.3, 9.8) 88.6 (85.8, 90.9) 4.2 (3.0, 5.7) 100 Highest 6.4 (4.7, 8.8) 90.9 (88.2, 93.0) 2.7 (1.7, 4.3) 100
Table 9.5: Percentage of adults ≥15 years old by their perception of the harmfulness of cigarettes and selected demographic characteristics – GATS Philippines, 2015.
Residence x wealth index quintile 3
Percentage (95% CI)
Demographic Characteristics
Think that some types of cigarettes could be
Less Harmful All Equally Harmful Don't Know
135 Global Adult Tobacco Survey : Philippines Country Report, 2015
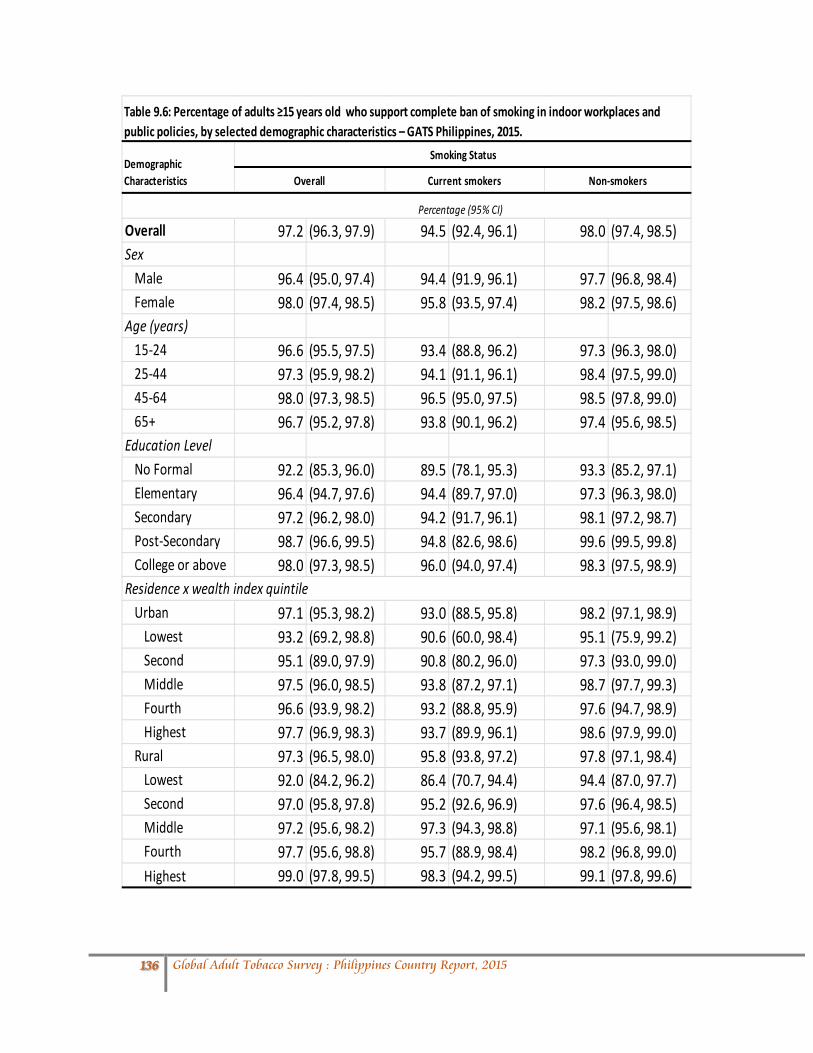
Overall 97.2 (96.3, 97.9) 94.5 (92.4, 96.1) 98.0 (97.4, 98.5)Sex
Male 96.4 (95.0, 97.4) 94.4 (91.9, 96.1) 97.7 (96.8, 98.4)Female 98.0 (97.4, 98.5) 95.8 (93.5, 97.4) 98.2 (97.5, 98.6)
Age (years)15-24 96.6 (95.5, 97.5) 93.4 (88.8, 96.2) 97.3 (96.3, 98.0)25-44 97.3 (95.9, 98.2) 94.1 (91.1, 96.1) 98.4 (97.5, 99.0)45-64 98.0 (97.3, 98.5) 96.5 (95.0, 97.5) 98.5 (97.8, 99.0)65+ 96.7 (95.2, 97.8) 93.8 (90.1, 96.2) 97.4 (95.6, 98.5)
Education LevelNo Formal 92.2 (85.3, 96.0) 89.5 (78.1, 95.3) 93.3 (85.2, 97.1)Elementary 96.4 (94.7, 97.6) 94.4 (89.7, 97.0) 97.3 (96.3, 98.0)Secondary 97.2 (96.2, 98.0) 94.2 (91.7, 96.1) 98.1 (97.2, 98.7)Post-Secondary 98.7 (96.6, 99.5) 94.8 (82.6, 98.6) 99.6 (99.5, 99.8)College or above 98.0 (97.3, 98.5) 96.0 (94.0, 97.4) 98.3 (97.5, 98.9)
Urban 97.1 (95.3, 98.2) 93.0 (88.5, 95.8) 98.2 (97.1, 98.9) Lowest 93.2 (69.2, 98.8) 90.6 (60.0, 98.4) 95.1 (75.9, 99.2) Second 95.1 (89.0, 97.9) 90.8 (80.2, 96.0) 97.3 (93.0, 99.0) Middle 97.5 (96.0, 98.5) 93.8 (87.2, 97.1) 98.7 (97.7, 99.3) Fourth 96.6 (93.9, 98.2) 93.2 (88.8, 95.9) 97.6 (94.7, 98.9) Highest 97.7 (96.9, 98.3) 93.7 (89.9, 96.1) 98.6 (97.9, 99.0)Rural 97.3 (96.5, 98.0) 95.8 (93.8, 97.2) 97.8 (97.1, 98.4) Lowest 92.0 (84.2, 96.2) 86.4 (70.7, 94.4) 94.4 (87.0, 97.7) Second 97.0 (95.8, 97.8) 95.2 (92.6, 96.9) 97.6 (96.4, 98.5) Middle 97.2 (95.6, 98.2) 97.3 (94.3, 98.8) 97.1 (95.6, 98.1) Fourth 97.7 (95.6, 98.8) 95.7 (88.9, 98.4) 98.2 (96.8, 99.0) Highest 99.0 (97.8, 99.5) 98.3 (94.2, 99.5) 99.1 (97.8, 99.6)
Residence x wealth index quintile
Table 9.6: Percentage of adults ≥15 years old who support complete ban of smoking in indoor workplaces and public policies, by selected demographic characteristics – GATS Philippines, 2015.
Percentage (95% CI)
Demographic Characteristics Current smokers Non-smokersOverall
Smoking Status
136 Global Adult Tobacco Survey : Philippines Country Report, 2015

Table 10.0: Percentage distribution of adults ≥15 years old by selected demographic characteristics – GATS Philippines 2009 and 20152015
Demographic Characteristic
Unweighted Count
Weighted count
Percentage (95% CI 1 ) Unweighted Count Weighted count
Percentage (95% CI 1 )
Overall 9,701 61,282 100 11,644 70,064 100Sex
Male 4,740 30,554 49.9 (49.0, 50.8) 5,781 34,936 49.9 (48.9, 50.8)Female 4,961 30,728 50.1 (49.2, 51.0) 5,863 35,128 50.1 (49.2, 51.1)
Age (years)
15-24 1988 18129 29.6 (28.4, 30.8) 2338 20599 29.4 (28.4, 30.4)25-44 4581 25715 42.0 (40.7, 43.3) 4967 29193 41.7 (40.7, 42.7)
45-64 2360 13479 22.0 (21.0, 23.0) 3210 15699 22.4 (21.6, 23.2)65+ 772 3959 6.5 (5.9, 7.1) 1129 4573 6.5 (6.1, 7.0)ResidenceUrban 4,332 30,488 49.8 (47.6, 51.9) 4,610 32,629 46.6 (43.0, 50.2)Rural 5,369 30,794 50.2 (48.1, 52.4) 7,034 37,434 53.4 (49.8, 57.0)Education Level 2
No Formal 264 2041 3.3 (2.7, 4.1) 273 1160 1.7 (1.3, 2.1)Elementary 3007 21619 35.3 (33.6, 37.0) 3430 17124 24.4 (23.2, 25.7)Secondary 3741 21711 35.4 (34.1, 36.8) 4623 29193 41.7 (40.5, 42.8)Post-Secondary 246 2258 3.7 (3.1, 4.4) 361 2352 3.4 (2.9, 3.8)College or above 2442 13646 22.3 (20.8, 23.8) 2953 20220 28.9 (27.6, 30.1)
2009
1 95 % Confidence Interval
Note: For 2009 the following observations were missing: 0 for age, 0 for gender, 0 for residence, and 1 for education.Note: For 2015 the following observations were missing: 0 for age, 0 for gender, 0 for residence, and 4 for education.
2 Education Level: No Formal = No formal schooling; Elementary = Elementary undergraduate or elementary graduate; Secondary = High schoolundergraduate or high school graduate; Post-Secondary = Post-secondary years 1, 2 or 3; College or Higher = College undergraduate, collegegraduate, or post graduate degree completed
137 Global Adult Tobacco Survey : Philippines Country Report, 2015

Smoking Status2009 2015
Relative change
Overall Percentage
Current tobacco smoker 28.2 (27.0, 29.5) 22.7 (21.7, 23.6) -19.8*
Daily smoker 22.5 (21.4, 23.7) 18.7 (17.8, 19.6) -16.9*
Occasional smoker 5.7 (5.1, 6.4) 4.0 (3.5, 4.5) -31.0*
Occasional smoker, formerly daily 2.2 (1.8, 2.6) 1.7 (1.5, 2.0) -20.4*
Occasional smoker, never daily 3.6 (3.1, 4.1) 2.2 (1.9, 2.6) -37.5*
Non-smoker 71.8 (70.5, 73.0) 77.3 (76.4, 78.3) 7.8*
Former daily smoker 6.8 (6.2, 7.4) 4.9 (4.4, 5.4) -27.7*
Never daily smoker 65.0 (63.7, 66.3) 72.5 (71.4, 73.5) 11.5*
Former occasional smoker 4.5 (4.0, 5.1) 3.0 (2.5, 3.5) -34.6*
Never smoker 60.5 (59.2, 61.8) 69.5 (68.4, 70.6) 14.9*
Male
Current tobacco smoker 47.6 (45.7, 49.6) 40.3 (38.7, 41.9) -15.4*
Daily smoker 38.2 (36.4, 40.2) 33.9 (32.3, 35.5) -11.4*
Occasional smoker 9.4 (8.3, 10.6) 6.4 (5.6, 7.4) -31.6*
Occasional smoker, formerly daily 3.7 (3.1, 4.4) 2.9 (2.5, 3.5) -20.2*
Occasional smoker, never daily 5.7 (4.9, 6.7) 3.5 (2.9, 4.2) -39.0*
Non-smoker 52.4 (50.4, 54.3) 59.7 (58.1, 61.3) 14.0*
Former daily smoker 11.0 (10.0, 12.2) 7.9 (7.2, 8.8) -28.1*
Never daily smoker 41.3 (39.3, 43.4) 51.8 (50.0, 53.5) 25.3*
Former occasional smoker 5.7 (4.9, 6.6) 4.2 (3.6, 5.0) -25.6*
Never smoker 35.6 (33.6, 37.7) 47.5 (45.7, 49.4) 33.4*
Female
Current tobacco smoker 9.0 (8.0, 10.1) 5.1 (4.5, 5.8) -43.0*
Daily smoker 6.9 (6.0, 7.8) 3.6 (3.1, 4.1) -47.4*
Occasional smoker 2.1 (1.6, 2.7) 1.5 (1.2, 1.9) -28.4*
Occasional smoker, formerly daily 0.7 (0.4, 1.0) 0.5 (0.4, 0.7) -22.1
Occasional smoker, never daily 1.4 (1.0, 2.0) 1.0 (0.7, 1.3) -31.4*
Non-smoker 91.0 (89.9, 92.0) 94.9 (94.2, 95.5) 4.2*
Former daily smoker 2.5 (2.1, 3.0) 1.9 (1.5, 2.3) -26.0*
Never daily smoker 88.5 (87.3, 89.6) 93.0 (92.2, 93.8) 5.1*
Former occasional smoker 3.3 (2.7, 4.1) 1.7 (1.3, 2.2) -49.9*
Never smoker 85.2 (83.9, 86.4) 91.4 (90.5, 92.2) 7.2*
Results for prevalence estimates / averages and 95% CIs are rounded to the nearest tenth (0.1).
* p<0.05
Note: Current use includes both daily and occasional (less than daily) use.
Table 10.1: Percentage of adults ≥15 years old, by detailed smoking status and Sex – GATS Philippines 2009 and 2015
The relative changes are calculated using un-rounded prevalence estimates and might be different if calculated using rounded prevalence estimates shown in this table.
Percentage (95% CI)
138 Global Adult Tobacco Survey : Philippines Country Report, 2015

Table 10.2: Percentage of adults ≥15 years old who are current smokers of various smoked tobacco products, by selected demographic characteristics – GATS Philippine 2009 and 2015
Manufactured Hand-rolled Kretek Manufactured Hand-rolled Kretek Manufactured Hand-rolled Kretek
Overall 28.2 (27.0, 29.5) 27.9 (26.8, 29.2) 27.0 (25.8, 28.2) 1.9 (1.6, 2.4) 0.0 (0.0, 0.1) 0.4 (0.2, 0.6) 22.7 (21.7, 23.6) 22.5 (21.5, 23.4) 21.5 (20.6, 22.5) 2.5 (2.0, 3.1) 0.4 (0.2, 0.9) 1.1 (0.7, 1.5) -19.8* -19.6* -20.3* 28.1 1022 181.4*Gender
Male 47.6 (45.7, 49.6) 47.2 (45.3, 49.2) 46.6 (44.7, 48.6) 2.3 (1.8, 2.9) 0.1 (0.0, 0.2) 0.5 (0.2, 0.9) 40.3 (38.7, 41.9) 40.1 (38.5, 41.7) 38.9 (37.3, 40.5) 4.1 (3.2, 5.1) 0.6 (0.3, 1.5) 1.7 (1.1, 2.5) -15.4* -15.1* -16.5* 78.0* 1020 253.5*Female 9.0 (8.0, 10.1) 8.8 (7.8, 9.9) 7.5 (6.5, 8.5) 1.6 (1.2, 2.2) 0.0 (0.0, 0.1) 0.3 (0.2, 0.5) 5.1 (4.5, 5.8) 4.9 (4.3, 5.6) 4.2 (3.7, 4.8) 0.9 (0.7, 1.3) 0.1 (0.0, 0.3) 0.5 (0.3, 0.7) -43.0* -43.9* -43.5* -41.9* 1033 61.5
Age (years) 15-24 20.9 (18.8, 23.1) 20.8 (18.7, 23.0) 20.7 (18.7, 23.0) 0.2 (0.1, 0.5) 0.0 (0.0, 0.1) 0.1 (0.0, 0.5) 15.9 (14.4, 17.6) 15.8 (14.3, 17.5) 15.8 (14.3, 17.5) 0.9 (0.5, 1.7) 0.2 (0.1, 0.7) 0.6 (0.3, 1.0) -23.6* -23.7* -23.8* 360.0 1219 384.225-44 31.9 (30.2, 33.7) 31.7 (30.0, 33.5) 31.4 (29.7, 33.1) 1.5 (1.1, 2.1) 0.1 (0.0, 0.2) 0.2 (0.1, 0.4) 26.0 (24.6, 27.4) 25.9 (24.5, 27.3) 25.1 (23.7, 26.5) 2.5 (1.9, 3.3) 0.6 (0.2, 1.3) 1.2 (0.7, 1.9) -18.7* -18.4* -20.0* 68.2* 924.3 451.9*45-64 31.3 (28.9, 33.9) 31.0 (28.5, 33.6) 28.9 (26.5, 31.4) 3.9 (3.0, 5.0) 0.0 (0.0, 0.2) 0.5 (0.2, 1.1) 26.8 (25.2, 28.4) 26.4 (24.8, 28.1) 24.9 (23.4, 26.6) 3.6 (2.9, 4.5) 0.3 (0.1, 0.8) 1.3 (0.8, 1.9) -14.6* -14.7* -13.7* -6.7 1255 161.065+ 27.6 (23.6, 31.9) 25.9 (22.1, 30.2) 20.6 (17.1, 24.6) 6.3 (4.4, 9.0) 0.0 N/A 2.2 (1.1, 4.4) 17.7 (15.3, 20.5) 16.8 (14.4, 19.6) 12.6 (10.6, 14.9) 5.7 (4.2, 7.5) 0.0 N/A 1.6 (0.9, 2.7) -35.8* -35.0* -38.7* -10.9 . -28.0Residence Urban 24.9 (23.2, 26.6) 24.7 (23.1, 26.5) 24.5 (22.8, 26.2) 0.7 (0.4, 1.1) 0.0 (0.0, 0.1) 0.1 (0.0, 0.3) 21.7 (20.5, 23.0) 21.7 (20.4, 22.9) 21.3 (20.1, 22.6) 0.8 (0.6, 1.1) 0.1 (0.0, 0.3) 0.6 (0.4, 0.9) -12.7* -12.5* -12.9* 13.8 235.3 420.0Rural 31.6 (29.9, 33.2) 31.1 (29.5, 32.8) 29.5 (27.9, 31.1) 3.2 (2.5, 4.0) 0.0 (0.0, 0.1) 0.6 (0.4, 1.1) 23.5 (22.1, 24.9) 23.2 (21.8, 24.6) 21.7 (20.4, 23.1) 4.0 (3.1, 5.0) 0.6 (0.2, 1.6) 1.5 (0.9, 2.3) -25.6* -25.6* -26.4* 24.9 1659 131.9Education Level No Formal 40.4 (32.6, 48.7) 36.7 (29.3, 44.8) 30.4 (23.4, 38.5) 9.1 (5.4, 14.8) 0.0 N/A 5.3 (2.3, 11.6) 27.5 (21.1, 35.0) 26.2 (19.9, 33.7) 18.4 (13.1, 25.4) 9.1 (6.1, 13.5) 0.0 N/A 1.5 (0.6, 3.4) -32.0* -28.6* -39.4* 0.2 . -72.0*Elementary 36.9 (34.8, 39.1) 36.6 (34.4, 38.8) 34.7 (32.6, 36.9) 4.1 (3.3, 5.1) 0.1 (0.0, 0.2) 0.4 (0.2, 0.7) 30.1 (28.0, 32.3) 29.7 (27.6, 31.9) 26.7 (24.6, 28.8) 6.1 (5.0, 7.4) 0.4 (0.1, 1.3) 1.8 (1.2, 2.7) -18.5* -18.8* -23.1* 47.2* 558.7 364.1*Secondary 26.5 (24.8, 28.3) 26.4 (24.7, 28.2) 26.2 (24.5, 28.0) 0.4 (0.3, 0.7) 0.0 (0.0, 0.1) 0.1 (0.0, 0.4) 23.8 (22.4, 25.3) 23.7 (22.3, 25.2) 23.5 (22.1, 25.0) 1.6 (1.0, 2.5) 0.5 (0.2, 1.2) 1.0 (0.6, 1.7) -10.3* -10.4* -10.3* 257.6* 3214 737.4Post-Secondary 23.5 (17.6, 30.6) 23.5 (17.6, 30.6) 23.5 (17.6, 30.6) 0.0 (0.0, 0.3) 0.0 N/A 0.0 N/A 18.4 (14.0, 23.8) 18.4 (14.0, 23.8) 18.4 (14.0, 23.8) 0.3 (0.3, 0.4) 0.0 N/A 0.4 (0.1, 2.9) -21.7 -21.7 -21.6 780.2 . .College or above 16.1 (14.3, 18.1) 16.1 (14.3, 18.0) 16.0 (14.2, 17.9) 0.1 (0.1, 0.3) 0.0 (0.0, 0.2) 0.1 (0.0, 0.2) 14.9 (13.6, 16.3) 14.8 (13.5, 16.2) 14.8 (13.5, 16.2) 0.7 (0.4, 1.3) 0.3 (0.1, 0.9) 0.5 (0.2, 1.1) -7.4 -7.9 -7.5 359.8 813.9 604.3
* p<0.05
2 Includes any other reported smoking tobacco products.
N/A- The estimate is "0.0"
Percentage
Other smoked tobacco2
Type of Cigarette
Relative change
Other smoked tobacco2
Any smoked tobacco product Any cigarette1Any cigarette1
Any smoked tobacco product Any cigarette1
Other smoked tobacco2
Any smoked tobacco product
Demographic Characteristic
2009 2015
Type of CigaretteType of Cigarette
Percentage (95% CI) Percentage (95% CI)
Note: Current use includes both daily and occasional (less than daily) use.Results for prevalence estimates / averages and 95% CIs are rounded to the nearest tenth (0.1).The relative changes are calculated using un-rounded prevalence estimates and might be different if calculated using rounded prevalence estimates shown in this table.1Includes manufactured cigarettes and hand rolled cigarettes.
139 Global Adult Tobacco Survey : Philippines Country Report, 2015

Mean (95% CI) Mean (95% CI) PercentageOverall 10.6 (10.1,11.1) 11.0 (10.5,11.5) 3.1Sex
Male 11.3 (10.7, 11.8) 11.2 (10.7, 11.7) -0.7Female 6.9 (6.1, 7.8) 8.6 (6.9 10.2) 23.4
Age (years)
15-24 8.9 (7.8,10.0) 8.8 (7.9,9.7) -1.025-44 10.8 (10.2,11.5) 11.2 (10.4,11.9) 3.3
45-64 11.9 (11.1,12.8) 12.2 (11.5,12.9) 2.165+ 8.3 (6.7 , 9.8) 10.6 (8.5,12.7) 28.0ResidenceUrban 9.9 (9.3,10.6) 10.9 (10.3,11.5) 9.9*Rural 11.2 (10.4,11.9) 11.0 (10.2,11.8) -1.6
Education LevelNo Formal 10.5 (7.8 ,13.3) 9.3 (6.7,12.0) -11.4Elementary 10.9 (10.2,11.6) 11.0 (10.3,11.7) 0.9Secondary 10.4 (9.6 ,11.2) 10.9 (10.2,11.6) 4.4Post-Secondary 11.5 (8.2, 4.9) 10.0 (8.5,11.4) -13.6College or above 9.9 (8.8,11.0) 11.4 (10.2,12.6) 15.4*
* p<0.05
NOTE: Results for prevalence estimates / averages and 95% CIs are rounded to the nearest tenth (0.1).
Relative change
Demographic Characteristic 2009 2015
Table 10.3: Average number of cigarettes smoked per day for daily cigarette smokers, by selected demographic characteristics – GATS Philippines 2009 and 2015
The relative changes are calculated using un-rounded prevalence estimates and might be different if calculated using rounded prevalence estimates shown in this table.
2009 2015 Relative changeMean (95% CI) Mean (95% CI) Percentage
Overall 17.3 (17.0 , 17.6) 17.5 (17.3, 17.8) 1.4
Sex
Male 17.2 (16.9, 17.4) 17.5 (17.2, 17.7) 1.8
Female 18.8 (17.7, 19.9) 18.3 (17.3 , 19.4) -2.4
Residence
Urban 17.2 (16.8 , 17.6) 17.5 (17.2 , 17.9) 1.8Rural 17.4 (17.1 , 17.7) 17.5 (17.2 , 17.9) 1.0NOTE: Results for prevalence estimates / averages and 95% CIs are rounded to the nearest tenth (0.1).
* p<0.05
Demographics Characteristic
Average Age at Smoking Initiation (years)
The relative changes are calculated using un-rounded prevalence estimates and might be different if calculated using rounded prevalence estimates shown in this table.
Table 10.4: Average age at initiation among ever daily smokers 15-34 years old, by selected demographic characteristics - GATS Philippines 2009 and 2015
140 Global Adult Tobacco Survey : Philippines Country Report, 2015

Table 10.5:Smoking Cessation Status of adults 15 years and older by sex – GATS Philippines 2009 and 2015Demographic Characteristic 2009 2015
Relative change
Percentage (95% CI ) Percentage (95% CI ) PercentageOverall
Former daily smokers among ever daily smoker 21.5 (19.8, 23.4) 19.3 (17.6, 21.1) -10.2*Made quit attempt in past 12 months1 47.9 (45.5, 50.3) 52.2 (49.7, 54.6) 9.0*Those who successfully quit in past 12 months2 4.5 (3.7, 5.6) 4.0 (3.2, 5.0) -12.3Interested or planning to quit smoking 60.4 (57.5, 63.1) 76.7 (74.5, 78.7) 27.0*Male
Former daily smokers among ever daily smoker 20.9 (19.0, 22.8) 17.7 (16.1, 19.5) -14.9*Made quit attempt in past 12 months1 46.7 (44.0, 49.4) 51.5 (48.9, 54.2) 10.3*Those who successfully quit in past 12 months2 4.2 (3.3, 5.3) 3.6 (2.9, 4.5) -14.3Interested or planning to quit smoking 60.3 (57.4, 63.2) 76.6 (74.2, 78.8) 26.9*FemaleFormer daily smokers among ever daily smoker 25.0 (20.7, 29.7) 31.0 (25.9, 36.6) 24.1Made quit attempt in past 12 months1 53.9 (48.2, 59.4) 57.1 (51.4, 62.6) 6Those who successfully quit in past 12 months2 6.3 (4.1, 9.6) 6.9 (3.8, 12.2) 8.9Interested or planning to quit smoking 60.5 (53.7, 66.9) 77.4 (72.4, 81.8) 28.0*1 Among current smokers and former smokers who have been abstinent for less than 12 months.2 Among all past year smokers (current and those that quit<12 months ago).
NOTE: Results for prevalence estimates / averages and 95% CIs are rounded to the nearest tenth (0.1).
* p<0.05
The relative changes are calculated using un-rounded prevalence estimates and might be different if calculated using rounded prevalence estimates shown in this table.
141 Global Adult Tobacco Survey : Philippines Country Report, 2015

2009 2015Relative change
Percentage (95% CI ) Percentage (95% CI ) Percentage
Overall
Home 54.4 (52.5, 56.3) 34.7 (33.0, 36.4) -36.2*
Workplace 32.6 (29.9, 35.5) 21.5 (19.5, 23.6) -34.3*
Government Building 25.5 (23.3, 27.8) 13.6 (11.9,15.5) -46.7*
Male Home 58.1 (55.8, 60.3) 39.0 (37.0, 41.2) -32.8*
Workplace 38.8 (35.1, 42.7) 26.4 (23.6, 29.5) -32.0*
Govt Bldg. 27.9 (25.3, 30.7) 15.6 (13.5, 18.1) -44.0*
Female
Home 50.6 (48.4, 52.8) 30.3 (28.5, 32.2) -40.1*
Workplace 26.2 (22.9, 29.8) 16.4 (14.4, 18.5) -37.5*
Government Building 23.1 (20.6, 25.9) 11.7 (10.0, 13.6) -49.6*
Urban
Home 43.4 (40.7, 46.1) 29.5 (27.2, 31.8) 32.1*
Workplace 25.3 (22.2, 28.6) 18.2 (15.9, 20.8) -27.9*
Govt Bldg. 23.7 (21.0, 26.7) 13.7 (10.9, 17.1) -42.1*
Rural
Home 65.2 (62.8, 67.6) 39.3 (36.8, 41.8) -39.8*
Workplace 46.2 (41.8, 50.7) 26.8 (23.4, 30.6) -41.9* Government Building 27.1 (23.9, 30.6) 13.5 (11.6, 15.6) -50.3*Note:Results for prevalence estimates / averages and 95% CIs are rounded to the nearest tenth (0.1).
* p<0.05
Adults Exposed to Tobacco Smoke1 In…
Table 10.6: Percentage of adults ≥15 years old who visited that place in the past 30 days by selected demographic characteristics – GATS Philippines 2009 and 2015
Demographic Characteristic
The relative changes are calculated using un-rounded prevalence estimates and might be different if calculated using rounded prevalence estimates shown in this table.
142 Global Adult Tobacco Survey : Philippines Country Report, 2015
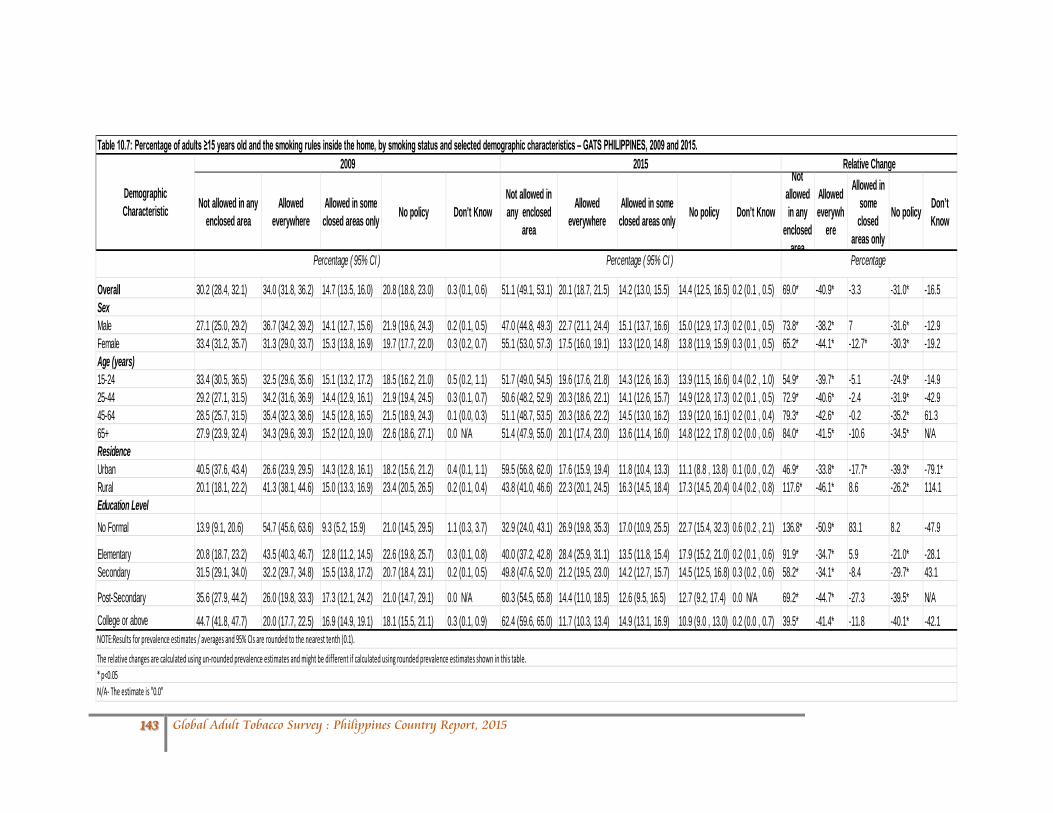
Not allowed in any enclosed area
Allowed everywhere
Allowed in some closed areas only No policy Don’t Know
Not allowed in any enclosed
area
Allowed everywhere
Allowed in some closed areas only No policy Don’t Know
Not allowed in any
enclosed area
Allowed everywh
ere
Allowed in some
closed areas only
No policy Don’t Know
Overall 30.2 (28.4, 32.1) 34.0 (31.8, 36.2) 14.7 (13.5, 16.0) 20.8 (18.8, 23.0) 0.3 (0.1, 0.6) 51.1 (49.1, 53.1) 20.1 (18.7, 21.5) 14.2 (13.0, 15.5) 14.4 (12.5, 16.5) 0.2 (0.1 , 0.5) 69.0* -40.9* -3.3 -31.0* -16.5SexMale 27.1 (25.0, 29.2) 36.7 (34.2, 39.2) 14.1 (12.7, 15.6) 21.9 (19.6, 24.3) 0.2 (0.1, 0.5) 47.0 (44.8, 49.3) 22.7 (21.1, 24.4) 15.1 (13.7, 16.6) 15.0 (12.9, 17.3) 0.2 (0.1 , 0.5) 73.8* -38.2* 7 -31.6* -12.9Female 33.4 (31.2, 35.7) 31.3 (29.0, 33.7) 15.3 (13.8, 16.9) 19.7 (17.7, 22.0) 0.3 (0.2, 0.7) 55.1 (53.0, 57.3) 17.5 (16.0, 19.1) 13.3 (12.0, 14.8) 13.8 (11.9, 15.9) 0.3 (0.1 , 0.5) 65.2* -44.1* -12.7* -30.3* -19.2Age (years)15-24 33.4 (30.5, 36.5) 32.5 (29.6, 35.6) 15.1 (13.2, 17.2) 18.5 (16.2, 21.0) 0.5 (0.2, 1.1) 51.7 (49.0, 54.5) 19.6 (17.6, 21.8) 14.3 (12.6, 16.3) 13.9 (11.5, 16.6) 0.4 (0.2 , 1.0) 54.9* -39.7* -5.1 -24.9* -14.925-44 29.2 (27.1, 31.5) 34.2 (31.6, 36.9) 14.4 (12.9, 16.1) 21.9 (19.4, 24.5) 0.3 (0.1, 0.7) 50.6 (48.2, 52.9) 20.3 (18.6, 22.1) 14.1 (12.6, 15.7) 14.9 (12.8, 17.3) 0.2 (0.1 , 0.5) 72.9* -40.6* -2.4 -31.9* -42.945-64 28.5 (25.7, 31.5) 35.4 (32.3, 38.6) 14.5 (12.8, 16.5) 21.5 (18.9, 24.3) 0.1 (0.0, 0.3) 51.1 (48.7, 53.5) 20.3 (18.6, 22.2) 14.5 (13.0, 16.2) 13.9 (12.0, 16.1) 0.2 (0.1 , 0.4) 79.3* -42.6* -0.2 -35.2* 61.365+ 27.9 (23.9, 32.4) 34.3 (29.6, 39.3) 15.2 (12.0, 19.0) 22.6 (18.6, 27.1) 0.0 N/A 51.4 (47.9, 55.0) 20.1 (17.4, 23.0) 13.6 (11.4, 16.0) 14.8 (12.2, 17.8) 0.2 (0.0 , 0.6) 84.0* -41.5* -10.6 -34.5* N/AResidenceUrban 40.5 (37.6, 43.4) 26.6 (23.9, 29.5) 14.3 (12.8, 16.1) 18.2 (15.6, 21.2) 0.4 (0.1, 1.1) 59.5 (56.8, 62.0) 17.6 (15.9, 19.4) 11.8 (10.4, 13.3) 11.1 (8.8 , 13.8) 0.1 (0.0 , 0.2) 46.9* -33.8* -17.7* -39.3* -79.1*Rural 20.1 (18.1, 22.2) 41.3 (38.1, 44.6) 15.0 (13.3, 16.9) 23.4 (20.5, 26.5) 0.2 (0.1, 0.4) 43.8 (41.0, 46.6) 22.3 (20.1, 24.5) 16.3 (14.5, 18.4) 17.3 (14.5, 20.4) 0.4 (0.2 , 0.8) 117.6* -46.1* 8.6 -26.2* 114.1Education LevelNo Formal 13.9 (9.1, 20.6) 54.7 (45.6, 63.6) 9.3 (5.2, 15.9) 21.0 (14.5, 29.5) 1.1 (0.3, 3.7) 32.9 (24.0, 43.1) 26.9 (19.8, 35.3) 17.0 (10.9, 25.5) 22.7 (15.4, 32.3) 0.6 (0.2 , 2.1) 136.8* -50.9* 83.1 8.2 -47.9
Elementary 20.8 (18.7, 23.2) 43.5 (40.3, 46.7) 12.8 (11.2, 14.5) 22.6 (19.8, 25.7) 0.3 (0.1, 0.8) 40.0 (37.2, 42.8) 28.4 (25.9, 31.1) 13.5 (11.8, 15.4) 17.9 (15.2, 21.0) 0.2 (0.1 , 0.6) 91.9* -34.7* 5.9 -21.0* -28.1Secondary 31.5 (29.1, 34.0) 32.2 (29.7, 34.8) 15.5 (13.8, 17.2) 20.7 (18.4, 23.1) 0.2 (0.1, 0.5) 49.8 (47.6, 52.0) 21.2 (19.5, 23.0) 14.2 (12.7, 15.7) 14.5 (12.5, 16.8) 0.3 (0.2 , 0.6) 58.2* -34.1* -8.4 -29.7* 43.1
Post-Secondary 35.6 (27.9, 44.2) 26.0 (19.8, 33.3) 17.3 (12.1, 24.2) 21.0 (14.7, 29.1) 0.0 N/A 60.3 (54.5, 65.8) 14.4 (11.0, 18.5) 12.6 (9.5, 16.5) 12.7 (9.2, 17.4) 0.0 N/A 69.2* -44.7* -27.3 -39.5* N/ACollege or above 44.7 (41.8, 47.7) 20.0 (17.7, 22.5) 16.9 (14.9, 19.1) 18.1 (15.5, 21.1) 0.3 (0.1, 0.9) 62.4 (59.6, 65.0) 11.7 (10.3, 13.4) 14.9 (13.1, 16.9) 10.9 (9.0 , 13.0) 0.2 (0.0 , 0.7) 39.5* -41.4* -11.8 -40.1* -42.1
Table 10.7: Percentage of adults ≥15 years old and the smoking rules inside the home, by smoking status and selected demographic characteristics – GATS PHILIPPINES, 2009 and 2015.2015
Percentage ( 95% CI ) Percentage ( 95% CI )
The relative changes are calculated using un-rounded prevalence estimates and might be different if calculated using rounded prevalence estimates shown in this table.
NOTE:Results for prevalence estimates / averages and 95% CIs are rounded to the nearest tenth (0.1).
* p<0.05N/A- The estimate is "0.0"
Percentage
Demographic Characteristic
2009 Relative Change
143 Global Adult Tobacco Survey : Philippines Country Report, 2015

Overall 336.3 (314.8, 357.8) 24.9 (23.9, 25.9) 678.4 (640.5, 716.4) 48.0 (46.6, 49.4) 101.7* 92.4*Sex
Male 355.8 (332.3, 379.3) 25.1 (24.0, 26.1) 696.1 (656.7, 735.6) 47.8 (46.3, 49.3) 95.6* 90.6*Female 213.6 (179.2, 248.1) 23.5 (21.0, 26.1) 515.8 (396.8, 634.8) 50.2 (47.5, 52.9) 141.4* 113.5*
Age15-24 288.7 (235.7, 341.7) 29.2 (26.4, 32.0) 577.7 (509.7, 645.6) 51.5 (47.9, 55.0) 100.1* 76.4*25-44 372.2 (344.7, 399.7) 26.3 (25.0, 27.7) 707.6 (650.2, 765.0) 49.7 (47.9, 51.5) 90.1* 89.0*45-64 340.2 (306.5, 373.8) 20.8 (19.2, 22.3) 725.6 (668.9, 782.2) 44.4 (42.6 , 46.2) 113.3* 113.6*65+ 182.6 (124.4, 240.9) 18.4 (13.7, 23.0) 552.6 (407.1, 698.1) 38.2 (34.1, 42.3) 202.6* 108.1*
ResidenceUrban 374.6 (341.2, 408.0) 29.5 (27.8, 31.2) 736.6 (678.9, 794.2) 50.9 (48.4, 53.4) 96.6* 72.3*Rural 304.6 (276.8, 332.5) 21.5 (20.3, 22.7) 627.1 (577.3, 676.9) 45.2 (43.8, 46.7) 105.9* 110.4*
Education No Formal 313.9 (191.5, 436.2) 22.3 (13.6, 31.0) 513.0 (348.1, 678.0) 34.1 (27.2, 41.1) 63.5 52.9Elementary 280.7 (255.6, 305.7) 20.0 (18.9, 21.1) 616.6 (562.9, 670.3) 42.5 (40.2, 44.8) 119.7* 112.2*Secondary 365.2 (327.3, 403.0) 28.2 (26.7, 29.7) 702.4 (646.1, 758.6) 50.0 (48.3, 51.6) 92.3* 77.2*Post-Secondary 481.2 (309.5, 653.0) 34.2 (28.8, 39.6) 606.5 (503.8, 709.2) 50.4 (47.4, 53.3) 26 47.3*College or above 422.4 (370.5, 474.3) 33.4 (30.7, 36.1) 741.8 (658.8, 824.8) 52.8 (50.4, 55.3) 75.6* 58.2*
Table 10.8: Cigarette expenditures among manufactured cigarette smokers ≥ 15 years, by selected demographic characteristics - GATS, Philippines 2009 and 2015
**In adjusted constant pricesNOTE:Results for prevalence estimates / averages and 95% CIs are rounded to the nearest tenth (0.1).The relative changes are calculated using un-rounded prevalence estimates and might be different if calculated using rounded prevalence estimates shown in this table.
2009** 2015 Relative change
PercentagePHL Pesos PHL Pesos
Demographic Characteristics
Cigarette expenditure per month
Average cost of 20 manufactured
cigarettes
Cigarette expenditure per month
Average cost of 20 manufactured
cigarettes
Cigarette expenditure per month
Average cost of 20 manufactured
cigarettes
144 Global Adult Tobacco Survey : Philippines Country Report, 2015

Percentage (95% CI ) Percentage (95% CI ) PercentageOverall 70.0 (67.4, 72.6) 80.4 (78.0, 82.5) 14.7*Sex
Male 69.4 (66.6, 72.1) 80.0 (77.6, 82.3) 15.3*Female 74.0 (68.3, 78.9) 83.3 (78.2, 87.4) 12.6*
Age (years)15-24 82.1 (76.2, 86.8) 89.7 (85.4, 92.9) 9.3*25-44 71.6 (68.2, 74.7) 81.5 (78.5, 84.1) 13.9*45-64 57.6 (52.6, 62.4) 72.4 (68.6, 75.9) 25.7*65+ 58.7 (48.7, 68.0) 67.1 (58.1, 74.9) 14.2ResidenceUrban 78.2 (74.4, 81.6) 83.5 (79.9, 86.5) 6.7*Rural 63.2 (59.5, 66.8) 77.7 (74.5, 80.6) 22.9*Education LevelNo Formal 38.8 (26.8, 52.4) 61.1 (42.7, 76.9) 57.4Elementary 64.7 (60.7, 68.5) 76.5 (72.0, 80.4) 18.2*Secondary 78.3 (75.0, 81.3) 84.8 (82.1, 87.1) 8.2 *Post-Secondary 77.8 (60.8, 88.7) 81.9 (71.1, 89.3) 5.3College or above 73.7 (67.5 , 79.0) 77.3 (73.4, 80.9) 5.0NOTE:Results for prevalence estimates / averages and 95% CIs are rounded to the nearest tenth (0.1).
* p<0.05
Demographic Characteristic
2009 2015 Relative change
Table 10.9: Percentage of adults ≥15 who use single sticks, by selected demographic characteristics – GATS Philippines 2009 and 2015
The relative changes are calculated using un-rounded prevalence estimates and might be different if calculated using rounded prevalence estimates shown in this table.
145 Global Adult Tobacco Survey : Philippines Country Report, 2015

2009 2015 Relative change
Overall Percentage
In newspapers or in magazines 30.9 (29.1 , 32.7) 35.9 (33.9 , 38.0) 16.3*
On television or the radio 67.5 (65.4 , 69.4) 68.8 (66.8 , 70.7) 2.0
On television 59.8 (57.6 , 61.9) 63.7 (61.6 , 65.6) 6.5*
On the radio 38.7 (36.6 , 40.8) 39.1 (37.2 , 41.0) 1.0
On billboards 26.0 (24.2 , 27.8) 30.5 (28.5 , 32.5) 17.4*
On monorail 8.5 (7.1 , 10.2) 7.1 (6.3 , 8.0) -17.3*
Cinema advertisement 6.5 (5.5 , 7.6) 6.7 (5.9 , 7.7) 3.4
In health care facility 47.2 (45.1 , 49.3) 57.9 (55.8 , 60.0) 22.6*
In malls 23.6 (21.7 , 25.6) 23.8 (22.0 , 25.7) 1.0
Somewhere else 8.4 (7.5 , 9.5) 7.4 (6.3 , 8.6) -12.5
Any Location 80.1 (78.3 , 81.8) 83.2 (81.5 , 84.8) 3.9 *
Male
In newspapers or in magazines 31.7 (29.6, 33.8) 36.9 (34.4, 39.5) 16.5*
On television or the radio 68.0 (65.7 , 70.3) 68.4 (66.1 , 70.5) 0.5
On television 60.6 (58.2 , 62.9) 62.8 (60.5 , 65.0) 3.7
On the radio 39.6 (37.1 , 42.1) 40.8 (38.7 , 43.0) 3.0
On billboards 26.3 (24.3 , 28.5) 31.2 (29.1 , 33.5) 18.5*
On monorail 9.0 (7.5 , 10.8) 7.5 (6.5 , 8.6) -16.7
Cinema advertisement 6.3 (5.3 , 7.5) 6.9 (6.0 , 8.1) 9.8
In health care facility 45.3 (43.0 , 47.6) 55.3 (52.9 , 57.7) 22.1*
In malls 23.4 (21.3 , 25.6) 23.7 (21.7 , 25.9) 1.5
Somewhere else 8.4 (7.3 , 9.7) 7.2 (6.0 , 8.7) -13.8
Any Location 80.0 (78.0 , 81.9) 82.9 (80.8 , 84.8) 3.6*
Female
In newspapers or in magazines 30.0 (28.0 , 32.2) 34.9 (32.7 , 37.1) 16.0*
On television or the radio 66.9 (64.6 , 69.2) 69.2 (67.0 , 71.3) 3.4
On television 59.0 (56.6 , 61.3) 64.5 (62.3 , 66.6) 9.4*
On the radio 37.7 (35.5 , 40.0) 37.3 (35.3 , 39.4) -1.1
On billboards 25.6 (23.5 , 27.7) 29.7 (27.5 , 32.0) 16.3*
On monorail 8.1 (6.6 , 9.9) 6.6 (5.8 , 7.6) -17.8
Cinema advertisement 6.6 (5.5 , 8.1) 6.5 (5.6 , 7.5) -2.6
In health care facility 49.1 (46.7 , 51.5) 60.5 (58.2 , 62.7) 23.2*
In malls 23.7 (21.6 , 26.0) 23.9 (22.0 , 25.9) 0.6
Somewhere else 8.5 (7.4 , 9.7) 7.5 (6.4 , 8.8) -11.2
Any Location 80.2 (78.2 , 82.1) 83.6 (81.8, 85.2) 4.2*
15-24
In newspapers or in magazines 32.9 (30.2 , 35.7) 35.2 (32.4 , 38.2) 7.1
On television or the radio 68.7 (65.7 , 71.5) 67.4 (64.4 , 70.3) -1.9
On television 63.5 (60.4 , 66.5) 63.7 (60.7 , 66.6) 0.3
On the radio 35.2 (32.1 , 38.3) 34.7 (32.1 , 37.4) -1.4
On billboards 25.8 (23.2 , 28.6) 30.0 (27.2 , 32.9) 16.0*
On monorail 9.9 (7.7 , 12.6) 7.2 (6.1 , 8.5) -26.9*
Cinema advertisement 8.1 (6.5 , 10.0) 7.1 (6.0 , 8.4) -11.8
In health care facility 47.8 (44.6 , 51.0) 55.4 (52.6 , 58.1) 16.0*
In malls 27.5 (24.5 , 30.8) 25.2 (22.7 , 28.0) -8.3
Somewhere else 11.0 (9.3 , 12.9) 9.5 (7.7 , 11.5) -14.0
Any Location 82.0 (79.5 , 84.3) 81.9 (79.4 , 84.2) -0.1
25+
In newspapers or in magazines 30.0 (28.2 , 31.9) 36.2 (34.2 , 38.2) 20.5*
On television or the radio 66.9 (64.8 , 69.0) 69.4 (67.4 , 71.2) 3.6
On television 58.2 (56.0 , 60.4) 63.6 (61.6 , 65.6) 9.4*
On the radio 40.1 (38.0 , 42.3) 40.9 (39.0 , 42.8) 1.9
On billboards 26.0 (24.2 , 27.9) 30.7 (28.7 , 32.7) 18.0*
On monorail 8.0 (6.7 , 9.5) 7.0 (6.2 , 8.0) -12.2
Cinema advertisement 5.8 (4.9 , 6.8) 6.5 (5.6 , 7.5) 12.3
In health care facility 47.0 (44.9 , 49.1) 59.0 (56.8 , 61.1) 25.5*
In malls 21.9 (20.1 , 23.8) 23.2 (21.4 , 25.1) 6.0
Somewhere else 7.4 (6.5 , 8.3) 6.5 (5.6 , 7.6) -11.5
Any Location 79.3 (77.5 , 81.1) 83.8 (82.1 , 85.3) 5.6*
Urban
In newspapers or in magazines 38.1 (35.5 , 40.8) 43.5 (40.5 , 46.6) 14.1*
On television or the radio 73.6 (70.7 , 76.3) 70.5 (67.6 , 73.3) -4.1
On television 69.2 (66.4 , 72.0) 67.0 (64.0 , 69.8) -3.3
On the radio 38.2 (35.0 , 41.5) 38.8 (36.2 , 41.5) 1.6
On billboards 33.0 (30.1 , 36.0) 36.4 (33.6 , 39.2) 10.3
On monorail 15.8 (13.1 , 18.9) 13.2 (11.7 , 15.0) -16.2
Cinema advertisement 10.1 (8.4 , 12.0) 11.3 (9.8 , 13.0) 11.7
In health care facility 53.9 (50.7 , 57.1) 58.5 (55.9 , 61.2) 8.5*
In malls 31.8 (28.6 , 35.2) 31.5 (28.9 , 34.1) -1.0
Somewhere else 9.8 (8.4 , 11.3) 8.3 (6.8 , 10.2) -15.2
Any Location 86.6 (84.0 , 88.7) 84.0 (81.4 , 86.4) -2.9
Rural
In newspapers or in magazines 23.7 (21.4 , 26.1) 29.2 (26.7 , 31.8) 23.4*
On television or the radio 61.4 (58.5 , 64.3) 67.3 (64.5 , 69.9) 9.5*
On television 50.4 (47.2 , 53.5) 60.8 (58.0 , 63.5) 20.6*
On the radio 39.1 (36.6 , 41.8) 39.3 (36.6 , 42.0) 0.3
On billboards 19.0 (17.0 , 21.2) 25.3 (22.6 , 28.2) 33.2*
On monorail 1.4 (0.9 , 2.1) 1.7 (1.1 , 2.5) 23.0
Cinema advertisement 2.9 (2.1 , 4.0) 2.7 (2.0 , 3.7) -6.5
In health care facility 40.6 (37.9 , 43.3) 57.4 (54.3 , 60.4) 41.4*
In malls 15.4 (13.6 , 17.5) 17.1 (14.7 , 19.8) 11.1
Somewhere else 7.1 (5.8 , 8.6) 6.6 (5.2 , 8.2) -7.4
Any Location 73.7 (71.1 , 76.2) 82.5 (80.2 , 84.7) 11.9*
NOTE:Results for prevalence estimates / averages and 95% CIs are rounded to the nearest tenth (0.1).
* p<0.05
Table 10.10: Percentage of adults ≥15 years old who noticed anti-cigarette smoking information during the last 30 days in various places, by selected demographic characteristics – GATS Philippines 2009 and 2015
Percentage (95% CI)
The relative changes are calculated using un-rounded prevalence estimates and might be different if calculated using rounded prevalence estimates shown in this table.
146 Global Adult Tobacco Survey : Philippines Country Report, 2015
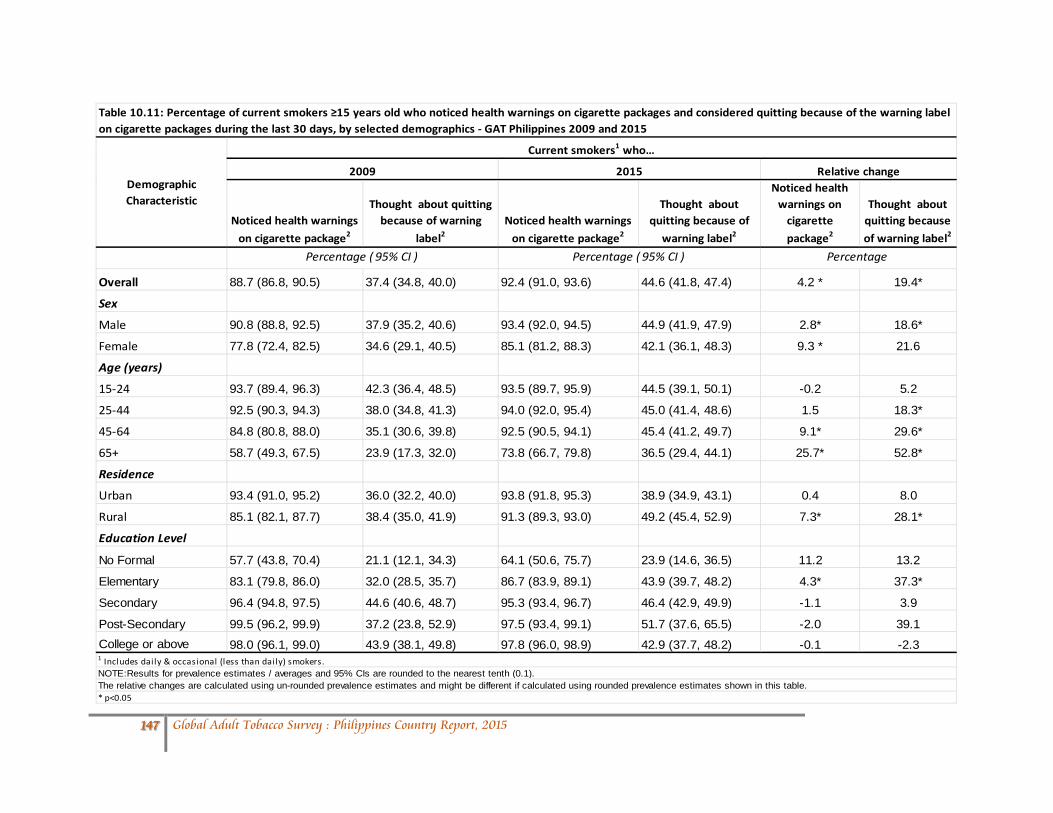
Noticed health warnings on cigarette package2
Thought about quitting because of warning
label2Noticed health warnings
on cigarette package2
Thought about quitting because of
warning label2
Noticed health warnings on
cigarette package2
Thought about quitting because of warning label2
Overall 88.7 (86.8, 90.5) 37.4 (34.8, 40.0) 92.4 (91.0, 93.6) 44.6 (41.8, 47.4) 4.2 * 19.4*
Sex
Male 90.8 (88.8, 92.5) 37.9 (35.2, 40.6) 93.4 (92.0, 94.5) 44.9 (41.9, 47.9) 2.8* 18.6*
Female 77.8 (72.4, 82.5) 34.6 (29.1, 40.5) 85.1 (81.2, 88.3) 42.1 (36.1, 48.3) 9.3 * 21.6
Age (years)
15-24 93.7 (89.4, 96.3) 42.3 (36.4, 48.5) 93.5 (89.7, 95.9) 44.5 (39.1, 50.1) -0.2 5.2
25-44 92.5 (90.3, 94.3) 38.0 (34.8, 41.3) 94.0 (92.0, 95.4) 45.0 (41.4, 48.6) 1.5 18.3*
45-64 84.8 (80.8, 88.0) 35.1 (30.6, 39.8) 92.5 (90.5, 94.1) 45.4 (41.2, 49.7) 9.1* 29.6*
65+ 58.7 (49.3, 67.5) 23.9 (17.3, 32.0) 73.8 (66.7, 79.8) 36.5 (29.4, 44.1) 25.7* 52.8*
Residence
Urban 93.4 (91.0, 95.2) 36.0 (32.2, 40.0) 93.8 (91.8, 95.3) 38.9 (34.9, 43.1) 0.4 8.0
Rural 85.1 (82.1, 87.7) 38.4 (35.0, 41.9) 91.3 (89.3, 93.0) 49.2 (45.4, 52.9) 7.3* 28.1*
Education Level
No Formal 57.7 (43.8, 70.4) 21.1 (12.1, 34.3) 64.1 (50.6, 75.7) 23.9 (14.6, 36.5) 11.2 13.2
Elementary 83.1 (79.8, 86.0) 32.0 (28.5, 35.7) 86.7 (83.9, 89.1) 43.9 (39.7, 48.2) 4.3* 37.3*
Secondary 96.4 (94.8, 97.5) 44.6 (40.6, 48.7) 95.3 (93.4, 96.7) 46.4 (42.9, 49.9) -1.1 3.9
Post-Secondary 99.5 (96.2, 99.9) 37.2 (23.8, 52.9) 97.5 (93.4, 99.1) 51.7 (37.6, 65.5) -2.0 39.1College or above 98.0 (96.1, 99.0) 43.9 (38.1, 49.8) 97.8 (96.0, 98.9) 42.9 (37.7, 48.2) -0.1 -2.3
Table 10.11: Percentage of current smokers ≥15 years old who noticed health warnings on cigarette packages and considered quitting because of the warning label on cigarette packages during the last 30 days, by selected demographics - GAT Philippines 2009 and 2015
1 Includes daily & occasional (less than daily) smokers.NOTE:Results for prevalence estimates / averages and 95% CIs are rounded to the nearest tenth (0.1).The relative changes are calculated using un-rounded prevalence estimates and might be different if calculated using rounded prevalence estimates shown in this table.* p<0.05
Relative change
Percentage
Current smokers1 who…
Percentage ( 95% CI )Percentage ( 95% CI )
Demographic Characteristic
2009 2015
147 Global Adult Tobacco Survey : Philippines Country Report, 2015

2009 2015Relative change
2009 2015Relative change
Percentage Percentage
Overall 53.7 (51.7, 55.7) 40.5 (38.2, 42.8) -24.7* 74.3 (72.4, 76.1) 58.6 (56.1, 61.0) -21.2*
Sex
Male 58.3 (55.8, 60.7) 43.2 (40.6, 45.8) -25.8* 78.0 (75.9, 80.0) 61.7 (59.0, 64.4) -20.9*
Female 49.3 (47.0, 51.5) 37.8 (35.4, 40.2) -23.4* 70.6 (68.4, 72.8) 55.5 (52.9, 58.0) -21.5*
Age (years)
15-24 59.3 (56.2, 62.3) 41.7 (38.6, 44.8) -29.8* 79.4 (76.7, 82.0) 61.0 (57.9, 64.0) -23.2*
25-44 55.4 (52.9, 57.9) 42.4 (39.8, 45.0) -23.5* 76.1 (73.7, 78.3) 60.4 (57.7, 63.1) -20.5*
45-64 49.2 (46.2, 52.1) 38.3 (35.6, 41.0) -22.1* 69.5 (66.7, 72.2) 56.1 (53.3, 59.0) -19.2*
65+ 33.0 (29.0, 37.4) 30.3 (27.0, 33.8) -8.2 55.9 (51.2, 60.6) 44.5 (41.0, 48.1) -20.4*
Residence
Urban 56.7 (54.0, 59.5) 39.2 (36.3, 42.1) -30.9* 78.3 (75.9, 80.6) 58.0 (54.6, 61.4) -25.9*
Rural 50.8 (47.9, 53.7) 41.6 (38.2, 45.1) -18.1* 70.3 (67.4, 73.1) 59.1 (55.6, 62.5) -16.0*
Education Level
No Formal 31.4 (23.8, 40.1) 14.3 (9.2, 21.5) -54.4* 48.3 (39.1, 57.6) 32.0 (22.9, 42.7) -33.7*
Elementary 48.1 (45.2, 51.0) 36.8 (33.8, 39.8) -23.6* 69.2 (66.3, 71.9) 53.8 (50.4, 57.2) -22.2*
Secondary 60.0 (57.4, 62.6) 42.6 (39.9, 45.3) -29.0* 79.0 (76.7, 81.1) 60.6 (57.8, 63.4) -23.2*
Post-Secondary 58.5 (50.0, 66.5) 41.8 (35.8, 48.2) -28.4* 76.7 (68.7, 83.1) 58.3 (51.8, 64.6) -23.9*
College or above 55.2 (52.2, 58.1) 41.9 (39.3, 44.7) -24.0* 78.5 (76.0, 80.8) 61.3 (58.4, 64.0) -22.0*
Table 10.12: Percentage of adults ≥15 years old who noticed cigarette marketing during the last 30 days in various places, by selected demographic characteristics – GATS Philippines 2009 and 2015
NOTE:Results for prevalence estimates / averages and 95% CIs are rounded to the nearest tenth (0.1).The relative changes are calculated using un-rounded prevalence estimates and might be different if calculated using rounded prevalence estimates shown in this table.* p<0.05
Noticed advertisements in stores where cigarettes are sold Noticed any advertisement, sponsorship, or promotionCharacteristic
Percentage ( 95% CI ) Percentage ( 95% CI )
148 Global Adult Tobacco Survey : Philippines Country Report, 2015

Smoking causes serious illness
SHS causes serious illness
Smoking causes serious illness
SHS causes serious illness
Smoking causes serious illness
SHS causes serious illness
Overall 94.0 (93.1, 94.8) 91.6 (90.7, 92.5) 95.0 (94.1, 95.8) 93.5 (92.5, 94.4) 1.0 2.1*Sex
Male 93.1 (91.9, 94.2) 90.2 (88.9, 91.4) 94.8 (93.8, 95.7) 92.6 (91.2, 93.8) 1.9* 2.6*Female 94.9 (94.0, 95.7) 93.0 (91.9, 94.0) 95.2 (94.2, 96.0) 94.5 (93.5, 95.3) 0.2 1.5 *
Age15-24 95.0 (93.6, 96.1) 92.7 (91.0, 94.1) 95.5 (94.5, 96.4) 93.8 (92.5, 94.9) 0.5 1.225-44 94.2 (93.1, 95.2) 92.9 (91.8, 93.9) 94.8 (93.4, 95.9) 94.0 (92.6, 95.2) 0.6 1.245-64 93.8 (92.0, 95.3) 90.1 (88.1, 91.8) 95.1 (94.0, 96.0) 93.1 (91.9, 94.1) 1.3 3.3*65+ 89.1 (85.8, 91.7) 83.9 (79.9, 87.2) 94.0 (91.8, 95.6) 90.4 (88.2, 92.2) 5.5* 7.7*
ResidenceUrban 95.3 (94.3, 96.2) 93.9 (92.5, 95.0) 94.6 (92.9, 95.9) 94.4 (92.5, 95.8) -0.8 0.5Rural 92.7 (91.3, 94.0) 89.4 (87.9, 90.7) 95.4 (94.4, 96.2) 92.8 (91.6, 93.8) 2.8* 3.8*
Education No Formal 84.0 (77.9, 88.7) 68.7 (60.5, 75.9) 88.3 (81.9, 92.6) 82.7 (75.0, 88.4) 5.1 20.3*Elementary 90.4 (88.6, 92.0) 87.4 (85.5, 89.1) 93.1 (91.4, 94.5) 89.5 (87.5, 91.3) 3.0* 2.5Secondary 95.9 (95.0, 96.6) 93.6 (92.5, 94.6) 95.3 (94.2, 96.2) 94.3 (93.2, 95.3) -0.6 0.8Post-Secondary 95.8 (90.8, 98.1) 96.5 (92.6, 98.4) 96.3 (93.7, 97.9) 98.4 (96.8, 99.2) 0.6 1.9College or above 98.0 (97.3, 98.6) 97.8 (97.0, 98.4) 96.4 (95.4, 97.2) 95.8 (94.7, 96.7) -1.7* -2.1*
Table 10.13: Percentage of adults ≥ 15 years who believe that smoking causes serious illness and that second hand smoke causes serious illness, by selected demographic characteristics - GATS Philippines 2009 and 2015
Demographic Characteristics
NOTE:Results for prevalence estimates / averages and 95% CIs are rounded to the nearest tenth (0.1).The relative changes are calculated using un-rounded prevalence estimates and might be different if calculated using rounded prevalence estimates shown in this table.* p<0.05
2009 2015 Relative change
Percentage (95% CI) Percentage (95% CI) Percentage
149 Global Adult Tobacco Survey : Philippines Country Report, 2015

APPENDIX B: 2015 PHILIPPINES GATS QUESTIONNAIRE
Global Adult Tobacco Survey (GATS) Philippines Questionnaire
ENGLISH
Full Survey November 2015
150 Global Adult Tobacco Survey : Philippines Country Report, 2015

GATS FORM 1 PSA Approval Number: PSA-1539 Expires on 31 October 2016
HOUSEHOLD QUESTIONNAIRE
CONFIDENTIALITY: This survey is authorized by RA 10625. All data obtained cannot be used for taxation, investigation, or law enforcement purposes.
QUESTIONNAIRE ID NUMBER ___ ___ ___ ___ ___ [USE PRE-PRINTED LABEL IF APPLICABLE] REGION REPLICATE PROVINCE STRATUM CITY/MUNICIPALITY PSU NO. BARANGAY ROTATION GROUP URBAN/RURAL EA NAME OF HOUSEHOLD HEAD ADDRESS VISIT RECORD
Visit Number 1 2 3 4
Date of visit
__ __ __ __ Day Month
__ __ __ __ Day Month
__ __ __ __ Day Month
__ __ __ __ Day Month
Household Result*
____
____
____
____ Individual Result*
____
____
____
____
Interviewer ___ ___ ___ ___ ___ ___ ___ ___
Team Supervisor
___ ___
___ ___
___ ___
___ ___
Supervisor (PS, RS, RD, PSO, CO)
___ ___
___ ___
___ ___
___ ___
Republic of the Philippines PHILIPPINE STATISTICS AUTHORITY
Manila
151 Global Adult Tobacco Survey : Philippines Country Report, 2015

Result Codes
Pending Household Questionnaire Codes
102: Completed Part of Household Questionnaire, Could Not Finish Roster
103: Household Questionnaire Not Complete, Could Not Identify An Appropriate Screening Respondent
104: Household Refusal
105: Unoccupied/Vacant/Demolished House
106: Selected Address is Not a Household
108: Other Household Nonresponse
109: Nobody Home
Final Household Questionnaire Codes
200: Completed Household Questionnaire, One Person Selected
201: Completed Household Questionnaire, No One Selected
202: Completed Part of Household Questionnaire, Could Not Finish Roster
203: Household Questionnaire Not Complete, Could Not Identify An Appropriate Screening Respondent
204: Household Refusal
205: Unoccupied/Vacant/Demolished House
206: Selected Address is Not a Household
208: Other Household Nonresponse
209: Nobody Home
887: Reopened Final Coded Questionnaire
999: Household Replaced by Another Randomly Selected Address in the Missed Housing Unit Procedure
152 Global Adult Tobacco Survey : Philippines Country Report, 2015
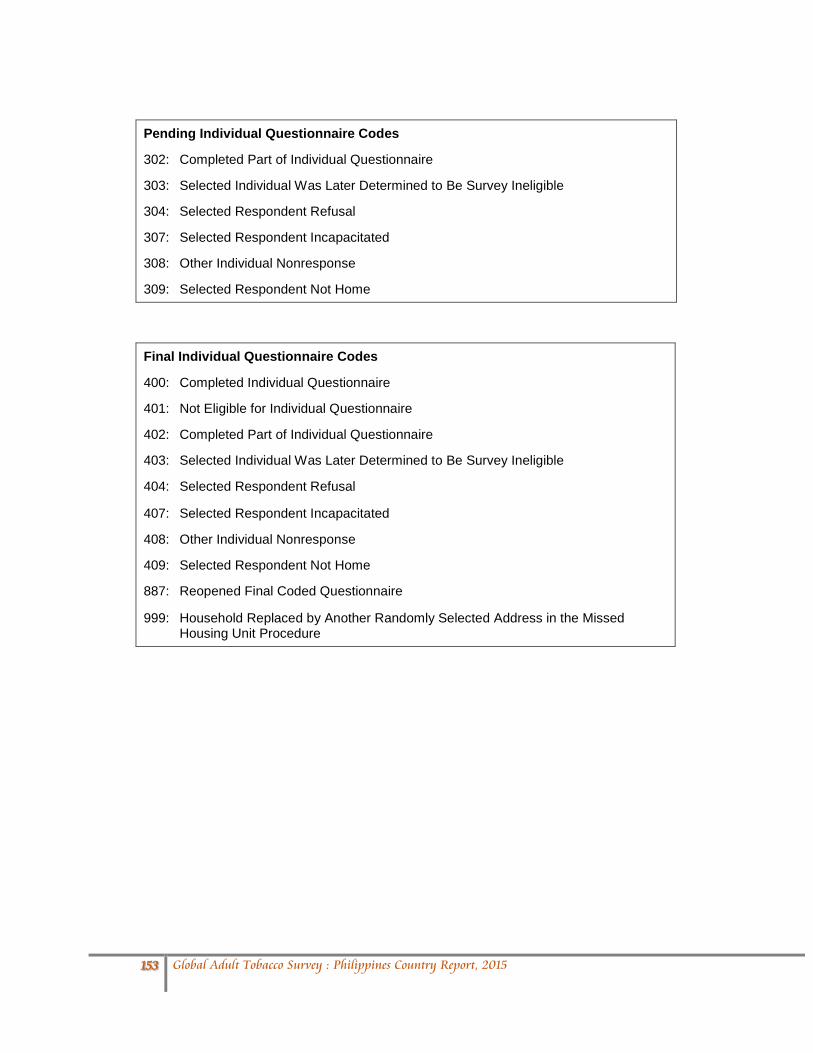
Pending Individual Questionnaire Codes
302: Completed Part of Individual Questionnaire
303: Selected Individual Was Later Determined to Be Survey Ineligible
304: Selected Respondent Refusal
307: Selected Respondent Incapacitated
308: Other Individual Nonresponse
309: Selected Respondent Not Home
Final Individual Questionnaire Codes
400: Completed Individual Questionnaire
401: Not Eligible for Individual Questionnaire
402: Completed Part of Individual Questionnaire
403: Selected Individual Was Later Determined to Be Survey Ineligible
404: Selected Respondent Refusal
407: Selected Respondent Incapacitated
408: Other Individual Nonresponse
409: Selected Respondent Not Home
887: Reopened Final Coded Questionnaire
999: Household Replaced by Another Randomly Selected Address in the Missed Housing Unit Procedure
153 Global Adult Tobacco Survey : Philippines Country Report, 2015

Household Questionnaire
TIME HH INTERVIEW STARTED [24 HOUR CLOCK]
___ ___ : ___ ___ HRS MINS
INTRO. [THE HOUSEHOLD SCREENING RESPONDENT SHOULD BE 18 YEARS OF AGE OR
OLDER AND YOU MUST BE CONFIDENT THAT THIS PERSON CAN PROVIDE ACCURATE INFORMATION ABOUT ALL MEMBERS OF THE HOUSEHOLD.IF NEEDED, VERIFY THE AGE OF THE HOUSEHOLD SCREENING RESPONDENT TO MAKE SURE HE/SHE IS 18 YEARS OF AGE OR OLDER. THE HOUSEHOLD SCREENING RESPONDENT CAN BE LESS THAN 18 YEARS OLD, ONLY IF NO HOUSEHOLD MEMBERS ARE 18 YEARS OF AGE OR OLDER.]
INTRO1. An important survey of adult tobacco use behavior is being conducted by the Philippine
Statistics Authority (PSA), in collaboration with the Department of Health (DOH) throughout the Philippines and your household has been selected to participate. All houses selected were chosen from a scientific sample and it is very important to the success of this project that each participates in the survey. All information gathered will be kept strictly confidential. I have a few questions to find out who in your household is eligible to participate.
HH1. First, I’d like to ask you a few questions about your household. In total, how many persons live in
this household?
[INCLUDE ANYONE WHO CONSIDERS THIS HOUSEHOLD THEIR USUAL PLACE OF RESIDENCE]
HH2. How many of these household members are 15 years of age or older?
[IF HH2 = 00 (NO HOUSEHOLD MEMBERS ≥ 15 IN HOUSEHOLD)] [THERE ARE NO ELIGIBLE HOUSEHOLD MEMBERS. THANK THE RESPONDENT FOR HIS/HER TIME. THIS WILL BE RECORDED IN THE RECORD OF CALLS AS A CODE 201.]
154 Global Adult Tobacco Survey : Philippines Country Report, 2015

HH4. I now would like to collect information about only these persons that live in this household who are 15 years of age or older. Let’s start listing them from oldest to youngest.
HH4a. What is the {oldest/next oldest} person’s first name? ________________________ HH4b. What is this person’s age?
[IF RESPONDENT DOESN’T KNOW, PROBE FOR AN ESTIMATE]
[IF REPORTED AGE IS 15 THROUGH 17, BIRTH DATE IS ASKED]
HH4c. What is the month of this person’s date of birth?
HH4cYEAR. What is the year of this person’s date of birth?
[IF DON’T KNOW, ENTER 7777 IF REFUSED, ENTER 9999]
HH4d. Is this person male or female?
MALE ............... 1 FEMALE ........... 2
HH4e. Does this person currently smoke tobacco, including cigarettes, cigars, pipes?
YES .................. 1 NO .................... 2 DON’T KNOW .. 7 REFUSED ........ 9
[REPEAT HH4a – HH4e FOR EACH PERSON REPORTED IN HH2]
155 Global Adult Tobacco Survey : Philippines Country Report, 2015

HH4a. First Name HH4b. Age
ONLY IF AGE = 15-17 HH4c. Date of Birth
HH4d. Gender
HH4e. Current Smoker?
M F YES NO DK
1 _____________________________ ___ ___ Month: __ __ Year: __ __ __ __ 1 2 1 2 7
2 _____________________________ ___ ___ Month: __ __ Year: __ __ __ __ 1 2 1 2 7
3 _____________________________ ___ ___ Month: __ __ Year: __ __ __ __ 1 2 1 2 7
4 _____________________________ ___ ___ Month: __ __ Year: __ __ __ __ 1 2 1 2 7
5 _____________________________ ___ ___ Month: __ __ Year: __ __ __ __ 1 2 1 2 7
6 _____________________________ ___ ___ Month: __ __ Year: __ __ __ __ 1 2 1 2 7
7 ____________________________ ___ ___ Month: __ __ Year: __ __ __ __ 1 2 1 2 7
8 ____________________________ ___ ___ Month: __ __ Year: __ __ __ __ 1 2 1 2 7
9 ____________________________ ___ ___ Month: __ __ Year: __ __ __ __ 1 2 1 2 7
10 ____________________________ ___ ___ Month: __ __ Year: __ __ __ __ 1 2 1 2 7
156 Global Adult Tobacco Survey : Philippines Country Report, 2015

NOTE: SELECTION OF INDIVIDUAL RESPONDENT WILL BE PERFORMED AUTOMATICALLY BY THE iPAQ HANDHELD PROGRAM. HH5 AND HH6 WILL ALSO BE CODED AUTOMATICALLY.
SELECTION OF INDIVIDUAL RESPONDENT USING RANDOMIZATION TABLE:
NUMBER OF ELIGIBLE
MALES/FEMALES IN HOUSEHOLD
LAST DIGIT OF QUESTIONNAIRE ID NUMBER
0 1 2 3 4 5 6 7 8 9
0 END INTERVIEW
1 1 1 1 1 1 1 1 1 1 1
2 1 2 1 2 1 2 1 2 1 2
3 3 1 2 3 1 2 3 1 2 3
4 1 2 3 4 1 2 3 4 1 2
5 1 2 3 4 5 1 2 3 4 5
6 6 1 2 3 4 5 6 1 2 3
7 5 6 7 1 2 3 4 5 6 7
8 1 2 3 4 5 6 7 8 1 2
9 8 9 1 2 3 4 5 6 7 8
10 9 10 1 2 3 4 5 6 7 8 USE RANDOMIZATION TABLE ABOVE TO SELECT INDIVIDUAL RESPONDENT AND WRITE THE SELECTED NUMBER IN HH5 BELOW
- IF ONLY ONE ELIGIBLE (MALE/FEMALE) LIVES IN THE HOUSEHOLD, WRITE “1” IN HH5
- IF NO ELIGIBLE (MALES/FEMALES) LIVE IN THE HOUSEHOLD, WRITE “0” IN HH5 AND END INTERVIEW
- IF MORE THAN 20 (MALES/FEMALES) LIVE IN THE HOUSEHOLD, END THE INTERVIEW
AND CONSULT WITH YOUR SUPERVISOR BEFORE SELECTING ANYONE FOR THE INDIVIDUAL INTERVIEW
HH5. [NAME OF THE SELECTED ELIGIBLE PERSON IS:
{FILL SELECTED HH MEMBER’S FIRST NAME} ASK IF SELECTED RESPONDENT IS AVAILABLE AND IF SO, PROCEED TO THE INDIVIDUAL QUESTIONNAIRE.
IF SELECTED RESPONDENT IS NOT AVAILABLE, MAKE AN APPOINTMENT AND RECORD IT AS A COMMENT ON RECORD OF CALLS.]
157 Global Adult Tobacco Survey : Philippines Country Report, 2015

NAME _____________________________ DATE OF THE NEXT VISIT: ________________ TIME: _____________ DATE OF THE NEXT VISIT: ________________ TIME: _____________ DATE OF THE NEXT VISIT: ________________ TIME: _____________ DATE OF THE NEXT VISIT: ________________ TIME: _____________
TIME HH INTERVIEW ENDED [24 HOUR CLOCK]
___ ___ : ___ ___ HRS MINS
158 Global Adult Tobacco Survey : Philippines Country Report, 2015

GATS FORM 2 PSA Approval Number: PSA-1539 Expires on 31 October 2016
Individual Questionnaire
CONSENT1. [SELECT THE APPROPRIATE AGE CATEGORY BELOW. IF NEEDED, CHECK THE AGE OF SELECTED RESPONDENT FROM THE “CASE INFO” SCREEN IN THE TOOLS MENU.] 15-17 ................................................ 1→ GO TO CONSENT2 18 OR OLDER ................................. 2 → GO TO CONSENT5 EMANCIPATED MINOR (15-17) ..... 3→ GO TO CONSENT5
CONSENT2. Before starting the interview, I need to obtain consent from a parent or guardian of
[NAME OF RESPONDENT] and from [NAME OF RESPONDENT]. [IF BOTH SELECTED RESPONDENT AND PARENT/GUARDIAN ARE AVAILABLE, CONTINUE WITH INTERVIEW. IF PARENT/GUARDIAN IS NOT AVAILABLE, BREAK-OFF INTERVIEW AND SCHEDULE AN APPOINTMENT TO RETURN. IF MINOR RESPONDENT IS NOT AVAILABLE, CONTINUE WITH OBTAINING PARENTAL CONSENT.]
CONSENT3. [READ THE FOLLOWING TO THE PARENT/GUARDIAN AND SELECTED
RESPONDENT (IF AVAILABLE):]
I am working with the Philippine Statistics Authority (PSA). This institution is collecting information about tobacco use in the Philippines. This information will be used for public health purposes by the Department of Health.
Your household and [NAME OF RESPONDENT] have been selected at random. [NAME OF RESPONDENT] responses are very important to us and the community, as these answers will represent many other persons.
The interview will last around 30 minutes. [NAME OF RESPONDENT] participation in this survey is entirely voluntary. The information that [NAME OF RESPONDENT] will provide will be kept strictly confidential and [NAME OF RESPONDENT] will not be identified by his/her responses. Personal information will not be shared with anyone else, not even other family members including you. [NAME OF RESPONDENT] can withdraw from the study at any time, and may refuse to answer any question.
We will leave the necessary contact information with you. If you have any questions about this survey, you can contact the telephone numbers listed.
If you agree with [NAME OF RESPONDENT]’s participation in this survey, we will conduct a private interview with him/her.
Republic of the Philippines PHILIPPINE STATISTICS AUTHORITY
Manila
159 Global Adult Tobacco Survey : Philippines Country Report, 2015

[ASK PARENT/GUARDIAN:] Do you agree with [NAME OF RESPONDENT]’s participation? YES ..... 1→ GO TO CONSENT4 NO ....... 2→ END INTERVIEW
CONSENT4. [WAS THE SELECTED MINOR RESPONDENT PRESENT?]
PRESENT .............. 1→ GO TO CONSENT6 NOT PRESENT ...... 2→ GO TO CONSENT5
CONSENT5. [READ TO THE SELECTED RESPONDENT:]
I am working with the Philippine Statistics Authority (PSA).This institution is collecting information about tobacco use in the Philippines. This information will be used for public health purposes by the Department of Health.
Your household and you have been selected at random. Your responses are very important to us and the community, as these answers will represent many other persons. The interview will last around 30 minutes. Your participation in this survey is entirely voluntary. The information that you will provide us will be kept strictly confidential, and you will not be identified by your responses. Personal information will not be shared with anyone else, not even other family members. You can withdraw from the study at any time, and may refuse to answer any question.
We will leave the necessary contact information with you. If you have any questions about this survey, you can contact the telephone numbers listed.
{FILL IF CONSENT4=2: Your parent/guardian has given his/her permission for you to participate in this study}
If you agree to participate, we will conduct a private interview with you.
CONSENT6. [ASK SELECTED RESPONDENT:] Do you agree to participate?
YES ..... 1→ PROCEED WITH INTERVIEW NO ....... 2→ END INTERVIEW
INTLANG. [INTERVIEW LANGUAGE]
ENGLISH ......... 1 TAGALOG ........ 2 CEBUANO ....... 3 ILOCANO ......... 4 HILIGAYNON ... 5 BICOLANO ....... 6 WARAY ............ 7
160 Global Adult Tobacco Survey : Philippines Country Report, 2015
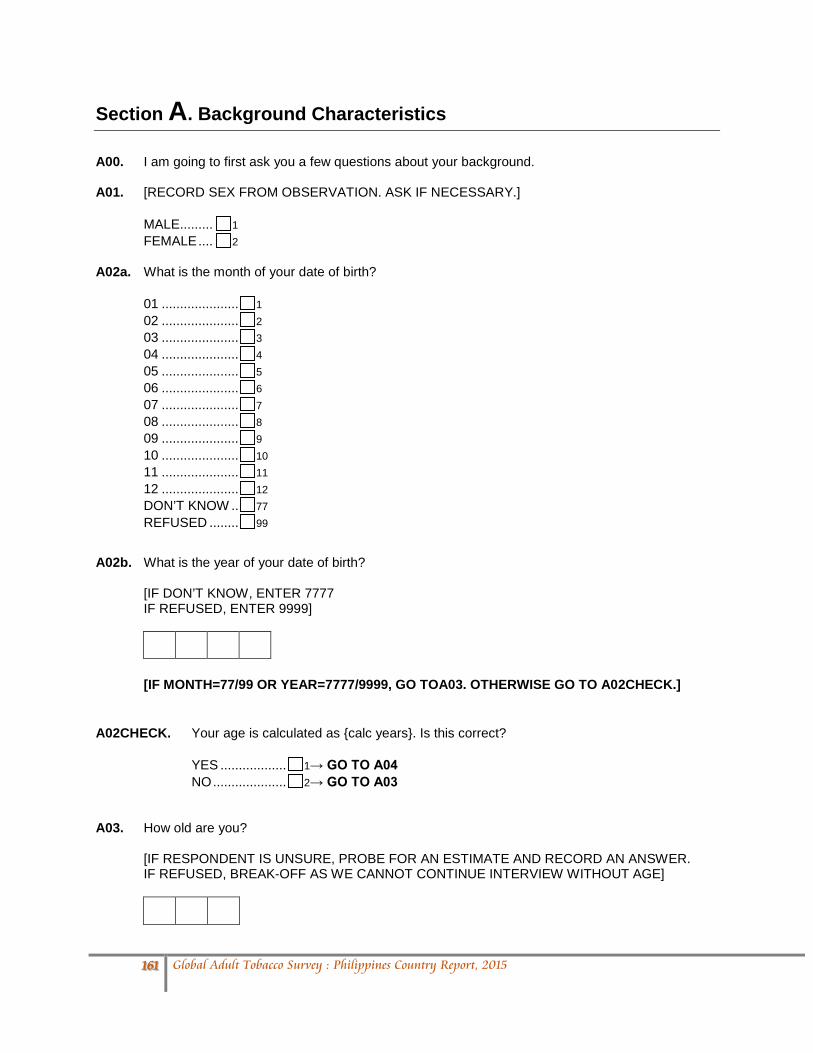
Section A. Background Characteristics A00. I am going to first ask you a few questions about your background. A01. [RECORD SEX FROM OBSERVATION. ASK IF NECESSARY.]
MALE......... 1 FEMALE .... 2
A02a. What is the month of your date of birth?
01 ..................... 1 02 ..................... 2 03 ..................... 3 04 ..................... 4 05 ..................... 5 06 ..................... 6 07 ..................... 7 08 ..................... 8 09 ..................... 9 10 ..................... 10 11 ..................... 11 12 ..................... 12 DON’T KNOW .. 77 REFUSED ........ 99
A02b. What is the year of your date of birth?
[IF DON’T KNOW, ENTER 7777 IF REFUSED, ENTER 9999]
[IF MONTH=77/99 OR YEAR=7777/9999, GO TOA03. OTHERWISE GO TO A02CHECK.]
A02CHECK. Your age is calculated as {calc years}. Is this correct?
YES .................. 1→ GO TO A04 NO .................... 2→ GO TO A03
A03. How old are you?
[IF RESPONDENT IS UNSURE, PROBE FOR AN ESTIMATE AND RECORD AN ANSWER. IF REFUSED, BREAK-OFF AS WE CANNOT CONTINUE INTERVIEW WITHOUT AGE]
161 Global Adult Tobacco Survey : Philippines Country Report, 2015

A03a. [WAS RESPONSE ESTIMATED?]
YES ........................ 1 NO .......................... 2 DON’T KNOW ........ 7
A04. What is the highest level of education you have completed? INTERVIEWER: SELECT ONLY ONE CATEGORY
NO GRADE COMPLETED................................................ 1
PRESCHOOL .................................................................... 2 ELEMENTARY UNDERGRADUATE … ........................... 3 ELEMENTARY GRADUATE . ........................................... 4 HIGH SCHOOL UNDERGRADUATE . ............................. 5 HIGH SCHOOL GRADUATE. ........................................... 6 POST SECONDARY ......................................................... 7
COLLEGE UNDERGRADUATE ....................................... 8 COLLEGE GRADUATE .................................................... 9
POST GRADUATE DEGREE COMPLETED.................... 10 DON’T KNOW ................................................................... 77 REFUSED ......................................................................... 99
A05. Which of the following best describes your main work status over the past 12 months?
Government employee, non-government employee, self-employed, student, housekeeper, retired, unemployed-able to work, or unemployed-unable to work?
[INCLUDE SUBSISTENCE FARMING AS SELF-EMPLOYED]
GOVERNMENT EMPLOYEE ................. 1 NON-GOVERNMENT EMPLOYEE ........ 2 SELF-EMPLOYED .................................. 3 STUDENT ............................................... 4 HOUSEKEEPER ..................................... 5
RETIRED ................................................ 6
UNEMPLOYED, ABLE TO WORK ......... 7
UNEMPLOYED, UNABLE TO WORK .... 8 DON’T KNOW ......................................... 77 REFUSED ............................................... 99
162 Global Adult Tobacco Survey : Philippines Country Report, 2015

AA06. Please look at this card and let me know which category your monthly income falls under.
[INTERVIEWER: HAND SHOWCARD TO RESPONDENT AND ENTER ONLY 1 CATEGORY]
NO INCOME .............................. 0 1 TO 3,499 ................................. 1
3,500 TO 4,999 .......................... 2
5,000 TO 8,499 .......................... 3 8,500 TO 19,999 ...................... 4 20,000 TO 20,999 ...................... 5 21.000 TO 29,999 ...................... 6
30,000 TO 39,999 ...................... 7 40,000 TO 49,999 ..................... 8 50,000 OR HIGHER .................. 9 DON’T KNOW ............................ 77
REFUSED .................................. 99 A06. Please tell me whether this household or any person who lives in the household has the following items:
YES
NO DON’T KNOW
REFUSED
▼ ▼ ▼ ▼ a. Electricity? .............................. 1 .......... 2 ................ 7 9 b. Flush toilet? ............................ 1 .......... 2 ................ 7 9 c. Fixed telephone (Landline)? ... 1 .......... 2 ................ 7 9 d. Cellular phone? ...................... 1 .......... 2 ................ 7 9 e. Television? ............................. 1 .......... 2 ................ 7 9 f. Radio/Radio cassette? ............ 1 .......... 2 ................ 7 9 g. Refrigerator/Freezer? ............. 1 .......... 2 ................ 7 9 j. Washing machine? .................. 1 .......... 2 ................ 7 9
l. CD/VCD/DVD Player? ............. 1 .......... 2 ................ 7 9
m. Component/Karaoke? ........... 1 .......... 2 ................ 7 9
n. Personal computer/Laptop ..... 1 .......... 2 ................ 7 9
h. Car/Jeep/Van? ....................... 1 .......... 2 ................ 7 9 i. Scooter/motorcycle/tricycle? ... 1 .......... 2 ................ 7 9 k. Bicycle/pedicab? .................... 1 .......... 2 ................ 7 9 o. Tractor ................................... 1 .......... 2 ................ 7 9
p. Motorized banca/boat? .......... 1 .......... 2 ................ 7 9
163 Global Adult Tobacco Survey : Philippines Country Report, 2015

Section B. Tobacco Smoking B00. I would now like to ask you some questions about smoking tobacco, including cigarettes, cigars,
pipes, kreteks, and smoking tobacco using a waterpipe. Please do not answer about electronic cigarettes and smokeless tobacco at this time. B01. Do you currently smoke tobacco on a daily basis, less than daily, or not at all?
DAILY ............................ 1→ SKIP TO B04 LESS THAN DAILY ....... 2 NOT AT ALL .................. 3→ SKIP TO B03 DON’T KNOW ............... 7→ SKIP TO NEXT SECTION REFUSED ..................... 9→ SKIP TO NEXT SECTION
B02. Have you smoked tobacco daily in the past?
YES ............................... 1→ SKIP TO B08 NO ................................. 2→ SKIP TO B10 DON’T KNOW ............... 7→ SKIP TO B10 REFUSED ..................... 9→ SKIP TO B10
B03. In the past, have you smoked tobacco on a daily basis, less than daily, or not at all?
[IF RESPONDENT HAS DONE BOTH “DAILY” AND “LESS THAN DAILY” IN THE PAST, CHECK “DAILY”] DAILY ............................ 1→ SKIP TO B11 LESS THAN DAILY ....... 2→ SKIP TO B13 NOT AT ALL .................. 3→ SKIP TO NEXT SECTION DON’T KNOW ............... 7→ SKIP TO NEXT SECTION REFUSED ..................... 9→ SKIP TO NEXT SECTION
164 Global Adult Tobacco Survey : Philippines Country Report, 2015

B04. How old were you when you first started smoking tobacco daily?
[IF DON’T KNOW OR REFUSED, ENTER 99]
[IF B04=99, ASK B05. OTHERWISE SKIP TO B06.] B05. How many years ago did you first start smoking tobacco daily?
[IF REFUSED, ENTER 99]
B06. On average, how many of the following products do you currently smoke each day? Also, let me
know if you smoke the product, but not every day.
[IF RESPONDENT REPORTS SMOKING THE PRODUCT BUT NOT EVERY DAY, ENTER 888 IF RESPONDENT REPORTS IN PACKS OR CARTONS, PROBE TO FIND OUT HOW MANY ARE IN EACH AND CALCULATE TOTAL NUMBER] a. Manufactured cigarettes? PER DAY
a1. [IF B06a=888] On average, how many manufactured cigarettes do you currently smoke each week?
PER WEEK
b. Hand-rolled cigarettes? PER DAY
b1. [IF B06b=888] On average, how many hand-rolled cigarettes do you currently smoke each week?
PER WEEK
c. Kreteks? PER DAY
c1. [IF B06c=888] On average, how many kreteks do you currently smoke each week?
PER WEEK
d. Pipes full of tobacco? PER DAY
d1. [IF B06d=888] On average, how many pipes full of tobacco do you currently smoke each week?
PER WEEK
e. Cigars, cheroots, or cigarillos? PER DAY
e1. [IF B06e=888] On average, how many cigars, cheroots, or cigarillos do you currently smoke each week?
PER WEEK
f. Number of water pipe sessions per day? PER DAY
f1. [IF B06f=888] On average, how many water pipe sessions do you currently participate in each week?
PER WEEK
g. Any others? (→g1. Please specify the other type you currently smoke each day:_______________________)
PER DAY
g1. [IF B06g=888] On average, how many [FILL PRODUCT] do you currently smoke each week?
PER WEEK
165 Global Adult Tobacco Survey : Philippines Country Report, 2015

B07. How soon after you wake up do you usually have your first smoke? Would you say within 5 minutes, 6 to 30 minutes, 31 to 60 minutes, or more than 60 minutes?
WITHIN 5 MINUTES .................. 1 6 TO 30 MINUTES ..................... 2 31 TO 60 MINUTES ................... 3 MORE THAN 60 MINUTES ....... 4
REFUSED .................................. 9 [SKIP TO NEXT SECTION]
166 Global Adult Tobacco Survey : Philippines Country Report, 2015

[CURRENT LESS THAN DAILY SMOKERS] B08. How old were you when you first started smoking tobacco daily?
[IF DON’T KNOW OR REFUSED, ENTER 99]
[IF B08 = 99, ASK B09. OTHERWISE SKIP TO B10.] B09. How many years ago did you first start smoking tobacco daily?
[IF REFUSED, ENTER 99]
B10. How many of the following do you currently smoke during a usual week?
[IF RESPONDENT REPORTS DOING THE ACTIVITYWITHIN THE PAST 30 DAYS, BUT LESS THAN ONCE PER WEEK, ENTER 888 IF RESPONDENT REPORTS IN PACKS OR CARTONS, PROBE TO FIND OUT HOW MANY ARE IN EACH AND CALCULATE TOTAL NUMBER]
a. Manufactured cigarettes? ................................ PER WEEK
b. Hand-rolled cigarettes? ................................... PER WEEK
c. Kreteks? .......................................................... PER WEEK
d. Pipes full of tobacco? ...................................... PER WEEK
e. Cigars, cheroots, or cigarillos? ........................ PER WEEK
f. Number of water pipe sessions per week? ..... PER WEEK
g. Any others? ..................................................... PER WEEK
→g1. Please specify the other type you currently smoke during a usual week:
________________________________________ [SKIP TO NEXT SECTION]
167 Global Adult Tobacco Survey : Philippines Country Report, 2015

[FORMER SMOKERS] B11. How old were you when you first started smoking tobacco daily?
[IF DON’T KNOW OR REFUSED, ENTER 99]
[IF B11 = 99, ASK B12. OTHERWISE SKIP TO B13a.] B12. How many years ago did you first start smoking tobacco daily?
[IF REFUSED, ENTER 99]
B13a. How long has it been since you stopped smoking?
[ONLY INTERESTED IN WHEN RESPONDENT STOPPED SMOKING REGULARLY ─ DO NOT INCLUDE RARE INSTANCES OF SMOKING ENTER UNIT ON THIS SCREEN AND NUMBER ON NEXT SCREEN] YEARS .......................... 1 MONTHS ....................... 2 WEEKS ......................... 3 DAYS............................. 4 LESS THAN 1 DAY ....... 5→ SKIP TO B14 DON’T KNOW ............... 7→ SKIP TO NEXT SECTION
REFUSED ..................... 9→ SKIP TO NEXT SECTION
B13b. [ENTER NUMBER OF (YEARS/MONTHS/WEEKS/DAYS)]
[IF B13a/b< 1 YEAR (<12 MONTHS), THEN CONTINUE WITH B14. OTHERWISE SKIP TO NEXT SECTION.]
168 Global Adult Tobacco Survey : Philippines Country Report, 2015

B14. Have you visited a doctor or other health care provider in the past 12 months?
YES .................. 1 NO .................... 2→ SKIP TO B18 REFUSED ........ 9→ SKIP TO B18
B15. How many times did you visit a doctor or health care provider in the past 12 months? Would you
say 1 or 2 times, 3 to 5 times, or 6 or more times?
1 OR 2 .............. 1 3 TO 5 .............. 2 6 OR MORE ..... 3
REFUSED ........ 9 B16. During any visit to a doctor or health care provider in the past 12 months, were you asked if you
smoke tobacco?
YES .................. 1 NO .................... 2→ SKIP TO B18 REFUSED ........ 9→ SKIP TO B18
B17. During any visit to a doctor or health care provider in the past 12 months, were you advised to
quit smoking tobacco?
YES .................. 1 NO .................... 2
REFUSED ........ 9 B18. During the past 12 months, did you use any of the following to try to stop smoking tobacco?
YES NO REFUSED ▼ ▼ ▼
a. Counseling, including at a smoking cessation clinic? ...................... 1 ...... 2 ......... 9 b. Nicotine replacement therapy, such as the patch or gum? .............. 1 ...... 2 ......... 9 c. Other prescription medications, for example Champix? .................. 1 ...... 2 ............ 9 d. Traditional medicines, for example Chinese Meds, Acupuncture, Herbal cigarettes that contain no tobacco? ...................................... 1 ...... 2 ............ 9 e. A quit line or a smoking telephone support line? ............................. 1 ...... 2 ......... 9 h. Using electronic cigarettes, or other similar devices (e-cigarette, vape-pen, e-shisha, e-pipes)?.......................................................... 1 ...... 2 ......... 9 f. Switching to smokeless tobacco? .................................................... 1 ...... 2 ......... 9 f1. Self-educational materials such as posters, pamphlets, informational sheets, etc.? ............................................................... 1 ...... 2 ......... 9 i. Try to quit without assistance? .......................................................... 1 ...... 2 ......... 9 g. Anything else? .................................................................................. 1 ...... 2 ......... 9
→g1. Please specify what you used to try to stop smoking: ________________________________________
169 Global Adult Tobacco Survey : Philippines Country Report, 2015
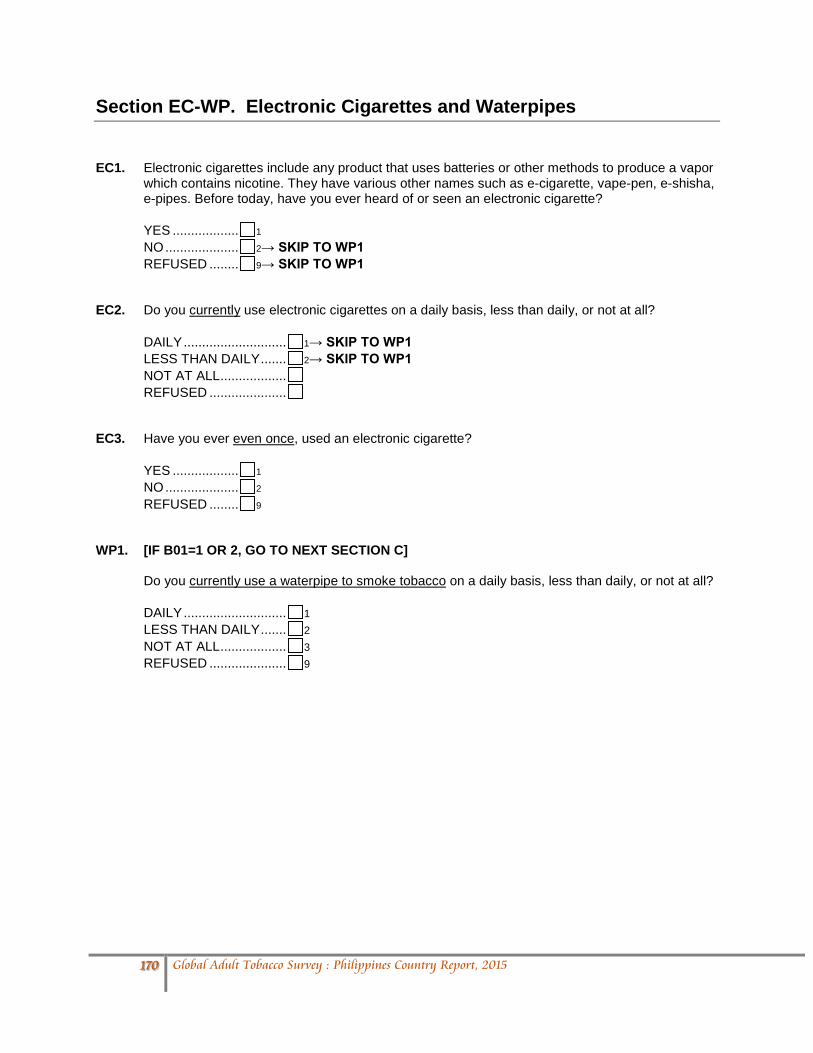
Section EC-WP. Electronic Cigarettes and Waterpipes EC1. Electronic cigarettes include any product that uses batteries or other methods to produce a vapor
which contains nicotine. They have various other names such as e-cigarette, vape-pen, e-shisha, e-pipes. Before today, have you ever heard of or seen an electronic cigarette?
YES .................. 1 NO .................... 2→ SKIP TO WP1 REFUSED ........ 9→ SKIP TO WP1
EC2. Do you currently use electronic cigarettes on a daily basis, less than daily, or not at all?
DAILY ............................ 1→ SKIP TO WP1 LESS THAN DAILY ....... 2→ SKIP TO WP1 NOT AT ALL .................. REFUSED .....................
EC3. Have you ever even once, used an electronic cigarette?
YES .................. 1 NO .................... 2 REFUSED ........ 9
WP1. [IF B01=1 OR 2, GO TO NEXT SECTION C]
Do you currently use a waterpipe to smoke tobacco on a daily basis, less than daily, or not at all?
DAILY ............................ 1 LESS THAN DAILY ....... 2 NOT AT ALL .................. 3 REFUSED ..................... 9
170 Global Adult Tobacco Survey : Philippines Country Report, 2015

Section C. Smokeless Tobacco C00. The next questions are about using smokeless tobacco, such as snuff, chewing tobacco, and dip.
Smokeless tobacco is tobacco that is not smoked, but is sniffed through the nose, held in the mouth, or chewed.
C01. Do you currently use smokeless tobacco on a daily basis, less than daily, or not at all?
[IF RESPONDENT DOES NOT KNOW WHAT SMOKELESS TOBACCO IS, EITHER PRESENT A SHOWCARD OR READ DEFINITION FROM QXQ SCREEN]
DAILY ............................ 1→ SKIP TO C04 LESS THAN DAILY ....... 2 NOT AT ALL .................. 3→ SKIP TO C03 DON’T KNOW ............... 7→ SKIP TO NEXT SECTION REFUSED ..................... 9→ SKIP TO NEXT SECTION
C02. Have you used smokeless tobacco daily in the past?
YES ............................... 1→ SKIP TO C10 NO ................................. 2→ SKIP TO C10 DON’T KNOW ............... 7→ SKIP TO C10 REFUSED ..................... 9→ SKIP TO C10
C03. In the past, have you used smokeless tobacco on a daily basis, less than daily, or not at all?
[IF RESPONDENT HAS DONE BOTH “DAILY” AND “LESS THAN DAILY” IN THE PAST, CHECK “DAILY”] DAILY ............................ 1→ SKIP TO NEXT SECTION LESS THAN DAILY ....... 2→ SKIP TO NEXT SECTION NOT AT ALL .................. 3→ SKIP TO NEXT SECTION DON’T KNOW ............... 7→ SKIP TO NEXT SECTION REFUSED ..................... 9→ SKIP TO NEXT SECTION
171 Global Adult Tobacco Survey : Philippines Country Report, 2015

[CURRENT DAILY SMOKELESS TOBACCO USERS] C04. How old were you when you first started using smokeless tobacco daily?
[IF DON’T KNOW OR REFUSED, ENTER 99]
[IF C04 = 99, ASK C05. OTHERWISE SKIP TO C06.] C05. How many years ago did you first start using smokeless tobacco daily?
[IF REFUSED, ENTER 99]
C06. On average, how many times a day do you use the following products? Also, let me know if you
use the product, but not every day.
[IF RESPONDENT REPORTS USING THE PRODUCT BUT NOT EVERY DAY, ENTER 888] a.
a. Chewing tobacco? PER DAY
a1. [IF C06a=888] On average, how many times a week do you currently use chewing tobacco?
PER WEEK
b. Betel quid with tobacco? PER DAY
b1. [IF C06b=888] On average, how many times a week do you currently use betel quid with tobacco?
PER WEEK
c. Any others? (→e1. Please specify the other type you currently use each day:_________________________)
PER DAY
c1. [IF C06c=888] On average, how many times a week do you currently use [FILL PRODUCT]?
PER WEEK
[SKIP TO NEXT SECTION]
172 Global Adult Tobacco Survey : Philippines Country Report, 2015

[CURRENT LESS THAN DAILY SMOKELESS TOBACCO USERS] C10. How many times a week do you usually use the following?
[IF RESPONDENT REPORTS DOING THE ACTIVITYWITHIN THE PAST 30 DAYS, BUT LESS THAN ONCE PER WEEK, ENTER 888]
a. a. Chewing tobacco? ......................................... TIMES PER WEEK
b. b. Betel quid with tobacco? ................................ TIMES PER WEEK
c. c. Any others? .................................................... TIMES PER WEEK
d. ........................................................... →c1. Please specify the other type you currently use during a usual week:
________________________________________ C19. [ADMINISTERED ONLY IF B01=2 AND C01=2]
You mentioned that you smoke tobacco, but not every day and that you also use smokeless tobacco, but not every day. Thinking about both smoking tobacco and using smokeless tobacco, would you say you use tobacco on a daily basis or less than daily? DAILY ............................ 1 LESS THAN DAILY ....... 2 REFUSED ..................... 9
[SKIP TO NEXT SECTION]
173 Global Adult Tobacco Survey : Philippines Country Report, 2015

Section D1. Cessation─Tobacco Smoking IF B01= 1 OR 2 (RESPONDENT CURRENTLY SMOKES TOBACCO), CONTINUE WITHTHIS SECTION. IF B01 = 3, 7, OR 9(RESPONDENT DOES NOT CURRENTLY SMOKE TOBACCO), SKIP TONEXT SECTION.
D01. The next questions ask about any attempts to stop smoking that you might have made during the
past 12 months. Please think about tobacco smoking.
During the past 12 months, have you tried to stop smoking?
YES .................. 1 NO .................... 2→ SKIP TO D04 REFUSED ........ 9→ SKIP TO D04
DD01. Which of the following were your reasons in trying to quit smoking tobacco in the past 12 months?
YES NO REFUSED ▼ ▼ ▼
a. Health reasons? .............................................................. 1 .............. 2 ................ 9
b. To save money? .............................................................. 1 .............. 2 ................ 9 c. High price of cigarettes? .................................................. 1 .............. 2 ................ 9 d. Compliance to anti-smoking policies/laws? ..................... 1 .............. 2 ................ 9 e. Your family wants you to quit smoking?........................... 1 .............. 2 ................ 9 f. Smoking is not allowed inside your workplace? ............... 1 .............. 2 ................ 9 g. Anything else? ................................................................. 1 .............. 2 ................ 9
g1.Specify:___________________________ D02a. Thinking about the last time you tried to quit, how long did you stop smoking?
[ENTER UNIT ON THIS SCREEN AND NUMBER ON NEXT SCREEN] MONTHS .......................................... 1 WEEKS ............................................ 2 DAYS................................................ 3 LESS THAN 1 DAY (24 HOURS) .... 4→ SKIP TO D03 DON’T KNOW .................................. 7→ SKIP TO D03
REFUSED ........................................ 9→ SKIP TO D03
D02b. [ENTER NUMBER OF (MONTHS/WEEKS/DAYS)]
174 Global Adult Tobacco Survey : Philippines Country Report, 2015

D03. During the past 12 months, did you use any of the following to try to stop smoking tobacco?
YES NO REFUSED ▼ ▼ ▼
a. Counseling, including at a smoking cessation clinic? ...................... 1 ...... 2 ......... 9 b. Nicotine replacement therapy, such as the patch or gum? .............. 1 ...... 2 ......... 9 c. Other prescription medications, for example Champix? .................. 1 ...... 2 ............ 9 d. Traditional medicines, for example Chinese Meds, Acupuncture, Herbal cigarettes that contain no tobacco? ...................................... 1 ...... 2 ............ 9 e. A quit line or a smoking telephone support line? ............................. 1 ...... 2 ......... 9 h. Using electronic cigarettes, or other similar devices (e-cigarette, vape-pen, e-shisha, e-pipes)?.......................................................... 1 ...... 2 ......... 9 f. Switching to smokeless tobacco? .................................................... 1 ...... 2 ......... 9 f1. Self-educational materials such as posters, pamphlets, informational sheets, etc.? ............................................................... 1 ...... 2 ......... 9 i. Try to quit without assistance? .......................................................... 1 ...... 2 ......... 9 g. Anything else? .................................................................................. 1 ...... 2 ......... 9
→ g1. Please specify what you used to try to stop smoking: ________________________________________
D04. Have you visited a doctor or other health care provider in the past 12 months?
YES .................. 1 NO .................... 2→ SKIP TO D08 REFUSED ........ 9→ SKIP TO D08
D05. How many times did you visit a doctor or health care provider in the past 12 months? Would you
say 1 or 2 times, 3 to 5 times, or 6 or more times?
1 OR 2 .............. 1 3 TO 5 .............. 2 6 OR MORE ..... 3 REFUSED ........ 9
D06. During any visit to a doctor or health care provider in the past 12 months, were you asked if you
smoke tobacco?
YES .................. 1 NO .................... 2→ SKIP TO D08 REFUSED ........ 9→ SKIP TO D08
D07. During any visit to a doctor or health care provider in the past 12 months, were you advised to
quit smoking tobacco?
YES .................. 1 NO .................... 2
REFUSED ........ 9
175 Global Adult Tobacco Survey : Philippines Country Report, 2015

D08. Which of the following best describes your thinking about quitting smoking? I am planning to quit
within the next month, I am thinking about quitting within the next 12 months, I will quit someday but not within the next 12 months, or I am not interested in quitting?
QUIT WITHIN THE NEXT MONTH .......................... 1
THINKING WITHIN THE NEXT 12 MONTHS.......... 2
QUIT SOMEDAY, BUT NOT NEXT 12 MONTHS. .. 3 NOT INTERESTED IN QUITTING ........................... 4 DON’T KNOW .......................................................... 7
REFUSED ................................................................ 9
176 Global Adult Tobacco Survey : Philippines Country Report, 2015

Section E. Secondhand Smoke E00. I would now like to ask you a few questions about smoking in various places. E01. Which of the following best describes the rules about smoking inside of your home: 1. Smoking is
allowed inside of your home; 2.Smoking is generally not allowed inside of your home but there are exceptions;3. Smoking is never allowed inside of your home; or 4.There are no rules about smoking in your home?
ALLOWED ............................................... 1 NOT ALLOWED, BUT EXCEPTIONS .... 2 NEVER ALLOWED ................................. 3→ SKIP TO E04 NO RULES .............................................. 4→ SKIP TO E03 DON’T KNOW ......................................... 7→ SKIP TO E03 REFUSED ............................................... 9→ SKIP TO E03
E02. Inside your home, is smoking allowed in every room?
YES ........................ 1 NO .......................... 2 DON’T KNOW ........ 7
REFUSED .............. 9 E03. How often does anyone smoke inside your home? Would you say daily, weekly, monthly, less
than monthly, or never?
DAILY .................................. 1 WEEKLY ............................. 2 MONTHLY ........................... 3 LESS THAN MONTHLY...... 4 NEVER ................................ 5 DON’T KNOW ..................... 7
REFUSED ........................... 9 E04. Do you currently work outside of your home?
YES ..................................... 1
NO/DON’T WORK ............... 2→ SKIP TO E09INTRO REFUSED ........................... 9→ SKIP TO E09INTRO
E05. Do you usually work indoors or outdoors?
INDOORS .............. 1→ SKIP TO E07 OUTDOORS .......... 2 BOTH ..................... 3→ SKIP TO E07 REFUSED .............. 9
177 Global Adult Tobacco Survey : Philippines Country Report, 2015

E06. Are there any indoor areas at your work place?
YES ........................ 1 NO .......................... 2→ SKIP TO E09INTRO DON’T KNOW ........ 7→ SKIP TO E09INTRO REFUSED .............. 9→ SKIP TO E09INTRO
E07. Which of the following best describes the indoor smoking policy where you work: 1.Smoking is
allowed anywhere, 2. Smoking is allowed only in some indoor areas, 3.Smoking is not allowed in any indoor areas, or 4. There is no policy?
ALLOWED ANYWHERE ...................................... 1 ALLOWED ONLY IN SOME INDOOR AREAS .... 2 NOT ALLOWED IN ANY INDOOR AREAS ......... 3 THERE IS NO POLICY ........................................ 4 DON’T KNOW ...................................................... 7
REFUSED ............................................................ 9 E08. During the past 30 days, did anyone smoke in indoor areas where you work?
YES ........................ 1 NO .......................... 2 DON’T KNOW ........ 7
REFUSED .............. 9 E09INTRO. The next questions ask whether you have visited these places during the past 30 days, and if
anyone smoked or you smelled cigarette smoke during your visit. E09. During the past30 days, did you visit any government buildings or government offices?
YES ........................ 1 NO .......................... 2→ SKIP TO E11 DON’T KNOW ........ 7→ SKIP TO E11 REFUSED .............. 9→ SKIP TO E11
E10. Did anyone smoke inside of any government buildings or government offices that you visited in
the past 30 days? YES ........................ 1 NO .......................... 2 DON’T KNOW ........ 7
REFUSED .............. 9
178 Global Adult Tobacco Survey : Philippines Country Report, 2015

E11. During the past 30 days, did you visit any health care facilities? YES ........................ 1 NO .......................... 2→ SKIP TO E13 DON’T KNOW ........ 7→ SKIP TO E13 REFUSED .............. 9→ SKIP TO E13
E12. Did anyone smoke inside of any health care facilities that you visited in the past 30 days?
YES ........................ 1 NO .......................... 2 DON’T KNOW ........ 7
REFUSED .............. 9 E13. During the past 30 days, did you visit any restaurants?
YES ........................ 1 NO .......................... 2→ SKIP TO E25 DON’T KNOW ........ 7→ SKIP TO E25 REFUSED .............. 9→ SKIP TO E25
E14. Did anyone smoke inside of any restaurants that you visited in the past 30 days?
YES ........................ 1 NO .......................... 2 DON’T KNOW ........ 7
REFUSED .............. 9 E25. During the past 30 days, did you visit any bars or night clubs?
YES ........................ 1 NO .......................... 2→ SKIP TO E15 DON’T KNOW ........ 7→ SKIP TO E15 REFUSED .............. 9→ SKIP TO E15
E26. Did anyone smoke inside of any bars or night clubs that you visited in the past 30 days?
YES ........................ 1 NO .......................... 2 DON’T KNOW ........ 7
REFUSED .............. 9
179 Global Adult Tobacco Survey : Philippines Country Report, 2015

E15. During the past 30 days, did you use any public transportation? YES ........................ 1 NO .......................... 2→ SKIP TO E21 DON’T KNOW ........ 7→ SKIP TO E21 REFUSED .............. 9→ SKIP TO E21
E16. Did anyone smoke inside of any public transportation that you used in the past 30 days?
YES ........................ 1 NO .......................... 2 DON’T KNOW ........ 7
REFUSED .............. 9 E21. During the past 30 days, did you visit any universities?
YES ........................ 1 NO .......................... 2→ SKIP TO E19 DON’T KNOW ........ 7→ SKIP TO E19 REFUSED .............. 9→ SKIP TO E19
E22. Did anyone smoke inside of any universities that you visited in the past 30 days?
YES ........................ 1 NO .......................... 2 DON’T KNOW ........ 7
REFUSED .............. 9 E19. During the past 30 days, did you visit any other schools or educational institutions?
YES ........................ 1 NO .......................... 2→ SKIP TO E17 DON’T KNOW ........ 7→ SKIP TO E17 REFUSED .............. 9→ SKIP TO E17
E20. Did anyone smoke inside of any schools or educational institutions that you visited in the past 30 days? YES ........................ 1 NO .......................... 2 DON’T KNOW ........ 7
REFUSED .............. 9 E17. Based on what you know or believe, does breathing other people’s smoke cause serious illness
in non-smokers?
YES ........................ 1 NO .......................... 2 DON’T KNOW ........ 7
REFUSED .............. 9
180 Global Adult Tobacco Survey : Philippines Country Report, 2015

Section F. Economics─Manufactured Cigarettes IF [B01=1 OR 2 (RESPONDENT CURRENTLY SMOKES DAILY OR LESS THAN DAILY)] AND [(B06a OR B10a)> 0 AND<= 888(RESPONDENT SMOKES MANUFACTURED CIGARETTES)], THEN CONTINUE WITH THIS SECTION.
OTHERWISE, SKIP TO NEXT SECTION.
F01a. The next few questions are about the last time you purchased cigarettes for yourself to smoke.
The last time you bought cigarettes for yourself, how many cigarettes did you buy?
[ENTER UNIT ON THIS SCREEN AND NUMBER ON NEXT SCREEN] CIGARETTES .................................. 1 PACKS ............................................. 2 REAMS............................................. 3 OTHER (SPECIFY) .......................... 4→F01c. [SPECIFY THE UNIT]:_____________________ NEVER BOUGHT CIGARETTES .... 5→ SKIP TO NEXT SECTION REFUSED ........................................ 9→ SKIP TO F03
F01b. [ENTER NUMBER OF (CIGARETTES/PACKS/REAMS/OTHER)]
[IF F01a=CIGARETTES, GO TO F02] [IF F01a=PACKS, GO TO F01dPack] [IF F01a=REAMS, GO TO F01dCart] [IF F01a=OTHER, GO TO F01dOther] F01dPack. Did each pack contain 10 cigarettes, 20 cigarettes, or another amount?
10 ............................ 1 20 ............................ 2 OTHER AMOUNT .. 7→ F01dPackA. How many cigarettes were in each pack? REFUSED ............... 9
[GO TO F02]
181 Global Adult Tobacco Survey : Philippines Country Report, 2015
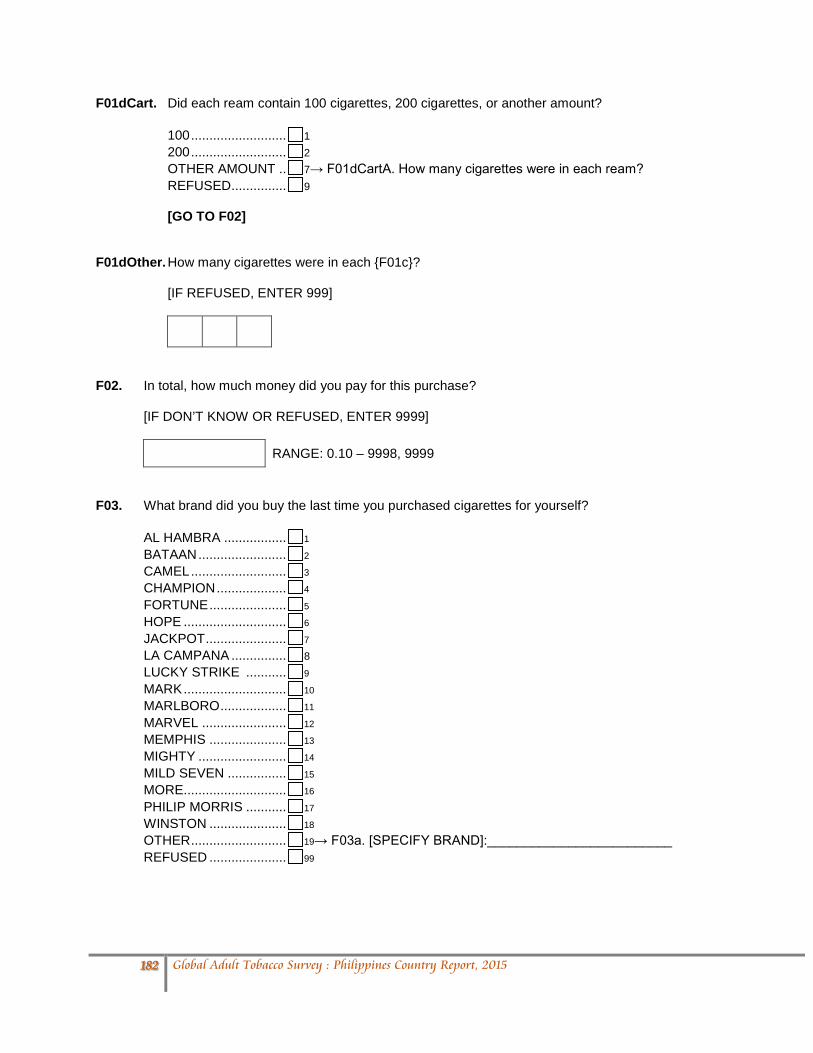
F01dCart. Did each ream contain 100 cigarettes, 200 cigarettes, or another amount? 100 .......................... 1 200 .......................... 2 OTHER AMOUNT .. 7→ F01dCartA. How many cigarettes were in each ream? REFUSED ............... 9
[GO TO F02]
F01dOther. How many cigarettes were in each {F01c}? [IF REFUSED, ENTER 999]
F02. In total, how much money did you pay for this purchase?
[IF DON’T KNOW OR REFUSED, ENTER 9999] RANGE: 0.10 – 9998, 9999
F03. What brand did you buy the last time you purchased cigarettes for yourself?
AL HAMBRA ................. 1 BATAAN ........................ 2 CAMEL .......................... 3 CHAMPION ................... 4 FORTUNE ..................... 5 HOPE ............................ 6
JACKPOT ...................... 7 LA CAMPANA ............... 8 LUCKY STRIKE ........... 9 MARK ............................ 10 MARLBORO .................. 11
MARVEL ....................... 12 MEMPHIS ..................... 13
MIGHTY ........................ 14 MILD SEVEN ................ 15
MORE............................ 16
PHILIP MORRIS ........... 17 WINSTON ..................... 18
OTHER .......................... 19→ F03a. [SPECIFY BRAND]:_________________________
REFUSED ..................... 99
182 Global Adult Tobacco Survey : Philippines Country Report, 2015

F04. The last time you purchased cigarettes for yourself, where did you buy them?
VENDING MACHINE .............................. 1 STORE .................................................... 2 STREET VENDOR (“TAKATAK”) ........... 3 MILITARY STORE .................................. 4 DUTY-FREE SHOP ................................ 5 OUTSIDE THE COUNTRY ..................... 6
KIOSKS ................................................... 7
INTERNET .............................................. 8
FROM ANOTHER PERSON ................... 9 CONVENIENCE STORE/GROCERY ..... 10 OTHER .................................................... 11 → F04a. [SPECIFY LOCATION]: __________________ DON’T REMEMBER ............................... 77
REFUSED ............................................... 99 F05. Were these cigarettes filtered or non-filtered?
FILTERED ....................... 1 NON-FILTERED .............. 2 DON’T KNOW ................. 7
REFUSED ....................... 9
F06. Were these cigarettes labeled as light, mild, or low tar?
LIGHT .................................. 1 MILD .................................... 2 LOW TAR ............................ 3 NONE OF THE ABOVE ...... 4
DON’T KNOW ..................... 7
REFUSED ........................... 9 F07. Were these cigarettes menthol or non-menthol?
MENTHOL ....................... 1 NON-MENTHOL ............. 2 DON’T KNOW ................. 7
REFUSED ....................... 9
183 Global Adult Tobacco Survey : Philippines Country Report, 2015

FF2. The tax on cigarettes in the Philippines has increased in January 2013, January 2014, and January 2015, resulting in higher prices of cigarettes. Have the increases in cigarette prices affected your smoking?
YES ........................ 1 NO .......................... 2SKIP TO NEXT SECTION DON’T KNOW ........ 7SKIP TO NEXT SECTION
REFUSED .............. 9SKIP TO NEXT SECTION FF3. In which of the following ways have the increases in cigarette prices affected your smoking? Did
the price increases influence you to...
YES NO REFUSED ▼ ▼ ▼
a. Make an attempt to stop smoking? ................................ 1 ........... 2 9 b. Think about quitting smoking? ....................................... 1 ........... 2 9 c. Decrease the number of sticks you smoke per day? ..... 1 ........... 2 9 d. Switch to a cheaper brand? ........................................... 1 ........... 2 9 e. Buy cigarettes in bulk/ream? .......................................... 1 ........... 2 9 f. Ask for cigarettes from other smokers? ......................... 1 ........... 2 9 g. Anything else? ................................................................ 1 ........... 2 9
g1. Specify:___________________________
184 Global Adult Tobacco Survey : Philippines Country Report, 2015

Section G. Media G01intro. The next few questions ask about your exposure to the media and advertisements in the last 30
days. G01. In the last 30 days, have you noticed information about the dangers of smoking cigarettes or that
encourages quitting in any of the following places?
b.
YES
NO NOT
APPLICABLE
REFUSED ▼ ▼ ▼ ▼
a. In newspapers or in magazines? ..... 1 ........ 2 ............... 7 .................. 9 b. On television?................................... 1 ........ 2 ............... 7 .................. 9 c. On the radio?.................................... 1 ........ 2 ............... 7 .................. 9 d. On billboards? .................................. 1 ........ 2 ............... 7 .................. 9 d1. On railways(MRT/LRT)? ................. 1 ........ 2 ............... 7 ....................... 9 d2. Cinema advertisements? ................ 1 ........ 2 ............... 7 ....................... 9 d3. In health care facilities? .................. 1 ........ 2 ............... 7 ....................... 9 d4. In malls? .......................................... 1 ........ 2 ............... 7 ....................... 9 e. Somewhere else? ............................ 1 ........ 2 ........................................ 9
[DO NOT INCLUDE HEALTH WARNINGS ON CIGARETTE PACKAGES]
→e1. Please specify where:_____________________________________ G02. In the last 30 days, did you notice any health warnings on cigarette packages?
YES ...................................................................... 1 NO ........................................................................ 2→ SKIP TO G04 DID NOT SEE ANY CIGARETTE PACKAGES ... 3→ SKIP TO G04 REFUSED ............................................................ 9→ SKIP TO G04
G03. [ADMINISTER IF B01 = 1 OR 2. ELSE GO TO G04]
In the last 30 days, have warning labels on cigarette packages led you to think about quitting?
YES ........................ 1 NO .......................... 2 DON’T KNOW ........ 7
REFUSED .............. 9
185 Global Adult Tobacco Survey : Philippines Country Report, 2015

G04. The next questions are about advertising and promotions that are designed to promote cigarette smoking. In the last 30 days, have you noticed any advertisements or signs promoting cigarettes in the following places?
YES
NO NOT
APPLICABLE
REFUSED ▼ ▼ ▼ ▼
a. In stores where cigarettes are sold? .................................. 1 ........ 2 ............ 7……… 9 b. On television?..................................................................... 1 ........ 2 ............ 7……… 9 c. On the radio?...................................................................... 1 ........ 2 ............ 7……… 9 d. On billboards? .................................................................... 1 ........ 2 ............ 7……… 9 e. On posters, leaflets, calendars?......................................... 1 ........ 2 ............ 7……… 9 f. In newspapers or magazines? ........................................... 1 ........ 2 ............ 7……… 9 g. In cinemas? ........................................................................ 1 ........ 2 ............ 7……… 9 h. On the internet? ................................................................ 1 ........ 2 ............ 7……… 9 i. On public transportation vehicles or stations? .................. 1 ........ 2 ............ 7……… 9 j. On public walls? ................................................................ 1 ........ 2 ............ 7……… 9 k. Anywhere else? .................................................................. 1 ........ 2………………………... 9
→k1. Please specify where: __________________________ G05. In the last 30 days, have you noticed any sport or sporting event that is associated with cigarette
brands or cigarette companies?
YES ........................ 1 NO .......................... 2 DON’T KNOW ........ 7
REFUSED .............. 9 G06. In the last 30 days, have you noticed any of the following types of cigarette promotions?
c.
YES
NO DON’T KNOW
REFUSED
▼ ▼ ▼ ▼ a. Free samples of cigarettes? ............................................... 1 ........ 2 ........ 7 ............ 9 b. Cigarettes at sale prices? ................................................... 1 ........ 2 ........ 7 ............ 9 c. Raffle tickets for cigarettes? ............................................... 1 ........ 2 ........ 7 ............ 9 d. Free gifts or special discount offers on other
products when buying cigarettes? .................................. 1 ........ 2 ........ 7 ............ 9 e. Clothing or other items with a cigarette
brand name or logo? ...................................................... 1 ........ 2 ........ 7 ............ 9 f. Cigarette promotions in the mail? ...................................... 1 ........ 2 ........ 7 ............ 9 g. Sponsor in any concert, art show, or fashion events? ....... 1 ........ 2 ........ 7 ............ 9
186 Global Adult Tobacco Survey : Philippines Country Report, 2015

Section H. Knowledge, Attitudes & Perceptions H01. The next question is asking about smoking tobacco. Based on what you know or believe, does smoking tobacco cause serious illness?
YES ........................ 1 NO .......................... 2 DON’T KNOW ........ 7
REFUSED .............. 9 H02. Based on what you know or believe, does smoking tobacco cause the following…
YES
NO DON’T KNOW
REFUSED
▼ ▼ ▼ ▼ a. Stroke (blood clots in the brain that may cause paralysis)? ............. 1 ........ 2 ............ 7 ............... 9 b. Heart attack? .................................... 1 ........ 2 ............ 7 ............... 9 c. Lung cancer?.................................... 1 ........ 2 ............ 7 ............... 9 d. Bladder cancer? ............................... 1 ........ 2 ............ 7 ............... 9 e. Tuberculosis? ................................... 1 ........ 2 ............ 7 ............... 9 f. Premature birth? .............................. 1 ........ 2 ............ 7 ............... 9 g. Bone loss? ........................................ 1 ........ 2 ............ 7 ............... 9
H03. Based on what you know or believe, does using smokeless tobacco cause serious illness?
YES ........................ 1 NO .......................... 2 DON’T KNOW ........ 7
REFUSED .............. 9 [H02_1 SHOULD ONLY BE ASKED OF CURRENT TOBACCO SMOKERS (B01 = 1 OR 2)] H02_1. Based on your experience of smoking, do you think that your current brand might be a little less
harmful, is no different, or might be a little more harmful, compared to other cigarettes?
A LITTLE LESS HARMFUL ....... 1 NO DIFFERENT ......................... 2
A LITTLE MORE HARMFUL ...... 3 DON’T KNOW ............................ 7 REFUSED .................................. 9
187 Global Adult Tobacco Survey : Philippines Country Report, 2015

H02_2. Do you think that some types of cigarettes could be less harmful than other types, or are all cigarettes equally harmful?
COULD BE LESS HARMFUL .... 1 ALL EQUALLY HARMFUL ......... 2
DON’T KNOW ............................ 7 REFUSED .................................. 9
H02_3. Do you believe cigarettes are addictive?
YES ........................ 1 NO .......................... 2 DON’T KNOW ........ 7
REFUSED .............. 9 H04. Would you favor or oppose a law that would completely prohibit smoking in indoor workplaces like
restaurants and bars and public places like terminals, waiting shed, and “carinderia/turo-turo”?
FAVOR ............. 1 OPPOSE .......... 2 DON’T KNOW .. 7
REFUSED ........ 9
188 Global Adult Tobacco Survey : Philippines Country Report, 2015

Section CP. Cigarette Packs IF [AGE >= 18]
AND
[B01 = 1 OR 2 (RESPONDENT CURRENTLY SMOKES DAILY OR LESS THAN DAILY)]
AND
[(B06a OR B10a) > 0 AND <= 888 (RESPONDENT SMOKES MANUFACTURED CIGARETTES)],
THEN CONTINUE WITH THIS SECTION.
OTHERWISE, SKIP TO NEXT SECTION I.
CP01. Do you have a pack of your cigarettes with you? I would like to take a few pictures of the pack.
The information obtained would only be used for the purpose of the study and would not be disclosed to anyone including your family members or any authority.
RESPONDENT WILLING TO SHOW PACK ....... 1 RESPONDENT DOES NOT HAVE A PACK ....... 2→ SKIP TO CP03 RESPONDENT REFUSES TO SHOW PACK ..... 3→ SKIP TO CP03
CP02. [INTERVIEWER: TAKE PICTURES OF CIGARETTE PACK]
[QUESTION TYPE = PICTURE CAPTURE]
a. FRONT SIDE b. TOP
CP02x1. [INTERVIEWER SELECT ANSWER BY YOURSELF: DOES THIS CIGARETTE PACK HAVE A
HEALTH WARNING ON IT?]
YES ........................ 1 NO .......................... 2 DON’T KNOW ........ 7
REFUSED .............. 9
CP02x2. [INTERVIEWER SELECT ANSWER BY YOURSELF: DOES THIS CIGARETTE PACK HAVE A
TAX STAMP ON IT?]
YES ........................ 1 NO .......................... 2 DON’T KNOW ........ 7
REFUSED .............. 9
[GO TO NEXT SECTION I]
189 Global Adult Tobacco Survey : Philippines Country Report, 2015

CP03. Did the last pack of cigarettes you purchased have a health warning on it?
[USE SHOWCARD]
YES ........................ 1 NO .......................... 2 DON’T KNOW ........ 7
REFUSED .............. 9
CP04. Did the last pack of cigarettes you purchased have a tax stamp on it?
[USE SHOWCARD]
YES ........................ 1 NO .......................... 2 DON’T KNOW ........ 7
REFUSED .............. 9
190 Global Adult Tobacco Survey : Philippines Country Report, 2015

End Individual Questionnaire I00. Those are all of the questions I have. Thank you very much for partcipating in this important survey. I02. [RECORD ANY NOTES ABOUT INTERVIEW:]
_______________________________________________________________________ _______________________________________________________________________ _______________________________________________________________________ _______________________________________________________________________ _______________________________________________________________________
191 Global Adult Tobacco Survey : Philippines Country Report, 2015

APPENDIX C: ESTIMATION OF SAMPLING ERRORS
The estimates from a sample survey are affected by two types of error: (1) non-sampling errors, and (2) sampling errors. Non-sampling errors are the result of errors or mistakes that cannot be attributable to sampling and were made in implementing data collection and data processing, such as errors in coverage, response errors, non-response errors, faulty questionnaires, interviewer recording errors, data processing errors, etc. Although numerous efforts were made during the implementation of GATS in Philippines to minimize those errors, non-sampling errors are impossible to avoid and difficult to evaluate statistically.
The sample of respondents selected in the GATS Philippines was only one of the samples that could have been selected from the same population, using the same design and sample size. Each of these samples would yield results that differed somewhat from the results of the actual sample selected. Sampling errors are a measure of the variability between all possible samples. The extent of variability is not known exactly, but can be estimated statistically from the survey results.
The following sampling error measures are presented for each of the selected indicator:
Estimate (R): Weighted prevalence estimate of the indicator:
Standard Error (SE): Sampling errors are usually measured in terms of standard errors for particular estimate or indicator (R). Standard error of an estimate is thus simply the square root of the variance of that estimate, and is computed in the same units as the estimate.
Sample Size (n): Total number of observations used to calculate the prevalence estimate (R).
Design Effect (Deft): Design effect denoted by ‘deff’ is the ratio of the actual variance of an indicator, under the sampling method used in the survey, to the variance calculated under the assumption of simple random sampling. The square root of the design effect denoted by ‘deft’ is used to show the efficiency of the sample design and is calculated for each estimate as the ratio between the standard error using the given sample design and the standard error that would result if a simple random sample had been used. A DEFT value of 1.0 indicates that the sample design is as efficient as a simple random sample, while a DEFT value above 1.0 indicates the increase in the standard error due to the use of a more complex sample design. In general, for a well-designed survey, DEFT usually ranges from 1 to 3. It is common, however, for DEFT to be much larger, up to 7 or 8.
Relative Standard Error (RSE): Relative standard error also known as coefficient of variation (CV) is the ratio of the standard error to the value of the indicator.
Margin of Error (MOE): Margin of error is computed as the product of the desired confidence measure and the standard error of the estimate. The level of confidence is usually based on a value (Z) of the standard normal distribution. For example, for a 95% level of confidence, we can use Z=1.96.
Confidence Limits (R±1.96SE): Confidence limits are calculated to show the interval within which the true value for the population can be reasonably assumed to fall. For any given statistic calculated from the survey, the value of that statistics will fall within a range of plus or minus two times the standard error of the statistic in 95 percent of all possible samples of identical size and design.
192 Global Adult Tobacco Survey : Philippines Country Report, 2015

Calculation of Standard Error
If the sample of respondents had been selected as a simple random sample, it would have been possible to use straight forward formulas for calculating sampling errors. However, the GATS Philippines sample is the result of a multi-stage stratified design, and consequently it was necessary to use more complex formulae. For the calculation of sampling errors from GATS Philippines data, SPSS complex samples version 18 was used. The Taylor linearization method of variance estimation was used for survey estimates that are means or proportions.
The Taylor linearization method treats any percentage or average as a ratio estimate, r = y/x, where y represents the total sample value for variable y, and x represents the total number of cases in the group or subgroup under consideration. The variance of r is computed using the formula given below:
∑ ∑= =
−
−−
==2
1 1
22
22
11)var()(
h
m
i h
hhi
h
hh
mZ
Zm
mx
frrSE
in which, ,hihihi rxyZ −= and hhh rxyZ −=
where h (=1 or 2) represents the stratum which is urban or rural,
mh is the total number of PSUs selected in the hth stratum,
yhi is the sum of the weighted values of variable y in the ith PSU in the hth stratum,
xhi is the sum of the weighted number of cases in the ith PSU in the hth stratum, and
f is the overall sampling fraction, which is so small that it is ignored.
The results are presented in this appendix for the country as a whole, for gender, urban and rural areas. For each variable or indicator, the type of statistic (mean, proportion, or rate) and the base population are given in Table C-1. In addition to the standard error (SE) described above, Tables C-2 to C-6 includes the value of the estimate (R), the sample size (n), the design effect (DEFF), the relative standard error (SE/R), margin of error (MOE) and the 95 percent confidence limits (R±1.96SE), for each indicator.
193 Global Adult Tobacco Survey : Philippines Country Report, 2015

Appendix Table C1: List of Indicators for Sampling Errors, GATS Philippines, 2015
Indicator Estimate Base Population
Current Tobacco Users Proportion Adults ≥ 15 years old
Current Tobacco Smokers Proportion Adults ≥ 15 years old
Current Cigarette Smokers Proportion Adults ≥ 15 years old
Current Users of Smokeless Tobacco Proportion Adults ≥ 15 years old
Dai ly Tobacco Smoker Proportion Adults ≥ 15 years old
Dai ly Cigarette Smokers Proportion Adults ≥ 15 years old
Former Dai ly Tobacco Smokers Among Al l Adults Proportion Adults ≥ 15 years old
Former Tobacco Smokers Among Ever Dai ly Smokers Proportion Ever da i ly tobacco smokers ≥ 15 years old
Time to Fi rs t Tobacco use within 5 minutes of waking Proportion Dai ly tobacco users ≥ 15 years old
Time to Fi rs t Tobacco use within 6-30 minutes of waking Proportion Dai ly tobacco users ≥ 15 years old
Smoking Quit Attempt in the Past 12 Months Proportion Current smokers and former smokers who have been abstinent for less than 12 months
Health Care Provider Asked about Smoking Proportion Current smokers and former smokers who have been abstinent for less than 12 months and who vis i ted a HCP during the past 12 months
Health Care Provider Advised Quitting Smoking Proportion Current smokers and former smokers who have been abstinent for less than 12 months and who vis i ted a HCP during the past 12 months
Use of Pharmacotherapy for Smoking Cessation Proportion Current smokers and former smokers who have been abstinent for less than 12 months
Use of Counsel ing/Advice or Quit Lines for Smoking Cessation Proportion Current smokers and former smokers who have been abstinent for less than 12 months
Planning to qui t, thinking about qui tting, or wi l l qui t smoking Proportion Current smokers ≥ 15 years old
Exposure to SHS at Home Proportion Adults ≥ 15 years old
Exposure to SHS at Workplace Proportion Adults who work indoors
Exposure to SHS in Government Bui ldings/Offices Proportion Adults ≥ 15 years old who have vis i ted in past 30 days
Exposure to SHS in Heal th Care Faci l i ties Proportion Adults ≥ 15 years old who have vis i ted in past 30 days
Exposure to SHS in Restaurants Proportion Adults ≥ 15 years old who have vis i ted in past 30 days
Exposure to SHS in Publ ic Transportation Proportion Adults ≥ 15 years old who have vis i ted in past 30 days
Last cigarette purchase in s tore Proportion Current manufactured cigarette smokers ≥ 15 years old
Noticed Anti -tobacco Information on radio or televis ion Proportion Adults ≥ 15 years old
Noticed Heal th Warning Labels on Cigarette Packages Proportion Current smokers ≥ 15 years old
Thinking of Quitting Because of Heal th Warning Labels on Cigarette Package Proportion Current smokers ≥ 15 years old
Noticed Any Cigarette Adverti sement or Promotion Proportion Adults ≥ 15 years old
Bel ieves that Tobacco Smoking Causes Serious I l lness Proportion Adults ≥ 15 years old
Bel ieves that Tobacco Smoking Causes Strokes Proportion Adults ≥ 15 years old
Bel ieves that Tobacco Smoking Causes Heart Attacks Proportion Adults ≥ 15 years old
Bel ieves that Tobacco Smoking Causes Lung Cancer Proportion Adults ≥ 15 years old
Bel ieves that Secondhand Causes Serious I l lness in Non-Smokers Proportion Adults ≥ 15 years old
Number of Cigarettes Smoked per Day (by da i ly smokers ) (Number) Mean Current da i ly cigarette smokers ≥ 15 years old
Time s ince Quitting Smoking (in years ) Mean Former smokers ≥ 15 years old
Monthly Expenditures on Manufactured Cigarettes (Phi l ippino Pesos - PhP) Mean Current Manufactured cigarette smokers ≥ 15 years old
Age at Dai ly Smoking Ini tiation Among Adults Age 15-34 (in Years ) Mean Ever da i ly smokers ≥ 15 years old 194 Global Adult Tobacco Survey : Philippines Country Report, 2015

Indicator Estimate ( R )Standard Error
(SE)Sample s i ze
(n)Des ign Effect
(DEFF)Relative Error
(SE/R)Margin of Error
(MOE)Lower Limit (R-
1.96SE)Upper Limit (R+1.96SE)
Current Tobacco Users 0.238 0.005 11583 1.602 0.021 0.01 0.229 0.248Current Tobacco Smokers 0.227 0.005 11644 1.534 0.021 0.01 0.217 0.236Current Cigarette Smokers 0.225 0.005 11644 1.547 0.021 0.01 0.215 0.234Current Users of Smokeless Tobacco 0.017 0.002 11550 3.941 0.141 0.00 0.012 0.022Dai ly Tobacco Smokers 0.187 0.004 11644 1.538 0.024 0.01 0.178 0.196Dai ly Cigarette Smokers 0.184 0.004 11644 1.567 0.024 0.01 0.175 0.192Former Dai ly Tobacco Smokers Among Al l Adults 0.049 0.003 11644 1.610 0.052 0.00 0.044 0.054Former Tobacco Smokers Among Ever Dai ly Tobacco Smokers 0.193 0.009 3204 1.653 0.046 0.02 0.175 0.211Time to Fi rs t smoke within 5 minutes of waking 0.174 0.010 2275 1.689 0.059 0.02 0.154 0.195Time to Fi rs t smoke within 6-30 minutes of waking 0.353 0.013 2275 1.768 0.038 0.03 0.327 0.379Smoking Quit Attempt in the Past 12 Months 0.522 0.013 2888 1.834 0.024 0.02 0.497 0.546Health Care Provider Asked about Smoking 0.705 0.020 804 1.607 0.029 0.04 0.665 0.745Health Care Provider Advised Quitting Smoking 0.565 0.022 804 1.647 0.040 0.04 0.521 0.609Use of Pharmacotherapy for Smoking Cessation 0.124 0.014 1502 2.557 0.110 0.03 0.097 0.150Use of Counsel ing/Advice or Quit Lines for Smoking Cessation 0.136 0.012 1499 1.856 0.089 0.02 0.113 0.160Planning to qui t, thinking about qui tting or wi l l qui t smoking 0.767 0.011 2761 1.826 0.014 0.02 0.745 0.788Exposure to SHS at Home 0.347 0.009 11506 3.969 0.025 0.02 0.329 0.364Exposure to SHS at Workplace 0.215 0.010 2513 1.628 0.049 0.02 0.194 0.235Exposure to SHS in Government Bui lding/Offices 0.136 0.009 4884 3.375 0.066 0.02 0.118 0.154Exposure to SHS in Heal th Care Faci l i ties 0.042 0.003 4823 1.357 0.080 0.01 0.036 0.049Exposure to SHS in Restaurants 0.219 0.008 5782 2.398 0.038 0.02 0.203 0.236Exposure to SHS in Publ ic Transportation 0.376 0.010 8629 3.333 0.025 0.02 0.357 0.395Last cigarette purchased in s tore 0.987 0.003 2580 1.646 0.003 0.01 0.980 0.992Noticed Anti -tobacco Information on radio or televis ion 0.688 0.010 11624 5.553 0.015 0.02 0.668 0.708Noticed Heal th Warning Labels on Cigarette Packages 0.924 0.007 2791 1.697 0.007 0.01 0.912 0.937Thinking of Quitting Because of Heal th Warning Labels on Cigarette Package 0.446 0.014 2777 2.307 0.032 0.03 0.418 0.474Noticed Any Cigarette Adverti sement or Promotion 0.586 0.012 11583 7.309 0.021 0.02 0.562 0.610Bel ieves that Tobacco Smoking Causes Serious I l lness 0.950 0.004 11641 4.412 0.004 0.01 0.942 0.958Bel ieves that Tobacco Smoking Causes Strokes 0.796 0.008 11641 4.620 0.010 0.02 0.780 0.812Bel ieves that Tobacco Smoking Causes Heart Attacks 0.857 0.007 11640 5.019 0.008 0.01 0.843 0.871Bel ieves that Tobacco Smoking Causes Lung Cancer 0.964 0.003 11643 2.865 0.003 0.01 0.958 0.969Bel ieves that SHS Causes Serious I l lness in Non-smokers 0.935 0.005 11640 4.716 0.005 0.01 0.925 0.945Number of Cigarettes Smoked per Day (by da i ly smokers ) 10.926 0.252 2,227 1.760 0.023 0.493 10.433 11.419Time s ince Quitting Smoking (in years ) 11.616 0.489 676 1.255 0.042 0.959 10.657 12.574Monthly Expenditures on Manufactured Cigarettes (Pesos) 678.434 17.501 2,513 1.643 0.026 34.302 644.132 712.737Age at Dai ly Smoking Ini tiation Age 15-34 17.536 0.126 1,038 1.239 0.007 0.246 17.289 17.782
Confidence Limits
Appendix Table C2. Sampling Errors -Overall, GATS Philippines, 2015.
195 Global Adult Tobacco Survey : Philippines Country Report, 2015

Indicator Estimate ( R )Standard Error
(SE)Sample s i ze
(n)Des ign Effect
(DEFF)Relative Error
(SE/R)Margin of Error
(MOE)Lower Limit (R-
1.96SE)Upper Limit (R+1.96SE)
Current Tobacco Users 0.419 0.008 5762 1.639 0.020 0.02 0.403 0.436Current Tobacco Smokers 0.403 0.008 5781 1.626 0.020 0.02 0.387 0.419Current Cigarette Smokers 0.401 0.008 5781 1.628 0.021 0.02 0.385 0.417Current Users of Smokeless Tobacco 0.027 0.004 5733 3.681 0.152 0.01 0.019 0.035Dai ly Tobacco Smokers 0.339 0.008 5781 1.700 0.024 0.02 0.323 0.355Dai ly Cigarette Smokers 0.334 0.008 5781 1.725 0.024 0.02 0.318 0.350Former Dai ly Tobacco Smokers Among Al l Adults 0.079 0.004 5781 1.394 0.053 0.01 0.071 0.088Former Tobacco Smokers Among Ever Dai ly Tobacco Smokers 0.177 0.009 2789 1.439 0.049 0.02 0.160 0.194Time to Fi rs t smoke within 5 minutes of waking 0.179 0.011 2026 1.641 0.061 0.02 0.158 0.201Time to Fi rs t smoke within 6-30 minutes of waking 0.356 0.014 2026 1.728 0.039 0.03 0.329 0.383Smoking Quit Attempt in the Past 12 Months 0.515 0.013 2505 1.814 0.026 0.03 0.489 0.542Health Care Provider Asked about Smoking 0.728 0.022 656 1.600 0.030 0.04 0.684 0.771Health Care Provider Advised Quitting Smoking 0.581 0.023 656 1.454 0.040 0.05 0.536 0.627Use of Pharmacotherapy for Smoking Cessation 0.131 0.015 1289 2.499 0.113 0.03 0.102 0.160Use of Counsel ing/Advice or Quit Lines for Smoking Cessation 0.134 0.013 1286 1.761 0.094 0.02 0.109 0.159Planning to qui t, thinking about qui tting or wi l l qui t smoking 0.766 0.012 2403 1.777 0.015 0.02 0.743 0.788Exposure to SHS at Home 0.390 0.011 5716 2.767 0.027 0.02 0.369 0.411Exposure to SHS at Workplace 0.264 0.015 1283 1.489 0.057 0.03 0.235 0.294Exposure to SHS in Government Bui lding/Offices 0.156 0.012 2329 2.427 0.075 0.02 0.133 0.179Exposure to SHS in Heal th Care Faci l i ties 0.049 0.006 1872 1.288 0.115 0.01 0.038 0.060Exposure to SHS in Restaurants 0.268 0.012 2936 2.038 0.044 0.02 0.245 0.291Exposure to SHS in Publ ic Transportation 0.399 0.012 4119 2.410 0.030 0.02 0.376 0.423Last cigarette purchased in s tore 0.987 0.003 2580 1.527 0.003 0.01 0.981 0.993Noticed Anti ,tobacco Information on radio or televis ion 0.684 0.011 5766 3.447 0.017 0.02 0.661 0.706Noticed Heal th Warning Labels on Cigarette Packages 0.934 0.006 2430 1.643 0.007 0.01 0.921 0.946Thinking of Quitting Because of Heal th Warning Labels on Cigarette Package 0.449 0.015 2416 2.285 0.034 0.03 0.419 0.479Noticed Any Cigarette Adverti sement or Promotion 0.617 0.014 5751 4.486 0.022 0.03 0.591 0.644Bel ieves that Tobacco Smoking Causes Serious I l lness 0.948 0.005 5781 2.806 0.005 0.01 0.939 0.958Bel ieves that Tobacco Smoking Causes Strokes 0.782 0.010 5781 3.375 0.013 0.02 0.762 0.802Bel ieves that Tobacco Smoking Causes Heart Attacks 0.850 0.008 5781 3.194 0.010 0.02 0.833 0.866Bel ieves that Tobacco Smoking Causes Lung Cancer 0.960 0.004 5781 1.932 0.004 0.01 0.953 0.967Bel ieves that SHS Causes Serious I l lness in Non-smokers 0.926 0.006 5,779 3.520 0.007 0.013 0.913 0.938Number of Cigarettes Smoked per Day (by da i ly smokers ) 11.166 0.257 1,993 1.733 0.023 0.504 10.662 11.669Time s ince Quitting Smoking (in years ) 11.544 0.514 552 1.113 0.045 1.008 10.536 12.552Monthly Expenditures on Manufactured Cigarettes (Pesos) 696.147 17.822 2,250 1.592 0.026 34.931 661.216 731.078Age at Dai ly Smoking Ini tiation Age 15-34 17.467 0.129 962 1.223 0.007 0.253 17.214 17.720
Appendix Table C3. Sampling Errors -Males, GATS Philippines, 2015.Confidence Limits
196 Global Adult Tobacco Survey : Philippines Country Report, 2015

Indicator Estimate ( R )Standard Error
(SE)Sample s i ze
(n)Des ign Effect
(DEFF)Relative Error
(SE/R)Margin of Error
(MOE)Lower Limit (R-
1.96SE)Upper Limit (R+1.96SE)
Current Tobacco Users 0.058 0.003 5821 1.259 0.060 0.01 0.051 0.064Current Tobacco Smokers 0.051 0.003 5863 1.266 0.063 0.01 0.045 0.057Current Cigarette Smokers 0.049 0.003 5863 1.260 0.065 0.01 0.043 0.055Current Users of Smokeless Tobacco 0.007 0.001 5817 1.270 0.178 0.00 0.004 0.009Dai ly Tobacco Smokers 0.036 0.003 5863 1.086 0.070 0.00 0.031 0.041Dai ly Cigarette Smokers 0.034 0.002 5863 1.067 0.072 0.00 0.029 0.039Former Dai ly Tobacco Smokers Among Al l Adults 0.019 0.002 5863 1.449 0.114 0.00 0.014 0.023Former Tobacco Smokers Among Ever Dai ly Tobacco Smokers 0.310 0.027 415 1.453 0.088 0.05 0.256 0.363Time to Fi rs t smoke within 5 minutes of waking 0.128 0.023 249 1.151 0.178 0.04 0.083 0.173Time to Fi rs t smoke within 6-30 minutes of waking 0.322 0.031 249 1.118 0.097 0.06 0.261 0.384Smoking Quit Attempt in the Past 12 Months 0.571 0.029 383 1.288 0.050 0.06 0.515 0.627Health Care Provider Asked about Smoking 0.602 0.057 148 1.995 0.095 0.11 0.490 0.714Health Care Provider Advised Quitting Smoking 0.488 0.057 148 1.933 0.117 0.11 0.376 0.600Use of Pharmacotherapy for Smoking Cessation 0.075 0.019 213 1.139 0.257 0.04 0.038 0.113Use of Counsel ing/Advice or Quit Lines for Smoking Cessation 0.151 0.028 213 1.298 0.185 0.05 0.096 0.206Planning to qui t, thinking about qui tting or wi l l qui t smoking 0.774 0.024 358 1.179 0.031 0.05 0.727 0.822Exposure to SHS at Home 0.303 0.009 5790 2.426 0.031 0.02 0.285 0.322Exposure to SHS at Workplace 0.164 0.010 1230 0.975 0.064 0.02 0.143 0.184Exposure to SHS in Government Bui lding/Offices 0.117 0.009 2555 2.032 0.078 0.02 0.099 0.134Exposure to SHS in Heal th Care Faci l i ties 0.038 0.004 2951 1.098 0.097 0.01 0.031 0.045Exposure to SHS in Restaurants 0.170 0.009 2846 1.573 0.052 0.02 0.153 0.187Exposure to SHS in Publ ic Transportation 0.355 0.010 4510 2.054 0.029 0.02 0.335 0.375Last cigarette purchased in s tore 0.984 0.009 2580 1.170 0.009 0.02 0.965 1.001Noticed Anti ,tobacco Information on radio or televis ion 0.692 0.011 5858 3.218 0.016 0.02 0.671 0.713Noticed Heal th Warning Labels on Cigarette Packages 0.851 0.018 361 0.946 0.021 0.04 0.815 0.887Thinking of Quitting Because of Heal th Warning Labels on Cigarette Package 0.421 0.031 361 1.427 0.074 0.06 0.360 0.482Noticed Any Cigarette Adverti sement or Promotion 0.555 0.013 5832 4.136 0.024 0.03 0.529 0.581Bel ieves that Tobacco Smoking Causes Serious I l lness 0.952 0.005 5860 2.689 0.005 0.01 0.943 0.961Bel ieves that Tobacco Smoking Causes Strokes 0.810 0.008 5860 2.545 0.010 0.02 0.794 0.826Bel ieves that Tobacco Smoking Causes Heart Attacks 0.865 0.008 5859 2.941 0.009 0.02 0.850 0.880Bel ieves that Tobacco Smoking Causes Lung Cancer 0.967 0.003 5862 2.170 0.004 0.01 0.960 0.974Bel ieves that SHS Causes Serious I l lness in Non-smokers 0.944 0.005 5,861 2.465 0.005 0.009 0.935 0.953Number of Cigarettes Smoked per Day (by da i ly smokers ) 8.562 0.857 234 1.704 1.639 0.100 6.883 10.241Time s ince Quitting Smoking (in years ) 11.920 1.139 124 1.558 1.293 0.096 9.688 14.152Monthly Expenditures on Manufactured Cigarettes (Pesos) 515.781 58.964 263 1.633 1.546 0.114 400.211 631.351Age at Dai ly Smoking Ini tiation Age 15-34 18.349 0.517 76 1.461 0.028 1.013 17.336 19.363
Confidence Limits
Appendix Table C4. Sampling Errors - Females,GATS Philippines, 2015.
197 Global Adult Tobacco Survey : Philippines Country Report, 2015

Indicator Estimate ( R )Standard Error
(SE)Sample s i ze
(n)Des ign Effect
(DEFF)Relative Error
(SE/R)Margin of Error
(MOE)Lower Limit (R-
1.96SE)Upper Limit (R+1.96SE)
Current Tobacco Users 0.221 0.006 4578 1.088 0.029 0.01 0.208 0.233Current Tobacco Smokers 0.217 0.006 4610 1.092 0.029 0.01 0.205 0.230Current Cigarette Smokers 0.217 0.006 4610 1.100 0.029 0.01 0.204 0.229Current Users of Smokeless Tobacco 0.006 0.001 4564 1.257 0.215 0.00 0.003 0.008Dai ly Tobacco Smokers 0.186 0.006 4610 1.111 0.032 0.01 0.174 0.198Dai ly Cigarette Smokers 0.185 0.006 4610 1.101 0.032 0.01 0.173 0.196Former Dai ly Tobacco Smokers Among Al l Adults 0.043 0.004 4610 1.690 0.091 0.01 0.035 0.050Former Tobacco Smokers Among Ever Dai ly Tobacco Smokers 0.176 0.014 1189 1.713 0.082 0.03 0.147 0.204Time to Fi rs t smoke within 5 minutes of waking 0.160 0.014 877 1.308 0.088 0.03 0.133 0.188Time to Fi rs t smoke within 6-30 minutes of waking 0.350 0.019 877 1.395 0.054 0.04 0.313 0.387Smoking Quit Attempt in the Past 12 Months 0.502 0.021 1075 1.810 0.041 0.04 0.461 0.542Health Care Provider Asked about Smoking 0.715 0.031 308 1.408 0.043 0.06 0.655 0.775Health Care Provider Advised Quitting Smoking 0.552 0.033 308 1.354 0.060 0.06 0.487 0.617Use of Pharmacotherapy for Smoking Cessation 0.105 0.022 519 2.675 0.210 0.04 0.062 0.148Use of Counsel ing/Advice or Quit Lines for Smoking Cessation 0.111 0.017 519 1.440 0.149 0.03 0.079 0.144Planning to qui t, thinking about qui tting or wi l l qui t smoking 0.763 0.017 1043 1.619 0.022 0.03 0.730 0.796Exposure to SHS at Home 0.295 0.012 4586 3.054 0.040 0.02 0.271 0.318Exposure to SHS at Workplace 0.182 0.012 1418 1.454 0.068 0.02 0.158 0.207Exposure to SHS in Government Bui lding/Offices 0.137 0.016 1773 3.782 0.116 0.03 0.106 0.168Exposure to SHS in Heal th Care Faci l i ties 0.037 0.004 1837 0.873 0.112 0.01 0.029 0.045Exposure to SHS in Restaurants 0.192 0.011 2678 2.023 0.056 0.02 0.171 0.214Exposure to SHS in Publ ic Transportation 0.406 0.013 3735 2.532 0.031 0.03 0.381 0.431Last cigarette purchased in s tore 0.990 0.004 2580 1.332 0.004 0.01 0.982 0.998Noticed Anti -tobacco Information on radio or televis ion 0.705 0.015 4608 4.812 0.021 0.03 0.677 0.734Noticed Heal th Warning Labels on Cigarette Packages 0.938 0.009 1044 1.377 0.009 0.02 0.921 0.955Thinking of Quitting Because of Heal th Warning Labels on Cigarette Package 0.389 0.021 1044 1.884 0.053 0.04 0.349 0.430Noticed Any Cigarette Adverti sement or Promotion 0.580 0.017 4609 5.552 0.030 0.03 0.547 0.614Bel ieves that Tobacco Smoking Causes Serious I l lness 0.946 0.008 4610 5.137 0.008 0.01 0.931 0.961Bel ieves that Tobacco Smoking Causes Strokes 0.820 0.010 4610 3.438 0.013 0.02 0.799 0.841Bel ieves that Tobacco Smoking Causes Heart Attacks 0.887 0.009 4610 3.954 0.010 0.02 0.869 0.905Bel ieves that Tobacco Smoking Causes Lung Cancer 0.971 0.004 4610 2.560 0.004 0.01 0.963 0.979Bel ieves that SHS Causes Serious I l lness in Non-smokers 0.943 0.008 4,610 5.946 0.009 0.016 0.927 0.960Number of Cigarettes Smoked per Day (by da i ly smokers ) 10.865 0.315 872 1.604 1.129 0.029 10.247 11.482Time s ince Quitting Smoking (in years ) 11.609 0.658 233 1.577 0.894 0.057 10.319 12.898Monthly Expenditures on Manufactured Cigarettes (Pesos) 736.556 24.140 1,002 1.655 1.118 0.033 689.242 783.869Age at Dai ly Smoking Ini tiation Age 15-34 17.521 0.182 435 1.137 0.010 0.357 17.164 17.878
Confidence Limits
Appendix Table C5. Sampling Errors - Urban,GATS Philippines, 2015
198 Global Adult Tobacco Survey : Philippines Country Report, 2015
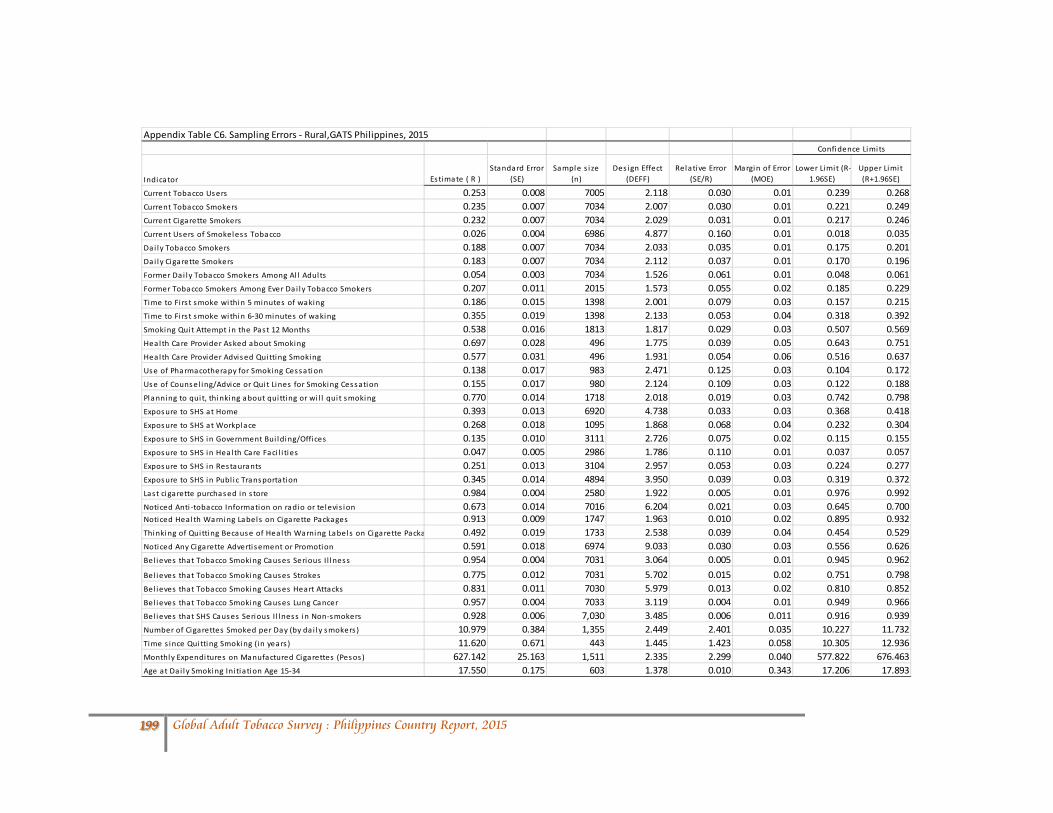
Indicator Estimate ( R )Standard Error
(SE)Sample s i ze
(n)Des ign Effect
(DEFF)Relative Error
(SE/R)Margin of Error
(MOE)Lower Limit (R-
1.96SE)Upper Limit (R+1.96SE)
Current Tobacco Users 0.253 0.008 7005 2.118 0.030 0.01 0.239 0.268Current Tobacco Smokers 0.235 0.007 7034 2.007 0.030 0.01 0.221 0.249Current Cigarette Smokers 0.232 0.007 7034 2.029 0.031 0.01 0.217 0.246Current Users of Smokeless Tobacco 0.026 0.004 6986 4.877 0.160 0.01 0.018 0.035Dai ly Tobacco Smokers 0.188 0.007 7034 2.033 0.035 0.01 0.175 0.201Dai ly Cigarette Smokers 0.183 0.007 7034 2.112 0.037 0.01 0.170 0.196Former Dai ly Tobacco Smokers Among Al l Adults 0.054 0.003 7034 1.526 0.061 0.01 0.048 0.061Former Tobacco Smokers Among Ever Dai ly Tobacco Smokers 0.207 0.011 2015 1.573 0.055 0.02 0.185 0.229Time to Fi rs t smoke within 5 minutes of waking 0.186 0.015 1398 2.001 0.079 0.03 0.157 0.215Time to Fi rs t smoke within 6-30 minutes of waking 0.355 0.019 1398 2.133 0.053 0.04 0.318 0.392Smoking Quit Attempt in the Past 12 Months 0.538 0.016 1813 1.817 0.029 0.03 0.507 0.569Health Care Provider Asked about Smoking 0.697 0.028 496 1.775 0.039 0.05 0.643 0.751Health Care Provider Advised Quitting Smoking 0.577 0.031 496 1.931 0.054 0.06 0.516 0.637Use of Pharmacotherapy for Smoking Cessation 0.138 0.017 983 2.471 0.125 0.03 0.104 0.172Use of Counsel ing/Advice or Quit Lines for Smoking Cessation 0.155 0.017 980 2.124 0.109 0.03 0.122 0.188Planning to qui t, thinking about qui tting or wi l l qui t smoking 0.770 0.014 1718 2.018 0.019 0.03 0.742 0.798Exposure to SHS at Home 0.393 0.013 6920 4.738 0.033 0.03 0.368 0.418Exposure to SHS at Workplace 0.268 0.018 1095 1.868 0.068 0.04 0.232 0.304Exposure to SHS in Government Bui lding/Offices 0.135 0.010 3111 2.726 0.075 0.02 0.115 0.155Exposure to SHS in Heal th Care Faci l i ties 0.047 0.005 2986 1.786 0.110 0.01 0.037 0.057Exposure to SHS in Restaurants 0.251 0.013 3104 2.957 0.053 0.03 0.224 0.277Exposure to SHS in Publ ic Transportation 0.345 0.014 4894 3.950 0.039 0.03 0.319 0.372Last cigarette purchased in s tore 0.984 0.004 2580 1.922 0.005 0.01 0.976 0.992Noticed Anti -tobacco Information on radio or televis ion 0.673 0.014 7016 6.204 0.021 0.03 0.645 0.700Noticed Heal th Warning Labels on Cigarette Packages 0.913 0.009 1747 1.963 0.010 0.02 0.895 0.932Thinking of Quitting Because of Heal th Warning Labels on Cigarette Packa 0.492 0.019 1733 2.538 0.039 0.04 0.454 0.529Noticed Any Cigarette Adverti sement or Promotion 0.591 0.018 6974 9.033 0.030 0.03 0.556 0.626Bel ieves that Tobacco Smoking Causes Serious I l lness 0.954 0.004 7031 3.064 0.005 0.01 0.945 0.962Bel ieves that Tobacco Smoking Causes Strokes 0.775 0.012 7031 5.702 0.015 0.02 0.751 0.798Bel ieves that Tobacco Smoking Causes Heart Attacks 0.831 0.011 7030 5.979 0.013 0.02 0.810 0.852Bel ieves that Tobacco Smoking Causes Lung Cancer 0.957 0.004 7033 3.119 0.004 0.01 0.949 0.966Bel ieves that SHS Causes Serious I l lness in Non-smokers 0.928 0.006 7,030 3.485 0.006 0.011 0.916 0.939Number of Cigarettes Smoked per Day (by da i ly smokers ) 10.979 0.384 1,355 2.449 2.401 0.035 10.227 11.732Time s ince Quitting Smoking (in years ) 11.620 0.671 443 1.445 1.423 0.058 10.305 12.936Monthly Expenditures on Manufactured Cigarettes (Pesos) 627.142 25.163 1,511 2.335 2.299 0.040 577.822 676.463Age at Dai ly Smoking Ini tiation Age 15-34 17.550 0.175 603 1.378 0.010 0.343 17.206 17.893
Confidence Limits
Appendix Table C6. Sampling Errors - Rural,GATS Philippines, 2015
199 Global Adult Tobacco Survey : Philippines Country Report, 2015

APPENDIX D: SAMPLE DESIGN
The 2015 Philippine GATS used the Philippine 2003 Master Sample (MS) created for PSA’s household-based surveys with some modifications to conform to the GATS protocol on sampling design. One of the four replicates of the MS was used for the GATS. Stratification Within each region, the first level of stratification was by province, HUCs and ICCs. This stratification is helpful for making separate design-based estimates for provinces, HUCs and ICCs. However, the estimates at this level generally will have low reliability. Implicit stratification was also applied within the final explicit strata using the following variables: Proportion of strong houses; agricultural indicator; and per capita income (i.e. total income of the municipality divided by its total population).
Stages of Selection The 2003 MS was based on a three-staged sample design with barangays or combination of small contiguous barangays within the same municipality as primary sampling units (PSU). The average PSU size or the average number of households in a PSU is 923. For the 2015 Philippine GATS, additional stage of selection is added to select one eligible respondent per household.
200 Global Adult Tobacco Survey : Philippines Country Report, 2015

At the first stage, where there were 16,579 primary sampling units (PSUs) across the country, a sample of 2,826 PSUs were drawn using probability proportional to the estimated size (PPES), the measure of size being the number of households from the 2000 Census of Population and Housing. From the full set of 2,826 sampled PSUs, 4 replicates are formed by randomly assigning any number from 1 to 4 to each PSU. PSUs with same number were grouped together to form one replicate. For the 2015 Philippine GATS, replicate 4 is selected. In the second stage of selection, within each selected PSU, enumeration areas (EAs) were selected with probability proportional to the number of households in the EA. An EA was defined as an area with discernible boundaries consisting of approximately 350 contiguous households. For the 2015 Philippine GATS, there are 794 sample EAs in replicate 4. In the third stage, within each sampled EA, 16 to 18 housing units on the average were selected using systematic sampling. For operational considerations, at most 30 housing units are selected per sample EAs. All households in the sample housing units are interviewed except for housing units with more than three households. In those cases, only three households are selected. For the 2015 Philippine GATS, all households listed in the sample housing unit are interviewed. However, if additional household/s are found during the actual visit, random selection process is applied to reselect sample household within the sample housing unit. Finally, from each sampled household, one eligible respondent from the household members 15 years old and over, regardless of sex, was randomly selected for interview using the GATS Individual Questionnaire. Base weights In general, the base weight for a sampled unit is given by the inverse of that unit’s probability of selection for the sample. Thus, selection probabilities are computed.
In the 2003 MS, the probability that a housing unit is included in the sample varies across domains/regions but is designed to be constant within each region. In nearly all cases, all households in sampled housing units are included in the sample. In these cases, the selection probability for a household is the same as that for its housing unit. If the selection probability for a housing unit in region/domain d is Hence, the base weight for a sampled household in domain d in a housing unit in
which all households are included is If a survey collects data on all persons in sampled households, the selection probabilities of persons and households are the same. Hence the household base weights also apply to persons. However, for the 2015 Philippine GATS, only one eligible respondent is randomly selected from all eligible members within the household. Thus, person base weights are computed.
Nonresponse adjustments
Adjustments are also made to the base weights to compensate for nonresponse by sampled units eligible for the survey. The adjustment inflates the base weights of “similar” responding units to compensate for nonresponding units using weighting class adjustment.
df ′1/d dw f ′=
201 Global Adult Tobacco Survey : Philippines Country Report, 2015

Population weighting adjustment
Generally, weighted sample distributions do not conform to known population distributions (e.g. projected population counts). Here, the nonresponse adjusted person weights is further adjusted so that the weighted survey estimates of the national sex/age distribution and of the regional total population distribution produced the corresponding population projection distributions.
Final weights The final survey weight assigned to each responding unit is computed as the product of the base weight, the nonresponse adjustment, and the population weighting adjustment. The final weights are then used to produce valid estimates of population parameters. The final weights is used in the estimation procedure.
Estimation Procedure Most of the estimates generated from surveys that utilized the 2003 MS design are in the form of totals, means, proportions, or ratios. The survey estimate of the population total for variable y, denoted by Y, is
then ˆi iY w y= Σ ., where iwΣ estimates the total number of units in the population, N.
The extension to estimating a population mean for y, /Y Y N= , is straightforward. With Y
estimating Y and iwΣ estimating N, Y may be estimated by /i i iy w y w= Σ Σ . Letting 1iy = if
respondent i has a given characteristic and 0iy = if not, then y estimates the proportion with the characteristic. Furthermore, Population ratio in the form /R Y X= , where X is the population total for another
variable denoted by x may be estimated by the ratio estimator /i i i ir w y w x= Σ Σ . A mean or proportion
is the special case with 1ix = for all units in the population.
202 Global Adult Tobacco Survey : Philippines Country Report, 2015

APPENDIX E: TECHNICAL AND SURVEY STAFF
Department of Health (DOH) Dr. Agnes Segarra – GATS Country Coordinator Fe A. Sinson Theresa D. Timbang Lea Mylene R. Rebanal Krizzell Wangiwang World Health Organization (WHO) Mina Kashiwabara Dr. Florante Trinidad Centers for Disease Control and Prevention (CDC) Krishna Mohan Palipudi, CDC Focal Point for Philippines Edward Rainey Simone Salandy Luhua Zhao Anna Dean Jeremy Morton Indu Ahluwalia RTI International Steve Litavecz
CDC Foundation Rachna Chandora Brandon Talley Questionnaire Review Committee (QRC) Gary Giovino (Chair) Ron Borland Prakash C. Gupta Jeremy Morton
Sample Review Committee (SRC) James Michael Bowling (Chair) William D. Kalsbeek Tarun K. Roy Krishna Mohan Palipudi
203 Global Adult Tobacco Survey : Philippines Country Report, 2015

Country Report Contributors
Dr. Agnes Segarra Fe A. Sinson Theresa D. Timbang Lea Mylene R. Rebanal Krizzell Wangiwang Dr. Florante Trinidad Wilma A. Guillen Plenee Grace J. Castillo Dr. Cristina Galang Pio Justine Asuncion Dr. Socorro Santos Aurora D. Banda-Alfonso
PSA PROJECT MANAGEMENT STAFF
Lisa Grace S. Bersales, Ph.D. - National Statistician and Civil Registrar General Romeo S. Recide – Deputy National Statistician
Wilma A. Guillen - Assistant National Statistician (2015 – Present) Manuel L. Laopao – Interim Assistant National Statistician (2014 – 2015)
PSA CORE PROJECT TECHNICAL STAFF
Benedicta A. Yabut Jeremias A. Luis
Erma Y. Aquino Elpidio A. Maramot Wilma C. Sulit Randolph S. Valdez Percival A. Salting Joan P. Martinez Maria Teresa V. Olivares Florante Varona
PSA INFORMATION TECHNOLOGY SUPPORT
Gene Lorica Edgar Fajutagana
Karina Paz Bacuyag Mark Anden
204 Global Adult Tobacco Survey : Philippines Country Report, 2015

IT Orientation and Training on Pretest Benedicta Yabut Frederic Fornea Elpidio Maramot Randolph Valdez Erma Aquino Ralph Bariata Marjorie Villaver Maritess Tan
Joan Martinez Ma. Theresa Rapanan Wilma Sulit Nenita Marquez Ma. Teresa Olivares Filipinas Lim Percival Salting Gemelyn Macabiog Gene Lorica Norma Ayuban Edgar Fajutagana Gloria Morales Mark Anden Florante Varona Corazon de Luna Joseph Cajeta Karina Paz Bacuyag Rosie Sta. Ana
Pretest 1 Erma Aquino Ana Cadaro Edna Rapanot Gemelyn Macabiog
Mercedes Hoquis Gloria Miorales
Wilma Sulit Lorenzo Bautista Randolph Valdez Maritess Tan
Norma Ayuban Inocencia Macabiog
Priscilla Bacus Charito Capacete
Romelyn Anden
Over-all Supervisor: Elpidio Maramot Supervisor-at-large: Benedicta Yabut
205 Global Adult Tobacco Survey : Philippines Country Report, 2015

Pretest 2 Overall supervisors/ Data Manager: Edgar Fajutagana Technical: Elpidio Maramot/Erma Aquino IT: Karina Paz Bacuyag/Mark Anden Michael Oliveros/Kristine Bautista
Wilma Sulit Fe Sinson Gemelyn Macabiog Percival Salting Filipinas Lim Ma. Theresa Rapanan Lea Mylene Rebanal Gloria Morales
Joan Martinez Theresa Timbang Maritess Tan Maria Teresa Olivares Nenita Marquez Randolph Valdez Krizell Wangiwang Norma Ayuban
Task Force Training
Central Office
Edward Rainey-CDC Jennielyn Mariano Jeremias Luis Rosalinda Mapaye Elpidio Maramot Lawrence Marquez Erma Aquino Enrique Maglalang Jr. Randolph Valdez Donna de Jesus Wilma Sulit Ma. Paz Sulpico Percival Salting Chris Domingo Maritess Tan Melchor Olmos Gemelyn Macabiog Ma. Rosario de Luna Ana Cadaro Dr. Agnes Segarra Florante Varona Fe Sinson Jade Laranjo Krizzell Wangiwang Karina Bacuyag Lea Mylene Rebanal Edgar Nogales Theresa Timbang Mark Anden Kristine Bautista
206 Global Adult Tobacco Survey : Philippines Country Report, 2015

Task Force Training
FIELD OFFICE
Region Name of Personnel
I Arturo de Sola Niño Tuazon
II Angelina Callangan Myrna Jane Oli
III Marcelino de Mesa Allan Bruno
IV-A Charity Bautista Elvin Arasula
IV-B Maribel Bernardo Donna Marie Mobe
V Anna Bajamundi Gresan Adique
VI April Dream Pugon-Perez Rovelyn Llamas
VII Myrna Trinidad Cataluña Felixberto Sato Jr.
VIII Sheryl Ann Jamisola Jonas Repulda
IX Roxan Kastine Lumapas Mark Anthony Belderol
X Georgette Gayomali Roy Michael Difuntorum
XI Corazon Dres Jann Blair Salinas
XII Rodolfo Mendoza Edward Donald Eloja
NCR Marilyn Vergara Joel Pertez
CAR Jomar Cariaga
ARMM Noronisa Macadadaya Ysmael Baraquir
CARAGA Odelia Acero Charis Fernandez
207 Global Adult Tobacco Survey : Philippines Country Report, 2015

Other Resource Persons in the Task Force Training
Mr. Edward Rainey - CDC Mr. Stephen Litavecz - RTI Ms. Mina Kashiwabara - WHO
Dr. Agnes Segarra - DOH Ms. Theresa Timbang - DOH Ms. Fe Sinson - DOH
Dialect Translators/ Reviewers
Dialect Translator Reviewer
Tagalog Maritess Tan Benedicta Yabut Ilocano Maria Theresa Rapanan Erma Aquino
Bicol Percival Salting Blanca Ortiz Waray Michael Bello Socorro Abejo
Hiligaynon Ma. Goretti Novilla Solficar Pescuela Cebuano Lily Elegue Guillermo Lipio Jr.
2nd Level Trainers
Name Area of Assignment Rosalinda Sacdalan (Central Office) I Arturo de Sola (Field Office) Niño tuazon (Field Office)
Lawrence Marquez (C.O.) II Angelina Callangan (F.O.) Mary Jane Oli (F.O.) Jennielyn Mariano (C.O.) III Wilma Sulit (C.O.) Patricia Ramos (F.O.) Jessie Lobo (F.O.) Mark Anden (C.O.) IVB Maribel Bernardo (F.O.) Donna Marie Mobe (F.O.) Florante Varona (C.O.) V Anna Bajamundi (F.O.) Gresan Adique (F.O.) Enrique Maglalang (C.O.) VI Joan Martinez (C.O.)
208 Global Adult Tobacco Survey : Philippines Country Report, 2015

April Dream Pugon-Perez (F.O.) Rovelyn Llamas (F.O.) Ma. Teresa Olivares (C.O.) VII Myrna Trinidad Cataluña (F.O.) Felixberto Sato Jr. (F.O.) Sheryl Ann Jamisola (F.O.) VIII Jonas Repulda (F.O.) Ma. Rosario de Luna (C.O.) IX Roxan Kastine Lumapas (F.O.) Mark Anthony Belderol (F.O.) Donna de Jesus (C.O.) X Georgette Gayomali (F.O.) Roy Michael Difuntorum (F.O.) Wilma A. Guillen (C.O.) XI Benedicta Yabut (C.O.) Ma. Paz Sulpico (C.O.) Corazon Dres (F.O.) Jann Blair Salinas (F.O.) Jade Laranjo (C.O.) XII Christopher Domingo (C.O.) Rodolfo Mendoza (F.O.) Edward Donald Eloja (F.O.) Marilyn Vergara (F.O.) NCR Joel Pertez (F.O.) Percival Salting (C.O.) CAR Jomar Cariaga (F.O.) Edgar Nogales (C.O.) ARMM Noronisa Macadadaya (F.O.) Ysmael Baraquir (F.O.) Karina Bacuyag (C.O.) Caraga Odelia Acero (F.O.) Charis Fernandez (F.O.)
FIELD OFFICE
Region I – Ilocos
Name Designation Regional Office
Socrates Ramores Interim Regional Director Arturo De Sola Regional Supervisor Niño Tuazon Regional I.T. Supervisor
Ilocos Norte
Alejandro Rapacon, Jr. Provincial Statistics Officer Rodel Ragonjan Provincial Supervisor Leo Tolentino Field Interviewer
209 Global Adult Tobacco Survey : Philippines Country Report, 2015

Ilocos Sur
Reynor Fernando OIC-Provincial Statistics Officer Gloria Pascua Provincial Supervisor Honeylene Valery Tipon Field Interviewer
La Union Imelda Buyuccan Provincial Statistics Officer Divino Amor Rivera Provincial Supervisor Marieta Piaoan Team Supervisor Reynante Bautista Field Interviewer Billy Orcilla Field Interviewer
Pangasinan
Edgar Norberte Provincial Statistics Officer Xavier Narvas Provincial Supervisor Reynaldo Sotelo Team Supervisor Roland Madrid Team Supervisor Michael Uson Field Interviewer Julius Velasco Field Interviewer John Niebres Field Interviewer Frances Martin Fernandez Field Interviewer
Region II – Cagayan Valley
Name Designation Regional Office
Marilyn Estrada Interim Regional Director Angelina Callangan Regional Supervisor Myrna Jane Oli Regional I.T. Supervisor
Batanes
Ramil Abad Provincial Statistics Officer Jaime Cobico Provincial Supervisor Nestor Guisando Field Interviewer
Cagayan Elena Rivera Provincial Statistics Officer Cristeta Retoma Provincial Supervisor Adela Follante Team Supervisor Encarnacion Ricerra Field Interviewer Ana Pagadduan Field Interviewer
Isabela Julius Emperador Provincial Statistics Officer Emielee Eugenie Pataueg Provincial Supervisor
210 Global Adult Tobacco Survey : Philippines Country Report, 2015

Jose Marie Geronimo Team Supervisor Elison Cabiles Field Interviewer Quintin Domingo Sr. Field Interviewer Fritzy Gae Garma Field Interviewer
Nueva Vizcaya
Girme Bacuyan Provincial Statistics Officer Daisy Villar Provincial Supervisor Easter John Bautista Field Interviewer
Quirino Cherry Grace Agustin Provincial Statistics Officer Liz Duque Provincial Supervisor Allan Somera Field Interviewer
Region III – Central Luzon
Name Designation Regional Office
Edgardo Pare Interim Regional Director Marcelino de Mesa Regional Supervisor Allan Bruno Regional I.T. Supervisor
Aurora
Mercy Duaso Provincial Statistics Officer Irene Sindac Provincial Supervisor Benito Orozco Field Interviewer
Bataan Ledesma Morante Provincial Statistics Officer Allan Bruno Provincial Supervisor Maricar Castillo Field Interviewer
Bulacan
Emma Fabian Provincial Statistics Officer Marcelino De Mesa Provincial Supervisor Gilbert Ignacio Team supervisor Jayson Gervacio Field Interviewer Jemeliz Angeles Field Interviewer Ravenal Santos Field Interviewer
Nueva Ecija
Elizabeth Rayo Provincial Statistics Officer Ria Salvador Provincial Supervisor Jonnabel Yu Team supervisor Amelita Almayda Field Interviewer Precious Bernardino Field Interviewer
211 Global Adult Tobacco Survey : Philippines Country Report, 2015

Pampanga
Florencio Angulo, Jr. Provincial Statistics Officer Annalyn Alinea Provincial Supervisor Crisol Gamido Team supervisor Jane Janga Field Interviewer Renz Hart Talucod Field Interviewer
Tarlac Arlene Divino Provincial Statistics Officer Amalio Salak Provincial Supervisor Jude Eric Galang Field Interviewer Manfort Domingo Jr. Field Interviewer
Zambales
Ma. Virginia Olveña Provincial Statistics Officer Rizabelle Lorenzo Provincial Supervisor Jowie Sepulveda Field Interviewer
Region IVA - CALABARZON
Name Designation Regional Office
Rosalinda Bautista Interim Regional Director Charity Bautista Regional Supervisor Elvin Arasula Regional I.T. Supervisor
Batangas
Charito Armonia Provincial Statistics Officer Arcangel Malabanan Provincial Supervisor Eflida Adel Team Supervisor Delfina Marilou Ocampo Field Interviewer Gemma Mercado Field Interviewer Miguelito Ruedas Field Interviewer
Cavite Lucia Iraida Soneja Provincial Statistics Officer Teresa Vidal Provincial Supervisor Thelma Artista Team Supervisor Ninfa Anisco Field Interviewer Anamor Asilar Field Interviewer Charry Mae Mana-ay Field Interviewer
Laguna Magdalena Serqueña Provincial Statistics Officer Annelyn Condino Provincial Supervisor
212 Global Adult Tobacco Survey : Philippines Country Report, 2015

Catherine Brosas Team Supervisor Marilou Aguila Field Interviewer Norlyn Cabrera Field Interviewer Marites Callejo Field Interviewer
Quezon
Airene Pucyutan Provincial Statistics Officer Liwayway Rebualos Provincial Supervisor Roberto Ramos Team Supervisor Wilman Ebonia Field Interviewer Cleofe Legson Field Interviewer
Rizal
Evelyn Sevilla Provincial Statistics Officer Gemalli Agustin Provincial Supervisor Janice Tan Team Supervisor Cherry Ann Villanueva Field Interviewer Nova Fulgencio Field Interviewer
Region IVB - MIMAROPA
Name Designation Regional Office
Leni Rioflorido Interim Regional Director Maribel Bernardo Regional Supervisor Donna Marie Mobe Regional I.T. Supervisor
Marinduque
Wilma Jinang Provincial Statistics Officer Gemma Opis Provincial Supervisor Michelle Lamarca Field Interviewer
Occidental Mindoro Samuel Villar Provincial Statistics Officer Griselda Malabanan Provincial Supervisor Joanne Alcantara Field Interviewer
Oriental Mindoro
Efren Armonia Provincial Statistics Officer Pepito David Provincial Supervisor Herbert Romero Field Interviewer
Palawan
Benjamin Quintero Provincial Statistics Officer Dennis Hilario Provincial Supervisor Jeanette Degillo Team supervisor
213 Global Adult Tobacco Survey : Philippines Country Report, 2015

Salvacion Mayang Field Interviewer Rizza Badango Field Interviewer
Romblon Lino Faminialagao Provincial Statistics Officer Jonathan Firmalo Provincial Supervisor Josil Odyseus Rotoni Field Interviewer
Region V - Bicol
Regional Office Cynthia Perdiz Interim Regional Director Anna Bajamundi Regional Supervisor Gresan Adique Regional I.T. Supervisor
Albay
Cecil Brondial Provincial Statistics Officer Diosdado Basquiñas Provincial Supervisor Coney Frances Baleda Team supervisor Jeffrey Aragon Field Interviewer Antonio Mariano Saludo Field Interviewer
Camarines Norte
Anabella Barquilla Provincial Statistics Officer John Vincent Ramorez Provincial Supervisor Francis Allben Abrenica Field Interviewer
Camarines Sur
Clemente Manaog Provincial Statistics Officer Neil De La Torre Provincial Supervisor Maria Rizaly Agustin Team supervisor Analy Alcozar Field Interviewer Shiela Azuer Field Interviewer
Catanduanes
Elisa Solares Provincial Statistics Officer Jocelyn Uchi Provincial Supervisor Nanette Temeña Field Interviewer
Masbate Arnulfo Virtucio Provincial Statistics Officer Narec Conag Provincial Supervisor Erlita Oliverio Team supervisor Clavel Monteron Field Interviewer Robert Baarde Field Interviewer
Sorsogon
214 Global Adult Tobacco Survey : Philippines Country Report, 2015

Elvira Apogñol Provincial Statistics Officer Ma. Donna Elano Provincial Supervisor Janice Estadola Field Interviewer
Region VI – Western Visayas
Regional Office
Norman Julag-ay Interim Regional Director April Dream Pugon-Perez Regional Supervisor Rovelyn Llamas Regional I.T. Supervisor
Aklan
Rodelyn Panadero Provincial Statistics Officer Peter Mangilog Provincial Supervisor Elsa Salvacion Field Interviewer
Antique Jesus Escote Jr. Provincial Statistics Officer Randy Tacogdoy Provincial Supervisor Marlon Vargas Field Interviewer
Capiz
Frankie Dordas Provincial Statistics Officer Joevel Cobrador Provincial Supervisor Jeremy Dela Cruz Field Interviewer
Iloilo and Guimaras
William Jaro Provincial Statistics Officer Nelida Amolar Provincial Supervisor Elmer Tumlos Team Supervisor Jorna Pedroso Field Interviewer Ramel Majaducon Field Interviewer Juby Espinosa Field Interviewer
Negros Occidental Fred Sollesta Provincial Statistics Officer Luis Gonzales Provincial Supervisor Irna Asuero Team supervisor Marylisa Billones Field Interviewer Ruby Aimee Licaniel Field Interviewer Analie Quiquiles Field Interviewer
Region VII – Central Visayas
Regional Office Ariel Florendo Interim Regional Director Myrna Trinidad Cataluña Regional Supervisor Felixberto Sato Jr. Regional I.T. Supervisor
215 Global Adult Tobacco Survey : Philippines Country Report, 2015

Bohol
Jessamyn Anne Alcazaren Provincial Statistics Officer Fidel Antopina Jr. Provincial Supervisor Armand Pergamino Team supervisor Oliver Taghap Field Interviewer Leedy Mae Doydora Field Interviewer
Cebu Firmo Diputado Provincial Statistics Officer April Aglan Mifil Gocela Provincial Supervisor Rogelio Perez Jr. Team Supervisor Jose Ronie Pedroza Team Supervisor Julia Carreon Field Interviewer Glen Paolo Reyes Field Interviewer Cirilo Ranili Field Interviewer Janice Alqueza Field Interviewer Zosimo Enodio Jr. Field Interviewer
Negros Oriental
Ariel Fortuito Provincial Statistics Officer Harold Roy Infante Provincial Supervisor Alberto Girasol Team Supervisor Eric Torres Field Interviewer Michael Armas Field Interviewer
Siquijor
Leopoldo Alfanta Jr. Provincial Statistics Officer Sarin Fatima Lauron Field Interviewer
Region VIII – Eastern Visayas
Regional Office
Raul Dones Interim Regional Director Sheryl Ann Jamisola Regional Supervisor Jonas Repulda Regional I.T. Supervisor
Biliran
Francisco Rostata Provincial Statistics Officer Reynaldo Rostata Provincial Supervisor Niño Javines Field Interviewer
Eastern Samar Ronnie Bajado Provincial Statistics Officer Suzanne Amosco Provincial Supervisor Jane Caroline Grafil Field Interviewer
216 Global Adult Tobacco Survey : Philippines Country Report, 2015

Leyte Wilma Perante Provincial Statistics Officer Anesia Babante Provincial Supervisor Rodolfo Novillo Jr. Team Supervisor Ethelyn Luz Dadizon Field Interviewer Raissa Esmero Field Interviewer Jelenie Biore Field Interviewer
Northern Samar
Julian Gallano Provincial Statistics Officer Mae Moreno Provincial Supervisor Ruth Perez Field Interviewer
Samar (Western)
Riza Moraleta OIC-Provincial Statistics Officer Ligaya Prieto Provincial Supervisor Jude Andre Versoza Field Interviewer
Southern Leyte Eutemio Llevado Jr. Provincial Statistics Officer Jenny Ang Provincial Supervisor Rodessa Roa Field Interviewer
Region IX – Zamboanga Peninsula
Name Designation
Regional Office Ronaldo Taghap Interim Regional Director Roxan Kastine Lumapas Regional Supervisor Mark Anthony Belderol Regional I.T. Supervisor Jhasmin Candido Field Interviewer
Zamboanga del Sur/Sibugay
Adelaida Cuarte Provincial Statistics Officer Dimna Bienes Provincial Supervisor Arli Jone Monarca Team Supervisor Acasis Maglinti Field Interviewer Karla May Jimeno Field Interviewer Raymark dela Peña Field Interviewer
Zamboanga del Norte Ma. Lila Daan Provincial Statistics Officer Sesenia Belorio Provincial Supervisor Richard Reyes Field Interviewer Arnie Morados Field Interviewer
217 Global Adult Tobacco Survey : Philippines Country Report, 2015

Isabela City/Basilan Naser Usman Provincial Statistics Officer Nicanor Pableo Provincial Supervisor Emily Akanul Field Interviewer
Region X – Northern Mindanao
Regional Office Eddie Nasol Interim Regional Director Georgette Gayomali Regional Supervisor Roy Michael Difuntorum Regional I.T. Supervisor
Bukidnon
Rene Lauro Provincial Statistics Officer Jonathan Cabugsa Provincial Supervisor Maximino Cabangisan Team supervisor Tyrone Boyd Pulgo Field Interviewer Bryan Omandac Field Interviewer
Camiguin Ruben Gamale Provincial Statistics Officer Francisco Galagar Provincial Supervisor Lovenia Lagang Field Interviewer
Lanao del Norte
Osler Mejares Provincial Statistics Officer Ibrahim Labe Provincial Supervisor Earl Omandam Team Supervisor Stephanie Dingson Field Interviewer Jonah Mae Dablo Field Interviewer
Misamis Occidental
Julito Pilar Provincial Statistics Officer Marlou Cajeta Provincial Supervisor Jojo Bano Field Interviewer
Misamis Oriental Janith Aves Provincial Statistics Officer Donagay Capareda Provincial Supervisor Loida Gonzales Team Supervisor Edsel Eyson Field Interviewer Rosalie Descallar Field Interviewer
218 Global Adult Tobacco Survey : Philippines Country Report, 2015

Region XI - DAVAO
Regional Office Jaime Paller Interim Regional Director Corazon Dres Regional Supervisor Jann Blair Salinas Regional I.T. Supervisor
Davao del Norte/Compostella Valley
Pepito Amoyen Provincial Statistics Officer Danilo Gonzales Provincial Supervisor Jessie Madulin Team Supervisor Ruby Rose Decatoria Field Interviewer Reynilda Gulay Field Interviewer
Davao del Sur Randolph Anthony Gales Provincial Statistics Officer Rodon Tahil Provincial Supervisor Rogelio Lebria Team Supervisor Jesus Abante Team Supervisor Estefanio Tabigue Field Interviewer Lucero Montoya Field Interviewer Rosalie Suarez Field Interviewer Rhodora Grenien Field Interviewer
Davao Oriental
Abraham Enrico Gulay Jr. Provincial Statistics Officer Fe Antipuesto Provincial Supervisor Virginia Mangaron Field Interviewer
Region XII -SOCCSKSARGEN
Name Designation
Regional Office Maqtahar Manulon Interim Regional Director Rodolfo Mendoza Regional Supervisor Edward Donald Eloja Regional I.T. Supervisor SOCSARGEN Ruben Abaro Jr. Provincial Statistics Officer Marifi de Asis Provincial Supervisor Joan Brioso Team Supervisor Annalee Billon Team Supervisor Jona Fe Mandario Field Interviewers Josefina Lapasa0ran Field Interviewers Princess Sarah Laxamana Field Interviewers
Cotabato
219 Global Adult Tobacco Survey : Philippines Country Report, 2015

Belinda Penuela Provincial Statistics Officer Helen Colango Provincial Supervisor Ronilo Geveso Team Supervisor Alma Parillo Field Interviewers Mohaliden Mohamad Field Interviewers Sultan Kudarat Rafael Sambrano Provincial Statistics Officer Jurilyn P. Abraham Provincial Supervisor Alexis M. Ganayo Team Supervisor Jonathan Gines Field Interviewers Rowena Novesteros Field Interviewers
National Capital Region (NCR)
Regional Office Lourdes Homecillo Interim Regional Director Marilyn Vergara Regional Supervisor Joel Pertez Regional I.T. Supervisor
NCR I (Manila, San Juan, Pasay)
Danilo Cubinar Provincial Statistics Officer Marlyn Miranda Provincial Supervisor/Team Supervisor Irene Karen Dizon Field Interviewer Kenneth Mendiola Field Interviewer
NCR II (Marikina , Quezon City)
Apolinar Oblea Provincial Statistics Officer Jean De Villa Provincial Supervisor/Team Supervisor Noemi Salazar Field Interviewer Felicitas Ferrer Field Interviewer Ritchelle Berge Reguetta Field Interviewer April Estipona Field Interviewer
NCR III (Mandaluyong, Pasig, Makati, Pateros)
Paciano Dizon Provincial Statistics Officer Florfina Perez Provincial Supervisor/Team Supervisor Deovelyn Fetalvero Field Interviewer Regina Waquez Field Interviewer
NCR IV (Caloocan, Malabon, Navotas, Valenzuela)
Belen Razo Provincial Statistics Officer Sahabil Abtuh Provincial Supervisor Perla Gabriel Team Supervisor Hannah Dancel Field Interviewer Rosal Buenaventura Field Interviewer Michael Merosa Field Interviewer
220 Global Adult Tobacco Survey : Philippines Country Report, 2015

NCR V (Las Piñas, Muntinlupa, Parañaque, Taguig)
Bambie Villaruel Provincial Statistics Officer Carmelita Andres Provincial Supervisor/Team Supervisor Bernard Ereño Field Interviewer Kenneth Velasco Field Interviewer
Cordillera Autonomous Region (CAR)
Regional Office Olivia Gulla Interim Regional Director Jomar Cariaga Regional Supervisor/ I.T. Supervisor
Abra
Felixberto Perdido Provincial Statistics Officer Lemuel Marlowe Amit Provincial Supervisor Precy Bazar Field Interviewer
Apayao Augusto Kalngan Provincial Statistics Officer Fe Peros Provincial Supervisor Rodolfo Balinan Field Interviewer
Benguet
Villafe Alibuyog Provincial Statistics Officer Eric Aplosen Provincial Supervisor/Team supervisor Ma. Teresa Belen Field Interviewer Jinky Runas Field Interviewer Vanesa Mayumi Field Interviewer
Ifugao
Joseph Aclibon Provincial Statistics Officer Gavino Mongalini Jr. Provincial Supervisor Betshiba Balajo Field Interviewer
Kalinga Maribel Dalayday Provincial Statistics Officer Cesar Bautista Provincial Supervisor Edwin Litorco Field Interviewer
Mt. Province
Adrian Cerezo Provincial Statistics Officer Valentina Domaoa Provincial Supervisor Aida Cati-an Field Interviewer
221 Global Adult Tobacco Survey : Philippines Country Report, 2015

Autonomous Region in Muslim Mindanao (ARMM)
Regional Office Suod Barodi Interim Regional Director Noronisa Macadadaya Regional Supervisor Ysmael Baraguir Regional I.T. Supervisor Lanao del Sur Mohammadali Alonto Provincial Statistics Officer Abulkhair Ditucalan Provincial Supervisor Yasrulah Sheik Team Supervisor Mohammadali Pacasum Field Interviewers Asliah Datu Field Interviewers
Maguindanao including Cotabato City Razulden Mangelen Provincial Statistics Officer Akan Tula Provincial Supervisor Ma. Judema Angot Team Supervisor King Addev Torres Field Interviewers Mariffie Navos Field Interviewers Sulu Mahmur Sarail Provincial Statistics Officer Medzhor Tan Provincial Supervisor Freendhona Patarasa Field Interviewers Minda Sahibad Field Interviewers Tawi-Tawi Hobnel Monel Provincial Statistics Officer Naim Tanjilul Provincial Supervisor Aladztrim Mulsahi Field Interviewers
Caraga
Name Designation Regional Office
Rosalinda Apura Interim Regional Director Odelia Acero Regional Supervisor Charis Fernandez Regional I.T. Supervisor
Agusan del Norte
Reynelo Magno Provincial Statistics Officer Charis Fernandez Provincial Supervisor Keziah Echin Field Interviewer Estrellita Rañin Field Interviewer
222 Global Adult Tobacco Survey : Philippines Country Report, 2015

Agusan del Sur Brigido Acebu Provincial Statistics Officer Demetrio Dejolde Provincial Supervisor Flordeliz Cagalitan Team Supervisor Glorevie Liston Field Interviewer Michelle Padios Field Interviewer
Surigao del Norte
Virgilio Avelina OIC-Provincial Statistics Officer Ma. Denia Trinquite Provincial Supervisor Susan Pantilo Team Supervisor Kemuel Tejada Field Interviewer Kinneth Sullano Field Interviewer
Surigao del Sur Ruel Dres Provincial Statistics Officer Jennifer Estose Provincial Supervisor Rachelle Marie Santos Field Interviewer Rizaly Malce Field Interviewer
223 Global Adult Tobacco Survey : Philippines Country Report, 2015

APPENDIX F: MPOWER SUMMARY INDICATORS
Appendix Table F1: MPOWER Summary Indicators,GATS Philippines, 2015
Indicator Overall Male Female Urban RuralM: Monitor tobacco use and prevention policiesCurrent tobacco use 23.8 41.9 5.8 22.1 25.3Current tobacco smokers 22.7 40.3 5.1 21.7 23.5Current cigarette smokers1 22.5 40.1 4.9 21.7 23.2Current manufactured cigarette smokers 21.5 38.9 4.2 21.3 21.7Current smokeless tobacco use 1.7 2.7 0.7 0.6 2.6Average number of cigarettes smoked per day 11.0 11.2 8.6 10.9 11.0Average age at daily smoking initiation2 17.5 17.5 18.3 17.5 17.5P: Protect people from tobacco smokeExposure to secondhand smoke at home at least monthly 34.7 39.0 30.3 29.5 39.3Exposure to secondhand smoke at work3† 21.5 26.4 16.4 18.2 26.8Exposure to secondhand smoke in public places:4†
Government building/offices 13.6 15.6 11.7 13.7 13.5Health care facilities 4.2 4.9 3.8 3.7 4.7Restaurants 21.9 26.8 17.0 19.2 25.1Public transportation 37.6 39.9 35.5 40.6 34.5
O: Offer help to quit tobacco useMade a quit attempt in the past 12 months5§ 52.2 51.5 57.1 50.2 53.8Advised to quit smoking by a health care provider5,6§ 56.5 58.1 48.8 55.2 57.7Attempted to quit smoking using a specific cessation method5:
Pharmacotherapy 12.4 13.1 7.5 10.5 13.8Counseling/advice 13.6 13.4 15.1 11.1 15.5
Interest in quitting smoking 76.7 76.6 77.4 76.3 77.0Successful Quitters7 4.0 3.6 6.9 3.4 4.4W: Warn about the dangers of tobaccoBelief that tobacco smoking causes serious illness 95.0 94.8 95.2 94.6 95.4Belief that smoking causes stroke, heart attack and lung cancer 76.1 74.9 77.2 79.4 73.2Belief that breathing other peoples' smoke causes serious illness 93.5 92.6 94.5 94.4 92.8Noticed anti-cigarette smoking information at any location† 83.2 82.9 83.6 84.0 82.8Thinking of quitting because of health warnings on cigarette packages† 44.6 44.9 42.1 38.9 49.2E: Enforce bans on tobacco advertising, promotion and sponsorshipNoticed any cigarette advertisement, sponsorship or promotion† 58.6 61.7 55.5 58.0 59.1R: Raise taxes on tobaccoAverage cigarette expenditure per month (PhP) 8 678.4 696.1 515.8 736.6 627.1Average cost of a pack of manufactured cigarettes(PhP) 8 48.0 47.8 50.2 50.9 45.2Last cigarette purchase was from a store8 98.7 98.7 98.4 99.0 98.4Observed tax stamp on cigarette package 77.6 77.7 76.4 78.5 76.7Observed graphic health warning on cigarette pack 76.5 77.3 69.3 73.4 79.5
Sex Residence
§Among all adults.† In the last 30 days.
1Includes manufactured cigarettes, hand-rolled cigarettes and kreteks. 2 Among daily smokers age 15-34 years. 3Among those who work outside of the home who usually work indoors or both indoors and outdoors. 4 Among those who visited the specific public places in the past 30 days. 5 Includes current smokers and those who quit in the past 12 months. 6Among those who visited a health care provider in past 12 months. 7 Among all past year smokers (current and those that quit<12 months ago). 8 Among current manufactured cigarette smokers. † During the past 30 days. PhP - Philippino Pesos.
224 Global Adult Tobacco Survey : Philippines Country Report, 2015

Overall Male Female Overall Male Female Overall Male FemaleM: Monitor tobacco use and prevention policiesCurrent tobacco user 29.7 (28.5, 31.0) 49.5 (47.5, 51.5) 10.1 (9.0, 11.2) 23.8 (22.9, 24.8) 41.9 (40.3, 43.6) 5.8 (5.1, 6.5) -19.9* -15.3* -42.8*Current tobacco smokers 28.2 (27.0, 29.5) 47.6 (45.7, 49.6) 9.0 (8.0, 10.1) 22.7 (21.7, 23.6) 40.3 (38.7, 41.9) 5.1 (4.5, 5.8) -19.8* -15.4* -43.0*Current cigarette smokers1 27.9 (26.8, 29.2) 47.2 (45.3, 49.2) 8.8 (7.8, 9.9) 22.5 (21.5, 23.4) 40.1 (38.5, 41.7) 4.9 (4.3, 5.6) -19.6* -15.1* -43.9*Current manufactured cigarette smokers 27.0 (25.8, 28.2) 46.6 (44.7, 48.6) 7.5 (6.5, 8.5) 21.5 (20.6, 22.5) 38.9 (37.3, 40.5) 4.2 (3.7, 4.8) -20.3* -16.5* -43.5*Average number of cigarettes smoked per day (number) 10.6 (10.1, 11.1) 11.3 (10.7, 11.8) 6.9 (6.1, 7.8) 11.0 (10.5, 11.5) 11.2 (10.7, 11.7) 8.6 (6.9, 10.3) 3.1 -0.7 23.4Average age at daily smoking initiation (years)2 17.3 (17.0, 17.6) 17.2 (16.9, 17.4) 18.8 (17.7, 19.9) 17.5 (17.3, 17.8) 17.5 (17.2, 17.8) 18.3 (17.2, 19.5) 1.4 1.8 -2.4Former smokers among ever daily smokers3 21.5 (19.8, 23.4) 20.9 (19.0, 22.8) 25.0 (20.7, 29.7) 19.3 (17.6, 21.1) 17.7 (16.1, 19.5) 31.0 (25.9, 36.6) -10.2* -14.9* 24.1P: Protect people from tobacco smokeExposure to secondhand smoke at home at least monthly 54.4 (52.5, 56.3) 58.1 (55.8, 60.3) 50.6 (48.4, 52.8) 34.7 (33.0, 36.4) 39.0 (37.0, 41.2) 30.3 (28.5, 32.2) -36.2* -32.8* -40.1*Exposure to secondhand smoke at work 4, † 32.6 (29.9, 35.5) 38.8 (35.1, 42.7) 26.2 (22.9, 29.8) 21.5 (19.5, 23.6) 26.4 (23.6, 29.5) 16.4 (14.4, 18.5) -34.3* -32.0* -37.5*Exposure to secondhand smoke in public places: 5. †
Government building/offices 25.5 (23.3, 27.8) 27.9 (25.3, 30.7) 23.1 (20.6, 25.9) 13.6 (11.9, 15.5) 15.6 (13.5, 18.1) 11.7 (10.0, 13.6) -46.7* -44.0* -49.6*Health care facilities 7.6 (6.5, 8.9) 8.0 (6.4, 10.0) 7.3 (6.0, 8.9) 4.2 (3.6, 4.9) 4.9 (3.9, 6.2) 3.8 (3.1, 4.6) -44.4* -38.7* -48.5*Restaurants 33.6 (31.2, 36.1) 38.4 (35.3, 41.5) 28.6 (25.9, 31.4) 21.9 (20.3, 23.6) 26.8 (24.6, 29.2) 17.0 (15.3, 18.8) -34.8* -30.1* -40.7*Public Transportation 55.3 (53.3, 57.3) 61.1 (58.6, 63.5) 49.7 (47.3, 52.1) 37.6 (35.8, 39.5) 39.9 (37.6, 42.3) 35.5 (33.5, 37.5) -32.0* -34.6* -28.6*
O: Offer help to quit tobacco useMade a quit attempt in the past 12 months 6 47.9 (45.5, 50.3) 46.7 (44.0, 49.4) 53.9 (48.2, 59.4) 52.2 (49.7, 54.6) 51.5 (48.9, 54.2) 57.1 (51.4, 62.6) 9.0* 10.3* 6.0Advised to quit smoking by a health care provider 6, 7 51.5 (47.0, 56.0) 53.3 (48.0, 58.5) 45.6 (36.7, 54.8) 56.5 (52.0, 60.8) 58.1 (53.5, 62.6) 48.8 (37.8, 59.9) 9.7 9.1 7.1Attempted to quit smoking using a specific cessation method 6:
Pharmacotherapy 5.9 (4.2, 8.3) 5.9 (4.0, 8.5) 6.2 (3.5, 10.8) 12.4 (9.9, 15.3) 13.1 (10.4, 16.3) 7.5 (4.5, 12.3) 109.2* 123.4* 22.1Counseling/advice 12.3 (9.9, 15.0) 12.8 (10.2, 15.8) 10.0 (6.5, 15.2) 13.6 (11.4, 16.2) 13.4 (11.1, 16.1) 15.1 (10.4, 21.5) 11.3 5.2 51.0
Interested or planning to quit smoking 60.4 (57.5, 63.1) 60.3 (57.4, 63.2) 60.5 (53.7, 66.9) 76.7 (74.5, 78.7) 76.6 (74.2, 78.8) 77.4 (72.4, 81.8) 27.0* 26.9* 28.0*Successful Quitters 8 4.5 (3.7, 5.6) 4.2 (3.3, 5.3) 6.3 (4.1, 9.6) 4.0 (3.2, 5.0) 3.6 (2.9, 4.5) 6.9 (3.8, 12.2) -12.3 -14.3 8.9W: Warn about the dangers of tobaccoBelief that tobacco smoking causes serious illness 94.0 (93.1, 94.8) 93.1 (91.9, 94.2) 94.9 (94.0, 95.7) 95.0 (94.1, 95.8) 94.8 (93.8, 95.7) 95.2 (94.2, 96.0) 1.0 1.9* 0.2Belief that breathing other peoples' smoke causes serious illness 91.6 (90.7, 92.5) 90.2 (88.9, 91.4) 93.0 (91.9, 94.0) 93.5 (92.5, 94.4) 92.6 (91.2, 93.8) 94.5 (93.5, 95.3) 2.1* 2.6* 1.5*Noticed anti-cigarette smoking information at any location † 80.1 (78.3, 81.8) 80.0 (78.0, 81.9) 80.2 (78.2, 82.1) 83.2 (81.5, 84.8) 82.9 (80.8, 84.8) 83.6 (81.8, 85.2) 3.9* 3.6* 4.2*Thinking of quitting because of health warnings on cigarette packages † 37.4 (34.8, 40.0) 37.9 (35.2, 40.6) 34.6 (29.1, 40.5) 44.6 (41.8, 47.4) 44.9 (41.9, 47.9) 42.1 (36.1, 48.3) 19.4* 18.6* 21.6E: Enforce bans on tobacco advertising, promotion and sponsorshipNoticed advertisements in stores where cigarettes are sold 9, † 53.7 (51.7, 55.7) 58.3 (55.8, 60.7) 49.3 (47.0, 51.5) 40.5 (38.2, 42.8) 43.2 (40.6, 45.8) 37.8 (35.4, 40.2) -24.7* -25.8* -23.3*
Noticed any cigarette advertisement, sponsorship or promotion † 74.3 (72.4, 76.1) 78.0 (75.9, 80.0) 70.6 (68.4, 72.8) 58.6 (56.1, 61.0) 61.7 (59.0, 64.4) 55.5 (52.9, 58.0) -21.2* -20.9* -21.5*R: Raise taxes on tobaccoAverage cigarette expenditure per month (PhP) 10 336.3 (314.8, 357.8) 355.8 (332.3, 379.3) 213.6 (179.2, 248.1) 678.4 (640.5, 716.4) 696.1 (656.7, 735.6) 515.8 (396.8, 634.8) 101.7* 95.6* 141.4*Average cost of a pack of manufactured cigarettes (PhP) 10 24.9 (23.9, 25.9) 25.1 (24.0, 26.1) 23.5 (21.0, 26.1) 48.0 (46.4, 49.5) 47.8 (46.1, 49.4) 50.2 (47.3, 53.2) 92.4* 90.6* 113.5*Last cigarette purchase was from a store 10 97.6 (96.7, 98.2) 97.6 (96.6, 98.3) 97.2 (94.4, 98.7) 98.7 (98.0, 99.1) 98.7 (98.0, 99.2) 98.4 (95.6, 99.4) 1.1* 1.1* 1.2
Appendix Table F2: MPOWER Summary Indicators, GATS Philippines 2009 and 20152009 2015 Relative change
Percentage (95% CI) Percentage (95% CI) Percentage
1 Includes manufactured cigarettes, hand-rolled cigarettes and kreteks. 2 Among daily smokers age 15-34 years. 3 Current non-smokers. 4 Among those who work outside of the home who usually work indoors or both indoors and outdoors. 5 Among those who visited the specific public places in the past 30 days. 6 Includes current smokers and those who quit in the past 12 months. 7Among those who visited a health care provider in past 12 months. 8 Among all past year smokers (current and those that quit<12 months ago). 9 Includes those who noticed cigarettes at sale prices; free gifts or discount offers on other products when buying cigarettes; or any advertisements or signs promoting cigarettes in stores where cigarettes are sold. 10 Among current manufactured cigarette smokers. † During the past 30 days. PhP - Philippine Pesos. * p < 0.05
NOTE: Results for prevalence estimates, averages and 95% CIs are rounded to the nearest tenth (0.1).
The relative change (R) of the two estimates in the survey years 2009 (r2009) and 2015 (r2015) is calculated by R=(r2009 - r2015/r2009), as a percentage. The relative changes are calculated using un-rounded prevalence estimates and might be different if calculated using rounded prevalence estimates shown in this table.
Indicator
NOTE: Current use refers to daily and less than daily use. Adults refer to persons aged 15 years and older. Data have been weighted to be nationally representative of all non-institutionalized men and women aged 15 years and older. Percentages reflect the prevalence of each indicator in each group, not the distribution across groups.
225 Global Adult Tobacco Survey : Philippines Country Report, 2015

APPENDIX G: GLOSSARY OF TERMS
GATS Global Adult Tobacco Survey FCTC Framework Convention on Tobacco Control
MPOWER
Monitor tobacco use and prevention policies
Protect people from tobacco smoke
Offer help to quit tobacco use
Warn about the dangers of tobacco
Enforce bans on tobacco advertising, promotion and sponsorship
Raise taxes on tobacco
CDC Centers for Disease Control and Prevention, USA WHO World Health Organization DOH Department of Health PSA Philippine Statistics Authority PSUs Primary Sampling Units SSUs Secondary Sampling Units Adults Population who aged 15 years and over SES Socioeconomic status PHW Pictorial Health Warning
Tobacco Products
Two types of tobacco products; 1) Smoked tobacco: manufactured cigarettes, hand–rolled cigarettes, others smoked tobacco such as pipe, cigar, cheroots, water pipes, and others
2) Smokeless tobacco: snuff by keeping mouth/nose, chewing tobacco, betel quid with tobacco, and others
Smoking frequency
Classified into three categories, i.e., 1) Daily smoking means smoking at least one tobacco product every day or nearly every day over a period of a month or more
2) Occasional smoking (/less than daily) 3) Never smoking includes tried once or twice in lifetime
SHS Secondhand smoke. Smoke from other people’s tobacco
Prevalence (%) Statistical concept referred to the number of occurrences of tobacco use that are present in a particular population, aged 15 years and over at a given time
Quit attempt Current tobacco smokers who tried to quit during the past 12 months and former
tobacco smokers who have been abstinences for > 12 months
HCPs Health Care Providers include various health professions such as medical doctors, nurses, pharmacist, health workers etc.
226 Global Adult Tobacco Survey : Philippines Country Report, 2015

APPENDIX H: INDICATOR DEFINITION
Indicator Definition
Ratio Expression of a relationship between two quantities which can be related or totally independent of each other. General term for any quotient.
Proportion A ratio in which the denominator includes the numerator.
Percentage A proportion multiplied by a constant 100 so that it is expressed as per 100
Percentage of adults who currently smoke tobacco
Number of current daily and less than daily tobacco smokers divided by the total number of respondents
Percentage of adults who currently smoke tobacco daily
Number of current daily tobacco smokers divided by the total number of respondents
Percentage of adults who currently smoke cigarettes
Number of current daily and less than daily cigarette smokers divided by the total number of respondents
Percentage of adults who smoke cigarettes daily
Number of current daily cigarette smokers divided by the total number of respondents
Percentage of adults who are ever daily tobacco smokers and currently do not smoke tobacco.
Number of ever daily tobacco smokers and currently do not smoke tobacco divided by total number of respondents
Percentage of ever daily tobacco smokers who currently do not smoke tobacco.
Number of ever daily tobacco smokers who currently do not smoke tobacco divided by number of ever daily tobacco smokers
Percentage of adults who currently use smokeless tobacco
Number of current daily and less than daily smokeless tobacco users divided by total number of respondents
Percentage of adults who currently use smokeless tobacco daily
Number of current daily smokeless tobacco users divided by total number of respondents
Percentage of adults who are ever daily smokeless tobacco users and currently do
Number of ever daily smokeless tobacco users who currently do not use smokeless tobacco divided by total
227 Global Adult Tobacco Survey : Philippines Country Report, 2015

not use smokeless tobacco. number of respondents.
Percentage of ever daily smokeless tobacco users who currently do not use smokeless tobacco.
Number of ever daily smokeless tobacco users who currently do not use smokeless tobacco divided by number of ever daily smokeless tobacco users
Percentage of adults who currently use tobacco
Number of current daily and less than daily tobacco smokers and/or smokeless tobacco users divided by total number of respondents
Percentage of adults who smoked tobacco during the past 12 months and tried to quit during the past 12 months.
Number of current tobacco smokers who tried to quit during the past 12 months and former tobacco smokers who have been abstinent for <12 months divided by total number of current tobacco smokers and former tobacco smokers who have been abstinent for <12 months.
Percentage of current tobacco smokers who are planning to quit or thinking about quitting smoking.
Number of current tobacco smokers who are planning or thinking about quitting smoking within the next month, 12 months, or someday divided by number of current tobacco smokers
Percentage of current smokers who made a quit attempt during the past 12 months and recent quitters (<12 months), who used [pharmacotherapy; counseling/advice; other cessation methods] during the last 12 months.
Number of current smokers who made a quit attempt during the past 12 months and recent quitters (<12 months), who used [pharmacotherapy; counseling/advice; other cessation methods] during the last 12 months divided by number of current smokers who made a quit attempt during the past 12 months and recent quitters (<12 months).
Percentage of current tobacco smokers and recent quitters (<12 months) who visited a doctor or health care provider (HCP) during the past 12 months and were advised to quit smoking tobacco
Number of current tobacco smokers and former tobacco smokers who have been abstinent for <12 months, who report being advised to quit smoking during a visit to a HCP within the past 12 months divided by number of current tobacco smokers and former tobacco smokers who have been abstinent for <12 months, who visited a HCP in the past 12 months.
Percentage of daily cigarette smokers who report smoking an average of [less than 5; 5-9; 10-14; 15-24; and 25+] cigarettes per day
: Daily cigarette smokers reporting an average of [less than 5; 5-9; 10-14; 15-24; and 25+] cigarettes per day divided by daily cigarette smokers
Percentage of ever daily smokers ages 20-34 years old who started smoking daily at [<15;
Number of ever daily smokers ages 20-34 years old who started smoking daily at [<15; 15-16; 17-19 and 20+]
228 Global Adult Tobacco Survey : Philippines Country Report, 2015

15-16; 17-19 and 20+] years of age. years of age divided by number of ever daily smokers ages 20-34 years old.
Percentage of former daily smokers who quit smoking [<1 year ago, 1 to <5 years ago, 5 to <10 years ago, 10+ years ago].
Number of former daily smokers who quit smoking [<1 year ago, 1 to <5 years ago, 5 to <10 years ago, 10+ years ago] divided by number of former daily smokers who do not smoke tobacco
Percentage of adults who currently [only smoke tobacco; smoke tobacco and use smokeless tobacco; only use smokeless tobacco; do not use tobacco].
Number of respondents who currently [only smoke tobacco; smoke tobacco and use smokeless tobacco; only use smokeless tobacco; do not use tobacco] divided by total number of respondents
Percentage of daily smokers or smokeless tobacco users who report first tobacco use [≤5 minutes; 6-30 minutes; 31-60 minutes; >60 minutes] after waking.
Number of daily smokers or smokeless tobacco users who report first tobacco use [≤5 minutes; 6-30 minutes; 31-60 minutes; >60 minutes] after waking divided by total number of daily smokers or smokeless tobacco users.
Percentage of indoor workers who were exposed to tobacco smoke at work in the past 30 days
Number of respondents who reported being exposed to smoke in indoor areas at work during the past 30 days divided by Number of respondents who work outside of the home who usually work indoors or both indoors and outdoors.
Percentage of adults who were exposed to tobacco smoke at home at least monthly.
Number of respondents who reported being exposed to smoke at home either daily, weekly or monthly divided by total number of respondents
Percentage of adults who visited restaurants in the past 30 days and were exposed to tobacco smoke inside.
Number of respondents who reported being exposed to smoke inside restaurants in the past 30 days divided by number of respondents who reported visiting restaurants in the past 30 days.
Percentage of manufactured cigarette smokers whose last cigarette purchase was from a [vending machine, store, street vendor,…].
Number of manufactured cigarette smokers whose last cigarette purchase was from a [vending machine, store, street vendor,…] divided by number of manufactured cigarette smokers
Average cost of 100 packs of manufactured cigarettes as a percentage of Gross Domestic Product (GDP) per capita.
Consumption-weighted cost of 100 packs of manufactured cigarettes divided by per capita GDP in the country
Percentage of adults who have noticed Number of respondents who have noticed cigarettes at
229 Global Adult Tobacco Survey : Philippines Country Report, 2015

cigarettes at sale prices, free gifts or discount offers on other products when buying cigarettes, or any advertisements or signs promoting cigarettes in stores where cigarettes are sold in the last 30 days.
sale prices, free gifts or discount offers on other products when buying cigarettes, or any advertisements or signs promoting cigarettes in stores where cigarettes are sold in the last 30 days divided by total number of respondents
Percentage of adults who have noticed any advertisements or signs promoting cigarettes, cigarette company sponsorship of sporting events, or cigarette promotions in the last 30 days other than in stores where cigarettes are sold.
Number of respondents who have noticed any advertisements or signs promoting cigarettes, cigarette company sponsorship of sporting events, or cigarette promotions in the last 30 days other than in stores where cigarettes are sold divided by total number of respondents.
Percentage of current tobacco smokers who reported thinking about quitting smoking in the last 30 days because of the warning labels on cigarette packages.
Number of current smokers who thought about quitting smoking in the last 30 days because of the warning labels on cigarette packages divided by number of current smokers.
Percentage of adults who have noticed information about the dangers of smoking cigarettes or that encourages quitting on TV or radio in the last 30 days.
Number of respondents who have noticed information about the dangers of smoking cigarettes or that encourages quitting on TV or radio in the last 30 days divided by total number of respondents.
Percentage of current smokers who noticed health warnings on cigarette packages in the last 30 days.
Number of current smokers who noticed health warnings on cigarette packages in the last 30 days divided by number of current smokers.
Percentage of adults who believe that smoking tobacco causes serious illness.
Number of respondents who believe that smoking tobacco causes serious illness divided by total number of respondents.
Percentage of adults who believe that breathing other people’s smoke causes serious illness in non-smokers.
Number of respondents who believe that breathing other people's smoke causes serious illness in non-smokers divided by total number of respondents
230 Global Adult Tobacco Survey : Philippines Country Report, 2015

231 Global Adult Tobacco Survey : Philippines Country Report, 2015

232 Global Adult Tobacco Survey : Philippines Country Report, 2015

Copyright © 2022 FDOKUMEN