Managing Variable Patient Flows at Hospitals - DiVA Portal
160
Linköping Studies in Science and Technology, Thesis No. 1682 Managing Variable Patient Flows at Hospitals Olle Olsson 2014 Department of Management and Engineering Linköping University, SE-581 83 Linköping
-
Upload
khangminh22 -
Category
Documents
-
view
2 -
download
0
Transcript of Managing Variable Patient Flows at Hospitals - DiVA Portal
Linköping Studies in Science and Technology, Thesis No. 1682
Managing Variable Patient Flows at Hospitals
Olle Olsson
2014
Department of Management and Engineering Linköping University, SE-581 83 Linköping

© Olle Olsson, 2014 Linköping studies in science and technology, Thesis No. 1682 ISBN: 978-91-7519-208-6 ISSN: 0280-7971 Printed by: LiU-Tryck, Linköping Distributed by: Linköping University Department of Management and Engineering SE-581 83 Linköping, Sweden Tel: +46 13 281000, fax: +46 13 281873

ABSTRACT Healthcare is a large industry faced with major challenges, such as decreasing inpatient bed numbers and increases in the share of elderly people, which require improved efficiency and effectiveness. The organisation of hospitals normally comprises highly specialised clinical departments, through which patient flows are managed. Since patient flows often involve several clinical departments, this requires much coordination both in space and time. With every individual patient having different diseases, severity levels and responses to therapy, the variability in patient flows has an impact on the inflow, internal flow and outflow at clinical departments and hospitals. Historically, healthcare resources have not been adapted to these variations. The purpose of this licentiate thesis is therefore to explore how variable patient flows are managed in hospitals. This comprises how variable patient flows affect hospitals as well as how variable patient flows are handled. It also includes the organisational configuration, and the influence it has on the actions used to handle variable patient flows in hospitals.
Both the hierarchical levels, roles and teams that make decisions and manage the flow of patients as well as the actions used to handle variable patient flows at hospitals are included in the research. Hence, an approach where the hospital is regarded as a system is used, an approach often described as a system perspective. Three research methods have been used in this licentiate thesis. The first research method used was simulation modelling, to study how changes in an acute patient flow affected an emergency department and inpatient ward at a small hospital. A case study at a university hospital was performed to study both the actions used to handle variable patient flows as well as the influence of the organisational configuration. Several literature reviews, both structured and unstructured, has also been made to compare and evaluate the results from the empirical data.
There are several effects of variable patient flows. The case study indicates that increased patient flow variability leads to increases in bed utilization variability and thereby problems with bed shortages. Mismatches between patient inflow and outflow, in terms of number of patients, also lead to bed shortages. Literature reviews also show that bed shortages in inpatient wards are a major cause of overcrowding in emergency departments. The results from the simulation model point toward emergency departments being more adapted to variable patient inflow than inpatient wards. To handle these issues there is a need for flexibility when providing healthcare services, something suggested in the literature.
50 actions used at the university hospital to handle variable acute patient flows were identified in the research. A majority of these are used to handle the effects of the variation, not the variation itself. Nor is it effects of individual variations, such as patient inflow, that are handled but the combined effect of the variations in several variables. For

example, much time and effort are spent handling bed shortages. One third of the actions are used at a hospital level, with the aim to have positive effects for the hospital as a whole. Two thirds are used and developed at a departmental level, with the aim to improve the situation at the clinical department by using the action. By having most of the actions used at individual clinical departments, without considering the impact on whole hospital, there is an obvious risk of sub-optimization.
One explanation for many actions being used at a departmental level could be that there is lack of strategic direction and decision-making ability at top management level due to the use of unanimous decision-making in the hospital management group. This hinders the control and coordination of the actions used at different clinical departments, rendering them more similar to separate organisations. Departmental collaboration is also impeded as well as organisational learning at the hospital, both bottom-up and sideways in the hierarchies, encumbering the development and sharing of successful actions for handling variable patient flows.

ACKNOWLEDGEMENTS First and foremost, I would like to thank my supervisors, Håkan Aronsson, Erik Sandberg and Mats Abrahamsson. You have all been an inspiration to both starting and finishing this licentiate thesis. To my main supervisor, Håkan, your in-depth knowledge about the nature of healthcare has always encouraged me to try to see what you see. I take with me an increased understanding that will undoubtedly be of much service in my future career. Erik, without your encouragement, insightful comments and pinpointing questions, this thesis would not have been nearly as good. Also, thank you Mats for keeping me on the right track all the way.
Malin, by reading and discussing an earlier draft of this thesis you challenged me to get the most out of the material at hand. I will be forever grateful for your effort and ambition in doing so.
To all contacts and respondents at Hässleholm hospital and Linköping university hospital, thank you for your time, helpfulness and devotion in making healthcare better each day. Special thanks go to Peter Kalén and Frida Gertsson at Hässleholm hospital as well as Stefan Franzén and Christer Andersson at Linköping university hospital. With your assistance, collaboration was easy and exciting.
To my colleagues, thank you for deliberating discussions concerning both research and teaching as well as the latest events during many uplifting coffee breaks. A special thanks to the logistics PhDs, without your comradeship, these last years would not have run by as fast. Fredrik, thanks for all the laughs and inspiration you’ve given me as my roommate. Never stop being the elevating character that you are. Mårten, your positive attitude to life and training is always catching. Uni, thanks for staying late at all division parties. Malin, your dedication to our research field as well as social events at the division have brought me much joy and experience. Christina, with your new perspectives and jolly personality your presence is never unnoticed. Karin, your kindness, humour and loyalty to coffee have brought me many enjoyable moments.
To my family, the solid foundation you have given me has always made it easy in choosing the path forward. My mother early on speculated about me becoming a doctor, and no, not that other type of doctor, still some road ahead, but a milestone reached. Maria, my love, my life. With your engaging and positive approach to life, you will always inspire me to do my best. I’m looking forward to a future together, “ona da island, ina da sun”.


TABLE OF CONTENT
1 INTRODUCTION 1
1.1 HEALTHCARE IS A LARGE INDUSTRY WITH INCREASING DEMANDS 1 1.2 THE NECESSITY FOR A SYSTEM PERSPECTIVE IN HEALTHCARE 2 1.3 THE PROSPECT OF APPLYING LOGISTICS AND SCM IN HEALTHCARE 3 1.4 CHARACTERISTICS OF HEALTHCARE SERVICES 4 1.5 VARIABILITY IN HEALTHCARE SERVICES 6 1.6 HANDLING VARIABILITY FROM A LOGISTICS/SCM PERSPECTIVE 8 1.7 PURPOSE AND RESEARCH QUESTIONS 10 1.8 THESIS OUTLINE 12
2 RESEARCH METHODOLOGY 15
2.1 RESEARCH DESIGN 15 2.2 RESEARCH METHODS 15 2.3 THE RESEARCHER’S CONTRIBUTION TO THE PAPERS AND CASE REPORT 16 2.4 ORGANISATIONS STUDIED 17 2.5 CASE STUDY 18 2.5.1 STUDIED SYSTEM 19 2.5.2 DATA COLLECTION 19 2.6 LITERATURE REVIEWS 21 2.6.1 SYSTEMATIC LITERATURE REVIEWS 21 2.6.2 NARRATIVE LITERATURE REVIEWS 23 2.7 SIMULATION 24 2.7.1 DESIGN 24 2.7.2 VALIDATION 25 2.8 UNIT OF ANALYSIS AND HOW THE RESEARCH QUESTIONS WERE ANALYSED 25
3 SUMMARY OF APPENDED PAPERS 29
3.1 PAPER I: UNDERSTANDING THE IMPACT OF VARIATION ON HEALTHCARE
SYSTEMS 29 3.2 PAPER II: DEVELOPMENTS IN THE FIELD OF HEALTHCARE LOGISTICS AND
SCM – A PATIENT FLOW FOCUS 30 3.3 PAPER III: MANAGING A VARIABLE ACUTE PATIENT FLOW – CATEGORISING
THE STRATEGIES 32 3.4 PAPER IV: MANAGING A VARIABLE ACUTE PATIENT FLOW – PLANNING AND
DECISION-MAKING 34
4 ANSWERING THE RESEARCH QUESTIONS 37
4.1 RQ1: HOW DO VARIABLE PATIENT FLOWS AFFECT HOSPITALS? 37 4.2 RQ2: HOW ARE VARIABLE PATIENT FLOWS HANDLED AT HOSPITALS? 41

4.3 RQ3: HOW DOES THE ORGANISATIONAL CONFIGURATION INFLUENCE THE
ACTIONS USED TO HANDLE VARIABLE PATIENT FLOWS IN HOSPITALS? 46
5 CONCLUSIONS AND PROPOSITIONS 49
5.1 RETURNING TO THE PURPOSE 49 5.2 PROPOSITIONS FOR FUTURE RESEARCH AND PRACTICE 51
REFERENCES
APPENDIX 1: INTERVIEW GUIDE
APPENDIX 2: INFORMATION GATHERING ACTIVITIES
APPENDIX 3: SEARCH TERMS AND NUMBER OF HITS FOR SYSTEMATIC LITERATURE REVIEW
APPENDIX 4: MAPPING TOOLS IN HEALTHCARE PROCESSES
APPENDIX 5: LOGISTICS HANDBOOK FOR THE HEALTHCARE INDUSTRY
APPENDIX 6: PAPER I: UNDERSTANDING THE IMPACT OF VARIATION ON HEALTHCARE SYSTEMS
APPENDIX 7: PAPER II: DEVELOPMENTS IN THE FIELD OF HEALTHCARE LOGISTICS AND SCM – A PATIENT FLOW FOCUS
APPENDIX 8: PAPER III: MANAGING A VARIABLE ACUTE PATIENT FLOW – CATEGORISING THE STRATEGIES
APPENDIX 9: PAPER IV: MANAGING A VARIABLE ACUTE PATIENT FLOW – PLANNING AND DECISION-MAKING
APPENDIX 10: CASE REPORT

LIST OF FIGURES FIGURE 1.1 – PROTECTING PRODUCTION FROM VARIATION IN SUPPLY AND DEMAND BY HAVING
INVENTORY .......................................................................................................................................................... 8 FIGURE 1.2 – SERVICE PRODUCTION IN A HEALTHCARE CONTEXT .................................................................. 9 FIGURE 2.1 – THE RELATIONSHIPS BETWEEN THE PAPERS FROM THE DIFFERENT PHASES OF THE
LITERATURE REVIEW ........................................................................................................................................ 22 FIGURE 3.1 – RELATIONSHIPS BETWEEN THE SIMULATED VARIABLES ........................................................... 30 FIGURE 3.2 – OVERVIEW OF THE LEAGILE APPROACHES USED TO MANAGE A VARIABLE ACUTE PATIENT
FLOW ................................................................................................................................................................... 33 FIGURE 3.3 – MIDDLE MANAGEMENT STRATEGY INVOLVEMENT AT THE HOSPITAL (ADAPTED FROM
FLOYD AND WOOLDRIDGE, 1992, P. 154) ..................................................................................................... 35 FIGURE 4.1 – DAILY ARRIVAL PATTERN FOR THE ED AND AN INPATIENT WARD ........................................ 37 FIGURE 4.2 – PATIENT FLOW VARIABILITY IN RELATION TO PATIENT GROUP CHARACTERISTICS ........... 40 FIGURE 4.3 – HOW VARIABLE PATIENT FLOWS AFFECT HOSPITALS ................................................................ 41 FIGURE 4.4 – RELATIONSHIPS BETWEEN FACTORS WITHIN THE ORGANISATIONAL CONFIGURATION
THAT INFLUENCE THE USE OF ACTIONS TO HANDLE VARIABLE PATIENT FLOWS. ............................. 46 FIGURE 5.1 – RELATIONSHIPS BETWEEN THE RESEARCH QUESTIONS ............................................................ 50
LIST OF TABLES TABLE 2.1 – RESEARCH METHODS APPLIED FOR THE APPENDED PAPERS ..................................................... 16 TABLE 2.2 – THE TWO HOSPITALS IN FIGURES ..................................................................................................... 18 TABLE 2.3 – TYPES OF LITERATURE REVIEWS AND THEIR RELATIONSHIPS TO PAPERS AND CHAPTERS IN
THIS THESIS ........................................................................................................................................................ 21 TABLE 2.4 – THE LINK BETWEEN THE RESEARCH QUESTIONS AND THE APPENDED PAPERS AND CASE
REPORT ............................................................................................................................................................... 26 TABLE 3.1 – THE RESULTS FROM THE SIMULATION RUNS CONCERNING DEPARTMENT 38 ........................ 29 TABLE 3.2 – RESULTS FROM THE SIMULATION RUNS CONCERNING THE ED ................................................. 30 TABLE 4.1 – EFFECTS ON LOS IN INPATIENT WARD AND ED WHEN PATIENT INFLOW OR DURATION OF
ACTIVITIES IS CHANGED .................................................................................................................................. 38 TABLE 4.2 – NUMBER OF ACTIONS USED AT DIFFERENT ORGANISATIONAL LEVELS .................................. 44

1
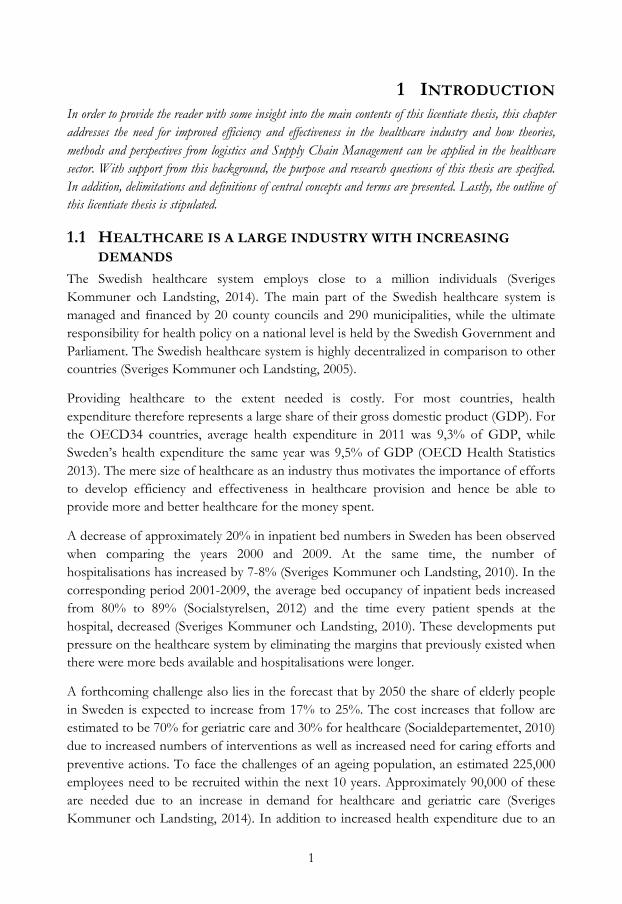
1 INTRODUCTION In order to provide the reader with some insight into the main contents of this licentiate thesis, this chapter addresses the need for improved efficiency and effectiveness in the healthcare industry and how theories, methods and perspectives from logistics and Supply Chain Management can be applied in the healthcare sector. With support from this background, the purpose and research questions of this thesis are specified. In addition, delimitations and definitions of central concepts and terms are presented. Lastly, the outline of this licentiate thesis is stipulated.
1.1 HEALTHCARE IS A LARGE INDUSTRY WITH INCREASING DEMANDS
The Swedish healthcare system employs close to a million individuals (Sveriges Kommuner och Landsting, 2014). The main part of the Swedish healthcare system is managed and financed by 20 county councils and 290 municipalities, while the ultimate responsibility for health policy on a national level is held by the Swedish Government and Parliament. The Swedish healthcare system is highly decentralized in comparison to other countries (Sveriges Kommuner och Landsting, 2005).
Providing healthcare to the extent needed is costly. For most countries, health expenditure therefore represents a large share of their gross domestic product (GDP). For the OECD34 countries, average health expenditure in 2011 was 9,3% of GDP, while Sweden’s health expenditure the same year was 9,5% of GDP (OECD Health Statistics 2013). The mere size of healthcare as an industry thus motivates the importance of efforts to develop efficiency and effectiveness in healthcare provision and hence be able to provide more and better healthcare for the money spent.
A decrease of approximately 20% in inpatient bed numbers in Sweden has been observed when comparing the years 2000 and 2009. At the same time, the number of hospitalisations has increased by 7-8% (Sveriges Kommuner och Landsting, 2010). In the corresponding period 2001-2009, the average bed occupancy of inpatient beds increased from 80% to 89% (Socialstyrelsen, 2012) and the time every patient spends at the hospital, decreased (Sveriges Kommuner och Landsting, 2010). These developments put pressure on the healthcare system by eliminating the margins that previously existed when there were more beds available and hospitalisations were longer.
A forthcoming challenge also lies in the forecast that by 2050 the share of elderly people in Sweden is expected to increase from 17% to 25%. The cost increases that follow are estimated to be 70% for geriatric care and 30% for healthcare (Socialdepartementet, 2010) due to increased numbers of interventions as well as increased need for caring efforts and preventive actions. To face the challenges of an ageing population, an estimated 225,000 employees need to be recruited within the next 10 years. Approximately 90,000 of these are needed due to an increase in demand for healthcare and geriatric care (Sveriges Kommuner och Landsting, 2014). In addition to increased health expenditure due to an
2
increasing share of elderly people in the Swedish population, the technological development in advanced treatments and pharmaceuticals also increases demand for healthcare services. By 2050, the costs for Swedish healthcare are expected to increase by 80% due to possible new treatments, increased aspiration levels and more patients (Socialdepartementet, 2010).
To summarize, healthcare is a large industry where one of the main objectives is to provide as much health services as possible at as low a cost as possible, while present and future developments exert even more pressure to do more with less. Improved efficiency and effectiveness in healthcare services is thus needed in the present and in the future.
1.2 THE NECESSITY FOR A SYSTEM PERSPECTIVE IN HEALTHCARE
To improve efficiency and effectiveness in healthcare the patient flow needs to be focused (Parnaby and Towill, 2008) since it is central to an organisation's capacity to provide healthcare services, while other operations provide support with the aim of creating conditions for an efficient and effective patient flow. A holistic view of the whole patient process is therefore needed (Aronsson et al., 2011; Meijboom et al., 2011; Parnaby and Towill, 2009). Nor will overall quality in healthcare processes improve until all those involved in providing care for a patient see themselves as part of the same team, regardless of organisational affiliation (Bringewatt, 1998).
The need for a systemic perspective has also been put forward as a prerequisite for finding possible solutions to major issues in healthcare provision. One conclusion from a literature review concerning the causes of and solutions to overcrowded EDs was that potential solutions would need a multidisciplinary system-wide support (Trzeciak and Rivers, 2003). This conclusion was supported by participants in a focus group study, who claimed that different causes of overcrowding could not be tackled independently, but should be addressed with a holistic approach (Estey et al., 2003). The problem of overcrowding is system-based and related to lack of incentives, or even perverse incentives for hospital administrators concerning delivering inpatient beds and other resources for acute patients, as concluded by the Physician Hospital Care Committee (2006). Solutions to overcrowded EDs will mainly be found in appropriate bed management strategies, including the use of step-down and community resources, so that appropriate inpatient beds remain available for acutely sick patients (Richardson and Mountain, 2009).
Ineffective patient transfers are also a contributing factor to the high bed occupancies in inpatient clinics. These inefficiencies are strongly related to ineffective inter-departmental interaction, ineffective information handoffs, and ineffectiveness of current information technologies (Abraham and Reddy, 2010).

3
Another issue that requires a holistic approach is that of bed-blocking. A blocked bed can be defined as: “.. a bed occupied by a patient who in the consultant’s opinion no longer require the services provided for that bed, but who cannot be discharged or transferred to more suitable accommodation” (Hall and Bytheway, 1982, p. 1987). Bed-blocking can be a problem if patients from a specialised inpatient unit cannot be transferred to a revalidation unit when they are ready for that, since they block beds for patients in need of the specialised treatment (Andersson and Karlberg, 2000). Such “bed-blockers” would not only cost the system much less when placed in a less-specialised facility, they would also receive more appropriate care and services. (Meijboom et al., 2011). Bed-blocking also often occurs when elderly people with high care needs cannot be accepted by permanent care facilities. The issue of high bed occupancy within acute hospitals thus partly stems from a mismatch between demand and supply for spaces in permanent care facilities, and thus cannot be fully comprehended by viewing the hospital system in isolation from other sectors that support the health and well-being of elderly people (Travers et al., 2008).
There are many issues in healthcare that originates from a lack of system perspective. A system perspective has however been a theoretical foundation for logistics (Bowersox, 1978; Novack et al., 1992) and Supply Chain Management (Mentzer et al., 2001; Sanders; 2007) research. The potential of applying logistics and Supply Chain Management (SCM) in a healthcare context will therefore be discussed in the following section.
1.3 THE PROSPECT OF APPLYING LOGISTICS AND SCM IN HEALTHCARE
Like any other organisation, a healthcare organisation is a system of components that interact to achieve a number of goals. A foundation in systems theory is that none of these components can act independently of another in a system, that the components are interrelated. A system thus has to be understood and managed as a whole to achieve efficiency and effectiveness (Langley et al., 2008). When components are managed individually, without considering the impact on the larger system, sub-optimization often follows (Stock and Lambert, 2001). Though originating from political science/sociology discipline, systems theory has been used as a base in logistics and SCM research (Stock, 1997).
The concepts of logistics and SCM are flow-oriented (Christopher, 2005). To move towards a flow-oriented system instead of a functionally oriented system, that is typical in healthcare organisations, is needed (Mould et al., 2010) and has the potential to decrease sub-optimization by an end-to-end view when developing the supply chain (Wood, 2004). Poor flow also leads to higher mortality rates and healthcare costs (The Health Foundation, 2013). Focusing on patient flow in health systems is therefore crucial.
Interest in logistics and SCM has increased in recent years as regards how to create a more flow-oriented system (Oskarsson et al., 2013). In a licentiate thesis, Wiger (2013)

4
shows that healthcare systems can be described as a logistics systems by evaluating a healthcare system in terms of the main features of a logistics system, such as flow-orientation, measurements to capture the entire system’s performance and control of the transformation between input and output. These results indicate that applying logistics concepts in a healthcare context is a way to increase efficiency in healthcare services.
As discussed earlier, the flow of patients is the core process in healthcare, while flows of material are secondary (Vissers and Beech, 2005). Traditional logistics and SCM research has a physical product focus, since the organisations studied are, and have been, predominantly manufacturing and trade organisations, for which the flow of material is the primary flow. The potential of applying existing concepts, models and practices from logistics and SCM has been emphasised by several authors (Aronsson et al., 2011; de Vries and Huijsman, 2011; Towill and Christopher, 2005). Aronsson et al. (2011) argue that SCM has the potential to work well as a philosophy for a patient flow focus while Towill and Christopher (2005) show that material flow concepts from logistics and SCM can form the basis for effective healthcare delivery systems with a patient flow focus. There are, however, indications that the healthcare sector is behind the industry sector when it comes to implementing SCM practices (McKone-Sweet et al., 2005; de Vries and Huijsman, 2011).
The use of logistics and SCM theories, models and practices in healthcare has been sparsely researched. Shah et al. (2008) claim a lack of academic research in healthcare SCM while de Vries and Huijsman (2011) argue that the body of knowledge regarding the healthcare industry from a supply chain perspective is fragmented. Management philosophies are often implemented together with SCM practices. Research on how management philosophies, such as lean and agile manufacturing, Lean Six Sigma and business process re-engineering, are applied by health care providers and to what extent health care providers can benefit from these practices is therefore also needed (de Vries and Huijsman, 2011).
Before discussing more explicitly how logistics and SCM concepts have been applied in the research reported in this licentiate thesis some characteristics of healthcare services will be deliberated in the forthcoming section.
1.4 CHARACTERISTICS OF HEALTHCARE SERVICES Grönroos (2007) describes three important characteristics of services in comparison to goods:
• A service is more likely to consists of linked activities (intangible) than goods (tangible)
• A service is produced and consumed at least partly at the same time • The customer participates at least partly in the service production process

5
This argument is further built upon by Grönroos and Ravald (2011). They divide the value-creating process into three steps, where the first is a production phase aiming at facilitating value creation where only the supplier is present, for example preparing an operating theatre before a surgical operation. The second phase consists of the interaction between customer and supplier, while the third phase consists of the parts of the process that the customer performs without interaction with the supplier, e.g. exercises for rehabilitation after surgery.
Other characteristics of services is that they are often labour-intensive, difficult to resell, not able to stored and transported due to simultaneous production and consumption, difficult to automate, are often perishable (unused capacity is capacity lost forever) and have a quality dimension that is difficult to evaluate (Arlbjörn and Halldorsson, 2002).
In recent years, the concept of service SCM has emerged and been elaborated conceptually in general (Ellram et al., 2004; Ellram et al., 2007), in a healthcare context (Baltacioglu et al., 2007), and in the municipal sector (Arlbjörn et al., 2011). An important aspect in distinguishing service supply chains is that they are bidirectional, meaning that the customers are also suppliers (Sampson, 2000; Sampson and Froehle, 2006).
Berry and Bendapudi (2007) describe the differences between healthcare and other services. One of the differences is that customers are sick. The patients often also live in the service “factory” and the emotions that follow an illness influence their ability to make choices. Further, customers are reluctant to use the medical services; they need a treatment but may not want it. The patient often does not want the role of “co-producer” that is often needed for a favourable outcome of a service. Since healthcare services are inherently personal, but not private the customers relinquish privacy. Patients may have to disrobe and discuss highly personal matters with clinicians they are meeting for the first time. There is also a need for healthcare personnel to understand each individual customer and customize the service accordingly to the patient’s medical condition, age, mental condition, personal traits, preferences and family circumstances. In other words, customers need “whole person” service, which puts pressure on the clinician’s ability and willingness to combine knowledge of medicine with knowledge of the individual patient. Another difference between healthcare and most services is that customers are at risk. A profession that is supposed to heal too often causes harm. Hospital-acquired infections, medication errors and communication errors harm millions of patients every year worldwide. A last major difference is that clinicians are stressed. Serving acutely ill people is exceedingly stressful work and doctors as well as nurses are often visibly tired and fatigued. The work shifts are long and include, especially for nurses, “heavy” work such as lifting or turning patients. The emotional stress of serving people with serious illnesses and delivering bad news to patients and families further contributes to a stressful environment for clinicians.
6
The complexity of healthcare services discussed above also generates variations when providing healthcare services. A labour-intensive healthcare service with simultaneous production and consumption as well as diffuse quality dimension is for example subject to several types of variation that are not present when producing a ballpoint pen. Variability is therefore of specific interest to study in healthcare services and is therefore discussed below.
1.5 VARIABILITY IN HEALTHCARE SERVICES In this thesis, variability, or in other words variation, is labelled as a deviation from the mean value of a certain variable. For example, the deviations in the number of patients that arrive at an emergency department are henceforth described as variation. The variation for a certain variable can be dependent on the variations of components making up the variable. The arrival pattern of patients at an emergency department, are for instance influenced by the day of the week, weather and demographic distribution. The variation can also be measured on different levels, where the number of patients arriving at an emergency department is highly variable when comparing different hours of the day, while the monthly number of patients is fairly constant. Since variation, as a concept, is complex, different types of variation that are important to recognise in healthcare will be described below, to help the reader understand the concept. In the next section (1.6), the types of variability that are studied in this thesis will be chosen.
From the perspective of an organisation, variability can be divided into two groups: externally created and internally created. The former is strongly related to the customers and suppliers. The latter is created by the way work within the organisation is done. Allder et al., (2011) describe a number of behaviours in healthcare systems that internally create variability:
1. The system artificially increases demand variation (arrival variability) – First appointment referral requests are often batched between general practitioners and secondary care, creating artificial ups and downs in demand.
2. Capacity variation is introduced into the system – Queues are made worse by the discontinuous scheduling of specific clinics on only one or two days per week. The capacity to discharge is also often decreased during holiday periods, due to an increased share of inexperienced physicians that are reluctant to discharge patients.
3. Prioritisation increases variation – One of the known effects of prioritisation systems, such as basic forms of triage, is that it splits demand into subgroups. These subgroups experience relatively higher net demand variation, increasing the average wait in the system.
4. Subspecialties generate increases in variation – Any form of ring-fencing, such as the creation of a new specialist clinic, increases delay in a very similar way to that of prioritisation since it creates smaller pools of patients. Sharing resources between multiple providers on the contrary smoothes demand and reduces queues.

7
5. Waiting list initiatives increase variation – Adding short-term capacity to try to eliminate queues, increases the demand variation and generates temporary surges in demand that spread through the whole system. This unbalances the system and moves delays from one place to another. Often the initiative simply shifts the delays from one specialty to another, as previously shared resources are diverted.
Customers do not all want service at the same time or at times necessarily convenient for the organisation that provides a service. In many situations it is possible to address arrival variability through appointment systems, but in situations where the customers cannot foresee or delay their needs this solution is not usable (Frei, 2006; Bicheno et al., 2009), an obvious example being acute patients arriving at an emergency department. With every individual patient having different diseases, severity levels and responses to therapy much variability is also introduced (Litvak and Long 2000; Noon et al., 2003). The time a patient spends at an inpatient ward, in surgery or at a doctor’s appointment are all dependent on these variables. In addition, the interactions of multiple diseases and the effects of a given treatment make it difficult to foresee the next step in the patient process and sometimes each diagnostic test or test of therapy generates new information that influences future decisions, creating an iterative patient process (Bohmer, 2005).
The fact that customers’ desires do not emerge along standard lines poses challenges for practically every kind of service business (Frei, 2006). In healthcare where patients need treatment but may not want it (Berry and Bendapudi, 2007) variation in patients’ desires are created.
Another source of variability is the differences in the capabilities that customers possess. It may originate from differences in knowledge, skill, physical abilities, or resources and some customers therefore perform tasks easily while some require hand-holding. Obviously the capability variability becomes more important to handle when the customers are active participants in the production and delivery of a service (Frei, 2006).
When customers must perform some activity in a service interaction, it is up to the customer how much effort they apply to the task (Frei, 2006). In the third phase of the value-creating process (Grönroos and Ravald, 2011) previously described, where customers perform activities without interaction with the supplier, e.g. rehabilitation exercises after surgery, it becomes essential to handle variation in patient effort. The opinions of what it means to be treated well in a service environment also vary among customers. The unpredictability in personal preference makes it complicated to serve a broad base of customers (Frei, 2006).
Of course there is also variability that originates from the service providers. Due to different approaches, preferences and different levels of ability, healthcare personnel introduce variability in service provision (Litvak and Long 2000; Noon et al., 2003). For instance, physicians always make a judgment as a basis for decisions on further treatment.
8
Due to the inherent complexity and variability discussed above, healthcare managers believe that, unlike manufacturing industry, they cannot control their service production or predict their patient inflow (Jarret, 1998; Vissers et al., 2001). However, this perception is only partially true. Several authors (Allder et al., 2011; Lega et al., 2012; McLaughlin, 1996; Silvester et al., 2004; Walley et al., 2006) claim that much of this variability can be handled by working smarter, through strategies such as capacity management systems and standardised patient processes for homogenous sub-groups of patients. Instead, healthcare resources are often used inappropriately and not adapted to the variations that exist (Walley et al., 2006). It is therefore of interest to study how variations are handled in healthcare. The following section will discuss how a logistics/SCM perspective can be used to address variability in healthcare services.
1.6 HANDLING VARIABILITY FROM A LOGISTICS/SCM PERSPECTIVE
Variability has been an important construct in a number of fields, including organizational theory, marketing and SCM (Chen and Paulraj, 2004). Understanding the impact of different sources of variability is also a cornerstone of effective SCM (Davis, 1993). In a manufacturing context, Hopp and Spearman (2000) have proven a series of fundamental relationships. Two of these are of specific interest for this research:
1. Increased variability always degrades the performance of a production system. 2. Variability in a production system will be buffered by some combination of inventory, capacity or
time. In other words, if not handled, variation will affect you in one or more of these three ways.
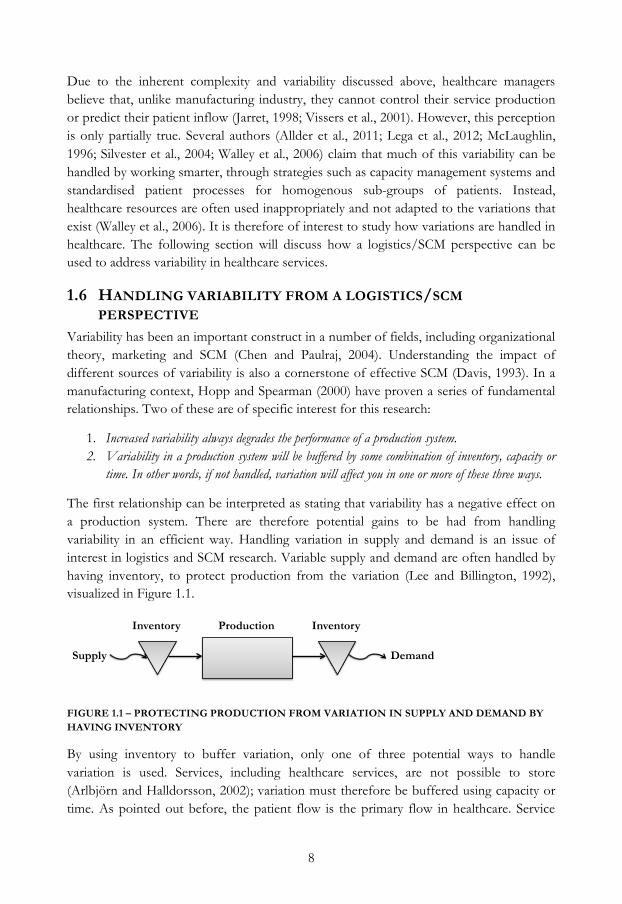
The first relationship can be interpreted as stating that variability has a negative effect on a production system. There are therefore potential gains to be had from handling variability in an efficient way. Handling variation in supply and demand is an issue of interest in logistics and SCM research. Variable supply and demand are often handled by having inventory, to protect production from the variation (Lee and Billington, 1992), visualized in Figure 1.1.
FIGURE 1.1 – PROTECTING PRODUCTION FROM VARIATION IN SUPPLY AND DEMAND BY HAVING INVENTORY
By using inventory to buffer variation, only one of three potential ways to handle variation is used. Services, including healthcare services, are not possible to store (Arlbjörn and Halldorsson, 2002); variation must therefore be buffered using capacity or time. As pointed out before, the patient flow is the primary flow in healthcare. Service
Inventory Production Inventory
Demand Supply
9
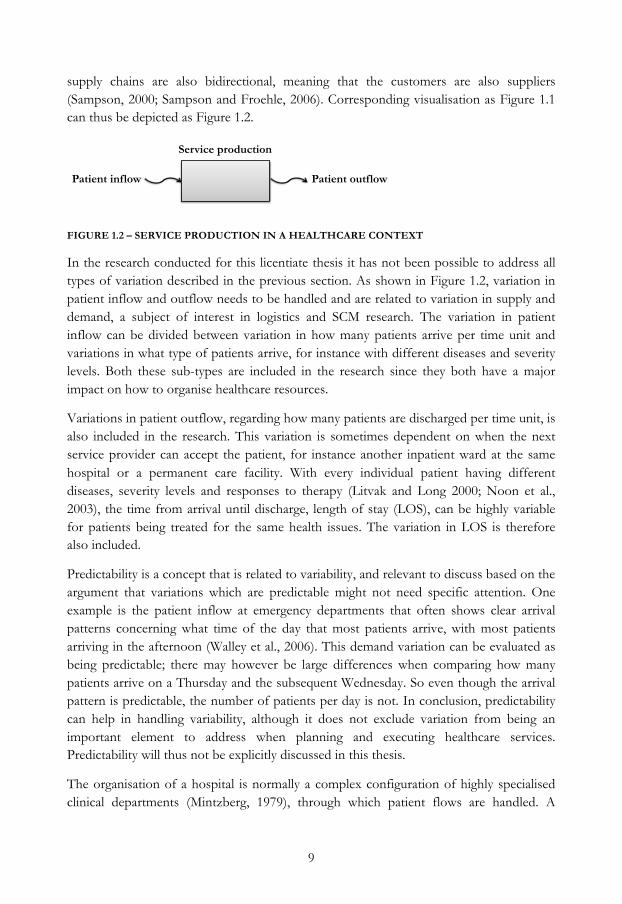
supply chains are also bidirectional, meaning that the customers are also suppliers (Sampson, 2000; Sampson and Froehle, 2006). Corresponding visualisation as Figure 1.1 can thus be depicted as Figure 1.2.
FIGURE 1.2 – SERVICE PRODUCTION IN A HEALTHCARE CONTEXT
In the research conducted for this licentiate thesis it has not been possible to address all types of variation described in the previous section. As shown in Figure 1.2, variation in patient inflow and outflow needs to be handled and are related to variation in supply and demand, a subject of interest in logistics and SCM research. The variation in patient inflow can be divided between variation in how many patients arrive per time unit and variations in what type of patients arrive, for instance with different diseases and severity levels. Both these sub-types are included in the research since they both have a major impact on how to organise healthcare resources.
Variations in patient outflow, regarding how many patients are discharged per time unit, is also included in the research. This variation is sometimes dependent on when the next service provider can accept the patient, for instance another inpatient ward at the same hospital or a permanent care facility. With every individual patient having different diseases, severity levels and responses to therapy (Litvak and Long 2000; Noon et al., 2003), the time from arrival until discharge, length of stay (LOS), can be highly variable for patients being treated for the same health issues. The variation in LOS is therefore also included.
Predictability is a concept that is related to variability, and relevant to discuss based on the argument that variations which are predictable might not need specific attention. One example is the patient inflow at emergency departments that often shows clear arrival patterns concerning what time of the day that most patients arrive, with most patients arriving in the afternoon (Walley et al., 2006). This demand variation can be evaluated as being predictable; there may however be large differences when comparing how many patients arrive on a Thursday and the subsequent Wednesday. So even though the arrival pattern is predictable, the number of patients per day is not. In conclusion, predictability can help in handling variability, although it does not exclude variation from being an important element to address when planning and executing healthcare services. Predictability will thus not be explicitly discussed in this thesis.
The organisation of a hospital is normally a complex configuration of highly specialised clinical departments (Mintzberg, 1979), through which patient flows are handled. A
Service production
Patient outflow Patient inflow

10
patient process often involves a large number of clinical departments, which requires much coordination in both space and time (Aronsson et al., 2011). Applying a system perspective concerning how variable patient flows are managed at hospitals could therefore be a relevant approach.
1.7 PURPOSE AND RESEARCH QUESTIONS Based on the discussions in the previous sections, the purpose of this licentiate thesis is:
To explore how variable patient flows are managed in hospitals
A shift towards more flow orientation instead of a functional orientation, that is typical in healthcare organisations, is needed (Mould et al., 2010). The concepts of logistics and SCM are flow-oriented (Christopher, 2005) and the potential of applying these in healthcare has been emphasised by several authors (Aronsson et al., 2011; de Vries and Huijsman, 2011; Towill and Christopher, 2005). There is also a lack of academic research regarding healthcare SCM (Shah et al., 2008) and indications that the health care sector is behind the industry sector when it comes to implementing SCM practices (McKone-Sweet et al., 2005; de Vries and Huijsman, 2011), which makes it relevant to choose the term explore.
The term variable patient flows means, in this thesis, patient flows under the influence of variation, where the following types of variation, as discussed in the previous section, are encompassed:
• Inflow: number of patients arrived per time unit • Inflow: types of patients • Internal flow: LOS • Outflow: number of patients discharged per time unit
To provide structure and focus, the purpose of this thesis has been divided into three research questions. These will be justified and elaborated below. The term managed will be specified in relation to research question 3.
As discussed in section 1.6, healthcare services are not possible to store (Arlbjörn and Halldorsson, 2002) and variation must therefore be handled by using capacity or time. Queues are often used to protect against variation in healthcare, but must be of limited length dependent on the health issue at hand. When treating patients with acute health issues queues are also of limited use. Nor is it an option to refuse healthcare services and admission to a hospital. With every individual patient having different diseases, severity levels and responses to therapy (Litvak and Long 2000; Noon et al., 2003) it becomes difficult to foresee the next step in the patient process (Bohmer, 2005) or plan for the discharge of a patient. In conclusion, these difficulties can be visualised by how the square in Figure 1.2 is influenced by the variability in patient inflow and outflow as well as the

11
internal flow of patients. To increase the understanding of how these difficulties negatively affect hospitals, the first research question was developed:
RQ1: How do variable patient flows affect hospitals?
The impact of variable patient flows is influenced by the way the variability is handled. In similarity with the argumentation above, the variability in patient inflow and outflow as well as the internal flow of patients is handled in the square in Figure 1.2. In previous research, the ability of healthcare providers to handle variation in demand has been questioned. Walley et al. (2006) for instance argue that healthcare resources are often used inappropriately and not adapted to the variations that exist. A primary cause of queuing in the United Kingdom’s National Health Service (NHS) has also been attributed to a mismatch between demand and capacity variation (Silvester et al., 2004). To provide knowledge as to why variable patient flows are not satisfactorily handled in healthcare, the second research question was stipulated:
RQ2: How are variable patient flows handled at hospitals?
The term handle in this thesis means the operational actions used and do not include how the decision to use an action is reached.
In section 1.2 the need for a system perspective was emphasised to overcome issues such as overcrowded EDs (Trzeciak and Rivers, 2003; Estey et al., 2003), ineffective patient transfers (Abraham and Reddy, 2010) and bed-blocking (Andersson and Karlberg, 2000; Travers et al., 2008). With the functional organisation of hospitals, made up of highly specialised clinical departments (Mintzberg, 1979; Mould et al., 2010), there is an obvious risk of sub-optimization (Wood, 2004). That the organisational configuration of a hospital influences the options for handling variable patient flow is thus reasonable. Variable patient flows are handled by actions on all hierarchical levels of the hospital organisation. The actions chosen for handling variable patient flows at the hospital are thus influenced by the organisational configuration. To clarify this relationship, the third research question was postulated:
RQ3: How does the organisational configuration influence the actions used to handle variable patient flows in hospitals?
The term organisational configuration needs some elaboration as to what is included in the concept. Since the development of actions to handle variable patient flows are performed at both departmental and top management levels, as well as intermediate levels, these levels are included. Both long-term and short term planning is also included as well as the operational decision-making regarding which actions to choose in different circumstances. Concepts such as mandates, authority and information sharing are also encompassed. In one of the appended papers, denoted Paper IV in this thesis, another term was used with the same meaning as organisational configuration, namely planning and decision-making.
12
The final delimitation at this stage is the term managed, included in the purpose. In this thesis it encompasses both the actions used to handle variable patient flows as well as the organisational configuration that influences it. In the appended Paper III and IV and case report, the term was used to discuss both the actions as well as the organisational configuration related to handling variable patient flows. The previously defined handle, was thus not used to denote operational actions in these papers. To complicate things further, in the appended case report, operational actions used for handing variable patient flows were denoted by either actions or strategies.
The choice to include all the aspects discussed above in the thesis is connected to the choice to explore in the purpose, in turn due to the lack of previous research. The exploratory orientation will be further elaborated in the next chapter.
1.8 THESIS OUTLINE First and foremost, it is important to clarify that this thesis is a compilation thesis, consisting of four papers and a case report. The objective of the main part of the thesis (thesis frame) is to link the other parts to each other and thereby provide additional contributions that the papers and case report do not provide on their own. Although the aim of the thesis frame is to provide sufficient descriptions and discussions of the findings in the papers and case report, the reader may occasionally need to review a paper for a more detailed picture. Below the chapters of this licentiate thesis is presented:
CHAPTER 1: INTRODUCTION The first chapter sets out to provide the reader with some insight into the reasons for performing the research reported in this thesis. With support from this background, the purpose and research questions are specified. Delimitations and definitions of central concepts and terms are also presented in the chapter.
CHAPTER 2: RESEARCH METHODOLOGY The aim of the second chapter is to describe the overall research approach used for the research presented in this licentiate thesis. In addition to describing the research design and the methods used, the organisations studied are presented. A description of how the research questions have been answered concludes the chapter.
CHAPTER 3: SUMMARY OF APPENDED PAPERS In this chapter a summary of each of the four appended papers is presented, allowing the reader to acquire basic understanding of the content of each paper. The summary of each paper follows a certain structure. After presenting the purpose of a paper, the main results and contributions of the paper are described.
CHAPTER 4: ANSWERING THE RESEARCH QUESTIONS This chapter seeks to find answers to the three research questions developed in the first chapter. The research questions are analysed one by one, with input from the four

13
appended papers as well as the case report. Individual contributions and synthesis of the contributions from the papers and case report are mixed when exploring a research question.
CHAPTER 5: CONCLUSIONS AND PROPOSITIONS In this chapter the conclusions from each research question are combined and related to each other in order to answer the purpose of the thesis. The second part of the chapter provides propositions for future research and practice. These propositions are primarily based on the author’s evaluation and identification of patterns in the research material reported in this thesis.

14
15
2 RESEARCH METHODOLOGY The aim of this chapter is to describe the overall research approach used for the research presented in this licentiate thesis. It includes the research design as well as the methods used and organisations studied. A description of how the research questions have been answered concludes the chapter.
2.1 RESEARCH DESIGN Research design can generally be described as the logical relationship between a study’s research question and the data that needs to be collected. But before deciding upon research design, the type of research that shall be conducted must however be deliberated, since the existing knowledge within a research field affects the appropriateness of different types of research and thus research designs (Yin, 2009). Ellram (1996) describes three objectives of research depending on the maturity of the research field: exploratory, descriptive and explanatory. Exploratory research is used when limited prior knowledge exists within a research field and basic understanding of a phenomenon is needed. The field of healthcare logistics and SCM is in its infancy (De Vries and Huijsman, 2011) and an exploratory objective is thus appropriate.
The exploratory objective of the research conducted in this thesis guided the author to adopt a research approach similar to abductive reasoning. Described as a combination of inductive and deductive reasoning, abductive reasoning allow the author to adopt an iterative research process and thus go back and forth between the empirical and theoretical worlds (Dubois and Gadde, 2002; Kovács and Spens, 2005). With an abductive research process, the starting point is often empirical observations that do not match existing theories, initiating an iterative process where finding new theoretical frameworks or extending existing ones are the objective (Kovács and Spens, 2005). It is also recommended when the researcher’s intent is to understand an observed phenomenon and its context using the lens of an existing theory (Shah et al., 2008). With the new field of healthcare logistics and SCM, where existing theories have been sparsely tested in a healthcare context, the use of abductive reasoning, with the aim to increase understanding by adding a new perspective is relevant. The research design thus used an iterative process, deliberating existing literature through the use of literature reviews and empirical evidence from simulation modelling and a case study. Going back and forth between these worlds has been a crucial part of the research process, allowing deeper understanding of the research field and more generalizable conclusions from this thesis.
2.2 RESEARCH METHODS As briefly mentioned above, three research methods have been used in this licentiate thesis. The first research method used was simulation modelling. Thereafter several literature reviews were conducted, both structured and more iterative. Not all of the literature reviews were used in the research for the appended papers, but the use of the literature reviews will be discussed later. A case study was also performed and the
16
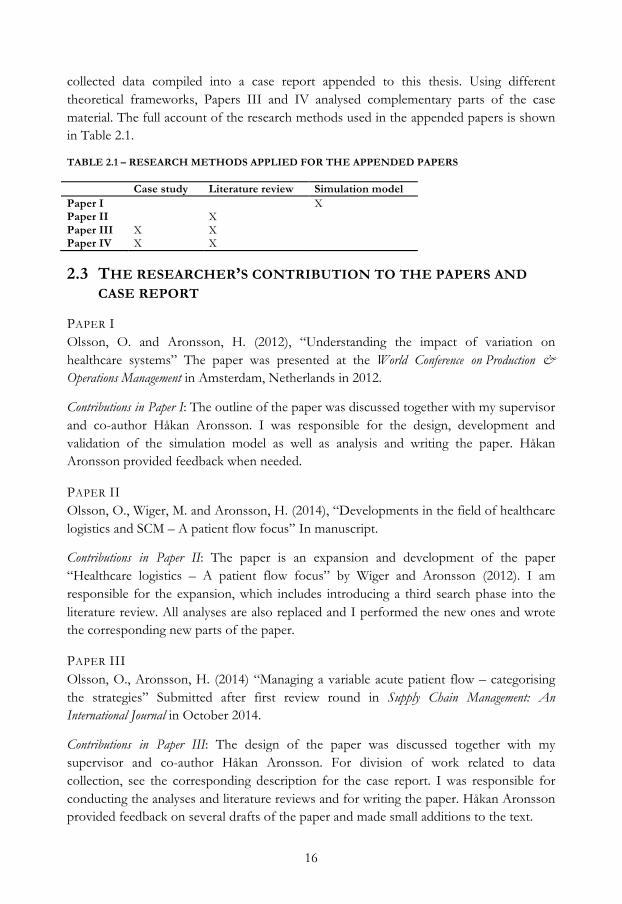
collected data compiled into a case report appended to this thesis. Using different theoretical frameworks, Papers III and IV analysed complementary parts of the case material. The full account of the research methods used in the appended papers is shown in Table 2.1.
TABLE 2.1 – RESEARCH METHODS APPLIED FOR THE APPENDED PAPERS
Case study Literature review Simulation model Paper I X Paper II X Paper III X X Paper IV X X
2.3 THE RESEARCHER’S CONTRIBUTION TO THE PAPERS AND CASE REPORT
PAPER I Olsson, O. and Aronsson, H. (2012), “Understanding the impact of variation on healthcare systems” The paper was presented at the World Conference on Production & Operations Management in Amsterdam, Netherlands in 2012.
Contributions in Paper I: The outline of the paper was discussed together with my supervisor and co-author Håkan Aronsson. I was responsible for the design, development and validation of the simulation model as well as analysis and writing the paper. Håkan Aronsson provided feedback when needed.
PAPER II Olsson, O., Wiger, M. and Aronsson, H. (2014), “Developments in the field of healthcare logistics and SCM – A patient flow focus” In manuscript.
Contributions in Paper II: The paper is an expansion and development of the paper “Healthcare logistics – A patient flow focus” by Wiger and Aronsson (2012). I am responsible for the expansion, which includes introducing a third search phase into the literature review. All analyses are also replaced and I performed the new ones and wrote the corresponding new parts of the paper.
PAPER III Olsson, O., Aronsson, H. (2014) “Managing a variable acute patient flow – categorising the strategies” Submitted after first review round in Supply Chain Management: An International Journal in October 2014.
Contributions in Paper III: The design of the paper was discussed together with my supervisor and co-author Håkan Aronsson. For division of work related to data collection, see the corresponding description for the case report. I was responsible for conducting the analyses and literature reviews and for writing the paper. Håkan Aronsson provided feedback on several drafts of the paper and made small additions to the text.

17
PAPER IV Olsson, O., Aronsson, H. and Sandberg, E. (2014) “Managing a variable acute patient flow – planning and decision-making” Submitted to Journal of Health Organization and Management in May 2014.
Contributions in Paper IV: All three authors collaborated concerning the design of the paper. For division of work related to data collection, see the corresponding description for the case report. The literature review as well as analysis and conclusions were my responsibility, with assistance from Erik Sandberg.
CASE REPORT Olsson, O., Aronsson, H. (2014) “Managing a variable acute patient flow at a university hospital”.
Contributions in case report: The data collection was my responsibility, and Håkan Aronsson assisted during most data collection activities. I transcribed the interviews and wrote the case report.
2.4 ORGANISATIONS STUDIED One of the healthcare organisations studied in this thesis is the hospital in Hässleholm, a part of Hässleholm’s hospital organisation. With operations in four towns in Skåne (a county in the south of Sweden), Hässleholm’s hospital organisation has approximately 500 employees and a turnover of just over SEK 600 million (Hässleholms sjukhusorganisation, 2013). They have responsibility for all internal medicine, orthopaedics, psychiatry, diagnostic imaging and rehabilitation in Hässleholm’s catchment area (70,000 inhabitants) and for all orthopaedics and psychiatry in Kristianstad catchment area (100 000 inhabitants) as well as the main responsibility for orthopaedic artificial joint surgery and highly specialized psychiatry in half of Skåne (500,000 inhabitants). Hässleholm hospital is the largest part of the organisation and operates the entire hospital.
The university hospital in Linköping is the second healthcare organisation studied in this thesis. In addition to organ transplants, the university hospital provides diagnostics, consultation and treatment within every medical speciality. The catchment area for highly specialised care consists of three counties, with a total of approximately one million residents. In some cases the catchment area is even bigger, i.e. the whole country. The university hospital profiles itself through an advanced emergency and trauma care and a focus on highly specialised care and research.
To provide an overview, some general figures for the two hospitals are provided in Table 2.2. The figures for Hässleholm hospital are provided for 2011 since the organisation was mainly studied during 2011. The study of the university hospital in Linköping was

18
initiated during 2012 and figures for both 2011 and 2012 are thus provided to enable comparison.
TABLE 2.2 – THE TWO HOSPITALS IN FIGURES
Hässleholm, 2011 Linköping, 2011 Linköping, 2012 Production 110 beds
6,000 hospitalisations 4,000 operations 36,000 outpatient visits to physician
570 beds 42,000 hospitalisations 15,000 operations 270,000 outpatient visits to physician
572 beds 43,000 hospitalisations 17,000 operations 285,000 outpatient visits to physician
Employees 570 in total Nurses 26% Assistant nurses 25% Physicians 17% Management/administrative 17% Other 13%
5,100 in total Nurses 35% Assistant nurses 22% Physicians 16% Management/administrative 10% Other 17%
5,200 in total Nurses 35% Assistant nurses 22% Physicians 17% Management/administrative 10% Other 17%
2.5 CASE STUDY Case study research is both applicable and desirable when a lack of theory exists, or when the environmental context is different from previous development and usage of theory (Stuart et al., 2002). Strengths with case study research are that it can be used for exploratory investigations, where many variables are still unknown and limited previous knowledge of phenomena exists (Meredith, 1998). The use of logistics and SCM theories in a healthcare setting is a novel area of research (de Vries and Huijsman, 2011). A case study approach therefore seems suitable to explore the applicability of logistics and SCM theories in a healthcare context.
Meredith (1998) also concludes that case studies can be used to increase understanding in fields where the subject matter is complex. Healthcare systems are one of the most complex systems known to contemporary society, and hospitals in particular are considered to be exceptionally complicated organizations (Glouberman and Mintzberg, 2001). At hospitals acute patients arrive continuously at the emergency department (ED). In comparison to elective patients, whose care episode is planned ahead by each clinical department individually, the acute patient flow is more challenging to manage efficiently, mostly due to the unpredictability of the patient inflow as regards time, health issue and response to treatment. At a clinical department admitting acute patients from the ED, the patient inflow is therefore difficult to predict. To describe how the acute patient flow is managed at a university hospital a case study approach thus seems appropriate. Because the phenomenon studied is complex and a hospital includes multiple clinical departments that have many characteristics of independent organisations, a single case study approach was chosen (Yin, 2009).
The choice of organisation to study fell on the university hospital in Linköping. Several of the clinical departments operating at the hospital account for clinical results of top

19
international standard (Landstinget i Östergötland, 2014). Geographical proximity as well as access to information also contributed to the choice of organisation. In a comparison between the university hospitals in Sweden assessing medical quality, financial performance, customer satisfaction, waiting time and hygiene, the university hospital in Linköping also came out with a clear first place (Dagens Medicin, 2013). Consequently, the ability of the university hospital in Linköping to manage a variable acute patient flow was anticipated to be of similar relative quality compared to other university hospitals.
2.5.1 STUDIED SYSTEM The purpose of the case report is to provide a description concerning how a variable acute patient flow is managed at the uäniversity hospital. Both the hierarchical levels, roles and teams that make decisions and manage the flow of acute patients at the hospital as well as the actions used at the hospital to handle a variable acute patient flow are therefore included. Since the entire hospital is studied, and several clinics treat both acute and elective patients, no distinct limitations are included; instead, an approach where the hospital is regarded as a system is used. The basis for considering the hospital as a system is that it should be able to manage a variable acute patient flow without help from other hospitals. The relationship between the hospital and its environment, mainly the collaboration with primary health care, is included but not explicitly studied. The motivation is that actions that are used to be able to admit fewer patients or enhance the admission process by the local health service can be used to handle a variable acute patient flow.
Many actors influence the handling of the variable acute patient flow. At the management level, the development of long-term goals and strategies are executed, thus empirical evidence from the management level is included in the study. General strategic visions, priorities and plans, which are not clearly realised into action, are not included however. Middle managers often have extensive knowledge of the operations within the clinical department they manage while also having responsibility for strategic development. Together with a position entitled coordinator, having the responsibility for coordinating the patient flow at the clinical department and handling bed allocation as well as division of labour between teams and wards, the actions at a middle management and operational level are included. Activities performed by nurses or physicians to handle their daily task are not included. One reason for this is that variation in individual skills and preferences impedes the standardisation of actions to handle a variable acute patient flow. There are also actors and working teams on management and middle management level, but beside the hierarchical levels, influencing and exploiting actions to manage the variable acute patient flow. These are therefore also included.
2.5.2 DATA COLLECTION In line with recommendations from Eisenhardt (1989), constructs from the literature were collected prior to data collection. Literature reviews concerning the concepts lean,
20
agile and leagile as well as strategy formation and middle management strategy involvement were used. These are further described in section 2.6.2. An interview guide that captured the constructs from the identified literature was developed (see Appendix 1 for the interview guide). Not every question was put to every respondent; instead, the interview guide was adapted for each interview. The following subjects were covered:
• Overall strategic direction and aims in managing a variable acute patient flow • Participating actors • What decisions are made at the different hierarchical levels • Goals, documents, planning horizons and budget related to the planning • Possible improvements, problems and initiatives related to the planning • Coordination, integration and collaborations between different actors and
hierarchical levels as well as external collaborations with regard to both planning and actions used
• Actions related to scheduling, staffing, task and responsibility for different actors, patient distribution and transfers, acute versus elective patients, bed management, handling patient inflow and outflow
Every semi-structured interview was recorded, transcribed and sent to the respondent for confirmation, to increase reliability and validity as recommended by Yin (2009). Unstructured observations and interviews as well as observations from meetings (for a list of the information gathering activities, see Appendix 2) were also used in order to gain an understanding of the context studied as well as actors within the system and achieve triangulation of data (Stuart et al., 2002). Since these activities were performed ahead of the semi-structured interviews, the researchers were able to gain fundamental knowledge of the daily operations, which facilitated sorting of information during the subsequent interviews as well as asking additional questions, thus strengthening validity (Stuart et al., 2002). By observing activities in different parts of the hospital while being shown the premises, during the unstructured observations, it was also possible to triangulate and evaluate statements from respondents in the semi-structured interviews.
In line with the overall research design, an exploratory approach was used during the data collection activities. This means asking open-ended questions during the interviews while also allowing the respondents to interpret the questions by not interfering except when the respondent clearly talks off topic.
During the interviews, observations and meetings, formal strategy and planning documents were not specifically asked for. Instead, specific documents were only asked for if a respondent have mentioned it on their own. Due to the number of interviews performed with respondents from different parts of the organisation, every important strategy and planning document was judged to have been identified. Moreover, formal documents that are not used in planning or decision-making have thus been disregarded.

21
By reporting partial results to a working team consisting of clinical department chiefs, empirical evidence could be verified. To ensure validity, the final case description was also sent to three key informants, all with in-depth knowledge of the hospitals operations, and feedback was obtained and incorporated in the description.
2.6 LITERATURE REVIEWS Literature reviews are important components of the research process and can be used for formulation of research questions as well as in the research that follows (Punch, 2005; Tranfield et al., 2003). Several literature reviews have been performed during the research process, both systematic reviews that are transparent, replicable and scientific (Tranfield et al., 2003), together with narrative reviews with broader scopes and more iterative approaches (Bryman and Bell, 2011). In the research conducted for this licentiate thesis, systematic literature reviews have been performed to search literature within a specific subject. Narrative literature reviews have instead been used to find relevant literature that could be used to analyse empirical data. Table 2.3 shows the main literature reviews that have been conducted during the research process, including the type of review and where the findings can be found. Both types of literature reviews will be discussed in more detail below.
TABLE 2.3 – TYPES OF LITERATURE REVIEWS AND THEIR RELATIONSHIPS TO PAPERS AND CHAPTERS IN THIS THESIS
Focus area Type of literature review Main results found in Systematic Narrative
Healthcare logistics and SCM X Paper II Overcrowding X Chapter 1, 4 Process mapping X Appendix 4 Lean, agile and leagile X Paper III Strategy formation/middle management
X Paper IV
2.6.1 SYSTEMATIC LITERATURE REVIEWS Two systematic literature reviews have been executed in the research for this licentiate thesis. The aim of the first review was to identify the healthcare field in logistics and SCM literature, and in particular literature addressing patient flows and not physical product flows. The reason for excluding papers that address physical product flow was that these are mainly support flows to the main flow of patients.
Reviewing specific journals instead of searching in databases has been used in several literature reviews (e.g. Fabbe-Costes and Jahre, 2007; Sachan and Datta, 2005; Spens and Kovács, 2006; Van der Vaart and van Donk, 2008). Published articles that address logistics and SCM issues in health services are scattered over different research fields such as health service management, healthcare management, service management and SCM.
22
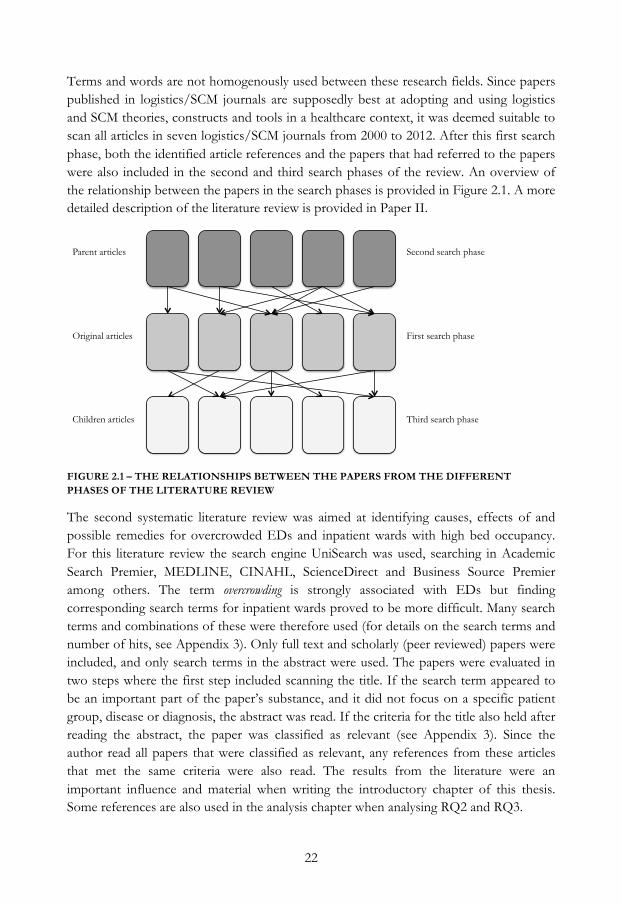
Terms and words are not homogenously used between these research fields. Since papers published in logistics/SCM journals are supposedly best at adopting and using logistics and SCM theories, constructs and tools in a healthcare context, it was deemed suitable to scan all articles in seven logistics/SCM journals from 2000 to 2012. After this first search phase, both the identified article references and the papers that had referred to the papers were also included in the second and third search phases of the review. An overview of the relationship between the papers in the search phases is provided in Figure 2.1. A more detailed description of the literature review is provided in Paper II.
FIGURE 2.1 – THE RELATIONSHIPS BETWEEN THE PAPERS FROM THE DIFFERENT PHASES OF THE LITERATURE REVIEW
The second systematic literature review was aimed at identifying causes, effects of and possible remedies for overcrowded EDs and inpatient wards with high bed occupancy. For this literature review the search engine UniSearch was used, searching in Academic Search Premier, MEDLINE, CINAHL, ScienceDirect and Business Source Premier among others. The term overcrowding is strongly associated with EDs but finding corresponding search terms for inpatient wards proved to be more difficult. Many search terms and combinations of these were therefore used (for details on the search terms and number of hits, see Appendix 3). Only full text and scholarly (peer reviewed) papers were included, and only search terms in the abstract were used. The papers were evaluated in two steps where the first step included scanning the title. If the search term appeared to be an important part of the paper’s substance, and it did not focus on a specific patient group, disease or diagnosis, the abstract was read. If the criteria for the title also held after reading the abstract, the paper was classified as relevant (see Appendix 3). Since the author read all papers that were classified as relevant, any references from these articles that met the same criteria were also read. The results from the literature were an important influence and material when writing the introductory chapter of this thesis. Some references are also used in the analysis chapter when analysing RQ2 and RQ3.
Parent articles
Original articles
Children articles
Second search phase
Third search phase
First search phase

23
2.6.2 NARRATIVE LITERATURE REVIEWS Narrative literature reviews have been used for three focus areas, as shown in Table 2.3. These reviews build on the snowball approach, meaning that papers or books of relevance have provided references of interest, which in their turn have included references to additional relevant literature. For the narrative literature review on strategy formation, the book “Strategy: Process, Content, Context: An International Perspective” by de Wit and Meyer (1998) was used as a starting point. Since the contribution in Paper IV is not the development of new strategy literature, but instead to extend the understanding of planning and decision-making in healthcare, traditional, well-established literature on the strategy formation process was judged to be sufficient and a systematic literature review therefore excessive.
The literature review of lean, agile and leagile had an initial focus on the concept of leagile. Since the concept has been used to a limited extent, and the published papers can thus account for previous research thoroughly, the snowball approach was an appropriate choice to easily identify influential literature regarding the concept of leagility. The concept is used to describe different combinations of lean and agile as process strategies and thus describes combinations of limited subsets of the concepts lean and agile. Lean, in particular includes both tools, methods and operative development (e.g. Bicheno 2004) as well as strategic and cultural guidance (e.g. Hines et al., 2004). The concept has been used in both industrial and public settings since the concept gained widespread attention through the bestseller “The Machine that Changed the World” (Womack et al., 1990). By reviewing references in the papers that described leagility, literature concerning lean and agile as process strategies could be identified.
Process mapping is essential when developing the supply chain (Murphy, 2005) and in healthcare also an important step to improve the understanding of patient needs by mapping the patient pathway (Mould et al., 2010). The literature review covering process mapping tools included searching databases within the areas of management and medicine as well as visiting and searching in libraries and talking to colleagues. The databases used were Academic Search Premier, Business Source Premier and MEDLINE. Among the search terms were; mapping tool, process mapping, flow chart and process analysis examples. The mapping tools identified through the literature review were included in the study if they were used to map a process. Tools used to support project management were however excluded. The literature review also includes the identification of what question/questions the mapping tool can answer and what analysis that the tool enables. If a mapping tool were identified with lacking or vague information about question or analysis further searches to identify these aspects were conducted.
The results from the literature review are mainly found in Appendix 4 and Appendix 5. The former is a work-in-progress paper presented the NOFOMA conference 2011 in Harstad, Norway. The paper presents the process mapping tools identified through the
24
literature review and also concludes which of these are most appropriate to use in a healthcare setting. The recommendations from this paper have been followed when process mapping tools have been used in subsequent research, e.g. flowcharts have been used in Paper I and III and the case report and the organisation chart was used in Paper IV and the case report. The literature identified was also used when writing a guide to logistics development for healthcare personnel (Appendix 5) commissioned by Hässleholm hospital.
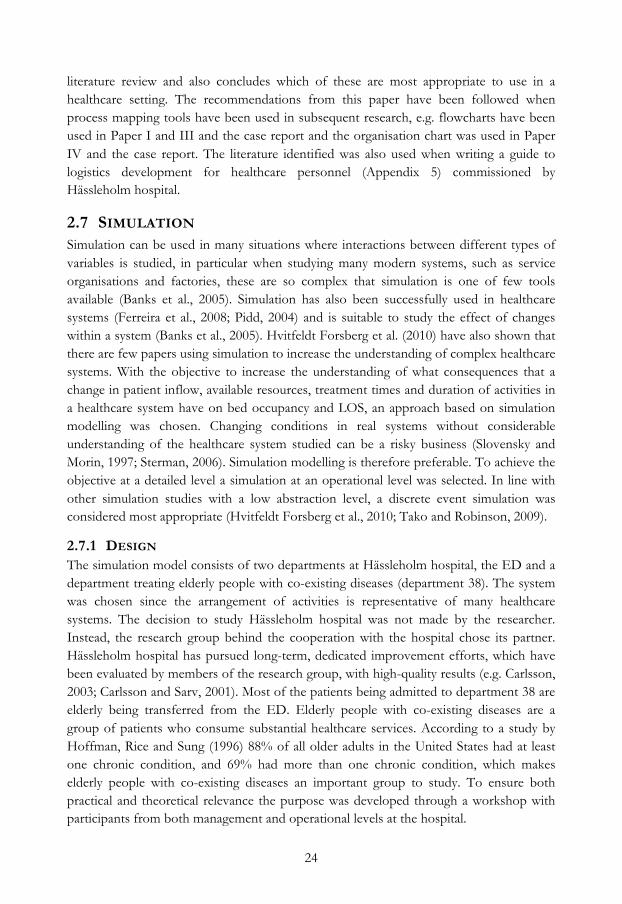
2.7 SIMULATION Simulation can be used in many situations where interactions between different types of variables is studied, in particular when studying many modern systems, such as service organisations and factories, these are so complex that simulation is one of few tools available (Banks et al., 2005). Simulation has also been successfully used in healthcare systems (Ferreira et al., 2008; Pidd, 2004) and is suitable to study the effect of changes within a system (Banks et al., 2005). Hvitfeldt Forsberg et al. (2010) have also shown that there are few papers using simulation to increase the understanding of complex healthcare systems. With the objective to increase the understanding of what consequences that a change in patient inflow, available resources, treatment times and duration of activities in a healthcare system have on bed occupancy and LOS, an approach based on simulation modelling was chosen. Changing conditions in real systems without considerable understanding of the healthcare system studied can be a risky business (Slovensky and Morin, 1997; Sterman, 2006). Simulation modelling is therefore preferable. To achieve the objective at a detailed level a simulation at an operational level was selected. In line with other simulation studies with a low abstraction level, a discrete event simulation was considered most appropriate (Hvitfeldt Forsberg et al., 2010; Tako and Robinson, 2009).
2.7.1 DESIGN The simulation model consists of two departments at Hässleholm hospital, the ED and a department treating elderly people with co-existing diseases (department 38). The system was chosen since the arrangement of activities is representative of many healthcare systems. The decision to study Hässleholm hospital was not made by the researcher. Instead, the research group behind the cooperation with the hospital chose its partner. Hässleholm hospital has pursued long-term, dedicated improvement efforts, which have been evaluated by members of the research group, with high-quality results (e.g. Carlsson, 2003; Carlsson and Sarv, 2001). Most of the patients being admitted to department 38 are elderly being transferred from the ED. Elderly people with co-existing diseases are a group of patients who consume substantial healthcare services. According to a study by Hoffman, Rice and Sung (1996) 88% of all older adults in the United States had at least one chronic condition, and 69% had more than one chronic condition, which makes elderly people with co-existing diseases an important group to study. To ensure both practical and theoretical relevance the purpose was developed through a workshop with participants from both management and operational levels at the hospital.
25
In accordance with recommendations from Law (2007) and Banks et al. (2005) an iterative process comprising phases of data collection, building (in AnyLogic-software) and validating the simulation model was used. Data was mainly collected from interviews with healthcare personnel, observations at the studied departments and data for every patient that visited the ED (11,000 patients) and department 38 (1,400 patients) in 2010.
One way to lessen queue problems is to reduce service time variation, something that can be achieved by streaming patients into groups that exhibit similar service characteristics (Walley et al., 2006). Based on this premise a cluster analysis was performed for all patients admitted to department 38 in 2010. Two significant groups were distinguished, one of these, in relation to the other, consisting of older patients with more co-existing diseases as well as considerably longer LOS. Unfortunately it was not possible for healthcare personnel to medically discriminate between the groups when a patient was being admitted to the department, making it impossible to differentiate the patient flow both in the real world and in the simulation.
2.7.2 VALIDATION Validation of simulation models is of outmost importance, and this was executed through a number of measures. To ensure high face validity (Banks et al., 2005) the model was built in co-operation with both management and healthcare personnel, something widely recommended (see for example Banks et al., 2005; Law, 2007; Reagan-Cirincione et al., 1991; Wolstenholme, 1993). To achieve transparency, and thereby increases the trust that users have in the model (Pidd, 1996), extensive documentation of the simulation model was also compiled, including the overall logic for the model as well as built in assumptions and simplifications. Representatives of the different personnel categories (management, administrative, nurses, doctors) involved in the healthcare system read the documentation and critically discussed the model’s validity at an internal meeting (Banks et al., 2005; Law, 2007). Feedback was gathered and incorporated into the model. Real bed occupancy, 88%, was also compared to the modelled occupancy, 87±2%, and the results were satisfactory. It is important to test the simulation model’s validity according to the resemblance between modelled and actual output data (Law, 2007). The Kolmogorov-Smirnov test was used to determine the similarity between modelled and actual LOS for both the ED and department 38. Mean values, confidence interval and standard deviations displayed a solid unity between modelled and actual values. The validation processes used concluded that the model of the existing system was valid.
2.8 UNIT OF ANALYSIS AND HOW THE RESEARCH QUESTIONS WERE ANALYSED
The unit of analysis is a vital component in research design (Yin, 2009), comprising the main entity analysed in a research study. It is important to distinguish whether the unit of analysis is at an individual, division, company or corporate level, depending on the research question (Flynn et al., 1990). In this thesis, the unit of analysis is how variable
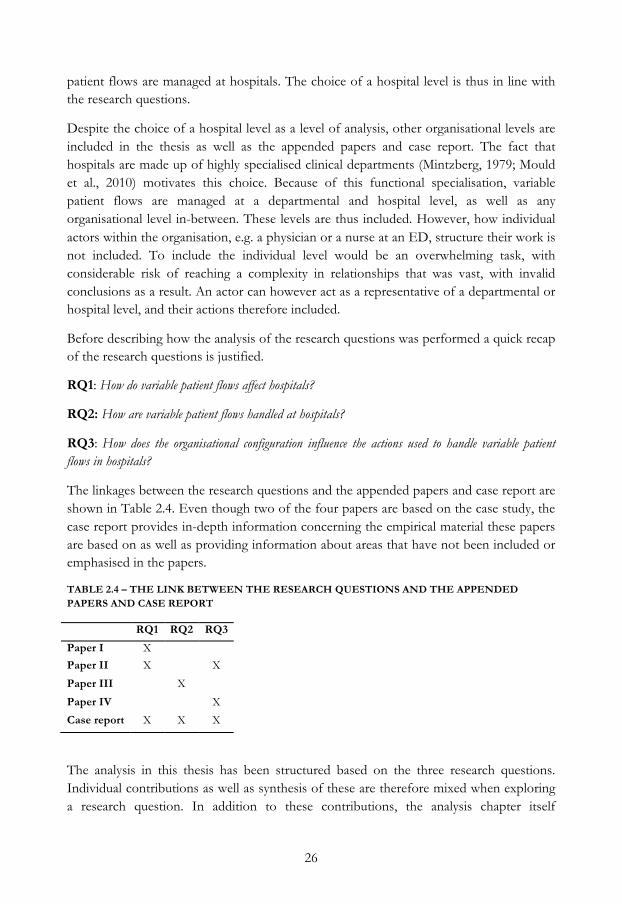
26
patient flows are managed at hospitals. The choice of a hospital level is thus in line with the research questions.
Despite the choice of a hospital level as a level of analysis, other organisational levels are included in the thesis as well as the appended papers and case report. The fact that hospitals are made up of highly specialised clinical departments (Mintzberg, 1979; Mould et al., 2010) motivates this choice. Because of this functional specialisation, variable patient flows are managed at a departmental and hospital level, as well as any organisational level in-between. These levels are thus included. However, how individual actors within the organisation, e.g. a physician or a nurse at an ED, structure their work is not included. To include the individual level would be an overwhelming task, with considerable risk of reaching a complexity in relationships that was vast, with invalid conclusions as a result. An actor can however act as a representative of a departmental or hospital level, and their actions therefore included.
Before describing how the analysis of the research questions was performed a quick recap of the research questions is justified.
RQ1: How do variable patient flows affect hospitals?
RQ2: How are variable patient flows handled at hospitals?
RQ3: How does the organisational configuration influence the actions used to handle variable patient flows in hospitals?
The linkages between the research questions and the appended papers and case report are shown in Table 2.4. Even though two of the four papers are based on the case study, the case report provides in-depth information concerning the empirical material these papers are based on as well as providing information about areas that have not been included or emphasised in the papers.
TABLE 2.4 – THE LINK BETWEEN THE RESEARCH QUESTIONS AND THE APPENDED PAPERS AND CASE REPORT
RQ1 RQ2 RQ3
Paper I X
Paper II X X
Paper III X
Paper IV X
Case report X X X
The analysis in this thesis has been structured based on the three research questions. Individual contributions as well as synthesis of these are therefore mixed when exploring a research question. In addition to these contributions, the analysis chapter itself

27
contributes to answering the research questions and purpose. Except for the literature identified in the literature reviews, no additional literature or theories are used.
The analysis was performed chronologically and thus starts with the first research question. In Paper I and the case report the variations in patient inflow are described. Paper I also studies the effects of changes in patient inflow, treatment times and duration of activities, an analysis used to compare the robustness of an inpatient ward with the ED, when under influence from variability in these variables. Based on conclusions from the case report, Paper II and some references from the literature review on overcrowding, a more qualitative analysis was performed concerning how variability in patient flows is dependent on patient group characteristics and how it influences bed occupancy.
For the second research question, contributions from Paper III and the Case report were analysed, since both describe the actions used at a university hospital to handle variable acute patient flows. The alignment between the two divisions used in Paper III and the case report is compared in the analysis. The terminology developed by The National Board of Health and Welfare concerning definitions of regular beds, overcrowding and relocation were used to expand the analysis and shed some light regarding the appropriateness of actions used. The organisational level on which each action is used, an aspect of interest for answering RQ2, is also analysed.
In the analysis of the third research question, a model was developed that lists a number of factors within organisational configuration at a hospital that influence the use of actions to handle variable patient flows. Causality between these factors is also included in the model. Paper IV and the case report provide the main contributions to the analysis, while Paper II also provides some insightful input. The model was developed by scanning the case report and Paper IV with the aim of finding factors that influenced the use of actions for handling variable patient flows. Both the influence of the factors identified and the relationships between them were evaluated based on the author’s in depth knowledge of the empirical data from the university hospital. In comparison to the other research questions, a larger part of the contribution comes from the analysis chapter itself since the model are not included in any of the appended papers or case report.

28
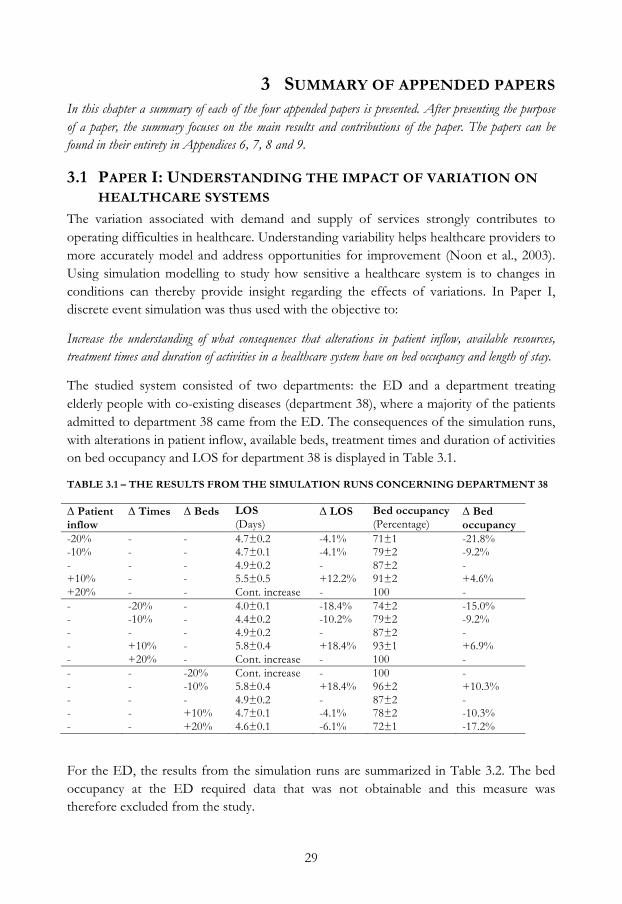
29
3 SUMMARY OF APPENDED PAPERS In this chapter a summary of each of the four appended papers is presented. After presenting the purpose of a paper, the summary focuses on the main results and contributions of the paper. The papers can be found in their entirety in Appendices 6, 7, 8 and 9.
3.1 PAPER I: UNDERSTANDING THE IMPACT OF VARIATION ON HEALTHCARE SYSTEMS
The variation associated with demand and supply of services strongly contributes to operating difficulties in healthcare. Understanding variability helps healthcare providers to more accurately model and address opportunities for improvement (Noon et al., 2003). Using simulation modelling to study how sensitive a healthcare system is to changes in conditions can thereby provide insight regarding the effects of variations. In Paper I, discrete event simulation was thus used with the objective to:
Increase the understanding of what consequences that alterations in patient inflow, available resources, treatment times and duration of activities in a healthcare system have on bed occupancy and length of stay.
The studied system consisted of two departments: the ED and a department treating elderly people with co-existing diseases (department 38), where a majority of the patients admitted to department 38 came from the ED. The consequences of the simulation runs, with alterations in patient inflow, available beds, treatment times and duration of activities on bed occupancy and LOS for department 38 is displayed in Table 3.1.
TABLE 3.1 – THE RESULTS FROM THE SIMULATION RUNS CONCERNING DEPARTMENT 38
Δ Patient inflow
Δ Times Δ Beds LOS (Days)
Δ LOS
Bed occupancy (Percentage)
Δ Bed occupancy
-20% - - 4.7±0.2 -4.1% 71±1 -21.8% -10% - - 4.7±0.1 -4.1% 79±2 -9.2% - - - 4.9±0.2 - 87±2 - +10% - - 5.5±0.5 +12.2% 91±2 +4.6% +20% - - Cont. increase - 100 - - -20% - 4.0±0.1 -18.4% 74±2 -15.0% - -10% - 4.4±0.2 -10.2% 79±2 -9.2% - - - 4.9±0.2 - 87±2 - - +10% - 5.8±0.4 +18.4% 93±1 +6.9% - +20% - Cont. increase - 100 - - - -20% Cont. increase - 100 - - - -10% 5.8±0.4 +18.4% 96±2 +10.3% - - - 4.9±0.2 - 87±2 - - - +10% 4.7±0.1 -4.1% 78±2 -10.3% - - +20% 4.6±0.1 -6.1% 72±1 -17.2%
For the ED, the results from the simulation runs are summarized in Table 3.2. The bed occupancy at the ED required data that was not obtainable and this measure was therefore excluded from the study.
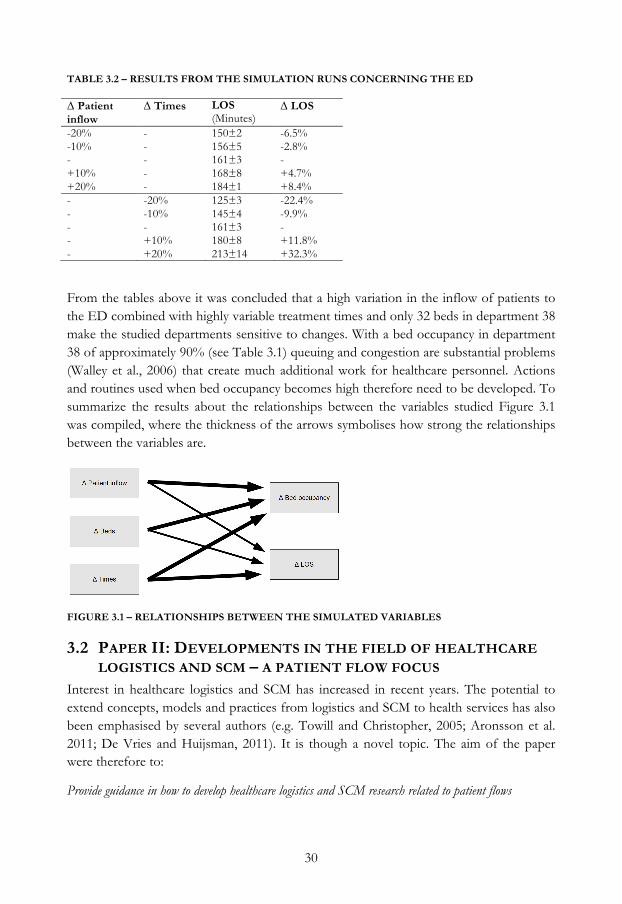
30
TABLE 3.2 – RESULTS FROM THE SIMULATION RUNS CONCERNING THE ED
Δ Patient inflow
Δ Times LOS (Minutes)
Δ LOS
-20% - 150±2 -6.5% -10% - 156±5 -2.8% - - 161±3 - +10% - 168±8 +4.7% +20% - 184±1 +8.4% - -20% 125±3 -22.4% - -10% 145±4 -9.9% - - 161±3 - - +10% 180±8 +11.8% - +20% 213±14 +32.3%
From the tables above it was concluded that a high variation in the inflow of patients to the ED combined with highly variable treatment times and only 32 beds in department 38 make the studied departments sensitive to changes. With a bed occupancy in department 38 of approximately 90% (see Table 3.1) queuing and congestion are substantial problems (Walley et al., 2006) that create much additional work for healthcare personnel. Actions and routines used when bed occupancy becomes high therefore need to be developed. To summarize the results about the relationships between the variables studied Figure 3.1 was compiled, where the thickness of the arrows symbolises how strong the relationships between the variables are.
FIGURE 3.1 – RELATIONSHIPS BETWEEN THE SIMULATED VARIABLES
3.2 PAPER II: DEVELOPMENTS IN THE FIELD OF HEALTHCARE LOGISTICS AND SCM – A PATIENT FLOW FOCUS
Interest in healthcare logistics and SCM has increased in recent years. The potential to extend concepts, models and practices from logistics and SCM to health services has also been emphasised by several authors (e.g. Towill and Christopher, 2005; Aronsson et al. 2011; De Vries and Huijsman, 2011). It is though a novel topic. The aim of the paper were therefore to:
Provide guidance in how to develop healthcare logistics and SCM research related to patient flows
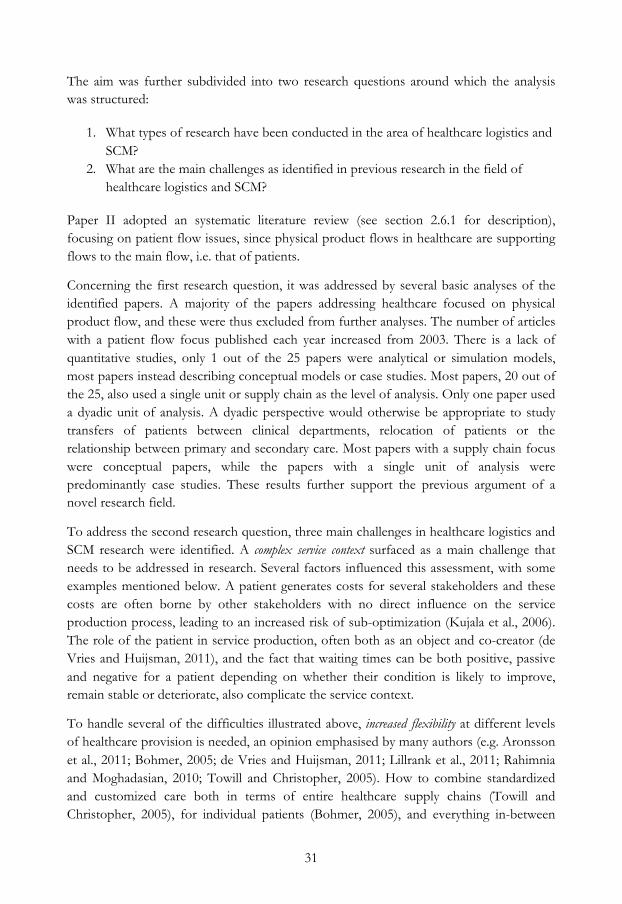
31
The aim was further subdivided into two research questions around which the analysis was structured:
1. What types of research have been conducted in the area of healthcare logistics and SCM?
2. What are the main challenges as identified in previous research in the field of healthcare logistics and SCM?
Paper II adopted an systematic literature review (see section 2.6.1 for description), focusing on patient flow issues, since physical product flows in healthcare are supporting flows to the main flow, i.e. that of patients.
Concerning the first research question, it was addressed by several basic analyses of the identified papers. A majority of the papers addressing healthcare focused on physical product flow, and these were thus excluded from further analyses. The number of articles with a patient flow focus published each year increased from 2003. There is a lack of quantitative studies, only 1 out of the 25 papers were analytical or simulation models, most papers instead describing conceptual models or case studies. Most papers, 20 out of the 25, also used a single unit or supply chain as the level of analysis. Only one paper used a dyadic unit of analysis. A dyadic perspective would otherwise be appropriate to study transfers of patients between clinical departments, relocation of patients or the relationship between primary and secondary care. Most papers with a supply chain focus were conceptual papers, while the papers with a single unit of analysis were predominantly case studies. These results further support the previous argument of a novel research field.
To address the second research question, three main challenges in healthcare logistics and SCM research were identified. A complex service context surfaced as a main challenge that needs to be addressed in research. Several factors influenced this assessment, with some examples mentioned below. A patient generates costs for several stakeholders and these costs are often borne by other stakeholders with no direct influence on the service production process, leading to an increased risk of sub-optimization (Kujala et al., 2006). The role of the patient in service production, often both as an object and co-creator (de Vries and Huijsman, 2011), and the fact that waiting times can be both positive, passive and negative for a patient depending on whether their condition is likely to improve, remain stable or deteriorate, also complicate the service context.
To handle several of the difficulties illustrated above, increased flexibility at different levels of healthcare provision is needed, an opinion emphasised by many authors (e.g. Aronsson et al., 2011; Bohmer, 2005; de Vries and Huijsman, 2011; Lillrank et al., 2011; Rahimnia and Moghadasian, 2010; Towill and Christopher, 2005). How to combine standardized and customized care both in terms of entire healthcare supply chains (Towill and Christopher, 2005), for individual patients (Bohmer, 2005), and everything in-between

32
(Aronsson et al., 2011; Lillrank et al., 2011; Rahimnia and Moghadasian, 2010) is a challenge that requires further research from the healthcare logistics and SCM field.
Treatment of patients often requires input from multiple healthcare providers and the transfer from one provider to the next is generally the weakest point in a system of healthcare providers (Adler et al., 2003; Aronsson et al., 2011; de Vries and Huijsman, 2011; Meijboom et al., 2011; Parnaby and Towill, 2008; Parnaby and Towill, 2009; Saha et al., 2009; Towill, 2006). A holistic view of the whole patient process is therefore stressed by many authors (e.g. Aronsson et al., 2011; Glouberman and Mintzberg, 2001; Kujala et al., 2006; Meijboom et al., 2011; Parnaby and Towill, 2008; Parnaby and Towill, 2009; Towill, 2006) to enable proper coordination of multiple actors.
3.3 PAPER III: MANAGING A VARIABLE ACUTE PATIENT FLOW – CATEGORISING THE STRATEGIES
The field of health care SCM is in its infancy; although there are some exemplary initiatives in healthcare there is a lack of academic research (Shah et al., 2008). Paper III was designed to fill some of that gap by applying the concepts of lean, agile and leagile in a study in a healthcare setting, something that has been sparsely explored, even though there are examples (e.g. Aronsson et al., 2011; Towill and Christopher, 2005; Rahimnia and Moghadasian, 2010). In healthcare, there is also a high degree of variability (Ronen and Pliskin, 2006), specifically for acute patients where the patient inflow concerning time, health issues and response to treatment is highly variable. Moreover, healthcare resources are often used inappropriately and not adapted to the variations that exist (Walley et al., 2006). The purpose of this study was therefore:
To explore if actions used at a hospital to manage a variable acute patient flow can be categorised using the concepts of lean, agile and leagile.
A single case study at a university hospital (see section 2.5 for description) was chosen to allow in-depth investigation of the actions used to handle the variable acute patient flow. Many authors discuss the use of a lean or agile strategy as a company-wide strategy or used in different combinations between the two (Kidd, 1995; Mason-Jones et al., 2000; Aitken et al., 2002). Paper III, however, explores and categorises individual actions as being lean or agile. To achieve this, both lean and agile strategies were sub-divided into three categories based on the literature. 50 actions were identified in the collected data and each was placed in one of the three agile or lean categories:
• Agile: Extending the use of a resource (7) • Agile: Altering the amount of a resource, ahead of demand (9) • Agile: Altering the amount of a resource, as a response to demand (12) • Lean: An action that increases patient flow standardisation (7) • Lean: An action that reduces the need for a resource (11)
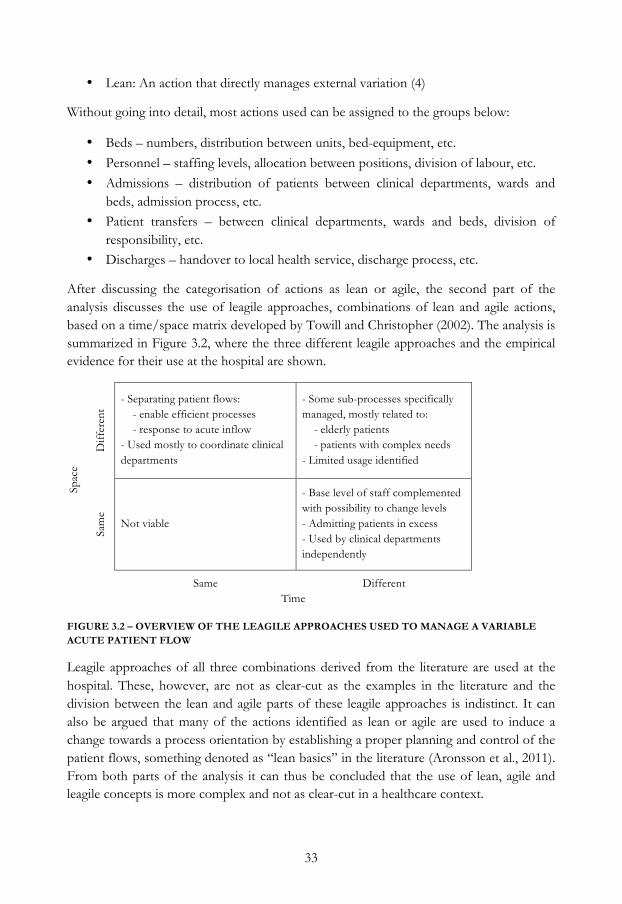
33
• Lean: An action that directly manages external variation (4)
Without going into detail, most actions used can be assigned to the groups below:
• Beds – numbers, distribution between units, bed-equipment, etc. • Personnel – staffing levels, allocation between positions, division of labour, etc. • Admissions – distribution of patients between clinical departments, wards and
beds, admission process, etc. • Patient transfers – between clinical departments, wards and beds, division of
responsibility, etc. • Discharges – handover to local health service, discharge process, etc.
After discussing the categorisation of actions as lean or agile, the second part of the analysis discusses the use of leagile approaches, combinations of lean and agile actions, based on a time/space matrix developed by Towill and Christopher (2002). The analysis is summarized in Figure 3.2, where the three different leagile approaches and the empirical evidence for their use at the hospital are shown.
S
pace
Diff
eren
t
- Separating patient flows: - enable efficient processes - response to acute inflow - Used mostly to coordinate clinical departments
- Some sub-processes specifically managed, mostly related to: - elderly patients - patients with complex needs - Limited usage identified
Sam
e
Not viable
- Base level of staff complemented with possibility to change levels - Admitting patients in excess - Used by clinical departments independently
Same Different Time FIGURE 3.2 – OVERVIEW OF THE LEAGILE APPROACHES USED TO MANAGE A VARIABLE ACUTE PATIENT FLOW
Leagile approaches of all three combinations derived from the literature are used at the hospital. These, however, are not as clear-cut as the examples in the literature and the division between the lean and agile parts of these leagile approaches is indistinct. It can also be argued that many of the actions identified as lean or agile are used to induce a change towards a process orientation by establishing a proper planning and control of the patient flows, something denoted as “lean basics” in the literature (Aronsson et al., 2011). From both parts of the analysis it can thus be concluded that the use of lean, agile and leagile concepts is more complex and not as clear-cut in a healthcare context.
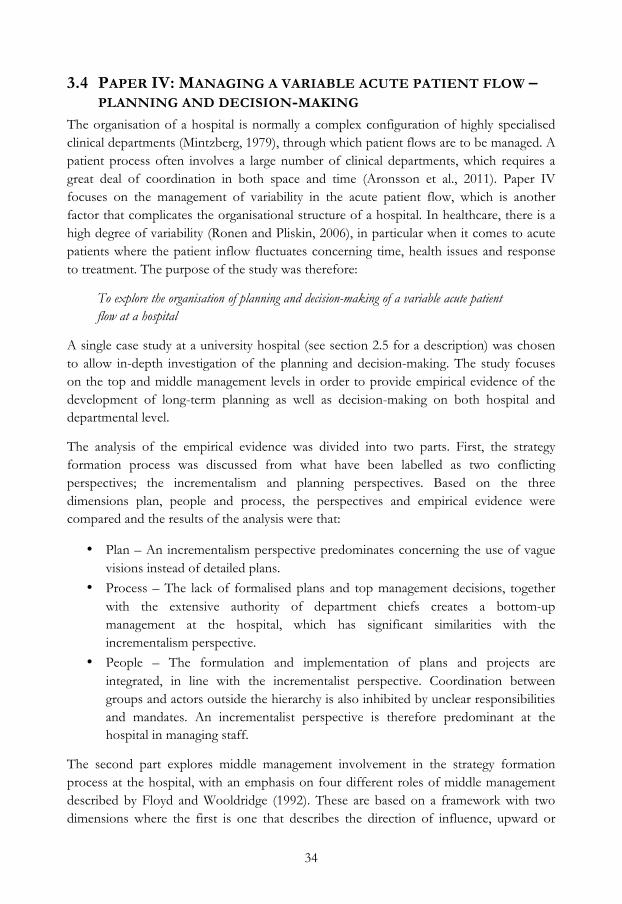
34
3.4 PAPER IV: MANAGING A VARIABLE ACUTE PATIENT FLOW – PLANNING AND DECISION-MAKING
The organisation of a hospital is normally a complex configuration of highly specialised clinical departments (Mintzberg, 1979), through which patient flows are to be managed. A patient process often involves a large number of clinical departments, which requires a great deal of coordination in both space and time (Aronsson et al., 2011). Paper IV focuses on the management of variability in the acute patient flow, which is another factor that complicates the organisational structure of a hospital. In healthcare, there is a high degree of variability (Ronen and Pliskin, 2006), in particular when it comes to acute patients where the patient inflow fluctuates concerning time, health issues and response to treatment. The purpose of the study was therefore:
To explore the organisation of planning and decision-making of a variable acute patient flow at a hospital
A single case study at a university hospital (see section 2.5 for a description) was chosen to allow in-depth investigation of the planning and decision-making. The study focuses on the top and middle management levels in order to provide empirical evidence of the development of long-term planning as well as decision-making on both hospital and departmental level.
The analysis of the empirical evidence was divided into two parts. First, the strategy formation process was discussed from what have been labelled as two conflicting perspectives; the incrementalism and planning perspectives. Based on the three dimensions plan, people and process, the perspectives and empirical evidence were compared and the results of the analysis were that:
• Plan – An incrementalism perspective predominates concerning the use of vague visions instead of detailed plans.
• Process – The lack of formalised plans and top management decisions, together with the extensive authority of department chiefs creates a bottom-up management at the hospital, which has significant similarities with the incrementalism perspective.
• People – The formulation and implementation of plans and projects are integrated, in line with the incrementalist perspective. Coordination between groups and actors outside the hierarchy is also inhibited by unclear responsibilities and mandates. An incrementalist perspective is therefore predominant at the hospital in managing staff.
The second part explores middle management involvement in the strategy formation process at the hospital, with an emphasis on four different roles of middle management described by Floyd and Wooldridge (1992). These are based on a framework with two dimensions where the first is one that describes the direction of influence, upward or
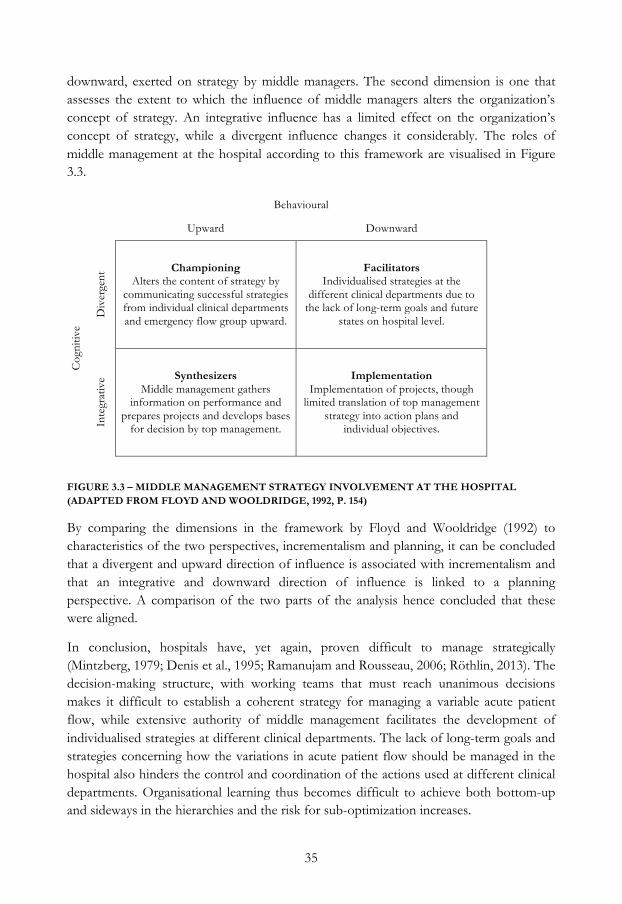
35
downward, exerted on strategy by middle managers. The second dimension is one that assesses the extent to which the influence of middle managers alters the organization’s concept of strategy. An integrative influence has a limited effect on the organization’s concept of strategy, while a divergent influence changes it considerably. The roles of middle management at the hospital according to this framework are visualised in Figure 3.3.
Behavioural
Upward Downward
Cog
nitiv
e
Div
erge
nt Championing
Alters the content of strategy by communicating successful strategies from individual clinical departments and emergency flow group upward.
Facilitators Individualised strategies at the
different clinical departments due to the lack of long-term goals and future
states on hospital level.
Inte
grat
ive Synthesizers
Middle management gathers information on performance and
prepares projects and develops bases for decision by top management.
Implementation Implementation of projects, though
limited translation of top management strategy into action plans and
individual objectives.
FIGURE 3.3 – MIDDLE MANAGEMENT STRATEGY INVOLVEMENT AT THE HOSPITAL (ADAPTED FROM FLOYD AND WOOLDRIDGE, 1992, P. 154)
By comparing the dimensions in the framework by Floyd and Wooldridge (1992) to characteristics of the two perspectives, incrementalism and planning, it can be concluded that a divergent and upward direction of influence is associated with incrementalism and that an integrative and downward direction of influence is linked to a planning perspective. A comparison of the two parts of the analysis hence concluded that these were aligned.
In conclusion, hospitals have, yet again, proven difficult to manage strategically (Mintzberg, 1979; Denis et al., 1995; Ramanujam and Rousseau, 2006; Röthlin, 2013). The decision-making structure, with working teams that must reach unanimous decisions makes it difficult to establish a coherent strategy for managing a variable acute patient flow, while extensive authority of middle management facilitates the development of individualised strategies at different clinical departments. The lack of long-term goals and strategies concerning how the variations in acute patient flow should be managed in the hospital also hinders the control and coordination of the actions used at different clinical departments. Organisational learning thus becomes difficult to achieve both bottom-up and sideways in the hierarchies and the risk for sub-optimization increases.

36

37
4 ANSWERING THE RESEARCH QUESTIONS This chapter seeks to find answers to the three research questions developed in the first chapter. The research questions are analysed one by one, with input from the four appended papers as well as the case report. As described in the methodology chapter, individual contributions as well as synthesis of these are mixed when exploring a research question.
4.1 RQ1: HOW DO VARIABLE PATIENT FLOWS AFFECT HOSPITALS?
The analyses for RQ1 are based on the results from Paper I and II, the case report and a literature review on overcrowding. They might come across as dispersed, therefore Figure 4.3 has been developed to provide an overview of the different conclusions and how they relate to patient flow variability. Every conclusion is summarized in a box in the figure and referred to in the text.
In Paper I, the patient inflow to the ED and an inpatient ward were mainly dependent on the time of day and the day of the week (plotted in Figure 4.1).
FIGURE 4.1 – DAILY ARRIVAL PATTERN FOR THE ED AND AN INPATIENT WARD
For the ED, the inflow is in line with previous studies (e.g. Walley et al., 2006). For the inpatient ward, a majority of the patients came from the ED, and since most patients have
0
1
2
3
4
5
6
7 8 9 10 11 12 13 14 15 16 17 18 19 20 21 22
Patie
nts/
hour
Time of day
Daily arrival pattern, ED Mondays
Other weekdays
Weekends
0
0,2
0,4
0,6
0,8
1
0 2 4 6 8 10 12 14 16 18 20 22
Patie
nts/
hour
Time of day
Daily arrival pattern, inpatient ward Mondays
Other weekdays
Weekends

38
an LOS at the ED of around 2-3 hours most arrivals at the inpatient ward were in the afternoon.
Similar patterns can be seen in the case report. The arrival pattern of patients visiting the ED at the university hospital is rather predictable as regards how it varies during the day and between days of the week. Patients’ health issues, however, are subject to larger variations and are thus more difficult to predict, which affects clinical departments admitting patients from the ED. For the clinical departments that admit most patients from the ED, between 0 and 10 admissions took place during office hours and a similar number during the remaining hours must be handled. For clinical departments admitting few patients/day, the variation in numbers is less problematic to handle (no. 1 in Figure 4.3). There is considerable variation on a weekly basis, but monthly and yearly variations in inflow from the ED are small.
In Paper I changes in patient inflow, treatment times and duration of activities, that can be compared to variability, for an ED and an inpatient ward was tested. The results point towards EDs being more adapted to variable patient inflow than inpatient wards (no. 2 in Figure 4.3). When comparing the effects of a changed patient inflow, the ED was more robust, with less increase in LOS due to increased patient inflow (see Table 4.1). When changing treatment times and duration of activities (Δ Times in Table 4.1), similar, although less clear-cut, conclusions can be drawn.
TABLE 4.1 – EFFECTS ON LOS IN INPATIENT WARD AND ED WHEN PATIENT INFLOW OR DURATION OF ACTIVITIES IS CHANGED
Inpatient ward ED Δ Patient inflow Δ Times LOS (Days) Δ LOS LOS (Minutes) Δ LOS -20% 4.7±0.2 -4.1% 150±2 -6.5% -10% 4.7±0.1 -4.1% 156±5 -2.8 % - 4.9±0.2 - 161±3 - +10% 5.5±0.5 +12.2% 168±8 +4.7% +20% Cont. increase - 184±1 +8.4% - -20% 4.0±0.1 -18.4% 125±3 -22.4% - -10% 4.4±0.2 -10.2% 145±4 -9.9% - - 4.9±0.2 - 161±3 - - +10% 5.8±0.4 +18.4% 180±8 +11.8% - +20% Cont. increase - 213±14 +32.3%
A high variation in the inflow of patients, highly variable treatment times and only 32 beds in the inpatient ward in Paper I make it sensitive to changes. With an average bed occupancy of approximately 90%, queuing and congestion are substantial problems (no. 3 in Figure 4.3), something also concluded in previous research (Walley et al., 2006).
Queues form when an organisation is unable to handle variation with flexibility (Silvester et al., 2004). The need for flexibility is thus an effect of variable patient flows (no. 4 in Figure 4.3). The need for increased flexibility was address as one of three main challenges

39
in Paper II. Many authors emphasise the need for flexibility in healthcare provision (e.g. Aronsson et al., 2011; Bohmer, 2005; de Vries and Huijsman, 2011; Lillrank et al., 2011; Rahimnia and Moghadasian, 2010; Towill and Christopher, 2005). Towill and Christopher (2005) discuss the use of standardised and customized care for groups of patients by elaborating the use of healthcare pipelines, where a pipeline refers to the flow of patients from referral to full recovery. Based on the complexity of treatment, where a more complex treatment is subject to more variation, a choice is made between standardised and customised parts of the pipeline (Towill and Christopher, 2005; Aronsson et al., 2011).
In comparison to Paper I, the case study at the university hospital in Linköping looks at a larger system, where several clinical departments and inpatient wards are included. Variation in patient outflow is also included in the study. One pattern identified is that different patient groups entail different amounts of variation. From a hospital perspective, three dimensions were found to be important when distinguishing patient groups. These dimensions are described in the case report, but two are related to variability in patient flows and how it affects hospitals and are discussed below. The third dimension is a separation between local patients, i.e. county residents, and regional patients from other counties.
Patient inflow to the clinical departments can be categorised as acute and elective, where the elective inflow are patients whose arrival is planned at the clinical department and who do not pass the ED. Acute patients are not planned and can arrive both from the ED and without passing the ED. Since the acute patient inflow for clinical departments is highly variable, as discussed previously, it requires flexibility from the clinical departments to handle.
The university hospital studied is organised for patients with organ dysfunction, as most hospitals are. Many patients have health issues where specific organs can be pinpointed and specialised clinical departments provide adequate treatment, which in many instances is made up of an orderly sequence of steps. There are, however, patients with diffuse symptoms, often with multiple diseases, that can be cared for at several clinical departments and since these general medicine patients often have several health issues, they are easily transferred between clinical departments. An internal investigation performed 2005-2006 at the university hospital in the case report concluded that approximately 40% of general medicine patients were transferred between clinical departments at least once during their care episode. With the uncertainty concerning the optimal testing strategy, the effects of a given treatment, the potential interactions of multiple diseases and treatments for these patients, Bohmer (2005) argues for an increased need for customization and a lower possible level of standardization. In contrast to more standardized care, which consists of an orderly sequence of steps, customized care is iterative because each diagnostic test or test of therapy generates new
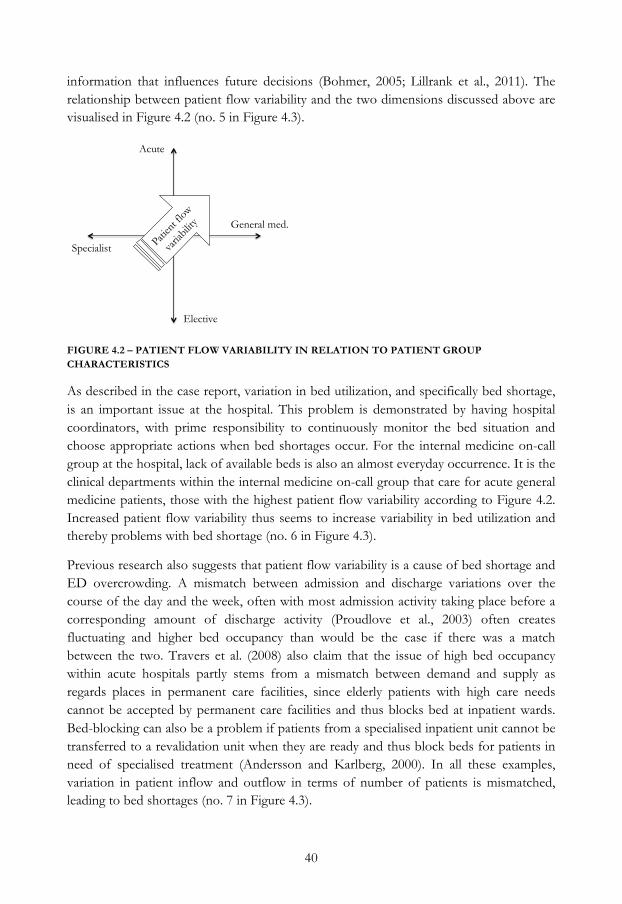
40
information that influences future decisions (Bohmer, 2005; Lillrank et al., 2011). The relationship between patient flow variability and the two dimensions discussed above are visualised in Figure 4.2 (no. 5 in Figure 4.3).
FIGURE 4.2 – PATIENT FLOW VARIABILITY IN RELATION TO PATIENT GROUP CHARACTERISTICS
As described in the case report, variation in bed utilization, and specifically bed shortage, is an important issue at the hospital. This problem is demonstrated by having hospital coordinators, with prime responsibility to continuously monitor the bed situation and choose appropriate actions when bed shortages occur. For the internal medicine on-call group at the hospital, lack of available beds is also an almost everyday occurrence. It is the clinical departments within the internal medicine on-call group that care for acute general medicine patients, those with the highest patient flow variability according to Figure 4.2. Increased patient flow variability thus seems to increase variability in bed utilization and thereby problems with bed shortage (no. 6 in Figure 4.3).
Previous research also suggests that patient flow variability is a cause of bed shortage and ED overcrowding. A mismatch between admission and discharge variations over the course of the day and the week, often with most admission activity taking place before a corresponding amount of discharge activity (Proudlove et al., 2003) often creates fluctuating and higher bed occupancy than would be the case if there was a match between the two. Travers et al. (2008) also claim that the issue of high bed occupancy within acute hospitals partly stems from a mismatch between demand and supply as regards places in permanent care facilities, since elderly patients with high care needs cannot be accepted by permanent care facilities and thus blocks bed at inpatient wards. Bed-blocking can also be a problem if patients from a specialised inpatient unit cannot be transferred to a revalidation unit when they are ready and thus block beds for patients in need of specialised treatment (Andersson and Karlberg, 2000). In all these examples, variation in patient inflow and outflow in terms of number of patients is mismatched, leading to bed shortages (no. 7 in Figure 4.3).
Acute
Elective
Specialist
General med.
Patien
t flow
varia
bility
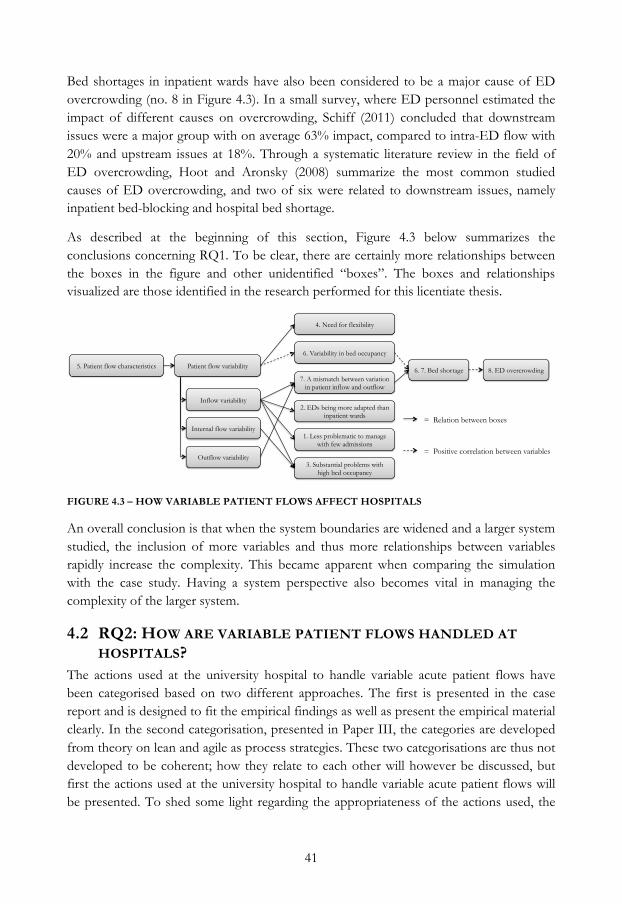
41
Bed shortages in inpatient wards have also been considered to be a major cause of ED overcrowding (no. 8 in Figure 4.3). In a small survey, where ED personnel estimated the impact of different causes on overcrowding, Schiff (2011) concluded that downstream issues were a major group with on average 63% impact, compared to intra-ED flow with 20% and upstream issues at 18%. Through a systematic literature review in the field of ED overcrowding, Hoot and Aronsky (2008) summarize the most common studied causes of ED overcrowding, and two of six were related to downstream issues, namely inpatient bed-blocking and hospital bed shortage.
As described at the beginning of this section, Figure 4.3 below summarizes the conclusions concerning RQ1. To be clear, there are certainly more relationships between the boxes in the figure and other unidentified “boxes”. The boxes and relationships visualized are those identified in the research performed for this licentiate thesis.
FIGURE 4.3 – HOW VARIABLE PATIENT FLOWS AFFECT HOSPITALS
An overall conclusion is that when the system boundaries are widened and a larger system studied, the inclusion of more variables and thus more relationships between variables rapidly increase the complexity. This became apparent when comparing the simulation with the case study. Having a system perspective also becomes vital in managing the complexity of the larger system.
4.2 RQ2: HOW ARE VARIABLE PATIENT FLOWS HANDLED AT HOSPITALS?
The actions used at the university hospital to handle variable acute patient flows have been categorised based on two different approaches. The first is presented in the case report and is designed to fit the empirical findings as well as present the empirical material clearly. In the second categorisation, presented in Paper III, the categories are developed from theory on lean and agile as process strategies. These two categorisations are thus not developed to be coherent; how they relate to each other will however be discussed, but first the actions used at the university hospital to handle variable acute patient flows will be presented. To shed some light regarding the appropriateness of the actions used, the
Patient flow variability
Inflow variability
Outflow variability
Internal flow variability
2. EDs being more adapted than inpatient wards
1. Less problematic to manage with few admissions
3. Substantial problems with high bed occupancy
4. Need for flexibility
5. Patient flow characteristics
6. Variability in bed occupancy
7. A mismatch between variation in patient inflow and outflow
6. 7. Bed shortage 8. ED overcrowding
= Relation between boxes
= Positive correlation between variables
42
terminology developed by The National Board of Health and Welfare concerning definitions of regular beds, overcrowding and relocation will be used.
The actions used at the university hospital to handle variable acute patient flows were divided into four categories in the case report. The categories were based on the perspective of the hospital as a system where the ED’s primary task is to investigate and provide a diagnosis that decides into which clinical department a patient is admitted, while the clinical department where the patient is admitted provides further diagnosis, treatment and care and discharges the patient. Hence, the first category were related to handling the patient inflow, e.g. to avoid unnecessary admissions by different actions. Concerning inflow, the actions identified were focused on using other types of healthcare instead of inpatient care in a hospital ward.
Actions that enable efficient acute patient flows within the hospital make up the second category. In this category, many actions concern different ways of adapting the supply of care provision to demand. Distributing admissions evenly between clinical departments is an aspiration, even though it is only general medicine patients that can be admitted to different clinical departments, as discussed in the previous section. Adapting beds and wards to patient needs and adapting staffing to patient inflow are other actions within the category.
The third category relates to working with the outflow. Many actions used to create an efficient outflow concern the timing and planning of the discharge process, for example by preparing discharge in parallel with treatment. Achieving discharges early in the day is another action used to some extent at the hospital.
Like the second category, the fourth category contains actions with the aim of adapting supply of care services to demand, i.e. some sort of flexibility. The main difference between the second and fourth category is that the latter includes actions that are used as a response to variations in demand, instead of being proactive actions like those in the second category. Since it is not explicitly decided how many beds are allocated for acute and elective patients at most clinical departments, the proportion of elective and acute patients is allowed to vary.
A regular bed is defined by The National Board of Health and Welfare (2012, p. 17, author’s translation) as ”a bed within inpatient care with the physical layout, equipment and staffing necessary to secure patient safety and work environment”. When all regular beds are occupied at a clinical department a frequently used action is to admit patients to additional beds. The use of an additional bed is defined as overcrowding by the same institution if the “admitted patient is being cared for under circumstances that do not fulfil those of an regular bed” (The National Board of Health and Welfare, 2012, p. 18, author’s translation). At the university hospital, additional beds are often located in rooms intended for other uses, such as communal spaces or offices. The number of additional
43
beds (see appendix 1 in the Case report for an account for each clinical department) is decided by each clinical department and is considered when deciding staffing levels. The additional beds are often used by many clinical departments and are generally considered to be unproblematic to use. Nevertheless, according to the definition above, the use of the additional beds can be called overcrowding.
A patient is evaluated as being relocated if he or she is “a registered patient who is being cared for at a care unit other than the one that has the medical expertise and medical responsibility for the patient” (The National Board of Health and Welfare, 2012, p. 18, author’s translation). Relocation is an action used at the university hospital in different ways:
• To enable a patient at the ED to be admitted to a bed at an appropriate clinical department.
• A patient can also be placed in a bed at a clinical department directly from the ED as a relocated patient from another clinical department that does not have any available beds.
• Patients can also be relocated in speculation, before there is a patient in need of the bed.
To counteract strain on healthcare resources, a choice can be made to decrease or stop the elective intake at one or several clinical departments. The most extreme action, used to counteract great strain on healthcare resources at the hospital, is to open an entire additional ward. It is only used a few times a year, when the demand for beds exceeds the supply for a longer period of time.
In Paper III, the actions used at the university hospital to handle variable acute patient flows were categorised using three lean and three agile categories. These are listed below, together with the number of actions denoted within each category. Below each category, there is a comment on how the actions were categorised with the four categories in the case report:
• Agile: Extending the use of a resource (7) o Predominantly flexibility category
• Agile: Altering the amount of a resource, ahead of demand (9) o Mix of the categories efficient flow, flexibility and outflow
• Agile: Altering the amount of a resource, as a response to demand (12) o Predominantly flexibility category
• Lean: An action that increases patient flow standardisation (7) o Predominantly efficient flow category
• Lean: An action that reduces the need for a resource (11) o Evenly between inflow and outflow categories

44
• Lean: An action that directly handles external variation (4) o Mix of the categories efficient flow, flexibility and inflow
As concluded in Paper III, actions from every lean and agile category were used at the hospital. Several actions within the agile category “alter the amount of a resource as a response to demand” were used at the hospital. This can be deduced to insufficient level of the other two agile categories, since they are used more proactively.
Virtually all actions in the flexibility category in the case report were placed in an agile category in Paper III, while basically all actions in the efficient flow category in the case report were placed in a lean category in Paper III. These results are not surprising, since flexibility is associated with agility (Aronsson et al., 2011; Christopher and Towill, 2000), and the aim to continuously eliminate waste within lean constitutes going towards efficiency in the primary flow (Womack et al., 1990). The two categorisations thus seem to be in line with each other.
When deliberating the actions used to handle variable acute patient flows, most are used to handle the effects of the variation, not the variation itself. For example, only four out of the fifty actions handle external variation directly, and thus patient flow variability, as can be seen from the list above. Nor is it individual variations, such as patient inflow, that are handled but the combined effect of the variations in several variables. An effect of variable patient flows is bed shortages, a relationship identified in the previous section and visualized in Figure 4.3. Much time and effort are spent handling bed shortages at the university hospital and this was a recurrent topic in the interviews. The number of available beds is easily measured and a clear indicator of the utilization of resources at the hospital; it is therefore not strange that it has been given a lot of attention. The utilization of other resources also varies of course, but can be more complex to measure, such as personnel, or harder to change quickly, such as rooms and buildings. Nor is it surprising that the difficulties with bed shortages were prominent with the explorative approach used in the data collection (see section 2.5.2).
In Paper III, the fifty actions identified at the university hospital are summarized. The paper does not, however, discuss the organisational level on which each action is used, an aspect of interest for answering RQ2. Summarising the number of actions used at different organisational levels from Appendix 2 in Paper III thus gives Table 4.2
TABLE 4.2 – NUMBER OF ACTIONS USED AT DIFFERENT ORGANISATIONAL LEVELS
Organisational level Number of actions Clinical department 29 Between clinical departments 6 Hospital 11 Between hospital and local health services 3 Between hospitals 1

45
Before discussing the implications of the distribution on different organisational levels among the actions, the separation between actions on hospital and departmental level needs to be explained. Actions on a hospital level are decided to be applied by top management and/or have the aim to have positive effects for the hospital as a whole. The use of the actions can still be at a departmental level. Examples are to divide acute patients that need admission to an inpatient ward evenly between clinical departments or have assistance evaluators located at the hospital, which enables faster and smoother discharge planning. Actions at a departmental level are often developed at a clinical department and used with the aim of some improvement for the clinical department and departments that use the action. Examples include having beds allocated for patients who are expected to be discharged within 24 hours or two clinical departments sharing a joint ward for patients with short LOS and small deviations from expected LOS.
Many actions are used at a departmental level (35), while few (15) are used at a hospital level. As discussed in the introduction chapter managing components individually, without consideration of the impact on the larger system, the risk of sub-optimization is very great (Stock and Lambert, 2001). Hence, there is a need for more actions on a hospital level. There can always be good and less good actions being developed both at a departmental and hospital level, but the risk of developing actions that generate sub-optimization is lower at a hospital level. The fact that many actions are used at a departmental level will be deliberated in the section below when the influence of the organisational configuration upon the handling of variable patient flows are deliberated.

46
4.3 RQ3: HOW DOES THE ORGANISATIONAL CONFIGURATION INFLUENCE THE ACTIONS USED TO HANDLE VARIABLE PATIENT FLOWS IN HOSPITALS?
Figure 4.4 has been developed to address the third research question. It shows factors within the organisational configuration at a hospital that influence the use of actions to handle variable patient flows. Causality is visualised by arrows, where boxes 5 and 6 are preceded by the other four boxes. These relationships are not comprehensive and other relationships exist. For a description of how the model was developed, see section 2.8.
FIGURE 4.4 – RELATIONSHIPS BETWEEN FACTORS WITHIN THE ORGANISATIONAL CONFIGURATION THAT INFLUENCE THE USE OF ACTIONS TO HANDLE VARIABLE PATIENT FLOWS.
As described in the case report, the operational structure of the county council is arranged around divisions with operations at several hospitals. To simplify and improve decision-making concerning local and hospital specific issues, such as how to handle acute patient flows, the hospital management team was established. The emergency flow group, a subordinate group to the hospital management group was also established, whose responsibility it is to plan, coordinate and develop a well-functioning and secure acute patient flow originating from the ED. All decisions taken by these groups have to be agreed on by all members, making it difficult to establish a coherent strategy for handling a variable acute patient flow at the hospital (box 1 in Figure 4.4).
As concluded in Paper IV, this decision-making structure can be a partial explanation for the lack of long-term goals and strategies concerning how the variations in acute patient flows should be handled at the university hospital (box 2 in Figure 4.4).
3. Extensive authority of clinical departments
1. Decision-making by consensus in working teams
5. Many positions operationally involved in handling the acute
patient flows
2. Lack of long-term goals and future states
6. Organisational learning difficult to achieve both bottom-up and sideways
4. Departmental collaboration hindered

47
In the planning concerning how many beds should be open during summer and Christmas at the university hospital, there is no authority that decides how many beds should be open in total. Instead, every clinical department is basically allowed to decide for themselves. Previous research has also concluded that the organisational configuration of hospitals as professional bureaucracies is difficult to manage strategically (Mintzberg, 1979; Denis et al., 1995; Ramanujam and Rousseau, 2006; Röthlin, 2013), something also concluded in Paper IV. Highly specialised clinical departments (Mintzberg, 1979) often guard their decision-making and professional practices against the influence of top management and other organisational structures (Ho et al., 1999). The lack of strategic direction at the university hospital can hinder the control and coordination of the actions used at different clinical departments, rendering them more similar to separate organisations. The possibility to make decisions on top management level concerning variables important in handling variable acute patient flows; such as beds, personnel, admission, patient transfers and discharges is therefore limited. When deliberating the actions used for handling acute patient flows at the hospital in Paper III and the case report, most actions were on a departmental level. These results point towards clinical departments having extensive authority (box 3 in Figure 4.4).
In Paper II, coordination of multiple actors was identified as one of three main challenges for healthcare logistics and SCM, and the transfer of patients from one provider to the next was generally the weakest point in a system of healthcare organisations (Adler et al., 2003; Aronsson et al., 2011; de Vries and Huijsman, 2011; Meijboom et al., 2011; Parnaby and Towill, 2008; Parnaby and Towill, 2009; Saha et al., 2009; Towill, 2006). Since organisations in a healthcare supply chain typically have no financial exchange for services as a patient moves from one organisation to another, the downstream organisation (who receive patients from upstream organisations) have little power over upstream organisations to dictate the process used to perform the work, the pace at which the work is done, or the quality of the outcome (Saha et al., 2009). At the university hospital, clinical departments that do not have the capacity to admit patients from the ED or another clinical department often hinder the flow of acute patients. In this instance, the downstream member of the supply chain has more power to dictate the process. In either case, the flow of patients is encumbered.
As concluded in Paper IV, shared responsibility for general medicine patients and different funding for acute and elective patients together with the different shares of elective and acute patients for different clinical departments holds incentives for clinical departments to act in ways that are unfavourable for other clinical departments. Unclear responsibility borders and interfaces have the effect that when considering the hospital as a system, the risk of sub-optimization is obvious. Departmental collaboration is thus evaluated as being hindered by the extensive authority of clinical departments (box 4 in Figure 4.4).
48
As described in the case report, there are several official positions established to operationally handle the acute patient flows on a hospital level (box 5 in Figure 4.4). At the clinical departments, the coordinators, the doctor on duty, if any, and sometimes the department chief are operationally involved. With the extensive authority of clinical departments, and vague mandates for the hospital coordinators, operative managing doctors and chief medical officers spends much time and resources discussing and considering appropriate responses to current events, such as to which clinical department a patient at the ED should be admitted. Similar observations are upheld by Proudlove and Boaden (2005). They argue that bed shortages and high bed occupancy often led to a concentration on juggling the placement of admissions: bed-finding and fire fighting. Many of the decisions related to finding short-term solutions involve resolving conflicts, for example the competition for beds between emergency and elective admissions, and the appropriateness of placement versus where beds are available. Without clear long-term goals and strategic direction for the hospital as a whole it becomes harder to evaluate the interests of clinical departments versus the interests of the hospital, and more time and resources are spent operationally handling the flow of acute patients. The development of actions for handling acute patient flows thus becomes more complicated.
As concluded in Paper IV and in the previous analysis, the extensive authority of middle management facilitates the development of individualised actions at different clinical departments. The lack of long-term goals and future states concerning how the variations of acute patient flows should be handled in the hospital also hinder the control and coordination of the actions used at different clinical departments. This also inhibits organisational learning at the hospital, both bottom-up and sideways in the hierarchies (box 6 in Figure 4.4). In Paper IV it was further concluded that if organisational learning had been on more sufficient levels at the hospital, feedback loops would have been clearer and adoption of successful actions between clinical departments more widely used.

49
5 CONCLUSIONS AND PROPOSITIONS In this chapter the conclusions for each research question are synthesised in order to answer the purpose of the licentiate thesis. The second section of the chapter provides propositions for future research and practice. These propositions are primarily based on the author’s evaluation and identification of patterns in the research material reported in this thesis.
5.1 RETURNING TO THE PURPOSE Healthcare is a large industry faced with major challenges, such as decreased inpatient bed numbers (Sveriges Kommuner och Landsting, 2010), increases in the share of elderly patients (Socialdepartementet, 2010) that require improved efficiency and effectiveness. At the same time, the complexity of healthcare services generates much variation, something healthcare resources have not been adapted to (Walley et al., 2006). The primary flow that needs to be handled in healthcare is that of patients. With the functional organisation of hospitals, made up of highly specialised clinical departments (Mintzberg, 1979; Mould et al., 2010), there is an obvious risk of sub-optimization when handling variable patient flows. In this licentiate thesis, an exploratory approach based on a system perspective have therefore been applied to study how variable patient flows are managed at hospitals. The purpose was hence:
To explore how variable patient flows are managed in hospitals
The purpose was further divided into three research questions, namely:
RQ1: How do variable patient flows affect hospitals?
RQ2: How are variable patient flows handled at hospitals?
RQ3: How does the organisational configuration influence the actions used to handle variable patient flows in hospitals?
By addressing the three research questions, understanding of how variable patient flows are managed in hospitals has been increased and the purpose of this thesis thus answered. As discussed in section 1.7, the term ‘managed’ includes both the actions used to handle variable patient flows and the organisational configuration. The first research question also contributes to the purpose by influencing the other two research questions. The relationships between the research questions have not been addressed explicitly so far, and this contribution will therefore be discussed in this section. The relationships are summarized in Figure 5.1, where the major results from each research question are shown.

50
FIGURE 5.1 – RELATIONSHIPS BETWEEN THE RESEARCH QUESTIONS
The effects of variable patient flows (RQ1) influence how variable patient flows are handled (RQ2). There are several examples in the research where this relationship is displayed. One effect of patient flow variability, the need for flexibility, is matched by having 28 out of the 50 actions being categorised as agile ones (see Figure 5.1). Bed shortages and overcrowding are effects of patient flow variability that much time and effort are spent handling at the university hospital.
As emphasised in section 1.7, the way the variability is handled (RQ2) also influences the impact of variable patient flows (RQ1). The results from Paper I and the case report support this statement. Being better at handling variable patient flows decreases the negative effects of the variation. EDs and clinical departments with a large share of acute patients for example seem better at handling variable patient flows, preventing them from becoming overcrowded as easily.
The linkage between the second and third research questions is fairly straightforward. The actions used to handle variable patient flows (RQ2) are under the influence of the organisational configuration at the hospital (RQ3). One example is that many actions are used at a departmental level (35), while few (15) are used at a hospital level (see Figure 5.1) since the clinical departments have extensive authority in combination with a lack of long-term goals and decision-making by unanimous decisions at top management levels. The fact that departmental collaboration is hindered by the almost self-governing clinical
Patient flow variability
Inflow variability
Outflow variability
Internal flow variability
2. EDs being more adapted than inpatient wards
1. Less problematic to manage with few admissions
3. Substantial problems with high bed occupancy
4. Need for flexibility
5. Patient flow characteristics
6. Variability in bed occupancy
7. A mismatch between variation in patient inflow and outflow
6. 7. Bed shortage 8. ED overcrowding
= Relation between boxes
= Positive correlation between variables
3. Extensive authority of clinical departments
1. Decision-making by consensus in working teams
5. Many positions operationally involved in handling the acute
patient flows
2. Lack of long-term goals and future states
6. Organisational learning difficult to achieve both bottom-up and sideways
4. Departmental collaboration hindered
Organisational level Number of actions
Clinical department 29
Between clinical departments 6
Hospital 11
Between hospital and local health services 3
Between hospitals 1
• Agile: Extending the use of a resource (7) o Predominantly flexibility category
• Agile: Altering the amount of a resource, ahead of demand (9) o Mix of the categories efficient flow, flexibility and outflow
• Agile: Altering the amount of a resource, as a response to demand (12) o Predominantly flexibility category
• Lean: An action that increases patient flow standardisation (7) o Predominantly efficient flow category
• Lean: An action that reduce the need for a resource (11) o Evenly between inflow and outflow categories
• Lean: An action that directly manage external variation (4) o Mix of the categories efficient flow, flexibility and inflow
!
RQ3: Influence of organisational configuration
RQ2: How variable patient flows are handled
RQ1: Effects of variable patient flows
51
departments can be related to only 6 actions are categorised as being used between clinical departments while 35 are used internally at clinical departments (see Figure 5.1).
How variable patient flows affect a hospital (RQ1) is also influenced by the organisational configuration (RQ3). This is particularly true when considering the departmental level of the hospital. As concluded above, being better at handling variable patient flows decreases the negative effects of the variation, e.g. overcrowding. With a lack of long-term goals and vision concerning how variable patient flows should be handled at a hospital level, most actions used at a departmental level are allowed. By allowing clinical departments to not admit patients whom they are not sure have health issues that correspond to their speciality, other clinical departments are obliged to accept these general medicine patients. The variability in patient inflow, and the effect that variability has on the clinical department, is thereby altered by the organisational configuration.
5.2 PROPOSITIONS FOR FUTURE RESEARCH AND PRACTICE The research performed for this thesis is based on a system perspective where both horizontal and vertical levels are acknowledged, by studying both the vertical organisational hierarchies and horizontal patient flows. Since this thesis is based on research conducted in collaboration with two hospitals, the generalizability can be discussed. However, understanding of the complexity in healthcare provision from a holistic perspective has been acquired. Therefore, propositions, with the aim to guide future research and practice, have been developed. These are primarily based on the author’s evaluation and identification of patterns in the research material reported in this thesis. The requirements concerning empirical and theoretical support are therefore less rigid in comparison to the conclusions section presented above. Some of the propositions are closely related to the purpose of this thesis and some are stand-alone observations assimilated during the research process. Relevance to future research and practice has been a guiding principle when developing the propositions.
As concluded in section 4.2, actions from both lean and agile categories are used at the university hospital. With a fairly even division of lean and agile actions, both types of actions for handling variable patient flows appear to be needed. Limited previous research concerning the use of lean (Radnor et al., 2006) and other management philosophies, such as agile, in the healthcare sector (de Vries and Huijsman, 2011) justify some recognition to the conclusion. Hence:
Proposition 1: Both lean and agile actions are used, and needed in hospitals to handle variable patient flows.
The use of both lean and agile actions is a positive result; for instance, the use of a base-level of staff and beds, complemented with a preparedness to quickly increase staff and available beds if the need arises, one of four leagile approaches in Paper III, may be an appropriate combination of lean and agile in healthcare services.

52
Another of the four leagile approaches in Paper III, separating patient flows, was distinguished in many of the actions used to handle a variable acute patient flows at the university hospital. Most of these actions were used when a clinical department could not handle their patient inflow. There were, however, some actions used to separate patient flows to enable more efficient processes. One example was to require clinical departments that normally admit acute patients to cancel their elective intake to protect clinical departments with only or predominantly elective patients from having to do the same, and thereby be given the possibility to adopt more lean processes. An agile approach, designed to accommodate unpredictable demand (Christopher and Towill, 2000) would be more appropriate for clinical departments admitting a larger share of acute patients. Thus:
Proposition 2: To protect certain clinical departments from variable patient flows, and allowing these to adopt lean processes, by requiring other clinical departments to handle these variable patient flows, by having agile processes, could lead to increased efficiency for the hospital as a whole.
In the analysis for RQ3, it was concluded that departmental collaboration is hindered by the almost self-governing clinical departments and many positions are therefore operationally involved in handling acute patient flows (boxes 4 and 5 in Figure 4.4). There are also only 6 actions being used between clinical departments, indicating a lack of collaboration (see Table 4.2). To limit the time and effort spent discussing and deliberating the boundaries between the clinical departments’ assignments, a clearer separation of these assignments would be appropriate. Basing the assignments for clinical departments on patient group characteristics and thus patient flow variability, as described in Figure 4.2, could be one way of achieving this. As argued in proposition 2, agile actions are suitable to accommodate unpredictable demand while lean actions are more appropriate when handling predictable demand. The third proposition therefore suggests:
Proposition 3: A clearer separation of patient flows, where acute general medicine patients are handled by agile actions and elective specialist patients by lean actions, could lead to increased efficiency for the hospital as a whole.
Concerning RQ2, it was concluded that a majority of the actions used in handling variable acute patient flows handle the effects of the variation, not the variation itself. There were only four out of the fifty actions that directly handled patient flow variability (see section 4.2). An effect of variable patient flows is bed shortages, a relationship identified and visualized in Figure 4.3. Much time and effort are spent handling bed shortages at the university hospital. It has been a recurrent topic in the interviews and there are many official positions that have been established to operationally handle the acute patient flows on a hospital level (box 5 in Figure 4.4). These often concentrate on organising the placement of admissions from the ED, where many decisions are related to finding short-term solutions to resolve conflicts, such as the competition for beds between acute and elective admissions or the appropriateness of placement versus where the available beds

53
are. This has previously been argued by Proudlove and Boaden (2005), and calls for the next proposition:
Proposition 4: It is predominantly the effects of patient flow variability, and in particular the issue of bed shortages, that are handled at hospitals, not the variability itself.
From Table 4.2 it can be seen that many actions also are used at a departmental level, while few are used at a hospital level. In section 5.1 this was related to the extensive authority of clinical departments, lack of long-terms goals and the fact that decision-making are accomplished by unanimous decisions at top management levels. Many positions are also operationally involved in handling the acute patient flow (box 5 in Figure 4.4) and much time and effort are spent discussing and deliberating the boundaries between the clinical departments. Stock and Lambert (2001) claim that when components are managed individually, without consideration of the impact on the larger system, there is a substantial risk of sub-optimization. Hence, there is a need for more actions on a hospital level since these actions have lower risk of generating sub-optimization. Therefore the following proposition claims:
Proposition 5: To decrease sub-optimization and protection of boundaries between clinical departments there is a need for more actions on a hospital level for handling variable patient flows.
As concluded in Paper III, several actions in the agile category that “alter the amount of a resource as a response to demand” are used at the hospital. This can be attributed to an insufficient level of the other two agile categories, since these are used more proactively. With a larger share of proactive actions, the reactive actions are needed more infrequently and thus the work for personnel in employing these actions is decreased. Hence:
Proposition 6: There is a need for more proactive actions for handling variable patient flows at hospitals.
The last proposition is based on a finding from analysing RQ3, namely that clinical departments have extensive authority (box 3 in Figure 4.4), rendering them similar to separate organisations. As previous authors have concluded, the organisation of a hospital is also a complex configuration of highly specialised clinical departments (Mintzberg, 1979), with patient flows that often involve a large number of clinical departments, and thus requires much coordination both in space and time (Aronsson et al., 2011). One main challenge, identified in Paper II, is that the transfer from one healthcare provider to the next is generally the weakest point in a system of healthcare providers (Adler et al., 2003; Aronsson et al., 2011; de Vries and Huijsman, 2011; Meijboom et al., 2011; Parnaby and Towill, 2008; Parnaby and Towill, 2009; Saha et al., 2009; Towill, 2006). From a system perspective, it is important to understand and manage a system as a whole to achieve efficiency and effectiveness (Langley et al., 2008). When working with healthcare SCM (defined in Paper II) the findings in this thesis point to the importance of realising

54
and addressing two levels of systems: one where the hospital is a supply chain entity and one where the clinical department is a supply chain entity. Thus, the final proposition:
Proposition 7: There is a need to understand and address Healthcare SCM from two standpoints: one where the hospital comprises a supply chain entity and one where the clinical department comprise a supply chain entity
The propositions presented above were developed with the aim to guide future research and practice. To enhance the applicability of the propositions for further research, the objective has been to develop propositions that are specific. The research and propositions presented above also illustrate the need for a system perspective where both the effects of variable patient flows as well as the actions and how the organisation influence these actions are acknowledged in the research. It also indicates a field in need of further research to increase understanding of how variable patient flows are managed at hospitals.
REFERENCES Abraham, J. and Reddy, M. (2010), “Challenges to inter-departmental coordination of
patient transfers: A workflow perspective”, International Journal Of Medical Informatics, Vol. 79, No. 2, p. 112-122.
Adler, P.S., Riley, P., Kwon, S.W., Signer, J., Lee, B. and Satrasala, R. (2003), "Performance improvement capability: keys to accelerating performance improvement in hospitals", California Management Review, Vol. 45, No. 2, pp. 12-33.
Aitken, J., Christopher, M. and Towill, D. (2002), “Understanding, Implementing and Exploiting Agility and Leanness”, International Journal of Logistics Research and Applications: A Leading Journal of Supply Chain Management, Vol. 5, No. 1, pp. 59-74.
Allder, S., Walley, P. and Silvester, K. (2011), ”Is follow-up capacity the current NHS bottleneck?”, Clinical Medicine, Vol. 11, No 1, pp. 31-34.
Andersson, G. and Karlberg, I. (2000), “Integrated care for the elderly: the background and effects of the reform of Swedish care of the elderly”, International Journal of Integrated Care, Vol. 1, No. 1, pp. 1-10.
Arlbjörn, J.S., Freytag, P.V. and de Haas, H. (2011), “Service supply chain management: A survey of lean application in the municipal sector”, International Journal of Physical Distribution & Logistics Management, Vol. 41, No. 3, pp. 277-295.
Arlbjörn, J.S. and Halldorsson, A. (2002), “Logistics knowledge creation: reflections on content, context and processes”, International Journal of Physical Distribution & Logistics Management, Vol. 32, No. 1, pp. 22-40.
Aronsson, H., Abrahamsson, M. and Spens, K. (2011), “Developing lean and agile health care supply chains”, Supply Chain Management: An International Journal, Vol. 16, No. 3, pp. 176-183.
Baltacioglu, T., Ada, E., Kaplan, M.D., Yurt, O. and Kaplan, Y.C. (2007), “A new framework for service supply chains”, The Service Industries Journal, Vol. 27, No. 2, pp. 105-124.
Banks, J., Carson II, J.S., Nelson, B.L., Nicol, D.M. (2005), Discrete-Event System Simulation, Fourth Edition, New Jersey, Pearson Prentice Hall.
Berry, L. and Bendapudi, N. (2007), “Health Care: A Fertile Field for Service Research”, Journal of Service Research, Vol. 10, No. 2, pp. 111-122.
Bicheno, J. (2004), The New Lean Toolbox – Towards fast, flexible flow, Buckingham, PICSIE Books.

Bicheno, J., Anhede, P. and Hillberg, J. (2009), Lean Handbok för Service och Tjänster, Revere.
Bohmer, R.M.J. (2005), “Medicine's service challenge: blending custom and standard care, Health Care Management Review, Vol. 30, No. 4, pp. 322-330.
Bowersox, D.J. (1978), “The logistics of the last quarter of the 20th century”, Journal of Business Logistics, Vol. 1, No. 1, pp. 1-9.
Bringewatt, R.J. (1998), “Healthcare’s next big hurdle”. The Healthcare Forum Journal, Vol. 41, No. 5, pp. 14-16.
Bryman, A. and Bell, E. (2011), Business Research Methods, New York, Oxford University Press.
Carlsson, J. (2003), Förändringsbokslut 2003, Utvärderingsrapport Hässleholms sjukhus.
Carlsson, J. and Sarv, L. (2001), Utvärdering av HAK-projektet i Region Skåne, Region Skåne, Utvärderingsrapport 2001.
Chen, I. and Paulraj, A. (2004), “Towards a theory of supply chain management: the constructs and measurements”, Journal of Operations Management, Vol. 22, No. 2, pp. 119-150.
Christopher, M. (2005), Logistics and supply chain management: creating value-added networks, Pearson education.
Christopher, M. and Towill, D.R. (2000), “Supply chain migration from lean and functional to agile and customised”, Supply Chain Management: An International Journal, Vol. 5, No. 4, pp. 206-213.
Dagens Medicin (2013), ”Väntad seger för Linköping”, [Online] Available: http://www.dagensmedicin.se/nyheter/basta-sjukhuset-2012/vantad-seger-for-linkoping/ (accessed July 3rd 2013).
Davis, T. (1993), “Effective supply chain management”, Sloan Management review, (Summer), pp. 35-46.
Denis, J.L., Langley, A. and Lozeau, D. (1995), “The role and impact of formal strategic planning in public hospitals”, Health Services Management Research, Vol. 8, No. 2, pp. 86-110.
de Vries, J. and Huijsman, R. (2011) “Supply chain management in health services: an overview”, Supply Chain Management: An International Journal, Vol. 16, No. 3, pp. 159-165.
de Wit, B. and Meyer, R. (1998), Strategy: Process, Content, Context: An International Perspective, London, International Thomson Business.

Dubois, A. and Gadde, L.-E. (2002), ”Systematic Combining: an Abductive Approach to Case Research”, Journal of Business Research, Vol. 55, No. 7, pp. 553-560.
Eisenhardt, K.M. (1989), ”Building theories from case study research”, Academy of Management Review, Vol. 14, No. 4, pp. 532-550.
Ellram, L.M. (1996), ”The Use of the Case Study Method in Logistics Research”, Journal of Business Logistics, Vol. 17, No. 2, pp. 93-138.
Ellram, L.M., Tate, W.L. and Billington, C. (2004), “Understanding and managing the services supply chain”, Journal of Supply Chain Management, Vol. 40, No. 4, pp. 17-32.
Ellram, L.M., Tate, W.L. and Billington, C. (2007), “Services Supply Management: The next frontier for improved organizational performance”, California Management Review, Vol. 49, No. 4, pp. 44-66.
Estey, A., Ness, K., Saunders, L., Alibhai, A. and Bear, R. (2003), “Understanding the causes of overcrowding in emergency departments in the Capital Health Region in Alberta: a focus group study”, Canadian Journal Of Emergency Medicine, Vol. 5, No. 2, p. 87-94.
Fabbe-Costes, N. and Jahre, M. (2007), “Supply chain integration improves performance: the Emperor’s new suit?”, International Journal of Physical Distribution & Logistics Management, Vol. 37, No. 10, pp. 835-55.
Floyd S.W. and Wooldridge B. (1992), “Middle management involvement in strategy and its association with strategic type: a research note”, Strategic Management Journal, Vol. 13, No. 1 (Special Issue), pp. 153-167.
Flynn, B.B., Kakibara, S.S., Schroeder, R.G., Bates, K.A. and Flynn, E.J. (1990), “Empirical Research Methods in Operations Management”, Journal of Operations Management, Vol. 9, No. 2, pp. 250-284.
Ferreira, R.B., Coelli, F.C., Pereira, W.C.A. and Almeida, R.M.V.R. (2008), “Optimizing patient flow in a large hospital surgical centre by means of discrete-event computer models”, Journal of Evaluation in Clinical Practice, Vol. 14, No. 6, pp. 1031-1037.
Frei, F. (2006), “Breaking the Trade-Off Between Efficiency and Service”, Harvard Business Review, November 2006, pp. 1-11.
Glouberman, S. and Mintzberg, H. (2001), “Managing the Care of Health and the Cure of Disease – Part I: Differentiation”, Health Care Management Review, Vol. 26, No. 1, pp. 56-69.
Grönroos, C. (2007), Service management och marknadsföring-en CRM ansats, Malmö, Liber

Grönroos, C. and Ravald, A. (2011), “Service as business logic: implications for value creation and marketing”, Journal of Service Management, Vol. 22, No. 1, pp. 5-22.
Hall, D. and Bytheway, B. (1982), “The blocked bed. Definition of a problem”, Social Science And Medicine, Vol. 16, No. 22, p. 1985-1991.
Hines, P., Holweg, M. and Rich, N. (2004), “Learning to Evolve. A review of Contemporary Lean Thinking”, International Journal of Operations and Production Management, Vol. 24, No. 10, pp. 994-1011.
Ho, S.J.K., Chan, L. and Kidwell, R.E. Jr. (1999), “The implementation of business process reengineering in American and Canadian hospitals”, Health Care Management Review, Vol. 24, No. 2, pp. 19-31.
Hoffman, C., Rice, D. and Sung, H.Y. (1996), “Persons with chronic conditions: Their prevalence and costs”, The journal of the American Medical Association, Vol. 276, No. 18, pp. 1473-1479.
Hoot, N.R. and Aronsky, D. (2008), “Systematic review of emergency department crowding: causes, effects, and solutions”, Annals of Emergency Medicine, Vol. 52, No. 2, pp. 126–136.
Hopp, W.J. and Spearman, M. L. (2000), Factory physics (second edition), Boston, McGraw-Hill.
Hvitfeldt Forsberg, H., Aronsson, H., Keller, C. and Lindblad, S. (2010), “Managing Health Care Decisions and Improvement Through Simulation Modeling”, Quality Management in Health Care, Vol. 19, No. 4, pp. 1-15.
Hässleholms sjukhusorganisation (2013), Fakta, [Online], Available: http://www.skane.se/sv/Webbplatser/Hassleholm/Hassleholm_internet/Patienter--narstaende11/Fakta/ [Accessed January 15th 2013].
Jarret, P.G. (1998), “Logistics in the health care industry”, International Journal of Physical Distribution and Logistics, Vol. 28, No. 9, pp. 741–772.
Kidd, P.T. (1995), “Agile Manufacturing: a strategy for the 21st century”, Agile Manufacturing, IEE Colloquium on, pp. 1-6.
Kujala, J., Lillrank, P., Kronström, V. and Peltokorpi, A. (2006), “Time-based management of patient processes”. Journal of Health Organization and Management, Vol. 20, No. 6, pp. 512-524.
Landstinget i Östergötland (2014), Vård i världsklass, [Online], Avaliable: http://www.lio.se/Om-landstinget/Vard-i-varldsklass/ [Accessed Marsh 24th 2014].
Langley, J.C., Coyle, J.J., Gibson, B.J., Novack, R.A. and Bardi, E.J. (2008), Managing Supply Chains: a logistics approach, Canada, Cengage Learning.
Law, A.M. (2007), Simulation Modeling and Analysis, Fourth edition, New York, McGraw-Hill.
Lee, H.L. and Billington C. (1992), “Managing Supply Chain Inventory: Pitfalls and Opportunities”, Sloan Management Review, Vol. 33, Spring, pp. 65-73.
Lega, F., Marsilio, M. and Villa, S. (2012), “An evaluation framework for measuring supply chain performance in the public healthcare sector: evidence from the Italian NHS”, Production Planning & Control: The Management of Operations, Vol. 24, No. 10-11, pp. 931-947
Lillrank, P., Groop, J. and Venesmaa, J. (2011), “Processes, episodes and events in health service supply chains”, Supply Chain Management: An International Journal, Vol. 16, No. 3, pp. 194-201.
Litvak, E. and Long, M.C. (2000), “Cost and quality under managed care: irreconcilable differences?”, The American Journal of Managed Care, Vol. 6, No. 3, pp. 305-312.
Mason-Jones, R., Naylor, B. and Towill, D. (2000), “Lean, agile or leagile? Matching your supply chain to the market place”, International Journal of Production Research, Vol. 38, No. 17, pp. 4061-4070.
McKone-Sweet, K.E., Hamilton, P. and Wills, S.B. (2005), “The ailing healthcare supply chain: a prescription for change”, Journal of Supply Chain Management, Vol. 41, No.1, pp. 4-17.
McLaughlin, C.P. (1996), “Why variation reduction is not everything: a new paradigm for service operations”, International Journal of Service Industry Management, Vol. 7, No. 3, pp. 17-30.
Meijboom, B., Schmidt-Bakx, S. and Westert, G. (2011), “Supply chain management practices for improving patient-oriented care”, Supply Chain Management: An International Journal, Vol. 16, No. 3, pp. 166-175.
Mentzer, J.T., DeWitt, W., Keebler, J.S., Min, S., Nix, N.W., Smith, C.D. and Zacharia, Z.G. (2001), “Defining supply chain management”, Journal of Business Logistics, Vol. 22, No. 2, pp. 1-25.
Meredith, J. (1998), ”Building operations management theory through case and field research”, Journal of Operations Management, Vol. 16, No. 4, pp. 441-454.
Mintzberg, H. (1979), The Structuring of Organizations, Englewood Cliffs, NJ, Prentice Hall.
Mould, G., Bowers, J. and Ghattas, M. (2010), “The evolution of the pathway and its role in improving patient care”, Quality and Safety in Health Care, Vol. 19, No. 5, pp. 1-6.
Murphy, M. (2005), “Demystifying flowcharts”, Materials management in health care, August, 2005.
Noon, C.E., Hankins, C.T. and Côté, M.J. (2003), “Understanding the Impact of Variation in the Delivery of Healthcare Services”, Journal of Healthcare Management, Vol. 48, No. 2, pp. 82-97.
Novack, R.A., Rinehart, L.M. and Wells, M.V. (1992), “Rethinking concept foundations in logistics management”, Journal of Business Logistics, Vol. 13, No. 2, pp. 233-267.
OECD Health Statistics 2013, http://dx.doi.org/10.1787/health-data-en; WHO Global Health Expenditure Database [Accessed May 5th 2014].
Oskarsson, B., Aronsson, H. and Ekdahl, B. (2013), Modern logistik – för ökad lönsamhet, upplaga 4, Stockholm, Liber.
Parnaby, J. and Towill, D. (2009), “Engineering cellular organisation and operation for effective healthcare delivery supply chains”, International Journal of Logistics Management, Vol. 20, No. 1, pp. 5-29.
Parnaby, J. and Towill, D.R. (2008), “Seamless healthcare delivery systems”, International Journal of Health Care Quality Assurance, Vol. 21, No. 3, pp. 249-273.
Physician Hospital Care Committee, 2006, Improving Access to Emergency Care: Addressing System Issues. Available at: http://www.health.gov.on.ca/en/common/ministry/publications/reports/improving_access/improving_access.pdf; (Accessed Sep 10, 2013).
Pidd, M. (1996), Tools for Thinking – Modeling in Management Science, Chichester, John Wiley & Sons.
Pidd, M. (2004), Computer Simulation – in Management Science, Chichester, John Wiley & Sons.
Proudlove, N, and Boaden, R. (2005), “Using operational information and information systems to improve in-patient flow in hospitals”, Journal Of Health Organisation And Management, Vol. 19, No. 6, p. 466-477.
Proudlove, N., Gordon, K. and Boaden, R. (2003), “Can good bed management solve the overcrowding in A&E?”, Emergency Medicine Journal, Vol. 20, No. 2, pp. 149-155.
Punch, K.F. (2005), Introduction to Social Research: Quantitative and Qualitative Approaches, London, SAGE Publications.

Radnor, Z., Walley, P., Stephens, A. and Bucci, G. (2006), “Evaluation of the lean approach to business management and its use in the public sector” (summary report). Research Findings No. 20/2006, Scottish Executive, Office of Chief Researcher, Edinburgh.
Rahimnia, F. and Moghadasian, M. (2010), “Supply chain leagility in professional services: how to apply decoupling point concept in healthcare delivery system”, Supply Chain Management: An International Journal, Vol. 15, No. 1, pp. 80-91.
Ramanujam, R. and Rousseau, D. (2006), “The challenges are organizational not just clinical”, Journal of Organizational Behavior, Vol. 27, No. 2, pp. 811-827.
Reagan-Cirincione, P., Shuman, S., Richardson, G.P. and Dorf, S.A. (1991), “Decision Modeling: Tools for Strategic Thinking”, Interfaces, Vol. 21, No. 6, pp. 52-65.
Richardson D.B. and Mountain D. (2009), “Myths versus facts in emergency department overcrowding and hospital access block”, Medical Journal of Australia, Vol. 190, No. 7, pp. 369-374.
Ronen, B. and Pliskin, J. (2006), Focused operations management for health services organizations, Hoboken, Wiley.
Röthlin, F. (2013), “Managerial strategies to reorient hospitals towards health promotion: Lessons from organisational theory”, Journal of Health Organization and Management, Vol. 27, No. 6, pp. 747-761.
Sachan, A. and Datta, S. (2005), “Review of supply chain management and logistics research”, International Journal of Physical Distribution & Logistics Management, Vol. 35, No. 9, pp. 664-705.
Saha, P., Pinjani, A., Al-Shabibi, N., Madari, S., Ruston, J. and Magos, A. (2009) “Why we are wasting time in the operating theatre?” The International Journal of Health Planning and Management, Vol. 24, No. 3, pp. 225-232.
Sampson, S.E. (2000) “Customer-supplier Duality and Bidirectional Supply Chains in Service Organizations”, International Journal of Service Industry Management, Vol. 11, No. 4, pp. 348-364.
Sampson, S.E., and Froehle, C.M. (2006), “Foundations and Implications of a Proposed Unified Services Theory”, Production and Operations Management, Vol. 15, No. 2, pp. 329-343.
Sanders, N.R. (2007), “The benefits of using e-business technology: the supplier perspective”, Journal of Business Logistics, Vol. 28, No. 2, pp. 177-207.

Schiff, G.D. (2011), “System dynamics and dysfunctionalities: Levers for overcoming emergency department overcrowding”, Academic Emergency Medicine, Vol. 18, No. 12, pp. 1255-1261.
Shah, R., Goldstein, S.M., Unger, B.T. and Henry, T.D. (2008), “Explaining Anomalous High Performance in a Health Care Supply Chain*”, Decision Sciences, Vol. 39, No. 4, pp. 759-789.
Silvester, K., Lendon, R., Bevan, H., Steyn, R. and Walley, P. (2004), ”Reducing waiting times in the NHS: is lack of capacity the problem?”, Clinician in Management, Vol. 12, No. 3, pp. 105-109.
Slovensky, D.J. and Morin, B. (1997), “Learning through simulation: the next dimension in quality improvement”, Qual Manag Health Care, Vol. 5, No. 3, pp. 72-79.
Socialdepartementet (2010), Den ljusnande framtid är vård - Delresultat från LEV-projektet, Stockholm, Regeringskansliet.
Socialstyrelsen (2012) Modell för kunskapsstyrning av överbeläggningar och utlokalisering av patienter, Artikelnr 2012-11-3.
Spens, K.M. and Kovács, G. (2006), “A content analysis of research approaches in logistics research”, International Journal of Physical Distribution & Logistics Management, Vol. 36, No. 5, pp. 374-390.
Sterman, J.D. (2006), “Learning from evidence in a complex world”, American Journal of Public Health, Vol. 96, No. 3, pp. 505-514.
Stock, J.R. (1997), “Applying theories from other disciplines to logistics”, International Journal of Physical Distribution & Logistics Management, Vol. 27, No. 9/10, pp. 515-539.
Stock, J.R. and Lambert, D.M. (2001), Strategic logistics management, New York, McGraw-Hill Companies.
Stuart, I., McCutcheon, D., Handfield, R., McLachlin, R., Samson, D. (2002), ”Effective case research in operations management: a process perspective”, Journal of Operations Management, Vol. 20, No. 5, pp. 419-433.
Sveriges Kommuner och Landsting (2005), Svensk sjukvård i internationell belysning - en jämförelse av vårdbehov, kostnader och resultat, ISBN, no 91-7164-029-0.
Sveriges Kommuner och Landsting (2010), Från sjukhussäng till e-hälsa – utvecklingstendenser inom hälso- och sjukvården, ISBN 978-91-7164-558-6.
Sveriges Kommuner och Landsting (2014), Så möter vi rekryterings- utmaningarna i vården och omsorgen, Available: http://www.skl.se/press/nyheter_2/stora-jobbmojligheter-i-varden-och-omsorgen [Accessed April 23th 2014].
Tako, A.A. and Robinson, S. (2009), “Comparing discrete-event simulation and system dynamics: users’ perceptions”, Journal of the Operational Research Society, Vol. 60, No. 3, pp. 296-312.
The Health Foundation (2013), Improving patient flow – How two trusts focused on flow to improve the quality of care and use available capacity effectively, Learning report, April 2013, London.
The National Board of Health and Welfare (2012), Modell för kunskapsstyrning av överbeläggningar och utlokalisering av patienter, [Online], Available: http://www.socialstyrelsen.se/publikationer2012/2012-11-3 [Accessed April 20th 2014].
Towill, D. and Christopher, M. (2002), “The Supply Chain Strategy Conundrum: To be Lean Or Agile or To be Lean And Agile?”, International Journal of Logistics: Research and Application, Vol. 5, No. 3, pp. 299-309.
Towill, D. and Christopher, M. (2005), “An evolutionary approach to the architecture of effective healthcare delivery systems”, Journal of Health Organization and Management, Vol. 19, No. 2, pp. 130-147.
Towill, D.R. (2006), “Viewing Kaiser Permanente via the logistician lens”, International Journal of Health Care Quality Assurance, Vol. 19, No. 4, pp. 296-315.
Tranfield, D., Denyer, D. and Smart, P. (2003), “Towards a Methodology for Developing Evidence-Informed Management Knowledge by Means of Systematic Review”, British Journal of Management, Vol. 14, No. 3, pp. 207-222.
Travers, C., McDonnell, G., Broe, G., Anderson, P., Karmel, R., Duckett, S. and Gray, L. (2008), “The acute-aged care interface: Exploring the dynamics of 'bed blocking'”, Australasian Journal On Ageing, Vol. 27, No. 3, pp. 116-120.
Trzeciak S. and Rivers E.P. (2003), “Emergency department overcrowding in the United States: an emerging threat to patient safety and public Health”, Emergency Medicine Journal,Vol. 20, No. 5, pp. 402-405.
Van der Vaart, T. and van Donk, D.-P. (2008), “A critical review of survey-based research in supply chain integration”, International Journal of Production Economics, Vol. 111, No. 1, pp. 42-55.
Vissers, J.M.H., Bertrand, J.W.M., and De Vries, G. (2001), “A framework for production control in health care organizations”, Production Planning & Control, Vol. 12, No. 6,pp. 591-604.
Vissers, J. and Beech, R. (2005), Health operations management: patient flow logistics in health care, Abingdon, Routledge.

Wiger, M. (2013), Logistics management in a healthcare context – Methodological development for describing and evaluating a healthcare organisation as a logistics system, Doctoral thesis no. 1602, Linköping university.
Walley, P., Silvester, K. and Steyn, R. (2006), ”Managing Variation in Demand: Lessons from the UK National Health Service”, Journal of Healthcare Management, Vol. 51, No. 5, pp. 309-320.
Wolstenholme, E.F. (1993), “A Case Study in Community Care Using Systems Thinking”, Journal of the Operational Research Society, Vol. 44, No. 9, pp. 925-934.
Womack, J.P., Jones, D.T. and Roos, D. (1990), The Machine that Changed the World, Rawson Associates, New York, NY.
Wood, N. (2004), “Learning to see: How does your supply chain function?”, Management Services, Vol. 48, No. 4, pp. 16-20.
Yin, R.K. (2009), Case study research: Design and method (4th ed.), Thousand Oaks, CA: Sage

APPENDIX 1
INTERVIEW GUIDE


INTERVJUFRÅGOR BRUTTOLISTA STRATEGIER FÖR ATT HANTERA VARIATION
ÖVERGRIPANDE ARBETE FÖR ATT HANTERA VARIATION • Kan du övergripande beskriva hur strategierna för att hantera ett varierande akutflöde ser ut? • I den position som du arbetar i, vad kan du göra för att hantera variation i akutflödet?
o Finns det några begränsningar i vad du kan göra?
KOORDINERING • Hur koordineras det arbete du utför för att hantera variation i akutflödet med andra runt omkring
dig? • Har ni något samarbete med andra befattningar/avdelningar/kliniker inom sjukhuset i relation till
ett varierande akutflöde? • Har ni något samarbete med externa aktörer utanför sjukhuset (såsom patientinflödet på
akutmottagningen och kommunens agerande) i relation till ett varierande akutflöde?
OPERATIV FLEXIBILITET • Mäter och följer ni någon typ av variation, exempelvis variation i vårdtid, patientinflöde,
beläggning? • Hur hanteras toppar i beläggning och patientinflöde orsakade av akutflödet?
o Har ni möjlighet/tid att förbereda er och i så fall, hur långt i förväg? o Ringer ni in personal? o Flytta personal eller förändra personalens arbetsuppgifter? o Strypa det elektiva flödet? o Andra åtgärder?
§ Nedanstående hämtade från Handlingsplan vid vårdplatsbrist: • Tillfälligt upprättande av extra vårdplatser • Minskad elektiv verksamhet • Vårdplatsmöte • Samverkan över länet (flytta patient till motsvarande enhet på annat
sjukhus) • Utskrivningsklara patienter (flyttas temporärt till annan enhet på
sjukhuset) • Flyttning av patient till annan klinik • Ställningstagande till vård i hemmet • Överbeläggning • Beredskapsavdelning
• Hur hanteras ett akutflöde som är mindre än ”normalt”? o Skickar ni hem personal?
• Finns det någon skillnad i förfarande vid behov av att ringa in och/eller skicka hem personal beroende på vilken personalkategori det gäller?
• Görs någon separation mellan akutpatienter med olika komplexa sjukvårdsbehov på den enhet du arbetar?
SCHEMALÄGGNING

• Vilka övergripande faktorer tas hänsyn till vid bemanningsplanering (ex. beläggning, kompetens, enskilda önskemål)?
o Anpassar ni bemanningen efter variationer i akutflödet, exempelvis baserat på prognoser av akutinflödet?
PROBLEM OCH MÖJLIGHETER • Vilka problem ser du med det nuvarande sättet att hantera akutflödet?
• Hur skulle du vilja förbättra det?
PLANERINGSARBETE FÖR ATT HANTERA VARIATION
ÖVERGRIPANDE PLANERING SAMT ER DEL I HELHETEN • Kan du övergripande beskriva hur planeringen för att hantera ett varierande akutflöde ser ut?
o Vilka aktörer (personer/befattningar/grupper) är delaktiga? o Vilka typer av beslut tas på olika nivåer i organisationen?
• Utifrån bilden nedan, hur kopplas er del i planeringsarbetet med de andras? o Vad är det som lämnas över mellan de olika nivåerna o Vilka beslut tas på er nivå? o Har ni kontakt med andra nivåer som inte är omedelbart ovanför eller nedanför er
hierarkiskt?
PROBLEM OCH MÖJLIGHETER • Vilka problem ser du med det nuvarande planeringsarbetet? • Hur skulle du vilja förbättra planeringsarbetet?
PLANERINGSARBETET I DETALJ • Finns det uppsatta mål och/eller vision med i planeringen?
o Finns det någon budget kopplad till dessa? • Finns det någon dokumenterad handlingsplan/planering för hur ett varierande akutflöde ska
hanteras? o Hur har denna tagits fram? o Kontrolleras det att planen följs och i så fall hur? o Finns det någon budget kopplad till planen? o Kan vi ta del av den?
Lands&ngsdirektör.
Centrum.
Kliniker.
Beslut.
Beslut.
Beslut.

o Kommer handlingsplanen att revideras med jämna tidsintervall? o Finns det några alternativa handlingsplaner som kan göras verksamma vid specifika
omständigheter? • Varifrån kommer initiativ och förslag på förbättring av den nuvarande strategin?
o Hur hanteras förbättringsförslag? o Om du fick en idé, hur skulle du gå till väga för få möjlighet att testa den?
• Hur tas externa faktorer som ligger utanför sjukhusets kontroll (såsom patientinflödet på akutmottagningen och kommunens agerande) med i planeringen?
• Används några hjälpmedel av något slag i planeringsarbetet? • Finns det tid avsatt för förbättringsarbete kring dessa frågor?
Hur långt framåt planeras det för (planeringshorisont)?


APPENDIX 2
INFORMATION GATHERING ACTIVITIES

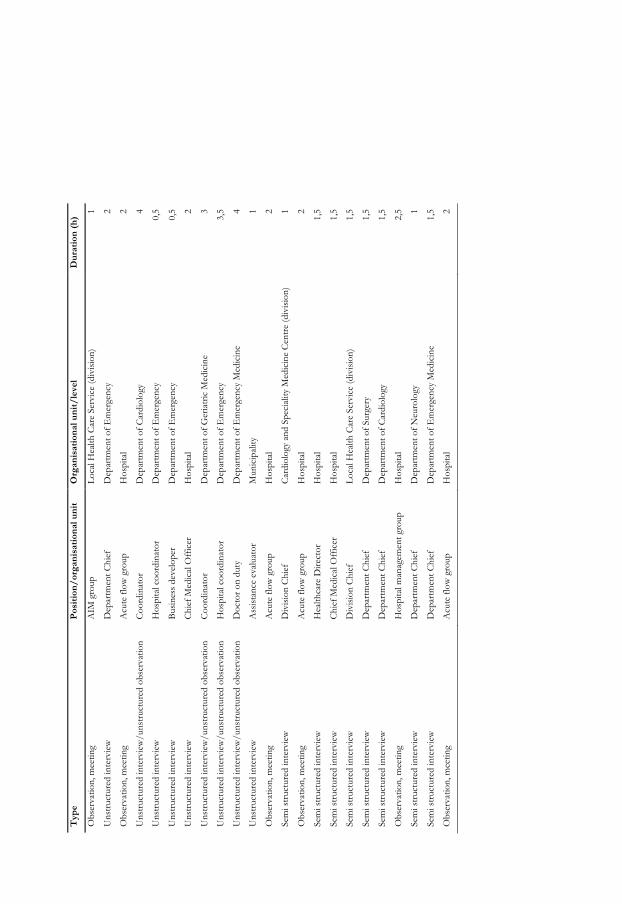
Typ
e P
osit
ion/
orga
nisa
tion
al u
nit
Org
anis
atio
nal u
nit/
leve
l D
urat
ion
(h)
Obs
erva
tion,
mee
ting
A
IM g
roup
Lo
cal H
ealth
Car
e Se
rvic
e (d
ivis
ion)
1
Uns
truc
ture
d in
terv
iew
D
epar
tmen
t Chi
ef
Dep
artm
ent o
f Em
erge
ncy
2
Obs
erva
tion,
mee
ting
A
cute
flow
gro
up
Hos
pita
l 2
Uns
truc
ture
d in
terv
iew
/uns
truc
ture
d ob
serv
atio
n
Coo
rdin
ator
D
epar
tmen
t of C
ardi
olog
y 4
Uns
truc
ture
d in
terv
iew
H
ospi
tal c
oord
inat
or
Dep
artm
ent o
f Em
erge
ncy
0,5
Uns
truc
ture
d in
terv
iew
B
usin
ess
deve
lope
r D
epar
tmen
t of E
mer
genc
y 0,
5
Uns
truc
ture
d in
terv
iew
C
hief
Med
ical
Off
icer
H
ospi
tal
2
Uns
truc
ture
d in
terv
iew
/uns
truc
ture
d ob
serv
atio
n
Coo
rdin
ator
D
epar
tmen
t of G
eria
tric
Med
icin
e 3
Uns
truc
ture
d in
terv
iew
/uns
truc
ture
d ob
serv
atio
n H
ospi
tal c
oord
inat
or
Dep
artm
ent o
f Em
erge
ncy
3,5
Uns
truc
ture
d in
terv
iew
/uns
truc
ture
d ob
serv
atio
n
Doc
tor
on d
uty
Dep
artm
ent o
f Em
erge
ncy
Med
icin
e 4
Uns
truc
ture
d in
terv
iew
A
ssis
tanc
e ev
alua
tor
Mun
icip
ality
1
Obs
erva
tion,
mee
ting
A
cute
flow
gro
up
Hos
pita
l 2
Sem
i str
uctu
red
inte
rvie
w
Div
isio
n C
hief
C
ardi
olog
y an
d Sp
ecia
lity
Med
icin
e C
entr
e (d
ivis
ion)
1
Obs
erva
tion,
mee
ting
A
cute
flow
gro
up
Hos
pita
l 2
Sem
i str
uctu
red
inte
rvie
w
Hea
lthca
re D
irect
or
Hos
pita
l 1,
5
Sem
i str
uctu
red
inte
rvie
w
Chi
ef M
edic
al O
ffic
er
Hos
pita
l 1,
5
Sem
i str
uctu
red
inte
rvie
w
Div
isio
n C
hief
Lo
cal H
ealth
Car
e Se
rvic
e (d
ivis
ion)
1,
5
Sem
i str
uctu
red
inte
rvie
w
Dep
artm
ent C
hief
D
epar
tmen
t of S
urge
ry
1,5
Sem
i str
uctu
red
inte
rvie
w
Dep
artm
ent C
hief
D
epar
tmen
t of C
ardi
olog
y 1,
5
Obs
erva
tion,
mee
ting
H
ospi
tal m
anag
emen
t gro
up
Hos
pita
l 2,
5
Sem
i str
uctu
red
inte
rvie
w
Dep
artm
ent C
hief
D
epar
tmen
t of N
euro
logy
1
Sem
i str
uctu
red
inte
rvie
w
Dep
artm
ent C
hief
D
epar
tmen
t of E
mer
genc
y M
edic
ine
1,5
Obs
erva
tion,
mee
ting
A
cute
flow
gro
up
Hos
pita
l 2


APPENDIX 3
SEARCH TERMS AND NUMBER OF HITS FOR
SYSTEMATIC LITERATURE REVIEW

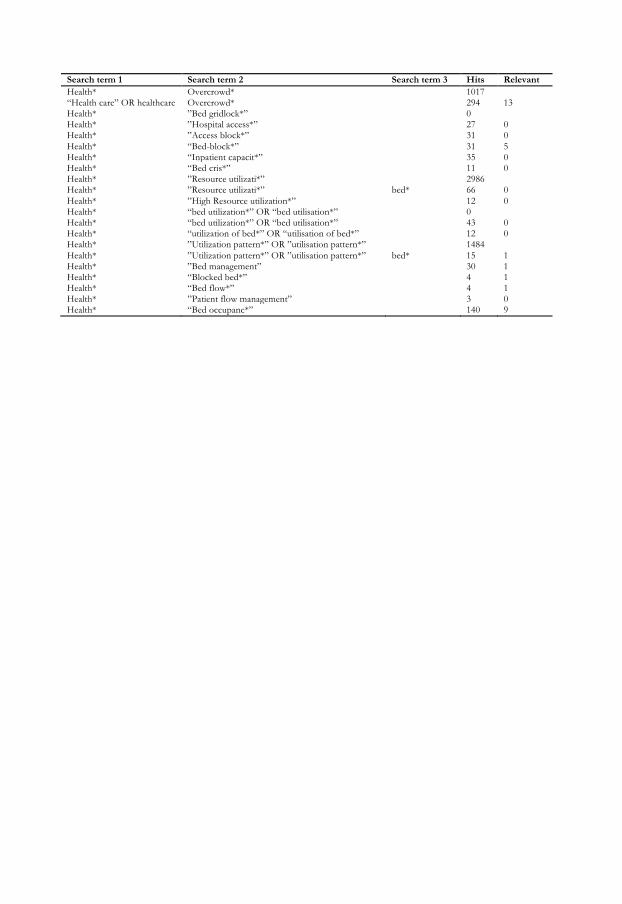
Search term 1 Search term 2 Search term 3 Hits Relevant Health* Overcrowd* 1017 “Health care” OR healthcare Overcrowd* 294 13 Health* ”Bed gridlock*” 0 Health* ”Hospital access*” 27 0 Health* ”Access block*” 31 0 Health* “Bed-block*” 31 5 Health* “Inpatient capacit*” 35 0 Health* “Bed cris*” 11 0 Health* ”Resource utilizati*” 2986 Health* ”Resource utilizati*” bed* 66 0 Health* ”High Resource utilization*” 12 0 Health* “bed utilization*” OR “bed utilisation*” 0 Health* “bed utilization*” OR “bed utilisation*” 43 0 Health* “utilization of bed*” OR “utilisation of bed*” 12 0 Health* ”Utilization pattern*” OR ”utilisation pattern*” 1484 Health* ”Utilization pattern*” OR ”utilisation pattern*” bed* 15 1 Health* ”Bed management” 30 1 Health* “Blocked bed*” 4 1 Health* “Bed flow*” 4 1 Health* ”Patient flow management” 3 0 Health* “Bed occupanc*” 140 9


APPENDIX 4
MAPPING TOOLS IN HEALTHCARE PROCESSES


MAPPING TOOLS IN HEALTHCARE PROCESSES AN EXPLORATORY CASE STUDY
Olle Olsson*
Håkan Aronsson**
*) Department of Management and Engineering, The Institute of Technology, Linköping University, SE-581 83, Linköping, Sweden E-mail: [email protected], Tel: +4613281521
**) Department of Management and Engineering, The Institute of Technology, Linköping University, SE-581 83, Linköping, Sweden E-mail: [email protected], Tel: +4613284449
Paper number: 19579
Paper number: 19579
ABSTRACT
Purpose of this paper The aim of this paper is to identify mapping tools in today’s literature and evaluate them from a healthcare perspective.
Design/methodology/approach A literature review is combined with a case study for practical relevance. Using a broad and scoping literature review, mapping tools from different areas are identified. The case study examines the use of mapping tools within a healthcare organisation and explores what alternative mapping tools that are most suited for the healthcare organisation.
Findings The analysis concludes that the two mapping tools originating from healthcare, mapping the last ten patients and tracer study, are most suited for the healthcare organisation. It is further concluded that there is a lack of well-defined mapping tools concerning the purpose and analysis methods of the maps.
Research limitations/implications
Being adapted for healthcare processes, the mapping tools suited for the healthcare organisation is limited to a healthcare context. The fact that the case study only examines one healthcare organisation limits the generalizability of the conclusions. Future research on both improving existing and developing new mapping tools is encouraged. Practical implications
Through the presentation of mapping tools and results of the case study, healthcare personnel can make well-informed choices between mapping tools.
What is original/value of paper
The occurrence of mapping tools with clear purposes and analysis methods in literature has not been extensively studied before. In contrast to material flows, the area of mapping healthcare processes, and patient pathways in particular, has also been sparsely researched.
Keywords: Mapping tool, Healthcare, Patient pathway, Process, Flowchart

1. INTRODUCTION
Increasing demand and decreasing resources have forced health care systems, on a global level, to find new approaches and concepts to be able to improve quality and at the same time lower cost and increase value. (Aronsson et al., 2011) The organisation of healthcare has typically been functional, with the effect that the patients move between different departments as treatment progress. This contributes to a number of patient visits with intermediate waits. To move towards a process-oriented system, mainly focusing on the patient’s needs can result in fewer patient visits, less waiting and more efficient use of staff and facilities. (Mould et al., 2010) Process orientation is an important corner stone in supply chain management (SCM), as acknowledged by both practitioners and SCM researchers: The Supply Chain Operations References-model is based on five management processes (Lambert et al., 2005); processes are a vital part in the framework developed by The Global Supply Chain Forum in the form of supply chain business processes, one of three interrelated elements within the framework (Lambert & Cooper, 2000) and Mentzer et al. (2001) discusses SCM as a set of management processes.
There are indications that the health care sector is behind the industry sector when it comes to implementing SCM practices. (Vries & Huijsman, 2011) This was displayed by McKone-Sweet et al. (2005) through their study of obstacles to building an effective SCM strategy within a health-care supply chain. The major obstacles were lack of senior management support, conflicting priorities, limited knowledge of SCM among health-care professionals and relationship bottlenecks between departments. At the same time, there are potential for health services to use concepts, models and practices within SCM as well as benefit from the lessons learned in the industrial sector concerning implementation of SCM (Vries & Huijsman, 2011; Aronsson et al., 2011). To avoid sub-optimisation it is important to have an end-to-end view when developing the supply chain (Wood, 2004) and move towards a process-oriented system (Mould et al., 2010). Development of a process in a structured and controlled fashion requires that the starting point is known (Oskarsson et al., 2006), therefore flowcharts and other mapping tools are essential when developing the supply chain (Murphy, 2005). To improve the understanding of patient needs, mapping the patient pathway is an important step. A variety of tools are available, from simple and accessible tools with limited capacity to extensive and complex tools using computer technologies. Some tools aim at providing precise definitions of activities while some place a greater emphasis on visualising existing work practices to a wide audience. (Mould et al., 2010) An important thing to bear in mind is that maps are means, not ends (Staccini et al., 2005). A map is a description of reality in one way or another. What is described of course depends on the question that the map is supposed to help answer, and how the analysis of the map is conducted. Therefore it is important to not only understand the mapping tool but also what question it is supposed to answer. This article explores mapping tools and the usage of mapping tools within healthcare. It consists of two major parts where the first part presents the mapping tools identified through a literature review. Thereafter, the second part evaluates the mapping tools from a healthcare context using a case study conducted at a healthcare organisation. The need for this article will be displayed below.

2. METHODOLOGY
The methodology used in this study is a literature review combined with a case study. How these have been conducted will be presented below.
2.1. Literature review Within management it is necessary to conduct scoping studies to evaluate the significance and size of the literature and to define the subject area or topic. In such studies it is also important to consider cross-disciplinary perspectives and alternative ways in which a research topic has been assessed previously. (Tranfield et al., 2003) The literature review conducted for this paper was made using an iterative process, including searching databases within the areas of management and medicine, visiting and searching in libraries and talking to colleagues.
The snowballing technique, where inspection of the reference sections of articles already included in the review [I], has also been used. The databases used are Academic Search Premier, Business Source Premier and MEDLINE. Among the search terms are; mapping tool, process mapping, flow chart and process analysis examples.
The mapping tools identified through the literature review were included in the study if they passed the following criteria:
• The tool is used to map a process • Tools used to support project management are excluded
The literature study also includes the identification of what question/questions the mapping tool can answer and what analysis that the tool enables. If a mapping tool has been identified with lacking or vague information about question or analysis further searches to identify these aspects have been made.
2.2. Case study A case study is an element of analysis in case research. It can either be performed by using different cases to study different issues at one firm, or to conduct a research of the same issue in several contexts within a firm. (Voss et al., 2002) The case study used in this paper utilizes the later methodology by exploring the use of mapping tools in different projects at Hässleholm hospital. The choice of Hässleholm hospital can be derived to two main reasons. First, their limited knowledge of mapping tools and practices within SCM, according to McKone-Sweet et al. (2005) and Vries & Huijsman (2011) not unusual for healthcare organisations. This can be displayed by a comment from the respondent:
“Simple flowcharts are used to create a mutual understanding of a process but the usage stops there. It is hard to proceed to the next step and start eliminating activities because you eliminate yourself or others in a way.”
Secondly, mapping tools could be used to visualise activities that are being performed even though not demanded by the patient, or as the respondent put it:

“We know what the patients needs in medical terms, rehabilitation, what activities a medical consultation should include and so on. But if you examine what are actually being done there are also other activities performed, when looking from above, that are not demanded by the patients.”
A key question in case research is the number of respondents that should be included. Voss et al. (2002) claims that if a set of questions can be reliably answered by one “key informant”, the research process should focus on that person. In this case the interviewee is at a managerial level and is responsible for development projects throughout the hospital. He is thereby having up-to-date information concerning both the wide use of mapping tools and knowledge of the depth of use. The respondents name is Peter Kalén and he is one of two deputy-managing directors. Interviews have been conducted at two occasions which each lasted for approximately one hour. The empirical data (see chapter 4.2) only constitutes opinions from the respondent, not from the authors.
The most obvious limitation of single cases is the poor generalizability of theory, models and conclusions attained from only case study (Voss et al., 2002). However, we argue that the results from this study could be generalised, with precaution, to other healthcare organisations, that present similar issues as the case study demonstrates.
3. MAPPING TOOLS IN LITERATURE
The different mapping tools that will be presented in this chapter are the result of the literature review described in the methodology section. The chapter is concluded with a map of the identified mapping tools and related questions and analysis.
3.1. Flowchart To establish how a change affected a process, the starting point must be known. This information can be gathered through a Flowchart, by connecting the symbols seen in Figure 3.1, to map the process or flow of interest. (Oskarsson et al., 2006) Flowcharts can include other symbols than those in Figure 3.1 below, however the most common ones are included in the figure.
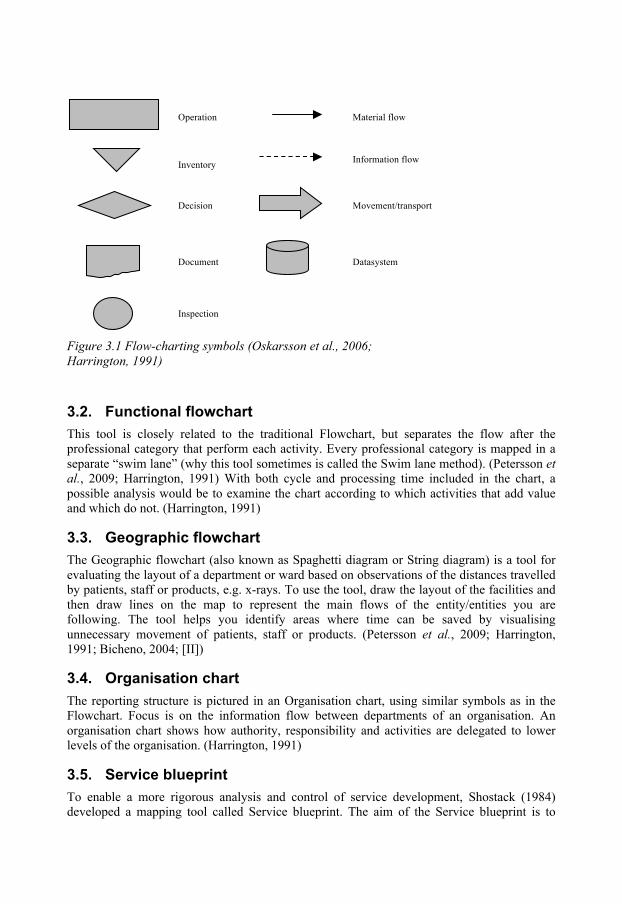
Figure 3.1 Flow-charting symbols (Oskarsson et al., 2006; Harrington, 1991)
3.2. Functional flowchart This tool is closely related to the traditional Flowchart, but separates the flow after the professional category that perform each activity. Every professional category is mapped in a separate “swim lane” (why this tool sometimes is called the Swim lane method). (Petersson et al., 2009; Harrington, 1991) With both cycle and processing time included in the chart, a possible analysis would be to examine the chart according to which activities that add value and which do not. (Harrington, 1991)
3.3. Geographic flowchart The Geographic flowchart (also known as Spaghetti diagram or String diagram) is a tool for evaluating the layout of a department or ward based on observations of the distances travelled by patients, staff or products, e.g. x-rays. To use the tool, draw the layout of the facilities and then draw lines on the map to represent the main flows of the entity/entities you are following. The tool helps you identify areas where time can be saved by visualising unnecessary movement of patients, staff or products. (Petersson et al., 2009; Harrington, 1991; Bicheno, 2004; [II])
3.4. Organisation chart The reporting structure is pictured in an Organisation chart, using similar symbols as in the Flowchart. Focus is on the information flow between departments of an organisation. An organisation chart shows how authority, responsibility and activities are delegated to lower levels of the organisation. (Harrington, 1991)
3.5. Service blueprint To enable a more rigorous analysis and control of service development, Shostack (1984) developed a mapping tool called Service blueprint. The aim of the Service blueprint is to
Information flow
Material flow Operation
Inventory
Decision
Document Datasystem
Movement/transport
Inspection

identify points where value is added for customers and points where the service might fail to add value (fail points)(Bicheno, 2004). It uses similar symbols, boxes, arrows and circles (for points where the service might fail), as in flow-charting. Line of visibility divides the parts that are visible to the customer from those that are invisible. (Shostack, 1984) The Service blueprint can be used to analyse the execution of activities and also establish measures to prevent the service from failing (fail-safe measures). Since all services depend on time, the designer should determine a standard execution time. (Shostack, 1984)
3.6. Service map In the same fashion as previous tools, the Service map uses basically the same symbols as in flow-charting and is also constructed in a similar way. However, when making a Service map, the vertical axis represents the organisation structure, and along the horizontal axis work steps are arranged chronologically from left to right (Kingman-Brundage, 1991). Structural relationships are visualized through (Kingman-Brundage, 1991):
1. Line of interaction – between the customer and front-line employees. 2. Line of visibility – Separates activities, performed by front line employees, visible
and invisible to the customer. 3. Line of internal interaction – Separates activities performed by front-line employees
and the support team. 4. Line of implementation – Segregates management from the service operation.
3.7. Tracer study Paperwork is often a source of delay. The Tracer study, originating from healthcare, is a tool that maps the information flow for a process. It uses a tag, for example a coloured paper sheet for paperwork or a “pop-up” for electronic records. Everyone coming in contact with the tagged document is asked to sign and date the marker. By mapping the flow of e.g. ten consecutive tags, a good understanding of the information flow can be achieved. [III]
3.8. Mapping the last ten patients The purpose of this tool is to identify the size of any variance along the key stages where patients wait for a long time. The execution is simply to follow for example ten patients from a defined starting point to a defined stopping point, and map the key stages including times along the process. This tool often gives enough information to prompt discussion and to try understanding the causes of the variance, with the aim of identifying potential solutions. [IV]
Based on the patient with the eighth longest time through each activity a process template is developed to enable detailed planning of the process. This constitutes the preferred analysis method for this mapping tool. [IV]
3.9. Value stream mapping Value stream mapping is an extensive tool originating from lean production. It focuses on the “future state” of a process, which represents a significant change in the way the process currently operates. Among the ultimate goals are a pull system, or even better, a continuous flow. The adoption of the tool includes describing the process with mapping symbols as well as different time measures. The analysis of the “current state map” follows several well-defined steps. (Bicheno, 2004; Rother & Shook, 2004; [V])

3.10. Process activity mapping The Process activity map is used to evaluate value adding or non-value adding at micro level, and is also derived from lean production (Bicheno, 2004). It consists of a table where every activity is described in a row according to the headings in Table 3.1. Every activity is categorized to one of the five columns to the right, where only an operation can add value. (Hines et al., 2000)
Table 3.1 Headings used in a process activity map (adapted from Hines et al., 2000)
Nr Step/
activity
Area Distance (m) Time (min) Staff
Operation
Movem
ent
Inspection
Storage
Delay
The Process activity map is detailed and should therefore only be used on sub-processes where there are particular concerns. (Bicheno, 2004) Due to the fact that the process activity map is a table, complex relationships between activities can be difficult to illustrate. (Hines et al., 2000)
3.11. IDEF diagram Integrated definition (IDEF) diagrams consist of rectangular boxes and arrows. Each diagram should consist of between three and six boxes, except for the top-level diagram, which only has one box. The top-level diagram is broken down to the other levels of diagrams. (Darnton & Darnton 1997; Staccini et al., 2005) Arrows connecting to different sides of a box means different things (Darnton & Darnton 1997; Staccini et al., 2005):
• The inputs (left side) – information or material used to produce the output of an activity. • The controls (top) – information or material that regulate the transformation of inputs
into outputs in an activity. • The outputs (right side) – information or material resulting from the activity. • The mechanisms (bottom) – usually people, machines, or existing systems that perform
or provide energy to the activity.
In comparison to flow charts, IDEF diagrams has fewer symbols which can be prohibiting when mapping more complex processes/flows. (Darnton & Darnton, 1997)
3.12. Hierarchical task analysis Hierarchical task analysis (HTA) is originating from the early 1900s and so-called scientific management movement of that time. (Salmon et al., 2010) HTA results in a hierarchical diagram that organises human work by goal. High-level goals are attained by carrying out a number of sub-goals, so dependencies are represented in the hierarchical structure. Thus, HTA does not include in what sequence things need to be done. (Colligan et al., 2010) HTA consists of three units of analysis, which is illustrated in Figure 3.2: TEST (where the goal is to see if the nail is flush with the surface of the wood), if the nail is not flush then an OPERATION is executed (i.e., striking the nail with the hammer), then another TEST is
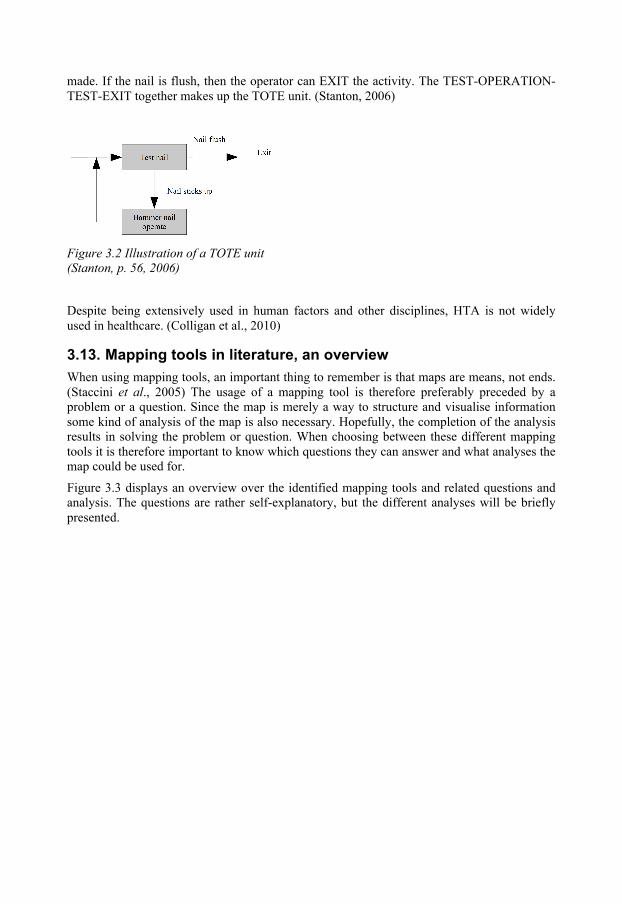
made. If the nail is flush, then the operator can EXIT the activity. The TEST-OPERATION-TEST-EXIT together makes up the TOTE unit. (Stanton, 2006)
Figure 3.2 Illustration of a TOTE unit (Stanton, p. 56, 2006)
Despite being extensively used in human factors and other disciplines, HTA is not widely used in healthcare. (Colligan et al., 2010)
3.13. Mapping tools in literature, an overview When using mapping tools, an important thing to remember is that maps are means, not ends. (Staccini et al., 2005) The usage of a mapping tool is therefore preferably preceded by a problem or a question. Since the map is merely a way to structure and visualise information some kind of analysis of the map is also necessary. Hopefully, the completion of the analysis results in solving the problem or question. When choosing between these different mapping tools it is therefore important to know which questions they can answer and what analyses the map could be used for.
Figure 3.3 displays an overview over the identified mapping tools and related questions and analysis. The questions are rather self-explanatory, but the different analyses will be briefly presented.
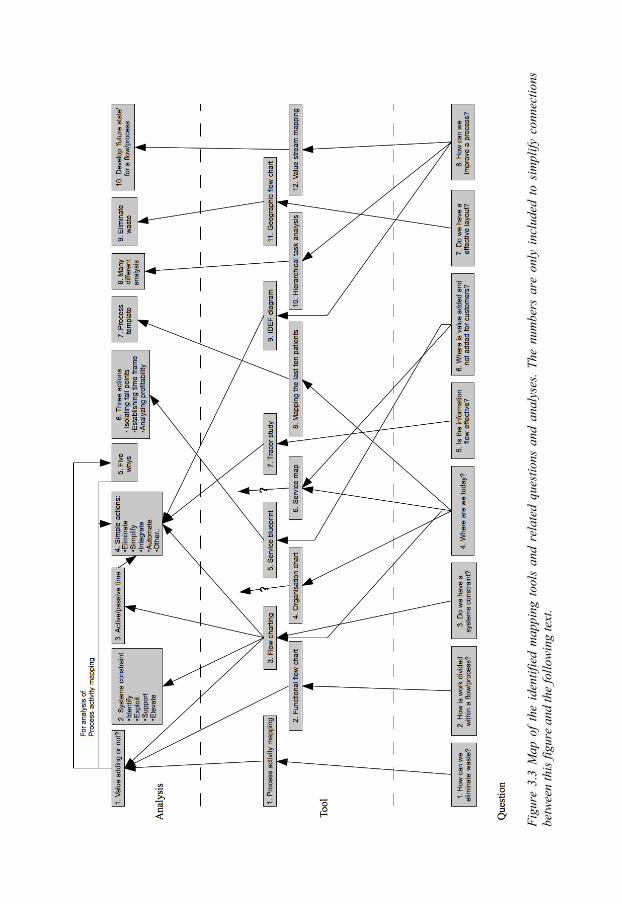
Fi
gure
3.3
Map
of
the
iden
tifie
d m
appi
ng t
ools
and
rel
ated
que
stio
ns a
nd a
naly
ses.
The
num
bers
are
onl
y in
clud
ed t
o si
mpl
ify c
onne
ctio
ns
betw
een
this
figu
re a
nd th
e fo
llow
ing
text
.

The elimination of waste in a process or flow is a recurrent focus in the methods for analysis. For the geographic flowchart this is not further outlined (see no. 9 in Figure 3.3)([I]). Other ways are to analyse the maps is to evaluate each activity as value adding, such as diagnosing a patient, non-value adding but necessary, such as transferring a patient between healthcare departments, and non-value adding activities that can be eliminated (see no. 1 in Figure 3.3) (Wedgwood, 2007; Womack & Jones, 1996). To identify the systems constraint, and thereafter focus resources on managing the constraint is another method of analysis (see no. 2 in Figure 3.3)([VI]). A similar approach are to divide the total time that is spent in a process or flow, measured in active and passive time, where active time is when some type of activity is performed and passive time represents some kind of waiting (see no. 3 in Figure 3.3)(Oskarsson et al., 2006).
Many mapping tools have rather vague practices for how the maps should be analysed and use general steps such as; eliminate (Oskarsson et al., 2006; Maull & Childe, 1994; Hines et al., 2000), simplify (Oskarsson et al., 2006; Maull & Childe, 1994), restructure (Oskarsson et al., 2006; Maull & Childe, 1994; Hines et al., 2000) and improve communication (Maull & Childe, 1994; Persson, 1995)(see no. 4 in Figure 3.3). A simple analysis is to keep asking ‘why’ to a problem until the fundamental problem emerges (see no. 5 in Figure 3.3)(Bicheno, 2004). There are some mapping tools that have well-defined analysis methods; however they will not be accounted for in this article (see no. 6, 7, 8 and 10 in Figure 3.3).
4. MAPPING TOOLS WITHIN HEALTHCARE
In this chapter, the mapping tools used at the healthcare organisation is shortly presented (see chapter 4.1). The following section includes the empirical data extracted from the interviews conducted in the case study (see chapter 4.2). The opinions that are expressed in this section belong to the respondent and the authors evaluate these opinions in two steps. First, mapping tools that are not appropriate for the healthcare organisation, based on the authors’ evaluation of the respondent’s opinions, is excluded from further analysis. The second step is to compare the remaining mapping tools by summarising the advantages and disadvantages expressed by the respondent.
4.1. What is used? At the healthcare organisation, the use of mapping tools is rather limited. Simple forms of charts are used to visualise patient pathways and other processes, see Figure 4.1 and Figure 4.2.
Figure 4.1 Simple chart used to visualise the main process for stroke patients
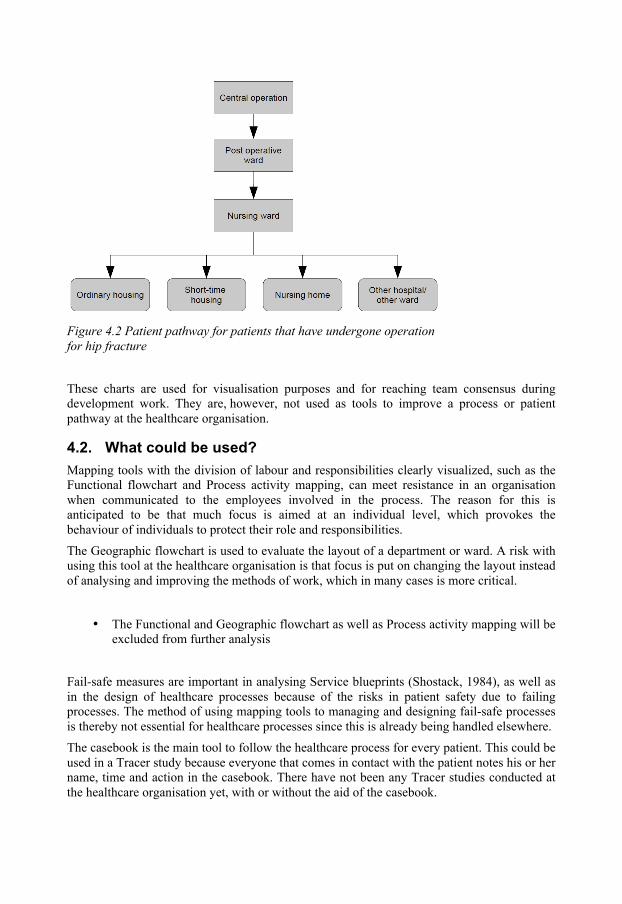
Figure 4.2 Patient pathway for patients that have undergone operation for hip fracture
These charts are used for visualisation purposes and for reaching team consensus during development work. They are, however, not used as tools to improve a process or patient pathway at the healthcare organisation.
4.2. What could be used? Mapping tools with the division of labour and responsibilities clearly visualized, such as the Functional flowchart and Process activity mapping, can meet resistance in an organisation when communicated to the employees involved in the process. The reason for this is anticipated to be that much focus is aimed at an individual level, which provokes the behaviour of individuals to protect their role and responsibilities. The Geographic flowchart is used to evaluate the layout of a department or ward. A risk with using this tool at the healthcare organisation is that focus is put on changing the layout instead of analysing and improving the methods of work, which in many cases is more critical.
• The Functional and Geographic flowchart as well as Process activity mapping will be excluded from further analysis
Fail-safe measures are important in analysing Service blueprints (Shostack, 1984), as well as in the design of healthcare processes because of the risks in patient safety due to failing processes. The method of using mapping tools to managing and designing fail-safe processes is thereby not essential for healthcare processes since this is already being handled elsewhere. The casebook is the main tool to follow the healthcare process for every patient. This could be used in a Tracer study because everyone that comes in contact with the patient notes his or her name, time and action in the casebook. There have not been any Tracer studies conducted at the healthcare organisation yet, with or without the aid of the casebook.

To plan according to an average patient, which is the base of analysis when using the tool of Mapping the last ten patients, requires a fairly constant flow of patients which limits the usefulness of the tool. An advantage is that the variance in the flow of individual patients is highly interesting in relation to the average patient flow. Information is generally easy to collect through IT-based casebook systems.
The breakdown of a process according to goals and sub-goals of the process, used in a HTA, is not so intuitive as one might think and takes time to understand. This creates a barrier for usage in the healthcare organisation. The IDEF diagram uses a similar method of breaking down a process, which is hard to implement due to related arguments.
• The HTA and IDEF diagram will be excluded from further analysis
Within healthcare, many resources are put on actions to decrease waiting time for patients. At the healthcare organisation they use a tool to map and analyse times for referrals and flow of patients. There are similarities to Value stream mapping, which also has a focus on different time aspects in a flow. A disadvantage with Value stream mapping from a healthcare context is the limited attention paid to the information flow. It also involves many steps to develop the “future state” of a process of which many are time-consuming and complicated (see for example Rother & Shook, 2004).
• Value stream mapping will be excluded from further analysis Since the mapping tools are infrequently used, the symbols that are used in flow-charting and several other mapping tools identified are difficult to use for the majority of the employees at the healthcare organisation.
Having excluded the mapping tools that were evaluated not to be appropriate for the healthcare organisation, six mapping tools remain. Based on arguments presented in chapter 4, a chart that compares the mapping tools using advantages and disadvantages for using these tools at the healthcare organisation has been created.
Table 4.1 Comparison of the remaining six mapping tools. 1 equals an advantage while -1 equals a disadvantage.
Tool Argument
Flowchart Organisation chart Service Blueprint
Service Map
Tracer study
Mapping the last ten patients
Symbols hard to use -1 -1 -1
Information flow included 1 1 1 1 1
Time important factor 1 1 1
Data easily accessible 1 1
Based on average patient -1
Fail safe actions excluded -‐1
Summary 0 1 0 0 2 2
5. CONCLUSION
It is clear that the mapping tools from healthcare are most suited for the healthcare organisation (see Table 4.1). Mapping the last ten patients maps the patient flow and the tracer study maps the information flow. The two mapping tools therefore complement one another.
The maturity in application of mapping tools at the healthcare organisation is fairly low. It is therefore not surprising that mapping tools used in healthcare are the most suited for the organisation. Based on the premise that flowcharts and other mapping tools are essential when developing the supply chain (Murphy, 2005) the conclusion correspond with the arguments by Vries and Huijsman (2011) as well as McKone-Sweet et al. (2005), that the healthcare sector is behind the industry sector when it comes to implementing SCM practices.
The case study also concluded that application of mapping tools within the healthcare organisation is desirable and achievable, in line with the conclusions by Vries and Huijsman (2011) and Aronsson et al. (2011) that health services can benefit from the use concepts, models and practices from SCM.
There are only four mapping tools of which a well-defined analysis method has been identified, Value stream mapping, Hierarchical task analysis, Process activity mapping and Mapping the last ten patients. A well-defined analysis method is considered to be a method involving several steps, where every step is described thoroughly enough for a person with limited experience in the area to understand. The other mapping tools presented only poorly described analyses that encompassed steps such as “simplify activities” or “improve communication”. For two of the mapping tools no analysis method could be identified, the Organisation chart and Service map.
The questions presented in Figure 3.3 are all rather general, displaying the lack of distinct and delimited questions. Put together this shows a rarity of mapping tools with well-defined questions and analyses. This seriously limits the usefulness of mapping tools since a poorly defined question leads to the use of a mapping tool when it is not ideal or even appropriate. When the analysis method is unclear and too general it increases the risk of that the use of the mapping tool stops at describing the process or patient pathway. This is repeatedly occurring at the healthcare organisation studied. Future research in the area of mapping tools is recommended in two broad directions. First, the development of existing mapping tools, primarily concerning question and analysis, is suggested. Secondly, invention of well-defined mapping tools is encouraged.
ACKNOWLEDGEMENTS
Many thanks are sent to Peter Kalén at Hässleholm hospital for sharing his thoughts and ideas.
REFERENCES
Aronsson, H., Abrahamsson, M. and Spens, K. (2011) “Developing lean and agile health care supply chains”, Supply Chain Management: An International Journal, Vol. 16, No. 3, pp. 176-183. Bicheno, J. (2004), The New Lean Toolbox – Towards fast, flexible flow, PICSIE Books, Buckingham.
Colligan, L., Andersson, J. E., Potts, H. WW. and Berman, J. (2010), “Does the process map influence the outcome of quality improvement work? A comparison of a sequential flow diagram and a hierarchical task analysis diagram”, BMC Health Services Research, Vol. 10, No. 7, pp. 1-9. Darnton, G. and Darnton, M. (1997), Business Process Analysis, International Thomson Business Press, London. Harrington, H. J. (1991), Business Process Improvement – the breakthrough strategy for total quality, productivity, and competitiveness, McGraw-Hill Inc, United States of America. Hines, P., Lamming, R., Jones, D., Cousins, P. and Rich, N. (2000), Value Stream Management – Strategy and Excellence in the Supply Chain, Prentice Hall. Kingman-Brundage, J. (1991), “Technology, Design and Service Quality”, International Journal of Service Industry Management, Vol. 2, No. 3, pp. 47-59. Lambert, D. M. and Cooper, M. C. (2000), “Issues in Supply Chain Management”, Industrial Marketing Management, Vol. 29, No.1, pp. 65-83. Lambert, D. M., García-Dastugue, S. J. and Croxton, K. L. (2005), “An evaluation of process-oriented supply chain management frameworks”, Journal of business logistics, Vol. 26, No. 1, pp. 25-51. Maull, R. and Childe, S. (1994), “Business Process Re-engineering: An Example from the Banking Sector”, International Journal of Service Industry Management, Vol. 5, No. 3, pp. 26-34. Mentzer, J. T., DeWitt, W., Keebler, J. S., Min, S. and Nix, N. W. (2001), ”Defining supply chain management”, Journal of business logistics, Vol. 22 No. 2, pp. 1-25. McKone-Sweet, K. E., Hamilton, P. and Wills, S. B. (2005), “The ailing healthcare supply chain: a prescription for change”, Journal of Supply Chain Management, Vol. 41, No.1, pp. 4-17. Mould, G., Bowers, J. and Ghattas, M. (2010), “The evolution of the pathway and its role in improving patient care” Quality and Safety in Health Care, Vol. 19, pp. 1-6. Murphy, M. (2005), “Demystifying flowcharts”, Materials management in health care, August, 2005. Oskarsson, B., Aronsson, H. and Ekdahl, B. (2006), Modern logistik – för ökad lönsamhet, Liber, Helsingborg, Sweden. Persson, G. (1995), “Logistics Process Redesign: Some Useful Insights”, The International Journal of Logistics Management, Vol. 6, No. 1, pp. 13-26. Petersson, P., Johansson, O., Broman, M., Blücher, D. and Alsterman, H. (2009), Lean – Gör avvikelser till framgång, Part Media, Sweden. Rother, M. and Shook, J. (2004), Lära sig att se – Att kartlägga och förbättra värdeflöden för att skapa mervärden och eliminera slöseri, Svensk utgåva, Stiftelsen Plan utbildning, Stockholm, Sweden. Salmon, P., Jenkins, D., Stanton, N. and Walker, G. (2010), ”Hierarchical task analysis vs. cognitive work analysis: comparison of theory, methodology and contribution to system design”, Theoretical Issues in Ergonomics Science, Vol. 11, No. 6, pp. 504-531. Shostack, G. L. (1984), “Designing services that deliver”, Harvard Business Review, Vol. 62, No. 1, pp. 133-139. Staccini, P., Joubert, M., Quaranta J-F. and Fieschi, M. (2005), “Mapping care processes within a hospital: from theory to a web-based proposal merging enterprise modelling and ISO normative principles”, International Journal of Medical Informatics, Vol. 74, No. 2-4, pp. 335-344.
Stanton, N. A. (2006), “Hierarchical task analysis: Developments, applications and extensions”, Applied Ergonomics, Vol. 37, No. 1, pp. 55-79. Tranfield, D., Denyer, D. and Smart, P. (2003), "Towards a Methodology for Developing Evidence-Informed Management Knowledge by Means of Systematic Review", British Journal of Management, Vol. 14, No. 3, pp. 207-222. Voss, C., Tsikriktsis, N. and Frolich, M. (2002), “Case research in operations management” International Journal of Operations & Production Management, Vol. 22, No. 2, pp. 195-219. Vries, J. and Huijsman, R. (2011), “Supply chain management in health services: an overview”, Supply Chain Management: An International Journal, Vol. 16, No. 3, pp. 159-165. Wedgwood, I. D. (2007), Lean sigma – a practitioner’s guide, Prentice Hall. Wood, N. (2004), “Learning to see: How does your supply chain function?”, Management Services, Vol. 48, No. 4, pp. 16-20. Womack, J. P. and Jones, D. T. (1996), Lean Thinking – Banish waste and create wealth in your corporation, Simon & Schulster. [I] Snowballing, aim research – Advanced Institute of Management Research http://www.networkedcranfield.com/logicofenquiry/gst/SR/stages/Pages/Snowballing.aspx (28 February 2011) [II] Spaghetti Diagram, NHS – Institute for Innovation and Improvement, available at: http://www.institute.nhs.uk/quality_and_service_improvement_tools/quality_and_service_improvement_tools/process_mapping_-_spaghetti_diagram.html (17 February 2011) [III] Tracer Study, NHS – Institute for Innovation and Improvement, available at: http://www.institute.nhs.uk/quality_and_service_improvement_tools/quality_and_service_improvement_tools/process_mapping_-_tracer_study.html (21 February 2011) [IV] Mapping the last ten patients, NHS – Institute for Innovation and Improvement, available at: http://www.institute.nhs.uk/quality_and_service_improvement_tools/quality_and_service_improvement_tools/process_mapping_-_value_stream_mapping.html (17 February 2011) [V] Value Stream Mapping, NHS – Institute for Innovation and Improvement, available at: http://www.institute.nhs.uk/quality_and_service_improvement_tools/quality_and_service_improvement_tools/process_mapping_-_value_stream_mapping.html (21 February 2011) [VI] Theory of constraints, NHS – Institute for Innovation and Improvement, available at: http://www.institute.nhs.uk/quality_and_service_improvement_tools/quality_and_service_improvement_tools/theory_of_constraints.html (21 February 2011)

APPENDIX 5 LOGISTICS HANDBOOK FOR THE HEALTHCARE INDUSTRY


LOGISTIKHANDBOK FÖR HÄLSO-‐ OCH SJUKVÅRDEN Olle Olsson & Håkan Aronsson
Rapport
Institutionen för ekonomisk och industriell utveckling Avdelningen Logistik
LIU-‐IEI-‐RR-‐-‐13/00189—SE
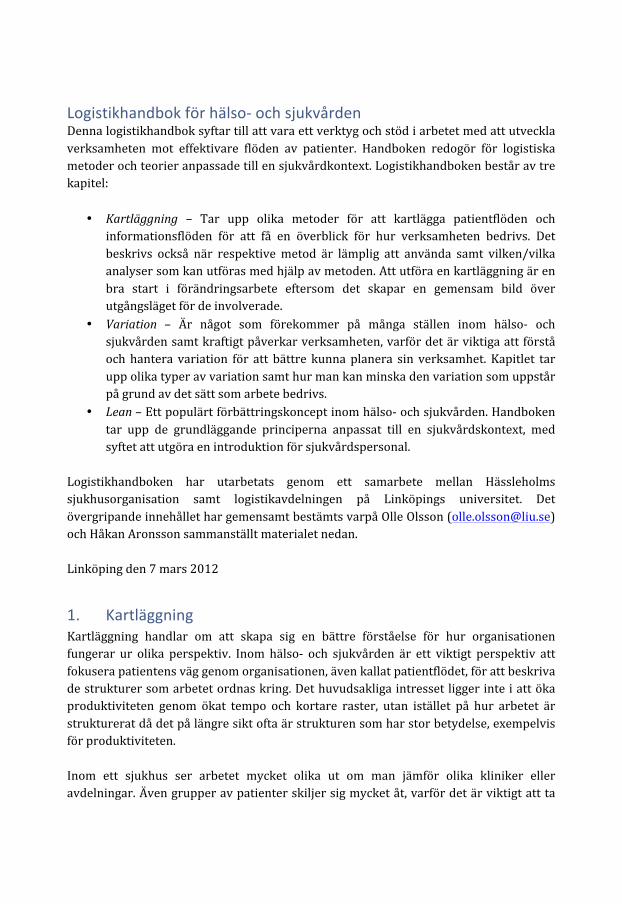
Logistikhandbok för hälso-‐ och sjukvården Denna logistikhandbok syftar till att vara ett verktyg och stöd i arbetet med att utveckla verksamheten mot effektivare flöden av patienter. Handboken redogör för logistiska metoder och teorier anpassade till en sjukvårdkontext. Logistikhandboken består av tre kapitel:
• Kartläggning – Tar upp olika metoder för att kartlägga patientflöden och informationsflöden för att få en överblick för hur verksamheten bedrivs. Det beskrivs också när respektive metod är lämplig att använda samt vilken/vilka analyser som kan utföras med hjälp av metoden. Att utföra en kartläggning är en bra start i förändringsarbete eftersom det skapar en gemensam bild över utgångsläget för de involverade.
• Variation – Är något som förekommer på många ställen inom hälso-‐ och sjukvården samt kraftigt påverkar verksamheten, varför det är viktiga att förstå och hantera variation för att bättre kunna planera sin verksamhet. Kapitlet tar upp olika typer av variation samt hur man kan minska den variation som uppstår på grund av det sätt som arbete bedrivs.
• Lean – Ett populärt förbättringskoncept inom hälso-‐ och sjukvården. Handboken tar upp de grundläggande principerna anpassat till en sjukvårdskontext, med syftet att utgöra en introduktion för sjukvårdspersonal.
Logistikhandboken har utarbetats genom ett samarbete mellan Hässleholms sjukhusorganisation samt logistikavdelningen på Linköpings universitet. Det övergripande innehållet har gemensamt bestämts varpå Olle Olsson ([email protected]) och Håkan Aronsson sammanställt materialet nedan. Linköping den 7 mars 2012
1. Kartläggning Kartläggning handlar om att skapa sig en bättre förståelse för hur organisationen fungerar ur olika perspektiv. Inom hälso-‐ och sjukvården är ett viktigt perspektiv att fokusera patientens väg genom organisationen, även kallat patientflödet, för att beskriva de strukturer som arbetet ordnas kring. Det huvudsakliga intresset ligger inte i att öka produktiviteten genom ökat tempo och kortare raster, utan istället på hur arbetet är strukturerat då det på längre sikt ofta är strukturen som har stor betydelse, exempelvis för produktiviteten. Inom ett sjukhus ser arbetet mycket olika ut om man jämför olika kliniker eller avdelningar. Även grupper av patienter skiljer sig mycket åt, varför det är viktigt att ta

hänsyn till dessa skillnader vid arbetet med strukturen inom en enhet. Övergripande kan information enligt listan nedan behövas för att skapa sig en bild av sin organisation:
• Resurser. Vilka resurser har enheten till sitt förfogande i form av till exempel antal anställda, antal sängplatser, antal undersökningsrum med mera.
• Patienter. Vilka patientgrupper behandlas på enheten, hur ser fördelningen ut mellan patientgrupperna, vad är typiskt för varje patientgrupp.
• Resultat. Hur ser kvaliteten på arbetet ut, vilka resultat uppnås och vilka resultat önskas uppnås.
• Resurser/patientgrupper. Kopplingen mellan vilka resurser som förbrukas av vilka patientgrupper. Att koppla samman aktiviteter med nytta för patienterna är att gå ytterligare ett steg i analysen.
Ovanstående lista är långt ifrån heltäckande och syftar endast till att ge läsaren en bild av vilken typ av information som kan behövas för att göra en kartläggning.
1.1. Struktur Det finns många typer av metoder inom ett område som kartläggning. Detta dokument kommer ta upp tre metoder, flödeskartläggning, spårstudie och processanalys, då dessa är vanligt förekommande samt använder olika sätt att visualisera ett flöde, exempelvis ett patientflöde. En överhängande del av dokumentet kommer dock behandla flödeskartläggning då denna metod bedöms ha en större möjlighet att användas inom många sjukvårdsflöden. Inom varje metod kommer främst information gällande hur metoden används samt hur kartläggningarna kan analyseras att tas upp.
1.2. Flödeskartläggning För att veta hur en förändring påverkade verksamheten måste man veta vart man startade, alltså hur det stod till innan förändringen genomfördes. En god start är då att kartlägga material-‐ och informationsflödet i form av vilka aktiviteter som gås igenom, hur information förs vidare, vilka alternativa flödesvägar som finns och vilka personer eller avdelningar som är inblandade i flödet. Detta kan göras genom en flödeskartläggning. (Oskarsson et al., 2006) Ett val görs här att använda benämningen flödeskartläggning, även fast många andra benämningar kunde ha använts, exempelvis processkartläggning. Flödeskartläggning används här som samlingsbegrepp för metoder som använder visuella symboler för att beskriva ett flöde, inom sjukvården vanligtvis ett patientflöde även fast andra flöden självklart kan kartläggas. Några vanliga symboler vid flödeskartläggning ses i Figur 1.

FIGUR 1. SYMBOLER SOM ANVÄNDS VID FLÖDESKARTLÄGGNING, FRITT UTFORMAD EFTER HARRINGTON (1991) OCH OSKARSSON ET AL. (2006)
Flödeskartläggningar kan inbegripa fler symboler än de som redovisas ovan, de vanligaste symbolerna är dock de ovanstående. Det förekommer även att tidsangivelser för aktiviteter inkluderas. I Figur 2 nedan kan resultatet av en flödeskartläggning över patientflödet på en akutmottagning ses (gällande patienter med hjärtrelaterade problem).
Informationsflöde
Materialflöde/ Patientflöde
Operation/aktivitet
Lager
Beslutspunkt
Pappersdokument Datasystem
Förflyttning/transport
Inspektion/kontroll
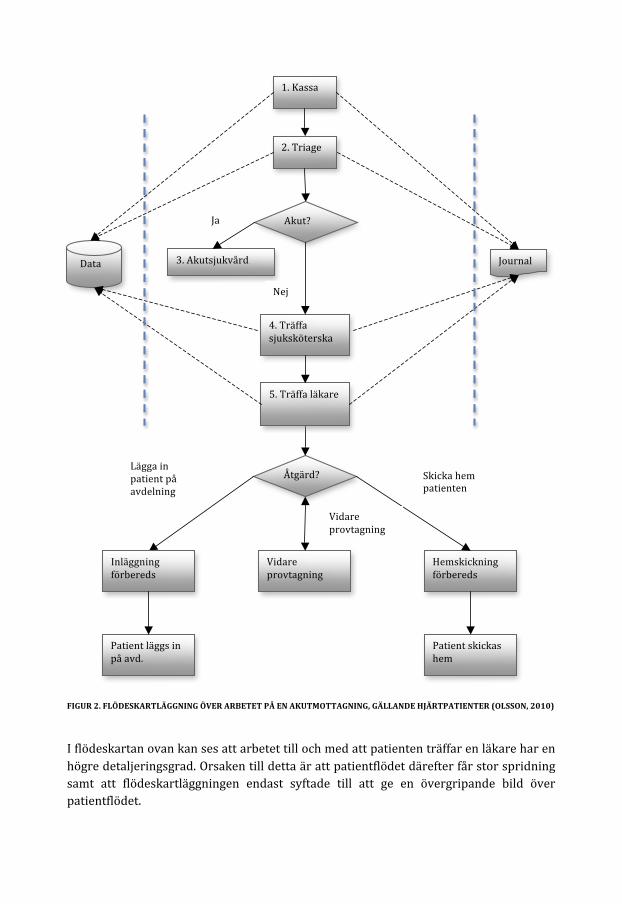
FIGUR 2. FLÖDESKARTLÄGGNING ÖVER ARBETET PÅ EN AKUTMOTTAGNING, GÄLLANDE HJÄRTPATIENTER (OLSSON, 2010)
I flödeskartan ovan kan ses att arbetet till och med att patienten träffar en läkare har en högre detaljeringsgrad. Orsaken till detta är att patientflödet därefter får stor spridning samt att flödeskartläggningen endast syftade till att ge en övergripande bild över patientflödet.
1. Kassa
Hemskickning förbereds
4. Träffa sjuksköterska
2. Triage
Data
Åtgärd?
Inläggning förbereds
Vidare provtagning
Skicka hem patienten
Lägga in patient på avdelning
Vidare provtagning
Journal
Akut?
3. Akutsjukvård
Ja
Nej
5. Träffa läkare
Patient läggs in på avd.
Patient skickas hem
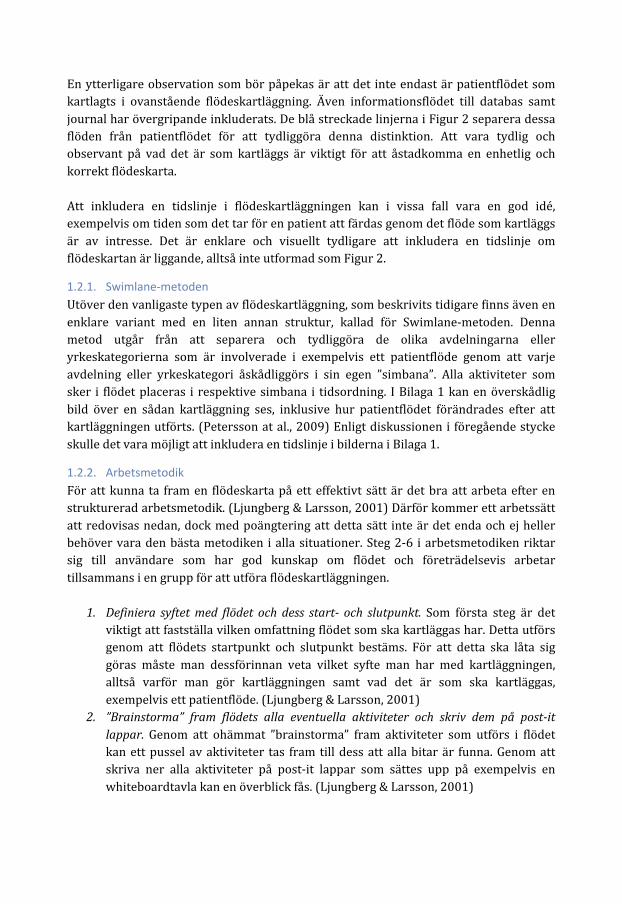
En ytterligare observation som bör påpekas är att det inte endast är patientflödet som kartlagts i ovanstående flödeskartläggning. Även informationsflödet till databas samt journal har övergripande inkluderats. De blå streckade linjerna i Figur 2 separera dessa flöden från patientflödet för att tydliggöra denna distinktion. Att vara tydlig och observant på vad det är som kartläggs är viktigt för att åstadkomma en enhetlig och korrekt flödeskarta. Att inkludera en tidslinje i flödeskartläggningen kan i vissa fall vara en god idé, exempelvis om tiden som det tar för en patient att färdas genom det flöde som kartläggs är av intresse. Det är enklare och visuellt tydligare att inkludera en tidslinje om flödeskartan är liggande, alltså inte utformad som Figur 2.
1.2.1. Swimlane-‐metoden Utöver den vanligaste typen av flödeskartläggning, som beskrivits tidigare finns även en enklare variant med en liten annan struktur, kallad för Swimlane-‐metoden. Denna metod utgår från att separera och tydliggöra de olika avdelningarna eller yrkeskategorierna som är involverade i exempelvis ett patientflöde genom att varje avdelning eller yrkeskategori åskådliggörs i sin egen ”simbana”. Alla aktiviteter som sker i flödet placeras i respektive simbana i tidsordning. I Bilaga 1 kan en överskådlig bild över en sådan kartläggning ses, inklusive hur patientflödet förändrades efter att kartläggningen utförts. (Petersson at al., 2009) Enligt diskussionen i föregående stycke skulle det vara möjligt att inkludera en tidslinje i bilderna i Bilaga 1.
1.2.2. Arbetsmetodik För att kunna ta fram en flödeskarta på ett effektivt sätt är det bra att arbeta efter en strukturerad arbetsmetodik. (Ljungberg & Larsson, 2001) Därför kommer ett arbetssätt att redovisas nedan, dock med poängtering att detta sätt inte är det enda och ej heller behöver vara den bästa metodiken i alla situationer. Steg 2-‐6 i arbetsmetodiken riktar sig till användare som har god kunskap om flödet och företrädelsevis arbetar tillsammans i en grupp för att utföra flödeskartläggningen.
1. Definiera syftet med flödet och dess start-‐ och slutpunkt. Som första steg är det viktigt att fastställa vilken omfattning flödet som ska kartläggas har. Detta utförs genom att flödets startpunkt och slutpunkt bestäms. För att detta ska låta sig göras måste man dessförinnan veta vilket syfte man har med kartläggningen, alltså varför man gör kartläggningen samt vad det är som ska kartläggas, exempelvis ett patientflöde. (Ljungberg & Larsson, 2001)
2. ”Brainstorma” fram flödets alla eventuella aktiviteter och skriv dem på post-‐it lappar. Genom att ohämmat ”brainstorma” fram aktiviteter som utförs i flödet kan ett pussel av aktiviteter tas fram till dess att alla bitar är funna. Genom att skriva ner alla aktiviteter på post-‐it lappar som sättes upp på exempelvis en whiteboardtavla kan en överblick fås. (Ljungberg & Larsson, 2001)
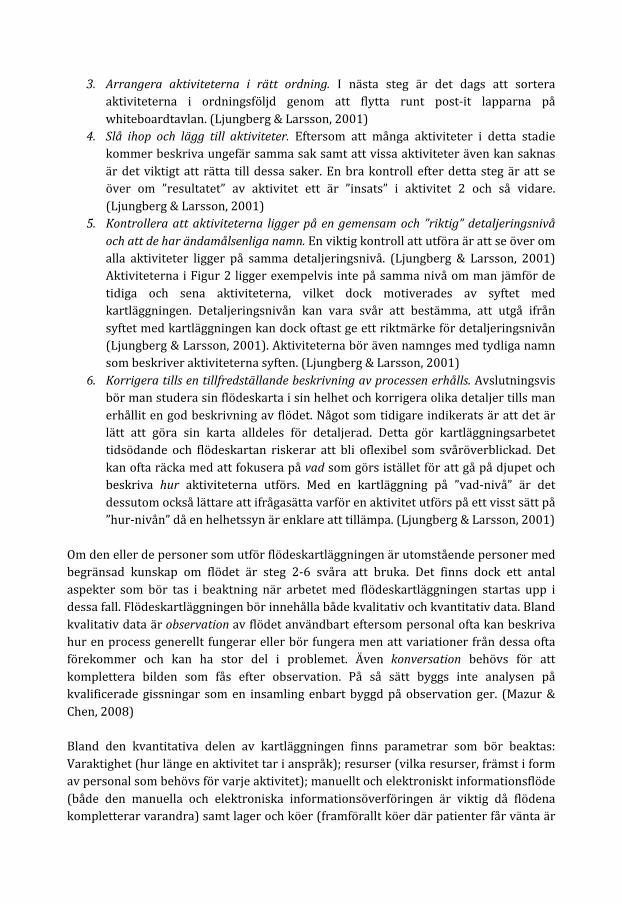
3. Arrangera aktiviteterna i rätt ordning. I nästa steg är det dags att sortera aktiviteterna i ordningsföljd genom att flytta runt post-‐it lapparna på whiteboardtavlan. (Ljungberg & Larsson, 2001)
4. Slå ihop och lägg till aktiviteter. Eftersom att många aktiviteter i detta stadie kommer beskriva ungefär samma sak samt att vissa aktiviteter även kan saknas är det viktigt att rätta till dessa saker. En bra kontroll efter detta steg är att se över om ”resultatet” av aktivitet ett är ”insats” i aktivitet 2 och så vidare. (Ljungberg & Larsson, 2001)
5. Kontrollera att aktiviteterna ligger på en gemensam och ”riktig” detaljeringsnivå och att de har ändamålsenliga namn. En viktig kontroll att utföra är att se över om alla aktiviteter ligger på samma detaljeringsnivå. (Ljungberg & Larsson, 2001) Aktiviteterna i Figur 2 ligger exempelvis inte på samma nivå om man jämför de tidiga och sena aktiviteterna, vilket dock motiverades av syftet med kartläggningen. Detaljeringsnivån kan vara svår att bestämma, att utgå ifrån syftet med kartläggningen kan dock oftast ge ett riktmärke för detaljeringsnivån (Ljungberg & Larsson, 2001). Aktiviteterna bör även namnges med tydliga namn som beskriver aktiviteterna syften. (Ljungberg & Larsson, 2001)
6. Korrigera tills en tillfredställande beskrivning av processen erhålls. Avslutningsvis bör man studera sin flödeskarta i sin helhet och korrigera olika detaljer tills man erhållit en god beskrivning av flödet. Något som tidigare indikerats är att det är lätt att göra sin karta alldeles för detaljerad. Detta gör kartläggningsarbetet tidsödande och flödeskartan riskerar att bli oflexibel som svåröverblickad. Det kan ofta räcka med att fokusera på vad som görs istället för att gå på djupet och beskriva hur aktiviteterna utförs. Med en kartläggning på ”vad-‐nivå” är det dessutom också lättare att ifrågasätta varför en aktivitet utförs på ett visst sätt på ”hur-‐nivån” då en helhetssyn är enklare att tillämpa. (Ljungberg & Larsson, 2001)
Om den eller de personer som utför flödeskartläggningen är utomstående personer med begränsad kunskap om flödet är steg 2-‐6 svåra att bruka. Det finns dock ett antal aspekter som bör tas i beaktning när arbetet med flödeskartläggningen startas upp i dessa fall. Flödeskartläggningen bör innehålla både kvalitativ och kvantitativ data. Bland kvalitativ data är observation av flödet användbart eftersom personal ofta kan beskriva hur en process generellt fungerar eller bör fungera men att variationer från dessa ofta förekommer och kan ha stor del i problemet. Även konversation behövs för att komplettera bilden som fås efter observation. På så sätt byggs inte analysen på kvalificerade gissningar som en insamling enbart byggd på observation ger. (Mazur & Chen, 2008) Bland den kvantitativa delen av kartläggningen finns parametrar som bör beaktas: Varaktighet (hur länge en aktivitet tar i anspråk); resurser (vilka resurser, främst i form av personal som behövs för varje aktivitet); manuellt och elektroniskt informationsflöde (både den manuella och elektroniska informationsöverföringen är viktig då flödena kompletterar varandra) samt lager och köer (framförallt köer där patienter får vänta är

viktiga att åskådliggöra då de förlänger genomloppstiden drastiskt). (Mazur & Chen, 2008)
1.2.3. Analys En flödeskartläggning utförs inte för sakens skull, utan med ett bakomliggande syfte. Ofta är syftet kopplat till förbättring av något slag. Då syftet med kartläggningen och de förutsättningar som råder i det specifika fallet, exempelvis i form av begräsning i resurser eller externa och interna regelverk, är mycket varierande är det svårt att beskriva en allmängiltig tillvägagångssätt för att analysera ett flöde utifrån en flödeskartläggning. Istället följer några metoder att utgå ifrån i analysen samt några aspekter att ta i beaktning när det gäller hälso-‐ och sjukvården. Analysen av flödet genom flödeskartläggningen kan utföras i fyra moment (Mazur & Chen, 2008):
1. Hitta stora problem (källan, ej symptomen) 2. Beskriv förbättringsförslag (vad skall göras?) 3. Utforma en implementeringsplan (hur och när skall saker göras?) 4. Utarbeta en plan för mätning av effekten (hur jämförs dagsläget med det nya
flödet). Ett annat tillvägagångsätt är att klassificera alla aktiviteter i flödet som värdeskapande aktiviteter, icke värdeskapande aktiviteter som är nödvändiga eller icke värdeskapande aktiviteter och därefter rikta in analysen på att ta bort den sistnämnda typen av aktivitet. (Wedgwood, 2007) Värde definieras här av slutkunden och skapas av producenten. Det är dock mycket svårt att specificera exakt vilket värde en produkt eller tjänst har. För att tydliggöra klassificeringen av en aktivitet kan några exempel ses nedan (Womack & Jones, 1996):
• Värdeskapande aktiviteter. Till exempel montering av två komponenter eller diagnos av patient.
• Icke värdeskapande aktiviteter som är nödvändiga. Icke värdeskapande aktiviteter vilka är oundvikliga på grund av använd exempelvis teknologi eller organisationsstruktur. Exempelvis kvalitetskontroller eller inmatning av patientuppgifter i ett journalsystem.
• Icke värdeskapande aktiviteter. Icke värdeskapande aktiviteter som kan elimineras. (Womack & Jones, 1996):
Specifikt för hälso-‐ och sjukvården är det relevant att ta följande tre aspekter med i beaktning vid analysen (Mazur & Chen, 2008):
• Teknologi. Det finns en stark koppling mellan användandet av teknologi och förbättrad kvalitet och patientsäkerhet. Därför bör strävan riktas mot högre

produktivitet, effektivitet och patientsäkerhet genom ett förbättrat brukande av automation och teknologi för kommunikation och styrning.
• Process. Ansträngning bör också styras mot att förenkla och standardisera flöden. Syftet med att standardisera är här att avlasta personalen i form av att de inte behöver ha så många och komplicerade arbetsuppgifter i huvudet samtidigt. Därmed förenklas och effektiviseras även arbetet med inskolning av ny personal.
• Personal. Eftersom sjukvården är en personalintensiv bransch finns ett stort behov till att processer och flöden är anpassade till människans styrkor och svagheter. Bland styrkor kan nämnas stor minneskapacitet, bred repertoar av reaktioner på olika händelser samt flexibilitet och kreativitet vid val av reaktion. Bland svagheter finns problem med att göra flera saker samtidigt, återge detaljerad information och begränsad beräkningskapacitet. Exemplet i föregående stycke visar på att standardisering kan göras i enlighet med egenskaper hos människans natur.
1.2.4. Ledtidsanalys Att analysera ett material-‐ eller informationsflöde för att minska genomloppstiden kallas vanligtvis ledtidsanalys. En god grund för att utföra en ledtidsanalys är att en flödeskartläggning genomförts innan. Även kompletterande beskrivningar av flödet kan ibland behövas, exempelvis en uppdelning av tiden i aktiv och passiv tid, vilket kommer att gås igenom i följande avsnitt. Därefter kommer ett antal grundläggande åtgärder gås igenom för att kunna minska genomloppstiden i flödet. (Oskarsson et al., 2006)
Aktiv och passiv tid Den totala tiden genom ett flöde kan delas in i aktiv och passiv tid. Aktiv tid är då någon form av aktivitet utförs exempelvis transport, inmatning i datasystem eller diagnos av patient inom sjukvården. Resterande del av den totala tiden är passiv tid, till exempel då ett ärande ligger i ”inkorgen” på någons skrivbord eller när en patient väntar att träffa en läkare på akutmottagningen. För att reducera den totala genomloppstiden är det främst den passiva tiden som skall angripas då den ofta står för en stor del av genomloppstiden. (Oskarsson et al., 2006)
Tidsreduktion i processer och flöden För att åstadkomma tidsreduktioner i flödet är det främst den passiva tiden som skall fokuseras, men den aktiva tiden kan även den reduceras utan att försämra flödet i någon aspekt. Det finns många verktyg och åtgärder, mer eller mindre generella och konkreta att använda i syfte att minska totala tiden i ett flöde. Nedan tas några utvalda metoder upp med avstamp i fem åtgärder av Oskarsson et al. (2006):
1. Eliminera. Ta bort aktiviteter som inte tillför något värde i flödet, exempelvis dubbelarbete.
2. Förenkla. Gör aktiviteter som måste utföras mindre komplexa, till exempel förenklar ett bättre användargränssnitt i datorprogram.
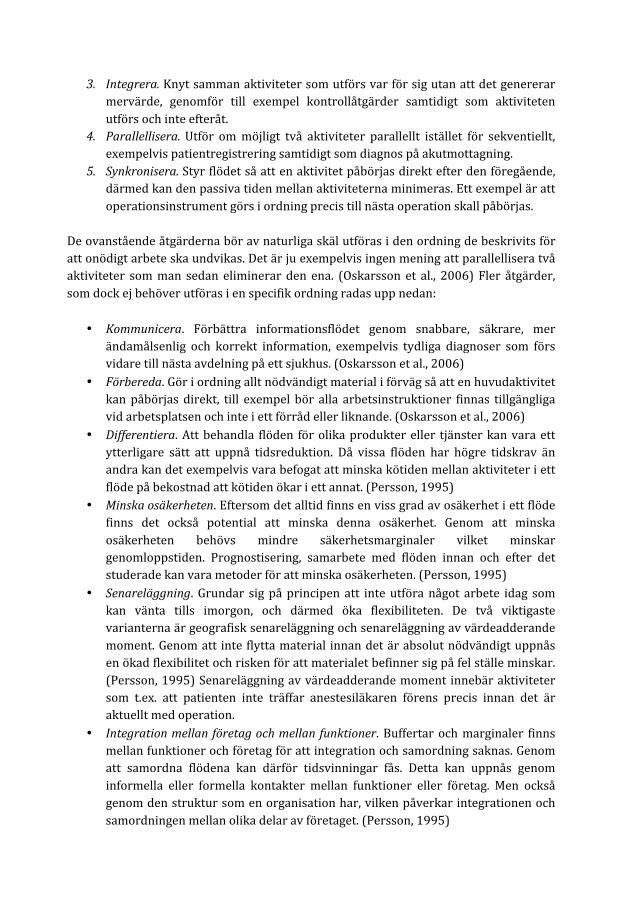
3. Integrera. Knyt samman aktiviteter som utförs var för sig utan att det genererar mervärde, genomför till exempel kontrollåtgärder samtidigt som aktiviteten utförs och inte efteråt.
4. Parallellisera. Utför om möjligt två aktiviteter parallellt istället för sekventiellt, exempelvis patientregistrering samtidigt som diagnos på akutmottagning.
5. Synkronisera. Styr flödet så att en aktivitet påbörjas direkt efter den föregående, därmed kan den passiva tiden mellan aktiviteterna minimeras. Ett exempel är att operationsinstrument görs i ordning precis till nästa operation skall påbörjas.
De ovanstående åtgärderna bör av naturliga skäl utföras i den ordning de beskrivits för att onödigt arbete ska undvikas. Det är ju exempelvis ingen mening att parallellisera två aktiviteter som man sedan eliminerar den ena. (Oskarsson et al., 2006) Fler åtgärder, som dock ej behöver utföras i en specifik ordning radas upp nedan:
• Kommunicera. Förbättra informationsflödet genom snabbare, säkrare, mer ändamålsenlig och korrekt information, exempelvis tydliga diagnoser som förs vidare till nästa avdelning på ett sjukhus. (Oskarsson et al., 2006)
• Förbereda. Gör i ordning allt nödvändigt material i förväg så att en huvudaktivitet kan påbörjas direkt, till exempel bör alla arbetsinstruktioner finnas tillgängliga vid arbetsplatsen och inte i ett förråd eller liknande. (Oskarsson et al., 2006)
• Differentiera. Att behandla flöden för olika produkter eller tjänster kan vara ett ytterligare sätt att uppnå tidsreduktion. Då vissa flöden har högre tidskrav än andra kan det exempelvis vara befogat att minska kötiden mellan aktiviteter i ett flöde på bekostnad att kötiden ökar i ett annat. (Persson, 1995)
• Minska osäkerheten. Eftersom det alltid finns en viss grad av osäkerhet i ett flöde finns det också potential att minska denna osäkerhet. Genom att minska osäkerheten behövs mindre säkerhetsmarginaler vilket minskar genomloppstiden. Prognostisering, samarbete med flöden innan och efter det studerade kan vara metoder för att minska osäkerheten. (Persson, 1995)
• Senareläggning. Grundar sig på principen att inte utföra något arbete idag som kan vänta tills imorgon, och därmed öka flexibiliteten. De två viktigaste varianterna är geografisk senareläggning och senareläggning av värdeadderande moment. Genom att inte flytta material innan det är absolut nödvändigt uppnås en ökad flexibilitet och risken för att materialet befinner sig på fel ställe minskar. (Persson, 1995) Senareläggning av värdeadderande moment innebär aktiviteter som t.ex. att patienten inte träffar anestesiläkaren förens precis innan det är aktuellt med operation.
• Integration mellan företag och mellan funktioner. Buffertar och marginaler finns mellan funktioner och företag för att integration och samordning saknas. Genom att samordna flödena kan därför tidsvinningar fås. Detta kan uppnås genom informella eller formella kontakter mellan funktioner eller företag. Men också genom den struktur som en organisation har, vilken påverkar integrationen och samordningen mellan olika delar av företaget. (Persson, 1995)
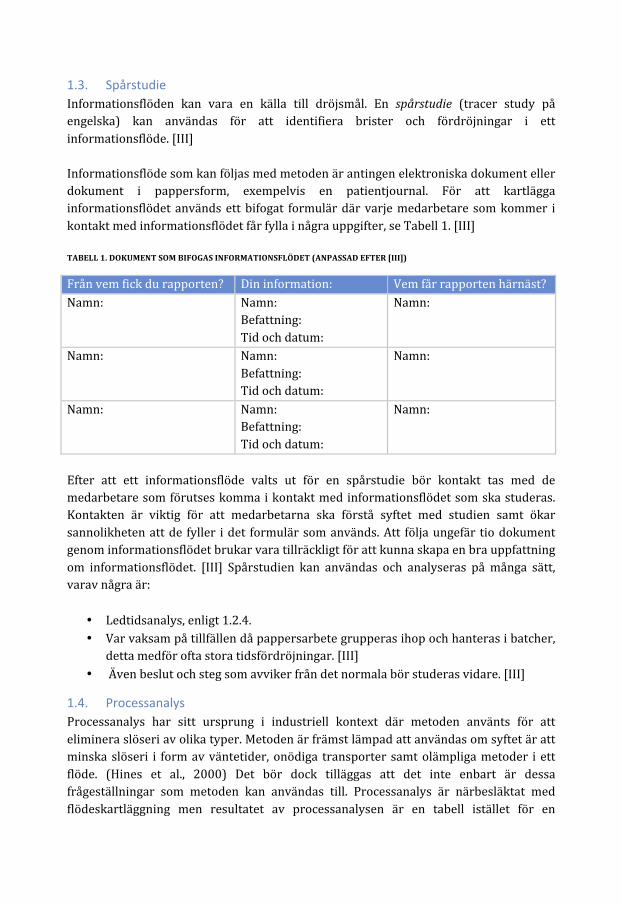
1.3. Spårstudie Informationsflöden kan vara en källa till dröjsmål. En spårstudie (tracer study på engelska) kan användas för att identifiera brister och fördröjningar i ett informationsflöde. [III] Informationsflöde som kan följas med metoden är antingen elektroniska dokument eller dokument i pappersform, exempelvis en patientjournal. För att kartlägga informationsflödet används ett bifogat formulär där varje medarbetare som kommer i kontakt med informationsflödet får fylla i några uppgifter, se Tabell 1. [III] TABELL 1. DOKUMENT SOM BIFOGAS INFORMATIONSFLÖDET (ANPASSAD EFTER [III])
Från vem fick du rapporten? Din information: Vem får rapporten härnäst? Namn: Namn:
Befattning: Tid och datum:
Namn:
Namn: Namn: Befattning: Tid och datum:
Namn:
Namn: Namn: Befattning: Tid och datum:
Namn:
Efter att ett informationsflöde valts ut för en spårstudie bör kontakt tas med de medarbetare som förutses komma i kontakt med informationsflödet som ska studeras. Kontakten är viktig för att medarbetarna ska förstå syftet med studien samt ökar sannolikheten att de fyller i det formulär som används. Att följa ungefär tio dokument genom informationsflödet brukar vara tillräckligt för att kunna skapa en bra uppfattning om informationsflödet. [III] Spårstudien kan användas och analyseras på många sätt, varav några är:
• Ledtidsanalys, enligt 1.2.4. • Var vaksam på tillfällen då pappersarbete grupperas ihop och hanteras i batcher,
detta medför ofta stora tidsfördröjningar. [III] • Även beslut och steg som avviker från det normala bör studeras vidare. [III]
1.4. Processanalys Processanalys har sitt ursprung i industriell kontext där metoden använts för att eliminera slöseri av olika typer. Metoden är främst lämpad att användas om syftet är att minska slöseri i form av väntetider, onödiga transporter samt olämpliga metoder i ett flöde. (Hines et al., 2000) Det bör dock tilläggas att det inte enbart är dessa frågeställningar som metoden kan användas till. Processanalys är närbesläktat med flödeskartläggning men resultatet av processanalysen är en tabell istället för en
flödeskarta. Detta medför att komplicerade förhållanden mellan aktiviteter kan vara svåra att åskådliggöra i en processanalys. Det är vanligast att man kartlägger ett fysiskt flöde med en processanalys, det går dock även att använda denna metod på informationsflöden. (Hines et al., 2000) I den mån en processanalys av ett informationsflöde skiljer sig från en processanalys av ett fysiskt flöde kommer detta tas upp. Det finns ett generellt angreppssätt vid användandet av processanalys (Hines et al., 2000):
1. Utför en preliminär analys av det aktuella flödet. 2. Kartlägg och mät varje aktivitet. Resultatet blir snarlikt den processkarta som
ses i Tabell 4 i Bilaga 2. 3. Studera flödet av aktiviteter i processkartan och identifiera slöseri. För att
identifiera slöseri kan det vara en god idé att använda klassificeringen av aktiviteter som värdeskapande eller icke värdeskapande, som togs upp i analysavsnittet för flödeskartläggning. En tumregel för denna analys är att endast en operation kan vara värdeskapande, men behöver dock inte vara det.
4. Överväg om: a. Aktiviteterna kan omstruktureras till ett mer effektivt flöde. b. Flödesupplägg och förflyttningar i flödet kan förbättras. c. Alla aktiviteter, och aktiviteternas delar är nödvändiga samt vad som skulle
hända om överflödiga delar eliminerades.
2. Variation Variation kan delas upp i två varianter: externt skapad variation och internt skapad variation. Den första är starkt kopplad till kunderna (patienterna) och den andra uppkommer på grund av det sätt som arbete bedrivs. Nedan kommer fem typer kundberoende variation tas upp vartefter olika sätt att minska den internt skapade variationen tas upp.
2.1. Externt skapad variation – Ankomstmönster Tyvärr anländer patienter inte enhetligt, exempelvis till en akutmottagning. De ställer inte heller enhetliga krav på sjukvårdssystemet. I vissa fall är det möjligt att styra efterfrågan, till exempel genom bokningssystem, men i många fall är detta inte möjligt inom sjukvården. På lång sikt kan dock efterfrågan vara förutsägbar, där ett exempel är sambandet mellan antalet benbrott och halka på vintern. Att sträva mot att bättre kunna förutse efterfrågan ökar möjligheten att planera sin verksamhet och anpassa sin kapacitet till efterfrågan. (Bicheno et al., 2009) Detta kan göras genom att undersöka:
• Säsongsmönster
• Mönster enligt månad, vecka, dag eller timme • Regelbundna händelser, exempelvis jul och sommar • Förhållanden med stora oregelbundna händelser, såsom epidemier. (Bicheno et
al., 2009) Dessa typer av studier kan till exempel användas på en akutmottagning där antalet patienter som inkommer under olika tider på dygnet ofta är förutsägbart. Att då anpassa schemat för personalen som arbetar till ankomstmönstret hos patienterna minskar stressen och köerna.
2.2. Externt skapad variation – Behov Olika patienter har olika behov. Det finns några olika sätt att generellt hanterad detta. Ett sätt är att begränsa urvalet kunderna (Bicheno et al., 2009) vilket inom sjukvården kanske inte är lämpligt i många fall. Att differentiera patientflödena kan vara ett annat sätt (Bicheno et al., 2009). Ett exempel på detta är användningen av Fast track på akutmottagningar. Fast track är en metod med syfte att öka effektiviteten och flödet genom akutmottagningen, genom att skapa ett alternativt flöde genom akutmottagningen. Vilka patienter som behandlas i detta flöde varierar, men en variant är att patienter med icke-‐akuta, enkla behov hanteras i fast track-‐flödet för att dessa patienter snabbt ska hanteras och inte förlänga köer på akutmottagningen. (Considine et al., 2008) För studier som testat Fast track se Ieraci (2008), Vega och McGuire (2007), Sanchez et al. (2006) samt Considine et al. (2008). Att kontinuerligt registrera och diskutera klagomål kan vara ett sätt att öka medvetenheten kring behovsvariation och utarbeta bättre arbetssätt. (Bicheno et al., 2009)
2.3. Externt skapad variation – Kunskap Alla patienter har inte samma kunskapsnivå. Vissa kräver mer stöd och vägledning än andra. Att ta reda på hur patienternas kunskap varierar ökar inte bara nyttan för patienterna utan möjliggör också en ökad produktivitet inom organisationen. Att minska kunskapsvariation är tufft arbete. En bra start är att följa upp vilka fel som patienterna gör och i vilken utsträckning. Därmed kan insatser läggas in där de gör mest nytta. Kunskapsvariation är ofta en ouppmärksammad problemkälla varför den kan finnas kvar under många år. (Bicheno et al., 2009)
2.4. Externt skapad variation – Ansträngning Det finns också en variation i hur mycket patienterna anstränger sig för att slutföra en transaktion. Ett exempel är hur duktig en patient är på att utföra de övningar som en sjukgymnast ålägger patienten. Andelen patienter som anstränger sig kan ökas genom att vädja till hans/hennes känsla för gemenskap, tacka honom/henne för en bra insats, använda humor, samt göra det enkelt och självklart att anstränga sig. (Bicheno et al., 2009)

2.5. Externt skapad variation – Personlig preferens Det här är variation i personlig åsikt. Visa patienter vill ha mycket personlig uppmärksamhet, andra inte, varför vårdprocessen bör ta hänsyn till patienternas preferenser.
2.6. Minska internt skapad variation – Utjämning Utjämning är en grundläggande förutsättning som är viktig ur både ett flödes-‐ och kvalitetsperspektiv. Planeringsmässigt innebär utjämning av ett flöde (ex. patientflöde) att se till så beläggningen blir så jämn som möjligt över tiden. Därmed minskar stressen och kvaliteten blir jämnare och bättre. Nedan tas två typer av utjämning upp, avseende volym och arbetsinnehåll. (Petersson et al., 2009) Utjämning avseende volym innebär att alltid ”producera” lika mycket per tidsenhet, vilket skapar ett jämnt kapacitetsbehov och enklare planering av resurser, exempelvis kirurger och operationslokaler. På grund av att efterfrågan på varor och tjänster inte är konstant är en total utjämning ofta inte möjlig, men varje litet steg mot utjämning skapar bättre förutsättningar för att effektivisera verksamheten. För organisationer som producerar tjänster som är kundspecifika kan orderboken användas som vågbrytare mellan kundefterfrågan och produktionen. I tider med hög efterfrågan kan då vissa order få vänta längre än normalt medan tider med låg efterfrågan medför att kön i orderboken arbetas av. (Petersson et al., 2009) Ett exempel på utjämning avseende volym kan hämtas från en lunchrestaurang. Genom att anslå ett diagram med uppmätt kötid vid olika tidpunkter under lunchtimmarna gjordes kunderna medvetna om de stora skillnaderna. Därmed förändrade vissa kunder sina lunchtider för att slippa stå i kö vilket medförde nöjdare kunder och en jämnare arbetsbelastning för personalen. (Petersson et al., 2009) Många organisationer har en situation där många olika tjänster produceras i samma flöde, varav vissa har högre arbetsinnehåll än andra. Det är då viktigt att sträva mot att utjämna avseende arbetsinnehåll för att resurserna, exempelvis personal och lokaler, över tid ska kunna användas så effektivt som möjligt. Detta kan åstadkommas genom att sprida ut de resurskrävande tjänsterna så att de hamnar så långt ifrån varandra som möjligt i flödet. I Figur 3 nedan visas detta genom att staplarnas höjd symboliserar arbetsinnehållet i olika tjänster som produceras i ett flöde. (Petersson et al., 2009)
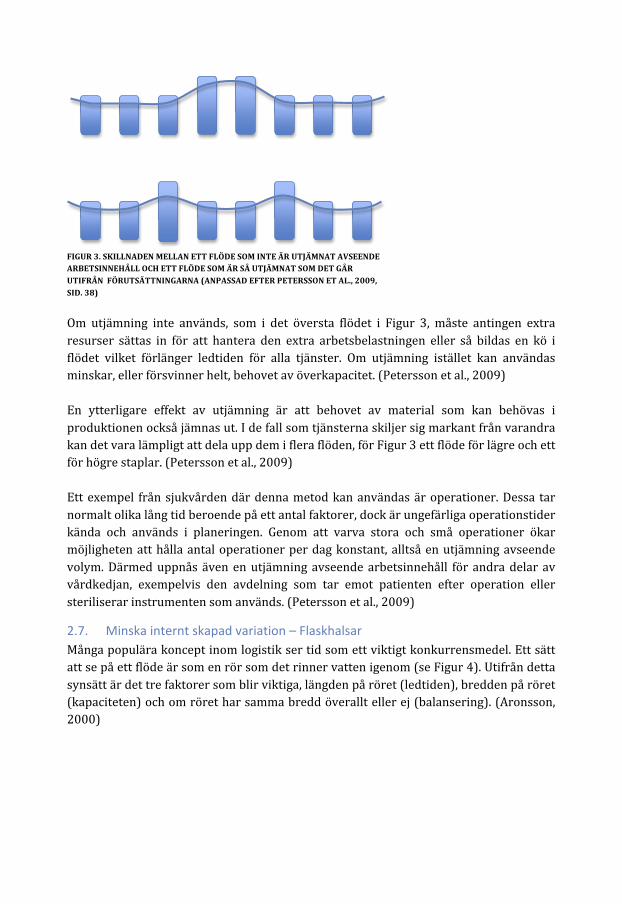
Om utjämning inte används, som i det översta flödet i Figur 3, måste antingen extra resurser sättas in för att hantera den extra arbetsbelastningen eller så bildas en kö i flödet vilket förlänger ledtiden för alla tjänster. Om utjämning istället kan användas minskar, eller försvinner helt, behovet av överkapacitet. (Petersson et al., 2009) En ytterligare effekt av utjämning är att behovet av material som kan behövas i produktionen också jämnas ut. I de fall som tjänsterna skiljer sig markant från varandra kan det vara lämpligt att dela upp dem i flera flöden, för Figur 3 ett flöde för lägre och ett för högre staplar. (Petersson et al., 2009) Ett exempel från sjukvården där denna metod kan användas är operationer. Dessa tar normalt olika lång tid beroende på ett antal faktorer, dock är ungefärliga operationstider kända och används i planeringen. Genom att varva stora och små operationer ökar möjligheten att hålla antal operationer per dag konstant, alltså en utjämning avseende volym. Därmed uppnås även en utjämning avseende arbetsinnehåll för andra delar av vårdkedjan, exempelvis den avdelning som tar emot patienten efter operation eller steriliserar instrumenten som används. (Petersson et al., 2009)
2.7. Minska internt skapad variation – Flaskhalsar Många populära koncept inom logistik ser tid som ett viktigt konkurrensmedel. Ett sätt att se på ett flöde är som en rör som det rinner vatten igenom (se Figur 4). Utifrån detta synsätt är det tre faktorer som blir viktiga, längden på röret (ledtiden), bredden på röret (kapaciteten) och om röret har samma bredd överallt eller ej (balansering). (Aronsson, 2000)
FIGUR 3. SKILLNADEN MELLAN ETT FLÖDE SOM INTE ÄR UTJÄMNAT AVSEENDE ARBETSINNEHÅLL OCH ETT FLÖDE SOM ÄR SÅ UTJÄMNAT SOM DET GÅR UTIFRÅN FÖRUTSÄTTNINGARNA (ANPASSAD EFTER PETERSSON ET AL., 2009, SID. 38)
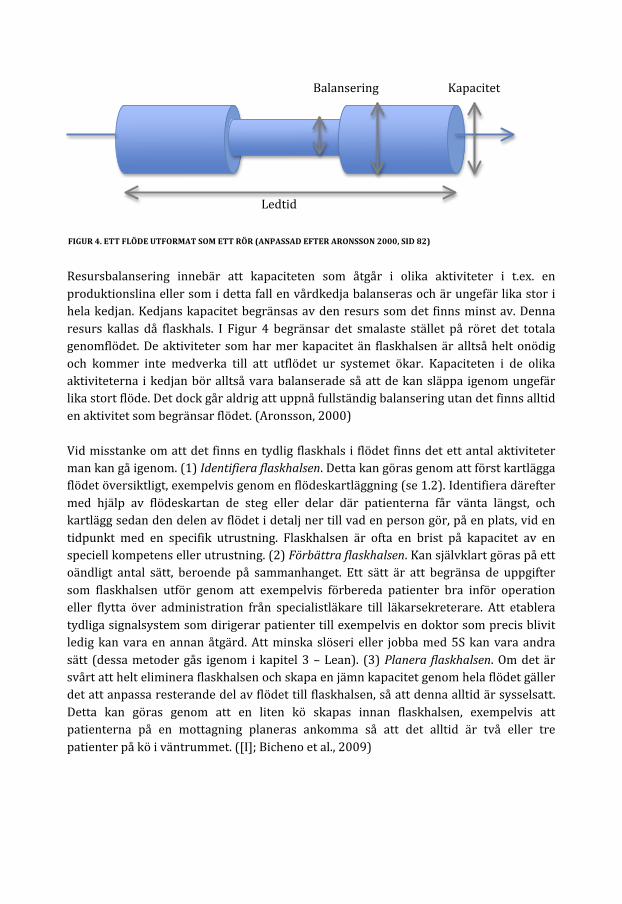
Resursbalansering innebär att kapaciteten som åtgår i olika aktiviteter i t.ex. en produktionslina eller som i detta fall en vårdkedja balanseras och är ungefär lika stor i hela kedjan. Kedjans kapacitet begränsas av den resurs som det finns minst av. Denna resurs kallas då flaskhals. I Figur 4 begränsar det smalaste stället på röret det totala genomflödet. De aktiviteter som har mer kapacitet än flaskhalsen är alltså helt onödig och kommer inte medverka till att utflödet ur systemet ökar. Kapaciteten i de olika aktiviteterna i kedjan bör alltså vara balanserade så att de kan släppa igenom ungefär lika stort flöde. Det dock går aldrig att uppnå fullständig balansering utan det finns alltid en aktivitet som begränsar flödet. (Aronsson, 2000) Vid misstanke om att det finns en tydlig flaskhals i flödet finns det ett antal aktiviteter man kan gå igenom. (1) Identifiera flaskhalsen. Detta kan göras genom att först kartlägga flödet översiktligt, exempelvis genom en flödeskartläggning (se 1.2). Identifiera därefter med hjälp av flödeskartan de steg eller delar där patienterna får vänta längst, och kartlägg sedan den delen av flödet i detalj ner till vad en person gör, på en plats, vid en tidpunkt med en specifik utrustning. Flaskhalsen är ofta en brist på kapacitet av en speciell kompetens eller utrustning. (2) Förbättra flaskhalsen. Kan självklart göras på ett oändligt antal sätt, beroende på sammanhanget. Ett sätt är att begränsa de uppgifter som flaskhalsen utför genom att exempelvis förbereda patienter bra inför operation eller flytta över administration från specialistläkare till läkarsekreterare. Att etablera tydliga signalsystem som dirigerar patienter till exempelvis en doktor som precis blivit ledig kan vara en annan åtgärd. Att minska slöseri eller jobba med 5S kan vara andra sätt (dessa metoder gås igenom i kapitel 3 – Lean). (3) Planera flaskhalsen. Om det är svårt att helt eliminera flaskhalsen och skapa en jämn kapacitet genom hela flödet gäller det att anpassa resterande del av flödet till flaskhalsen, så att denna alltid är sysselsatt. Detta kan göras genom att en liten kö skapas innan flaskhalsen, exempelvis att patienterna på en mottagning planeras ankomma så att det alltid är två eller tre patienter på kö i väntrummet. ([I]; Bicheno et al., 2009)
Balansering Kapacitet
Ledtid
FIGUR 4. ETT FLÖDE UTFORMAT SOM ETT RÖR (ANPASSAD EFTER ARONSSON 2000, SID 82)
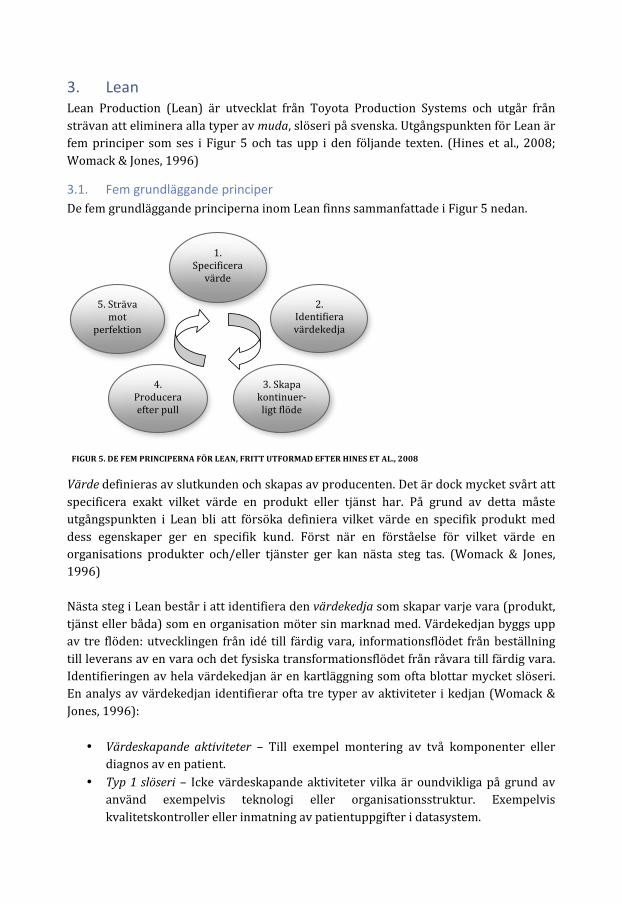
3. Lean Lean Production (Lean) är utvecklat från Toyota Production Systems och utgår från strävan att eliminera alla typer av muda, slöseri på svenska. Utgångspunkten för Lean är fem principer som ses i Figur 5 och tas upp i den följande texten. (Hines et al., 2008; Womack & Jones, 1996)
3.1. Fem grundläggande principer De fem grundläggande principerna inom Lean finns sammanfattade i Figur 5 nedan.
Värde definieras av slutkunden och skapas av producenten. Det är dock mycket svårt att specificera exakt vilket värde en produkt eller tjänst har. På grund av detta måste utgångspunkten i Lean bli att försöka definiera vilket värde en specifik produkt med dess egenskaper ger en specifik kund. Först när en förståelse för vilket värde en organisations produkter och/eller tjänster ger kan nästa steg tas. (Womack & Jones, 1996) Nästa steg i Lean består i att identifiera den värdekedja som skapar varje vara (produkt, tjänst eller båda) som en organisation möter sin marknad med. Värdekedjan byggs upp av tre flöden: utvecklingen från idé till färdig vara, informationsflödet från beställning till leverans av en vara och det fysiska transformationsflödet från råvara till färdig vara. Identifieringen av hela värdekedjan är en kartläggning som ofta blottar mycket slöseri. En analys av värdekedjan identifierar ofta tre typer av aktiviteter i kedjan (Womack & Jones, 1996):
• Värdeskapande aktiviteter – Till exempel montering av två komponenter eller diagnos av en patient.
• Typ 1 slöseri – Icke värdeskapande aktiviteter vilka är oundvikliga på grund av använd exempelvis teknologi eller organisationsstruktur. Exempelvis kvalitetskontroller eller inmatning av patientuppgifter i datasystem.
1. Specificera värde
5. Sträva mot
perfektion
4. Producera efter pull
3. Skapa kontinuer-‐ligt flöde
2. Identifiera värdekedja
FIGUR 5. DE FEM PRINCIPERNA FÖR LEAN, FRITT UTFORMAD EFTER HINES ET AL., 2008

• Typ 2 slöseri – Icke värdeskapande aktiviteter som kan elimineras.
Typ 2 slöseri är alltså aktiviteter som är helt onödiga och därför endast innebär slöseri med resurser medan typ 1 slöseri för tillfället är nödvändiga men med nya arbetssätt kan elimineras. Eftersom värdekedjan ofta går genom flera organisationer eller avdelningar behöver även kartläggningen sträcka sig genom alla dessa. Detta på grund av att slöseri kan finnas exempelvis i form av att flera avdelningar utför samma uppgifter, alltså dubbelarbete eller att aktiviteterna som olika avdelningar utför inte passar ihop. (Womack & Jones, 1996) När värde har specificerats och värdekedjan kartlagts åligger nästa steg: att skapa ett kontinuerligt flöde av de aktiviteter som ingår i värdekedjan. Det bör här nämnas att det sannolikt har identifierats icke värdeskapande aktiviteter i kartläggningen som självklart bör elimineras innan detta steg tar vid. Detta steg innebär att ordna de kvarvarande värdeadderande aktiviteterna i en flödesstruktur och låta produkterna eller tjänsterna flöda igenom dem. Denna struktur skiljer sig från den funktionella organisationen där aktiviteterna är organiserade efter typ av aktivitet och arbetet ofta utförs i batcher istället för i ett kontinuerligt flöde. Genom detta arbetssätt minskas väntetider och genomloppstider drastiskt och detta leder till kortare ledtider för slutkunden och snabbare respons på kundernas krav. (Womack & Jones, 1996) Tack vare förändringarna ovan minskar genomloppstiderna från beställning till leverans dramatiskt och produkter kan produceras först när de efterfrågas av slutkunden. Det innebär att kunden drar produkten (producera efter pull) genom processerna istället för att produkten produceras mot lager och trycks ut på marknaden. Efterfrågan blir jämnare och prognoser behövs inte längre eftersom endast det som efterfrågas produceras. Det femte och sista steget benämns att sträva mot perfektion (se Figur 5). Detta kan te sig överdrivet men efter att ha genomgått de föregående fyra stegen har en stor potential i sättet att arbeta ofta urskiljts, men också vetskapen att det ständigt finns möjlighet att förbättra flödena, bättre förstå värde för kunderna med mera. Att ständigt arbeta vidare enligt denna filosofi ter sig självklart varför det femte steget återkopplar till det första genom ständig kamp mot slöseri. (Womack & Jones, 1996)
3.2. Slöseri Som nämndes i början av avsnittet utgår Lean från strävan att eliminera slöseri. Därför kommer den följande texten behandla sju olika typer av slöseri. (Hines et al., 2008) Slöseri är något som inte ökar värdet för kunden, så för att arbeta med att eliminera slöseri har en uppdelning i sju typer av slöseri gjorts vilka kan ses nedan (Hines et al., 2008; Petersson et al., 2009):
1. Onödig rörelse – Icke genomtänkt placering av verktyg och komponenter medför att arbetaren måste böja eller sträcka sig för att nå dessa. Ett annat exempel är att en medarbetare måste gå en sträcka för att hämta verktyg och material.
2. Väntan – Längre tidsperioder av inaktivitet för personer, information eller produkter vilket för med sig svagt flöde och långa ledtider.
3. Onödiga transporter – Kan vara förflyttning av personer, information eller produkter vilket medför slöseri av tid, ansträngning och kostnad.
4. Överproduktion – Producera för mycket eller för tidigt vilket resulterar i dåligt flöde av information eller produkter och ökande lager.
5. Olämpliga processer – Användning av icke lämpliga verktyg eller metoder i ett arbetsmoment eller när enklare tillvägagångssätt finns.
6. Defekter – Frekventa misstag i skrivbordsarbete, bristande produktkvalitet eller otillräcklig service till kund.
7. Onödigt lager – Överflödigt lager och fördröjning av information eller produkter med följden att kostnader ökar och service till kund blir sämre.
3.3. 5S 5S är en metod för att skapa och bibehålla en organiserad, ren och säker arbetsplats. (Wedgwood, 2007) Metoden kan ses som ett verktyg i den ständiga kampen mot slöseri, exempelvis kan slöseri i form av onödig rörelse (se 3.2) reduceras genom implementeringen av 5S. De fem aktiviteter som metoden inbegriper är som följer (Wedgwood, 2007):
• Sortera – Behåll endast vad som behövs på arbetsstationen, ta bort allt annat. • Systematisera – Arrangera de kvarvarande sakerna efter hur de används och
märk upp var sakerna ska finnas. • Städa – Håll stationen ren genom kontinuerlig städning baserad på en tydlig
ansvarsfördelning för utförandet. • Standardisera – Förvalta de åtgärder som hittills utförts genom att upprätta en
standard för hur arbetsstationen skall se ut och dokumentera denna. • Skapa vana – Utbilda alla medarbetare i hur ordningen ska bibehållas och vilka
regler som gäller. Detta är det svåraste steget, så genomför kontroller.

Referenser Bicheno, J., Anhede, P. & Hillberg, J. (2009) Lean Handbok för Service och Tjänster. Revere Considine, J. Kropman, M. Kelly, E. Winter, C. (2008) “Effect of emergency department fast track on emergency department length of stay: a case– control study”. Emergency Medicine Journal. Vol. 25 2008 sid. 815-‐819. Harrington, H J. (1991) Process business improvement – the breakthrough strategy for total quality, productivity, and competitiveness. McGraw-‐Hill Inc. Hines, P. Lamming, R. Jones, D. Cousins, P. Rich, N. (2000) Value Stream Management – Strategy and Excellence in the Supply Chain. Prentice Hall. Ieraci, S. Digiusto, E. Sonntag, P. Dann, L. Fox, D. (2008) “Streaming by case complexity: Evaluation of a model for emergency department Fast Track”. Emergency Medicine Australasia. Vol. 20 2008 sid. 241–249 Ljungberg, A. Larsson, E. (2001) Processbaserad verksamhetsutveckling. Studentlitteratur. Mazur, L M. Chen, S-‐J. (2008) “Understanding and reducing the medication delivery waste via systems mapping and analysis”. Health Care Management Science. Vol. 11 2008 sid. 55–65. Olsson, O. (2010) Vad är nästa steg? En fallstudie om flödesförbättring och förändringsarbete på Danderyds sjukhus akutmottagning. Linköping University Electronic Press. Oskarsson, B. Aronsson, H. Ekdahl, B. (2006) Modern logistik – för ökad lönsamhet. Liber. Tredje upplagan. Persson, G. (1995) “Logistics Process Redesign: Some Useful Insights”. The international Journal of Logistics Management. Vol. 6 nr. 1 1995 sid. 13-‐26. Petersson, P. Johansson, O. Broman, M. Blücher, D. Alsterman, H. (2009) Lean – Gör avvikelser till framgång. Part Media Sanchez, M. Smally, A J. Grant, R J. Jacobs, L M. (2006) “Effects of a fast-‐track area on emergency department performance”. The Journal of Emergency Medicine. Vol. 31 nr. 1 2006 sid. 117–120

Vega, V. McGuire, S. (2007) “Speeding Up the Emergency Department: The RADIT Emergency Program at St. Joseph Hospital of Orange”. HOSPITAL TOPICS: Research and Perspectives on Healthcare. Vol. 85 nr. 4 2007 sid. 17-‐24 Womack, J P. Jones, D T. (1996) Lean Thinking – Banish waste and create wealth in your corporation. Simon & Schulster. Wedgwood, I D. (2007) Lean sigma – a practitioner’s guide. Prentice Hall. [I] Theory of constraints, NHS – Institute for Innovation and Improvement, available at: http://www.institute.nhs.uk/quality_and_service_improvement_tools/quality_and_service_improvement_tools/theory_of_constraints.html (3 November 2011)

Bilaga 1
TABELL 2. ETT EXEMPEL PÅ EN FLÖDESKAR
TA FÖR ETT PATIENTFLÖDE, BESKRIVEN MED SWIMLANE-‐MODELLEN. (PETERSSON ET AL., 2009)
Patient
Anmäler sig i
kassan
Betalar
Pratar
med
under-‐
sköterska
Lämnar
uppgifter till
sjuksköterska
Lämnar
uppgifter till
läkare
Hem
gång
Sekreterare
Registrerar
och tar betalt
Informerar
under-‐
sköterska
Undersköterska
Tar
emot
information
om patient
Tar
patient
till
under-‐
sökningsrum
Pratar
med
patient
Informerar
sjuksköterska
Sjuksköterska
Tar uppgifter
om
patient,
ordination
Informerar
läkare
Läkare
Tar
emot
information
om patient
Tar uppgifter
om
patient,
undersöker
samt
ordination

TABELL 3. ETT EXEMPEL PÅ HUR PATIENTFLÖDET I TABELLEN OVAN KAN
FÖRÄN
DRAS. (PETERSSON ET AL., 2009)
Patient
Pratar
med
sekreterare,
under-‐
sköterska,
sjuksköterska
och läkare
Betalar
Hem
gång
Sekreterare
Tar uppgifter
om patient
Registrerar
och tar betalt
Undersköterska
Tar uppgifter
om patient
Tar uppgifter
om patient
Sjuksköterska
Tar uppgifter
om
patient,
ordination
Läkare
Tar uppgifter
om
patient,
undersöker
samt
ordination

Appendix 6-9
Papers
The articles associated with this thesis have been removed for copyright
reasons. For more details about these see:
http://urn.kb.se/resolve?urn=urn:nbn:se:liu:diva- 111635

APPENDIX 10
CASE REPORT

MANAGING A VARIABLE ACUTE PATIENT FLOW AT A UNIVERSITY HOSPITAL OLLE OLSSON & HÅKAN ARONSSON
Rapport
Institutionen för ekonomisk och industriell utveckling
Avdelningen Logistik
LIU-‐IEI-‐RR-‐-‐14/00212—SE

1. INTRODUCTION TO THE CASE DESCRIPTION 1
1.1. THE ORGANISATION 1 1.2. OVERVIEW OF THE SYSTEM 2 1.3. VARIABLE PATIENT CHARACTERISTICS 3 1.4. PATIENT FLOW AT THE ED 4 1.5. PATIENT FLOW AT A CLINICAL DEPARTMENT 4 1.6. DEFINITIONS AND DELIMITATIONS 5
2. PLANNING AND DECISION STRUCTURE 6
2.1. HIERARCHICAL LEVEL 6 2.1.1. CHIEF EXECUTIVE OFFICER 7 2.1.2. DIVISION CHIEFS 7 2.1.3. DEPARTMENT CHIEFS 7 2.1.4. COORDINATORS 8 2.1.5. INPATIENT WARDS AND INDIVIDUALS 8 2.2. BESIDE THE HIERARCHY 8 2.2.1. HEALTHCARE DIRECTOR 9 2.2.2. CHIEF MEDICAL OFFICERS 9 2.2.3. DOCTORS ON DUTY 9 2.2.4. OPERATIVE MANAGING DOCTOR 10 2.2.5. HOSPITAL COORDINATORS 10 2.3. WORKING TEAMS 11 2.3.1. HOSPITAL MANAGEMENT GROUP 11 2.3.2. EMERGENCY FLOW GROUP 11 2.3.3. AIM GROUP 12 2.4. MANAGING BED SHORTAGE 12 2.5. DIFFERENT DEPARTMENTS HAVE DIFFERENT REQUIREMENTS 14 2.5.1. LOCAL ó REGION PATIENTS 14 2.5.2. SPECIALIST ó GENERAL PATIENTS 14 2.5.3. ACUTE ó ELECTIVE PATIENTS 15 2.6. SUMMER AND CHRISTMAS 15
3. STRATEGIES 16
3.1. INFLOW 16 3.1.1. ALTERNATIVES TO INPATIENT CARE 16 3.1.2. IMPROVED HANDOFF BETWEEN INPATIENT AND PRIMARY CARE 16 3.1.3. AVOIDING UNNECESSARY ADMISSIONS 17 3.2. INTERNAL FLOW 17 3.2.1. ADAPTING BEDS AND WARDS TO PATIENT NEEDS 17 3.2.2. PATIENT DISTRIBUTION 17 3.2.3. ADAPTING STAFFING TO PATIENT INFLOW 17 3.2.4. SMOOTHING BED UTILISATION 18 3.2.5. CANCELLING ELECTIVE INTAKES 18 3.3. OUTFLOW 18 3.3.1. DISCHARGE EARLY IN THE DAY 18 3.3.2. TIMING OF THE DISCHARGE 18

3.3.3. COLLABORATING WITH LOCAL HEALTH SERVICE 18 3.4. FLEXIBILITY 19 3.4.1. ADDITIONAL BED CAPACITY 19 3.4.2. REARRANGING PATIENTS 19 3.4.3. ADAPTING STAFFING TO DEMAND 20 3.4.4. COUNTERACTING STRAIN ON HEALTHCARE RESOURCES 20 3.4.5. REDUCTION OF BEDS DURING HOLIDAYS 20
REFERENCES
APPENDIX – ADDITIONAL BEDS AT THE HOSPITAL

1
1. INTRODUCTION TO THE CASE DESCRIPTION This chapter includes an overview of the organisation and its acute patient flow, which has been studied. The purpose of this case report is to provide a description concerning how a variable acute patient flow is managed at the University hospital. Therefore, in the following two chapters, aspects of this issue will be described. Firstly, in chapter 2, the hierarchical levels, roles and teams that make decisions and manage the flow of acute patients at the hospital will be described. Secondly, in chapter 3, strategies used at the hospital to manage a variable acute patient flow will be explained.
1.1. THE ORGANISATION The county council is the fourth largest county in Sweden, in terms of number of inhabitants. Approximately 430,000 people are living in the county, which consists of thirteen municipalities. The most important responsibility of the county council is to provide residents with healthcare. The county council’s operations are distributed through ten divisions (number 1-‐10 in figure 1 below) in various areas of healthcare and medical treatment, and five of these (number 1-‐5) are providing specialised care services for the entire county. Depicted in the picture are also the chief executive officer with support staff and support and service functions. The picture also illustrates the University hospital (UH) and the other two hospitals (H) that provide medical services in the county. Except for local health care service, one hospital only provides specialised care from the diagnostics centre.
Figure 1 – The operational structure of the county council
Except for organ transplantation the University hospital provides diagnostics, consultation and treatment within every medical speciality. The catchment area concerning highly specialised care consists of three counties, with a total of approximately one million residents. In some cases the catchment area is even bigger, e.g. the entire nation as catchment area. The University hospital profiles itself through an advanced emergency and trauma care and a focus on highly specialised care and research. The six divisions with operations at the University hospital are further divided into clinical departments or clinical departments.
Chief&Executive&Of.icer& Management&support&staff&
1.&Anaesthetics,&Operations&and&Speciality&Surgery&Centre&
2.&Surgery,&Orthopaedics&and&Oncology&Centre&
3.&Paediatrics,&Gynaecology&and&Obstetrics&Centre&
4.&Cardiology&and&Speciality&Medicine&Centre&
5.&Diagnostics&Centre&
6.&Local&Health&Care&&Service&in&Western&County&
7.&Local&Health&Care&Service&in&&Central&County&
8.&Local&Health&Care&Service&in&Eastern&County&
9.&Local&Health&Care&Service&in&Northern&County&
10.&Public&Dental&Care&
Support&and&Service&Functions&
H&
H&UH&
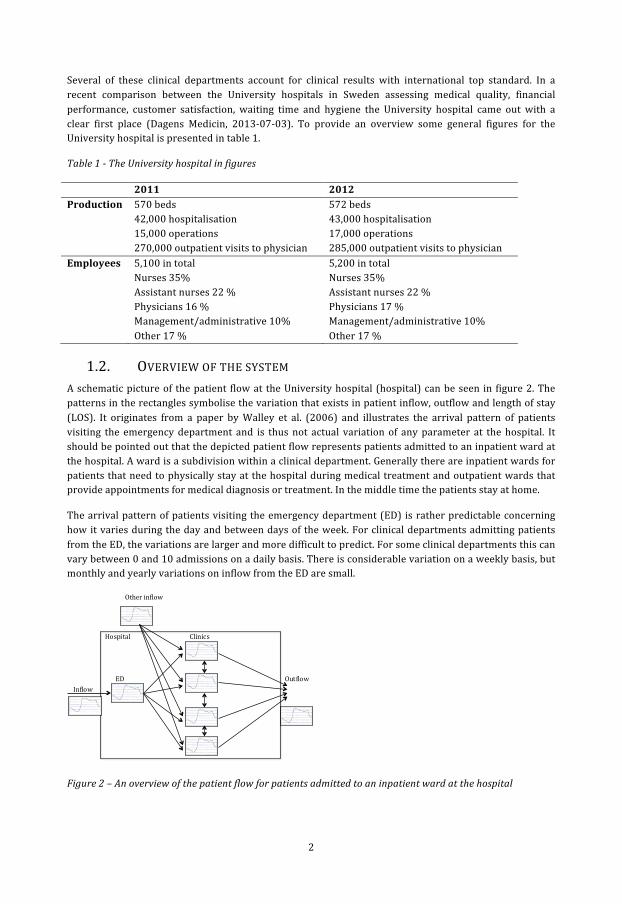
2
Several of these clinical departments account for clinical results with international top standard. In a recent comparison between the University hospitals in Sweden assessing medical quality, financial performance, customer satisfaction, waiting time and hygiene the University hospital came out with a clear first place (Dagens Medicin, 2013-‐07-‐03). To provide an overview some general figures for the University hospital is presented in table 1.
Table 1 -‐ The University hospital in figures
2011 2012 Production 570 beds
42,000 hospitalisation 15,000 operations 270,000 outpatient visits to physician
572 beds 43,000 hospitalisation 17,000 operations 285,000 outpatient visits to physician
Employees 5,100 in total Nurses 35% Assistant nurses 22 % Physicians 16 % Management/administrative 10% Other 17 %
5,200 in total Nurses 35% Assistant nurses 22 % Physicians 17 % Management/administrative 10% Other 17 %
1.2. OVERVIEW OF THE SYSTEM A schematic picture of the patient flow at the University hospital (hospital) can be seen in figure 2. The patterns in the rectangles symbolise the variation that exists in patient inflow, outflow and length of stay (LOS). It originates from a paper by Walley et al. (2006) and illustrates the arrival pattern of patients visiting the emergency department and is thus not actual variation of any parameter at the hospital. It should be pointed out that the depicted patient flow represents patients admitted to an inpatient ward at the hospital. A ward is a subdivision within a clinical department. Generally there are inpatient wards for patients that need to physically stay at the hospital during medical treatment and outpatient wards that provide appointments for medical diagnosis or treatment. In the middle time the patients stay at home.
The arrival pattern of patients visiting the emergency department (ED) is rather predictable concerning how it varies during the day and between days of the week. For clinical departments admitting patients from the ED, the variations are larger and more difficult to predict. For some clinical departments this can vary between 0 and 10 admissions on a daily basis. There is considerable variation on a weekly basis, but monthly and yearly variations on inflow from the ED are small.
Figure 2 – An overview of the patient flow for patients admitted to an inpatient ward at the hospital
!!!!
ED!
Clinics!
Inflow!Outflow!
Hospital!
Other!inflow!

3
Most clinical departments have acute and elective patient inflow, which is not originated from the ED. Elective defines patients that are planned to arrive for a specific medical treatment. It is not unusual that patients need to be transferred between clinical departments during the care episode in the hospital. An internal investigation performed 2005-‐2006 concluded that approximately 40 % of internal medicine patients were transferred between clinical departments at least once during their care episode. There are also variations on the length of stay and discharges for clinical departments, although these are rather individual-‐dependent. The tendency of early or late discharge is related to experience, risk taking and other individual characteristics of the physician. This aspect of a variable patient flow will however not be further explored.
1.3. VARIABLE PATIENT CHARACTERISTICS Every patient is unique, having different health issues and combination of health issues, severity levels and responses to therapy. Basically every decision concerning the treatment and care of a patient is therefore a judgement call, from decision concerning admission, treatment, discharge and aftercare. In spite of this, it can be valuable to distinguish patients with similar characteristics in patient groups, even though by doing so the reality is simplified. From a hospital perspective some characteristics are important to recognise. These are illustrated in figure 3, and will be explained below.
Figure 3 – Characteristics that distinguish patient groups from a hospital perspective
As discussed earlier, the patient inflow to the clinical departments can be categorised as acute and elective, where the elective inflow are patients whose arrival is planned at the clinical department and do not pass the ED. Acute patients are not planned and can arrive both by the ED and without passing by the ED. The later can be patients that have been in contact with a clinical department before, due to previous health issues, and therefore have permission to directly contact and arrive at the clinical department. It can also be patients with such clear symptoms that ambulance personnel can identify the health issue with certainty or communicate with health personnel at a specific clinical department, and drive directly to the clinical department responsible for the health issue. Both these instances correspond to patients with need for specialist care, depicted in the middle level of figure 3. The other characteristic is for patients with diffuse symptoms, often with multiple diseases, that can be cared for at several clinical departments. In general there are only patients within the category of internal medicine that can be admitted to several clinical departments.
Furthermore, a separation between local patients, i.e. county residents, and regional patients from other counties are made. Patients from other counties are accepted since the counties have a contract stating that residents are entitled to a specific treatment the county in exchange for financial compensation from
Local&
All&patients&
Region&
Acute& Elective&Acute& Acute& Acute&Elective&Elective&Elective&
Specialist& General&General& Specialist&

4
the county where the citizen lives. These contracts are for specialised care only and patients denoted general are cared for in their home county, represented by the cross in the picture.
1.4. PATIENT FLOW AT THE ED The patient flow at the ED is depicted in figure 4, and will be further described below.
Figure 4 – Patient flow at the ED
In total between 100 and 150 patients arrive each day to the ED and a third of these arrive by ambulance. Before arriving at the ED the ambulance personnel makes an assessment regarding how critical the patient’s state of health is. Two thirds arrive by walking to the reception for registration. After registration, and possible queuing; the patient’s state of health is evaluated based on past history as well as vital parameters such as blood pressure. If the patient needs immediate care, an acute care team provide care of the patient. Otherwise, the evaluation decides in which order the patients at the ED are provided further care. In general, a doctor, nurse and assistant nurse collaborates in teams, and these are assigned patients. To reach a decision whether a patient should be admitted to an inpatient ward or discharged, some tests, such as blood or cell tests, might be needed. An x-‐ray can also be performed and/or a specialist be consulted for an expert opinion. Approximately a third of the patients visiting the ED are admitted. The physician provides a suggestion concerning which inpatient ward the patient should be admitted to and a coordinator is asked to find a bed at an appropriate inpatient ward.
1.5. PATIENT FLOW AT A CLINICAL DEPARTMENT After being admitted to an inpatient ward, at a clinical department, there are some general activities that are often performed. If the patient needs transport to the ward, the hospital transport service is contacted. When arriving to the ward, the patient is registered and provided a bed. The patient meets a physician, and a care plan, which specifies the treatment or care procedures needed, is established. During treatment and after the care plan is fulfilled, the patient is assessed during the doctor’s rounds. As discussed above, some patients are also judged as needing specialised treatment from another clinical department and are therefore transferred. When the patient’s medical needs are lower than the ward’s care level, there is a decision on aftercare. For patients needing further care, rehabilitation or assistance in the home a discharge plan is established together with representatives from the local health care service. Other patients are discharged with an appointment at the outpatient ward and some just go home. At the inpatient ward most personnel are nurses, assistant nurses, physicians and these often work in teams. The nurses and assistant nurses are mainly responsible for care, while the physicians are responsible for medical decisions and treatment.
Emergency department
2/3 of all
patients
RegistrationQue
EvaluationQue Team
assessmentNext?
Consultant
Tests
X-ray
Acute?
Ambulatory
care
No
Admitt
Discharge
Acute?
No
Acute care
Yes
Yes
1/3 of all
patients
Acute
1/3 of all
patients
2/3 of all
patients

5
1.6. DEFINITIONS AND DELIMITATIONS To care and treat all patients with different health issues and severity levels, there are clinical departments with different specialities. The beds into which patients are admitted to are also differentiated. Some have equipment and staff to provide treatment and care for severely ill patients that are unconscious. Some have telemetry equipment to monitor the heart rate of a patient, some rooms have two or four beds while other are singles. When several patients share a room, the risk of infection increases. A bed is simply not exchangeable for another bed. From hereon, the term bed includes the equipment and personnel needed to ensure patient safe care, unless other interpretation is apparent.
The following description focuses on the acute patient flow, originating from patients visiting the ED. In comparison to elective patients, whose care episode is planned ahead by each clinical department, the acute patient flow is more challenging to manage efficiently, mostly due to the unpredictability concerning the patient inflow concerning time, health issue and response to treatment. It is basically only within internal medicine that patients can be admitted to several clinical departments. This patient group are therefore of specific interest, since there are more choices of actions to manage and distribute the patient inflow. It should be noted that since the entire hospital is studied, and several clinical departments treat both acute and elective patients, there are no distinct limitations included; instead an approach where the hospital is regarded as a system is used.
The description below is divided into two major parts. The first explains the different hierarchical levels, roles and teams that make decisions and manage the flow of acute patients. The second part explains the actions taken to manage a variable acute patient flow on a daily basis. The strategies and actions used to manage extreme situations are not included in the description, since these are managed by a specific catastrophic organisation, and not the regular organisation described below, in the first part.

6
2. PLANNING AND DECISION STRUCTURE An organisation chart including the hierarchical levels, roles and teams that make decisions and manage the flow of acute patients at the hospital is pictured below. The dashed lines correspond to information flow between actors while the thick lines match the authorities that are delegated from higher levels to lower levels of the organisation. The thick lines only correspond to information flow related to the acute patient flow. In contrast to the traditional organisation chart (see Harrington, 1991), the figure includes actors that cannot be considered as belonging to a specific hierarchical level. This is because they have certain tasks and responsibilities related to the acute patient flow and are hence denoted as being beside the hierarchy. The picture further includes working teams that handle aspects directly or indirectly related to the acute patient flow and correspondingly have mandates in accordance to these aspects.
Figure 5 – The authorities (thick lines) delegated from higher levels of the organisation and the information flow (dashed lines) between actors beside the hierarchy, hierarchical levels and working teams concerning the acute patient flow at the hospital.
The observant reader has now recognised that there are no arrows directly connecting the working teams with the actors beside the hierarchy. The reason for this is that several of the actors beside the hierarchy are also included in one or more of the working teams. Thus, communication is irrespectively created. As depicted in the figure much of the information flow between the working teams and actors beside the hierarchy are also carried out through the hierarchical levels. Parts of the figure will be displayed when discussing the different actors, levels and teams further on in this paper. Relations that are not discussed within a section will be shaded; to clarify which information flows and mandates are discussed in each section.
2.1. HIERARCHICAL LEVEL Below the mandates and responsibilities for the actors in the hierarchical levels are discussed, as well as information flow between actors.
Chief&Executive&Of.icer&
Divisions&
Clinical&Departments&
Wards&
Individuals&
Operative&Managing&Doctor&
Chief&Medical&Of.icers&&
Hospital&Management&Group&
Emergency&Flow&Group&
Beside&the&hierarchy& Working&teams&Hierarchical&level&
AIM&Group&
Hospital&Coordinators&
Doctors&on&Duty&
Healthcare&Director&
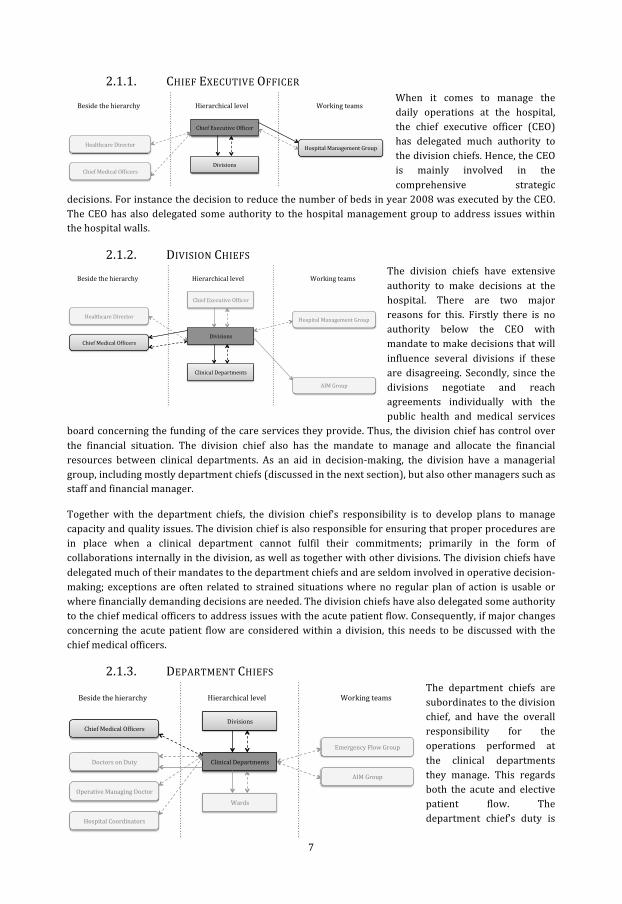
7
2.1.1. CHIEF EXECUTIVE OFFICER When it comes to manage the daily operations at the hospital, the chief executive officer (CEO) has delegated much authority to the division chiefs. Hence, the CEO is mainly involved in the comprehensive strategic
decisions. For instance the decision to reduce the number of beds in year 2008 was executed by the CEO. The CEO has also delegated some authority to the hospital management group to address issues within the hospital walls.
2.1.2. DIVISION CHIEFS The division chiefs have extensive authority to make decisions at the hospital. There are two major reasons for this. Firstly there is no authority below the CEO with mandate to make decisions that will influence several divisions if these are disagreeing. Secondly, since the divisions negotiate and reach agreements individually with the public health and medical services
board concerning the funding of the care services they provide. Thus, the division chief has control over the financial situation. The division chief also has the mandate to manage and allocate the financial resources between clinical departments. As an aid in decision-‐making, the division have a managerial group, including mostly department chiefs (discussed in the next section), but also other managers such as staff and financial manager.
Together with the department chiefs, the division chief’s responsibility is to develop plans to manage capacity and quality issues. The division chief is also responsible for ensuring that proper procedures are in place when a clinical department cannot fulfil their commitments; primarily in the form of collaborations internally in the division, as well as together with other divisions. The division chiefs have delegated much of their mandates to the department chiefs and are seldom involved in operative decision-‐making; exceptions are often related to strained situations where no regular plan of action is usable or where financially demanding decisions are needed. The division chiefs have also delegated some authority to the chief medical officers to address issues with the acute patient flow. Consequently, if major changes concerning the acute patient flow are considered within a division, this needs to be discussed with the chief medical officers.
2.1.3. DEPARTMENT CHIEFS The department chiefs are subordinates to the division chief, and have the overall responsibility for the operations performed at the clinical departments they manage. This regards both the acute and elective patient flow. The department chief’s duty is
Chief&Executive&Of.icer&
Divisions&Chief&Medical&Of.icers&&
Hospital&Management&Group&
Beside&the&hierarchy& Working&teams&Hierarchical&level&
Healthcare&Director&
Chief&Executive&Of.icer&
Divisions&
Clinical&Departments&
Chief&Medical&Of.icers&&
Hospital&Management&Group&
Beside&the&hierarchy& Working&teams&Hierarchical&level&
AIM&Group&
Healthcare&Director&
Divisions'
Clinical'Departments'
Wards'Operative'Managing'Doctor'
Chief'Medical'Of8icers''
Emergency'Flow'Group'
Beside'the'hierarchy' Working'teams'Hierarchical'level'
AIM'Group'
Hospital'Coordinators'
Doctors'on'Duty'

8
to have a planning system that enables the clinical department to use the resources, such as personnel, equipment and bed, in an efficient way.
A managerial group helps the department chief in decision-‐making. The composition of the managerial group differs between clinical departments, but it often include heads of nursing, medically responsible physicians and coordinators. Ideas for improvement are decided upon by the managerial group and tested on the clinical departments operations. The department chief ultimately decides the overall planning and decisions concerning number of beds, allocation of beds between wards and patient groups. Since number and allocation of beds have effects on other clinical departments, specifically regarding the acute patient flow, these decisions are communicated and discussed with the chief medical officers and division chief. The chief medical officers can also address the department chief with requests of increased number of beds for acute patients.
2.1.4. COORDINATORS At the clinical departments a few nurses or assistant nurses, often with many years of experience, are entitled as coordinators. Every weekday, one of the coordinators at each clinical department is on daytime duty. The responsibility is centred round coordinating the patient flow at the clinical department and
managing bed allocation as well as division of labour between teams and wards. Since many clinical departments have both acute and elective patient flows a balance between the two must be achieved. The coordinator has also the responsibility of allocating personnel between teams and wards, as well as to call in extra personnel when needed, e.g. due to sickness or when having patients with demanding care needs. The above-‐described tasks often occupy a big portion of the working hours for the coordinators.
2.1.5. INPATIENT WARDS AND INDIVIDUALS As described in the section above the coordinator at the clinical department have much responsibility in establishing a smooth patient flow at the clinical department. There is no uniform practice for how mandates are delegated or communication structured when comparing inpatient wards at different clinical departments regarding patient flow issues. Of course physicians, nurses and assistant nurses have separate tasks, responsibilities and authority concerning care provision, but a distinction for responsibility and communication concerning patient flow issues from a logistic perspective cannot be acknowledged. Therefore the inpatient wards and individuals parts of the planning and decision structure related to the acute patient flow will not be
further elaborated.
2.2. BESIDE THE HIERARCHY Below the mandates and responsibilities for the actors beside the hierarchy are discussed, as well as information flow between actors.
Clinical'Departments'
Wards'
Individuals'
Hierarchical'level'
Divisions'
Clinical'Departments'
Wards'Operative'Managing'Doctor'
Chief'Medical'Of8icers''
Emergency'Flow'Group'
Beside'the'hierarchy' Working'teams'Hierarchical'level'
AIM'Group'
Hospital'Coordinators'
Doctors'on'Duty'
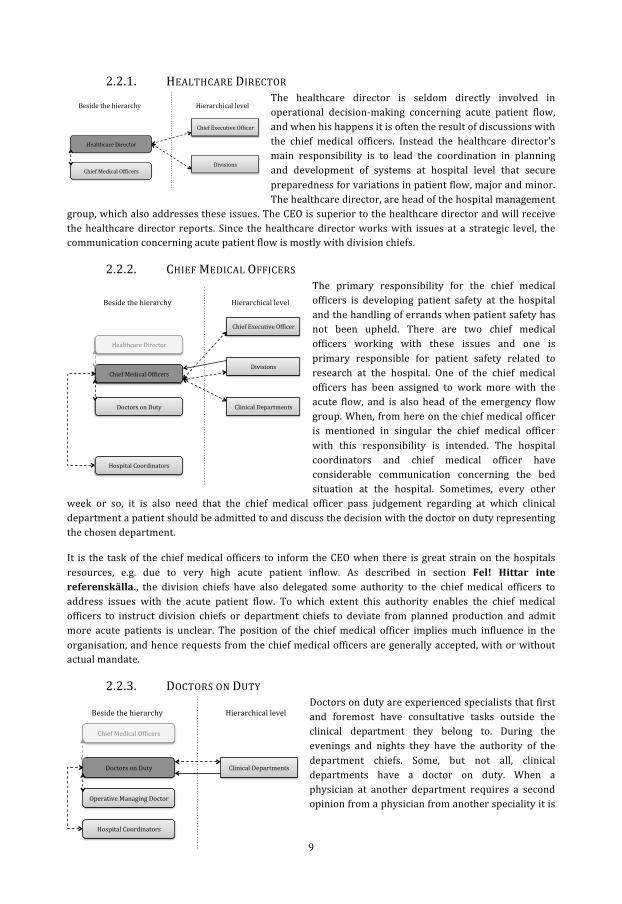
9
2.2.1. HEALTHCARE DIRECTOR The healthcare director is seldom directly involved in operational decision-‐making concerning acute patient flow, and when his happens it is often the result of discussions with the chief medical officers. Instead the healthcare director’s main responsibility is to lead the coordination in planning and development of systems at hospital level that secure preparedness for variations in patient flow, major and minor. The healthcare director, are head of the hospital management
group, which also addresses these issues. The CEO is superior to the healthcare director and will receive the healthcare director reports. Since the healthcare director works with issues at a strategic level, the communication concerning acute patient flow is mostly with division chiefs.
2.2.2. CHIEF MEDICAL OFFICERS The primary responsibility for the chief medical officers is developing patient safety at the hospital and the handling of errands when patient safety has not been upheld. There are two chief medical officers working with these issues and one is primary responsible for patient safety related to research at the hospital. One of the chief medical officers has been assigned to work more with the acute flow, and is also head of the emergency flow group. When, from here on the chief medical officer is mentioned in singular the chief medical officer with this responsibility is intended. The hospital coordinators and chief medical officer have considerable communication concerning the bed situation at the hospital. Sometimes, every other
week or so, it is also need that the chief medical officer pass judgement regarding at which clinical department a patient should be admitted to and discuss the decision with the doctor on duty representing the chosen department.
It is the task of the chief medical officers to inform the CEO when there is great strain on the hospitals resources, e.g. due to very high acute patient inflow. As described in section Fel! Hittar inte referenskälla., the division chiefs have also delegated some authority to the chief medical officers to address issues with the acute patient flow. To which extent this authority enables the chief medical officers to instruct division chiefs or department chiefs to deviate from planned production and admit more acute patients is unclear. The position of the chief medical officer implies much influence in the organisation, and hence requests from the chief medical officers are generally accepted, with or without actual mandate.
2.2.3. DOCTORS ON DUTY Doctors on duty are experienced specialists that first and foremost have consultative tasks outside the clinical department they belong to. During the evenings and nights they have the authority of the department chiefs. Some, but not all, clinical departments have a doctor on duty. When a physician at another department requires a second opinion from a physician from another speciality it is
Chief&Executive&Of.icer&
Divisions&Chief&Medical&Of.icers&&
Beside&the&hierarchy& Hierarchical&level&
Healthcare&Director&
Chief&Executive&Of.icer&
Divisions&
Clinical&Departments&
Chief&Medical&Of.icers&&
Beside&the&hierarchy& Hierarchical&level&
Hospital&Coordinators&
Doctors&on&Duty&
Healthcare&Director&
Clinical'Departments'
Operative'Managing'Doctor'
Chief'Medical'Of7icers''
Beside'the'hierarchy' Hierarchical'level'
Hospital'Coordinators'
Doctors'on'Duty'

10
often the doctor on duty from that speciality that consults them.
The doctors on duty furthermore decide which patients should be admitted to, and discharged from, the clinical department when needed. Therefore they coordinate their work with the coordinator at the clinical department as well as the hospital coordinators, operative managing doctor and physicians at the ED. For the doctors on duty, many working hours are spent coordinating admissions and discharges, often without the need for medical expertise that the doctors on duty have. Moreover, the doctors on duty have varying authorities to accept and decline patients to their clinical department.
2.2.4. OPERATIVE MANAGING DOCTOR The operative managing doctor is a fairly new position working at the ED, which together with an operative managing nurse have the responsibility for the patient flow in the ED as well as assisting the teams with medical assessments. When involved actors cannot reach an agreement the operative managing doctor also has the authority to decide to which clinical department a patient will be admitted. These actors can be hospital coordinators, doctors on duty and coordinators. The position is however
lacking acceptance within the organisation when it comes to the decision mandate, which complicates this decision-‐making.
The position was partly implemented to relieve the pressure from the hospital coordinators and doctors on duty when it comes to finding beds at appropriate wards. The operative managing doctor is also intended to be a resource for actors outside the hospital, for instance when a physician at a care centre needs advice on whether to send a patient to the hospital, and in extension to make decisions on bypassing the ED and admit patients evaluated at a care centre. Both experienced and rather inexperienced physicians hold the position of operative managing doctors, even though the position requires much integrity, social skills as well as knowledge on logistics and how the hospital works as a totality.
2.2.5. HOSPITAL COORDINATORS Experienced nurses hold the position of hospital coordinators, and there are two hospital coordinators on daytime duty on weekdays, and one during daytime on weekends and holidays. The primary responsibility for the hospital coordinators is to be updated concerning the bed situation at the entire hospital and hence they have a comprehensive view of the situation. To gain this information, the hospital coordinators uses an information system called Accessa, into which coordinators at the clinical departments report the number of available beds at
the moment as well as planned admissions and discharges for today and sometimes also for the next day. Planned discharges is a figure that is sometimes neglected, often due to insufficient discharge planning at the department.
The information in Accessa is primarily used to coordinate admissions from the ED to inpatient wards at the hospital. The hospital coordinator discusses the appropriate inpatient ward with the physician that has taken care of the patient at the ED, and sometimes the operative managing doctor is addressed for medical advice. For patients with general medicine issues, where several clinical departments are able to
Clinical'Departments'
Operative'Managing'Doctor'
Beside'the'hierarchy' Hierarchical'level'
Hospital'Coordinators'
Doctors'on'Duty'
Clinical'Departments'
Operative'Managing'Doctor'
Chief'Medical'Of7icers''
Beside'the'hierarchy'
Hospital'Coordinators'
Doctors'on'Duty'
Hierarchical'level'

11
provide treatment, it often becomes a qualitative evaluation based on the bed situation and experience of the hospital coordinators concerning at which inpatient ward the patient should be admitted. The hospital coordinator thereafter contacts the coordinator at the clinical department to prepare them for the patient’s arrival. If the coordinator does not want to accept the patient, e.g. due to limited capacity of some sort or the patient not being evaluated as being their responsibility, other actors such as the operative managing doctor, doctor on duty and chief medical officer can be involved in the decision-‐making, as has been described in the sections about these positions.
In the afternoon the hospital coordinators phone the other clinical department coordinators to gain fresh figures on available beds before the evening and night. Based on experience, a plan for the night is thereafter compiled. The plan can include instructions on which inpatient wards that have available beds, where patients should be admitted or where, if necessary, relocated patients should be placed.
2.3. WORKING TEAMS Below the mandates and responsibilities for the working teams are discussed, as well as information flow between actors.
2.3.1. HOSPITAL MANAGEMENT GROUP The distribution and characteristics of acute patients are geographically dependent due to distribution of age groups, salary levels and other population characteristics. Thus, the operational structure of the county council arranged around divisions is not the best match, and a more self-‐contained hospital organisation would be more appropriate. As compensation, the hospital management group was established around year 2003-‐2004 to manage local and hospital specific issues such as acute patient flow
and collaboration with the university, adjacently located to the hospital. Example of matters that have been addressed, deliberated and decided upon by the hospital management group are the extension of the hospital premises, uniform employment of nurses and number of beds during summer and Christmas.
Concerning the acute patient flow, the group is responsible for development of structures, functions and roles to support coordinated planning on hospital level. During extreme situations the group can decide on extensive actions overriding division boarders. The members of the hospital management group are the six division chiefs with operations at the hospital as well as all chief medical officers, dean of the faculty of medicine at the university and the healthcare director, i.e. the head of the group.
All decisions taken by the group have to be agreed on by all members, and if someone opposes the decision, the issue is raised to the CEO or the council management group, for a decision. The hospital management group deliberate and decide between potential improvement project, which should be initiated and which gets potential funding. There is no standardised approach for identifying which improvement projects to deliberate; instead these are gathered through different sources of information. A customary procedure for adopting potential improvements frequently used is to test an improvement project in the operations for a limited period of time and then evaluate the effects.
2.3.2. EMERGENCY FLOW GROUP The emergency flow group was started around 4-‐5 years ago as a subordinate group to the hospital management group. It’s responsibility is to plan, coordinate and develop a well-‐functioning and secure acute patient flow originating from the ED. Members of the group are the chief medical officer, hospital coordinators and
Clinical'Departments'
Hospital'Management'Group'
Emergency'Flow'Group'
Working'teams'Hierarchical'level'
Chief&Executive&Of.icer&
Divisions&
Hospital&Management&Group&
Emergency&Flow&Group&
Working&teams&Hierarchical&level&

12
department chiefs or medically responsible physicians from a number of clinical departments. The body of the group consists of department chiefs, and they are important members since they have in-‐depth knowledge of the operational activities at the clinical departments. There are concerned parties among the clinical departments that are not members of the group, and the reason for this is that the group would become to big if they were included. Within the emergency flow group, essential issues regarding the acute patient flow are discussed and processed.
Issues that can be resolved with the mandates within the group can be decided after external, but affected, clinical departments have approved. All decisions have to be agreed by all affected, thus a unanimous decision reached. If a unanimous decision cannot be reached or the mandates within the group are not sufficient, the issue is raised to the hospital management group for decision. Some issues are also prepared for decision by the emergency flow group and then passed on for decision to the hospital management group. Examples of issues that are discussed by the emergency flow group are:
• Changes of number of beds during Christmas and summer. • Joint improvement projects around the acute patient flow. • Development of standardised and common routines among the departments. • Changes at individual clinical departments that may affect other departments, for example
improvement projects, staffing changes and new routines.
The boundary between the emergency flow group and hospital management group, concerning which issues that should be resolved at which group, is imprecise. This is displayed by the fact that issues that are raised by the emergency flow group often are sent back without a decision from the hospital management group. From an emergency flow group perspective the issues have not been possible to resolve by the group, due to lack of mandate or agreement, and are therefore raised. However, at the hospital management group the general opinion is that these issues are more appropriately managed by the emergency flow group, therefore no decision, but rather recommendations or suggestions are sent back. Since the chief medical officer is a member of both the hospital management group and emergency flow group, communication between the two often goes by the chief medical officer.
2.3.3. AIM GROUP There are ten clinical departments specialised in different fields of internal medicine. Their department chiefs, together with the division chief for the Cardiology and Speciality Medicine Centre and Local Health Care Service in the Central County have established the acute internal medicine group (AIM group). They meet every 4-‐6 weeks to discuss issues for acute patient flow of internal medicine patients. Members of this group performed an evaluation where it was concluded that
there is a need for 10-‐12 additional beds, including personnel, at the hospital to secure appropriate care for acute internal medicine patients. The recommendation was to enlarge the department of emergency medicine. Due to limitations in building space and finances, these plans were not realised. Instead a few beds were opened at other clinical departments.
2.4. MANAGING BED SHORTAGE The “plan of action during bed shortage” has existed for at least ten years and has been revised several times. Revisions have been initiated when a need for it has been identified. It expresses a plan of action to secure the availability for beds for the acute patient flow and includes actions to counteract very high utilisation of the hospital’s beds and other resources. The aim is to simplify admission of acute patients by providing fast access to a bed and avoid admission of an acute patient to an “inappropriate” department. The responsibility and authority for different actors are described in general terms. It is stated in the plan
Divisions'
Clinical'Departments'
Working'teams'Hierarchical'level'
AIM'Group'
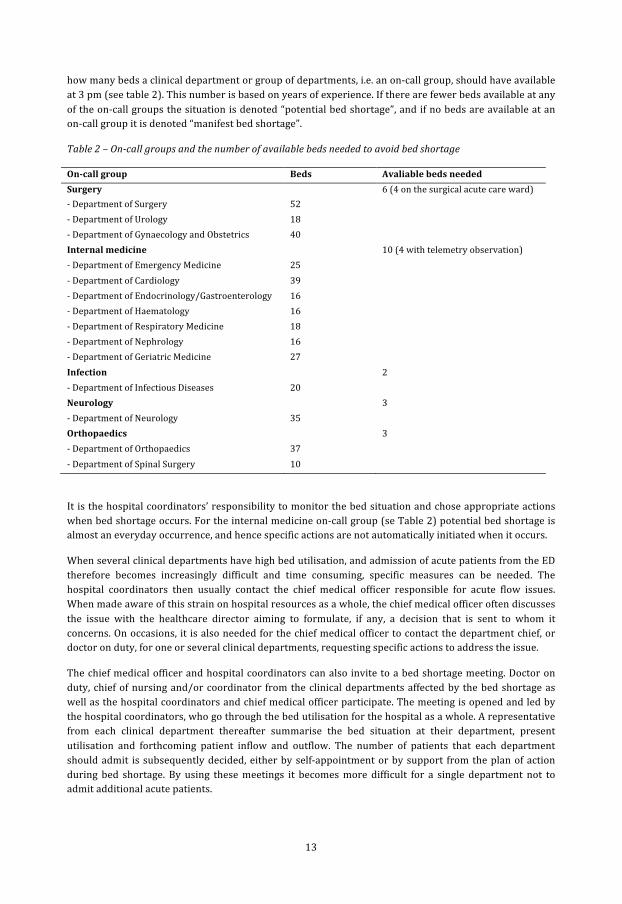
13
how many beds a clinical department or group of departments, i.e. an on-‐call group, should have available at 3 pm (see table 2). This number is based on years of experience. If there are fewer beds available at any of the on-‐call groups the situation is denoted “potential bed shortage”, and if no beds are available at an on-‐call group it is denoted “manifest bed shortage”.
Table 2 – On-‐call groups and the number of available beds needed to avoid bed shortage
On-‐call group Beds Avaliable beds needed Surgery 6 (4 on the surgical acute care ward) -‐ Department of Surgery 52 -‐ Department of Urology 18 -‐ Department of Gynaecology and Obstetrics 40 Internal medicine 10 (4 with telemetry observation) -‐ Department of Emergency Medicine 25 -‐ Department of Cardiology 39 -‐ Department of Endocrinology/Gastroenterology 16 -‐ Department of Haematology 16 -‐ Department of Respiratory Medicine 18 -‐ Department of Nephrology 16 -‐ Department of Geriatric Medicine 27 Infection 2 -‐ Department of Infectious Diseases 20 Neurology 3 -‐ Department of Neurology 35 Orthopaedics 3 -‐ Department of Orthopaedics 37 -‐ Department of Spinal Surgery 10
It is the hospital coordinators’ responsibility to monitor the bed situation and chose appropriate actions when bed shortage occurs. For the internal medicine on-‐call group (se Table 2) potential bed shortage is almost an everyday occurrence, and hence specific actions are not automatically initiated when it occurs.
When several clinical departments have high bed utilisation, and admission of acute patients from the ED therefore becomes increasingly difficult and time consuming, specific measures can be needed. The hospital coordinators then usually contact the chief medical officer responsible for acute flow issues. When made aware of this strain on hospital resources as a whole, the chief medical officer often discusses the issue with the healthcare director aiming to formulate, if any, a decision that is sent to whom it concerns. On occasions, it is also needed for the chief medical officer to contact the department chief, or doctor on duty, for one or several clinical departments, requesting specific actions to address the issue.
The chief medical officer and hospital coordinators can also invite to a bed shortage meeting. Doctor on duty, chief of nursing and/or coordinator from the clinical departments affected by the bed shortage as well as the hospital coordinators and chief medical officer participate. The meeting is opened and led by the hospital coordinators, who go through the bed utilisation for the hospital as a whole. A representative from each clinical department thereafter summarise the bed situation at their department, present utilisation and forthcoming patient inflow and outflow. The number of patients that each department should admit is subsequently decided, either by self-‐appointment or by support from the plan of action during bed shortage. By using these meetings it becomes more difficult for a single department not to admit additional acute patients.
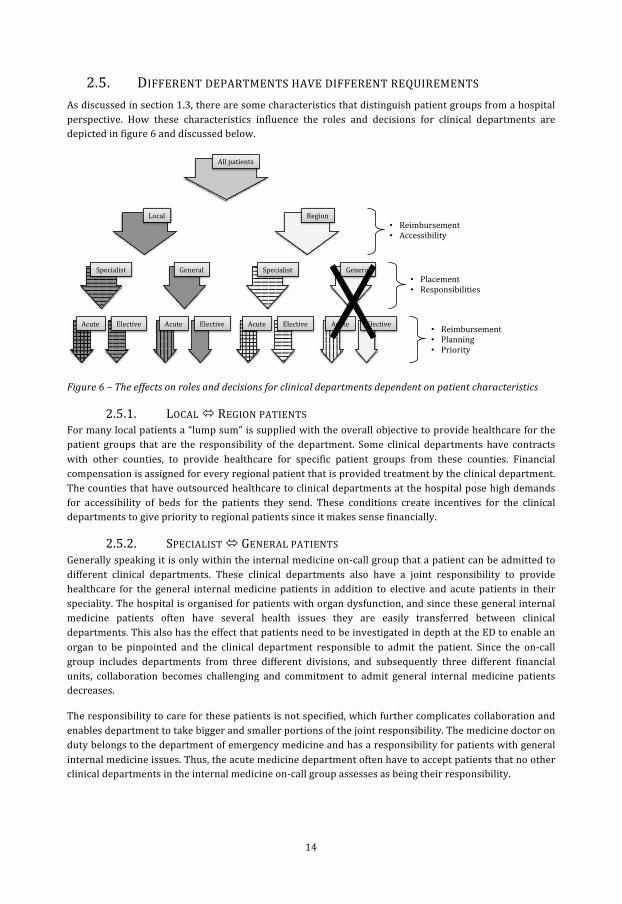
14
2.5. DIFFERENT DEPARTMENTS HAVE DIFFERENT REQUIREMENTS As discussed in section 1.3, there are some characteristics that distinguish patient groups from a hospital perspective. How these characteristics influence the roles and decisions for clinical departments are depicted in figure 6 and discussed below.
Figure 6 – The effects on roles and decisions for clinical departments dependent on patient characteristics
2.5.1. LOCAL ó REGION PATIENTS For many local patients a “lump sum” is supplied with the overall objective to provide healthcare for the patient groups that are the responsibility of the department. Some clinical departments have contracts with other counties, to provide healthcare for specific patient groups from these counties. Financial compensation is assigned for every regional patient that is provided treatment by the clinical department. The counties that have outsourced healthcare to clinical departments at the hospital pose high demands for accessibility of beds for the patients they send. These conditions create incentives for the clinical departments to give priority to regional patients since it makes sense financially.
2.5.2. SPECIALIST ó GENERAL PATIENTS Generally speaking it is only within the internal medicine on-‐call group that a patient can be admitted to different clinical departments. These clinical departments also have a joint responsibility to provide healthcare for the general internal medicine patients in addition to elective and acute patients in their speciality. The hospital is organised for patients with organ dysfunction, and since these general internal medicine patients often have several health issues they are easily transferred between clinical departments. This also has the effect that patients need to be investigated in depth at the ED to enable an organ to be pinpointed and the clinical department responsible to admit the patient. Since the on-‐call group includes departments from three different divisions, and subsequently three different financial units, collaboration becomes challenging and commitment to admit general internal medicine patients decreases.
The responsibility to care for these patients is not specified, which further complicates collaboration and enables department to take bigger and smaller portions of the joint responsibility. The medicine doctor on duty belongs to the department of emergency medicine and has a responsibility for patients with general internal medicine issues. Thus, the acute medicine department often have to accept patients that no other clinical departments in the internal medicine on-‐call group assesses as being their responsibility.
Local&
All&patients&
Region&
Acute& Elective&Acute& Acute& Acute&Elective&Elective&Elective&
Specialist& General&General& Specialist&• Placement&• Responsibilities&
• Reimbursement&• Planning&• Priority&
• Reimbursement&• Accessibility&

15
2.5.3. ACUTE ó ELECTIVE PATIENTS There is no explicit number of beds allocated for acute patients in the clinical departments. Some departments do differentiate between elective and acute beds, but this division is merely to create structure for the internal operations and alterations in the proportions between the two are up to the department chief. When no clear distinction between elective and acute beds is upheld, the proportion of elective and acute patients is allowed to vary. These variations can have different reasons. Due to an increased inflow of acute patients by the ED some departments might be forced to admit higher levels of acute patients and thereby cancel elective inflow. Clinical departments with solely elective patients seldom need to cancel elective inflow to admit acute patients.
Another reason for a varying proportion of elective and acute patients is increased elective production, for example to reduce queues for elective treatment. This limits the possible acute inflow to a department. Moreover, this behaviour increases the inflow of acute patients to other departments. Since some clinical departments receive funding for each elective patient treated, but not from acute patients admitted from the ED, this encourages elective patients to be given priority.
For many years it has been discussed to base a part of the financial division on proportion of acute patients treated, but such a division has not yet been realised. Furthermore, there are more national and local goals tied to financial rewards for the elective care. Since no financial incentives are devoted to acute patients from the ED, it also creates negative incentives to develop more efficient patient flow and outflow for the acute patients. Such behaviour would only result in more acute patients, more work and higher costs.
2.6. SUMMER AND CHRISTMAS Summer and Christmas put strain on the organisation, since the personnel requires vacation. Thus, beds must be closed, which increases the utilisation on the remaining resources. Generally speaking, bed capacity for summer and Christmas is planned in the following way:
1. Around 2-‐3 months before Christmas and 4-‐5 months before summer, all clinical departments are asked for the number of beds they will have open.
2. This information is compiled during the forthcoming months and from a hospital perspective it is concluded that more open beds would be needed.
3. The errand is lifted to the hospital management group and it is concluded that it are not enough beds open and that the situation is not adequate. The department chiefs are informed that they need to increase the number of opened beds by declining vacation to a portion of the personnel.
4. The department chiefs understand the arguments, but since they already have granted vacation they do not address the issue.
5. After the holiday period it is concluded that more structured guidelines and earlier bed capacity planning is needed.
From a hospital perspective there is no authority that decides how many beds should be open during the holidays, instead every clinical department is basically allowed to decide on their own.
16
3. STRATEGIES The strategies used at the hospital to manage a variable acute patient flow have, in this paper, been divided into four categories. The categories are based on the perspective of the hospital as a system where the ED’s major task is to investigate and supply a diagnosis that decides into which clinical department a patient is admitted, while the clinical department where the patient is admitted provides further diagnosis, treatment and care, and discharge of the patient.
Hence, the first category is related to managing the inflow, e.g. to avoid unnecessary admissions by different actions. Measures that enable an efficient acute patient flow within the hospital comprise the second category, such as distributing admissions evenly between clinical departments. The third category relates to working with the outflow, for example by preparing discharge in parallel with treatment. The fourth category is more directly associated with managing a variable acute patient flow since it includes actions for adapting daily operations to the actual situation at the hospital, clinical department or ward.
In general many strategies are used at clinical level, while some are used between clinical departments and at a hospital level. The strategies used by different clinical departments are though rather differentiated.
Activities performed by nurses or physicians to manage their daily task are not included. A reason for this is that variation in individual skill and preference impedes the standardisation of strategies to manage a variable acute patient flow. Neither are general strategic visions, priorities nor plans, which are not clearly realised into action, included. Since parts of the actions are used for another reason than the aim of this description, the actions will not be denoted strategies but instead action or measure. The four categories will in turn be described in this chapter.
3.1. INFLOW Concerning inflow the actions used is focused on using other types of healthcare instead of inpatient care in a hospital ward.
3.1.1. ALTERNATIVES TO INPATIENT CARE At the department of neurology, some care that earlier were inpatient have been changed to outpatient care by sending patients home from the ED with a scheduled doctors appointment instead. In 2012 the number of admissions as a consequence decreased by the same amount as the doctor’s visits have increased. For patients that are frequent visitors and/or have complex healthcare needs, a project where they are assigned a personal care coach to simplify and structure all their contacts with healthcare, has been initiated. One of the aims is to avoid unnecessary visits to the ED and subsequent admissions.
For elderly patients in a general bad condition, a specific track on the ED is used. By having all appropriate competences available to quickly provide treatment and care for the patient, including established and fast communication with elderly care, for many patients admission can be avoided. This procedure is appropriate since elderly patients in bad condition often have long LOS when admitted to inpatient care. Based on the same reason, advanced domiciliary services are provided around-‐the-‐clock by the municipality to enable chronically sick elderly that needs limited medical supervision, provided by a physician or nurse, to stay at home.
3.1.2. IMPROVED HANDOFF BETWEEN INPATIENT AND PRIMARY CARE The county has introduced an enhanced handoff process between inpatient care and primary care while discharging patients with increased risk for readmission. This includes providing easily understood verbal and written information to the patient. The physician at the outpatient ward is responsible for providing quick and standardised information concerning necessary actions to the physician responsible for the patient in the primary care. The later should contact the patient within two workdays from the discharge
17
to ensure that the patient has understood their situation, and if necessary book a new appointment at the care centre.
3.1.3. AVOIDING UNNECESSARY ADMISSIONS To an uncertain extent can the availability of beds at inpatient wards influence the decision to admit or sending home a patient after diagnosis have been reached at the ED. When most clinical departments are fully occupied it can also lead to extensive investigations at the ED, in hope of reaching a decision where the patient do not need to be admitted. This behaviour can lead to the ED being crowded.
3.2. INTERNAL FLOW In this category many actions concerns different ways of adapting the supply of care provision to the demand.
3.2.1. ADAPTING BEDS AND WARDS TO PATIENT NEEDS Except for a division of patients between clinical departments other allocation actions are used at the hospital. During the summer, when the local health service has decreased capacity to accept patients to care facilities due to vacations, a ward for patient that is medically ready for discharge is temporarily introduced. This ward is only staffed with assistant nurses and located at the department of geriatric medicine. If a ward has a patient that is medically ready for discharge and awaiting assistance from the local health service, a patient transfer to the temporary ward can free up a bed earlier. The department of geriatric medicine has also two beds allocated for patients that are expected to be discharged within 24 hours. To gather patients with short LOS and small deviations from expected LOS, the department of urology and department of surgery have opened a joint ward with the aim of a standardised and effective care process.
3.2.2. PATIENT DISTRIBUTION As previously discussed (see section 2.5.2) it is generally only within the internal medicine on-‐call group that a patient can be admitted to different clinical departments. These clinical departments also have a joint responsibility to provide healthcare for these general internal medicine patients. A special case is a memo between the department of emergency medicine and department of cardiology stipulating the boarder between which patients should be admitted to each clinical department. For patients in the “grey area” between the clinical departments, the present bed situation should guide their decision. Some other practices are also used to allocate patients. The department of cardiology has a routine together with ambulance personnel to bypass the ED for patients with specific heart issues. The ambulance personnel send an electrocardiogram to the clinical department and a nurse evaluate if the ambulance should go directly with the patient to the department of cardiology instead of the ED. Some clinical departments use a measure of how resource demanding the patients belonging to a care team is and use this measure to allocate forthcoming admissions between the care teams.
3.2.3. ADAPTING STAFFING TO PATIENT INFLOW Most inpatient wards have reduced staffing levels, mainly for physicians but also nurses, during weekends and holidays, partly due to no elective intake during these days. At the ED staffing is adapted to the inflow of patients during day and night. The department of emergency medicine has the same staffing levels all year around, with a decrease in physician staffing during weekends. During holidays physician staffing is instead increased due to higher patient inflow. Some clinical departments uses models where different work shifts are compensated differently, e.g. four times payment for a night shift during holiday compared to a day shift on a weekday. These models make personnel less reluctant towards inconvenient working hours.
18
3.2.4. SMOOTHING BED UTILISATION The hospital coordinators divide acute patients that need admission to an inpatient ward based on the aim that bed utilisation should not be too unevenly distributed between clinical departments. If avoided it is also desirable to have available beds at every clinical department. The plan of action during bed shortage also give guidance by stipulating how many beds a clinical department or on-‐call group should have available at 3 pm (see 2.4). Based on the aim of even bed utilisation, a number of clinical departments dedicated beds to patients belonging to the internal medicine on-‐call group during fall 2012, when the later could not man the physical beds due to lack of nurses.
3.2.5. CANCELLING ELECTIVE INTAKES When elective intake needs to be cancelled to avoid overcrowded outpatient wards a choice of which clinical departments that should cancel elective intakes must be made. In general, the clinical departments that normally admit acute patients are more often required to cancel elective intake. Logically these have more adapted processes, routines and workflow to manage acute patients. Clinical departments with elective patients that can be assessed as more “acute” are also more relieved from cancelling this intake.
3.3. OUTFLOW Many actions used to create an efficient outflow is concerned with the timing and planning of the discharge process.
3.3.1. DISCHARGE EARLY IN THE DAY Some clinical departments achieve discharges early in the day and thereby liberate beds for arriving patients. This is accomplished by early in the morning letting the physicians quickly evaluate patients that can potentially be discharged. Prior to this evaluation the nurses and/or assistant nurses have assembled information in the form of e.g. blood samples, EKG and observations to enable the decision on discharge. Another approach to enable early discharge is to use individualised round, meaning that patients that can potentially be discharged are assessed first. To decide upon early discharges the day before are another action to achieve early discharges.
3.3.2. TIMING OF THE DISCHARGE Except for completing discharges early in the day it is important with the timing of the discharge. A dimension thereof is off course the medical assessment. To discharge patients on weekends and not just on weekdays are used by some clinical departments, to enable discharges adapted to the patients needs and avoid unnecessary hospital days. To prepare for discharge in parallel with treatment is also used to enable discharge as soon as it is medically justified. For elderly patients, advanced domiciliary services can assist in medical assessment and thereby aid in both discharge and aftercare decisions. Due to high pressure on personnel or beds, sometimes patients are discharged earlier than otherwise would be the case.
3.3.3. COLLABORATING WITH LOCAL HEALTH SERVICE The collaboration between inpatient and primary health care is executed differently among the county´s municipalities. The local health services have specific assistance evaluators, working weekdays, which aid in discharge planning regarding after care, rehabilitation and admittances to care facilities. For the municipality where the hospital is located these are placed at the hospital, which enables a faster and smoother discharge planning. There are also differences between the priorities in the municipalities, where some oblige the need for accepting elderly to care facilities by having assistance evaluators working on-‐call during longer holidays such as Christmas. To avoid prolonged LOS it also is desirable to summon for discharge planning as early as possible after the patients is medically ready for discharge. As an exception, discharge planning can be called for before the patient is medically ready for discharge, e.g. when a patient needs medical equipment or rebuilding at home before being discharged. To avoid bed
19
blocking by an elderly patient that is medically ready for discharge, a place can sometimes be provided at a short time care facility before admittance to a permanent care facility.
3.4. FLEXIBILITY Similarly to section 3.2 this category contains many actions concerned with different ways of adapting the supply of care provision to the demand. The main difference is that actions in this category are used as a response to variations in demand, instead of being proactive actions as those in the Internal flow category.
3.4.1. ADDITIONAL BED CAPACITY When all regular beds are occupied at a clinical department a frequently used action is to admit patients to additional beds. These beds are physical beds, sometimes located in regular patient rooms, but also often located in rooms intended for other activities, such as communal spaces or offices. The number of additional beds (see appendix 1 for an account for each clinical department) is decided by each clinical department and is considered when deciding staffing levels. The additional beds are often occupied for many clinical departments and are generally considered as unproblematic to use. Other similar actions, that are however more problematic and more seldom used, is to have patients in beds in excess of the additional ones, to mix male and female patients in rooms with two beds or more and place patients in beds in the corridor. Nevertheless, these actions are used as a last resort, and when medically justifiable only.
3.4.2. REARRANGING PATIENTS When both regular and additional beds are full, while a patient needs to be admitted, a clinical department can choose the option to have a patient spend the night at home or in a nearby hotel. This presuppose that the patient is medically fit to take care of oneself and do not need observation. For the clinical departments that have operations at several hospitals in the county, the possibility of moving patients between these are a possibility, it is though not so commonly used.
When a patient at the ED requires admission to a clinical department where a discharge is needed to free up a bed the patient might have to wait at the ED for some time. A measure that can be used to free up a bed at clinical department is to move a patient to another clinical department. The relocated patient is still under the medical responsibility of the clinical department, but receives a bed and care from the other clinical department. The first clinical department is accounted for all cost and revenues associated with the patient. Relocation can be performed to enable a patient at the ED to be admitted to a bed at an appropriate clinical department. Off course patients can be moved between wards and beds within a clinical department, but it does not count as relocation. A patient can also be placed in a bed at a clinical department directly from the ED as a relocated patient from another clinical department that do not have any available beds.
Patients can also be relocated in speculation, before there is a patient in need of the bed. This is most often executed as a preparation before the night, to simplify the admission process when many of the actors that work with admissions are not available. For beds with telemetry equipment, of which there are a limited number, this is a typical action and there are also other types of beds that are prioritised to have available. It should be noted that when a patient is moved between clinical departments within the internal medicine on-‐call group it is not classified as relocation since all clinical departments can provide patient safe care for internal medicine patients. When recurrent demand for relocation exists between two clinical departments a care agreement should be specified. It specifies how the patients should be cared for to ensure a patient safe care process as well as routines and division of labour between the clinical departments. These agreements can be established between any two clinical departments.
When there is a lack of available beds, collaboration between the three hospitals in the county is also possible. There is a routine describing that every chief medical officer can contact a chief medical officer at another hospital with a request to transfer a patient between the hospitals. The patient shall be medically
20
evaluated before transfer. This collaboration is rarely used, partly because when one hospital is full, the others are normally full too.
3.4.3. ADAPTING STAFFING TO DEMAND As discussed previously (see 3.2) some clinical departments use models where separate work shifts are compensated differently. These models enable personnel to be sent home when there is nothing to do and thus adapt staffing to demand. For clinical departments that do not have the situation where personnel can be sent home, e.g. due to unpredictable surges in acute patient inflow, these models often prove too costly. Due to sickness or patients with demanding care needs, additional nurses or assistant nurses can be called in, even though extra personnel is seldom called in to open new beds.
There is also a central staffing function that has additional personnel that can be hired for temporary staffing surges. A predominant part of the personnel at the central staffing function are hired long-‐term, but short-‐term bookings are possible even though it is not extensively used. To balance staffing between different wards at a clinical department, personnel can divide their effort between wards and some clinical departments have specific nurses or assistant nurses that only work where it is temporarily most needed.
3.4.4. COUNTERACTING STRAIN ON HEALTHCARE RESOURCES It is not explicitly decided how many beds that are allocated for acute and elective patients at the clinical departments, thus the elective and acute patients ratio is allowed to vary. Due to strain on healthcare resources, a choice to decrease or stop the elective intake can be made, either by a department chief or chief medical officer (see 2.2.2). This action can normally be executed to the forthcoming day and therefore has limited effect on the present situation and other actions are mostly chosen, e.g. by utilising additional beds at different clinical departments. After being initiated, the necessity of decreased or stopped elective intake is re-‐evaluated for one day at a time. In addition to the normal undertaking, the chief medical officers also have the mandate to request a clinical department to temporarily provide a number of extra beds for acute patients.
The most extreme action, used to counteract great strain on healthcare resources at the hospital, is to open an entire additional ward. It is only used a few times a year, when the demand for beds exceeds the supply for a longer period of time. The location is based upon the situation and available premises at the time. The staffing is decided and planned by the central staffing function, chief medical officer and emergency flow group.
3.4.5. REDUCTION OF BEDS DURING HOLIDAYS During summer as well as Christmas and New Year holiday the number of beds are significantly reduced. Compare to normal operations, approximately 130 beds were closed during the weekdays of the Christmas and New Year holiday and additionally 20 beds during the other days. Since personnel require vacation, beds are closed and elective treatment is reduced. Normally, some acute patients are relocated to beds that are closed during the holidays, and a buffer is thus removed. During the summer of 2013, the department of neurology did reduce elective treatment, but did not close any beds, which allowed them to increase the number of beds for acute patients. Thereby the clinical department received revenues due to relocated patients from other clinical departments.

REFERENCES Dagens Medicin (2013-‐07-‐03) ”Väntad seger för Linköping” http://www.dagensmedicin.se/nyheter/basta-‐sjukhuset-‐2012/vantad-‐seger-‐for-‐linkoping/ obtained July third, 2013.
Harrington, H J. (1991) Process business improvement – the breakthrough strategy for total quality, productivity, and competitiveness. McGraw-‐Hill Inc.
Walley, P., Silvester, K. and Steyn, R. (2006), ”Managing Variation in Demand: Lessons from the UK National Health Service”, Journal of Healthcare Management, Vol. 51, Issue 5, pp. 309-‐320.

APPENDIX – ADDITIONAL BEDS AT THE HOSPITAL On-‐call group and clinical department Additional beds Surgery -‐ Department of Surgery 0 -‐ Department of Urology 1 -‐ Department of Gynaecology and Obstetrics 1 Internal medicine -‐ Department of Emergency Medicine 1 -‐ Department of Cardiology 2/1 -‐ Department of Endocrinology/Gastroenterology 1 -‐ Department of Haematology 1 -‐ Department of Respiratory Medicine 1 -‐ Department of Nephrology 1 -‐ Department of Geriatric Medicine 0 Infection -‐ Department of Infectious Diseases 1 Neurology -‐ Department of Neurology 0 Orthopaedics -‐ Department of Orthopaedics 3 -‐ Department of Spinal Surgery 0 Other -‐ Department of Advanced Home Care 0 -‐ Department of Ophthalmology 1 -‐ Department of Otorhinolaryngology 1 -‐ Department of Oncology 1 -‐ Department of Hand and Plastic Surgery 1 -‐ Department of Thoracic and Vascular Surgery 0 Sum 16