
Benefits of Information Visualization Systems for Administrative Data Analysts
Upload
independentCategory
view
1download
0
Managers' Motives to Withhold Segment Disclosures and the Effect of SFAS no. 131 onAnalysts' Information EnvironmentAuthor(s): Christine A. Botosan and Mary StanfordReviewed work(s):Source: The Accounting Review, Vol. 80, No. 3 (Jul., 2005), pp. 751-771Published by: American Accounting AssociationStable URL: http://www.jstor.org/stable/4093175 .Accessed: 03/07/2012 14:05
Your use of the JSTOR archive indicates your acceptance of the Terms & Conditions of Use, available at .http://www.jstor.org/page/info/about/policies/terms.jsp
.JSTOR is a not-for-profit service that helps scholars, researchers, and students discover, use, and build upon a wide range ofcontent in a trusted digital archive. We use information technology and tools to increase productivity and facilitate new formsof scholarship. For more information about JSTOR, please contact [email protected].
.
American Accounting Association is collaborating with JSTOR to digitize, preserve and extend access to TheAccounting Review.
http://www.jstor.org

THE ACCOUNTING REVIEW Vol. 80, No. 3 2005 pp. 751-771
Managers' Motives to Withhold
Segment Disclosures and the Effect of SFAS No. 131 on Analysts'
Information Environment
Christine A. Botosan University of Utah
Mary Stanford Texas Christian University
ABSTRACT: Using retroactive disclosures required by Statement of Financial Account- ing Standards (SFAS) No. 131, we examine managers' incentives for withholding seg- ment information under SFAS No. 14 and the impact of SFAS No. 131 on analysts' information environment for a sample of firms that previously reported as single- segment firms and initiated segment disclosure with SFAS No. 131. We examine this set of firms because they likely had the strongest incentives to withhold segment in- formation and analysts potentially had the most to gain when these firms were forced to begin providing segment disclosures under SFAS No. 131. We find that these firms used the latitude in SFAS No. 14 to hide profitable segments operating in less com- petitive industries than their primary operations. However, we find no evidence to sug- gest that these firms used the latitude in SFAS No. 14 to mask poor performance. In contrast, our results suggest that by withholding segment information, these firms al- lowed themselves to appear as if they were underperforming their competition when this was not the case. Thus, their decision to withhold segment disclosures under SFAS No. 14 appears to be motivated by a desire to protect profits in less competitive in- dustries. In terms of the impact of SFAS No. 131 on analysts' information environment, our evidence suggests that SFAS No. 131 increased analysts' reliance on public data, but we provide weak evidence to suggest that this shift may have come at the cost of a marginal increase in overall uncertainty and squared error in the mean forecast.
The authors benefited from the input of workshop participants at Cornell University and the 2004 American Accounting Association Annual Meeting. We also thank Sanjeev Bhojraj, Dave Farber, Charles Lee, Paul Hribar, Andy Leone, Richard Schneible, Doug Stevens, Bill Wempe, and our two anonymous reviewers for helpful com- ments. The authors gratefully acknowledge the contribution of I/B/E/S Inc. for providing earnings per share forecast data, available through the Institutional Brokers Estimate System and the financial support of the Noble Foundation and the David Eccles School of Business. These data have been provided as part of a broad academic program to encourage earnings expectation research.
Editor's note: This paper was accepted by Terry Shevlin, Senior Editor. Submitted November 2003 Accepted November 2004
751
752 Botosan and Stanford
I. INTRODUCTION n June 1997 the Financial Accounting Standards Board (FASB) issued SFAS No. 131, Disclosures about Segments of an Enterprise and Related Information. Effective for fiscal periods beginning after December 15, 1997, the standard requires public com-
panies to provide information about their reportable operating segments as defined for internal decision-making, resource allocation, and performance assessment purposes. The preceding standard, SFAS No. 14, Financial Reporting for Segments of a Business Enter- prise, required disclosure of disaggregated information by business and geographic segment, but allowed managers flexibility in identifying their reportable segments.
In part, SFAS No. 131 was a response to financial analysts' long-standing complaints that SFAS No. 14 allowed too much flexibility in defining reportable operating segments and that this flexibility was exploited by some firms to avoid providing segment disclosures (Knutson 1993; AICPA 1994; Pacter 1993). However, those opposed to the standard claimed that SFAS No. 131 disclosures would impose competitive costs on firms. This study sheds light on these issues by examining managers' motives to withhold information under SFAS No. 14 and the impact of SFAS No. 131 disclosures on analysts' information environment. We conduct this analysis on a sample of 615 firms that were self-proclaimed single-segment firms under SFAS No. 14, but initiated segment reporting under SFAS No. 131. Hereafter, we refer to these firms as the "change firms."
These firms are suited to our research question because, by virtue of their decision to withhold industry segment information pre-SFAS No. 131, they utilized the flexibility in SFAS No. 14 to the greatest extent possible, presumably because of perceived high disclo- sure costs. In addition, if analysts rely on private information in the absence of company- generated segment disclosures, the onset of public disclosure could impact analysts' relative reliance on private versus public information sources. If such changes occur, then we expect to observe changes in analyst consensus, uncertainty, and forecast error, following the adop- tion of SFAS No. 131.
During the SFAS No. 131 debate, competitive harm was raised as a significant cost associated with segment disclosures. Preparers argued that proprietary information such as revenue, pricing, and cost structure information by product line might be inferred from segment disclosures. We investigate this issue by examining whether newly reported seg- ments operating in industries distinct from their firm's primary industry operate in com- petitive environments different from their firm's primary operations. Of the 615 firms in- cluded in our analysis, only 340 firms have at least one newly reported segment operating in an industry with a three-digit SIC code that differs from their firm's primary SIC code. Hereafter, we refer to these segments as "hidden segments" and use this subsample for our competitive environment analysis.
We compute a weighted average concentration ratio across each of the 340 firms' hidden segments using segment sales as the weight. We then compare this segment-based concen- tration ratio to the concentration ratio for the firms' primary industries. The median within- firm difference is significantly negative (p-value 0.0446).' Since competition decreases as concentration ratios increase, this indicates that the hidden segments generally operate in less competitive industries than their firm's primary industry. Moreover, we find the same result using two alternative measures of competitive environment: the Herfindahl index and the Harris (1998) Speed of Profit Adjustment measure. Accordingly, based on these results we conclude that firms used the flexibility afforded them by SFAS No. 14 to hide operations
SDue to the presence of outlying observations we focus on median values for all of our statistical tests.
The Accounting Review, July 2005

Managers' Motives to Withhold Segment Disclosures 753
in less competitive industries. This result confirms that of Harris (1998) who also finds managers are less likely to separately disclose operations in less competitive industries, using a sample of multi-segment firms and SFAS No. 14 data.
Managers with operations in less competitive industries may withhold segment infor- mation to protect profits, thereby mitigating the proprietary costs of disclosure. However, some allege that managers used the flexibility inherent in SFAS No. 14 to conceal poor performance. We conduct a variety of tests and find results consistent with firms using the flexibility afforded by SFAS No. 14 to mitigate proprietary costs and protect profits in less competitive industries rather than to conceal poor performance.
SFAS No. 131 is unique in that it is the first standard specifically targeted to addressing financial analysts' complaints. To investigate the impact of the new disclosures on analysts' information environment, we develop hypotheses concerning how the increase in public disclosure resulting from SFAS No. 131 might affect analysts' forecasts. We use the Barron et al. (1998) model that relates properties of analysts' information environments to prop- erties of their forecasts to develop hypotheses and to estimate the effect of SFAS No. 131 on analysts' consensus, overall uncertainty, and squared error in the mean forecast.
We examine changes between 1997 and 1998 (the year before disclosure) and 1998 and 1999 (first year of disclosure) in analyst consensus, overall uncertainty, and squared error in the mean forecast. We rerun the analysis for a subset of firms with sufficient data through 2000 to determine if any observed changes are sustained in the near term. However, we lose one-fifth of our sample firms with I/B/E/S data when we move to the longer term, weakening the power of this analysis.
Coincident with the adoption of SFAS No. 131, we document a significant and sustained increase in consensus among the change firms' analysts. Since consensus captures analysts' relative reliance on public information versus the combined set of public and private in- formation, an increase in consensus suggests increased reliance on public information. At the same time, we find some evidence of an increase in overall uncertainty among the change firms' analysts. These results suggest that analysts abandon a more costly, albeit more informative private information set, in favor of a less costly public information set. Reliance on this public information set increases consensus while abandoning the richer private information set increases uncertainty. However, when we rerun the uncertainty anal- ysis for the subset of firms with data through 2000, we find no evidence of a change in overall uncertainty coincident with the adoption of SFAS No. 131. Accordingly, the latter result is sensitive to the set of firms examined.
In computing the mean forecast, the process of averaging across analysts' forecasts mitigates the impact of error in analysts' private information sets since this source of er- ror is idiosyncratic. However, the process of averaging does not mitigate the impact of error in the analysts' public information set as this source of error is common to all analysts (Barron et al. 1998). As a result, it is possible for the magnitude of the error in the mean forecast to increase with increased reliance on public information. Coincident with the adoption of SFAS No. 131, we document a significant increase in the magnitude of the error in the mean forecast. However, when we rerun the analysis for the subset of firms with data through 2000, we find no evidence of a change in the magnitude of the error in the mean forecast coincident with the adoption of SFAS No. 131. Accordingly, this result is sensitive to the set of firms examined.
Section II provides a brief description of the evolution of SFAS No. 131 and outlines our research questions in the context of related research. Section III describes our empirical proxies, while Section IV lays out our sample selection procedures and provides descriptive
The Accounting Review, July 2005

754 Botosan and Stanford
statistics. Section V presents the results of our analyses. Finally, Section VI provides a brief summary and conclusions.
II. BACKGROUND AND HYPOTHESES DEVELOPMENT SFAS No. 131 and SFAS No. 14
Prior research shows that the industry segment disclosures furnished by firms in com- pliance with SFAS No. 14 enhanced security valuation (Kinney 1971; Collins and Simonds 1979; Tse 1989) and improved analysts' earnings forecasts (Kinney 1971; Collins 1976; Baldwin 1984; Swaminathan 1991). This literature suggests that the information provided in compliance with SFAS No. 14 was useful to the capital markets. Even so, financial analysts and other users of financial reports maintain that SFAS No. 14 was inadequate in several respects (Knutson 1993). First, although encouraged, quarterly disclosure of segment information was not required under SFAS No. 14. The Association for Investment Man- agement and Research (AIMR) and the American Institute of Certified Public Accountants (AICPA) claimed that quarterly disclosure of segment information was one of the most important improvements needed (Knutson 1993; AICPA 1994). Evidence in Botosan and Harris (2000) disputes the severity of this problem, however. They find that more than 60 percent of their sample firms disclosed quarterly segment data on a voluntary basis prior to 1987. Thus, analysts' complaints may have stemmed from extremely poor disclosures by a minority of firms. Other improvements requested by users included (1) a greater number of segments for some enterprises, (2) more information about segments, (3) a segment breakdown that corresponds with internal management reports, and (4) consistency of segment information with information provided in other parts of the annual report.
SFAS No. 131 was implemented to rectify these perceived inadequacies of SFAS No. 14. Specifically, SFAS No. 131 requires interim reporting of segment information. In ad- dition, firms must identify industry segments for external reporting purposes in the same manner that management views operating segments for internal decision-making purposes. Also, firms are required to disclose information about each reportable segment that is similar to the information available to internal decision makers. Thus, firms may now choose their own definition of segment profit regardless of whether it is consistent with generally ac- cepted accounting principles. As discussed below, this particular attribute of SFAS No. 131 complicates the analysis of segment-level profitability.
Related Literature This paper examines managers' motives for withholding segment information under
SFAS No. 14 and the impact of SFAS No. 131 disclosures on analysts' information envi- ronment. In this respect, it adds to a growing body of research that uses firms' segment reporting choices as a setting in which to address questions related to the costs and benefits of voluntary and mandatory disclosures. For example, Harris (1998) provides empirical evidence that competition affects managers' segment disclosure choices. Piotroski (1999) documents an association between voluntary increases in the number of reportable segments and capital market benefits. Finally, Botosan and Harris (2000) find that firms are more likely to voluntarily increase the frequency of their segment disclosures following declines in market liquidity and analyst consensus, presumably to mitigate increased information asymmetry among market participants. Each of these studies uses SFAS No. 14 data.
More recently several studies investigate questions pertaining to segment reporting un- der SFAS No. 131. Herrmann and Thomas (2000) examine the reporting behavior of a sample of firms drawn from the largest of the Fortune 500 following the advent of SFAS No. 131. They conclude that SFAS No. 131 improved segment reporting based on an
The Accounting Review, July 2005

Managers' Motives to Withhold Segment Disclosures 755
assessment of changes in the number of reportable segments and the consistency between segment disclosures and the rest of the annual report. Street et al. (2000) find similar improvements for a sample of Global 1000 firms. In addition, 49 percent of the firms in their sample that reported no segment data under SFAS No. 14 initiated segment disclosures under SFAS No. 131. Both of these studies focus on how SFAS No. 131 impacted the segment disclosures firms provide; neither investigates managers' motives to withhold seg- ment information or the impact of SFAS No. 131 adoption on analysts' information environment.
Existing studies examining the effect of SFAS No. 131 on the information environment include Berger and Hann (2003) (hereafter BH) and Venkataraman (2001). BH compare industry-based forecasts of revenue and earnings using SFAS No. 14 data, to forecasts using retroactively disclosed SFAS No. 131 data, in order to measure the new information provided by SFAS No. 131 disclosures. They find that differences in these forecasts are associated with analysts' forecasts and stock prices suggesting that analysts and market participants had access to some of the SFAS No. 131 data before it was reported. This is consistent with analysts and market participants relying on private sources of information for these data, in the absence of SFAS No. 131 disclosures.
At the same time, consistent with SFAS No. 131 providing new information, BH doc- ument a decline in analysts' forecast errors coincident with the adoption of SFAS No. 131. We also examine changes in forecast errors coincident with the adoption of SFAS No. 131, but in contrast to BH, we limit our sample to firms that initiated segment disclosure under SFAS No. 131. This may explain why our results differ.
Finally, BH provide evidence that SFAS No. 131 improved monitoring. They find that, relative to multi-segment firms, firms initiating segment disclosure under the new standard had a smaller diversification discount pre-SFAS No. 131, and higher discount post-SFAS No. 131. They conclude "the new standard is effective in inducing diversified firms to reveal previously 'hidden' information about the firm's diversification strategy and its re- source transfers across segments" (BH 2003, 212).
Venkataraman (2001) uses the Barron et al. (1998) model to estimate the precision of public and private information and finds that the precision of public information and overall precision of information increased for firms that changed the number of segments they disclosed post-SFAS No. 131. In contrast, our analysis focuses on changes in analysts' relative reliance on public versus private information following the adoption of SFAS No. 131. Moreover, our sample is limited to firms initiating segment disclosures under SFAS No. 131, whereas the Venkataraman (2001) sample is not. In addition, Venkataraman (2001) does not investigate managers' motives to withhold segment information.
In summary, the research conducted to date indicates that the adoption of SFAS No. 131 resulted in a finer partitioning of firms' operating activities, a reduction in analyst forecast errors, and improved monitoring. Moreover, the extant evidence suggests that some of the information disclosed under SFAS No. 131 was obtainable prior to the requirement to disclose and that the precision of analysts' public and overall information set increased following SFAS No. 131.
We extend this research in several respects. First, we focus on firms that initiated segment disclosures in response to SFAS No. 131. This sample of firms is particularly interesting because the managers of these firms took maximum advantage of the flexibility inherent in SFAS No. 14 in defining their segments in order to avoid providing segment disclosures altogether. In contrast, much of the prior research employs samples more broadly defined to include firms whose segment disclosures changed following SFAS No. 131. Second, for our sample of initiating firms we examine both managers' motives for
The Accounting Review, July 2005

756 Botosan and Stanford
choosing to withhold segment disclosures prior to SFAS No. 131 and the impact of the initiation of disclosure on aspects of analysts' information environment not examined in prior research.
Research Questions Our first set of research questions focus on managers' motives for withholding segment
information under SFAS No. 14. Hayes and Lundholm's (1996) model of managers' vol- untary decisions to report segment data predicts that managers protect excess profits from being diminished by competitors through nondisclosure. This implies less disclosure in less competitive industries if excess profits (i.e., monopoly profits) are more likely in such industries and if these profits are protected by nondisclosure. Using SFAS No. 14 data, Harris (1998) finds that, when choosing among operations in different industries, managers are less likely to disclose operations in less competitive industries, consistent with abnormal profits being more prevalent there and with disclosure costs, on average, being correspond- ingly higher. Since theoretical evidence suggests that managers mitigate competitive costs through nondisclosure and existing empirical evidence suggests such competitive costs are higher in less competitive industries, we use the retroactive data that became available following the adoption of SFAS No. 131 to test the following hypothesis (all hypotheses are stated in alternate form):
Hi: The segment operations that firms concealed under SFAS No. 14 tended to operate in less competitive industries than the firm's primary industry.
The Hayes and Lundholm (1996) theory suggests that managers hide certain segments to protect profits. However, analysts and others complained that managers abused the lati- tude in SFAS No. 14 to conceal poor performance. Accordingly, we examine the following nondirectional hypothesis related to firm profit performance:
H2: The profit performance of firms that concealed segments under SFAS No. 14 was different from other firms in their industries.
Our second set of research questions concerns the effect of SFAS No. 131 on analysts' information environment. We use the Barron et al. (1998) model, which relates unobservable properties of analysts' information environments (e.g., overall uncertainty and consensus) to observable properties of their forecasts including forecast dispersion, squared error in the mean forecast, and the number of forecasts.
Barron et al. (1998) assume that analysts observe a public signal that is common to all analysts and a private signal that is unique to each individual analyst. They also assume that analysts' forecasts are unbiased and based only on their public and private signals. In this setting, Barron et al. (1998) demonstrate that analysts' overall uncertainty (V) is com- prised of common uncertainty (C) arising from analysts' reliance on the public signal and idiosyncratic uncertainty (D) arising from each analyst's reliance on his or her private signal. This relationship is captured by Equation (1):
V = C + D. (1)
Analyst consensus (p) is the ratio of common uncertainty to overall uncertainty. It captures analysts' relative reliance on public versus private information by measuring the
The Accounting Review, July 2005

Managers' Motives to Withhold Segment Disclosures 757
proportion of total uncertainty that is common across analysts due to analysts' reliance on public information. This relationship is captured by Equation (2):
p = C/V. (2)
Finally, squared error in the mean forecast (SE) fully reflects common uncertainty, but reflects only a fraction of idiosyncratic uncertainty. This result obtains because the process of averaging across N analyst forecasts has no effect on common uncertainty, but because uncertainty arising from analysts' reliance on private information is idiosyncratic, the effect of this uncertainty is diversified away in the mean forecast. This relationship is captured by Equation (3):
SE = C + DIN. (3)
With the passage of SFAS No. 131 additional segment information became publicly available. Segment disclosures are considered by financial analysts to be vital to their work (Knutson 1993). In addition, SFAS No. 131 specifically targeted analysts' complaints about the prior standard. Accordingly, we expect analysts to reduce their reliance on costly private information, choosing instead to employ the public information made available with the introduction of SFAS No. 131. Consequently we examine the following hypothesis, which predicts an increase in consensus post-SFAS No. 131:
H3: There is a significant increase in analysts' forecast consensus following the intro- duction of SFAS No. 131 disclosures.
While the Barron et al. (1998) model formalizes the definition of overall uncertainty, it does not predict the effect of SFAS No. 131 on overall uncertainty. In our setting, analysts are likely to abandon more costly private information in favor of less costly public infor- mation. To the extent these information sets vary in informativeness two outcomes are possible. If the public information set is more informative than the private information previously obtained, overall uncertainty will decline. Alternatively, if the public informa- tion set is less informative, uncertainty may increase. Accordingly, we examine the follow- ing nondirectional hypotheses pertaining to overall uncertainty:
H4: There is a change in the level of analysts' overall uncertainty following the intro- duction of SFAS No. 131 disclosures.
Finally, because squared error in the mean forecast fully reflects common uncertainty, but only partially reflects idiosyncratic uncertainty, the impact of SFAS No. 131 on squared error in the mean forecast is not clear. If analysts reduce their reliance on costly private information in light of the availability of SFAS No. 131 disclosures, then the diversification effect associated with private information is sacrificed. If the SFAS No. 131 information is sufficiently precise to offset this loss, then squared error in the mean forecast may decline; if not, then it may increase. Consequently, we test the following nondirectional hypothesis pertaining to the impact of SFAS No. 131 adoption on squared error in the mean forecast:
H5: There is a change in the squared error in the mean forecast following the intro- duction of SFAS No. 131 disclosures.
The Accounting Review, July 2005
758 Botosan and Stanford
III. RESEARCH DESIGN AND EMPIRICAL PROXIES Proprietary Costs
We provide evidence on managers' motives to withhold segment information under SFAS No. 14 by examining the competitive environment of the change firms' hidden seg- ments. We define industry in terms of the three-digit SIC assigned by Compustat and we use four-firm concentration ratios to measure competitive environment in our primary tests. We compute four-firm concentration ratios by taking the ratio of the sum of sales for the four largest firms in an industry to total industry sales. Our computations incorporate all firms included on the Compustat PST, Full Coverage, and Research tapes. As the market share held by the four largest firms increases, competition decreases; thus, concentration ratios are inversely related to the level of competition.
In supplementary analysis we use the Herfindahl index and the Harris (1998) Speed of Profit Adjustment metric to measure competitive environment. We estimate the Her- findahl index by summing the squared market share of all firms in an industry. The Herfindahl index is similar to the four-firm concentration ratio in that as it increases com- petition decreases. However, the Herfindahl index includes all firms in an industry not just the largest four.
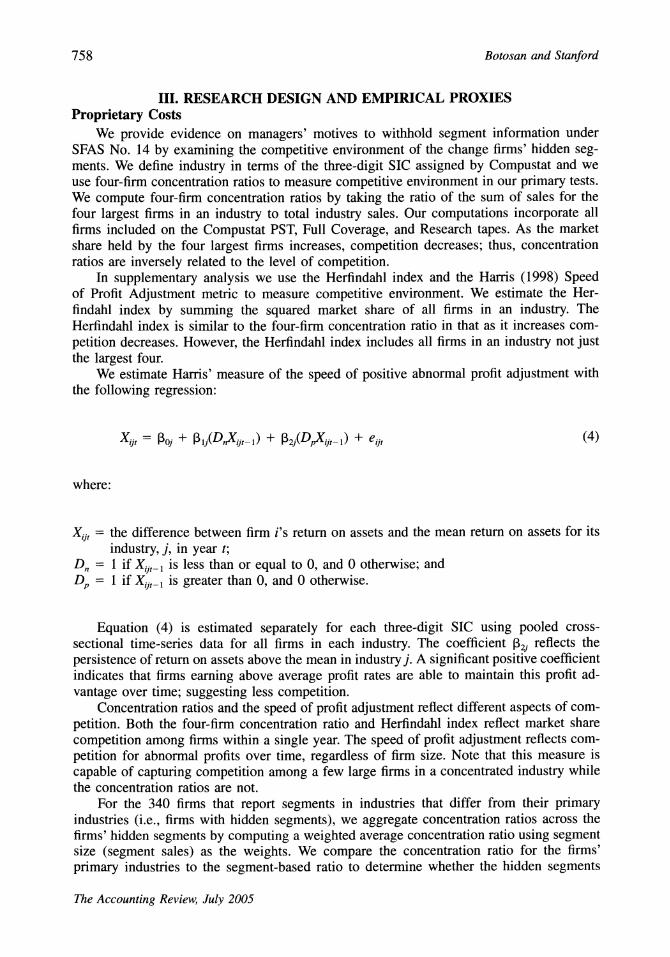
We estimate Harris' measure of the speed of positive abnormal profit adjustment with the following regression:
Xijt = Poj + Ilj(DnXijt-,)
+ 12j(DXijt-,)
+ eijt (4)
where:
X,,i = the difference between firm i's return on assets and the mean return on assets for its
industry, j, in year t; D, = 1 if Xijt,_ is less than or equal to 0, and 0 otherwise; and D, = 1 if Xijj, is greater than 0, and 0 otherwise.
Equation (4) is estimated separately for each three-digit SIC using pooled cross- sectional time-series data for all firms in each industry. The coefficient p32 reflects the persistence of return on assets above the mean in industry j. A significant positive coefficient indicates that firms earning above average profit rates are able to maintain this profit ad- vantage over time; suggesting less competition.
Concentration ratios and the speed of profit adjustment reflect different aspects of com- petition. Both the four-firm concentration ratio and Herfindahl index reflect market share competition among firms within a single year. The speed of profit adjustment reflects com- petition for abnormal profits over time, regardless of firm size. Note that this measure is capable of capturing competition among a few large firms in a concentrated industry while the concentration ratios are not.
For the 340 firms that report segments in industries that differ from their primary industries (i.e., firms with hidden segments), we aggregate concentration ratios across the firms' hidden segments by computing a weighted average concentration ratio using segment size (segment sales) as the weights. We compare the concentration ratio for the firms' primary industries to the segment-based ratio to determine whether the hidden segments
The Accounting Review, July 2005

Managers' Motives to Withhold Segment Disclosures 759
operated in more or less competitive industries than the firms' primary industries.2 Evidence that the firm's hidden segments operate in less competitive industries is consistent with H1.
Firm Performance Under SFAS No. 131 firms are allowed to define segment profit for external reporting
in terms of the internal amounts used by corporate executives to evaluate segment profit- ability. As a result, many different definitions of profit appear in firms' SFAS No. 131 disclosures and in many instances it is extremely difficult to identify the definition of profit employed by a firm in preparing its segment disclosures.3 Indeed, many of the concerns expressed by academics, regulators, and the business community in relation to "pro forma earnings" are equally applicable to the segment profit disclosures provided under SFAS No. 131. Moreover, many firms do not allocate selling, general, and administrative (SG&A) expenses to their segments producing unrealistically high profit margins at the segment level.
The multitude of profit definitions employed by firms and the ensuing difficulty we had identifying each firm's profit definition, combined with the bias induced by firms' decisions not to allocate SG&A expenses to their segments, make it difficult for us to assess profit- ability using reported segment profits. Accordingly, we employ segment sales and industry profit margins in our profit analysis as described below.
We undertake several comparisons to provide evidence on firm performance in the final fiscal years of SFAS No. 14 (1996 and 1997) and first fiscal year of SFAS No. 131 (1998). First, we assess the change firms' profit performance relative to a set of single-segment firms matched by three-digit SIC code, which continue to report as single-segment firms following the adoption of SFAS No. 131. Hereafter we refer to these firms as "no-change" firms. This comparison is relevant, because the change firms pooled with the no-change firms prior to SFAS No. 131 by virtue of the change firms' decision to withhold industry segment information. The no-change firms tend to be substantially smaller than the change firms, however, raising the possibility that differences in firm size confound our results. To address this issue, our second comparison assesses each change firm's profit performance relative to a firm matched by three-digit SIC code and sales. While the match firms are similar to the change firms in terms of size, they are fundamentally different in that the match firms did not use the flexibility afforded by SFAS No. 14 to the same extent as the change firms, perhaps because the nature of their operations did not afford them the flex- ibility to do so. Since both comparisons bring different advantages and disadvantages to bear, we believe that both are incrementally informative.
We examine the profitability of the change firms at both the firm-level and segment- level. We begin by assessing firm performance at the firm-level using benchmark measures of industry performance that were observable by market participants in real time. These comparisons assess how the change firms' profitability differs from that of other firms operating in the change firms' primary industries. The "other" firms used in this analysis are either the no-change firms or the match firm, but regardless, we estimate expected firm- level profit for the change firms by multiplying firm sales by an estimated industry net
2 For example, InfoUSA's firm SIC is 7374; under the new standard they report segments in SICs 7331 and 7374. Thus, we compare the four-firm concentration ratio for the firm's primary industry, SIC 737, to the concentration ratio for SIC 733 (in this case, the weight is 1.0).
3 We identified the following six profit definitions for our sample firms: earnings before interest and tax (57 percent), earnings before tax (12 percent), net income (12 percent), gross profit (11 percent), earnings before interest taxes, depreciation and/or amortization (5 percent), and earnings before discontinued operations and/ or extraordinary items (3 percent). However, even these definitions were inconsistent across firms.
The Accounting Review, July 2005

760 Botosan and Stanford
profit margin. For the analysis involving the no-change firms, our estimated industry net profit margin is the median net profit margin of the no-change firms, but for the analysis involving the match firm, we use the match firm's net profit margin. Finally, we estimate the change firms' unexpected profits, our test statistic, by taking the difference between the firms' reported and expected profits and scaling by their reported profits. These procedures produce two test statistics: one involving a comparison between the change and the median no-change firm, and the other involving a comparison between the change firms and their match firm.
We also assess firm performance at the segment-level using benchmark measures of industry performance that were not observable by market participants in real time. Instead, these benchmark measures would have been observable only if the firm had provided seg- ment disclosures. These comparisons assess how the change firms' profitability differs from that of other firms operating in the change firms' segments' industries. For purposes of this analysis we estimate expected segment-level profit for each of the change firms' segments by multiplying segment sales by the estimated industry net profit margin applicable to each segment. For purposes of the analysis involving the no-change firms, our estimated industry net profit margin is the median net profit margin of the no-change firms operating in the same three-digit SIC codes as the segments. For purposes of the analysis involving the match firm, our estimated industry net profit margin is the net profit margin of a match firm matched at the segment level on the basis of three-digit SIC code and sales.4 Finally, we sum the segment-level expected profits to arrive at firm-level expected profits and com- pute firm-level unexpected profits, our test statistic, by taking the difference between the firms' reported and expected profits and scaling by their reported profits. This procedure produces two additional test statistics, one involving the no-change firms and the other involving the match firms.
On the one hand, finding that the change firms are less profitable than their competitors using the observable, firm-level benchmark, but are more profitable using the unobservable, segment-level benchmark is consistent with firms using the flexibility in SFAS No. 14 to conceal segment details that could be used by competitors to the detriment of the firm. Such a conclusion is also supported if we find that the change firms are more profitable than their competitors using both the observable and unobservable benchmarks. On the other hand, finding that the change firms are more profitable than their competitors, using the observable firm-level benchmark, but are less profitable using the unobservable segment- level benchmark, is consistent with firms using the flexibility in SFAS No. 14 to conceal poor performance. Such a conclusion is also supported if we find that the change firms appear less profitable than their competition using both the observable and unobservable benchmarks.
Consensus, Uncertainty, and Squared Error in the Mean Forecast As stated in the hypothesis section of the paper, the Barron et al. (1998) model clarifies
the relation between certain properties of analysts' information environment (overall un- certainty, V, and consensus, p) and properties of analysts' forecasts (forecast dispersion, D, squared error in the mean forecast, SE, and the number of forecasts, N). Using the relations describe by Equations (1) through (3) presented in the hypothesis section, Barron et al.
4 Prior to performing the match we combine the sales of segments with the same three-digit SIC code. We identify the match firms based on the closest match to the combined sales figure and in so doing intentionally bias the matching process toward larger firms, thereby mitigating concerns of small-firm bias in the segment-level analysis.
The Accounting Review, July 2005

Managers' Motives to Withhold Segment Disclosures 761
(1998) express observable D and SE in terms of unobservable V and p. Barron et al. (1998) then reverse these expressions to specify unobservable V and p in terms of observable D, SE, and N, yielding the following equations, which we use to estimate V and p:
V =1 D + SE (5)
D
SE -
Np (6)
1- D+SE
where:
V = overall uncertainty; D = forecast dispersion, measured as the sample variance of the individual forecasts;
SE = squared error in the mean forecast, measured as the difference between earnings per share and the mean forecast, i.e., (EPS - mean forecast)2;
p = analyst consensus; and N = number of forecasts.
Using I/B/E/S one-quarter-ahead forecasts of quarterly earnings issued prior to each quarterly earnings announcement, we compute consensus, overall uncertainty, and squared error in the mean forecasts for each quarter beginning with January 1, 1997 and ending on December 31, 2000. We retain only the most recent forecast for each analyst for each quarter. We average the quarterly values of consensus, overall uncertainty, and squared error in the mean forecast across the four quarters within each year to arrive at average estimates for each firm year.
IV. SAMPLE SELECTION AND DESCRIPTION Sample Selection
We begin our sample selection with the 5,114 firms reporting as single-segment firms in their 1996 annual report. We eliminate non-December year-end firms for consistency and to ease data collection because we hand-collect segment data for 1996 through 1998. Com- pustat does not report the 1996 and 1997 retroactive segment data the change firms dis- closed in their 1998 financial statements. Accordingly, we hand-collect this segment data from the sample firms' 10-Ks and assign Compustat's 1998 segment SIC codes to the 1996 and 1997 retroactive segment data.
We examined footnote disclosures for each change firm to verify that SFAS No. 131 is the reason for initiating segment disclosure. We also compared the sum of our hand- collected segment sales data to consolidated sales data reported on Compustat. Due to concerns about data quality, we eliminated 16 firms for which the difference between these sales figures exceeds 10 percent. Also excluded from our final sample are firms whose SIC code places them in the banking, insurance, or utility industries. We exclude these firms because their disclosure behavior may be influenced by regulatory requirements.
Our final sample consists of 615, December year-end, change firms for which a 1998 10-K could be located and for which all other necessary data were available. For comparison purposes, we also identified 1,945 December year-end, no-change firms that report as
The Accounting Review, July 2005

762 Botosan and Stanford
single-segment firms before and after SFAS No. 131 and 615 match firms matched to the sample firms based on three-digit SIC code and sales. Since our profitability analysis in- volves comparisons at the segment-level as well as the firm-level, we also identify match firms for the segments based on segment three-digit SIC code and segment sales summed across segments with the same three-digit SIC code.
The sample firms operate in a wide variety of industries. Based on the firms' primary two-digit SIC codes, the most populated industry for the change and no-change firms is 73, which is business services. SIC 73 comprises 18.05 percent of the change firms and 14.81 percent of the no-change firms. In all, 41 two-digit SIC codes are represented in our final sample of change firms. Thus, our results are unlikely to be driven by any particular industry.
Consistent with findings in prior research, about 30 percent of the December year-end firms claiming single-segment status in 1996 began disclosing segment information under SFAS No. 131 (Berger and Hann 2003; Herrmann and Thomas 2000; Street et al. 2000). Thus, it appears that SFAS No. 131 has been effective in achieving the FASB's goal of increasing the number of reportable segments.
Sample Description Descriptive statistics for the year ended 1998 are reported in Table 1. Panel A provides
descriptive statistics pertaining to the number of segments reported by the change and match firms, and total sales and profit margin (earnings before extraordinary items/sales) for all three groups of firms. As shown, the mean (median) number of segments reported by firms forced to initiate segment disclosure with the adoption of SFAS No. 131 is 2.9 (3.0). By comparison, the number of segments reported by the match firms, most of which provided segment disclosures under SFAS No. 14, is slightly higher on average (3.2), but slightly lower at the median (2.0).
The median change firm has total sales of approximately $177 million in 1998. By construction, the median match firm's sales are close, albeit somewhat smaller, at $166 million. On a firm-by-firm basis (not tabled) the difference between the sales of each change firm and its match is approximately 3 percent of change firm sales at the mean, and 0.2 percent of change firm sales at the median. While these differences are statistically different from zero, economically the match on sales is quite close. In contrast, the no-change firm sample is comprised of relatively small firms. Median total sales of $55 million for the no- change sample is significantly less than the corresponding figure for the change firms.
Firm-level profit margin for the median change firms is 2.5 percent, whereas the cor- responding figures for the match and no-change firms are 3.4 percent and 1.0 percent, respectively. A tail of observations with extremely negative profit margins characterizes all three samples. Due to the existence of these outlying observations our subsequent statistical analyses focus on tests of median values.
Table 1, Panel B describes the nature of the change firms' newly revealed segments. The mean (median) proportion of all newly disclosed segments operating in the same industry as the firm's primary industry is 72.98 percent (75.00 percent). This is consistent with the change firms claiming to operate in only one industry prior to SFAS No. 131. However, 340, or 55 percent, of the 615 change firms report segments in industries different from their firm's primary industry. Consistent with analysts' complaints, the mean (median) proportion of firm sales accounted for by these segments is 31.22 percent (23.45 percent). Since SFAS No. 14 required segment disclosure of operations that accounted for 10 percent or more of sales, assets, or profits, this evidence suggests these firms abused the "latitude" in the standard to avoid disclosure.
The Accounting Review, July 2005

Managers' Motives to Withhold Segment Disclosures 763
TABLE 1 Descriptive Statistics for 1998
Panel A: Firm-Level Descriptive Statistics
Percentile Standard Variablea Mean 1% 25% 50% 75% 99% Deviation
Number of segments Change firmsb 2.90 2.00 2.00 3.00 3.00 6.00 1.00 Match firmsc 3.18 1.00 2.00 2.00 4.00 12.00 2.17
Total sales Change firms 1242.33 1.45 54.76 176.67 669.61 26273.00 4924.00 Match firms 913.50 1.42 52.98 165.92 605.88 8875.00 3506.00 No-change firmsd 428.99 0.08 12.20 55.40 217.49 8814.27 1728.00
Profit margin Change firms -0.218 -6.679 -0.041 0.025 0.072 0.400 1.438 Match firms -0.147 -5.306 -0.042 0.034 0.078 0.489 1.017 No-change firms -7.272 -53.029 -0.378 0.010 0.079 0.950 156.012
Panel B: Nature of Revealed Segments Mean Median
Proportion of segments with same three-digit SIC as the firm's primary SIC 72.98% 75.00%
Proportion of firm sales accounted for by segments with a three-digit SIC 31.22% 23.45% different from the firm's primary SIC, n = 340
Panel C: Number of Segments Reported
Change Firms Match Firms # % # %
One 0 0.0 96 16.2 Two 260 42.3 212 35.8 Three 220 35.8 83 14.0 Four 87 14.1 83 14.0 Five 32 5.2 45 7.6 Six 15 2.4 28 4.7 Seven 1 0.2 21 3.6
Eight or more 0 0.0 24 4.1
Total firms 615 100.0 592 100.0
a Number of segments is the number of segments reported by the firm in 1998. Total sales are the dollar amount reported by the firm in its 1998 financial statements stated in millions of dollars. Profit margin is earnings before extraordinary items for the year ended 1998 scaled by total sales at the end of 1998.
b The change firm sample consists of 615 firms that reported as single-segments firms before the adoption of SFAS No. 131 and multi-segment firms after the adoption of SFAS No. 131.
c The match firm sample consists of 615 firms matched to the change firms on the basis of three-digit SIC code and sales. Twenty-three of these firms are not included on the Compustat Segment tape. As a result, the number of segment statistic quoted above is based on 592 observations.
d The no-change firm sample consists of 1,945 firms that reported as single-segment firms before and after the adoption of SFAS No. 131.
The Accounting Review, July 2005

764 Botosan and Stanford
Table 1, Panel C reports the distribution of the number of new segments reported by the change firms and the number of segments reported by the match firms. The majority of the change firms, 42.3 percent, report only two segments. However a substantial pro- portion, 35.8 percent, reports three segments and 14.1 percent report four segments. Again this is consistent with some of the change firms abusing the flexibility allowed under SFAS No. 14 to provide significantly less disclosure than under SFAS No. 131. Less than 8 percent of the change firms report more than four segments. In contrast, at one extreme, 16 per- cent of the match firm sample consists of single-segment firms, while at the other extreme, 20 percent of the match firms report more than four segments.
V. EMPIRICAL RESULTS Competitive Environment and Profit Performance
Table 2, Panel A suggests that the change firms' hidden segments operate in less com- petitive industries than their primary industries. For firms with hidden segments, n = 340, the mean (median) difference between the concentration ratio of the firms' primary indus- tries and the weighted average concentration ratio of the hidden segments' industries is -0.006 (-0.012) with p-values of 0.67 (0.04). Since a smaller concentration ratio implies a more competitive environment, a negative value indicates that the firms' hidden segments operate in less competitive industries than the firms' primary industries. Although only significant at the median, the difference in firm and weighted average segment concentration ratios is negative for 56 percent of the firms indicating that for a majority of the firms their hidden segments operate in less competitive industries.
In supplementary analysis, not included in the tables, we examine two alternative mea- sures of competitive environment: the Herfindahl ratio and the Harris (1998) Speed of Profit Adjustment (SPA) measure. The results obtained with the Herfindahl ratio are quite similar to those reported in the table. The change firms' hidden segments operate in less competitive industries than their firms' primary industries, but this result is significant only at the median (p-value 0.045). Stronger evidence consistent with H1 is documented with the SPA measure, however. Using this measure the hidden segments operate in less competitive industries than their firms' primary industries and this result is highly significant at both the mean and median (p-values of 0.0001 for both). Accordingly, based on the results of these three sets of analyses we conclude that firms withholding segment disclosures under SFAS No. 14 hid operations in less competitive industries, consistent with H1.
Panel B of Table 2 documents the results of our firm-level assessment of the profit performance of the change firms relative to the no-change and match firms. Recall that this benchmark would have been observable in real time. At the median, we find that the change firms' reported profits are significantly greater than the benchmark profits implied by the no-change firms' net profit margins, in all three years. However, we also find that the change firms' reported profits are significantly less at the median than the benchmark profits implied by the size and industry match firms' net profit margins, in all three years.
Panel C of Table 2 documents the results of our segment-level assessment of profit performance. Recall, that for this analysis we compute a benchmark measure of expected profit that could have been computed only if the firms had provided segment disclosures. At the median, we find that the change firms' reported profits are significantly greater than the expected profits implied by the net profit margins of the no-change firms operating in same industries as the change firms' segments. In addition, we find no difference between the change firms' profits and the expected profits implied by the net profit margins of the match firms operating in the same industries as the change firms segments.
The Accounting Review, July 2005

co?
co
co
---
TABLE 2 Analysis of Competitive Environment and Profit Performance
(p-values in parentheses)a
Panel A: Competitive Environment Analysisb
1998 Mean Median
Firm-by-firm difference between the firm's industry concentration ratio and the weighted-average concentration ratio of -0.006 -0.012 the segments' industries (computed as firm - weighted average segment) (0.6747) (0.0446)
Panel B: Firm-Level Profitability Analysisc 1996 1997 1998
Comparison Set Mean Median # Mean Median # Mean Median #
No-Change Firms 2.478 0.384 535 5.493 0.251 611 6.314 0.172 615 (0.0114) (0.0004) (0.0026) (0.0152) (0.2079) (0.0309)
Match Firms 1.005 -0.038 535 -1.153 -0.121 611 -3.066 -0.150 615 (0.2872) (0.0195) (0.2454) (0.0228) (0.1559) (0.0351)
Panel C: Segment-Level Profitability Analysisd 1996 1997 1998
Comparison Set Mean Median # Mean Median # Mean Median #
No-Change Firms 2.625 0.426 535 5.208 0.296 611 9.720 0.184 615 (0.0099) (0.0001) (0.0017) (0.0002) (0.0835) (0.0004)
Match Firms -0.069 0.102 534 9.272 0.017 610 -0.505 0.115 612 (0.8981) (0.7396) (0.2126) (0.4276) (0.7830) (0.1159)
a p-values in parentheses below the mean figures are from a two-tailed t-test. p-values in parentheses below the median figures are from a two-tailed signed rank test. b Concentration is the four-firm industry concentration ratio computed using data from 1998 for all firms on Compustat. The figure in the table is the difference
between industry concentration in the firm's primary SIC and a weighted average segment-based concentration ratio using segment sales as the weight. This analysis incorporates only those segments whose SIC codes differ from their firms' primary SIC code (340 firms).
c Firm-level profit performance: We estimate expected profit at the firm-level by multiplying the firm's sales by the industry profit margin associated with the firm's primary SIC code using one of two comparison sets: (1) the median no-change firm profit margin, or (2) the match firm profit margin. The figure quoted in the table is computed by taking the difference between the firm's reported profit and expected profit and scaling by reported profit.
d Segment-level profit performance: We estimate expected profit (ultimately at the firm-level) by multiplying each segment's sales by the industry profit margin associated with the segment's industry using one of two comparison sets: (1) the median no-change firm profit margin, or (2) the match firm profit margin with the match identified based on segment three-digit SIC code and segment sales. We sum across segments to arrive at firm-level expected profit. The figure quoted in the table is computed by taking the difference between the firm's reported profit and expected profit and scaling by reported profit.
(h
O
;S
;S 0~0
Ch 1
C X hr
O O

766 Botosan and Stanford
Taken together, the results presented in Panels B and C of Table 2 suggest the following with respect to H2. First, it is clear from the analysis involving the match firms that by withholding segment disclosures, the change firms allowed themselves to appear as if they were underperforming their competition, when this was not the case. Moreover, relative to both the pre-SFAS No. 131 observable and unobservable benchmarks, the change firms outperformed the no-change firms in their industries in all three years. In neither case is the evidence consistent with the change firms withholding segment disclosures to hide poor performance. Finally, in supplementary analyses we re-analyze the data including only the 340 firms with hidden segments. The results of these analyses (not included in the tables) produce even stronger results consistent the conclusions drawn from Table 2, Panels B and C.
Overall, the results in Table 2 pertaining to both the competitive environment analysis and the profitability analysis, reveal a consistent and compelling story. That is, the change firms were motivated to exploit the flexibility inherent in SFAS No. 14 to protect profits from competitors, not to hide poor performance from the capital market. These results are consistent with abnormal profits being more likely, on average, in less competitive indus- tries, and managers of firms that earn excess profits facing higher proprietary disclosure costs.
Effect on Financial Analysts Table 3, Panel A presents the results of our analysis of changes in consensus, overall
uncertainty, and error in the mean forecast for the change firms with forecast data on I/B/E/S. For comparison, Panel B presents the same information for the no-change firms with I/B/E/S data. For each variable we present both the value of the variable for the year and the change in its value from the preceding year.
We test our hypotheses pertaining to the changes in analysts' information environment in two ways. First, we compute within-firm year-to-year changes in consensus, overall uncertainty, and squared error in the mean forecast; p-values for differences from zero are reported in parentheses. Second, we compare the change experienced by the change firms to that experienced by the no-change firms; p-values for differences between groups are reported in square brackets. This latter comparison is conducted to control for changes in analysts' information environment unrelated to the adoption of SFAS No. 131, but if the initiation of segment disclosure by the change firms impacts the information environment of the no-change firms through information spillover effects, this analysis understates the effect of SFAS No. 131 on analysts' information environment.
We present results for two time horizons. The first incorporates levels and changes in analyst forecast properties for: (1) the year before segment data became available, i.e., between 1997 and 1998, and (2) the first year with segment data available, i.e., between 1998 and 1999. There are 327 change firms with sufficient I/B/E/S data to perform these computations. The second extends the time horizon to include the second year with segment data available, i.e., between 1999 and 2000. Fewer firms have I/B/E/S data for all years 1997-2000, reducing our sample size for the change firms to 258.5 This latter analysis allows us to assess whether any changes in the forecast properties observed between 1998 and 1999 reverse in 2000, but at the cost of a reduced level of statistical power. Due to additional reductions in sample size, we do not extend our analysis beyond 2000.
5 The sample size declines by similar amounts for both the change and no-change firms, 21 percent and 19 percent, respectively, when we require four consecutive years of I/B/E/S data. Accordingly, we do not believe this decline is indicative of any bias in the change sample.
The Accounting Review, July 2005

-con
a
a cz
TABLE 3 Effect of SFAS No. 131 Disclosures Available Beginning in 1998 on Financial Analysts
(p-values for difference from zero in parentheses)a [p-values for test comparing the change and no-change firms]a
Two-Year Horizon Three-Year Horizon 1997 1998 1999 1997 1998 1999 2000
Panel A: Change Firms
Mean consensusb 0.587 0.553 0.605 0.575 0.556 0.614 0.600 Mean change in consensusc -0.033 0.051 -0.019 0.059 -0.014
(0.190) (0.027) (0.478) (0.026) (0.585) [0.487] [0.028] [0.562] [0.020] [0.139]
Mean overall uncertaintyb 0.005 0.006 0.008 0.004 0.005 0.006 0.008 Mean change in overall uncertaintyc 0.001 0.002 0.001 0.000 0.003
(0.287) (0.060) (0.213) (0.656) (0.004) [0.557] [0.124] [0.642] [0.184] [0.649]
Squared error in the mean forecastb 0.004 0.004 0.007 0.003 0.004 0.005 0.007 Change in the squared error in the mean 0.001 0.002 0.001 0.001 0.002
forecaste (0.445) (0.043) (0.408) (0.389) (0.021) [0.617] [0.085] [0.649] [0.105] [0.851]
Mean number of analysts 7.91 8.69 9.05 8.39 9.09 9.81 9.43 No. of firms 327 327 327 258 258 258 258
(continued on next page)
al

oo
TABLE 3 (continued)
Two-Year Horizon Three-Year Horizon 1997 1998 1999 1997 1998 1999 2000
Panel B: No-Change Firms
Mean consensus 0.606 0.595 0.574 0.608 0.608 0.581 0.615 Mean change in consensus -0.012 -0.021 0.001 -0.027 0.034
(0.528) (0.288) (0.979) (0.200) (0.086) Mean overall uncertainty 0.004 0.006 0.006 0.004 0.006 0.005 0.007 Mean change in overall uncertainty 0.001 0.000 0.002 -0.001 0.002
(0.005) (0.835) (0.001) (0.084) (0.001) Squared error in the mean forecast 0.004 0.005 0.005 0.004 0.005 0.004 0.005 Change in the squared error in the mean forecast 0.001 0.000 0.001 -0.001 0.002
(0.029) (0.907) (0.035) (0.103) (0.007) Average number of analysts 6.91 8.26 9.06 7.34 8.81 10.06 9.67 No. of firms 529 529 529 429 426 426 426
a p-values are two-sided except for change in consensus in 1999, which is one-sided due to our hypotheses. b Consensus and overall uncertainty are measured with Equations (6) and (5), respectively. Squared error in the mean forecast is the square of earnings per share less the mean forecast, i.e., (EPS - mean forecast)2.
c SFAS No. 131 data became available for the first time in annual reports for years ending Dec. 31, 1998. Change amounts for the 1998 column are the difference between 1997 and 1998, the year before the SFAS No. 131 became available. Change amounts for the 1999 column are the difference between 1998 and 1999, the first year the SFAS No. 131 was available. Change amounts for the 2000 column are the difference between 1999 and 2000, the year after SFAS No. 131 data was available.
o•
r,o
t,o

Managers' Motives to Withhold Segment Disclosures 769
We document a significant increase in analyst forecast consensus for the change firms coincident with SFAS No. 131. As expected, between 1997 and 1998 (the year prior to the onset of disclosure) the mean change in consensus is not statistically significant. However, between 1998 and 1999 (the initial year of disclosure) consensus increases 0.051 (p-value = 0.027) from 0.553 to 0.605. In contrast, changes in consensus are not statistically sig- nificant for either year for the no-change firms (see Panel B of Table 3), even with a 60 percent larger sample size. The t-tests comparing the two groups indicate that the increase in consensus experienced by the change firms is statistically greater than the change in consensus experienced by the no-change firms (p-value of 0.028). Using a reduced sample of firms with forecasts in all four years from 1997 to 2000, we show that the increase in analyst forecast consensus is sustained through 2000 (the year following initial disclosure). Specifically, this subsample experiences a significant increase in consensus from 1998 to 1999 (p-value of 0.026), but an insignificant change in consensus both the year prior to initial disclosure, and the year after. Since consensus captures the amount of common information relative to total information impounded in analysts' forecasts, this increase suggests greater reliance on public information, consistent with H3. Overall, these results indicate that analysts responded to the change in their information environment by increas- ing their reliance on the public information that became available under SFAS No. 131.
Table 3, Panels A and B document mixed results from our analysis of changes in overall uncertainty around the introduction of SFAS No. 131. Consistent with H4, the data indicate no change in overall uncertainty for the change firms between 1997 and 1998 (the pre- SFAS No. 131 period), but a marginally significant increase in overall uncertainty between 1998 and 1999 (p-value of 0.060). In contrast, the no-change firms experience a significant increase in overall uncertainty the year before initial disclosure of segment information by the change firms, but experience no significant change in overall uncertainty in the year of disclosure. At the same time, analysis of the smaller sample for which we have a longer time-series of data, indicates no significant change in the change firms analysts' mean overall uncertainty until 2000 (the second year of disclosure), but significant changes in the no-change firms analysts' mean overall uncertainty in each year. Accordingly, we con- clude that there is evidence of a marginal increase in overall uncertainty coincident with the adoption of SFAS No. 131, but this result is sensitive to the subset of firms examined.
Finally, Table 3, Panels A and B present the results of our analysis of changes in the squared error in the mean forecast (SE) around the adoption of SFAS No. 131. These results are similar to those discussed above pertaining to overall uncertainty. For the change firms, we document no significant change in the SE prior to adoption of SFAS No. 131, but a significant increase in the SE coincident with SFAS No. 131 adoption (p-value of 0.043). In contrast, the no-change firms experienced an increase in the SE the year prior to the adoption of SFAS No. 131, but no change in the SE in the year of adoption. These results are consistent with H5. However, using the smaller sample for the longer time horizon, we find no significant change in the change firm analysts' SE until 2000, whereas the no- change firm analysts' experienced significant increases in SE the year before and the year after adoption. Accordingly, we conclude that there is evidence of an increase in squared error in the mean forecast coincident with the adoption of SFAS No. 131, but this result is sensitive to the subset of firms examined.
VI. SUMMARY AND CONCLUSION Using retroactive disclosures required by Statement of Financial Accounting Standards
(SFAS) No. 131, we examine managers' incentives for withholding segment information under SFAS No. 14 and the impact of SFAS No. 131 on analysts' information environment
The Accounting Review, July 2005

770 Botosan and Stanford
for a sample of firms that previously reported as single-segment firms. We examine this set of firms because they likely had the strongest incentives to withhold segment information and analysts potentially had the most to gain when these firms were forced to begin pro- viding segment disclosures under SFAS No. 131. Moreover, these firms epitomized analysts' complaints that some firms abused the latitude in SFAS No. 14 to avoid providing any segment disclosure. Thus, we believe this set of firms is well suited to the research questions we investigate.
Our study provides varying degrees of support for both sides of the debate surrounding SFAS No. 131. First, our results suggest that the managers of firms forced to initiate segment disclosures under SFAS No. 131 withheld segment information under SFAS No. 14 to protect profits in less competitive industries, not to conceal poor performance as some have alleged. This supports managers' claims regarding the proprietary costs of segment disclosure and does not support analysts' claims that managers concealed poor performance. Second, the majority of the firms initiating segment disclosures under SFAS No. 131 (55 percent) report segment operations in industries distinct from their firm's primary industry. The mean (median) percent of firm sales accounted for by these operations is 31.2 percent (23.5 percent), which is far in excess of the SFAS No. 14 requirement to report any segment accounting for 10 percent or more of sales, assets, or profits. This supports analysts' claims that multi-segment firms masqueraded as single-segment firms under SFAS No. 14. At the same time, 45 percent of the change firms report segments, all of which have the same three-digit SIC code as the firm's primary industry. Thus, even though these change firms now report segment data, the data provided pertains to activities in a single-industry clas- sification, providing limited cross-industry variation among the newly reported segments. Finally, our evidence suggests that while SFAS No. 131 encourages greater reliance on public information (presumably due to lower information acquisition costs), overall uncer- tainty and the magnitude of the error in the mean forecast also increased marginally for the change firms. These results suggest that the analysts' shift to greater reliance on public information came at a cost in terms of forecast accuracy. However, these results are sensitive to the set of firms examined.
REFERENCES American Institute of Certified Public Accountants (AICPA), Special Committee on Financial Re-
porting. 1994. Improving Business Reporting--A Customer Focus. Jersey City, NJ: AICPA. Baldwin, B. 1984. Segment earnings disclosure and the ability of security analysts to forecast earnings
per share. The Accounting Review (July): 376-389. Barron, O., O. Kim, S. Lim, and D. Stevens. 1998. Using analysts' forecasts to measure properties
of analysts' information environment. The Accounting Review 74 (October): 421-433. Berger, P. G., and R. Hann. 2003. The impact of SFAS No. 131 on information and monitoring.
Journal of Accounting Research (Supplement): 163-224. Botosan, C., and M. Harris. 2000. Motivations for changes in disclosure frequency and its conse-
quences: An examination of voluntary quarterly segment disclosures. Journal of Accounting Research 38 (Autumn): 329-354.
Collins, D. 1976. Predicting earnings with sub-entity data: Some further evidence. Journal of Ac- counting Research (Spring): 163-177.
, and R. Simonds. 1979. SEC line-of-business disclosure and market risk adjustments. Journal of Accounting Research (Autumn): 352-383.
Financial Accounting Standards Board (FASB). 1975. Financial Reporting for Segments of a Business Enterprise. Statement of Financial Accounting Standards No. 14. Stamford, CT: FASB.
The Accounting Review, July 2005

Managers' Motives to Withhold Segment Disclosures 771
--- . 1997. Disclosures About Segments of an Enterprise and Related Information. Statement of Financial Accounting Standards No. 131. Stamford, CT: FASB.
Harris, M. 1998. The association between competition and managers' business segment reporting choices. Journal of Accounting Research (Spring): 111-128.
Hayes, R., and R. Lundholm. 1996. Segment reporting to the capital market in the presence of a competitor. Journal of Accounting Research (Autumn): 261-279.
Herrmann D., and W. Thomas. 2000. An analysis of segment disclosures under SFAS No. 131 and SFAS No. 14. Accounting Horizons (September): 287-302.
Kinney, W. Jr. 1971. Predicting earnings: Entity versus sub-entity data. Journal of Accounting Re- search (Spring): 127-136.
Knutson, P. 1993. Financial Reporting in the 1990s and Beyond. A position paper of the Association for Investment Management and Research. Charlottesville, VA: Association for Investment Man- agement and Research.
Pacter, P. 1993. Reporting Disaggregated Information. Financial Accounting Series Research Report. Norwalk, CT: FASB.
Piotroski, J. 1999. The impact of newly reported segment information on market expectations and stock prices. Working paper, University of Chicago.
Street, D., N. Nicols, and S. Gray 2000. Segment disclosures under SFAS No. 131: Has business segment reporting improved? Accounting Horizons (September): 259-285.
Swaminathan, S. 1991. The impact of SEC mandated segment data on price variability and divergence of beliefs. The Accounting Review (January): 23-41.
Tse, S. 1989. Attributes of industry, industry segment, and firm-specific information in security val- uation. Contemporary Accounting Research 5: 592-614.
Venkataraman, R. 2001. The impact of SFAS 131 on financial analysts' information environment. Working paper, Pennsylvania State University.
The Accounting Review, July 2005
Copyright © 2022 FDOKUMEN