Managerial Biases and Energy Savings: An Empirical Analysis of the Adoption of Process Improvement...
31
1 Managerial Biases and Energy Savings: An Empirical Analysis of the Adoption of Process Improvement Recommendations February 16, 2009 Suresh Muthulingam * Anderson School of Management, University of California, Los Angeles, California 90095-1481, [email protected] Charles J. Corbett * Anderson School of Management, University of California, Los Angeles, California 90095-1481, [email protected] Shlomo Benartzi Anderson School of Management, University of California, Los Angeles, California 90095-1481, [email protected] Bohdan Oppenheim Frank R. Seaver College of Science and Engineering, Loyola Marymount University, Los Angeles, California 90045-2659, [email protected] * Corresponding authors Abstract We investigate the adoption and non-adoption of energy efficiency initiatives using a database of over 100,000 recommendations provided to more than 13,000 small and medium sized manufacturing firms. Even though the average payback across all recommendations is just over one year, many of these profitable opportunities are not implemented. Using a probit instrumental variable model, we identify four biases in the adoption of these recommendations. First, managers are myopic as they miss out on many profitable opportunities. Second, managers are more influenced by upfront costs than by net benefits when evaluating such initiatives. Third, adoption of a recommendation depends not only on its characteristics but also on the sequence in which the recommendations are presented. Adoption rates are higher for initiatives appearing early in a list of recommendations. Finally, adoption is not influenced by the number of options provided to decision makers. This contributes to the debate about whether or not choice overload occurs. We highlight decision biases previously unobserved in the Operations Management literature using field data rather than experimental data. We draw implications for enhancing adoption of energy efficiency initiatives and for other decision contexts where a collection of process improvement recommendations are made to firms. Keywords: Process Improvement, Energy Efficiency, Decision Bias, Adoption, Environment, Behavioral Operations 1. Introduction This paper investigates the adoption and non-adoption of energy-saving opportunities resulting from recommendations made to small and medium sized manufacturing firms. Most of these energy-saving
-
Upload
anderson-ucla -
Category
Documents
-
view
0 -
download
0
Transcript of Managerial Biases and Energy Savings: An Empirical Analysis of the Adoption of Process Improvement...
1
Managerial Biases and Energy Savings: An Empirical Analysis of
the Adoption of Process Improvement Recommendations
February 16, 2009
Suresh Muthulingam
*
Anderson School of Management, University of California, Los Angeles, California 90095-1481, [email protected]
Charles J. Corbett*
Anderson School of Management, University of California, Los Angeles, California 90095-1481, [email protected]
Shlomo Benartzi Anderson School of Management, University of California, Los Angeles, California 90095-1481, [email protected]
Bohdan Oppenheim Frank R. Seaver College of Science and Engineering, Loyola Marymount University, Los Angeles, California
90045-2659, [email protected]
*Corresponding authors
Abstract
We investigate the adoption and non-adoption of energy efficiency initiatives using a database of over 100,000 recommendations provided to more than 13,000 small and medium sized manufacturing firms. Even though the average payback across all recommendations is just over one year, many of these profitable opportunities are not implemented. Using a probit instrumental variable model, we identify four biases in the adoption of these recommendations. First, managers are myopic as they miss out on many profitable opportunities. Second, managers are more influenced by upfront costs than by net benefits when evaluating such initiatives. Third, adoption of a recommendation depends not only on its characteristics but also on the sequence in which the recommendations are presented. Adoption rates are higher for initiatives appearing early in a list of recommendations. Finally, adoption is not influenced by the number of options provided to decision makers. This contributes to the debate about whether or not choice overload occurs. We highlight decision biases previously unobserved in the Operations Management literature using field data rather than experimental data. We draw implications for enhancing adoption of energy efficiency initiatives and for other decision contexts where a collection of process improvement recommendations are made to firms.
Keywords: Process Improvement, Energy Efficiency, Decision Bias, Adoption, Environment,
Behavioral Operations
1. Introduction
This paper investigates the adoption and non-adoption of energy-saving opportunities resulting from
recommendations made to small and medium sized manufacturing firms. Most of these energy-saving

2
opportunities pertain to process improvements in operations, such as improved management of existing
systems, modification or replacement of equipment, minimization of waste or resource usage, enhanced
quality management, adoption of preventive maintenance and improvement of productivity and
management practices.
Adoption of process improvements contributing to energy efficiency can have a significant impact.
For instance, the Intergovernmental Panel on Climate Change (IPCC) estimates that over 2.5 gigatonnes
of CO2 equivalents per year can be saved in 2030 using energy efficiency measures. This is nearly 4% of
overall anthropogenic CO2 emissions forecast for 2030 (Bernstein et al. 2007) and equivalent to the
emissions of nearly 54% of the passenger vehicles in the world in 2004 (Bush et al. 2006, Emission Facts
2005). The United States has been aware of the immense potential and has been striving to improve
energy efficiency since the early seventies. Industry accounts for a third of the energy usage in the United
States, which is why the US Department of Energy (DOE) has been working to improve energy intensity
in industry through the Industrial Technologies Program (ITP).
The Industrial Assessment Centers (IAC) program is part of the ITP and provides free energy
efficiency assessments to small and medium sized firms. The IAC program has been in existence since
1976 and is estimated to have provided cumulative energy savings of 1280 trillion BTU by 2005 (Impacts
2005). The energy efficiency assessments are done by faculty and students from accredited engineering
schools (Muller et al. 2004). Specific improvement recommendations covering the entire gamut of
operational improvements including equipment modification, operating procedures and management
practices are provided in a report to the firm. Subsequently, the implementation status of the
recommendations is tracked by the respective IAC.
The recommendations usually have very attractive rates of return and their average payback period is
just over a year. A former IAC director (one of the authors) illustrates how easy it can be to achieve
substantial savings: “A quarter-inch diameter hole in a compressed air system implies $5,000 per year in
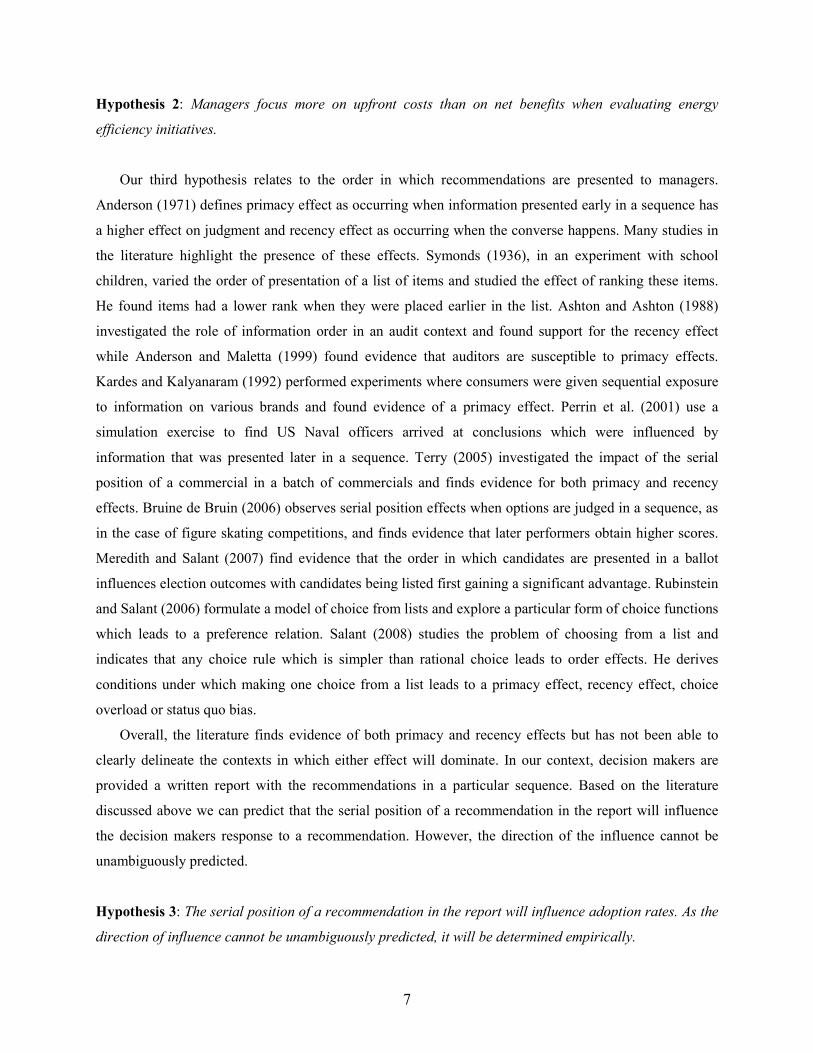
wasted energy costs.” However, even with attractive rates of return, many energy efficient process
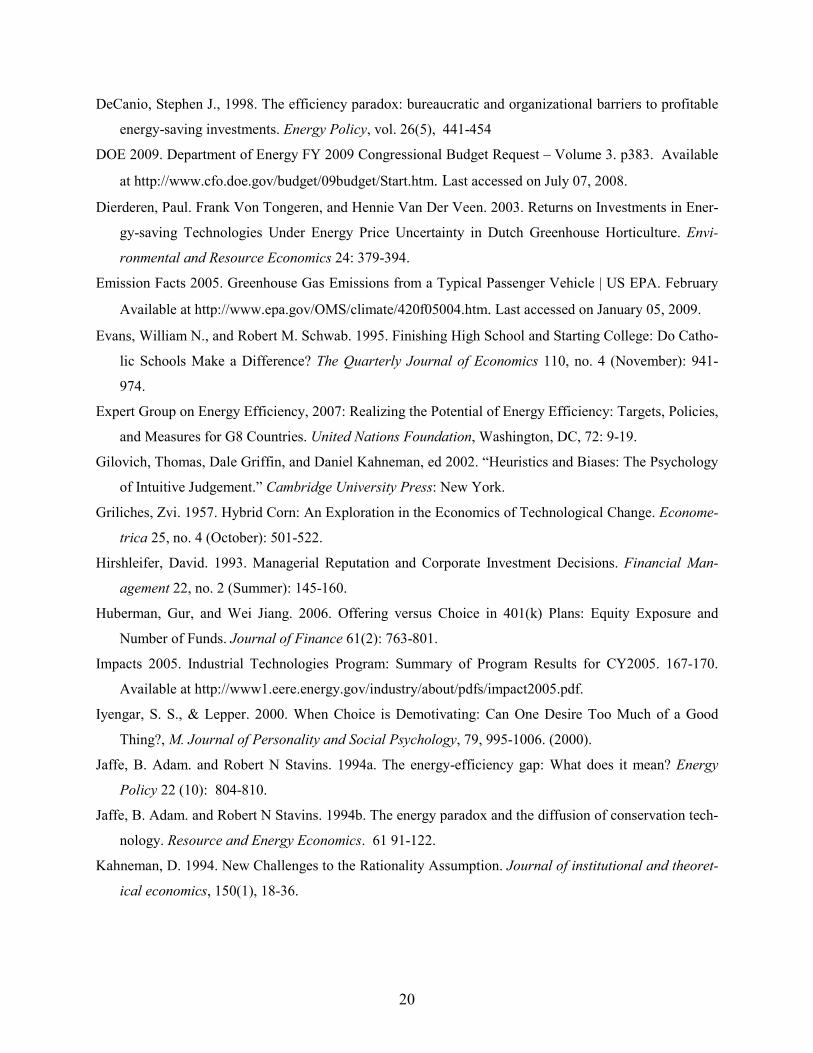
improvement recommendations are not implemented, as demonstrated in Figure 1. This is in line with
what has been documented in the energy efficiency literature. Many studies indicate that a significant
proportion of energy efficiency opportunities are not exploited (Expert Group on Energy Efficiency
2007). Various studies have postulated theories and explanations for this apparent anomaly; however, the
literature struggles to explain the high rates of non-adoption of profitable energy efficiency initiatives.
The literature has drawn extensively from fields ranging from economics to organizational learning in its
attempt to explain the gap in adoption. Behavioral explanations using concepts ranging from bounded
rationality to inertia have also been proposed in the literature (Rohdin and Thollander 2006). However, as
Kempton et al. (1992) point out, much of the psychological research has focused on residential energy
3
users at home. Behavioral aspects related to the adoption of energy efficiency initiatives in an industrial
context are largely unexplored.
In this paper, we study the role of biases in the adoption of energy efficiency initiatives in an
operational context. We find that managers are myopic as they miss out on many profitable energy
efficiency initiatives. They are more influenced by upfront costs than by net benefits when evaluating
these initiatives. Further, we find that the adoption of a recommendation is influenced by the sequence in
which it is presented. We also find that decision makers are not influenced by the number of
recommendations made to them.
This paper aims to make four key contributions. First, it studies the adoption of energy efficiency
initiatives to enable a better understanding of the reasons why a significant proportion of the energy
efficiency potential remains untapped. This understanding may help improve adoption rates. Second,
since the recommendations cover a wide range of operations, this understanding may facilitate adoption
of process improvement initiatives more generally. Third, the paper demonstrates decision biases
previously undocumented in the OM literature. Fourth, it highlights behavioral issues using actual field
data as opposed to the majority of the behavioral operations literature which uses experiments.
The rest of the paper is organized as follows. In Section 2, we review relevant literature. In Section 3,
we present the hypotheses. In Section 4, we describe the data. In Section 5, we present our methodology
and results. In Section 6, we discuss the results, implications of our findings and limitations of our
analysis. In Section 7, we provide a summary, discuss policy implications and indicate areas for further
research.
2. Literature Review
Our work draws on and contributes to several streams of literature: the adoption of innovations in general,
the adoption of energy efficiency innovations in particular, and the behavioral literature pertaining to
choice decisions between multiple (non-exclusive) alternatives. We provide a broad overview of the
relevant literature in these areas, but defer a more detailed discussion of literature pertaining to our
specific hypotheses to the next section.
Rogers (2003) suggests that the relative advantage of an innovation – the ratio of the expected
benefits and the costs of adopting an innovation – is one of the strongest predictors of an innovation’s rate
of adoption. One of the sub-dimensions of relative advantage is economic profitability. Evidence
supporting the influence of economic profitability on the rate of adoption has been observed across many
innovations, ranging from hybrid corn in agriculture (Griliches 1957) to continuous mining machines in
bituminous coal (Mansfield 1961). In the context of environmental innovations, Porter and Van der Linde
4
(1995) and many others provide numerous examples of innovations which provide net benefits to firms.
King and Lenox (2002) find that firms adopting waste prevention practices gain unexpected innovation
offsets. Corbett and Klassen (2006) synthesize the growing stream of literature which indicates that
investments in environmental improvements often provide unexpected but significant profit
improvements. In line with the environmental literature, several studies in the energy efficiency literature
indicate the presence of many profitable improvement opportunities. Shama (1983), Lovins and Lovins
(1993) and many others provide examples of such opportunities which may be realized at negligible costs
or provide rates of returns often over 30%. However, DeCanio (1993) points out “Many investments in
energy efficiency fail to be made despite their apparent profitability.” Jaffe and Stavins (1994a) identify
the gap between actual energy use on the one hand and the optimal energy use on the other hand as the
“energy-efficiency gap.”
The energy efficiency literature has drawn on many fields in a bid to explain the paradox of low
adoption rates of profitable energy efficiency improvements. The reasons used in the literature include
market-failure and non-market-failure explanations (Jaffe and Stavins 1994b), organizational and
institutional factors (DeCanio 1998), technology adoption and learning by using (Mulder et al. 2003), real
options framework (Dierderen et al. 2003), and complexity of regulation (Mueller 2006). Anderson and
Newell (2004), the only scholarly study to our knowledge that has used the IAC data, link economic
incentives to energy efficiency initiatives and find that adoption depends more on initial cost than on
annual savings. However, the literature struggles to explain the “energy-efficiency gap.”
An underlying assumption in most studies which address the “energy-efficiency gap” is that agents
are rational, but as Kahneman (1994) points out people may not be entirely rational in their choices.
Managers may cope with uncertainty and complexity of decision making by adopting simplifying
heuristics which may lead to systematic bias (Gilovich et al. 2002). A growing body of literature suggests
behavioral issues influence a variety of operational settings, ranging from a simple newsvendor setting
(Schweitzer and Cachon 2000) to complex supply chain settings (Croson and Donohue 2006). As energy
efficiency initiatives typically involve the entire spectrum of operations (Oppenheim 2007), it may be
relevant to examine behavioral issues that influence their adoption. In this paper, we investigate
behavioral biases in the adoption of energy efficiency opportunities.
We examine managerial myopia and cost focus by drawing on various streams of literature which
highlight this behavior. Laverty (1996) synthesizes five broad explanations in the literature that drive
economic short-termism. These explanations include flawed management practices, managerial
opportunism, stock market myopia, fluid and impatient capital, and information asymmetry. The short-
termism may influence managers to adopt low cost projects. We investigate the influence of the sequence
in which choices are presented by relating to the literature on order effects. Bruine de Bruin and Keren

5
(2003) observe that people make judgments by comparing options as they are presented in a sequence.
Impressions of each new option are formed by comparing its unique features to those of the option that
preceded it. They find that order or presentation dictates the order of comparison, which leads to order
effects. We study the effect of the number of choices provided by relating to the literature which
examines choices when decision makers are provided a set of options. Sethi-Iyengar et al. (2004) find that
401(k) plan participation levels drop with an increased number of investment options. While, Koelemeijer
and Oppewal (1999) find that an increase in assortment attracts additional purchases in the context of cut
flowers. We extrapolate observations from these literatures to our context on the adoption of energy
efficiency initiatives and develop relevant hypotheses.
3. Hypotheses
Our hypotheses are grounded in the literature on adoption of innovations and energy efficiency initiatives
while drawing upon the behavioral literature related to heuristics, biases and order effects. We develop
four hypotheses related to the adoption of energy efficiency initiatives.
Our first hypothesis relates to managerial myopia in the adoption of energy efficiency opportunities.
Several studies in the energy efficiency literature show the existence of many profitable energy-saving
opportunities. Koomey and Sanstad (1994) highlight through four examples the presence of profitable
energy conservation opportunities for both consumers and producers. The IPCC highlights a range of
energy-efficiency opportunities in the industrial sector such as improved housekeeping and maintenance
measures for older, less-efficient plants which may yield energy savings of 10-20% to higher capital
expenditure measures which can result in energy savings of 40-50% (Bernstein et al. 2007). However, a
significant proportion of these opportunities are not realized (Expert Group on Energy Efficiency 2007).
The mere presence of unrealized opportunities need not indicate that managers are myopic. However,
if managers have access to funds which cost less than the returns provided by the unrealized profitable
opportunities then one may argue that managers missed options to utilize the funds and realize possible
gains. This behavior may result from looking at the opportunity at too close a cognitive distance, similar
to the myopic behavior highlighted by Benartzi and Thaler (1999) in the context of investment in
retirement savings. Or it may result from using an investment horizon of a year to evaluate opportunities,
similar to the “myopic loss aversion” behavior highlighted by Benartzi and Thaler (1995) in the context of
investments in stocks and fixed income securities.
One of the most expensive sources of funds mentioned in the literature is trade credit. The Federal
Reserve Board’s 2003 Survey of Small Business Finances indicates that trade credit was used by 60
percent of small businesses. Petersen and Rajan (1995) highlight that funds obtained through trade credit
6
have an annualized rate of 44.6%. They argue a firm may utilize this expensive source of funds as long as
the returns from investments exceed the cost of funds.
In our context, if we find that the rates of return for unrealized initiatives is higher than the cost of
trade credit then we may conclude managers missed out on profitable opportunities. This is especially true
given that most recommendations are quite trivial to implement (for instance, they may require
coordinating with a vendor, and hence “the cost of managerial effort” is not a major obstacle). Note that
we are not concerned with why an individual firm may not adopt these opportunities, but with a collection
of firms. For the collection of firms in our study, if we find a significant proportion of unrealized
opportunities have rates of return higher than the cost of accessible funds then we may conclude that
managers are exhibiting myopia with regard to the adoption of energy efficiency initiatives.
Hypothesis 1: Managers display myopia in the adoption of energy saving initiatives. They fail to adopt
profitable energy efficiency initiatives even though the rates of return of such initiatives are higher than
the cost of funds for small businesses.
Our second hypothesis relates to the focus on upfront costs rather than on net benefits. Numerous
studies in the literature point out a range of reasons why managers focus on costs while evaluating
improvement opportunities. In the context of energy saving initiatives, Stern and Aronson (1984) argue
that expenditures which fit in the present budget cycle may require fewer approvals and prompt managers
to focus on low cost projects. Hirshleifer (1993) points out managers may be concerned about their
reputation and consequently not undertake investments with large costs as such projects may affect their
cash flows and reflect poorly on their performance. Thakor (1993) highlights that managerial incentives
to build reputation may lead to myopic investment decisions. Antle and Eppen (1995) highlight that
organizations may adopt capital rationing in the presence of asymmetric information and moral hazard.
Zhang (1997) uses a principal agent model to highlight that capital rationing may be advantageous for
some organizations which face asymmetric information between managers and owners. In such
instances, managers may undertake lower cost projects to meet the capital rationing constraint. Marginson
and McAulay (2008) indicate that accounting information measures may influence managers to adopt a
short-term outlook and take actions solely to maximize short-term results. When purchasing energy
efficient refrigerators, Meier and Whittier (1983) find that nearly 60% of buyers used a discount rate over
35% to evaluate the benefits of the more efficient appliance. Extrapolating to our context, we predict
managers will be influenced to a greater degree by initial costs than by net benefits in the adoption of
energy efficiency initiatives.
7
Hypothesis 2: Managers focus more on upfront costs than on net benefits when evaluating energy
efficiency initiatives.
Our third hypothesis relates to the order in which recommendations are presented to managers.
Anderson (1971) defines primacy effect as occurring when information presented early in a sequence has
a higher effect on judgment and recency effect as occurring when the converse happens. Many studies in
the literature highlight the presence of these effects. Symonds (1936), in an experiment with school
children, varied the order of presentation of a list of items and studied the effect of ranking these items.
He found items had a lower rank when they were placed earlier in the list. Ashton and Ashton (1988)
investigated the role of information order in an audit context and found support for the recency effect
while Anderson and Maletta (1999) found evidence that auditors are susceptible to primacy effects.
Kardes and Kalyanaram (1992) performed experiments where consumers were given sequential exposure
to information on various brands and found evidence of a primacy effect. Perrin et al. (2001) use a
simulation exercise to find US Naval officers arrived at conclusions which were influenced by
information that was presented later in a sequence. Terry (2005) investigated the impact of the serial
position of a commercial in a batch of commercials and finds evidence for both primacy and recency
effects. Bruine de Bruin (2006) observes serial position effects when options are judged in a sequence, as
in the case of figure skating competitions, and finds evidence that later performers obtain higher scores.
Meredith and Salant (2007) find evidence that the order in which candidates are presented in a ballot
influences election outcomes with candidates being listed first gaining a significant advantage. Rubinstein
and Salant (2006) formulate a model of choice from lists and explore a particular form of choice functions
which leads to a preference relation. Salant (2008) studies the problem of choosing from a list and
indicates that any choice rule which is simpler than rational choice leads to order effects. He derives
conditions under which making one choice from a list leads to a primacy effect, recency effect, choice
overload or status quo bias.
Overall, the literature finds evidence of both primacy and recency effects but has not been able to
clearly delineate the contexts in which either effect will dominate. In our context, decision makers are
provided a written report with the recommendations in a particular sequence. Based on the literature
discussed above we can predict that the serial position of a recommendation in the report will influence
the decision makers response to a recommendation. However, the direction of the influence cannot be
unambiguously predicted.
Hypothesis 3: The serial position of a recommendation in the report will influence adoption rates. As the
direction of influence cannot be unambiguously predicted, it will be determined empirically.
8
Our fourth hypothesis relates to the number of recommendations provided to the managers. The
literature on choice overload is relevant to our context. On the one hand, a body of literature argues that
decision makers are overwhelmed when they are provided too much choice. Benartzi and Thaler (2007)
highlight many instances of this problem and discuss issues specifically related to retirement savings.
They find that many decision makers adopt a naïve strategy of allocating their assets equally over “n”
choices, which they call the “1/n rule.” Huberman and Jiang (2006) analyze similar problems when the
number of choices is large. They find that decision makers first restrict their choices to a smaller subset of
“n” choices and then they allocate the assets equally over the subset of choices. They call this the
“conditional 1/n rule.” Iyengar and Lepper (2000) study the cases when consumers are provided a wide
array of choice (24 flavors of jam) and limited choice (6 flavors of jam). They find that consumers were
more likely to make a purchase when they have limited choice.
On the other hand, a body of literature argues that decision makers are drawn toward increased choice
options. Bown et al. (2003), in a set of three studies, demonstrate that decision makers prefer options that
allow them to take more choices over those that do not, even when the additional choices cannot improve
the final outcome. Oppewal and Koelemeijer (2005) use a choice experiment with a large consumer panel
to show that adding any item to an assortment improves the assortment evaluation, irrespective of the size
or attributes of the assortment. Schienbehenne et al. (2009) replicate earlier studies that demonstrated
choice overload and do not find the “too-much-choice” effect. They also perform a meta-analysis of
studies in the literature and find the choice overload effect to be much less robust than previously thought.
Overall the literature finds evidence of both choice overload and preference for increased choice
options but has not been able to clearly delineate the contexts in which either effect will dominate. Based
on the literature discussed above, we can predict the number of recommendations provided will influence
adoption rate. However, we cannot unambiguously predict the direction of this effect.
Hypothesis 4: The number of recommendations in an assessment will influence adoption rates. As the
direction of influence cannot be unambiguously predicted, it will be determined empirically.
4. Data
The US Department of Energy’s IAC program funds a network of universities to conduct free energy
assessments for small and medium sized manufacturing firms. Assessments are done by engineering
faculty and students from participating universities across the US. Over 50 universities have participated

9
in the program at various times since it started in 1976. In fiscal year 2007, the budget for the IAC
program was just over $4 million and around 350 assessments were expected to be performed (DOE
2009).
Firms eligible for the assessments are chosen based on multiple criteria. These include whether the
plant’s products are within standard industrial classification codes 20 through 39, whether the plant is
within 150 miles of the host campus, has gross annual sales below $100 million, has employee count less
than 500, has annual energy bills between $100,000 and $2 million and has no professional in-house staff
to perform the assessment (Muller et al. 2004). A small number of larger firms exceeding these criteria
are included in the database. These firms were assessed by IACs under different DOE programs, and on
special request of DOE.
Firms may either contact the IAC expressing an interest in the assessment or the IAC may directly
contact potential firms. The IAC team collects information to understand current energy usage in the firm.
The next step is a site visit by the IAC team led by a faculty member. Typically the visit entails interviews
with the plant management, plant tours and collection of operational data. Some energy saving
opportunities are identified by observing the plant operations. The fourth author, a former IAC director,
indicated that in some instances it was surprisingly easy to identify opportunities: “In some plants we hear
a constant hiss which indicates compressed air is leaking out.” Other recommendations are identified by
analyzing the operational data and linking it with observations in the plant visit. As the former IAC
director says; “In one plant we saw excess flash (extra material) on parts made using an injection molding
process and later using the specific heat values for the molding material we identified they were using
around forty times the energy required for the process.” Subsequent to the visit, the team provides a
written report with details of specific recommendations to improve efficiency across energy streams,
waste streams and productivity. After six to nine months, the plants are contacted by the IAC to ascertain
which of the recommendations have been implemented or will be implemented in the next year. The
information on the recommendations and their implementation status is provided to the IAC database
managers using standard templates.
Information on the recommendations and the assessments is maintained in a database at a public
website hosted by the Center for Advanced Energy Systems at Rutgers University. The database has
details of each assessment performed since 1981. Currently there are over 13,000 assessments with over
100,000 recommendations. The information maintained for each assessment includes plant demographics
such as annual sales, employees, plant area, production hours, energy consumed, manufacturing sector,
date of assessment, etc. For each recommendation the information maintained includes expected savings,
quantity of energy conserved, implementation costs, payback calculations, whether the recommendation
was implemented or not, etc. Details on the information maintained in the IAC database and on the IAC
10
assessment process are available in “The DOE Industrial Assessment Database Manual” (Muller et al.
2004). The DOE has developed a coding system for the recommendations called Assessment
Recommendation Code (ARC). This classifies recommendations into 25 major categories and over 600
sub-categories. The ARC number for each recommendation and the order in which the recommendations
appeared in the report are also stored in the database.
We use the data from the IAC database for the years 1981-2006. We do not use the data for the years
2007-08 as the data pertaining to the implementation process is not yet complete. In our analysis, we
adjust all monetary figures for inflation, scaling to year 2006 US dollars using the producer price index
WPUSOP3000 series for finished goods from the Bureau of Labor Statistics (BLS 2008). We exclude 778
recommendations which have payback values greater than nine years, 44 recommendations that involve
additional costs and do not provide any positive savings, and eight recommendations which have negative
costs for implementation. These are all outliers and possibly errors; including them would not change our
conclusions. Overall, the data pertaining to 92,723 recommendations are used in the analysis. However,
some observations are not included in specific analyses; these are indicated where we present our results.
Table 1 provides descriptive statistics for our data.
The average estimated implementation cost across all recommendations is $20,767 while the average
estimated annual savings is $19,297. The average estimated simple payback period across all the
recommendation is just over a year; however, even with the short payback periods, firms only adopted
50.01% of all recommendations. The actual adoption rates are probably lower still as implementation
rates are based on projected implementation data provided by the firms and in some instances partial
implementation may be recorded as complete implementation. Additionally, in some instances it is
possible that firms might report higher implementation to avoid the embarrassment of reporting low
implementation rates.
5. Methodology and Results
We test our hypothesis related to managerial myopia separately from the other hypotheses. We use a
nonparametric sign test to test the hypothesis related to managerial myopia. To test the other hypotheses,
we employ two econometric models that relate adoption to the economic drivers and specific
characteristics of recommendations. First, we estimate a conditional logit model, building on Anderson
and Newell (2004), and find that costs, savings, and the serial position of a recommendation influence the
implementation rate. However, this model does not correct for the fact that the serial position may be
endogenous as the IAC were asked to present more attractive recommendations first. Second, to account
11
for the endogenous explanatory variable, we estimate a probit instrumental variables model. All the
analyses were done using STATA version 10.0.
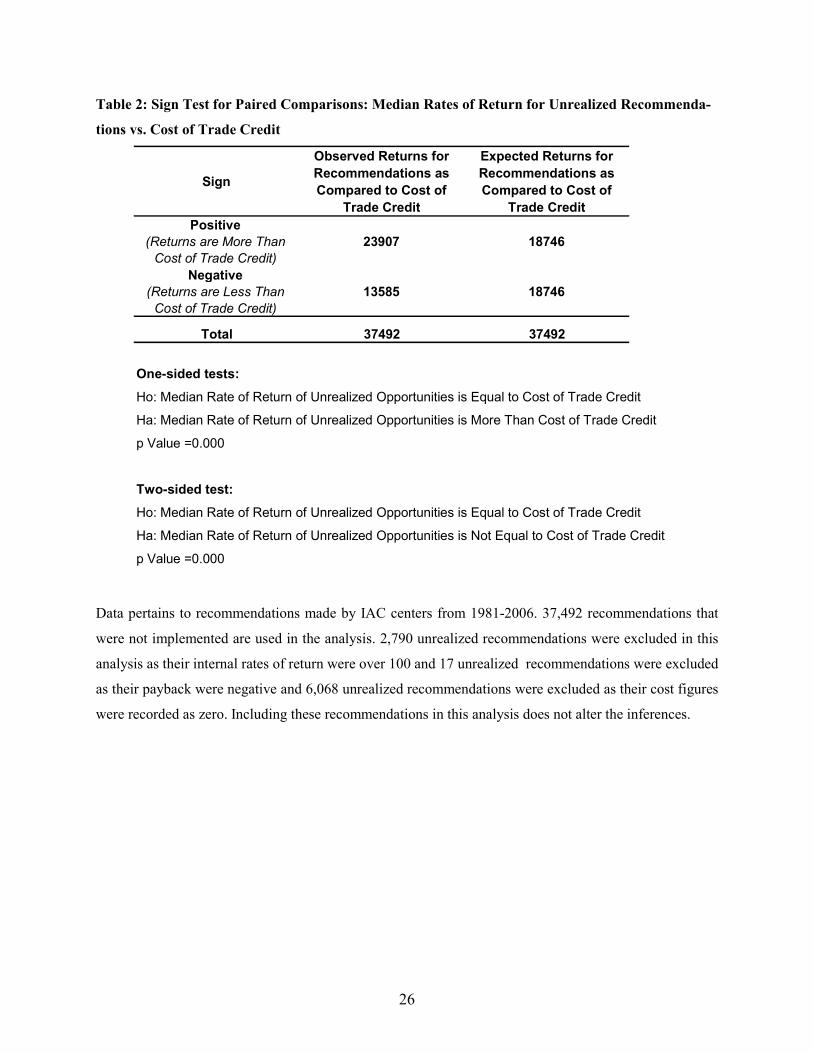
To test our hypothesis related to managerial myopia, we compute the Internal Rate of Return (IRR)
for the recommendations which were not implemented. In our IRR calculation we assume that the annual
savings accrue for three years. We compare the median IRR of unrealized opportunities against trade
credit which is one of most expensive source of funds for small businesses mentioned in the literature
(Petersen and Rajan 1995). The results of this comparison are provided in Table 2.
5.1 Conditional Logit Model
We build on Anderson and Newell’s (2004) econometric model by incorporating variables to capture the
uncertainty of the returns of a recommendation and the sequence in which the recommendations are
presented.
We estimate a set of conditional logit models for the adoption decision, with an indicator variable Yi
that equals 1 if recommendation i is adopted and equals 0 otherwise. The choice problem is defined by the
latent variable model:
Yi* = α + Mi*β + Vi*γ + Ti* δ + Si* φ + Ci* λ + εi (1)
where Yi* is the net benefit of adopting recommendation i; Mi is the vector of financial variables for
recommendation i; Vi is the variance of the payback associated with recommendation i; Ti is a vector
which indicates the type of recommendation i; Si represents the serial position of the recommendation i in
the report; Ci indicates the firm-level fixed effects; and εi represents the error term. We include the
variance of the payback of a recommendation to capture the uncertainty related to its returns. We compute
the variance of payback of a specific type of recommendation i as ∑j [(Payback)ij-(Average Payback)i]2,
where j represents all firms in our dataset that were given recommendation i. Note this variable is not a
perfect measure of the uncertainty related to the returns as it also captures the underlying heterogeneity of
the firms in the dataset, but as long as there is a recommendation-specific element to the overall variance,
this measure will be correlated with the uncertainty associated with a recommendation. We include the
variables for the type of recommendations to capture the effects due to the heterogeneity among the
recommendations. These variables identify each recommendation as belonging to one of the twenty-five
different mutually exclusive major categories based on the first two digits of the ARC number. In this
model, we do not include the number of recommendations as that effect will be embedded in the firm-
level fixed effects Ci.
12
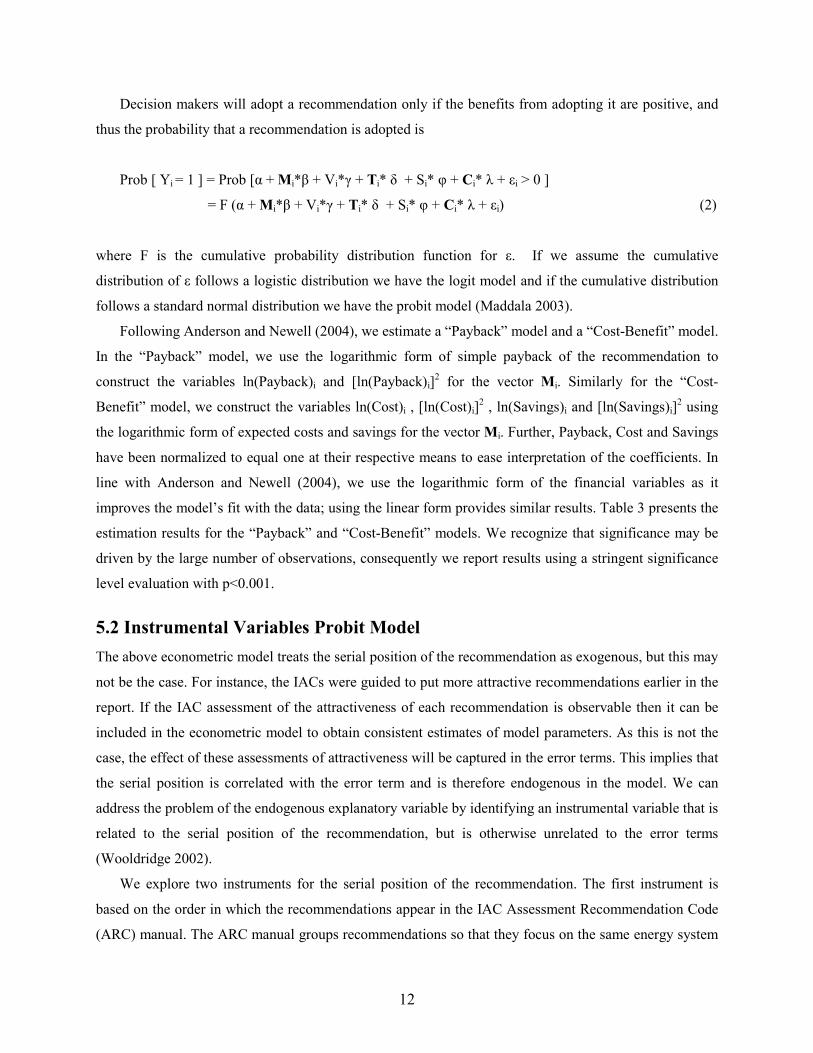
Decision makers will adopt a recommendation only if the benefits from adopting it are positive, and
thus the probability that a recommendation is adopted is
Prob [ Yi = 1 ] = Prob [α + Mi*β + Vi*γ + Ti* δ + Si* φ + Ci* λ + εi > 0 ]
= F (α + Mi*β + Vi*γ + Ti* δ + Si* φ + Ci* λ + εi) (2)
where F is the cumulative probability distribution function for ε. If we assume the cumulative
distribution of ε follows a logistic distribution we have the logit model and if the cumulative distribution
follows a standard normal distribution we have the probit model (Maddala 2003).
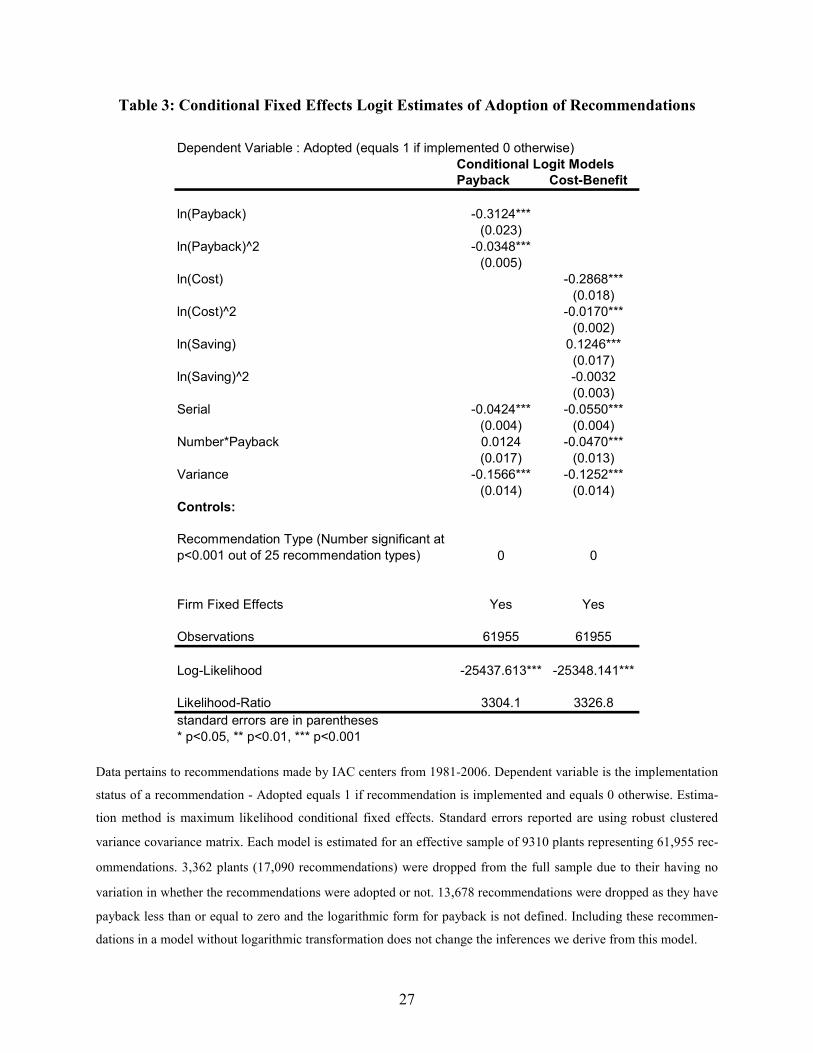
Following Anderson and Newell (2004), we estimate a “Payback” model and a “Cost-Benefit” model.
In the “Payback” model, we use the logarithmic form of simple payback of the recommendation to
construct the variables ln(Payback)i and [ln(Payback)i]2 for the vector Mi. Similarly for the “Cost-
Benefit” model, we construct the variables ln(Cost)i , [ln(Cost)i]2 , ln(Savings)i and [ln(Savings)i]
2 using
the logarithmic form of expected costs and savings for the vector Mi. Further, Payback, Cost and Savings
have been normalized to equal one at their respective means to ease interpretation of the coefficients. In
line with Anderson and Newell (2004), we use the logarithmic form of the financial variables as it
improves the model’s fit with the data; using the linear form provides similar results. Table 3 presents the
estimation results for the “Payback” and “Cost-Benefit” models. We recognize that significance may be
driven by the large number of observations, consequently we report results using a stringent significance
level evaluation with p<0.001.
5.2 Instrumental Variables Probit Model
The above econometric model treats the serial position of the recommendation as exogenous, but this may
not be the case. For instance, the IACs were guided to put more attractive recommendations earlier in the
report. If the IAC assessment of the attractiveness of each recommendation is observable then it can be
included in the econometric model to obtain consistent estimates of model parameters. As this is not the
case, the effect of these assessments of attractiveness will be captured in the error terms. This implies that
the serial position is correlated with the error term and is therefore endogenous in the model. We can
address the problem of the endogenous explanatory variable by identifying an instrumental variable that is
related to the serial position of the recommendation, but is otherwise unrelated to the error terms
(Wooldridge 2002).
We explore two instruments for the serial position of the recommendation. The first instrument is
based on the order in which the recommendations appear in the IAC Assessment Recommendation Code
(ARC) manual. The ARC manual groups recommendations so that they focus on the same energy system
13
(for example, combustion systems) or they follow a similar strategy for enhancement (for example,
maintenance). The recommendations are ordered by a unique ARC code. We use the ARC code to
sequence the recommendations made to a firm so that the recommendation with the lowest ARC code is
given the first rank and so forth. The assessors use the ARC codes to report their recommendations to the
IAC Database managers. Consequently their reporting of recommendations in the report may partly
follow the sequence in the ARC manual. As the ARC manual is maintained centrally, the ARC will not be
related to the preferences of a specific firm, hence the instrument should not be correlated with the error
terms.
The second instrument is related to the propensity with which each IAC makes a recommendation.
We compile the frequency with which each IAC makes a particular recommendation across all
assessments. We use this to sequence the recommendations made to a specific firm so that the
recommendation with the highest frequency gets the first serial position and so forth. The resulting
sequence is a reflection of the specific IACs familiarity with specific recommendations and this may be
related to the way in which they present the recommendations to a specific firm. This sequence is based
on the IACs interaction with all firms it has assessed and as such it will not be related to the preferences
of a specific firm; hence the instrument should not be correlated with the error term.
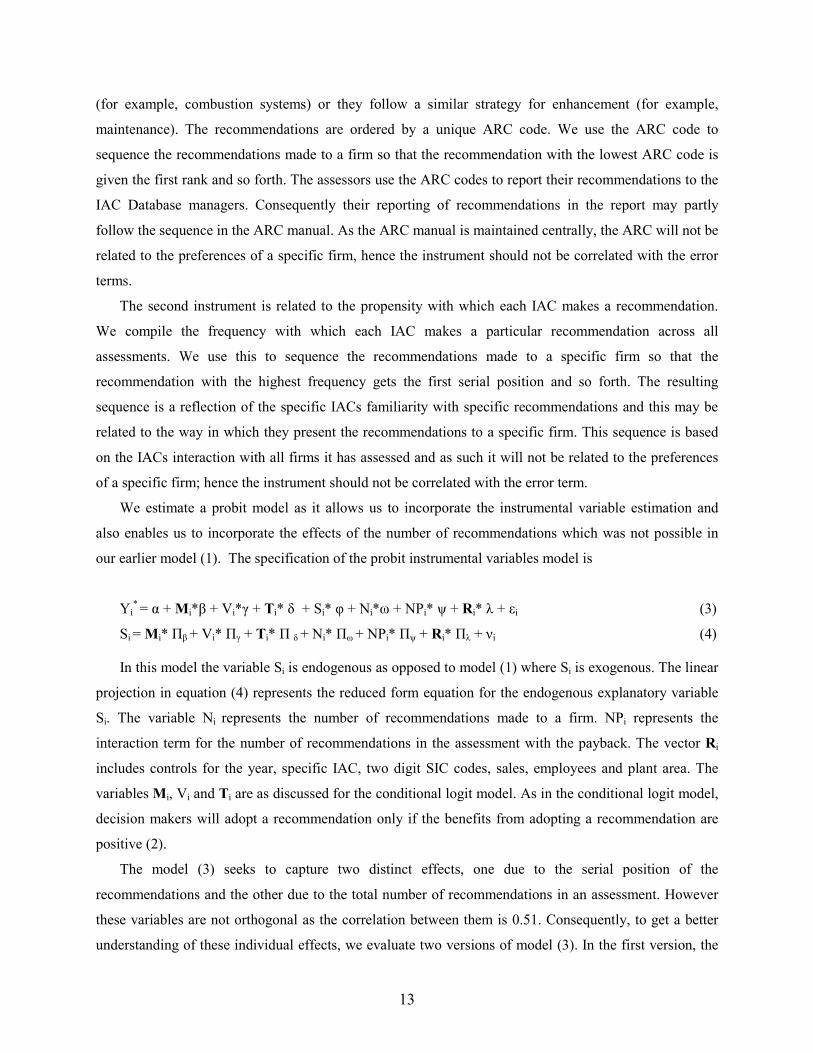
We estimate a probit model as it allows us to incorporate the instrumental variable estimation and
also enables us to incorporate the effects of the number of recommendations which was not possible in
our earlier model (1). The specification of the probit instrumental variables model is
Yi* = α + Mi*β + Vi*γ + Ti* δ + Si* φ + Ni*ω + NPi* ψ + Ri* λ + εi (3)
Si = Mi* Πβ + Vi* Πγ + Ti* Π δ + Ni* Πω + NPi* Πψ + Ri* Πλ + νi (4)
In this model the variable Si is endogenous as opposed to model (1) where Si is exogenous. The linear
projection in equation (4) represents the reduced form equation for the endogenous explanatory variable
Si. The variable Ni represents the number of recommendations made to a firm. NPi represents the
interaction term for the number of recommendations in the assessment with the payback. The vector Ri
includes controls for the year, specific IAC, two digit SIC codes, sales, employees and plant area. The
variables Mi, Vi and Ti are as discussed for the conditional logit model. As in the conditional logit model,
decision makers will adopt a recommendation only if the benefits from adopting a recommendation are
positive (2).
The model (3) seeks to capture two distinct effects, one due to the serial position of the
recommendations and the other due to the total number of recommendations in an assessment. However
these variables are not orthogonal as the correlation between them is 0.51. Consequently, to get a better
understanding of these individual effects, we evaluate two versions of model (3). In the first version, the
14
serial position of a recommendation is used as is; in the second version, the serial position of a
recommendation is normalized within an assessment so that it equals one at its mean. For instance, in an
assessment with five recommendations the serial positions will be recorded as 1, 2, 3, 4, and 5 in the first
version, while it will be recorded as 1/3, 2/3,1,4/3, and 5/3 in the second version. Both specifications have
advantages and disadvantages.
To validate the instruments for each version of model (3), we run a simple OLS regression of the
variables for serial position of the recommendation on the instruments related to the ARC code and the
IACs propensity to make a type of recommendation. The R2 we obtain for this regression is 0.23 for the
first version and 0.04 for the second version. For the first version this is comparable to similar values
reported in the literature (e.g., Evans and Schwab (1995) report R2 of 0.16 when they regress their
endogenous variable -- catholic school -- on their instrument -- catholic religion). We also ran an ordered
probit model for the first version. The z-stat for the instrument related to ARC code and the IAC’s
propensity to make a type of recommendation is 91.90 and 70.64 respectively and both are statistically
significant at p<0.001. Therefore, the chosen instruments are valid determinants of the serial position of
the recommendations for the first version of model (3). The validity of the instruments for the second
version of model (3) is not clearly established and we proceed under the assumption that we have weak
instruments for the second version.
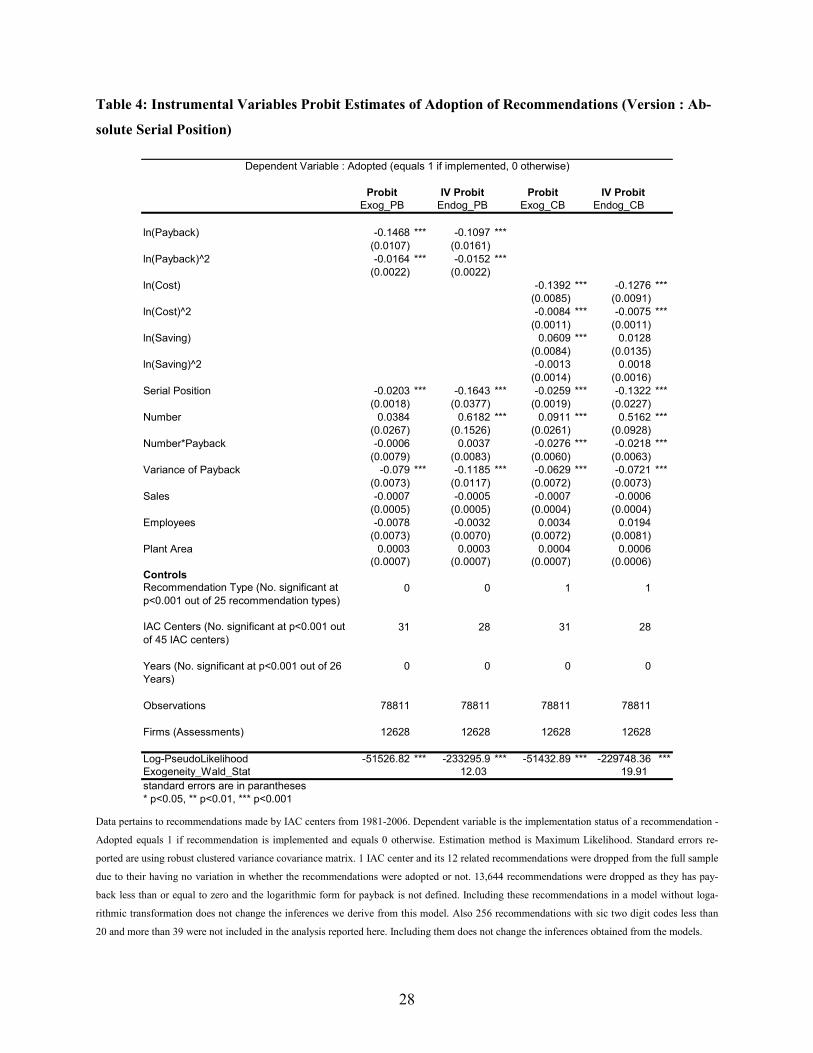
For both versions, we evaluate two probit models for the Payback model discussed in (1): one where
the variable Si is treated as exogenous and the other where it is treated as endogenous. The models are
labeled Exog_PB and Endog_PB respectively. Similarly for both versions, we evaluate two probit models
for the Cost-Benefit model discussed in (1) and label the models Exog_CB and Endog_CB. Tables 4 and
5 present the results for the four models with the first and second specification for the sequence variable
respectively.
6. Results, Implications and Limitations
In this section, we present our main results related to our four hypotheses, draw implications from
our results and then discuss limitations and alternative explanations for our study. With respect to our
hypothesis on managerial myopia, we appeal to the summary statistics in Table 1, where we observe that
nearly half the recommendations are not implemented despite the fact that average payback for the
recommendations is just over a year. From the results of the nonparametric sign test in Table 2, we see
that the median rates of return for the unrealized recommendations are significantly higher than the cost
of trade credit, one of most expensive sources of funds available to small business managers. Further, the
median rate of return for recommendations not implemented is 84% which is a very attractive proposition
15
considering any rational investment hurdle rate. These observations provide support for hypothesis 1 that
managers are myopic and indeed miss out on many profitable energy saving opportunities. This is in line
with existing literature – our contribution is that we build on this by identifying that returns for the
unrealized opportunities are higher than one of the most expensive sources of funds available to
managers. This is relevant for the IAC program which aims to improve energy-efficiency of small and
medium sized firms. The objectives of the program may not be met by just providing information on
profitable energy-efficiency opportunities. Additional factors, as highlighted in the discussions of our
subsequent hypotheses, need to be considered to improve adoption of energy-efficiency initiatives.
With respect to our other hypotheses, we draw inferences from the results for the conditional logit
model provided in Table 3 and the results for the probit models provided in Tables 4 and 5. We observe
that the coefficients for the cost variables are significant and larger than those for the savings variables in
the Exog_CB and Endog_CB models in Tables 4 and 5 and the Cost-Benefit model in Table 3. In
addition, the coefficients for the savings variables are not significant in the instrumental variables probit
model. These observations provide support for hypothesis 2 that managers are influenced more by initial
costs than by net benefits when evaluating energy efficiency opportunities. This has significant
implications for the IAC program as well as other initiatives where managers are provided costs and
savings for investment opportunities.
The results related to hypothesis 2 are similar to Anderson and Newell (2004), but we build on their
models by incorporating variables related to the uncertainty of the returns and to the underlying
behavioral factors that influence the adoption decision. The coefficient for the variance of payback for all
the models in Tables 3, 4 and 5 are significant and have a negative sign as expected.
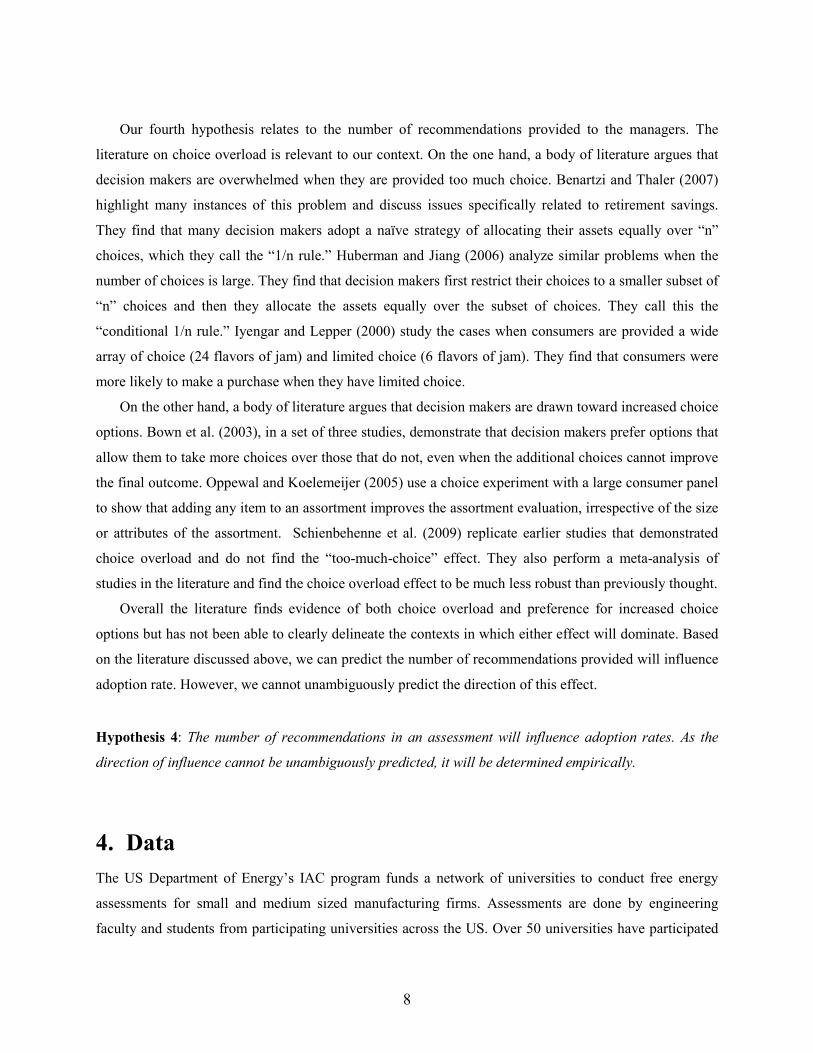
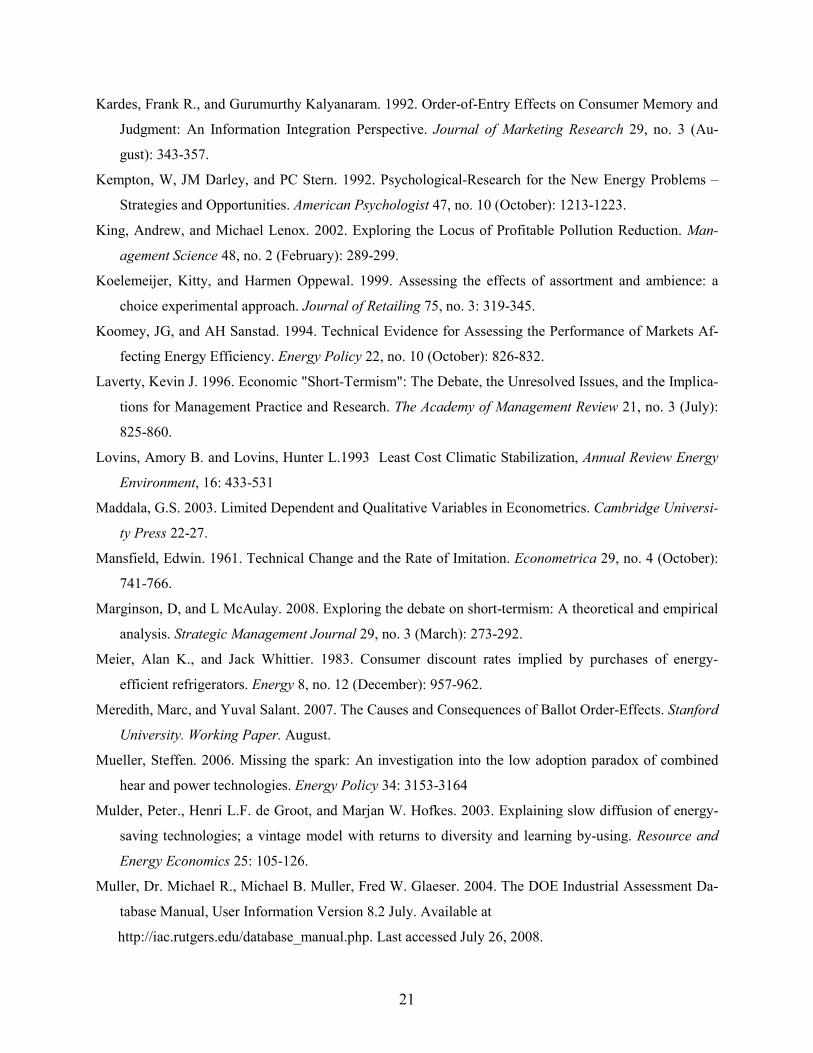
With regards to hypothesis 3 on the order effects, we observe that the average adoption rate falls for
recommendations that occur later in the report (as demonstrated in Figure 2), from over 50% for the
earliest recommendations to around 40% for the last ones. Further, we observe that the coefficients of the
serial position of the recommendation are significant across all models in Tables 3, 4, and 5. This
supports hypothesis 3 that the serial position of a recommendation has an influence on the adoption rate.
In addition, the coefficients of the serial position are negative across all models in Tables 3, 4 and 5.
These indicate that the probability of implementation falls as the recommendation occurs later in the
report. Additionally, in Table 4 for the Endog_CB model, if we consider an average assessment where the
recommendation is moved from the fourth position to the fifth position in the report then its probability of
adoption will fall by 0.052. This is the same effect as will be achieved by increasing the cost of
implementation by $34,446 from the average level of $20,767. In Tables 4 and 5, the coefficient of the
serial position is over four times larger for the endogenous model than for the exogenous models. This
indicates that the impact of the serial position in the exogenous model tends to be understated due to the
16
correlation with the error terms. Overall this provides empirical support for the primacy effect in our
context (i.e., recommendations that appear later in the report have lower rates of adoption than those that
occur earlier in the report).
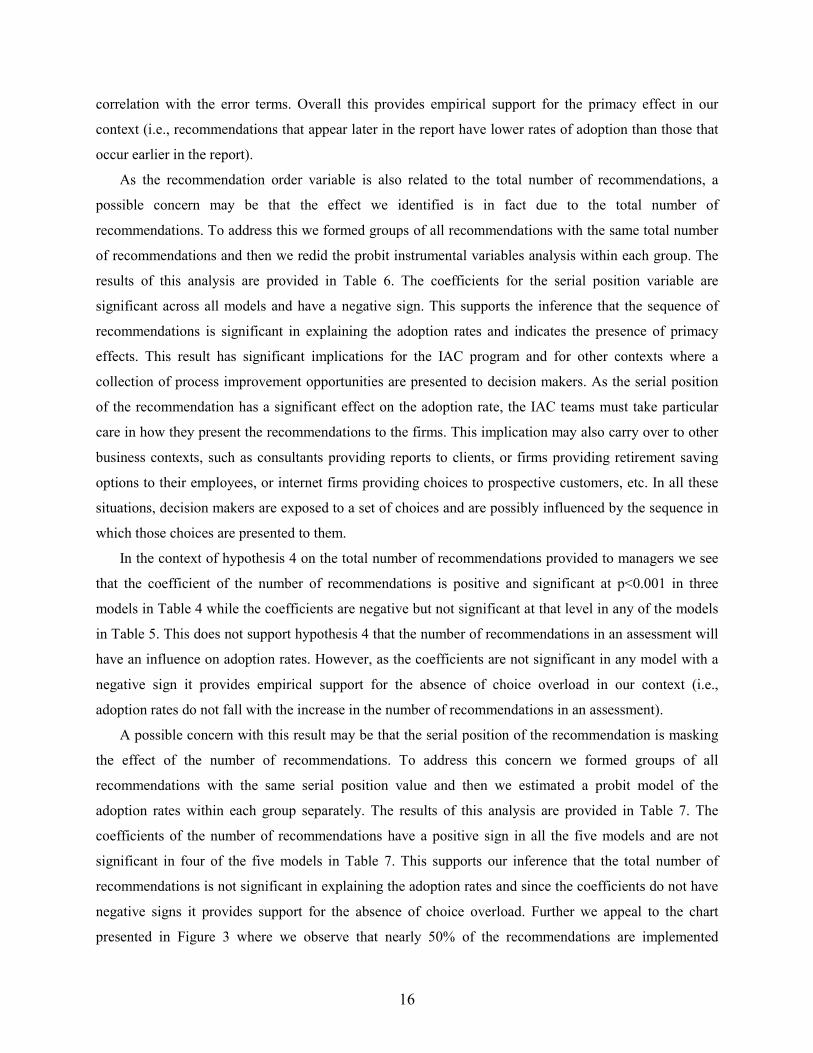
As the recommendation order variable is also related to the total number of recommendations, a
possible concern may be that the effect we identified is in fact due to the total number of
recommendations. To address this we formed groups of all recommendations with the same total number
of recommendations and then we redid the probit instrumental variables analysis within each group. The
results of this analysis are provided in Table 6. The coefficients for the serial position variable are
significant across all models and have a negative sign. This supports the inference that the sequence of
recommendations is significant in explaining the adoption rates and indicates the presence of primacy
effects. This result has significant implications for the IAC program and for other contexts where a
collection of process improvement opportunities are presented to decision makers. As the serial position
of the recommendation has a significant effect on the adoption rate, the IAC teams must take particular
care in how they present the recommendations to the firms. This implication may also carry over to other
business contexts, such as consultants providing reports to clients, or firms providing retirement saving
options to their employees, or internet firms providing choices to prospective customers, etc. In all these
situations, decision makers are exposed to a set of choices and are possibly influenced by the sequence in
which those choices are presented to them.
In the context of hypothesis 4 on the total number of recommendations provided to managers we see
that the coefficient of the number of recommendations is positive and significant at p<0.001 in three
models in Table 4 while the coefficients are negative but not significant at that level in any of the models
in Table 5. This does not support hypothesis 4 that the number of recommendations in an assessment will
have an influence on adoption rates. However, as the coefficients are not significant in any model with a
negative sign it provides empirical support for the absence of choice overload in our context (i.e.,
adoption rates do not fall with the increase in the number of recommendations in an assessment).
A possible concern with this result may be that the serial position of the recommendation is masking
the effect of the number of recommendations. To address this concern we formed groups of all
recommendations with the same serial position value and then we estimated a probit model of the
adoption rates within each group separately. The results of this analysis are provided in Table 7. The
coefficients of the number of recommendations have a positive sign in all the five models and are not
significant in four of the five models in Table 7. This supports our inference that the total number of
recommendations is not significant in explaining the adoption rates and since the coefficients do not have
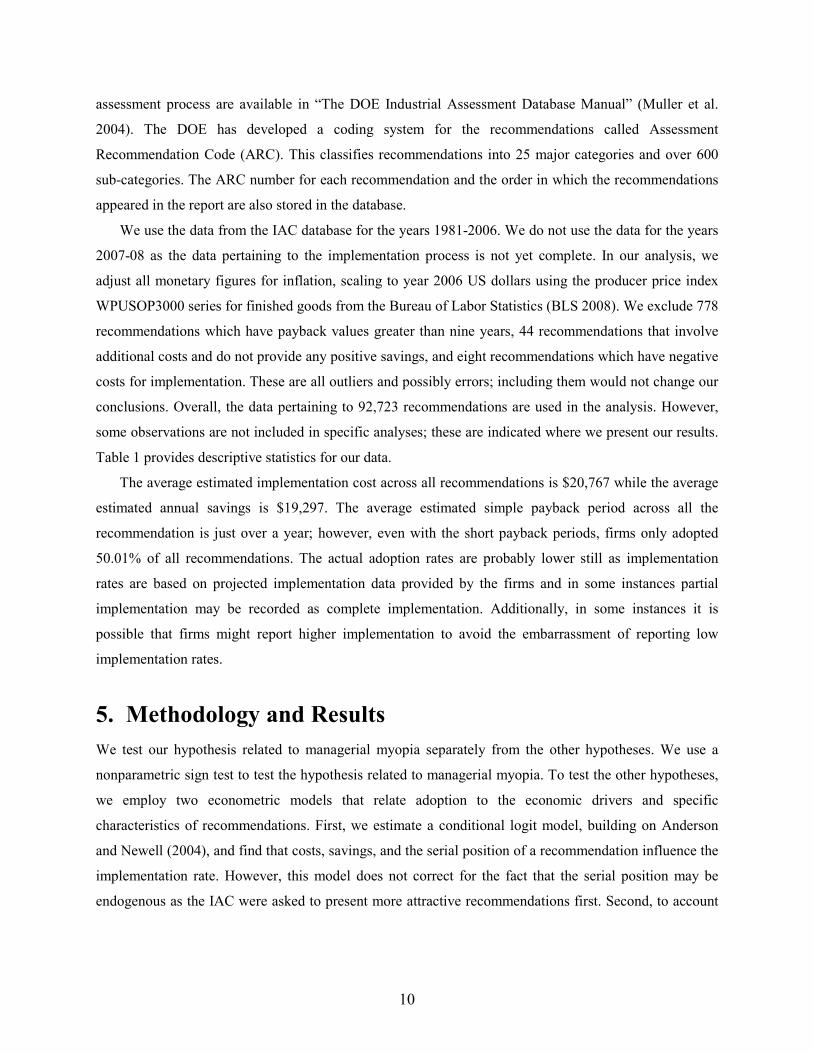
negative signs it provides support for the absence of choice overload. Further we appeal to the chart
presented in Figure 3 where we observe that nearly 50% of the recommendations are implemented
17
irrespective of the number of recommendations made to a firm. This might indicate that decision makers
are not adopting a choice heuristic as suggested by Iyengar and Lepper (2000) but are adopting some
other simplifying heuristic (Gilovich et al. 2002) which prompts them to adopt on average half of all
recommendations they receive. Note though that there is a substantial variance around the average
adoption rate of 50%; further research could take a firm-based perspective to explain variation in adoption
patterns across firms, rather than the recommendation-level analysis we do here. This result also may
have implications for situations in which a list of recommendations is provided to operations managers. In
many instances consultants tend to focus on providing a few critical recommendations in the belief that
adoption may increase if the set of choices is limited. However, as demonstrated here, operations
managers do not seem to be overwhelmed by choices, consequently it may be advisable to present all
opportunities.
A possible alternative explanation for our results is that firms might plan to adopt all the
recommendations but decide to do so in the sequence in which the recommendations are presented. Hence
when the IACs contact them to check on the implementation status they would have implemented
recommendations which were presented early in the report. This would be consistent with our findings as
this would imply that firms are using the sequencing of recommendations to guide their adoption
sequence decision making as opposed to deciding that based on the merits of a recommendation.
A possible cause for concern may be that some unobserved costs of implementation which are not
included in the analysis are driving the results. The only way this is addressed in this study is by
controlling for the recommendation types, but this is not a comprehensive and robust approach and
remains as a possible limitation of this study. However given the heterogeneity of firm types based on
their standard industrial classifications and the wide variety of recommendations, we do not believe such
unobserved costs, if any, would be present across all recommendations in such a way as to systematically
bias our results.
7. Summary and Discussion
In this paper we analyze the adoption of energy efficiency related process improvement
recommendations made to small and medium sized firms and find evidence related to four biases. First,
managers are myopic as they miss out on many profitable energy efficiency initiatives. Our contribution
is to highlight that these profitable opportunities have rates of return which are significantly higher than
the most expensive source of funds mentioned in the literature. Second, managers are more influenced by
initial costs than by net benefits when evaluating such initiatives. Given the focus on costs it may be
prudent to present the lifetime savings of a recommendation rather than the annual savings along with the
18
implementation costs, or provide options to spread the implementation costs over the lifetime of the
initiative. This may prompt managers to focus on net benefits and improve the adoption of such
initiatives. Third, the sequence in which the recommendations are presented influences adoption rates:
recommendations which appear early in a list of recommendations have higher rates of adoption
compared to those which appear later in the list. A possible strategy in light of this result could be to
include recommendations that have larger societal impact, such as energy saving or pollution reduction,
earlier in the report. This will increase the adoption rates of these recommendations and provide higher
benefits to society. Fourth, we do not find evidence of choice overload. Adoption does not decrease with
the number of recommendations provided to operations managers. This points to the possibility of
providing more recommendations to the managers, which may result in increased overall adoption. Our
study thus highlights biases which have been previously unobserved in the operations management
context. Moreover, since most of the energy saving recommendations relate to some form of operational
process improvements, our findings have broader implications for the adoption of process improvements
in operations. Better understanding of these biases and underlying managerial behavior may facilitate the
adoption of process improvement initiatives across general operational settings. Finally we contribute to
the behavioral operations literature by studying behavioral issues using actual field data as opposed to the
majority of the studies which use experimental data.
An intriguing area for further research would be to identify similar groups of firms who may have
comparable efficiency improvement requirements and then see if the adoption varies with the order of the
recommendations and the number of the recommendations. This would require a controlled field
experiment and would provide greater support and insights leading to the decision of adoption.
Acknowledgments
We thank Richard G. Newell for sharing the analysis related to his paper. We thank Magali Delmas, Vered Doctori-Blass, Steven Lippman, Rudolph Marloth, Kumar Rajaram, Subramaniam Ramanarayanan, Rakesh Sarin and Christopher Tang for valuable comments. The first author is also grateful to the Harold Price Center for Entrepreneurial Studies at the UCLA Anderson School of Management for financial support.
References
Anderson, BH, and MJ Maletta. 1999. Primacy effects and the role of risk in auditor belief-revision
processes. Auditing-A Journal of Practice & Theory 18, no. 1 (SPR): 75-89.
Anderson, N.H. 1971. Integration Theory and Attitude Change. Psychological Review 78(3): 171-206.
19
Anderson, Soren T., and Richard G. Newell. 2004. Information programs for technology adoption: The
case of energy-efficiency audits. Resource and Energy Economics 26, no. 1 (March): 27-50.
Antle, Rick, and Gary D. Eppen. 1985. Capital Rationing and Organizational Slack in Capital Budgeting.
Management Science 31, no. 2 (February): 163-174.
Ashton, Alison H., and Robert H. Ashton. 1988. Sequential Belief Revision in Auditing. The Accounting
Review 63, no. 4 (October): 623-641.
Benartzi, Shlomo, and Richard H. Thaler. 1995. Myopic Loss Aversion and the Equity Premium Puzzle.
The Quarterly Journal of Economics 110, no. 1 (February): 73-92.
Benartzi, Shlomo, and Richard H. Thaler. 1999. Risk Aversion or Myopia? Choices in Repeated Gambles
and Retirement Investments. Management Science 45, no. 3 (March): 364-381.
Benartzi, Shlomo, and Richard H. Thaler. 2007. Heuristics and biases in retirement savings behavior.
Journal of Economic Perspectives 21, no. 3 (SUM): 81-104.
Bernstein, L., J. Roy, K. C. Delhotal, J. Harnisch, R. Matsuhashi, L. Price, K. Tanaka, E. Worrell, F.
Yamba, Z. Fengqi, 2007: Industry. In Climate Change 2007: Mitigation. Contribution of Working
Group III to the Fourth Assessment Report of the Intergovernmental Panel on Climate Change [B.
Metz, O.R. Davidson, P.R. Bosch, R. Dave, L.A. Meyer (eds)], Cambridge University Press, Cam-
bridge, United Kingdom and New York, NY, USA. 456-460 & 475-477.
BLS 2008: Producer Price Index Highlights - Finished Goods (wpusop3000). Back data. Available at
http://www.bls.gov/xg_shells/ro4xgppihi.htm. Last accessed July 27, 2008.
Bown, Nicola J., Daniel Read, and Barbara Summers. 2003. The lure of choice. Journal of Behavioral
Decision Making 16, no. 4: 297-308.
Bruine de Bruin, Wändi. 2006. Save the last dance II: Unwanted serial position effects in figure skating
judgments. Acta Psychologica 123, no. 3 (November): 299-311.
Bruine de Bruin, Wändi, and G Keren. 2003. Order effects in sequentially judged options due to the direc-
tion of comparison. Organizational Behavior and Human Decision Processes 92, no. 1-2 (Novem-
ber): 91-101.
Bush, W. James., John Sousanis, and Paul Zajac. 2006. Ward’s Motor Vehicle Facts and Figures 2006.
51-54.
Corbett, C.J. and R.D. Klassen. 2006. Extending the Horizons: Environmental Excellence as Key to Im-
proving Operations. Manufacturing & Service Operations Management 8 (1) 5-22.
Croson, R, and K Donohue. 2006. Behavioral causes of the bullwhip effect and the observed value of in-
ventory information. Management Science 52, no. 3 (March): 323-336.
DeCanio, J. Stephen. 1993. Barriers within firms to energy-efficient investments. Energy Policy (Septem-
ber): 906-914.
20
DeCanio, Stephen J., 1998. The efficiency paradox: bureaucratic and organizational barriers to profitable
energy-saving investments. Energy Policy, vol. 26(5), 441-454
DOE 2009. Department of Energy FY 2009 Congressional Budget Request – Volume 3. p383. Available
at http://www.cfo.doe.gov/budget/09budget/Start.htm. Last accessed on July 07, 2008.
Dierderen, Paul. Frank Von Tongeren, and Hennie Van Der Veen. 2003. Returns on Investments in Ener-
gy-saving Technologies Under Energy Price Uncertainty in Dutch Greenhouse Horticulture. Envi-
ronmental and Resource Economics 24: 379-394.
Emission Facts 2005. Greenhouse Gas Emissions from a Typical Passenger Vehicle | US EPA. February
Available at http://www.epa.gov/OMS/climate/420f05004.htm. Last accessed on January 05, 2009.
Evans, William N., and Robert M. Schwab. 1995. Finishing High School and Starting College: Do Catho-
lic Schools Make a Difference? The Quarterly Journal of Economics 110, no. 4 (November): 941-
974.
Expert Group on Energy Efficiency, 2007: Realizing the Potential of Energy Efficiency: Targets, Policies,
and Measures for G8 Countries. United +ations Foundation, Washington, DC, 72: 9-19.
Gilovich, Thomas, Dale Griffin, and Daniel Kahneman, ed 2002. “Heuristics and Biases: The Psychology
of Intuitive Judgement.” Cambridge University Press: New York.
Griliches, Zvi. 1957. Hybrid Corn: An Exploration in the Economics of Technological Change. Econome-
trica 25, no. 4 (October): 501-522.
Hirshleifer, David. 1993. Managerial Reputation and Corporate Investment Decisions. Financial Man-
agement 22, no. 2 (Summer): 145-160.
Huberman, Gur, and Wei Jiang. 2006. Offering versus Choice in 401(k) Plans: Equity Exposure and
Number of Funds. Journal of Finance 61(2): 763-801.
Impacts 2005. Industrial Technologies Program: Summary of Program Results for CY2005. 167-170.
Available at http://www1.eere.energy.gov/industry/about/pdfs/impact2005.pdf.
Iyengar, S. S., & Lepper. 2000. When Choice is Demotivating: Can One Desire Too Much of a Good
Thing?, M. Journal of Personality and Social Psychology, 79, 995-1006. (2000).
Jaffe, B. Adam. and Robert N Stavins. 1994a. The energy-efficiency gap: What does it mean? Energy
Policy 22 (10): 804-810.
Jaffe, B. Adam. and Robert N Stavins. 1994b. The energy paradox and the diffusion of conservation tech-
nology. Resource and Energy Economics. 61 91-122.
Kahneman, D. 1994. New Challenges to the Rationality Assumption. Journal of institutional and theoret-
ical economics, 150(1), 18-36.
21
Kardes, Frank R., and Gurumurthy Kalyanaram. 1992. Order-of-Entry Effects on Consumer Memory and
Judgment: An Information Integration Perspective. Journal of Marketing Research 29, no. 3 (Au-
gust): 343-357.
Kempton, W, JM Darley, and PC Stern. 1992. Psychological-Research for the New Energy Problems –
Strategies and Opportunities. American Psychologist 47, no. 10 (October): 1213-1223.
King, Andrew, and Michael Lenox. 2002. Exploring the Locus of Profitable Pollution Reduction. Man-
agement Science 48, no. 2 (February): 289-299.
Koelemeijer, Kitty, and Harmen Oppewal. 1999. Assessing the effects of assortment and ambience: a
choice experimental approach. Journal of Retailing 75, no. 3: 319-345.
Koomey, JG, and AH Sanstad. 1994. Technical Evidence for Assessing the Performance of Markets Af-
fecting Energy Efficiency. Energy Policy 22, no. 10 (October): 826-832.
Laverty, Kevin J. 1996. Economic "Short-Termism": The Debate, the Unresolved Issues, and the Implica-
tions for Management Practice and Research. The Academy of Management Review 21, no. 3 (July):
825-860.
Lovins, Amory B. and Lovins, Hunter L.1993 Least Cost Climatic Stabilization, Annual Review Energy
Environment, 16: 433-531
Maddala, G.S. 2003. Limited Dependent and Qualitative Variables in Econometrics. Cambridge Universi-
ty Press 22-27.
Mansfield, Edwin. 1961. Technical Change and the Rate of Imitation. Econometrica 29, no. 4 (October):
741-766.
Marginson, D, and L McAulay. 2008. Exploring the debate on short-termism: A theoretical and empirical
analysis. Strategic Management Journal 29, no. 3 (March): 273-292.
Meier, Alan K., and Jack Whittier. 1983. Consumer discount rates implied by purchases of energy-
efficient refrigerators. Energy 8, no. 12 (December): 957-962.
Meredith, Marc, and Yuval Salant. 2007. The Causes and Consequences of Ballot Order-Effects. Stanford
University. Working Paper. August.
Mueller, Steffen. 2006. Missing the spark: An investigation into the low adoption paradox of combined
hear and power technologies. Energy Policy 34: 3153-3164
Mulder, Peter., Henri L.F. de Groot, and Marjan W. Hofkes. 2003. Explaining slow diffusion of energy-
saving technologies; a vintage model with returns to diversity and learning by-using. Resource and
Energy Economics 25: 105-126.
Muller, Dr. Michael R., Michael B. Muller, Fred W. Glaeser. 2004. The DOE Industrial Assessment Da-
tabase Manual, User Information Version 8.2 July. Available at
http://iac.rutgers.edu/database_manual.php. Last accessed July 26, 2008.
22
Oppenheim, Bohdan W. 2007. Impact of Productivity on Energy Conservation, Strategic Planning for
Energy and the Environment, Vol.26, No. 3.
Oppewal, Harmen, and Kitty Koelemeijer. 2005. More choice is better: Effects of assortment size and
composition on assortment evaluation. International Journal of Research in Marketing 22, no. 1
(March): 45-60.
Perrin, BM, BJ Barnett, L Walrath, and JD Grossman. 2001. Information order and outcome framing: An
assessment of judgment bias in a naturalistic decision-making context. Human Factores 43, no. 2
(SUM): 227-238.
Petersen, MA, and RG Rajan. 1995. The Effect of Credit Market Competition on Lending Relationships.
Quarterly Journal of Economics 110, no.2 (May): 407-443.
Porter, Michael E., and Claas van der Linde. 1995. Toward a New Conception of the Environment-
Competitiveness Relationship. The Journal of Economic Perspectives 9, no. 4 (Autumn): 97-118.
Rogers, Everett .M. 2003. Diffusion of Innovations (5th edition). Free Press 219-266.
Rohdin, P., and P. Thollander. 2006. Barriers to and driving forces for energy efficiency in the non-
energy intensive manufacturing industry in Sweden. Energy 31, no. 12 (September): 1836-1844.
Rubinstein, A., and Y. Salant. 2006. A model of choice from lists. Theoretical Economics 1, no. 1: 3-17.
Salant, Yuval. 2008. Procedural Analysis of Choice Rules with Applications to Bounded Rationality.
+orthwestern University. Working Paper. November.
Scheinbehenne, Benjamin., Rainer Greifeneder and Peter M. Todd. 2009. Can there ever be Too Many
Options? Re-Assessing the Effect of Choice Overload. Working Paper.
Schweitzer, ME, and GP Cachon. 2000. Decision bias in the newsvendor problem with a known demand
distribution: Experimental evidence. Management Science 46, no. 3 (March): 404-420.
Sethi-Iyengar, S., Huberman, G., and Jiang, W. 2004. How Much Choice is Too Much? Contributions to
401(k) Retirement Plans. In Mitchell, O.S. & Utkus, S. (Eds.) Pension Design and Structure: +ew
Lessons from Behavioral Finance, 83-95. Oxford: Oxford University Press.
Shama, Avraham.1983. Energy conservation in US buildings : Solving the high potential/low adoption
paradox from a behavioural perspective Energy Policy, Volume 11, Issue 2, June, pp 148-167.
Stern, P. C, and E. (eds.) Aronson. 1984. Energy use: the human dimension. United States: W.H. Freeman
and Co., New York, NY.
Symonds, P.. 1936. Influence of order of presentation of items in ranking. Journal of educational psy-
chology 27 (6): 445-449.
Terry, W. Scott. 2005. Serial Position Effects in Recall of Television Commercials. Journal of General
Psychology 132, no. 2 (April): 151-163.

23
Thakor, Anjan V. 1993. Corporate Investments and Finance. Financial Management 22, no. 2 (Summer):
135-144.
Wooldridge, Jeffery M. 2002. Econometric Analysis of Cross Section and Panel Data. Cambridge, MA:
MIT Press 83-113.
Zhang, GC. 1997. Moral hazard in corporate investment and the disciplinary role of voluntary capital ra-
tioning. Management Science 43, no. 6 (June): 737-750.
24
Figure 1: Energy Savings Implemented as a Percentage of Total Savings
Recommended
020
40
60
80
100
Percentage
1985 1990 1995 2000 2005Year
Over 50% of energy savings recommended are not implemented. Moreover, the percentage of energy sav-ings implemented is decreasing over time.
Figure 2: Adoption Rate vs. Serial Position of Recommendation in the Report
A drop in adoption rates, of over 13% is observed between recommendations which occur in the 1st vs. 15th position in a report.

25
Figure 3: Adoption Rate vs. 6umber of Recommendations in an Assessment
On average, approximately half of the recommendations are implemented irrespective of the number of
recommendations made to a firm.
Table 1: Descriptive Statistics
Variable Mean S.D Minimum Maximum
Adopted** 0.5001 0.50 0 1
Payback (years) 1.0579 1.29 0 9
Implementation Cost (US$) 20,766.82 301,632.42 0 55,429,808
Annual Savings (US$) 19,296.85 130,001.21 1.12 8,519,905
Annual Sales (US $) 41,729,814.57 247,954,127.97 0 25,000,000,000
Employees 175.02 177.78 0* 5,800
Floor Area (square feet) 201,027.04 2,592,045.59 0* 150,000,000
Annual Energy Cost (US$) 727,867.34 2,643,844.22 0* 189,742,848Statistics are based on data for the 92,723 recommendations, representing 12,703 assessments.
Monetary figures are in 2006 US Dollars
** Adopted =1 if the recommendation is implemented and 0 otherwise * 6ote: Data is missing and coded as 0 for : 1) Annual Sales (755 records), 2) Employees (101 records) 3) Floor Area (26,596 records). All the analysis has also been done by removing the missing data and the results of the study are still valid.
26
Table 2: Sign Test for Paired Comparisons: Median Rates of Return for Unrealized Recommenda-
tions vs. Cost of Trade Credit
Sign
Observed Returns for
Recommendations as
Compared to Cost of
Trade Credit
Expected Returns for
Recommendations as
Compared to Cost of
Trade Credit
Positive
(Returns are More Than
Cost of Trade Credit)
23907 18746
Negative
(Returns are Less Than
Cost of Trade Credit)
13585 18746
Total 37492 37492
One-sided tests:
Ho: Median Rate of Return of Unrealized Opportunities is Equal to Cost of Trade Credit
Ha: Median Rate of Return of Unrealized Opportunities is More Than Cost of Trade Credit
p Value =0.000
Two-sided test:
Ho: Median Rate of Return of Unrealized Opportunities is Equal to Cost of Trade Credit
Ha: Median Rate of Return of Unrealized Opportunities is Not Equal to Cost of Trade Credit
p Value =0.000
Data pertains to recommendations made by IAC centers from 1981-2006. 37,492 recommendations that
were not implemented are used in the analysis. 2,790 unrealized recommendations were excluded in this
analysis as their internal rates of return were over 100 and 17 unrealized recommendations were excluded
as their payback were negative and 6,068 unrealized recommendations were excluded as their cost figures
were recorded as zero. Including these recommendations in this analysis does not alter the inferences.
27
Table 3: Conditional Fixed Effects Logit Estimates of Adoption of Recommendations
Conditional Logit Models
Payback Cost-Benefit
ln(Payback) -0.3124***
(0.023)
ln(Payback)^2 -0.0348***
(0.005)
ln(Cost) -0.2868***
(0.018)
ln(Cost)^2 -0.0170***
(0.002)
ln(Saving) 0.1246***
(0.017)
ln(Saving)^2 -0.0032
(0.003)
Serial -0.0424*** -0.0550***
(0.004) (0.004)
Number*Payback 0.0124 -0.0470***
(0.017) (0.013)
Variance -0.1566*** -0.1252***
(0.014) (0.014)
Controls:
Recommendation Type (Number significant at
p<0.001 out of 25 recommendation types) 0 0
Firm Fixed Effects Yes Yes
Observations 61955 61955
Log-Likelihood -25437.613*** -25348.141***
Likelihood-Ratio 3304.1 3326.8
standard errors are in parentheses
* p<0.05, ** p<0.01, *** p<0.001
Dependent Variable : Adopted (equals 1 if implemented 0 otherwise)
Data pertains to recommendations made by IAC centers from 1981-2006. Dependent variable is the implementation
status of a recommendation - Adopted equals 1 if recommendation is implemented and equals 0 otherwise. Estima-
tion method is maximum likelihood conditional fixed effects. Standard errors reported are using robust clustered
variance covariance matrix. Each model is estimated for an effective sample of 9310 plants representing 61,955 rec-
ommendations. 3,362 plants (17,090 recommendations) were dropped from the full sample due to their having no
variation in whether the recommendations were adopted or not. 13,678 recommendations were dropped as they have
payback less than or equal to zero and the logarithmic form for payback is not defined. Including these recommen-
dations in a model without logarithmic transformation does not change the inferences we derive from this model.
28
Table 4: Instrumental Variables Probit Estimates of Adoption of Recommendations (Version : Ab-
solute Serial Position)
Probit IV Probit Probit IV Probit
Exog_PB Endog_PB Exog_CB Endog_CB
ln(Payback) -0.1468 *** -0.1097 ***
(0.0107) (0.0161)
ln(Payback)^2 -0.0164 *** -0.0152 ***
(0.0022) (0.0022)
ln(Cost) -0.1392 *** -0.1276 ***
(0.0085) (0.0091)
ln(Cost)^2 -0.0084 *** -0.0075 ***
(0.0011) (0.0011)
ln(Saving) 0.0609 *** 0.0128
(0.0084) (0.0135)
ln(Saving)^2 -0.0013 0.0018
(0.0014) (0.0016)
Serial Position -0.0203 *** -0.1643 *** -0.0259 *** -0.1322 ***
(0.0018) (0.0377) (0.0019) (0.0227)
Number 0.0384 0.6182 *** 0.0911 *** 0.5162 ***
(0.0267) (0.1526) (0.0261) (0.0928)
Number*Payback -0.0006 0.0037 -0.0276 *** -0.0218 ***
(0.0079) (0.0083) (0.0060) (0.0063)
Variance of Payback -0.079 *** -0.1185 *** -0.0629 *** -0.0721 ***
(0.0073) (0.0117) (0.0072) (0.0073)
Sales -0.0007 -0.0005 -0.0007 -0.0006
(0.0005) (0.0005) (0.0004) (0.0004)
Employees -0.0078 -0.0032 0.0034 0.0194
(0.0073) (0.0070) (0.0072) (0.0081)
Plant Area 0.0003 0.0003 0.0004 0.0006
(0.0007) (0.0007) (0.0007) (0.0006)
Controls
0 0 1 1
31 28 31 28
0 0 0 0
Observations 78811 78811 78811 78811
Firms (Assessments) 12628 12628 12628 12628
Log-PseudoLikelihood -51526.82 *** -233295.9 *** -51432.89 *** -229748.36 ***
Exogeneity_Wald_Stat 12.03 19.91
standard errors are in parantheses
* p<0.05, ** p<0.01, *** p<0.001
Dependent Variable : Adopted (equals 1 if implemented, 0 otherwise)
Recommendation Type (No. significant at
p<0.001 out of 25 recommendation types)
IAC Centers (No. significant at p<0.001 out
of 45 IAC centers)
Years (No. significant at p<0.001 out of 26
Years)
Data pertains to recommendations made by IAC centers from 1981-2006. Dependent variable is the implementation status of a recommendation -
Adopted equals 1 if recommendation is implemented and equals 0 otherwise. Estimation method is Maximum Likelihood. Standard errors re-
ported are using robust clustered variance covariance matrix. 1 IAC center and its 12 related recommendations were dropped from the full sample
due to their having no variation in whether the recommendations were adopted or not. 13,644 recommendations were dropped as they has pay-
back less than or equal to zero and the logarithmic form for payback is not defined. Including these recommendations in a model without loga-
rithmic transformation does not change the inferences we derive from this model. Also 256 recommendations with sic two digit codes less than
20 and more than 39 were not included in the analysis reported here. Including them does not change the inferences obtained from the models.
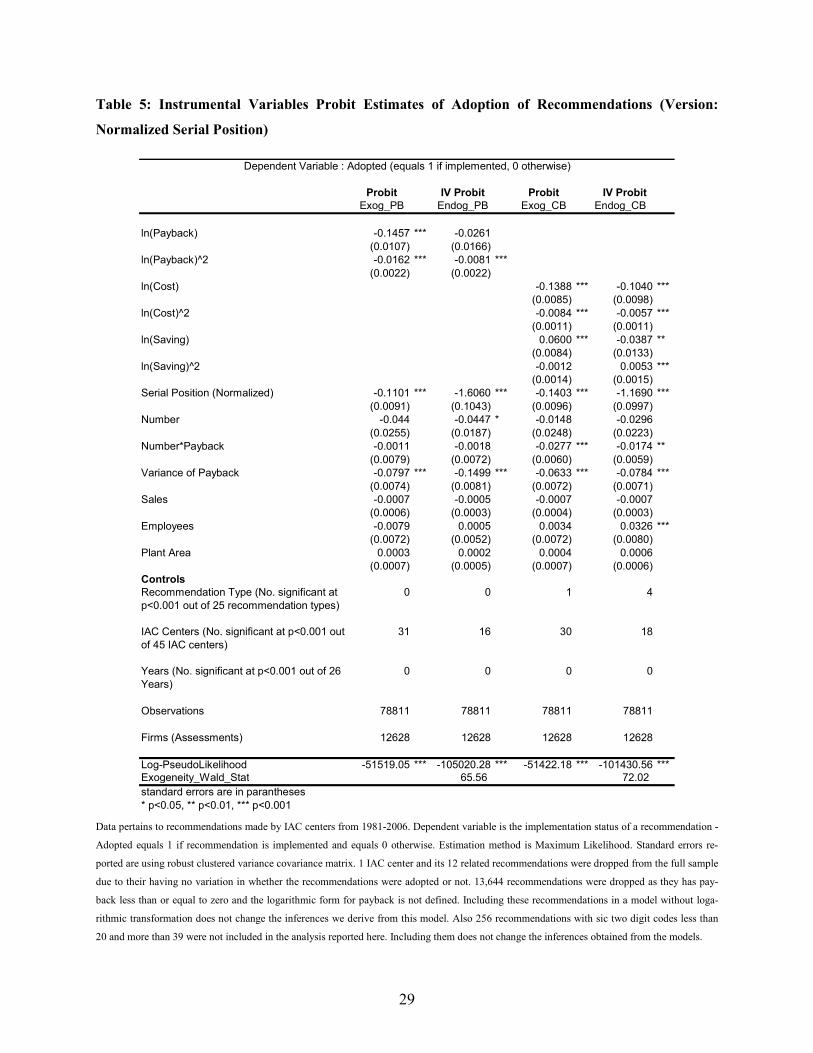
29
Table 5: Instrumental Variables Probit Estimates of Adoption of Recommendations (Version:
6ormalized Serial Position)
Probit IV Probit Probit IV Probit
Exog_PB Endog_PB Exog_CB Endog_CB
ln(Payback) -0.1457 *** -0.0261
(0.0107) (0.0166)
ln(Payback)^2 -0.0162 *** -0.0081 ***
(0.0022) (0.0022)
ln(Cost) -0.1388 *** -0.1040 ***
(0.0085) (0.0098)
ln(Cost)^2 -0.0084 *** -0.0057 ***
(0.0011) (0.0011)
ln(Saving) 0.0600 *** -0.0387 **
(0.0084) (0.0133)
ln(Saving)^2 -0.0012 0.0053 ***
(0.0014) (0.0015)
Serial Position (Normalized) -0.1101 *** -1.6060 *** -0.1403 *** -1.1690 ***
(0.0091) (0.1043) (0.0096) (0.0997)
Number -0.044 -0.0447 * -0.0148 -0.0296
(0.0255) (0.0187) (0.0248) (0.0223)
Number*Payback -0.0011 -0.0018 -0.0277 *** -0.0174 **
(0.0079) (0.0072) (0.0060) (0.0059)
Variance of Payback -0.0797 *** -0.1499 *** -0.0633 *** -0.0784 ***
(0.0074) (0.0081) (0.0072) (0.0071)
Sales -0.0007 -0.0005 -0.0007 -0.0007
(0.0006) (0.0003) (0.0004) (0.0003)
Employees -0.0079 0.0005 0.0034 0.0326 ***
(0.0072) (0.0052) (0.0072) (0.0080)
Plant Area 0.0003 0.0002 0.0004 0.0006
(0.0007) (0.0005) (0.0007) (0.0006)
Controls
0 0 1 4
31 16 30 18
0 0 0 0
Observations 78811 78811 78811 78811
Firms (Assessments) 12628 12628 12628 12628
Log-PseudoLikelihood -51519.05 *** -105020.28 *** -51422.18 *** -101430.56 ***
Exogeneity_Wald_Stat 65.56 72.02
standard errors are in parantheses
* p<0.05, ** p<0.01, *** p<0.001
Dependent Variable : Adopted (equals 1 if implemented, 0 otherwise)
Recommendation Type (No. significant at
p<0.001 out of 25 recommendation types)
IAC Centers (No. significant at p<0.001 out
of 45 IAC centers)
Years (No. significant at p<0.001 out of 26
Years)
Data pertains to recommendations made by IAC centers from 1981-2006. Dependent variable is the implementation status of a recommendation -
Adopted equals 1 if recommendation is implemented and equals 0 otherwise. Estimation method is Maximum Likelihood. Standard errors re-
ported are using robust clustered variance covariance matrix. 1 IAC center and its 12 related recommendations were dropped from the full sample
due to their having no variation in whether the recommendations were adopted or not. 13,644 recommendations were dropped as they has pay-
back less than or equal to zero and the logarithmic form for payback is not defined. Including these recommendations in a model without loga-
rithmic transformation does not change the inferences we derive from this model. Also 256 recommendations with sic two digit codes less than
20 and more than 39 were not included in the analysis reported here. Including them does not change the inferences obtained from the models.
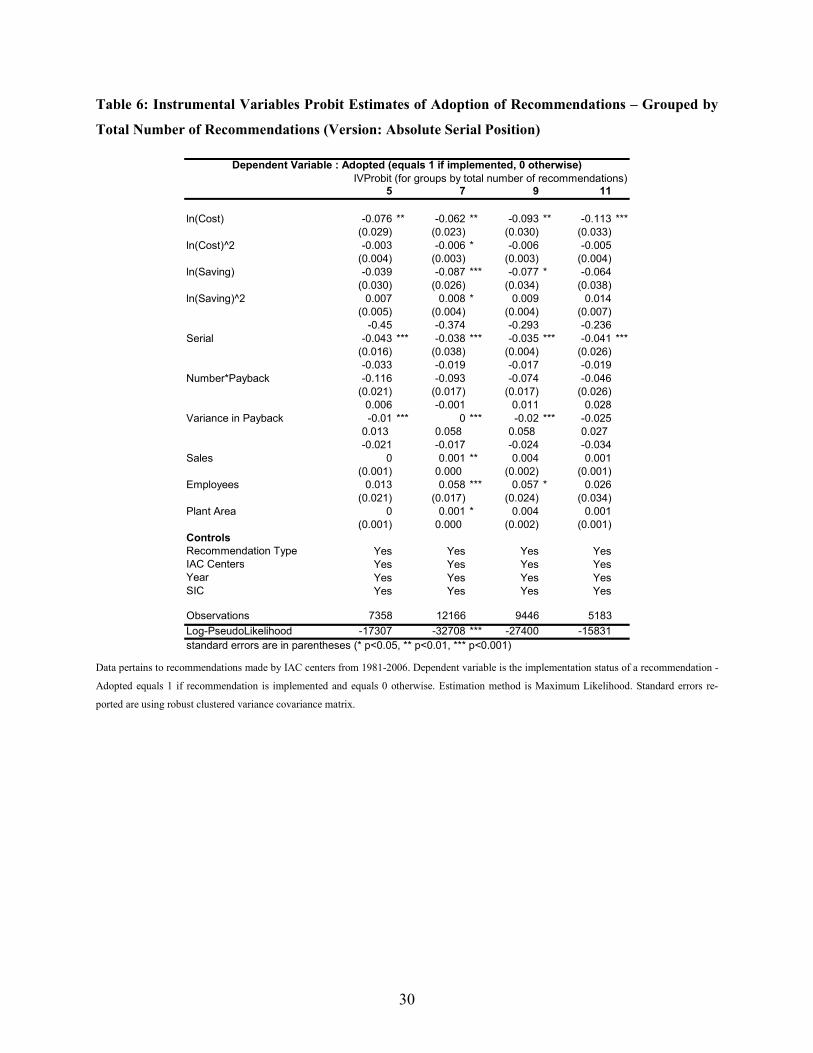
30
Table 6: Instrumental Variables Probit Estimates of Adoption of Recommendations – Grouped by
Total 6umber of Recommendations (Version: Absolute Serial Position)
5 7 9 11
ln(Cost) -0.076 ** -0.062 ** -0.093 ** -0.113 ***
(0.029) (0.023) (0.030) (0.033)
ln(Cost)^2 -0.003 -0.006 * -0.006 -0.005
(0.004) (0.003) (0.003) (0.004)
ln(Saving) -0.039 -0.087 *** -0.077 * -0.064
(0.030) (0.026) (0.034) (0.038)
ln(Saving)^2 0.007 0.008 * 0.009 0.014
(0.005) (0.004) (0.004) (0.007)
-0.45 -0.374 -0.293 -0.236
Serial -0.043 *** -0.038 *** -0.035 *** -0.041 ***
(0.016) (0.038) (0.004) (0.026)
-0.033 -0.019 -0.017 -0.019
Number*Payback -0.116 -0.093 -0.074 -0.046
(0.021) (0.017) (0.017) (0.026)
0.006 -0.001 0.011 0.028
Variance in Payback -0.01 *** 0 *** -0.02 *** -0.025
0.013 0.058 0.058 0.027
-0.021 -0.017 -0.024 -0.034
Sales 0 0.001 ** 0.004 0.001
(0.001) 0.000 (0.002) (0.001)
Employees 0.013 0.058 *** 0.057 * 0.026
(0.021) (0.017) (0.024) (0.034)
Plant Area 0 0.001 * 0.004 0.001
(0.001) 0.000 (0.002) (0.001)
Controls
Recommendation Type Yes Yes Yes Yes
IAC Centers Yes Yes Yes Yes
Year Yes Yes Yes Yes
SIC Yes Yes Yes Yes
Observations 7358 12166 9446 5183
Log-PseudoLikelihood -17307 -32708 *** -27400 -15831
standard errors are in parentheses (* p<0.05, ** p<0.01, *** p<0.001)
IVProbit (for groups by total number of recommendations)
Dependent Variable : Adopted (equals 1 if implemented, 0 otherwise)
Data pertains to recommendations made by IAC centers from 1981-2006. Dependent variable is the implementation status of a recommendation -
Adopted equals 1 if recommendation is implemented and equals 0 otherwise. Estimation method is Maximum Likelihood. Standard errors re-
ported are using robust clustered variance covariance matrix.

31
Table 7: Probit Estimates of Adoption of Recommendations – Grouped by Serial Position of Rec-
ommendations
1 3 5 7 9
ln(Cost) -0.166 *** -0.172 *** -0.155 *** -0.141 *** -0.142 ***
(0.020) (0.026) (0.029) (0.031) (0.042)
ln(Cost)^2 -0.012 *** -0.011 *** -0.012 *** -0.012 ** -0.002
(0.003) (0.003) (0.004) (0.004) (0.006)
ln(Saving) 0.082 *** 0.106 *** 0.086 ** 0.048 0.042
(0.020) (0.026) (0.029) (0.031) (0.038)
ln(Saving)^2 0 0.003 0.005 0.001 -0.008
(0.004) (0.005) (0.005) (0.005) (0.006)
Number of Recommendations 0.041 0.076 0.125 * 0.08 0.038
(0.050) (0.049) (0.055) (0.071) (0.106)
Number*Payback -0.014 -0.017 -0.042 * -0.051 * 0.008
(0.018) (0.019) (0.020) (0.021) (0.025)
Variance in Payback -0.09 *** -0.071 *** -0.069 ** -0.036 -0.116 **
(0.019) (0.020) (0.022) (0.024) (0.038)
Sales 0.001 0.001 -0.008 -0.005 -0.006
(0.001) (0.002) (0.005) (0.004) (0.006)
Employees 0.013 -0.009 0.003 0.003 0.002
(0.015) (0.015) (0.015) (0.018) (0.029)
Plant Area 0 0 0 -0.001 -0.003
(0.001) (0.001) (0.001) (0.002) (0.002)
Controls
Recommendation Type Yes Yes Yes Yes Yes
IAC Centers Yes Yes Yes Yes Yes
Year Yes Yes Yes Yes Yes
SIC Yes Yes Yes Yes Yes
Observations 10769 10745 9331 6162 2994
Log-PseudoLikelihood -6678 *** -6959.5 *** -6089.7 *** -4012.7 *** -1901.7
standard errors are in parentheses (* p<0.05, ** p<0.01, *** p<0.001)
Dependent Variable : Adopted (equals 1 if implemented, 0 otherwise)
Probit (for groups by same serial position values)
Data pertains to recommendations made by IAC centers from 1981-2006. Dependent variable is the implementation status of a recommendation -
Adopted equals 1 if recommendation is implemented and equals 0 otherwise. Estimation method is Maximum Likelihood. Standard errors re-
ported are using robust clustered variance covariance matrix.