Management Studies (ISSN 2328-2185), Vol.2, No.2, 2014
73
-
Upload
independent -
Category
Documents
-
view
2 -
download
0
Transcript of Management Studies (ISSN 2328-2185), Vol.2, No.2, 2014

David
David Publishing Company
www.davidpublishing.com
PublishingDavid
Management Studies
Volume 2, Number 2, (Serial Number 3)2014February
Publication Information:
Management Studies is published monthly in hard copy (ISSN 2328-2185) and online by David Publishing Company
located at 240 Nagle Avenue #15C, New York, NY 10034, USA.
Aims and Scope:
Management Studies, a monthly professional academic journal, covers all sorts of researches on Engineering
Management, Project Management, Environmental Management, Technology Management, International (Business)
Management, Operations Management, Financial Management, Marketing, Human Resource Management, Logistics
Management, Leadership, Tourism Management, Knowledge Management, Administration Management, Information
Management, Hospitality Management, Electronic Commerce, and other latest findings and achievements from
experts and scholars all over the world.
Editorial Board Members:
Nirmala Devi Nath (New Zealand)
Jamnean Joungtrakul (Korea)
Zohar Laslo (Israel)
Joanna Kuczewska (Poland)
Gancho Todorov Ganchev (Bulgaria)
Athanasios Migdalas (Greece)
Natalia Petrovna Kusnezova (Russia)
Renata Korsakienė (Lithuania)
Mariya Stankova (Bulgaria)
Agnieszka Zakrzewska–Bielawska (Poland)
Shelly SHEN (China)
Vincenzo Zarone (Italy)
Athanasia Karakitsiou (Greece)
Bonny TU (China)
Manuscripts and correspondence are invited for publication. You can submit your papers via Web Submission, or
E-mail to [email protected], [email protected]. Submission guidelines and
Web Submission system are available at http://www.davidpublishing.org, http://www.davidpublishing.com.
Editorial Office:
240 Nagle Avenue #15C, New York, NY 10034, USA
E-mail: [email protected]; [email protected]
Copyright©2014 by David Publishing Company and individual contributors. All rights reserved. David Publishing
Company holds the exclusive copyright of all the contents of this journal. In accordance with the international
convention, no part of this journal may be reproduced or transmitted by any media or publishing organs (including
various websites) without the written permission of the copyright holder. Otherwise, any conduct would be
considered as the violation of the copyright. The contents of this journal are available for any citation, however, all
the citations should be clearly indicated with the title of this journal, serial number and the name of the author.
Abstracted / Indexed in:
Database of EBSCO, Massachusetts, USA
Ulrich’s Periodicals Directory, USA
ProQuest/CSA Social Science Collection, Public Affairs Information Service (PAIS), USA
Cabell’s Directories, USA
Summon Serials Solutions, USA
Chinese Database of CEPS, American Federal Computer Library center (OCLC), USA
Index Copernicus, Poland
Qualis/Capes index, Brazil
Norwegian Social Science Data Services (NSD), Database for Statistics on Higher Education (DBH), Norway
Universe Digital Library S/B, ProQuest, Malaysia
Polish Scholarly Bibliography (PBN), Poland
Chinese Scientific Journals Database, VIP Corporation, Chongqing, China
Google Scholar
China National Knowledge Infrastructure (CNKI), China
Subscription Information:
Price (per year): Print $520 Online $320 Print and Online $600
David Publishing Company, 240 Nagle Avenue #15C, New York, NY 10034, USA
Tel: +1-323-984-7526, 323-410-1082 Fax: +1-323-984-7374, 323-908-0457
E-mail: [email protected]
David Publishing Company
www.davidpublishing.com
DAVID PUBLISHING
D
Management Studies
Volume 2, Number 2, February 2014 (Serial Number 3)
Contents
Project Management
An Empirical Study on Project Management Maturity in Human Resources 73
Seweryn Spalek
International (Business) Management
Main Factors Affecting the Balance of Investments in Serbia and New Trends of Investment 81
Nada Milenković, Jelena Andrašić, Miloš Pjanić
Marketing
Small and Medium Enterprises (SMEs) and Competitiveness: An Empirical Study 88
Luisa Carvalho, Teresa Costa
Human Resource Management
Company Value and Employee Satisfaction: Theoretical Analysis and Empirical Findings 96
Josef Neuert, Hans-Jürgen Brenninger
Tourism Management
Research on Cultural Tourism Issues of Trikala City, Greece 111
Mitoula Roido, Gratsani Athina
Educational Management
Managing a University From its Revenue Perspective—Empirical Illustration of Poznan
University of Economics 123
Marek Cieślak, Remigiusz Napiecek

Management Studies, ISSN 2328-2185 February 2014, Vol. 2, No. 2, 73-80
An Empirical Study on Project Management
Maturity in Human Resources*
Seweryn Spalek
Silesian University of Technology, Gliwice, Poland
The assessment of the Project Management Maturity (PMM) level shows the company how good it is at managing
projects. This measurement can be performed in different domains of expertise. In the article, the issue of PMM in
the human resources (HR) area is examined. The discussion is based on a world-wide empirical research project
conducted in more than 400 companies. The study was mostly focused on the machinery industry as there is a
dearth of research on project management topics in this branch of the economy. Therefore, by investigating the
PMM level in the HR area, a picture of the state of project management in the machinery industry will be created.
For the purposes of comparison, a study was conducted on the construction (CONS) and information technology
(IT) industries which, in contradistinction, are very well recognized in the scientific literature related to project
management issues. This approach will help to better contextualize and understand the results from the machinery
industry. The PMM level measurement was done using the author’s model which assesses maturity on a scale of
one to five, where one is the lowest and five, the highest level of maturity. The results of the study revealed that
there were differences among the industries in PMM levels and between Polish and foreign companies.
Keywords: Project management maturity (PMM), human resources (HR), assessment, level, machinery,
construction (CONS), information technology (IT), empirical study.
Introduction
Human resource management (HRM) is of high importance for companies doing business (Becker &
Huselid, 2006). People in projects are a key asset and require special attention (Adler, Heckscher, & Prusak,
2011; Spalek, 2011). The Project Management Maturity (PMM) concept is used to measure how good the
company is in managing projects (Kerzner, 2004; Spalek, 2014). There are different models of assessing the
level of PMM in various areas of investigation (Cooke-Davies, 2007; Crawford, 2006). However, the vast
majority of them assess the PMM in each area separately, including human resources (HR) (Pemsel &
Wiewiora, 2013). One notable exception is the Organizational PMM Model (OPM3®), which measures
maturity against a comprehensive list of best practices (Ghorbanali, Khosravi, Afshari, Borzabadi, & Valipour,
2011).
The discussion in the paper is based on a world-wide empirical study conducted in three types of
industries: machinery, CONS, and IT. The investigation was carried out on more than 400 global companies.
* This work was supported by the National Science Center Grant.
Seweryn Spalek, Ph.D., Faculty of Organisation and Management, Silesian University of Technology Correspondence concerning this article should be addressed to Seweryn Spalek, Faculty of Organisation and Management,
Silesian University of Technology, Akademicka 2A, 44-100, Gliwice, Poland. E-mail: [email protected].
DAVID PUBLISHING
D
AN EMPIRICAL STUDY ON PROJECT MANAGEMENT MATURITY IN HUMAN RESOURCES
74
The main focus of the study was intentionally on machinery industry companies. This was as the result of
a literature review on project management related topics (Blomquist, Hallgren, Nilsson, & Soderholm, 2010;
Kwak & Anbari, 2009). It revealed that there was a plethora of studies in the CONS and IT industries (Carcary,
2011; Dantes & Hasibuan, 2010; Kang, O’Brien, & Mulva, 2013; Kmieciak, Michna, & Meczynska, 2012;
Pinter & Psunder, 2013; Pretorius, Steyn, & Jordaan, 2012; Spalek, 2013; Willis & Rankin, 2012), while there
was a significant shortage of investigations into machinery industry companies.
Therefore, the article research question is: What is the PMM level of machinery industry companies in
relation to their CONS and IT counterparts?
PMM and HR
The concept of assessing PMM was developed based on the Capability Maturity Model (CMM) which
was proposed for software development purposes (Twaites, Collofello, & Zenzen, 2004). Then, building on this
idea, further PMM models were developed for different purposes (Belt, Oiva-Kess, Harkonen, Mottonen, &
Kess, 2009; J. Y. Lee, D. Y. Lee, & Kang, 2007; SCAMPI, 2006; Spalek, 2012). Their applications vary
between industries (Khoshgoftar & Osman, 2009). Moreover, their scopes of measurement can be different
(Wendler, 2012). At the moment of writing, there are several PMM models supported by various authors and
by organizations (OGC, 2006; PMI, 2008). The majority of them address HRM issues very carefully. This is
due to the importance of highly skilled workers in projects nowadays. Their experience, knowledge, and
practical abilities are crucial for successful project execution. Therefore, it is desirable that the company
possesses a system to measure the performance of project managers as part of an overall employee assessment
system and operates a formal program of training and development for those taking part in projects (Kuprenas,
Madjidi, & Alexander, 1999). In order to assign competent people to their projects, the company is advised to
provide various career paths for individuals having different functions in projects. This should result in
designating competent people to their project endeavors. Moreover, the technical skills of people involved in
projects should be assessed using a formal system of measurement to ensure that the people assigned to projects
have adequate competencies to fulfill their roles.
Furthermore, the development of professional project managers and team members ought to be ensured
through established procedures in the company. As a result, those holding chosen positions in a project should
be provided with training on project management.
By endorsing membership in communities related to project management, the company can raise the
overall awareness level on the importance of exchanging knowledge between the individuals involved in
projects.
As soft skills are of high importance in managing projects nowadays, project managers should be given
training in them (Stevenson & Starkweather, 2010).
The result of all activities related to project managers should be an increase of their competencies in (Isik,
Arditi, Dikmen, & Birgonul, 2009):
project initialization;
project planning;
project execution;
project control and monitoring;
project conclusion;

AN EM
projec
leader
cognit
effect
Other
ethics (Bad
The m
improveme
Raicu, 201
HR al
teamw
recrui
staff d
All ac
environmen
2011; Spal
The e
questionna
The compa
Union and
were reach
thoroughly
discussion.
MPIRICAL S
ct communica
rship;
tion (e.g., ade
ive project m
than busines
diru, 2009).
most mature
ent through t
3):
llocation;
work;
itment;
development.
ctivities unde
nt in which t
ek, 2012).
mpirically gr
aire ensured th
anies particip
North Amer
hed through
y analyzing a
. The division
STUDY ON P
ation;
equate inform
management.
ss related iss
project mana
the processes
ertaken by t
the implemen
rounded resea
he gathering
pating in the
ica. Some of
direct maili
all the gathe
n into the bran
Figure
PROJECT M
mation proces
sues, project
agement com
s associated w
the company
ntation of pro
Res
arch on PMM
of valid data
study were f
f them were fr
ing, industria
ered question
nches is show
e 1. Companies
Constructio25%
MANAGEME
sing and appl
managers are
mpanies are re
with (Anders
y in the HR
oject managem
search Met
M was conduc
from a large
from over 20
from the Midd
al internet fo
nnaires, 447
wn in Figure
participating in
Mon
IT18%
ENT MATUR
lication);
e well advise
ecommended
en & Vaagaa
area are hig
ment office i
thod
cted using a w
number of re
0 countries, w
dle East and
orums, and a
of them qua
1.
n the study by in
Machinery57%
ITY IN HUM
ed to be acqu
d to continuo
asar, 2009; V
ghly significa
is strongly ad
web-based su
espondents (S
with the majo
Asia & Pacif
advertisemen
alified for fu
ndustry.
MAN RESOU
uainted with
usly search f
Vrincut, Deac
ant in the m
dvised (Aubry
urvey. The fo
Spalek & Zdo
ority from th
fic areas. The
nts at trade
urther data an
URCES 75
the code of
for areas of
c, Badea, &
multi-project
y & Hobbs,
ormat of the
onek, 2011).
he European
e companies
fairs. After
nalysis and

AN EMPIRICAL STUDY ON PROJECT MANAGEMENT MATURITY IN HUMAN RESOURCES
76
The assessment of the PMM level was done using the author’s model which measures maturity in the
following areas:
methods and tools;
HR;
project environment;
project knowledge management.
In the model, the assessment is done in each area separately. In this article, the discussion is limited to the
HR area only.
The results from the PMM assessment are on a scale of one to five, where one represents the lowest and
five, the highest level of maturity. They are named accordingly: initial, standardized, appliance, system
management, and self-improvement.
In order to better investigate the maturity levels, only the data from companies employing more than 49
people were chosen for further discussion. Such companies numbered 429. Slightly more than half of them
were Polish companies. The final data sample, divided into industries, consisted of 126 machineries (IND), 61
CONS, and 40 IT companies.
Results and Discussion
Cronbach’s Alpha tests (see Table 1) were applied to check data reliability, reaching values over 0.8.
Table 1 Reliability Statistics of Polish (POL) and Foreign (Other) Companies Country Cronbach’s alpha
POL 0.880
Other 0.867
The descriptive data analysis shows that the highest dispersion of data is in foreign IT companies and is
slightly lower for the POL CONS industry, while the lowest dispersion is noted for foreign CONS firms and
fractionally higher for the POL IT sector. The POL and foreign machinery companies reported nearly the same,
middle dispersion.
The 5th level of maturity (the highest) was reached by foreign machinery and IT companies only. The
other groups reported the 3rd level as being the highest, while POL IT entities reached only the 2nd level. Each
group of POL companies and foreign IT ones reported the 1st level of maturity (the lowest), while other foreign
ones showed the 2nd level as being the minimum.
Detailed descriptive statistics of each group of companies are shown in Table 2.
It is remarkable that all POL IT companies reached only the 1st or 2nd level of PMM in the HR area,
while above 80% of foreign ones reported the 3rd or 4th level. Moreover, nearly 10% of foreign IT firms
showed the highest level of maturity. This observation shows that foreign IT companies are investing much
more in the HR area than POL ones and, therefore, that can negatively impact on the competitiveness of the
latter ones over time.
Above 90% of the POL machinery industry companies reported only the 1st or 2nd level maturity, while
98% of foreign ones reached the 2nd or 3rd level. The result for POL companies which reached the lowest
“initial” level of maturity means that there are no project management practices at all and, in the short term, it
must be increased, otherwise it will be very hard for them to compete with foreign ones.
AN EMPIRICAL STUDY ON PROJECT MANAGEMENT MATURITY IN HUMAN RESOURCES
77
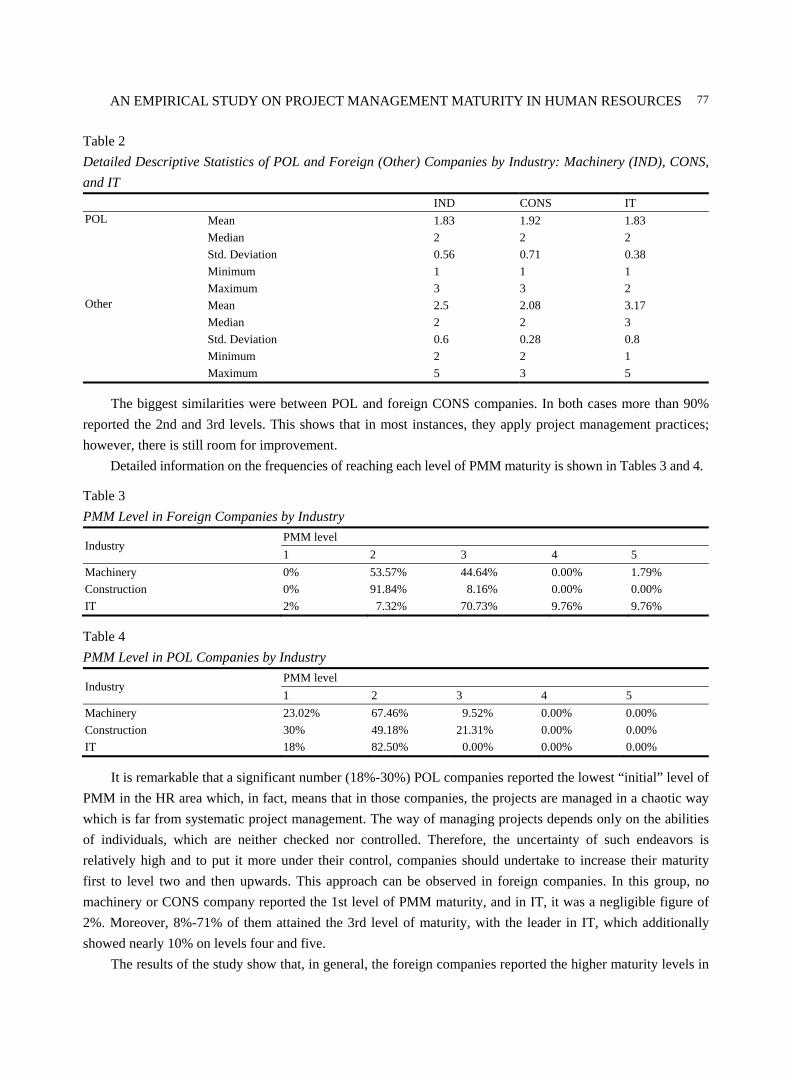
Table 2
Detailed Descriptive Statistics of POL and Foreign (Other) Companies by Industry: Machinery (IND), CONS,
and IT
IND CONS IT POL Mean 1.83 1.92 1.83
Median 2 2 2
Std. Deviation 0.56 0.71 0.38
Minimum 1 1 1
Maximum 3 3 2 Other Mean 2.5 2.08 3.17
Median 2 2 3
Std. Deviation 0.6 0.28 0.8
Minimum 2 2 1
Maximum 5 3 5
The biggest similarities were between POL and foreign CONS companies. In both cases more than 90%
reported the 2nd and 3rd levels. This shows that in most instances, they apply project management practices;
however, there is still room for improvement.
Detailed information on the frequencies of reaching each level of PMM maturity is shown in Tables 3 and 4.
Table 3
PMM Level in Foreign Companies by Industry
Industry PMM level
1 2 3 4 5
Machinery 0% 53.57% 44.64% 0.00% 1.79%
Construction 0% 91.84% 8.16% 0.00% 0.00%
IT 2% 7.32% 70.73% 9.76% 9.76%
Table 4
PMM Level in POL Companies by Industry
Industry PMM level
1 2 3 4 5
Machinery 23.02% 67.46% 9.52% 0.00% 0.00%
Construction 30% 49.18% 21.31% 0.00% 0.00%
IT 18% 82.50% 0.00% 0.00% 0.00%
It is remarkable that a significant number (18%-30%) POL companies reported the lowest “initial” level of
PMM in the HR area which, in fact, means that in those companies, the projects are managed in a chaotic way
which is far from systematic project management. The way of managing projects depends only on the abilities
of individuals, which are neither checked nor controlled. Therefore, the uncertainty of such endeavors is
relatively high and to put it more under their control, companies should undertake to increase their maturity
first to level two and then upwards. This approach can be observed in foreign companies. In this group, no
machinery or CONS company reported the 1st level of PMM maturity, and in IT, it was a negligible figure of
2%. Moreover, 8%-71% of them attained the 3rd level of maturity, with the leader in IT, which additionally
showed nearly 10% on levels four and five.
The results of the study show that, in general, the foreign companies reported the higher maturity levels in
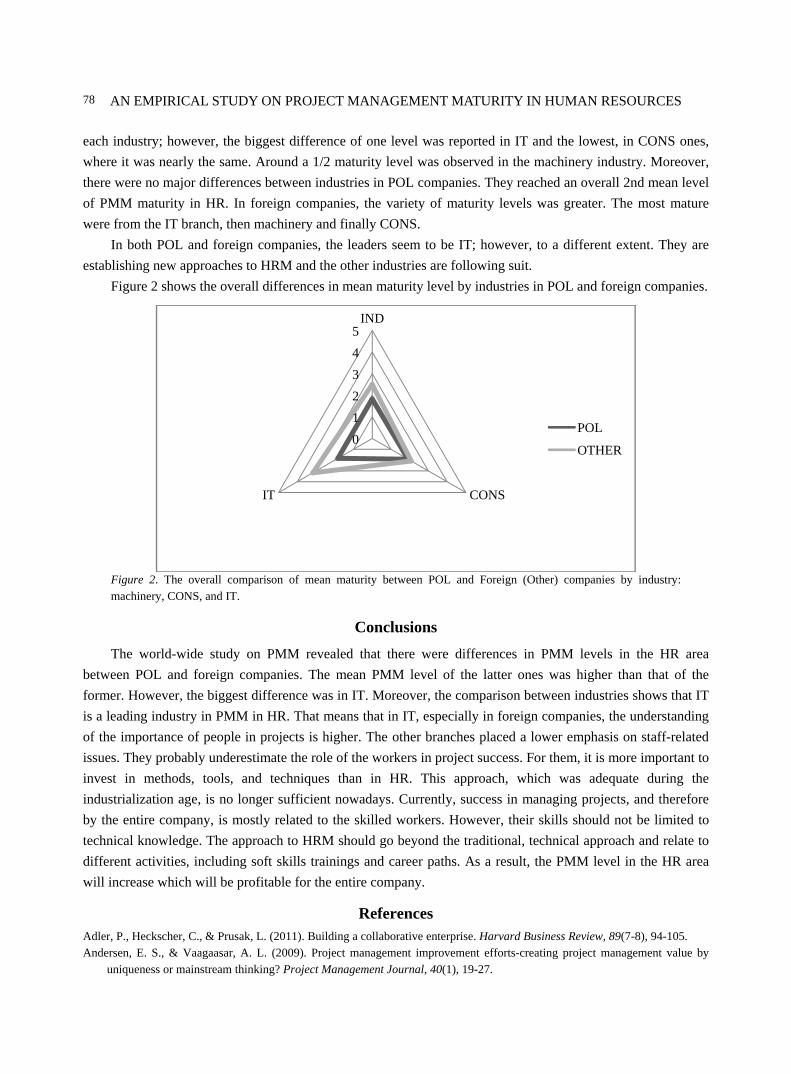
AN EMPIRICAL STUDY ON PROJECT MANAGEMENT MATURITY IN HUMAN RESOURCES
78
each industry; however, the biggest difference of one level was reported in IT and the lowest, in CONS ones,
where it was nearly the same. Around a 1/2 maturity level was observed in the machinery industry. Moreover,
there were no major differences between industries in POL companies. They reached an overall 2nd mean level
of PMM maturity in HR. In foreign companies, the variety of maturity levels was greater. The most mature
were from the IT branch, then machinery and finally CONS.
In both POL and foreign companies, the leaders seem to be IT; however, to a different extent. They are
establishing new approaches to HRM and the other industries are following suit.
Figure 2 shows the overall differences in mean maturity level by industries in POL and foreign companies.
Figure 2. The overall comparison of mean maturity between POL and Foreign (Other) companies by industry: machinery, CONS, and IT.
Conclusions
The world-wide study on PMM revealed that there were differences in PMM levels in the HR area
between POL and foreign companies. The mean PMM level of the latter ones was higher than that of the
former. However, the biggest difference was in IT. Moreover, the comparison between industries shows that IT
is a leading industry in PMM in HR. That means that in IT, especially in foreign companies, the understanding
of the importance of people in projects is higher. The other branches placed a lower emphasis on staff-related
issues. They probably underestimate the role of the workers in project success. For them, it is more important to
invest in methods, tools, and techniques than in HR. This approach, which was adequate during the
industrialization age, is no longer sufficient nowadays. Currently, success in managing projects, and therefore
by the entire company, is mostly related to the skilled workers. However, their skills should not be limited to
technical knowledge. The approach to HRM should go beyond the traditional, technical approach and relate to
different activities, including soft skills trainings and career paths. As a result, the PMM level in the HR area
will increase which will be profitable for the entire company.
References Adler, P., Heckscher, C., & Prusak, L. (2011). Building a collaborative enterprise. Harvard Business Review, 89(7-8), 94-105. Andersen, E. S., & Vaagaasar, A. L. (2009). Project management improvement efforts-creating project management value by
uniqueness or mainstream thinking? Project Management Journal, 40(1), 19-27.
0
1
2
3
4
5IND
CONSIT
POL
OTHER
AN EMPIRICAL STUDY ON PROJECT MANAGEMENT MATURITY IN HUMAN RESOURCES
79
Aubry, M., & Hobbs, B. (2011). A fresh look at the contribution of project management to organizational performance. Project Management Journal, 42(1), 3-16.
Badiru, A. B. (2009). Project management code of ethics and professional conduct. Boca Raton, FL, USA: CRC Press, Taylor & Francis Group.
Becker, B. E., & Huselid, M. A. (2006). Strategic human resources management: Where do we go from here? Journal of Management, 32(6), 898-925.
Belt, P., Oiva-Kess, A., Harkonen, J., Mottonen, M., & Kess, P. (2009). Organisational maturity and functional performance. International Journal of Management and Enterprise Development, 6(2), 147-164.
Blomquist, T., Hallgren, M., Nilsson, A., & Soderholm, A. (2010). Project-as-practice: In search of project management research that matters. Project Management Journal, 41(1), 5-16.
Carcary, M. (2011). A design science approach to development of the IT capability maturity framework (IT CMF). Nr Reading: Academic Conferences Ltd..
Cooke-Davies, T. (2007). Project management maturity models. In P. W. G. Morris, & J. K. Pinto (Eds.), Wiley guide to managing projects (pp. 1234-1255). Hoboken, N.J., USA: John Wiley & Sons.
Crawford, J. K. (2006). The project management maturity model. Information Systems Management, 23(4), 50-58. Dantes, G. R., & Hasibuan, Z. A. (2010). Strategical and tactical impact on ERP implementation: Case study on ERP
implementation in Indonesia. Proceedings of 15th International Business Information Management Association Conference. Cairo, Egypt.
Ghorbanali, A., Khosravi, S., Afshari, H., Borzabadi, M., & Valipour, M. (2011). Improving project management competency by using an OPM3 approach. In S. Juan (Ed.), Economics, business and management (pp. 166-170). Singapore: Int Assoc Computer Science & Information Technology Press-Iacsit Press.
Isik, Z., Arditi, D., Dikmen, I., & Birgonul, M. T. (2009). Impact of corporate strengths/weaknesses on project management competencies. International Journal of Project Management, 27(6), 629-637.
Kang, Y., O’Brien, W. J., & Mulva, S. P. (2013). Value of IT: Indirect impact of IT on construction project performance via Best Practices. Automation in Construction, 35, 383-396.
Kerzner, H. (2004). Project management best practices: Achieving global excellence. Hoboken, N.J.: John Wiley & Sons. Khoshgoftar, M., & Osman, O. (2009). Comparison of maturity models. New York: IEEE. Kmieciak, R., Michna, A., & Meczynska, A. (2012). Innovativeness, empowerment and IT capability: Evidence from SMEs.
Industrial Management & Data Systems, 112(5-6), 707-728. Kuprenas, J. A., Madjidi, F., & Alexander, A. S. (1999). A project management training program. Journal of Management in
Engineering, 15(6), 47-55. Kwak, Y. H., & Anbari, F. T. (2009). Analyzing project management research: Perspectives from top management journals.
International Journal of Project Management, 27(5), 435-446. Lee, J. Y., Lee, D. Y., & Kang, S. W. (2007). An overview of the business process maturity model (BPMM). Advances in Web
and Network Technologies, and Information Management, 4537, 384-395. OGC. (2006). PRINCE2 maturity model (Version 1.0). London, UK: Office of Government Commerce. Pemsel, S., & Wiewiora, A. (2013). Project management office a knowledge broker in project-based organisations. International
Journal of Project Management, 31(1), 31-42. Pinter, U., & Psunder, I. (2013). Evaluating construction project success with use of the m-topsis method. Journal of Civil
Engineering and Management, 19(1), 16-23. PMI. (2008). Organizational project management maturity model (OPM3®), knowledge foundation (2nd ed.). Newtown Square,
P.A., USA: Project Management Institute. Pretorius, S., Steyn, H., & Jordaan, J. C. (2012). Project management maturity and project management success in the engineering
and construction industries in Southern Africa. South African Journal of Industrial Engineering, 23(3), 1-12. SCAMPI. (2006). Standard CMMI appraisal method for process improvement (SCAMPISM): Method definition document.
Retrieved from http://www.sei.cmu.edu/library/abstracts/reports/06hb002.cfm Spalek, S. (2011). A modern approach to managing projects. Zilina, Slovak: EDIS University Publishing House. Spalek, S. (2012). Reaching maturity through project-based learning. Proceedings of the Management, Knowledge and Learning
International Conference 2012. Celje, Slovenia. Spalek, S. (2012). The role of project management office in the multi-project environment. International Journal of Management
and Enterprise Development, 12(2), 172-188.
AN EMPIRICAL STUDY ON PROJECT MANAGEMENT MATURITY IN HUMAN RESOURCES
80
Spalek, S. (2013). Improving industrial engineering performance through a successful project management office. Inzinerine Ekonomika-Engineering Economics, 24(2), 88-98.
Spalek, S. (2014). Does investment in project management pay off? Industrial Management & Data Systems, 114(5). Spalek, S., & Zdonek, D. (2011). The issues connected with carrying out research on project management using a web-based
survey approach. Management and Production Engineering Review, 2(1), 40-46. Stevenson, D. H., & Starkweather, J. A. (2010). PM critical competency index: IT execs prefer soft skills. International Journal of
Project Management, 28(7), 663-671. Twaites, G., Collofello, J., & Zenzen, F. (2004). The CMMI—More than just process. Proceedings of the Tenth ISSAT
International Conference on Reliability and Quality in Design. Las Vegas, Nevada, USA. Vrincut, M., Deac, V., Badea, F., & Raicu, I. (2013). Project management improvement possibilities for it projects. Proceedings of
the 12th International Conference on Informatics in Economy (IE 2013), Education, Research & Business Technologies. Bucharest, Romania.
Wendler, R. (2012). The maturity of maturity model research: A systematic mapping study. Information and Software Technology, 54(12), 1317-1339.
Willis, C. J., & Rankin, J. H. (2012). Demonstrating a linkage between construction industry maturity and performance: A case study of Guyana and New Brunswick. Canadian Journal of Civil Engineering, 39(5), 565-578.
Management Studies, ISSN 2328-2185
February 2014, Vol. 2, No. 2, 81-87
Main Factors Affecting the Balance of Investments in
Serbia and New Trends of Investment
Nada Milenković, Jelena Andrašić, Miloš Pjanić
University of Novi Sad, Subotica, Serbia
The importance of investment for the development of some country is undeniable. In today’s economic conditions,
it is necessary to observe all the influencing factors and examine their impact on the investments in the economy of
some country. The goal of each country is to create a favorable climate (conditions) for the investments, because
they stimulate the growth and development of the country. The aim of this paper is to point of the current situation
(the past few years) of the foreign investments in Serbia’s economy and to highlight the main factors that
influenced this situation. In a past few years, there is another trend of unexploited resource of investment seen in
Serbia, which is more and more attractive in the region, but unfortunately unjustly neglected in Serbia. These
sources are venture capital and private equity funds. Some of the influencing factors that must be emphasized are
the country’s general economic situation, political risks, taxation, the financing of the investments, the
government’s incentives (subsidies), support from some specialized institutions, etc..
Keywords: foreign investments, influencing factors, venture capital and private equity funds.
Introduction
After the fall of the socialist system of economy, transition economies have opened their markets for the
entry of foreign investment. Looked from the side of the investitures, these countries, including Serbia,
represented a new market potential for them. From the point of developing countries, this investment
represented the possibility of external growth and development.
It was only in the early 21st century when Serbia was affected directly by investments although its
socialist system collapsed in the 1990s. The reason for this lies in unregulated legislation and high political risk
of the country (Milenković, Ikonić, & Milošević, 2011).
In January 2001, Serbia’s new government launched an ambitious program aimed at a rapid transition to a
market economy, the normalization of relations with foreign creditors and integration with regional, European
Union (EU) and world markets. The government’s economic program rested on three pillars: (1) more prudent
macroeconomic policies; (2) market-oriented structural reforms; and (3) the mobilization of significant
financial and technical support from donors (Government of Republic of Serbia, 2010; 2011a).
Serbia has enacted specific legislation outlining guarantees and safeguards for foreign investors. The
Nada Milenković, M.Sc., Ph.D. candidate, Faculty of Economics Subotica, University of Novi Sad.
Jelena Andrašić, dipl.oecc, Ph.D. candidate, Faculty of Economics Subotica, University of Novi Sad.
Miloš Pjanić, dipl.oecc, Ph.D. candidate, Faculty of Economics Subotica, University of Novi Sad.
Correspondence concerning this article should be addressed to Nada Milenković, Segedinski put 9-11, 24000 Subotica, Serbia.
E-mail: [email protected].
DAVID PUBLISHING
D

MAIN FACTORS AFFECTING THE BALANCE OF INVESTMENTS IN SERBIA
82
current Law on Foreign Investments establishes the framework for investment in Serbia (Government of
Republic of Serbia, 2003). The law eliminates previous investment restrictions; extends national treatment to
foreign investors; allows the transfer/repatriation of profits and dividends; provides guarantees against
expropriation; and allows customs duty waivers for equipment imported as capital-in-kind. In order to attract
foreign direct investment (FDI), Serbia developed a range of incentives for investors in 2006, including cash
grants to investors that create significant new jobs, as well as tax incentives in the form of credits, cuts in
payroll contributions and reduced corporate tax rates (Dimireva, 2010).
Serbian government has created Serbia Investment and Export Promotion Agency (SIEPA) with the
mandate to promote Serbia as favorable location for FDI. This agency provides direct assistance to investors.
SIEPA has successfully attracted some headline strategic investors (Dimitrijević, 2000).
Thanks to all measures and development programs that the government has taken to improve investment
in Serbia in the past decade, there was an increase in foreign investment noted. This growth has been stunted
under the influence of the global economic crisis that affected the economic system of Serbia.
Research Questions and Research Methods
The aim of this review paper is to present the situation of FDI in Serbia and to draw attention to the new
trends of investment. So, the main question that arises is what are the factors that have significant influence on
the volume and dynamics of foreign investment? Is there a mechanism (institutions, development strategy with
clearly defined goals, etc.) that initiates and encourages foreign investors to invest in our country?
To obtain answers to these questions in this article, it will use the following methodology. Using available
resources it will be determine the balance of investments in Serbia in the past period. Then by analyzing the
documents issued by state institutions it will be determined if there is support that encourages foreign investment
in Serbia. Document analysis and interview based facts lead to conclusions about the important factors that may
be set aside as incentive to attract foreign investment. In conclusion, there is an analysis given that point of unused
opportunities to attract foreign investment in the form of venture capital and private equity funds.
Analysis
Overview of Investments in the Last Decade
In the period after the 1990s of the 20th century, Serbia opened up to foreign investment. The growth of
investments is credited to a series of measures taken to establish a favorable climate for investment. A
significant increase in investments is recorded in the past decade. According to the Serbian Chamber of
Commerce in the period 2002-2011, the movement of FDI was as follows (see Figure 1).
Figure 1. The movement of FDI in the period 2002-2011. Source: Serbian Chamber of Commerce, 2012.

MAIN FACTORS AFFECTING THE BALANCE OF INVESTMENTS IN SERBIA
83
As it can be seen based on Figure 1, in 2006 there was a sharply increase in the volume of foreign
investments. The reason for such a large increase is the restructuring of large state-owned companies by FDI. In
the period after 2006, the amount of FDI is continuously moving nearly two million U.S. dollars.
Economic development in the last decade is characterized by inadequate investment in production. The
inflow of foreign funds in Serbia after 2000 was characterized by predominantly investing in infrastructure and
energy, while very little is spent directly in production. Only in 2006 has taken steps to encourage green field
investments, and also tenders were called for some concessions. In the aim of faster economic development, it
is necessary in addition to encouraging investment in the form of loans from international and regional financial
organizations, government measures etc.. It is necessary to take into account the sectoral direction of the
investment, they must be directed in production capacity, which must be export oriented. Investing in
production from domestic and foreign sources, primarily also from FDI, will enable Serbia to join the process
of faster development (Nikolić, 2011; Quaterly Monitor of Economic Trends and Policies, 2011).
If a comparative analysis is made with other post-socialist countries in 2009 and 2010, as it can be seen
from Figure 2, the extent of Serbian FDI is in the sixth place among developing countries.
Figure 2. Transition economies: Top 10 recipients of FDI inflows, 2009, 2010 (billion of dollars). Source: UNCTAD,
World Investment Report 2011.
Based on Figure 2, it can be seen that the inflow of FDI into the Russian Federation was the largest, with
most investments in infrastructure and manufacturing, on the second place Russia is followed by Kazakhstan,
which is attractive for FDI because of the great natural wealth that is insufficiently exploited. If you look at
Serbia, it can be concluded that the lead among the neighboring countries (Montenegro, Croatia, and Albania),
although in 2010 compared to 2009, the volume of FDI has declined. This decrease in value was due to effects
of the financial crisis which affected the monetary sector of Serbia and therefore reduced the investors’ interest
in investing in Serbia.
MAIN FACTORS AFFECTING THE BALANCE OF INVESTMENTS IN SERBIA
84
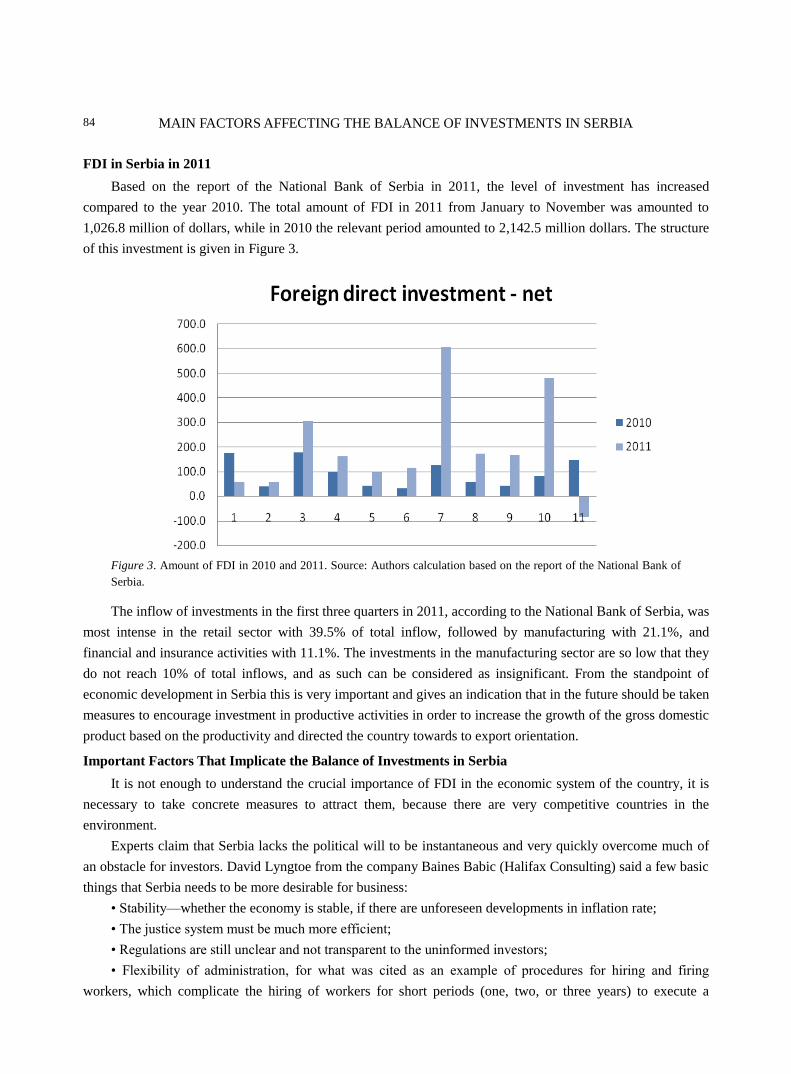
FDI in Serbia in 2011
Based on the report of the National Bank of Serbia in 2011, the level of investment has increased
compared to the year 2010. The total amount of FDI in 2011 from January to November was amounted to
1,026.8 million of dollars, while in 2010 the relevant period amounted to 2,142.5 million dollars. The structure
of this investment is given in Figure 3.
Figure 3. Amount of FDI in 2010 and 2011. Source: Authors calculation based on the report of the National Bank of
Serbia.
The inflow of investments in the first three quarters in 2011, according to the National Bank of Serbia, was
most intense in the retail sector with 39.5% of total inflow, followed by manufacturing with 21.1%, and
financial and insurance activities with 11.1%. The investments in the manufacturing sector are so low that they
do not reach 10% of total inflows, and as such can be considered as insignificant. From the standpoint of
economic development in Serbia this is very important and gives an indication that in the future should be taken
measures to encourage investment in productive activities in order to increase the growth of the gross domestic
product based on the productivity and directed the country towards to export orientation.
Important Factors That Implicate the Balance of Investments in Serbia
It is not enough to understand the crucial importance of FDI in the economic system of the country, it is
necessary to take concrete measures to attract them, because there are very competitive countries in the
environment.
Experts claim that Serbia lacks the political will to be instantaneous and very quickly overcome much of
an obstacle for investors. David Lyngtoe from the company Baines Babic (Halifax Consulting) said a few basic
things that Serbia needs to be more desirable for business:
• Stability—whether the economy is stable, if there are unforeseen developments in inflation rate;
• The justice system must be much more efficient;
• Regulations are still unclear and not transparent to the uninformed investors;
• Flexibility of administration, for what was cited as an example of procedures for hiring and firing
workers, which complicate the hiring of workers for short periods (one, two, or three years) to execute a
MAIN FACTORS AFFECTING THE BALANCE OF INVESTMENTS IN SERBIA
85
particular project (he reminds that this is the simplest in Denmark, which has one of the lowest rates
unemployment in the world);
• Education staff is working out of date, and the education system in Serbia has long been building staff
that learn to memorize, but not to develop skills.
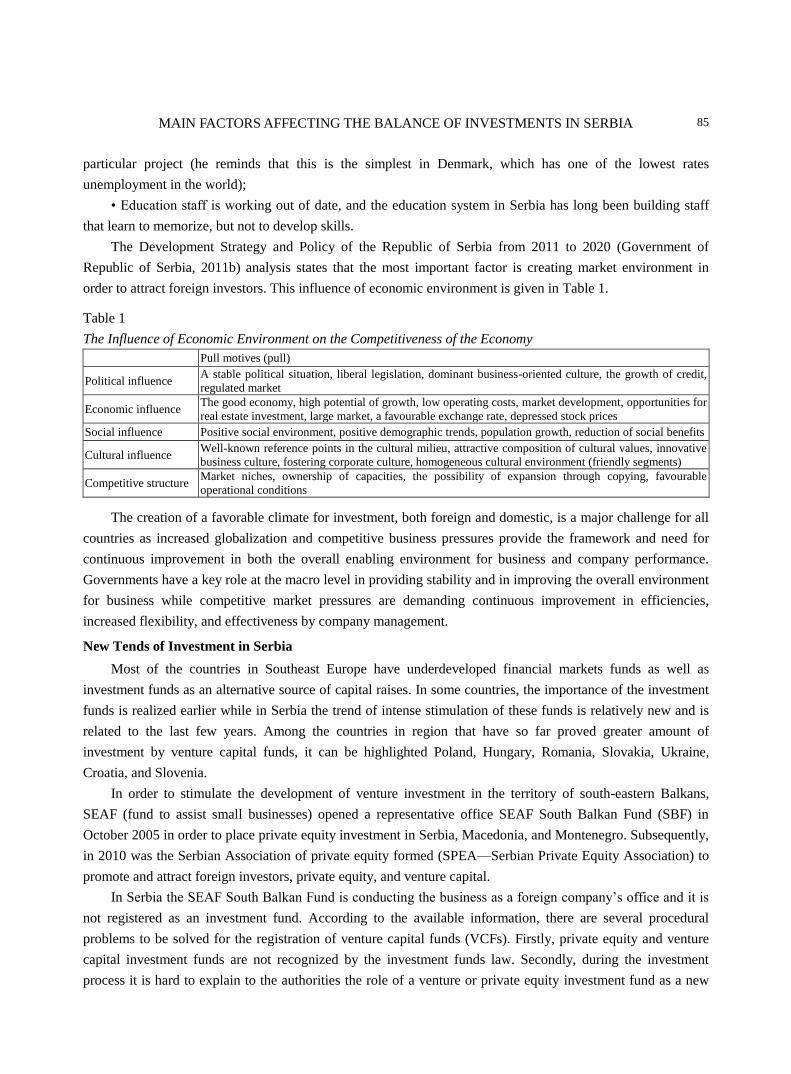
The Development Strategy and Policy of the Republic of Serbia from 2011 to 2020 (Government of
Republic of Serbia, 2011b) analysis states that the most important factor is creating market environment in
order to attract foreign investors. This influence of economic environment is given in Table 1.
Table 1
The Influence of Economic Environment on the Competitiveness of the Economy
Pull motives (pull)
Political influence A stable political situation, liberal legislation, dominant business-oriented culture, the growth of credit,
regulated market
Economic influence The good economy, high potential of growth, low operating costs, market development, opportunities for
real estate investment, large market, a favourable exchange rate, depressed stock prices
Social influence Positive social environment, positive demographic trends, population growth, reduction of social benefits
Cultural influence Well-known reference points in the cultural milieu, attractive composition of cultural values, innovative
business culture, fostering corporate culture, homogeneous cultural environment (friendly segments)
Competitive structure Market niches, ownership of capacities, the possibility of expansion through copying, favourable
operational conditions
The creation of a favorable climate for investment, both foreign and domestic, is a major challenge for all
countries as increased globalization and competitive business pressures provide the framework and need for
continuous improvement in both the overall enabling environment for business and company performance.
Governments have a key role at the macro level in providing stability and in improving the overall environment
for business while competitive market pressures are demanding continuous improvement in efficiencies,
increased flexibility, and effectiveness by company management.
New Tends of Investment in Serbia
Most of the countries in Southeast Europe have underdeveloped financial markets funds as well as
investment funds as an alternative source of capital raises. In some countries, the importance of the investment
funds is realized earlier while in Serbia the trend of intense stimulation of these funds is relatively new and is
related to the last few years. Among the countries in region that have so far proved greater amount of
investment by venture capital funds, it can be highlighted Poland, Hungary, Romania, Slovakia, Ukraine,
Croatia, and Slovenia.
In order to stimulate the development of venture investment in the territory of south-eastern Balkans,
SEAF (fund to assist small businesses) opened a representative office SEAF South Balkan Fund (SBF) in
October 2005 in order to place private equity investment in Serbia, Macedonia, and Montenegro. Subsequently,
in 2010 was the Serbian Association of private equity formed (SPEA—Serbian Private Equity Association) to
promote and attract foreign investors, private equity, and venture capital.
In Serbia the SEAF South Balkan Fund is conducting the business as a foreign company’s office and it is
not registered as an investment fund. According to the available information, there are several procedural
problems to be solved for the registration of venture capital funds (VCFs). Firstly, private equity and venture
capital investment funds are not recognized by the investment funds law. Secondly, during the investment
process it is hard to explain to the authorities the role of a venture or private equity investment fund as a new

MAIN FACTORS AFFECTING THE BALANCE OF INVESTMENTS IN SERBIA
86
partner in the company, its rights and obligations. These are some reasons causing the low level of
attractiveness to venture capital investment funds (Makojević, 2009).
According to a survey conducted by Alexander Groh, Heinrich Liechtenstein, and Karsten Lieser, Serbia
is at place 89 of attractiveness to attract venture capital and private equity funds. Countries in the region that
have gone through a similar transformation of socio-economic environment of business have a much better
rank in relation to Serbia. For example comparing to Poland which is on 28 place, the Czech Republic and
Slovakia which are on 35 and 44 place; Hungary, Slovenia, and Croatia which are on 42, 45, and 65 place
respectively, Serbia is much more behind them and has to do more on the attractiveness of its own. The first
and fundamental prerequisite for attracting venture capital and private equity funds is to create a healthy
business and economic environment.
It is evident that in Serbia there is not enough capital but there are some prospective sectors to attract
venture investors, but the state must make several steps to make Serbian market more attractive for foreign
investors. The first changes should be done in the legal framework concerning investing through investment
funds. Some other issues are the taxes. Investors are looking for the country where they can earn but also pay
low or no taxes. Venture capital and private equity investment funds are interested in small and medium
companies with growing opportunities, so one of the suggestions is to make tax free for the investment in
start-up small and medium companies. In that way is the state taking risk (sharing the risk with the investors)
by not collecting taxes immediately, hoping that the deferment will promote higher tax collection in future. The
state can also support these investment opportunities through venture capital and private equity funds by
creating a state investment fund which should be considered as a partner to the venture and private equity
investors.
Conclusions
The attraction and retention of foreign investment is a key objective in many countries as it is well
recognized that foreign investment has the important potential to create incremental and sustainable jobs, they
increase exports, transfer technology, and business knowledge, enhance competitiveness, boost overall
productivity, and ultimately reduce poverty through overall economic growth and development. All developing
countries should focus on creating a favorable climate for attracting foreign investment in form of FDI or in
form of more and more increasingly widespread VC/PE funds in order to take all the advantages of the capital
inflow. The most important factors are related to macroeconomic and political stability, but a major role of
attractiveness play also institutions (in first line state owed institutions) which encourage the inflow of
investments.
In recent years, Serbia has undertaken and implemented a large number of measures to stabilize economic
conditions and in this way to attract foreign investment. A major contribution was given by the government’s
agency for investment promotion and export opportunities, which provides assistance to investors in the
pre-investment, investment, and post-investment phase. SIEPA facilitate foreign investors in many ways to
invest in Serbia, because it provides advisory services related to legislation, agreements, and exemptions (Siepa,
2012). It also releases funds to investors, pointing to favorable sources of financing.
Therefore, Serbia has fulfilled a large number of conditions for attracting foreign investment, which can be
observed according to the statistics of growth inflows from FDI. To further encourage foreign investment, but
in first hand to encourage the development and activity of VC/PE funds and in that way to stimulate the SME
MAIN FACTORS AFFECTING THE BALANCE OF INVESTMENTS IN SERBIA
87
business sector, Serbia should focus on the stability of monetary and fiscal system. Also, it should not forget
the influence of the political risk which has always been strong in the region. In favor of stabilization of
conditions is getting the nominations for membership of the EU, which in future can contribute to a greater
inflow of foreign investment in Serbia.
References
Dimireva, I. (2010). Serbia investment climate 2009. Retrieved from http://www.eubusiness.com/europe/serbia/invest
Dimitrijević, M. (2000). Foreign direct investment. Belgrade: SIEPA.
Government of Republic of Serbia. (2003). Law on foreign investment. The Official Journal of SRJ, 3/2002 and 5/2003, Belgrade.
Government of Republic of Serbia. (2010). Decree on conditions and methods of attracting direct investment. The Official
Gazette of RS, No. 34/10 and 41/10, Belgrade.
Government of Republic of Serbia. (2011a). Development strategy of Free Zones in Serbia from 2011 to 2016. The Official
Gazette of RS, No. 55/05, 71/05-correction, 101/07, 65/08 and 16/11, Belgrade.
Government of Republic of Serbia. (2011b). The development strategy and policy of the Republic of Serbia from 2011 to 2020.
The Official Gazette of RS, No. 55/05, 71/05-correction, 101/07, 65/08 and 16/11.
Makojević, N. (2009). Venture capital funds—Current position in the economy of Serbia. Ekonomski Horizonti, 11(1), 25-32.
Milenković, N., Ikonić, D., & Milošević, S. (2012). Insurance companies as one of the drivers of entrepreneurship in developing
countries. Proceedings from 5th International Conference for Entrepreneurship, Innovation and Regional Development.
Sofia University, Sofia, Bulgaria.
NBS-National Bank of Serbia. (2012). Serbia’s international investment position in 2010 and 2011 (Statistical data).
Nikolić G. (2011). Stagnacija industrije na ’zapadu’ i njen snažan rast na ’istoku’ na početku XXI veka, Macroeconomic trends
and analysis, No. 196. Economics Institute in Belgrade.
Quaterly Monitor of Economic Trends and Policies. (2011). The foundation for the advancement of economics of the Faculty of
Economics in Belgrade, No. 24.
Serbia Investment and Export Promotion Agency (SIEPA). (2011). Invest in Serbia. Retrieved from
http://www.siepa.gov.rs/files/pdf2010/Invest_in_Serbia._eng._2011.pdf
Serbian Chamber of Commerce. (2012). Investment projects-statistical data-internet presentation. Retrieved from
http://www.pks.rs/PrivredaSrbije.aspx?id=801&p=0&
United Nations Conference on Trade and Development (UNCTAD). (2011). World investment report 2011.
Management Studies, ISSN 2328-2185 February 2014, Vol. 2, No. 2, 88-95
Small and Medium Enterprises (SMEs) and
Competitiveness: An Empirical Study
Luisa Carvalho
Open University, Lisbon, Portugal
University of Évora, Évora, Portugal
Teresa Costa
Institute Polytechnic of Setubal, Setubal, Portugal
Globalisation and competitiveness affected the way of enterprises undertake innovation, particularly in the case of
Small and Medium Enterprises (SMEs). According with European Commission (2013) in Europe 99% of the
enterprises is SMEs. SMEs all over the world are considered as the lifeblood of the economies. The importance of
this research is justified by the predominance of SMEs that represents the majority of enterprises in Portugal. SMEs
contribute to the creation of jobs, as well as to the competitiveness of the economies, specially, in crisis time. This
study has two main objectives; firstly propose a literature review focused on competitiveness of SMEs. Secondly
analysis a sample of 23 enterprises identified as leaders of Portuguese SMEs in 2012. The data considering a
ranking list of the largest 1,000 Portuguese SMEs in 2012, published by Exame (2013). This analysis considers
some SMEs features such as, sales, market share, dimension, and sector. Additionally this research presents a SME
case included in this database. Through the application of a questionnaire the study provides a complementary
micro perspective of the factors that influences enterprises competitiveness. The questionnaire is divided into three
parts: Part one refers to the characterization of the enterprise; Part two assesses the entrepreneurial competitiveness,
considering nine questions to assess performance, six questions to assess internal processes and four questions to
understand the relations with customers; and part three analyses the diffusion of innovation through three questions.
Finally the study provides important clues relevant for the development of public policies that can support the
innovation and competitiveness of SMEs. Moreover the discussions highlight some variables approached in
literature review considered as pertinent in the case of innovative SME due to their contribution to exports and to
economic growth.
Keywords: competitiveness, diffusion of innovation, performance, Small and Medium Enterprises (SMEs),
Research and Development (R&D)
Introduction
Small and Medium Enterprises (SMEs) represent a large part of all enterprises in global economies.
Luisa Carvalho, Ph.D., Professor, Department of Social Sciences and Management, Open University; Researcher, Center for
Advanced Studies in Management and Economics (CEFAGE), University of Évora, Portugal Teresa Costa, Ph.D., Professor, Department of Economics and Management, Institute Polytechnic of Setubal. Correspondence concerning this article should be addressed to Luisa Carvalho, Universidade Aberta, Edifício Inovação I, Av.
Jacques Delors, 211, 2740-122 Porto Salvo, Oeiras, Portugal. E-mail: [email protected].
DAVID PUBLISHING
D
SMALL AND MEDIUM ENTERPRISES (SMES) AND COMPETITIVENESS
89
Studies’ concern competitiveness of SME become crucial to a better understanding of the conditions that affect
positively or negatively these enterprises and consequently the competiveness of the countries in the global
market.
This study intends to present a literature review focused on competitiveness of SMEs. And, also analyze a
sample of 23 enterprises identified as leaders of Portuguese SMEs in 2012. The data used in this research were
collected from a ranking list of the largest 1,000 Portuguese SMEs in 2012, published by Exame (2013). To
complement this research, this paper presents a case of SME (included the large database) that provides a
complementary micro perspective of the factors that influence enterprises competitiveness.
SMEs and Competitiveness
Competitiveness is a popular concept across different levels of studies and involves different disciplines
such as comparative advantage or price competitiveness perspective, strategy, and management perspective, as
well as historical and socio-cultural perspective (Nelson, 1992; Waheeduzzaman & Ryans, 1996). This concept
is also understood as the ability to increase market share, profit, growth, value added and to stay competitive
for a long term (Ramasamy, 1995).
Studies developed for the research of O’Farrell, Hitchens, and Moffat (1992) showed a relationship
between sources of competitiveness and firm performance, considering price, quality, design, marketing, and
management. Additionally, Slevin and Covin (1995) measured the “total competitiveness” of SMEs, attending
to several factors, such as, firm’s structure, culture, human resources, and product/service development. Other
theoretical approaches (Stoner, 1987; Bamberger, 1989; Pratten, 1991; Chaston & Mangles, 1997) highlighted
a number of firm specific factors respectively, financial, human and technological resources, organizational
structure and system, productivity, innovation, quality, productivity, image and reputation, culture,
product/service variety, flexibility, and customer services.
SMEs represent more than 90% of the enterprises in many countries (Gunasekaran, Rai, & Griffin, 2011;
Poon & Swatman 1999; Cull, Davis, Lamoreaux, & Rosenthal, 2006; Ozgulbas, Koyuncugil, & Yilmaz, 2006).
Furthermore, most of SMEs experience a lack of market power as well as market turbulent and become more
vulnerable to external influences than larger companies. Also internal sources of competitiveness are stressed in
literature, specifically the human factor, i.e., the role played by the owner/manager and their skills and
experience (Stoner, 1987). However, Salavou, Baltas, and Lioukas (2004) point out some advantages of SMEs
over large companies due to its size and flexibility in adapting to changes such as, market and learning-oriented
and when facing strong competition, they tend to be more innovative and resilient.
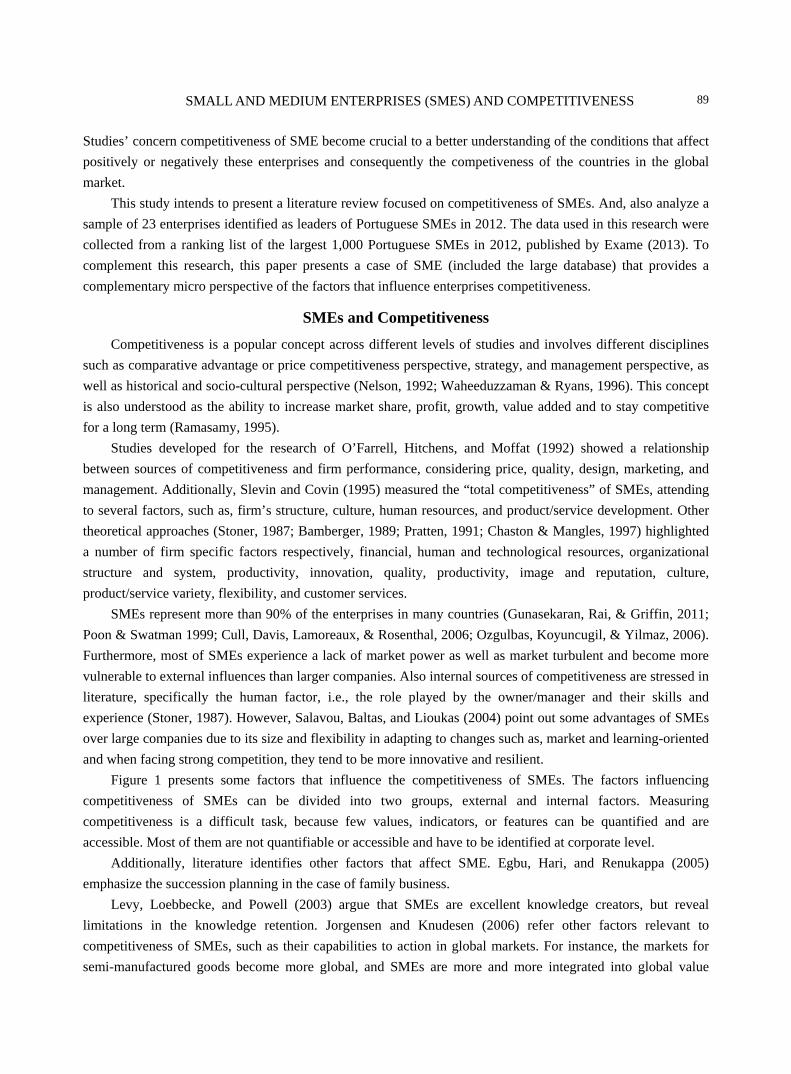
Figure 1 presents some factors that influence the competitiveness of SMEs. The factors influencing
competitiveness of SMEs can be divided into two groups, external and internal factors. Measuring
competitiveness is a difficult task, because few values, indicators, or features can be quantified and are
accessible. Most of them are not quantifiable or accessible and have to be identified at corporate level.
Additionally, literature identifies other factors that affect SME. Egbu, Hari, and Renukappa (2005)
emphasize the succession planning in the case of family business.
Levy, Loebbecke, and Powell (2003) argue that SMEs are excellent knowledge creators, but reveal
limitations in the knowledge retention. Jorgensen and Knudesen (2006) refer other factors relevant to
competitiveness of SMEs, such as their capabilities to action in global markets. For instance, the markets for
semi-manufactured goods become more global, and SMEs are more and more integrated into global value
SMALL AND MEDIUM ENTERPRISES (SMES) AND COMPETITIVENESS
90
chains. In the literature it is possible to find some general questions: Is it possible (or not) to find a consensus
about the role of SMEsto the national economy? What are their contribution to Gross Domestic Product (GDP)
and to job creation? Globalization highlights the role of the global markets that could increase the opportunities
for SMEs (Gradzol, Gradzol, & Rippey, 2005; Karaev, Koh, & Szamosi, 2007). While, to compete in the global
market, SMEs have to enhance their individual competitiveness (Fassoulsa, 2006) as well as obtain advantage
and exploit synergy effects by cooperative relations with other SMEs and related partner institutions.
Figure 1. SME competitiveness. Source: authors.
Also other factors can be found in literature that reveals important limitations concerning SME research.
Although the significant importance of SMEs and their contribution to economic growth are huge they still
faced numerous challenges. These challenges are related with the access to finance or poor management skills,
which is a result of lack of adequate training and education. These factors contribute to the high rates of
business failure and represent limitations in their entrepreneurial growth. The background of the top
management team is considered as a key factor that influences SME survival and development (Lu & Beamish,
2001; Stoian & Rialp-Criado, 2010).
Nevertheless, research about Portuguese SME is more focused on some fields, such as internationalization
(Oliveira & Teixeira, 2011), innovation (Trigo, Calapez, & Santos, 2009), or in capital structure and
profitability (Nunes, Serrasqueiro, & Leitão, 2010; Serrasqueiro & Nunes, 2012). This gap justifies the purpose
of other empirical studies applied to SME considering other relevant fields of management studies.
Empirical Study
Methodology
In order to achieve the research purpose, an empirical study was developed considering two main parts:
Firstly, it studies a sample of 23 enterprises identified as leaders of the 1,000 Portuguese SMEs in 2012. The
data was collected by Exame (2013) and include the biggest 1,000 Portuguese SMEs in 2012; Secondly, it
analyses a specific case of one enterprise from the data of 23 leaders SMEs, this analysis is based on a
questionnaire applied to the SME in order to collect micro information considering a set of variables relevant to
the research. The questionnaire is divided into three parts: Part one refers to the characterization of the
enterprise; Part two assesses the entrepreneurial competitiveness, considering nine questions to assess
SME Competitiveness
External factors Employment globalizations economic and social context
alliances networks
Internal factors Marketing innovation
productivity capital management,
organization and structure efficiency
Measures/indicators: Revenues, export, profit,
market share, productivity, corporate
value, customer satisfaction, value of the
product, service
SMALL AND MEDIUM ENTERPRISES (SMES) AND COMPETITIVENESS
91
performance, six questions to assess internal processes and four questions to understand the relations with
customers; and part three analyses the diffusion of innovation through three questions. The questionnaire uses a
Likert scale with seven degrees (one represents very lower and seven very higher). All questions were made
considering the comparison of the analyzed SME with the other competitive SME from the same sector in the
last three years. The questionnaire was sent and receipt during March of 2013.
As already referred, the first empirical research uses a data collected in 2013 considering a ranking list
published of the largest 1,000 Portuguese SMEs (Exame, 2013). The 1,000 largest Portuguese SMEs were
selected based on the following criteria:
(1) Less than 250 employees;
(2) Sales less than or equal to 50 million Euros;
(3) Liquid assets equal to or less than 43 million Euros;
(4) Not to be detained for more than 50% by another company unless that mother company is also SME;
(5) Not belong to the financial sector.
(6) Enterprises were classified into 27 branches of activities and considered several indicators, such as:
Localization/region: C-Centre, LVT-Lisbon and Tagus Valley, N-North; Ac-Azores;
Gross added value for sales: measures contribution of the enterprise to the economy for each euro sold, in
percentage.
Gross added value: refers to the sum of sales and services, work for the company, changes in production,
subsidies for exploration, and additional revenue less intermediate consumption and supplies and services;
Sales: sales of products and services;
Sales growth: refers to the increased sales and services between the current and previous year in percentage;
Labor productivity: respect to gross value added per worker, measures the efficiency of enterprises in the
use of human resources.
SME Leaders Description
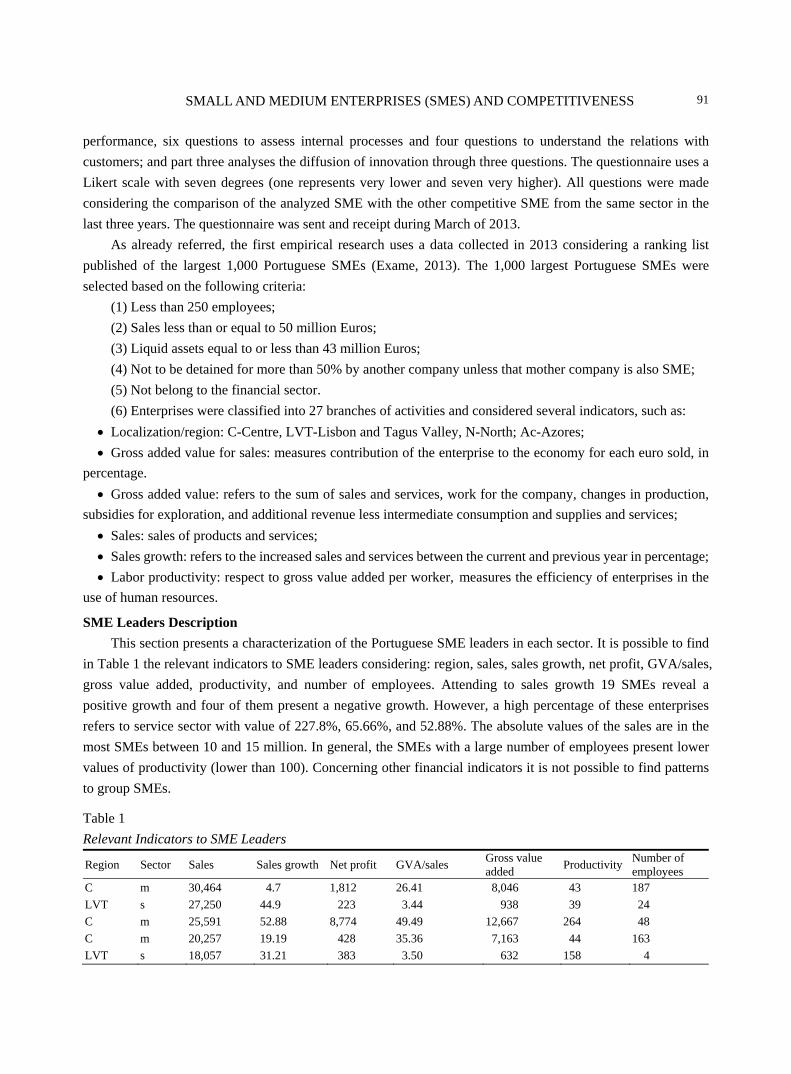
This section presents a characterization of the Portuguese SME leaders in each sector. It is possible to find
in Table 1 the relevant indicators to SME leaders considering: region, sales, sales growth, net profit, GVA/sales,
gross value added, productivity, and number of employees. Attending to sales growth 19 SMEs reveal a
positive growth and four of them present a negative growth. However, a high percentage of these enterprises
refers to service sector with value of 227.8%, 65.66%, and 52.88%. The absolute values of the sales are in the
most SMEs between 10 and 15 million. In general, the SMEs with a large number of employees present lower
values of productivity (lower than 100). Concerning other financial indicators it is not possible to find patterns
to group SMEs.
Table 1
Relevant Indicators to SME Leaders
Region Sector Sales Sales growth Net profit GVA/sales Gross value added
Productivity Number of employees
C m 30,464 4.7 1,812 26.41 8,046 43 187
LVT s 27,250 44.9 223 3.44 938 39 24
C m 25,591 52.88 8,774 49.49 12,667 264 48
C m 20,257 19.19 428 35.36 7,163 44 163
LVT s 18,057 31.21 383 3.50 632 158 4
92
(Table 1 co
Region S
N m
N m
LVT m
C m
LVT s
N s
N m
C s
N s
LVT s
LVT m
LVT s
N m
AÇ s
LVT s
N s
LVT m
C m
Note. Source
Figure
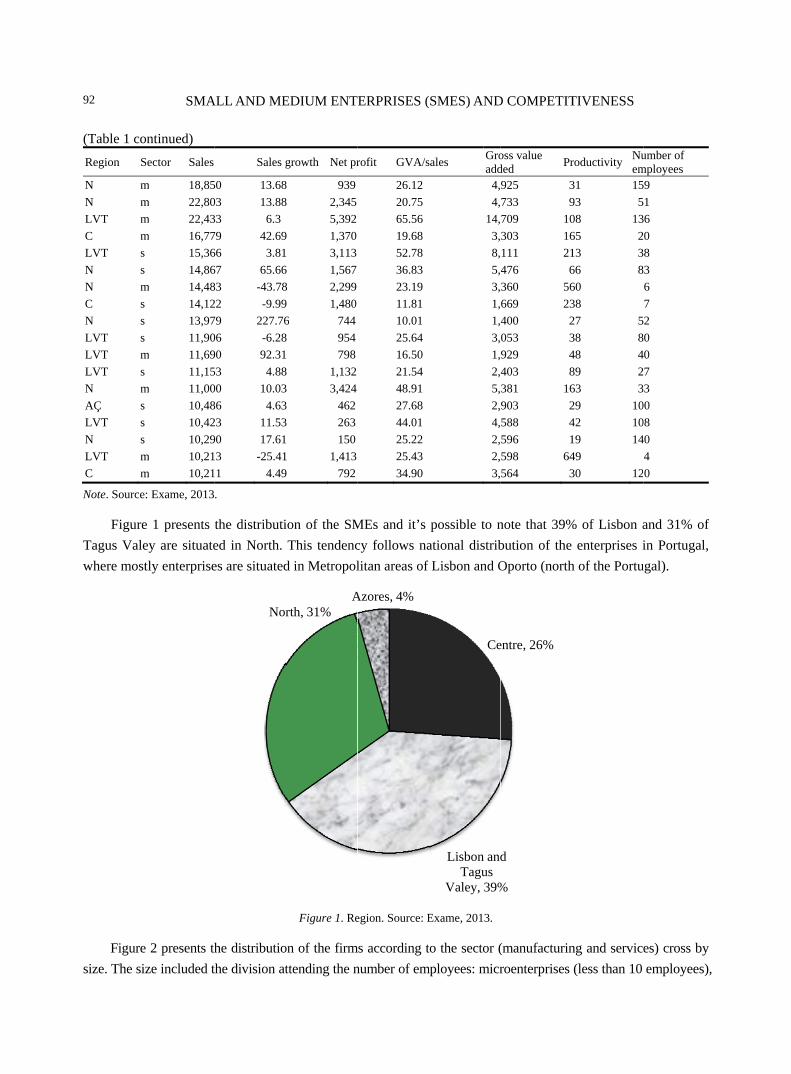
Tagus Vale
where mos
Figure
size. The si
SMA
ontinued)
Sector Sales
m 18,85
m 22,80
m 22,43
m 16,77
s 15,36
s 14,86
m 14,48
s 14,12
s 13,97
s 11,90
m 11,69
s 11,15
m 11,00
s 10,48
s 10,42
s 10,29
m 10,21
m 10,21
e: Exame, 2013
e 1 presents
ey are situate
stly enterprise
e 2 presents th
ize included t
ALL AND ME
Sales g
50 13.68
03 13.88
33 6.3
79 42.69
66 3.81
67 65.66
83 -43.78
22 -9.99
79 227.76
06 -6.28
90 92.31
53 4.88
00 10.03
86 4.63
23 11.53
90 17.61
3 -25.41
1 4.49
.
the distributi
ed in North.
es are situated
he distributio
the division at
Nor
EDIUM ENT
growth Net pr
8 939
8 2,345
5,392
9 1,370
3,113
6 1,567
8 2,299
9 1,480
6 744
8 954
798
8 1,132
3,424
462
263
150
1 1,413
9 792
ion of the SM
This tendenc
d in Metropol
Figure 1. Re
on of the firm
ttending the n
rth, 31%A
ERPRISES (
rofit GVA/s
26.12
20.75
65.56
19.68
52.78
36.83
23.19
11.81
10.01
25.64
16.50
21.54
48.91
27.68
44.01
25.22
25.43
34.90
MEs and it’s
cy follows na
litan areas of
egion. Source: E
ms according t
number of em
Azores, 4%
(SMES) AND
sales Groadd
4,
4,
14,
3,
8,
5,
3,
1,
1,
3,
1,
2,
5,
2,
4,
2,
2,
3,
possible to n
ational distrib
f Lisbon and O
Exame, 2013.
to the sector (
mployees: micr
Ce
Lisbon andTagus
Valey, 39%
D COMPETIT
oss value ded
Pr
925 3
733 9
709 10
303 16
111 21
476 6
360 56
669 23
400 2
053 3
929 4
403 8
381 16
903 2
588 4
596 1
598 64
564 3
note that 39%
bution of the
Oporto (north
(manufacturin
roenterprises
entre, 26%
d
%
TIVENESS
roductivity Nuem
31 15
93 5
08 13
65 2
13 3
66 8
60
38
27 5
38 8
48 4
89 2
63 3
29 10
42 10
19 14
49
30 12
% of Lisbon a
enterprises i
h of the Portu
ng and service
(less than 10
umber of mployees
9
1
6
0
8
3
6
7
2
0
0
7
3
00
08
40
4
0
and 31% of
in Portugal,
ugal).
es) cross by
employees),
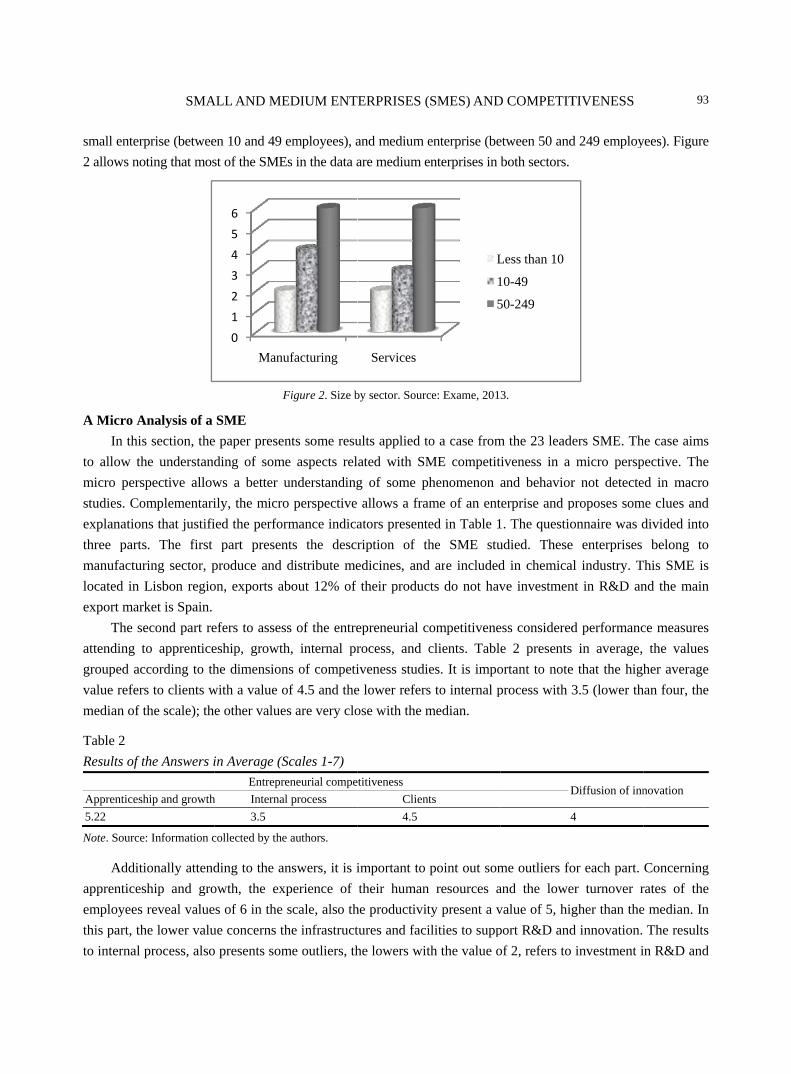
small enter
2 allows no
A Micro A
In this
to allow th
micro pers
studies. Co
explanation
three parts
manufactur
located in
export mar
The s
attending t
grouped ac
value refer
median of t
Table 2
Results of t
Apprenticesh
5.22
Note. Source
Addit
apprentices
employees
this part, th
to internal
SMA
rprise (betwee
oting that mos
Analysis of a
s section, the
he understand
spective allow
omplementari
ns that justifi
s. The first
ring sector, p
Lisbon regio
rket is Spain.
econd part re
to apprentice
ccording to th
rs to clients w
the scale); th
the Answers i
hip and growth
e: Information c
ionally attend
ship and gro
reveal value
he lower valu
process, also
ALL AND ME
en 10 and 49 e
st of the SME
F
SME
e paper presen
ding of some
ws a better u
ily, the micro
ied the perfor
part presen
produce and
on, exports ab
efers to asses
eship, growth
he dimension
with a value o
e other value
in Average (S
Entrepre
h Internal
3.5
collected by the
ding to the an
owth, the exp
es of 6 in the
ue concerns th
o presents som
0
1
2
3
4
5
6
Manu
EDIUM ENT
employees), a
Es in the data a
Figure 2. Size b
nts some resu
e aspects rel
understanding
o perspective
rmance indica
nts the descr
distribute me
bout 12% of
s of the entre
h, internal pr
ns of competi
of 4.5 and the
s are very clo
Scales 1-7)
eneurial compe
l process
e authors.
nswers, it is i
perience of
scale, also th
he infrastruct
me outliers, th
ufacturing
ERPRISES (
and medium e
are medium e
by sector. Sourc
ults applied to
ated with SM
g of some ph
allows a fram
ators presente
ription of th
edicines, and
their produc
epreneurial c
rocess, and c
iveness studie
e lower refers
ose with the m
etitiveness
Client
4.5
important to
their human
he productivit
tures and faci
he lowers wit
Services
(SMES) AND
enterprise (be
enterprises in
ce: Exame, 201
o a case from
ME competit
henomenon a
me of an ent
ed in Table 1
he SME stu
d are included
cts do not hav
ompetitivene
clients. Table
es. It is impo
s to internal p
median.
ts
point out som
resources a
ty present a v
ilities to supp
th the value o
L
1
5
D COMPETIT
etween 50 and
both sectors.
3.
m the 23 lead
iveness in a
and behavior
terprise and p
1. The questio
udied. These
d in chemica
ve investmen
ess considered
e 2 presents
ortant to note
process with 3
D
4
me outliers fo
and the lowe
value of 5, hig
port R&D and
of 2, refers to
Less than 10
10-49
50-249
TIVENESS
d 249 employ
ers SME. Th
micro persp
r not detecte
proposes som
onnaire was d
e enterprises
al industry. T
nt in R&D an
d performanc
in average,
e that the high
3.5 (lower th
Diffusion of inn
4
or each part.
er turnover r
gher than the
d innovation.
investment i
93
yees). Figure
he case aims
pective. The
ed in macro
me clues and
divided into
belong to
This SME is
nd the main
ce measures
the values
her average
han four, the
novation
Concerning
rates of the
e median. In
The results
in R&D and

SMALL AND MEDIUM ENTERPRISES (SMES) AND COMPETITIVENESS
94
patents and the highest with value of 5 in both of them respect to marketing innovation and customer services.
In section of the question related with clients, satisfaction with service and customer loyalty point 5 in the scale,
revealing the preoccupation of the firm with clients and demand side of the business. Finally the third part
analyses the diffusion of innovation and presents an answer with a higher value 5, respecting to cooperation
with other partners and institutions to develop R&D.
Conclusions
In summary, it’s consensual that globalization and competitiveness affected the way of enterprises
undertake innovation, particularly in the case of SMEs. These enterprises play an important role in several
economies and the studies about SMEs and competiveness are extremely suitable. This research proposes an
empirical study that analyzes a sample of 23 enterprises identified as leaders of Portuguese SMEs in 2012.
Additionally the empirical study applied a questionnaire to an enterprise in order to have a micro perspective of
the factors that influence competitiveness.
The results of the empirical study to the 23 leaders are divided almost into two equal parts in two sectors,
manufacturing and services, respecting performance indicators revealing similar patterns. Most of them located
in urban regions are medium enterprises and are situate in similar intervals with respect to the sales, sales
growth, or productivity. Concerning to the size is important to note that inside the 1,000 SMEs of the data the
leaders are the largest, suggesting that the scale could be crucial to sustainability and competitiveness of
Portuguese SMEs.
The additional microanalysis allows a better understanding of some process inside a SME and reveals
some aspects important to a future reflection. It was possible to understand the low auto perception of the
management concerning the internal process and resources affect to R&D and patents. These SMEs produce
mainly generic medicines and this strategy can justify the lower scores related with internal process due with
their outsourcing strategy. The product development and R&D investment are low because they are focused on
manufacturing medicines developed by other enterprises with a high concern about lower costs and higher
quality.
Moreover, the studied SMEs reveal a higher concern with clients (satisfaction, loyalty, and services) and
assume that develop marketing innovation directed to the market. These results suggest that the dependency of
this kind of enterprise with the demand and maybe a push innovation model is our perception that inside the
data most of them could reveal similar behavior.
Finally, it is also interesting to highlight the model of cooperation to develop innovation, assuming the
importance of the cooperation with other institutions and research centers.
SMEs are drivers of economic growth. A healthy SME sector contributes prominently to the economy
through creating more employment opportunities, generating higher production volumes, increasing exports,
and introducing innovation and entrepreneurship skills.
Future research will aim to enlarge the number of SMEs inquired and compare results using a multivariate
analysis to search similar patterns and behaviors and segmented according to size, sector, and region.
References Bamberger, I. (1989). Developing competitive advantage in small and medium sized firms. Long Range Planning, 22(5), 80-88. Chaston, I., & Mangles, T. (1997). Core capabilities as predictors of growth potential in small manufacturing firms. Journal of
Small Business Management, 35(1), 47-57.
SMALL AND MEDIUM ENTERPRISES (SMES) AND COMPETITIVENESS
95
Cull, R., Davis, L. E., Lamoreaux, N. R., & Rosenthal, J. L. (2006). Historical financing of small and medium size enterprises. Journal of Banking and Finance, 30, 3017-3042.
Egbu, C. O., Hari, S., & Renukappa, S. H. (2005). Knowledge management for sustainable competiveness in small and medium surveying practices. Structural Survey, 23(1), 7-21.
European Commission. (2013). Small and medium-sized enterprises (SMEs): Fact and figures about the EU’s small and medium enterprise (SME). Retrieved from http://ec.europa.eu/enterprise/policies/sme/facts-figures-analysis/
Exame. (2013). Dossier especial 1000 PME exame. Janeiro de 2013, 345, 70-96. Fassoulsa, E. D. (2006). Transforming the supply chain. Journal of Manufacturing Technology Management, 17(6), 848-860. Gradzol, J. R., Gradzol, C. J., & Rippey, S. T. (2005). An emerging framework for global strategy. International Journal of
Manufacturing Technology Management, 7(1), 1-19. Gunasekaran, A., Rai, B., & Griffin, M. (2011). Resilience and competitiveness of small and medium size enterprises: An
empirical research. International Journal of Production Research, 49(18), 5489-5509. Jorgensen, A. L., & Knudesen, J. S. (2006). Sustainable competitiveness in global value chains: How do small Danish firms
behave. Corporate Governance, 8(4), 449-462. Karaev, A., Koh, S. C. L., & Szamosi, L. T. (2007). The cluster approach and SME competitiveness: A review. Journal of
Manufacturing Technology Management, 18(7), 818-835. Levy, M., Loebbecke, C., & Powell, P. (2003). SMEs, cooperation and knowledge sharing: The role of information system.
European Journal of Information System, 12(1), 3-17. Lu, J., & Beamish, P. (2001). The internationalization and performance of SME. Strategic Management Journal, 22(6-7),
565-586. Nelson, R. (1992). Recent writings on competitiveness: Boxing the compass. California Management Review, 34(2), 127-137. Nunes, P. M., Serrasqueiro, Z., & Leitão, J. (2010). Are there nonlinear relationships between the profitability of Portuguese
services SMEs and its specific determinants?. Service Industries Journal, 30(8), 1313-1341. O’Farrell, P. N., Hitchens, D., & Moffat, L. (1992). The competitiveness of business services firms: A matched comparison
between Scotland and the South East of England. Regional Studies, 26(6), 519-525. Oliveira, P., & Teixeira, A. A. C. (2011). The internationalization profiles of Portuguese SMEs. FEP Working Papers No. 439. Ozgulbas, N., Koyuncugil, A. S., & Yilmaz, F. (2006). Identifying the effect of firm size on financial performance of SMEs. The
Business Review, 6(1), 162-167. Poon, S., & Swatman, P. M. C. (1999). An exploratory study of small business Internet commerce issues. Information and
Management, 35(1), 9-18. Pratten, C. (1991). The competitiveness of small firms. Occasional Paper 57, Department of Applied Economics, University of
Cambridge. Cambridge, UK: Cambridge University Press. Ramasamy, H. (1995). Productivity in the age of competitiveness: Focus on manufacturing in Singapore. In Productivity in the
Age of Competitiveness, APO Monograph Series (16), Asian Productivity Organizations, Tokyo. Ruzzier, M., Hisrich, R., & Antoncic, B. (2006). SME internationalization research: Past, present, and future. Journal of Small
Business and Enterprise Development, 13(4), 476-497. Salavou, H., Baltas, G., & Lioukas, S. (2004). Organizational innovation in SMEs: The importance of strategic orientation and
competitive structure. European Journal of Marketing, 38(9-10), 1091-1112. Serrasqueiro, Z., & Nunes, P. M. (2012). Is age a determinant of SMEs’ financing decisions? Empirical evidence using panel data
models. Entrepreurship Theory and Practice, 36(4), 627-654. Slevin, D. P., & Covin, J. G. (1995). New ventures and total competitiveness: A conceptual model, empirical results, and case
study examples. Frontiers of Entrepreneurship Research (pp. 574-588). Stoian, M. C., & Rialp-Criado, A. (2010). Analyzing export behavior through managerial characteristics and perceptions: a
multiple case-based research. Journal of Global Marketing, 23(4), 333-348. Stoner, C. (1987). Distinctive competitive and competitive advantage. Journal of Small Business Management, 25(2), 33-39. Trigo, V., Calapez, T., & Santos, M. C. (2009). SMEs and internationalization: An empirical study of SMEs in Portugal.
Economia Global e Gestão, 14(3), 9-24. Waheeduzzaman, A., & Ryans, J. (1996). Definition, perspectives, and understanding of international competitiveness: A quest
for a common ground. Competitiveness Review, 6(2), 7-26.
Management Studies, ISSN 2328-2185
February 2014, Vol. 2, No. 2, 96-110
Company Value and Employee Satisfaction: Theoretical
Analysis and Empirical Findings
Josef Neuert
Fulda University, Fulda, Germany
Hans-Jürgen Brenninger
University of Latvia, Riga, Latvia
Employee satisfaction and its potential impact on business and company success have been in the focus of
organizational and managerial practise and research ever since. This paper outlines the theoretical framework of
this particular cause-effect proposition, and further examines if there is empirical evidence to substantiate the
underlying research hypothesis, saying that increasing degrees of employee satisfaction have a positive impact on
the company value. The company value can be measured by the equity value of a firm. With the primary data
analysis, the authors compared 11 companies which took part in the Great Place to Work (GPTW) Contest in 2007
and 2009 (only in 2009) regarding their equity values and GPTW scores. The figures of these companies were
provided to the authors in an anonymous form. The authors had no influence on the number of companies the
GPTW Institute provided to them. The GPTW Institute tried to find companies which attend both contests and also
show their financial data in the ―Elektronischen Bundesanzeiger‖. This paper aims to foster these results with some
additional primary statistical analyses for hypothesis testing. For this investigation, the authors conducted various
types of statistical procedures which seem to confirm the underlying proposition. With different types of correlation
analysis, the relationship between equity value and GPTW score was elaborated. By regarding the absolute average
Earnings Before Interest and Tax (EBIT) and equity value of the eleven out of the 100 best companies, some
differences can be pointed out by setting them in comparison to 30 randomly selected companies from Germany.
Keywords: employee satisfaction, company value, equity value, regression analysis, cause-effect relations
Introduction
Numerous studies and authors support the proposition that there is a cause-effect relation between employee
satisfaction (among other influencing variables like customer satisfaction, leadership, technology etc.) and the
financial results of companies (Heskett, Jones, Loveman, Sasser, & Schlesinger, 1994; Hurley & Estelami, 2007).
The main hypothesis of the underlying research paper is that ―Employee Satisfaction has an Impact on the Level
of Company Value‖. Based on a theoretical investigation, a secondary data analysis from the United States of
America (USA), and a primary data analysis from Germany, the authors intend to demonstrate that there is a
Josef Neuert, Ph.D., Professor of International Business Economics, Fulda University.
Hans-Jürgen Brenninger, MBA, Managing Director, Brenninger GmbH, Ph.D. Candidate, Faculty of Economics and
Management, University of Latvia.
Correspondence concerning this article should be addressed to Hans-Jürgen Brenninger, Dachsteinstr. 13, 83395 Freilassing,
Germany. E-mail: [email protected].
DAVID PUBLISHING
D
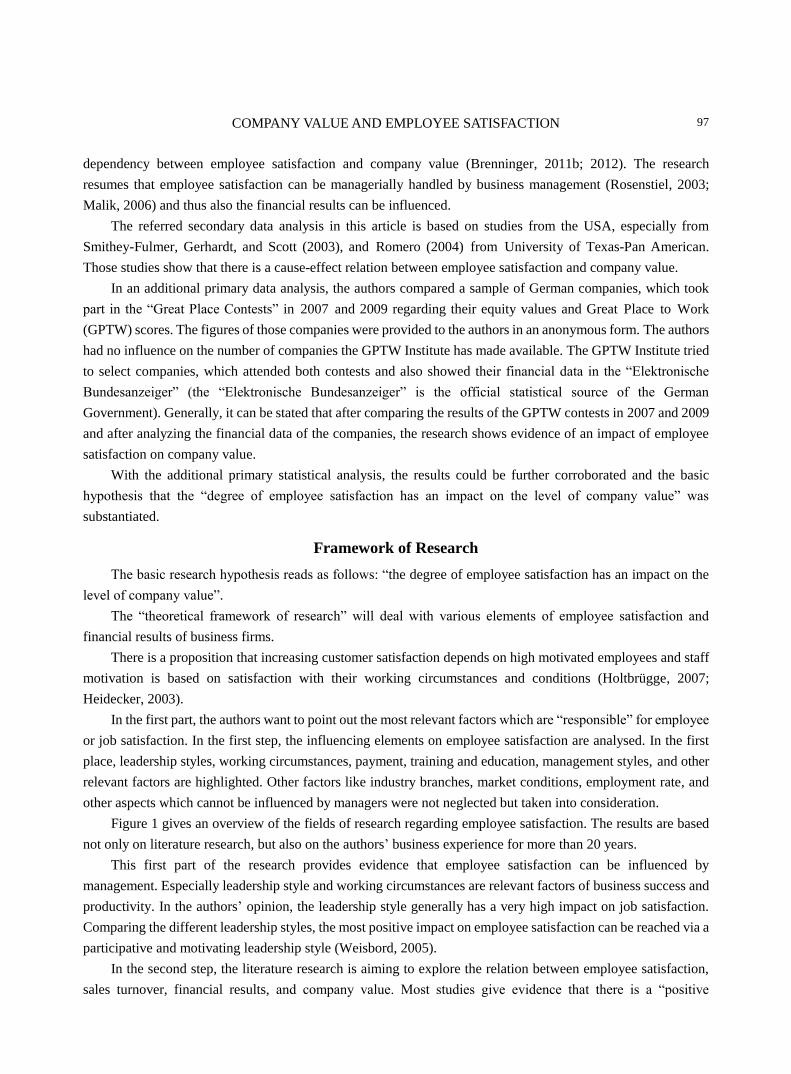
COMPANY VALUE AND EMPLOYEE SATISFACTION
97
dependency between employee satisfaction and company value (Brenninger, 2011b; 2012). The research
resumes that employee satisfaction can be managerially handled by business management (Rosenstiel, 2003;
Malik, 2006) and thus also the financial results can be influenced.
The referred secondary data analysis in this article is based on studies from the USA, especially from
Smithey-Fulmer, Gerhardt, and Scott (2003), and Romero (2004) from University of Texas-Pan American.
Those studies show that there is a cause-effect relation between employee satisfaction and company value.
In an additional primary data analysis, the authors compared a sample of German companies, which took
part in the ―Great Place Contests‖ in 2007 and 2009 regarding their equity values and Great Place to Work
(GPTW) scores. The figures of those companies were provided to the authors in an anonymous form. The authors
had no influence on the number of companies the GPTW Institute has made available. The GPTW Institute tried
to select companies, which attended both contests and also showed their financial data in the ―Elektronische
Bundesanzeiger‖ (the ―Elektronische Bundesanzeiger‖ is the official statistical source of the German
Government). Generally, it can be stated that after comparing the results of the GPTW contests in 2007 and 2009
and after analyzing the financial data of the companies, the research shows evidence of an impact of employee
satisfaction on company value.
With the additional primary statistical analysis, the results could be further corroborated and the basic
hypothesis that the ―degree of employee satisfaction has an impact on the level of company value‖ was
substantiated.
Framework of Research
The basic research hypothesis reads as follows: ―the degree of employee satisfaction has an impact on the
level of company value‖.
The ―theoretical framework of research‖ will deal with various elements of employee satisfaction and
financial results of business firms.
There is a proposition that increasing customer satisfaction depends on high motivated employees and staff
motivation is based on satisfaction with their working circumstances and conditions (Holtbrügge, 2007;
Heidecker, 2003).
In the first part, the authors want to point out the most relevant factors which are ―responsible‖ for employee
or job satisfaction. In the first step, the influencing elements on employee satisfaction are analysed. In the first
place, leadership styles, working circumstances, payment, training and education, management styles, and other
relevant factors are highlighted. Other factors like industry branches, market conditions, employment rate, and
other aspects which cannot be influenced by managers were not neglected but taken into consideration.
Figure 1 gives an overview of the fields of research regarding employee satisfaction. The results are based
not only on literature research, but also on the authors’ business experience for more than 20 years.
This first part of the research provides evidence that employee satisfaction can be influenced by
management. Especially leadership style and working circumstances are relevant factors of business success and
productivity. In the authors’ opinion, the leadership style generally has a very high impact on job satisfaction.
Comparing the different leadership styles, the most positive impact on employee satisfaction can be reached via a
participative and motivating leadership style (Weisbord, 2005).
In the second step, the literature research is aiming to explore the relation between employee satisfaction,
sales turnover, financial results, and company value. Most studies give evidence that there is a ―positive
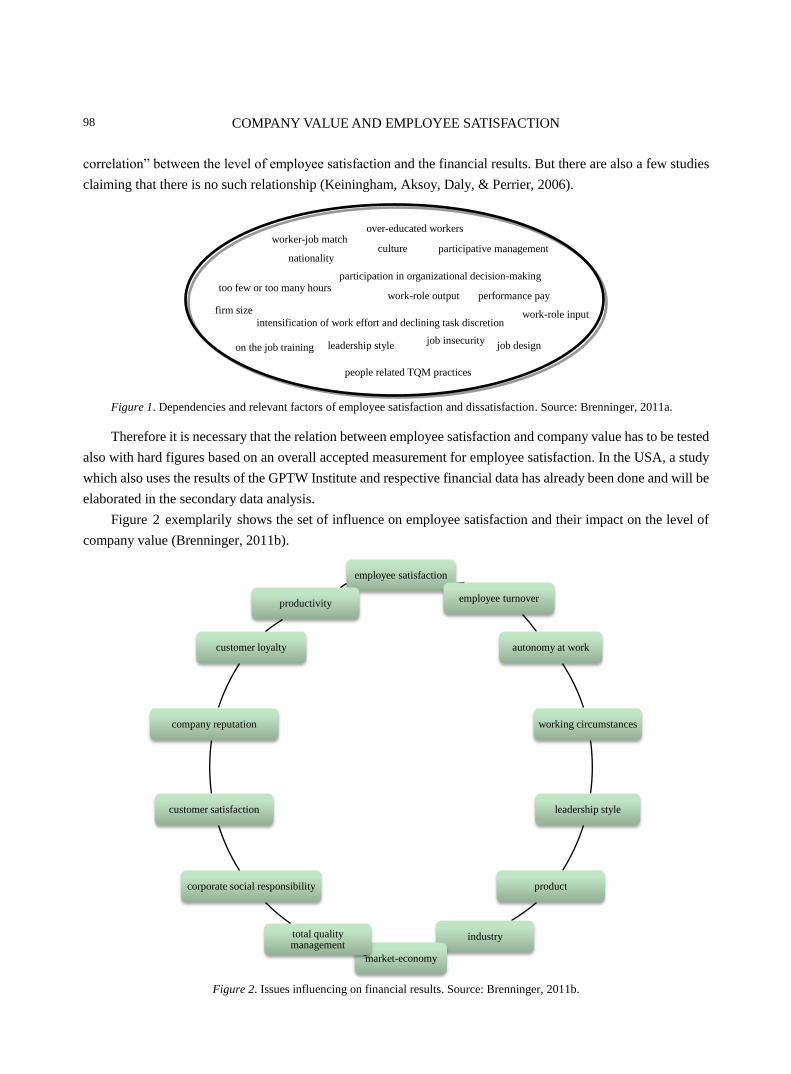
COMPANY VALUE AND EMPLOYEE SATISFACTION
98
correlation‖ between the level of employee satisfaction and the financial results. But there are also a few studies
claiming that there is no such relationship (Keiningham, Aksoy, Daly, & Perrier, 2006).
Figure 1. Dependencies and relevant factors of employee satisfaction and dissatisfaction. Source: Brenninger, 2011a.
Therefore it is necessary that the relation between employee satisfaction and company value has to be tested
also with hard figures based on an overall accepted measurement for employee satisfaction. In the USA, a study
which also uses the results of the GPTW Institute and respective financial data has already been done and will be
elaborated in the secondary data analysis.
Figure 2 exemplarily shows the set of influence on employee satisfaction and their impact on the level of
company value (Brenninger, 2011b).
Figure 2. Issues influencing on financial results. Source: Brenninger, 2011b.
employee satisfaction
employee turnover
autonomy at work
working circumstances
leadership style
product
industry
market-economy
total quality management
corporate social responsibility
customer satisfaction
company reputation
customer loyalty
productivity
participation in organizational decision-making
job insecurity
worker-job match
too few or too many hours
over-educated workers
performance pay
firm size
on the job training
people related TQM practices
work-role input
work-role output
nationality
job design
participative management
leadership style
culture
intensification of work effort and declining task discretion

COMPANY VALUE AND EMPLOYEE SATISFACTION
99
Theoretical Model and Set of Hypothesis
The second part ―Theoretical Model and Set of Hypothesis‖ deals with the independent variable ―employee
satisfaction‖, the description of the GPTW Contest, the dimensions of a GPTW, the measurement of employee
satisfaction, and approaches for computing the company value as the dependent variable.
The independent variable employee satisfaction will be measured by the results of the GPTW Contests in
2007 and 2009.
The GPTW® Institute, Inc. is a research and management consultancy firm based in the U.S. with
international affiliate offices throughout the world. At the GPTW® Institute, they have been dealing with
employees’ affairs and the evaluation of employers since 1980, in order to understand what makes a workplace
great.
The GPTW Institute measures the following five dimensions of employee satisfaction with a confidential
questionnaire of about 60 questions:
Credibility: Measures how employees see their managers in terms of confidentiality and reliability;
Respect: Measures the degree how employees feel being respected from their managers;
Fairness: Measures how employees feel being treated fair from their managers;
Pride: Measures the solidarity from the employees to the team and the company;
Camaraderie: Measures the quality of relationship between the employees.
Based on this dataset the GPTW Institute randomly selected a sample of companies for the authors’ analyses
which could also be found in the German ―Elektronischer Bundesanzeiger‖.
The main goal of this research is to test whether there is an evident relation between the level of employee
satisfaction and the respective company values. Therefore the authors calculated the company values for this
sample of companies which are among the 100 best in the GPTW Contest in Germany in those years.
There are several approaches for computing the company value (see Figure 3). For most of these, a lot of
financial data from balance sheets and profit and loss accounts are necessary. Most of these data, especially future
based planning data, are not available in the ―Elektronischen Bundesanzeiger‖. Therefore, this study will use the
EBIT-Multiple Model (developed by HJK Management Consultancy).
Figure 3. Company value model. Source: Ballwieser, 1993; HJK Management Consultancy, 2012.
Figure 3 gives an overview of possible calculation methods for computing the equity value. It depends on
the availability of data, to determine which model is appropriate and fits best. In practice and in real world,
COMPANY VALUE AND EMPLOYEE SATISFACTION
100
businesses EBIT multiples are used very often and even though no future planning material is available, the
company or equity value can be estimated.
Empirical Investigation
The third part of this study, the ―Empirical Investigation‖, is based on a secondary data analysis from the
USA, and the financial results of the randomly selected companies, which attended the GPTW Contest in
Germany in 2007 and 2009, and on additional primary statistical analysis with data from German companies.
Secondary Data Analysis From the USA
In this secondary data analysis from the USA, Ingrid Smithey-Fulmer from the Edi Broad Graduate School
of Management Michigan State University, Barry Gerhard from the School of Business University of
Wisconsin-Madison, and Kimberly S. Scott from the Wm. Wrigley Jr. Company conducted a study named: Are
the 100 best better?—An empirical investigation of the relationship between being a GPTW and firm
performance.
They suggest that positive employee relations effectively serve as an intangible and enduring asset, and may,
therefore, be a source of sustained competitive advantage at the firm level. They surveyed a number of measures
of firm-level performance and conceptualized how each measure is likely to be affected by highly positive
firm-level employee relations. They then empirically investigated whether positive employee relations are related
to firm performance, focusing on publicly traded firms, including the 100 ―Best Companies‖ to work for in
America. The relative performance of these Best Companies is examined via comparisons to both, companies in
the broad market and a group of matched firms. Their analysis suggests that companies on the ―100 Best‖ list
enjoy not only highly positive workforce attitudes, but also performance advantages over the broad market, and
in some cases, over matched firms (Smithey-Fulmer et al., 2003).
In their study Smithey-Fulmer et al. (2003) formulated three hypotheses:
Hypothesis 1: Companies included on the 100 Best list will exhibit stable levels of positive employee
attitudes over time.
Hypothesis 2: Companies included on the 100 Best list will exhibit better performance relative to other
companies because of their emphasis on employee relations.
Hypothesis 3: The superior performance of the 100 Best firms relative to other companies as captured by
Return on Assets (ROA) will be more persistent over time than superior performance as measured by
market-to-book value of equity or by annual stock returns.
The January 12, 1998 Fortune article The 100 Best Companies to Work for in America (Levering &
Moskowitz, 1998) was the source of the Best Companies that are in the focus of this study, 238 companies were
invited to submit information supporting inclusion in the 100 Best. This particular group was selected by the
authors Levering and Moskowitz (1998), from their own ―database of more than 1,000 companies‖, because they
met certain minimum criteria (firms had to have been in existence for at least 10 years and employ a minimum of
500 people) and because they were considered as ―most viable candidates for the list‖. Of those invited, 161
agreed to participate in.
The majority of employee survey questions used in selecting the 1998 100 Best list were created and
administered by the GPTW Institute® of San Francisco, and this instrument is referred to as the GPTW® Trust
Index©. Their Web site (Retrieved from www.greatplacetowork.com) describes a number of sample items from
the survey along with the dimensions they intended to capture.
COMPANY VALUE AND EMPLOYEE SATISFACTION
101
They used the 100 Best list as a starting point for their analysis of financial performance; they eliminated
privately held companies, nonprofit organizations, public utilities, and financial institutions from their analysis.
To be included in the study, they required that each of the 100 best companies had compustat data available in the
matching year (1997, the year prior to publication) to facilitate the selection of a matching company. The final
sample of Smithey-Fulmer et al. (2003) consisted of 50 companies from the January 1998 100 Best list.
In their study Smithey-Fulmer et al. (2003) elaborated the results and pointed out some issues for discussion
and future directions.
They found that organization-level employee attitudes of the 100 Best firms were both highly positive and
stable over time (supporting Hypothesis 1), bolstering the case for the characterizations of positive employee
relations as strategic assets as described in the strategic management literature. Then they found that accounting
ratios (ROA and market-to-book value of equity) of publicly traded companies included in the 100 Best list were
generally better than those of a matched comparison group, supporting Hypothesis 2 and establishing a link
between employee attitudes and organization-level financial performance, which had previously been unstudied.
As for stock returns, they found that the 100 Best companies outperformed the broad market when considering
cumulative (longer-term) returns, though not consistently for annual returns. They did not find that the 100 Best
significantly outperformed their matched peers in most annual return comparisons other than 1998; they did
outperform their peers in the years from 1995 to 1997 cumulative return period. Taken together, these results
suggest that 100 Best companies are able to successfully manage relationship with multiple stakeholder groups
(Jones, 1995), in this case, both employees and shareholders. At a minimum, these companies are able to create
attractive workplaces without hurting the bottom line, and in many cases the 100 Best exhibit superior
performance. Their hypothesis that different measure of performance would be affected differently over time is
partially supported (Hypothesis 3) (Smithey-Fulmer et al., 2003).
The following managerial implications and implications for further research can be drawn from those
findings:
This study gives evidence that employee satisfaction leads to better company performance and financial
results. Therefore managers have to give their employees a workplace environment which leads to high staff
satisfaction;
This research was conducted in the United States. Therefore it has to be verified, if those methods also fit for
other countries and cultures.
Operationalization of “Employee Satisfaction” for the Analysis of the Results of the GPTW Contest
2007/2009 in Germany
Based on an employee survey and a culture audit, attending companies of this contest in Germany were
ranked from one to 100. In this research, the results from eleven randomly selected companies, which attended
the contests in 2007 and 2009 or only in 2009, were analyzed. Unfortunately, the sample was limited to only
eleven companies for which the GPTW Institute provided the relevant data set.
After the analysis of one by one of these eleven companies, attending the GPTW Contest, the most
significant findings can be pointed out:
All these 11 companies have a very high employee satisfaction score;
The six companies which took part twice in this contest (2007 and 2009), and reached a rank among the 100
Best, are outstanding regarding their employee satisfaction scores;

COMPANY VALUE AND EMPLOYEE SATISFACTION
102
The average score in 2009 is higher than the average score in 2007, meaning that these 11 outstanding
companies could increase their average employee satisfaction score from 2007 to 2009.
Table 1 gives an overview regarding the employee satisfaction scores of the attending 11 companies with
the average score.
Table 1
Employee Satisfaction Scores of Attending 11 Companies With Average Score
Company 2007 2009
1 135.48 130.68
2 133.07 152.80
3 - 129.27
4 165.92 159.38
5 130.65 150.48
6 152.35 132.08
7 112.11 152.80
8 - 134.74
9 - 138.81
10 - 122.17
11 - 126.74
Average score 138.26 139.09
Note. Source: GPTW.
Operationalization of “Equity Value” as the Dependent Variable
In the next step, the EBITs and equity values of the companies attending the GPTW Contest have to be
computed.
The companies were selected from the GPTW Institute and provided in an anonymous design. All the
figures and numbers of the companies are from of the ―Elektronischer Bundesanzeiger‖. The authors received the
data directly from the GPTW Institute in an unattributed form, because confidentiality GPTW eliminated the
names of the companies.
The ―Elektronischer Bundesanzeiger‖ is a major official data source, issued by the German Federal
Government. It collects mandatory data delivered by all of the German companies which are subject to the
German economic and commercial legislation. The data of the ―Elektronischer Bundesanzeiger‖ represent an
overall picture of the EBIT as well as the equity value of the population of German companies.
After computing EBIT and equity value for these companies attending the GPTW Contest, the following
findings can be pointed out and serve as the base for additional research implications.
Table 2 shows the absolute figures in terms of EBIT and equity value of the companies attending the GPTW
Contest.
All of the randomly selected companies show quite strong financial results. Only one company shows
significant bank debts. Seven out of eight Companies could increase their EBIT during the regarded period. Six
out of eight companies could increase their equity value, as well. Both, average EBIT (26.4%) and equity value
(30.45%) grew during the regarded period.
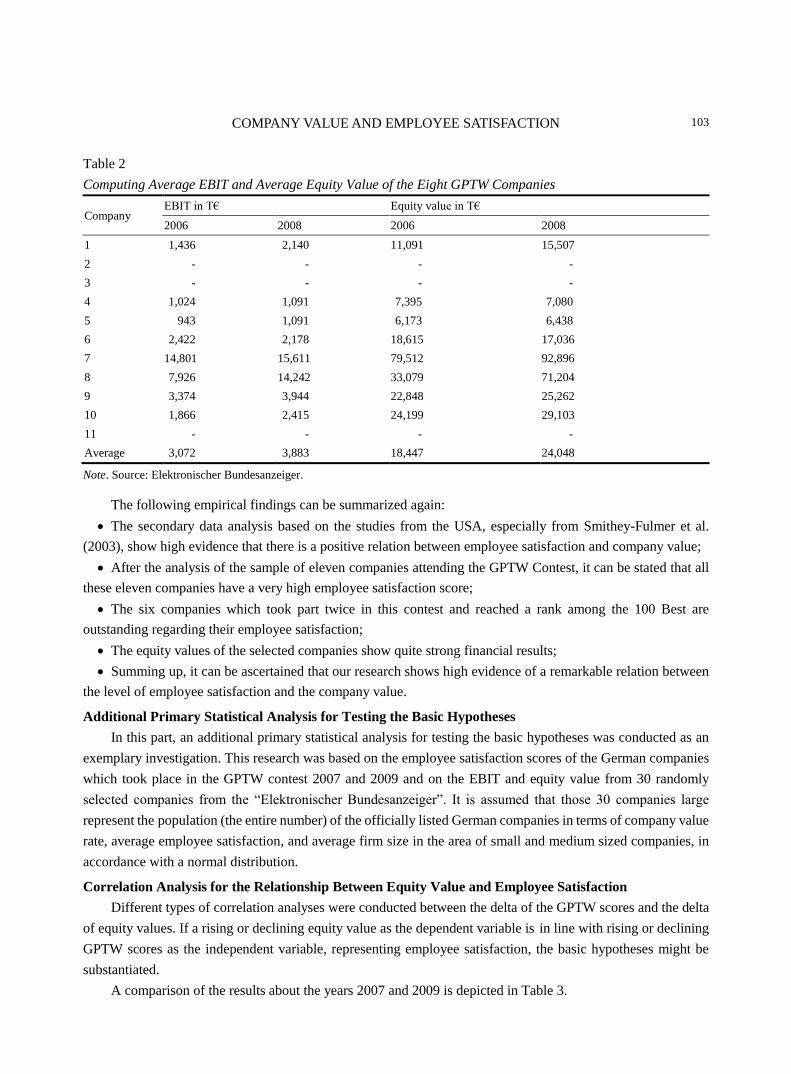
COMPANY VALUE AND EMPLOYEE SATISFACTION
103
Table 2
Computing Average EBIT and Average Equity Value of the Eight GPTW Companies
Company EBIT in T€ Equity value in T€
2006 2008 2006 2008
1 1,436 2,140 11,091 15,507
2 - - - -
3 - - - -
4 1,024 1,091 7,395 7,080
5 943 1,091 6,173 6,438
6 2,422 2,178 18,615 17,036
7 14,801 15,611 79,512 92,896
8 7,926 14,242 33,079 71,204
9 3,374 3,944 22,848 25,262
10 1,866 2,415 24,199 29,103
11 - - - -
Average 3,072 3,883 18,447 24,048
Note. Source: Elektronischer Bundesanzeiger.
The following empirical findings can be summarized again:
The secondary data analysis based on the studies from the USA, especially from Smithey-Fulmer et al.
(2003), show high evidence that there is a positive relation between employee satisfaction and company value;
After the analysis of the sample of eleven companies attending the GPTW Contest, it can be stated that all
these eleven companies have a very high employee satisfaction score;
The six companies which took part twice in this contest and reached a rank among the 100 Best are
outstanding regarding their employee satisfaction;
The equity values of the selected companies show quite strong financial results;
Summing up, it can be ascertained that our research shows high evidence of a remarkable relation between
the level of employee satisfaction and the company value.
Additional Primary Statistical Analysis for Testing the Basic Hypotheses
In this part, an additional primary statistical analysis for testing the basic hypotheses was conducted as an
exemplary investigation. This research was based on the employee satisfaction scores of the German companies
which took place in the GPTW contest 2007 and 2009 and on the EBIT and equity value from 30 randomly
selected companies from the ―Elektronischer Bundesanzeiger‖. It is assumed that those 30 companies large
represent the population (the entire number) of the officially listed German companies in terms of company value
rate, average employee satisfaction, and average firm size in the area of small and medium sized companies, in
accordance with a normal distribution.
Correlation Analysis for the Relationship Between Equity Value and Employee Satisfaction
Different types of correlation analyses were conducted between the delta of the GPTW scores and the delta
of equity values. If a rising or declining equity value as the dependent variable is in line with rising or declining
GPTW scores as the independent variable, representing employee satisfaction, the basic hypotheses might be
substantiated.
A comparison of the results about the years 2007 and 2009 is depicted in Table 3.
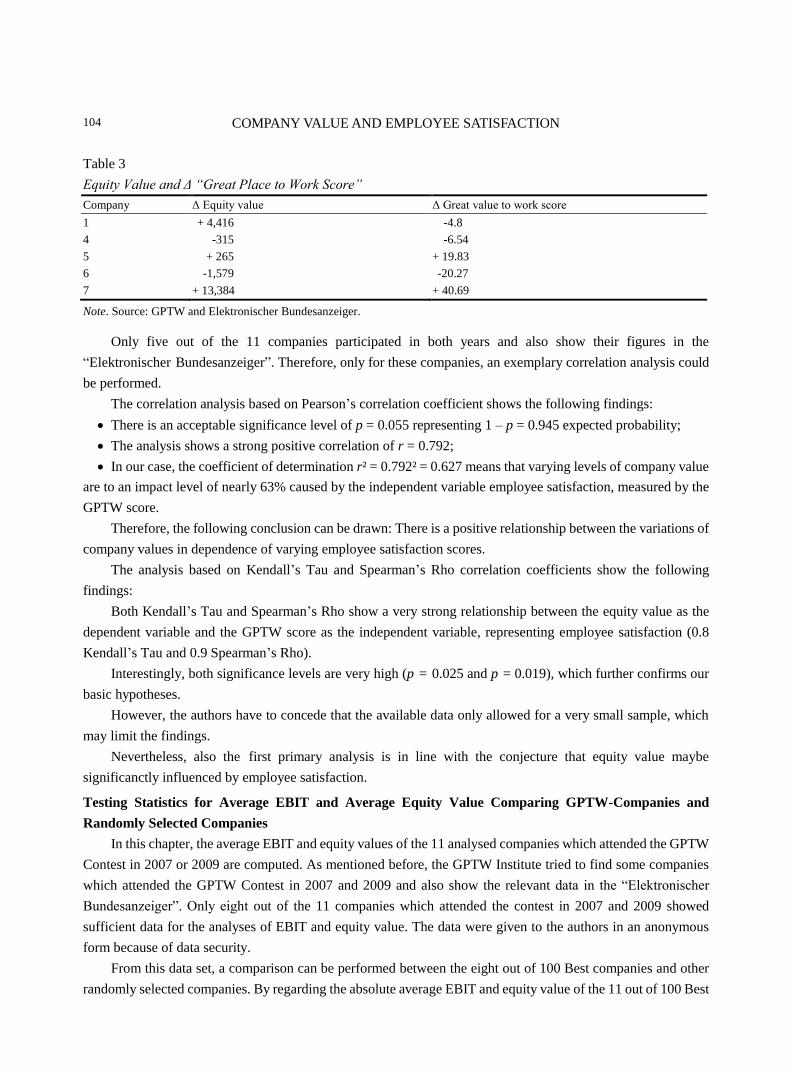
COMPANY VALUE AND EMPLOYEE SATISFACTION
104
Table 3
Equity Value and Δ “Great Place to Work Score”
Company Δ Equity value Δ Great value to work score
1 + 4,416 -4.8
4 -315 -6.54
5 + 265 + 19.83
6 -1,579 -20.27
7 + 13,384 + 40.69
Note. Source: GPTW and Elektronischer Bundesanzeiger.
Only five out of the 11 companies participated in both years and also show their figures in the
―Elektronischer Bundesanzeiger‖. Therefore, only for these companies, an exemplary correlation analysis could
be performed.
The correlation analysis based on Pearson’s correlation coefficient shows the following findings:
There is an acceptable significance level of p = 0.055 representing 1 – p = 0.945 expected probability;
The analysis shows a strong positive correlation of r = 0.792;
In our case, the coefficient of determination r² = 0.792² = 0.627 means that varying levels of company value
are to an impact level of nearly 63% caused by the independent variable employee satisfaction, measured by the
GPTW score.
Therefore, the following conclusion can be drawn: There is a positive relationship between the variations of
company values in dependence of varying employee satisfaction scores.
The analysis based on Kendall’s Tau and Spearman’s Rho correlation coefficients show the following
findings:
Both Kendall’s Tau and Spearman’s Rho show a very strong relationship between the equity value as the
dependent variable and the GPTW score as the independent variable, representing employee satisfaction (0.8
Kendall’s Tau and 0.9 Spearman’s Rho).
Interestingly, both significance levels are very high (p = 0.025 and p = 0.019), which further confirms our
basic hypotheses.
However, the authors have to concede that the available data only allowed for a very small sample, which
may limit the findings.
Nevertheless, also the first primary analysis is in line with the conjecture that equity value maybe
significanctly influenced by employee satisfaction.
Testing Statistics for Average EBIT and Average Equity Value Comparing GPTW-Companies and
Randomly Selected Companies
In this chapter, the average EBIT and equity values of the 11 analysed companies which attended the GPTW
Contest in 2007 or 2009 are computed. As mentioned before, the GPTW Institute tried to find some companies
which attended the GPTW Contest in 2007 and 2009 and also show the relevant data in the ―Elektronischer
Bundesanzeiger‖. Only eight out of the 11 companies which attended the contest in 2007 and 2009 showed
sufficient data for the analyses of EBIT and equity value. The data were given to the authors in an anonymous
form because of data security.
From this data set, a comparison can be performed between the eight out of 100 Best companies and other
randomly selected companies. By regarding the absolute average EBIT and equity value of the 11 out of 100 Best
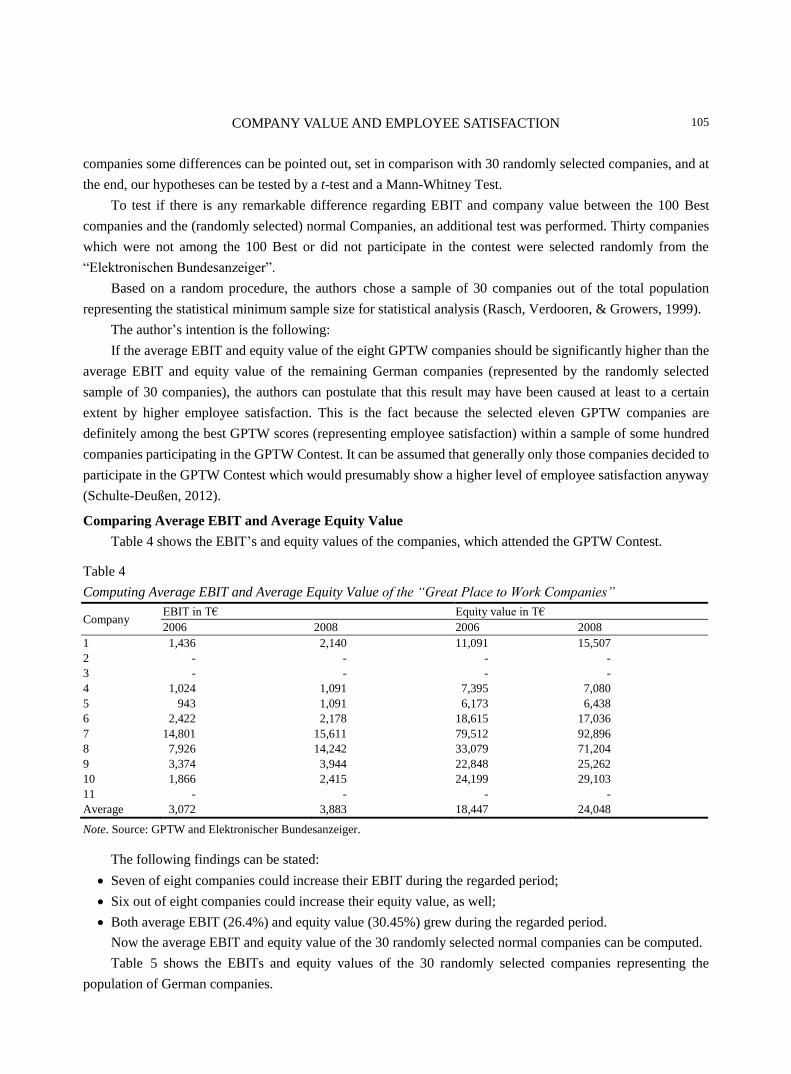
COMPANY VALUE AND EMPLOYEE SATISFACTION
105
companies some differences can be pointed out, set in comparison with 30 randomly selected companies, and at
the end, our hypotheses can be tested by a t-test and a Mann-Whitney Test.
To test if there is any remarkable difference regarding EBIT and company value between the 100 Best
companies and the (randomly selected) normal Companies, an additional test was performed. Thirty companies
which were not among the 100 Best or did not participate in the contest were selected randomly from the
―Elektronischen Bundesanzeiger‖.
Based on a random procedure, the authors chose a sample of 30 companies out of the total population
representing the statistical minimum sample size for statistical analysis (Rasch, Verdooren, & Growers, 1999).
The author’s intention is the following:
If the average EBIT and equity value of the eight GPTW companies should be significantly higher than the
average EBIT and equity value of the remaining German companies (represented by the randomly selected
sample of 30 companies), the authors can postulate that this result may have been caused at least to a certain
extent by higher employee satisfaction. This is the fact because the selected eleven GPTW companies are
definitely among the best GPTW scores (representing employee satisfaction) within a sample of some hundred
companies participating in the GPTW Contest. It can be assumed that generally only those companies decided to
participate in the GPTW Contest which would presumably show a higher level of employee satisfaction anyway
(Schulte-Deußen, 2012).
Comparing Average EBIT and Average Equity Value
Table 4 shows the EBIT’s and equity values of the companies, which attended the GPTW Contest.
Table 4
Computing Average EBIT and Average Equity Value of the “Great Place to Work Companies”
Company EBIT in T€ Equity value in T€
2006 2008 2006 2008
1 1,436 2,140 11,091 15,507
2 - - - -
3 - - - -
4 1,024 1,091 7,395 7,080
5 943 1,091 6,173 6,438
6 2,422 2,178 18,615 17,036
7 14,801 15,611 79,512 92,896
8 7,926 14,242 33,079 71,204
9 3,374 3,944 22,848 25,262
10 1,866 2,415 24,199 29,103
11 - - - -
Average 3,072 3,883 18,447 24,048
Note. Source: GPTW and Elektronischer Bundesanzeiger.
The following findings can be stated:
Seven of eight companies could increase their EBIT during the regarded period;
Six out of eight companies could increase their equity value, as well;
Both average EBIT (26.4%) and equity value (30.45%) grew during the regarded period.
Now the average EBIT and equity value of the 30 randomly selected normal companies can be computed.
Table 5 shows the EBITs and equity values of the 30 randomly selected companies representing the
population of German companies.
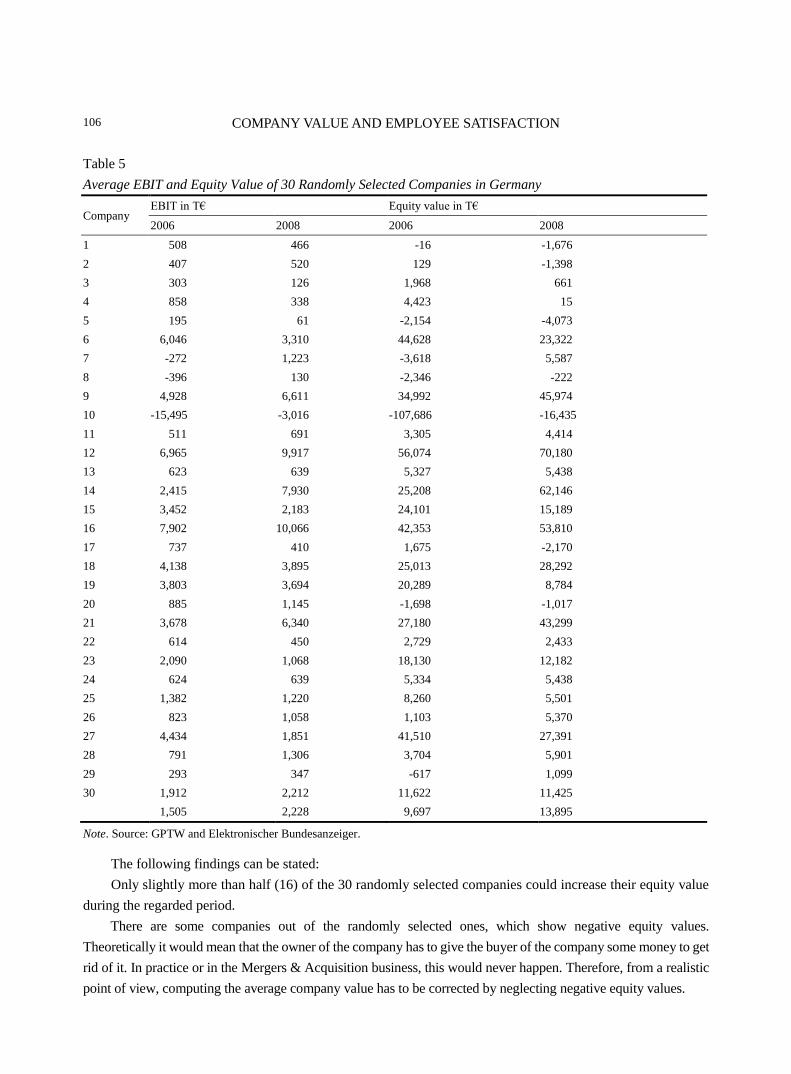
COMPANY VALUE AND EMPLOYEE SATISFACTION
106
Table 5
Average EBIT and Equity Value of 30 Randomly Selected Companies in Germany
Company EBIT in T€ Equity value in T€
2006 2008 2006 2008
1 508 466 -16 -1,676
2 407 520 129 -1,398
3 303 126 1,968 661
4 858 338 4,423 15
5 195 61 -2,154 -4,073
6 6,046 3,310 44,628 23,322
7 -272 1,223 -3,618 5,587
8 -396 130 -2,346 -222
9 4,928 6,611 34,992 45,974
10 -15,495 -3,016 -107,686 -16,435
11 511 691 3,305 4,414
12 6,965 9,917 56,074 70,180
13 623 639 5,327 5,438
14 2,415 7,930 25,208 62,146
15 3,452 2,183 24,101 15,189
16 7,902 10,066 42,353 53,810
17 737 410 1,675 -2,170
18 4,138 3,895 25,013 28,292
19 3,803 3,694 20,289 8,784
20 885 1,145 -1,698 -1,017
21 3,678 6,340 27,180 43,299
22 614 450 2,729 2,433
23 2,090 1,068 18,130 12,182
24 624 639 5,334 5,438
25 1,382 1,220 8,260 5,501
26 823 1,058 1,103 5,370
27 4,434 1,851 41,510 27,391
28 791 1,306 3,704 5,901
29 293 347 -617 1,099
30 1,912 2,212 11,622 11,425
1,505 2,228 9,697 13,895
Note. Source: GPTW and Elektronischer Bundesanzeiger.
The following findings can be stated:
Only slightly more than half (16) of the 30 randomly selected companies could increase their equity value
during the regarded period.
There are some companies out of the randomly selected ones, which show negative equity values.
Theoretically it would mean that the owner of the company has to give the buyer of the company some money to get
rid of it. In practice or in the Mergers & Acquisition business, this would never happen. Therefore, from a realistic
point of view, computing the average company value has to be corrected by neglecting negative equity values.
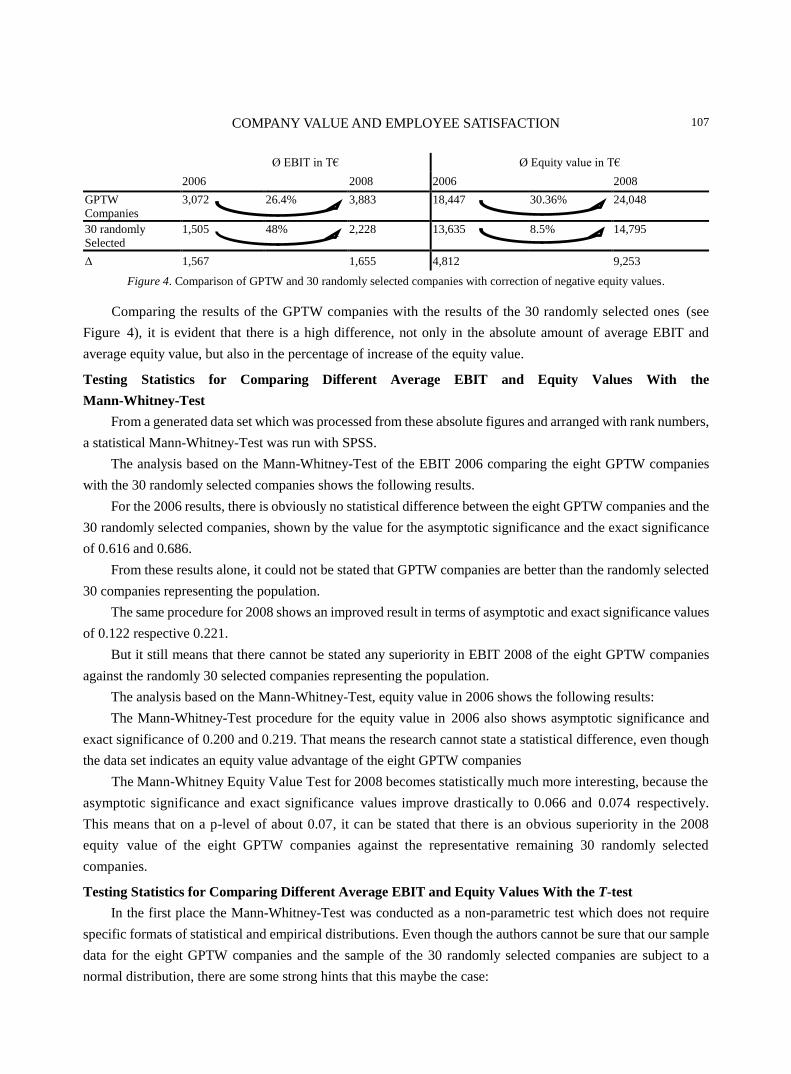
COMPANY VALUE AND EMPLOYEE SATISFACTION
107
Ø EBIT in T€ Ø Equity value in T€
2006 2008 2006 2008
GPTW
Companies
3,072
26.4%
3,883
18,447
30.36%
24,048
30 randomly
Selected
1,505
48%
2,228
13,635
8.5%
14,795
Δ 1,567 1,655 4,812 9,253
Figure 4. Comparison of GPTW and 30 randomly selected companies with correction of negative equity values.
Comparing the results of the GPTW companies with the results of the 30 randomly selected ones (see
Figure 4), it is evident that there is a high difference, not only in the absolute amount of average EBIT and
average equity value, but also in the percentage of increase of the equity value.
Testing Statistics for Comparing Different Average EBIT and Equity Values With the
Mann-Whitney-Test
From a generated data set which was processed from these absolute figures and arranged with rank numbers,
a statistical Mann-Whitney-Test was run with SPSS.
The analysis based on the Mann-Whitney-Test of the EBIT 2006 comparing the eight GPTW companies
with the 30 randomly selected companies shows the following results.
For the 2006 results, there is obviously no statistical difference between the eight GPTW companies and the
30 randomly selected companies, shown by the value for the asymptotic significance and the exact significance
of 0.616 and 0.686.
From these results alone, it could not be stated that GPTW companies are better than the randomly selected
30 companies representing the population.
The same procedure for 2008 shows an improved result in terms of asymptotic and exact significance values
of 0.122 respective 0.221.
But it still means that there cannot be stated any superiority in EBIT 2008 of the eight GPTW companies
against the randomly 30 selected companies representing the population.
The analysis based on the Mann-Whitney-Test, equity value in 2006 shows the following results:
The Mann-Whitney-Test procedure for the equity value in 2006 also shows asymptotic significance and
exact significance of 0.200 and 0.219. That means the research cannot state a statistical difference, even though
the data set indicates an equity value advantage of the eight GPTW companies
The Mann-Whitney Equity Value Test for 2008 becomes statistically much more interesting, because the
asymptotic significance and exact significance values improve drastically to 0.066 and 0.074 respectively.
This means that on a p-level of about 0.07, it can be stated that there is an obvious superiority in the 2008
equity value of the eight GPTW companies against the representative remaining 30 randomly selected
companies.
Testing Statistics for Comparing Different Average EBIT and Equity Values With the T-test
In the first place the Mann-Whitney-Test was conducted as a non-parametric test which does not require
specific formats of statistical and empirical distributions. Even though the authors cannot be sure that our sample
data for the eight GPTW companies and the sample of the 30 randomly selected companies are subject to a
normal distribution, there are some strong hints that this maybe the case:

COMPANY VALUE AND EMPLOYEE SATISFACTION
108
Firstly, GPTW companies’ scores generally follow a normal distribution (Retrieved from
www.greatplacetowork.com) and secondly there is no indication that scores and values of the population of
German companies do not follow a normal distribution (Retrieved from www.elektronischerbundesanzeiger.de).
Therefore the authors also conducted a t-test to find out whether the EBIT and equity value of the GPTW
companies of 2006 and 2008 are higher than the EBIT and equity value of the representative sample of the 30
randomly selected companies.
Based on these assumptions the t-test shows the following findings:
The EBIT of 2006 of the GPTW companies and the other 30 randomly selected companies, which
represent the population of German companies, does not show a statistical difference, meaning the
0-hypotheses of equal EBIT’s cannot be rejected in this case.
The analysis based on the t-Test EBIT 2008 shows the following findings:
Interestingly, for EBIT 2008, there is a significant difference between the eight GPTW companies and the
30 randomly selected companies on a high significance level of p = 0.027.
Therefore it can be stated that the average EBIT 2008 of the eight GPTW companies is significantly
higher than the EBIT 2008 of the representative group of the 30 randomly selected companies.
The next step is to conduct the statistical calculation for the equity value of these two groups of companies.
The analysis based on the t-Test equity value 2006 shows the following findings:
The equity value 2006 of the GPTW companies and the other 30 randomly selected companies, which
represent the population of German companies, does not show a statistical difference, meaning the
0-hypotheses of equal equity values cannot be rejected.
Finally, the analysis based on the t-Test equity value 2008 shows the following findings:
Our test procedure indicates, based on the t-value, that the 0-hypotheses (equal equity values) should be
rejected and that there is an obvious difference between the equity value of the eight GPTW companies and the
30 randomly selected companies (representing the population of German companies). However, the level of
significance is relatively non-sufficient.
Comparing Average Great Place to Work Scores
Finally, the average score of our 11 attending companies will be compared with the average score of the 100
Best and with the average score of all attending companies, to see if there are also some remarkable findings.
For the year 2007, the average total score of all attending companies was 115.9 and for the 100 Best 132.7.
For the year 2009 the average total score of all attending companies was 107.2 and for the 100 Best 128.9.
The diversification of these two years is caused by two effects. First, the GPTW Institute has differently
calibrated their validation for the year 2009, which leads to stricter regulations and therefore to lower scores.
Second, there is a tendency that more companies take place in the contest knowing that they don’t really have a
chance to win the contest (Schulte-Deußen, 2012).
Table 6 shows that the 11 randomly selected companies are obviously above the average 100 Best scores.
Interestingly, the average score of all attending companies and the 100 Best companies declined during the
regarded period, while the average GPTW score of the 11 randomly selected companies increased during the
regarded period. That may lead to the assumption that these 11 companies, which are among the top 50 out of the
100 Best, could increase their employee satisfaction level more than the rest and that they belong to the top rated
German companies in terms of employee satisfaction.
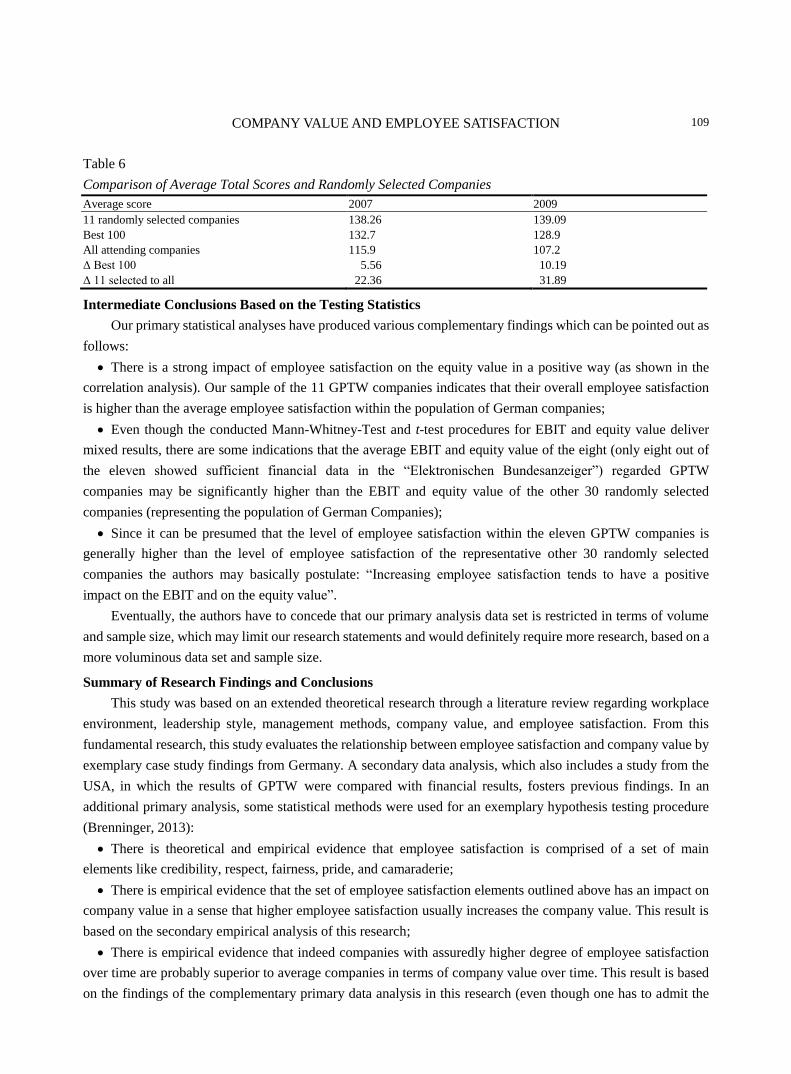
COMPANY VALUE AND EMPLOYEE SATISFACTION
109
Table 6
Comparison of Average Total Scores and Randomly Selected Companies
Average score 2007 2009
11 randomly selected companies 138.26 139.09
Best 100 132.7 128.9
All attending companies 115.9 107.2
Δ Best 100 5.56 10.19
Δ 11 selected to all 22.36 31.89
Intermediate Conclusions Based on the Testing Statistics
Our primary statistical analyses have produced various complementary findings which can be pointed out as
follows:
There is a strong impact of employee satisfaction on the equity value in a positive way (as shown in the
correlation analysis). Our sample of the 11 GPTW companies indicates that their overall employee satisfaction
is higher than the average employee satisfaction within the population of German companies;
Even though the conducted Mann-Whitney-Test and t-test procedures for EBIT and equity value deliver
mixed results, there are some indications that the average EBIT and equity value of the eight (only eight out of
the eleven showed sufficient financial data in the ―Elektronischen Bundesanzeiger‖) regarded GPTW
companies may be significantly higher than the EBIT and equity value of the other 30 randomly selected
companies (representing the population of German Companies);
Since it can be presumed that the level of employee satisfaction within the eleven GPTW companies is
generally higher than the level of employee satisfaction of the representative other 30 randomly selected
companies the authors may basically postulate: ―Increasing employee satisfaction tends to have a positive
impact on the EBIT and on the equity value‖.
Eventually, the authors have to concede that our primary analysis data set is restricted in terms of volume
and sample size, which may limit our research statements and would definitely require more research, based on a
more voluminous data set and sample size.
Summary of Research Findings and Conclusions
This study was based on an extended theoretical research through a literature review regarding workplace
environment, leadership style, management methods, company value, and employee satisfaction. From this
fundamental research, this study evaluates the relationship between employee satisfaction and company value by
exemplary case study findings from Germany. A secondary data analysis, which also includes a study from the
USA, in which the results of GPTW were compared with financial results, fosters previous findings. In an
additional primary analysis, some statistical methods were used for an exemplary hypothesis testing procedure
(Brenninger, 2013):
There is theoretical and empirical evidence that employee satisfaction is comprised of a set of main
elements like credibility, respect, fairness, pride, and camaraderie;
There is empirical evidence that the set of employee satisfaction elements outlined above has an impact on
company value in a sense that higher employee satisfaction usually increases the company value. This result is
based on the secondary empirical analysis of this research;
There is empirical evidence that indeed companies with assuredly higher degree of employee satisfaction
over time are probably superior to average companies in terms of company value over time. This result is based
on the findings of the complementary primary data analysis in this research (even though one has to admit the
COMPANY VALUE AND EMPLOYEE SATISFACTION
110
relatively low sample size for this procedure);
The main results of this research show that there may be evidence of a cause-effect relation between
employee satisfaction and company value;
Our hypothesis that the ―degree of employee satisfaction has an impact on the level of company value‖ is
(preliminary) substantiated.
References
Ballwieser, W. (1993). Methods of valuation of companies. In G. Gebhardt, W. Gerke, & M. Steiner (Eds.), Handbook of
financial management: Instruments and markets of corporate financing (pp. 151-176). Munich: Beck.
Brenninger, H. J. (2011a). Employee satisfaction: Not fortune, but approach. Proceedings of International Conference for
Doctoral Students: Current Issues in Economics and Management Sciences (pp. 114-125). Riga: University of Latvia.
Brenninger, H. J. (2011b). Company value and employee satisfaction: Exemplary findings from the USA and possibilities for
computing company value. Proceedings of Global Business Management Research Conference 2011. University of Applied
Sciences Fulda, Fulda, Germany.
Brenninger, H. J. (2012). Company value and employee satisfaction: Exemplary case study findings. Proceedings of International
Conference on New Challenges of Economic and Business Development (pp. 62-77). University of Latvia, Riga.
Brenninger, H. J. (2013). Company value and employee satisfaction: Primary data analysis for testing the basic
hypothesis—Employee satisfaction has an impact on the level of company value. Proceedings of International Scientific
Conference on New Challenges of Economic and Business Development (pp. 96-105). University of Latvia. Riga.
Glebe, D. (2009). Referring to the world wide crisis at the bank market and the influence of nearly all other economic branches
(Börse verstehen: Die globale Finanzkrise) (p. 96). Berlin, Germany: Books on Demand.
Heidecker, M. (2003). Value-based human capital management in order to increase the company’s value by human resources
management (Wertorientiertes human capital management—Zur Steigerung des Unternehmenswertes durch die
Personalarbeit) (pp. 52-74). German: German University Publishers.
Herzberg, F., Mausner, B., & Snyderman, B. (1957). The motivation to work. New York: John Wiley.
Heskett, J. L., Jones, T. O., Loveman, G. W., Sasser, W. E. Jr., & Schlesinger, L. A. (1994). Putting the service-profit chain to
work. Harvard Business Review, 72(2), 164-174.
HJK Management Consultancy. (2012). EBIT-Multiples—What is the value of my company? (EBIT-Multiplikatoren—Was ist
mein Unternehmen wert?). Retrieved from http://www.hjk-mc.de/pdf/hjk-mc_ebit-multiplikatoren.pdf
Holtbrügge, D. (2007). Personal management. Berlin et al.: Springer.
Hurley, R. F., & Estelami, H. (2007). An exploratory study of employee turnover indicators as predictors of customer satisfaction.
Journal of Services Marketing, 21(3), 186-199.
Jones, T. M. (1995). Instrumental stakeholder theory: A synthesis of ethics and economics. Academy of Management Review,
20(2), 404-437.
Keiningham, T. L., Aksoy, L., Daly, R. M., & Perrier, K. (2006). Reexamining the link between employee satisfaction and store
performance in a retail environment. International Journal of Service Industry Management, 17(1), 51-57.
Levering, R., & Moskowitz, M. (1998). The 100 best companies to work for in America. Fortune, 137, 84-95.
Malik, F. (2006). Führen, Leisten, Leben. New York: Campus.
Rasch, D., Verdooren, L. R., & Growers, J. I. (1999). Fundamentals in the design and analysis of experiments and surveys (p.
253). München, Wien: Oldenbourg Verlag Munich.
Romero, E. J. (2004). Are the great places to work also great performers?. The Academy of Management Executive, 18(2),
150-152.
Rosenstiel, L. V. (2003). Motivation management (p. 52). Weinheim: Beltz.
Schneider, A. (2009). Die Finanzkrise und ihre Auswirkungen auf den Mittelstand—Eine Analyse. Hamburg, Germany: Igel
Verlag.
Schulte-Deußen, K. (2012). Great place to work® Deutschland. Retrieved from http://www.greatplacetowork.de
Smithey-Fulmer, I., Gerhardt, B., & Scott, K. S. (2003). Are the 100 best better? An empirical investigation of the relationship
between being a great place to work an firm performance. Personnel Psychology, 56, 965-993.
Weisbord, M. (2005). Techniques to match to our values (p. 4). San Francisco: Organization Design Forum.
Weisbord, M., & Janoff, S. (2008). Let people be responsible. Retrieved from http://www.consultingtoday.com

Management Studies, ISSN 2328-2185
February 2014, Vol. 2, No. 2, 111-122
Research on Cultural Tourism Issues of Trikala City, Greece
Mitoula Roido, Gratsani Athina
Harokopio University, Athens, Greece
Cultural tourism in regional cities has grown rapidly in recent years. In order to be successful and sustainable,
management of the local authorities is considered as an urgent need to investigate the views of the local community.
The purpose of this study was to investigate and interpret the residents’ views of Trikala city, in Thessaly, for the
benefits of cultural tourism and their attitude to the relevant bodies and local authorities. The empirical analysis is
based on the use of cross section data, which were derived from a sample survey to 372 residents of the city. The
empirical analysis shows that, generally, the benefits of cultural tourism are recognized, even if the region is at an
early stage of development. The findings of logistic regression model show that the view that competent bodies
ensure that the promotion of local culture and local heritage is determined by the abundance of events, festivals,
and local museums in the city. From the proper utilization of architectural heritage attractions and local heritage,
the knowledge of recent achievements concern cultural tourism and the appropriate infrastructure in the city.
Keywords: Trikala city, cultural tourism, financial impacts of cultural tourism
Introduction
The term ―culture‖ was developed in the 18th century, as an expression of western consciousness. It refers
to social structure and techniques and features a set of people and societies (Vryzas, 2005). It also refers to all
mental events (customs, arts, technical, scientific, and artistic achievements) of society or nation (Karagiannis,
2011). According to MacDonald and Jolliffe (2003), culture involves family patterns, folklore, social customs,
museums, monuments, historic structures, artifacts, natural history, and even wilderness areas. Particularly, the
World Heritage Convention was held in 1972, recorded with clarity the meaning of ―cultural heritage‖ which
includes the works of architecture, building blocks, and spaces (human creations or nature and human creations)
(Mitoula, 2011).
Cultural objects are not just creations and expressions, but are everything considered as cultural heritage
from historical perspective, which accumulated over the years and offered a sense of heritage (Báez
Montenegro, Niklitschek Huaquin, & César Herrero Prieto, 2009). Cultural heritage is a major issue since it can
be preserved for future use, while benefited in the present (MacDonald & Jolliffe, 2003). It is the basis for
increasing the attractiveness of tourism and cultural offer of local communities (Huibin, Marzuki, & Razak,
2012). Culture, as a tourist attraction, plays an important role for international tourists and an important source
of foreign exchange income (Popescu & Corbos, 2010; Huibin et al., 2012). It is assumed that the increased
demand for cultural heritage to various destinations has enhanced the tourism competitiveness (Bowitz &
Mitoula Roido, Associate Professor, Department of Home Economics & Ecology, Harokopio University.
Gratsani Athina, Master in Sustainable Development, Department of Home Economics & Ecology, Harokopio University.
Correspondence concerning this article should be addressed to Mitoula Roido, Harokopio University, 70 El.Venizelou, Kallithea,
17122, Greece. E-mail: [email protected].
DAVID PUBLISHING
D

RESEARCH ON CULTURAL TOURISM ISSUES OF TRIKALA CITY, GREECE
112
Ibenholt, 2009).
Nowadays, culture is a factor of great importance for the design of national tourism policy. Culture, as a
concept, is associated with the occurrence and development of cities. However, it is a means for tourism
promotion in rural and regional areas (Bachleitner & Zins, 1999), as many studies have shown that culture and
tourism are resources for socio-economic development in regional communities (MacDonald & Jolliffe, 2003).
The increase in tourism attractiveness through cultural heritage and the effective promotion and exploitation of
cultural resources can enhance the tourism competitiveness at local level. However, the international literature
(research and practice) has proved that the residents’ attitude towards cultural initiatives of tourism is essential
for the sustainability of its development and final success.
Residents’ Perceptions of Tourist Areas
Cultural tourism is defined as the movement of people to cultural attractions away from their normal place
of residence with the intention to collect new information and experiences in order to meet their cultural needs
(Bachleitner & Zins, 1999, Shamsuddoha, Alamgir, & and Nasir, 2011). It is a kind of special interest tourism,
based on search and participation in aesthetic, spiritual, emotional, and psychological experiences. It is
approached by a holistic way, but with emphasis on heritage (monuments, archaeological sites, and museums,
etc.) (Keitumetse, 2009, Huibin et al, 2012, Hughes & Allen, 2005). Cultural tourism includes tourism in urban
cities (mainly historical and large cities) and historical buildings (such as museums, theaters). It can also include
tourism in rural and regional areas, showcasing the traditions of indigenous communities, their values and
lifestyle (Besculides, Lee, & McCormick, 2002; Shamsuddoha et al, 2011; Huibin et al., 2012). Cultural tourism
is also interested in local language, cuisine, technology of the past, clothing and leisure activities (Asplet &
Cooper, 2000).
Cultural tourism is one of the fastest growing sectors in tourism industry (Wang, Fu, Cecil, & Hji-Avgoustis,
2008). Its demand in Europe has increased significantly since 1970, due to ―new middle class‖, with high
education and income levels (Richards, 1996).
Cultural tourism contributes to local economic regeneration and prosperity, as it creates new job
opportunities (Besculides et al., 2002). It also contributes to the increase of national income, by intensive
utilization of the available workforce and stimulates investment (food, accommodation, entertainment). When
the investment belongs to local investors, the profit remains in the region and helps further investment
(Ioan-Frank & Istoc, 2007). Simultaneously, cultural tourism encourages the opening of small and medium
enterprises with local traditional products (Bachleitner & Zins, 1999), reinforces the learning of residents,
assessment, awareness, pride of community, national identity, exchanging of ideas. Furthermore, it increases the
demand for local arts production (Burns & Sancho, 2003; Taylor, 2001; Besculides et al., 2002). Therefore,
proper management of cultural tourism has positive socioeconomic impacts and may even contribute to the
preservation and protection of cultural resources (Ioan-Frank & Istoc, 2007).
Cultural resources have been used as a means to enhance economic stability, while little research has been
conducted on other possible benefits (personal, sociopolitical, economic, and environmental) that tourism can
bring to local communities (Besculides, Lee, & McCormick, 2002). Generally, more research is needed for
cultural tourism in regional areas, particularly in the fields such as the development of attractions,
entrepreneurship encouragement, information of markets, quality service supply, and attractiveness preservation
(MacDonald & Jolliffe, 2003).
RESEARCH ON CULTURAL TOURISM ISSUES OF TRIKALA CITY, GREECE
113
A more effective promotion of employment and utilization of available cultural resources will lead to an
increase of the produced Gross Domestic Product (GDP) and a growth in the number of jobs created by the
travelling expenses and tourism industry. In addition it will lead to a significant increase in the number of
international and local arrivals of visitors and, international and local tourism revenues as well (Dugulan, Balaure,
Popescu, & Veghes, 2010).
Residents’ Perceptions of Tourist Areas
Studies have shown that residents’ perceptions are affected by their dependence on tourism activities and
providing jobs for the residents is very important (Sdrali & Chazapi, 2007; Bachleitner & Zins, 1999;
Besculides et al., 2002). The participation and cooperation of local people, local authorities, and policy makers
are needed in order to be achievable in the sustainable tourism industry (Sdrali & Chazapi, 2007).
When cultural tourism is used as a tool for development in rural areas, policy makers should consider
factors such as cultural identity and authenticity, because they may be affected due to the growing impacts of
tourism (Bachleitner & Zins, 1999). Of course, residents worry that by sharing their culture, it can lead to
commercialization. In order to provide economic and cultural benefits to the community, the residents should
be positive and participate actively in the care and protection of their cultural heritage (Besculides et al., 2002).
The support of tourism development of the host community is affected by the level of their concern, the
exploitation of tourism resources by them, the state of the local economy, the costs and expected benefits of
tourism development (Gursoy, Jurowski, & Uysa, 2002). It has been found that residents support tourism when
economic benefits arise. Generally, the economic profit is more noticeable by residents than social or
environmental (Ritchie & Inkari, 2006).
In most communities, the benefits of tourism are gathered in a limited number of people, those who have
the capital to invest. Local authorities should distribute the benefits of tourism to the local community, allowing,
in this way, a larger proportion of local population to benefit from the tourism development. At the same time,
regular monitoring of tourism development should provide information for the needs and views of the residents
of local communities (Andriotis & Vaughan, 2003).
National or regional tourism development program should be adapted in order to meet the needs of each
community. Otherwise it is unlikely to bring satisfactory results from the viewpoint of residents. Research
results show that there is a relationship between the attitude of residents towards tourism and the final result
(Andereck & Vogt, 2000). They also show that tourism offers many economic benefits, and the residents’
standard of living is increasing due to tourism.
Other studies also show a complex relationship among the level of economic development, the level of
tourism development, and the expected perceived socioeconomic and environmental impacts. Very few believe
that tourism will provide more jobs, will fortify investment, and predict that prices of goods and services will
be increased due to tourism. Almost three quarters of respondents consider that a small group of people, and not
the whole community, are shouldering the economic benefits (Johnson, Snepenger, & Sevgin, 1994). As for the
economic impacts, residents believe that tourism will attract investment in the region (mainly the locals)
(Sevgin, Peristianis, & Warner, 1996).
Overall, residents support tourism development and very few have a negative attitude. Older residents
recognize that tourism is a strong and sustainable economic development strategy in order to confront the
weakening of other economic sectors. Other studies show that residents are satisfied with the way that tax
RESEARCH ON CULTURAL TOURISM ISSUES OF TRIKALA CITY, GREECE
114
money is spent on advertising and updating on tourism issues (Liu & Var, 1986). Finally, residents who live in
rural areas may perceive tourism as an important economic development strategy (Látková & Vogt, 2011).
Sightseeing of Trikala City
The city of Trikala is located in the center of Greece, in the prefecture of Trikala, in the district of
Thessaly and covers an area of 3,367 square kilometers (Nimas, 1987). According to data from the Greek
National Statistical Service, from the 2011 census, the permanent population of the city amount to 80,900
residents, while the regional unit of Trikala to 129,700 residents (Retrieved from http://www.statistics.gr). The
ground of the region is mostly mountainous (71%), but the city is located in the flat part. The climate is
continental. In the plain area, the summer is too hot, the winter too cold, it rains frequently and in recent years
rarely snows.
Trikala is one of the oldest cities in Greece. It was inhabited since the 3rd century before christ (B.C.). In
1200 anno domini (A.D.), Anna Komnene, Princess of Byzantium, indicated the name of Trikala (Katsoyiannos,
1992; Papazisis, 1996). The city has monuments and intense cultural activity, which in recent years have
increased greatly. Thereafter of the text, the main attractions, historical and architectural monuments, museums,
infrastructures, and the main expressions of cultural identity of the city are referred. The above are strong
elements of the city’s cultural identity and strong tourist attraction poles.
Varousi is the oldest traditional settlement of the city with medieval town planning. The oldest buildings
were dated from 1800 to 1900. Varousi is a residential area with bunk houses, northern Greek architecture, and
narrow helical streets (Kleidonopoulos, 2003) and without shopping or entertainment centers. Underneath the
houses, there are Trikki’s Asklipieio and the ancient theater (Nimas, 1987). In this region there are late
Byzantine churches with wonderful wall paintings, inscriptions, and temples (Ziakas, 1978).
The Byzantine fortress dates back the 6th century A.D. (classical and Hellenistic era) (Ziakas, 1978). It
holds the site of the ancient acropolis which was surrounded by walls of classical era. It was completely
renovated in the 6th century by Justinian (Papazisis, 1996).
Asclepieion of ancient Trikke: Many ancient authors argue that God of medicine, Aesculapius, came from
the ancient Triki, and that there was the oldest and most important Asklipieio (sanatorium) of antiquity
(Papastergiou, 1998). The first excavations were carried out by archaeologist P. Kastriotis in 1902 with
expenditure of the Municipality of Trikala. They were continued in 1964, since then they had been stopped as a
result not to have exploited this important archaeological monument (Nimas, 1987).
The Koursoum Mosque (Mosque of Osman Shah), a characteristic monument of oriental architecture and
one of the last remaining in Greece, is located in the city center. It is the only survived of overall seven that the
city had. The importance of this mosque, except from its seniority and the fact that it was built by a great
architect, Sinan (who had built 81 mosques), results from its majestic dome (Nimas, 1987). It was built in the
16th century after the Turkish order of Prince Osman Siach (son of Sultan Suleiman) in the years of the Great
Empire Suleiman (1520-1566).
The Mill of Matsopoulos is located in southwest of the city. In 1884, the first pasta factory was settled
there and a little later one of the first flour milling of Greece. It is the first mill that was built in Greece, the
largest in the Balkans and one of the most important traditional monuments of Industrial Heritage in Greece.
This complex building, along with the surrounding area of 90 acres, is more than 3,500 square meters. Mill
consists of three floors, its internal installations are all wooden and its external lining is made of stone and is

RESEARCH ON CULTURAL TOURISM ISSUES OF TRIKALA CITY, GREECE
115
surrounded by greenery. Today, the mill serves as a cultural center.
River Lithaios and bridges: The River Lithaios secures the water supply of the city (Moutsopoulou, 1987),
through the town of Trikala diagonally from northwest to southeast. According to the ancient geographer
Stravonas, the god of medicine, Asclepius, was born on its banks. Over the past, the two banks of Lithaios were
connected with three stone bridges and one wooden footbridge, while now with 11 large and solid bridges half
of which are for pedestrians. The central bridge was constructed in 1886 by French engineers (length 31 meters,
height 6.30 meters) and is metallic (Nimas, 1987). In the riverbed, there are ornamentals and vegetation.
The Fieldwork
A fieldwork took place in order to investigate the factors that influence residents’ views about the benefits
of cultural tourism on residents’ satisfaction with the actions of competent bodies on cultural tourism and
cultural heritage promotion. There were distributed 400 questionnaires to residents of Trikala city in the period
between June and July 2012. Of these, 372 are valid and are used in the statistical analysis. The questionnaire
was completed anonymously, the sample was chosen by random sampling method. An attempt was made to
cover the whole range of ages (18 years old and over) and all educational levels. Data processing and statistical
analysis was performed with the use of SPSS18.
Descriptive Statistics
The statistical analysis shows that the participation of women (58%) was higher than that of men (42%).
Greater was the participation of young people aged 18-27 years old (28%), of which 26.3% were 35-45 years
old, 23.7% were 28-34 years old, and 22% were from 46-68 years. With regard to the educational level, 50.3%
were of higher education and the majority of respondents were employed (80.1%), while the majority of
respondents (63.2%) had income to 20,000 €.
It is characteristic that 47% of respondents consider that the historical buildings of the city are kept in
good condition, 35% agree that cultural events are advertised to attract visitors, and only 32% agree that there
are plenty of events, festivals, and local museums in the city. As regards the utilization of the city heritage, it is
believed by most residents that there has not been a proper utilization of the local heritage and the attractions of
architectural city heritage for the promotion of cultural tourism, at a rate of 75% and 80% respectively. It is
remarkable that 58% do not know the recent achievements in the cultural tourism, while 64% are not aware of
the cultural program of the city.
Generally, it is argued that cultural tourism contributes to the preservation of cultural heritage. Most
residents (61%) believe that cultural tourism helps to the revival of traditions, customs, local arts, and crafts,
and 59% agree that it maintains the traditional culture and folklore. Sixty-four percent believes that cultural
tourism sensitizes the residents of the city for cultural heritage, while 68% do not believe it affects adversely
the lifestyle and social relations. As for the economy, it is argued that cultural tourism develops local economy
and provides more jobs in 73% and 67% respectively. Only 28% believe that the cost of living increases.
Subsequently, 69.6% agree that the benefits of cultural tourism will outweigh the consequences. Finally, only
21.7% of respondents support that competent bodies ensure the promotion of local culture and local heritage.
Multiple Linear Regressions
In the analysis of multiple linear regressions, the dependent variable is the measurement of the opinion
about the benefits of cultural tourism in relation to its impacts. The independent variables are demographic data,
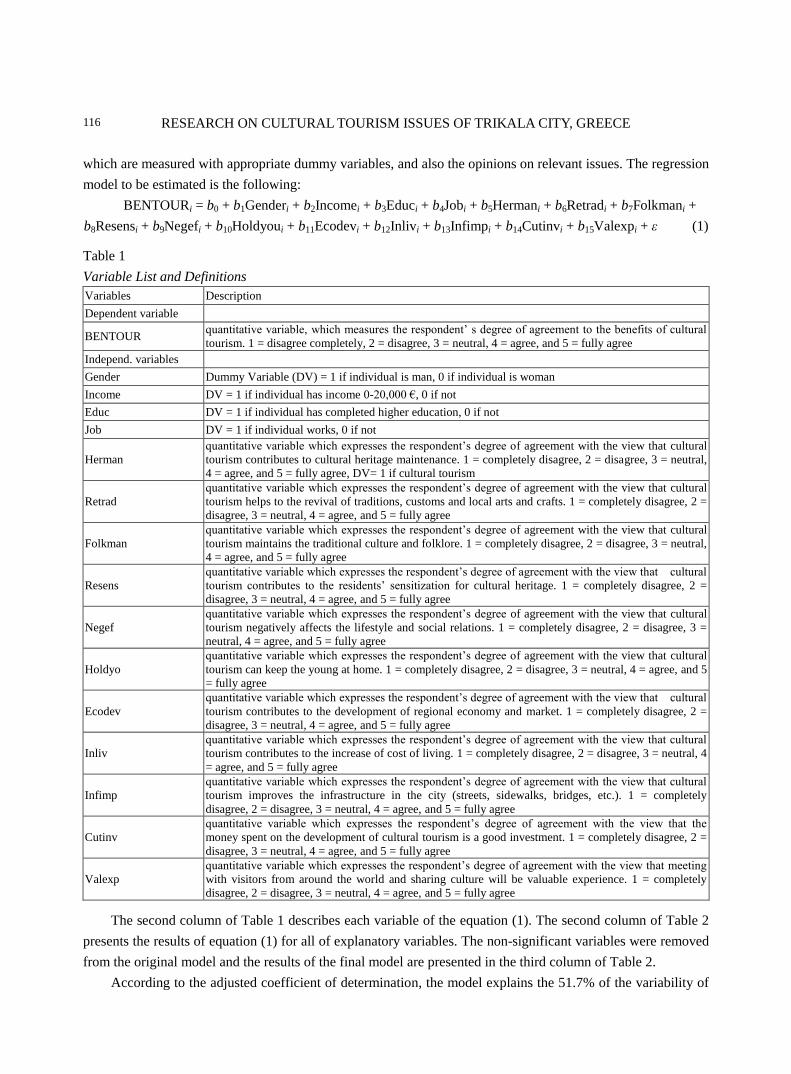
RESEARCH ON CULTURAL TOURISM ISSUES OF TRIKALA CITY, GREECE
116
which are measured with appropriate dummy variables, and also the opinions on relevant issues. The regression
model to be estimated is the following:
BENTOURi = b0 + b1Genderi + b2Incomei + b3Educi + b4Jobi + b5Hermani + b6Retradi + b7Folkmani +
b8Resensi + b9Negefi + b10Holdyoui + b11Ecodevi + b12Inlivi + b13Infimpi + b14Cutinvi + b15Valexpi + ε (1)
Table 1
Variable List and Definitions
Variables Description
Dependent variable
BENTOUR quantitative variable, which measures the respondent’ s degree of agreement to the benefits of cultural
tourism. 1 = disagree completely, 2 = disagree, 3 = neutral, 4 = agree, and 5 = fully agree
Independ. variables
Gender Dummy Variable (DV) = 1 if individual is man, 0 if individual is woman
Income DV = 1 if individual has income 0-20,000 €, 0 if not
Educ DV = 1 if individual has completed higher education, 0 if not
Job DV = 1 if individual works, 0 if not
Herman
quantitative variable which expresses the respondent’s degree of agreement with the view that cultural
tourism contributes to cultural heritage maintenance. 1 = completely disagree, 2 = disagree, 3 = neutral,
4 = agree, and 5 = fully agree, DV= 1 if cultural tourism
Retrad
quantitative variable which expresses the respondent’s degree of agreement with the view that cultural
tourism helps to the revival of traditions, customs and local arts and crafts. 1 = completely disagree, 2 =
disagree, 3 = neutral, 4 = agree, and 5 = fully agree
Folkman
quantitative variable which expresses the respondent’s degree of agreement with the view that cultural
tourism maintains the traditional culture and folklore. 1 = completely disagree, 2 = disagree, 3 = neutral,
4 = agree, and 5 = fully agree
Resens
quantitative variable which expresses the respondent’s degree of agreement with the view that cultural
tourism contributes to the residents’ sensitization for cultural heritage. 1 = completely disagree, 2 =
disagree, 3 = neutral, 4 = agree, and 5 = fully agree
Negef
quantitative variable which expresses the respondent’s degree of agreement with the view that cultural
tourism negatively affects the lifestyle and social relations. 1 = completely disagree, 2 = disagree, 3 =
neutral, 4 = agree, and 5 = fully agree
Holdyo
quantitative variable which expresses the respondent’s degree of agreement with the view that cultural
tourism can keep the young at home. 1 = completely disagree, 2 = disagree, 3 = neutral, 4 = agree, and 5
= fully agree
Ecodev
quantitative variable which expresses the respondent’s degree of agreement with the view that cultural
tourism contributes to the development of regional economy and market. 1 = completely disagree, 2 =
disagree, 3 = neutral, 4 = agree, and 5 = fully agree
Inliv
quantitative variable which expresses the respondent’s degree of agreement with the view that cultural
tourism contributes to the increase of cost of living. 1 = completely disagree, 2 = disagree, 3 = neutral, 4
= agree, and 5 = fully agree
Infimp
quantitative variable which expresses the respondent’s degree of agreement with the view that cultural
tourism improves the infrastructure in the city (streets, sidewalks, bridges, etc.). 1 = completely
disagree, 2 = disagree, 3 = neutral, 4 = agree, and 5 = fully agree
Cutinv
quantitative variable which expresses the respondent’s degree of agreement with the view that the
money spent on the development of cultural tourism is a good investment. 1 = completely disagree, 2 =
disagree, 3 = neutral, 4 = agree, and 5 = fully agree
Valexp
quantitative variable which expresses the respondent’s degree of agreement with the view that meeting
with visitors from around the world and sharing culture will be valuable experience. 1 = completely
disagree, 2 = disagree, 3 = neutral, 4 = agree, and 5 = fully agree
The second column of Table 1 describes each variable of the equation (1). The second column of Table 2
presents the results of equation (1) for all of explanatory variables. The non-significant variables were removed
from the original model and the results of the final model are presented in the third column of Table 2.
According to the adjusted coefficient of determination, the model explains the 51.7% of the variability of

RESEARCH ON CULTURAL TOURISM ISSUES OF TRIKALA CITY, GREECE
117
the dependent variable. That is, the variability of opinion about whether the benefits of cultural tourism will be
more than impacts depends on 51.7% of the independent variables.
Table 2
Multiple Linear Regression Estimation for the Residents’ Degree of Agreement That the Benefits of Cultural
Tourism Will Outweigh the Impacts
Independent variables First Model Final Model
b t-statistic b t-statistic
constant 1.213*** 4.429 1.155*** 4.411
gender -0.064 -0.922
income 0.191*** 2.664 0.186*** 2.664
educ 0.002 0.030
job -0.177** -2.063 -0.169** -1.990
herman 0.022 0.432
retrad -0.041 -0.824
folkman 0.094* 1.736 0.073* 1.708
resens -0.078* -1.750 -0.075* -1.761
negef -0.153*** -5.043 -0.155*** -5.175
holyou -0.089** -2.531 -0.092*** -2.644
ecodev 0.133*** 2.920 0.134*** 3.014
inliv -0.058* -1.820 -0.054* -1.727
infimp 0.129*** 3.163 0.131*** 3.247
cutinv 0.308*** 6.915 0.308*** 6.975
valexp 0.306*** 6.128 0.312*** 6.301
F statistic 27.130*** 37.100***
R2 0.533 0.531
R2 (adj) 0.514 0.517
Note. ***, **, *, represent the level of significant at 1%, 5%, and 10%, respectively.
The analysis shows that gender and education do not affect the dependent variable. Therefore, both men
and women express the same opinion on average for the benefits of cultural tourism. Similarly, people of all
education levels express the same opinion on average. The degree of agreement with the views that cultural
tourism contributes to maintaining of cultural heritage and that helps in the revival of traditions, customs, local
arts, and crafts, does not interpret the degree of agreement with the view that the benefits of cultural tourism
will outweigh effects.
According to the final model, the estimated equation of the factors that determine the level of agreement
for the cultural tourism benefits is:
BENTOURi = 1.155 + 0.186Income – 0.169Job + 0.073Folkman – 0.075Resens – 0.155Negef –
0.092Holdyou + 0.134Ecodev – 0.054Inliv + 0.131Infimp + 0.308Cutinv + 0.312Valexp
Income and employment are statistically significant determinants of the degree of agreement about the
benefits of cultural tourism at 1% and 5% respectively. Individuals with income up to 20,000 € express more
positive opinion, by 2.664 points, for the benefits of cultural tourism in relation to persons of other income
category. The negative sign in employment shows that people who work have less positive opinion than the
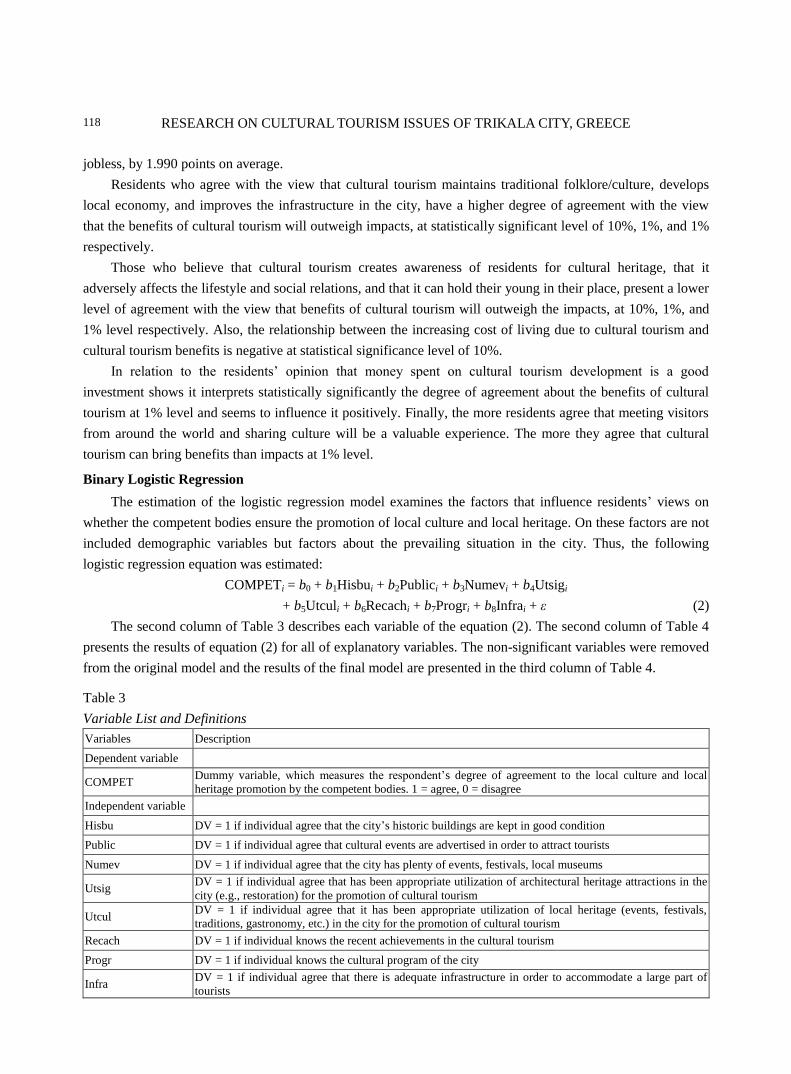
RESEARCH ON CULTURAL TOURISM ISSUES OF TRIKALA CITY, GREECE
118
jobless, by 1.990 points on average.
Residents who agree with the view that cultural tourism maintains traditional folklore/culture, develops
local economy, and improves the infrastructure in the city, have a higher degree of agreement with the view
that the benefits of cultural tourism will outweigh impacts, at statistically significant level of 10%, 1%, and 1%
respectively.
Those who believe that cultural tourism creates awareness of residents for cultural heritage, that it
adversely affects the lifestyle and social relations, and that it can hold their young in their place, present a lower
level of agreement with the view that benefits of cultural tourism will outweigh the impacts, at 10%, 1%, and
1% level respectively. Also, the relationship between the increasing cost of living due to cultural tourism and
cultural tourism benefits is negative at statistical significance level of 10%.
In relation to the residents’ opinion that money spent on cultural tourism development is a good
investment shows it interprets statistically significantly the degree of agreement about the benefits of cultural
tourism at 1% level and seems to influence it positively. Finally, the more residents agree that meeting visitors
from around the world and sharing culture will be a valuable experience. The more they agree that cultural
tourism can bring benefits than impacts at 1% level.
Binary Logistic Regression
The estimation of the logistic regression model examines the factors that influence residents’ views on
whether the competent bodies ensure the promotion of local culture and local heritage. On these factors are not
included demographic variables but factors about the prevailing situation in the city. Thus, the following
logistic regression equation was estimated:
COMPETi = b0 + b1Hisbui + b2Publici + b3Numevi + b4Utsigi
+ b5Utculi + b6Recachi + b7Progri + b8Infrai + ε (2)
The second column of Table 3 describes each variable of the equation (2). The second column of Table 4
presents the results of equation (2) for all of explanatory variables. The non-significant variables were removed
from the original model and the results of the final model are presented in the third column of Table 4.
Table 3
Variable List and Definitions
Variables Description
Dependent variable
COMPET Dummy variable, which measures the respondent’s degree of agreement to the local culture and local
heritage promotion by the competent bodies. 1 = agree, 0 = disagree
Independent variable
Hisbu DV = 1 if individual agree that the city’s historic buildings are kept in good condition
Public DV = 1 if individual agree that cultural events are advertised in order to attract tourists
Numev DV = 1 if individual agree that the city has plenty of events, festivals, local museums
Utsig DV = 1 if individual agree that has been appropriate utilization of architectural heritage attractions in the
city (e.g., restoration) for the promotion of cultural tourism
Utcul DV = 1 if individual agree that it has been appropriate utilization of local heritage (events, festivals,
traditions, gastronomy, etc.) in the city for the promotion of cultural tourism
Recach DV = 1 if individual knows the recent achievements in the cultural tourism
Progr DV = 1 if individual knows the cultural program of the city
Infra DV = 1 if individual agree that there is adequate infrastructure in order to accommodate a large part of
tourists
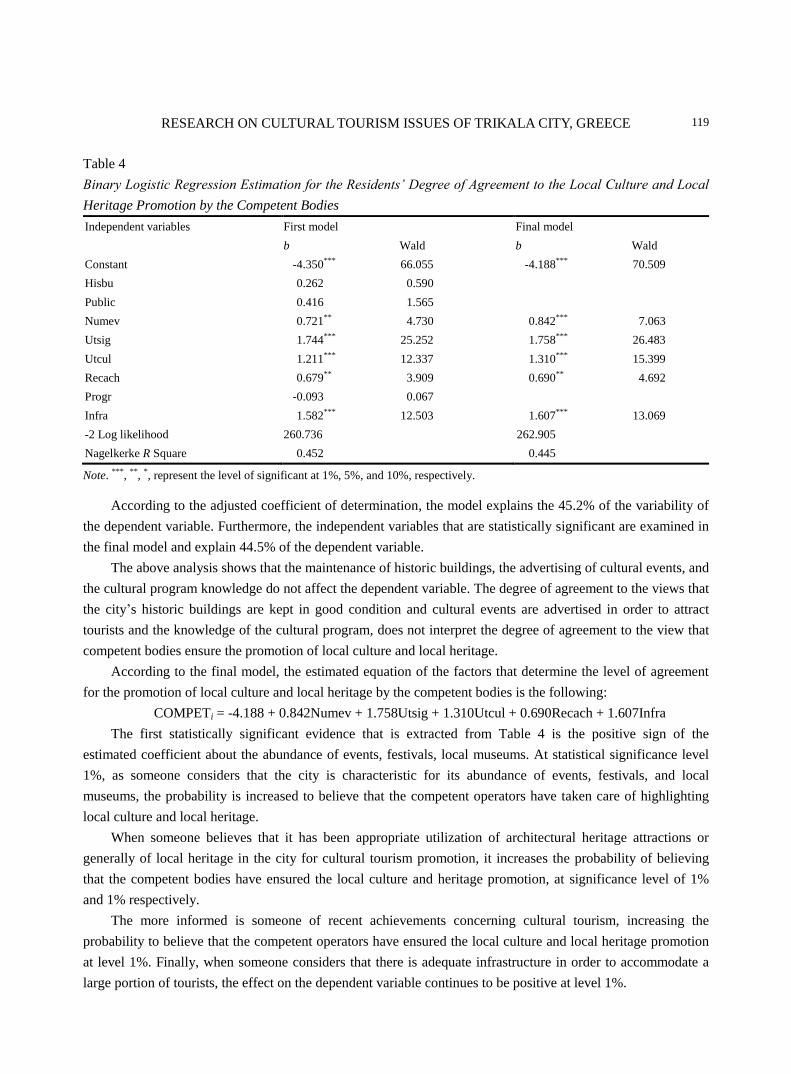
RESEARCH ON CULTURAL TOURISM ISSUES OF TRIKALA CITY, GREECE
119
Table 4
Binary Logistic Regression Estimation for the Residents’ Degree of Agreement to the Local Culture and Local
Heritage Promotion by the Competent Bodies
Independent variables First model Final model
b Wald b Wald
Constant -4.350*** 66.055 -4.188*** 70.509
Hisbu 0.262 0.590
Public 0.416 1.565
Numev 0.721** 4.730 0.842*** 7.063
Utsig 1.744*** 25.252 1.758*** 26.483
Utcul 1.211*** 12.337 1.310*** 15.399
Recach 0.679** 3.909 0.690** 4.692
Progr -0.093 0.067
Infra 1.582*** 12.503 1.607*** 13.069
-2 Log likelihood 260.736 262.905
Nagelkerke R Square 0.452 0.445
Note. ***, **, *, represent the level of significant at 1%, 5%, and 10%, respectively.
According to the adjusted coefficient of determination, the model explains the 45.2% of the variability of
the dependent variable. Furthermore, the independent variables that are statistically significant are examined in
the final model and explain 44.5% of the dependent variable.
The above analysis shows that the maintenance of historic buildings, the advertising of cultural events, and
the cultural program knowledge do not affect the dependent variable. The degree of agreement to the views that
the city’s historic buildings are kept in good condition and cultural events are advertised in order to attract
tourists and the knowledge of the cultural program, does not interpret the degree of agreement to the view that
competent bodies ensure the promotion of local culture and local heritage.
According to the final model, the estimated equation of the factors that determine the level of agreement
for the promotion of local culture and local heritage by the competent bodies is the following:
COMPETi = -4.188 + 0.842Numev + 1.758Utsig + 1.310Utcul + 0.690Recach + 1.607Infra
The first statistically significant evidence that is extracted from Table 4 is the positive sign of the
estimated coefficient about the abundance of events, festivals, local museums. At statistical significance level
1%, as someone considers that the city is characteristic for its abundance of events, festivals, and local
museums, the probability is increased to believe that the competent operators have taken care of highlighting
local culture and local heritage.
When someone believes that it has been appropriate utilization of architectural heritage attractions or
generally of local heritage in the city for cultural tourism promotion, it increases the probability of believing
that the competent bodies have ensured the local culture and heritage promotion, at significance level of 1%
and 1% respectively.
The more informed is someone of recent achievements concerning cultural tourism, increasing the
probability to believe that the competent operators have ensured the local culture and local heritage promotion
at level 1%. Finally, when someone considers that there is adequate infrastructure in order to accommodate a
large portion of tourists, the effect on the dependent variable continues to be positive at level 1%.
RESEARCH ON CULTURAL TOURISM ISSUES OF TRIKALA CITY, GREECE
120
Conclusions
It is generally argued that cultural tourism contributes positively to the region, offering benefits and
investments in local community. When there is proper planning and management, it can have also positive
socio-economic impact and contributes to the protection of cultural resources.
Income and employment are statistically significant determinants of the degree of agreement about the
benefits of cultural tourism. Greater degree of agreement with the view that benefits of cultural tourism will
outweigh impacts is presented to the residents who agree with the view that cultural tourism retains its
traditional folklore/culture, develops local economy, and improves infrastructure in the city. Those who believe
that cultural tourism contributes to awareness of residents for cultural heritage, that it adversely affects lifestyle
and social relations, and that it can hold the young in their place, present a lower level of agreement with the
view that benefits of cultural tourism will outweigh the consequences. The same seems to be with the
increasing living cost and cultural tourism benefits. As residents agree that money spent on cultural tourism
development is a good investment and that the meeting with visitors from around the world will be a valuable
experience, they agree more that cultural tourism can bring benefits than impacts.
The most significant were the findings of logistic regression for the investigation of factors that affect the
degree of residents’ agreement with the view that ―competent bodies ensure the promotion of local culture and
local heritage‖. The empirical results indicate that the probability of someone to agree with the above views is
increased when they consider that the city is characteristic for the abundance of events, festivals, and local
museums. This probability also increases when someone considers that it has been appropriate utilization of
architectural heritage attractions and generally local heritage for the promotion of cultural tourism. The more
informed is someone of recent achievements concerning cultural tourism, increasing the probability to believe
that the competent operators have ensured the local culture and local heritage promotion. When someone
considers that there is adequate infrastructure in the city for tourists, the effect on the dependent variable
continues to be positive.
Sustainable tourism except for natural environment includes social and cultural environment of the
destinations. Therefore, it should, in short and long term, meet the needs of the local population. The policies
for tourism management should aim at promoting sustainable development, being interdependent, and
promoting social equity. The provision operators of tourist services should implement and monitor an
integrated management approach for cultural tourism quality, specifying standards, quality, and integration of
concerns of tourists and residents. When cultural tourism is used as a development tool, policy makers should
consider the factors that may be affected due to the growing impact of tourism and to create a strategy in order
to minimize them.
The continuous improvement of public services and infrastructure, the additional financial support for
cultural tourism development, the improving of area image, and the support for employment and business
opportunities can improve levels of satisfaction, bring more tourists to the city, and even enhance the quality of
residents’ life. In contrast, the absence of sustainable economic alternatives reduces satisfaction and continued
support for tourism. Tourism development programs that are not adapted to meet the needs of each community
are unlikely to produce satisfactory results for the residents. Local authorities should distribute benefits within
the local community, so that a greater proportion of local population can benefit from the expansion of tourism.
In conclusion, in an integrated management approach of cultural heritage and cultural tourism, competent
RESEARCH ON CULTURAL TOURISM ISSUES OF TRIKALA CITY, GREECE
121
bodies should take into account the perceptions of local community about the sustainability of this kind of
project. However, the analysis of economic, social, and environmental variables should be studied before any
tourism development plan, and then over time the economic, social, and environmental impacts of tourism
development should be monitored and evaluated.
References
Andereck, K., & Vogt, C. (2000). The relationship between residents’ attitudes toward tourism and tourism development options.
Journal of Travel Research, 39, 27-36.
Andriotis, K., & Vaughan, R. (2003). Urban residents’ attitudes toward tourism development: The case of crete. Journal of Travel
Research, 42, 172-185.
Asplet, M., & Cooper, M. (2000). Cultural designs in New Zealand souvenir clothing: The question of authenticity. Tourism
Management, 21(3), 307-312.
Bachleitner, R., & Zins, Α. (1999). Cultural tourism in rural communities: The residents’ perspective. Journal of Business
Research, 44(3), 199-209.
Báez Montenegro, A., Niklitschek Huaquin, M., & César Herrero Prieto, L. (2009). The valuation of historical sites: A case study
of Valdivia, Chile. Journal of Environmental Planning and Management, 52(1), 97-109.
Besculides, A., Lee, M. E., & McCormick, P. J. (2002). Residents’ perceptions of the cultural benefits of tourism. Annals of
Tourism Research, 29(2), 303-319.
Bowitz, E., & Ibenholt, K. (2009). Economic impacts of cultural heritage—Research and perspectives. Journal of Cultural
Heritage, 10, 1-8.
Burns, P., & Sancho, M. (2003). Local perceptions of tourism planning: The case of Cuellar, Spain. Tourism Management, 24(3),
331-339.
Dugulan, D., Balaure, V., Popescu, I. C., & Veghes, C. (2010). Cultural heritage, natural resources and competitiveness of the
travel and tourism industry in central and Eastern European countries. Annales Universitatis Apulensis Series Oeconomica,
2(12), 742-748.
Getz, D. (1994). Residents’ attitudes towards tourism—A longitudinal study in Spey Valley, Scotland. Tourism Management,
15(4), 247-258.
Gursoy, D., Jurowski, C., & Uysal, M. (2002). Resident attitudes: A structural modeling approach. Annals of Tourism Research,
29(1), 79-105.
Hughes, H., & Allen, D. (2005). Cultural tourism in Central and Eastern Europe: The views of ―induced image formation agents‖.
Tourism Management, 26(2), 173-183.
Huibin, X., Marzuki, A., & Razak, A. A. (2012). Protective development of cultural heritage tourism: The case of Lijiang, China.
Theoretical and Empirical Researches in Urban Management, 7(1), 39-54.
Ioan-Frank, V., & Istoc, E. M. (2007). Cultural Tourism And Sustainable Development. Romanian Journal of Economic
Forecasting, 4(1), 89-96.
Johnson, J., Snepenger, D., & Sevgin, A. (1994). Residents’ perceptions of tourism development. Annals of Tourism Research,
21(3), 629-642.
Karagiannis, S. (2013). Cultural tourism as a development factor of the Greek countryside: Research—Suggestions. Sustainable
Development, Culture, Traditions Journal, 2, 20-30.
Katsoyiannos, N. (1992). Trikala and its settlements. Trikala: Cultural Organization of the Municipality of Trikala.
Keitumetse, S. (2009). The eco-tourism of cultural heritage management (ECTCHM): Linking heritage and ―environment‖ in the
Okavango Delta regions of Botswana. International Journal of Heritage Studies, 15(2), 223-244.
Kleidonopoulos, G. (2003). Varousi, our cultural identity. Trikala: Municipality of Trikala.
Látková, P., & Vogt, C. (2011). Residents’ attitudes toward existing and future tourism development in rural communities.
Journal of Travel Research, 51(1), 50-67.
Liu, J., & Var, T. (1986). Resident attitudes towards tourism impacts in Hawaii. Annals of Tourism Research, 13(2), 193-214.
MacDonald, R., & Jolliffe, L. (2003). Cultural rural tourism: Evidence from Canada. Annals of Tourism Research, 30(2),
307-322.
Mitoula, R. (2011). Sustainable development in the city of Volos through reuse of industrial buildings. Sustainable Development,
Culture, Traditions Journal, 2, 147-160.
RESEARCH ON CULTURAL TOURISM ISSUES OF TRIKALA CITY, GREECE
122
Moutsopoulou, N. (1987). Trikalina. Trikala: Philological Historical Literary Association of Trikala.
Nimas, T. (1987). Geography, history, monuments, tourism (Trikala, Kalambaka, Meteora, Pindos, Chasia). Thessaloniki: Bros
Publishing Company Bros Kyriakidis.
Papastergiou, K. (1998). Asclepius, the first doctor without borders. Trikala: Municipality of Trikala.
Papazisis, T. (1996). Calendar of Trikala 1996, cultural tourist guide of Trikala district. Trikala: Cultural Organization of the
Municipality of Trikala.
Popescu, R. I., & Corbos, R. A. (2010). The role of urban tourism in the strategic development of Brasov area. Theoretical and
Empirical Researches in Urban Management, 7(16), 69-85.
Richards, G. (1996). Production and consumption of European cultural tourism. Annals of Tourism Research, 23(2), 261-283.
Ritchie, B. W., & Inkari, M. (2006). Host community attitudes toward tourism and cultural tourism development: The case of the
Lewes District, Southern England. International Journal of Tourism Research, 8(1), 27-44.
Sdrali, D., & Chazapi, K. (2007). Cultural tourism in a greek insular community: The residents’ perspective. Tourismos: An
International Multidisciplinary Journal of Tourism, 2(2), 61-75.
Sevgin, A., Peristianis, N., & Warner, J. (1996). Residents’ attitudes to tourism development: The case of Cyprus. Tourism
Management, 17(7), 481-494.
Shamsuddoha, M., Alamgir, M., & Nasir, T. (2011). Cultural tourism: Bangladesh tribal areas perspective. Journal of Tourism,
12(12), 28-32.
Taylor, J. (2001). Authenticity and sincerity in tourism. Annals of Tourism Research, 28(1), 7-26.
Vryzas, K. (2005). Global communication and cultural identities. Athens: Ed. Gutenberg.
Wang, S., Fu, Y. Y., Cecil, A. K., & Hji-Avgoustis, S. (2008). Impacts of cultural tourism upon quality of life: the resident’s
perspective. Proceedings from 2008 International CHRIE Conference. Atlanta, Georgia, U.S.A..
Ziakas, G. (1978). Antiquities—Monuments of Trikala Prefecture. Trikala: Municipal Library.
Management Studies, ISSN 2328-2185 February 2014, Vol. 2, No. 2, 123-139
Managing a University From Its Revenue
Perspective—Empirical Illustration of
Poznan University of Economics
Marek Cieślak, Remigiusz Napiecek
Poznan University of Economics, Poznan, Poland
The concept of higher education development allowing universities to make full contribution to the Lisbon Strategy,
assumes an increased competitiveness of European universities. Such increase should result in making them more
attractive to students, improving teaching quality, and finally ensuring higher levels of research and innovation.
Universities will not become innovative and responsive to change unless they are given real autonomy and
accountability. This requires new internal governance systems based on strategic priorities and on professional
management of human resources, investment, and administrative procedures. The purpose of this paper is to
evaluate the relationship between education and scientific activities of universities. The said interrelation was
analyzed both from the perspective of the university’s main sources of revenues (i.e., subsidies), as well as from the
perspective of financial results generated by the university’s internal units. The paper’s objective determines the
choice of research methods, based on critical, comparative, and descriptive analysis. The paper contains elements of
deductive reasoning. The authors’ analysis showed a strongly negative correlation of research performance to
educational performance. The structure of algorithms used to calculate the subsidy paid to a given university may
suggest a negative correlation between its revenues from educational activity and those from research. However, by
analyzing the variability of revenues vis-a-vis the main components of algorithms used to calculate the subsidy one
can conclude that revenues from research and from education are not interrelated. This lack of any relationship
could be explained by considerable inertia of the subsidies. Changes in key algorithm components do not have a
proportional effect on the amount of available subsidy.
Keywords: university, revenues, educational activity, research activity, correlation
Introduction
Growing demand for improved operational performance of universities has inspired new practices in
accounting, as well as new university performance appraisal systems (Townley, 1997; Lapsley & Miller, 2004).
In many countries, university financing has been tied to their educational and research results. As regards
research, those results are typically measured by the number of publications whose prestige and scientific
importance (or simply quality) is determined on the basis of international rankings of scientific journals.
Marek Cieślak, Doctor of Social Science (Economics), Faculty of Management, Poznan University of Economics. Remigiusz Napiecek, Doctor of Social Science (Economics), Faculty of Management, Poznan University of Economics. Correspondence concerning this article should be addressed to Remigiusz Napiecek, Poznan University of Economics, al.
Niepodległości 10, 61-875 Poznań, Poland. E-mail: [email protected].
DAVID PUBLISHING
D
MANAGING A UNIVERSITY FROM ITS REVENUE PERSPECTIVE
124
Education in its turn is assessed on the basis of the number of students and the quality of lectures, with the
evaluation criteria being the lecturer’s experience in business practice and the opinion of students.
Over the last six years, Poland has seen substantial changes in university financing. Division into research
centers on the one hand and universities’ offering more practical education on the other has been postulated.
Other proposals included ensuring equal rights of private and public universities in order to promote
quality-based competition in the education market (which has been contested by public universities and thus
partially abandoned).
Universities have been encouraged to and rewarded for introducing innovative curricula; interfaces
between universities and businesses have been established; higher education tailored to the needs of the labor
market has been promoted.
Simultaneously however the negative effect of Poland’s demographic structure on university performance
has been very clearly visible. Shrinking student numbers heavily affect universities’ financial condition.
A 2010 report by Ernst and Young commissioned by the Ministry of Science and Higher Education
(Ministerstwo Nauki i Szkolnictwa Wyższego, MNiSW) was the first one to warn against the “demographic
tsunami” (EY, 2010).
The objectives expected from Polish universities have changed over the years, but recently they seem to
concentrate on two areas: scientific development and training of professionals wanted on the labor market. The
pursuance of those objectives is inseparably connected with university financing. Of equal importance here are
the source, distribution and amount of funding as a whole, and the division of those funds between universities’
internal units (usually faculties).
Polish universities are expected to change their operational principles and put more emphasis on research
activities. After 20 years of educational boom and catching up with Western Europe1 time has come to take
steps aimed at raising the prestige of Polish universities compared to their foreign counterparts. This can be
achieved only by improving the quality and enhancing the efficiency of scientific research. The structure of
research financing is being changed, with a growing importance of specific project grants and gradual
marginalization of general-purpose subsidies. In fact, this is a fundamental change, because as of now 80% of
universities’ revenues come from educational activity.
In 2013, the state budget will contribute Poland 18,000 million to higher education and scientific research
(approximately 0.54% of the budget), two thirds of which will be spent on the former and one thirds on the
latter.
On top of that, higher education and research are paid for by individuals and other private contributors,
and the total amount of public and private expenses on these two objectives is just under 2% of the Gross
Domestic Product (GDP)2, which is in keeping with European standards (EY, 2010). It should be remembered
however that over the last six years, GDP per capita in Poland has varied from 55% to 66% of the European
Union (EU) average (Eurostat, 2013). Public funds take the form of two cash flows:
(1) Education subsidy used to finance full-time courses;
1 In mid 1990s the percentage of Poles with a degree was 6.6%, as compared to over 15% today; 39.1% of people aged 30-34 hold a degree (European average: 35.8%). The net enrolment ratio in higher education in Poland grew from 8.8% in 1990 to 40.6% in 2011 (Retrieved November 24, 2013, from http://www.nauka.gov.pl/g2/oryginal/2013_07/0695136d37bd577c8ab03acc5c59a1f6.pdf). 2 In Poland, 29.6% of the total expenses on higher education comes from private sources and the balance comes from public funds. The notion of private funds includes both tuition fees and funds obtained from businesses (EY, 2010).
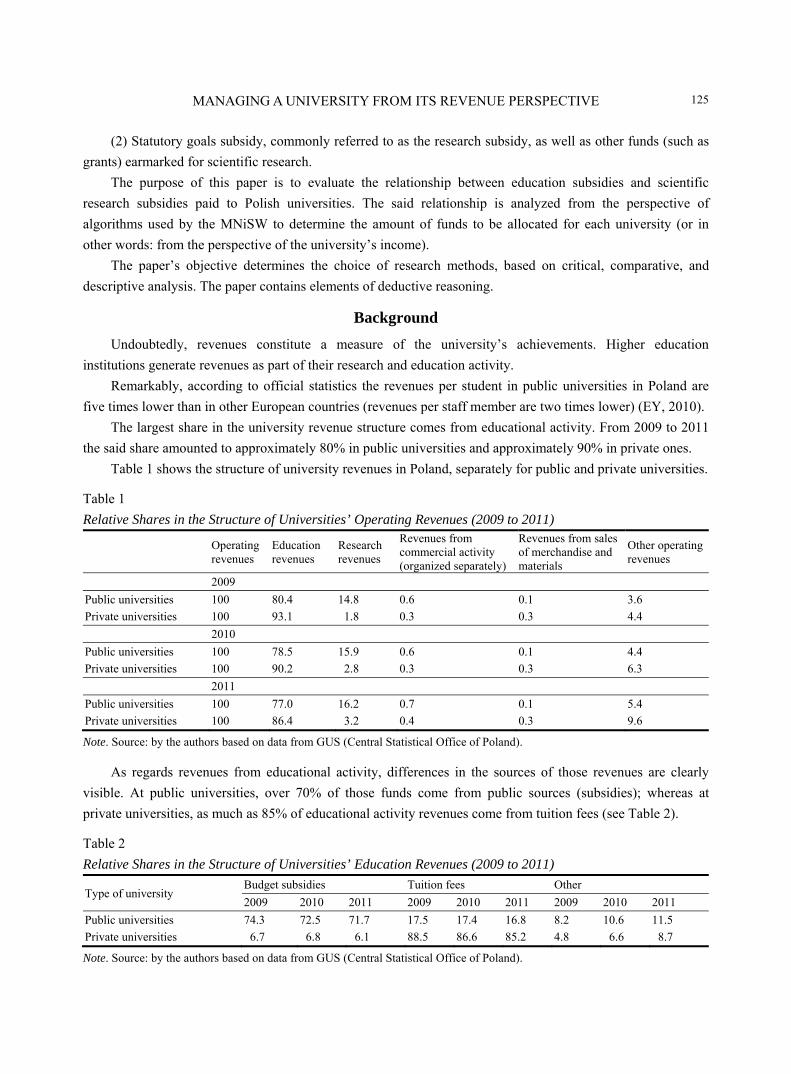
MANAGING A UNIVERSITY FROM ITS REVENUE PERSPECTIVE
125
(2) Statutory goals subsidy, commonly referred to as the research subsidy, as well as other funds (such as
grants) earmarked for scientific research.
The purpose of this paper is to evaluate the relationship between education subsidies and scientific
research subsidies paid to Polish universities. The said relationship is analyzed from the perspective of
algorithms used by the MNiSW to determine the amount of funds to be allocated for each university (or in
other words: from the perspective of the university’s income).
The paper’s objective determines the choice of research methods, based on critical, comparative, and
descriptive analysis. The paper contains elements of deductive reasoning.
Background
Undoubtedly, revenues constitute a measure of the university’s achievements. Higher education
institutions generate revenues as part of their research and education activity.
Remarkably, according to official statistics the revenues per student in public universities in Poland are
five times lower than in other European countries (revenues per staff member are two times lower) (EY, 2010).
The largest share in the university revenue structure comes from educational activity. From 2009 to 2011
the said share amounted to approximately 80% in public universities and approximately 90% in private ones.
Table 1 shows the structure of university revenues in Poland, separately for public and private universities.
Table 1
Relative Shares in the Structure of Universities’ Operating Revenues (2009 to 2011)
Operating revenues
Education revenues
Research revenues
Revenues from commercial activity (organized separately)
Revenues from sales of merchandise and materials
Other operating revenues
2009
Public universities 100 80.4 14.8 0.6 0.1 3.6
Private universities 100 93.1 1.8 0.3 0.3 4.4
2010
Public universities 100 78.5 15.9 0.6 0.1 4.4
Private universities 100 90.2 2.8 0.3 0.3 6.3
2011
Public universities 100 77.0 16.2 0.7 0.1 5.4
Private universities 100 86.4 3.2 0.4 0.3 9.6
Note. Source: by the authors based on data from GUS (Central Statistical Office of Poland).
As regards revenues from educational activity, differences in the sources of those revenues are clearly
visible. At public universities, over 70% of those funds come from public sources (subsidies); whereas at
private universities, as much as 85% of educational activity revenues come from tuition fees (see Table 2).
Table 2
Relative Shares in the Structure of Universities’ Education Revenues (2009 to 2011)
Type of university Budget subsidies Tuition fees Other
2009 2010 2011 2009 2010 2011 2009 2010 2011
Public universities 74.3 72.5 71.7 17.5 17.4 16.8 8.2 10.6 11.5
Private universities 6.7 6.8 6.1 88.5 86.6 85.2 4.8 6.6 8.7
Note. Source: by the authors based on data from GUS (Central Statistical Office of Poland).
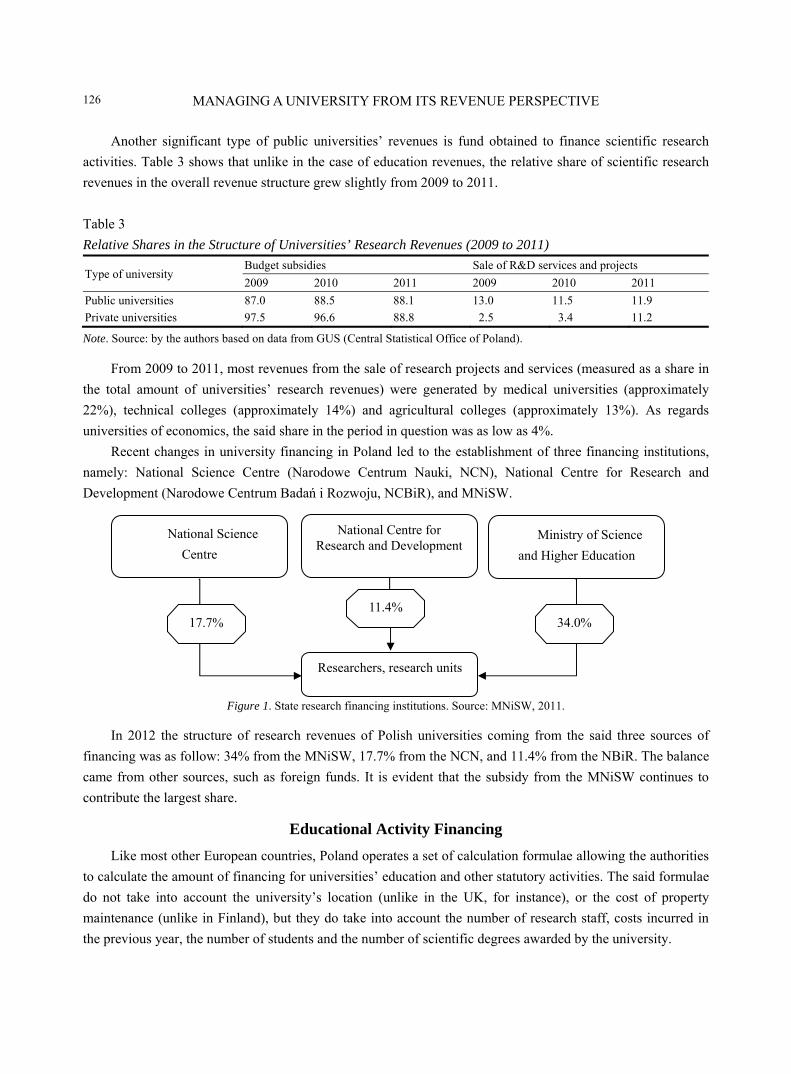
MANAGING A UNIVERSITY FROM ITS REVENUE PERSPECTIVE
126
Another significant type of public universities’ revenues is fund obtained to finance scientific research
activities. Table 3 shows that unlike in the case of education revenues, the relative share of scientific research
revenues in the overall revenue structure grew slightly from 2009 to 2011.
Table 3
Relative Shares in the Structure of Universities’ Research Revenues (2009 to 2011)
Type of university Budget subsidies Sale of R&D services and projects
2009 2010 2011 2009 2010 2011
Public universities 87.0 88.5 88.1 13.0 11.5 11.9
Private universities 97.5 96.6 88.8 2.5 3.4 11.2
Note. Source: by the authors based on data from GUS (Central Statistical Office of Poland).
From 2009 to 2011, most revenues from the sale of research projects and services (measured as a share in
the total amount of universities’ research revenues) were generated by medical universities (approximately
22%), technical colleges (approximately 14%) and agricultural colleges (approximately 13%). As regards
universities of economics, the said share in the period in question was as low as 4%.
Recent changes in university financing in Poland led to the establishment of three financing institutions,
namely: National Science Centre (Narodowe Centrum Nauki, NCN), National Centre for Research and
Development (Narodowe Centrum Badań i Rozwoju, NCBiR), and MNiSW.
Figure 1. State research financing institutions. Source: MNiSW, 2011.
In 2012 the structure of research revenues of Polish universities coming from the said three sources of
financing was as follow: 34% from the MNiSW, 17.7% from the NCN, and 11.4% from the NBiR. The balance
came from other sources, such as foreign funds. It is evident that the subsidy from the MNiSW continues to
contribute the largest share.
Educational Activity Financing
Like most other European countries, Poland operates a set of calculation formulae allowing the authorities
to calculate the amount of financing for universities’ education and other statutory activities. The said formulae
do not take into account the university’s location (unlike in the UK, for instance), or the cost of property
maintenance (unlike in Finland), but they do take into account the number of research staff, costs incurred in
the previous year, the number of students and the number of scientific degrees awarded by the university.
Researchers, research units
National Science
Centre
National Centre for Research and Development
Ministry of Science
and Higher Education
17.7% 11.4%
34.0%
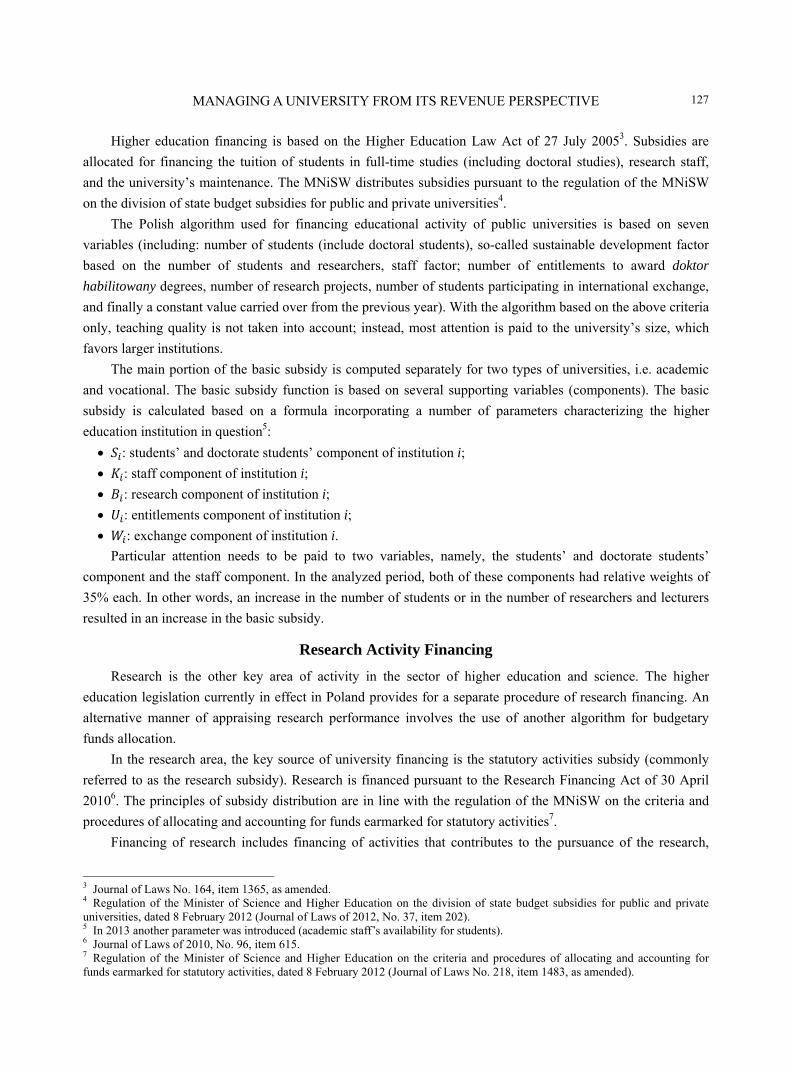
MANAGING A UNIVERSITY FROM ITS REVENUE PERSPECTIVE
127
Higher education financing is based on the Higher Education Law Act of 27 July 20053. Subsidies are
allocated for financing the tuition of students in full-time studies (including doctoral studies), research staff,
and the university’s maintenance. The MNiSW distributes subsidies pursuant to the regulation of the MNiSW
on the division of state budget subsidies for public and private universities4.
The Polish algorithm used for financing educational activity of public universities is based on seven
variables (including: number of students (include doctoral students), so-called sustainable development factor
based on the number of students and researchers, staff factor; number of entitlements to award doktor
habilitowany degrees, number of research projects, number of students participating in international exchange,
and finally a constant value carried over from the previous year). With the algorithm based on the above criteria
only, teaching quality is not taken into account; instead, most attention is paid to the university’s size, which
favors larger institutions.
The main portion of the basic subsidy is computed separately for two types of universities, i.e. academic
and vocational. The basic subsidy function is based on several supporting variables (components). The basic
subsidy is calculated based on a formula incorporating a number of parameters characterizing the higher
education institution in question5:
: students’ and doctorate students’ component of institution i;
: staff component of institution i;
: research component of institution i;
: entitlements component of institution i;
: exchange component of institution i.
Particular attention needs to be paid to two variables, namely, the students’ and doctorate students’
component and the staff component. In the analyzed period, both of these components had relative weights of
35% each. In other words, an increase in the number of students or in the number of researchers and lecturers
resulted in an increase in the basic subsidy.
Research Activity Financing
Research is the other key area of activity in the sector of higher education and science. The higher
education legislation currently in effect in Poland provides for a separate procedure of research financing. An
alternative manner of appraising research performance involves the use of another algorithm for budgetary
funds allocation.
In the research area, the key source of university financing is the statutory activities subsidy (commonly
referred to as the research subsidy). Research is financed pursuant to the Research Financing Act of 30 April
20106. The principles of subsidy distribution are in line with the regulation of the MNiSW on the criteria and
procedures of allocating and accounting for funds earmarked for statutory activities7.
Financing of research includes financing of activities that contributes to the pursuance of the research,
3 Journal of Laws No. 164, item 1365, as amended. 4 Regulation of the Minister of Science and Higher Education on the division of state budget subsidies for public and private universities, dated 8 February 2012 (Journal of Laws of 2012, No. 37, item 202). 5 In 2013 another parameter was introduced (academic staff’s availability for students). 6 Journal of Laws of 2010, No. 96, item 615. 7 Regulation of the Minister of Science and Higher Education on the criteria and procedures of allocating and accounting for funds earmarked for statutory activities, dated 8 February 2012 (Journal of Laws No. 218, item 1483, as amended).
MANAGING A UNIVERSITY FROM ITS REVENUE PERSPECTIVE
128
research/technical, and innovations policy of the state. In particular, this refers to scientific research and
development projects, as well as other projects of key importance for the state’s civilizational progress as well
as its economic and cultural development.
The division of funds from the Ministry is based on universities’ research performance appraised by
means of performance indicators equivalent to the ratio of points scored by the university to the number of its
research and development staff.
(1)
where:
Ei: research performance of institution i;
pi: number of points scored by institution i as part of its research activity;
: number of research and/or development staff at institution i.
The next stage is the relative performance calculation, equal to the ratio of the university’s individual
performance to maximum performance achieved by the most efficient institution in a homogenous group
(separately for research activity and for practical application of research and development projects).
(2)
where:
: relative performance of institution i;
Ei: performance of institution i;
Emax: maximum performance in a homogenous group of research entities.
The final value of the performance indicator is arrived at by aggregating the relative performance products
calculated separately for research activity (EI) and for practical application of research and development
projects (EII). Each of the relative performances is weighted separately.
(3)
where:
: final performance of institution i;
: relative research activity performance of institution i;
: research activity performance weight;
: relative performance of institution i in the area of practical application of research and development
projects;
: weight of performance in practical application of research and development projects.
One of the parameters that affect the amount of available funding is the number of research and
development staff employed by institution i. An increase in staff numbers may lead to poorer research
performance, if the performance of the newly employed persons is below the overall performance previously
achieved by the entity.
A question needs to be asked whether the staff component used in the educational activity subsidy
calculation formula is negatively correlated with the institution’s research performance. This may be the case if
the growth in the number of staff exceeds, e.g., the growth in the number of research points scored.
The following part of this paper sets out to prove that the algorithms used to calculate educational activity
on one hand and research activity on the other are mutually competitive (exclusive). The said hypothesis will be
MANAGING A UNIVERSITY FROM ITS REVENUE PERSPECTIVE
129
verified by analyzing the example of the Poznań University of Economics (PUE), on the basis of data for 2009
to 2011. The choice of the period follows from the need to ensure data comparability, as in 2012 the algorithm
used to calculate the subsidy for educational activity of Polish universities was modified.
Research and Education Performance as a Measure of Mutual Dependence of Universities’ Operational Areas
Operational performance is one of the key attributes of organizations managing a given set of resources.
Drucker (1976) defines performance as an attribute that determines the functioning and development of the
organization in question. However, one’s pursuance of pro-efficiency operation depends on a number of
conditions (Czechowski, 1997):
system and institutional conditions (distant environment);
market conditions (near environment);
internal conditions.
In the case of the higher education and science sector, the environment is of particular attention for the
performance definition methodology. The sector’s underlying legislation contains a set of expectations that
largely determine the mode of managing higher education and science institutions. Thus, is the notion of
performance known from for-profit organizations operating in highly competitive markets equally applicable to
public finance sector entities?
In the literature one can find a number of publications on the performance of higher education institutions:
Sinuany-Stern, Mehrez, and Barboy (1994) were the first to evaluate the performance of various departments at
a single university8. Similar studies were subsequently held by King (1997), Arcelus and Coleman (1997),
Sarrico and Dyson (2000), Tauer, Fried, and Fry (2007), Kao and Hung (2008); and finally by Napiecek (2013).
In terms of universities’ functional performance, it is necessary to ensure adequate division of resources
among the three main operational areas. Richardson, Parker, and Udell (1992) define them as education,
research, and administration. Last years’ research into mutual relationships among the three areas has
concentrated on their complementarity and exclusivity9 (Murphy, 1994). The exclusivity of education and
research is understandable, taking into account the limited amount of working time of academics. Fox (1992) is
of the opinion that those two areas are competitive, rather than complementary. In most cases, time devoted to
teaching does not contribute to research achievements. The only exception could be tuition in the form of
seminars. An alternative view on the interrelation between those areas is presented by Bauerlein (2009) who
claims that research activity at the university improves its financial condition and prestige, causes greater
interest in doctoral studies and may thus reduce teaching workloads.
In their turn, Hattie and Marsh (1996) point to the multifaceted nature of the relationships between
education and research. Their conclusion is based on a review of multiple analyses investigating the
relationship between tutorials and research activities. In their opinion, a negative relationship sets in the
shortage model (i.e., negative correlation of time available for education and for research) or in models
stressing differences between personal characteristics and skills required in teaching on one hand and in
research on the other.
8 The study was held at Ben-Gurion University in Israel. 9 The exclusivity of those areas takes place if the effects from two different academic activity areas are negatively correlated to each other.
MANAGING A UNIVERSITY FROM ITS REVENUE PERSPECTIVE
130
In contrast, Hattie and Marsh (1996) propose for instance that complementarity of the two discussed areas
results from the fact that good research performance is a condition sine qua non (without which not) for good
quality teaching. The reverse relationship (the influence of education on research) is analyzed as well. Hattie
and Marsh (2002) see a positive effect of the teaching process on the quality of scientific research in that it
makes it possible to verify research assumptions, results, and conclusions. If those aspects are discussed with a
greater audience consisting of people at another (earlier) stage of scholarly development, one becomes capable
of viewing research processes from a number of different perspectives.
Another argument in favor of the complementarity of both areas is the similarity of personality features
required, such as involvement, creativity, inquisitiveness, and analytical thinking. Referring back to
performance, the authors claim that in such cases it is possible to assert a positive relationship and
complementarity between educational performance and research efficiency.
Hattie and Marsh (1996; 2002) conclude their analysis by declaring neutrality of the two areas. In their
opinion, the relationship of those areas is most probably neutral, which why the prevailing belief in the
inseparable bond connecting education and research is a myth.
However, the prevailing view in the literature is that the two main areas of academic activity are
interrelated. The relationship between research results on one hand and teaching workload and available funds
on the other was confirmed by a survey of Australian economists carried out by Fox and Milbourne (1999). Its
results showed that a 10% increase in teaching workload may reduce research results by up to 20%, while a 10%
increase in the number of awarded research grants can improve annual research results by as much as 15%.
Another survey, carried out by a team led by Fender, Taylor, and Burke (2005) among United States (US)
economists, confirmed that a researcher’s teaching workload has a significant bearing on the number of his/her
publications. Apart from the relationship between research and teaching the survey also analyzed the relations
taking place at the interface with the university’s administration. The results showed a negative correlation of
scientific output and time devoted to teaching and administrative duties. Departments with fewer teaching
hours and less involvement in organizational aspects on the part of academics were characterized by better
research output.
Similar conclusions were presented in the report on scientific productivity of public universities in Poland
by EY (2010). The research conducted by its authors show that negative relationship between teaching load and
research output exists. Specifically, ceteris paribus (all other things being equal or held constant), a decrease in
teaching load by 10% could be associated with as much as 8%-16% improvement in research efficiency. The
report also shows that although such a negative relationship can be observed not only in Polish universities,
researchers employed in Polish universities have much bigger teaching load than their counterparts in other
countries, and moreover they quite often work at more than one university10.
In the opinion of Katz and Colemen (2001), education and research are complementary to each other.
Positive effect of scientific research on education is also reported by Feldman (1987) and Korhonen, Tainio,
and Wallenius (2001) who point out research achievements make curriculum updates possible, thus
contributing to continuous improvement in teaching quality. Armstrong (1995) stresses the role of the teaching
process as a carrier of knowledge derived from research. Several authors (Armstrong, 1983; Franke, Edlung, &
Oster, 1990; Reich, 1991; Franke & Edlung, 1992) agree with the view that sharing that knowledge with
10 Strangely enough, this sentence was not published in English version of the report.
MANAGING A UNIVERSITY FROM ITS REVENUE PERSPECTIVE
131
students contributes to developing more involved and inquisitive forms of learning among students. In his turn,
Collopy (1992), having assumed that research success depends not only on time devoted to research but also
more on better time management, concluded that involvement in research projects stimulates improved
management of available time. Efficient time management is subsequently extrapolated to the realm of
teaching.
Further analyses of the relationships between the three aforementioned main areas of university activity
can be found in the works of Sellers-Rubio, Mas-Ruiz, and Casado-Díaz (2010) and Napiecek (2013).
Seller-Rubio et al. (2010) formulated a total of eight hypotheses verified on the basis of measuring technical
efficiency of various departments at a Spanish university. Empirical data came from 48 such departments, and
the measurement of technical efficiency was based on the Data Envelopment Analysis (DEA) model. Napiecek
(2013) used the DEA model to analyze the interrelationship of the three academic activity areas with
performance calculated using the sustainable performance appraisal model for 53 departments at the PUE
(Napiecek, 2013).
Analysis of Interrelation Between Revenues From Educational and Research Activities of PUE’s Faculties
The PUE was established in 1926. It is one of the best, oldest, and most prestigious economic
universities11 in Poland, widely known for its academic excellence. It occupies top positions in the rankings
published by respected magazines. With its reputation for quality it specializes in the education of
highly-qualified managers, economic experts, as well as national and international administration personnel
capable of operating successfully in the globalized business. It also has an undisputed position as a leader in
economic research as well as a major center for applied studies, expert evaluation, analysis, and consultancy.
To a significant extent, the credit for the university’s high position in academic rankings goes to its
qualified teaching staff. The school employs over six hundred academics, including approximately a hundred
and thirty professors.
The PUE is the only university in Poland to enjoy full academic rights in finance, economic, management,
and commodity sciences. Education is provided in the form of first, second, and third (doctoral) cycle studies,
MBA programs as well as post-master’s degree studies (UEP, 2013).
The structure of the PUE consists of the following five faculties (further subdivided into departments):
Faculty of Economics—WE;
Faculty of International Business and Economics—WGM;
Faculty of Informatics and Electronic Economy—WIGE;
Faculty of Commodity Science—WT;
Faculty of Management—WZ.
Apart from the faculties, the PUE also operates three research centers (Centre for European
Documentation and Research, Centre for Research and Expert Assessment in Commodity Science, and
Regional Statistics Centre) as well as other units (i.e., Main Library, Publishing House, Franco-Polish Centre
for Management Studies, Department of Foreign Languages, etc.).
On January 1, 2014, the university will launch its Executive Centre, whose brand name will be
Wielkopolska Szkoła Biznesu (Wielkopolska Business School). 11 In Poland, a university of economics is simultaneously a business school.

MANAGING A UNIVERSITY FROM ITS REVENUE PERSPECTIVE
132
The following part of the paper analyzes education and research revenues of the PUE. As already
mentioned, the level of funding obtained by universities depends inter alia (among other things) on the
so-called students’ component and staff component.
Numerical data showing the value of the students’ component used to calculate the educational subsidy are
presented in Table 4.
Table 4
Number of Students, Full-Time Doctoral Students, Foreigners
2009 2010 2011
Number of students
Students’ number equivalent
Ratio Number of students
Students’ number equivalent
RatioNumber of students
Students’ number equivalent
Ratio
WE 2,027 2,191 1.08 2,008 2,212 1.10 2,139 2,951 1.38
WGM 964 1,193 1.24 1,175 1,269 1.08 1,295 1,339 1.03
WIGE 543 815 1.50 595 919 1.54 635 981 1.54
WT 933 2,340 2.51 937 2,322 2.48 892 2,151 2.41
WZ 2,176 3,299 1.52 2,425 3,846 1.59 2,481 3,971 1.60
6,643 9,837 7,140 10,567 7,442 11,392
Note. Source: by the authors based on the data from PUE.
The figures in the “students’ number equivalent” columns correspond to aggregated student numbers
multiplied by education cost intensity coefficients12 at every PUE faculty. The students’ number equivalent is
one of the elements of the formula used to calculate the educational subsidy.
Another important component of the educational subsidy calculation algorithm is the staff component. The
figures for each of the PUE’s faculties for the years 2009 to 2011 are presented in Table 5.
Table 5
Number of Academic Staff
2009 2010 2011
Number of staff
Staff number equivalent
Ratio Number of staff
Staff number equivalent
Ratio Number of staff
Staff number equivalent
Ratio
WE 114 180 1.57 109 175 1.60 108 172 1.60
WGM 47 74 1.58 49 78 1.58 52 85 1.63
WiGE 59 88 1.50 66 99 1.48 73 110 1.51
WT 60 96 1.61 62 101 1.62 70 116 1.65
WZ 153 238 1.56 152 241 1.58 157 252 1.61
432 676 439 692 459 735
Note. Source: by the authors based on the data from PUE.
Not like in the case of students, the number of academic staff is converted to the academic staff number
equivalent. Table 5 shows the mean values of equivalent ratios. The said ratios are determined by the MNiSW
and depend on the academic degrees of the staff.
Analysis of Research Subsidy Collection Efficiency
The analysis of research subsidy collection efficiency covers only the subsidies paid by the MNiSW. The 12 Education cost intensity coefficients are determined by the Ministry of Science and Higher Education and depend on majors taught and degrees offered; higher coefficients are also given for foreign students. The table shows the weighted average of coefficients for PUE faculties.
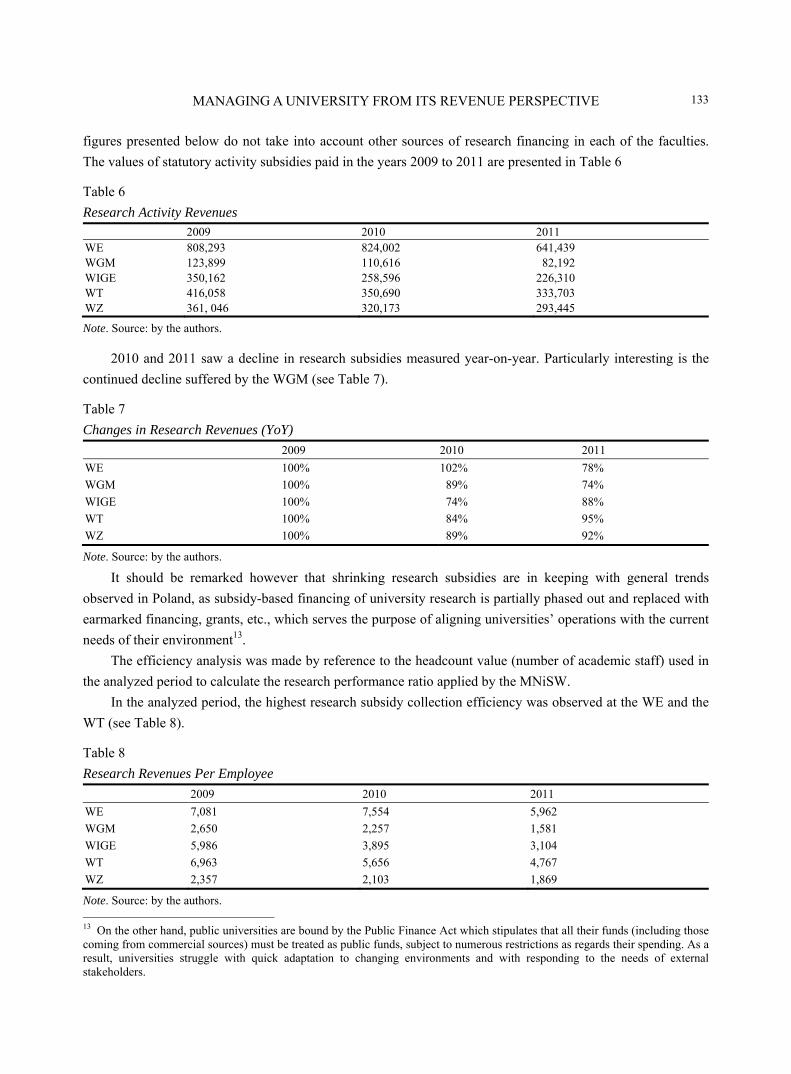
MANAGING A UNIVERSITY FROM ITS REVENUE PERSPECTIVE
133
figures presented below do not take into account other sources of research financing in each of the faculties.
The values of statutory activity subsidies paid in the years 2009 to 2011 are presented in Table 6
Table 6
Research Activity Revenues 2009 2010 2011
WE 808,293 824,002 641,439 WGM 123,899 110,616 82,192 WIGE 350,162 258,596 226,310 WT 416,058 350,690 333,703 WZ 361, 046 320,173 293,445
Note. Source: by the authors.
2010 and 2011 saw a decline in research subsidies measured year-on-year. Particularly interesting is the
continued decline suffered by the WGM (see Table 7).
Table 7
Changes in Research Revenues (YoY)
2009 2010 2011
WE 100% 102% 78%
WGM 100% 89% 74%
WIGE 100% 74% 88%
WT 100% 84% 95%
WZ 100% 89% 92%
Note. Source: by the authors.
It should be remarked however that shrinking research subsidies are in keeping with general trends
observed in Poland, as subsidy-based financing of university research is partially phased out and replaced with
earmarked financing, grants, etc., which serves the purpose of aligning universities’ operations with the current
needs of their environment13.
The efficiency analysis was made by reference to the headcount value (number of academic staff) used in
the analyzed period to calculate the research performance ratio applied by the MNiSW.
In the analyzed period, the highest research subsidy collection efficiency was observed at the WE and the
WT (see Table 8).
Table 8
Research Revenues Per Employee
2009 2010 2011
WE 7,081 7,554 5,962
WGM 2,650 2,257 1,581
WIGE 5,986 3,895 3,104
WT 6,963 5,656 4,767
WZ 2,357 2,103 1,869
Note. Source: by the authors. 13 On the other hand, public universities are bound by the Public Finance Act which stipulates that all their funds (including those coming from commercial sources) must be treated as public funds, subject to numerous restrictions as regards their spending. As a result, universities struggle with quick adaptation to changing environments and with responding to the needs of external stakeholders.

MANAGING A UNIVERSITY FROM ITS REVENUE PERSPECTIVE
134
Table 9 shows research performance ratios of individual faculties of the PUE, calculated and used by the
MNiSW to compute research subsidies paid to individual faculties.
Table 9 Research Performance Ratios of the Faculties of the PUE
Basic organizational units of the PUE—faculties Final research performance ratio
Category of institutionE
Faculty of Informatics and Electronic Economy—WIGE 56.97 1 Faculty of Commodity Science—WT 55.83 1 Faculty of Economics—WE 46.28 1 Faculty of Management—WZ 37.87 2 Faculty of International Business and Economics—WGM 36.25 2
Note. Source: by the authors.
High research performance was confirmed in the case of the WT. However, measured with the
methodology applied by the Ministry, the highest performance was observed at the WIGE. The said faculty
shows the lowest ratio of students per academic staff member (see Table 10). In its turn, the WGM has the lowest
research performance and the highest number of students per academic.
Table 10 Number of Full Time Students Per Academic Staff Member
2009 2010 2011 WE 18 18 20 WGM 21 24 25 WIGE 9 9 9 WT 16 15 13 WZ 14 16 16
Note. Source: by the authors based on the data from PUE.
The above deliberations and calculations thus show that the level of faculties’ research performance
measured with the research subsidies allocation algorithm is negatively correlated to the values corresponding
to the analyzed components in the formula used to calculate the amount of educational subsidy.
Analysis of Educational Subsidy Collection Efficiency
In the case of educational activity, the subsidy collection efficiency was analyzed with regard to the two
aforementioned components of the educational subsidy calculation algorithm, i.e., the number of students and
the number of academic staff.
The amount of educational activity subsidies collected by each of the PUE’s faculties and an overview of
their changes from 2009 and 2011 are presented in Tables 11 and 12.
Table 11 Educational Activity Revenues (Poland 000)
2009 2010 2011 WE 13,395 13,354 13,390 WGM 7,208 7,482 7,458 WIGE 6,247 6,527 6,244 WT 9,361 9,411 9,337 WZ 19 512 19,308 20,047 Note. Source: by the authors.

MANAGING A UNIVERSITY FROM ITS REVENUE PERSPECTIVE
135
Table 12
Changes in Educational Activity Revenues
2009 2010 2011
WE 100% 100% 100%
WGM 100% 104% 100%
WIGE 100% 104% 96%
WT 100% 101% 99%
WZ 100% 99% 104%
Note. Source: by the authors.
The efficiency in education subsidy collection measured per student was compared to the actual number of
students, as well as to the students’ number equivalent, thus taking into account the effect of education cost
intensity (see Table 13).
Table 13
Education Activity Revenues Per Student (Poland 000)
2009 2009 2010 2010 2011 2011
WE 6.61 6.11 6.65 6.04 6.07 5.56
WGM 7.48 6.04 6.37 5.90 5.54 4.78
WIGE 11.50 7.67 10.97 7.11 9.52 6.25
WT 10.03 4.00 10.04 4.05 10.67 4.28
WZ 8.97 5.92 7.96 5.02 8.09 5.22
Note. Source: by the authors.
The difference is particularly striking in the case of the WT, whose education cost intensity coefficient is
the highest among all PUE faculties. If calculations of the collection efficiency are made on the basis of the
actual number of students, the faculty in question turns out to be one of the leaders. However, if the students’
number equivalent is used instead of the actual number, the faculty’s efficiency becomes the lowest. It is thus
necessary to analyze financial performance of each faculty in order to verify whether the cost of education
incurred at the WT is indeed higher.
Likewise, in the case of the staff component, the WT was one of the efficiency leaders. Similarly
successful was the WGM (see Table 14).
Table 14
Education Activity Revenues Per Staff Member (Poland 000)
2009 2010 2011
WE 117.34 122.42 124.46
WGM 154.19 152.70 143.43
WiGE 106.79 98.30 85.65
WT 156.66 151.79 133.38
WZ 127.36 126.82 127.69
Note. Source: by the authors.
Another area in analyzing the interrelation between education and research is the financial results of each
faculty. Table 15 shows the results from educational activity.
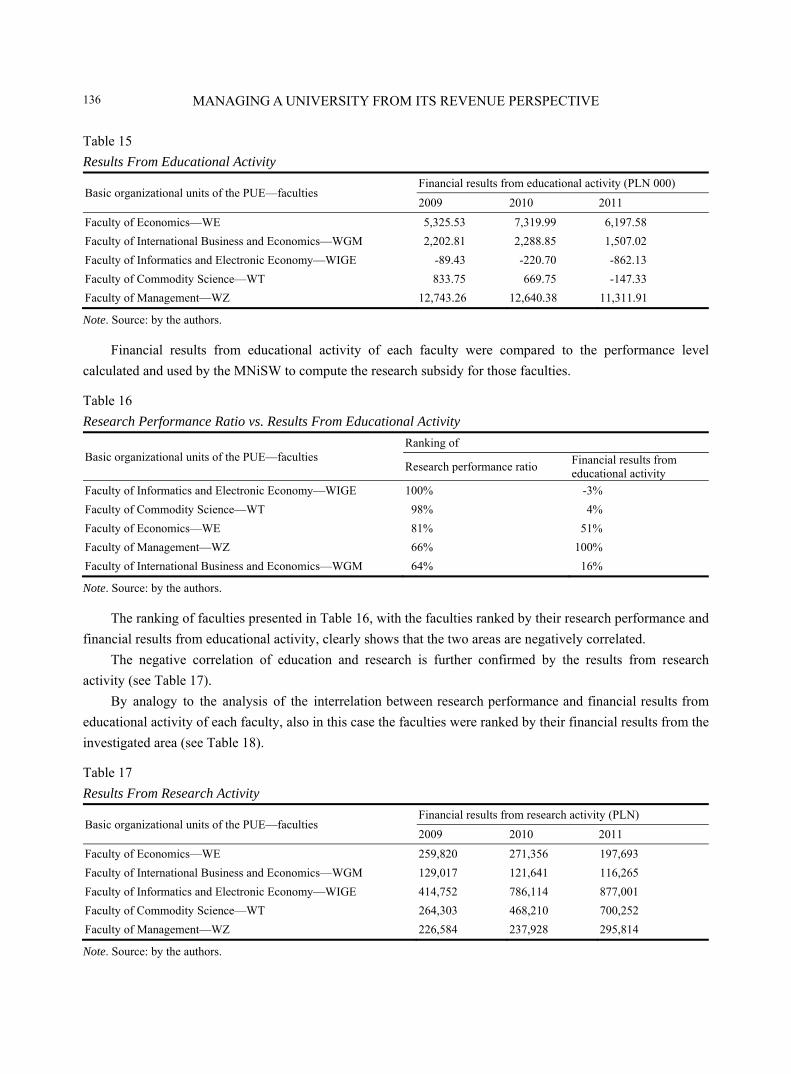
MANAGING A UNIVERSITY FROM ITS REVENUE PERSPECTIVE
136
Table 15
Results From Educational Activity
Basic organizational units of the PUE—faculties Financial results from educational activity (PLN 000)
2009 2010 2011
Faculty of Economics—WE 5,325.53 7,319.99 6,197.58
Faculty of International Business and Economics—WGM 2,202.81 2,288.85 1,507.02
Faculty of Informatics and Electronic Economy—WIGE -89.43 -220.70 -862.13
Faculty of Commodity Science—WT 833.75 669.75 -147.33
Faculty of Management—WZ 12,743.26 12,640.38 11,311.91
Note. Source: by the authors.
Financial results from educational activity of each faculty were compared to the performance level
calculated and used by the MNiSW to compute the research subsidy for those faculties.
Table 16
Research Performance Ratio vs. Results From Educational Activity
Basic organizational units of the PUE—faculties Ranking of
Research performance ratio Financial results from educational activity
Faculty of Informatics and Electronic Economy—WIGE 100% -3%
Faculty of Commodity Science—WT 98% 4%
Faculty of Economics—WE 81% 51%
Faculty of Management—WZ 66% 100%
Faculty of International Business and Economics—WGM 64% 16%
Note. Source: by the authors.
The ranking of faculties presented in Table 16, with the faculties ranked by their research performance and
financial results from educational activity, clearly shows that the two areas are negatively correlated.
The negative correlation of education and research is further confirmed by the results from research
activity (see Table 17).
By analogy to the analysis of the interrelation between research performance and financial results from
educational activity of each faculty, also in this case the faculties were ranked by their financial results from the
investigated area (see Table 18).
Table 17
Results From Research Activity
Basic organizational units of the PUE—faculties Financial results from research activity (PLN)
2009 2010 2011
Faculty of Economics—WE 259,820 271,356 197,693
Faculty of International Business and Economics—WGM 129,017 121,641 116,265
Faculty of Informatics and Electronic Economy—WIGE 414,752 786,114 877,001
Faculty of Commodity Science—WT 264,303 468,210 700,252
Faculty of Management—WZ 226,584 237,928 295,814
Note. Source: by the authors.
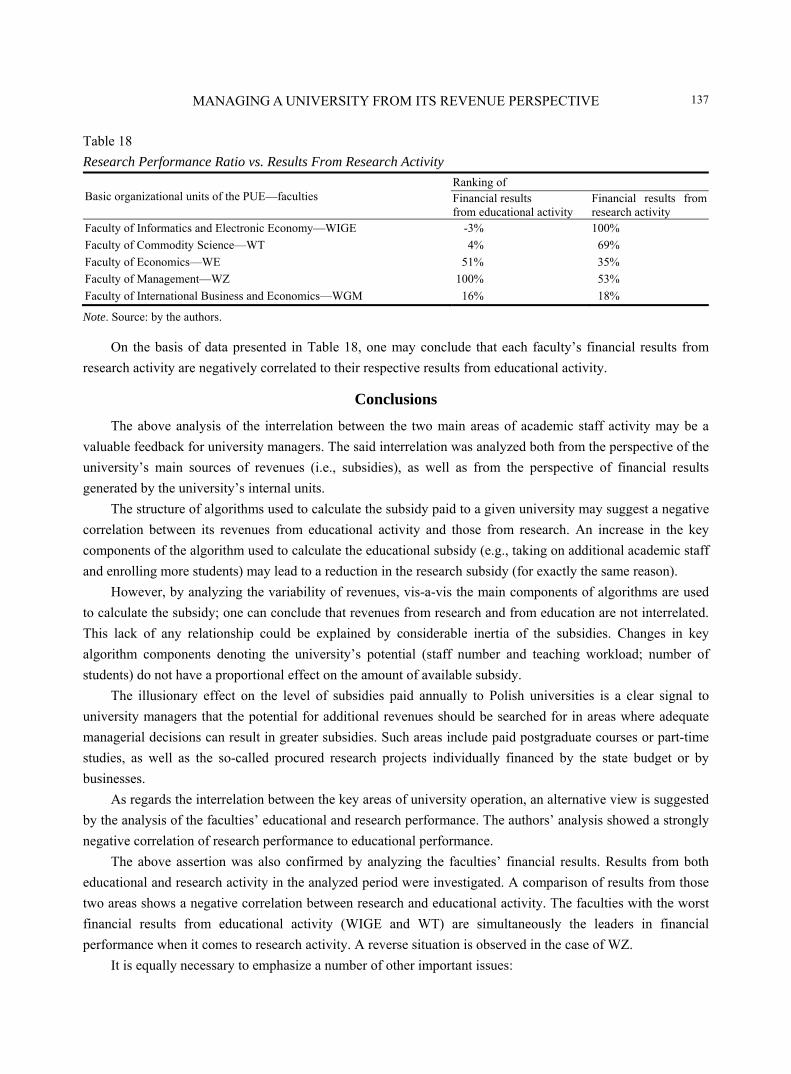
MANAGING A UNIVERSITY FROM ITS REVENUE PERSPECTIVE
137
Table 18
Research Performance Ratio vs. Results From Research Activity
Basic organizational units of the PUE—faculties Ranking of Financial results from educational activity
Financial results from research activity
Faculty of Informatics and Electronic Economy—WIGE -3% 100%
Faculty of Commodity Science—WT 4% 69%
Faculty of Economics—WE 51% 35%
Faculty of Management—WZ 100% 53%
Faculty of International Business and Economics—WGM 16% 18%
Note. Source: by the authors.
On the basis of data presented in Table 18, one may conclude that each faculty’s financial results from
research activity are negatively correlated to their respective results from educational activity.
Conclusions
The above analysis of the interrelation between the two main areas of academic staff activity may be a
valuable feedback for university managers. The said interrelation was analyzed both from the perspective of the
university’s main sources of revenues (i.e., subsidies), as well as from the perspective of financial results
generated by the university’s internal units.
The structure of algorithms used to calculate the subsidy paid to a given university may suggest a negative
correlation between its revenues from educational activity and those from research. An increase in the key
components of the algorithm used to calculate the educational subsidy (e.g., taking on additional academic staff
and enrolling more students) may lead to a reduction in the research subsidy (for exactly the same reason).
However, by analyzing the variability of revenues, vis-a-vis the main components of algorithms are used
to calculate the subsidy; one can conclude that revenues from research and from education are not interrelated.
This lack of any relationship could be explained by considerable inertia of the subsidies. Changes in key
algorithm components denoting the university’s potential (staff number and teaching workload; number of
students) do not have a proportional effect on the amount of available subsidy.
The illusionary effect on the level of subsidies paid annually to Polish universities is a clear signal to
university managers that the potential for additional revenues should be searched for in areas where adequate
managerial decisions can result in greater subsidies. Such areas include paid postgraduate courses or part-time
studies, as well as the so-called procured research projects individually financed by the state budget or by
businesses.
As regards the interrelation between the key areas of university operation, an alternative view is suggested
by the analysis of the faculties’ educational and research performance. The authors’ analysis showed a strongly
negative correlation of research performance to educational performance.
The above assertion was also confirmed by analyzing the faculties’ financial results. Results from both
educational and research activity in the analyzed period were investigated. A comparison of results from those
two areas shows a negative correlation between research and educational activity. The faculties with the worst
financial results from educational activity (WIGE and WT) are simultaneously the leaders in financial
performance when it comes to research activity. A reverse situation is observed in the case of WZ.
It is equally necessary to emphasize a number of other important issues:

MANAGING A UNIVERSITY FROM ITS REVENUE PERSPECTIVE
138
Abandoning teaching activity would cause an immediate decrease of revenues related to it (particularly in
terms of paid courses and to a lesser degree from subsidies, due to their inert nature) while starting research
activity could yield profits no sooner than after a certain period of time. Moreover, as a rule and with few
exceptions, the Polish law disallows decreasing the number of teaching hours of academic staff below a
minimum set by the legislation. All that means that shifting the workload from teaching to research activities is
most probably neither possible, nor would it increase profitability (to be confirmed by ongoing research);
All Polish universities obtain revenues mostly from educational activity; it is hard to assume that they act
irrationally by sacrificing science for the benefit of teaching. The PUE, as a public university, cannot make
profit on extramural (weekend) studies—although they help finance other activities by facilitating adequate
cost allocation. The university is only allowed to make profit on postgraduate studies—these profits then help
finance other activities;
Subsidies for teaching activity are predictable, repetitive, and dependent on objective factors. Amounts
granted for scientific activity are established in a more arbitrary manner (the total amount allocated for
universities in Poland are decreasing each year). Revenues from research, as prestigious as they may be, are
lower, harder to get and less predictable than those from teaching;
Although the PUE needs to maintain a certain level of scientific quality to preserve its university status,
from purely business perspective it would be more rational to focus on educational activity alone.
For all institutions in the higher education sector—considering the nature of their operation and their
evaluation criteria—a strategy aiming at maximized efficiency is becoming increasingly important. The amount
of available subsidies is not subject to considerable fluctuations, which ensures a relatively constant level of
revenues. In a longer perspective, however, the results achieved by a university should be translated into an
improved assessment of its operations and thus to secure more funds for financing education and research.
References Arcelus, F. J., & Coleman, D. F. (1997). An efficiency review of university departments. International Journal of System Science,
28, 721-729. Armstrong, J. (1983). The Ombudsman: Learner responsibility in management education, or ventures into forbidden research.
Interfaces, 13(2), 26-38. Armstrong, J. (1995). The devils advocate responses to an MBA students claim that research harms learning. Journal of
Marketing, 59, 101-106. Bauerlein, M. (2009). Professors on the production line, students on their own. Future of American Education Project,
AEI-Working Paper. Collopy, F. (1992). The Ombudsman: Factors influencing academic research productivity: A survey of management scientists.
Interfaces, 22(5), 35-38. Czechowski, L. (1997). Multidimensional evaluation of a company efficiency. Gdansk: The University of Gdansk Publishing
House. Drucker, P. (1976). Managing for results. Warsaw: PWN. Eurostat. (2013). Retrieved November 24, 2013, from
http://epp.eurostat.ec.europa.eu/tgm/table.do?tab=table&init=1&plugin=1&language=en&pcode=tec00114 EY. (2010). Scientific productivity of public higher education institutions in Poland: A comperative bibliometric analysis.
Warsaw: Ernst &Young. Feldman, K. (1987). Research productivity and scholarly accomplishment of college teachers as related to their institutional
effectiveness. Research in Higher Education, 26, 227-298. Fender, B. F., Taylor, S. W., & Burke, K. G. (2005). Making the big leagues: Factors contributing to publication in elite
economics journals. Atlantic Economic Journal, 33(1), 93-103.
MANAGING A UNIVERSITY FROM ITS REVENUE PERSPECTIVE
139
Fox, K. J., & Milbourne, R. (1999). What determines research output of academic economists?. Economic Records, 75(3), 256-267.
Fox, M. F. (1992). Research, teaching, and publication productivity: Mutuality versus competition in academia. Sociology of Education, 65, 293-305.
Franke, R., & Edlung, T. (1992). Development and application of a longitudinal procedure for quantitative case analysis. In H. Klein (Ed.), Forging new partnerships with cases, simulations, games and other interactive methods (pp. 361-372). WACRA, Needham.
Franke, R., Edlung, T., & Oster, F. (1990). The development of strategic management: Journal quality and article impact. Strategic Management Journal, 45(6), 243-253.
Hattie, J., & Marsh, H. W. (1996). The relationship between research and teaching: A meta analysis. Review of Educational Research, 66(4), 507-542.
Hattie, J., & Marsh, H. W. (2002). The relation between research productivity and teaching effectiveness—Complementary, antagonistic, or independent constructs?. Journal of Higher Education, 73(5), 603-641.
Kao, C., & Hung, H. T. (2008). Efficiency analysis of university departments: An empirical study. Omega, 36, 653-664. Katz, E., & Coleman, M. (2001). The growing importance of research at academic colleges of education in Israel. Education Plus
Training, 43(2), 82-93. King, W. D. (1997). Input and output substitution in higher education. Economic Letters, 57, 107-111. Korhonen, P., Tainio, R., & Wallenius, J. (2001). Value efficiency analysis of academic research. European Journal of
Operational Research, 130(1), 121-132. Lapsley, I., & Miller, P. (2004). Transforming universities: The uncertain, erratic path. Financial Accountability and Management,
20(2), 103-106. MniSW. (2011). The reform of Polish science: Building on knowledge. Retrieved September 1, 2012, from
https://www.nauka.gov.pl Murphy, F. (1994). Don’t let shallow reporters set the agenda. Interfaces, 24(2), 13-17. Napiecek, R. (2013). Cost accounting in balanced evaluation of universities achievements. Poznan: UEP Publishing House. Reich, R. (1991). The work of nations: Preparing ourselves to 21st century capitalism. New York: Knopf. Richardson, P., Parker, R. S., & Udell, G. G. (1992). Does research enhance or inhibit teaching? A exploratory study. Journal of
Education for Business, 68(2), 79-83. Sarrico, C. S., & Dyson, R. G. (2000). Using DEA for planning in UK universities: An institutional perspective. Journal of the
Operational Research Society, 51(7), 789-800. Sellers-Rubio, R., Mas-Ruiz, F. S., & Casado-Díaz, A. B. (2010). University efficiency: Complementariness versus trade-off
between teaching, research and administrative activities. Higher Education Quarterly, 64(4), 373-391. Sinuany-Stern, Z., Mehrez, A., & Barboy, A. (1994). Academic departments efficiency via DEA. Computers & Operations
Research, 21, 543-556. Tauer, L. W., Fried, H. O., & Fry, W. E. (2007). Measuring efficiencies of academic departments within a college. Education
Economics, 15, 473-489. Townley, B. (1997). The institutional logic of performance appraisal. Organization Studies, 18(2), 261-285. UEP. (2013). Retrieved from http://www.ue.poznan.pl/study-at-poznan-university-of-economics /university/