
Vol. 3, No. 4, August-September (ISSN 2278 - SHIV SHAKTI ...
Upload
independentCategory
view
1download
0

David
David Publishing Company
www.davidpublishing.com
PublishingDavid
Management Studies
Volume 2, Number 1, (Serial Number 2)2014January

Publication Information:
Management Studies is published monthly in hard copy (ISSN 2328-2185) and online by David Publishing Company
located at 240 Nagle Avenue #15C, New York, NY 10034, USA.
Aims and Scope:
Management Studies, a monthly professional academic journal, covers all sorts of researches on Engineering
Management, Project Management, Environmental Management, Technology Management, International (Business)
Management, Operations Management, Financial Management, Marketing, Human Resource Management, Logistics
Management, Leadership, Tourism Management, Knowledge Management, Administration Management, Information
Management, Hospitality Management, Electronic Commerce, and other latest findings and achievements from
experts and scholars all over the world.
Editorial Board Members:
Nirmala Devi Nath (New Zealand)
Jamnean Joungtrakul (Korea)
Zohar Laslo (Israel)
Joanna Kuczewska (Poland)
Gancho Todorov Ganchev (Bulgaria)
Athanasios Migdalas (Greece)
Natalia Petrovna Kusnezova (Russia)
Renata Korsakienė (Lithuania)
Mariya Stankova (Bulgaria)
Agnieszka Zakrzewska–Bielawska (Poland)
Shelly SHEN (China)
Vincenzo Zarone (Italy)
Athanasia Karakitsiou (Greece)
Bonny TU (China)
Manuscripts and correspondence are invited for publication. You can submit your papers via Web Submission, or
E-mail to [email protected], [email protected]. Submission guidelines and
Web Submission system are available at http://www.davidpublishing.org, http://www.davidpublishing.com.
Editorial Office:
240 Nagle Avenue #15C, New York, NY 10034, USA
E-mail: [email protected]; [email protected]
Copyright©2014 by David Publishing Company and individual contributors. All rights reserved. David Publishing
Company holds the exclusive copyright of all the contents of this journal. In accordance with the international
convention, no part of this journal may be reproduced or transmitted by any media or publishing organs (including
various websites) without the written permission of the copyright holder. Otherwise, any conduct would be
considered as the violation of the copyright. The contents of this journal are available for any citation, however, all
the citations should be clearly indicated with the title of this journal, serial number and the name of the author.
Abstracted / Indexed in:
Database of EBSCO, Massachusetts, USA
Ulrich’s Periodicals Directory, USA
ProQuest/CSA Social Science Collection, Public Affairs Information Service (PAIS), USA
Cabell’s Directories, USA
Summon Serials Solutions, USA
Chinese Database of CEPS, American Federal Computer Library center (OCLC), USA
Index Copernicus, Poland
Qualis/Capes index, Brazil
Norwegian Social Science Data Services (NSD), Database for Statistics on Higher Education (DBH), Norway
Universe Digital Library S/B, ProQuest, Malaysia
Polish Scholarly Bibliography (PBN), Poland
Chinese Scientific Journals Database, VIP Corporation, Chongqing, China
Google Scholar
China National Knowledge Infrastructure (CNKI), China
Subscription Information:
Price (per year): Print $520 Online $320 Print and Online $600
David Publishing Company, 240 Nagle Avenue #15C, New York, NY 10034, USA
Tel: +1-323-984-7526, 323-410-1082 Fax: +1-323-984-7374, 323-908-0457
E-mail: [email protected]
David Publishing Company
www.davidpublishing.com
DAVID PUBLISHING
D

Management Studies
Volume 2, Number 1, January 2014 (Serial Number 2)
Contents
Project Management
An Empirical Study of the Content Characteristics of Social Projects
(According to In-depth Interviews) 1
Larisa Nikitina, Maria Tabachnikova
International (Business) Management
Dimensions of the Internationalization-Performance Relationship: Applied to Euronext 100
Multinationals 10
Samia Belaounia, Mehdi Nekhili
Marketing
A Strategic Perspective to Small Firms in Relationship Marketing: A Case Study of Francistown 21
Rodreck Chirau, Sumburani Sigauke
Inconsistency Quality Products (on Six Sigma Programs) Effect on Customer Loyality:
Case Study of Industry “Tahu” 35
Ayi Tejaningrum
Knowledge Management
Meta-synthetic Strategies for Digital Recordkeeping and Knowledge Utilization:
International Trends 43
Xiaomi An, Judith Ellis

Administration Management
Reform of Financial Institutions—Getting it Right 53
Matjaz Nahtigal
Information Management
Using MWD: A Business Intelligence System for Tourism Destination Web 62
Aurkene Alzua-Sorzabal, Jon Kepa Gerrikagoitia, Fidel Rebón

Management Studies, ISSN 2328-2185 January 2014, Vol. 2, No. 1, 1-9
An Empirical Study of the Content Characteristics of Social
Projects (According to In-depth Interviews)
Larisa Nikitina, Maria Tabachnikova
Voronezh State University (VSU), Voronezh, Russian Federation
This paper specifies substantial characteristics of social projects at the present stage of development of the Russian
civil society. A social project is considered as a project system based on a set of measures of social orientation; has
specific objectives; and is located in space and time-restricted. The sample data of 25 in-depth interviews with
representatives of the business community, public authorities, and civil society institutions, all active participants in
community development in the Voronezh administrative region served as an empirical basis for this paper. The
analysis of respondents’ views on the importance of social projects has enabled to define their descriptive and
normative features. The main descriptive features include the following: overcoming specific urgent problems in a
society; implementing state social policy; quantitative changes in the material life conditions of an individual or a
social group; creating labor markets; implementing social innovations; two-way influence of the quality and
quantity of social projects and the level of socio-economic structure (company, region, country). Normative
features include: encouraged development of state institutions; stability of the environment; balanced
socio-economic development; formation of a community of reasonable individuals; development of human
potential. Conclusions have been made about the nature, characteristics, and goals and objectives of social projects
and their role in social and economic development of the region, spheres of social projects implementation
significant for Russia, about active participants, success and failure factors of social projects, prospects and
intensity of social engineering in the Voronezh administrative region and Russia as a whole. Soft systems
methodology has been used for stating and structuring the empirical data. The results obtained have enabled to lay
the foundation for finding the concepts and mechanisms to coordinate the participants in community development.
Keywords: social project, project management, project system, community development, root definition, goals and
objectives of social projects
Introduction
Social projects’ development and implementation is an essential element in managing sustainable
development in any country. In this regard, it is of vital importance to carry out both theoretical and applied
research in social engineering as a form of social activity of the economic entity and as a process of
implementation of social innovations.
A contradictory situation in the regions of Russia has occurred due to imbalance between the potential and
Larisa Nikitina, Doctor of Science, Full Professor, Economic Department, Voronezh State University. Maria Tabachnikova, Candidate of Science, Associate Professor, Economic Department, Voronezh State University. Correspondence concerning this article should be addressed to Maria Tabachnikova, 20-Let VLKSM, building 54A, apt. 64,
Voronezh, 394036, Russian Federation. E-mail: [email protected].
DAVID PUBLISHING
D

AN EMPIRICAL STUDY OF THE CONTENT CHARACTERISTICS OF SOCIAL PROJECTS
2
the results of social and economic development. Outstanding innovative ideas come about which can provide
an effective solution of social problems, state structures with a fixed social functionality are formed, there is
proven experience in project implementation by the business elite. An example is the positive dynamics of
social projects implementation of the largest Russian companies during the period from 2004 to 2010 (see
Table 1).
Table 1
Social Projects Implementation by Russian Companies
Availability of projects Proportion of the total number of companies (%)
2004 2005 2006 2007 2008 2009 2010
Projects targeted at employees and their families 70 71 80 79 77 77 79
Projects targeted at population at the companies’ location 53 53 60 65 75 67 65
Projects for the companies’ contractors 17 11 18 26 32 31 29
Note. Source: Survey of corporate governance in Russia: A comparative analysis of the results 2004-2010 (Retrieved from http://rid.ru/wp-content/uploads/2012/06/1CG-research-2004-2010.pdf).
The development and implementation of social projects is a system of multilateral and multi-level
cooperation of representatives of business structures, government and civil society, permanently altering their
role in social welfare and solving social problems under the influence of a number of trends. The latter include
low susceptibility of a number of social problems to the traditional measures of influence, deepening
inequalities between social groups, expansion of the social needs of the population, and others (Moskovskaya,
2011).
However, a clear interaction between the key participants in the social and economic processes is missing,
thus not allowing to reach the full potential of each participant. Actions of public authorities, business
structures, and civil society institutions are often spontaneous, causing short-term isolated effects not related to
the general concept of the strategic development of the region and the country as a whole.
The need to study the characteristics of social projects is caused by a profound structural transformation of
all social relations associated with the post-industrial transition. A number of structural changes that have a
major impact on social practices should be highlighted.
First, social needs and development priorities undergo changes. According to researchers, today the most
significant social priority is not prosperity, but equal access to healthcare and education for all population
groups (Grigorieva, 2011).
Second, the methodological context of understanding social phenomena (practices) changes. Today it
includes such concepts as nonlinearity, chaos, multi-purposefulness and others (Castel, 2009). Thereby, the
criteria for validity of social knowledge shift towards the multiplicity of possible explanations for the processes
under study (Yadov, 2009).
Third, new challenges, such as social ecology, social security, and super-intensification of migration
processes, grow urgent, and relevant (Bogomolov, 2010).
Fourth, the essential characteristics of social services change in a way that they become continuous,
individualized, and global (Mau, 2012). A modern man continuously increases his/her cultural and educational
level, uses healthcare services, chooses a pension plan. The trajectories of choice of services become more
individualized, and they become global and competitive.
Fifth, social processes, like all modern practices, become more dynamic and technologically advanced.

AN EMPIRICAL STUDY OF THE CONTENT CHARACTERISTICS OF SOCIAL PROJECTS
3
Such forms of effective interactions appear as social networks, communities of practice, crowdsourcing, etc..
The above-mentioned structural changes are bound to affect the substantial characteristics of all
contemporary social practices, including social projects.
In the context of post-industrial changes, provisions of the new system paradigm proposed by Kleiner
(2011) are brought into focus. In this paradigm, all social and economic phenomena are considered in the light
of the creation, interaction, evolution, transformation, and elimination of economic systems. Under this theory,
a social project is seen as a project-type system based on a set of measures of social orientation, which has
specific objectives, is located in space and restricted in time.
Data Description and Research Methodology
The major problem of any socio-economic survey is the availability of empirical data (or the possibility of
obtaining it). In other words, the researcher is faced with the problem of quality and reliability of the sample
data. Good quality of the empirical data is related to their amount, necessary, and sufficient for adequate
representation. In turn, reliability of the data is provided by choosing the right methods for data collection and
processing methods.
During the period from July to October 2012, 25 in-depth interviews were conducted with representatives
of business structures, civil society institutions, government and management authorities actively engaged in
the development and implementation of social projects in the Voronezh administrative region. The respondents
from the business structures included owners and managers of the enterprises operating in Voronezh. Among
representatives of the civil society were social projects proponents, founders of movements and non-profit
organizations, heads of the largest universities in the region, and actors of youth organizations and journalists.
On the part of government and management authorities participated in the study were heads of departments,
divisions and sections of the government of the Voronezh administrative region.
The questionnaire included three sets of questions on the nature of social projects, the mechanism of social
project management, and personal participation in social projects. This article presents the results of research
into the nature, characteristic features, objectives of social projects and their role in socio-economic
development of the region, spheres of project implementation significant for the current Russian reality, on
active participants, success and failure factors of social projects, prospects and the intensity of social
engineering development in the Voronezh administrative region and Russia as a whole.
First of all, the study found that from a business perspective a social project is a project of public relations
development, social organization, performing an external organizing function. In addition, the study
demonstrated that in business structures actively implementing social projects the functions of ownership and
control are combined, so the second most important aspect of social engineering is a businessman’s (owner’s)
need for self-fulfillment, according to 70% of the experts.
For representatives of civil society institutions a social project is inextricably linked with the improvement
of the quality of life of the whole population or its certain groups and thus benefits the society. Most experts
(65%) associate social projects with improved quality of life, and 35%—with the solution of specific problems
for the benefit of the society or individual social groups.
From the point of view of the representatives of public authorities, a social project is an instrument of the
state social policy whose main distinguishing feature is implementation of social innovation.
Most representatives of business community associate social projects’ objectives with material support,

AN EMPIRICAL STUDY OF THE CONTENT CHARACTERISTICS OF SOCIAL PROJECTS
4
quantitative changes in the conditions of the life of an individual or of certain social groups, and to a much
lesser extent with the change in qualitative characteristics of an individual. Thus, only one of the business
experts points out that “a social project should change something in people’s minds”.
One-third of the representatives of the civil society perceive the project objectives as something specific,
they do not have an abstract view of a social project only in reference to a particular quantitative social issue.
Fifty-five percent of the experts distinctly point out that the project objectives are linked to external improved
quantitative indicators of the living conditions, i.e., to social environment features which people consider
external. Only 22% of experts in this group denoted the inward goal of social projects, i.e., a qualitative change
in the human condition.
All representatives of public authorities qualified creation of a comfortable environment and fight against
anti-social phenomena as social project objectives. One of the experts associates the project objectives with
implementation and dissemination of social innovation, “A social project is not just about the implementation
of standards and government regulations. It is characterized by a novelty value—new forms of service, new
types of activity”. None of the representatives of public authorities associates the project objectives with the
development of self-awareness. Thus, the problems of individual people are not considered in general
goal-setting.
It should be noted that even at the stage of defining the essence, nature, and goals of the project the
experts’ opinions fall into three groups of binary oppositions: quantitative-qualitative, external-internal, and
action-process. External goals include changing conditions of the environment and overcoming the problems
that have already emerged in a society (reactive goals). Internal goals include changing societal needs
corresponding to structures of the social reality of the project initiators (proactive goals). Quantitative changes
mean changes in the material life conditions of a particular person, group, or society. Qualitative changes mean
a change in an individual’s, group or society consciousness. An action is a single procedure of implementing a
social project, a process is the implementation of the long-term projects with a common social purpose.
Most business people pointed out that the hallmark of a social project is absence of commercial orientation.
Besides, experts believe that social projects and business projects differ radically at all stages of their life-cycle,
including the stage of accomplishing all the goals or objectives. Only one of the experts in this group
mentioned the interrelation between the two, noting that “a social project is always a part of a business project
in terms of the problems of employment, self-fulfillment, and education”.
Civil society representatives identified two distinctive characteristics of a social project: first, the
complexity of measuring goals and objectives in financial terms (55%), and second, cost and need for external
financing (45%).
Among the distinguishing characteristics of social projects representatives of state bodies named the effect
of projects in a social sphere (67%) and absence of profits (33%). One of the experts pointed out that “the
concept ‘social’ is absolutely incompatible with the concepts of ‘business’ and ‘politics’”.
It should be noted that such a polarization of expert opinions (i.e., to see a social project as part of the
business project and, conversely, to completely exclude business and politics from the social aspects) clearly
illustrates a mutual mistrust of key actors in the process.
In response to a question about the role of social projects in the socio-economic development of the
country, the region, a company, and an individual, almost all business representatives were unanimous. Most
experts agreed that high-quality system social projects at any of the above levels make the process of

AN EMPIRICAL STUDY OF THE CONTENT CHARACTERISTICS OF SOCIAL PROJECTS
5
socio-economic development balanced and sustainable, form relationships significant to the economy,
contribute to the stability of the environment.
Civil society representatives identified more practical aspects of the role of social projects, such as
creation of labor markets, maintaining balance and social equilibrium, formation of a community of reasonable
individuals, development of human potential.
The majority (65%) of public authorities’ representatives noted that social projects stimulate growth and
development of public institutions, other experts pointed to a cause-and-effect relationship between the level of
social and economic development and the quantity and quality of social projects implemented.
The analysis of respondents’ views on the importance of social projects has enabled to define their
descriptive and normative features. The descriptive features include the following:
overcoming specific urgent problems in a society;
implementing state social policy;
quantitative changes in the material life conditions of an individual or a social group;
creating labor markets;
implementing social innovations;
two-way influence of the quality and quantity of social projects and the level of socio-economic structure
(company, region, country).
Normative (standard-setting, desirable, target) features include:
encouraged development of state institutions;
stability of the environment, balanced socio-economic development;
formation of a community of reasonable individuals;
development of human potential.
In response to the question on priority and importance of community development areas (healthcare,
education, culture, and sports), 70% of the representatives of the business community emphasized the need for
equal and harmonious development of all areas, 30% of them pointed to the importance of implementing
projects in one of them.
Most representatives of the civil society (63% and 54%, respectively) considered education and healthcare
as priority ones, and only a third of experts believed that the above-mentioned social spheres are equally
important.
Similar comments were received from the representatives of the state, who considered education and
healthcare as priority (half and half, respectively), while 33% pointed to the importance of all the spheres.
Overall, more than a half of the experts been surveyed (56%) shared the same opinion on the matter and
considered social projects in education as priority. Almost all of the experts believe that the situation in the
Voronezh administrative region, in general, is no different from the nationwide practice of social engineering.
In response to the question of the role of the government, business and non-profit organizations in social
engineering, all business representatives pointed out that the state has a key responsibility in social
development, personality formation, his/her values and ideals. At the same time, 70% of the respondents
mentioned that the government should encourage businesses to participate in social projects, not imposing any
unusual functions and not interfering with the business processes, and noted untapped and underused business
potential in social projects. Only 40% of experts emphasized a creative role of non-profit organizations in

AN EMPIRICAL STUDY OF THE CONTENT CHARACTERISTICS OF SOCIAL PROJECTS
6
social engineering.
Over a half of the civil society representatives (55%) see non-profit organizations as the initiators, insiders
and monitors of the process, 45% of them think that the state plays a key role in social engineering. A
significant proportion of experts (55%) refer to the role of business in financing projects, however, half of them
mention that in a negative context.
All government officials underline the key role and responsibility of the state. “Vector, regulatory
frameworks, standards, algorithm and goals are all set by the state, all the rest can join. We have very weak
non-profit board practices”, according to an expert. Only one representative of public authorities mentioned the
need for public-private partnerships in implementation of social projects.
It is obvious that such a spread of experts’ opinions on these issues emphasizes mistrust and disagreement
of the participants’ opinions on various aspects of social projects. At the same time, it is quite symptomatic that
all the experts noted the leading role of the state.
In response to the question on active participants in social projects, most business representatives defined
them as devotees—people with a proactive approach to life, the leaders, that is, individuals. Almost half of the
respondents (42%) reported an active role of the state and business in social projects implementation.
Representatives of the civil society (80%) consider community organizations, volunteers, and people with
their everyday concerns and unresolved questions as active participants in social projects. Only 20% of
respondents indicated an active role of the state and business, and one of the experts stated that “a social project
can only be inspired by an individual’s personality”.
All representatives of public authorities consider state structures as active participants in social projects.
Only 30% of the experts mentioned business structures alongside with the state ones.
The responses to a set of questions related to the key actors of the process highlight the need for their
cooperation, information exchange, creation of a concept of social projects customers, support and
encouragement of devotees and volunteers.
The question “Who is most interested in the results of social projects?” caused quite a wide range of
opinions among the business representatives. One third of the experts reported that all participants in the
process are equally interested, but from different perspectives. According to one of the experts, “The state is
interested in increased power and influence, customers are interested in the regularity of social projects and
support, business structures pursue an objective of better public relations and motivation of personnel, since
employees are proud of their enterprise participating in social projects”. One third of respondents believe that
customers are those mostly interested for the sake of stability and productivity; 28% emphasized that target
users of a social project are those most interested in its implementation. One expert noted that it is an individual
personality who is most affected by a project.
Most of the civil society representatives responded that target users are affected, since “their problems of
security and social guarantees are resolved”; 27% of the experts stated that everybody should be interested in
an effective project. According to one of the experts, “Everyone living here who believes this to be their
country. There should not be any contradiction. As soon as we start to make distinctions, social problems come
up”. The same percentage (27%) of experts believe that they project initiators and implementers of the process
are those most interested in results, since they gain “the capitalization of a human personality”.
Half of the representatives of public authorities noted that the results of social projects are of most interest

AN EMPIRICAL STUDY OF THE CONTENT CHARACTERISTICS OF SOCIAL PROJECTS
7
to the citizens, the population. One third of the experts believe that everyone should be interested; two experts
mentioned that the main interested party is the state. According to one of them, “The state is the most
concerned as all the effects of social projects are large-scale, long-term, and global. The result is often
postponed”.
Differences in the contextual definition used by different groups of experts seem worth emphasizing. Thus,
business representatives name target users as those most interested in social project results, civil society
representatives mention the society, beneficiaries, individuals, and the representatives of public authorities’
report of the citizens, the population.
In response to the question “What determines the success of a social project?”, the majority of business
representatives pointed out three factors, clear goals and objectives, the right selection and formation of
instruments, and adequate resources. Many experts (42%) highlighted the role of the individual leader and
implementer of the project. Two of the experts drew their attention to the readiness and maturity of the project
consumer (target user). One expert pointed out the importance of a systemic vision and actions in the field of
social engineering.
Most civil society representatives consider personal characteristics of the initiators, leaders, project team,
and project partners as the key success component of a social project. According to one of the experts, “Success
of a project depends on the initiator persistence, the strength and power of the first intention”. Most experts
stress the importance of coordination and resource management skills, while 35% believe the “right goals” are
a significant success component. Two experts noted the importance of the information component, social
project publicity.
What stands out in the survey is the diversity of opinions of the representatives of public authorities on the
components of success of a social project. Half of the surveyed experts stress the importance of the project
timeliness and its focus on a specific category of citizens. One third of the respondents believe the key success
factor is the interaction between all project participants, another third consider financing as a significant
measure of success, one of the experts emphasizes a proactive leader’s position, and another one notes the
personnel and management competence.
The final question in the essential set was the one on the factors that affect the intensity of development of
social projects in Russia and the Voronezh administrative region. Most representatives of the Voronezh
business structures believe that the intensity of development is directly related to the activity and demands of
civil society, and 42% of respondents believe that it is essential to create effective institutions for social projects
preparation and implementation. However, most experts emphasize that it is the state structures which are
responsible for the creation of such institutions.
Most civil society representatives associate the development of social engineering with the development of
a society, citizens’ initiatives, and preservation of the democratic trend. What stands out in the survey is the
analysis and inclusion of the own civic position in development factors. Thus, according to one of the experts,
“For many involved in social projects it is a form of internal emigration, civil immunity, a meaningful existence
in this paradoxical world”. Over one third (36%) of respondents relate the intensity of development of social
projects with governmental support and initiatives.
Most representatives of public authorities associate the development of social engineering with
government agencies, government support, and gubernatorial initiatives; and only one of the experts links
community development with the development of the civil society.

AN EMPIRICAL STUDY OF THE CONTENT CHARACTERISTICS OF SOCIAL PROJECTS
8
Results and Conclusions
It is advisable to use the structure of “root definitions” from the Soft Systems Methodology (SSM) by
Checkland and Scholes (1990) as a tool to organize and record the empirical data. A root definition reflects a
particular point of view on the process, the vision of the system by a party or parties. This is a clear and concise
description of the process vision, through the mandatory structural elements. Information structured with
consideration of all the foregoing elements, on the one hand, make the report concise, and on the other hand,
quite amply reveal the position of the process parties (see Table 2).
Table 2
Substantial Characteristics of the Structural Elements of Social Projects
Structural elements Representatives of business structures
Representatives of civil society institutions
Representatives of public authorities
Clients (benefit from social projects implementation)
Society ready to accept a social project
Specific users, beneficiaries, whose problems of security and social protection are solved
Citizens, population
Actors (key participants of the process)
Active people, the state as a regulator of the relations, business leaders establishing the level for social responsibility
Public organizations, volunteers, people with long-standing unresolved problems
State structures, business structures
Transformation (description of the nature of social changes)
Development of public relations, quantitative and qualitative changes in living conditions
Solving specific social problems, quantitative and qualitative change of the living conditions
Creation of a comfortable environment, elimination of anti-social phenomena, introduction of social innovation
Outlook (basic assumptions about the significance of the results of social projects)
Stable, harmonious and balanced socio-economic development
Creation of labor markets, preservation of social equilibrium, human development, formation of tastes, rituals, social criteria, consumer culture
Stimulate the development of the state, region, accelerate economic growth
Owners (people who seriously affect the launch and implementation of social projects, able to dramatically change the effectiveness of their implementation)
Public authorities, major business
Society, public authorities Public authorities
Significant environmental factors
Development of the civil society, social project customer institutionalization, promotion and popularization of social activity
Social landscape of the region, personal activity of citizens, civil society development, government support
Government support, governor’s initiatives
The empirical evidence derived from this study has enabled to identify the sore points of the process:
(1) Mistrust and lack of coordination of participants, search for options for cooperation, distribution of
responsibilities;
(2) The need for creation of stimulating public policies (regulatory, legislative, tax regulations, and
procedures);
(3) Lack of social order, customers not ready, lack of consumers’ interest;
(4) Absence of effective institutions for social projects preparation and implementation, need for training
personnel;
(5) Lack of awareness, lack of promotion and popularization of social activity, ideas, project initiatives.

AN EMPIRICAL STUDY OF THE CONTENT CHARACTERISTICS OF SOCIAL PROJECTS
9
References Bogomolov, O. T. (2010). Non-economic facets of economy: The unknown interference. Moscow: Institute of Economic
Strategies. Castel, R. (2009). Metamorphosis of the social issues: Chronicles of wage labor. St. Petersburg: Aletheja. Checkland, P., & Scholes, J. (1990). Soft systems methodology in action. New York: John Wileys Sons Inc.. Grigorieva, I. A. (2011). Current social policy: Opportunities and limitations. St. Petersburg: SU named after Alexander Pushkin. Kleiner, G. B. (2011). System resource of economy. Problems of Economics, 1, 87-114. Mau, V. A. (2012). Economy and politics in 2011: Global crisis and search for a new growth model. Problems of Economics, 2,
7-30. Moskovskaya, A. A. (2011). Russian and global social entrepreneurship. Moscow: Publishing House of the Higher School of
Economics. Yadov, V. A. (2009). Modern theoretical sociology as a conceptual framework. St. Petersburg: Intersotsis.

Management Studies, ISSN 2328-2185 January 2014, Vol. 2, No. 1, 10-20
Dimensions of the Internationalization-Performance
Relationship: Applied to Euronext 100 Multinationals
Samia Belaounia
Neoma Business School, Mont-Saint Aignan, France
Mehdi Nekhili
University of Reims Champagne Ardennes, Reims, France Neoma Business School, Mont-Saint-Aignan, France In spite of the extensive literature regarding the relationship between corporate internationalization and performance, questions still remain due to conflicting empirical results. Is this due to the diversity of the conceptualization of international profile? The results of statistical non-parametric tests obtained from a sample of 68 Euronext 100 companies over the period 2005-2009 point to a different relationship, between internationalization and performance, depending on whether the extent of international activities or their dispersion is considered.
Keywords: internationalization, performance, multinationals, Euronext
Introduction
Since the beginning of the 1980s, globalization has been introduced as a hegemonic phenomenon. An
abundant literature focuses on the impact of internationalization strategies on performance, with fields as
diverse as international management, financial theory or industrial organization. Beyond the diversity of the
functional graphs testing for the internationalization-performance relationship (in U, J, inverted-J or even
S-shaped forms) that lead Allen and Pantzalis (1996) to make it endogenous, the inverted U-shape dominates.
In other words, an increase in the degree of internationalization boosts performance, but only up to a specific
threshold, beyond which the influence of internationalization becomes unfavorable. The curve’s inflexion point
could coincide with intermediate levels of the degree of internationalization, along a continuum. Empirical
results, however, appear contradictory, leaving the internationalization-performance relationship dangling.
Approximately 40 years of research has given rise to more questions than answers, pushing Glaum and
Oesterle (2007), to highlight this point in their article’s title. Could the diversity of the conceptualization of
internationalization explain the differences in results, leading us to believe that it is merely an apparent
contradiction? Indeed, research does not prioritize the same dimension of internationalization. A case in point,
dispersion can both target geographic markets seeking to qualify international positioning without accounting
for the fact that production or other links of the value chain are relocated; or be apprehended by the
contribution level of foreign subsidiaries to group activity overlooking positioning diversity. In each case,
Samia Belaounia, Associate Professor, Finance Department, Neoma Business School. Mehdi Nekhili, Professor, Finance Department, University of Reims Champagne Ardennes; Affiliated Professor, Finance
Department, Neoma Business School. Correspondence concerning this article should be addressed to Samia Belaounia, 1, Rue du Maréchal Juin, 76130, Mont-Saint
Aignan, France. E-mail: [email protected].
DAVID PUBLISHING
D

DIMENSIONS OF THE INTERNATIONALIZATION-PERFORMANCE RELATIONSHIP
11
distance and location were not crossed-checked. For instance, pure exporters are not identified; and when
location is accounted for, international profiles are not ranked by the cultural or spatial heterogeneity of
geographical zones, which could be used to characterize positioning.
This point, therefore, justifies studying the internationalization-performance relationship by connecting
each internationalization dimension to performance as a means to better define internationalization. Moreover,
the corollary provides a richer characterization of the international profile, accounting for both distance and
location. Another reason for this study lies in the fact that most studies focus on either American or Asian
companies. Yet, the non-neutrality of the country of origin (Glaum & Oesterle, 2007) reinforces this question
for European multinationals. Our method evaluating the degree of internationalization is based on a typology of
geographical zones which are richer than the Triade, and commonly used in empirical studies.
Our article is structured as follows. In part one, we review the literature on
internationalization-performance relationship and showcase the merits of a multi-dimensional approach to
internationalization. In part two, we assess our methodology (sample, variables, and statistical methods). In part
three, we show and provide a discussion of our results.
Internationalization and Performance: The Relationship Remains Ambiguous
Internationalization: Advantages, Costs, and Risks
The benefits of internationalization are numerous, with each management field emphasizing a specific
dimension. Internationalization, for instance, pushes business beyond domestic frontiers by using its surplus
strategic assets. Indeed, these assets cannot be bartered due to the importance of transaction costs (Rugman,
1981). Pooling the use of specific assets across different geographic zones also yields economies of scale on an
international level, which are also idiosyncratic. Providing a distinctive perspective, the asset management
theory emphasizes lowering risk by taking positions across geographical zones whose economic parameters are
inversely correlated (D. J. Denis, D. K. Denis, & Yost, 2002). Another means of reducing risk lies in
transferring mature products towards markets which are in the growth phase of the product life cycle (Vernon,
1966). Finally, by internationalizing, the company leverages market imperfections to establish itself in host
countries, taking advantage of tax systems, operating costs and access to financial resources (Dunning, 2001).
In terms of the learning process, internationalization helps build the skills providing better operational
flexibility compared to solely domestic entities (Kogut, 1985).
Nevertheless, leveraging these advantages also triggers costs that found the U-shaped form of the
internationalization-performance relationship. Literature distinguishes two types of costs, which borne at the
beginning of the internationalization process, due to a certain ignorance of local markets with different cultural,
institutional, and economic codes. These are required costs to reunite local market information to adapt
products to the targeted zones. Costs can also arise from the stigma foreign companies which are subjected to
by state authorities of host countries or simply due to the economic patriotism of local consumers (Zaheer,
1995). More, beyond a certain degree of internationalization, the company bears a second type of costs. They
are viewed as transaction costs, and are linked to costs borne to coordinate culturally diversified sets, for
example, multicultural teams at operational or management levels (Hill, 1988). Costs borne to manage
information increases with the degree of internationalization and the distance between operational units, when
conceived multi-dimensionally based on a Ghemawat (2001) approach. Coordination efforts may saturate
management capacity.

DIMENSIONS OF THE INTERNATIONALIZATION-PERFORMANCE RELATIONSHIP
12
While most of the works converged towards an inverted U-shape to characterize the
internationalization-performance relationship, empirical results diverged. Several factors explain this point.
First, strategic motivations may vary with the stage of internationalization. For instance, Prange and Verdier
(2011) showed that at the beginning of the process, the company primarily seeks commercial efficiency and
seeks to strengthen its local establishment, which does not necessarily mean optimizing its return on investment
(ROI). Results of the Ruigrok and Wagner (2004) meta-analysis back this interpretation. Drawing on 62
empirical studies taken from 10 academic reviews, recognized as references in management, the studies point
to an enhanced relationship between the degree of internationalization and performance, impacted by the
contextual parameters which are linked to strategic aims. The authors highlight the differential impact of
increased internationalization on performance according to the dimension accounted for performance. Like
many empirical studies, impact is significantly higher when a pure operational performance (via cost cutting) is
accounted for as opposed to a synthesized profitability indicator based on accounting data.
Internationalization, a Multi-dimensional Concept
Diverging results were also found in the diversity of the dimensions of internationalization considered by
the studies. Internationalization must be considered as a multi-dimensional concept (Sullivan, 1994). As such, a
scope of geographic zones are defined by the degree of foreign market penetration and production relocation,
these two dimensions respectively overlap the width and depth of internationalization. Few studies postulate a
different impact regarding the performance of the dimensions of internationalization. Goerzen and Beamish
(2003), for instance, postulate that the depth of internationalization plays positively on performance (by
prioritizing economic advantages in terms of experience and flexibility). Nevertheless, width (via the number of
targeted countries) generates the opposite effect due to the complexity fostered by managing units overseeing
diverse environments (Kostova & Zaheer, 1999). This leads to the necessity to provide locally-adapted answers
to the strategic and management issues confronted in these environments. For subsidiaries, there may be
internal translation costs to comply with local demand, creating differences between local practices and that of
the centre. When standardization is global, the company also bears high translation costs to satisfy the host
country’s expectations. These are two types of costs linked to the diverse environments the company addresses
(Goerzen & Beamish, 2003).
Allen and Pantzalis (1996) also observed the highest levels of operational flexibility, a privileged
dimension of performance, for key international networks which are moderately deep and scattered. Allen and
Pantzalis (1996) characterized the multinational’s network as the result of an arbitrage between width and depth,
without postulating a defined direction on how these dimensions influence performance. Operational flexibility
represents a multinational’s capacity to optimally transfer resources among its operational, research, marketing,
and financial units. As such, one of the advantages the multinational draws on versus a domestic company, is
the availability of an internal market to optimize resource location and transfers and thus provide greater
flexibility. Consistent with this perspective, authors conceptualize operational flexibility as a portfolio of
material and financial options which have been withdrawn from multi-nationalization.
Research Methodology
The Sample
The sample includes non-financial companies, from the Euronext 100 during the period 2005 to 2009. The
sample contains 68 companies (see Table 1). Financial, real estate, and insurance companies were excluded.

DIMENSIONS OF THE INTERNATIONALIZATION-PERFORMANCE RELATIONSHIP
13
Companies which did not provide sufficient data on the geographic dispersion of their activities were also
excluded.
Table 1
List of the Sample Companies Ab Inbev, Accor, Ahold, Air France-KLM, Air Liquide, AkzoNobel, Alcatel-Lucent, ALSTOM, ASML, Belgacom, Bouygues, Brisa, Capgemini, Carrefour, Casino, Guichard, Christian Dior, Colruyt, Danone, Dassault Systèmes, DELHAIZE, DSM, EADS, EDP, Essilor, France Telecom, GDF Suez, Heineken, Hermes, Imerys, JCDecaux, KPN, L’Oréal, Lafarge, Lagardère, LVMH, Michelin, Mobistar, Pages Jaunes, Pernod Ricard, Peugeot, Philips, Portugal Telecom, PPR, Publicis, Randstad, Reedelsevier, Renault, Safran, Sanofi, Schneider, SES, Shell, Sodexo, Solvay, St Gobain, ST Microelectronics, Suez Technip, TF1, Thales, TNT, Total, UCB, Unilever, Veolia, Vinci, Vivendi, Wolters Kluwer.
The Variables
The variables were calculated using the consolidated financial statements of the sampled companies (see
Table 2).
Table 2
Summary of Parameters and Calculation Methods
Parameter Definition Calculation methods
ECAt Entropy calculated for year t revenue Geographic dispersion of revenues via the entropy index calculated using the structure of regional foreign sales
EEFt Entropy calculated for total employees for the year tGeographic dispersion of employees via the entropy index calculated per regional structure
ETAt Entropy calculated for total sector-based assets for the year t
Geographic dispersion of assets via the entropy index calculated for its regional structure
ROAt Rate of economic return for the year t Net income/Total assets
ROEt Rate of financial return for the year t Net income/Shareholders’ equity
Q Tobin t Q Ratio for the year t Total market capitalization and debt over total assets
The degree of internationalization and its dimensions. Literature speaks of two types of indicators used
to operationalize the profile of internationalization: corporate revenue share or capital equity invested in foreign
subsidiaries; the geographic dispersion of revenues via the entropy index calculated on its structure per region,
using the following formula:
Entropy (E) = ∑pi * ln(1/pi)
where pi is the weight of zone i in revenues or in total assets.
The disadvantage of the first variable lies in its failure to account for the distance between the
geographic markets targeted, since this parameter interferes with the company’s capacity to sell its products
and its potential exploitation of centralizing resources. Nevertheless, the second indicator integrating
distance does not account for the geographic setting. Nor does it allow us to differentiate pure exporters from
players who relocate a part of their value chain. It might, however, impact the organizational complexity
associated with structure, coordination costs, and the economic advantages yielded from internationalization.
Moreover, the geographic dispersion of employees displays the interest, unlike sector-based assets
(including tangible capital assets), of not being influenced by the degree of materialization and its capitalistic
intensity.
As such, we apprehend the international profile by the entropy index calculated for the geographic
distribution of revenues, division-based assets and employees on the basis of consolidated financial statements.

DIMENSIONS OF THE INTERNATIONALIZATION-PERFORMANCE RELATIONSHIP
14
Employees, for instance, refer to the group of consolidated entities and not just (like some studies) subsidiaries
in which their participating stakes exceed the 50% threshold.
Our characterization aims to cross-check distance with location.
Finally, due to its characteristics, the entropy index increases based on the number of zones in which the
company operates. For example, entropy associated with an equi-distribution of revenues for two different
regions is weaker than when associated to three regions. This is not inconsistent with our characterization of the
international profile, since the number of zones on which the company positions itself constitutes a dimension
of the geographic diversification which should be considered on a per company basis.
We consequently define three indicators linked to a dimension of internationalization:
The depth of internationalization is based on the degree of geographic dispersion alternatively with
revenues, assets, and employees at group level. This is calculated using the entropy index, and allows us to
cross-check distance (because sales, assets, and employees are divided on a continental basis and the criteria for
aggregation accounts, to some extent, for spatial and cultural homogeneity);
The width of internationalization is based on the number of continents where the company has operations,
and emphasizes the diversity of environments which the multinational firm faces with lesser or greater
management issues.
We do, however, underline that in practice it is difficult to differentiate a depth indicator from a width
indicator. Indeed, accounting for entropy’s properties, its value is impacted by the number of geographic zones
to calculate it, and which corresponds to our width indicator. This explains why we have integrated the number
of continents as an explicit variable.
Ultimately, the international profile is apprehended through the following four indicators:
ECAt: calculated entropy (for year t) from the revenue structure per geographic zone (i.e., by continent);
EEFt: calculated entropy (for year t) from the employee structure by geographic zone;
ETAt: calculated entropy (for year t) from the structure of assets by geographic zone;
NB: number of continents.
Typology of geographic zones. Financial data at our disposal covers the four geographic zones: Europe,
Americas, Asia-Pacific, and Africa-Middle East. By specifying Africa and the Middle East, the typology
appears richer than in most studies using the Triad as a sole reference like Rugman and Verbeke (2008) or
Rugman and Oh (2011)1. Our study uses a continent-based typology. Perhaps less sharp than Hofstede’s (1980)
typology, we consider, like Kwok and Tadesse (2006), that this strategy reflects cultural differentiation,
although it does not eliminate intra-continental heterogeneity. Indeed, each continent would encompass several
specific geographic zones through pre-cited typologies, each being homogenous in terms of identified cultural
dimensions2. Moreover, a continental typology would create subsets of countries within the same geographic
region, capturing, for instance, the spatial distance, another significant dimension in the localization decision.
Geographic distance may impact the location decision since companies tend to prioritize activities within their
immediate environment (Angué & Mayrhofer, 2010).
Performance measures. Three parameters are considered to measure performance: Return on Assets
(ROA), Return on Equity (ROE), and Tobin’s Q ratio. The first parameter, ROA calculates the firm’s stock
1 Indeed, the Triad does not separate Africa and the Middle East. 2 Thus, for example, South East Asia and “Confucianist” Asia, Latin Europe, and Northern Europe are highlighted, although available data does not yield the possibility of going as far as cultural differentiation.

DIMENSIONS OF THE INTERNATIONALIZATION-PERFORMANCE RELATIONSHIP
15
market valuation (firm’s total market value over total assets value), defining the level of economic
performance. The second performance parameter is ROE and defines the financial returns in terms of
shareholder investment. This parameter is calculated as the ratio between the net income and the level of
shareholder equity. The final parameter, the Q ratio measures the firm’s stock market value in relation to its
total assets, and measures the replacement costs of a firm’s assets. In several empirical studies, the
accounting value constitutes an approximate measure, but it is regarded as satisfactory in terms of the
replacement costs of assets.
Statistical Method
We use the Kruskal Wallis (KW) test, a non-parametric test which can be used to rank more than two
independent samples from the same population. It is particularly recommended when considered parameters do
not follow a normal distribution. Measuring data dispersion is not required for non-parametric tests when
samples originate from the same distribution. Too significant results in sample dispersion do not point to a
natural variance. Our population comprises European multinationals ranked on the Euronext 100 from 2005 to
2009. Since these companies were not economically linked to one another, we consider them to be independent
subgroups.
The KW test, therefore, helps establish a ranking by analyzing the samples two by two. These are
represented in our case by the quartiles constituted for each internationalization dimension. Two dimensions
are defined and operationalized through four parameters which are, respectively, the number of continents,
the degree of dispersion associated with the international structure of sales, employees, and assets. First, and
for each year, the companies are ranked in ascending order per indicator and internationalization degree,
leading to the constitution of four quartiles. Then, quartiles are paired and compared in terms of the sum of
average ranks which they respectively correspond to. Companies are ranked by using one of the performance
parameters.
In our study, four sample groups are compared, with the number of comparisons totaling six. These
comparisons cover quartiles of same group (except when internationalization is identified by the number of
continents), the critical value z is equal to 2.638 and the critical median (with a threshold risk of 5%) is 17.89.
Moreover, tests are carried out on an annual basis, to analyze year-on-year change and to identify cyclical
events, as well as to observe extraordinary events.
Results and Discussions
Table 3 displays the annual descriptive statistics of all our study parameters. We notice that apart from
assets (ETA), for which we expect the international deployment to be relatively static, the degree of
geographic dispersion of sales (ECA) and of employees (EEF) tends to increase over the period. More than a
focus, these figures translate intensified internationalization and a greater experience in this area from the
sample companies. Calculated entropy, however, for total assets (ETA) decreased in 2008 and in 2009
compared with the past figures and did so until 2007. Yet, this phenomenon is neither observed for the
geographic dispersion of employees (EEF) nor for the geographic dispersion of revenues (ECA). In terms of
performance parameters, the ROA and the ROE showed a sharp downwards trend for the same period
2008-2009. We may assign it to the cyclical context, by interpreting this as an after effect of the 2007-2008
crisis, whose impacts were registered a year later. The Q ratio weakened in 2008, but renewed with growth in
2009.

DIMENSIONS OF THE INTERNATIONALIZATION-PERFORMANCE RELATIONSHIP
16
Table 3
Descriptive Statistics of the Sample
Descriptive statistics Minimum Maximum Average Standard deviation
nb_continents 1 4 2.93 0.982
ECA2005 0 0.8813 0.5010 0.2130
ECA2006 0 0.8957 0.5153 0.2059
ECA2007 0 0.8908 0.5239 0.2030
ECA2008 0 0.9018 0.5295 0.2029
ECA2009 0 0.9176 0.5363 0.2005
EEF2005 0 0.8923 0.4222 0.2401
EEF2006 0 0.8874 0.4442 0.2335
EEF2007 0 0.8985 0.4575 0.2273
EEF2008 0 0.9102 0.4646 0.2325
EEF2009 0 0.9146 0.4637 0.2318
ETA2005 0 0.8635 0.4348 0.2276
ETA2006 0 0.8487 0.4440 0.2241
ETA2007 0 0.8854 0.4639 0.2151
ETA2008 0 0.8738 0.4453 0.2196
ETA2009 0 0.8768 0.4319 0.2409
ROA2005 -0.0571 2.3361 0.1180 0.2821
ROA2006 -0.0094 2.7871 0.1294 0.3383
ROA2007 -0.2709 2.3310 0.1311 0.3123
ROA2008 -1.3200 2.1704 0.0782 0.3173
ROA2009 -0.3433 2.5491 0.0982 0.3336
ROE2005 -0.3961 0.6413 0.1806 0.1328
ROE2006 -0.1437 0.5668 0.1799 0.1177
ROE2007 -0.2960 0.8411 0.2036 0.1746
ROE2008 -0.9902 1.5165 0.1537 0.2518
ROE2009 -0.1863 1.5201 0.1237 0.2152
QRATIO2005 0.0232 56.5664 2.7497 7.0994
QRATIO2006 0.0236 53.3832 2.9953 7.0760
QRATIO2007 0.0388 51.5979 2.9839 7.9984
QRATIO2008 0.0297 35.4948 2.1130 5.2122
QRATIO2009 0.0302 54.2598 3.1269 8.0640
The multi-variance analysis should enlighten us on the nature of the relationship between the degree of
internationalization and the performance. As such, let us note that our observations consolidate our interest in
analyzing this relationship annually and on an individual corporate group level. The observation of minimal and
maximal values, as well as the standard deviation of the group of variables, points to strong data dispersion,
justifying the recourse to non-parametric tests. The multi-variance analysis uses the KW test by
operationalizing the intensity of internationalization by its depth (entropy) and its width (number of continents).
Table 4 presents test results carried out on average companies with different performance indicators for each
category of entropy in our study. Let us recall that each time we move from one quartile to the next one up, the
degree of internationalization increases.
Apart from the year 2009, the only relevant results were obtained when the geographic locations were
compared in terms of ROE and the Q ratio, with a different effect on internationalization depending on the
performance parameter used. Table 4 shows relevant results for the ROA. Moreover, the key relevant

DIMENSIONS OF THE INTERNATIONALIZATION-PERFORMANCE RELATIONSHIP
17
comparisons are highlighted when the depth of the internationalization was operationalized by the geographic
dispersion of material assets other than employees (ETA). Indeed, results are neither relevant with geographic
dispersion of revenues (ECA) nor with that of employees (EEF).
Table 4
Results of Comparative Tests Considering the Depth of Internationalization (Entropy)
2005 2006 2007 2008 2009
ECA EEF ETA ECA EEF ETA ECA EEF ETA ECA EEF ETA ECA EEF ETA
ROA
Q1-Q2 -3.29 7.47 -7.8 7.23 7.94 -0.41 7.53 4.76 1.64 5.82 2.47 -1.35 2.17 -2.82 -3.35
Q1-Q3 -16.8* 1.41 3.06 7.47 -0.47 -2.94 8.11 0.35 7.76 9.64 6.3 -8.59 10.23 6.11 9.17
Q1-Q4 -13.5 -6.06 -4.53 0.23 6.76 -3.82 5.94 6.35 1.53 3.47 11.35 3.94 11.7 6 6.06
Q2-Q3 -9.2 10.53 10.9 10.17 -8.41 -2.53 -0.59 -4.41 6.11 3.82 3.8 -7.23 8.06 8.94 12.53
Q2-Q4 -5.9 3.06 3.3 2.94 -1.17 -3.41 -1.59 1.59 -0.12 -2.35 8.9 5.3 9.53 8.82 9.41
Q3-Q4 7.64 9.11 -7.6 2.7 7.23 -0.88 -2.17 6 -6.23 -6.17 5.06 12.53 1.47 -0.12 -3.11
ROE
Q1-Q2 6.59 5.29 -14.06 4.24 8.12 -4 6 2 -5 4 -1.24 -13 2.18 -3.41 -9.23
Q1-Q3 14.12 1.65 5.35 14.94 4.12 7 10 2 7 8 3.12 -7 11.94 0.94 7.05
Q1-Q4 11.53 11.76 2 11.53 11.65 4 6 6 3 10 13.53 6 17.06* 10.82 10.05
Q2-Q3 7.53 -3.65 19.41** 10.71 -4 11 4 0 12 4 4.35 5 9.76 4.35 16.29*
Q2-Q4 4.94 6.47 16.06 7.3 3.53 8 0 5 8 6 14.76 19** 14.88 14.23 19.29**
Q3-Q4 -2.59 10.12 -3.35 -3.41 7.53 -3 -4 5 -5 2 10.41 14 5.12 9.88 3
Q ratio
Q1-Q2 -8.29 -7.06 -13.41 -17.47* -1.35 -15 -16* -7.53 -14.6 -15.7 -1.9 -17.7* -20.9** -6.9 -16.3*
Q1-Q3 -25.65** -23.23** -31.58** -34.82** -23.53** -31** -34.9** -29.5** -32.3** -34.1** -22.9** -31.9** -30.1** -14.3 -32.9**
Q1-Q4 -26.41** -35** -48.06** -43.6** -32.41** -48** -44.3** -34.4** -47** -45.3** -31.5** -47.7** -43.2** -32.8** -48.8**
Q2-Q3 -17.35** -16.17* -18.17** -17.35* -22.17** -16* -18.3** -21.9** -17.7* -18** -21** -14.2 -9.2 -7.4 -16.5*
Q2-Q4 -18.12** -27.94** -34.64** -26.11** -31.06** -33** -27.8** -26.9** -32.4** -29.5** -29.5** -30** -22.2** -25.9** -32.5**
Q3-Q4 -0.76 -11.76 -16.47* -8.76 -8.88 -17* -9.4 -4.5 -14.6 -11.2 -8.5 -15.8 -13.1 -18.5** -16
Notes. * Relevant at 10%; ** relevant at 5%.
For instance, in 2005, 2008, and 2009, from the second quartile, the growing depth of internationalization
(via the geographic dispersion of assets—ETA) is accompanied with a deterioration of the ROE, independent of
crisis effects. Furthermore, in 2005 and in 2009, companies of the second quartile distinguish themselves from
the third quartile, this advantage is also expressed as an entity constituting the fourth quartile of 2009.
Moreover, for this final year, when the degree of internationalization is operationalized by the geographic
dispersion of sales (ECA), the advantage of weak internationalization also takes the lead, but only for the
“extreme” quartiles (quartiles 1 and 4), with a threshold risk of 10%.
When financial performance is measured using accounting data (ROA and ROE), results reflect the
superiority of a relatively weak internationalization strategy, and given a specific threshold and only for the
geographic dispersion of assets (ETA). Considering market performance (Q ratio), we observe, unlike past
results, a growth relationship between the degree of internationalization and performance. Moreover, relevant
comparisons concern a larger share of the sample and are convergent for the three depth-based parameters. For
companies in the second half of the sample (quartiles 3 and 4) and representing the more internationalized
groups, market performance (Q ratio) appears superior to the ratio recorded respectively for the first two
quartiles. Moreover, when considering revenues, assets, or employees on an annual basis, we can rank three
quartiles out of four. What justifies the favorable impact of internationalization on market performance could
be the stock market’s perception of a lower risk factor for the more internationalized entities (Morck & Yeung,

DIMENSIONS OF THE INTERNATIONALIZATION-PERFORMANCE RELATIONSHIP
18
1991). Indeed, our geographic typology is continent-oriented, the higher levels of entropy should be congruent
with a significantly high degree of internationalization. This interpretation helps explain geographic zone
positioning whose economic parameters are inversely correlated, hence a weaker risk. This reading also
explains the difference in results whether we consider the return on assets (for which none of the quartile
comparisons seem relevant) or the return on equity. An explanation is that internationalization favors the use of
debt leverage, benefiting return on equity. As such, and for the entire sample, the average ROE seems to exceed
that of ROA, which should illustrate the existence of leverage (see Table 3) on shareholder equity profitability.
Yet, this remark is valid for most of the companies taken individually. As such, the most internationalized firms
have more debt due to the geographic diversification of their activities, allowing them to reduce their
operational risk (Shapiro, 1999).
Table 5 displays comparative tests of the ranks based on the width of internationalization (operationalized
by the number of continents3). It shows that the width of internationalization does not maintain the same
relationship with performance as with depth. Furthermore, the impact on performance is conditioned by the
considered dimension of this latter parameter, i.e., assets (ROA), equity (ROE), or market valuation (Q ratio).
Indeed, the number of continents in which the company has activities negatively impacts performance, it should
be financial or economic. This remark is valid for the entire period due to the statistical nature of this parameter.
Multinational firms, for instance, established on one continent generate returns on assets and shareholder equity
which are greater than companies with a presence across four continents, result that may induce difficulties
linked to the management of a strong spatial and cultural heterogeneity. However, this result is only for
“extreme” profiles, companies with entities across two or three continents are neither set out from the latter nor
amongst themselves by their financial performance. Beyond the differences in how the width of
internationalization is operationalized, this result seems coherent with that of Goerzen and Beamish (2003).
Table 5
Results of the Comparative Tests by Considering the Width of the Internationalization (Number of Continents)
Results of the non-parametric tests ROE ROA Q ratio
Type 1-Type 2 17 17 -8
Type 1-Type 3 16 16 -28.5**
Type 1-Type 4 23** 23** -26.4**
Type 2-Type 3 1 1 -20.5**
Type 2-Type 4 6 6 -18.4**
Type 3-Type 4 7 7 -2.03
Notes. ** Relevant at 5%. Type 1: companies established on one continent; Type 2: companies established on two continents; Type 3: companies established on three continents; and Type 4: companies established on four continents.
Conclusions
Results of our empirical study show that the complex relationship between internationalization and
performance depends on the considered dimensions of internationalization and performance respectively.
Indeed, whether the first one is conceived through the geographic dispersion of sales, of employees or of assets,
we know that internationalization has a negative influence on performance or neutralizes it. So, the majority of
relevant results are observed for the depth of internationalization identified by the geographic distribution of 3 Let’s note that it is useless here to proceed with tests for each year, the number of continents remaining stable for each group for the entire period.

DIMENSIONS OF THE INTERNATIONALIZATION-PERFORMANCE RELATIONSHIP
19
assets. A negative impact linked to the expansion of internationalization’s width (with less conclusive results
however) is also observed for the ROI parameters.
More, regardless of whether performance is based on accounting data or integrates the stock market price,
the effects of internationalization are different. When performance uses historical data, the growing balance in
the intercontinental distribution of activity seems neutral regarding the return on assets. So, contrary to the
dominant theory argument, it would not be accompanied by more complex management, additional adaptation
costs and/or a loss of reactivity attributable to coordination requirements. It does, however, negatively impact
the return on shareholder equity, at a given degree of internationalization. Nevertheless, when the performance
indicator integrates the stock price, we observe a growth relationship. Would this represent an advantage in
terms of risk? Let’s note that this hypothesis seems strengthened by the observation of a favorable influence of
internationalization on financial profitability which disappears when economic profitability is assessed. Our
operationalization of economic and financial performance, therefore, raises the interpretative hypothesis of how
debt leveraged is optimized. This could be based on investors’ perception of a weaker risk for profits below a
defined internationalization threshold.
Ultimately, our study tends to consolidate the importance of a multi-dimensional conceptualization of the
internationalization to optimally identify their impact on performance. This could also contribute to strengthen
the thesis according to which the contradiction of obtained empirical studies would only be apparent, linked in
part to a different conceptualization of the international profile between the different studies.
References Allen, L., & Pantzalis, C. (1996). Valuation of the operating flexibility of multinational corporations. Journal of International
Business Studies, 27, 633-653. Angué, K., & Mayrhofer, U. (2010). International Joint-ventures in R&D: The effects of distance on the choice of the partners’
country of orign. Management, 13(1), 1-37. Denis, D. J., Denis, D. K., & Yost, K. (2002). Global diversification, industrial diversification, and firm value. Journal of Finance,
57(5), 1951-1979. Dunning, J. H. (2001). The eclectic (OLI) paradigm of international production: Past, present and future. International Journal of
the Economics of Business, 8(2), 173-190. Ghemawat, P. (2001). Distance still matters: The hard reality of global expansion. Harvard Business Review, 79(8), 137-147. Glaum, M., & Oesterle, M. (2007). 40 years of research on internationalization and firm performance: More questions than
answers?. Management International Review, 47, 307-317. Goerzen, A., & Beamish, P. W. (2003). Geographic scope and multinational enterprise performance. Strategic Management
Journal, 24(13), 63-67. Hill, C. W. (1988). Differentiation vs. low cost or differentiation and low cost: A contingency framework. Academy of
Management Review, 13(3), 401-412. Hofstede, G. (1980). Culture’s consequences: International differences in work-related values. Beverly Hills, C.A.: Sage. Kogut, B. (1985). Designing global strategies: Profiting from operational flexibility. Sloan Management Review, 26, 27-38. Kostova, T., & Zaheer, S. (1999). Organizational legitimacy under conditions of complexity: The case of the multinational
enterprise. Academy of Management Review, 24, 64-81. Kwok, C. Y., & Tadesse, S. (2006). National culture and financial systems. Journal of International Business Studies, 37(2),
227-247. Morck, R., & Yeung, B. (1991). Why investors values multinationality?. Journal of Business, 64, 165-187. Prange, C., & Verdier, S. (2011). Dynamic capabilities, internationalization processes and performance. Journal of World
Business, 46(1), 123-133. Rugman, A. M. (1981). Inside the multinational: The economics of international markets. London: Croom Helm. Rugman, A. M., & Oh, C. H. (2011). Methodological issues in the measurement of multinationality of US firms. Multinational

DIMENSIONS OF THE INTERNATIONALIZATION-PERFORMANCE RELATIONSHIP
20
Business Review, 19(3), 202-212. Rugman, A. M., & Verbeke, A. (2008). A regional solution to the strategy and structure of multinationals. European Management
Journal, 26, 305-313. Ruigrok, W., & Wagner, H. (2004). Internationalization and firm performance: Meta-analytic review and future research
directions. Proceedings of Annual Meeting of International Business. Stockholm, Sweden. Shapiro, A. C. (1999). Multinational financial management (6th ed.). New Jersey: Prentice Hall. Sullivan, D. (1994). Measuring the degree of internationalization of a firm. Journal of International Business Studies, 25,
325-342. Vernon, R. (1966). International investment and international trade in the product life cycle. Quarterly Journal of Economics, 80,
190-207. Zaheer, S. (1995). Overcoming the liability of foreignness. Academy of Management Journal, 38(2), 341-364.

Management Studies, ISSN 2328-2185 January 2014, Vol. 2, No.1, 21-34
A Strategic Perspective to Small Firms in Relationship
Marketing: A Case Study of Francistown
Rodreck Chirau, Sumburani Sigauke
Botho University, Francistown, Botswana
This paper seeks to advance the strategies which can be employed by small-scale retail outlets as they normally
fight for survival. Many small firms face a number of challenges in terms of technology, economic strength,
geographic expansion, human resources, and relationship marketing. These challenges emanate duly from the
untrained and inexperienced workforce that knows little about the tools needed to market products and services
successfully. Not only that, but even many small-scale retail service providers are pushed into their business with
very little or actually without any marketing knowledge. They are driven some by seeing small niches in the market
or just they have enough capital to start a small business. Little focus is actually made on the longer-term customer
lifetime value; hence most of them fail and close down. This paper shall merge the literature review with the
practical situation of what is currently happening on the ground. Questionnaires were designed and handed to
small-scale retailers in Francistown, and follow-up interviews conducted to a randomly selected number of these
retailers. The small retail outlets considered had less than 30 employees, meaning between one and 30 employees.
This was done to ensure that effective strategies are put in place not only to help new start-up retailers and existing
ones, but also big firms that might have been neglecting the importance of relationship marketing. This paper
reframes and redefines the strategies for winning small-scale retailers that will compete locally and globally.
Keywords: relationship marketing, small retail outlets, strategies
Introduction
Relationship marketing became dominant in the 1980s and was exclusively applied to large firms. This
study attempts to explore possibilities that can be derived from its full exploitation. Most small firms in Africa
are facing mounting pressures to contain costs and improve quality given the dumping of mostly cheap Chinese
products on the market. China’s expansion and ascension as the second largest economy after United States of
America, has greatly affected the growth and sustenance of most small firms in Africa. So much pressure has
been mounted to both small and big firms in most developing countries. Overnight, customers have so many
different brands to choose from. This situation has also been compounded by the technological expansion and
improved technologies. Most firms are left without choice but to impose survival strategies. The irony of it all
is that survival is hugely depended on improved technologies. The solution now lies on an integrated delivery
network that involves customers/suppliers partnering and or any kind of alliances. Some authorities argue that
Rodreck Chirau, MBA, MSc., BA (English and Communication Studies), Business Department, Botho University. Sumburani Sigauke, MBA, Bachelor of Business Studies, Accounting Department, Botho University. Correspondence concerning this article should be addressed to Rodreck Chirau, P. Bag F451, Francistown, Botswana. E-mail:
DAVID PUBLISHING
D

A STRATEGIC PERSPECTIVE TO SMALL FIRMS IN RELATIONSHIP MARKETING
22
partnering may be a solution as firms may utilize the facilities and expertise of other service providers.
This paper tends to present the findings on how the level of education impacts on the relationship
marketing (RM) strategies used by a small firm. Small firms in Africa in general are seen as the future power
houses of development. Industry development in Botswana has been limited to government institutions and
only recently the government has responded to the calls by the Bretton Woods institutions to give space to
private companies. The impact of world recession and modern theories of how small firms can be a good
source of employment has since seen the government of Botswana with one policy or the other. Recession has
also eaten into the government reserves and as such, the government is no longer guaranteed of future earnings
from diamonds. This is especially so during the current Euro zone crisis where the traditional markets of
Botswana diamond have been heavily curtailed. This has naturally prompted a search for diversifying the
economy and further stroke the local market into action. As such, there is need to promote growth of the local
economic activities to kick-start the ambitious program of diversifying the economy.
We intend to advance the strategies which could be employed by small-scale retail outlets as they
normally fight for survival by enhancing relationship marketing. Many small firms face a number of challenges
in terms of technology, economic strength, geographic expansion, human resources, and relationship marketing.
These challenges emanate duly from the untrained and inexperienced workforce that knows little about the
tools needed to market products and services successfully. Not only that, but even many small-scale retail
service providers are pushed into their businesses with very little or actually without any marketing knowledge.
Some have barely enough capital but are mere survivalist entrepreneurs who are more driven by the immediate
need to feed the family and may not be called opportunity driven entrepreneurs (Venter, Urban, & Rwigema,
2008). Little focus is actually made on the longer-term customer lifetime value; hence most of them fail and
close down. So the question is, how can they strategise for long term benefits in their relationships?
The researchers address this issue by firstly defining RM and briefly touching on the discourse of RM
which will show that RM has traversed many terrains, which then brought together fully explains the concept of
RM. This is followed by a brief discussion of small firms so that the reader fully understands that our area of
concentration is small firms in Francistown. Research questions are addressed and the methodology follows.
Results, analysis discussions follow and we draw the conclusion. Finally recommendations follow.
Defining RM
Relationship marketing is a highly mature discipline, which originated mostly from mature markets in the
industrialised countries. It is observable that little evidence and applications of RM come from the micro-firms
in developing countries. Generally, RM is a discipline which has got an evolutionary impact on the general
marketing. Some authorities view it as a mere splitting of the hair and view it as a mere extension of marketing
put in some difficult language. Various labels have been put forward. RM has been labelled by Berry (1983) as
“... attracting, maintaining and—in multi service organizations—enhancing customer relationships”. Sorce
(2002) echoed these sentiments and said it creates “mutually beneficial exchange between business partners”.
Fitchett and McDonagh (2000) effectively captured the impact of RM on marketing and conclude that,
“Relational marketing has come to dominate the (r) evolutionary imagination of marketing thought”.
Gummesson (1999, p. 24) extended the concept of RM to “total relationship marketing” and maintained that it
still remains a domain of marketing “based on relationships, networks, and interaction”. Gummesson (1999)
concluded that “RM has given recognition to collaboration as part of the market economy”. This is a very

A STRATEGIC PERSPECTIVE TO SMALL FIRMS IN RELATIONSHIP MARKETING
23
crucial contribution to marketing. This recognition carries a lot of weight especially after a lot of debate of
marketing tools. Previously these tools were not recognized as contributing anything to a firm but have been
accused of siphoning a lot of resources and lacked measurement. RM, as a discipline, attempts to measure the
contribution of RM to a business entity.
Discourse in Research Marketing
With so many varied definitions of RM, it is more effective and efficient to capture and summarize the
various phases of RM. A good summary has been advanced by Fitchett and McDonagh (2000). Table 1
summaries the discourse.
Table 1
Historical Development of the Discourse of RM Industrial Emphasis References Industrial marketing and purchasing group Business to business Channel relations Buyer-seller relationships Relational resources
Mutual interdependence consensus and collaboration closeness trust and satisfaction Resource-advantage theory
Hakanson and Ostberg (1975) Ford (1980) Gummesson (1987) Spekman et al. (1997) Nielson (1998) Selnes (1998) Hunt (1997)
Services Emphasis References Service markets Small groups Selling services Forming relationships
Coined term RM Respect Trust Situation characteristics
Berry (1983) Gupta (1983) Crosby et al. (1990) Gronroos (1990) Barnes (1995)
Consumers Emphasis References
Quality service Implementation Advanced technology Intrusion or intimacy Definition confusion Structure Co-operation Social networks Consumer behaviour Consumer marketing Consumer survey Rhetoric vs reality
Consumer retention Database use Customer retention Privacy Value relations Content analysis and concept categorization Interpersonal vs. commercial Customer as collaborator Guanxivs RM Equity of relations Interaction and network approaches Inappropriate metaphoric transfer Review of business-customer relationship BCR
Reicheld and Sasser (1990) Petrison and Wang (1993) Patterson et al. (1996)Pine et al. (1995) Cova (1993) O’Maalley et al. (1997) Tzokas and Saren (1996) Harker (1999) Iacobucci and Ostrum (1996) Zineldin (1998) Arias (1998) Szmigin and Bourne (1998) Pels (1999) O’Malley (1999) O’Malley and Tynan (forthcoming)
Note. Source: Fitchett and McDonagh, 2000.
For a long time, now, many authorities have been dealing with different facets of RM in an uncoordinated
manner before it was developed as a fully fledged discipline. This previous approach to the discipline has
generated a lot of weaknesses. However, these weaknesses are not the subject of discussion in this paper.
Small Firms
Small firms in this study refer to organizations with less than 30 employees. This figure has been chosen
for convenience and is close to the definition proposed by small, medium, and macro enterprise (SMME)
taskforce of 1998 who say a small enterprise makes an annual turnover of between BWP 60,000 and BWP 1.5
million and employ not more than 25 people (Republic of Botswana, 1999).
Benefits Enjoyed by the Firm in the Relationship
Generally there are many benefits that can be enjoyed when a firm is in relationship. Fitchett and

A STRATEGIC PERSPECTIVE TO SMALL FIRMS IN RELATIONSHIP MARKETING
24
McDonagh (2000) put forward the following benefits:
Terms of reference: The organization defines the interaction that it has with its consumers as a relationship
only if it is considered to benefit organizational interests (e.g., secure growth, increase repeat consumption);
Relational basis: The organization defines and regulates the terms and conditions of the relationship.
Consumers have little opportunity to specify their own terms and/or can alter them only if sanctioned by the
organization;
Opportunity to vary relational terms: The organization, due to the relational basis, can adapt, modify, and
change the terms of a customer relationship without negotiation. Consumers are tied to relational terms;
Relational conflict: When disagreement in the relationship emerges or either party fails to comply with the
agreed relational basis, organizations have a greater opportunity to arbitrate on the resolution arrangements and
have a greater capacity to improve penalties.
Questionnaire Development
The study was largely a descriptive research. The researchers trained six students to help in collecting data
by using a questionnaire instrument coupled with a systematic observation during the administration of the
questionnaire. The students were expected to write individual reports concerning their experiences during the
data collection.
The assistant researchers moved street by street administering the questionnaire randomly selecting retail
shops to administer the questionnaire. They were basically looking for volunteers who were prepared to
administered the questionnaire. Each student had 15 questionnaires which he/she administered in a period
between 09:30 and 17:00 hours.
The questionnaire instrument had 24 questions on a Likert scale of 5. The responses were ranging from
strongly disagree to strongly agree (see Appendix Table A1). The population of the establishment was “all
small firms in Francistown whose business ranges from small clothing/boutique (15), engineering (8),
construction (2), finance/cash loan (5), entertainment (4), electrical/Chinese shops (16), grocery shops (9), hair
saloons (6), car rental/filling stations (3), agriculture (4), health/opticians (4), car wash (4), furniture (5), café (4)
and couriers (1)”. Figures in the bracket are the actual number of firms in each category where the
questionnaire was administered. The range covered fairly represents the many small firms that are in
Francistown. The population of registered small firms in Francistown is about 400. The sample size represents
22.5% of the total small firms in Francistown. This is a fair representation. The researchers got 100% return on
the questionnaire since the respondents were met during their normal working hours and the assistant
researchers only administered only 15 questionnaires. They were persuading the respondents to fill in the
questionnaire in their presence so that they would give them assistance since majority of the respondents have a
language problem. Chinese nationals were responding to the questionnaire with the assistance of their shop
assistance. The local business people were asked the questions through our trained assistants (who are students)
at the Botho University and are also local citizens of Botswana.
The questionnaire was post coded to enable easier analysis on Statistical Package for Social Scientist
(SPSS). Cross tabulation technique was used to cross one’s level of education with all the 24 questions that the
respondents were subjected to. The questionnaire design was made with the consideration of the following
research questions.
(1) How much is technology being used by small firms?

A STRATEGIC PERSPECTIVE TO SMALL FIRMS IN RELATIONSHIP MARKETING
25
(2) What are the levels of management involvement of small firms in their business operations?
(3) To what level are the employees and management trained in small firms?
(4) What are the motivational levels practised in the small firms?
Sample Characteristics
Observation shows a lot of generation and death of small firms around Francistown. The rate of creation of
small firms is almost equal to the rate of death of the small firms. This problem has been compounded by the
world recession which has affected the buying power of customers. The growth of small firms in some areas of
Francistown came about due to economic crisis that has reduced the neighbouring Zimbabwe to a basket case.
In a way which has opened a lot of opportunities for most people with entrepreneurial minds such as Chinese
nationals and Indian trophy hunters. The Indian communities have taken full residence of the country unlike
their Chinese counterparts who are only starting to venture into mainstream Africa.
Indian nations seem to be pursuing business in many different sectors and have mostly started businesses
in construction, education, retailing (especially hardware and electronic gadgets). Chinese individuals are also
into retailing, especially clothing items and electronic gadgets. Nigerian nationals have invaded the car and
pharmacy industries and Zimbabwean and Zambians expatriates are largely employees. It will be interesting to
find how businesses are owned according to nationality. However, this is not a subject of study in this research.
Manufacturing Firms
Generally, manufacturing in Francistown is limited to small manufacturing plants which are hardly
comparable to most world class manufacturing plants. Botswana generally imports most goods from
neighbouring countries, largely South Africa. The manufacturing is limited to the production of school
uniforms, overalls for mine workers, poultry producers. There is no wide variety of these producers.
Money Lenders
Money lenders play a major role in the economy of Francistown. Most small businesses get their capital
requirements from these expensive sources. These financing sources have in a big way also contributed to the
winding up of most small firms when they fail to pay back the expensive rates. In some cases, people lose some
of their capital goods such as vehicles because they are usually used as some form of collateral when borrowing
money from “Matshonisa” (Micro-lenders).
Construction Firms
There is quite a lot construction going on in Botswana and more especially in the town. This construction
is being done by Chinese companies. Most local companies are outsourced, and this affects the relationship
marketing since the Chinese are not there to stay and the locals remain. Even so, the local firms are not local in
the “real sense” but are foreign companies that are using local fronts. The nature of these fronts is basically
politicians. It will be exciting to find out how these relationships can affect RM. So far construction industry is
one of the major employers of most local people. However, the surprising part in the industry is that most
employees are foreigners and the local people are muscling their way into the industry as they begin to
appreciate the benefits of indigenization and empowerment programs that have been introduced by the
government. In this area “malemasky” or “tenderpreneurs” (concepts explaining how the local people through
their connections through political power become masters of tenders and generally make their money by being
merely “omang” holders) (local people/empowered by their national identity cards) rule the roost. Very few
people are genuine business people.

A STRATEGIC PERSPECTIVE TO SMALL FIRMS IN RELATIONSHIP MARKETING
26
Results, Discussion, and Analysis
This section summarises our results. We combined some of our findings, discussion, and literature review
to present and analyse the results.
Regular Communication With Customers
All categories (100%) indicated that they communicate with customers regularly. This is consistent with
the spirit of RM. Gummesson (n.d.) emphasised the importance of networks. He argued that “if we dissolve the
social networks or relationships, the earth is left with five billion independent and self sustaining hermits” (p.
75). Business people in Francistown are generally recognising the need to engage customers. Maybe the
challenge is that you may “step on partner’s toes” (p. 75). Working with customers may be described as some
form of dance. It requires the dancing skill and the ability to manage what is communicated. This study did not
cover “what is communicated” but rather how to “get into the dancing arena”. Communication is a prerequisite
of successful RM.
Usage of Technology
Generally business people in Francistown are sceptical about the use of technology. It appears that they
rely more on traditional technology and are suspicious of the more recent technology. Telephone usage is high
in all categories. This finding appears to be inconsistent with Cook (2011) who says “yet telephone contact is
now being challenged by increasing use of the internet by consumers as a preferred method of interacting with
businesses” (p. 24). Business people in Francistown appear to be going at a tangent with the trends in consumer
requirement development. Modern social networks like Badoo, tagged, LinkedIn, have not been generally
accepted. Figure 1 shows higher percentage of the diploma holders (55.6%) compared to certificate holders
who do not use email. This is a surprising finding taking into consideration that diploma holders are likely to be
exposed and more likely to accept new technologies due to their level of education.
Figure 1.Usage of social networks by the level of business education.
0
5
10
15
20
25
30
35
Usage of Social Networks by Educational Level Certificate
Usage of Social Networks by Educational Level Diploma
Usage of Social Networks by Educational Level Degree
Usage of Social Networks by Educational Level Masters/Doctorate
Usage of Social Networks by Educational Level No qualification

A STRATEGIC PERSPECTIVE TO SMALL FIRMS IN RELATIONSHIP MARKETING
27
Failure to adapt to technology keeps the business stagnant as the business is likely to maintain the old
customers and fail to attract new ones, which may be a challenge in this revolutionary age. Cook (2011)
reiterated that “Organisations that do not have a presence in terms of social networks run the risk of becoming
the dinosaurs of their age” (p. 27). So, in the long term, in Botswana, the government is investing and
promoting ICT uses and adaptation. To survive, therefore, there is need to positively respond to these
technologies. Small firms need not adapt all of them at once, but could start say with the most popular ones in
Botswana, that is, Face book or Google, and subsequently the others.
And some interesting results are as follows.
Targeted Marketing
In all categories, the results show that generally, business people understand the importance of targeting as
a way of rewarding loyal customers, 92.3% of certificate holders tailor promotions on those customers that give
them continuous business. The same trend can be observed in diploma holders (88.9%), degree holders (64.7%),
master’s holders (77.8%), and even those without any qualifications (71.7%).
It is interesting to note that most owners and managers have a number of incentives that they used to retain
their customers. Hair Salons offer free service after is a customer visits them for about four to five times. The
same salons show adaptability to customer changing hair styles or fashion. The same can also be said about the
car washes. Those who are into retailing indicated that they offer some month-end specials for the customers
that give them more business. Results also show that those into health (opticians) offer free consultation to their
regular customers. However, the rest only give incentives or offer presents during the festive season especially
over the Christmas holidays.
Customer Suggestions and Follow-ups
There was almost a 100% agreement on this that small firms allow their customers to air out their views
and suggestions in improving RM. Some small firms indicated that they even visit their customers at home.
This is more prevalent among those who operate car washes, tailors of garments (manufacturers), and
health facilities. These are also the few who use mobile Internet. Kotler, Keller, Koshy, and Jha (2007)
noted that:
Salespeople working with key customers must do more than call when they think customers might be ready to place order. They should call or visit at the other times and offer free services, take customers to dinner, and make useful suggestions about business. (p. 525)
Communications
Most of the business owners in Francistown indicated that they communicate with their customers as often
as possible, but further probes indicate that this is with regular customers who will be enquiring about the
availability of certain goods they need. The owners hardly contact their customers any other time, and most are
not concerned with having customer profiles except for the few that buy in large quantities. The owners hardly
make use of either direct responses via the radios or television or using the local newspapers and magazines.
Francistown has “The Advertiser” and “The Northern” magazines which are distributed weekly, but most of the
small firms do not use these. However, internal communication is strong: managers, owners, and their staff
always communicate business related issues from time to time as is supported by our results. These findings are
described in Table 2 according to business owner qualifications.

A STRATEGIC PERSPECTIVE TO SMALL FIRMS IN RELATIONSHIP MARKETING
28
Table 2
Responses on Communication Qualification Explanation of responses
No qualifications
No qualification category produced surprising results. It was expected that most users do not use most modern methods of communication. The results are competent and generally in the same trends with the other categories. The most plausible explanation is that, this is now the work of experience of the companies. Experience was not one of the variables studied in this study; therefore this is beyond the scope of this study. No qualification category use: catalogues (30.4%), online (30.2%), mobile (67.4%), direct mail (17.4%), couponing (34.7%), telemarketing (47.8%), e-mail marketing (34.8%), direct response radio/TV (10.8%), magazine/newspapers (41.3%), and out of home (47.8%).
Certificate holders
The certificate holders do not use direct response television/radio (100%), catalogues (53.9%), direct response magazines/newspapers (53.9%), direct mail (92.3%), e-marketing (84.6%), bus shelters (69.3%) and are anti internet (69.2%). However, majority of them love the mobile (84.75) and to a certain extent use telemarketing (53.9%).
Diploma
Diploma holders are using the following communication strategies: Catalogues (55.5%), Mobile (77.8%), direct mail (33.3%), telemarketing (22.2%), e-marketing (33.3%), direct response magazines/newspapers (55.5%), out of home (11.1%). However, 0% is using couponing and direct response radio/television. These contrast to what we have in big shops where the managers with diplomas use these methods extensively. This could be explained by the fact that they are probably too cost conscious.
Degree
Degree holders’ use less of catalogues (35.3%) compared to their diploma counterparts. They also use online (29.4%), mobile (76.5%), direct mail (47.1%), couponing (17.7%), telemarketing (35.3%), e-marketing (17.6%). 0% are using direct response television/radio, but 47.1% are using direct response magazines/newspapers. Diploma holders use more of out of home methods compared to diploma holders (29.4%).
Masters/Doctorate
Masters/Doctorate holders use catalogues (44.4%), online (33.3%), mobile (88.9%), direct mail (44.4%), couponing (22.2%), telemarketing (33.3%), e-marketing (33.3%), direct response radio (0%), direct magazines/newspapers (11.1%), out of home (11.1%).
From these results, it is apparent that communication has to be enhanced and broadened for RM to be
effective. Lamb, Hair, and McDaniel (2004) noted that:
RM is a strategy that entails forging long-term partnership with customers. It begins with developing a clear understanding of who your customers are, what they value, what they want to buy, and how they prefer to interact with you and be served by you. (p. 12)
This means that a number of channels need to be opened so that strong relations are made strong with
customers.
Training of Employees
Generally all categories say staff is highly trained in handling customers: certificate holders (84.7%),
diploma (88.9%), degree (70.6%), masters/doctorate (88.9%), and no qualifications (80.4%). Most of the
training that was referred to is in-house training. Most organizations believe that employees can learn on their
own how to build relations with customers. Certificate holders (84.7%), diploma (55.5%), degree (70.6%),
masters/doctorate (88.8%) and with those without business qualifications (84.8%) saying employees can learn
on their own.
Here are also responses on continuous staff development, firms holding meetings every morning before
they start work to strategize customer handling techniques: certificate (61.6%), diploma (44.4%), degree
(41.1%), masters/doctorate (77.8%), and no qualification (60.9%).
It was observed during the interviews that the training for most workers is internal, and is done when the
need arises. Given that most employees do not possess business related qualifications, training should

A STRATEGIC PERSPECTIVE TO SMALL FIRMS IN RELATIONSHIP MARKETING
29
encompass all things about customer care. According to Kurtz and Boone (2006), they noted that “Relationship
marketing does not rest entirely on information technology; it also incorporates good manners, or etiquette,
such as greeting people properly, with a firm handshake” (p. 27).
It was noted during the questionnaire process and interviews that management involvement of managers is
on basic principles about keeping the business going. They hardly work on creating the organizational vision,
mission statement, and company objectives that someone can easily read on visiting their offices. Unlike big
businesses, on entering management offices one easily reads these. This is important in constantly reminding
all stakeholders about the purposes of being in business. Cook (2011) emphasized this point by saying thus
“The approach which many organizations adopt in formulating a customer service strategy can be outlined as
follows; link to vision, values and corporate objectives” (p. 51).
Employee Motivation
The firm offers small tokens/rewards to motivate staff improve their attitudes to customer care. The results
showed greater support of this: certificate holders (84.7%), diploma (88.9%), degree (82.3%), masters/doctorate
(66.6%), and no qualification (69.6%) (see Figure 2) say they are offering small tokens to motivate staff.
Figure 2 shows that all categories agree that their firms offer employee motivation in almost equal proportions.
The levels of motivation are also enhanced by the empowering of employees to solve customer problems
(which is also consistent with the offer of tokens).
Some of the items mentioned by the owners and managers to motivate their employees by offering
transport to and from work, and allowing their workers to buy their products at reduced prices. They also offer
bonus at the end of the year, and sometimes give the workers some food hampers. Some indicated that they
review and increase the salaries of their employees. Sadly, however, some retail outlets said they offered these
incentives when they were initially opening the shop, and have since stopped doing so.
Figure 2. Employee motivation response level.
Certificate holder, 84.7%
Diploma holder, 88.9%
Degree holder, 82.3%
Masters/Doctorate holder, 66.6%
No qualification, 69.6%
Employee motivation response level-agreeing

A STRATEGIC PERSPECTIVE TO SMALL FIRMS IN RELATIONSHIP MARKETING
30
Any success of RM needs to be fully supported by a happy workforce. Kurtz and Boone (2003) further
reiterated this by saying that “Employees can seldom, if ever, satisfy customers when they themselves are
unhappy” (p. 321). Things which satisfy employees need not be big especially for small firms, but surprises in
line with food hampers, lunch offers, and small presents as tokens of appreciation will go a long way in
satisfying the employees. Even employee of the month awards without money will always make a difference.
Employees are also motivated by being empowered to solve some problems brought by customers. The
researchers however found out that whilst employees are allowed to do this, this is very much restricted which
is however, normal. Some indicated that it is only on minor problems, or under supervision, otherwise
management does this alone. Most foreigners owned small firms allowed employees to solve problems since
they are the ones who will understand the local language (Setswana).
Figure 3 refers to objective awareness levels in the respondents. Generally all categories agree that, there
is clear communication between management and staff as a sign of good motivation (Certificate holders
(92.3%), diploma (100%), degree (82.4%), masters/doctorate (100%), and no qualification (73.9%)).
Figure 3. Objective awareness response level.
Others Services Rendered
If the product is not available, management tries to make it available for the customer who gives
continuous business. This follows the same trends as previously discussed above but however about the lessons
learnt from big businesses, the percentages take a dramatic plunge to certificate holders (53.9%), diploma
(66.6%), degree (64.7%), masters/doctorate (66.6%), and no qualification (54.3%).
Certificate holder, 92.3%
Diploma holder, 100%
Degree holder, 82.4%
Masters/Doctorate holder, 100%
No qualifications, 73.9%
Objective awareness response level-agreeing

A STRATEGIC PERSPECTIVE TO SMALL FIRMS IN RELATIONSHIP MARKETING
31
Summary of Findings
Business people in Francistown are generally recognising the need to engage customers;
Most small retailers in Francistown rely more on traditional technology and are suspicious of the more
recent technology;
Level of education and experience affect the adoption of modern social network technologies which can be
employed by small firms to enhance relationship marketing;
Business people in Francistown appear to be going at a tangent with the trends in consumer requirement
development;
Business people understand the importance of targeting as a way of rewarding loyal customers;
Small firms allow their customers to air out their views and suggestions in improving relationship
marketing;
Small firms in Francistown communicate with regular customers who will be enquiring about the
availability of certain goods they need;
Small firms in Francistown are not taking advantage of cheap and free magazines to communicate with their
customers;
Training used by small firms in Francistown is largely internal;
Management in small firms is heavily involved in the process of relationship marketing;
Employees are highly motivated.
Discussion
It appears that all sectors are generally doing well but the major challenge appears like, the companies lack
capacity to expand in doing the things that they have set themselves. The following conclusions can be drawn
from the discussion:
Education is a success factor for small businesses considering, looking at those with diplomas, degrees, and
higher degrees who tend to differ with those with certificates and without qualifications on how they employ RM
and other marketing communication technologies;
Most firms are being run by uneducated people. The lower the education, the lower the application of
technology;
Experience is a great player in the success of small businesses as they appreciate the importance of RM and
do make effort to apply the minimum RM practices;
Technology is not being used optimally;
Most businesses are very slow in applying new technologies and cling to old technologies yet there are
better and cheaper technologies which can be more efficient;
The form of training being used is in-house training. This level of training is only capable of maintaining the
status quo of the organization and does not aim out towards expansion and attracting new customers;
Most small firms know what their customers expect from them;
Given the level of management involvement, most small firms are likely to survive and maintain the same
levels of operations.
Conclusions
Small business owners in Francistown have an idea of RM, however, they lag behind in terms of the
technologies and other tools that are used to enhance the customer experience. They really need to consider

A STRATEGIC PERSPECTIVE TO SMALL FIRMS IN RELATIONSHIP MARKETING
32
some or all of the recommendations made in this regard to remain competitive. Failure to keep customers into
the long-term future affects the business continuity and opens it to aggressive competition that eventually
closes many such businesses out. RM needs to be invested into, through training of staff, continuous
professional development of the owners, and taking advantage of the available RM tools. These small
scale-scale business owners usually lack the long term focus. Without which, according to Katsande (2004), in
quoting Wilson and Gillison (1995), wrote that “organizations that are efficient and effective thrive”,
“organizations that are efficient and ineffective die slowly” (p. 15). Small scale businesses by virtue of lacking
the skills that are required are normally found to be ineffective, that is to say they fail to get the required results
and eventually close down.
Recommendations/Strategies
There is strong need to consider using the off-the-job training method which will bring in fresh and new
ideas in terms of RM rather than depending on internal training alone;
There is need to tap into the use of mobile/cell phone internet which is becoming popular with the
customers;
Management and owners still need to expand their levels of education, and broaden their visions so that
small firms are seen expanding;
Owners and management need to build strong associations or ties with well established and big business
managers instead of confining themselves to their territories;
There is need to infuse new blood into the management of small firms in order to adjust and accept new
technologies;
Small firms need not adapt all of the modern social technologies all at once, but could start say with the most
popular ones in Botswana, that is, Face book or Google, and subsequently the others;
Further research is recommended to confirm that employees are well trained.
References Berry, L. (1983). Relationship marketing. Chicago: American Marketing Association. Cook, S. (2011). Customer care excellence. New Delhi: Kogan Page Ltd.. Fitchett, J., & McDonagh, P. (2000). A citizen’s critique of relationship marketing in risk society. Journal of Strategic Marketing,
8(2), 209-222. Gummesson, E. (1999). Total relationship marketing: Experimenting with a synthesis of research frontiers. Australian Marketing
Journal, 7(1), 72-85. Katsande, C. K. (2004). Strategic marketing management. Harare: Zimbabwe Open University Module. Kotler, P., Keller, K. L., Koshy, A., & Jha, M. (2007). Marketing management—A South Asian perspective. India: Dorling
Kindersley Pvt. Ltd.. Kurtz, D. L., & Boone, L. E. (2006). Principles of marketing. Delhi: Akash Press. Lamb, W. C., Hair, J. F., & McDaniel, C. (2004). Marketing. Singapore: Thomson Asia Pte. Ltd.. Public of Botswana. (1999). Policy on small medium and micro-enterprises in Botswana. Government White Paper No. 1,
Gaborone. Sorce, P. (2002). Relationship marketing strategy. Rochester, N.Y.: Rochester Institute of Technology. Venter, R., Urban, B., & Rwigema, H. (2008). Entrepreneurship: Theory in practice (2nd ed.). London: University Press.

A STRATEGIC PERSPECTIVE TO SMALL FIRMS IN RELATIONSHIP MARKETING
33
Appendix A
Dear business owner:
We are conducting a study on your experiences with relationship marketing in your business. We would appreciate if you
would fill in the attached questionnaire and return it to us as soon as possible. Please tick the relevant response under the correct
heading that best describes your response.
Table A1
Questionnaire
Strongly disagree
DisagreeNeither agree or disagree
AgreeStrongly agree
A Communication
1 We often communicate with customers
2 There is a lot of use of emails, SMS, telephone, in communicating with our customers
3 We make use of public relations quite a lot
4 Tailored promotions are used to keep customers who give us great business
5 The firm allows customers to air their views about business, as a two way communication process
6 Communication is enhanced by making follow-ups with clients after they buy from us
7 Catalogues and direct communication are heavily used in building strong relationships
8
B Training of employees
1 The staff is highly trained in customer care handling
2 Employees learn on their own how to build relations with customers
3 Managers and owners always talk to employees about building closer ties with clients
5 As part of continuous staff development, we hold meetings every day before start of work. These are meetings how to build a unified approach to customer treatment
C Management involvement
1 Level of interaction with the owners and managers is high in the organisation
2 Owner and manager are coming up with initiatives in providing customer care
3 Management is interested a lot in customer complaint handling
4
D Employee motivation
1 The firm offers small tokens/rewards to motivate staff and enhance their attitude on customer care
2 Employees are empowered to solve customer problems
3 Employees are aware of the objectives of the organisation and everyone works towards that
4 There is clear communication between management and staff as a sign of good motivation
5 Do staff get surprises from their bosses for behaviours that enhance good customer care, as form of encouragement

A STRATEGIC PERSPECTIVE TO SMALL FIRMS IN RELATIONSHIP MARKETING
34
(Table A1 continued)
Strongly disagree
DisagreeNeither agree or disagree
AgreeStrongly agree
E Others services rendered
1 If the product is not available, effort is put get it for the customer that give us continuous business
2 Any lessons on how to care for customers learnt from big businesses that you practice, e.g., provision of chairs for customers before they are saved, as done by Barclays, PEP airtime customers
,
3 Use of the social networks in a dancing business-client interaction
4 Delivery is provided and is flexible and this is helping in keeping our customers
5 Our customer preferences is what determines what provide to them most

Management Studies, ISSN 2328-2185 January 2014, Vol. 2, No. 1, 35-42
Inconsistency Quality Products (on Six Sigma Programs) Effect
on Customer Loyality: Case Study of Industry “Tahu”
Ayi Tejaningrum
STIE EKUITAS, Bandung, Indonesia
Product “Tahu” is a traditional food of Sumedang city in Indonesia, and becomes an icon of the city. This study
aims to see how consistent the quality of the products developed by small and medium-sized enterprises (SMEs) in
the prosess six sigma program compliance effect on customer loyalty. The method used in this paper is descriptive
exploratory. Based on a sample of 30 SMEs and 143 end-consumers, it showed that inconsistency in the quality
common among SMEs with small production capacity size that gives discomfort to the consumer. Inconsistency in
the quality values at each of SMEs which are distinguished by the production capacity is 3.301 or unclassified often
inconsistent on a small scale SMEs, 3.460 or unclassified SMEs are often inconsistent in size and capacity being
4.227 or inconsistent unclassified rare or likely to be consistent on SMEs the size of the production capacity.
Based on calculations using simple regression, suggest that the effect of dimensional consistency of product quality
to customer loyalty is at 34%, while the balance of 66% is influenced by other variables such as promotion,
competition level, location of the company etc.. It is recommended for further research is to be able to analyze the
causes of the high product quality inconsistencies SMEs.
Keywords: inconsistency quality, six sigma, customer loyalty
Introduction
Background Research
The study was conducted on 30 small and medium-sized enterprises (SMEs) engaged in the manufacturing
“Tahu” in the city of West Java Indonesia Sumedang. “Tahu” is the Indonesian traditional food, such as
soy-based foods are processed by boiling it to get the juice and left to curdle. Thickening of the soybean in
Indonesian society is known by the name of “Tahu”. Almost all Indonesian people love this food, both in
cooking and in cooking with other variations.
Common problems experienced by SMEs include: low quality of products, low commitment to fulfill
customer orders both locally and overseas, simple technology can result in a diversity of products, the lack of
communication and information networks with the relevant parties, and doing less research activities to analyze
the market demand etc. (Tejaningrum, 2012). This condition occurs also in SMEs crafters “Tahu” in the town
of Sumedang, where consumers feel that the sense of “Tahu” tends to vary, sometimes find the “Tahu” with
good taste, sometimes a bit high in salt so salty, or sometimes find a product that is somewhat stale, whereas
Ayi Tejaningrum, Dr., SE., MT, Management Department, STIE EKUITAS. Correspondence concerning this article should be addressed to Ayi Tejaningrum, PHH Mustopa No 31, Bandung, Indonesia.
E-mail: [email protected].
DAVID PUBLISHING
D

INCONSISTENCY QUALITY PRODUCTS (ON SIX SIGMA PROGRAMS) EFFECT
36
from the same industry.
This study wants to see how far the relationship between the consistency of product quality dimension
“Tahu” to customer loyalty, and also analyzes the extent of the consistency of the quality of these products
occur at various scales of production.
Identification of the Problem
The identifications of the problem are the following:
How will consumers respond consistency of quality at various scales of production?
How does effect the level of consistency of quality with loyalty?
Is there a difference in the consistency of the quality dimensions at various scales of production?
What factors lead to inconsistencies dimensional product quality?
Purposes and Research Objectives
The purposes and research objectives of this paper are:
To find out how consumers will respond consistency of quality at various scales of production;
To see the effect of the level of consistency of product quality with loyalty;
To determine whether there are differences in quality consistency at various scales of production;
To determine what factors lead to inconsistency in the quality products.
Research Design
The Concept of SMEs
The concept of SMEs will be used in this study follows the provisions set out in the Constitution of the
Republic of Indonesia No. 20 Invitation 2008 on Micro, Small, and Medium Enterprise. Here is the concept
(Tejaningrum, 2012):
Small business: Is a productive economic activity that stand alone, which is conducted by an individual or
business entity that is not a subsidiary or branch company is not owned, controlled, or be a part either directly or
indirectly from a medium or large businesses that meet business criteria;
Medium enterprises: Is a productive economic activity that stand alone, which is conducted by an individual
or business entity that is not a subsidiary or branch company owned, controlled, or a part, either directly or
indirectly by the small business or a large business with the amount of wealth or annual net sales proceeds as
provided in this Act.
Table 1
Criteria for Micro, Small, and Medium Enterprise According to Law No. 20 of 2008
No. Business Criteria
Asset Revenue
1 Micro Max. 50 million Max. 300 million
2 Small business > 50 million-500 million > 300 million-2.5 billion
3 Medium enterprise > 500 million-10 billion > 2.5 billion-50 billion
Note. Source: Law No. 20 of 2008 (2012).
In this study, the classification of SMEs will refer to the Law of the Republic of Indonesia No. 20 of 2008,
as shown in Table 1. The craftsmen “Tahu” will be classified small if it has no assets of more than Rp 50
million and a turnover of not more than Rp 300 million. Classification small if it has assets of more than Rp 50

INCONSISTENCY QUALITY PRODUCTS (ON SIX SIGMA PROGRAMS) EFFECT
37
million to Rp 500 million with a turnover of more than Rp 300 million to Rp 2.5 billion. For classification
effort is being, has assets of up to Rp 500 million to Rp 10 billion with a turnover of between Rp 2.5 billion to
Rp 50 billion.
Based on these criteria, the study was divided into three groups of SME uptaken by soybean as the main
raw material of the industry “Tahu”. The classification is in Table 2.
Table 2
Classification Scale Industrial “Tahu” Sumedang City
No. Business Criteria
Absorption soybean/Mont Number of SMEs
1 Micro Max. 1,500 kilograms 14
2 Small business > 1,500 kilograms-3,000 kilograms 12
3 Medium entreprises > 3,000 kilograms 8
Note. Source: Compiled from field data.
In the SME classification using soy as the basis of the absorption calculation is based on the clustering of
matter in a practical convenience, but still refers to Law No. 80 of 2008.
The Concept of Quality and Quality Consistency
Adopting the concept of quality of some of the renowned quality experts includes: Goetsch and David
(2002, p. 3), Shigeru (1994, p. 6), Juran (1995, p. 9), in particular the definition of quality by Tejaningrum
(2012):
Complies with specifications that match or even exceed the specifications of the expected customers, both
internal customers and external customers where these specifications shall include specifications for goods and
services to deliver them;
Quality is dynamic in line with changing consumer behavior over time;
The dimensions of quality should be sourced from the perception of consumers, not producers.
Dimensions of quality in the product from the adopting quality dimension (Garvin, 1988; as cited in
Tjiptono & Chadra, 2005) and consists of eight dimensions: (1) performace; (2) feature; (3) reliability; (4)
conformance to specifications; (5) durability; (6) servicebilty; (7) esthetic; and (8) perceived quality. If we
apply the eight dimensions in the industry “Tahu” it will look as follows:
Performance: regarding the basic operating characteristics of the sense of “Tahu”;
Feature regard to secondary or complementary characteristics of the product to “Tahu” which packaging is
used, how to present, accompanying food package etc.;
Reliability with respect to a small chance of damage or disfigurement know scorched, stale taste and form
that broke;
Conformance to specifications, the extent of the design and operating characteristics meet the standards that
have been set previously. In this case is with respect to the overall specification “Tahu” which are the shape, color,
taste, price, food broadcaster, packaging etc.;
Durability: associated with the product “Tahu” how long it can still be eaten or expired;
Servicebility: with respect to the speed and comfort of consumers “Tahu” to get the service and the
cleanliness and security of the service;
Esthetics, the product appeal to the senses, in this case with regard to shape, color, appearance, size,

INCONSISTENCY QUALITY PRODUCTS (ON SIX SIGMA PROGRAMS) EFFECT
38
packaging, etc.;
Perceived quality: is related to the perception of the quality delivered by the various brands consumers the
industry like “Epen oyib”, “Tahu bungkeng”, “Tahu Sari Rasa”, “Tahu Haji Tatang” etc..
Of the eight dimensions of quality of their products, consumers will analyze the consistency dimension of
the products from time to time, or the scheme can be seen in Table 3 and Figure 1.
Table 3
Dimension the Quality of the Product “Tahu” No. Quality dimension Quality specification
1 Performance Sense
2 Feature Food broadcaster, wrapping, how to present, cleanliness
3 Durability Shelf life
4 Conformance to specifications Color, flavor, crispy level
5 Serviceability Speed and comfort care, proper hygiene services
6 Estetika Color, shape, appearance, size
7 Perceived quality Image of the company
8 Reliability Charred, taste stale, dirty, not crisp
Based on Table 3, then the dimension of the quality of the product idea can be identified in Figure 1.
Figure 1. The dimension of the quality.
Consistency of Quality the Six Sigma Program
Consistency of a quality product that has been determined based on the specifications that are expected by
consumers, the company has an obligation to maintain the consistency of the product. Common problems in
SMEs happen to inconsistency in the quality of products (Tejaningrum, 2012). Consistency in product quality
that often occurs in SMEs is the price of products, colors, sizes, flavors for food industry, performance or
overall appearance, product durability, speed and convenience of service, low quality assurance (Tejaningrum,
2012). Why this consistency must be maintained, the principle is to provide certainty to consumers, it will be
very closely related to the expectation value of the consumer at the time brought before making a transaction.
Consumers will conduct transactions, while, at least have the hope or expectation of the quality of the product
to be bought, hope this is usually in the form of price, speed of service, taste, color, size, performace, durability,
comfort care, etc.. With this expectation value, consumers will compare the performance values obtained at the
time the goods have been consumed. Understanding Six sigma was considered, by Pande, Neuman, and
Cavanagh (2000), as the target of operating performance as measured by statistics with only 3.4% for every
million activities defects or opportunities. The author himself defines six sigma as a consistency of product
quality, where the product will be uniform, and if anything happens variability chances only 3.4% of the one
Performace, feature, esthetic, durability, servicebility, conformance of specification, reliability, perceived quality
Dimensional consistency of quality “Tahu”: • Consistency sense out • Consistency accompanying food flavors • Consistency level of crispy • Consistency comfort • Consistency of service speed • Consistency durability • Consistency of performance • Consistency avoid disability

INCONSISTENCY QUALITY PRODUCTS (ON SIX SIGMA PROGRAMS) EFFECT
39
million products.
The Concept of Customer Loyalty
Consumer satisfaction is the comparison between expectation and reality when consuming a good or
service. If performance is below expectations, the customer is not satisfied. If performance is below
expectations, the customer is not satisfied. If performance meets customer expectations, the customer is
satisfied. If performance exceeds expectations, the customer is highly satisfied or delighted (Kotler, 2003).
Satisfaction is absolutely difficult to define because so many variables that influence it. While loyalty,
researchers took kosep as the level of consumer loyalty, penilaianya indicator is that if he is loyal then he will
continue to make a deal with the company when the product is needed, and they will not heed the advertising or
promotion of a competitor, they will buy other products produced by the company. In this study, the
consistency of the quality dimensions was measured using a Likert scale 5-story, namely, very consistent (5),
consistent (4), fairly consistent (3), less consistent (2), and inconsistent (1).
Research Methods
The method used in this research is descriptive qualitative method. Where data are described only
descriptively to describe the situation and conditions.
Population and Sample
Population of this study is the industry “Tahu” Sumedang town. Number of artisans who are subjected to
as many as 30, with 123 involving consumers or buyers fried Tahu. Sample of 30 SMEs is classified into
groups of micro, small, and medium enterprises (MSMEs) as to what has been presented in Table 2.
Analysis of Results
Response Consumers on Consistency Product Quality “Tahu”
Consistency of quality dimensions “Tahu” that were identified in item eight measurements (dimensions
performace, features, esthetic, durability, servicebility, conformance of spesification, reliability, perceived
quality) was measured using a questionnaire as a tool to collect data by calculating the level of consistency of
quality dimensions, using a Likert five scale: very consistent (5), consistent (4), fairly consistent (3), less
consistent (2), and inconsistent (1). Of 123 end-users, distributed on three scale production of micro, small, and
medium, respectively.
Table 4
The Average Level of Dimensional Consistency of Product Quality
No. Variable quality product Micro Small Medium
1 Consistency sense out 3.47 4.24 4.5
2 Consistency accompanying food flavors 3.24 3.89 4.31
3 Consistency level of crispy 2.65 3.21 3.86
4 Consistency comfort 3.24 4.26 3.98
5 Consistency of service speed 3.56 3.42 4.33
6 Consistency durability 3.20 4.21 4.46
7 Consistency of performance 3.49 3.89 4.12
8 Consistency avoid disability 3.56 3.98 4.26
Average 3.301 3.460 4.227
Note. Source: Calculated from field data.

INCONSISTENCY QUALITY PRODUCTS (ON SIX SIGMA PROGRAMS) EFFECT
40
With reference to Table 4, the following is the average value of consistency level. Micro scale has
averaged 3.301, a small scale has an average value of consistency level of product quality at 3.460 and the
average level of consistency of product quality dimensions is 4.227 medium scale. These data showed that the
scale was has the consistency of product quality dimensions higher than the small and micro scale. Small scale
has an average value of dimensional consistency of better quality than the micro scale.
Effect of the Level of Consistency of Product Quality Dimensions on Consumer Loyalty
To see the relationship between the dimensional consistency of product quality to the level of consumer
loyalty, it must first see the value or level of consumer loyalty to their respective industries. Loyalty levels were
measured using a Likert scale. A score of 5 is given to consumers with excellent loyalty criteria, value of 4 to
the criteria of loyalty, good value for category 3 loyalty enough, the value of 2 for the category of less loyalty,
and value 1 for the category of bad loyalty. Here are the average values of customer loyalty to the product on a
scale out of business.
Table 5
The Average Level of Consumer Loyalty Based on a Scale out of Business
Average consistency
No. Variable quality of the product Micro Small Medium
1 Loyalty is very high 4 12 22
2 High loyalty 7 14 13
3 Loyalty enough 11 9 4
4 Loyalty less 11 6 2
5 There is no loyalty 8 - -
Total consumer 41 41 41
Average 2.707 3.780 4.341
Based on the data in Table 5, the micro scale that the number of consumers who fall into the category of
very loyal customers there are four consumers, at scales that fall into the category of very loyal customers there
are 12 consumers, while for medium scales that fall into the category of very loyal customers there are 22
consumers.
Medium business scale has a number of very loyal customers compared to most small and micro scale.
The number of consumers who fall into the category of a good level of loyalty, the most widely owned by as
many as 14 small scale, but this is not much different from the medium scales have 13 customers, while at the
micro scale there are only have seven customers. While to the average level of loyalty, the average value
obtained for the micro scale of 2.707, for a small scale, there has an average value of 3.780 and the scale has an
average value of 4.341.
Effect of the Level of Consistency of the Dimensions of Quality Products out of Consumer Loyalty
Hypothesis to calculate the influence of the dimensions of quality products out of consumer loyalty are:
Ho: r = 0
H1: r ≠ 0
It means that the first hypothesis (Ho), states that there is no influence of the dimensional consistency of
product quality to consumers’ loyalty, and its hypothesis (H1) shows the influence of the level of consistency of
product quality consumer loyalty. By using the alpha (α = 5%), the results obtained following analysis in Figure 2.
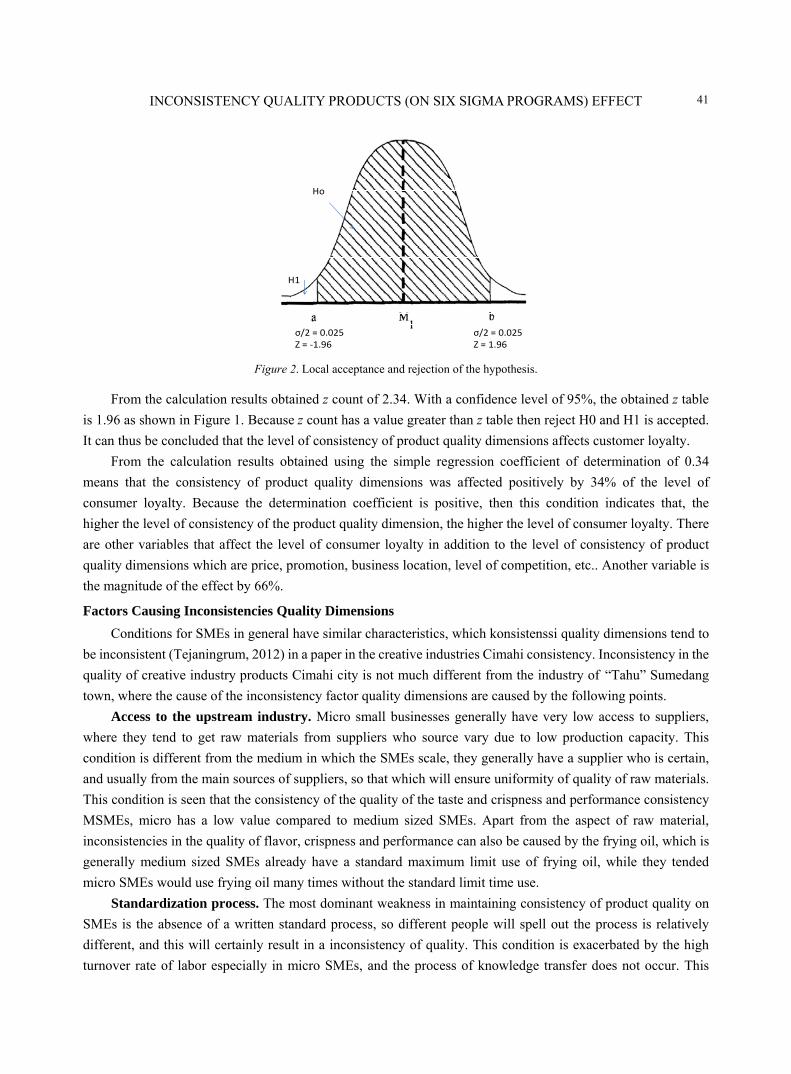
INCONSISTENCY QUALITY PRODUCTS (ON SIX SIGMA PROGRAMS) EFFECT
41
σ/2 = 0.025Z = ‐1.96
σ/2 = 0.025Z = 1.96
Ho
H1
Figure 2. Local acceptance and rejection of the hypothesis.
From the calculation results obtained z count of 2.34. With a confidence level of 95%, the obtained z table
is 1.96 as shown in Figure 1. Because z count has a value greater than z table then reject H0 and H1 is accepted.
It can thus be concluded that the level of consistency of product quality dimensions affects customer loyalty.
From the calculation results obtained using the simple regression coefficient of determination of 0.34
means that the consistency of product quality dimensions was affected positively by 34% of the level of
consumer loyalty. Because the determination coefficient is positive, then this condition indicates that, the
higher the level of consistency of the product quality dimension, the higher the level of consumer loyalty. There
are other variables that affect the level of consumer loyalty in addition to the level of consistency of product
quality dimensions which are price, promotion, business location, level of competition, etc.. Another variable is
the magnitude of the effect by 66%.
Factors Causing Inconsistencies Quality Dimensions
Conditions for SMEs in general have similar characteristics, which konsistenssi quality dimensions tend to
be inconsistent (Tejaningrum, 2012) in a paper in the creative industries Cimahi consistency. Inconsistency in the
quality of creative industry products Cimahi city is not much different from the industry of “Tahu” Sumedang
town, where the cause of the inconsistency factor quality dimensions are caused by the following points.
Access to the upstream industry. Micro small businesses generally have very low access to suppliers,
where they tend to get raw materials from suppliers who source vary due to low production capacity. This
condition is different from the medium in which the SMEs scale, they generally have a supplier who is certain,
and usually from the main sources of suppliers, so that which will ensure uniformity of quality of raw materials.
This condition is seen that the consistency of the quality of the taste and crispness and performance consistency
MSMEs, micro has a low value compared to medium sized SMEs. Apart from the aspect of raw material,
inconsistencies in the quality of flavor, crispness and performance can also be caused by the frying oil, which is
generally medium sized SMEs already have a standard maximum limit use of frying oil, while they tended
micro SMEs would use frying oil many times without the standard limit time use.
Standardization process. The most dominant weakness in maintaining consistency of product quality on
SMEs is the absence of a written standard process, so different people will spell out the process is relatively
different, and this will certainly result in a inconsistency of quality. This condition is exacerbated by the high
turnover rate of labor especially in micro SMEs, and the process of knowledge transfer does not occur. This

INCONSISTENCY QUALITY PRODUCTS (ON SIX SIGMA PROGRAMS) EFFECT
42
results in a low durability consistency, also the performance of the product itself.
Equipment that traditional. Most SMEs have problems with regard to classic that is still traditional
production equipment with a low calibration values, this condition will result in a high level of product variety.
Conclusion and Suggestion
From this paper, we can conclude that:
Small businesses have a value inconsistency micro dimensions of product quality compared with small
and medium businesses, where the value of the average consumer’s perception for dimensional consistency of
product quality at the micro scale is 3.301 or consistent enough entry categories, including the category of
3.460 small scale and medium scale consistent enough 4.227 including a consistent scale;
The highest level of customer loyalty occurs in medium scale enterprises, while the lowest level of loyalty
is on the scale of micro enterprises. The average value for the level of customer loyalty on a scale of 2.707
micro enterprises, small scale value of loyalty in 3.780, and the value of loyalty on the scale being 4.341;
The level of consumer loyalty to the micro scale SMEs amounted to 2.71 or log in categories less loyal,
small scale entry of 3.78 or category and quite loyal and medium scale include the category of 4.34 or loyal. This
data suggest consumers take out a medium scale enterprises have a high loyalty rate than small and micro scale;
Influence the level of consistency of the product dimension to customer loyalty is at 34%. While the
remaining 66% are other variables such as location of the business, selling price, promotion system, the level of
competition etc.;
The need to sustain the role of government procurement of raw materials so as to ensure uniform product
quality, to form a ministry under the official container trade;
The need for the role of government to improve the knowledge and skills of SMEs in maintaining the
consistency of product quality dimensions.
References Goetsch, L. D., & Davis, B. S. (2002). Quality management for production, processing and services. New Jersey: Prentice-Hall. Juran, J. M. (1995). Quality designing, creating the new definition of quality into goods and services. Jakarta: Library Binaman
Pressindo. Kotler, P. (2003). Marketing management (11th ed.). Upper Saddle River, N.J.: Prentice Hall. Law No. 20 of 2008. (2012). Small and medium enterprises. Retrieved from http://www.depkop.go.id Pande, P. S., Neuman, R. P., & Cavanagh, R. R. (2000). The six sigma way. New York: The McGraw-Hill Companies. Pydek, T. (2001). The six sigma handbook. Jakarta: Four Salemba. Shigeru, M. (1994). Wide total quality control. Jakarta: Management Institute. Tejaningrum, A. (2012). Inkonsistensi Dimensi Kulitas Industri Kreatif UMKM Kota Cimahi Dalam Mencapai Nilai Six Sigma.
Proccedings from Seminar Nasioanl Kewirausahaan dan Industri Kreatif Bisnis II. SNKIB II Universitas Tarumanegara. Tejaningrum. A. (2013). Effect of creativity and innovation prodution on performance of organization (Case study of Industrial
wood craft). Proceedings from 3rd International Conference on Management. Penang Malaysia. Tjiptono, F., & Chadra, G. (2005). Service quality satisfaction. Yogyakarta: Andi Offset.

Management Studies, ISSN 2328-2185 January 2014, Vol. 2, No. 1, 43-52
Meta-synthetic Strategies for Digital Recordkeeping and
Knowledge Utilization: International Trends*
Xiaomi An
Renmin University of China (RUC), Beijng, China
Judith Ellis
Enterprise Knowledge Pty Ltd., Melbourne, Australia
With the increasing number of applications and services online, more and more business processes are carried out
in a fully integrated digital working environment. To ensure the success of a business and the smart capture and
reuse of organizational knowledge, adequate recordkeeping is essential. A review of the related literature indicates
that international trends and future directions of recordkeeping awareness, recordkeeping processes and regimes,
recordkeeping systems and technologies are moving towards meta-synthetic support in a digital environment at
strategic level. However, little has been discussed about specific strategies of meta-synthetic support for digital
recordkeeping, and in turn, organizational knowledge. The purpose of this paper is to propose the adoption and
adaptation of the ISO/TC 46/SC 11 series of standards and the integrated use of ISO management systems
standards (MSSs) as enablers of meta-synthetic strategies to enhance organizational performance and accountability
through sustainable digital recordkeeping. The integrated use of ISO MSSs provides ever increasing opportunities
for integrated product, process, service, and compliance control. The mechanisms of the above meta-synthetic
strategies are collaboration, optimization, innovation, and compliance. The theoretical foundations are the
integrated use of life-cycle, continuum and ecosystem theories with multidisciplinary perspectives. The practical
outcomes are the support of varied evidence-based collaborations at multiple levels, such as national strategies and
plans for digital continuity, knowledge sharing and reuse, open government initiatives, e-government information
architecture and services competence building, and enterprise information governance.
Keywords: digital recordkeeping, knowledge management, innovation, meta-synthetic strategies, international
trends
Introduction
With more software applications and business and government services online, business processes within
an organization are increasingly carried out in a fully integrated, common digital working environment. More * Acknowledgements: This work is partly supported by the National Natural Science Foundation of China Key Program (Project Number: 71133006/G0314; Project Name: Developments of the Information Resources Industry in China: Strategies and Policies) and the National Social Science Foundation of China Major Program (Project Number: 13 & ZD 184; Project Name: Novel Mechanisms for the Integration of National Digital Archival Resources and Their Utilization).
Xiaomi An, Ph.D., Professor, Key Laboratory of Data Engineering and Knowledge Engineering of the Ministry of Education, Renmin University of China/School of Information Resources Management, Renmin University of China.
Judith Ellis, Managing Director, Enterprise Knowledge Pty Ltd.. Correspondence concerning this article should be addressed to Xiaomi An, Room 23, Jingyuan Building 9, Renmin University
of China, Beijng, 100872, China. E-mail: [email protected].
DAVID PUBLISHING
D

META-SYNTHETIC STRATEGIES FOR DIGITAL RECORDKEEPING
44
records are born-digital and are expected to be maintained, used, and reused digitally and for multiple purposes
over time.
Creation and management of records are integral to any organization’s activities, processes and systems, records enable business efficiency, accountability, risk management and business continuity. They also enable organizations to capitalize on the value of their information resources as business, commercial and knowledge assets, and to contribute to the preservation of collective memory, responding to the challenges of the global and digital environment. (ISO30300, 2011; ISO30301, 2011)
Good digital recordkeeping is an essential component of successful e-business and organizational
innovation.
Open government initiatives in advanced countries are undergoing a transition from paper to electronic
recordkeeping. For example, all ministries of the Netherlands are required to be connected in the cloud by 2015
(Hofman, 2011), and Library and Archives Canada plans to be fully digital by 2017 (Allard, 2011), the Obama
administration has set a goal for the federal government to go completely paperless by the end of 2019, by 2019,
federal agencies will manage all permanent electronic records in an electronic format in US (Managing
Government Records Directive, 2012). Digital recordkeeping is the backbone of open government initiatives and
should be integrated into business processes (Presidential Memorandum—Managing Government Records, 2011).
There are increasing expectations of citizens and customers that organizations should operate in a trustworthy,
accountable, transparent, and socially responsible manner (ISO/TC46/SC11, 2007). However, according to a 2007
survey in China, almost 80% of organizations had no measures in place for the storage of records of emerging
technology in China (Zhang, 2008). According to a 2010 survey by the National Archives and Records
Administration (NARA), 95% of federal agencies were at a high to moderate risk of compromising the integrity,
authenticity, and reliability of records due to no management regime for digital records, such disturbing results
reveal that many government records are at risk of being lost forever (Ferriero, 2012). The need for robust digital
recordkeeping is becoming more pressing (Australian National Audit Office, 2012).
The challenges of the digital environment have been the focus of many initiatives in recent years.
Challenges include:
How to effectively assure the authenticity, reliability, integrity, usability, and reusability of records through
the continuum of their existence in an ever-changing digital environment;
How to maintain both the business value and the enduring societal value of records in conformity with
increasing diverse legal, business, cultural, and societal requirements throughout the records continuum;
How to robustly enhance consistent and sustainable recordkeeping frameworks to bring people, process, and
technology together as a complex new whole (Mcleod, Childs, & Hardiman, 2010; Upward, 2013).
International trends and future directions of recordkeeping awareness, recordkeeping processes and
regimes, recordkeeping systems and technologies have been identified as moving towards meta-synthetic
support in the digital world (An, Sun, & Zhang, 2011). However, there are few discussions on meta-synthetic
strategies for digital recordkeeping based on the integrated use of ISO recordkeeping and management systems
for records (MSR) products in archival and recordkeeping literature (Cabero, Martín-Pozuelo, & Zazo, 2011).
The adoption and adaptation of ISO/TC 46/SC 11 series of standards and integrated use of ISO MSSs as
enablers of a meta-synthetic strategy for digital recordkeeping lead to innovation in and for society. “MSSs
provide tools for a system and verifiable approach to organization control in an environment that encourages
good business practices” (Bustelo & Ellis, 2011). ISO/TC 46/SC 11 standards provide a managerial framework,

META-SYNTHETIC STRATEGIES FOR DIGITAL RECORDKEEPING
45
as well as standards and guidance for the design and application of recordkeeping practices and processes to
ensure authoritative and reliable information and evidence of business activity in organizations for as long as it
is needed for any purpose.
Concept of the Meta-synthetic Strategy
The concept of “meta-synthetic” originated in the late 1980s from Chinese scholars (Qian, Yu, & Da,
1990). It refers to a comprehensive integration methodology, combining people, knowledge and tools,
integrating quantitative and qualitative methods, theories and practices, dynamic and static processes, macro
and micro levels, centralized and distributed environment, etc. (Qian et al., 1990; Da, 1995; Li & Liu, 1998; Yu,
2005; Gu, 2007). The implications of the meta-synthetic concept are that its holistic and systems approach to
the integration of different independent parts as an integrated whole results in a large, open, and complex
system (An & Wang, 2010; An, 2011b). The adoption of meta-synthetic strategy has competitive advantages of
collaborative ways of thinking, optimized process, innovative system and compliance services through
integrated use of ISO MSR series of standards and other ISO recordkeeping products.
The hypothetical meta-synthetic strategy recommended in this paper for digital recordkeeping and
utilisation capture includes four elements:
(1) Collaborative ways of thinking towards unified goals for value-added services and high organizational
effectiveness. This thinking merges expectations of clients from more than one field or stakeholders from more
than one group, for example, evidence-based governance and collaboration for ISO MSSs implementations
(ISO 9000 Quality management, ISO 31000 Risk management, ISO 26000 Social responsibility, ISO 27000
Information security management, ISO 14000 Environment management, ISO 5001 Energy management,
ISO/TS 22003 Food safety management, ISO 28003 supply chain security management, ISO 19011 auditing
management, etc.). As a result, disaster recovery and business continuity, corporate and collective memory, and
benefits to all the organization’s stakeholders would be strengthened;
(2) Optimized processes promoting competitive complementary advantages for best practice and overall
efficiency. Such processes merge procedures, methods, and tools from more than one business process, such as
life-cycle management, continuum regime, and ecosystem. As a result, redundant and duplicate information is
eliminated, and business efficiency, effective decision-making, IT performance, and the effectiveness and
efficiency of organization as a whole are improved;
(3) Innovative services promoting the best value of products for a cost effective economy, which merge
multiple product quality criteria and requirements across systems. Relationships and linkages amongst MSS
would be built to be adaptable to organizational structure and culture change to enable information sharing,
sustainable development, and organizational innovation and competence building;
(4) Compliance synergy promoting consolidated conformity assessment with diverse kinds and multiple
levels of legal, regulatory, policy and standards requirements. As a result, the responsibility chain, legislative
and regulatory compliance, defence of stakeholders rights and interests, accountability and the social
responsibility of organizations are enhanced.
Such a strategy aims to build an overall management framework through which the organization’s
objectives are set, performed, and controlled, and at the same time provide the benefits through integration with
impacts such as eliminating redundancy, establishing consistency, optimizing processes and resources,
consolidating assessments, reducing maintenance, and improving decision making (ISO, 2008).

META-SYNTHETIC STRATEGIES FOR DIGITAL RECORDKEEPING
46
The Mechanisms of Meta-synthetic Strategies
Table 1 suggests the integrated use of ISO/TC 46/SC 11 products and ISO MSSs as robust enablers of a
meta-synthetic strategy for digital recordkeeping and knowledge capture. The mechanism is the integrated use
of three methodologies for digital recordkeeping, in terms of life-cycle (records management), continuum
(management systems for records), and ecosystem methodology (management systems standards) as a
complementary whole (An et al., 2010; An, 2011b). The life-cycle methodology focuses on protecting the value
of records as evidence of transactions across time and space in records systems at the operational level. This
needs the collaboration of various stakeholders as a cooperative whole. The continuum methodology focuses on
sharing the value of records as evidence and the resources of an organization across time-space at the
meso-level. This requires optimization of processes and systems as a harmonious whole. Ecosystems
methodology focuses on creating the value of records as organizational evidence, resources, and assets across
time-space at strategic level. This requires innovation in recordkeeping capability to be embedded in
management systems as an interactive whole. Based on the integrated use of the three methodologies, the
meta-synthetic methodology focuses on adding value to records as societal memory, resources, and assets by
taking advantage of the disciplines of business continuity management, recordkeeping, and knowledge
management as an adaptive whole, to face challenges of complexity, uncertainty, compliance, and
sustainability of business and systems in a networked society.
Table 1
Mechanisms of Meta-synthetic Strategies
Meta-synthetic mechanism Life-cycle methodologyContinuum methodology
Ecosystem methodology
Meta-synthetic methodology
Why/values made (knowledge management)
Protecting value/recordkeeping
Sharing value /MSR
Creating value/MSSsAdding value to sustainability/business continuity records & knowledge management
What/process featured (business continuity management)
Passive/standalone/ finite
Proactive/ connected
Interactive/networked/indefinite
Adaptive to uncertainty
How/systems and technology worked (risk management)
Product control Process control Service control Compliance control
Where/gaps filled in (business continuity, records & knowledge management)
Collaboration/ inclusiveness of different group of people
Optimization/ orderliness under control
Innovation/integrity of different parts
Compliance synergy/ complexity, uncertainty, compliance, and sustainability capacity building
Integrated use of ISO MSR series of standards and other ISO recordkeeping products would provide a
comprehensive set of solutions which would have three implications for the organization (An, 2011a; ISO/TC
46/SC11, 2012):
(1) Improvement of the efficiency, effectiveness, and economy of organizational resources and assets
adaptable to complex global competition;
(2) Enhancement of the quality assurance of documented information to support evidence-based
governance and knowledge use, adaptable to dynamic change in information and communication technologies;
(3) Accumulation, sharing, and exchanging information, evidence, memory, and knowledge of e-business
and e-service systems, aiming at collaboration, optimization, innovation, and compliance of business processes
and systems.

META-SYNTHETIC STRATEGIES FOR DIGITAL RECORDKEEPING
47
The Enablers of Meta-synthetic Strategies
With e-business increasingly using web-based emerging technologies such as the cloud, social networks,
and social media in a global market, with some outsourcing moving to crowd sourcing, and with
ever-increasing global competition for conformity assessment (e.g., audit, certification), there are increasing
international, national, and local regulatory requirements for evidence-based collaboration to support legal
protection, accountability, corporate governance, financial and practice audits, security, reputation management,
business continuity planning and implementation. There is greater need for cost-effective strategies to improve
informed decision-making, performance management, productivity improvement, consistency, continuity and
quality assurance in management and operations, as well as faster and more accurate service delivery, resource
management, and cost control. There are greater stakeholder expectations of openness, trust, and ethical
behavior by organizations. There are opportunities for innovation through capture and reuse of organizational
knowledge, and the use of strategic knowledge to support business (ISO/TC46/SC11, 2007). Table 1 shows the
benefits of integrated use of ISO/TC 46/SC 11 products and ISO MSSs as enablers of meta-synthetic strategy to
meet the above demands through integrated service, process, product, and compliance controls (ISO 30300,
2011; ISO 30301, 2011; ISO 15489, 2001; Bustelo & Ellis, 2010, 2011).
To address the above needs, there are four key enablers of meta-synthetic strategies for digital
recordkeeping and knowledge capture as summarized in Table 2.
(1) Integrated service control.
Integrated service control refers to customers and other stakeholders focusing on a collaborative way of
thinking whereby leadership and accountability for the authenticity, reliability, integrity, and usability of
records are strategically and operationally integrated into the way of doing business. This is to support
evidence-based collaboration, legal obligations, business requirements, and the management of risks and client
needs. Digital recordkeeping is no longer the responsibility of records specialists alone, it comprises
partnerships between all the stakeholders involved across multiple business applications, as well as appropriate
leadership. Funds and people would be guaranteed from top management, and resources allocated to managing
records generated by business would be commensurate with the assessment of risk, the nature of the activities,
and the size and type of organization. Thus scalable, extensible, and sustainable services can be built to
improve the quality, accessibility, and availability of records and timely response to best utilize their multiple
values.
(2) Integrated process control.
Integrated process control refers to a process system approach to management, optimized by continual
improvement so that management of risk, quicker response to dynamic change, measurement and assessment of
performance are interrelated processes of recordkeeping programs. The overall management systems for
recordkeeping operations are linked to save resources, cut costs, and improve efficiency and productivity. Thus
cost-effectiveness, efficiency, and green business processes can be continually improved.
(3) Integrated product control.
Integrated product control refers to a range of integrated controls for records, including: The creation and
control of records are integral to an organization’s activities; the proper management of records is integrated
into processes and systems automatically for effective and efficient conduct of business; techniques, processes,
and systems used to create and manage records are aligned with the organization’s specific business

META-SYNTHETIC STRATEGIES FOR DIGITAL RECORDKEEPING
48
requirements; the requirements for records, their management and ongoing use are incorporated into the design
and implementation of an organization’s overall information framework; business rules are developed for
designing and implementing systems which manage, use, and dispose of records; business system and
processes are designed so that records are secure from unauthorized use or modification and are accurate,
authoritative, accessible, and acceptable as evidence and assets as long as they are needed (ISO 15489, 2001;
Bustelo & Ellis, 2010, 2011).
(4) Integrated compliance control.
Integrated compliance control refers to consolidated conformity assessment and related activities that meet
all the legal, regulatory, and policy requirements and support accountable business practice, legal compliance
and protection. Such an approach will enable easy communication, technical operability, cost savings, better
delivery, sustainable development, and competitive advantage. Thus accountability, transparency, and openness
of business practice can be enhanced.
Table 2
Enablers of Meta-synthetic Strategies and the Optimal Benefits Meta-synthetic enabler Integrated use of MSSs and ISO/TC 46/SC11 product Optimal benefit
Integrated service control Action of an organization to meet a demand or need (ISO 26000: 2010, 2.1.6)
accessibility, availability, timely response, scalable, extensible, sustainable
Integrated process control Set of interrelated or interacting activities which transforms inputs into outputs (ISO 9000: 2005, 3.4.1)
cost-effectiveness, efficient, energy green
Integrated product control Results of a process (ISO 9000: 2005, 3.4.2)
authenticity, reliability, integrity, usability, reusability
Integrated compliance control
Responsibility of an organization for its decisions and activities, and state of being answerable to its governing bodies, legal authorities and, more broadly, its other stakeholders regarding these decisions and activities (ISO 26000: 2010, 2.1.10)
accountability, transparency, openness, good governance
Table 3
Meta-synthetic Strategies in Digital Recordkeeping Practice Meta-synthetic initiative
Meta-synthetic perspective Meta-synthetic approach Meta-synthetic outcome
Recordkeeping awareness (collaborative ways of thinking)
From bottom up to top down; From managing records as data to managing records as business, evidentiary and societal resources and assets
Towards information resources management and knowledge asset management; Multidisciplinary interests and pluralist approaches
Managing complexity, uncertainty, compliance and sustainability
Recordkeeping regime (optimized process)
From static process to dynamic process; From a passive approach to a proactive and interactive approach
Towards collaboration within and between organizations and social innovation; Digital continuity action plan and holistic approaches to business continuity management
Integrated life-cycle, continuum and eco-system regime
Recordkeeping systems and technologies (innovative systems)
From life-cycle separated processes to seamless workflow of EDMS, ERMS, and trusted digital repository integration; From isolated business continuity, recordkeeping and knowledge management systems to an integrated management system
Towards recordkeeping capability embedded into business continuity management systems and knowledge management systems; ecosystem building
Connectivity, collaboration, community and compliance capacity building

META-SYNTHETIC STRATEGIES FOR DIGITAL RECORDKEEPING
49
Outcomes of Meta-synthetic Strategies
Table 3 indicates that meta-synthetic strategies can provide collaborative ways of thinking for
recordkeeping awareness, optimized processes for recordkeeping regimes, and innovative models for systems
and technologies that keep records and capture organizational knowledge.
As a result of meta-synthetic strategies, recordkeeping awareness changes from bottom up to top down.
Recordkeeping moves towards managing records as business, evidentiary and community resources and
knowledge assets. This is to ensure that public sector resources are created, maintained, and used more
efficiently through collaboration by sharing ideas, expertise, and systems, by minimizing duplication, by
coordinating ways to manage digital information efficiently, and thereby ensuring digital information is
authentic, reliable, discoverable, accessible, usable, and reusable over time, whilst also ensuring what is not
needed is properly disposed of in a controlled environment (Digital Continuity Action Plan of New Zealand,
2009; Digital Continuity Plan of Australia, 2011). The focus of recordkeeping and knowledge capture and reuse
is on areas of open data, strategic and complexity, collective decisions around business value and enduring
societal value, contribution to a digital economy, information access, and organizational accountability (Piche,
2011).
Recordkeeping regimes change from static to dynamic, from passive to proactive, interactive, and
adaptable approaches. Initiatives have been taken towards cross-organizational collaboration and societal
innovation, holistic approaches across multiple levels and multi-dimensional governance (Feng et al., 2011).
Benefits of information to agency businesses, the government and the community are optimized; people,
processes, and technology are aligned to support effective information management; information is
fit-for-purpose over its life (Digital Continuity Plan of Australia, 2011). The direction of recordkeeping moves
towards information resource management and knowledge asset management, utilizing multidisciplinary
interests and pluralist approaches to deal with challenges of complexity and uncertainty in a dynamically
changing digital environment and to support varied evidence-based needs (Managing Digital Continuity of UK,
2011).
Recordkeeping systems and technologies change from separated life-cycle processes and systems to
seamless workflow of electronic document management system (EDMS), electronic records management
system (ERMS), and trusted digital repository (TDR) integration (Liu, 2011); and move from isolated business
management, records management, and knowledge management systems to integrated management systems
(An, 2009; An et al., 2010; An, 2011b; Upward, 2013). The direction of digital recordkeeping focuses on
cross-agency information sharing and collaboration across the public sector which will minimize duplication of
effort and expenditure, generate cost savings, improve service delivery, and provide an inclusive and unified
whole government plan at a strategic level linking digital recordkeeping to business success (Digital Continuity
Action Plan of New Zealand, 2009; Digital Continuity Plan of Australia, 2011; Managing Digital Continuity of
UK, 2011) .
Meta-synthetic frameworks are built into open government initiatives, e-government information
architecture, emerging technologies solutions and enablers, and government plans to improve the public value
of e-government services and e-government performance as a whole. This provides a foundation for open
government, leverages information to improve agency performance, and reduces unnecessary costs and burdens
(Information matters: Building government’s capability in managing knowledge and information, 2008;

META-SYNTHETIC STRATEGIES FOR DIGITAL RECORDKEEPING
50
Managing Government Records Directive, 2012). Framework requirements for recordkeeping are based upon
legislation, and international standards such as ISO 30300, ISO 30301, ISO 15489, and ISO 23081 (Hofman,
2011). Collaboration between business areas and information management areas is critical to the success of
effective recordkeeping; collaboration between departments, agencies, and archival repositories is critical to the
successful implementation of the recordkeeping plans, not just a technical framework (Hofman, 2011; Piche,
2011; AFNOR-CN11, 2012).
Conclusions
This paper proposes the integrated use of international standards produced by ISO/TC 46/SC 11 and ISO
MSSs as enablers of a meta-synthetic strategy to support effective evidence-based collaboration and good
governance for digital recordkeeping, which will support more efficient and accountable government, thereby
benefiting all stakeholders. This approach will build links with business continuity management, quality
management, security and risk management, audit and knowledge management. It provides a holistic and
systematic approach to digital recordkeeping that covers all aspects of the creation, control, and use of records
as long as they are required. Different management aspects and systems are integrated for shared outcomes and
various impacts through integrated service, process, product, and compliance control. The mechanisms of a
meta-synthetic strategy are collaboration, optimization, innovation, and compliance. Complementary and
multi-disciplinary approaches of life-cycle, continuum and ecosystem methodology come together as an
integrated, harmonious, and comprehensive new whole.
A meta-synthetic approach focuses on complete sets of solutions to managing complexity, uncertainty,
compliance, and sustainability in an ever-changing networked society. This is to build connectivity,
collaboration, community, and compliance among recordkeeping, business continuity management, knowledge
management, legal requirements, and technological infrastructure to support varied evidence-based
requirements across boundaries at multiple levels and in multiple dimensions such as national strategies and
plans of digital continuity, knowledge sharing and reuse, open government initiatives, e-government
information architecture and services competence building, and enterprise information governance.
References AFNOR-CN11. (2012). ISO 30300-30301-management system for records: Definition, design, integration to other management
system standards. Paris: AFNOR. Allard, G. (2011). Managing government information as a strategic asset. Information Awareness Seminar. Sydney, Australia. An, X. (2009). Integrated management of business, records and knowledge. Proceedings from the 54th ARMA International
Conference. Orlando, Florida, U.S.. An, X. (2011a). Development of electronic records and documents management standards of ISO: An overview. Proceedings
from the Second National Forum on Electronic Records Management. Renmin University of China, Beijing. An, X. (2011b). Managing records using emerging technology: Meta-synthetic theories and practices. Proceedings from
International Conference on Records and Information Management Using Emerging Technologies. Nanjing University, China.
An, X., Sun, S., & Zhang, W. (2011). Managing electronic records in e-government: Current trends and future directions internationally. Proceedings of the 5th International Conference on Management and Service Science. Wuhan, China.
An, X., & Wang, W. (2010). Towards comprehensive integration management of business continuity, records and knowledge. Proceedings of the 6th International Conference on Networked Computing and Advanced Information Management (pp. 5-9). Seoul, Korea.
An, X., Dawson, A., Bai, X., & Wang, W. (2010). Framework for managing national research project records as knowledge assets:

META-SYNTHETIC STRATEGIES FOR DIGITAL RECORDKEEPING
51
Integrated use of lifecycle, continuum and ecosystem knowledge management methodologies. Proceedings from the 7th International Conference on Intellectual Capital, Knowledge Management & Organizational Learning (pp. 37-46). Hong Kong.
Australian National Audit Office. (2012). Audit report No. 53. 2011-12: Records management in the Australian public service. Retrieved from http://www.anao.gov.au/~/media/Uploads/Audit%20Reports/2011%2012/201112%20Audit%20Report%20No53.pdf
Bustelo, C., & Ellis, J. (2010). Better records = Better business: Using ISO 30300 in the strategic management of your organization. The Hague: Archives/Records Management Technical Sub-Committee of Information and Documentation Technical Committee of the International Organization for Standardization (ISO/TC46/SC11).
Bustelo, C., & Ellis, J. (2011). What is ISO30300? Who, when, where, why and how to implement. Retrieved from http://www.iso30300.es/wp-content/uploads/2011/12/Innovadoc2011_JEllisCBustelo.pdf
Cabero, M. M. M., Martín-Pozuelo, M. P., & Zazo, J. L. B. (2011). ISO 15489 and other standardized management systems: Analogies and synergies. Records Management Journal, 21(2), 104-121.
Da, R. (1995). Meta-synthesis of intelligent system. Zhejiang: Zhejiang Science and Technology Publishing House. Digital Continuity Action Plan of New Zealand. (2009). Retrieved from
http://archives.govt.nz/sites/default/files/ActionPlanDoc.pdf Digital Continuity Plan of Australia. (2011). Retrieved from
http://www.naa.gov.au/records-management/agency/digital/digital-continuity/plan/index.aspx Feng, H., liu, Y., Qian, Y., Zhang, N., Zhang, Y., & Xu, Y. (2011). National strategies for managing electronic records. Beijing:
Renmin University of China Publishing House. Ferriero, D. S. (2012). A presidential charge to improve federal records management. Retrieved from
http://www.oah.org/news/20120201_archivist.html Gu, J., Wang, H., & Tan, X. (2007). Meta-synthesis method system and systematology research. Beijing: Science Press. Hofman, H. (2011). Recordkeeping implementation issues in the Netherlands. Retrieved from
http://www.whitehouse.gov/the-press-office/2011/11/28/presidential-memorandum-managing-government-records Information matters: Building government’s capability in managing knowledge and information. (2008). Retrieved from
http://www.nationalarchives.gov.uk/documents/information-management/information-matters-strategy.pdf ISO 15489. (2001). Information and documentation—Records management—Part 1: General. Geneva: ISO. ISO 26000. (2010). Guidance on social responsibility. Geneva: ISO. ISO 30300. (2011). Information and documentation—Management systems for records—Fundamentals and vocabulary. Geneva:
ISO. ISO 30301. (2011). Information and documentation—Management systems for records—Requirements. Geneva: ISO. ISO 9000. (2005). Quality management systems—Fundamentals and vocabulary. Geneva: ISO. ISO. (2008). The integrated use of management system standards. Geneva: ISO. ISO/TC46/SC11. (2007). ISO 15489 management statement. Geneva: ISO. ISO/TC46/SC11. (2012). Relationships between the ISO 30300 series of standards and other products of ISO/TC46/SC11:
Records processes and controls. Retrieved from http://www.iso30300.es/wp-content/uploads/2012/03/ISOTC46SC11_White_paper_relationship_30300_technical_standards12032012v6.pdf
Li, B., & Liu, Z. (1998). Integration management: Management innovation of high technology age. Beijing: Renmin University Publishing House.
Liu, Y. (2011). The system framework of electronic records management regime. Proceedings from the Second National Forum on Electronic Records Management. Beijing, China.
Managing Digital Continuity of UK. (2011). Retrieved from http://www.nationalarchives.gov.uk/documents/information-management/managing-digital-continuity.pdf
Managing Government Records Directive. (2012). Retrieved from http://www.whitehouse.gov/sites/default/files/omb/memoranda/2012/m-12-18.pdf
Mcleod, J., Childs, S., & Hardiman, R. (2010). AC+erm final report. Retrieved from http://www.northumbria.ac.uk/static/5007/ceispdf/final.pdf.
Piche, J. (2011). The whole of society model and the recordkeeping methodology. Proceedings from the 27th ISO/TC46/SC11 Meeting. London.

META-SYNTHETIC STRATEGIES FOR DIGITAL RECORDKEEPING
52
Presidential Memorandum—Managing Government Records. (2011). Retrieved from http://www.whitehouse.gov/the-press-office/2011/11/28/presidential-memorandum-managing-government-records
Qian, X., Yu, J., & Da, R. (1990). A new area in science—Open and complex huge system and the methodology. Nature Magazine, 13(1), 3-10.
Upward, F. (2013). Recordkeeping informatics: Re-figuring a discipline in crisis with a single minded approach. Records Management Journal, 23(1), 37-50.
Yu, J. (2005). From meta-synthetic ideas to meta-synthetic practice. Management Science Journal, 10, 4-10. Zhang, N. (2008). Current status of electronic records management in China: Investigation and thoughts. Archival Science
Bulletin, 6, 15-19.

Management Studies, ISSN 2328-2185 January 2014, Vol. 2, No. 1, 53-61
Reform of Financial Institutions—Getting it Right
Matjaz Nahtigal
University of Primorska, Koper, Slovenia
The purpose of this article is to reflect upon the importance and the role of financial institutions before, during, and
after the financial crisis and to outline proposals for alternative approaches to the financial crisis. Without an
understanding of the historic development, nature and scope, and important limitations of modern financial
institutions, the regulatory reform of modern financial institutions cannot be successful. The success of financial
reforms and their restructuring can only be measured when modern financial institutions participate, support, and
develop the real economy and support a more balanced, inclusive, and diverse social development process. This is
what the really “exciting” banking and finance organizations should stand for. The regulatory reforms, bail-outs,
and dominant ideas about the European banking union, for example, are impeding, rather than facilitating, hope for
real economic and social recovery on both sides of the Atlantic. The method used in the present article, is legal and
institutional analysis of the financial institutions. The empirical and comparative overview of the role and
importance of financial institutions shows the variety of financial institutions developed in different historical and
socio-economic circumstances. They show there is no one single best model of financial institutions that could be
universally applicable. The design and the regulatory framework for the financial institutions should therefore take
into account the overall strategy of economic and social development. In absence of any such comprehensive
strategy it is unlikely that the regulatory reform of the financial institutions can be successful.
Keywords: the role of financial institutions, regulatory reform of financial institutions, the tenuous linkages
between the real economy and the financial institutions, financial hypertrophy and financial crisis, alternative
financial institutions
Introduction
The purpose of this article is to reflect upon the importance and the role of financial institutions before,
during and after the financial crisis and to outline proposals for alternative approaches to the financial crisis.
Financial institutions are commonly mentioned in academic and public debates, but their role remains
inadequately understood. Financial institutions and their activities grew immensely over the last few decades.
They became highly sophisticated so much, so that many of their detailed operations and transactions are only
understood by highly specialized experts. This is part of the reason why they attract a lot of attention, not only
for the purpose of bailing them out, but rather to better understand their role, importance, and relevance to the
real economy and to the societies at large.
It is worth remembering that in the period between 1950 and 1980, financial institutions were primarily
“uninteresting”, “boring institutions” with the task of allocating financial resources from the savers to the
Matjaz Nahtigal, Associate Professor of Law, Faculty of Management, University of Primorska. Correspondence concerning this article should be addressed to Matjaz Nahtigal, Faculty of Management, University of
Primorska, Cankarjeva 5, 6105 Koper, Slovenia. E-mail: [email protected].
DAVID PUBLISHING
D

REFORM OF FINANCIAL INSTITUTIONS—GETTING IT RIGHT
54
productive activities of the society. In the period between 1980 and 2008, however, a fundamental shift in the
world of finance occurred. Consequently, the world of finance and financial institutions has become one of the
fastest growing sectors. The role, size, and importance of finance have changed from the auxiliary role of
supporting the development of other economic and social activities to a dominant role and position in modern
(Western) societies. This fundamental shift has largely gone unnoticed.
At the explanatory level, the fundamental shift in the importance of finance can be explained as a
necessary, natural development of mature capitalist societies. Only after the crisis, with its epicenter in the large
financial institutions of the most advanced and developed countries worldwide, has it become clear that it will
not be possible to return to the path of sustainable and equitable development without comprehensive structural
changes in the role and activities of financial institutions.
The primary purposes of this article are twofold: (1) to illustrate how the financial system has become
increasingly dysfunctional; and (2) to illustrate the possibilities of how to redirect and reorient financial
institutions in the future to again become socially valuable and useful institutions.
Real Economy, Financial Institutions, and Long-Term Development
Among the critics of the present financial environment, created in the last decades, is a significantly
important and radical idea: breaking up several of the biggest financial institutions. The argument of Johnson
and several other important scholars is that the best way to tame large financial institutions and prevent future
financial disasters at the expense of society is to break-up the largest financial institutions. The simplest
explanation of the argument is that in making financial institutions smaller, a potential collapse of certain
financial institutions would not bring international finance into turmoil. When large financial institutions
operate in a highly leveraged form, with a great deal of debt and very little equity, huge and unfair costs may be
imposed on the rest of the economy. While the implicit subsidies provided to too-big-to-fail companies allow
executives and investors to increase compensation by hundreds of millions of dollars, the costs imposed on the
rest of us are in the trillions of dollars. This led Johnson to the conclusion that this is a monstrously unfair and
inefficient system. Many sensible public figures are increasingly pointing this out (Johnson, 2012).
There are also other similar proposals for providing safer banking. One idea is legislating higher capital
requirements. The purpose of this is to make sure banks and other large financial institutions depend more on
equity and less on debt and to a binding “leverage ratio”—a requirement according to which the banks should
have at least 10% in equity relative to their total assets (Johnson, 2012).
Johnson admits that even smaller financial institutions, in comparison with today’s megabanks, would not
be sufficient to ensure financial stability. They would ensure, however, more efficient supervision and reduce
systemic risks in cases of financial turmoil.
The authors arguing in support of the limitation on the size and leverage of financial institutions also
discuss, with lesser attention, the issue of the quality of these hypothetically restructured financial institutions.
The open issue would remain as to whether these smaller financial institutions would be capable of providing
stronger and better long-term support for the development of the real economy. Suppose that the first part of the
issue can be described as a quantitative issue—the size, the cap on debt, on leverage and so on. As such, the
second part of the issue can be described as qualitative. The qualitative issue can be described as the issue of
the quality of financial support for innovations, for the enhancement of productivity, and for the expansion of
output.

REFORM OF FINANCIAL INSTITUTIONS—GETTING IT RIGHT
55
The distinction should be made between all kinds of financial activities aiming at securing long-term
support for the development of a real economy and those financial activities aiming at creating benefits for the
executives and investors. Needless to say, this distinction is, in reality, almost impossible to draw, but it
nevertheless remains crucial. Dirk Bezemer, a finance professor from the Groningen University, is one of the
few experts who pointed out this crucial, although rarely mentioned and analyzed, distinction. He has made a
distinction between credit that supports economic growth and credit that fuels bubbles and subsequently hinders
growth.
Bezemer’s path breaking analysis starts with the recognition that current macroeconomic models do not
distinguish between the credit flows that help and hinder the economy (Bezemer, 2012a, p. 3). He is convinced
that the neglect of credit and debt in economic theory left us unprepared for dealing with the financial crisis.
Moreover, he has pointed out the paradox that the dominant macroeconomic models of “general equilibrium”
do not have “money, financial flows, credit, or debt”. The models that are widely used in policy institutes,
academia, and central banks, have no bank. These models assume the liabilities of all borrowers always exactly
match the assets of all lenders.
The assumption is that, on the basis of accounting equality, the financial sector’s assets are the real
sector’s liabilities. According to Bezemer, however, this accounting equality, on which macroeconomic models
are based, is highly misleading and does not explain the true nature of modern finance. Namely,
…most of that debt growth has not been due to lending to the real sector—to non-financial firms, supporting growth in wages and profit. Almost all of it was due to mortgage lending and to credit to the non-bank financial sector credit, to inflate stocks and property prices and to create and trade options, futures, and other derivative instruments. These credit flows, and the activities they fuelled—share buybacks, leveraged buyouts, securitization—create no wage or profits for the many, but capital gains for the few, and a huge net debt burden on the economy.
Property and asset prices may be falling, but the debts that jacked them up are not. The threat to growth today is not a shrinking of the financial sector, but it enormous size. The accumulated claims by the non-bank financial sector cause a daily drain of purchasing power on the economy in debt services. This is money that could be effective demand for goods and services and stimulate economic growth. Nowadays, finance is stifling, not stimulating growth. (Bezemer, 2012b)
These findings have far reaching consequences for the debate on the role and importance of financial
institutions in the modern economy and society. They go beyond the discussion of the size and scope of large
financial institutions. On the basis of these insights, Bezemer has illustrated the process of the gradual
de-linking of finances and the real economy over the last three decades. The financial institutions have turned
away from supporting the real economy and from growing and developing in tandem with the real economy
and society. These valuable insights by Bezemer, who has reminded us that James Tobin, when discussing the
efficiency of the financial system, warned us that “… we are throwing more and more resources, including
cream of our youth, into activities that generate high private rewards disproportionate to their social
productivity” (Bezemer, 2012a, p. 2).
The theoretical reason for the confusion in explaining the role and importance of large financial
institutions in modern societies comes from accounting equality, according to which the financial sector’s
assets are the real sector’s liabilities. There is, however, a trade-off between “the financing of production (out
of retained earnings and fresh lending) on the one hand and credit flows returning into the financial sector on
the other” (Bezemer, 2009a, p. 13). As noted by Bezemer, this trade-off is absent from the mainstream models,
but is crucial to understanding the crisis.

REFORM OF FINANCIAL INSTITUTIONS—GETTING IT RIGHT
56
On the basis of the flow-of-funds, credit has shifted away from the real economy to the financial assets
market. This shift has created its own dynamics, according to which the credits into financial assets and
financial instruments increased returns. This encouraged the next cycle of credit flows, debt growth, and asset
price rises. The unsustainable dynamic in the period of irrational exuberance was perhaps not viewed as deeply
problematic, because the real economy developed and grew at the same time. In good economic times, the shift
of credits from the real economy to the financial assets did not present a concern, due to the accounting identity
assumption. This assumption created an illusion of common growth and prosperity. The longer the illusion
lasted, the more destructive the social and economic consequences turned out to be.
If the above analysis is correct and the mainstream economic and legal experts and policy-makers failed to
address the phenomenon, then the financial institutions turned away from supporting the real economy into
extracting benefits from it. The crucial issue is how to re-connect the financial institutions and the real economy
such that the financial institutions start supporting the real economy again. It is a challenge, not only in how to
rebalance the power and influence the large financial institutions, but also in how to channel credit flows back
into the real economy. This redirection would not necessarily make banking and finance “boring” again, but it
would make sure that the financial institutions grow and develop in a sustainable manner together with the real
economy and the society at large. As a result, this redirection would probably decrease returns and bonuses to
large financial institutions and their executives. It would, however, spread economic, financial, and other
opportunities to the larger segment of businesses, new entrepreneurs, to start up firms and to many other
segments of society. The qualitative dimension of the financial reform should be added to the quantitative
dimension of the financial reform.
For the time being, governments on both sides of the Atlantic pay little attention to such an alternative
approach to the reform of the financial institutions. They continue to bail out the entire financial sector,
regardless of the cost for the public finance, and ultimately, for the taxpayers. Their perspective seems to be
that after bailing out the financial institutions, things would return back to prosperity, as witnessed in the years
before the financial crisis. The problem with this approach is that the period of the so-called prosperity was
based on many unsustainable and illusory premises. It was based on the supply of cheap money, on the toxic
flows of excessive liquidity to increasingly inflated prices of financial assets, and on the so-called credit
democracy for the citizens. Not one of the premises was sustainable and not one can be restored.
The attempt to restore the status-quo ante situation by merely making more regulations on large financial
institutions would only mean that financial institutions are still not sources of support and that they may
continue to present a “sustained drain of liquidity from the real sector to the finance, insurance and real estate
(FIRE) sector” (Bezemer, 2009a, p. 13). This problem with credit flows, which was little understood and rarely
mentioned before the crisis, continues to be unresolved. The consequences of not recognizing what Bezemer
has recognized—that the credits flowing to the financial assets are distinct from the credits flowing to the real
economy—go beyond the issue of the optimal size and scope of the financial institutions. Bezemer has offered
another important argument to support this view:
In the 1980-2007 era of cheap credit and deregulation, banks had every incentive to move from real-economy projects, yielding a profit, towards lending against rising asset prices, yielding a capital gain. In the 1990s and 2000s, loan volumes rose to unprecedented levels, supporting global assets booms in property, derivatives and the carry trade. The share of lending by US banks to the US financial sector—instead of to the real economy—went from 60 percent of the outstanding loan stock in 1980 (up from 50 percent in the 1950s) to more than 80 percent in 2007. (Bezemer, 2009b)

REFORM OF FINANCIAL INSTITUTIONS—GETTING IT RIGHT
57
Unfortunately, the similar data for the EU are not available, but it would probably be a fair assessment that
in the last few decades, the EU, before and after the creation of the Eurozone, took a very similar path of
development. This means that financial liberalization, cross-border mergers, and the creation of large European
banks led to a similar path of unsustainable development with negative economic and social consequences. As
a result, the EU faces similar challenges in restructuring the banking sector to the US.
The challenges of restructuring the banking sector and financial markets go substantially beyond
regulatory measures and quantitative limitations on the size and leverage. The crucial debate remains how to
recreate a socially beneficial financial sector. In this sense, Bezemer is right when he is reminding us that the
financial sector continues to be bloated and dysfunctional. As long as modern societies cannot channel credits
via financial institutions primarily in the enhancement of productivity, wages, and the growth of the real
economy, the efforts to bail out such a financial sector will present a drain, not a support, for the long-term
economic and social development of modern societies. Therefore, the key challenge for modern societies is to
restructure and redirect financial institutions to again start performing socially useful functions.
Nothing less than the future of democracy is at stake. Concern about the future of democracy in relation to
the role and importance of financial institutions was very well understood by scholars, practitioners, and
politicians, such as Louis Brandeis, Douglas Williams, and Franklin Roosevelt, decades ago. However, it is
poorly understood by the present generation of leaders and mainstream scholars.
Another important aspect of the finance and financial institutions situation that was overlooked by most
mainstream economists, lawyers, and policy-makers is that corporations, businesses, and other parts of the real
economy are increasingly self-financed. This observation was almost completely ignored before the crisis in
good economic times and remains to be largely overlooked today. Only a handful of scholars pointed to this
issue of self-financing. Scholars who pointed out this phenomenon, including Roberto Unger, Zhiyuan Cui, and
Colin Mayer, observed that relatively little real investment in the expansion of production and productivity is
financed directly through stock markets:
Corporations in all major Western countries fund almost all their capital expenditures—investment in plant, machinery, and inventories—internally, through retained earnings, in other words, through profits and depreciation. Since 1952, retained earnings have covered 95 percent of capital expenditures. Since the early 1980s, through mergers and acquisitions, buybacks, and dividend distributions, more stock has been retrieved from stock markets than has been issued. As a result, new equity as a net source of finance is negative. (Unger, 1998, p. 283)
Why is it possible that such an important and revolutionary insight has been ignored for such a long time?
Part of the theoretical and practical reason lies in the nature of modern financial activities as explained
previously. Another part of the reason lies with the neoclassical and Keynesian literature, according to which
the accounting identity between savings and investment exists by definition. Whatever is saved is going to
automatically be invested. This implies that saving cannot be wasted and money cannot be squandered in the
financial casino.
The reality of modern complex financial institutions illustrates a different picture. Huge volumes of
financial transactions and trading between financial institutions do not necessarily and automatically guarantee
that the financial flows will be channeled to enhance productivity and output. Empirical analyses illustrate that
corporations have to rely on their own savings to finance their development. This observation, put forward by
economic and legal scholars Bezemer, Unger, and Cui, has been suppressed by the neoclassical and Keynesian
literature. The growing gap between the financial institution and the real economy was less problematic in good

REFORM OF FINANCIAL INSTITUTIONS—GETTING IT RIGHT
58
economic times—when the underlying fragility and unsustainability of the financial arrangement was not taken
seriously. It remains unaddressed today. Without addressing it, it is difficult to determine how it would be
possible to overcome the ongoing crisis, except in the form of a temporary “kicking the can’ manner”.
In addition to the theoretical reasons, practical reasons for ignoring the problem of the inefficient
allocation of scarce resources lay ahead. Financial markets and financial institutions grew immensely in the last
decades. Confronting them directly would require courage and wisdom, as well as the theoretical knowledge
and practical skills rarely seen of public figures, such as policy-makers and advisers. It remains more
convenient to marginally improve the regulatory framework while bailing out many of the failing financial
institutions with taxpayer money, rather than approach a comprehensive and strategic restructuring of the
financial sector. Strategic restructuring would require a quantitative restructuring in terms of size and caps, as
well as a qualitative restructuring of financial institutions in order to reconnect them with the real economy and
the rest of the society.
These are the reasons why the approach toward banking bail-outs and toward the banking union in the
European context is far from efficient from a broad social and economic perspective. The entire approach needs
to be re-directed. The regulatory efforts should follow, not precede, such a reorientation. The best start in a new
direction, such as this, is to focus on what worked best in the past. These were networks of small local banks
which provided long-term support for the development of small and medium sized local businesses. Local
banks have traditionally been a backbone of local and regional development in many advanced economies,
including the US decentralized banking sector and the German system of Landesbanks. They have a much
better insight into the needs, possibilities, and potential of local businesses and have a much bigger stake in the
success of local and regional development. They represent one alternative possibility of how to secure a
deepening of finance in place of the futile process of financial hypertrophy (Lothian & Unger, 2011, p. 30).
Other forms of financial institutions with much larger stakes in supporting the long-term competitiveness
of the real economy, and with much greater interest in the more equal and inclusive access to credit, should
evolve. The difference between financial hypertrophy and financial deepening was established by Unger and
Lothian. They explain the contrast in the following way:
By the hypertrophy of finance, we understand increase in the size of the financial sector, of its share in profit, talent, and influence, regardless of the service that it renders to the real economy. By financial deepening, we mean the intimacy of the relation between finance and the real economy: not only consumption but also and above all production and innovation. (Lothian & Unger, 2011, p. 27)
Institutional innovations in the area of finance are something substantially different than the proliferation
of financial instruments and financial innovations in the last decades. Financial innovations served the purpose
of enhancing the volume of trade without the ultimate goal of supporting the development of the real economy.
Would not it be really exciting for banking to re-connect the financial institutions with the development of the
real economy, so that the next generation of talented bankers would participate, support, and help develop the
real economy and society at large? It is true that the banking bonuses for the top executives and the returns on
equity could (and should) be closer in line with the developments, returns, and rewards in the real economy, but
such a realignment would serve the real social needs and return prospects for the many excluded parts of the
population.
On the basis of the analysis presented above, it would be necessary to multiply and diversify financial

REFORM OF FINANCIAL INSTITUTIONS—GETTING IT RIGHT
59
institutions in order to reconnect the world of finance with the world of real economy. For example, the role of
venture capital, which provides equity to start-up firms, the role of regional development funds, the role of
pension funds (on the need to activate pension funds for the purposes of long-term economic development
(Unger, 1998, pp. 148-150), and the role of other financial institutions can all contribute to the diversification
of financial institutions. It also contributes to more innovative ways for how to provide long-term support for
the real economy and its restructuring for start-up firms, industrial innovations, and the productivity
enhancement (the possibility to transform the US financial system toward more equitable and more efficient
system) (Dymski, Epstein, & Pollin, 1993).
A reorientation of the financial institutions is not without risks. The key point is that decisions for when
and how to provide finances for the real economy must be taken on the basis of a high level of expertise and an
understanding of the real economy. It must also be independent on any political meddling at the local, regional,
and national level. Policy-makers should support the improved links between the financial sector and the real
sector, but they cannot, and should not, interfere with the professional decisions of which investment
opportunities deserve high quality financial support. The same principle applies, even in the case of public
venture funds. However, these venture funds present a rare, but potentially promising, vehicle of the future
socially inclusive economic development.
Financial deepening, as a qualitative and quantitative contrast to development, would lead to a more
balanced, more diverse, and subsequently more inclusive development of the financial sector, real economy and
society at large. It would require strong leadership and a renewed opening of space for the economic, social,
and financial initiatives bottom-up approach, as well as better chances to pursue a comprehensive economic and
social reconstruction. It would present a task, as Lothian and Unger (2011, pp. 28-33) suggested in their
proposal, to return the financial institutions from the position of bad master again into a position of good
servant to the economy and society.
Such a restructuring of the financial institutions would certainly require broader social and economic
visions of modern economies and societies and would require broader social alliances. It would not be a magic
wand, but certainly present a more transparent, more balanced, and more inclusive approach to the economic
and social recovery. Needless to say, it would also meet with strong opposition in the form of present financial
and political oligarchies which continue to stymie any coherent and comprehensive approach to the recovery
beyond hopeless but allegedly necessary bail-outs and banking unions in the trans-Atlantic world.
Conclusions
Since the beginning of the crisis, many valuable proposals for how to tame financial institutions were put
forward. Among the most well-known is the Volcker rule, which is the prohibition of internal hedge funds,
internal private equity funds, and proprietary trading in commercial banking institutions. They include a return
to “narrow banking”, limitations of the size and leverage of financial institutions. Laurence Kotlikoff suggested
a limited purpose banking, in which banks are not allowed to borrow short and lend long. In addition, all risky
assets must be held in mutual funds (Johnson & Kwak, 2011, p. 6461). In practice, new legislation and
regulation, such as Dodd-Frank, was adopted. In a long and protracting legislative procedure—including heavy
lobbying and opposition from the Wall Street—a comprehensive new legislation was adopted by the US.
According to Johnson, the Dodd-Frank Act presents an important step forward in supervising and
regulating large financial institutions and a missed opportunity. It is a complex legislation which leaves a

REFORM OF FINANCIAL INSTITUTIONS—GETTING IT RIGHT
60
dizzying number of details to regulatory discretion. Thus, it will depend largely on the integrity, quality,
independence, and professionalism of the regulatory bodies. More specifically, the courts will have to supervise
and regulate the financial institutions better than they have in the past.
Lawyers at Davis Polk counted 243 new rules and 67 new studies required by the Dodd-Frank Act.
Despite the comprehensive legal framework, many important aspects are exempted from legislation, such as the
new requirements for trading and clearing derivatives, which includes an exemption for “commercial end
users” that use derivatives for hedging purposes. Johnson has pointed out that the size of that loophole turns out
to be largely dependent on the wording of the rule defining exempt transactions (Johnson & Kwak, 2011, pp.
4396-4413).
It will be many years, before a judgment on the efficiency of such legislation could be made. It will also
take many years before it will become clear as to whether the President’s announcement, when signing the
Dodd-Franck Act, of the American people never again being asked to foot the bill for Wall Street’s mistakes
and about the transparency and risk reduction of such a bill (Johnson & Kwak, 2011, loc. 4324-44) will be
possible to verify. It is already possible, however, to say that the Dodd-Frank Act does not present as
substantial a reform of the financial institutions as the Glass-Stegall Act, in the New Deal era, despite the fact
that the magnitude of the problems and issues related to the role of financial institutions is bigger today than at
any other period of industrial, financial, and social development.
Alternatively, more thoroughly thought out approaches toward financial sector restructuring are needed.
According to the available reports and data, in the EU, the European commission has approved €4.5 trillion (37
percent of EU GDP) in state aid measures to financial institutions between 2008 and 2011 (EU Observer, June
2012). According to the report by former European Commissioner Liikanen:
During October 2008 to end 2010, European governments used a total of €1.6 trillion of state aid to support the banking sector, in the form of guarantees and liquidity support, recapitalisation, and asset relief measures. It was perceived that, without government intervention, a systemic crisis with serious consequences for the economy would have materialised. (Liikanen report, 2012, p. 20)
The real tragedy is, however, that despite this massive support in state aid and other support measures,
many EU member states economics and their regions economies continue to be in recession with high
unemployment and with very weak financial institutions. The situation is not significantly better in the US,
despite a more integrated federal financial system. The challenges ahead for the policy-makers today are even
bigger than at the eruption of the crisis. “Kicking the can down the road” has its limitations too.
As a starting point for a more substantive reform of financial institutions, it can be helpful to turn to
Bezemer, who argues convincingly that there is no neutral regulatory framework. Only after the nature,
character, and scope of modern financial institutions is understood and only after a significantly reoriented role
of the financial sector in the modern economy and society is envisaged, it becomes possible to turn to the
adoption of a substantially different regulatory framework. Such a framework would be more inclined to
provide high quality financial support for the development of a real economy, for its active restructuring, for
enhancement of productivity, and for the benefit of more socially inclusive overall development. Namely:
More specifically, the balance sheets of firms, households, and governments, and the regulations in the economic system on what sorts of balance sheets are being allowed, co-determine what forms new credit flows can take, how much there can be of it to different sectors (e.g., to the FIRE sector versus the real economy), and consequently how the economy will evolve. These will not the only factors shaping the economy, but neither can they be fully abstracted from,

REFORM OF FINANCIAL INSTITUTIONS—GETTING IT RIGHT
61
as is current practice in much of economic research. In sum, there seem to be important contributions that accounting researchers can make to economics—rather than just the other way around, as is sometimes suggested. (Bezemer 2009a, p. 33)
There is no doubt that financial institutions and financial instruments will develop in the future. Shiller is
correct about that and also about the many socially useful innovations that were developed in the past. The
trouble is, however, that financial institutions in the last three decades contributed less to the public good than
they did before the crisis. Many mainstream academics, policy-makers, monetary authorities, financial
institutions’ representatives, and corporate media defended the liberalized, deregulated financial institutions.
The biggest challenge remains how to make the financial institutions serve broad social interests and make sure
that they are doing their best in delivering better products and services. Unlike Shiller, who believes that
improved regulations would be sufficient enough for financial institutions to serve broad social interests in the
best possible manner (Shiller, 2012, loc. 432-52), many other scholars, described previously, argue
convincingly that a mere regulatory reform will not be sufficient. Independent minded scholars from all over
the world would make a historical mistake if they did not deeply understand the substantive nature of this
disagreement. They should also not pay attention to the possible alternative ways to approach the financial,
economic, and social reconstruction of modern societies in different parts of the world.
References Bezemer, D. (2009a). No one saw this coming: Understanding financial crisis through accounting models. Retrieved June 5, 2013,
from http://mpra.ub.uni-muenchen.de/15892/1/MPRA_paper_15892.pdf Bezemer, D. (2009b). Lending must support the real economy. Financial Times. Bezemer, D. (2012a). Finance and growth: When credit helps and when it hinders. Retrieved June 5, 2013, from
http://www.scribd.com/doc/93886065/Bezemer-Dirk-Berlin-Paper Bezemer, D. (2012b). Finance and economic growth delinked. Retrieved June 5, 2013, from
http://www.eurointelligence.com/eurointelligence-news/archive/single-view/article/finance-and-economic-growth-delinked.html
Dymski, G., Epstein, G., & Pollin, R. (1993). Transforming the U.S. financial system—Equity and efficiency for the 21st century. Armonk, N.Y.: M.E. Sharpe.
EU Observer. (2012). Brussels: Banks should pay for banks. Retrieved June 6, 2013, from http://euobserver.com/economic/116517
Ewing, J., & Alderman, L. (2011). Deutsche bank’s chief casts long shadow in Europe. New York Times. Johnson, S. (2011). Battle of the bank policy heavyweights, economics. Retrieved June 10, 2013, from
http://economix.blogs.nytimes.com/2011/03/10/battle-of-the-bank-policy-heavyweights/ Johnson, S. (2012). Breaking up four big banks. New York Times. Johnson, S., & Kwak, J. (2011). 13 bankers: The Wall Street takeover and the next financial meltdown. New York: Vintage
Books. Liikanen report. (2012). High-level expert group on reforming the structure of the EU banking sector. Retrieved June 10, 2013,
from http://ec.europa.eu/internal_market/bank/docs/high-level_expert_group/report_en.pdf Lothian, T., & Unger, R. (2011). Crisis, slump, superstition and recovery—Thinking and acting beyond vulgar Keynesianism,
joint piece. Retrieved June 5, 2013, from http://www.law.harvard.edu/faculty/unger/english/pdfs/JOINT_PIECE.pdf Shiller, R. (2012). Finance and good society. Princeton, N.J.: Princeton University Press. Strange, S. (1986). Casino capitalism. Oxford: Basil Blackwell. Unger, R. (1998). Democracy realized. London: Verso. Wolf, M. (2009). Why is it so hard to keep financial sector caged?. Financial Times.

Management Studies, ISSN 2328-2185
January 2014, Vol. 2, No.1, 62-72
Using MWD: A Business Intelligence System for
Tourism Destination Web*
Aurkene Alzua-Sorzabal, Jon Kepa Gerrikagoitia, Fidel Rebón
CICtourGUNE, Donostia-San Sebastián, Spain
The importance of Internet as mass media in the field of tourism is that it constitutes an important channel of
marketing institutions and business network of the tourist destinations. But very few subsequent processes of
management, maintenance, improvement, and exploitation of this appearance are deeply studied. The interactive
nature of the website, as both transmitter of information and receiver, has attracted the attention of scholars since
the interaction allows opening new approaches to the study of the network traffic (the pages user has visited, order
them, the time that it has been in them, the actions carried out...) and cyber behavior. Information flows from the
physical to the cyber world, and vice versa, adapting the converged world to human behavior and social dynamic.
The business intelligence systems based on Internet enable organizations intelligent actions to address
time-sensitive business processes and benefit from analytics. As result provides the opportunity to anticipate and
estimate visitor habits in a changing environment. This paper presents the research and technological fields which
have been incorporated to study of the destination web, a business intelligent tool based on Internet that it aims to
increase the performance of the local manager or tour operator by providing an enhanced insight through the
behavior of visitors on the website and future trends in research are expressed.
Keywords: tourism destination web monitor, web mining, web analytics, business intelligence system
A System Within the Business Intelligence Based on Internet
The present time has been recognized as a technology-mediated world, with computing and
communication entities interacting among themselves, as well as with users. In this technology-rich scenario,
real-world components interact with cyberspace thus driving towards what some scholars have called the
Cyber-Physical World (CPW) convergence (Conti et al., 2012). Information flows from the physical to the
cyber world, and vice versa, adapting the converged world to human behavior and social dynamics.
In this new technology-mediated world, information about the physical reality is seamlessly conveyed into
the cyber world. However, it is not obvious about how to transfer information and knowledge from the cyber
world toward the physical one. This opens up the field for the creation of innovative research and advanced
services to better understand and interact with the surrounding physical world as well as the social activities.
* Acknowledgements: The authors would like to thank the managers of BASQUETOUR (Basque Tourism Agency) and EJIE
(Computer Society of Basque Government) for their excellent cooperation and Basque Government for its ETORTEK program.
Aurkene Alzua-Sorzabal, Ph.D., Executive Director of CICtourGUNE.
Jon Kepa Gerrikagoitia, Ph.D., Director of Tourism Systems in the Digital Age Area, CICtourGUNE.
Fidel Rebón, Ph.D. Candidate, Research of Tourism Systems in the Digital Age Area, CICtourGUNE.
Correspondence concerning this article should be addressed to Fidel Rebón, Mikeletegi Pasealekua, 71-3, 20009 Donostia,
Gipuzkoa, Spain. E-mail: [email protected].
DAVID PUBLISHING
D

USING MWD: A BUSINESS INTELLIGENCE SYSTEM FOR TOURISM DESTINATION WEB
63
In fact, information technology and business intelligence, provide a novel direction to support enterprise
business in a new way (Chaudhuri, Dayal, & Narasayya, 2011). Business intelligence based on Internet is one
of the most robust trends that trigger the awakening of a growing interest in the field of strategic management
and e-science (Teo & Choo, 2001; Du Toit, 2003).
At this moment it is seeing a confluence of practices and technologies into business that enable
organizations intelligent actions to address time-sensitive business processes and benefit from analytics. As a
result, the new situation provides the opportunity to anticipate and estimate consumer habits on a changing
environment (Shih, Liu, & Hsu, 2010; Alzua-Sorzabal, Gerrikagoitia, & Torres-Manzanera, 2013).
The change has brought new means of communication, characterized by a decentralized set of
communication networks allowing fast, economical, direct and ubiquitous collections and generation of
information (Kahn et al., 1997; Pérez, Rodríguez, & Rubio, 2003). Hence, people are empowered to express,
share, create, consume, and organize information in a new manner (Pisani, 2008). Thus, the mass media come
into view as a suitable tool to develop communication strategies within the context of strategic marketing
(Varadarajan, 2010).
The importance of Internet as mass media in the field of tourism is that it constitutes an important channel
of marketing institutions and business network of the tourist destinations, providing huge volumes of
information available to potential tourists (Wang & Fesenmaier, 2006; Buhalis & Law, 2008).
The traditional communication channel (TV, newspapers, radio etc.) is replaced by websites that allow
access to all information (Abou-Shouk, Lim, & Megicks, 2012); enabling web users to get prices of products
and tourism resources in a transparent and dynamic (Lanquar, 2001). The new technology-mediated
environment not only provides destinations a new means of promotion and enhancement of tourist activities,
but also, new means of learning about the tourist taste and preferences. Advance solutions, tolls, and metrics,
play a very important role in this process of developing a deep understanding of the present and future visitor.
Beyond traditional web analytics, destination’s stakeholders are needed of innovations to support the intelligent
monitoring of the visitors, in order to anticipate and improve their performance. Destination management
organization (DMO) must find out to whom, to what, to how, and to when to refer to the visitor.
In this context, Centre for Cooperative Research in Tourism (CICtourGUNE) has designed an enhanced
system within the business intelligent based on Internet for measurement, analysis, and modelling of
destination digital visitors named destination web monitor (DWM). This paper presents the research and
technological fields which have been incorporated in recent years on the web sites of the DMOs, it defines the
DWM and future trends in research within the scope of the DMO’s website are expressed.
Related Work
The DMOs invest many resources: time, effort, and money in order to have a presence on the internet; but
very few of them are studying the subsequent processes of management, maintenance, improvement, and
exploitation of this appearance (Wang & Fesenmaier, 2006).
The interactive nature of the website, as both transmitter of information and receiver, have attracted the
attention of scholars since the interaction allows to open new approaches to the study of the network traffic (the
pages user has visited, order them, the time that it has been in them, the actions carried out...) and cyber
behavior.
Furthermore, new disciplines appeared in the last decade, such as, web mining in order to move forward in

USING MWD: A BUSINESS INTELLIGENCE SYSTEM FOR TOURISM DESTINATION WEB
64
discovering and analyzing useful information from web sites (Agarwal, 2010). It implies areas and technologies
related to information management and retrieval, artificial intelligence, machine learning, natural language
processing, network analysis, and integration of information (Cooley, Mobasher, & Srivastava, 1997; Wang,
Abraham, & Smith, 2005). Currently three approaches can be recognized: web usage mining, web content
mining, and web structure mining.
Web usage mining techniques are based on the process of discovering patterns of usage on web data
(Srivastava, Cooley, Deshpande, & Tan, 2000; Iváncsy & Vajk, 2006). It is about getting users profiles
inferring unobservable information about the user from their observable information (Arbelaitz et al., 2012a). It
is particularly interesting to discover the paths that are rarely followed by the visitor or the crossing of them
among the most visited pages (Shahabi, Zarkesh, Adibi, & Shah, 1997). Thus, the resulting indicators facilitate
the optimal design of a DMO’s website (Spiliopoulou, Faulstich, & Winkler, 1999).
Within the second group, the web content mining techniques define processes that try to discover useful
information from the content of web pages (Srivastava, Desikan, & Kumar, 2005). The contents hosted on a
web page can be text, images, videos, data stream, metadata, and hypertext (text, language marches, hyperlinks)
(Weiss, Vélez, & Sheldon, 1996). At present, researches are turning their attention to web multimedia mining
techniques, which seek to recognize and select the images (Rodríguez-Vaamonde, Ruiz-Ibáñez, &
González-Rodríguez, 2012) and video sections of interest (Ocaña, Martos, & Vicente, 2002).
Web structure mining techniques are focused on inferring knowledge from websites through the “links”
that they host. In this context we underline the work carried out by Piazzi, Baggio, Neidhardt, and Werthner
(2011) and Merinero, Rodríguez, and Pulido Fernández (2009).
The existing literature on the diverse web mining techniques applied to tourism destination shows that the
acquired information about the behavior of visitors, allows to customize the navigation scheme and/or the
content to new visitors according to previously defined behavior patterns (Das & Vyas, 2011; Perona, Arbelaitz,
Gurrutxaga, & Muguerza, 2010; Pierrakos, Paliouras, Papatheodorou, & Spyropoulos, 2003). Thus, web
personalization strategies have been developed in order to optimize and enrich visitor’s experience.
There are a large volume of professional solutions in the market (Google Analytics, Piwik, AWStats)
which incorporate the capture of the digital footprint and a process of web analytics. Web analytics is the
science that covers statistics, information technologies, as well as the economy, management, marketing
principles and several experts systems from other fields.
A diverse set of tracking tools, which capture the interaction of visitors, is needed to obtain the
information automatically on the digital footprint left by the visitor on the website. Currently, tracking tools
work at different levels: (1) server, using server logs; (2) client, by a remote agent (JavaScripts or Java Applet)
or by modifying the source code of a web browser; and (3) proxy, through an intermediate level where it stores
data between web browsers and web server (Srivastava et al., 2000). Most of the published studies are based on
tools and server logs (Cooley et al., 1997; Srivastava et al., 2005; Zaïane, Xin, & Han, 1998; Arbelaitz et al.,
2013); although more recent studies are using the implementation of a script on the websites (Shao & Gretzel,
2010; Pitman, Zanker, Fuchs, & Lexhagen, 2010; Plaza, 2011; Arbelaitz et al., 2013).
The DWM System
Definition
For this research the following definition of DWM has been adopted: a system to measure, analyze, and

USING MWD: A BUSINESS INTELLIGENCE SYSTEM FOR TOURISM DESTINATION WEB
65
model the behavior of visitors in different virtual areas (region, territories, tourist brands, associations, capitals,
districts, municipalities) in which a destination is promoted and with the objective of providing benchmarking
ratios that facilitate strategic surveillance and intelligent marketing policies.
DWM contributes to gaining a holistic understanding of the destination, which facilitates the extraction of
explicit and tacit knowledge of the networked system comprising different sites in its two aspects: relations
between them and the interaction of the visitor in each of them.
The design of the DWM satisfies the five levels of the web analytics maturity model (WAMM) (Gassman,
2008); a set of best practices covers the entire lifecycle of a product or service from conception to delivery and
maintenance.
General Architecture of DWM
Figure 1 shows the general stages of the processes within the DWM. The user accesses the destination
website through a PC, a smartphone, a tablet, or a PDA, and at that moment, it is when the capture of its
interaction with the site starts.
The collected data are processed in external servers to later convert it into useful information that will be
monitored. Once the monitoring of results is available, it proceeds to analyze and evaluate in order to draw
conclusions on the consumer profile about the destination.
Process of extraction, transformation and loading
Data Base
Reports
Data Warehouse
Query Send Information
+ Other web of Destination
Figure 1. General stages of DWM.
The technical platform starts capturing data before the visitor accesses the destination web page, recording
the search engine and the search word that has led the destination, in the case that the access is not direct. It is
possible to incorporate a small JavaScript code that must be hosted on each destination website. It records in
real time all the actions that the user makes and these are stored in a MySQL1 database belonging to the web
analytics tool.
After installing the tracking code on the web pages of the DMO, it proceeds to check the status of the
implementation.
Once the data are stored in the MySQL, an Extract, Transform and Load (ETL) process transports it to
another SQL server2 database on a daily basis. All the raw data need a cleaning process, for instance, to
1 Oracle and affiliates database. 2 Microsoft corporation database.

USING MWD: A BUSINESS INTELLIGENCE SYSTEM FOR TOURISM DESTINATION WEB
66
remove sessions generated by robots (Tan & Kumar, 2004).
When the cleaning process is finished, an analysis services3 project generates a cube with its dimensions
and fact tables to be able to interact with the obtained data. The project facilitates the design, creation, and
management of multidimensional structures that contain aggregated data from the SQL server database.
So far it has data in clean tables, which can be exploited through simple reports. To obtain answers to
more elaborate issues, the tables are transformed in order to work on the data easily with mathematical
packages that allow applying knowledge discovery in databases (KDD) techniques. This is a non-trivial process
to discover knowledge and useful information within the data contained in any repository of information
(Fayyad, Piatetsky-Shapiro, & Smyth, 1996).
The most common techniques of KDD employed in the domain of the website are: (1) characterization to
find rules that outline the general characteristics of the data obtained; (2) comparison to discover discriminatory
rules, for example, to determine the behavior of web robots; (3) associations and correlations of data where the
presence of a set of them implies the presence of others; (4) the prediction that seeks to predict a value or
values of an attribute based on its relevance to the rest; (5) the classification which compares sequences from a
group within a segment of users that show similar patterns of navigation; (6) the time series analysis that
recognizes patterns, characteristics, trends, differences, similarities intervals along a time sequence; and (7) the
sequence of behavior that is based on obtaining the patterns by which the presence of a set of data is followed
by another in temporal order (Zaïane et al., 1998).
Each action URL is assigned a topic because the combination of action and use provides a better
understanding of the real interest of the visitor (Arbelaitz et al., 2012b).
This assignment can be performed via specifications of interest found in the profiles of the users
(Ravindran & Gauch, 2004), open directory project (ODP) (Open Directory Project, 2013), or through the
analysis of the visited web pages (Sugiyama, Hatano, & Yoshikawa, 2004).
The first classification addresses in a fast and successful way the main menu topics of the website. Its
appearance is usually done in a standardized manner with values between 0 and 1. The information obtained is
displayed in a simple and clear way through reports and/or graphics that are incorporated into a SharePoint4
solution. This web solution allows fast access from anywhere platform.
All these techniques within the scope of web usage mining can be completed with the analysis of web site
content, web content mining, and studying the structure of the site, web structure mining. The set of processes
contributes to the system network that makes up different sites and the relationships between them through the
interactions of visitors that will help to achieve a holistic understanding of the destination as a whole.
Definition and Measurement of Variables
Professional web analytics tools, whose degree of maturity is positioned in the technical details (Level I),
respond to basic questions such as: fractional number of visits by nationality and location; engine search
references other websites, direct traffic, social networking; number of unique users; number of new visits
versus number of concurrent visits; number of hits per page, number of visited pages, pages viewed by
language, ratio of pages per visit, bounce rate number... (Peterson, 2006).
In addition, the maturity level of the DWM base allows formulating more elaborated questions, as the one
3 This allows processing online analytical (OLAP) and data mining processes. 4 Microsoft content management platform.

USING MWD: A BUSINESS INTELLIGENCE SYSTEM FOR TOURISM DESTINATION WEB
67
collected in Table 1. These enriched answers are displayed on a scoreboard that displays data on the
performance, behavior and, trends and predictions. The generic indicators of performance include workload,
efficiency, effectiveness, and productivity. The behavior indicators respond to the behavior of visitors and the
generic indicators over trend and prediction are focused on discovering new preferences and projections
focusing on the visitor and the behavior.
Table 1
Questions That Are Answered by Applying KDD Techniques to DWM
Questions Technical
What do our users? Sequential patterns
What do they like most and which least? Association rules or patterns frequently
How have they found? (Entry platform... ) Analysis of classification
Are there groups differentiated by origin? Analysis of clustering and classification analysis
What are the most common profiles by origin/topic? Association rules or patterns frequently
Are there behaviors differentiated by origin/topic? Clustering and other statistical techniques
What are the most common tour paths? Sequential patterns
What is the user behavior over time? Comparison between periods, trends... Other statistical techniques
What are the buying habits of tourists? Analysis of classification and association rules
or patterns frequently
What are the features they have in common successful products and services? Association rules or most frequent patterns and
other statistical techniques
The scoreboard developed by the DWM displays data on the performance (see Figure 2), behavior (see
Figure 3) and, trends and predictions (see Figure 4). Generic indicators of performance include workload,
efficiency, effectiveness, and productivity. The behavior indicators respond to the behavior of visitors and the
generic indicators over trend and prediction are focused on discovering new preferences and projections
focusing on the visitor and the behavior.
Figure 2. MWD performance indicators.
GENERIC
INDICATORS
PERFORMANCE
(KPIS)
TOTAL NUMBER OF
ACTIONS
TOTAL NUMBER
OF VISITS
TOTAL NUMBER OF
UNIQUE VISITS
TOTAL TIME ON
THE SITE
OPERATING SYSTEM
SCREEN RESOLUTION
Workload
PERCENTAGE OF
REBOUND
AVERAGE TIME ON
THE WEB SITE
AVERAGE NUMBER
OF ACTIONS
Efficiency
PERCENTAJE OF NEW VISITS
LOYALTY
Effectiveness
NEW VISITS
RECURRENT VISITS
LIN AND QNX WS 3 SYM WI 7 WVI MAC UNK IPD WPH W 2 K BLB IPA WI 8 WXP IPH
0 0 0 0 0 0 0 0 0 0 0 0 0 0 0 0 0
320 x 240 320 x 480 480 x 360 360 x 640 480 x 800 768 x 1024 640 x 960 1280 x 800
0 0 0 0 0 0 0 0
Acquire information
(profitable)

USING MWD: A BUSINESS INTELLIGENCE SYSTEM FOR TOURISM DESTINATION WEB
68
GENERIC INDICATORS BEHAVIOR
(KPIS)
NACIONALITY 1 (%)
NACIONALITY 4 (%)NACIONALITY 3 (%)NACIONALITY 2 (%)
SUBNACIONALITY 1 (%)SUBNACIONALITY 2 (%)SUBNACIONALITY 3 (%)
WHO ARE THEY? RECURRENT UNIQUE USERS
(%)
NEW UNIQUE USERS(%)
ACTION. 1
SEARCH ENGINES(%)
REFERENCES WEBSITES
(%)
DIRECT TRAFFIC(%)
SOCIAL NETWORKS(%)
WHERE THEY COME FROM?
IDIOM 2Nº of VIsits
IDIOM 1Nº of VIsits
IDIOM 3Nº of VIsits
IDIOM 4Nº of VIsits
TOTAL OF ACTIONS
ACTIONS/VISITBOUNCE
(%)
ACTION. 2
ACTION. 3 ACTION. 4
ACTION. 5 ACCIÓ N. 6
ACTION. 7 ACTION. 8
ARE THEY FAITHFUL?
HOW THEY LIKE US?
UNIQUE USERS (%)
HOW MANY ARE THEY?
+ 3 ACTIONS 2 - 3 ACTIONS 1 ACTION
+ 30 Sg. - 30 Sg.
Figure 3. MWD behavior indicators.
GENERIC INDICATORS TREND(KPIS)
TIME VISITOR CONNECTION OVER TIME
NUMBER OF VISITS TO MAKE MORE OF AN
ACTION ALONG TIME
KEYWORDS ANALYSIS ALONG A TIME SERIES
EVOLUTION OF THE GROUPS
DIFFERENTIATED BY ORIGIN
EVOLUTION OF PROFILES
FREQUENTLY BY ORIGIN / TOPIC
EVOLUTION OF BEHAVIORS
DIFFERENTIATED BY ORIGIN/TOPIC
DISTRIBUTION OF VISITS OVER TIME
TREND IN FREQUENTLY ROUTES
BEHAVIOR OF USERS WITH RESPECT TO TIME
TOURISTS BUYING HABIT
DISTRIBUTION OF ACTIONS FIRST TIME
ALONG
EVOLUTION OF ARRIVAL
VISITORS
BEHAVIORS
DISTRIBUTION OF ACTIONS LAST TIME
ALONG
CONNECTION ANALYSIS BY ORIGIN TIME ALONG
TIME
DISTRIBUTION OF THE ACTIONS OVER TIME
RESIDENCE TIME DISTRIBUTION OF USERS ALONG TIME
CONNECTIONS
ACTIONS
KEYWORDS
Figure 4. MWD trend indicators.
Discussion on the Different Studied Web Analytics Tools and MWD
Currently there is a large volume of vendors and solutions in the market, which apart from achieving the
gathering of the digital footprint are responsible for performing web analytics processes, such as Google
GENERIC INDICATORS
BEHAVIOR (KPIS)
GENERIC INDICATORS TREND
(KPIS)

USING MWD: A BUSINESS INTELLIGENCE SYSTEM FOR TOURISM DESTINATION WEB
69
Analytics, Piwik, AWStats, Adobe Analytics, etc..
In this section the discussion will focus on the first three ones that are the most widely used. Nonetheless,
significant methodological and technical differences can be identified among them. Respecting the extraction of
information, it can be done through server logs or using a script hosted on the website.
AWStats collects the navigation trace left in server logs; not allowing direct access to the data but
exposing them through a web reports. In obtaining the attributes to capture, the mentioned system does not
register the visited pages that they are hosted on the server cache. And so, it is not easy tracking the individual
cookies and queries to data hosted on the server, and the user time spent on visiting a page is inferred by an
algorithm.
Google Analytics and Piwik accomplish the capture of the digital footprint through a script, which should
be hosted on the website of the DMO, and whose implementation requires the involvement of the prescriber of
the web. The script transforms the user interaction in recognizable actions in a database, but does not enable to
capture the page reloads or clicks the button return (Srivastava et al., 2000).
Another significant difference should be noticed between Google Analytics and Piwik. In Google
Analytics data are housed on Google servers; so direct access to data is not facilitated. However, access to an
API or through a manual export to spreadsheets or simple text format is supported. The main limitation is that
data are allotted by day and do not cover the navigation attributes. To the contrary, Piwik provides full access
to the data and support further analytical possibilities. In this case, the data are disaggregated and related to the
time at which the action is performed. In addition, Piwik, allows data imports from Google Analytics.
Due to the described improvements the technological environment of DWM has been developed upon
Piwik in order to capture the digital footprint from the DMOs web pages. Moreover, customizing capture
DWM allows catching variables that are not available by default in Piwik, for example, the used device.
In DWM, it aims to increase the performance of the local manager or tour operator by providing an
enhanced insight through the behavior of visitors on the website. It is a clear improvement of the existing
solutions since it assists on audience segmentation according to the reason of the visit; facilitates the selection
of the clusters of tourism products in the interest shown by visitors: culture, sports, landscape, ecology,
alternative, etc.. The information generated by the monitor supports decision-making processes in increasing in
the number of followers and provides the most suitable periods of the year for a more effective communication
campaign. Because it is capable of responding to complex issues where only are able to respond those tools
whose maturity level is five.
Ultimately, DWM enables optimization and design of tourism web sites in a time sensitive framework.
Conclusion and Future Work
Internet and the web presence of the DMOs have broken heavily on custom and everyday uses for travel
research as well as moderator of the image formation and the willingness to travel to a destination. Intelligent
systems in the tourism, as it is the case with DWM, support tourism organizations to better understand the
business environment and potential customers. The new generation of information systems provides a novel
way to identify the most relevant information, greater decision support, greater mobility and ultimately, greater
and enjoyment of the tourist experience (Gretzel, 2011).
The DWM as a platform for competitive intelligence improved online marketing strategies. The DMO’s
decision-making will be supported by evidences on the effect of marketing strategies as far as on attracting new

USING MWD: A BUSINESS INTELLIGENCE SYSTEM FOR TOURISM DESTINATION WEB
70
customers, increasing the degree of loyalty of the visitors and launching programs to encourage the
spontaneous recommendations. In this way, the user is at the center of the system and their behavior with the
DMO site is interpreted in a quantitative and qualitative mode.
Future efforts in the investigating of the architectures and the algorithms that exploit the data within DWM
promise to lead us to the next generation of intelligence within website of the DMO.
By the 2014 it is expected to exceed the current figure of four billion mobile devices around the world;
with a higher number of mobile devices connected to the Internet than desktop computers (Martín,
López-de-Ipiña, Alzua-Sorzabal, Lamsfus, & Torres-Manzanera, 2013). The mobile device becomes a window
on the information in real time and having this accurate information is changing tourist behavior at the
destination would be crucial to enhance destination management and customer expectations. The developed
system, DWM, will support this new challenge, since it would facilitate through new developments to study the
visitor behavior on a destination through mobile applications and linked it to previously conduct a virtual visit
to destination.
Furthermore, DWM, foresees a new data storage structure that allows new connections between different
big data systems (Lohr, 2012). Because the highly disaggregated level of the data, DWM will make possible a
better adjustment with reality; more accurate, enabling complex answer questions related to multiple attributes
of tourism.
References
Abou-Shouk, M., Lim, W. M., & Megicks, P. (2012). Internet adoption by travel agents: A case of Egypt. International Journal of
Tourism Research, 15(3), 298-312.
Agarwal, B. B. D. S. (2010). Web mining: Information and pattern discovery on the world wide web. International Journal of
Science, Technology & Management (pp. n.d).
Alzua-Sorzabal, A., Gerrikagoitia, J. K., & Torres-Manzanera, E. (2013). Opening and closing Internet booking channel for hotels:
A first approximation. Retrieved from http://dx.doi.org/10.1016/j.tmp.2012.10.001
Arbelaitz, O., Gurrutxaga, I., Lojo, A., Muguerza, J., Pérez, J. M., & Perona, I. (2012a). Adaptation of the user navigation scheme
using clustering and frequent pattern mining techiques for profiling. Proceedings from KDIR 2012—International
Conference on Knowledge Discovery and Information Retrieval. Barcelona, Spain.
Arbelaitz, O., Gurrutxaga, I., Lojo, A., Muguerza, J., Pérez, J. M., & Perona, I. (2012b). Enhancing a web usage mining based
tourism website adaptation with content information. Proceedings from KDIR 2012—International Conference on
Knowledge Discovery and Information Retrieval (pp. 287-292). Barcelona, Spain.
Arbelaitz, O., Gurrutxaga, I., Lojo, A., Muguerza, J., Pérez, J. M., & Perona, I. (2013). A navigation-log based web mining
application to profile the interests of users accessing the web of Bidasoa Turismo. Proceedings from ENTER 2013 eTourism
Conference. Innsbruck, Austria.
Buhalis, D., & Law, R. (2008). Progress in information technology and tourism management: 20 years on and 10 years after the
Internet—The state of eTourism research. Tourism Management, 29(4), 609-623.
Chaudhuri, S., Dayal, U., & Narasayya, V. (2011). An overview of business intelligence technology. Communications of the ACM,
54(8), 88-98.
Conti, M., Das, S. K., Bisdikian, C., Kumar, M., Ni, L. M., Passarella, A., … Zambonelli, F. (2012). Looking ahead in pervasive
computing: Challenges and opportunities in the era of cyber-physical convergence. Pervasive and Mobile Computing, 8(1),
2-21.
Cooley, R., Mobasher, B., & Srivastava, J. (1997). Web mining: Information and pattern discovery on the world wide web.
Proceedings from Ninth IEEE International Conference on Tools With Artificial Intelligence (pp. 558-567). New Port Beach,
CA, USA.
Das, K., & Vyas, O. P. (2011). A conceptual model for website personalization and web personalization. International Journal of
Research and Reviews in Information Sciences (IJRRIS), 1(4), 126-131.

USING MWD: A BUSINESS INTELLIGENCE SYSTEM FOR TOURISM DESTINATION WEB
71
Du Toit, A. S. A. (2003). Competitive intelligence in the knowledge economy: What is in it for South African manufacturing
enterprises? International Journal of Information Management, 23(2), 111-120.
Fayyad, U., Piatetsky-Shapiro, G., & Smyth, P. (1996). From data mining to knowledge discovery in databases. AI Magazine,
17(3), 37-54.
Gassman, B. (2008). Introduction to the gartner maturity model for web analytics. Retrieved from
http://www.gartner.com/DisplayDocument?doc_cd=159097
Gretzel, U. (2011). Intelligent systems in tourism: A social science perspective. Annals of Tourism Research, 38(3), 757-779.
Iváncsy, R., & Vajk, I. (2006). Frequent pattern mining in web log data. Acta Polytechnica Hungarica, 3(1), 77-90.
Kahn, R., Leiner, B. M., Cerf, V. G., Clark, D. D., Kleinrock, L., Lynch, D. C., … Wolff, S. (1997). The evolution of the Internet
as a global information system. International Information and Library Review, 29(2), 129-151.
Lanquar, R. (2001). Tourism marketing (Marketing Turístico). Barcelona: Ariel.
Lohr, S. (2012). The age of big data. Retrieved from http://goo.gl/OHE7xM
Martín, D., López-de-Ipiña, D., Alzua-Sorzabal, A., Lamsfus, C., & Torres-Manzanera, E. (2013). A methodology and a web
platform for the collaborative development of context-aware systems. Sensors, 13(5), 6032-6053.
Merinero Rodríguez, R., & Pulido Fernández, J. I. (2009). Tourism development and relational dynamics: Analysis methodology
for the active management of destinations (Desarrollo turístico y dinámica relacional: metodología de análisis para la gestión
activa de destinos turísticos). Notebooks of tourism (Cuadernos de turismo), 23, 173-194.
Ocaña, A. M., Martos, I. O., & Vicente, E. F. (2002). Pattern recognition in images of tourism using unsupervised learning
techniques (Reconocimiento de Formas en Imágenes Turísticas Mediante Técnicas de Aprendizaje no Supervisado).
Proceedings from IV Congress “Tourism and Information Technology and Communications” (Congreso “Turismo y
Tecnologías de la Información y las Comunicaciones”) (pp. 289-315).
Open Directory Project. (2013). Retrieved from http://www.dmoz.org
Pérez, E., Rodríguez, E., & Rubio, F. (2003). Tourism in the information society: Emerging models (Turismo en la sociedad de la
información: modelos emergentes). Retrieved from http://www.uoc. edu/dt/20352/20352_resum.html
Perona, I., Arbelaitz, O., Gurrutxaga, I., & Muguerza, J. (2010). Towards web personalization for users with special needs using
web navigation logs. Proceedings from III Spanish Congress of Computer Science (Congreso Español de Informática)
(CEDI 2010) (pp. 293-302). Valencia, Spain.
Peterson, E. (2006). Web analytics demystified: The big book of key performance indicators. Retrieved from http://goo.gl/dn2INq
Piazzi, R., Baggio, R., Neidhardt, J., & Werthner, H. (2011). Destinations and the web: A network analysis view. Information
Technology and Tourism, 13(3), 215-228.
Pierrakos, D., Paliouras, G., Papatheodorou, C., & Spyropoulos, C. D. (2003). Web usage mining as a tool for personalization: A
survey. User Modeling and User-Adapted Interaction, 13(4), 311-372.
Pisani, F. (2008). Digital journalism (Periodismo digital). Retrieved from http://www.youtube.com/watch?v=tt7UKJpShqk
Pitman, A., Zanker, M., Fuchs, M., & Lexhagen, M. (2010). Web usage mining in tourism a query term analysis and clustering
approach. In U. Gretzel, R. Law, & M. Fuchs (Eds.), Information and Communication Technologies in Tourism 2010.
Proceedings of the International Conference in Lugano, Switzerland.
Plaza, B. (2011). Google analytics for measuring website performance. Tourism Management, 32(3), 477-481.
Ravindran, D., & Gauch, S. (2004). Exploiting hierarchical relationships in conceptual search. Proceedings from the Thirteenth
ACM International Conference on Information and knowledge Management (pp. 238-239). Washington, D.C., USA.
Rodríguez-Vaamonde, S., Ruiz-Ibáñez, P., & González-Rodríguez, M. (2012). Combined use of semantic technologies and visual
analysis for automatic image annotation and retrieval (Uso combinado de tecnologías semánticas y análisis visual para la
anotación automática de imágenes y su recuperación). The information profesional (El profesional de la información), 21(1),
27-33.
Shahabi, C., Zarkesh, A. M., Adibi, J., & Shah, V. (1997). Knowledge discovery from users web-page navigation. Proceedings
from Seventh International Workshop on Data Engineering (pp. 20-29). Birmingham, UK.
Shao, J., & Gretzel, U. (2010). Looking does not automatically lead to booking: Analysis of clickstreams on a Chinese travel
agency website. In U. Gretzel, R. Law, & M. Fuchs (Eds.), Information and Communication Technologies in Tourism 2010.
Proceedings of the International Conference in Lugano, Switzerland.
Shih, M. J., Liu, D. R., & Hsu, M. L. (2010). Discovering competitive intelligence by mining changes in patent trends. Expert
Systems With Applications, 37(4), 2882-2890.
Spiliopoulou, M., Faulstich, L. C., & Winkler, K. (1999). A data miner analyzing the navigational behaviour of web users.

USING MWD: A BUSINESS INTELLIGENCE SYSTEM FOR TOURISM DESTINATION WEB
72
Proceedings from the Workshop on Machine Learning in User Modelling of the ACAI99. Greece.
Srivastava, J., Cooley, R., Deshpande, M., & Tan, P. N. (2000). Web usage mining: Discovery and applications of usage patterns
from web data. ACM SIGKDD Explorations Newsletter, 1(2), 12-23.
Srivastava, T., Desikan, P., & Kumar, V. (2005). Web mining-concepts, applications and research directions. Foundations and
Advances in Data Mining, 180, 275-307.
Sugiyama, K., Hatano, K., & Yoshikawa, M. (2004). Adaptive web search based on user profile constructed without any effort
from users. Proceedings from the 13th International Conference on World Wide Web (pp. 675-684). New York, USA.
Tan, P. N., & Kumar, V. (2002). Discovery of web robot sessions based on their navigational patterns. Data Mining and
Knowledge Discovery, 6(1), 9-35.
Teo, T. S. H., & Choo, W. Y. (2001). Assessing the impact of using the Internet for competitive intelligence. Information and
Management, 39(1), 67-83.
Varadarajan, R. (2010). Strategic marketing and marketing strategy: Domain, definition, fundamental issues and foundational
premises. Journal of the Academy of Marketing Science, 38(2), 119-140.
Wang, X., Abraham, A., & Smith, K. A. (2005). Intelligent web traffic mining and analysis. Journal of Network and Computer
Applications, 28(2), 147-165.
Wang, Y., & Fesenmaier, D. R. (2006). Identifying the success factors of web-based marketing strategy: An investigation of
convention and visitors bureaus in the United States. Journal of Travel Research, 44(3), 239-249.
Weiss, R., Vélez, B., & Sheldon, M. A. (1996). HyPursuit: A hierarchical network search engine that exploits content-link
hypertext clustering. Proceedings of the Seventh ACM Conference on Hypertext (pp. 180-193). Bethesda, MD, USA.
Zaïane, O. R., Xin, M., & Han, J. (1998). Discovering web access patterns and trends by applying OLAP and data mining
technology on web logs. Proceedings from IEEE International Forum on Research and Technology Advances in Digital
Libraries (pp. 19-29). Washington, D.C., USA.

Copyright © 2022 FDOKUMEN