Malaysia : Wind Energy Distribution Recent Development - IASE
53
Malaysia : Wind Energy Distribution Recent Development PROF DR AZAMI ZAHARIM 1 Centre for Engineering Education and Built Environment (P3K) Faculty of Engineering and Built Environment (FKAB) UKM 2 Solar Energy Research Institute (SERI) , UKM 3 Institute of Islam Hadhari, UKM 1 Univerisiti Kebangsaan Malaysia
-
Upload
khangminh22 -
Category
Documents
-
view
0 -
download
0
Transcript of Malaysia : Wind Energy Distribution Recent Development - IASE

Malaysia : Wind Energy Distribution
Recent Development
PROF DR AZAMI ZAHARIM
1Centre for Engineering Education and Built Environment (P3K)
Faculty of Engineering and Built Environment (FKAB) UKM 2Solar Energy Research Institute (SERI) , UKM
3Institute of Islam Hadhari, UKM
1
Un
iver
isit
i Keb
angs
aan
Mal
aysi
a

Table of Content
Introduction…………………………………………................................ 3
Research Wind in Malaysia…………………………………………………. 5
Study Area & Data…………………………………………………………….. 21
Methodology……………………………………………………………………. 28
Result & Discussion…………………………………………………………… 43
Conclusion..………………………………………………………………………. 51
Un
iver
isit
i Keb
angs
aan
Mal
aysi
a
2

….(1) INTRODUCTION
Solar Energy Research Institute (SERI), UKM Malaysia is an institute that responsible in handling research on renewable
energy development in Malaysia. It was formed to address the immediate issue of fossil fuels consumption that causing
environmental pollution and global warming.
The rapid depletion of fossil fuels resources has resulted in the increase of it prices. Together with environmental issues
and it impacts, making alternative resources such as wind energy are one of the important renewable sources
3
Un
iver
isit
i Keb
angs
aan
Mal
aysi
a

Research on wind and its potential in producing energy is carried out by researchers around the world.
(Saidur et al., 2010 and 2011) have concluded that wind speed, wind direction, speed swings and wind direction strong relationship
Belu and Koracin (2013 and 2015) have concluded that there is a strong linkage between wind speed and direction. So the
relationship between wind direction and the potential to increase wind power generation needs to be investigated.
Detailed knowledge of wind in an area is a key requirement in general assessment of wind energy potential as a whole
With low average speed throughout the year, small-scale wind energy systems may be more suitable for development in Malaysia. Systems such as wind turbines are more influenced by cut-in speeds
than turbine height (Akorede et al., 2013). 4
Un
iver
isit
i Keb
a n
gsaa
n M
alay
sia

..(2) RESEARCH WIND IN MALAYSIA
(a) Wind Speed
• The research trend as can be seen start explode by wind speed research.
• Wind speed has become the most selected parameter to be studied as it much more easier to be conducted.
• There are numerous researches related on wind speed were discussed on the statistical distribution for wind speed. Weibull, Gamma and Inverse Gamma are among the statistical distribution that being used. The details are shown in Table 1.
5
Un
iver
isit
i Keb
angs
aan
Mal
aysi
a

Table 1 Details of researches
Researcher(s) Finding
K.Sopian et.al [1] 1995
• For 1982-1991 data, Mersing and Kuala Terengganu have the highest potential to generate wind energy with a mean power density of 85.61 W/m2 and 32.5 W/m2.
• The highest mean monthly wind speed was recorded at Mersing (4-5.5m/s).
Shamshad et.al [2] 2007
Revealed that the second order of Markov Chain model has improved the autocorrelation (AR) of synthetic generated wind speed data.
A. Zaharim et.al [3] 2008
Found that the accurate distribution of wind speed was Weibull approximation.
6
Un
iver
isit
i Keb
angs
aan
Mal
aysi
a

Researcher(s) Finding
S.K Najid et.al [4] 2009
Revealed that Burr distribution is the most appropriate probability distribution for that data set. (For the year of 2005-2006, Terengganu data)
A. Zaharim et.al [5] 2009
Found that the wind speed data for Terengganu is adequate with the Weibull and Gamma distribution.
Shamsad et.al [6] 2009 Found that maximum likelihood is the best estimator in explaining the Weibull parameters. The maximum wind speed in Peninsular Malaysia is located at Mersing with the average wind speed at 3 m/s.
7
Un
iver
isit
i Keb
angs
aan
Mal
aysi
a

R.Norhayati [7] 2010
• Introduced the use of FirstLook software in analysing monthly and yearly mean wind speed and attaining the view of wind speed distribution.
• Suggested that Kota Belud, Kudat and Langkawi are the most potential location to install wind turbine generator in Malaysia.
• Suggested the use of shrouded WTG with wind-lens technology in capturing the low wind speed in Malaysia
K.H Yong et.al [8] and A. Albani et.al [9] 2011
• Discovered the wind speed mapping of Malaysia by using Inverse Distance Weighted Method (IDW).
• Found that Kudat and Sandakan is a good wind potential based on its high wind speed all over year.
8
Un
iver
isit
i Keb
angs
aan
Mal
aysi
a

N. Masseran et.al [10] 2012 and 2013
Revealed that Mersing had the most potential for energy production with the percentage of the time was 18.2%. A good fit for most of the stations in East Malaysia was found using the Gamma and Burr distributions, though there was no clear pattern observed for all regions in East Malaysia.
Islam, M.R et al [11] 2012
Assessing wind energy potentiality for selected sites in Malaysia Mersing, Melaka and Kuantan in 2006-2008. The annual highest values of the Weibull shape parameter (k) and the Weibull scale parameter (c) were 2.18 and 3.11 m/s.
9
Un
iver
isit
i Keb
angs
aan
Mal
aysi
a

Osamah Basheer Shukur, Muhammad Hisyam Lee [11] 2014
Proposed a hybrid KF-ANN approach (Kalman Filter and Artifical Neural Network) and was proposed to improve the accuracy of wind speed forecasting.
10
Un
iver
isit
i Keb
angs
aan
Mal
aysi
a

(b) Wind Direction
• Studies on wind direction is not as spread/aggressive as wind speed. But as year to year the number of research increases as shown in Table 2.
Table 2 Details of researches in wind direction
A.G Hussin et.al [12] 1998
• Which used wind direction data in developing a model named the unreplicated complex linear functional relationship model.
A.G Hussin et.al [13] 2006
• Introduced a software named AXIS for analysing Malaysia wind direction.
• However this package contains some limitation that needs other software to complement it.
11
Un
iver
isit
i Keb
angs
aan
Mal
aysi
a

S.Fatimah Hassan et.al [14] 2009
• Introduce the application of ORIANA software to analyse Malaysia wind direction data.
• Software is found to be more comprehensive than the previous
• A Comparison of Asymptotic and Bootstrapping Approach in Constructing
• Confidence Interval of the Concentration Parameter in von Mises Distribution
N.A.B Kamisan et.al [15] 2010 A.M Razali et.al [16] 2012 and A.M Razali et.al [16] 2012
Von Mises distribution was the best circular distribution to describe wind direction in Malaysia
N.Masseran [18] 2015 Using Markov Chain model in describing stochastic behavior of wind direction in Malaysia
12
Un
iver
isit
i Keb
angs
aan
Mal
aysi
a

(c) Wind Power
• Wind power analysis in this section consists of
wind turbine and wind energy estimation
• Studies of both area were being done either by statistician or engineers.
• For research in wind turbine, recent studies shows that their keen is to cater the low wind speed in Malaysia and optimize
the energy.
• Details shown in Table 3.
13
Un
iver
isit
i Keb
angs
aan
Mal
aysi
a

W.T Chong et al. [1] 2013
• Positioned a vertical axis wind turbine (VAWT) above a cooling tower to harness the wind energy.
• It was observed that VAWT does not give negative impact on the performance of cooling tower.
• The current drawn from the fan motor was 0.39A.
• It is appropriate for low wind speed area. (Figure 1)
P.D Abdul Aziz et al. [2] 2014 • A simulation study on airfoils using VAWT design for low wind speed.
• With the proper airfoils design that suits the low wind speed condition, the turbine can functions efficiently as well as maximize the power produced by turbine.
• The number of blades affects the tip speed ratio (TSR) and power coefficient (Cp) produced by the wind turbine. In this case, three blades are optimal and have stable power coefficient
Table 3 Details of researches in wind turbine
14
Un
iver
isit
i Keb
angs
aan
Mal
aysi
a

Figure 1 Artist’s impression of the energy recovery wind turbine generator on top of the cooling tower. 15
Un
iver
isit
i Keb
angs
aan
Mal
aysi
a

A.Hamdan et al. [3] 2014 • The application of biocomposites fibers or green material in fabricating VAWT in order to avoid and reduce the utilization of synthetics fiber composite is highlighted.
• The smart material in structural health monitoring (SHM) such as piezoelectric can perform as sensor, actuator and energy harvester.
Willy Tjiu et al. [4] 2015 • The variations in Darrieus VAWT is assed including the performance, components, operational reliability.
• The current development and future prospects is also being highlighted as shown in Figure 2.
• H-Rotor type of VAWT especially of Helical H-rotor is investigated in details in this research.
16
Un
iver
isit
i Keb
angs
aan
Mal
aysi
a

Figure 2 Timeline of Darrieus VAWT development
17
Un
iver
isit
i Keb
angs
aan
Mal
aysi
a

• For research in wind power, the recent researches is shown in Table 4.
M.F. Akorede et al. [1] 2013 • The potential of wind energy resource for production of electric power has been investigated using Weibull distribution.
• Small size turbine is economically wiser to be employed based on the low profile of wind speed. (which is 5.4 m/s @10m height at Mersing).
M.Irwanto et al. [2] 2014 • Study on wind speed in Chuping and Kangar, Perlis have been done.
• It reveals that wind energy potential are categorized very poor with the wind power density of 2.13 W/m2 and 19.69 W/m2 @50 m height at Chuping and Kangar respectively.
Table 4 Details of researches in wind power
18
Un
iver
isit
i Keb
angs
aan
Mal
aysi
a

K.M. Nor et al. (2014) • The use of numerical weather prediction (NWP) models for the wind resource assessment has discerned mesoscale wind that have an eminent impact on the wind regime in Malaysia.
• Affirm the existing potential of wind energy in Malaysia.
N. Masseran (2015) • Discuss the statistical properties of the wind power density function.
• The method of Monte Carlo integration is proposed in this study for determining the statistical properties of wind power density such as Gamma and Inverse Gamma pdfs that cannot be easily obtained directly.
19
Un
iver
isit
i Keb
angs
aan
Mal
aysi
a

Comparison of univariate and bivariate parametric model for wind energy analysis
Although the trend of jointing wind speed and wind direction in wind power assessment has begun abroad, there is no/very
little such analysis in Malaysia.
This study combines the wind speed and wind direction in a bivariate probability model to investigate the significance effect of wind direction in determining the wind power
density at Mersing, Malaysia.
The method of obtaining circular-linear distribution with specified marginal distributions by Johnson & Wehrly has
been used for this purpose.
The best fit model for univariate and bivariate probabilistic model and annual wind power density for each model are discovered and used to represent the availability of wind
energy potential across Mersing, Malaysia.
20
Un
iver
isit
i Keb
angs
aan
Mal
aysi
a

…… (3) STUDY AREA AND DATA
Mersing is located at the southern part of Peninsular Malaysia, with geographic coordinate 2.4333° N and 103.8333° E.
Throughout the year, Mersing experiences a wet and humid condition with mean daily temperature is 31°C and nearly 70
percent humidity (Razali et al., 2012).
As shown in Figures and Diagrams next few slide,
Mersing is located near to the sea that caused influenced by the effect of sea breezes and land breezes.
Hourly wind speed (m/s) at 10 meter height data of Mersing is provided by the Malaysian Meteorological Department. The
data records is from January 2007 to December 2013.
21
Un
iver
isit
i Keb
angs
aan
Mal
aysi
a

UKM Marine Ecosystem Research Centre
22

Demo Projects at Solar Energy Research Institute (SERI) UKM
2 kW Wind PV Hybrid System in UKM Marine Station in Mersing Johor ( 1kW of Wind Energy Conversion System and1 kW of Silicon Polychrystaline Solar Panel)
23
Un
iver
isit
i Keb
angs
aan
Mal
aysi
a

Smart Energy Management and Control
System
Solar Photovoltaic Panels
Wind Turbine
Energy from solar
Energy from wind
Electricity
EKOMAR
24
Un
iver
isit
i Keb
angs
aan
Mal
aysi
a
Solar Photovoltaic Panels
Wind Turbine
DC
DC
AC
DC
Hybrid Controller
DC
AC
DC Load
Dump Load
AC Load
25
Un
iver
isit
i Keb
angs
aan
Mal
aysi
a

Parameters Status
Weather Sensors
Solar Radiation (W/m2) Installed & collecting data
Wind speed (m/s) Installed & collecting data
Wind Direction Installed & collecting data
Humidity (%) Installed & collecting data
Temperature (oC) Installed & collecting data
Energy Generation / Supply
Voltage (V) Type of sensor is to be determined
Current (A) Type of sensor is to be determined
Energy (W.hr) Type of sensor is to be determined
Energy Consumption
Energy (W.hr) Type of sensor is to be determined
Form all source: solar PV, wind turbine & TNB (individually)
26
Un
iver
isit
i Keb
angs
aan
Mal
aysi
a
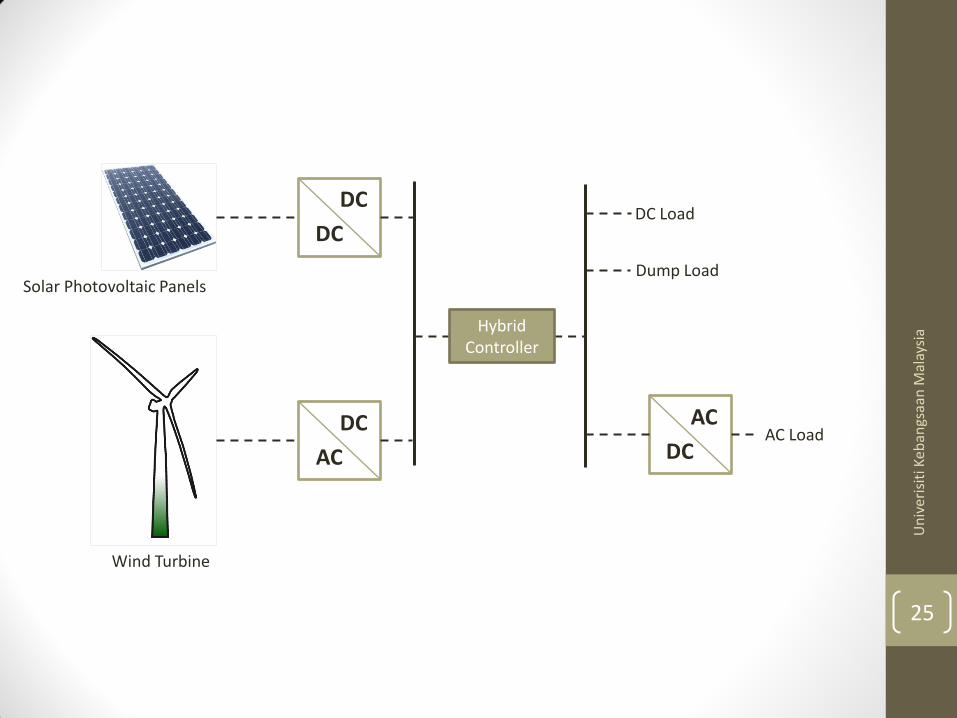
Solar PV (AC)
Wind Turbine (AC)
Hybrid Controller
Dump Load
AC Load
Smart Energy Management
Wind Turbine (AC)
PA
PA
PA
PA
27
Un
iver
isit
i Keb
angs
aan
Mal
aysi
a

…. (4) METHODOLOGY
Method:
Data for the year of 2004-2014 from DOE (52 stations) & MET (1 station)
Method:
R2, AIC and RMSE to select the best
distribution for each station.
• Wind speed: Weibull, Gama, Gama Inverse,
Burr
• Wind direction: FmVM
Method:
R2 and RMSE to select the best
distribution for each station.
• Weibull-FmVM
• Gama-FmVM
• Gama Inverse-FmVM
• Burr-FmVM
Data collection
Univariate model
selection
Bivariate model
selection
Expectation: data analysis
Expectation: one univariate distribution
for each station
Expectation: one bivariate distribution
for each station
28
Un
iver
isit
i Keb
angs
aan
Mal
aysi
a

Method:
dvvvfP v
v
v
3max
min
)(2
1
2
0
max
min,
3 ),(2
1 v
vv dvdvfvP
Method:
Mean wind power density (W/m2) for each univariate and bivariate
distribution in each station
Wind power analysis Wind power comparison
Expectation: Determine station which the highest mean wind power density as the potential
station
Expectation: Bivariate distribution might gives higher
(W/m2) 29
Un
iver
isit
i Keb
angs
aan
Mal
aysi
a

WIND DIRECTION
• Weibull • Gamma • Inverse
Gamma • Burr
WIND SPEED
Finite mixture von Mises
Wind power density
Wind power density
Joint distribution of
speed/direction
• Weibull x FmVM • Gama x FmVM • Inv. Gama x
FmVM • Burr x FmVM
30
Un
iver
isit
i Keb
angs
aan
Mal
aysi
a

jj
H
1j j0
jcosexp
2f
2
0
2
2
0
0
H
1j
j
jj
2!
1
cosexp2
1
1 and .H1,2,......jfor 10
, 0 , 20 , 20
j
jj
j
d
Finite mixture Von Mises (FmVM)
For:
31
Un
iver
isit
i Keb
angs
aan
Mal
aysi
a

There are numerous circular probability distributions such as Uniform, Wrapped Normal (WN), Wrapped Cauchy (WC) and
General Wrapped Stable (WS) distribution
Finite mixture Von Mises (FmVM) is chosen basically depend on the nature of data which is circular
with multi modal that best explain with this type of probability distribution
The importance of the study of wind direction is to identify
dominant direction of wind in order to optimize the wind capture. The significant effect of wind direction in producing a
maximum wind power can be distinguish.
32
Un
iver
isit
i Keb
angs
aan
Mal
aysi
a

Probability distribution of joint wind speed and direction
𝑓𝑣,𝜃 𝑣, 𝜃 = 2𝜋𝑔 𝜁 𝑓𝑣 𝑣 𝑓𝜃 𝜃 ;
−∞ ≤ 𝑣 < ∞ 0 ≤ 𝜃 < 2𝜋
where 𝜁 = 2𝜋[𝐹𝑣(𝑣) − 𝐹𝜃(𝜃)]
• that originally suggested by Johnson and Wehrly (1978)
33
Un
iver
isit
i Keb
angs
aan
Mal
aysi
a

Distribution
Weibull Distribution
The probability density function of a Weibull random variable is :
34
Un
iver
isit
i Keb
angs
aan
Mal
aysi
a
where k > 0 is the shape parameter and λ > 0 is the scale parameter of the distribution).
The Weibull distribution is widely used in reliability and life data analysis
due to its versatility. Depending on the values of the parameters, the
Weibull distribution can be used to model a variety of life behaviors.

Un
iver
isit
i Keb
angs
aan
Mal
aysi
a
35
Probability density function

Gamma distribution
𝑓 𝑥; 𝛼, 𝛽 =1
Γ 𝛼𝑥𝛼−1𝑒𝑥𝑝 −
𝑥
𝛽
represents the probability density function (pdf) for Gama
distribution where α = shape parameter, β = scale parameter;
Γ 𝑥 = Gama function. As for α and β, the value can be estimated
by using:
𝛽 = 𝑥
𝛼
ln 𝛼 − Ψ 𝛼 = 𝑙𝑛1
𝑛 𝑥𝑖
𝑛𝑖=1 −
1
𝑛 ln 𝑥𝑖
𝑛𝑖=1
The Gamma distribution is widely used in engineering, science, and business, to model continuous variables that are always positive and have skewed distributions. The Gamma distribution can be useful for any variable which is always positive, such as cohesion or shear strength for example. 36
Un
iver
isit
i Keb
angs
aan
Mal
aysi
a

Un
iver
isit
i Keb
angs
aan
Mal
aysi
a
37
Probability density plots of gamma distributions

Un
iver
isit
i Keb
angs
aan
Mal
aysi
a
38
Inverse-gamma distribution
The inverse gamma distribution’s probability density function is defined over the support 𝑥 > 0
with shape parameter 𝛼 and scale parameter 𝛽. Here 𝜏(.) denotes the gamma function.
The inverse gamma distribution (also called the inverted gamma distribution) is the reciprocal of the gamma distribution. It has two positive parameters (α and β): The shape parameter α controls the height and the scale parameter β controls the spread.

Un
iver
isit
i Keb
angs
aan
Mal
aysi
a
39
Inverse-gamma distributions

Un
iver
isit
i Keb
angs
aan
Mal
aysi
a
40
Burr distribution
The Burr (Type XII) distribution has probability density function :
The Burr distribution (sometimes called the Burr Type XII distribution or Singh–
Maddala distribution) is a unimodal family of distributions with a wide variety of
shapes. ... The Burr distribution Type XII is defined by the following parameters: c
and k: shape parameters.

Un
iver
isit
i Keb
angs
aan
Mal
aysi
a
41
Probability density function of Burr distribution

Wind Power Analysis
The wind power density is the number of watts of electrical energy produced per square meter of air space (W/m²). The general formula for wind power is:
𝑃 =1
2𝜌𝑘𝑉3
But for calculating the probability of wind power density at different wind speed and direction will be:
𝑃 𝑣, 𝜃 =1
2𝜌𝑓𝑣,𝜃(𝑣, 𝜃)𝑣3
with assuming that air density and wind speed are not correlated and
that the air density is constant
42
Un
iver
isit
i Keb
angs
aan
Mal
aysi
a

….(5) RESULT & DISCUSSION UNIVARIATE (WIND SPEED)
Jadual 4.4 Keputusan bagi nilai AIC terhadap penyuaian
setiap fungsi ketumpatan kebarangkalian
Stesen Weibull Gama Gama
Songsang Burr
AIC AIC AIC AIC
A05 158774 188916 185724 184211
E01 455027 429242 442943 451432
G03 439831 411129 419161 429213
I06 438610 405350 440806 442829
K05 422480 418918 433996 407494
L01 423033 453190 458482 403577
N02 433102 411995 446722 411531
NOTE: A05 Mersing E01 Bkt Rambai G03 USM, P.Pinang I06 Kangar K05 Sandakan L01 Kuching N02 Kuala Terengganu
Weibull distribution is best for representing wind speed data in Mersing.
43
Un
iver
isit
i Keb
angs
aan
Mal
aysi
a
Jadual 4.3 Nilai pekali R2 terhadap penyuaian
setiap fungsi ketumpatan kebarangkalian
Stesen Weibull Gama Gama
Songsang Burr
R2 R2 R2 R2
A05 0.996899 0.986178 0.920197 0.881672
E01 0.977579 0.995016 0.934345 0.924682
G03 0.94559 0.955917 0.894872 0.918076
I06 0.998042 0.940832 0.891178 0.961566
K05 0.96213 0.907459 0.94831 0.986514
L01 0.964101 0.907408 0.933424 0.985029
N02 0.946792 0.948063 0.942363 0.98175
Jadual 4.5 Jadual menunjukkan nilai RMSE bagi setiap
taburan di setiap stesen kajian
Stesen Weibull Gama Gama
Songsang Burr
RMSE RMSE RMSE RMSE
A05 0.026396 0.0339182 0.0449569 0.026854
E01 0.0513391 0.047676 0.0545139 0.0502155
G03 0.0102681 0.005129 0.0365057 0.0435398
I06 0.018805 0.0213129 0.0387335 0.0522882
K05 0.0433222 0.0472967 0.0467208 0.021613
L01 0.0123 0.0260848 0.0440105 0.0542975
N02 0.0519422 0.056503 0.0522876 0.024238

UNIVARIATE (WIND DIRECTION)
• R2 dan AIC for each FmVM model component for Mersing
( )( )
( )( )
( )( )( )
( )( )( )
( )( )( )
( )( )( )
( )( )( )
2
0
2
0
4
0
3
0
2
0
1
0
-cos14.95576exp14.95576Ι2
0.132026
+-cos14.04048exp14.04048Ι2
0.16176
+-cos19.55538exp19.55538Ι2
0.317662
+-cos10.62431exp10.62431Ι2
0.046866
+-cos14.95576exp14.95576Ι2
0.065021
+-cos12.25072exp12.25072Ι2
276666.0=
μθπ
μθπ
μθπ
μθπ
μθπ
μθπ
θfθ
• PDF estimation for FmVM (H=6)
• FmVM (H=6) is proven with six peaks in the graf
• Dominant direction for
Mersing are southwest and
northeast
44
Un
iver
isit
i Keb
angs
aan
Mal
aysi
a

• BIVARIATE (WIND SPEED AND WIND DIRECTION)
Weibull-FMvM Gama-FMvM Inverse Gama-FMvM Burr-FMvM
R2 0.795418 0.999820 0.992452 0.963967
RMSE 0.652964 0.217915 0.984396 0.376102
R2 and RMSE value for each distribution for Mersing
45
Un
iver
isit
i Keb
angs
aan
Mal
aysi
a

Wind Power Density (W/m2)
0
10
20
30
40
50
60
70
80
90
jan feb march apr may june july aug sept oct nov dec
Kuas
a ket
um
pat
an a
ngin
(W
/m2
)
Bulan mengikut tahun
2007 2008 2009 2010 2011 2012 2013
Univariate distribution - Mersing (A05)
The highest Mean wind power density (W/m2) is between Dec-March each year because of the effect of North East monsoon.
46
Un
iver
isit
i Keb
angs
aan
Mal
aysi
a

Wind Power Density (W/m2)
Bivarite Distribution –Mersing Station (A05)
0
0.5
1
1.5
2
2.5
3
3.5
4
4.5
0
5
10
15
20
25
30
35
1 2 3 4 5 6 7 8 9 10 11 12
Laj
u a
ngin
(m
/s)
Ket
um
pat
an k
uas
a an
gin
(W
/m2)
Bulan
2007 2007 2007
0
0.5
1
1.5
2
2.5
3
3.5
4
4.5
0
5
10
15
20
25
30
35
40
45
Jan Feb Mac Apr May Jun Jul Aug Sep Oct Nov Dec
Laj
u a
ngin
(m
/s)
Ket
um
pat
an k
uas
a an
gin
(W
/m2)
Bulan
2011 2011 2011
10
15
20
25
30
2007 2008 2009 2010 2011 2012 2013
Min
kuas
a ket
um
pat
an (
W/m
2)
Tahun
model tunggal halaju angin
model tercantum halaju dan arah angin
Monthly wind power density comparison for the year of 2007 and 2011
Yearly mean wind power density
47
Un
iver
isit
i Keb
angs
aan
Mal
aysi
a

Mean Wind Power Density (W/m2)
Kod Negeri
Min kuasa
Univariat
(W/m2)
Min kuasa
Bivariat
(W/m2)
Kod Negeri
Min kuasa
Univariat
(W/m2)
Min kuasa
Bivariat
(W/m2)
A01 Johor 2.865371 3.300833 I05 Perak 2.454603 3.007613
A02 Johor 1.717685 2.482579 I06 Perlis 12.118465 13.160617
A03 Johor 3.724170 4.391232 J01 Putrajaya 4.275321 4.973804
A04 Johor 2.830018 3.058678 K01 Sabah 1.693251 2.009030
B01 K.Lumpur 2.076809 2.698878 K02 Sabah 4.924081 3.293787
B02 K.Lumpur 2.183713 3.004837 K03 Sabah 2.132249 3.746043
C01 Kedah 3.536048 4.142882 K04 Sabah 1.819608 2.713090
C02 Kedah 2.176932 2.203653 K05 Sabah 2.154176 3.035266
C03 Kedah 3.454630 3.929410 L01 Sarawak 4.159495 4.360648
D01 Kelantan 3.132914 3.701892 L02 Sarawak 2.485864 2.911435
D02 Kelantan 2.592936 3.201550 L03 Sarawak 8.789561 9.913950
E01 Melaka 6.435791 7.198625 L04 Sarawak 1.816859 3.129930
E02 Melaka 4.686600 4.943361 L05 Sarawak 1.527487 2.339029
F01 N.Sembilan 7.803786 8.422670 L06 Sarawak 1.452409 1.994502
F02 N.Sembilan 2.120636 2.876307 L07 Sarawak 2.006543 2.122130
F03 N.Sembilan 4.505838 5.718471 L08 Sarawak 1.042157 1.634772
G01 P.Pinang 1.626808 2.617868 L09 Sarawak 1.959992 1.065011
G02 P.Pinang 2.279498 2.438833 L10 Sarawak 2.987399 3.884843
G03 P.Pinang 2.521373 3.481835 M01 Selangor 2.501364 3.506558
H01 Pahang 1.100129 1.485416 M02 Selangor 1.757678 2.712422
H02 Pahang 2.899468 3.296379 M03 Selangor 2.292602 3.175162
H03 Pahang 3.334175 3.945696 M04 Selangor 5.875507 5.148712
I01 Perak 4.281090 4.377591 M05 Selangor 2.065338 2.866829
I02 Perak 2.005725 2.873321 N01 Terengganu 2.674440 2.735186
I03 Perak 1.193083 1.751586 N02 Terengganu 2.682187 3.118565
I04 Perak 2.532040 3.464673 N03 Terengganu 1.913448 2.087685
• Mersing (A05) - 19.4510 W/m2 (univariate) and 19.8092 W/m2 (bivariate).
• Most of the stations show increment (W/m2) in the bivariate compared to univariate.
• Except for ILP Miri (L09) and SM Sains K.Selangor (M04) show decrement for about (-0.895) and (-0.727) respectively.
• This shows that, the increment in (W/m2) in bivariate is not affected by the equation, but by the data of wind speed and direction in each station.
48
Un
iver
isit
i Keb
angs
aan
Mal
aysi
a

Estimation of electric energy generated by turbine
49
Un
iver
isit
i Keb
angs
aan
Mal
aysi
a

Estimation of electric energy generated by turbine
50
Un
iver
isit
i Keb
angs
aan
Mal
aysi
a
The estimation is based on the mean wind speed of 2.86 m/s with the mean wind power density of 22.89752 (W/m2), for
Mersing (2011).

…. (6) CONCLUSION
• Finite mixture of Von Mises (FmVM)
is the best distribution that explain wind direction data in Malaysia
• Bivariate Gamma – FmVM and Inverse Gamma – FmVM distribution are the distribution that suit to model the
wind data in Malaysia
• Not all stations give the same wind speed distribution for both univariate and bivariate model. For example,
Mersing (univariate = Weibull and bivariate = Gamma - FmVM).
51
Un
iver
isit
i Keb
angs
aan
Mal
aysi
a

• 96.23% stations show increment in mean wind power density (W/m2) for bivariate compared to univariate model
which 1.8% increment in (W/m2) in Mersing
• Spin radius=10 m will generates 129.4838 kWh monthly. Eventhough it is only 37% domestic energy consumption (350 kWh monthly), but it can be an alternative to energy
sources
• Small scale wind energy system may be appropriate in Malaysia based on the lower mean speed average
throughout the year (2.15-2.39 m/s) which help domestic users in remote areas
52
Un
iver
isit
i Keb
angs
aan
Mal
aysi
a

THANK
YOU
53
Un
iver
isit
i Keb
angs
aan
Mal
aysi
a