faktor–faktor yang mempengaruhi status anemia siswa siswi ...
Malaria Induces Anemia through CD8� T Cell-Dependent ParasiteClearance and Erythrocyte Removal in the Spleen
Innocent Safeukui,a,b Noé D. Gomez,a,c Aanuoluwa A. Adelani,a,b Florence Burte,d Nathaniel K. Afolabi,e Rama Akondy,f
Peter Velazquez,g Anthony Holder,d Rita Tewari,h Pierre Buffet,i Biobele J. Brown,e Wuraola A. Shokunbi,j David Olaleye,k
Olugbemiro Sodeinde,d,e James Kazura,l Rafi Ahmed,f Narla Mohandas,m Delmiro Fernandez-Reyes,d,e Kasturi Haldara,b
Boler-Parseghian Center for Rare and Neglected Diseases, University of Notre Dame, Notre Dame, Indiana, USAa; Department of Biological Sciences, University of NotreDame, Notre Dame, Indiana, USAb; Feinberg School of Medicine, Department of Pathology, Northwestern University, Chicago, Illinois, USAc; Division of Parasitology, MRCNational Institute for Medical Research, London, United Kingdomd; Department of Paediatrics, College of Medicine, University of Ibadan, University College Hospital,Ibadan, Oyo, Nigeriae; Emory Vaccine Center, Emory University School of Medicine, Atlanta, Georgia, USAf; Department of Microbiology and Immunology, IndianaUniversity School of Medicine, South Bend, Indiana, USAg; Centre for Genetics and Genomics, School of Biology, University of Nottingham, Nottingham, United Kingdomh;INSERM-UPMC (Paris 6 University), Unité Mixte de Recherche s945, Paris, Francei; Childhood Malaria Research Group, University College Hospital, Ibadan, Nigeriaj;Department of Virology, College of Medicine, University of Ibadan, Ibadan, Nigeriak; Center for Global Health and Diseases, Case Western Reserve University, Cleveland,Ohio, USAl; Red Cell Physiology Laboratory, New York Blood Center, New York, New York, USAm
ABSTRACT Severe malarial anemia (SMA) in semi-immune individuals eliminates both infected and uninfected erythrocytes andis a frequent fatal complication. It is proportional not to circulating parasitemia but total parasite mass (sequestered) in the or-gans. Thus, immune responses that clear parasites in organs may trigger changes leading to anemia. Here, we use an outbred-ratmodel where increasing parasite removal in the spleen escalated uninfected-erythrocyte removal. Splenic parasite clearance wasassociated with activated CD8� T cells, immunodepletion of which prevented parasite clearance. CD8� T cell repletion and con-comitant reduction of the parasite load was associated with exacerbated (40 to 60%) hemoglobin loss and changes in propertiesof uninfected erythrocytes. Together, these data suggest that CD8� T cell-dependent parasite clearance causes erythrocyte re-moval in the spleen and thus anemia. In children infected with the human malaria parasite Plasmodium falciparum, elevation ofparasite biomass (not the number of circulating parasites) increased the odds ratio for SMA by 3.5-fold (95% confidence inter-vals [CI95%], 1.8- to 7.5-fold). CD8� T cell expansion/activation independently increased the odds ratio by 2.4-fold (CI95%, 1.0- to5.7-fold). Concomitant increases in both conferred a 7-fold (CI95%, 1.9- to 27.4-fold)-greater risk for SMA. Together, these datasuggest that CD8�-dependent parasite clearance may predispose individuals to uninfected-erythrocyte loss and SMA, thus in-forming severe disease diagnosis and strategies for vaccine development.
IMPORTANCE Malaria is a major global health problem. Severe malaria anemia (SMA) is a complex disease associated with par-tial immunity. Rapid hemoglobin reductions of 20 to 50% are commonly observed and must be rescued by transfusion (whichcan carry a risk of HIV acquisition). The causes and risk factors of SMA remain poorly understood. Recent studies suggest thatSMA is linked to parasite biomass sequestered in organs. This led us to investigate whether immune mechanisms that clear para-sites in organs trigger anemia. In rats, erythropoiesis is largely restricted to the bone marrow, and critical aspects of the spleenexpected to be important in anemia are similar to those in humans. Therefore, using a rat model, we show that severe anemia iscaused through CD8� T cell-dependent parasite clearance and erythrocyte removal in the spleen. CD8 activation may also be anew risk factor for SMA in African children.
Received 13 December 2014 Accepted 16 December 2014 Published 20 January 2015
Citation Safeukui I, Gomez ND, Adelani AA, Burte F, Afolabi NK, Akondy R, Velazquez P, Holder A, Tewari R, Buffet P, Brown BJ, Shokunbi WA, Olaleye D, Sodeinde O, Kazura J,Ahmed R, Mohandas N, Fernandez-Reyes D, Haldar K. 2015. Malaria induces anemia through CD8� T cell-dependent parasite clearance and erythrocyte removal in the spleen.mBio 6(1):e02493-14. doi:10.1128/mBio.02493-14.
Editor John C. Boothroyd, Stanford University
Copyright © 2015 Safeukui et al. This is an open-access article distributed under the terms of the Creative Commons Attribution-Noncommercial-ShareAlike 3.0 Unportedlicense, which permits unrestricted noncommercial use, distribution, and reproduction in any medium, provided the original author and source are credited.
Address correspondence to Kasturi Haldar, [email protected].
This article is a direct contribution from a Fellow of the American Academy of Microbiology.
Malaria continues to be a major health challenge in the world.Plasmodium falciparum causes the most virulent form of
human malaria. In 2012, it killed over 600,000 children, largely insub-Saharan Africa (1). The asexual-blood-stage parasite infectserythrocytes and is responsible for all of the symptoms and pathol-ogy associated with disease. Uncomplicated malaria consists ofcycles of high fever and chills. Severe malaria includes additional
pathologies, including anemia, respiratory distress, lactic acidosis,and cerebral malaria (2).
Severe malaria greatly increases the risk of death. The majorpathophysiological state is severe malarial anemia (SMA). SMA isa complex disease, associated with partial immunity and resultsfrom the loss of both uninfected and infected erythrocytes, alongwith a concomitant block in erythropoiesis (2–4). Rapid hemo-
RESEARCH ARTICLE crossmark
January/February 2015 Volume 6 Issue 1 e02493-14 ® mbio.asm.org 1
m
bio.asm.org
on February 3, 2015 - P
ublished by m
bio.asm.org
Dow
nloaded from

globin reductions of 20 to 50% are commonly observed (5) andmust be rescued by transfusion (which can carry a risk of otherinfections). However, the cause of this reduction and whether italso inexplicably influences dyserythropoiesis remain poorly un-derstood. SMA in human populations is not proportional to cir-culating parasitemia, and recent studies suggest that it is linked tototal parasite biomass sequestered in organs (6, 7). This led us toquery whether immune mechanisms that kill parasites in organsmay trigger anemia.
Mechanistic investigation can be greatly facilitated by relevantanimal models and organ systems with physiological correspon-dence to human systems. Malarial anemia has previously beeninvestigated in several mice and rat models (8–11). Murine mod-els are attractive due to the availability of genetics and relatedtools. However, one drawback is that erythropoiesis, which in hu-mans is in the bone marrow, is anomalously active in the mousespleen (especially in response to a stress like anemia) (9, 12). Thisprofoundly influences the organizational and functional compo-nents of an organ expected to be important in erythrocyte re-moval, a major mechanism of anemia (9). In contrast, in rats,erythropoiesis is largely restricted to the bone marrow, and criticalaspects of the spleen red pulp architecture are similar to those ofhumans (13, 14). Hence, the pathophysiology of human splenicdisease is likely to be better mimicked and measured in rats, whoselarger size also facilitates monitoring anemia. Here, we have uti-lized the Wistar rat model, where malarial anemia is due to eryth-rocyte removal rather than dyserythropoiesis (8). We elucidatesplenic mechanisms that exacerbate anemia by erythrocyte re-moval (up to ~50 to 60% hemoglobin reduction). We furtherextend these findings to patient studies and thus identify new riskfactors for SMA in African children.
RESULTS
Comparative analysis of spleens and livers from aged Wistar ratsinfected with Plasmodium berghei ANKA reveals that the spleenshows mass expansion associated with anemia and the major par-asite burden.
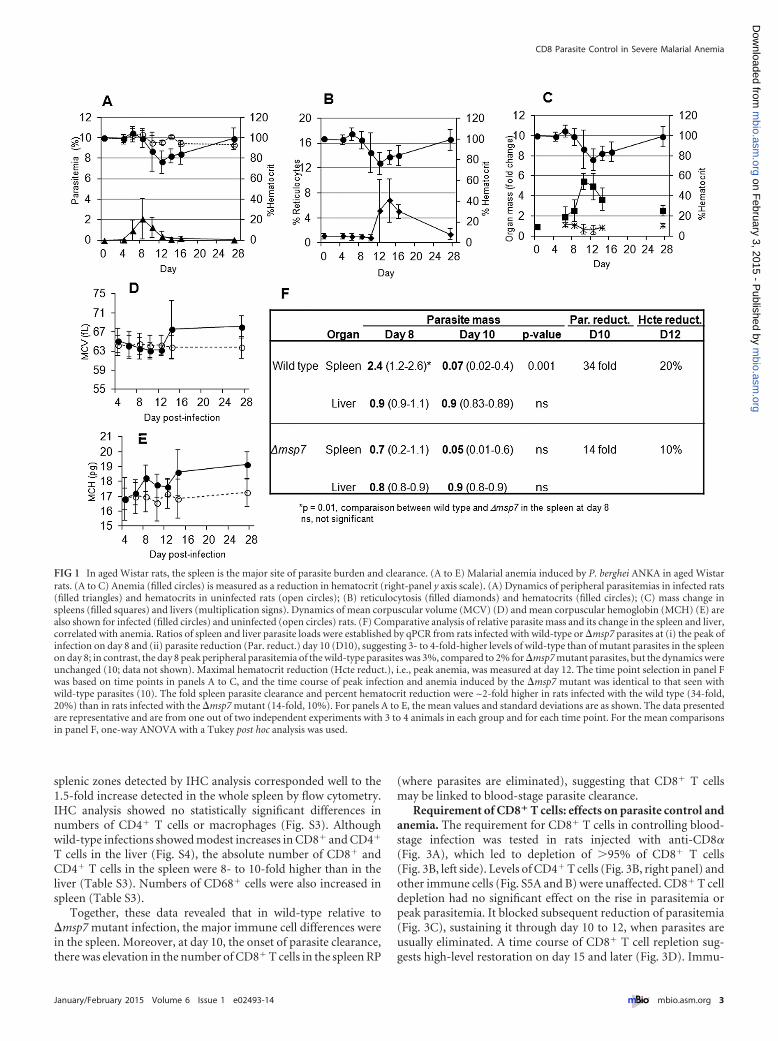
Rats infected with wild-type P. berghei ANKA displayed lowperipheral parasitemia (3%) that peaked at day 8 postinfection(p.i.) (Fig. 1A). At day 10, peripheral parasitemia and the hemat-ocrit declined. By days 12 to 14, parasites were completely elimi-nated, with an ~20% reduction in the hematocrit (range, 16 to40%), suggesting simultaneous clearance of both infected and un-infected erythrocytes (the variation in hematocrit reduction ischaracteristic of an outbred model [8, 10]). The subsequent ro-bust increase of reticulocytes (Fig. 1B) confirmed that erythrocytereduction (or anemia) was not due to a block in erythropoiesis.Rather, it was by removal of uninfected erythrocytes (since thehematocrit declined 20% at 3% parasitemia). After recovery fromanemia (days 24 to 28), the animals were cured and immune tosubsequent parasite challenge (8, 10).
Since this is a model of malarial anemia, the spleen and the liverare expected to be the major affected organs. Notably, there was,on average, a �5-fold increase in spleen mass but no increase inliver mass by day 10 (Fig. 1C). Elevation of mean corpuscularvolume (MCV) and mean corpuscular hemoglobin (MCH),highly characteristic of stress erythropoiesis, in the bone marrow(as in humans) was also noted (Fig. 1D and E), suggesting that thesplenic expansion shown in Fig. 1C was not linked to increasedsplenic erythropoiesis (as in murine systems) but that it may play
a major role in the removal of infected and uninfected erythro-cytes.
Anemia has been linked to total parasite biomass in organs inhuman falciparum malaria (7). Quantitative PCR (qPCR) re-vealed that at day 8 (of peak infection), the rat spleen was themajor site of P. berghei burden, containing over 70% of the para-sites (Fig. 1F, upper panel). By day 10, there was a 34-fold reduc-tion in the number of parasites in the spleen (to levels lower thanin the liver, which remained unchanged), and the dynamics ofsplenic clearance was the same for wild-type and mutant parasites(10). Pathological analyses of lung, kidney, and brain failed toreveal significant parasite material compared to that in the spleenor even the liver (see Fig. S1 in the supplemental material). Thelung showed small mass fluctuations, but they were largely reduc-tions, and their dynamics were not coincident with peak infection,numbers of detectable parasites, or anemia (see Table S1). To-gether, these data suggested that spleen was the major site of par-asite burden. Moreover, the timing of parasite elimination wasalso that of erythrocyte clearance and anemia.
We further investigated a P. berghei ANKA mutant with a de-letion of msp7, a gene implicated in blood cell invasion and thuslikely to influence total parasite load and anemia (10). At day 8,there was no difference in parasite loads in the liver, but in thespleen, the �msp7 strain’s peak load was 3-fold lower than that ofits wild-type counterpart (Fig. 1F). �msp7 strain clearance wascoincident with a 14-fold reduction in spleen parasites at day 10and a 10% reduction of uninfected erythrocytes at day 12(Fig. 1F). This comparative analysis of the �msp7 and wild-typeparasites suggested that increasing fold parasite clearance in thespleen escalated uninfected-erythrocyte removal and thus anemia.
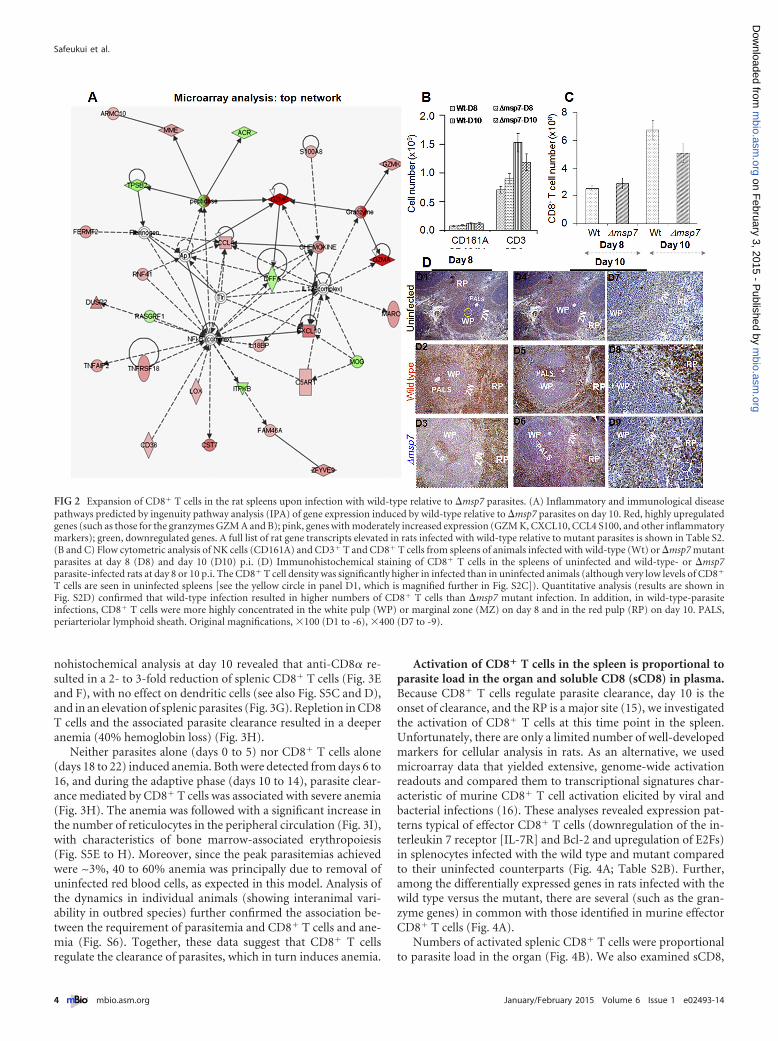
Expansion of splenic CD8� T cells, in wild type relative to�msp7 infection. To understand in an unbiased way splenic pro-cesses that underlie increased clearance of parasite load (ratherthan overall infection per se), we examined differences in hostresponse to wild-type parasites relative to �msp7 mutant para-sites. To do this, we undertook whole-genome microarray expres-sion analyses of wild-type- relative to mutant-infected spleens atday 10 (uninfected animals were also included as controls)(Fig. S2A). Three hundred seventy-seven genes showed significantchanges in expression (�1.5-fold change, P � 0.005) (Table S2A).In the top network (Fig. 2A), 7 (of the top 20) genes were forgranzymes (including granzyme B), suggesting involvement ofCD8� T cells or NK cells.
Flow cytometry analyses confirmed that P. berghei infectioninduced infiltration of B cells, NK cells, and CD3� T cells (bothCD8� and CD4� T cells) in the spleen (see the combined infor-mation of Fig. 2B and C and S2B and C). NK cell counts remainedlow, with no difference seen between wild-type- and mutant-infected spleens (Fig. 2B), which also showed no significant differ-ences in B cell counts (Fig. S2B). Wild-type-associated elevationwas seen in CD3� T cells, with a 1.5-fold increase in CD8� T cellson day 10 in wild-type- compared to �msp7 mutant-infected cells(Fig. 2C).
Quantitative immunohistochemical (IHC) analyses of spleenzones revealed that compared to �msp7 mutant-infected animals,wild-type-infected animals showed specific, 2-fold increases inCD8� T cell concentrations in the white pulp/periarteriolar lym-phoid sheaths and marginal zone (WP/PALS and MZ) at day 8(Fig. 2D). By day 10, the CD8� T cells had migrated to the red pulp(RP) (Fig. 2D and S2C and D). The 2-fold increase in specific
Safeukui et al.
2 ® mbio.asm.org January/February 2015 Volume 6 Issue 1 e02493-14
m
bio.asm.org
on February 3, 2015 - P
ublished by m
bio.asm.org
Dow
nloaded from
splenic zones detected by IHC analysis corresponded well to the1.5-fold increase detected in the whole spleen by flow cytometry.IHC analysis showed no statistically significant differences innumbers of CD4� T cells or macrophages (Fig. S3). Althoughwild-type infections showed modest increases in CD8� and CD4�
T cells in the liver (Fig. S4), the absolute number of CD8� andCD4� T cells in the spleen were 8- to 10-fold higher than in theliver (Table S3). Numbers of CD68� cells were also increased inspleen (Table S3).
Together, these data revealed that in wild-type relative to�msp7 mutant infection, the major immune cell differences werein the spleen. Moreover, at day 10, the onset of parasite clearance,there was elevation in the number of CD8� T cells in the spleen RP
(where parasites are eliminated), suggesting that CD8� T cellsmay be linked to blood-stage parasite clearance.
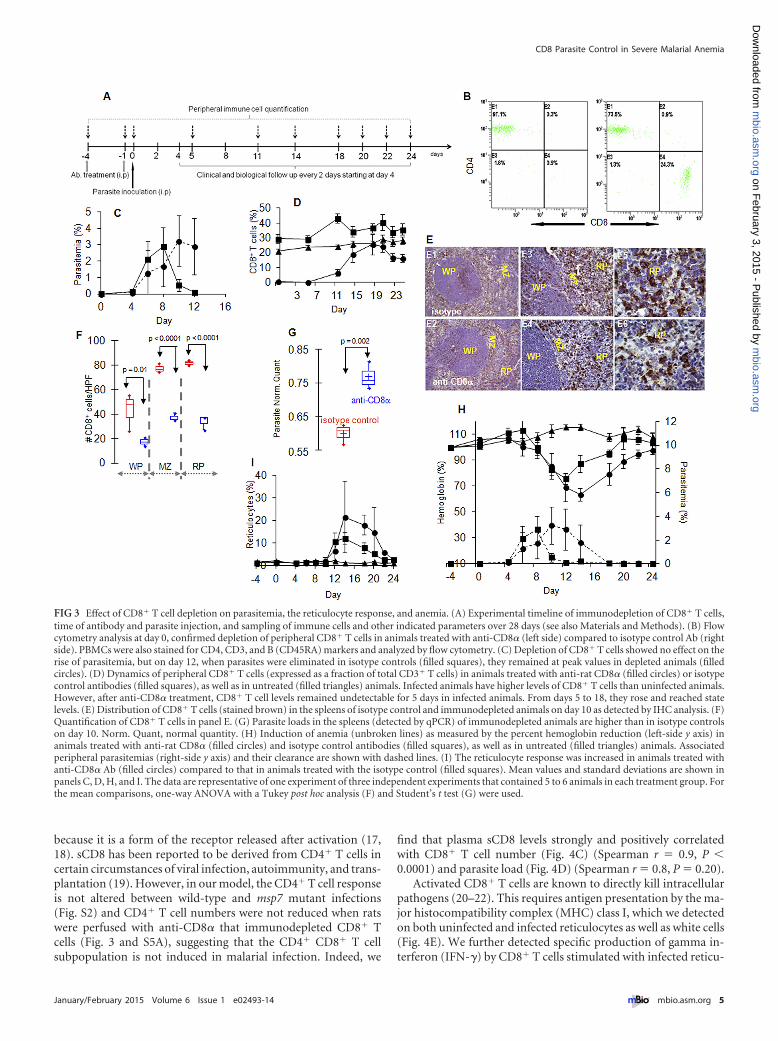
Requirement of CD8� T cells: effects on parasite control andanemia. The requirement for CD8� T cells in controlling blood-stage infection was tested in rats injected with anti-CD8�(Fig. 3A), which led to depletion of �95% of CD8� T cells(Fig. 3B, left side). Levels of CD4� T cells (Fig. 3B, right panel) andother immune cells (Fig. S5A and B) were unaffected. CD8� T celldepletion had no significant effect on the rise in parasitemia orpeak parasitemia. It blocked subsequent reduction of parasitemia(Fig. 3C), sustaining it through day 10 to 12, when parasites areusually eliminated. A time course of CD8� T cell repletion sug-gests high-level restoration on day 15 and later (Fig. 3D). Immu-
FIG 1 In aged Wistar rats, the spleen is the major site of parasite burden and clearance. (A to E) Malarial anemia induced by P. berghei ANKA in aged Wistarrats. (A to C) Anemia (filled circles) is measured as a reduction in hematocrit (right-panel y axis scale). (A) Dynamics of peripheral parasitemias in infected rats(filled triangles) and hematocrits in uninfected rats (open circles); (B) reticulocytosis (filled diamonds) and hematocrits (filled circles); (C) mass change inspleens (filled squares) and livers (multiplication signs). Dynamics of mean corpuscular volume (MCV) (D) and mean corpuscular hemoglobin (MCH) (E) arealso shown for infected (filled circles) and uninfected (open circles) rats. (F) Comparative analysis of relative parasite mass and its change in the spleen and liver,correlated with anemia. Ratios of spleen and liver parasite loads were established by qPCR from rats infected with wild-type or �msp7 parasites at (i) the peak ofinfection on day 8 and (ii) parasite reduction (Par. reduct.) day 10 (D10), suggesting 3- to 4-fold-higher levels of wild-type than of mutant parasites in the spleenon day 8; in contrast, the day 8 peak peripheral parasitemia of the wild-type parasites was 3%, compared to 2% for �msp7 mutant parasites, but the dynamics wereunchanged (10; data not shown). Maximal hematocrit reduction (Hcte reduct.), i.e., peak anemia, was measured at day 12. The time point selection in panel Fwas based on time points in panels A to C, and the time course of peak infection and anemia induced by the �msp7 mutant was identical to that seen withwild-type parasites (10). The fold spleen parasite clearance and percent hematocrit reduction were ~2-fold higher in rats infected with the wild type (34-fold,20%) than in rats infected with the �msp7 mutant (14-fold, 10%). For panels A to E, the mean values and standard deviations are as shown. The data presentedare representative and are from one out of two independent experiments with 3 to 4 animals in each group and for each time point. For the mean comparisonsin panel F, one-way ANOVA with a Tukey post hoc analysis was used.
CD8 Parasite Control in Severe Malarial Anemia
January/February 2015 Volume 6 Issue 1 e02493-14 ® mbio.asm.org 3
m
bio.asm.org
on February 3, 2015 - P
ublished by m
bio.asm.org
Dow
nloaded from
nohistochemical analysis at day 10 revealed that anti-CD8� re-sulted in a 2- to 3-fold reduction of splenic CD8� T cells (Fig. 3Eand F), with no effect on dendritic cells (see also Fig. S5C and D),and in an elevation of splenic parasites (Fig. 3G). Repletion in CD8T cells and the associated parasite clearance resulted in a deeperanemia (40% hemoglobin loss) (Fig. 3H).
Neither parasites alone (days 0 to 5) nor CD8� T cells alone(days 18 to 22) induced anemia. Both were detected from days 6 to16, and during the adaptive phase (days 10 to 14), parasite clear-ance mediated by CD8� T cells was associated with severe anemia(Fig. 3H). The anemia was followed with a significant increase inthe number of reticulocytes in the peripheral circulation (Fig. 3I),with characteristics of bone marrow-associated erythropoiesis(Fig. S5E to H). Moreover, since the peak parasitemias achievedwere ~3%, 40 to 60% anemia was principally due to removal ofuninfected red blood cells, as expected in this model. Analysis ofthe dynamics in individual animals (showing interanimal vari-ability in outbred species) further confirmed the association be-tween the requirement of parasitemia and CD8� T cells and ane-mia (Fig. S6). Together, these data suggest that CD8� T cellsregulate the clearance of parasites, which in turn induces anemia.
Activation of CD8� T cells in the spleen is proportional toparasite load in the organ and soluble CD8 (sCD8) in plasma.Because CD8� T cells regulate parasite clearance, day 10 is theonset of clearance, and the RP is a major site (15), we investigatedthe activation of CD8� T cells at this time point in the spleen.Unfortunately, there are only a limited number of well-developedmarkers for cellular analysis in rats. As an alternative, we usedmicroarray data that yielded extensive, genome-wide activationreadouts and compared them to transcriptional signatures char-acteristic of murine CD8� T cell activation elicited by viral andbacterial infections (16). These analyses revealed expression pat-terns typical of effector CD8� T cells (downregulation of the in-terleukin 7 receptor [IL-7R] and Bcl-2 and upregulation of E2Fs)in splenocytes infected with the wild type and mutant comparedto their uninfected counterparts (Fig. 4A; Table S2B). Further,among the differentially expressed genes in rats infected with thewild type versus the mutant, there are several (such as the gran-zyme genes) in common with those identified in murine effectorCD8� T cells (Fig. 4A).
Numbers of activated splenic CD8� T cells were proportionalto parasite load in the organ (Fig. 4B). We also examined sCD8,
FIG 2 Expansion of CD8� T cells in the rat spleens upon infection with wild-type relative to �msp7 parasites. (A) Inflammatory and immunological diseasepathways predicted by ingenuity pathway analysis (IPA) of gene expression induced by wild-type relative to �msp7 parasites on day 10. Red, highly upregulatedgenes (such as those for the granzymes GZM A and B); pink, genes with moderately increased expression (GZM K, CXCL10, CCL4 S100, and other inflammatorymarkers); green, downregulated genes. A full list of rat gene transcripts elevated in rats infected with wild-type relative to mutant parasites is shown in Table S2.(B and C) Flow cytometric analysis of NK cells (CD161A) and CD3� T and CD8� T cells from spleens of animals infected with wild-type (Wt) or �msp7 mutantparasites at day 8 (D8) and day 10 (D10) p.i. (D) Immunohistochemical staining of CD8� T cells in the spleens of uninfected and wild-type- or �msp7parasite-infected rats at day 8 or 10 p.i. The CD8� T cell density was significantly higher in infected than in uninfected animals (although very low levels of CD8�
T cells are seen in uninfected spleens [see the yellow circle in panel D1, which is magnified further in Fig. S2C]). Quantitative analysis (results are shown inFig. S2D) confirmed that wild-type infection resulted in higher numbers of CD8� T cells than �msp7 mutant infection. In addition, in wild-type-parasiteinfections, CD8� T cells were more highly concentrated in the white pulp (WP) or marginal zone (MZ) on day 8 and in the red pulp (RP) on day 10. PALS,periarteriolar lymphoid sheath. Original magnifications, �100 (D1 to -6), �400 (D7 to -9).
Safeukui et al.
4 ® mbio.asm.org January/February 2015 Volume 6 Issue 1 e02493-14
m
bio.asm.org
on February 3, 2015 - P
ublished by m
bio.asm.org
Dow
nloaded from
because it is a form of the receptor released after activation (17,18). sCD8 has been reported to be derived from CD4� T cells incertain circumstances of viral infection, autoimmunity, and trans-plantation (19). However, in our model, the CD4� T cell responseis not altered between wild-type and msp7 mutant infections(Fig. S2) and CD4� T cell numbers were not reduced when ratswere perfused with anti-CD8� that immunodepleted CD8� Tcells (Fig. 3 and S5A), suggesting that the CD4� CD8� T cellsubpopulation is not induced in malarial infection. Indeed, we
find that plasma sCD8 levels strongly and positively correlatedwith CD8� T cell number (Fig. 4C) (Spearman r � 0.9, P �0.0001) and parasite load (Fig. 4D) (Spearman r � 0.8, P � 0.20).
Activated CD8� T cells are known to directly kill intracellularpathogens (20–22). This requires antigen presentation by the ma-jor histocompatibility complex (MHC) class I, which we detectedon both uninfected and infected reticulocytes as well as white cells(Fig. 4E). We further detected specific production of gamma in-terferon (IFN-�) by CD8� T cells stimulated with infected reticu-
FIG 3 Effect of CD8� T cell depletion on parasitemia, the reticulocyte response, and anemia. (A) Experimental timeline of immunodepletion of CD8� T cells,time of antibody and parasite injection, and sampling of immune cells and other indicated parameters over 28 days (see also Materials and Methods). (B) Flowcytometry analysis at day 0, confirmed depletion of peripheral CD8� T cells in animals treated with anti-CD8� (left side) compared to isotype control Ab (rightside). PBMCs were also stained for CD4, CD3, and B (CD45RA) markers and analyzed by flow cytometry. (C) Depletion of CD8� T cells showed no effect on therise of parasitemia, but on day 12, when parasites were eliminated in isotype controls (filled squares), they remained at peak values in depleted animals (filledcircles). (D) Dynamics of peripheral CD8� T cells (expressed as a fraction of total CD3� T cells) in animals treated with anti-rat CD8� (filled circles) or isotypecontrol antibodies (filled squares), as well as in untreated (filled triangles) animals. Infected animals have higher levels of CD8� T cells than uninfected animals.However, after anti-CD8� treatment, CD8� T cell levels remained undetectable for 5 days in infected animals. From days 5 to 18, they rose and reached statelevels. (E) Distribution of CD8� T cells (stained brown) in the spleens of isotype control and immunodepleted animals on day 10 as detected by IHC analysis. (F)Quantification of CD8� T cells in panel E. (G) Parasite loads in the spleens (detected by qPCR) of immunodepleted animals are higher than in isotype controlson day 10. Norm. Quant, normal quantity. (H) Induction of anemia (unbroken lines) as measured by the percent hemoglobin reduction (left-side y axis) inanimals treated with anti-rat CD8� (filled circles) and isotype control antibodies (filled squares), as well as in untreated (filled triangles) animals. Associatedperipheral parasitemias (right-side y axis) and their clearance are shown with dashed lines. (I) The reticulocyte response was increased in animals treated withanti-CD8� Ab (filled circles) compared to that in animals treated with the isotype control (filled squares). Mean values and standard deviations are shown inpanels C, D, H, and I. The data are representative of one experiment of three independent experiments that contained 5 to 6 animals in each treatment group. Forthe mean comparisons, one-way ANOVA with a Tukey post hoc analysis (F) and Student’s t test (G) were used.
CD8 Parasite Control in Severe Malarial Anemia
January/February 2015 Volume 6 Issue 1 e02493-14 ® mbio.asm.org 5
m
bio.asm.org
on February 3, 2015 - P
ublished by m
bio.asm.org
Dow
nloaded from
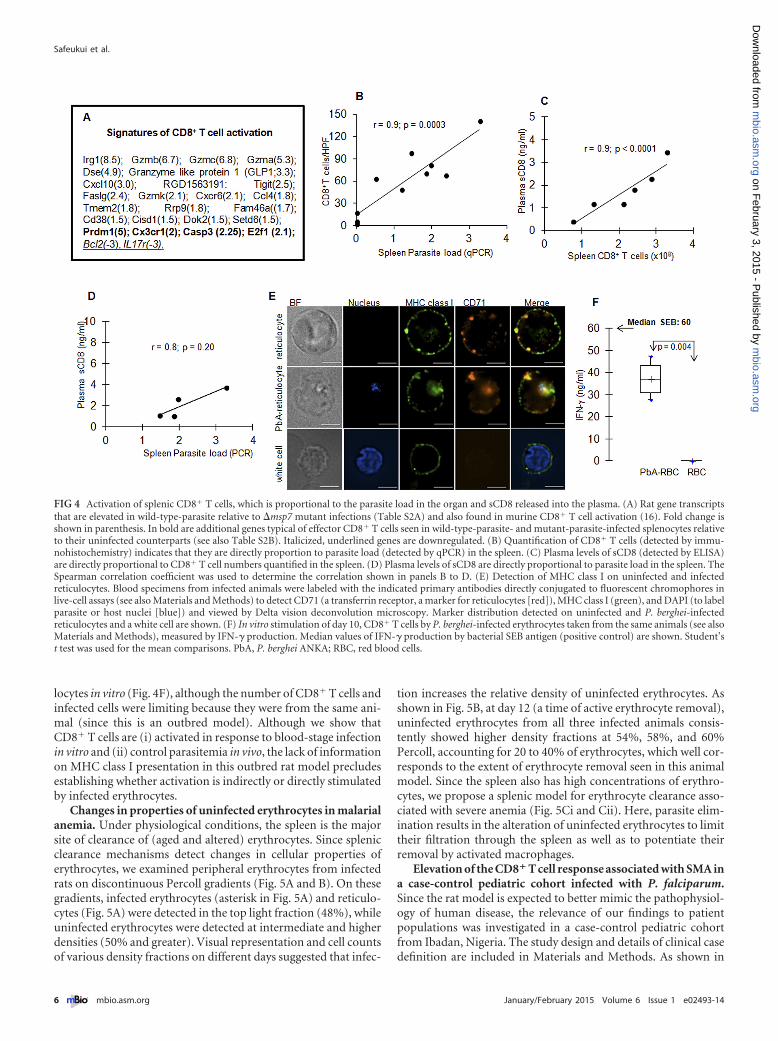
locytes in vitro (Fig. 4F), although the number of CD8� T cells andinfected cells were limiting because they were from the same ani-mal (since this is an outbred model). Although we show thatCD8� T cells are (i) activated in response to blood-stage infectionin vitro and (ii) control parasitemia in vivo, the lack of informationon MHC class I presentation in this outbred rat model precludesestablishing whether activation is indirectly or directly stimulatedby infected erythrocytes.
Changes in properties of uninfected erythrocytes in malarialanemia. Under physiological conditions, the spleen is the majorsite of clearance of (aged and altered) erythrocytes. Since splenicclearance mechanisms detect changes in cellular properties oferythrocytes, we examined peripheral erythrocytes from infectedrats on discontinuous Percoll gradients (Fig. 5A and B). On thesegradients, infected erythrocytes (asterisk in Fig. 5A) and reticulo-cytes (Fig. 5A) were detected in the top light fraction (48%), whileuninfected erythrocytes were detected at intermediate and higherdensities (50% and greater). Visual representation and cell countsof various density fractions on different days suggested that infec-
tion increases the relative density of uninfected erythrocytes. Asshown in Fig. 5B, at day 12 (a time of active erythrocyte removal),uninfected erythrocytes from all three infected animals consis-tently showed higher density fractions at 54%, 58%, and 60%Percoll, accounting for 20 to 40% of erythrocytes, which well cor-responds to the extent of erythrocyte removal seen in this animalmodel. Since the spleen also has high concentrations of erythro-cytes, we propose a splenic model for erythrocyte clearance asso-ciated with severe anemia (Fig. 5Ci and Cii). Here, parasite elim-ination results in the alteration of uninfected erythrocytes to limittheir filtration through the spleen as well as to potentiate theirremoval by activated macrophages.
Elevation of the CD8� T cell response associated with SMA ina case-control pediatric cohort infected with P. falciparum.Since the rat model is expected to better mimic the pathophysiol-ogy of human disease, the relevance of our findings to patientpopulations was investigated in a case-control pediatric cohortfrom Ibadan, Nigeria. The study design and details of clinical casedefinition are included in Materials and Methods. As shown in
FIG 4 Activation of splenic CD8� T cells, which is proportional to the parasite load in the organ and sCD8 released into the plasma. (A) Rat gene transcriptsthat are elevated in wild-type-parasite relative to �msp7 mutant infections (Table S2A) and also found in murine CD8� T cell activation (16). Fold change isshown in parenthesis. In bold are additional genes typical of effector CD8� T cells seen in wild-type-parasite- and mutant-parasite-infected splenocytes relativeto their uninfected counterparts (see also Table S2B). Italicized, underlined genes are downregulated. (B) Quantification of CD8� T cells (detected by immu-nohistochemistry) indicates that they are directly proportion to parasite load (detected by qPCR) in the spleen. (C) Plasma levels of sCD8 (detected by ELISA)are directly proportional to CD8� T cell numbers quantified in the spleen. (D) Plasma levels of sCD8 are directly proportional to parasite load in the spleen. TheSpearman correlation coefficient was used to determine the correlation shown in panels B to D. (E) Detection of MHC class I on uninfected and infectedreticulocytes. Blood specimens from infected animals were labeled with the indicated primary antibodies directly conjugated to fluorescent chromophores inlive-cell assays (see also Materials and Methods) to detect CD71 (a transferrin receptor, a marker for reticulocytes [red]), MHC class I (green), and DAPI (to labelparasite or host nuclei [blue]) and viewed by Delta vision deconvolution microscopy. Marker distribution detected on uninfected and P. berghei-infectedreticulocytes and a white cell are shown. (F) In vitro stimulation of day 10, CD8� T cells by P. berghei-infected erythrocytes taken from the same animals (see alsoMaterials and Methods), measured by IFN-� production. Median values of IFN-� production by bacterial SEB antigen (positive control) are shown. Student’st test was used for the mean comparisons. PbA, P. berghei ANKA; RBC, red blood cells.
Safeukui et al.
6 ® mbio.asm.org January/February 2015 Volume 6 Issue 1 e02493-14
m
bio.asm.org
on February 3, 2015 - P
ublished by m
bio.asm.org
Dow
nloaded from
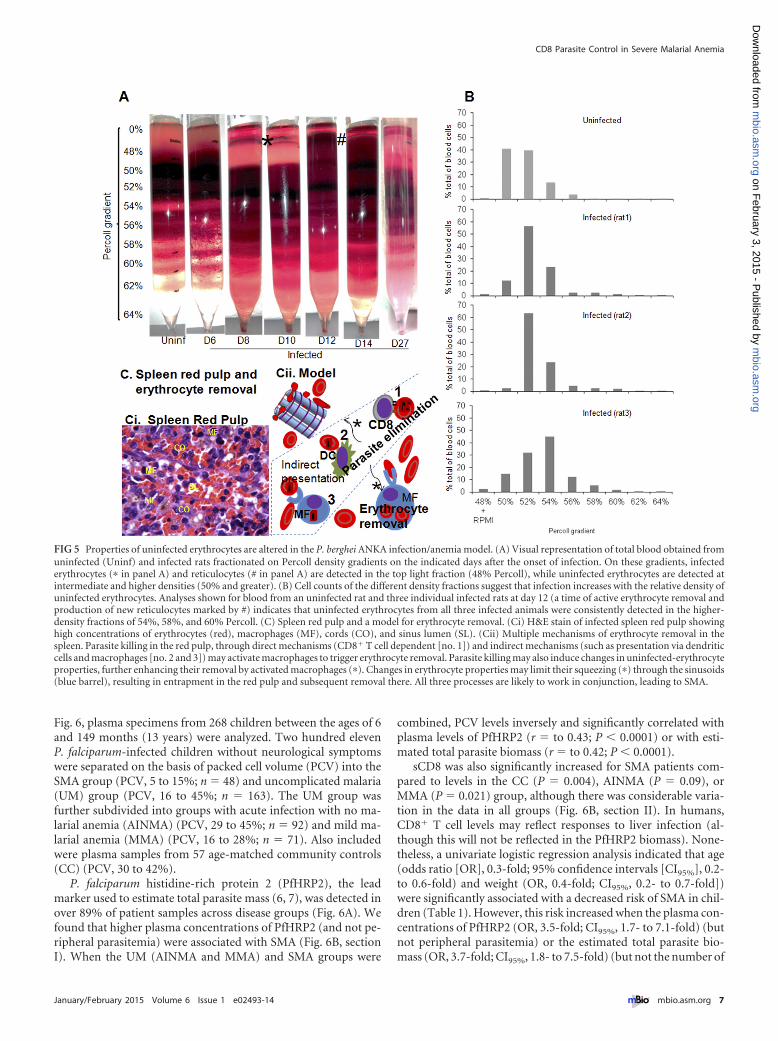
Fig. 6, plasma specimens from 268 children between the ages of 6and 149 months (13 years) were analyzed. Two hundred elevenP. falciparum-infected children without neurological symptomswere separated on the basis of packed cell volume (PCV) into theSMA group (PCV, 5 to 15%; n � 48) and uncomplicated malaria(UM) group (PCV, 16 to 45%; n � 163). The UM group wasfurther subdivided into groups with acute infection with no ma-larial anemia (AINMA) (PCV, 29 to 45%; n � 92) and mild ma-larial anemia (MMA) (PCV, 16 to 28%; n � 71). Also includedwere plasma samples from 57 age-matched community controls(CC) (PCV, 30 to 42%).
P. falciparum histidine-rich protein 2 (PfHRP2), the leadmarker used to estimate total parasite mass (6, 7), was detected inover 89% of patient samples across disease groups (Fig. 6A). Wefound that higher plasma concentrations of PfHRP2 (and not pe-ripheral parasitemia) were associated with SMA (Fig. 6B, sectionI). When the UM (AINMA and MMA) and SMA groups were
combined, PCV levels inversely and significantly correlated withplasma levels of PfHRP2 (r � to 0.43; P � 0.0001) or with esti-mated total parasite biomass (r � to 0.42; P � 0.0001).
sCD8 was also significantly increased for SMA patients com-pared to levels in the CC (P � 0.004), AINMA (P � 0.09), orMMA (P � 0.021) group, although there was considerable varia-tion in the data in all groups (Fig. 6B, section II). In humans,CD8� T cell levels may reflect responses to liver infection (al-though this will not be reflected in the PfHRP2 biomass). None-theless, a univariate logistic regression analysis indicated that age(odds ratio [OR], 0.3-fold; 95% confidence intervals [CI95%], 0.2-to 0.6-fold) and weight (OR, 0.4-fold; CI95%, 0.2- to 0.7-fold])were significantly associated with a decreased risk of SMA in chil-dren (Table 1). However, this risk increased when the plasma con-centrations of PfHRP2 (OR, 3.5-fold; CI95%, 1.7- to 7.1-fold) (butnot peripheral parasitemia) or the estimated total parasite bio-mass (OR, 3.7-fold; CI95%, 1.8- to 7.5-fold) (but not the number of
FIG 5 Properties of uninfected erythrocytes are altered in the P. berghei ANKA infection/anemia model. (A) Visual representation of total blood obtained fromuninfected (Uninf) and infected rats fractionated on Percoll density gradients on the indicated days after the onset of infection. On these gradients, infectederythrocytes (� in panel A) and reticulocytes (# in panel A) are detected in the top light fraction (48% Percoll), while uninfected erythrocytes are detected atintermediate and higher densities (50% and greater). (B) Cell counts of the different density fractions suggest that infection increases with the relative density ofuninfected erythrocytes. Analyses shown for blood from an uninfected rat and three individual infected rats at day 12 (a time of active erythrocyte removal andproduction of new reticulocytes marked by #) indicates that uninfected erythrocytes from all three infected animals were consistently detected in the higher-density fractions of 54%, 58%, and 60% Percoll. (C) Spleen red pulp and a model for erythrocyte removal. (Ci) H&E stain of infected spleen red pulp showinghigh concentrations of erythrocytes (red), macrophages (MF), cords (CO), and sinus lumen (SL). (Cii) Multiple mechanisms of erythrocyte removal in thespleen. Parasite killing in the red pulp, through direct mechanisms (CD8� T cell dependent [no. 1]) and indirect mechanisms (such as presentation via dendriticcells and macrophages [no. 2 and 3]) may activate macrophages to trigger erythrocyte removal. Parasite killing may also induce changes in uninfected-erythrocyteproperties, further enhancing their removal by activated macrophages (�). Changes in erythrocyte properties may limit their squeezing (�) through the sinusoids(blue barrel), resulting in entrapment in the red pulp and subsequent removal there. All three processes are likely to work in conjunction, leading to SMA.
CD8 Parasite Control in Severe Malarial Anemia
January/February 2015 Volume 6 Issue 1 e02493-14 ® mbio.asm.org 7
m
bio.asm.org
on February 3, 2015 - P
ublished by m
bio.asm.org
Dow
nloaded from
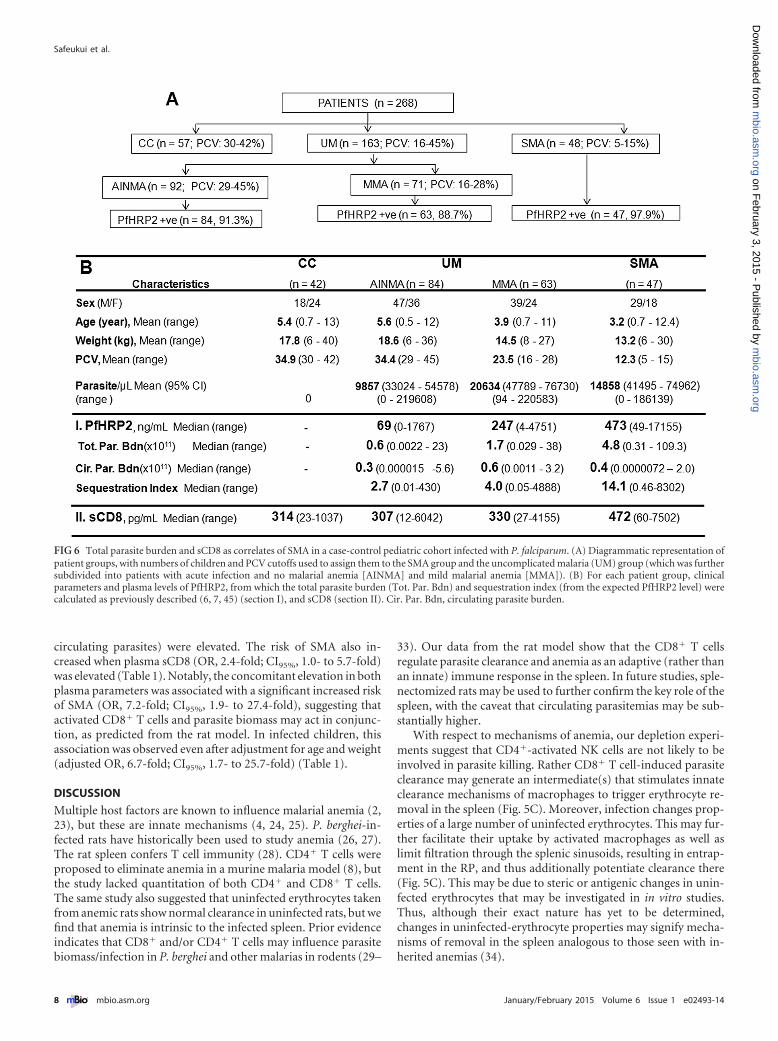
circulating parasites) were elevated. The risk of SMA also in-creased when plasma sCD8 (OR, 2.4-fold; CI95%, 1.0- to 5.7-fold)was elevated (Table 1). Notably, the concomitant elevation in bothplasma parameters was associated with a significant increased riskof SMA (OR, 7.2-fold; CI95%, 1.9- to 27.4-fold), suggesting thatactivated CD8� T cells and parasite biomass may act in conjunc-tion, as predicted from the rat model. In infected children, thisassociation was observed even after adjustment for age and weight(adjusted OR, 6.7-fold; CI95%, 1.7- to 25.7-fold) (Table 1).
DISCUSSION
Multiple host factors are known to influence malarial anemia (2,23), but these are innate mechanisms (4, 24, 25). P. berghei-in-fected rats have historically been used to study anemia (26, 27).The rat spleen confers T cell immunity (28). CD4� T cells wereproposed to eliminate anemia in a murine malaria model (8), butthe study lacked quantitation of both CD4� and CD8� T cells.The same study also suggested that uninfected erythrocytes takenfrom anemic rats show normal clearance in uninfected rats, but wefind that anemia is intrinsic to the infected spleen. Prior evidenceindicates that CD8� and/or CD4� T cells may influence parasitebiomass/infection in P. berghei and other malarias in rodents (29–
33). Our data from the rat model show that the CD8� T cellsregulate parasite clearance and anemia as an adaptive (rather thanan innate) immune response in the spleen. In future studies, sple-nectomized rats may be used to further confirm the key role of thespleen, with the caveat that circulating parasitemias may be sub-stantially higher.
With respect to mechanisms of anemia, our depletion experi-ments suggest that CD4�-activated NK cells are not likely to beinvolved in parasite killing. Rather CD8� T cell-induced parasiteclearance may generate an intermediate(s) that stimulates innateclearance mechanisms of macrophages to trigger erythrocyte re-moval in the spleen (Fig. 5C). Moreover, infection changes prop-erties of a large number of uninfected erythrocytes. This may fur-ther facilitate their uptake by activated macrophages as well aslimit filtration through the splenic sinusoids, resulting in entrap-ment in the RP, and thus additionally potentiate clearance there(Fig. 5C). This may be due to steric or antigenic changes in unin-fected erythrocytes that may be investigated in in vitro studies.Thus, although their exact nature has yet to be determined,changes in uninfected-erythrocyte properties may signify mecha-nisms of removal in the spleen analogous to those seen with in-herited anemias (34).
FIG 6 Total parasite burden and sCD8 as correlates of SMA in a case-control pediatric cohort infected with P. falciparum. (A) Diagrammatic representation ofpatient groups, with numbers of children and PCV cutoffs used to assign them to the SMA group and the uncomplicated malaria (UM) group (which was furthersubdivided into patients with acute infection and no malarial anemia [AINMA] and mild malarial anemia [MMA]). (B) For each patient group, clinicalparameters and plasma levels of PfHRP2, from which the total parasite burden (Tot. Par. Bdn) and sequestration index (from the expected PfHRP2 level) werecalculated as previously described (6, 7, 45) (section I), and sCD8 (section II). Cir. Par. Bdn, circulating parasite burden.
Safeukui et al.
8 ® mbio.asm.org January/February 2015 Volume 6 Issue 1 e02493-14
m
bio.asm.org
on February 3, 2015 - P
ublished by m
bio.asm.org
Dow
nloaded from

Upon parasite clearance in humans, CD8� T cell responses areclearly directly elicited by liver-stage infection (20, 21, 35, 36).Activation by blood-stage infection has also been suggested (36,37). In our studies, the infections bypass the liver stage. Priorstudies suggest that murine CD8� T cells recognize blood-stagerodent malaria parasites (22, 38). Dendritic cells may contributeand be present in preparations of CD8� T cells (but in our studies,immunodepletion of animals with anti-CD8� did not depleteCD8� dendritic cells). There may be additional mechanisms ofactivation, such as exosomes derived from infected reticulocytes(39). We find that the increase in CD8� T cells is directly propor-tional to parasite biomass in the spleen. We find sCD8 to be astrong surrogate for CD8� T cells. Since the plasma volumes re-quired are small, dual assessment of sCD8 and PfHRP2 parasiteburden may be readily expanded to larger clinical studies for iden-tification of patients at greatest risk for SMA.
In malaria, anemia requires persistent parasite clearance, likelyongoing in semi-immune parasitemic individuals. Our workshows that in pediatric patients, the CD8� host response can in-dependently increase the risk of SMA. Moreover, the host re-sponse and parasite burden can be synergized in severe-disease
predictions. It will be important to engineer a highly protectiveCD8� T cell response in the presence of minimal parasite loads toreduce the risk of anemia, which has been frequently associatedwith the challenge phase of testing malaria vaccines (40–42).
MATERIALS AND METHODSWistar rat model of P. berghei infection and anemia. BALB/c mice werefirst injected intraperitoneally (i.p.) with thawed stabilates of blood-stageP. berghei ANKA. Subsequently, live parasites isolated from mice wereused to infect aged Wistar rats. Fifteen-week-old rats were injected i.p.with 106 wild-type or �msp7 mutant parasites (10). Parasitemia, hemo-globin, and other blood parameters were monitored every 2 days. Parasitelevels were monitored by performing Giemsa staining of thin blood filmor qPCR, and hemoglobin (Hb) levels were determined by the method ofDrabkins (as noted in reference 10).
Microarray experiments and data analysis. Spleens from 2 wild-type-parasite-infected, 2 �msp7 mutant-infected, and 2 uninfected rats (15weeks of age) were surgically harvested, kept in RNAlater, and stored at�20°C until used. RNA was isolated using a Roche MagNA Pure compactautomated system, and labeling was done using a MessageAmp PremierRNA amplification kit (Invitrogen). Affymetrix rat 430 2.0 array hybrid-izations were performed by the UCLA Clinical Microarray Core, UCLA,Los Angeles, CA, according to the standard Affymetrix GeneChip expres-sion analysis protocol. RNA from each animal was profiled individually.Thresholds for selecting significant genes were set at a relative differenceof �1.5-fold, an absolute difference of �100 signal intensity units, and a Pof �0.05. Genes that met all three criteria were considered significantlychanged.
General histopathology and analysis. Spleen, liver, lung, brain, andkidney were harvested from rats not infected or infected with wild-type or�msp7 parasites. Harvested organs were cut into smaller portions andplaced into fixative (10% neutral buffered formalin) for at least 48 h atroom temperature. Samples were then processed and paraffin embeddedat AML Laboratories Inc. (Baltimore, MD), and thin sections (3 to 4 �m)were produced with a microtome and stained with hematoxylin and eosin(H&E).
Immunohistochemistry and imaging. Mouse monoclonal antibodies(MAbs) utilized were anti-rat (i) CD8� (clone OX-8, catalog no.MCA48G), (ii) CD4 (clone W3/25, no. MCA55R), (iii) CD68 (clone ED1,no. MCA341R; AbD Serotec, Oxford, United Kingdom), and (iv) OX 62for dendritic cells (DC) (clone OX-62, no. MCA1029GA; AbD Serotec,Oxford, United Kingdom; also referred to as anti-DC). Formalin paraffin-embedded spleen or liver sections (3 to 4 �m) were dewaxed in xylene. Forsamples probed by MAbs anti-CD4, anti-CD68, and anti-DC, antigenretrieval required preincubation of deparaffinized samples with 0.05%proteinase K (Dako, Hamburg, Germany; no. S3004) in 0.05 mol/literTris-HCl (pH, 7.5) for 8 min at room temperature (RT). After beingwashed, sections were immersed in 3% H2O2 in phosphate-buffered sa-line (PBS) for 20 min at RT to block endogenous peroxidase. After anadditional wash, the sections were treated with 5% horse serum for30 min, followed by successive incubation in avidin and biotin (no. SP-2001 avidin/biotin blocking kit; Vector Laboratories) to block endoge-nous biotin. Anti-CD8� (dilution, 1/100), anti-CD4 (dilution, 1/100),anti-CD68 (dilution, 1/500), or anti-DC (dilution, 1/100) was applied tothe sections in PBS with 1% horse serum and kept overnight at 4°C (forMAbs anti-CD8, anti-CD4, and anti-DC) or for 60 min at RT (for MAbanti-CD68). Affinity-purified, biotinylated, and rat absorbed horse anti-mouse IgG (no. BA-2001) and the Vectastain ABC Elite system for perox-idase (no. PK 6102) were from Vector Laboratories (Burlingame, VT,USA). The Ab was used to detect anti-CD8�, anti-CD4, anti-CD68, oranti-DC in all samples. Reagents were prepared according to the manu-facturers’ recommendations. The peroxidase complexes were revealed byincubation with 3,3=-diaminobenzidine-tetra-hydrochloride (DAB; sub-strate no. SK-4100; Vector Laboratories) or Vector NoraRED (no. SK-4800; Vector Laboratories), and the sections were lightly counterstained
TABLE 1 sCD8 is a risk factor for SMA and shows synergy withPfHRP2 for development of a dual, preferred, predictive index of SMAa
Characteristic OR CI95% (fold) P value
SexMale 1Female 0.9 0.5–1.8 0.79
Age (yr)Lower 1Higher 0.3 0.2–0.6 0.001
Weight (kg)Lower 1Higher 0.4 0.2–0.7 0.003
Parasitemia (%)Lower 1Higher 1.4 0.7–2.8 0.29
Plasma PfHRP2 (ng/ml)Lower 1Higher 3.5 1.7–7.1 0.0005
Plasma sCD8 (�g/ml)Lower 1Higher 2.4 1.0–5.7 0.04
Circulating parasite biomassLower 1Higher 0.8 0.4–1.6 0.58
Total parasite biomassLower 1Higher 3.7 1.8–7.5 0.0004
Plasma samples with CD8-PfHPR2Lower-lower 1Higher-lower 2.2 0.5–9.3 0.30Lower-higher 2.8 0.6–12.1 0.17Higher-higher 7.2 1/9/27.4 0.004
Multivariate logistic regressionPlasma samples with CD8-PfHPR2
Lower-lower 1Higher-lower 2.1b 0.5–8.9 0.33Lower-higher 2.6b 0.6–11.4 0.20Higher-higher 6.7b 1/7/25.7 0.006
a Univariate logistical-regression analysis was undertaken to determine the odds ratio(OR) associated with the risk of SMA for age, weight, PfHRP2 level, estimated totalparasite biomass, circulating parasites in the blood, and plasma sCD8.b Adjusted values were used for age and weight.
CD8 Parasite Control in Severe Malarial Anemia
January/February 2015 Volume 6 Issue 1 e02493-14 ® mbio.asm.org 9
m
bio.asm.org
on February 3, 2015 - P
ublished by m
bio.asm.org
Dow
nloaded from
with Mayer’s hemalum. The slides were then mounted in Cytoseal XYL(no. 8312-4; Thermo Scientific, Kalamazoo, MI, USA). Incubations fornegative controls were carried out with sections incubated with normalmouse IgG1 (no. MCA1209; AbD Serotec, Oxford, United Kingdom) orin the absence of the primary antibody.
For each spleen slide, images were collected within the follicle (whitepulp [WP]) and the adjacent marginal zone (MZ; marginal sinus in-cluded) and red pulp (RP). Follicles with a clear differentiation betweenthe white pulp, the adjacent MZ, and the RP were selected for imaging.The collection of the images was done at a magnification of �1,000 (high-power fields [HPF]). The images of all areas of the follicle and the adjacentMZ were collected, while at least 10 randomly selected fields in the adja-cent RP around the follicle were collected. Pictures were acquired on aNikon Olympus microscope using a Nikon digital DS-Fi1-U2 cameracontrolled by NIS-Elements F3.0 Nikon software (all from Nikon Instru-ments Inc., Tokyo, Japan). Images were visualized with a DPIan Apo40�/1.00 oil immersion or a DPIan Apo 100�/1.30 oil immersion objec-tive lens (Nikon). For each sample, positive cells were counted and local-ized on at least two follicles with the adjacent MZ and RP.
For each liver slide, images were collected within the entire tissuesample at a magnification of �1,000. For each type of cellular stain (CD8�
T cells, CD4� T cells, CD68� cells, or DC), more than 600 photographswere analyzed. The densities of CD8� T cells, CD4� T cells, CD68� cells,or DC were estimated as the number of positive cells per HPF.
Live-cell immunofluorescence assay. Fluorescein isothiocyanate(FITC) mouse monoclonal anti-rat RT1A (clone OX-18, catalog no.554919; BD Biosciences, USA) was used to detect MHC class I. Phyco-erythrin (PE) mouse anti-rat CD71 (clone OX-26, no. 554891) was usedto detect rat CD71. Fresh blood was collected, washed with PBS (pH �7.4), and then incubated with anti-RT1A and anti-CD71 (4 �g/ml) di-luted in PBS-bovine serum albumin (BSA; 2%) for 30 min on ice underslight agitation. After five washes with PBS, cell nuclei were stained with4=,6-diamidino-2-phenylindole (DAPI) for 5 min. Cells were then washedwith PBS and fixed with PBS-formaldehyde (1%). Slides were mountedwith Vectashield medium (Vector Laboratories, Burlingame, CA) for im-aging. Images were visualized with a 100� oil immersion objective lensand captured using an inverted Olympus IX fluorescence microscope anda CoolSnap HQ2 charge-coupled-device (CH350/LCCD) camera con-trolled by DeltaVision software (Applied Precision, Seattle, WA).
Percoll density gradients. Discontinuous Percoll density gradients(Sigma-Aldrich, St. Louis, MO, USA) consisting of 1.5-ml fractions, withdensities ranging from 48 to 64% Percoll in RPMI medium, were assem-bled as indicated in Fig. 5A. Peripheral blood was collected from unin-fected and infected animals, washed three times, and diluted in RPMImedium (hematocrit � 80%). From this suspension, 1 ml was layered onthe Percoll gradient and separated by centrifugation at 3,000 rpm for40 min at 19°C. Fractions were collected by careful pipetting. The numberof cells per fraction was counted using a Malassez chamber.
RNA extraction. For each spleen sample, three sections (5 �m each)separated by 50 �m were collected and pooled for RNA extraction. TotalRNA was extracted with an RNeasy FFPE kit (reference no. 73504; Qia-gen) according to the manufacturer’s instructions. RNA extracts werequantified using a NanoDrop ND-1000 (NanoDrop Technologies, Wil-mington, DE, USA). The integrity of the RNA was controlled with an RNAnano chip (2100 Bioanalyzer; Agilent Biotechnologies, Wilmington, DE).Samples were immediately stored at �20°C.
Quantitative real-time PCR. Primers were designed from the P. ber-ghei Anka 18S rRNA gene (GenBank accession no. AJ243513.1) and therat GAPDH (glyceraldehyde-3-phosphate dehydrogenase) gene (Gen-Bank accession no. NM_017008). The sequence of the specific primers forP. berghei 18S RNA and rat GAPDH were 18S RNA forward (5= AATCTTGAACGAGGAATGCCTAGT 3=), 18S RNA reverse (5= ACGGGCGGTGTGTACAAAG 3=), GAPDH forward (5= TGGCCTCCAAGGAGTAAGAAAC 3=), and GAPDH reverse (5=GGCCTCTCTCTTGCTCTCAGTATC 3=). Amplification of the GAPDH sequence served as the internal
control for normalization. qPCR was performed using the 7900 HT Fastreal-time PCR system (Applied Biosystems) with a 20-�l reaction volumeand the Power SYBR Green RNA-to-CT one-step kit (catalog referenceno. 4389986; Applied Biosystems). Serial dilutions of the cDNA (1:1, 1:10,1:100, 1:1,000, 1:10,000) with nuclease-free water (reference no. AM9935;Applied Biosystems) were used to generate a relative standard curve for18S RNA as well as GAPDH. The concentrations of target sequence in thesamples are extrapolated from the standard curve. The quantities werenormalized by dividing the quantity of the 18S RNA by the quantity of theGADPH.
Spleen lymphocyte isolation and characterization by flow cytom-etry. To isolate lymphocytes, spleens were harvested from rats infectedwith wild-type and �msp7 mutant parasites on day 8 and day 10. Totalsplenocytes were isolated, erythrocytes were lysed, and residual cells werestained for B (CD45RA), NK (CD161a), and CD3 (CD4 and CD8) cells.Subsets of cells were identified by first gating them on lymphocytes byforward and side scatter. CD3 singly positive cells were then analyzed forCD4 and CD8 expression. A suitable isotype control for each antibody wasincluded as a control, and compensation was performed wherever re-quired. Events were recorded in a Beckman Coulter FC500 flow cytometerand data analyzed with FlowJo.
In vitro stimulation of CD8� T cells with wild-type parasites. Wholeblood was separated in two parts, one for peripheral blood mononu-cleated cells (PBMCs) and CD8� T cell purification and the other part forinfected-erythrocyte purification. Erythrocytes were lysed with NH4Cl,and the cells were washed twice in fresh medium. CD8� T cells werepurified with positive selection using a magnetically activated cell sorting(MACS) cell separation system (Miltenyi Biotech, USA) according to themanufacturer’s protocols. The purity of CD8� T was 95%. Infected eryth-rocytes were obtained as described previously (43).
For the in vitro stimulation assay, 106 purified CD8� T cells werestimulated with 105 purified infected erythrocytes (with ~40% infectedreticulocytes) suspended in 200 �l incubation medium (RPMI 1640 plusL-glutamine plus neomycin plus 30% fetal bovine serum) for 72 to 82 h,and the levels of IFN-� in the supernatant were determined by a sandwichenzyme-linked immunosorbent assay (ELISA). Uninfected erythrocytesand staphylococcal enterotoxin B antigen (SEB; 5 �g/ml; Sigma) wereused as negative and positive controls, respectively.
Animal procedures. Animal protocols were reviewed and approvedby the institutional animal care and use committees of Northwestern Uni-versity (protocol no. 2006-0935) and the University of Notre Dame (pro-tocol no. 11-070).
Ethics statement. Parents or guardians of study participants gave in-formed written consent. The research was approved by the internationallyaccredited joint ethics committees of the College of Medicine of the Uni-versity of Ibadan and the University College Hospital, Ibadan, Nigeria. Allprocedures with human subjects were approved by the Institutional Re-view Board of the University of Notre Dame.
Patient study design and sample collection. All study participants ofthis case-control study were recruited during 2009 to 2012. Children withmalaria were recruited by the Childhood Malaria Research Group(CMRG) at the University College Hospital (UCH), Ibadan, Nigeria.Community control (CC) children (malaria negative) were recruitedfrom local vaccination clinics and school visits from multiple districts ofIbadan.
The children were from 6 months to 13 years old. They were screenedfor parasite detection by microscopy following Giemsa staining of thickand thin blood films as performed routinely at the UCH. Clinical defini-tions used were as indicated by the WHO criteria for severe P. falciparummalaria (44). All infected children were positive for P. falciparum. Un-complicated malaria (UM) cases were additionally defined as febrile witha PCV (packed cell volume) of �20% (not requiring hospital admission).Severe malarial anemia (SMA) cases showed PCVs of �16%. CC childrenappeared healthy, without any disease symptoms. They were P. falciparumnegative in both thick and thin Giemsa smears and selected for age and sex
Safeukui et al.
10 ® mbio.asm.org January/February 2015 Volume 6 Issue 1 e02493-14
m
bio.asm.org
on February 3, 2015 - P
ublished by m
bio.asm.org
Dow
nloaded from
match with the patient group. The clinical data were compiled for eachpatient; blood samples were collected in an EDTA tube, and the plasmawas separated (1,000 � g, 10 min), aliquoted, and frozen at �80°C untilused.
Quantitative analyses of PfHRP2, parasite biomass, the sequestra-tion index, and sCD8. The quantification of P. falciparum histidine-richprotein 2 (PfHRP2) in the plasma of malaria patients was carried out bysandwich ELISA essentially as previously described (6). Briefly, the mousemonoclonal Ab anti-P. falciparum HRP2 IgM (MPFM-55A; ImmunologyConsultants Laboratory Inc., USA) and horseradish peroxidase (HRP)-conjugated anti-P. falciparum IgG (MPFG-55P; Immunology Consul-tants Laboratory Inc., USA) were used for plate coating and for detection,respectively. The detection limit of the assay was 31.25 pg/ml. Positivecases were defined as those in which duplicate derived concentrationswere greater than the detection limit. Each ELISA plate contained samplesfrom UM patients and from age-matched SMA patients.
Circulating and whole-body parasite biomasses were calculated usingthe previously reported formulas (6, 7). Total parasite biomass was calcu-lated only from individuals with detectable PfHRP2 in the plasma. Thesequestration index was calculated as the total parasite burden divided bythe circulating burden (45).
Plasma sCD8 ELISA. Plasma quantification of sCD8 was done by asandwich ELISA using the mouse monoclonal antibody anti-humanCD8� (clone D-9, sc-7970; Santa Cruz Biotechnology, Inc.), which rec-ognizes both human and rat sCD8, as the primary antibody and the rabbitpolyclonal antibody anti-human CD8� (clone H-160, sc-7188; SantaCruz Biotechnology, Inc.) as the secondary antibody; these were detectedby the HRP-conjugated goat polyclonal Ab anti-rabbit IgG (H�L) (PI-1000; Vector Laboratories). Each ELISA plate contained samples from CCpatients and from age-matched UM and SMA patients.
Statistical analysis. The Wilcoxon signed-rank test for matched pairswas used to compare continuous outcomes at different time points. TheMann-Whitney U test, Student’s t test, Kruskal-Wallis test, or one-wayanalysis of variance (ANOVA) with a Tukey or Bonferroni post hoc anal-ysis was used to compare continuous outcomes of different groups at thesame time point. The correlation between different continuous measureswas determined using the Spearman correlation coefficient.
SMA risk factors were evaluated using univariate and multivariatelogistic-regression models. The binary outcome (yes/no) was a dependentvariable. Eight independent variables were studied: sex, age, body weight,peripheral parasitemia, plasma concentrations of PfHRP2 and sCD8, andthe estimated circulating and total parasite biomasses. Apart from sex, allindependent variables were coded as binary (high or low according to themedian). Since in the rat model we show that concomitant increases ofparasite clearance and CD8� T cell number predict anemia, we definedanother independent variable, which is the combination of plasma con-centrations of PfHRP2 and sCD8. This last variable has 4 classes accordingto the median (low and high for plasma concentrations of both sCD8 andPfHRP2, low plasma concentrations of sCD8 and high concentrations ofPfHRP2, and high plasma concentrations of sCD8 and low concentrationsof PfHRP2). The effects of independent variables for the risk of developingSMA were evaluated using unconditional univariate regression analysis.The factors significant at a level of 0.05 in the univariate analysis were thenincluded in a multivariate logistic model. All statistical analyses were per-formed with SPSS statistical software (PASW statistic version 18). AllP values were two sided, and those �0.05 were considered significant.
SUPPLEMENTAL MATERIALSupplemental material for this article may be found at http://mbio.asm.org/lookup/suppl/doi:10.1128/mBio.02493-14/-/DCSupplemental.
Figure S1, PDF file, 0.3 MB.Figure S2, GIF file, 0.5 MB.Figure S3, GIF file, 0.9 MB.Figure S4, PDF file, 0.5 MB.Figure S5, PDF file, 0.2 MB.Figure S6, PDF file, 0.02 MB.
Table S1, PDF file, 0.01 MB.Table S2A, XLS file, 0.1 MB.Table S2B, XLS file, 0.03 MB.Table S3, PDF file, 0.03 MB.
ACKNOWLEDGMENTS
We thank Souvik Bhattacharjee for recombinant HRP2 and Trupti Pan-dharkar for comparative analysis of rat and murine genes and bioinfor-matic analyses.
This work was supported by the NIH (grants P01 HL078826 to K.H.,A.H., N.M., P.B., and R.T.; R0HL069630 and R01AI039071 to K.H.; andF31 HL09277 to N.D.G.) and the UK Medical Research Council (grantsU117532067 to A.H. and D.F.-R. and G0900109 to R.T.). The authorsdeclare no competing financial interests.
Innocent Safeukui, Rama Akondy, David Olaleye, Rafi Ahmed, An-thony Holder, Olugbemiro Sodeinde, James Kazura, Narla Mohandas,Delmiro Fernandez-Reyes, and Kasturi Haldar designed the research; In-nocent Safeukui, Noé D. Gomez, Aanuoluwa A. Adelani, Florence Burte,Nathaniel K. Afolabi, Rita Tewari, and Biobele J. Brown performed theresearch; Innocent Safeukui, Noé D. Gomez, Aanuoluwa A. Adelani, Flor-ence Burte, Nathaniel K. Afolabi, Rita Tewari, Rafi Ahmed, AnthonyHolder, Rita Tewari, Pierre Buffet, Biobele J. Brown, Wuraola A.Shokunbi, David Olaleye, Olugbemiro Sodeinde, James Kazura, RafiAhmed, Narla Mohandas, Delmiro Fernandez-Reyes, and Kasturi Haldaranalyzed the data and interpreted the results; Nathaniel K. Afolabi, Bio-bele J. Brown, Wuraola A. Shokunbi, David Olaleye, Olugbemiro So-deinde, and Delmiro Fernandez-Reyes recruited malaria patients and an-alyzed clinical data; Innocent Safeukui performed statistical analyses;Innocent Safeukui, Rama Akondy, Anthony Holder, Rita Tewari, PierreBuffet, Biobele J. Brown, Wuraola A. Shokunbi, David Olaleye, Olugbe-miro Sodeinde, James Kazura, Rafi Ahmed, Narla Mohandas, DelmiroFernandez-Reyes, and Kasturi Haldar wrote the paper; and PeterVelazquez, designed the research, analyzed the data, and interpreted theresults.
REFERENCES1. WHO. 2012. Malaria report 2012. WHO, Geneva, Switzerland. http://
www.who.int/malaria/publications/world_malaria_report_2012/wmr2012_summary_en.pdf.
2. Miller LH, Baruch DI, Marsh K, Doumbo OK. 2002. The pathogenicbasis of malaria. Nature 415:673– 679. http://dx.doi.org/10.1038/415673a.
3. Menendez C, Fleming AF, Alonso PL. 2000. Malaria-related anaemia.Parasitol Today 16:469 – 476. http://dx.doi.org/10.1016/S0169-4758(00)01774-9.
4. Buffet PA, Safeukui I, Deplaine G, Brousse V, Prendki V, Thellier M,Turner GD, Mercereau-Puijalon O. 2011. The pathogenesis of Plasmo-dium falciparum malaria in humans: insights from splenic physiology.Blood 117:381–392. http://dx.doi.org/10.1182/blood-2010-04-202911.
5. Hedberg K, Shaffer N, Davachi F, Hightower A, Lyamba B, Paluku KM,Nguyen-Dinh P, Breman JG. 1993. Plasmodium falciparum-associatedanemia in children at a large urban hospital in Zaire. Am J Trop Med Hyg48:365–371. http://www.ajtmh.org/content/48/3/365.long..
6. Dondorp AM, Desakorn V, Pongtavornpinyo W, Sahassananda D,Silamut K, Chotivanich K, Newton PN, Pitisuttithum P, SmithymanAM, White NJ, Day NP. 2005. Estimation of the total parasite biomass inacute falciparum malaria from plasma PfHRP2. PLoS Med 2:e204. http://dx.doi.org/10.1371/journal.pmed.0020204.
7. Hendriksen IC, Mwanga-Amumpaire J, von Seidlein L, Mtove G, WhiteLJ, Olaosebikan R, Lee SJ, Tshefu AK, Woodrow C, Amos B, Karema C,Saiwaew S, Maitland K, Gomes E, Pan-Ngum W, Gesase S, Silamut K,Reyburn H, Joseph S, Chotivanich K, Fanello CI, Day NP, White NJ,Dondorp AM. 2012. Diagnosing severe falciparum malaria in parasitae-mic African children: a prospective evaluation of plasma PfHRP2 mea-surement. PLoS Med 9:e1001297. http://dx.doi.org/10.1371/journal.pmed.1001297.
8. Evans KJ, Hansen DS, van Rooijen N, Buckingham LA, Schofield L.2006. Severe malarial anemia of low parasite burden in rodent modelsresults from accelerated clearance of uninfected erythrocytes. Blood 107:1192–1199. http://dx.doi.org/10.1182/blood-2005-08-3460.
CD8 Parasite Control in Severe Malarial Anemia
January/February 2015 Volume 6 Issue 1 e02493-14 ® mbio.asm.org 11
m
bio.asm.org
on February 3, 2015 - P
ublished by m
bio.asm.org
Dow
nloaded from
9. Lamikanra AA, Brown D, Potocnik A, Casals-Pascual C, Langhorne J,Roberts DJ. 2007. Malarial anemia: of mice and men. Blood 110:18 –28.http://dx.doi.org/10.1182/blood-2006-09-018069.
10. Gómez ND, Safeukui I, Adelani AA, Tewari R, Reddy JK, Rao S, HolderA, Buffet P, Mohandas N, Haldar K. 2011. Deletion of a malaria invasiongene reduces death and anemia, in model hosts. PLoS One 6:e25477.http://dx.doi.org/10.1371/journal.pone.0025477.
11. Thawani N, Tam M, Bellemare MJ, Bohle DS, Olivier M, de Souza JB,Stevenson MM. 2014. Plasmodium products contribute to severe malarialanemia by inhibiting erythropoietin-induced proliferation of erythroidprecursors. J Infect Dis 209:140 –149. http://dx.doi.org/10.1093/infdis/jit417.
12. Millot S, Andrieu V, Letteron P, Lyoumi S, Hurtado-Nedelec M, KarimZ, Thibaudeau O, Bennada S, Charrier JL, Lasocki S, Beaumont C.2010. Erythropoietin stimulates spleen BMP4-dependent stress erythro-poiesis and partially corrects anemia in a mouse model of generalizedinflammation. Blood 116:6072– 6081. http://dx.doi.org/10.1182/blood-2010-04-281840.
13. Chen LT. 1980. Intrasplenic microcirculation in rats with acute hemolyticanemia. Blood 56:737–740. http://www.bloodjournal.org/content/56/4/737.long..
14. Deplaine G, Safeukui I, Jeddi F, Lacoste F, Brousse V, Perrot S, BiliguiS, Guillotte M, Guitton C, Dokmak S, Aussilhou B, Sauvanet A, CazalsHatem D, Paye F, Thellier M, Mazier D, Milon G, Mohandas N,Mercereau-Puijalon O, David PH, Buffet PA. 2011. The sensing ofpoorly deformable red blood cells by the human spleen can be mimickedin vitro. Blood 117:e88 – e95. http://dx.doi.org/10.1182/blood-2010-10-312801.
15. Safeukui I, Correas JM, Brousse V, Hirt D, Deplaine G, Mulé S, LesurtelM, Goasguen N, Sauvanet A, Couvelard A, Kerneis S, Khun H, Vigan-Womas I, Ottone C, Molina TJ, Tréluyer JM, Mercereau-Puijalon O,Milon G, David PH, Buffet PA. 2008. Retention of Plasmodium falci-parum ring-infected erythrocytes in the slow, open microcirculation ofthe human spleen. Blood 112:2520 –2528. http://dx.doi.org/10.1182/blood-2008-03-146779.
16. Best JA, Blair DA, Knell J, Yang E, Mayya V, Doedens A, Dustin ML,Goldrath AW, The Immunological Genome Project Consortium. 2013.Transcriptional insights into the CD8� T cell response to infection andmemory T cell formation. Nat Immunol 14:404 – 412. http://dx.doi.org/10.1038/ni.2536.
17. Fujimoto J, Levy S, Levy R. 1983. Spontaneous release of the leu-2 (T8)molecule from human T cells. J Exp Med 158:752–766. http://jem.rupress.org/content/158/3/752.long. http://dx.doi.org/10.1084/jem.158.3.752.
18. Tomkinson BE, Brown MC, Ip SH, Carrabis S, Sullivan JL. 1989.Soluble CD8 during T cell activation. J Immunol 142:2230 –2236. http://www.jimmunol.org/content/142/7/2230.long..
19. Kenny E, Mason D, Saoudi A, Pombo A, Ramírez F. 2004. CD8 alpha isan activation marker for a subset of peripheral CD4 T cells. Eur J Immunol34:1262–1271. http://dx.doi.org/10.1002/eji.200324363.
20. Overstreet MG, Cockburn IA, Chen YC, Zavala F. 2008. Protective CD8T cells against plasmodium liver stages: immunobiology of an “unnatural”immune response. Immunol Rev 225:272–283. http://dx.doi.org/10.1111/j.1600-065X.2008.00671.x.
21. Epstein JE, Tewari K, Lyke KE, Sim BK, Billingsley PF, Laurens MB,Gunasekera A, Chakravarty S, James ER, Sedegah M, Richman A,Velmurugan S, Reyes S, Li M, Tucker K, Ahumada A, Ruben AJ, Li T,Stafford R, Eappen AG, Tamminga C, Bennett JW, Ockenhouse CF,Murphy JR, Komisar J, Thomas N, Loyevsky M, Birkett A, Plowe CV,Loucq C, Edelman R, Richie TL, Seder RA, Hoffman SL. 2011. Liveattenuated malaria vaccine designed to protect through hepatic CD8� Tcell immunity. Science 334:475– 480. http://dx.doi.org/10.1126/science.1211548.
22. Imai T, Ishida H, Suzue K, Hirai M, Taniguchi T, Okada H, Suzuki T,Shimokawa C, Hisaeda H. 2013. CD8� T cell activation by murine eryth-roblasts infected with malaria parasites. Sci Rep 3:1572. http://dx.doi.org/10.1038/srep01572.
23. Perkins DJ, Were T, Davenport GC, Kempaiah P, Hittner JB, Ong’echaJM. 2011. Severe malarial anemia: innate immunity and pathogenesis. IntJ Biol Sci 7:1427–1442. http://dx.doi.org/10.7150/ijbs.7.1427.
24. Waitumbi JN, Opollo MO, Muga RO, Misore AO, Stoute JA. 2000. Redcell surface changes and erythrophagocytosis in children with severe Plas-
modium falc iparum anemia. Blood 95:1481–1486. http : / /www.bloodjournal.org/content/bloodjournal/95/4/1481.full.pdf..
25. Gwamaka M, Fried M, Domingo G, Duffy PE. 2011. Early and extensiveCD55 loss from red blood cells supports a causal role in malarial anaemia.Malar J 10:386. http://dx.doi.org/10.1186/1475-2875-10-386.
26. Zuckerman A. 1957. Blood loss and replacement in plasmodial infections.I. Plasmodium berghei in untreated rats of varying age and in adult ratswith erythropoietic mechanisms manipulated before inoculation. J InfectDis 100:172–206. http://dx.doi.org/10.1093/infdis/100.2.172.
27. Spira D, Zuckerman A. 1965. Blood loss and replacement in plasmodialinfections. VI. Plasmodium berghei in splenectomized rats. J Infect Dis115:337–344. http://dx.doi.org/10.1093/infdis/115.4.337.
28. Pierrot C, Adam E, Hot D, Lafitte S, Capron M, George JD, Khalife J.2007. Contribution of T cells and neutrophils in protection of young sus-ceptible rats from fatal experimental malaria. J Immunol 178:1713–1722.http://dx.doi.org/10.4049/jimmunol.178.3.1713.
29. Lundie RJ, de Koning-Ward TF, Davey GM, Nie CQ, Hansen DS, LauLS, Mintern JD, Belz GT, Schofield L, Carbone FR, Villadangos JA,Crabb BS, Heath WR. 2008. Blood-stage plasmodium infection inducesCD8� T lymphocytes to parasite-expressed antigens, largely regulated byCD8alpha� dendritic cells. Proc Natl Acad Sci U S A 105:14509 –14514.http://dx.doi.org/10.1073/pnas.0806727105.
30. Miyakoda M, Kimura D, Yuda M, Chinzei Y, Shibata Y, Honma K, YuiK. 2008. Malaria-specific and nonspecific activation of CD8� T cells dur-ing blood stage of Plasmodium berghei infection. J Immunol 181:1420 –1428. http://dx.doi.org/10.4049/jimmunol.181.2.1420.
31. Amante FH, Haque A, Stanley AC, Rivera Fde L, Randall LM, WilsonYA, Yeo G, Pieper C, Crabb BS, de Koning-Ward TF, Lundie RJ, GoodMF, Pinzon-Charry A, Pearson MS, Duke MG, McManus DP, LoukasA, Hill GR, Engwerda CR. 2010. Immune-mediated mechanisms ofparasite tissue sequestration during experimental cerebral malaria. J Im-munol 185:3632–3642. http://dx.doi.org/10.4049/jimmunol.1000944.
32. Claser C, Malleret B, Gun SY, Wong AY, Chang ZW, Teo P, See PC,Howland SW, Ginhoux F, Rénia L. 2011. CD8� T cells and IFN-�mediate the time-dependent accumulation of infected red blood cells indeep organs during experimental cerebral malaria. PLoS One 6:e18720.http://dx.doi.org/10.1371/journal.pone.0018720.
33. Horne-Debets JM, Faleiro R, Karunarathne DS, Liu XQ, Lineburg KE,Poh CM, Grotenbreg GM, Hill GR, MacDonald KP, Good MF, Renia L,Ahmed R, Sharpe AH, Wykes MN. 2013. PD-1 dependent exhaustion ofCD8� T cells drives chronic malaria. Cell Rep 5:1204 –1213. http://dx.doi.org/10.1016/j.celrep.2013.11.002.
34. Embury SH, Clark MR, Monroy G, Mohandas N. 1984. Concurrentsickle cell anemia and alpha-thalassemia. Effect on pathological propertiesof sickle erythrocytes. J Clin Invest 73:116 –123. http://dx.doi.org/10.1172/JCI111181.
35. Sedegah M, Sim BK, Mason C, Nutman T, Malik A, Roberts C, JohnsonA, Ochola J, Koech D, Were B, Hoffman SL. 1992. Naturally acquiredCD8� cytotoxic T lymphocytes against the Plasmodium falciparum cir-cumsporozoi te prote in . J Immunol 149:966 –971. ht tp : / /www.jimmunol.org/content/149/3/966.long..
36. Good MF, Doolan DL. 2010. Malaria vaccine design: immunologicalconsiderations. Immunity 33:555–566. http://dx.doi.org/10.1016/j.immuni.2010.10.005.
37. Pombo DJ, Lawrence G, Hirunpetcharat C, Rzepczyk C, Bryden M,Cloonan N, Anderson K, Mahakunkijcharoen Y, Martin LB, Wilson D,Elliott S, Elliott S, Eisen DP, Weinberg JB, Saul A, Good MF. 2002.Immunity to malaria after administration of ultra-low doses of red cellsinfected with Plasmodium falciparum. Lancet 360:610 – 617. http://dx.doi.org/10.1016/S0140-6736(02)09784-2.
38. Howland SW, Poh CM, Gun SY, Claser C, Malleret B, Shastri N,Ginhoux F, Grotenbreg GM, Rénia L. 2013. Brain microvessel cross-presentation is a hallmark of experimental cerebral malaria. EMBO MolMed 5:916 –931. http://dx.doi.org/10.1002/emmm.201202273.
39. Martin-Jaular L, Nakayasu ES, Ferrer M, Almeida IC, Del Portillo HA.2011. Exosomes from plasmodium yoelii-infected reticulocytes protectmice from lethal infections. PLoS One 6:e26588. http://dx.doi.org/10.1371/journal.pone.0026588.
40. Jones TR, Stroncek DF, Gozalo AS, Obaldia N, III, Andersen EM, LucasC, Narum DL, Magill AJ, Sim BK, Hoffman SL. 2002. Anemia inparasite- and recombinant protein-immunized aotus monkeys infectedwith Plasmodium falciparum. Am J Trop Med Hyg 66:672– 679. http://www.ajtmh.org/content/66/6/672.long..
Safeukui et al.
12 ® mbio.asm.org January/February 2015 Volume 6 Issue 1 e02493-14
m
bio.asm.org
on February 3, 2015 - P
ublished by m
bio.asm.org
Dow
nloaded from
41. Sagara I, Dicko A, Ellis RD, Fay MP, Diawara SI, Assadou MH, SissokoMS, Kone M, Diallo AI, Saye R, Guindo MA, Kante O, Niambele MB,Miura K, Mullen GE, Pierce M, Martin LB, Dolo A, Diallo DA,Doumbo OK, Miller LH, Saul A. 2009. A randomized controlled phase 2trial of the blood stage AMA1-C1/Alhydrogel malaria vaccine in childrenin Mali . Vaccine 27:3090 –3098. http://dx.doi .org/10.1016/j.vaccine.2009.03.014.
42. Ellis RD, Fay MP, Sagara I, Dicko A, Miura K, Guindo MA, Guindo A,Sissoko MS, Doumbo OK, Diallo D. 2011. Anaemia in a phase 2 study ofa blood stage falciparum malaria vaccine. Malar J 10:13. http://dx.doi.org/10.1186/1475-2875-10-13.
43. Janse CJ, Ramesar J, Waters AP. 2006. High-efficiency transfection and
drug selection of genetically transformed blood stages of the rodent ma-laria parasite Plasmodium berghei. Nat Protoc 1:346 –356. http://dx.doi.org/10.1038/nprot.2006.53.
44. World Health Organization. 2000. Severe falciparum malaria. WorldHealth Organization, communicable diseases cluster. Trans R Soc TropMed Hyg 94(Suppl 1):S1–S90. http://whqlibdoc.who.int/publications/2000/TropMedandHygiene_2000_94_S1_pp1-10.pdf.
45. Silamut K, Phu NH, Whitty C, Turner GD, Louwrier K, Mai NT,Simpson JA, Hien TT, White NJ. 1999. A quantitative analysis of themicrovascular sequestration of malaria parasites in the human brain. AmJ Pathol 155:395– 410. http://dx.doi.org/10.1016/S0002-9440(10)65136-X.
CD8 Parasite Control in Severe Malarial Anemia
January/February 2015 Volume 6 Issue 1 e02493-14 ® mbio.asm.org 13
m
bio.asm.org
on February 3, 2015 - P
ublished by m
bio.asm.org
Dow
nloaded from
Copyright © 2022 FDOKUMEN