
Making mobile users’ devices aware of the surrounding physical environment: an approach based on...
10
Making mobile users’ devices aware of the surrounding physical environment: an approach based on cognitive heuristics M. Mordacchini and A. Passarella Istituto di Informatica e Telematica CNR, Italy M.J. Chorley, G.B. Colombo and V. Tanasescu School of Computer Science & Informatics Cardiff University, UK Abstract—In this paper we investigate the properties of a cognitive heuristics based approach, by way of which the mobile devices of users can become aware of the physical environment surrounding them. Cognitive heuristics are the mental models used in cognitive psychology to describe how human brains efficiently process the huge amount of information constantly coming from the environment around us. As personal mobile devices represent proxies in the cyber world of their human users, we investigate how the same cognitive heuristics can be used by mobile devices to become self-aware of the features of the physical environment around their users. Specifically, we assume that physical locations are described as a network of tags. We consider a self-organising opportunistic network environment, where devices exchange information when meeting directly. We propose algorithms based on cognitive heuristics through which users’ nodes obtain tags either directly when coming in proximity of locations, or indirectly through other nodes they meet. We analyse the properties of the networks of tags resulting at individual nodes, as they emerge from this process, as a function of various cognitive parameters. We show that using cognitive heuristics leads, under the same resource constraints, to much more effective information diffusion with respect to other reference solutions. Interestingly, we find critical thresholds for key parameters that discriminate between information diffusion and information loss. Finally, we show that, despite resource constraints, the structure of the network of tags at individual nodes is remarkably close to the ideal that would be obtained with infinite resources. I. I NTRODUCTION The ubiquitous and pervasive presence in the physical world of devices that interact among themselves, their users and other sources of information in the environment is leading to an increasingly complex information landscape, where data flows from the physical world to the cyber one, and vice-versa. This scenario is known as the Cyber-Physical World (CPW) convergence [1]. In this scenario, the opportunistic networking paradigm [2] is considered as one of the enabling paradigms for a wide range of applications, including smart cities, e-health, intelligent transportation systems, etc [1]. In this context, it will play a key role in making the network self-organised at multiple levels. At the networking level, opportunistic networks exploit the store-carry and forward paradigm, and opportunistically exploit direct encounters between nodes to carry messages towards destinations. In a data-centric perspective, the oppor- tunistic paradigm allows nodes to self-organise in order to disseminate data opportunistically, for example on the basis of the users interests. In addition, the role of mobile devices in the CPW convergence scenario is particularly relevant, since they are actually proxies of their users in the cyber world. Acting as proxies of their human users, they are in charge of autonomously discovering, collecting and evaluating the information available in the cyber world, determining its relevance for their users and taking the data that is of interest for them. This situation is very similar to what human brains constantly do, both in isolation, and during interactions (i.e., discussions) between people. Indeed, humans are continuously presented with a vast amount of information coming from the physical environment they are acting in. Brains are able to swiftly react and process new information, by asserting its relevance with respect to the comprehension and perception of the surrounding environment. Human brains are able to perform this task in spite of limits of time and knowledge thanks to the human ability to organise the information in memory and by using simple cognitive decision-making rules, known as cognitive heuristics [3]. These are very effective, yet simple and “computationally inexpensive” rules, that are functionally described in the cognitive science literature. In this paper, we propose to apply human memory organ- isation models and information selection rules (i.e. cognitive heuristics) in order to let mobile devices become aware of the features of the physical environment where they move. Using cognitive heuristics at nodes is motivated exactly by the role of proxies of users personal devices, that, therefore, organise and process information in the cyber world as they human users do in the physical world. According to the proposed algorithms, users personal devices self-organise through direct interactions among them and with physical locations in the environment, in order to efficiently disseminate information about the physical locations towards relevant users. As a side effect of the dissemination process, nodes become aware of the features of the environment their users are moving in. More specifically, we assume that locations in the physical world spread their description in the environment, in the form of sets of tags. 1 Mobile devices passing near those locations can then be exposed to this information and can interact with physical locations in order to acquire their tags. Moreover, mobile nodes communicate with other mobile devices and op- portunistically exchange information, thus mutually increasing their knowledge about the environment. In order to model the organisation of this information, we use a solution inspired by the Semantic Associative Network models of human memory, described in the cognitive psychology field. In these networks, 1 Interestingly, as a case study we consider a case where these descriptions emerge from a flow of information from the physical world to the cyber one. In fact, we assume that they are extracted from online descriptions of the locations given by human users that physically visited them (see Sec. IV).
Transcript of Making mobile users’ devices aware of the surrounding physical environment: an approach based on...

Making mobile users’ devices aware of thesurrounding physical environment: an approach
based on cognitive heuristics
M. Mordacchini and A. PassarellaIstituto di Informatica e Telematica
CNR, Italy
M.J. Chorley, G.B. Colombo and V. TanasescuSchool of Computer Science & Informatics
Cardiff University, UK
Abstract—In this paper we investigate the properties of acognitive heuristics based approach, by way of which the mobiledevices of users can become aware of the physical environmentsurrounding them. Cognitive heuristics are the mental modelsused in cognitive psychology to describe how human brainsefficiently process the huge amount of information constantlycoming from the environment around us. As personal mobiledevices represent proxies in the cyber world of their humanusers, we investigate how the same cognitive heuristics can beused by mobile devices to become self-aware of the featuresof the physical environment around their users. Specifically,we assume that physical locations are described as a networkof tags. We consider a self-organising opportunistic networkenvironment, where devices exchange information when meetingdirectly. We propose algorithms based on cognitive heuristicsthrough which users’ nodes obtain tags either directly whencoming in proximity of locations, or indirectly through othernodes they meet. We analyse the properties of the networks of tagsresulting at individual nodes, as they emerge from this process, asa function of various cognitive parameters. We show that usingcognitive heuristics leads, under the same resource constraints, tomuch more effective information diffusion with respect to otherreference solutions. Interestingly, we find critical thresholds forkey parameters that discriminate between information diffusionand information loss. Finally, we show that, despite resourceconstraints, the structure of the network of tags at individualnodes is remarkably close to the ideal that would be obtainedwith infinite resources.
I. INTRODUCTION
The ubiquitous and pervasive presence in the physicalworld of devices that interact among themselves, their usersand other sources of information in the environment is leadingto an increasingly complex information landscape, where dataflows from the physical world to the cyber one, and vice-versa.This scenario is known as the Cyber-Physical World (CPW)convergence [1].
In this scenario, the opportunistic networking paradigm [2]is considered as one of the enabling paradigms for a wide rangeof applications, including smart cities, e-health, intelligenttransportation systems, etc [1]. In this context, it will playa key role in making the network self-organised at multiplelevels. At the networking level, opportunistic networks exploitthe store-carry and forward paradigm, and opportunisticallyexploit direct encounters between nodes to carry messagestowards destinations. In a data-centric perspective, the oppor-tunistic paradigm allows nodes to self-organise in order todisseminate data opportunistically, for example on the basisof the users interests. In addition, the role of mobile devicesin the CPW convergence scenario is particularly relevant,
since they are actually proxies of their users in the cyberworld. Acting as proxies of their human users, they are incharge of autonomously discovering, collecting and evaluatingthe information available in the cyber world, determining itsrelevance for their users and taking the data that is of interestfor them. This situation is very similar to what human brainsconstantly do, both in isolation, and during interactions (i.e.,discussions) between people. Indeed, humans are continuouslypresented with a vast amount of information coming from thephysical environment they are acting in. Brains are able toswiftly react and process new information, by asserting itsrelevance with respect to the comprehension and perceptionof the surrounding environment. Human brains are able toperform this task in spite of limits of time and knowledgethanks to the human ability to organise the information inmemory and by using simple cognitive decision-making rules,known as cognitive heuristics [3]. These are very effective,yet simple and “computationally inexpensive” rules, that arefunctionally described in the cognitive science literature.
In this paper, we propose to apply human memory organ-isation models and information selection rules (i.e. cognitiveheuristics) in order to let mobile devices become aware of thefeatures of the physical environment where they move. Usingcognitive heuristics at nodes is motivated exactly by the roleof proxies of users personal devices, that, therefore, organiseand process information in the cyber world as they humanusers do in the physical world. According to the proposedalgorithms, users personal devices self-organise through directinteractions among them and with physical locations in theenvironment, in order to efficiently disseminate informationabout the physical locations towards relevant users. As a sideeffect of the dissemination process, nodes become aware ofthe features of the environment their users are moving in.More specifically, we assume that locations in the physicalworld spread their description in the environment, in the formof sets of tags.1 Mobile devices passing near those locationscan then be exposed to this information and can interact withphysical locations in order to acquire their tags. Moreover,mobile nodes communicate with other mobile devices and op-portunistically exchange information, thus mutually increasingtheir knowledge about the environment. In order to model theorganisation of this information, we use a solution inspired bythe Semantic Associative Network models of human memory,described in the cognitive psychology field. In these networks,
1Interestingly, as a case study we consider a case where these descriptionsemerge from a flow of information from the physical world to the cyber one.In fact, we assume that they are extracted from online descriptions of thelocations given by human users that physically visited them (see Sec. IV).
vertices represent the semantic concepts (i.e. tags) associatedto physical locations, and the edges represent the relationshipsbetween tags (e.g. they are used to describe the same location).Starting from this structure of information, and assuming thatlimited resources are available upon contacts between nodes orbetween a node and a location (such that only limited amountof information can be transferred), a physical location or amobile node selects, upon contact, the most relevant data tocommunicate to the other interacting party. In our solution, theselection of the information to be exchanged is also driven bycognitive models of how humans exchange information duringa discussion. Intuitively, common concepts of interest drive theselection of the concepts that more easily come to mind, sincethey are more related with the common concepts. To replicatethis process, we propose to exploit the fluency heuristic [4]strategy. The fluency heuristic is the cognitive strategy thatallows the brain to choose among two or more alternatives.Among all the alternatives, this heuristic favours the ones thatare recognised, i.e. have been “seen” in the environment asufficient number of times. Among them, it then chooses theone that is perceived as being recognised faster, , becausemore strongly related to common concepts of the discussion.We show how the graph information representation based onassociative network models and the information selection strat-egy based on the fluency heuristic can be coupled to achievean effective dissemination of the physical world descriptionamong mobile nodes in an opportunistic network. We reportresults on the analysis of the emerging properties of graphswith tags of physical locations stored at each node as a sideeffect of these interactions, and the behaviour of the proposedsolution under different settings of its main parameters. Specif-ically, we show that the cognitive-based dissemination schemeis more efficient than standard solutions not using cognitiveheuristics. Through a sensitiveness analysis we highlight phasetransitions for the dissemination of location information. Wealso highlight that the tag networks at individual nodes arestructurally very similar to the asymptotic one, containing theunion of all physical locations’ descriptions, that would becollected with infinite available resources.
The rest of the paper is organised as follows: in Sec. IIwe report previous work about information dissemination inopportunistic networks and the extraction of representations ofphysical places from online descriptions. In Sec. III we presentthe main algorithms about the information organisation and ex-change processes. In Sec. IV we illustrate how the descriptionof the physical locations has been derived. Sec. V shows resultsabout the properties and behaviour of the proposed system ina simulated environment. Finally, Sec. VI concludes the paper.
II. RELATED WORK
The data dissemination problem in opportunistic networksis a sensitive issue that has been faced by many works in theliterature (see [2] for a complete survey). All of them are basedon “traditional” computer-science heuristic solutions. Onlysome recent works [5], [6], [7] start to consider solutions com-ing from the cognitive science field to devise simple and lowresource-demanding schemes for effectively disseminating theinformation among nodes in an opportunistic network scenario.In scenarios were mobile devices are proxies of the humanusers, using heuristics that exploit the same mechanisms usedby the human brain to take decisions prove to be particularlyefficient. In fact, these solutions proved to be as efficient asother “traditional” approaches in disseminating the data towardinterested nodes, while, at the same time, requiring muchlower resources to reach this result. Independently from the
adopted dissemination strategy, anyway, all those approachesdo not take into consideration the semantic side of data,or, more precisely, how different pieces of information areconnected to each other for humans because of their semanticrelationship. To cope with this issue, in [8] an algorithm forspreading semantic information has been proposed. On theother hand, the work proposed in [9] represents, at the bestof our knowledge, the first attempt for equipping nodes withcognitive-based solutions for the opportunistic exchange anddiffusion of semantic information and its associated content.All these works, anyway, do not take into account any possibleinteraction between mobile devices and the physical envi-ronment the nodes are moving in. Moreover, also the dataavailable in the network is assumed to be not related in anyway to the physical context. Thus, by using those schemes,it is not possible for nodes in an opportunistic network tobecome aware of their surrounding environment. In this paperwe propose to overcome these limitations, using a solutionthat allows nodes to acquire a knowledge about the physicalspace their users move. This is obtained through a semanticrepresentation of the information about physical locations, andits spreading through a direct communication of the deviceswith the physical locations they encounter in the environment,and between them. To treach this goal, we show how cognitivememory representations and information selection schemestaken from cognitive psychology can be exploited to this end.
In order to communicate their features to mobile nodespassing near-by, physical locations need to generate theirown descriptions. Virtual representations of place have beenthe topic of active research, with an understanding that, forthe human mind, the geospatial environment is organisedas places rather than sets of geospatial coordinates [10].Places appear as complex thematic entities in relation withthe physical configuration of the environment as well as withhuman cognition such as memory [11]. Places, as part of theenvironment, present physical or social opportunities for actionor information [12], as well as for social interaction with otheragents, or the absence of them [13]. Therefore, they are spatialregions that support information of significance for the agentin an environment and act as cognitive anchors, through salientfeatures that make them useful or interesting, memorablebecause of past experiences, or desirable as expected loci ofanticipated ones [14], [15], [16].
Online representation of places has been the object ofseveral publications in the literature. For example, [17] sug-gests that if it is possible to ‘visit’ virtual representations ofplaces and collect from them the information we are seeking.Tags could be the basis of a novel process for the extractionand building of digital location, place, events and semanticdescriptions [18], [19] which could lead to a re-design ofthe concept of an urban area [20] closer to demands fromparallel research areas, such as cognitive psychology andthe formulation of a new notion of ‘place’ conceived of asencompassing meanings, sense of attachment, and satisfactionprovided by the people interacting with it [21], [11]. Theauthors have presented a proof of concept for a keywordextraction methodology using online tips and reviews from anumber of online sources, see [22] for a complete description.This has also been adopted in this current research to builda dataset to represent a number of sample venues of differentcharacteristics and types.
Digital representation of information and opportunities foraction available at places are made available notably throughthe use of crowdsourced information, such as reviews [23].

Mobile devices and location-based services now allow themonitoring of geographical positions in real time, thus movingfrom an initial adaptation of online maps and navigatorstowards services more oriented to provide reviews and per-sonalised recommendations such as Yelp and Qype2. Otherservices combine location and user mobility information witha social networking component. Among those Foursquare,Flickr3, and Google+ Local4 have converged to a place rep-resentation that focuses on the individual needs of users, interms of users being at a particular location at a particular timeoften making use of tags, annotations and other user generatedcontent [19], thus differentiating from an initial representationof places as a stand-alone virtual location that appeared distantfrom the real user’s needs [11], [17].
The importance of the use of shared keywords and ‘tags’as a form of metadata in content organisation (collaborativetagging) has been widely recognised as a basis for modernsuggestion and recommendation systems [24]. Free tags, asopposed to controlled vocabularies are generally preferred byusers as more personal and less cognitively demanding [25],[26]. Location services can be used to mine crowdsourceddata in a place and reusing keywords extracted from thesedescriptions (tags) to inform the user, use of this technique ofsummarisation is not yet widespread.
While most of this research assumes fixed data sharingplatforms such as Online Social Networks, this papers focuseson the issue of disseminating physical locations information(i.e. tags generated according to the methodology above, betterdescribed in Sec. IV) in mobile social networks scenarios,where devices of the users exchange information between eachother, without any mediation of fixed infrastructures.
III. ORGANISATION AND DISSEMINATION OF PHYSICALLOCATION INFORMATION
In this section, we show how human cognitive informationcollection and selection schemes can be exploited to drivethe dissemination of the information describing locations ofthe physical world among mobile devices, making them (and,in turn, their users) aware of the features of the physicalenvironment they are moving in.
We face two main challenges in designing a system fordisseminating location tags. The first one is how tags areorganised in the nodes’ memories and associated to locations.In particular, we wish to let each device become aware thattags describing the same location are in some way relatedto each other and that different locations can share commonsets of tags, allowing users to apply further strategies, e.g. thecomputation of similarities between locations, based on thelocations’ descriptions. The second challenge is how tags areefficiently passed either from locations to users’ devices, orbetween users’ devices, upon encounters. In the following weseparately address these two challenges.
A. Memory Organisation
To address the first challenge, we refer to the cognitive as-sociative memory description of the human brain. The humanassociative memory is modelled in the cognitive sciences usingthe so-called Semantic Associative Network (SN) models [27].These models focus on the patterns and strength of associative
2http://www.yelp.co.uk/, http://www.qype.co.uk/3https://foursquare.com/; http://www.flickr.com/4http://www.google.com/+/learnmore/local/
Bar 33 - 5
Bacchus - 2
Buffalo Bar - 8
coffee
Fig. 1: Example of an annoted vertex in a user SN
linkages among concepts in the brain. Associative networkmodels represent the memory as a graph, where concepts arethe nodes. Each pair of concepts is connected in case thebrain has made an association between them. Edges of an SNare weighted, where the weight reflects the strength of eachassociation in memory.
In order to take advantage of this cognitive mechanism, wedefine the physical locations description and each user’s mem-ory about them as a weighted graph G = {V,E,m(e, t)} :t ∈ T . In this definition, t is an instant in the time frameT , V is the set of vertices (i.e. locations’ tags) and E is theset of edges (i.e. the connections between tags). Moreover,we consider that each node (tag) of the graph G is annotatedwith the set of physical places associated to that tag known bythe device, as illustrated in Fig. 1. Clearly, physical locationsmaintain only the associations with their own name. On theother hand, along with the association with the names ofphysical locations, mobile devices keep track of the numberof times this association has been observed in exchanges withother peers. This information will be used in the data exchangeprocess, as explained in the second part of this section.
As we stated above, in a SN, links have an associatedweight that represents the strength with which the brain isable to “recall” the association between the pair of concepts inmemory. This process is replicated in G using a memory weightfunction m(e, t). We define this function in the followingway. We consider that an edge eij has the initial conditionm(eij , t0) = 1, where t0 is the edge’s creation time. Weconsider that physical locations do not change their descriptionover time. Thus, in the SN of a physical place, m(eij , t0) = 1, ∀e ∈ E and ∀t ∈ T . For a mobile node, at any instant intime t > t0, m(eij , t) decreases exponentially depending onthe length of the interval (t′, t) , where t′ is the last time eijwas “refreshed” in memory (i.e. used in interactions with othernodes or locations). We can then define m(eij , t) as:
m(eij , t) = e−βij(t−t′) (1)
where βij is a factor that regulates the “speed of forgetting”,defined as
βij =β
ptijwhere β is a speed regulator parameter and ptij is the “popular-ity” of edge eij , i.e. the number of times it was used during theencounters of that specific user with other people until time t.This information is stored as an additional label (together withthe weight) associated with the edge, and updated as describedin the following section. The exponential forgetting functionis a well-known representation of the forgetting process incognitive psychology [4]. Rather than a limit, the forgetprocess helps human brains to discard less relevant informationwhen making decisions [4]. For this reason, whenever the valueof the memory weight function for an edge eij goes belowa memory weight threshold Mmin, eij is removed from G.Since human memories are more likely to drop information

that is rarely accessed than frequently used data, we bindthe definition of the memory weight function to the edgepopularity. Therefore, connections between tags that are rarelyused during exchanges with other devices or locations are moreeasily “forgotten”. The forget process can affect also the tagsretention in memory. In fact, as shown in Fig. 2, a node inG is dropped from the graph in the case where it becomesisolated, i.e. it is not connected anymore to any other nodein G, due to the deletion of one or more of its outgoingedges. Note that in the tag network stored at a physicallocation, edges still represent an association between tags,although clearly not bound to any human reasoning process,but representing how the tags representing that location arelinked to each other. In Sec. V we explore the performanceof the dissemination system starting from different ways oforganising the individual locations’ tags networks.
coffee jazz
music
club
coffee jazz
music
club
Fig. 2: Effect of edge “forgetting” on an isolated node
All the operations described above allow locations andnodes to store and handle the information in their memories.We now give a description of the mechanisms that allow theexchange and update of data using a semantic associativenetwork description.
B. Information Selection and Exchange
We consider that, upon meeting, a node (either mobile orphysical) starts to exchange its knowledge with the other partyby selecting the most relevant concepts for that given contactat that time from its SN. The information exchange processstarts from concepts that the two parties have in common.From those starting points, the information is selected bynavigating each SN, according to a weighting scheme. Thisprocess is similar to what is called a sequential search overhuman associative memories [28]. This search mechanismstarts with an activated semantic concept (key-concept) andthen proceeds vertex by vertex in the SN, following the linksthat connect them. Whenever a “dead end” is found, the searchis reinitiated. In order to determine the relevant paths to followwhen exploring a SN, we apply a very simple rule: when anode in a SN has more than one outgoing edge, the link withthe “strongest activation” (measured by the retrieval weightindex explained in the following) is selected. This behaviour isthe implementation of the Fluency Heuristic (FH) [4] cognitivestrategy. We now describe the precise algorithm by which theFH is used by a physical location or a mobile node to retrievethe most relevant semantic information to be exchanged fromits memory. In the following, the description is made fromthe viewpoint of a location or a node that is selecting theinformation to pass. We call this node the donor node, whilethe other party is called the recipient node. As we alreadystated, we assume that physical locations do not change theirdescriptions. Thus, they are always only donor nodes. On theother hand, two mobile nodes swap roles (donor and recipient)upon contact to realise a bidirectional exchange of information.In this phase, we call donor node’s SN G = (V,E,m(e, t))the donor network, while the other peer’s semantic networkG′ = (V ′, E′,m′(e′, t)) is termed the recipient network. The
subgraph C = (V , E, m(e, t)) selected from the donor net-work to be passed to the recipient one is called the contributednetwork. The following description assumes also that thereexist resource consumption constraints that limit the number ofexchangeable tags (i.e. nodes of the SN) to a maximum valueTmax. For the same reason, we assume that the donor nodecan select no more than Lmax names of physical locationsassociated with each tag it includes in the contributed network.The pseudo-code of the subsequent description is given inAlg. 1 and 2. The pseudo-code of Alg. 1 is the same we usein [9] and we report it here for the reader’s convenience. Aswe stated above, we assume that the dialogue starts from aset of key vertices K = {vk|vk ∈ V ∩ V ′} (line 3 of Alg. 1),i.e. a set of semantic concepts that the SNs of the donor andrecipient nodes have in common. Given this set of commonconcepts, the visit of the SN starts from the most relevant nodesin the set. Vertex relevance is computed by summing up thememory weights of a vertex’s incoming edges (line 8). In orderto represent the relevance of a vertex, we consider that it isincreased every time it is included in K during informationexchanges by augmenting the popularities of all the edgesattached to it (lines 5–7).
Algorithm 1 Contributed Network computation at time t∗
1: Let G = (V,E,m(e, t)) be the donor network;2: Let C = (V , E, m(e, t)) be the contributed network;3: Let K be the set of key vertices, K ⊆ V4: for each vi ∈ K do5: for each eij ∈ E do6: increase popularity of eij7: end for8: Let relij =
∑eij∈Em(eij , t
∗)9: end for
10: for each vi ∈ K taken in desc. order w.r.t. relij do11: C∪ = visit(vi, 1, t
∗ − t)12: end for13: Send C to the other node
Taking the key vertices (sorted by relevance) one at atime, edges and vertices are visited and passed from the donornetwork to the contributed one using Alg. 2, based on theFH. Before exploring the SN, since vertices are annotatedwith the physical location names, once a vertex is selected,its set of annotations is considered (line 5 of Alg. 2). Whilephysical locations always only associate their names to passedvertices, we assume that mobile nodes order vertex annotationsin descending order with respect to their popularities. Thus, thelocations that are most frequently associated with a given tagare chosen first to be exchanged. As already pointed out, nomore than Lmax locations are included in the annotations ofthe nodes included in the contributed network (lines 8–12).Then, the edges used to visit a SN are selected using the FH.Since the FH favours recognised objects (i.e. objects seen morethan a given amount of times) against unrecognised items, westart by excluding all the edges whose popularity is below arecognition threshold θrec (line 15 of Alg. 2).
In order to replicate the subsequent discrimination made bythe FH, and based on the perceived retrieval time, we considerthat the most relevant edges are the ones with higher memoryweight values and closer to a key vertex. Anyway, the longerthe contact time between two nodes, the more time is availableto navigate the donor network and include edges and verticesin the contributed one. These factors are taken into account inthe algorithm by computing a retrieval weight value for eachoutgoing edge edge eij of a vertex vi (line 16). The retrieval
weight is computed as in Equation 2:
w(eij , n, t∗ − t) = m(eij , t
∗)1− e−τ(t∗−t)
n(2)
where m(eij , t∗) is the memory weight value of eij at time t∗,
n is the number of hops in the shortest path to the nearest keyvertex and τ is a “speed” factor that regulates the dependencyof this value on the communication duration (t∗ − t). With alonger communication time, edges have more chances to be“warmed up” by the “discussion” and, then exchanged. Wealso refer to the retrieval weight as the warm value. Using thisquantity, edges are sorted according to their retrieval weightand are then taken one at the time in descending order (line16). Clearly, since for each physical location m(eij , t
∗) = 1for each edge eij , the retrieval weight for an edge in physicallocation SN depends only on the distance from a key vertex andthe communication duration. Each selected edge is includedin the contributed network and allows the donor networkexploration from this link to continue (lines 4–21). We considerthat the edges whose retrieval value is below a threshold Wmin
are not relevant for the actual information exchange and, thus,they are excluded from the contributed network (line 17).Moreover, once an edge is included in the contributed network,its memory weight is set to the maximum in both the donor andthe contributed networks, since its inclusion in the exchangeddata corresponds to an “activation” in memory (lines 19 and20).
Algorithm 2 Functionc visit(vi, n, t∗ − t)1: Let G = (V,E,m(e, t)) be the donor network;2: Let C = (V , E, m(e, t)) be the contributed network;3: if |V | < tag limit then4: Let vi = vi5: Let L be the set of the annotations of vi6: order L in desc. order w.r.t. the annotation pop.7: Let L = ∅8: if |L| ≤ Lmax then9: L = L
10: else11: put the first Lmax elements of L in L12: end if13: Annotate vi with L14: V ∪ = vi15: Let R = {eij ∈ E|pt
∗
ij ≥ θrec}16: for each eij ∈ R in desc. order w.r.t. w(eij , n, t
∗ − t) do17: if w(eij , n, t
∗ − t) ≥Wmin then18: E∪ = eij19: m(eij , t
∗) = 120: m(eij , t
∗) = 121: C∪ = visit(vj , n+ 1, t∗ − t)22: end if23: end for24: end if25: Return C
Whenever |V | = Tmax and/or no other edges can beselected from the donor network, the contributed networkcomputation ends and the resulting graph is passed to therecipient node. This node, in turn, merges the received con-tributed network to the recipient one by simply adding allthe missing vertices and edges. Moreover, as for the donornode, all the edges received from the contributed network(new or already present) set their memory weight to 1, sincethey are “activated” by the “conversation”. When merging the
contributed and the recipient networks, the recipient node alsoconsiders the annotations of each vertex of the contributednetwork. In case the vertex was already present in the recipientnetwork, the recipient node increases the popularity of all theannotations that already exist in the recipient network vertexand are present in the contributed one. Otherwise (i.e. thevertex was not previously in the recipient network, or theannotation is not already present) the popularity of the receivedannotations is set to 1.
IV. DATASET CREATION
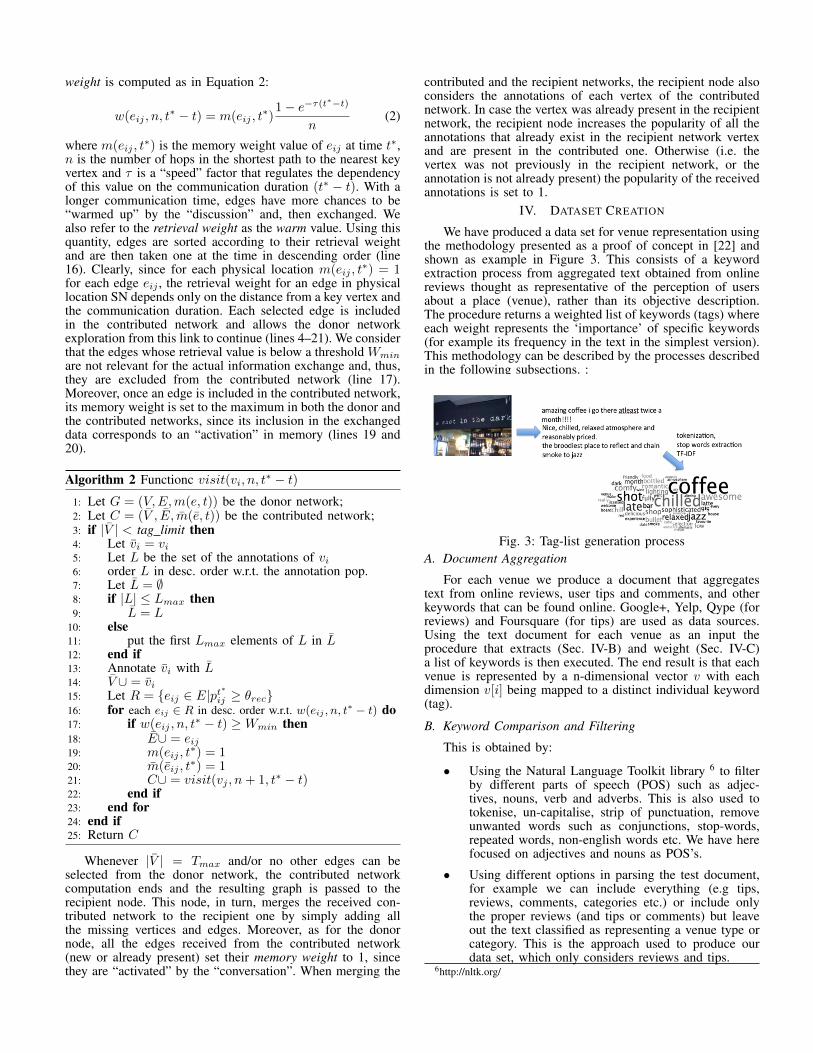
We have produced a data set for venue representation usingthe methodology presented as a proof of concept in [22] andshown as example in Figure 3. This consists of a keywordextraction process from aggregated text obtained from onlinereviews thought as representative of the perception of usersabout a place (venue), rather than its objective description.The procedure returns a weighted list of keywords (tags) whereeach weight represents the ‘importance’ of specific keywords(for example its frequency in the text in the simplest version).This methodology can be described by the processes describedin the following subsections. :
Fig. 3: Tag-list generation processA. Document Aggregation
For each venue we produce a document that aggregatestext from online reviews, user tips and comments, and otherkeywords that can be found online. Google+, Yelp, Qype (forreviews) and Foursquare (for tips) are used as data sources.Using the text document for each venue as an input theprocedure that extracts (Sec. IV-B) and weight (Sec. IV-C)a list of keywords is then executed. The end result is that eachvenue is represented by a n-dimensional vector v with eachdimension v[i] being mapped to a distinct individual keyword(tag).
B. Keyword Comparison and Filtering
This is obtained by:
• Using the Natural Language Toolkit library 6 to filterby different parts of speech (POS) such as adjec-tives, nouns, verb and adverbs. This is also used totokenise, un-capitalise, strip of punctuation, removeunwanted words such as conjunctions, stop-words,repeated words, non-english words etc. We have herefocused on adjectives and nouns as POS’s.
• Using different options in parsing the test document,for example we can include everything (e.g tips,reviews, comments, categories etc.) or include onlythe proper reviews (and tips or comments) but leaveout the text classified as representing a venue type orcategory. This is the approach used to produce ourdata set, which only considers reviews and tips.
6http://nltk.org/

C. Relevance Weighting
There are different procedures to produce the tag weight-ing. In particular we can use:
• The word count of each term in the text document.
• More sophisticated procedures such as TF-IDF(see [29] for technical details). In this case the weight-ing for a specific venue also depends on documentsabout other venues (the collections of documents usedis called the corpus).
Term Frequency (TF) is a simple weighting scheme forkeywords in a document, that uses the bag of words model.TF assumes the weight of a keyword to be equal to thenumber of occurrences of term t in the document. Using termfrequency alone however has little discriminating power in athemed corpus, as some keywords will probably be found inall documents. For example the word ‘beer’ will be found inmany or all pub reviews. The idea is therefore to adjust termfrequency using the count of occurrences of the term in thewhole collection. This measure is the document frequency DF ,or number of documents that contain a term t. To use DF toscale the term frequency, the inverse document frequency IDFof a term t is defined as
idf(t) = log(N/df(t)) (3)
where N is the number of documents in the corpus. The TF-IDF weighting scheme assigns to term t a weight in documentd given by:
tf − idf(t, d) = tf(t, d)× idf(t) (4)The weighting has the following characteristics:
• highest when the term occurs many times within asmall number of documents
• lower when the terms occurs fewer times in a docu-ment, or occurs in many documents
• lowest when the term occurs in virtually all documents
In this work we have considered about 10 venues in thecity of Cardiff (UK) using a ‘global’ corpus consisting of thecollection of all documents considered. This results in a totalof 2210 tags, with an average of 221 tags per location.
V. PROPERTIES OF THE SEMANTIC NETWORK OFLOCATIONS AT MOBILE NODES
In this section we present results about the properties ofthe information dissemination process and of the SN of mobilenodes obtained in a simulated environment. Tab. I shows themain parameters used for the simulation. We considered a1000m2 wide area where 100 nodes move according to arandom waypoint model. Inside this area, there are 10 staticphysical locations (placed uniformly at random in the simu-lation area) that spread their information. The description ofthese locations is derived from a real-world dataset, describedin more detail in Sec. IV. This simulation settings have beenchosen as they are able to highlight the general behaviour andthe macroscopic features of the proposed approach, allowingus to give an intial evaluation on the system performancein a realistic scenario. In order to model the SNs of thephysical locations, in the following we consider three differentconfigurations, based on the tag popularities derived from theTF-IDF frequencies of the locations tags in the dataset. Thefirst configuration organises the nodes of the locations’ SNs as
TABLE I: Main simulation parameters
Simulation ParametersSimul. Area 1000m2
Numb. of Nodes 100Numb. of Phys. Loc. 10
Node speed unif. in [1, 1.86]m/s
Transm. range 20mSimulation time 75000s
β 0.1τ 0.1θrec 5
a chain, with the most relevant tag at one end, connected tothe second most popular tag, and so on, till the least populartag at the other end. Semantic networks derived from onlinedescription could be also viewed as the aggregation of theassociations made by a plurality of different users. Studies inthe cognitive sciences (e.g. [30]) report that aggregate semanticassociative networks show scale-free properties. Therefore, wealso use two more clustered approaches, obtained using thealgorithm reported in [31]. Since this is a growing model ofa graph with scale-free properties, for each location we runthe algorithm by introducing the vertices in the graph growingprocess on the base of their TF-IDF order of relevance. Thefirst configuration has a clustering coefficient of about 0.2 andthe other one has a clustering coefficient of 0.5. Hereafter, werefer to all these three configurations as the Chain, CC=0.2and CC=0.5. configurations, respectively. At the start of thesimulation each node SN is initialised by choosing a groupof tags from the set of all the available tags. Each tag hasa 0.01 probability to be added to a node SN. Initially, tagsin a node SN are not connected to each other, i.e. the nodeSN do not have any edge. Moreover, tags are not annotated.Nodes should then acquire the knowledge about relantionshipsbetween tags and association to physical location through theinteraction between physical locations and other nodes. In thefollowing, the performance metrics that we use are the HitRatio and the Coverage. The first one is the average overall the nodes of the ratio between the number of tags heldby each node and the overall number of tags available fromthe physical locations. The Hit Ratio indicates the amount ofinformation acquired by the nodes in the system. The secondmeasure is defined as the average of the per-node Coverage.This value, in turn, is computed as average (computed overall locations stored in the node SN as tags annotations) ratiobetween the the number of tags in the node SN annotated witha location, and the number of tags that describe that locationand are also stored at the node. Note that the node may notstore all the locations associated to a stored tag, and thuscoverage measures how complete is the information for thestored tags. In order to make the values of the memory andretrieval weights more intuitive for the reader, in the followingwe use these conventions. A notation like forget = 50s meansthat the Mmin weight is set in such a way that edges withpopularity 1 are dropped from a SN in case they are not seenbefore 50s from the last time they were used in an exchange.On the other hand, a notation like warm = 25s means that theWmin threshold is computed taking into account, as a referencecase, an interaction between nodes of 2s, that let to include(warm up) at least edges at distance 1 from a key node if theyare not used (i.e. they were subject to the forget process) fromno more than 25s. All the reported results are the mean of 10different runs of the algorithm, obtained by using 10 differentmobility traces for the nodes and 10 different placements inthe area for locations.
A. Comparison with an epidemic dissemination model
In this first set of results, we show a comparison betweenour solution and an epidemic-like [32] data disseminationscheme. In this epidemic scheme, locations and mobile devicesselect the tags to pass to another encountered peer uniformly atrandom from the set of data they hold in their memories. Uponcontact, for each exchanged tag, a set of known associatedlocations is also passed to the other party, by selecting themuniformly at random from the ones in memory. The epidemicscheme is also subject to the same restrictions of the cognitive-based approach. Thus, no more than Tmax tags can be passedat each encounter and no more than Lmax locations can beassociated with each exchanged tag. Moreover, we assumethat data in the epidemic approach is subject to an agingprocess, similar to that of the cognitive case. For each tagstored by a device in the epidemic scenario, we computea “popularity” value in the same way as for edges in thecognitive approach. Then, we can define a memory weightfunction m(di, t) = e−βi(t−t′) applied to each data di. Itis simply the cognitive memory weight function (Form. 1)applied to data items rather then edges. We use this functionwith exactly the same parameters as the cognitive function,i.e. the β value and the same Mmin threshold, used to dropitems from memory. This epidemic scheme is a very simplebenchmark for our algorithm. In particular, it does not use anysemantic representation of tags and any association betweenthem. Epidemic is the most simple scheme that can be used todisseminate location information without using our cognitivebased approach, but subject to the same resource constraints.Comparing our scheme with epidemic allows us to check thatthe former, under the same resource constraints, is able toachieve better information dissemination, thus resulting in amore efficient use of the available resources.
In the following simulations, we vary the maximum num-ber of exchangeable tags Tmax and the memory weight thresh-old Mmin values, keeping fixed the minimum retrieval Wmin
and maximum number of exchangeable vertex annotationsLmax parameters. In particular, Lmax = 2 and Wmin iscomputed for a warm time = 25s. In all the results reportedin Figs. 4–5, it is possibile to see that the cognitive-basedapproach is able to outperform the epidemic approach interms of both the Hit Ratio and Coverage, independently ofthe tag and forget parameters and the cognitive location tagnetwork configuration. Moreover, note that, in all cases theepidemic approach reaches a point where it enters a sort ofoscillatory behaviour, where the values of the performancefigures increase and decrease, floating around a stabilisationpoint. This behaviour is due to the effect of the forgettingprocess. In this region, the increase of the performance figuresdue to newly acquired tags is soon compensated by the dropof the oldest, least popular tags.
On the other hand, the cognitive-based approach takesadvantage of a structured information representation, wherethe forget process is applied to the edges in each SN, before itimpacts on the data. Specifically, organising tags in semanticnetworks allow the system to avoid oscillations, as importanttags have time to become “well established” in the nodessemantic networks, while tags that are really less importantare correctly dropped. Finally, it is possible to observe thatmore clustered location SNs allow a better flow of information.This is expected, as clustered tags are closer to each otherin the locations SN, and thus it is easier for each tag to bepassed in the mobile nodes SN (remember that the lowerthe number of hops between a tag and the set of common
tags, the higher the chance of ending up in the contributednetwork). Anyway, differences between the two clusteredconfigurations are evident only in the experiment with thelowest Tmax and forget values (Fig. 4). It has to be notedthat the Chain configuration achieves Coverage results veryclose to the clustered configurations when using higher forgetand tag limit values (e.g. Fig. 5). Thus, even with the mostdifficult starting configuration, information spreads efficientlyusing the cognitive based schemes.
B. Sensitiveness Analysis
The previous results highlight the dependance of the per-formance figures on the Tmax and forget parameters. In orderto better understand this point, in the next set of experimentswe report the performance of the system under various valuesof all its main parameters. The results are obtained for a Chainlocation SN configuration, that is, the most difficult case fordisseminating the information. Similar outcomes, with higherperformances, as observed in the previous results, can beobserved with all the clustered location SN configurations. Ifnot otherwise stated, the results are obtained with forget = 75s,Tmax = 150, warm = 25s, and Lmax = 2. Fig. 6a showsthe Hit Ratio variations due to various values of the forgetparameter. As observed in the comparison with the epidemic-like model, the higher the forget time, the higher the HitRatio. Note that the difference between the two lowest forgetvalues are far bigger than the difference between the othersettings. In particular, the lowest forget value leads to a veryslow increase of the Hit Ratio over time. A similar situationis observed in Fig. 6b for the Tmax value, where the lowestvalue results in an even slower Hit Ratio increase than forthe forget case. On the other hand, fewer differences emergefor the warm value (Fig. 6c). In particular, an increase fromwarm = 25s to warm = 50s does not give a great differencein the final Hit Ratio values. Therefore, the system seems to beless sensitive to this value than the previous ones. Note that,although higher values of forget and tag limits could result inhigher Hit Ratios, their setting should be pondered. In fact,higher Tmax values lead to a higher resource consumption,since more information could be exchanged at every encounter,while higher forget values make the system less responsiveand adaptive to changes in the environment. In fact, in casethe oldest information suddenly becomes less relevant, makingit stay for longer periods in memory will force the devices toevaluate it during encounters, even if it is now not relevant.
The Coverage value has a dependance to the variousparameters which is similar to the dependence of the HitRatio. In Fig. 7a we show the impact of the forget value. Asfor the Hit Ratio, it is possible to see that a small increasein the forget threshold (from 50s to 75s) leads to a greatincrease in the Coverage measure. These observations seemsto point to the fact that there exist a point over which theinformation dissemination process is able to proceed morerapidly. We investigate this fact more in detail in the nextset of experiments. Fig. 7b shows that the higher the numberLmax of suggested location with each tag, the higher theCoverage. Since increasing the Lmax value produces a higherresource consumption during exchanges, the tuning of thisparameter should take into account a trade-off between higherperformances and resource consumption constraints, as for theTmax parameter.C. Macroscopic properties of the mobile nodes SNs
The following results focus on more general, macroscopicproperties of the system. In particular, we investigate more

0 10000 20000 30000 40000 50000 60000 70000Time
0
0.2
0.4
0.6
0.8
1
Hita
Rat
io
EpidemicChainClust. Coeff. = 0.2Clust. Coeff. = 0.5
(a) Hit Ratio
0 10000 20000 30000 40000 50000 60000 70000Time
0
0.2
0.4
0.6
0.8
1
Cov
erag
e
EpidemicChainClust. Coeff. = 0.2Clust. Coeff. = 0.5
(b) Coverage
Fig. 4: Hit Ratio (a) and Coverage (b) results comparison; #tags =75, forget=75s
0 10000 20000 30000 40000 50000 60000 70000Time
0
0.2
0.4
0.6
0.8
1
Hit
Rat
io
EpidemicChainClust. Coeff. = 0.2Clust. Coeff. = 0.5
(a) Hit Ratio
0 10000 20000 30000 40000 50000 60000 70000Time
0
0.2
0.4
0.6
0.8
1
Cov
erag
e
EpidemicChainClust. Coeff. = 0.2Clust. Coeff. = 0.5
(b) Coverage
Fig. 5: Hit Ratio (a) and Coverage (b) results comparisons; #tags =150, forget=150s
1 10 100 1000 10000 100000Time
0
0.2
0.4
0.6
0.8
1
Hit
Rat
io
forget = 50 sforget = 75 sforget = 150 sforget = 300 s
(a) Forget impact
1 10 100 1000 10000 100000Time
0
0.2
0.4
0.6
0.8
1
Hit
Rat
io
# max exch. tags = 50# max exch. tags = 75# max exch. tags = 150
(b) Tag Limit impact
1 10 100 1000 10000Time
0
0.2
0.4
0.6
0.8
1
Hit
Rat
io
warm = 15 swarm = 25 swarm = 50 s
(c) Activation threshold impact
Fig. 6: Impact on the Hit Ratio of various settings of the parameters of the forget (a), tag limit (b) and warm activation (c) values
0 20000 40000 60000Time
0
0.2
0.4
0.6
0.8
1
Cov
erag
e
forget = 50sforget = 75sforget = 150sforget = 300s
(a)
0 20000 40000 60000Time
0
0.2
0.4
0.6
0.8
1
Cov
erag
e
#suggested loc. = 2#suggested loc. = 5
(b)
Fig. 7: Impact on the Coverage of various settings of the parameters of the forget threshold (a) and the number of suggestedlocations (b)
deeply the possible presence of a phase transition in the knowl-edge acquisition process, as suggested by the previous results.
Moreover, we study some general properties of the nodes’ SN,such as degree distribution and clustering coefficient.
1 10 100 1000 10000Time
0.01
0.02
0.03
0.04
0.05
Hit
Rat
io
forget = 50sforget = 75sforget = 150s
(a) Chain
1 10 100 1000 10000Time
0
0.02
0.04
0.06
0.08
Hit
Rat
io
forget = 50 sforget = 75 sforget = 150 s
(b) Clust. Coeff. = 0.2
1 10 100 1000 10000Time
0
0.02
0.04
0.06
0.08
Hit
Rat
io
forget = 50 sforget = 75 sforget = 150 s
(c) Clust. Coeff. = 0.5
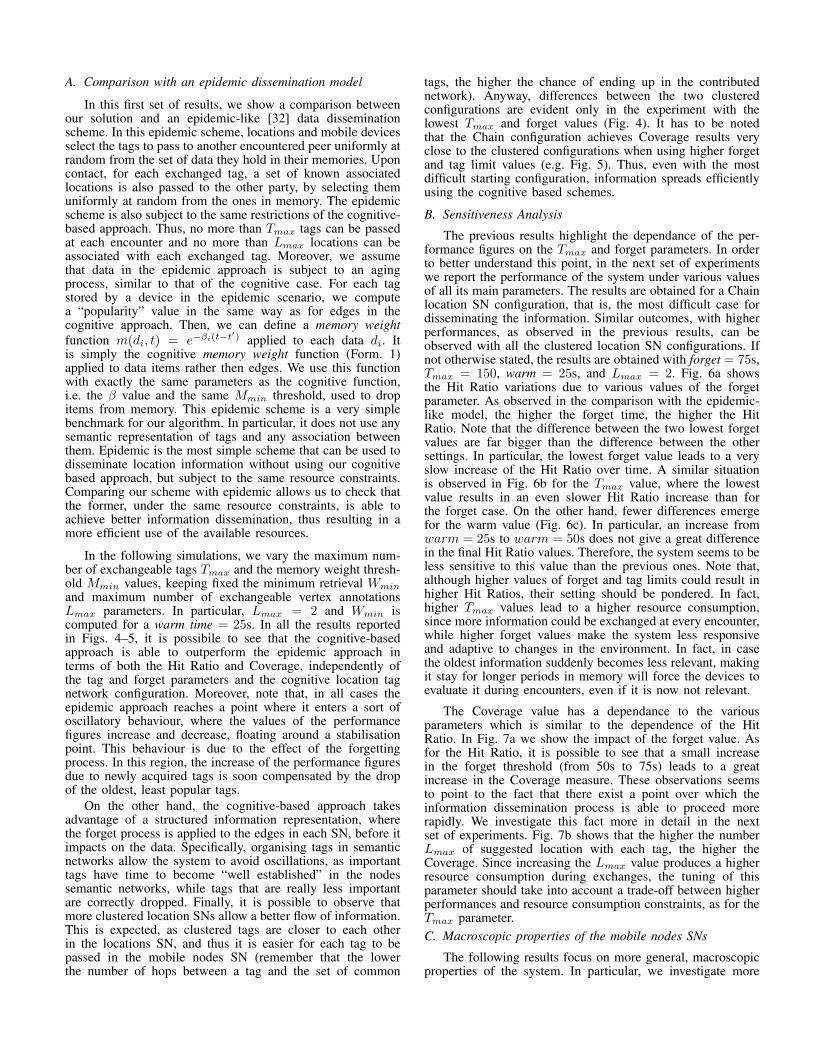
Fig. 8: Phase transitions for the Hit Ratio metric; #tags = 50, warm threshold = 15s
Fig. 8 presents an analysis on the phase transition for theHit Ratio for all the three SN location organisation configura-tions. The results are obtained by varying the forget value andwith a Tmax = 50 and warm = 15s. Similar results can beobtained with different configurations of the parameters. Notethat for the lowest forget values, all the configurations lead toa loss of information rather than an increase. This is due tothe fact that the forget process is quicker than the knowledgeacquisition process, so that data is dropped rapidly before itcan be seen again or new data can be added. Interestingly,the Hit Ratio does not reach a value of 0. Physical Locationsdo not change their SNs. Hence, devices can always addsome information from them, even if they drop it in a veryshort time. Eventually, the system reaches a stabilisation pointwhere the Hit Ratio does not increase or decrease anymore.This behaviour is changed by increasing the forget value. Inparticular, for the two clustered configurations, a small increaseof the forget parameter (from 50s to 75s) leads from a loss ofinformation to a gain of knowledge. This process is achievedalso for the Chain configuration, but it needs higher valuesof the forget parameter. This sudden change highlights thepresence of a phase transition point, showing that if the datastored in memory is able to reach a given critical mass, itprompts an increase of knowledge. Under that value, even theinformation initially owned by each node can get lost.
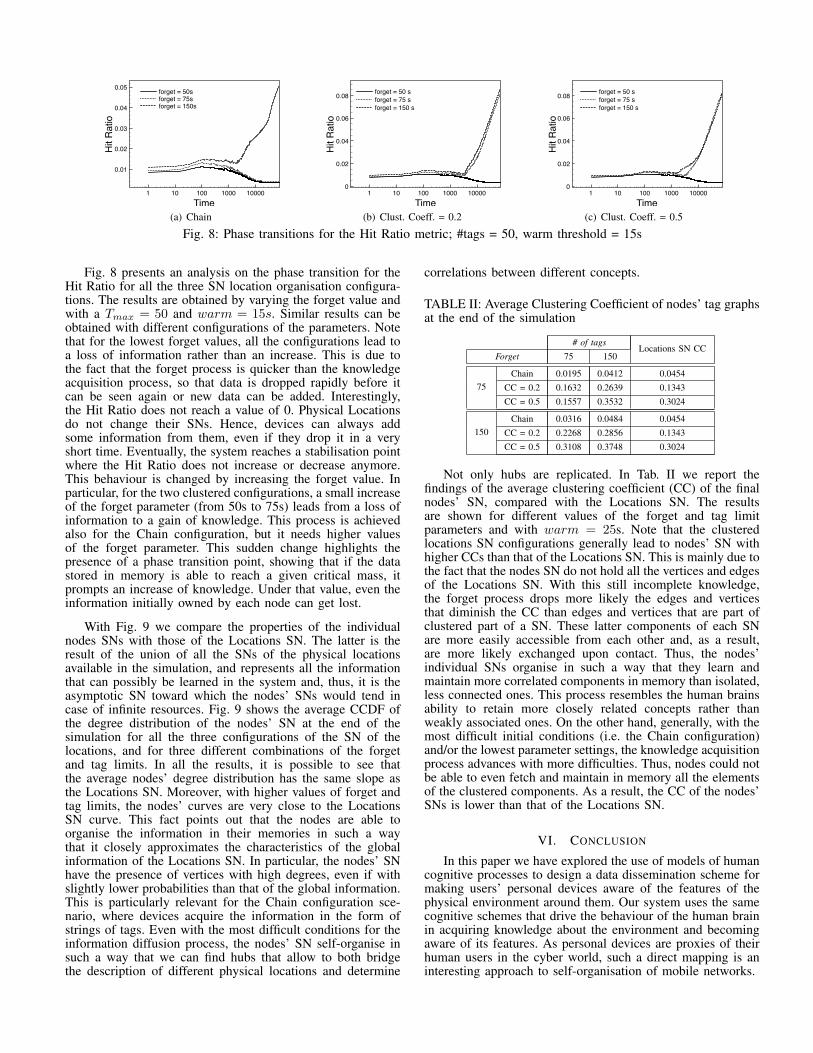
With Fig. 9 we compare the properties of the individualnodes SNs with those of the Locations SN. The latter is theresult of the union of all the SNs of the physical locationsavailable in the simulation, and represents all the informationthat can possibly be learned in the system and, thus, it is theasymptotic SN toward which the nodes’ SNs would tend incase of infinite resources. Fig. 9 shows the average CCDF ofthe degree distribution of the nodes’ SN at the end of thesimulation for all the three configurations of the SN of thelocations, and for three different combinations of the forgetand tag limits. In all the results, it is possible to see thatthe average nodes’ degree distribution has the same slope asthe Locations SN. Moreover, with higher values of forget andtag limits, the nodes’ curves are very close to the LocationsSN curve. This fact points out that the nodes are able toorganise the information in their memories in such a waythat it closely approximates the characteristics of the globalinformation of the Locations SN. In particular, the nodes’ SNhave the presence of vertices with high degrees, even if withslightly lower probabilities than that of the global information.This is particularly relevant for the Chain configuration sce-nario, where devices acquire the information in the form ofstrings of tags. Even with the most difficult conditions for theinformation diffusion process, the nodes’ SN self-organise insuch a way that we can find hubs that allow to both bridgethe description of different physical locations and determine
correlations between different concepts.
TABLE II: Average Clustering Coefficient of nodes’ tag graphsat the end of the simulation
# of tagsLocations SN CC
Forget 75 150
75Chain 0.0195 0.0412 0.0454
CC = 0.2 0.1632 0.2639 0.1343
CC = 0.5 0.1557 0.3532 0.3024
150Chain 0.0316 0.0484 0.0454
CC = 0.2 0.2268 0.2856 0.1343
CC = 0.5 0.3108 0.3748 0.3024
Not only hubs are replicated. In Tab. II we report thefindings of the average clustering coefficient (CC) of the finalnodes’ SN, compared with the Locations SN. The resultsare shown for different values of the forget and tag limitparameters and with warm = 25s. Note that the clusteredlocations SN configurations generally lead to nodes’ SN withhigher CCs than that of the Locations SN. This is mainly due tothe fact that the nodes SN do not hold all the vertices and edgesof the Locations SN. With this still incomplete knowledge,the forget process drops more likely the edges and verticesthat diminish the CC than edges and vertices that are part ofclustered part of a SN. These latter components of each SNare more easily accessible from each other and, as a result,are more likely exchanged upon contact. Thus, the nodes’individual SNs organise in such a way that they learn andmaintain more correlated components in memory than isolated,less connected ones. This process resembles the human brainsability to retain more closely related concepts rather thanweakly associated ones. On the other hand, generally, with themost difficult initial conditions (i.e. the Chain configuration)and/or the lowest parameter settings, the knowledge acquisitionprocess advances with more difficulties. Thus, nodes could notbe able to even fetch and maintain in memory all the elementsof the clustered components. As a result, the CC of the nodes’SNs is lower than that of the Locations SN.
VI. CONCLUSION
In this paper we have explored the use of models of humancognitive processes to design a data dissemination scheme formaking users’ personal devices aware of the features of thephysical environment around them. Our system uses the samecognitive schemes that drive the behaviour of the human brainin acquiring knowledge about the environment and becomingaware of its features. As personal devices are proxies of theirhuman users in the cyber world, such a direct mapping is aninteresting approach to self-organisation of mobile networks.

1 10Degree
1e-06
1e-05
1e-04
0.001
0.01
0.1
1
CC
DF
Locations SN#tags 75 - forget = 75s#tags 150 - forget = 75s#tags 150 - forget = 150s
(a) Chain
1 10 100Degree
1e-07
1e-06
1e-05
1e-04
0.001
0.01
0.1
1
CC
DF
Locations SN - CC = 0.2#tags = 75 - forget = 75#tags = 150 - forget = 75#tags = 150 - forget = 150
(b) Clust. Coeff. = 0.2
1 10 100Degree
1e-07
1e-06
1e-05
1e-04
0.001
0.01
0.1
1
CC
DF
Locations SN - CC = 0.5#tags = 75 - forget = 75s#tags = 150 - forget = 75s#tags = 150 - forget = 150s
(c) Clust. Coeff. = 0.5
Fig. 9: Mean degree distribution in the nodes’ final SNs
The algorithm we have proposed is shown to be quite effi-cient from a number of standpoints. Under limited resources,it results in more effective dissemination of information withrespect to reference solutions that do not exploit cognitivemodels. This result is achieved thanks to a structured infor-mation representation in memory, based on cognitive models,that allows the most relevant data to be kept in the users’devices, allowing an increase of knowledge. Moreover, thestructural properties of the network of information describingphysical places collected autonomously at nodes is remarkablyclose to what would be achieved (asymptotically) with infiniteresources. Finally, a sensitiveness analysis revealed interestingproperties of the system, such as the presence of phasetransitions in the dissemination process, determined by thesystem’s parameters. Interestingly, the presented results opento further investigations, such as, for example, models thatcan mathematically describe the properties of these transitionphases, or, in a totally different domain, ways of organisingthe description of physical places that optimise their diffusion.Nevertheless, the set of results we have presented in the paperalready provides a solid indication about the effectiveness ofour approach for implementing a self-organising data dissem-ination scheme for making mobile nodes autonomously awareof the features of the physical environment around them.
ACKNOWLEDGMENT
This work is supported by the RECOGNITION (FP7-IST257756) and EINS (FP7-FIRE 288021) EC projects.
REFERENCES
[1] M. Conti et al., “Looking ahead in pervasive computing: Challengesand opportunities in the era of cyber–physical convergence,” Pervasiveand Mobile Computing, vol. 8, no. 1, pp. 2–21, 2012.
[2] C. Boldrini and A. Passarella, “Data dissemination in opportunisticnetworks,” in Mobile Ad Hoc Networking: Cutting Edge Directions,Second Edition, S. Basagni et al., Ed. Wiley, 2013, pp. 453–490.
[3] G. Gigerenzer, “Why heuristics work,” Perspectives on PsychologicalScience, vol. 3, no. 1, pp. 20–29, 2008.
[4] L. J. Schooler, R. Hertwig et al., “How forgetting aids heuristicinference,” Psychological review, vol. 112, no. 3, pp. 610–627, 2005.
[5] M. Conti, M. Mordacchini, and A. Passarella, “Data dissemination inopportunistic networks using cognitive heuristics,” in Proc. of AOC2011. IEEE, 2011, pp. 1–6.
[6] R. Bruno, M. Conti, M. Mordacchini, and A. Passarella, “An analyticalmodel for content dissemination in opportunistic networks using cog-nitive heuristics,” in Proc. of MSWIM 2012. ACM, 2012, pp. 61–68.
[7] L. Valerio, M. Conti, E. Pagani, and A. Passarella, “Autonomiccognitive-based data dissemination in opportunistic networks,” in Proc.of IEEE WOWMOM 2013, 2013, pp. 1–10.
[8] M. Conti, M. Mordacchini, A. Passarella, and L. Rozanova, “Asemantic-based algorithm for data dissemination in opportunistic net-works,” in Proc. of IWSOS 2013. Springer, 2013.
[9] M. Mordacchini, L. Valerio, M. Conti, and A. Passarella, “A cognitive-based solution for semantic knowledge and content dissemination inopportunistic networks,” in Proc. of AOC 2013. IEEE, 2013.
[10] M. J. Egenhofer and D. M. Mark, “Naive Geography,” in SpatialInformation Theory A Theoretical Basis for GIS, 1995, pp. 1–15.
[11] Y. Tuan, Space and place: The perspective of experience. Universityof Minnesota Press, 2001.
[12] M. Raubal, H. J. Miller, and S. Bridwell, “User-Centred Time Geog-raphy for Location-Based Services,” Geografiska Annaler: Series B,Human Geography, vol. 86, no. 4, pp. 245–265, 2004.
[13] C. Clark and D. L. Uzzell, “The Affordances of the Home, Neighbour-hood, School and Town Centre for Adolescents,” Journal of Environ-mental Psychology, vol. 22, no. 1-2, pp. 95–108, 2002.
[14] J. J. Gibson, The Ecological Approach to Visual Perception. LawrenceErlbaum, 1986.
[15] T. Jordan, M. Raubal, B. Gartrell, and M. Egenhofer, “An Affordance-Based Model of Place in GIS,” SDH 98, vol. 98, pp. 98–109, 1998.
[16] B. Bennett and P. Agarwal, “Semantic categories underlying the mean-ing of ’place’,” Proc. of COSIT 2007, pp. 78–95, 2007.
[17] M. Zook and M. Graham, “Mapping digiplace: geocoded internet dataand the representation of place,” Environment and planning, vol. 34,no. 3, p. 466, 2007.
[18] T. Rattenbury, N. Good, and M. Naaman, “Towards automatic extractionof event and place semantics from flickr tags,” in Proceedings of ACMSIGIR 2007. ACM, 2007, pp. 103–110.
[19] L. Hollenstein and R. Purves, “Exploring place through user-generatedcontent: Using flickr tags to describe city cores,” Journal of SpatialInformation Science, no. 1, pp. 21–48, 2012.
[20] J. Cranshaw et al., “The livehoods project: Utilizing social media tounderstand the dynamics of a city,” in Proc. of ICWSM 2012, 2012.
[21] R. Stedman, “Toward a social psychology of place predicting behaviorfrom place-based cognitions, attitude, and identity,” Environment andbehavior, vol. 34, no. 5, pp. 561–581, 2002.
[22] G. B. Colombo, M. J. Chorley, V. Tanasescu, S. M. Allen, C. B.Jones, and R. M. Whitaker, “Will you like this place? a tag-based placerepresentation approach,” in Proc. of PerMoby 2013, San Diego, 2013.
[23] M. F. Goodchild, “Citizens as sensors: the world of volunteeredgeography,” GeoJournal, vol. 69, no. 4, pp. 211–221, Nov. 2007.
[24] S. A. Golder and B. A. Huberman, “Usage patterns of collaborativetagging systems,” J. Inf. Sci., vol. 32, no. 2, pp. 198–208, Apr. 2006.
[25] E. Quintarelli, “Folksonomies: power to the people,” in Proc. of ISKOI2005, 2005.
[26] R. Sinha, “Tagging from personal to social - WWW 06 keynote,” Tech.Rep., 2006.
[27] B. Gawronski and B. K. Payne, Handbook of implicit social cognition:Measurement, theory, and applications. The Guilford Press, 2010.
[28] R. S. Wyer Jr, “Principles of mental representation,” Social psychology:Handbook of basic principles, vol. 2, pp. 285–307, 2007.
[29] C. D. Manning, P. Raghavan, and H. Schtze, Introduction to InformationRetrieval. New York, NY, USA: Cambridge University Press, 2008.
[30] S. Deyne and G. Storms, “Word associations: Network and semanticproperties,” Behavior Research Methods, vol. 40, no. 1, pp. 213–231,2008.
[31] P. Holme and B. J. Kim, “Growing scale-free networks with tunableclustering,” Physical review E, vol. 65, no. 2, p. 026107, 2002.
[32] A. Vahdat, D. Becker et al., “Epidemic routing for partially connectedad hoc networks,” Technical Report CS-200006, Duke University, Tech.Rep., 2000.