Rijksuniversiteit Groningen Detectability of biosignatures in ...

Making Great Leaps Forward: Accounting for Detectability inHerpetological Field Studies
MARC J. MAZEROLLE,1,2 LARISSA L. BAILEY,1 WILLIAM L. KENDALL,1 J. ANDREW ROYLE,1
SARAH J. CONVERSE,3 AND JAMES D. NICHOLS1
1USGS Patuxent Wildlife Research Center, 12100 Beech Forest Road, Laurel, Maryland 20708, USA3Colorado Cooperative Fish and Wildlife Research Unit, USGS Patuxent Wildlife Research Center,
12100 Beech Forest Road, Laurel, Maryland 20708, USA
ABSTRACT.—Detecting individuals of amphibian and reptile species can be a daunting task. Detection can
be hindered by various factors such as cryptic behavior, color patterns, or observer experience. These factors
complicate the estimation of state variables of interest (e.g., abundance, occupancy, species richness) as well
as the vital rates that induce changes in these state variables (e.g., survival probabilities for abundance;
extinction probabilities for occupancy). Although ad hoc methods (e.g., counts uncorrected for detection,
return rates) typically perform poorly in the face of no detection, they continue to be used extensively in
various fields, including herpetology. However, formal approaches that estimate and account for the
probability of detection, such as capture-mark-recapture (CMR) methods and distance sampling, are
available. In this paper, we present classical approaches and recent advances in methods accounting for
detectability that are particularly pertinent for herpetological data sets. Through examples, we illustrate the
use of several methods, discuss their performance compared to that of ad hoc methods, and we suggest
available software to perform these analyses. The methods we discuss control for imperfect detection and
reduce bias in estimates of demographic parameters such as population size, survival, or, at other levels of
biological organization, species occurrence. Among these methods, recently developed approaches that no
longer require marked or resighted individuals should be particularly of interest to field herpetologists. We
hope that our effort will encourage practitioners to implement some of the estimation methods presented
herein instead of relying on ad hoc methods that make more limiting assumptions.
Data from field studies on amphibian andreptile populations or communities are typicallyreported as some form of count statistic reflect-ing population size, species presence/absence,or species richness. For instance, depending onthe objectives and methods, statistics mightinclude the number of Spotted Salamanders(Ambystoma maculatum) captured at a pond driftfence per unit of sampling effort (trap night),the total number of lizard species seen duringa visual encounter survey in a forest quadrat, orthe number of control and treatment sites whereGreen Frogs (Rana clamitans) were heard calling.In other cases, the number of previouslymarked individuals caught on a later occasion(i.e., a return rate) might be used as a measureof survival for that period. These count indicesor return rates are then used in subsequentstatistical analyses (e.g., ANOVA, linear re-gression) to evaluate patterns and test hypoth-eses of interest. Such approaches assume that
individuals or species are detected perfectly(i.e., the probability of detecting an individualor a species is 1), or that the probability ofdetection is constant. Such practices have beenextensively criticized in the literature, becausethe assumption of perfect or constant detect-ability is seldom true (Preston, 1979; Nichols,1992; Pollock et al., 2002; Williams et al., 2002).
Most field herpetologists will agree that manyamphibians and reptiles are difficult to detect intheir natural environments. Indeed, many spe-cies are nocturnal, have cryptic color patterns,live underground or in murky waters, and maybe conspicuous only during certain times of theyear or under particular weather conditions. Inaddition, detectability can depend on thesampling method selected, sampling effort,habitat type, as well as on the visual or auralacuity of the observers, their fatigue, experience,and motivation (Heyer et al., 1994; Bailey et al.,2004a). Thus, evaluating the size of a populationof a target species, survival probability, or thetotal number of species present within a studyarea requires more sophisticated approachesthan simple count-based indices.
In a population study, the expected value ofthe total number of individuals counted (C 5total number of individuals observed, heard,
2 Corresponding Author. Present address: Departe-ment des sciences appliquees, Universite du Quebecen Abitibi-Temiscamingue, 445 boulevard de l’Uni-versite, Rouyn-Noranda, Quebec J9X 5E4, Canada;E-mail: [email protected]
Journal of Herpetology, Vol. 41, No. 4, pp. 672–689, 2007Copyright 2007 Society for the Study of Amphibians and Reptiles

captured, etc.) during a sampling period isgiven by the product of the probability ofdetection (P) and the true unknown totalnumber of individuals (N) in the population,such that E(C) 5 PN (Otis et al., 1978; Nichols,1992; Anderson, 2001; Williams et al., 2002). Toillustrate, consider that during the sampling ofa forest quadrat an investigator encounters 40Red-Backed Salamanders (Plethodon cinereus).This means that PN 5 40, or N 5 40/P. Withoutany knowledge of the probability of detection, itbecomes impossible to estimate N: there are aninfinite number of combinations of PN yielding40 (e.g., 0.1 3 400, 0.25 3 160, 0.5 3 80, 1 3 40).We know that at least 40 individuals occur inthe quadrat (i.e., salamanders detected by theinvestigator), but all we can conclude aboutpopulation size is that N $ 40 unless weestimate P. One quickly realizes the magnitudeof the problem and potential repercussions onthe assessment of population size and trends.Such issues are apparent in the evaluation ofglobal amphibian declines (Houlahan et al.,2000; Alford et al., 2001; Green, 2003; Schmidt,2004). Imperfect detectability also extends to theestimation of survival, the number of speciespresent at a site, or the number of sites occupiedby a species of interest.
In an attempt to mitigate the confoundingeffects of detectability, investigators have at-tempted to standardize methods or samplingconditions (Heyer et al., 1994; Pollock et al.,2002; Anderson, 2001, 2003), but it remainsdifficult to account for, or even identify, allpossible factors influencing detection (e.g.,observer hearing or visual acuity, animalbehavior, weather conditions). Fortunately,a number of statistical approaches have beendeveloped to estimate the probability of de-tection from single-site population studies tocommunity level studies over large scales.However, these methods are not widely usedby the herpetological community, and mostherpetological papers from field surveys arestill based on some form of count statistic orreturn rate uncorrected for the probability ofdetection. Here, we review methods for esti-mating detection probability that may appeal toa wide audience, ranging from the undergrad-uate student to the seasoned field researcherconducting herpetological fieldwork.
We begin by introducing model selection andrelated concepts that are used throughout thispaper. The rest of the paper is divided in twomajor sections. In the first part, we reviewmethods that are used to estimate abundanceand some of the vital rates that influenceabundance (i.e., survival and movement prob-abilities) when individuals are captured orresighted. For the second part, we shift our
focus to techniques where individuals are notcaptured or resighted, often conducted at largerspatial scales where it is either impractical orimpossible to individually mark animals. Here,the interest may be to estimate the proportion ofsites occupied by a species, abundance, or theprobability that a species will go extinct at a site.Throughout this paper, we use real herpetolog-ical data sets to illustrate the use and interpre-tation of these methods. We also provideAppendix 1 detailing existing software thatallows practitioners to implement the methodsmentioned herein, as well as formally test someof their assumptions.
MODEL SELECTION
In many examples featured in this paper, weuse model selection strategies and inferencebased on the second-order Akaike InformationCriterion, or AICc (Akaike, 1973; Hurvich andTsai, 1989; Burnham and Anderson, 2002). Thisframework consists of specifying, a priori,potential models explaining the process ofinterest and selecting models that fit the datawell with a minimum number of variables (i.e.,a trade-off between bias and variance). Amongthe advantages of this approach, one candirectly weigh the evidence in favor of a model,given the set of candidate models, using Akaikeweights (wi) (Burnham and Anderson, 2002).For instance, for a given data set, a model withan Akaike weight of 0.5 has four times thesupport of a model with an Akaike weight of0.125 (0.5/0.125 5 4): such comparisons aretermed ‘‘evidence ratios.’’ In cases whereseveral models have similar weight, one canbase inferences on the whole set of candidatemodels, a procedure called model averaging ormultimodel inference (Buckland et al., 1997;Burnham and Anderson, 2002). This consists ofusing the information available (e.g., estimate ofa parameter of interest, predicted value) fromthe whole set of models to compute a meanweighted by the Akaike weight of each model.For more details on the use of the AICc andmultimodel inference in herpetology, consultMazerolle (2006).
PART I: ESTIMATING ABUNDANCE AND ASSOCIATED
VITAL RATES WHEN INDIVIDUALS ARE CAPTURED
OR RESIGHTED
In this section, we present methods toestimate abundance and associated vital ratesof a population, while accounting for detect-ability, when individuals are captured orresighted. We present three classes of capture-mark-recapture (CMR) models: closed-popula-tion, open-population, and robust design mod-
ACCOUNTING FOR DETECTABILITY IN FIELD STUDIES 673

els. Closed population models focus on estimat-ing abundance where the target population issampled over a short time period during whichno births, deaths, immigrations, or emigrationsoccur. In contrast, open population modelstypically focus on demographic rates such assurvival and involve studies over longer timeperiods where birth, death, immigration, oremigration can occur. The third class, robustdesign, is a mixture of open and closedpopulation models.
CLOSED POPULATIONS MODELS: ABUNDANCE
Closed population estimators have been de-veloped for different study designs (Otis et al.,1978; Williams et al., 2002). Well-known estima-tors like the Lincoln-Petersen (Lincoln, 1930)only require two sampling occasions. However,three or more sampling occasions (t) permitmore flexible modeling and are highly recom-mended. Individuals are normally captured,marked and released to be recaptured orresighted on a later occasion. Alternatively,individuals may be removed from the popula-tion following initial capture (removal or de-pletion methods: Otis et al., 1978; White et al.,1982). At the end of the study, one can generatea capture history for each individual witha series of ones and zeros to indicate whetherthe individual was seen on each occasion. Forinstance, we see from a history of ‘‘101’’ that theindividual was captured on the first and thirdoccasion but not on the second occasion. Thecombination of these types of data with variousclosed-population models allows one to esti-mate population size (N) and capture probabil-ities (P).
Assumptions.—Assumptions of the closed-population models include the following: (1)No births, deaths, immigration, or emigrationduring the sampling interval (the closureassumption); (2) All individuals are equallylikely to be captured within each sample (equalcapture probability) and no animal has proba-bility of capture equal to zero, P ? 0; (3) Marksare not lost or overlooked by the observer, andall marks are recorded correctly.
Numerous models have been developed torelax assumption 2; the most widely applied arethose included in program CAPTURE (Appen-dix 1). However, researchers are in no waylimited to these models (Pledger, 2000; White,2005; Conn et al., 2006). Collectively, closed-population models allow detection (i.e., cap-ture) to vary with time (t), behavioral (or trap)response (b), and heterogeneity (h). Here,heterogeneity implies that capture probabilitiesvary among individuals in a manner not readilyexplained by potential individual covariates.
When variation among individuals is associatedwith factors such as species type, body sizeclass, or sex, stratified analyses can be used (i.e.,analysis by groups). If covariates are measuredon each individual (e.g., mass, length), one caninclude the effect of these covariates on captureprobability with the conditional likelihood(conditional on individuals observed) modelsof Huggins (1989, 1991) and Alho (1990). In thisspecific case, abundance is not itself a parameterin the model but is computed as a derivedparameter, based on the estimated captureprobability.
Example.—Bailey et al.’s (2004b,c,d) study onterrestrial salamanders compared a variety ofpopulation estimation methods. The data werecollected over a three-year period at severalsites within Great Smoky Mountains NationalPark, where salamanders of multiple speciesover 18-mm snout–vent length (SVL) wereindividually marked using fluorescent elasto-mer (Bailey et al., 2004b). For illustrativepurposes, we analyze a small subset of theirdata, consisting of two species (Plethodon serra-tus and Plethodon glutinosus complex) from onesite in 1999. In this example, a CMR study wasconducted over four consecutive days, followedimmediately by a temporary removal studywhere the site was visited every other day foreight days (resulting in four removal occasions:captured individuals were held during the eightdays, then released, Bailey et al., 2004d). Thespecies were treated as groups in the analysis;hence, abundance was estimated for eachspecies. Including the species in a commonanalysis allowed us to share information acrossthe species, which provides greater statisticalefficiency (i.e., better precision of the estimates).
We used the free software Program MARK4.2 (Appendix 1) to estimate population sizewith data collected during the four consecutivevisits using four models: Mo (constant captureprobability), Mb (behavioural response), Mt
(time variation), Mspecies (variation among spe-cies). Huggins-Alho conditional closed-capturemodels were used. We then compared themodel-averaged population estimates to esti-mates from the subsequent removal study.Removal study estimates were obtained withthe variable probability removal estimator (Mbh,Pollock et al., 1990) of program CAPTURE(Appendix 1). Finally, we report a simple Lin-coln-Petersen (two-sample Mt; Lincoln, 1930)estimate obtained by condensing captures fromthe mark-recapture study, collectively consider-ing them a single initial sample, then using theremoval study as a single ‘‘recapture occasion.’’
Results.—Model selection results from theCMR analyses indicated slightly higher supportfor a model with species-specific detection
674 M. J. MAZEROLLE ET AL.
probabilities compared to the constant detectionmodel, but there was considerable modelselection uncertainty (Table 1). The evidenceratio with the second-ranked model (0.51/0.415 1.24) does not give clear evidence that theMspecies model is the ‘‘best’’ model; thus, allmodels are included in a model-averagedestimate of population size. The populationestimate (for both species combined) from theremoval study was lower than either the model-averaged estimate or the Lincoln-Petersen esti-mate (Table 2), a common finding by Bailey etal. (2004d).
Discussion.—The assumption of equal detec-tion probability across time, space, and individ-uals is unlikely to hold for most amphibian andreptile species. Modern closed-population mod-els offer researchers a variety of options forrelaxing this assumption and combining data tobetter estimate p (White, 2005; Conn et al., 2006).In the example presented here, there is consid-erable uncertainty in the factors that contributeto variation in detection probability for a popu-lation of terrestrial salamanders consisting oftwo species. The removal population estimatewas somewhat lower than the model-averagedfour-occasion CMR estimate or the Lincoln-Petersen estimate, which are both robust totemporal variation. Ignoring heterogeneityleads to underestimates in population size,whereas ignoring model selection uncertaintymay also lead to an overstatement of theprecision of population estimates (see Table 2).
For further examples of closed mark-recapturepopulation estimation in herpetofaunal popula-tions, see Jung et al. (2000, 2002, 2005), Fogartyand Vilella (2003), Funk et al. (2003), and Nelsonet al. (2002). Removal methods have been usedby Bruce (1995), Salvidio (1998), Petranka andMurray (2001), and Jung et al. (2002).
Other Approaches Related to Sampling ClosedPopulations.—Other designs can also account fordetectability and estimate abundance, namelydouble sampling methods with independent ordependent observers. The independent observ-er method consists of two observers (observers
1 and 2) counting animals (or objects) indepen-dently within a very short time period so thatthe population can be considered closed (Wil-liams et al., 2002; Moore et al., 2004). Toimplement this method, we must identify theindividuals observed only by observer 1, onlyby observer 2, and the individuals detectedby both observers. The method can be extendedto more than two observers and analyzed withthe closed models presented above (Nicholset al., 1986). This method could be potentiallyuseful to estimate the number of alligator nestsor salamander burrows, where each observerwould take the position of each object ofinterest with a global positioning system(GPS) receiver.
In a dependent observer study, data arerecorded differently. Observer 1 indicates toobserver 2 each time an animal is sighted,whereas observer 2 notes all animals seen byobserver 1 as well as any individual missed byobserver 1; observers switch roles halfwaythrough the survey (Cook and Jacobson, 1979;Nichols et al., 2000). Software is also available toanalyze such data (Appendix 1). Implementa-tions of this method in herpetology include Junget al. (2002) and Grant et al. (2005).
Another alternative consists of estimatingdetectability and abundance from a markedsubpopulation (Williams et al., 2002). Here, theidea is to capture, mark, and release individualsduring an initial sampling effort and thenconduct one or more surveys without physicallycapturing individuals shortly after initial release(to respect the closure assumption). For in-stance, one could batch mark (e.g., by immer-sion in a solution of neutral red dye) tadpolescaptured at a pond during a single captureevent, release the individuals back into thepond, and then survey the pond a few hourslater by snorkeling to record the number ofmarked individuals resighted. This is a specialcase of the Lincoln-Petersen estimator. Formultiple resighting occasions, a program existsto implement different estimators for suchstudies (Appendix 1).
TABLE 1. Model selection results from analysis ofmark-recapture closed-population of Plethodon serratus
and Plethodon glutinosus complex at one site in GreatSmoky Mountains National Park during 1999.
ModelaNumber of
parameters (K) AICc DAICc
Akaikeweight (wi)
Mspecies 2 97.74 0.00 0.51Mo 1 98.19 0.46 0.41Mt 4 101.47 3.74 0.08
a Behavioral model (Mb) was fit to the data, but the modeldid not converge.
TABLE 2. Estimates, standard errors, and 95% con-fidences intervals of terrestrial salamander populationsize (N
_
) from capture-recapture and removal modelsconducted at one site in Great Smoky MountainsNational Park during 1999.
N_
SE(N_
) 95% CI
Closed-population(model averaged)
74 50.40 (24, 172)
Removal Mbh 29 8.76 (24, 68)Lincoln-Petersen 63 12.61 (38, 87)
ACCOUNTING FOR DETECTABILITY IN FIELD STUDIES 675

OPEN POPULATION MODELS: SURVIVAL ESTIMATION
The Jolly-Seber model is the basic openpopulation capture-recapture model (Jolly,1965; Seber, 1965). The study design appropriatefor using this model consists of capturing,marking, and releasing individuals during threeor more time periods t (i.e., capture occasions).Each time period is separated by an intervalduring which individuals are subject to mortal-ity and during which new individuals may berecruited into the population. The originalparameterization of this model allowed forestimation of population size at each timeperiod, as well as recruitment, survival, anddetection probabilities. Multiple alternativeparameterizations of the Jolly-Seber model havebeen developed, both to allow for estimation ofadditional parameters (including, in variouscases, recruitment, seniority, population growthrate, and super-population size) and also toallow for improved properties for model esti-mation (see Discussion below).
A familiar simplified form of the Jolly-Sebermodel is the ‘‘deaths-only’’ model, known asthe Cormack-Jolly-Seber (CJS) model (Cormack,1964; Jolly, 1965; Seber, 1965). Model parametersinclude apparent survival probabilities (Q) andcapture probabilities (P). Here, apparent sur-vival refers to the probability that an individualalive at time t survives to time t + 1 and does notpermanently emigrate out of the study area. Inother words, mortality and permanent emigra-tion are confounded in the CJS model (seeassumption 2, below).
Assumptions.—Assumptions of the CJS modelinclude the following: (1) Individuals arehomogeneous in their survival and detectionprobabilities; (2) There is no emigration fromthe study area, or a relaxed form of Assumption(2) is that all emigration is permanent; (3)Samples are instantaneous, and animals arereleased immediately after sampling; (4) Marksare not lost, and all marks are correctly read.
When ad hoc methods (e.g., return rates)which do not account for detection ,1 are usedto estimate survival, they produce only a mini-mum estimate of survival (for a useful discus-sion, see Schmidt et al., 2002). These methodsproduce valid estimates of survival only ifassumptions 2 through 4 hold, in addition tothe strong assumption that detection probabil-ities are equal to 1.
Example.—Frequently, in addition to estimat-ing survival probabilities, investigators are in-terested in answering questions about thefactors that influence survival. These mayinclude group variables (e.g., sex, site), envi-ronmental variables (e.g., rainfall, human dis-turbance), or variables at the individual level
(e.g., size, physiological condition). Lebreton etal. (1992) provided a basic framework foraddressing questions of this kind within mark-recapture models.
Converse et al. (2005) presented such ananalysis for Ornate Box Turtles (Terrapene ornataornata). The data were collected over a 20-yrperiod at a drift fence in western Nebraskamaintained primarily for a study of Yellow MudTurtles (Kinosternon flavescens; Iverson, 1991).Here, for illustrative purposes, we present anextension of the analysis by Converse et al.(2005), in which we examine whether animportant interaction exists between sex andminimum winter temperature (DcJanMN; esti-mated as the minimum temperature over themonths December and January), that is, wheth-er male and female survival are related insubstantially different ways to minimum wintertemperature.
We used the free software Program MARK4.2 (Appendix 1) for the analysis. We proposedtwo models of apparent survival, one withan interaction between sex and DcJanMN—Q(Sex ? DcJanMN)—and one without—Q (Sex +DcJanMN). In both cases, detection probabilitieswere allowed to vary across sampling year t,designated as P(t). We used model selectionprocedures implemented directly in ProgramMARK, to make inference about the biologicalquestion of interest (Burnham and Anderson,2002).
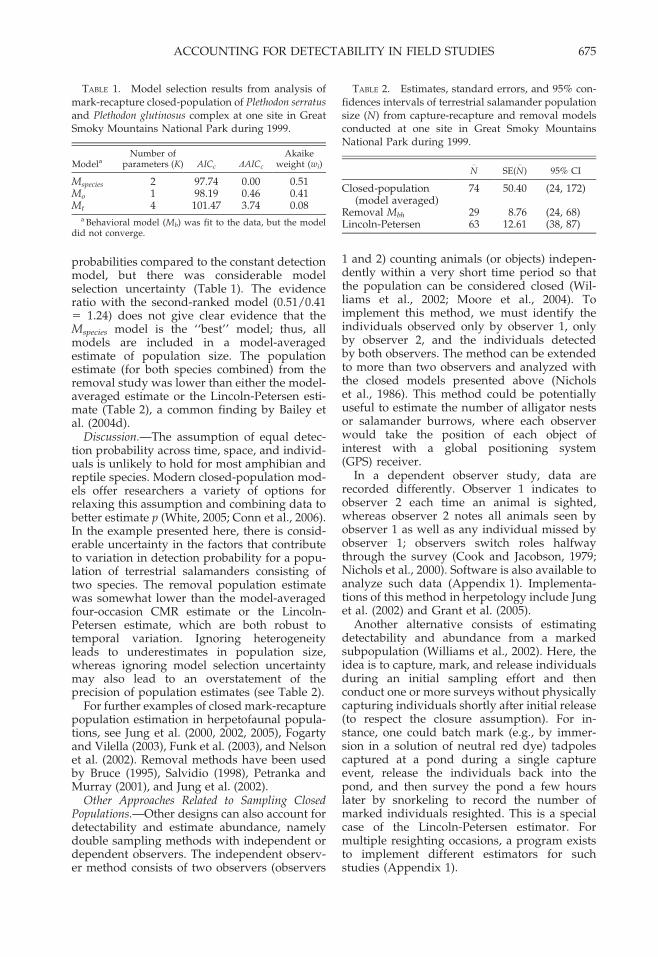
Results.—Model selection results indicatedonly slightly higher support for the model withan interaction between survival and DcJanMNthan for the model without an interaction term(Table 3). In this example, the evidence ratioof Akaike weights (0.51/0.49 5 1.04) is notconvincing that the model with the interactionterm is a definitively better model of apparentsurvival than the model without. Figure 1
TABLE 3. Model selection results from analysis ofapparent survival rates (Q) of Ornate Box Turtlescaptured at a drift fence in western Nebraska overa 20-yr period. Note that DcJanMN stands forminimum winter temperature.
Modela
Number ofparameters
(K) AICc DAICc
Akaikeweight
(wi)
Q (Sex ? DcJanMN)P(t)
15 650.99 0.00 0.51
Q (Sex + DcJanMN)P(t)
14 651.08 0.09 0.49
a In both models an additional variable was used, as inConverse et al. (2005), to avoid biasing results caused bytemporary emigration but is omitted from the model nameshere for brevity. See that paper for more discussion of thevariable.
676 M. J. MAZEROLLE ET AL.
illustrates the relationship between estimatedapparent survival and minimum winter tem-perature for the model with the interactionterm.
Discussion.—Converse et al. (2005) speculatedthat the observed negative relationship betweenestimated apparent survival and minimumwinter temperature was caused by rapid de-pletion of lipid reserves caused by highermetabolic rates in warm winters. The resultspresented here indicate that female survivalmay be slightly more sensitive than malesurvival to this effect. However, the evidencefor higher sensitivity in females is not strong.
The analysis presented in Converse et al.(2005) also suggested that the data violatedassumption 2 (i.e., temporary emigration wasoccurring). This was diagnosed because esti-mates of survival dropped substantially in thelast time interval (Converse et al., 2005). Ifindeed temporary emigration was prominent inthese data, the phenomenon can be dealt with inseveral ways, most effectively through design(see Robust Design below).
Alternative parameterizations and extensionsof the Jolly-Seber model include the works ofPradel (1996), Pradel et al. (1997), Schwarz andArnason (1996), and Link and Barker (2005).These models enable the estimation of addi-tional parameters such as abundance, seniority,recruitment, transience, and population growthrate. However, these additional parameterscome at the price of more restrictive assump-
tions than the CJS model. Readers shouldconsult the cited sources for more information.
For further examples of applications of theCJS model to estimate survival in herpetofaunalpopulations, see Woodward et al. (1987), Flatt etal. (1997), Schmidt and Anholt (1999), HolenwegPeter (2001), Kazmaier et al. (2001), Diller andWallace (2002), Schmidt et al. (2002), Anholt etal. (2003), Bjorndal et al. (2003), Hokit andBranch (2003), Retallick et al. (2004), Altwegg etal. (2005), Lind et al. (2005), Scherer et al. (2005),and Schmidt et al. (2005).
MULTISTATE POPULATION MODELS AND THE
ROBUST DESIGN
In the CJS open population model describedabove, it is assumed that each animal withina predefined group (e.g., sex class) is subject tothe same probabilities of survival and capture.However, in many cases, these assumptions areseverely compromised. For example, terrestrialsalamanders spend considerable time under-ground. Pond-breeding amphibians and nestingsea turtles might disperse to other breedinglocations or skip breeding altogether. Meta-morphs become unavailable for capture, untilthey become reproductively active and return tobreeding sites. Ignoring these issues will oftenbias estimates of survival. Furthermore, varia-tion in vital rates among these life stages, aswell as probabilities of movement or transitionbetween stages, are often of interest for testing
FIG. 1. Apparent survival estimates for male (closed circles) and female (open circles) Ornate Box Turtles asa function of minimum winter temperature, presented on a standard normal scale. Estimates are based ona model of apparent survival with an interaction term between sex and minimum winter temperature(DcJanMN). Predicted survival rates are equal for the two sexes when temperatures are slightly more than 0.5standard deviations above the mean. However, model selection results indicate that the estimated interactionbetween sex and DcJanMN is not a strong effect. (Converse et al., 2005).
ACCOUNTING FOR DETECTABILITY IN FIELD STUDIES 677
hypotheses about life history or constructingpopulation models.
Multistate mark-recapture models (MSMR,Arnason, 1973; Brownie et al., 1993; Schwarz etal., 1993) allow investigators to account formultiple locations or life stages (see Lebretonand Pradel, 2002; Kendall, 2004). For example,a study of both breeding and nonbreedingamphibians associated with two different pondsmight be viewed as consisting of four states(breeders in pond 1, nonbreeders affiliated withpond 1, and the same for pond 2). Under thisclass of models, parameters consist of survivaland capture probabilities for each state andprobabilities of transition between states (e.g.,from breeder to nonbreeder, or from pond 1 topond 2). Assumption 1 of the CJS model ismodified to assume that within each state thereis no undescribed heterogeneity in apparentsurvival and capture probabilities. Apparentsurvival under these models means an animalsurvives and does not permanently emigratefrom the collection of monitored states.
In many herpetological studies, temporaryemigration from the study area(s) causes com-plications, violating assumption 2 of the CJSmodel (see above). For many herpetofaunalpopulations, it is impractical to reasonablysample intermediate life stages, nonbreeders,or individuals that are skipping a breedingseason (Kendall and Bjorkland, 2001; Bailey etal., 2004e; Dutton et al., 2005) or those thatdisperse temporarily to breeding sites outsidethe study area (Rivalan et al., 2005). Multistatemodels can account for these emigrants bydefining one or more unobservable states, forwhich detection probability is zero (see Kendalland Nichols, 2002; Schaub et al., 2004). Howev-er, information on unobservable states must bederived indirectly; thus, in most cases somesupplemental information (e.g., satellite telem-etry) is required to estimate parameters ina robust way (Kendall, 2004). Alternatively,unobservable states such as skipped breedingor temporary emigration can be accounted forindirectly by employing some version of therobust design (e.g., Pollock, 1982; Williams etal., 2002). This framework consists of partition-ing each primary sampling period of interestinto multiple secondary sampling periods,where it is assumed that the state of the animalis maintained over all secondary samples. Wewill briefly describe three versions of thisdesign, each with different assumptions aboutthe capture process within a season (primaryperiod), that are pertinent to herpetofaunalpopulations.
Pollock’s Robust Design.—The original versionof the robust design (Pollock, 1982) assumesthat, for the duration of the sampling effort
within a given primary period, the populationof interest is closed to additions and subtrac-tions (i.e., no births, immigrants, deaths, oremigrants). The idea, as applied by Bailey et al.(2004d), is to nest a series of closed populationmodel analyses, one for each primary period,within an open population analysis based oneither the CJS or multistate models. Thepotential advantages are the ability to estimatemore parameters of interest, with better pre-cision, and where temporary emigration occurs,the ability to estimate survival with less biasand movement probabilities that are time-specific. Finally, Kendall (1999) showed thatthis model structure is robust even when certaintypes of violations of the closure assumptionoccur within primary periods (e.g., losses suchas emigration or death).
Open Robust Design.—The function and mod-eling advantages of the open robust design(Schwarz and Stobo, 1997; Kendall and Bjork-land, 2001) are similar to those of Pollock’sclosed robust design. In this case, however,closure within a season is not assumed; hence,modeling of capture probability is not as flexibleas with closed models. Instead, animals areassumed to arrive and depart the study area ina staggered fashion during sampling. In otherwords, arrival and departure times for individ-uals within a primary period are variable. Theassumption of demographic closure still holds(i.e., no births or deaths). We then model arrival,detection, and departure within each season, inaddition to between-season parameters. Kendalland Bjorkland (2001) and Dutton et al. (2005)applied this model to nesting sea turtles.
Gateway Robust Design.—Bailey et al. (2004e)developed the gateway robust design for thecase of pond-breeding salamanders, wherebreeders are captured at drift fences as theyarrive and depart from a breeding pond. Allcaptured individuals are breeders; therefore, theassumption of a static state described above issatisfied. In this case, however, mortality be-tween entry and exit is permitted and modeled.Church et al. (2007) applied this type of modelto the case of a metapopulation based onbreeding ponds, where each pond has a breed-ing and nonbreeding component.
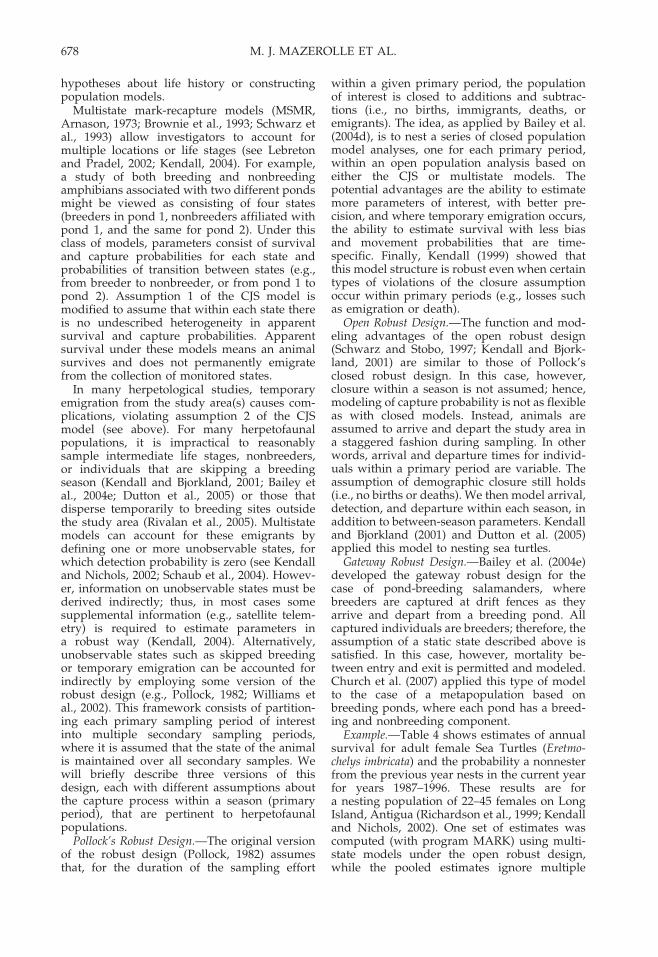
Example.—Table 4 shows estimates of annualsurvival for adult female Sea Turtles (Eretmo-chelys imbricata) and the probability a nonnesterfrom the previous year nests in the current yearfor years 1987–1996. These results are fora nesting population of 22–45 females on LongIsland, Antigua (Richardson et al., 1999; Kendalland Nichols, 2002). One set of estimates wascomputed (with program MARK) using multi-state models under the open robust design,while the pooled estimates ignore multiple
678 M. J. MAZEROLLE ET AL.

within-year captures and are consistent with thestandard CJS model structure presented in theprevious section. Notice the great improvementin precision (i.e., SE’s) by incorporating within-year information.
Discussion.—Interesting phenomena, such astemporary emigration (sometimes correspond-ing to nonbreeding) and arrival and departureat a study area, generate problems in classicmodels, such as the CJS model. Multistate androbust design models are formidable tools todeal with such scenarios and provide a meansto investigate these important life history pro-cesses. We believe that herpetologists willbenefit by including them in their data analysisarsenal. Readers may consult Wood et al. (1998),Blomberg and Shine (2001), Lowe (2003), andFretey et al. (2004) for applications of some ofthe models discussed in this section. Severalprograms are available to implement multistateand robust design models (Appendix 1).
PART II: ESTIMATING SPECIES PRESENCE, ABUNDANCE,
AND ASSOCIATED VITAL RATES WHEN INDIVIDUALS ARE
NOT CAPTURED OR RESIGHTED
Marking and recapturing individuals overa large collection of sites is logistically difficult.In this section, we focus on the estimation ofspecies presence, abundance, and vital rateswhen individuals are not necessarily capturedor resighted. The first approach we describedeals with estimating the probability of occu-pancy (i.e., presence) of a given species overa collection of sites. Then, we present tech-niques to deal with call indices. The last partdeals with two methods of estimating abun-dance, namely point count and distance sam-pling techniques.
SITE OCCUPANCY MODELS
In some cases, interest shifts from the numberof individuals of a given species in a populationat a single site to the number of populations ofthe species within a larger area or collection ofsites. For this purpose, one investigates thepatterns of species presence across sites. A siteis certainly ‘‘occupied’’ if the species is detectedat that site, but failure to detect a species duringall sampling occasions does not necessarilyimply the species is absent (e.g., see Weir etal., 2005). To address such problems, siteoccupancy models are an appealing tool as theysimultaneously estimate the probabilities ofdetection (P) and occupancy (y) (MacKenzie etal., 2002, 2006; Gu and Swihart, 2004). This typeof analysis is analogous to closed populationsmodels that estimate the number of individuals,except that in the site occupancy problem, thesite is the sampling unit and the total number ofsites sampled is known (MacKenzie et al. 2002).Also note that here, P represents the probabilityof detecting the species at a site conditional onits presence at that site during the survey.Typical data in the site occupancy frameworkconsist of repeated surveys at a collection ofsites, such as anuran call surveys conducted atbreeding sites, dipnetting for overwinteringtadpoles in ponds, or observing lizards in forestquadrats.
We start with cases where one conductsmultiple visits (at least two) to a set of samplesites (for guidelines on study design, seeMacKenzie et al. 2002, 2006; MacKenzie andRoyle, 2005). Here, a visit could consist of a callsurvey on a given night at a given site. Oneeither detects or does not detect the speciesduring the sampling visit. Thus, following Tvisits at a set of N sites, we can generatea detection history consisting of ones (detec-tions) and zeros (no detections) for each site.
Assumptions.—Assumptions of site occupancymodels are analogous to those for closedpopulations: (1) The occupancy state of the sitesis static during the period over which surveysare conducted. This means that no local extinc-tions or colonizations occur between the firstand last sampling visit. This assumption can berelaxed if movements in or out of the sites arerandom. (2) The probability of occupancy is thesame for all sites. (3) The probability ofdetecting the species in a survey, given it ispresent, is the same for all sites. (4) Within eachsite, detection of the species in each survey isindependent of detections during other surveys.
Typically, what constitutes a suitably‘‘closed’’ period (Assumption 1) depends onthe organism in question: for amphibians, thiscould be a single breeding season or wintering
TABLE 4. Estimates of survival and breedingprobabilities for Hawksbill Sea Turtles (Eretmochelys
imbricata) tagged at Long Island, Antigua, 1987–1996,from a multistate capture-recapture model, eitherusing or ignoring detailed capture histories withina year.
Parameter
Estimate (SE)
Open robustdesign
Pooled withinyear
Survival 0.95 (0.013) 0.94 (0.015)Breeding Prob. 1989 0.80 (0.10) 0.80 (0.16)Breeding Prob. 1990 0.40 (0.08) 0.40 (0.17)Breeding Prob. 1991 0.60 (0.08) 0.58 (0.14)Breeding Prob. 1992 0.68 (0.09) 0.66 (0.17)Breeding Prob. 1993 0.49 (0.08) 0.49 (0.19)Breeding Prob. 1994 0.46 (0.08) 0.45 (0.17)Breeding Prob. 1995 0.61 (0.09) 0.59 (0.21)Breeding Prob. 1996 0.34 (0.08) 0.34 (0.09)
ACCOUNTING FOR DETECTABILITY IN FIELD STUDIES 679

period. We can relax assumptions 2 and 3 byallowing occupancy and detection to be mod-eled as functions of covariates. Covariates onoccupancy (y) have to be constant through timebecause the occupancy status is constant, orclosed, over all surveys. Covariates on P can beeither constant or vary through time (i.e.,sampling occasions). Sites with no detectionsare still visited and a value for the covariate(s) iscollected, whereas in capture-recapture models,we do not know the value of a covariate for ananimal that was never captured (Otis et al.,1978; MacKenzie et al., 2006).
Example.—To illustrate the use of site occu-pancy models, we analyzed patterns of GreenFrog (Rana clamitans) occupancy in 34 acidic bogponds in eastern New Brunswick, Canada,searched on five occasions with visual and callsurveys during a single breeding season in 2000(data adapted from Mazerolle et al., 2005). Forsimplicity, we considered models with distanceto the closest pond as a possible covariate for yand air temperature as potentially influencingP. We contrasted these models with models thatassume constant occupancy and detection.
The analysis, run in program PRESENCE(Appendix 1), indicated moderate support (wi
5 0.61) for the model consisting of an effect ofdistance to the closest pond on Green Frogoccupancy and air temperature on the proba-bility of detection (Table 5). This model wasfollowed closely (wi 5 0.39) by the one withconstant occupancy probability across all sites,and detectability varying with air temperature(Table 5). Following model-averaging, an esti-mated 61.6 6 10.6% (estimate 6 SE) of siteswere occupied by Green Frogs. In contrast, thenaive estimate (based on the number of pondswhere Green Frogs were detected) indicatedthat only 52.9% of ponds were occupied,thereby underestimating the probability of
occupancy. Occupancy marginally increased asthe distance to neighboring ponds decreased(BetaDistpond: 20.893, 95% CI: 21.982, 0.197).Green frog detectability increased with temper-ature (BetaAirtemp: 1.307, 95% CI: 0.634, 1.980).
Discussion.—Site occupancy analyses are rap-idly gaining attention. For some additionalexamples of their use in herpetology, seeSchmidt (2004, 2005), Pellet and Schmidt(2005), and Smith et al. (2006). A number ofextensions to the single season model have beendeveloped with a wide array of applications.For instance, Royle and Link (2006) developedmodels where the species can be wronglyidentified as present when it is absent fromthe site (e.g., for cases where volunteers ina monitoring program have variable experi-ence). We mention other modifications to theclassic single season model below.
Applications to Species Richness Estimation.—MacKenzie et al. (2006) suggest using siteoccupancy analyses to estimate the fraction ofa species list present at a site in a single season.This approach shows promise in species-richregions such as the tropics in cases where a listof the species occurring in the area alreadyexists. In this framework, one records whethereach species on the list has been detected duringeach sampling visit at a single study site. Incomparison with the classic site occupancydesign, here, the species become the ‘‘sites,’’and y now represents the fraction of speciespresent at the site. In other words, each specieshas a detection history at this single study site.One can include covariates on detection for eachspecies, such as body size or habitat specializa-tion. In other instances, investigators may wishto estimate species richness at several sites. Toaddress this issue, Dorazio and Royle (2005),Dorazio et al. (2006), and Royle et al. (2007) havedeveloped animal community models by spec-ifying species-specific models of occurrence.
Multiple Season Models.—MacKenzie et al.(2003) have extended the single-season modelto multiple seasons using Pollock’s robustdesign (see multistate population modelsabove): sites are demographically closed duringseasons (no colonizations or extinctions) butopen between sampling seasons conducted overmultiple years. In addition to occupancy anddetection probabilities, these models allow theestimation of extinction and colonization pa-rameters, and one quickly realizes their value todraw inferences about metapopulation dynam-ics over large spatial and temporal scales.Hossack and Corn (2007) have an interestingapplication of multiseason models to amphibi-ans before and after wildfires.
Models Incorporating Heterogeneity in Detec-tion.—Heterogeneity in detectability introduces
TABLE 5. Model selection results from siteoccupancy analysis of Green Frogs at 34 bog pondsin eastern New Brunswick, Canada over five samplingvisits during 2000. Models used to estimate occupancy(y) and detection (P) included covariates of distanceto closest pond (Distpond), air temperature (Airtemp),and search effort (Effort).
Models
Number ofparameters
(K) AICc DAICc
Akaikeweight
(wi)
y(Distpond)P(Airtemp)
4 141.87 0 0.61
y(.) P(Airtemp) 3 142.79 0.92 0.39y(Distpond) P(Effort) 4 161.30 19.43 0.00y(Distpond) P(.) 3 161.88 20.01 0.00y(.) P(Effort) 3 161.93 20.06 0.00y(.) P(.) 2 163.19 21.31 0.00
680 M. J. MAZEROLLE ET AL.

a negative bias (underestimation) of occupancyestimates (Mazerolle, M. J., J. D. Nichols, andJ. E. Hines, unpubl. data). When no covariatesare available to model heterogeneity in de-tection probabilities, one can use a modifiedversion of the finite mixtures models (Norrisand Pollock, 1996; Pledger, 2000) to classify sitesinto two or more groups with differing proba-bilities of detection (MacKenzie et al., 2006: 139;Royle, 2006). Under the premise that heteroge-neity in detection is largely caused by abun-dance (i.e., detectability increases with abun-dance), Royle and Nichols (2003) developedmodels to estimate the average number ofindividuals/site and the detectability of indi-vidual animals. In contrast, detectability inclassic site occupancy models (above) is condi-tional on occupancy of at least one individual ofthe species. Royle (2006) provides a generaltreatment of models dealing with site-specificheterogeneity in detectability.
CALL INDEX MODELS
Many surveys of vocal anurans consist ofcalling surveys in which an observer recordsa calling index. For example, the familiar‘‘Wisconsin index’’ used by the North AmericanAmphibian Monitoring Program (NAAMP),takes on values 0–3, where zero is equivalent tonot detected; one represents discrete, no over-lapping calls; two corresponds to discrete, over-lapping calls; and three indicates a full chorus(Weir and Mossman, 2005). In this framework,the goal is to estimate the true abundance level,also termed the latent (i.e., unobserved) abun-dance index. Conceptually, this is the maximumindex value that could be observed in a verylarge number of visits at a given site.
The aim of call index models is to estimate thelatent abundance index (Royle, 2004a; Royleand Link, 2005). We either try to estimate itsvalue at specific sites, its distribution among‘‘replicate’’ sites, or the manner in whichcovariates influence the latent abundance indexand detection. In other words, we strive todescribe the proportion of sites occupied bypopulations capable of generating index valuesof 0, 1, 2, and 3 at the sites.
Assumptions.—Call index models share theassumptions of classic single-season occupancymodels (Assumptions 1–4). The data for a siteconsist of the index histories defined over thetotal number of visits (i.e., abundance index ateach visit).
Implementation.—An important issue with callindex models is that the latent abundance indexat a site may not be observed over the samplingvisits because of sampling error. As a result, onemust estimate the probabilities of correctly
observing the true abundance class duringa sample visit, as well as the probability ofmisclassifying a site in the wrong abundanceclasses. The reader is directed to Royle and Link(2005) for technical details of this approach. Callindex models including the effects of covariateson detectability can be implemented in pro-gramming software such as R (Appendix 1),using a routine supplied on the web by Royleand Link (2005). To our knowledge, this modelhas not yet been used for analyzing herpetolog-ical data with the exception of Royle and Link(2005).
POINT COUNT MODELS
Point count models deal with situationswhere individual counts are obtained at a col-lection of sites, but individuals are not or cannotbe marked. In such a framework, Royle (2004b)developed a model to estimate average abun-dance at the sites, as well as a probability ofdetection of the species. The simplest modelproduces two parameters: the probability ofdetecting individuals and the mean abundanceacross sites. Abundance is modeled either asa Poisson or negative binomial distribution, twodiscrete distributions commonly used to modelcounts of individuals (Royle, 2004b). For in-stance, a study amenable to such analyses couldconsist of counting the number of TimberRattlesnakes (Crotalus horridus) observed inrocky outcrops at a collection of sites visitedon two or more occasions during the snakeseason of activity.
Assumptions.—In this framework, one visitsa collection of sites for two or more samplingvisits during which we assume the following:(1) There is no change in abundance at the sitebetween the first and last visit; (2) Detection isconstant across sites; (3) Detections within eachsite are independent across visits; (4) Abun-dance follows the distribution specified in themodel. Models with added flexibility and re-alism can be built by including covariates (e.g.,habitat type) on abundance.
Example.—In this example, we compare theabundance of ranid frogs in 12 bog and 12upland ponds of eastern New Brunswick,Canada. Data originate from minnow traps setfor three consecutive days during July 1999 tocapture tadpoles, juveniles, and adults (MJM,unpubl. data). Traps were checked every dayfor their contents, yielding a count of individ-uals in each pond, and captured animals werereleased. We considered models with ranid frogabundance following either a Poisson or a neg-ative binomial distribution. Models includedpond type (bog vs. upland) as a covariate onabundance, and effort (number of traps/pond)
ACCOUNTING FOR DETECTABILITY IN FIELD STUDIES 681

as a covariate potentially influencing individualdetectability. We contrasted these models withsimpler forms consisting of constant abundanceand/or detectability.
Models fitting ranid frog abundance toa negative binomial distribution did not pro-duce consistent estimates, because of numericaldifficulties with the model for this data. Thus,we only report on models fitting abundance toa Poisson distribution. The model consisting ofabundance depending on the pond type anddetectability varying with effort ranked highest,having 49 times more support (evidence ratio 5
0.97 : 0.03) than its closest competitor (Table 6).In conditions where a model has an Akaikeweight . 0.90, it is appropriate to base inferenceon this single ‘‘best’’ model (Burnham andAnderson, 2002). The leading model revealedthat ranid frog abundance was considerablylower in bog ponds than upland ponds (BetaType:23.23, 95% CI: 24.25, 22.21), whereas detect-ability increased with trap effort (BetaEffort: 0.40,95% CI: 0.15, 0.64). Mean abundance at bog andupland ponds was 0.5 and 11.8 individuals perpond, respectively. This is not surprising giventhe acidic nature of the bog ponds which canlimit frog use (mean pH 6 SD: 3.67 6 0.27).Thus, overall pond occupancy could be esti-mated at 100% for upland (1 2 e211.8 5 1) and39% for bog ponds (i.e., 1 2 e20.5 5 0.39).
Discussion.—Point count models have beenused primarily in ornithological contexts (Keryet al., 2005; Royle et al., 2005). Dodd andDorazio (2004) and McKenny et al. (2006)applied this approach with amphibians, butotherwise, we know of no other publishedexamples with herpetological data sets. Pro-gram PRESENCE (Appendix 1) can implementpoint count models with covariates fittingabundance to a Poisson distribution, but for
more flexibility such as fitting models withnegative binomial abundance, one can use R(Appendix 1) with available code (see Kery etal., 2005).
DISTANCE SAMPLING: ESTIMATING ABUNDANCE FROM
LINE OR POINT TRANSECTS
A class of models has been developed forsituations where the goal is to estimate densityusing line or point transects after accounting fordetectability (Buckland et al. 1993, 2001, 2004).In a line transect, the observer travels alonga line, records all detected individuals on one orboth sides to some specified width, and mea-sures the perpendicular distance of each to thecenter line. In contrast, with the point transecttechnique, the observer remains at a point,records all individuals detected around thatpoint, and measures the distance of each fromthe point. In both point and line transects, weestimate detectability from a detection function,g(x), which is dependent on the distance to theline or point. Essentially, this function rests onthe premise that detectability on the line orpoint is one, and decreases with distance fromthe line or point (i.e., animals further from theline are less likely to be detected).
Assumptions.—The main assumptions of dis-tance sampling models include the following:(1) All individuals on the line are observed(detectability at distance 0 5 1, i.e., all individ-uals along the line are detected). (2) Individualsare detected at their initial position. A relaxedform of this assumption is that any predetectionmovement is random with respect to the line.(3) Distances are measured accurately.
A new class of distance models has emergedto deal with cases where the assumption ofperfect detection at distance zero cannot be met(Buckland et al., 2004). To respect assumption 2,animals must be detected before they attemptany evasive movement (i.e., before beingflushed from their initial position), otherwise,this will introduce problems at the analysisstage. For the third assumption, distance caneither be recorded on a continuous scale orgrouped into intervals (4–8 distance intervalsare recommended), depending on the organism.
Implementation.—Some elements of samplingdesign are worth mentioning to successfullyimplement distance sampling methods. First,the number of detections is a key component.Buckland et al. (2001) suggest, as a minimum,a total of 60–80 detections from 10–20 replicatetransects or points to reliably estimate thedetection function and density within a studyarea. Second, line or point transects should beplaced randomly, to ensure plots are represen-tative of the study area. Specifically, placement
TABLE 6. Model selection results from point countanalysis of ranid frogs captured at 12 bog ponds and12 upland ponds in eastern New Brunswick, Canada,with minnow traps set over three consecutive days inJuly 2002. Models used to estimate abundance (l) andindividual detection (P) included covariates of pondtype (Type), and trapping effort (Effort). Note thatonly the models fitting abundance to a Poissondistribution are shown, as the models with a negativebinomial component had convergence problems.
Models
Number ofparameters
(K) AICc DAICc
Akaikeweight
(wi)
l(Type) P(Effort) 4 237.02 0 0.97l(Type) P(.) 3 244.20 7.18 0.03l(.) P(Effort) 3 326.86 89.84 0l(.) P(.) 2 331.84 94.82 0
682 M. J. MAZEROLLE ET AL.

should not be along roads, trails, or fence lines,as one cannot assume that patterns along theseare the same as in other areas (Buckland et al.,2001). Finally, when it is impossible to measureperpendicular distance (e.g., an animal is seenahead in the transect instead of on a side), theobserver can measure the distance to the animal(r) and sighting angle (h) to calculate theperpendicular distance as r sin(h). Alternatively,one can place a flag where each individual wasobserved and return later to measure theperpendicular distance.
Although not very widespread in the herpe-tological literature, distance sampling methodshave been used with Desert Tortoise (Gopherusagassizii) (Anderson et al., 2001; Freilich et al.,2005), Eleutherodactylus frogs (Funk et al., 2003),and forest lizards and snakes (Rodda andCampbell, 2002). This technique could bepotentially useful to estimate abundance ofspecies that are easily observed such as snakesin desert shrub habitat or salamanders ata breeding pond during a nocturnal survey.
MISCONCEPTIONS ABOUT METHODS ACCOUNTING
FOR DETECTABILITY
Throughout this paper, we reviewed some ofthe major approaches to simultaneously esti-mating and accounting for the probability ofdetection in herpetological studies. Based ontheir limited use in the body of herpetologicalliterature, we recognize that many investigatorsput their trust in ad hoc methods using raw datauncorrected for detectability (e.g., raw counts,trap rates, return rates) and are reticent to adopta mark-recapture framework perhaps in partdue to misconceptions, some of which weaddress here.
Unrealistic Assumptions.—One common criti-cism of capture-recapture methods is that thereare a number of rigid assumptions made inorder to validly use these models. We havenoted the important assumptions earlier foreach of the model types we presented. Viola-tions of some of these assumptions may lead tobiases in the estimates of interest such asabundance, survival, or occupancy (Nichols etal., 1982, 1984; Pollock et al., 1990; Royle, 2006).However, when choosing ad hoc methods overtechniques that account for probabilities ofdetection, practitioners (tacitly) make a numberof even stronger assumptions. These typicallyinclude expectations of constant probabilities ofdetection across time, sites, or habitats or evendetection probabilities of one! Yet, these as-sumptions are rarely tested for their validity oreven acknowledged (Anderson, 2001; Pollock etal., 2002; Williams et al., 2002; White, 2005).
Previous work on a variety of taxa, includingreptiles and amphibians, provides strong evi-dence that assumptions of constant p rarely holdin field settings. For example, when detectionprobability is estimated using real field data,models with constant probability of detectionare rarely supported (see examples herein). Thebottom line is that ad hoc methods should notbe preferred over techniques that estimateprobabilities of detection (Pollock et al., 1990;Nichols and Pollock, 1983; MacKenzie et al.,2002): even when assumptions are violated,formal estimation methods typically yield esti-mators with smaller biases than those based onad hoc methods.
Methods Are Too Expensive.—Mark-recapturemethods (e.g., estimating survival, abundance)can sometimes require impressive amounts ofresources (time, personnel, labor, funds) andthat is frequently viewed as their most impor-tant drawback. The first response to thiscriticism is that it is not universally true anddepends on several factors such as the behaviorof the target species (ease of capture), popula-tion size, capture techniques, marking tech-niques, habitat type, accessibility, and overallgoal (short-term vs. long-term study). But ifexpense is an issue, a shift of state variable fromabundance to occupancy, for example, canrender even a geographically extensive studyaffordable. A second response is that thealternatives to a well-designed study are weakinferences and conclusions that are not de-fensible. If nontrivial field effort is to beexpended in an investigation, then we shouldcapitalize on that investment by using goodstudy design and analytical methods.
Proper planning is essential regarding theobjectives, target species, sampling technique,and particularly, sampling intensity (Williamset al., 2002; MacKenzie and Royle, 2005; MacK-enzie et al., 2006). However, even with the bestintentions, a scarcity of captures hinders one’sability to conduct many analyses. In suchsituations, MacKenzie et al. (2005) and Bowdenet al. (2003) have discussed the possibility ofborrowing information from other times, loca-tions and even species as a means of developingreasonable inferences when sampling rare orelusive species. Pilot studies allow investigatorsto assess the feasibility of a study, especiallyconcerning the encounter success (i.e., samplesize) and permit readjustment of samplingprotocols as necessary. A sound study designcan alleviate many problems potentially en-countered at the analysis stage (e.g., too fewcaptures, continuous sampling effort instead ofdiscrete sampling occasions, violation of closureassumption).
ACCOUNTING FOR DETECTABILITY IN FIELD STUDIES 683
Detectability Is a Trait of Species.—Detectabilityis not a trait of a species. Because detectability isinfluenced by many factors (see introduction), itis possible to obtain different estimates ofdetectability for the same species across studies.For instance, Schmidt (2005) and Pellet andSchmidt (2005) used site occupancy models ondifferent call survey data of Natterjack Toads(Bufo calamita) to estimate mean detectability as27.3% and 44.2%, respectively. Thus, detectabil-ity needs to be estimated in each study to obtainthe parameters of interest (e.g., abundance,survival, occupancy).
CONCLUSION
In the last decade, there has been extensivedevelopment in field and analytical methodsaccounting for detectability, and, as a result,new applications have surfaced. In the contextof the spatial distribution of animals at land-scape scales, the appearance of models adaptedto call indices or raw counts of individuals ata collection of sites visited repeatedly havebrought more flexibility in the estimation ofabundance, because they do not require markedindividuals (Royle, 2004b; Royle and Link,2005).
The methods we covered herein allow in-vestigators to control for variable and imperfectdetectability and estimate demographic param-eters with less bias than ad hoc methods. Theseparameters include survival, recruitment, or, atlarger scales, parameters such as extinction andcolonization used in metapopulations dynam-ics. Unbiased parameter estimation is vital inassessing the state of populations (e.g., amphib-ian declines, see Schmidt, 2004; Pellet andSchmidt, 2005), predicting population viability,and properly managing natural resources.
We encourage herpetologists to adopt meth-ods that account for detectability. It is our hopethat the methods and sampling designs pre-sented in this paper will inspire researchers toadopt them and, at the very least, will exposeherpetologists to these improved statisticalmethods. With these tools in hand, herpetolo-gists can make great leaps forward, by pro-viding incentive (i.e., accurate estimates ofabundance, survival, occupancy) for the conser-vation of amphibian and reptile populations.
Acknowledgments.—Thanks to J. B. Iverson forgenerously allowing use of his Ornate BoxTurtle capture data. This work was fundedthrough the Natural Sciences and EngineeringResearch Council of Canada and USGS Am-phibian Research and Monitoring Initiative.Comments from P. S. Corn, B. Schmidt, andtwo reviewers enhanced the manuscript.
LITERATURE CITED
AKAIKE, H. 1973. Information theory as an extension ofthe maximum likelihood principle. In B. N. Petrovand F. Csaki (eds.), Second International Sympo-sium on Information Theory, pp. 267–281. Akade-miai Kiado, Budapest.
ALFORD, R. A., P. M. DIXON, AND J. H. K. PECHMANN.2001. Global amphibian declines. Nature 412:499–500.
ALHO, J. M. 1990. Logistic regression in capture-recapture models. Biometrics 46:623–635.
ALTWEGG, R., S. DUMMERMUTH, B. R. ANHOLT, AND T.FLATT. 2005. Winter weather affects Asp ViperVipera aspis population dynamics through suscep-tible juveniles. Oikos 55:55–66.
ANDERSON, D. R. 2001. The need to get the basics rightin wildlife field studies. Wildlife Society Bulletin29:1294–1297.
———. 2003. Response to Engeman: index valuesrarely constitute reliable information. WildlifeSociety Bulletin 31:288–291.
ANDERSON, D. R., K. P. BURNHAM, B. C. LUBOW, L.THOMAS, P. S. CORN, P. A. MEDICA, AND R. W.MARLOW. 2001. Field trials of line transect methodsapplied to estimation of desert tortoise abundance.Journal of Wildlife Management 65:583–597.
ANHOLT, B. R., H. HOTZ, G.-D. GUEX, AND R. D.SEMLITSCH. 2003. Overwinter survival of Ranalessonae and its hemiclonal associate Rana esculenta.Ecology 84:391–397.
ARNASON, A. N. 1973. The estimation of populationsize, migration rates, and survival in a stratifiedpopulation. Researches on Population Ecology15:1–8.
BAILEY, L. L., W. L. KENDALL, D. R. CHURCH, AND H. M.WILBUR. 2004e. Estimating survival and breedingprobability for pond-breeding amphibians: a mod-ified robust design. Ecology 85:2456–2466.
BAILEY, L. L., T. R. SIMONS, AND K. H. POLLOCK. 2004a.Estimating site occupancy and species detectionprobability parameters for terrestrial salamanders.Ecological Applications 14:692–702.
———. 2004b. Estimating detection probability pa-rameters for Plethodon salamanders using therobust capture-recapture design. Journal of Wild-life Management 68:1–13.
———. 2004c. Spatial and temporal variation indetection probability of Plethodon salamandersusing the robust capture-recapture design. Journalof Wildlife Management 68:14–24.
———. 2004d. Comparing population size estimatorsfor plethodontid salamanders. Journal of Herpe-tology 38:370–380.
BJORNDAL, K. A., A. B. BOLTEN, AND M. Y. CHALOUPKA.2003. Survival probability estimates for immatureGreen Turtles Chelonia mydas in the Bahamas.Marine Ecology Progress Series 252:273–281.
BLOMBERG, S. P., AND R. SHINE. 2001. Modelling lifehistory strategies with capture-recapture data:evolutionary demography of the water skinkEulamprus tympanum. Austral Ecology 26:349–359.
BOWDEN, D. C., G. C. WHITE, A. B. FRANKLIN, AND J. L.GANEY. 2003. Estimating population size withcorrelated sampling unit estimates. Journal ofWildlife Management 67:1–10.
684 M. J. MAZEROLLE ET AL.
BROWNIE, C., J. E. HINES, J. D. NICHOLS, K. H. POLLOCK,AND J. B. HESTBECK. 1993. Capture-recapture studiesfor multiple strata including non-Markovian tran-sitions. Biometrics 49:1173–1187.
BRUCE, R. C. 1995. The use of temporary removalsampling in a study of population-dynamics of thesalamander Desmognathus monticola. AustralianJournal of Ecology 20:403–412.
BUCKLAND, S. T., D. R. ANDERSON, K. P. BURNHAM, AND J. L.LAAKE. 1993. Distance Sampling: Estimation of Bi-ological Populations. Chapman and Hall, New York.
BUCKLAND, S. T., D. R. ANDERSON, K. P. BURNHAM, J. L.LAAKE, D. L. BORCHERS, AND L. THOMAS. 2001.Introduction to Distance Sampling: EstimatingAbundance of Biological Populations. OxfordUniversity Press, New York.
———. 2004. Advanced Distance Sampling: Estimat-ing Abundance of Biological Populations. OxfordUniversity Press, Oxford.
BUCKLAND, S. T., K. P. BURNHAM, AND N. H. AUGUSTIN.1997. Model selection: an integral part of inference.Biometrics 53:603–618.
BURNHAM, K. P., AND D. R. ANDERSON. 2002. ModelSelection and Multimodel Inference: A PracticalInformation-Theoretic Approach. 2nd ed. Spring-er-Verlag, New York.
BURNHAM, K. P., D. R. ANDERSON, G. C. WHITE, C.BROWNIE, AND K. H. POLLOCK. 1987. Design andanalysis methods for fish survival experimentsbased on release-recapture. American FisheriesSociety Monographs 5:1–437.
CHOQUET, R., A.-M. REBOULET, J.-D. LEBRETON, O.GIMENEZ, AND R. PRADEL. 2005. U-CARE 2.2 User’sManual (Utilities CApture-REcapture). CEFE,Montpellier, France.
CHOQUET, R., A.-M. REBOULET, R. PRADEL, O. GIMENEZ,AND J.-D. LEBRETON. 2004. M-SURGE: new softwarespecifically designed for multistate capture-recap-ture models. Animal Biodiversity and Conserva-tion 27:1–9.
CHURCH, D. R., L. L. BAILEY, H. M. WILBUR, W. L.KENDALL, AND J. E. HINES. 2007. Iteroparity in thevariable environment of the salamander Amby-stoma tigrinum. Ecology 88:891–903.
CONN, P. B., A. D. ARTHUR, L. L. BAILEY, AND G. R.SINGLETON. 2006. Estimating the abundance ofmouse populations of known size: promises andpitfalls of new methods. Ecological Applications16:829–837.
CONVERSE, S. J., J. B. IVERSON, AND J. A. SAVIDGE. 2005.Demographics of an Ornate Box Turtle populationexperiencing minimal human-induced distur-bances. Ecological Applications 15:2171–2179.
COOK, R. D., AND J. O. JACOBSON. 1979. A design forestimating visibility bias in aerial surveys. Bio-metrics 35:735–742.
CORMACK, R. M. 1964. Estimates of survival from thesighting of marked animals. Biometrika 51:429–438.
DILLER, L. V., AND R. L. WALLACE. 2002. Growth,reproduction, and survival in a population ofCrotalus viridis oreganus in North Central Idaho.Herpetological Monographs 16:26–45.
DODD, C. K., Jr., AND R. M. DORAZIO. 2004. Using countsto simultaneously estimate abundance and de-tection probabilities in a salamander community.Herpetologica 60:468–478.
DORAZIO, R. M., AND J. A. ROYLE. 2005. Estimating sizeand composition of biological communities bymodeling the occurrence of species. Journal ofthe American Statistical Association 100:389–398.
DORAZIO, R. M., J. A. ROYLE, B. SODERSTROM, AND A.GLIMSKAR. 2006. Estimating species richness andaccumulation by modeling species occurrence anddetectability. Ecology 87:842–854.
DUTTON, D. L., P. H. DUTTON, M. CHALOUPKA, AND R. H.BOULON. 2005. Increase of a Caribbean LeatherbackTurtle Dermochelys coriacea nesting populationlinked to long-term nest protection. BiologicalConservation 126:186–194.
FLATT, T., S. DUMMERMUTH, AND B. R. ANHOLT. 1997.Mark-recapture estimates of survival in popula-tions of the Asp Viper, Vipera aspis aspis. Journal ofHerpetology 31:558–564.
FOGARTY, J. H., AND F. J. VILELLA. 2003. Use of native forestand eucalyptus plantations by Eleutherodactylusfrogs. Journal of Wildlife Management 67:186–195.
FREILICH, J. E., R. J. CAMP, J. J. DUDA, AND A. E. KARL.2005. Problems with sampling desert tortoises:a simulation analysis based on field data. Journalof Wildlife Management 69:45–56.
FRETEY, T., E. CAM, B. LE GARFF, AND J.-Y. MONNAT. 2004.Adult survival and temporary emigration in theCommon Toad. Canadian Journal of Zoology82:859–872.
FUNK, W. C., D. ALMEIDA-REINOSO, F. NOGALES-SORNOSA,AND M. R. BUSTAMANTE. 2003. Monitoring popula-tion trends of Eleutherodactylus frogs. Journal ofHerpetology 37:245–256.
GRANT, E. H. C., R. E. JUNG, J. D. NICHOLS, AND J. E. HINES.2005. Double-observer approach to estimating eggmass abundance of pool-breeding amphibians.Wetlands Ecology and Management 13:305–320.
GREEN, D. M. 2003. The ecology of extinction:population fluctuation and decline in amphibians.Biological Conservation 111:331–343.
GU, W., AND R. K. SWIHART. 2004. Absent or un-detected? Effects of non-detection of speciesoccurrence on wildlife-habitat models. BiologicalConservation 116:195–203.
HEYER, W. R., M. A. DONNELLY, R. W. MCDIARMID, L.-A.C. HAYEK, and M. S. FOSTER (eds.). 1994. Measuringand Monitoring Biological Diversity: StandardMethods for Amphibians. Smithsonian InstitutionPress, Washington DC.
HINES, J. E. 1994. MSSURVIV User’s Manual. NationalBiological Service, Laurel, MD.
HOKIT, D. G., AND L. C. BRANCH. 2003. Habitat patchsize affects demographics of the Florida ScrubLizard (Sceloporus woodi). Journal of Herpetology37:257–265.
HOLENWEG PETER, A.-K. 2001. Survival in adults of thewater frog Rana lessonae and its hybridogeneticassociate Rana esculenta. Canadian Journal ofZoology 79:652–661.
HOSSACK, B. R., AND P. S. CORN. 2007. Responses ofpond-breeding amphibians to wildfire: short-termpatterns in occupancy and colonization. EcologicalApplications 17:1403–1410.
HOULAHAN, J. E., C. S. FINDLAY, B. R. SCHMIDT, A. H.MEYER, AND S. L. KUZMIN. 2000. Quantitativeevidence for global amphibian population de-clines. Nature 404:752–755.
ACCOUNTING FOR DETECTABILITY IN FIELD STUDIES 685

HUGGINS, R. M. 1989. On the statistical analysis ofcapture experiments. Biometrika 76:133–140.
———. 1991. Some practical aspects of conditionallikelihood approach to capture experiments. Bio-metrics 47:725–735.
HURVICH, C. M., AND C.-L. TSAI. 1989. Regression andtime series model selection in small samples.Biometrika 76:297–307.
IHAKA, R., AND R. GENTLEMAN. 1996. R: a language fordata analysis and graphics. Journal of Computa-tional and Graphical Statistics 5:299–314.
IVERSON, J. B. 1991. Life history and demography of theYellow Mud Turtle, Kinosternon flavescens. Herpe-tologica 47:373–395.
JOLLY, G. M. 1965. Explicit estimates from capture-recapture data with both death and immigration:stochastic model. Biometrika 52:225–247.
JUNG, R. E., G. H. DAYTON, S. J. WILLIAMSON, J. R. SAUER,AND S. DROEGE. 2002. An evaluation of popula-tion index and estimation techniques for tad-poles in desert pools. Journal of Herpetology 36:465–472.
JUNG, R. E., S. DROEGE, J. R. SAUER, AND R. B. LANDY.2000. Evaluation of terrestrial and streamsidesalamander monitoring techniques at ShenandoahNational Park. Environmental Monitoring andAssessment 63:65–79.
JUNG, R. E., J. A. ROYLE, J. R. SAUER, C. ADDISON, R. D.RAU, J. L. SHIRK, AND J. C. WHISSEL. 2005. Estimationof stream salamander (Plethodontidae, Desmog-nathinae and Plethodontinae) populations in She-nandoah National Park, Virginia, USA. Alytes22:72–84.
KAZMAIER, R. T., E. C. HELLGREN, D. R. SYNATZSKE, AND J.C. RUTLEDGE. 2001. Mark-recapture analysis ofpopulation parameters in a Texas tortoise (Go-pherus berlandieri) population in southern Texas.Journal of Herpetology 35:410–417.
KENDALL, W. L. 1999. Robustness of closed capture-recapture methods to violations of the closureassumption. Ecology 80:2517–2525.
———. 2004. Coping with unobservable and mis-classified states in capture-recapture studies. An-imal Biodiversity and Conservation 27:97–107.
KENDALL, W. L., AND R. BJORKLAND. 2001. Using openrobust design models to estimate temporaryemigration from capture-recapture data. Biomet-rics 57:1113–1122.
KENDALL, W. L., AND J. D. NICHOLS. 2002. Estimatingstate-transition probabilities for unobservablestates using capture-recapture/resighting data.Ecology 83:3276–3284.
KENDALL, W. L., J. D. NICHOLS, AND J. E. HINES. 1997.Estimating temporary emigration using capture-recapture data with Pollock’s robust design.Ecology 78:563–578.
KERY, M., J. A. ROYLE, AND H. SCHMID. 2005. Modelingavian abundance from replicated counts usingbinomial mixture models. Ecological Applications15:1450–1461.
LEBRETON, J.-D., K. P. BURNHAM, J. CLOBERT, AND D. R.ANDERSON. 1992. Modeling survival and testingbiological hypotheses using marked animals:a unified approach with case studies. EcologicalMonographs 62:67–118.
LEBRETON, J.-D., AND R. PRADEL. 2002. Multi staterecapture models: modelling incomplete individ-ual histories. Journal of Applied Statistics 29:353–370.
LINCOLN, F. C. 1930. Calculating waterfowl abundanceon the basis of banding returns. U.S. Departmentof Agriculture Circular 118:1–4.
LIND, A. J., H. H. WELSH JR., AND D. A. TALLMON. 2005.Garter snake population dynamics from a 16-yearstudy: considerations for ecological monitoring.Ecological Applications 15:294–303.
LINK, W. A., AND R. J. BARKER. 2005. Modelingassociation among demographic parameters inanalysis of open population capture-recapturedata. Biometrics 61:46–54.
LOWE, W. H. 2003. Linking dispersal to local popula-tion dynamics: a case study using a headwatersalamander system. Ecology 84:2145–2154.
MACKENZIE, D. I., AND J. A. ROYLE. 2005. Designingoccupancy studies: general advice and allocatingsurvey effort. Journal of Applied Ecology 42:1105–1114.
MACKENZIE, D. I., J. D. NICHOLS, G. B. LACHMAN, S.DROEGE, J. A. ROYLE, AND C. A. LANGTIMM. 2002.Estimating site occupancy rates when detectionprobabilities are less than one. Ecology 83:2248–2255.
MACKENZIE, D. I., J. D. NICHOLS, J. E. HINES, M. G.KNUTSON, AND A. B. FRANKLIN. 2003. Estimating siteoccupancy, colonization, and local extinction whena species is detected imperfectly. Ecology 84:2200–2207.
MACKENZIE, D. I., J. D. NICHOLS, J. A. ROYLE, K. H.POLLOCK, L. L. BAILEY, AND J. E. HINES. 2006.Occupancy Estimation and Modeling: InferringPatterns and Dynamics of Species Occurrence.Academic Press, New York.
MACKENZIE, D. I., J. D. NICHOLS, N. SUTTON, K.KAWANISHI, AND L. L. BAILEY. 2005. Improvinginferences in population studies of rare species thatare detected imperfectly. Ecology 86:1101–1113.
MAZEROLLE, M. J. 2006. Improving data analysis inherpetology: using Akaike’s Information Criterion(AIC) to assess the strength of biological hypoth-eses. Amphibia-Reptilia 27:169–180.
MAZEROLLE, M. J., A. DESROCHERS, AND L. ROCHEFORT.2005. Landscape characteristics influence pondoccupancy by frogs after accounting for detectabil-ity. Ecological Applications 15:824–834.
MCKENNY, H. C., W. S. KEETON, AND T. M. DONOVAN.2006. Effects of structural complexity enhance-ment on eastern Red-Backed Salamander (Pletho-don cinereus) populations in northern hardwoodforests. Forest Ecology and Management 230:186–196.
MOORE, J. E., D. M. SCHEIMAN, AND R. K. SWIHART. 2004.Field comparison of removal and modified double-observer modeling for estimating detectability andabundance of birds. Auk 121:865–876.
NELSON, N. J., S. N. KEALL, S. PLEDGER, AND C. H.DAUGHERTY. 2002. Male-biased sex ratio in a smalltuatara population. Journal of Biogeography29:633–640.
NICHOLS, J. D. 1992. Capture-recapture models: usingmarked animals to study population dynamics.Bioscience 42:94–102.
686 M. J. MAZEROLLE ET AL.
NICHOLS, J. D., J. E. HINES, AND K. H. POLLOCK. 1984.Effects of permanent trap response in captureprobability on Jolly-Seber capture-recapture modelestimates. Journal of Wildlife Management48:289–294.
NICHOLS, J. D., J. E. HINES, J. R. SAUER, F. W. FALLON, J. E.FALLON, AND P. J. HEGLUND. 2000. A double-observerapproach for estimating detection probabilityand abundance from point counts. Auk 117:393–408.
NICHOLS, J. D., AND K. H. POLLOCK. 1983. Estimationmethodology in contemporary small mammalcapture-recapture studies. Journal of Mammalogy64:253–260.
NICHOLS, J. D., S. L. STOKES, J. E. HINES, AND M. J.CONROY. 1982. Additional comments on the as-sumption of homogeneous survival rates in mod-ern bird banding estimation models. Journal ofWildlife Management 46:953–962.
NICHOLS, J. D., R. E. TOMLINSON, AND G. WAGGERMAN.1986. Estimating nest detection probabilities forwhite-winged dove nest transects in Tamaulipas,Mexico. Auk 103:825–828.
NORRIS, J. L., AND K. H. POLLOCK. 1996. NonparametricMLE under two closed capture-recapture modelswith heterogeneity. Biometrics 52:639–649.
OTIS, D. L., K. P. BURNHAM, G. C. WHITE, AND D. R.ANDERSON. 1978. Statistical inference from capturedata on closed animal populations. WildlifeMonographs 62:1–135.
PELLET, J., AND B. R. SCHMIDT. 2005. Monitoringdistributions using call surveys: estimating siteoccupancy, detection probabilities and inferringabsence. Biological Conservation 123:27–35.
PETRANKA, J. W., AND S. S. MURRAY. 2001. Effectivenessof removal sampling for determining salamanderdensity and biomass: a case study in an Appala-chian streamside community. Journal of Herpetol-ogy 35:36–44.
PLEDGER, S. 2000. Unified maximum likelihood esti-mates for closed capture-recapture models usingmixtures. Biometrics 56:434–442.
POLLOCK, K. H. 1982. A capture-recapture designrobust to unequal probability of capture. Journalof Wildlife Management 46:752–757.
POLLOCK, K. H., J. D. NICHOLS, C. BROWNIE, AND J. E.HINES. 1990. Statistical inference for capture-re-capture experiments. Wildlife Monographs 107:1–98.
POLLOCK, K. H., J. D. NICHOLS, T. R. SIMONS, G. L.FARNSWORTH, L. L. BAILEY, AND J. R. SAUER. 2002.Large scale wildlife monitoring studies: statisticalmethods for design and analysis. Environmetrics13:105–119.
PRADEL, R. 1996. Utilization of capture-mark-recapturefor the study of recruitment and populationgrowth rate. Biometrics 52:703–709.
PRADEL, R., J. E. HINES, J.-D. LEBRETON, AND J. D.NICHOLS. 1997. Capture-recapture survival modelstaking account of transients. Biometrics 53:60–72.
PRESTON, F. W. 1979. The invisible birds. Ecology 60:451–454.
RETALLICK, R. W. R., H. MCCALLUM, AND R. SPEARE. 2004.Endemic infection of the amphibian chytrid fungusin a frog community post-decline. Public Libraryof Science Biology 2:e351.
REXSTAD, E., AND K. P. BURNHAM. 1992. Users’ Guide forInteractive Program CAPTURE: Abundance Esti-mation of Closed Animal Populations. ColoradoState University, Fort Collins.
RICHARDSON, J. I., R. BELL, AND T. H. RICHARDSON. 1999.Population ecology and demographic implicationsdrawn from an 11-year study of nesting HawksbillTurtles (Eretmochelys imbricata) at Jumby Bay, LongIsland, Antigua, West Indies. Chelonian Conser-vation and Biology 3:244–250.
RIVALAN, P., A-C PREVOT-JULLIARD, R. CHOQUET, R.PRADEL, B. JACQUEMIN, AND M. GIRONDOT. 2005.Trade-off between current reproductive effortand delay to next reproduction in the LeatherbackSea Turtle. Oecologia 145:564–574.
RODDA, G. H., AND E. W. CAMPBELL. 2002. Distancesampling of forest snakes and lizards. Herpetolog-ical Review 33:271–274.
ROYLE, J. A. 2004a. Modeling abundance index datafrom anuran calling surveys. Conservation Biology18:1378–1385.
———. 2004b. N-mixture models for estimatingpopulation size from spatially replicated counts.Biometrics 60:108–115.
———. 2006. Site occupancy models with heteroge-neous detection probabilities. Biometrics 62:97–102.
ROYLE, J. A., R. M. DORAZIO, AND W. A. LINK. 2007.Analysis of multinomial models with unknownindex using data augmentation. Journal of Com-putational and Graphical Statistics 16:67–85.
ROYLE, J. A., AND W. A. LINK. 2005. A general class ofmultinomial mixture models for anuran callingsurvey data. Ecology 86:2505–2512.
———. 2006. Generalized site occupancy modelsallowing for false positive and false negativeerrors. Ecology 87:835–841.
ROYLE, J. A., AND J. D. NICHOLS. 2003. Estimatingabundance from repeated presence-absence dataor point counts. Ecology 84:777–790.
ROYLE, J. A., J. D. NICHOLS, AND M. KERY. 2005.Modelling occurrence and abundance of specieswhen detection is imperfect. Oikos 353:353–359.
SALVIDIO, S. 1998. Estimating abundance and biomassof a Speleomantes strinatii (Caudata, Plethodonti-dae) population by temporary removal sampling.Amphibia-Reptilia 19:113–124.
SCHAUB, M., O. GIMENEZ, B. R. SCHMIDT, AND R. PRADEL.2004. Estimating survival and temporary emigra-tion in the multistate capture-recapture frame-work. Ecology 85:2107–2113.
SCHERER, R. D., E. MUTHS, B. R. NOON, AND P. S. CORN.2005. An evaluation of weather and disease ascauses of decline in two populations of borealtoads. Ecological Applications 15:2150–2160.
SCHMIDT, B. R. 2004. Declining amphibian populations:the pitfalls of count data in the study of diversity,distributions, dynamics, and demography. Herpe-tological Journal 14:167–174.
———. 2005. Monitoring the distribution of pond-breeding amphibians when species are detectedimperfectly. Aquatic Conservation: Marine andFreshwater Ecosystems 15:681–692.
SCHMIDT, B. R., AND B. R. ANHOLT. 1999. Analysis ofsurvival probabilities of female Common Toads,Bufo bufo. Amphibia-Reptilia 20:97–108.
ACCOUNTING FOR DETECTABILITY IN FIELD STUDIES 687

SCHMIDT, B. R., R. FELDMANN, AND M. SCHAUB. 2005.Demographic processes underlying populationgrowth and decline in Salamandra salamandra.Conservation Biology 19:1149–1156.
SCHMIDT, B. R., M. SCHAUB, AND B. R. ANHOLT. 2002.Why you should use capture-recapture methodswhen estimating survival and breeding probabil-ities: on bias, temporary emigration, overdisper-sion, and Common Toads. Amphibia-Reptilia23:375–388.
SCHWARZ, C. J., AND A. N. ARNASON. 1996. A generalmethodology for the analysis of capture-recaptureexperiments in open populations. Biometrics52:860–873.
SCHWARZ, C. J., J. F. SCHWEIGERT, AND A. N. ARNASON.1993. Estimation migration rates using tag-recov-ery data. Biometrics 49:177–193.
SCHWARZ, C. J., AND W. T. STOBO. 1997. Estimationtemporary migration using the robust design.Biometrics 53:178–194.
SEBER, G. A. 1965. A note on the multiple recapturecensus. Biometrika 52:249–259.
SMITH, L. L., W. J. BARICHIVICH, J. S. STAIGER, K. G. SMITH,AND C. K. DODD JR. 2006. Detection probabilitiesand site occupancy estimates for amphibians atOkefenokee National Wildlife Refuge. AmericanMidland Naturalist 155:149–161.
STANLEY, T. R., AND J. D. RICHARDS. 2005. Softwarereview: a program for testing capture-recapturedata for closure. Wildlife Society Bulletin 33:782–785.
WEIR, L. A., AND M. J. MOSSMAN. 2005. North AmericanAmphibian Monitoring Program (NAAMP). In M.J. Lannoo (ed.), Amphibian Declines: Conservation
Status of United States Species, pp. 307–313.University of California Press, Berkeley.
WEIR, L. A., J. A. ROYLE, P. NANJAPPA, AND R. E. JUNG.2005. Modeling anuran detection and site occu-pancy on North American Amphibian MonitoringProgram (NAAMP) routes in Maryland. Journal ofHerpetology 39:627–639.
WHITE, G. C. 1983. Numerical estimation of survivalrates from band-recovery and biotelemetry data.Journal of Wildlife Management 47:716–728.
———. 1996. NOREMARK: population estimationfrom mark-resighting surveys. Wildlife SocietyBulletin 24:50–52.
———. 2005. Correcting wildlife counts with de-tection probabilities. Wildlife Research 32:211–216.
WHITE, G. C., D. R. ANDERSON, K. P. BURNHAM, AND D. L.OTIS. 1982. Capture-Recapture and Removal Meth-ods for Sampling Closed Populations. Los AlamosNational Laboratory, Los Alamos, NM.
WHITE, G. C., AND K. P. BURNHAM. 1999. ProgramMARK: survival estimation from populations ofmarked animals. Bird Study 46 (Suppl.):120–138.
WILLIAMS, B. K., J. D. NICHOLS, AND M. J. CONROY. 2002.Analysis and Management of Animal Populations.Academic Press, New York.
WOOD, K. V., H. F. PERCIVAL, J. D. NICHOLS, AND J. E. HINES.1998. Size-sex variation in survival rates andabundance of Pig Frogs, Rana grylio, in northernFlorida wetlands. Journal of Herpetology 32:527–535.
WOODWARD, A. R., T. C. HINES, C. L. ABERCROMBIE, AND J.D. NICHOLS. 1987. Survival of young AmericanAlligators on a Florida lake. Journal of WildlifeManagement 51:931–937.
Accepted: 11 June 2007.
688 M. J. MAZEROLLE ET AL.
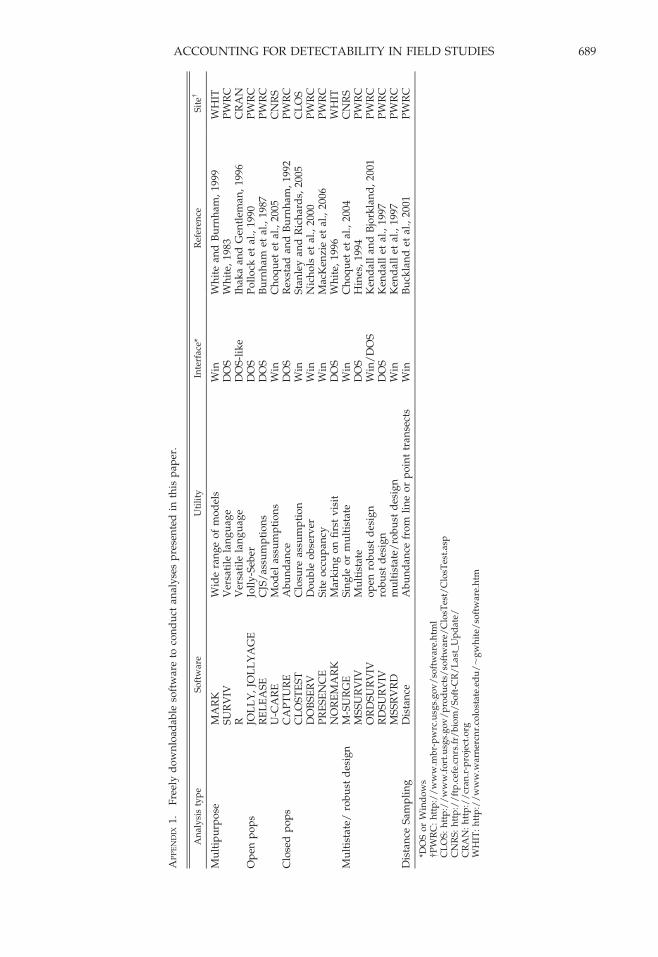
AP
PE
ND
IX1.
Fre
ely
do
wn
load
able
soft
war
eto
con
du
ctan
aly
ses
pre
sen
ted
inth
isp
aper
.
An
aly
sis
typ
eS
oft
war
eU
tili
tyIn
terf
ace*
Ref
eren
ceS
ite{
Mu
ltip
urp
ose
MA
RK
Wid
era
ng
eo
fm
od
els
Win
Wh
ite
and
Bu
rnh
am,
1999
WH
ITS
UR
VIV
Ver
sati
lela
ng
uag
eD
OS
Wh
ite,
1983
PW
RC
RV
ersa
tile
lan
gu
age
DO
S-l
ike
Ihak
aan
dG
entl
eman
,19
96C
RA
NO
pen
po
ps
JOL
LY
,JO
LL
YA
GE
Joll
y-S
eber
DO
SP
oll
ock
etal
.,19
90P
WR
CR
EL
EA
SE
CJS
/as
sum
pti
on
sD
OS
Bu
rnh
amet
al.,
1987
PW
RC
U-C
AR
EM
od
elas
sum
pti
on
sW
inC
ho
qu
etet
al.,
2005
CN
RS
Clo
sed
po
ps
CA
PT
UR
EA
bu
nd
ance
DO
SR
exst
adan
dB
urn
ham
,19
92P
WR
CC
LO
ST
ES
TC
losu
reas
sum
pti
on
Win
Sta
nle
yan
dR
ich
ard
s,20
05C
LO
SD
OB
SE
RV
Do
ub
leo
bse
rver
Win
Nic
ho
lset
al.,
2000
PW
RC
PR
ES
EN
CE
Sit
eo
ccu
pan
cyW
inM
acK
enzi
eet
al.,
2006
PW
RC
NO
RE
MA
RK
Mar
kin
go
nfi
rst
vis
itD
OS
Wh
ite,
1996
WH
ITM
ult
ista
te/
rob
ust
des
ign
M-S
UR
GE
Sin
gle
or
mu
ltis
tate
Win
Ch
oq
uet
etal
.,20
04C
NR
SM
SS
UR
VIV
Mu
ltis
tate
DO
SH
ines
,19
94P
WR
CO
RD
SU
RV
IVo
pen
rob
ust
des
ign
Win
/D
OS
Ken
dal
lan
dB
jork
lan
d,
2001
PW
RC
RD
SU
RV
IVro
bu
std
esig
nD
OS
Ken
dal
let
al.,
1997
PW
RC
MS
SR
VR
Dm
ult
ista
te/
rob
ust
des
ign
Win
Ken
dal
let
al.,
1997
PW
RC
Dis
tan
ceS
amp
lin
gD
ista
nce
Ab
un
dan
cefr
om
lin
eo
rp
oin
ttr
anse
cts
Win
Bu
ckla
nd
etal
.,20
01P
WR
C
*DO
So
rW
ind
ow
s{P
WR
C:
htt
p:/
/w
ww
.mb
r-p
wrc
.usg
s.g
ov
/so
ftw
are.
htm
lC
LO
S:
htt
p:/
/w
ww
.fo
rt.u
sgs.
go
v/
pro
du
cts/
soft
war
e/C
losT
est/
Clo
sTes
t.as
pC
NR
S:
htt
p:/
/ft
p.c
efe.
cnrs
.fr/
bio
m/
So
ft-C
R/
La
st_U
pd
ate/
CR
AN
:h
ttp
://
cran
.r-p
roje
ct.o
rgW
HIT
:h
ttp
://
ww
w.w
arn
ercn
r.co
lost
ate.
edu
/,
gw
hit
e/so
ftw
are.
htm
ACCOUNTING FOR DETECTABILITY IN FIELD STUDIES 689
Copyright © 2022 FDOKUMEN