Citrate Toxicity During Massive Blood Transfusion - Notify ...
arX
iv:a
stro
-ph/
0311
178v
1 7
Nov
200
3Mon. Not. R. Astron. Soc. 000, 1–11 (2003) Printed 2 February 2008 (MN LATEX style file v1.4)
On the Detectability of the SZ Effect of Massive Young
Galaxies
Daniel Rosa–Gonzalez1,2, Roberto Terlevich1,3, Elena Terlevich1⋆, Amancio Friaca4
and Enrique Gaztanaga5.1 INAOE, Luis Enrique Erro 1. Tonantzintla, Puebla 72840. Mexico.2 Astrophysics Group, Blackett Laboratory, Imperial College, Prince Consort Road, London SW7 2BW.3 Institute of Astronomy, Madingley Road, CB3 OHA Cambridge, U.K.4 Instituto Astronomico e Geofısico, USP, R. do Matao 1226, Cidade Universitaria, 05508-900, Sao Paulo, SP, Brazil.5 Institut d’Estudis Espacials de Catalunya. Edifici Nexus, Gran Capita, 2-4, desp. 201, 08034 Barcelona, Spain
Accepted . Received ; in original form 2 February 2008 (ElGaSZ-v105)
ABSTRACT
The Sunyaev-Zel’dovich (SZ) effect expected to be associated with massive star-formation activity produced during the formation of the most luminous bulges ofnormal galaxies is discussed.
Using 1-D chemohydrodynamical models for spheroidal galaxy evolution we showthat during the early epochs of galaxy evolution the gas in massive events of starformation may reach temperatures and densities high enough to produce values of thecomptonisation parameter y comparable to those present in galaxy clusters.
In this scenario, we discuss the possibility of detection of the SZ signature in highredshift starforming galaxies with the next generation of mm telescopes capable ofarcsecond resolution and equipped with high sensitivity detectors.
We show how millimeter colour–colour diagrams or diagnostic diagrams could beused to distinguish between the dust emission and the SZ effect and suggest the useof simultaneous multifrequency observations to improve the chances of detecting theSZ effect.
Key words: Cosmology: Cosmic Microwave Background, Galaxies: Evolution, Radio:millimetre
1 INTRODUCTION
The SZ effect (Sunyaev & Zel’dovich 1972) is produced whenthe cosmic microwave background (CMB) photons from theRayleigh-Jeans region, due to the interaction with the fastelectrons, move to the Wien tail of the CMB spectrum thusproducing a unique spectral signature. This signature showsan increase with respect to the mean CMB brightness of theobserved intensity for wavelengths shorter than 1.34 mmand a decrease for wavelengths longer than 1.34 mm. Thisis known as the thermal SZ effect. Another component isthe kinetic SZ effect, due to the interaction with CMB pho-tons of plasma coherently moving with respect to the refer-ence frame where the CMB is isotropic (e.g. Rephaeli 1995,Birkinshaw 1999, Church, Jaffe and Knox 2001).
The SZ effect constitutes a powerful tool to study thephysical properties of the intercluster gas, and when com-
⋆ Visiting Fellow at IoA, UK
bined with X-ray observations, also to estimate cosmologicalconstants such as the Hubble constant H0, the current massdensity of the universe ΩM or the cosmological constant Λ(e.g. Majumdar 2001, Diego et al. 2002, Levine, Schulz &White 2002, Reese et al. 2002, Majumdar & Mohr 2003).
It is understood that in clusters the thermal SZ effectdue to the interaction of CMB photons with electrons withtemperatures around 108K dominates over the kinetic SZeffect. This fact is evidenced by combining observations at1 mm where the thermal effect is close to the maximum, at1.4 mm where it is almost zero and the kinetic SZ effect canbe marginally detected and at 2 mm where the thermal SZhas its minimum and is negative (e.g. Lamarre et al. 1998,Mauskopf et al. 2000).
The advent of a new generation of mm telescopes(LMT/GTM or ALMA, described in section 3) that com-bine relatively high angular resolution with high sensitivitywill allow to explore the possibility of detecting the SZ effectin volumes much smaller than that of a cluster of galaxies.
c© 2003 RAS
2 D. Rosa–Gonzalez et al.
Would it be possible for these new instruments to detect theSZ signature in individual galaxies?
Natarajan & Sigurdsson (1999), Rosa-Gonzalez etal. (2000, 2001), Majumdar, Nath and Chiba (2001) andRosa-Gonzalez (2002) have indeed explored the detactabil-ity of the SZ effect in individual galaxies.
Natarajan & Sigurdsson (1999) studied the SZ effectdue to galactic outflows powered by the mechanical energyprovided by the accretion of matter to the central supermas-sive black hole in QSOs. Majumdar et al. (2001) proposethe evolution of supernova driven galactic winds during theearly stages of evolution of a normal galaxy, as the cause ofthe distortion of the CMB radiation due to the kinetic SZeffect. A similar model was originally proposed by Tegmark,Silk and Evrard (1993) to explain the absence of absorp-tion lines in the observed spectra of high redshift quasars(Gunn-Peterson effect, Gunn & Peterson 1965). The explo-sion model assumes an initial energy input which is equalto the 2% of the total luminosity generated in the super-nova explosions during about 5×10⁷ years. The range ofgalaxy masses covered by this model goes from 5×10⁷M⊙
to 1011M⊙.Rosa-Gonzalez et al. (2000, 2001) and Rosa-Gonzalez
(2002) discussed the possibility of observing the SZ effectin the centre of young giant spheroidal galaxies. They in-clude in the calculations both the thermal and the kineticSZ effect.
In the accepted galaxy formation scenario described bythe hierarchical model (e.g. Navarro, Frenk & White 1995),massive galaxies form after merging with smaller systemthat have been formed in a previous epoch. However, thereis observational evidence that a significant number of L∗
galaxies exist at redshift of about 5 and beyond (Hu, Cowie& McMahon 1998, Stanway, Bunker & McMahon 2003).Jimenez et al. (1999) discussed the possibility of the exis-tence of massive elliptical galaxies at high redshift, contraryto early predictions of the hierarchical models of galaxy for-mation. The study of massive galaxies at high redshift thatcould be detected through the unique SZ signature could beused to constrain the different galaxy formation scenarios.
The SZ effect due to young galaxies together with radiosources (Holder 2002) and dusty galaxies (Blain, Ivison &Smail 1998, Blain 1998) are potential sources of noise in sen-sitive studies of SZ clusters and upcoming measurements ofthe CMB fluctuations (e.g. FIRST, Plank). Therefore, theircharacteristic emission and physical scale must be quanti-fied.
In this paper we explore in detail the possibility of de-tection of the SZ effect in young galaxies undergoing a mas-sive starformation event. We discuss the confusion due todust emission and suggest a diagnostic to segregate betweendust emission and SZ effect distortions.
1.1 Thermal SZ effect
The SZ effect describes the brightness change of the CMBdue to the inverse Compton scattering by hot electrons (Sun-yaev & Zel’dovich 1972).
The change in intensity between the unaffected CMBradiation and the radiation which go through the hot gascan be expressed by the integral,
∆I = τe2h
c2
∫ +∞
−∞
dsP (s)
ν30
exp(
hν0
kTrad
) −ν3
exp(
hνkTrad
)
(1)
where the energy of the CMB photons is given by hνo, theenergy of the photons which come out from the cluster ishν, s is defined by s = log(ν/ν0), τe is the optical depthfor scattering and P(s) is the probability that an incidentphoton with energy hνo becomes a photon with an energyhν (Birkinshaw 1999).
The integral in the Equation 1 can be calculated by us-ing the non relativistic expression given by the Kompaneetsapproximation (Kompaneets 1957),
∆I(x) = h(x)yI0 (2)
where the distortion of the photon spectrum, h(x) is definedby
h(x) = x4 ex
(ex − 1)2
(
x cothx
2− 4
)
(3)
x is the dimensionless frequency, x = hν/(kTrad) withTrad = 2.728 the temperature of the CMB,
I0 =2h
c2
(
kBTrad
h
)3
(4)
and the Comptonization parameter “y ” is defined by theintegral of the electron pressure along the line of sight
y = σT
∫
dl nekBTe
mec2(5)
In this equation σT is the Thomson scattering cross section,ne and Te are the electron number density and the electrontemperature respectively, kB is the Boltzmann constant andmec
2 is the rest energy of an electron; (see Rybicki & Light-man 1980 for a more detailed derivation of the different ex-pressions described above and Birkinshaw 1999 for a recentreview). The effect of the hot gas on the CMB spectrum is toproduce a fractional change in the brightness of the CMBradiation. We remark that the amplitude of the SZ effectis redshift-independent and depends only on the integratedproperties of all the hot gas along the line of sight. The SZeffect can be considered as a tool to detect high pressureelectron gas over cosmological distances.
1.2 Kinetic SZ effect
The kinetic SZ effect, as already mentioned, is due to themovement of the plasma with respect to the CMB restframe. For a shell of matter which is moving with a radialvelocity v with respect to the Hubble flow, the change of theintensity due to the kinetic SZ effect (∆Ikin) is given by,
∆Ikin = −v
cτeI0
x4ex
(ex − 1)2(6)
where τe is the scattering optical depth, I0 is given by equa-tion 4 and x is the dimensionless frequency.
At low frequencies, the ratio between the kinetic SZeffect (∆Ikin) to the thermal SZ effect (∆Ith) is independentof the scattering optical depth and can be calculated by,
∆Ikin
∆Ith=
1
2
v
c
mec2
kTe(7)
c© 2003 RAS, MNRAS 000, 1–11
On the Detectability of the SZ Effect of Massive Young Galaxies 3
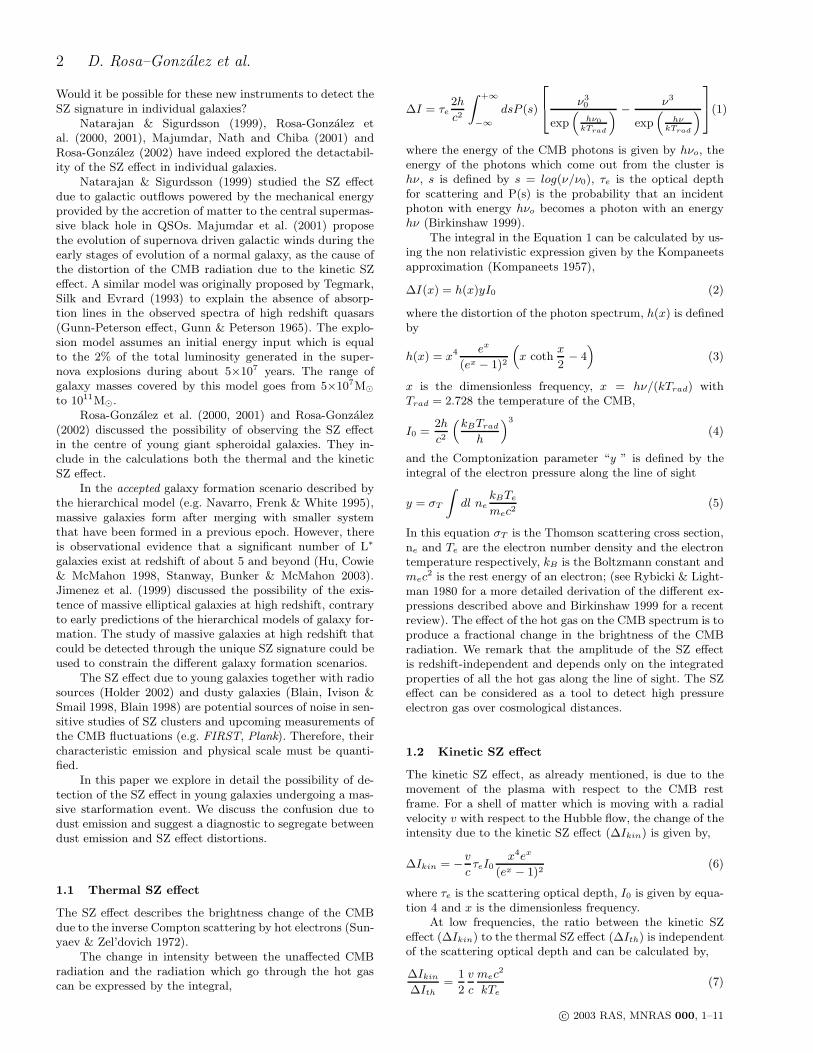
Figure 2. Electron density and temperature profiles for the model of baryonic mass 2x10¹²M⊙. The different lines correspond to differenttimes: 20 Myr for the solid line, 600 Myr for the dotted line, 1 Gyr for the dashed line, 4 Gyr for the dot–dashed line and 11 Gyr for thedot-dot-dashed line.
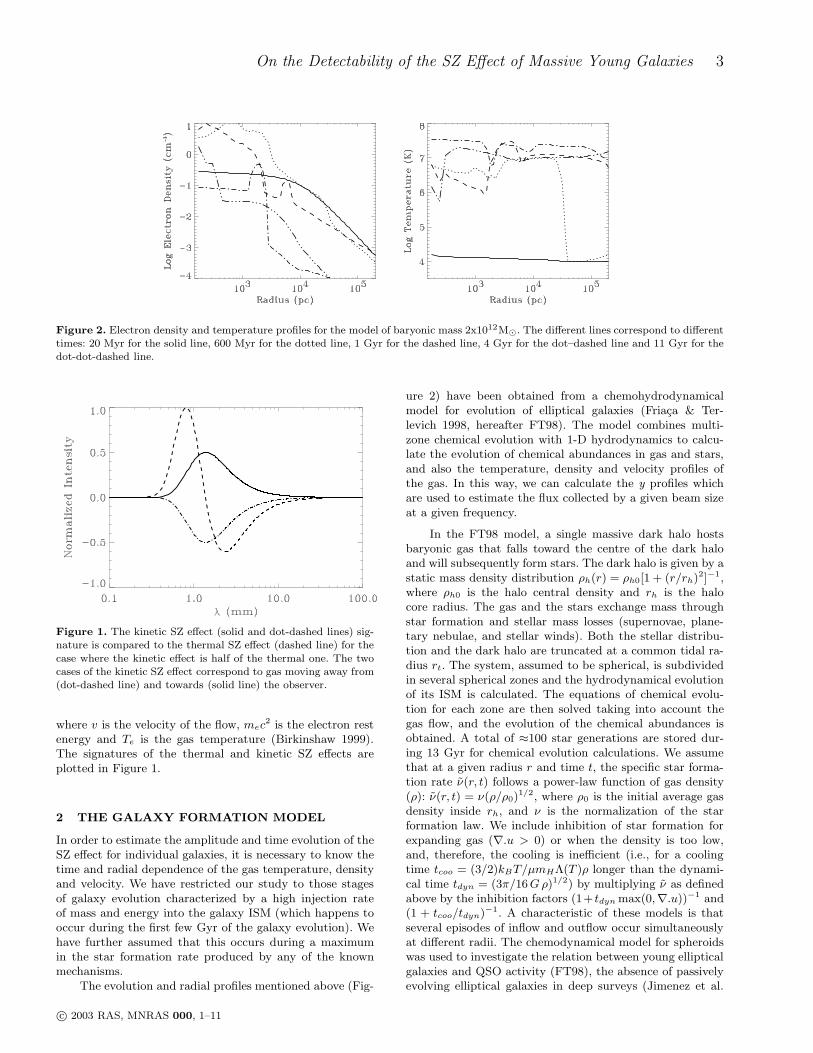
Figure 1. The kinetic SZ effect (solid and dot-dashed lines) sig-nature is compared to the thermal SZ effect (dashed line) for the
case where the kinetic effect is half of the thermal one. The twocases of the kinetic SZ effect correspond to gas moving away from(dot-dashed line) and towards (solid line) the observer.
where v is the velocity of the flow, mec2 is the electron rest
energy and Te is the gas temperature (Birkinshaw 1999).The signatures of the thermal and kinetic SZ effects areplotted in Figure 1.
2 THE GALAXY FORMATION MODEL
In order to estimate the amplitude and time evolution of theSZ effect for individual galaxies, it is necessary to know thetime and radial dependence of the gas temperature, densityand velocity. We have restricted our study to those stagesof galaxy evolution characterized by a high injection rateof mass and energy into the galaxy ISM (which happens tooccur during the first few Gyr of the galaxy evolution). Wehave further assumed that this occurs during a maximumin the star formation rate produced by any of the knownmechanisms.
The evolution and radial profiles mentioned above (Fig-
ure 2) have been obtained from a chemohydrodynamicalmodel for evolution of elliptical galaxies (Friaca & Ter-levich 1998, hereafter FT98). The model combines multi-zone chemical evolution with 1-D hydrodynamics to calcu-late the evolution of chemical abundances in gas and stars,and also the temperature, density and velocity profiles ofthe gas. In this way, we can calculate the y profiles whichare used to estimate the flux collected by a given beam sizeat a given frequency.
In the FT98 model, a single massive dark halo hostsbaryonic gas that falls toward the centre of the dark haloand will subsequently form stars. The dark halo is given by astatic mass density distribution ρh(r) = ρh0[1 + (r/rh)2]−1,where ρh0 is the halo central density and rh is the halocore radius. The gas and the stars exchange mass throughstar formation and stellar mass losses (supernovae, plane-tary nebulae, and stellar winds). Both the stellar distribu-tion and the dark halo are truncated at a common tidal ra-dius rt. The system, assumed to be spherical, is subdividedin several spherical zones and the hydrodynamical evolutionof its ISM is calculated. The equations of chemical evolu-tion for each zone are then solved taking into account thegas flow, and the evolution of the chemical abundances isobtained. A total of ≈100 star generations are stored dur-ing 13 Gyr for chemical evolution calculations. We assumethat at a given radius r and time t, the specific star forma-tion rate ν(r, t) follows a power-law function of gas density(ρ): ν(r, t) = ν(ρ/ρ0)
1/2, where ρ0 is the initial average gasdensity inside rh, and ν is the normalization of the starformation law. We include inhibition of star formation forexpanding gas (∇.u > 0) or when the density is too low,and, therefore, the cooling is inefficient (i.e., for a coolingtime tcoo = (3/2)kBT/µmHΛ(T )ρ longer than the dynami-cal time tdyn = (3π/16G ρ)1/2) by multiplying ν as definedabove by the inhibition factors (1+ tdyn max(0,∇.u))−1 and(1 + tcoo/tdyn)−1. A characteristic of these models is thatseveral episodes of inflow and outflow occur simultaneouslyat different radii. The chemodynamical model for spheroidswas used to investigate the relation between young ellipticalgalaxies and QSO activity (FT98), the absence of passivelyevolving elliptical galaxies in deep surveys (Jimenez et al.
c© 2003 RAS, MNRAS 000, 1–11
4 D. Rosa–Gonzalez et al.
1999), Lyman Break Galaxies (Friaca & Terlevich 1999),Blue Core Spheroids (Friaca & Terlevich 2001), the coupledspheroid and black hole formation (Archibald et al. 2002),and the link between DLAs and dwarf galaxies (Lanfranchi& Friaca 2003).
The models are parameterized according to the (initial)baryonic mass inside the tidal radius, MG = Mg + M∗, rh,rt, and the ratio of the halo to the (initial) luminous mass,Mh/MG. We have investigated a grid of runs with MG be-tween 1011 and 5 × 10¹² M⊙, and rh in the range 2.5 − 15kpc (see FT98). We set rt = 28rh and Mh/MG = 5. Thatvalue is compatible with the recent WMAP results where thebaryon density Ωb = 0.047 ± 0.006 and the matter densityΩM = 0.29 ± 0.07 (Spergel et al. 2003). Smaller (larger)values of the ratio dark matter versus baryonic mass do notsignificantly alter the observed fluxes, but due to the shal-lower (deeper) potential well, the galactic winds will appearearlier (later). For example, in the model with MG = 1012
M⊙, the galactic wind occurs at 1.51, 1.55 and 1.67 Gyr, forMh/MG = 3, 5 and 7.5 respectively.
The chemical evolution is driven by the stellar winds,planetary nebulae and SN phase which produce the enrich-ment of the ISM. New generation of stars form in the moremetal-rich medium. We do not assume instantaneous recy-cling approximation for the chemical enrichment, but in-stead we take into account the delays for gas restoring fromthe stars due to the main-sequence lifetimes. Instantaneousmixing with the ISM is assumed for the stellar ejecta. Weuse metallicity dependent yields for SNe II, SNe Ia, and in-termediate mass stars (IMS): the SNe II yields of Woosley &Weaver (1995), for metallicities Z/Z⊙ = 0, 10−4, 10−2, 10−1
and 1; SNIa yields from Iwamoto et al. (1999) — their mod-els W7 and W70 (progenitor metallicity Z=Z⊙ and Z=0,respectively); the yields for IMS (0.8 − 8 M⊙), with initialZ=0.001, 0.004, 0.008, 0.02 and 0.4, from van den Hoek &Groenewegen (1997) (their variable ηAGB case). For moredetails of the nucleosynthesis prescriptions, see FT98. Themodels start with an entirely gaseous protogalaxy with pri-mordial chemical abundances (Y = 0.24, Z = 0).
In the FT98 models there is self-consistency of the hy-drodynamics, chemical evolution and atomic physics, sincethe cooling function is evaluated based on the actual chemi-cal abundances obtained from the chemo-dynamical mod-elling. For the sake of simplicity, our cooling function isa function only of the abundances of O and Fe, whichare the main coolants for T > 105 K. In the calculationof the cooling function, the abundances of elements otherthan Fe and O have been scaled to the O abundance asni = ni,P + (ni,⊙ − ni,P )nO/nO,⊙, where ni is the ISMabundance by number of the element i, ni,P its primordialabundance and ni,⊙ its solar abundance [the photosphericvalues of Holweger (2001) for N and O , and the meteoriticvalues of Grevesse & Sauval (1998) for the other elements].
It is important to note that the FT98 models describethe evolution of isolated galaxies and do not take into ac-count effects such as mergers that play an important rolein structure formation within hierarchical galaxy formationmodels. However, the FT98 models can be considered as adescription of the evolution of the hot gas after a major starforming event produced by interaction or merger. In addi-tion, while the present chemodynamical model accounts forcomplex flow patterns, with inflow in some regions and out-
flow in other regions, the model does not take into accountasymmetric fluxes due to the assumed spherical symmetry.Despite the limitations due to the spherical symmetry, thedetailed predictions of this model are useful due to the goodradial resolution of the galaxy and the realistic treatmentof the star formation and proper calculation of the chemicalevolution of the gas and stars. The FT98 model representsa complementary tool to the semi-analytic models of galaxyformation, which currently adopt very simplified recipes ofstar-formation but with coarser space resolution (e.g. Som-merville & Primack 1999, Benson et al. 2001).
An important aspect relevant to the present calculationis that the models provide an estimate of the size of thehot gas region. This is central for deriving the expected fluxbecause the effective y parameter (which is the average of they parameters within a given beam size, Section 2.1) dependsstrongly on the size of the telescope beam.
2.1 The SZ effect in massive young galaxies.
The FT98 models predict that the hot gas in massive starforming regions with ages between 108 and 109 years canreach temperatures exceeding 107K and densities higherthan 1 cm−3 within a radius of a few kpc. These tempera-tures and densities imply values of the Comptonization pa-rameter y larger than 10−4. The maximum temperaturesof the gas in the models (∼ 1 keV) are well below therelativistic limit (∼ 500 keV), and, therefore, we use thenon-relativistic approximation (e.g. Birkinshaw 1999) to es-timate the SZ effect (Equation 2). Notice that the central y
parameter is calculated for a region of a few hundred parsecsacross. Only in this region is the y parameter comparable tothose observed in galaxy clusters.
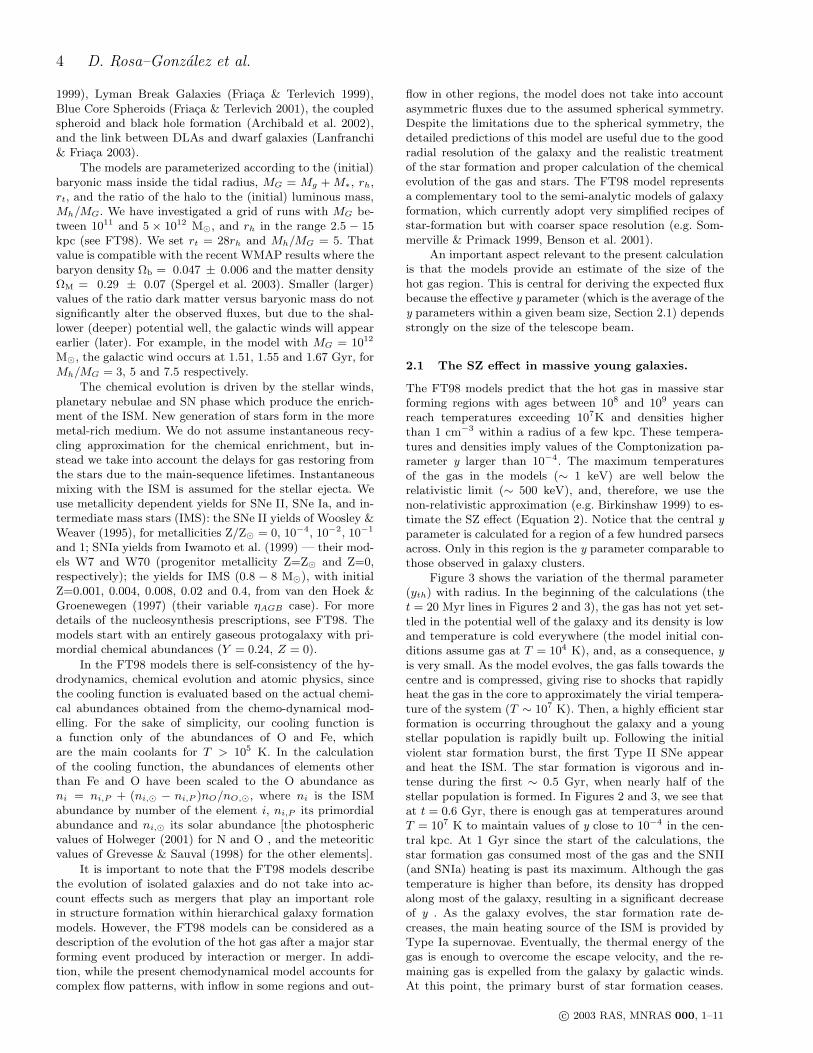
Figure 3 shows the variation of the thermal parameter(yth) with radius. In the beginning of the calculations (thet = 20 Myr lines in Figures 2 and 3), the gas has not yet set-tled in the potential well of the galaxy and its density is lowand temperature is cold everywhere (the model initial con-ditions assume gas at T = 104 K), and, as a consequence, y
is very small. As the model evolves, the gas falls towards thecentre and is compressed, giving rise to shocks that rapidlyheat the gas in the core to approximately the virial tempera-ture of the system (T ∼ 107 K). Then, a highly efficient starformation is occurring throughout the galaxy and a youngstellar population is rapidly built up. Following the initialviolent star formation burst, the first Type II SNe appearand heat the ISM. The star formation is vigorous and in-tense during the first ∼ 0.5 Gyr, when nearly half of thestellar population is formed. In Figures 2 and 3, we see thatat t = 0.6 Gyr, there is enough gas at temperatures aroundT = 107 K to maintain values of y close to 10−4 in the cen-tral kpc. At 1 Gyr since the start of the calculations, thestar formation gas consumed most of the gas and the SNII(and SNIa) heating is past its maximum. Although the gastemperature is higher than before, its density has droppedalong most of the galaxy, resulting in a significant decreaseof y . As the galaxy evolves, the star formation rate de-creases, the main heating source of the ISM is provided byType Ia supernovae. Eventually, the thermal energy of thegas is enough to overcome the escape velocity, and the re-maining gas is expelled from the galaxy by galactic winds.At this point, the primary burst of star formation ceases.
c© 2003 RAS, MNRAS 000, 1–11
On the Detectability of the SZ Effect of Massive Young Galaxies 5
Figure 3. The thermal y parameter as a function of radius. Dif-ferent lines correspond to different times: 20 Myr for the solidline, 600 Myr for the dotted line, 1 Gyr for the dashed line, 4 Gyrfor the dot–dashed line and 11 Gyr for the dot-dot-dashed line.The baryonic mass of the galaxy is 2×10¹²M⊙.
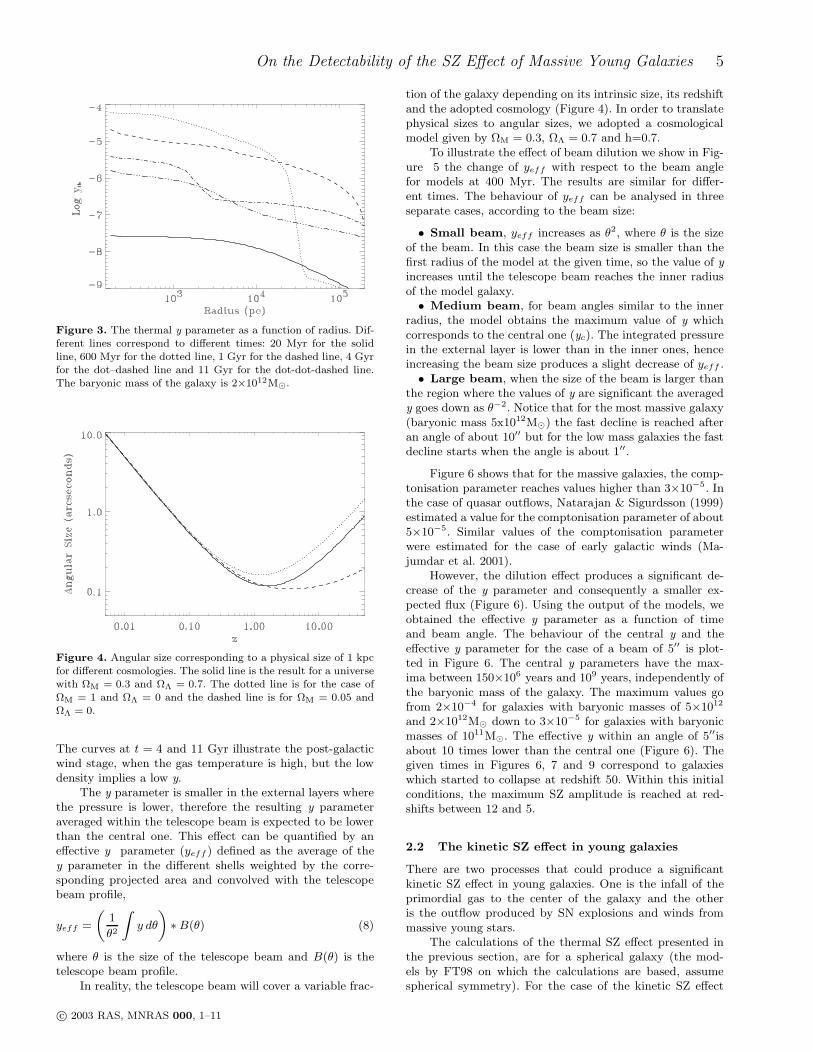
Figure 4. Angular size corresponding to a physical size of 1 kpcfor different cosmologies. The solid line is the result for a universewith ΩM = 0.3 and ΩΛ = 0.7. The dotted line is for the case ofΩM = 1 and ΩΛ = 0 and the dashed line is for ΩM = 0.05 andΩΛ = 0.
The curves at t = 4 and 11 Gyr illustrate the post-galacticwind stage, when the gas temperature is high, but the lowdensity implies a low y.
The y parameter is smaller in the external layers wherethe pressure is lower, therefore the resulting y parameteraveraged within the telescope beam is expected to be lowerthan the central one. This effect can be quantified by aneffective y parameter (yeff ) defined as the average of they parameter in the different shells weighted by the corre-sponding projected area and convolved with the telescopebeam profile,
yeff =
(
1
θ2
∫
y dθ
)
∗ B(θ) (8)
where θ is the size of the telescope beam and B(θ) is thetelescope beam profile.
In reality, the telescope beam will cover a variable frac-
tion of the galaxy depending on its intrinsic size, its redshiftand the adopted cosmology (Figure 4). In order to translatephysical sizes to angular sizes, we adopted a cosmologicalmodel given by ΩM = 0.3, ΩΛ = 0.7 and h=0.7.
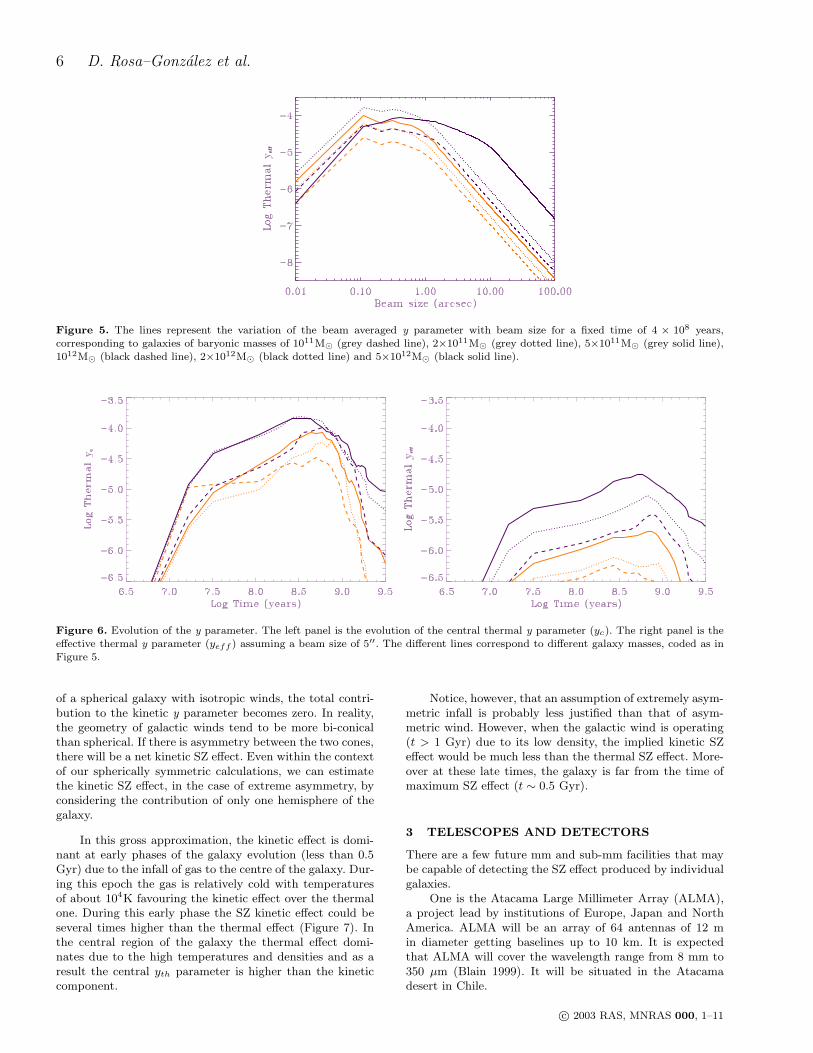
To illustrate the effect of beam dilution we show in Fig-ure 5 the change of yeff with respect to the beam anglefor models at 400 Myr. The results are similar for differ-ent times. The behaviour of yeff can be analysed in threeseparate cases, according to the beam size:
• Small beam, yeff increases as θ2, where θ is the sizeof the beam. In this case the beam size is smaller than thefirst radius of the model at the given time, so the value of y
increases until the telescope beam reaches the inner radiusof the model galaxy.
• Medium beam, for beam angles similar to the innerradius, the model obtains the maximum value of y whichcorresponds to the central one (yc). The integrated pressurein the external layer is lower than in the inner ones, henceincreasing the beam size produces a slight decrease of yeff .
• Large beam, when the size of the beam is larger thanthe region where the values of y are significant the averagedy goes down as θ−2. Notice that for the most massive galaxy(baryonic mass 5x10¹²M⊙) the fast decline is reached afteran angle of about 10′′ but for the low mass galaxies the fastdecline starts when the angle is about 1′′.
Figure 6 shows that for the massive galaxies, the comp-tonisation parameter reaches values higher than 3×10⁻⁵. Inthe case of quasar outflows, Natarajan & Sigurdsson (1999)estimated a value for the comptonisation parameter of about5×10−5. Similar values of the comptonisation parameterwere estimated for the case of early galactic winds (Ma-jumdar et al. 2001).
However, the dilution effect produces a significant de-crease of the y parameter and consequently a smaller ex-pected flux (Figure 6). Using the output of the models, weobtained the effective y parameter as a function of timeand beam angle. The behaviour of the central y and theeffective y parameter for the case of a beam of 5′′ is plot-ted in Figure 6. The central y parameters have the max-ima between 150×106 years and 109 years, independently ofthe baryonic mass of the galaxy. The maximum values gofrom 2×10⁻⁴ for galaxies with baryonic masses of 5×10¹²
and 2×10¹²M⊙ down to 3×10⁻⁵ for galaxies with baryonicmasses of 1011M⊙. The effective y within an angle of 5′′isabout 10 times lower than the central one (Figure 6). Thegiven times in Figures 6, 7 and 9 correspond to galaxieswhich started to collapse at redshift 50. Within this initialconditions, the maximum SZ amplitude is reached at red-shifts between 12 and 5.
2.2 The kinetic SZ effect in young galaxies
There are two processes that could produce a significantkinetic SZ effect in young galaxies. One is the infall of theprimordial gas to the center of the galaxy and the otheris the outflow produced by SN explosions and winds frommassive young stars.
The calculations of the thermal SZ effect presented inthe previous section, are for a spherical galaxy (the mod-els by FT98 on which the calculations are based, assumespherical symmetry). For the case of the kinetic SZ effect
c© 2003 RAS, MNRAS 000, 1–11
6 D. Rosa–Gonzalez et al.
Figure 5. The lines represent the variation of the beam averaged y parameter with beam size for a fixed time of 4 × 10⁸ years,corresponding to galaxies of baryonic masses of 1011M⊙ (grey dashed line), 2×10¹¹M⊙ (grey dotted line), 5×10¹¹M⊙ (grey solid line),1012M⊙ (black dashed line), 2×10¹²M⊙ (black dotted line) and 5×10¹²M⊙ (black solid line).
Figure 6. Evolution of the y parameter. The left panel is the evolution of the central thermal y parameter (yc). The right panel is theeffective thermal y parameter (yeff ) assuming a beam size of 5′′. The different lines correspond to different galaxy masses, coded as inFigure 5.
of a spherical galaxy with isotropic winds, the total contri-bution to the kinetic y parameter becomes zero. In reality,the geometry of galactic winds tend to be more bi-conicalthan spherical. If there is asymmetry between the two cones,there will be a net kinetic SZ effect. Even within the contextof our spherically symmetric calculations, we can estimatethe kinetic SZ effect, in the case of extreme asymmetry, byconsidering the contribution of only one hemisphere of thegalaxy.
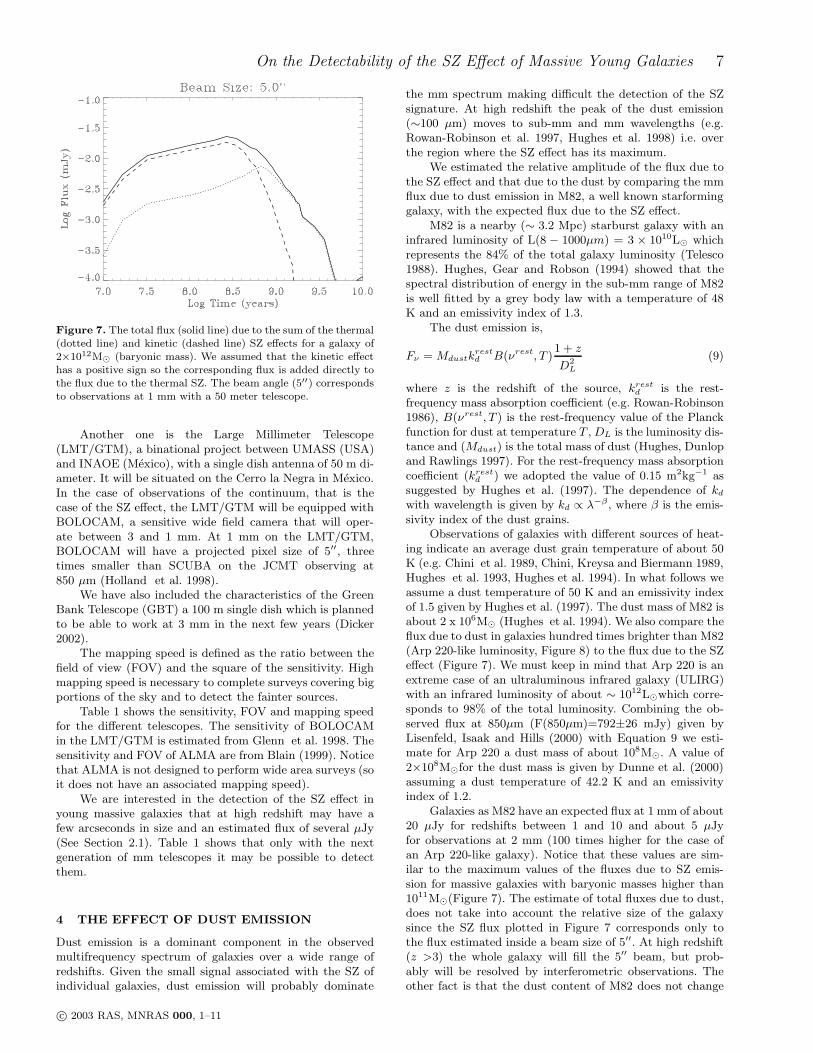
In this gross approximation, the kinetic effect is domi-nant at early phases of the galaxy evolution (less than 0.5Gyr) due to the infall of gas to the centre of the galaxy. Dur-ing this epoch the gas is relatively cold with temperaturesof about 104K favouring the kinetic effect over the thermalone. During this early phase the SZ kinetic effect could beseveral times higher than the thermal effect (Figure 7). Inthe central region of the galaxy the thermal effect domi-nates due to the high temperatures and densities and as aresult the central yth parameter is higher than the kineticcomponent.
Notice, however, that an assumption of extremely asym-metric infall is probably less justified than that of asym-metric wind. However, when the galactic wind is operating(t > 1 Gyr) due to its low density, the implied kinetic SZeffect would be much less than the thermal SZ effect. More-over at these late times, the galaxy is far from the time ofmaximum SZ effect (t ∼ 0.5 Gyr).
3 TELESCOPES AND DETECTORS
There are a few future mm and sub-mm facilities that maybe capable of detecting the SZ effect produced by individualgalaxies.
One is the Atacama Large Millimeter Array (ALMA),a project lead by institutions of Europe, Japan and NorthAmerica. ALMA will be an array of 64 antennas of 12 min diameter getting baselines up to 10 km. It is expectedthat ALMA will cover the wavelength range from 8 mm to350 µm (Blain 1999). It will be situated in the Atacamadesert in Chile.
c© 2003 RAS, MNRAS 000, 1–11
On the Detectability of the SZ Effect of Massive Young Galaxies 7
Figure 7. The total flux (solid line) due to the sum of the thermal(dotted line) and kinetic (dashed line) SZ effects for a galaxy of2×1012M⊙ (baryonic mass). We assumed that the kinetic effecthas a positive sign so the corresponding flux is added directly tothe flux due to the thermal SZ. The beam angle (5′′) correspondsto observations at 1 mm with a 50 meter telescope.
Another one is the Large Millimeter Telescope(LMT/GTM), a binational project between UMASS (USA)and INAOE (Mexico), with a single dish antenna of 50 m di-ameter. It will be situated on the Cerro la Negra in Mexico.In the case of observations of the continuum, that is thecase of the SZ effect, the LMT/GTM will be equipped withBOLOCAM, a sensitive wide field camera that will oper-ate between 3 and 1 mm. At 1 mm on the LMT/GTM,BOLOCAM will have a projected pixel size of 5′′, threetimes smaller than SCUBA on the JCMT observing at850 µm (Holland et al. 1998).
We have also included the characteristics of the GreenBank Telescope (GBT) a 100 m single dish which is plannedto be able to work at 3 mm in the next few years (Dicker2002).
The mapping speed is defined as the ratio between thefield of view (FOV) and the square of the sensitivity. Highmapping speed is necessary to complete surveys covering bigportions of the sky and to detect the fainter sources.
Table 1 shows the sensitivity, FOV and mapping speedfor the different telescopes. The sensitivity of BOLOCAMin the LMT/GTM is estimated from Glenn et al. 1998. Thesensitivity and FOV of ALMA are from Blain (1999). Noticethat ALMA is not designed to perform wide area surveys (soit does not have an associated mapping speed).
We are interested in the detection of the SZ effect inyoung massive galaxies that at high redshift may have afew arcseconds in size and an estimated flux of several µJy(See Section 2.1). Table 1 shows that only with the nextgeneration of mm telescopes it may be possible to detectthem.
4 THE EFFECT OF DUST EMISSION
Dust emission is a dominant component in the observedmultifrequency spectrum of galaxies over a wide range ofredshifts. Given the small signal associated with the SZ ofindividual galaxies, dust emission will probably dominate
the mm spectrum making difficult the detection of the SZsignature. At high redshift the peak of the dust emission(∼100 µm) moves to sub-mm and mm wavelengths (e.g.Rowan-Robinson et al. 1997, Hughes et al. 1998) i.e. overthe region where the SZ effect has its maximum.
We estimated the relative amplitude of the flux due tothe SZ effect and that due to the dust by comparing the mmflux due to dust emission in M82, a well known starforminggalaxy, with the expected flux due to the SZ effect.
M82 is a nearby (∼ 3.2 Mpc) starburst galaxy with aninfrared luminosity of L(8 − 1000µm) = 3 × 10¹⁰L⊙ whichrepresents the 84% of the total galaxy luminosity (Telesco1988). Hughes, Gear and Robson (1994) showed that thespectral distribution of energy in the sub-mm range of M82is well fitted by a grey body law with a temperature of 48K and an emissivity index of 1.3.
The dust emission is,
Fν = Mdustkrestd B(νrest, T )
1 + z
D2L
(9)
where z is the redshift of the source, krestd is the rest-
frequency mass absorption coefficient (e.g. Rowan-Robinson1986), B(νrest, T ) is the rest-frequency value of the Planckfunction for dust at temperature T , DL is the luminosity dis-tance and (Mdust) is the total mass of dust (Hughes, Dunlopand Rawlings 1997). For the rest-frequency mass absorptioncoefficient (krest
d ) we adopted the value of 0.15 m2kg−1 assuggested by Hughes et al. (1997). The dependence of kd
with wavelength is given by kd ∝ λ−β, where β is the emis-sivity index of the dust grains.
Observations of galaxies with different sources of heat-ing indicate an average dust grain temperature of about 50K (e.g. Chini et al. 1989, Chini, Kreysa and Biermann 1989,Hughes et al. 1993, Hughes et al. 1994). In what follows weassume a dust temperature of 50 K and an emissivity indexof 1.5 given by Hughes et al. (1997). The dust mass of M82 isabout 2 x 10⁶M⊙ (Hughes et al. 1994). We also compare theflux due to dust in galaxies hundred times brighter than M82(Arp 220-like luminosity, Figure 8) to the flux due to the SZeffect (Figure 7). We must keep in mind that Arp 220 is anextreme case of an ultraluminous infrared galaxy (ULIRG)with an infrared luminosity of about ∼ 1012L⊙which corre-sponds to 98% of the total luminosity. Combining the ob-served flux at 850µm (F(850µm)=792±26 mJy) given byLisenfeld, Isaak and Hills (2000) with Equation 9 we esti-mate for Arp 220 a dust mass of about 108M⊙. A value of2×108M⊙for the dust mass is given by Dunne et al. (2000)assuming a dust temperature of 42.2 K and an emissivityindex of 1.2.
Galaxies as M82 have an expected flux at 1 mm of about20 µJy for redshifts between 1 and 10 and about 5 µJyfor observations at 2 mm (100 times higher for the case ofan Arp 220-like galaxy). Notice that these values are sim-ilar to the maximum values of the fluxes due to SZ emis-sion for massive galaxies with baryonic masses higher than1011M⊙(Figure 7). The estimate of total fluxes due to dust,does not take into account the relative size of the galaxysince the SZ flux plotted in Figure 7 corresponds only tothe flux estimated inside a beam size of 5′′. At high redshift(z >3) the whole galaxy will fill the 5′′ beam, but prob-ably will be resolved by interferometric observations. Theother fact is that the dust content of M82 does not change
c© 2003 RAS, MNRAS 000, 1–11
8 D. Rosa–Gonzalez et al.
Table 1. Main characteristics of the most sensitive telescopes at the mm range. The upper value of 10 km for ALMA correspond to the
maximum separation between two antennas. The mapping speed (∗) is measured in arcminute2
hour mJy2.
Telescope Camera Wavelength Angular Resolution Sensitivity FOV Mapping Speed
and diameter (mm) (arcsec) (mJy/√
Hz) (arcmin2) (∗)
JCMT (15 m) SCUBA 0.85 15 90 2 0.9GBT (100 m) 3mm–Camera 3.00 8 0.2 0.3 27000
LMT/GTM (50 m) BOLOCAM 1.2 6 2 2 1800ALMA (< 10 km) – 1.30 0.03 0.46 0.16 –
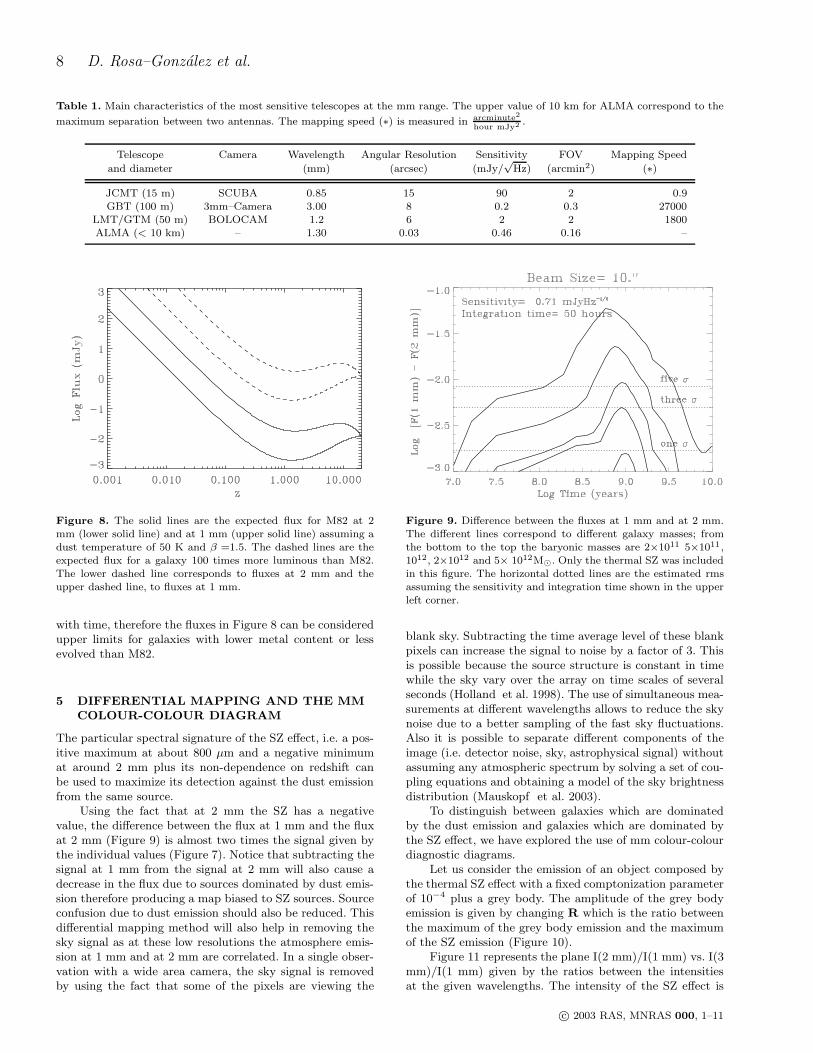
Figure 8. The solid lines are the expected flux for M82 at 2mm (lower solid line) and at 1 mm (upper solid line) assuming adust temperature of 50 K and β =1.5. The dashed lines are theexpected flux for a galaxy 100 times more luminous than M82.The lower dashed line corresponds to fluxes at 2 mm and theupper dashed line, to fluxes at 1 mm.
with time, therefore the fluxes in Figure 8 can be consideredupper limits for galaxies with lower metal content or lessevolved than M82.
5 DIFFERENTIAL MAPPING AND THE MM
COLOUR-COLOUR DIAGRAM
The particular spectral signature of the SZ effect, i.e. a pos-itive maximum at about 800 µm and a negative minimumat around 2 mm plus its non-dependence on redshift canbe used to maximize its detection against the dust emissionfrom the same source.
Using the fact that at 2 mm the SZ has a negativevalue, the difference between the flux at 1 mm and the fluxat 2 mm (Figure 9) is almost two times the signal given bythe individual values (Figure 7). Notice that subtracting thesignal at 1 mm from the signal at 2 mm will also cause adecrease in the flux due to sources dominated by dust emis-sion therefore producing a map biased to SZ sources. Sourceconfusion due to dust emission should also be reduced. Thisdifferential mapping method will also help in removing thesky signal as at these low resolutions the atmosphere emis-sion at 1 mm and at 2 mm are correlated. In a single obser-vation with a wide area camera, the sky signal is removedby using the fact that some of the pixels are viewing the
Figure 9. Difference between the fluxes at 1 mm and at 2 mm.The different lines correspond to different galaxy masses; fromthe bottom to the top the baryonic masses are 2×10¹¹ 5×1011,1012, 2×10¹² and 5× 10¹²M⊙. Only the thermal SZ was includedin this figure. The horizontal dotted lines are the estimated rmsassuming the sensitivity and integration time shown in the upperleft corner.
blank sky. Subtracting the time average level of these blankpixels can increase the signal to noise by a factor of 3. Thisis possible because the source structure is constant in timewhile the sky vary over the array on time scales of severalseconds (Holland et al. 1998). The use of simultaneous mea-surements at different wavelengths allows to reduce the skynoise due to a better sampling of the fast sky fluctuations.Also it is possible to separate different components of theimage (i.e. detector noise, sky, astrophysical signal) withoutassuming any atmospheric spectrum by solving a set of cou-pling equations and obtaining a model of the sky brightnessdistribution (Mauskopf et al. 2003).
To distinguish between galaxies which are dominatedby the dust emission and galaxies which are dominated bythe SZ effect, we have explored the use of mm colour-colourdiagnostic diagrams.
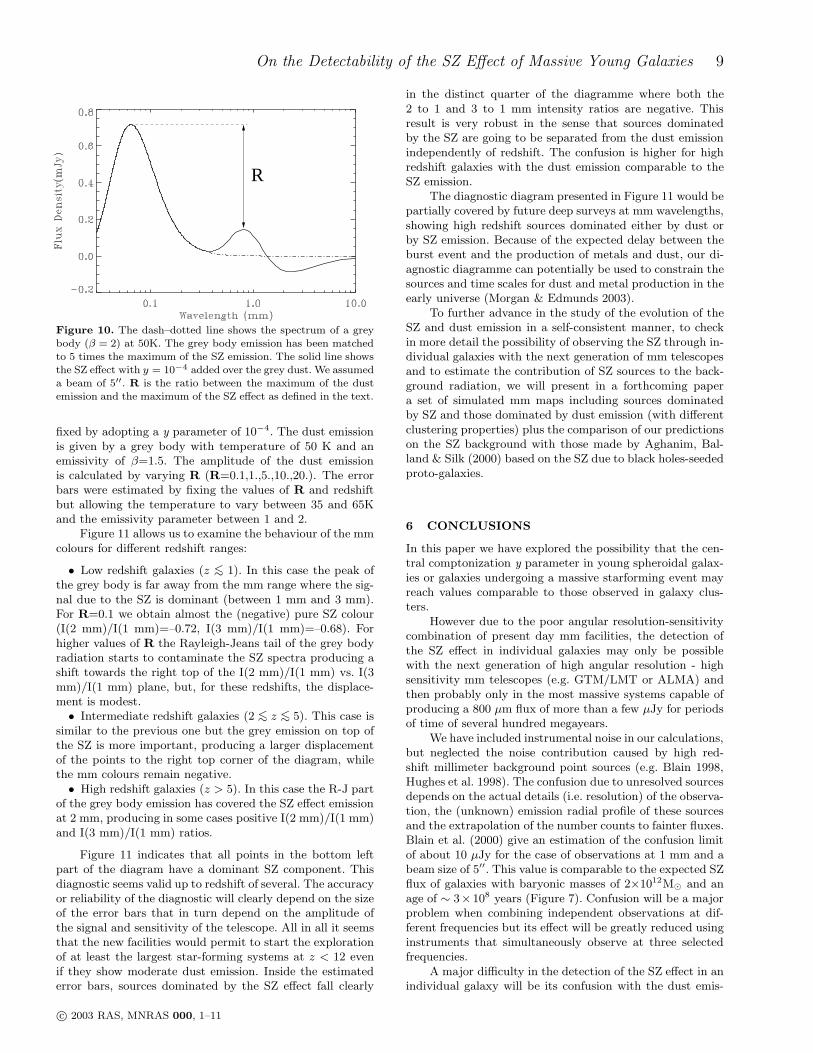
Let us consider the emission of an object composed bythe thermal SZ effect with a fixed comptonization parameterof 10−4 plus a grey body. The amplitude of the grey bodyemission is given by changing R which is the ratio betweenthe maximum of the grey body emission and the maximumof the SZ emission (Figure 10).
Figure 11 represents the plane I(2 mm)/I(1 mm) vs. I(3mm)/I(1 mm) given by the ratios between the intensitiesat the given wavelengths. The intensity of the SZ effect is
c© 2003 RAS, MNRAS 000, 1–11
On the Detectability of the SZ Effect of Massive Young Galaxies 9
R
Figure 10. The dash–dotted line shows the spectrum of a greybody (β = 2) at 50K. The grey body emission has been matchedto 5 times the maximum of the SZ emission. The solid line showsthe SZ effect with y = 10−4 added over the grey dust. We assumeda beam of 5′′. R is the ratio between the maximum of the dustemission and the maximum of the SZ effect as defined in the text.
fixed by adopting a y parameter of 10−4. The dust emissionis given by a grey body with temperature of 50 K and anemissivity of β=1.5. The amplitude of the dust emissionis calculated by varying R (R=0.1,1.,5.,10.,20.). The errorbars were estimated by fixing the values of R and redshiftbut allowing the temperature to vary between 35 and 65Kand the emissivity parameter between 1 and 2.
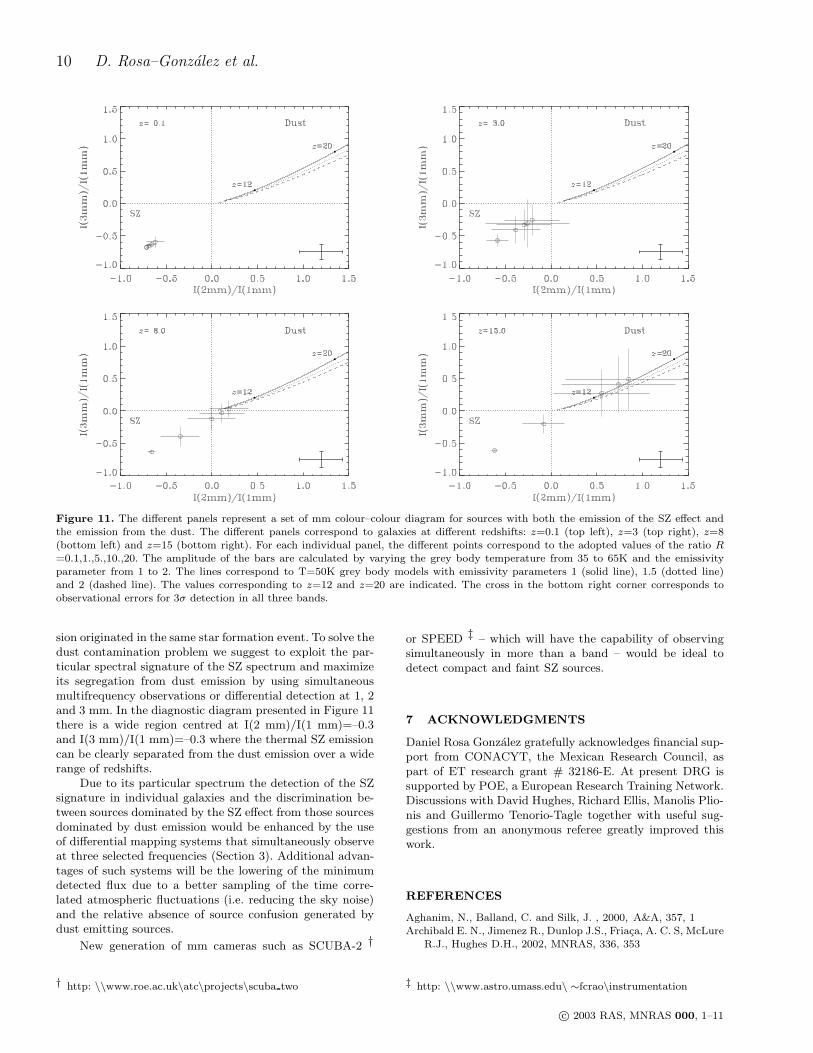
Figure 11 allows us to examine the behaviour of the mmcolours for different redshift ranges:
• Low redshift galaxies (z <∼ 1). In this case the peak ofthe grey body is far away from the mm range where the sig-nal due to the SZ is dominant (between 1 mm and 3 mm).For R=0.1 we obtain almost the (negative) pure SZ colour(I(2 mm)/I(1 mm)=–0.72, I(3 mm)/I(1 mm)=–0.68). Forhigher values of R the Rayleigh-Jeans tail of the grey bodyradiation starts to contaminate the SZ spectra producing ashift towards the right top of the I(2 mm)/I(1 mm) vs. I(3mm)/I(1 mm) plane, but, for these redshifts, the displace-ment is modest.
• Intermediate redshift galaxies (2 <∼ z <∼ 5). This case issimilar to the previous one but the grey emission on top ofthe SZ is more important, producing a larger displacementof the points to the right top corner of the diagram, whilethe mm colours remain negative.
• High redshift galaxies (z > 5). In this case the R-J partof the grey body emission has covered the SZ effect emissionat 2 mm, producing in some cases positive I(2 mm)/I(1 mm)and I(3 mm)/I(1 mm) ratios.
Figure 11 indicates that all points in the bottom leftpart of the diagram have a dominant SZ component. Thisdiagnostic seems valid up to redshift of several. The accuracyor reliability of the diagnostic will clearly depend on the sizeof the error bars that in turn depend on the amplitude ofthe signal and sensitivity of the telescope. All in all it seemsthat the new facilities would permit to start the explorationof at least the largest star-forming systems at z < 12 evenif they show moderate dust emission. Inside the estimatederror bars, sources dominated by the SZ effect fall clearly
in the distinct quarter of the diagramme where both the2 to 1 and 3 to 1 mm intensity ratios are negative. Thisresult is very robust in the sense that sources dominatedby the SZ are going to be separated from the dust emissionindependently of redshift. The confusion is higher for highredshift galaxies with the dust emission comparable to theSZ emission.
The diagnostic diagram presented in Figure 11 would bepartially covered by future deep surveys at mm wavelengths,showing high redshift sources dominated either by dust orby SZ emission. Because of the expected delay between theburst event and the production of metals and dust, our di-agnostic diagramme can potentially be used to constrain thesources and time scales for dust and metal production in theearly universe (Morgan & Edmunds 2003).
To further advance in the study of the evolution of theSZ and dust emission in a self-consistent manner, to checkin more detail the possibility of observing the SZ through in-dividual galaxies with the next generation of mm telescopesand to estimate the contribution of SZ sources to the back-ground radiation, we will present in a forthcoming papera set of simulated mm maps including sources dominatedby SZ and those dominated by dust emission (with differentclustering properties) plus the comparison of our predictionson the SZ background with those made by Aghanim, Bal-land & Silk (2000) based on the SZ due to black holes-seededproto-galaxies.
6 CONCLUSIONS
In this paper we have explored the possibility that the cen-tral comptonization y parameter in young spheroidal galax-ies or galaxies undergoing a massive starforming event mayreach values comparable to those observed in galaxy clus-ters.
However due to the poor angular resolution-sensitivitycombination of present day mm facilities, the detection ofthe SZ effect in individual galaxies may only be possiblewith the next generation of high angular resolution - highsensitivity mm telescopes (e.g. GTM/LMT or ALMA) andthen probably only in the most massive systems capable ofproducing a 800 µm flux of more than a few µJy for periodsof time of several hundred megayears.
We have included instrumental noise in our calculations,but neglected the noise contribution caused by high red-shift millimeter background point sources (e.g. Blain 1998,Hughes et al. 1998). The confusion due to unresolved sourcesdepends on the actual details (i.e. resolution) of the observa-tion, the (unknown) emission radial profile of these sourcesand the extrapolation of the number counts to fainter fluxes.Blain et al. (2000) give an estimation of the confusion limitof about 10 µJy for the case of observations at 1 mm and abeam size of 5′′. This value is comparable to the expected SZflux of galaxies with baryonic masses of 2×10¹²M⊙ and anage of ∼ 3×10⁸ years (Figure 7). Confusion will be a majorproblem when combining independent observations at dif-ferent frequencies but its effect will be greatly reduced usinginstruments that simultaneously observe at three selectedfrequencies.
A major difficulty in the detection of the SZ effect in anindividual galaxy will be its confusion with the dust emis-
c© 2003 RAS, MNRAS 000, 1–11
10 D. Rosa–Gonzalez et al.
Figure 11. The different panels represent a set of mm colour–colour diagram for sources with both the emission of the SZ effect andthe emission from the dust. The different panels correspond to galaxies at different redshifts: z=0.1 (top left), z=3 (top right), z=8(bottom left) and z=15 (bottom right). For each individual panel, the different points correspond to the adopted values of the ratio R
=0.1,1.,5.,10.,20. The amplitude of the bars are calculated by varying the grey body temperature from 35 to 65K and the emissivityparameter from 1 to 2. The lines correspond to T=50K grey body models with emissivity parameters 1 (solid line), 1.5 (dotted line)and 2 (dashed line). The values corresponding to z=12 and z=20 are indicated. The cross in the bottom right corner corresponds toobservational errors for 3σ detection in all three bands.
sion originated in the same star formation event. To solve thedust contamination problem we suggest to exploit the par-ticular spectral signature of the SZ spectrum and maximizeits segregation from dust emission by using simultaneousmultifrequency observations or differential detection at 1, 2and 3 mm. In the diagnostic diagram presented in Figure 11there is a wide region centred at I(2 mm)/I(1 mm)=–0.3and I(3 mm)/I(1 mm)=–0.3 where the thermal SZ emissioncan be clearly separated from the dust emission over a widerange of redshifts.
Due to its particular spectrum the detection of the SZsignature in individual galaxies and the discrimination be-tween sources dominated by the SZ effect from those sourcesdominated by dust emission would be enhanced by the useof differential mapping systems that simultaneously observeat three selected frequencies (Section 3). Additional advan-tages of such systems will be the lowering of the minimumdetected flux due to a better sampling of the time corre-lated atmospheric fluctuations (i.e. reducing the sky noise)and the relative absence of source confusion generated bydust emitting sources.
New generation of mm cameras such as SCUBA-2 †
† http: \\www.roe.ac.uk\atc\projects\scuba two
or SPEED ‡ – which will have the capability of observingsimultaneously in more than a band – would be ideal todetect compact and faint SZ sources.
7 ACKNOWLEDGMENTS
Daniel Rosa Gonzalez gratefully acknowledges financial sup-port from CONACYT, the Mexican Research Council, aspart of ET research grant # 32186-E. At present DRG issupported by POE, a European Research Training Network.Discussions with David Hughes, Richard Ellis, Manolis Plio-nis and Guillermo Tenorio-Tagle together with useful sug-gestions from an anonymous referee greatly improved thiswork.
REFERENCES
Aghanim, N., Balland, C. and Silk, J. , 2000, A&A, 357, 1Archibald E. N., Jimenez R., Dunlop J.S., Friaca, A. C. S, McLure
R.J., Hughes D.H., 2002, MNRAS, 336, 353
‡ http: \\www.astro.umass.edu\ ∼fcrao\instrumentation
c© 2003 RAS, MNRAS 000, 1–11
On the Detectability of the SZ Effect of Massive Young Galaxies 11
Benson A.J., Frenk C.S., Baugh C.M., Cole S., Lacey C.G., 2001,
MNRAS, 327, 1041Birkinshaw, M. , 1999, Phys. Rept., 310, 97
Blain, A. W., Ivison, R. J. and Smail, I. , 1998, MNRAS, 296, 29
Blain, A. , 1998, MNRAS, 297, 502Blain, A. , 1999, Science with the Atacama Large Millimeter
Array (ALMA)
Blain, A. W., Smail, I., Ivison, R. J., Kneib, J.-P. and Frayer,D. T. , 2002, Physics Reports, 369, 111
Chini, R. and Kruegel, E. and Kreysa, E. and Gemuend, H. -. ,1989, A&A, 216, L5
Chini, R. and Kreysa, E. and Biermann, P. L. , 1989, A&A, 219,87
Church, S., Jaffe, A. and Knox, L. , 2001, CMB and Inflation:the report from Snowmass 2001
Dicker, S. , 2002, Private communication
Diego, J. M., Martınez-Gonzalez, E., Sanz, J. L., Benitez, N. andSilk, J. , 2002, MNRAS, 331, 556
Dunne, L., Eales, S., Edmunds, M., Ivison, R., Alexander, P. and
Clements, D. L. , 2000, MNRAS, 315, 115Friaca, A. C. S. and Terlevich, R. J. , 1998, MNRAS, 298, 399
Friaca A.C.S., Terlevich R.J., 1999, MNRAS, 305, 90
Friaca A.C.S., Terlevich R.J., 2001, MNRAS, 325, 335Glenn, J., Bock, J. J., Chattopadhyay, G., Edgington, S. F.,
Lange, A. E., Zmuidzinas, J., Mauskopf, P. D., Rownd, B.,Yuen, L. and Ade, P. A. , 1998, Proc. SPIE Vol. 3357, p.326-334, Advanced Technology MMW, Radio, and TerahertzTelescopes, Thomas G. Phillips; Ed., 3357, 326
Grevesse N., Sauval A.J., 1998, Space Science Reviews, 85, 161
Gunn, J. E. and Peterson, B. A. , 1965, ApJ, 142, 1633
Holder, G. P. , 2002, ApJ, 580, 36Holland, W. S., Greaves, J. S., Zuckerman, B., Webb, R. A. ,
McCarthy, C., Coulson, I. M., Walther, D. M. , Dent, W. R.F., Gear, W. K. and Robson, I. , 1998, Nature, 392, 788
Holweger H., 2001, in Wimmer-Schweingruber R.F., ed., Solarand Galactic Composition. Springer, Berlin, p.23
Hu, E. M., Cowie, L. L. and McMahon, R. G. , 1998, ApJL, 502,99
Hughes, D. H. and Robson, E. I. and Dunlop, J. S. and Gear,W. K. , 1993, MNRAS, 263, 607
Hughes, D.H. and Gear, W.K. and Robson, E.I. , 1994, MNRAS,270, 641
Hughes, D. H. and Dunlop, J. S. and Rawlings, S. , 1997, MNRAS,289, 766
Hughes, D. H., Serjeant, S., Dunlop, J., Rowan-Robinson, M. ,Blain, A., Mann, R. G., Ivison, R., Peacock, J. , Efstathiou,A., Gear, W., Oliver, S., Lawrence, A. , Longair, M., Gold-schmidt, P. and Jenness, T. , 1998, Nature, 394, 241
Iwamoto K., Brachwitz F., Nomoto K., Kishimoto N., Umeda H.,Hix W.R., Thielemann F.-K., 1999, ApJS, 125, 439
Jimenez, R., Friaca, A. C. S., Dunlop, J. S., Terlevich, R. J.,Peacock, J. A. and Nolan, L. A. , 1999, MNRAS, 305, 16
Kompaneets, A. S. , 1957, Zh.E.F.T., 31, 876
Lamarre, J. M., Giard, M., Pointecouteau, E., Bernard, J. P.,Serra, G., Pajot, F., Desert, F. X., Ristorcelli, I., Torre, J. P.,Church, S., Coron, N., Puget, J. L. and Bock, J. J. , 1998,ApJL, 507, L5
Lanfranchi G.A., Friaca A.C.S., 2003, MNRAS, 343, 481
Lisenfeld, U., Isaak, K. G. and Hills, R. , 2000, MNRAS, 312, 433
Levine, E. S., Schulz, A. E. and White, M. , 2002, ApJ, 577, 569
Majumdar, S. , 2001, ApJL, 555, 7Majumdar, S., Nath, B. B. and Chiba, M. , 2001, MNRAS, 324,
537
Majumdar, S. and Mohr, J. J. , 2003, ApJ, 585, 603
Mauskopf, P. D., Ade, P. A. R., Allen, S. W., Church, S. E., Edge,A. C., Ganga, K. M., Holzapfel, W. L., Lange, A. E., Rownd,B. K., Philhour, B. J. and Runyan, M. C. , 2000, ApJ, 538,505
Mauskopf, P. D., Ade, P. A. R., Bock, J. J., Church, S. E., Ganga,
K. M., Holzapfel, W. L., Philhour, B. J., Wilbanks, T. M. andLange, A. E , 2003, in preparation
Morgan, H. L. and Edmunds, M. G. , 2003, MNRAS, 343, 427Natarajan, P. and Sigurdsson, S. , 1999, MNRAS, 302, 288Navarro, J. F., Frenk, C. S. and White, S. D. M. , 1995, MNRAS,
275, 56Rephaeli, Y. , 1995, ARAA, 33, 541Reese, E. D., Carlstrom, J. E., Joy, M., Mohr, J. J., Grego, L.
and Holzapfel, W. L. , 2002, ApJ, 581, 53Rosa-Gonzalez, D., 2002, Ph.D. Thesis, INAOE, Mexico.Rosa-Gonzalez, D., Terlevich, R.J., Terlevich, E., Friaca, A. and
Gaztanaga, E. , 2000, Deep Millimeter Surveys: Implicationsfor Galaxy Formation and Evolution, ed. James Lowenthaland David Hughes.
Rosa-Gonzalez, D., Terlevich, E., Gaztanaga, E., Terlevich, R.J.and Friaca, A. , 2001, A new era in cosmology, ed. Tom Shanksand Nigel Metcalfe.
Rowan-Robinson, M., Mann, R. G., Oliver, S. J., Efstathiou, A.,Eaton, N., Goldschmidt, P., Mobasher, B., Serjeant, S. B. G.,Sumner, T. J., Danese, L., Elbaz, D., Franceschini, A., Egami,E., Kontizas, M., Lawrence, A., McMahon, R., Norgaard-Nielsen, H. U., Perez-Fournon, I. and Gonzalez-Serrano, J.I. , 1997, MNRAS, 289, 490
Rybicki,G.B. and Lightman, A.P. , 1980, Radiative Processes inAstrophysics, New York: Wiley
Somerville R.S., Primack J.R., 1999, MNRAS, 310, 1087Spergel, D. N., Verde, L., Peiris, H. V., Komatsu, E., Nolta, M. R.,
Bennett, C. L., Halpern, M., Hinshaw, G., Jarosik, N., Kogut,A., Limon, M., Meyer, S. S., Page, L., Tucker, G. S., Weiland,J. L. and Wollack, E. and Wright, E. L. , 2003, ApJS, 148,175
Stanway, E. R., Bunker, A. J. and McMahon, R. G. , 2003, MN-RAS, 342, 439
Sunyaev, R. A. and Zel’dovich, Ya. B. , 1972, Comments Astro-phys. and Space Sci., 4, 173
Tegmark, M., Silk, J. and Evrard, A. , 1993, ApJ, 417, 54Telesco, C. M. , 1988, ARAA, 26, 343van de Hoek L.B., Groenewegen M.A.T., 1997, A&A, 123, 305Woosley S.E., Weaver T.A., 1995, ApJS, 101, 181
This paper has been produced using the Royal AstronomicalSociety/Blackwell Science LATEX style file.
c© 2003 RAS, MNRAS 000, 1–11
Copyright © 2022 FDOKUMEN