MAINTENANCE FOR IMPROVED PUNCTUALITY - CiteSeerX
83
LICENTIATE THESIS Luleå University of Technology Department of Civil and Environmental Engineering Division of Operation and Maintenance Engineering 2005:88|:02-757|: -c -- 05⁄88 -- 2005:88 Maintenance for Improved Punctuality - A Study of Condition Monitoring Technology for the Swedish Railway Sector Rikard Granström
-
Upload
khangminh22 -
Category
Documents
-
view
1 -
download
0
Transcript of MAINTENANCE FOR IMPROVED PUNCTUALITY - CiteSeerX
LICENTIATE T H E S I S
Luleå University of TechnologyDepartment of Civil and Environmental EngineeringDivision of Operation and Maintenance Engineering
2005:88|: 02-757|: -c -- 05⁄88 --
2005:88
Maintenance for Improved Punctuality- A Study of Condition Monitoring
Technology for the Swedish Railway Sector
Rikard Granström
LICENTIATE THESIS
MAINTENANCE FOR IMPROVED PUNCTUALITY -A STUDY OF CONDITION MONITORING TECHNOLOGY FOR THE
SWEDISH RAILWAY SECTOR
RIKARD GRANSTRÖM
Luleå University of Technology Department of Civil and Environmental Engineering Division of Operation and Maintenance Engineering
JvtC - Luleå Railway Research Centre


i
ACKNOWLEDGEMENTS
This thesis work presented in this thesis was carried out at the Division of Operation and Maintenance Engineering and Luleå Railway Research Centre, Luleå University of Technol-ogy. The research was funded by the European Union Structural Fund Project, whose spon-sorship is gratefully acknowledged.
First I would like to express my gratitude to my supervisor, Professor Uday Kumar and my co-supervisor Adjunct Professor Ulf Olsson. I would also like to thank Hans Kempen, man-ager at Banverket Consulting, Luleå, for his support.
The support from the following people at Banverket is acknowledged: Hans Loskog, Tho-mas Rahmstedt, Dan Johansson, Lars Sundholm, Jörgen Nyberg, Anders Khemi and Stefan Nilsson (Stinsson).
I would like to express my special thanks to my colleague Peter Söderholm for the many fruitful discussions we had during this endeavour. Further I would like to thank Ulla Espling for her sharing of railway knowledge, Håkan Schunesson for helping me complete this the-sis, and also all my colleagues at the division of Operation and Maintenance Engineering and Luleå Railway Research Centre.
Finally, I would like to express my gratitude to my beloved Maria and my daughter Julia for their patience and understanding during my late evening work sessions at home.
Rikard Granström
Älvsbyn, November 2005

ii
iii
ABSTRACT
Banverket (‘the Swedish National Railway Administration’) is responsible for management of the infrastructure in Sweden. Banverket’s main objective, stated by the Swedish govern-ment, is to assure a cost-effective and long-term provision of transportation for citizens and the business sector. In order to stay competitive with other forms of transportation, the rail-way needs to be cost-effective and provide reliable service. The reliable service is to a great extent reflected in terms of train punctuality. Railway components in general have a fairly long life, which means that the cost effectiveness of the transportation system is highly de-pendent on the effectiveness (doing the right things) and the efficiency (doing the things right) of its operation and maintenance process.
The purpose of maintenance is to ensure business objectives through the assurance of re-quired technical functions. Maintenance in the railway ensures the function of the systems that are essential for the operation of the transportation system. In other words, maintenance is a vital tool for achieving punctuality, which next to safety is Banverket’s most important goal area.
Developments in sensor technology and in the information and communication technology sector have provided new opportunities to use technology to assess infrastructural and rolling stock conditions. Decision support derived from condition monitoring systems can provide opportunities for improved maintenance management. In other words, condition monitoring can provide conditions for improved maintenance effectiveness and efficiency and hence punctuality.
The thesis explores three areas. The first area is the exploration of current train delay statis-tics, performed in order to assess how the statistics can represent the influence of different factors on punctuality. The second is an exploration of the link between punctuality and maintenance and more specifically condition monitoring. The third area explores current condition monitoring applications at Banverket to form a knowledge foundation for further condition monitoring implementations intended to improve the reliability and hence the punctuality of the transportation system.
In the perspective of the studies are important factors for successful applications of condition monitoring technology proposed. These are factors such as knowledge of problem character-istics, information accuracy, measurement limitations and ability to combine condition based maintenance objectives with business objectives etc. Furthermore, are recommendations for future condition monitoring implementations made. These are recommendations for enhanc-ing the condition-based maintenance, which in turn is dependent on applications of condition monitoring.
The final discussions are based upon overall experience from working with the material. The discussion links to the initial research problem, whose intension is to widen the horizon of possible condition monitoring applications.
Keywords: Maintenance, punctuality, railway, train delay, condition monitoring, CBM.

iv
v
SAMMANFATTNING
Den Svenska riksdagen har fastställt att Banverkets huvudmål är att tillgodose en samhälls-ekonomiskt effektiv och långsiktigt hållbar transportförsörjning för medborgare och närings-liv. För att järnvägssektorn skall kunna vara konkurrenskraftig i förhållande till andra trans-portmedel måste den vara kostnadseffektiv och tillgodose en tillförlitlig tjänst. Den tillförlit-liga tjänsten är till stor del avspeglad i transportsystemets punktlighet. Komponenter inom järnvägen har en förhållandevis hög livslängd, vilket innebär att kostnadseffektiviteten hos transportsystemet till stor del kommer att avgöras av hur väl man lyckas ombesörja sina un-derhållsaktiviteter under systemens livslängd.
Underhållets syfte är att tillgodose affärsmål, detta åstadkommes genom att underhållet sä-kerställer den nödvändiga tekniska funktionen hos systemen. Underhållet inom järnvägen säkerställer funktionen hos de system som är nödvändiga för driften av transportsystemet. Underhållet är ett viktigt verktyg för att uppnå punktlighet, vilket näst efter säkerheten är Banverkets viktigaste målområde.
Utvecklingen inom sensorteknologiområdet samt utvecklingen inom informations och kom-munikationssektorn har bidragit med nya möjligheter att kontinuerligt kunna mäta och effek-tivt diagnostisera både infrastrukturens och det rullande materiels underhållsbehov. Besluts-stöd från tillståndsövervakningstekniken erbjuder möjligheter till förbättrad underhållsstyr-ning. Förbättrad underhållsstyrning skapar förutsättningar för slagkraftigare underhållsinsat-ser vilket medger en förbättrad tillförlitlighet hos systemen och därmed förbättrad punktlig-het.
Denna uppsats utforskar tre områden. Det första området är en studie av tågförseningsstati-stik, denna studie utfördes för att fastställa hur statistiken kan representera olika faktorers inverkan på punktligheten. Det andra området är en studie för att skapa en koppling mellan tillståndsövervakning och punktlighet. Det tredje området består i studier av tillståndsöver-vakningsteknik inom Banverket, vilka utförts för att skapa en kunskapsgrund för framtida tillståndsövervakningslösningar, vilka syftar till att förbättra tillförlitligheten och därmed punktligheten inom transportsystemet.
Från utförda studier presenteras faktorer som är viktiga för lyckade tillståndsövervaknings-implementeringar inom Banverket. Detta kan vara faktorer som att känna till problemets ka-rakteristik, informationstillförlitlighet, mätmetodbegränsningar och förmåga att koppla de tillståndsbaserade underhållsmålen med de övergripande affärsmålen etc. Från detta är re-kommendationer för framtida implementeringar av tillståndsövervakningsteknik skapade. Dessa rekommendationer syftar primärt till att belysa faktorer som kan beaktas innan man bestämmer sig för att implementera tillståndsövervakningsteknik. Dessa rekommendationer syftar till att förbättra det tillståndsbaserade underhållet, vilket i sig är beroende av effektiv tillståndsövervakning.
Den slutgiltiga diskussionen baseras på erfarenheter från det utförda arbetet. Diskussionen länkas till forskningsproblemet vilket syftar till att vidga horisonten för möjliga applika-tionsområden för tillståndsövervakningsteknik.

vi
vii
CONTENT
1 INTRODUCTION AND BACKGROUND ................................................... 11.1 THE SWEDISH RAILWAY SECTOR .....................................................................................2 1.2 PUNCTUALITY .................................................................................................................2 1.3 MAINTENANCE ................................................................................................................5 1.4 MAINTENANCE AND PUNCTUALITY ...............................................................................13 1.5 INFRASTRUCTURAL OPERATION AND MAINTENANCE .....................................................15 1.6 CONDITION MONITORING IN THE RAILWAY SECTOR.......................................................17
2 RESEARCH FRAMEWORK AND METHODOLOGY .......................... 212.1 RESEARCH PROBLEM.....................................................................................................21 2.2 DELIMITATIONS.............................................................................................................22 2.3 PURPOSE OF THE STUDY ................................................................................................22 2.4 RESEARCH QUESTIONS..................................................................................................23 2.5 RESEARCH METHODOLOGY...........................................................................................23
3 STUDY OF PUNCTUALITY AND TRAIN DELAY STATISTICS ....... 254 LINK BETWEEN CONDITION MONITORING AND PUNCTUALITY................................................................................................... 305 CONDITION MONITORING CASE STUDIES ....................................... 35
5.1 WHEEL IMPACT DETECTOR ............................................................................................35 5.2 HOTBOX AND DRAGGING BRAKE DETECTOR ..................................................................43 5.3 TURNOUT, FILAMENT LAMP AND POWER SUPPLY MONITORING......................................53
6 DISCUSSION AND CONCLUSION........................................................... 616.1 FACTORS SUPPORTING A SUCCESSFUL CONDITION MONITORING APPLICATION AT BANVERKET ..............................................................................................................................616.2 RECOMMENDATIONS FOR FUTURE CONDITION MONITORING APPLICATIONS................62 6.3 IMPORTANCE OF EXTENDED SYSTEM USAGE ..................................................................63 6.4 SUGGESTIONS FOR FURTHER RESEARCH .......................................................................64
7 REFERENCES .............................................................................................. 66

1
1 Introduction and Background Technology is a key element to our modern living standards. As we get more dependent on our technical systems, we tend to get more vulnerable to the consequences of the absence of correct technical functions. Such vulnerability can be exposed on such occasions as the mass power supply failure in southern Sweden caused by the storm Gudrun in 2004. Other well known examples exposing our vulnerability to technical system failures are the Shadi Kor dam collapse (Pakistan February 10, 2005), the explosion of the space shuttle Columbia (USA, February 2003), the massive power supply failure (Italy, September 28, 2003), the Hatfield train crash (England, October 17 2000), the Concorde crash outside Paris (France, July 25, 2000), the Enschede train crash (Germany, June 4, 1998) and the explosion of a nu-clear reactor in Chernobyl (Russia, April 26, 1986).
As the technical systems provide more services to us, we become more dependent on their functions and more exposed to their risks. The technical systems’ complexity and cost (of operating and owning) increase at the same time as the tolerance of absence of their function decreases. Stakeholder requirements on the systems’ dependability, safety and cost are fac-tors that outline specifications for technical design which will affect system operational life characteristics, the need for maintenance and the life cycle cost (Blanchard, 1995).
The purpose of the railway sector is to satisfy an important part of society’s need for trans-portation. In order for the railway sector to stay competitive with other forms of transporta-tion, it needs to be cost-effective and provide a reliable service. From the point of view of railway technical systems, the railway is characterized by one-dimensional movement, abil-ity for fast transportation (<500 km/h), ability to transport heavy cargo, steel wheels to steel rail providing low friction, low energy consumption, long braking distances, only one train at a time per track section and high demands on traffic guidance (Gullberg, 2000).
The basic function of the railway has not changed much in the last 100 years. It is still steel wheels on steel rail taking you from point A to point B provided with safety measures guar-anteeing train separation (only one train per given track section at a given time). What has changed, however, is how the railway is utilized. Technologies such as signalling- and traffic control systems provide opportunities to increase train speed, lessen the distance between trains and increase the number of trains on the track. At the same time as technology has made the railway more effective, it has also made it more complex and sensitive to distur-bances. Railway components have in general a fairly long life. For example, some railway components’ life length stretches beyond forty years (Espling, 2004). This implies that the cost for the component during its operational life will be greatly dependent on the effective-ness and the efficiency of its maintenance.
2
1.1 The Swedish railway sector In 1988 the Swedish railway sector saw the separation of infrastructural management and traffic operation. The Swedish National Railway Administration Banverket (responsible for infrastructural management) was formed and the former one-organisational infrastructural and traffic management company SJ (‘the Swedish State Railways’) now became responsi-ble only for traffic operation. Gradually the traffic operation segment was deregulated and SJ became (in some areas) an object for competition from other traffic operating companies. Further in 1998 Banverket was divided into a customer-contractor organisation where the internal contractor organisation was gradually exposed to competition. This created new op-portunities for new maintenance contractors and consultants to provide their services to the railway market. At present there are several different maintenance entrepreneurs and consul-tancy companies working in the railway sector. For 2006 twenty six traffic operators have applied for permit to operate on Banverket’s tracks (fifteen for personnel traffic, eight for freight, and three for both freight and personnel traffic) (Banverket, 2005_b).
As stated by the Swedish Government (Banverket, 2004), Banverket is a governmental of-fice owned by the Swedish state. Banverket’s main objective stated by the Swedish Govern-ment is to ensure a cost-effective and long-term provision of transportation for citizens and the business sector. The governmental demands say that Banverket has a sector responsibil-ity, which means that Banverket has a collective responsibility for the whole railway. This implies that Banverket should follow and actively pursue the development in the whole rail-way sector. In other words, the responsibility for train punctuality lies in the hands of Ban-verket.
1.2 Punctuality Next to safety, punctuality is Banverket’s most important goal area (Fahlen & Jonsson, 2005). According to the Swedish National Encyclopaedia, a person who is punctual ‘keeps exactly to the agreed time’. According to this definition, punctual is an execution of an agreement at a specific time between different parties. In the railway this agreement is syn-onymous with the timetable, where the timetable is the agreement that describes where and at what time a specific transport is to be located. The timetable is an agreement between the train operators and the infrastructural manager.
Punctuality is acknowledged as a key performance indicator (Åhren, 2002), which to some extent indicates to what extent the transportation system as a whole (e.g. infrastructure, roll-ing stock, and traffic control) manages to deliver transports on time according to the timeta-ble. Expressed as a function, the infrastructural manager provides prerequisites for punctual-ity to the transportation system by providing, at a specific time, a functional infrastructure that allows specified transports to operate at a certain speed and intensity based on the time-table. From a traffic operator perspective, punctuality is provided by providing, at a specific time, personnel and rolling stock with specified performance characteristics that allow opera-tion at a certain speed according to the timetable. If the infrastructural manager, the traffic operator or both combined fail to deliver their services, the result will be unpunctuality.
3
Punctuality is not a measure of how well the transportation system is used. Provided that a train sticks to the timetable, the same train can be regarded as punctual if the travel time is specified at ten minutes or at twenty minutes. A known way of solving punctuality issues is to prolong the estimated travel time.
Punctuality is usually calculated by dividing the number of punctual trains by the total num-ber of trains and presenting the result as the percentage of punctual trains (Olsson & Haug-land, 2004). Banverket’s definition of punctual is: ‘arrival at the end station plus five min-utes’. Swedish punctuality is calculated in the manner explained by Olsson & Haugland (2004), but it should be noted that cancelled trains are not included. Rudnicki (1997) defines punctuality as ‘a feature consisting in a predefined vehicle arriving, departing or passing at a predefined point at a predefined time’. This definition comes close to describing how Swed-ish train delay statistics work.
Train delay statistics are used in order to gain an understanding of what causes unpunctuality to the Swedish railway sector. Banverket uses different approaches such as database systems and collaborative work, such as PULS (punctuality through collaboration between operators and Banverket) (Fahlen & Jonsson, 2005), for the follow-up of train delays. The most central database system is TFÖR (train delay system), which is used for train delay follow-up and encoding of failure causes. TFÖR registers the train’s correlation to the timetable and re-trieves the train delay information from the traffic control system’s track circuit indications. The delays are manually encoded by personnel at the train traffic control centre. The traffic controllers are supposed to register a cause of delay when the extra delay is more than five minutes. The extra delay is the change in delay between two stations, which means that if a train is extra delayed for three minutes between two stations and for an additional four min-utes between the next two stations, the train is in fact seven minutes late in relation to the timetable, but is not regarded as delayed and is therefore not encoded. The reason for this somewhat tolerant definition of extra delay is to limit the work of encoding and analyzing delay data.
The TFÖR structure is an inheritance from SJ. The system contains some ninety-seven dif-ferent codes for train delay encoding. The different codes define to some extent the contribu-tion to train delays from the different stakeholders involved in railway operation. The codes are gathered in accordance with their belonging into six main areas (problem owners), which are:
Planned maintenance and renewal work: Planned maintenance and renewal work that consumes more time than is agreed on in the timetable. Traffic-control-codes: Train delays that can be correlated to the traffic control cen-tres’ operative work. Operators’ codes: Delays that can be correlated to the traffic operators’ activities such as: train driver missing, late departure from freight terminal, inspection of wag-ons, shunting, and so on. Vehicle codes: Delays due to faults or lack of performance of the rolling material. Motive power or carriage damage, e.g. pantograph, hotbox and dragging-brakes de-tector alarms, brake malfunctions, and wheel damage. Infrastructure codes: Codes for identifying delays caused by systems such as signal-ling, track, electrification and telecommunications.
4
Others: Covers what is left out, such as sabotage, natural obstacles (snow, ice, and trees), illness, and other causes that cannot be defined.
TFÖR can link primary and secondary delays depending on what type or types of delays that are of interest. This link makes it possible to separate or seek relations between delays that have emerged from primary causes (e.g. faults related to turnouts, rail, pantographs, and wheels) with delays emerging from secondary causes (delays caused by other delayed traf-fic). It is important to be able to trace the chain of events caused by a fault in order to grasp its total consequences.
Train traffic control centre personnel establish the linkages between the primary delay and secondary delays either automatically or manually during their operations. Delays are classi-fied as follows:
Primary reported extra delay, i.e. an extra delay of a train initiated directly by the cause, reported in a primary cause code, e.g. Track work. Secondary derived extra delay, i.e. an extra delay of one’s own or another train, caused by a primary reported extra delay. This figure is calculated from the data ob-tained from the primary reported extra delay. Total primary caused relation is defined as ‘a primary reported extra-delay added with secondary derived extra delays’. For example, a ten-minute primary reported ex-tra delay causes twenty-five minutes to another train and thus twenty five minutes to the own train secondary. The twenty-five minutes are connected to one’s own train and reported failure code. Secondary reported extra delay, i.e. an extra delay of one’s own train, reported using a secondary delay code, e.g. Trains meet. Total reported extra delay is a primary reported extra delay added with a secondary reported extra delay.
Banverket uses the failure report system 0FELIA for follow-up of failures and faults to the infrastructure. 0FELIA is managed by the train traffic control centre personnel. TFÖR data can be linked to 0FELIA data. This link provides opportunities to gain further precise infor-mation of the underlying factors that cause delays. Extra delays in TFÖR with the failure code infrastructure are matched with failures registered in 0FELIA. This is done manually by personnel at the train traffic control centre. A failure or a fault can be reported by train driv-ers, train dispatchers, different traffic operators, repairmen, Banverket’s inspection person-nel, entrepreneurs or private persons.
5
1.3 Maintenance The purpose of maintenance is to ensure business objectives through the assurance of re-quired technical functions. For example, in the railway sector, maintenance ensures the func-tion of the systems that are essential for the operation of the transportation system. In short, the function of maintenance is the control of plant availability (Kelly & Harris 1978).
Maintenance costs are typically 3-5% of turnover, and in the aircraft industry, for example, may rise as high as 16%. In the latter case maintenance is around 12% of the annual capital cost of an airline, so obviously over the life of an aircraft, the maintenance costs are well in excess of the capital costs (File, 1991). Kelly & Harris (1978) say that in the process industry it is not uncommon for the annual maintenance cost to exceed the purchase price of the plant, so there is plenty of incentive for reducing maintenance costs.
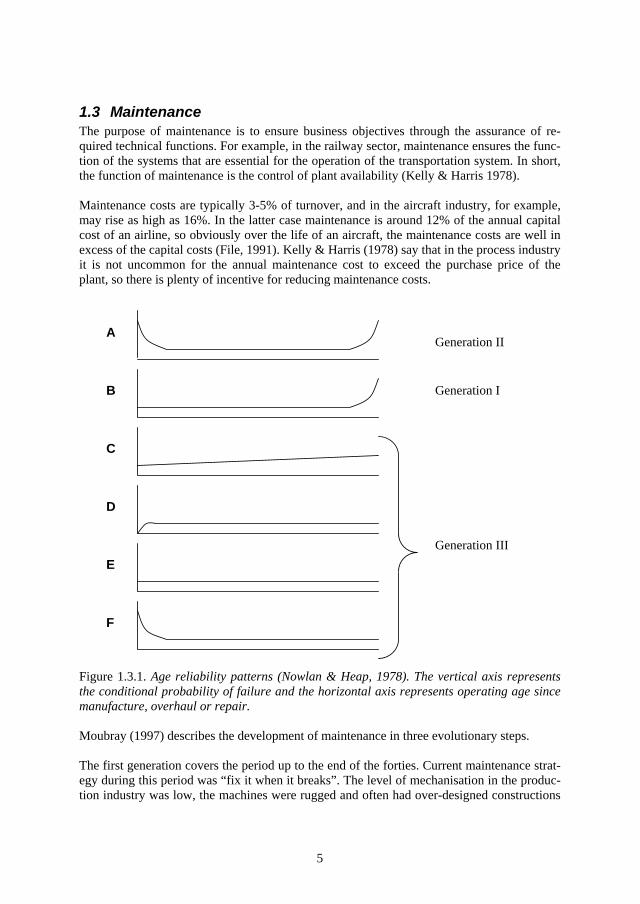
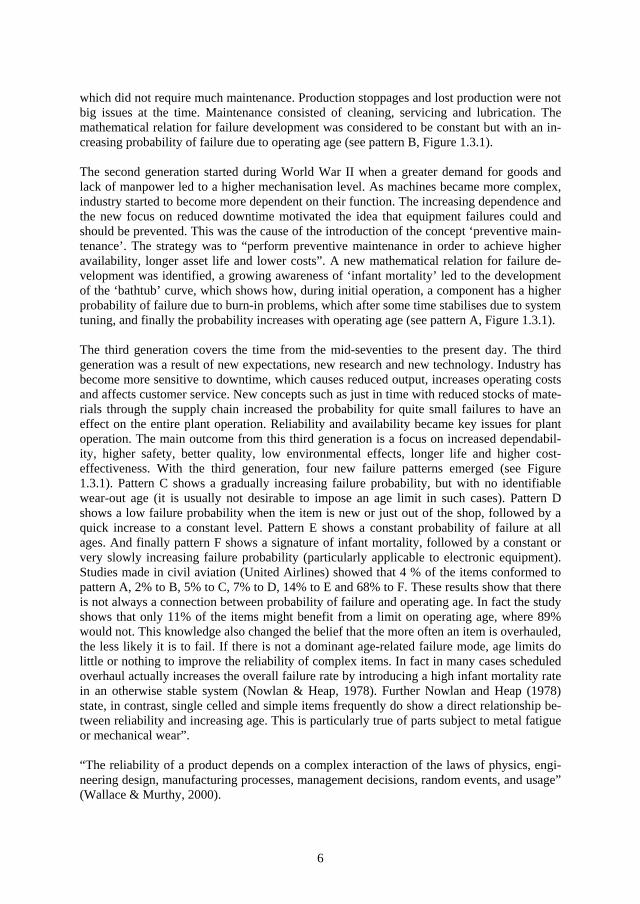
Figure 1.3.1. Age reliability patterns (Nowlan & Heap, 1978). The vertical axis represents the conditional probability of failure and the horizontal axis represents operating age since manufacture, overhaul or repair.
Moubray (1997) describes the development of maintenance in three evolutionary steps.
The first generation covers the period up to the end of the forties. Current maintenance strat-egy during this period was “fix it when it breaks”. The level of mechanisation in the produc-tion industry was low, the machines were rugged and often had over-designed constructions
A
B
E
C
D
F
Generation I
Generation II
Generation III
6
which did not require much maintenance. Production stoppages and lost production were not big issues at the time. Maintenance consisted of cleaning, servicing and lubrication. The mathematical relation for failure development was considered to be constant but with an in-creasing probability of failure due to operating age (see pattern B, Figure 1.3.1).
The second generation started during World War II when a greater demand for goods and lack of manpower led to a higher mechanisation level. As machines became more complex, industry started to become more dependent on their function. The increasing dependence and the new focus on reduced downtime motivated the idea that equipment failures could and should be prevented. This was the cause of the introduction of the concept ‘preventive main-tenance’. The strategy was to “perform preventive maintenance in order to achieve higher availability, longer asset life and lower costs”. A new mathematical relation for failure de-velopment was identified, a growing awareness of ‘infant mortality’ led to the development of the ‘bathtub’ curve, which shows how, during initial operation, a component has a higher probability of failure due to burn-in problems, which after some time stabilises due to system tuning, and finally the probability increases with operating age (see pattern A, Figure 1.3.1).
The third generation covers the time from the mid-seventies to the present day. The third generation was a result of new expectations, new research and new technology. Industry has become more sensitive to downtime, which causes reduced output, increases operating costs and affects customer service. New concepts such as just in time with reduced stocks of mate-rials through the supply chain increased the probability for quite small failures to have an effect on the entire plant operation. Reliability and availability became key issues for plant operation. The main outcome from this third generation is a focus on increased dependabil-ity, higher safety, better quality, low environmental effects, longer life and higher cost-effectiveness. With the third generation, four new failure patterns emerged (see Figure 1.3.1). Pattern C shows a gradually increasing failure probability, but with no identifiable wear-out age (it is usually not desirable to impose an age limit in such cases). Pattern D shows a low failure probability when the item is new or just out of the shop, followed by a quick increase to a constant level. Pattern E shows a constant probability of failure at all ages. And finally pattern F shows a signature of infant mortality, followed by a constant or very slowly increasing failure probability (particularly applicable to electronic equipment). Studies made in civil aviation (United Airlines) showed that 4 % of the items conformed to pattern A, 2% to B, 5% to C, 7% to D, 14% to E and 68% to F. These results show that there is not always a connection between probability of failure and operating age. In fact the study shows that only 11% of the items might benefit from a limit on operating age, where 89% would not. This knowledge also changed the belief that the more often an item is overhauled, the less likely it is to fail. If there is not a dominant age-related failure mode, age limits do little or nothing to improve the reliability of complex items. In fact in many cases scheduled overhaul actually increases the overall failure rate by introducing a high infant mortality rate in an otherwise stable system (Nowlan & Heap, 1978). Further Nowlan and Heap (1978) state, in contrast, single celled and simple items frequently do show a direct relationship be-tween reliability and increasing age. This is particularly true of parts subject to metal fatigue or mechanical wear”.
“The reliability of a product depends on a complex interaction of the laws of physics, engi-neering design, manufacturing processes, management decisions, random events, and usage” (Wallace & Murthy, 2000).
7
Reliability is according to SS-EN 13306 (2001): Ability of an item to perform a required function under given conditions for a given time interval.
Availability is according to SS-EN 13306 (2001): Ability of an item to be in a state to perform a required function under given condi-tions at a given instant of time or during a given time interval, assuming that the re-quired external resources are provided.
Dependability is according to SS-EN 13306 (2001): Collective term used to describe the availability and its influencing factors: reliabil-ity, maintainability and maintenance supportability.
Other reliability studies such as those used in the study performed by Allen (2001), where four different studies are compared, show that only 8-29 % of failures are age-related in such a way that the failure rate increases with operating age. The studied sources were two aero-plane studies, the United Airline study and a study performed by Broberg (1973). The fol-lowing two were studies of naval ships and naval submarines. The aeroplane studies show that 89 to 92 percent of aeroplane components conform to pattern C, D or E, while in the na-val vessels studies a slightly lower number of components, 71-77 percent, conform to these patterns. The number of times that these patterns occur in aeroplanes or in military vessels is not necessarily the same as in industry. But there is no doubt that as assets become more complex, we see more and more of pattern E and F (Moubray, 1997). This is due to the mix-ture of distributions of the life of components in complex systems.
What determines how maintenance is to be performed, what strategies optimally satisfy busi-ness objectives and how this connects to the previously discussed component reliability characteristics will be discussed further. For the further reasoning the following definitions are outlined:
According to Swedish Standard SS-EN 13306 (2001):
Maintenance is the Combination of all technical, administrative and managerial actions during the life cycle of an item intended to retain it in, or restore it to, a state in which it can per-form the required function.
An item is defined as Any part, component, device, subsystem, functional unit, equipment or system that can be individually considered. With the note (A number of items e.g. a population of items, or a sample, may itself be considered as an item)
Failure is the Termination of the ability of an item to perform a required function. (After a failure the item has a fault, which may be complete or partial) (“Failure” is an event as dis-tinguished from “fault”, which is a state.)
8
Fault is the State of an item characterized by the inability to perform a required function, exclud-ing the inability during preventive maintenance or other planned actions, or due to lack of external resources.
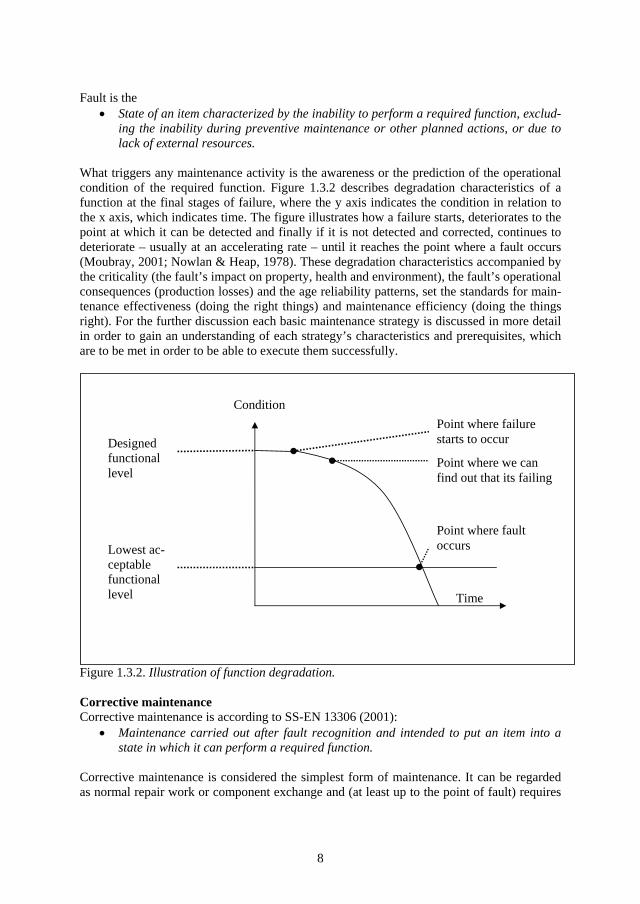
What triggers any maintenance activity is the awareness or the prediction of the operational condition of the required function. Figure 1.3.2 describes degradation characteristics of a function at the final stages of failure, where the y axis indicates the condition in relation to the x axis, which indicates time. The figure illustrates how a failure starts, deteriorates to the point at which it can be detected and finally if it is not detected and corrected, continues to deteriorate – usually at an accelerating rate – until it reaches the point where a fault occurs (Moubray, 2001; Nowlan & Heap, 1978). These degradation characteristics accompanied by the criticality (the fault’s impact on property, health and environment), the fault’s operational consequences (production losses) and the age reliability patterns, set the standards for main-tenance effectiveness (doing the right things) and maintenance efficiency (doing the things right). For the further discussion each basic maintenance strategy is discussed in more detail in order to gain an understanding of each strategy’s characteristics and prerequisites, which are to be met in order to be able to execute them successfully.
Figure 1.3.2. Illustration of function degradation.
Corrective maintenanceCorrective maintenance is according to SS-EN 13306 (2001):
Maintenance carried out after fault recognition and intended to put an item into a state in which it can perform a required function.
Corrective maintenance is considered the simplest form of maintenance. It can be regarded as normal repair work or component exchange and (at least up to the point of fault) requires
Time
Point where fault occurs
ConditionPoint where failure starts to occur
Point where we can find out that its failing
Designedfunctionallevel
Lowest ac-ceptable functionallevel
9
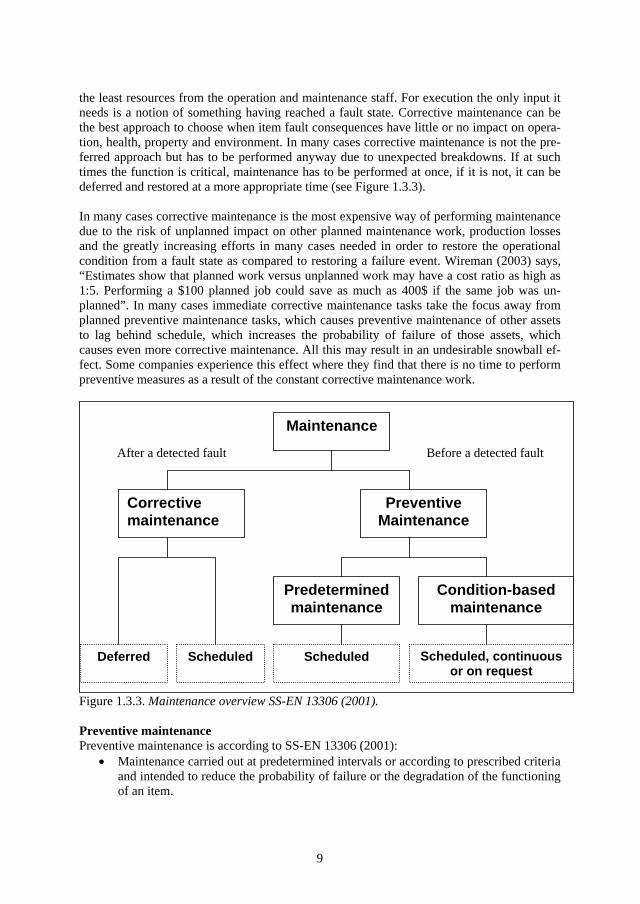
the least resources from the operation and maintenance staff. For execution the only input it needs is a notion of something having reached a fault state. Corrective maintenance can be the best approach to choose when item fault consequences have little or no impact on opera-tion, health, property and environment. In many cases corrective maintenance is not the pre-ferred approach but has to be performed anyway due to unexpected breakdowns. If at such times the function is critical, maintenance has to be performed at once, if it is not, it can be deferred and restored at a more appropriate time (see Figure 1.3.3).
In many cases corrective maintenance is the most expensive way of performing maintenance due to the risk of unplanned impact on other planned maintenance work, production losses and the greatly increasing efforts in many cases needed in order to restore the operational condition from a fault state as compared to restoring a failure event. Wireman (2003) says, “Estimates show that planned work versus unplanned work may have a cost ratio as high as 1:5. Performing a $100 planned job could save as much as 400$ if the same job was un-planned”. In many cases immediate corrective maintenance tasks take the focus away from planned preventive maintenance tasks, which causes preventive maintenance of other assets to lag behind schedule, which increases the probability of failure of those assets, which causes even more corrective maintenance. All this may result in an undesirable snowball ef-fect. Some companies experience this effect where they find that there is no time to perform preventive measures as a result of the constant corrective maintenance work.
Figure 1.3.3. Maintenance overview SS-EN 13306 (2001).
Preventive maintenancePreventive maintenance is according to SS-EN 13306 (2001):
Maintenance carried out at predetermined intervals or according to prescribed criteria and intended to reduce the probability of failure or the degradation of the functioning of an item.
Scheduled, continuous or on request
After a detected fault
Maintenance
PreventiveMaintenance
Correctivemaintenance
Condition-basedmaintenance
Predeterminedmaintenance
Deferred Scheduled Scheduled
Before a detected fault
10
Preventive maintenance is in contrast to corrective maintenance carried out before a fault has occurred in order to prevent the consequences of the fault. Preventive maintenance is per-formed in either a predetermined manner or based on the actual condition.
Predetermined maintenancePredetermined maintenance is according to SS-EN 13306 (2001):
Preventive maintenance carried out in accordance with established intervals of time or number of units of use but without previous condition investigation.
Scheduled maintenance is according to SS-EN 13306 (2001): Preventive maintenance carried out in accordance with an established time schedule or established number of units of use.
Predetermined maintenance is a suitable strategy for items whose faults have critical conse-quences for operation, health, property or environment. It is suitable for simple items or complex items with a dominant failure mode that conform to age reliability patterns that show a increasing probability of failure in relation to operating age; see Figure 1.3.1 (pattern A, B, C). Predetermined maintenance is carried out at fixed intervals independent of the item’s actual condition. The intervals are based on the prediction of condition.
Predetermined maintenance can be unnecessarily costly if the maintenance intervals are too short. That means the maintenance is carried out before the execution has any improving ef-fect on the reliability of the item. There is a balance between the cost of maintenance execu-tion, and the risk of facing the consequences of an item fault, which in many cases deter-mines the length of the maintenance intervals. If the consequences of a fault are severe, the intervals are shortened and the maintenance execution costs rise. But, as mentioned earlier, in many cases scheduled overhaul actually increases the overall failure rate by introducing a high infant mortality rate in an otherwise stable system (Nowlan & Heap, 1978). Predeter-mined maintenance can be a waste of money if the intervals are too long, since a fault that has occurred becomes a matter of corrective maintenance. Another aspect that the predeter-mined maintenance is not capable of coping with is the impact on reliability due to changes in operating condition. This is further discussed in the section “Reliability characteristics in relation to operating condition”.
Condition-based maintenance Condition-based maintenance is according to SS-EN 13306 (2001):
Preventive maintenance based on performance and/or parameter monitoring and the subsequent actions.
Condition-based maintenance execution is based on information about the actual and pre-dicted item condition derived from scheduled, continuous or on request inspections of the item’s condition. Condition-based maintenance is a suitable strategy for items whose faults have consequences for operation, health, property or environment. In contrast to predeter-mined maintenance, it is suitable for items that conform to age reliability patterns that show random probability of failure in relation to operating age; see Figure 1.3.1, pattern D, E, F. Condition-based maintenance is based on the fact that most items give some kind of warning that they are in the process of failing. If a clear failure condition can be identified and the
11
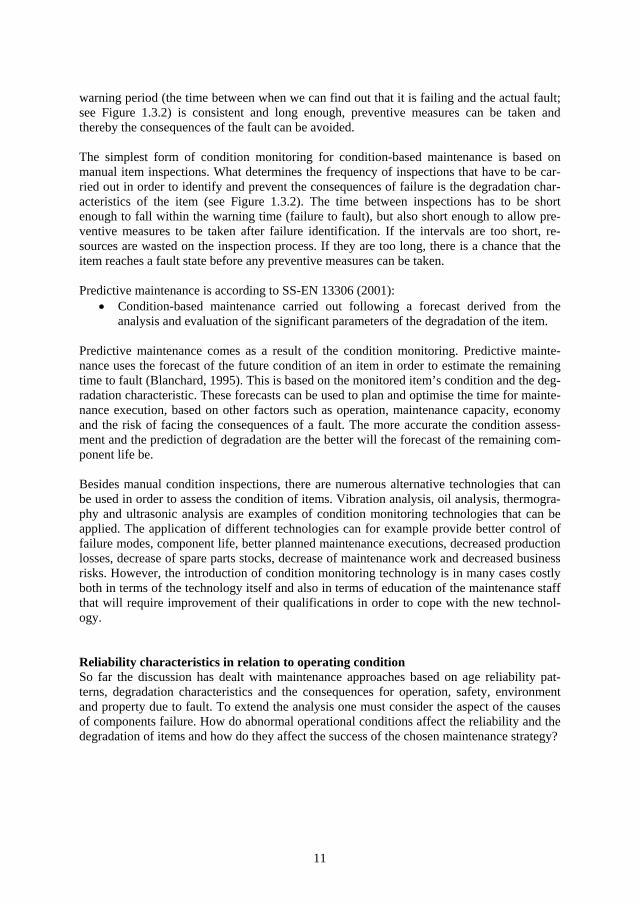
warning period (the time between when we can find out that it is failing and the actual fault; see Figure 1.3.2) is consistent and long enough, preventive measures can be taken and thereby the consequences of the fault can be avoided.
The simplest form of condition monitoring for condition-based maintenance is based on manual item inspections. What determines the frequency of inspections that have to be car-ried out in order to identify and prevent the consequences of failure is the degradation char-acteristics of the item (see Figure 1.3.2). The time between inspections has to be short enough to fall within the warning time (failure to fault), but also short enough to allow pre-ventive measures to be taken after failure identification. If the intervals are too short, re-sources are wasted on the inspection process. If they are too long, there is a chance that the item reaches a fault state before any preventive measures can be taken.
Predictive maintenance is according to SS-EN 13306 (2001): Condition-based maintenance carried out following a forecast derived from the analysis and evaluation of the significant parameters of the degradation of the item.
Predictive maintenance comes as a result of the condition monitoring. Predictive mainte-nance uses the forecast of the future condition of an item in order to estimate the remaining time to fault (Blanchard, 1995). This is based on the monitored item’s condition and the deg-radation characteristic. These forecasts can be used to plan and optimise the time for mainte-nance execution, based on other factors such as operation, maintenance capacity, economy and the risk of facing the consequences of a fault. The more accurate the condition assess-ment and the prediction of degradation are the better will the forecast of the remaining com-ponent life be.
Besides manual condition inspections, there are numerous alternative technologies that can be used in order to assess the condition of items. Vibration analysis, oil analysis, thermogra-phy and ultrasonic analysis are examples of condition monitoring technologies that can be applied. The application of different technologies can for example provide better control of failure modes, component life, better planned maintenance executions, decreased production losses, decrease of spare parts stocks, decrease of maintenance work and decreased business risks. However, the introduction of condition monitoring technology is in many cases costly both in terms of the technology itself and also in terms of education of the maintenance staff that will require improvement of their qualifications in order to cope with the new technol-ogy.
Reliability characteristics in relation to operating conditionSo far the discussion has dealt with maintenance approaches based on age reliability pat-terns, degradation characteristics and the consequences for operation, safety, environment and property due to fault. To extend the analysis one must consider the aspect of the causes of components failure. How do abnormal operational conditions affect the reliability and the degradation of items and how do they affect the success of the chosen maintenance strategy?
12
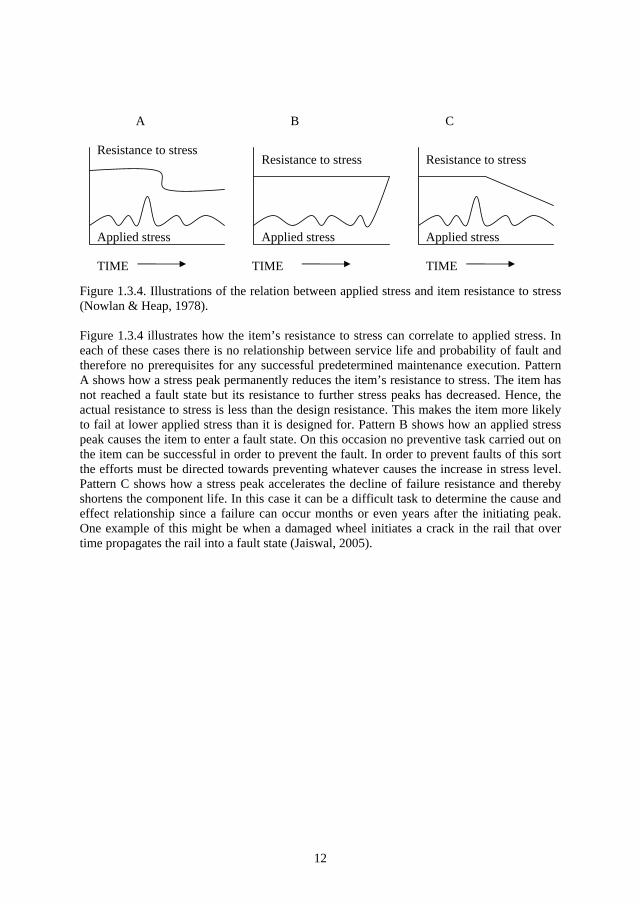
Figure 1.3.4. Illustrations of the relation between applied stress and item resistance to stress (Nowlan & Heap, 1978).
Figure 1.3.4 illustrates how the item’s resistance to stress can correlate to applied stress. In each of these cases there is no relationship between service life and probability of fault and therefore no prerequisites for any successful predetermined maintenance execution. Pattern A shows how a stress peak permanently reduces the item’s resistance to stress. The item has not reached a fault state but its resistance to further stress peaks has decreased. Hence, the actual resistance to stress is less than the design resistance. This makes the item more likely to fail at lower applied stress than it is designed for. Pattern B shows how an applied stress peak causes the item to enter a fault state. On this occasion no preventive task carried out on the item can be successful in order to prevent the fault. In order to prevent faults of this sort the efforts must be directed towards preventing whatever causes the increase in stress level. Pattern C shows how a stress peak accelerates the decline of failure resistance and thereby shortens the component life. In this case it can be a difficult task to determine the cause and effect relationship since a failure can occur months or even years after the initiating peak. One example of this might be when a damaged wheel initiates a crack in the rail that over time propagates the rail into a fault state (Jaiswal, 2005).
Resistance to stress
TIME
CBA
Resistance to stress Resistance to stress
Applied stress Applied stress Applied stress
TIMETIME
13
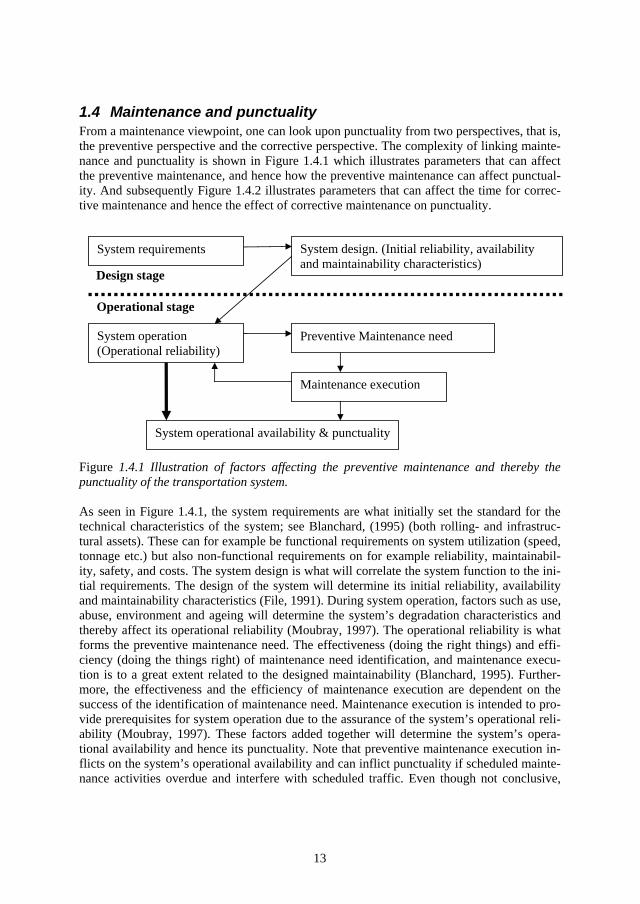
1.4 Maintenance and punctuality From a maintenance viewpoint, one can look upon punctuality from two perspectives, that is, the preventive perspective and the corrective perspective. The complexity of linking mainte-nance and punctuality is shown in Figure 1.4.1 which illustrates parameters that can affect the preventive maintenance, and hence how the preventive maintenance can affect punctual-ity. And subsequently Figure 1.4.2 illustrates parameters that can affect the time for correc-tive maintenance and hence the effect of corrective maintenance on punctuality.
Figure 1.4.1 Illustration of factors affecting the preventive maintenance and thereby the punctuality of the transportation system.
As seen in Figure 1.4.1, the system requirements are what initially set the standard for the technical characteristics of the system; see Blanchard, (1995) (both rolling- and infrastruc-tural assets). These can for example be functional requirements on system utilization (speed, tonnage etc.) but also non-functional requirements on for example reliability, maintainabil-ity, safety, and costs. The system design is what will correlate the system function to the ini-tial requirements. The design of the system will determine its initial reliability, availability and maintainability characteristics (File, 1991). During system operation, factors such as use, abuse, environment and ageing will determine the system’s degradation characteristics and thereby affect its operational reliability (Moubray, 1997). The operational reliability is what forms the preventive maintenance need. The effectiveness (doing the right things) and effi-ciency (doing the things right) of maintenance need identification, and maintenance execu-tion is to a great extent related to the designed maintainability (Blanchard, 1995). Further-more, the effectiveness and the efficiency of maintenance execution are dependent on the success of the identification of maintenance need. Maintenance execution is intended to pro-vide prerequisites for system operation due to the assurance of the system’s operational reli-ability (Moubray, 1997). These factors added together will determine the system’s opera-tional availability and hence its punctuality. Note that preventive maintenance execution in-flicts on the system’s operational availability and can inflict punctuality if scheduled mainte-nance activities overdue and interfere with scheduled traffic. Even though not conclusive,
Design stage
Operational stage
System requirements
System operation (Operational reliability)
Maintenance execution
System operational availability & punctuality
System design. (Initial reliability, availability and maintainability characteristics)
Preventive Maintenance need
14
this is an illustration of the fact that coming to terms with punctuality in terms of preventive maintenance is a far larger issue than merely managing maintenance execution.
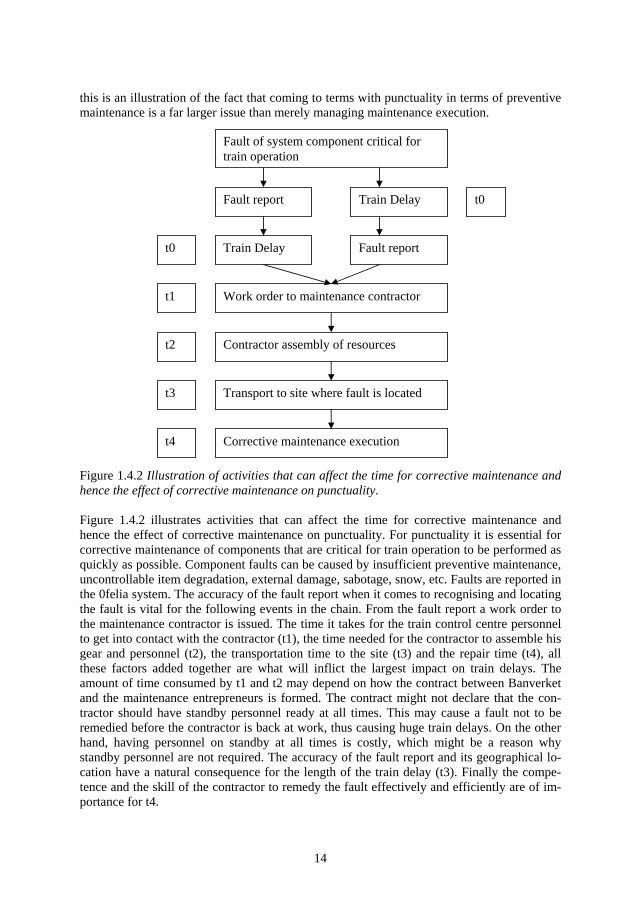
Figure 1.4.2 Illustration of activities that can affect the time for corrective maintenance and hence the effect of corrective maintenance on punctuality.
Figure 1.4.2 illustrates activities that can affect the time for corrective maintenance and hence the effect of corrective maintenance on punctuality. For punctuality it is essential for corrective maintenance of components that are critical for train operation to be performed as quickly as possible. Component faults can be caused by insufficient preventive maintenance, uncontrollable item degradation, external damage, sabotage, snow, etc. Faults are reported in the 0felia system. The accuracy of the fault report when it comes to recognising and locating the fault is vital for the following events in the chain. From the fault report a work order to the maintenance contractor is issued. The time it takes for the train control centre personnel to get into contact with the contractor (t1), the time needed for the contractor to assemble his gear and personnel (t2), the transportation time to the site (t3) and the repair time (t4), all these factors added together are what will inflict the largest impact on train delays. The amount of time consumed by t1 and t2 may depend on how the contract between Banverket and the maintenance entrepreneurs is formed. The contract might not declare that the con-tractor should have standby personnel ready at all times. This may cause a fault not to be remedied before the contractor is back at work, thus causing huge train delays. On the other hand, having personnel on standby at all times is costly, which might be a reason why standby personnel are not required. The accuracy of the fault report and its geographical lo-cation have a natural consequence for the length of the train delay (t3). Finally the compe-tence and the skill of the contractor to remedy the fault effectively and efficiently are of im-portance for t4.
Fault of system component critical for train operation
Work order to maintenance contractor
Contractor assembly of resources
Train Delay Fault report
Fault report Train Delay
Transport to site where fault is located
Corrective maintenance execution
t0
t0
t1
t2
t3
t4
15
The time t0 to t4 exhibits how long the critical system component function has been unavail-able to train traffic. Depending on the length of t0 to t4, train delays spread more or less across the network. If t0 to t4 becomes too high, then Banverket will start cancelling trains. Cancelled trains are not included in the punctuality statistics. Therefore the total effect of large traffic disruptions is never made apparent in delay statistics.
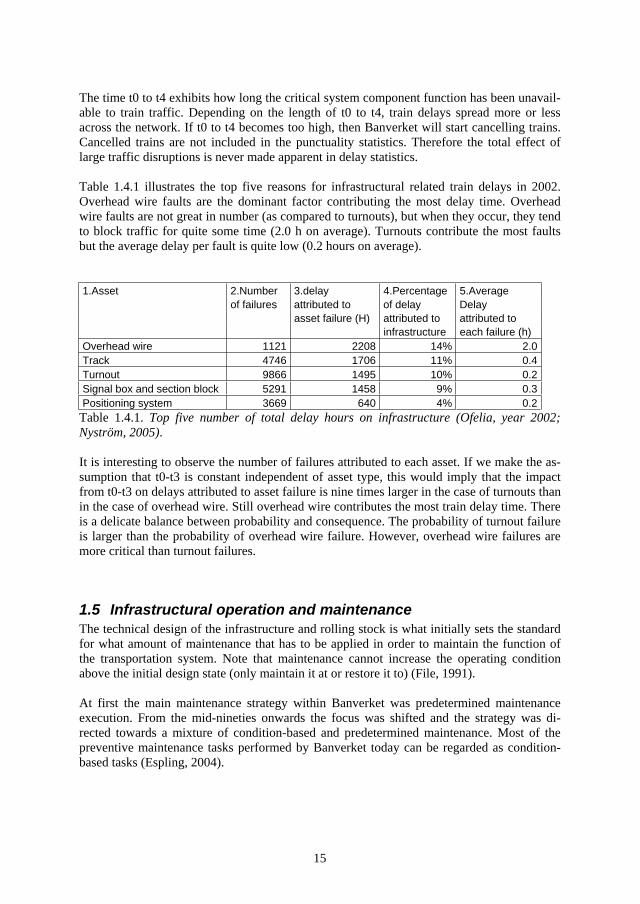
Table 1.4.1 illustrates the top five reasons for infrastructural related train delays in 2002. Overhead wire faults are the dominant factor contributing the most delay time. Overhead wire faults are not great in number (as compared to turnouts), but when they occur, they tend to block traffic for quite some time (2.0 h on average). Turnouts contribute the most faults but the average delay per fault is quite low (0.2 hours on average).
1.Asset 2.Number 3.delay 4.Percentage 5.Average of failures attributed to of delay Delay asset failure (H) attributed to attributed to infrastructure each failure (h) Overhead wire 1121 2208 14% 2.0Track 4746 1706 11% 0.4Turnout 9866 1495 10% 0.2Signal box and section block 5291 1458 9% 0.3Positioning system 3669 640 4% 0.2
Table 1.4.1. Top five number of total delay hours on infrastructure (Ofelia, year 2002; Nyström, 2005).
It is interesting to observe the number of failures attributed to each asset. If we make the as-sumption that t0-t3 is constant independent of asset type, this would imply that the impact from t0-t3 on delays attributed to asset failure is nine times larger in the case of turnouts than in the case of overhead wire. Still overhead wire contributes the most train delay time. There is a delicate balance between probability and consequence. The probability of turnout failure is larger than the probability of overhead wire failure. However, overhead wire failures are more critical than turnout failures.
1.5 Infrastructural operation and maintenance The technical design of the infrastructure and rolling stock is what initially sets the standard for what amount of maintenance that has to be applied in order to maintain the function of the transportation system. Note that maintenance cannot increase the operating condition above the initial design state (only maintain it at or restore it to) (File, 1991).
At first the main maintenance strategy within Banverket was predetermined maintenance execution. From the mid-nineties onwards the focus was shifted and the strategy was di-rected towards a mixture of condition-based and predetermined maintenance. Most of the preventive maintenance tasks performed by Banverket today can be regarded as condition-based tasks (Espling, 2004).
16
OperationOperational measures are performed in connection with the assets in order to ensure the as-sets’ functions without affecting their technical condition (Banverket, 2001). Operational measures taken by Banverket consist of: management of the failure and fault report system 0felia, electric power operation monitoring, operation of infrastructural assets, e.g. technical housing, snow removal, cleaning and prevention of slipperiness.
Corrective maintenance Corrective maintenance performed by Banverket is divided into three types of categories, i.e. immediate fault repairs, management of repairs, and correction of immediate inspection re-marks (Banverket, 2001).
Predetermined maintenance The periodicity of predetermined maintenance tasks is synchronised with different inspec-tions classes, which are based on traffic volume and train speed for the specific track line (Banverket, 2003). The maintenance intervals vary from every second week up to every third year. In summary, predetermined maintenance performed by Banverket consists of;
Cleaning, adjustment, and lubrication Component exchange (filament signalling lamps, and batteries) Testing and control of different safety systems Detector systems: analysis software overview, calibration and cleaning
Condition-based maintenance Condition-based maintenance and safety inspection intervals are determined by the type of item and which inspection class the item belongs to. The Inspection class is determined by traffic volume and train speed. In summary, condition-based maintenance performed by Banverket consists of (Banverket, 2002_a);
Safety and maintenance inspections Correction of minor inspection remarks Condition control Track maintenance Subgrade maintenance Revisions
Reinvestments Reinvestments are performed in order to “at least” achieve initial design condition. Rein-vestments are to be preceded by the asset being technically consumed or uneconomical to maintain (Banverket, 2001). Banverket distinguishes between maintenance costs and rein-vestment costs. The distinction lies in the amount of money spent per given object. For ob-jects relating to track, the component exchange per given track length must cost at least two million kronor to be regarded as a reinvestment. For other assets 300,000 kronor is the mini-mum limit to be regarded as a reinvestment.
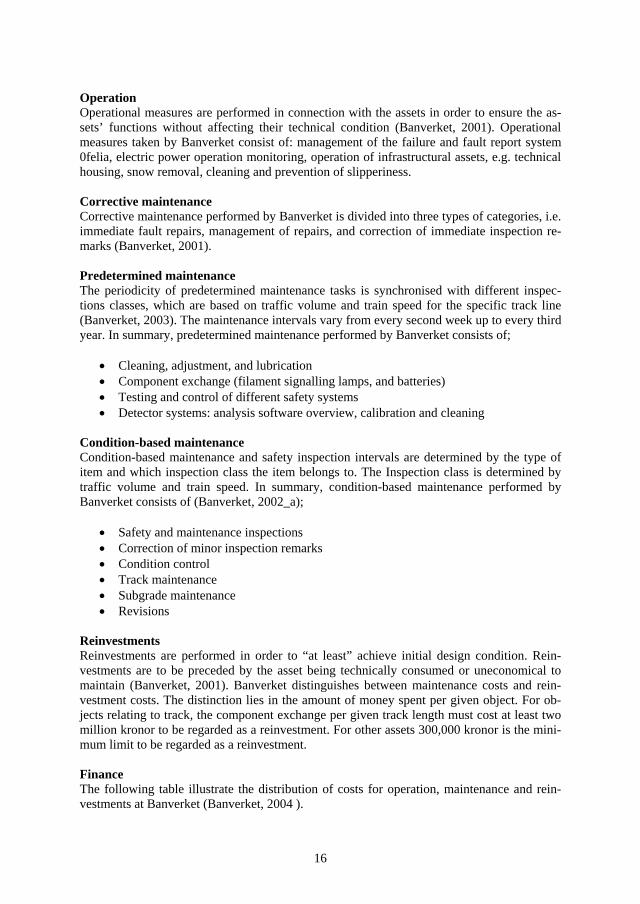
FinanceThe following table illustrate the distribution of costs for operation, maintenance and rein-vestments at Banverket (Banverket, 2004 ).
17
Finance of infrastructural operation, maintenance and reinvestments (million kronor);
Year: (2004) (2003) (2002) Operation: 699 678 635 Corrective maintenance 634 644 611 Preventive maintenance 1376 1313 1303 Other maintenance 53 47 31 Other -46 215 -160 Reinvestments 1305 1085 824 Total operation, maintenance and reinvestment costs: 4021 3982 3244
The term costs might be better rephrased as funding, i.e. how much money Banverket allows to be spent on the respective cost item. As can be seen in the table, infrastructural mainte-nance funding does not vary much over the years. Due to this fact Banverket has to prioritise among maintenance tasks in order to achieve the best use of the money.
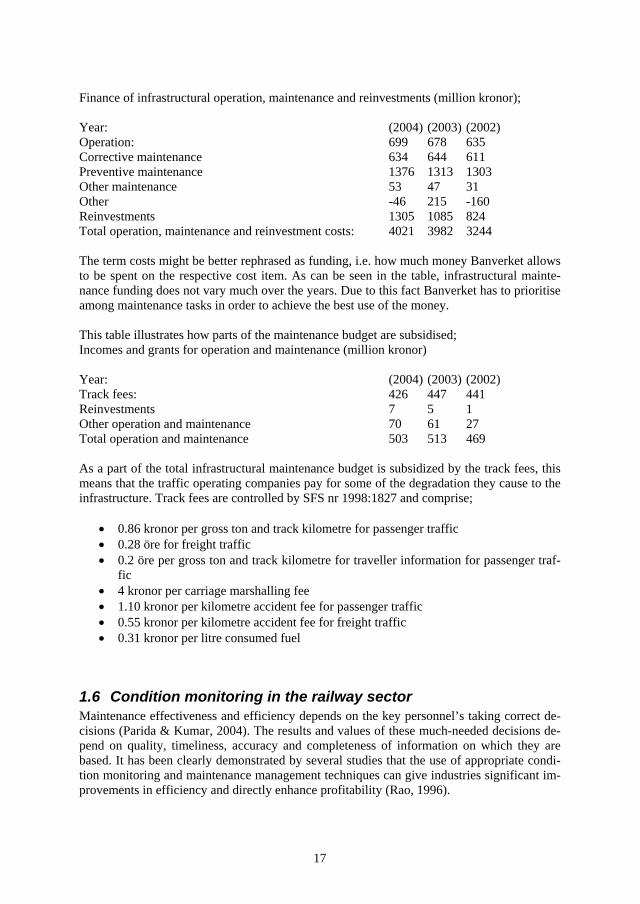
This table illustrates how parts of the maintenance budget are subsidised; Incomes and grants for operation and maintenance (million kronor)
Year: (2004) (2003) (2002) Track fees: 426 447 441 Reinvestments 7 5 1 Other operation and maintenance 70 61 27 Total operation and maintenance 503 513 469
As a part of the total infrastructural maintenance budget is subsidized by the track fees, this means that the traffic operating companies pay for some of the degradation they cause to the infrastructure. Track fees are controlled by SFS nr 1998:1827 and comprise;
0.86 kronor per gross ton and track kilometre for passenger traffic 0.28 öre for freight traffic 0.2 öre per gross ton and track kilometre for traveller information for passenger traf-fic 4 kronor per carriage marshalling fee 1.10 kronor per kilometre accident fee for passenger traffic 0.55 kronor per kilometre accident fee for freight traffic 0.31 kronor per litre consumed fuel
1.6 Condition monitoring in the railway sector Maintenance effectiveness and efficiency depends on the key personnel’s taking correct de-cisions (Parida & Kumar, 2004). The results and values of these much-needed decisions de-pend on quality, timeliness, accuracy and completeness of information on which they are based. It has been clearly demonstrated by several studies that the use of appropriate condi-tion monitoring and maintenance management techniques can give industries significant im-provements in efficiency and directly enhance profitability (Rao, 1996).
18
Numerous different condition monitoring solutions are available in the railway sector to as-sess maintenance needs and to support maintenance decision-making. Condition monitoring solutions provide opportunities to gain control of failure modes that may be difficult or im-possible to identify by manual visual inspections. Vendors offer solutions for monitoring of both infrastructural and rolling stock assets. Condition monitoring technology is used by the Swedish railway sector. Known examples are the track position measurements performed by the measurement wagon STRIX, wheel impact detection systems, hotbox and dragging brake detectors and the ultrasonic measurements performed for detecting cracks in the rail.
Turnouts are responsible for a lot of maintenance and repair expenditures and are the cause of a huge number of network failures (UIC, 2002). This is to a great extent due to the com-plexity of the turnout: “special components need special attention”. Furthermore, the nature of turnouts is such that their failures can seriously endanger safety (causing severe acci-dents). For this reason, even the smallest malfunction or irregularity requires immediate at-tention. This can therefore cause traffic closures, which can severely affect the system’s availability, which can cause huge operational costs in delay minutes. Many man-hours are spent on turnout inspections and maintenance, mostly due to a lack of knowledge of the cur-rent condition and unawareness of maintenance needs. In addition to the lack of knowledge of turnout conditions, is the limited ability to perform maintenance on the track nowadays more acknowledged. Therefore is the reduction of the amount of maintenance and the fre-quency of the inspections that have to be carried out important factors for implementing bet-ter turnout condition monitoring tools. Several different condition monitoring solutions are available for continuously assessing the condition and the maintenance need of turnouts. Systems for monitoring the condition of turnouts can be found in;
SURVAIG. French system, developed by Cogifer SIDIS-W. German system, developed by Siemens Roadmaster 2000. System, developed by VAE. Installed at various places throughout Germany, Austria and Switzerland POSS. Dutch system, developed by Strukton Railinfra Pointwatch. UK system, developed by CDSRail CEDIAS. System, developed for the Italian railway ACC. System developed by Ansaldo Signal FÖSA Swedish system developed by Banverket Produktion
Typical parameters for turnout monitoring are motor current, operating force, changeover time, number of turnout operations, number of failed operations, rail temperature and air temperature. Research carried out at the University of Central England (Birmingham) (UIC, 2002) on the Pointwatch system showed that monitoring of motor current, operating force and changeover time can assess failure modes such as: drive and detector rod maladjustment, slipping clutch, worn motor brushes, switch blocked or left clamped after maintenance, relay contact resistance change, loosening or breakage of stretcher arm bolts, degreased or con-taminated slide chairs and locking bar maladjustment.
The turnout is regarded as a part of the signalling system even though it is also a part of the track. Further condition monitoring solutions in the signalling system can be found for ob-jects such as the interlocking system, signals, track circuits and cable insulations. System solutions for these are offered by vendors such as Ansaldo Signal, Lancier and Banverket
19
Consulting. Interlocking monitoring may consist of (Glazebrook, 2004) monitoring of PCB cards, keyboards, display units, communication links, input voltage and current, output volt-age and current, and output ripple. Signalling filament lamp monitoring may consist of monitoring of the number of times the lamp has been operated, total illumination time for each lamp and the average voltage and current of each lamp. Key parameters for monitoring of track circuits are monitoring of average voltage between the rails and the feeder end, av-erage current drawn at the feed end, average voltage between the rails and the receiver end, number of times that the track circuit has been “occupied” and the total track circuit “occu-pation” time. Cable insulation monitoring may consist of resistance measurements and pres-sure measurements for pressurised cables.
Different condition monitoring solutions are available for assessing rolling stock and infra-structural conditions of components that are in direct physical contact with each other, such as in the pantograph to overhead wire interface or the wheel to rail interface. Such solutions for monitoring of infrastructure are typically mounted to the rolling stock, while solutions for monitoring of rolling stock are often wayside mounted.
Below follows a summary of different solutions that are available for assessing failure modes in the pantograph to overhead wire interface (some of which are discussed in greater detail in chapter 4). Systems for monitoring the condition and the position of the overhead wire may be found in;
STRIX, Sweden. Vehicle mounted system that measures the horizontal and vertical alignment (relative to track position) of the overhead wire; the overhead wire’s flexi-bility can also be assessed. WIRE CHECK. Technogamma. Vehicle mounted system which uses laser technol-ogy to assess overhead wire wear and the horizontal and vertical position of the over-head wire (relative to track position). These measurements are made without physical contact with the overhead wire and can therefore not assess the overhead wire’s flexibility. OLIVE. System provided by AEA technology. Vehicle mounted system that meas-ures the horizontal overhead wire’s alignment (relative to track position) and its flexibility. ROGER OLTOUCH & ROGER OLGEO. MER MEC. Vehicle mounted systems. Damill AB Swedish company. Providing image analysis solutions for assessing over-head wire alignment.
Systems for monitoring the uplift pressure of the pantograph can be found in;
Panchex. Provided by AEA technology. BUBO. Banverket Produktion, Sweden.
Systems for monitoring and protecting the pantograph’s carbon slipper condition can be found in;
KIKA. Banverket. Uses the same technology as the police authorities’ speed cam-eras. The system uses radar sensors to sense the approach of trains and takes a picture
20
of the pantograph when the train passes. The software performs an image analysis of the picture and sends alarms according to prescribed criteria. Schunk. Automatic dropping device. Drops pantograph when carbon slipper is worn off, or in case of impact on the collector head. Stemman. Automatic dropping device. Drops pantograph in case of impact on the collector head. FADD. AEA Technology. Automatic dropping device. Drops pantograph when car-bon slipper is worn off.
There follow examples of condition monitoring systems for rolling stock condition assess-ment. For a more thorough state of the art review of this area, see Lagnebäck (2004). Condi-tion monitoring systems for monitoring wheels, bogies, brakes and bearings can be found in;
WILD, Salient. Wheel impact detection system. FUES, Bombardier. Hotbox and dragging brake detection. WheelChex. AEA Technology. Wheel impact detection with trending capability. VIEW. AEA Technology. Automated visual inspection and wear analysis of wheel, shoe and brake components. TEKNIS. Wayside Monitoring Alliance. Wheel condition monitor with trending ca-pability.RailBAM. VIPAC. Bearing Acoustic monitor with trending capability. Detects bear-ing damage with acoustic measurements. WheelSpec. Wayside Monitoring Alliance. System for measuring wheel wear and wheel and bogie condition, using non-contact laser measurement techniques.
Further there are solutions for measuring track profiles, ultrasonic and eddy-current meas-urements for track condition assessment, thermographic solutions for assessing conditions of electric systems, engine monitoring systems etc. This is not a conclusive summary of all condition monitoring systems that are available in the railway market today. However, it il-lustrates that there is definitely no shortage of initiative to provide technical solutions to solve problems. Hence, there is probably no major problem of finding a possible solution for receiving information about technical systems’ functions. The problem may be more related to finding a proper solution. A proper solution is not necessarily encompassed by what can be measured. It is rather encompassed by whether the solution can provide the decision sup-port required for effective and efficient maintenance management. From such a perspective there arises a need for critical assessment of condition monitoring solutions in order to assess their ability to solve problems.
21
2 Research Framework and Methodology
2.1 Research Problem The purpose of maintenance is to ensure business objectives through the assurance of re-quired technical functions. When systems vital for traffic operation fail to deliver their re-quired function, delays and unpunctuality will emerge, as do the systems’ need for corrective maintenance. Hertenstein & Kaplan, (1991) state, “a 1% improvement in the reliability of cargo delivery could yield as much as 5% revenue increase in several markets”. So in socio-economic terms it is not difficult to argue that there are benefits to be reached when striving to keep the corrective maintenance at a minimum for components that are vital for the trans-portation systems’ functions.
Maintenance in the railway sector is one vital element for ensuring the function of the sys-tems that are required for transportation system operation. The Swedish railway sector is an-nually faced with a cumulative number of train delays averaging somewhere around 70,000-75,000 hours. Train delays relating to infrastructural and rolling stock failures and faults contribute with close to forty percent of the cumulative number of train delays (Banverket, 2004). For this reason there is an indication that the present maintenance practice in the transportation system is not sufficient in order to prevent faults and hence train delays.
Governmental regulations state that the Swedish national railway administrator Banverket has an overall responsibility for train punctuality, independent of whether train delays are caused by Banverket or the train operating companies (Ericsson et al, 2002). Banverket is responsible for the functioning of the railway system as a whole, but with its own mainte-nance and reinvestment activities it can only affect the infrastructure. Banverket is faced with a limited budget for infrastructural maintenance and reinvestments. Hence Banverket has to direct attention to areas where the overall function of the infrastructure ‘at the mo-ment’ is best served. This can cause preventive maintenance measures to be delayed or can-celled in favour of immediate corrective work. In other words, diverting attention to per-forming corrective work in order to restore the system to operating condition can cause other faults. Wireman (2003) states that estimates show that preventive maintenance work versus corrective maintenance work may have a cost ratio as high as 1:5. Considering Banverket’s budget for corrective maintenance (634 million kronor; Banverket, 2004) this statement im-plies that Banverket could reach a cost benefit of 507.5 million by transferring from correc-tive to preventive maintenance, if it is performed in an effective and efficient way.
A key element in order for preventive maintenance to be performed in an effective and effi-cient way is the control of the items’ degradation characteristics (Nowlan & Heap, 1978). If the items’ degradation characteristics can be controlled, monitored and predicted, mainte-nance planning and time for maintenance execution can be optimised, based on factors such as operation, maintenance capacity, economy and the risk associated with faults.
The Swedish rail network consists mostly of single line tracks that are more sensitive to traf-fic disturbances than double track lines, due to unavoidable secondary delay effects (see chapter 1.2). This causes a great demand for accurate timetable planning and identification of maintenance and reinvestment needs. Moreover, train traffic in Sweden is increasing
22
(Banverket, 2004), tracks are getting more crowded and there is less available time for track maintenance. Infrastructural maintenance and traffic operation are “competing” for access to the tracks for performing their activities. In order to avoid faults and train delays, and to al-low maintenance activities to be effectively and efficiently planned and executed, there is a need for good condition and degradation assessment.
In order for Banverket to improve punctuality, the prediction of maintenance needs and costs is crucial. One important approach in order to achieve this desirable situation is to apply new methods for condition monitoring and degradation forecasting. This is to enable system health information to serve as decision support and as input to accurate maintenance plan-ning.
2.2 Delimitations At the beginning of the research, participants from the industry and the university decided in response to the research proposal that the project should focus on technical aspects of main-tenance at Banverket. Against the background of current condition monitoring developments in the railway sector it was also decided that the project should focus on technical condition monitoring. From this perspective condition monitoring technology for improved condition based maintenance in the Swedish railway sector became the main limitation. Punctuality, or rather unpunctuality, is regarded in the sense that it is an effect of malfunction of any asset whose function is required in order to operate the transportation system. Due to this limita-tion, maintenance execution is not within the scope of this thesis, nor are design aspects of items considered.
Rolling stock maintenance is considered only in terms of the rolling stock’s physical interac-tion with infrastructure. This is because the focus is on infrastructure, but it is not realistic to completely ignore the interface with the rolling stock.
2.3 Purpose of the study The purpose of this study is to explore the status of current condition monitoring applications in the Swedish railway sector. This is to assess how condition monitoring technology can improve the condition-based maintenance in order to improve system reliability and thereby punctuality. The objective of the study is to give suggestions for improved applications of condition monitoring technology, in order to enhance maintenance effectiveness and effi-ciency and to achieve punctuality goals.
The core of the research lies in the study of condition monitoring data and systems in order to identify how data can serve a maintenance process with information that is essential for an effective and efficient maintenance execution that is vital for the technical systems’ func-tions and hence the transportation system’s punctuality.
23
2.4 Research Questions The research presented in this thesis explores the following questions.
How do train delay statistics reflect causes of failures useful for maintenance man-agement? How can a link between condition monitoring and punctuality be described? How can current condition monitoring applications at Banverket support mainte-nance management? What kinds of factors support a successful condition monitoring application at Ban-verket?What recommendations for future condition monitoring applications can be given?
2.5 Research Methodology The study sets out to study a generic problem where two parties’ combined efforts provide services for a third party. The studied case is the railway sector in which the infrastructural manager Banverket and the train operating companies provide transportation service to soci-ety.
The research is divided into three parts:
Study of punctuality and train delay statistics (chapter 3) Link between condition monitoring and punctuality (chapter 4) Condition monitoring case studies (chapter 5)
The first research question “How do train delay statistics reflect causes of failures useful for maintenance management?” is explored in the punctuality and train delay study (chapter 3). This study is used to explore characteristics of current train delay statistics. This is per-formed in order to assess how the statistics can serve maintenance management with infor-mation to identify problem areas and problem owners. This study is deductive in its nature, as it explores the chain of events from system level train delay to component level fault. The data collection is based on archival data and interviews. The sources of evidence are derived from TFÖR, 0FELIA and discussions with train control centre personnel. The data analysis is descriptive statistical analysis (Blische & Muthhy, 2000).
The subsequent section of the study is used to explore the second research question “How can a link between condition monitoring and punctuality be described (chapter 4)?”. This study is used as an illustration of the nature of a punctuality problem. The data collection is derived from experience from work performed at Banverket. The study uses qualitative data analysis to derive an inductive reasoning influenced by the FMEA approach (Stamatis, 1995) to explore the problem from component level failure mode to system level failure or fault. On the basis of the nature of different failure modes, a selection process for condition moni-toring implementation is formed.
The third research question “How can current condition monitoring applications at Ban-verket support maintenance management (chapter 5)?” is explored in three condition moni-
24
toring case studies. These studies are used to derive experience from current applications of condition monitoring technology at Banverket to form a knowledge foundation for future implementations for improved punctuality. These studies are inductive in their exploration from component data to system decision-making. The data collection is both qualitative and quantitative. The sources of evidence are system data, archival records and document stud-ies. The data analysis method is single case analysis (Yin, 2003).
The answers to the following research question “What kinds of factors support a successful condition monitoring application at Banverket (chapter 6)” are based on experiences from the three parts of the research. The data collection is derived from archival analysis in the performed studies. The data analysis method is cross case analysis in accordance with Yin, (2003).
The answer to the final research question “What recommendations for future condition monitoring applications can be given (chapter 6)” is an extended summary of the previous research questions, based on experience from the three parts of the research. Data was col-lected through archival analysis in the performed studies. The analysis of data was per-formed by cross case analysis; see (Yin, 2003).
25
3 Study of punctuality and train delay statistics This study is an exploration of punctuality and train delay statistics. This study was per-formed to assess to what extent different factors come to influence punctuality and train de-lays. In the study the initial research question “How do train delay statistics reflect causes of failures useful for maintenance management?” is explored.
INTRODUCTION TO AND DEFINITIONS OF THE STUDY
This study explores the characteristics of existing train delay statistics and describes risks when maintenance efforts and design of incentives for improved railway operation are based on statistics that do not reflect the true root causes of problems. For further information see Granström & Söderholm (2005).
The material presented in this study is based upon a database analysis of train-delay statistics from the TFÖR system, for the period of January 2001 to December 2004. In this paper the ‘total primary caused relationship’ is used, which is the relationship Banverket uses when presenting monthly delay statistics (Johansson, 2005).
The study started with an examination of how much the infrastructure influenced the punctu-ality. This initial study showed that available delay statistics did not provide realistic infor-mation of the contribution to delays from the operators’ rolling stock and the infrastructure. Therefore, the study focused on exploring the true meaning of the statistics, in order to un-derstand how the statistics come to reflect causes of delays. The statistics chosen for the study were train delays related to the pantograph to overhead wire interface and the wheel to rail interface, since these interfaces are the physical contact points between the rolling stock and the infrastructure. There is also some interest in exploring train delays relating to over-head wire and rail due to their criticality (see chapter 1.4). 0FELIA data provided by Ana-lysgruppen (analysis group, formation of competence for statistical analysis at Banverket’s northern region) for the period 2001-2003 was used in order to identify what the main re-ported root cause symptoms were for the respective infrastructural component failure (Pet-tersson, 2004). Why symptoms instead of “true root causes” were used was due to the fact that in 50 % of the reports the “true root cause” was not reported. How in terms of train-delay statistics TFÖR comes to reflect what is derived from the 0FELIA data is explained by how the operative work with encoding of delays is carried out at the traffic-control-centre. This is illustrated by a simple process mapping (Mizuno, 1988) showing the consecutive ac-tivities or chain of events leading to encoding of train delays due to failures in the interface between the pantograph and the overhead wire or the interface between the wheel and the rail.
ANALYSIS OF DATA
The distribution per problem owner (according to available statistics) is described in Figure 3.1. As can be seen in Figure 3.1 (left graph) the train delay contribution per problem owner (planned work, traffic control, operators, vehicle, infrastructure and others) shows relatively small fluctuations over the years. Figure 3.1 (right graph) shows a mean value of the respec-
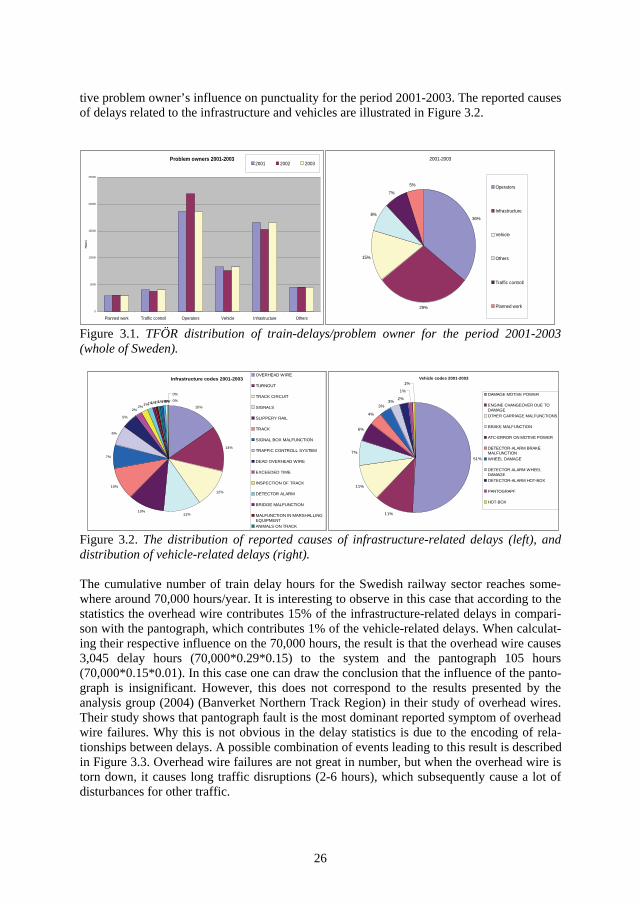
26
tive problem owner’s influence on punctuality for the period 2001-2003. The reported causes of delays related to the infrastructure and vehicles are illustrated in Figure 3.2.
Problem owners 2001-2003
0
5000
10000
15000
20000
25000
Planned work Traffic controll Operators Vehicle Infrastructure Others
Hou
rs
2001 2002 20032001-2003
36%
29%
15%
8%
7%
5% Operators
Infrastructure
Vehicle
Others
Traffic controll
Planned work
Figure 3.1. TFÖR distribution of train-delays/problem owner for the period 2001-2003 (whole of Sweden).
Infrastructure codes 2001-2003
15%
14%
12%
11%10%
10%
7%
6%
5%
2%2%1%1%1%1%1%1%0%0%
0%
0%
OVERHEAD WIRE
TURNOUT
TRACK CIRCUIT
SIGNALS
SLIPPERY RAIL
TRACK
SIGNAL BOX MALFUNCTION
TRAFFIC CONTROLL SYSTEM
DEAD OVERHEAD WIRE
EXCEEDED TIME
INSPECTION OF TRACK
DETECTOR ALARM
BRIDGE MALFUNCTION
MALFUNCTION IN MARSHALLINGEQUIPMENTANIMALS ON TRACK
Vehicle codes 2001-2003
51%
11%
11%
7%
6%
4%
3%3% 2%
1%
1%
DAMAGE MOTIVE POWER
ENGINE CHANGEOVER DUE TODAMAGEOTHER CARRIAGE MALFUNCTIONS
BRAKE MALFUNCTION
ATC-ERROR ON MOTIVE POWER
DETECTOR-ALARM BRAKEMALFUNCTIONWHEEL DAMAGE
DETECTOR ALARM WHEELDAMAGEDETECTOR-ALARM HOT-BOX
PANTOGRAPF
HOT-BOX
Figure 3.2. The distribution of reported causes of infrastructure-related delays (left), and distribution of vehicle-related delays (right).
The cumulative number of train delay hours for the Swedish railway sector reaches some-where around 70,000 hours/year. It is interesting to observe in this case that according to the statistics the overhead wire contributes 15% of the infrastructure-related delays in compari-son with the pantograph, which contributes 1% of the vehicle-related delays. When calculat-ing their respective influence on the 70,000 hours, the result is that the overhead wire causes 3,045 delay hours (70,000*0.29*0.15) to the system and the pantograph 105 hours (70,000*0.15*0.01). In this case one can draw the conclusion that the influence of the panto-graph is insignificant. However, this does not correspond to the results presented by the analysis group (2004) (Banverket Northern Track Region) in their study of overhead wires. Their study shows that pantograph fault is the most dominant reported symptom of overhead wire failures. Why this is not obvious in the delay statistics is due to the encoding of rela-tionships between delays. A possible combination of events leading to this result is described in Figure 3.3. Overhead wire failures are not great in number, but when the overhead wire is torn down, it causes long traffic disruptions (2-6 hours), which subsequently cause a lot of disturbances for other traffic.
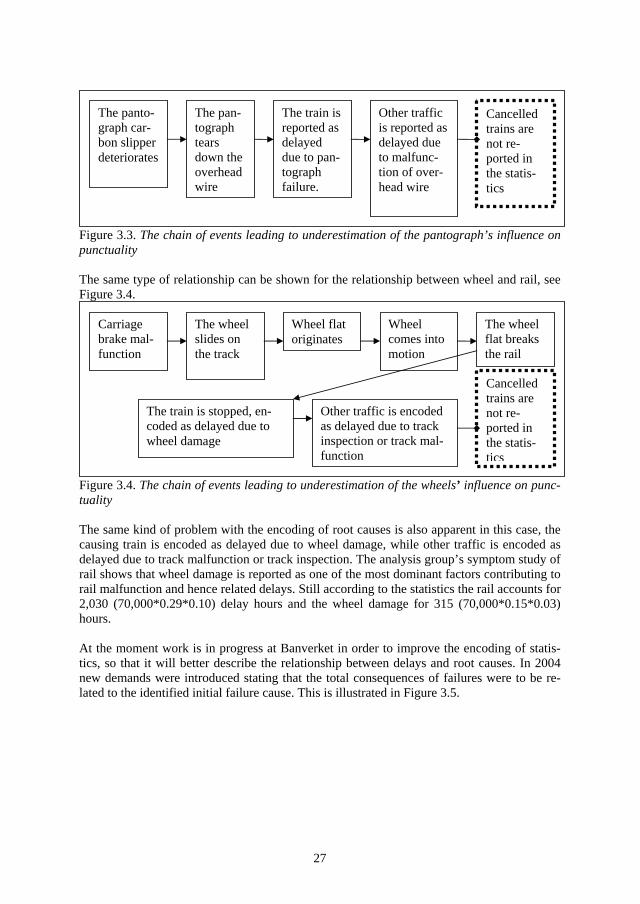
27
Figure 3.3. The chain of events leading to underestimation of the pantograph’s influence on punctuality
The same type of relationship can be shown for the relationship between wheel and rail, see Figure 3.4.
Figure 3.4. The chain of events leading to underestimation of the wheels’ influence on punc-tuality
The same kind of problem with the encoding of root causes is also apparent in this case, the causing train is encoded as delayed due to wheel damage, while other traffic is encoded as delayed due to track malfunction or track inspection. The analysis group’s symptom study of rail shows that wheel damage is reported as one of the most dominant factors contributing to rail malfunction and hence related delays. Still according to the statistics the rail accounts for 2,030 (70,000*0.29*0.10) delay hours and the wheel damage for 315 (70,000*0.15*0.03) hours.
At the moment work is in progress at Banverket in order to improve the encoding of statis-tics, so that it will better describe the relationship between delays and root causes. In 2004 new demands were introduced stating that the total consequences of failures were to be re-lated to the identified initial failure cause. This is illustrated in Figure 3.5.
Carriage brake mal-function
The wheel slides on the track
Wheel flat originates
Wheelcomes into motion
The wheel flat breaks the rail
The train is stopped, en-coded as delayed due to wheel damage
Other traffic is encoded as delayed due to track inspection or track mal-function
Cancelledtrains are not re-ported in the statis-tics
The panto-graph car-bon slipper deteriorates
The pan-tographtearsdown the overheadwire
The train is reported as delayeddue to pan-tographfailure.
Other traffic is reported as delayed due to malfunc-tion of over-head wire
Cancelledtrains are not re-ported in the statis-tics
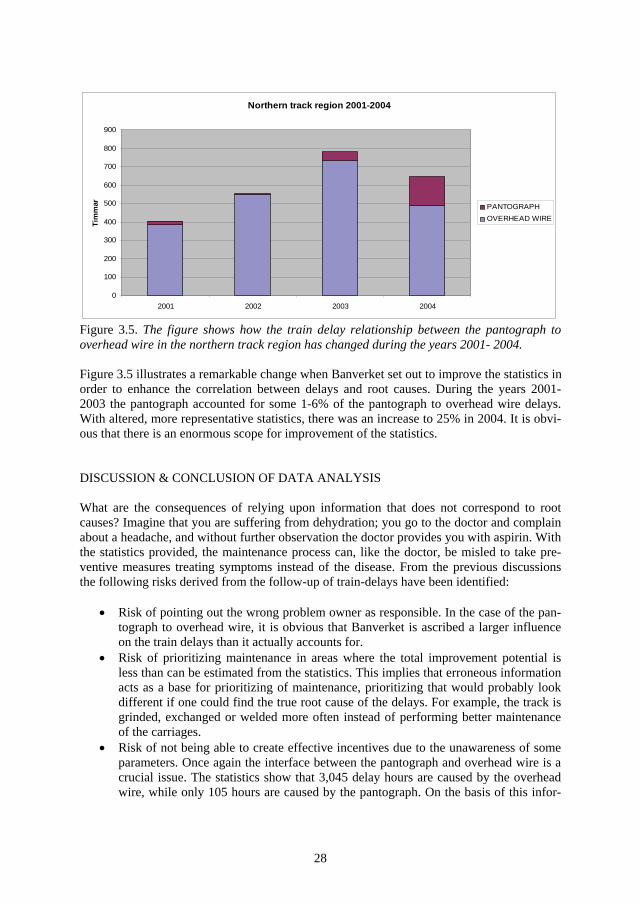
28
Northern track region 2001-2004
0
100
200
300
400
500
600
700
800
900
2001 2002 2003 2004
Tim
mar PANTOGRAPH
OVERHEAD WIRE
Figure 3.5. The figure shows how the train delay relationship between the pantograph to overhead wire in the northern track region has changed during the years 2001- 2004.
Figure 3.5 illustrates a remarkable change when Banverket set out to improve the statistics in order to enhance the correlation between delays and root causes. During the years 2001- 2003 the pantograph accounted for some 1-6% of the pantograph to overhead wire delays. With altered, more representative statistics, there was an increase to 25% in 2004. It is obvi-ous that there is an enormous scope for improvement of the statistics.
DISCUSSION & CONCLUSION OF DATA ANALYSIS
What are the consequences of relying upon information that does not correspond to root causes? Imagine that you are suffering from dehydration; you go to the doctor and complain about a headache, and without further observation the doctor provides you with aspirin. With the statistics provided, the maintenance process can, like the doctor, be misled to take pre-ventive measures treating symptoms instead of the disease. From the previous discussions the following risks derived from the follow-up of train-delays have been identified:
Risk of pointing out the wrong problem owner as responsible. In the case of the pan-tograph to overhead wire, it is obvious that Banverket is ascribed a larger influence on the train delays than it actually accounts for. Risk of prioritizing maintenance in areas where the total improvement potential is less than can be estimated from the statistics. This implies that erroneous information acts as a base for prioritizing of maintenance, prioritizing that would probably look different if one could find the true root cause of the delays. For example, the track is grinded, exchanged or welded more often instead of performing better maintenance of the carriages. Risk of not being able to create effective incentives due to the unawareness of some parameters. Once again the interface between the pantograph and overhead wire is a crucial issue. The statistics show that 3,045 delay hours are caused by the overhead wire, while only 105 hours are caused by the pantograph. On the basis of this infor-
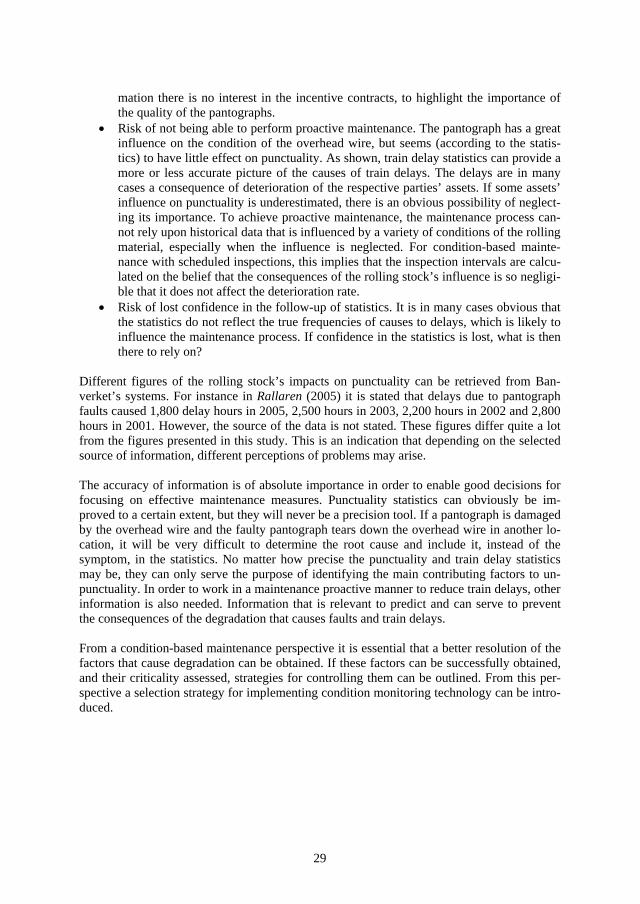
29
mation there is no interest in the incentive contracts, to highlight the importance of the quality of the pantographs. Risk of not being able to perform proactive maintenance. The pantograph has a great influence on the condition of the overhead wire, but seems (according to the statis-tics) to have little effect on punctuality. As shown, train delay statistics can provide a more or less accurate picture of the causes of train delays. The delays are in many cases a consequence of deterioration of the respective parties’ assets. If some assets’ influence on punctuality is underestimated, there is an obvious possibility of neglect-ing its importance. To achieve proactive maintenance, the maintenance process can-not rely upon historical data that is influenced by a variety of conditions of the rolling material, especially when the influence is neglected. For condition-based mainte-nance with scheduled inspections, this implies that the inspection intervals are calcu-lated on the belief that the consequences of the rolling stock’s influence is so negligi-ble that it does not affect the deterioration rate. Risk of lost confidence in the follow-up of statistics. It is in many cases obvious that the statistics do not reflect the true frequencies of causes to delays, which is likely to influence the maintenance process. If confidence in the statistics is lost, what is then there to rely on?
Different figures of the rolling stock’s impacts on punctuality can be retrieved from Ban-verket’s systems. For instance in Rallaren (2005) it is stated that delays due to pantograph faults caused 1,800 delay hours in 2005, 2,500 hours in 2003, 2,200 hours in 2002 and 2,800 hours in 2001. However, the source of the data is not stated. These figures differ quite a lot from the figures presented in this study. This is an indication that depending on the selected source of information, different perceptions of problems may arise.
The accuracy of information is of absolute importance in order to enable good decisions for focusing on effective maintenance measures. Punctuality statistics can obviously be im-proved to a certain extent, but they will never be a precision tool. If a pantograph is damaged by the overhead wire and the faulty pantograph tears down the overhead wire in another lo-cation, it will be very difficult to determine the root cause and include it, instead of the symptom, in the statistics. No matter how precise the punctuality and train delay statistics may be, they can only serve the purpose of identifying the main contributing factors to un-punctuality. In order to work in a maintenance proactive manner to reduce train delays, other information is also needed. Information that is relevant to predict and can serve to prevent the consequences of the degradation that causes faults and train delays.
From a condition-based maintenance perspective it is essential that a better resolution of the factors that cause degradation can be obtained. If these factors can be successfully obtained, and their criticality assessed, strategies for controlling them can be outlined. From this per-spective a selection strategy for implementing condition monitoring technology can be intro-duced.
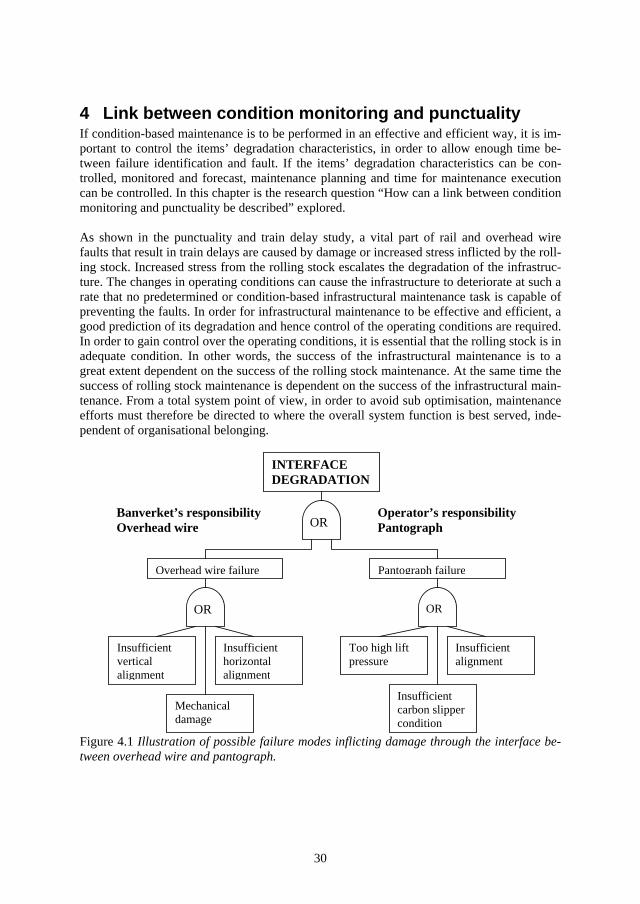
30
4 Link between condition monitoring and punctuality If condition-based maintenance is to be performed in an effective and efficient way, it is im-portant to control the items’ degradation characteristics, in order to allow enough time be-tween failure identification and fault. If the items’ degradation characteristics can be con-trolled, monitored and forecast, maintenance planning and time for maintenance execution can be controlled. In this chapter is the research question “How can a link between condition monitoring and punctuality be described” explored.
As shown in the punctuality and train delay study, a vital part of rail and overhead wire faults that result in train delays are caused by damage or increased stress inflicted by the roll-ing stock. Increased stress from the rolling stock escalates the degradation of the infrastruc-ture. The changes in operating conditions can cause the infrastructure to deteriorate at such a rate that no predetermined or condition-based infrastructural maintenance task is capable of preventing the faults. In order for infrastructural maintenance to be effective and efficient, a good prediction of its degradation and hence control of the operating conditions are required. In order to gain control over the operating conditions, it is essential that the rolling stock is in adequate condition. In other words, the success of the infrastructural maintenance is to a great extent dependent on the success of the rolling stock maintenance. At the same time the success of rolling stock maintenance is dependent on the success of the infrastructural main-tenance. From a total system point of view, in order to avoid sub optimisation, maintenance efforts must therefore be directed to where the overall system function is best served, inde-pendent of organisational belonging.
Figure 4.1 Illustration of possible failure modes inflicting damage through the interface be-tween overhead wire and pantograph.
Banverket’s responsibility Overhead wire
Operator’s responsibility Pantograph
INTERFACEDEGRADATION
OR OR
Insufficienthorizontalalignment
Mechanicaldamage
Insufficientcarbon slipper condition
Insufficientalignment
Too high lift pressure
Insufficientverticalalignment
OR
Overhead wire failure Pantograph failure
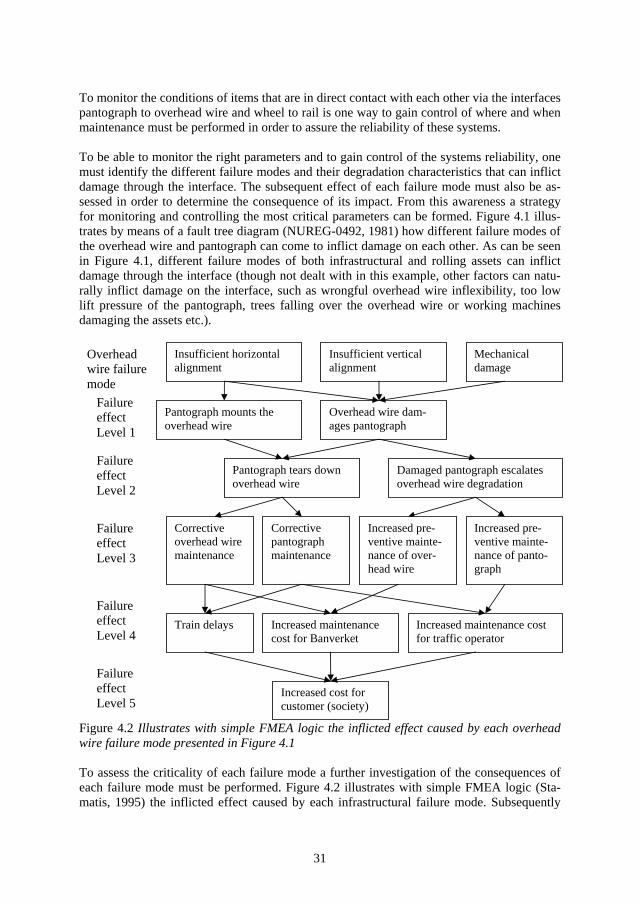
31
To monitor the conditions of items that are in direct contact with each other via the interfaces pantograph to overhead wire and wheel to rail is one way to gain control of where and when maintenance must be performed in order to assure the reliability of these systems.
To be able to monitor the right parameters and to gain control of the systems reliability, one must identify the different failure modes and their degradation characteristics that can inflict damage through the interface. The subsequent effect of each failure mode must also be as-sessed in order to determine the consequence of its impact. From this awareness a strategy for monitoring and controlling the most critical parameters can be formed. Figure 4.1 illus-trates by means of a fault tree diagram (NUREG-0492, 1981) how different failure modes of the overhead wire and pantograph can come to inflict damage on each other. As can be seen in Figure 4.1, different failure modes of both infrastructural and rolling assets can inflict damage through the interface (though not dealt with in this example, other factors can natu-rally inflict damage on the interface, such as wrongful overhead wire inflexibility, too low lift pressure of the pantograph, trees falling over the overhead wire or working machines damaging the assets etc.).
Figure 4.2 Illustrates with simple FMEA logic the inflicted effect caused by each overhead wire failure mode presented in Figure 4.1
To assess the criticality of each failure mode a further investigation of the consequences of each failure mode must be performed. Figure 4.2 illustrates with simple FMEA logic (Sta-matis, 1995) the inflicted effect caused by each infrastructural failure mode. Subsequently
Overheadwire failure mode
Insufficient horizontal alignment
Overhead wire dam-ages pantograph
Insufficient vertical alignment
Mechanicaldamage
Damaged pantograph escalates overhead wire degradation
Pantograph mounts the overhead wire
Pantograph tears down overhead wire
Failure effectLevel 1
Failure effectLevel 2
Failure effectLevel 3
Correctivepantographmaintenance
Increased pre-ventive mainte-nance of over-head wire
Increased pre-ventive mainte-nance of panto-graph
Correctiveoverhead wire maintenance
Train delays
Increased cost for customer (society)
Increased maintenance cost for traffic operator
Increased maintenance cost for Banverket
Failure effectLevel 4
Failure effectLevel 5
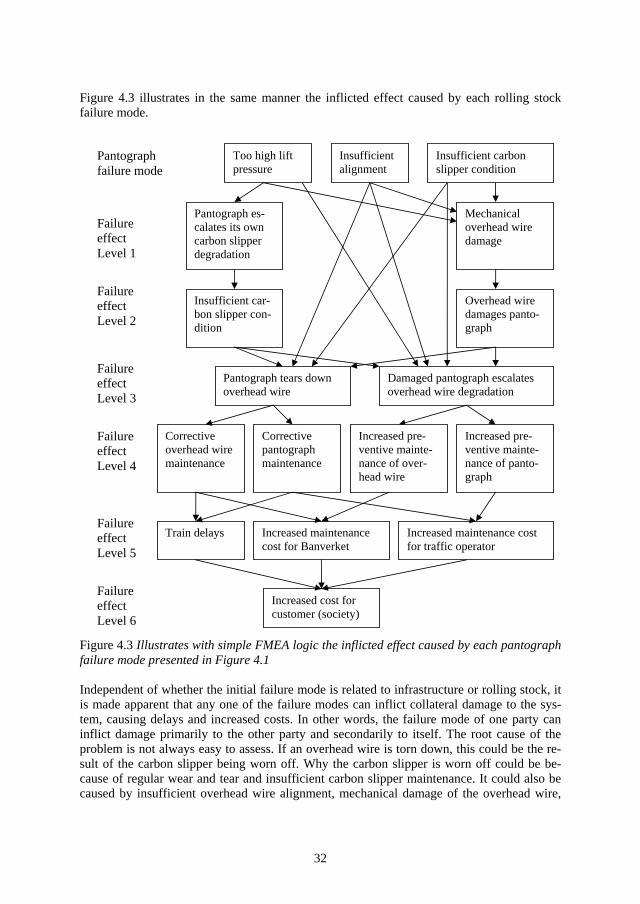
32
Figure 4.3 illustrates in the same manner the inflicted effect caused by each rolling stock failure mode.
Figure 4.3 Illustrates with simple FMEA logic the inflicted effect caused by each pantograph failure mode presented in Figure 4.1
Independent of whether the initial failure mode is related to infrastructure or rolling stock, it is made apparent that any one of the failure modes can inflict collateral damage to the sys-tem, causing delays and increased costs. In other words, the failure mode of one party can inflict damage primarily to the other party and secondarily to itself. The root cause of the problem is not always easy to assess. If an overhead wire is torn down, this could be the re-sult of the carbon slipper being worn off. Why the carbon slipper is worn off could be be-cause of regular wear and tear and insufficient carbon slipper maintenance. It could also be caused by insufficient overhead wire alignment, mechanical damage of the overhead wire,
Pantograph es-calates its own carbon slipper degradation
Pantographfailure mode
Insufficient carbon slipper condition
Insufficientalignment
Too high lift pressure
Insufficient car-bon slipper con-dition
Mechanicaloverhead wire damage
Overhead wire damages panto-graph
Damaged pantograph escalates overhead wire degradation
Pantograph tears down overhead wire
Correctivepantographmaintenance
Increased pre-ventive mainte-nance of over-head wire
Increased pre-ventive mainte-nance of panto-graph
Correctiveoverhead wire maintenance
Train delays
Increased cost for customer (society)
Increased maintenance cost for traffic operator
Increased maintenance cost for Banverket
Failure effectLevel 1
Failure effectLevel 2
Failure effectLevel 3
Failure effectLevel 4
Failure effectLevel 5
Failure effectLevel 6
33
insufficient pantograph alignment or too high lift pressure of the pantograph. Insufficient horizontal and vertical alignment of the overhead wire can be caused by changes in the sub grade conditions. These sub grade conditions can cause the poles to which the overhead wire is mounted to come out of position. This will affect the overhead wires relative position to the track and thus its position relative to the pantograph. The position of the track can also be affected by the sub grade conditions. If the track position is changed, this will also affect the pantograph’s position relative to the overhead wire.
DISCUSSION & CONCLUSION OF INTERFACE EXPLORATION
Even though Figures 4.1, 4.2 and 4.3 do not include all possible failure modes and all possi-ble influence relations, they illustrate that the issue of controlling the degradation behaviour in the interface cannot be solved by only preventing one of the failure modes. The same methodology can be used for assessing failure modes and effects in other technical systems or system interfaces e.g. in the interface between wheel and rail and wheels and turnouts.
After the failure modes have been identified and their criticality assessed, a strategy for gain-ing control of the failure modes can be developed. The purpose of RCM is to design the pre-ventive maintenance based on factors such as criticality, applicability and cost effectiveness; see Nowlan & Heap (1978). The high complexity of failure modes and the actual operating conditions, indicate that a condition-based maintenance approach is to be preferred for the overhead wire to pantograph interface. What condition monitoring strategy (manual inspec-tions or technology) is best to apply to the different failure modes can be discussed for each failure mode.
Uplift pressure measurements. The pantograph increases its uplift pressure towards the overhead wire at higher speeds. Wrongly adjusted pantographs can cause too high lift pressure, and thereby collateral damage to the system. The uplift pressure during operation is impossible to verify by stand-still manual inspections. From this perspec-tive it may be beneficial to implement a monitoring solution that can assess the uplift pressure during operation. The adjustment of the pantograph and its uplift pressure can be monitored by measuring the uplift of the overhead wire. Too low uplift pres-sure can also be monitored. Too low uplift pressure can cause lightning effects be-tween the overhead wire and the pantograph; this can cause damage to the carbon slipper. Uplift pressure measurements are correlated with the train speed, wind speed and temperature. Solutions to this are offered by vendors like Banverket Produktion (BUBO) and AEA Technology (PANCHEX).
Insufficient pantograph alignment and carbon slipper condition. The train driver is supposed to assess the condition of the pantograph before setting off. Due to the fact that the train driver cannot see the pantograph from the ground, makes it difficult for her/him to verify the pantograph’s condition outside the workshop (Banverket, 2002_b). Depending on criticality, it may in this case be advantageous to find a more continuous monitoring method. Pantograph alignment and carbon slipper condition can be measured by systems like KIKA. KIKA is a wayside monitor that uses radar sensors, photography and image analysis to assess the condition of the pantograph carbon slipper. Insufficient carbon slipper condition can also be controlled by Auto-matic Drop Devices (ADD), which can monitor the carbon slipper thickness. If some
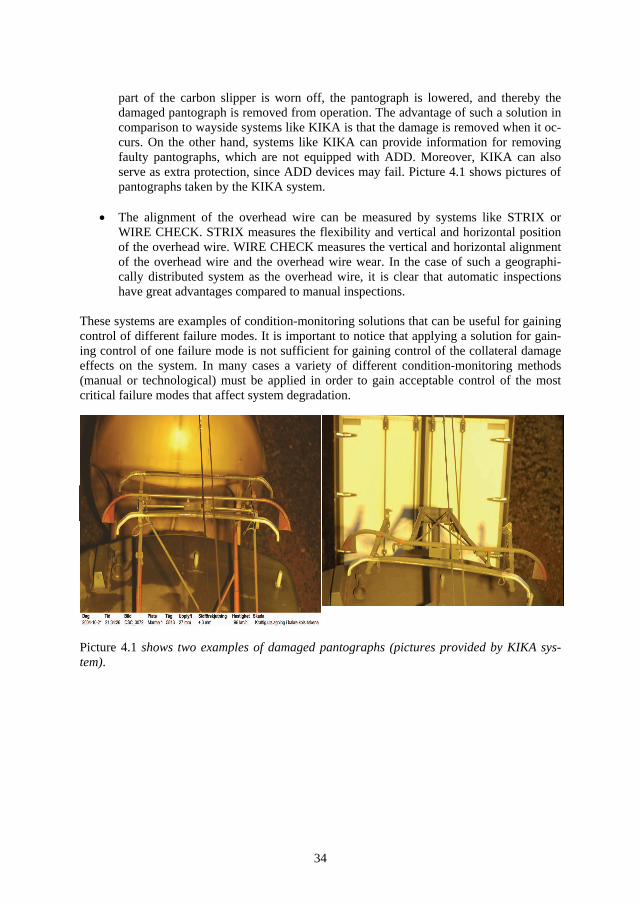
34
part of the carbon slipper is worn off, the pantograph is lowered, and thereby the damaged pantograph is removed from operation. The advantage of such a solution in comparison to wayside systems like KIKA is that the damage is removed when it oc-curs. On the other hand, systems like KIKA can provide information for removing faulty pantographs, which are not equipped with ADD. Moreover, KIKA can also serve as extra protection, since ADD devices may fail. Picture 4.1 shows pictures of pantographs taken by the KIKA system.
The alignment of the overhead wire can be measured by systems like STRIX or WIRE CHECK. STRIX measures the flexibility and vertical and horizontal position of the overhead wire. WIRE CHECK measures the vertical and horizontal alignment of the overhead wire and the overhead wire wear. In the case of such a geographi-cally distributed system as the overhead wire, it is clear that automatic inspections have great advantages compared to manual inspections.
These systems are examples of condition-monitoring solutions that can be useful for gaining control of different failure modes. It is important to notice that applying a solution for gain-ing control of one failure mode is not sufficient for gaining control of the collateral damage effects on the system. In many cases a variety of different condition-monitoring methods (manual or technological) must be applied in order to gain acceptable control of the most critical failure modes that affect system degradation.
Picture 4.1 shows two examples of damaged pantographs (pictures provided by KIKA sys-tem).
35
5 Condition monitoring case studies The three case studies presented below are evaluations of condition-monitoring systems. These evaluations were designed in order to assess the condition-monitoring systems’ meas-urement accuracy. The first two presented cases are evaluations of operational condition-monitoring systems, while the third is an evaluation of a test pilot system. These three stud-ies were all initiated by Banverket, because they found it necessary to assess the quality of the delivered data. By participating in testing and performing evaluations of the condition-monitoring systems, the present writer had a chance to learn, observe and reflect on how the condition monitoring systems are being used and on the extent to which they are capable of providing adequate decision support.
The studies are based on experience from the application of condition monitoring in the Swedish railway sector. These studies were performed to explore the research question “How can current condition-monitoring applications at Banverket support maintenance man-agement”.
5.1 Wheel impact detector
TEST INTRODUCTION
In January 2000 a test was performed in order to assess the reliability of one of the WILD wheel impact detection systems installed on the iron ore line (Northern Sweden). The reason for performing the test was to assess the system’s measurement accuracy by means of man-ual inspections of the wheel before the system was to become operational. The test results showed that the system provides good data quality and that it does not cause any false alarms (Karlsson, 2000).
However, when operational, some of the alarms indicated by the system were reported as false by manual train driver inspections. Subsequently in 2003 Banverket launched an addi-tional test. Like the previous test this one was performed in order to identify to what extent alarms from the system could be verified by manual inspections. The result (if successful) would serve as momentum for exclusion of manual train driver inspections, which were per-ceived to be insufficient (and hence the cause of reported false alarms). Exclusion of manual inspections means that the subsequent actions taken because of an indicated alarm are based on the detector system’s data rather than on the manual inspections. In order to be able to cancel manual inspections, it is absolutely necessary that the data provided by the system is accurate.
The following study was carried out in 2003 to evaluate the wheel impact detector’s reliabil-ity after three years of continuous operation. For further information see Granström (2003).
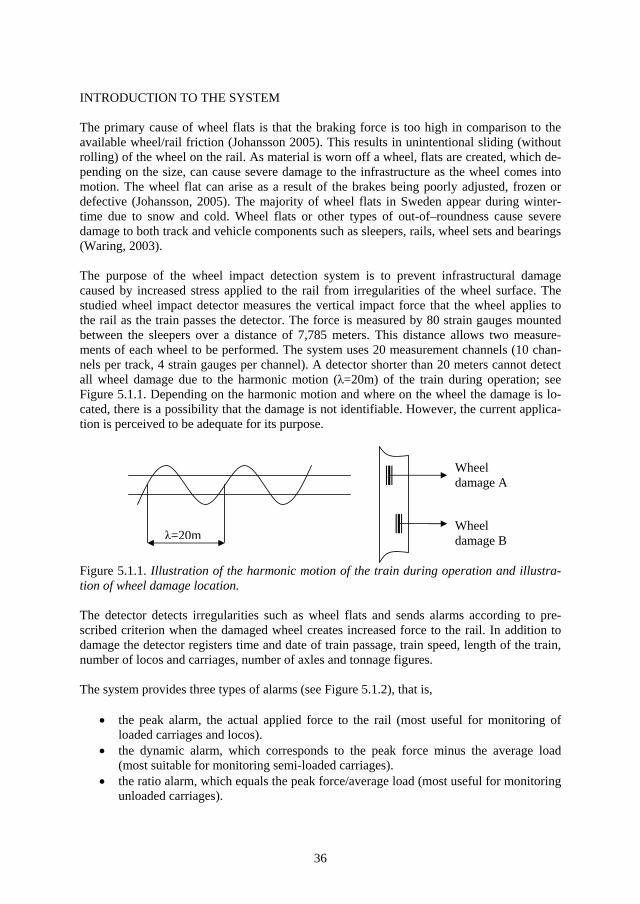
36
INTRODUCTION TO THE SYSTEM
The primary cause of wheel flats is that the braking force is too high in comparison to the available wheel/rail friction (Johansson 2005). This results in unintentional sliding (without rolling) of the wheel on the rail. As material is worn off a wheel, flats are created, which de-pending on the size, can cause severe damage to the infrastructure as the wheel comes into motion. The wheel flat can arise as a result of the brakes being poorly adjusted, frozen or defective (Johansson, 2005). The majority of wheel flats in Sweden appear during winter-time due to snow and cold. Wheel flats or other types of out-of–roundness cause severe damage to both track and vehicle components such as sleepers, rails, wheel sets and bearings (Waring, 2003).
The purpose of the wheel impact detection system is to prevent infrastructural damage caused by increased stress applied to the rail from irregularities of the wheel surface. The studied wheel impact detector measures the vertical impact force that the wheel applies to the rail as the train passes the detector. The force is measured by 80 strain gauges mounted between the sleepers over a distance of 7,785 meters. This distance allows two measure-ments of each wheel to be performed. The system uses 20 measurement channels (10 chan-nels per track, 4 strain gauges per channel). A detector shorter than 20 meters cannot detect all wheel damage due to the harmonic motion ( =20m) of the train during operation; see Figure 5.1.1. Depending on the harmonic motion and where on the wheel the damage is lo-cated, there is a possibility that the damage is not identifiable. However, the current applica-tion is perceived to be adequate for its purpose.
Figure 5.1.1. Illustration of the harmonic motion of the train during operation and illustra-tion of wheel damage location.
The detector detects irregularities such as wheel flats and sends alarms according to pre-scribed criterion when the damaged wheel creates increased force to the rail. In addition to damage the detector registers time and date of train passage, train speed, length of the train, number of locos and carriages, number of axles and tonnage figures.
The system provides three types of alarms (see Figure 5.1.2), that is,
the peak alarm, the actual applied force to the rail (most useful for monitoring of loaded carriages and locos).the dynamic alarm, which corresponds to the peak force minus the average load (most suitable for monitoring semi-loaded carriages). the ratio alarm, which equals the peak force/average load (most useful for monitoring unloaded carriages).
=20m
Wheeldamage A
Wheeldamage B
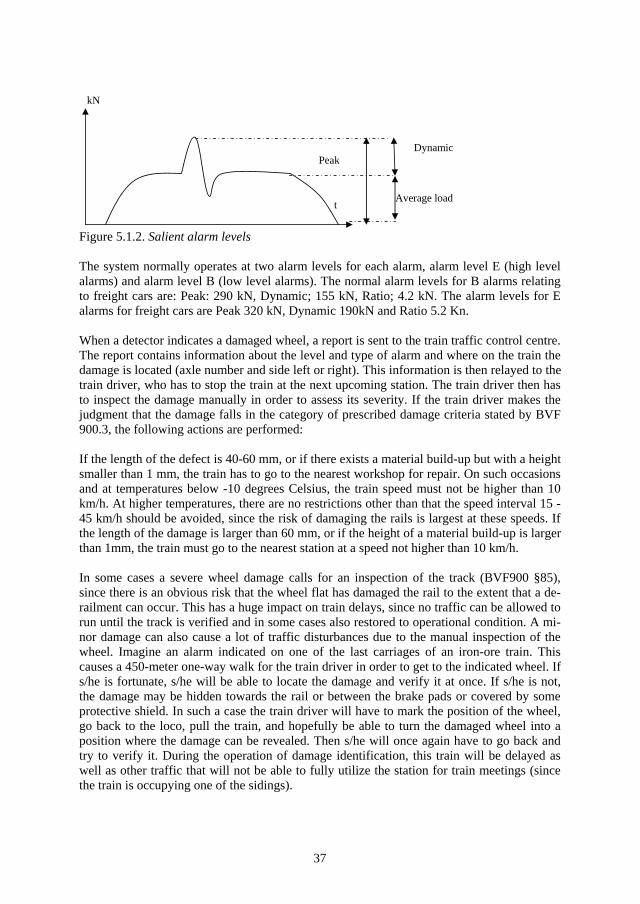
37
Figure 5.1.2. Salient alarm levels
The system normally operates at two alarm levels for each alarm, alarm level E (high level alarms) and alarm level B (low level alarms). The normal alarm levels for B alarms relating to freight cars are: Peak: 290 kN, Dynamic; 155 kN, Ratio; 4.2 kN. The alarm levels for E alarms for freight cars are Peak 320 kN, Dynamic 190kN and Ratio 5.2 Kn.
When a detector indicates a damaged wheel, a report is sent to the train traffic control centre. The report contains information about the level and type of alarm and where on the train the damage is located (axle number and side left or right). This information is then relayed to the train driver, who has to stop the train at the next upcoming station. The train driver then has to inspect the damage manually in order to assess its severity. If the train driver makes the judgment that the damage falls in the category of prescribed damage criteria stated by BVF 900.3, the following actions are performed:
If the length of the defect is 40-60 mm, or if there exists a material build-up but with a height smaller than 1 mm, the train has to go to the nearest workshop for repair. On such occasions and at temperatures below -10 degrees Celsius, the train speed must not be higher than 10 km/h. At higher temperatures, there are no restrictions other than that the speed interval 15 - 45 km/h should be avoided, since the risk of damaging the rails is largest at these speeds. If the length of the damage is larger than 60 mm, or if the height of a material build-up is larger than 1mm, the train must go to the nearest station at a speed not higher than 10 km/h.
In some cases a severe wheel damage calls for an inspection of the track (BVF900 §85), since there is an obvious risk that the wheel flat has damaged the rail to the extent that a de-railment can occur. This has a huge impact on train delays, since no traffic can be allowed to run until the track is verified and in some cases also restored to operational condition. A mi-nor damage can also cause a lot of traffic disturbances due to the manual inspection of the wheel. Imagine an alarm indicated on one of the last carriages of an iron-ore train. This causes a 450-meter one-way walk for the train driver in order to get to the indicated wheel. If s/he is fortunate, s/he will be able to locate the damage and verify it at once. If s/he is not, the damage may be hidden towards the rail or between the brake pads or covered by some protective shield. In such a case the train driver will have to mark the position of the wheel, go back to the loco, pull the train, and hopefully be able to turn the damaged wheel into a position where the damage can be revealed. Then s/he will once again have to go back and try to verify it. During the operation of damage identification, this train will be delayed as well as other traffic that will not be able to fully utilize the station for train meetings (since the train is occupying one of the sidings).
Dynamic
Average load
Peak
t
kN
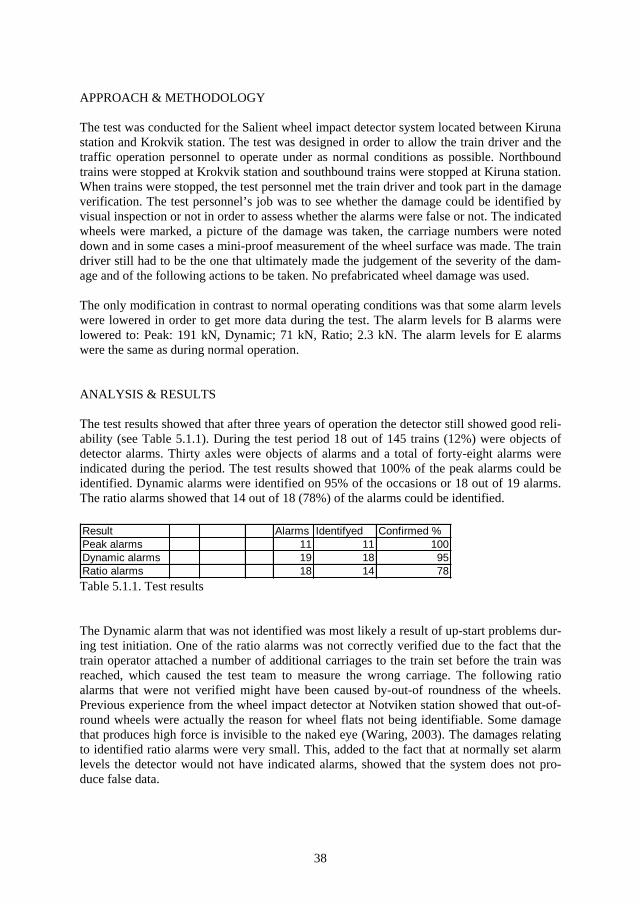
38
APPROACH & METHODOLOGY
The test was conducted for the Salient wheel impact detector system located between Kiruna station and Krokvik station. The test was designed in order to allow the train driver and the traffic operation personnel to operate under as normal conditions as possible. Northbound trains were stopped at Krokvik station and southbound trains were stopped at Kiruna station. When trains were stopped, the test personnel met the train driver and took part in the damage verification. The test personnel’s job was to see whether the damage could be identified by visual inspection or not in order to assess whether the alarms were false or not. The indicated wheels were marked, a picture of the damage was taken, the carriage numbers were noted down and in some cases a mini-proof measurement of the wheel surface was made. The train driver still had to be the one that ultimately made the judgement of the severity of the dam-age and of the following actions to be taken. No prefabricated wheel damage was used.
The only modification in contrast to normal operating conditions was that some alarm levels were lowered in order to get more data during the test. The alarm levels for B alarms were lowered to: Peak: 191 kN, Dynamic; 71 kN, Ratio; 2.3 kN. The alarm levels for E alarms were the same as during normal operation.
ANALYSIS & RESULTS
The test results showed that after three years of operation the detector still showed good reli-ability (see Table 5.1.1). During the test period 18 out of 145 trains (12%) were objects of detector alarms. Thirty axles were objects of alarms and a total of forty-eight alarms were indicated during the period. The test results showed that 100% of the peak alarms could be identified. Dynamic alarms were identified on 95% of the occasions or 18 out of 19 alarms. The ratio alarms showed that 14 out of 18 (78%) of the alarms could be identified.
Table 5.1.1. Test results
The Dynamic alarm that was not identified was most likely a result of up-start problems dur-ing test initiation. One of the ratio alarms was not correctly verified due to the fact that the train operator attached a number of additional carriages to the train set before the train was reached, which caused the test team to measure the wrong carriage. The following ratio alarms that were not verified might have been caused by-out-of roundness of the wheels. Previous experience from the wheel impact detector at Notviken station showed that out-of-round wheels were actually the reason for wheel flats not being identifiable. Some damage that produces high force is invisible to the naked eye (Waring, 2003). The damages relating to identified ratio alarms were very small. This, added to the fact that at normally set alarm levels the detector would not have indicated alarms, showed that the system does not pro-duce false data.
Result Alarms Identifyed Confirmed %Peak alarms 11 11 100Dynamic alarms 19 18 95Ratio alarms 18 14 78
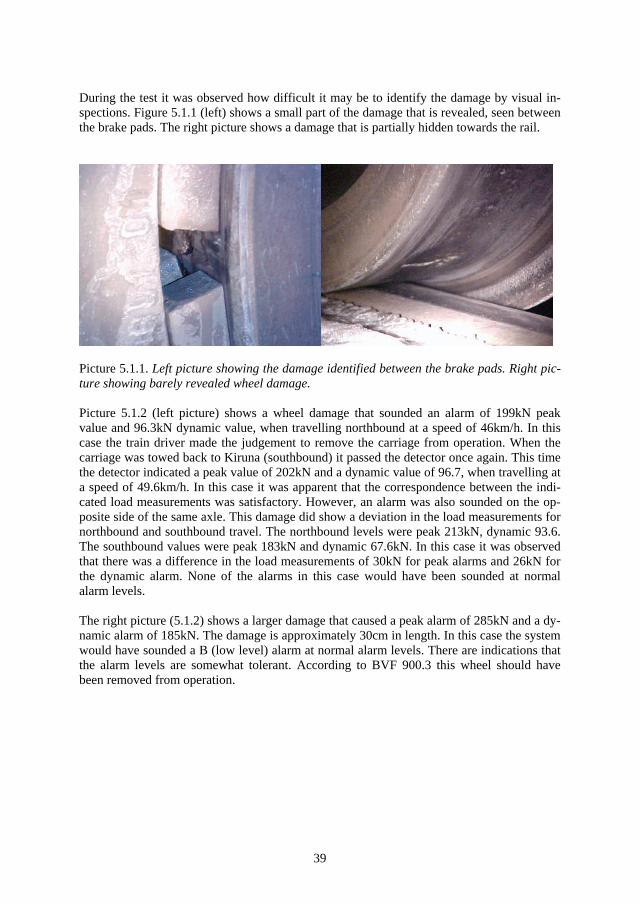
39
During the test it was observed how difficult it may be to identify the damage by visual in-spections. Figure 5.1.1 (left) shows a small part of the damage that is revealed, seen between the brake pads. The right picture shows a damage that is partially hidden towards the rail.
Picture 5.1.1. Left picture showing the damage identified between the brake pads. Right pic-ture showing barely revealed wheel damage.
Picture 5.1.2 (left picture) shows a wheel damage that sounded an alarm of 199kN peak value and 96.3kN dynamic value, when travelling northbound at a speed of 46km/h. In this case the train driver made the judgement to remove the carriage from operation. When the carriage was towed back to Kiruna (southbound) it passed the detector once again. This time the detector indicated a peak value of 202kN and a dynamic value of 96.7, when travelling at a speed of 49.6km/h. In this case it was apparent that the correspondence between the indi-cated load measurements was satisfactory. However, an alarm was also sounded on the op-posite side of the same axle. This damage did show a deviation in the load measurements for northbound and southbound travel. The northbound levels were peak 213kN, dynamic 93.6. The southbound values were peak 183kN and dynamic 67.6kN. In this case it was observed that there was a difference in the load measurements of 30kN for peak alarms and 26kN for the dynamic alarm. None of the alarms in this case would have been sounded at normal alarm levels.
The right picture (5.1.2) shows a larger damage that caused a peak alarm of 285kN and a dy-namic alarm of 185kN. The damage is approximately 30cm in length. In this case the system would have sounded a B (low level) alarm at normal alarm levels. There are indications that the alarm levels are somewhat tolerant. According to BVF 900.3 this wheel should have been removed from operation.
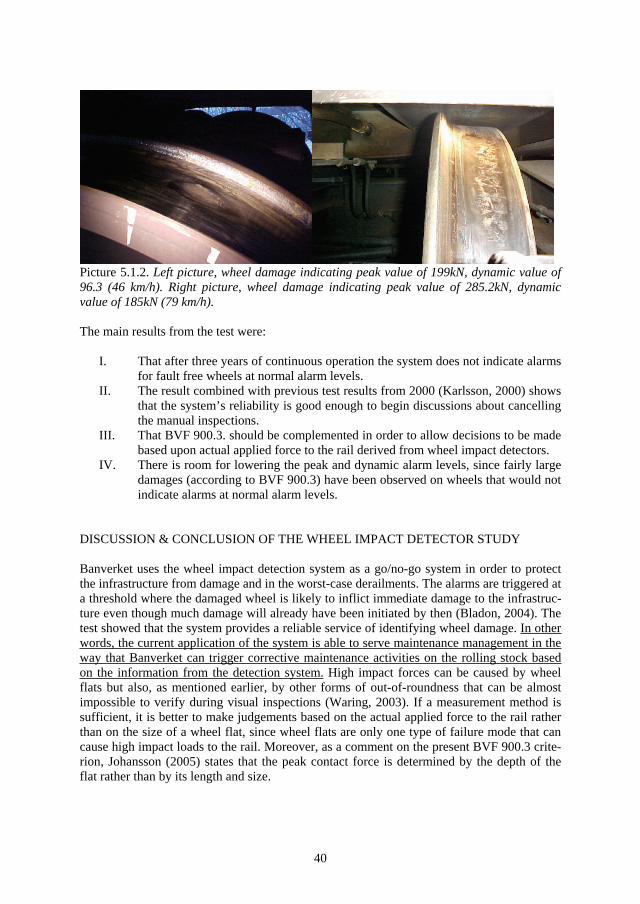
40
Picture 5.1.2. Left picture, wheel damage indicating peak value of 199kN, dynamic value of 96.3 (46 km/h). Right picture, wheel damage indicating peak value of 285.2kN, dynamic value of 185kN (79 km/h).
The main results from the test were:
I. That after three years of continuous operation the system does not indicate alarms for fault free wheels at normal alarm levels.
II. The result combined with previous test results from 2000 (Karlsson, 2000) shows that the system’s reliability is good enough to begin discussions about cancelling the manual inspections.
III. That BVF 900.3. should be complemented in order to allow decisions to be made based upon actual applied force to the rail derived from wheel impact detectors.
IV. There is room for lowering the peak and dynamic alarm levels, since fairly large damages (according to BVF 900.3) have been observed on wheels that would not indicate alarms at normal alarm levels.
DISCUSSION & CONCLUSION OF THE WHEEL IMPACT DETECTOR STUDY
Banverket uses the wheel impact detection system as a go/no-go system in order to protect the infrastructure from damage and in the worst-case derailments. The alarms are triggered at a threshold where the damaged wheel is likely to inflict immediate damage to the infrastruc-ture even though much damage will already have been initiated by then (Bladon, 2004). The test showed that the system provides a reliable service of identifying wheel damage. In other words, the current application of the system is able to serve maintenance management in the way that Banverket can trigger corrective maintenance activities on the rolling stock based on the information from the detection system. High impact forces can be caused by wheel flats but also, as mentioned earlier, by other forms of out-of-roundness that can be almost impossible to verify during visual inspections (Waring, 2003). If a measurement method is sufficient, it is better to make judgements based on the actual applied force to the rail rather than on the size of a wheel flat, since wheel flats are only one type of failure mode that can cause high impact loads to the rail. Moreover, as a comment on the present BVF 900.3 crite-rion, Johansson (2005) states that the peak contact force is determined by the depth of the flat rather than by its length and size.
41
Experience from other detector systems
To utilize the system as a go/no-go system might be sufficient for the infrastructural man-agement. However, experiences from the Teknis wheel condition monitor indicate that once a wheel defect occurs, the severity of impacts will increase over time, which often leads to collateral damage (Bladon, 2004). Furthermore, on the basis of experience from the Wheel-Chex (enhancement from the Salient systems WILD installations) monitoring systems, War-ing 2003 says that “flats do NOT run out, they turn into ‘out of round’ wheels. They just hide, become silent ‘out of round’ wheels with the impact force still there. Such ‘out of round’ wheels are much harder to identify visually and tend to give higher impact force over time and at higher speed.”. There are also strong indications that there is a synergy effect between wheel impacts and bearing defects. Wheel defects shorten bearing fatigue life, which can lead to premature bearing failure (Irani, 2001; Southern et al, 2004). From this perspective, wheel impact data might be of better use to the traffic operators, allowing them to work proactively from the awareness of rolling stock condition derived from the impact detection systems.
An example of where a wheel impact detection system transforms from a go/no-go system to a system providing vital data to traffic operation can be found in the UK Wheelchex pro-gram. Wasserman (2002) states, “As Wheelchex was originally perceived to be a track “tool”, it was assumed to be an aid to remove vehicles that failed to meet the Railway Group standard limits. However, as the System team recognised, the actual data “owner” should have been the train operator as early detection of deterioration was perceived to be a better use of the system.” In order to be successful, Railtrack had to recognise the users of the sys-tem, operators had to be included to complete the system development, and procedures for communicating and using the data had to be written. Railtrack made sure that all operators and maintainers were invited to participate in workshops on training as well as on system development. Railtrack created a Data Processing Centre where operators and others can re-trieve reports, trends and queries whether about specific trains or general statistics. Wasserman (2002) further states that most operators have recognised that the output has supplied them both with information about managing maintenance and means of conforming to Railway Group Standards.
Further work at Banverket
In early 2005 a test was initiated at Banverket where the manual inspections were cancelled for E level Peak (high level) alarms. This meant that if a carriage is damaged and triggers a high level Peak alarm, the carriage must, independent of train driver inspection of the dam-age, be left at the next station. During the test other alarms were treated as under normal conditions. Prior to this test, Banverket had declared that it is important to get feedback from the traffic operators on whether fault-free carriages have been left on the track. The results from this test showed that that there has been close to no feedback from the traffic operators. However, Banverket interprets this as a good result, since none of the traffic operators have been complaining. Moreover, in 2006 the test will be expanded with high level dynamic and ratio alarms deciding whether the train operators (independent of train driver inspection) should take their carriages to the nearest workshop for repair. The carriages are not allowed to leave the workshop before they have been restored to acceptable working condition.
42
Banverket is obviously progressing in their use of the wheel impact detection systems, but as they progress, traffic operation is not provided with more than go/no-go signals. Perhaps it would be more advantageous for Banverket and the traffic operators to form a cooperative test where data from the impact detection systems are linked to individual carriages. This would provide opportunities for Banverket to make a better evaluation of the system, since indicated loads below alarm levels can continuously be verified during operation, and at the same time it could be assessed whether data can be used to predict deterioration. Such a test could therefore provide both parties with information about the system’s ability to work as an early warning system. This test could also provide opportunities for traffic operation to perform their maintenance in a more scheduled way, at the same time as Banverket could keep track of whether individual carriages really have been properly maintained. This infor-mation could also provide information to traffic operators for identifying whether some indi-viduals are more prone to failure. Continuous verification of measurement data from differ-ent wheel impact detectors could also serve measurement accuracy verification, since sys-tematic deviations in load measurements from a single detector could indicate detector mal-functions. Connecting wheel impact data to individual carriages can automatically be per-formed by using MTAB’s vehicle identification system. Each MTAB carriage and loco is equipped with an identification tag whose signal is picked up at specific points. These identi-fication data linked to detector data can allow individual wheels on carriages to be continu-ously monitored.
Accumulated tonnage is one important factor for assessing the degradation of infrastructural assets (UIC, 2002). It is a difficult task for Banverket to get hold of accumulated tonnage figures from the traffic operating companies, since they regard them as trade secrets (Espling, 2004). However, tonnage figures can be extracted from the wheel impact detection systems at present, but this function is not used. Moreover, the impact detector can also be used to identify overloading of carriages and whether loads are unevenly distributed on car-riages.
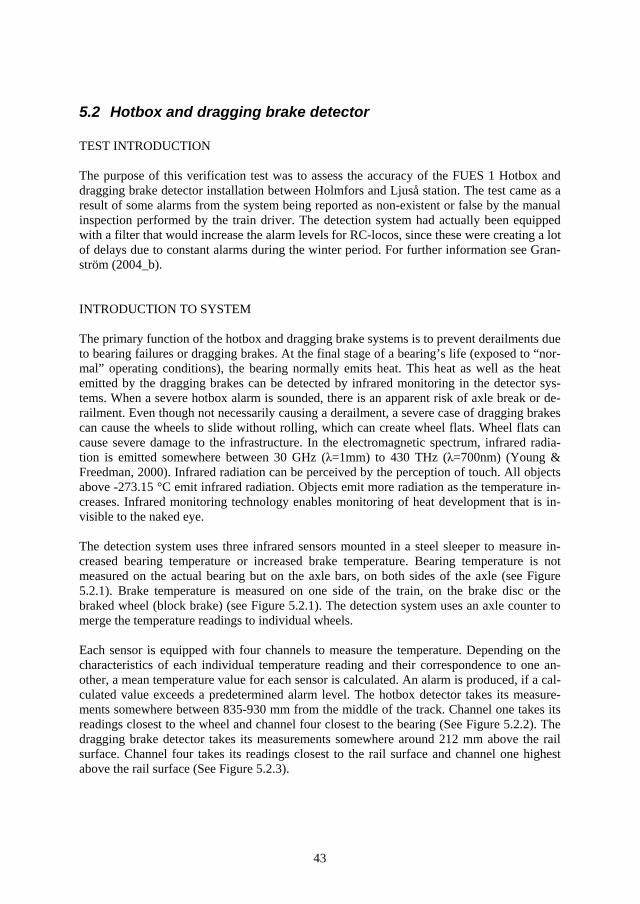
43
5.2 Hotbox and dragging brake detector
TEST INTRODUCTION
The purpose of this verification test was to assess the accuracy of the FUES 1 Hotbox and dragging brake detector installation between Holmfors and Ljuså station. The test came as a result of some alarms from the system being reported as non-existent or false by the manual inspection performed by the train driver. The detection system had actually been equipped with a filter that would increase the alarm levels for RC-locos, since these were creating a lot of delays due to constant alarms during the winter period. For further information see Gran-ström (2004_b).
INTRODUCTION TO SYSTEM
The primary function of the hotbox and dragging brake systems is to prevent derailments due to bearing failures or dragging brakes. At the final stage of a bearing’s life (exposed to “nor-mal” operating conditions), the bearing normally emits heat. This heat as well as the heat emitted by the dragging brakes can be detected by infrared monitoring in the detector sys-tems. When a severe hotbox alarm is sounded, there is an apparent risk of axle break or de-railment. Even though not necessarily causing a derailment, a severe case of dragging brakes can cause the wheels to slide without rolling, which can create wheel flats. Wheel flats can cause severe damage to the infrastructure. In the electromagnetic spectrum, infrared radia-tion is emitted somewhere between 30 GHz ( =1mm) to 430 THz ( =700nm) (Young & Freedman, 2000). Infrared radiation can be perceived by the perception of touch. All objects above -273.15 °C emit infrared radiation. Objects emit more radiation as the temperature in-creases. Infrared monitoring technology enables monitoring of heat development that is in-visible to the naked eye.
The detection system uses three infrared sensors mounted in a steel sleeper to measure in-creased bearing temperature or increased brake temperature. Bearing temperature is not measured on the actual bearing but on the axle bars, on both sides of the axle (see Figure 5.2.1). Brake temperature is measured on one side of the train, on the brake disc or the braked wheel (block brake) (see Figure 5.2.1). The detection system uses an axle counter to merge the temperature readings to individual wheels.
Each sensor is equipped with four channels to measure the temperature. Depending on the characteristics of each individual temperature reading and their correspondence to one an-other, a mean temperature value for each sensor is calculated. An alarm is produced, if a cal-culated value exceeds a predetermined alarm level. The hotbox detector takes its measure-ments somewhere between 835-930 mm from the middle of the track. Channel one takes its readings closest to the wheel and channel four closest to the bearing (See Figure 5.2.2). The dragging brake detector takes its measurements somewhere around 212 mm above the rail surface. Channel four takes its readings closest to the rail surface and channel one highest above the rail surface (See Figure 5.2.3).
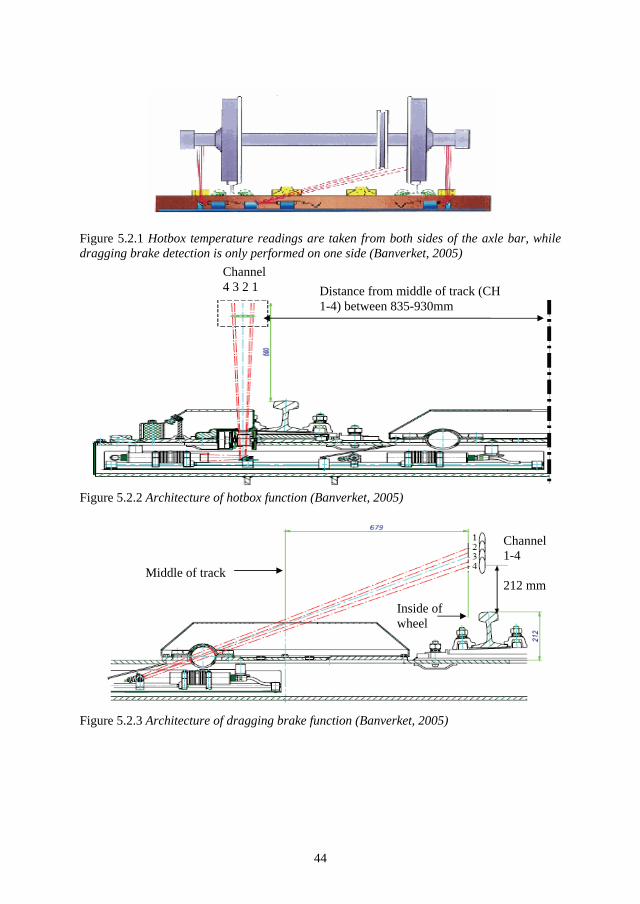
44
Figure 5.2.1 Hotbox temperature readings are taken from both sides of the axle bar, while dragging brake detection is only performed on one side (Banverket, 2005)
Figure 5.2.2 Architecture of hotbox function (Banverket, 2005)
Figure 5.2.3 Architecture of dragging brake function (Banverket, 2005)
Channel4 3 2 1 Distance from middle of track (CH
1-4) between 835-930mm
Middle of track
Inside of wheel
Channel1-4
212 mm
45
The hotbox detector is equipped with three types of alarms;
Over temperature alarm. High and low alarm level. Alarms are sounded when the in-dicated temperature exceeds the predetermined alarm level. (During normal operation at Banverket this it the only alarm used).
o During normal operation the low level alarm is set at 80 °C for surrounding temperatures below 0°C, 80°C + surrounding temperatures between 0°C and 20°C and 100°C for surrounding temperatures above 20°C.
o For high level alarms during normal operation, alarm levels are set at 100°C for surrounding temperatures below 0°C, 100°C + surrounding temperatures for temperatures between 0°C and 20°C and 120°C for surrounding tempera-tures above 20°C.
Differential alarms. High and low alarm level. Alarms are sounded when the indi-cated temperature difference between the right and left side on the same axle exceeds the predetermined alarm level. High and low level alarms are set at 75°C. Relative alarm. High and low alarm level. Alarms are sounded according to the pre-determined alarm level, when the indicated axle temperature exceeds the average temperature; for all axles on the same side of the train high and low level alarms are set at 50°C
The dragging brake detector is equipped with two types of alarms:
Block brake alarm. High and low level. Alarms are sounded when the indicated tem-perature exceeds the predetermined alarm level.
o During normal operation the low level alarm is set at 250 °C for surrounding temperatures below 0°C, 250°C + surrounding temperatures between 0°C and 70°C and 320°C for surrounding temperatures above 70°C.
o For high level alarms during normal operation, alarm levels are set at 400°C for any surrounding temperature.
Disc brake alarm. High and low level. Alarms are sounded when the indicated tem-perature exceeds the predetermined alarm level.
o During normal operation the low level alarm is set at 350 °C for surrounding temperatures below 0°C, 350°C + surrounding temperatures between 0°C and 70°C and 420°C for surrounding temperatures above 70°C.
o For high level alarms during normal operation, alarm levels are set at 500°C for any surrounding temperature.
When a detector indicates a temperature above the prescribed alarm level, a report is sent to the train traffic control centre, containing information about the alarm level, the type of alarm and where on the train the damage is located (axle number and side left or right). This information is then relayed to the train driver, who carefully has to stop the train at the next upcoming station. The train driver then has to manually inspect the braked wheel, the brake disc or the bearing in order to make a judgement on the severity of the increased tempera-ture, and the following actions to be taken (BVF 592.11). The train driver is at best equipped with an infrared thermometer to assess the temperature, but in many cases s/he must rely on the perception of touch.
46
APPROACH & METHODOLOGY
The test was conducted during winter, since this is when most alarms occur. There was also some interest in verifying whether temperatures below zero and drifting snow could affect the detector measurements.
The test was designed in order to allow the train driver and the traffic operation personnel to operate under as normal conditions as possible. The test crew was based at Ljuså station. Northbound trains were stopped at Ljuså station and southbound trains were stopped at Holmfors station (8 minutes from Ljuså). Southbound trains passing the detector installation between Sandträsk and Gransjö (north of Ljuså) were also included in the test in order to ob-tain more data (northbound trains stopping at Sandträsk were not included, since it took too long to get there). Northbound trains were in this case stopped at Gransjö station (10 minutes from Ljuså).
When trains were stopped, the test personnel met the train driver and took part in the verifi-cation of the increased temperature. The test personnel’s job was to measure the indicated increased temperature with an infrared thermometer and a thermographic camera. Tempera-ture readings were also taken on adjacent axles in order to be able to determine whether the increased temperature readings could be isolated. Furthermore, a picture of the alarmed ob-ject was taken with a digital camera and the carriage numbers were noted down. The train driver still had to be the one that ultimately made the judgement upon the severity of the heat development and the following actions to be taken. It should be mentioned that a weakness in the methodology of not measuring at the detector site is that there is a possibility of heat-ing effects as brakes are applied when the train is stopped. However it was not feasible to perform measurements at the detector site. During the test the RC loco filtering was can-celled. Prior to the test the detection system was calibrated by Banverket’s personnel in order to provide the best prerequisites for performing the test. The measurement instruments used by the test team were also calibrated with the same equipment that was used for calibration of the detection system.
The only modification in contrast to normal operating conditions was that some alarm levels were lowered in order to get more data during the test. The hotbox low-level alarm was low-ered to 50°C and the low level dragging brake alarms were lowered to 160°C. The high level alarms were the same as during normal operation.
ANALYSIS & RESULTS
The presented results can only be representative of RC locos, since those were the only ob-jects indicating alarms during the test. The conclusions that are drawn should perhaps be re-garded as strong indications, since the random sample is too low to draw any final conclu-sions.
The test results showed that on all occasions when a dragging brake alarm was sounded, a distinct increased temperature could also be identified (table 5.2.1). However, none of the hotbox alarms could be verified during the test.
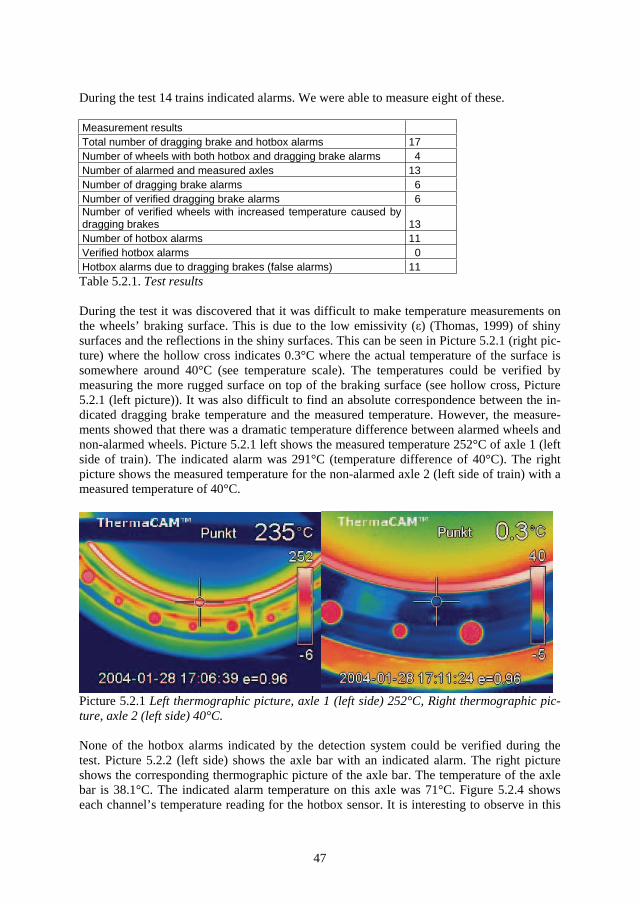
47
During the test 14 trains indicated alarms. We were able to measure eight of these.
Measurement results Total number of dragging brake and hotbox alarms 17 Number of wheels with both hotbox and dragging brake alarms 4 Number of alarmed and measured axles 13 Number of dragging brake alarms 6 Number of verified dragging brake alarms 6 Number of verified wheels with increased temperature caused by dragging brakes 13 Number of hotbox alarms 11 Verified hotbox alarms 0 Hotbox alarms due to dragging brakes (false alarms) 11 Table 5.2.1. Test results
During the test it was discovered that it was difficult to make temperature measurements on the wheels’ braking surface. This is due to the low emissivity ( ) (Thomas, 1999) of shiny surfaces and the reflections in the shiny surfaces. This can be seen in Picture 5.2.1 (right pic-ture) where the hollow cross indicates 0.3°C where the actual temperature of the surface is somewhere around 40°C (see temperature scale). The temperatures could be verified by measuring the more rugged surface on top of the braking surface (see hollow cross, Picture 5.2.1 (left picture)). It was also difficult to find an absolute correspondence between the in-dicated dragging brake temperature and the measured temperature. However, the measure-ments showed that there was a dramatic temperature difference between alarmed wheels and non-alarmed wheels. Picture 5.2.1 left shows the measured temperature 252°C of axle 1 (left side of train). The indicated alarm was 291°C (temperature difference of 40°C). The right picture shows the measured temperature for the non-alarmed axle 2 (left side of train) with a measured temperature of 40°C.
Picture 5.2.1 Left thermographic picture, axle 1 (left side) 252°C, Right thermographic pic-ture, axle 2 (left side) 40°C.
None of the hotbox alarms indicated by the detection system could be verified during the test. Picture 5.2.2 (left side) shows the axle bar with an indicated alarm. The right picture shows the corresponding thermographic picture of the axle bar. The temperature of the axle bar is 38.1°C. The indicated alarm temperature on this axle was 71°C. Figure 5.2.4 shows each channel’s temperature reading for the hotbox sensor. It is interesting to observe in this
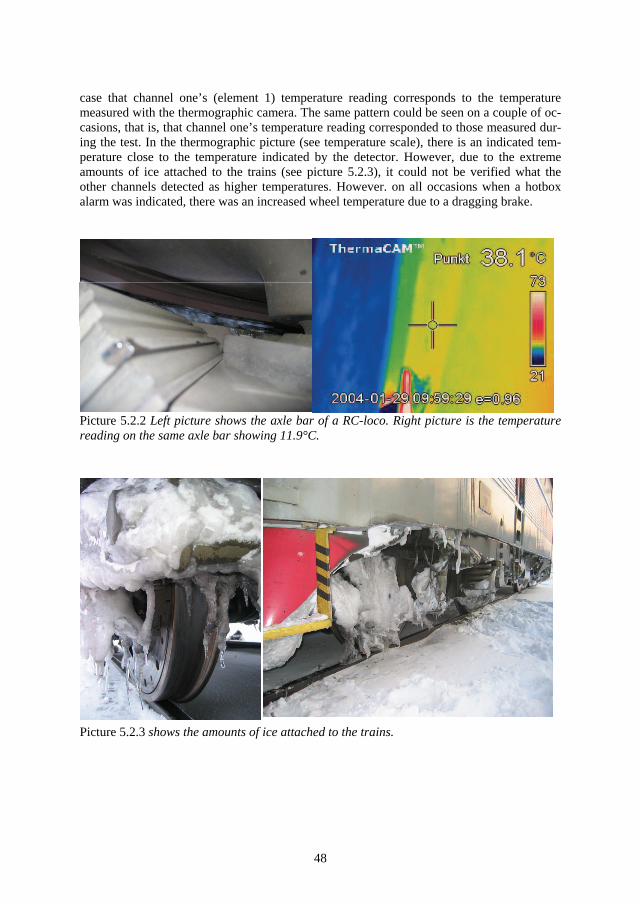
48
case that channel one’s (element 1) temperature reading corresponds to the temperature measured with the thermographic camera. The same pattern could be seen on a couple of oc-casions, that is, that channel one’s temperature reading corresponded to those measured dur-ing the test. In the thermographic picture (see temperature scale), there is an indicated tem-perature close to the temperature indicated by the detector. However, due to the extreme amounts of ice attached to the trains (see picture 5.2.3), it could not be verified what the other channels detected as higher temperatures. However. on all occasions when a hotbox alarm was indicated, there was an increased wheel temperature due to a dragging brake.
Picture 5.2.2 Left picture shows the axle bar of a RC-loco. Right picture is the temperature reading on the same axle bar showing 11.9°C.
Picture 5.2.3 shows the amounts of ice attached to the trains.
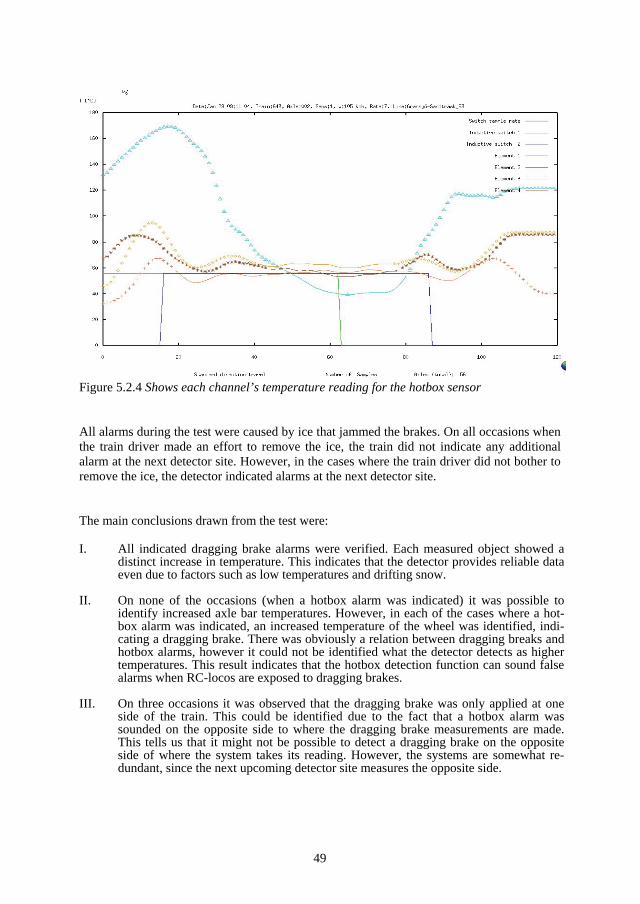
49
Figure 5.2.4 Shows each channel’s temperature reading for the hotbox sensor
All alarms during the test were caused by ice that jammed the brakes. On all occasions when the train driver made an effort to remove the ice, the train did not indicate any additional alarm at the next detector site. However, in the cases where the train driver did not bother to remove the ice, the detector indicated alarms at the next detector site.
The main conclusions drawn from the test were:
I. All indicated dragging brake alarms were verified. Each measured object showed a distinct increase in temperature. This indicates that the detector provides reliable data even due to factors such as low temperatures and drifting snow.
II. On none of the occasions (when a hotbox alarm was indicated) it was possible to identify increased axle bar temperatures. However, in each of the cases where a hot-box alarm was indicated, an increased temperature of the wheel was identified, indi-cating a dragging brake. There was obviously a relation between dragging breaks and hotbox alarms, however it could not be identified what the detector detects as higher temperatures. This result indicates that the hotbox detection function can sound false alarms when RC-locos are exposed to dragging brakes.
III. On three occasions it was observed that the dragging brake was only applied at one side of the train. This could be identified due to the fact that a hotbox alarm was sounded on the opposite side to where the dragging brake measurements are made. This tells us that it might not be possible to detect a dragging brake on the opposite side of where the system takes its reading. However, the systems are somewhat re-dundant, since the next upcoming detector site measures the opposite side.
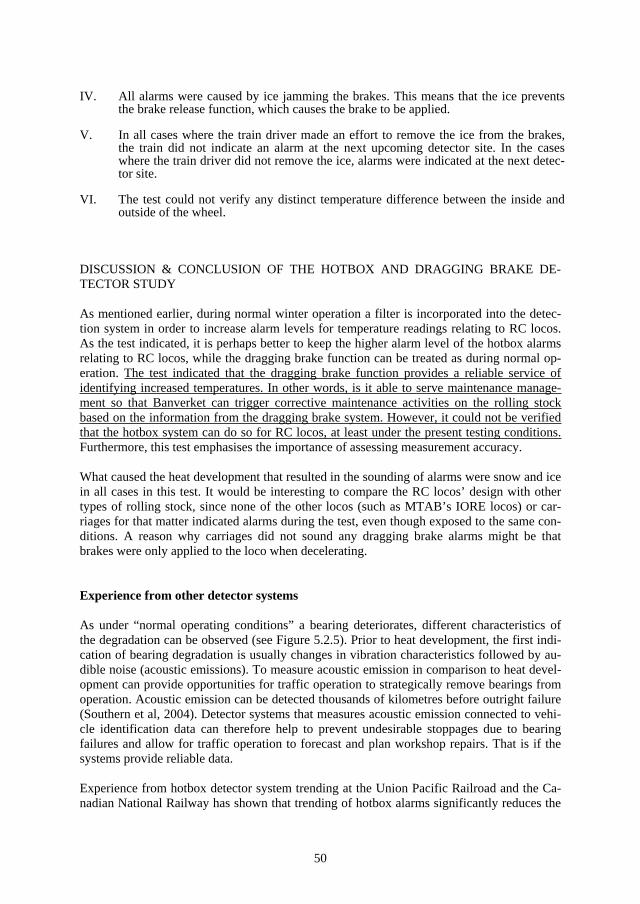
50
IV. All alarms were caused by ice jamming the brakes. This means that the ice prevents the brake release function, which causes the brake to be applied.
V. In all cases where the train driver made an effort to remove the ice from the brakes, the train did not indicate an alarm at the next upcoming detector site. In the cases where the train driver did not remove the ice, alarms were indicated at the next detec-tor site.
VI. The test could not verify any distinct temperature difference between the inside and outside of the wheel.
DISCUSSION & CONCLUSION OF THE HOTBOX AND DRAGGING BRAKE DE-TECTOR STUDY
As mentioned earlier, during normal winter operation a filter is incorporated into the detec-tion system in order to increase alarm levels for temperature readings relating to RC locos. As the test indicated, it is perhaps better to keep the higher alarm level of the hotbox alarms relating to RC locos, while the dragging brake function can be treated as during normal op-eration. The test indicated that the dragging brake function provides a reliable service of identifying increased temperatures. In other words, is it able to serve maintenance manage-ment so that Banverket can trigger corrective maintenance activities on the rolling stock based on the information from the dragging brake system. However, it could not be verified that the hotbox system can do so for RC locos, at least under the present testing conditions.Furthermore, this test emphasises the importance of assessing measurement accuracy.
What caused the heat development that resulted in the sounding of alarms were snow and ice in all cases in this test. It would be interesting to compare the RC locos’ design with other types of rolling stock, since none of the other locos (such as MTAB’s IORE locos) or car-riages for that matter indicated alarms during the test, even though exposed to the same con-ditions. A reason why carriages did not sound any dragging brake alarms might be that brakes were only applied to the loco when decelerating.
Experience from other detector systems
As under “normal operating conditions” a bearing deteriorates, different characteristics of the degradation can be observed (see Figure 5.2.5). Prior to heat development, the first indi-cation of bearing degradation is usually changes in vibration characteristics followed by au-dible noise (acoustic emissions). To measure acoustic emission in comparison to heat devel-opment can provide opportunities for traffic operation to strategically remove bearings from operation. Acoustic emission can be detected thousands of kilometres before outright failure (Southern et al, 2004). Detector systems that measures acoustic emission connected to vehi-cle identification data can therefore help to prevent undesirable stoppages due to bearing failures and allow for traffic operation to forecast and plan workshop repairs. That is if the systems provide reliable data.
Experience from hotbox detector system trending at the Union Pacific Railroad and the Ca-nadian National Railway has shown that trending of hotbox alarms significantly reduces the
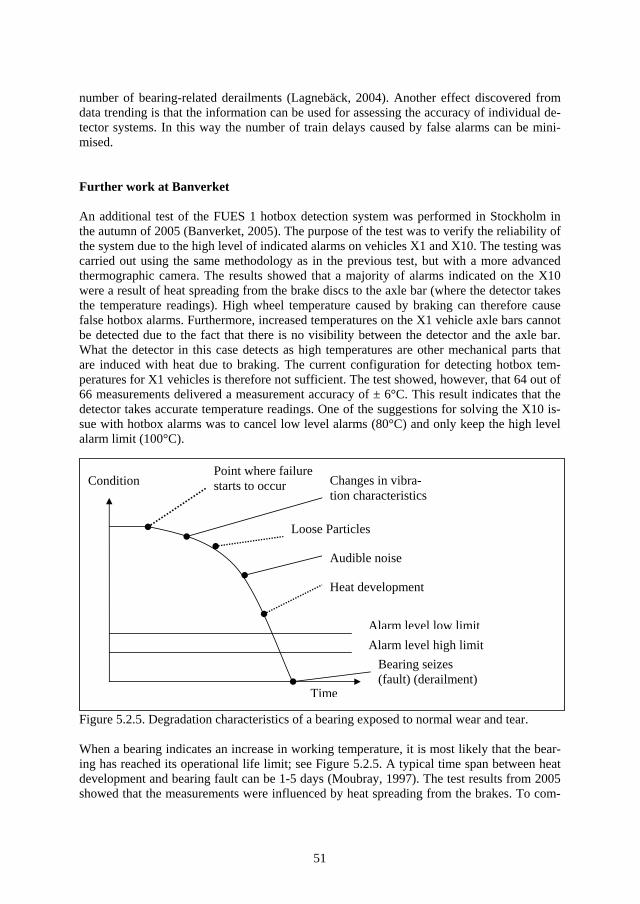
51
number of bearing-related derailments (Lagnebäck, 2004). Another effect discovered from data trending is that the information can be used for assessing the accuracy of individual de-tector systems. In this way the number of train delays caused by false alarms can be mini-mised.
Further work at Banverket
An additional test of the FUES 1 hotbox detection system was performed in Stockholm in the autumn of 2005 (Banverket, 2005). The purpose of the test was to verify the reliability of the system due to the high level of indicated alarms on vehicles X1 and X10. The testing was carried out using the same methodology as in the previous test, but with a more advanced thermographic camera. The results showed that a majority of alarms indicated on the X10 were a result of heat spreading from the brake discs to the axle bar (where the detector takes the temperature readings). High wheel temperature caused by braking can therefore cause false hotbox alarms. Furthermore, increased temperatures on the X1 vehicle axle bars cannot be detected due to the fact that there is no visibility between the detector and the axle bar. What the detector in this case detects as high temperatures are other mechanical parts that are induced with heat due to braking. The current configuration for detecting hotbox tem-peratures for X1 vehicles is therefore not sufficient. The test showed, however, that 64 out of 66 measurements delivered a measurement accuracy of ± 6°C. This result indicates that the detector takes accurate temperature readings. One of the suggestions for solving the X10 is-sue with hotbox alarms was to cancel low level alarms (80°C) and only keep the high level alarm limit (100°C).
Figure 5.2.5. Degradation characteristics of a bearing exposed to normal wear and tear.
When a bearing indicates an increase in working temperature, it is most likely that the bear-ing has reached its operational life limit; see Figure 5.2.5. A typical time span between heat development and bearing fault can be 1-5 days (Moubray, 1997). The test results from 2005 showed that the measurements were influenced by heat spreading from the brakes. To com-
Alarm level high limit
Changes in vibra-tion characteristics
Heat development
Time
ConditionPoint where failure starts to occur
Loose Particles
Bearing seizes (fault) (derailment)
Alarm level low limit
Audible noise
52
pensate for this induced heat, alarm levels can be set higher or as in this case be cancelled. The consequence of such an action is that the time between failure identification and fault is reduced (Figure 5.2.5).
The dragging brake and hotbox detectors serve today as a go/no-go systems. On the basis of the experience from other detector systems, it might be advantageous for both Banverket and the traffic operators to combine vehicle identification data and detector data. (First of all Banverket needs to assess what types of rolling stock the systems can monitor). If detector data (acoustic or infrared) can be connected to vehicle identification data, operators can get an opportunity to remove bearings that continuously show out of normal measurement read-ings before the detection systems indicate alarms, thereby allowing them to make more or less planned workshop repairs and avoid undesirable stoppages. Such information could be used by Banverket to assess the measurement accuracy of the systems, since systematic measurement deviations from individual detectors can be identified, thus indicating detector malfunctions. The information can possibly also serve as input to the traffic operators to as-sess whether some individuals are more prone to failure. The data should also be able to serve the railway sector with information about which types of rolling stock that show better behaviour during operation, information that can be useful when acquiring new assets. As in the case of the wheel impact detection systems, data might become more useful when shared with traffic operation.
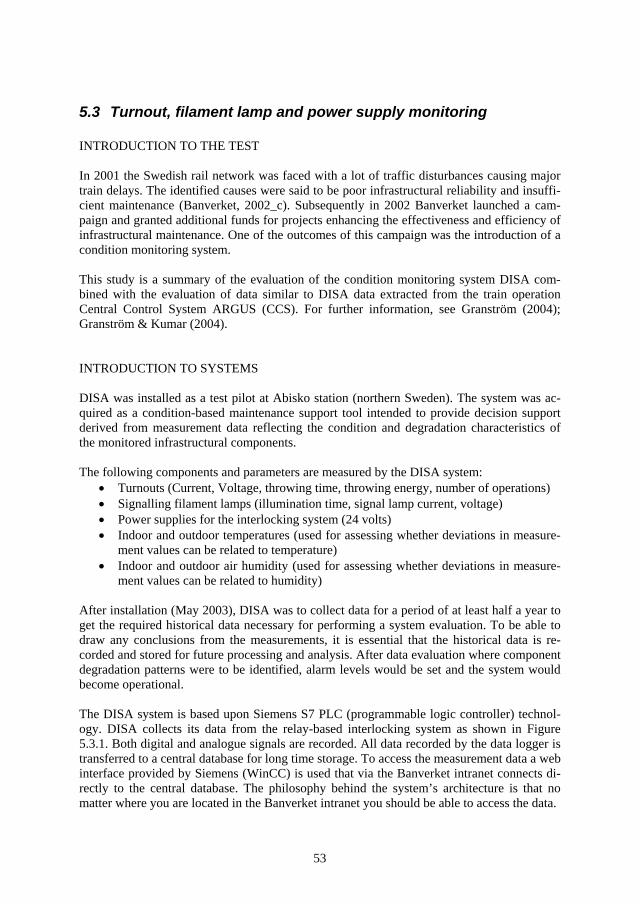
53
5.3 Turnout, filament lamp and power supply monitoring
INTRODUCTION TO THE TEST
In 2001 the Swedish rail network was faced with a lot of traffic disturbances causing major train delays. The identified causes were said to be poor infrastructural reliability and insuffi-cient maintenance (Banverket, 2002_c). Subsequently in 2002 Banverket launched a cam-paign and granted additional funds for projects enhancing the effectiveness and efficiency of infrastructural maintenance. One of the outcomes of this campaign was the introduction of a condition monitoring system.
This study is a summary of the evaluation of the condition monitoring system DISA com-bined with the evaluation of data similar to DISA data extracted from the train operation Central Control System ARGUS (CCS). For further information, see Granström (2004); Granström & Kumar (2004).
INTRODUCTION TO SYSTEMS
DISA was installed as a test pilot at Abisko station (northern Sweden). The system was ac-quired as a condition-based maintenance support tool intended to provide decision support derived from measurement data reflecting the condition and degradation characteristics of the monitored infrastructural components.
The following components and parameters are measured by the DISA system: Turnouts (Current, Voltage, throwing time, throwing energy, number of operations) Signalling filament lamps (illumination time, signal lamp current, voltage) Power supplies for the interlocking system (24 volts) Indoor and outdoor temperatures (used for assessing whether deviations in measure-ment values can be related to temperature) Indoor and outdoor air humidity (used for assessing whether deviations in measure-ment values can be related to humidity)
After installation (May 2003), DISA was to collect data for a period of at least half a year to get the required historical data necessary for performing a system evaluation. To be able to draw any conclusions from the measurements, it is essential that the historical data is re-corded and stored for future processing and analysis. After data evaluation where component degradation patterns were to be identified, alarm levels would be set and the system would become operational.
The DISA system is based upon Siemens S7 PLC (programmable logic controller) technol-ogy. DISA collects its data from the relay-based interlocking system as shown in Figure 5.3.1. Both digital and analogue signals are recorded. All data recorded by the data logger is transferred to a central database for long time storage. To access the measurement data a web interface provided by Siemens (WinCC) is used that via the Banverket intranet connects di-rectly to the central database. The philosophy behind the system’s architecture is that no matter where you are located in the Banverket intranet you should be able to access the data.
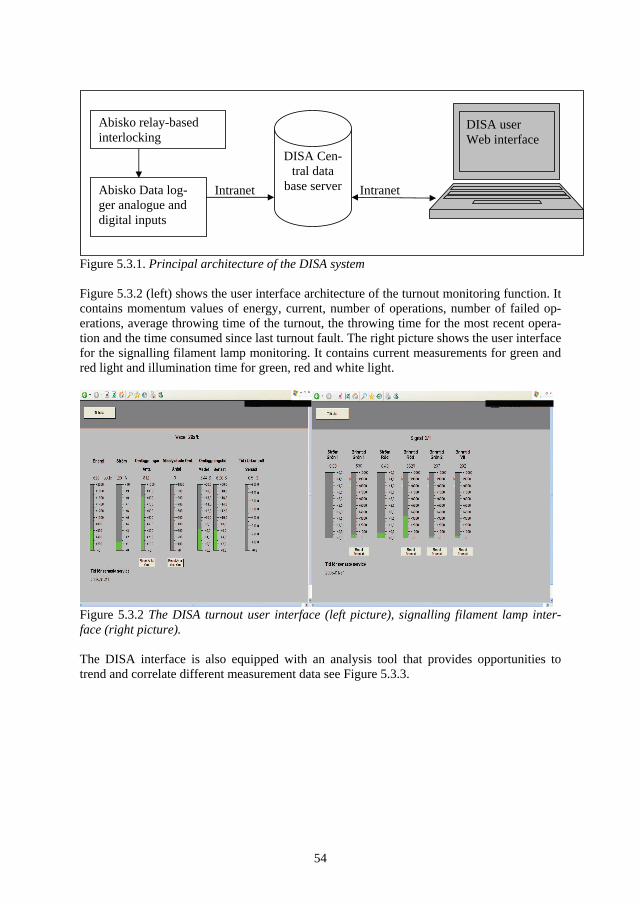
54
Figure 5.3.1. Principal architecture of the DISA system
Figure 5.3.2 (left) shows the user interface architecture of the turnout monitoring function. It contains momentum values of energy, current, number of operations, number of failed op-erations, average throwing time of the turnout, the throwing time for the most recent opera-tion and the time consumed since last turnout fault. The right picture shows the user interface for the signalling filament lamp monitoring. It contains current measurements for green and red light and illumination time for green, red and white light.
Figure 5.3.2 The DISA turnout user interface (left picture), signalling filament lamp inter-face (right picture).
The DISA interface is also equipped with an analysis tool that provides opportunities to trend and correlate different measurement data see Figure 5.3.3.
Intranet Intranet
DISA Cen-tral data
base server
DISA user Web interface
Abisko relay-based interlocking
Abisko Data log-ger analogue and digital inputs
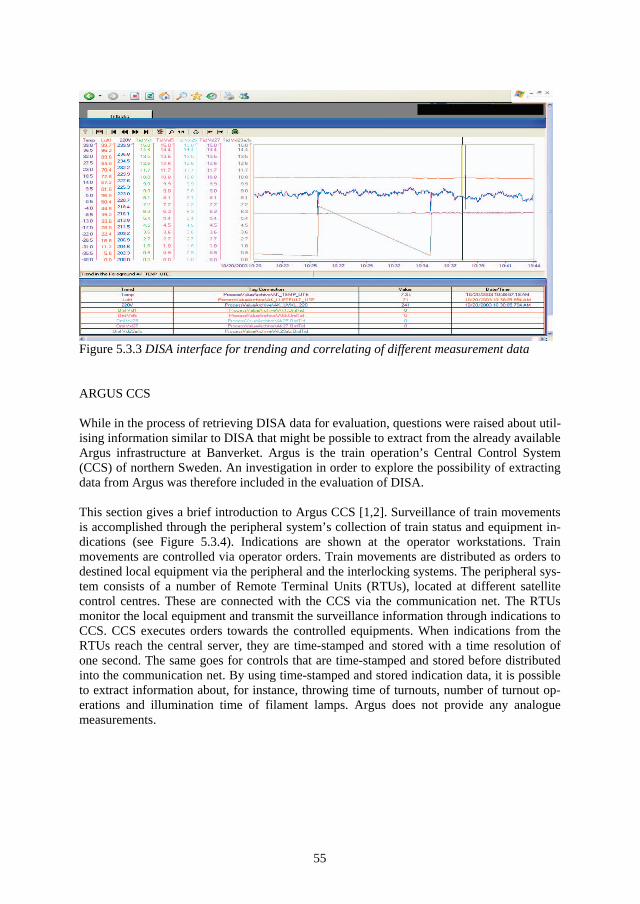
55
Figure 5.3.3 DISA interface for trending and correlating of different measurement data
ARGUS CCS
While in the process of retrieving DISA data for evaluation, questions were raised about util-ising information similar to DISA that might be possible to extract from the already available Argus infrastructure at Banverket. Argus is the train operation’s Central Control System (CCS) of northern Sweden. An investigation in order to explore the possibility of extracting data from Argus was therefore included in the evaluation of DISA.
This section gives a brief introduction to Argus CCS [1,2]. Surveillance of train movements is accomplished through the peripheral system’s collection of train status and equipment in-dications (see Figure 5.3.4). Indications are shown at the operator workstations. Train movements are controlled via operator orders. Train movements are distributed as orders to destined local equipment via the peripheral and the interlocking systems. The peripheral sys-tem consists of a number of Remote Terminal Units (RTUs), located at different satellite control centres. These are connected with the CCS via the communication net. The RTUs monitor the local equipment and transmit the surveillance information through indications to CCS. CCS executes orders towards the controlled equipments. When indications from the RTUs reach the central server, they are time-stamped and stored with a time resolution of one second. The same goes for controls that are time-stamped and stored before distributed into the communication net. By using time-stamped and stored indication data, it is possible to extract information about, for instance, throwing time of turnouts, number of turnout op-erations and illumination time of filament lamps. Argus does not provide any analogue measurements.
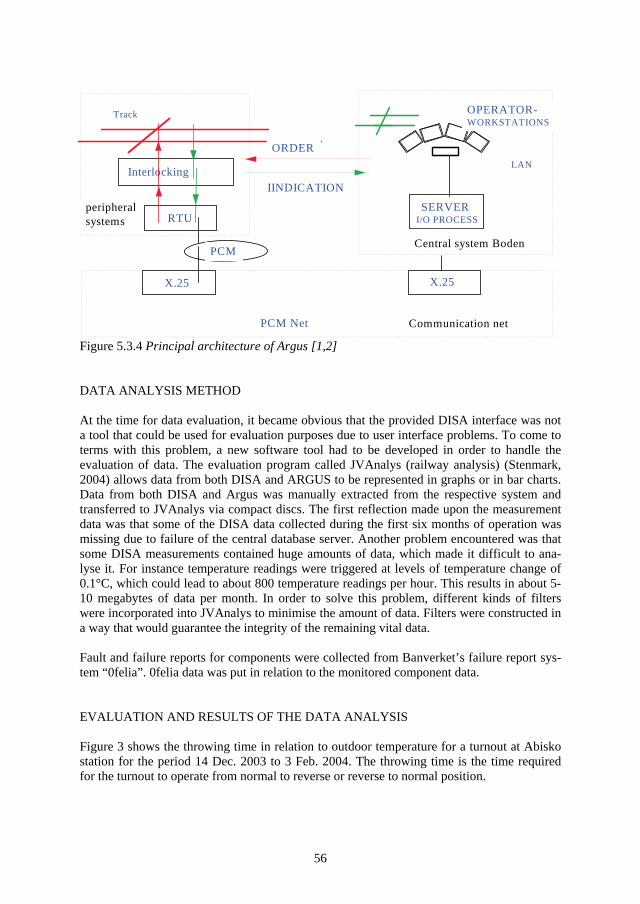
56
RTU
PCM Net
Track
Interlocking
SERVER I/O PROCESS
LAN
OPERATOR- WORKSTATIONS
X.25 X.25
PCM
ORDER
IINDICATION
Communication net
Central system Boden
peripheral systems
Figure 5.3.4 Principal architecture of Argus [1,2]
DATA ANALYSIS METHOD
At the time for data evaluation, it became obvious that the provided DISA interface was not a tool that could be used for evaluation purposes due to user interface problems. To come to terms with this problem, a new software tool had to be developed in order to handle the evaluation of data. The evaluation program called JVAnalys (railway analysis) (Stenmark, 2004) allows data from both DISA and ARGUS to be represented in graphs or in bar charts. Data from both DISA and Argus was manually extracted from the respective system and transferred to JVAnalys via compact discs. The first reflection made upon the measurement data was that some of the DISA data collected during the first six months of operation was missing due to failure of the central database server. Another problem encountered was that some DISA measurements contained huge amounts of data, which made it difficult to ana-lyse it. For instance temperature readings were triggered at levels of temperature change of 0.1°C, which could lead to about 800 temperature readings per hour. This results in about 5-10 megabytes of data per month. In order to solve this problem, different kinds of filters were incorporated into JVAnalys to minimise the amount of data. Filters were constructed in a way that would guarantee the integrity of the remaining vital data.
Fault and failure reports for components were collected from Banverket’s failure report sys-tem “0felia”. 0felia data was put in relation to the monitored component data.
EVALUATION AND RESULTS OF THE DATA ANALYSIS
Figure 3 shows the throwing time in relation to outdoor temperature for a turnout at Abisko station for the period 14 Dec. 2003 to 3 Feb. 2004. The throwing time is the time required for the turnout to operate from normal to reverse or reverse to normal position.
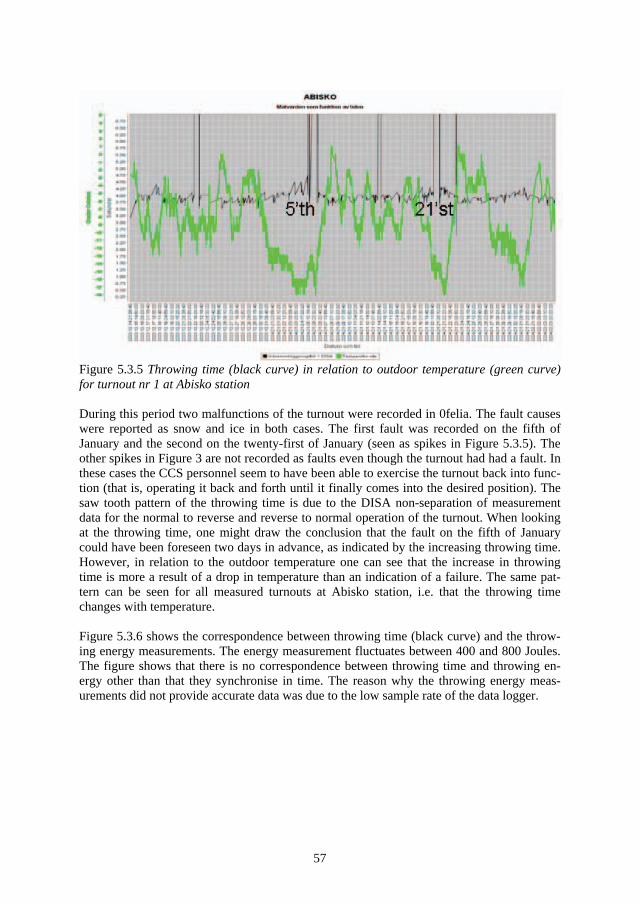
57
Figure 5.3.5 Throwing time (black curve) in relation to outdoor temperature (green curve) for turnout nr 1 at Abisko station
During this period two malfunctions of the turnout were recorded in 0felia. The fault causes were reported as snow and ice in both cases. The first fault was recorded on the fifth of January and the second on the twenty-first of January (seen as spikes in Figure 5.3.5). The other spikes in Figure 3 are not recorded as faults even though the turnout had had a fault. In these cases the CCS personnel seem to have been able to exercise the turnout back into func-tion (that is, operating it back and forth until it finally comes into the desired position). The saw tooth pattern of the throwing time is due to the DISA non-separation of measurement data for the normal to reverse and reverse to normal operation of the turnout. When looking at the throwing time, one might draw the conclusion that the fault on the fifth of January could have been foreseen two days in advance, as indicated by the increasing throwing time. However, in relation to the outdoor temperature one can see that the increase in throwing time is more a result of a drop in temperature than an indication of a failure. The same pat-tern can be seen for all measured turnouts at Abisko station, i.e. that the throwing time changes with temperature.
Figure 5.3.6 shows the correspondence between throwing time (black curve) and the throw-ing energy measurements. The energy measurement fluctuates between 400 and 800 Joules. The figure shows that there is no correspondence between throwing time and throwing en-ergy other than that they synchronise in time. The reason why the throwing energy meas-urements did not provide accurate data was due to the low sample rate of the data logger.
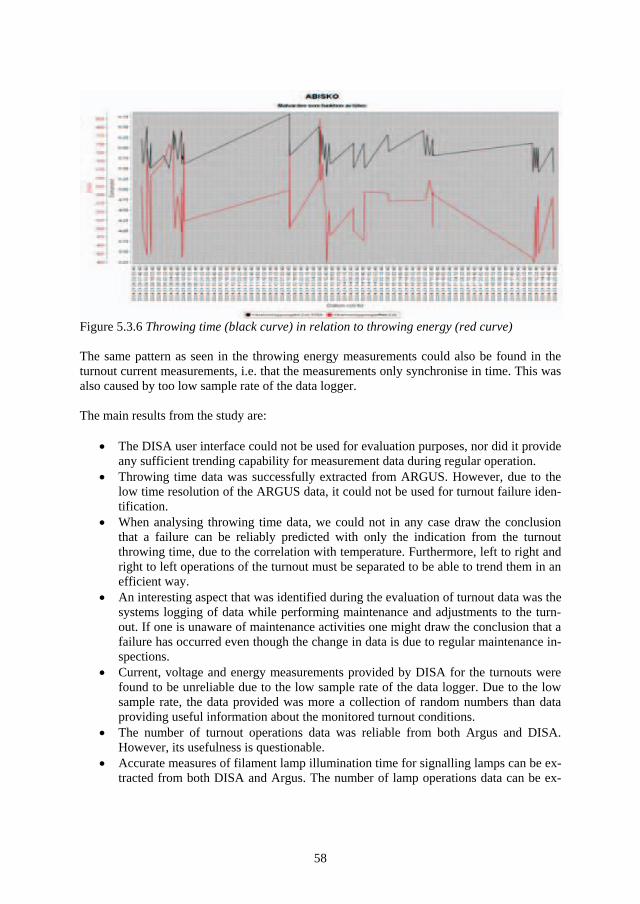
58
Figure 5.3.6 Throwing time (black curve) in relation to throwing energy (red curve)
The same pattern as seen in the throwing energy measurements could also be found in the turnout current measurements, i.e. that the measurements only synchronise in time. This was also caused by too low sample rate of the data logger.
The main results from the study are:
The DISA user interface could not be used for evaluation purposes, nor did it provide any sufficient trending capability for measurement data during regular operation. Throwing time data was successfully extracted from ARGUS. However, due to the low time resolution of the ARGUS data, it could not be used for turnout failure iden-tification.When analysing throwing time data, we could not in any case draw the conclusion that a failure can be reliably predicted with only the indication from the turnout throwing time, due to the correlation with temperature. Furthermore, left to right and right to left operations of the turnout must be separated to be able to trend them in an efficient way. An interesting aspect that was identified during the evaluation of turnout data was the systems logging of data while performing maintenance and adjustments to the turn-out. If one is unaware of maintenance activities one might draw the conclusion that a failure has occurred even though the change in data is due to regular maintenance in-spections.Current, voltage and energy measurements provided by DISA for the turnouts were found to be unreliable due to the low sample rate of the data logger. Due to the low sample rate, the data provided was more a collection of random numbers than data providing useful information about the monitored turnout conditions. The number of turnout operations data was reliable from both Argus and DISA. However, its usefulness is questionable. Accurate measures of filament lamp illumination time for signalling lamps can be ex-tracted from both DISA and Argus. The number of lamp operations data can be ex-
59
tracted from both ARGUS and DISA. (The number of times a filament lamp is oper-ated is the predominant source of filament lamp stress Blazebrook, (2004)). No conclusions could be drawn from the measurements of signalling lamp current, voltage and the interlocking power supply measurements, since no failures of these components had occurred.
DISCUSSION & CONCLUSION
The turnout throwing time and temperature measurements provided indications of the neces-sity to adapt a turnout failure model to external conditions and separate normal to reverse and reverse to normal monitoring of the turnout operations. This conclusion conforms to those drawn by M’arquez et al (2003) in their study of railway turnouts, where they state, that the model for detecting faults must adapt to external conditions, i.e. changes in the envi-ronment (humidity, temperature, etc.), friction forces, etc. and the model must detect faults in both directions of the turnout mechanism movement.
By using the throwing time the actual number of turnout faults could be monitored by both DISA and ARGUS. A malfunction of a turnout is not recorded in 0felia, if the turnout can be exercised back into function. There are indications that turnouts that frequently have to be exercised back into position contribute with more 0felia reported faults than others. If this can be further evaluated and verified, this information can be used to identify more trouble-some turnouts.
There seemed to be little or no correlation between the number of operations and the number of turnout faults. Turnouts on main tracks are operated more frequently than others and the measurements indicated that the main track turnouts experienced more faults. It cannot be concluded, however, that there is a direct relationship between the number of turnout opera-tions and the number of faults, since the frequency of faults is to a greater extent related to traffic than to turnout operation (Nissen, 2005).
The evaluation showed that DISA (in its current shape) could not be used as a preventive maintenance support tool or as an early warning system. In other words, in its current shape the system cannot support maintenance management. Improvements to the system have to be performed in order for it to be able to serve its main purpose.
Some of the data collected by DISA was successfully extracted from the Argus system, which provides an opportunity to collect data from 84 Argus CCS controlled stations in the Northern Region. Accumulated tonnage and the number of axels passing the turnouts are dominant sources of turnout deterioration (UIC, 2002; Nissen, 2005). While working with the Argus system it was observed that there are possibilities to interlink train-paths data from the Argus system with tonnage and axle figures derived from the wheel impact detection sys-tems. Such information could serve the maintenance process with information about what kinds of stresses are applied to different turnouts during operation. From such awareness can better turnout degradation predictions and turnout maintenance management strategies be obtained. Further research is needed in order to assess the value of Argus data: if proven use-ful, there is an obvious opportunity to retrieve data in a cost-effective way.
60
For further work at Banverket
A reason for why some measurement methods did not show to be satisfactory was due to that none of the measurement methods prior to installation had been properly verified. In accor-dance with other monitoring systems some of the right signals (M’arquez et al, 2003; Glaze-brook, 2004) were measured but not in the right way. The technique on which the system was based was selected on the primary criteria that it was robust (insensitive to disturbances) and that it was already being used within Banverket. This strategy was intended to support the decision process with reliable data at the same time as less training of the personnel that were to operate the system would be required. Unfortunately, this contributed to system limi-tations concerning data acquisition and data analysis tools in comparison to techniques and solutions offered by other vendors.
What should have been considered by the contractor before choosing the condition monitor-ing technique is what kind of decision support they want their measurements to deliver. What kind of condition information is needed in order to identify failure modes and upon what grounds of information can maintenance decisions be made? This can of course be a difficult task due to unawareness of what kinds of monitoring information that can serve as decision support. In many cases different measurement methods have to be tried out in order to assess their usefulness. An investigation should have been carried out to verify whether useful information could already be extracted from available systems. Initial small-scale test-ing of measurement methods should have been performed on objects to verify which meas-urement methods can deliver sufficient data in order to assess different failure modes. De-sign of the system should not have been commenced before the measurement methods were verified. The technique best suited for the job should have been selected. Involvement of the personnel that would eventually handle the system data would have been a great asset to the project, since the user interfaces must eventually be adapted to their needs. This study under-lines the importance of not making too large-scale endeavours before verifying the accuracy and the actual use of the data. As described by (Payne et al, 2001), “Having established that condition based maintenance (CBM) is the best strategy to employ the specific approach to be taken for an item of equipment is for many an area of concern. Unfortunately this has led to poor implementation in many companies resulting in miss focus of maintenance efforts, recording and storing of gigabytes of data for no objective reason and surprisingly often even without analysis. At worst the net result has been no prior fault detection.” From this perspective and from both a contractor’s and a customer’s point of view, the study empha-sises the importance of critically assessing condition monitoring solutions in order to avoid undesirable pitfalls.
Different kinds of condition monitoring techniques are being used and have been used for some time at Banverket. Still condition monitoring is an area that has to mature in order to allow all its potential benefits to be reached. Even though the net result is not in correlation to what was initially intended to be the outcome of the project, a lot has been observed and a broader view of the magnitude of the difficulties concerning condition monitoring has been grasped. This project will serve other future projects with important information about some of the pitfalls and shortcuts on the way towards effective and efficient condition-based main-tenance in the railway sector.
61
6 Discussion and Conclusion Condition monitoring technology has great potential for making condition-based mainte-nance more effective and efficient, if it is able to provide adequate decision support. The per-formed studies show that different factors apart from the actual technology itself can come to affect the success of condition monitoring applications. Such issues must be sorted out in order to enable the condition monitoring benefits to be reached.
If deciding that the solution to coming to terms with a specific problem is to implement a condition monitoring solution, the following most vital experiences from the former studies are outlined to answer the research question “What kinds of factors support a successful condition monitoring application at Banverket?”.
6.1 Factors Supporting a Successful Condition Monitoring Appli-cation at Banverket
In the initial study of train delay statistics it was shown that depending on how data is regis-tered, and from which source of information data is collected, different perceptions of what creates problems can be retrieved. In order to avoid sub optimisation and to enable effective focusing of efforts, it is essential that the information systems provide a clear picture of what the problem actually is.
By the linking of punctuality and condition monitoring it was shown how the causes of prob-lems can be due to several factors. It was shown how engineering interaction can reach be-yond organisational boundaries. Different failure modes relating to both infrastructure and rolling stock can create collateral damage to the system. It was illustrated how gaining con-trol of collateral damage effects cannot be solved by only preventing one of the failure modes. Furthermore, it was illustrated that applying only one condition monitoring solution might not be sufficient to gain control of the variety of different failure modes.
Three studies were carried out to assess the condition monitoring systems’ measurement ac-curacy, that is, the measurement accuracy of two operational systems and one system in-stalled as a test pilot. The train delay study was initially intended to explore statistics, but eventually turned out to be an exploration of data accuracy. A common link between all four studies is that they all required data quality assessment. The DISA study needed a natural assessment due to the fact that it was a Test pilot. The other three systems are, however, op-erational systems. The lesson to be taught is therefore that it is essential to assess that the systems deliver satisfactory measurement accuracy, in order for them to be able to provide adequate decision support.
However, as seen in the hotbox detector study and the turnout study, measurement accuracy alone does not necessarily provide information for accurate assessment of failure modes. From the additional hotbox detector study it was shown that the hotbox detector provides accurate temperature readings. However, in was discovered that induced heat from the X10 locos’ brakes can cause the detector to indicate a bearing failure, thus making the measure-ment method somewhat insufficient for assessing bearing conditions, even though the meas-
62
urements are accurate. Further the X-1 loco axle bar could not be monitored due to non-visibility of the axle bar, which tells us that the current measurement configuration is not suf-ficient for X-1 locos. The throwing time measurements in the DISA study showed to have a correlation to outdoor temperature. In other words, the throwing time alone is not sufficient for accurate failure assessment. This adds up to the conclusion that it is important to be aware of the measurement methods limitations, in order to be able to avoid decisions to be made based on the wrong information.
In the case of the wheel impact detection system, it was verified on two occasions that the system provides accurate data. However, before and after the test false alarms were reported by the train drivers. This can be an indication that the procedures for handling alarms are not adequate. As mentioned above, the wheel impact detection systems can detect other failure modes than wheel flats (such as out-of-roundness), which can cause high impact loads on the rail. Such out-of-roundness can be very difficult or impossible to assess by manual inspec-tions. This combined with the difficulty observed when trying to verify damages during the test, tells us that the manual inspections are not capable of assessing the failure modes as well as the detection system is. This leads to the conclusion that the procedures for handling condition-monitoring data are crucial for the success of the application.
From both the study of the Argus system and the experience derived from detector and vehi-cle identification systems abroad, it is described how data from separate systems can come to generate greater values if they can be combined and utilised for maintenance management purposes. Further the Argus study shows that there can be possibilities to extract data useful for maintenance management from already available systems. Therefore it can be concluded that there are benefits to be reached if data from existing systems can be utilised in better ways.
Banverket’s present goal for the go/no-go systems (detectors) is to prevent worst-case sce-narios of rolling stock degradation. However, one of the business goals of both Banverket and the traffic operators is to provide reliable transportation service. Allowing operators to retrieve merged and trended detector system data linked to individual carriages before faults have occurred can provide opportunities for them to act proactively on the information and avoid undesirable stoppages. Banverket would also benefit from such a scenario, since the detector system function could be continuously verified, damaged rolling material could be removed from operation before reaching alarm levels, and it could be verified whether the rolling stock has been properly maintained. From such a perspective there is an opportunity for both Banverket and the traffic operators to use condition-monitoring data to link their condition-based maintenance goals to their combined business goals.
6.2 Recommendations for Future Condition Monitoring Applica-tions
Applying a measurement solution is not a natural solution to all the problems. As can be seen in the studies, different factors, technical as well as organisational, can affect the suc-cess of the implementations. To answer the final research question “What recommendations for future condition monitoring applications can be given?” there follows a list of questions (based on experience from the studies) that can be considered before starting to implement
63
condition-monitoring solutions. In connection to each recommendation are references given to chapters where further details can be found.
What is the problem we wish to solve? Is it a problem on system level like punctual-ity or component level such as a specific failure mode? (chapter 3 & 4) What causes the problem? From a clear perception of what is causing the problem it can be decided whether to treat symptoms or disease. (chapter 3 & 4) Is it a single-organisation problem or a several-organisation problem? Whose efforts are required to solve the problem (Banverket, traffic operators, both combined or others)? (chapter 3 & 4) What failure mode/modes do we need to gain control of to solve the problem? (chap-ter 4) Who needs information to control the failure mode/modes? (chapter 5.1 & 5.2 ) What information do they need? (chapter 5.1, 5.2 & 5.3) Can required information be extracted from available systems? (chapter 5.3) Does any condition monitoring solution reflect the desired failure mode? (chapter 5.1, 5.2 & 5.3) Does any condition monitoring solution allow sufficient time for preventive mainte-nance (time between failure identification and fault)? (chapter 5.1 & 5.2) How accurate are the measurement solutions? (chapter 5.1, 5.2 & 5.3) What are the limitations of the solutions? (chapter 5.2 & 5.3) How are we going to use the solution? (chapter 5.1) Can the solution solve our problem? (chapter 5.1, 5.2 & 5.3)
6.3 Importance of extended system usage To form reasoning for extended system usage of condition monitoring in the railway sector it is important to initiate a discussion from a wider perspective.
For Banverket to manage maintenance with a limited budget, it is important to be able to foresee and control upcoming maintenance needs and costs. The same situation applies to the traffic operators. This situation is particularly interesting in the light of the fact that most train delay time and the highest life cycle cost (Larsson, 2005) can be related to the physical contacts (the interfaces) between the pantograph to overhead wire and the wheel to rail re-spectively. These vital technical systems’ function, degradation and need for maintenance are strongly dependent of their respective conditions and their interaction. Fry (1999) de-scribes the situation as, “poor condition of one element can directly cause significant expo-nential costs to be incurred by the other. In circumstances where the condition of another company’s assets can have such a significant effect on your own costs, how can this be effec-tively managed?”
The net outcome of this reasoning is that the railway sector has a lot to gain from the percep-tion that some of their problems are combined and that their separate maintenance processes in some cases should be seen as one combined maintenance process even though they are separated into different organisations.
64
How well Banverket and the traffic operators can manage together to control their separate and their combined maintenance processes is what will determine the competitiveness of their combined enterprise. In other words, exponentially increased maintenance costs of in-frastructure caused by insufficient rolling stock conditions will cause higher costs for society in terms of governmental funding. Exponentially increased costs of rolling stock caused by insufficient infrastructural conditions will cause higher costs for society in terms of freight charges and ticket prices. This illustrates the interrelationship among traffic operation, infra-structural management, society and their combined objective. The safety, reliability, punctu-ality and competitiveness of the transportation system is greatly dependent on how well in-frastructural management and traffic operation together manage to keep their assets within acceptable condition limits.
In the study it was shown that the present detector applications can achieve greater values if they are used in a way that allows both infrastructural management and traffic operation to benefit from system data. Condition monitoring systems can therefore provide opportunities for both infrastructural management and traffic operation to serve both their separate and their combined objectives. In order to achieve such a desirable situation, development work in both Banverket and the traffic operation companies is required. However, due to the oper-ating companies’ short operational perspectives of three to five years (Espling, 2004) in comparison to Banverket’s much more long-term perspective, the operators need strong in-centives for taking part in any development work. One way to create incentives for the traffic operators may be to utilise condition-monitoring solutions in order to relate traffic charges to the actual condition of the rolling stock. From this perspective the condition monitoring technology can serve both as preventive maintenance support and as an objective assessment of the rolling stock’s condition, which can be deterministic for differentiated freight charge control. Differentiated freight charges controlled by technical conditions can create a com-petitive advantage for traffic operators to perform better maintenance of their assets. Such a development can also induce the railway sector to produce better rolling assets that will re-quire less maintenance during their operational life.
From the infrastructural point of view, condition monitoring could, in addition to providing preventive maintenance support, serve as a baseline for control of maintenance performance contracts. Condition monitoring can control maintenance performance contracts to execute penalties of or provide bonuses to the maintenance contractors depending on how they man-age to keep their assets within acceptable condition limits. Such a development could pro-duce incentives for maintenance contractors to perform better maintenance on the infrastruc-tural assets.
6.4 Suggestions for Further Research This thesis has mostly considered how condition-monitoring technology is being used and how it can be used to provide information to enhance the effectiveness and the efficiency of maintenance in the railway sector. A factor that has not been considered so far is when con-dition monitoring technology is the best approach to apply to a specific problem. Even though condition monitoring technology has great potential, it is not always the natural solu-tion to all problems. Further investigations are needed to compare condition monitoring ap-

65
proaches in relation to other approaches of maintenance problem solving for improving punctuality.
One suggestion for further research is to perform a more in-depth analysis of a spe-cific problem area in the railway system. This could for example be a study of the in-terface between the pantograph and the overhead wire, in which different problem solving approaches are evaluated to determine which is most applicable to different failure modes. A methodology derived from such a study can be of a generic charac-ter, which means that it can be applied to other problem areas in the railway sector.
Another suggestion is to investigate the possibility of using condition-monitoring technology to control maintenance performance contracts.
Another possible direction of further research could be to investigate the feasibility of using condition monitoring to control differentiated freight charges.
66
7 References Allen, T, M (2001) U.S. Navy Analysis of Submarine Maintenance Data and the Develop-
ment of Age and Reliability Profiles. Department of the Navy SUBMEPP Ports-mouth, NH, USA. Plant Maintenance and Resource Center. April 2005, Edition 52.
Banverket, (2001). Definition av begrepp inom banhållningsprocessen. Banverket. BVF 826 (2001-09-11)
Banverket, (2002_a). Säkerhets- och underhållsbesiktning av fasta anläggningar. Banverket. BVF 807. 2002-04-15
Banverket, (2002_b). Förstudie angående mätningar på strömavtagar-/kontaktledningssystem BKL 02/07
Banverket (2002_c), Vinterutredning: Åtgärdsprogram inom järnvägssektorn. GD 02-111/OR40
Banverket, (2003). Förutbestämmt underhåll. Banverket. BVF 817 (2003-04-01)
Banverket, (2004). Banverket årsredovisning 2004
Banverket, (2005). Verifieringsprov med värmekamera. Detektoranläggning FUES I Hanin-ge Centrum Nsp. Banverket 2005-09-30, B05-2046/IT40.
Banverket, (2005_b) Fastställelse av tågplan för T05.1 (050612-060107). Banverket docu-ment; TO4-1330rrR5, Web source: http://www.banverket.se/upload/7405/fastbes.pdf
Bladon, T. (2004). Supersite will advance techniques of wayside monitoring. Railway Ga-zette International, July 2004, NO 7, Volume 160 (407-409).
Blanchard, B,S. Verma,D. Peterson, E, L. (1995) Maintainability: A key to effective Ser-viceability and Maintenance Management. John Wiley & Sons, Inc. New York, USA.
Blischke, W, R. Murthy, D, N, P. (2000). Reliability: Modelling, Prediction, and Optimiza-tion. John Wiley & Sons, INC. New York, USA.
Broberg (1973). Study belived done under NASA sponsorship (reported in 1973) and cited in Failure Diagnosis & Performance Monitoring Vol. 11 edited by L.F. Pau, pub-lished by Marcel-Dekker, 1981.
Ericsson, L. Sjöberg, S. Svensson, A. Ullv’en, M. (2002) Banverkets sektorsansvar. Ban-verket 2002-12-05. Web source: http://www.banverket.se/upload/pdf/jarnvagsna-tet/sektorsansvar/BV_sektorsansvar.pdf
Espling, U (2004). Ramverk för en drift- och underhållsstrategi ur ett regelstyrt infrastruk-turperspektiv. ”Licentiate thesis”. Division of Operation and Maintenance Engineer-ing. Luleå University of technology, 2004. ISSN:1402-1757
67
Fahlen, J. Jonsson, T. (2005) “Train punctuality in an new perspective” European railway review, Issue 1 2005 (60-63).
File, W.T. (1991). Cost Effective Maintenance: Design & implementation. Butterworth-Heinemann Ltd. Oxford, UK
FRY, K. (1999). The Importance of Condition Monitoring in Providing Fault-Free Infra-structure. Fault-Free Infrastructure Conference, Derby, U.K. 23-24 November 1999. PP 17-25. Professional Engineering Publishing Limited.
Glazebrook, A. (2004). State of the Art Integrated Condition Monitoring System for Railway Signalling System Elements. Maintenance & Renewal of Permanent Way Power & Signalling Structures & Earthworks Conference 2004. London, UK.
Granström, R & Kumar, U (2004). Condition monitoring of railway infrastructure –A case study in northern Sweden. Proceedings of the 17th International Congress on Condi-tion Monitoring And Diaggnostic Engineering Management (COMADEM 2004)
Granström, R. & Söderholm, P. (2005). Punctuality Measurements Effect on the Mainte-nance Process: A Study of Punctuality Statistics for the Swedish Railway. Proceed-ings of the Eighth International Conference and Exhibit on Railway Engineering, 29-30 June 2005, London, UK.
Granström, R. (2004). Driftövervakning I signalanläggningar. Division of Operation and Maintenance Engineering. Luleå University of Technology 2004:07 ISSN:1402 – 1536
Granström, R. (2004_b). Verifieringstest, fältprov FUES (varmgång, tjuvbromsdetektor). Banverket norra regionen 2004.
Granström, R. (2003). Verifieringstest hjuskadedetektoranläggningen Krokvik. Banverket 2003.
Gullberg, C. (2000). Järnvägssignalsystem. En tvåtimmarsföreläsning på KTH 16/11, 2000 om tekniska system för att motverka människans kreativa förmåga att upprepa gamla misstag. Presentation material. Adtranz Signal. 2000-11-16 SESIG/TAA 00 082
Hertenstein, J.H. and Kaplan, R.S. (1991) Burlington Northern: The ARES decision (a). Publishing Division, Harvard Business School, Boston, MA.
Irani, F D. Andersson, G B. Urban, C L (2001). Development and deployment of advanced condition monitoring systems. Procceding 7th international Heavy Haul Conference 2001
Jaiswal, J. (2005). Maintenance is a vital part of the system approach. International Railway Journal. September 2005, VOL XLV, No 9, (22-26).
68
Johansson, A (2005). Out-of-Round Railway Wheels – Causes and Cpnsequences. Depart-ment of applied mechanics Chalmers University of Sweden Göteborg Sweden 2005
Johansson, T. (2005). ”Månadsrapport tågtrafik Mars 2005”, Banverket reference: T05-157/TR00
Karlsson, P (2000). Interntest hjulskadedetektoranläggningen Krokvik 2000-03-27-30. BRNP Rapport. Northern Track Region Banverket Sweden.
Kelly, A & Harris, M.J (1978). Management of Industrial Maintenance. Butterworth & Co. London UK.
Lagnebäck, R (2004). Tillståndsbaserat underhåll för malmvagnar. En förstudie. Master the-sis. Division of Operation and Maintenance Engineering. Luleå University of tech-nology 2004.
Larsson, D. (2004). A Study of the Track Degradation Process Related to Changes in Rail-way Traffic. Licentiate thesis. Division of Operation and Maintenance Engineering, Luleå University of technology.
M’arquez, F P. Schmid, F. Collado, J C. (2003). A reliability centred approach to remote condition monitoring. A railway points case study. Reliability Engineering & system Safety 80 (2003) 33-40
Mizuno, Shigeru (1988). ”Management for Quality Improvement: The Seven New QC Tools”. Productivity Press, Cambridge.
Moubray, J (1997). RCM II, Reliability-centred Maintenance. Second edition. Industrial Press Inc. New York, NY, USA
Nissen, A. (2005). Analys av statistik av spårväxlars underhållsbehov. “Licentiate thesis”.(in press) Division of Operation and Maintenance Engineering. Luleå University of Technology, 2005.
Nowlan, F, S & Heap, H, F (1978). Reliability-Cantered Maintenance. National Technical Information Service. U.S. Department of Commerce Springfield. VA. 22161.
NUREG-0492 (1981). Fault Tree Handbook. US Nuclear Regulatory Commission, Washing-ton, DC
Olsson, N.O.E. Haugland, H. (2004). “Influencing factors on train punctuality –results from some Norwegian studies”. Transport Policy 11 (2004) 387-397
Parida, A, Kumar, U. (2004). Managing Information is key to Maintenance Effectiveness. E-Proceedings of the IMS’2004, July 15-17, 2004, Arles, France.
69
Payne, B S. Ball, A D. Husband, M. Simmers, B. Gu, F. (2001). An approach to the devel-opment of condition monitoring for a new machine by example. (COMADEM 2001 Proceedings of the 14th international congress)
Pettersson, M. (2004) ”Analys 2004” Analysgruppen norra banregionen. Banverket internal document not yet published.
Rao, B.K.N (1996) Handbook of Condition Monitoring. Oxford : Elsevier Advanced Tech-nology. 1996.
Rudnicki, A. (1997). “Measures or regularity and punctuality in public transport operation”. Transportation systems, preprints of the Eight International Federation of Automatic Control 2
Southern, C. Rennison, D. Kopke, U (2004). RailBAM – An advaced bearing acoustic moni-tor: initial operational performance results. Conference proceeding, Conference on Railway Engineering Darwin 20-23 June 2004.
Stamatis,D,H. (1995). Failure Mode and Effect Analysis. FMEA from Theory to Execution. ASQ Quality Press Milwaukee, Wisconsin USA.
Stenmark, J. (2004). Operation monitoring using JVAnalys. “Master Thesis”. Luleå Univer-sity of technology 2004.
Thomas, R, A. (1999). The Thermography Monitoring Handbook. First Edition. Coxmoor Publishing Company. Information Press, Oxford, UK
UIC. (2002). Switches and crossings management system: EcoSwitch. Feasibility study. European Rail Research Institute, 2002.
Wallace R. Blischke, D. N Prabhkar Murthy (2000), Reliability Modelling, Prediction, and Optimization. New York : Wiley, cop. 2000
Waring,R (2003). Fewer damaged wheels through the use of impact detectors. Conference Proceeding: The World Congress on Railway Research 2003. AEA Technology Rail.
Wasserman, S (2002). An Update on Understanding and Managing the Wheel/Rail Inter-face", Wheels on Rails conference- London, April 23rd 2002.
Yin, R, K. (2003). Case Study Research: Design and Methods. Third Edition. Thousand Oaks, CA, USA Sage Publications, Inc.
Young H,D. Freedman, R, A. (2000). University Physics; With Modern Physics. Tenth edi-tion. Addison-Wesley Longman, Inc, New York, USA
Åhren, T. (2004). ”Indikatorer inom Banverket”, Division of Operation and Maintenance Engineering, Luleå University of Technology.

70
[1] System maintenance manual for the Boden train control System
[2] TCC Boden RTU system diagnostic and maintenance manual