
MAHDY - Final Thesis.pdf - Kent Academic Repository
298
Kent Academic Repository Full text document (pdf) Copyright & reuse Content in the Kent Academic Repository is made available for research purposes. Unless otherwise stated all content is protected by copyright and in the absence of an open licence (eg Creative Commons), permissions for further reuse of content should be sought from the publisher, author or other copyright holder. Versions of research The version in the Kent Academic Repository may differ from the final published version. Users are advised to check http://kar.kent.ac.uk for the status of the paper. Users should always cite the published version of record. Enquiries For any further enquiries regarding the licence status of this document, please contact: [email protected] If you believe this document infringes copyright then please contact the KAR admin team with the take-down information provided at http://kar.kent.ac.uk/contact.html Citation for published version Mahdy, Mohamed Mostafa M. (2014) Applying architecture simulation tools to assess building sustainable design: Adapting the Egyptian residential energy code for climate change. Doctor of Philosophy (PhD) thesis, University of Kent,. DOI Link to record in KAR https://kar.kent.ac.uk/47435/ Document Version UNSPECIFIED
-
Upload
khangminh22 -
Category
Documents
-
view
0 -
download
0
Transcript of MAHDY - Final Thesis.pdf - Kent Academic Repository

Kent Academic RepositoryFull text document (pdf)
Copyright & reuse
Content in the Kent Academic Repository is made available for research purposes. Unless otherwise stated all
content is protected by copyright and in the absence of an open licence (eg Creative Commons), permissions
for further reuse of content should be sought from the publisher, author or other copyright holder.
Versions of research
The version in the Kent Academic Repository may differ from the final published version.
Users are advised to check http://kar.kent.ac.uk for the status of the paper. Users should always cite the
published version of record.
Enquiries
For any further enquiries regarding the licence status of this document, please contact:
If you believe this document infringes copyright then please contact the KAR admin team with the take-down
information provided at http://kar.kent.ac.uk/contact.html
Citation for published version
Mahdy, Mohamed Mostafa M. (2014) Applying architecture simulation tools to assess buildingsustainable design: Adapting the Egyptian residential energy code for climate change. Doctorof Philosophy (PhD) thesis, University of Kent,.
DOI
Link to record in KAR
https://kar.kent.ac.uk/47435/
Document Version
UNSPECIFIED

UNIVERSITY OF KENT KENT SCHOOL OF ARCHITECTURE
APPLYING ARCHITECTURE SIMULATION TOOLS TO ASSESS
BUILDING SUSTAINABLE DESIGN
Adapting the Egyptian residential energy code for climate change
Mohamed Mostafa M. Mahdy
Thesis submitted as a partial requirement for the award of Doctor of Philosophy
Supervisor
Professor. Marialena Nikolopoulou
Canterbury, UK - 2014

ii
Acknowledgement:
Praise be to Allah through whose mercy (and favours) all good things are accomplished.
First and foremost I would like to express my gratitude to my supervisor Prof. Marialena Nikolopoulou who was abundantly helpful and offered invaluable assistance. Also for her continuous support, encouragement and guidance, the work under her supervision was an honour and great pleasure.
I express my warm thanks to my co-supervisor Dr. Richard Watkins, for his influential contributions, especially in the weather data files part.
I wish also to express my sincere appreciation to my committee members, Prof. Lamine Mahdjoubi and Dr. Giridharan Renganathan for their constructive criticism, valuable suggestions and for sharing the truthful and illuminating views on a number of issues related to the project.
I would like to convey thanks to the Ministry of Defence and the Military Technical College (MTC) in Egypt for their moral and financial support. I am also thankful for the support of my local supervisor Associate Prof. Mohamed Barakat, and all my colleagues in the department of Architecture.
Special appreciations to all the members of Kent School of Architecture (KSA), for their friendly advice during the project work.
I am sincerely grateful to my parents for their encouragement and endless support, which played an essential role in my life, and many appreciation to my dear brothers for supporting me.
Eventually, I would like to take this opportunity to express all the greetings and gratefulness to my beloved wife and my dear children for their understanding and endless love through the duration of my studies and all my life.
I hope that you find it worthwhile and helpful. Enjoy the read!
Mohamed Mahdy

iii
Abstract:
In Egypt, residential and commercial buildings energy consumption has been increasing to more than 44% of the total energy consumption, partly due to Egypt’s rapid increase in population, which led to the aggravation of the energy crisis. Building energy codes have recently become an effective technique to enhance energy efficiency in buildings, as regulating the buildings' energy performance 乞 via energy standards 乞 can be regarded as an effective means to reduce energy consumption.
This research focuses on improving the energy performance of the building envelope, using the principles of environmental design, in the hot-arid climatic context of Egypt, aiming to reduce the energy consumption in the residential sector. This will reflect on reducing the use of HVAC systems, subsequently reducing the energy running costs and the corresponding CO2 emissions. This is carried out through studying the building envelope section in the Egyptian Residential Energy Code (EREC). The work focuses on the residential sector, as in almost every country this is the major energy consumer, and more specifically, the large housing projects. In order to identify the validity of EREC under future climate change, the research aims to study the different design solutions and construction methods recommended by the code or commonly used in the building industry sector in Egypt and evaluate them under the different climate change scenarios to identify the climate change effects on the indoor thermal comfort, the energy consumption and the financial implications (investment vs. running costs). The Buildings' thermal performance simulations (BPS), was adopted as the major technique in the research.
The BPS tool "EnergyPlus" and its architectural friendly interface "DesignBuilder" were used to simulate the buildings thermal behaviour in the different climatic periods, in order to assess and modify EREC to adapt to the future climate change effects. The future weather data files, which represent the climate change conditions, were generated via the morphing technique, using the Climate Change World Weather File Generator tool (CCWorldWeatherGen). Moreover, a long term financial analysis method was employed to relate the theoretical study to the real world, based on the financial theory of Discounted Cash Flow (DCF) and its practical formula Net Present Value (NPV), to produce an accurate estimation of the financial efficiency of the projects.
The research outcomes are considered as an attempt to highlight current limitations of the residential energy code, especially in its behaviour against climate change. The results focus on energy consumption reductions for the residential units, along with financial benefits on the long term, while maintaining the indoor thermal comfort conditions using active and passive techniques. Through the results analysis, it was found it is not necessary to use the most expensive materials and techniques in order to achieve the most effective thermal insulation, as there are some cheaper materials and techniques in the Egyptian market, more beneficial and cost effective over the long term (under future climate change scenarios). The results have proven that, only two parts of the code's recommendations are compatible with the predicted climate changes on the long term (fenestration and shading devices), and they can mitigate the associated temperatures increase and could continue to be used efficiently through the prescriptive approach in the code. While the code's recommendations for the external walls' specifications, was found to be inadequate and inefficient over the long term. Thus, the study recommends not to use the code's prescriptive approach to determine the external walls' thermal specifications, and to use the code's overall performance path instead. In addition, the research has provided what seems to be the optimum and the most cost-effective combination of specifications to be used (in three different climatic zones), in order to achieve the best levels of performance in terms of indoor thermal comfort levels and energy consumption reduction for the project over the long term. The results are likely to be of interest to a wide range of designers, architects and to support both policy and decision makers taking steps forward towards energy efficiency obligations, particularly in Egypt.

iv

v
Table of contents:
Acknowledgement ....................................................................................................................................... ii
Abstract ....................................................................................................................................................... iii
Table of contents ........................................................................................................................................ v
List of figures ............................................................................................................................................. viii
List of tables ............................................................................................................................................... xii
CHAPTER 1: INTRODUCTION: ............................................................................................................... 1
1.1: RESEARCH PROBLEMS ........................................................................................................................... 5
1.2: RESEARCH HYPOTHESIS AND OBJECTIVES ............................................................................................ 6
1.3: RESEARCH METHODOLOGY AND TECHNIQUES ...................................................................................... 7
1.3.1: The methodology .......................................................................................................................... 7
1.3.2: The employed techniques ............................................................................................................. 8
1.4: RESEARCH LOCATION AND THE CLIMATE ............................................................................................ 16
1.4.1: Egyptian climatic regions ........................................................................................................... 16
1.4.2: Climatic analysis of Egyptian cities ........................................................................................... 18
1.5: THESIS OUTLINE ................................................................................................................................. 22
1.6: PAPERS PRODUCED FROM THIS RESEARCH .......................................................................................... 24
CHAPTER 2: ENERGY USE AND THE NEED FOR SUSTAINABILITY ......................................... 25
2.1: DISRUPTION OF ECOLOGICAL BALANCE AND THE NEED FOR SUSTAINABILITY .................................... 25
2.2: ENERGY DILEMMA .............................................................................................................................. 27
2.3: THE CONCEPT OF ENERGY ................................................................................................................... 29
2.4: GREENHOUSE EFFECT AND CLIMATE CHANGE ..................................................................................... 31
2.4.1: The phenomenon of greenhouse effect and global warming ...................................................... 31
2.4.2: Climate change........................................................................................................................... 35
2.5: ENERGY SOURCES IN EGYPT ............................................................................................................... 40
2.5.1: Traditional natural sources (fossil fuel/depleted fuel) ............................................................... 40
2.5.2: Renewable sources ..................................................................................................................... 42
2.6: RATES OF ENERGY DEMAND AND CONSUMPTION IN EGYPT ................................................................ 45
2.7: RATIONALIZING ENERGY USE IN EGYPT .............................................................................................. 46
CHAPTER 3: THERMAL PROPERTIES AND THE ROLE OF PASSIVE ARCHITECTURE ...... 48
3.1: HEAT CONCEPT ................................................................................................................................... 48
3.2: MECHANISMS OF HEAT TRANSFER ...................................................................................................... 49
3.2.1: Conduction ................................................................................................................................. 50
3.2.2: Convection ................................................................................................................................. 50
3.2.3: Radiation .................................................................................................................................... 50
3.3: THERMAL AND PHYSICAL PROPERTIES OF BUILDING MATERIALS ........................................................ 51
3.3.1: Thermophysical properties ......................................................................................................... 51
3.3.2: Available building materials in Egypt ........................................................................................ 55
3.4: THERMAL COMFORT ........................................................................................................................... 59
3.4.1: Thermal comfort definitions ....................................................................................................... 59
3.4.2: Factors affecting thermal comfort .............................................................................................. 60
3.4.3: Thermal comfort zone................................................................................................................. 60
3.4.4: The adaptive model .................................................................................................................... 62
3.5: PASSIVE ARCHITECTURE AND THE REDUCTION OF ENERGY CONSUMPTION ......................................... 64
3.5.1: Passive design ............................................................................................................................ 65
3.5.2: A brief overview of the vernacular Architecture techniques ...................................................... 66
3.5.3: Lessons learned from the vernacular Architecture .................................................................... 73

vi
CHAPTER 4: THE EGYPTIAN RESIDENTIAL ENERGY CODE ..................................................... 75
4.1: PREFACE ............................................................................................................................................. 75
4.2: THE DEVELOPMENT OF THE EGYPTIAN CODE ...................................................................................... 77
4.3: EREC'S IMPLEMENTATION PROBLEMS AND LIMITATIONS ................................................................... 78
4.4: THE CODE'S SECTIONS ......................................................................................................................... 79
4.5: BUILDING ENVELOPE .......................................................................................................................... 81
4.5.1: Steps needed for opaque elements to achieve compatibility with EREC's requirements ............ 81
4.5.2: Steps needed for fenestration to achieve compatibility with EREC's requirements ................... 86
4.6: BUILDING MATERIALS USED IN EGYPT ................................................................................................ 89
CHAPTER 5: MODEL DEVELOPMENT ............................................................................................... 91
5.1: THERMAL COMFORT ZONE .................................................................................................................. 91
5.2: OBTAINING FUTURE CLIMATIC DATA .................................................................................................. 92
5.3: DATABASE AND SHADING CALCULATION TOOL .................................................................................. 92
5.3.1: The EREC Construction Database ............................................................................................ 93
5.3.2: The Shading Calculation tool ..................................................................................................... 97
5.4: THERMODYNAMIC SIMULATION .......................................................................................................... 98
5.4.1: The main case study ................................................................................................................... 98
5.4.2: The calibration ........................................................................................................................... 99
5.4.3: Automation of the simulation processes (EPP) ........................................................................ 101
5.5: FINANCIAL APPRAISAL ...................................................................................................................... 102
5.6: TYPICAL OCCUPANTS SCHEDULES FOR RESIDENTIAL END USE ENERGY SIMULATIONS ...................... 105
5.6.1: Occupants activities ................................................................................................................. 105
5.6.2: HVAC Systems .......................................................................................................................... 106
5.7: BUILDING MATERIALS USED IN EGYPT .............................................................................................. 107
5.8: PRICES OF BUILDING MATERIALS AND ENERGY ................................................................................. 110
5.8.1: Construction Material Costs .................................................................................................... 110
5.8.2: Electric Energy Prices ............................................................................................................. 110
CHAPTER 6: EVALUATION ELEMENTS OF BUILDI NG’S THERMAL PERFORMANCE ..... 112
6.1: EXTERNAL WALLS ............................................................................................................................ 113
6.1.1: Current construction practice in Egypt .................................................................................... 113
6.1.2: Expanding the area of research and engaging climate change ............................................... 116
6.1.3: Testing the insulation ability to encounter the climate change ................................................ 123
6.1.4: Investigating the new material's thermal characteristics ......................................................... 133
6.2: FENESTRATION ................................................................................................................................. 139
6.2.1: The effect of climate change on shading strategies .................................................................. 139
6.2.2: Evaluation of the fenestration specifications in EREC ............................................................ 144
6.3: COMBINING THE RESULTS ................................................................................................................. 161
6.4: SOLID PART’S SHADING .................................................................................................................... 179
CHAPTER 7: APPLICATION OF DESIGN RECOMMENDATIONS .............................................. 190
7.1: PARAMETERIZATION ......................................................................................................................... 191
7.1.1: The criteria for selection and the determinants of simulations ................................................ 191
7.1.2: Description of the selected typologies ...................................................................................... 194
7.2: RESULTS AND ANALYSIS ................................................................................................................... 201
7.2.1: Alexandria ................................................................................................................................ 203
7.2.2: Cairo ........................................................................................................................................ 212
7.2.3: Aswan ....................................................................................................................................... 220
CHAPTER 8: CONCLUSIONS ............................................................................................................... 229
8.1: STARTING POINT ............................................................................................................................... 229
8.2: MAIN PARAMETERS TESTED AND THE NEW CONTRIBUTION .............................................................. 230
8.3: RESEARCH FINDINGS AND RECOMMENDATIONS ................................................................................ 232
8.4: FUTURE WORK .................................................................................................................................. 234

vii
REFERENCES .......................................................................................................................................... 235
APPENDICES ............................................................................................................................................ 246
Appendix I: Thermal and physical properties of the commonly used materials in Egypt.
Appendix II: From construction to operation: Achieving indoor thermal comfort via altering external
walls specifications in Egypt.
Appendix III: The cost of achieving thermal comfort via altering external walls specifications in Egypt;
from construction to operation through different climate change scenarios.
Appendix IV: Prediction of future energy consumption reduction using GRC envelope optimization for
residential buildings in Egypt.
Appendix V: Climate change scenarios effects on residential buildings shading strategies in Egypt.
Appendix VI: Evaluation of fenestration specifications in Egypt in terms of energy consumption and
long term cost-effectiveness.
Appendix VII: Simulation results for the case study buildings (3 and 4) in Alexandria.
Appendix VIII: Simulation results for the case study buildings (3 and 4) in Cairo.
Appendix IX: Simulation results for the case study buildings (3 and 4) in Aswan.
Appendix X: Abbreviations.
Appendix XI: Formulae for the calculation of future values.

viii
List of figures:
FIGURE 1-1: THE GROWTH OF THE WORLD POPULATION IN RETURN FOR FOSSIL FUELS ENERGY SUPPLY
(EDWARDS 1999). ...................................................................................................................................... 1
FIGURE 1-2: RESEARCH METHODOLOGY. ........................................................................................................... 8
FIGURE 1-3: THE CONTINUOUS DYNAMIC INTERACTIONS BETWEEN THE DIFFERENT SYSTEMS (HENSEN 2004). .. 9
FIGURE 1-4: RANKING OF SOME OF MAJOR BPS TOOLS (ATTIA ET AL. 2012B). ................................................. 10
FIGURE 1-5: FUTURE WEATHER PROJECTIONS (MONTHLY MEAN TEMPERATURE AND DIRECT SOLAR
RADIATION) FOR ALEXANDRIA , CAIRO AND ASWAN. ............................................................................... 13
FIGURE 1-6: THE RESEARCH MIND-MAP. ........................................................................................................... 15
FIGURE 1-7: EGYPT IN THE KÖPPEN’S CLASSIFICATION. ................................................................................... 17
FIGURE 1-8: THE ANNUAL SOLAR RADIATION IN EGYPT (NREA 2011) ............................................................. 17
FIGURE 1-9: EGYPT'S CLIMATIC ZONES CLASSIfiCATION MAP ACCORDING TO EREC ........................................ 18
FIGURE 1-10: CHANGE IN AVERAGE ANNUAL TEMPERATURE BY 2100 FROM 1960–1990 BASELINE CLIMATE,
WHICH BASED ON THE MULTIPLE CLIMATE MODEL SIMULATIONS OF A BUSINESS-AS-USUAL SCENARIO OF
GREENHOUSE GAS EMISSIONS (MET.OFFICE ET AL. 2011). ...................................................................... 21
FIGURE 1-11: THE ANNUAL AVERAGE TEMPERATURES IN THE PAST (OBSERVED AND SIMULATED VARIATIONS),
AND THE FUTURE EXPECTATIONS OVER THE EAST AFRICAN COMMUNITY AND EGYPT, USING THE RCP2.6 AND RCP8.5 EMISSIONS SCENARIOS (IPCC 2014A) ................................................................................. 21
FIGURE 2-1: INCREASING POPULATION DENSITY IN THE WORLD THROUGHOUT THE AGES (CUNNINGHAM AND
CUNNINGHAM 2008). ............................................................................................................................... 26
FIGURE 2-2: ENERGY PER CAPITA PER YEAR IN 1990, ACCORDING TO THE GEOGRAPHICAL DISTRIBUTION
(COUNCIL 1993). ...................................................................................................................................... 27
FIGURE 2-3: ENERGY CONSUMPTION PER CAPITA IN 2011 – TOE (BP 2012)..................................................... 28
FIGURE 2-4: TOTAL CARBON EMISSIONS BY REGION (LEFT) COMPARED BY TOTAL POPULATION SIZE (RIGHT)
(ELGENDY 2012). ..................................................................................................................................... 28
FIGURE 2-5: DEVELOPMENT OF WORLD TOTAL PRIMARY ENERGY SUPPLY (1971 TO 2008) BY FUEL MTOE (IEA
2010). ....................................................................................................................................................... 29
FIGURE 2-6: FUEL SHARES OF TOTAL PRIMARY ENERGY SUPPLIES (TPES) (IEA 2010). *OTHER INCLUDES
GEOTHERMAL, SOLAR, WIND, HEAT, ETC. ................................................................................................. 29
FIGURE 2-7: RATES OF SOLAR ENERGY THAT IS REFLECTED AND ABSORBED BY THE EARTH (BOTKIN AND
KELLER 2011). ......................................................................................................................................... 30
FIGURE 2-8: THE HYDROLOGIC CYCLE ON EARTH, SHOWING THE TRANSFER OF WATER IN THOUSANDS OF
KM3/YEAR (BOTKIN AND KELLER 2011). .................................................................................................. 30
FIGURE 2-9: DIAGRAM SHOWING THE GREENHOUSE EFFECT.............................................................................. 31
FIGURE 2-10: THE SUN EMITS ENERGY IN THE VISIBLE AND NEAR INFRARED (SHORT WAVELENGTH) CONTRARY
TO EARTH WHICH EMITSENERGY IN FAR INFRARED (LONG WAVELENGTH) (BOTKIN AND KELLER 2011). ................................................................................................................................................................. 32
FIGURE 2-11: GREENHOUSE EFFECT AND THE DIFFERENT THERMAL RADIATION WAVELENGTHS. ..................... 32
FIGURE 2-12: THE IMPORTANCE OF GREENHOUSE EFFECT MECHANISM (ELDER 2010). .................................... 33
FIGURE 2-13: MAJOR CONTRIBUTORS TO GREENHOUSE EFFECT (MCMULLAN 2007). ....................................... 33
FIGURE 2-14: SHARE OF ARAB COUNTRIES (INCLUDING EGYPT) IN TOTAL WORLD CARBON EMISSIONS
(ELGENDY 2012). ..................................................................................................................................... 34
FIGURE 2-15: THE CURRENT AND RAPID EXPECTED CARBON EMISSIONS GROWTH IN THE ARAB REGION
(ELGENDY 2012). ..................................................................................................................................... 34
FIGURE 2-16: URBAN HEAT ISLANDS (UHI) PHENOMENON (EPA 2008). .......................................................... 38
FIGURE 2-17: MAPOF OIL FIELDS AND NATURAL GAS IN EGYPT (MOP 2012). .................................................. 40
FIGURE 2-18: PROVEN RESERVES OF OIL AND NATURAL GAS IN EGYPT (OEP 2000, NREA 2011). .................. 41

ix
FIGURE 2-19: THE RATE OF NATURAL GAS CONSUMPTION IN VARIOUS SECTORS FOR THE YEAR 2009/2010
(MOP 2012). ............................................................................................................................................ 41
FIGURE 2-20: RENEWABLE ENERGY LOCATIONS IN EGYPT (NREA 2011). ....................................................... 42
FIGURE 2-21: ANNUAL DIRECT NORMAL IRRADIATION ZONES IN EGYPT (NREA 2011). ................................. 43
FIGURE 2-22: AREAS WITH HIGH WIND SPEED WHICH IS QUALIFIED FOR WIND ENERGY PROJECTS IN EGYPT
(NREA 2011). .......................................................................................................................................... 44
FIGURE 2-23: SECTORS CONSUMING OF ELECTRIC POWER IN EGYPT (MOEE 2011). ........................................ 46
FIGURE 2-24: CONSUMPTION RATES FOR SERVICE SECTORS OF ELECTRIC POWER IN EGYPT 2009/10 –
2010/2011 (MOEE 2011). ....................................................................................................................... 46
FIGURE 3-1: CERTAIN FORMS OF THERMAL PENETRATION FROM THE EXTERNAL ENVIRONMENT INTO THE
BUILDING. ................................................................................................................................................ 49
FIGURE 3-2: THERMAL CONDUCTIVITY FOR DIFFERENT MATERIALS, AT NORMAL TEMPERATURE AND PRESSURE
(INCROPERA ET AL. 2011) ........................................................................................................................ 52
FIGURE 3-3: LOCATIONS FOR RAW MATERIALS USED IN CONSTRUCTION MATERIALS INDUSTRY IN EGYPT
(HBRC 2007). .......................................................................................................................................... 58
FIGURE 3-4: THE DIFFERENCE IN HEAT PERMEABILITY RATE THROUGH DIFFERENT BUILDING ENVELOPE
COMPONENTS ........................................................................................................................................... 65
FIGURE 3-5: HOUSE SHOWS MANY OF VERNACULAR ARCHITECTURE TREATMENTS DESIGNED BY HASSAN
FATHY - SIDI KREIR, EGYPT ..................................................................................................................... 67
FIGURE 3-6: NEB AMUN'S HOUSE AIR CATCHER AS IT WAS ILLUSTRATED ON HIS GRAVE (FATHY 1988). ......... 68
FIGURE 3-7: TOWERS THAT PULLS AIR (EL-WAKEEL AND SERAG 1989). .......................................................... 68
FIGURE 3-8: AIR CATCHER PROVIDED BY A SOURCE OF WATER TO MOISTURIZE THE AIR. DESIGNED BY HASSAN
FATHY (FATHY 1988). .............................................................................................................................. 69
FIGURE 3-9: AIR CATCHER (MALKAF ) IN OLD CAIRO (STEELE 1997). .............................................................. 69
FIGURE 3-10:MALKAF IN THE HOUSE OF MOHEB EL DEEN - CAIRO - FIFTEENTH CENTURY (STEELE 1997). ..... 69
FIGURE 3-11: AIR EXPELLING TOWERS (EL-WAKEEL AND SERAG 1989). ......................................................... 69
FIGURE 3-12: HORIZONTAL PLAN AND A PHOTO SHOWING THE INTERIOR COURTYARD IN SUHAYMI HOUSE –
CAIRO (STEELE 1997). ............................................................................................................................. 71
FIGURE 3-13: USING THE INNER COURTYARDS TO VENTILATE THE HOUSE INDOOR SPACES (EL-WAKEEL AND
SERAG 1989). ........................................................................................................................................... 71
FIGURE 3-14: TURNED WOOD ORNAMENTS WHICH FORMING THE MASHRABIA (STEELE 1997)......................... 72
FIGURE 3-15: PHOTOS ILLUSTRATING THE FORM OF MASHRABIA FROM OUTSIDE AND THE INSIDE (STEELE
1997). ....................................................................................................................................................... 73
FIGURE 4-1: ENERGY STANDARDS PATHS (AHMED ET AL. 2011)....................................................................... 76
FIGURE 4-2: EREC'S MAIN PARTS. .................................................................................................................... 81
FIGURE 4-3: HORIZONTAL & VERTICAL SUN-BREAKERS. ................................................................................. 88
FIGURE 5-1: NEW EXPANDED THERMAL COMFORT ZONE. ................................................................................ 91
FIGURE 5-2: STRUCTURE CHART FOR THE DATABASE ARCHITECTURE. ............................................................. 93
FIGURE 5-3: THE MODEL AND TYPICAL PLAN FOR THE USED PROTOTYPE. ......................................................... 98
FIGURE 5-4: THE UTILITY BILLS COMPARISON. ................................................................................................. 99
FIGURE 5-5: THE AVERAGE MONTHLY CONSUMPTION AND THE SIMULATED MONTHLY ELECTRICITY USAGE.. 100
FIGURE 5-6: THE ORDINARY METHOD USED TO CONDUCT SIMULATIONS......................................................... 101
FIGURE 5-7: NEW TECHNIQUE USED TO HANDLE THE SIMULATIONS. ............................................................... 102
FIGURE 5-8: : ADDING NEW MATERIAL IN DB. ................................................................................................ 107
FIGURE 5-9: NEW CONSTRUCTION COMPONENT SPECIFICATIONS. ................................................................... 108
FIGURE 5-10: THE NEW CONSTRUCTION COMPONENT'S SECTION. ................................................................... 108
FIGURE 5-11: SAMPLE OF THE EXTERNAL WALLS USED IN THE RESEARCH. ..................................................... 109

x
FIGURE 5-12: THE THERMAL CALCULATIONS OF THE NEW COMPONENT. ........................................................ 109
FIGURE 6-1: MONTHLY MEAN TEMPERATURE VARIATIONS ACCORDING TO THE DIFFERENT CONSTRUCTION
MATERIALS AND VENTILATION SYSTEMS. ............................................................................................... 114
FIGURE 6-2: MONTHLY ENERGY CONSUMPTION (KWH). ................................................................................ 115
FIGURE 6-3: ANNUAL ENERGY COST FOR DIFFERENT WALL CONSTRUCTIONS (EGP). ..................................... 115
FIGURE 6-4: SIMULATION RESULTS FOR ALEXANDRIA CITY ............................................................................ 118
FIGURE 6-5: SIMULATION RESULTS FOR CAIRO CITY....................................................................................... 119
FIGURE 6-6: SIMULATION RESULTS FOR ASWAN CITY. .................................................................................... 120
FIGURE 6-7: THE RELATIONSHIP BETWEEN THE INITIAL COST OF THE EXTERNAL WALLS AND THE AVERAGE
ANNUAL RUNNING COST. ........................................................................................................................ 121
FIGURE 6-8: SIMULATION RESULTS FOR ALEXANDRIA CLIMATIC ZONE (2002-2020). ..................................... 126
FIGURE 6-9: SIMULATION RESULTS FOR ALEXANDRIA CLIMATIC ZONE (2050-2080). ..................................... 127
FIGURE 6-10: SIMULATION RESULTS FOR CAIRO CLIMATIC ZONE (2002-2020). .............................................. 128
FIGURE 6-11: SIMULATION RESULTS FOR CAIRO CLIMATIC ZONE (2050-2080). .............................................. 129
FIGURE 6-12: SIMULATION RESULTS FOR ASWAN CLIMATIC ZONE (2002-2020). ............................................ 130
FIGURE 6-13: SIMULATION RESULTS FOR ASWAN CLIMATIC ZONE (2050-2080). ............................................ 131
FIGURE 6-14: TYPICAL PLAN AND MODEL FOR BUILDING - 1. .......................................................................... 134
FIGURE 6-15: TYPICAL PLAN AND MODEL FOR BUILDING - 2. .......................................................................... 134
FIGURE 6-16: SIMULATION RESULTS FOR BUILDING-1 (2020). ........................................................................ 136
FIGURE 6-17: SIMULATION RESULTS FOR BUILDING-1 (2050). ........................................................................ 136
FIGURE 6-18: SIMULATION RESULTS FOR BUILDING-1 (2080). ........................................................................ 137
FIGURE 6-19: SIMULATION RESULTS FOR BUILDING-2 (2020). ........................................................................ 137
FIGURE 6-20: SIMULATION RESULTS FOR BUILDING-2 (2050). ........................................................................ 138
FIGURE 6-21: SIMULATION RESULTS FOR BUILDING-2 (2080). ........................................................................ 138
FIGURE 6-22: SOLAR ANALYSIS OF THE MODEL USED IN ALEXANDRIA ........................................................... 141
FIGURE 6-23: SOLAR ANALYSIS OF THE MODEL USED IN CAIRO. ..................................................................... 141
FIGURE 6-24: SOLAR ANALYSIS OF THE MODEL USED IN ASWAN. ................................................................... 141
FIGURE 6-25: SHADING DEVICES EFFECT IN REDUCING EXTERIOR WINDOW'S SOLAR GAINS – CAIRO. ............. 143
FIGURE 6-26: TYPICAL PLAN FOR THE MODELED FLAT. .................................................................................. 145
FIGURE 6-27: SOLAR ANALYSIS OF THE MODEL USED IN ALEXANDRIA &A SWAN. .......................................... 145
FIGURE 6-28: SIMULATION RESULTS FOR ALEXANDRIA IN 2002 AND 2020 WEATHER PERIODS. ..................... 149
FIGURE 6-29: SIMULATION RESULTS FOR ALEXANDRIA IN 2050 AND 2080 WEATHER PERIODS. ..................... 150
FIGURE 6-30: SIMULATION RESULTS FOR CAIRO IN 2002 AND 2020 WEATHER PERIODS. ................................ 151
FIGURE 6-31: SIMULATION RESULTS FOR CAIRO IN 2050 AND 2080 WEATHER PERIODS. ................................ 152
FIGURE 6-32: SIMULATION RESULTS FOR ASWAN IN 2002 AND 2020 WEATHER PERIODS. .............................. 153
FIGURE 6-33: SIMULATION RESULTS FOR ASWAN IN 2050 AND 2080 WEATHER PERIODS. .............................. 154
FIGURE 6-34: THE HOURLY THERMAL BEHAVIOUR AND THE OVERHEATING HOURS THROUGH THE SUMMER
MONTHS IN CAIRO USING G2 AND G3 GLASS. ......................................................................................... 160
FIGURE 6-35: SIMULATION RESULTS FOR BUILDING-1 IN ALEXANDRIA - 2002 AND 2020 WEATHER PERIODS.
............................................................................................................................................................... 162
FIGURE 6-36: SIMULATION RESULTS FOR BUILDING-1 IN ALEXANDRIA - 2050 AND 2080 WEATHER PERIODS.
............................................................................................................................................................... 163
FIGURE 6-37: SIMULATION RESULTS FOR BUILDING-1 IN CAIRO- 2002 AND 2020 WEATHER PERIODS. ........... 164
FIGURE 6-38: SIMULATION RESULTS FOR BUILDING-1 IN CAIRO - 2050 AND 2080 WEATHER PERIODS. .......... 165
FIGURE 6-39: SIMULATION RESULTS FOR BUILDING-1 IN ASWAN - 2002 AND 2020 WEATHER PERIODS. ........ 166
FIGURE 6-40: SIMULATION RESULTS FOR BUILDING-1 IN ASWAN - 2050 AND 2080 WEATHER PERIODS. ........ 167

xi
FIGURE 6-41: SIMULATION RESULTS FOR BUILDING-2 IN ALEXANDRIA - 2002 AND 2020 WEATHER PERIODS.
............................................................................................................................................................... 168
FIGURE 6-42: SIMULATION RESULTS FOR BUILDING-2 IN ALEXANDRIA - 2050 AND 2080 WEATHER PERIODS.
............................................................................................................................................................... 169
FIGURE 6-43: SIMULATION RESULTS FOR BUILDING-2 IN CAIRO - 2002 AND 2020 WEATHER PERIODS. .......... 170
FIGURE 6-44: SIMULATION RESULTS FOR BUILDING-2 IN CAIRO - 2050 AND 2080 WEATHER PERIODS. .......... 171
FIGURE 6-45: SIMULATION RESULTS FOR BUILDING-2 IN ASWAN - 2002 AND 2020 WEATHER PERIODS. ........ 172
FIGURE 6-46: SIMULATION RESULTS FOR BUILDING-2 IN ASWAN - 2050 AND 2080 WEATHER PERIODS. ........ 173
FIGURE 6-47: EXAMPLES FOR THE DIFFERENT PROBABILITIES OF SHADING THE SOLID PARTS. ........................ 181
FIGURE 6-48: SIMULATION RESULTS FOR CAIRO CLIMATIC ZONE - SOUTHERN FAÇADE SHADING 10% (2002 -
2020). ..................................................................................................................................................... 184
FIGURE 6-49: SIMULATION RESULTS FOR CAIRO CLIMATIC ZONE - SOUTHERN FAÇADE SHADING 10% (2050 -
2080). ..................................................................................................................................................... 185
FIGURE 6-50: SIMULATION RESULTS FOR CAIRO CLIMATIC ZONE - SOUTHERN FAÇADE SHADING 20% (2002 -
2020). ..................................................................................................................................................... 186
FIGURE 6-51: SIMULATION RESULTS FOR CAIRO CLIMATIC ZONE - SOUTHERN FAÇADE SHADING 20% (2050 -
2080). ..................................................................................................................................................... 187
FIGURE 7-1: THE MAIN CITIES THAT REPRESENTED THE THREE CLIMATIC ZONES WHICH HAVE BEEN TESTED. 190
FIGURE 7-2: THE BUILDING'S MODEL AND A FLAT TYPICAL PLAN.................................................................... 194
FIGURE 7-3: THE PROJECT LAYOUT. ................................................................................................................ 195
FIGURE 7-4: THE BUILDING TYPOLOGY WHICH WAS USED FOR SIMULATIONS. ................................................ 195
FIGURE 7-5: THE BUILDING'S MODEL. ............................................................................................................. 196
FIGURE 7-6: THE TYPICAL FLAT PLAN. ............................................................................................................ 196
FIGURE 7-7: THE PROJECT LAYOUT. ................................................................................................................ 197
FIGURE 7-8: SOME OF THE BUILDINGS IN THE HOUSING PROJECT. ................................................................... 197
FIGURE 7-9: THE BUILDING FLOOR PLAN. ........................................................................................................ 198
FIGURE 7-10: THE BUILDING'S MODEL. ........................................................................................................... 198
FIGURE 7-11: THE BUILDING'S MODEL AND A FLAT TYPICAL PLAN.................................................................. 199
FIGURE 7-12: THE PROJECT LAYOUT. .............................................................................................................. 200
FIGURE 7-13: THE HOUSING PROJECT PHOTO. ................................................................................................. 200
FIGURE 7-14: THE GENERAL RESULTS OF THE SIMULATIONS. .......................................................................... 205
FIGURE 7-15: THE ANNUAL ENERGY COST. ..................................................................................................... 206
FIGURE 7-16: THE GENERAL RESULTS OF THE SIMULATIONS. .......................................................................... 209
FIGURE 7-17: THE ANNUAL ENERGY COST. ..................................................................................................... 210
FIGURE 7-18: THE GENERAL RESULTS OF THE SIMULATIONS. .......................................................................... 213
FIGURE 7-19: THE ANNUAL ENERGY COST. ..................................................................................................... 214
FIGURE 7-20: THE GENERAL RESULTS OF THE SIMULATIONS. .......................................................................... 217
FIGURE 7-21: THE ANNUAL ENERGY COST. ..................................................................................................... 218
FIGURE 7-22: THE GENERAL RESULTS OF THE SIMULATIONS. .......................................................................... 221
FIGURE 7-23: THE ANNUAL ENERGY COST. ..................................................................................................... 222
FIGURE 7-24: THE GENERAL RESULTS OF THE SIMULATIONS. .......................................................................... 225
FIGURE 7-25: THE ANNUAL ENERGY COST. ..................................................................................................... 226
FIGURE 8-1: THE SPECULATIVE GRAPHICAL REPRESENTATION OF THE FINANCIAL ANALYSIS FOR THE DIFFERENT
SCENARIOS. ............................................................................................................................................ 235

xii
List of tables:
TABLE 1-1: THE AVERAGE ANNUAL TEMPERATURES FOR ALEXANDRIA . .......................................................... 19
TABLE 1-2: THE AVERAGE ANNUAL TEMPERATURES FOR CAIRO. ..................................................................... 20
TABLE 1-3: THE AVERAGE ANNUAL TEMPERATURES FOR ASWAN. ................................................................... 20
TABLE 2-1: ENERGY CONSUMPTION AND EQUIVALENT EMISSIONS IN EGYPT (1990 - 2011). ............................. 34
TABLE 2-2: CONSUMPTIONS AND EMISSIONS FROM PETROLEUM PRODUCTS AND NATURAL GAS, ACCORDING TO
ALL THE SERVICE SECTORS IN EGYPT - 1997/98 (OEP 1998A). ................................................................ 35
TABLE 2-3: TABLE SHOWS THE CONSUMED FUEL BY TYPE IN ELECTRICITY PRODUCTION COMPANIES FROM 2001
- 2011 (MOEE 2011). .............................................................................................................................. 35
TABLE 2-4: SPECIFICATIONS AND POSSIBILITIES OF SOME WIND FARMS IN EGYPT (NREA 2011). .................... 44
TABLE 2-5: ENERGY GENERATED FROM HYDROPOWER PLANTS (GWH)(MOEE 2011). ................................... 45
TABLE 3-1: THE TOTAL RATE OF HEAT EMISSION FOR AN ADULT MALE FOR VARIOUS ACTIVITIES (BRADLEY
AND JOHNSTON 2011, CIBSE 2007). ........................................................................................................ 59
TABLE 3-2: SOME STUDIES FOR THE IDENTIFICATION OF THE THERMAL COMFORT ZONE (GIRA 2002). ............. 61
TABLE 3-3: THERMAL SENSATION AS MENTIONED IN EREC. ............................................................................ 61
TABLE 4-1: BUILDING ENVELOPE REQUIREMENTS IN ALEXANDRIA . ................................................................. 83
TABLE 4-2: BUILDING ENVELOPE REQUIREMENTS IN CAIRO. ............................................................................ 84
TABLE 4-3: BUILDING ENVELOPE REQUIREMENTS IN ASWAN ........................................................................... 85
TABLE 4-4: THE WWR INTERVALS ACCORDING TO EREC. .............................................................................. 86
TABLE 4-5: SOME OF THE AVAILABLE GLASS TYPES IN EGYPT. ......................................................................... 87
TABLE 4-6: TABLE 2B / ANNEX B IN EREC. ..................................................................................................... 89
TABLE 4-7: SOME THERMAL PROPERTIES FOR THE CONSTRUCTION MATERIALS COMMONLY USED IN EGYPT. .. 90
TABLE 5-1: MATERIAL TYPE TABLE. ................................................................................................................. 94
TABLE 5-2: THE USED MATERIALS TABLE. ........................................................................................................ 94
TABLE 5-3: THE MATERIAL PROPERTIES TABLE. .............................................................................................. 95
TABLE 5-4: THE LAYER TABLE. ........................................................................................................................ 95
TABLE 5-5: THE CONSTRUCTION TYPE TABLE. ................................................................................................. 95
TABLE 5-6: SAMPLE OF THE CONSTRUCTION MATERIALS STORED IN THE CONSTRUCTION TABLE. .................... 96
TABLE 5-7: THE CONSTRUCTION COMPOSITION TABLE. ................................................................................... 96
TABLE 5-8: THE DETAILS OF THE EXTERNAL WALL "12CM". ............................................................................. 96
TABLE 5-9: THE "M INREQ_OPENING" TABLE. .................................................................................................. 97
TABLE 5-10: SAMPLE OF THE STORED DATA IN TABLE " MINREQ_OPENING " FOR EASTERN FACADES. ........... 97
TABLE 5-11: AN EXAMPLE OF THE F INANCIAL ANALYSIS TABLES. ................................................................. 104
TABLE 5-12: MOST PREVALENT WORKING / OCCUPATION HOURS IN EGYPT.................................................... 106
TABLE 5-13: EXTERNAL WALLS MAIN CHARACTERISTICS. ............................................................................. 110
TABLE 5-14: USED GLASS SPECIFICATIONS. .................................................................................................... 110
TABLE 5-15: THE CURRENT ELECTRICITY TARIFF. ........................................................................................... 111
TABLE 5-16: THE PROPOSED NEW ELECTRICITY TARIFF. ................................................................................. 111
TABLE 6-1: MAIN CHARACTERISTICS OF THE EXTERNAL WALLS. .................................................................... 113
TABLE 6-2: EXTERNAL WALLS MAIN CHARACTERISTICS. ................................................................................ 116
TABLE 6-3: SUMMARY OF THE RUNNING COSTS, BASED ON THE THERMAL SIMULATIONS FOR THE DIFFERENT
WALL TYPES, CITIES AND WEATHER PERIODS (ALL COSTS SHOWN IN EGP)............................................ 121
TABLE 6-4: INITIAL AND RUNNING COST BASED COMPARISON AGAINST THE 12CM WALL (EGP/FLAT). ......... 122
TABLE 6-5: EREC REQUIREMENTS FOR THE DIFFERENT CLIMATIC ZONES. ..................................................... 123
TABLE 6-6: MAIN CHARACTERISTICS OF THE EXTERNAL WALLS. ................................................................... 124
TABLE 6-7: LONG TERM FINANCIAL ANALYSIS FOR THE DIFFERENT CLIMATIC ZONES. .................................... 132

xiii
TABLE 6-8: EXTERNAL WALLS MAIN THERMAL CHARACTERISTICS. ............................................................... 133
TABLE 6-9: WINDOW TO WALL RATIO FOR THE DIFFERENT FAÇADES. ........................................................... 140
TABLE 6-10: SOLAR SPECIFICATIONS FOR THE SIMULATED BUILDING. ............................................................ 140
TABLE 6-11: AVERAGE MONTHLY ENERGY CONSUMPTION (KWH)................................................................ 143
TABLE 6-12: AVERAGE MONTHLY INDOOR A IR TEMPERATURE (°C). ............................................................ 143
TABLE 6-13: SHADING EFFECTS - THE DIFFERENCE WITH AND WITHOUT USING SHADING DEVICES (KWH). .... 143
TABLE 6-14: USED GLASS SPECIFICATIONS. .................................................................................................... 144
TABLE 6-15: THE WWR INTERVALS ACCORDING TO EREC. .......................................................................... 146
TABLE 6-16: SHADING CALCULATION TOOL OUTPUTS. ................................................................................... 147
TABLE 6-17: FINANCIAL ANALYSIS - ALEXANDRIA . ....................................................................................... 156
TABLE 6-18: FINANCIAL ANALYSIS – CAIRO. ................................................................................................. 157
TABLE 6-19: FINANCIAL ANALYSIS – ASWAN. ............................................................................................... 158
TABLE 6-20: GENERAL DESCRIPTION OF THE MATERIALS USED IN THE SIMULATIONS. .................................... 161
TABLE 6-21: TOTAL INITIAL COST OF THE SIMULATED BUILDINGS (EGP). ...................................................... 174
TABLE 6-22: FINANCIAL ANALYSIS FOR BUILDIN G B-1 ................................................................................... 175
TABLE 6-23: FINANCIAL ANALYSIS FOR BUILDING B-2 ................................................................................... 176
TABLE 6-24: BUILDING’S SHADING PROBABILITIES FOR ONE CLIMATIC ZONE FOR ONE WDF. ........................ 181
TABLE 6-25: FINANCIAL ANALYSIS FOR THE SIMULATION RESULTS OF CAIRO CLIMATIC ZONE. ..................... 188
TABLE 7-1: THE DIFFERENT CONSTRUCTION MATERIALS COMBINATIONS USED IN THE RESEARCH. ................ 192
TABLE 7-2: GENERAL SIMULATIONS' TABLE FOR THE APPLICATION OF DESIGN RECOMMENDATIONS.............. 193
TABLE 7-3: BASIC CHARACTERISTICS OF THE MODEL. .................................................................................... 194
TABLE 7-4: BASIC CHARACTERISTICS OF THE MODEL. .................................................................................... 196
TABLE 7-5: BASIC CHARACTERISTICS OF THE MODEL. .................................................................................... 198
TABLE 7-6: BASIC CHARACTERISTICS OF THE MODEL. .................................................................................... 199
TABLE 7-7: THE PROJECT'S FINANCIAL ANALYSIS. .......................................................................................... 207
TABLE 7-8: THE PROJECT'S FINANCIAL ANALYSIS. .......................................................................................... 211
TABLE 7-9: THE PROJECT'S FINANCIAL ANALYSIS. .......................................................................................... 215
TABLE 7-10: THE PROJECT'S FINANCIAL ANALYSIS. ........................................................................................ 219
TABLE 7-11: THE PROJECT'S FINANCIAL ANALYSIS. ........................................................................................ 223
TABLE 7-12: THE PROJECT'S FINANCIAL ANALYSIS. ........................................................................................ 227
TABLE 8-1: SPECIFICATIONS RECOMMENDED BY THE RESEARCH FOR THE DIFFERENT PARTS OF THE BUILDING
ENVELOPE . ............................................................................................................................................. 232

1
Chapter 1: Introduction:
Sustain the planet and change it for a better place to live, is of the main concerns for the civilized communities. This includes implementing the main principles of sustainability, to ensure the preservation of the environment in good and clean condition for the future generations. In this regard, the energy dilemma has always been a challenging and complex problem of increasing importance for the mankind.
Unto the eighteenth century, most of the energy needed for mankind was supplied through several energy sources, such that provided by human and animal efforts, wood and coal, as well as wind and water. With population growth and the emergence of industrial revolution more goods and services became available, and the world’s need of fuel has increased significantly (Fig. 1-1). Many development activities that followed the industrial revolution have harmed the environment and depleted its resources, which led to threaten the natural ecological balance (Daabas 1994). It has become clear that the energy uses required for development is accompanied with adverse environmental impacts cannot be avoided, though it can be alleviated. Among the most important environmental impacts for energy use what is known as "global warming" or "greenhouse effect" which is linked to the planet temperature rise and climate change. This phenomenon is a result of increased concentrations of what called greenhouse gases (GHG) in the atmosphere (such as CO2), which is mostly caused by the use of fossil fuels.
Figure 1-1: The growth of the world population in return for fossil fuels energy supply (Edwards 1999).
The widening gap between population growth and the available energy can be clearly noticed, as various research have shown the inability of existing energy resources to face the increasing demands of energy expected in 2015,
with increasing rate of failure beginning in 2020 and what followed.

2
According to IPCC (International Panel on Climate Change) recent reports and conference in Doha-2012 (UNFCCC 2012), the climate change physical concept is getting more scientific understanding as "most of the observed increase in global average temperatures since the mid-20th century is very likely due to the observed increase in anthropogenic GHG concentrations". Fossil fuels such as oil, natural gas and coal is responsible for the most of carbon dioxide emissions, starting from the search process, then exploration, transportation, manufacturing and finally the consumption (Mohamed Amin 1999). The increase of the greenhouse gases due to burning of fossil fuels increase the greenhouse effect which reduces the amount of heat which the Earth should radiate back into space (McMullan 2007), causing a kind of thermal imbalance, as a result of the amount of excess heat that retained within the atmosphere.
In the past few decades, the depletion of fossil fuel and global climate change have been challenging concerns facing most people around the world. According to the International Energy Agency (IEA) today we are facing the global peak of oil production, which is expected by the year 2020 (Macalister and Monbiot 2008, Sherman 2009). It is expected that, between 2020 and 2050, the oil and gasoline will be rare and very expensive, so both developed and developing countries within the next 30 years will need to find new methods to acquire energy. Before this point is reached, the use of these fuels must be reduced in an endeavour to diminish global climate change (Botkin and Keller 2011).
In most of the modern cities, the built environment is one of the largest energy consuming sectors (McMullan 2007, Huovila et al. 2007). The production and transportation of building construction materials and the construction process in most of the countries consumes about 25 - 40% of the total energy used (Huovila et al. 2007). Buildings through their life-cycle (including construction, operation, maintenance and demolition) consume approximately 50% of the final energy consumption in the members states of the European Union, and contribute almost for 50% of the CO2 emissions released in the atmosphere, which is considered to be the basic gas responsible for the greenhouse effect (Ali et al. 2013). Residential and commercial buildings energy consumption has been increasing to record more than 44% of total energy consumption in Egypt, due in part, to Egypt’s rapid increase in population (Ahmed et al. 2011, HBRC 2008). While buildings produce GHG emissions at all stages of their life-cycle, the operation of a residential building generally accounts for 80 - 90% of the total emissions, mainly due to space heating and cooling, hot water, lighting and other household appliances (Ren et al. 2011). In Egypt, about 50% or more of the energy used in urban areas during the peak time, consumed due to the air-conditioning demands alone (Attia and Herde 2009). Therefore, the reduction of this consumption will be reflected on the amount of GHG emitted and may contribute significantly to mitigating global warming.
One of the solutions to this problem is to reduce the energy consumption, through sophisticated building design. Moreover, the IPCC identified that the reduction of energy consumption and GHG emission from the building sector has one of the highest benefit-cost ratios among many possible mitigation measures across different sectors (Ren et al. 2011). Therefore, current practice of construction industry in Egypt as a mid-latitude region needs to consider passive architectural design for residential buildings as a crucial strategy for climate change mitigation through reducing the reliance on the mechanical means to achieve the indoor thermal comfort.
The depletion of non-renewable resources and the environmental impact of energy consumption, particularly energy use in buildings, have awakened considerable interest in energy efficiency. Building energy codes have recently become effective techniques to achieve efficiency targets (Radhi, 2009). Regulation of building energy performance (via energy standards) is the most effective means to reduce energy consumption (Mansy 2013). Energy standards achieve this

3
objective by specifying the minimum levels of energy performance in the built environment, including the minimum specifications for building materials and the minimum efficiency of appliances used in buildings. Consequently, energy codes are considered one of the most frequently used instruments for energy efficiency improvements that can play an important role in enhancing energy efficient design in buildings (Ahmed et al. 2011).
Many governments have realized the importance of applying the energy codes. In the late 1970s many countries throughout the world (firstly in Europe and North America) introduced building regulations aimed to reduce the energy consumption in different kinds of buildings (BPIE 2011, Liu et al. 2010). Typically, these regulations concentrate on aspects of heat loss through the building envelope with minimum levels of required insulation, and is often characterized by being prescriptive to reduce the need for complex calculations (Hanna 2010, Hanna et al. 2011). There has been a clear increase in formal governmental efforts to promote climate change mitigation since the last Assessment Report (AR4/2007) of the Intergovernmental Panel on Climate Change (IPCC). The aforementioned efforts are different in terms of approach, scale, and emphasis, but most of them take the form of legislation, strategies, policies, and coordination mechanisms, and often target the design or early implementation stage. Since global greenhouse gas emissions have continued to increase in recent years, it is clearly important to monitor the exerted efforts to evaluate if it was sufficiently strong and effective to lead to the reductions required to stabilize global temperature (IPCC 2014b).
In Egypt, this step was taken a few years ago, in 2006, by issuing The Egyptian Code for Improving the Efficiency of Energy use in Buildings – Part 1: Residential Buildings (HBRC 2008). For simplicity, it will be referred to as EREC for Egyptian Residential Energy Code. In 2000, the Housing and Building Research Centre (HBRC) of Egypt obtained a grant from the United Nations Development Programme (UNDP) to develop and apply energy efficiency building codes for new residential and commercial buildings in Egypt, with an additional fund from the Egyptian government (Sheta and Sharples 2010, Huang et al. 2003). Over the next three years work continued with the help of an international consulting team adding their many years of experience in the development of building energy standards in the US and other countries. This team provided scientific assistance in several areas, including surveys of existing building conditions and energy use, the use of computer simulations to analyze building energy performance, and the design and construction of energy-efficient buildings. In June 2003 the proposed version of the EREC was completed, followed by the proposed commercial energy code in 2004, then both codes underwent public review before submitting them to the government for promulgation (Huang et al. 2003). The energy standard for housing EREC has turned to law in 2005, and issued in 2006 (Ahmed et al. 2011).
Any new system faces many problems, likewise the energy codes in spite of its mandatory application leads to many economic advantages that can overcome market barriers (Liu et al. 2010). The new regulations have been dealt with reluctance by different sectors of the building industry, probably due to the additional costs implied in meeting higher performance standards for more energy efficient buildings (Morrissey et al. 2011). Moreover, the consumers in Egypt have a lack of interest to use the energy efficient technologies, due to the governmental subsidies for energy prices particularly in the residential sector (Liu et al., 2010), in addition to the ineffective implementation and enforcement for the energy efficiency code (Ahmed et al. 2011). As mentioned, Egypt appears to face daunting challenges to implement their two building energy codes (residential buildings issued in 2006 - commercial buildings in 2009) in an environment where basic building code requirements are not effectively enforced.

4
In practice, an effective strategy to enforce optimum design is through appropriate legislation for energy efficiency (Radhi et al. 2009). However, these codes must be enforceable at the beginning of the process of transforming a country’s construction sector toward more energy-efficient buildings (Liu et al. 2010). It is important for the countries that have not applied any energy codes before, to start with realistic goals and full awareness of the cost incurred accordingly. Then a positive feedback loop will be initiated: enforcement, supply of technologies and materials, then accordingly, the ability to comply will evolve, expand and be strengthened over time (Liu et al. 2010). Successful implementation of energy codes is a complex and multi-faceted process that may take several years to achieve (Liu et al. 2010). Enforcement failures could be attributed to the lack of available technical, institutional, or market capacities. Nevertheless, the main point often is the lack of necessary governmental support, interventions and persistency which are essential to enable the development of those capacities (Liu et al. 2010).
The committee involved in writing the Egyptian code, EREC, developed a detailed implementation plan. This plan was meant to clarify the different aspects involved into the practical side of the code's implementation, such as (Huang et al. 2003) : Strengthen the code's enforcement structure and administration, establish a systematic compliance process, develop a user’s manual, conduct training program on the code, initiate outreach programs to advertise the code, and estimate energy savings and cost effectiveness when using the code through energy and economic analysis. However, in the early period of implementation the code was not mandatory and therefore not very well accepted, and unfortunately this situation remains the same. As stated before, EREC is far from being integrated into the construction industry in Egypt due to two main reasons: (1) the lack of awareness of the topic of energy efficiency amongst common construction practitioners in Egypt. (2) the absence of legislative support and enforcement (Ahmed et al. 2011).
Energy efficiency in the marketplace in Egypt can be achieved through enforcing the energy codes by the law, or by encouraging higher levels of performance in buildings voluntarily via programs that award participating buildings a sort of excellence or privilege such as awarding an Energy Star Building, Green Building, or the privilege of tax credits (Mansy 2013). Also the green building community (which is newly formed in Egypt) might provide a new motivation in constructing more energy efficient buildings. In addition to the aforementioned suggestions, this study is expected to provide one of the motives that could urge people to comply with the requirements of the code. This self commitment will be reflected in personal benefit through long-term financial gains, as will be illustrated later in the rest of the chapters.
This confidence in people's cooperation stems from a previous survey conducted by the Arab Forum for Environment and Development (AFED) in 2009, covering 19 Arab countries (including Egypt) in order to collect public attitudes toward climate change issues. The survey showed that, 93% of the survey sample pledged to personally participate and take action to reduce their contribution to the problem (AFED 2009, Reiche 2010). Aside from the people, the benefits of applying the new codes will also benefit the state, in terms of reducing energy demand which will save the cost and time of the establishment of new power plants; which is cheaper than investing in increased energy capacity (BPIE 2011).

5
1.1: Research problems
The Building sector in Egypt is faced by many fundamental problems, such as the inability to provide indoor thermal comfort for the buildings inhabitants at cheap tariff without the governmental subsidy. This process costs the country's annual budget billions of Egyptian pounds every year. At the same time it is not appropriate to rely significantly on the renewable energy, due to its high price in terms of initial and maintenance costs. Another problems addressed in this research, such as the deficiency in the amounts of the produced energy to meet the needs and requirements of the consumers. In addition to the proper available ways to ensure thermal comfort in residential buildings under current and future climate conditions.
Achieving the desired thermal comfort level using the principles of environmental design (the passive techniques) is the initial proposed solution. In other words, reducing the use of mechanical equipments (the active systems - HVAC) in the process of indoor acclimatization, in current climatic conditions and under future climate change scenarios, as much as possible in order to reduce the energy consumption; subsequently reducing the operational costs and CO2 emissions.
In general, there are three main approaches to reduce the energy consumption in the residential sector, without considering the occupants’ behaviour (Ren et al. 2011): First, energy demand reduction through improving energy performance of building envelopes. Second, reducing the energy needs via switching to use energy efficient appliances. Third, the installation of renewable energy (such as solar PVs, wind turbines, etc.). This research will adopt the first solution through studying the building envelope section in the Egyptian Residential Energy Code. The solution could be implemented in the construction practice through the strict and compulsory application for the energy code (EREC) mainly, and any other associated regulations that supports the same approach. This obligation should be the next step after the process of proving the ability of the energy code to protect the buildings in the long run and keep the indoor thermal comfort, under climate change scenarios. Which will give confidence to the venture capitalists that the implementation of this code or a revised version thereof will retain their investment in the future, and they will not be forced to invest more funds in order to mitigate the climate change effects later.
This proposed solution was taken based on the consensus of many experts that the most cost-effective way of meeting climate change targets is through improved energy efficiency (BPIE 2011). The justification for focusing on the energy efficiency in buildings can be summarised in the following arguments (BPIE 2011):
- Securing of energy supplies. - Lower the GHG emissions (which means a major contribution to climate change strategies). - Reducing the energy costs for customers. - Cheaper than investing in increased energy producing capacity. - Improving the indoor thermal comfort (using active techniques) with reasonable running costs. - A major contribution to the objective of sustainable development. Political courage and will, innovative investment tools and societal awareness are key factors for transforming the construction sector (BPIE 2011).

6
1.2: Research Hypothesis and Objectives
In 2006, on course to achieve thermal comfort in affordable price, the Ministry of Housing in Egypt issued the first Egyptian energy code. EREC was originally produced to prescribe the minimum requirements and specifications for the construction of buildings that aim to provide comfort in the built environment for the occupants, with minimum energy consumption and minimum running costs. The Egyptian Residential Energy Code (in its Arabic version and in any related published papers or reports) did not contain any reference to climate change as one of the determinants in the current construction operations (Huang et al. 2003, HBRC 2008, Ahmed et al. 2011, Mansy 2013). So, there are concerns about the ability of the current code specifications (EREC) to mitigate the expected climate change effects, while it is necessary to design the energy codes today to be able to mitigate the effects of the global warming (Ren et al. 2011). Hence it was necessary to test the hypothesis of whether the code, as it stands, is able to cope with the future climate change effects on the residential buildings. Consequently the following research questions emerged:
1- Is EREC in its current form (specifications and recommendations) resistant to the future climate change ?
2- If not, what is the required measures to be taken to develop the code to keep pace with the projected changes?
3- Are the measures that will be proposed economically feasible?
In brief, EREC can be divided into five main parts (Section 4.4). Among these five parts is the building envelope section (represents the architectural part) which will be the main focus in this thesis. A thorough analysis of this part will show the major four sections of the architectural part of the code, which will form the spine of the research. These four parts will be tested separately and in combination with each other (Chapter 6) to examine the compatibility of the code's recommendations in each part against the future climate change, and address potential incompatibilities.
The work will focus on the residential sector, as in almost every country this is the major energy consumer (Swan and Ugursal 2009a). The large housing projects will be the main concern, while testing the research hypothesis, in order to achieve the maximum savings in energy consumption in the case of actual application.
In order to identify the relevance between EREC and future climate change, the research aims to study the different design solutions and construction methods recommended by the code or commonly used in the building industry sector in Egypt for the current weather conditions. These are evaluated under the different climate change scenarios to identify the climate change effects on the indoor thermal comfort, the energy consumption and the financial implications (investment vs. running costs).

7
1.3: Research methodology and techniques
1.3.1: The methodology
The methodology used in the research, in order to assess the hypothesis and achieve the objectives, can be summarized as follows:
1- Test the currently used construction materials in Egypt, and its ability to provide the required indoor thermal comfort using the free running mode (natural ventilation) under the current climatic conditions.
2- Expand the testing scope to include different external wall specifications, and the inclusion of the climate change scenarios into the simulations. In addition to perform a financial appraisal to evaluate the effect of the different external walls on the project’s initial and running cost.
3- Examine the code's recommendations for the external walls specifications, in three different climatic zones in Egypt (Alexandria, Cairo and Aswan), under the current and future climate change scenarios, in order to obtain the optimum external walls' specifications for each climatic zone.
4- Test the ability of the shading calculation method, listed in EREC, to create effective shading devices that can work efficiently under the future climate changes.
5- Assess the multiple relationships between the different fenestration specifications in the energy code, which includes a large number of uncorrelated recommendations and data, in order to specify the optimum combination of these specifications to reduce the energy consumption in economical ways.
6- Test a passive technique used in the vernacular architecture but not included in the code, shading the opaque parts of the external walls, in order to identify its effectiveness to be used in a contemporary form.
7- Employ four different residential building typologies, in order to ensure the accuracy of the overall recommendations and the possibility of generalizing the application of these results over various residential buildings in Egypt.
Energy efficiency in the marketplace in Egypt can be achieved through enforcing the energy codes by the law, or by encouraging higher levels of performance in buildings voluntarily via programs that award participating buildings a sort of excellence or privilege such as awarded an Energy Star Building, Green Building, or the privilege of tax credits (Mansy 2013). In addition to the aforementioned suggestions, we are looking forward to the outcomes of this study to be one of the motives that could urges people to comply to the requirements of the code. This self commitment will be reflected in personal benefit through long-term financial gains, as will be illustrated later in the rest of the chapters. This confidence in people's cooperation was built based on a previous survey conducted by the Arab Forum for Environment and Development (AFED) in 2009, covering 19 Arab countries (including Egypt) in order to collect public attitudes toward climate change issues. The survey showed that, 93% of the survey sample pledged to personally participate and take action to reduce their contribution to the problem (AFED 2009, Reiche 2010).

8
1.3.2: The employed techniques
Many techniques were adopted to implement in the research methodology (see Fig. 1-2):
1- Simulation: building thermal performance simulation tools (BPS) is utilized for assessing and modifying the Egyptian Residential Energy Code to adapt to the future climate change effects, as the building simulation is considered the most appropriate tool for energy performance evaluation. It gives the ability to predict the energy performance of different design configurations and to assess various efficiency measures (Radhi 2009). The BPS tool "EnergyPlus" and its architectural friendly interface "DesignBuilder" were used to simulate the buildings thermal behaviour in the current weather conditions and under the future predicted climatic conditions.
2- Future Insight: future weather data files, which represent the climate change conditions, will be generated via the morphing technique, using the Climate Change World Weather File Generator tool (CCWorldWeatherGen). The new data will be in the form of future weather data files for 2020, 2050 and 2080 for the different climatic zones in Egypt.
3- Financial Analysis: in order to relate the theoretical study to the real world, a long term financial analysis (based on the financial theory of Discounted Cash Flow - DCF, and its practical formula Net Present Value - NPV) will be employed to produce an accurate estimation of the financial efficiency of the projects.
In view of the above, the code will be modified and recommendations will be added to ensure maximum compatibility with the requirements of future climate, in the presence of long term cost effectiveness.
Figure 1-2: Research Methodology.
Case study models
(prototypes)
Different weather data files
Simulation processes
Results analysis (thermal + energy
financial)

9
1.3.2.1: Building performance simulation (BPS) tools
Building energy and environmental performance simulation programs have been used for more than 40 years, where it was invented in the 1960s and 1970s to address building thermal performance, load calculation and energy analysis (Clarke 2001, Kusuda 1999, Attia 2010, Baba et al. 2013, Crawley 2008). The first attempt was in the 1960s when the US government was concerned in some projects to evaluate the thermal environment in fallout shelters (Kusuda 1999). As a result of the growing interest in supporting the early decisions for the design process and their impact on energy performance and cost, a lot of BPS decision support tools have been developed since the 1980s in order to have an early clear vision about energy performance in buildings to produce more energy efficient and sustainable buildings (Hensen 2004).
Crawley in ASHRAE meeting at Chicago, 2003 (Baba et al. 2013) and Clarke (Clarke 2001), defined the Building Performance Energy Simulation (BPES) tools as a powerful tools helping to find design solutions that ensure occupant well-being, reduce energy consumption, meet sustainability aspirations, mitigate environment impact and contribute to climate change abatement. The above-mentioned benefits of this kind of tools, became available due to its ability to emulate the dynamic interactions of heat, light, mass and sound within the building to predict its energy and environmental performance according to the surrounding climate, occupants, conditioning systems and noise sources. These software tools (building energy simulation) are used by practitioners to evaluate and simulate the building's (virtual model) performance. This kind of simulations must be undertaken for of a given climate data for a certain location, in order to investigate the building's dynamic response (thermal response for the different heat transfer mechanisms) for the surrounding environment and the inner influences (see Fig 1-3). The thermal performance simulation includes overheating prediction, heating and cooling equipment design, evaluating alternative technologies (energy efficiency and renewable energy), regulatory compliance, etc. (Crawley 2008). This kind of simulations (BPS) can provide a substantial improvements in fuel consumption and comfort levels, results in reducing the greenhouse gasses emissions, by treating the buildings and their systems as complete optimized entities not just as the sum of a number of separately designed and optimized sub-systems or components (Hensen 2004). The great improvements in computing power, algorithms, and physical data in the past few years allow these tools to simulate physical processes at high levels of detail and time scales (Hensen 2004). The use of the BPS tools is considered an important trend for modern building energy codes development, in order to help understanding the complex issues of building energy performance.
Figure 1-3: The continuous dynamic interactions between the different systems (Hensen 2004).

10
Since its initial conception this discipline has been continuously evolving, resulting in the production of a variety of BPS tools used globally by design professionals as a fundamental way to support their design decisions for energy efficient buildings (Attia et al. 2012b). The number of tools listed on the U.S. Department of Energy (DOE) Building Energy Software Tools Directory (BESTD) website reached more than 389 by the year 2010 (Attia 2010).
Architects are more concerned with design issues (such as geometry, orientation, aesthetic, natural ventilation and day lighting), while engineers are more concerned with mechanical systems and control, hence, the difference in the type of tools required by each profession (Baba et al. 2013). Dynamic thermal simulations were employed for this research using EnergyPlus (DOE 2012), which is a modular, structured code based on the features and capabilities of earlier tools BLAST and DOE-2.1E, with input and output of text files. The integrated solutions in this simulation module provides more accurate space temperature prediction, realistic system controls, radiant heating and cooling systems, and indoor air flow (Crawley et al. 2008). Unfortunately, this program is considered one of the less attractive for architects (Fig. 1-4). The more friendly interface (Graphical User Interfaces - GUI) DesignBuilder (DB) in its third version (V.3.0.0.105) (DB 2012) was used to overcome this problem, while benefiting of all the features and strengths in EnergyPlus. The single zone system was used in the DesignBuilder compact HVAC model for the simulation processes. In this system, local cooling coils are used to condition air which is supplied to the zone through a local air delivery system (DB 2011).
Figure 1-4: Ranking of some of major BPS tools (Attia et al. 2012b).
1.3.2.2: Future weather data files
In order to simulate the thermal response of a building, all the widely used Building Performance Simulation (BPS) programs have to use weather conditions data (hourly meteorological data) (Chan 2011, Guan 2009). Which are often typical data derived from hourly observations recorded at a specific location by the national weather service or meteorological office (Crawley 2008). In Egypt like most of the developing countries, these climatic data required to conduct energy design analysis are not easily available. The main challenges are the breadth (the number of years

11
recording the weather data) and the depth (the detailed hourly coverage of the main weather variables) of the weather data (Moustafa and Hegazy 2013). Taking into account that the main hourly weather variables required for detailed energy simulations and for the creation of the required weather data files (EPW/TMY2) for that, includes (Moustafa and Hegazy 2013, Jentsch et al. 2008): Dry-bulb temperature. Wet-bulb temperature. Dew-point temperature (or relative humidity). Wind speed and wind direction. Global horizontal solar radiation (or cloud cover information), and sunshine duration. Atmospheric pressure. Precipitation.
The Typical Meteorological Year format (TMY2), is one of the most widely available hourly data files, which used for predicting the average energy requirements for buildings (heating, cooling and ventilation). It was developed by the U.S. National Renewable Energy Laboratory (NREL) in the beginning of the 1990s, using the weather data that have been measured in the period of 1961–1990 (Jentsch et al. 2008). The TMY2 files represent a data set of hourly values of meteorological parameters for a typical one year period, the typical months which constitute this typical TMY2 weather year are identified from the measured long-term data using a Finkelstein-Schafer statistic (Jentsch et al. 2008). This format (as representing a typical year) exclude the extreme conditions (peak). Therefore, the Test Reference Year (TRY) format was developed (by the Chartered Institution of Building Services Engineers, CIBSE, in the UK), and it has been compiled in a similar way to TMY2 files using Finkelstein–Schafer statistics (Jentsch et al. 2008). However, the TMY files was found to give a good representation of the long-term typical weather condition over a year, better than the TRY weather data which found less reliable in replicating average historical conditions (Chan 2011).
In this context, four different weather data files for the climatic periods of 2002, 2020, 2050 and 2080 were generated to be used in the simulations (for each location), to provide the most comprehensive simulation period available to test the hypothesis, starting from the current weather conditions (2002), then the predicted weather data files (2020, 2050 and 2080).
Through the use of Climate Change World Weather File Generator (CCWorldWeatherGen) (SERG 2012a), the future weather data files for 2020, 2050 and 2080 were generated, for the climatic zones that have been tested in Egypt. The aforementioned files covers the periods of 2010-2039, 2040-2069 and 2070-2099 respectively (Du et al. 2012). The available weather data files provide a maximum test period of 88 years, as the beginning of year 2012 was assumed to be the starting construction year. The WDFs were divided as follows:
2002 weather data file (cover the period of 14 years): from 2012 to 2025. 2020 weather data file (cover the period of 14 years): from 2026 to 2039. 2050 weather data file (cover the period of 30 years): from 2040 to 2069. 2080 weather data file (cover the period of 30 years): from 2070 to 2099.

12
CCWorldWeatherGen (SERG 2012a) is a Microsoft® Excel based tool employs the "Morphing" methodology for climate change transformation of weather data, that has been developed by Belcher, Hacker and Powell (Belcher et al. 2005, Ren et al. 2011, SERG 2012b, Jentsch et al. 2008), to generate climate change weather data files, which can be used in BPS programs. This can be applicable through transforming current Energy-Plus Weather data files (EPW) into climate change EPW 1 or TMY2 weather files that are compatible with the majority of BPS programs. The tool uses data obtained from the IPCC Third Assessment Report model summary data of the HadCM3-A2 experiment ensemble, and coarse General Circulation Model (GCM) data (SERG 2012b). Therefore, all the results (climate change weather data generated with this tool) are subject to the limitations and uncertainties that are mentioned in the IPCC assessment reports2 regarding the climate change (SERG 2012a, Jentsch et al. 2008). Additionally, the current weather files are also subject to uncertainties, due to their reference timeframe, their underlying data collection or calculation methods and natural climate variations (Jentsch et al. 2008).
The following figure (Fig. 1-5) shows the predicted scenarios for the future climate change, from the present current conditions (2002) to the 2080 projections in the three climatic zones (Alexandria, Cairo and Aswan respectively) in Egypt. The left graphs presents the average monthly outside temperatures for the current and the three future scenarios, while the graphs on the right shows the direct solar radiations for the same climatic periods. As noticed, the temperature increases by moving from a climatic period to another with a clear difference in all of the three tested climatic zones. While the solar radiation graphs did not show the same rates of change at any of the different zones, on the contrary the solar radiation rates were very close to the existing conditions. In Alexandria, the graphs show a difference in the outdoor temperatures ranging from 2.75 ºC to 4.85 ºC between the current weather conditions and the predicted future conditions in 2080. The gap increases especially in the summer hot period, where the increase of the outdoor temperature has a direct effect on the human's thermal comfort. In Cairo, the outdoor temperatures difference is ranging from 2.8 ºC to 5.4 ºC, while in Aswan, it ranges from 3.4 ºC to 5.8 ºC.
1 EPW files (EnergyPlus/ESP-r Weather): has been created by the developers of ESP-r and EnergyPlus. This files in essence represent a modification of the original TMY2 file type structure, and it allows integration of sub-hourly data. It is based on the file generation methodology and the data available within the TMY2 format (Jentsch et al. 2008). 2 http://www.ipcc.ch/publications_and_data/publications_and_data_reports.shtml

13
Alexandria
Cairo
Aswan
Figure 1-5: Future weather projections (Monthly mean temperature and Direct solar radiation) for Alexandria, Cairo and Aswan.

14
1.3.2.3: Financial Analysis
In real world the decision for implementation is influenced by many factors, and one of these major factors is the financial effectiveness. In order to enhance the theoretical study and boost it to mimic the real world decision making, a financial appraisal was conducted to analyse the results of the different outputs of the simulations. Additionally, this assures the applicability of the results for implementation in the construction industry in Egypt, and highlights its benefits in the long run, and the compensation for the possible high initial investments.
This study investigated the potential pathways (posed through EREC) and their long term cost effectiveness for climate change adaptation in terms of the total energy consumption, and related initial and running costs in the residential sector in Egypt. (Ren et al. 2011) in their study about the adaptation pathways for Australian residential buildings, defined the effectiveness as the initial cost at the current year for an adaptation option to reduce annual energy consumption in terms of the costs per kilowatt energy reduction ($/kWh), or per kilogram of equivalent carbon dioxide reduction ($/CO2-e kg), the lower the value of cost-effectiveness, the more effective the adaptation option. In the current research, the long term concept has been added, as the buildings' adaptation to the different climate change scenarios in the future has been assessed. Thus, the initial construction cost, the annual running cost in addition to long term investments have been involved in this issue.
There are many techniques of project appraisal (Bierman and Schmidt 1971, Brealy and Myers 1991, Hawkins and Pearce 1971) and others. These techniques vary in their method of calculation, and the investment decision criteria, but they all appraise any investment project profitability. The financial appraisal involves calculating the expected return of an investment (or a project) based on the interaction of cash flows of the project. The "Discounted Cash Flow - DCF" method of evaluating projects cash flows has been proven to be the most attractive amongst investment decision makers. This is because of its intuitive simplicity and easy of calculation, a calculable value using the DCF always exits for all scenarios, it takes unique value for each unique case, and offers adequate basis for comparison (Brealy and Myers 1991). The DCF is used to calculate the "Net Present Value - NPV", which is net value of a project cash flows taking into account the time value of money. The future cash flows are estimated based on different scenarios and discounted to their equivalent Present value (PV), the sum of all future cash flows minus the initial investment costs, and any other running costs is the Net Present Value (NPV). The NPV is used as an indicator of profitability. NPV is commonly used in the world of corporate finance and also can implemented for making decisions about everyday purchases and investments. Any construction project includes an initial cost that will affect the annual operating costs (running costs) for the project's equipments and processes. Increase the initial cost, by employing better materials and more efficient equipments, mostly reflects on reducing the running costs. This reduction in the running costs are seen as cash inflows in future years and dealt with as payback to the higher initial investment. The NPV converts the project's expected future cash flows to their "present value" at the beginning of the project, then all of the present values (over the project's life span) are added together to calculate a single number that can characterise the overall value of the project (profitability of the investment), NPV typically is calculated over a specific time period of interest (UNEP 2002, Pratt and Niculita 2008, Ross et al. 2007).

15
Different aspects and procedures of the research are demonstrated in the mind-map (Fig. 1-6). The map has four main branches: (1) the research work, (2) the case studies, (3) the thesis sections, and (4) the computer software used. First of all the problem was defined, then the sub questions appeared. These questions will be covered in the "research work" part via 1338 different simulations (Chapter 6). The overall conclusions and findings will be implemented and tested using the "case study models" and the results will be analysed using different "computer software" (Chapter 7). All the research steps, procedures, findings and recommendations then will be written in the different sections of the "thesis".
Figure 1-6: The research mind-map.
16
The aforementioned procedures and efforts were conducted in an attempt to improve the Egyptian energy code (EREC) in order to:
1- Accommodate the future predicted climate changes, and adapt new or existing buildings to the increasing temperatures in the future in a cost effective way. So the buildings can be designed or refurbished to accommodate the future temperature rises without consuming more energy.
2- Encourage and induce the people to use the modified code to build compatible buildings for their own benefits, whether financial or environmental. Through proving the ability of the low running costs of the compatible buildings to compensate its high initial cost (than the ordinary buildings) during the operation lifespan.
1.4: Research location and the climate
1.4.1: Egyptian climatic regions
Egypt is a large country with an area of approximately 1,000,000 km2, located between 22º N - .1º .7ガ N latitude and 24º 57ガ E - .5º 45ガ E longitude. Egypt possesses a diversity of climate conditions ranging from extremely hot conditions in the desert regions such as the Western Desert, to cold conditions in Mountain St. Catherine in Sinai Peninsula (Mahmoud 2011). However, the general climate of Egypt is characterized by the hot arid climate "BWh" according to Köppen classification as shown in Fig. 1-7 (Kottek et al. 2006, Peel et al. 2007), with very high solar radiation intensity most of the year (Solar-GIS 2013, SODA 2013). As in the Egyptian solar Atlas (Fig. 1-8), the average direct normal solar radiation is 2000 – 3200 kWh/m2/year, the sunshine duration ranges between 9 – 11 h/day from North to South with very few cloudy days (NREA 2011). Egypt is divided into eight climatic zones (HBRC 2008, El-Wakeel and Serag 1989):
1- Northern Coast zone. 2- Cairo and Delta zone. 3- Northern Upper Egypt zone. 4- Southern Upper Egypt zone. 5- East Coast zone. 6- Highland’s zone. 7- Desert zone. 8- Southern Egypt zone.
The current research will focus on the main three climatic zones (shown in Fig. 1-9): (1) Cairo and Delta zone (Cairo governorate), (2) North coast zone (Alexandria governorate) and (3) the Southern Egypt zone (Aswan governorate). About 50% of the construction projects carried out in Egypt are located in Cairo and Alexandria governorates (Huang et al. 2003). In addition to that, Cairo and Alexandria were among the most three cities in Egypt in using air conditioners, where the three cities (Cairo, Alexandria and Asyut) contain about 88% of the air-conditioned apartments in Egypt according to the 2006 census (CAPMAS 2006), making them of the most Egyptian cities in energy consumption in the residential sector. While Aswan governorate is considered a very different zone in terms of the climatic aspects compared to the other zones (El-Wakeel and Serag 1989, HBRC 2008, Gira 2002).

17
Figure 1-7: Egypt in the Köppen’s classification.
(Adapted From: http://koeppen-geiger.vu-wien.ac.at/present.htm)
Figure 1-8: The annual solar radiation in Egypt (NREA 2011)

18
Figure 1-9: Egypt's climatic zones classification map according to EREC (HBRC 2008)
1.4.2: Climatic analysis of Egyptian cities
Egypt's climate is influenced by a number of factors, foremost the geographical location between latitudes 22º N - .1º .7ガ N. At the north east of Africa, it overlooks the Mediterranean Sea in the north front with length of 995 km, and on the Red Sea in the Eastern front with length of 1941 km, while surrounded by the deserts on the rest of the sides. As a result, the most important characteristics of the climate in Egypt can be summarized as: hot , low humidity with light rainfall. The distinction can be made between two climatic seasons only namely the dry hot summer (extends between May and October), and the mild winter with light rain (extends between November and April). In the winter, temperatures reaches their lowest level in the month of January, but the influence of the Mediterranean Sea appears clearly in heating the northern coast region. While the average temperature reaches the maximum in the month of July in all parts of the country except for the northern coast region, where this occurs slowly and rise up to the maximum in the month of August (for more details see the next section) (Met.Office et al. 2011, El-Wakeel and Serag 1989).

19
1.4.2.1: Climate overview
The significant differences in temperatures appear between summer and winter, and between coastal and inland areas. Generally, the extent of change in maximum and minimum temperatures ranging between 6 -10 ºC. The typical maximum temperatures during the day in the middle of the summer ranging between 30 ºC at Alexandria to 41 ºC in the south at Aswan, while these maximum temperatures in the middle of the winter ranging between 18 ºC in the north and 23 °C in the south (Met.Office et al. 2011, El-Wakeel and Serag 1989). An overview of climate of the major cities in the three main climatic regions will be discussed:
1- The North coast zone (Alexandria governorate): Represented by the city of Alexandria
Latitude Longitude Elevation above sea level CDD (25ºC)* HDD (18.3ºC)*
31.20ºN 29.95ºE 7.00 m 153 469 * (HBRC 2008)
The average annual temperatures shown in Table 1-1 (WMO and EMA 2012).
Table 1-1: The average annual temperatures for Alexandria.
Month
Mean Temperature (o C) Mean Total Rainfall
(mm) Mean Number of
Rain Days Daily Minimum
Daily Maximum
Jan 9.1 18.4 52.8 11.0 Feb 9.3 19.3 29.2 8.9 Mar 10.8 20.9 14.3 6.0 Apr 13.4 24.0 3.6 1.9 May 16.6 26.5 1.3 1.0 Jun 20.3 28.6 0.01 0.04 Jul 22.8 29.7 0.03 0.04 Aug 23.1 30.4 0.1 0.04 Sep 21.3 29.6 0.8 0.2 Oct 17.8 27.6 9.4 2.9 Nov 14.3 24.1 31.7 5.4 Dec 10.6 20.1 52.7 9.5
The maximum recorded temperature was 44.5ºC in 30/5/1991, while the minimum recorded temperature was 2 ºC in 9/2/1990 (EMA 2012, Zakaria 2009).
2- Cairo and Delta zone (Cairo governorate): Represented by the city of Cairo.
Latitude Longitude Elevation above sea level CDD (25ºC)* HDD (18.3ºC)*
30.13ºN 31.40ºE 74.00 m 296 344
* (HBRC 2008)
The average annual temperatures shown in Table 1-2 (WMO and EMA 2012).

20
Table 1-2: The average annual temperatures for Cairo.
Month
Mean Temperature (o C) Mean Total Rainfall
(mm) Mean Number of
Rain Days Daily Minimum
Daily Maximum
Jan 9.0 18.9 5.0 3.5 Feb 9.7 20.4 3.8 2.7 Mar 11.6 23.5 3.8 1.9 Apr 14.6 28.3 1.1 0.9 May 17.7 32.0 0.5 0.5 Jun 20.1 33.9 0.1 0.1 Jul 22.0 34.7 0.0 0.0 Aug 22.1 34.2 TR 0.0 Sep 20.5 32.6 TR 0.0 Oct 17.4 29.2 0.7 0.5 Nov 14.1 24.8 3.8 1.3 Dec 10.4 20.3 5.9 2.8
The maximum recorded temperature was 47ºC in 21/5/1987, while the minimum recorded temperature was 6 ºC in 6/2/1996 (EMA 2012, Zakaria 2009).
3- The Southern Egypt zone (Aswan governorate): Represented by the city of Aswan.
Latitude Longitude Elevation above sea level CDD (25ºC)* HDD (18.3ºC)*
23.97ºN 32.78ºE 194.00 m 1278 127 * (HBRC 2008)
The average annual temperatures shown in Table 1-3 (WMO and EMA 2012).
Table 1-3: The average annual temperatures for Aswan.
Month
Mean Temperature (o C) Mean Total Rainfall
(mm) Mean Number of
Rain Days Daily Minimum
Daily Maximum
Jan 8.7 22.9 TR 0.0 Feb 10.2 25.2 TR 0.0 Mar 13.8 29.5 TR 0.0 Apr 18.9 34.9 TR 0.0 May 23.0 38.9 0.1 0.1 Jun 25.2 41.4 0.0 0.0 Jul 26.0 41.1 0.0 0.0 Aug 25.8 40.9 0.7 0.5 Sep 24.0 39.3 TR 0.0 Oct 20.6 35.9 0.6 0.25 Nov 15.0 29.1 TR 0.0 Dec 10.5 24.3 TR 0.0
The maximum recorded temperature was 49ºC in 9/6/2006, while the minimum recorded temperature was 1.4 ºC in 16/1/2007 (EMA 2012, Zakaria 2009).

21
1.4.2.2: Climate projections
According to (Met.Office et al. 2011), temperatures in Egypt are expected to increase by around 3°C to 3.5°C. The CMIP3 ensemble output (Coupled Model Intercomparison Project Phase 3, produced by the Met. Office, Hadley Centre) for temperature, for the A1B emission scenario, for Egypt and the surrounding region is shown below (Fig. 1-10).
Figure 1-10: Change in average annual temperature by 2100 from 1960–1990 baseline climate, which based on the multiple climate model simulations of a business-as-usual scenario of greenhouse gas emissions
(Met.Office et al. 2011).
While the projected future temperatures all over Africa that are mentioned in the IPCC fifth Assessment Report (IPCC 2014a), indicates that, the future annual average temperatures are projected to increase and exceed the 1986-2005 baseline by about 3°C to 6°C by the end of this century under CMIP5 GCMs (RCP8.5) as shown in Fig. 1-11.
Figure 1-11: The annual average temperatures in the past (Observed and simulated variations), and the future expectations over the East African community and Egypt, using the RCP2.6 and RCP8.5 emissions scenarios
(IPCC 2014a)

22
1.5: Thesis Outline
The thesis addressed the different topics and points of the research through a number of different chapters and sections. The most important points that have been addressed in these different parts can be summarized as follows:
Chapter 2: Energy use and the need for sustainability
This chapter aims to discuss different aspects of energy and its irrational use trends beyond the industrial revolution. The phenomenon of the greenhouse effect and its substantial role in the global warming (as one of the main contributors to climate change), all of these aspects will be discussed along with some proposed sustainable solutions to remedy the problem. The energy policy in Egypt, either conventional or renewable, occupied a great interest in this chapter as the main field for the research.
Chapter 3: Thermal properties and the role of passive architecture
This chapter introduces a review for the most important factors that affects the buildings' thermal performance, through the related studies and existing literature materials. Mechanisms of heat transfer, thermal and physical properties of building materials, in addition to the available building materials in Egypt will be discussed. The thermal comfort issue is also considered, along with some different aspects of passive architecture techniques (which were used in the Egyptian vernacular architecture) to reduce the energy consumption and achieve indoor thermal comfort.
Chapter 4: The Egyptian residential energy code
This chapter reviews in general and in brief the origination of The Egyptian Code for Improving the Efficiency of Energy Use in Buildings, and some of its limitations and implementation problems, along with an explanation for some of the most important parts which will be the main focus in this study. Some methods for the buildings to comply with the requirements of the code will be mentioned, besides some of the physical and thermal properties of some building materials commonly used in Egypt are identified.
Chapter 5: Model Development
In this chapter, many of the key research aspects will be discussed in order to establish some bases that will be used during the work. The thermal comfort zone in Egypt and the way to obtain the future weather data files due to climate change, will be among the topics to be discussed. As well as, some computerized aiding tools, thermodynamic simulation tools and its calibration steps, the typical occupancy schedules and HVAC systems, and the commonly used building materials in Egypt which will be used in the simulations. The financial analysis that has been addressed in the research will be also discussed combined with the associated prices of building materials and energy in Egypt.

23
Chapter 6: Evaluation elements of building’s thermal performance
In this part, the different questions that contributed in achieving the research objectives will be described. The main theme of these inquiries was the architectural part in the Egyptian Residential Energy Code (EREC), which consists mainly of the basic components of the building envelope. These main components are the external wall insulation, fenestration specifications, in addition to the proposed part of solid elements shading. Many questions have been addressed such as the potentials of the commonly used or the new materials in the Egyptian market to cope with climate change, the applicability of EREC's recommendations regarding the external walls in the future climatic conditions. Moreover, other questions regarding fenestration will be addressed such as the expected efficiency of the shading devices' calculation method listed in the code in light of climate change, and the best combination of the different variables that affects the selection process of the building fenestration and its associated shading devices. Finally, the benefits in terms of thermal comfort and financial returns on the long term of the re-use of one of the vernacular architecture passive methods (solid parts shading), with the implementation of many of the current code recommendations.
Chapter 7: Application of design recommendations
All the research work findings will be implemented and tested through four case study models, in order to assure the accuracy and validity of the results. Additionally, generalize these findings over the different climatic zones in Egypt, in order to obtain the buildings' general thermal behaviour in each zone under the different climate change scenarios. The aim is to ensure the achievement of the various recommendations to the main objectives of the research, of maintaining the adequate thermal comfort at the present time and in the future, with a commitment to reduce energy consumption over the current levels of consumption, as well as achieving long term cost effectiveness.
Chapter 8: Conclusions
The most important results that have been reached through the research will be reviewed, in order to extract the conclusions and recommendations that can benefit and contribute to the construction industry in Egypt. The research outcomes considered as attempt to highlight the residential energy code weaknesses points, especially in its behaviour against the climate change phenomenon. Leading to the suggestion of regionally replicable energy retrofitting solutions based on the code's recommendations and main suggestions. The conducted simulations for the used models, using the research findings, indicate potential energy consumption reductions for the residential units, along with financial benefits on the long term. In addition to retain the indoor thermal comfort within the allowable comfortable limits. In light of these findings, this chapter presents conclusions and recommendations that are potentially replicable across the region. Also identify routes for further research and next steps for this work.

24
1.6: Papers produced from this research
MAHDY, M. M. & NIKOLOPOULOU, M. 2012. From construction to operation: Achieving indoor thermal comfort via altering external walls specifications in Egypt International Conference on Green Buildings Technologies and Materials (GBTM). China.
MAHDY, M. M. & NIKOLOPOULOU, M. 2013. The cost of achieving thermal comfort via altering external walls specifications in Egypt; from construction to operation through different climate change scenarios. Building Simulation conference. France.
MAHDY, M. M., NIKOLOPOULOU, M. & FAHMY, M. 2013. Climate Change scenarios effects on residential buildings shading strategies in Egypt Building Simulation Cairo 2013 - Towards Sustainable & Green Built Environment. Cairo - Egypt.
MAHDY, M. M. & NIKOLOPOULOU, M. 2014. Evaluation of fenestration specifications in Egypt in terms of energy consumption and long term cost-effectiveness. Energy and Buildings, 69, 329-343.
FAHMY, M., MAHDY, M. M. & NIKOLOPOULOU, M. 2014. Prediction of future energy consumption reduction using GRC envelope optimization for residential buildings in Egypt. Energy and Buildings, 70, 186-193.
In addition, there are three papers currently underway:
a) The Ability of the Egyptian Code Specifications for the External Walls Insulation to Adapt the Future Climate Change Scenarios.
b) Solid Parts and Fenestration in Building Envelope are They Working in Series or in Parallel under Climate Change - Study in Egypt.
c) Evaluation of Shading the Solid Parts of Building Envelopes under Climate Change Scenarios in Egypt.

25
Chapter 2: Energy use and the need for sustainability
2.1: Disruption of ecological balance and the need for sustainability
Ecosystems are dynamic systems that changes over time and under the influence of the external environmental effects and by their own internal processes. These systems can cope, recover and overcome any disturbance by modifying the species behaviour within the system commensurate with the new situation if the damage is not enormous (Botkin and Keller 2011, Faggal 2002). Ecosystems poise is the secret of continuity and the ability of the environment to sustain life on earth without substantial problems, and it means a balance in all courses of basic food and methods of transmission of energy within the ecosystem. In other words the balance between production and consumption and decomposition within the ecosystem.
The human reacts with the environment positively or negatively, the positive interaction is what is called development. Human society uses elements of the environment to extract raw materials and energy resources then convert them into goods and services. Every stage of the manufacturing or consumption emits waste to the environment, which is considered as a negative correlation between the human and the environment. While the efforts to protect the environment and conserve natural resources is considered within the positive correlations (Wagner 1994).
Ecosystem imbalance began with the increase of global population (Fig.2-1) and the increase of environmental resources consumption after the industrial revolution. Subsequently, the excessive use of natural resources caused fast disruption and degradation in many environments and ecosystems. Many of the problems that threaten humans have emerged such as pollution, hunger, desertification and the depletion of natural resources as a direct result of human intervention in the natural life in various ways such as (Faggal 2002, Al -Najjar 1994):
a- Introducing strange elements in the ecosystem as insecticides or gases from burning the fuel. b- Abnormal increase in one of the ecosystem elements such as increasing the flow of waste in
rivers and streams. c- Human direct intervention such as drying lakes, deforestation and filling ponds. d- Many urban development activities in human societies.
Chapter Introduction:
To address the research problem and its causes from a holistic perspective, this chapter aims
to discuss different aspects of energy and its irrational use trends beyond the industrial
revolution. The phenomenon of the greenhouse effect and its substantial role in the global
warming (as one of the main contributors to climate change), all of these aspects will be
discussed along with some proposed sustainable solutions to remedy the problem. The energy
policy in Egypt, either conventional or renewable, occupied a great interest in this chapter as
the main region for the research.

26
Figure 2-1: Increasing population density in the world throughout the ages (Cunningham and Cunningham 2008).
Construction activities in human societies are the focus of attention in this research. As buildings require a lot of uninterrupted energy supplies during the construction process, beginning with the extraction of raw materials, transportation, installation and ending with demolition of the building at the end of its life cycle and the transformation of these materials to waste or reuse it (NY.consultants 1999). The irrational energy use in construction industry affects the environment, and necessitates using different sustainability principles to secure the future of the upcoming generations. The process of reducing energy consumption begin in the early stages of urban planning and through the site design stages and the building design then the construction process (Hui 2002). This operation carried out on several levels, what concerns us is the energy conservation at the building level (Jong-Jin Kim 1998), via providing the required energy for the building's operation through utilizing of passive heating and cooling techniques, achieving natural ventilation, taking advantage of day lighting and using energy efficient equipments and appliances. In addition to follow some other key aspects that makes the design complies to the principles of sustainability (RIBA 2000, Makram 2008, USGBC 1996):
1- Minimizing the use of fossil energy even if it was embodied in the materials, or even if it was used in transport or construction process, and the energy used in the operation process of the building during its lifetime.
2- Reduce the total costs over the life span of the building which includes: the initial costs of the project establishment, in addition to operating costs (energy, maintenance and repair), as well as the costs of renovation or demolition.
3- Utilization of passive design techniques and solar energy strategies (building orientation - openings locations – glass types - shading methods - thermal mass - natural lighting - natural ventilation - Summer cooling methods – using of Photovoltaic cells),without hurting any other aspects of the building, with the use of machines in the minimalistic.
4- Make sure that the design has the highest specialized standards in addition the best aesthetic excellence.
5- Raise the level of performance of the building’s internal environment through: increasing energy efficiency, improving lighting and interior comfort, in addition to provide a healthy indoor environment for life.

27
2.2: Energy dilemma
People use energy to obtain services such as heating, cooling and lighting. Therefore, the energy is a commodity related to humanitarian needs and interests, in addition to its influence on their social life and surrounding environment. Until the eighteenth century most energy needs were supplied locally via traditional energy sources provided by human, animal, wood and coal, as well as wind and water. With population growth and the emergence of industrial revolution more goods and services became available, and the world’s need of fuel has increased significantly. In 1960 the world consumption of fuel was 3.3 billion tons of oil equivalents (TOE), while in 1990 consumption was 8.8 billion-TOE, an increase of 166% and an average annual increase of 3.3%. However, the rate of energy consumption varies from place to another. In 1990 the average energy consumption per capita in North America was 7.82 TOE, while in South Asia 0.39 TOE, as shown in Fig. 2-2 (Faggal 2002).
Figure 2-2: Energy per capita per year in 1990, according to the geographical distribution (Council 1993).
World primary energy consumption grew by 2.5% in 2011, generally in line with the average of the past ten years. Consumption in the countries of OECD (Organization for Economic Co-operation and Development) were cut down by 0.8%, while the Non-OECD consumption grew by 5.3%. The average energy consumption per capita for the year 2011 is demonstrated in Fig. 2-3 (BP 2012), which reflects on the carbon emissions as shown in Fig.2-4.
7.82
5.01
3.22 2.91
1.29 1.17 1.02
0.53 0.39
1.66
0
1
2
3
4
5
6
7
8
9

28
Figure 2-3: Energy consumption per capita in 2011 – TOE (BP 2012).
Figure 2-4: Total carbon emissions by region (left) compared by total population size (right) (Elgendy 2012).
The peak for wood use in USA was in 1880s, and during this period the use of coal was popular but it began to decline after 1920, when oil and gas started to become available, Today we are facing the global peak of oil production which is expected by 2020, after this peak it is expected between 2020–2050 that the oil and gasoline will be rare and very expensive, so both developed and developing countries within the next 30 years will need to find new methods to acquire energy. Before this point is reached, the use of these fuels must be reduced in an endeavour to diminish global climate change (Botkin and Keller 2011).
Fossil fuels (petroleum, coal and natural gas) provided more than three quarters (77.2%) of the overall requirements of a world energy in 1990, traditional non-commercial energy (wood fuel) 10.3%, nuclear energy 4.5%, hydroelectric energy 5.7% and renewable energy 2.3% (Council 1993). Despite the expected contributions increase for the renewable energy sources (non-fossil) to meet energy needs (see Figs 2-5 and 2-6), but the bulk of these needs will continue to be provided by fossil fuels for a long time to come. Fossil fuel resources, which took millions of years to form, may be exhausted in just a few hundred years, so the current decisions will affect energy use for generations (Botkin and Keller 2011).

29
Figure 2-5: development of world total primary energy supply (1971 to 2008) by fuel MTOE (IEA 2010).
Figure 2-6: Fuel shares of total primary energy supplies (TPES) (IEA 2010).
*Other includes geothermal, solar, wind, heat, etc.
2.3: The concept of energy
In terms of physics, work is the product of a force times a distance (exerting a force over a distance moved), while the energy is the ability to do the work itself. Energy is always transformed from one form to another, while maintaining the same amount, i.e. Energy cannot be destroyed or created out of nowhere but is always conserved (the first law of thermodynamics1 ).The fundamental energy unit in the metric system is the Joule; 1 Joule is defined as a force of 1 Newton2 applied over a distance of 1 meter (Botkin and Keller 2011).
The sun is the origin for all kinds of energy sources on Earth, such as heat, wind and water movement, and it is the cause of all weather events. The sun and the distribution of dry land and the sea on the surface of the Earth are among the factors affecting the movement of wind, temperature and rainfall and other climatic phenomena (McMullan 2007). The amount of energy that is exploited by humans is too small for what is offered annually by the sun (see Fig. 2-7), as humans just use 1/250000 of the amount of energy radiated by the sun. 47% of this energy goes to heat surface of Earth and sea and atmosphere, while 23% for the evaporation of water from lakes and
1 “Thermodynamics is the science that keeps track of energy as it undergoes various transformations from one type to another. We use the first law to keep track of the quantity of energy” Ehrlich, P. R., A.H. Ehrlich, and J.P. Holdren (1970) Eco-science: Population, Resources, Environment., San Francisco: W.H.Freeman. 2 “A Newton (N) is the force necessary to produce an acceleration of 1 m per second to a mass of 1kg” Botkin, D. B. and Keller, E. A. (2011) Environmental Science, Earth as a Living Planet.

30
oceans, which falls in the form of rain flowing in rivers then again in the seas and oceans (Fig.2-8), either 0.2% of the sun's energy causes the difference in temperature of the land and the oceans, causing the movement of winds from high pressure areas to low pressure areas (OEP 1998b).
Figure 2-7: Rates of solar energy that is reflected and absorbed by the Earth (Botkin and Keller 2011).
Figure 2-8: The hydrologic cycle on Earth, showing the transfer of water in thousands of km3/year (Botkin and Keller 2011).
Therefore, the sun had a strong impact directly on human’s life on earth, but it is like the coin, the first flip is the negative and undesirable effect that leads to the increase of temperature over the limits required for the convenience of humans in some regions of the world, the second side is positive, which is to take advantage of the sun's energy which used in different purposes. The most important uses of this energy in buildings is heating, cooling and producing hot domestic water.

31
2.4: Greenhouse effect and climate change
2.4.1: The phenomenon of greenhouse effect and global warming
Environmental issues occupy the list of concerns in today's world, scientists and experts are interested in analysing the impact of energy issues on the environment and on the development process. It has become clear that the energy uses required for development is accompanied by adverse environmental impacts that cannot be avoided, but it is possible for them to be reduced.
Among the most important environmental impacts of energy use what is known as "global warming" or "greenhouse effect" which linked to the planet temperature rise and climate change (see Fig. 2-9). This phenomenon is a result of increased concentrations of what is called greenhouse gases (GHG) in the atmosphere, such as CO2
3. According to IPCC (Intergovernmental Panel on Climate Change) recent reports and conference in Doha-2012 (UNFCCC 2012), the climate change physical concept is getting more scientific understanding as "most of the observed increase in global average temperatures since the mid-20th century is very likely due to the observed increase in anthropogenic GHG concentrations". Fossil fuels such as oil, natural gas and coal is responsible for the most of carbon dioxide emissions, starting from the search process, then exploration, transportation, manufacturing and finally the consumption (Mohamed Amin 1999).
Figure 2-9: diagram showing the greenhouse effect. (Incoming visible solar radiation is absorbed then re-emitted in the infrared form, but it
is absorbed again by the atmosphere maintaining the greenhouse effect)
One of the causes of the greenhouse effect is the dissimilarity in thermal radiation properties (such as the wave length) of objects at different temperatures (see Fig. 2-10), i.e. the sun at a very high temperature emits a short wave length radiation which can pass through the atmosphere and glass. This heat will be absorbed by the objects inside a greenhouse or a building, which will re-radiate the heat in the form of long waves due to their low temperature compared to the sun. The long
3 The CO2 concentrations in the atmosphere have increased by 35% over the past 200 years. The climatologists caution that mean global temperatures will possibly raise 1.5° to 6°C (2.7°–11°F) by 2100, If present trends continue. Cunningham, W. P. and Cunningham, M. A. (2008) Environmental Science: a global concern. , Tenth ed., New York: McGraw-Hill.

32
wave length radiation do not easily penetrate the glass, as the glass is opaque to long wave radiation (Fig 2-11), so the re-radiated heat will trapped into the closed space and cause the temperature inside the green house to rise (McMullan 2007).
Figure 2-10: The sun emits energy in the visible and near infrared (Short wavelength) contrary to Earth
which emitsenergy in far infrared (Long wavelength) (Botkin and Keller 2011).
Figure 2-11: Greenhouse effect and the different thermal radiation wavelengths.
The greenhouse effect is one of the most important mechanisms that help life and make it possible on Earth, as the atmosphere acts like a large green house (Fig. 2-12), protecting the earth from harmful radiation coming from space and allowed to retain a certain percentage of the heat that comes from the sun. The increase of the greenhouse gases due to burning of fossil fuels increase the greenhouse effect which reduces the amount of heat which the Earth should radiate back into space (McMullan 2007). I.e. a kind of thermal unbalance occurs, as a result of the amount of excess heat that retained within the atmosphere, leading to global warming.

33
Figure 2-12: The importance of greenhouse effect mechanism (Elder 2010).
- Left: Naturally occurring greenhouse gases-carbon dioxide (CO2), methane (CH4), and nitrous oxide (N2O) - normally trap some of the sun’s heat, keeping the planet from freezing. - Right: Human activities, such as the burning of fossil fuels, are increasing greenhouse gas levels, leading to an enhanced greenhouse effect. The result is global warming and unprecedented rates of climate change.
Greenhouse gases are those which have influence on the greenhouse effect, and their quantities may be influenced by human behaviour (see Fig. 2-13). Among the most significant greenhouse gases (McMullan 2007) are:
Carbon dioxide (CO2): result from the burning of fossil fuels, forests, chimneys and motor vehicle exhausts.
Methane (CH4): produced by decay of organic matter and it is the main component of natural gas supplies.
Nitrogen oxides (NOx): the various oxides of nitrogen, which mainly generated from vehicle gas emissions.
Chlorofluorocarbons (CFCs): this chemical compounds produced mainly to be use in refrigerators, spray cans, and insulation. CFCs are among the marginal greenhouse gases but they have a very hazardous role as they can break out to the upper atmosphere then chemically react with it, that cause the depletion of the ozone layer which filters out ultraviolet light which in large amounts can hurt life forms on Earth and cause skin cancer for humans. For this reason many international conventions have been developed since 1990 to reduce the use of this family of gases as much as possible.
Figure 2-13: Major contributors to greenhouse effect (McMullan 2007).
35%
10%
4%
70%
25%
9%
H2O
CO2
CH4
To
From

34
As shown in Table 2-1 the consumption evolution for petroleum and natural gas products in Egypt. The consumption increased from 27 million tons in 1990/91 to 34 million tons in 1997/98, consequently the emissions increased from 75 million tons to 94 million tons (OEP 2001). However, due to the significant efforts to maintain the environment, the consumption has been reduced in subsequent years 2009-2011, and thus emissions (NREA 2011).
Table 2-1: Energy consumption and equivalent emissions in Egypt (1990 - 2011).
Year Fuel consumption
(million TOE) Emissions of carbon dioxide
(million tons) 1990/91 27 75 1991/92 27 75 1992/93 27 74 1993/94 27 73 1994/95 28 77 1995/96 30 83 1996/97 31 85 1997/98 34 94 2009/10 30 76 2010/11 29 78
Arab region's carbon emissions are relatively modest, at the level of each country (see Fig. 2-14) and at the level of the Arab region as a whole (Fig. 2-4). Where there is about 5% of the world's population while it produces less than 5% of the total greenhouse gas emissions in the world. However, emissions in the Arab region are increasing very quickly (Fig. 2-15), it is predicted that the Arab person by 2015 will cause gas emissions that are higher than the average person (Elgendy 2012).
Figure 2-14: Share of Arab countries (including Egypt) in total world carbon emissions (Elgendy 2012).
Figure 2-15: The current and rapid expected carbon emissions growth in the Arab region (Elgendy 2012).

35
Table 2-2 shows the detailed consumption of the petroleum products and natural gas in different sectors in Egypt in the year 1997/98, and its corresponding emissions. As noticed, the electricity generation sector consumed the maximum amount of fuel, consequently produced most amounts of greenhouse gas emissions, which requires action to reduce the consumption of electricity to maintain the environment as much as possible. Especially as the annual consumption rates for electric power generation is on the rise, as evidenced by the recent Statistics for the years from 2001 to 2011 and shown in Table 2-3, resulting in more emissions.
Table 2-2: Consumptions and emissions from petroleum products and natural gas, according to all the service sectors in Egypt - 1997/98 (OEP 1998a).
Sectors
Butane Gasoline Kerosene Solar Diesel Other
Tot
al P
etro
leum
C
onsu
mpt
ion
Natural gas
Tot
al e
nerg
y co
nsum
ptio
n (t
hous
and
TO
E)
Con
sum
ptio
n
Em
issi
ons
Con
sum
ptio
n
Em
issi
ons
Con
sum
ptio
n
Em
issi
ons
Con
sum
ptio
n
Em
issi
ons
Con
sum
ptio
n
Em
issi
ons
Con
sum
ptio
n
Em
issi
ons
Con
sum
ptio
n
Em
issi
ons
Industry 68 203 0 0 3 10 2078 6669 4067 12646 1116 868 7332 3078 4628 10410
Transport 0 0 2155 6690 408 1312 4074 13075 847 2634 257 393 7741 0 0 7741
Agriculture 0 0 0 0 81 260 5 16 0 0 42 62 128 0 0 128
Home - Commercial
1800 5371 0 0 1077 3464 0 0 0 0 0 0 2877 222 580 3099
Electricity 0 0 0 0 0 0 208 668 4101 12752 12 18 4321 6506 16990 10827
Petroleum 0 0 0 0 0 0 437 1402 315 979 7 10 759 711 1857 1470
Total 1868 5574 2155 6690 1569 5046 6802 21830 9330 29011 1474 1452 23158 10517 24055 33675
Table 2-3: Table shows the consumed fuel by type in electricity production companies from 2001 - 2011 (MOEE 2011).
Fuel type 01/02 02/03 03/04 04/05 05/06 06/07 07/08 08/09 09/10 10/11
Heavy fuel oil (thousand tons) 1498 3232 1237 4070 3722 4348 4774 5321 5929 5302
Natural gas (Million m3) 14812 15600 19372 18298 20496 21008 21907 23013 24314 25894
LIGHT FUEL OIL (thousand tons) 2.408 5.449 4.375 28.778 6.722 3.7 2.7 5..7 4.4 3.3
Special L.F.O (thousand tons) 0.84 0.87 35.02 61.32 63.35 49 102 116 170.81 81.7
Total consumption(thousand TOE) 14377 17053 15261 19725 21234 22286 23562 24895 26772 27430
2.4.2: Climate change
In previous eras, architects considered seasonal changes, however the long term rise in the temperature was not considered (they were designing based on the premise of unchanging climate), which means that, the building that provides thermal comfort at the beginning of its life is supposed to continue the same level of performance in the future until the end of its useful life. This assumption is no longer valid. It is becoming increasingly difficult to ignore the element of global climate change, as evidenced by the reports of the Intergovernmental Panel on Climate Change (IPCC) (IPCC 2007b). Climate change is a fact that has been proven in the scientific community worldwide. The temperature of the planet has risen by 1°C in the last 250 years and is expected to rise again by about 4°C in the coming 100 years, which shows the fast escalation of the problem. The evidence of climate change is growing more alarming every year; the exceptionally hot summers (2003/2005) warned experts that the pace of this warming is faster than their worst

36
scenarios4 (Roaf et al. 2009). Meteorological data from most of the globe shows changes in the patterns of precipitation, glacial formations and animal habitats. These changes negatively affect many environmental services that peoples of the world rely on, such as agriculture, energy and healthy living environments (Omar and Ayyad 2013).
Climate change has been a rich topic for research around the world in the last couple of decades. Numerous institutions and organizations are engaged in scientific research in the field. The IPCC was established in 1988 to address the issue. One of the main activities of the IPCC is the preparation of comprehensive assessment reports about the state of scientific, technical and socioeconomic knowledge on climate change, including its causes potential impacts and response strategies (Omar and Ayyad 2013). The recent IPCC reports and conferences have drawn attention to the increased likelihood that unexpected climate events and changes might happen especially after reaching the 400 ppm CO2 limit (IPCC 2007a). This concept is getting more scientific understanding as "most of the observed increase in global average temperatures since the mid 20th century is very likely due to the observed increase in anthropogenic GHG concentrations" (IPCC 2007a, Ren et al. 2011, UNFCCC 2012).
2.4.2.1: Historical Background
The beginning of the industrial revolution in mid 18th century (its results can't be denied) eliminates the clean environment concept. Burning of millions of tons of fossil fuel causes Greenhouse Gas emissions (GHG) such as carbon dioxide (CO2), and as a result this caused the Global Warming which leads to Climate Change. Climate change is a global challenge caused mainly by human civilization and its urban and industrial developments due to global population growth in the last 200 years (Levermore 2008a, Levermore 2008b, IPCC 2007b).
In 1827, Joseph Fourier acknowledged the global warming phenomenon for the first time in a scientific paper "... Such effects are able to make to vary, in the course of many centuries, the average degree of heat, because the analytic expressions contain coefficients relating to the state of the surface and which greatly influence the temperature" (Omar and Ayyad 2013, Keller 2010, Connolley 2014). Physical measurements of global CO2 emissions have been taken since the year 1950s 5 (These Mauna Loa 6 atmospheric CO2 measurements which began in 1958 constitute the longest continuous record of atmospheric CO2 concentration available in the world) (Roaf et al. 2009). The possibility that the climate could be changing was first identified as far back as the 1960s, and the battle against climate change and its main contributory gas CO2 began (Roaf et al. 2009).
In the early 1970s other issues came to attention: acid rain, upper atmospheric pollution, and ozone depletion. Ground based measurements of ozone were first started in 1956, at Hally bay, Antarctica. While the satellite measurements of ozone started in 1970s. In 1974, M.J.Molina and F.S.Rowland published a laboratory study (Molina and Rowland 1974) demonstrating the ability of chlorofluorocarbons (CFCs) to catalytically break down the ozone in the presence of high frequency ultraviolet light (UV). Further studies estimate that the ozone layer would be depleted by CFCs by about 7% within 60 years. Based on such studies and its recommendations, the USA banned CFCs in aerosol sprays in 1978, and then slowly other countries started to do so.
4For the global weather warning that extreme weather events are on increase www.unic.org.in/news/2003/pr/pr111.html. 5Mauna Loa Solar Observatory site http://mlso.hao.ucar.edu/ 6Mauna Loa volcano: on the Pacific island of Hawaii.

37
Later on in 1979, the World Climate Conference of the World Meteorological Organization concluded, "It appears plausible that an increased amount of carbon dioxide in the atmosphere can contribute to a gradual warming of the lower atmosphere, especially at higher latitudes" (Omar and Ayyad 2013). By the mid of 1980s the simulated predictions of the scientists on the warming climate began to demonstrate a close approximation to what was actually happening in the measured records, with clear evidence of increasing temperature and the frequency and intensity of extreme weather events (Roaf et al. 2009). In 1988, the UN Environment Programme and the World Meteorological Organization established the Intergovernmental Panel on Climate Change (IPCC), which consists of hundreds of leading scientists and experts on global warming. IPCC mainly formulate realistic strategies to deal with the problem (Roaf et al. 2009).
2.4.2.2: Reasons
It is believed that global warming and climate change are caused by urban population increases, human welfare and the worldwide industrial growth (IPCC 2010). Many of the gases emitted out of the combustion of fossil fuels lead to altering the climate on Earth. These gases are building up in the upper atmosphere to form an increasingly dense layer that allows solar radiation into the Earth’s atmosphere, however as this layer gets dense it prevents more and more heat from radiating back out into space, so warming the lower atmosphere and changing the climate (Roaf et al. 2009). There is great concern that higher ‘greenhouse’ gas levels and, in particular, CO2 from burning fossil fuels are subtly increasing the insulation of the atmosphere, thus causing a rise in the world’s average temperature (Thomas and LLP 2006). Chemicals, mainly chlorofluorocarbons (CFCs) and hydro-chlorofluorocarbons (HCFCs which are depleting the ozone layer), also contribute to global warming (Thomas and LLP 2006).
Buildings’ construction is one of the main consumers of land and raw materials, and a significant user of fossil energy which emit greenhouse gases. According to data from the World Watch Institute, the construction of buildings consumes 40% of the stone, sand and gravel, 25% of the timber and 16% of the water used annually in the world (Ali et al. 2013). The production and transport of building materials and the construction process in most of countries consumes about 25-40% of the total energy used. Buildings through their life-cycle (construction period, use and demolition) consume approximately 50% of the final energy consumption in the members states of the European Union and contribute almost 50% of the CO2 emissions released in the atmosphere, which is considered to be the basic gas responsible for the greenhouse effect (Ali et al. 2013). The IPCC identified that the reduction of energy consumption and GHG emission from the building sector has one of the highest benefit-cost ratios among many possible mitigation measures across different sectors (Ren et al. 2011).Therefore, current practice of construction industry in Egypt as a mid-latitude region needs to consider passive architectural design for residential buildings as a crucial strategy for climate change mitigation.
While buildings produce GHG emissions at all stages of their life-cycle (including construction, operation, maintenance and demolition), the operation of a residential building generally accounts for 80-90% of the total emissions, mainly from space heating and cooling, hot water, lighting and other household appliances (Ren et al. 2011). Therefore, GHG emissions from building operation may contribute considerably to the global warming. It should be noted that the warming climate may add more pressure on building energy consumption and subsequently GHG emissions. In particular, the increase in building cooling energy consumption and its related GHG emissions, in addition to associated Urban Heat Island effects (Fig. 2-16), can further exacerbates global warming that leads to even higher cooling demands in the future (Ren et al. 2011, Fahmy 2010).

38
Figure 2-16: Urban heat islands (UHI) phenomenon (EPA 2008).
2.4.2.3: Symptoms
With the increased scientific certainty of the climate change concept according to the United Nations Framework Convention on Climate Change recent reports and conference in Doha (UNFCCC 2012). We have to admit that, the effect of global warming will change the ecology of many parts on Earth and will cause trouble for the residents in those areas, where it will change the pattern of their lives and their way for providing their needs. Climate change impacts, from higher temperature and health issues to floods and energy consumption increases, can lead to completely different master plans for urban developments in order to adapt cities in the next few decades (Fahmy 2010). Some of the common effects might be (McMullan 2007, Cunningham and Cunningham 2008):
Global warming causes melting permafrost at the poles which raises sea levels, flooding low islands and coastal regions, changing the patterns of snow and ice sheets than usual and reduces the average ice cover of earth, causing it to absorb more heat and thus warming further more (Theis and Tomkin 2012, Omar and Ayyad 2013).
Causing severe weather events and change rainfall patterns, which trigger droughts and emergence of new deserts in some areas and floods in others.
Changing ocean currents which will cause local climate change in many regions of the world.
Humans and other forms of life have not developed biological mechanisms to protect themselves from large amounts of high-energy ultraviolet radiation (UV), which is filtered out by the ozone layer. The depletion of ozone will led to higher incidence of skin cancer, eye cataracts and damage to land and marine vegetation (Thomas and LLP 2006).
The potential impact of climate change on the operating performance of buildings, in the IPCC’s Third Assessment Report (IPCC 2001) summarizes the impact on the built environment simply as “increased electric cooling demand and reduced energy supply reliability” (Crawley 2008).
The intergovernmental Panel on Climate Change tone is getting loud to urge starting actions as the number of climate change related disasters is increasing (Hulme et al. 2002, Holmes and Hacker 2007, Jentsch et al. 2008). In Africa and Mediterranean region, air temperature has already increased between 1-2˚C since 1970 and is expected to increase another 4˚C by 2100 as the Special Report on Emission Scenario (SRES) tells (IPCC 2000).
International reports and studies show that Egypt is one of the countries that are expected to be influenced greatly by those climate changes. These effects may entail drowning of some parts of the northern delta of the Nile, in addition to increasing salinity of its soil; this part is the home to around 20 million inhabitants and responsible for around 15-20 % of the national food produce.

39
Accelerated desertification of agricultural land in the Nile valley represents a considerable threat to land fertility and food production (Omar and Ayyad 2013). This issue can have very devastating consequences on Egypt and its people, in the form of big deficit in food production, drowning of large urban and agricultural land, prolonged power shortages, fresh water scarcity, and as a result wide economic and societal decline. The IPCC AR4 report has also warned about that in 2007; "Unmitigated climate change would, in the long term, be likely to exceed the capacity of natural, managed and human systems to adapt" (IPCC 2007b). Egypt may have to revise its construction methods, consumption patterns, agricultural techniques and land use schemes under the anticipated global warming consequences (Omar and Ayyad 2013), and follow a smart growth scenario in combination with tackling the renewable sources seriously (Fahmy 2010).
2.4.2.4: Solutions
Assessment Report, AR4, of the IPCC confirmed that global warming is happening and linked the anthropogenic emissions of green house gases and climate change, then focused on the impact of the phenomenon on the world’s population and species. AR4 then reported the means of mitigating the impacts on the economic implications and the technological options for tackling global warming. The report emphasized the need to start reducing emissions by 2015 to prevent the world’s temperature from rising more than 2ºC over pre-industrialized temperatures (Roaf et al. 2009), the same concept was confirmed in 2008 by (Hansen et al. 2008), claiming that climate stability could only be guaranteed by reduction of CO2 levels from the current level of 385ppm (and rising 2ppm a year) to 350ppm .
Civilization will fight civilization, the built environment will cause people to suffer uncomfortable future with about 70% of world population living in urban areas by 2050 (IPCC 2007b). In the context of global climate change, buildings considered as one of the main energy consumers and carbon emitters “it is from the building sector that the great cuts have been predicted as possible, and must be forthcoming” (Raof et al. 2009). According to IPCC buildings consumed 40% of energy sources and led to 36% of energy related carbon emission in industrialized countries (Ali et al. 2013). The 4˚C air temperature increase scenario (A1FI) means that energy consumption could be doubled. The hours of sunshine and the proportion of direct radiation to diffused radiation are projected to increase in the future, while the modelling studies demonstrate a steady increase in cooling capacity and associated energy consumption required for buildings (Levermore et al. 2012). If this hasn't been considered towards reducing energy consumption in residential buildings, the running cost of housing might be unbearable keeping in mind the original construction cost (Fahmy et al. 2014). Therefore, the need to minimize overheating will become an increasing factor in design. For that reason, it is even more critical for the designers to simulate the performance of their buildings under future climatic conditions, to provide an indication of the future thermal behaviour of the building and its ability to provide acceptable conditions, perhaps with some modifications during their service life (Levermore et al. 2012).Climate change mitigation and adaptation are two general approaches in response to global warming (Ren et al. 2011):
1. Climate mitigation: is designed to reduce GHG emissions and in return to reduce the global warming impact.
2. Climate adaptation: is designed to adjust actions in the society to cope with climate changes that are already happening or are the likely consequences of current GHG emissions. Practically, it can be implemented by (Ren et al. 2011): (a) Reducing the potential exposures to climate change. (b) Increasing the ability to adapt to changing environment. It is unlikely to avoid the exposure to the climatic changes, while improving the ability to respond to climate change (adaptive capacity) by enhancing the building's energy performance is considered to be one of the easiest and the lowest cost options to decrease a building’s energy

40
use, owner operating costs, and carbon footprint (Ali et al. 2013). Reducing GHG emissions by improving building energy performance may include the implementation of additional insulation, better ventilation, double glazing, shading devices, thermal mass and adoption of renewable energy technologies (Ren et al. 2011). Generally, there are some practical approaches to reduce the energy consumption of residential houses (Ren et al. 2011): a) Reduce the energy demand by improving energy performance of building envelops. b) Use of energy efficient appliances. c) Installation of renewable energy, such as solar PVs, wind turbines, solar hot water, etc. d) Fuel switching by switching to appliances that use alternative low greenhouse gas
emissions energy sources.
Climate mitigation and adaptation are not a welfare mode of sustainability or a prosperous idea of architectural design and building construction rather than a necessity. Climate adaptation should be properly considered in both building design and operation stages to reduce the impact of climate change whether for existing or new residential buildings, by enhancing their adaptive capacity to accommodate the impact and maintain total energy consumption and GHG emissions no more than the current level in the period of their service life (Ren et al. 2011). Eventually, both GHG mitigation and climate adaptation were suggested to be added to building energy codes and thermal comfort standards (Kwok and Rajkovich 2010, Fahmy 2010, Ren et al. 2011).
2.5: Energy sources in Egypt
Fossil fuels originated from plants and animal materials existed millions of years ago. It is a form of storing solar energy in this geological non-renewable reserve. Other sources of energy such as geothermal, nuclear, hydropower, and solar are known as alternative energy sources because they will act as alternatives to fossil fuels in the future. Some, like solar and wind energy, are non-depleted resources so they are known as renewable energy sources (Botkin and Keller 2011). The energy resources in Egypt vary from the fossil fuel sources (petrol - natural gas - coal) to the renewable sources (solar energy - wind energy). The fossil fuel sources of energy are in the process of depletion, as confirmed by the reports of the Egyptian Ministry of Petroleum, therefore it is necessary to rely on new energy sources before the end of the available stock (OEP 2000).
2.5.1: Traditional natural sources (fossil fuel/depleted fuel)
Figure 2-17: Mapof oil fields and natural gas in Egypt (MOP 2012).
Oil fields Natural gas Natural gas exploration

41
2.5.1.1: Crude oil
Egyptian crude oil is obtained from the Gulf of Suez, Sinai and the Western desert (see Fig. 2-17). Total reserves (Fig. 2-18) at the end of 1998 were about 2.97 billion barrels of crude oil equivalent (OEP 2000), by the year 2010 they reached 4.4 billion barrels of crude oil equivalent (NREA 2011).
Figure 2-18: Proven reserves of oil and natural gas in Egypt (OEP 2000, NREA 2011).
2.5.1.2: Natural gas
The presence of a large inventory of natural gas sufficient for many years caused the spread of gas usage in Egypt within several sectors (Fig. 2-19) such as industrial, residential and commercial sectors. This stock located in the Delta area, western desert and Gulf of Suez. The total reserves at the end of 1998 were about 7 billion barrels of oil equivalent, by the year 2010 they reached 13.54 billion barrels of oil equivalent (NREA 2011). Production of natural gas and its derivatives increased from about 12.86 million metric tons (14.29 million tons oil equivalent barrels) in 1997/96 to 13.28 million metric tons (14.76 million tons oil equivalent barrels) in 1998/97 with an annual average growth rate of 3.28%, and increasing in energy produced from 24.4% in 1997/96 to 25.62% in 1998/97. These rates continue to rise as a result of the continuing discoveries of natural gas over the past years (OEP 2001).
Figure 2-19: The rate of natural gas consumption in various sectors for the year 2009/2010 (MOP 2012).
1996/97 1997/98 2010/2011
Petrolum 3.03 2.97 4.4
Natural gas 6.32 7 13.54
0
2
4
6
8
10
12
14
16
Bil
lio
n b
arr
els
30%
56%
11%
3%
Industry.
Electricity production.
Oil and its derivatives.
Fueling cars and houses.

42
2.5.1.3: Coal
Types of coal and other carbonaceous ores have been found in central Sinai in the year 1959 at depths of 418 meters and even 2960 meters during the search for oil. However, the Egyptian General Authority for Geological Survey began the search for coal in 1965 (Helal 2001). The sources of coal in Egypt are limited and are concentrated in the areas of Bid'ah, Thwra, Ouoon mosses, Kalabsha and Magharaa. Even though, coal reserves were estimated within 27 million tons, the industrial sector still needs to import additional 2 million tons of coal annually for use in the manufacture of iron and steel (OEP 2001).
2.5.2: Renewable sources
The major renewable energy sources in Egypt are the solar energy, wind energy and hydropower. The Ministry of Electricity and Energy (MoEE) invested in a large scale developments to take advantage of the available renewable resources, to achieve the goal of increasing the share of renewable energy to cover 20% of the energy needs in Egypt by the year 2020 (NREA 2011). The map in Fig. 2-20 shows the existing renewable energy projects along with experimental and future projects.
Existing projects Experimental and pilot projects Future projects
Figure 2-20: Renewable energy locations in Egypt (NREA 2011).
2.5.2.1: Solar energy
Solar energy projects are considered a cornerstone in disseminating the renewable energy utilization. The Egyptian Solar Atlas was issued in 1991, and shows that the average direct normal solar radiation is 2000 – 3200 kWh/m2/year, the sunshine duration ranges between 9 – 11 h/day from North to South with very few cloudy days (NREA 2011). These high solar radiation rates (see Fig. 2-21) encouraged the implementation of several projects to take advantage of solar energy in generating electricity and thermal energy using solar water heaters, which were produced and used in the new cities and resorts as well as industrial sector. The state adopts an ambitious plan to

43
increase reliance on solar energy via developing and establishing more electric power plants using solar thermal systems (OEP 2000). As a result of this plan, the total capacity is expected to increase from about 1050 megawatts in 2007 to 4050 MW by 2017,this means the electric power being generated from solar thermal stations will rise from around 6.6 billion kilowatt hours / year in 2007 to 25.5 billion kWh / year in 2017 (OEP 2001). PV cells have been used in the electrification of an Egyptian village (Awlad Sheikh in Natrun valley) distant from the electricity grid, where 40 houses have been supplied with 212 watts solar cells capacity per house which is enough to run lighting and some electrical appliances, and some other solar cells have been developed for street lighting and pumping water to the village. This project aims to develop and reconstruct areas far from the electric grid using environment friendly systems (OEP 2001).
Figure 2-21: Annual Direct Normal Irradiation zones in Egypt (NREA 2011).
Solar energy represents one of the methods for generating electricity in Egypt, using any of the following techniques (NREA 2011):
1- Solar thermal electricity generation: This system based on the same energy conversion methods, and the same components that used in conventional thermal power plants to produce electricity, except replacing the used traditional fuel by thermal energy resulting from concentration solar radiation. Such systems can be used in central power plants or as individual units in remote areas with limited capacity. This technique used in projects such as Al -Kuraymat village (90 km South of Cairo) which integrated solar combined cycle power plant with total cost of 340 Million US Dollar, and total capacity of 140 MW, capacity of solar Island 20MW, net electric energy 852 GWh/year, solar electric energy 34 GWh/year, fuel saving due to the solar portion 10000 TOE/year (NREA 2011). As a future project, Komombo site in southern Egypt was selected to host 200 MW solar thermal power plant project within the fifth years plan (2012-2017), it is expected to start functioning late 2015.
2- Photovoltaic systems (PV): In spite of being an expensive technology, photovoltaic systems are considered the most appropriate energy application for rural and remote areas of small scattered loads which are far away from national grid. The cost of PV systems maintenance is considered reasonable compared to its life time which is about 25 years. The total installed capacity of PV systems in Egypt is around 10 MW for lighting, water pumping, wireless communications, cooling and commercial advertisements on highways. There are two proposed future projects to implement 20 MW in solar plant in Hurghada in co-operation with Japan, and another project to implement 20 MW in solar plant in komombo in co-operation with France.

44
2.5.2.2: Wind energy
Electric power generation by the use of wind power, is considered one of methods less polluting and damaging to the environment as it only use the force of air. Wind power systems depend on mechanical energy as the wind moves turbine blades, and this mechanical energy is converted to electricity through electrical generators. Wind energy has achieved great progress in the average capacity for each turbine, in addition to enhancing the efficiency of the operation control and grid connection. However, the high wind speed element remains the key to the project's economical success. Egypt Wind Atlas (NREA et al. 2005) was issued in December 2005 in co-operation with Riso laboratories of Denmark and Egyptian Meteorological Authority (EMA); it aims to indicate the areas with high wind speed which is qualified for wind energy projects. According to the wind atlas (NREA et al. 2005) some of the world’s great potential wind power resources are located in Egypt, so it can be exploited to construct wind turbines and wind farms to generate electrical power. Among the most important of these areas are the Red Sea coast between Ras Gharib and Safaga (gulf of Suez – see Fig. 2-22), north-west coast to Mersa Matruh, Sharq Alowaynat, and west and east Nile valley where the wind speed in these areas 20-30 km/h (6-9m/s) and this speed is sufficient for the economic feasibility of generating electricity (NREA 2011).
Figure 2-22: Areas with high wind speed which is qualified for wind energy projects in Egypt (NREA 2011).
Wind farms has been established on the coast of the Red Sea with capacity of 4 x 100 kilowatts since 1988 then it has been linked to a local network for electricity distribution. This success encouraged a local program for manufacturing wind energy equipment. Other wind farms (listed in Table 2-4) have been constructed with local manufacturing components amounted to 45% (OEP 2000).
Table 2-4: Specifications and possibilities of some wind farms in Egypt (NREA 2011).
Starts total production
2010/2011
saving of oil
equivalents
reducing of CO2
emission
total installed
capacity
Hurghada Wind Farm 1993 7 GWh 1.5 thousand tons 4 thousand tons 5 MW
Zafarana Wind Farm 2001 1495 GWh 327 thousand tons 837 thousand tons 545 MW

45
Number of future wind projects have been planned to reach the desired objectives (NREA 2011): (1) 200 MW wind farm projects in co-operation with European Investment Bank (EIB) and European Commission in Gulf of Zayt. (2) 420 MW wind farm in Gabal El Zayt and west of the Nile in co-operation with Japan government. (3) 300 MW wind farm with the co-operation of Spain government. (4) 200 MW wind farm in Gulf of Suez with the co-operation of United Arab Emirates. (5) 200 MW wind farm in Gulf of Suez with the co-operation of KFW, EIB, French Development Agency and the European Union.
2.5.2.3: Hydropower energy
Hydropower is the power generated from hydro resources, and it is the third major energy resource in the utilization and considered one of the cheapest and cleanest sources of power generation in Egypt (NREA 2011). Most of the river Nile’s hydropower potential (about 85 %) has already been exploited to generate about 13 TWh of electricity per annum. Hydro power generation started in Egypt in 1960 with the construction of Aswan dam to control the Nile water discharge for irrigation. In 1967 the high dam hydro power plant (2.1 GW) was built, followed by the commissioning of the second Aswan power plant with capacity of 615 MW in 1985. In cooperation with the Ministry of Water Resources and Public Works, Esna hydropower plant with capacity of 90 MW was commissioned in 1993. Naga-Hammed hydropower plant (total capacity of 165MW) was built in 2008 (Faggal 2002). The share for hydropower generation in 2010/2011 (see Table 2-5) was about 8.9 % of the total power generated in Egypt (MOEE 2011). New Assuit hydro power plant with total installed capacity of 32 MW is expected to start by year 2017 (MOEE 2011).
Table 2-5: Energy Generated from Hydropower Plants (Gwh)(MOEE 2011).
Plant 2009/2010 2010/2011
High dam 8821 9000
Aswan dam-1 1376 1461
Aswan dam-2 1700 1632
Esna 493 495
Naga-Hamady 473 458
Total 12863 13046
2.6: Rates of energy demand and consumption in Egypt
There is a direct relationship between a country’s living level (measured by the gross national product) and energy consumption of the individual (Botkin and Keller 2011). Primary energy consumption in Egypt increased in 1997/98 where it reached 39.9 million TOE compared to 36.7 million TOE in 1996/97 with an average growth rate of 8.895%. The petroleum energy represents 93.1% of the total primary energy consumed in Egypt in 1997/98. The following figures (Fig. 2-23 and Fig. 2-24) shows the service sectors consumption of electric power in Egypt in the years from 2006 until 2011, which demonstrates the dominance of the residential sector on electricity consumption over the represented years, which requires positive steps towards rationalization of energy consumption in this sector.

46
Industry
32%
Agriculture
4%
Facilities
5%
Lighting
5%
Residential
41%
2010/11
Figure 2-23: Sectors consuming of electric power in Egypt (MOEE 2011).
Figure 2-24: Consumption rates for service sectors of electric power in Egypt 2009/10 – 2010/2011 (MOEE 2011).
2.7: Rationalizing energy use in Egypt
Rationalization of energy consumption was a reaction to the growing demand for conventional energy and the high costs of the energy consumed, in addition to being one of the most important tools that helped in the fight against environmental pollution in the world. The subject of energy conservation and maintaining the integrity of the environment became a characteristic of a civilized society which is free from the causes of pollution and the problems it caused in the water, air and ground (Faggal 2002). Rationalizing and conserving energy refers simply to use less energy and adjusting the energy needs and uses, to minimize the amount of energy needed for a given task. Changing the current wrong behaviours in using energy is the most
Industry Agriculture Facilities Lighting Government
al Residential Commercial
2006/07 34569 3789 4228 6653 5562 36596 7046
2007/08 37045 4209 4380 6759 5691 40271 8240
2008/09 37273 4617 4714 6982 5563 43811 8754
2009/10 38916 4834 5555 7050 5443 47431 9674
2010/11 40702 4927 5759 6186 5977 51370 10238
0
10000
20000
30000
40000
50000
60000
Me
ga
wa
tt h
ou
r
Industry
33%
Agriculture
4%
Facilities
5%
Lighting
6%
Residential
40%
2009/10

47
effective way to achieve this objective, this includes the values and decisions in address global environmental problems beginning with local level (Botkin and Keller 2011).
Science has achieved significant progress in preparation of studies and plans to get to the means by which we can conserve conventional energy and activate the optimal exploitation of alternative energy. During recent years, many of the world’s countries started to conduct studies, develop policies, enact laws and take practical measures in various sectors of the energy conservation and rationalization of consumption and contribute to solve the environmental problems caused by them, depending on the circumstances of each community. The rationalization of energy consumption is based on the following basis (Faggal 2002): 1 - Reduce and organize the energy consumption in the nonessential areas. 2 - Choose appliances and equipment with high efficiency in terms of energy consumption. 3 - Use the available techniques for the rationalization of energy consumption. 4 - Use the new energy sources and renewable alternative to conventional energy.
The building sector's energy consumption represents a high percentage of the total energy consumption. A lot of solutions were founded to increase energy efficiency and conservation in building sector using building materials and architectural design concepts. The new buildings can be designed and constructed to consume less energy for comfortable living, but for older buildings the potential for conserve energy through architectural design is extremely limited, as the location and orientation of the building in the site has already been determined, and the reconstruction may not be cost-effective. Therefore best approach to energy conservation in this situation is the thermal insulation, installation of windows shading devices, double glazing windows, and regular maintenance (Botkin and Keller 2011, El-Azzawy 1995).
Chapter Conclusion:
This chapter covers selected major and fundamental topics related to energy issue in general and in Egypt particularly. Among these subjects the phenomena of greenhouse effect and global warming, and the associated global climate change. The different energy sources, rates of energy demand and consumption in Egypt were among the topics included too.
The irrational energy use trends and the irresponsible construction behaviours affect the natural environment, and necessitate using different sustainability principles to secure the future of the upcoming generations. Otherwise, civilization will fight civilization, and the built environment will cause people to suffer uncomfortable future.
The reduction of the project's total cost over its useful life must be taken into consideration. This includes the initial costs of the project establishment, in addition to operating costs such as energy price, maintenance and repair, as well as the costs of renovation or demolition.
Climate adaptation should be properly considered in both building design and operation stages to reduce the impact of climate change whether for existing or new residential buildings, by enhancing their adaptive capacity to accommodate the impact and maintain total energy consumption and GHG emissions no more than the current level in the period of their service life. Eventually, both GHG mitigation and climate adaptation were suggested to be added to building energy codes and thermal comfort standards.

48
Chapter 3: Thermal properties and the role of Passive architecture
3.1: Heat concept
As described in the existing literature, heat was defined as one of the four elements of nature (Fire, Air, Water and Earth) (McMullan 2007). Heat is a form of energy, energy is most often converted or transformed from one form to another, but without effect on energy quantity in accordance with the principle that energy cannot be perish or created out of nowhere but is always conserved, which known as the first law of thermodynamics1 (Botkin and Keller 2011). Energy can be transferred by interactions of a system (work and heat) with its environment (Incropera et al. 2011).
The thermal energy is an inner molecular property of a material, and it forms a middle phase in other energy forms production. Thermal energy radiated originally from the Sun which is also the source of most energy forms used on Earth. These energy forms includes fossil fuels such as coal and oil which were originally forests and other organic forms benefited from daylight (McMullan 2007). Heat is a form of energy, appears in the speed of matter particles movement or in the form of electromagnetic radiation. Among its most important features:
1. Temperature is not a physical amount it is an indication of matter particles movement speed. It is also the condition of the body which determines whether heat shall flow from it or vice versa2 (McMullan 2007).
2. The material's temperature rises when it absorbs energy in its thermal image, whether by the transfer of molecular motion of adjacent materials or by absorb the electromagnetic radiation.
The transfer of thermal energy through the building structure is a major factor in the building's heat balance. So the thermal insulation is a dominant factor in reducing the thermal losses from the building’s fabric, its cost will be paid back through the reduction of energy consumed in heating or cooling, annual savings in the fuel amount needed, and finally in the reduction of carbon emissions (McMullan 2007).
1 Science which tracks energy quantity when transformed from one form to another. 2 As the heat flows from substances of high temperature to objects at lower temperature.
Chapter Introduction:
This chapter introduces a review for the most important factors that affects the buildings'
thermal performance, through the related studies, and existing literature materials.
Mechanisms of heat transfer, thermal and physical properties of building materials, in
addition to the available building materials in Egypt will be discussed. The thermal comfort
issue is also considered, along with some different aspects of passive architecture techniques
(which were used in the Egyptian vernacular architecture) to reduce the energy consumption
and achieve indoor thermal comfort.

49
3.2: Mechanisms of heat transfer
Heat flow is the transfer of thermal energy from one source to another. The heat energy always tends to transfer from a high temperature source to a low temperature source. If numerous objects at different temperatures are close together, the heat will flow between these objects until the temperature of each one is equal to one another, i.e. they reach the thermal equilibrium (Bradley and Johnston 2011). As long as it occurs a difference in temperatures in a medium or between media, heat transfer must occur (Incropera et al. 2011).
Heat transfer takes three main forms (Fig. 3-1), mentioned in most of the references (El-Wakeel and Serag 1989, McMullan 2007, Incropera et al. 2011):
1- Conduction: transfer of heat through the materials particle from the higher energy particle to the lowest.
2- Convection: transfer of heat energy by the movement of the material particles. 3- Radiation: transfer of heat through vacuum by electromagnetic waves.
There are some other references that added some other forms, such as: 1- Heat transfer through natural ventilation or infiltration (OEP 1998b). 2- Evaporation and Condensation: change of the material state from liquid to gas and vice, leads
to the absorption and emission of heat from the same material (El-Wakeel and Serag 1989, McMullan 2007).
Figure 3-1: Certain forms of thermal penetration from the external environment into the building.
1- Radiation: movement of rays (infrared) through glass is a notable factor of heat gain especially in summer.
2-Air infiltration: leakage of air through unsealed gaps, responsible for some of the buildings heat gain.
3-Conduction: direct transfer of heat through low conductive frame material (e.g. aluminium).
4- Convection: heat gain through air that heats up through warmer glass (e.g. single glass).
4- Convection: heat gain through air that heats up through warmer glass (e.g. single glass).

50
3.2.1: Conduction
Known as the transfer of heat energy through material when a temperature gradient exists in a stationary medium as solids or fluids (liquids and gases), from the more energetic to the less energetic particles of the substance, without changing the location of the material's molecules. Molecules near the heat source gains thermal energy, appears as acceleration in particles movement, and in turn transmitted it to neighbouring molecules by drift of free electron from one atom to another (Bradley and Johnston 2011, McMullan 2007, Incropera et al. 2011).
The rate at which conduction occurs varies according to the substance and its state, and it can be reduced via thermal insulation using materials with large distances between its atoms such as low density materials (Gases). Such materials used as the active ingredient for thermal insulation in fabrics like glass fibre and aerated concrete. Poor conductors are called “Insulators” such liquids, gases and porous materials that trap a lot of air. On the contrary, metals (e.g. copper) are good conductors (McMullan 2007, Bradley and Johnston 2011).
3.2.2: Convection
Heat transfer via convection comprised of two sub-mechanisms. In addition to energy transfer due to random molecular motion (conduction), energy is also transferred by the macroscopic motion of the fluid3 (the bulk). Such motion in the presence of a temperature gradient contributes to heat transfer, because the molecules in the aggregate retain their random motion, the total heat transfer is then due to a superposition of energy transport by the random motion of the molecules and by the bulk motion of the fluid (Incropera et al. 2011).
When an amount of fluid (e.g. air) adjacent to hot surface heated by conduction, it expands and be considerably less density compared to the ambient air, the hot fluid replaced and driven up by densest cold fluid, that creates a continuous current transfers the heat among this fluid through the transmission of particles, and creates what is known as convection currents. This form can only occur in fluids (Liquids and gases) (McMullan 2007).
3.2.3: Radiation
Defined as the transfer of heat energy by electromagnetic waves, where heat is emitted from a body and transmitted across space as energy from the high temperature's body to the colder body across the void or any transparent medium such as air or glass. This form of heat transfer occurs because the thermal energy of the material's surface molecules generates electromagnetic waves in the infrared range (McMullan 2007, Incropera et al. 2011). Every object is continuously emitting and absorbing heat to and from surroundings, “Prévost’s theory” of exchanges explains that as, the balance of these two processes determines whether or not the temperature of the object rises, falls or stays the same (McMullan 2007).
All surfaces or bodies of finite temperature emit energy in the form of electromagnetic waves. The rate of which a body emits or absorbs radiant heat depends upon the nature and temperature of its surface. This rate is governed by many factors such as (McMullan 2007, Bradley and Johnston 2011):
The temperature difference between radiating and receiving surfaces. High temperature bodies emit a larger proportion of short wavelengths, which have better penetration ability than longer wavelengths.
The distance between the surfaces. Rough surfaces present a large total area and absorb or emit more heat than polished surfaces.
3 This motion is associated with the fact that, at any instant large numbers of molecules are moving collectively or as aggregates (Incropera et al., 2011).

51
Emissivity of the surfaces: dark surfaces absorb most light and heat (dull matt black have the highest absorption and emission of radiant heat), while bright reflective surfaces are poor emitters and receivers (shiny silver have the lowest absorption and emission of radiant heat).
Heat radiation is a form of wave energy similar to radio and light waves. It does not require medium for its transfer, it can take place across a vacuum, but can be restricted by using surfaces that do not readily absorb or emit radiant heat, such surfaces which reflect electromagnetic waves of heat radiation (McMullan 2007, Bradley and Johnston 2011). It is clear that heat transfer by conduction and convection requires the presence of a temperature gradient in some form of matter. In contrast, heat transfer by thermal radiation requires no matter. The radiation process also relevant to many industrial heating, cooling, and drying processes, as well as to energy conversion methods that include fossil fuel combustion and solar radiation (Incropera et al. 2011).
3.3: Thermal and physical properties of building materials
Heat transfer rate to and from the building depends on several factors, including what is related to the building itself and which is attributed to the surrounding climatic factor. Buildings consist of different building materials, different in physical and thermal properties (thermal characteristics). Changing or modifying these properties by selecting different combinations of materials affect the building's ability to resist heat flow, thus affect the thermal performance and behaviour of the building and its response for surrounding environmental variables (El-Wakeel and Serag 1989). The thermophysical properties for the materials which constitute the outer envelope of the building (roof - walls - openings), building mass and orientation, ventilation and air leakage, can be considered the most important factors affecting the heat transfer for the buildings. In addition to the external surrounding environment which influence the buildings with many influences such as solar radiation, wind, and relative humidity.
3.3.1: Thermophysical properties
Heat transfer rate is influenced by several properties of matter. These properties generally named thermophysical properties and include two different categories, transport and thermodynamic properties. The transport properties include the diffusion rate coefficients such as “k” (thermal conductivity). Thermodynamic properties are related to the equilibrium state of a system. Density (p) and specific heat (cp) are two such properties used widely in thermodynamic analysis (Incropera et al. 2011).
3.3.1.1: Thermal Conductivity (k-value; W/m K)
Known also as lambda value (そ), it is a measure of the heat conduction rate through a material under certain conditions, and it is measured as the heat flow in watts across a thickness of 1m of material for a temperature difference of 1 degree Kelvin (K) and a surface area of 1m2 (McMullan 2007). Thermal conductivity is a material’s property provides an indication of the rate at which energy is transferred through the material by the conduction process. It depends on the physical properties of the material, and its atomic and molecular structure, which related to the material’s state as shown in Fig.3-2. Generally, the thermal conductivity of a solid state material is larger than for a liquid material, and certainly larger than that of a gas state material, due to the differences in intermolecular spacing for the two states (Incropera et al. 2011).

52
Figure 3-2: Thermal conductivity for different materials, at normal temperature and pressure
(Incropera et al. 2011)
3.3.1.2: Thermal Resistivity (r; m K/W)
Thermal resistance is an alternative index of heat conduction rate through materials, it is an inverted value of thermal conductivity, as shown in Equation 1(El-Wakeel and Serag 1989, McMullan 2007).
司 噺 層【暫 (eq. 1)
Where: k= thermal conductivity of the material (W/m K).
Values of thermal conductivity and resistivity can vary according to the following circumstances (McMullan 2007):
Manufacturing difference in material batches, in terms of density and thickness has significant effects on the k-values of the products.
Increasing the moisture content increases the conduction and decreases the insulation effect. The time effect in terms of deterioration in performance for example, the k-value of expanded
polystyrene typically changes from 0.035 to 0.04 with time.
3.3.1.3: Thermal Resistance (R-value; m2K/W)
Insulation systems consist of low thermal conductivity materials to achieve high thermal resistance combinations (structural elements). Thermal insulation effect depends on two factors, thermal conductivity (k) and the thickness (d) of each of the used materials in the construction (McMullan 2007). Thermal resistance is a measure of opposition of heat transfer provided by a particular part in the building. There are three types of thermal resistance (McMullan 2007):
a) Material resistance (R): for any part of the building consists of many layers, it depends separately for each material on the thermal conductivity (k) for this material, and the layer thickness. The higher the R-value the more insulation effect for this material (Equation 2) or another formula can be used (Equation 3).
R=d/k (eq. 2)
Where: R= thermal resistance of that material (m2 K/W). d= thickness of the material (m). k= thermal conductivity of the material (W/m K)
R= r X d (eq. 3)
Where: (r = 1/k) resistivity of the material (m K/W)

53
b) Surface resistance (Rsi - Rso): The air in contact with a surface forms stationary layer which oppose the heat flow. One of the factors that affect the rate of heat flow between the outside and the inside medium is the static air layer adjacent to both indoor and outdoor surface of the external walls. These layers increase the wall thermal resistance, as air is a poor conductor of heat. The thickness of these static air layers decreases when air speed increases, and its thickness increases with increasing wall surface roughness, its affected also by other factors such as, direction of heat flow, exposure to climatic influences (sheltered or exposed) and its surface properties (materials with high or low emissivity) (McMullan 2007, El-Wakeel and Serag 1989). When determining the thermal resistance of a wall, thermal resistance of the external and internal surfaces must be added.
c) Airspace resistance - empty cavity (Ra): depends on the nature of the heat transfer forms (conduction, convection and radiation) within the cavity. Its affected by many factors such as: Thickness of the airspace cavity. Flow of air in the cavity (ventilated or unventilated).
Lining of the airspace (normal surface or reflective surface with low emissivity).
Total thermal resistance (Rt): the total thermal resistance is the sum of the thermal resistances for all the consecutive layers in a structural element, just like the electrical resistance for elements connected in series.
Rt = ∑ R (eq. 4)
For an external wall the summation will be (McMullan 2007):
Rt = Rsi + R1 + R2 + .... + Ra + Rso (eq. 5)
For a partial fill there would also be a cavity air space resistance (Ra) (Bradley and Johnston 2011).
3.3.1.4: Thermal Transmittance (U-value; W/m2K)
Is the overall rate at which the heat transferred through building envelope, and is defined as: the rate of heat flow in Watts, passing through a composite structural element of 1m2, and temperature difference between the outer surface and the inner surface (across the element) of 1°C or 1°K (Bradley and Johnston 2011). The U-value of a building element is calculated (Equation 3) as the reciprocal of the total thermal resistance (Rt) of that element, including the inside and outside surface resistances (Bradley and Johnston 2011).
U = 1 / Rt = 1 /(Rsi + R1 + R2 + Ra + Rso) (eq. 6)
Where: U = thermal transmittance. Rt = total thermal resistance. Rsi = inner surface resistance. Rso= outer surface resistance. Ra = cavity air space resistance (if any). R1,2,.= different layers resistance.
The U-value is used to determine how rapidly heat will pass through a structure component, for given internal and external temperatures. The U-value also provides a common basis for comparing the thermal insulation of different types of elements, and is used to predict the heat gains and losses from buildings.

54
3.3.1.5: Heat capacity (pcp ; J/m3K)
It is the product of specific heat capacity [cp; J/kg. K] and density [p; kg/m3]. Usually termed the volumetric heat capacity or thermal mass, it is the amount of heat required for raising the temperature of one volume unit (1m3) one degree Celsius (El-Wakeel and Serag 1989). Heat capacity measures the ability of a material to store thermal energy. Substances of large density, such as many solids and liquids are very good energy storage media and have similar heat capacities (pcp> 1 MJ/m3K). On the contrary, because of their very small densities, gases are poorly suited for thermal energy storage (pcp≈1 kJ/m3K). Due to the very tiny difference in specific heat capacity between building materials, the density is the main factor that effect the heat capacity for building materials, in the same time the materials heat transmittance, because the greater the amount of heat required to heat the materials of the wall or ceiling the less the heat access through it (Incropera et al. 2011).
3.3.1.6: Time lag ȋɔǢ hours)
When a wall or ceiling absorbs the thermal energy, that causes its temperature to rise up, then most of that heat emits after the sunset, i.e. after the absence of the heat source (El-Wakeel and Serag 1989). During this iterative process the inner surface reaches its maximum temperature after the outer surface by a certain period, i.e. the effect of the external weather conditions transmitted to the inner space after a while. This period called time lag, and it is affected by the external walls and roofs thermal resistance, thickness, density and the outdoor and indoor temperature difference. This means, by increasing the wall's thermal mass that will need more energy to rise the wall's temperature and subsequently the time needed for that (OEP 1998b).
3.3.1.7: Surface characteristics
The capability of a material to absorb or emit radiant heat is a surface property of this material. A rough black surface can absorb and emit most of the radiant heat, on the contrary shiny silvered surfaces absorb and emit least heat (McMullan 2007). To identify these surface properties, coefficients of emission and absorption are used. Any material surface is compared to a theoretically material surface named "Black body" which considered as the ideal emitter and absorber with a given coefficient equal to one (McMullan 2007, Incropera et al. 2011).
1. Absorptivity : It is the property that determines the fraction of the incident radiation absorbed by a surface, and converting this radiation which intercepted by the matter to internal thermal energy (Incropera et al. 2011). The absorption coefficient is the fraction of radiant energy absorbed by a body compared to that absorbed by the black body (McMullan 2007).
2. Reflectivity: The reflectivity is the property that determines the fraction of the incident radiation reflected (redirection) by a surface (McMullan 2007, Incropera et al. 2011).
3. Emissivity(E; W/m2): Emissivity is the fraction of energy radiated by a surface compared with that radiated by the black body at the same temperature (McMullan 2007, Incropera et al. 2011).
Wavelength of the radiation which specified by the temperature of the radiation source, is the main factor to determine the values of emissivity and absorptivity coefficients. While the colour of most building materials has an important effect on the heat absorbed by the building from the sun (high-temperature radiation) but has little effect on the heat emitted from buildings (low-temperature radiation) (McMullan 2007).

55
3.3.2: Available building materials in Egypt
Building materials are one of the key requirements necessary to meet the needs of urban expansion in Egypt. The provision of building materials from the natural resources available locally or through local manufacturing is one of the fundamentals of sustainable development. It is also one of the most important economic fundamentals in the implementation of development plans especially in the construction sector (OEP 1998b). The accuracy of engineering calculations depends on the validity of the thermophysical properties for the used building materials, where the misleading information in the initial system analysis process led to many failures to meet a required performance specifications, or flaws in equipment and design process. So the selection of reliable data is an integral part of any careful engineering analysis (Incropera et al. 2011). Thermophysical properties data used in this thesis (Appendix I) were obtained from reliable sources, such as:
1- Egyptian Residential Energy Code (EREC) (HBRC 2008). 2- Egyptian Specifications for Thermal Insulation Work Items (HBRC 2007). 3- Directory of Architecture and energy - Egypt (OEP 1998b).
3.3.2.1: General classification for the traditional raw natural building materials in Egypt
A list for some of the most important raw natural materials available in Egypt will be discussed. These materials can be used in construction or establishment of building materials industries that could contribute to the provision of building materials needs. In addition to some essential materials in the construction industry such as insulation materials, which can be fully imported from abroad or some of its components then complete the manufacturing process in Egypt (OEP 1998b, HBRC 2007):
1- Aggregates: Aggregates can be defined as filler for concrete mix, consists of rocky grains with specific characteristics in terms of diameter, gradation, physical and mechanical properties, as well as the chemical composition to suit the purpose for which it was designed and used for (OEP 1998b). Aggregates can be divided to: a) Natural aggregates: taken from the natural quarries without introducing any industrial
processes that can change its natural state, such as sand and gravel: 1) Sand: Exists in Egypt in the form of sediments in many areas, such as seashores
and the banks of the river Nile, and as a superficial cover for other types of rocks, or in the form of sand dunes. Sand that contain a proportion of Silica equal to 80% or more, are used in construction and following industries: sandstone industry, clay bricks, concrete bricks, concrete works, mortar, cement tiles and ceramics. Sand with high-purity (more than 98% Silica) used in the glass industry. 2) Gravel: Used especially in concrete industry, while thin gravel used at times in manufacturing concrete bricks.
b) Manufactured aggregates: includes several types according to the treatment processes that introduced to its natural form, such as Allica or different crushing plants stones outputs (broken limestone, granite or other rocks). It also can divide according to the grain size to small rubble, and large rubble.
2- Concrete brick: Sand located in Sinai can be used in the manufacture of concrete bricks, as a fine aggregate in the concrete bricks mixture, after taking into account the proportion of cement added to the mixture, and the methods of forming and processing. 3- Calcareous sediments: Limestone is one of the most common types of sedimentary rocks consisting mainly of calcium carbonate and contains some magnesium carbonate and silicate materials such as

56
quartz grains (about 92% of calcium and magnesium carbonate, 5% silicon oxide). Limestone usually characterized by the presence of an amount of fossils and seashells. The limestone mainly used in building industry as building bricks, but also the broken stones can be used in the manufacture of concrete bricks. The powder resulted from crushing the limestone sometimes used in tile industry. The limestone sediments considered essential in the lime industry, cement and paints. 4- Clay sediments: The clay rocks are one of the widespread sedimentary rocks that formed as a result of natural erosion factors such as wind and water. It can be moved from its place through different transport factors such as water or wind, and precipitate out in new Sedimentary basins in valleys or deltas of rivers, or in the seas and lakes. There are several methods to use the clays according to their metallic components and its purity. a) Desert clay: used in manufacturing of clay bricks, in cement industry and fine
aggregate industry. b) Kaolin: the pure kaolin clay, used in ceramics and paints industry and in manufacturing of refractory bricks, non-pure types can be used in the clay bricks industry.
5- Gypsum sediments: Gypsum is a very soft sulphate mineral, composed of calcium sulphate dihydrate, with the chemical formula CaSO4·2H2O (Cornelis Klein 1985). Gypsum broadly used in Egypt in several fields, including gypsum blocks industry, salty farmland reclamation and as an important adhesive plaster in construction and in building materials industry. The geological information and various studies have shown gypsum presence in large quantities in Egypt. 6- Basalt rocks: Mainly reside in the South Sinai Governorate in two sites, mountain Matla and mountain Tacna. Broken basalt used in manufacturing of special concretes, tiles and paving roads. 7- Marble: Marble is extracted in Egypt from several natural sources exists in Sinai, such as crystallized and metamorphic limestone. These rocks can be cut into sheets subject to refine and polishing. 8- Granite: These rocks exist in Sinai Peninsula, especially in south of Sinai and often located in the mountains and it extends to several kilometres. Granite divided into several types according to its different colours, which determined by the mineral composition, such as white and pink granite. 9- Thermal insulation materials: Thermal insulation material is a substance or group of substances, can reduce heat transfer when they used correctly. Insulating materials exists in several forms including (HBRC 2007): a) Loose insulation materials: Granulated powder, can be poured on the surfaces to
insulate them, or fills the spaces between the double walls. Adhesive materials can be added to the granulated powder to form solid insulating sheets. 1) Vermiculite: Mineral clay similar to mica; exists in Egypt in the Red Sea mines.
Consists of crusts produced by heating the raw Vermiculite at high temperature, so it expands and increase in size several times, volumetric gradient ranges for these crusts from 0.15 mm to 9.5 mm. The Vermiculite is a non-flammable material, and is not suitable for the growth of insects or rodents. Can used in its loose condition, or mixed with aggregates and cement to produce light insulating concrete, or for the production of insulating panels if added to the appropriate adhesive material. 2) Perlite: Natural rocky material in the form of white granular, prepared by heating

57
the Perlite volcanic rocks to the temperature of 1200°C, then the Perlite molecules expanded and transformed to the white colour. The loose Perlite resists the growth of fungi and algae. It used in its loose form, or by mixing with cement or gypsum to produce insulating plaster and Perlite insulation panels.
b) Semi-rigid insulation materials: consists of organic or inorganic materials, which have different degrees of compressibility. They are usually in the form of rolls, and may encapsulate with aluminium or copper foil or with plastic or paper from one side or both sides. They may be covered by a grid of metal wires, and can be considered in some cases as a final finishing material. 1) Cork: extracted out of the bark of oak trees after drying then cut to grains in length
of 0.5 cm to 2 cm, then compressed and roasted to achieve the required thicknesses and densities. The roasting process cause the resins in bark to melt and stick cork granules together to produce cork boards, with different thicknesses ranging from 2.5 cm to 15 cm. Cork ignites at a temperature of 300 C, and resists the growth of fungi and insects, and used in acoustic and thermal insulation of buildings and may be used in the form of grains to fill the space between the double walls. 2) Mineral wool: Available in three types as follows: Glass wool: resulting from the smelting of glass then turn it into a glass fibre no
more than about 10 microns in diameter. Can be transformed to semi-rigid panels by adding adhesive materials, and can be covered for protection using reflective aluminium foil or ignition-resistant cardboard. Glass wool is non-flammable, but its fibres are very harmful when friction with the skin or in the case of inhalation may cause bronchitis, so the necessary safety precautions must be taken when handling and use. Glass wool generally used for thermal insulation in several forms such as loose fibre, mats and semi-rigid panels.
Rock wool: fibres resulting from the smelting of high thermal resistance metals, and consists mainly of lime and silica. Panels are formed by adding adhesives for rock wool fibres, and then covered by suitable cover panels of aluminium foil or cardboard. Generally used for thermal insulation, it is available in several forms other than the semi-rigid panels such as mats and loose fibre.
Slag wool: produced by converting molten slag furnaces to fibres with diameter of about 8 microns via centrifugal method. Adhesives added to the fibres to form the panels, and then it may be covered by aluminium foil or cardboard. Generally used for thermal insulation in several forms like semi-rigid panels, mats and loose fibre.
c) Rigid insulation materials: Produced in the form of panels with different dimensions, and made of materials such as glass, rubber or plastic. 1) Expanded Polystyrene: manufactured from polystyrene cells, by using steam to
expand the cells and make it integrate. Then processed by a foamed material (pentane) to create small channels in the liquid polymer, and then chopping the blocks to sheet with required thickness. Expanded polystyrene used in thermal insulation of walls and roofs, acoustic insulation and light bricks manufacture. 2) Extruded Polystyrene: manufactured of polystyrene polymer with inflator foam material, and some other additions to control the size, proliferation and distribution of cells in the final product. The product used in thermal insulation of walls and roofs, as well as the production of insulating tiles and in the manufacture of light bricks and light concrete.
d) Foamed insulation materials: are available in two forms: (1) Two of chemical substances produce the foam when mixed, and can be injected in the required form. (2) A single chemical compound used as a generator of foam inside the concrete mixture to

58
produce lightweight insulating concrete. 1) Polyurethane: manufactured by mixing two main compounds Isocyanate and Polyol,
also by adding other chemicals as catalyst for reaction and other inflator materials to form foam construction at the beginning of the reaction. Care should be taken where it is a flammable substance, result in harmful gases. Used to fill the spaces between the double walls and in the form of rigid insulating boards. 2) Foamed concrete: produced by the use of a chemical inflator mixed with water in a blender to generate gaseous cells, and the resulting product added to the cement mixture to form thermal insulation concrete. Used to insulate exposed surfaces, as a lightweight material to fill in the gaps and to make the necessary inclinations.
Figure 3-3 shows the locations of some natural sources of raw materials used in the building and construction industry, whether that needs to be manufactured or require just simple preparation before use.
Figure 3-3: Locations for raw materials used in construction materials industry in Egypt (HBRC 2007).

59
3.4: Thermal comfort
3.4.1: Thermal comfort definitions
Thermal comfort is one of the most important factors affecting the physiological comfort of the mankind. Human body performs its vital functions better at temperature 37ºC4 . Therefore, in order to keep the body at comfortable temperature, the body needs to get rid of the heat generated by the metabolic system (depend on the surrounding balance) which varies from 100W at rest to 1000W at very active (Thomas and LLP 2006) (See table 3-1). Humans feel comfortable when thermal equilibrium achieved between surrounding climatic effects and human body, where the surrounding medium can removes excess body heat and moisture at the same rate as their production. So it is necessary that, the rate at which heat is emitted from the body equals to the rate at which heat is generated within the body ,while maintaining the body core temperature constant at 35°C-37°C (OEP 1998b, CIBSE 2007). In other words, the human ability to get rid of continuous heat generated by the heat exchange between the human and the surrounding thermal environment. This can be achieved through the thermoregulatory system (heat control mechanisms) embedded in the human body, through different strategies such shivering and sweating which allows a wide range of environmental conditions to be tolerated (Bradley and Johnston 2011).
Table 3-1: The total rate of heat emission for an adult male for various activities (Bradley and Johnston 2011, CIBSE 2007).
Degree of human activity Typical application Total rate of heat emission
(Adult male /Watts)
Seated at rest, inactive Theatre, cinema 115
Moderate office work Office 140
Standing, light work, walking Department store 160
Light bench work Factory 235
Heavy work Factory 440
Gym. work Gymnasium 585
Watson (Donald Watson et al. 1983) defined the thermal comfort as the mental state that makes human satisfied with the surrounding environmental conditions. The same meaning in other words was narrated by ASHRAE (ASHRAE 1992, McMullan 2007, Bradley and Johnston 2011) as "that condition of mind which expresses satisfaction with the thermal environment". In another meaning, the human ability to get rid of continuous heat generated by the heat exchange between the human and the surrounding thermal environment. According to CIBSE - KS16 (CIBSE 2010), the thermal comfort is where there is broad satisfaction with the thermal environment, which mean that most of the space users are not feeling neither too hot nor too cold, as thermal comfort is subjective and varies from individual to another, and it is impossible to find one set of conditions at which everyone will feel completely comfortable. However, usually there is a range of thermal conditions that can satisfy the majority of occupants and make them feel acceptably comfortable.
Unlike thermal comfort, thermal discomfort is where people start to feel they are too hot or too cold (uncomfortable). The absence of thermal comfort is not only a discomfort subjective sensation resulting from stress at a particular moment in time, but also has cumulative effects on the physiological response reflected on the human behavioural patterns (coordination, dexterity, ability and concentration) which can cause traffic accidents, street riots, sexual aggression, and domestic violence. Despite of this, the humans often are not exposed to the adverse health effects in this
4 Over 39.5ºC can cause some damage to body systems, from 42ºC to 43ºC thermoregulatory system can breaks down causing death. Conversely, below -36ºC muscular weakness and exposure result in death (Bradley and Johnston 2011).

60
phase. While in case of the indoor thermal conditions getting worse, the state of thermal stress will cause harmful medical symptoms, such as dehydration or heat exhaustion in hot environments or frostbite in cold climates. Weak persons as the elderly may experience circulatory, respiratory or other problems due to overheating (Auliciems and Szokolay 2007). Furthermore, the exposure to thermal stress may increase mortality rates (Auliciems and Szokolay 2007, CIBSE 2010).
3.4.2: Factors affecting thermal comfort
In the hot climate zones, heat exchange occurs between the body and the surrounding environment to allow the body to emit the excess heat via: conduction, convection, radiation and evaporation which use the latent heat content of the water vapour (perspiration) and in the breath (respiration) to transfer the heat out of the body (McMullan 2007, OEP 1998b).
There are many variables affecting the thermal comfort (OEP 1998b, McMullan 2007, Bradley and Johnston 2011, HBRC 2008, Brager and Dear 2001):
1- Physical variables: which dating to the climatic conditions such as air temperature, radiant temperature, humidity, solar radiation and air movement.
2- Personal variables: which are related to humans, such as size, age, gender, clothing, activity level, health and moreover the body ability to adapt to the surrounding thermal conditions.
3- Other factors are affecting the thermal comfort too, such as: having pleasant view, having some control on the surrounding indoor environment, and having interesting work. For some variables defining acceptable ranges are possible, but the overall optimal value for all the factors will depends on how they interact with each other (Thomas and LLP 2006).
The indoor climate can be controlled by building’s design to meet human comfort needs. A range of climatic conditions can be considered thermally comfortable and acceptable inside buildings when it eliminates any sensation of thermal discomfort, whether sense of heat or cold (Givoni 1998), as thermal comfort occurs when occupants of a building are unaware of their surroundings (Bradley and Johnston 2011). Building envelope helps in achieving these needs by separating the indoor space from the external surrounding environment and help to modify it. (Bradley and Johnston 2011, USDoE 2004, Okba 2005). Building envelope is subject to external and internal heat influences:
1- External influences: such as solar gains, radiative exchange with the surroundings, convective heat loss or gain due to the winds flow and gains or losses of moisture.
2- Internally: lighting, appliances use such as ventilation fans, cooking and heating.
3.4.3: Thermal comfort zone
Even at the same circumstances no more than 50% of the people who have been exposed will give the same estimate about the thermal conditions (McMullan 2007), as the thermal comfort is a subjective matter and will vary with individuals (Thomas and LLP 2006). Therefore the aim is to thermally satisfy the highest possible percentage of the space occupants (CIBSE 2007).
According to (ASHRAE 2004), the thermal comfort zone articulate a range of environmental variables (air temperature, mean radiant temperature, humidity and air speed) which are expected to form an acceptable thermal environment at particular values of metabolic rate, and clothing insulation. In order to set up the boundaries of the thermal comfort zone, an analysis has to be done to understand the nature of the thermal discomfort sources (heat or cold), and the relationship of the various climatic factors (Givoni 1998). As the thermal comfort zone represents the weather conditions that provides the thermal comfort of the human body and assumes when that occurs, the

61
physiological activity of the human body (needed to regulate the body's temperature) reach its lowest rate as the external conditions provide thermal stability (OEP 1998b).
Many researchers have conducted a lot of studies to identify the thermal comfort zone for the humans within the architectural space. The results of some of these studies have been summarized in Table 3-2.
Table 3-2: Some studies for the identification of the thermal comfort zone (Gira 2002).
Name Year Place Temperatures that satisfy the majority
Eliss 1952 Tropics 22°C Ambler 1955 Nigeria 22-26°C Weiss 1959 Sydney / Australia 22-24°C Webb 1960 Singapore 22.5°C Macpherson 1963 Australia 22.5°C Koenigsberger 1974 - 22-27°C
Moreover, the thermal comfort limits have been measured and found to be for the majority of ordinary people between 21°C to 27°C, and the relative humidity of 20% to 70% (OEP 1998b). However, with the presence of solar radiation and air movement, the borders of the thermal comfort zone differ in complex way and become difficult to study the effect of each individual element where each influencing the other (OEP 1998b). Therefore, many attempts appeared to assess the effects of the overlapping of these variables, and to collect them together in the form of a direct relationship between climatic variables and thermal comfort in the form of charts easy to handle. According to the Egyptian Residential Energy Code (HBRC 2008) the feeling of the surrounding thermal conditions can be divided depending on the effective temperature as follows (Table 3-3):
Table 3-3: Thermal sensation as mentioned in EREC.
Thermal sensation Effective temperature (ºC)
Very hot > 37.5 ºC Hot 34.5 - 37.5 ºC Tends to hot (slightly hot) 25.6 - 34.5 ºC Comfortable 22.2 - 25.6 ºC Tends to cold (slightly cold) 17.5- 22.2 ºC Cold 14.5 - 17.5 ºC Very cold < 14.5 ºC
Previous research underpins the theory of Adaptive Comfort (Humphreys et al. 2013, Humphreys 1996, Levermore et al. 2012). Demonstrating that people can adapt and can be comfortable at higher temperatures than those conventionally adopted. As mentioned by (Givoni 1998), people who live and acclimatized to prevailing hot environment regions, would prefer higher temperature and would suffer less in hot environment than the people living in cold regions. Accordingly (in this research), the thermal comfort zone (22.2°C-25.6°C) mentioned in EREC (Table 3-3) has been extended to the prevailing hot climatic conditions in Egypt and became (20°C-29°C). The modification has been applied using Givoni approach (Givoni 1998) through the inclusion of both mean values of the slightly hot zone (25.6°C-34.5°C) and of the slightly cold zone (17.5°C-22.2°C) to form the new modified thermal comfort zone (20°C-29°C). In addition, this model has been relying on as the adaptive approach, most probably, would conserve more energy than the other standards (Humphreys 1996, Auliciems and Szokolay 2007). Eventually, the expansion of the thermal comfort zone was carried based on the adaptive model, then the new thermal comfort zone (that has been expanded) was used in the analysis of the results in a non adaptive way.

62
3.4.4: The adaptive model
The main thermal comfort factors were known to the ancients. Hippocrates (400 B.C.) has left a description of physiological climate in terms of some of these factors: temperature, humidity, wind, and radiation which is still qualitatively valid (WEBB 1958, Auliciems and Szokolay 2007). The philosopher Vitruvius (1st century BC) is quoted saying “We must at the outset take note of the countries and climates in which buildings are built” (Oktay 2002). The aforementioned efforts were followed by many attempts and discoveries, for instance (Auliciems and Szokolay 2007): Heberden (early 19th century) has recognised that humidity is one of the contributing factors of thermal sensation, not only the air temperature as it was known. During (1905) in England, Haldane conducted the first serious study on comfort (especially the effect of high temperatures). The engineers started the research for thermal comfort and found that it was necessary to establish design temperatures. In 1923 Houghten and Yagloglou from the American society of heating and ventilating engineers (ASHVE) laboratories tried to define the comfort zone. Vernon and Warner (1932), then Bedford (1936) carried out experimental studies among factory workers, motivated by the industrial hygiene to find out the limits of environmental conditions for work, followed by the analytical work of Winslow, Herrington and Gagge (1937). During and after World War two, other disciplines (physiology, medicine, geography, climatology and architecture) involved in the thermal comfort research besides engineering. Victor Olgyay (1963) was the first one to gather the findings of the various disciplines and take advantage of them for practical architectural applications. In general, thermal comfort indices have been established via two main techniques:
1- Controlled chamber studies (laboratory experiments), to specify an optimum value that has been assumed to satisfy all people. For instance, Fanger stated and confirmed the validity of his comfort equation and PMV index (Predicted Mean Vote) for all humans in spite of their geographical location or climate (Saberi et al. 2006, Auliciems and Szokolay 2007).
2- Field investigations, that based on people at sedentary work, in their normal real built environment and wearing the clothing of their choice. This kind of studies concluded to a completely different observations, refers to the importance of the geographic component for the thermal comfort (Auliciems and Szokolay 2007).
These findings led Humphreys in the 1970s, then Andris Auliciems in Australia (1981) to investigate the thermal neutrality of the human body, which was defined as the temperature at which the person feels thermally neutral "comfortable" (Saberi et al. 2006, Humphreys et al. 2013). Auliciems and Humphrey's research were based on field investigations of people in daily life under different conditions, then the experiments results were statistically analyzed by using regression analysis (Saberi et al. 2006, CIBSE 2007, Humphreys and Nicol 1998). This led to formulate the adaptive model of thermoregulation, which is an approach to thermal comfort that depends on the behavioural adaptations that people make in order to stay comfortable. The “adaptive model reflects a give and take relationship between the environment and the user” (Dear et al. 1997, Humphreys and Nicol 2002, Humphreys et al. 2007, Brager and Dear 1998), and it has shown people's adaptability for a higher temperatures than those conventionally adopted (Levermore et al. 2012). The adaptation was defined as the physiological, psychological or behavioural adjustment of building occupants to the interior thermal environment in order to avoid discomfort (BSEN 2007). The adaptive model states that factors beyond fundamental physics and physiology plays an important role in impacting people’s expectations and thermal preferences (Brager and Dear 2001), and has been defined as the model that relates indoor design temperatures or acceptable temperature ranges to outdoor meteorological or climatological parameters (ASHRAE 2004).

63
People's behavioural adaptations seems to follow a two-way process (Humphreys et al. 2013, CIBSE 2010):
1- The process of adapting the people to their surrounding thermal environment: by changing their clothing insulation, their posture, and perhaps their activity.
2- The process of adapting their thermal environment to their current requirements: by some actions such as opening windows, adjusting blinds, and in some cases adjusting the heating or cooling.
Through these processes the people can be considered in dynamic equilibrium with their surroundings. This adaptation can be assisted through facilitating control over the thermal environment by providing practical, convenient and effective means for thermal control sufficient for the users to adjust the indoor thermal environment to their own requirements (ceiling fans, openable windows, or local temperature controls in buildings that are heated or air conditioned), that's why people have more adaptive opportunity at home (CIBSE 2007).
The adaptive model of thermal comfort considers thermal sensations, satisfaction, and acceptability are all influenced by the match between: (1) the immediate physiological responses to the indoor parameters (2) the "climato-cultural" expectations which based on the previous experiences of the prevailing climatic conditions (Brager and Dear 2001, Humphreys 1996). The indoor comfort temperatures were as low as 17°C in UK, and as high as 32°C in Iraq as mentioned by Humphreys in 1975 (Humphreys 1996). It was obvious that the difference is greater than the insulation of the clothes to compensate. Humphreys concluded that other mechanisms were also at work. Moreover, the indoor mean temperature in each of the previous populations was almost so close to their own comfort temperatures, which prove that people's adaptation mechanisms, were generally quite successful.
Previous research work such as (Nikolopouloua and Steemers 2003, Brager and Dear 1998, Dear and Brager 1998, Givoni 1998, Nikolopoulou et al. 2001, Humphreys and Nicol 2002, Humphreys et al. 2007) have tried to clarify the adaptation modality of humans to comfort, and have concluded to:
1- Through behavioural adjustments, this sometimes refers to cultural, social or personal adjustments (for clothing, activities and eating or drinking hot or cold). Other times environmental adaptation may reflect on design considerations and modification for urban spaces, for example vernacular buildings normally provide thermal comfort while using only modest amounts of fuel (Humphreys 1996).
2- Physiological adaptation is the human reaction when move to a different climatic zone. 3- Human natural or subconscious responses is a part of the psychological adaptation, which
depicts some human behaviours in urban spaces.
The development of the adaptive approach to thermal comfort was reviewed from 1970 to 1995, and it was a subject of many investigations and theoretical discussions globally to validate the hypothesis and to refute the old notion of a constant or static optimum (Humphreys 1996).

64
3.5: Passive architecture and the reduction of energy consumption
The sun sends immense quantities of energy on Earth, this solar radiation that reaches the Earth is estimated by about 50% of its original strength (El-Wakeel and Serag 1989, Botkin and Keller 2011). The Sun is having a strong and direct impact on human life, as it is the origin for all kinds of energy sources on Earth (El-Wakeel and Serag 1989). However, it is like a coin the first face is the positive which is to take advantage of the solar energy used for different purposes, and the second face is negative represented in the overheating in some regions of the world. In colder climates and winter months, this energy can be quite beneficial, warming the homes and reducing the need for heating fuel. There is available technology helps to create electricity using sunlight (Photovoltaic’s cells - PV). However, in the warm summer months unmanaged solar energy creates a thermal heating load that must be removed in order to achieve thermal comfort.
Buildings are designed to meet occupant’s basic needs for shelter, security and comfort. The building envelope allows these needs to be met by separating the interior of a building from the exterior surrounding environment. The envelope also help modifying the interior environment to satisfy the needs of the occupants by controlling the flow of heat between outdoor and indoor environments by admitting radiant energy and allowing heat from daylight through windows, etc. (Bradley and Johnston 2011, USDoE 2004, Okba 2005). Therefore the thermal performance of the building envelope is one of the most important determinants of the building’s energy consumption. Building envelope refers to building materials and finishes used in the outer shell of the building, which defined the inner space and separates it from the outdoor environment. The building envelope consists of external walls, roof, windows and doors; it used to control the temperature and humidity inside the inner space, helping to reduce energy use in the building. When the solar radiation falls on a wall, portion of these rays reflects back to the surrounding, in the meanwhile the other part of the solar radiation absorbed by the wall and transformed into energy rises up the temperature of the wall's external surface, then the heat transfers through the wall till it reach the wall's inner surface. Appropriate envelope interacts with the surrounding environment through good use of natural lighting and passive solar techniques (Makram 2008, Kassim and Bathis 2003).
The heat transfer form varies when it flows from outside the building to inside or vice, depending on many factors such as temperature difference and the components of the external walls or any other part of building’s envelope. Heat transmitted in the same way through the roofs and walls, but the amount of solar radiation falling on the roofs are greater as a result of the length of exposure to the sun, so the ratio of heat leaked through the roofs are more than the vertical walls. Openings considered the main source of heat penetrating inside the building through the glass as shown in Fig. 3-4, penetrating varies by the type of glass and by its specifications as transparency and purity grade (El-Wakeel and Serag 1989). In general the building as a whole (site, form, materials and structure) have to be considered, all the components can be used to reduce energy consumption while maintain comfort (Thomas and LLP 2006).

65
Figure 3-4: The difference in heat permeability rate through different building envelope components
(El-Wakeel and Serag 1989).
3.5.1: Passive design
Climate has a vital role in the design of buildings. Today we are facing some environmental problems such as global warming, Ozone layer depletion and shortage of fossil fuels. These challenges oblige the officials to consider the effects of climate on building design (Khoshsima et al. 2011). The Passive House concept used to slash the energy consumption of buildings. It implies the utilization of the sun’s energy together with local climate characteristics and selected building materials. These aspects used to maintain thermally comfortable conditions within the built-environment (Morrissey et al. 2011, Rabah 2005), instead of relying predominantly on ‘active’ systems that consume a lot of energy to achieve thermal comfort. In this regard, the construction industry (when using the passive design techniques widely) has a significant opportunity for designing and constructing buildings that enable significant reductions in energy consumption during the course of their use (Morrissey et al. 2011).
The passive techniques used in heating or cooling buildings depend on the study of the natural course of the sun (El-Wakeel and Serag 1989). The monthly average temperature and humidity rates values throughout the months of the year were used to conclude the design requirements of the means of passive or mechanical climatic treatments for each of the climatic regions in Egypt (OEP 1998b). Due to the climatic conditions prevailing in Egypt (hot arid climate) according to Köppen classification (Kottek et al. 2006, Peel et al. 2007), cooling is the main concern which needed to overcome it to improve the buildings' indoor climate through the most appropriate use for natural thermal phenomena (El-Wakeel and Serag 1989). It has been abundantly clear for some time that, the building sector is a primary contributor of climate-changing pollutants (PHIUS 2012). Therefore, providing a climatically responsive sustainable buildings (low energy cooling
Fenestration (Direct radiation) Roofs Infiltration Fenestration (Conduction) Walls Doors
24
Time (Hours)
3 6 9 12 15 18 21
0
Th
e a
mou
nt o
f he
at tr
ans
mitt
ed (
BT
U/h
r)
250-
250
500
750
1000
1250
1500
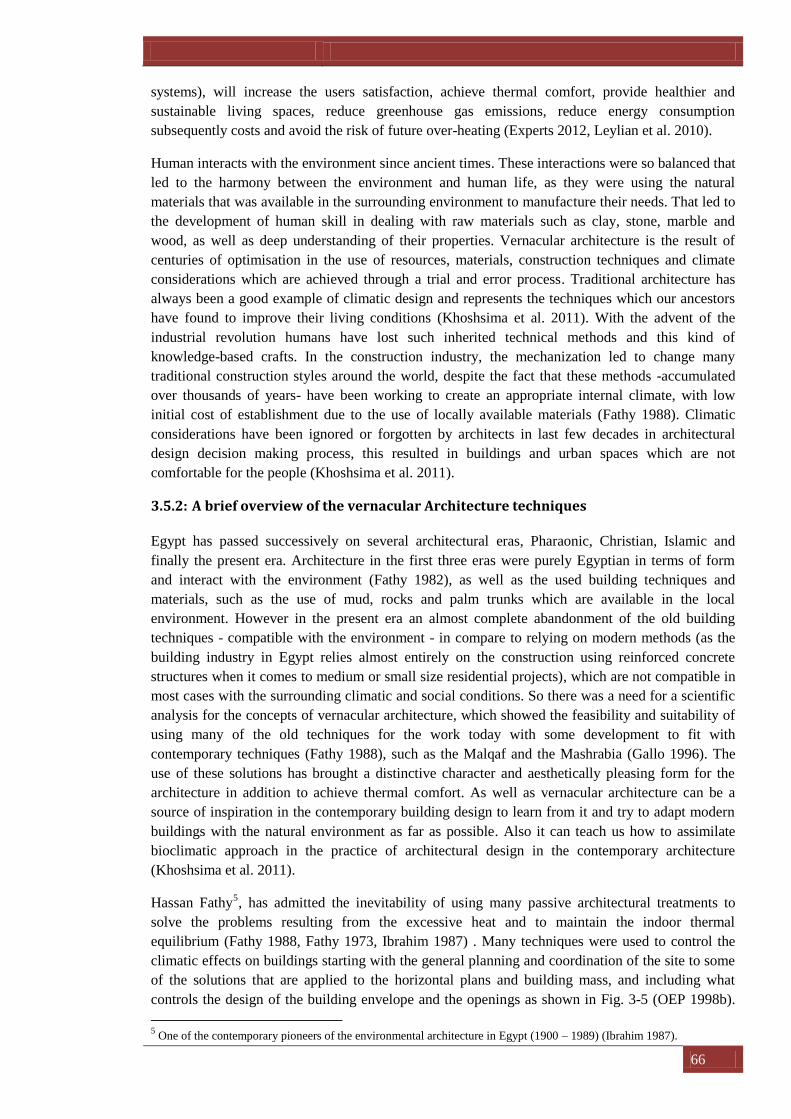
66
systems), will increase the users satisfaction, achieve thermal comfort, provide healthier and sustainable living spaces, reduce greenhouse gas emissions, reduce energy consumption subsequently costs and avoid the risk of future over-heating (Experts 2012, Leylian et al. 2010).
Human interacts with the environment since ancient times. These interactions were so balanced that led to the harmony between the environment and human life, as they were using the natural materials that was available in the surrounding environment to manufacture their needs. That led to the development of human skill in dealing with raw materials such as clay, stone, marble and wood, as well as deep understanding of their properties. Vernacular architecture is the result of centuries of optimisation in the use of resources, materials, construction techniques and climate considerations which are achieved through a trial and error process. Traditional architecture has always been a good example of climatic design and represents the techniques which our ancestors have found to improve their living conditions (Khoshsima et al. 2011). With the advent of the industrial revolution humans have lost such inherited technical methods and this kind of knowledge-based crafts. In the construction industry, the mechanization led to change many traditional construction styles around the world, despite the fact that these methods -accumulated over thousands of years- have been working to create an appropriate internal climate, with low initial cost of establishment due to the use of locally available materials (Fathy 1988). Climatic considerations have been ignored or forgotten by architects in last few decades in architectural design decision making process, this resulted in buildings and urban spaces which are not comfortable for the people (Khoshsima et al. 2011).
3.5.2: A brief overview of the vernacular Architecture techniques
Egypt has passed successively on several architectural eras, Pharaonic, Christian, Islamic and finally the present era. Architecture in the first three eras were purely Egyptian in terms of form and interact with the environment (Fathy 1982), as well as the used building techniques and materials, such as the use of mud, rocks and palm trunks which are available in the local environment. However in the present era an almost complete abandonment of the old building techniques - compatible with the environment - in compare to relying on modern methods (as the building industry in Egypt relies almost entirely on the construction using reinforced concrete structures when it comes to medium or small size residential projects), which are not compatible in most cases with the surrounding climatic and social conditions. So there was a need for a scientific analysis for the concepts of vernacular architecture, which showed the feasibility and suitability of using many of the old techniques for the work today with some development to fit with contemporary techniques (Fathy 1988), such as the Malqaf and the Mashrabia (Gallo 1996). The use of these solutions has brought a distinctive character and aesthetically pleasing form for the architecture in addition to achieve thermal comfort. As well as vernacular architecture can be a source of inspiration in the contemporary building design to learn from it and try to adapt modern buildings with the natural environment as far as possible. Also it can teach us how to assimilate bioclimatic approach in the practice of architectural design in the contemporary architecture (Khoshsima et al. 2011).
Hassan Fathy5, has admitted the inevitability of using many passive architectural treatments to solve the problems resulting from the excessive heat and to maintain the indoor thermal equilibrium (Fathy 1988, Fathy 1973, Ibrahim 1987) . Many techniques were used to control the climatic effects on buildings starting with the general planning and coordination of the site to some of the solutions that are applied to the horizontal plans and building mass, and including what controls the design of the building envelope and the openings as shown in Fig. 3-5 (OEP 1998b). 5 One of the contemporary pioneers of the environmental architecture in Egypt (1900 – 1989) (Ibrahim 1987).

67
For example, the window to wall ratio (WWR) must be reduced as approaching the equator to cut the amount of heat entering the indoor spaces. In the same time the indoor temperature can also be reduced by shading external surfaces to prevent the solar radiation from penetrating inside the building. In Egypt, Iraq, India and Pakistan, for example, the prominent balconies have been used to cast shadows, and the large openings have been dealt with by using wooden nets (Mashrabia) to reduce glare of the sun, in addition to allow natural ventilation and increase the flow of cold air. As it should also isolate the external walls to reduce the flow of heat into the building (McMullan 2007), and painted it with light colours as increased surface reflection reduces heat flow (El-Wakeel and Serag 1989).
Other passive techniques can be used, due to the very wide difference between day and night temperatures, and the almost complete absence of cloud screening. Thus the thermal comfort of the occupants inside buildings in such climatic zone depends largely upon the thermal properties of the external walls and roof. Therefore, the vernacular architecture has taken advantage of the time lag of the building materials resulting from the high heat capacity of the building envelope which based on the type of building materials used and wall thickness (Leylian et al. 2010). On the other hand this thermal mass will lose its heat energy to the atmosphere through radiation at night by taking advantage of clear skies, and the stored heat effect fading before the beginning of the next day (Fathy 1988, Fathy 1973, Turner 2003).
Figure 3-5: House shows many of vernacular architecture treatments designed by Hassan Fathy - Sidi Kreir, Egypt
The following are some of the most important elements of vernacular architecture in the hot arid zones: 1- Air Catchers (Malkaf / Malqaf): The Malkaf idea back to ancient historical times, as it was used
by the ancient Egyptians in their houses in "Amarnah hill" as the mural graphics appear in the tombs of Thebes. For example, the house of "Neb Amun" (1300 BC) which was illustrated on his grave (Fig. 3-6). The word Malkaf is the Arabic terminology for the Persian word "Badhanj", which consists of two parts "Bad" which means wind and "Hanjidan" which means withdraw (Suleiman and Himmo 2012). Air Catchers exists in the hot zone countries from Pakistan to

68
Egypt and North Africa. The Malkaf is a chimney jutting out above the house, its horizontal cross-section took several shapes such as square, rectangle, circular and there were few types of octagonal section in Iran (Suleiman and Himmo 2012). Although different forms and materials were used in their construction, however, they perform the same function by providing natural air stream (especially in dense areas, where surrounding buildings obstruct free stream air flow, and wind induced ventilation through windows were not effective) for ventilation, passive cooling and moisturizing the inside of the building (El-Wakeel and Serag 1989, Fathy 1988, Gallo 1996, Gadi 2000, Montazeri and Azizian 2008, Khan et al. 2008). In most cases wind Catchers operates via air pressure difference even if they use different methodologies (El-Wakeel and Serag 1989): a- Towers that pull air into the space: Is a shaft above the building with an opening faced the
direction of the prevailing wind to grab the passing air over the building which is usually strong, cold and clean (Fathy 1973). Then pushed it into the building to compensates the need for regular windows to provide ventilation (Fathy 1988).This technique can free us from the need to orientate the house for the prevailing wind direction (Fathy 1973). Exists in Egypt and Iraq under the name of (Malkaf), in Pakistan and Iran as (Badjir) and on the west coast of the Arabian Gulf as (Barjeel). The air catchers were operated through the transmission of air from areas of high pressure that located at the tower inlet that oriented in the direction of the prevailing winds, to areas of low pressure that exists within the architectural space (Fig. 3-7), leading to create continuous air stream from the outside to the inside. The efficiency of air towers is reliant upon creating the maximum pressure difference between the inlet and outlet of the air (Hughes et al. 2012, Montazeri et al. 2010). The hot air lose its temperature by touching the inner walls of the tower (shaft) which refrigerated overnight, then the air enters the rooms through a small hole beneath the tower and be pulled to the outside through a large opening in the opposite wall in order to increase the speed of the air. The air may be moisturized by passing it over a body of water if needed (Figs. 3-8, 3-9 and 3-10) (El-Wakeel and Serag 1989).
b- Towers expelling hot air from inside the building: this kind of towers exists in Iran and the Arab Gulf countries, usually used when the wind loaded with dust. The tower inlet oriented to the opposite direction of the wind, thus low pressure generated on the opposite side where there is the tower inlet (Fig. 3-11), leading to pull the warm air from inside the room then replace it with clean and pure air from the house shaded courtyard (El-Wakeel and Serag 1989).
Figure 3-6: Neb Amun's house air catcher as it was
illustrated on his grave (Fathy 1988).
Figure 3-7: Towers that pulls air (El-Wakeel and Serag 1989).

69
Figure 3-8: Air catcher provided by a source of water to moisturize the air.
Designed by Hassan Fathy (Fathy 1988).
Figure 3-9: Air catcher (Malkaf) in old Cairo (Steele 1997).
Figure 3-10:Malkaf in the house of Moheb El Deen - Cairo - fifteenth century (Steele 1997).
Figure 3-11: air expelling Towers (El-Wakeel and Serag 1989).

70
Many research have been conducted in order to develop the use of Air Catchers. As an example of these attempts, (Montazeri and Azizian 2008) investigated the Hydrodynamic performance of a one-sided wind catcher by experimental wind tunnel and smoke visualization testing. (Hughes et al. 2012) inspected the privileges of equipping the wind towers with wetted columns or wetted surfaces, and the gained improvements in ventilation and thermal performance of the passive device. In the same area, (Saffari and Hosseinnia 2009) found that, a wetted columns with the height of 10 m was able to reduce the internal air temperature by 12ºC and increase the relative humidity of air by 22%. (Badran 2003) investigated the performance of an evaporative cooling wind tower system (0.57X0.57 m) with a vertical height of 4 m, and they found it can generate an airflow of 0.3 m3/s and reduce the internal temperature by 11 K (equivalent to the capacity of 1 ton refrigeration). (Attia and Herde 2009) proved that buildings equipped with Malqaf, can significantly benefited of the direction of the prevailing winds and keep spaces more comfortable. (Gawad 2010) supports Koln's6 viewpoint about the Malkaf technique, where he believes this technique seems to be a suitable choice for non-fully developed regions (rural areas), and can only work well for individual units and not for multi-storey buildings. Finally, (Pirhayati et al. 2013) reached a conviction that the use of this technique by the ancient architects and designers was based on a deep understanding of the principles of many disciplines such as thermodynamics, aerodynamics, heat transfer, material strength and thermal human comfort.
2- Courtyards: Another key element of Arabic vernacular architecture is the courtyard."Courtyards are transitional zones that improve comfort conditions by modifying the microclimate around the building and by enhancing the airflow in the building" (Santamouris and Wouters 2006). It is used to regulate the indoor's climate in the looking-in houses, which is preferred in hot climates rather than the looking-out houses that increases the vulnerability to harsh conditions (Fahmy 2010). Additionally, courtyards provides security and privacy for the residents, and daylight for the rooms which were built around them (Safarzadeh and Bahadori 2005).
The inner courtyard is the common denominator in the design of the traditional buildings in hot arid region (Fig. 3-12) such as North Africa and the Middle East, where the difference between the temperatures of the day and the night are significant (Waziri 2002 , Gadi 2000). In Iran (in hot arid climate), the most preferred plan type is the courtyard houses, in order to reduce the area affected by the solar radiation (Leylian et al. 2010).
In the evening, hot air starts rising-up from inside the courtyard and replaced by densest cold air. The yard remains cool in the morning until the afternoon when the sun heats the air inside it thus begins to climb to the top. The convection currents keeps the building cool in the afternoon period (Fig. 3-13) (El-Wakeel and Serag 1989), and with the help of plants and water for evaporative cooling and by the high walls surrounding the courtyard the floor temperature can be reduced (Leylian et al. 2010).
6 "Ventilation and Solar Protection in Hot and Dry Climate Zone", Institute for Technology and Resources Management, Germany, 2004

71
Figure 3-12: Horizontal plan and a photo showing the interior courtyard in Suhaymi house – Cairo
(Steele 1997).
Figure 3-13: Using the inner courtyards to ventilate the house indoor spaces (El-Wakeel and Serag 1989).

72
3- Sun breakers: Among the most important factors in determining the behaviour of the occupant is the thermal and day-lighting requirements (Kuhn et al. 2001). Among envelope elements, openings provide physical access to the building, create views to the outside, admit daylight or solar energy for heating, and supply natural ventilation (Okba 2005). It is also considered the main source of heat penetrating inside the building (El-Wakeel and Serag 1989, Datta 2001, Offiong and Ukpoho 2004).
Therefore, the most effective way to reduce the solar load on fenestration is to intercept direct sun radiation before it reaches the glass (Offiong and Ukpoho 2004, Marrero et al. 2010) to control the indoor temperature, improve thermal comfort and reduce cooling loads (Al -Tamimi et al. 2011, Corrado et al. 2004, Radhi et al. 2009). Fully shaded openings during hot weather can reduce solar heat gains by as much as 80% (Okba 2005, Al -Tamimi et al. 2011, Marrero et al. 2010). A considerable amount of literature has been published on shading devices in different regions (Yang and Hwang 1995, Offiong and Ukpoho 2004, Radhi et al. 2009, Corrado et al. 2004, Marrero et al. 2010, Al -Tamimi et al. 2011, Okba 2005, Ali and Ahmed 2012, Ahmed 2012), some of which were in similar climatic zones to Egypt. However they all agreed about the importance of shading technique. Previous study on a high-rise residential building in Taiwan (Al -Tamimi et al. 2011) indicated that envelope shading is the best strategy to decrease cooling energy consumption, which achieved savings of 11.3% on electricity consumption. Yang (Yang and Hwang 1995) found that power consumption readings from direct air conditioning indicate an average savings of 25% if external shading is properly installed.
The ancients have discovered the importance of the sun breakers and its ability to prevent solar radiation from penetrating into the buildings, thus reduce the amount of heat gained within the space. They have developed several forms of sun breakers whether horizontal or vertical. However Mashrabia was the most form belongs to the Arab heritage reflects the needs, characteristics, habits and traditions of these communities. The word "Mashrabia" is derived from the Arabic word "shareb" which means drink and originally meant "a drinking place". This was a cantilevered space with a lattice openings, where the air movement across the openings help cooling small jars via the evaporation effect (Gallo 1996). Now the name "Mashrabia" refers to a kind of oriel window built out from the wall in which is fixed a latticework screen of turned wood separated by specific and regular distances in accurate geometric ornamental form (Fig. 3-14). The Mashrabia provides an external view for the indoor spaces with privacy for the occupants of the house, and it softens the harsh external solar radiation before letting it into the room (Fig. 3-15) (Fathy 1973, Fathy 1988).
Figure 3-14: Turned wood ornaments which forming the Mashrabia (Steele 1997).

73
Figure 3-15: Photos illustrating the form of Mashrabia from outside and the inside (Steele 1997).
3.5.3: Lessons learned from the vernacular Architecture
Hassan Fathy stated in 1970 that “The architect who builds a solar furnace then introduces a vast refrigerating plant to make it habitable is underestimating the complexity of the problem and working below the proper standards of architecture” (Fathy 1982, Ibrahim 1987). It is possible to design buildings to operate in the free-running mode and to be comfortable when the prevailing mean outdoor temperature lies within the range 10-30°C (Humphreys et al. 2013). The difficulty in maintaining thermal comfort by natural ventilation alone in the future was shown (Barclay et al. 2012). Moreover, the use of the majority of vernacular techniques have become very difficult nowadays due to economic aspects related to the initial cost and the consumption (wasting) of internal space of the building because of the large thickness of the external walls. Additionally, the old fashion vernacular style does not also allow to build multi-storey buildings where roofs are covered by domes or vaults, in addition to the fact that its construction methods are difficult to use in urban areas and are fit more for the rural areas (Ibrahim 1987). So there have been numerous attempts to extract what it can be applied from the elements and techniques of the vernacular architecture to be applied and used in the contemporary buildings:
1- Controlling the thermal transmission in the hot arid zone (El-Wakeel and Serag 1989):
a. Increase the thermal resistance of the external walls and ceiling to reduce the heat transmission from outdoor to indoor and vice versa, using new thermal insulation materials.
b. Light colours for the building envelope plays a key role in protecting the building from the heat flow due to the reflectance properties of these colours.
c. The building materials density cause it a great heat capacity, reflected in the increase of the time lag period which maintains the internal temperature for as long as possible.
d. The use of double walls gives good results, due to the poor thermal conductivity for the air trapped between the walls and act as thermal insulation layer. Small openings must be opened to move this air continuously, otherwise its temperature will rises up which causes low effective thermal insulation.
2- Protecting the building against the incident solar radiation (El-Wakeel and Serag 1989):
a. Building orientation: which preferred in Egypt for the long façade to be facing the North direction, to minimize the heat amount received by the Northern façade during the summer, while maximizing the amount of heat for the Southern façade in the winter.

74
b. The form of the building: reflects on the amount of self-shading that the building cast on itself, which it increases by increasing the form complexity.
c. Treatment of the solid parts of the building envelope: the roofs always exposed to the maximum amount of solar radiation, so it is in need for special treatments such as the construction of two surfaces separated from each other and allow the movement of air between them to act as thermal insulator while the upper surface plays the role of umbrella, or using water sprinklers on rooftops. While the external walls exposed to less amount of radiation, it still needs special treatments especially in hot climatic zones with high intensity of solar radiation. The shaded areas on the façades must be increased, by using rough materials for the final surface of the wall, or by using the technique of prominence of brick on the façades to increase self-shading of the wall, and may also resort to shade the facades by sun breakers or build double skin walls.
d. Treatment of the openings: As the main source of heat penetration inside the buildings. So, the use of sun breakers to prevent direct sun radiation from penetrating the space considered of the most important factors that controls the amount of heat transferring to the buildings. Mashrabia is one of the most successful solutions to address the openings, in addition to its basic function in blocking sunlight and achieving indoor visual comfort, it also helps in natural ventilation within the architectural spaces, as it achieve privacy for the occupants.
Chapter Conclusion:
The literature review presented in this chapter covers some major and fundamental topics related to the research. These topics include different heat transfer mechanisms and associated thermal and physical properties of building materials. In addition to thermal comfort different aspects and some vernacular architecture techniques used in Egypt.
Climatic considerations have been ignored or forgotten by architects in the last few decades. In this era where we are facing many environmental problems that affect climate, the effects of climate on building design must be considered. The Passive design concepts must be used to reduce building's energy consumption, instead of relying predominantly on active systems that consume a lot of energy to achieve thermal comfort. Appropriate building's envelope helps in modifying the interior environment to satisfy the needs of the occupants and reduces the energy consumption required to achieve the indoor thermal comfort.
Finally we have to admit that, thermal comfort is not only an unpleasant subjective sensation resulting from stress at a particular moment in time, but also has cumulative effects on the physiological response reflected on the human behavioural patterns, and can increase mortality rates.

75
Chapter 4: The Egyptian Residential Energy Code
4.1: Preface
Around the globe, energy is a major component of any national sustainable development strategy. Energy efficiency is taking a key role in the public and political discourse, due to the fear of energy scarcity, ever-increasing energy prices, and national security issues. The sustainability of energy needs a sustainable long term vision for energy supply and energy demand balance scenarios, as well as setting quantitative targets and necessary mechanisms to ensure the rational use of all energy resources and to minimize its negative impact on the environment. Regulation of building energy performance (via energy standards) is the most effective means to reduce energy consumption (Mansy 2013). Energy standards achieve this objective by specifying the minimum levels of energy performance in the built environment, including the minimum specifications for building materials and the minimum efficiency of appliances used in buildings. Consequently, energy codes considered one of the most frequently used instruments for energy efficiency improvements that can play an important role in enhancing energy efficient design in buildings (Ahmed et al. 2011).
Since 1970s many countries throughout the world introduced building regulations aimed at reducing energy consumption in residential and commercial buildings. Typically, these regulations concentrate on aspects of heat loss through the building envelope with minimum levels of required insulation, and is often characterized by being prescriptive and reduce the need for complex calculations (Hanna 2010, Hanna et al. 2011). However, there are two types of building energy standards (Ahmed et al. 2011) (Fig. 4-1), and they both were employed in EREC:
1- Prescriptive standards: This kind of codes sets separate performance levels for building envelope and for the used equipment, such as minimum thermal resistance of external walls. It is used more frequently due to the ease of enforcing them.
Chapter Introduction:
The Egyptian Residential Energy Code (HBRC 2008) was developed in 2006 to provide specifications and recommendations for the construction of buildings that aims to provide a comfortable built environment for the occupants, in light of efficient utilization of energy (Ahmed et al. 2011).
This chapter reviews in general and in brief the origination of The Egyptian Code for Improving the Efficiency of Energy Use in Buildings –Part 1: Residential Buildings (for simplicity it will be referred to as EREC for Egyptian Residential Energy Code), and some of its limitations and implementation problems. In addition to the constituent parts of the code, along with an explanation of some of the most important parts of the code which will be the main focus in this study. Some methods for the buildings to comply with the requirements of EREC will be mentioned, besides some of the physical and thermal properties of some building materials commonly used in Egypt are identified.

76
2- Overall performance-based standards: which prescribing only an annual energy consumption level or energy cost budget, and it provides more incentives for innovation. According to EREC, the proposed design achieves the Egyptian code requirements through the overall performance track, in case of its annual energy consumption never exceeds the consumption of a standard building. The standard building is a simulation model identical to the proposed design, and fully complied to all the code's requirements in the prescriptive path. This implies that, the compliance to the overall performance path is a tacit compliance to the prescriptive path in somehow.
The method adopted in this work was built on the merger between the two tracks for optimal results, in an attempt to follow of the methods used in the international codes which based on the use of overall performance method in reporting and calculating energy consumption for buildings. This approach is gradually winning positions in policy-making in many countries while revising their building codes, such as USA, Canada, UK, New Zealand, Australia, Netherlands, Sweden, Norway, Singapore and Hong Kong (Vorsatz et al. 2011). The prescriptive approach (the main stream in EREC) was tested against the future climate change to measure its ability to cope and provide the required indoor conditions with minimum energy consumption. In the case of its inability to provide that, it was resorted to the overall performance technique to achieve better performance rates.
While the number of new buildings is growing rapidly, regulations were set to significantly increase the buildings thermal performance in attempts to meet climate change mitigation goals (Morrissey et al. 2011). Unfortunately, new regulations usually are met with reticence from sectors of the building industry, probably due to the additional costs implied in meeting higher performance standards for more energy efficient buildings (Morrissey et al. 2011). However, the current poor buildings' energy performance levels, in addition to the upward trend in household consumption, are stemming mainly from weak performance standards or much less effective standards than predicted (Morrissey et al. 2011, Ahmed et al. 2011, Hanna et al. 2011). In addition to the discouraging of energy prices and market to the use of energy efficient technologies (Ahmed et al. 2011). Above all of this, the ineffective implementation and enforcement of the energy efficiency codes in some of the developing countries (Ahmed et al. 2011), taking in consideration that the application of mandatory energy codes result in many economic advantages that can overcome market barriers and provide more energy-efficient buildings (Liu et al. 2010).
Figure 4-1: Energy standards paths (Ahmed et al. 2011).
Basic / Mandatory Requirements
Building Envelope
Lighting HVAC Electrical Lifts &
Escalators Service / Water
Heating
Prescriptive Requirements Energy Budget / Cost Whole
Building System / Component
Performance

77
In practice, an effective strategy to enforce optimum design is through appropriate legislation for energy efficiency (Radhi et al. 2009). However these codes must be enforceable at the beginning of the process of transforming a country’s construction sector toward more energy-efficient buildings (Liu et al. 2010). It is important (for the countries that have not applied any energy codes before) to start with realistic goals and full awareness of the cost incurred accordingly, then the positive feeding loop will be initiated: enforcement, supply of technologies and materials, then accordingly, the ability to comply will evolve, expand and be strengthened over time (Liu et al. 2010). Successful implementation of energy codes is a complex and multi-faceted process that may take several years to achieve (Liu et al. 2010). The development of the code is just the first of three steps needed to successfully launch the process. Development, Implementation, and Administration and Enforcement (or voluntary compliance, with incentives) are the three required steps (Huang et al. 2003). Enforcement failures could be attributed to the lack of available technical, institutional, or market capacities. Nevertheless, the main point often is the lack of necessary governmental support, interventions and persistency which are essential to enable the development of those capacities (Liu et al. 2010).
Egypt appears to face daunting challenges to implement their two building energy codes (residential buildings issued in 2006 - commercial buildings in 2009) in an environment where basic building code requirements are not effectively enforced. The consumer's lack of interest in using the energy efficiency technologies, are due to the governmental subsidies for energy prices particularly in the residential sector (Liu et al. 2010). The green building community (which is newly formed in Egypt) might provide a new motivation in constructing more energy efficient buildings, but this will not be a substitute for the aforementioned government support.
4.2: The development of the Egyptian code
Regulating energy consumption to achieve an Energy-efficient Building requires establishing a set of minimum requirements as a baseline to evaluating the performance of the new buildings. This step was taken in Egypt few years ago (in 2006) by issuing EREC (Mansy 2013). In the year 2000, the Housing and Building Research Centre (HBRC) of Egypt obtained a grant from the United Nations Development Programme (UNDP) to develop and apply energy efficiency building codes for new residential and commercial buildings in Egypt, with additional fund from the Egyptian government (Sheta and Sharples 2010, Huang et al. 2003). Over the next three years, work continued with the help of an international consulting team adding their many years of experience in the development of building energy standards in the US and other countries, and to provide scientific assistance in several areas, including surveys of existing building conditions and energy use, the use of computer simulations to analyze building energy performance, and the design and construction of energy-efficient buildings. In June 2003 the proposed version of the EREC was completed followed by the proposed commercial energy code in 2004, both codes underwent for a public review before submitting them to the government for promulgation (Huang et al. 2003). The energy standard for housing EREC (which will be the main concern) became law in 2005, and issued in 2006 (Ahmed et al. 2011).
EREC has both prescriptive and performance-based compliance paths. The code follows the ASHRAE-90.1 Energy- Efficient Design of Low-Rise Residential Buildings in many aspects (structure, organization, purpose and compliance paths), although it covers all types of residential buildings (Ahmed et al. 2011, Huang et al. 2003). A key component in the development of the proposed codes was the use of energy simulation programs (DOE-2.1E) to evaluate building energy performance. Moreover, the international consultancy team provided technical support in developing Egyptian weather data (Huang et al. 2003).

78
4.3: EREC's implementation problems and limitations
The EREC's problems represented in two parts, the first one regard to the executing, while the other regard to the limitations aspects, which will be the main concern in this thesis.
The committee involved in writing the code developed a detailed implementation plan. This plan was meant to clarify the different aspects involved into the practical side of the code's implementation, such as putting the infrastructure, training, and supporting materials and software, as well as initiate a major outreach program to introduce the concept of energy efficiency in buildings to the Egyptian market as a preliminary step to impose working with the code (Huang et al. 2003). However, in the early period of implementation the code was not mandatory and therefore not very well accepted, and unfortunately this situation remains so far. As stated before, EREC is far from being integrated into the construction industry in Egypt due to two main reasons: (1) the lack of awareness of the topic of energy efficiency amongst common construction practitioners in Egypt. (2) the absence of legislative support and enforcement (Ahmed et al. 2011).
Another limitation, not putting the future climate change into consideration while preparing the code was the main problem in regard to the technical aspects. The code (in its Arabic version and in any related published papers or reports) did not contain any reference to the climate change as one of the main (or even minor) determinants in the current construction operations (Huang et al. 2003, HBRC 2008, Ahmed et al. 2011, Mansy 2013). The conducted simulations and research in this work confirmed this deficit in some parts of the code (while other parts have proven their ability to comply with future climate changes). In addition to a word of mouth from one of the code developing team who confirmed this observation since the beginning.
Climate change has been mentioned many times in the policies that directs the buildings energy efficiency codes, as one of the threats and greatest challenges of our time. It was mentioned to show the intention to minimize the energy consumption thus the GHG associated emissions. In spite of this, no real reflection on the national energy codes, as none of them does not includes a real application for the future climate change weather files or predicting its impact on energy efficiency in buildings or the related financial issues on the long run. A quick review to some of the Middle east codes, and related publications, such as Saudi Arabia, Jordan, Kuwait, in addition to Egypt, did not show any evidence of involving the climate change predictions into these codes (Awadallah et al. 2009, RSS 2010, Hanna 2010, Patlitzianas et al. 2006, Reiche 2010, SBCNC 2007). Putting in consideration, most of these Arab codes were written based on international codes from the USA, Canada, Australia, and also the European Codes.
While investigating the same issue in the European and USA energy codes and related publications, to the best of the researcher efforts, no clear evidence, scientific publication, or direct provision to support or decline the idea (BPIE 2011, Bulkeley and Kern 2006, Peterson and Rose 2006, Byrne et al. 2007, Lutsey and Sperling 2008, Vorsatz et al. 2011, DOE 2010). The best that the researcher got belongs to (Sanders and Phillipson 2003) as they stated: "even with this level of uncertainty, wind loading, with the possibility of structural failure and loss of life, is so important that consideration should be given to the possibility that it may change significantly in future when codes are being revised" ,and as they also explained "Many parts of the Building Regulations are implemented by reference to British and European Standards and Codes produced by other independent professional bodies, these bodies react to the possibility of climate change in different ways. Standards have always been based on well-established information, such as climate data measured over the past 30 years, and to modify them to include uncertain information on future climate changes implies a major change in their way of working. This change has not yet been

79
confronted by either British or European Standards organisations; consideration should be given to the ways in which it can be met", and finally they wrote "Standards and Codes of Practice that underpin many Regulations have always been based on past knowledge and practice. It is important that a mechanism for incorporating uncertain information on future climates is developed to allow Standards to remain relevant". These statements supports the claim that the codes does not depend on expected future data, and it is not adopted in the development of codes, only if the methodology and the ideology did not changed after all of these years.
Even though, all the aforementioned codes and regulations did not adopt the future weather data due to the climate change into the code's developing process. However, this issue considered of great importance for many reasons such as reducing greenhouse gas emissions, which will work to maintain the stability of the temperature. In addition to that, relying on future climate change data in the development of codes would have a payoffs and economic returns directly to the users in the long run, this point will act as a support power to change the perception of people about the code. The code will be considered as a useful tool for the people, which will facilitate the process of urging and persuading them to apply the new energy codes. Aside from the people, the benefits of applying the new codes will also goes back to the state, in terms of reducing energy demand which will save the cost and time of the establishment of new power plants.
4.4: The code's sections
The Egyptian residential energy code specifies the minimum requirements to improve energy efficiency in residential buildings, in order to attain and improve thermal and visual comfort in the indoor environment. In addition it provides the minimum performance standards for building windows and openings, shading devices, natural and mechanical ventilation, air conditioning equipments, natural and artificial lighting, domestic hot water system and electrical power systems (Hanna et al. 2011, HBRC 2008, Huang et al. 2003). The code is divided into nine chapters in addition to the appendices (Huang et al. 2003, HBRC 2008):
1- Foundations and general concepts: This chapter explains the building components that must comply with the code, the buildings that are subject to this code, as well as the application stages, and finally a general explanation for the different chapters of the code.
2- General requirements to apply the code: Describes the requirements that must be adhered in different construction situations (new building - a new addition to an existing building - an amendment to an existing building) in order to correspond to the code, in addition to the administrative documents needed for that.
3- Building envelope: This chapter identifies the mandatory requirements of the outer casing of the residential buildings, such as the maximum allowable U-values or minimum insulation R-values for the opaque elements of the building, in addition to the maximum allowable U-value and Solar Heat Gain Coefficient (SHGC) for glazing as a function of the Window-to-Wall ratio (WWR).
4- Natural ventilation and thermal comfort: This chapter contains the minimum requirements for the area of open windows, ventilation shafts and recommended ventilation rates for naturally ventilated buildings.

80
5- Air conditioning and mechanical ventilation: The purpose of this chapter is to achieve the minimum requirements of thermal comfort, health and public safety resulting from using air-conditioning or mechanical ventilation, with utilizing the best methods to save energy consumption. The chapter contains the minimum efficiency requirements for air-conditioning equipments, ductwork, piping insulation.
6- Domestic hot water systems: Includes the design foundations for hot water networks as to ensure the efficient use of energy, and the minimum requirements and controls for service water heating equipment.
7- Natural and artificial lighting: Chapter seven of EREC contains the mandatory requirements for artificial lighting equipments, as well as the natural lighting requirements and methods to improve its efficiency.
8- Electrical power systems: This chapter discusses electric loads and safety in residential buildings, and sets the minimum efficiency requirements for the electric power systems including the transformers and motors.
9- Overall performance of the building: This chapter explains the requirements to be met when using computerized dynamic thermal simulation software (for calculating the whole-building energy performance) to be compatible with the requirements of the code and reliable rather than using manual methods mentioned above in the previous chapters. This allowance of an alternate performance “path” for compliance is similar to the approach taken in various US building energy standards such as ASHRAE 90.1 or California’s Title-24 (Huang et al. 2003).
10- Terminology, definitions and appendices: The last chapter of the standard is a reference for definitions and abbreviations. The appendices contain many important information, such as: the steps for the opaque elements or exterior openings to achieve compatibility with the requirements of the code, how to chose and calculate shading devices, some glass types' physical and thermal properties such as shaded glass ratio due to shading devices (SGR) and thermal transmittance (U-value, W/m2K), some of the thermal properties of some common building materials in Egypt. In addition there are some appendices focusing on artificial lighting and electrical power distribution.
In brief, EREC can be divided into five main parts as shown in Fig. 4-2. The Building envelope provides the main function of buildings (shelter, security and comfort) and helps to control the indoor environment, in addition to its impact on the surrounding environment, energy consumption and human health and well being. Therefore, building envelope (which is the architectural part in EREC) will be the main concern in this thesis. More insight reading in this part will clarify it is consists of two sections (Fig. 4-2):
1- Thermal insulation. 2- Fenestration.
Both parts have a direct effect on the indoor thermal comfort through the different heat transfer mechanisms. Besides the effect of the openings dimensions (WWR) on visual comfort, and its relation to the amount of benefiting natural lighting (Lighting systems section), and utilizing natural ventilation (Natural ventilation section).

81
3- Another part was suggested by the author (not originally listed in EREC): Solid parts shading, which was one of the commonly used passive techniques in the vernacular architecture. This part was added in order to utilizing this technique in a contemporary form, as well as testing its benefits in the presence of other means of climatic treatments.
Figure 4-2: EREC's main parts.
4.5: Building envelope
The building envelope represents the connection between the internal environment and the outside conditions. Therefore, one of the main functions of this envelope is to reduce the need to modify the indoor conditions to be more suitable for habitation than the outdoor. Occasionally the envelope fails to meet its objective for some reasons, such as in the case of non-environmentally responsive designs, or extreme weather conditions that make it impossible to achieve indoor thermal comfort through passive means, thus necessitating the use of mechanical means to achieve the required comfort level. However the reliance on the non-passive means can be reduced through increasing the harmony of the building envelope with the surrounding environment.
The Building envelope consists mainly of the external walls, roof and fenestration components, which their proper thermal design considered one of the fundamental design features of energy efficient buildings (Hanna 2010). Therefore, this part mainly demonstrates the steps to make these elements achieve the basic requirements of the code.
4.5.1: Steps needed for opaque elements to achieve compatibility with EREC's
requirements
In order for external walls or roof to comply with EREC, the following steps must be applied:
1- Calculate the Thermal Resistance for each element: Thermal Resistance value (R-value; m2K/W) must be calculated for any layer of the constituent layers of the external walls or

82
roof. This value is obtained according to the layer's thickness and Thermal Conductivity value (k- value; W/mK).
2- Calculate the total Thermal Resistance: By gathering the different R-values for each of the structural element layers. Then adding the R-values (Surface resistance) of the external and internal air layers adjacent to the structural element, which are approximately (0.13 m2K/W) for the internal (Rsi) and (0.04 m2K/W) for the external air layer (Rso) as mentioned in EREC.
3- Determine the minimum required thermal resistance: For external walls or roof 1, based on the geographical orientation and the solar radiation absorbency (Absorptivity) of the outer surface. Tables 4-1, 4-2 and 4-3 are examples for Alexandria, Cairo and Aswan climatic zones (as EREC contains 16 tables for the conditioned and unconditioned buildings in the different 8 climatic zones in Egypt - see Section 1.4.1).
4- Achieving the minimum required value of the thermal resistance: By comparing the total thermal resistance of the structural element with the minimum required thermal resistance obtained from the code (Tables 4-1, 4-2 and 4-3). The thermal resistance must cover the minimum required amount; else, other steps must be followed to work on achieving the compatibility with the requirements of the code. Such as adding an air gap or thermal insulation material to the wall or roof, to achieve the required thermal resistance value.
5- Modifying the thermal resistance value of a structural element: By subtracting the total thermal resistance of the structural element out of the minimum required value of the thermal resistance. Then according to the occurrence of the result in any of the following three periods 0.4, 0.6 or 0.8, the result will be applied through one of the columns 5, 6 or 7 in Tables 4-1, 4-2 and 4-3. This will facilitate getting the value of the required thermal resistance that must be fulfilled by the additional thermal insulation, to achieve the minimum required thermal resistance.
6- Choosing the proper thermal insulation material: By choosing a thermal insulation material available locally at a reasonable price and with appropriate layer thickness, to achieve the thermal resistance that cover the value obtained from the previous step.
These steps were used in different attempts to evaluate the effect of external walls with different material specifications on the project’s initial cost and running cost for achieving indoor thermal comfort in the present time and under climate change scenarios.
1 By using the tables from (3-2) to (3-17) listed in the code.

83
Table 4-1: B
uilding envelope requirements in A
lexandria.
1 2 3 4 5 6 7 8 9 10 11 12 13 14 15
Orientation External surface
absorptivity
minimum required thermal
resistance (R) (m2K/W)
Element's thermal resistance
Window to Wall Ratio (WWR) 0.4 0.6 0.8
Additional thermal resistance required for
thermal insulation (m2K/W) W<10% 10%<W<20% 20%<W<30% 30%<W W<10% 10%<W<20% 20%<W<30% 30%<W
Solar Heat Gain Coefficient (SHGC) Shaded Glass Ratio (SGR) Roof 0.70 2.15 1.75 1.55 1.35
Walls
North 0.38 0.35 NR NR NR
NR NR NR 0.71 NR NR NR 40% 0.50 0.39 NR NR NR 0.70 0.47 NR NR NR
N.E N.W
0.38 0.54 0.14 NR NR 0.71 0.65 0.55 NA 40% 50% 60% NA 0.50 0.65 0.25 NR NR
0.70 0.83 0.43 0.23 NR
East West
0.38 0.72 0.32 0.12 NR 0.65 0.55 0.40 NA 55% 65% 75% NA 0.50 0.88 0.48 0.28 NR
0.70 1.15 0.75 0.55 0.35
S.E S.W
0.38 0.62 0.22 NR NR 0.65 0.55 0.40 NA 55% 65% 75% NA 0.50 0.75 0.35 0.15 NR
0.70 0.97 0.57 0.37 0.17
South 0.38 0.47 NR NR NR
NR 0.71 0.64 0.55 NR 40% 60% 80% 0.50 0.55 0.15 NR NR 0.70 0.69 0.29 NR NR
- NR: Not Required. - NA: Not Allowed.

84
Table 4-2: B
uilding envelope requirements in C
airo.
1 2 3 4 5 6 7 8 9 10 11 12 13 14 15
Orientation External surface
absorptivity
minimum required thermal
resistance (R) (m2K/W)
Element's thermal resistance
Window to Wall Ratio (WWR) 0.4 0.6 0.8
Additional thermal resistance required for
thermal insulation (m2K/W) W<10% 10%<W<20% 20%<W<30% 30%<W W<10% 10%<W<20% 20%<W<30% 30%<W
Solar Heat Gain Coefficient (SHGC) Shaded Glass Ratio (SGR) Roof 0.70 2.70 2.30 2.10 1.90
Walls
North 0.38 0.55 0.15 NR NR
NR NR 0.71 0.67 NR NR 40% 50% 0.50 0.59 0.19 NR NR 0.70 0.67 0.27 NR NR
N.E N.W
0.38 0.74 0.34 0.14 NR 0.65 0.55 0.45 NA 50% 60% 70% NA 0.50 0.85 0.45 0.25 NR
0.70 1.03 0.63 0.43 0.23
East West
0.38 0.92 0.52 0.32 0.12 0.55 0.45 NA NA 60% 70% NA NA 0.50 1.08 0.68 0.48 0.28
0.70 1.35 0.95 0.75 0.55
S.E S.W
0.38 0.82 0.42 0.22 NR 0.55 0.45 NA NA 60% 70% NA NA 0.50 0.95 0.55 0.35 0.15
0.70 1.17 0.77 0.57 0.37
South 0.38 0.67 0.27 NR NR
0.71 0.64 0.55 NA 50% 60% 70% NA 0.50 0.75 0.35 0.15 NR 0.70 0.89 0.49 0.29 NR
- NR: Not Required. - NA: Not Allowed.

85
Table 4-3: B
uilding envelope requirements in A
swan
1 2 3 4 5 6 7 8 9 10 11 12 13 14 15
Orientation External surface
absorptivity
minimum required thermal
resistance (R) (m2K/W)
Element's thermal resistance
Window to Wall Ratio (WWR) 0.4 0.6 0.8
Additional thermal resistance required for
thermal insulation (m2K/W) W<10% 10%<W<20% 20%<W<30% 30%<W W<10% 10%<W<20% 20%<W<30% 30%<W
Solar Heat Gain Coefficient (SHGC) Shaded Glass Ratio (SGR) Roof 0.70 3.00 2.60 2.40 2.20
Walls
North 0.38 1.00 0.60 0.40 0.20
0.68 0.62 0.59 NA 40% 50% 60% NA 0.50 1.00 0.60 0.40 0.20 0.70 1.10 0.70 0.50 0.30
N.E N.W
0.38 1.10 0.70 0.50 0.30 0.53 0.44 0.34 NA 55% 65% NA NA 0.50 1.10 0.70 0.50 0.30
0.70 1.30 0.90 0.70 0.50
East West
0.38 1.20 0.80 0.60 0.40 0.43 0.34 NA NA 65% 75% NA NA 0.50 1.40 1.00 0.80 0.60
0.70 1.56 1.20 1.10 0.90
S.E S.W
0.38 1.20 0.80 0.60 0.40 0.43 0.34 NA NA 65% 75% NA NA 0.50 1.30 0.90 0.70 0.50
0.70 1.40 1.00 0.80 0.60
South 0.38 0.90 0.50 0.30 NR
0.56 0.52 0.44 NA 50% 60% 80% NA 0.50 1.00 0.60 0.40 0.20 0.70 1.10 0.70 0.50 0.30
- NR: Not Required. - NA: Not Allowed.

86
4.5.2: Steps needed for fenestration to achieve compatibility with EREC's requirements
In addition to the data listed in this chapter, the EREC recommendations 2 (HBRC 2008) were taken as a guide line and have been followed to assess the compatibility of the external openings to the EREC's requirements. The outlines of the verification process will be clarified in brief firstly, and then it will be presented in detail in the remaining part of this section. This process mainly consists of two major steps, the verification step then the calculation step: A. The verification step: The Window to Wall Ratio (WWR) must be determined, and then the
value of the Solar Heat Gain Coefficient (SHGS) must be specified. The maximum allowable SHGC values must be obtained for each façade. Finally, the verification must be done to ensure that the value of SHGC does not exceed the maximum allowed in EREC, if this verified so the openings not in need for any shading devices, otherwise they need a separate treatment such as the shading devices.
B. The calculation step: In order to provide the appropriate dimensions for the shading devices (if required), the Shaded Glass Ratio (SGR) must be calculated, and then the sun-breaker Prominence Factor (PF) will be obtained using SGR. Finally, an equation (equation number one in step five in this section) will be used to calculate the required W value (Fig. 4-3) for each window in all the façades. The W value represents the shading devices depth in the building.
This method of importance as it involves the calculation method for one of the passive architecture techniques which will be assessed in the following chapters, along with its contribution to minimizing the energy consumption. The calculation method is not complicated rather than being used frequently for each window in each facade, which imposed the provision of fast and precise calculation means (see Section 5.3). This method includes utilizing a part of the aforementioned tables (Table 4-1, 4-2 and 4-3), besides other tables:
1- Window to Wall Ratio (WWR): Is the ratio between the areas of the openings in an external façade to the total area of this façade (HBRC 2008, Hanna et al. 2011). The WWR must meet the requirements of EREC in terms of: Solar Heat Gain Coefficient (SHGC) and Shaded Glass Ratio (SGR), both according to the climatic zone of the building and the orientation of the openings (as will be shown later) to prevent the penetration of excess quantities of heat which would increase the indoor thermal loads. EREC has divided the WWR into four intervals as shown in Table 4-4.
Table 4-4: The WWR intervals according to EREC.
WWR interval WWR (%)
1 Less than ten percent <10%
2 From 10 to 20 percent 10% - 20%
3 From 20 to 30 percent 20% - 30%
4 More than thirty percent >30%
2- Solar Heat Gain Coefficient (SHGC): Is the ratio between the sum of penetrated solar radiation through glass, and the heat emitted from the glass by convection and radiation, to the incident total solar radiation on the glass surface (HBRC 2008). Specifying the value of Solar Heat Gain Coefficient (SHGS) for the openings was the second step (using Table B1/ Annex B) (HBRC 2008), according to the type of glass and frame used, and whether fixed or movable. There are many glass categories listed in EREC, four of the main glass categories commonly used in Egypt and mentioned and specified in EREC are (HBRC 2008): a) Single glass. b) Single Reflective glass. c) Double glass. d) Double Reflective glass.
2 Annex A-3 in the code.

87
A sa
mple of som
e of the available glass types in each of these four categories mentioned in the
original table (Table B
1/ Annex B
- in the code) will be listed in T
able 4-5.
Table 4-5: S
ome of the available glass types in E
gypt.
Glass Type (mm)
Glass Centre
SHGC for direct solar radiation incident angles
SHGC for the window and frame Visible Light Transmittance
(VLT)
VLT SC 0º 40º 50º 60º 70º Aluminium frame Other frames Vertical incidence
movable fixed movable fixed movable fixed
Single glass
Clear 3.2 mm 0.90 1 0.86 0.85 0.83 0.78 0.67 0.75 0.78 0.63 0.75 0.65 0.78
Clear 6.4 mm 0.89 0.94 0.81 0.80 0.77 0.73 0.62 0.71 0.74 0.60 0.71 0.65 0.78
Green 6.4 mm 0.74 0.68 0.58 0.56 0.54 0.51 0.44 0.51 0.53 0.43 0.51 0.54 0.64
Single Reflective glass Clear Reflective 6.4 mm – (Stainless steel Cover 8%)
0.08 0.22 0.19 0.19 0.18 0.17 0.15 0.18 0.18 0.15 0.17 0.06 0.07
Clear Reflective 6.4 mm – (Stainless steel Cover 14%)
0.14 0.29 0.25 0.25 0.24 0.23 0.20 0.23 0.24 0.19 0.22 0.10 0.12
Green Reflective 6.4 mm – (Stainless steel Cover 14%)
0.12 0.29 0.25 0.25 0.24 0.23 0.20 0.23 0.24 0.19 0.22 0.09 0.10
Double glass Clear 3.2 mm – Transparent / Transparent - (6.0 mm air)
0.81 0.78 0.75 0.73 0.70 0.63 0.49 0.66 0.68 0.55 0.66 0.59 0.71
Clear 6.4 mm – Transparent / Transparent - (6.0 mm air)
0.78 0.81 0.70 0.68 0.65 0.58 0.45 0.61 0.64 0.52 0.61 0.57 0.68
Clear 6.4 mm – Green / Transparent - (6.0 mm air)
0.66 0.54 0.47 0.44 0.42 0.38 0.30 0.42 0.43 0.35 0.41 0.48 0.57
Double Reflective glass Clear Reflective 6.4 mm - Transparent (Stainless steel Cover 8%) / Transparent - (6mm air)
0.70 0.15 0.13 0.13 0.12 0.12 0.10 0.13 0.13 0.10 0.12 0.05 0.06
Clear Reflective 6.4 mm - Transparent (Stainless steel Cover 14%) / Transparent - (6mm air)
0.13 0.20 0.17 0.17 0.16 0.15 0.12 0.17 0.16 0.13 0.15 0.09 0.11
Clear Reflective 6.4 mm - Green (Stainless steel Cover 14%) / Transparent - (6mm air)
0.11 0.18 0.16 0.16 0.15 0.14 0.12 0.16 0.16 0.13 0.14 0.08 0.10
- VLT: Visible Light Transmittance - SC: Shading Coefficient.

88
3- The maximum allowable SHGC: Can be obtained using data mentioned in EREC3 (HBRC 2008) (for a sample of these data refer to Tables 4-1, 4-2 and 4-3). According to the windows orientation and WWR, the maximum allowable SHGC values were obtained for each façade.
4- Verifying SHGC compatibility with EREC requirements: It is important to verify that the value of SHGC does not exceed the maximum allowed in EREC; otherwise the openings are not compatible with the requirements of the code. In the latter, EREC recommends one of the following three methods:
a) Reduce the size of the openings, so that it achieves allowable SHGC. b) Improve the properties of the glazing or change the frame. c) Use shading for the openings partially or fully, with one of the external shading means.
If the third option (c) is the appropriate architectural solution, the fifth step must be used to calculate the depth of the sun-breakers. If any of the other options (a or b) is chosen, in this case, the previous steps must be re-calculated in order to make sure they meet the requirements of the Code.
5- Shaded Glass Ratio (SGR) & Prominence Factor (PF): SGR is the ratio between the shaded glass areas to the total area of the opening during the period from 9:00 am to 5:00 pm on 21st September (HBRC 2008). In the case that the openings were not compatible with the requirements of the code, the minimum SGR coefficient that should be achieved for the openings can be determined with help of the code 4 (refer to Tables4-1, 4-2 and 4-3). Then its equivalent quantity (SGR factor) according to the shading device form (horizontal, vertical and combined sun-breakers) and orientation can be obtained using the code 5 (HBRC 2008) (Table 4-6). The SGR factor calculation is subject to the façade orientation and to the sun-breaker Prominence Factor (PF), which leads to obtaining the required sun-breaker depth (W) using equation (1), and its parameters are shown in Fig. 4-3. 噺 抜 岫 髪 岻 (eq. 1)
Where: A is the opening width or height, W is the sun-breaker depth and B is the distance between the opening and the sun-breaker. Using this equation, the sun-breakers dimensions could be calculated.
Figure 4-3: Horizontal & Vertical Sun-breakers.
3 Tables from (3-2) to (3-17) in the code. 4 Tables from (3-2) to (3-17) in the code. 5 Table 2B / Annex B in the code.

89
PF
Geo
grap
hica
l Orie
ntat
ion
E
SE
S
SW
W
SG
R c
oeffi
cien
t res
ultin
g fro
m th
e us
e of
Hor
izon
tal s
un b
reak
ers:
0.
10
0.19
0.
15
0.17
0.
11
0.13
0.20
0.
37
0.30
0.
35
0.23
0.
25
0.40
0.
65
0.60
0.
69
0.46
0.
45
0.60
0.
81
0.78
1.
00
0.61
0.
57
0.80
0.
90
0.89
1.
00
0.77
0.
66
1.00
0.
90
0.96
1.
00
0.78
0.
72
SG
R c
oeffi
cien
t res
ultin
g fro
m th
e us
e of
Ver
tical
sun
br
eake
rs:
0.10
0.
11
0.05
0.
20
0.05
0.
15
0.20
0.
21
0.09
0.
35
0.10
0.
29
0.40
0.
43
0.17
0.
55
0.20
0.
41
0.60
0.
61
0.26
0.
67
0.30
0.
49
0.80
0.
70
0.34
0.
74
0.40
0.
56
1.00
0.
79
0.43
0.
79
0.50
0.
70
SG
R c
oeffi
cien
t res
ultin
g fro
m th
e us
e of
Com
bine
d su
n-br
eake
rs:
0.10
0.
27
0.18
0.
34
0.23
0.
18
0.20
0.
49
0.35
0.
58
0.45
0.
34
0.40
0.
74
0.64
0.
86
0.61
0.
53
0.60
0.
87
0.81
1.
00
0.71
0.
65
0.80
0.
94
0.92
1.
00
0.77
0.
73
1.00
0.
98
0.97
1.
00
0.82
0.
78
The aforementioned steps were employed in solving two main issues (see Chapter 6), the first one was to investigate the effect of climate change on the used shading techniques, which is one of the most effective passive design techniques in Egypt. The second issue was, to find and test the best combinations of the different variables that affect the selection process of the building fenestration. The effect of these variables (window-wall ratio and glass thermal properties) and their associated shading devices (recommended by EREC) on the optimization of energy consumption, as well as its long-term cost-effectiveness were investigated according to each climatic zone, to achieve indoor thermal comfort, as well as long-term cost-effectiveness.
Table 4-6: Table 2B / Annex B in EREC.
4.6: Building materials used in Egypt
Most of the main thermal properties for the construction materials commonly used in Egypt were listed in EREC6 . However, to complete and cover all the specifications and more materials (to be used in the research), the Egyptian Specifications for Thermal Insulation Work Items (HBRC 2007) were involved as well. Samples of the combined thermal and physical (Thermophysical) properties have been listed in Table 4-7.
6 Tables 3B and 6B / Annex B in the code.

90
Table 4-7: Some thermal properties for the construction materials commonly used in Egypt.
Name Thickness
(m)
Thermal Conductivity-k
(W/m.K)
Thermal Resistance-R
(m2K/W)
Specific heat
(J/kg.K)
Density (kg/m3)
Solid Red Brick - Tafly 0.120 1.000 0.120 829 1950
Solid Red Brick - Tafly 0.250 1.000 0.250 829 1950
Solid Cement Block 0.200 1.250 0.160 880 1800
Hollow Red Brick - Tafly - 0.600 0.000 - 1790
Hollow Cement Block - 1.600 0.000 - 1140
Portland Cement Mortar 0.020 0.900 0.022 896 1570
Reinforced Concrete 0.150 1.440 0.104 1000 2460
Concrete Tiles 0.010 1.400 0.007 1000 2100
Gypsum - 0.150 0.000 1090 320
GRC 0.010 0.670 0.015 1100 2000
GRC 0.015 0.670 0.022 1100 2000
Plaster 0.005 0.160 0.031 1000 600
Limestone 0.500 0.790 0.633 900 1600
Sand - 0.330 0.000 800 1520
Expanded polystyrene 0.020 0.034 0.588 1400 35
Expanded polystyrene 0.050 0.034 1.471 1400 35
Glass Wool 0.050 0.045 1.111 840 20
MW stone wool (board) 0.040 0.035 1.143 840 225
Betomine Damp Insulation 0.020 0.150 0.133 1000 1055
Porcelain - 1.300 0.000 840 2300
Ceramic - 1.600 0.000 840 2000
Mosaic Tiles - 1.600 0.000 - 2450
Chapter Conclusion:
This chapter has discussed in brief many aspects regarding the Egyptian Residential Energy Code. The cursory review for the code contents in this chapter clarifies many aspects that will be discussed in the following chapters.
Some of EREC's limitations and implementation problems were discussed. The different methods of compliance to the code requirements were also discussed especially for the building envelope which is our main concern in this research. Some of the building materials commonly used in local building industry and its associated thermophysical properties (listed in the code) were also incorporated, these materials were employed later in the simulations in order to achieve the research objectives.

91
Chapter 5: Model development
5.1: Thermal comfort zone
According to the Egyptian energy code for residential buildings (Section 3.4.3), the thermal comfort zone was defined as 22.2 ºC - 25.6 ºC. The current thermal comfort range was modified and expanded to include a wider range (20 °C - 29° C), in order to thermally satisfy the highest possible percentage of occupants and to reflect the true thermal nature of people in Egypt more accurately. This expansion will reflect in direct reduction in energy consumption especially in the summer period (Humphreys 1996, Auliciems and Szokolay 2007). The thermal comfort zone modification was based on:
The adaptive model (Humphreys et al. 2013, Humphreys 1996, Levermore et al. 2012). Givoni's hypothesis (Givoni 1998), regarding the acclimatization to the prevailing
environment.
Accordingly, the current thermal comfort zone (22.2°C-25.6°C) has been extended to the prevailing hot climatic conditions in Egypt and became (20°C-29°C), using Givoni approach (Givoni 1998) through the inclusion of both mean values of the slightly hot zone (25.6°C-34.5°C) and of the slightly cold zone (17.5°C-22.2°C) to form the new modified thermal comfort zone 20°C-29°C, as shown in Fig. 5-1.
Figure 5-1: New expanded Thermal Comfort Zone.
Thermal sensation
Very cold Cold slightly cold Comfortable slightly hot Hot Very hot
Chapter Introduction:
In this chapter, many of the key research aspects will be discussed in order to establish some bases that will be used during the work. The thermal comfort zone in Egypt and the way to obtain the future weather data files due to climate change, will be among the topics to be discussed. As well as, some computerized aiding tools, thermodynamic simulation tools and its calibration steps, the typical occupancy schedules and HVAC systems, and the commonly used building materials in Egypt which will be used in the simulations. The financial analysis that has been addressed in the research will be also discussed combined with the associated prices of building materials and energy in Egypt.
29 ºC
20 ºC
25.6 ºC
34.5 ºC
37.5 ºC
17.5 ºC
14.5 ºC
22.2 ºC
New Thermal Comfort Zone

92
To be noted, in this work we have not used PMV (Predicted Mean Value) at all, as we are working with the assumption that, higher air temperatures are tolerated in this climatic context. Therefore, air temperature are used as a solely indicator for indoor thermal comfort.
5.2: Obtaining future climatic data
The current weather data files (2002) were obtained from the official site of the U.S Department of Energy (USDoE 2012). Each file named using the ISO standard three-letter country abbreviation (i.e. EGY for Egypt), followed by the location name, World Meteorological Organization designation (WMO) and the source format (CTZ2, CWEC, CSWD, CTYW, ETMY, IGDG, IMGW, IMS, INETI, ISHRAE, ITMY, IWEC, KISR, NIWA, RMY, SWEC, SWERA, or TMY3) (USDoE 2012).
For this current research, three compressed (ZIP) files were obtained and used in the simulations: EGY_Alexandria.623180_ETMY. EGY_Cairo.Intl.Airport.623660_ETMY. EGY_Aswan.624140_ETMY.
Each compressed file contains three files for each location: Energy-Plus weather files (EPW). A summary report on the data (STAT).
An ASHRAE Design Conditions Design Day Data file (DDY).
The used files (source format) of the Egyptian Typical Meteorological Year (ETMY), were developed for standards development and energy simulation by Joe Huang and Associates from data provided by U.S National Climatic Data Centre for periods of record from 20 to 30 years. The source of the hourly climatic data is the Energy-Plus (EPW) weather file, which developed by Joe Huang using recorded data from 12 to 21 years, all ending in 2003 (Moustafa and Hegazy 2013).
The future weather data files for 2020, 2050 and 2080 were generated for the different climatic zones, through the use of Climate Change World Weather File Generator (CCWorldWeatherGen) (SERG 2012a) to cover the periods of 2010-2039, 2040-2069 and 2070-2099 respectively (Du et al. 2012). The new weather data files have been used accordingly for the simulations, after using the DB weather data converter tool to convert them into an hourly weather data files that can be used in DB. These weather data files provide a maximum test period of 88 years, as the beginning of year 2012 was assumed to be the starting construction year, and they were divided as follows: 2002 weather data file (cover the period of 14 years): from 2012 to 2025. 2020 weather data file (cover the period of 14 years): from 2026 to 2039. 2050 weather data file (cover the period of 30 years): from 2040 to 2069. 2080 weather data file (cover the period of 30 years): from 2070 to 2099.
5.3: Database and shading calculation tool
In order to calculate the EREC-standard measurements, such as U-value for external walls, allowable window-wall ration, and the width of the shading devices given various specifications about the building model, several tables – with a lot of records - in the EREC need to be scanned manually to find the required values. Moreover, the frequent manual execution for this process - such as required by the multiple simulations in this research - will consume a lot of time and will be prone to a lot of errors. Therefore, this was the motivation to store the EREC data in a database (SQL Server database) and implement a calculation tool in order to automate the whole process.

93
The overall idea is to give the calculation tool a list of parameters (i.e., model specifications), and the tool (a C# program) will query the stored EREC data in the database to find the required values in a reliable and effective manner.
5.3.1: The EREC Construction Database 1
The first component in this automated system is the Construction Database (ConstDB), which store the EREC various data. ConstDB is design to be easy to understand, extended and use in terms of querying for any required measurements. Microsoft SQL Server 2012 has been used to implement the database. Fig. 5-2 exhibit the overall diagram of the database.
Figure 5-2: Structure Chart for the database architecture.
1 This section has been done with technical support of Dr. Khalid Salama (computer science – UKC).

94
Each data table in ConstDB represents an entity in the EREC domain. The following is a brief description of some of these entities and the corresponding table for each.
1. Material Type: This represents the various types of the materials that can be used in a building envelope, such as, Glass, Wood, Brick, etc. Each material type record in the [MaterialType] table has a code and a name. Table 5-1 lists all the material types stored in the ConstDB.
Table 5-1: Material type table.
2. Material: This represents the actual materials that are used in the building envelope. Each material record in the [Material] has a code, a name, and set of thermal properties, and is associated with one Material Type. Table 5-2 shows some of the materials stored in the ConstDB.
Table 5-2: The used materials table.
3. Material Properties: This represents the extended properties for some specific material types, such as Solar Heat Gain Coefficient (SHGC) values for materials belonging to the “Glass” Material Type. Each record in the [Material] table can have one or more record in the [MaterialProperties] table. Table 5-3 shows some of the material properties for the glass Materials.

95
Table 5-3: The Material Properties table.
4. Layer: This represents a realization of a material in layer. In other words, Each Layer has one Material (each record in the [Layer] table is associated with one record in the [Material] table), and the “thickness” of the material is what defines the layer itself, and consequently its price and its thermal resistance. Note that the thermal resistance R of a layer = Thickness/Thermal Conductivity. Table 5-4 shows a subset of the layers stored in the database and used in the experiments.
Table 5-4: The Layer table.
5. Construction Type: This represents the various construction types of a building envelope. Each record in the [Construction Type] table has a code and a name. Table 5-5 lists all the construction types store in the ConstDB.
Table 5-5: The Construction Type table.

96
6. Construction: This represents the actual constructions used in the building envelopes. ConstDB stored a set of well-known constructions used in various building envelopes in Egypt, as shown in Table 5-6. Each record in the [Construction] table has a code, a name, and is associated with one record in the [ConstructionType] Table. Note that each construction is composed of a set of layers, which are defined in the [ConstructionComposition] table. The “Total Thermal Resistance” of a construction is the sum of the thermal resistance values of its layers plus 0.17 (which is external plus the internal air thermal resistance).
Table 5-6: Sample of the construction materials stored in the Construction table.
7. Construction Composition: This defines the various layers that compose a specific construction, plus the position (order) of each layer in this construction envelope. Note that, the relationship between the [Construction] table and the [Layer] table is many-to-many (i.e., one construction contains many layers, and one layer can present in many construction). Therefore, the [ConstructionComposition] Table acts as a bridge between the Construction and the Layer entities. Table 5-7 list a set of construction compositions stored in the table. Besides, Table 5-8 shows a user-friendly view of the “External Wall – 12cm” construction.
Table 5-7: The Construction Composition table.
Table 5-8: The details of the external wall "12cm".

97
8. Minimum Opening Requirements: This is represented in [MinReq_Opening] table in the ConstDB. The table contains the EREC maximum allowable Solar Heat Gain Coefficient (SHGC), and Shaded Glass Ratio (SGR) values, with respect to the orientation, WWR, construction type, conditioning status, and the climatic zone. Table 5-9 show the EREC specifications stored in the database. Table 5-10 shows a user-friendly view of the specifications in the [MinReq_Opening] table where there wall direction is “East”.
Table 5-9: The "MinReq_Opening" table.
Table 5-10: Sample of the stored data in table " MinReq_Opening " for eastern facades.
5.3.2: The Shading Calculation tool
A tool has been created, using Microsoft.Net C# programming language, to implement the calculation logic of the shading devices dimensions, with respect to the EREC specifications stored in the ConstDB. The shading calculation tool works as follows:

98
The user supplies the following specifications of the building model at hand as parameters to the calculation tool:
Climatic Zone. Orientation of each wall in the building. The used Window Wall Ratio.
Conditioning Status.
The EREC's recommendations (HBRC 2008) were taken as a guideline and followed in the preparation of the database and the calculation tool. The detailed calculation steps were discussed in sections 4.5.1 and 4.5.2, for both the solid parts and fenestration in the building envelope. The database and the calculation tool have been tested through comparing the manually carried out calculations to the automated outputs, and found totally identical. The database in general is still under development, while the shading calculation part is almost finished. However, both lacks a user friendly interface. While the section concerned in achieving the compatibility of the solid parts of the building envelope with EREC's requirements is still under development. The product in its final state (the database after development) may represent the E-version of the Egyptian residential energy code.
5.4: Thermodynamic simulation
5.4.1: The main case study
To test the research hypotheses and confirm the results, a number of case study typologies have been selected (Section 7.1.2). The main case study model was selected for being one of the typologies used in a governmental middle class typical housing projects, and has been used extensively in Cairo governorate.
The building consists of six floors, where each has two residential flats with an approximate area of 70 m2/flat. The average number of occupants per flat is four. The building model and floor plan are shown in Figure 5-3, the flat consists of living space, kitchen, two bedrooms and a bathroom.
Figure 5-3: The model and typical plan for the used prototype.

99
5.4.2: The calibration
Accuracy assurance is a very important element in any simulation task in order to obtain reliable data, the accuracy assurance process involves the use of a validated software (Hensen 2004). In addition to use a correct simulation methodology, it is more effective to use the simulation processes in comparing the predicted performance of design alternatives, more than predicting a single design performance in absolute sense (Hensen 2004).
The quality of the inputs affect the accuracy of the results (Baba et al. 2013). According to Humbert (Humbert et al. 2011), the sources of deviation in the data input during the modelling process, that lead to lack of accurate results for the simulations, can be divided into four categories: 1- The building's location and geometrical data. 2- Thermal specifications for building materials and for equipments. 3- Weather data used for the simulations. 4- Occupancy pattern and needs.
Different assumptions and choices of input data can lead to discrepancies between the actual consumption and the simulated outputs. Wrong choice for the used climatic data can result in uncertainty up to 23.8% in the energy consumption (Humbert et al. 2011). Different parameters involved in the simulation processes in this work, including the modelling, the properties of the building materials, lighting and HVAC systems configurations, water heaters, and other household appliances have been examined and calibrated in order to obtain more accurate results for the simulations. The main simulation model was used for the calibration process by comparing a whole year simulation results of the aforementioned model (in Cairo climatic zone), to two energy consumption patterns in Cairo (obtained from two different sources):
1- Utility bills comparison: The electricity utility company (North Cairo Electricity Distribution company) has provided the researcher with the monthly consumption rates for 100 apartment (represent the same used model) for a whole year. The energy consumption rates obtained from the bills (represents the real time consumption) were entered in spreadsheets, to identify the patterns of use and the prevailing weather effects. The consumption rates are shown as a clustered columns in Fig. 5-4, while the simulation results for the monthly electricity usage are shown in the same figure, represented by the blue line, for the purpose of facilitating the comparison. As shown in the figure, the model's energy consumption pattern which obtained from the simulation process, matches by a reasonable margin the average monthly electricity usage pattern.
Figure 5-4: The utility bills comparison.

100
2- Field survey for the average monthly consumption: As an extension for many previous similar studies, a recent energy survey conducted in Cairo (Attia 2012, Attia et al. 2012a), was used as the data source for the second calibration and validation step. This survey relied on many of the previous studies namely:
The residential energy survey (1998), which was conducted by the Organization for Energy Planning (OEP) in cooperation with Cairo University. A sample of 2634 flat scattered in 16 different neighbourhood within the greater Cairo were investigated. The results showed that the average energy consumption per annum per flat was about 2866 kWh (UNDP/GEF 2003, OEP/DRTPC 1999).
Another three more surveys have been conducted by OEP during years 2001-2002, in three major cities in Egypt namely Port Said, Alexandria and Asyut which was conducted with the collaboration of the Faculty of Engineering in Asyut (ECEP/DRTPC 2001, AU/OEP 2002).
Two more surveys have been conducted through the years 2001 - 2003 by the Egyptian Housing and Building Research Centre (HBRC), residential and commercial buildings in Cairo and Alexandria were involved in this work (Aziz et al. 2001).
More field works were carried out by (Michel and Elsayed 2006) in Cairo and Alexandria, with a focus on new residential buildings in order to improve the current building practices.
Attia and associates (Attia et al. 2009) tried to estimate the flat average energy consumption in Cairo, but they only focused on a small sample of higher income apartments with high energy consumption.
The average monthly electricity consumption for a typical residential flat in Cairo (obtained from the results of this recent energy survey), was used for an energy consumption comparison with the simulated energy consumption of the main model. These surveyed energy consumption data were plotted in Fig. 5-5 (marked out as clustered columns), to clarify the shape of the relationship between the monthly simulated energy consumption (in the blue line) of the aforementioned model in Cairo with the similar prototype flats average data. As shown in the figure, the average of the simulated monthly electricity usage matches the overall profile of the data obtained from the recent field survey and follows its general patterns of use.
Figure 5-5: The average monthly consumption and the simulated monthly electricity usage.

101
In general the aforementioned comparisons illustrates a good agreement between the simulation results and the different two energy consumption patterns in Cairo. This reasonable agreement gives us good confidence in the results and its conformity to the reality in a reasonable ratio. In addition to the ability of relying on this simulations when studying the different alternatives and solutions proposed in the study.
5.4.3: Automation of the simulation processes (EPP)
A new code has been developed and used to facilitate the huge number of simulation processes and to ensure the accuracy of the results. The initial simulation execution strategy (Fig. 5-6) was to use DesignBuilder (DB) and its Energy Plus integration. Three parts are included, a model, a location setting on the model and a weather data file per location and year settings. The simulation is then run and the results are observed by exporting the simulation results as a CSV file through DB for the visual representation. The approach was sufficient as a proof of concept and for initial tweaking of the model and other parameters. However, the plan was to run a huge number of simulations, which led to the need of a faster less human dependent solution. Thus, Energy-Plus-Plus (EPP) was born.
Figure 5-6: The ordinary method used to conduct simulations.
A Java automated runner for Energy Plus simulations (e+), the first version (see Fig. 5-7) of which was used to produce some results in this work. This version provides automation for the simulation step, the most time consuming step of the process. The simulation scripts (IDF files) are produced using DB after configuring the location and are independent of the yearly weather files, i.e. a single simulation script can run against all four weather data files the study is concerned with (2002, 2020, 2050 and 2080). So all scripts of a specific model and location is then gathered in batches and then passed as inputs to EPP along with all the weather files of the specific location. It is then run to generate Energy Plus output (ESO files), that is parsing using DB later on and then exported into CSVs.
EPP is modular in design and built with the intention of streamlining the entire process including script generation, output parsing and parallel simulation execution. The end goal is to provide a single model (or models) and a collection of weather data files, and then get spread sheets of the results in a timely fashion. However, at this point the only automated part is bulk simulation execution. EPP is under development to achieve the above functionality aiming to reduce the human intervention in the multiple simulations execution as much as possible, granting the ability to execute more simulations and cover a broader spectrum of possibilities with more supporting evidence.
DB
- Model - Location - WDF
CSV
e+
DB

102
Figure 5-7: New technique used to handle the simulations.
5.5: Financial appraisal
The concept for the financial study in this research is summarized in finding the difference in the long term financial gains over 88 years period (see Section 5.2) between:
1) The investors who prefer to invest a small amount of money in the initial cost of the construction (refer to as X).
2) Those who prefer to invest a larger amount of money in the initial cost of the building (refer to as Y) to employ better construction materials to the building envelope.
The aim is to differentiate between the various sets of construction materials that resulted from the recommendations of EREC, and its suitability to adapt the future climate change in each of the climatic zones that have been tested. In addition to achieve indoor thermal comfort, minimize the energy consumption, while attaining the maximum financial benefits, which would be more appealing option for occupants justifying the higher initial cost. The initial investment and running costs were the main focus (after achieving the indoor thermal comfort), as they are of primary importance for the people who are investing and occupying the buildings. So the focus has been on energy costs for keeping the building comfortable along with the associated financial costs (from construction to operation), as these are the costs that the user would have to bear.
In the current financial appraisal, we assume that, investor X used one of the construction materials sets, while investor Y used a higher initial cost set (with higher thermal specifications). For each building materials set, we calculate the initial cost paid by investor X and Y. The difference between the initial costs for the different sets of building materials will be invested in a bank with the regular 9% interest rate in Egypt (NBE 2012), The interests is assumed to be compounded on yearly basis (i.e. the any earned interest will be re-invested in the same bank). The future value of the deposited money is calculated using the following formula (See Appendix XI for further description of the formula):
V1 = M1 × (1 + 0.09) N (eq. 1)
DB
DB
CSV‘s
IDF‘s
WDF‘s
Models for one
Location
EPP
e+ ESO‘s

103
Where: 怠 The future value of money deposited in a bank for investment in N years’ time. 怠 The difference in initial costs calculated in Egyptian pound (EGP).
N Number of Years of bank investment.
In addition, the bills paid for the consumed energy by each investor is referred to as the running costs, the difference in the running cost between any set of materials and the base case set of building materials (savings in the annual energy bills in EGP) is assumed to be deposited every year into a bank for investment at the same rate of 9%. After N years the future value of the money deposited for investment, 態 , from the running costs savings is calculated using the following equation (See Appendix XI for further description of the formula):
撃態 噺 岫怠袋待┻待苔岻灘貼迭貸怠待┻待苔 抜警態 (eq. 2)
Where: 態 The future value of money generated from annual deposits for N years of investment (EGP). 態 The difference in running costs in Egyptian pound (EGP).
N Number of Years of bank investment.
In the final analysis, one of the material sets will be taken as the base line case (according to the nature and requirements of each experiment). The financial implications for the results of the simulations will be summarized in the final tables (Table 5-11 for example), which will demonstrate the financial appraisal of the different sets of materials in the various climatic zones, as the financial study was designed to be applied for each climatic zone separately. These tables show the running costs for the energy consumed in each zone for each climatic period used in the simulations (sub- total), and the average annual running cost obtained by dividing the running cost of the four climatic periods added together (overall) by 88 years, as well as the initial cost of each building material set. Note that, in each of the results' tables, the final total amount of savings shown in negative indicates that its corresponding set of material is more cost effective than the baseline set (i.e. only the negative numbers in the column "saving in initial cost vs. saving in running cost" according to the mathematical equations, indicates financial gains on the long term for any of the various alternatives of the study versus the base case).
The subsidised electricity tariff as well as the interest rate are assumed to be fixed over the study period. Taking into consideration that, the increase in the electricity tariffs (the removal of subsidies) or the decrease in the interest rate will reflect into increased financial benefits in favour of the research hypothesis, where these possibilities have been tested as the worst case scenario that can be expected. In one of the case studies, to verify this claim, several attempts were conducted on the economic model. The interest rate was reduced to 2% and the price of energy was increased up to six-fold, despite of this the general indicators of the results remained stationary, although the figures have been changed.

104
Table 5-11: An example of the f inancial analysis tables.

105
5.6: Typical occupants schedules for residential end use energy simulations
5.6.1: Occupants activities
Many studies have investigated the major end use activities that consumes energy such as heating or cooling the indoor spaces, domestic hot water (DHW), appliances and lighting (Swan and Ugursal 2009b, Yao and Steemers 2005). Energy use in buildings strongly dependant on the way people use their available systems at home and their general behaviour. As (Robinson 2006) has stated, the most complex processes taking place within buildings are those that resulted from human behaviours. According to (Page et al. 2008) and (Robinson 2006) the occupants' influence can be measured through their actions and activities such as cooking, using light, etc., as well as their interactions with the indoor environment controllers such as the HVAC systems. Occupants attributes such as income, education, family size, occupation hours, home ownership, desire for comfort, and energy conservation incentives are highly influential on energy consumption (Guerin et al. 2000, Nugroho et al. 2010, Lutzenhiser and Bender 2010).
The assumptions for occupants' domestic activity patterns used in the research to construct representative simulation models, were built based on the average size of the Egyptian family in the urban places, which consists in average of four people per flat (the national average flat occupancy is 4.19 person / flat) (CAPMAS 2006). In addition to the prevailing working hours, which identifies the occupation hours, hourly usage profiles and operation patterns and weekend days. The aforementioned data were extracted out of previous and similar research in Egypt in the same field, where many bodies in Egypt have been conducted several energy monitoring activities and surveys during the past two decades. Among these bodies the Organization for Energy Planning (OEP) and several institutions, universities and research centres (Khalil 2005).
The occupants' domestic activity patterns used in the research was based mainly on a recent work introduced by (Attia 2012) in Alexandria, Cairo and Asyut. This recent survey represents an extension of number of previous work (UNDP/GEF 2003, OEP/DRTPC 1999, ECEP/DRTPC 2001, AU/OEP 2002, Aziz et al. 2001, Michel and Elsayed 2006, Attia et al. 2009) in the same field (Section 5.4.2). The work has been conducted in two phases in order to obtain more accurate information. The first step was an utility bills analysis, while the second phase was executed through conducting a field survey. During the first phase, the electricity bills have been analysed using computer software to identify the different patterns of use, peak demand and weather effects. While during the field survey, the energy consuming devices most commonly used in the Egyptian house have been identified such as air conditioning units, lighting, water heaters, stoves, etc., in addition to their operation's hours in summer and winter. Data resulting from the two phases were combined and analysed to form a realistic estimation of the energy performance in residential buildings, along with hourly usage profiles and operation patterns represents the typical residential flats in Egypt. The results revealed a difference in energy consumption rates according to each typology in each city in accordance to their own circumstances. Nevertheless, the occupant’s consumption patterns in most of the tested residential buildings still has a prevalent national character. The most common occupant’s pattern was resulted due to the prevailing lifestyle in Egypt:
During the normal weekdays: - Most of the flats occupants would be away from home between 08:00 and 15:00. - About 25% of them would finish their work after 17:00. - Most probably all the occupants would be at home by 23:00.
On weekend days (Friday and Saturday in Egypt): - Most of the occupants would stay at home at least on Fridays.

106
In light of the aforementioned work, the activity schedules (Table 5-12) were prepared to be used in the simulations processes, where the Y axis represents the proportion of consumption for each hour of the day, according to the number of family members present in the house at this time of the day. During the sleeping hours, some energy consuming activities continue to operate as air conditioners, fans or any other appliances, while in the early morning most of the occupants wake up for work or school, that is why the usage rate increases. During the working hours, the consumption levels decrease but not to zero as a lot of housewives stays at home for their regular duties. After the working hours, family members returns successively thus the consumption rates increases gradually. This increase continues until the beginning of sleeping hours. The daily routine differs in the weekend days, where the waking up time will be delayed, then part of the occupants prefer to spend their time out, so the consumption rate do not reach its maximum levels until their return. Then the bedtime normal consumption rates begins.
Table 5-12: Most prevalent working / occupation hours in Egypt.
1 2 3 4 5 6 7 8 9 10 11 12 13 14 15 16 17 18 19 20 21 22 23 24
weekdays
75% 75% 100% 75%
50% 50%
25%
weekend days
75% 100% 75%
50% 50%
5.6.2: HVAC Systems
Time schedules are responsible for controlling many certain activities in the simulations in DesignBuilder, sometimes in conjunction with the cooling and heating setpoints. These data defines the occupancy periods and the operating hours for appliances, equipment, lighting and HVAC systems (DB 2011). Fixed energy consumption schedules were used for the simulations, and has been defined via fixed activity template based on the common lifestyle for the residents of Egypt such as holidays, work hours, etc. (Attia et al. 2012a). For each combination of parameters that have been tested, a simulation has been conducted to evaluate thermal comfort and to obtain the total energy consumption in kWh from room electricity (household appliances such as washing machines, fridges, vacuum cleaners, irons, etc.), lighting, DHW, and the HVAC systems.
HVAC systems were used in this simulations as it is possible to design buildings to provide thermal comfort for the occupants while operate in free mode, when the prevailing mean outdoor temperature lies within the range 10-30°C (Humphreys et al. 2013), which did not applied to our cases especially during the summer hot period. Moreover, natural ventilation were not sufficient to achieve thermal comfort individually in the summer period in Cairo using different external walls specifications (see Section 6.1.1).
Hybrid systems (mixed mode of HVAC systems and natural ventilation) were used to benefit from passive cooling when available and make efficient use of mechanical cooling systems during extreme periods. Simple HVAC systems setup were used in the simulations, where the heating and cooling systems are modelled using basic loads calculation algorithm (Energy Plus zone HVAC ideal loads) (DB 2011), in order to supply hot or cold air to meet the heating or cooling loads according to the required setpoints. The HVAC specifications include the use of split air-

107
conditioning units (with cooling COP = 1.83) for the whole day in the summer when the temperature exceeds 29ºC until it drops below 25ºC; otherwise, natural ventilation was used.
5.7: Building materials used in Egypt
Due to the lack of specifications for the commonly used construction materials in Egypt in "DesignBuilder" library, a whole package of these materials were created from scratch to be used in the simulations. These materials were used later in the formation of the structural elements used in the construction of the building envelope and other internal components of the buildings. The thermal properties of these materials have been obtained from two official sources, in order to ensure the information accuracy:
The Egyptian Residential Energy Code (EREC) (HBRC 2008).
The Egyptian Specifications for Thermal Insulation Work Items (HBRC 2007).
The different properties that were obtained were used in a two steps process to create the different building construction components needed:
1- Creating new material: By adding the thermal properties of the new materials to be formed such as, Conductivity (W/mK), Specific Heat (J/kgK), Density (kg/m3) and Thermal resistance (m2k/W). as shown in Fig. 5-8.
Figure 5-8: : Adding new material in DB.

108
2- Forming the constructional components: Assembling the materials together. In this phase, the number of layers involved in each construction component need to be specified. It is required to assign specific thickness for each layer, in addition to its order whether it is the outermost layer or the innermost layer (see Fig. 5-9). Upon finishing the creation process of the construction component, an image of the component section can be produced as shown in Fig. 5-10 (two external wall sections used in the simulations are shown in Fig. 5-11), in addition to a full summary for the new component's thermal calculations as shown in Fig. 5-12, such as the U-value (W/m2K) and the R-value (m2K/W).
Figure 5-9: New construction component specifications.
Figure 5-10: The new construction component's section.

109
Double wall of half red-brick with additional internal
5 cm of expanded polystyrene thermal insulation layer. Double wall of half red-brick with 5 cm air gap
in between.
Figure 5-11: Sample of the external walls used in the research.
Figure 5-12: The thermal calculations of the new component.
The specifications for some external wall constructions and glass types used in this research are presented in Tables 5-13 and 5-14 (HBRC 2008, HBRC 2007). A list of thermal and physical properties for some of the commonly used building materials in Egypt, and different types of construction sections combined with illustrations will be found in Appendix - I.

110
Table 5-13: External Walls main characteristics.
External Walls ABBRV. Thickness
cm U-value W/m2K
Description
Half red-brick wall 12cm 12 2.519 Most commonly used
Full red-brick wall 25cm 25 1.898 Commonly used
Double wall of half red-brick with 5 cm air gap in between.
Dair 29 1.463 Commonly used
Double wall of half red-brick with additional internal 5 cm of expanded polystyrene thermal insulation layer.
Dins 29 0.503 Commonly used
Full red-brick wall plus additional 1cm of expanded polystyrene thermal insulation layer.
25+ 26 1.22 EREC minimum requirements
for Alexandria
Full red-brick wall plus additional 2cm of expanded polystyrene thermal insulation layer.
25++ 27 0.897 EREC minimum requirements
for Cairo
Full red-brick wall plus additional 3cm of expanded polystyrene thermal insulation layer.
25 (+3) 28 0.71 EREC minimum requirements
for Aswan.
Table 5-14: Used glass specifications.
Glass type ABBRV. Category SHGC* LT ** U-Value (W/m2K)
Clear 6.4mm G1 Single 0.71 0.65 5.76
Clear Reflective 6.4mm – (Stainless steel Cover 8%) G2 Single
Reflective 0.18 0.06 5.36
Clear 3.2mm– Transparent/Transparent - (6.0mm air) G3 Double 0.66 0.59 3.71
Clear Reflective 6.4mm - Transparent (Stainless steel Cover 8%)/ Transparent - (6mm air) G4
Double Reflective
0.13 0.05 2.66
*SHGC: Solar Heat Gain Coefficient. ** LT: Light Transmission.
5.8: Prices of building materials and energy
5.8.1: Construction Material Costs
The price-list of construction materials, derived from The Engineering Authority Indicative Guide (EAAF 2012), was used to calculate the initial cost of the different building materials in each case tested in the simulations. These numbers were used later for the financial analysis.
5.8.2: Electric Energy Prices
For the financial analysis, the cost of the annual energy consumption per flat was calculated using the electricity tariff derived by the Egyptian Ministry of Electricity and Energy for the residential sector (MOEE 2012), which is referred to as operation cost or running cost. The different categories and prices are shown in Table 5-15.

111
Table 5-15: The current electricity tariff.
no. Category (kW) Price (EGP) no. Category (kW) Price (EGP)
1 50 0.05 4 351-650 0.24
2 51-200 0.11 5 651-1000 0.39
3 201-350 0.16 6 Over 1000 0.48
Early in year 2014, after the main simulations and results were finished, the Ministry of Electricity issued a new electricity tariff (not implemented yet - 2014). This new tariff (Table 5-16) has been used in the final financial analysis for the case-studies discussed in chapter 7 in addition to the previous tariff, for the purpose of comparison between the results in both cases.
Table 5-16: The proposed new electricity tariff.
no. Category (kW) Price (EGP) no. Category (kW) Price (EGP)
1 50 0.05 4 351-650 0.29
2 51-200 0.13 5 651-1000 0.53
3 201-350 0.19 6 Over 1000 0.67
Chapter Conclusion:
This chapter discussed the reasons for selecting the study's climatic zones, the different obtained climate change weather data files, the expanded thermal comfort zone in Egypt which has been used for the simulations. Aside from, a full explanations for the computer aiding tools that facilitates many issues in the simulation processes. The financial analysis' assumptions and it role in the comparability between different solutions were discussed as well.
It has turned out from this chapter, how important the role that could be played by the BPS programs in order to help understanding the complex issues related to the thermal performance of buildings and energy issues related to them, which considered as an important trend for the development of modern energy codes.

112
Chapter 6: Evaluation elements of building╆s thermal performance
In order to achieve the goals in this research, many questions need to be addressed. For each question and unclear issue, many attempts have been conducted in order to clarify the uncertainty. This chapter includes number of unclear issues that caught attention, and it is believed that it will be of importance to complete the research. This chapter consists of three main parts, each part will regard certain issue in EREC. Generally, the basic components of the building envelope mentioned in the code: External walls, fenestration specifications, and solid part's shading.
As both prescriptive and overall performance methods were used in EREC for reporting and calculating energy consumption for buildings, both of them were used in the assessment as well. The prescriptive approach in EREC will be tested at the beginning against the future climate change, to measure its ability to cope and provide the required indoor conditions with minimum energy consumption. In the case of inability to provide that or its failure to cope with the climate change, the overall performance approach will be used instead, to select and test other specifications, that not recommended by EREC, to achieve better performance rates than what we got from the EREC, as overall performance approach is currently used worldwide to revise building codes significantly (Vorsatz et al. 2011).
Chapter Introduction:
In this part, the different questions that contributed in achieving the research objectives will be described. The main theme of these inquiries was the architectural part in the Egyptian Residential Energy Code (EREC), which consists mainly of the basic components of the building envelope. These main components are the external wall insulation, fenestration specifications, in addition to the proposed part of solid elements shading.
Many questions have been addressed such as the potentials of the commonly used or the new materials in the Egyptian market to cope with climate change, the applicability of EREC's recommendations regarding the external walls in the future climatic conditions. Moreover, other questions regarding fenestration will be addressed such as the expected efficiency of the shading devices' calculation method listed in the code in light of climate change, and the best combination of the different variables that affects the selection process of the building fenestration and its associated shading devices. Finally, the benefits in terms of thermal comfort and financial returns on the long term of the re-use of one of the vernacular architecture passive methods (solid parts shading), with the implementation of many of the current code recommendations.

113
6.1: External walls
Due to the nature of the hot arid climate zone in which Egypt is located, large thickness external walls have always been preferred in practice. This is to reduce and delay the heat transfer from the harsh external conditions (El-Wakeel and Serag 1989). At present, the widely used construction sections for the residential external walls are the full red-brick (25cm thickness) and the half red-brick (12 cm thickness). However, the latter is mostly preferred in practice in order to minimize the initial financial cost of the construction project, due to its small initial cost compared to other external walls specifications, and to maximize the available area inside spaces for use . This ignores the negative impact of thermal comfort on the inhabitants as well as its impact on the running cost of the energy consumption for cooling, heating, etc. It was important to determine the relationship between the specifications recommended by the code and the status quo of the construction industry in Egypt. The thermal behaviour of the most commonly used materials in the Egyptian market to construct the external walls were verified against what has been obtained from EREC.
6.1.1: Current construction practice in Egypt
No. of simulations Climatic zones WDFs No. of models 8 Cairo 2002 1
The research starting steps 1 represented in the study of the effect of using different external wall specifications on three essential aspects: the initial cost of the construction, the thermal comfort of the inhabitants, and the operation cost in terms of energy consumption. The use of four external walls specifications have been evaluated (Table 6-1). The evaluation is performed based on simulating both natural ventilation and mechanical means (HVAC). The work will focus on Cairo and Delta climatic zone (Cairo governorate).
Table 6-1: Main characteristics of the external walls.
External Walls Thickness
cm U-value W/m2K
Description
Half red-brick wall 12 2.519 Commonly used
Full red-brick wall 25 1.898 Commonly used
Limestone bearing-wall 50 1.228 Egyptian vernacular architecture
Full red-brick wall plus additional 2cm of expanded polystyrene thermal insulation layer
27 0.897 EREC minimum recommendation
Note that the first two specifications, namely the half red-brick wall and the full red-brick wall, are most commonly used in practice, since they have a relatively low initial construction cost. We aim to evaluate their cost-effectiveness, considering the energy consumption, in comparison with the second two specifications.
1 This work has been published in the form of conference paper (Appendix II ).

114
The model (Section 5.4.1) has been tested under the current climatic conditions, using the weather data file for Cairo climatic zone. The simulations results (Fig. 6-1) indicated that, in natural ventilation all the scenarios of the different external walls specifications are out of the thermal comfort zone between April until October (Summer period). Hence, mechanical means (split air-conditioning units) are required to achieve thermal comfort over the different seasons of the year.
Figure 6-1: Monthly mean temperature variations according to the different construction materials and ventilation systems.
Among the different tested specifications and while using the HVAC systems. The EREC recommended external wall, the full red-brick of the 25 cm thickness with additional 2cm of expanded polystyrene thermal insulation layer (25++) has achieved the best thermal performance amongst the three other specifications. The 25++ wall reduced the energy consumption over the whole year by 31%, thus minimizing the annual energy cost as shown in Figs 6-2 and 6-3.
On the other hand, the most commonly used half red-brick (12cm) has the maximum energy consumption, and is the highest operation cost. In addition, a quick financial comparison between the best (25++) and the worst (12cm) specifications, taking into account the initial and the running costs, highlights the financial advantage of the 25++ type as an investment over the long term.

115
Figure 6-2: Monthly Energy Consumption (kWh).
Figure 6-3: Annual energy cost for different wall constructions (EGP).
The simulation results recommend the use of the full red-brick of the 25 cm thickness with additional 2cm of expanded polystyrene thermal insulation layer (25++) for the construction of the external walls in Cairo, as recommended by EREC. This 25++ specification has shown to achieve the best thermal comfort as well as minimize the energy consumption, which affects the CO2 emissions and the long term running cost.

116
6.1.2: Expanding the area of research and engaging climate change
No. of simulations Climatic zones WDFs No. of models
36 Alexandria
Cairo Aswan
2002 2020 2050
1
The next step 2 involved investigating the use of more wall constructions under climate change conditions, for different climatic zones (instead of performing the simulations in just a single zone). The effect of more external walls with different specifications on the project’s initial cost and running cost have been evaluated to achieve the internal thermal comfort in the project. This attempts have been conducted in the present time and under climate change scenarios (2002, 2020 and 2050). This work extends the earlier simulations by testing three different climatic zones in Egypt (Alexandria, Cairo and Aswan). The impact of the different external walls specifications on the initial cost of the project as well as on the running cost of the energy consumption has been also evaluated. The optimum specification case is then selected for each climatic zone, based on thermal comfort and the best economical solutions.
The simulations evaluate the use of four external walls (Table 6-2): (1) the basic half red-brick wall (12 cm) most commonly used in Egypt, (2) the full red-brick wall with 2 cm of external expanded polystyrene thermal insulation layer (25++), (3) the double wall of half red-brick with 5 cm air gap in between (Dair), and (4) the double wall of half red-brick with 5 cm of internal expanded polystyrene thermal insulation layer (Dins). The previous model was tested while HVAC systems installed, the assist of HVAC systems was the only focus in this simulations as according to the previous work section 6.1.1, natural ventilation were not sufficient to achieve thermal comfort individually in the summer period; under the same experiment conditions in Cairo with different specifications. This result was similar to the results of (Humphreys et al. 2013), where they stated that, it is possible to design buildings to provide thermal comfort for the occupants while operate in free mode, when the prevailing mean outdoor temperature lies within the range of 10-30°C, which is not always available in the different Egyptian climatic regions. The goal was to reduce the periods in which we will need to use the air conditioning, which will result in reducing the energy consumption in general.
Table 6-2: External walls main characteristics.
External Walls Abbreviation Thickness
cm U-Value W/m2K
Half red-brick wall. 12cm 12 2.519
Full red-brick wall plus additional 2 cm of external expanded polystyrene thermal insulation layer.
25++ 27 0.897
Double wall of half red-brick with 5 cm air gap in between.
Dair 29 1.463
Double wall of half red-brick with additional internal 5 cm of expanded polystyrene thermal insulation layer.
Dins 29 0.503
The results obtained from the simulation of the four construction envelopes are divided in three separate graphs: Monthly Energy Consumption (kWh), Annual Energy Cost in Egyptian Pound
2 This work has been published in the form of conference paper (Appendix III ).

117
(EGP) and Indoor/outdoor temperature (°C). These measures are plotted for the three climatic zones (Alexandria, Cairo and Aswan) in Figs. 6-4, 6-5 and 6-6 respectively. Each graph divided into three different weather periods (2002, 2020 and 2050).
For each weather period, the upper left graph represents the monthly energy consumption for the four types of external walls. As expected, the energy consumption increases because of the temperature increase under climate change (Crawley 2007) in all of the climatic zones.
The upper right graph in each weather period represents the annual energy cost according to the household electricity tariffs used in Egypt (MOEE 2012). As expected, the results show that the cost is directly proportional to the increase in energy consumption.
The lower graph presents the indoor and outdoor mean temperature variations for the whole year, with each number corresponding to the respective month, along with the thermal comfort zone. As expected, these vary for the different climate zones, weather periods and type of construction for the external wall.
As shown, the simulation demonstrated that the double wall of half red-brick with additional internal 5 cm of expanded polystyrene thermal insulation (Dins) wall specification has achieved the best thermal performance amongst the three other specifications, and reduced the energy consumption for all the different simulations by at least 2% compared to the second best thermal performance wall specification. On the other hand, the most commonly used half red-brick (12cm) wall has the highest energy consumption.
The financial implications for the results of the simulations are summarised in Table 6-3. These show the running costs for the energy consumed in each city for each period (sub-total), as well as the average annual running cost obtained by dividing the running cost of the three periods added together (overall) by 40 years period, which is the estimated the half-life span of the buildings in Egypt, without any major retrofitting taking place. Using the results in Table 6-3, Figure 6-7 demonstrates the relationship between the initial cost of each external wall specification (reflects the U-value for each construction), and the average annual running cost for each specification in each of the climatic zones used in the experiments.
As expected, as the initial cost increases the average annual running cost decreases. At the beginning, the curves are very steep, as the initial cost increases (and the U-value decreases), the slope is smaller. This implies that the maximum benefit is obtained by replacing the use of the 12cm specification (the first point on the x axis), which has the lowest initial cost and the highest running cost, by the double wall with air gap specification (the second point on the x axis), which has the second lowest initial cost and the second highest running cost. The marginal change in the running cost decreases as moving from one specification to another with higher initial cost. It seems to be more cost effective to use the double wall with air gap at initial cost of 6400 EGP, with average annual running costs of 1817.30 EGP in Aswan, 1008.30 EGP in Cairo and 657.60 EGP in Alexandria. Comparing the above by taking into account the long term financial benefits or investments provides further insight in the analysis of the results.

118
Figure 6-4: Simulation results for Alexandria city.

119
Figure 6-5: Simulation results for Cairo city.

120
Figure 6-6: Simulation results for Aswan city.

121
Table 6-3: Summary of the running costs, based on the thermal simulations for the different wall types, cities and weather periods (all costs shown in EGP).
Figure 6-7: The relationship between the initial cost of the external walls and the average annual running cost.
Dair 12cm 25++ Dins

122
The long term financial study assumes that the buildings' owners invest what they save from the initial cost, or what they save from the running cost in a bank savings account for the specified 40 years period, using the regular 9% interest rate in Egypt (NBE 2012). Table 6-4 shows the difference in the initial and average annual running cost for every external wall, compared to the 12cm wall, which provides the cheapest option and is the reason that is most commonly used across Egypt, along with the accumulated amount for each type after the 40 years investment. The comparison also presents the potential savings indicating that there is a financial gain from using advanced construction instead of the basic 12cm external wall.
Table 6-4: Initial and Running cost based comparison against the 12cm wall (EGP/flat).
Alex Different in initial cost
Accumulation after 40 yrs
Different in running costs
Accumulation after 40 yrs
Saving in initial cost vs. saving in running cost
12 - - - - - 25++ 6358 183212.01 437.05 147671.52 35,540.49 12 over 25++ Dair 3352 96591.17 393.8 133058.10 - 36,466.94 12 under Dair Dins 9542 274962.09 474.4 160291.43 114,670.67 12 over Dins
Cairo
12 - - - - - 25++ 6358 183212.01 670.6 226583.96 - 43,371.96 12 under 25++ Dair 3352 96591.17 582.8 196917.88 - 100,326.72 12 under Dair Dins 9542 274962.09 742.4 250843.92 24,118.17 12 over Dins
Aswan
12 - - - - - 25++ 6358 183212.01 1196.5 404276.34 - 221,064.33 12 under 25++ Dair 3352 96591.17 994.6 336057.87 - 239,466.71 12 under Dair Dins 9542 274962.09 1360.9 459824.21 - 184,862.12 12 under Dins
* Only negative numbers in the last column indicates financial gains against the base case.
From the analysis of the results listed in the table, it can be notice that:
Alexandria: All construction specifications achieve thermal comfort. However, only the double wall with air gap is the one that gains financial benefits comparing to the 12cm wall.
Cairo: Both the 25++ wall and the double wall with air gap are beneficial constructions, where they both achieve thermal comfort. However, the financial gain of the double wall with air gap (Dair) is higher than the 25++ wall by 57%. So it is more cost effective.
Aswan: All the construction specifications, except the 12cm wall, are more beneficial. However, when we compare with the thermal comfort graphs “Aswan” (Fig. 6-6), it is shown that only the double wall with insulation (Dins) seems to maintain acceptable thermal comfort for the climate change scenarios, while also achieving the long term financial gains.
Eventually, the simulation results recommend the use of the double wall with insulation (Dins) as the optimum external wall in Aswan, and the use of the double wall with air gap (Dair) for Alexandria and Cairo climatic zones. These specifications have shown to achieve indoor thermal comfort, minimize the energy consumption, while attaining the maximum financial benefits, which would make them a more appealing option for occupants, justifying the higher initial cost.

123
6.1.3: Testing the insulation ability to encounter the climate change
No. of simulations Climatic zones WDFs No. of models
72 Alexandria
Cairo Aswan
2002 2020 2050 2080
1
To finalise this part (Section 6.1) after adding all the information that has become available, a new simulation based research has been conducted. As facade configurations are predicted to be responsible for up to 45% of the building’s cooling loads (Hamza 2008). Hence, selecting and applying appropriate external walls insulation plays a significant role in mitigating the various methods of heat transfer into the buildings, and has a direct effect on the energy consumption to achieve indoor thermal comfort, consequently the amount of CO2 emissions.
The main aim of this section is to evaluate EREC's specifications (HBRC 2008) in determining the thermal requirements of the external walls in residential buildings (Table 6-5), to achieve the required thermal comfort with minimum energy consumption, along with optimum initial investment and running costs. This work are evaluated for the different climate change scenarios. It extends the construction materials examined in the previous sections (6.1.1 and 6.1.2) by broadening the research scope to include and simulate the EREC's recommendations for the external walls in Alexandria and Aswan, in addition to testing three more external wall types commonly used in Egypt.
Table 6-5: EREC requirements for the different climatic zones.
Climatic regions EREC requirements
Min R-value m2K/W
Max U-value W/m2K
Alexandria 0.75 1.33
Cairo 0.95 1.05
Aswan 1.30 0.77
The walls which meet the requirements of the Egyptian code (see Section 4.5.1) in the different climatic zones will be tested against the commonly used walls in the construction industry in Egypt (Table 6-6). The optimum specification case is then selected for each climatic zone, based on thermal comfort and the best economical solutions. The analysis moves beyond energy consumption in the present and looks into future scenarios and long-term consumption, based on financial analysis for the economic returns in the long-term.

124
Table 6-6: Main characteristics of the External Walls.
External Walls ABBRV. Thick.
cm U-value W/m2K
Description
Half red-brick wall 12cm 12 2.519 Most commonly used
Double wall of half red-brick with 5 cm air gap in between.
Dair 29 1.463 Commonly used
Double wall of half red-brick with additional internal 5 cm of expanded polystyrene thermal insulation layer.
Dins 29 0.503 Commonly used
Full red-brick wall plus additional 1cm of expanded polystyrene thermal insulation layer.
25+ 26 1.22 EREC minimum
requirements for Alexandria
Full red-brick wall plus additional 2cm of expanded polystyrene thermal insulation layer.
25++ 27 0.897 EREC minimum
requirements for Cairo
Full red-brick wall plus additional 3cm of expanded polystyrene thermal insulation layer.
25(+3) 28 0.71 EREC minimum
requirements for Aswan
The results obtained from the simulations are plotted for the three climatic zones in Figs. (6-8 / 6-9) for Alexandria climatic zone, Figs. (6-10 / 6-11) for Cairo and Figs. (6-12 / 6-13) for Aswan respectively. Each graph divided into two different weather periods (2002 - 2020) or (2050 - 2080) for each climatic zone. The graphs are followed by Table 6-7 which contains the results of the long term financial study for each climatic region. The results will be discussed from different perspectives for each climatic zone, the thermal comfort point of view, the energy consumption and the financial aspects:
Alexandria: a) Thermal comfort: As shown from the graphs (Figs. 6-8 and 6-9), all the external walls
have achieved the required levels of thermal comfort in all the different climatic periods that have been tested, and almost followed the same pattern of thermal behaviour with minor differences in all the different seasons of the year. The Dins wall has always achieved the superiority in thermal performance with a very small margin over the rest of the tested walls in all the different climatic periods.
b) Energy consumption: The model built using the most commonly used construction material in the market in Egypt, the 12cm external wall, seems to consume the higher amount of energy over the year for the different climatic periods. While the Dins and 25(+3) external walls have the minimum energy consumption, however, the Dins wall section achieved the minimum annual energy cost edging out the 25(+3) with a very small margin.
c) Financial study: The financial implementation of the simulations results show the superiority of the Dair wall over the other external walls in the long term (88 years) financial study, by at least double the gains of the next best external wall, the 25+ wall (which meets the energy code requirements for Alexandria climatic region).
From the analytical study of the aforementioned perspectives, the Dair wall was then selected as the optimum choice for Alexandria climatic zone, even if it did not achieved the minimum energy consumption, as it achieved the best long-term financial investment in addition to the

125
ability to provide indoor thermal comfort under the different conditions of the future climate change.
Cairo: a) Thermal comfort: All the external walls that have been tested have achieved the
requirements of thermal comfort in all the climatic period (Figs. 6-10 and 6-11). Despite the fact that the 12cm wall was on the threshold of the thermal comfort zone in the last climatic period (2080).
b) Energy consumption: Similarly, the 12cm external wall has consumed the highest amount of energy during the year amongst all the external walls that have been tested. While the Dins and 25(+3) external walls have achieved the minimum energy consumption, however, the Dins wall section achieved the minimum annual energy cost edging out the 25(+3) with a very small margin.
c) The long term financial study for the simulations results shows the superiority of the Dair wall over the other external walls, by about 30% more in the overall financial gains than the next best external walls, the 25(+3) and the 25++ wall (which meets the energy code requirements for Cairo climatic region).
Thus the Dair wall has been selected as the optimum external wall for Cairo climatic zone, for achieving thermal comfort along the different climatic periods, accompanied with achieving the maximum long term financial benefits.
Aswan: a) Thermal comfort: All the different specifications have achieved the indoor thermal
comfort for 2002 and 2020 climatic periods, though the 12cm wall stands on the threshold of thermal comfort even with the help of the HVAC systems in the period of 2020. In the period 2050, the 12cm and the Dair external walls have exceeded the thermal comfort zone in the hot summer season, however, the 12cm wall went more beyond the thermal comfort borders starting from the beginning of June until mid August. While in 2080 all the walls exceeded the thermal comfort limits except the Dins wall. The wall 25(+3) (which meets the requirements of the code for Aswan) exceeded that barrier for almost two months from mid June to mid August in 2080 climatic period.
b) Energy consumption: As usual the 12cm external wall stands at the forefront of the most energy consuming external walls, thus the highest annual energy cost. The Dins external wall achieved the minimum energy consumption, and thus the lowest annual energy cost.
c) Financial study: All the walls that have been tested financially overcome the 12cm base case. Though, the 25(+3) wall comes in the first place in terms of the financial returns, nevertheless it wasn't chosen as the optimum external wall for this climatic region due to its inability to achieve the required thermal comfort in all the climatic periods that have been tested. Hence the Dins wall was selected for its ability to achieve the thermal comfort in addition to achieve more financial gains versus the 12cm wall on the long run.
Therefore, the Dins wall found to be the optimum external wall for Aswan climatic zone, as it is the only wall specification that complies with the thermal comfort requirements in all the tested climatic periods, and achieves financial benefits in the same time on the long term.
According to the thermal and the financial analysis, all the results that have been deduced in the three climatic regions supports the findings from the previous sections (6.1.1 and 6.1.2) and give the preference to the walls that have been previously selected.

126
Figure 6-8: Simulation results for Alexandria climatic zone (2002-2020).

127
Figure 6-9: Simulation results for Alexandria climatic zone (2050-2080).

128
Figure 6-10: Simulation results for Cairo climatic zone (2002-2020).

129
Figure 6-11: Simulation results for Cairo climatic zone (2050-2080).

130
Figure 6-12: Simulation results for Aswan climatic zone (2002-2020).

131
Figure 6-13: Simulation results for Aswan climatic zone (2050-2080).

132
Table 6-7: Long term financial analysis for the different climatic zones.
* Only negative numbers in the last column indicates financial gains against the base case.

133
6.1.4: Investigating the new material's thermal characteristics
No. of simulations Climatic zones WDFs No. of models
54 Alexandria
Cairo Aswan
2020 2050 2080
2
More efforts 3 have been conducted in order to examine the new materials in the Egyptian market, the thermal insulation capabilities and potentials of these materials were tested. Building envelope optimization is investigated with the application of different Glass fibre Reinforced Cement (10cm and 12cm GRC-foam sandwich) walls' compositions in comparison to the most commonly used construction materials in Egypt the 12cm wall. The aim of is to evaluate the buildings performance when using the GRC walls in comparison to using the traditional brick walls materials, as a prelude to used them when their price decrease thus could achieve the long term cost effectiveness.
Three wall types were used in the simulations (Table 6-8):
1- single wall of half red brick, which is the most commonly used external wall in Egypt named (Ct).
2- 7.5cm Glass fibre Reinforced Cement, GRC which is already produced by one of the Egyptian companies (C1).
3- 10cm GRC (C2), which is suggested by this study to face the heat stresses expected in the future.
Table 6-8: External Walls main thermal characteristics.
Material
Name Abb.
Thickness Density Thermal
conductivity - k Specific heat
Thermal
resistance Rt U-Value
(m) (Kg/m3) (W/mK) (J/Kg.K) (m2K/W) (m2K/W) (W/m2K)
GRC
C1
0.01 2000 0.67 1100 0.015
2.7 0.37 Foam 0.075 20 0.03 1400 2.5
GRC 0.01 2000 0.67 1100 0.015
GRC
C2
0.015 2000 0.67 1100 0.022
3.548 0.282 Foam 0.1 20 0.03 1400 3.333
GRC 0.015 2000 0.67 1100 0.022
Plaster
Ct
0.005 600 0.16 1000 0.031
0.397 2.519
Mortar 0.02 1570 0.9 896 0.022
Solid red brick 0.12 1950 1 829 0.120
Mortar 0.02 1570 0.9 896 0.022
Plaster 0.005 600 0.16 1000 0.031
3 This work has been published in the form of journal article (Appendix IV).

134
Two new models 4 were employed in this research, both with ground floor and five typical floors applying HVAC and both with same window wall ration, orientation and envelope configurations in the same simulation.
Building-1: The building consists of six floors; each has four residential flats with an approximate area of 86 m2. The average number of occupants per flat is four. The building floor plan and model are shown in Fig. 6-14.
Figure 6-14: Typical plan and model for building - 1.
Building-2: The building consists of six floors, where each has four residential flats with an approximate area of 85 m2. The average number of occupants per flat is four (Fig. 6-15).
Figure 6-15: Typical plan and model for building - 2.
4 Full description for the models is available in Section 7.1.2.

135
The results obtained from the simulations of all the three external walls construction (C1, C2 and Ct) and the three climatic zones (Alexandria, Cairo and Aswan), were plotted for each building in three separate graphs, Figs. 6-16, 6-17 and 6-18 for building-1, and Figs. 6-19, 6-20 and 6-21 for building-2. Each graph represents the behaviour in one of the three used different weather periods (2020, 2050 and 2080). Each graph divided into three different sub-graphs give indications of Monthly Energy Consumption (kWh), Annual Energy Cost in Egyptian Pound (EGP) and Indoor/outdoor temperature (°C).
Generally all the results followed the same patterns, but with an expected increase in the energy consumption (subsequently the annual energy cost) due to the temperature increase under climate change (Crawley 2007), when moving from a climatic period to the following period. From the thermal comfort point of view, the results of the simulations can be analysed for the two used buildings as follows:
Building-1: during the climatic period 2020, all the external walls used have achieved the required thermal comfort. But during the next period 2050 the Ct wall specification at Aswan didn’t succeed to achieve the adequate level of thermal comfort and the same wall specification (Ct) in Aswan too, has failed in the next period 2080 as well. It was noted that Ct wall at Cairo was at the threshold of thermal comfort in the last climatic period 2080 even if it doesn’t exceed it.
Building-2: The Ct external wall specification failed to achieve the required thermal comfort level in Aswan in the first climatic period 2020, may be due to the building's uncomplicated design, which leads to lack of self-shading (see Section 3.5.3). The Ct repeated the same performance in all the following climatic periods. In addition the Ct wall in Cairo failed as well at the 2080 period, while the Ct wall in Alexandria was at the threshold of thermal comfort in the same climatic period 2080.
Generally, the simulations revealed consistent results and demonstrated that the 10cm GRC (C2) wall specification has achieved the best thermal performance, monthly energy consumption and consequently the best annual energy cost amongst the two other specifications. On the other hand, the most commonly used external wall, the single wall of half red-brick (Ct) has the worst thermal performance, thus the highest energy consumption and energy cost.

136
Figure 6-16: Simulation results for Building-1 (2020).
Figure 6-17: Simulation results for Building-1 (2050).

137
Figure 6-18: Simulation results for Building-1 (2080).
Figure 6-19: Simulation results for Building-2 (2020).

138
Figure 6-20: Simulation results for Building-2 (2050).
Figure 6-21: Simulation results for Building-2 (2080).

139
From the aforementioned work in this part ( Section 6.1) the need of use some mechanical means to reach the thermal comfort zone has been concluded, especially in the summer period. The future aim will be to reduce the periods in which we must use these mechanical methods as much as possible. The inability of the code's recommendations for external walls to adapt to the future climate change, in the three different climatic zones is another conclusion. The analysis has recommended three external walls specifications (commonly used in Egypt), to be used in order to provide the indoor thermal comfort and long term financial effectiveness over the different climatic periods which represents the different climate change scenarios. The suggested walls include, the Double wall of half red-brick with 5 cm air gap in between (Dair) to be used in Alexandria and Cairo climatic zones. While in Aswan, the Double wall of half red-brick with additional internal 5cm of expanded polystyrene thermal insulation layer (Dins) was the selected option. A more advanced and high-tech materials and specifications, available in the Egyptian market, were tested in order to be used. However, this trial was faced by the financial barriers which will prohibit the people from using them, therefore we turned to the traditional materials and techniques which affordable and available in the local market.
6.2: Fenestration
After investigating the thermal insulation of the external walls, the other main component of the building envelope will be examined. The fenestration is of importance as openings provide views to the outside, admit daylight (visual comfort and benefiting of natural lighting), and allow for natural ventilation (Okba 2005). Openings, however, considered the main source of heat penetrating inside the building, in the form of solar radiation (El-Wakeel and Serag 1989, Datta 2001, Offiong and Ukpoho 2004). Therefore, the most effective way to reduce the solar load on fenestration is to intercept direct sun radiation before it reaches the glass (Offiong and Ukpoho 2004, Marrero et al. 2010) to control the indoor temperature, improve thermal comfort and reduce cooling loads (Al -Tamimi et al. 2011, Corrado et al. 2004, Radhi et al. 2009), as fully shaded openings during hot weather can reduce solar heat gains by as much as 80% (Okba 2005, Al -Tamimi et al. 2011, Marrero et al. 2010).
6.2.1: The effect of climate change on shading strategies
No. of simulations Climatic zones WDFs No. of models
24 Alexandria
Cairo Aswan
2002 2020 2050 2080
1
Before testing the recommendations of the fenestration in EREC, it was necessary to determine the effectiveness of the current EREC recommended shading parameters under the future climate change conditions 5. This is considered as an extension to the earlier work by including the shading as one of the main elements that affect the indoor thermal comfort.
5 This work has been published in the form of conference paper (Appendix V).

140
The wall constructions employed for the simulations are obtained from the recommendations of Section 6.1. The double wall of half red-brick with 5 cm of internal expanded polystyrene thermal insulation layer (Dins) wall as the optimum external wall in Aswan, and the use of the double wall of half red-brick with 5 cm air gap in between (Dair) wall for Alexandria and Cairo.
The EREC recommendations "Annex A-3" (HBRC 2008) was taken as a guideline, followed in the preparation of the shading devices for this study. The first step was to calculate the proportion of the fenestration area to the total façade area, Window to Wall Ration (WWR), as shown in Table 6-9. Then the rest of the steps were followed as discussed in Section 4.5.2.
Table 6-9: Window to Wall Ratio for the different façades.
Elevation Openings
(m2) Elevation
(m2) WWR (%)
North 69.6 445 15.6
East 39.6 328 12
South 69.6 445 15.6
West 39.6 328 12
Using EREC's recommendations and according to the building orientation and WWR, the sun-breakers dimensions were determined as shown in Table 6-10.
Table 6-10: Solar specifications for the simulated building.
Alexandria Cairo Aswan
Orientation East South West E S W E S W
SHGC 0.55 0.71 0.55 0.45 0.64 0.45 0.34 0.52 0.34
Verify SHGC
No Yes No No No No No No No
SGR 65% - 65% 70% 60% 70% 75% 60% 75%
Sun-breaker Vertical - Vertical Vertical Horz. Vertical Vertical Horz. Vertical
PF 0.80 - 1 0.80 0.40 1 1 0.40 1
Dimensions 1m - 1.3m 1m 0.5m 1.3m 1.3m 0.5m 1.3m
The different external shading treatments for the building model in each climatic zone (Alexandria, Cairo and Aswan) are shown in Figures 6-22, 6-23 and 6-24 respectively.

141
Figure 6-22: Solar analysis of the model used in Alexandria
Figure 6-23: Solar analysis of the model used in Cairo.
Figure 6-24: Solar analysis of the model used in Aswan.

142
The results show the affect of using shading devices on three different outcomes: Monthly Energy Consumption (kWh), Indoor Air Temperature (°C) and Solar Gains from exterior windows (kWh). These measures were taken during the summer period for the three climatic zones, under the different weather scenarios (2002, 2020, 2050 and 2080). The results are almost with the same indications, so Cairo and Delta climatic zone results (as the intermediate zone) were discussed and its results were displayed as a representative for the two other zones, as follows:
1- Monthly Energy Consumption: Energy consumption was calculated for each flat per month during the summer period, with and without the external shaded devices obtained from EREC as shown in Table 6-11. As noticed, the effect of using EREC recommended shading devices is almost the same during the different four weather periods that was simulated in this research. For example during July the differences for the various climatic scenarios were 4.84, 4.93, 4.99 and 5.53 respectively.
2- Indoor Air Temperature: The indoor air temperatures were investigated during the hot period in Egypt for the different climatic zones, through the aforementioned weather periods, by calculating the difference in the internal temperatures while using the external shading devices, and in case it is not used. The stability of the effect of using sun breakers has been observed (Table 6-12), during the various climatic scenarios used in the simulations, and as an example, in the month of July, the shading effect on reducing the indoor air temperature while using the HVAC systems, for the different four weather periods were mentioned as 0.04, 0.03, 0.03 and 0.03 consecutive.
3- Solar Gains from exterior windows: For further verification, the solar gains from exterior windows were extracted as one of the simulation results, to find out the amount of solar radiation that have been blocked by the use of different sun breakers recommended by EREC. Table 6-13, shows the solar gains from exterior windows in the different months that has been simulated, using different weather data files. Comparing the effect of using shading devices namely (Diff) over the different climate change scenarios, illustrate the firmness of the effect of using the recommended sun breakers over the various parameters of the experiments, as the average blocked solar radiation values over July are 13.30 kWh for the current weather conditions, 12.41 kWh for 2020 weather data file, 12.51 kWh for 2050 climate change scenario and 12.50 kWh for the predicted weather in 2080. This is almost constant, despite the projected climate changes. Complement to the above, Fig. 6-25 illustrates graphically the effect of sun breakers for all the weather periods, to illustrate the differences between what obscured by sun breakers at present, and the stability of its effect under the impact of various climate change scenarios in the future.
From these results reviews, it became clear that the effect of solar shading devices approved by EREC, is almost constant under the influence of climate change scenarios and its efficiency and effectiveness will remain in the future. As most probably the climate change is a result of the observed increase in anthropogenic GHG concentrations, and it does not include any change in the solar radiation incidence angles (UNFCCC 2012).
In spite of the previous result, adaptation to climate change on the building scale might be more effective if a comprehensive applications of passive techniques took place rather than only shading windows, or wall construction as we discussed before (Section 6.1). This comprehensive orientation will be the future research objective.

143
Table 6-11: Average Monthly Energy Consumption (kWh).
2002 2020 2050 2080
W S Diff. W S Diff. W S Diff. W S Diff.
May 433.06 428.81 4.25 482.23 477.79 4.44 539.33 534.62 4.71 654.43 649.42 5.01
June 574.98 570.72 4.26 628.83 624.77 4.06 708.02 703.80 4.22 843.09 838.67 4.42
July 656.17 651.33 4.84 755.92 750.99 4.93 888.33 883.33 4.99 1060.84 1055.31 5.53
August 705.44 698.78 6.66 835.22 828.30 6.91 958.53 951.46 7.08 1146.21 1138.96 7.25
Sept. 521.83 509.00 12.83 608.29 595.69 12.60 689.41 676.67 12.74 871.61 858.81 12.80
- W: without shading devices. - S: with shading devices.
Table 6-12: Average Monthly Indoor Air Temperature (°C).
2002 2020 2050 2080
W S Diff. W S Diff. W S Diff. W S Diff.
May 25.83 25.77 0.05 26.17 26.12 0.05 26.47 26.43 0.04 27.00 26.96 0.04
June 26.79 26.75 0.03 27.01 26.98 0.03 27.33 27.30 0.03 27.85 27.82 0.03
July 27.15 27.11 0.04 27.49 27.45 0.03 27.90 27.87 0.03 28.52 28.48 0.03
August 27.22 27.17 0.05 27.62 27.56 0.05 27.99 27.94 0.05 28.74 28.68 0.05
Sept. 26.72 26.62 0.10 27.08 26.98 0.10 27.37 27.27 0.10 27.97 27.88 0.10
Table 6-13: Shading effects - the difference with and without using shading devices (kWh).
2002 2020 2050 2080
W S Diff. W S Diff. W S Diff. W S Diff.
May 172.04 158.97 13.06 165.19 152.43 12.76 165.56 152.80 12.76 165.64 152.88 12.76
June 169.77 156.76 13.01 162.25 150.03 12.22 161.40 149.15 12.25 161.40 149.15 12.25
July 167.14 153.84 13.30 157.34 144.94 12.41 156.23 143.71 12.51 156.32 143.82 12.50
August 164.10 146.40 17.71 155.81 138.71 17.10 154.15 137.12 17.03 154.83 137.77 17.06
Sept. 174.01 137.93 36.09 169.29 134.09 35.20 167.64 132.95 34.68 167.66 132.97 34.69
Figure 6-25: Shading devices effect in reducing exterior window's solar gains – Cairo.

144
6.2.2: Evaluation of the fenestration specifications in EREC
No. of simulations Climatic zones WDFs No. of models
112 Alexandria
Cairo Aswan
2002 2020 2050 2080
1
The Egyptian Residential Energy Code (EREC) provides specifications and recommendations for the construction of buildings that aim to offer comfort built environment for the occupants. Among these specifications are many dependency relationships between different variables that affect the selection process of the building fenestration. After ascertaining the validity of the shading specifications mentioned in the code to work in the projected future climate conditions, a further step was taken 6. This work aims to study the effect of these variables (window-wall ratio and glass thermal properties) and their associated shading devices (recommended by EREC) on the optimization of energy consumption, and its long-term cost-effectiveness. As well as trying to find the best combination between these variables (WWR, glass types and associated shading devices) in each climatic zone (to strengthen the previous goals), as such data are not existed in the code.
These attempts were conducted in the main three climate zones in Egypt, under different climate change scenarios. The work involves utilizing the database and shading calculation tool developed (refer to Section 5.3). As before, appropriate materials were used for the construction in the different three climatic zones, evaluated in previous simulations (Section 6.1), which recommended the use of the double wall of half red-brick with 5 cm of internal expanded polystyrene thermal insulation layer (Dins) wall as the optimum external wall in Aswan, and the use of the double wall of half red-brick with 5 cm air gap in between (Dair) wall for Alexandria and Cairo. One glass type from each of the four main glass categories listed in EREC, was selected to be employed in the models during the simulations (Table 6-14).
Table 6-14: Used glass specifications.
Name Category SHGC* LT ** U-Value (W/m2K)
G1 Clear 6.4mm Single 0.71 0.65 5.76
G2 Clear Reflective 6.4mm – (Stainless steel Cover 8%) Single
Reflective 0.18 0.06 5.36
G3 Clear 3.2mm– Transparent/Transparent - (6.0mm air) Double 0.66 0.59 3.71
G4 Clear Reflective 6.4mm - Transparent (Stainless steel Cover 8%) / Transparent - (6mm air)
Double Reflective
0.13 0.05 2.66
*SHGC: Solar Heat Gain Coefficient. ** LT: Light Transmission.
6 This work has been published in the form of journal article (Appendix VI ).

145
Extensive modelling of different kinds was employed to achieve the objectives of the research. These include:
1) Development of a computerized shading device calculation tool, to calculate the sun-breakers depth (W) for each window in the tested model, based on EREC recommendations and calculation methods.
2) Extensive dynamic thermal simulations (112 simulations), using the building performance simulation (BPS) interface tool “DesignBuilder”, to evaluate the effect of the various parameters on monthly energy consumption (kWh) and indoor air temperature (°C). A typical residential building (Figs. 6-26 and 6-27) with mechanical air conditioning (HVAC) installed was used for the simulations, in the three main Egyptian climatic zones defined in EREC (HBRC 2008, OEP 1998b), Cairo and Delta, the North coast, and the Southern climatic zone. These have been tested under the current climate conditions (2002), and the different climate change scenarios for three periods: 2020, 2050 and 2080.
3) Modelling of long-term financial analysis to identify the most cost-effective glazing type to be used in each climatic zone, for each WWR. This takes into account the initial as well as the running cost of each glazing type when applied.
Figure 6-26: Typical plan for the Modeled flat.
Figure 6-27: Solar analysis of the model used in Alexandria &Aswan.

146
WWR is the ratio between the areas of the openings in an external façade to the total area of this façade (HBRC 2008). The WWR must meet the requirements of EREC in terms of : Solar Heat Gain Coefficient (SHGC), Shaded Glass Ratio (SGR), both according to the climatic zone of the building, and the direction of the openings to prevent the penetration of excess quantities of heat which would increase the indoor thermal loads. EREC has divided the WWR into four intervals as shown in Table 6-15, all of these four intervals were investigated in the simulations.
Table 6-15: The WWR intervals according to EREC.
WWR interval WWR (%)
1 Less than ten percent <10%
2 From 10 to 20 percent 10% - 20%
3 From 20 to 30 percent 20% - 30%
4 More than thirty percent >30%
The results of the simulations can be discussed according to two main aspects, the simulation results and the financial aspects:
1- Simulation results:
a) Sun-breaker Depth (W) Outputs:
The outputs of the shading calculation tool are shown in Table 6-16. The table is divided into three parts, one for each climatic zone. Each climatic zone part in Table 6-16 shows the W values (which then feed in DB) in the cells with the light gray background. Each cell with of a W value is a projection of four parameters (function of) WWR, opening type, shading device type and glass type. The first parameter is the WWR, where the four ratio intervals defined by the EREC, are used in the simulation. The second parameter is the opening type. According to the simulation model (Figs. 6-26 and 6-27), the building has seven types of openings: O1, O2, O3, in the south elevation O4, O5 in the east elevation, and O6, O7 in the west façade. The first record in each WWR part in the table shows the actual WWR values for each opening. The third parameter is the shading device type used for each opening in the building. The shading device type is either vertical (V) or horizontal (H) as shown in the Table. The fourth (and the last) parameter by which the W value in the table is defined, is the glass type (G1, G2, G3, or G4). Note that the cells with Zero W values indicates that no shading is needed, while the cells with dashes indicate that such an opening, given its corresponding WWR and façade orientation, is not allowed in this climatic zone, according to EREC.
According to the outputs in Table 6-16, there are three important points: The glass types Single Clear Reflective 6.4mm (G2) and Double Clear Reflective 6.4mm (G4),
which are both reflective glass types, do not need any shading device (W values are zero). This applies to all the three climatic zones with all the allowed WWR intervals.
The W value outputs of both Single Clear 6.4mm (G1) and Double Clear 3.2mm (G3) glass types are always the same in each WWR interval.
As expected (according to the code's recommendations and the current case), due to the high solar radiation intensity in Egypt, the fourth WWR interval (>30%) is not allowed to be used in any of the elevation orientations in both Cairo and Aswan climatic zones, while it is allowed in Alex climatic zone only in the south elevation. On the other hand, the third WWR interval (20% - 30%) is not allowed in both Cairo and Aswan climatic zones in the East and the West elevations.

147
Table 6-16: Shading calculation tool outputs.
Climatic Zone Alexandria External Walls Dair
Climatic Zone Cairo External Walls Dair
Climatic Zone Aswan External Walls Dins
WWR % S-Elevation (24.36*15)
E-Elevation
(14.76*15)
W-Elevation
(14.76*15) WWR % S-Elevation (24.36*15)
E-Elevation
(14.76*15)
W-Elevation
(14.76*15) WWR % S-Elevation (24.36*15)
E-Elevation
(14.76*15)
W-Elevation
(14.76*15)
O1 O2 O3 O4 O5 O6 O7
O1 O2 O3 O4 O5 O6 O7
O1 O2 O3 O4 O5 O6 O7
Wri
tte
n W
WR
<
10
%
Actual 9.21 1.00
/10
0.55
/20
0.35/
10
0.82
/10
0.82
/10
0.82
/10
0.82
/10
Wri
tte
n W
WR
<
10
%
Actual 9.21 1.00
/10
0.55
/20
0.35/
10
0.82
/10
0.82/
10
0.82/
10
0.82/
10
Wri
tte
n W
WR
<
10
%
Actual 9.21 1.00
/10
0.55
/20
0.35/
10
0.82
/10
0.82
/10
0.82
/10
0.82
/10
Shading
Glass
H H H V V V V
Shading
Glass
H H H V V V V
Shading
Glass
H H H V V V V
G1 0 0 0 0.55 0.55 0.74 0.74
G1 0 0 0 0.55 0.55 0.92 0.92
G1 0.56 0.56 0.56 0.74 0.74 0.92 0.92
G2 0 0 0 0 0 0 0
G2 0 0 0 0 0 0 0
G2 0 0 0 0 0 0 0
G3 0 0 0 0.55 0.55 0.74 0.74
G3 0 0 0 0.55 0.55 0.92 0.92
G3 0.56 0.56 0.56 0.74 0.74 0.92 0.92
G4 0 0 0 0 0 0 0
G4 0 0 0 0 0 0 0
G4 0 0 0 0 0 0 0
Wri
tte
n W
WR
1
0 %
- 2
0 %
Actual 18.32 1.88
/ 10
1.10
/ 20
0.75
/ 10
1.66
/10
1.62
/10
1.66
/10
1.62
/10
Wri
tte
n W
WR
1
0 %
- 2
0 %
Actual 18.32 1.88
/ 10
1.10
/ 20
0.75
/ 10
1.66
/10
1.62/
10
1.66/
10
1.62/
10
Wri
tte
n W
WR
1
0 %
- 2
0 %
Actual 18.32 1.88
/ 10
1.10
/ 20
0.75
/ 10
1.66
/10
1.62
/10
1.66
/10
1.62
/10
Shading
Glass
H H H V V V V
Shading
Glass
H H H V V V V
Shading
Glass
H H H V V V V
G1 0 0 0 1.41 1.38 1.76 1.72
G1 0.56 0.56 0.56 1.41 1.38 1.76 1.72
G1 0.56 0.56 0.56 1.76 1.72 1.76 1.72
G2 0 0 0 0 0 0 0
G2 0 0 0 0 0 0 0
G2 0 0 0 0 0 0 0
G3 0 0 0 1.41 1.38 1.76 1.72
G3 0.56 0.56 0.56 1.41 1.38 1.76 1.72
G3 0.56 0.56 0.56 1.76 1.72 1.76 1.72
G4 0 0 0 0 0 0 0
G4 0 0 0 0 0 0 0
G4 0 0 0 0 0 0 0
Wri
tte
n W
WR
2
0 %
- 3
0 %
Actual 27.32 2.88
/10
1.63
/20
1.05/
10
2.5/
10
2.4/
10
2.5/
10
2.4/
10
Wri
tte
n W
WR
2
0 %
- 3
0 %
Actual 27.32 2.88
/10
1.63
/20
1.05/
10
2.5/
10
2.4/1
0
2.5/1
0
2.4/1
0
Wri
tte
n W
WR
2
0 %
- 3
0 %
Actual 27.32 2.88
/10
1.63
/20
1.05/
10
2.5/
10
2.4/
10
2.5/
10
2.4/
10
Shading
Glass
H H H V V V V
Shading
Glass
H H H V V V V
Shading
Glass
H H H V V V V
G1 0.56 0.56 0.56 2.6 2.5 2.6 2.5
G1 0.84 0.84 0.84
G1 0.84 0.84 0.84
G2 0 0 0 0 0 0 0
G2 0 0 0
G2 0 0 0
G3 0.56 0.56 0.56 2.6 2.5 2.6 2.5
G3 0.84 0.84 0.84
G3 0.84 0.84 0.84
G4 0 0 0 0 0 0 0
G4 0 0 0
G4 0 0 0
Wri
tte
n W
WR
>
30
%
Actual 36.12 3.82
/10
2.13
/20
1.40/
10
3.32
/10
3.17
/10
3.32
/10
3.17
/10
Wri
tte
n W
WR
>
30
%
Actual 36.12 3.82
/10
2.13
/20
1.40/
10
3.32
/10
3.17/
10
3.32/
10
3.17/
10
Wri
tte
n W
WR
>
30
%
Actual 36.12 3.82
/10
2.13
/20
1.40/
10
3.32
/10
3.17
/10
3.32
/10
3.17
/10
Shading
Glass
H H H V V V V
Shading
Glass
H H H V V V V
Shading
Glass
H H H V V V V
G1 0.84 0.84 0.84
G1
G1
G2 0 0 0
G2
G2
G3 0.84 0.84 0.84
G3
G3
G4 0 0 0
G4
G4

148
b) Energy and Thermal comfort Results:
The results obtained from the simulations are presented for the three climatic zones as follows: Figs. 6-28 and 6-29 for Alexandria, Figs. 6-30 and 6-31 for Cairo and Figs. 6-32 and 6-33 for Aswan respectively. The results of the simulations can be analysed from two different perspectives:
Perspective 1: Comparing different WWRs for each glass type:
G1 (Single 6.4mm): In terms of energy consumption showed in the upper left graphs in the different figures, the <10% WWR produced the best results (i.e. minimum energy consumption). The minimum energy consumption implies the lowest running cost (showed in the upper right graph). As for the thermal comfort, the same WWR (<10%) produces the best thermal comfort results (i.e. avoiding the upper limits of the thermal comfort zone during the summer as shown in the lower graph). For G1, the overall results of <10% WWR are remarkably better than the other WWRs.
G2 (Single reflective 6.4mm): As expected, the <10% WWR produced the best results in terms of energy consumption, running cost, and thermal comfort. These results haven't outweighed the other WWRs results by significant values. More precisely, the <10% WWR outperforms the 10 - 20% WWR with only 0.7% in terms of annual energy consumption running cost. For G2, no specific WWR is favoured over another.
G3 (Double 3.2mm): Also, the <10% WWR has the least energy consumption and the lowest running cost.WWR<10% produced the best thermal comfort results as well. For G3, the <10% WWR has remarkable better results. However, the results of 10% - 20% and 20% - 30% WWRs are almost the same.
G4 (Double reflective 6.4mm): Same as G2, which are both reflective glasses, there is no noticeable variation in the performance of the different WWRs in terms of energy consumption, running cost, and thermal comfort, while the <10% WWR is produced slightly better results.
Perspective 2: Comparing different glass types for each WWR:
<10%: G4 obtained the best results in terms of the energy consumption, running cost and thermal comfort, followed by G2. However, the differences in the performance are not noticeable between different glass types in such a WWR.
10%-20%: Similarly, the reflective glass types, G4 and G2 obtained the first and the second best results, respectively. Moreover, the differences in the results between the various types of the glasses increase as the WWR increases.
20%-30%: G4 obtained the best results, followed by G2. The difference in the results in this WWR is even more noticeable than the difference between the various glass types in the previous WWRs.
>30%: No results were obtained for this WWR, because it is not allowed to open any windows as mentioned before.
Note that the same results (i.e. the best WWR for a given glass type, or the best glass type for a given WWR), in terms of energy consumption, running cost, and thermal comfort are consistently found between the same glass types and WWRs in the various climatic periods and in the three climatic zones. The absolute values of energy consumption, and temperatures, differ in different climatic zones, generally increases from a climatic period to a next one, because of the temperature increase under climate change (Crawley 2007). Note also that Clear Reflective 6.4mm (G2), in spite of being single, achieved better results than the Double Clear 3.2mm (G3) comparing for the energy consumption and thermal comfort.

149
Figure 6-28: Simulation results for Alexandria in 2002 and 2020 weather periods.
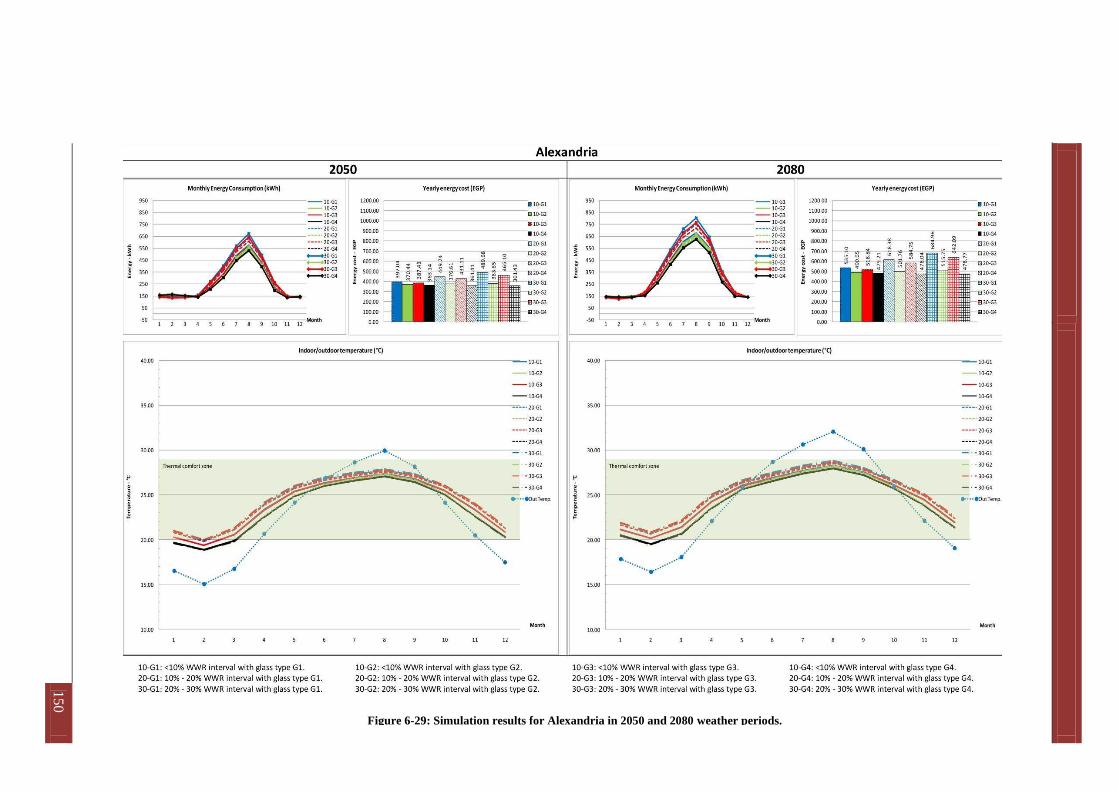
150
Figure 6-29: Simulation results for Alexandria in 2050 and 2080 weather periods.

151
Figure 6-30: Simulation results for Cairo in 2002 and 2020 weather periods.

152
Figure 6-31: Simulation results for Cairo in 2050 and 2080 weather periods.

153
Figure 6-32: Simulation results for Aswan in 2002 and 2020 weather periods.

154
Figure 6-33: Simulation results for Aswan in 2050 and 2080 weather periods.

155
2- Financial Analysis:
The four different glass types used in the simulations are compared with respect to the long term financial aspect. The aim is to point out the best cost effective glass type to be used in each climatic zone for each WWR, taking into account the initial cost and the running cost of each when applied. The financial implications for the results of the simulations are summarised in Tables 6-17, 6-18 and 6-19 for the three climatic zones (Alexandria, Cairo and Aswan) respectively. These show the running costs for the energy consumed in each zone for each climatic period used in the simulations (sub- total), and the average annual running cost obtained by dividing the running cost of the four climatic periods added together (overall) by 88 years, as well as the initial cost of each glass type which calculated according to the glass area for each WWR, and the cost of its associated shading devices. From the analysis of the results listed in the aforementioned tables and for each climatic zone, the following can be summarized for each WWR: Alexandria:
All the glass specifications with all the different WWRs achieve thermal comfort during the various climatic periods as shown in Figs. 6-28 and 6-29. The glass type that seems to achieve the highest financial benefits (Table 6-17) will be listed for each WWR in Alexandria: - <10%: G2 seems to be the only glass type that financially overcomes the G1 glass in this Window/Wall Ratio. - 10%-20%: Similarly, the reflective glass G2 is the only the one that gains financial benefits comparing to the G1 glass in this WWR. - 20%-30%: The reflective glass types G2 and G4 both, gain financial benefits over the G1 glass. However, G2 has got higher financial returns compared to G4.
Cairo: All the different glass types with the <10% and 10% - 20% WWRs seem to achieve thermal comfort in the four different climatic periods (Figs. 6-30 and 6-31). For the 20% - 30% WWR, the openings are only allowed in the South façade (as previously mentioned) without the East and West façades, so this WWR was ignored in the simulations and consequently in the financial analysis. The glass types with the higher financial benefits will be listed for each WWR: - <10%: Evidenced by the financial analysis (Table 6-18), that G2 is the only glass type that has achieved financial gains over the G1 glass in this Window/Wall Ratio. - 10% - 20%: As demonstrated in Table 6-18, the reflective glass types G2 and G4 gained financial benefits over the G1 glass. Though, G2 has got the maximum financial returns.
Aswan: All the glass types with the <10% and 10% - 20% WWRs appear to achieve indoor thermal comfort during the various climatic periods (Figs. 6-32 and 6-33), except for the G1 glass with the 10% - 20% WWR in 2080 as shown in Fig. 6-33. The glass types with the best financial benefits (Table 6-19) will be listed in terms of WWR: - <10%: G2 and G4 glass types, seems to achieve more financial benefits than the basic G1 glass. However, G2 solve in the first place. - 10% - 20%: As usual, G2 and G4 overcome the G1 glass in terms of financial gains for the long term. However, G2 has got the maximum financial returns.

156
Table 6-17: Financial Analysis - Alexandria.
* The negative red numbers indicates a financial gain against the G1 glass at any WWR.
2002 2020 2050 2080
interest years
Glass WWR Initial
cost
2012-2025 (14 years) 2026-2039 (14 years) 2040-2069 (30 years) 2070-2099 (30 years) Overall annual
running cost
Average annual
running cost
(Overall/88)
9% 88.00
Running
cost Sub total
Running
cost Sub total
Running
cost Sub total
Running
cost Sub total
diff in initial
cost
accumulation
after88 years
diff in running
costs
accumulation after
88 years saving in initial cost vs. saving
in running cost G1
10%
37950.6 255.19 3572.708 317.50 4444.936 397.04 11911.21 535.10 16053.03 35981.88 408.89 0 0.00 0.00 0.00
G2 35526 244.71 3425.915 300.21 4202.893 370.44 11113.05 490.65 14719.6 33461.45 380.24 - 2,424.60 - 4,372,657.10 - 28.64 - 625,258.77 -4,997,915.87 G1 under
G2
G3 41102.1 250.40 3505.666 310.33 4344.634 387.43 11622.84 518.84 15565.09 35038.23 398.16 3,151.50 5,683,588.57 - 10.72 - 234,098.45 5,449,490.12 G1 over
G3
G4 40110 241.86 3386.025 295.29 4134.006 363.14 10894.13 479.21 14376.44 32790.60 372.62 2,159.40 3,894,380.82 - 36.26 - 791,681.93 3,102,698.89 G1 over
G4
2002 2020 2050 2080
Glass WWR Initial
cost
2012-2025 (14 years) 2026-2039 (14 years) 2040-2069 (30 years) 2070-2099 (30 years) Overall annual
running cost
Average annual
running cost
(Overall/88)
Running
cost Sub total
Running
cost Sub total
Running
cost Sub total
Running
cost Sub total
diff in initial
cost
accumulation after
88 years
diff in running
costs
accumulation after
88 years saving in initial cost vs. saving
in running cost G1
20%
77159.1 283.60 3970.363 359.51 5033.153 449.74 13492.15 618.38 18551.29 41046.96 466.44 0 0.00 0.00 0.00
G2 70618 246.49 3450.903 304.04 4256.605 376.61 11298.32 501.76 15052.91 34058.74 387.03 - 6,541.10 - 11,796,579.79 - 79.41 - 1,733,613.41 -13,530,193.19 G1 under
G2
G3 83423.6 274.68 3845.529 345.57 4837.943 431.11 12933.27 584.75 17542.45 39159.19 444.99 6,264.50 11,297,744.12 - 21.45 - 468,312.01 10,829,432.12 G1 over
G3
G4 79730 240.00 3359.949 293.49 4108.921 361.41 10842.16 478.04 14341.11 32652.13 371.05 2,570.90 4,636,502.57 - 95.40 - 2,082,559.01 2,553,943.56 G1 over
G4
2002 2020 2050 2080
Glass WWR Initial
cost
2012-2025 (14 years) 2026-2039 (14 years) 2040-2069 (30 years) 2070-2099 (30 years) Overall annual
running cost
Average annual
running cost
(Overall/88)
Running
cost Sub total
Running
cost Sub total
Running
cost Sub total
Running
cost Sub total
diff in initial
cost
accumulation after
88 years
diff in running
costs
accumulation after
88 years saving in initial cost vs. saving
in running cost G1
30%
120969.4 306.14 4285.982 387.89 5430.465 489.68 14690.44 684.96 20548.69 44955.58 510.86 0 0.00 0.00 0.00
G2 105338 249.69 3495.643 308.85 4323.884 383.85 11515.6 515.75 15472.62 34807.75 395.54 - 15,631.40 - 28,190,527.18 - 115.32 - 2,517,438.13 -30,707,965.30 G1 under
G2
G3 130313.9 295.32 4134.413 372.21 5210.899 465.10 13952.91 642.09 19262.69 42560.91 483.65 9,344.50 16,852,385.66 - 27.21 - 594,062.38 16,258,323.28 G1 over
G3
G4 118930 239.39 3351.443 293.24 4105.395 361.43 10842.92 478.77 14363.1 32662.86 371.17 - 2,039.40 - 3,677,966.22 - 139.69 - 3,049,534.19 -6,727,500.41 G1 under
G4

157
Table 6-18: Financial Analysis – Cairo.
* The negative red numbers indicates a financial gain against the G1 glass at any WWR.
2002 2020 2050 2080
interest years
Glass WWR Initial
cost
2012-2025 (14 years) 2026-2039 (14 years) 2040-2069 (30 years) 2070-2099 (30 years) Overall
annual
running cost
Average annual
running cost
(Overall/88)
9% 88.00
Running
cost Sub total
Running
cost Sub total
Running
cost Sub total
Running
cost Sub total
diff in
initial cost
accumulation
after88 years
diff in
running costs
accumulation
after 88 years saving in initial cost vs. saving
in running cost G1
10%
38488.8 375.79 5261.026 446.53 6251.453 531.27 15938.16 727.77 21833.08 49283.73 560.04 0 0.00 0.00 0.00
G2 35526 346.85 4855.913 413.08 5783.064 492.58 14777.31 665.12 19953.48 45369.77 515.57 - 2,962.80 - 5,343,276.60 - 44.48 - 970,959.57 -6,314,236.17
G1
under
G2
G3 41640.3 365.93 5123.067 434.32 6080.493 516.16 15484.73 702.54 21076.06 47764.34 542.78 3,151.50 5,683,588.57 - 17.27 - 376,923.49 5,306,665.08 G1 over
G3
G4 40110 339.81 4757.313 403.84 5653.691 480.77 14423.1 642.39 19271.82 44105.93 501.20 1,621.20 2,923,761.32 - 58.84 - 1,284,489.74 1,639,271.58 G1 over
G4
2002 2020 2050 2080
Glass WWR Initial
cost
2012-2025 (14 years) 2026-2039 (14 years) 2040-2069 (30 years) 2070-2099 (30 years) Overall
annual
running cost
Average annual
running cost
(Overall/88)
Running
cost Sub total
Running
cost Sub total
Running
cost Sub total
Running
cost Sub total
diff in
initial cost
accumulation
after 88 years
diff in
running costs
accumulation
after 88 years saving in initial cost vs. saving
in running cost G1
20%
80268.7 421.01 5894.117 495.96 6943.376 599.25 17977.45 822.69 24680.75 55495.69 630.63 0 0.00 0.00 0.00
G2 70618 352.18 4930.494 421.22 5897.075 504.01 15120.22 689.89 20696.57 46644.36 530.05 - 9,650.70 - 17,404,603.59 - 100.58 - 2,195,807.87 -19,600,411.46
G1
under
G2
G3 86533.2 403.76 5652.673 475.55 6657.709 569.18 17075.46 778.36 23350.73 52736.57 599.28 6,264.50 11,297,744.12 - 31.35 - 684,473.27 10,613,270.85 G1 over
G3
G4 79730 337.88 4730.254 402.24 5631.303 480.26 14407.69 644.88 19346.45 44115.69 501.31 - 538.70 - 971,521.23 - 129.32 - 2,823,110.77 -3,794,632.00
G1
under
G4
2002 2020 2050 2080
Glass WWR Initial
cost
2012-2025 (14 years) 2026-2039 (14 years) 2040-2069 (30 years) 2070-2099 (30 years) Overall
annual
running cost
Average annual
running cost
(Overall/88)
Running
cost Sub total
Running
cost Sub total
Running
cost Sub total
Running
cost Sub total
diff in
initial cost
accumulation
after 88 years
diff in
running costs
accumulation
after 88 years saving in initial cost vs. saving
in running cost G1
30%
0.00 0 0.00 0 0.00 0 0.00 0 0.00 0.00 0 0.00 0.00 0.00
G2
0.00 0 0.00 0 0.00 0 0.00 0 0.00 0.00 - - - - -
G3
0.00 0 0.00 0 0.00 0 0.00 0 0.00 0.00 - - - - -
G4
0.00 0 0.00 0 0.00 0 0.00 0 0.00 0.00 - - - - -

158
Table 6-19: Financial Analysis – Aswan.
* The negative red numbers indicates a financial gain against the G1 glass at any WWR.
2002 2020 2050 2080
interest years
Glass WWR Initial
cost
2012-2025 (14 years) 2026-2039 (14 years) 2040-2069 (30 years) 2070-2099 (30 years) Overall annual
running cost
Average annual
running cost
(Overall/88)
9% 88.00
Running
cost Sub total
Running
cost Sub total
Running
cost Sub total
Running
cost Sub total
diff in initial
cost
accumulation
after88 years
diff in running
costs
accumulation after
88 years saving in initial cost vs. saving
in running cost G1
10%
40634.7 575.03 8050.487 654.82 9167.534 759.06 22771.84 936.87 28106.03 68095.90 773.82 0 0.00 0.00 0.00
G2 35526 510.95 7153.271 582.57 8155.927 665.73 19971.81 826.74 24802.14 60083.15 682.76 - 5,108.70 - 9,213,310.78 - 91.05 - 1,987,775.88 -11,201,086.67 G1 under
G2
G3 43786.2 549.05 7686.748 624.33 8740.599 715.56 21466.77 880.21 26406.28 64300.40 730.69 3,151.50 5,683,588.57 - 43.13 - 941,573.58 4,742,014.99 G1 over
G3
G4 40110 486.04 6804.491 552.85 7739.899 628.76 18862.81 767.01 23010.27 56417.47 641.11 - 524.70 - 946,272.86 - 132.71 - 2,897,144.25 -3,843,417.11 G1 under
G4
2002 2020 2050 2080
Glass WWR Initial
cost
2012-2025 (14 years) 2026-2039 (14 years) 2040-2069 (30 years) 2070-2099 (30 years) Overall annual
running cost
Average annual
running cost
(Overall/88)
Running
cost Sub total
Running
cost Sub total
Running
cost Sub total
Running
cost Sub total
diff in initial
cost
accumulation after
88 years
diff in running
costs
accumulation after
88 years saving in initial cost vs. saving
in running cost G1
20%
81286.45 693.12 9703.722 808.88 11324.27 947.28 28418.38 1180.65 35419.6 84865.97 964.39 0 0.00 0.00 0.00
G2 70618 552.41 7733.708 633.13 8863.804 741.55 22246.37 934.27 28028.08 66871.96 759.91 - 10,668.45 - 19,240,069.96 - 204.48 - 4,463,890.83 -23,703,960.80 G1 under
G2
G3 87550.95 647.93 9070.951 744.23 10419.24 868.08 26042.32 1071.55 32146.61 77679.12 882.72 6,264.50 11,297,744.12 - 81.67 - 1,782,888.56 9,514,855.57 G1 over
G3
G4 79730 505.71 7079.909 576.54 8071.621 658.78 19763.41 817.25 24517.43 59432.37 675.37 - 1,556.45 - 2,806,987.60 - 289.02 - 6,309,478.96 -9,116,466.56 G1 under
G4
2002 2020 2050 2080
Glass WWR Initial
cost
2012-2025 (14 years) 2026-2039 (14 years) 2040-2069 (30 years) 2070-2099 (30 years) Overall annual
running cost
Average annual
running cost
(Overall/88)
Running
cost Sub total
Running
cost Sub total
Running
cost Sub total
Running
cost Sub total
diff in initial
cost
accumulation after
88 years
diff in running
costs
accumulation after
88 years saving in initial cost vs. saving
in running cost G1
30%
0.00 0 0.00 0 0.00 0 0.00 0 0.00 0.00 0 0.00 0.00 0.00
G2
0.00 0 0.00 0 0.00 0 0.00 0 0.00 0.00 - - - - 0.00
G3
0.00 0 0.00 0 0.00 0 0.00 0 0.00 0.00 - - - - 0.00
G4
0.00 0 0.00 0 0.00 0 0.00 0 0.00 0.00 - - - - 0.00

159
Simulation results showed different performances for each specification across the climatic zones when using different WWR. However, in general, the results recommend the Single Clear Reflective 6.4mm, with 8% Stainless-Steel Cover (G2), as the most cost-effective glass type to be used on the long term, achieving even better results than the Double Clear 3.2mm (G3) in terms of energy consumption and thermal comfort.
For more insight in this final conclusion, instead of analyzing the simulation results on monthly average basis (as all the previous results have been analyzed), a comparison has been held between these two glass types (in Cairo, using 2002 WDF and 20% WWR) on hourly basis.
Fig. 6-34 shows the indoor thermal behaviour while using the G2 and G3 glass types during the hot summer period in Egypt (from April to September), and the attached table illustrate the overheating hours in each month. It can be seen from the data in the graphs and the table that, the G3 overheating hours significantly exceeds the G2 glass type during all the summer months, this difference ranges between 13 hours in April up to 129 hours in July, may be due to the difference in the solar radiation incidence angles in each of these months. This result supports the aforementioned recommendation about the G2 glass type.

160
G2 G3
Figure 6-34: The hourly thermal behaviour and the overheating hours through the summer months in Cairo using G2 and G3 glass.
Indoor Air temp. (°C) G2 G3 G2 G3 G2 G3 G2 G3 G2 G3 G2 G3
29 - 29.99 4 11 7 34 31 106 38 132 61 127 33 47
30 - 30.99 5 7 5 2 30 12 37 21 61 9 35
31 - 31.99 4 1 2 7 9 13 4
32 - 32.99 2 8
33 - 33.99 3 3
34 - 34.99 2
Total hours 9 22 7 40 33 138 62 191 82 201 42 86
Summer months
April May June July August September

161
6.3: Combining the results
No. of simulations Climatic zones WDFs No. of models
72 Alexandria
Cairo Aswan
2002 2020 2050 2080
2
A new interrogation point has emerged, regarding the joint performance of the two different aforementioned EREC specifications (solid parts and fenestration recommendations). The conclusions of the previous work on the building envelope (Sections 6.1 and 6.2) were tested together in a new research to establish feasibility. The aim of this new work is to make sure that the use of what seems to be the best combinations for the external walls (solid part) in addition to the optimum solutions for fenestration (openings), will results in a better overall performance in energy consumption and thermal comfort, than implementing one of the two choices without the other.
DesignBuilder (DB) was used to investigate the effect of using three different sets of construction materials on the buildings' thermal behaviour:
1- Ordinary external wall materials combined with the selected fenestration resulted from the aforementioned work (OS).
2- Selected external wall materials with ordinary fenestration parameters (SO). 3- Selected external wall materials with selected fenestration (SS). 4- The fourth probability: Ordinary external wall materials with ordinary fenestration
parameters (OO) was excluded, as it was tested in previous studies (Sections 6.1.1 and 6.1.2) and never achieve satisfactory outcomes.
The ordinary materials (O) are the most commonly used materials in Egypt, most probably due to their low price. While the selected materials (S) were obtained as results of the previous research (Sections 6.1 and 6.2). the different materials for each O and S category, used in the simulations for the different climatic zones are listed in Table 6-20.
Table 6-20: General description of the materials used in the simulations.
Category Building Envelope
Alexandria Cairo Aswan
Ordinary (O)
External Walls Half red-brick wall (12cm) Half red-brick wall (12cm) Half red-brick wall (12cm)
Fenestration Single clear 6.4mm (G1) Single clear 6.4mm (G1) Single clear 6.4mm (G1)
Selected (S)
External Walls Double wall of half red-
brick-air gap (Dair) Double wall of half red-
brick-air gap (Dair) Double wall of half red-brick-insulation (Dins)
Fenestration Single clear Reflective
6.4mm (G2) + 20% WWR Single clear Reflective
6.4mm (G2) + 20% WWR Single clear Reflective
6.4mm (G2) + 20% WWR
The results contain indicators for 72 simulations (for two models B-1 and B-2) that have been conducted through the research. The aforementioned results divided into three separate graphs: the monthly energy consumption (kWh), annual energy cost in Egyptian Pound (EGP), as well as the levels of thermal comfort compared to the outdoor and indoor temperatures (°C). These measures were plotted for the three climatic zones (Alexandria, Cairo and Aswan) in Figs. 6-35/36, 6-37/38 and 6-39/40 for B-1 building, and in Figs. 6-41/42, 6-43/44 and 6-45/46 for B-2 building respectively.

162
2002
2020
Figure 6-35: Simulation results for Building-1 in Alexandria - 2002 and 2020 weather periods.
0
200
400
600
800
1000
1200
1400
1 2 3 4 5 6 7 8 9 10 11 12
En
erg
y -
kW
h
Month
Monthly Energy Consumption (kWh)
OS
SO
SS
Hot period
10.00
15.00
20.00
25.00
30.00
35.00
40.00
1 2 3 4 5 6 7 8 9 10 11 12
Te
mp
era
ture
-°C
Month
Indoor/outdoor temperature (°C)
OS
SO
SS
Out Temp.
Thermal comfort zone
Hot period
35
0.2
6
37
0.3
7
32
1.7
3
0.00
500.00
1000.00
1500.00
2000.00
2500.00
En
erg
y c
ost
-E
GP
Yearly energy cost (EGP)
OS
SO
SS
0
200
400
600
800
1000
1200
1400
1 2 3 4 5 6 7 8 9 10 11 12
En
erg
y -
kW
h
Month
Monthly Energy Consumption (kWh)
OS
SO
SS
Hot period
10.00
15.00
20.00
25.00
30.00
35.00
40.00
1 2 3 4 5 6 7 8 9 10 11 12
Te
mp
era
ture
-°C
Month
Indoor/outdoor temperature (°C)
OS
SO
SS
Out Temp.
Thermal comfort zone
Hot period
43
6.8
7
46
8.5
1
39
8.3
2
0.00
500.00
1000.00
1500.00
2000.00
2500.00
En
erg
y c
ost
-E
GP
Yearly energy cost (EGP)
OS
SO
SS

163
2050
2080
Figure 6-36: Simulation results for Building-1 in Alexandria - 2050 and 2080 weather periods.
0
200
400
600
800
1000
1200
1 2 3 4 5 6 7 8 9 10 11 12
En
erg
y -
kW
h
Month
Monthly Energy Consumption (kWh)
OS
SO
SS
Hot period
10.00
15.00
20.00
25.00
30.00
35.00
40.00
1 2 3 4 5 6 7 8 9 10 11 12
Te
mp
era
ture
-°C
Month
Indoor/outdoor temperature (°C)
OS
SO
SS
Out Temp.
Thermal comfort zone
Hot period
55
1.0
7
59
7.3
6
49
1.3
8
0.00
500.00
1000.00
1500.00
2000.00
2500.00
En
erg
y c
ost
-E
GP
Yearly energy cost (EGP)
OS
SO
SS
0
200
400
600
800
1000
1200
1400
1 2 3 4 5 6 7 8 9 10 11 12
En
erg
y -
kW
h
Month
Monthly Energy Consumption (kWh)
OS
SO
SS
Hot period
10.00
15.00
20.00
25.00
30.00
35.00
40.00
1 2 3 4 5 6 7 8 9 10 11 12
Te
mp
era
ture
-°C
Month
Indoor/outdoor temperature (°C)
OS
SO
SS
Out Temp.
Thermal comfort zone
Hot period
77
3.8
5
84
3.6
6
66
9.5
0
0.00
500.00
1000.00
1500.00
2000.00
2500.00
En
erg
y c
ost
-E
GP
Yearly energy cost (EGP)
OS
SO
SS

164
2002
2020
Figure 6-37: Simulation results for Building-1 in Cairo- 2002 and 2020 weather periods.
0
200
400
600
800
1000
1200
1400
1 2 3 4 5 6 7 8 9 10 11 12
En
erg
y -
kW
h
Month
Monthly Energy Consumption (kWh)
OS
SO
SS
Hot period
10.00
15.00
20.00
25.00
30.00
35.00
40.00
1 2 3 4 5 6 7 8 9 10 11 12
Te
mp
era
ture
-°C
Month
Indoor/outdoor temperature (°C)
OS
SO
SS
Out Temp.
Thermal comfort zone
Hot period
51
3.3
5
55
0.8
7
46
3.1
6
0.00
500.00
1000.00
1500.00
2000.00
2500.00
En
erg
y c
ost
-E
GP
Yearly energy cost (EGP)
OS
SO
SS
0
200
400
600
800
1000
1200
1400
1 2 3 4 5 6 7 8 9 10 11 12
En
erg
y -
kW
h
Month
Monthly Energy Consumption (kWh)
OS
SO
SS
Hot period
10.00
15.00
20.00
25.00
30.00
35.00
40.00
1 2 3 4 5 6 7 8 9 10 11 12
Te
mp
era
ture
-°C
Month
Indoor/outdoor temperature (°C)
OS
SO
SS
Out Temp.
Thermal comfort zone
Hot period
62
1.3
5
65
9.7
1
55
0.0
0
0.00
500.00
1000.00
1500.00
2000.00
2500.00
En
erg
y c
ost
-E
GP
Yearly energy cost (EGP)
OS
SO
SS

165
2050
2080
Figure 6-38: Simulation results for Building-1 in Cairo - 2050 and 2080 weather periods.
0
200
400
600
800
1000
1200
1400
1 2 3 4 5 6 7 8 9 10 11 12
En
erg
y -
kW
h
Month
Monthly Energy Consumption (kWh)
OS
SO
SS
Hot period
10.00
15.00
20.00
25.00
30.00
35.00
40.00
1 2 3 4 5 6 7 8 9 10 11 12
Tem
pe
ratu
re -
°C
Month
Indoor/outdoor temperature (°C)
OS
SO
SS
Out Temp.
Thermal comfort zone
Hot period
77
4.7
3
81
3.3
1
67
6.4
9
0.00
500.00
1000.00
1500.00
2000.00
2500.00
En
erg
y c
ost
-E
GP
Yearly energy cost (EGP)
OS
SO
SS
0
200
400
600
800
1000
1200
1400
1 2 3 4 5 6 7 8 9 10 11 12
En
erg
y -
kW
h
Month
Monthly Energy Consumption (kWh)
OS
SO
SS
Hot period
10.00
15.00
20.00
25.00
30.00
35.00
40.00
1 2 3 4 5 6 7 8 9 10 11 12
Te
mp
era
ture
-°C
Month
Indoor/outdoor temperature (°C)
OS
SO
SS
Out Temp.
Thermal comfort zone
Hot period
10
82
.21
11
15
.78
93
0.3
5
0.00
500.00
1000.00
1500.00
2000.00
2500.00
En
erg
y c
ost
-E
GP
Yearly energy cost (EGP)
OS
SO
SS

166
2002
2020
Figure 6-39: Simulation results for Building-1 in Aswan - 2002 and 2020 weather periods.
0
200
400
600
800
1000
1200
1400
1 2 3 4 5 6 7 8 9 10 11 12
En
erg
y -
kW
h
Month
Monthly Energy Consumption (kWh)
OS
SO
SS
Hot period
10.00
15.00
20.00
25.00
30.00
35.00
40.00
1 2 3 4 5 6 7 8 9 10 11 12
Te
mp
era
ture
-°C
Month
Indoor/outdoor temperature (°C)
OS
SO
SS
Out Temp.
Thermal comfort zone
Hot period
10
21
.49
94
9.0
1
72
2.9
6
0.00
500.00
1000.00
1500.00
2000.00
2500.00
En
erg
y c
ost
-E
GP
Yearly energy cost (EGP)
OS
SO
SS
0
200
400
600
800
1000
1200
1400
1 2 3 4 5 6 7 8 9 10 11 12
En
erg
y -
kW
h
Month
Monthly Energy Consumption (kWh)
OS
SO
SS
Hot period
10.00
15.00
20.00
25.00
30.00
35.00
40.00
1 2 3 4 5 6 7 8 9 10 11 12
Te
mp
era
ture
-°C
Month
Indoor/outdoor temperature (°C)
OS
SO
SS
Out Temp.
Thermal comfort zone
Hot period
12
25
.90
11
09
.10
85
3.9
2
0.00
500.00
1000.00
1500.00
2000.00
2500.00
En
erg
y c
ost
-E
GP
Yearly energy cost (EGP)
OS
SO
SS

167
2050
2080
Figure 6-40: Simulation results for Building-1 in Aswan - 2050 and 2080 weather periods.
0
200
400
600
800
1000
1200
1400
1 2 3 4 5 6 7 8 9 10 11 12
En
erg
y -
kW
h
Month
Monthly Energy Consumption (kWh)
OS
SO
SS
Hot period
10.00
15.00
20.00
25.00
30.00
35.00
40.00
1 2 3 4 5 6 7 8 9 10 11 12
Te
mp
era
ture
-°C
Month
Indoor/outdoor temperature (°C)
OS
SO
SS
Out Temp.
Thermal comfort zone
Hot period
14
73
.94
12
94
.41
10
12
.86
0.00
500.00
1000.00
1500.00
2000.00
2500.00
En
erg
y c
ost
-E
GP
Yearly energy cost (EGP)
OS
SO
SS
0
200
400
600
800
1000
1200
1400
1 2 3 4 5 6 7 8 9 10 11 12
En
erg
y -
kW
h
Month
Monthly Energy Consumption (kWh)
OS
SO
SS
Hot period
10.00
15.00
20.00
25.00
30.00
35.00
40.00
1 2 3 4 5 6 7 8 9 10 11 12
Te
mp
era
ture
-°C
Month
Indoor/outdoor temperature (°C)
OS
SO
SS
Out Temp.
Thermal comfort zone
Hot period
18
94
.51
16
01
.37
12
80
.02
0.00
500.00
1000.00
1500.00
2000.00
2500.00
En
erg
y c
ost
-E
GP
Yearly energy cost (EGP)
OS
SO
SS

168
2002
2020
Figure 6-41: Simulation results for Building-2 in Alexandria - 2002 and 2020 weather periods.
0
200
400
600
800
1000
1200
1400
1 2 3 4 5 6 7 8 9 10 11 12
En
erg
y -
kW
h
Month
Monthly Energy Consumption (kWh)
OS
SO
SS
Hot period
10.00
15.00
20.00
25.00
30.00
35.00
40.00
1 2 3 4 5 6 7 8 9 10 11 12
Te
mp
era
ture
-°C
Month
Indoor/outdoor temperature (°C)
OS
SO
SS
Out Temp.
Thermal comfort zone
Hot period
41
6.1
3
37
7.2
0
36
8.1
8
0.00
500.00
1000.00
1500.00
2000.00
2500.00
En
erg
y c
ost
-E
GP
Yearly energy cost (EGP)
OS
SO
SS
0
200
400
600
800
1000
1200
1400
1 2 3 4 5 6 7 8 9 10 11 12
En
erg
y -
kW
h
Month
Monthly Energy Consumption (kWh)
OS
SO
SS
Hot period
10.00
15.00
20.00
25.00
30.00
35.00
40.00
1 2 3 4 5 6 7 8 9 10 11 12
Te
mp
era
ture
-°C
Month
Indoor/outdoor temperature (°C)
OS
SO
SS
Out Temp.
Thermal comfort zone
Hot period
52
6.9
7
47
8.2
3
45
9.1
7
0.00
500.00
1000.00
1500.00
2000.00
2500.00
En
erg
y c
ost
-E
GP
Yearly energy cost (EGP)
OS
SO
SS

169
2050
2080
Figure 6-42: Simulation results for Building-2 in Alexandria - 2050 and 2080 weather periods.
0
200
400
600
800
1000
1200
1400
1 2 3 4 5 6 7 8 9 10 11 12
En
erg
y -
kW
h
Month
Monthly Energy Consumption (kWh)
OS
SO
SS
Hot period
10.00
15.00
20.00
25.00
30.00
35.00
40.00
1 2 3 4 5 6 7 8 9 10 11 12
Te
mp
era
ture
-°C
Month
Indoor/outdoor temperature (°C)
OS
SO
SS
Out Temp.
Thermal comfort zone
Hot period
67
6.0
0
61
0.2
9
57
8.0
2
0.00
500.00
1000.00
1500.00
2000.00
2500.00
En
erg
y c
ost
-E
GP
Yearly energy cost (EGP)
OS
SO
SS
0
200
400
600
800
1000
1200
1400
1 2 3 4 5 6 7 8 9 10 11 12
En
erg
y -
kW
h
Month
Monthly Energy Consumption (kWh)
OS
SO
SS
Hot period
10.00
15.00
20.00
25.00
30.00
35.00
40.00
1 2 3 4 5 6 7 8 9 10 11 12
Te
mp
era
ture
-°C
Month
Indoor/outdoor temperature (°C)
OS
SO
SS
Out Temp.
Thermal comfort zone
Hot period
96
8.1
3
85
6.5
6
80
2.8
2
0.00
500.00
1000.00
1500.00
2000.00
2500.00
En
erg
y c
ost
-E
GP
Yearly energy cost (EGP)
OS
SO
SS

170
2002
2020
Figure 6-43: Simulation results for Building-2 in Cairo - 2002 and 2020 weather periods.
0
200
400
600
800
1000
1200
1400
1 2 3 4 5 6 7 8 9 10 11 12
En
erg
y -
kW
h
Month
Monthly Energy Consumption (kWh)
OS
SO
SS
Hot period
10.00
15.00
20.00
25.00
30.00
35.00
40.00
1 2 3 4 5 6 7 8 9 10 11 12
Te
mp
era
ture
-°C
Month
Indoor/outdoor temperature (°C)
OS
SO
SS
Out Temp.
Thermal comfort zone
Hot period
62
4.0
7
55
6.8
9
53
8.4
5
0.00
500.00
1000.00
1500.00
2000.00
2500.00
En
erg
y c
ost
-E
GP
Yearly energy cost (EGP)
OS
SO
SS
0
200
400
600
800
1000
1200
1400
1 2 3 4 5 6 7 8 9 10 11 12
En
erg
y -
kW
h
Month
Monthly Energy Consumption (kWh)
OS
SO
SS
Hot period
10.00
15.00
20.00
25.00
30.00
35.00
40.00
1 2 3 4 5 6 7 8 9 10 11 12
Te
mp
era
ture
-°C
Month
Indoor/outdoor temperature (°C)
OS
SO
SS
Out Temp.
Thermal comfort zone
Hot period
77
6.8
6
68
1.8
4
65
1.0
0
0.00
500.00
1000.00
1500.00
2000.00
2500.00
En
erg
y c
ost
-E
GP
Yearly energy cost (EGP)
OS
SO
SS

171
2050
2080
Figure 6-44: Simulation results for Building-2 in Cairo - 2050 and 2080 weather periods.
0
200
400
600
800
1000
1200
1400
1 2 3 4 5 6 7 8 9 10 11 12
En
erg
y -
kW
h
Month
Monthly Energy Consumption (kWh)
OS
SO
SS
Hot period
10.00
15.00
20.00
25.00
30.00
35.00
40.00
1 2 3 4 5 6 7 8 9 10 11 12
Te
mp
era
ture
-°C
Month
Indoor/outdoor temperature (°C)
OS
SO
SS
Out Temp.
Thermal comfort zone
Hot period
96
5.0
0
84
1.9
0
80
5.2
4
0.00
500.00
1000.00
1500.00
2000.00
2500.00
En
erg
y c
ost
-E
GP
Yearly energy cost (EGP)
OS
SO
SS
0
200
400
600
800
1000
1200
1400
1 2 3 4 5 6 7 8 9 10 11 12
En
erg
y -
kW
h
Month
Monthly Energy Consumption (kWh)
OS
SO
SS
Hot period
10.00
15.00
20.00
25.00
30.00
35.00
40.00
1 2 3 4 5 6 7 8 9 10 11 12
Te
mp
era
ture
-°C
Month
Indoor/outdoor temperature (°C)
OS
SO
SS
Out Temp.
Thermal comfort zone
Hot period
13
62
.70
11
63
.29
11
10
.12
0.00
500.00
1000.00
1500.00
2000.00
2500.00
En
erg
y c
ost
-E
GP
Yearly energy cost (EGP)
OS
SO
SS

172
2002
2020
Figure 6-45: Simulation results for Building-2 in Aswan - 2002 and 2020 weather periods.
0
200
400
600
800
1000
1200
1400
1 2 3 4 5 6 7 8 9 10 11 12
En
erg
y -
kW
h
Month
Monthly Energy Consumption (kWh)
OS
SO
SS
Hot period
10.00
15.00
20.00
25.00
30.00
35.00
40.00
1 2 3 4 5 6 7 8 9 10 11 12
Te
mp
era
ture
-°C
Month
Indoor/outdoor temperature (°C)
OS
SO
SS
Out Temp.
Thermal comfort zone
Hot period
13
00
.39
85
1.1
9
78
5.9
7
0.00
500.00
1000.00
1500.00
2000.00
2500.00
En
erg
y c
ost
-E
GP
Yearly energy cost (EGP)
OS
SO
SS
0
200
400
600
800
1000
1200
1400
1 2 3 4 5 6 7 8 9 10 11 12
En
erg
y -
kW
h
Month
Monthly Energy Consumption (kWh)
OS
SO
SS
Hot period
10.00
15.00
20.00
25.00
30.00
35.00
40.00
1 2 3 4 5 6 7 8 9 10 11 12
Te
mp
era
ture
-°C
Month
Indoor/outdoor temperature (°C)
OS
SO
SS
Out Temp.
Thermal comfort zone
Hot period
15
53
.70
10
00
.52
92
3.7
4
0.00
500.00
1000.00
1500.00
2000.00
2500.00
En
erg
y c
ost
-E
GP
Yearly energy cost (EGP)
OS
SO
SS

173
2050
2080
Figure 6-46: Simulation results for Building-2 in Aswan - 2050 and 2080 weather periods.
0
200
400
600
800
1000
1200
1400
1 2 3 4 5 6 7 8 9 10 11 12
En
erg
y -
kW
h
Month
Monthly Energy Consumption (kWh)
OS
SO
SS
Hot period
10.00
15.00
20.00
25.00
30.00
35.00
40.00
1 2 3 4 5 6 7 8 9 10 11 12
Te
mp
era
ture
-°C
Month
Indoor/outdoor temperature (°C)
OS
SO
SS
Out Temp.
Thermal comfort zone
Hot period
18
67
.47
11
78
.80
10
91
.09
0.00
500.00
1000.00
1500.00
2000.00
2500.00
En
erg
y c
ost
-E
GP
Yearly energy cost (EGP)
OS
SO
SS
0
200
400
600
800
1000
1200
1400
1 2 3 4 5 6 7 8 9 10 11 12
En
erg
y -
kW
h
Month
Monthly Energy Consumption (kWh)
OS
SO
SS
Hot period
10.00
15.00
20.00
25.00
30.00
35.00
40.00
1 2 3 4 5 6 7 8 9 10 11 12
Te
mp
era
ture
-°C
Month
Indoor/outdoor temperature (°C)
OS
SO
SS
Out Temp.
Thermal comfort zone
Hot period
24
09
.95
14
56
.83
13
57
.70
0.00
500.00
1000.00
1500.00
2000.00
2500.00
En
erg
y c
ost
-E
GP
Yearly energy cost (EGP)
OS
SO
SS

174
The financial study was involved in order to point out the most cost effective set of the three different sets of building materials (OS, SO and SS) in each climatic zone, taking into account the total initial cost and the running cost for each set. The total initial cost as mentioned in Table 6-21 was calculated by adding the initial cost of the external walls to the fenestration cost for each building (B-1 and B-2).
Table 6-21: Total initial cost of the simulated buildings (EGP).
Climatic zone Wall cost Fenestration cost Total
Bu
ild
ing
- 1
OS All 1528 3531 5059
SO
Alex 3104 3858 6962
Cairo 3104 4013 7117
Aswan 5969 4064 10033
SS
Alex 3104 3531 6635
Cairo 3104 3531 6635
Aswan 5969 3531 9500
Bu
ild
ing
- 2
OS All 1832 3746 5578
SO
Alex 3721 3595 7316
Cairo 3721 3755 7476
Aswan 7156 3755 10911
SS
Alex 3721 3746 7467
Cairo 3721 3746 7467
Aswan 7156 3746 10902
In the financial study, the Case SS will be taken as the baseline as it achieved the lowest monthly energy consumption, thus the lowest annual cost for energy, as well as it achieved the best level of thermal comfort for the occupants of the spaces in all the simulations. This includes the two buildings (B-1 and B-2) that have been studied. The financial implications for the results of the simulations are summarised in Tables 6-22 and 6-23 for buildings B-1 and B-2 respectively. Each table demonstrate the financial analysis of the three climatic zones (Alexandria, Cairo and Aswan) sequentially.

175
9% 88.00
Running cost Sub total Running cost Sub total Running cost Sub total Running cost Sub total diff in initial cost accumulation after 88 yrs diff in running costs accumulation after 88 yrs
SS 6635 321.73 4504.15833 398.32 5576.4366 491.38 14741.496 669.50 20084.8614 44906.95 510.31 0 0.00 0.00 0.00
OS 5059 350.26 4903.65889 436.87 6116.17615 551.07 16532.147 773.85 23215.6438 50767.63 576.90 1,576.00- 2,842,245.15- 66.60 1,453,895.47 -1,388,349.68 SS under OS
SO 6962 370.37 5185.20578 468.51 6559.15428 597.36 17920.941 843.66 25309.886 54975.19 624.72 327.00 589,729.80 114.41 2,497,692.51 3,087,422.31 SS over SO
Overall annual
running cost
Average annual running cost
(Overall/88)saving in initial cost vs. saving in
running cost
20%
2002 2020 2050 2080
2040-2069 (30 years) 2070-2099 (30 years)Case WWR Initial cost
2012-2025 (14 years) 2026-2039 (14 years)
9% 88.00
Running cost Sub total Running cost Sub total Running cost Sub total Running cost Sub total diff in initial cost accumulation after 88 yrs diff in running costs accumulation after 88 yrs
SS 6635 463.16 6484.27918 550.00 7700.01947 676.49 20294.589 930.35 27910.6491 62389.54 708.97 0 0.00 0.00 0.00
OS 5059 513.35 7186.85309 621.35 8698.95146 774.73 23241.838 1082.21 32466.3923 71594.03 813.57 1,576.00- 2,842,245.15- 104.60 2,283,419.69 -558,825.46 SS under OS
SO 7117 550.87 7712.19179 659.71 9235.87695 813.31 24399.199 1115.78 33473.4477 74820.72 850.24 482.00 869,265.33 141.26 3,083,883.32 3,953,148.65 SS over SO
Overall annual
running cost
Average annual running cost
(Overall/88) saving in initial cost vs. saving in
running cost (EGP)
20%
2002 2020 2050 20802040-2069 (30 years) 2070-2099 (30 years)
Case WWR Initial cost2012-2025 (14 years) 2026-2039 (14 years)
9% 88.00
Running cost Sub total Running cost Sub total Running cost Sub total Running cost Sub total diff in initial cost accumulation after 88 yrs diff in running costs accumulation after 88 yrs
SS 9500 722.96 10121.3848 853.92 11954.9368 1012.86 30385.654 1280.02 38400.6848 90862.66 1032.53 0 0.00 0.00 0.00
OS 5059 1021.49 14300.8264 1225.90 17162.6214 1473.94 44218.34 1894.51 56835.4007 132517.19 1505.88 4,441.00- 8,009,143.85- 473.35 10,333,510.15 2,324,366.30 G1 under G2
SO 10033 949.01 13286.1628 1109.10 15527.3926 1294.41 38832.44 1601.37 48041.1671 115687.16 1314.63 533.00 961,241.54 282.10 6,158,375.97 7,119,617.50 G1 over G3
Case WWRInitial
cost
2012-2025 (14 years) 2026-2039 (14 years) Overall annual
running cost
Average annual running cost
(Overall/88)saving in initial cost vs. saving in
running cost (EGP)
20%
2002 2020 2050 2080
2040-2069 (30 years) 2070-2099 (30 years)
Alexandria
Cairo
Aswan
Table 6-22: Financial analysis for building B-1
* Only negative numbers in the last column indicates financial gains against the base case

176
9% 88.00
Running cost Sub total Running cost Sub total Running cost Sub total Running cost Sub total diff in initial cost accumulation after 88 yrs diff in running costs accumulation after 88 yrs
SS 7467 368.18 5154.562 459.17 6428.40785 578.02 17340.676 802.82 24084.5239 53008.17 602.37 0 0.00 0.00 0.00
OS 5578 416.13 5825.8373 526.97 7377.63618 676.00 20279.988 968.13 29043.9702 62527.43 710.54 1,889.00- 3,406,726.58- 108.17 2,361,505.34 -1,045,221.24 SS under OS
SO 7316 377.20 5280.75166 478.23 6695.15948 610.29 18308.608 856.56 25696.8981 55981.42 636.15 151.00- 272,321.71- 33.79 737,592.89 465,271.18 SS over SO
Case WWRInitial
cost
2012-2025 (14 years) 2026-2039 (14 years) Overall annual
running cost
Average annual running
cost (Overall/88)saving in initial cost vs. saving in
running cost
20%
2002 2020 2050 2080
2040-2069 (30 years) 2070-2099 (30 years)
9% 88.00
Running cost Sub total Running cost Sub total Running cost Sub total Running cost Sub total diff in initial cost accumulation after 88 yrs diff in running costs accumulation after 88 yrs
SS 7467 538.45 7538.29126 651.00 9114.06295 805.24 24157.052 1110.12 33303.5451 74112.95 842.19 0 0.00 0.00 0.00
OS 5578 624.07 8737.03997 776.86 10876.0262 965.00 28949.858 1362.70 40881.1348 89444.06 1016.41 1,889.00- 3,406,726.58- 174.22 3,803,287.60 396,561.02 SS under OS
SO 7477 556.89 7796.47295 681.84 9545.71414 841.90 25256.883 1163.29 34898.5702 77497.64 880.66 10.00 18,034.55 38.46 839,661.78 857,696.33 SS over SO
Case WWR Initial cost2012-2025 (14 years) 2026-2039 (14 years) Overall annual
running cost
Average annual running cost
(Overall/88)saving in initial cost vs. saving in
running cost
20%
2002 2020 2050 2080
2040-2069 (30 years) 2070-2099 (30 years)
9% 88.00
Running cost Sub total Running cost Sub total Running cost Sub total Running cost Sub total diff in initial cost accumulation after 88 yrs diff in running costs accumulation after 88 yrs
SS 10902 785.97 11003.5177 923.74 12932.3098 1091.09 32732.791 1357.70 40731.0421 97399.66 1106.81 0 0.00 0.00 0.00
OS 5578 1300.39 18205.462 1553.70 21751.8061 1867.47 56024.029 2409.95 72298.5655 168279.86 1912.27 5,324.00- 9,601,594.65- 805.46 17,583,713.54 7,982,118.88 SS over OS
SO 10912 851.19 11916.6287 1000.52 14007.2173 1178.80 35364.029 1456.83 43705.0315 104992.91 1193.10 10.00 18,034.55 86.29 1,883,706.03 1,901,740.58 SS over SO
Overall annual
running cost
Average annual running cost
(Overall/88)saving in initial cost vs. saving in
running cost
20%
2002 2020 2050 2080
2040-2069 (30 years) 2070-2099 (30 years)Case WWR Initial cost
2012-2025 (14 years) 2026-2039 (14 years)
Alexandria
Cairo
Aswan
Table 6-23: Financial analysis for building B-2
* Only negative numbers in the last column indicates financial gains against the base case

177
Both the analysis of the simulation results, along with the financial analysis will be used in the following discussion, by looking at each building (B-1 and B-2) in all of the climatic zones used in the simulations:
1- Building (B-1):
Alexandria:
The Case SS achieved the best energy performance (monthly energy consumption and annual cost), in addition to the best thermal performance in terms of thermal comfort.
As noticed from the thermal comfort curves (Figs. 6-35/36) all the building specifications (OS, SO and SS) achieved the requirements of the thermal comfort in all the different climatic periods, in addition to the convergence levels of thermal performance for all the specifications. This was especially prevalent in the middle of the hot period (July and August), which make us resort to the financial studies that suggest the use of case OS, as the only case that overcomes case SS financially as shown in Table 6-22.
Cairo:
The Case SS again achieved the best energy performance, as well as the best thermal performance in terms of thermal comfort.
In spite of achieving higher financial returns (see Table 6-22) compared to SS, the case OS will not be chosen as the best case for Cairo, as according to the thermal performance curves (Figs. 6-37/38) OS will be so close to a lack of thermal comfort in the climatic period of 2080. So it seems that the SS combination will be the only specification that achieves thermal comfort with financial gains.
Aswan:
Likewise the Case SS achieved the best energy performance, in addition to the best thermal performance as shown in Figures 6-39 and 6-40, and the best financial gains according to the financial study (See Table 6-22).
In order to achieve thermal comfort, it is necessary to use the SS combination, where other specifications do not achieve even an asymptotic level of thermal comfort of the SS specifications in all climatic periods, especially in the period of 2080, where it didn't meet the thermal comfort requirements.
2- Building (B-2):
Alexandria:
The Case SS has achieved the best monthly energy consumption and annual energy cost, in addition to the best thermal performance.
As shown in the thermal comfort curves in Figures 6-41 and 6-42, all the building material sets achieved the thermal comfort requirements in all the different climatic periods with very close levels of performance, which makes us resort to the financial studies that suggest the use of case OS, which was the only case that overcomes SS financially as shown in Table 6-23.

178
Cairo:
The case SS, seems to achieve the best energy and thermal performance (Figs. 6-43 and 6-44), as well as the best financial gains according to the financial study (Table 6-23).
Aswan:
Case SS, achieved the best energy performance (monthly energy consumption and annual cost), in addition to the best thermal performance in terms of thermal comfort as shown in Figures 6-45, and 6-46. As well as the best financial gains as shown in Table 6-23.
The results showed different performance for each building materials set across the climatic zones. However, in general, the results recommend:
The use of the half red-brick wall (12cm) for the external walls and the Single clear Reflective 6.4mm (G2) glass with 20% WWR (OS set), as the most cost-effective combination to be used on the long run in Alexandria.
The set SS was recommended to be used for Cairo and Aswan climatic zones, as the most cost-effective set of building materials:
In Cairo the SS set consists of the Double wall of half red-brick with 5cm air gap (Dair) for the external walls, and the Single clear Reflective 6.4mm (G2) glass with 20% WWR.
While the SS set for Aswan consists of the Double wall of half red-brick with additional internal 5cm of expanded polystyrene thermal insulation layer (Dins) for the external walls, and the Single clear Reflective 6.4mm (G2) glass with 20% WWR for fenestration.
The work shows that for every climatic region, there is an optimum combination of material specifications to achieve the appropriate levels of indoor thermal comfort as well as long term cost-effectiveness. The study also shows that the material specification (SS) is not necessarily the most cost-effective in the long term. These results will employed later in Chapter-7 to test the research recommendations for the building envelope design, using four different case study models.

179
6.4: Solid part╆s shading
No. of simulations Climatic zones WDFs No. of models
768 Alexandria
Cairo Aswan
2002 2020 2050 2080
1
As a vital method for mitigating the solar radiation effect on buildings, shading is considered of paramount importance, especially in Egypt as a hot arid climate country, with very high solar radiation intensity most of the year. Hence, the importance of studying the different shading strategies against future climate change emerged. The Solid parts shading, as one of the commonly used passive techniques in the vernacular architecture (not originally listed in EREC), was suggested to be investigated in this research. The aim is to utilizing this technique in a contemporary form, as well as testing its benefits in the presence of other means of climatic treatments.
Shading the external envelope can be achieved in different ways, E.g. by surrounding the building by a group of trees that hinder the exposure to the solar radiation, by cultivation of green areas to reduce the reflection of the solar radiation on the walls, or by clustering the buildings to reduce the exposure of the external surfaces to direct sunlight. The different heights of the buildings and the small width of the pedestrian streets, lead these buildings to shade each other, resulting into less thermal energy penetrating indoors. However, modern development and vehicular traffic made it difficult to keep the narrow roads with human scale and the previous climatic advantages (El-Wakeel and Serag 1989).
Not all the design features of the traditional houses might be appropriate nowadays, although the traditional house considered the climate as a main determinant. Solar screens were widely used in the Middle-Eastern countries for centuries to reduce the required cooling energy. However, there is a lack in understanding of their performance quantitatively, in addition to the unavailability of scientific means to develop new efficient designs to suit the harsh desert conditions nowadays (Sherifa et al. 2012). A considerable number of publications have addressed the effect of shading the openings (such as windows), on energy consumption in different regions, some with the same climatic conditions as Egypt, all stressing the importance of the shading technique (Ali and Ahmed 2012, Ahmed 2012, Al -Tamimi et al. 2011, Yang and Hwang 1995). However, these studies considered the effect of shading devices over fenestration or on a combination of walls including windows. In sharp contrast, a limited number of publications addressed the effect of shading the solid parts of the building envelope (opaque solid walls) specially in such a hot arid climatic zone like Egypt (Sherif et al. 2011, Sherifa et al. 2012). Of these very rare manuscripts, El-Wakeel (El-Wakeel and Serag 1989), who only mentioned the technique of using another wall to shield the main wall, Kravchuk and Boland (Kravchuk and J. W. Boland 2000), who concluded that the wall shading will improve the indoor thermal comfort in Adelaide city in South Australia. Ahmed al-Sharif, et al. (Sherif et al. 2011), paid attention to the effect of shading the external opaque walls on the potential savings in energy consumption, in order to conclude the best utilization of external wall shading methods.

180
The solid parts of the external walls is addressed for exposure to different proportions of direct or reflected solar radiation, subject to the direction of the sun during the daylight hours and to the changing in the ray's incidence angles in the different seasons of the year. One of the solutions for solid walls treatment is shading it using the sun breakers, such as those used for fenestration (the non opaque parts) or by using double walls (Gomez-Munoz and Porta-Gandara 2003a, El-Wakeel and Serag 1989, Gomez-Munoz and Porta-Gandara 2003b).
The final investigation focused on the determination of the optimum ratios for shading the solid parts of the building envelope, using the double walls technique (screens) in three main climatic zones in Egypt, under different climate change scenarios. The simulations utilized an integration between the screens shading technique and the thermal insulation of the external wall types as examined in Section 6.1, in addition to using the different fenestration parameters as mentioned in Section 6.2.
The research included the developing and utilizing of the new code (EPP) (discussed in section 5.4.3) to facilitate a total of 768 dynamic thermal simulation processes and to ensure the accuracy of the results, this computerized tool provides a partial automation of the simulation processes in order to conserve the time and achieve more accurate results. The ratios of the solid shading screens were selected based on the following assumptions:
1) As shown from EREC and previous work Section 6.2.2, the maximum Window to Wall Ratio (WWR) allowable for the entire climatic zones in Egypt is 20%, which will be used in the work.
2) To represent the effect of the external shading provided by the surrounding buildings, vegetation and other obstacles. A ratio of 30% has been assumed for the solid parts of each façade.
3) The building self shading produced by the balconies and the other prominence elements in the building, assumed to cover another 10% of the building's envelope.
From the aforementioned assumptions, there will be about 60% of the building's envelope covered, and about 40% of each façade left without protection against the direct and indirect solar radiation7. The cost effective protection for these remaining parts will be evaluated, by taking into account all the possible probabilities in shading these remaining 40% of each façade using solid screens mounted on the external walls. The screens are assumed to be 10 cm away from the main walls, made of light steel frames with iron mesh covered with cement, then painted in light colours, with a total thickness of 5 cm. This is a commonly used technique in Egypt to create a light but durable partition that can resist the outdoor weather conditions with minimum maintenance requirements. All the shading probabilities for the South, East and West façades have been addressed by altering the different percentages from 10% to 40% of unprotected parts of each façade, as shown in Figure 6-47 (for example 10-40-20% refers to the shading screen’s area: 10% of the total façade area for the Southern façade, 40% for the Eastern façade and 20% for the Western façade). All the shading percentages will be altered for the East and West façades while keeping the South constant, then altering the South and start it all over again to get a sum of 64 probabilities (see Table 6-24). This process will repeated for the three climatic zones (Alexandria, Cairo and Aswan) resulting in increasing the probabilities to 192 simulations, while repeating the process for the four current and future Weather Data Files (2002, 2020, 2050 and 2080) this gives a total of 768 simulation, providing the results for this work.
7 Even though this set of assumptions does not represent all the possible eventualities in real life, it can be considered as a start for more investigations in the same field to prove whether it is efficient to use this kind of shading techniques.

181
10-40-20% 20-30-20%
30-30-10% 40-20-10%
Figure 6-47: Examples for the different probabilities of shading the solid parts.
Table 6-24: Building’s shading probabilities for one climatic zone for one WDF.
South Façade East Façade
10% 10% 20% 30% 40%
Wes
t F
açad
e 10% 20% 30% 40%
South Façade East Façade
20% 10% 20% 30% 40%
Wes
t F
açad
e 10% 20% 30% 40%
South Façade East Façade
30% 10% 20% 30% 40%
Wes
t F
açad
e 10% 20% 30% 40%
South Façade East Façade
40% 10% 20% 30% 40%
Wes
t F
açad
e 10% 20% 30% 40%

182
A huge reduction in energy consumption was expected. However, a very small reduction resulted due to the appropriate construction materials that have been used, which obtained from the previous work Sections 6.1 and 6.2. The analysis process will address three phases: (1) Thermal comfort results, (2) Financial analysis and (3) Assessment of different alternatives.
The results obtained from the different simulations are divided in three separate graphs: Monthly Energy Consumption (kWh), Annual Energy Cost in Egyptian Pound (EGP) and Indoor/outdoor temperature (°C). These measures were plotted for the three climatic zones, different shading alternatives and different climate change scenarios in 48 graphs. However, as the results for the three different climatic zones were consistent, almost with the same indications, therefore, the results for Cairo climatic zone (16 graphs) were discussed and some of its graphs were displayed (Figs. 6-48 to 6-51) as a representative for the other obtained results. Results presented are generally followed the same patterns, but with some decrease in energy consumption, subsequently the annual energy cost in Alexandria (to the North), and some increase in energy consumption in Aswan (to the South), due to the general weather conditions in each climatic zone. The graphs were listed according to the climatic periods (2002, 2020, 2050 or 2080) and to the solid parts shading ratio which named after the Southern façade (10, 20, 30 or 40%).
1- Thermal comfort results:
The thermal comfort is one of the main and the most influential concerns in the design process. The thermal comfort (in cost effective way) was already achieved for all the tested models with different shading probabilities in all the different climatic zones and periods, due to using of the proper building envelope insulation and fenestration treatment (the base case itself already achieved thermal comfort from the beginning). Nevertheless, the goal was to decrease the energy consumption and enhance the financial aspects using the solid parts shading technique while maintaining the thermal comfort conditions.
As it turns out, the simulations did not show any remarkable development in the thermal comfort curves (see Figs. 6-48 to 6-51), just a very small improvement (reduction in the indoor air temperature) of 2-3% achieved as the best result in Cairo, and from 1-2% in Alexandria and Aswan according to the Indoor Air Temperatures resulted from the simulations, but as mentioned before within the acceptable range of the thermal comfort zone. At the same time this slight improvements have not shown any noticeable effects on the financial aspects.
2- Financial analysis:
As all the cases achieved the thermal comfort, a long term financial analysis has been conducted to find out which case is more cost effective than the base case on the long term. The financial implications for the results of the simulations in Cairo (representative for the rest of the climatic zones Alexandria and Aswan) are summarized in Table 6-25.

183
However, none of the different alternatives has outperform the base case in any of the different three climatic zones. As indicated in table 6-25, only the negative numbers in the column "saving in initial cost vs. saving in running cost" according to the mathematical equations, indicates financial gains on the long term for any of the various alternatives of the study versus the base case, which proves that a proper thermal insulation and fenestration treatment are sufficient to achieve thermal comfort in cost effective way on the long term and under the climate change scenarios.
3- Assessment of different alternatives:
In spite of the ineffectiveness of the different tested ratios and the sufficiency of using the insulation and fenestration treatments, the energy consumption (running cost) and initial cost analysis has been conducted to point out the optimum solid shading ratio in case of the desire of improving the thermal comfort and energy consumption even by a small amount. The ratio 10-10-10 was found to be the most cost effective case among the other ratios in all the climatic zones, when the running cost compared to the initial cost on the long term, due to the very small differences in the running cost between the different shading ratios, while the differences in the initial costs was higher (see Table 6-25).
Simulation results as well as the associated financial analysis showed that, there is no need to use the solid parts shading technique in the presence of the proper external walls insulation and fenestration treatments for each different climatic zone, as it is not achieving significant improvements to the indoor thermal comfort, and moreover it is not cost effective for any tested ratio as well.

184
2002
2020
Figure 6-48: Simulation results for Cairo climatic zone - Southern Façade shading 10% (2002 - 2020).

185
2050
2080
Figure 6-49: Simulation results for Cairo climatic zone - Southern Façade shading 10% (2050 - 2080).

186
2002
2020
Figure 6-50: Simulation results for Cairo climatic zone - Southern Façade shading 20% (2002 - 2020).

187
2050
2080
Figure 6-51: Simulation results for Cairo climatic zone - Southern Façade shading 20% (2050 - 2080).

188
Table 6-25: Financial analysis for the simulation results of Cairo climatic zone.

189
Chapter Conclusion:
This chapter highlighted the inability of the present construction industry in Egypt to mitigate the future climate change using the currently used construction materials for the external walls. Even the EREC's recommendations, didn't show cost effective results on the long term under climate change effects. The overall performance method was used to test other feasible solutions, available in the Egyptian market, in order to achieve better overall performance and cost effectiveness. The results regarding this issue recommended the use of different construction materials vary according to climatic zone.
The shading devices calculation method listed in EREC has proven the ability to produce a proper shading devices that can provide the same shading efficiency in the present and under future climate conditions. The financial implication of the simulation results generally recommend the use of, the Single Clear Reflective 6.4mm glass with 8% Stainless-Steel Cover, as the most cost-effective glass type to be used in the long run with any WWR in the different climatic zones.
The results also indicated that, there was no necessity to use the solid parts shading technique, if appropriate external walls' insulation and fenestration treatments have been used for all climatic zones, as it does not significantly improve the indoor thermal comfort and it is not cost effective.
Generally, the overall results suggested what seems to be the optimum construction choices for the three different climatic zones tested in Egypt. The results recommend the use of the half red-brick wall (12cm) for the external walls and the Single clear Reflective 6.4mm (G2) glass with 20% WWR (OS set), as the most cost-effective combination to be used on the long run in Alexandria. While in Cairo, the Double wall of half red-brick with 5cm air gap (Dair) was chosen for the external walls, with the Single clear Reflective 6.4mm (G2) glass with 20% WWR. Finally in Aswan, the Double wall of half red-brick with additional internal 5cm of expanded polystyrene thermal insulation layer (Dins) for the external walls, and the Single clear Reflective 6.4mm (G2) glass with 20% WWR for fenestration were chosen.

190
Chapter 7: Application of design recommendations
In order to test the aforementioned findings in Chapter six, different building typologies were tested using the dynamic thermal simulations technique to assess the buildings thermal performance. Four different middle class buildings in government housing projects were employed in order to conduct the simulations, with a number of rooms in each flat typically ranging (in this class) between 2 and 3 bedrooms. This class of housing were selected as it is according to the latest census in 2006, conducted by the Central Agency for Public Mobilization and Statistics (CAPMAS 2006), it represented the type of housing that is inhabited by the largest population (43%) on the nationwide. These different building typologies were originally located in Alexandria and Cairo governorates, which are then tested in the three main climatic zones in Egypt (Cairo and Delta zone, North coast zone and the Southern Egypt zone) represented by their main cities Alexandria, Cairo and Aswan respectively (see Fig 7-1). The following section will define the different configurations of the buildings envelopes.
Figure 7-1: The main cities that represented the three climatic zones which have been tested.
Chapter Introduction:
All the research work findings will be implemented and tested through four case study models, in order to assure the accuracy and validity of the results. Additionally, generalize these findings over the different climatic zones in Egypt, in order to obtain the buildings' general thermal behaviour in each zone under the different climate change scenarios. The aim is to ensure the achievement of the various recommendations to the main objectives of the research, of maintaining the adequate thermal comfort at the present time and in the future, with a commitment to reduce energy consumption over the current levels of consumption, as well as achieving long term cost effectiveness.

191
7.1: Parameterization
7.1.1: The criteria for selection and the determinants of simulations
The four typologies were selected out of different models have been used in large housing projects in Egypt and have been repeated hundreds of times. This is the type of buildings which we were aiming at to implement the new construction proposals (Table 7-1), in order to achieve the maximum savings in energy consumption in the case of actual application. Whether on the existing buildings or for the new buildings. Each typology were named after its original construction district whether at Alexandria or Cairo. Zahra2, Helwan and Tagam3 are different districts in Cairo, while CD-Beshr is a famous district in Alexandria.
As with previous simulations in chapter 6, each typology is tested against different external influences and internal conditions. The simulations have conducted according to Table 7-2, which clarifies the different climatic zones, climatic periods, in addition to the various treatments that will be used for each model. Where:
1- The Climatic Region: refers to the climatic zone that will be concerned in the simulation (Alexandria, Cairo and Aswan).
2- The Climatic Period: which refers to the weather data file used for the simulation (2002, 2020, 2050 and 2080).
3- The abbreviations (NV, HVAC, EREC and IMPR): refers to the different construction specifications and HVAC systems used in the model:
NV (Natural ventilation): means the building in its current conditions without any modifications, neither thermal insulation nor HVAC systems. To verify the existence of thermal comfort.
HVAC (Mechanical improvements): refers to the same building after adding the HVAC systems, to improve the indoor thermal conditions.
EREC (Egyptian Residential Energy Code): refers to the building after implementing the Egyptian code (EREC) recommendations. In order to minimize the using of the HVAC systems.
IMPR (Further improvements / Research recommendations): the final step, which will include the implementation of the research findings. To achieve the indoor thermal comfort, with minimum energy consumption and long term cost effectiveness.

192
Table 7-1: The different construction materials combinations used in the research.

193
Table 7-2: General simulations' table for the application of design recommendations.

194
7.1.2: Description of the selected typologies
As the main two Egyptian governorates, models from real housing projects at Alexandria and Cairo were selected to conduct the simulations. About 50% of the construction projects carried out in Egypt are located in Cairo and Alexandria governorates (Huang et al. 2003). In addition to that, Cairo and Alexandria were among the highest three cities in Egypt in using air conditioners, where the three cities (Cairo, Alexandria and Asyut) contain about 88% of the air-conditioned apartments in Egypt according to the 2006 census (CAPMAS 2006). Which made these cities within the highest energy consumption levels in the residential sector in Egypt.
7.1.2.1: Model -1 (Zahra2)
The building consists of six floors, where each has two residential flats with an approximate area of 70 m2/flat. The average number of occupants per flat is four. Table 7-3, demonstrates the basic characteristics of the building, while the building model and floor plan are shown in Figure 7-2. As shown, the flat consists of living space, kitchen, two bedrooms and bathroom.
Table 7-3: Basic characteristics of the model.
The model Characteristics
Building floors 6 floors
Number of flats 12 flat
Flat area 70 m2
Floor height 3 m / floor
Figure 7-2: The building's model and a flat typical plan.
The main layout of the housing project is located in Nasr-city at Cairo, in AL- Zahra2 district as shown in Fig. 7-3. The project represents a middle class typical housing project, consists of hundreds of buildings of different typologies. The project was built in several sequential stages over the years, the selected prototype (Fig. 7-4) is the last stage of the project and its construct dates back to about 6 years.

195
Figure 7-3: The project layout.
Figure 7-4: The building typology which was used for simulations.

196
7.1.2.2: Model -2 (Helwan)
The building consists of six floors, where each has four residential flats with an approximate area of 80 m2/flat. The average number of occupants per flat is four. Table 7-4, demonstrates the basic characteristics of the building, while the building model and floor plan is shown in Figs. 7-5 and 7-6. As shown, the flat consists of living space, kitchen, three bedrooms and bathroom.
Table 7-4: Basic characteristics of the model.
The model Characteristics
Building floors 6 floors
Number of flats 24 flat
Flat area 80 m2
Floor height 3 m / floor
Figure 7-5: The building's model.
Figure 7-6: The typical flat plan.

197
The main layout of the housing project is located in Helwan district within Cairo governorate (shown in Fig. 7-7). A photos of the project are shown in Fig. 7-8.
Figure 7-7: The project layout.
Figure 7-8: Some of the buildings in the housing project.
7.1.2.3: Model -3 (Tagam3)
This model consists of six floors; each has four residential flats with an approximate area of 86 m2 /flat. The average number of occupants per flat is four. The building floor plan and model are shown in Figs. 7-9 and 7-10 respectively. While table 7-5, demonstrates the basic characteristics of the building.

198
Figure 7-9: The building floor plan.
Figure 7-10: The building's model.
Table 7-5: Basic characteristics of the model.
The model Characteristics
Building floors 6 floors
Number of flats 24 flat
Flat area 86 m2
Floor height 3 m / floor

199
7.1.2.4: Model -4 (CD-Beshr)
The building consists of five floors, where each has four residential flats with an approximate area of 86 m2. The average number of occupants per flat is four. The building model and floor plan are shown in Fig. 7-11, the flat consists of living space, kitchen, two bedrooms and bathroom. Table 7-6, demonstrates the basic characteristics of the building.
Figure 7-11: The building's model and a flat typical plan.
Table 7-6: Basic characteristics of the model.
The model Characteristics
Building floors 5 floors
Number of flats 20 flat
Flat area 86 m2
Floor height 3 m / floor
The main layout of the housing project is located in CD-Beshr district at Alexandria governorate (shown in Fig. 7-7). A photo of the project is shown in Fig. 7-8.

200
Figure 7-12: The project layout.
Figure 7-13: The housing project photo.

201
7.2: Results and analysis
The different aforementioned buildings were simulated using EnergyPlus through DesignBuilder interface, in order to identify the energy consumption needed to maintain the indoor thermal comfort conditions in the current climatic conditions and under the future predicted climate change. Many combinations of construction materials and solutions were altered (refer to Table 7-1) to obtain the best combination for each climatic zone, while applying the concept of long term cost effectiveness.
As with the work presented in chapter 6, the results obtained from the simulations of the different construction envelopes are divided into separate graphs and tables for each case study. These contains: Monthly Energy Consumption (kWh), Annual Energy Breakdown (kWh), Annual Energy Cost in Egyptian Pound (EGP) and Indoor/outdoor temperatures (°C). In addition to the project's overall financial situation analysis. These measures are plotted for the different buildings in the three climatic zones Alexandria, Cairo and Aswan. The graphs represents the different results for the four different weather periods (2002, 2020, 2050 and 2080).
1- The first graph includes:
a) The monthly energy consumption for the different types of construction combinations. As expected, the energy consumption increases because of the temperature increase under climate change (Crawley 2007) in all of the climatic zones.
b) The indoor and outdoor mean temperature variations for the whole year, with each number corresponding to the respective month, along with the thermal comfort zone. As expected, these vary for the different climatic zones, climatic periods and type of constructions and treatments used in the model.
c) The annual energy Breakdown through the different climatic periods, to clarify the specific details of energy use in the models according to the results of the simulations. The cooling demands (via air conditioning) dominates the energy consumption in all the different climatic zones through all the various climatic period, this clearly shown in the southern Egypt climatic zone (Aswan).
2- The second graph includes: The annual energy cost according to the current and the proposed
new household electricity tariffs used in Egypt (see Section 5.8.2), for the different four climatic periods used in the simulations. As expected, the results show that the cost is directly proportional to the increase in energy consumption. Additionally, the new tariff reflected on a higher monthly electricity bills which gives a bad impression on the short term, but the final decision will be taken according to the overall financial analysis.
3- The third figure contains two tables represents the financial implementations of the results
based on the Net Present Value (NPV) financial model (see Section 5.5). The four different construction and treatment types (NV, HVAC, EREC and IMPR) used in the simulations are compared with respect to the long term financial aspect. The two electric energy tariffs will be used in the financial study, the current electricity tariff and the new issue of the tariff which will be implemented soon at the end of 2014 or early 2015.

202
The aim is to point out the best cost effective construction type to be used in each of the climatic zones, taking into account the initial cost and the running cost of each when applied. The tables shows the running costs for the energy consumed in any of the climatic zones concerned in the simulations, for each climatic period (sub-total), as well as the average annual running cost obtained by dividing the running cost of the four periods added together (Overall annual running cost) by 88 years (the maximum available test period). In the financial study, the "NV" case was neglected as it is never maintains the indoor thermal comfort for the whole year. While the "HVAC" case was selected as the base-case for being the first construction combination to achieve indoor thermal comfort with minimum initial cost, although, it has the highest energy consumption as well (running costs). The financial study has been performed for each model in each climatic zone separately. For each tested construction combination, the initial cost has been calculated according to the building materials and treatments that have been used in the model. The difference in the initial cost of any case and the base case (HVAC) is invested by saving the money in a bank with the regular 9% interest rate in Egypt (NBE 2012). In addition, the bills paid for the consumed energy in each different case is referred to as the running cost. The difference in the running cost between any case and the base case will reflect in savings in EGP (Egyptian pounds) in the annual energy bills.
The results are listed according to the climatic zones. In each climatic zone, the complete results for the four different buildings will be included sequentially:

203
7.2.1: Alexandria
7.2.1.1: Building-1
Building type Zahra2 Climatic zone Alexandria
1- The general results of the simulations for this building (Fig. 7-14) clarifies different remarks, regarding the general differences between the various kinds of the construction materials and treatments used in the simulations:
For the different climatic periods (2002, 2020, 2050 and 2080), the NV case (which represent the building as it is, in its current condition, without any modifications or any kind of thermal treatments) always achieved the minimum energy consumption, as there is no mechanical means are involved in improving its indoor thermal comfort. In this case, the energy consumed mainly in the artificial lighting, and the operations of the household appliances (Room Electricity), as well as the Domestic Hot Water (DHW) as shown from the annual energy breakdown. Therefore, this type of buildings (NV) always fail to achieve indoor thermal comfort for at least two months in the year (in the summer period) under the current climatic conditions, as shown in Fig. 7-14. This period of thermal discomfort will increases to about five months in the future (2080 climatic period), due to the effect of the climate change in the successive climatic periods.
The integration of the HVAC systems in order to improve the indoor thermal conditions (Case HVAC), involved a significant increase in the energy consumption (especially in the summer months) represented mostly in the energy required for cooling in the hot period. The need for the cooling energy increases as a result for the temperature increase by moving from a climatic period to the period that followed. Even though, there is a significant increase in the energy consumption, the thermal comfort has been achieved in all the different climatic periods, but with expensive and inefficient price (as will be discussed in the financial analysis).
The implementation of EREC recommendations (case EREC) led to a reduction in energy consumption of up to about 33% compared to the HVAC case (under the current climatic conditions), but with an increase in the initial cost of 78%. These improvements have kept the indoor thermal conditions within the acceptable range for all the different climatic periods used in the simulations, and have significantly reduced the required cooling loads which reflected on the energy use reduction.
The IMPR case (Further improvements / research recommendations) includes the use of different construction materials and treatments derived from the energy code or available in the construction market in Egypt. To ensure achieving the indoor thermal comfort with the best benefits of the financial aspects. In this case (IMPR) a reduction of 73% in the project's initial cost has been achieved compared to the EREC case. With an annual increase in the energy consumption (under the current climatic conditions - 2002) estimated by about 11%. The thermal comfort still within the acceptable levels, with a slight increase in the necessary energy for cooling in the hot period.

204
2- The annual energy cost according to the current and the proposed new household electricity tariffs, is shown in Fig. 7-15. The annual energy cost is directly proportional to the increase in energy consumption, and this is subject to the different categories in the residential electricity tariff. In other words, high consumption of energy will be reflected in increased prices in the energy categories itself (Section 5.8.2). This was clearly appeared in the future climatic periods, where the difference between the various construction combinations (NV, HVAC, EREC and IMPR) in the consumed energy cost increases in non uniformly manner. As shown in Fig. 7-15, the "EREC" and "IMPR" cases always represents the minimum annual energy costs for the cases that have achieved the indoor thermal comfort (HVAC, EREC, IMPR), during the different periods of the simulations.
It should be noted that, evaluation of the construction materials and the methods of treatment used in the study is not based on the total energy consumed or the cost of annual consumption only, but rather is based on the overall financial analysis. Bearing in mind that, achieving thermal comfort is always the main point.
3- The overall financial analysis benefited from the financial aspects of all the elements involved in the project, such as the initial cost of the project, the running costs of the project, whether according to the current energy prices or the proposed new tariff which is expected to be used in the near future. As well as the long term financial investments for the amounts of money resulting from the use of the different construction solutions.
The financial implementations of the results are shown in Table 7-7. The table shows the difference in the initial and average annual running cost for every construction materials used, compared to the "HVAC" case, along with the accumulated amount for each type after the 88 years investment. The comparison also presents the potential savings indicating that, there is a financial gain from using the "IMPR" combination instead of the other cases (NV, HVAC and EREC). This advantage of the "IMPR" case is applicable whether with the current electricity tariff or in the case of the application of the new (more expensive) proposed tariff. Which will reflect in more financial returns in favour of the "IMPR" construction materials. This means in the case of the removal or minimize of energy subsidies, the "IMPR" proposed model will continue to be applicable for implementation even with better financial benefits.
From the analysis of the simulations results of this building, it can be noticed that:
All the cases except the initial case "NV" have achieved the required indoor thermal comfort among the different climatic periods, with the assistance of HVAC systems. The aim of using various construction scenarios for the building fabrics is to minimize the time of operation for the HVAC, in order to minimize the energy consumption for cooling.
Achieving the minimum energy consumption does not necessarily mean that, the construction type is the best case for application economically. As is the case with types "EREC" and "IMPR", where case EREC achieved the minimum consumption of electricity, while IMPR was less expensive in the initial construction cost. According to the long term financial analysis, the IMPR case was better to be applied, in addition to its ability to maintain the indoor thermal comfort in all the climatic periods and also achieve savings in energy consumption.

205
Figure 7-14: The general results of the simulations.

206
Figure 7-15: The annual energy cost.

207
Table 7-7: The project's financial analysis.

208
7.2.1.2: Building - 2
Building type Helwan Climatic zone Alexandria
1- The general results of the simulations for this building (Fig. 7-16) clarifies different remarks,
regarding the general differences between the various kinds of the construction materials and treatments used in the simulations:
For all the different climatic periods, the "NV" case could not remain within the indoor
thermal comfort in all the different seasons of the year especially in the summer period. The main energy consumed in this case was for the operations of the household appliances (Room Electricity), then for lighting and Domestic Hot Water (DHW) as shown from the annual energy breakdown.
In case HVAC, a significant increase in the energy consumption has been noticed due to involving the HVAC systems to achieve the indoor thermal comfort when needed. Most of the energy consumed for cooling demands.
The energy consumption decreased in case EREC, due to the application of the energy code recommendations. The application of EREC reflected on the reduction of cooling loads.
The IMPR case kept the thermal comfort in the acceptable ranges, while minimizing the required initial cost. Thus includes a slight increase in the energy consumption required for cooling in the summer period, without affecting the general financial gains on the long term.
2- The annual energy cost according to the current and the proposed new household electricity tariffs, will be shown in Fig. 7-17. The analysis of the annual energy cost charts in the different climatic periods and under different tariffs, clarifies the different energy costs for each of the used construction materials. In general, the NV combination consume the minimum amount of energy annually, thus the minimum cost, followed by the case EREC, then IMPR cases. Finally the HVAC case, which just depend on the mechanical equipments without any further treatments, thus the higher energy bills.
3- The financial implementations of the results are shown in Table 7-8. The financial tables (whether using the current or the new energy prices) showed that, the IMPR construction type is more beneficial than the HVAC or the EREC case constructions, where all of them can achieve the thermal comfort. However, the financial gain of the IMPR construction is higher than the others, thus it is more cost effective.
The other two case study buildings (Appendix X) in the Alexandria climatic zone, showed the same patterns of monthly energy consumption, thermal behaviours, and energy breakdown. In addition to the same patterns of annual energy costs, and the overall financial analysis.

209
Figure 7-16: The general results of the simulations.

210
Figure 7-17: The annual energy cost.

211
Table 7-8: The project's financial analysis.

212
7.2.2: Cairo
7.2.2.1: Building-1
Building type Zahra2 Climatic zone Cairo
1- The general results of the simulations for this building (Fig. 7-18) clarifies different remarks,
regarding the general differences between the various kinds of the construction materials and treatments used in the simulations:
For all the different climatic periods, the "NV" case could not remain the indoor thermal
comfort in all the different seasons of the year especially in the summer period. The main energy consumed in this case was for lighting, then for the operations of the household appliances (Room Electricity) and Domestic Hot Water (DHW) as shown from the annual energy breakdown.
In case "HVAC", a significant increase in the energy consumption has been noticed due to involving the HVAC systems to achieve the indoor thermal comfort when needed. Most of the energy consumed for cooling demands. It is noticeable that the indoor temperatures almost reached the threshold of the thermal comfort zone, during the summer months in the 2080 climatic period.
The energy consumption decreased in case EREC, due to the application of the energy code recommendations. The application of EREC reflected on the reduction of cooling loads.
The IMPR case kept the thermal comfort in the acceptable ranges, while minimizing the required initial cost. Thus includes a slight increase in the energy consumption required for cooling in the summer period, without affecting the general financial gains on the long term.
2- The annual energy cost according to the current and the proposed new household electricity tariffs, will be shown in Fig. 7-19. The analysis of the annual energy cost charts in the different climatic periods and under different tariffs, clarifies the different energy costs for each of the used construction materials. In general, the NV construction materials consume the minimum amount of energy annually (without achieving thermal comfort), thus the minimum cost. Followed by the cases EREC, then the case IMPR. Finally the HVAC case, which just depend on the mechanical equipments without any further treatments, thus the higher energy bills.
3- The financial implementations of the results are shown in Table 7-9. Both cases EREC and IMPR achieved the indoor thermal comfort for the whole year, in all the climatic periods that were tested. However, the financial gains of the IMPR construction is higher than the EREC case construction, whether using the current electricity tariff or the new energy prices. Thus "IMPR" is more cost effective to be used in Cairo climatic zone.

213
Figure 7-18: The general results of the simulations.

214
Figure 7-19: The annual energy cost.

215
Table 7-9: The project's financial analysis.

216
7.2.2.2: Building-2
Building type Helwan Climatic zone Cairo
1- The general results of the simulations for this building (Fig. 7-20) clarifies different remarks,
regarding the general differences between the various kinds of the construction materials and treatments used in the simulations:
For all the different climatic periods, the "NV" case could not remain the indoor thermal
comfort in all the different seasons of the year especially in the summer period. The main energy consumed in this case was for the operations of the household appliances (Room Electricity), then for lighting and Domestic Hot Water (DHW) as shown from the annual energy breakdown.
In case "HVAC", a significant increase in the energy consumption has been noticed due to involving the HVAC systems to achieve the indoor thermal comfort when needed. Most of the energy was consumed for cooling demands. It is noticeable that the indoor temperatures exceeds the threshold of the thermal comfort zone, for almost two months during the summer period in the 2080 climatic period.
The energy consumption decreased in case EREC, due to the application of the energy code recommendations. The application of EREC reflected on the reduction of cooling loads.
The IMPR case kept the thermal comfort in the acceptable ranges, while minimizing the required initial cost. Thus includes a slight increase in the energy consumption required for cooling in the summer period, without affecting the general financial gains on the long term.
2- The annual energy cost according to the current and the proposed new household electricity tariffs, will be shown in Fig. 7-21. The analysis of the annual energy cost charts in the different climatic periods and under different tariffs, clarifies the different energy costs for each of the used construction materials. In general, the NV combination consume the minimum amount of energy annually, thus the minimum cost, followed by the case EREC, then IMPR cases. Finally the HVAC case, which just depend on the mechanical equipments without any further treatments, thus the higher energy bills.
3- The financial implementations of the results are shown in Table 7-10. The financial tables (whether using the current or the new energy prices) showed that, the IMPR construction type is more beneficial than the HVAC or the EREC case constructions. The financial gains of the IMPR construction is higher than the others when using any of the energy tariffs, thus it is more cost effective to be used in this climatic region..
The other two case study buildings (Appendix XI) in the Cairo climatic zone, showed the same patterns of monthly energy consumption, thermal behaviours, and energy breakdown. In addition to the same patterns of annual energy costs, and the overall financial analysis.

217
Figure 7-20: The general results of the simulations.

218
Figure 7-21: The annual energy cost.

219
Table 7-10: The project's financial analysis.

220
7.2.3: Aswan
7.2.3.1: Building-1
Building type Zahra2 Climatic zone Aswan
1- The general results of the simulations for this building are shown in Fig. 7-22, it clarifies different
remarks, regarding the general differences between the various kinds of the construction materials and treatments used in the simulations:
For all the different climatic periods, the "NV" case could not remain the indoor thermal
comfort in all the different seasons of the year especially in the summer period. The main energy consumed in this case was for lighting, then for the operating the household appliances (Room Electricity) and Domestic Hot Water (DHW) as shown from the annual energy breakdown.
In case "HVAC", a significant increase in the energy consumption has been noticed due to involving the HVAC systems to achieve the indoor thermal comfort when needed. Most of the energy consumed for cooling demands.
The energy consumption decreased in case EREC, due to the application of the energy code recommendations. The application of EREC reflected on the reduction of cooling loads.
In this case the IMPR construction specifications has achieved better indoor thermal conditions than the EREC case. Thus, less energy consumption for cooling demands during the summer period. However, this involves a slightly higher initial cost, without affecting the general financial gains on the long term.
2- The annual energy cost according to the current and the proposed new household electricity tariffs, will be shown in Fig. 7-23. The analysis of the annual energy cost charts in the different climatic periods and under different tariffs, clarifies the different energy costs for each of the used construction specifications. In general, the NV construction specifications consume the minimum amount of energy annually (without achieving thermal comfort), thus the minimum cost. Followed by the cases IMPR, then the case EREC. Finally the HVAC case, which just depend on the mechanical equipments without any further treatments, thus the higher energy bills.
3- The financial implementations of the results are shown in Table 7-11. The cases HVAC, EREC and IMPR achieved the indoor thermal comfort for the whole year, in all the climatic periods that were tested. However, the financial gains of the IMPR specifications is higher than the other constructions, whether using the current electricity tariff or the new energy prices. Thus "IMPR" is more cost effective to be used in Aswan climatic zone.

221
Figure 7-22: The general results of the simulations.

222
Figure 7-23: The annual energy cost.

223
Table 7-11: The project's financial analysis.

224
7.2.3.2: Building-2
Building type Helwan Climatic zone Aswan
1- The general results of the simulations for this building (Fig. 7-24) clarifies different remarks,
regarding the general differences between the various kinds of the construction materials and treatments used in the simulations:
For all the different climatic periods, the "NV" case could not remain the indoor thermal
comfort in all the different seasons of the year especially in the summer period. The main energy consumed in this case was for the operations of the household appliances (Room Electricity), then for lighting and Domestic Hot Water (DHW) as shown in the annual energy breakdown.
In case "HVAC", a significant increase in the energy consumption has been noticed due to involving the HVAC systems to achieve the indoor thermal comfort when needed. Most of the energy was consumed for cooling demands.
The energy consumption decreased in case EREC, due to the application of the energy code recommendations. The application of EREC reflected on the reduction of cooling loads.
Further reduction in energy consumption has been achieved by using the IMPR specifications, especially in the summer period due to the less energy needed for cooling demands. This reduction associated with slightly better indoor thermal conditions than the EREC case. However, this involves a slightly higher initial cost, without affecting the general financial gains on the long term.
2- The annual energy cost according to the current and the proposed new household electricity tariffs, will be shown in Fig. 7-25. The analysis of the annual energy cost charts in the different climatic periods and under different tariffs, clarifies the different energy costs for each of the used construction specifications. In general, the NV construction specifications consume the minimum amount of energy annually (without achieving thermal comfort), thus the minimum cost. Followed by the cases IMPR, then the case EREC. Finally the HVAC case, which just depend on the mechanical equipments without any further treatments, thus the higher energy bills.
3- The financial implementations of the results are shown in Table 7-12. The cases HVAC, EREC and IMPR achieved the indoor thermal comfort for the whole year, in all the climatic periods that were tested. However, the financial gains of the IMPR specifications is higher than the other constructions, whether using the current electricity tariff or the new energy prices. Thus "IMPR" is more cost effective to be used in Aswan climatic zone.
The other two case study buildings (Appendix XII) in the Aswan climatic zone, showed the same patterns of monthly energy consumption, thermal behaviours, and energy breakdown. In addition to the same patterns of annual energy costs, and the overall financial analysis.

225
Figure 7-24: The general results of the simulations.

226
Figure 7-25: The annual energy cost.

227
Table 7-12: The project's financial analysis.

228
Chapter Conclusion:
In this chapter the optimum construction specifications developed in chapter 6 are applied in four different building typologies, located in the three dominant climatic zones in Egypt (Alexandria, Cairo and Aswan) and have been tested, along with the current construction specifications commonly used in Egypt nowadays (with and without the aid of the HVAC systems), and the recommendations of the Egyptian residential energy code (EREC).
This is tested under the future climate change effects, using three predicted climatic periods (2020,2050 and 2080) in addition to the current weather conditions (2002). The tests also includes a long term financial study, built on the Net Present Value (NPV) financial model, in order to differentiate between the various construction specifications If achieved thermal comfort with less energy consumption, and help to choose the best long term cost effective construction specification to be applied in each of the climatic zones.
The various indicators of the simulations results for all building typologies that have been tested under all the climatic conditions and in all the climatic zones supported the selection of the research findings "IMPR", to be implemented in the different climatic zones in Egypt. The IMPR construction includes the use of the half red-brick wall (12cm) for the external walls and the Single clear Reflective 6.4mm (G2) glass with 20% WWR, as the most cost-effective combination to be used on the long run in Alexandria. While in Cairo, it is recommend the use of the Double wall of half red-brick with 5cm air gap (Dair) for the external walls, with the Single clear Reflective 6.4mm (G2) glass with 20% WWR. Finally in Aswan, the Double wall of half red-brick with additional internal 5cm of expanded polystyrene thermal insulation layer (Dins) for the external walls, and the Single clear Reflective 6.4mm (G2) glass with 20% WWR for fenestration were chosen.

229
Chapter 8: Conclusions
8.1: Starting point
Despite issuing the Egyptian energy code for residential buildings (EREC) in 2006, it has not had the desirable effects with Egypt's construction industry. Additionally, the code's recommendations are not taught to the undergraduate architects at any of the different Egyptian universities, despite the fact that this is a key route for wide dissemination and implementation. These are the current conditions regarding the energy code in Egypt after almost nine years of issuing it.
The main objective for this study was to assess the ability of the recommendations and specifications contained in EREC to cope with the expected future climatic changes, and to ensure that the implementation of the research final recommendations will result in achieving the required indoor thermal comfort with consuming the minimum possible amount of energy. In addition to assure the long term financial gains, through the rational use of available materials in the Egyptian market.
The aforementioned efforts reflect the desire to contribute to spread the use of the energy code on a large scale in Egypt, by working to convince the investors with the importance of the application of the code to maintain their investments in the initial cost of the project. In other words, the construction materials which they have invested will continue to retain its ability to provide a thermally comfortable indoor environment to the residents even under the influence of high temperatures in the future, and they will not be forced to devote more investments in the same
Chapter Introduction:
The most important results that have been reached through the research will be reviewed, in order to extract the conclusions and recommendations that can benefit and contribute to the construction industry in Egypt.
The research outcomes considered as an attempt to highlight the residential energy code weaknesses points, especially in its behaviour against the climate change phenomenon. These outcomes led to a suggested solutions to improve the thermal performance of the residential buildings in Egypt, with the possibility to adjust to suit the application at regional level. The conducted simulations for the used models, using the research findings, indicate potential energy consumption reductions for the residential units, along with financial benefits on the long term. In addition to maintain the indoor thermal comfort within the allowable comfortable limits.
In light of these findings, this chapter presents conclusions and recommendations that are potentially replicable across the region. Also identify routes for further research and next steps for this work.

230
building to raise its thermal efficiency. The proof of this hypothesis may be one of the important factors that could support the use of EREC in the absence of the mandatory application for the code by the government. This is in addition to what the extensive use of the code may include on both levels: the new buildings or modifying the existing buildings, of huge savings in energy consumption, especially during the hot summer months in Egypt.
Therefore, the research relied on the building's thermal performance simulation processes (BPS) to be the main technique used in the study. Where the BPS is able to provide an accurate true picture for the thermal performance of the buildings, with the possibility of conducting these tests in the current weather conditions or under the effects of different climate change scenarios in the future. This means opening the way to test all the recommendations or construction materials that were suggested by the code or available in the construction market, in order to know how much those elements were influenced by the various climatic factors in the future. Through long-term economic appraisal (based on existing economic models) the efficiency of the recommendations, specifications or construction materials and techniques were determined.
The code has been studied in detail, and it has been divided into different sections. The different parts were studied separately and integrated with the rest of the parts, in order to find out the optimal combinations and specifications that can achieve the indoor thermal comfort in the residential buildings under the future climate change.
8.2: Main parameters tested and the new contribution
To achieve the research objectives, 1338 simulations have been conducted, in order to assess the quality of the recommendations and specifications listed in EREC especially, and in the Egyptian construction market in general. The research conclusions have passed through several stages:
1- The first step was testing the specifications of the currently used construction materials in the Egyptian market, and its ability to provide the required indoor thermal comfort using the free running mode (natural ventilation) under the current climatic conditions.
2- The next step included the use of different external wall construction specifications, and integrate the climate change scenarios into the simulations. Additionally, the effect of the different external walls on the project’s initial cost and running cost (in order to achieve the internal thermal comfort) have been evaluated.
3- Examining the code's recommendations for the external walls specifications, according to the prescriptive methodology (Section 4.1). This step extends the previous work in the same topic by broadening the research scope to include EREC's recommendations for the external walls in three different climatic zones in Egypt (Alexandria, Cairo and Aswan), under the current and future climate change scenarios. The results highlight the inability of the code's recommendations, in its current state, to address the predicted climate changes in the future. Which imposes the necessity for resorting to use the second proposed methodology in the code (the overall performance method - Section 4.1). The overall performance-based path was used to test several construction materials available in the Egyptian market, whereby, the optimum external walls' specifications for each climatic zone have been obtained.

231
4- After investigating the external walls (thermal insulation), other aspects of the building envelope (fenestration) were examined. This step included testing the ability of the shading calculation method (as proposed by the code to calculate the dimensions of the required sun breakers) to calculate effective shading devices that can work with the same efficiency under the future climate changes. The different simulations and tests have proved the validity of the shading calculation method, currently used in EREC, and its ability to calculate solar shading devices functioning almost with the same efficiency in the future.
5- The outcomes of the previous point paved the way for the fifth step, which included the assessment of the multiple relationships between the different fenestration specifications in the energy code. The fenestration specifications in the code contained large number of uncorrelated recommendations and data, such as the allowable WWR for the external walls in the different orientations, large amount of glass types with different thermal specifications, in addition to the aforementioned shading devices' calculation method. The previously given data were not accompanied with any recommendations to specify the optimum combination of these fenestration specifications to reduce the energy consumption in economical ways. The aforementioned efforts resulted in the development of general recommendations regarding the selection of the different fenestration specifications.
6- The technique of shading the opaque parts of the external walls in buildings was also been tested, as a passive treatment used in the vernacular architecture but not included in the code. Different simulations and financial studies have proven the ineffectiveness of using the solid parts shading technique, while using the previously proposed research recommendations for the external walls and fenestration. This technique did not show any significant improvement to the thermal comfort levels in the indoor spaces at the present time or in the future, but only a very small ratio of energy consumption reduction at very high financial cost. Thus, the use of this technique is not recommended.
7- Finally, in order to ensure the accuracy of the overall recommendations (Table 8-1), and the possibility of generalizing the application of these results over various residential buildings in Egypt. The research findings were applied to four different residential building typologies, and the models were tested using the different available weather data files (2002, 2020, 2050 and 2080), in the three main Egyptian climatic regions (Alexandria, Cairo and Aswan). The long term financial analysis has also been taken into account, when evaluating the results of the different case studies.
The aforementioned efforts contribute to the knowledge through defining new aspects to the Egyptian context:
1- Assess the ability of EREC to cope with the expected future climate changes, with identifying the parts which can still be used.
2- Prove the ability of some of the current used materials in the Egyptian market (with low initial cost), to perform appropriately in the future under certain conditions.
3- Confirm the effectiveness and validity of using the current shading specifications (listed in the code) under the future climate conditions.

232
4- Examine and connect the different fenestration parameters mentioned in EREC and affecting the residential buildings. In addition to suggesting the optimal combination of the fenestration’s selection parameters (for the different configurations mentioned in EREC) in each tested climatic zone.
5- Recommend a set of optimum specifications (Table 8-1), to facilitate the achievement of the research objectives.
6- Test and prove the inefficient use of one of the passive design techniques (shading the opaque parts), when using the recommended specifications.
Table 8-1: Specifications recommended by the research for the different parts of the building envelope .
Climatic region
Construction type Research recommendations
Alexandria
External Walls Half red-brick wall (12cm)
Fenestration Single clear Reflective 6.4mm (G2) + 20% WWR
HVAC When needed
Natural Ventilation When applicable
Cairo
External Walls Double wall of half red-brick-air gap (Dair)
Fenestration Single clear Reflective 6.4mm (G2) + 20% WWR
HVAC When needed
Natural Ventilation When applicable
Aswan
External Walls Double wall of half red-brick-insulation (Dins)
Fenestration Single clear Reflective 6.4mm (G2) + 20% WWR
HVAC When needed
Natural Ventilation When applicable
8.3: Research findings and recommendations
Through the previous research steps several points have been concluded, these conclusions will be used as the base for the research recommendations. These points concern the optimum means to address the code and apply it appropriately to achieve thermal comfort within the residential buildings, while reducing the energy consumption at present time and in the future, under predicted climate change, with achieving the cost effectiveness of the project over the long run:

233
1- The research general findings for the external walls and fenestration (glass type and WWR) are summarized in Table 8-1, sorted by the climatic region. These findings includes the use of the half red-brick wall (12cm) for the external walls in Alexandria, and the Double wall of half red-brick with 5cm air gap (Dair) in Cairo, and for Aswan, the Double wall of half red-brick with additional internal 5cm of expanded polystyrene thermal insulation layer (Dins) was found to be the most cost-effective external wall. Regarding the fenestration, the Single clear Reflective 6.4mm (G2) glass with 20% WWR, was proven to be the optimum and the most cost-effective combination to be used on the long run with all the previous external walls in the different climatic zones.
The study recommends using the results and the specifications that have been reached in this work (the optimum combinations - Table 8-1), with the need to continue to test the specifications of the new materials regularly in order to keep the continuous update of the proposed specifications. These continuous updates are for the purpose of achieving the best levels of performance (in terms of indoor thermal comfort levels and energy consumption reduction), in case the prices of these new materials reached the appropriate limits according to the financial study to ensure the achievement of economic gains and financial returns for the project over the long term.
2- Only two parts of the code's recommendations are compatible with the predicted climate changes on the long term, and they can mitigate the associated temperatures increase: the fenestration part and the shading devices part. These two parts could continue to be used efficiently through the prescriptive approach (Section 4.1) which used mainly in the code.
However, it would be preferred to use the proposed specifications of this work as the best possible combination of the code's recommendations for these parts. As the various simulations proved that the specifications proposed by the research, represents the optimal combinations between the different fenestration and shading devices parameters in the code for the different climatic regions, and it can achieve the required thermal comfort under different climate change scenarios while achieving financial effectiveness in the long term.
3- The code's recommendations for the external walls' specifications, which reflects the amount of thermal insulation for the building envelope, was found to be inadequate and inefficient over the long term. Due to the inability of some of the specifications which recommended by the code to achieve the required thermal comfort in some cases (in different climatic periods and zones), or for the failure to achieve the desired economical feasibility of using these specifications in some situations.
Thus, the study recommends not to use the prescriptive approach (Section 4.1) to determine the external walls' thermal specifications, and to use the overall performance path instead. This alternative has provided appropriate solutions to achieve the research objectives such as achieving the indoor thermal comfort with minimizing the required energy consumption over the long term.

234
8.4: Future work
Through working in the different sections of the research, several aspects have appeared to the researcher where the work could expand. Each of these aspects can be addressed individually after the completion of the general structure and results of the main work. Of these points:
1- The researcher is aiming to conduct more experiments on new construction materials in order to achieve better results, in terms of achieving the indoor thermal comfort with minimum energy consumption, taking into account the project's economic aspects. Such new construction materials available in the Egyptian market are the GRC (Glass-fibre Reinforced Cement) panels, the aerated concrete blocks and others manufactured via the nano technology. However, the current prices of these materials (in spite of their appropriate thermal characteristics) prevented their use currently, as they wouldn't achieve any economic benefits for the project on the long run.
The researcher has started the work on this point, by testing different GRC panels against the current most commonly used construction specification in Egypt (Section 6.1.4). Despite the good results, the financial aspects (the high initial cost for the GRC panels) prevented its use in this research for the lack of economic feasibility.
2- In the future, the researcher is aiming to exert more efforts in the analysis of the simulation results using hourly basis as recommended by (Raftery et al. 2011), and minimizing the periods of simulations and financial appraisal to 40 years (the half-life span for the buildings in Egypt, without any major retrofitting taking place) in order to obtain more realistic results.
3- The researcher intends to expand the studies on involving passive architecture techniques (inspired from the vernacular architecture in the middle east), such as Malkaf and Mashrabia and trying to implement them in contemporary form.
4- The construction materials database and the shading devices calculation tool (mentioned in Section 5.3), can be considered as a starting point to provide the electronic version of the Egyptian Residential Energy Code (EREC). The database and the calculation tool in their current state have significant limitations, most importantly the lack of a user interface easy to handle by non-specialists in scripting. Development work must be done in order to launch these tools as an e-version of EREC on the internet, and this task will occupy a significant part of the future efforts of the researcher.
5- Another step to give the database more facilitating functions, is the integration of the long term financial study into the database. The new function will provide the investors and the designers with an easy to use decision support tool. This tool will work through the intended integration between the building performance simulation tools (BPS), the database and the long term financial study. The user will provide the model, location, orientation, weather data files (WDF) and construction materials using the BPS tool interface, then the database will alter more available construction materials and run different simulations to provide the user with a range of construction options accompanied by long term financial analysis of the aforementioned list of construction options. The economic analysis helps in defining the construction materials options with long term

235
financial benefit, thus functioning as a decision support tool for the designers, engineers and investors.
The following screenshots mimic the user friendly interface for the new financial function which intended to be combined into the database. The case study building "Helwan" in Alexandria (Section 7.2.1.2), was used to prepare these illustrations. The three parts of the Figure 8.1 shows the speculative graphical representation for the financial analysis of the three different sets of materials used in the simulations (HVAC, EREC and IMPR) consecutively.
HV
AC
ER
EC
IMP
R
Figure 8-1: The speculative graphical representation of the financial analysis for the different scenarios.
The top: represents the model when using the HVAC systems, the middle: when using the code's recommendations, and the bottom: when using the research recommendations.
Developing and improving, an easy to use, computerized decision support tool (especially over the internet), can significantly help in disseminating the use of the code over a large segment of users in Egypt. In the same time it could be an effective way to involve the stakeholders, the people who want to build their own homes and the new generations of architects (whether students or recent graduates), and sensitizing them for the importance of implementing the code's recommendations and the associated recommendations that resulted from this study, as it will have direct economic benefits for building owners and the state.
The owners will achieve benefits through reducing the prices of the monthly energy bills, which would compensate the relatively high initial cost for the project (the price of the construction materials), especially with the increase in energy running costs due to reducing the energy subsidy in the new proposed tariff which is expected to be used in the near future (Section 5.8.2). However, this has had a positive effect on increasing the financial returns from using the methods of

236
treatment and the construction materials proposed in this work, as is apparent from the financial analysis of the results (Section 7.2).
Regarding the benefits for the state, it will be in the reduction of energy demand in general, which will minimize the need to build more energy plants at high financial cost and long time to establish, as work on reducing the consumption from the current energy resource is much cheaper than invest in increasing the energy capacity (BPIE 2011). Additionally, the reduction in the energy demands, would reduce the pressure on the existing power plants. As a result, it will reduce the number and periods of electrical power outages, which the Egyptian Ministry of Electricity and Energy (MoEE) have forced to use in order to meet the growing demands for energy. The results will be reflected on the overall economical situation of the country.
Wide dissemination of the importance of using the code among the new generation of architects and raising the awareness through lectures and articles in professional journals, will have a significant impact in mainstreaming the use of EREC. This belief based on the faith in the ability of the new generation to persuade different kinds of customers to use the code during their future career, in light of the government support lack for the mandatory implementation for the code.
The aforementioned efforts in this research can be reflected in some implementation notes (road map) for the different parties concerned with the code, such as the government, manufacturers, and architects and engineers:
Government: - Support the mandatory implementation for the code. - Increase the research funds regarding the buildings' behaviour in the future and its relation to
energy consumption. - Launch a package of incentives in the case of self adherence to the requirements of the code. - Disseminate the engineering awareness of this field between the architects and the engineers
at all levels. - Work to change the mentality and ways of dealing with energy between the people through
outreach and media programs.
Manufacturers: - Attempting to provide the building materials for affordable prices by relying on locally
available raw materials. - Attempt to manufacture new and high-tech materials in Egypt to facilitate access to them. - Increase the cooperation with research centres and universities to keep up with the latest
scientific breakthroughs.
Architects and engineers: - Help in raise the level of awareness in the importance of the code and the necessity for
commitment to it, in order to save energy and get many benefits on both public and private levels.
- Commitment to implement the code's recommendations in the projects they are working on. - Keep up to date to the latest research work in this field.

237
References:
AFED, A. F. f. E. a. D.-. (2009) Arab Environment: Impact of Climate Change on the Arab Countries - AFED Report - 2009. Available at: http://www.afedonline.org/afedreport09/, Beirut, Lebanon: Arab Forum for Environment and Development.
Ahmed, A. A. E.-M. M. A. (2012) 'Using simulation for studying the influence of vertical shading devices on the thermal performance of residential buildings (Case study: New Assiut City)', Ain Shams Engineering Journal, 3(2), 163-174.
Ahmed, A. N., Samaan, M. M., Farag, O. M. A. and Aishy, A. S. E. (2011) 'Using Simulation Tools for Enhancing Residential Buildings Energy Code in Egypt ', in 12th Conference of International Building Performance Simulation Association, Sydney, 14-16 November,
Al -Najjar, M. S. (1994) Environmental pollution in Egypt - the risks and solutions, Cairo: Egyptian General Books Authority
Al -Tamimi, Fadzil, N. A. and Syed, S. F. (2011) 'The Potential of Shading Devices for Temperature Reduction in High-Rise Residential Buildings in the Tropics', Procedia Engineering, 21, 273-282.
Ali, A. A. M. and Ahmed, T. M. F. (2012) 'Evaluating the impact of shading devices on the indoor thermal comfort of residential buildings in Egypt', in IBPSA, SB 2012, Wisconsin, USA,
Ali, A. A. M., Hagishima, A., Abdel-Kader, M. and Hammad, H. (2013) 'Vernacular and Modern Building: Estimating the CO2 emissions from the building materials in Egypt', in Building Simulation Cairo 2013 - Towards Sustainable & Green Built Environment, Cairo, Egypt, June 23rd - 24th, IBPSA-Egypt, 3-13.
ASHRAE, A. S. o. H. R. a. A.-C. E. (1992) 'ASHRAE Standard 55', ISO7730(
ASHRAE, A. S. o. H. R. a. A.-C. E. (2004) 'Thermal Environmental Conditions for Human Occupancy (ANSI/ASHRAE Standard 55 - 2004)',
Attia, S. (2010) Building Performance Simulation Tools: Selection Criteria and User Survey Belgium: Architecture et climat, Université catholique de Louvain
Attia, S. (2012) A Tool for Design Decision Making: Zero Energy Residential Buildings in Hot Humid Climates unpublished thesis Université catholique de louvain
Attia, S., Evrard, A. and Gratia, E. (2012a) 'Development of benchmark models for the Egyptian residential buildings sector', Applied Energy, 94(0), 270-284.
Attia, S., Galal, M. and Herde, A. D. (2009) Impact and potential of community scale low-energy retrofit: case study in Cairo, translated by Delft, Netherlands.
Attia, S., Hensen, J. L., Beltrán, L. and Herde, A. D. (2012b) 'Selection Criteria for Building Performance Simulation Tools: Contrasting Architects' and Engineers' Needs', Journal of Building Performance Simulation, 5(3).
Attia, S. and Herde, A. D. (2009) 'Designing the Malqaf for Summer Cooling in Low-Rise Housing, An Experimental Study ', in PLEA2009 - 26th Conference on Passive and Low Energy Architecture, Quebec City, Canada, 22-24 June 2009,
AU/OEP, F. o. E. a. A. U. a. O. f. E. P.-. (2002) Analysis of Energy Consumption Pattern and Environmental Indicators for The Residential Sector of Asyut City, Egypt.: Faculty of Engineering at Asyut University and Organization for Energy Planning - Egypt.
Auliciems, A. and Szokolay, S. V. (2007) 'Thermal comfort', PLEA Notes 3, (Note 3).
Awadallah, T., Adas, H., Obaidat, Y. and Jarrar, I. (2009) 'Energy Efficient Building Code for Jordan ', in Energy conference, Jerusalem,
Aziz, S., Se, G., He, S., H., O. and R., A. (2001) Residential Building Survey in Cairo and Alexandria Cairo: Housing and Building Research Centre (HBRC).

238
Baba, A., Mahdjoubi, L., Olomolaiye, P. and Booth, C. (2013) 'State-of-the-art on buildings performance energy simulations tools for architects to deliver low impact building (LIB) in the UK', International Journal of Development and Sustainability, 2(3), 1867-1884.
Badran, A. A. (2003) 'Performance of cool towers under various climates in Jordan', Energy and Buildings, 35(10), 1031–1035.
Barclay, M., Sharples, S., Kang, J. and Watkins, R. (2012) 'The natural ventilation performance of buildings under alternative future weather projections', Building Services Engineering Research and Technology, 33(1), 35-50.
Belcher, S., Hacker, J. and Powell, D. (2005) 'Constructing design weather data for future climates', Building Service Engineering Research & Technology, 26(1), 49-61.
Bierman, H. and Schmidt, S. (1971) The Capital Budgeting Decision, third ed., MacMillan Press.
Botkin, D. B. and Keller, E. A. (2011) Environmental Science, Earth as a Living Planet.
BP, B. P. c.-. (2012) Statistical Review of World Energy 2012.
BPIE, B. P. I. E.-. (2011) Europe’s Buildings Under The Microscope: A country-by-country review of the energy performance of buildings., Brussels Buildings Performance Institute Europe (BPIE).
Bradley, J. and Johnston, D. (2011) The curriculum for environmental science & services level 1 (Thermal comfort and thermal properties of buildings), Leeds Metropolitan University.
Brager, G. S. and Dear, R. d. (2001) 'Climate, Comfort & Natural Ventilation: A new adaptive comfort standard for ASHRAE Standard 55', eScholarship Repository, University of California [online], available: [accessed
Brager, G. S. and Dear, R. J. d. (1998) 'Thermal adaptation in the built environment: a literature review', Energy and Buildings, 27(1), 83-96.
Brealy, R. and Myers, S. (1991) Principles of Corporate Finance, fourth ed., McGraw Hill.
BSEN, B. S. (2007) British Standard 15251: Indoor environmental input parameters for design and assessment of energy performance of buildings addressing indoor air quality, thermal environment, lighting and acoustics., European Committee for Standardization (CEN).
Bulkeley, H. and Kern, K. (2006) 'Local Government and the Governing of Climate Change in Germany and the UK', Urban Studies, 43(12), 2237– 2259.
Byrne, J., Hughes, K., Rickerson, W. and Kurdgelashvili, L. (2007) 'American Policy Conflict in The Greenhouse: Divergent Trends in Federal, Regional, State, and Local Green Energy and Climate Change Policy', Energy Policy, 35, 4555–4573.
CAPMAS, C. A. f. P. M. a. S.-. (2006) The Final Results of Population and Housing Census 2006. Available at: http://www.capmas.gov.eg/ Cairo: Central Agency for Public Mobilization and Statistics.
Chan, A. L. S. (2011) 'Developing future hourly weather files for studying the impact of climate change on building energy performance in Hong Kong', Energy and Buildings, 43, 2860–2868.
CIBSE (2007) CIBSE Guide A: Environmental design, 7th ed., London: Page Bros. Ltd.
CIBSE (2010) How to manage overheating in buildings: A practical guide to improving summertime comfort in buildings (KS16), London: The Charlesworth Group.
Clarke, J. A. (2001) Energy Simulation in Building Design, UK: Butterworth-Heinemann.
Connolley, W. M. (2014) 'William M. Connolley's page about Fourier 1827: MEMOIRE sur les temperatures du globe terrestre et des espaces planetaires. Available at: http://www.wmconnolley.org.uk/sci/fourier_1827/', [online], available: [accessed
Cornelis Klein, C. S. H. (1985) Manual of Mineralogy, 20th ed. ed., Wiley.

239
Corrado, V., Serra, V. and Vosilla, A. (2004) 'Performance analysis of external shading devices', in Plea2004 - The 21th Conference on Passive and Low Energy Architecture, Eindhoven, The Netherlands,
Council, I. E. (1993) 'Energy for tomorrow's world'.
Crawley, D. B. (2007) 'Impact of climate change on buildings', in Conference on Sustainable Building South-East Asia (SB07SEA), Kuala Lumpur, Malaysia, 5-7th November 2007,
Crawley, D. B. (2008) 'Estimating the impacts of climate change and urbanization on building performance', Journal of Building Performance Simulation, 1(2), 91-115.
Crawley, D. B., Hand, J. W., Kummert, M. l. and Griffith, B. T. (2008) 'Contrasting the capabilities of building energy performance simulation programs', Building and Environment, 43, 661–673.
Cunningham, W. P. and Cunningham, M. A. (2008) Environmental Science: a global concern. , Tenth ed., New York: McGraw-Hill.
Daabas, M. Y. (1994) Strategies to protect the environment from pollution, Cairo: Dar Al Maaref.
Datta, G. (2001) 'Effect of fixed horizontal louver shading devices on thermal performance of building by TRNSYS simulation', Renewable Energy, 23, 497–507.
DB, D. S. L.-. (2011) DesignBuilder Printable Documentation v3.0. Retrieved from: http://www.designbuilder.co.uk/component/option,com_docman/task,cat_view/gid,20/Itemid,30/, Stroud, Gloucs, UK.
DB, D. S. L.-. (2012) DesignBuilder software. Retrieved from: http://www.designbuilder.co.uk/", email to [accessed
Dear, R. d., Brager, G. and Cooper, D. (1997) Developing an Adaptive Model of Thermal Comfort and Preference, ASHRAE.
Dear, R. J. d. and Brager, G. S. (1998) Developing an Adaptive Model of Thermal Comfort and Preference, translated by ASHRAE, 145-167.
DOE, U. D. o. E.-. (2010) Building Energy Codes 101: An Introduction, USA: Department of Energy, Building Energy Codes Program (BECP)
DOE, U. S. D. o. E.-. (2012) EnergyPlus. Available at: www.energyplus.gov, email to [accessed
Donald Watson, FAIA and Labs, K. (1983) Climatic Design: Energy - Efficient Building Principles and Practices
Du, H., Underwood, C. and Edge, J. (2012) 'Generating design reference years from the UKCP09 projections and their application to future air-conditioning loads', Building Services Engineering Research and Technology, 33(1), 63-79.
EAAF, E. A. o. t. A. F.-. (2012) Indicative Guide Cairo, Egypt: Engineering Authority of the Armed Forces.
ECEP/DRTPC, E. C. a. E. P. p. a. t. D. R. a. T. P. C. o. C. U.-. (2001) Residential Energy Survey and Environmental Indicators in Greater Cairo, Egypt: the Development Research and Technological Planning Center of Cairo University and The Organization for Energy Planning. .
Edwards, B. (1999) Sustainable Architecture, Second ed., Architectural Press.
Ehrlich, P. R., A.H. Ehrlich, and J.P. Holdren (1970) Eco-science: Population, Resources, Environment., San Francisco: W.H.Freeman.
El-Azzawy, A. r. H. (1995) Energy and buildings, Amman: Majdlawi press - Jordan.
El-Wakeel, S. and Serag, M. (1989) Climate and Tropical Architecture, Cairo: Alem Al Kutob.
Elder, W. (2010) 'What is Climate Change?', [online], available: http://www.nps.gov/goga/naturescience/climate-change-causes.htm [accessed

240
Elgendy, K. (2012) 'A Visual Guide to Energy and Emissions in the Middle East', [online], available: http://www.carboun.com/ [accessed
EMA, E. M. A.-. (2012) 'Temperatures in the Arab Republic of Egypt', [online], available: http://nwp.gov.eg/ [accessed
EPA, U. S. E. P. A.-. (2008) EPA’s 2008 Report on the Environment Washington:
Experts, G. o. (2012) Good Practice Guide 5 - Low-energy-cooling. Online at: http://www.islington.gov.uk/services/planning/plan_conserve/urban_design/sustainable/Pages/default.aspx, 5, London: Islington council
Faggal, A. A. E.-d. (2002) The Integrated Relation Between the Natural Energy and the Environmental Impact in Touristic Resorts, unpublished thesis (PhD Thesis),
Fahmy, M. (2010) Interactive Urban Form Design of Local Climate Scale in Hot Semi-arid Zone, unpublished thesis (PhD Thesis), The University of Sheffield.
Fahmy, M., Mahdy, M. M. and Nikolopoulou, M. (2014) 'Prediction of future energy consumption reduction using GRC envelope optimization for residential buildings in Egypt', Energy and Buildings, 70(0), 186-193.
Fathy, H. (1973) Architecture for the poor - an experiment in rural Egypt, USA: University of Chicago.
Fathy, H. (1982) Architecture and the environment Your Book, Cairo - Egypt: Dar El-Maaref.
Fathy, H. (1988) Natural Energy and Vernacular Architecture First Edition ed., Cairo - Egypt: Arab Institution for Studies and Publishing.
Gadi, M. B. (2000) 'Design and Simulation of A New Energy Conscious System, basic concept', Mohamed B. Gadi, 65, 349-353.
Gallo, C. (1996) 'Passive Cooling as Design Methodology: Some Examples from The Past to The Present ', Journal of Renewable Energy, 8(1-4), 309-314.
Gawad, A. F. A. (2010) Optimization of Natural Ventilation of Ancient Buildings Towards Sustainability of Modern Buildings – Part 1: One-Story Building translated by Ain Soukhna, Red Sea, Egypt.
Gira, A. A. E. A. (2002) Evaluation of the Thermal Performance of Educational Buildings in Egypt, unpublished thesis (PhD Thesis), Ain Shams University - Egypt.
Givoni, B. (1998) Climate Consideration’s in building and urban design New York: John Wiley & Sons.
Gomez-Munoz, V. M. and Porta-Gandara, M. A. (2003a) 'General model to build awnings and external walls with optimum shading interaction', Renewable Energy, 29, 605–613.
Gomez-Munoz, V. M. and Porta-Gandara, M. A. (2003b) 'Simplified architectural method for the solar control optimization of awnings and external walls in houses in hot and dry climates', Renewable Energy, 28(1), 111-127.
Guan, L. (2009) 'Preparation of future weather data to study the impact of climate change on buildings', Building and Environment, 44, 793–800.
Guerin, D. A., Yust, B. L. and Coopet, J. G. (2000) 'Occupant Predictors of Household Energy Behavior and Consumption Change as Found in Energy Studies Since 1975', Family and Consumer Sciences Research Journal, 29(1), 48-80.
Hamza, N. (2008) 'Double versus single skin facades in hot arid areas', Energy and Buildings, 40(3), 240-248.
Hanna, G. B. (2010) 'Energy Efficient Residential Building Code for Arab Countries ', in The 10th International Conference for Enhanced Building Operations, Kuwait, October 26-28,
Hanna, G. B., Guirguis, N. M. and Aziz, A. A. (2011) 'Building Energy Code for New Residential Buildings in Egypt.', Journal of Environmental Science and Engineering, 5.

241
Hansen, J., Sato, M., Kharecha, P., Beerling, D., Berner, R., Masson-Delmotte, V., Pagani, M., Raymo, M., Royer, D. L. and Zachos, J. C. (2008) 'Target Atmospheric CO2: Where Should Humanity Aim? ', The Open Atmospheric Science Journal, 217-231.
Hawkins, C. J. and Pearce, D. W. (1971) Capital lnvestment Appraisal, MacMillan Press.
HBRC, H. a. B. N. R. C.-. (2007) 'The Egyptian Specifications for Thermal Insulation Work Items', 176/1998,
HBRC, H. a. B. N. R. C.-. (2008) 'Egyptian Code for Improving the Efficiency of Energy Use in Buildings, Part 1: Residential Buildings (306/1).', ECP 305-2005
Helal, A. (2001) Mineral Resources - Current State And Development Prospects Up to The Year 2020, Cairo - Egypt: Academic Bookshop.
Hensen, J. L. M. (2004) 'Towards more effective use of building performance simulation in design', in the 7th International Conference on Design & Desicion Support Systems in Architecture and Urban Planning, Eindhoven, 2-5 July.
Holmes, M. J. and Hacker, J. N. (2007) 'Climate change, thermal comfort and energy: Meeting the design challenges of the 21st century', Energy and Buildings, 39(7), 802-814.
Huang, J., Berkeley, L., Deringer, J., Krarti, M. and Masud, J. (2003) 'The Development of Residential and Commercial Building Energy Standards for Egypt', in Energy Conservation in Buildings Workshop, Kuwait, December 15-17
Hughes, B. R., Calautit, J. K. and Ghani, S. A. (2012) 'The Development of Commercial Wind Towers for Natural Ventilation: A Review ', Applied Energy, 92, 606–627.
Hui, S. C. M. (2002) 'Sustainable Architecture and Building Design (SABD)', [online], available: http://www.arch.hku.hk/research/BEER/sustain.htm [accessed
Hulme, M., Lu, X. and Turnpenny, J. (2002) Climate change scenarios for the United Kingdom; The UKCIP02 scientific report.
Humbert, M., Tasca-Guernouti, S., Berger, J., Lahrech, R. and Fery, A. (2011) 'Design of Refurbishment: Determining of Parameters to be Measured to Adjust The Predicted Energy Calculation', in 12th Conference of International Building Performance Simulation Association, Sydney, 14-16 November,
Humphreys, M. A. (1996) 'Thermal comfort temperatures world-wide - the current position', Renewable Energy, 8(1-4 ), 139-144.
Humphreys, M. A. and Nicol, J. F. (1998) Understanding the Adaptive Approach to Thermal Comfort, translated by San Francisco: ASHRAE.
Humphreys, M. A. and Nicol, J. F. (2002) 'The validity of ISO-PMV for predicting comfort votes in every-day thermal environments', Energy and Buildings, 34(6), 667-684.
Humphreys, M. A., Nicol, J. F. and Rajac, I. A. (2007) 'Field Studies of Indoor Thermal Comfort and the Progress of the Adaptive Approach', Journal of Advances in Building Energy Research, 1(1), 55-88.
Humphreys, M. A., Rijal, H. B. and Nicol, J. F. (2013) 'Updating the adaptive relation between climate and comfort indoors; new insights and an extended database ', Building and Environment, 63, 40-55.
Huovila, P., Ala-Juusela, M., Melchert, L. and Pouffary, S. (2007) Buildings and climate change: Status, Challenges and Opportunities, Paris: United Nations Environment Programme (UNEP), Sustainable Buildings and Construction Initiative (SBCI).
Ibrahim, A. B. (1987) Arab architects: Hassan Fathy Cairo - Egypt: Centre for Planning and Architectural Studies.
IEA, I. E. A.-. (2010) Key World Energy Statistics

242
Incropera, F. P., DeWitt, D. P., Bergman, T. L. and Lavine, A. S. (2011) Fundamentals of Heat and Mass Transfer, John Wiley & Sons.
IPCC, I. P. o. C. C.-. (2000) Special Report on Emissions Scenarios (SRES). Online at: http://www.ipcc.ch/ipccreports/sres/emission/index.php?idp=0, Geneva, Switzerland.
IPCC, I. P. o. C. C.-. (2007a) Fourth Assessment Report of Climate Change, Working Group 1: The Physical Science Basis. Online at: https://www.ipcc.ch/publications_and_data/ar4/wg1/en/spmsspm-understanding-and.html#footnote12, Geneva, Switzerland:
IPCC, I. P. o. C. C.-. (2007b) Synthesis Report, fourth assessment report of climate change. Online at: http://www.ipcc.ch/publications_and_data/ar4/syr/en/contents.html, Geneva, Switzerland:
IPCC, I. P. o. C. C.-. (2010) Hadcm3 Climate Scenario Data Download Page. On line at: http://www.ipcc-data.org/sres/hadcm3_download.html, Retrieved 25-5, 2010, Geneva, Switzerland.
IPCC, I. P. o. C. C.-. (2014a) The Fifth Assessment Report (IPCC WGII AR5). Chapter 22: Africa "Final Draft". Online at: http://www.ipcc.ch/report/ar5/index.shtml, Copenhagen, Denmark.
IPCC, I. P. o. C. C.-. (2014b) The Fifth Assessment Report (IPCC WGIII AR5). Chapter 15: National and Sub-national Policies and Institutions "Final Draft". Copenhagen, Denmark.
Jentsch, M. F., Bahaj, A. S. and James, P. A. (2008) 'Climate change future proofing of buildings - Generation and assessment of building simulation weather files', Energy and Buildings, 40, 2148–2168.
Jong-Jin Kim, B. R. (1998) Introduction to sustainable design, Ann Arbor: National Pollution Prevention Centre for Higher Education, University Ave.
Kassim, A. and Bathis, H. (2003) Energy efficiency opportunities for government hospitals, report prepared under the Malaysian, Danish environmental cooperation program.
Keller, S. (2010) 'Scientization: putting global climate change on the scientific agenda and the role of the IPCC', Poiesis & Praxis, 7(3), 197-209.
Khalil, E. E. (2005) 'Energy performance of buildings directive in Egypt: a new direction', HBRC JOURNAL, 1(11), 197-213.
Khan, N., Su, Y. and Riffat, S. B. (2008) 'A Review on Wind Driven Ventilation Techniques ', Energy and Buildings, 40, 1586-1604.
Khoshsima, E., Mahdavi, A., Rao, S. P. and Inangda, N. (2011) 'Learning from the Past: Case Study of Traditional Architecture of Southern Shores of Caspian Sea Region in Iran', International Journal of Applied Science and Technology.
Kottek, M., Grieser, J., Beck, C., Rudolf, B. and Rubel, F. (2006) 'World Map of the Köppen-Geiger climate classification updated', Meteorologische Zeitschrift, 15(3), 259-263.
Kravchuk, O. and J. W. Boland (2000) 'Maintaining indoor temperature by external shading', in 38th Annual Conference of ANZSES, Brisbane, 29 Nov.-1 Dec.,
Kuhn, T. E., Bühler, C. and Platzer, W. J. (2001) 'Evaluation of overheating protection with sun-shading systems', Solar Energy, 69, Supplement 6(0), 59-74.
Kusuda, T. (1999) 'Early History and Future Prospects of Building System Simulation', in Building Simulation conference, Kyoto, Japan, 3-15.
Kwok, A. G. and Rajkovich, N. B. (2010) 'Addressing climate change in comfort standards', Building and Environment, 45, 18–22.
Levermore, G. J. (2008a) 'A review of the IPCC Assessment Report Four, Part 1: the IPCC process and greenhouse gas emission trends from buildings worldwide', Building Service Engineering, 29(4), 349-361.

243
Levermore, G. J. (2008b) 'A review of the IPCC Assessment Report Four, Part 2: Mitigation options for residential and commercial buildings', Building Service Engineering, 29(4), 363-374.
Levermore, G. J., Courtney, R., Watkins, R., Cheung, H., Parkinson, J. B., Laycock, P., Natarajan, S., Nikolopoulou, M., McGilligan, C., Muneer, T., Tham, Y., nderwood, C. P., Edge, J. S., Du, H., Sharples, S., Kang, J., Barclay, M. and Sanderson, M. (2012) Deriving and using future weather data for building design from UK climate change projections – an overview of the COPSE Project, Manchester, UK: Manchester University.
Leylian, M. R., Amirkhani, A., Bemanian, M. R. and Abedi, M. (2010) 'Design principles in the hot and arid climate of iran, the case of kashan ', INTERNATIONAL JOURNAL of ACADEMIC RESEARCH, 2(5).
Liu, F., Meyer, A. S. and Hogan, J. F. (2010) Mainstreaming Building Energy Efficiency Codes in Developing Countries: Global Experiences and Lessons from Early Adopters, The International Bank for Reconstruction and Development / The World Bank.
Lutsey, N. and Sperling, D. (2008) 'America’s Bottom-Up Climate Change Mitigation Policy', Energy Policy, 36, 673–685.
Lutzenhiser, L. and Bender, S. (2010) 'The “Average American” unmasked: Social Structure and Differences in Household Energy Use and Carbon Emissions', People-Centered Initiatives for Increasing Energy Savings, 133.
Macalister, T. and Monbiot, G. (2008) 'Global oil supply will peak in 2020, says energy agency', The Guardian, Monday 15 December 2008available: http://www.theguardian.com/business/2008/dec/15/global-oil-supply-peak-2020-prediction [accessed 10/2012].
Mahmoud, A. H. A. (2011) 'An analysis of bioclimatic zones and implications for design of outdoor built environments in Egypt', Building and Environment, 46(3), 605-620.
Makram, A. A. S. (2008) Sustainable Architecture As an Approach for Hospitals Design unpublished thesis (PhD Thesis), Alexandria university.
Mansy, K. A. (2013) 'Establishing a Reference Performance for Office Buildings in Cairo, Egypt ', in Building Simulation Cairo 2013 - Towards Sustainable & Green Built Environment, Cairo - Egypt, June 23rd - 24th,
Marrero, P., Oliveira, I. and C., A. (2010) 'Effect of louver shading devices on building energy requirements', Applied Energy, 87(6), 2040-2049.
McMullan, R. (2007) Environmental Science in Building.
Met.Office, H. C.-., Nottingham, U. o., Reading, W. I.-t. U. o., Hydrology, C. f. E. a., Leeds, U. o., Anglia, T. C.-U. o. E. and Southampton, T. C.-U. o. (2011) Climate: Observations, projections and impacts - Egypt. Available at: http://www.metoffice.gov.uk/climate-guide/science/uk/obs-projections-impacts, Devon, UK
Michel, S. and Elsayed, H. (2006) 'Examples of Low Energy Design at Urban Scale in Egypt ', in PLEA2006 - The 23rd Conference on Passive and Low Energy Architecture, , , Geneva, Switzerland, 6-8 September 2006,
MOEE, M. o. E. a. E.-E.-. (2011) MOEE Annual report Cairo - Egypt.
MOEE, M. o. E. a. E.-E.-. (2012) 'Egyptian Ministry of Electricity and Energy, electricity selling prices', [online], available: http://www.egyptera.com/ar/a-Bill_Tariffs.htm [accessed
Mohamed Amin, M. M. (1999) Environmental pollution the problem of the Era.
Molina, M. J. and Rowland, F. S. (1974) 'Stratospheric sink for chlorofluoromethanes: chlorine atom-catalysed destruction of ozone', Nature, 249, 810 - 812.
Montazeri, H. and Azizian, R. (2008) 'Experimental Study on Natural Ventilation Performance of One-Sided Wind Catcher ', Building and Environment, 43, 2193-2202.

244
Montazeri, H., Montazeri, F., Azizian, R. and Mostafavi, S. (2010) 'Two-sided wind catcher performance evaluation using experimental, numerical and analytical modeling', Renewable Energy, 35(7), 1424–1435.
MOP, M. o. P. E.-. (2012) 'Ministry of Petroleum - Egypt official web page', [online], available: http://www.petroleum.gov.eg/en/pages/default.aspx [accessed
Morrissey, J., Moore, T. and Horne, R. E. (2011) 'Affordable passive solar design in a temperate climate: An experiment in a residential building orientation', Renewable Energy, 36(2), 568-577.
Moustafa, W. and Hegazy, I. (2013) 'Towards a sufficient building performance in Egypt: investigating the effect of climatic data types ', International Journal of Scientific & Engineering Research, 4(6), 1142-1148.
NBE, N. B. o. E.-. (2012) 'Interest rates', [online], available: http://www.nbe.com.eg/ [accessed
Nikolopoulou, M., Baker, N. and Steemers, K. (2001) 'Thermal Comfort in Outdoor Urban Spaces: Understanding the Human Parameter', Solar Energy, 70(3), 227–235.
Nikolopouloua, M. and Steemers, K. (2003) 'Thermal comfort and psychological adaptation as a guide for designing urban spaces', Energy and Buildings, 35(1), 95-101.
NREA, N. a. r. e. a. (2011) New and renewable energy authority - Annual report - Egypt, Cairo New and renewable energy authority.
NREA, N. a. r. e. a., (EMA), E. M. A. and Denmark, R. N. L. o. (2005) Wind Atlas for Egypt: measurements and modelling, Cairo - Egypt: New and renewable energy authority.
Nugroho, S. B., Fujiwara, A., Zhang, J., Kanemoto, K., Moersidik, S. S. and Abbas, S. (2010) Development of A Household Energy Consumption Model for Megacities in Asia, translated by Hong Kong
NY.consultants, I. a. t. o. s. t. u. i. N. Y. c. t. w. c. p.-. (1999) High Performance Building Guidelines, New York: New York City Department of Design and Construction.
OEP, O. o. E. P.-E.-. (1998a) Bulletin of energy in Egypt, Organization of Energy Planning - Egypt.
OEP, O. o. E. P.-E.-. (1998b) Directory of Architecture and energy, Organization of Energy Planning - Egypt.
OEP, O. o. E. P.-E.-. (2000) Energy Information Centre, Organization of Energy Planning - Egypt.
OEP, O. o. E. P.-E.-. (2001) Energy around the globe, Organization of Energy Planning - Egypt.
OEP/DRTPC, O. f. E. P. a. t. D. R. a. T. P. C. o. C. U.-. (1999) Energy Consumption Survey on The Residential Sector in Cairo Egypt: Organization for Energy Planning and the Development Research and Technological Planning Centre of Cairo University.
Offiong, A. and Ukpoho, A. U. (2004) 'External window shading treatment effects on internal environmental temperature of buildings', Renewable Energy, 29(14), 2153-2165.
Okba, E. M. (2005) 'Building envelope design as a passive cooling technique ', in Passive and Low Energy Cooling for the Built Environment, Santorini, Greece
Oktay, D. (2002) 'Design with the climate in housing environments: an analysis in Northern Cyprus', Building and Environment, 37(1003-1012).
Omar, M. M. and Ayyad, K. M. (2013) 'A Review for the Influence of Climate Change on Development in Egypt in the 21st century', in Building Simulation Cairo 2013 - Towards Sustainable & Green Built Environment, Cairo, Egypt, June 23rd - 24th, IBPSA-Egypt,
Page, J., Robinson, D., Morel, N. and Scartezzini, J. L. (2008) 'A generalised stochastic model for the simulation of occupant presence', Energy and Buildings, 40, 83–98.
Patlitzianas, K. D., Doukas, H. and Psarras, J. (2006) 'Enhancing renewable energy in the Arab States of the Gulf: Constraints & efforts ', Energy Policy, 34, 3719–3726.

245
Peel, M. C., Finlayson, B. L. and McMahon, T. A. (2007) 'Updated world map of the Köppen-Geiger climate classification', Hydrology and Earth System Sciences Discussions, 4, 439–473.
Peterson, T. D. and Rose, A. Z. (2006) 'Reducing Conflicts Between Climate Policy and Energy Policy in The US: The Important Role of The States ', Energy Policy, 34, 619–631.
PHIUS, P. h. i.-. (2012) 'The Passive House ', [online], available: http://www.passivehouse.us/passiveHouse/PassiveHouseInfo.html [accessed
Pirhayati, M., Ainechi, S., Torkjazi, M. and Ashrafi, E. (2013) 'Ancient Iran, The Origin Land of Wind Catcher in the World ', Research Journal of Environmental and Earth Sciences, 5, 433-439.
Pratt, S. P. and Niculita, A. V. (2008) Valuing a Business: The Analysis and Appraisal of Closely Held Companies, 5th Edition ed., New York: McGraw-Hill Professional.
Rabah, K. (2005) 'Development of energy-efficient passive solar building design in Nicosia Cyprus', Renewable Energy, 30(6), 937-956.
Radhi, H. (2009) 'Can envelope codes reduce electricity and CO2 emissions in different types of buildings in the hot climate of Bahrain?', Energy, 34, 205-215.
Radhi, H., Eltrapolsi, A. and Sharples, S. (2009) 'Will energy regulations in the Gulf States make buildings more comfortable - A scoping study of residential buildings', Applied Energy, 86(12), 2531-2539.
Raftery, P., Keane, M. and Costa, A. (2011) 'Calibrating whole building energy models: Detailed case study using hourly measured data', Energy and Buildings, 43, 3666–3679.
Raof, S., Crichton, D. and Nicol, F. (2009) Adapting Buildings and Cities for Climate Change: A 21st Century Survival Guide, 2nd ed., Oxford, UK: Architectural Press.
Reiche, D. (2010) 'Energy Policies of Gulf Cooperation Council (GCC) countries - possibilities and limitations of ecological modernization in rentier states', Energy Policy, 38, 2395–2403.
Ren, Z., Chen, Z. and Wang, X. (2011) 'Climate change adaptation pathways for Australian residential buildings', Building and Environment, 46(11), 2398-2412.
RIBA, R. I. o. B. A.-. (2000) RIBA Environmental Manifesto, London.
Roaf, S., Crichton, D. and Nicol, F. (2009) Adapting buildings and cities for climate change, Second Edition ed., Elsevier.
Robinson, D. (2006) 'Some trends and research needs in energy and comfort prediction', in Windsor conference,
Ross, S. A., Westerfield, R. W. and Jordan, B. D. (2007) Corporate Finance Fundamentals, 8th ed., New York: Irwin Professional Publishing
RSS, T. R. S. S.-. (2010) Directory of green buildings in Jordan, Jordan: The Royal Scientific Society, National Building Council.
Saberi, O., Saneei, P. and Javanbakht, A. (2006) 'Thermal Comfort in Architecture ', in Comfort and energy use in building Windsor,
Safarzadeh, H. and Bahadori, M. N. (2005) 'Passive Cooling Effects of Courtyards ', Building and Environment, 40, 89–104.
Saffari, H. and Hosseinnia, S. M. (2009) 'Two-phase Euler-Lagrange CFD simulation of evaporative cooling in a Wind Tower', Energy and Buildings, 41(9), 991–1000.
Sanders, C. H. and Phillipson, M. C. (2003) 'UK Adaptation Strategy and Technical Measures: The Impacts of Climate Change on Buildings ', Building Research & Information, 31 (3 ), 210-221.
Santamouris, M. and Wouters, P. (2006) Building Ventilation: The State of the Art, Routledge.
SBCNC, S. B. C. N. C.-. (2007) 'Saudi Building Code (SBC)', First issue,

246
SERG, S. E. R. G.-. (2012a) 'Climate Change World Weather File Generator', [online], available: http://www.serg.soton.ac.uk/ccworldweathergen/ [accessed
SERG, S. E. R. G.-. (2012b) 'Climate Change World Weather File Generator manual (V 1.6)', [online], available: http://www.energy.soton.ac.uk/ccworldweathergen/ [accessed
Sherif, A., El-Deeb, K., Zafarany, A. E. and Aly, M. (2011) 'Effectiveness or External wall Shading in Reducing the Energy Consumption or Desert Buildings ', in International Conference on Sustainable Design and Construction (ICSDC), Kansas City, Missouri, USA, 23-25 March 2011,
Sherifa, A., El-Zafaranyb, A. and Arafaa, R. (2012) 'External perforated window Solar Screens: The effect of screen depth and perforation ratio on energy performance in extreme desert environments', Energy and Buildings, 52 1–10.
Sherman, D. (2009) '2020 vision', The Economist, Dec 10th 2009available: http://www.economist.com/node/15065719 [accessed
Sheta, W. and Sharples, S. (2010) 'A building simulation sustainability analysis to assess dwellings in a new cairo development ', in Fourth National Conference of IBPSA-USA, New York City, New York,
SODA, S. R. D.-. (2013) 'Maps of Irradiation - Africa - Photovoltaic Solar Electricity Potential', [online], available: http://www.soda-is.com/eng/map/maps_for_free.html#pvgis-africa [accessed
Solar-GIS, G. M. S. s. r. o.-. (2013) 'Global Horizontal Irradiation - Africa and Middle East', [online], available: http://solargis.info/doc/_pics/freemaps/1000px/ghi/SolarGIS-Solar-map-Africa-and-Middle-East-en.png [accessed
Steele, J. (1997) An Architecture for People: The Complete Works of Hassan Fathy, Whitney Library of Design.
Suleiman, S. and Himmo, B. (2012) 'Direct Comfort Ventilation. Wisdom of The Past and Technology of the Future (wind-catcher)', Sustainable Cities and Society, 5, 8-15
Swan, L. G. and Ugursal, V. I. (2009a) 'Modeling of end-use energy consumption in the residential sector: A review of modeling techniques', Renewable and Sustainable Energy Reviews, 13.
Swan, L. G. and Ugursal, V. I. (2009b) 'Modeling of end-use energy consumption in the residential sector: A review of modeling techniques', Renewable and Sustainable Energy Reviews, 13, 1819–1835.
Theis, T. and Tomkin, J. (2012) Sustainability: A Comprehensive Foundation Connexions, Rice University.
Thomas, R. and LLP, M. F. (2006) Environmental Design: An introduction for architects and engineers third ed., UK: Taylor & Francis
Turner, L. (2003) 'Climate and Architecture ' in Report for Honor's Section 8 of MET1010 Introduction to the Atmosphere Florida - USA: Florida State University.
UNDP/GEF, U. N. D. P. a. G. E. F.-. (2003) Energy Survey and Environmental Indicators in The Residential Sector in Greater Cairo, Cairo.
UNEP, U. N. E. P.-. (2002) Profiting From Cleaner Production: Performing Net Present Value (NPV) Calculations, France.
UNFCCC, U. N. f. c. o. c. c.-. (2012) 'Doha Climate Change Conference (DOHA2012). Online at: https://unfccc.int/meetings/doha_nov_2012/meeting/6815.php', [online], available: [accessed
USDoE, U. S. D. o. E.-. (2004) 'Energy Efficiency and Renewable Energy: Building Envelope', [online], available: www.eere.energy.gov [accessed
USDoE, U. S. D. o. E.-. (2012) 'Weather data', [online], available: http://apps1.eere.energy.gov/buildings/energyplus/weatherdata_about.cfm [accessed
USGBC, U. G. B. C.-. (1996) Sustainable Building Technical Manual (SBTM), Green Building Design, Construction, and Operations., USA: Public Technology Inc.

247
Vorsatz, D. Ü.-., Petrichenko, K. and butcher, a. C. (2011) 'How far can buildings take us in solving climate change? anovel approach to building energy and related emission forecasting', in Energy efficiency first: The foundation of a low-carbon society (eceee 2011 Summer Study), Belambra Presqu’île de Giens, France, 6–11 June,
Wagner, T. P. (1994) In Our Backyard: A Guide to Understanding Pollution and Its Effects, Van Nostrand Reinhold.
Waziri, Y. (2002 ) Applications for Environmental Architecture Cairo - Egypt: Madbouly Library.
WEBB, C. G. (1958) 'An analysis of some observations of thermal comfort in an equatorial climate', British Journal of Industrial Medicine.
WMO, W. M. O.-. and EMA, T. E. M. A.-. (2012) 'World weather. Available at: http://www.worldweather.org/059/m059.htm', [online], available: [accessed
Yang, K. H. and Hwang, R. L. (1995) 'Energy conservation of buildings in Taiwan', Pattern Recognition, 28(10), 1483-1491.
Yao, R. and Steemers, K. (2005) 'A method of formulating energy load profile for domestic buildings in the UK', Energy and Buildings, 37, 663–671.
Zakaria, T. S. (2009) Deviation of Climate Elements in Egypt From the Normal Rates, Zagazig: Zagazig University.

248
Appendices:
Appendix I: Thermal and physical properties of the commonly used materials in Egypt.
Appendix II: From construction to operation: Achieving indoor thermal comfort via altering external walls specifications in Egypt.
Appendix III: The cost of achieving thermal comfort via altering external walls specifications in Egypt; from construction to operation through different climate change scenarios.
Appendix IV: Prediction of future energy consumption reduction using GRC envelope optimization for residential buildings in Egypt.
Appendix V: Climate change scenarios effects on residential buildings shading strategies in Egypt.
Appendix VI: Evaluation of fenestration specifications in Egypt in terms of energy consumption and long term cost-effectiveness.
Appendix VII: Simulation results for the case study buildings (3 and 4) in Alexandria.
Appendix VIII: Simulation results for the case study buildings (3 and 4) in Cairo.
Appendix IX: Simulation results for the case study buildings (3 and 4) in Aswan.
Appendix X: Abbreviations.
Appendix XI: Formula for the calculation of future values.

249
Appendix I
Thermal and physical properties of the commonly used materials in Egypt

250
No. Construction Thickness U-Value
Picture Material name
Default thickness Density
Thermal Conductivity Specific
heat
Thermal Resistance
d k R
(cm) (W/m2K) (m) (kg/m3) (W/m.K) (J/kg.K) (m2K/W)
1 Half red-brick wall
(12cm)
12 2.519
Plaster 0.005 600 0.16 1000 0.031
Mortar 0.02 1570 0.9 896 0.022
Solid red brick 0.12 1950 1 829 0.120
Mortar 0.02 1570 0.9 896 0.022
Plaster 0.005 600 0.16 1000 0.031
2 Full red-brick wall
(25cm)
25 1.898
Plaster 0.005 600 0.16 1000 0.031
Mortar 0.02 1570 0.9 896 0.022
Solid red brick 0.25 1950 1 829 0.250
Mortar 0.02 1570 0.9 896 0.022
Plaster 0.005 600 0.16 1000 0.031
3 Limestone bearing
wall 50 1.228
Plaster 0.005 600 0.16 1000 0.031
Mortar 0.02 1570 0.9 896 0.022
Limestone 0.5 1650 0.93 900 0.538
Mortar 0.02 1570 0.9 896 0.022
Plaster 0.005 600 0.16 1000 0.031

251
No. Construction Thickness U-Value
Picture Material name
Default thickness Density
Thermal Conductivity Specific
heat
Thermal Resistance
d k R
(cm) (W/m2K) (m) (kg/m3) (W/m.K) (J/kg.K) (m2K/W)
4
Full red-brick wall plus additional
1cm of expanded polystyrene thermal
insulation layer
(25+)
26 1.218
Plaster 0.005 600 0.16 1000 0.031
Mortar 0.02 1570 0.9 896 0.022
Expanded polystyrene
0.01 35 0.034 1400 0.294
Solid red brick 0.25 1950 1 829 0.250
Mortar 0.02 1570 0.9 896 0.022
Plaster 0.005 600 0.16 1000 0.031
5
Full red-brick wall plus additional
2cm of expanded polystyrene thermal
insulation layer
(25++)
27 0.897
Plaster 0.005 600 0.16 1000 0.031
Mortar 0.02 1570 0.9 896 0.022
Expanded polystyrene
0.02 35 0.034 1400 0.588
Solid red brick 0.25 1950 1 829 0.250
Mortar 0.02 1570 0.9 896 0.022
Plaster 0.005 600 0.16 1000 0.031

252
No. Construction Thickness U-Value
Picture Material name
Default thickness Density
Thermal Conductivity Specific
heat
Thermal Resistance
d k R
(cm) (W/m2K) (m) (kg/m3) (W/m.K) (J/kg.K) (m2K/W)
6
Full red-brick wall plus additional
3cm of expanded polystyrene thermal
insulation layer
25 (+3)
28 0.71
Plaster 0.005 600 0.16 1000 0.031
Mortar 0.02 1570 0.9 896 0.022
Expanded polystyrene
0.03 35 0.034 1400 0.882
Solid red brick 0.25 1950 1 829 0.250
Mortar 0.02 1570 0.9 896 0.022
Plaster 0.005 600 0.16 1000 0.031
7
Double wall of half red-brick with
5cm air gap in between
(Dair)
29 1.463
Plaster 0.005 600 0.16 1000 0.031
Mortar 0.02 1570 0.9 896 0.022
Solid red brick 0.12 1950 1 829 0.120
Air gap 0.05 1000 0.3 1000 0.167
Solid red brick 0.12 1950 1 829 0.120
Mortar 0.02 1570 0.9 896 0.022
Plaster 0.005 600 0.16 1000 0.031

253
No. Construction Thickness U-Value
Picture Material name
Default thickness Density
Thermal Conductivity Specific
heat
Thermal Resistance
d k R
(cm) (W/m2K) (m) (kg/m3) (W/m.K) (J/kg.K) (m2K/W)
8
Double wall of half red-brick with
additional internal 5 cm of expanded
polystyrene thermal insulation layer
(Dins)
29 0.503
Plaster 0.005 600 0.16 1000 0.031
Mortar 0.02 1570 0.9 896 0.022
Solid red brick 0.12 1950 1 829 0.120
Expanded polystyrene
0.05 35 0.034 1400 1.471
Solid red brick 0.12 1950 1 829 0.120
Mortar 0.02 1570 0.9 896 0.022
Plaster 0.005 600 0.16 1000 0.031
9
Glass fiber Reinforced Cement,
GRC, wall
(C1)
7.5 0.370
GRC 0.01 2000 0.67 1100 0.015
Foam 0.075 20 0.03 1400 2.5
GRC 0.01 2000 0.67 1100 0.015
10
Glass fiber Reinforced Cement,
GRC, wall
(C2)
10 0.282
GRC 0.015 2000 0.67 1100 0.022
Foam 0.1 20 0.03 1400 3.333
GRC 0.015 2000 0.67 1100 0.022

254
Appendix II
From construction to operation: Achieving indoor thermal comfort via altering external walls specifications in Egypt

255
Appendix III
The cost of achieving thermal comfort via altering external walls specifications in Egypt; from construction to operation through different climate change scenarios

256
Appendix IV
Prediction of future energy consumption reduction using GRC envelope optimization for residential buildings in Egypt

257
Appendix V
Climate change scenarios effects on residential buildings shading strategies in Egypt

258
Appendix VI
Evaluation of fenestration specifications in Egypt in terms of energy consumption and long term cost-effectiveness

259
Appendix VII
Simulation results for the case study buildings (3 and 4) in Alexandria.

260
Building - 3
Building type Tagam3 Climatic zone Alexandria
2002 2020
2050 2080
The general results of the simulations.

261
Current tariff New tariff 20
02
2020
2050
2080
The annual energy cost.

262
Financial Analysis
* Only negative numbers in the last column "saving in initial cost vs. saving in running cost" indicates financial gains against the base case.
C
urrent tariff N
ew tariff
The project's financial analysis.

263
Building - 4:
Building type CD-Beshr Climatic zone Alexandria
2002 2020
2050 2080
The general results of the simulations.

264
Current tariff New tariff 20
02
2020
2050
2080
The annual energy cost.

265
Financial Analysis
* Only negative numbers in the last column "saving in initial cost vs. saving in running cost" indicates financial gains against the base case.
C
urrent tariff N
ew tariff
The project's financial analysis

266
Appendix VIII
Simulation results for the case study buildings (3 and 4) in Cairo.

267
Building-3
Building type Tagam3 Climatic zone Cairo
2002 2020
2050 2080
The general results of the simulations.

268
Current tariff New tariff 20
02
2020
2050
2080
The annual energy cost.

269
Financial Analysis
* Only negative numbers in the last column "saving in initial cost vs. saving in running cost" indicates financial gains against the base case.
C
urrent tariff N
ew tariff
The project's financial analysis.

270
Building-4
Building type CD-Beshr Climatic zone Cairo
2002 2020
2050 2080
The general results of the simulations.

271
Current tariff New tariff 20
02
2020
2050
2080
The annual energy cost.

272
Financial Analysis
* Only negative numbers in the last column "saving in initial cost vs. saving in running cost" indicates financial gains against the base case.
C
urrent tariff N
ew tariff
The project's financial analysis

273
Appendix IX
Simulation results for the case study buildings (3 and 4) in Aswan.

274
Building-3
Building type Tagam3 Climatic zone Aswan
2002 2020
2050 2080
The general results of the simulations.

275
Current tariff New tariff 20
02
2020
2050
2080
The annual energy cost.

276
Financial Analysis
* Only negative numbers in the last column "saving in initial cost vs. saving in running cost" indicates financial gains against the base case.
C
urrent tariff N
ew tariff
The project's financial analysis.

277
Building - 4
Building type CD-Beshr Climatic zone Aswan
2002 2020
2050 2080
The general results of the simulations.
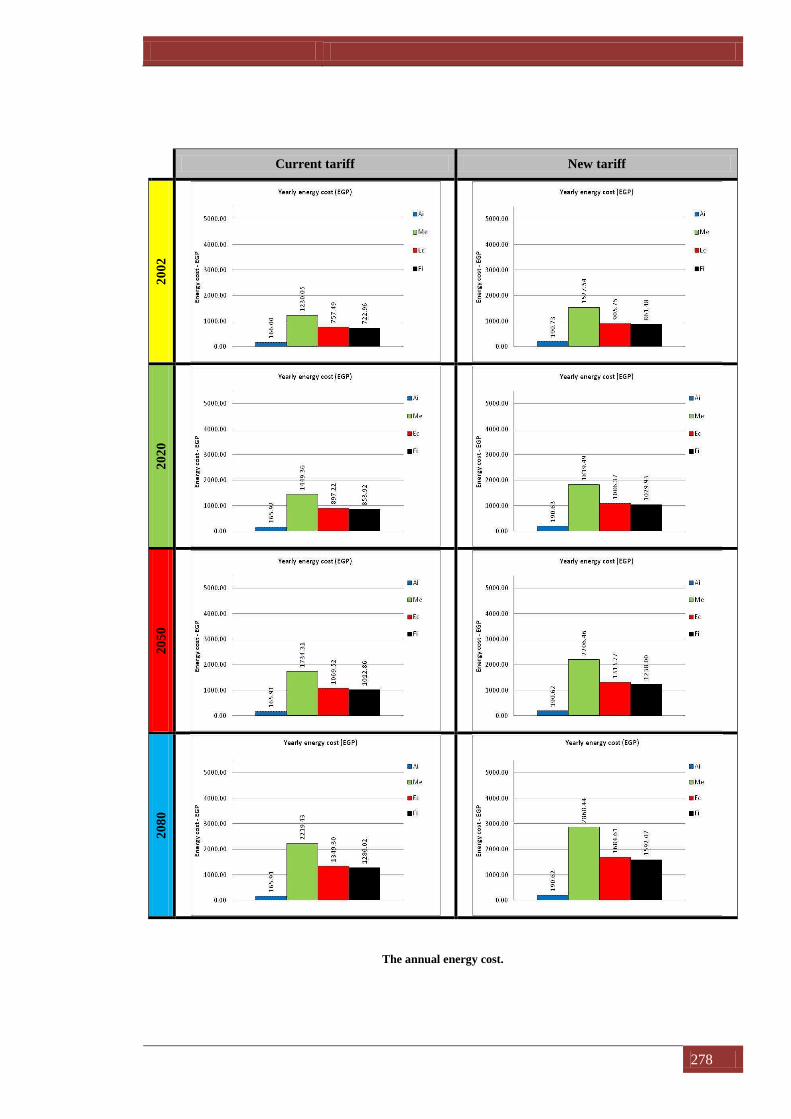
278
Current tariff New tariff 20
02
2020
2050
2080
The annual energy cost.

279
Financial Analysis
* Only negative numbers in the last column "saving in initial cost vs. saving in running cost" indicates financial gains against the base case.
C
urrent tariff N
ew tariff
The project's financial analysis

280
Appendix X
Abbreviations

281
AR4 IPCC Fourth Assessment Report: Climate Change - 2007
AR5 IPCC Fifth Assessment Report: Climate Change - 2013
BPES Building Performance Energy Simulation
BPS Building Performance Simulation
CMIP3 Coupled Model Intercomparison Project Phase 3 - produced by the Met Office, Hadley Centre
CMIP5 Coupled Model Intercomparison Project Phase 5.
CO2 Carbon dioxide
DB DesignBuilder
DCF Discounted Cash Flow
DOE US Department of Energy
E+ EnergyPlus
GHG Green House Gases
GUI Graphical User Interfaces
HBRC Housing and Building Research Centre
HVAC Heating Ventilation and Air Conditioning
IPCC Intergovernmental Panel on Climate Change
MoEE Egyptian Ministry of Electricity and Energy
NPV Net Present Value
NV Natural Ventilation
PMV index Predicted Mean Vote Index
ppm Part per million
PV Present Value
PV cells Photovoltaics
TOE Tonnes of Oil Equivalent
UNDP United Nations Development Programme
WDF Weather Data File
W-value Sun-breakers depth

282
Appendix XI
Formula for the calculation of future values

283
The future value of single deposit now:
The future value of a deposit of 警, that is deposited now after 1 year of investment using 9% interest rate compounded annually is calculated as follows: 繋撃怠 噺 警 抜 岫な 髪 ど┻どひ岻 If the amount 繋撃怠 is deposited again for another year, the future value after a further year is as follows 繋撃態 噺 繋撃怠 抜 岫な 髪 ど┻どひ岻 If the money is reinvested again and again for N years 繋撃朝 噺 繋撃朝貸怠 抜 岫な 髪 ど┻どひ岻 Substituting for 繋撃朝貸怠 in the equation 繋撃朝 噺 岷繋撃朝貸態 抜 岫な 髪 ど┻どひ岻峅 抜 岫な 髪 ど┻どひ岻 Substituting for 繋撃朝貸態 in the equation 繋撃朝 噺 岷繋撃朝貸戴 抜 岫な 髪 ど┻どひ岻峅 抜 岫な 髪 ど┻どひ岻 抜 岫な 髪 ど┻どひ岻 By induction 繋撃朝 噺 繋撃怠 抜敷岫な 髪 ど┻どひ岻朝貸怠
繋撃朝 噺 警 抜 岫な 髪 ど┻どひ岻 抜敷岫な 髪 ど┻どひ岻朝貸怠
繋撃朝 噺 警 抜 岫な 髪 ど┻どひ岻朝
The future value of annual deposit, at the beginning of each year:
The future value of a deposit of 警 now after N year is
待繋撃朝 噺 警 抜 岫な 髪 ど┻どひ岻朝
Where subscript preceding 繋撃 is the time of deposit, and 軽 subscript is the length of investment
period. The future value of a deposit of 警 after one year from now for 軽 伐 な years is
怠繋撃朝貸怠 噺 警 抜 岫な 髪 ど┻どひ岻朝貸怠 By induction, the future value of a deposit of 警 after 券 years from now for 軽 伐 券 years is
津繋撃朝貸津 噺 警 抜 岫な 髪 ど┻どひ岻朝貸津

284
Now, as there are 軽 annual deposits of value 警 and all were brought forward to time 軽 using the future value formula. They call be added up to find the total future value of all deposits:
畦朝 噺 繋撃朝髪怠繋撃朝貸怠┼髪津繋撃朝貸津┼髪朝貸怠繋撃怠 畦朝 噺 警 抜 岫な 髪 ど┻どひ岻朝 髪 警 抜 岫な 髪 ど┻どひ岻朝貸怠 髪橋警 抜 岫な 髪 ど┻どひ岻朝貸津 髪橋警 抜 岫な 髪 ど┻どひ岻怠 畦朝 噺 警 抜 岷岫な 髪 ど┻どひ岻朝 髪 岫な 髪 ど┻どひ岻朝貸怠 髪橋岫な 髪 ど┻どひ岻朝貸津 髪橋髪 岫な 髪 ど┻どひ岻怠峅 Using the geometric progression formula
畦朝 噺 警 抜 岫な 髪 ど┻どひ岻朝 伐 岫な 髪 ど┻どひ岻岫な 髪 ど┻どひ岻
畦朝 噺 警 抜 岫な 髪 ど┻どひ岻朝貸怠 伐 など┻どひ