308Thesis_Final.pdf - Kent Academic Repository
227
Development and application of mammalian molecular cytogenetic tools for genome reconstruction, evolution and reproductive screening A thesis submitted to the University of Kent for the degree of DOCTOR OF PHILOSOPHY In the Faculty of Sciences November 2019 Rebecca Jennings The School of Biosciences
-
Upload
khangminh22 -
Category
Documents
-
view
1 -
download
0
Transcript of 308Thesis_Final.pdf - Kent Academic Repository

Development and application of mammalian
molecular cytogenetic tools for genome
reconstruction, evolution and reproductive
screening
A thesis submitted to the University of Kent for the degree of
DOCTOR OF PHILOSOPHY
In the Faculty of Sciences
November 2019
Rebecca Jennings
The School of Biosciences

Declaration
No part of this thesis has been submitted in support of an application for any degree or
qualification of the University of Kent or any other University or institute of learning.
Rebecca Jennings

Acknowledgements
To begin, I would like to thank my supervisor Darren for your endless support and
guidance over the last four years. Furthermore, for providing me with the opportunity
to work in such an amazing field. It has been an honour to work within your lab.
A big thank you to Becky, your enthusiasm and expertise have honestly enabled my
constant development as a scientist. A special thank you to Lucas, you are without doubt
one of the most selfless individuals I’ve ever had the pleasure of meeting. Lucas, your
generosity and sense of humour made the challenging times more enjoyable. I wish you
all the happiness in the future.
I would like to thank the other members of the Griffin and Ellis lab; Claudia you were
always keen to help with any problem I encountered in the lab, and more recently thank
you for the constant supply of cakes, I will definitely miss them. Giuseppe, thank you for
helping me with all the tricky calculations and for teaching me the occasional Italian
word. To everyone else: Nikki, Ane, Ozlem, Henry, Lisa and Dany thank you for your
ongoing support, I am so grateful to have had the pleasure to work alongside you all.
I would also like to acknowledge the University of Kent GTA programme for my PhD
support throughout the second year.
I would like to thank my ever devoted family, my parents, for without you this would not
have been possible. You went above and beyond to ensure that I succeeded in this goal
and for the love and care you gave Ryan, my son, who has shown the upmost love and
patience whilst I’ve been on this journey. Lastly, I would like to thank my boyfriend
James, you were always there if I needed to air an opinion, practice a presentation or
provide the prosecco when needed, which was fairly often. I love you all.

I Contents
Contents
Acknowledgements ....................................................................................................... 3
I Contents...................................................................................................................... 4
II List of Figures ........................................................................................................... 13
III List of Tables ........................................................................................................... 21
IV Abbreviations .......................................................................................................... 24
V Abstract ................................................................................................................... 26
1 Introduction ........................................................................................................ 28
1.1 Cytogenetic Technologies ............................................................................ 30
1.1.1 Classical Cytogenetic analysis................................................................. 30
1.2 Molecular cytogenetic analysis .................................................................... 32
1.2.1 Fluorescent in situ hybridisation ............................................................ 32
1.2.2 Chromosome painting ........................................................................... 33
1.2.2.1 Sub-telomeric FISH ....................................................................................... 35
1.2.2.2 BAC clones and comparative mapping .......................................................... 35
1.2.2.3 Comparative genome hybridisation .............................................................. 36
1.2.2.4 Array comparative genomic hybridisation .................................................... 37
1.3 Genome sequencing technologies ............................................................... 38
1.3.1 Overview ............................................................................................... 38
1.3.2 First generation sequencing (Sanger sequencing) .................................. 39
1.3.3 Massively parallel sequencing (Next generation sequencing) ................. 40
1.3.4 Third generation sequencing ................................................................. 41
1.4 Genome assembly methodologies ............................................................... 42
1.4.1 Physical mapping of sequence reads ...................................................... 45
1.5 Chromosomal rearrangements in disease and evolution ............................. 47
1.5.1 Numerical chromosomal abnormalities ................................................. 47

1.5.1.1 Aneuploidy ................................................................................................... 48
1.5.1.2 Polyploidy .................................................................................................... 48
1.5.2 Structural chromosomal rearrangements .............................................. 49
1.5.2.1 Chromosomal duplications ........................................................................... 50
1.5.2.2 Chromosomal insertions and deletions ......................................................... 50
1.5.2.3 Chromosomal Inversion................................................................................ 52
1.5.2.4 Robertsonian Chromosomal translocation .................................................... 54
1.5.2.5 Reciprocal translocations.............................................................................. 56
1.5.2.5.1 Translocation pairings at meiosis ............................................................ 58
1.6 Mammalian karyotype evolution ................................................................. 60
1.6.1 Mechanisms of karyotype evolution ...................................................... 63
1.6.2 Sex chromosome evolution.................................................................... 63
1.7 Sex determination ........................................................................................ 64
1.7.1 Disorders of sexual development ........................................................... 66
1.7.2 Freemartinism in cattle .......................................................................... 68
1.7.3 XY complete gonadal dysgenesis (Swyer syndrome) .............................. 69
1.8 Rationale for this thesis ............................................................................... 70
2 Materials and methods ....................................................................................... 72
2.1 Chromosome Preparation ............................................................................ 72
2.1.1 Sample collection - Tissue ...................................................................... 72
2.1.1.1 Complete media preparation ........................................................................ 72
2.1.1.2 Primary cell culture through enzyme digestion ............................................. 72
2.1.1.3 Cell culture refresh ....................................................................................... 73
2.1.1.4 Cell passage.................................................................................................. 73
2.1.1.5 Harvesting fibroblast cell culture .................................................................. 74
2.1.2 Company Sample Contributions ............................................................. 75
2.1.2.1 Blood lymphocyte culture............................................................................. 75
2.2 DNA extraction ............................................................................................. 76
2.2.1 Genomic DNA extraction (kit) ................................................................ 76
2.3 BAC selection ............................................................................................... 76

2.3.1 Positional BAC selection – bovine translocation screening ......................76
2.3.2 Conservation score BAC selection – bovine cross species analysis.......... 76
2.3.3 BAC selection – human (conservation score selection) .......................... 77
2.3.4 BAC selection – mouse X chromosome (conservation score selection)... 77
2.4 Generation of labelled FISH probe ............................................................... 77
2.4.1 LB broth preparation ............................................................................. 77
2.4.2 LB agar preparation ............................................................................... 78
2.4.3 BAC Glycerol stock ................................................................................. 78
2.4.4 Plating BACs and Isolation...................................................................... 78
2.4.5 DNA amplification .................................................................................. 79
2.4.5.1 Incorporation of fluorophore (Nick translation) ............................................ 79
2.4.5.2 Agarose gel preparation ............................................................................... 80
2.4.5.3 Probe purification ........................................................................................ 80
2.5 Fluorescent in situ hybridisation – standard ................................................ 81
2.5.1 Second day FISH .................................................................................... 81
2.5.1.1 Octochrome device set up ............................................................................ 82
2.5.1.2 Multiprobe device set up .............................................................................. 83
2.6 Image analysis .............................................................................................. 84
2.6.1 Microscopy ............................................................................................ 84
2.6.2 Success rate definition ........................................................................... 84
2.6.3 Karyotype Production ............................................................................ 84
2.6.4 FLpter Analysis ....................................................................................... 84
2.7 Identification of genes located within BACs ................................................. 85
2.8 Sex determination ........................................................................................ 85
2.8.1 SRY primers and primer design .............................................................. 85
2.8.2 Amplicon sequencing ............................................................................. 86
2.8.3 Primer design......................................................................................... 86
2.8.4 Primer rehydration ................................................................................ 86
2.8.5 Multiplex polymerase chain reaction (PCR) ............................................ 87
2.8.6 KOD Hot Start (PCR) ............................................................................... 87

2.8.7 PCR gel preparation ................................................................................88
2.8.7.1 DNA extraction from sperm .......................................................................... 88
2.9 Sperm FISH ................................................................................................... 89
2.9.1 Sample preparation ............................................................................... 89
2.9.2 Sperm FISH ............................................................................................ 89
2.10 Statistics ....................................................................................................... 90
2.10.1 Chi-Square test ...................................................................................... 90
2.10.2 Pearson correlation coefficient .............................................................. 90
3 Comparative molecular cytogenetic study in mammals ....................................... 91
3.1 Specific aim 1. To develop a series of universally hybridising cytogenetic
tools (BAC clones) based on sequence selection aimed at furthering the study of
comparative genomics in mammals (Artiodactyla, Rodentia and Primates) .......... 91
3.2 Background .................................................................................................. 91
3.2.1 Sequenced-based comparative analysis ................................................. 92
3.2.2 Artiodactyla ........................................................................................... 95
3.2.3 Rodentia ................................................................................................ 96
3.2.4 Primates ................................................................................................ 97
3.3 Specific aims ................................................................................................. 99
3.4 Species Selection Criteria ............................................................................. 99
3.5 BAC selection criteria and conservation score definition ............................100
3.6 Results .........................................................................................................101
3.6.1 Specific aim 1a. Cross-species analysis of a set of pre-existing cattle BACs
on Artiodactyla species ......................................................................................101
3.6.2 Specific aim 1b. To use a panel of 7 cattle BACs originally applied by
Larkin et al (2006ab), (and selected on the basis of sequence homology) to assess
the extent to which they hybridise universally across a series of phylogenetically
diverse mammals. ..............................................................................................107
3.6.3 Specific aim 1c. To generate a preliminary panel of sequence-based BACs
originally derived from three different Orders....................................................110

3.6.3.1 Cattle ......................................................................................................... 110
3.6.3.2 Mouse X chromosome sequence-selected BACs to illustrate mouse-rat
differences ................................................................................................................ 113
3.6.3.3 Human selected BACs (conservation selected)............................................ 116
3.6.3.4 Extended human ........................................................................................ 121
3.6.4 Specific aim 1d. To test the hypothesis that sequence selection
significantly improves BAC hybridization efficiency cross-species and speculate as
to the prospects of a universal mammalian BAC set as was developed for birds
(Damas et al., 2017). ..........................................................................................125
3.7 Discussion ...................................................................................................126
3.7.1 Cattle BACs non-selected (selection based on position) ........................127
3.7.2 Cattle BACs selected proactively ...........................................................128
3.7.3 Selected mouse X chromosome BACs ...................................................129
3.7.4 Human BACs selected through sequence-based analysis ......................129
3.8 Conclusions .................................................................................................131
4 Investigations into sex determination abnormalities and reproductive issues in
mammals ...................................................................................................................132
4.1 Specific aim 2. To use molecular cytogenetic tools for the screening of
chromosomal abnormalities in a series of mammals including: pigs, cattle, horses,
tigers and gorilla, investigating the reasons for reproductive issues in individual
animals ..................................................................................................................132
4.2 Background .................................................................................................132
4.3 Case report I – Red River Hog (Potamochoerus porcus) ..............................133
4.3.1 Discussion .............................................................................................134
4.4 Case study II Horses (Equus caballus) with ambiguous genitalia.................135
4.4.1 Background...........................................................................................135
4.4.2 Results ..................................................................................................136
4.4.3 Discussion .............................................................................................137
4.5 Case study III Sumatran tiger (Panthera tigris sumatrae) referred due to
ambiguous genitalia ..............................................................................................138

4.5.1 Background........................................................................................... 138
4.5.2 Discussion .............................................................................................139
4.6 Case study IV investigating the cause of spontaneous abortion in a trio group
of captive western lowland gorilla ........................................................................140
4.6.1 Background...........................................................................................140
4.6.2 Materials and methods .........................................................................142
4.6.3 Results ..................................................................................................143
4.6.3.1 Generate karyotypes of three captive western lowland gorilla, to test the
hypothesis that foetal loss was due to a chromosome aneuploidy or larger structural
rearrangement .......................................................................................................... 143
4.6.3.2 Chromosome painting ................................................................................ 144
4.6.3.3 aCGH to DNA extracted from the trio group with the intention of identifying
an unbalanced chromosomal abnormality in the male and / or infant gorilla ............. 145
4.6.4 Discussion .............................................................................................146
4.6.4.1 Karyotype analysis ...................................................................................... 147
4.6.4.2 FISH analysis ............................................................................................... 147
4.6.4.3 aCGH analysis ............................................................................................. 147
5 Genetic abnormalities in cattle and the development of a FISH-based chromosome
screening device .........................................................................................................149
5.1 Specific aim 3. Based on specific aim 2, to implement a novel scheme for
screening for chromosome translocations in cattle, testing the hypothesis that it
can be applied for the detection of hitherto intractable reciprocal chromosome
translocations ........................................................................................................149
5.2 Background .................................................................................................149
5.2.1 Breeding selection ................................................................................150
5.2.2 The rob (1;29) and other translocations ................................................150
5.2.3 Sex determination and abnormalities ...................................................152
5.2.4 Cattle karyotyping – a state of the art ...................................................153
5.3 Specific aims ................................................................................................155
5.4 Results .........................................................................................................155

5.4.1 Specific aim 3a. To generate and validate a device and scheme capable of
detecting reciprocal and Robertsonian translocations in cattle ..........................155
5.4.2 Specific aim 3b. To provide proof of principle that this novel scheme can
be applied, though the screening of 40 bulls, establishing a series of novel case
reports for chromosome rearrangements in cattle .............................................157
Identification of common 1;29 translocations ..............................................157
Investigation of sex chromosomes in cattle with ambiguous genitalia .........157
Identification of a reciprocal translocation, thereby testing the hypothesis that
hitherto undetectable reciprocal translocations can be detected using this
technology .........................................................................................................157
5.4.2.1 Case report I - Detection of heterozygous and homozygous 1;29
translocations ............................................................................................................ 157
5.4.2.2 Case report II - Investigation of sex chromosomes in a cow with
underdeveloped genitalia .......................................................................................... 159
5.4.2.3 Case report III - Identification of a reciprocal translocation, thereby testing the
hypothesis that hitherto undetectable reciprocal translocations can be detected using
this technology .......................................................................................................... 163
5.4.2.4 Summary of cattle screening results ........................................................... 165
5.5 Discussion ...................................................................................................165
5.5.1 Implementation of multiprobe FISH device for cattle screening ............165
5.5.2 Chromosomal rearrangement case studies ...........................................166
5.5.2.1 Case report I - Detection of heterozygous and homozygous 1;29
translocations ............................................................................................................ 166
5.5.2.2 Case Report II - Investigation of sex chromosomes in a cow with
underdeveloped genitalia - XY gonadal dysgenesis .................................................... 167
5.6 Conclusions .................................................................................................168
6 Incidence rate of chromosomal translocations in boars detected through
multiprobe FISH .........................................................................................................170
6.1 Specific aim 4. Based on specific aim 2, to implement a high throughput
FISH-based porcine cytogenetic screening technique, screening over 1000 animals

and testing the hypothesis that overall published incidence of translocations in this
species has been under-reported ..........................................................................170
6.2 Background .................................................................................................170
6.3 Specific aims ................................................................................................173
6.4 Results .........................................................................................................174
6.4.1 Specific aim 4a. To play a significant part in the development of a porcine
cytogenetic analytical system using both the multiple probe FISH device (and
traditional karyotyping) towards the screening of over 1000 boars, thereby
addressing the question of what is the incidence of chromosomal abnormalities in
this population ...................................................................................................174
6.4.2 Specific aim 4b. To test the hypothesis that a significant proportion of
translocations that were detected by this approach would not have been
identified by traditional banding techniques ......................................................176
6.4.3 Specific aim 4c. To apply cytogenetic technologies to a chimeric (XX/XY)
boar that identified through technologies used in specific aim 1a, to test the
hypothesis that XX bias is present in the germ line .............................................180
6.5 Discussion ...................................................................................................182
6.6 Conclusion ...................................................................................................184
7 General Discussion .............................................................................................185
7.1 Achievement summary ...............................................................................185
7.1.1 Technological improvements in agricultural chromosome screening ....187
7.1.2 Cytogenetic tools for genome assembly................................................188
7.1.3 Cytogenetic tools – the wider studies ...................................................189
7.2 Further work arising from this study ...........................................................190
7.3 Personal Perspectives .................................................................................191
8 References...................................................................................................... 8-192
9 Appendix ........................................................................................................ 9-215
10 Publications arising from this work ............................................................... 10-217


II List of Figures
Figure 1-1. The cell cycle and division. Diagram to show cell cycle and cell division,
including all stages from DNA replication in interphase through to the production of two
genetically identical daughter cells and cytokinesis. DNA replication (interphase) is
followed by condensation of chromosomes and formation of mitotic spindles in
prophase. Capture and organisation of the chromosomes is initiated in prometaphase.
Chromosomes align at the metaphase plate (center) during metaphase. Sister
chromatids are separated during anaphase and pulled to opposite ends of the cell in
preparation for telophase whereby structures are reformed in the separating cells.
Cytokinesis is the division of cytoplasm between the two cells. (Image source:
biocyclopedia.com)
Figure 1-2. The human karyotype. Giemsa stained metaphase chromosomes of human
(Homo sapiens) (2n=46 XX) (Image source: Thirumulu, 2011)
Figure 1-3. FISH technology. Schematic to show FISH approach. DNA probe generated
from isolation of required DNA region within BAC and fluorescently labelled using nick
translation. Labelled probe and target DNA are denatured to allow hybridisation of
labelled DNA to target DNA. The probe is then visualised through fluorescent microscope
on metaphase chromosomes. (Adapted from Medcaretips.com)
Figure 1-4. Cross Species Chromosome Painting. Sequential multicolour hybridization
using 13 river buffalo DNA probes on human metaphase chromosomes. a) river buffalo
(Bubalus bubalis, 2n = 50) mitosis used as control; b) cattle (Bos taurus, 2n = 60); c) goat
(Capra hircus, 2n = 60) and d) sheep (Ovis aries, 2n = 54) mitosis in Zoo-FISH experiments.
Source (Paucilullo et al., 2014)
Figure 1-5. Workflow diagram for aCGH. Schematic diagram to show aCGH technique.
Step 1- Fluorescently label the patient DNA. Step 2- Fluorescently label reference
(control) DNA. Step 3- Mix samples and apply to the microarray. Step 4- DNA samples
hybridise to the immobilised single stranded DNA probes. Step 5- Computational analysis
to measure the signal intensity. Step 6- Data analysis. Image: Nature (2015)
Figure 1-6. Schematic to illustrate Sanger sequencing. DNA is first denatured into single
strands. Reaction requires a radiolabelled (or fluorescently labelled) DNA primer, DNA
polymerase, dNTPs and ddNTPs. Four reactions are set up, one for each nucleotide, G,
A, T and C. In each reaction all four dNTPs are included, but only one ddNTP (ddATP,
ddCTP, ddGTP or ddTTP) is added. Fragments are then separated by size through gel
electrophoresis and visualised.

Figure 1-7. Schematic workflow of two shotgun sequencing approaches. Schematic
represents two approaches used in whole human genome sequencing. Comparison of
BAC-by-BAC (hierarchical shotgun approach) and whole genome shotgun assembly
approach. Source: thermofisher.com
Figure 1-8. Workflow diagram of RACA. A) RACA requires a reference genome, target
de novo genome in scaffold form and outgroup genomes. B) Syntenic fragments (SF) are
produced when the target genome is aligned against the reference genome, orientation
of the target fragment is shown via + and -.C) A score is given to the syntenic fragment
which represents the adjacency. D) A SF graph is built. E) Constructed chains of SFs that
are extracted by the RACA algorithm. Source: (Kim et al., 2013)
Figure 1-9. Schematic to show chromosomal abnormalities, Schematic illustrates
abnormalities including duplication and insertion and deletion. A) No abnormality
present. B) Segmental duplication in chromosome A. C and D represent normal
chromosomes. Segmental exchange from chromosome C to sub-centromeric region of
chromosome D, creating products E and F.
Figure 1-10. Schematic to show a chromosomal inversion. Whereby the chromosome
affected breaks at two points, this region, which is bounded by the breakpoints and is
then reinserted in the reversed orientation.
Figure 1-11. Chromosome comparison of human, chimpanzee, gorilla and orang-utan.
(Left to right) Schematic representation of late-prophase chromosomes (1000-band
stage) of man, chimpanzee, gorilla, and orang-utan, arranged from left to right,
respectively, to visualize homology between the chromosomes of the great apes and the
human complement. Source (Yunis and Prakash, 1982).
Figure 1-12. Schematic to show Robertsonian and reciprocal translocations. A)
Robertsonian translocation – the centromeric fusion of two acrocentric chromosomes
to create a fused product as observed in cattle (rob (1;29)). B) Reciprocal translocation,
genetic exchange between two chromosomes to create a translocated pair. Exchange
between chromosomes 13 and 14 is the most common in humans.

Figure 1-13. Representation of chromosomal segregation possibilities. Diagram
illustrates the segregation possibilities in an individual carrying a heterozygous reciprocal
translocation. Quadrivalent configuration results from non-homologous pairings which
can lead to alternate segregation (viable gametes) or adjacent I, adjacent II, 3:1 and 4:0
(3:1 and 4:0 not shown) with the last four combinations producing non-viable
unbalanced gametes. Source: semanticscholar.org
Figure 1-14. A Proposed relationship tree for placental mammals. Karyotype evolution
showing the landmark rearrangements in placental mammals. Source: karger.com
Figure 1-15. Representation of chromosomal segregation possibilities in an individual
carrying a heterozygous reciprocal translocation. Quadrivalent configuration results
from non-homologous pairings which can lead to alternate segregation (viable gametes)
or adjacent I, adjacent II, 3:1 and 4:0 (3:1 and 4:0 not shown) with the last four
combinations producing non-viable unbalanced gametes. (Image Source:
semanticscholar.org)
Figure 1-16. The differences in inheritance and sex specification between XY, ZW and
UV sex-chromosome systems. Females are red and males blue. In mammals (XY
systems), the Y chromosome is present in males only, inheriting the X from the mother.
In birds (ZW systems), the W chromosome is female-specific whereby the female will
always inherit the Z from the farther. In UV systems, sex is expressed in the haploid
phase, with U chromosomes confined to females and V chromosomes limited to males.
(Image source: Bachtrog et al., 2011
Figure 1-17. Schematic representation showing vascular anastomose between
heterozygotic twins. The consequence of this placental vascular exchange between
heterozygotic twins is blood chimerism (2n=60 XX/XY) and the passage of male gonad
determinants (such as androgens) to the developing female foetus (Image source:
Esteves, Båge and Carreira, 2012
Figure 2-1. Schematic to show Octochrome device slide. Device allows for unique
bespoke probe design and the ability to run eight BAC probe investigations on one slide.
Figure 2-2 Schematic to show cattle multiprobe device. Schematic to show the probe
design of the bovine multiprobe device with each square containing a TexasRed and FITC
labelled probe for the proximal (p) and distal (d) of each chromosome respectively.

Figure 3-1. Comparison of chromosomes in primates using chromosome paints. Colour-
banded chromosomes of human, chimpanzee, gorilla and orang-utan, arranged
according to the numbering system of the human ideogram. Note the 5;17 translocation
in the gorilla and the numerous inversions involving chromosomes 5, 9 and 17 in
chimpanzee, and 8, 9, 10, 12, 14 and 18 in gorilla, and 3, 7, 9, 11, 12 and 20 in orang-
utan. Chromosomes in each cases colour-banded using multicolour gibbon probe set
(Harlequin FISH, Cambio). (Image source: Ferguson-Smith et al. (2000).
Figure 3-2. FISH image to show cattle chromosomes 2 and 25 on Defassa waterbuck.
Labelled BAC for cattle chr 25 CH240-325L8 FITC (d) and cattle chr 2 CH240-227E16
TxRed (q) on metaphase chromosomes of the defassa waterbuck, illustrating fusing on
cattle chromosomes 2 and 25. Arrows illustrating indicated signals observed.
Figure 3-3. FISH image result of cattle chromosome 5 BACs on Red lechwe. Labelled
BACs for cattle chromosome 5. CH240-326L8 (d) in FITC and CH240-248M21 (q) in TxRed
hybridised to metaphase chromosomes of Red lechwe. Arrows illustrating indicated
signals observed.
Figure 3-4. FISH image of BACs selected based on conservation hybridised to Defassa
waterbuck. Labelled selected cattle BACs from cattle chromosome 19 on metaphase
chromosomes of Defassa waterbuck. BACs – CH240-43K17 (FITC) and CH240-233H17
(TxRed). BACs appear to localise to waterbuck chromosome 1. Arrows illustrating
indicated signals observed.
Figure 3-5. Correlation graph showing divergence vs hybridisation success rate of
conservation-score selected cattle BACs on extended study. Data extracted from table
3-7. Graph shows a negative correlation between success rate and hybridisation.
Pearson correlation coefficient R= – .692 (significant at p<0.5). Demonstrating a
decrease in success rate with an increase in divergence time.
Figure 3-6. Screenshot from NCBI clone finder. Screenshot from NCBI clone finder
demonstrating the misplacement of autosomal CH29-542H8 on the X chromosome.
Figure 3-7. Schematic to show BAC placement of X chromosome of mouse and rat using
FLpter results. Schematic of FLpter measurement results of selected BACs on metaphase
chromosomes of mouse and rat, demonstrating numerous rearrangements between
both species. BAC clone number IDs shown in table 3-9.

Figure 3-8. Correlation graph showing divergence vs hybridisation success rate of
human BACs on distantly related species. Data extracted from table 3-14. Graph shows
a negative correlation between success rate and hybridisation. Pearson correlation
coefficient R= – 0.910. Demonstrating a decrease in success rate with an increase in
divergence time.
Figure 4-1. Traditional karyotype of Red river hog. DAPI stained metaphase
chromosomes of intersex red river hog. Karyotype comprises of 2n=34 (XX).
Figure 4-2. FISH image of X chromosome and SRY gene BACs on Red river hog. Labelled
BAC probes for X chromosome CH242-19N1 (FITC) and SRY gene WTSI-1061-9B10
(TxRed), illustrating 2n=34 (XX) karyotype as SRY labelled probe was not detected
through dual-colour FISH. Arrows illustrating indicated signals observed.
Figure 4-3. Traditional karyotype of horse referred for cytogenetic analysis. DAPI
stained metaphase chromosomes of intersex horse. (2n=64 (XY)).
Figure 4-4. Traditional karyotype of Sumatran tiger referred for cytogenetic analysis.
DAPI stained metaphase chromosomes of a Sumatran Tiger (2n=38 XX).
Figure 4-5. Primate phylogenetic tree. Phylogenetic tree to show primate evolution,
highlighted are the chimpanzee-human speciation event and the monkey-great ape
speciation event. (Image source: Genetics | The Smithsonian Institution’s Human Origins
Program.
Figure 4-6. Traditional karyotype of foetus gorilla. DAPI stained metaphase
chromosomes of foetus gorilla (2n=48 (XX)) illustrating extended region on gorilla
chromosome 15. Chromosome 22 also has a large satellite.
Figure 4-7. FISH image to show human chromosome 14 chromosome paint on gorilla.
Metaphase chromosomes of gorilla, counter stained with DAPI and labelled for
chromosome paint form human chromosome 14 on metaphase chromosomes of. A) the
male gorilla (TxRed) and B) the foetus (TxRed pseudo-coloured to blue). Images captures
by fluorescence microscope at x1000 magnification. Arrows illustrating indicated signals
observed.

Figure 4-8. aCGH results. aCGH analysis of the fetus compared to the female gorilla.
Screenshot showing duplication in region encoding LINC00906 on chromosome 19
(p12.3) (left) and a deletion in the region encoding the CNTN3 gene on chromosome 3
(q11q12).
Figure 5-1. Schematic to show domestication of cattle. Diagram illustrating the
domestication of cattle. (Image adapted from (The Domestication of Species and the
Effect on Human Life | Real Archaeology)
Figure 5-2. Traditional karyotype of cattle. DAPI stained metaphase chromosomes of
Bos taurus (2n=60 XX) indicating a virtually intractable karyotype
Figure 5-3. Schematic illustrating cattle multiprobe device. Schematic to show
comparative system using BACs selected from the most proximal (p) and most distal
region (d) of each bovine chromosome. The X is labelled p and q for the most distal
(subtelomeric) regions of the p and q arm.
Figure 5-4. Traditional karyotype of bull carrying a heterozygous 1;29 Robertsonian
translocation. Traditional DAPI stained karyotype of a 2n=59 bull with a rob (1;29).
Robertsonian translocation and missing chromosome 29 are circled in red.
Figure 5-5. Traditional karyotype of bull carrying a homozygous 1;29 Robertsonian
translocation. DAPI stained metaphase chromosomes of a homozygous 1;29
Robertsonian translocation in a British white (2n=58 (XX)). Homozygous rb (1;29) circled
in red
Figure 5-6. FISH image of BACS from chromosomes 1 and 29 on referred animals.
Metaphase chromosomes of assumed 1;29 translocation carrier. From left image A)
Labelled BAC probes for BTA chromosome 1. CH240-321O2 (FITC) CH240-96M6 (Txred)
white arrow illustrates translocation. Image B) Labelled BAC probes for chromosome 29.
CH240-367D17 (FITC) and CH240-257F23 (Txred) white arrow indicating translocation.
Figure 5-7. Traditional karyotype of animal referred for cytogenetic analysis. DAPI
stained metaphase chromosomes of the phenotypical cow referred for karyotype
analysis. Chromosomes derived from lymphocyte culture. Karyotype analysis detected
the presence of Y chromosome (2n=60 (XY)).

Figure 5-8. FISH image demonstrating results obtained from hybridisation of X
chromosome probes on intersex animal. Labelled bovine X chromosome BAC probes
hybridised to reproductive tract metaphase chromosomes of query sample. FISH result
illustrates the presence of a Y chromosome with BAC labelled with FITC hybridising to
the psudeoautosomal region of the Y chromosome.
Figure 5-9. SRY isolation through PCR. DNA products from PCR visualised on a 1.4%
agarose gel. PCR set up using PrimerBlast primers under conditions described in section.
Lanes 1) empty. 2) negative control. 3) male control. 4) female control. 5) DNA from
mammary gland of referred animal. 6) DNA from reproductive tract of referred animal.
Ladder 1) 1Kb. Ladder 2) 100 bp. Amplicon is 874bp in length confirming the presence of
SRY in the query sample, negative control is free from contamination.
Figure 5-10. Traditional karyotype of a bull carrying 12;23 reciprocal translocation. BTA
8348. Traditional DAPI stained karyotype of bull identified as 2n=60 rcp (12;23)
Figure 6-1. Traditional karyotype of a boar carrying 3;9 reciprocal translocation.
Traditional DAPI stained metaphase chromosomes of a boar identified to carry (2=38
(rcp t(3;9)).
Figure 6-2. Traditional karyotype of a boar carrying 2;14 reciprocal translocation. DAPI
stained metaphase chromosomes of a boar identified to carry (2=38 (rcp t(2;14)).
Figure 6-3. Traditional karyotype of a boar carrying a 9;12 reciprocal translocation.
DAPI stained metaphase chromosomes of a boar identified to carry a cryptic (2n=38) rcp
t(9;12)).
Figure 6-4. Traditional karyotype of a boar carrying a 4;5 reciprocal translocation. DAPI
stained metaphase chromosomes of a boar identified to carry a cryptic (2n=38) (rcp
t(4;5)).
Figure 6-5. FISH image of labelled probes on mosaic boar. Labelled BAC probes for X
chromosome (CH242-19N1 (FITC)) and SRY (WTI-1061-9B10 (TxRed)) Left image -
lymphocyte metaphase chromosomes showing the presence of X (FITC signal) and Y
chromosome (TxRed signal). Right image – dual colour FISH using X chromosome FITC
labelled probe and SRY labelled TxRed probe on fixed sperm from mosaic boar


Rebecca Jennings
21
III List of Tables
Table 2-1. Table to show individual company blood sample contributions between 2017
and August 2019. Companies anonymised as per request.
Table 2-2. Table to show PCR primer sequence, amplicon size (Bp) and annealing
temperature
Table 2-3. Table PWO master mix PCR conditions resulting in the bovine SRY product
874bp product
Table 2-4. KOD Hot Start PCR conditions resulting in the bovine SRY 874bp PCR product.
Table 3-1. Karyotypic analysis of species used in specific aim 1a. Divergent times
obtained using timetree.org.
Table 3-2. Table to show cattle chromosome 19 BACs selected based on conservation
and previous in silico analysis that mapped them to human chromosome 17 and mouse
chromosome 11. Cytogenetic analysis mapped the BACs to mink chromosome 8. BACs
taken from (Larkin et al,.2006). Table contains location on chromosome, mean all
conservation score, repeat % and GC content.
Table 3-3. Overall success rate of subtelomeric cattle BACs on metaphase chromosomes
of American bison, Defassa waterbuck, Red lechwe, pig, Javan chevrotain, and sheep.
Divergence time and chromosome number included.
Table 3-4. Table to show successful hybridisations using bovine subtelomeric cattle BACS
on species within the artiodactyl order. Table include species, chromosome location of
BAC, repeat % content of BAC, conservation mean all score and GC content of BAC.
Species include BBA-American Bison, OAR-domestic sheep, KEL-waterbuck, KLE-red
lechwe, SSC-domestic pig and TNI-Javan chevrotain.
Table 3-5. Results from BACs selected based on sequence analysis on metaphase
chromosomes of Artiodactyl species used throughout this chapter.
Table 3-6. Species included in the extended cross-species study. Divergent times –
Kumar et al (2017). Diploid numbers for numerous papers used throughout this study.

Rebecca Jennings
22
Table 3-7. Results from extended mammalian study using cattle BACs selected by RVC,
using the sequenced-based approach described in section 3.3.1.
Table 3-8. Preliminary cattle BACs selected from CHORI 240 library through sequence-
based HI-C interactional analysis with mean all score and BAC clone ID
Table 3-9. X chromosome mouse BACs selected using sequence-based approach. Start
and end position included.
Table 3-10. The mean FLpter results of BAC clone location on X chromosome of mouse
and rat. Two-tailed t test illustrating the results are statistically different. All BACs were
assigned a number for image ease in figure 3-6.
Table 3-11. Human BACs selected for cross-species analysis. Human genome used as a
reference to create a universal mammalian BAC set.
Table 3-12. Karyotypic analysis of species used in this work. Divergent times obtained
using timetree.org (Kumar et al., 2017).
Table 3-13. Results obtained from cross-species hybridisations using BACs selected
based on conservation scores obtained by RVC.
Table 3-14. Hybridisation success rates using 15 sequence-based selected BACs on 10
mammalian species.
Table 3-15. Human BACs select using sequenced-based approached including BAC clone
ID, chromosomal location in human, mean all score, GC content and %Inrepeats.
Table 3-16. Karyotypic analysis including diploid chromosome number of species used in
this work. Divergent times obtained using timetree.org (Kumar et al., 2017).
Table 3-17. Full BAC list test on metaphase chromosomes of gorilla, De Brazza’s monkey,
howler monkey and Sulawesi macaque
Table 3-18. Hybridization success rates when full human BAC panel applied to gorilla,
howler monkey, De Brazza’s monkey and Sulawesi macaque.
Table 3-19. Order specific hybridisation success rates using Order-specific selected BACs
and Order-specific non-selected BACs

Rebecca Jennings
23
Table 5-1. Table to show summary of 40 cattle chromosome analyses performed in this
study.
Table 6-1. Summary of total porcine samples screened and the method of analysis
between 2016-2019.
Table 6-2. Summary of porcine screening results from 2016 – 2019 using multiprobe FISH
device and karyotyping
Table 6-3. Reanalysis of results obtained from screening of boars using the multiprobe
FISH device. Prediction of the likelihood that a diagnosis would be achieved through
karyotype, result obtained from reanalysis of FISH images.
Table 6-4. Reciprocal translocations identified through FISH. Prediction of the likelihood
that a diagnosis would be achieved through karyotype, result obtained from reanalysis
of FISH images.
Table 6-5. Table to show chi squared calculation results and p value for results obtained
from FISH analysis using labelled probes from the X chromosome and SRY gene located
on the Y chromosome on fixed sperm of XX/XY chimeric boar. Analysis performed using
Excel 10.
Table 6-6. Results from lymphocyte metaphase chromosomes using labelled BAC probes
for X chromosome (CH242-19N1 (FITC)) and SRY (WTI-1061-9B10 (TxRed)) located on
the Y chromosome.

Rebecca Jennings
24
IV Abbreviations
aCGH Array Comparative genomic hybridisation
BAC Bacterial Artificial Chromosomes
BBA Bison bison
Bp Base pair
BTA Bos Taurus
Chr Chromosome
CGH Comparative genomic hybridisation
CNV Copy number variation
DAPI 4’, 6 - diamidino-2-phenylindole
MGH2O Molecular Grade Water
DTT Dithiothreitol
FISH Fluorescence in situ hybridisation
FITC Fluorescein
KCL Potassium Chloride
KEL Kobus ellipsiprymnus
KLE Kobus lechwe
LB Lysogeny broth
LRS Long read sequencing
mya Million years ago
NGS Next generation sequencing
OAR Ovis aries
PBS Phosphate Buffered Saline
PCF Predicted Chromosome Fragment
PCR Polymerase Chain Reaction

Rebecca Jennings
25
RACA Reference assisted
RCP Reciprocal translocation
RVC Royal Veterinary College
SSC Sus scorfa
TJA Tragulus javanicus
TxRed Texas Red
Rebecca Jennings
26
V Abstract
Chromosomal analysis enables a genome-wide overview of an organism, it can provide
information when used to study cellular function, the taxonomic relationship between
divergent species and disease phenotypes. Consequently, chromosomal analysis is used
to identify chromosomal rearrangements in an individual, which can be associated with
disease and/or reproductive complications, or within a population, which is associated
with speciation and reproductive isolation. The techniques used to examine the
chromosomes of an organism have improved considerably over the past four decades.
Observations were traditionally achieved through the production of Giemsa stained
chromosomes which permitted banding analysis, therefore enabling the detection of
differences in chromosome morphology and number, to more specific, molecular
cytogenetic approaches (fluorescence in situ hybridisation - FISH) which can be used to
identify sub-microscopic differences. Today, genome sequencing facilitates genome-
wide analysis at a higher resolution than previously possible; sequence information can
be used in a multitude of ways, including identification of specific mutations which result
in disease, investigating homologous segments between divergent species and for
ascertaining potential drug targets. However, without a physical genetic map it is now
apparent that by themselves genome sequence assemblies fail to provide sufficient
information regarding certain biological questions, in particular genome organisation
throughout times of mammalian evolution. However, it is now apparent that map-based
chromosome-level assemblies are required for deeper analysis of the genome.
With this in mind, the purpose of this work was to extend upon, and develop efficient
cytogenetic tools to screen for chromosomal rearrangements in mammalian species, in
the context evolutionarily events and to examine chromosomal rearrangements that
manifest as fertility problems in a range of agricultural and zoological animals.
Using traditional karyotyping techniques, Ducos et al (2007) demonstrated that the
translocation incidence rate was 0.47% in unproven boars. In this work, a large number
of boars (>1000) were analysed using a FISH-based screening device, whereby 13 unique
Rebecca Jennings
27
chromosomal translocations were detected, resulting in an incidence rate of 1%.
Therefore, the results in this work demonstrate that the incidence rate is under reported
in the current literature.
Before this work, karyotype analysis was the only technique used to identify
chromosomal rearrangements in cattle. As a consequence of the success observed in
pigs, a FISH-based device was developed to screen for chromosomal translocations in
cattle. Using this technology, heterozygous and homozygous 1;29 translocations were
identified, and an unreported 12;23 reciprocal translocation.

Rebecca Jennings
28
1 Introduction
In eukaryotes, nuclear DNA is divided and packaged into thread-like structures known as
chromosomes. The morphology and number of chromosomes present within the
nucleus differs between different species. For example, the human genome contains
approximately 6.4 x 10⁹ nucleotides, which are distributed over 23 pairs of chromosomes
(22 autosomal pairs and one pair of sex chromosomes. In preparation for mitosis nuclear
DNA begins to condense forming rod-like structures that are functionally inactive
(Nagano et al., 2017). Upon mitotic exit, chromosomal structures rapidly decondense so
that they are accessible to transcriptional elements, thus become functionally active
once more. The ability to condense the entire genome into these organised structures is
an essential requisite for ensuring successful transmission of the replicated genome to
daughter cells, as shown in figure 1-1 (Vagnarelli, 2013).
Figure 1-1 Cell cycle and division. Diagram to show cell cycle and division, including all stages from DNA
replication in interphase through to the production of two genetically identical daughter cells and
cytokinesis. DNA replication (interphase) is followed by condensation of chromosomes and formation of
mitotic spindles in prophase. Capture and organisation of the chromosomes is initiated in prometaphase.
Chromosomes align at the metaphase plate (center) during metaphase. Sister chromatids are separated
during anaphase and pulled to opposite ends of the cell in preparation for telophase whereby structures
are reformed in the separating cells. Cytokinesis is the division of cytoplasm between the two cells. (Image
source: biocyclopedia.com)
Rebecca Jennings
29
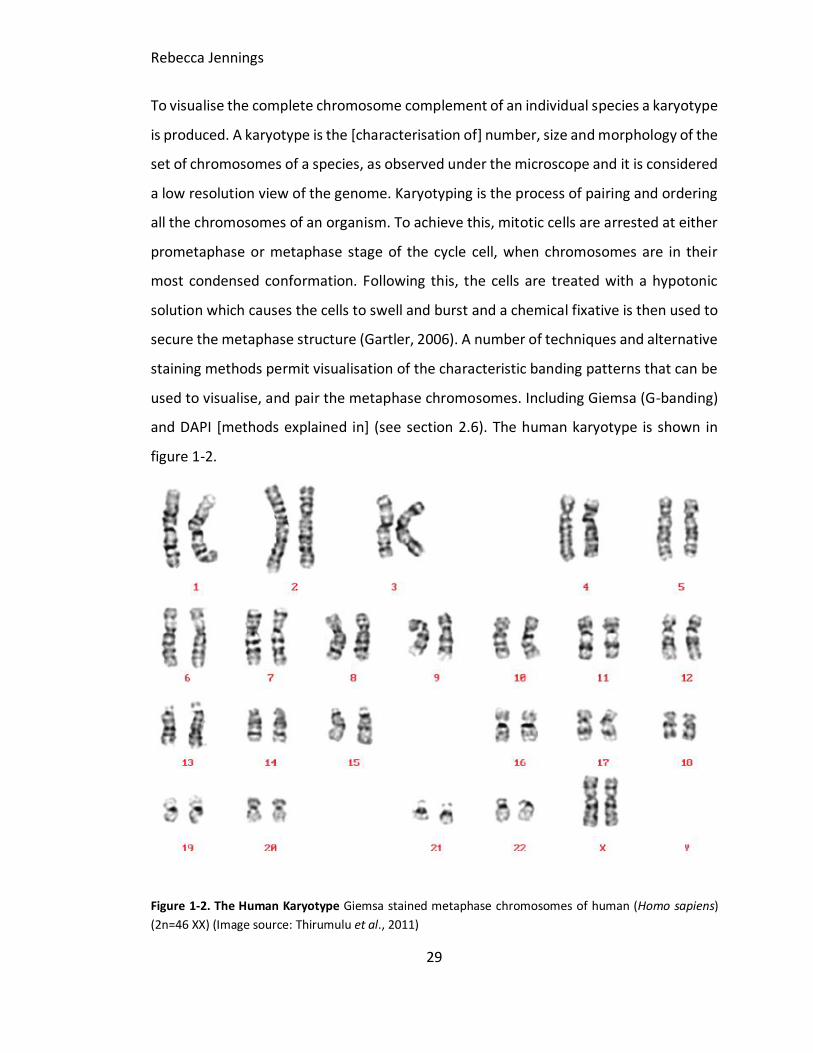
To visualise the complete chromosome complement of an individual species a karyotype
is produced. A karyotype is the [characterisation of] number, size and morphology of the
set of chromosomes of a species, as observed under the microscope and it is considered
a low resolution view of the genome. Karyotyping is the process of pairing and ordering
all the chromosomes of an organism. To achieve this, mitotic cells are arrested at either
prometaphase or metaphase stage of the cycle cell, when chromosomes are in their
most condensed conformation. Following this, the cells are treated with a hypotonic
solution which causes the cells to swell and burst and a chemical fixative is then used to
secure the metaphase structure (Gartler, 2006). A number of techniques and alternative
staining methods permit visualisation of the characteristic banding patterns that can be
used to visualise, and pair the metaphase chromosomes. Including Giemsa (G-banding)
and DAPI [methods explained in] (see section 2.6). The human karyotype is shown in
figure 1-2.
Figure 1-2. The Human Karyotype Giemsa stained metaphase chromosomes of human (Homo sapiens)
(2n=46 XX) (Image source: Thirumulu et al., 2011)
Rebecca Jennings
30
As a result of cytogenetic improvements, extensive investigations into the human
karyotype, more specifically, when in a disease state, have been explored. Karyotypes
can be used to analyse gross genetic change; this includes a change in chromosome
number, known as aneuploidy, and any abnormality that involves over 2 Mb of DNA,
including duplications, deletions and inversions all of which can be symptomatic of
disease (Lu et al., 2007). In humans, most aneuploidies are lethal, with the exception of
trisomy 21, or Down Syndrome, trisomy 13 (Patu syndrome) and trisomy 18 (Edwards
syndrome), however the latter two chromosomal abnormalities will result in death
shortly after birth. This chromosomal abnormality is prevalent in geriatric mothers; a 20-
year-old mother will have a 1 in 1500 risk of delivering a trisomy 21 baby, whereas this
risk increases to >1 in 50 in a 45-year-old mother (NHS, 2017). Additionally, the
karyotype can be used to study evolution in a group of organisms where observations
include differences in chromosome number, position of centromeres and banding
patterns. Chromosomes within a taxon (i.e. family, genus or even the same species) may
vary and this variation can be seen as differences in chromosome number (aneuploidy
and ploidy level), a difference in chromosome size (µm) and differences in chromosome
morphology (centromere position) (Baltisberger and Hörandl, 2016). Additionally,
chromosomal rearrangements can also play critical role in evolution, diversification and
speciation, meaning that comparative karyotypic analysis can permit inferences to
species divergence and evolution (Jang et al., 2013).
1.1 Cytogenetic Technologies
1.1.1 Classical Cytogenetic analysis
Throughout the 1880s investigations into human chromosome number and structure
began and prior to this studies had focused on chromosomes of plants and animals
(Ferguson-Smith, 2008). Numerous studies throughout the late 19th and early 20th
century sought to identify the correct chromosome complement of humans, in 1956 Tjio
and Levan achieved this with the publication of ‘The Chromosome Number of Man’, thus
signalling a new era in cytogenetics (Tjio and Levan, 1956). This breakthrough discovery
Rebecca Jennings
31
was in part due to advances in technologies used to perform cytogenetic analysis,
namely: cell culture conditions and culture components and availability of the spindle
disrupting agent colchicine which induces mitotic arrest and fixation. To visualise the
characteristic chromosomal bands, the swollen metaphase cells are subjected to
different staining techniques that bind and stain different elements of the chromosome,
thus permitting visualisation of the characteristic chromosomal bands seen in a
karyotype. Staining methods include, the most commonly used G-banding (trypsin
treatment followed by Giemsa staining), Q-banding (fluorescence-based stain including
Quinacrine and DAPI 4’,6-diamidino-2phenylindole (as seen in figure 1-2)), C-banding in
which chromosome preparations are exposed to alkaline and acidic conditions to reveal
bands of constitutive heterochromatin, and R-banding in which chromosomes are
incubated in a hot phosphate buffer then treated with Giemsa revealing the reverse of
G-banding (Bates, 2011). Moreover, the improvements in culture conditions and
chromosome harvest alongside staining advancements meant that it was possible to
accurately describe the correct chromosome number of many mammalian species. In
humans, this enabled the discovery of chromosomal aberrations that cause disease,
including trisomy 21, (Down syndrome) which was the first numerical abnormality
identified in three patients by Lejeune in 1959 (Ferguson-Smith, 2008). At the same time,
in Britain, abnormalities involving the sex chromosomes were emerging, including 45 XO
(Turner syndrome), 47 XXY (Klienfelter syndrome). These findings provided the first
evidence that sex was determined by the testes-determining factor on the Y
chromosome (Sinclair et al., 1990). Since then additional numerical abnormalities have
been identified, including trisomy 18 (Edward syndrome) and trisomy 13 (Patau
syndrome) (Kannan and Zilfalil, 2009).
The human karyotype is the most extensively described of all mammalian species,
however efforts to establish chromosome number and elucidate abnormalities in other
species of interest occurred in parallel. Over the past 50 years’ chromosomal analysis of
domestic animals has become an important factor in commercial breeding. For example,
using the methods described in this section, Ingemar Gustavsson reported the presence

Rebecca Jennings
32
of a 1;29 centromeric fusion in a population of Swedish Red and White cattle in 1964
(Gustavsson and Rockborn., 1964). Gustavsson identified the significance of this
chromosomal abnormality five years later, reporting that carriers of this translocation
displayed impaired fertility, namely, daughters of translocation positive sires returned
to service more often than expected (Gustavsson, 1969). The 1;29 translocation is
considered the most widespread translocation in cattle, it has been observed in all
breeds, with an exception of Holstein-Friesian cattle (Switonski, 2014). The consequence
of this chromosomal abnormality in addition with other aberrant karyotypes observed
in cattle will be discussed further in section 1.5.
1.2 Molecular cytogenetic analysis
1.2.1 Fluorescent in situ hybridisation
As previously mentioned, classical cytogenetic analysis became a powerful tool for the
detection of chromosomal abnormalities, however, the resolution of the techniques
remained limited to a count of 400-500 bands per haploid genome (Riegel, 2014). During
the 1960s several applications were introduced in an effort to increase cytogenetic
resolution. The first molecular approach to locate and isolate specific nucleic acids was
called in situ hybridisation (ISH), which was based on the discovery that radioactively
labelled ribosomal RNA hybridised to acrocentric chromosomes and subsequently
visualised using autoradiography. In 1981 Langer et al improved ISH technique through
the indirect labelling of a nonradioactive probe (such as biotin), facilitated through nick
translation, which permitted visualisation of DNA or complementary RNA sequences
when hybridised with fluorescently labelled avidin (Riegel, 2014). The production of
fluorescent molecules ultimately resulted in direct binding to DNA bases, and the
resulting fluorescent in situ hybridisation (FISH) increased the resolution of cytogenetic
analysis and enabled the detection of chromosomal rearrangements at a sub-
microscopic level (Riegel, 2014). Therefore, considering its capabilities, FISH became an
important component of molecular diagnostics at the start of the 21st century. For
example, with the increase in discovery of disease-related genes, FISH could be used to

Rebecca Jennings
33
diagnose the presence of an affected individual, the tests included: BCR/ABL1, HER2
amplification and ALK rearrangement (Hu et al., 2014). The technique involves
hybridisation of a region-specific, fluorescently labelled DNA probe, derived from a
bacterial artificial chromosome (BAC), to a cytological target: metaphase chromosomes
(refer to figure 1-3), interphase nuclei, extended chromatin fibres or DNA microarrays.
Figure 1-3. FISH Technology. DNA probe generated from isolation of required DNA region within BAC and
fluorescently labelled using nick translation. Labelled probe and target DNA are denatured to allow
hybridisation of labelled DNA to target DNA. The probe is then visualised through fluorescent microscope
on metaphase chromosomes. (Adapted from Medcaretips.com)
1.2.2 Chromosome painting
Chromosome painting was a term first described by Pinkel et al (1988), and later
developed independently by two groups at Yale University and Livermore National
Libraries (Carter, 1994). Chromosome painting is an approach facilitated by the use of
cloned DNA libraries derived from flow-sorted chromosomes. To overcome
hybridisation issues concerning chromosome specificity, incurred by the presence of
genome wide repetitive sequence motifs, suppression hybridisation is used. The method
ultimately blocks labelled, repetitive DNA with an excess of unlabelled, whole genomic

Rebecca Jennings
34
Figure 1-4. Cross Species Chromosome Painting Sequential multicolour hybridization using 13 river
buffalo DNA probes on human metaphase chromosomes. a) river buffalo (Bubalus bubalis, 2n = 50) mitosis
used as control; b) cattle (Bos taurus, 2n = 60); c) goat (Capra hircus, 2n = 60) and d) sheep (Ovis aries,
2n = 54) mitosis in Zoo-FISH experiments. (Pauciullo et al., 2014)
DNA, such as COT-1 or species specific Hybloc (Ried et al., 1998). Chromosome painting
probes are now available for a number of species, including human, mouse, gibbon and
river buffalo (figure 1-4) (Pauciullo et al., 2014). Multicolour FISH, facilitated through
chromosome paints, can be used to distinguish multiple chromosomes, or chromosomal
targets in a single experiment, therefore this technique has been widely used in
comparative cytogenetics (Ried et al., 1998). Moreover, comparative chromosome
painting can be used to identify homologous segments in divergent species, and map
chromosomal rearrangements that have occurred during evolution of the species. This
technique has shown the most success in species within, but not between placental
mammals, birds, marsupials and monotremes (Ferguson-Smith, 2015). However,

Rebecca Jennings
35
successful hybridisations were observed when chromosome paints derived from avian
species were applied to reptiles, despite over 300 million years’ divergence (Ferguson-
Smith, 2015).
1.2.2.1 Sub-telomeric FISH
Over the past 20 years, cytogenetic investigations have reported a number of sub-
microscopic chromosomal rearrangements involving segments within the telomeric
regions of chromosomes. Abnormalities include, but not limited to: α thalassaemia, cri
du chat syndrome and Miller-Dieker syndrome (Hélias-Rodzewicz et al., 2002). Due to
the high gene content observed within the telomeric region of chromosomes,
rearrangements involving these regions may have serve phenotypic consequences.
Additionally, it was also apparent from that work that cryptic translocations could be a
common occurrence (Hélias-Rodzewicz et al., 2002). Given the nature of these cryptic
abnormalities they are incredibly difficult to diagnose through standard karyotyping
methods. Therefore, in the late 1990s a novel approach was developed to isolate BAC
probes from the sub-telomeric region each human autosome, and sex chromosome.
Moreover, the intention was to identify cryptic translocations, either balanced or
unbalanced in humans, all of which could be missed using standard karyotyping and CGH
techniques (Knight et al., 1997). This technique proved highly successful, so much so that
recent work extended to domestic animals through the establishment of a sub-telomeric
panel of BACs that identified novel cryptic translocations in breeding boars (O’Connor et
al., 2017).
1.2.2.2 BAC clones and comparative mapping
Since their development BACs have become a powerful tool in functional and
comparative genomics. BACs are large genomic constructs that are artificially and stably
transformed into Escherichia coli and BACs span an average of 100 – 300 kb of genomic
DNA, meaning that most mammalian genes can be encompassed by a single BAC. As
mentioned above, BACs can be used to detect chromosomal rearrangements that would

Rebecca Jennings
36
otherwise be missed. More recently, it has come to light that they can significantly aid
with efforts to produce chromosome-level genome assemblies. In 2017, Damas et al
published work that highlighted the significance of BAC use in genome assembly efforts.
In their study BACs were isolated from the chicken (Gallus gallus) CHORI 261 BAC library
(the chicken genome was selected as this is the most annotated of the avian species),
and then used in combination with in silico technologies. This combined technique
resulted in the chromosome-level genome assembly of two avian species - peregrine
falcon (Falco peregrinus) and pigeon (Columba livia) (Damas et al., 2017). Moreover, this
method of combined assembly was so successful that the following year the complete
chromosome-level assembly of an additional three avian species was published
(O’Connor et al., 2018). For this reason, cross-species BAC mapping mediated, facilitated
cytogenetic confirmation of predicted in silico placement in the de novo species.
1.2.2.3 Comparative genome hybridisation
Chromosomal aneuploidies and structural abnormalities are an underlying cause of
miscarriage, congenital anomalies and dysmorphism. For this reason, diagnostic tools to
detect chromosomal abnormalities are a necessity. Comparative genomic hybridisation
(CGH) is a technique that facilitates the detection of chromosomal copy number
variations (CNV) on a genome-wide level. Thus, CGH provides an overview of the
genome, whereby it can identify chromosomal gains and losses (Weiss et al., 1999). The
first reported used of this technique was in 1992 by Kallioniemi et al at the University of
California. Initially, the method was used to detect balanced chromosomal change in
tumour patients. The tumour DNA was first labelled with a fluorochrome (green) and
mixed (1:1) with labelled (red) control DNA, then applied to human metaphase
chromosome preparations with both DNA and metaphase chromosomes being obtained
from a healthy individual (Weiss et al., 1999). The fluorescently-labelled DNA competes
for hybridisation to their locus of origin. The green to red ratio is then measured and the
signal intensity is relative to loss or gain of genetic material. However, CGH cannot
elucidate structural chromosomal rearrangements within the query sample; for
Rebecca Jennings
37
example, balanced translocations and inversions. Furthermore, it was predicted that for
a region to be identified using this method, the variation would need to be 2 Mb or
larger. Additionally, contamination from control cellular material, or DNA can lead to a
decrease in sensitivity of CGH (Weiss et al., 1999). For the reasons mentioned above,
vital information can often go undiagnosed.
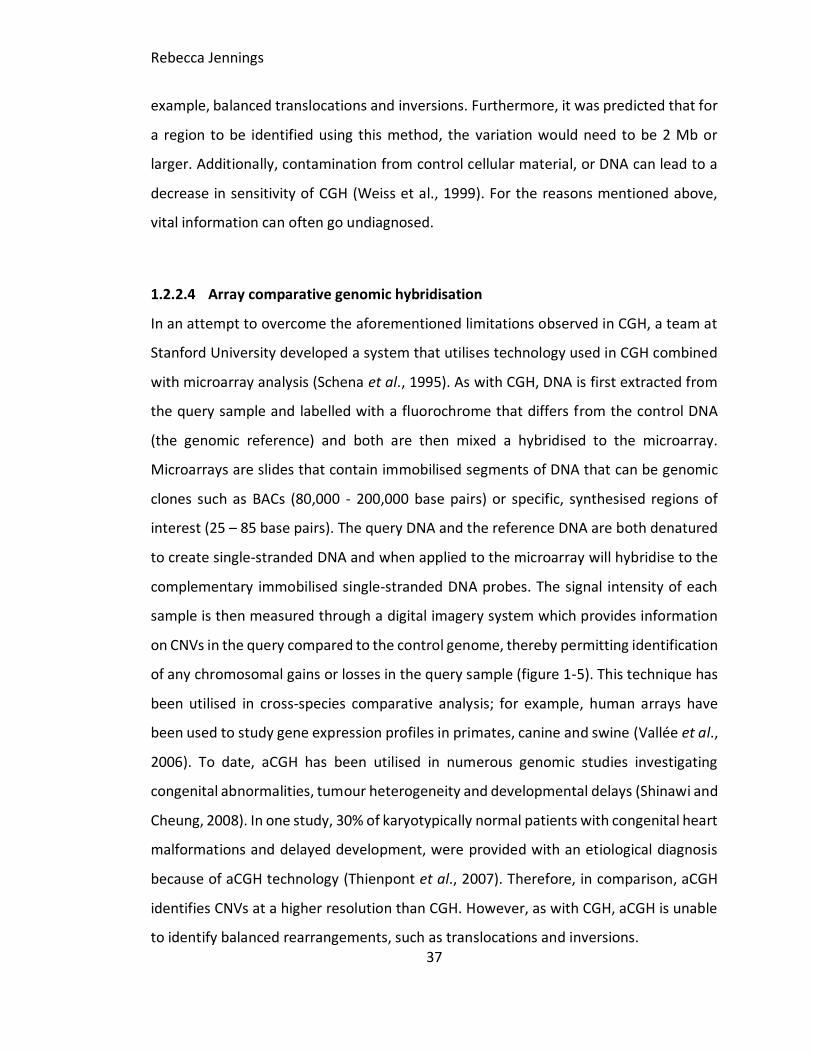
1.2.2.4 Array comparative genomic hybridisation
In an attempt to overcome the aforementioned limitations observed in CGH, a team at
Stanford University developed a system that utilises technology used in CGH combined
with microarray analysis (Schena et al., 1995). As with CGH, DNA is first extracted from
the query sample and labelled with a fluorochrome that differs from the control DNA
(the genomic reference) and both are then mixed a hybridised to the microarray.
Microarrays are slides that contain immobilised segments of DNA that can be genomic
clones such as BACs (80,000 - 200,000 base pairs) or specific, synthesised regions of
interest (25 – 85 base pairs). The query DNA and the reference DNA are both denatured
to create single-stranded DNA and when applied to the microarray will hybridise to the
complementary immobilised single-stranded DNA probes. The signal intensity of each
sample is then measured through a digital imagery system which provides information
on CNVs in the query compared to the control genome, thereby permitting identification
of any chromosomal gains or losses in the query sample (figure 1-5). This technique has
been utilised in cross-species comparative analysis; for example, human arrays have
been used to study gene expression profiles in primates, canine and swine (Vallée et al.,
2006). To date, aCGH has been utilised in numerous genomic studies investigating
congenital abnormalities, tumour heterogeneity and developmental delays (Shinawi and
Cheung, 2008). In one study, 30% of karyotypically normal patients with congenital heart
malformations and delayed development, were provided with an etiological diagnosis
because of aCGH technology (Thienpont et al., 2007). Therefore, in comparison, aCGH
identifies CNVs at a higher resolution than CGH. However, as with CGH, aCGH is unable
to identify balanced rearrangements, such as translocations and inversions.

Rebecca Jennings
38
Figure 1-5. Work Flow for aCGH. Schematic diagram to show aCGH technique. Step 1- Fluorescently
label the patient DNA. Step 2- Fluorescently label reference (control) DNA. Step 3- Mix samples and
apply to the microarray. Step 4- DNA samples hybridise to the immobilised single stranded DNA probes.
Step 5- Computational analysis to measure the signal intensity. Step 6- Data analysis. Source (Nature
2011)
1.3 Genome sequencing technologies
1.3.1 Overview
The order of nucleic acids in a polynucleotide chain ultimately dictate the hereditary and
biochemical properties of all terrestrial life (Heather and Chain, 2016). Moreover, the
ability to read and infer such sequences provides vital information to a multitude of
different fields of research, including population genetics and conservational genetic
studies, cancer and disease biology and progression, and finally provide answers
inferring to evolutionary history (Heather and Chain, 2016).

Rebecca Jennings
39
1.3.2 First generation sequencing (Sanger sequencing)
Early efforts to sequence DNA were unwieldly, it was not until around 1976 that the
technology required to decode hundreds of bases in a short period of time was available.
The technology developed by Sanger and Coulson, known as the chain terminator
procedure was release in parallel with Maxam and Gilbert’s method known as the
chemical cleavage procedure (Sanger et al., 1977). However, Sanger’s method prevailed
and was deemed first generation sequencing, or more commonly known as Sanger
sequencing. The technique involved four extensions of a radiolabelled primer by DNA
polymerase, each with trace amounts of one chain-terminating nucleotide, to produce
fragments of different lengths, resulting in a read length of 500-1000 bp.
Figure 1-6. Schematic to illustrate Sanger sequencing. DNA is first denatured into single strands. Reaction
requires a radiolabelled (or fluorescently labelled) DNA primer, DNA polymerase, dNTPs and ddNTPs. Four
reactions are set up, one for each nucleotide, G, A, T and C. In each reaction all four dNTPs are included,
but only one ddNTP (ddATP, ddCTP, ddGTP or ddTTP) is added. Fragments are then separated by size
through gel electrophoresis and visualised. (Adapted from atdbio.com)

Rebecca Jennings
40
To visualise and quantify the fragments present in each base-specific reaction,
polyacrylamide gel electrophoresis was used, thereby separating the DNA fragments by
size with base pair resolution, as illustrated in figure 1-6. By 1987, automated,
fluorescence-based Sanger-sequencing machines were in use and generating around
1000 bp per day (Shendure et al., 2017).
1.3.3 Massively parallel sequencing (Next generation sequencing)
During the 1980s and 1990s numerous groups around the world explored alternatives
to Sanger’s electrophoretic sequencing, in an effort to reduce cost and increase
sequence output so that an efficient method could be established to obtain data from
whole genome analysis. It was not until after the Human Genome Project was completed
in 2003 that massively parallel, or ‘next generation sequencing’ (NGS) as it was more
commonly known, surpassed Sanger’s sequencing performance (Margulies et al., 2005).
Next generation sequencing differed in a number of ways, however, the major difference
came in the form of multiplexing; unlike Sanger’s one tube per reaction, multiplexing
enabled a complex library of DNA templates to be densely immobilised on to a two-
dimensional surface, meaning that all templates were accessible to a single reaction
volume. Additional differences included in vitro amplification, and sequencing-by-
synthesis, whereby incorporation of a fluorescently labelled nucleotide is captured via
imaging technology (Shendure et al., 2017). From 2005 onwards, genomics entered a
new era, individual laboratories were able to gain access to equipment that resulted in
a wealth of sequenced-based research being published. The most commonly used NGS
platforms include, 454 Pyrosequencing (2005), Illumnia/Solexa Genome Analyser (2007),
(Siqueira et al., 2012). However, NGS technologies experiences certain limitations; the
sequence read length achievable is considered short (50 – 400 bp), meaning that specific
biological problems may not be addressed, including genome assembly and
determination of complex gene regions, gene isoform detection and methylation
detection (Rhoads and Au, 2015). It was noted that genomes assembled de novo (Damas
et al., 2017) using NGS technologies were often of a lower quality compared to de novo
assemblies generated through older, more expensive technologies (Sanger). This was

Rebecca Jennings
41
due to the aforementioned short reads resulting in fragmented assemblies which could
mean critical gene sequence information is missing. Therefore, improved systems that
enabled longer read length was required.
1.3.4 Third generation sequencing
Third generation sequencing, or long read sequencing became available in around 2010
when PacBio Single-Molecule Real Time (SMRT) was released (Eid et al., 2009). Third
generation sequencing technologies were developed to increase throughput and read
lengths and decrease costs, run times and error rates that were observed in next
generation sequencing. Unlike NGS, third generation single-molecule sequencing
platforms generate read lengths of over 10,000 bp, in some instances read lengths of
over 100,000 bp (Lee et al., 2016). Therefore, single-molecule sequencing technologies
have greatly improved analysis of genome structure. Indeed, longer read lengths can
span repetitive elements, resulting in a more contiguous reconstruction of genome
sequence, provide information pertaining to structural variation; split read analysis
permits identification of translocations, insertions and deletions (Lee et al., 2016).
Today, handheld sequencing devices are avaliable, and can be used in remote locations;
a recent example includes surveillance of Ebola outbreaks in Africa (Quick et al., 2016).
The handheld device, developed by Oxford Nanopre Technologies in 2014, measures the
minute disruptions to the electrical current as DNA is passed through a nanopore,
generating read lengths of ~100,000 bp (Lee et al., 2016). However, users of these third
generation platforms report a high error rate, therefore sequencing requires shorter
templates and multiple rounds to achieve an accurate result. Although, sequencing
technologies have improved considerably, the ultimate goal in any assembly effort is
produce a contiguous sequence read which spans the entire length of a chromosome
from the p-terminus to the q-terminus. However, this has not yet been achieved in
mammals, often meaning that additional tools are required to generate chromosome-
level assemblies, as described in section 3.

Rebecca Jennings
42
1.4 Genome assembly methodologies
There are essentially two techniques used to sequence a genome. Initial genome
sequencing efforts employed the BAC-by-BAC approach (i.e. a map-based method),
whereby a crude map of the entire genome is constructed prior to sequencing. Map
construction requires randomly dissecting chromosomes into fragments that span
approximately 150,000 bp, and these chromosomal fragments are then inserted into a
BAC which is given a unique fingerprint identification tag which permits order and
orientation analysis of the fragments. Fingerprinting involves cutting the BAC with a
single restriction enzyme to elucidate common sequence markers in overlapping
fragments, representing the minimal tiling path, and thereby establishing the location of
each BAC along the target chromosome (Saski et al., 2014). The BAC clone is then
fragmented once more and sequenced using Sanger technology (see section 1.3.2),
generating millions of short read sequence reads. These reads are then aligned so that
identical sequences overlap and contiguous sequences (contigs) are assembled into a
finished sequence (Saski et al., 2014). In 2001, The Human Genome Project employed a
two-phase approach which included the BAC-by-BAC method, whereby a physical map
(constructed previously) served as a platform for generating and analysing sequence
data produced in the shotgun phase (Lander et al., 2001). Indeed, by the end of the
shotgun phase 90% of the human genome was sequenced in draft form, proving it to be
a reliable method. However, BAC-by-BAC sequencing is expensive, laborious and time-
consuming, and it is for this reason that faster and cheaper sequencing methods were
developed in the years after The Human Genome Project (2001).
In parallel to the Human Genome Project (2001), another privately-funded team led by
Craig Venter attempted to sequence the human genome. In this work they utilised a
technique known as the whole genome shotgun sequencing directly on the human
genome DNA (instead of cloned fragments that had already been mapped, therefore
bypassing the use a reference genome map (Green, 2001). Whole genome shotgun
sequencing methods entails sequencing multiple overlapping DNA fragments in parallel.
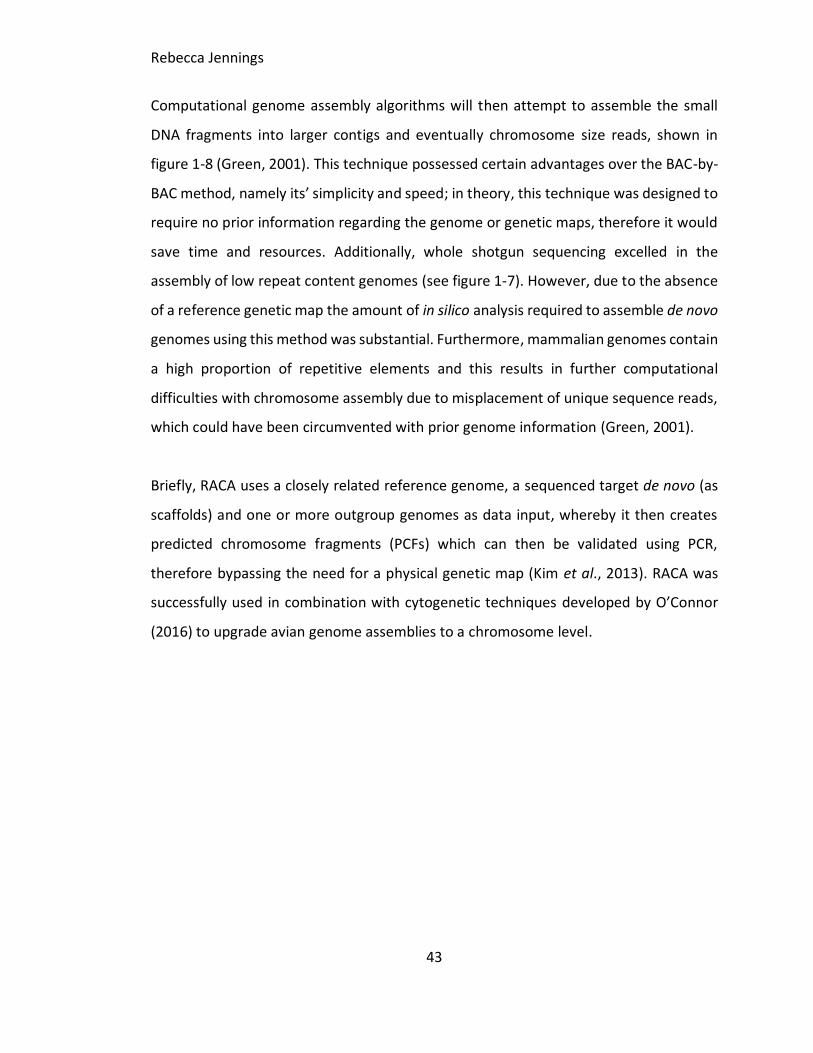
Rebecca Jennings
43
Computational genome assembly algorithms will then attempt to assemble the small
DNA fragments into larger contigs and eventually chromosome size reads, shown in
figure 1-8 (Green, 2001). This technique possessed certain advantages over the BAC-by-
BAC method, namely its’ simplicity and speed; in theory, this technique was designed to
require no prior information regarding the genome or genetic maps, therefore it would
save time and resources. Additionally, whole shotgun sequencing excelled in the
assembly of low repeat content genomes (see figure 1-7). However, due to the absence
of a reference genetic map the amount of in silico analysis required to assemble de novo
genomes using this method was substantial. Furthermore, mammalian genomes contain
a high proportion of repetitive elements and this results in further computational
difficulties with chromosome assembly due to misplacement of unique sequence reads,
which could have been circumvented with prior genome information (Green, 2001).
Briefly, RACA uses a closely related reference genome, a sequenced target de novo (as
scaffolds) and one or more outgroup genomes as data input, whereby it then creates
predicted chromosome fragments (PCFs) which can then be validated using PCR,
therefore bypassing the need for a physical genetic map (Kim et al., 2013). RACA was
successfully used in combination with cytogenetic techniques developed by O’Connor
(2016) to upgrade avian genome assemblies to a chromosome level.

Rebecca Jennings
44
Figure 1-7. Schematic workflow of two shotgun sequencing approaches. Schematic represents two
approaches used in whole human genome sequencing. Comparison of BAC-by-BAC (hierarchical shotgun
approach) and whole genome shotgun assembly approach.
Source: Adapted from science.co.uk
The intention of this work was to utilise a similar combined approach to upgrade
mammalian de novo genome assemblies to a chromosome level. Thus, identifying
conserved chromosomal segments and evolutionary breakpoints, which will provide
information regarding evolutionary forces that drove mammalian evolution (Lewin et al.,
2009).

Rebecca Jennings
45
Figure 1-8. Workflow diagram of RACA. A) RACA requires a reference genome, target de novo genome in
scaffold form and outgroup genomes. B) Syntenic fragments (SF) are produced when the target genome
is aligned against the reference genome, orientation of the target fragment is shown via + and -.C) A score
is given to the syntenic fragment which represents the adjacency. D) A SF graph is built. E) Constructed
chains of SFs that are extracted by the RACA algorithm. (Kim et al., 2013)
1.4.1 Physical mapping of sequence reads
As mentioned throughout this thesis, improvements and advancements in sequencing
techniques have increased the read length now available. For example, PacBio P6-C4
technology is reported to produce read length N50 of 14kb, with a maximum read length
of 40 kb, however, assembly fails if the region is problematic
e.g. centromere, and heterochromatin (Lee et al., 2016). Moreover, the majority of

Rebecca Jennings
46
draft de novo genomes consist of thousands of individual fragments with little or no
information on how these fragments are assembled into chromosomes. This inability to
generate contiguous sequence reads (chromosome-level assembly) has proven
problematic in developmental and molecular studies due to the possibility of gene
spanning several different contigs and incorrectly annotated (Fierst, 2015).
Furthermore, in the context of evolutionary studies, an incorrect assembly will lack the
genomic content required to perform comparative analysis (Fierst, 2015). Over the years
numerous mapping tools have been developed to address this problem. Such mapping
tools include linkage, radiation hybrid, BACs and cross-species FISH. For this reason,
cytogenetic tools have played a crucial role in assisting the production of chromosome-
level genome assemblies (Lewin et al., 2009). To circumvent the limitations observed in
NGS de novo genome assembly, computational de novo assembling algorithms were
developed, including ABySS, ALLPATH-LG, and Velvet (Kim et al., 2013). However, NGS
short read length makes it incredibly difficult to assemble into chromosomes for large
genomes. In 2013, Kim et al developed an assembling algorithm known as Reference
Assisted Chromosome Assembly (RACA) which was designed to order and orientate
sequence scaffolds generated by NGS (Kim et al., 2013). Briefly, RACA uses a closely
related reference genome, a sequenced target de novo (as scaffolds) and one or more
outgroup genomes as data input, whereby it then creates predicted chromosome
fragments (PCFs) which can then be validated using PCR, therefore bypassing the need
for a physical genetic map (Kim et al., 2013) (process shown in figure 1-8). RACA was
successfully used in combination with cytogenetic techniques by O’Connor et al in 2016
to upgrade avian genome assemblies to a chromosome level (O’connor, 2016). The
intention of this work was to utilise a similar combined approach to upgrade
mammalian de novo genome assemblies to a chromosome level. Thus, identifying
conserved chromosomal segments and evolutionary breakpoints, which will provide
information regarding evolutionary forces that drove mammalian evolution (Lewin et
al., 2009).

Rebecca Jennings
47
1.5 Chromosomal rearrangements in disease and evolution
Chromosomal rearrangements, in particular translocations and inversions, are an
important mechanism of karyotype evolution and diversity. The importance of
chromosomal rearrangements in evolutionary terms, was first described by Dobzhansky
and Sturtevant (1938), whereby the team presented a rearrangement scenario of 17
inversions for the species Drosophila pseudoobscura and Drosophila miranda
(Dobzhansky and Sturtevant, 1938). It is commonly accepted that carriers of
heterozygous chromosomal rearrangements produced unbalanced gametes and as a
result are sterile, thus contributing to reproductive isolation.
Chromosomal disorders are caused by alterations in either chromosome number or
chromosome structure. Chromosomal abnormalities are considered the leading cause
of miscarriage, with 10-15% of all clinically recognised pregnancies resulting in a
spontaneous abortion during the first trimester (Hyde and Schust, 2015). Trisomies are
the most frequently detected abnormality (61.2%), followed by tripliodies (12.4%),
monosomy X (10.5%), tetraploidies (9.2%) and structural anomalies (4.7%) (Hyde and
Schust, 2015). As mentioned previously, certain trisomies are observed in mammals,
which include trisomy 13, 18 and more commonly 21. However, most autosomal
trisomies are not compatible with life and will result in spontaneous abortion. Carriers
of balanced chromosomal abnormalities will appear phenotypically ‘normal’ however
will as a consequence, suffer suboptimal fertility. The study described in this thesis,
explores chromosomal rearrangements in mammalian species, with the intention of
identifying abnormalities that result in decreased fertility and to recognise
rearrangements that result in reproductive isolation.
1.5.1 Numerical chromosomal abnormalities
Numerical abnormalities are defined as any aberrant change in chromosome number
and traditionally they are usually diagnosed through molecular cytogenetic techniques

Rebecca Jennings
48
whereby the loss or gain of either an individual chromosome (aneuploidy), or full set of
chromosomes (polyploidy) is observed.
1.5.1.1 Aneuploidy
Aneuploidy refers to a state in which the number of chromosomes present within a cell
is not the exact multiple of the haploid genome, resulting in an unbalanced genome,
observed as either a gain (trisomy) or loss (monosomy) of chromosomes (Oromendia
and Amon, 2014). In humans, aneuploidy is reported to be the leading cause of
developmental delays and spontaneous abortion. It is reported that 15-20% of all clinical
pregnancies will result in a first trimester miscarriage (Jia et al., 2015). Chromosomal
abnormalities in the developing foetus, including aneuploidy, account for 96% of these
first trimester losses and are considered the primary etiology of spontaneous abortion
(Jia et al., 2015). In humans, the following chromosomes are commonly involved in
aneuploidy states: X, Y, 13, 16, 18, 21 and 20 (Jia et al., 2015). Previous work found that
errors in meiotic chromosome segregation frequently occur in oogenesis (~20%),
especially during the first meiotic division and this error rate is reported to increase with
elevated maternal age (Schaeffer et al., 2018). Furthermore, aneuploidy is well
documented in other mammalian species including mouse (3-5%), cattle (7.1-30% at
meiosis II) and in swine (4.9-11.9%) (Hornak et al., 2011). Additionally, aneuploidy is
commonly observed in cancer cells, whereby it was found that 70-90% of all human solid
tumours contain an unbalanced genome (Oromendia and Amon, 2014).
1.5.1.2 Polyploidy
In mammals, polyploidy is typically fatal with most embryos dying early in development,
although there are reports of tetraploids in the red viscacha rat (Tympanoctomys
barrerae) lineage are available (Yamazaki et al., 2016). In ‘normal’, somatic cells, the
chromosome complement comprises of a maternal haploid set and a paternal haploid
set (haploid chromosome number is species dependent). However, a typical tetraploid

Rebecca Jennings
49
cell will consist of two haploid maternal and paternal sets, meaning the resulting foetus
is technically ‘balanced’. For example, the haploid chromosome number in humans is 23,
meaning that human tetraploids will comprise of 92 chromosomes (Yamazaki et al.,
2016). Polyploidy is not tolerated well in mammals with most resulting in spontaneous
abortion before the end of the first trimester with triploidy (an extra haploid
chromosome set (chromosome number of 69 in humans)) accounting for approximately
17-20% of chromosomally abnormal first trimester miscarriages. As such, triploidy is
estimated to occur in 1 in 3,500 pregnancies at 12 weeks, 1 in 30,000 at 16 weeks and 1
in 250,000 at 20 weeks (Kolarski et al., 2017). The extra haploid set is responsible for
numerous birth defects, including facial abnormalities, micrognatia, cleft lip, heart
defects, neural tube defects (spina-bifida), and severe growth problems in the foetus if
born (Kolarski et al., 2017).
Considering the above, polyploidy is however relatively common in nature, particularly
in plants and fungi, with an estimated prevalence of 30%-70% in angiosperms (flowering
plants). In humans, polyploidy occurs in specific tissues as part of the terminal
differentiation. Changes in chromosome number (ploidy) can also be as a result of
pathophysiological events, such as virally-induced cell fusion or erroneous cell division
(Storchova and Kuffer, 2008).
1.5.2 Structural chromosomal rearrangements
The term structural chromosomal rearrangement describes several different events
which include: duplications, insertions, deletions, inversions and translocations, all of
which are due to errors in recombination (double-strand DNA breaks followed by
incorrect repair mechanisms), ultimately altering gene dosage and order (Griffiths et al.,
1999). Furthermore, these structural chromosomal rearrangements can result in
unbalanced gametes through unequal segregation in meiosis, leading to aneuploidy
(refer to section 1.5.1.1) which can increase the risk of miscarriage.

Rebecca Jennings
50
1.5.2.1 Chromosomal duplications
The architecture of the genome means that certain areas are considered fragile and
more prone to DNA breakage, leading the alterations (insertion, deletion and
translocation), usually due to pairing errors in meiosis (Sun et al., 2008). DNA is subjected
to many endogenous and exogenous factors that affect replication and chromosome
segregation. For example, DNA damage can occur through endogenous replication stress
or through exogenous sources, causing base changes, double or single strand breaks and
DNA – protein cross links (Shaffer and Lupski, 2000). Duplications can be segmental
(from a few nucleotides to serval thousand kilobases), as shown in figure 1-10, or may
cover the entire genome, where it is known as polyploidisation (see section 1.5.1.2).
Interstitial duplications result from an exchange of genetic material within a
chromosome, retaining the telomere and thus altering the gene dosage at that loci
(Shaffer and Lupski, 2000). Over recent years, numerous studies have sought to
understand the molecular complexities of autism. Autism spectrum disorders are a
heterogeneous group of neural-behavioural syndromes that are characterised by mild
facial dysmorphism (in some, but not all cases), deficits in social interactions, impaired
or delayed development and repetitive behaviours (Urraca et al., 2013). Copy number
variations are the most common genetic lesion identified in autism, the most common
being duplications within chromosome 15q (Urraca et al., 2013). In evolutionary terms,
gene duplication is considered an important mechanism of acquiring new genes that are
under reduced selection pressure and ultimately creating genetically novel organisms
(Magadum et al., 2013).
1.5.2.2 Chromosomal insertions and deletions
Chromosomal insertions and deletions usually arise due to pairing errors in meiosis.
Large-scale deletions and duplications may be generated by the pairing of non-allelic
interspersed or tandem repeats, followed by breakage and re-joining of chromatid
fragments. (Sun et al., 2008). Chromosome deletions occur as a result of excised DNA,
(figure 1-10), and the phenotypic effects of a chromosomal deletion are dependent on
Rebecca Jennings
51
the size and location of the deleted material. Previous investigation established that a
22q11 deletion is the most common human chromosomal deletion syndrome, affecting
approximately 1:4000-6000 live births (Chromosomal Deletion Syndrome, 2013). The
phenotypic abnormalities associated with this deletion include, palate anomalies and a
characteristic facial appearance. Clinically carriers of this deletion will suffer learning
impairments, neonatal hypocalcaemia, thymic hypoplasia, and immune deficiencies.
Approximately 15% of cases are familial segregating as an autosomal dominant trait with
marked variability (Chromosomal Deletion Syndrome, 2013).
Chromosomal insertions occur when a segment of one chromosome is translocated and
inserted into another and this can be in the form of an interchromosomal insertion (non-
homologous chromosome) or an intrachromosomal insertion (insertion of a segment
into the same chromosome) (Gu et al., 2016). Repeat DNA sequences can increase the
likelihood of abnormal chromosome pairing and unequal crossing-over, with insertions
and deletions being the outcome of such events (Gu et al., 2016).
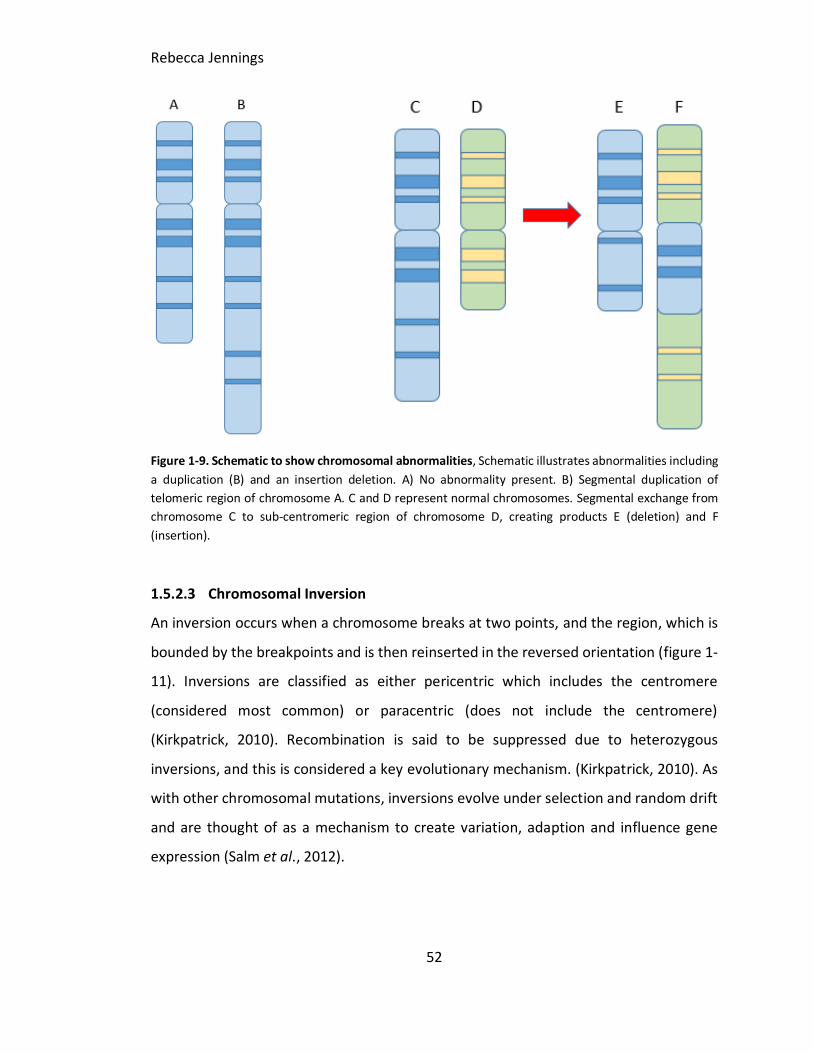
Rebecca Jennings
52
Figure 1-9. Schematic to show chromosomal abnormalities, Schematic illustrates abnormalities including
a duplication (B) and an insertion deletion. A) No abnormality present. B) Segmental duplication of
telomeric region of chromosome A. C and D represent normal chromosomes. Segmental exchange from
chromosome C to sub-centromeric region of chromosome D, creating products E (deletion) and F
(insertion).
1.5.2.3 Chromosomal Inversion
An inversion occurs when a chromosome breaks at two points, and the region, which is
bounded by the breakpoints and is then reinserted in the reversed orientation (figure 1-
11). Inversions are classified as either pericentric which includes the centromere
(considered most common) or paracentric (does not include the centromere)
(Kirkpatrick, 2010). Recombination is said to be suppressed due to heterozygous
inversions, and this is considered a key evolutionary mechanism. (Kirkpatrick, 2010). As
with other chromosomal mutations, inversions evolve under selection and random drift
and are thought of as a mechanism to create variation, adaption and influence gene
expression (Salm et al., 2012).

Rebecca Jennings
53
Figure 1-10. Schematic to show a chromosomal inversion. The chromosome affected breaks at two
points, this region, which is bounded by the breakpoints and is then reinserted in the reversed orientation
as illustrated in the above.
Kirkpatrick (2010) claimed that chromosomal inversions were the driving force behind
human speciation. For example, the genomes of human and chimpanzee are said to
differ by large pericentric inversions and several smaller paracentric inversions. Early
comparative work, using late stage prophase banded chromosomes of human,
chimpanzee, gorilla and orang-utan (figure 1-11) was published by Junis and Prakash
(1982). Due to the resolution of comparative analysis at the time of publication, they
were able to identified nine inversions, (Yunis and Prakash, 1982). However, Fauk et al
(2005) discovered approximately 1,500 inversions between the two species using
comparative analysis of genome sequences (Feuk et al., 2005). Moreover, this work
illustrates that sequenced-based analysis facilitates the detection of micro-inversions
that are beyond the scope of the microscope.
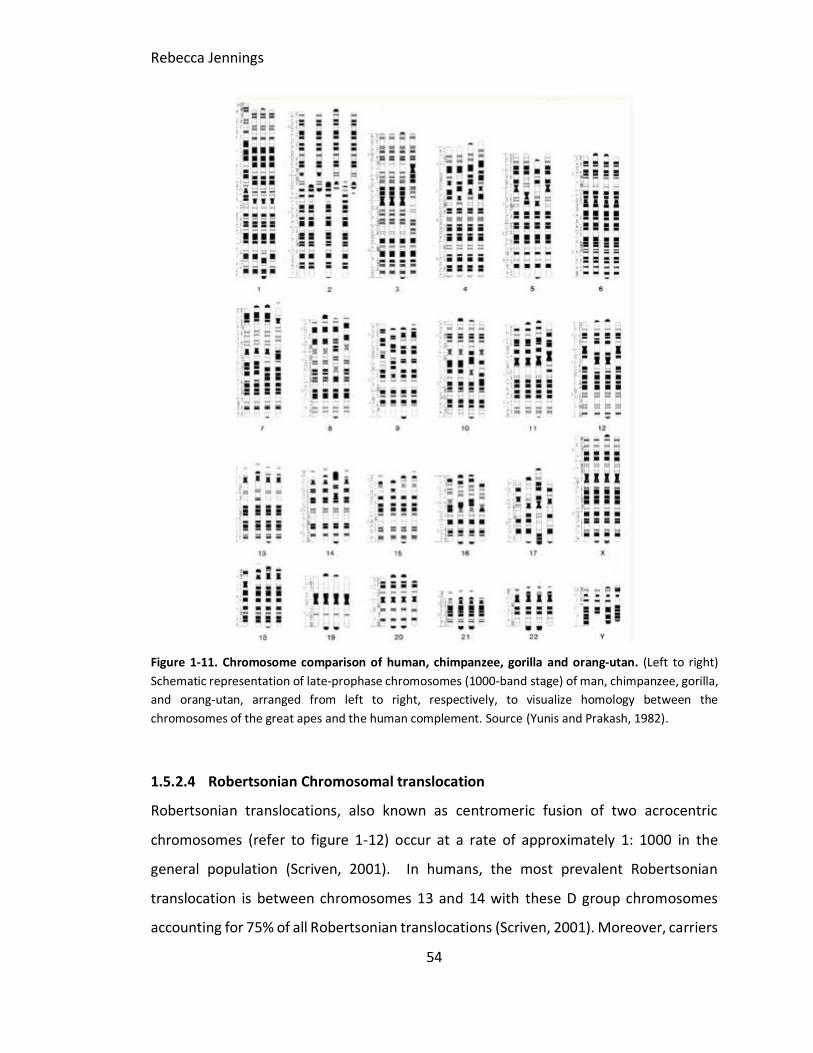
Rebecca Jennings
54
Figure 1-11. Chromosome comparison of human, chimpanzee, gorilla and orang-utan. (Left to right)
Schematic representation of late-prophase chromosomes (1000-band stage) of man, chimpanzee, gorilla,
and orang-utan, arranged from left to right, respectively, to visualize homology between the
chromosomes of the great apes and the human complement. Source (Yunis and Prakash, 1982).
1.5.2.4 Robertsonian Chromosomal translocation
Robertsonian translocations, also known as centromeric fusion of two acrocentric
chromosomes (refer to figure 1-12) occur at a rate of approximately 1: 1000 in the
general population (Scriven, 2001). In humans, the most prevalent Robertsonian
translocation is between chromosomes 13 and 14 with these D group chromosomes
accounting for 75% of all Robertsonian translocations (Scriven, 2001). Moreover, carriers

Rebecca Jennings
55
of a Robertsonian translocation will produce six different gametes. At the end of meiosis
I, segregation of the translocated and non-translocated chromosomes from the two
different chromosome pairs involved leads to the formation of either balanced gametes,
via alternate segregation, or unbalanced gametes through adjacent segregation during
anaphase. Consequently, the zygote will be monosomy or trisomy for that chromosome
(Song et al., 2016). Monosomy zygotes are not compatible with life and for this reason
they will usually end in a first trimester spontaneous abortion. However, the live born
outcome of the aforementioned rob (13;14) trisomy can result in trisomy 13 or 14.
Trisomy 14 is not compatible with life, whereas trisomy 13 (Patu syndrome) is reportedly
observed at the second trimester in <0.4% cases (Scriven, 2001). The overall miscarriage
risk for individuals carrying this translocation remains at approximately 15%, however
some will suffer recurrent miscarriages as a consequence of this rearrangement.
Robertsonian translocations are common chromosomal rearrangements that can lead
to rapid and efficient reproductive isolation between karyotypically similar populations.
Additionally, homozygous translocation carriers are reported to be as a consequence of
heterozygous translocation mating (Song et al., 2016).
In agriculture, this form of translocation is widely reported in cattle with the rob (1;29)
translocation being the most widespread, affecting all breeds except Holstein-Friesian
cattle (Switonski, 2014). Heterozygous carriers of the 1;29 translocation are
phenotypically normal, however carriers are reported to suffer a reduction in fertility of
3-5% (Bonnet-Garnier et al., 2008). This reduction in fertility is explained through the
formation of unbalanced gametes: 2.76% in sperm and 4.06% in oocytes, which result in
increased embryonic mortality (De Lorenzi et al., 2012).

Rebecca Jennings
56
Figure 1-12. Schematic to show Robertsonian and reciprocal translocations. A) Robertsonian
translocation – the centromeric fusion of two acrocentric chromosomes to create a fused product as
observed in cattle (rob (1;29)). B) Reciprocal translocation, genetic exchange between two chromosomes
to create a translocated pair. Exchange between chromosomes 13 and 14 is the most common in humans
1.5.2.5 Reciprocal translocations
Reciprocal translocation is defined as an exchange of genetic material between two
chromosomes, with no apparent loss (figure 1-13). Moreover, if the resulting
arrangement does not produce a truncated gene, the carrier will appear phenotypically
normal (Farimani et al., 2012). However, as with the previously discussed chromosomal
abnormalities (see section 1.5), individuals carrying a balanced reciprocal translocation
are at an increased risk of suffering nondisjunction at meiosis, resulting in different
forms of segregation and ultimately fertility problems (Farimani et al., 2012). In humans,
previous work found that certain highly homologous regions are at a higher risk of
recombination. These hotspot regions include 11q23, 17q11 and 22q11, leading to the
frequent translocations t(11;22), t(17;22) (Morin et al., 2017).
The overall aim of this study was to develop and implement a device in cattle that could
screen for chromosomal abnormalities that reduce fertility in agricultural animals.

Rebecca Jennings
57
Before this study, a number of different studies had examined the effect that reciprocal
translocations have on fertility in pig and cattle. Due to the use of artificial insemination
(AI) in commercial breeding today, it is imperative that reciprocal translocation carriers
are isolated and removed from the herd prior to entry into the AI breeding programme,
thereby preventing dissemination of the rearrangement to future progeny and retaining
the profitability of the herd. Previously, Henricson and Bäckström (1964) identified the
first reciprocal translocation in swine, that involved genetic exchange between
chromosomes 4 and 14 t(4;14). This was discovered using traditional chromosome
banding techniques (Henricson and Bäckström, 1964). Since then the cytogenetic
screening of commercial animals has developed into a practice that is performed in only
a handful of laboratories globally. Furthermore, most commercial screening today still
uses traditional banding techniques, which can only detect chromosomal
rearrangements that involve >3 Mb of DNA, meaning that smaller cryptic translocations
will be missed. Routine cytogenetic screening of hypoprolific commercial swine
originated in Toulouse France in the 1990s and since then the group are reported to have
examined over 13,000 boars (Ducos et al., 2007). Moreover, it was estimated that
reciprocal translocations are present in 1:2000 (0.47%) unproven boars awaiting entry
into the AI breeding program (Ducos et al., 2007).
In cattle, only 19 reciprocal translocations involving different chromosomes have been
reported (De Lorenzi et al., 2011). However, due to the acrocentric nature of the cattle
karyotype De Lorenzi purposed that only 16% of reciprocal translocations are
recognisable using traditional karyotyping alone, meaning that 84% of reciprocal
translocations go undiagnosed. Therefore, this form of rearrangement is grossly
underestimated in cattle. Moreover, a method to screen for, and for diagnosis purposes
is required. For this reason, part of the work in this study was to implement a
chromosome screening service in cattle.

Rebecca Jennings
58
1.5.2.5.1 Translocation pairings at meiosis
Chromosomal translocations involve the exchange of genetic material between two non-
homologous chromosomes, whereby genetic position is altered but not overall content,
thus forming a balanced translocation. In a study investigating spermatozoa of
individuals carrying a t(4;5(p15.1; p12)) translocation it was observed that during meiosis
I, the translocated chromosomes pair to their homologous segments, forming
quadrivalents which can then segregate into five different configurations (figure 1-14).
Segregation includes, alternate (producing viable gametes), adjacent I, adjacent II, 3:1
and 4:0 with the last four combinations producing non-viable unbalanced gametes
(Wiland et., al 2007). In this study, 6:10 pregnancies resulted in spontaneous abortion,
hypothetically due to the formation of unbalanced gametes (Wiland et al., 2007). Visual
representation of segregation combinations (figure 1-15).

Rebecca Jennings
59
Figure 1-13. Representation of chromosomal segregation possibilities. Diagram illustrates the
segregation possibilities in an individual carrying a heterozygous reciprocal translocation. Quadrivalents
configuration results from non-homologous pairings which can lead to alternate segregation (viable
gametes) or adjacent I, adjacent II, 3:1 and 4:0 (3:1 and 4:0 not shown) with the last four combinations
producing non-viable unbalanced gametes. Source: www.semanticscholar.org

Rebecca Jennings
60
1.6 Mammalian karyotype evolution
The initial concept that all life on earth originated from a common ancestor was first
proposed by Darwin in 1859, through his seminal work ‘The Origin of the Species’,
thereby introducing biologists to the idea that all phenotypically related species were
descent from early progenitors (Ferguson-Smith and Trifonov, 2007). However, even
before the publication of this work previous investigations by Linnaeus, in 1758
recognised that certain species shared morphological features, whereby classifying
organisms in terms of genealogies with species, families and orders depended on their
similarities (Ferguson-Smith, 2008). Today, biologists can investigate the relationship
between any given species using an array of cytogenetic and molecular techniques, as
discussed previously, thus providing information which can elucidate karyotype
evolution between distantly related species.
In comparison to other vertebrates, mammals show a high degree of karyotype
variability. The chromosome complement in mammals can range from 2n=6/7 in the
Indian muntjac (Muntiacus muntjak), to 2n=102 in the red viscacha rat (Tympanoctomys
barrerae) (Contreras, Torres-Mura and Spotorno, 1990) (Graphodatsky, Trifonov and
Stanyon, 2011). As with any comparative analysis described in this thesis, initial
investigations into mammalian karyotype evolution were studied using traditional
cytogenetic techniques, for example chromosome banding and chromosome painting
which enabled identification of conserved regions between species (Kemkemer et al.,
2009). More recently, whole genome sequence comparisons have identified regions
known as conserved linkage groups, that are syntenic segments with highly conserved
gene order. Furthermore, the information these conserved segments provide can then
be used to reconstruct the ancestral karyotype. It is believed that the organisation of the
human genome is highly conserved, demonstrating remarkable similarities to the
putative eutherian karyotype which would be found around 105 mya (Kemkemer et al.,
2009). In 2005, a comparative study using genetic markers, morphological and fossil

Rebecca Jennings
61
analysis produced an evolutionary tree showing the landmark rearrangements in
placental mammals, (figure 1-15) (Froenicke, 2005).
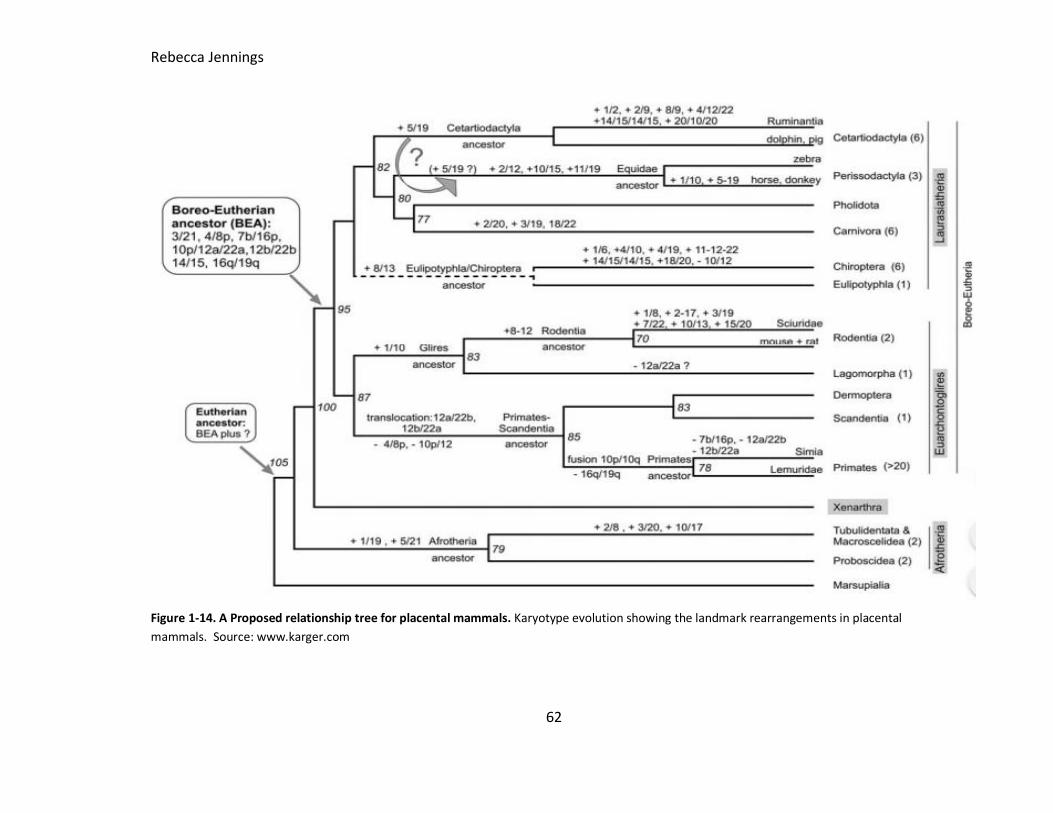
Rebecca Jennings
62
Figure 1-14. A Proposed relationship tree for placental mammals. Karyotype evolution showing the landmark rearrangements in placental
mammals. Source: www.karger.com
Rebecca Jennings
63
1.6.1 Mechanisms of karyotype evolution
Non-homologous recombination at meiosis is the process by which conserved regions of
the genome are separated and fused at a different location (Wiland et al., 2007). In
section 1.5, chromosomal rearrangements were discussed in the context of fertility
issues, however it well known that chromosomal rearrangements are the prerequisite
to reproductive isolation and speciation. Moreover, an aberrant event in meiosis can
result in the formation of morphologically abnormal chromosomes (for that species).
Furthermore, metacentric chromosomes are often the product of a chromosomal fusion
between two acrocentric chromosomes, whereas the opposite can be considered for
acrocentric chromosomes (fission of a metacentric chromosome). In this context, the
karyotype of cattle consists of 30 pairs of acrocentric chromosomes (excluding the sex
chromosomes), whereas in a closely-related artiodactyl species like the defassa
waterbuck, the karyotype comprises of 27 pairs of which three are submetacentric.
Indeed, Kingwood et al (2000) established that the submetacentric chromosomes
observed in the karyotype of the defassa waterbuck were due to a fusion of cattle
chromosomes 1;19, 2;25 and 6;18. Mechanisms that promote fixation of chromosomal
changes, despite the associated reduction in fertility, include a) meiotic drive, b) the
beneficial effects that a particular rearrangement has on gene expression and c)
establishment of recombination suppression which facilitates adaptive evolution (Potter
et al., 2017). Wyttenbach reported that meiotic drive favours Robertsonian
translocations in the common shrew; meiotic drive is powerful evolutionary mechanism
that can drive mutations into fixation that would usually reduce fitness (Potter et al.,
2017).
1.6.2 Sex chromosome evolution
Sex chromosomes are studied for a number of different reasons, which include
investigating their role in sex determination and as a general mechanism of evolution,
whereby they can provide information regarding fundamental evolutionary forces. The

Rebecca Jennings
64
sex chromosomes observed in mammals (XY system) are thought to have evolved from
autosomes, with the first differentiation event occurring approximately 240 million years
ago, shortly after the divergence of the mammalian and avian lineage (Lahn and Page,
1999). Lahn and Page (1999) reported that human sex chromosome evolution was
punctuated by at least four events, adding that each event suppressed recombination
between the X and Y chromosomes, while retaining gene order on the X chromosome
(Lahn and Page, 1999). It was previously documented that the first step in the evolution
of the Y chromosome was probably through the acquisition of a sex-determining locus
on one of proto-sex chromosomes. With an inversion of this sex-determining region (SRY
which is located on the male-specific Y chromosome) suppressing recombination further
(Mackiewicz et al., 2018). Moreover, this lack of recombination ultimately led to the
degradation and silencing of most of the Y-linked genes (Mackiewicz et al., 2018).
1.7 Sex determination
In mammals, sex determination is a complex developmental processes. Moreover, it is
an intricate system of genetic, epigenetic and hormonal determinants that govern the
development of either the male or female phenotype (De Lorenzi et al., 2018). However,
on a chromosomal level sex determination occurs through the inheritance of the X and
Y sex chromosomes. In nature, three principle chromosomal systems govern sex
determination; male XY heterogamety (as seen in mammals), female ZW heterogamety
(as seen in birds) and haploid UV phase determination (as seen in some algae) (Bachtrog
et al., 2011). In organisms that mate as diploids, for example flowering plants and
animals, the sex chromosomes take on one, of two forms. In XY systems the male is
found to be heterogametic XY, the female is characterised by the homogametic XX.
However, in ZW systems females are heterogametic (ZW) while males are homogametic
(ZZ), (figure 1-16) (Bachtrog et al., 2011). For this purpose of this study, only XY systems
will be covered.

Rebecca Jennings
65
Figure 1-16. The differences in inheritance and sex specification between XY, ZW and UV sex-
chromosome systems. Females are red and males blue. In mammals (XY systems), the Y chromosome is
present in males only, inheriting the X from the mother. In birds (ZW systems), the W chromosome is
female-specific whereby the female will always inherit the Z from the farther. In UV systems, sex is
expressed in the haploid phase, with U chromosomes confined to females and V chromosomes limited to
males. (Image Source: Bachtrog et al., 2011)

Rebecca Jennings
66
Therefore, in mammal’s sex determination occurs through inheritance of the X and Y sex
chromosomes. The presence or absence of the Y-encoded male-determining Sry gene
directs the developing gonad to differentiate into the testes, which in turn directs the
sexual development of the rest of the embryo (Kocer et al., 2009). A number of genes
are implicated in sex determination and of these the SRY, and SRY-box 9 (SOX9) genes
are required to differentiate the supporting cell lineage into male Sertoli cells rather than
female granulosa cells (Kocer et al., 2009). In females, the absence of Y-encoded male
determining genes results in the differentiation of the supporting cell lineage into
granulosa cells when SRY expression does not occur. Once gonadal differentiation is
established, they secrete hormones that cause sex-specific patterns of development in
many other tissues, including the external genitalia, internal genitalia (Wolffian and
Müllerian duct structures) and the brain (Arnold, 2012). Due to the complexities of
mammalian sex determination, variations in typical sexual development are found in
nature, this will be discussed in the following section.
1.7.1 Disorders of sexual development
Classifications of variations of sex characteristics, or intersex traits, have changed
significantly throughout history. In general, disorders of sex development, or
intersex, refers to the state of being born with biological sex characteristics that vary
from what is typically thought of as exclusively male or female (Griffiths, 2018). Today,
intersex variation is classified by a physiological and morphological anomaly, defined as
a congenital condition by which the development of chromosomal, gonadal, or
anatomical sex is atypical (Griffiths, 2018). Furthermore, the reproductive organs and/or
external genital differ from those typically associated with the male or female phenotype
(Rich et al., 2016).
Investigations into sex development deviations started in the 1960s, and were facilitated
by the use of traditional cytogenetic techniques in combination with examination of
physiological and phenotypic examinations. McFeely et al (1967) presented the results

Rebecca Jennings
67
obtained from 14 intersex variation cases in domestic mammals, including: dog, cow, pig
and cat. This work established that genotype does not always reflect phenotype, with
the majority of animals examined diagnosed as male pseudohermaphrodites. At this
time the molecular mechanism behind the cause was unknown (McFeely et al., 1967).
However, today cytogenetic analysis can provide important information; the karyotype
becomes a low resolution map of the genome and it can reveal differences in
chromosome number (aneuploidy) and structural differences i.e. translocations,
deletions, insertions and inversions, depending on the size of the abnormality (too small
and the aberration will not be detected) (Polipalli et al., 2016). For this reason, karyotype
analysis commonly used as a diagnostic tool in the initial stages of an investigation to
elucidate the specific abnormality causing the irregular phenotype or disorder, as shown
throughout this thesis.
Today, advancements in molecular techniques have meant that numerous genes
associated with sex development in mammals have been identified, along with the
consequence of mutations within. In most cases, mutations in the following genes: SRY,
WT-1, SOX9 and DAX-1 result in interrupted sex determination in mammals, causing an
intermediate phenotype. (Pailhoux et al., 2001). Intersex variation is well described in
pigs, with a published incidence rate of 0.1-0.5% in XX females, rising to 20% within an
isolated herd (Pailhoux et al., 2001). Detection of affected animals usually occurs
through observation of abnormal external genitalia by the breeder or at slaughter, with
intermediate phenotypes usually observed (Pailhoux et al., 2001). Intersex variation is
also described in domestic horses, while androgen insensitivity syndrome (AIS) is
frequently reported to affect thoroughbred mares. AIS is defined as the failure to
masculinise target organs by androgen secretions during embryo development. In most
cases the animal will appear phenotypically female, however will display stallion-like
behaviour and genotype (2n=64 XY, SRY+), transmission of this disorder is purposed to
follow an X-linked recessive pattern of inheritance (Welsford et al., 2017).

Rebecca Jennings
68
1.7.2 Freemartinism in cattle
A bovine freemartin is defined as a sterile female calf that was born co-twin with a male
foetus. The sterile calf will present with underdeveloped or miss-developed genital tract
as a result of vascular anastomose (exchange) between both foetuses, (figure 1-17)
(Esteves et al., 2012). The consequence of this placental vascular exchange between
heterozygotic twins is blood chimerism (2n=60 XX/XY) and the passage of male gonad
determinants (such as androgens) to the developing female foetus (Esteves et al., 2012).
Esteves et al estimates that up to 95% of female foetuses in a male / female twin
pregnancy are affected (Esteves et al., 2012).
Figure 1-17. Vascular anastomose between heterozygotic twins (cattle). The consequence of this
placental vascular exchange between heterozygotic twins is blood chimerism (2n=60 XX/XY) and the
passage of male gonad determinants (such as androgens) to the developing female foetus (Image source:
Esteves et al., 2012)
The external genitalia of the affected female appear phenotypically normal, and
therefore the calf will be raised as female. However, upon closer inspection minor
abnormalities are visible whereas the internal genitalia will have been masculinised to
an extent which will impair fertility of that animal. Common abnormalities observed in
Freemartin heifers include hypoplastic or absent uterus, absence of the continuity
between the vagina and the uterus (if present) and streak gonads (Esteves et al., 2012).
Exchange between developing foetuses

Rebecca Jennings
69
Prevalence of this condition is proportional to the prevalence of twinning within the
population shown in a study investigating twinning in different breeds which found that
rates can vary from 0.2 in the Brahman to 8.9 in the Brown Swiss (Esteves et al., 2012).
1.7.3 XY complete gonadal dysgenesis (Swyer syndrome)
Swyer syndrome is classified as a disorder of sex development (DSD), which covers any
disorder in which chromosomal, gonadal or anatomic sex development is abnormal.
Swyer syndrome is a rare genetic disorder that is characterised by the failure of the
internal sex glands to develop. In humans, an individual with Swyer syndrome will appear
phenotypically female, however karyotype analysis will reveal a 2n=46 XY chromosome
complement (as in males) (Michala et al., 2008). In most cases the genetic cause remains
unknown, although it is believed that mutations in the genes involved in male XY sex
differentiation of the foetus are involved. In 15-20% of cases a mutation or deletion
within the SRY gene is responsible for this disorder, resulting in the failure of gonadal
tissue to differentiate into testes (Machado et al., 2014). Additionally, mutations in the
following genes have been identified in Swyer females: MAP31K, NORB1 on the X
chromosome and DEAH37 (Michala et al., 2008).
Previously, Swyer syndrome was reported in the following species: cattle, dogs and
horses, however most of this work was performed using traditional cytogenetic
techniques meaning that the true genetic cause was often undiagnosed. However, with
the advancements and improvements in sequencing techniques it is now possible to
isolate and sequence the genes involved in sex determination meaning that a deeper
understanding as the etiology of the disorder can be assessed.

Rebecca Jennings
70
1.8 Rationale for this thesis
Although improved technologies now permit genome analysis at a higher resolution
than previously possible, certain biological and evolutionary questions still remain
unanswered. This is partly due to the absence of chromosome-level genome assemblies
in most mammalian species. However, with the previously reported success in birds, it
would be advantageous to apply the combined bioinformatic and cytogenetic approach
to up-grading mammalian genome assemblies to a chromosome level. Thereby enabling
investigations into mammalian evolution and genome reconstruction. For this reason,
the development of a universal BAC panel that would facilitate chromosome-level
genome assembly in mammals is essential.
Before this study, any attempt to examine the chromosomal integrity of an agricultural
animal was achieved through traditional karyotype analysis. Karyotyping is time
consuming and error prone, and may also result in translocation carriers going
undiagnosed (see section 2.6.1.1). Moreover, the use of high genetic merit animals in AI
calls for an increased level of chromosomal analysis, therefore ensuring translocation
carriers are isolated from the herd. For this reason, an efficient and reliable means to
screen for fertility damaging chromosomal rearrangements in breeding animals would
be beneficial to agricultural breeding companies worldwide.

Rebecca Jennings
71
Taking the above background into consideration, the specific aims of this study are as
follows:
Specific aim 1. To develop a series of universally hybridising cytogenetic tools (BAC
clones) based on sequence selection aimed at furthering the study of comparative
genomics in mammals (Artiodactyla, Rodentia and Primates)
Specific aim 2. To develop a screening service for chromosome abnormalities in a series
of mammals including: pig (and related species), horse, tiger and gorilla, thus
investigating the reasons for reproductive issues in individual animals
Specific aim 3. Based on specific aim 2, to implement a novel scheme for screening for
chromosome translocations in cattle, testing the hypothesis that it can be applied for
the detection of hitherto intractable reciprocal chromosome translocations
Specific aim 4. Based on specific aim 2, to implement a high throughput FISH-based
porcine cytogenetic screening service, screening over 1000 animals and testing the
hypothesis that the published incidence of translocations in this species is under-
reported
Rebecca Jennings
72
2 Materials and methods
2.1 Chromosome Preparation
2.1.1 Sample collection - Tissue
Mammalian tissue samples were obtained through The Aspinall Foundation, Port
Lympne Wildlife Park and local suppliers. The Animal Welfare and Ethics Review Board
(AWERB) at the University of Kent reviewed and approved sampling prior to proposed
research.
2.1.1.1 Complete media preparation
All cell culture work was performed in a class II lamina flow hood. Fibroblasts were
cultured in minimum essential media (MEM) (Fisher) supplemented with 10% foetal
bovine serum (FBS) (Gibco) and 1% Pen-Strep-L-Glutamine (Sigma). FBS was increased
to 20% when cells required additional supplementation (e.g Ardvark and Indian
Muntjac). Complete media was stored at 4oC.
2.1.1.2 Primary cell culture through enzyme digestion
A standard protocol was developed and used throughout to establish cell cultures.
Mammalian tissue samples were obtained through biopsy, performed by veterinarians
at The Aspinall Foundation Port Lympne Wildlife Park or from animals that were
euthanised on site. All procedures were performed aseptically in a class II laminar airflow
hood. Tissue sample was transferred to a sterile petri dish containing 1ml of Hanks
Balanced Salt Solution (HBSS) including 1% Pen-Strep Fungizone to prevent
contamination. The tissue was then cut using a sterile disposable scalpel. Tissue was cut
to a diameter of 0.5mm3 and transferred to a 15ml falcon containing 500µL of
0.125mg/ml Liberase TM Roche, an enzymatic collagenase which facilitates dissociation
of tissue, allowing for the release of individual cells due to protease activity. Incubation
of tissue / cell solution at 37oC for a minimum of 4 hours with gentle agitation applied
every hour throughout. Upon sufficient digestion 4.5ml of complete media was
introduced, a pipetting motion was used to dissociate cells from tissue, contents were

Rebecca Jennings
73
then transferred to a vented T25 culture flask ensuring that cell solution was evenly
distributed across the bottom of the flask to promote even cell growth. Incubation was
performed in a humidified incubator at 37oC with 5% CO2. Culture flasks were observed
using Nikon Eclipse TE200 microscope 24 hours post enzyme digestion for contamination
and cell growth, 2.5ml of media was removed from culture and replenished with fresh
complete media.
2.1.1.3 Cell culture refresh
Cell cultures were refreshed every other day in a class II laminar air hood. Spent media
was aspirated from the flask and fresh complete media, as described in section 2.1.1.1
was added to a final volume of 5ml in a T25, 10ml in a T75 and 25ml in a T175.
2.1.1.4 Cell passage
Observation of cell growth and contamination was performed daily using Nikon Eclipse
TE200 microscope (magnification x400), passage of cell culture was carried out when
cells reached ~80% confluenency. All procedures were performed in a class II laminar
airflow hood. Culture was washed with 1ml of HBSS to remove any residual growth
media along with both calcium and magnesium ions. 1ml 0.05% Trypsin – EDTA was
introduced to T25 culture flask and placed on 37oC warming tray for 1 – 2 minutes to
promote cellular detachment, 9.5ml of growth media was added to neutralise the
enzymatic effects of trypsin – EDTA once cells were seen to be detached from base of
flask. 10ml of cell suspension was removed from T25 and transferred to a sterile vented
T75 taking care to distribute cell suspension evenly across the base of the flask, 4.5ml of
growth media was introduced to primary T25 culture flask for residual cells, both flasks
were then incubated at 37oC with 5% CO2.

Rebecca Jennings
74
2.1.1.5 Harvesting fibroblast cell culture
Cultures were observed for optimal growth phase 24 hours post passage using Nikon
Eclipse TE200 microscope, mitotic doublets appeared rounded and were abundant in
this phase. All procedures were carried out in a class II laminar airflow hood. 50µl of
Colcemid (10mg/ml) was added to a T25 flask to arrest the cells at metaphase, and 100µl
of Colcemid (10mg/ml) to T75 culture flask, cell cultures were then incubated for 30
minutes at 37oC in a humidified incubator. Cultures were washed with 1ml (T25), 2 ml
(T75) HBSS; rinse was then collected in a 15ml falcon tube. Trypsin – EDTA (0.05%) at a
volume of 1 or 2ml, dependent on flask volume was the introduced to cell culture and
placed on a warming tray at 37oC to detach cells. A 2 – 4ml of HBSS wash was used to
dislodge the remaining cells from the base of the flask, cell suspension was the
transferred to the 15ml falcon tube which contained the initial HBSS wash. Cell
suspension was centrifuged at 1000 rpm for 10 minutes, supernatant was removed to
approximately 0.5ml and the cell pellet resuspend gently using a Pasteur pipette. In
order to swell the cells 5ml of 0.075 M potassium chloride (KCL) was added in a dropwise
motion to the cell suspension and left to incubate for 20 minutes and 37oC. Fixative was
prepared using a 3:1 ratio of methanol and analytical grade glacial acetic acid; 3 drops
were introduced to the hypotonic cell suspension while gently agitating the tube,
chromosome preparation was then centrifuged at 1000 rpm for 10 minutes. Supernatant
was discarded as before and the pellet agitated gently using a Pasteur pipette to
resuspend, cell suspension was held in a Pasteur pipette whilst 5ml of ice-cold fix was
then added to the falcon tube before the cell suspension was introduced in a dropwise
motion. This step was repeated 3 – 5 times in order to clean the sample.

Rebecca Jennings
75
2.1.2 Company Sample Contributions
Company 2017 2018 (August) 2019
Company 1 72 5 7
Company 2 127 27 0
Company 3 21 0 0
Company 4 226 103 104
Company 5 51 0 0
Company 6 25 6 0
Company 7 0 161 82
Company 8 0 0 0
Total 522 302 193
Table 2-1. Table to show individual pig breeding company blood sample contributions between 2017 and
August 2019. Companies anonymised as per request.
2.1.2.1 Blood lymphocyte culture
Mammalian blood acquired via standard phlebotomy into heparin tubes, 500µl of
uncoagulated, whole blood was added to 9.5mls of PB Max karyotyping media, pre-
warmed to 37oC in a T25 culture flask, and incubated for 72 hours at 37oC, 5% Co2.
Culture flasks agitated lightly to resuspend the cell layer formation; 100µl of colcemid
(10mg/ml) was added to prevent spindle formation causing metaphase arrest and
incubated at 37oC for 30 minutes. The suspension was transferred to a 15 ml falcon and
centrifuged for 5 minutes at 1,900 rpm. The supernatant was discarded and the pellet
suspended, 0.075M potassium chloride (KCl) was added to 6ml, drop-wise, whilst
agitating, causing the cells to swell and lyse through osmosis, the solution was then
incubated for 12 minutes at 37oC. Ice-cold fixative is added drop-wise to the side of the
falcon tube to a final volume of 14ml before the tube is inverted to mix the solution and
centrifuged for 5 minutes at 1,900 rpm. Supernatant discarded and cell pellet resuspend,
fixative was then added drop-wise to 5ml before centrifugation at 1,900 rpm for 5

Rebecca Jennings
76
minutes. A further 4-5 fixative washes were applied to clean the chromosome
preparation and then stored at -20oC.
2.2 DNA extraction
2.2.1 Genomic DNA extraction (kit)
Genomic DNA was extracted using the Qiagen DNEasy Blood and Tissue kit.
Manufacturer guidelines were followed throughout. Tissue samples were obtained
through biopsy and blood samples through standard phlebotomy. Cell cultures were
established within the University of Kent.
2.3 BAC selection
2.3.1 Positional BAC selection – bovine translocation screening
BACs used in the screening of cattle for translocations were developed by Dr Rebecca
O’Connor. BAC clones were isolated using the Btau 4.6.1 NCBI genome database using
BACS from the CHORI-240 bovine BAC library. BACs were selected from the subtelomeric
region of the both the p and q arm of each chromosome, or the most proximal and distal
region of each chromosome when acrocentric.
2.3.2 Conservation score BAC selection – bovine cross species analysis
Bovine BACs used in preliminary mammalian cross species analysis were derived from
past research carried out at the Institute of Cytology and Genetics, Russian Academy of
Sciences (Larkin et al., 2006ab). BACs used in this study were anchored to BTA
chromosome 19. Bovine BACs used for translocation screening (refer to 2.3.1) were also
used for cross species analysis.

Rebecca Jennings
77
2.3.3 BAC selection – human (conservation score selection)
BAC selection was performed by colleagues at RVC using the following in silico genome
sequence analysis. Conservation score (mean all) obtained through PhastCons;
PhastCons is a program for identifying evolutionarily conserved elements in a multiple
alignment, given a phylogenetic tree, whereby conservation of a given sequence is
scored from 0 to 1. All bioinformatic analysis performed at RVC by Dr Larkin and group.
2.3.4 BAC selection – mouse X chromosome (conservation score selection)
BAC selection was performed by Dr Peter Ellis (University of Kent) and Dr Benjamin
Skinner (Cambridge University). BACs were selected by aligning the published X
chromosome sequences from a wide of mammals (human, rat, mouse, pig, cow, rabbit
and sheep). Alignment information identified putative large-scale rearrangements
between mouse, rat and human X chromosomes. Mouse BACs were isolated from
synteny blocks, where possible BACs were selected from each of the block. For each
candidate BAC sequence, the BAC end sequences were downloaded and BLAST back
against the mouse and rat genomes. Confirmation was then achieved through BAC
labelling procedures and FISH analysis (refer to section 2.6).
2.4 Generation of labelled FISH probe
2.4.1 LB broth preparation
10g of LB broth (Sigma) was added to 500ml of ddH2O and autoclaved at 120oC for 30
minutes, solution was left to cool to ~50oC whereby 300µl of chloramphenicol (25mg/ml)
(Sigma) an antibiotic to isolate E.coli containing the BAC, was added producing a final
concentration of Chloramphenicol of 15µg/ml.

Rebecca Jennings
78
2.4.2 LB agar preparation
10g of LB agar (Invitrogen) was added to 500ml of ddH2O and autoclaved for 30 minutes
at 120oC. Solution was left to cool to ~50oC whereby 300µl of chloramphenicol was
added resulting in a final concentration of 15µg/ml. Agar solution was then poured into
sterile plastic Petri dishes to an approximate volume of 10ml and left to set overnight at
4oC.
2.4.3 BAC Glycerol stock
A sterile p10 pipette tip was inserted into the agar stab of each selected BAC clone and
placed into a sterile 50ml falcon tube containing 30ml of LB broth, as mentioned in
section 2.4.1. The culture was moved to a 37oC, 140rpm shaker and left over night. In
the morning of the following day 10µl of the liquid culture was then streaked over the
LB agar plate using a sterile pipette, and left overnight in a 37oC incubator. Post
incubation two colonies were selected from the plate using a sterile pipette, both were
then transferred to a 15ml falcon tube containing 5ml of LB broth/7% glycerol, and left
overnight in a 140rpm shaker at 37oC. On the following day 2ml of the BAC containing E.
coli solution was removed and stored at -80oC.
2.4.4 Plating BACs and Isolation
A sterile p10 pipette was inserted into the frozen glycerol stock of the selected BAC, the
culture was streaked over a LB agar plate and left to culture overnight in a 37oC
incubator. The plate was washed with 2ml of sterile phosphate buffered saline (PBS), the
colonies were removed into the PBS using a disposable Pasteur pipette and transferred
to a 2ml micro centrifuge tube. The solution was centrifuged at 8,000rpm for 3 minutes,
whereby the QIASpin Mini Prep kit (Qiagen) was used to isolate DNA using the
manufacturers protocol.

Rebecca Jennings
79
2.4.5 DNA amplification
Prior to amplification the samples were pulsed centrifuged and the DNA concentration
of each selected BAC was measured on a spectrophotometer (NanoDrop –
ThermoScientific). DNA extracted from E. coli was then amplified using illustra
GenomiPhi V2 DNA Amplification Kit (GE Healthcare). The kit contents and DNA samples
were thawed and stored on ice. 3µl of the DNA sample was added to 27µl of sample
buffer, in a labelled 0.5ml tube and pulse centrifuged, the samples were incubated for
3mins at 95oC in a thermocycler, to denature the template DNA, and then placed on ice.
A master mix containing both enzyme and reaction buffer was created, enzyme volume
required calculated at a ratio of 3µl x the number of sample tubes x 1.2, and the reaction
buffer volume calculated at 9x the enzyme volume, 30µl was then added to the cooled
DNA probes, samples were then mixed, centrifuged and dry incubated for 1.5hrs at 30oC
which permitted amplification. Samples were placed in a water bath for 10mins at 65oC
to inactivate the enzyme, then stored on ice. 60µl of MBG H20 was added, along with
12µl of sodium acetate/EDTA buffer (50ml of 3M Sodium acetate (pH8) and 50ml of 0.5M
EDTA (pH8)) followed by 300µl of 100% ethanol, samples were then mixed via inversion
and centrifuged for 15mins at 11,000rpm. Supernatant was discarded and 500µl of 70%
ethanol was added, samples were centrifuged for 2mins at 11,000rpm, supernatant was
removed and the pellet was pulse centrifuged, remaining ethanol was discarded,
samples were then left for 15mins in a dry incubator to remove any residual ethanol.
60µl of Tris-HCl buffer was used to resuspend and stored at 4oC overnight.
2.4.5.1 Incorporation of fluorophore (Nick translation)
On the following day the samples were pulsed centrifuged and the DNA concentration
was measured using a spectrophotometer (NanoDrop, ThermoScientific). Required DNA
concentration was 166.5ng/µl, samples were removed if below required concentration
and diluted with 10mM Tris-HCl buffer if above. The volume of Tris-HCl required to dilute
sample was calculated as follows – DNA concentration multiplied by sample volume

Rebecca Jennings
80
(12µl), divided by the concentration required (166.5ng/µl) and subtract the total volume
(12µl).
Probes were prepared using diluted DNA sample. 12µl was transferred to a 0.2ml PCR
tube in addition to 10µl of Nick Translation buffer (NT buffer (Cytocell)); 10µl
Dithiothreitol (DTT); 8µl NucMixA (Cytocell) 4µl DNA Polymerase I (Promega); 1.5µl FITC-
Fluorescein-12-UTP (Roche); 1.5µl Texas-Red dUTP (Invitrogen), colour of fluorophore
used was determined through position relative to one another, 5µl of a 1:1000 dilution
of DNase (Roche) and 49.5µl of MGH2O, samples were then pulse centrifuged and
transferred to thermocycler. Program set to run at 15oC constantly for 1 hour and 40
minutes, followed by a heat inactivation step set for 10 minutes at 65oC.
2.4.5.2 Agarose gel preparation
To visualise DNA products a 1.4% agarose gel was prepared using 0.42g of agarose
(Invitrogen) dissolved into 30ml of 1xTris/Borate/EDTA (TBE (Invitrogen)). The solution
was heated to dissolve agarose, 1µl of SyberSafe (Invitrogen) was added when cool, the
solution was poured into a comb containing gel cassette and left to set. 2µl of a loading
dye was added to 2µl of DNA sample in a new 0.5ml tube and mixed, the 4µl mixed
solution was then placed into the wells alongside a 100bp DNA ladder (Bio). The gel
electrophoresis was then set for 25 minutes at 90 volts, the products were then
visualised using a trans-illuminator. Probes that were cut to the desired length produced
smears under ~500bp.
2.4.5.3 Probe purification
Probes were purified using the QIQuick Nucleotide Removal kit (Qiagen). Manufacturers
protocol followed throughout.

Rebecca Jennings
81
2.5 Fluorescent in situ hybridisation – standard
Fixed chromosome preparations were centrifuged at either 1,000rpm for 10 minutes if
derived from cell culture, or 1,900rpm for 5 minutes if derived from blood culture.
Supernatant was removed to ~0.5ml and agitated to resuspend. 10µl of chromosome
solution was dropped from a height of ~3 inches on to a labelled glass slide and left to
dry. Slides were immersed in 2xSSC (saline-sodium citrate) for 2 minutes, followed by a
series of dehydrating ethanol washes, 70% ethanol for 2 minutes, 85% ethanol for 2
minutes and 100% ethanol for 2 minutes, slides were left dry. Probe mix was made with
Hybridisation solution I (Cytocell), a formamide containing solution that destabilises the
helical state of DNA, 2µl of a species dependent HyBloc competitor DNA (Applied
Genetics Laboratories); 1.5µl of labelled FITC probe and 1µl of labelled Texas-Red probe
resulting in final total volume of 10µl. Whilst the slides are drying the probe mix was
loaded on to a 22x22mm coverslip, and placed on 37oC hotplate to warm. The
coverslip/probe mix was inverted and placed onto the slide and left for 2 minutes, slides
were then removed and the coverslips sealed with rubber cement. The slides were
placed on a 76oC hotplate for 2 minutes, to denature both the target DNA and the probe
simultaneously, the slides were transferred to hybridisation chambers and left to
incubate in a 37oC incubator. The length of time was dependent on the investigation,
same species FISH required an overnight hybridisation, cross species FISH required 72
hours’ hybridisation this permitted the labelled probe DNA to anneal to the target DNA.
2.5.1 Second day FISH
Post overnight incubation (same species) the rubber cement and coverslips were
removed from the slide and immersed in 0.4% SSC at 72oC and left for 2 minutes, to
remove any unbound probe, followed by a 30 second wash in 2xSSC - 0.05% tween at
room temperature. Cross species FISH omits the initial 72oC wash, this prevents the
disruption, and removal of any loosely bound probe. 10µl of DAPI (Vectorsheild) was

Rebecca Jennings
82
placed onto the area which contained the metaphase preparation and a 22x22mm
coverslip placed on top and left to develop for 10 minutes.
2.5.1.1 Octochrome device set up
Chromosome preparations were centrifuged and resuspend as mentioned in section 2.5.
4µl of the metaphase solution was dropped on to alternative boxes of the 8 box template
slide, as shown in figure 2-1, followed by 4µl of fixative (3:1 methanol: acetic acid) and
left to dry, remaining boxes were then dropped as previously described. Fluorescently
labelled probes, FITC (1µl) and TexasRed (0.5µl) were used alongside species dependent
HyBloc (1µl) and MGH2O (2.5µl) to a final volume of 4µl, the probe mix was the pulse
centrifuged and stored at 4oC until required. Octochrome device was placed on a 37oC
hotplate and 2µl of the probe mix solution was transferred to, and left to dry on to each
box of the device, once dried 2µl of Hybridisation solution I (Cytocell) was used to
rehydrate the probes before using the square boxes to align the slide and device
together and left for 8 minutes at 37oC. Target DNA and probes were denatured
simultaneously for 5 minutes at 76oC and left to hybridise in a 37oC water bath overnight
if same species or for 72 hours if cross species. Post hybridisation washes were
performed as described in section 2.5.
Figure 2-1. Octochrome schematic. Octochrome device slide. Device allows for unique bespoke probe
design and the ability to run eight BAC probe investigations on one slide.

Rebecca Jennings
83
2.5.1.2 Multiprobe device set up
Multiprobe device (Cytocell) was used to screen agricultural animals for chromosomal
translocations. Species specific probes were isolated by Dr Rebecca O’Connor and
incorporated into the multiprobe device by Cytocell. Boxes contained a unique probe
combination for each chromosome, distal p-arm (labelled in FITC) and distal q-arm
(labelled in TexasRed), the proximal sequence was isolated if the chromosome was
acrocentric.
Figure 2-2 Bovine multiprobe FISH device. Probe set up design of the bovine multiprobe device with each
square containing a TexasRed and FITC labelled probe for the proximal (p) and distal (d) of each
chromosome respectively.
A master mix was made for each chromosome combination (eg 1pq), containing 12µl
MGH2O; 3µl FITC labelled probe and 3µl TexasRed labelled probe. 1.2µl of the probe
master mix was air dried onto the device square that corresponded to the chromosome
number, as shown in figure 2-2. A complementary slide containing 24 boxes was used,
2µl of the chromosome preparation was dropped onto each box of the slide, followed
by 2µl of fixative and allowed to dry, the slides were then subjected to a series of washes,
as described in section 2.5. In order to rehydrate the probe combinations that had been

Rebecca Jennings
84
left to dry on the device, 1µl of the formamide buffer Hybridisation solution I (Cytocell)
was applied to the individual boxes of the device, and the chromosome preparation slide
inverted and placed over the corresponding boxes. Device and slide were left to
hybridise for 10 minutes. Target DNA and labelled probes subsequently denatured for 5
minutes at 76oC. Devices were transferred to a hybridisation chamber left to float in a
37oC water bath overnight. Post hybridisation washes, as mentioned in section 2.5.1
were performed on the slides the following morning.
2.6 Image analysis
2.6.1 Microscopy
Imaging performed on an Olympus BX-61 epifluorescence microscope with cooled CCD
camera, filters used to visualise chromosomes included DAPI, FITC and Texas Red,
SmartCapture 3 software (Digital Scientific) was then used to capture the images. Images
throughout this work are shown at x1000 magnification.
2.6.2 Success rate definition
Success rate is defined as the number of BACs (in a specific group eg positional BACs or
conservational) that produced a punctate, clear signal divided by the total number of
BACs in that group multiplied by 100 to create a percentage score.
2.6.3 Karyotype Production
SmartType (Digital Scientific) was used to analyse the karyotypes of the species used
throughout this thesis. SamrtType (Digital Scientific) was modified to accommodate the
range of species investigated.
2.6.4 FLpter Analysis
To analyse chromosomal rearrangements, labelled probes were used as markers to
identify their position along a chromosome, this was achieved through the use of the

Rebecca Jennings
85
ImageJ plugin (FLpter), whereby both chromosome length and marker position were
measured. The mean value of chromosome length and position was recorded ±SD. Probe
order was determined from the mean values recorded from FLpter analysis.
2.7 Identification of genes located within BACs
The genome browsers UCSC and Ensembl were used to confirm the predicted
chromosomal location of genes located within labelled BAC probes, all of which had been
determined through karyotype and FISH analysis. NCBI Clone finder was used to identify
genes located within high success rate BAC clones of the reference species. Ensembl’s
comparative genomics tool was used to locate the gene in the reference species, and
isolate the chromosomal location of that gene in multiple mammalian species through
regional comparison.
2.8 Sex determination
2.8.1 SRY primers and primer design
Initially, primer pair sequence for bovine SRY was taken from published work (De Lorenzi
et al., 2018). PrimerBlast was used to design primers for the regulatory element of SRY
and bovine SRY due to amplification failure using primers from published work. To
achieve successful amplification and isolation the following parameters were
considered: GC content, self 3’ complementary (score <2) and primer length.
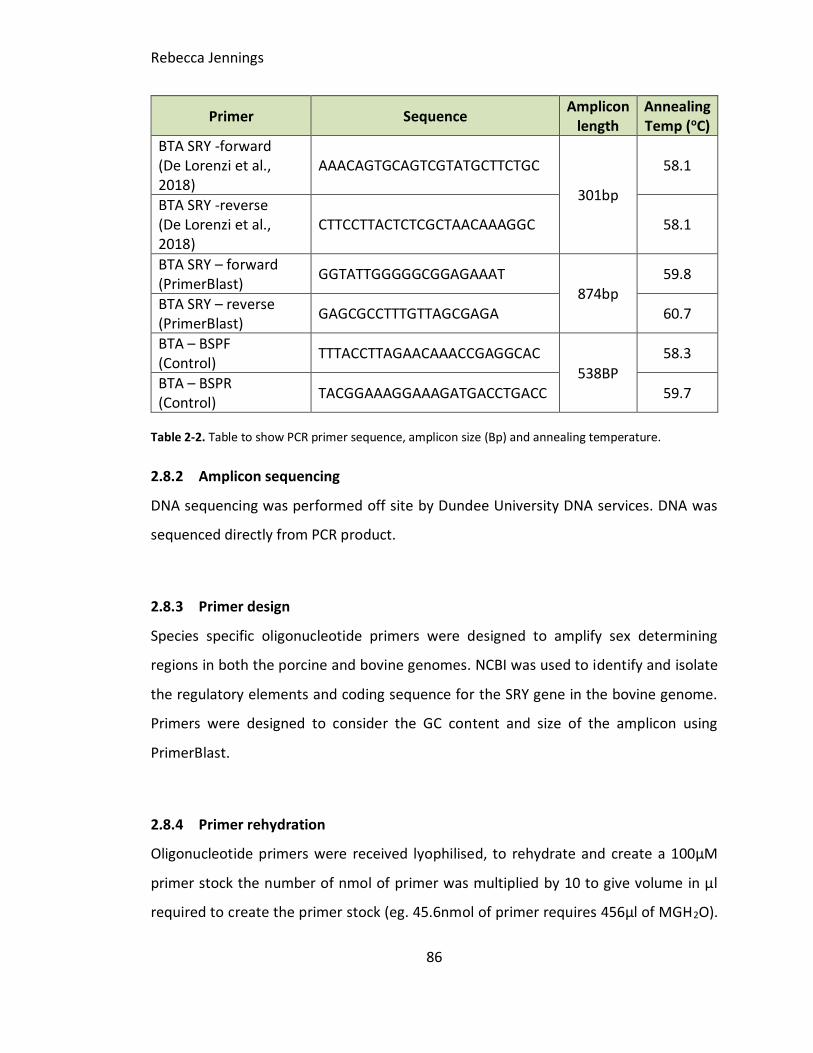
Rebecca Jennings
86
Primer Sequence Amplicon
length Annealing Temp (oC)
BTA SRY -forward (De Lorenzi et al., 2018)
AAACAGTGCAGTCGTATGCTTCTGC
301bp
58.1
BTA SRY -reverse (De Lorenzi et al., 2018)
CTTCCTTACTCTCGCTAACAAAGGC 58.1
BTA SRY – forward (PrimerBlast)
GGTATTGGGGGCGGAGAAAT 874bp
59.8
BTA SRY – reverse (PrimerBlast)
GAGCGCCTTTGTTAGCGAGA 60.7
BTA – BSPF (Control)
TTTACCTTAGAACAAACCGAGGCAC
538BP
58.3
BTA – BSPR (Control)
TACGGAAAGGAAAGATGACCTGACC 59.7
Table 2-2. Table to show PCR primer sequence, amplicon size (Bp) and annealing temperature.
2.8.2 Amplicon sequencing
DNA sequencing was performed off site by Dundee University DNA services. DNA was
sequenced directly from PCR product.
2.8.3 Primer design
Species specific oligonucleotide primers were designed to amplify sex determining
regions in both the porcine and bovine genomes. NCBI was used to identify and isolate
the regulatory elements and coding sequence for the SRY gene in the bovine genome.
Primers were designed to consider the GC content and size of the amplicon using
PrimerBlast.
2.8.4 Primer rehydration
Oligonucleotide primers were received lyophilised, to rehydrate and create a 100µM
primer stock the number of nmol of primer was multiplied by 10 to give volume in µl
required to create the primer stock (eg. 45.6nmol of primer requires 456µl of MGH2O).

Rebecca Jennings
87
Primers (Eurofins) were rehydrated with MGH2O using a sterile pipette, they were then
pulse centrifuged and stored at –20oC.
2.8.5 Multiplex polymerase chain reaction (PCR)
Genomic DNA concentration was measured using a spectrophotometer (NanoDrop,
ThermoScientific), DNA was diluted with MGH2O in a new microcentrifuge tube to a
standardised concentration of 25ng, whereby it was pulse centrifuged and stored on ice.
1µl of the primer stock was transferred to a new microcentrifuge tube along with 9µl of
sterile MGH2O using a sterile pipette, creating a working stock concentration of 10µM
and stored on ice. Master mix was produced containing 25µl PWO master mix (Roche),
18µl MGH2O and 2µl primer pair mix (Eurofins) per reaction. DNA was then transferred
to a sterile 0.2ml PCR tube along with 45µl of the master mix, whereby it was then pulse
centrifuged and stored on ice.
Step Target size 500-1000 bp
1. Polymerase activation 95o C 2 minutes
2. Denature 95o C 15 seconds
3. Annealing 62o C for 30 seconds
4. Extension 72o C for 30 seconds
5. Repeat steps 2-4 30 cycles
6. Final extension 72o C for 7 minutes
Table 2-3. Table PWO master mix PCR conditions resulting in the bovine SRY product 874bp product
2.8.6 KOD Hot Start (PCR)
Bovine genomic DNA was standardised to 25ng throughout. PCR setup was performed
in a sterile environment. A master mix containing KOD hot start buffer (1x), MgSO4
(1.5mM), dNTPS (2mM), forward and reverse primers (0.5µM) and KOD hot start
polymerase (0.02U/µl) was produced. All components were transferred into a sterile
eppendorf. MGH2O was calculated to produce a total volume of 25µl. Reactions were
then subjected to the conditions in table 2.2.

Rebecca Jennings
88
Step Target size 500-1000 bp
1. Polymerase activation 95o C 2 minutes
2. Denature 95o C 15 seconds
3. Annealing 61.3o C for 30 seconds
4. Extension 70o C for 20 seconds
5. Repeat steps 2-4 40 cycles
6. Final extension 75o C for 10 minutes
Table 2-4. KOD Hot Start PCR conditions resulting in the bovine SRY 874bp PCR product.
2.8.7 PCR gel preparation
A 1.4% gel as described in section 2.4.5.2 was made to visualise the amplicons.
2.8.7.1 DNA extraction from sperm
Genomic DNA was extracted from buffered porcine sperm suspension. 50µl of sperm
suspension was transferred to a clean microcentrifuge tube along with 1ml of wash
buffer (150mM NaCl, 10mM EDTA pH 8.0) and mixed through inversion. The sample was
then centrifuged for 10 minutes at 6,000g to pellet the sperm cells and the supernatant
was discarded. 500µl of the wash buffer was used to resuspend the pellet before the
sample was centrifuged for 2 minutes at 15,000g, the supernatant was removed and the
pellet subjected to 300µl of a lysis buffer (500 mM NaCl, 100 mM TRIS, 10 mM EDTA, 1%
sodium dodecyl sulphate (SDS), 100 mM DTT, pH 8.0) whereby the sample was incubated
for 90 minutes in a 65oC water bath. Post incubation 150µl of 7.5M ammonium acetate
was added to the sample to precipitate the dissolved proteins, the sample was then
centrifuged for 10 minutes at 15,000g after this the supernatant was transferred to a
fresh microcentrifuge tube and the tube containing the pellet discarded. In order to
isolate the genomic DNA 900µl of isopropanol was supplemented to the tube and spun
at 20,000g for 10 minutes, after this the supernatant was discarded and the pellet was
washed in 500µl of 98-100% ethanol and centrifuged as before. To finish, the
supernatant was removed and the pellet left to air dry at room temperature, after this
Rebecca Jennings
89
the DNA was rehydrated in 20µl of TE buffer (1mM of EDTA, 10mM tris pH8.0) and stored
at –20oC. The following morning the DNA samples were thawed and pulse centrifuged
before the concentration was measured using a spectrophotometer (NanoDrop,
ThermoScientific) and then returned to previous storage.
2.9 Sperm FISH
2.9.1 Sample preparation
Porcine semen was retrieved through JSR Genetics, boar semen was sent in an extender
buffer which is used to extend the life of the product, in order to remove this 2ml of the
boar semen was transferred to a clean 15ml falcon tube and supplemented with 6ml of
wash buffer (10mM NaCl, 10mM Tris pH7) and centrifuged for 5 minutes at 1,900rpm.
After this, the supernatant was discarded and the sperm pellet was resuspend in a
further 6mls wash buffer and centrifuged for 5 minutes at 1,900rpm, this was then
repeated a further time. Finally, the supernatant was removed and the pellet was
resuspend in ice old fixative (3:1 Methanol/Acetic acid) dropwise, the preparations were
then store at –20oC.
2.9.2 Sperm FISH
Sperm preparation was centrifuged for 5 minutes at 1,900rpm and the supernatant
discarded, the pellet is then supplemented with fresh ice-cold fixative and resuspend,
concentration of sample was determined at this stage through dropping 10µl of the
preparation on a clean glass slide and visualised under a bright field microscope. After
this a further 10µl of the fixed sperm preparation is dropped onto a clean glass slide and
transferred to a dry incubator for 20 minutes to age the preparation. In order to
decondense the preparation the slide is immersed in 10mM DTT, 0.1M Tris pH8 for 20
minutes, the slide was then washed twice in 2 x SSC for 3 minutes to rehydrate, a series
of ethanol washes were used to dehydrate the sample preparation, the slide was then

Rebecca Jennings
90
left to air dry. Labelled probes were used to identify sex determining regions in a number
of species, the probe mix components were as described in section 2.5 (5.5µl formamide
based Hybridisation solution I (Cytocell), 2µl competitor DNA HyBloc (Applied Genetics
Applications), 1.5µl FITC labelled probe and 1µl Texas Red labelled probe), for a final
volume of 10µl. Standard FISH protocol as described in section 2.5 was continued.
2.10 Statistics
2.10.1 Chi-Square test
Chi-square goodness of fit test was used to statistically compare the observed
distribution of sex chromosome carrying spermatocytes against the expected ratio (50%
X chromosome bearing and 50% Y chromosome carrying. Null hypothesis in this test
assumes that there is no significant difference between the observed and expected,
whereas the alternative hypothesis assumes that there is a significant difference
between the observed and the expected. Excel 10 was used to calculate the chi-square
and p-value for this work.
2.10.2 Pearson correlation coefficient
The Pearson correlation coefficient was used to assess the relationship/association
between divergence time (Mya) and success rate (the number of clear FISH signals
present in that species). The Pearson correlation coefficient was used as it provides
information about the magnitude of the association, or correlation, as well as the
direction of the relationship.

Rebecca Jennings
91
3 Comparative molecular cytogenetic study in mammals
3.1 Specific aim 1. To develop a series of universally hybridising
cytogenetic tools (BAC clones) based on sequence selection aimed at
furthering the study of comparative genomics in mammals
(Artiodactyla, Rodentia and Primates)
3.2 Background
It is well established that genome organisation influences genetic variation between
closely rated, and divergent species. Moreover, differences in chromosome number,
chromosome morphology and gene order direct evolution and variation, resulting in
phenotypic differences between species (O’Connor et al., 2019). Initially, comparisons
were achieved through karyotype analysis, whereby large-scale genomic differences
were observed that included paracentric inversions, Robertsonian translocations and
larger reciprocal translocations (Potter et al., 2017). Conventional banding techniques
were initially used to recognize specific chromosomal patterns and resolve complex
karyotypes, however this method requires extensive karyotype training and can prove
error prone. (Pauciullo et al., 2014). Additionally, investigating the karyotypic
rearrangements that differ between species using traditional methods has limitations.
For example, banding analysis can only detect rearrangements that involve >3 Mb of
DNA, while smaller intrachromosomal rearrangements are unrecognisable (Bishop,
2010).
Over the past 30 years, refinements in cytogenetic techniques have permitted karyotype
analysis at a higher resolution than previously possible and this has been largely
achieved through the advent of fluorescence in situ hybridisation (Bishop, 2010). Early
investigations into chromosomal evolution in divergent species used flow-sorted, whole
chromosome paint probes (Ferguson-Smith, Yang and O’Brien, 1998). One of the earliest
reports of chromosome paint usage as a tool for genomic comparison was by Weinberg

Rebecca Jennings
92
in 1990 (Wienberg et al., 1990). At the time this technique contributed significantly to
the identification of conserved homologous regions between divergent species (Levsky
and Singer, 2003). Since then, numerous studies have utilized this method. For example,
Schmitz et al (1998) applied flow-sorted porcine chromosome-specific paints to
metaphase chromosomes of cattle, permitting direct comparison of these distantly
related artiodactyl species using FISH, whereby the group identified a total of 44
homologous segments, including the X chromosome. However, they described
limitations to the use of such techniques, namely, smaller intrachromosomal
rearrangements and gene order cannot be detected through the use of chromosome
painting (Schmitz et al., 1998). More recently, in an attempt to increase the resolution
achievable in comparative cytogenetics, Frohlich et al (2017) examined the karyotypic
relationship between cattle and Cervidae species, using both chromosome paints and
region-specific BAC clones derived from cattle, and discovered that cattle chromosomes
26 and 28 are tandemly fused in one acrocentric chromosome in E. davidianus.
3.2.1 Sequenced-based comparative analysis
Over the past 40 years, genome sequencing and comparative analysis has improved
immensely and the ability to sequence species inexpensively has resulted in the
availability of sequence data from species that extends beyond animals of agricultural or
medical interest (Damas et al., 2017). Today, high quality genome sequence information
is available for many mammalian, and other vertebrate species, enabling genome
assembly and comparison of evolutionarily divergent species. The ultimate goal of any
genome assembly effort is to produce a sequence contig that spans the entire length of
one chromosome, from the p terminus to the q terminus (chromosome-level) (Damas et
al., 2017). However, it become apparent that draft, or even some so-called
‘chromosome-level’ genome assemblies fail to span the entire length of a given
chromosome, resulting in sub-chromosomal sized scaffolds (Damas et al., 2017).
Moreover, they fail to provide sufficient comparative information regarding structure
and organisation on a chromosome level (Lewin et al., 2009), contiguity of de novo
genome assemblies ensures completeness and is essential for structural variation and

Rebecca Jennings
93
linkage analysis (Jiao et al., 2017). Today, newer sequencing techniques such as PacBio
and Dovetail produce long-reads (LRS >10kb) that were expected to overcome the
limitations faced when using NGS short-reads (150-300bp) to assemble to a
‘chromosome level’ (Mantere, Kersten and Hoischen, 2019). However, unforeseen
restrictions are emerging, including library preparation while LRS technologies require
fresh material or intact cells and protocols for the isolation and handling of ultra-long,
high molecular weight DNA all require improvement. Additionally, contigs do not span
across chromosomal centromeres and heterochromatin blocks (Damas et al., 2017).
Therefore, de novo sequenced genome assemblies are often highly fragmented,
meaning that additional assembly algorithms are required to place together the NGS or
LRS scaffolds into longer contigs. RACA is an example of this. RACA requires a fully
assembled reference genome from the same order of the target species, where it then
orientates and orders NGS sequence scaffolds, producing sub-chromosome-sized
predicted chromosome fragments (PCF) (Kim et al., 2013). Additionally, computational
tools like Evolution Highway Chromosome Browser can be used visualize the assembled
data and compare the genomes of multiple species (Larkin and Farre-Belmonte, 2014).
Larkin et al (2014) compared the genomes of 11 mammalian species including pig, using
Satsuma synteny program, the block results were then visualized using evolution
highway chromosome browser and comparative chromosome location established
(Larkin., and Farre-Belmonte, 2014).
In 2017, a novel approach was developed to upgrade fragmented, de novo sequenced
NGS genomes to the chromosome level. The technique utilised a combination of
computational algorithms, including RACA to order scaffolds into PCFs. PCR and
computational verification was then applied to validate correct placement. Finally, PCFs
were then applied to metaphase chromosomes of the target species using a universal
set of avian BAC probes (Damas et al., 2017). This approach successfully upgraded
fragmented NGS genome assemblies of five avian species (pigeon, peregrine falcon,
budgerigar, saker falcon and ostrich). The resulting chromosme level assemblies
Rebecca Jennings
94
contained >80% of the genome and were comparable to similar sequencing and mapping
techniques (O’Connor et al., 2018). To date, this combined approach is limited to avian
species, with the exception of Larkin et al (2006) who reported a similar in silico and
cytogenetic technique in mammals, whereby BACs assigned to cattle chromosome 19
(BTA19) were mapped to mink chromosome 8 using FISH mapping (Larkin et al., 2006).
In a study prior to this, Larkin et al (2006a) used BLASTn similarity search to anchor
selected cattle BACs to human chromosome 17 (HSA17) and mouse chromosome 11
(MMU11) sequences, with five blocks of synteny observed in the comparative map of
BTA19 and HSA17 (Larkin et al., 2006a). With this in mind, Larkin et al (2006b) expanded
upon this work through the application of seven BACs, selected in aforementioned study
(Larkin et al., 2006a), to metaphase chromosomes of the mink. Successful hybridisations
were observed throughout, therefore establishing that BACs selected using genome
conservation in silico analysis hybridised well to distantly related species.
With the success of this combined approach in mind, the purpose of this study was to
generate preliminary data using non-selected (positional) cattle BACs and sequence-
based selected cattle BACs, extracted from previous studies (Larkin et al., 2006ab), to
examine if sequence-based selection increases hybridisation success rates in mammals.
Finally, use this data to refine selection criteria in preparation to create a universal set
of human BAC probes that hybridise across distantly related species, with the intention
of mapping de novo sequenced genome to a chromosome level. To achieve this, human
BACs were selected by colleagues at RVC with that selection based on genomic
properties defined through previous avian work, and preliminary data reported in this
study. The selection criteria included low repeat percentage, high mean all score and GC
content (gene rich).
The ultimate goal of any genome assembly effort is to create a contiguous sequenced
read from the p terminus to the q terminus of each individual chromosome (Damas et
al., 2017). Emerging techniques i.e. PacBio, BioNano and Dovetail still fail to achieve this
Rebecca Jennings
95
read length, this is demonstrated in the most recent assembly of the western lowland
gorilla (Kamilah August 2019). In this work PacBio RSII was used to produce an assembly
that consisted of 5,705 scaffolds, with 220 gaps between the scaffolds, meaning that
multiple scaffolds span the length of each chromosome. To overcome this problem in
birds a novel approach was developed to assembly de novo avian genome assemblies to
a chromosome level, using a combination of computational algorithms and physical
mapping of scaffolds to chromosomes, thus creating a universal panel of avian BACs that
could be used to generate chromosome-level assemblies (Damas et al., 2017). The
purpose of this study was to establish whether a similar feat can be achieved in mammals
through the use of BAC probes previously isolated in Artiodactyls (cattle), rodents (mice)
and primates (humans).
3.2.2 Artiodactyla
The mammalian order Artiodactyl comprises of around 200 extant species which are
grouped taxonomically into ten families, including Bovidae, Cervidae and Suidae (Rubes
et al., 2012; Kulemzina et al., 2009). Species within this order vary dramatically, both
phenotypically and karyotypically. For example, the Indian muntjac (Muntiacus muntjak)
possesses the lowest diploid number observed in mammals (2n=6/7), whilst the
presence of B chromosomes has been identified in the Siberian roe deer (Capreolus
pygargus, 2n = 70 + 1-14 B's) (Graphodatsky., et al, 2011). For this reason, and due to
the agricultural domestication of certain species found in this order (pig, sheep cattle)
they are of interest to scientists globally, partly due to their economic value. Multiple
research programs have sought to identify the karyotypic relationships between closely
related species in this Order. Originally, this was performed through conventional
cytogenetic approaches which included the comparison of chromosome banding, (see
section 2.6.1.1) (Kulemzina et al., 2009). Using a traditional method, it was proposed by
Wurster and Benirschke (1968), that the ancestral Bovidae karyotype was similar to that
of present-day cattle (2=60), adding that the karyotypic evolution observed in Bovids
derived primarily from Robertsonian translocations). Subsequently, comparative

Rebecca Jennings
96
analysis of livestock species was limited to a small set of gene markers, at that time only
70 genes had been mapped between sheep and pig and around 140 between cattle and
pig (Frönicke and Wienberg, 2001). In the decade that followed, comparative analysis
highlighted the importance of chromosome painting mediated through FISH, which
served to provide an overview of the major conserved homology between two divergent
species, defining the boundaries of homology. As discussed throughout this thesis
comparative genomics has moved into a new era, analysis now occurs at the sequence
level. However, sequence data alone fails to answer certain basic biological questions
pertaining to karyotype (chromosome) evolution and speciation events (Damas et al.,
2017). Moreover, the need to develop a method to physically anchor sequence reads to
their specific chromosome was addressed in avian species, and this work demonstrated
that Order-specific BACs may facilitate the same in mammals. Therefore, it is of scientific
interest to develop a panel of BACs that would assist in the de novo assembly of genomes
of species from within the Artiodactyl Order. A preliminary panel is described in this
study.
3.2.3 Rodentia
Rodentia is the largest mammalian Order, constituting almost half of all mammals with
over 2000 extant species including mice, rats, hamsters and voles. Rodents are
characterised by rootless, continuously growing incisors that are perpetually sharp due
to gnawing and chewing. The basic high-level taxonomy of Rodentia is divided into the
infraorders Hystricognathi and Sciurognathi which are characterised by the angle of the
lower jaw in relation to the incisors, first recognised by Tullberg in 1899. It is estimated
that the lineage which led to the last common ancestor of mouse (Mus) diverged from
humans approximately 90 million years ago (Kumar et al., 2017). Due to phylogenetic
and physiological similarities the mouse has served as a model for human biology and
disease for many years. Paired now with the ability to create transgenic, knockout and
knockin mice means that they are a powerful research tool resulting in an increase in
their use (Perlman, 2016). Therefore, considerable scientific interest has been directed

Rebecca Jennings
97
towards the mouse. Numerous genomic studies have highlighted the genetic
homologies between humans and mice. For example, early studies found that the mouse
genome is 14% smaller than that of humans and at the nucleotide level approximately
40% of the human genome will align to the mouse genome (Waterson., et al 2002).
Previously, it was found that the ancestral mammalian X chromosome gene order is
retained in a number of species including, cat, pig, horse and humans (Sandstedt and
Tucker, 2004). However, the order of genes located on the mouse X chromosome is
rearranged when compared to other mammalian species, indicating chromosomal
rearrangement during evolution of this species (Sandstedt and Tucker, 2004). In addition
to this, early gene linkage efforts identified that the gene order on human Xq is almost
the same as on rat X chromosome, suggesting that only small number of
intrachromosomal rearrangements have occurred between human Xq and rat X. This is
in stark contrast to the reported rearrangements observed between rat X and mouse X
(Kuroiwa et al., 2001). Recent phylogenetic analysis predicts that the mouse diverged
from the rat approximately 20 million years ago (Kumar et al., 2017). With this in mind,
a small panel of 8 BACs were selected using comparative alignment tools which enabled
detection of syntenic regions on the X in both rat and mouse. Once verified on the mouse
the BACs were then used to investigation X chromosome evolution in rodents.
3.2.4 Primates
It is well established that humans are great apes, sharing many physiological and
anatomical elements with both gorillas and chimpanzees, these similarities were initially
described by Darwin and Huxley in the first evolutionary studies investigating human
origin (Darwin and Huxley, 1863). Archaeological and phylogenetic analysis predicts that
the human – chimpanzee speciation event occurred approximately six million years ago,
while the human – gorilla speciation event happened roughly ten million years ago
(Scally et al., 2012). Any comparative effort initially begins by comparing humans and
primates. Chu and Bender (1962) were the first to compare karyotypes of human and
lemurs, commenting only on chromosome number and morphology (Chu and Bender,

Rebecca Jennings
98
1962). Throughout the 1970s, as cytogenetic techniques improved and chromosomal
bands could be visualized, again the human karyotype was compared to the primate
counterparts (Ferguson-Smith et al., 2005). Similarly, human and primate karyotypes
were the first to be examined when chromosome painting was introduced in the late
1980s. Moreover, cytogenetic techniques have improved, and the resolution obtained
using chromosomes paints has increased in parallel, thus permitting the identification of
numerous inversions, insertions and translocation throughout the different primate
species (figure 3-1).
Figure 3-1. Comparison of chromosomes in primates using chromosome paints. Colour-banded
chromosomes of human, chimpanzee, gorilla and orang-utan, arranged according to the numbering
system of the human ideogram. Note the 5;17 translocation in the gorilla and the numerous inversions
involving chromosomes 5, 9 and 17 in chimpanzee, and 8, 9, 10, 12, 14 and 18 in gorilla, and 3, 7, 9, 11, 12
and 20 in orang-utan. Chromosomes in each cases colour-banded using multicolour gibbon probe set
(Harlequin FISH, Cambio). Source: From Ferguson-Smith et al. (2000).

Rebecca Jennings
99
3.3 Specific aims
The specific aims of the experiments described in this study were as follows:
Specific aim 1a. Cross-species analysis of a set of pre-existing cattle BACs on
Artiodactyla species
Specific aim 1b. To use a panel of 7 cattle BACs originally applied by Larkin et al
(2006), (and selected on the basis of sequence homology) to assess the extent to
which they hybridize universally across a series of phylogenetically diverse
mammals.
Specific aim 1c. To proactively to generate a preliminary panel of sequence-based
BACs originally derived from cattle, mouse X chromosome and human and ask the
extent to which they hybridize across a range of mammalian species, and resolve a
series of previous intractable evolutionary changes.
Specific aim 1d. To test the hypothesis that sequence selection significantly improves
BAC hybridization efficiency cross-species and speculate as to the prospects of a
universal mammalian BAC set as was developed for birds (Damas et al., 2017).
3.4 Species Selection Criteria
Artiodactyl species used in this work are described in section 3.1.2, species were selected
due to karyotypic differences which include diploid number, chromosome morphology
and evolutionary distance from reference. Karyotypes were produced for four of the five
species analysed in this chapter, species selected are shown in table 3-1, alongside
taxonomic groupings and the evolutionary distance from the reference Bos taurus
(Kumar et al., 2017).

Rebecca Jennings
100
3.5 BAC selection criteria and conservation score definition
Individual order specific BAC selection is detailed in section 2.3. It is important to note
that BACs selected from Larkin et al (2006ab) were used to test the hypothesis that
evolutionally conserved BACs would hybridise across distantly related species. Larkin et
al (2006a) used BLASTn similarity search to anchor selected cattle BACs to human
chromosome 17 (HSA17) and mouse chromosome 11 (MMU11) sequences, with five
blocks of synteny observed in the comparative map of BTA19 and HSA17 (Larkin et al.,
2006a) (see section 3.1.1). Therefore, in silico studies by Larkin et al (2006ab) identified
seven high scoring, evolutionally conserved chromosome 19 cattle BACs, all of which
mapped to mink chromosome 8p, human chromosome 17 and mouse chromosome 11
(Larkin et al., 2006).
All conservational BACs were selected by RVC. Throughout the duration of this study,
selection algorithms and computational platforms improved. Conservation score (shown
as mean all throughout this work) was obtained via PhastCONs (Phylogenetic, Analysis,
with Space/Time models) platform, whereby conservation level is scored from 0 to 1. All
bioinformatic analysis was performed by Dr Denis Larkin and his team at RVC.
Species Divergent time (MYA) relative to
cattle (Kumar., et al 2017)
Diploid number
Waterbuck 24 mya 52 / 54
Red lechwe 24 mya 46
Sheep 24 mya 54
Mouse deer 44 mya 32
Pig 64 mya 38
Table 3-1. Karyotypic analysis of species used in specific aim 1a. Divergent times obtained from Kumar et
al (2017).

Rebecca Jennings
101
BAC Clone ID Chromosome arm Mean all % repeats
GC
Content
CH240-207O5 19 q 0.1186 28.7051 56.1653
CH240-233H17 19 q 0.2805 26.4699 40.792
CH240-253B15 19 q 0.289 25.0213 47.9061
CH240-403K17 19 q 0.2269 25.5416 53.3137
CH240-459E1 19 q 0.0789 41.4381 45.4545
CH240-45D9 19 q 0.1671 25.2656 42.6868
CH240-67N13 19 q 0.1359 29.0167 51.3158
Table 3-2. Table to show cattle chromosome 19 BACs selected based on conservation and previous in silico
analysis that mapped them to human chromosome 17 and mouse chromosome 11. Cytogenetic analysis
mapped the BACs to mink chromosome 8. BACs taken from (Larkin et al,.2006). Table contains location on
chromosome, mean all conservation score, repeat % and GC content.
3.6 Results
3.6.1 Specific aim 1a. Cross-species analysis of a set of pre-existing cattle BACs on
Artiodactyla species
Overall
Cross-species hybridisation was observed in all five (Waterbuck, Red lechwe, Sheep,
Chevrotain, Pig) species examined. However, success rates (refer to section 2.6.2)
ranged from 80% to 5%, declining with evolutionary distance (table 3-4). The full set of
BAC-specific results can be found in table 6. The results generated from this work
indicate that BACs selected for position alone hybridised to well to other Bovids, as
demonstrated by the results obtained using red lechwe (80%). However, when BACs
were applied to metaphase chromosomes of the sheep this result dropped to 5%, which
was more likely due to suboptimal chromosome preparation that prevented complete
analysis. Additionally, the results suggest that when positional BACs are applied to
species that fall beyond the family Bovidae hybridisation success falls to around 16%. For

Rebecca Jennings
102
this reason, it was decided that in order to create a universal set of BACs, that hybridise
across distantly related species, BAC selection would require in silico analysis. Therefore,
BAC selection for subsequent work was performed by colleagues at RVC using
PhastCons.
Defassa waterbuck exist in two distinct karyotypic forms, with a polymorphic fusion of
chromosomes 6 and 18 present in some populations. The results here show that the
waterbuck used in this study all possess a 2n=54 karyotype, illustrating the absence of
this fusion in this population. Results obtained through the use of the novel FISH-based
method, described in section 2.5.1.2, were consistent with previous publications, with
defassa waterbuck and red lechwe exhibiting the centromeric fusion of BTA 1;19 and
BTA 2;25, (Kingswood et al., 2000); see also 3-2. Bespoke BAC combinations were
incorporated into blank boxes in the comparative system, as shown in figure 2-2,
permitting all hybridisations on the same slide.
Species Divergent time
(MYA) relative to
cattle
Diploid number BAC Success Rate
American bison 5 mya 60 93%
Waterbuck 24 mya 52/54 47%
Red lechwe 24 mya 46 80%
Sheep 24 mya 54 5%
Mouse deer 44 mya 32 15%
Pig 64 mya 38 17%
Table 3-3. Overall success rate of subtelomeric cattle BACs on metaphase chromosomes of American
bison, Defassa waterbuck, Red lechwe, pig, Javan chevrotain, and sheep. Divergence time and
chromosome number included. Divergent times - Kumar et al (2017).
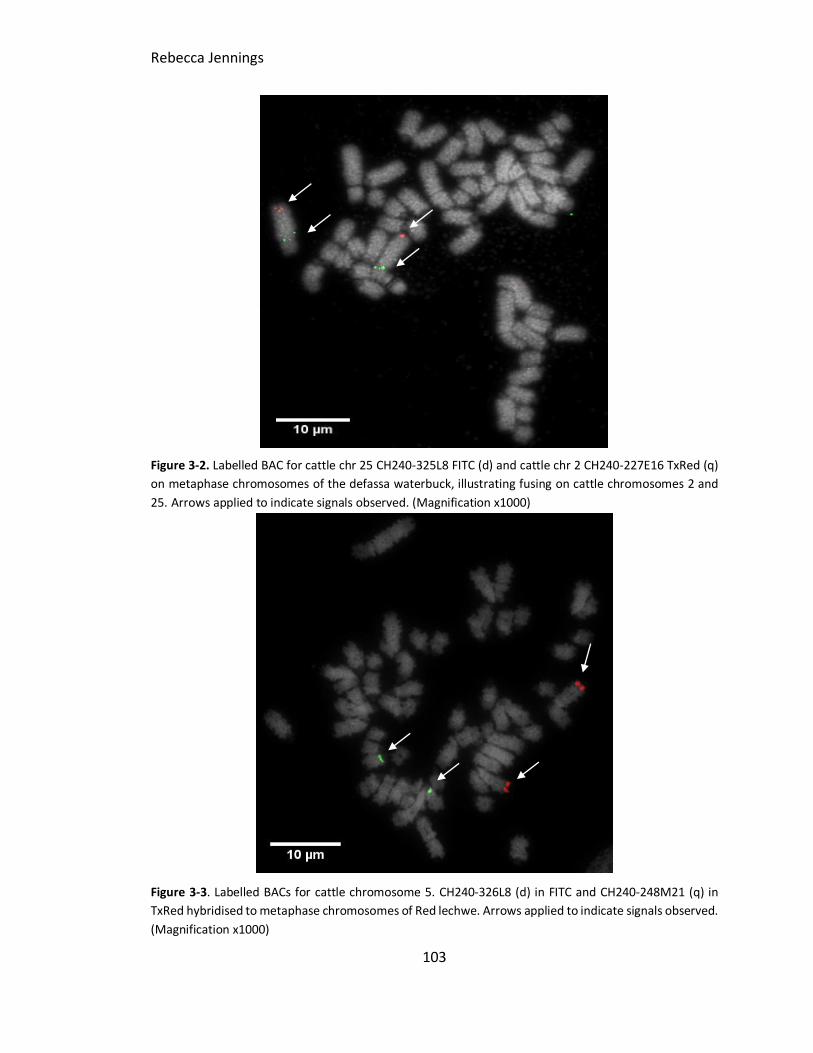
Rebecca Jennings
103
Figure 3-2. Labelled BAC for cattle chr 25 CH240-325L8 FITC (d) and cattle chr 2 CH240-227E16 TxRed (q)
on metaphase chromosomes of the defassa waterbuck, illustrating fusing on cattle chromosomes 2 and
25. Arrows applied to indicate signals observed. (Magnification x1000)
Figure 3-3. Labelled BACs for cattle chromosome 5. CH240-326L8 (d) in FITC and CH240-248M21 (q) in
TxRed hybridised to metaphase chromosomes of Red lechwe. Arrows applied to indicate signals observed.
(Magnification x1000)

Rebecca Jennings
104
BAC Clone ID Chr Arm Mean All
%In Repeats
GC Success BBA 5 mya
OAR 24mya
KEL 25 mya
KLE 24mya
TNI 44 mya
SSC 64 mya
CH240-321O2 1 p 0.0508 45.292 46.047 4 Yes No Yes Yes Yes No
CH240-96M6 1 q 0.1125 46.369 41.666 4 Yes No Yes Yes Yes No
CH240-457J20 2 p 0.0191 73.388 43.318 2 Yes No Yes No No No
CH240-227E16 2 q 0.0499 41.285 51.256 3 Yes No Yes Yes No No
CH240-154A5 3 p - - - 1 No No Yes No No No
CH240-302G6 3 q 0.0363 43.558 45.999 4 Yes No Yes Yes Yes No
CH240-416O20 4 p 0.0247 64.725 38.394 3 Yes No Yes Yes No No
CH240-193F3 4 q 0.0573 27.963 48.701 3 Yes No Yes Yes No No
CH240-326L8 5 p 0.0712 52 39.225 2 No Yes No Yes No No
CH240-248M21 5 q 0.0637 32.604 48.234 4 Yes Yes Yes Yes No No
CH240-5F18 6 q 0.0312 35.668 52.206 2 Yes No No Yes No No
CH240-415D2 7 p 0.0495 60.12 43.06 1 No No No Yes No No
CH240-276L16 7 q 0.0273 72.32 41.032 2 Yes No No No Yes No
CH240-443K7 8 p 0.0443 52.21 43.139 2 Yes No No Yes No No
CH240-241A18 8 q 0.0734 57.717 39.194 3 Yes No No Yes No Yes
CH240-25A3 9 p 0.058 67.214 37.704 1 Yes No No No No No
CH240-298I24 9 q 0.0157 29.993 50.296 1 Yes No No No No No
CH240-421B11 10 p 0.0737 37.03 44.325 5 Yes No Yes Yes Yes Yes
CH240-325F16 10 q 0.0589 39.551 52.221 5 Yes No Yes Yes Yes Yes
CH240-314K5 11 p 0.0472 46.273 46.46 4 Yes No Yes Yes No Yes

Rebecca Jennings
105
BAC Clone ID Chr Arm Mean All %In Repeats GC Content
Success BBA 5 mya
OAR 24 mya
KEL 24 mya
KLE 24mya
TNI 44 mya
SSC 64 mya
CH240-344O3 11 q 0.0817 18.745 63.498 3 Yes No No Yes No Yes
CH240-261C16 12 p 0.0441 61.672 37.117 3 Yes No Yes Yes No No
CH240-262C4 12 q 0.0484 33.655 46.353 3 Yes No Yes Yes No No
CH240-461F6 13 p 0.0636 58.324 40.573 2 Yes No No Yes No No
CH240-471M8 13 q 0.0704 50.222 45.247 2 Yes No No Yes No No
CH240-319C15 14 p ND 26.488 58.913 3 Yes No Yes Yes No No
CH240-240M1 14 q 0.0585 45.691 46.304 3 Yes No Yes Yes No No
CH240-225A24 15 p 0.0614 63.256 38.441 2 Yes No No Yes No No
CH240-386C2 15 q 0.0531 36.031 52.317 1 Yes No No No No No
CH240-139M7 16 p 0.062 39.524 47.393 5 Yes Yes Yes Yes Yes No
CH240-315I10 16 q 0.0915 29.448 47.481 4 Yes No Yes Yes Yes No
CH240-267P22 17 p 0.0652 59.349 39.979 2 Yes No No Yes No No
CH240-313I20 17 q 0.0674 24.005 57.661 2 Yes No No Yes No No
CH240-14C14 18 p 0.0523 55.699 43.587 2 Yes No Yes No No No
CH240-436N22 18 q 0.0442 44.638 51.744 4 Yes No Yes Yes No Yes
CH240-349G17 19 p 0.0395 65.426 38.048 3 Yes No Yes No No Yes
CH240-207O5 19 q 0.1186 28.705 56.165 5 Yes Yes Yes Yes No Yes
CH240-394L14 20 p 0.0909 49.977 42.328 2 Yes No No Yes No No
CH240-339K22 20 q 0.0333 29.39 55.425 2 Yes No No Yes No No
CH240-301D14 21 p 0.0424 69.408 40.701 3 Yes No No Yes yes No

Rebecca Jennings
106
BAC Clone ID Chr Arm Mean All
%In Repeats
GC Success BBA 5 mya
Sheep 24my
KEL 25 mya
KLE 24mya
TNI 44 mya
SSC 64 mya
CH240-62O23 21 q 0.043 46.251 50.112 2 Yes No No Yes No No
CH240-426O23 22 p 0.0382 55.084 42.072 3 Yes No No Yes Yes No
CH240-302J21 23 p 0.0344 77.712 38.398 1 Yes No No No No No
CH240-374G6 23 q 0.0004 27.028 51.161 3 Yes No Yes Yes No No
CH240-382F1 24 p 0.0731 47.069 45.121 4 Yes No No Yes yes Yes
CH240-19L13 24 q 0.0778 48.168 39.996 2 Yes No No Yes No No
CH240-198J4 25 p 0.0827 18.664 58.804 4 Yes No Yes Yes No Yes
CH240-379D22 25 q 0.0371 25.588 56.274 4 Yes No Yes Yes No Yes
CH240-428I10 26 p 0.0948 50.354 38.767 4 Yes No Yes Yes Yes No
CH240-389H1 26 q 0.0229 28.424 59.082 2 Yes No No Yes No No
CH240-7G11 27 p 0.0384 46.599 41.282 4 Yes No Yes Yes Yes No
CH240-352M8 27 q 0.0482 36.302 44.895 2 Yes No No Yes No No
CH240-313L4 28 p 0.034 44.964 45.489 3 Yes No Yes Yes No No
CH240-63D12 28 q 0.0664 44.298 44.22 1 No No No Yes No No
CH240-367D17 29 p 0.0532 64.057 42.116 3 Yes No Yes Yes No No
CH240-257F23 29 q 0.0543 42.388 53.878 3 Yes No Yes Yes No No
CH240-121E1 X p 0.1772 46.838 41.484 2 Yes No No Yes No No
CH240-472J20 X q 0.0517 47.906 43.694 3 Yes No No Yes Yes No
Table 3- 4. Table to show successful hybridisations using bovine subtelomeric cattle BACS on species within the artiodactyl order. Table include species,
chromosome location of BAC, repeat % content of BAC, conservation mean all score and GC content of BAC. Species include BBA-American Bison, OAR-
domestic sheep, KEL-waterbuck, KLE-red lechwe, SSC-domestic pig and TNI-Javan chevrotain.
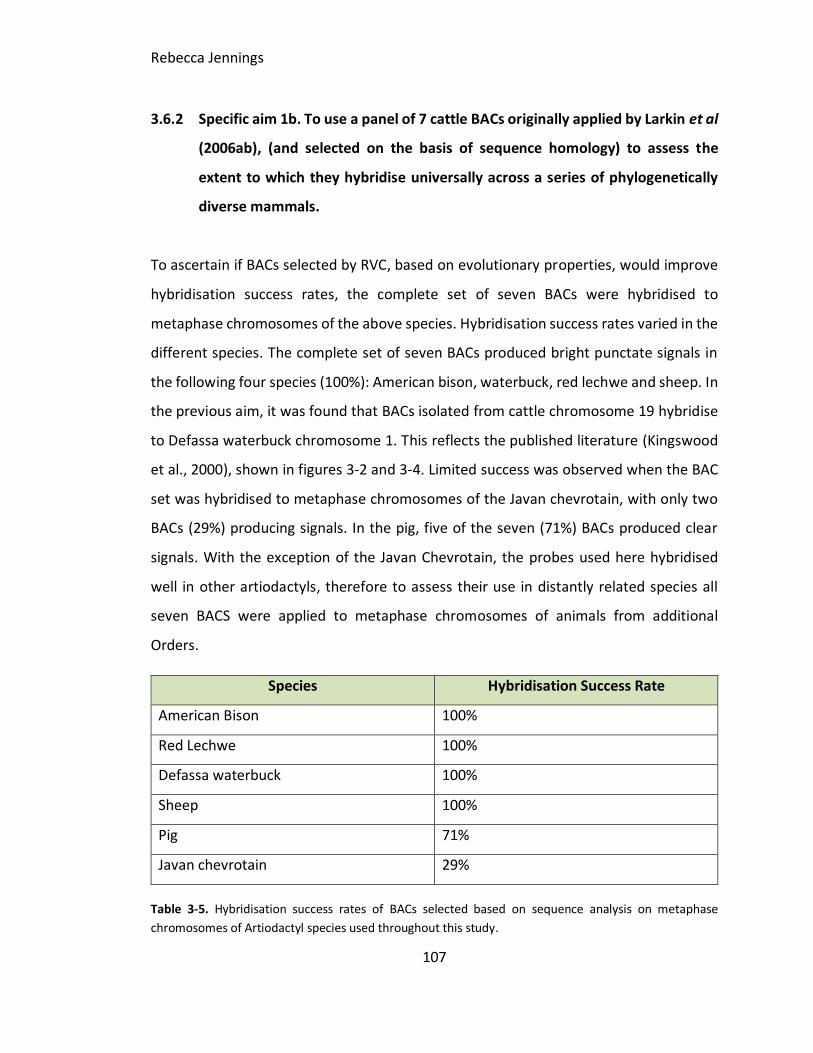
Rebecca Jennings
107
3.6.2 Specific aim 1b. To use a panel of 7 cattle BACs originally applied by Larkin et al
(2006ab), (and selected on the basis of sequence homology) to assess the
extent to which they hybridise universally across a series of phylogenetically
diverse mammals.
To ascertain if BACs selected by RVC, based on evolutionary properties, would improve
hybridisation success rates, the complete set of seven BACs were hybridised to
metaphase chromosomes of the above species. Hybridisation success rates varied in the
different species. The complete set of seven BACs produced bright punctate signals in
the following four species (100%): American bison, waterbuck, red lechwe and sheep. In
the previous aim, it was found that BACs isolated from cattle chromosome 19 hybridise
to Defassa waterbuck chromosome 1. This reflects the published literature (Kingswood
et al., 2000), shown in figures 3-2 and 3-4. Limited success was observed when the BAC
set was hybridised to metaphase chromosomes of the Javan chevrotain, with only two
BACs (29%) producing signals. In the pig, five of the seven (71%) BACs produced clear
signals. With the exception of the Javan Chevrotain, the probes used here hybridised
well in other artiodactyls, therefore to assess their use in distantly related species all
seven BACS were applied to metaphase chromosomes of animals from additional
Orders.
Species Hybridisation Success Rate
American Bison 100%
Red Lechwe 100%
Defassa waterbuck 100%
Sheep 100%
Pig 71%
Javan chevrotain 29%
Table 3-5. Hybridisation success rates of BACs selected based on sequence analysis on metaphase
chromosomes of Artiodactyl species used throughout this study.

Rebecca Jennings
108
Figure 3-4. FISH Image of cattle chromosome 19 on Waterbuck. Labelled selected cattle BACs from cattle
chromosome 19 on metaphase chromosomes of Defassa waterbuck. BACs – CH240-43K17 (FITC) and
CH240-233H17 (TxRed). BACs appear to localise to waterbuck chromosome 1. Arrows applied to indicate
signals observed. (Magnification x1000)
To extend this study and gather preliminary data for non-Artiodactyls, the complete set
of seven BACs were hybridised to an additional nine mammalian species, from five
taxonomically distinct orders (Artiodactyl (controls), Primates, Rodentia, Carnivora and
Chiroptera). The complete set was analyzed on the species shown in table 3-6. Species
with an estimated divergence time of around 25 million years achieved a 100%
hybridisation success rate. Species with an increased evolutionary distance from Bos
taurus failed to achieve such a high success rate. However, it was apparent that two of
the seven BACs used in this work (CH240-233H17 and CH240-43K17), produced bright
signals in all species examined (100%) and 11 of the 14 species tested (79%) respectively
(see table 3-7).

Rebecca Jennings
109
Species Divergent time relative to cattle (Kumar., et al 2017)
Diploid number
Blackbuck 24 mya 31-33 (XY) 30-32 (XX)
Barasingha 27 mya 56
Pig 64 mya 38
Camel 65 mya 74
Horse 78 mya 64
Dog 78 mya 78
White-throated round-eared bat
79 mya 34
Black lemur 96 mya 44
Mouse 96 mya 40
Human 96 mya 46
Table 3-6. Species included in the extended cross-species study. Divergent times – Kumar et al (2017).
Diploid numbers for numerous papers used throughout this study.
Species Hybridisation Success Rates
Blackbuck 100%
Barasingha 100%
Pig 71%
Camel 14%
Horse 29%
Dog 29%
White-throated round-eared bat 29%
Black lemur 29%
Mouse 79%
Human 14%
Table 3-7. Hybridisation success rates with different mammals using cattle BACs selected using the
sequenced-based approach described in section 3.3.1.
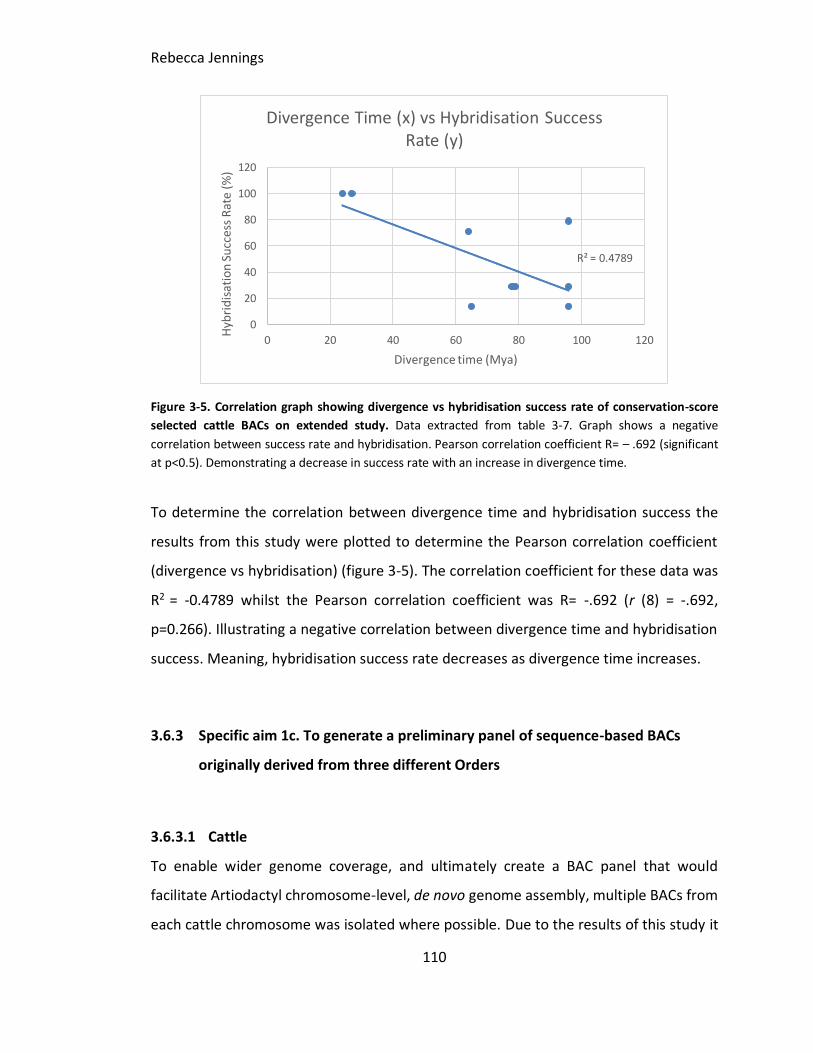
Rebecca Jennings
110
Figure 3-5. Correlation graph showing divergence vs hybridisation success rate of conservation-score
selected cattle BACs on extended study. Data extracted from table 3-7. Graph shows a negative
correlation between success rate and hybridisation. Pearson correlation coefficient R= – .692 (significant
at p<0.5). Demonstrating a decrease in success rate with an increase in divergence time.
To determine the correlation between divergence time and hybridisation success the
results from this study were plotted to determine the Pearson correlation coefficient
(divergence vs hybridisation) (figure 3-5). The correlation coefficient for these data was
R2 = -0.4789 whilst the Pearson correlation coefficient was R= -.692 (r (8) = -.692,
p=0.266). Illustrating a negative correlation between divergence time and hybridisation
success. Meaning, hybridisation success rate decreases as divergence time increases.
3.6.3 Specific aim 1c. To generate a preliminary panel of sequence-based BACs
originally derived from three different Orders
3.6.3.1 Cattle
To enable wider genome coverage, and ultimately create a BAC panel that would
facilitate Artiodactyl chromosome-level, de novo genome assembly, multiple BACs from
each cattle chromosome was isolated where possible. Due to the results of this study it
R² = 0.4789
0
20
40
60
80
100
120
0 20 40 60 80 100 120
Hyb
rid
isat
ion
Su
cces
s R
ate
(%)
Divergence time (Mya)
Divergence Time (x) vs Hybridisation Success Rate (y)

Rebecca Jennings
111
was decided that developing a universal set of human BACs for mammalian genome
assembly would not be possible. However, considering the results it may be possible to
develop an order-specific panel (table 3-8). At the time of submission this BAC panel had
not yet been validated.
Origin Chromosome BAC Clone ID
Cattle 1 CH240-475L23
Cattle 1 CH240-377G11
Cattle 2 CH240-420D19
Cattle 2 CH240-244I9
Cattle 2 CH240-386C22
Cattle 2 CH240-196L19
Cattle 2 CH240-514B6
Cattle 3 CH240-465O11
Cattle 3 CH240-474H7
Cattle 3 CH240-288K11
Cattle 3 CH240-297K13
Cattle 3 CH240-379P12
Cattle 4 CH240-60H16
Cattle 5 CH240-339P15
Cattle 6 CH240-124I9
Cattle 8 CH240-88P10
Cattle 8 CH240-18F3
Cattle 8 CH240-182G15
Cattle 9 CH240-412N22
Cattle 9 CH240-341J24
Cattle 11 CH240-256G3

Rebecca Jennings
112
Origin Chromosome BAC Clone ID
Cattle 11 CH240-258M12
Cattle 11 CH240-288F24
Cattle 12 CH240-329H2
Cattle 14 CH240-402O18
Cattle 14 CH240-396P6
Cattle 16 CH240-208E13
Cattle 17 CH240-26E21
Cattle 18 CH240-339M3
Cattle 19 CH240-333I1
Cattle 19 CH240-171A7
Cattle 19 CH240-97L3
Cattle 21 CH240-380F23
Cattle 21 CH240-344K23
Cattle 22 CH240-124B16
Cattle 23 CH240-310I12
Cattle 24 CH240-33I13
Cattle 24 CH240-305N4
Cattle 25 CH240-451P4
Cattle 26 CH240-368N15
Cattle 26 CH240-244D2
Cattle 26 CH240-224G7
Cattle 27 CH240-457O14
Cattle 28 CH240-394O23
Cattle 28 CH240-236P3
Cattle 29 CH240-226K16
Cattle X CH240-128C9
Cattle X CH240-29N7

Rebecca Jennings
113
Origin Chromosome BAC Clone ID
Cattle X CH240-359O3
Cattle X CH240-48F6
Table 3-8. Preliminary cattle BACs selected from CHORI 240 library through sequence-based HI-C
interactional analysis with mean all score and BAC clone ID
3.6.3.2 Mouse X chromosome sequence-selected BACs to illustrate mouse-rat
differences
Initially, the BACs selected were applied to metaphase chromosomes of the mouse to
assess correct placement within the karyotype (all hybridised to the X chromosome).
Overall, eight of the nine BACs successfully hybridised to the mouse X chromosome.
However, BAC clone CH29-542H8 was identified on an autosomal chromosome,
suggesting an error in the genome assembly as National Center for Biotechnology
Information (NCBI) places the BAC at the q terminus of the X chromosome, as shown in
figure 3-6. Once a working BAC panel was established all BACs produced clear, bright
punctate signals in rat also. The full list of BACs used in this work and the misplaced clone
(table 3-9).
Figure 3-6. Image to show BAC placement. Screenshot from NCBI clone finder demonstrating the
misplacement of autosomal CH29-542H8 on the X chromosome.

Rebecca Jennings
114
A minimum of 15 images per BAC were captured on metaphase chromosomes of the
mouse, and measured using FLpter on ImageJ; FLpter plugin measures the fractional
location of the probe along any chromosome relative to the p terminus (Sakamoto, et
al., 1995). The FLpter results obtained from this work validated genome sequence data.
To identify chromosomal rearrangements on the X chromosome in Rodentia species, the
full panel was applied to metaphase chromosomes of the rat (Rattus). Overall, the
selected BAC panel produced bright, punctate signals on metaphase chromosomes of
the rat. As before, a total of 15 images minimum per BAC were obtained and FLpter
measurements calculated. Results from both species are shown in table 3-10.
Origin BAC Start position End position
Mouse CH29-616G12 20,866,497 21,030,659
Mouse CH29-109N14 11,184,900 11,379,881
Mouse CH29-559H10 155,242,985 155,427,877
Mouse CH29-612I13 81,417,924 81,586,610
Mouse CH29-525I9 106,071,045 106,247,595
Mouse CH29-560M19 136,590,744 136,742,184
Mouse CH29-618G7 38,355,729 38,555,106
Mouse CH29-44F20 55,930,647 56,130,390
Mouse CH29-542H8 164775019 164972138
Table 3-9. X chromosome mouse BACs selected using sequence-based approach. Start and end position
included.
To investigate degrees of conservation and evolutionary rearrangements in this lineage
an additional three Rodentia species were to be used, including Peromyscus
maniculatus, Peromyscus californicus and Peromyscus leucopus. Cell lines were
established in all three species; however, culture conditions were unfavourable for
cellular proliferation which resulted in cellular senescence. For this reason,
investigations into X chromosome rearrangements within the rodent linage could not
extend beyond results detailed in this section (mouse and rat).
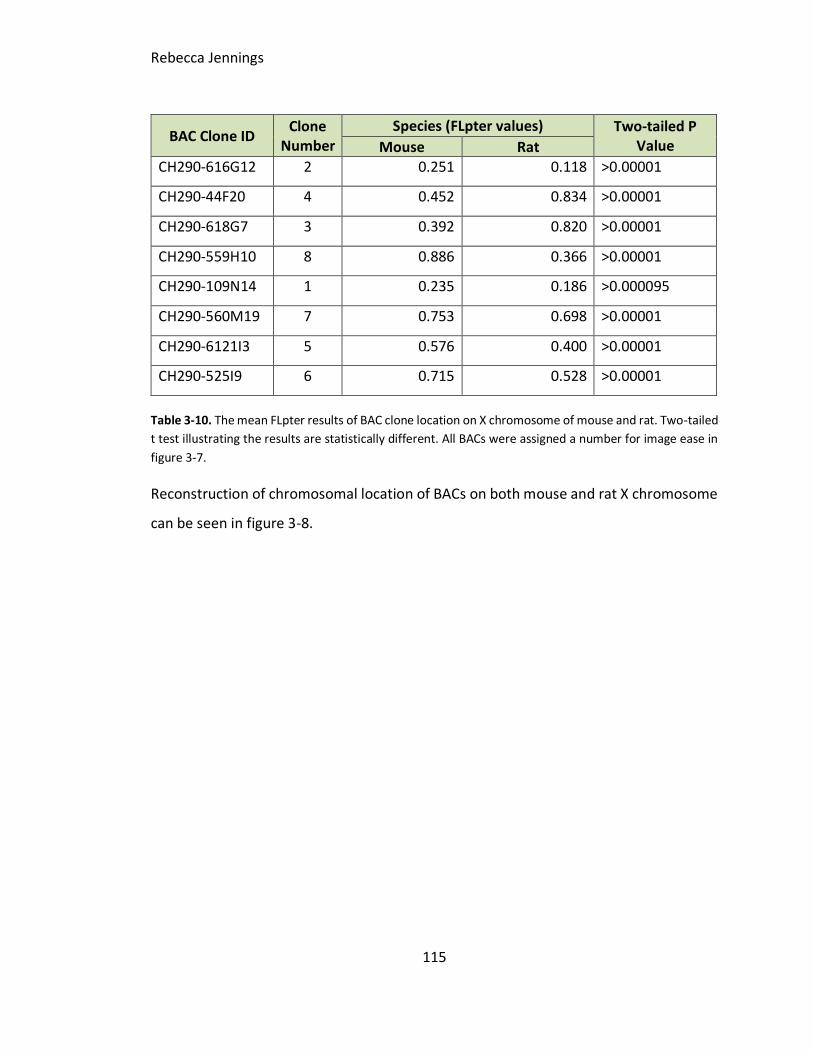
Rebecca Jennings
115
BAC Clone ID Clone
Number Species (FLpter values) Two-tailed P
Value Mouse Rat CH290-616G12 2 0.251 0.118 >0.00001
CH290-44F20 4 0.452 0.834 >0.00001
CH290-618G7 3 0.392 0.820 >0.00001
CH290-559H10 8 0.886 0.366 >0.00001
CH290-109N14 1 0.235 0.186 >0.000095
CH290-560M19 7 0.753 0.698 >0.00001
CH290-6121I3 5 0.576 0.400 >0.00001
CH290-525I9 6 0.715 0.528 >0.00001
Table 3-10. The mean FLpter results of BAC clone location on X chromosome of mouse and rat. Two-tailed
t test illustrating the results are statistically different. All BACs were assigned a number for image ease in
figure 3-7.
Reconstruction of chromosomal location of BACs on both mouse and rat X chromosome
can be seen in figure 3-8.

Rebecca Jennings
116
Figure 3-7. Schematic of BAC placement using FLpter results. Schematic of FLpter measurement results
of selected BACs on metaphase chromosomes of mouse and rat, demonstrating numerous
rearrangements between both species. BAC clone number IDs shown in table 3-9.
3.6.3.3 Human selected BACs (conservation selected)
The human genome was selected as the reference in this work for two reasons: firstly, it
is considered the most completely curated mammalian genome, and secondly for the
considerably large BAC library available. BACs were selected through a sequence-based
approach (refer to 3.3.1).
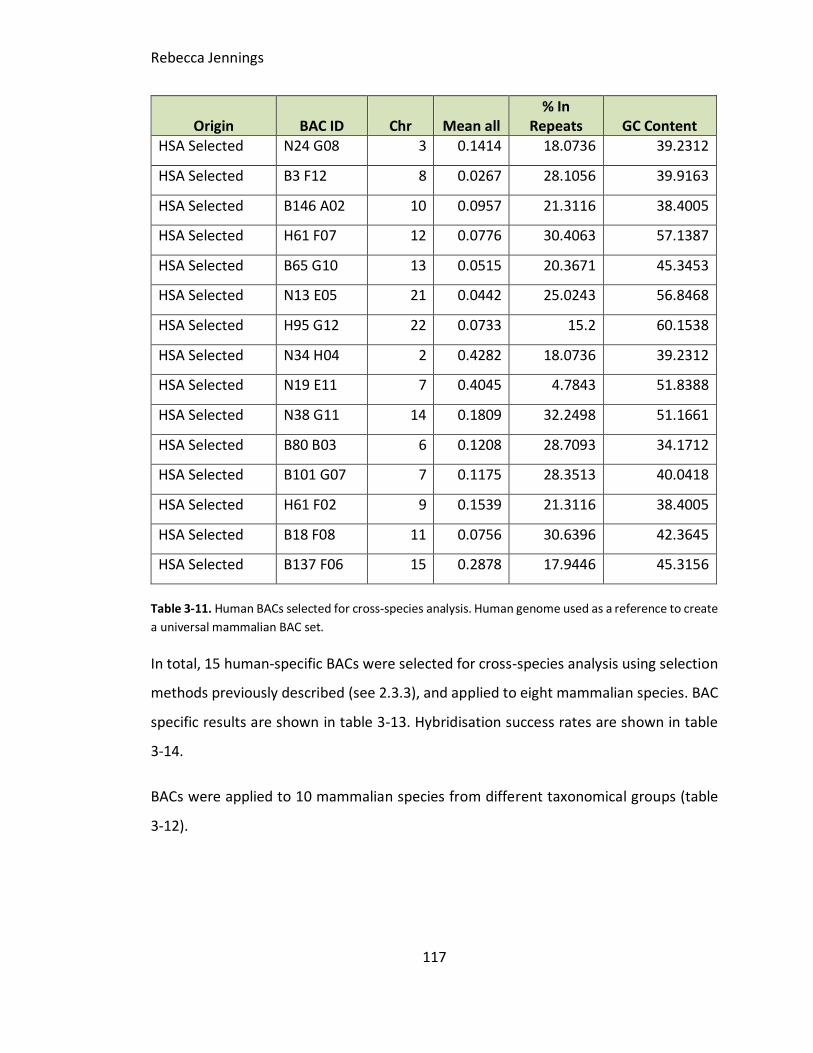
Rebecca Jennings
117
Origin BAC ID Chr Mean all % In
Repeats GC Content HSA Selected N24 G08 3 0.1414 18.0736 39.2312
HSA Selected B3 F12 8 0.0267 28.1056 39.9163
HSA Selected B146 A02 10 0.0957 21.3116 38.4005
HSA Selected H61 F07 12 0.0776 30.4063 57.1387
HSA Selected B65 G10 13 0.0515 20.3671 45.3453
HSA Selected N13 E05 21 0.0442 25.0243 56.8468
HSA Selected H95 G12 22 0.0733 15.2 60.1538
HSA Selected N34 H04 2 0.4282 18.0736 39.2312
HSA Selected N19 E11 7 0.4045 4.7843 51.8388
HSA Selected N38 G11 14 0.1809 32.2498 51.1661
HSA Selected B80 B03 6 0.1208 28.7093 34.1712
HSA Selected B101 G07 7 0.1175 28.3513 40.0418
HSA Selected H61 F02 9 0.1539 21.3116 38.4005
HSA Selected B18 F08 11 0.0756 30.6396 42.3645
HSA Selected B137 F06 15 0.2878 17.9446 45.3156
Table 3-11. Human BACs selected for cross-species analysis. Human genome used as a reference to create
a universal mammalian BAC set.
In total, 15 human-specific BACs were selected for cross-species analysis using selection
methods previously described (see 2.3.3), and applied to eight mammalian species. BAC
specific results are shown in table 3-13. Hybridisation success rates are shown in table
3-14.
BACs were applied to 10 mammalian species from different taxonomical groups (table
3-12).

Rebecca Jennings
118
Species Divergent time (MYA) relative to Human
Diploid chromosome number
Gorilla 9 mya 48
Sulawesi macaque 29 mya 42
Howler monkey 43 mya 52
Red lechwe 96 mya 48
Sheep 96 mya 54
Pig 96 mya 38
Dog 96 mya 78
Rusty spotted cat 96 mya 38
Mouse 96 mya 40
Table 3-12. Karyotypic analysis of species used in this work. Divergent times obtained using timetree.org
(Kumar et al., 2017).
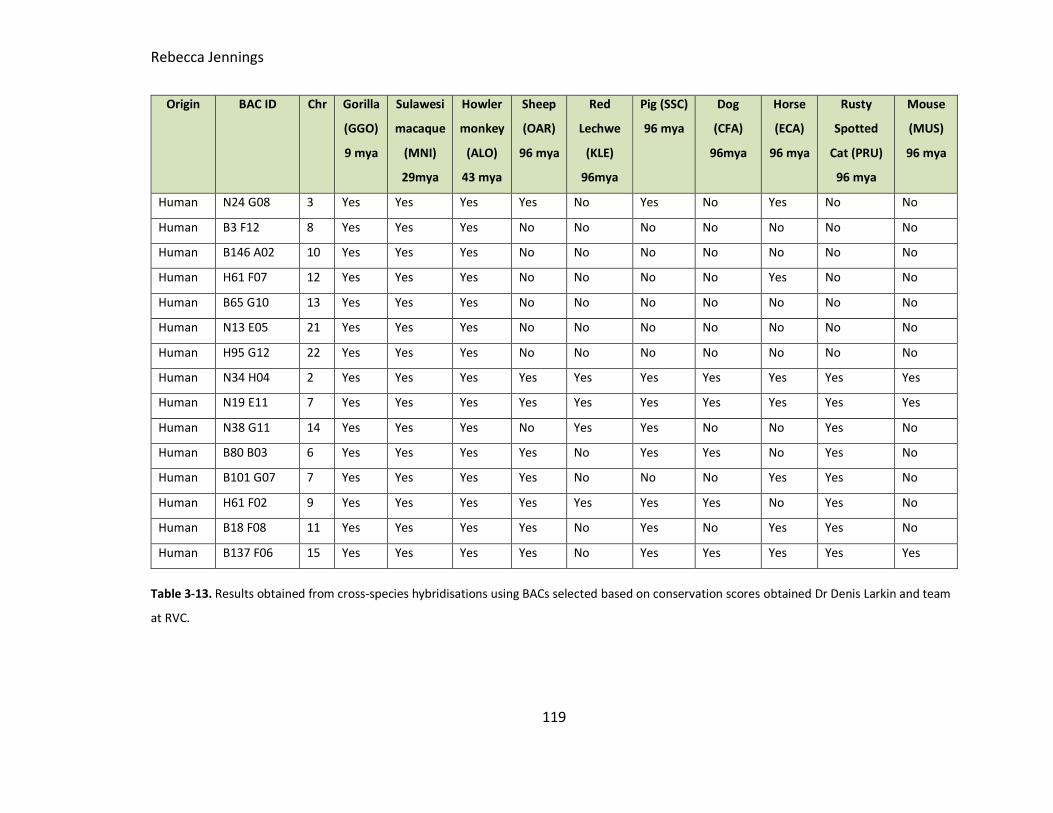
Rebecca Jennings
119
Origin BAC ID Chr Gorilla
(GGO)
9 mya
Sulawesi
macaque
(MNI)
29mya
Howler
monkey
(ALO)
43 mya
Sheep
(OAR)
96 mya
Red
Lechwe
(KLE)
96mya
Pig (SSC)
96 mya
Dog
(CFA)
96mya
Horse
(ECA)
96 mya
Rusty
Spotted
Cat (PRU)
96 mya
Mouse
(MUS)
96 mya
Human N24 G08 3 Yes Yes Yes Yes No Yes No Yes No No
Human B3 F12 8 Yes Yes Yes No No No No No No No
Human B146 A02 10 Yes Yes Yes No No No No No No No
Human H61 F07 12 Yes Yes Yes No No No No Yes No No
Human B65 G10 13 Yes Yes Yes No No No No No No No
Human N13 E05 21 Yes Yes Yes No No No No No No No
Human H95 G12 22 Yes Yes Yes No No No No No No No
Human N34 H04 2 Yes Yes Yes Yes Yes Yes Yes Yes Yes Yes
Human N19 E11 7 Yes Yes Yes Yes Yes Yes Yes Yes Yes Yes
Human N38 G11 14 Yes Yes Yes No Yes Yes No No Yes No
Human B80 B03 6 Yes Yes Yes Yes No Yes Yes No Yes No
Human B101 G07 7 Yes Yes Yes Yes No No No Yes Yes No
Human H61 F02 9 Yes Yes Yes Yes Yes Yes Yes No Yes No
Human B18 F08 11 Yes Yes Yes Yes No Yes No Yes Yes No
Human B137 F06 15 Yes Yes Yes Yes No Yes Yes Yes Yes Yes
Table 3-13. Results obtained from cross-species hybridisations using BACs selected based on conservation scores obtained Dr Denis Larkin and team
at RVC.

Rebecca Jennings
120
Species BAC success rate using sequence selection
Gorilla (GGO) 9 mya 100%
Sulawesi macaque (MNI) 29mya 100%
Howler monkey (ALO) 43 mya 100%
Pig (SSC) 96 mya 53%
Rusty Spotted Cat (PRU) 96 mya 53%
Sheep (OAR) 96 mya 47%
Horse (ECA) 96 mya 47%
Dog (CFA) 96mya 33%
Red Lechwe (KLE) 96mya 27%
Mouse (MUS) 96 mya 20%
Table 3-14. Hybridisation success rates using 15 sequence-based selected BACs on 10 mammalian species.
Overall success rates in this work varied considerably, from 100% observed in all
primates, to 20% observed in mouse (table 3-14). These results suggest that selection
based on sequence analysis increases hybridisation success rates in species from within
the same order as the reference genome, in this case primates. Considering this result,
in addition to results generated in the previous sections, BACs destined for de novo
genome assembly should be selected using computational programs. Additionally, BACs
should be isolated from a species within the same order as the de novo assembly, to
ensure increased success rates.
The results from this study were plotted to determine the Pearson correlation coefficient
(divergence vs hybridisation) (figure 3-7). The correlation coefficient for these data was
R2 = -0.8292 whilst the Pearson correlation coefficient was R= -0.910 (r (8) = -.910,
p=0.00257). Illustrating a negative correlation between divergence time and
hybridisation success. Meaning, hybridisation success rate is seen to decrease as
divergence time increases.
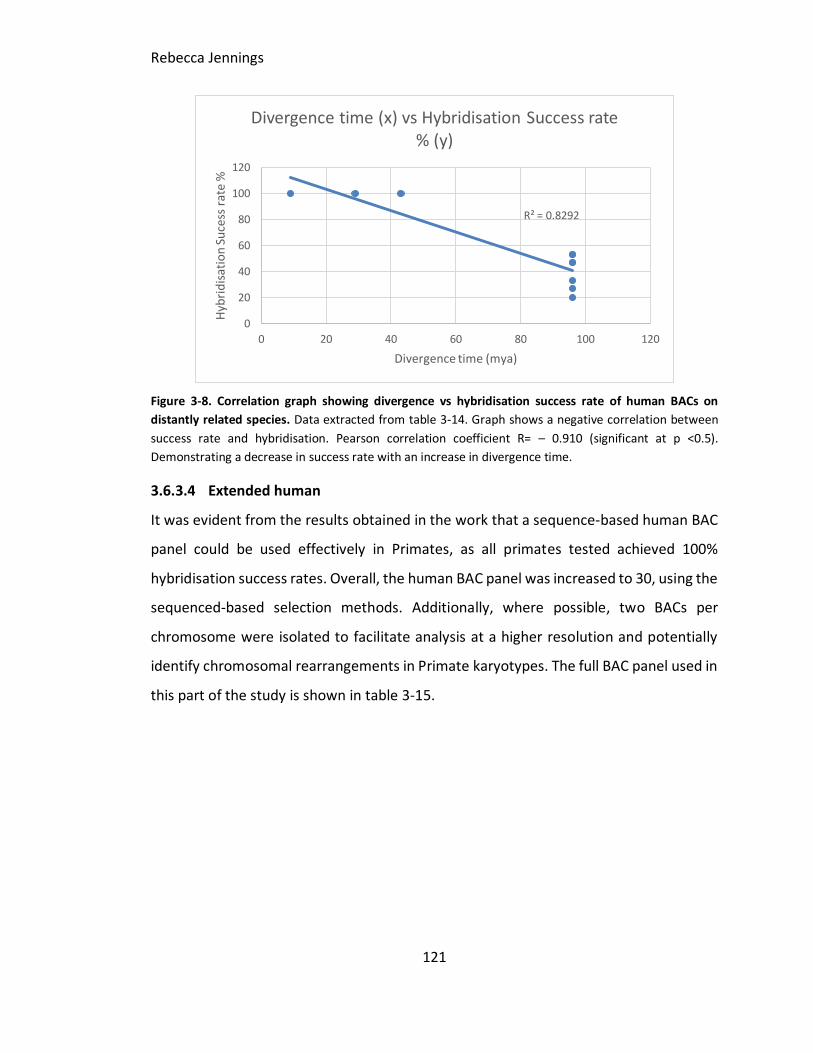
Rebecca Jennings
121
Figure 3-8. Correlation graph showing divergence vs hybridisation success rate of human BACs on
distantly related species. Data extracted from table 3-14. Graph shows a negative correlation between
success rate and hybridisation. Pearson correlation coefficient R= – 0.910 (significant at p <0.5).
Demonstrating a decrease in success rate with an increase in divergence time.
3.6.3.4 Extended human
It was evident from the results obtained in the work that a sequence-based human BAC
panel could be used effectively in Primates, as all primates tested achieved 100%
hybridisation success rates. Overall, the human BAC panel was increased to 30, using the
sequenced-based selection methods. Additionally, where possible, two BACs per
chromosome were isolated to facilitate analysis at a higher resolution and potentially
identify chromosomal rearrangements in Primate karyotypes. The full BAC panel used in
this part of the study is shown in table 3-15.
R² = 0.8292
0
20
40
60
80
100
120
0 20 40 60 80 100 120
Hyb
rid
isat
ion
Su
cess
rat
e %
Divergence time (mya)
Divergence time (x) vs Hybridisation Success rate % (y)

Rebecca Jennings
122
Origin Name Chr Position Mean All %InRepeats GC content
Hum H107 B07 1 mid 0.1141 47.259 47.5404
Hum H81 B04 1 p 0.1184 19.7188 62.8403
Hum B128 B12 2 mid 0.2351 22.9507 39.5496
Hum B28 G10 2 p 0.0677 34.0974 44.138
Hum N24 G08 3 q 0.1414 18.0736 39.2312
Hum N41 A09 3 p 0.2486 24.1762 36.3339
Hum B120 C09 5 q 0.1087 39.3012 36.0226
Hum H22 G06 5 mid 0.1023 36.9315 37.4251
Hum N19 E11 7 p 0.4045 4.7843 51.8388
Hum B101 G07 7 q 0.1175 28.3513 40.0418
Hum B146 A02 10 p 0.0957 21.3116 38.4005
Hum B116 C02 10 q 0.0415 34.1224 55.8
Hum B103 G04 11 p 0.0684 20.7018 60.4945
Hum B18 F08 11 q 0.0756 30.6396 42.3645
Hum H87 H12 12 p 0.3304 11.8707 50.9732
Hum H61 F07 12 q 0.0776 30.4063 57.1387
Hum B65 H06 13 mid 0.0981 52.2748 34.3136
Hum B65 G10 13 q 0.0515 20.3671 45.3453
Hum N38 G11 14 p 0.1809 32.2498 51.1661
Hum B15 E12 14 q 0.0869 42.3149 45.6795
Hum H23 E01 16 p No info No info No info
Hum B79 C07 16 q 0.063 39.2409 51.3428
Hum N31 B10 17 mid 0.1789 43.4967 52.2768
Hum H23 F08 17 q 0.1292 37.3257 54.4581
Hum B32 D06 20 p 0.0583 45.1594 45.0498
Hum H57 E05 20 q 0.1157 45.1601 39.8058
Hum B45 H08 21 p 0.1034 54.0677 40.091

Rebecca Jennings
123
Origin Name Chr Position Mean all %InRepeats GC Content
Hum N13 E05 21 q 0.0442 25.0243 56.8468
Hum H87 A10 X p 0.1267 54.027 37.9322
Hum B11 H06 X mid 0.2445 88.8604 37.442
Table 3-15. Human BACs select using sequenced-based approached including BAC clone ID, chromosomal
location in human, mean all score, GC content and %In repeats.
To ascertain whether this BAC panel could be used to facilitate chromosome-level
genome assembly, BACs selected were applied to metaphase chromosomes of four
primate species that differ in divergence time (relative to human) and chromosome
number as shown in table 3-16.
Species Divergent time relative to Human
Diploid chromosome number
Gorilla 9 mya 48
De Brazza’s monkey 24 mya 62
Sulawesi macaque 29 mya 42
Howler monkey 43 mya 52
Table 3-16. Karyotypic analysis including diploid chromosome number of species used in this work.
Divergent times obtained using timetree.org (Kumar et al., 2017).
Overall, variable results were obtained from the use of the BACs selected in section
3.4.3.4. In both the gorilla and Sulawesi macaque, 100% hybridisation was achieved with
all BACs producing bright, punctate signals. However, in both the Howler monkey and
De Brazza’s monkey a reduced success rate was observed at 67% and 57% respectively.
Interestingly, the results here indicate that the closest (gorilla (9 mya)) and most distant
(Sulawesi macaque (43 mya)) relative to human achieved the highest success rate
overall. Shown in tables 3-16 and 3-18.

Rebecca Jennings
124
Name Chr Gorilla (9 mya)
De Brazza’s (24 mya)
Howler monkey (29 mya)
Sulawesi macaque (43 mya)
H107 B07 1 Yes Yes Yes Yes
H81 B04 1 Yes Yes Yes Yes
B128 B12 2 Yes Yes Yes Yes
B28 G10 2 Yes Yes Yes Yes
N24 G08 3 Yes Yes Yes Yes
N41 A09 3 Yes Yes Yes Yes
B120 C09 5 Yes Yes No Yes
H22 G06 5 Yes Yes No Yes
N19 E11 7 Yes Yes Yes Yes
B101 G07 7 Yes Yes Yes Yes
B146 A02 10 Yes Yes No Yes
B116 C02 10 Yes Yes No Yes
B103 G04 11 Yes No Yes Yes
B18 F08 11 Yes Yes Yes Yes
H87 H12 12 Yes No Yes Yes
H61 F07 12 Yes No Yes Yes
B65 H06 13 Yes Yes Yes Yes
B65 G10 13 Yes Yes Yes Yes
N38 G11 14 Yes No Yes Yes
B15 E12 14 Yes No Yes Yes
H23 E01 16 Yes No Yes Yes
B79 C07 16 Yes No Yes Yes
N31 B10 17 Yes No No Yes
H23 F08 17 Yes No No Yes
B32 D06 20 Yes No No Yes
H57 E05 20 Yes No No Yes
B45 H08 21 Yes No No Yes

Rebecca Jennings
125
Name Chr Gorilla (9 mya)
De Brazza’s (24 mya)
Howler monkey (29 mya)
Sulawesi macaque (43 mya)
N13 E05 21 Yes No No Yes
H87 A10 X Yes Yes No Yes
B11 H06 X Yes Yes No Yes
Table 3-17. Full BAC list test on metaphase chromosomes of gorilla, De Brazza’s monkey, howler monkey
and Sulawesi macaque
Species Hybridisation Success Rates
Gorilla 100%
Sulawesi Macaque 100%
Howler monkey 67%
De Brazza’s monkey 57%
Table 3-18. Hybridization success rates with full human BAC panel applied to gorilla, howler monkey, De
Brazza’s monkey and Sulawesi macaque.
3.6.4 Specific aim 1d. To test the hypothesis that sequence selection significantly
improves BAC hybridization efficiency cross-species and speculate as to the
prospects of a universal mammalian BAC set as was developed for birds (Damas
et al., 2017).
To ascertain if selection based on in silico analysis improves hybridisation across distantly
related species, the results from the above aims were compared. To obtain an average
success rate for each order, the species-specific hybridisation results were collected
from each specific aim, and divided by the total number of species tested within that
Order (table 3-19). It is evident from the results achieved here, that cross-species BAC
hybridisation efficiency is improved when sequence selected BACs are applied to species
from within the same Order. This is demonstrated in all categories; sequence selected
human BACs achieved 81% success when applied to other Primates, however Artiodactyl
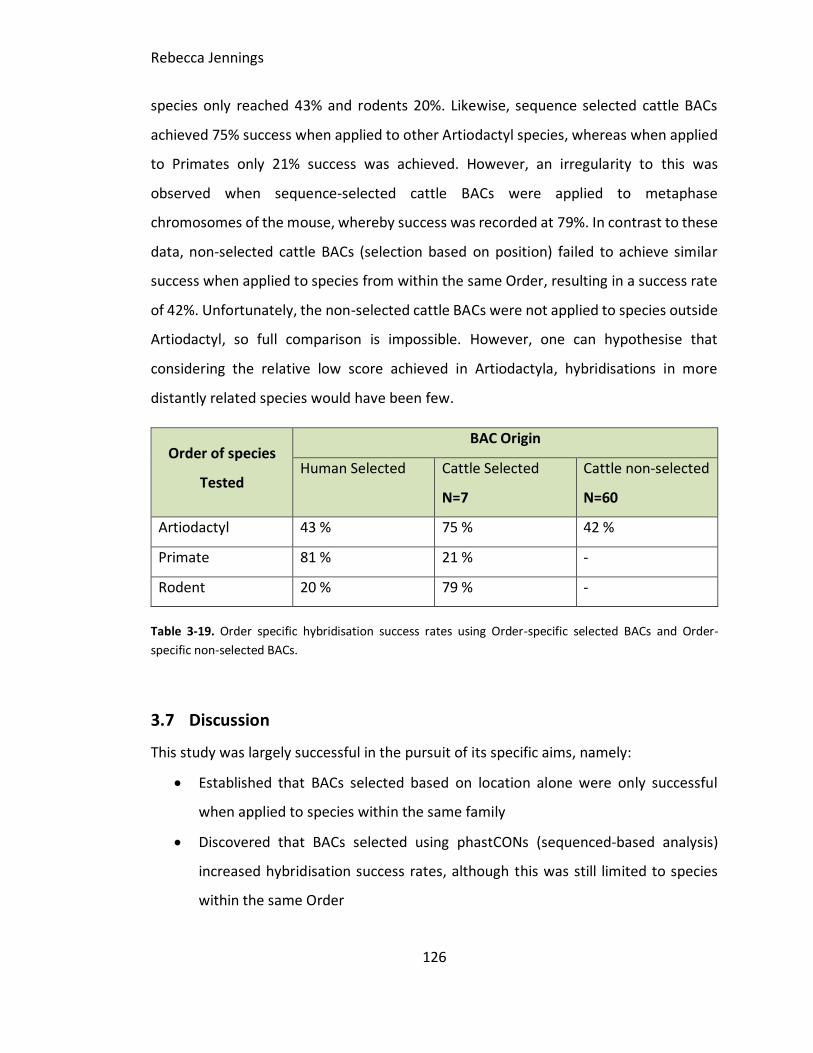
Rebecca Jennings
126
species only reached 43% and rodents 20%. Likewise, sequence selected cattle BACs
achieved 75% success when applied to other Artiodactyl species, whereas when applied
to Primates only 21% success was achieved. However, an irregularity to this was
observed when sequence-selected cattle BACs were applied to metaphase
chromosomes of the mouse, whereby success was recorded at 79%. In contrast to these
data, non-selected cattle BACs (selection based on position) failed to achieve similar
success when applied to species from within the same Order, resulting in a success rate
of 42%. Unfortunately, the non-selected cattle BACs were not applied to species outside
Artiodactyl, so full comparison is impossible. However, one can hypothesise that
considering the relative low score achieved in Artiodactyla, hybridisations in more
distantly related species would have been few.
Order of species
Tested
BAC Origin
Human Selected Cattle Selected
N=7
Cattle non-selected
N=60
Artiodactyl 43 % 75 % 42 %
Primate 81 % 21 % -
Rodent 20 % 79 % -
Table 3-19. Order specific hybridisation success rates using Order-specific selected BACs and Order-
specific non-selected BACs.
3.7 Discussion
This study was largely successful in the pursuit of its specific aims, namely:
Established that BACs selected based on location alone were only successful
when applied to species within the same family
Discovered that BACs selected using phastCONs (sequenced-based analysis)
increased hybridisation success rates, although this was still limited to species
within the same Order

Rebecca Jennings
127
Identified that BACs selected for genome assembly should be isolated from a
reference genome within the same order to increase hybridisation success and
therefore, an Order specific BAC set should be created to complete genome
assembly
3.7.1 Cattle BACs non-selected (selection based on position)
The results described in this chapter have illustrated that BACs selected based on
chromosomal location alone achieve low success rates. Notably a high degree of success
was limited to species within the Bovidae family. An exception to this were results
obtained from the sheep which were likely compromised by suboptimal chromosome
preparations. The success observed in Red lechwe (80%), and to an extent Defassa
waterbuck (47%) is likely due to a relatively short estimated divergence time (<25 mya
Kumar et al., 2017). This suggestion is upheld when comparing the results obtained from
the pig (17%) with a divergence time of 44 million years and chevrotain (15%) at 64
million years (Kumar et al., 2017). As described in section 3.1.2, Kingswood et al (2000)
sought to establish the karyotypic relationship between divergent species and it is
evident from the results obtained here that traditional karyotyping techniques can be
used to elucidate differences in chromosome number and gross structural
rearrangements. This includes centromeric fusions, however identifying the
chromosomes involved in the rearrangement requires tools that permit analysis at a
higher resolution. The subtelomeric BACs used in this work confirmed the previous
findings made by Kingswood et al (2000); i.e. the centromeric fusion of cattle
chromosomes 1 and 19 and cattle chromosomes 2 and 25 that was observed in both the
waterbuck and red lechwe.
Before this study, numerous studies had used chromosome paints in comparative
cytogenetics. However, few used labelled BAC probes for comparative analysis in
distantly related species. The use of these probes in comparative work removes the
ambiguity in chromosome identification and improves the accuracy of predicting

Rebecca Jennings
128
chromosomes involved in evolutionary rearrangements and in identifying segments of
conserved homology between distantly related species.
3.7.2 Cattle BACs selected proactively
Prior to the work presented in this chapter, seven cattle BACs had been selected based
on in silico sequence analysis, conservation scores were applied to each BAC, alongside
information regarding repeat elements, putative gene content and GC content (Larkin et
al., 2006). The results obtained here indicate that sequence-based selection increases
the efficiency of cross-species FISH, however this is limited to species from within the
same Order as the reference (Artiodactyl). Indeed, the hybridisation success observed
when using sequence-selected BACs was almost double that of non-selected BACs (30%
increase in efficiency). Additionally, the results suggest that successful hybridisations
could be achieved in more distantly related species. Notably, 79% of the sequence-
selected BACs hybridized to metaphase chromosomes of the mouse where the
estimated evolutionary distant between the mouse and the reference (Bos Taurus) is 96
million years (Kumar et al., 2017). However, this not true of all the species examined,
only one of the seven BACs tested was observed to hybridize to metaphase
chromosomes of human (14%). Considering this result, in silico selection based on
evolutionary score appears to increase the rate at which hybridisation is achieved in
certain, but not all distantly related species. Furthermore, one of the seven BACs
examined here resulted in a success rate of 100% across 14 species (CH240-233H17),
this BAC was found to have a high mean all conservation score (0.2085), low repeat
content percentage (26.47%) and an average GC content score (40.8). With the results
reported here in mind, it would appear mammalian BACs hybridise to species within the
same order, but increased success is observed in members of the same family. Ideally,
BACs require a low repeat percentage and high mean all score to achieve high
hybridisation success rates.
Rebecca Jennings
129
3.7.3 Selected mouse X chromosome BACs
It is evident that the X chromosome is highly rearranged between the two Rodent
species examined in this work and it is also clear that numerous intrachromosomal
inversions have led to this difference, namely, BACs 1 and 2 (CH29-109N14 and CH29-
616G12) which are noticeably inverted in the rat compared to the mouse. Strikingly, the
BAC order in the mouse (Mus) differs entirely from the BAC order detected in the rat
(Rattus). Considering the divergence time between the species examined (estimated at
21 million years (Kumar et al., 2017)), it would have been beneficial to apply the BAC
panel to chromosome preparation of Apodemus sylvaticus, being that it has a divergence
time of 15 million years from mouse (Kumar et al., 2017). However, suboptimal
chromosome preparations resulted in the inability to accurately complete FLpter
measurements.
3.7.4 Human BACs selected through sequence-based analysis
In this study human BACs isolated using selection criteria described throughout this
chapter were applied to ten mammalian species. It is evident from the results achieved
that 100% success rates can be achieved when human BACs, selected through sequence
analysis, are applied to other primate species. For instance, in the case of the howler
monkey, estimated to have diverged from human approximately 43 million years ago
(Kumar et al., 2017) 100% hybridization success was observed, whereas BACs selected
based on position failed to achieve >80% in species from within the same order.
However, the results here do indicate that hybridization efficiency drops considerably
when sequenced-selected BACs are applied to mammals outside of the Primate order,
with only 20% success being achieved when applied to metaphase chromosomes of the
mouse. The order specific nature of these results could be attributed to two factors.
Firstly, vast divergence at a molecular level is explained in part by the molecular clock
hypothesis. Zucker et al (1962) hypothesized that DNA and protein sequences evolve at
a rate that is relatively constant over time, this is demonstrated by the genetic
differences observed between two species (Kumar et al., 2005). Sequence divergence

Rebecca Jennings
130
and gene expression patterns are two fundamental mechanisms that drive diversity
between different species. For this reason, phenotypic evolution relies on mutations
that change genomic sequences, thus altering protein sequences and affect gene
regulation (Warnefors and Kaessmann, 2013). Therefore, the evolutionary distance
between the reference genome and the examined species is proportional to the
divergence experienced at a sequence level. An increase in evolutionary time could
result in an increase in sequence change which ultimately reduces hybridisation rates. A
recent study found that humans share only 40% of their DNA sequence with the mouse,
given that genome size has remained constant since their divergence, almost 100 million
years ago. This low proportion of ancestral DNA suggests that there has been a large
amount of DNA loss and gain in each lineage (Buckley, Kortschak and Adelson, 2018).
Second to size (~3.1Gb), an additional factor that can create ambiguity in genome
assembly and alignment analysis include heterozygosity, diverse repeat families, regions
of GC% bias and segmental duplications, it is estimated that the above constitutes
around 50% of the human genome (Jain et al., 2018). As shown in this study, BACs with
a low repeat content (alongside high mean all score) had a tendency to produce high
hybridisation success rates.
With this in mind, it is important to reflect upon the previous success experienced using
this approach in birds, and to some extent reptiles. The combined approach was highly
effective, generating five avian chromosome-level genome assemblies (O’Connor et al.,
2018). Avian genomes differ from mammals in numerous ways. Firstly, birds generally
have a smaller genome, which is partly due to a low repeat content and a lower fraction
of transposable elements, as well as shorter introns (Botero-Castro et al., 2017). Previous
work suggest that birds have experienced the loss of many genes, most likely via
evolutionary chromosomal rearrangements, with one genome-wide study estimating
the total number of genes in avian genomes being approximately 70% of that present in
humans (Botero-Castro et al., 2017). The striking differences reported in avian and
mammalian genome architecture and content could be one explanation as to why

Rebecca Jennings
131
limited success was noted in this work. From the results, it is evident that to achieve
success that parallels work reported by O’Connor et al (2018), a BAC set from each
mammalian order is required. Moreover, to effectively create a panel of BACs that will
assist with chromosome-level genome assembly in mammals it is now clear that a BAC
set, selected using selection criteria described throughout, will be required from every
mammalian order. Therefore, this study has significantly advanced developing resources
to enable this, namely a preliminary BAC set for the following three Orders: primates,
artiodactyla and rodents.
3.8 Conclusions
Despite the aforementioned success that this combined approached reported in birds,
and to an extend reptiles, the results here suggest that a similar approach could not be
implemented in mammals. It would appear that BACs selected via in silico (phastCONs)
increases hybridization efficiency, but this is limited to the reference order. Therefore, it
is unlikely that a universal set of human BACs would be created to assist with mammalian
chromosome-level genome assembly. With this in mind however, it is possible that a
number of Order-specific BAC panels could be created for cross-species hybridisations.
For example, a primate set, an artiodactyl set and a rodent set. However, the resources
used in this chapter can nonetheless find huge utility in the screening for chromosome
abnormalities in individual animals. For this reason, the experiments described in this
chapter will be utilised and this forms the basis of the subsequent three chapters.

Rebecca Jennings
132
4 Investigations into sex determination abnormalities and
reproductive issues in mammals
4.1 Specific aim 2. To use molecular cytogenetic tools for the screening
of chromosomal abnormalities in a series of mammals including: pigs,
cattle, horses, tigers and gorilla, investigating the reasons for
reproductive issues in individual animals
4.2 Background
With the ever-increasing popularity of genome sequencing, traditional chromosome
analysis is becoming a dying art. Recent technologies, particularly NGS and third
generation sequencing, have dramatically accelerated the pace of biological research,
whilst at the same time increasing expectations. (Durmaz et al., 2015). The previous
chapter highlighted the importance of chromosome level assembly and thus the role
that traditional and molecular cytogenetics has to play (increasingly so) in de-novo
genome assembly efforts. Armed with this information, reproductive isolation caused by
chromosome rearrangement can be assessed between species. As pointed out in the
general introduction (section 1.5), there are parallels to be drawn between the types of
chromosome abnormality that cause reproductive isolation between species and those
that cause individual reproductive problems in individuals. While modern genomic
approaches such as array CGH and NGS are excellent at detecting unbalanced
rearrangements, such as trisomy or microdeletions, those leading to reproductive
problems (i.e. balanced rearrangements such as inversions and translocations) are still
best detected by traditional cytogenetics, augmented by molecular methods (Shinawi
and Cheung, 2008). Moreover, a cell-by-cell analysis (e.g. for the detection of sex
chromosome mosaicism) is, again, best achieved by (molecular) cytogenetics. Despite
the continuing (and, some would say, increasing) need for non-human cytogenetic
diagnostic tools, laboratories specialising in this are few and far between. Today, clinical

Rebecca Jennings
133
laboratories that focus on human diagnostics rely far more on genomic approaches and
less on chromosome analysis. With this deficit in mind, the purpose of this study was to
utilise pre-existing molecular cytogenetic tools to ascertain the developmental or cause
of infertility in a number of agricultural and zoological animals.
4.3 Case report I – Red River Hog (Potamochoerus porcus)
Blood was drawn following standard phlebotomy from a Red River Hog for cytogenetic
analysis. The animal in this study presented as phenotypically female, however
examination revealed two partially descended testes, a vulva, a small penis and a
vestigial prepuce by the umbilicus. Following examination, the animal was bilaterally
castrated. The hypothesis tested therefore was that this animal was either a
chromosomal male or had male-specific sequences (SRY).
Traditional DAPI-stained metaphase chromosomes found the animal had a normal
female karyotype consisting of 2n=34 (XX), as shown in figure 4-1. FISH was subsequently
used to validate this result using labelled probes for the X chromosome and SRY gene
(WTSI-1061-9B10) were used to detect the presence of a Y chromosome (or at least Y
chromosome sequence) (figure 4-1).
Figure 4-1. Traditional karyotype of Red river hog. DAPI stained metaphase chromosomes of intersex red
river hog. Karyotype comprises of 2n=34 (XX).

Rebecca Jennings
134
Figure 4-2. FISH image showing results for X chromosome BACs on Red river hog. Labelled BAC probes
for X chromosome CH242-19N1 (FITC) and SRY gene WTSI-1061-9B10 (TxRed), illustrating 2n=34 (XX)
karyotype as SRY labelled probe was not detected through dual-colour FISH. Arrows applied to indicate
signals observed. (Magnification x1000)
4.3.1 Discussion
This case study demonstrates that cytogenetic analysis by karyotyping can be used to
establish the following three parameters: chromosome number, large structural
chromosomal rearrangements and the sex of the individual. In the case of the red river
hog traditional methods enabled the diagnosis of a 2n=34 (XX) karyotype, which was
subsequently confirmed using the more targeted FISH approach using a subtelomeric
porcine X chromosome BAC probe and Y specific SRY gene. The absence of the SRY gene
(TxRed signal) indicates that this animal could be an XX male SRY – negative, or that
significant sequence divergence between the different species meant that the SRY was
not detected. The estimated evolutionary distance between the domestic pig (Sus
scorfa) and the red river hog (Potamochoerus porcus) is 16.8 million years (Kumar et al.,
2017). In humans, cases of XX SRY-negative males are incredibly rare. The etiology of one
Rebecca Jennings
135
incident was due to a duplication of 17q, the region containing the SOX9 gene that is
involved in sex determination downstream to the SRY gene (Rajender et al., 2006).
4.4 Case study II Horses (Equus caballus) with ambiguous genitalia
4.4.1 Background
The domestic horse (Equus caballus (2n=64)) belongs to the order Perissodactyla, which
is also known as odd-toed ungulates and contains 17 extant species which are divided
into three distinct families, Equidae (horses, zebras), Rhinocerotidae (rhinoceros) and
Tapirdae (tapirs) (Norman and Ashley, 2000). Today, the domestic horse consists of
approximately 400 breeds used primarily for riding, showing, racing, driving and farming.
Domestication of the horse is believed to have occurred in India around 5,500 years ago,
and in the process dramatically transformed civilisation allowing trade over greater
distances and farming potential to increase (Schubert et al., 2014). Phylogenetic analysis
and archaeological studies predict that the last common ancestor of humans and horses
lived around 96 million years ago (Kumar et al., 2017).
The domestic horse suffers from chromosomal aberrations that cause embryonic loss,
congenital abnormalities and infertility. Chromosomal abnormalities in the horse are
reported to affect all breeds and cause significant loss to breeders as a result of high
veterinary cost and the care of both the mare and foal (Lear and Bailey, 2008).
Cytogenetic analysis as early as the 1970s reported abnormalities that included sex
chromosome monosomy, XY sex reversal or sex chromosome mosaicism. A clinical
review published in 1990 found that of 392 cases of chromosomal abnormalities 36%
were monosomy X (2n=63 X0), 29.8% were sex chromosome mosaic (2n=64 XX/XY) and
27.8% were XY sex-reversal (Lear and Bailey, 2008). Intersex variation is also described
in domestic horses, with androgen insensitivity syndrome (AIS) being frequently
reported to affect thoroughbred mares. AIS is defined as the failure to masculinise target
organs by androgen secretions during embryo development. In most cases the animal

Rebecca Jennings
136
will appear phenotypically female but presents a stallion-like behaviour and genotype
(2n=64 XY, SRY+) (Welsford et al., 2017). A laboratory that predominately uses molecular
cytogenetic tools to ascertain the cause of certain developmental or fertility issues in
one species (in this case pigs) is often asked to apply similar technology to other species.
The intention of the work described in this section was to establish the chromosome
complement of two horses displaying intersex variation due phenotypic dysmorphia
including ambiguous genitalia.
4.4.2 Results
A total of three horses from different pedigrees were analysed cytogenetically due to
ambiguous genitalia. Limited information was provided for all horses examined in this
study. However, information was as follows for one; six-year-old maiden thoroughbred
mare presented as phenotypically female with normal female external genitalia. Upon
examination this mare was found to have testicular tissue at the ovarian site, a
rudimentary uterus and no visible cervix. Blood was drawn and incubated as described
in section 2.2. Karyotype analysis from the thoroughbred mare indicated the presence
of a Y chromosome, resulting in a karyotype complement of 2n=64 (XY), shown in figure
4-3. Karyotype results from the two additional mares used in this study were found to
be karyotypically normal 2n=64 (XX).

Rebecca Jennings
137
Figure 4-3. Traditional karyotype of horse referred for cytogenetic analysis. DAPI-stained metaphase
chromosomes of intersex horse. (2n=64 (XY)).
4.4.3 Discussion
The success of the chromosomes screening technology developed here meant that a
number of horses were referred for cytogenetic analysis due to ambiguous genitalia.
Indeed, in the case of the thoroughbred mare referred for cytogenetic analysis,
traditional banding techniques identified the presence of the Y chromosome. However,
this method could not elucidate the specific genetic abnormality that resulted in this
intermediate phenotype. To achieve this, additional investigations would have been
required, including targeted FISH experiments or PCR to isolate a specific gene (SRY,
SOX9, WT1). In humans most cases of gonadal dysgenesis initially focused on the SRY
gene. However, it was found that mutations or deletions in the SRY gene only accounted
for 15% of females with 2n=46(XY) sex reversal (McDonald et al., 1997). For this reason,

Rebecca Jennings
138
if time had permitted, focus would not have been entirely on the SRY, additional genes
would have been examined via methods previously mentioned, to potentially establish
the abnormality. Additionally, AIS cannot be ruled out at this stage. As described in
section 1.7.1, AIS has previously been reported in thoroughbred mares, whereby normal
female external genitalia are observed in a horse that is karyotypically male (2n=64 (XY))
and displaying stallion behaviour. The serum testosterone level would be required to
diagnose this disorder, the normal reference range of serum testosterone in a non-
pregnant female is 20-45pg/mL, previous work found this to be significantly higher at
1154pg/ml in cases of AIS (Howden, 2004). Moreover, using the work detailed in this
case it is not possible to conclude the mechanism behind this intersex thoroughbred
mare.
4.5 Case study III Sumatran tiger (Panthera tigris sumatrae) referred
due to ambiguous genitalia
4.5.1 Background
The Sumatran tiger is the smallest extent tiger subspecies, from the Order Carnivora,
found only on the Indonesian Island Sumatra (O’Brien, Kinnaird and Wibisono, 2003).
The Sumatran Tiger is listed as critically endangered, (the highest category of threat), on
the IUCN Red List of Threatened Animals (Linkie et al., 2008).
To date, only a limited number of investigations into chromosomal abnormalities in
tigers exists. Previously, G-banded analysis of metaphase chromosomes of a Siberian
tiger at Kanas City Zoo was identified as possessing a Klinefelter Syndrome karyotype
(2n=39 XXY) (Suedmeyer, Houck and Kreeger, 2003). In this work, a single tiger with
ambiguous genitalia was referred for chromosomal analysis using cytogenetic
technology detailed throughout, with specific reference to the sex chromosomes.

Rebecca Jennings
139
Figure 4-4. Traditional karyotype of Sumatran tiger. DAPI stained metaphase chromosomes of a
Sumatran Tiger (2n=38 XX).
Karyotype analysis revealed the tiger possessed a chromosome complement of 2n=38
(XX). A total of 10 metaphase spreads were completed to accurately examine this animal.
4.5.2 Discussion
Traditional cytogenetic techniques used in this case study successfully identified the
chromosome complement of this animal (2n=38 XX). The results in this section suggest
the Sumatran tiger was karyotypically female. However, the ambiguous genitalia
reported imply that sex determination was comprised at some stage in development. As
discussed in the general discussion, sex determination is a complex system of genetic,
epigenetic and hormonal determinants that govern the development of either the male
or female phenotype (De Lorenzi et al., 2018). To establish the cause of this phenotype,
additional investigations were required, due to the unavailability of molecular
cytogenetic tools, a true diagnosis was not achieved.

Rebecca Jennings
140
4.6 Case study IV investigating the cause of spontaneous abortion in a
trio group of captive western lowland gorilla
4.6.1 Background
It is well established that humans share many physiological and anatomical elements
with both gorillas and chimpanzees. The similarities were initially described by Darwin
and Huxley in the first evolutionary studies investigating human origin (Darwin and
Huxley, 1863). The chimpanzee, bonobo and gorilla are reported to be the closest
relatives to humans (figure 4-5) (Scally et al., 2012). It is believed that great apes and
humans share up to 98.5% of their non-repetitive DNA (Lear et al., 2001). Given the close
relationship, a number of shared chromosomal abnormalities have been documented
between humans and non-human primates. These include trisomy 17 (homolog to
human chromosome 18) in bonobo (Lear et al., 2001) and trisomy 22 (homolog to human
chromosome 21) in gorilla, chimpanzee and orang-utan (Hirata et al., 2017). In humans,
trisomy 21 (Down Syndrome) is highly prevalent, with an incidence of between 1:750
and 1:100 live births. Individuals affected present with a characteristic phenotype which
includes facial dysmorphia, low muscle tone and short stature (Karmiloff-Smith et al.,
2016). All of which were also observed in a chimpanzee identified to carry a trisomy 22,
the homolog of HSA 21 (Hirata et al., 2017). Aneuploidy and genomic imbalances are
reported to be the leading cause of miscarriage in humans (Lu et al., 2007). It is estimated
that 15% of all conceptions fail to progress to a live birth (Cohain, Buxbaum and
Mankuta, 2017). In humans, foetal loss is reported to be as a result of autosomal trisomy,
monosomy X and polyploidy in 60%, 20% and 20% respectively (Hyde and Schust, 2015).
Due to the close relationship between humans and non-human primates, it is reasonable
to assume that similar chromosomal abnormalities may lead to spontaneous abortion in
non-human primates.

Rebecca Jennings
141
Figure 4-5. Primate phylogenetic tree. Phylogenetic tree to show primate evolution, highlighted are the
chimpanzee-human speciation event and the monkey-great ape speciation event. (Image source: Genetics
| The Smithsonian Institution’s Human Origins Program)
Over the years, traditional cytogenetic analysis has been used in combination with more
targeted approaches to increase the resolution at which genomic abnormalities are
detected. The first karyotype of the gorilla was published in 1961 (Hamerton et al.,
1961). In 1973, GIEMSA staining permitted fine structure analysis and initiated human
to non-human primate comparative studies, which become more complex with the
advent of FISH (Mrasek et al., 2001). Today, technologies such as FISH and aCGH can be
used to detect abnormalities that are beyond the capability of chromosome banding
techniques (Lu et al., 2007). Furthermore, aCGH, (see section 1.2.2.4), provides analysis
at a genome-wide level, making it an ideal technique to investigate unbalanced
chromosome rearrangements; for instance, aneuploidies, insertions and deletions.
In this study, a trio group (breeding pair and stillborn infant) of captive western lowland
gorillas from Port Lympne Wildlife Reserve were referred for molecular cytogenetic
analysis after a series of spontaneous miscarriages. The male (Sammi), presented with a

Rebecca Jennings
142
history or recurrent miscarriage when bred with three proven females. For this reason,
molecular cytogenetic tools were used in this section to elucidate the cause of
spontaneous abortion in a group of western lowland gorilla, thus attempting to identify
the individual with the abnormality in order to prevent further loss and perpetuation of
any genetic abnormality throughout the captive population. Specifically:
To apply traditional cytogenetic karyotyping techniques to a trio group of captive
western lowland gorilla, to test the hypothesis that foetal loss was due to a
chromosome aneuploidy or larger structural rearrangement
To apply human-specific chromosome paints and subtelomeric BACs to
metaphase chromosomes of the triad group to examine for chromosomal
translocations that may have resulted in late-term miscarriage
To apply aCGH to DNA extracted from the triad group with the intention of
identifying an unbalanced chromosomal abnormality in the male and / or infant
gorilla
4.6.2 Materials and methods
Three concurrent miscarriages were experienced in a group of five western lowland
gorillas. The first spontaneous abortion occurred at roughly three months, with
histopathology results from the placenta exhibiting no abnormalities (performed at the
wildlife reserve). The second spontaneous abortion occurred at roughly four months.
Histopathology revealed the foetus was absent of abnormalities. The third loss occurred
at roughly seven months (almost term). Tissue samples from the foetus and placenta
were extracted and prepare for culture as described in section 2.1.1.2. Tissue samples
were obtained through The Aspinall Foundation, Port Lympne Wildlife Park. The Animal
Welfare and Ethics Review Board (AWERB) at the University of Kent reviewed and
approved sampling prior to proposed research. Blood samples were obtained from the
mother (Massindi), father (Sammi) and foetus; samples were incubated as described in
sections 2.1.1.6. All cultures were examined karyotypically for aneuploidies and
Rebecca Jennings
143
chromosomal abnormalities, with the emphasis to screen the father as he was the
common factor. Veterinary staff at The Aspinall Foundation collected blood from the
animals after sedation, and collected it into sterile 1 ml heparin tubes. Mammalian Cell
culture and chromosome harvesting was performed as described in section 2.1. A total
of six traditional DAPI-stained karyotypes were obtained per animal. Cytocell© human
specific paint for chromosome 14 (homologous to gorilla 15) was applied. Following
extraction, DNA was analysed using aCGH at Oxford Gene Technology (OGT, Begbroke)).
4.6.3 Results
4.6.3.1 Generate karyotypes of three captive western lowland gorilla, to test the
hypothesis that foetal loss was due to a chromosome aneuploidy or larger
structural rearrangement
Karyotype results from the father and foetus did not identify any specific abnormality
that might be associated with an abnormality. Nonetheless, the presence of an extended
heterochromatic region in two of the chromosomes within the karyotype were
identified. In the foetus, gorilla chromosome 15 (homolog to human 14). The female
appeared karyotypically normal in all analyses (n=8). The karyotype of the foetus is
shown in figure 4-6, and all karyotypes were generated through the use of a humanised
setting in SmartType (karyotyping program).

Rebecca Jennings
144
Figure 4-6. Traditional karyotype of gorilla foetus. DAPI stained metaphase chromosomes of foetus gorilla
(2n=48 (XX)) illustrating extended region on gorilla chromosome 15. Chromosome 22 also has a large
satellite.
4.6.3.2 Chromosome painting
FISH (chromosome painting using a human chromosome 14 probe) was applied to
metaphase chromosomes of the male a foetus. Results obtained from chromosome
paint analysis indicated that both the foetus and the male gorilla were karyotypically
normal (figure 4-7). The extended heterochromatin region observed on chromosome 15
of the foetus is likely due to a normal (non-phenotypic) polymorphism. Owing to the
absence of any similar sized loss on another chromosome.

Rebecca Jennings
145
Figure 4-7. FISH image showing results from human chromosome 14 paint on male gorilla and foetus.
Metaphase chromosomes of gorilla, counter stained with DAPI and labelled for chromosome paint form
human chromosome 14 on metaphase chromosomes of. A) the male gorilla (TxRed) and B) the foetus
(TxRed pseudo-coloured to blue). Images captures by fluorescence microscope at x1000 magnification.
Arrows applied to indicate signals observed. (Magnification x1000)
4.6.3.3 aCGH to DNA extracted from the trio group with the intention of identifying
an unbalanced chromosomal abnormality in the male and / or infant gorilla
The female gorilla (Massinidi) was used as the reference genome due to the male’s
involvement in previous losses. The aCGH results identified two abnormalities in the
foetus when compared to the female, whereas the male showed no abnormality. The
abnormalities included a duplication in the region encoding LINC00906 on chromosome
19 (p12.3 (in human)) and a deletion in the region encoding the CNTN3 gene on
chromosome 3 (q11q12 (in human)). Screenshots from the aCGH analysis are shown in
figure 4-8.
A B

Rebecca Jennings
146
Figure 4-8. aCGH Results. aCGH analysis of the fetus compared to the female gorilla. Screenshot showing
duplication in region encoding LINC00906 on chromosome 19 (p12.3) (left) and a deletion in the region
encoding the CNTN3 gene on chromosome 3 (q11q12).
4.6.4 Discussion
This work was successful in the following areas:
Karyotypes provided an initial overview of the genome, namely apparently
normal karyotypes but nonetheless the presence of an extended
heterochromatin regions in the male and foetus.
FISH, using a human-specific chromosome paint suggested that all were
karyotypically normal, however at a low resolution.
aCGH identified a duplication and deletion in the genome of the foetus when
compared to the female.
This study sought to identify the genetic abnormality behind a series of miscarriages in
a group of captive western lowland gorillas. This work demonstrates the flow from low
resolution analysis (karyotype) to higher resolution analysis (aCGH), which enabled the
detection of two abnormalities in the foetus which may have resulted in foetal loss.

Rebecca Jennings
147
4.6.4.1 Karyotype analysis
Initial cytogenetic analysis identified a region of heterochromatin in chromosomes of the
male and infant. Heterochromatin is a densely packed region of DNA that inaccessible to
transcription factors. This observation is common in the karyotypes of gorilla. For
example, the first cytogenetic study proposed polymorphic heterochromatin in this
species (Miller et al., 1974). This initial investigation established the chromosome
complement (all 2n=48). Additionally, the trio did not carry any larger, structural
chromosomal rearrangements.
4.6.4.2 FISH analysis
Human specific chromosome paints were used to establish if the animals investigated
here were carriers of cryptic translocations. It is estimated that the DNA similarity is
approximately 98% between the human and gorilla (Scally et al., 2012). Due to this
conserved homology between humans and great apes it was possible to use human-
specific chromosome paints to elucidate the presence of cryptic translocations. Future
studies of this sort may elucidate the presence of translocations e.g. by a systematic
analysis of whole chromosome paints or sub-telomeric probes.
4.6.4.3 aCGH analysis
aCGH detected two abnormalities in the foetus when compared to the female. As
mentioned in section 3.1, any chromosomal aberration smaller than 3-5Mb is
undetectable through traditional banding techniques (Lu et al., 2007). The first, a
deletion in the region contained the CNTN3 protein coding gene. CNTN3 (contactin 3)
encodes a contactin that mediates cell surface interactions in nervous system
development and has some neurite outgrowth promoting activity (Kamei et al., 2000).
Limited information regarding the consequence of this deletion is available with previous
reports having identified it in individuals diagnosed with Autism, plasmacytoma and
Taylor’s Syndrome (Kamei et al., 2000). The second was a duplication in the region which

Rebecca Jennings
148
contained the RNA non-coding (ncRNA) LINC00906 gene. A ncRNA is a functional RNA
molecule that is transcribed from DNA but not translated, ncRNA regulate gene
expression. To the best of my knowledge, neither genetic abnormality has previously
been associated with spontaneous abortion. However, it is important to note here that
aCGH cannot identify balanced chromosomal rearrangements. For this reason, the
animals investigated in this study may possess a chromosomal rearrangement that is
undetectable via both cytogenetic analysis (due to the size of the rearrangement), or
through aCGH if the chromosomal exchange is balanced.

Rebecca Jennings
149
5 Genetic abnormalities in cattle and the development of a
FISH-based chromosome screening device
5.1 Specific aim 3. Based on specific aim 2, to implement a novel scheme
for screening for chromosome translocations in cattle, testing the
hypothesis that it can be applied for the detection of hitherto
intractable reciprocal chromosome translocations
5.2 Background
Domestic cattle comprise of more than 800 breeds, and are classified taxonomically into
two groups Bos taurus (hump-less) and Bos indicus (humped cattle) (Zhou et al., 2015).
They are from the order Artiodactyla, defined as even-toed ungulates. Large-scale
genomic analysis predicts that the lineage, which led to the last common ancestor of
cattle, was estimated to have diverged from humans approximately 92 mya (Liu et al.,
2006). Archaeological and genetic data indicate that domestication occurred around
10,000 years ago (Bollongino et al., 2012) and since then these agricultural animals have
assisted in human civilization through the production of meat and milk products (Zhou
et al., 2015). A representation of cattle domestication can be seen in figure 5.1.
Figure 5-1. Cattle domestication. The domestication of cattle. (Image adapted from: The Domestication
of Species and the Effect on Human Life | Real Archaeology)
To accommodate the growing population, it is estimated that in 2014 meat production
(beef and buffalo) reached 68 billion tonnes globally, whilst milk was predicted to reach
829 million tonnes in 2018 (Clark & Tilman, 2017). For this reason, the desire to select

Rebecca Jennings
150
animals with optimal fertility that carry advantageous, heritable traits is the ultimate
goal. Traditionally, animal selection was based on phenotype and pedigree analysis to
predict estimated breeding values (EBV). EBV traits include, calving ease, fertility, milking
ability, fat depth and carcass merit (Goddard and Hayes, 2007). This method of selection
was deemed highly successful at the time (2009), permitting the identification of animals
that retained increased meat production, milk yield, and resistance to disease and
possessed the ability to conceive (Bovine HapMap Consortium et al., 2009). In well-
structured breeding programs, genetic improvement occurs at the nucleus, that being a
small fraction of the breeding herd, this improvement is then disseminated through the
population. However, selection based on high-value genetic merit alone may prove
problematic if fertility issues are identified in the animal after it has entered the artificial
insemination (AI) breeding program. The AI program is commonly used in dairy cattle,
with up to 90% of farms across Europe adopting this technique (Rodríguez-Gil and
Estrada, 2013).
5.2.1 Breeding selection
Semen analysis is commonly used to predict male fertility in agricultural breeding
programs. Parameters analysed include volume, sperm morphology, motility and
concentration per ejaculate (Broekhuijse et al., 2012). However, there is growing
evidence to suggest that semen analysis is an unreliable tool for diagnosing suboptimal
fertility (Kastelic and Thundathil, 2008). In addition to semen analysis, non-return rates
(the number of females returning to the oestrus cycle i.e. failure to conceive) are used
as an assessment tool (Taylor et al., 2018). In cattle, the gestation period lasts 289 days
(Piedrafita et al., 2000) commonly resulting in a singleton birth. Twin pregnancies are
undesirable in dairy cattle due to an increased risk of spontaneous abortion, which may
have negative effects on the profitability of the herd (Ló Pez-Gatius, 2005).
5.2.2 The rob (1;29) and other translocations
Over the past 50 years, chromosomal analysis of agricultural animals has become an
important factor in commercial breeding. In 1964 Ingemar Gustavsson reported the

Rebecca Jennings
151
presence of a 1;29 centromeric fusion, more commonly known as a Robertsonian
translocation, (see section 1.5.24), in a population of Swedish Red and White cattle
(Gustavsson and Rockborn., 1964). The significance of this chromosomal abnormality
was discovered five years later, whereby carriers of this translocation were shown to
have impaired fertility, namely, daughters of translocation positive sires returned to
service more often than expected (Gustavsson et al., 1969). Gustavsson reported that
semen analysis of the bulls confirmed to carry the translocation were said to fit normal
parameters, indicating this method of examination was not reliable in predicting the
fertility of future progeny. This association between chromosomal abnormalities and
impaired fertility, led to the creation of veterinary cytogenetic laboratories that would
adapt chromosome-screening techniques designed for humans to suit domestic animals
(Udriou, 2017). Moreover, the need to identify animals and prevent perpetuation of
reduced fertility into the breeding population is paramount. Impaired fertility reduces
genetic gain, increases veterinary cost and reduces milk production all of which result in
a loss for the breeding company and may affect the global demand for cattle products.
The 1;29 translocation is considered the most widespread translocation in cattle and has
been observed in all breeds, with an exception of Holestein-Fresian cattle (Switonski,
2014). Heterozygous carriers of the 1;29 translocation are phenotypically normal,
however carriers are reported to suffer a reduction in fertility of 3-5% (Bonnet-Garnier
et al., 2008). This reduction can be explained through the formation of unbalanced
gametes: 2.76% in sperm and 4.06% in oocytes, which result in reduction in ability to
complete the meiotic process and increased embryonic mortality (De Lorenzi et al.,
2012). Homozygous carriers of this translocation are rare, although they have been
documented by Iannuzzi et al (2008). The incidence rate of this translocation varies
between breeds; previous work discovered this translocation in 8.5% of the Blonde
D’Aquitaine bulls examined (Bonnet-Garnier et al., 2008). Iannuzzi et al (2008) examined
the frequency and distribution of this translocation in eight Portuguese cattle breeds,
discovering the presence of the homozygous version in five of the breeds studied.

Rebecca Jennings
152
Moreover, 44 Robertsonian translocations affecting almost all chromosomes have been
reported in cattle (Larkin and Farre-Belmonte, 2014). In addition to this, reciprocal
translocations, (see section 1.5.2.5) are cause for concern due to economic loss through
impaired fertility. An Italian study investigated 20,030 animals, from 10 different breeds,
over a 15-year period. The results indicated that certain breeds were more prone to
reciprocal translocations than others, with an average incidence rate of 0.04% (De
Lorenzi et al., 2012) Due to difficulties in detecting reciprocal translocations in cattle only
19 have been reported (De Lorenzi et al., 2011). However, De Lorenzi et al (2011)
proposed that only 16% of reciprocal translocations are recognizable using traditional
GIEMSA staining analysis alone, meaning that around 84% of reciprocal translocations
could remain undiagnosed. Therefore, this form of chromosomal rearrangement is
underestimated in the cattle population. Additionally, De Lorenzi et al (2011) suggests
that the frequency could be five times higher than de novo Robertsonian translocations,
meaning that a more effective and accurate screening method is required. Moreover,
considering the karyotype of domestic cattle (high diploid number and acrocentric
morphology) traditional methods often results in translocations going undiagnosed.
5.2.3 Sex determination and abnormalities
In mammals, sex determination is one of the most complicated developmental
processes. It is a complex system of genetic, epigenetic and hormonal determinants that
govern the development of either the male or female phenotype (De Lorenzi et al.,
2018). Freemartin syndrome is the most frequent form of intersexuality observed in
cattle. It is defined as a sterile female cow, born co-twin with a male. Freemartin
syndrome arises when vascular anastomoses develop between the placentae of
developing dizygotic twin foetuses of a different gender. As a result, blood chimerism
(2n=60 XX/XY) and passage of gonad determinants such as Anti-Müllerian hormone and
androgens result in the disruption of female embryonic gonadal differentiation (Esteves
et al., 2012). The incidence rate of freemartins is reported to be between 0.2% in
Brahman cattle and 8.9% in Brown Swiss. However, when twinning does occur
Rebecca Jennings
153
development of the reproductive tract is compromised in 95% of female calves born co-
twin to a male (Rebhun’s Diseases of Dairy Cattle, 2018). In addition to this, Swyer
syndrome or XY gonadal dysgenesis, is a genetic abnormality that affects gonadal
development in mammals. The presence of the Y chromosome-linked sex-determining
region of Y (SRY) gene regulates and directs the development of functional testes
through a series of genetic pathways. Embryos lacking this gene (SRY) will activate a
different pathway leading to the development of ovaries (De Lorenzi et al., 2018).
However, other factors may interfere with the development of testes even in the
presence of a functioning SRY gene. Including mutations in the MAP3K1 gene, DHH gene
and NR5A1 gene resulting in the absence or incomplete differentiation of the testes
(Arboleda et al., 2014). Swyer syndrome is an incredibly rare condition (1 in 80,000) that
affects mammals with previous cases being reported in, but not limited to humans,
cattle, horses and dogs. Humans and animals identified as XY gonadal dysgenesis are
usually sterile meaning that early detection is imperative. Several cases of Swyer
syndrome have been reported in cattle, although a number of these were examined
before sequencing technology was available. Therefore, cytogenetic examination of the
SRY was achieved through PCR to establish any differences in fragment length
(deletion/duplication). However, a more recent investigation into this disorder allowed
the team to isolate and sequence the SRY gene (De Lorenzi et al., 2018).
5.2.4 Cattle karyotyping – a state of the art
To date, chromosomal screening in cattle is achieved through traditional karyotype
analysis. Due to the high diploid number (2n=60), (Bhambhani and Kuspira, 1969)
acrocentric morphology and chromosomes that are of a similar size (see figure 5-2), this
technique is laborious and error prone for detection of anything other than
Robertsonian translocations. To overcome this, BAC clones were isolated from the
proximal and distal region of each chromosome by Dr Rebecca O’Connor (O’Connor,
2016) to identify cryptic translocations, as described in section 2.3.1. This highly
successful technology is currently being used for the detection of cryptic translocations
in boars (O’Connor et al., 2017). However, these sub-telomeric probes had not yet been

Rebecca Jennings
154
transferred to a multi-hybridisation device, nor had a similar screening technology to
that of pigs been implemented in cattle. Therefore, the purpose of this study was to use
the technology developed in specific aim 4, with BACs isolated previously (O’Connor,
2016) and implement a multiprobe FISH screening device for the detection of all, but
particularly reciprocal translocations in cattle. Furthermore, to test the hypothesis that
reciprocal translocations are virtually undetectable through karyotyping alone, but easily
detected by this method.
Figure 5-2. Traditional karyotype of cattle. DAPI-stained metaphase chromosomes of Bos taurus (2n=60
XX) indicating a virtually intractable karyotype
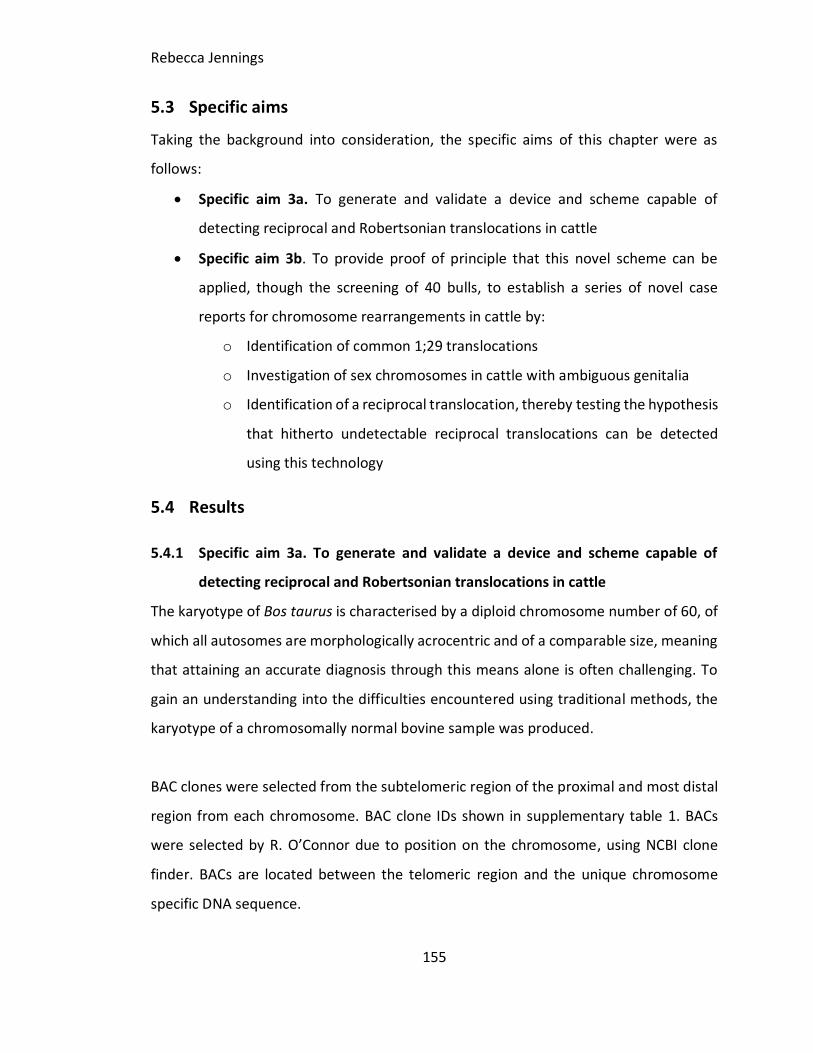
Rebecca Jennings
155
5.3 Specific aims
Taking the background into consideration, the specific aims of this chapter were as
follows:
Specific aim 3a. To generate and validate a device and scheme capable of
detecting reciprocal and Robertsonian translocations in cattle
Specific aim 3b. To provide proof of principle that this novel scheme can be
applied, though the screening of 40 bulls, to establish a series of novel case
reports for chromosome rearrangements in cattle by:
o Identification of common 1;29 translocations
o Investigation of sex chromosomes in cattle with ambiguous genitalia
o Identification of a reciprocal translocation, thereby testing the hypothesis
that hitherto undetectable reciprocal translocations can be detected
using this technology
5.4 Results
5.4.1 Specific aim 3a. To generate and validate a device and scheme capable of
detecting reciprocal and Robertsonian translocations in cattle
The karyotype of Bos taurus is characterised by a diploid chromosome number of 60, of
which all autosomes are morphologically acrocentric and of a comparable size, meaning
that attaining an accurate diagnosis through this means alone is often challenging. To
gain an understanding into the difficulties encountered using traditional methods, the
karyotype of a chromosomally normal bovine sample was produced.
BAC clones were selected from the subtelomeric region of the proximal and most distal
region from each chromosome. BAC clone IDs shown in supplementary table 1. BACs
were selected by R. O’Connor due to position on the chromosome, using NCBI clone
finder. BACs are located between the telomeric region and the unique chromosome
specific DNA sequence.

Rebecca Jennings
156
To create a device that enabled multiple hybridisations in one experiment, a design
similar to that which was used in the screening of boars was used (detailed in the
subsequent chapter). The final device configuration is shown in figure 5-3.
Figure 5-3 Schematic illustrating the cattle multiprobe device. Schematic to show comparative system
using BACs selected from the most proximal (p) and most distal region (d) of each bovine chromosome.
The X is labelled p and q for the most distal (subtelomeric) regions of the p and q arm.

Rebecca Jennings
157
5.4.2 Specific aim 3b. To provide proof of principle that this novel scheme can be
applied, though the screening of 40 bulls, establishing a series of novel case
reports for chromosome rearrangements in cattle
Identification of common 1;29 translocations
Investigation of sex chromosomes in cattle with ambiguous genitalia
Identification of a reciprocal translocation, thereby testing the
hypothesis that hitherto undetectable reciprocal translocations can be
detected using this technology
Using the technology shown in figure 5-3, a total 40 bulls were screened.
5.4.2.1 Case report I - Detection of heterozygous and homozygous 1;29 translocations
Cytogenetic analysis and diagnosis were requested for cattle displaying varying degrees
of suboptimal fertility. A total of six individual bovine case samples were examined. All
samples were screened via standard karyotype analysis. Three of the six animals
screened in this work were discovered to carry the 1;29 Robertsonian translocation
(figure 5-4). To establish if the chromosomes involved were 1 and 29, one sample was
screened using the multiprobe FISH-based method (figure 5-6). Interestingly, this work
reports the identification of a homozygous 1;29 Robertsonian translocation in two
British white animals screened as can be seen in figure 5-5.

Rebecca Jennings
158
Figure 5-4. Karyotype of bull carrying heterozygous 1;29 Robertsonian translocation. Traditional DAPI
stained karyotype of a 2n=59 bull with a rob (1;29). Robertsonian translocation and missing chromosome
29 are circled in red.
Figure 5-5. Karyotype of cow carrying homozygous 1;29 Robertsonian translocation DAPI stained
metaphase chromosomes of a homozygous 1;29 Robertsonian translocation in a British white (2n=58
(XX)). Homozygous rob (1;29) circled in red.

Rebecca Jennings
159
Figure 5-6. FISH image to show bull carrying a 1;29 Robertsonian translocation. Metaphase
chromosomes of karyotype diagnosed 1;29 translocation carrier. From left image A) Labelled BAC probes
for BTA chromosome 1. CH240-321O2 (FITC) CH240-96M6 (Txred) white arrow illustrates translocation.
Image B) Labelled BAC probes for chromosome 29. CH240-367D17 (FITC) and CH240-257F23 (Txred) white
arrows indicating translocation signals. (Magnification x1000)
5.4.2.2 Case report II - Investigation of sex chromosomes in a cow with
underdeveloped genitalia
This work examined the cause of infertility in a phenotypically female cow that
presented with under developed genitalia and the inability to conceive. Initially,
karyotypes were produced from metaphase chromosomes generated from lymphocyte
culture. A total of eleven karyotypes were produced at this stage, all of which identified
the animal as 2n=60 (XY) (figure 5-7).
Fluorescently labelled bovine DNA probes for the X chromosome were hybridised to
metaphase chromosomes of the query sample as this technique permitted diagnosis at
a higher resolution whilst reducing the analysis time. Results detected the Y
chromosome in all hybridisations observed.
A B

Rebecca Jennings
160
Figure 5-7. Traditional Karyotype of intersex cow. DAPI stained metaphase chromosomes of the
phenotypical cow referred for karyotype analysis. Chromosomes derived from lymphocyte culture.
Karyotype analysis detected the presence of Y chromosome (2n=60 (XY)).
Due to this diagnosis, tissue samples from the reproductive tract and mammary gland
were retrieved from the animal, and cell lines successfully established from both. In
addition to this, formalin-fixed samples were processed and examined off site at The
Agriculture and Food Development Authority (TEAGASC). Histopathological inspection
found the following, the uterus appeared immature with inactive glandular tissue,
ovarian cortices contained low numbers of recognizable oocytes and primary follicles
and no glandular elements were isolated from the mammary gland sections. To rule out
freemartins, or blood chimaeras (see section 2.1.1.6), karyotypes were produced from
metaphase chromosomes of both cell lines. All karyotypes analysed were 2n=60 (XY).
Hereafter, X chromosome probes were hybridised to the preparations. This permitted
faster results. Results generated from all cytogenetic analysis, recognised the presence
of the Y chromosome, as can be seen in the FISH result in figure 5-8. The X chromosome
BAC labelled with FITC hybridised to the puesdoautosomal region of the Y chromosome

Rebecca Jennings
161
and therefore TxRed was used when counting interphase nuclei. To determine the
genetic cause of this disorder at a molecular level, DNA was extracted from both cell
lines as described in section 2.2.1.
Figure 5-8. FISH image to show presence of Y chromosome in intersex cow. Labelled bovine X
chromosome BAC probes hybridised to reproductive tract metaphase chromosomes of query sample. FISH
result illustrates the presence of a Y chromosome with BAC labelled with FITC hybridising to the
psudeoautosomal region of the Y chromosome. Co-localisation observed on X chromosome. Arrows
included to indicate FISH signals. (Magnification x1000)
The bovine SRY gene was observed in both cell lines. Following the PCR conditions
described in section 2.8.3, the gene was successfully isolated in preparation for
sequencing. Interestingly, after initial success using the primers taken from De Lorenzi
et al (2018) replication of results proved difficult, optimisation of PCR conditions was
explored, whereby the enhancers DMSO and betaine were used to reduce
intramolecular effects. Additionally, a temperature gradient was used to identify the
optimal annealing temperature and finally the PWO master mix was replaced with KOD
hot start, a high fidelity DNA polymerase designed for accurate PCR reactions. However,
all optimisation strategies proved ineffective when visualising the products on an

Rebecca Jennings
162
agarose gel. For this reason, primers were designed through PrimerBlast using
parameters detailed in section 2.8.2. Upon successful annealing temperature
optimisation, a single ~874bp amplicon was observed (expected length size of SRY gene
product), result shown in figure 5-9. The SRY amplicon in the query sample appeared the
same length as the male control ruling out an insertion / deletion within the gene.
Figure 5-9. DNA products after PCR on 1.4% agarose gel. PCR products visualised on a 1.4% agarose gel. PCR set up using PrimerBlast primers under conditions described in section. Lanes 1) empty. 2) negative control. 3) male control. 4) female control. 5) DNA from mammary gland of referred animal. 6) DNA from reproductive tract of referred animal. Ladder 1) 1Kb. Ladder 2) 100 bp. Amplicon is 874bp in length confirming the presence of SRY in the query sample, negative control is free from contamination.
The 874bp SRY PCR product was sequenced and the sequence data converted to a FASTA
sequence using BioEdit software program. The FASTA sequence was then aligned against
SRY sequence data retrieved from NCBI GeneBank (Btau_5.0.1). The online alignment
tool Clustal Omega online was used to analysis the data. Results from alignment suggest
that the SRY gene within the phenotypically female cow was functioning, with the
absence of any point mutations or frame shifts. To establish if the regulatory element of
the SRY was mutated, primers were generated using PrimerBlast and samples run under
PCR conditions described in section 2.8.3. As before, SRY regulatory element PCR

Rebecca Jennings
163
product was sequenced and the sequences aligned using Clustal Omega. This also
showed the absence of mutations within the regulatory element of the SRY.
5.4.2.3 Case report III - Identification of a reciprocal translocation, thereby testing the
hypothesis that hitherto undetectable reciprocal translocations can be
detected using this technology
Two reciprocal translocation carriers were identified involving chromosomes 12 and 23
(figure 5-11), whilst the remaining bulls were chromosomally normal. Due to the
identification of a 12;23 reciprocal translocation in two commercial breeding bulls. It was
important to test the hypothesis that reciprocal translocations are notoriously difficult
to detect using standard karyotype analysis alone. For this reason, karyotypes of
translocation positive bulls were produced as described in section 2.6.1.1.
Figure 5-11. FISH image to show bull carrying a 12;23 reciprocal translocation. Labelled subtelomeric BAC
clones for BTA 23 (CH240-374G6 (Texas Red) and CH240-102P19 (FITC) misplacement of FISH signals
illustrates a reciprocal translocation between chr 12 and chr 23 (arrows). (Magnification x1000)
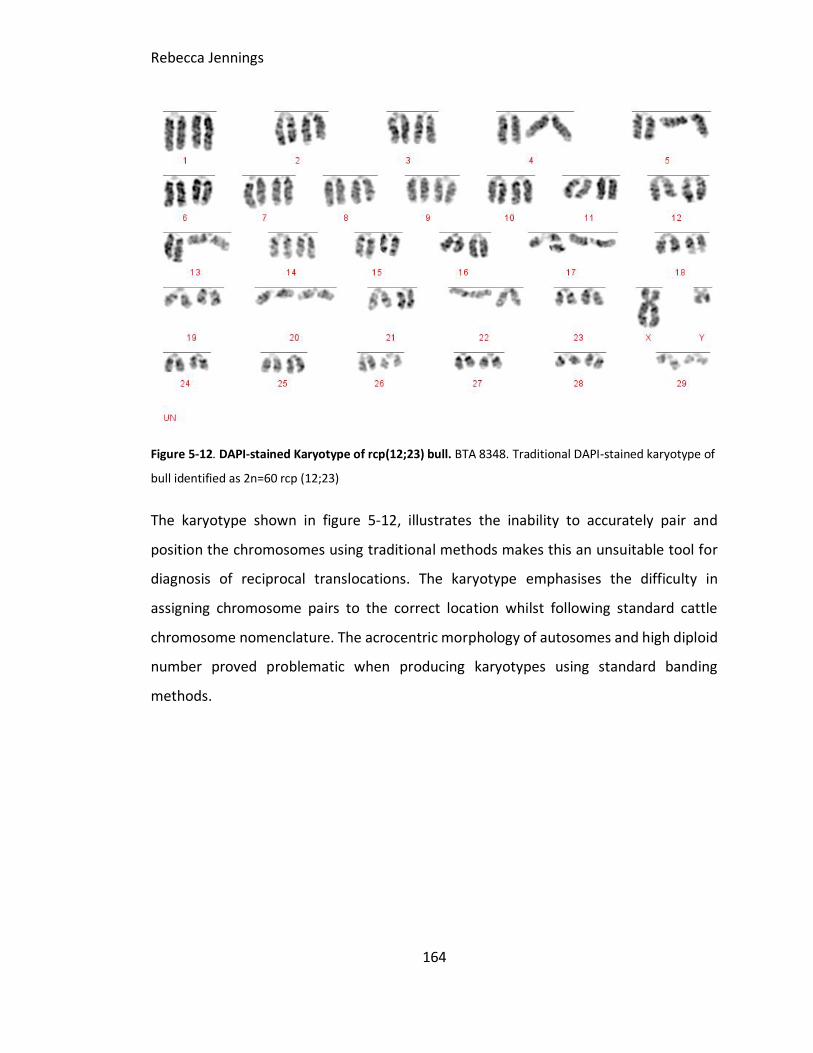
Rebecca Jennings
164
Figure 5-12. DAPI-stained Karyotype of rcp(12;23) bull. BTA 8348. Traditional DAPI-stained karyotype of
bull identified as 2n=60 rcp (12;23)
The karyotype shown in figure 5-12, illustrates the inability to accurately pair and
position the chromosomes using traditional methods makes this an unsuitable tool for
diagnosis of reciprocal translocations. The karyotype emphasises the difficulty in
assigning chromosome pairs to the correct location whilst following standard cattle
chromosome nomenclature. The acrocentric morphology of autosomes and high diploid
number proved problematic when producing karyotypes using standard banding
methods.
Rebecca Jennings
165
5.4.2.4 Summary of cattle screening results
Diagnosis Numbers Method of Detection
Heterozygous rb (1;29) 3 Karyotype – confirmed with FISH
Homozygous rb (1;29) 2 Karyotype – confirmed with FISH
rcp (12;23) 2 FISH
XY gonadal dysgenesis 1 Karyotype, FISH, PCR, sequencing
Normal 32 Karyotype, FISH
Table 5-2. Table to show summary of 40 cattle chromosome analyses performed in this study.
5.5 Discussion
This study was largely successful in the pursuit of its specific aims, namely:
Proof of principle was established, in that a novel scheme, was applicable for
detecting all translocations through the screening of 40 animals
The hypothesis was proven that hitherto undetectable reciprocal translocations
can be detected using this technology
This method resulted in reporting a series of novel case reports
5.5.1 Implementation of multiprobe FISH device for cattle screening
Before this study, standard karyotype analysis was the only method of diagnosing
chromosomal rearrangements in cattle, proving time consuming and error prone. It was
calculated by De Lorenzi et al (2012) that for a translocation to be observable through
karyotype alone an abnormal chromosome derivative must be either 15% (185 Mb)
longer than chromosome 1, or 40% (26.4 Mb) shorter than chromosome 25. With this is
mind, any translocation involving chromosomes 2-24 would be indistinguishable from
other autosomes. It is evident from the literature that an efficient and reliable technique

Rebecca Jennings
166
is required for the detection of cryptic translocations, along with routine screening of
cattle destined for AI breeding services. The results generated in this study validate the
use of a FISH-based screening device for the detection of reciprocal translocations in
cattle. This method identified cryptic translocations in 8% of the samples screened in this
study, two of which would have been undiagnosed if using standard karyotyping alone.
Therefore, these provide an example of support when considering the hypothesis
suggested by De Lorenzi et al (2012) that only 16% of cryptic translocations are
detectable through staining techniques alone. It is evident from figure 5-12 that in
addition to the difficulties experienced in producing a diagnosis-quality karyotype,
suboptimal chromosome preparations can produce ambiguous results. Knowing the
chromosomes that were involved in the rearrangement meant that there may have been
bias towards the location assigned in the karyotype. However, traditional methods
enabled the detection of a Robertsonian translocation, as shown in figures 5-4 and 5-5
and for this reason, it is plausible to suggest that traditional karyotyping methods of
screening are still applicable today. Robertsonian translocations are observed with ease,
however the FISH-based technique described in this chapter easily identifies the
chromosomes involved in the rearrangement, this being a method that requires
significant training whilst remaining error prone. Furthermore, cryptic translocations are
by definition impossible to observe using standard karyotyping techniques. The FISH-
based approach described in this work can potentially identify cryptic translocations with
ease.
5.5.2 Chromosomal rearrangement case studies
5.5.2.1 Case report I - Detection of heterozygous and homozygous 1;29 translocations
Efforts to eradicate chromosomal translocations from the breeding herd are ongoing. It
is evident from the results obtained in this small study that there are still chromosomal
translocations in the breeding population. This is in part due to the de novo nature of
these rearrangements, therefore screening for chromosomal translocations that result
in economic loss is more important than ever. Previous work by Gustavsson and
Rebecca Jennings
167
Rockborn (1964) suggests that the most common structural chromosome translocation
observed in cattle is the centromeric Robertsonian 1;29 translocation (Switonski, 2014).
In this study, 9.6% of cattle investigated were heterozygous carriers of this translocation
whilst 6.5% were carriers of the homozygous version. It is important to note here
however that this value is not an indication of the prevalence experienced in the
breeding population due to the small sample size. The presence of this translocation
varies significantly between breeds as this was demonstrated by Iannuzzi et al (2008),
whereby 1,626 animals from 8 Portuguese breeds were examined, reporting 69.9% in
Barrosa and 2.8% in Mirandesa (Iannuzzi et al., 2008). Iannuzzi et al (2008) discovered
that the frequency and distribution of the homozygous version of this translocation is to
be considerably lower than the heterozygous version with published cases only in certain
breeds. However, they discovered the homozygous 1;29 translocation in 17% of Barrosa
cattle, suggesting animals of this breed are highly likely to carry either form of this
rearrangement (Iannuzzi et al., 2008). Previously, British White sires had been imported
to Australia carrying this rearrangement, resulting in a national program to eradicate this
from the population. For this reason, all British White are now screened prior to
exportation (Holmes, 2019).
5.5.2.2 Case Report II - Investigation of sex chromosomes in a cow with
underdeveloped genitalia - XY gonadal dysgenesis
This study identified a case of bovine XY gonadal dysgenesis, or Swyer syndrome, an
incredibly rare genetic disorder that affects sex determination and development in
mammals. In humans, Swyer syndrome is reported to occur in approximately 1 in 80,000
people, 15-20% of cases manifest due to a mutation in the SRY gene, with most being de
novo in origin (Machado et al., 2014). Furthermore, a number of documented mutations
are reported which include the transcription factor NR5A1, the signalling pathway
regulator MAP3K1 and DHH which is a hedgehog protein that is important in male

Rebecca Jennings
168
development (Michala et al., 2008). This is one of only a few reports demonstrating this
disorder in cattle, with most coming at a time when the technology did not permit
analysis at the resolution achievable today. To expand on the current literature, it was
important to use current sequencing methods of analysis, alongside traditional
cytogenetic techniques when trying to establish the genetic mutation responsible for
this disorder. The results obtained from this study suggest the mutation was in an
unexamined gene, because the SRY and its promoter were deemed functional.
Moreover, it is important to mention that in humans over one third of cases remain
unexplained (De Lorenzi et al., 2018). The absence of testicular development in the
presence of both a functioning SRY gene and its promotor domain proved an interesting
case. Furthermore, had time permitted additional sequencing of genes involved in sex
determination could have been examined including MAP3K1, DHH and NR5A1.
Additionally, analysis of the Illumina TrueSeq data collected off site could have been
assessed. However, sequence analysis is ongoing and results should be available from
the Agriculture and Food Development Authority after the publication of this work.
5.6 Conclusions
The implementation of this technology has improved the efficiency and speed at which
cattle can be assessed for chromosomal translocations, permitting multiple
hybridisation experiments on two single slides. Chromosomal translocations directly
affect fertility and, for this reason, it is vital that any abnormality that can lead to a
reduction in the profitability of the herd is identified quickly and accurately. Moreover,
animals that possess abnormalities can be isolated and removed before entry into AI
breeding programs, thus reducing the possibility of economic loss. Due to the small
sample size used in this study it is not possible to conclude if reciprocal translocations
are five times more likely than de novo Robertsonian translocations, as suggested by De
Lorenzi (2012). For this reason, significant effort to disseminate the results of this study
to cattle breeding companies in the hope that an increasing number of bovine breeding
companies will use this technology to examine chromosomal integrity of animals used

Rebecca Jennings
169
in AI programs. Thereby, preventing propagation of any abnormality within the breeding
population. With the success of this screening method in mind, it is plausible to suggest
that this technique could be applied to any animal of interest, the horse being an ideal
candidate. The domestic horse (2n=64) is of interest worldwide, with thoroughbred
breeding being an incredibly competitive industry. For this reason, it is plausible to
assume that this form of chromosomal screening technology could be of benefit in this
species. Moreover, to ensure fertility damaging abnormalities are identified prior to any
breeding commitments. Previous cytogenetic studies in this species identified that profit
reducing chromosomal translocations are present in thoroughbred mares. Lear et al
(2008) discovered three separate cases: t(1;21), t(16,22) and t(4;13) and having the tools
to examine and diagnose chromosomal abnormalities in a fast and efficient way would
be beneficial for this industry. In the chapter 4, regular karyotyping of horses is described
although this could be potentially expanded to employ a FISH based technology.
Rebecca Jennings
170
6 Incidence rate of chromosomal translocations in boars
detected through multiprobe FISH
6.1 Specific aim 4. Based on specific aim 2, to implement a high
throughput FISH-based porcine cytogenetic screening technique,
screening over 1000 animals and testing the hypothesis that overall
published incidence of translocations in this species has been under-
reported
6.2 Background
The order, Artiodactyla is considered the one of the most diverse mammalian orders on
the planet, with over 190 extant species, including pigs, cattle, hippopotamus, sheep,
and antelope (Prothero and Foss 2007). The domestic pig comprises of over 500 breeds
(Nelson, 2014), with Darwin recognizing two taxonomically distinct groups, the
European Sus scrofa and an Asian form, Sus indicus (Darwin, 1868). Phylogenetic data
calculates that the lineage, which led to the last common ancestor of the pig, is thought
to have diverged from humans ~90 mya (Murphy et al., 2001). Domestication of the pig
is reported to have occurred in the Middle east contemporaneously to cattle around
9,000 years ago (Giuffra et al., 2000).
Today’s global human population is estimated at 7.7 billion people, this figure is
expected to rise annually and the demand for livestock and meat production will grow
in parallel with it. In 2018, USDA (United States Department of Agriculture) estimated
that global pork production would rise 2% to 113.1 million tonnes, with global output
reaching 48% (Linekar, 2018). In addition to this, the market for pig production changes
continuously in response to consumer preferences and societal requests, however, the
ultimate goal for breeding companies is to increase profitability and decrease economic
loss. Recently, the selection of boars used in breeding programs has shifted from

Rebecca Jennings
171
phenotypic selection using estimated breeding values (EBV) to boars selected using high
merit genetic markers alone (Nielsen, 2016), allowing for crossbreeding to be easily
achieved to meet consumer demands (Rodríguez-Gil and Estrada, 2013). A fundamental
problem with the use of this as a method of selection arises if the purebred boar, used
at the top the breeding pyramid, suffers from suboptimal fertility, resulting in a
reduction of litter size which can cause significant economic loss to the company.
Over the past 50 years, chromosomal analysis of agricultural animals has become an
important tool in commercial breeding. In 1964, Henricson and Bäckström identified the
first reciprocal translocation in swine, involving genetic exchange between chromosome
4 and 14 t(4;14) (Henricson and Bäckström, 1964). Routine cytogenetic analysis of swine
originated in Toulouse, France in the early 1990s and at that time only hypoprolificic
boars were screened for chromosomal abnormalities. However, within 10 years, the
majority of French swine breeding companies chose to screen the purebred boars before
AI entry. Furthermore, it is estimated that between initiating the program and 2002, over
13,765 individuals were screened by the laboratory in Toulouse (Ducos et al., 2007). To
date, over 168 translocations have been described in pigs, affecting all chromosomes
and all breeds with a reported incidence rate of 1/200 (0.47%) in phenotypically normal
pigs awaiting AI service (Fève et al., 2017; Ducos et al., 2007). In pigs, reciprocal
translocations are the most commonly reported chromosomal rearrangement.
Heterozygote carriers will produce a high proportion of unbalanced gametes, resulting
in early loss of the embryo; sperm production is also likely to be affected through
perturbation in forming a meiotic pairing cross and reduced recombination. In
multiparous species such as pigs, this manifests as a decrease in litter size and in a
greater proportion of sows served by that boar returning to heat (non-return rate) and
hence not pregnant. Reduction in litter size from translocation boars is reported to be
between 25% and 50% depending on the translocation (O’Connor et al., 2017). In
addition to chromosomal translocations, numerous publications have reported
incidences of leucocyte chimerism in pigs (2n=38 XX/XY). Leucocyte chimerism is
Rebecca Jennings
172
observed in animals from multiple or twin dizygotic pregnancies (multiparous), due to
the formation of anastomoses (connecting blood vessels) between the developing
foetuses (Kozubska-Sobocińska., et al, 2016). Leucocyte chimerism is commonly
reported in cattle, so much so it was deemed Freemartin Syndrome (see section 1.7.2).
Therefore, the need to identify animals that carry chromosomal aberrations and prevent
perpetuation of reduced fertility into the breeding population is paramount.
To overcome this, O’Connor et al (2018) established an in-house FISH based screening
device that permitted multiple hybridizations of sub-telomeric probes on one slide. To
date, O’Connor et al (2018) had produced 210 karyotypes and screened 26 boars using
this technology. The purpose of this part of the chapter was to take this initial advance
and develop it, and as a consequence establish the incidence rate of chromosomal
abnormalities in unproven boars. Therefore, permitting analysis at a higher resolution
than previously reported in the literature (Ducos et al., 2007).
The use of artificial insemination (AI) in pig breeding is a relatively recent concept when
compared to cattle. Commercial application of AI in pigs began in the 1980s and it has
since grown exponentially (Rodríguez-Gil and Estrada, 2013). Fertility assessment in
boars awaiting AI service is commonly measured through semen analysis, examining the
following, volume of sperm-rich fraction, concentration of the sperm-rich fraction,
progressive motility, morphological abnormalities and reacted acrosomes (Rodríguez-Gil
and Estrada, 2013). However, growing evidence suggests that semen analysis is an
unreliable tool for diagnosing suboptimal fertility (Kastelic and Thundathil, 2008).
Moreover, in 2006 Ruiz-Sánchez reported an incidence of known hypoprolificacy in a
group of boars with normal semen profiles, thus highlighting that this method of
diagnosis is not indicative of optimal fertility (Ruiz-Sánchez et al., 2006). In addition to
semen analysis, farrowing rates are commonly examined since a decrease in litter size is
considered the primary indicator of boars displaying sub-optimal fertility. The gestation
period in swine is 115 days and on average a sow will farrow 10 piglets per pregnancy,

Rebecca Jennings
173
however litter size does vary depending on the breed and genetic merit (Cox 1964).
Therefore, identifying fertility issues that may result in a reduction in litter size before
an animal is entered into the AI breeding program is imperative.
The development of a mature, high-throughput pig screening technology based on
molecular, rather than traditional, cytogenetics was not only overdue, but also would
allow the re-appraisal of the question of the incidence of chromosome translocations,
particularly those missed by traditional (G-banding) methods.
6.3 Specific aims
With the above background in mind, the specific aims of this study were as follows:
Specific aim 4a. To play a significant part in the development of a porcine cytogenetic
analytical system using multiple probe FISH device (and traditional karyotyping)
towards the screening of over 1000 boars, thereby addressing the question of what
is the incidence of chromosomal abnormalities in this population.
Specific aim 4b. To test the hypothesis that a significant proportion of translocations
that were detected by the multiprobe FISH screening approach would not have been
identified by traditional banding techniques.
Specific aim 4c. To apply cytogenetic technologies to a chimeric (XX/XY) boar that
was identified through the multiprobe FISH device and extend the analysis to test
the hypothesis that XX bias is present in the germ line.
Rebecca Jennings
174
6.4 Results
6.4.1 Specific aim 4a. To play a significant part in the development of a porcine
cytogenetic analytical system using both the multiple probe FISH device (and
traditional karyotyping) towards the screening of over 1000 boars, thereby
addressing the question of what is the incidence of chromosomal abnormalities
in this population
The initial establishment of porcine cytogenetic screening device (O’Connor et al., 2017)
allowed for the development of a high throughput system. My personal contribution was
to optimise the FISH protocol such that clear and bright signals were consistently seen
every time a sample was prepared and help streamline the analysis pipeline. Throughout
the duration of this study time taken to analyse one sample typically improved to around
35 minutes through optimisation of the protocol. Upon receipt of a blood sample, the
result is usually back to the breeding company within 3-4 weeks. An initial focus on basic
karyotyping has now given way to 100% of all samples being processed via FISH.
Additionally, the number of companies using the FISH-based technology over traditional
karyotyping has increased to 15 (from 10 countries). In total, 1,017 boars were screened
for chromosomal translocations over a three-year period. Of these, 768 were screened
using the FISH method (refer to section 2.5), whilst 239 porcine samples were analysed
using traditional karyotyping alone, as shown in table 6-1. During this time, eight
different reciprocal translocations were identified using the multiprobe FISH device.
Additionally, two reciprocal translocations were detected using traditional banding
methods and confirmed by FISH and all translocation discovered in our laboratory are
shown in table 6-2. Moreover, the incidence rate of chromosomal abnormalities
identified in this population was 2.3% and of these, 1% were found to be unique
reciprocal translocation carriers. In addition to this, a number of phenotypically normal
pigs with XX/XY chimerism were identified using the multiprobe FISH device, resulting in
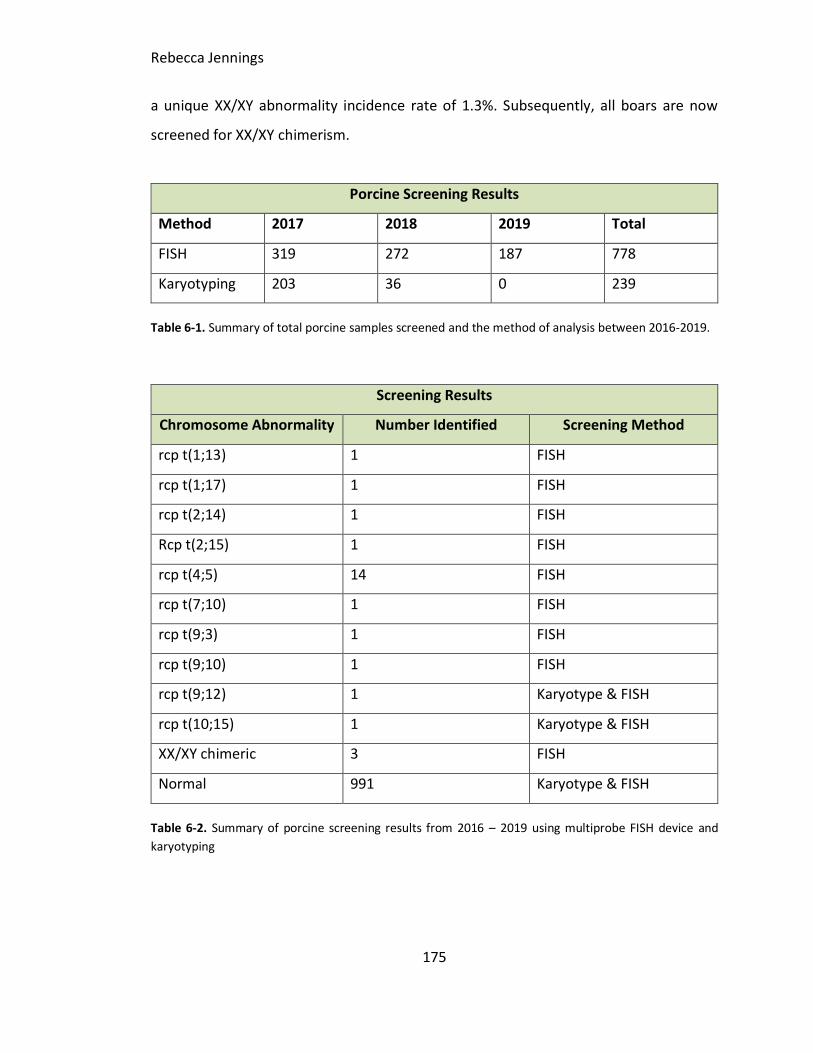
Rebecca Jennings
175
a unique XX/XY abnormality incidence rate of 1.3%. Subsequently, all boars are now
screened for XX/XY chimerism.
Porcine Screening Results
Method 2017 2018 2019 Total
FISH 319 272 187 778
Karyotyping 203 36 0 239
Table 6-1. Summary of total porcine samples screened and the method of analysis between 2016-2019.
Screening Results
Chromosome Abnormality Number Identified Screening Method
rcp t(1;13) 1 FISH
rcp t(1;17) 1 FISH
rcp t(2;14) 1 FISH
Rcp t(2;15) 1 FISH
rcp t(4;5) 14 FISH
rcp t(7;10) 1 FISH
rcp t(9;3) 1 FISH
rcp t(9;10) 1 FISH
rcp t(9;12) 1 Karyotype & FISH
rcp t(10;15) 1 Karyotype & FISH
XX/XY chimeric 3 FISH
Normal 991 Karyotype & FISH
Table 6-2. Summary of porcine screening results from 2016 – 2019 using multiprobe FISH device and
karyotyping

Rebecca Jennings
176
6.4.2 Specific aim 4b. To test the hypothesis that a significant proportion of
translocations that were detected by this approach would not have been
identified by traditional banding techniques
To test the hypothesis that some reciprocal translocations are undetectable (or very
difficult to detect routinely) through traditional methods – each of the translocations
detected through FISH analysis were re-analysed using karyotyping. Prior knowledge of
the specific translocation potentially over-estimates how many would have been
identified when analysing. Table 6-3 shows this reanalysis.
Chromosome Abnormality Would we have identified this by
karyotyping alone?
rcp t(1;13) No
rcp t(1;17) Yes
rcp t(2;14) Yes
rcp t(4;5) No
rcp t(7;10) Yes
rcp t(9;3) Yes
rcp t(9;12) No
rcp t(10;15) Yes
Table 6-3. Reanalysis of results obtained from screening of boars using the multiprobe FISH device.
Prediction of the likelihood that a diagnosis would be achieved through karyotype, result obtained from
reanalysis of FISH images.
To supplement this analysis, a further 14 historical samples with 12 known translocations
were analysed using standard karyotyping methods.

Rebecca Jennings
177
Chromosomal Abnormality Number Identified Would we have identified
this by karyotyping alone?
rcp t(1;19) 1 Yes
rcp t(2;9) 1 No
rcp t(3;13) 1 Yes
rcp t(4;9) 2 No
rcp t(4;9) 1 Yes
rcp t(7;9) 1 Yes
rcp t(8;12) 1 No
rcp t(9;10) 2 Yes
rcp t(9;15) 1 Yes
rcp t(13;X) 1 Yes
Table 6-4. Reciprocal translocations identified through FISH. Prediction of the likelihood that a diagnosis
would be achieved through karyotype, result obtained from reanalysis of FISH images.
The following figures show specific examples of the issues faced when relying on
karyotyping alone. The karyotype produced in figure 6-1 illustrates the potential
difficulty when trying to identify the reciprocal chromosome involved in the
translocation. It is evident from this karyotype that chromosome 3 is involved in the
translocation, however isolating the reciprocal chromosome using this method proved
time consuming, and ultimately required the multiprobe FISH device to confirm this
diagnosis.

Rebecca Jennings
178
Figure 6-1. Traditional karyotype of a boar carrying a 3;9 reciprocal translocation. DAPI-stained
metaphase chromosomes of a boar identified to carry (2=38 (rcp t(3;9)).
The karyotype produced in figure 6-2 demonstrates that traditional banding techniques
can identify translocations, if the exchange is large enough. This is in keeping with the
literature; a segmental rearrangement must be at least 3-5 Mb to be observed (Lu et al.,
2007).
Figure 6-2. Traditional karyotype of a boar carrying a 2;14 reciprocal translocation. DAPI-stained
metaphase chromosomes of a boar identified to carry (2=38 (rcp t(2;14)).
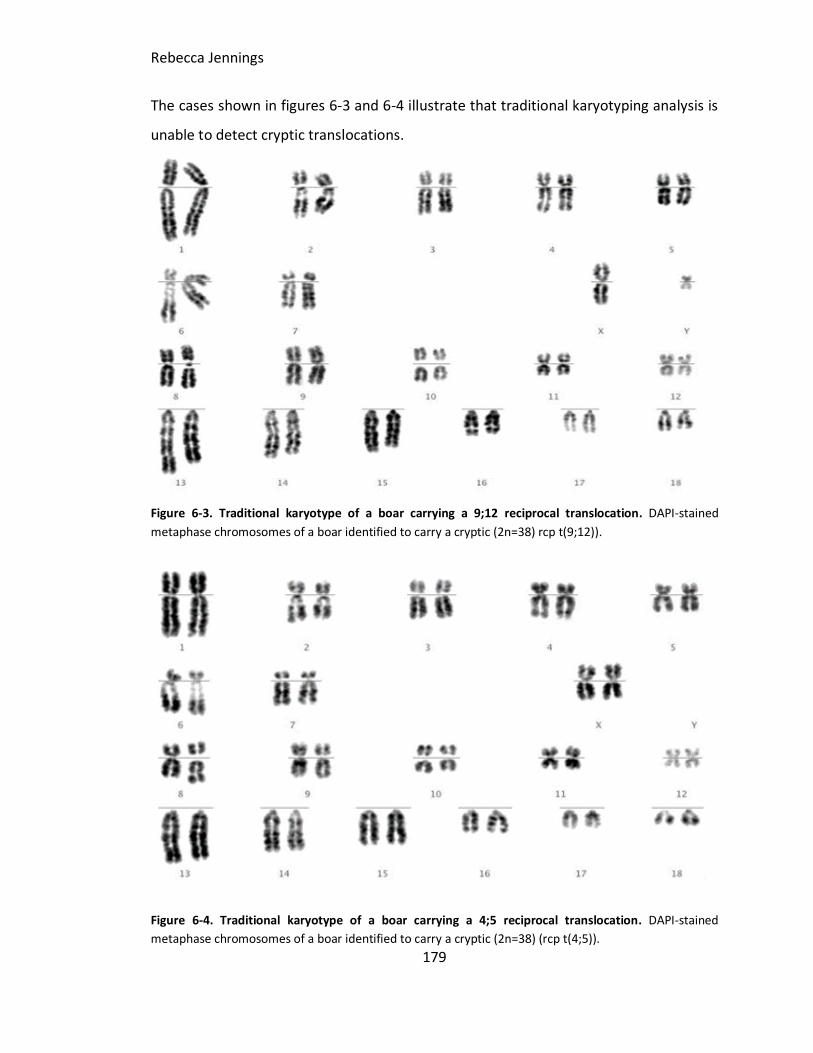
Rebecca Jennings
179
The cases shown in figures 6-3 and 6-4 illustrate that traditional karyotyping analysis is
unable to detect cryptic translocations.
Figure 6-3. Traditional karyotype of a boar carrying a 9;12 reciprocal translocation. DAPI-stained
metaphase chromosomes of a boar identified to carry a cryptic (2n=38) rcp t(9;12)).
Figure 6-4. Traditional karyotype of a boar carrying a 4;5 reciprocal translocation. DAPI-stained
metaphase chromosomes of a boar identified to carry a cryptic (2n=38) (rcp t(4;5)).

Rebecca Jennings
180
6.4.3 Specific aim 4c. To apply cytogenetic technologies to a chimeric (XX/XY) boar
that identified through technologies used in specific aim 1a, to test the
hypothesis that XX bias is present in the germ line
A porcine blood sample was drawn for routine chromosome screening, upon analysis
the boar appeared karyotypically female (2n38 (XX)). Additional FISH experiments using
labelled BAC probes from the X chromosomes and SRY gene (located on the Y
chromosome), indicated that the boar was chimeric (2n=38 (XX/XY)) in lymphocyte
culture, with 71.2% of cell identified as XX (figure 6-6). Sperm was subsequently analysed
using BACs isolated from the X chromosome and a labelled SRY marker to establish if the
XX/XY chimerism extended to the germ line. Sperm was fixed as per the protocol in
section 2.9. Overall, 392 spermatocytes were counted, 236 were identified as Y bearing,
whilst 156 contained the X chromosome, the remaining were classified as unassigned
due to the failure to produce a signal. A chi square, goodness of fit calculation was used
to assess the distribution compared to the expected. In general, the expected ratio
should be 50:50 X/Y bearing spermatocytes. Therefore, the null hypothesis is that 50%
of the counted spermatocytes will bear the X chromosome whilst the remaining 50% will
carry the Y chromosome. The hypothesis that XX/XY chimerism may result in a sex
chromosome ratio skew. The results were as follows, chi square 𝑋2 = 16.33, this result
revealed that the distribution of the results obtained here were significantly different
to the expected with a p value of 5.33 x 10⁻⁵ (0.05 significance level and 2 degrees of
freedom). To validate and compare the results above, sperm FISH was analysed as per
the protocol in section 2.9. Sperm from a non-chimeric boar was fixed and analysed
through FISH using labelled probes from the X chromosome and SRY gene which is
located on the Y chromosome. A total of 367 spermatocytes were analysed, 112 were
found to carry the X chromosome whilst 201 were found to carry the Y chromosome. As
before, a chi square calculation was used to assess the distribution of results with the
result being chi square 𝑋2 = 25.8, with a p value of 3.786 x 10 -7 (0.05 significance level).

Rebecca Jennings
181
Observed Expected (Differences)2 / Expected
X bearing 156.00 196.00 8.16
Y bearing 236.00 196.00 8.16
Chi-Square 16.33
p-value 5.33 x 10⁻⁵
Table 6-5. Table to show chi squared calculation results and p value for results obtained from FISH analysis
using labelled probes from the X chromosome and SRY gene located on the Y chromosome on fixed sperm
of XX/XY chimeric boar. Analysis performed using Excel 10.
Karyotype Interphase Nuclei Metaphase Percentage
XX 188 7 97.9%
XY 4 1 2.1%
Total 192 8 100%
Table 6-6. Results from lymphocyte metaphase chromosomes using labelled BAC probes for X
chromosome (CH242-19N1 (FITC)) and SRY (WTI-1061-9B10 (TxRed)) located on the Y chromosome
Limited farrowing rates from the boar were available from the swine breeder, with three
sows being served by this boar with a total number of 30 offspring born alive and 7 born
dead.

Rebecca Jennings
182
Figure 6-5. FISH image to show results from sex chromosome specific BACs on metaphase chromosomes
and sperm of mosaic boar. Labelled BAC probes for X chromosome (CH242-19N1 (FITC)) and SRY (WTI-
1061-9B10 (TxRed)) Left image - lymphocyte metaphase chromosomes showing the presence of X (FITC
signal) and Y chromosome (TxRed signal). Right image – dual colour FISH using X chromosome FITC labelled
probe and SRY labelled TxRed probe on fixed sperm from mosaic boar. (Magnification x1000)
6.5 Discussion
This work was largely successful in pursuit of its specific aims, in particular I:
Played a significant part in optimising the technique so that a results are reliable
and obtained within a shorter time frame
Generated results from the successful screening of over 1000 boars and
identified novel reciprocal translocations (at an incidence of 1%) within the
breeding population
The hypothesis was confirmed that hitherto undetectable reciprocal
translocations can be detected using this technology with 7 out of 18 (39%)
unlikely to have been detected by traditional karyotyping
Tools used in this work enabled a novel series of case reports in domestic and
non-domestic animals

Rebecca Jennings
183
This study demonstrates that chromosomal translocations are present in the breeding
population at a frequency of 1% which is double the previously published value of 0.47%
(Ducos et al., 2007). Furthermore, considering that an estimated 39% of reciprocal
translocations investigated in this study, would have been undiagnosed using standard
karyotyping techniques alone, it is reasonable to suggest that chromosomal screening
should be completed using the FISH-based method described in this work. As previously
mentioned throughout this study, chromosome abnormality screening is essential.
Isolating an individual carrying an abnormality that directly impairs fertility will prevent
transmission of the aberration to future progeny, thus preventing economic loss.
The use of traditional banding techniques to detect chromosomal translocations is still
used today, although this can only be achieved when a segmental rearrangement is
larger than 3-5 Mb at 400-600 band resolution and any smaller than this may go
undetected (Lu et al., 2007). The FISH-based approach developed in our laboratory
however is not constrained by this problem. This is demonstrated in figure 6-3 (rcp
(9;12)) and figure 6-4 (rcp t(4;5)), where the multiprobe FISH device was required in
these cases to elucidate the chromosomes involved in the reciprocal translocation,
therefore validating the use of this technology in chromosome screening.
Taken together, a total of 26 boars out of the 1,017 analysed (2.6%) had a translocation
or XX/XY chimerism. The 3 cases of XX/XY chimerism are probably unrelated, however
the identification of a reciprocal translocation in one boar (rcp (4;5)) initiated the
screening of their progeny and family population. Moreover, this translocation discovery
resulted in further screening of the carrier’s family. Identification of a further 13 cases
of the same translocation were identified here thereby decreasing the incidence of
chromosome abnormalities in this population to 1% for translocations or 1.3% for all
chromosome abnormalities. XX/XY chimerism is certainly detectable by karyotyping,
however the necessity to karyotype each boar means that analysis of an acceptable
number of metaphases would be prohibitively impractical in many cases. Using the

Rebecca Jennings
184
technology described in this chapter, a sufficient number of metaphases (50-100) can be
analysed in minutes. Even after analysing over 1000 cases, numbers are small, however
taking the published rates of chromosome abnormality in breeding boars to be 0.47%
(Quach et al., 2016), our re-analysis of “known” translocations using karyotyping to
reveal cryptic translocations, and the extra value of being able to screen for XX/XY
chimerism more effectively suggest that, as a result of our efforts, one and a half to twice
as many boars’ can be detected with the use of our approach.
The work performed to address specific aim 4c identified the existence of a 2n=38
(XX/XY) boar within the sample population. Initially, the boar was considered to be an
XX male; however, further FISH analysis identified the Y chromosome in 1.5% of the
lymphocyte metaphase/nuclei examined. The results obtained through the analysis of
sperm from this boar implies that the chimerism was not present in the germ line, as an
XX ratio skew was not observed. For this reason, it is reasonable to suggest that the
chimerism observed in the lymphocyte culture was a result of the formation of
anastomoses (connecting blood vessels) between the developing foetuses (Kozubska-
Sobocińska et al., 2016).
6.6 Conclusion
The porcine multiprobe FISH screening device has proven to be a reliable and effective
method to screen for cryptic translocations that are undetectable through traditional
karyotyping. Due to the direct effect chromosomal translocations have on fertility, it is
imperative that any abnormality is identified quickly and accurately. Moreover, animals
that reduced the profitability of the herd can be isolated and removed before entry into
AI breeding programs, thus decreasing the risk of economic loss experienced by the
breeding company. Considering this success, it is important to ascertain if this
technology can be implemented in other agricultural species. This work also
demonstrates that cytogenetic tools and analysis can be used as the starting point in any
Rebecca Jennings
185
chromosomal abnormality study. Traditional banding methods permit a genomic
overview, whilst targeted approaches can improve the resolution by which
abnormalities are identified.
7 General Discussion
7.1 Achievement summary
Overall this study was largely successful in pursuit of its specific aims, in particular:
The development and implementation of a multiprobe FISH device that enabled
the identification of hitherto undetectable cryptic translocations in cattle. The
results presented in chapter 5 indicate that traditional karyotyping alone often
fails to identify reciprocal chromosomal translocations that involve < 3 Mb of
DNA. Moreover, the use of this technology has increased translocation detection
rates, reduced actual screening time (one experiment to screen all
chromosomes) and improved the accuracy of the result. Ultimately, this
technology identified a novel reciprocal translocation in the breeding cattle
population that would have undiagnosed if using traditional karyotyping alone.
A high throughput, porcine multiprobe FISH-based chromosomal screening
device was successfully implemented, whereby over 1000 samples were
processed and analysed for the presence of fertility-compromising chromosomal
translocations. This technology facilitates the analysis of all subtelomeric regions
in around 30 minutes, thereby reducing the time required to screen one boar.
Moreover, the results shown in chapter 6 suggest that the incidence rate of
chromosomal translocations in unproven boars is 1%, double that reported by
Ducos et al (2007). For this reason, this study demonstrates that chromosomal
translocations are grossly underestimated in the breeding population of pigs.

Rebecca Jennings
186
Due to the development and success of the above cytogenetic tools, a series of
novel case reports were undertaken to investigate infertility and sexual
development in a wide range of mammalian species. It is evident from the results
obtained in this work that sexual ambiguity is present in different mammalian
species. Limited resources meant that in most cases a karyotype was the only
diagnostic tool avaliable and this was sufficient in most cases. However, the
availability of human-specific FISH probes, as described in chapter 3, meant that
a more intense investigation into a series of spontaneous abortions experienced
by a group of western lowland gorillas could take place.
A series of Order-specific BAC panels were created to assist in the production of
chromosome-level genome assemblies. Previous work had demonstrated the
reliability of a combined bioinformatic and BAC-mapping approach which
successfully up-graded avian genome assemblies to a chromosome level. In this
work, a number of limitations meant that a universal mammalian panel would
not be realised. However, preliminary work reported here suggested that a
number of Order-specific panels could be used to up-grade mammalian de novo
genome assemblies.
Overall, the goal of this project was to develop and implement a range of FISH-based,
molecular cytogenetic tools that would, a) facilitate the detection of fertility-reducing
cryptic translocations in agricultural animals (cattle and pigs), b) report the incidence of
chromosomal abnormalities in unproven boars and c) create a universal panel of BAC
probes that would aid genome assembly and reconstruction efforts. It is evident from
the work obtained throughout this study that the molecular cytogenetic tools used here,
should still be considered an important tool in diagnostic and basic research. Moreover,
the technology used in this thesis enabled investigations into chromosomal
rearrangements that are associated with sub-optimal fertility and chromosomal
rearrangements that mediate reproductive isolation.

Rebecca Jennings
187
7.1.1 Technological improvements in agricultural chromosome screening
The results presented throughout this thesis highlight the importance of chromosomal
screening in agricultural animals. This work demonstrates that reciprocal translocations
are prevalent in unproven boars, with an incidence rate of 1%. Moreover, the large
sample size (>1000) and use of a technology that facilitated the detection of cryptic
translocations, resulted in a higher incidence rate (double) than that previously found by
Ducos et al (2007). The technology used in chapter six was developed by O’Connor
(2016) to isolate animals that carry cryptic translocations. This form of translocation is
notoriously difficult to detect using only traditional banding technology alone and for
this reason, it is plausible to suggest that due to the methods used in this work, a
significant proportion of translocations were missed. Moreover, it was suggested by De
Lorenzi et al (2012) that if the genetic exchange is less than 3 Mb traditional banding
techniques are ill-equipped to identify cryptic chromosomal rearrangements. Therefore,
the technology used throughout this thesis successfully negates this limitation,
ultimately demonstrating this method should be considered the ‘gold standard’ of
chromosomal screening in this species.
Similarly, in cattle, this work has proven that traditional banding methods fail to
recognise cryptic reciprocal translocations; until now banding analysis, was the only
method used to screen for abnormalities in this species. Therefore, the development of
a FISH-based screening device will potentially improve the resolution to which
chromosomal abnormalities can be detected, as was demonstrated through the
identification of a 12;23 reciprocal translocation in two of the bulls screened (chapter 5).
These results showed that using banding methods alone this translocation would have
missed. The results obtained in chapter 5 demonstrate that chromosomal translocations
are present within the breeding populations of cattle. Previous work had already
established that the 1;29 translocation was considered widespread whereby it was
identified in almost all cattle breeds. Additionally, an interesting finding in this study was
the detection of two animals that carried the homozygous form of this translocation.

Rebecca Jennings
188
Although this rearrangement has been reported in other animals previously, it is
considered a somewhat rare event. Moreover, in evolutionary terms this form of
homozygous rearrangement mediates reproductive isolation, when if paired with
another carrier could become fixed in the population, therefore resulting in a speciation
event. It is widely established that in individuals that are heterozygous for a
chromosomal rearrangement, recombination between chromosomes that differ for the
rearrangement often generates unbalanced gametes, as described throughout this
thesis. However, in an individual that carries the homozygous form of a rearrangement,
recombination mispairing and segregation issues are avoided therefore forming
balanced gametes (Rieseberg, 2001). Previously, it was noted that the advantage, with
respect to establishment is only present when the population is small and selection
against the under-dominant mutation is weak (Rieseberg, 2001). For this reason, the
likelihood of this rearrangement becoming fixed is relatively low.
7.1.2 Cytogenetic tools for genome assembly
The ultimate goal of any genome sequencing effort is to produce a contiguous length of
sequence read that spans from the p terminus to the q terminus of every chromosome
in a given organism (Damas et al., 2017). However, with the current technologies
available this goal is not yet achievable and for this reason, computational tools along
with anchoring techniques (e.g. BAC-FISH mapping) are required to facilitate the
assembly of de novo sequenced genomes. The work presented in this study was as a
result of a highly successful project developed for avian genome assembly (Damas et al.,
2017). This combined approach used both assembly algorithms and cytogenetic analysis
which permitted the development of a universal set of BACs that facilitated assembly in
divergent species. The work presented in chapter 1 illustrates the difficulties in achieving
this universal BAC set in mammals. Indeed, unlike birds, the genomes of mammalian
species are incredibly repeat rich and it is believed that 30% of the human genome is
repetitive in nature. This means that hybridisation success of a similar standard to that
of pervious work was only observed in species that were closely related to the reference

Rebecca Jennings
189
genome i.e. genome from which the BACs were selected (Treangen and Salzberg, 2011).
However, this result indicated that instead of a universal panel (as seen in birds) a series
of Order-specific BACs could be developed and applied to chromosome-level genome
assembly in mammals. Fundamentally, this hypothesis is still in development, with only
a small panel of BACs (see section 3.4.3.1) currently avaliable for species within the
Artiodactyla and Primate Orders. However, this approach offers an answer to the
problems experienced in chapter 1 and will ultimately help facilitate chromosome-level
genome assembly in mammals.
7.1.3 Cytogenetic tools – the wider studies
It is evident from the work presented in this thesis that traditional karyotype analysis
can be used to elucidate certain questions pertaining to sexual development. In
particular, the results shown in chapter 4 illustrate the importance of this technique
when trying to determine the genotypic sex of an animal with ambiguous genitalia, as
seen in the case of the red river hog, thoroughbred horses and Sumatran tiger. In the
case of the red river hog, porcine sex chromosome-specific probes were used to confirm
the karyotype, thus providing the opportunity to analyse lymphocytes in both
metaphase and interphase states which ultimately increased the number of results
obtained and reduced time spent creating karyotypes. Furthermore, should the
development of the aforementioned Order-specific BAC panels occur, there may come
a time when FISH analysis could be used on all animals referred for karyotypic sex
determination. However, to gain a deeper understanding as to the mechanism behind
the interrupted development, additional analysis will be required.
In the case of the bovine Swyer, a plethora of cytogenetic and sequencing analyse were
performed in an attempt to understand the genetic abnormality behind the disorder. In
humans a mutation in the SRY is responsible for 15-20% of cases (Machado et al., 2001).
However, after successfully isolating the SRY and performing DNA sequencing analysis,
it was found to be fully functional. Previously, an SRY positive bovine Swyer was reported

Rebecca Jennings
190
by De Lorenzi et al (2012), as with this cases the SRY was found to be fully functional
with no mutations or frameshifts detected.
7.2 Further work arising from this study
While the work presented here has addressed some of the challenges faced in
chromosomal analysis and genome assembly efforts, the observations made during this
study have identified areas that require further examination, namely:
The development of a FISH-based screening device for the detection
chromosomal abnormalities in horses. Moreover, using a similar design to that
of cattle, (see section 2.5.1.2), a device could be developed that would screen
the entire chromosome complement of horses in one experiment over two
slides. Therefore, the logical next stage of this work would be to isolate BACs
from the proximal and distal region of each chromosome in horses. After
optimisation and BAC location verification tests, these could then be
incorporated into the multiprobe device, whereby thoroughbred breeders
and/or vets could check the chromosomal status of each individual horse.
Continuation of the development of a series of BAC panels that would assist in
the production of chromosome-level genome assemblies. The first step in this
work would be to apply the BAC described in section 3.4.3.1, to a range of
Artiodactyl species, starting with the Red lechwe (24 mya from reference) to pig
(64 mya from reference). Depending on the results obtained from this, a panel
could be developed that would up-grade de novo genome assemblies of species
from within this Order. Furthermore, this work could be extended to additional
mammalian Orders for instance Carnivora. Although BACs were successfully used
to examine chromosome rearrangements in the Rodent lineage, a full panel of
autosomic BACs could be established for species within Rodentia.

Rebecca Jennings
191
7.3 Personal Perspectives
Now that my PhD has come to an end, it is possible to reflect upon the last three years
and realise that it has been a truly incredible journey, one that has provided me with the
opportunity to develop my scientific and analytical skills. I, for one am exceptionally
proud of the work that I have achieved over the last three years.
This PhD provided me with chance to travel both nationally and internationally, it
provided the chance to disseminate my research to the wider scientific community;
invitations from the International Chromosome Conference in Prague to give an oral
presentation, as well my first ever conference talk at Genome Science and Genome 10 K
conference in Norwich (an experience that was both terrifying and exhilarating), and
finally, The European Cytogeneticist Association in Florence, a weekend that will never
be forgotten.
Throughout the duration of my PhD I encountered so many influential scientists, I was
encouraged to engage with and discuss my work in the hope that new collaborations or
projects could be initiated, this gave me the confidence to participate in conversation
with my peers and superiors. I have met some amazing people over the last three years,
some of which I consider true friends now, they helped make my PhD a fantastic
experience.

Rebecca Jennings
8-192
8 References
Arboleda, V. A., Sandberg, D. E. and Vilain, E. (2014) ‘DSDs: genetics, underlying
pathologies and psychosexual differentiation’, Nature Reviews Endocrinology, 10(10), pp.
603–615. doi: 10.1038/nrendo.2014.130.
Arnold, A. P. (2012) ‘The end of gonad-centric sex determination in mammals.’, Trends in
genetics: TIG, 28(2), pp. 55–61. doi: 10.1016/j.tig.2011.10.004.
Bachtrog, D. et al. (2011) ‘Are all sex chromosomes created equal?’, Trends in genetics:
TIG, 27(9), pp. 350–7. doi: 10.1016/j.tig.2011.05.005.
Baltisberger, M. and Hörandl, E. (2016) ‘Karyotype evolution supports the molecular
phylogeny in the genus Ranunculus (Ranunculaceae)’, Perspectives in Plant Ecology,
Evolution and Systematics. 18, pp. 1–14. doi: 10.1016/J.PPEES.2015.11.001.
Bates, S. E. (2011) ‘Classical Cytogenetics: Karyotyping Techniques’, , pp. 177–190. doi:
10.1007/978-1-61779-201-4_13.
Bhambhani, R. and Kuspira, J. (1969) ‘The somatic karyotypes of American bison and
domestic cattle’, Canadian Journal of Genetics and Cytology, 11(2), pp. 243–249. doi:
10.1139/g69-030.
Bishop, R. (2010) ‘Applications of fluorescence in situ hybridization (FISH) in detecting
genetic aberrations of medical significance’, Bioscience Horizons., 3(1), pp. 85–95. doi:
10.1093/biohorizons/hzq009.
Bollongino, R., Burger, J., Powell, A., Mashkour, M., Vigne, J.-D., & Thomas, M. G. (2012).
Modern Taurine Cattle Descended from Small Number of Near-Eastern Founders.
Molecular Biology and Evolution, 29(9), 2101–2104.
https://doi.org/10.1093/molbev/mss092
Bonnet-Garnier, A. et al. (2008) ‘Meiotic segregation analysis in cows carrying the t(1;29)
Robertsonian translocation’, Cytogenetic and Genome Research., 120(1–2), pp. 91–96.
doi: 10.1159/000118744.
Rebecca Jennings
8-193
Botero-Castro, F. et al. (2017) ‘Avian Genomes Revisited: Hidden Genes Uncovered and
the Rates versus Traits Paradox in Birds’, Molecular Biology and Evolution., 34(12), pp.
3123–3131. doi: 10.1093/molbev/msx236.#
Bovine HapMap Consortium, T. B. H., Gibbs, R. A., Taylor, J. F., Van Tassell, C. P., Barendse,
W., Eversole, K. A., … Dodds, K. G. (2009). Genome-wide survey of SNP variation uncovers
the genetic structure of cattle breeds. Science (New York, N.Y.), 324(5926), 528–532.
https://doi.org/10.1126/science.1167936
Bradford, A. (2014) Gorilla Facts. Available at: https://www.livescience.com/27337-
gorilla-facts.html (Accessed: 6 August 2019).
Broekhuijse, M. L. W. J. et al. (2012) ‘Application of computer-assisted semen analysis to
explain variations in pig fertility1’, Journal of Animal Science., 90(3), pp. 779–789. doi:
10.2527/jas.2011-4311.
Buckley, R. M., Kortschak, R. D. and Adelson, D. L. (2018) ‘Divergent genome evolution
caused by regional variation in DNA gain and loss between human and mouse’, PLOS
Computational Biology., 14(4), p. e1006091. doi: 10.1371/journal.pcbi.1006091.
Bunch, T. D., Foote, W. C. and Spillett, J. J. (1976) ‘Translocations of acrocentric
chromosomes and their implications in the evolution of sheep <i>(Ovis)</i>’;,
Cytogenetic and Genome Research. 17(3), pp. 122–136. doi: 10.1159/000130704.
Carter, N. (1994) ‘Cytogenetic Analysis by Chromosome Painting’, Cytornetry
(Communications in Clinical Cytometry). Available at:
https://onlinelibrary.wiley.com/doi/pdf/10.1002/cyto.990180103 (Accessed: 7 October
2019).
Chinwalla, A., Cook, L., Delehaunty, K. et al. Initial sequencing and comparative analysis
of the mouse genome. Nature 420, 520–562 (2002).
https://doi.org/10.1038/nature01262
Chowdhary, B. P. et al. (1998) ‘Emerging patterns of comparative genome organization in
some mammalian species as revealed by Zoo-FISH.’, Genome research, 8(6), pp. 577–89.
doi: 10.1101/GR.8.6.577.

Rebecca Jennings
8-194
Chromosomal Deletion Syndrome - an overview | ScienceDirect Topics (no date).
Available at: https://www.sciencedirect.com/topics/biochemistry-genetics-and-
molecular-biology/chromosomal-deletion-syndrome (Accessed: 18 October 2019).
Chu, E. H. Y. and Bender, M. A. (1962) ‘Cytogenetics and evolution of primates’. John
102(2), pp. 253–266. doi: 10.1111/j.1749-6632.1962.tb13644.x.
Cohain, J. S., Buxbaum, R. E. and Mankuta, D. (2017) ‘Spontaneous first trimester
miscarriage rates per woman among parous women with 1 or more pregnancies of 24
weeks or more.’, BMC pregnancy and childbirth., 17(1), p. 437. doi: 10.1186/s12884-017-
1620-1.
Contreras, L. C., Torres-Mura, J. C. and Spotorno, A. E. (1990) ‘The largest known
chromosome number for a mammal, in a South American desert rodent’, 46(5), pp. 506–
508. doi: 10.1007/BF01954248
Country Production Total Exports Livestock and Poultry: World Markets and Trade China’s
Share of World Meat Imports to Expand in 2019 (no date). Available at:
https://apps.fas.usda.gov/psdonline/circulars/livestock_poultry.pdf (Accessed: 8 May
2019)
Cox, D. F. (1964) ‘Genetic Variation in the Gestation Period of Swine’, Journal of Animal
Science., 23(3), pp. 746–751. doi: 10.2527/jas1964.233746x.
Damas, J. et al. (2017) ‘Upgrading short-read animal genome assemblies to chromosome
level using comparative genomics and a universal probe set.’, Genome research. 27(5),
pp. 875–884. doi: 10.1101/gr.213660.116.
Darwin, C. R. 1868. The variation of animals and plants under domestication. 1(1).
Volume 1.
De Lorenzi, L. et al. (2012) ‘Reciprocal translocations in cattle: frequency estimation’. doi:
10.1111/j.1439-0388.2011.00983.x.
De Lorenzi, L. et al. (2018) ‘XY (SRY-positive) Ovarian Disorder of Sex Development in
Cattle’, Sexual Development., 12(4), pp. 196–203. doi: 10.1159/000489869.
Rebecca Jennings
8-195
DeBry, R. W. and Sagel, R. M. (2001) ‘Phylogeny of Rodentia (Mammalia) Inferred from
the Nuclear-Encoded Gene IRBP’, Molecular Phylogenetics and Evolution. 19(2), pp. 290–
301. doi: 10.1006/MPEV.2001.0945.
Dobzhansky, T, and A H Sturtevant. 1938. “Inversions in the Chromosomes of Drosophila
Pseudoobscura.” Genetics 23 (1): 28–64.
http://www.ncbi.nlm.nih.gov/pubmed/17246876.
Dorain J. Garrick ed, Anatoly Ruvinsky, ed. n.d. “The Genetics of Cattle, 2nd Edition.”
Accessed July 10, 2019. https://www.vet-library.com/cart/p-1220-the-genetics-of-cattle-
2nd-edition.html.
Ducos, A. et al. (2007) ‘Chromosomal control of pig populations in France: 2002–2006
survey’, Genetics Selection Evolution, 39(5), pp. 583–597. doi: 10.1051/gse:2007023.
Ducos, A. et al. (2008) ‘Cytogenetic screening of livestock populations in Europe: an
overview.’, Cytogenetic and genome research., 120(1–2), pp. 26–41. doi:
10.1159/000118738.
Durmaz, A. A. et al. (2015) ‘Evolution of genetic techniques: past, present, and beyond.’,
BioMed research international. 2015, p. 461524. doi: 10.1155/2015/461524.
Eid, John, Adrian Fehr, Jeremy Gray, Khai Luong, John Lyle, Geoff Otto, Paul Peluso, et al.
2009. “Real-Time DNA Sequencing from Single Polymerase Molecules.” Science 323
(5910): 133–38. https://doi.org/10.1126/science.1162986.
Esteves, A., Båge, R. and Carreira, R. P. (2012) Freemartinism in Cattle Animal
Reproduction and fertility View project crithinkedu erasmus EU Project View project 76
publications 547 citations see profile. Available at:
https://www.researchgate.net/publication/256293263 (Accessed: 8 July 2019).
Farimani, M. et al. (2012) ‘Genetic counseling in carriers of reciprocal translocations
involving two autosomes’, Indian Journal of Human Genetics, 18(2), pp. 250–253. doi:
10.4103/0971-6866.100802.
Ferguson-Smith, M. A. (2008) ‘Cytogenetics and the evolution of medical genetics’,
Genetics in Medicine., 10(8), pp. 553–559. doi: 10.1097/GIM.0b013e3181804bb2.

Rebecca Jennings
8-196
Ferguson-Smith, M. A. (2015) ‘History and evolution of cytogenetics.’, Molecular
cytogenetics., 8, p. 19. doi: 10.1186/s13039-015-0125-8.
Ferguson-Smith, M. A. and Trifonov, V. (2007) ‘Mammalian karyotype evolution’, Nature
Reviews Genetics, pp. 950–962. doi: 10.1038/nrg2199.
Ferguson-Smith, M. A. et al. (2005) ‘The impact of chromosome sorting and painting on
the comparative analysis of primate genomes’, Cytogenetic and Genome Research,
108(1–3), pp. 112–121. doi: 10.1159/000080809.
Ferguson-Smith, M. A., Yang, F. and O’Brien, P. C. M. (1998) ‘Comparative Mapping Using
Chromosome Sorting and Painting’, ILAR Journal. 39(2–3), pp. 68–76. doi:
10.1093/ilar.39.2-3.68.
Feuk, L. et al. (2005) ‘Discovery of human inversion polymorphisms by comparative
analysis of human and chimpanzee DNA sequence assemblies’, PLoS Genetics., 1(4), pp.
0489–0498. doi: 10.1371/journal.pgen.0010056.
Fève, K. et al. (2017) ‘Identification of a t(3;4)(p1.3;q1.5) translocation breakpoint in pigs
using somatic cell hybrid mapping and high-resolution mate-pair sequencing’, PLOS ONE.
Public Library of Science, 12(11), p. e0187617. doi: 10.1371/journal.pone.0187617.
Fierst, J. L. (2015) ‘Using linkage maps to correct and scaffold de novo genome
assemblies: Methods, challenges, and computational tools’, Frontiers in Genetics.. doi:
10.3389/fgene.2015.00220.
Froenicke, L. (2005) ‘Origins of primate chromosomes - As delineated by Zoo-FISH and
alignments of human and mouse draft genome sequences’, Cytogenetic and Genome
Research., pp. 122–138. doi: 10.1159/000080810.
Frohlich, J. et al. (2017) ‘Karyotype relationships among selected deer species and cattle
revealed by bovine FISH probes’, PLOS ONE. 12(11), p. e0187559. doi:
10.1371/journal.pone.0187559.
Frönicke, L. and Wienberg, J. (2001) ‘Comparative chromosome painting defines the high
rate of karyotype changes between pigs and bovids’, Mammalian Genome, 12(6), pp.
442–449. doi: 10.1007/s003350010288.

Rebecca Jennings
8-197
Gallagher, D. S., Derr, J. N. and Womack, J. E. (1994) ‘Chromosome Conservation Among
the Advanced Pecorans and Determination of the Primitive Bovid Karyotype’, Journal of
Heredity., 85(3), pp. 204–210. doi: 10.1093/oxfordjournals.jhered.a111436.
Gartler, S. M. (2006) ‘The chromosome number in humans: a brief history’, Nature
Reviews Genetics, 7(8), pp. 655–660. doi: 10.1038/nrg1917.
Genetics | The Smithsonian Institution’s Human Origins Program (no date). Available at:
http://humanorigins.si.edu/evidence/genetics (Accessed: 29 February 2020).
Giuffra, E. et al. (2000) ‘The origin of the domestic pig: independent domestication and
subsequent introgression.’, Genetics. 154(4), pp. 1785–91. Available at:
http://www.ncbi.nlm.nih.gov/pubmed/10747069 (Accessed: 8 May 2019).
Goddard, M. E., & Hayes, B. J. (2007). Genomic selection. Journal of Animal Breeding and
Genetics, 124(6), 323–330. https://doi.org/10.1111/j.1439-0388.2007.00702.x
Graphodatsky, A. S., Trifonov, V. A. and Stanyon, R. (2011) ‘The genome diversity and
karyotype evolution of mammals’, Molecular Cytogenetics., 4, p. 22. doi: 10.1186/1755-
8166-4-22.
Graphodatsky, A. S., Trifonov, V. A. and Stanyon, R. (2011) ‘The genome diversity and
karyotype evolution of mammals’, Molecular Cytogenetics., 4, p. 22. doi: 10.1186/1755-
8166-4-22.
Green, E. D. (2001) ‘Strategies for the systematic sequencing of complex genomes’,
Nature Reviews Genetics, pp. 573–583. doi: 10.1038/35084503.
Griffiths, A. J. et al. (1999) ‘Chromosomal Rearrangements’. W. H. Freeman. Available at:
https://www.ncbi.nlm.nih.gov/books/NBK21367/ (Accessed: 14 October 2019).
Griffiths, D. A. (2018) ‘Shifting syndromes: Sex chromosome variations and intersex
classifications’, Social Studies of Science., 48(1), pp. 125–148. doi:
10.1177/0306312718757081.
Gu, S. et al. (2016) ‘Mechanisms for Complex Chromosomal Insertions’, PLoS Genetics.
Public Library of Science, 12(11). doi: 10.1371/journal.pgen.1006446.
Rebecca Jennings
8-198
Gustavsson, I. (1990) ‘Chromosomes of the Pig’, Advances in Veterinary Science and
Comparative Medicine. 34, pp. 73–107. doi: 10.1016/B978-0-12-039234-6.50008-2.
Gustavsson, I. (2009). ‘Cytogenetics, distribution and phenotypic effects of a
translocation in Swedish cattle’., 63(1–2), 68–169. https://doi.org/10.1111/j.1601-
5223.1969.tb02259.x
Gustavsson, I., & Rockborn, G. (1964). Chromosome Abnormality in Three Cases of
Lymphatic Leukaemia in Cattle. Nature, 203(4948), 990–990.doi:10.1038/203990a0
Hamerton, J. L. et al. (1961) ‘Somatic Chromosomes of the Gorilla’, Nature., 192(4799),
pp. 225–228. doi: 10.1038/192225a0.
Hardy, K. and Hardy, P. J. (2015) ‘1(st) trimester miscarriage: four decades of study.’,
Translational pediatrics. 4(2), pp. 189–200. doi: 10.3978/j.issn.2224-4336.2015.03.05.
Harton, G. L. and Tempest, H. G. (2012) ‘Chromosomal disorders and male infertility.’,
Asian journal of andrology. 14(1), pp. 32–9. doi: 10.1038/aja.2011.66.
Heather, J. M. and Chain, B. (2016) ‘The sequence of sequencers: The history of
sequencing DNA’, Genomics. 107(1), pp. 1–8. doi: 10.1016/J.YGENO.2015.11.003.
Hélias-Rodzewicz, Z. et al. (2002) ‘Subtelomeric rearrangements detected by FISH in three
of 33 families with idiopathic mental retardation and minor physical anomalies.’, Journal
of medical genetics., 39(9), p. e53. doi: 10.1136/jmg.39.9.e53.
Henley Centre, T. (2004) A report of research on the horse industry in Great Britain.
Available at: www.defra.gov.uk/rural/horses (Accessed: 17 July 2019).
Henricson, b. and Bäckström, L. (2009) ‘Translocation heterozygosity in a boar’,
Hereditas., 52(2), pp. 166–170. doi: 10.1111/j.1601-5223.1964.tb01947.x.
Hirata, S. et al. (2017) ‘Chimpanzee Down syndrome: a case study of trisomy 22 in a
captive chimpanzee’, Primates., 58(2), pp. 267–273. doi: 10.1007/s10329-017-0597-8.
Rebecca Jennings
8-199
Holmes, I. (2019) Roberstonian Translocation - British White Cattle Society Australia.
Available at: https://www.britishwhitecattleaustralia.com.au/roberstonian-
translocation/ (Accessed: 11 July 2019)
Hornak, M. et al. (2011) ‘Frequency of Aneuploidy Related to Age in Porcine Oocytes’,
PLoS ONE., 6(4), p. e18892. doi: 10.1371/journal.pone.0018892.
Howden, K. J. (2004) ‘Androgen insensitivity syndrome in a thoroughbred mare (64, XY--
testicular feminization).’, The Canadian veterinary journal = La revue veterinaire
canadienne., 45(6), pp. 501–3. Available at:
http://www.ncbi.nlm.nih.gov/pubmed/15283519 (Accessed: 25 July 2019).
Hu, L. et al. (2014) ‘Fluorescence in situ hybridization (FISH): an increasingly demanded
tool for biomarker research and personalized medicine.’, Biomarker research. 2(1), p. 3.
doi: 10.1186/2050-7771-2-3.
Huxley, T. (1863) Evidence as to Man’s place in nature, by Thomas Henry Huxley. Available
at: https://ebooks.adelaide.edu.au/h/huxley/thomas_henry/mansplace/ (Accessed: 5
August 2019).
Hyde, K. J. and Schust, D. J. (2015) ‘Genetic considerations in recurrent pregnancy loss.’,
Cold Spring Harbor perspectives in medicine., 5(3), p. a023119. doi:
10.1101/cshperspect.a023119.
Iannuzzi, A. et al. (2008) ‘Frequency and distribution of rob(1;29) in eight Portuguese
cattle breeds’, Cytogenetic and Genome Research. 120(1–2), pp. 147–149. doi:
10.1159/000118755
Iannuzzi, L., King, W. A. and Di Berardino, D. (2009) ‘Chromosome Evolution in Domestic
Bovids as Revealed by Chromosome Banding and FISH-Mapping Techniques’, Cytogenetic
and Genome Research. 126(1–2), pp. 49–62. doi: 10.1159/000245906.
Jain, M. et al. (2018) ‘Nanopore sequencing and assembly of a human genome with ultra-
long reads’, Nature Biotechnology. Nature Publishing Group, 36(4), pp. 338–345. doi:
10.1038/nbt.4060.

Rebecca Jennings
8-200
Jang, T.-S. et al. (2013) ‘Chromosomal diversification and karyotype evolution of diploids
in the cytologically diverse genus Prospero (Hyacinthaceae).’, BMC evolutionary biology.,
13, p. 136. doi: 10.1186/1471-2148-13-136.
Jia, C.-W. et al. (2015) ‘Aneuploidy in Early Miscarriage and its Related Factors.’, Chinese
medical journal., 128(20), pp. 2772–6. doi: 10.4103/0366-6999.167352.
Jiao, W.-B. et al. (2017) ‘Improving and correcting the contiguity of long-read genome
assemblies of three plant species using optical mapping and chromosome conformation
capture data.’, Genome research. 27(5), pp. 778–786. doi: 10.1101/gr.213652.116.
Kamei, Y. et al. (2000) ‘Human NB-2 of the Contactin Subgroup Molecules: Chromosomal
Localization of the Gene (CNTN5) and Distinct Expression Pattern from Other Subgroup
Members’, Genomics, 69(1), pp. 113–119. doi: 10.1006/geno.2000.6310.
Kannan, T. P. and Zilfalil, B. A. (2009) ‘Cytogenetics: past, present and future.’, The
Malaysian journal of medical sciences: MJMS. School of Medical Sciences, University of
Sains Malaysia, 16(2), pp. 4–9. Available at:
http://www.ncbi.nlm.nih.gov/pubmed/22589651 (Accessed: 4 October 2019).
Karmiloff-Smith, A. et al. (2016) ‘The importance of understanding individual differences
in Down syndrome.’, 5. doi: 10.12688/f1000research.7506.1.
Kastelic, J. and Thundathil, J. (2008) ‘Breeding Soundness Evaluation and Semen Analysis
for Predicting Bull Fertility’, Reproduction in Domestic Animals., 43, pp. 368–373. doi:
10.1111/j.1439-0531.2008.01186.x
Kemkemer, C. et al. (2009) ‘Gene synteny comparisons between different vertebrates
provide new insights into breakage and fusion events during mammalian karyotype
evolution’, BMC Evolutionary Biology, 9(1). doi: 10.1186/1471-2148-9-84.
Kim, J. et al. (2013) ‘Reference-assisted chromosome assembly’, Proceedings of the
National Academy of Sciences. National Academy of Sciences, 110(5), pp. 1785–1790. doi:
10.1073/PNAS.1220349110.
Kim, J. et al. (2017) ‘Reconstruction and evolutionary history of eutherian chromosomes’.
doi: 10.1073/pnas.1702012114.

Rebecca Jennings
8-201
Kingswood, S. C. et al. (2000) ‘Chromosomes of the antelope genus
<i>Kobus</i> (Artiodactyla, Bovidae): karyotypic divergence by centric fusion
rearrangements’, Cytogenetic and Genome Research, 91(1–4), pp. 128–133. doi:
10.1159/000056832.
Kirkpatrick, M. (2010) ‘How and why chromosome inversions evolve’, PLoS Biology, 8(9).
doi: 10.1371/journal.pbio.1000501.
Knight, S. J. et al. (no date) ‘Development and clinical application of an innovative
fluorescence in situ hybridization technique which detects submicroscopic
rearrangements involving telomeres.’, European journal of human genetics : EJHG, 5(1),
pp. 1–8. Available at: http://www.ncbi.nlm.nih.gov/pubmed/9156314 (Accessed: 8
October 2019).
Kocer, A. et al. (2009) ‘Germ cell sex determination in mammals’, Molecular Human
Reproduction, pp. 205–213. doi: 10.1093/molehr/gap008.
Kolarski, M. et al. (2017) ‘Genetic Counseling and Prenatal Diagnosis of Triploidy During
the Second Trimester of Pregnancy.’, Medical archives (Sarajevo, Bosnia and
Herzegovina). The Academy of Medical Sciences of Bosnia and Herzegovina, 71(2), pp.
144–147. doi: 10.5455/medarh.2017.71.144-147.
Kozubska-Sobocińska, A., Danielak-Czech, B. and Rejduch, B. (2016) ‘CytogenetiC and
moleCular diagnostiCs of XX/Xy Chimerism in Cattle, sheep, and goats-a review’, Anim.
Sci, 16(4), pp. 989–1005. doi: 10.1515/aoas-2016-0028.
Kulemzina, A. I. et al. (2009) ‘Cross-species chromosome painting in Cetartiodactyla:
reconstructing the karyotype evolution in key phylogenetic lineages.’, Chromosome
research : an international journal on the molecular, supramolecular and evolutionary
aspects of chromosome biology, 17(3), pp. 419–36. doi: 10.1007/s10577-009-9032-3.
Kumar, S. (2005) ‘Molecular clocks: four decades of evolution’, Nature Reviews Genetics,
6(8), pp. 654–662. doi: 10.1038/nrg1659.
Kumar, S. et al. (2017) ‘TimeTree: A Resource for Timelines, Timetrees, and Divergence
Times’, Molecular Biology and Evolution, 34(7), pp. 1812–1819. doi:
10.1093/molbev/msx116.

Rebecca Jennings
8-202
Kuroiwa, A. et al. (2001) ‘Conservation of the rat X chromosome gene order in rodent
species’, Chromosome Research. Kluwer Academic Publishers, 9(1), pp. 61–67. doi:
10.1023/A:1026795717658.
Lahn, B. T. and Page, D. C. (1999) ‘Four evolutionary strata on the human X chromosome.’,
Science (New York, N.Y.), 286(5441), pp. 964–7. doi: 10.1126/science.286.5441.964.
Lander, E. S. et al. (2001) ‘Initial sequencing and analysis of the human genome’, Nature,
409(6822), pp. 860–921. doi: 10.1038/35057062.
Lark, M., & Tilman, D. (2017). Comparative analysis of environmental impacts of
agricultural production systems, agricultural input efficiency, and food choice.
Environmental Research Letters, 12(6), 064016. https://doi.org/10.1088/1748-
9326/aa6cd5
Larkin, D. M. et al (2006a) ‘Comparative mapping of cattle chromosome 19: cytogenetic
localisation of 19 cattle BAC clones. Cytogenetic and Genome Research, 112, 235-240.
Larkin, D. M. et al. (2006b) ‘Comparative mapping of mink chromosome 8p: in situ
hybridization of seven cattle BAC clones’, Animal Genetics. John Wiley & Sons, Ltd
(10.1111), 37(4), pp. 429–430. doi: 10.1111/j.1365-2052.2006.01491.x.
Larkin, D., Farre-Belmonte, M. (2014) The Genetics of Cattle, 2nd Edition. Available at:
https://www.vet-library.com/cart/p-1220-the-genetics-of-cattle-2nd-edition.html
(Accessed: 10 July 2019).
Lear, T. L. and Bailey, E. (2008) ‘Equine clinical cytogenetics: the past and future’,
Cytogenetic and Genome Research. Karger Publishers, 120(1–2), pp. 42–49. doi:
10.1159/000118739.
Lear, T. L. et al. (2001) ‘Trisomy 17 in a bonobo (Pan paniscus) and deletion of 3q in a
lowland gorilla (Gorilla gorilla gorilla); comparison with human trisomy 18 and human
deletion 4q syndrome’, Cytogenetic and Genome Research. Karger Publishers, 95(3–4),
pp. 228–233. doi: 10.1159/000059350.
Lear, T. L. et al. (2008) ‘Three autosomal chromosome translocations associated with
repeated early embryonic loss (REEL) in the domestic horse (Equus caballus), Cytogenetic
and Genome Research, 120(1–2), pp. 117–122. doi: 10.1159/000118749.

Rebecca Jennings
8-203
Lee, H. et al. (2016) ‘Third-generation sequencing and the future of genomics’, bioRxiv.
Cold Spring Harbor Laboratory, p. 048603. doi: 10.1101/048603
Levsky, J. M. and Singer, R. H. (2003) ‘Fluorescence in situ hybridization: past, present and
future.’, Journal of cell science. The Company of Biologists Ltd, 116(Pt 14), pp. 2833–8.
doi: 10.1242/jcs.00633.
Lewin, H. A. et al. (2009) ‘Every genome sequence needs a good map.’, Genome research.
Cold Spring Harbor Laboratory Press, 19(11), pp. 1925–8. doi: 10.1101/gr.094557.109.
Linekar, A. (2018) USDA forecast growth in global pork production, 2017. Available at:
https://pork.ahdb.org.uk/prices-stats/news/2017/october/usda-forecast-growth-in-
global-pork-production/ (Accessed: 12 July 2019).
Linkie, M., Wibisono, H.T., Martyr, D.J. & Sunarto, S. 2008. Panthera tigris ssp.
sumatrae. The IUCN Red List of Threatened Species 2008:
e.T15966A5334836. http://dx.doi.org/10.2305/IUCN.UK.2008.RLTS.T15966A5334836.e
n. Downloaded on 15 October 2019.
Liu, G. E. et al. (2006) ‘Genomic divergences among cattle, dog and human estimated
from large-scale alignments of genomic sequences.’, BMC genomics., 7, p. 140. doi:
10.1186/1471-2164-7-140.
Ló Pez-Gatius, F. (2005) The Effect on Pregnancy Rate of Progesterone Administration
after Manual Reduction of Twin Embryos in Dairy Cattle. Available at: www.blackwell-
synergy.com (Accessed: 10 May 2019).
Lorenzen, E. D. et al. (2006) ‘Hybridization between subspecies of waterbuck (Kobus
ellipsiprymnus) in zones of overlap with limited introgression’, Molecular Ecology.
(10.1111), 15(12), pp. 3787–3799. doi: 10.1111/j.1365-294X.2006.03059.x
Lu, X. et al. (2007) ‘Clinical Implementation of Chromosomal Microarray Analysis:
Summary of 2513 Postnatal Cases’, PLoS ONE. 2(3), p. e327. doi:
10.1371/journal.pone.0000327.

Rebecca Jennings
8-204
Machado, C. et al. (2014) ‘A novel SRY nonsense mutation in a case of Swyer syndrome’
Journal of Pediatric and Neonatal Individualized Medicine •, 3(1), p. 30107. doi:
10.7363/030107.
Mackiewicz, D. et al. (2018) ‘Role of recombination and faithfulness to partner in sex
chromosome degeneration’, Scientific Reports. 8(1). doi: 10.1038/s41598-018-27219-1.
Magadum, S. et al. (2013) ‘Gene duplication as a major force in evolution’, Journal of
Genetics, 92(1), pp. 155–161. doi: 10.1007/s12041-013-0212-8.
Mantere, T., Kersten, S. and Hoischen, A. (2019) ‘Long-Read Sequencing Emerging in
Medical Genetics’, Frontiers in Genetics. 10, p. 426. doi: 10.3389/fgene.2019.00426.
Margulies, Marcel, Michael Egholm, William E. Altman, Said Attiya, Joel S. Bader, Lisa A.
Bemben, Jan Berka, et al. 2005. “Genome Sequencing in Microfabricated High-Density
Picolitre Reactors.” Nature 437 (7057): 376–80. https://doi.org/10.1038/nature03959.
Matsubayashi, H. (no date) ‘Cytogenetic comparison of the lesser mouse deer (Tragulus
javanicus) and the greater mouse deer (T. napu).’ doi:
10.1080/00087114.2004.10589398.
McDonald, M. T. et al. (1997) ‘XY sex reversal and gonadal dysgenesis due to 9p24
monosomy’, American Journal of Medical Genetics. John Wiley & Sons, Ltd, 73(3), pp.
321–326. doi: 10.1002/(SICI)1096-8628(19971219)73:3<321::AID-AJMG17>3.0.CO;2-L.
McFeely, R. A., Hare, W. C. D. and Biggers, J. D. (1967) ‘Chromosome Studies in 14 Cases
of Intersex in Domestic Mammals’, Cytogenetic and Genome Research, 6(3–4), pp. 242–
253. doi: 10.1159/000129945.
Michala, L. et al. (2008) ‘Swyer syndrome: presentation and outcomes’, BJOG: An
International Journal of Obstetrics and Gynaecology, 115(6), pp. 737–741. doi:
10.1111/j.1471-0528.2008.01703.x.
Miller, D. A. et al. (1974) ‘The gorilla karyotype: chromosome lengths and
polymorphisms’, Cytogenetic and Genome Research, 13(6), pp. 536–550. doi:
10.1159/000130305.

Rebecca Jennings
8-205
Morin, S. J. et al. (2017) ‘Translocations, inversions and other chromosome
rearrangements’, Fertility and Sterility., pp. 19–26. doi: 10.1016/j.fertnstert.2016.10.013.
Mrasek, K. et al. (2001) ‘Reconstruction of the female Gorilla gorilla karyotype using 25-
color FISH and multicolor banding (MCB)’, Cytogenetic and Genome Research., 93(3–4),
pp. 242–248. doi: 10.1159/000056991.
Murphy, W J et al. (2001) ‘Resolution of the early placental mammal radiation using
Bayesian phylogenetics.’, Science (New York, N.Y.)., 294(5550), pp. 2348–51. doi:
10.1126/science.1067179.
Musser, G. (no date) Rodent | mammal | Britannica.com. Available at:
https://www.britannica.com/animal/rodent (Accessed: 24 September 2019).
Nagano, T. et al. (2017) ‘Cell-cycle dynamics of chromosomal organization at single-cell
resolution’, Nature. 547(7661), pp. 61–67. doi: 10.1038/nature23001.
Nelson, R. (2014) Domestic Pig: Science, Breeds, and Life History of the Pig, 01/2014.
Available at: https://www.untamedscience.com/biodiversity/domestic-pig-2/ (Accessed:
8 May 2019).
NHS (2017) Down’s syndrome - Causes - NHS. Available at:
https://www.nhs.uk/conditions/downs-syndrome/causes/ (Accessed: 2 October 2019).
Nielsen, B. (2016) ‘Genomic selection in commercial pig breeding’. doi: 10.2527/af.2016-
0003.
Norman, J. E. and Ashley, M. V. (2000) ‘Phylogenetics of Perissodactyla and Tests of the
Molecular Clock’, Journal of Molecular Evolution., 50(1), pp. 11–21. doi:
10.1007/s002399910002
O’Brien, T. G., Kinnaird, M. F. and Wibisono, H. T. (2003) ‘Crouching tigers, hidden prey:
Sumatran tiger and prey populations in a tropical forest landscape’, Animal Conservation.
6(2), pp. 131–139. doi: 10.1017/S1367943003003172.
Rebecca Jennings
8-206
O’connor, R. E. (2016) Reproductive Isolation, in Individuals and During Evolution, as
Result of Gross Genomic Rearrangement in Pigs, Birds and Dinosaurs. Available at:
https://core.ac.uk/download/pdf/46663864.pdf (Accessed: 15 May 2019).
O’Connor, R. E. et al. (2017) ‘Isolation of subtelomeric sequences of porcine
chromosomes for translocation screening reveals errors in the pig genome assembly’,
Animal Genetics. 48(4), pp. 395–403. doi: 10.1111/age.12548.
O’Connor, R. E. et al. (2018) ‘Chromosome-level assembly reveals extensive
rearrangement in saker falcon and budgerigar, but not ostrich, genomes’, Genome
Biology., 19(1), p. 171. doi: 10.1186/s13059-018-1550-x.
O’Connor, R. E. et al. (2019) ‘Patterns of microchromosome organization remain highly
conserved throughout avian evolution’, Chromosoma. Springer, 128(1), pp. 21–29. doi:
10.1007/s00412-018-0685-6.
OGT (no date) aCGH for CNV Q & A Sheet. Available at:
https://www.ogt.com/assets/0000/1795/FAQ_aCGH_for_CNV_Q_and_A_sheet.pdf
(Accessed: 29 July 2019).
Oromendia, A. B. and Amon, A. (2014) ‘Aneuploidy: implications for protein homeostasis
and disease’, Disease Models & Mechanisms. 7(1), pp. 15–20. doi:
10.1242/DMM.013391.
Pailhoux, E. et al. (2001) ‘Time course of female-to-male sex reversal in 38,XX fetal and
postnatal pigs’, Developmental Dynamics., 222(3), pp. 328–340. doi: 10.1002/dvdy.1194.
Pauciullo, Alfredo, Angela Perucatti, Gianfranco Cosenza, Alessandra Iannuzzi, Domenico
Incarnato, Viviana Genualdo, Dino Di Berardino, and Leopoldo Iannuzzi. 2014.
“Sequential Cross-Species Chromosome Painting among River Buffalo, Cattle, Sheep and
Goat: A Useful Tool for Chromosome Abnormalities Diagnosis within the Family Bovidae.”
PLoS ONE 9 (10): e110297. https://doi.org/10.1371/journal.pone.0110297.
Pauciullo, A. et al. (2014) ‘Sequential Cross-Species Chromosome Painting among River
Buffalo, Cattle, Sheep and Goat: A Useful Tool for Chromosome Abnormalities Diagnosis
within the Family Bovidae’, PLoS ONE, 9(10), p. e110297. doi:
10.1371/journal.pone.0110297.
Rebecca Jennings
8-207
Perlman, R. L. (2016) ‘Mouse models of human disease: An evolutionary perspective.’,
Evolution, medicine, and public health., 2016(1), pp. 170–6. doi: 10.1093/emph/eow014.
Pevzner, P. and Tesler, G. (2003) ‘Genome rearrangements in mammalian evolution:
lessons from human and mouse genomes.’, Genome research. 13(1), pp. 37–45. doi:
10.1101/gr.757503.
Piedrafita, J. et al. (2000) ‘Variation in gestation length as breeding season advances in
Bruna dels Pirineus beef cattle breed’, Annales de Zootechnie., 49(4), pp. 353–356. doi:
10.1051/animres:2000126.
Polipalli, S. K. et al. (2016) ‘Cytogenetic Analysis for Suspected Chromosomal
Abnormalities; A Five Years’ Experience.’, Journal of clinical and diagnostic research:
JCDR. 10(9), pp. GC01–GC05. doi: 10.7860/JCDR/2016/19926.8494.
Population Clock (no date) 2019. Available at: https://www.census.gov/popclock/
(Accessed: 12 July 2019).
Potter, S. et al. (2017) ‘Chromosomal Speciation in the Genomics Era: Disentangling
Phylogenetic Evolution of Rock-wallabies’, Frontiers in Genetics. 8, p. 10. doi:
10.3389/fgene.2017.00010.
Prothero, D. R. and Foss, S. E. (2007) The evolution of artiodactyls. Available at:
https://books.google.co.uk/books?hl=en&lr=&id=qO8H_alEofAC&oi=fnd&pg=PR7&dq=
artiodactyla+phylogeny&ots=DpPlzI9aXY&sig=Y5aT5HY1WAni2zMFyAZkRhs-
6tc#v=onepage&q=artiodactyla phylogeny&f=false (Accessed: 14 November 2017).
Quach, A. T. et al. (2016) ‘Prevalence and consequences of chromosomal abnormalities
in Canadian commercial swine herds’, Genetics, Selection, Evolution : GSE 48(1). doi:
10.1186/s12711-016-0246-5.
Quick, J. et al. (2016) ‘Real-time, portable genome sequencing for Ebola surveillance’,
Nature, 530(7589), pp. 228–232. doi: 10.1038/nature16996.
Quilter, C. R. et al. (no date) X ⁄ XY⁄ XYY mosaicism as a cause of subfertility in boars: a
single case study. Available at: https://onlinelibrary.wiley.com/doi/pdf/10.1046/j.1365-
2052.2003.00924.x (Accessed: 13 May 2019).

Rebecca Jennings
8-208
Rajender, S. et al. (2006) ‘SRY-negative 46,XX male with normal genitals, complete
masculinization and infertility’, Molecular Human Reproduction. 12(5), pp. 341–346. doi:
10.1093/molehr/gal030.
Rebhun’s Diseases of Dairy Cattle (2018).. doi: 10.1016/C2013-0-12799-7.
Rhoads, A. and Au, K. F. (2015) ‘PacBio Sequencing and Its Applications’, Genomics,
Proteomics & Bioinformatics. 13(5), pp. 278–289. doi: 10.1016/J.GPB.2015.08.002.
Rich, A. L. et al. (2016) ‘The Increasing Prevalence in Intersex Variation from Toxicological
Dysregulation in Fetal Reproductive Tissue Differentiation and Development by
Endocrine-Disrupting Chemicals.’, Environmental health insights, 10, pp. 163–71. doi:
10.4137/EHI.S39825
Ried, T. et al. (1998) ‘Chromosome painting: a useful art’, Human Molecular Genetics.
7(10), pp. 1619–1626. doi: 10.1093/hmg/7.10.1619.
Riegel, M. (2014) ‘Human molecular cytogenetics: From cells to nucleotides.’, Genetics
and molecular biology. 37(1 Suppl), pp. 194–209. Available at:
http://www.ncbi.nlm.nih.gov/pubmed/24764754 (Accessed: 7 October 2019).
Rieseberg, L. H. (2001) ‘Chromosomal rearrangements and speciation’, Trends in Ecology
and Evolution, pp. 351–358. doi: 10.1016/S0169-5347(01)02187-5.
Rodríguez, A. et al. (2010) ‘Reproductive consequences of a reciprocal chromosomal
translocation in two Duroc boars used to provide semen for artificial insemination.’,
Theriogenology, 74(1), pp. 67–74. doi: 10.1016/j.theriogenology.2009.12.020.
Rodríguez-Gil, J. E. and Estrada, E. (2013) ‘Artificial Insemination in Boar Reproduction’,
in Boar Reproduction. Berlin, Heidelberg: pp. 589–607. doi: 10.1007/978-3-642-35049-
8_12
Rothschild, M. F., Ruvinsky, A. and C.A.B. International. (2011) The genetics of the pig.
CABI. Available at:
https://books.google.co.uk/books?hl=en&lr=&id=xEJllJ_2IScC&oi=fnd&pg=PA134&dq=R

Rebecca Jennings
8-209
othschild+and+Ruvinsky+reciprocal+translocations&ots=e1zy05hhbX&sig=osc1EQZ79ee
2qvRnvtASjwt0gdQ#v=onepage&q=Rothschild and Ruvinsky reciprocal
translocations&f=false (Accessed: 15 May 2019)
Rubes, J. et al. (2012) ‘Comparative Molecular Cytogenetics in Cetartiodactyla’,
Cytogenetic and Genome Research. 137(2–4), pp. 194–207. doi: 10.1159/000338932.
Ruiz-Sánchez, A. L. et al. (2006) ‘The predictive value of routine semen evaluation and IVF
technology for determining relative boar fertility’, Theriogenology. 66(4), pp. 736–748.
doi: 10.1016/J.Theriogenology.2005.12.012.
S. C. Kingswood, A. T. K., S. J. Charter, R. A. Aman, and O. A. Ryder (1998) ‘Centric Fusion
Polymorphisms in Waterbuck (Kobus ellipsiprymnus)’. Available at:
https://watermark.silverchair.com/890096.pdf?token=AQECAHi208BE49Ooan9kkhW_E
rcy7Dm3ZL_9Cf3qfKAc485ysgAAAj8wggI7BgkqhkiG9w0BBwagggIsMIICKAIBADCCAiEGCS
qGSIb3DQEHATAeBglghkgBZQMEAS4wEQQMDIZWeYXV3Qmi45GPAgEQgIIB8st-
OHneqLYHsQa_saz46rdg4Lkp4JUUV1bmzKsZ7ZDOJ0NY (Accessed: 28 May 2019).
Sakamoto, Masaru. Pinkel, Daniel. Mascio, Laura. Sudar, D. (1995) ‘Semiautomated DNA
Probe Mapping Using Digital Imaging Microscopy: 11. System Performance’, Cytometry.
Available at: https://onlinelibrary.wiley.com/doi/pdf/10.1002/cyto.990190108
(Accessed: 30 September 2019).
Salm, M. P. A. et al. (2012) ‘The origin, global distribution, and functional impact of the
human 8p23 inversion polymorphism’. doi: 10.1101/gr.126037.111.
Sandstedt, S. A. and Tucker, P. K. (2004) ‘Evolutionary strata on the mouse X chromosome
correspond to strata on the human X chromosome.’, Genome research., 14(2), pp. 267–
72. doi: 10.1101/gr.1796204.
Sanger, F., Nicklen, S. and Coulson, A. R. (1977) ‘DNA sequencing with chain-terminating
inhibitors.’, Proceedings of the National Academy of Sciences of the United States of
America, 74(12), pp. 5463–5467. doi: 10.1073/pnas.74.12.5463.
Saski, C. A. et al. (2014) ‘BAC sequencing using pooled methods’, in Bacterial Artificial
Chromosomes: Second Edition., pp. 55–67. doi: 10.1007/978-1-4939-1652-8_3.

Rebecca Jennings
8-210
Scally, A. et al. (2012) ‘Insights into hominid evolution from the gorilla genome sequence’,
Nature. 483(7388), pp. 169–175. doi: 10.1038/nature10842.
Schaeffer, E. et al. (2018) ‘Aneuploidy Rates Inversely Correlate with Implantation during
In Vitro Fertilization Procedures: In Favor of PGT’, in Medical Genetics and Genomics in
the era of Personalized Medicine. doi: 10.5772/intechopen.81884.
Schena, M. et al. (1995) ‘Quantitative monitoring of gene expression patterns with a
complementary DNA microarray.’American Association for the Advancement of Science,
270(5235), pp. 467–70. doi: 10.1126/science.270.5235.467.
Schmitz, A. et al. (2004) ‘Comparative Karyotype of Pig and Cattle Using Whole
Chromosome Painting Probes’, 128(3), pp. 257–263. doi: 10.1111/j.1601-
5223.1998.00257.x.
Schubert, M. et al. (2014) ‘Prehistoric genomes reveal the genetic foundation and cost of
horse domestication.’, Proceedings of the National Academy of Sciences of the United
States of America. National Academy of Sciences, 111(52), pp. E5661-9. doi:
10.1073/pnas.1416991111.
Scriven, P. N. (2001) ‘Robertsonian translocations--reproductive risks and indications for
preimplantation genetic diagnosis’, Human Reproduction. Oxford University Press (OUP),
16(11), pp. 2267–2273. doi: 10.1093/humrep/16.11.2267.
Shaffer, L. G. and Lupski, J. R. (2000) ‘Molecular Mechanisms for Constitutional
Chromosomal Rearrangements in Humans’, Annual Review of Genetics, 34(1), pp. 297–
329. doi: 10.1146/annurev.genet.34.1.297.
Shendure J et al,. (2017) ‘DNA sequencing at 40: past, present and future’, Nature.
Available at: http://arep.med.harvard.edu/pdf/Shendure_Waterston_2017.pdf
(Accessed: 9 October 2019).
Shinawi, M. and Cheung, S. W. (2008) ‘The array CGH and its clinical applications’, Drug
Discovery Today. Elsevier Current Trends, 13(17–18), pp. 760–770. doi:
10.1016/j.drudis.2008.06.007.

Rebecca Jennings
8-211
Sinclair, A. H. et al. (1990) ‘A gene from the human sex-determining region encodes a
protein with homology to a conserved DNA-binding motif’, Nature, 346(6281), pp. 240–
244. doi: 10.1038/346240a0.
Siqueira, J. F. et al. (2012) ‘Pyrosequencing as a tool for better understanding of human
microbiomes.’, Journal of oral microbiology 4. doi: 10.3402/jom.v4i0.10743.
Song, J. et al. (2016) ‘A family with Robertsonian translocation: A potential mechanism of
speciation in humans’, Molecular Cytogenetics., 9(1). doi: 10.1186/s13039-016-0255-7.
Storchova, Z. and Kuffer, C. (2008) ‘The consequences of tetraploidy and aneuploidy.’,
Journal of cell science. 121(Pt 23), pp. 3859–66. doi: 10.1242/jcs.039537.
Strawder, N. (2000) ADW: Tragulus javanicus. Available at:
https://animaldiversity.org/accounts/Tragulus_javanicus/ (Accessed: 6 June 2019).
Suedmeyer, W. K., Houck, M. L. and Kreeger, J. (2003) ‘Klinefelter syndrome (39 XXY) in
an adult Siberian tiger (Panthera tigris altaica).’, Journal of zoo and wildlife medicine:
official publication of the American Association of Zoo Veterinarians, 34(1), pp. 96–9. doi:
10.1638/1042-7260(2003)34[0096:KSXIAA]2.0.CO;2.
Sun, X. et al. (2008) ‘Insertion DNA promotes ectopic recombination during meiosis in
Arabidopsis’, Molecular Biology and Evolution, 25(10), pp. 2079–2083. doi:
10.1093/molbev/msn158.
Switonski, M., 2014, September. 50 years of studies on bovine 1/29 Robertsonian
translocation-from Giemsa staining to genomic analysis. In chromosome research (Vol.
22, No. 3, pp. 395-395).
Taylor, J. F., Schnabel, R. D. and Sutovsky, P. (2018) ‘Review: Genomics of bull fertility’,
animal, 12(s1), pp. s172–s183. doi: 10.1017/S1751731118000599.
The Domestication of Species and the Effect on Human Life | Real Archaeology (no date).
Available at: https://pages.vassar.edu/realarchaeology/2018/09/30/the-domestication-
of-species-and-the-effect-on-human-life/ (Accessed: 29 February 2020).

Rebecca Jennings
8-212
Thienpont, B. et al. (2007) ‘Submicroscopic chromosomal imbalances detected by array-
CGH are a frequent cause of congenital heart defects in selected patients’, European
Heart Journal. 28(22), pp. 2778–2784. doi: 10.1093/eurheartj/ehl560.
Thirumulu, K. (2011) ‘Cytogenetic Techniques in Diagnosing Genetic Disorders’, in
Advances in the Study of Genetic Disorders. doi: 10.5772/17481.
Tjio, j. H. And levan, a. (1956) ‘the chromosome number of man’,(10.1111), 42(1–2), pp.
1–6. doi: 10.1111/j.1601-5223.1956.tb03010.x.
Treangen, T. J. and Salzberg, S. L. (2011) ‘Repetitive DNA and next-generation sequencing:
computational challenges and solutions.’, Nature reviews., 13(1), pp. 36–46. doi:
10.1038/nrg3117.
Udroiu, I. and Sgura, A. (2017) ‘Cytogenetic tests for animal production: state of the art
and perspectives’, Animal Genetics, 48(5), pp. 505–515. doi: 10.1111/age.12581.
University of Washington (2019) Gorilla gorilla - Assembly - NCBI, 28-08-2019. Available
at: https://www.ncbi.nlm.nih.gov/assembly/Gorilla gorilla (Accessed: 24 September
2019)
Urraca, N. et al. (2013) ‘The interstitial duplication 15q11.2-q13 syndrome includes
autism, mild facial anomalies and a characteristic EEG signature.’, Autism research:
official journal of the International Society for Autism Research. 6(4), pp. 268–79. doi:
10.1002/aur.1284.
Vagnarelli, P. (2013) ‘Chromatin Reorganization Through Mitosis’, Advances in Protein
Chemistry and Structural Biology. 90, pp. 179–224. doi: 10.1016/B978-0-12-410523-
2.00006-7.
Vallée, M. et al. (2006) ‘Cross-species hybridizations on a multi-species cDNA microarray
to identify evolutionarily conserved genes expressed in oocytes’, BMC Genomics. 7(1), p.
113. doi: 10.1186/1471-2164-7-113.
Warnefors, M. and Kaessmann, H. (2013) ‘Evolution of the Correlation between
Expression Divergence and Protein Divergence in Mammals’, Genome Biology and
Evolution. 5(7), pp. 1324–1335. doi: 10.1093/gbe/evt093.
Rebecca Jennings
8-213
Weiss, M. M. et al. (1999) ‘Comparative genomic hybridisation.’, Molecular
pathology :52(5), pp. 243–51. doi: 10.1136/mp.52.5.243.
Waterston, Robert H., Kerstin Lindblad-Toh, Ewan Birney, Jane Rogers, Josep F. Abril,
Pankaj Agarwal, Richa Agarwala, et al. 2002. “Initial Sequencing and Comparative Analysis
of the Mouse Genome.” Nature 420 (6915): 520–62.
https://doi.org/10.1038/nature01262.
Welsford, G. E. et al. (2017) ‘Androgen Insensitivity Syndrome in a Family of Warmblood
Horses Caused by a 25-bp Deletion of the DNA-Binding Domain of the Androgen Receptor
Gene’, Sexual Development. 11(1), pp. 40–45. doi: 10.1159/000455114.
Wienberg, J. et al. (1990) ‘Molecular cytotaxonomy of primates by chromosomal in situ
suppression hybridization’, Genomics. pp. 347–350. doi: 10.1016/0888-7543(90)90292-
3.
Wiland, Ewa & Midro, At & Panasiuk, Barbara & Kurpisz, Maciej. (2006). The Analysis of
Meiotic Segregation Patterns and Aneuploidy in the Spermatozoa of Father and Son With
Translocation t(4;5)(p15.1;p12) and the Prediction of the Individual Probability Rate for
Unbalanced Progeny at Birth. Journal of andrology. 28. 262-72.
10.2164/jandrol.106.000919.
Wurster, D. H. and Benirschke, K. (1968) ‘Chromosome studies in the superfamily
Bovoidea’, Chromosoma. Springer-Verlag, 25(2), pp. 152–171. doi: 10.1007/BF00327175.
Yamazaki, W. et al. (2016) ‘The Influence of Polyploidy and Genome Composition on
Genomic Imprinting in Mice.’, The Journal of biological chemistry. 291(40), pp. 20924–
20931. doi: 10.1074/jbc.M116.744144.
Yang, F. et al. (1997) ‘Comparative Chromosome Painting in Mammals: Human and the
Indian Muntjac (Muntiacus muntjak vaginalis)’, Genomics., pp. 396–401. doi:
10.1006/GENO.1996.4497.
Yunis, J. J. and Prakash, O. (1982) ‘The origin of man: A chromosomal pictorial legacy’,
Science, 215(4539), pp. 1525–1530. doi: 10.1126/science.7063861.

Rebecca Jennings
8-214
Zhou, S. et al. (2015) ‘A clone-free, single molecule map of the domestic cow (Bos taurus)
genome’, BMC Genomics. BioMed Central, 16(1), p. 644. doi: 10.1186/s12864-015-1823-
7.

Rebecca Jennings
9-215
9 Appendix
Table S1. Cattle BACs selected based on chromosomal position.
BAC Origin BAC Clone ID Chromosome
Cattle Subtelo CH240-321O2 1
Cattle Subtelo CH240-96M6 1
Cattle Subtelo CH240-457J20 2
Cattle Subtelo CH240-227E16 2
Cattle Subtelo CH240-302G6 3
Cattle Subtelo CH240-416O20 4
Cattle Subtelo CH240-193F3 4
Cattle Subtelo CH240-326L8 5
Cattle Subtelo CH240-248M21 5
Cattle Subtelo CH240-5F18 6
Cattle Subtelo CH240-415D2 7
Cattle Subtelo CH240-276L16 7
Cattle Subtelo CH240-443K7 8
Cattle Subtelo CH240-241A18 8
Cattle Subtelo CH240-25A3 9
Cattle Subtelo CH240-298I24 9
Cattle Subtelo CH240-421B11 10
Cattle Subtelo CH240-325F16 10
Cattle Subtelo CH240-314K5 11
Cattle Subtelo CH240-344O3 11
Cattle Subtelo CH240-261C16 12
Cattle Subtelo CH240-262C4 12
Cattle Subtelo CH240-461F6 13
Cattle Subtelo CH240-471M8 13
Cattle Subtelo CH240-319C15 14
Cattle Subtelo CH240-240M1 14

Rebecca Jennings
9-216
BAC Origin BAC Clone ID Chromosome
Cattle Subtelo CH240-225A24 15
Cattle Subtelo CH240-386C2 15
Cattle Subtelo CH240-139M7 16
Cattle Subtelo CH240-315I10 16
Cattle Subtelo CH240-267P22 17
Cattle Subtelo CH240-313I20 17
Cattle Subtelo CH240-14C14 18
Cattle Subtelo CH240-436N22 18
Cattle Subtelo CH240-349G17 19
Cattle Subtelo CH240-390C5 19
Cattle Subtelo CH240-394L14 20
Cattle Subtelo CH240-339K22 20
Cattle Subtelo CH240-301D14 21
Cattle Subtelo CH240-62O23 21
Cattle Subtelo CH240-426O23 22
Cattle Subtelo CH240-313B20 22
Cattle Subtelo CH240-302J21 23
Cattle Subtelo CH240-374G6 23
Cattle Subtelo CH240-382F1 24
Cattle Subtelo CH240-19L13 24
Cattle Subtelo CH240-198J4 25
Cattle Subtelo CH240-379D22 25
Cattle Subtelo CH240-428I10 26
Cattle Subtelo CH240-389H1 26
Cattle Subtelo CH240-7G11 27
Cattle Subtelo CH240-352M8 27
Cattle Subtelo CH240-313L4 28
Cattle Subtelo CH240-63D12 28
Cattle Subtelo CH240-367D17 29

Rebecca Jennings
10-217
BAC Origin BAC Clone ID Chromosome
Cattle Subtelo CH240-257F23 29
Cattle Subtelo CH240-121E1 X
Cattle Subtelo CH240-472J20 X
10 Publications arising from this work
Original Research Manuscripts
Jennings, R., Griffin, D.K., O’Connor, R.E. (2020) A new approach for accurate
detection of chromosome rearrangements that affect fertility in cattle. Animals
2020, 10(1), 114
Published abstracts
Jennings R.L., Griffin D.K. 2019. Using molecular cytogenetics to screen for
chromosomal abnormalities in a family of captive western lowland gorillas with
recurrent fertility issues. Primate Eye.
Oral conference presentations
A Cross-Species Bioinformatics and FISH approach to physical mapping of
Mammalian Genomes. (Genome 10K and genomic science conference, 2017.
Norwich, UK).
Comparative genomics through the development of universal cross-species BAC
sets (International Chromosome Conference, 2018. Prague, Czech Republic.)

Rebecca Jennings
10-218

animals
Technical Note
A New Approach for Accurate Detection ofChromosome Rearrangements That Affect Fertilityin Cattle
Rebecca L. Jennings, Darren K. Griffin and Rebecca E. O’Connor *
School of Biosciences, University of Kent, Giles Lane, Canterbury CT2 7NJ, UK; [email protected] (R.L.J.);[email protected] (D.K.G.)* Correspondence: R.O'[email protected]
Received: 25 November 2019; Accepted: 8 January 2020; Published: 10 January 2020�����������������
Simple Summary: Globally, cattle production has more than doubled since the 1960s, with widespreaduse of artificial insemination (AI) and an emphasis on a small pool of high-genetic-meritanimals. Selecting AI bulls with optimal fertility is therefore vital, as impaired fertility reducesgenetic gains and reduces production, resulting in heavy financial and environmental losses.Chromosome translocations, where large parts of the genome are inappropriately attached inabnormal patterns, are a common cause of reduced fertility; however, reciprocal translocations aresignificantly underreported due to the difficulties inherent in analysing cattle chromosomes. Based onour previous work, we have developed an approach for the unambiguous detection of abnormalitiesthat affect fertility. We applied this method on the chromosomes of 39 bulls, detecting multipleabnormalities that affect fertility, including those that would be undetectable using traditionalscreening techniques. With UK dairy calving rates of only 50–60%, it is vital to reduce further fertilityloss in order to maximise productivity. The approach developed here identifies abnormalities thatDNA sequencing will not, and has the potential to lead to long-term gains, delivering meat and milkproducts in a more cost-effective and environmentally-responsible manner to a growing population.
Abstract: Globally, cattle production has more than doubled since the 1960s, with widespreaduse of artificial insemination (AI) and an emphasis on a small pool of high genetic merit animals.Selecting AI bulls with optimal fertility is, therefore, vital, as impaired fertility reduces genetic gainsand production, resulting in heavy financial and environmental losses. Chromosome translocations,particularly the 1;29 Robertsonian translocation, are a common cause of reduced fertility; however,reciprocal translocations are significantly underreported due to the difficulties inherent in analysingcattle chromosomes. Based on our porcine work, we have developed an approach for the unambiguousdetection of Robertsonian and reciprocal translocations, using a multiple-hybridization probe detectionstrategy. We applied this method on the chromosomes of 39 bulls, detecting heterozygous andhomozygous 1;29 translocations and a 12;23 reciprocal translocation in a total of seven animals.Previously, karyotype analysis was the only method of diagnosing chromosomal rearrangementsin cattle, and was time-consuming and error-prone. With calving rates of only 50–60%, it is vitalto reduce further fertility loss in order to maximise productivity. The approach developed hereidentifies abnormalities that DNA sequencing will not, and has the potential to lead to long-termgains, delivering meat and milk products in a more cost-effective and environmentally-responsiblemanner to a growing population.
Keywords: cattle; translocation; FISH; artificial insemination; subfertility; chromosome; genetics
Animals 2020, 10, 114; doi:10.3390/ani10010114 www.mdpi.com/journal/animals

Animals 2020, 10, 114 2 of 9
1. Introduction
On a global scale, cattle meat and milk production has more than doubled between 1961 and 2014,increasing from 28 million to 68 million tonnes per year for meat products, and 344 million to 792 milliontonnes for milk products [1]. To support this increasing demand, the use of artificial insemination (AI)has become widespread in the cattle breeding industry. In many breeding programmes, the emphasison genomic selection is on genotype and pedigree analysis, with relatively little attention being paid tothe underlying fertility of the animal. However, the extensive use of artificial insemination using asmall pool of high genetic-merit bulls, and the rising use of in vitro-produced embryos, means thatthe importance of selecting parents that also have optimal fertility is vital. Impaired fertility reducesgenetic gain, increases veterinary costs, and reduces milk and meat production, all of which result inheavy financial and environmental losses for the breeding company; costs that is ultimately passed onto the end consumer.
Semen analysis is commonly used as a fertility indicator in livestock breeding programmes wherevolume, morphology, motility and concentration are routinely measured [2]. However, this type ofanalysis is thought to be an unreliable indicator of fertility, and does not allow for the detection ofunderlying subfertility on a chromosomal level [3]. Instead, the most widely used parameter for thedetection of subfertility in cattle is the ‘nonreturn rate’ (the number of females returning to the oestruscycle, being therefore indicative of a failure to conceive) [4].
Chromosomal rearrangements, including Robertsonian (centromeric end fusion) and reciprocal(nonhomologous exchange) translocations, can have a significant detrimental effect on the fertilityof cattle. Where these rearrangements occur, the process of meiotic pairing and chromosomesegregation during gametogenesis is disturbed, leading to gametes that can be genetically unbalanced [5].These unbalanced gametes inevitably result in early embryonic loss due to reduced viability. In recentdecades, efforts have been made to diagnose fertility issues in domestic breeding animals usingchromosome analysis. In 1964, Ingemar Gustavsson first reported the presence of the 1;29 centromericfusion (Robertsonian translocation) in a population of Swedish Red and White cattle [6]. Since then,the 1;29 translocation has been the most commonly seen rearrangement of the 44 that have beenidentified in cattle so far [7], with cases found in all breeds, except Holstein-Fresian [8]. In one 15-yearstudy of the Italian breeding population, 7.1% animals were identified as carrying a Roberstoniantranslocation [9]. These heterozygous 1;29 carriers are phenotypically normal, but suffer a reductionin fertility of 3–5% [10]. Homozygous carriers are rare, but have been reported by several groups,although incidence varies between breeds. Reported examples of the homozygous 1;29 state includethe presence in 8.5% of Blonde d’Aquitaine bulls [10], along with cases found in five of the eightPortuguese cattle breeds [11]. All cattle (Bos taurus and Bos indicus) have the same chromosomecomplement with 2n = 60, and thus, any novel approach must be applicable to all commercial breeds.
Reciprocal translocations have been identified in cattle, albeit much less frequently, with theaforementioned Italian study reporting a rate of 0.03% [9]. To date, only 19 reciprocal translocationsinvolving different chromosomes in cattle have been reported [12]. In fact, De Lorenzi and colleaguessuggested that the frequency of reciprocal translocations is grossly underreported, largely due tothe inherent difficulties in detecting these rearrangements using routine cytogenetics [12]. The cattlekaryotype is notoriously difficult to analyse reliably because of a diploid number of 60, largely madeup of similar-sized acrocentric chromosomes, and is therefore problematic for the detection ofanything other than Robertsonian translocations. A molecular approach that will detect reciprocal andRobertsonian translocations is, therefore, essential.
Recently, we developed an approach for the detection of cryptic and overt translocations inboars [13]. This method uses a panel of subtelomeric fluorescence in-situ hybridisation (FISH)probes on a multihybridisation device as a means of highlighting the ends of each chromosome,thereby facilitating the identification of rearrangements between chromosomes. The purpose of thisstudy was to use similar technology to isolate and visualise each end of every chromosome in cattle.

Animals 2020, 10, 114 3 of 9
Here, as proof of principle, we use a small sample size; however, all cattle have the same chromosomes,thereby allowing for the detection of translocations, particularly the challenging reciprocal ones.
2. Materials and Methods
Heparinised whole blood samples from 39 Holstein bulls were obtained from local suppliers.Samples were collected as part of standard procedures used for commercial evaluation by in housetrained veterinarians via standard phlebotomy in heparin tubes. Whole blood samples were culturedfor 72 h in PB MAX Karyotyping medium (Gibco, Thermo Fisher Scientific, Waltham, MA, USA) at37 ◦C, 5% CO2. Cell division was arrested by the addition of colcemid at a concentration of 10.0 µg/mL(Gibco, Thermo Fisher Scientific, Waltham, MA, USA) for 35 min prior to hypotonic treatment with75 M KCl and fixation to glass slides using 3:1 methanol:acetic acid.
2.1. Selection and Preparation of Fluorescence In-Situ Hybridisation (FISH) Probes
Bacterial artificial chromosome (BAC) clones of approximately 150 kb in size were selected fromthe Btau 4.6.1 NCBI database (www.ncbi.nlm.nih.gov) and ordered from the CHORI-240 Bovine BAClibrary for each autosome and the X chromosome (see Table 1). A lack of available BACs for the Ychromosome meant that this chromosome was excluded from the study. BAC DNA was isolated usingthe Qiagen Miniprep Kit (Qiagen, Hilden, Germany), the products of which were then amplified anddirectly labelled by nick translation with FITC-Fluroescein-12-UTP (Roche, Basel, Switzerland) forsubcentromeric probes and Texas Red-12-dUTP (Invitrogen, Thermo Fisher Scientific, Waltham, MA,USA) for distal q-arm probes prior to purification. A list of BACs is given in Table 1.
Table 1. Cattle BACs by chromosome from the CHORI-240 library.
Chrom Arm Clone Name Span Chrom Arm Clone Name Span (bp)
1p CH240-321O2 179,965
16p CH240-139M7 166,377
d CH240-96M6 187,920 d CH240-315I10 186,228
2p CH240-457J20 198,157
17p CH240-267P22 176,654
d CH240-227E16 179,789 d CH240-313I20 182,729
3p CH240-154A5 174,225
18p CH240-14C14 163,878
d CH240-302G6 190,291 d CH240-436N22 179,260
4p CH240-416O20 170,609
19p CH240-349G17 169,018
d CH240-193F3 179,112 d CH240-390C5 180,283
5p CH240-326L8 188,525
20p CH240-394L14 182,595
d CH240-248M21 163,993 d CH240-339K22 183,557
6p CH240-324B6 180,970
21p CH240-301D14 163,699
d CH240-5F18 184,848 d CH240-62O23 176,169
7p CH240-415D2 182,547
22p CH240-426O23 182,818
d CH240-276L16 168,781 d CH240-313B20 173,299
8p CH240-443K7 175,465
23p CH240-102P19 179,615
d CH240-241A18 176,318 d CH240-374G6 174,942
9p CH240-25A3 177,086
24p CH240-382F1 171,530
d CH240-298I24 172,331 d CH240-19L13 171,917
10p CH240-421B11 166,378
25p CH240-198J4 186,545
d CH240-325F16 179,292 d CH240-379D22 163,818
11p CH240-314K5 165,445
26p CH240-428I10 181,997
d CH240-344O3 183,795 d CH240-389H1 176,691
12p CH240-261C16 164,440
27p CH240-7G11 184,155
d CH240-262C4 165,223 d CH240-352M8 184,694
13p CH240-461F6 188,788
28p CH240-313L4 181,707
d CH240-471M8 178,736 d CH240-63D12 183,932
14p CH240-319C15 181,738
29p CH240-367D17 179,713
d CH240-240M1 178,587 d CH240-257F23 188,054
15p CH240-225A24 151,902
Xp CH240-121E1 176,736
d CH240-386C2 168,728 q CH240-472J20 186,872

Animals 2020, 10, 114 4 of 9
2.2. Development of Multiprobe Device
Fluorescently-labelled probes were diluted to a concentration of 10 ng/µL in sterile distilledwater along with competitor DNA (Bovine Hybloc, Applied Genetics Laboratories, Melbourne, FL,USA). Each probe combination contained a probe isolated from each end of the chromosome, and wasindividually assigned with the appropriate chromosome number followed by the letter p (proximal) ord (distal). Using a proprietary Chromoprobe Multiprobe System device manufactured by CytocellLtd., Cambridge, UK, each probe combination (e.g., 1pd) for chromosomes 1 to 24 was air dried ontoa square of the device. The corresponding glass slide was subdivided into 24 squares, designed toalign to the 24 squares on the device upon which chromosome suspensions were fixed. A second8-square device was used to facilitate the larger number of chromosomes in the cattle karyotype.The precise orientation of the clones and development of the bespoke device is given in the resultssection (Figure 1).
Figure 1. Schematic demonstrating the layout of probes designed to map to each bovinechromosome-selected from the most proximal (p) and most distal region (d) of eachindividual chromosome.
2.3. Fluorescence In-Situ Hybridisation (FISH)
Slides were dropped with fixed metaphase preparations and dehydrated through an ethanolseries (2 min each in 2× sodium saline citrate (SSC), 70%, 85% and 100% ethanol at room temperature).Formamide-based hybridisation buffer (Cytocell Hyb I, Cambridge, UK) was pipetted onto each squareof the device in order to resuspend the probes. The glass slide and the device were sandwichedtogether and warmed on a 37 ◦C hotplate for 10 min. The probe and target DNA were subsequentlydenatured on a 75 ◦C hotplate for 5 min prior to overnight hybridisation in a dry hybridisationchamber in a 37 ◦C water bath. Slides were washed post hybridisation for 2 min in 0.4× SSCat 72 ◦C and 30 s in 2× SSC/0.05% Tween 20 at room temperature, then counterstained usingDAPI in VECTASHIELD. Metaphases for karyotyping were stained with DAPI in VECTASHIELDantifade medium (Vector Laboratories, Peterborough, UK). Image capturing was performed usingan Olympus BX61 epifluorescence microscope (Olympus, Tokyo, Japan) with a cooled CCD camera

Animals 2020, 10, 114 5 of 9
and SmartCapture (Digital Scientific UK, Cambridge, UK) system. The SmartType software (DigitalScientific UK, London, UK) was used for karyotyping purposes.
3. Results
3.1. Generation and Validation of a Device and Scheme Capable of Detecting Reciprocal and RobertsonianTranslocations in Cattle
Using technology adapted for translocation screening in pigs, the screening device was arrangedas shown in Figure 1, where, for each autosome, a proximal (near the centromere) and distal probewere labelled in green and red respectively to highlight the ends of each chromosome. For the Xchromosome, the proximal probe was located in a subtelomeric position at the end of the p arm andone at the distal end of the q-arm. Given the number of cattle chromosomes (2n = 60), a 24-square(as per the porcine device) plus an extra 8-square device was used.
3.2. Validation of Device and Karyotypes
A total of 39 bulls were screened using both karyotyping and the FISH multiprobe method,the results of which are show in Table 2. Bright signals were seen in each of the hybridizationsquares, with five animals revealing a 1;29 translocation. Three of these were heterozygous, and twowere homozygous. In two samples, the FISH method revealed a reciprocal translocation (rcp 12;23),thereby demonstrating that karyotypically-undetectable reciprocal translocations can be identifiedusing this technology. The results are given in Figures 2–5 and summarized in Table 2.
Table 2. Summary of results from screening 39 animals using karyotyping and FISH.
Diagnosis Numbers Method of Detection
Heterozygous Robertsonian (1;29) 3 Karyotype-confirmed with FISHHomozygous Robertsonian (1;29) 2 Karyotype-confirmed with FISH
Reciprocal (12;23) 2 FISH-karyotype appeared normalNormal 32 Karyotype, FISH
Figure 2. DAPI stained karyotype of a 2n = 59 bull with a rob (1;29). Robertsonian translocation andthe missing chromosome 29 are circled in red.

Animals 2020, 10, 114 6 of 9
Figure 3. Metaphase spread of heterozygous 1;29 translocation carrier. Left image shows labelled FISHprobes for chromosome 1, where CH240-321O2 (FITC) is the proximal probe and CH240-96M6 (TxRed)is the distal probe. The translocation is marked by an arrow. Right image shows labelled FISH probesfor chromosome 29, where CH240-367D17 (FITC) represents the proximal probe and CH240-257F23(TxRed) maps to the distal end- The translocation is marked by an arrow. Scale bar 10 µm.
Figure 4. DAPI stained metaphase chromosomes of a homozygous 1;29 Robertsonian translocationin a British White bull (2n = 58, XX). Homozygous Robertsonian translocation (1;29) circled in red.Diagnosis confirmed by FISH.
No reciprocal translocations were identified by karyotype analysis, although two carriers wereidentified using FISH. The translocation identified involved chromosomes 12 and 23, with the sametranslocation affecting two bulls, as shown in Figure 5.

Animals 2020, 10, 114 7 of 9
Figure 5. Labelled FISH probes for chromosome 23, where the proximal probe is CH240-102P19 (FITC)and the distal probe is (CH240-374G6 (Texas Red). A misplacement of signals illustrates a reciprocaltranslocation between chromosome 12 and chromosome 23.
4. Discussion
The consequences of using a subfertile bull in an AI breeding programme are many. First of all,while using a subfertile bull may result in a small number of pregnancies, the pregnancy rates willinevitably be significantly lower than expected. This then leads to extended calving intervals and anincreased likelihood that a higher proportion of cows will be culled for presumed sterility. Both of thesefactors result not just in reduced financial returns, but also in a large degree of wastage, raising ethicaland environmental concerns. This is particularly important when the very large bull to cow ratiosemployed in AI programmes are taken into account. With average calving rates of only 50–60% in UKdomestic dairy cattle, it is vital to prevent any further potential loss of fertility in order to maximise theopportunities for each cow to conceive and to improve productivity [14].
Prior to the results reported here, standard karyotype analysis, a time-consuming and error pronemethod, was the only means of diagnosing chromosomal rearrangements in cattle. De Lorenzi andcolleagues calculated that for a translocation to be observable through karyotyping alone, an abnormalchromosome derivative must be either at least 15% (185 Mb) longer than chromosome 1, or 40%(26.4 Mb) shorter than chromosome 25 [12]. Even with optimum G-banding preparations, it is likelythat most reciprocal translocations involving chromosomes 2–24 would be indistinguishable fromother autosomes. It is vital, therefore, that efficient and accurate methods are implemented for thedetection of chromosome translocations as part of a routine screening programme for cattle destinedfor AI. The results generated in this study demonstrate the validity of a FISH-based screening devicefor the detection of reciprocal translocations, two of which would remain undiagnosed if standardkaryotyping alone had been used. Efforts to eradicate chromosomal translocations from the cattlebreeding herd are ongoing; however, the results presented here demonstrate that both Robertsonianand reciprocal translocations are present in the breeding population. Many of these may be de novorearrangements, but it is highly likely that the reciprocal translocation identified here is one that hasbeen carried through multiple generations but which had not been identified due to the inherentdifficulties in screening using traditional methods. Screening for chromosomal translocations thatresult in economic loss is, therefore, more important than ever, and this study demonstrates, in only asmall group of animals, a means by which it could be achieved in the future.

Animals 2020, 10, 114 8 of 9
The Robertsonian translocations identified in this study, while detectable with basic karyotyping,can also easily and accurately be identified using FISH. Interestingly, despite great efforts in manybreeding programmes to eliminate the 1;29 translocation, our results suggest that either these effortshave not been wholly successful, or that this rearrangement continues to recur de novo. Withouthistorical data and ongoing routine screening of all animals entering the breeding population, it isdifficult to ascertain what proportion of these rearrangements fall into this category.
This paper provides a small proof of principle for an approach that could potentially havewide applicability. The development and implementation of this FISH-based assay has, however,already markedly improved the efficiency and accuracy of translocation screening, allowing multiplehybridisation experiments in a single assay. Whilst chromosomal translocations have been demonstratedto significantly affect fertility in all species tested, in cattle, many of these rearrangements haveremained undetected due to the inherent difficulties in finding them using previous technologies.The method presented here resolves this issue, allowing for the rapid identification of an abnormality,and corresponding rapid removal of affected animals from the herd. Not only will this lead toa reduction in the economic losses associated with using a subfertile bull, it will also reduce theneed for the unnecessary culling of cows and bulls that are suspected (but unproven) to be sterile,thereby reducing economic and environmental loss. Moreover, the karyotype of both Bos Taurus andBos indicus is identical (aside from the morphology of the Y chromosome), and therefore, although onlyestablished on a small number of individuals, this approach is universally applicable to all commercialbreeding bulls.
In addition, an increasing emphasis on the use of in vitro production (IVP) methods to improvecattle breeding means that the requirement for high genetic merit gametes is not just limited to theanalysis of bulls, but that the need to screen cows, and ultimately oocytes or embryos, for chromosomeabnormalities will also become increasingly important [15]. This screening approach allows bothdonor parents to be screened for underlying chromosomal abnormalities prior to their use in IVPprogrammes, thereby improving the genetic quality of the embryos generated using these methods.Other efforts in our laboratory allow for the screening of oocytes and embryos [15].
Finally, with the success of this screening method in place and the success of our previouslydeveloped method in screening for chromosome abnormalities in pigs, it is plausible to suggestthat this technique could be applied to any animal of interest, with the horse being an idealfuture candidate. The domestic horse (2n = 64) is of significant interest to many different groupsworldwide; the thoroughbred breeding industry, for example, could benefit from a similar screeningservice. Previous cytogenetic studies have identified chromosomal translocations that affect fertility inthoroughbred mares [16], another group for which breeders place a significant importance on highgenetic merit in the breeding population. Having the tools to examine and diagnose chromosomalabnormalities in a similarly fast and efficient manner would, therefore, be beneficial to this industry.
5. Conclusions
The approach developed here has the potential to lead to long-term improved productivity,delivering meat and milk products in a more cost-effective and environmentally-responsible mannerto a growing population. The widespread use of artificial insemination and IVP, and the large marketfor superior bull semen being sold to both small and large-scale cattle breeding operations suggeststhat improvements in productivity will have a wide impact. This will affect not only large commercialbreeders, but also smaller farmers, for whom reduced wastage per animal may be more critical.
Author Contributions: Conceptualization, D.K.G. and R.E.O.; methodology, D.K.G and R.E.O.; software,SmartType validation, R.E.O and R.L.J.; formal analysis, R.L.J., D.K.G. and R.E.O.; investigation, R.L.J. and R.E.O;resources, D.K.G and R.E.O.; data curation, R.L.J., R.E.O; writing—original draft preparation, R.E.O and R.L.J;writing—review and editing, R.E.O and D.K.G.; visualization R.E.O and R.L.J; supervision, D.K.G and R.E.O.;project administration, D.K.G.; funding acquisition, D.K.G and R.E.O. All authors have read and agreed to thepublished version of the manuscript.
Animals 2020, 10, 114 9 of 9
Funding: This research was funded by BBSRC, grant number BB/P020054/1; R.L.J. was supported, in part by aUniversity of Kent Graduate Training Assistant studentship; The APC was funded by The University of Kent.
Acknowledgments: The authors would like to thank friends and colleagues at Cytocell/OGT (Cambridge),particularly Gothami Fonseka, Richard Frodsham, Richard Evans, Iain Hay, Tori Anthony-Dubernet and JohnAnson for continuing support in our ongoing ventures.
Conflicts of Interest: The authors declare no conflict of interest. The funders had no role in the design of thestudy; in the collection, analyses, or interpretation of data; in the writing of the manuscript, or in the decision topublish the results.
References
1. Ritchie, H.; Roser, M. Meat and Dairy Production. Our World Data 2017. Available online: https://ourworldindata.org/meat-production (accessed on 10 January 2020).
2. Broekhuijse, M.L.W.J.; Šoštaric, E.; Feitsma, H.; Gadella, B.M. Application of computer-assisted semenanalysis to explain variations in pig fertility. J. Anim. Sci. 2012, 90, 779–789. [CrossRef] [PubMed]
3. Kastelic, J.P.; Thundathil, J.C. Breeding Soundness Evaluation and Semen Analysis for Predicting Bull Fertility.Reprod. Domest. Anim. 2008, 43, 368–373. [CrossRef] [PubMed]
4. Taylor, J.F.; Schnabel, R.D.; Sutovsky, P. Genomics of bull fertility. Animal 2018, 12, 172–183. [CrossRef][PubMed]
5. Raudsepp, T.; Chowdhary, B.P. Chromosome Aberrations and Fertility Disorders in Domestic Animals.Annu. Rev. Anim. Biosci. 2016, 4, 15–43. [CrossRef] [PubMed]
6. Gustavsson, I.; Rockborn, G. Chromosome abnormality in three cases of lymphatic leukæmia in cattle. Nature1964, 203, 990. [CrossRef] [PubMed]
7. Larkin, D.M.; Farré, M.; Garrick, D.J.; Ruvinsky, A. Cytogenetics and chromosome maps. In The Genetics ofCattle, 2nd ed.; Garrick, D.J., Ruvinsky, A., Eds.; CABI: Wallingford, UK, 2014; pp. 103–129.
8. Switonski, M. 50 years of studies on bovine 1/29 Robertsonian translocation-from Giemsa staining to genomicanalysis. Chromosome Res. 2014, 22, 395.
9. Ducos, A.; Revay, T.; Kovacs, A.; Hidas, A.; Pinton, A.; Bonnet-Garnier, A.; Molteni, L.; Slota, E.;Switonski, M.; Arruga, M.V.; et al. Cytogenetic screening of livestock populations in Europe: An overview.Cytogenet. Genome Res. 2008, 120, 26–41. [CrossRef] [PubMed]
10. Bonnet-Garnier, A.; Lacaze, S.; Beckers, J.F.; Berland, H.M.; Pinton, A.; Yerle, M.; Ducos, A. Meiotic segregationanalysis in cows carrying the t(1;29) Robertsonian translocation. Cytogenet. Genome Res. 2008, 120, 91–96.[CrossRef] [PubMed]
11. Iannuzzi, A.; Di Meo, G.P.; Caputi Jambrenghi, A.; Vonghia, G.; Iannuzzi, L.; Rangel-Figueiredo, T. Frequencyand distribution of rob(1;29) in eight Portuguese cattle breeds. Cytogenet. Genome Res. 2008, 120, 147–149.[CrossRef] [PubMed]
12. De Lorenzi, L.; Morando, P.; Planas, J.; Zannotti, M.; Molteni, L.; Parma, P. Reciprocal translocations in cattle:Frequency estimation. J. Anim. Breed. Genet 2012, 129, 409–416. [CrossRef] [PubMed]
13. O’Connor, R.E.; Fonseka, G.; Frodsham, R.; Archibald, A.L.; Lawrie, M.; Walling, G.A.; Griffin, D.K. Isolationof subtelomeric sequences of porcine chromosomes for translocation screening reveals errors in the piggenome assembly. Anim. Genet. 2017, 48, 395–403. [CrossRef] [PubMed]
14. Parkinson, T.J. Evaluation of fertility and infertility in natural service bulls. Vet. J. 2004, 168, 215–229.[CrossRef] [PubMed]
15. Turner, K.J.; Silvestri, G.; Black, D.H.; Dobson, G.; Smith, C.; Handyside, A.H.; Sinclair, K.D.; Griffin, D.K.Karyomapping for simultaneous genomic evaluation and aneuploidy screening of preimplantation bovineembryos: The first live-born calves. Theriogenology 2019, 125, 249–258. [CrossRef] [PubMed]
16. Lear, T.L.; Lundquist, J.; Zent, W.W.; Fishback, W.D.; Clark, A. Three autosomal chromosometranslocations associated with repeated early embryonic loss (REEL) in the domestic horse (Equus caballus).Cytogenet. Genome Res. 2008, 120, 117–122. [CrossRef] [PubMed]
© 2020 by the authors. Licensee MDPI, Basel, Switzerland. This article is an open accessarticle distributed under the terms and conditions of the Creative Commons Attribution(CC BY) license (http://creativecommons.org/licenses/by/4.0/).