Comparison of Image Classification Models on Varying Dataset Sizes
1
Solid State Ionics 249–250 (2013) 1–5
(doi: 10.1016/j.ssi.2013.07.001)
http://dx.doi.org/10.1016/j.ssi.2013.07.001
Magnetic and optical investigations on LaFeO3 powders with
different particle sizes and corresponding ceramics
Roberto Köferstein*, Lothar Jäger, Stefan G. Ebbinghaus
Institute of Chemistry, Inorganic Chemistry, Martin-Luther-University Halle-Wittenberg,
Kurt-Mothes-Strasse 2, 06120 Halle, Germany.
* Corresponding author. Tel.: +49-345-5525630; Fax: +49-345-5527028.
E-mail address: [email protected]
Abstract. The optical and magnetic properties of nano-LaFeO3 powders prepared by a starch
assisted soft-chemistry synthesis and corresponding ceramics have been investigated.
Magnetic measurements on LaFeO3 powders with crystallite sizes of 37−166 nm show
pronounced magnetization hysteresis loops. Measurements at 300 K reveal that the coercivity
(Hc) of 19−32 kOe depends on the crystallite size, whereas the low remanence values (Mr) of
roughly 0.2 emu/g and the maximal magnetization (Mmax) at 90 kOe of 1.05−0.85 emu/g are
only slightly changing. Investigations at 10 K reveal a loop shift (exchange bias) up to 12 kOe
in the negative direction depending on the crystallite size. Ceramic bodies, sintered at ≥ 1300
°C possess a considerably reduced hysteresis loop. Hc is decreased up to 3.0 kOe, whereas Mr
2
and Mmax are slightly increasing. None of the samples reaches saturation at 90 kOe indicating
an anti-ferromagnetic ordering of the spins. The optical band gaps of the LaFeO3 samples
were determined by means of diffuse reflectance spectra. For all LaFeO3 powders similar
band gaps of 2.65 eV were observed. However, ceramics with grain-size significantly larger
than 250 nm show smaller band gap values up to 2.12 eV.
Keywords: lanthanum orthoferrite; perovskite; ceramic; nano-particles, optical band gap;
magnetic properties
1. Introduction
Perovskite materials based on lanthanum orthoferrite (LaFeO3) are of great importance
because of their broad application potential in advanced technologies. Substituted LaFeO3
compounds have been studied as membrane-reactor material for the partial oxidation of
methane to syngas [1,2]. LaFeO3 based materials reveal catalytic potential for the
decomposition of e.g. hydrocarbons, chlorinated Volatile Organic Compounds (VOCs) or in
the reaction between NO and CO [3,4,5,6]. They are also promising candidates as catalysts in
heterogeneous Fenton-like reactions to generate ⋅OH radicals from H2O2 [7,8]. Due to the
small band gap LaFeO3 can be used in photocatalytic applications [9,10,11]. Furthermore,
lanthanum orthoferrites are also applied as sensor materials [12,13,14] and as electrode
material in Solid Oxide Fuel Cells (SOFCs) [15,16,17,18].
LaFeO3 is a canted G-type anti-ferromagnet with a Néel temperature of 467 °C [19]. At room
temperature it crystallizes in an orthorhombically distorted perovskite lattice.
To obtain fine-grained/nano-sized LaFeO3 powders several wet-chemical syntheses have been
developed such as precursor methods [20,21,22,23] sol-gel and combustion routes [9,24,25,
26] or by a microemulsion route [5,27].
3
Optical band gap (Eg) values between about 2.1 and 3.85 eV have been reported for LaFeO3
[9,10,25,28,29,30,31]. The optical band gap depends on preparation method and particle size
[32,33]. On the other hand, the band gaps of LaFeO3 were determined by different techniques,
what might be one of the reasons for deviating values. Calculations based on the local spin
density approximation (LSDA) by Shein et al. [34] and Yang et al. [35] resulted in band gaps
of 2.52 eV and 2.1 eV, respectively.
The aim of this paper is to investigate the magnetic and optical properties of nano-sized
LaFeO3 prepared by a simple and fast preparation route using starch as a complexation agent
as reported in a previous paper [36]. Additionally, coarse-grained LaFeO3 ceramic bodies
obtained by an additional sintering step were studied. The optical band gap and the field-
dependent magnetization were measured with respect to the particle size as well as to the
calcination-/sintering conditions.
2. Experimental
2.1. Material preparation
LaFeO3 samples were prepared by a decomposition process using starch both as complexation
agent and gellant as described elsewhere [36]. Briefly, La(NO3)3⋅6H2O (0.006 mol, Merck)
and Fe(NO3)3⋅9H2O (0.006 mol, Merck) were dissolved in 15 ml water and 2 g soluble starch
(Sigma-Aldrich) was added. The resulting suspension was continuously stirred on a heating
plate at room temperature for 15 min. Afterwards the temperature was raised to about 120 °C
and the mixture was stirred until it turned to a highly viscous orange gel.
The obtained (LaFe)-gel was calcined in static air up to 1000 °C (heating-/cooling rate 5
K/min) as summarized in Tab. 1 (powders 1a−1e). The LaFeO3 powder 1a calcined at 570 °C
for 2 h was used to produce ceramic bodies (S1−S6). For that purpose powder 1a was mixed
with 5 mass% of a saturated aqueous polyvinyl alcohol (PVA) solution as a pressing aid,
4
pressed into pellets and sintered between 1200 and 1450 °C for 1 and 10 h with a heating-
/cooling rate of 5 K/min in static air [36].
Chemical analyses (gravimetry, complexometry [37,38]) of the samples indicated a La/Fe
ratio of 0.998.
2.2. Characterization
The specific surface area was determined using nitrogen three-point BET (Nova 1000,
Quantachrome Corporation). The equivalent BET particle diameters were calculated
assuming a spherical or cubic particle shape [39]. Diffuse reflectance spectra were obtained at
room temperature in the range 380−1000 nm using a Perkin Elmer UV−VIS spectrometer
Lambda 19. BaSO4 was used as a white standard. Magnetic measurements were carried out
using a Quantum Design PPMS 9. The magnetizations were measured at 300 K and 10 K with
magnetic field cycling between −90 and +90 kOe.
3. Results and discussion
3.1. Samples characterization
In a previous paper [36] we have already reported on the temperature-dependent phase
evolution of LaFeO3 nano-scaled powders and their sintering behaviour resulting in ceramic
bodies. In this contribution we describe the magnetic and optical properties of these samples.
Table 1 summarized the calcination conditions, the specific surface areas, and the particle-
/crystallite sizes of these powders. At the lowest calcination temperature of 570 °C powder 1a
possesses a BET surface area of 25.7 m2/g and a crystallite size of 37 nm. TEM images
revealed an agglomerated powder with porous features. The individual particles are mainly in
the range of about 20 to 60 nm. Up to 1000 °C (powder 1e) the BET surface area decreases to
6.5 m2/g and the crystallite size increases to 166 nm. Ceramic bodies were obtained by
pressing powder 1a to compacts followed by sintering between 1200 and 1600 °C for 1 and

5
10 h in air. Sintering conditions, relative densities and the grain size ranges are also listed in
Tab. 1.
3.1. Magnetic measurements
Fig. 1 exemplarily shows the magnetization (M) depending on the applied magnetic field (H)
at 300 K for the LaFeO3 powders 1a, 1b, and 1e. The samples 1a−1e show hysteresis loops at
300 K with low remanences (Mr) of about 0.2 emu/g and large coercivities (Hc) up to 32 kOe.
We found that the coercivity depends on the calcination temperature and thus on the
crystallite size and reaches a maximum at a crystallite size of 106 nm (900 °C). Further
calcination at 1000 °C (crystallite size 166 nm) results in a slight reduced coercivity as
depicted in Fig. 2. The remanence varies only slightly with the crystallite size and the
magnetization at 90 kOe (Mmax) decreases with raising crystallite size (Tab. 2). Obviously, no
saturation is reached but the magnetization increases almost linearly with H.
Magnetic measurements at 300 K on the ceramic bodies made from powder 1a show that the
area of the hysteresis loop is strongly reduced for sintering temperatures ≥ 1300 °C (Fig. 3,
Tab. 2). Mmax and Mr first increase with raising sintering temperature but above 1300 °C they
change only slightly. It can be seen from Table 2 that the sintering time has only a marginal
influence on Mmax and Mr, respectively. In contrast, the coercivity decreases both with
increasing sintering temperature and sintering time.
The magnetic behaviours of the ceramic bodies at 10 K are similar to the ones at 300 K. The
values of Mr, Hc, and Mmax are only slightly higher by trend (Tab. 2). In contrast, in magnetic
measurements of the LaFeO3 powders (1a−1e) at 10 K we found different coercivity values
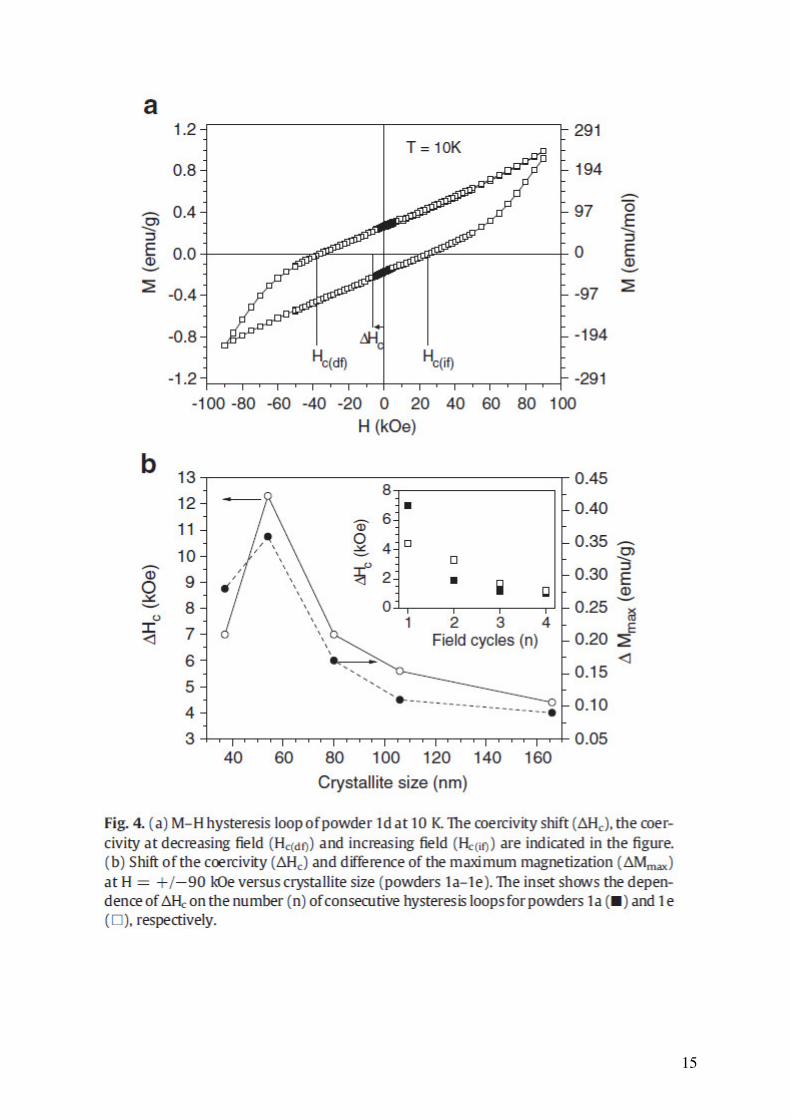
for decreasing and increasing fields as demonstrated for powder 1d in Fig. 4a. This exchange
bias-like behaviour results in a significant shift of the M−H loops (∆Hc) in the negative
direction with respect to the origin (H = 0). In consideration of the studies of Nogues and
Schuller [40] and Leslie-Pelecky and Schalek [41] the coercivity shift is defined as ∆Hc =
6
0.5(Hc(df) + Hc(if)), where Hc(df) is the coercivity at decreasing field and Hc(if) is the
coercivity at increasing field, i.e. powder 1a has coercivity values of −14.4 kOe (Hc(df)) and
+0.48 kOe (Hc(if)) resulting in ∆Hc = 7.0 kOe. ∆Hc was found to depend on the crystallite size.
For very small sizes between about 40 and 60 nm ∆Hc increases to a maximum of 12.3 kOe
while for larger crystallite sizes ∆Hc decreases (Fig. 4b). An analogous behaviour was also
found for nano-sized NiO particles, BiFeO3, Bi2Fe4O9 and for nano YFeO3 [42,43,44,45].
Wang and Gong [46] reported on a small loop shift for LaFeO3 nano-spheres, and loop shifts
up to 1.5 kOe were observed in nano-LaFeO3 prepared by a sol-gel route [47]. As a result of
the exchange-bias like shift and the resulting asymmetry of the hysteresis curve the values of
the maximum magnetization at H = +90 kOe and −90 kOe are different. For powder 1a Mmax
is 1.36 emu/g for H = +90 kOe while at H = −90 kOe Mmax accounts to only 1.08 emu/g. The
difference in the maximal magnetizations (∆Mmax) at H = +90/−90 kOe decreases with raising
particle size similar to the development of ∆Hc (Fig. 4b). Additionally we observed that ∆Hc
depends on the number (n) of field cycles. ∆Hc decreases with the number of consecutive
hysteresis loops as demonstrated for powders 1a and 1e in the inset in Fig. 4b. This so-called
training effect is often observed in ferromagnetic/antiferromagnetic thin films [40,48,49] and
also in e.g. NiFe2O4/NiO nano-composites [50] and core-shell Fe/Fe3O4 nano-particles [51].
Manna et al. [52] and Passamani et al. [53] found the training effect in Mn-doped BiFeO3
nano-particles and in ball-milled NiFe2O4 nano-particles, respectively. In general, loop shifts
occur in materials with ferromagnetic/anti-ferromagnetic interfaces (exchange bias) [40,54].
Ahmadvand et al. [47] discuss an exchange coupling between a ferromagnetic-like shell and
an antiferromagnetic core in nano-LaFeO3 particles. From the results above the loop shift is a
finite size effect. Nanoparticles exhibit a large disordered surface with reduced coordination
of surface spins. Calculations by Kodama et al. [42] on NiO nanoparticles showed that the
loop shift originates from the interaction between the reduced coordinated surface spins and
7
the core. Therefore, we did not observe any shift of the hysteresis loops for LaFeO3 ceramic
bodies because of their large grain sizes.
The magnetization curves of all samples both at 300 K and 10 K clearly show that up to 90
kOe the saturation magnetization is not yet reached, indicating mainly an anti-ferromagnetic
ordering of the spins [30,55]. Additionally, the shape of the hysteresis loops is characteristic
for a canted anti-ferromagnet in which due to the canting an uncompensated moment remains
leading to a weak ferromagnetic characteristic [19,56,57]. That behaviour is also observed in
other LaFeO3 samples as well as in Bi- and Y-orthoferrites [43,47,58].
3.3. Diffuse reflectance measurements
Fig. 5 shows the diffuse reflectance spectra of selected LaFeO3 powders 1a, 1c, and 1e
showing strong visible-light absorption. The Kubelka−Munk theory was used for analysis of
the diffuse reflectance spectra. It combines the reflectance data with the absorption coefficient
as shown in equation 1 [59,60]:
F(R) = s
α=
R
R
2
)1( 2−
(1)
where F(R) is the Kubelka−Munk function, R the reflectance, α the absorption coefficient and
s is the scattering factor. Since the scattering factor is wavelength independent, F(R) is
proportional α [60].
There are various techniques to extract the band gap energy from diffuse reflectance
measurements [61]. A simple way to determine the optical band gap is plotting of e.g. the
reflectance or absorbance versus wavelength. The onset of the linear increase in diffuse
reflectance/ absorbance is taken as the energy of the band gap. As pointed out by Lopez and
8
Gomez [62] and Nowak et al. [61] the band gap energy slightly depends on the graphic
representation and the above mentioned technique does not lead to an accurate band gab
energy. The optical band gap for LaFeO3 from diffuse reflectance spectra vary from 2.1 to
3.85 eV [9,10,25,28,29,30,31,63]. Apart from different LaFeO3 samples with different particle
sizes and synthesis routes the reason for these discrepancies also lie in the different graphical
determination techniques. To accurately determine the band gap it is necessary to find the
type of transition [61,64]. The McLean analysis [65,66] of the absorption edge was applied to
find the type of transition and to determine the optical band gap by equation 2 [67].
αhν = k(hν − Eg)1/n
(2)
where k is an energy-independent constant, Eg the optical band gap. The exponent n is
determined by the type of transition: n = 2 for direct allowed transitions, n = 2/3 for direct
forbidden transitions, n = 1/2 for indirect allowed transitions and n = 1/3 for indirect
forbidden transitions. Since F(R) is proportional to α (see above) the exponent n can be
determined by plotting (F(R)⋅hν)n vs. hν. The best fit to a straight line near the absorption
edge was found for n = 2 indicating a direct allow transition. Consequently, equation 2 can be
transformed to:
F(R)⋅hν = k(hν − Eg)1/2
(3)
From a plot of (F(R)⋅hν)2 vs. hν (inset in Fig. 5) the band gap energy can be determined by
extrapolating the slope to F(R) → 0.
The band gap energy for powder 1a with a crystallite size of 37 nm was determined as 2.65(2)
eV. The value of the band gap does not change significantly up to a calcination temperature of

9
1000 °C corresponding to a crystallite size of 166 nm (Tab. 3). An analogous result was also
found for LaFeO3 powders prepared from a sol-gel synthesis [9].
Ceramic bodies made from powder 1a show reduced band gaps (Tab. 3). Sintering at 1200 °C
for 1 h results in ceramic bodies (S1-1) with grain sizes of 0.25 to 0.9 nm and the band gap
was found to be 2.51(4) eV. Raising the sintering temperature to 1300 °C results in grains
between 0.6−2.5µm (S3-1) and the optical band gap is downshifted to 2.13(1) eV. Higher
sintering temperatures und thus larger grain sizes do not lead to a significant change of the
band gap. Additionally, sintering with prolonged soaking time up to 10 h has no significant
effect on the band gap energy.
As shown the LaFeO3 powders with crystallites sizes between 37 and 166 nm has higher band
gap energies than the coarse-grained ceramic bodies with grain sizes considerably larger than
250 nm. It is a well-know effect that small particles tend to exhibit increased band gaps
[32,33]. This effect allows to influences the colour and photocatalytic activities of the samples
during the transition from micro to nano particles.
Conclusion
We investigated the magnetic and optical properties of nano-sized LaFeO3 powders prepared
by decomposition of a starch-based (LaFe)-gel and ceramic bodies prepared from these
powders. Calcination in air of the (LaFe)-gel from 570 to 1000 °C yield very fluffy phase-
pure LaFeO3 powders with crystallite sizes between 37 and 166 nm. The powders show
pronounced M−H hysteresis loops. At 300 K the coercivity depends on the crystallite size and
for particles with sizes of about 120 nm reaches maximum values of up to 32 kOe. In contrast
very similar remanences around 0.2 emu/g, magnetization between 0.85 and 1.05 emu/g at 90
kOe were obtained for all powders at 300 K. Magnetization measurements at 10 K revealed
that the LaFeO3 powders show an exchange-bias like shift (∆Hc) of the hysteresis loops. A
10
maximum shift of 12 kOe was observed for a crystallite size of about 50 nm. The ceramic
bodies show a drastic decrease of both remanence and coercivity values with increasing grain
sizes, leading to Hc values down to 3 kOe. The M−H hysteresis loops show that no saturation
up to a magnetic field of 90 kOe was reached for any of the samples, suggesting an anti-
ferromagnetic ordering of the spins. The optical band gaps were determined by means of
diffuse reflectance spectra. Almost identical band gaps of 2.65 eV were determined for all
powder samples. In contrast, ceramic bodies (grain sizes larger than 250 nm) show smaller
band gaps between 2.51 and 2.12 eV, depending on the grain sizes.
Acknowledgements
Financial support by the German Science Foundation within the Collaborative Research
Centre (SFB 762) “Functionality of Oxide Interfaces” is gratefully acknowledged.

11
Table 1
Heat treatment, BET surface area and particle-/grain sizes of
LaFeO3 powders and ceramic bodies
Powder Calcination
procedure
SBET
(m2/g)
dBET
(nm)1)
dcryst
(nm)2)
1a 570 °C/ 2h 25.7 35 37
1b 700 °C/ 2h 17.1 53 54
1c 800 °C/ 2h 12.0 75 80
1d 900 °C/ 2h 9.1 99 106
1e 1000 °C/ 2h 6.5 139 166
Ceramics3)
Sintering
procedure
Relative
density (%)
Grain-size
range (µm)4)
S1-1 1200 °C/ 1h 50 0.25−0.9
S2-1 1250 °C/ 1h 75 0.3−1.5
S3-1 1300 °C/ 1h 91 0.6−2.5
S4-1 1350 °C/ 1h 93 12−33
S5-1 1400 °C/ 1h 95 15−36
S6-1 1450 °C/ 1h 95 30−85
S1-10 1200 °C/ 10h 69 0.5−1.7
S2-10 1250 °C/ 10h 90 0.8−3
S3-10 1300 °C/ 10h 95 2−7
S4-10 1350 °C/ 10h 97 16−70
S5-10 1400 °C/ 10h 98 22−94
S6-10 1450 °C/ 10h 98 24−100
1) calculated from the specific surface area
2) volume-weighted average crystallite size (Scherrer equation)
3) prepared from powder 1a, the relative density is in relation to 6.64 g/cm3
4) determined from SEM images
Table 2
Maximal magnetization (Mmax)1)
, coercivity (Hc) and remanence (Mr) of synthesized
LaFeO3 powders and ceramics at 300 K and 10 K
300 K 10 K
Sample Mmax
(emu/g)1)
Hc
(kOe)
Mr
(emu/g)
Mmax
(emu/g)1)
Hc
(kOe)2)
∆Hc
(kOe)3)
Mr
(emu/g)
powder 1a 1.05 19.5 0.23 1.36 14.4 7.0 0.27
powder 1b 1.03 23.8 0.21 1.03 25.9 12.3 0.25
powder 1c 0.86 28.3 0.20 1.01 27.1 7.0 0.23
powder 1d 0.90 31.7 0.23 0.99 36.3 5.6 0.27
powder 1e 0.85 29.6 0.20 0.92 34.4 4.4 0.24

12
ceramic S1-1 0.90 32.8 0.25 1.00 37.7 0.29
ceramic S2-1 1.02 32.1 0.35 1.14 36.3 0.42
ceramic S3-1 1.19 13.7 0.46 1.31 14.1 0.53
ceramic S4-1 1.21 5.7 0.48 1.33 5.8 0.55
ceramic S5-1 1.20 5.1 0.48 1.34 5.2 0.55
ceramic S6-1 1.20 4.3 0.49 1.36 4.4 0.56
ceramic S1-10 0.97 35.1 0.32 1.09 39.3 0.39
ceramic S2-10 1.11 21.3 0.43 1.31 14.1 0.53
ceramic S3-10 1.21 8.0 0.46 1.34 7.9 0.53
ceramic S4-10 1.21 3.7 0.50 1.34 3.7 0.56
ceramic S5-10 1.16 3.5 0.48 1.29 3.6 0.55
ceramic S6-10 1.15 3.0 0.47 1.27 3.0 0.54
1) magnetization at 90 kOe
2) collected at negative field (absolute value)
3) calculated from ∆Hc = 0.5(Hc(df) + Hc(if))
Table 3
Optical band gaps of LaFeO3 powders and ceramics
Sample Eg (eV)
powder 1a 2.65(2)
powder 1b 2.64(2)
powder 1c 2.66(2)
powder 1d 2.67(1)
powder 1e 2.64(3)
ceramic S1-1 2.51(4)
ceramic S3-1 2.13(1)
ceramic S6-1 2.12(1)
ceramic S1-10 2.48(2)
ceramic S3-10 2.17(2)
ceramic S6-10 2.16(2)

13

14
15

16

17
References
[1] E.V. Tsipis, M.V. Patrakeev, V.V. Kharton, A.A. Yaremchenko, G.C. Mather, A.L.
Shaula, I.A. Leonidov, V.L. Kozhevnikov, J.R. Frade, Solid State Sci. 7 (2005) 355–
365.
[2] C.-Y. Tsai, A.G. Dixon, W.R. Moser, Y.H. Ma, AIChe J. 43 (1997) 2741–2750.
[3] J. Deng, H. Dai, H. Jiang, L. Zhang, G. Wang, H. He, C.T. Au, Environ. Sci. Technol.
44 (2010) 2618–2623.
[4] Y.-G. Cho, K.-H. Choi, Y.-R. Kim, J.-S. Jung, S.-H. Lee, Bull. Korean Chem. Soc. 30
(2009) 1368–1372.
[5] A.E. Giannakas, A.K. Ladavos, P.J. Pomonis, Appl. Catal. B-Environ. 49 (2004) 147–
158.
[6] A.A. Barresi, D. Mazza, S. Ronchetti, R. Spinicci, M.Vallino, Stud. Surf. Sci. Catal.
130 (2000) 1223–1228.
[7] F. Magalhães, F.C.C. Moura, J.D. Ardisson, R.M. Lago, Mater. Res. 11 (2008) 307–
312.
[8] J. Faye, E. Guelou, J. Barrault, J.M. Tatibouet, S. Valange, Top. Catal. 52 (2009)
1211−1219
[9] K.M. Parida, K.H. Reddy, S. Martha, D.P. Das, N. Biswal, Int. J. Hydrogen. Energ. 35
(2010) 12161–12168.
[10] P. Tang, M. Fu, H. Chen, F. Cao, Mater. Sci. Forum 694 (2011) 150–154.
[11] Y. Wang, X. Yang, L. Lu, X. Wang, Thermochim. Acta 443 (2006) 225–230.
[12] P. Song, H. Quin, L. Zhang, K. An, Z. Lin, J. Hu, M. Jiang, Sens. Actuators B104
(2005) 312–316.
[13] E.N. Armstrong, T. Striker, V. Ramaswamy, J.A. Ruud, E.D. Wachsman, Sens.
Actuators B158 (2011) 159–170.

18
[14] P. Song, Q. Wang, Z. Zhang, Z. Yang, Sens. Actuators B147 (2010) 248–254.
[15] K. Huang, H.Y. Lee, J.B. Goodenough, J. Electrochem. Soc. 145 (1998) 3220–3227.
[16] T.H. Shin, S. Ida, T. Ishihara, J. Am. Chem. Soc. 133 (2011) 19399–19407.
[17] M.-H. Hung, M.V.M. Rao, D.-S. Tsai, Mater. Chem. Phys. 101 (2007) 297–302.
[18] F. Bidrawn, S. Lee, J.M. Vohs, R.J. Gorte, J. Electrochem. Soc. 155 (2008) B660–
B665.
[19] J.W. Seo, E.E. Fullerton, F. Nolting, A. Scholl, J. Fompeyrine, J.-P. Locquet, J. Phys.
Condens. Matter 20 (2008) 264014.
[20] E. Traversa, P. Nunziante, M. Sakamoto, Y. Sadaoka, M.C. Carotta, G. Martinelli, J.
Mater. Res. 13 (1998) 1335−1344.
[21] G. Shabbir, A.H. Qureshi, K. Saeed, Mater. Lett. 60 (2006) 3706–3709.
[22] H. Xu, X. Hu, L. Zhang, Cryst. Growth Des. 8 (2008) 2061–2065.
[23] X. Li, H. Zhang, M. Zhao, S. Li, B. Xu, J. Mater. Chem. 2 (1992) 253–254.
[24] S. Li, L. Jing, W. Fu, L. Yang, B. Xin, H. Fu, Mater. Res. Bull. 42 (2007) 203–212.
[25] M.B. Bellakki, B.J. Kelly, V. Manivannan, J. Alloys Compd. 489 (2010) 64−71.
[26] T. Liu, Y. Xu, Mater. Chem. Phys. 129 (2011) 1047–1050.
[27] F.-T Li, Y. Liu, R.-H. Liu, Z.-M. Sun, D.-S. Zhao, C.-G. Kou, Mater. Lett. 64 (2010)
223–225.
[28] T. Arima and Y. Tokura, Phys. Rev. B48 (1993) 17006−17009.
[29] M. Sorescu, T. Xu, J.D. Burnett, J.A. Aitken, J. Mater. Sci. 46 (2011) 6709−6717.
[30] M. Popa, J.M. Calderon Moreno, J. Alloys Compd. 509 (2011) 4108−4116.
[31] J. Chandradass, Ki Hyeon Kim, Mater. Chem. Phys. 122 (2010) 329–332.
[32] S.N. Sahu, K.K.Nanda, PINSA A67 (2001) 103−130.
[33] E. Roduner, Chem. Soc. Rev. 35 (2006) 583–592.
19
[34] I. R. Shein, K. I. Shein, V. L. Kozhevnikov, A. L. Ivanovski, Phys. Solid State 47
(2005) 2082–2088
[35] Z. Yang, Z. Huang, L. Ye, X. Xie, Phys. Rev. B60 (1999) 15674−15682.
[36] R. Köferstein and S.G. Ebbinghaus, Solid State Ionics 231 (2013) 43–48.
[37] G.O. Müller, Quantitativ-anorganisches Praktikum, 7th ed., Harry Deutsch,
Franfurt/Main, 1992.
[38] E.-G. Jäger, K. Schöne, G. Werner, Elektrolytgleichgewichte und Elektrochemie
(Arbeitsbuch 5), 4th ed. VEB Deutscher Verlag für Grundstoffindustrie, Leipzig,
1989.
[39] V.D. Allred, S.R. Buxton, J.P. McBride, J. Phys. Chem. 61 (1957) 117−120.
[40] J. Nogues and I.K. Schuller, J. Magn. Magn. Mater. 192 (1999) 203−232.
[41] D.L. Leslie-Pelecky and R.L. Schalek, Phys. Rev. B59 (1999) 457−462.
[42] R.H. Kodama, S.A. Makhlouf, A.E. Berkowitz, Phys. Rev. Lett. 79 (1997) 1393−1396.
[43] R. Maiti, S. Basu, D. Chakravorty, J. Magn. Magn. Mater. 321 (2009) 3274−3277.
[44] L. Wu, C. Dong, H. Chen, J. Yao, C. Jiang, D. Xue, J. Am. Ceram. Soc. 95 (2012)
3922–3927.
[45] Z.M. Tian, S.L. Yuan, X.L. Wang, X.F. Zheng, S.Y. Yin, C.H. Wang, L. Liu, J. Appl.
Phys. 106 (2009) 103912.
[46] D. Wang and M. Gong, J. Appl. Phys. 109 (2011) 114304.
[47] H. Ahmadvand, H. Salamati, P. Kameli, A. Poddar, M. Acet, K. Zakeri, J. Phys. D:
Appl. Phys. 43 (2010) 245002.
[48] D. Paccard, C. Schlenker, O. Massenet, R. Montmory, A. Yelon, phys. stat. sol. 16
(1966) 301–311.
[49] C. Schlenker, S.S.P. Parkin, J.C. Scott, K. Howard, J. Magn. Magn. Mater. 54–57
(1986) 801–802.
20
[50] Z.M. Tian, S.L. Yuan, L. Liu, S.Y. Yin, L.C. Jia, P. Li, S.X. Huo, J. Q. Li, J. Phys. D:
Appl. Phys. 42 (2009) 035008.
[51] Q. K. Ong, X.-M. Lin, A. Wei, J. Phys. Chem. C115 (2011) 2665–2672.
[52] P. K. Manna, S.M. Yusuf, R. Shukla, A.K. Tyagi, Phys. Rev. B83 (2011) 184412.
[53] E.C. Passamani, B.R. Segatto, C. Larica, R. Cohen, J.M. Greneche, J. Magn. Magn.
Mater. 322 (2010) 3917–3925.
[54] J. Nogues, J. Sort, V. Langlais, V. Skumryev, S. Surinach, J.S. Munoz, M.D. Baro,
Phys. Rep. 422 (2005) 65–117.
[55] H. Shen, G. Cheng, A. Wu, J. Xu, J. Zhao, Phys. Status Solidi A206 (2009) 1420–
1424.
[56] N.T. Thuy and D.L. Minh, Adv. Mater. Sci. Eng. (2012) 380306.
[57] S. Chikazumi, Physics of Ferromagnetism, second ed., Oxford University Press Inc.,
New York, 1997, pp.151.
[58] M.B. Bellakki, V. Manivannan, C. Madhu, A. Sundaresan, Mater. Chem. Phys. 116
(2009) 599−602.
[59] P. Kubelka and F. Munk, Z. Techn. Phys. 11 (1931) 593−601.
[60] G. Kortüm and J. Vogel, Z. Phys. Chem. 18 (1958) 110−122.
[61] M. Nowak, B. Kauch, P. Szperlich, Rev. Sci. Instrum. 80 (2009) 046107.
[62] R. Lopez and R. Gomez, J. Sol-Gel Sci. Technol. 61 (2012) 1–7.
[63] S. Thirumalairajan, K. Girija, I. Ganesh, D. Mangalaraj, C. Viswanathan, A.
Balamurugan, N. Ponpandian, Chem. Eng. J. 209 (2012) 420–428.
[64] R. Köferstein, F. Yakuphanoglu, J. Alloys Compd. 506 (2010) 678−682.
[65] T.P McLean, in: A.F. Gibson (Ed.), Progress in Semiconductors, Vol. 5, 1960, pp.
55−102.
[66] O. Schevciw and W. B. White, Mater. Res. Bull. 18 (1983) 1059−1068.
[67] S.M. Sze, Physics of Semiconductor Devices, J. Wiley & Sons, 1969, p. 52.
Copyright © 2022 FDOKUMEN