Abstract Research shows that a variety of building types, sizes ...
33
This is a post-peer-review, pre-copyedit version of an article published in Urban Design International. The final authenticated version is available online at: https://doi.org/10.1057/s41289-018-0060-5. © The authors, UCL. Abstract Research shows that a variety of building types, sizes and street morphologies can support a diversified mix of uses and thus contribute to the vitality of town centres. Other studies have highlighted the special role of minority ethnic businesses in this context. This study set out to examine the relationship between spatial accessibility, commercial diversity (as a measure of land use mixing) and minority ethnic business (MEB) diversity in ten of London’s high streets. We found that streets with a significant MEB presence were more likely to benefit from commercial diversity and that the sampled MEB units were measurably smaller in size. We also found the location of larger clusters of MEB businesses to be more accessible, both locally and across the city. The study also found three distinct types of MEB centres: ranging from high streets with a small MEB presence, others with a high rate of MEB mixing, and a third type: the ‘ethnic marketplace’, with a singular ethnic character. We conclude that greater attention should be given to designing street accessibility, lot configuration, mixed building sizes, and land use mixing, in order to serve the long-term economic and social vitality of local town centres. Authors: 1. Laura Vaughan, [email protected], 020 3108 9042. Space Syntax Laboratory, Bartlett School of Architecture, University College London, London, WC1E 6BT. (Corresponding author). 2. Sadaf S Khan, [email protected] 3. Lusine Tarkhanyan, [email protected] 4. Ashley Dhanani, [email protected]
-
Upload
khangminh22 -
Category
Documents
-
view
4 -
download
0
Transcript of Abstract Research shows that a variety of building types, sizes ...

This is a post-peer-review, pre-copyedit version of an article published in Urban Design International. The final
authenticated version is available online at: https://doi.org/10.1057/s41289-018-0060-5. © The authors, UCL.
Abstract
Research shows that a variety of building types, sizes and street morphologies can support a
diversified mix of uses and thus contribute to the vitality of town centres. Other studies have
highlighted the special role of minority ethnic businesses in this context. This study set out to
examine the relationship between spatial accessibility, commercial diversity (as a measure of
land use mixing) and minority ethnic business (MEB) diversity in ten of London’s high streets.
We found that streets with a significant MEB presence were more likely to benefit from
commercial diversity and that the sampled MEB units were measurably smaller in size. We
also found the location of larger clusters of MEB businesses to be more accessible, both
locally and across the city. The study also found three distinct types of MEB centres: ranging
from high streets with a small MEB presence, others with a high rate of MEB mixing, and a
third type: the ‘ethnic marketplace’, with a singular ethnic character.
We conclude that greater attention should be given to designing street accessibility, lot
configuration, mixed building sizes, and land use mixing, in order to serve the long-term
economic and social vitality of local town centres.
Authors:
1. Laura Vaughan, [email protected], 020 3108 9042. Space Syntax Laboratory, Bartlett
School of Architecture, University College London, London, WC1E 6BT. (Corresponding
author).
2. Sadaf S Khan, [email protected]
3. Lusine Tarkhanyan, [email protected]
4. Ashley Dhanani, [email protected]

This is a post-peer-review, pre-copyedit version of an article published in Urban Design International. The
final authenticated version is available online at: https://doi.org/10.1057/s41289-018-0060-5. © The
authors, UCL.
Keywords
space syntax, land use diversity, minority ethnic businesses, London, built form
Introduction
The local high street (the ‘high street’ is the primary commercial street in UK parlance,
broadly equivalent to ‘main street’ in north America) is a multi-facetted and complex
entity. It has to overcome the potential conflict of it serving both as a link to other
places as well as place in which to remain (Jones et al, 2007). When designed well, local
high streets can provide a wide range of goods and services for large numbers of
people arriving on foot or by public transport. The importance of such places is not
only economic: they can provide a local centre of interaction for the surrounding area
in the form of a range of use types, from shops, banks and offices, through to schools
and community functions (Griffiths, et al, 2008). London’s high streets typically have a
historical physical fabric, are a place of social, cultural, and political exchange as well as
economic activity, functioning both as a movement corridor and means of
communication through the city. They are likely to have multiple uses and ownership
(Gort Scott and UCL Bartlett School of Planning, 2010). Older high streets constitute a
distinctive and complex built form structure that supports socio-economic adaptability
by virtue of their ability to support a variety of populations using a diverse mix of land
use functions. This land use diversity stems from built form diversity, namely a mix of
small and large buildings, ideally with a mix of tenures (Vaughan, 2015a; Törmä, et al,
2017). Successful high streets in the UK will typically have a combination of national
chains alongside independent, entrepreneurial activity. Smaller businesses will hold
measurable value for local communities in contrast with large scale developments as
they provide both opportunities to develop businesses, specialised services, but also a
“social economy of community and voluntary activity” (Dobson, 2016, p. 337). This brief
overview suggests that urban form has a tangible role to play in providing a social
space, as an information resource (see Penn et al., below), as an opportunity for work,
or as a site of “social connections and interactions” (Watson, 2009, p. 1578).
This is a post-peer-review, pre-copyedit version of an article published in Urban Design International. The
final authenticated version is available online at: https://doi.org/10.1057/s41289-018-0060-5. © The
authors, UCL.
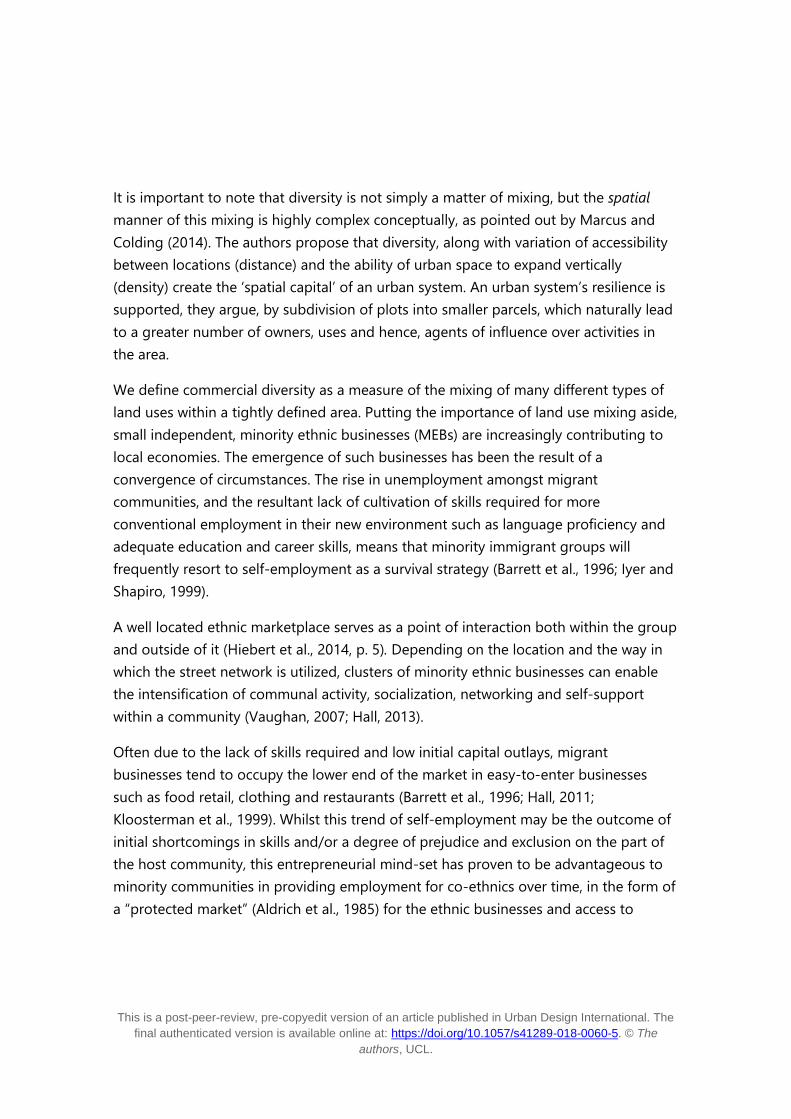
It is important to note that diversity is not simply a matter of mixing, but the spatial
manner of this mixing is highly complex conceptually, as pointed out by Marcus and
Colding (2014). The authors propose that diversity, along with variation of accessibility
between locations (distance) and the ability of urban space to expand vertically
(density) create the ‘spatial capital’ of an urban system. An urban system’s resilience is
supported, they argue, by subdivision of plots into smaller parcels, which naturally lead
to a greater number of owners, uses and hence, agents of influence over activities in
the area.
We define commercial diversity as a measure of the mixing of many different types of
land uses within a tightly defined area. Putting the importance of land use mixing aside,
small independent, minority ethnic businesses (MEBs) are increasingly contributing to
local economies. The emergence of such businesses has been the result of a
convergence of circumstances. The rise in unemployment amongst migrant
communities, and the resultant lack of cultivation of skills required for more
conventional employment in their new environment such as language proficiency and
adequate education and career skills, means that minority immigrant groups will
frequently resort to self-employment as a survival strategy (Barrett et al., 1996; Iyer and
Shapiro, 1999).
A well located ethnic marketplace serves as a point of interaction both within the group
and outside of it (Hiebert et al., 2014, p. 5). Depending on the location and the way in
which the street network is utilized, clusters of minority ethnic businesses can enable
the intensification of communal activity, socialization, networking and self-support
within a community (Vaughan, 2007; Hall, 2013).
Often due to the lack of skills required and low initial capital outlays, migrant
businesses tend to occupy the lower end of the market in easy-to-enter businesses
such as food retail, clothing and restaurants (Barrett et al., 1996; Hall, 2011;
Kloosterman et al., 1999). Whilst this trend of self-employment may be the outcome of
initial shortcomings in skills and/or a degree of prejudice and exclusion on the part of
the host community, this entrepreneurial mind-set has proven to be advantageous to
minority communities in providing employment for co-ethnics over time, in the form of
a “protected market” (Aldrich et al., 1985) for the ethnic businesses and access to

This is a post-peer-review, pre-copyedit version of an article published in Urban Design International. The
final authenticated version is available online at: https://doi.org/10.1057/s41289-018-0060-5. © The
authors, UCL.
speciality items such as food, clothing, music and entertainment to ethnic minority
groups who are looking to purchase products from home (Iyer and Shapiro, 1999).
MEB owners have been known to militate against financial risk by subdividing and
subletting space. This can result in adding diversity of land uses and creating
complementary services on one site (Hall, 2011), yet it is important to note that areas of
high ethnic diversity typically correspond to areas of deep deprivation. Given that
deprivation is often related to a lack of accessibility to resources such as jobs, it is
important to note research from Sweden which shows an association between spatial
segregation and fewer opportunities to engage with a wider social network, especially
for foreign-born people (Legeby, 2009). Whether this holds also for London is explored
here. In addition, a previous theoretical review has argued that the ethnic marketplace
is varied in its character (Vaughan, 2015b), ranging from the ‘Latino’ market of Wards
Corner in Seven Sisters and Southall Broadway, both of which draw people from their
immediate locality as well as from across the city to engage with their home culture; to
Walworth Road in south London, with its multiplicity of nationalities, serving as an
example of an emerging new phenomenon of the super-diverse landscape (Vertovec,
2006), where no single minority group stands out. This is one of several aspects of the
MEB which we investigate empirically here. In the following section we elaborate the
background to this study further.
Background to the case
London is a city where 179 nationalities are represented and 300 languages are spoken
(Knowles, 2013). It exhibits high levels of ethnic diversity, especially in inner London
boroughs (Paccoud, 2013). It has also been shown to be made up of a well-structured
network of town centres and sub-centres (Hillier, 1999) and, as indicated in the
introduction, there is an association between the longevity of a town centre, its land
use diversity and its spatial adaptability (see also Vaughan et al, 2017). It is for these
reasons that London was chosen as a focus for the study, which considered a sample of
ten high streets and their immediate environs. The streets were selected to obtain a
range of types defined by their residential ethnic composition, level of deprivation and
land use diversity.
This is a post-peer-review, pre-copyedit version of an article published in Urban Design International. The
final authenticated version is available online at: https://doi.org/10.1057/s41289-018-0060-5. © The
authors, UCL.
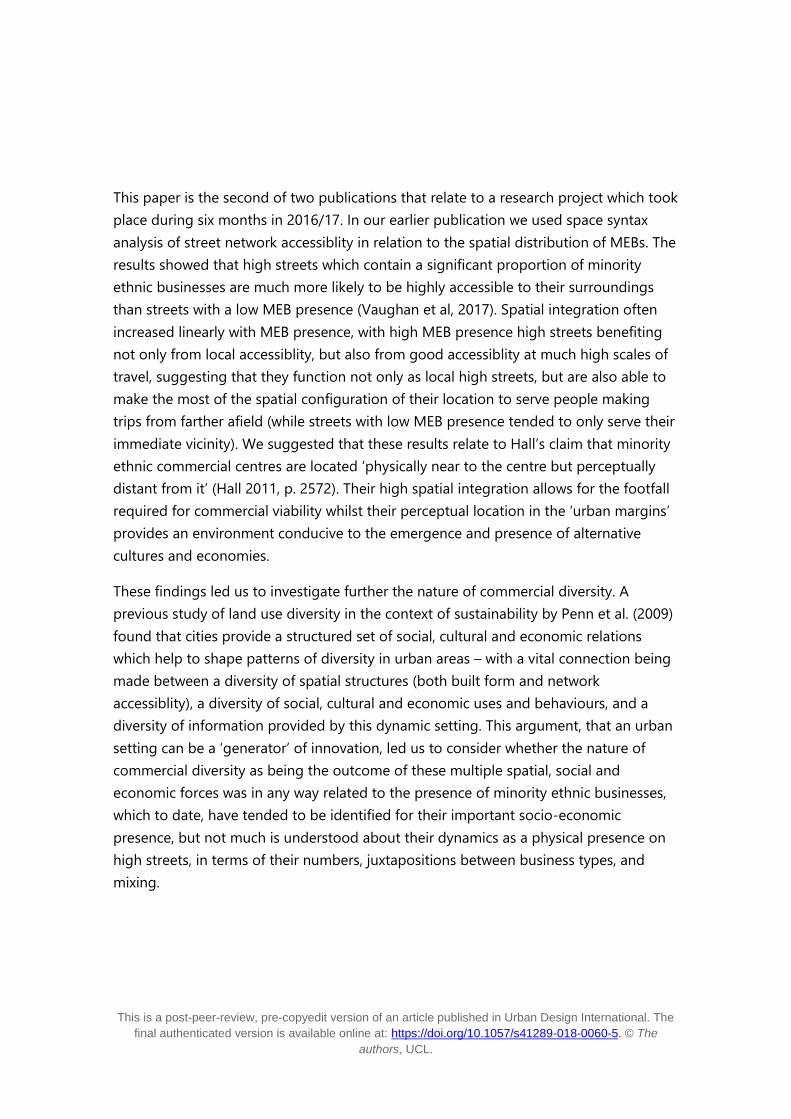
This paper is the second of two publications that relate to a research project which took
place during six months in 2016/17. In our earlier publication we used space syntax
analysis of street network accessiblity in relation to the spatial distribution of MEBs. The
results showed that high streets which contain a significant proportion of minority
ethnic businesses are much more likely to be highly accessible to their surroundings
than streets with a low MEB presence (Vaughan et al, 2017). Spatial integration often
increased linearly with MEB presence, with high MEB presence high streets benefiting
not only from local accessiblity, but also from good accessiblity at much high scales of
travel, suggesting that they function not only as local high streets, but are also able to
make the most of the spatial configuration of their location to serve people making
trips from farther afield (while streets with low MEB presence tended to only serve their
immediate vicinity). We suggested that these results relate to Hall’s claim that minority
ethnic commercial centres are located ‘physically near to the centre but perceptually
distant from it’ (Hall 2011, p. 2572). Their high spatial integration allows for the footfall
required for commercial viability whilst their perceptual location in the ‘urban margins’
provides an environment conducive to the emergence and presence of alternative
cultures and economies.
These findings led us to investigate further the nature of commercial diversity. A
previous study of land use diversity in the context of sustainability by Penn et al. (2009)
found that cities provide a structured set of social, cultural and economic relations
which help to shape patterns of diversity in urban areas – with a vital connection being
made between a diversity of spatial structures (both built form and network
accessiblity), a diversity of social, cultural and economic uses and behaviours, and a
diversity of information provided by this dynamic setting. This argument, that an urban
setting can be a ‘generator’ of innovation, led us to consider whether the nature of
commercial diversity as being the outcome of these multiple spatial, social and
economic forces was in any way related to the presence of minority ethnic businesses,
which to date, have tended to be identified for their important socio-economic
presence, but not much is understood about their dynamics as a physical presence on
high streets, in terms of their numbers, juxtapositions between business types, and
mixing.

This is a post-peer-review, pre-copyedit version of an article published in Urban Design International. The
final authenticated version is available online at: https://doi.org/10.1057/s41289-018-0060-5. © The
authors, UCL.
In contrast with conventional measures of high street success, which typically
look broadly at commercial diversity defined as the mix of retail and office
supply within a town centre (see e.g. BIS et al., 2011), here we were focused on
an urban design approach to land uses: seeing them not only as a source of
economic vitality, but wishing to consider the character of diversity as a socio-
spatial aspect of a high street in a socially diverse landscape. Rather than
looking at broad-brush categories of use (such as retail or communal), we
considered the finest grain of use type, country of origin of proprietor, the
building size and frontage and – importantly – where and in what arrangement
in relation to its neighbours it was positioned on the street. A diversity index for
land use type (business diversity) as well as ownership (MEB diversity, defined by
minority ethnic group) was constructed based on data gathered through direct
observation of each high street block in the case study areas. Diversity indices
are commonly used in ecological studies to measure the diversity of species in
an area, but there are increasing calls for a more precise definition – beyond
‘mixed use’ in urban design analysis. Authors such as Perdikogianni and Penn
(2006) have maintained the need to capture a more spatially detailed picture of
the lived experience of walking down a high street, claiming that “attention
needs to be paid to the location of uses and activities in relation to one another;
the nature of users and premises; the pattern of comings and goings; the mix
and balance of primary and other uses; the compatibility and synergy of uses;
the intensity, density, permeability and grain of development; and to detail such
as street layout and the ease of movement and density of footfall along routes”.
In other urban design related studies, especially in the field of health and place
research, this approach is very common (e.g. Frank et al, 2005; Sarkar, et al,
2013). In this study we used this approach to identify the composition of high
street blocks in terms of their land use types and MEBs. We explain the method
in more detail in the Analysis section.
The first hypothesis for this study is that high MEB presence and diversity has a
positive impact on the land-use mix in a local town centre. In other words, high streets
which contain a large number of minority ethnic businesses with a wide range of

This is a post-peer-review, pre-copyedit version of an article published in Urban Design International. The
final authenticated version is available online at: https://doi.org/10.1057/s41289-018-0060-5. © The
authors, UCL.
business types are likely to correspond to greater availability of a range of products and
service types within a given high street and that this will lead to adaptation of the built
form itself (by, for example, subdividing existing buildings).
Given that the literature is split between sources which show that MEB high streets
occur in areas of high deprivation due to the availability of a population more willing to
shop on foot, with other sources stating that this is an outcome of the presence of a
large captive minority ethnic residential population, we tested a second hypothesis,
that a high incidence of MEB businesses corresponds to a relatively deprived
population within walking distance (up to 2000m) from a high street.
This study therefore aimed to:
a) Document the number and mix of minority ethnic businesses (MEB) in local town
centres as well as the spatial character of their buildings and streets (namely,
hypothesis 1);
b) Explore the correspondence between the MEB character of each high street and high
rate of deprivation within the residential population in its vicinity (namely, hypothesis 2)
The following section details the study methods, after which we describe the results of
the analysis. The paper ends with a discussion of findings, drawing conclusions on how
a spatial reading of minority ethnic businesses can advance knowledge in the field of
urban design studies.
Methods
This section will describe the case study selection method, followed by the description
of the field observations of ethnic minority businesses across the high street and an
overall description of the case studies.

This is a post-peer-review, pre-copyedit version of an article published in Urban Design International. The
final authenticated version is available online at: https://doi.org/10.1057/s41289-018-0060-5. © The
authors, UCL.
Case study selection
In order to analyse the relationship between MEB presence and population diversity
and commercial diversity, a sample of local high streets was selected to represent a
cross-section of socially deprived/affluent and ethnically diverse/homogenous
residential neighbourhoods across London. The sample was chosen using the following
parameters:
- The index of multiple deprivation (IMD), using the last (2011) census data at the level
of Lower Layer Super Output Area (LSOA) geographical areas (each area contains
around 1000-1500 inhabitants).
- The eighteen categories of ethnicity as defined by the Office of National Statistics
(ONS) based on responses from the 2011 census that take into account multiple sub-
groups within five broad categories: ‘White’, ‘Asian’, ‘Black’, ‘Mixed’ and ‘Other’.
The resulting cases were then divided into four groups according to either high or low
deprivation and high or low socio-deprivation (filtering the top and bottom 20% of
both ethnic diversity and the index of multiple deprivation). The town centres were
further filtered by using land use diversity as the control variable, limiting the sample to
all centres within the top 30% of land use diversity, defined as follows:
- Land use classes were defined using data at the level of census Output Areas (OA), the
smallest level of area statistics available from the UK. These use thirteen categories [as
per the Town and Country (Uses Classes) Order 1987]: commercial general, commercial
agricultural, commercial industrial, commercial non-industrial, health and education,
leisure and tourism, retail, retail food, food and drink, transport and a miscellaneous
thirteenth category that includes land uses ranging from cash machines to waste
disposal.
The final stage was to vary the selection geographically. In total five town centres were
selected from inner London boroughs and five from outer London boroughs, with a
spread around the points of the compass, resulting in the following cases: North
Harrow in the north-west, Romford in the east, Southall to the west, Wimbledon Village
in the south-west and Burnt Oak in the north of the city. Inner London centres included
This is a post-peer-review, pre-copyedit version of an article published in Urban Design International. The
final authenticated version is available online at: https://doi.org/10.1057/s41289-018-0060-5. © The
authors, UCL.
St John’s Wood in the west, Bethnal Green to the east, Walworth Road in the south,
Putney in the south-west and Deptford in the south easterly quadrant of the city.
In order to arrive at an objective selection of cases, we used town centre boundaries to
find foci of retail and office activity across the sample. The boundaries are a UK national
measure of the highest office and retail activity in an area (Astbury and Thurstain-
Goodwin, 2014). Although they exclude industrial activity, this is a limitation that is of
lesser concern to this study’s focus on street-facing businesses.
Data gathering
Once centres had been selected, a researcher recorded all non-residential activity along
the high street within each centre. The extents of the high street were defined by
identifying the location of the peak levels of non-residential activity, constraining this to
length of the street situated between two major intersections that contained
morphologically similar buildings. The latter were typically a row of attached buildings
(namely, a terrace) with a predominance of commercial activity on the ground floor
with two stories above – and – normally a maximum of two lanes of traffic. The
researcher then surveyed all streets perpendicular to this section of the high street,
stopping where continuous commercial activity stemming from the main high street
ended (see example, Walworth Road, Peckham in Figure 1, which shows the extents of
the survey for one of the ten sampled case studies).

This is a post-peer-review, pre-copyedit version of an article published in Urban Design International. The
final authenticated version is available online at: https://doi.org/10.1057/s41289-018-0060-5. © The
authors, UCL.
Figure 1. Example of mapping of building data for the case of Walworth Road,
Peckham

This is a post-peer-review, pre-copyedit version of an article published in Urban Design International. The
final authenticated version is available online at: https://doi.org/10.1057/s41289-018-0060-5. © The
authors, UCL.
This process of documentation was undertaken using Google Street View correct for
2015 as the primary source of observational data collection along with on-site visits to
as many sites as practicable. These data were further supplemented by online sources
in order to confirm the nature of the business and validate the type of commercial
activity. We used All in London (http://www.allinlondon.co.uk) in all cases, and where
available, “hyperlocal” blogs such as Deptford Dame
(http://deptforddame.blogspot.co.uk) and East London Lines
(http://www.eastlondonlines.co.uk). The process of documentation recorded multiple
features, these included:
- the nature of the activity or business class – commercial general, commercial
agricultural, commercial industrial, commercial non-industrial, health and education,
leisure and tourism, retail, retail food, food and drink, transport.
- The floor or floors this activity was located on; i.e. ground, ground and first, first, etc.
- The name of the outlet
- The product(s) or services offered
- externally visible ethnic affiliation, e.g. Chinese takeaway, Turkish grocer, Afro-
Caribbean hairdresser discernible from visible shop signage on the exterior of the
outlet. This method follows the system used in a study of an area of south London (Hall
and Datta, 2010) and for an area of Athens (Vlachou and Vaughan, 2015).
- Whether the retailer was associated with a national chain (Tesco, Boots etc.), a smaller
local chain (e.g. local designers with limited outlets and local charity outlets), or was an
independent retailer.
- Whether space outside the commercial unit had been appropriated by the proprietor
in any way, e.g. for the display of goods or seating, which in turn reflects a degree of
interaction between the commercial unit and the public space (Kickert, 2016).
When recording on-site ethnicity, the intention was to record a more nuanced
conception of ethnic presence on the high street than those provided by ONS statistics
of residential population, which use broad groupings, such as a single group for
This is a post-peer-review, pre-copyedit version of an article published in Urban Design International. The
final authenticated version is available online at: https://doi.org/10.1057/s41289-018-0060-5. © The
authors, UCL.
'African'. Where available, the individual country of origin was recorded instead. This
process was carried out in a similar way to the work by O’Brien on place of birth of
residents, where a threshold of 8% of the total area population was used to determine
the presence of a minority community, whilst assuming a background majority of UK
British (O'Brien, 2016).1 Thus, if a retail unit was part of a national chain, ethnicity would
not be recorded, if it was an independent where the services or goods are aimed at a
particular ethnicity or ethnicities/religions, ethnicity would be recorded, and finally if it
was an independent where the ethnicity of the proprietor was identifiable yet the
services or goods offered are generic, ethnicity would not be recorded. Notably this
differs from methods in studies of MEB business people and networks, where the
background of the proprietor and their social/spatial relationship to the street would be
relevant (Hall, 2013). In this instance of a desk-based study, with a focus on MEBs as a
source of land use diversity, such data were deemed to be less relevant, though we do
not exclude the option of making such explorations in any follow-up to this study. The
researchers acknowledge that a certain level of detail may have been lost due to the
observation-based process of documentation, as certain outlets may have used generic
signage, whilst certain communities may intentionally seek to remain invisible in the
public domain – an invisibility that may be attributed to local racial hierarchies
(Knowles, 2013) – and hence not publicise their presence on the high street.
Summary statistics for the ten cases studied are presented in Table 1, which shows the
spatial characteristics of each of the cases as well as the socio-economic character of
their neighbourhood.
1 https://maps.cdrc.ac.uk/#/metrics/countryofbirth/default/BTTTFTT/10/-0.1500/51.5200/,
accessed on 24th May, 2016.

This is a post-peer-review, pre-copyedit version of an article published in Urban Design International. The
final authenticated version is available online at: https://doi.org/10.1057/s41289-018-0060-5. © The
authors, UCL.
Name Socio-economic category Length (m)
No. of Blocks
No. of units
Avg. unit area (m)
Deptford High Street High Deprivation-High Ethnic diversity
417 11 114 114.39
Watling Avenue, Burnt Oak High Deprivation-High Ethnic diversity
318 8 92 99.61
Putney High Street Low Deprivation-Low Ethnic diversity
673 11 136 158.14
Wimbledon Village High Street Low Deprivation-Low Ethnic diversity
496 14 109 112.50
Walworth Road High Deprivation-Low Ethnic Diversity
503 12 136 179.96
Bethnal Green Road High Deprivation-Low Ethnic Diversity
450 14 114 111.98
The Broadway, Southall High Deprivation-Low Ethnic Diversity
470 12 164 149.15
High Street, Romford High Deprivation-Low Ethnic Diversity
505 8 65 232.32
St. John’s Wood High Street Low Deprivation-High Ethnic Diversity
454 10 97 117.50
Station Road, North Harrow Low Deprivation-High Ethnic Diversity
404 11 83 140.17
Table 1. Case study spatial characteristics.
Analysis
Descriptive statistics
Of the 1,108 units recorded across ten cases, 266 or 24% of the total number of
recorded units were recorded as being visibly MEBs, namely with an externally visible
ethnic affiliation such as Polish butcher (see explanation in ‘Data Gathering’, above).
Further analysis of these businesses showed that MEBs seem to be of two types; those
that provide a generic service such as the shop selling cheap plastic household
products and luggage, the mobile phone and accessories store, the local internet cafe
and the other being those businesses supplying specifically ethnic products such as
clothing and fashion accessories, jewellery, hair and beauty services specific to a
particular community, money transfer and exchange services, ethnic food and other
services, such as legal advice for visa and immigration. This seems to be happening
within the background of general services such as banks, opticians or estate agents,
shoe repair and key cutting and retail outlets for national chain supermarkets.
This is a post-peer-review, pre-copyedit version of an article published in Urban Design International. The
final authenticated version is available online at: https://doi.org/10.1057/s41289-018-0060-5. © The
authors, UCL.
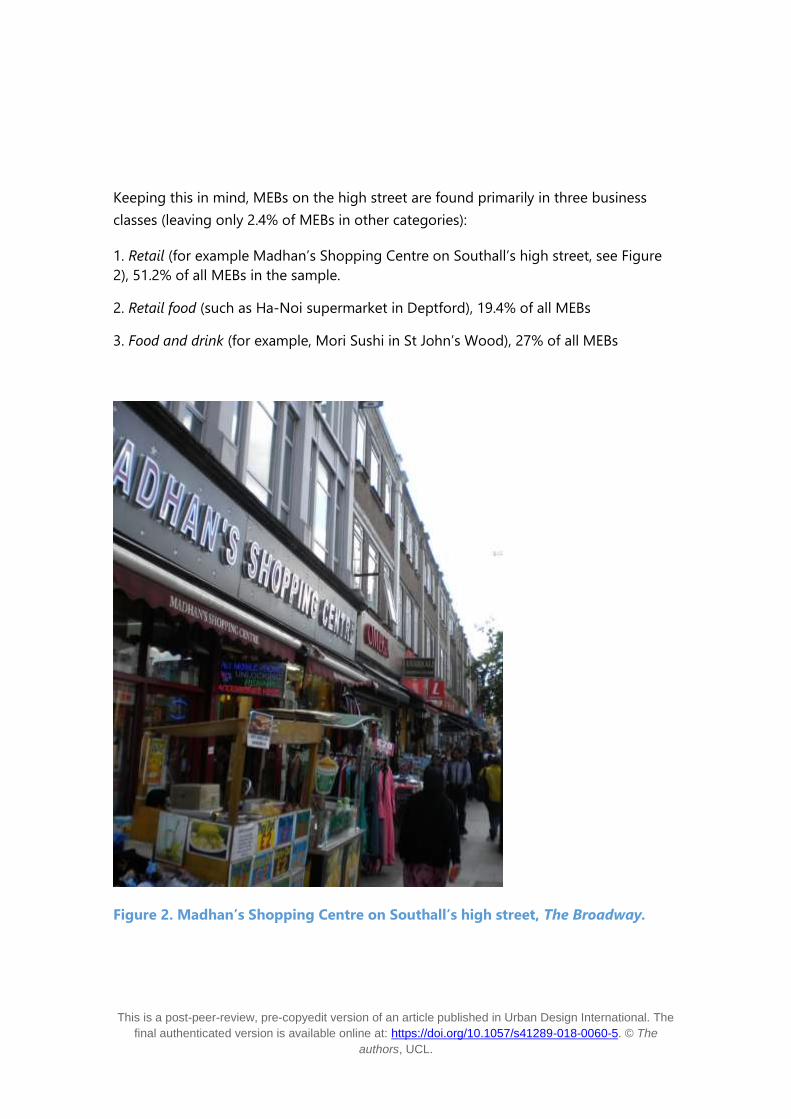
Keeping this in mind, MEBs on the high street are found primarily in three business
classes (leaving only 2.4% of MEBs in other categories):
1. Retail (for example Madhan’s Shopping Centre on Southall’s high street, see Figure
2), 51.2% of all MEBs in the sample.
2. Retail food (such as Ha-Noi supermarket in Deptford), 19.4% of all MEBs
3. Food and drink (for example, Mori Sushi in St John’s Wood), 27% of all MEBs
Figure 2. Madhan’s Shopping Centre on Southall’s high street, The Broadway.

This is a post-peer-review, pre-copyedit version of an article published in Urban Design International. The
final authenticated version is available online at: https://doi.org/10.1057/s41289-018-0060-5. © The
authors, UCL.
There were varying degrees of MEB concentration across the ten sites (see Figure 3,
which shows the overall percentage of MEB units from all units in each high street
studied). The percentages range from MEBs comprising over 50% of all units as is the
case on Southall’s Broadway, to just over 4% of all units in the case of St John’s Wood
High Street. Within this distribution it should be noted that North Harrow, Deptford
High Street, Burnt Oak and Southall all have over 25% of recorded units visually
identified as MEB. Three of the four latter cases were found to have a local population
with a high degree of ethnic diversity: North Harrow, Deptford and Burnt Oak. The
fourth, Southall, is predominantly South Asian with more than 50% visible MEB units;
• Locations with a high UK British presence, with a small presence of mainly food
and drink outlets or other small MEB businesses, ranging from 4% to 9.3% (St. John’s
Wood, Putney, Romford and Wimbledon Village);
• High ethnic mix of local residential communities (Walworth Road, North Harrow,
Deptford and Watling Avenue; though not Bethnal Green Road) with a paralleled
diversity of MEB functions, ranging from 14.7% to 31.5%;
• and the ‘ethnic marketplace’, where a single category of MEB businesses
dominate, as in Southall, with over 50% units, and a parallel high presence of people
from a South Asian background.

This is a post-peer-review, pre-copyedit version of an article published in Urban Design International. The
final authenticated version is available online at: https://doi.org/10.1057/s41289-018-0060-5. © The
authors, UCL.
Figure 3. Percentage of high street units that are MEBs.
Preliminary analysis using space syntax methods to measure how accessible each high
street was in relation to its surroundings found that high streets which contain a large
number of minority ethnic businesses benefit from being located on streets that are
central to their local neighbourhoods. This was particularly the case with high streets
which had a significant (20% or more) presence of MEB units. We found that on the
whole, high streets with a high MEB presence seem to be reasonably accessible at both
the local and the regional scale, more often than not located on significant
local/regional through routes of a locality (Vaughan et al, 2017). The findings support
the proposition that minority ethnic commercial centres tend to be located ‘physically
near to the centre but perceptually distant from it’ (Hall, 2011, p. 2572). This suggests
that their high spatial integration allows for the footfall required for commercial
viability whilst their perceptual location in the ‘urban margins’ provides an environment
conducive to the emergence and presence of alternative cultures and economies. This
is assessed further in the first section of the analysis, below.
This is a post-peer-review, pre-copyedit version of an article published in Urban Design International. The
final authenticated version is available online at: https://doi.org/10.1057/s41289-018-0060-5. © The
authors, UCL.
We also found that the average size of units containing MEB units was measurably
smaller (112 sq. metres compared with 149 sq. metres for non-MEB units). This was
supported by the fact that the largest areas appropriated by MEBs were in low
ethnically diverse and low deprivation areas such as Wimbledon Village High Street and
St. John’s Wood High Street. Unlike the more ethnically diverse centres, in these cases
they are mostly in the Restaurant and bar category. On the whole, the fact that ethnic
businesses are measurably smaller, particularly in areas of high deprivation, might give
rise to a greater diversity of activity and a greater presence of MEB units in areas where
access to a good mix of affordable goods and services is especially important to people
living in deprivation. This is assessed in the socio-economic exploration in the second
part of the analysis, below.
The impact of minority ethnic business diversity on the commercial diversity of a town centre
Building on the preliminary analysis described above, the following explores Hypothesis
1: that high MEB presence and diversity has a positive impact on the commercial
diversity of a local town centre. In order to test this hypothesis, a diversity index was
constructed based on data available for each high street block in the case study areas.
Diversity indexing is commonly used in ecological studies to measure the diversity of
species in a community. In this study we adopted this measure to identify the
composition of high street blocks in terms of their land use types and MEBs. Hence, for
every high street block, the land use diversity and MEB diversity were both calculated
using the Shannon-Wiener Diversity Index, which reflects how many species (or land
use types in this instance) there are within an area (a sampled high street block in this
instance). It measures the distribution such that a perfectly homogenous distribution of
activities along a given number of categories would have a maximum diversity. If there
is only one activity present, there is no diversity by this measure. For a full description
of the formula and its background, see Dhanani et al, 2017.
Higher scores of diversity are indicative of more and diverse land use (or MEB) presence
in the given block and a score closer to 0 indicates presence of a small number of land
use types (i.e. a single building with one land use type within a block face) or in the
case of MEB, a block face where no MEB business is present. As an example consider
This is a post-peer-review, pre-copyedit version of an article published in Urban Design International. The
final authenticated version is available online at: https://doi.org/10.1057/s41289-018-0060-5. © The
authors, UCL.
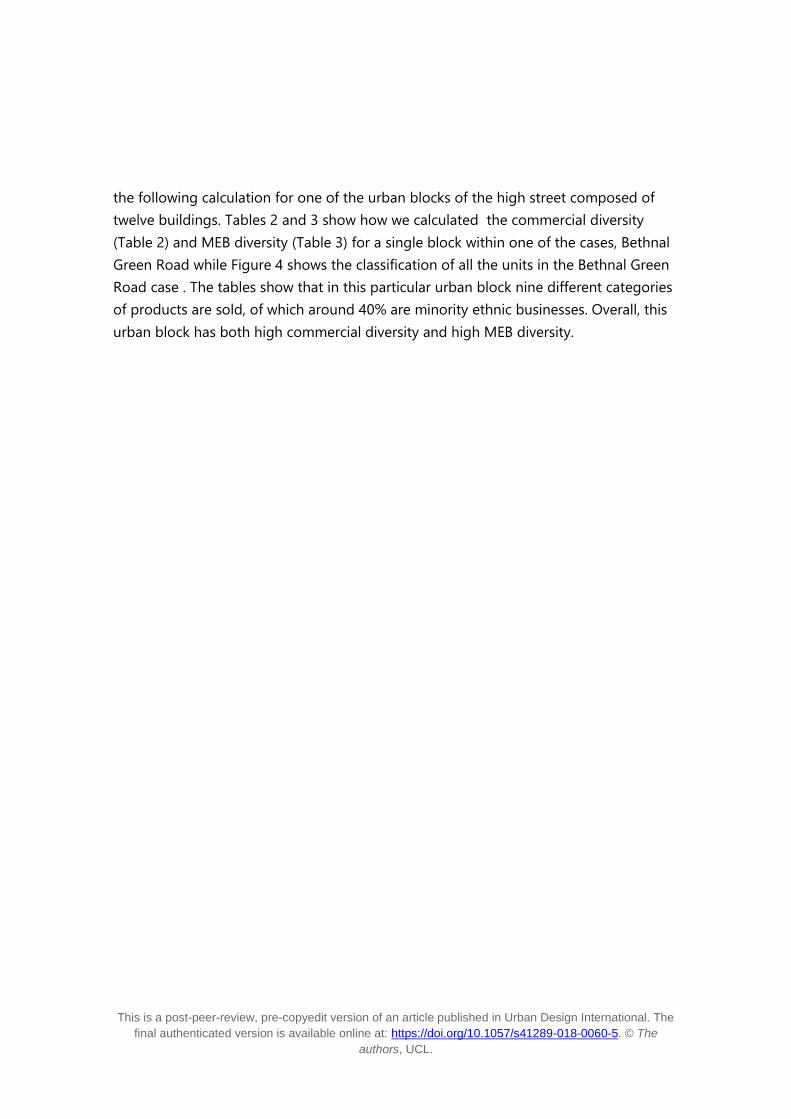
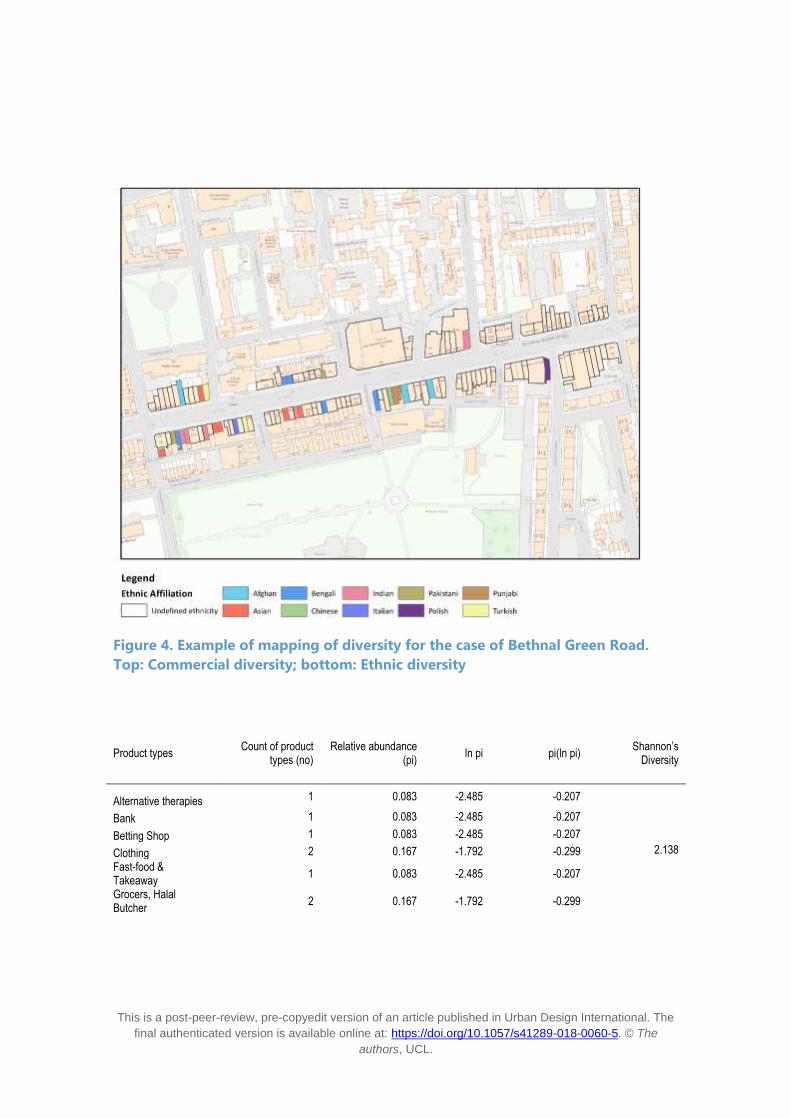
the following calculation for one of the urban blocks of the high street composed of
twelve buildings. Tables 2 and 3 show how we calculated the commercial diversity
(Table 2) and MEB diversity (Table 3) for a single block within one of the cases, Bethnal
Green Road while Figure 4 shows the classification of all the units in the Bethnal Green
Road case . The tables show that in this particular urban block nine different categories
of products are sold, of which around 40% are minority ethnic businesses. Overall, this
urban block has both high commercial diversity and high MEB diversity.

This is a post-peer-review, pre-copyedit version of an article published in Urban Design International. The
final authenticated version is available online at: https://doi.org/10.1057/s41289-018-0060-5. © The
authors, UCL.
This is a post-peer-review, pre-copyedit version of an article published in Urban Design International. The
final authenticated version is available online at: https://doi.org/10.1057/s41289-018-0060-5. © The
authors, UCL.
Figure 4. Example of mapping of diversity for the case of Bethnal Green Road.
Top: Commercial diversity; bottom: Ethnic diversity
Product types Count of product
types (no) Relative abundance
(pi) ln pi pi(ln pi)
Shannon’s Diversity
Alternative therapies 1 0.083 -2.485 -0.207
2.138
Bank 1 0.083 -2.485 -0.207
Betting Shop 1 0.083 -2.485 -0.207
Clothing 2 0.167 -1.792 -0.299
Fast-food & Takeaway
1 0.083 -2.485 -0.207
Grocers, Halal Butcher
2 0.167 -1.792 -0.299
This is a post-peer-review, pre-copyedit version of an article published in Urban Design International. The
final authenticated version is available online at: https://doi.org/10.1057/s41289-018-0060-5. © The
authors, UCL.
Household 1 0.083 -2.485 -0.207
Mobile phones and accessories
2 0.167 -1.792 -0.299
Printing 1 0.083 -2.485 -0.207
Total 12 - - -
Table 2. Example of diversity calculation of land uses for a single urban block on
the high street.
Ethnicity Count of ethnicity
types (no) Relative abundance
(pi) ln pi pi(ln pi) Shannon’s Diversity
Afghan 2 0.167 -1.792 -0.299
1.234
Bengali 1 0.083 -2.485 -0.207
Chinese 1 0.083 -2.485 -0.207
Undefined ethnicity 7 0.583 -0.539 -0.314
Punjabi 1 0.083 -2.485 -0.207
Total 12 - - -
Table 3. Example of diversity calculation of minority ethnic land uses for a single
urban block on the high street.
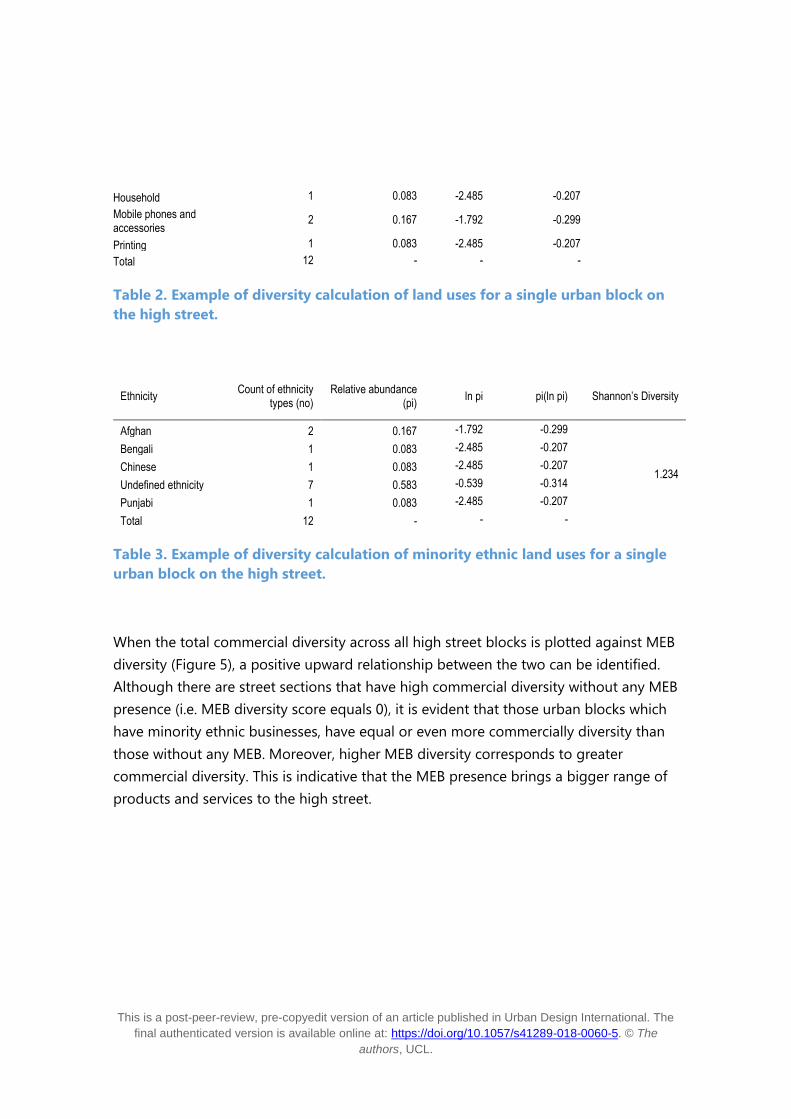
When the total commercial diversity across all high street blocks is plotted against MEB
diversity (Figure 5), a positive upward relationship between the two can be identified.
Although there are street sections that have high commercial diversity without any MEB
presence (i.e. MEB diversity score equals 0), it is evident that those urban blocks which
have minority ethnic businesses, have equal or even more commercially diversity than
those without any MEB. Moreover, higher MEB diversity corresponds to greater
commercial diversity. This is indicative that the MEB presence brings a bigger range of
products and services to the high street.
This is a post-peer-review, pre-copyedit version of an article published in Urban Design International. The
final authenticated version is available online at: https://doi.org/10.1057/s41289-018-0060-5. © The
authors, UCL.
Figure 5. A plot of commercial diversity against MEB diversity for urban blocks on
the high street.
We then used a regression model to establish whether there is a statistical relationship
between MEB diversity and commercial diversity. Here the dependent variable was the
commercial diversity calculated at block level and the independent or predictive
variable was the MEB diversity. Given the spatial nature of the data, spatial regression
was used for statistical purposes, namely an equation which takes account of the spatial
interaction expressed as a distance between street blocks, where blocks closer to each
other could potentially be more similar in their composition than the ones further apart
from each other. The results showed a strong positive statistical evidence in favour of

This is a post-peer-review, pre-copyedit version of an article published in Urban Design International. The
final authenticated version is available online at: https://doi.org/10.1057/s41289-018-0060-5. © The
authors, UCL.
Hypothesis 1.2 This signifies that the presence of minority ethnic businesses positively
affects the commercial diversity along a high street; moreover, more MEB diversity
brings more commercial diversity to the area. Importantly, this calculation takes
account of proximity between use types within a block, so considers clustering of types.
The implications of this result will be discussed below.
The relationship between minority ethnic business diversity in a town centre and the amount of
deprivation of the population in its vicinity
The following section explores the hypothesis that a high instance of MEB businesses
corresponds to a relatively deprived population within walking distance (up to 2000m)
from a high street.
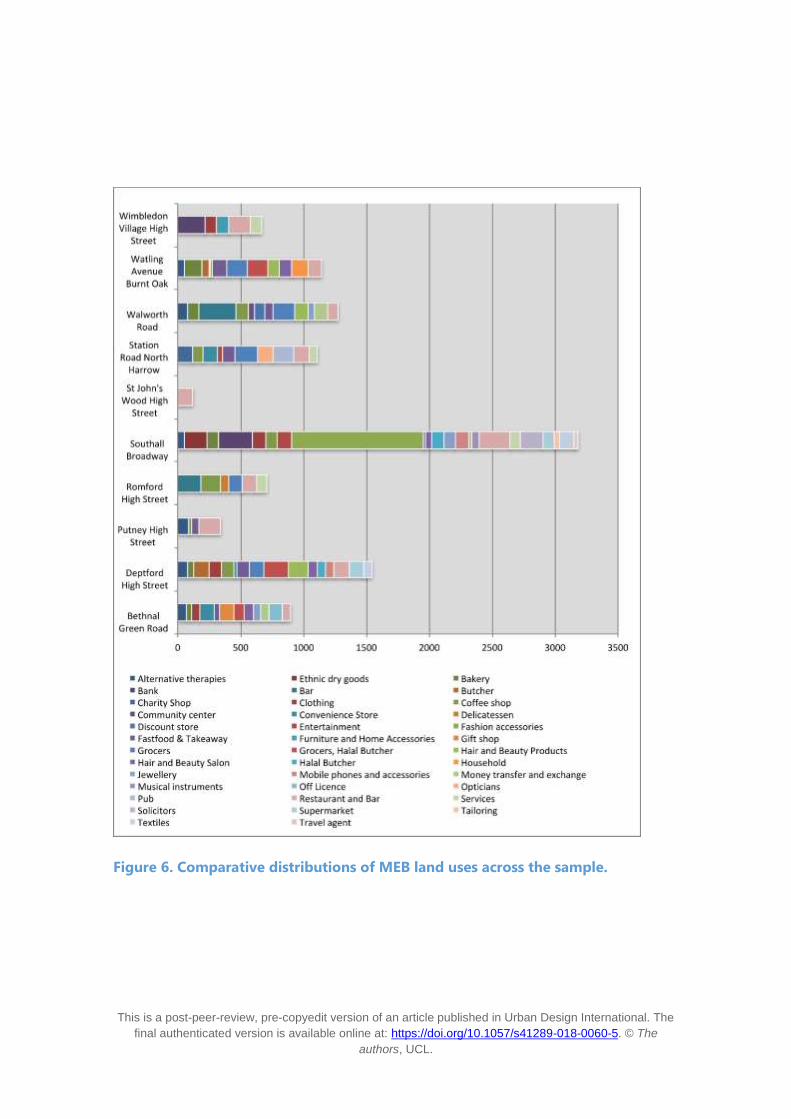
As stated earlier in this paper, MEBs are to be found primarily in three land use classes:
Retail, Retail Food and Food and Drink. A more detailed unpacking of where MEBs are
clustering within these broad classes can be found in Figure 6, which shows the
frequency distribution of 67 land use types across the 10 case studies. It shows that
first, MEBs are to be found in only 38 of the 67 sub-classes found across the cases. It
also shows that in contrast with the national chains stores commonly found on UK high
streets, such as betting shops, banks, estate agents, hardware stores or charity shops,
most MEBs are in sub-classes that are not otherwise occupied by chain or franchise
retailers – either offering niche goods (such as halal butchers) or niche services (such as
African hairdressers). The fact that minority ethnic businesses tend not to be chain
outlets is suggestive of an approach to MEB ownership that prefers to find – or create –
niche markets, rather than to compete with the mainstream.
2 In the regression model estimation for hypothesis N1, the dependent variable is commercial
diversity and the unit of analysis is urban blocks).). Here the intercept is 1.02, which indicates
that on average every urban block has 1.02 units of commercial diversity with the added
contribution of 0.13 for every unit increase in MEB diversity. Sample size n= 1,108; p<.001.
This is a post-peer-review, pre-copyedit version of an article published in Urban Design International. The
final authenticated version is available online at: https://doi.org/10.1057/s41289-018-0060-5. © The
authors, UCL.
Figure 6. Comparative distributions of MEB land uses across the sample.
This is a post-peer-review, pre-copyedit version of an article published in Urban Design International. The
final authenticated version is available online at: https://doi.org/10.1057/s41289-018-0060-5. © The
authors, UCL.
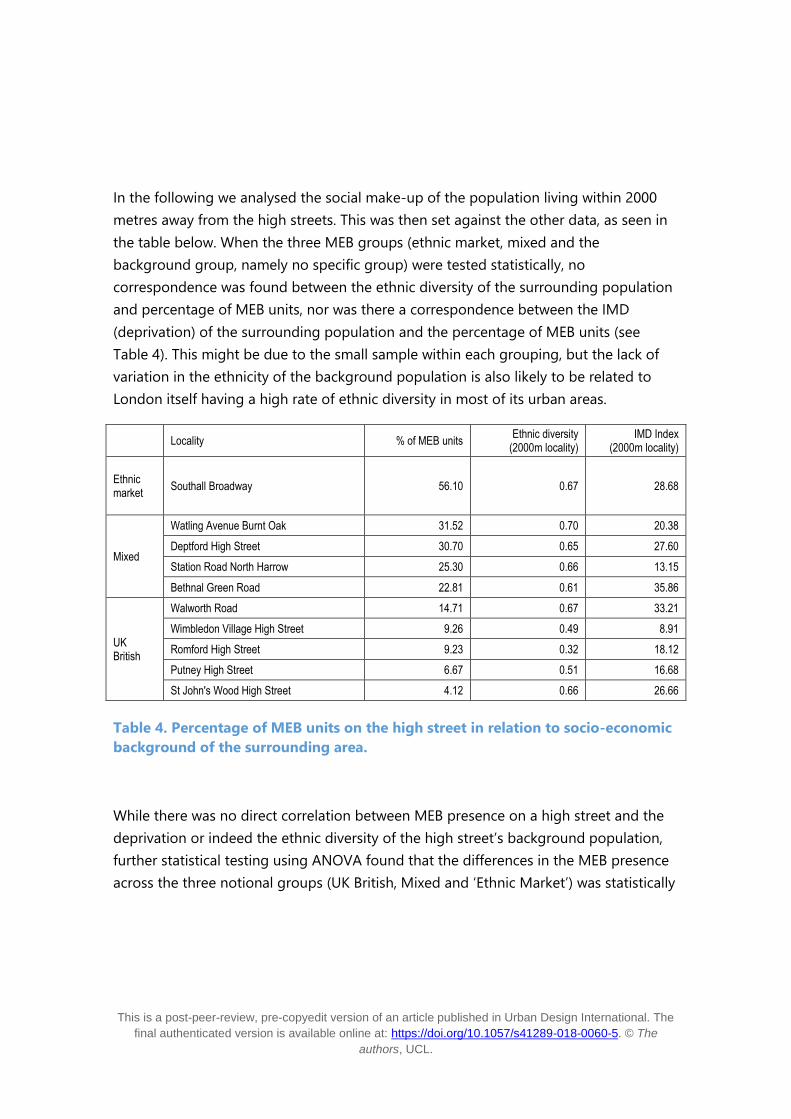
In the following we analysed the social make-up of the population living within 2000
metres away from the high streets. This was then set against the other data, as seen in
the table below. When the three MEB groups (ethnic market, mixed and the
background group, namely no specific group) were tested statistically, no
correspondence was found between the ethnic diversity of the surrounding population
and percentage of MEB units, nor was there a correspondence between the IMD
(deprivation) of the surrounding population and the percentage of MEB units (see
Table 4). This might be due to the small sample within each grouping, but the lack of
variation in the ethnicity of the background population is also likely to be related to
London itself having a high rate of ethnic diversity in most of its urban areas.
Locality % of MEB units
Ethnic diversity (2000m locality)
IMD Index (2000m locality)
Ethnic market
Southall Broadway 56.10 0.67 28.68
Mixed
Watling Avenue Burnt Oak 31.52 0.70 20.38
Deptford High Street 30.70 0.65 27.60
Station Road North Harrow 25.30 0.66 13.15
Bethnal Green Road 22.81 0.61 35.86
UK British
Walworth Road 14.71 0.67 33.21
Wimbledon Village High Street 9.26 0.49 8.91
Romford High Street 9.23 0.32 18.12
Putney High Street 6.67 0.51 16.68
St John's Wood High Street 4.12 0.66 26.66
Table 4. Percentage of MEB units on the high street in relation to socio-economic
background of the surrounding area.
While there was no direct correlation between MEB presence on a high street and the
deprivation or indeed the ethnic diversity of the high street’s background population,
further statistical testing using ANOVA found that the differences in the MEB presence
across the three notional groups (UK British, Mixed and ‘Ethnic Market’) was statistically
This is a post-peer-review, pre-copyedit version of an article published in Urban Design International. The
final authenticated version is available online at: https://doi.org/10.1057/s41289-018-0060-5. © The
authors, UCL.
significant.3 This shows that the groups are dissimilar in their composition of MEB units,
supporting the proposition made elsewhere that there are in fact three distinct types of
ethnic marketplaces (Vaughan, 2015b), ranging from a small-scale presence on an
otherwise mainstream high street, to the type of high street typified by Southall
Broadway, that not only serves its local South Asian population, but attracts Londoners
from across the city. The ‘ethnic marketplace’, we argue, provides a form of
engagement with a person’s home culture at critical points in their daily life, allowing
people to maintain a hybrid identity (such as Asian British).
The need to consider identity when analysing the urban morphology of minority ethnic
business is not trivial. In a detailed study by Nasser (2004) of Southall’s morphological
and socio-economic evolution, the author found that Southall’s high street has evolved
from being a prosaic suburban commercial centre, with Victorian and Edwardian
buildings, into a distinct kaleidoscope (‘Kaleido-scape’) of purpose-built buildings and
organisations which support a multiplicity of identities for which a simple labelling as
‘South Asian’ might be viewed as somewhat reductive. Importantly, Nasser shows how
the shop fronts highlight this variety, with business names and language scripts ranging
from English, Punjabi, Arabic to Urdu (op cit., p. 97), creating a ‘new hybrid urban
morphology that combines local vernaculars with global (or imported) elements (op cit.
p., 100).
Another notable point for Southall is that charity shops are often seen as indicators of
decline. While 25 units were identified across the 10 cases, they varied in their
character. In the case of Bethnal Green Road, the single charity shop serves a local
cause, the Spitalfields Crypt Trust, as opposed to the national charity shops found in
other areas. The absence of charity shops in areas with high South Asian
presence/faith-based communities may have to do with the fact that such services are
often managed by the local mosque, temple or gurdwara. Another interesting feature
that comes to light is low deprivation areas like Putney High Street and Wimbledon
Village High Street house are more likely to contain national charities like Cancer
Research UK, Oxfam and the British Heart Foundation; more local charities seem to set
3 F(1,7))=47.741, p=.001

This is a post-peer-review, pre-copyedit version of an article published in Urban Design International. The
final authenticated version is available online at: https://doi.org/10.1057/s41289-018-0060-5. © The
authors, UCL.
up shop on high streets in high deprivation areas like the aforementioned Spitalfields
Crypt Trust on Bethnal Green Road, the Deptford Action Group for the Elderly on
Deptford High Street, and the Trinity Hospice on Walworth Road.
Another aspect of deprivation was found when analysing the location of money
exchange/transfer outlets. We found that most units identified in the sample areas
shared space with other services, ranging from internet cafes to mobile phone
accessories, to hair and beauty salons, to garments. Interestingly, the highest
concentration of money exchange/transfer facilities were to be found in areas that are
classified as low ethnic diversity but where the dominant ethnic presence was that of
communities that would otherwise be perceived as an ethnic minority, with six units to
be found in both Southall (Asian/Indian) and Walworth Road (Black/African).
Discussion and conclusions
Suzanne Hall’s research into ethnicity and retail practices in minority ethnic high streets
has suggested that there is a need for specific forms of planning to support the growth
of small, independent shops and local high streets (Hall, 2011, 2013). She has also
demonstrated that there are specific practices by small shopkeepers that allow them to
operate in areas of high deprivation and to compete with national companies. This
paper has taken her approach to fine-grained social research into retail practices and
applied similarly fine-grained spatial research to explore the character of MEB high
streets. It has shown that, of the 1,108 units recorded across ten cases, 266 or 24% of
the total number of recorded units were visibly MEBs. We have found evidence to
support Hypothesis 1: there is a strong correlation between MEB diversity and
commercial diversity, which is a measure of the economic vitality that MEB businesses
can bring to a town centres. We also found that the size of MEB business units was
measurably smaller than non-MEB units, suggesting that the morphology of the built
environment can itself support a diversity of land uses, as another study of smaller
suburban town centres has found (Vaughan, 2015a).
The analysis did not find evidence to support a correspondence between MEB diversity
and the amount of deprivation in the background population (Hypothesis 2).

This is a post-peer-review, pre-copyedit version of an article published in Urban Design International. The
final authenticated version is available online at: https://doi.org/10.1057/s41289-018-0060-5. © The
authors, UCL.
Nevertheless, the residential population living around the cases selected exhibits the
full spectrum of varying ethnic diversity to be found in London’s residential
neighbourhoods: at one end of the spectrum low ethnic diversity in an area implies
high UK British presence, the spectrum then shifts to incorporate areas that exhibit a
high ethnic mix of communities, and finally there appears to be a third category,
comprising mono-ethnic areas where the ethnic diversity of the area may be low but
the dominant background presence is that of a minority ethnic community. These
findings are further supported by the percentage of MEB units to be found in these
areas, where Southall’s background South Asian population is served by what may be
considered an ‘ethnic market’ where over 50% of commercial units recorded were
MEBs, whilst Putney, Romford and Wimbledon Village High Street occupy the other
end of the spectrum with less than 10% of commercial units recorded as MEBs.
The analysis has also shown that MEBs are to be found primarily in three land use
classes – Retail, Retail Food and Food and Drink. It was seen that in affluent areas with
low neighbourhood ethnic diversity such as Wimbledon Village and Putney, the
distribution of MEBs across these three categories was skewed in favour of the Food
and Drink class with limited or no MEB presence in the Retail Food class. Where
neighbourhood ethnic diversity was higher, there was a greater MEB presence in both
the Retail and Retail Food class. This finding seems to indicate two things: first, that
where there is an embedded minority ethnic neighbourhood presence there is a more
diverse MEB presence and second, that there is an association (but not a strong
correlation) between both minority ethnic neighbourhood presence, MEB presence on
the high street, and deprivation.
As mentioned above, minority ethnic businesses are likely to occupy smaller units in
comparison to non-MEB units. The analysis testing the association between MEB
diversity and general commercial diversity found that the former encourages the latter.
There is also a greater diversity of products within the areas of high deprivation. This
may be to the benefit of a poorer population; not only in providing cheaper goods, but
more different sorts of goods and services within reach on foot – as well as more
opportunities for local employment. Taking all this into account, we argue that the
morphological structure of the high street blocks can create an opportunity for
commercial diversity. Indeed, the analysis of background deprivation strengthens the
This is a post-peer-review, pre-copyedit version of an article published in Urban Design International. The
final authenticated version is available online at: https://doi.org/10.1057/s41289-018-0060-5. © The
authors, UCL.
argument that commercial diversity is a factor that can support people living in
deprivation, from whatever ethnic background.
Finally, this study’s results show that a relatively small number of units can have a
significant effect on the composition of the high street and can contribute to its long-
term sustainability. This conclusion is supported by studies done in the US and
Australian contexts, which have found that street width and continuity, lot configuration
within the block, building size, and land use mixing can contribute to the longevity of a
town centre (see e.g. Scheer and Ferdelman, 2001, p. 20). Putting all the evidence
together, we conclude that minority ethnic high streets have measurable spatial
characteristics that stem from their location in particularly accessible locations within
the street network, in buildings that lend themselves to adaptation and in frontages
that are amenable to a wide variety of activities to take place within close proximity. We
have evidence to show that minority ethnic business high streets provide many of the
features of sustainability highlighted by Penn and colleagues (2009) cited at the start of
this paper: a greater diversity of uses that provides for greater opportunities for social
and informational exchange that is to the benefit of both the business owners and their
customers.
Emily Talen has quoted Peter Hall’s observation that the most potent manifestations of
non-diversity are problems that, “almost unbelievably”, city planning has not been
called upon to answer (Hall, 2002, cited in Talen, 2010). We would argue in a similar
vein that urban planning and design have a role to play in sustaining examples of
positive socio-economic diversity that is too easily dismissed as the uncongenial
outcome of a lack of investment, when the reality is that it can be a sign of a highly
dynamic instance of urban sustainability.
Limitations
This study has relied primarily on quantitative analysis and has focused on a sample of
high streets in London which may not be representative of cities elsewhere in the UK,
not only because of the UK capital’s size, but also because of its character of high
ethnic diversity, withpockets of high deprivation situated alongside high prosperity.
This is a post-peer-review, pre-copyedit version of an article published in Urban Design International. The
final authenticated version is available online at: https://doi.org/10.1057/s41289-018-0060-5. © The
authors, UCL.
Nevertheless, we have provided evidence for the importance of the minority ethnic
business both for the economic infrastructure of an area, but also in providing less
tangible benefits, such as sources of information or support for a population living in
deprivation.
Acknowledgement
This paper was produced with funding from the Street Mobility and Network
Accessibility research project, which was supported by the UK Engineering and Physical
Sciences Research Council (EPSRC), Economic and Social Research Council (ESRC), and
Arts and Humanities Research Council (AHRC) [grant number EP/K037323/1].
References:
Aldrich H., Cater J., Jones T., Evoy D. M., and Velleman P. (1985) Ethnic Residential
Concentration and the Protected Market Hypothesis, Social Forces, 63, 996-1009
Astbury G., and Thurstain-Goodwin M. (2014) Measuring the Impact of Out-of-Town
Retail Development on Town Centre Retail Property in England and Wales, Applied
Spatial Analysis and Policy, 7, 301-316
Barrett G. A., Jones T. P., and McEvoy D. (1996) Ethnic Minority Business: Theoretical
Discourse in Britain and North America, Urban Studies, 33, 783-809
Department for Business Innovation and Skills, Genecon LLP and Partners, and Urban
Pollinators (2011) Understanding High Street Performance. BIS, London
Dhanani A., Tarkhanyan L., and Vaughan L. (2017) Estimating Pedestrian Demand for
Active Transport Evaluation and Planning, Transportation Research Part A: Policy and
Practice, 103, 54-69
Dobson J. (2016) Rethinking Town Centre Economies: Beyond the ‘Place or People’
Binary, Local Economy, 31, 335-343
This is a post-peer-review, pre-copyedit version of an article published in Urban Design International. The
final authenticated version is available online at: https://doi.org/10.1057/s41289-018-0060-5. © The
authors, UCL.
Frank L. D., Schmid T. L., Sallis J. F., Chapman J., and Saelens B. E. (2005) Linking
Objectively Measured Physical Activity with Objectively Measured Urban Form -
Findings from Smartraq, American Journal of Preventive Medicine, 28: 117-125.
Gort Scott, and UCL Bartlett School of Planning (2010) High Street London. Design for
London, Greater London Authority, London, London
Griffiths S., Vaughan L., Haklay M., and Jones C. E. (2008) The Sustainable Suburban
High Street: Themes and Approaches, Geography Compass, 2, 1155-1188
Hall P. (2002) Cities of Tomorrow: An Intellectual History of Urban Planning and Design
in the Twentieth Century, 3rd Edn. Oxford: Blackwell
Hall S. M., and Datta A. (2010) The Translocal Street: Shop Signs and Local Multi-Culture
Along the Walworth Road, South London, City, Culture and Society, 1, 69-77
Hall S. M. (2011) High Street Adaptations: Ethnicity, Independent Retail Practices, and
Localism in London's Urban Margins, Environment and Planning A, 43, 2571-2588
Hall S. M. (2013) Super-Diverse Street: A ‘Trans-Ethnography’ across Migrant Localities,
Ethnic and Racial Studies, 38, 1-14
Hiebert D., Rath J., and Vertovec S. (2014) Urban Markets and Diversity: Towards a
Research Agenda, Ethnic and Racial Studies, 38, 5-21
Hillier B. (1999) Centrality as a Process: Accounting for Attraction Inequalities in
Deformed Grids, Urban Design International, 4, 107-127.
Iyer G. R., and Shapiro J. M. (1999) Ethnic Entrepreneurial and Marketing Systems:
Implications for the Global Economy, Journal of International Marketing, 7, 83-110
Jones P., Roberts M., and Morris L. (2007) Rediscovering Mixed-Use Streets: The
Contribution of Local High Streets to Sustainable Communities. Joseph Rowntree
Foundation & Polity Press, London
Kickert C. C. (2016) Active Centers–Interactive Edges: The Rise and Fall of Ground Floor
Frontages, Urban Design International, 21, 55-77

This is a post-peer-review, pre-copyedit version of an article published in Urban Design International. The
final authenticated version is available online at: https://doi.org/10.1057/s41289-018-0060-5. © The
authors, UCL.
Kloosterman R., Van der Leun J., and Rath J. (1999) Mixed Embeddedness:(in) Formal
Economic Activities and Immigrant Businesses in the Netherlands, International journal
of Urban and Regional Research, 23, 252-266
Knowles C. (2013) Nigerian London: Re-Mapping Space and Ethnicity in Superdiverse
Cities, Ethnic and Racial Studies, 36, 651-669
Legeby A. (2010) From Housing Segregation to Integration in Public Space: A Space
Syntax Approach Applied on the City of Södertälje, The Journal of Space Syntax, 1, 92-
107
Marcus L., and Colding J. (2014) Toward an Integrated Theory of Spatial Morphology
and Resilient Urban Systems, Ecology and Society, 19,
Nasser N. (2004) Southall's Kaleido-Scape: A Study in the Changing Morphology of a
West London Suburb, Built Environment, 30, 76-103
O'Brien O. (2016) A Map of Country of Birth across the UK. Retrieved on 5th July/16
2016 from: http://oobrien.com/2016/05/countryofbirth/.
Paccoud A. (2013) Country of Birth in the 2011 Census: Local Authorities and London’s
Extended Metropolitan Region. LSE Cities Working Paper London
Penn A., Perdikogianni I., and Mottram C. (2009) Chapter 11: The Generation of
Diversity, in: Cooper R., Evans G. and Boyko C. eds Designing Sustainable Cities:
Decision-Making Tools and Resources for Design. Wiley Blackwell: Chichester 219-237
Perdikogianni I., and Penn A. (2006) Is Urban Diversity Synonymous with Urban
Sustainability? What Do People “Suggest” for Clerkenwell in London? 2006 Annual
General Conference of the Canadian Society for Civil Engineering, Calgary, Canada
Sarkar C., Gallacher J., and Webster C. 2013. Built Environment Configuration and
Change in Body Mass Index: The Caerphilly Prospective Study (CaPS), Health &
Place 19: 33-44.
Scheer B. C., and Ferdelman D. (2001) Inner-City Destruction and Survival: The Case of
over-the-Rhine, Cincinnati, Urban Morphology, 5, 15-28

This is a post-peer-review, pre-copyedit version of an article published in Urban Design International. The
final authenticated version is available online at: https://doi.org/10.1057/s41289-018-0060-5. © The
authors, UCL.
Talen E. (2010) The Context of Diversity: A Study of Six Chicago Neighbourhoods, Urban
Studies, 47, 486-513
Törmä I., Griffiths S., and Vaughan L. (2017) High Street Changeability: The Effect of
Urban Form on Demolition, Modification and Use Change in Two South London
Suburbs. Urban Morphology, 21, 5-28
Vaughan L. (2007) The Spatial Syntax of Urban Segregation, Progress in Planning, 67,
199-294
Vaughan L. (2015a) Chapter 7: High Street Diversity, in: Vaughan L. ed Suburban
Urbanities: Suburbs and the Life of the High Street. UCL Press: London 153-174
Vaughan L. (2015b) The Ethnic Marketplace as Point of Transition, in: Kershen A. ed
London the Promised Land Revisited. Ashgate: Farnham, Surrey 35-54
Vaughan L., Sultan Khan S., Tarkhanyan L., and Dhanani A. (2017) The Spatial
Configuration of Minority Ethnic Business Diversity in London's High Streets. In:
Proceedings of the 11th International Space Syntax Symposium. University of Lisbon,
Lisbon, Portugal
Vertovec S. (2006) The Emergence of Super-Diversity in Britain. Centre of Migration,
Policy and Society, University of Oxford, Oxford, 25
Vlachou A., and Vaughan L. (2015) Successional Segregation in Gerani, Athens.
Unpacking the Spatial Structure of an Immigrant Quarter. Proceedings of the 10th
International Space Syntax Symposium. University College London, London
Watson S. (2009) The Magic of the Marketplace: Sociality in a Neglected Public
Space, Urban Studies 46: 1577-1591