Agglomerate strength and dispersion of pharmaceutical powders
10
Agglomerate strength and dispersion of pharmaceutical powders Santoso Adi a , Handoko Adi a , Hak-Kim Chan a,n , Warren H. Finlay b , Zhenbo Tong c , Runyu Yang c , Aibing Yu c a Advance Drug Delivery Group, University of Sydney, Sydney, NSW 2006, Australia b Department of Mechanical Engineering, University of Alberta, Edmonton, Alta., Canada T6G 2G8 c School of Materials Science and Engineering, University of New South Wales, Sydney, NSW 2052, Australia article info Article history: Received 18 October 2010 Received in revised form 2 January 2011 Accepted 1 February 2011 Available online 5 February 2011 Keywords: Agglomerate strength Mannitol Dry powder inhalation Aerosol Storage humidity abstract This study aims to investigate quantitatively the direct correlation between the mechanical strength of powder agglomerates and their dispersion into aerosols by a dry powder inhaler. Agglomerates of mannitol as a model drug-only formulation were prepared by a rolling method followed by exposure to various relative humidity (RH: 55%, 82%, 86% and 90%). The agglomerate strength was obtained from the compression of single agglomerates at a selected speed rate using an Instron testing machine. The dispersion performance (FPF Loaded ) was determined at flow rates of 60 and 100 l min 1 using an Aeroliser s coupled to a multistage liquid impinger. Results showed an inverse linear relationship between the agglomerate strength and the dispersion performance. An increase in strength from 3 to 183 kPa resulted in a significant drop (P o0.05) of 18% in the FPF Loaded . Agglomerates containing ‘solid bridges’ exhibited higher strength (three to eight times) and lower FPF (5–15%, corresponding to 86% and 90% RH) compared to those containing ‘liquid bridges’. These results have provided direct information on the agglomerate strength and its quantitative relationship with powder aerosol performance. & 2011 Elsevier Ltd. All rights reserved. 1. Introduction Dry powder inhalation (DPI) formulation normally contain an active pharmaceutical ingredient (API) that is engineered to have an aerodynamic diameter less than 5 mm, which is suitable for respiratory delivery (Pritchard, 2001). APIs may be formulated with or without excipients (blend formulation) so that they can be dispersed into their primary respiratory size upon inhalation (Adi, Larson, & Stewart, 2007; Adi et al. 2008a; 2008b; Murnane, Martin, & Marriott, 2009). Due to the fine size of the API particles, they tend to be highly cohesive and adhesive, resulting in the formation of agglomerates (Smith & Parry-Billings, 2003). The effect of agglomeration on the dispersion performance of powders has not been fully explored. Previous studies have demonstrated the potentially important role of agglomerate strength in the aerosolisation performance in DPI formulations (Adi et al., 2006; Begat, Morton, Staniforth, & Price, 2004; Das, Larson, Young, & Stewart, 2009; Shekunov, Feeley, Chow, Tong, & York, 2003). Adi et al. (2006) showed poor aerosolisation as a result of increase in the agglomerate strength of powder mixtures (containing drug or fine lactose or both). The increased strength was indicated by the higher air shear pressure required (using an Aerosizer TM ) for de-agglomeration. Das et al. (2009) added that storage of lactose Contents lists available at ScienceDirect journal homepage: www.elsevier.com/locate/jaerosci Journal of Aerosol Science 0021-8502/$ - see front matter & 2011 Elsevier Ltd. All rights reserved. doi:10.1016/j.jaerosci.2011.02.002 n Corresponding author. Tel.: +61 2 9351 3054; fax: +61 2 9351 4391. E-mail address: [email protected] (H.-K. Chan). Journal of Aerosol Science 42 (2011) 285–294
Transcript of Agglomerate strength and dispersion of pharmaceutical powders
Contents lists available at ScienceDirect
Journal of Aerosol Science
Journal of Aerosol Science 42 (2011) 285–294
0021-85
doi:10.1
n Corr
E-m
journal homepage: www.elsevier.com/locate/jaerosci
Agglomerate strength and dispersion of pharmaceutical powders
Santoso Adi a, Handoko Adi a, Hak-Kim Chan a,n, Warren H. Finlay b, Zhenbo Tong c,Runyu Yang c, Aibing Yu c
a Advance Drug Delivery Group, University of Sydney, Sydney, NSW 2006, Australiab Department of Mechanical Engineering, University of Alberta, Edmonton, Alta., Canada T6G 2G8c School of Materials Science and Engineering, University of New South Wales, Sydney, NSW 2052, Australia
a r t i c l e i n f o
Article history:
Received 18 October 2010
Received in revised form
2 January 2011
Accepted 1 February 2011Available online 5 February 2011
Keywords:
Agglomerate strength
Mannitol
Dry powder inhalation
Aerosol
Storage humidity
02/$ - see front matter & 2011 Elsevier Ltd. A
016/j.jaerosci.2011.02.002
esponding author. Tel.: +61 2 9351 3054; fa
ail address: [email protected] (H.-K. C
a b s t r a c t
This study aims to investigate quantitatively the direct correlation between the
mechanical strength of powder agglomerates and their dispersion into aerosols by a
dry powder inhaler. Agglomerates of mannitol as a model drug-only formulation were
prepared by a rolling method followed by exposure to various relative humidity (RH:
55%, 82%, 86% and 90%). The agglomerate strength was obtained from the compression
of single agglomerates at a selected speed rate using an Instron testing machine. The
dispersion performance (FPFLoaded) was determined at flow rates of 60 and 100 l min�1
using an Aerolisers coupled to a multistage liquid impinger. Results showed an inverse
linear relationship between the agglomerate strength and the dispersion performance.
An increase in strength from 3 to 183 kPa resulted in a significant drop (Po0.05) of 18%
in the FPFLoaded. Agglomerates containing ‘solid bridges’ exhibited higher strength
(three to eight times) and lower FPF (5–15%, corresponding to 86% and 90% RH)
compared to those containing ‘liquid bridges’. These results have provided direct
information on the agglomerate strength and its quantitative relationship with powder
aerosol performance.
& 2011 Elsevier Ltd. All rights reserved.
1. Introduction
Dry powder inhalation (DPI) formulation normally contain an active pharmaceutical ingredient (API) that is engineeredto have an aerodynamic diameter less than 5 mm, which is suitable for respiratory delivery (Pritchard, 2001). APIs may beformulated with or without excipients (blend formulation) so that they can be dispersed into their primary respiratory sizeupon inhalation (Adi, Larson, & Stewart, 2007; Adi et al. 2008a; 2008b; Murnane, Martin, & Marriott, 2009). Due to the finesize of the API particles, they tend to be highly cohesive and adhesive, resulting in the formation of agglomerates (Smith &Parry-Billings, 2003).
The effect of agglomeration on the dispersion performance of powders has not been fully explored. Previous studieshave demonstrated the potentially important role of agglomerate strength in the aerosolisation performance in DPIformulations (Adi et al., 2006; Begat, Morton, Staniforth, & Price, 2004; Das, Larson, Young, & Stewart, 2009; Shekunov,Feeley, Chow, Tong, & York, 2003). Adi et al. (2006) showed poor aerosolisation as a result of increase in the agglomeratestrength of powder mixtures (containing drug or fine lactose or both). The increased strength was indicated by the higherair shear pressure required (using an AerosizerTM) for de-agglomeration. Das et al. (2009) added that storage of lactose
ll rights reserved.
x: +61 2 9351 4391.
han).
S. Adi et al. / Journal of Aerosol Science 42 (2011) 285–294286
blend formulations at a relative humidity (RH) of 75% or greater influenced the agglomerate strength, leading to reducedde-agglomeration. Moreover, Shekunov et al. (2003) compared the agglomerate strength between micronized andsupercritically processed salmeterol xinafoate using theoretical prediction based on the aerodynamic stress required fordispersion. They found factors that contribute to lower agglomerate strength, including lower bulk density, larger volumemean diameter, larger aerodynamic shape factor, and smaller specific free energy of API particles, would also improveaerosolisation performance. In contrast, a paradoxical relationship between agglomerate strength and de-agglomerationefficiency was reported by Begat et al. (2004) for two different drug agglomerates consisting of either weaklycohesive salbutamol sulphate or highly cohesive budesonide particles dispersed as API-only formulations, or mixed withlactose carrier as blend formulations. An increase in the cohesive strength of these formulations led to an improvedde-agglomeration efficiency as shown by the higher fine particle fraction in the aerosols. It was postulated that increase indrag force and kinetic energy experienced by larger airborne budesonide agglomerates with increased cohesive strengthresulted in increased de-agglomeration efficiency within the device via impaction. In the previous studies, the mechanicalstrength of the agglomerates was obtained only indirectly from determining the shear pressure of the dispersing air in aparticle sizing equipment, or cohesion/adhesion between two drug particles or drug-lactose particles by atomic forcemicroscopy, or using theoretical prediction.
In the present study, we aimed to measure the mechanical strength of the agglomerates directly using a physical testinginstrument and to correlate the data to their dispersion performance. Agglomerates containing mannitol as a model highdose drug-only formulation was used. High dose powder aerosols are becoming more important for the delivery of inhaledantibiotics such as tobramycin (Geller, 2009). The choice of mannitol was due to the growing interest in its recent use as anaerosol preparation for bronchial provocation testing in asthmatics (Anderson et al., 1997) and for enhancement ofmucociliary clearance in patients with cystic fibrosis and bronchietasis (Daviskas, Anderson, Eberl, Chan, & Bautovich,1999; Robinson et al., 1999). To the authors’ knowledge, this is the first study that investigates the direct correlationbetween the mechanical strength and dispersion of agglomerates.
2. Materials and methods
2.1. Materials
Spray-dried mannitol (d0.50=3.070.1 mm) used throughout the study was supplied by Pharmaxis (Frenchs Forest, NSW,Australia). Water was purified by reverse osmosis (MilliQ, Millipore Australia Pty Ltd, Sydney, Australia).
2.2. Preparation of mannitol agglomerates with different strengths
Mannitol agglomerates were prepared by rolling the spray-dried mannitol powder in a stainless steel container (25 mmin diameter and 40 mm in length) on a tube roller (Ratek Instruments, Australia) at 60 rpm for 10 min. Agglomerateswith 1.570.2 mm in diameter were further selected under a Leica MZ6 stereo microscope (Leica Microsystems Pty Ltd,North Ryde, Australia).
To control the mechanical strength of the agglomerates, they were exposed to different levels of RH for 10 min in anenvironmentally controlled box, shown in Fig. 1, followed by further storage at 55% RH (ambient) for 1 h. The agglomerateswere placed on a Petri dish inside a polycarbonate box (45 cm�75 cm�80 cm) with temperature controlled at 2271 1C.The humidity inside the box was regulated via feedback from a temperature and humidity probe (HMP 35, Vaisala,Helsinki, Finland) to a controller (Electronics workshops, School of Biological Sciences, University of Sydney) that activatedor deactivated the humidifier (air-jet nebuliser, Ventalaire, Allersearch, Sydney, Australia) and dehumidifier (silica gel-filled column, 35 cm in length, 6 cm in diameter connected to an air pump, Charles Austen Pumps Ltd, Byfleet, England)according to the set point of the required humidity at an accuracy of 72%. A small electric fan was used for ventilation tomaintain uniform humidity and temperature throughout the box.
The selection of humidity level was based on the moisture sorption profile of mannitol. It was anticipated that theagglomerate strength would be proportional to the moisture adsorbed on the particle surface.
2.3. Moisture sorption of mannitol
The water sorption isotherms at 25 1C of mannitol powders were measured using a dynamic vapour sorption (DVS)microbalance (Surface Measurement Systems, London, UK), which controlled gravimetric uptake and loss of water vapourof the powder by means of an electronic microbalance with a resolution of 70.1 mg. This instrument was meant forcontrolling the RH of the vapour flowing around the sample by mixing saturated and dry carrier gases using mass-flowcontrollers. The whole system was kept isothermal by enclosure in a temperature-controlled incubator. Prior to themeasurement, the sample was dried inside the DVS microbalance at 25 1C and 0% RH for at least 600 min to bring thesample to near zero wt% H2O. Subsequently, the sample was exposed to RH from 0% to 90% and 90% to 0% in a stepwisefashion with increments of 10% RH. A weight change of less than 0.005% per min was chosen as the criterion for reachingequilibrium at each RH step before proceeding to the next RH step.

Fig. 1. Schematic diagram of an airtight humidity-controlled system, containing a controller which activates or deactivates the humidifier (air-jet
nebuliser) and dehumidifier (silica gel-filled column, 35 cm in length, 6 cm in diameter connected to an air pump). The holes at the front panel are used
to load the sample and sealed with plastic stoppers during the experiment.
S. Adi et al. / Journal of Aerosol Science 42 (2011) 285–294 287
2.4. Mechanical strength testing
Single agglomerates were measured using a dual column physical testing machine (Instron 3366, Instron Pty. Ltd.,Norwood, US) installed with two flat round compression platens, with 25 and 150 mm in diameter for the upper (movable)and lower (fixed) platens, respectively. During the measurement, the agglomerate was placed between the platens andcompressed using a 5 N load cell at a rate of 1 mm/min. The accuracy of the load cell was tested for small loadmeasurement using various standard weights ranging from 50 mN to 5 N, which showed linearity and repeatabilityerror of 70.25% of the measured value. The compression test was conducted on a minimum of 15 agglomerates for eachtype of sample to obtain a mean value. The compressive load applied to the agglomerate was plotted versus time usingmaterial testing software, Bluehill (INSTRON Pty. Ltd., Melbourne, Australia), showing an increase in the compressive loaduntil the first major breakdown of the agglomerate occurred. This breakdown caused a sudden drop in the compressiveload value which resulted in a peak load prior to breakdown. The agglomerate strength was calculated using methodsfor determining the fracture strength of spherical aggregates as follows (Hiramatsu & Oka, 1966; Kschinka, Perrella,Nguyen, & Bradt 1986):
Agglomerate strength¼2:8P
pdfð1Þ
where P is the first compressive load that caused a sudden drop in the compressive load versus time plot and df is thedistance between the loading points at the instant of failure as illustrated in Fig. 2. Assuming the deformations endured bythe upper and the lower parts of agglomerate prior to breakage were of equal amount (i.e. s1=s2), df is (da–2s1), where da isthe agglomerate diameter. Distance s1 was determined from the compressive load versus time plot, i.e. the time taken fromthe start of the load on the agglomerate till first breakage multiplied by the compression rate, which was 1 mm/min.Testing was done with the samples in ambient air (5573% RH).
2.5. Void fraction determination
The void fraction of the agglomerate (e) was calculated as follows:
e¼ 1�density of agglomerate
true density of mannitolð2Þ
The density of agglomerate was defined as the mass of the agglomerate after exposure to RH divided by its volume.To determine its volume, the agglomerate was approximated as a perfect sphere with its diameter measured using opticalmicroscopy. The true density of mannitol is 1.5 g cm�3 (Elversson, Andersson, & Millqvist-Fureby, 2007). The measure-ment was performed in triplicate for each type of samples.

Fig. 2. Schematic diagram for determining df, distance between loading points at the instant of failure. da is the agglomerate diameter. P is the
compressive load that causes the fracture. s1 and s2 are deformations endured by the upper and lower parts of the agglomerate until first breakage
occurs.
S. Adi et al. / Journal of Aerosol Science 42 (2011) 285–294288
2.6. Scanning electron microscopy (SEM)
Particle morphology of samples stored at different RHs was visualised using a Zeiss ULTRA plus SEM (Carl Zeiss SMT,Oberkochen, Germany) at 2 kV. All samples were mounted on aluminium stubs using carbon/graphite adhesive and coatedwith gold at 30 nm thickness prior to analysis.
2.7. Micro-CT X-ray scan
Mannitol agglomerates exposed to 55% and 90% RH were mounted next to each other on a white polypropylene rodusing adhesive. The X-ray scans were performed using a SkyScan 1172 system (SkyScan N.V., Aartselaar, Belgium) at100 kV, 100 mA and 10 W with rotation step of 0.2301 and image pixel size of 3.45 mm. No filter was applied. 3-D modelreconstruction was carried out using NRecon (SkyScan N.V., Aartselaar, Belgium) and VG Studio Max softwares (VolumeGraphics GmbH, Heidelberg, Germany).
2.8. Dispersion methodology
The dispersion performance of mannitol agglomerates used in both studies were determined using a multistage liquidimpinger (Copley, Nottinghamshire, UK) following procedures described in the British Pharmacopoeia (Pharmacopoeia,2009). In each dispersion, 40 mannitol agglomerates (weighing approximately 40 mg) were loaded into an Aerolizers anddispersed into the impinger running at 60 or 100 l min�1 for 4 or 2.4 s, respectively, controlled by a timed valve and usingambient air (5573% RH). Each run was performed in triplicate to obtain a mean value. Mannitol was assayed by high-performance liquid chromatography (Shimadzu, Kyoto, Japan) using refractive index detection (RID 10-A model,Shimadzu, Kyoto, Japan). Samples (100 ml) were injected into a C18 radial-pak column (Resolve C18 5 mm model, WatersCorporation, Milford, United States) with deionized water as the mobile phase running at a flow rate of 1 ml/min for 4 min.Four standard mannitol solutions (0.01, 0.1, 1 and 5 mg/ml) were used to construct a calibration curve which allowed themass of powder deposited on each stage of the impinger and the fine particle fraction to be determined. Fine particlefraction (FPFLoaded) was defined as the mass fraction of particles less than 5 mm in the aerosol, referenced against the totalmass of powder loaded into the inhaler. Numerically, FPFLoaded was calculated as the percentage of powder collected onstages 3, 4, and the filter. Values of the stage cut-off diameter were approximated as being inversely proportional to thesquare root of the air flow rate (Asking and Olsson, 1997). The particle size cut-offs (D) were corrected for differences inflow rates between 60 (Q60) and 100 l min�1 (Q100) using the following relationship:
D100 ¼D60
ffiffiffiffiffiffiffiffiffiffiQ60
Q100
sð3Þ

S. Adi et al. / Journal of Aerosol Science 42 (2011) 285–294 289
2.9. Statistical analysis
The measured strength and FPF values were subject to analysis of variance (ANOVA, Minitab 13.31, Minitab Ltd.,Coventry, United Kingdom), followed by Fishers pairwise post hoc multiple comparisons. Values of Po0.05 indicatedstatistically significant differences between multiple samples.
3. Results and discussion
The moisture uptake by mannitol was minimal at r80% RH, with only a gradual increase in weight. However, at higherRH, a large step change occurred in moisture uptake (Fig. 3). To prepare agglomerates with different strengths, four levelsof RH were thus selected, i.e. one at ambient 55% RH and three above 80% RH (82%, 86% and 90% RH). It was anticipatedthat the strength of an agglomerate could be varied according to the RH. At elevated RH the agglomerates tend to uptakewater vapour at a higher rate (Zeng, Martin, & Marriott, 2001), as supported in the present study by the higher weight gainwhen exposed to Z80% RH compared with 55% RH. As the water vapour condensation progressed, the solid along thesurface of the agglomerate would dissolve in the adsorbed film of water (Van Campen, Amidon, & Zografi, 1983). Thisdissolution of the particulate surface increased at increasingly higher RH (Podczeck, Newton, & James, 1997). However,when the RH was lowered following the high RH exposure, the adsorbed moisture would evaporate to establishequilibrium during which any dissolved mannitol in the surface water would precipitate out to form solid bridges betweenthe agglomerates (Fig. 4(B)–(D)), resulting in an increase in the mechanical strength. When subject to the Instroncompression test, the agglomerate yielded under a defined load (Fig. 5), representing the agglomerate mechanical strength(Table 1) which showed a 60-fold difference as the RH was increased from 55% to 90%.
An inverse correlation exists between agglomerate strength and dispersion performance (Fig. 6), i.e. a weakeragglomerate was better dispersed into fine particles. A significant drop in FPFLoaded (Po0.05) of approximately 18%absolute was observed as the agglomerate strength increased from 3 to 183 kPa. The Aerolizers has a relatively lowresistance [0.06 cm H2O/(L/min)] to air flow and thus 100 l min�1 can be achieved realistically using a comfortableinspiratory effort (Chew & Chan, 2001). The 60 l min�1 was used to compare the effect of a lower flow. The FPFLoaded valueswere similar between 60 and 100 l min�1, indicating that the lower airflow could overcome the agglomerate strength tothe same extent as the higher flow. The results are consistent with those using mannitol powders at ambientconditions. Coates, Chan, Fletcher, and Raper (2005) and Tong et al. (2010) found similar FPFLoaded results with nosignificant difference between 60 and 100 l min�1.
We found the increase in strength was predominantly contributed by the solid bridge formation instead of a decrease inthe porosity (or void fraction) of the agglomerates as a result of exposure to high RH (480% RH). Void fraction could affectagglomerate strength according to the Rumpf model (Rumpf, 1962) expressed by the following relationship:
sT ¼9
8
1�ee
� �Fc
d2ð4Þ
where sT is the agglomerate strength, e the void fraction of the agglomerate, Fc the cohesion force between primaryparticles and d the primary particle diameter. Kendall and Stainton (2001) also showed similar results to those by Rumpf.They postulated that agglomerate strength is a function (the 4th power) of the packing fraction with the latter inversely
Fig. 3. Dynamic water vapour sorption–desorption weight change profile for mannitol powder exposed up to 90% relative humidity.

Fig. 4. Scanning electron microscope images of four different mannitol agglomerates: A, B, C and D are mannitol agglomerates after exposure for 10 min
at 55%, 82%, 86% and 90% RH. The circles indicate the solid bridges formed between particles.
Fig. 5. An example of load-time profile obtained from compression test of mannitol agglomerate containing solid bridges as a result of exposure to
82% RH.
S. Adi et al. / Journal of Aerosol Science 42 (2011) 285–294290
related to the void fraction, as expressed by the following relationship:
s¼ 15:6j4R
Dð5Þ
where s is the agglomerate strength, j the packing fraction of the agglomerate, R the non-equilibrium value of work ofadhesion and D is the primary particle diameter. The change in void fraction was observed by X-ray micro CT as indicatedby variation in the light intensity absorbed along the surface, with bright regions representing lower void fraction (Fig. 7).

Table 1Strength and void fraction of various mannitol agglomerates containing liquid and solid bridges as a result of exposure to four different humidities (55%,
82%, 86% and 90%) for 10 min. Values in brackets indicate standard deviations (n=15 and n=3 for strength and void fraction measurements, respectively).
Humidity (% RH) Agglomerate strength Void fraction, e(Solid bridge) (%)
Solid bridge (kPa) Liquid bridge (kPa)
55 2.7 (0.4) 2.5 (0.2) 53.5 (0.7)
82 15.3 (0.7) 4.9 (0.9) 50.1 (0.9)
86 75.3 (3.9) 8.6 (0.6) 46.2 (1.2)
90 182.6 (6.0) 15.9 (0.2) 38.2 (1.5)
Fig. 6. The aerosol performance of various mannitol agglomerates containing solid bridges as a result of exposure to RH from 55% to 90%, dispersed using
Aerolizers at 60 and 100 l min�1.
Fig. 7. 3-D images of mannitol agglomerates exposed to 55% (A) and 90% RH (B) obtained using micro-CT.
S. Adi et al. / Journal of Aerosol Science 42 (2011) 285–294 291
The agglomerate having exposed to 90% RH revealed more bright regions (than the 55% RH sample), i.e. less void fraction.The void fraction obtained from density calculation showing a decrease of 6.4–28.6% after exposure at 82–90% RH(Table 1). Although statistically significant (Po0.05), such a change could only account for less than one-tenth of the60-fold increase in the agglomerate strength according to either Rumpf or Kendall and Stainton models. Thus, it can beconcluded that the effect of reduced void fraction on the agglomerate strength is minimal and therefore solid bridges aremainly responsible for the increased strength.
The formation of solid bridges may bear some resemblance to situations when a powder is subject to a humidity cycle,e.g. leaving a powder-containing DPI inadvertently in the bathroom. As shown in the present results, the mechanicalstrength of the agglomerate may be so high that the FPFLoaded will become unacceptably low. However, a more generalsituation could be moisture exposure without cycling, i.e. the adsorbed moisture alone leads to capillary force to enhancethe agglomerate strength. Sorption of water vapour may result in the formation of multilayer condensation of water
S. Adi et al. / Journal of Aerosol Science 42 (2011) 285–294292
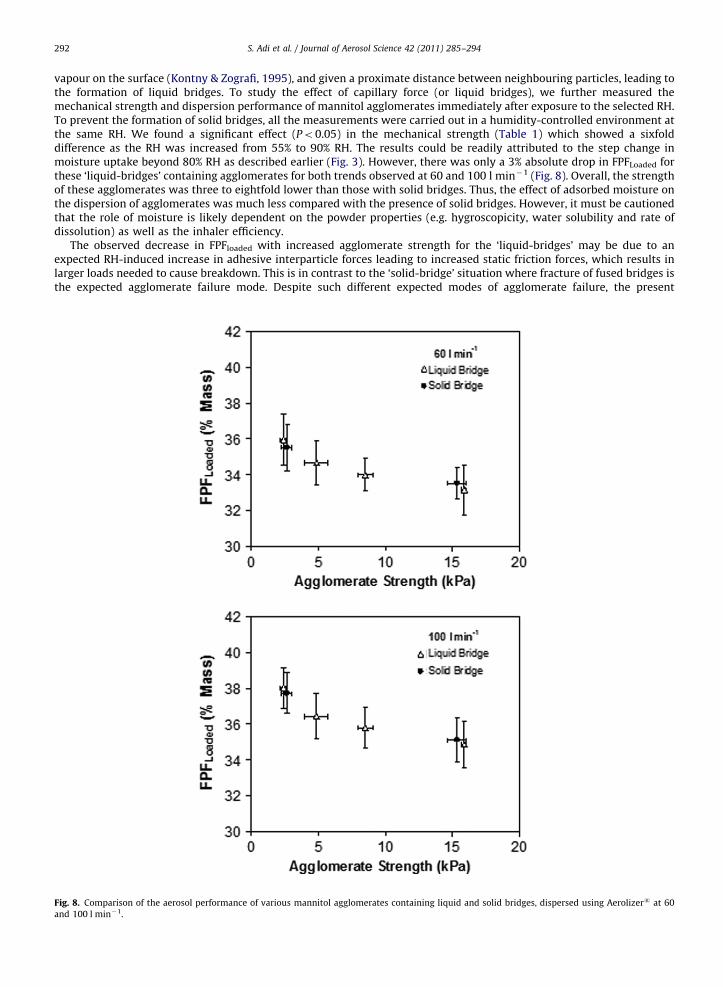
vapour on the surface (Kontny & Zografi, 1995), and given a proximate distance between neighbouring particles, leading tothe formation of liquid bridges. To study the effect of capillary force (or liquid bridges), we further measured themechanical strength and dispersion performance of mannitol agglomerates immediately after exposure to the selected RH.To prevent the formation of solid bridges, all the measurements were carried out in a humidity-controlled environment atthe same RH. We found a significant effect (Po0.05) in the mechanical strength (Table 1) which showed a sixfolddifference as the RH was increased from 55% to 90% RH. The results could be readily attributed to the step change inmoisture uptake beyond 80% RH as described earlier (Fig. 3). However, there was only a 3% absolute drop in FPFLoaded forthese ‘liquid-bridges’ containing agglomerates for both trends observed at 60 and 100 l min�1 (Fig. 8). Overall, the strengthof these agglomerates was three to eightfold lower than those with solid bridges. Thus, the effect of adsorbed moisture onthe dispersion of agglomerates was much less compared with the presence of solid bridges. However, it must be cautionedthat the role of moisture is likely dependent on the powder properties (e.g. hygroscopicity, water solubility and rate ofdissolution) as well as the inhaler efficiency.
The observed decrease in FPFloaded with increased agglomerate strength for the ‘liquid-bridges’ may be due to anexpected RH-induced increase in adhesive interparticle forces leading to increased static friction forces, which results inlarger loads needed to cause breakdown. This is in contrast to the ‘solid-bridge’ situation where fracture of fused bridges isthe expected agglomerate failure mode. Despite such different expected modes of agglomerate failure, the present
Fig. 8. Comparison of the aerosol performance of various mannitol agglomerates containing liquid and solid bridges, dispersed using Aerolizers at 60
and 100 l min�1.

S. Adi et al. / Journal of Aerosol Science 42 (2011) 285–294 293
approach of using compressive load failure shows an approximately linear relation between FPFlodaded and agglomeratestrength for both cases, which highlights the robustness of this approach to examining agglomerate behaviour.
Finally, it has also been reported that agglomerate size may affect the extent of breakage into fine particles. Boerefijn,Ning, and Ghadiri (1998) found a lower extent of breakage in larger agglomerates. In contrast, Begat et al. (2004) foundlarger budesonide agglomerates with higher cohesive strength dispersed better than the smaller salbutamol sulphateagglomerates with lower cohesive strength. To eliminate the size effect, only agglomerates of the same size (1.5 mm) wereused in the present work. The size was chosen because being too big would be unrealistic for DPI systems, whereas if theagglomerates are too small, then it becomes difficult to control the size precisely and to measure the mechanical strengthby the present Instron equipment. Nevertheless, the effect of the agglomerate size on dispersion will be worthwhile tostudy in the future if instrument capability permits.
4. Conclusion
A direct method to quantify the mechanical strength of the agglomerates has been successfully established usingphysical strength test. An inverse linear relationship between the agglomerate strength and the dispersion performance ofmannitol powder was confirmed from direct correlation between the agglomerate strength and FPFLoaded. The dispersionefficiency was determined primarily by the presence of solid bridges rather than the porosity or capillary force in theagglomerates at elevated RH.
Acknowledgements
The authors wish to acknowledge and thank to the National Health and Medical Research Council (NHMRC), AustralianResearch Council (ARC) and Faculty of Pharmacy, University of Sydney for the scholarships and financial support.
References
Adi, H., Larson, I., Chiou, H., Young, P. M., Traini, D., & Stewart, P. (2006). Agglomerate strength and dispersion of salmeterol xinafoate from powdermixtures for inhalation. Pharmaceutical Research, 23, 2556–2565.
Adi, H., Larson, I., & Stewart, P. J. (2007). Adhesion and redistribution of salmeterol xinafoate particles in sugar-based mixtures for inhalation. InternationalJournal of Pharmaceutics, 337, 229–238.
Adi, H., Young, P. M., Chan, H. K., Stewart, P. J., Agus, H., & Traini, D. (2008a). Cospray dried antibiotics for dry powder lung delivery. Journal ofPharmaceutical Science, 97, 3356–3366.
Adi, S., Adi, H., Tang, P., Traini, D., Chan, H. K., & Young, P. M. (2008b). Micro-particle corrugation, adhesion and inhalation aerosol efficiency. EuropeanJournal of Pharmaceutical Science, 35, 12–18.
Anderson, S. D., Brannan, J., Spring, J., Spalding, N., Rodwell, L. T. Chan, H. K., et al. (1997). A new method for bronchial-provocation testing in ashmaticsubjects using a dry powder of mannitol. American Journal of Respiratory and Critical Care Medicine, 156, 758–765.
Asking, L., & Olsson, B. (1997). Calibration at different flow rates of a multistage liquid impinger. Aerosol Science and Technology, 27, 39–49.Begat, P., Morton, D. A. V., Staniforth, J. N., & Price, R. (2004). The cohesive-adhesive balances in dry powder inhaler formulations II: Influence on fine
particle delivery characteristics. Pharmaceutical Research, 21, 1826–1833.Boerefijn, R., Ning, Z., & Ghadiri, M. (1998). Disintegration of weak lactose agglomerates for inhalation applications. International Journal of Pharmaceutics,
172, 199–209.British Pharmacopoeia. (2009). Consistency of Formulated Preparations, Apparatus C, Appendix XII C. London.Chew, N. Y. K., & Chan, H. K. (2001). In vitro aerosol performance and dose uniformity between the Foradile (R) Aerolizer (R) and the Oxis (R) Turbuhaler
(R). Journal of Aerosol Medicine, 14, 495–501.Coates, M. S., Chan, H. K., Fletcher, D. F., & Raper, J. A. (2005). Influence of air flow on the performance of a dry powder inhaler using computational and
experimental analyses. Pharmaceutical Research, 22, 1445–1453.Das, S., Larson, I., Young, P., & Stewart, P. (2009). Influence of storage relative humidity on the dispersion of salmeterol xinafoate powders for inhalation.
Journal of Pharmaceutical Science, 98, 1015–1027.Daviskas, E., Anderson, S. D., Eberl, S., Chan, H. K., & Bautovich, G. (1999). Inhalation of dry powder mannitol improves clearance of mucus in patients with
bronchiectasis. American Journal of Respiratory and Critical Care Medicine, 159, 1843–1848.Elversson, J., Andersson, K., & Millqvist-Fureby, A. (2007). An atomic force microscopy approach for assessment of particle density applied to single spray-
dried carbohydrate particles. Journal of Pharmaceutical Science, 96, 905–912.Geller, D. E. (2009). Aerosol antibiotics in cystic fibrosis. Respiratory Care, 54, 658–669.Hiramatsu, Y., & Oka, Y. (1966). Determination of the tensile strength of rock. International Journal of Rock Mechanics and Mining Science, 3, 89–99.Kendall, K., & Stainton, C. (2001). Adhesion and aggregation of fine particles. Powder Technology, 121, 223–229.Kontny, M. J., & Zografi, G. (1995). Sorption of Water by Solids. Drugs and the Pharmaceutical Sciences; Physical Characterization of Pharmaceutical Solids. New
York: Marcel Dekker, Inc.Kschinka, B. A., Perrella, S., Nguyen, H., & Bradt, R. C. (1986). Strengths of glass spheres in compression. Journal of the American Ceramic Society, 69,
467–472.Murnane, D., Martin, G. P., & Marriott, C. (2009). Dry powder formulations for inhalation of fluticasone propionate and salmeterol xinafoate microcrystals.
Journal of Pharmaceutical Science, 98, 503–515.Podczeck, F., Newton, J. M., & James, M. B. (1997). Influence of relative humidity of storage air on the adhesion and autoadhesion of micronized particles
to particulate and compacted powder surfaces. Journal of Colloid and Interface Science, 187, 484–491.Pritchard, J. N. (2001). The influence of lung deposition on clinical response. Journal of Aerosol Medicine Deposition, Clearance, and Effects in the Lung, 14,
19–26.Robinson, M., Daviskas, E., Eberl, S., Baker, J., Chan, H. K. Anderson, S. D., et al. (1999). The effect of inhaled mannitol on bronchial mucus clearance in
cystic fibrosis patients: A pilot study. European Respiratory Journal, 14, 678–685.Rumpf, H. (1962). The strength of granules and agglomerates. In W. A. Knepper (Ed.), Agglomeration. New York: Wiley Interscience.Shekunov, B. Y., Feeley, J. C., Chow, A. H. L., Tong, H. H. Y., & York, P. (2003). Aerosolisation behaviour of micronised and supercritically processed powders.
Journal of Aerosol Science, 34, 553–568.

S. Adi et al. / Journal of Aerosol Science 42 (2011) 285–294294
Smith, I. J., & Parry-Billings, M. (2003). The inhalers of the future? A review of dry powder devices on the market today. Pulmonary Pharmacology &Therapeutics, 16, 79–95.
Tong, Z. B., Yang, R. Y., Chu, K. W., Yu, A. B., Adi, S., & Chan, H. K. (2010). Numerical study of the effects of particle size and polydispersity on theagglomerate dispersion in a cyclonic flow. Chemical Engineering Journal, 164, 432–441.
Van Campen, L., Amidon, G. L., & Zografi, G. (1983). Moisture sorption kinetics for water-soluble substances. 1. Theoretical considerations of heat-transport control. Journal of Pharmaceutical Science, 72, 1381–1388.
Zeng, X. M., Martin, G. P., & Marriott, C. (2001). Particulate Interactions in Dry Powder Formulations for Inhalation. London: Taylor & Francis.