M. Ertsen, J. Murphy, L. Purdue, T. Zhu 2014A journey of a thousand miles begins with one small step...
14
Hydrol. Earth Syst. Sci., 18, 1369–1382, 2014 www.hydrol-earth-syst-sci.net/18/1369/2014/ doi:10.5194/hess-18-1369-2014 © Author(s) 2014. CC Attribution 3.0 License. Hydrology and Earth System Sciences Open Access A journey of a thousand miles begins with one small step – human agency, hydrological processes and time in socio-hydrology M. W. Ertsen 1 , J. T. Murphy 2,3 , L. E. Purdue 4 , and T. Zhu 1 1 Delft University of Technology, WaterResources Department, Delft, the Netherlands 2 Argonne National Laboratory, Argonne, USA 3 University of Chicago, Computation Institute, Chicago, USA 4 School of Sustainability, Arizona State University, Tempe, USA Correspondence to: M. W. Ertsen ([email protected]) Received: 4 November 2013 – Published in Hydrol. Earth Syst. Sci. Discuss.: 21 November 2013 Revised: 26 February 2014 – Accepted: 28 February 2014 – Published: 8 April 2014 Abstract. When simulating social action in modeling ef- forts, as in socio-hydrology, an issue of obvious importance is how to ensure that social action by human agents is well- represented in the analysis and the model. Generally, hu- man decision-making is either modeled on a yearly basis or lumped together as collective social structures. Both re- sponses are problematic, as human decision-making is more complex and organizations are the result of human agency and cannot be used as explanatory forces. A way out of the dilemma of how to include human agency is to go to the largest societal and environmental clustering possible: soci- ety itself and climate, with time steps of years or decades. In the paper, another way out is developed: to face human agency squarely, and direct the modeling approach to the agency of individuals and couple this with the lowest appro- priate hydrological level and time step. This approach is sup- ported theoretically by the work of Bruno Latour, the French sociologist and philosopher. We discuss irrigation archaeol- ogy, as it is in this discipline that the issues of scale and ex- planatory force are well discussed. The issue is not just what scale to use: it is what scale matters. We argue that under- standing the arrangements that permitted the management of irrigation over centuries requires modeling and understand- ing the small-scale, day-to-day operations and personal in- teractions upon which they were built. This effort, however, must be informed by the longer-term dynamics, as these pro- vide the context within which human agency is acted out. 1 Introduction Simulating social action is a rising field of study. Based on detailed, empirical study and specific understanding of both human actions and networks in society, more elaborate mod- els are being constructed. An issue of obvious importance is how to ensure that social action by human agents is well- represented in the analysis and the model; this issue is of vital importance for socio-hydrology as well. Although not necessarily so, in general one can find two responses to the question of how to represent human agency. In the first one, human decision-making – if considered at all – is modeled on a yearly basis; in the second one, human agency is lumped together, assuming that collective social structures – states, companies, but also social class or gender – provide an ad- equate framework representing human decision-making. We argue that both responses are problematic. Humans make decisions every day and not once a year, and even the once a year decisions (where to go on holiday for ex- ample) are not made once a year, but are more to be seen as a series of decisions. Clustering humans into organizations is problematic as well, as these organizations themselves are the result of agency, and clustering usually means associat- ing certain predefined features to those entities. Those fea- tures will usually also be the result of the model, and as such we have a problem of circularity. Please note that we do not argue that social structures do not exist, as anyone studying society would recognize that certain hierarchies, arenas and institutions do exist. We do argue, however, that these social Published by Copernicus Publications on behalf of the European Geosciences Union.
Transcript of M. Ertsen, J. Murphy, L. Purdue, T. Zhu 2014A journey of a thousand miles begins with one small step...
Hydrol. Earth Syst. Sci., 18, 1369–1382, 2014www.hydrol-earth-syst-sci.net/18/1369/2014/doi:10.5194/hess-18-1369-2014© Author(s) 2014. CC Attribution 3.0 License.
Hydrology and Earth System
SciencesO
pen Access
A journey of a thousand miles begins with one small step –human agency, hydrological processes and time in socio-hydrology
M. W. Ertsen1, J. T. Murphy 2,3, L. E. Purdue4, and T. Zhu1
1Delft University of Technology, Water Resources Department, Delft, the Netherlands2Argonne National Laboratory, Argonne, USA3University of Chicago, Computation Institute, Chicago, USA4School of Sustainability, Arizona State University, Tempe, USA
Correspondence to:M. W. Ertsen ([email protected])
Received: 4 November 2013 – Published in Hydrol. Earth Syst. Sci. Discuss.: 21 November 2013Revised: 26 February 2014 – Accepted: 28 February 2014 – Published: 8 April 2014
Abstract. When simulating social action in modeling ef-forts, as in socio-hydrology, an issue of obvious importanceis how to ensure that social action by human agents is well-represented in the analysis and the model. Generally, hu-man decision-making is either modeled on a yearly basisor lumped together as collective social structures. Both re-sponses are problematic, as human decision-making is morecomplex and organizations are the result of human agencyand cannot be used as explanatory forces. A way out of thedilemma of how to include human agency is to go to thelargest societal and environmental clustering possible: soci-ety itself and climate, with time steps of years or decades.In the paper, another way out is developed: to face humanagency squarely, and direct the modeling approach to theagency of individuals and couple this with the lowest appro-priate hydrological level and time step. This approach is sup-ported theoretically by the work of Bruno Latour, the Frenchsociologist and philosopher. We discuss irrigation archaeol-ogy, as it is in this discipline that the issues of scale and ex-planatory force are well discussed. The issue is not just whatscale to use: it is what scale matters. We argue that under-standing the arrangements that permitted the management ofirrigation over centuries requires modeling and understand-ing the small-scale, day-to-day operations and personal in-teractions upon which they were built. This effort, however,must be informed by the longer-term dynamics, as these pro-vide the context within which human agency is acted out.
1 Introduction
Simulating social action is a rising field of study. Based ondetailed, empirical study and specific understanding of bothhuman actions and networks in society, more elaborate mod-els are being constructed. An issue of obvious importance ishow to ensure that social action by human agents is well-represented in the analysis and the model; this issue is ofvital importance for socio-hydrology as well. Although notnecessarily so, in general one can find two responses to thequestion of how to represent human agency. In the first one,human decision-making – if considered at all – is modeled ona yearly basis; in the second one, human agency is lumpedtogether, assuming that collective social structures – states,companies, but also social class or gender – provide an ad-equate framework representing human decision-making. Weargue that both responses are problematic.
Humans make decisions every day and not once a year, andeven the once a year decisions (where to go on holiday for ex-ample) are not made once a year, but are more to be seen asa series of decisions. Clustering humans into organizationsis problematic as well, as these organizations themselves arethe result of agency, and clustering usually means associat-ing certain predefined features to those entities. Those fea-tures will usually also be the result of the model, and as suchwe have a problem of circularity. Please note that we do notargue that social structures do not exist, as anyone studyingsociety would recognize that certain hierarchies, arenas andinstitutions do exist. We do argue, however, that these social
Published by Copernicus Publications on behalf of the European Geosciences Union.

1370 M. W. Ertsen et al.: A journey of a thousand miles begins with one small step
structures can never be used as explanatory forces for pro-cesses we observe.
Comparable dangers can be expected for socio-hydrology,if it is not done carefully. The short-term effects of hydrologyon humans and the actions of humans to counter those whichin turn affect hydrology and so on need to be included in themodel. This means allowing for time patterns of wet yearsand dry years, abundant crop yields and crop failures, timesof economic prosperity and depression, shifts in the domi-nant politics, major storms, etc., and most of all how thesepatterns overlay one another. Short-term memories have amajor impact on water resources use by individuals and man-agement policies by administrators.
We argue that there are two feasible ways out of this issue,or two levels of modeling that we can do relatively safely; wewill develop some more specific ideas about one of them. Thefirst way out of the dilemma of how to include human agencyis essentially to ignore it completely and to go to the largestsocietal and environmental clustering possible: society itselfand climate, with a reasonable time step of years or decades,to determine links between the two to test certain theoriesand define/find/test analogies. We will not develop this ideafurther, as it is discussed in the contribution of Pande andErtsen to the SI in HESS-D (Pande and Ertsen, 2013).
The other way, and the one we will develop further in thispaper, is to face human agency squarely. To do so we directour modeling approach to the human agency of individuals– arguably the lowest possible scale that could be called a“social” approach – and couple this with the lowest appro-priate hydrological level and time step: daily or hourly rainand/or flow. With this approach we can employ our modelsto ask under which cultural-organizational constraints modeloutcomes are supported by our data. This detailed modelingpredefines as few cultural aspects as possible in the humanagents; instead it treats cultural aspects as constraining con-texts for the model, which itself is based on actions and ma-teriality. Personal relationships, in networks and institutions,are outcomes of the model’s operation.
This second approach is supported theoretically by thework of Bruno Latour, the French sociologist and philoso-pher. Latour argues that human decision-making and devel-opment of societal institutions is a local activity and con-structed within networks of actors (Latour, 2005). These net-works are continuously created and recreated by human ac-tors engaging with other human actors and non-human in-termediaries. Actor-networks are to be understood as a unit,without preliminary definitions of what is “inside” or “out-side” of, or “local” or “context” about a network. Networksare created through human agency engaging with other hu-man agents and material realities (like roads and rain); study-ing networks with any pre-suggested division in terms of lev-els, contexts or relations needs to be avoided. The resultingnetworks link short- and long-term human responses, fromindividual to societal level, to water flows and their stochastic
natures on scales as different as flows in hours to volumes peryear, decade or even century.
In this paper we discuss how such a focus on the short-term, small-scale interactions among people with(in) theirenvironment can be developed. We focus our discussion onirrigation systems, and specifically on studies within archae-ology, as these studies provide data sets that allow linkingshort term to long term. Irrigation is complex, due to feed-backs between material environment – the water source –and humans. Because of the highly detailed and complexrelations between human actions and the social and mate-rial context in irrigation, it is extremely difficult to developa well-suited scientific approach to model it. Not only dowe need to understand the effect of material conditions onhuman actions but we also need to understand how humanagency is linked to rules within irrigation systems. As such,irrigation is a clear – if not one of the best – example of socio-hydrology.
Perhaps paradoxically, archaeological examples are usefulfor this discussion because the archaeological record, withrespect to many things we might wish to know, is incomplete.The lacunae in our knowledge impinge on our modeling ef-forts in a way that brings questions of scale to the fore: weare forced to choose abstractions, and so must choose themcarefully. Likewise we are also asked to consider questionsthat we might like to answer against data that we have avail-able, and so to consider some approaches to be provisionalor hypothetical. The outcome is what Murphy (2009) termedan “exploratory” approach. Two key components of this arethe obligation to ask what components are required and theconcomitant freedom to discard those that are not. The issueis not just what scale to use: it is what scale matters. Our con-tention in this paper is that identifying and understanding thearrangements that permitted the management of large-scaleirrigation works, even those that persisted over centuries, re-quires modeling and understanding the small-scale, day-to-day operations and personal interactions upon which theywere built. This effort, however, must be informed by thedata from longer-term studies, for the longer-term dynamicsprovide the context within which our object of study, humanagency, is acted out.
2 Agent-based models as the way forward?
Irrigation systems are spatial assemblies of built elementssupplying crops with water. System’s operation is a mixtureof physical distribution facilities that bring water to fields andcrops, and socio-political coordination between the differentactors that use the water flows. Irrigated agriculture is morethan managing volumes each month or season; it is typicallyabout manipulating flows of water in time periods as shortas hours and days. Such short-term manipulations result inwater balances and volumes on larger temporal and spatialscales. Those lumped volumes and balances cannot be used,
Hydrol. Earth Syst. Sci., 18, 1369–1382, 2014 www.hydrol-earth-syst-sci.net/18/1369/2014/
M. W. Ertsen et al.: A journey of a thousand miles begins with one small step 1371
however, to derive the many small-scale manipulations ofwater flows that built the lumped results: reading back thedetail from the general is impossible (Ertsen, 2010; Ertsenand Van der Spek, 2009).
With their many entities, their interactions within a chang-ing environment, and the resulting emergent properties, irri-gation systems are typical of systems for which agent-basedmodeling (ABM) yields fruitful analysis. The application ofABM by creating software agents to play the role of irriga-tion users and managers is a straightforward use; modelingthe daily interactions of such agents together with the wa-ter fluxes is still in development, but promises better under-standing of irrigation systems as anthropogenic landscapes.Those landscapes are the result of many individual activities– on their own or within entities like households and socialgroups – within the physical boundaries (hydraulic and hy-drological) of the irrigated areas (Ertsen, 2012a, b).
Agent-based models have been applied successfully inrain-fed agriculture. Although far from being simple, rain-fall can be assumed to be available for all agents: actionsby agents do not affect water availability of other agents. Inmost studies on irrigation systems, an analogue reasoning isimplicitly assumed: water availability is an input just like rainfrom the sky. For example, Altaweel (2008) concluded that innorthern Mesopotamia irrigation promoted stable yields. Hedoes, however, represent water availability as a 150 mm wa-ter gift, as if the water came out of the sky like rain. There isno guarantee, however, that the irrigation system could actu-ally deliver water equally to all farmers, for hydraulic and/orsocial reasons. Compared to rain-fed agriculture, irrigationis complex, with extra feedbacks between environment andhumans. This requires detailed understanding of daily reali-ties in irrigation. Water availability along canals is a result ofhuman agency – including stealing, struggle and cooperation– affecting actual flows through time and space, and cannotbe assumed to be equal. This makes agent-based modeling inirrigation a major challenge.
To use ABM in understanding how socio-hydrological re-ality emerges from purposeful, (un)coordinated activities ofindividuals and small groups in irrigation systems, a funda-mental issue related to human action needs to be solved: thetime step in the analysis. This may seem a trivial model-ing question, but is actually a fundamental one for humanagency. Assume a canal with a user taking water and thenclosing his gate. This causes a changing water flow to a userdownstream, who may not want this extra water and closeshis own gate. Actions of this upstream user cause – throughactions of a downstream user – changing situations upstream.If this took only a few hours, analysis based on a time step of1 day misses this action-reaction. However, social relationsbetween users may be ruined: “If you steal my water today,I will hate you tomorrow”. Or, to put it more politely: “Imay not want to maintain the canal in cooperation with younext month or year”. If this is our concern, then arguably weshould not explain how irrigation-based societies collapsed
after centuries or even millennia, but why these societies didnot collapse each and every day.
Irrigation systems are highly dynamic systems, andhuman-induced patterns in irrigation are often idiosyncraticand unpredictable. However, they can be studied systemati-cally. In recent work, Ertsen (2010, 2012a, b) shows how in-teractions between humans, hydrology and hydraulics withinirrigation systems create patterns of water use, and pro-vides the basic modeling methodology to study these interac-tions. This approach is explicitly based on the physical pro-cesses creating surface and subsurface water fluxes. Substan-tial progress can be made by including a detailed analysisof material conditions and changes related to human agency,especially accounting for the new material conditions of ir-rigation systems created by human actions. Human agencymay be restricted by material conditions of an irrigation sys-tem, with certain actions not possible or more difficult toachieve, but in reality humans still make the key decisions inwater allocation, system management and irrigation develop-ment. Human agency, hydrological processes and hydraulicvariables create irrigation together. Combined modeling ofdaily interactions between human agency and water fluxeswill increase our understanding of irrigation systems as an-thropogenic landscapes, and how they emerge from socio-economic and environmental contexts.
Our discussion here presents three archaeological views ofcomponents of an irrigation system. Our examples are drawnfrom studies in the semi-arid American Southwest (Arizona),where irrigation has allowed farmers to cope with environ-mental constraints and grow crops for more than two millen-nia. The three views are presented as examples of long-term,medium-term, and short-term scales as revealed through ar-chaeology and related studies. Ideally we would present asingle, integrated picture that covers a single, unified exam-ple. In fact, the examples we choose here, though related,are separate. The progress of archaeological research couldeventually provide a unified and complete picture of the en-tire region, but for now we present them as examples – in-cluding their methodological details – to support our con-tention that an integrated view is both possible and necessaryfor the rich understanding we seek of how irrigation systems,including the social relationships and institutions that arisefrom and support them, are shaped – or, better, are made andcontinually re-made via human agency – through time.
3 Climate reconstructions: the archaeologicallong-term view
Irrigation systems are situated in a specific hydrological en-vironment. In this paper, we focus on the desert environ-ment of central and southern Arizona, an area rich in di-verse plant life (Fish, 1989) that supported some of thelargest irrigation works in the prehistoric New World. TheHohokam society, that persisted for a millennium between
www.hydrol-earth-syst-sci.net/18/1369/2014/ Hydrol. Earth Syst. Sci., 18, 1369–1382, 2014
1372 M. W. Ertsen et al.: A journey of a thousand miles begins with one small step
AD 450 and 1450 (Bayman, 2001; Fish and Fish, 2007;Gumerman, 1991), built extensive canals that drew waterfrom the Gila River (and its tributaries) and the Salt Riverin central Arizona and the Santa Cruz River in Southern Ari-zona. Archaeological research on these canals has been ex-tensive, but has focused on more readily available informa-tion about large-scale canal networks, their organization andthe paleo-environmental signature they record (e.g., Howard,1993; Howard and Huckleberry, 1991). Investigation intothe day-to-day operation of these systems at the field levelhas been limited or drawn from abstract scenarios (Murphy,2009, 2012) rather than archaeological data, which have notpreviously been available. Below we will discuss what datasets are available and how these could be used for the de-tailed, short-term modeling efforts we propose.
We start with climatic issues. Irrigation is an attempt tomodify the hydrological cycle and change its direct impact;the short-term impacts on irrigation and nature of hydrolog-ical features are important to consider when studying irriga-tion management. One of the challenges of doing so is todetermine the variability of hydrological features like tem-perature and available moisture. In other words, how do weobtain a similar record of climatic variability as the mea-surements we have today? As an illustration of how a use-able paleoclimatic data set can be achieved, we calculatedthe monthly temperature/precipitation in our (lowland) studyarea in Arizona. We used reconstructed climatic data basedon tree rings, of the kind that archaeologists in the US South-west have been building for decades. Climate reconstructionsbased on tree-ring proxy records have been considerably uti-lized, in large part because of their relatively high resolutionand reliability (Kohler, 2012).
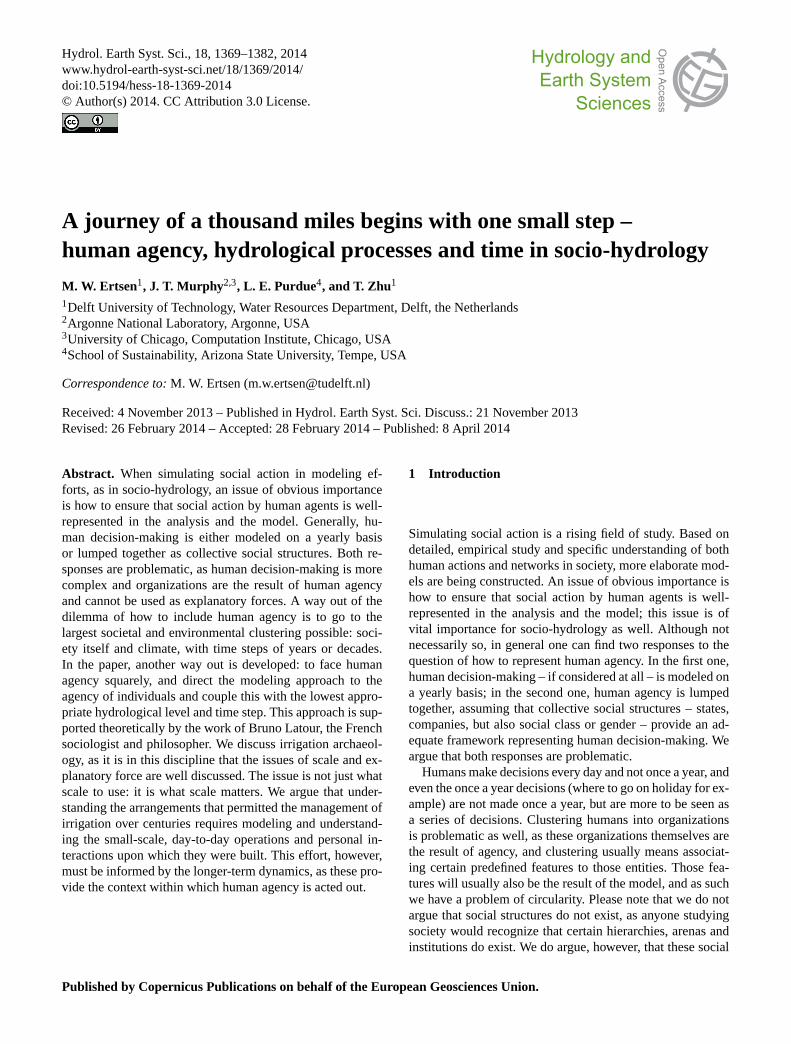
In the selection of potential tree-ring indexed series, weconsidered four principles: (1) the tree-ring sites should berelatively close to the study area; (2) the tree ring should bedistinctively sensitive to climatic variables (temperature andprecipitation); (3) the data set should cover the main periodone is interested in (which would be AD 450–1450 for themain Hohokam period); (4) and the data set should correlatewith the study area. Based on the first three principles, weselected the data from Salzer and Kipfmueller (2005), whichcover annual precipitation (in October–July) for a 1425 yearperiod (AD 570–1994) and annual mean-maximum tempera-ture for a 2262 year period (AD 250 BC–1997), based on cal-ibrated precipitation series with data from NOAA ClimateDivision 2 (CD2) and temperature series with data from FortValley research station. There are three tree-ring chronolo-gies in the lower forest border of Arizona (Flagstaff, Canyonde Chelly, and Navajo Mountain) being used for precipitationreconstruction and one in San Francisco Peaks in northernArizona (Flagstaff) for temperature reconstruction, as shownin Fig. 1.
We were able to meet the fourth principle by linkingthe monthly observed data in the lowlands and the differ-ence/ratio between yearly reconstructed tree-ring data and
26
Figures 746
747
Figure 1 Location of sites in Arizona for which tree-ring chronology is available 748
749
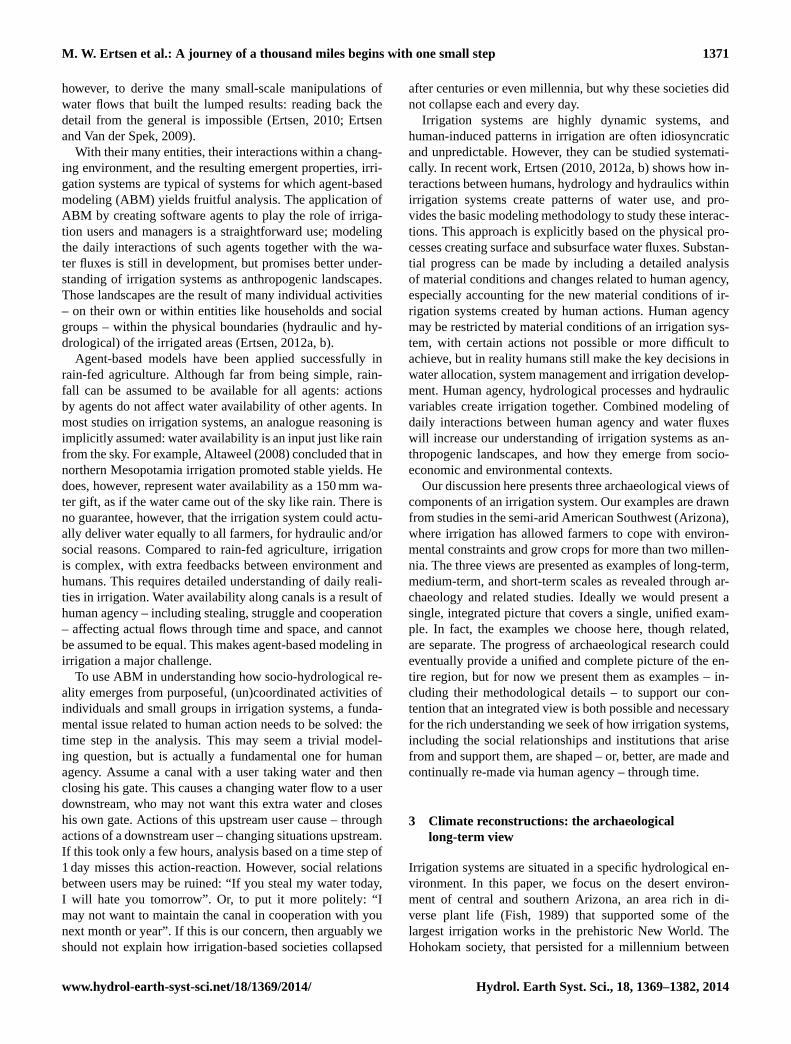
Figure 2 Statistical analysis on tree sites between observed and reconstructed temperatures 750
and precipitation, as well as observed data between tree sites and study area (data sources: 751
NOAA) 752
Fig. 1. Location of sites in Arizona for which tree-ring chronologyis available.
yearly observed data in the uplands. We assumed this a fea-sible approach as climate variability in upland and lowlandArizona are highly correlated. Obviously, we have to assumethat climatic variability has not changed over time, to be ableto include the observed data in the analysis. At the moment,there seems to be no way out of this assumption. Further-more, the 1000 years of tree-ring data series shows no evi-dence indicating climate changes in the uplands. Using thisapproach, two issues need to be dealt with: the altitudes ofthe tree sites, and the timescale of the data (see also Ni et al.,2002).
Starting with the first issue, the tree sites used for tree-ring-based analysis and our Hohokam irrigated area are noton the same altitude. All tree-ring sites are located at a highaltitude of above 2000 m, while the Hohokam area is situatedaround 450 m a.s.l. (above sea level). Associated with thisis the climatic zoning: tree-ring sites are found in the CD2zone, characterized by low temperatures and relatively sub-stantial rainfall, whereas the Hohokam main area is withinthe CD6 zone, with a hot and dry climate. We basically used astraightforward correlation between temperature and rainfallfor the two zones to reconstruct the annual data for the low-land area (Fig. 2). Precipitation data from zone CD6 and tem-perature data from Chandler Heights in the same area wereused as reference data. We then correlated tree-ring precipita-tion data between zones CD6 and CD2 and temperature databetween Chandler Heights and Fort valley. The correlationcoefficientr for temperature was 0.99, which was higher thanthe coefficient for precipitation of 0.83. We concluded thatboth rainfall and temperature in our study area were stronglycorrelated with data from the tree site zone.
The second issue of timescale related to the need to havea time series of rainfall and temperature data at a finerscale than the annual tree-ring chronologies (based on the
Hydrol. Earth Syst. Sci., 18, 1369–1382, 2014 www.hydrol-earth-syst-sci.net/18/1369/2014/
M. W. Ertsen et al.: A journey of a thousand miles begins with one small step 1373
Fig. 2. Statistical analysis on tree sites between observed and re-constructed temperatures and precipitation, as well as observed databetween tree sites and study area (data sources: NOAA).
October–July season). In order to allow using climatic dataon a meaningful scale to simulate crop productivity and wa-ter use, data on at least a monthly scale are required. As such,we needed to downscale the annual data into that of monthly-scale. For this downscaling, we used the climate factor (CF)method (Chen et al., 2011), which adjusts observed time se-ries by adding the difference (for temperature) or multiplyingthe ratio (for precipitation) between future and present cli-mates. One of the advantages of the CF method is its straight-forward application. Most CF methods are used for forecast-ing climatic variables, by computing the changes between abaseline and future scenario. For our own historical applica-tion, we modified the equations slightly by linking the changefactors that are between reconstructed tree-ring data and up-land observed data. As such, the CF method could take intoaccount climatic differences between high and low altitudes,by linking climate variability at high altitudes to the same inthe lowland, along the equations shown below.
Tdow,stu,m= Tobs,Cha,m+(T recon.,y− T obs,Fort,y
)Pdow,stu,m= Pobs,CD6,m×
(P recon.,y/P obs,CD2,y
)Tdow,stu,m is the downscaled monthly temperature for thestudy area.Tobs,Cha,mis the observed monthly temperatureat Chandler Heights in the reference period.T recon.,y is thereconstructed yearly temperature based on tree-ring data.T obs,Fort,y is the observed yearly temperature at Fort ValleyStation in the reference period.Pdow,stu,mis the downscaledmonthly precipitation for the study area.Pobs,CD6,mis the ob-served monthly temperature for CD6 in the reference period.P recon.,y is the tree-ring reconstructed yearly temperature.
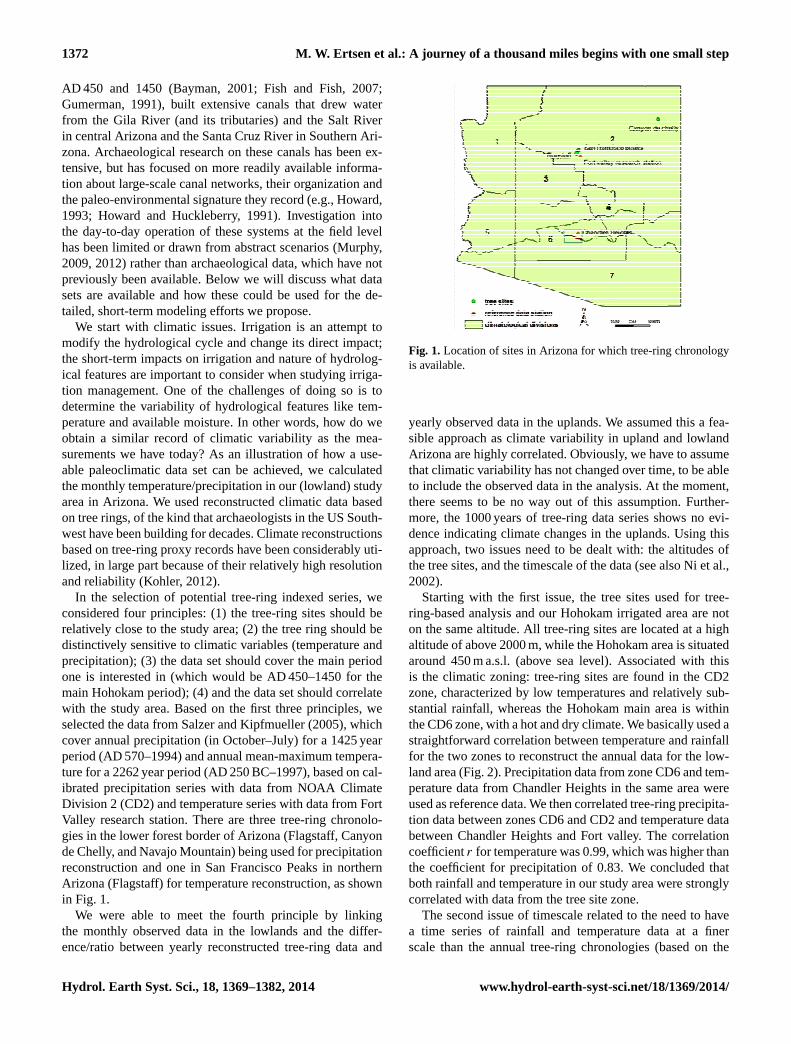
Fig. 3.Statistical validation of reconstructed temperatures based onthe correlation between simulated and observed temperatures.
P obs,CD2,yis the observed yearly temperature for CD2 in thereference period.
The observed monthly data from our study area (Chan-dler Heights and CD6) were used as adjusting data. Thereference periods cover 50 years for both precipitation (ca.1896–1945) and temperature (ca. 1909–1958). The adjust-ing series are randomly selected from the reference pe-riod. On the corresponding period, the difference or ratiobetween reconstruction and observation data of tree sitesare calculated and given to the adjusting series. Figure 3shows a high positive correlation (r) between simulationsand observations. The validation reduction of error statis-tic (RE) reaches 0.885 and 0.915 in mean-minimum tem-perature and mean-maximum temperature, respectively. Thehigh positive value indicates that the model performs a goodreconstruction for the whole simulation period, and betterthan in the calibration period. The root mean square differ-ences (RMSD) between simulation and observation are 2.34and 2.58, respectively.
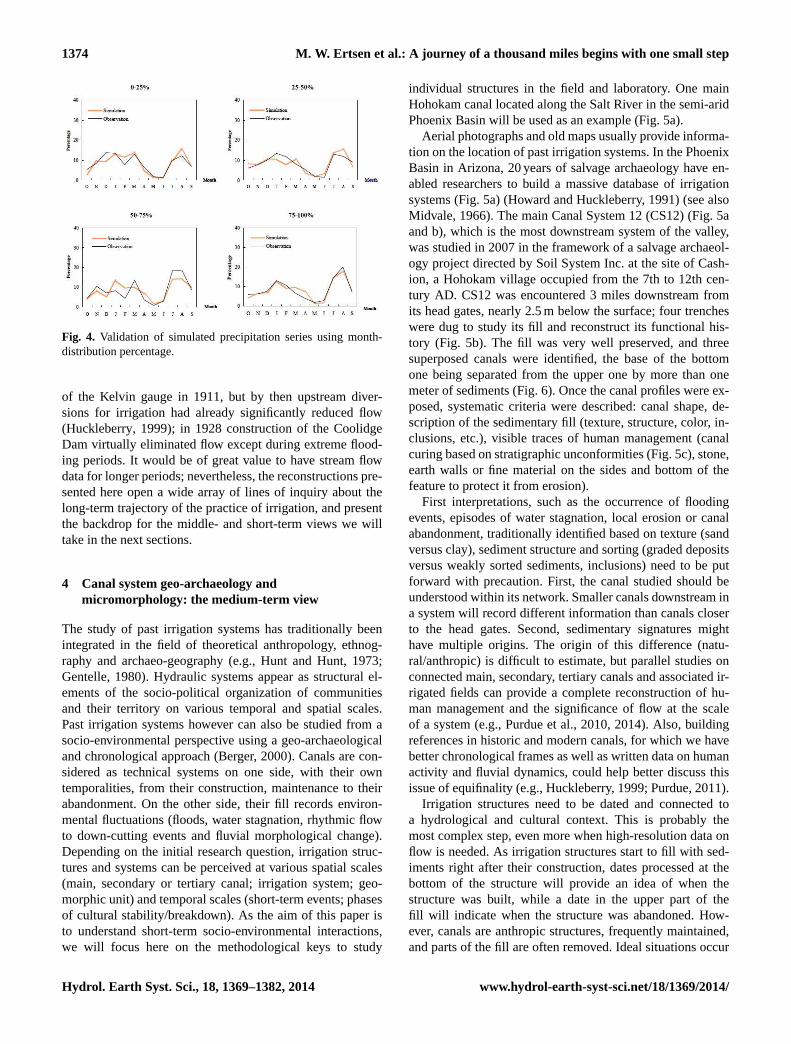
The simulated series of precipitation were validated bycomparing its month-distribution percentage with the obser-vations for the same percentage. Both measured and simu-lated series from 1896 to 1987 were classified into 4 binsaccording to the water-year precipitation of 0–25, 25–50, 50–75, and 75–100 %. Then, the proportions of each month’sprecipitation within the whole year were calculated for ob-servation and simulation, respectively. Finally we comparedthose percentages for simulation and observation. Figure 4suggests the downscaled methodology basically represents agood match for the rainfall frequencies of 0–25 and 25–50 %.For the 50–75 % category, representation in January, Febru-ary, July and August is less good. During dry years (75–100 %), the model performed very well over the whole year.In general, the model captured the precipitation frequency atmonthly scale well.
We would, of course, like to pursue this picture into evenfiner detail; this is especially true because the Gila Riverwas rather complex (see Graybill et al., 2006). A next stepwould be to link stream flow in the Gila River to the rain-fall data. Unfortunately, the data needed to support this arelacking: direct flow data exist beginning with the installation
www.hydrol-earth-syst-sci.net/18/1369/2014/ Hydrol. Earth Syst. Sci., 18, 1369–1382, 2014
1374 M. W. Ertsen et al.: A journey of a thousand miles begins with one small step
27
753
Figure 3 Statistical validation of reconstructed temperatures based on the correlation between 754
simulated and observed temperatures 755
756
Figure 4 Validation of simulated precipitation series suing month-distribution percentage 757
Fig. 4. Validation of simulated precipitation series using month-distribution percentage.
of the Kelvin gauge in 1911, but by then upstream diver-sions for irrigation had already significantly reduced flow(Huckleberry, 1999); in 1928 construction of the CoolidgeDam virtually eliminated flow except during extreme flood-ing periods. It would be of great value to have stream flowdata for longer periods; nevertheless, the reconstructions pre-sented here open a wide array of lines of inquiry about thelong-term trajectory of the practice of irrigation, and presentthe backdrop for the middle- and short-term views we willtake in the next sections.
4 Canal system geo-archaeology andmicromorphology: the medium-term view
The study of past irrigation systems has traditionally beenintegrated in the field of theoretical anthropology, ethnog-raphy and archaeo-geography (e.g., Hunt and Hunt, 1973;Gentelle, 1980). Hydraulic systems appear as structural el-ements of the socio-political organization of communitiesand their territory on various temporal and spatial scales.Past irrigation systems however can also be studied from asocio-environmental perspective using a geo-archaeologicaland chronological approach (Berger, 2000). Canals are con-sidered as technical systems on one side, with their owntemporalities, from their construction, maintenance to theirabandonment. On the other side, their fill records environ-mental fluctuations (floods, water stagnation, rhythmic flowto down-cutting events and fluvial morphological change).Depending on the initial research question, irrigation struc-tures and systems can be perceived at various spatial scales(main, secondary or tertiary canal; irrigation system; geo-morphic unit) and temporal scales (short-term events; phasesof cultural stability/breakdown). As the aim of this paper isto understand short-term socio-environmental interactions,we will focus here on the methodological keys to study
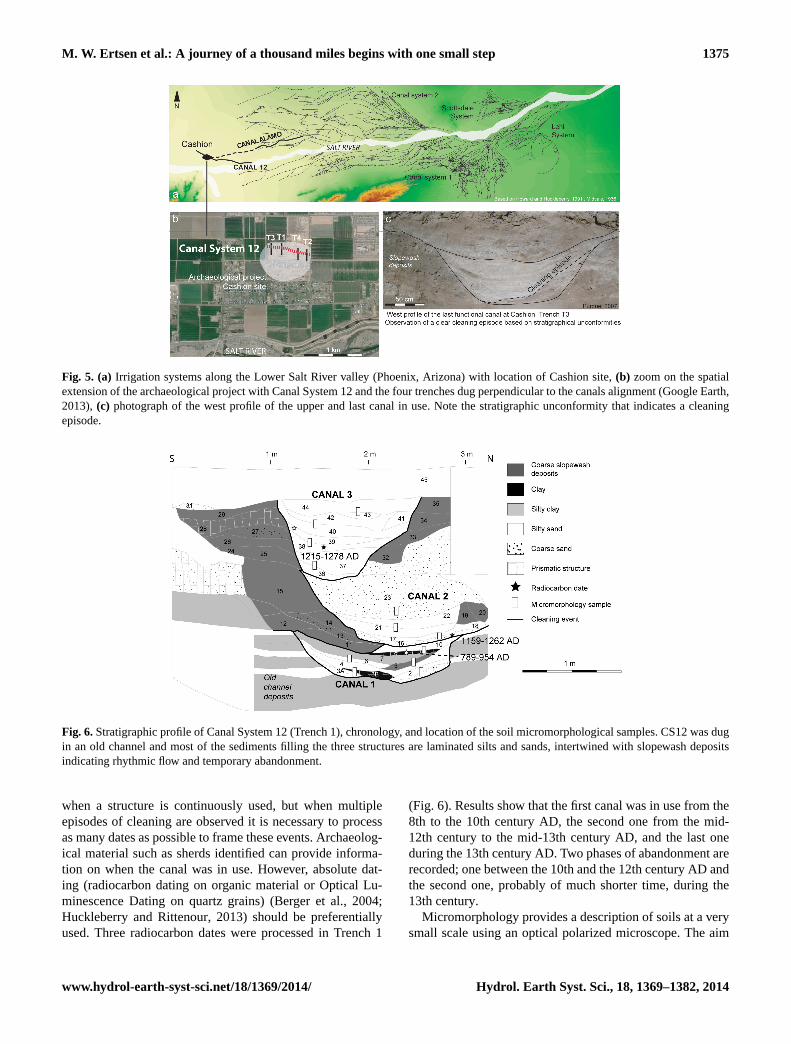
individual structures in the field and laboratory. One mainHohokam canal located along the Salt River in the semi-aridPhoenix Basin will be used as an example (Fig. 5a).
Aerial photographs and old maps usually provide informa-tion on the location of past irrigation systems. In the PhoenixBasin in Arizona, 20 years of salvage archaeology have en-abled researchers to build a massive database of irrigationsystems (Fig. 5a) (Howard and Huckleberry, 1991) (see alsoMidvale, 1966). The main Canal System 12 (CS12) (Fig. 5aand b), which is the most downstream system of the valley,was studied in 2007 in the framework of a salvage archaeol-ogy project directed by Soil System Inc. at the site of Cash-ion, a Hohokam village occupied from the 7th to 12th cen-tury AD. CS12 was encountered 3 miles downstream fromits head gates, nearly 2.5 m below the surface; four trencheswere dug to study its fill and reconstruct its functional his-tory (Fig. 5b). The fill was very well preserved, and threesuperposed canals were identified, the base of the bottomone being separated from the upper one by more than onemeter of sediments (Fig. 6). Once the canal profiles were ex-posed, systematic criteria were described: canal shape, de-scription of the sedimentary fill (texture, structure, color, in-clusions, etc.), visible traces of human management (canalcuring based on stratigraphic unconformities (Fig. 5c), stone,earth walls or fine material on the sides and bottom of thefeature to protect it from erosion).
First interpretations, such as the occurrence of floodingevents, episodes of water stagnation, local erosion or canalabandonment, traditionally identified based on texture (sandversus clay), sediment structure and sorting (graded depositsversus weakly sorted sediments, inclusions) need to be putforward with precaution. First, the canal studied should beunderstood within its network. Smaller canals downstream ina system will record different information than canals closerto the head gates. Second, sedimentary signatures mighthave multiple origins. The origin of this difference (natu-ral/anthropic) is difficult to estimate, but parallel studies onconnected main, secondary, tertiary canals and associated ir-rigated fields can provide a complete reconstruction of hu-man management and the significance of flow at the scaleof a system (e.g., Purdue et al., 2010, 2014). Also, buildingreferences in historic and modern canals, for which we havebetter chronological frames as well as written data on humanactivity and fluvial dynamics, could help better discuss thisissue of equifinality (e.g., Huckleberry, 1999; Purdue, 2011).
Irrigation structures need to be dated and connected toa hydrological and cultural context. This is probably themost complex step, even more when high-resolution data onflow is needed. As irrigation structures start to fill with sed-iments right after their construction, dates processed at thebottom of the structure will provide an idea of when thestructure was built, while a date in the upper part of thefill will indicate when the structure was abandoned. How-ever, canals are anthropic structures, frequently maintained,and parts of the fill are often removed. Ideal situations occur
Hydrol. Earth Syst. Sci., 18, 1369–1382, 2014 www.hydrol-earth-syst-sci.net/18/1369/2014/
M. W. Ertsen et al.: A journey of a thousand miles begins with one small step 1375
Fig. 5. (a) Irrigation systems along the Lower Salt River valley (Phoenix, Arizona) with location of Cashion site,(b) zoom on the spatialextension of the archaeological project with Canal System 12 and the four trenches dug perpendicular to the canals alignment (Google Earth,2013),(c) photograph of the west profile of the upper and last canal in use. Note the stratigraphic unconformity that indicates a cleaningepisode.
Fig. 6.Stratigraphic profile of Canal System 12 (Trench 1), chronology, and location of the soil micromorphological samples. CS12 was dugin an old channel and most of the sediments filling the three structures are laminated silts and sands, intertwined with slopewash depositsindicating rhythmic flow and temporary abandonment.
when a structure is continuously used, but when multipleepisodes of cleaning are observed it is necessary to processas many dates as possible to frame these events. Archaeolog-ical material such as sherds identified can provide informa-tion on when the canal was in use. However, absolute dat-ing (radiocarbon dating on organic material or Optical Lu-minescence Dating on quartz grains) (Berger et al., 2004;Huckleberry and Rittenour, 2013) should be preferentiallyused. Three radiocarbon dates were processed in Trench 1
(Fig. 6). Results show that the first canal was in use from the8th to the 10th century AD, the second one from the mid-12th century to the mid-13th century AD, and the last oneduring the 13th century AD. Two phases of abandonment arerecorded; one between the 10th and the 12th century AD andthe second one, probably of much shorter time, during the13th century.
Micromorphology provides a description of soils at a verysmall scale using an optical polarized microscope. The aim
www.hydrol-earth-syst-sci.net/18/1369/2014/ Hydrol. Earth Syst. Sci., 18, 1369–1382, 2014
1376 M. W. Ertsen et al.: A journey of a thousand miles begins with one small step
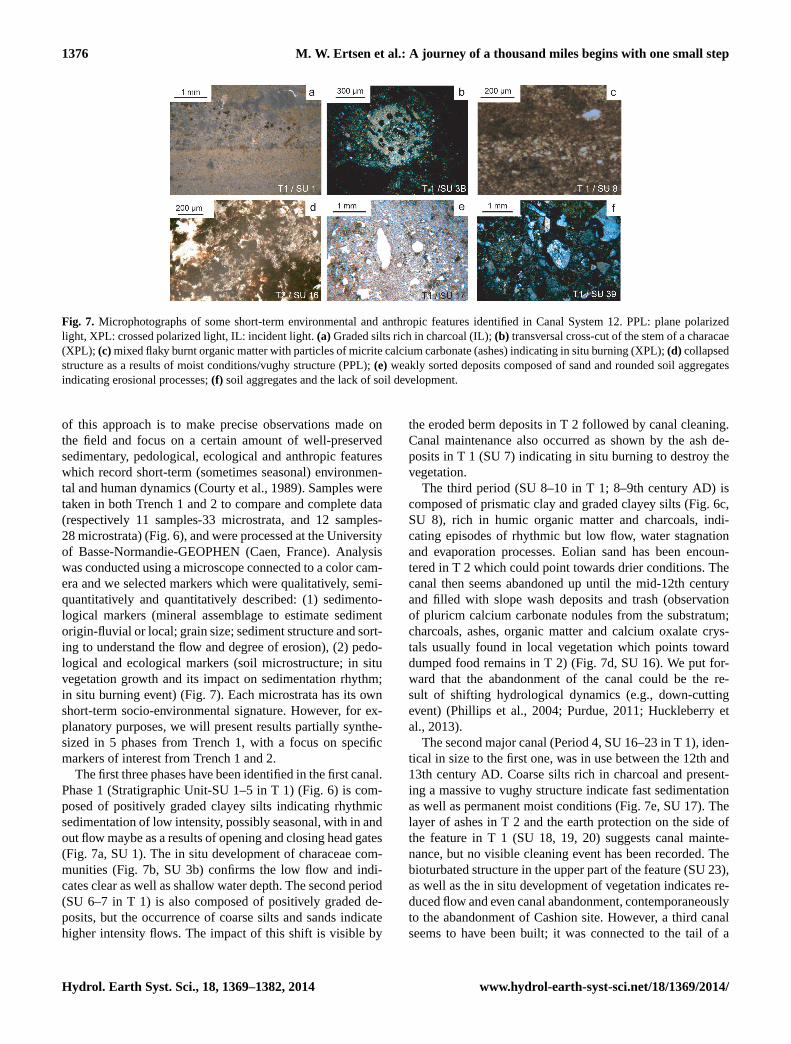
Fig. 7. Microphotographs of some short-term environmental and anthropic features identified in Canal System 12. PPL: plane polarizedlight, XPL: crossed polarized light, IL: incident light.(a) Graded silts rich in charcoal (IL);(b) transversal cross-cut of the stem of a characae(XPL); (c) mixed flaky burnt organic matter with particles of micrite calcium carbonate (ashes) indicating in situ burning (XPL);(d) collapsedstructure as a results of moist conditions/vughy structure (PPL);(e) weakly sorted deposits composed of sand and rounded soil aggregatesindicating erosional processes;(f) soil aggregates and the lack of soil development.
of this approach is to make precise observations made onthe field and focus on a certain amount of well-preservedsedimentary, pedological, ecological and anthropic featureswhich record short-term (sometimes seasonal) environmen-tal and human dynamics (Courty et al., 1989). Samples weretaken in both Trench 1 and 2 to compare and complete data(respectively 11 samples-33 microstrata, and 12 samples-28 microstrata) (Fig. 6), and were processed at the Universityof Basse-Normandie-GEOPHEN (Caen, France). Analysiswas conducted using a microscope connected to a color cam-era and we selected markers which were qualitatively, semi-quantitatively and quantitatively described: (1) sedimento-logical markers (mineral assemblage to estimate sedimentorigin-fluvial or local; grain size; sediment structure and sort-ing to understand the flow and degree of erosion), (2) pedo-logical and ecological markers (soil microstructure; in situvegetation growth and its impact on sedimentation rhythm;in situ burning event) (Fig. 7). Each microstrata has its ownshort-term socio-environmental signature. However, for ex-planatory purposes, we will present results partially synthe-sized in 5 phases from Trench 1, with a focus on specificmarkers of interest from Trench 1 and 2.
The first three phases have been identified in the first canal.Phase 1 (Stratigraphic Unit-SU 1–5 in T 1) (Fig. 6) is com-posed of positively graded clayey silts indicating rhythmicsedimentation of low intensity, possibly seasonal, with in andout flow maybe as a results of opening and closing head gates(Fig. 7a, SU 1). The in situ development of characeae com-munities (Fig. 7b, SU 3b) confirms the low flow and indi-cates clear as well as shallow water depth. The second period(SU 6–7 in T 1) is also composed of positively graded de-posits, but the occurrence of coarse silts and sands indicatehigher intensity flows. The impact of this shift is visible by
the eroded berm deposits in T 2 followed by canal cleaning.Canal maintenance also occurred as shown by the ash de-posits in T 1 (SU 7) indicating in situ burning to destroy thevegetation.
The third period (SU 8–10 in T 1; 8–9th century AD) iscomposed of prismatic clay and graded clayey silts (Fig. 6c,SU 8), rich in humic organic matter and charcoals, indi-cating episodes of rhythmic but low flow, water stagnationand evaporation processes. Eolian sand has been encoun-tered in T 2 which could point towards drier conditions. Thecanal then seems abandoned up until the mid-12th centuryand filled with slope wash deposits and trash (observationof pluricm calcium carbonate nodules from the substratum;charcoals, ashes, organic matter and calcium oxalate crys-tals usually found in local vegetation which points towarddumped food remains in T 2) (Fig. 7d, SU 16). We put for-ward that the abandonment of the canal could be the re-sult of shifting hydrological dynamics (e.g., down-cuttingevent) (Phillips et al., 2004; Purdue, 2011; Huckleberry etal., 2013).
The second major canal (Period 4, SU 16–23 in T 1), iden-tical in size to the first one, was in use between the 12th and13th century AD. Coarse silts rich in charcoal and present-ing a massive to vughy structure indicate fast sedimentationas well as permanent moist conditions (Fig. 7e, SU 17). Thelayer of ashes in T 2 and the earth protection on the side ofthe feature in T 1 (SU 18, 19, 20) suggests canal mainte-nance, but no visible cleaning event has been recorded. Thebioturbated structure in the upper part of the feature (SU 23),as well as the in situ development of vegetation indicates re-duced flow and even canal abandonment, contemporaneouslyto the abandonment of Cashion site. However, a third canalseems to have been built; it was connected to the tail of a
Hydrol. Earth Syst. Sci., 18, 1369–1382, 2014 www.hydrol-earth-syst-sci.net/18/1369/2014/
M. W. Ertsen et al.: A journey of a thousand miles begins with one small step 1377
canal belonging to Canal System 2, Canal Alamo (Fig. 7a).In use during the 13th century, this canal is much smallerin size and is filled with graded as well as weakly sortedcoarse silts to sands. The occurrence of soil aggregates andthe lack of soil development is an indicator of fast sedimen-tation, contrasted conditions (rhythmic sedimentation versuspossible flooding events) and soil erosion during that period(Fig. 7f, SU 39). The canal is cleaned at least once. Its upperpart is composed of coarse silts with a sub-angular structuresuggesting post-abandonment flood deposits.
This detailed analysis suggests that the fill of CS12 ismainly characterized by rhythmic deposition, despite it be-ing the most downstream system in the lower Salt River val-ley, with low flows around the 8–9th century AD, and moreintense and erosive flows between the 12th and 13th cen-tury AD. Two interesting events have been recorded. Thefirst one is the canal abandonment during the Sedentary Pe-riod, when massive flooding, widening and down-cutting oc-curred in the lower Salt River valley (Purdue, 2011; Phillipset al., 2004; Onken et al., 2004; Huckleberry et al., 2013).The second one is its connection to Canal System 2 af-ter that, suggesting difficulties in diverting water in down-stream systems, but cooperation to actually connect inde-pendent irrigation systems. The observation of ash deposits,cleaning events and lateral protection structure were part ofthe regular maintenance. From a methodological standpoint,the geo-archaeological approach provides very precise in-formation on short-term to middle-term environmental con-ditions in past irrigation canals. This information can helpto conduct better simulations on irrigation system manage-ment (e.g., change in slope through time; evolution of flowin main, distribution and lateral canals; irrigation manage-ment in fields). Systematic studies allow for the creation of atypology of canal fills and will provide local to regional datato help validate agent-based models.
5 Reconstructing irrigation at Las Capas: theshort-term view
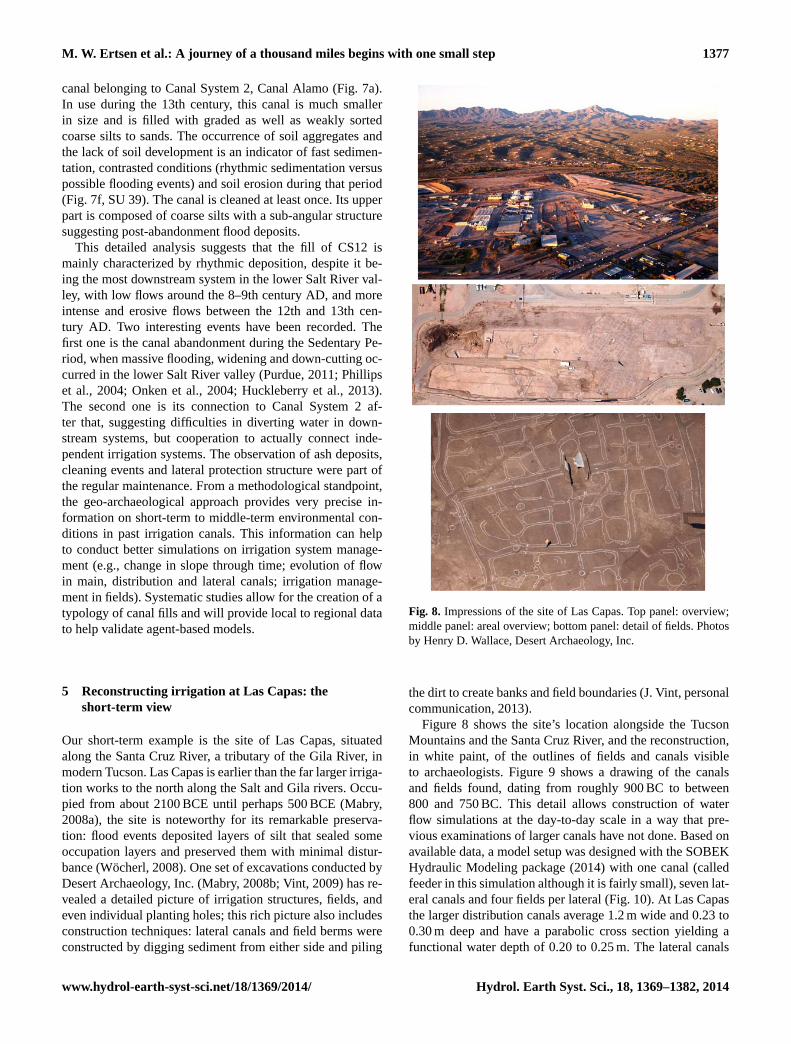
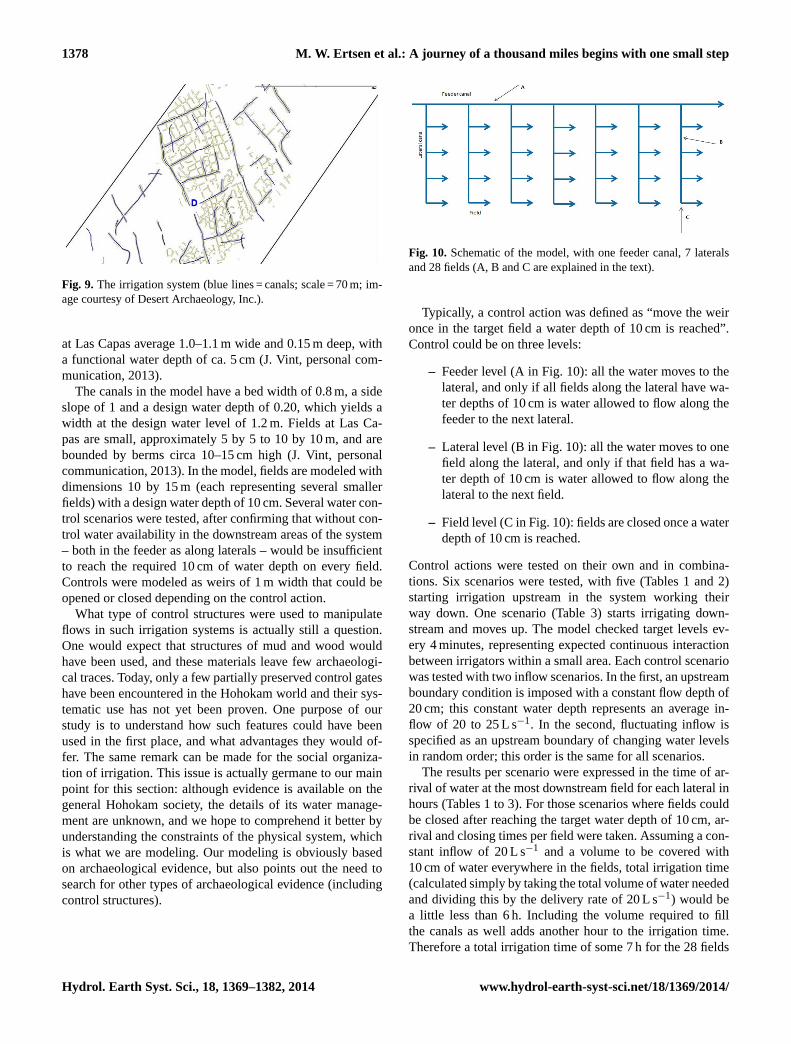
Our short-term example is the site of Las Capas, situatedalong the Santa Cruz River, a tributary of the Gila River, inmodern Tucson. Las Capas is earlier than the far larger irriga-tion works to the north along the Salt and Gila rivers. Occu-pied from about 2100 BCE until perhaps 500 BCE (Mabry,2008a), the site is noteworthy for its remarkable preserva-tion: flood events deposited layers of silt that sealed someoccupation layers and preserved them with minimal distur-bance (Wöcherl, 2008). One set of excavations conducted byDesert Archaeology, Inc. (Mabry, 2008b; Vint, 2009) has re-vealed a detailed picture of irrigation structures, fields, andeven individual planting holes; this rich picture also includesconstruction techniques: lateral canals and field berms wereconstructed by digging sediment from either side and piling
Fig. 8. Impressions of the site of Las Capas. Top panel: overview;middle panel: areal overview; bottom panel: detail of fields. Photosby Henry D. Wallace, Desert Archaeology, Inc.
the dirt to create banks and field boundaries (J. Vint, personalcommunication, 2013).
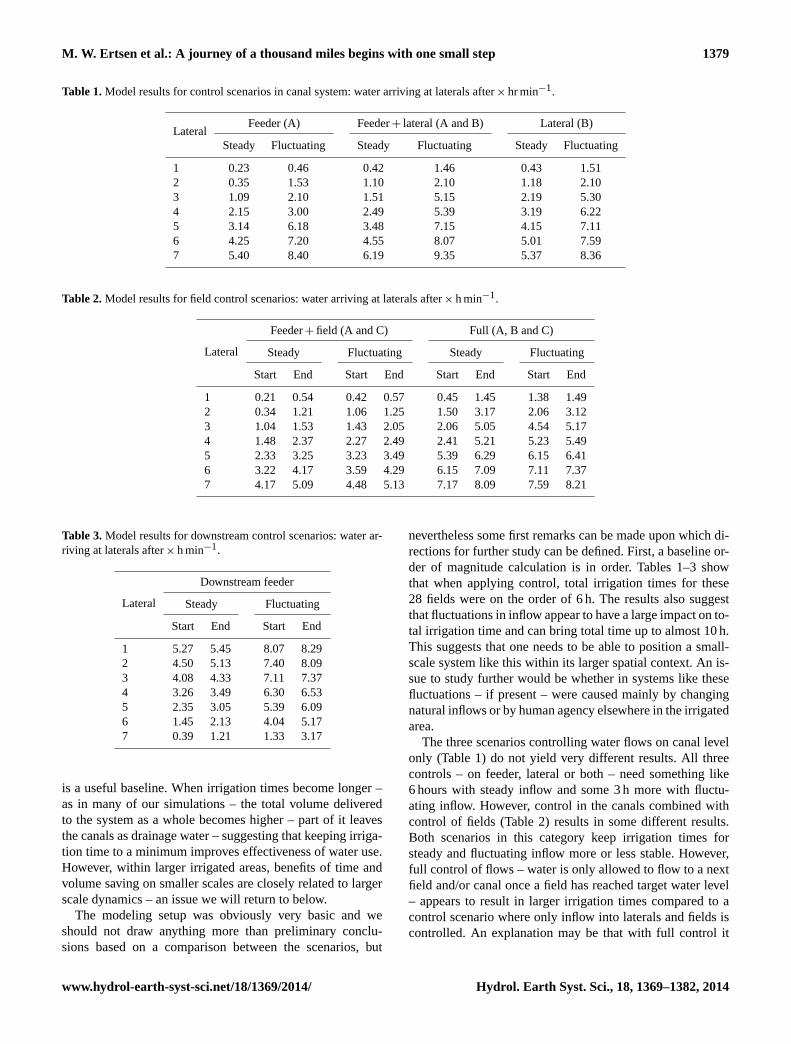
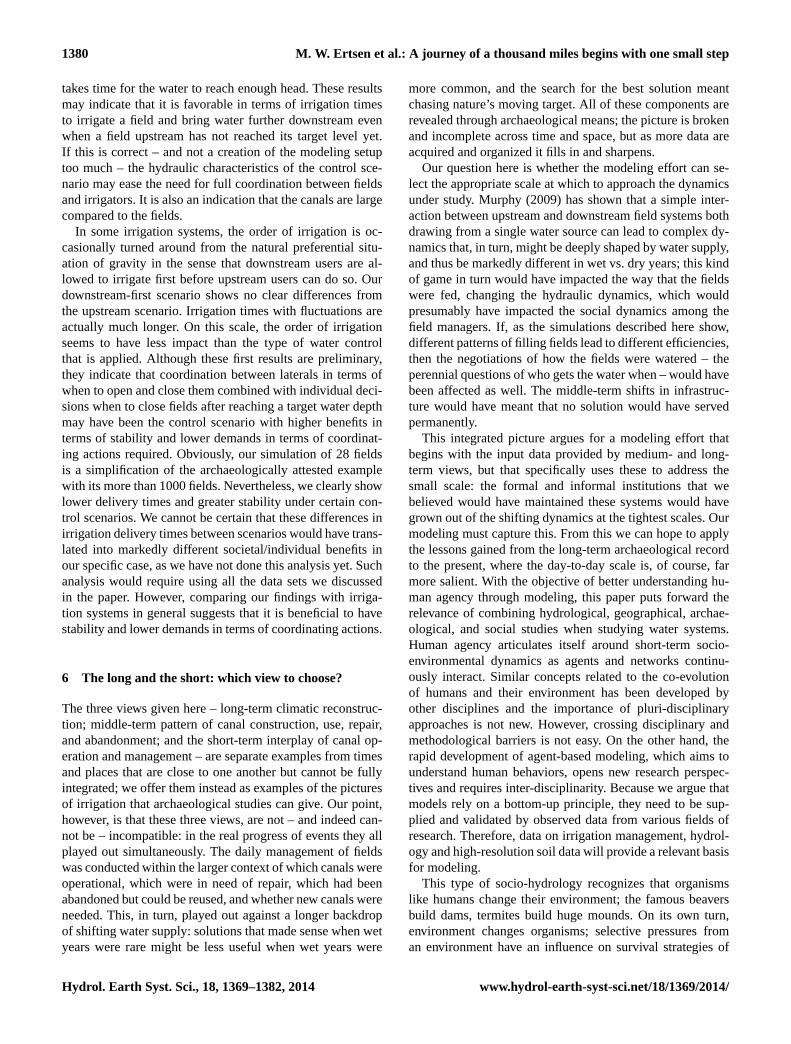
Figure 8 shows the site’s location alongside the TucsonMountains and the Santa Cruz River, and the reconstruction,in white paint, of the outlines of fields and canals visibleto archaeologists. Figure 9 shows a drawing of the canalsand fields found, dating from roughly 900 BC to between800 and 750 BC. This detail allows construction of waterflow simulations at the day-to-day scale in a way that pre-vious examinations of larger canals have not done. Based onavailable data, a model setup was designed with the SOBEKHydraulic Modeling package (2014) with one canal (calledfeeder in this simulation although it is fairly small), seven lat-eral canals and four fields per lateral (Fig. 10). At Las Capasthe larger distribution canals average 1.2 m wide and 0.23 to0.30 m deep and have a parabolic cross section yielding afunctional water depth of 0.20 to 0.25 m. The lateral canals
www.hydrol-earth-syst-sci.net/18/1369/2014/ Hydrol. Earth Syst. Sci., 18, 1369–1382, 2014
1378 M. W. Ertsen et al.: A journey of a thousand miles begins with one small step
Fig. 9. The irrigation system (blue lines = canals; scale = 70 m; im-age courtesy of Desert Archaeology, Inc.).
at Las Capas average 1.0–1.1 m wide and 0.15 m deep, witha functional water depth of ca. 5 cm (J. Vint, personal com-munication, 2013).
The canals in the model have a bed width of 0.8 m, a sideslope of 1 and a design water depth of 0.20, which yields awidth at the design water level of 1.2 m. Fields at Las Ca-pas are small, approximately 5 by 5 to 10 by 10 m, and arebounded by berms circa 10–15 cm high (J. Vint, personalcommunication, 2013). In the model, fields are modeled withdimensions 10 by 15 m (each representing several smallerfields) with a design water depth of 10 cm. Several water con-trol scenarios were tested, after confirming that without con-trol water availability in the downstream areas of the system– both in the feeder as along laterals – would be insufficientto reach the required 10 cm of water depth on every field.Controls were modeled as weirs of 1 m width that could beopened or closed depending on the control action.
What type of control structures were used to manipulateflows in such irrigation systems is actually still a question.One would expect that structures of mud and wood wouldhave been used, and these materials leave few archaeologi-cal traces. Today, only a few partially preserved control gateshave been encountered in the Hohokam world and their sys-tematic use has not yet been proven. One purpose of ourstudy is to understand how such features could have beenused in the first place, and what advantages they would of-fer. The same remark can be made for the social organiza-tion of irrigation. This issue is actually germane to our mainpoint for this section: although evidence is available on thegeneral Hohokam society, the details of its water manage-ment are unknown, and we hope to comprehend it better byunderstanding the constraints of the physical system, whichis what we are modeling. Our modeling is obviously basedon archaeological evidence, but also points out the need tosearch for other types of archaeological evidence (includingcontrol structures).
Fig. 10. Schematic of the model, with one feeder canal, 7 lateralsand 28 fields (A, B and C are explained in the text).
Typically, a control action was defined as “move the weironce in the target field a water depth of 10 cm is reached”.Control could be on three levels:
– Feeder level (A in Fig. 10): all the water moves to thelateral, and only if all fields along the lateral have wa-ter depths of 10 cm is water allowed to flow along thefeeder to the next lateral.
– Lateral level (B in Fig. 10): all the water moves to onefield along the lateral, and only if that field has a wa-ter depth of 10 cm is water allowed to flow along thelateral to the next field.
– Field level (C in Fig. 10): fields are closed once a waterdepth of 10 cm is reached.
Control actions were tested on their own and in combina-tions. Six scenarios were tested, with five (Tables 1 and 2)starting irrigation upstream in the system working theirway down. One scenario (Table 3) starts irrigating down-stream and moves up. The model checked target levels ev-ery 4 minutes, representing expected continuous interactionbetween irrigators within a small area. Each control scenariowas tested with two inflow scenarios. In the first, an upstreamboundary condition is imposed with a constant flow depth of20 cm; this constant water depth represents an average in-flow of 20 to 25 L s−1. In the second, fluctuating inflow isspecified as an upstream boundary of changing water levelsin random order; this order is the same for all scenarios.
The results per scenario were expressed in the time of ar-rival of water at the most downstream field for each lateral inhours (Tables 1 to 3). For those scenarios where fields couldbe closed after reaching the target water depth of 10 cm, ar-rival and closing times per field were taken. Assuming a con-stant inflow of 20 L s−1 and a volume to be covered with10 cm of water everywhere in the fields, total irrigation time(calculated simply by taking the total volume of water neededand dividing this by the delivery rate of 20 L s−1) would bea little less than 6 h. Including the volume required to fillthe canals as well adds another hour to the irrigation time.Therefore a total irrigation time of some 7 h for the 28 fields
Hydrol. Earth Syst. Sci., 18, 1369–1382, 2014 www.hydrol-earth-syst-sci.net/18/1369/2014/
M. W. Ertsen et al.: A journey of a thousand miles begins with one small step 1379
Table 1.Model results for control scenarios in canal system: water arriving at laterals after× hr min−1.
LateralFeeder (A) Feeder+ lateral (A and B) Lateral (B)
Steady Fluctuating Steady Fluctuating Steady Fluctuating
1 0.23 0.46 0.42 1.46 0.43 1.512 0.35 1.53 1.10 2.10 1.18 2.103 1.09 2.10 1.51 5.15 2.19 5.304 2.15 3.00 2.49 5.39 3.19 6.225 3.14 6.18 3.48 7.15 4.15 7.116 4.25 7.20 4.55 8.07 5.01 7.597 5.40 8.40 6.19 9.35 5.37 8.36
Table 2.Model results for field control scenarios: water arriving at laterals after× h min−1.
Lateral
Feeder+ field (A and C) Full (A, B and C)
Steady Fluctuating Steady Fluctuating
Start End Start End Start End Start End
1 0.21 0.54 0.42 0.57 0.45 1.45 1.38 1.492 0.34 1.21 1.06 1.25 1.50 3.17 2.06 3.123 1.04 1.53 1.43 2.05 2.06 5.05 4.54 5.174 1.48 2.37 2.27 2.49 2.41 5.21 5.23 5.495 2.33 3.25 3.23 3.49 5.39 6.29 6.15 6.416 3.22 4.17 3.59 4.29 6.15 7.09 7.11 7.377 4.17 5.09 4.48 5.13 7.17 8.09 7.59 8.21
Table 3.Model results for downstream control scenarios: water ar-riving at laterals after× h min−1.
Lateral
Downstream feeder
Steady Fluctuating
Start End Start End
1 5.27 5.45 8.07 8.292 4.50 5.13 7.40 8.093 4.08 4.33 7.11 7.374 3.26 3.49 6.30 6.535 2.35 3.05 5.39 6.096 1.45 2.13 4.04 5.177 0.39 1.21 1.33 3.17
is a useful baseline. When irrigation times become longer –as in many of our simulations – the total volume deliveredto the system as a whole becomes higher – part of it leavesthe canals as drainage water – suggesting that keeping irriga-tion time to a minimum improves effectiveness of water use.However, within larger irrigated areas, benefits of time andvolume saving on smaller scales are closely related to largerscale dynamics – an issue we will return to below.
The modeling setup was obviously very basic and weshould not draw anything more than preliminary conclu-sions based on a comparison between the scenarios, but
nevertheless some first remarks can be made upon which di-rections for further study can be defined. First, a baseline or-der of magnitude calculation is in order. Tables 1–3 showthat when applying control, total irrigation times for these28 fields were on the order of 6 h. The results also suggestthat fluctuations in inflow appear to have a large impact on to-tal irrigation time and can bring total time up to almost 10 h.This suggests that one needs to be able to position a small-scale system like this within its larger spatial context. An is-sue to study further would be whether in systems like thesefluctuations – if present – were caused mainly by changingnatural inflows or by human agency elsewhere in the irrigatedarea.
The three scenarios controlling water flows on canal levelonly (Table 1) do not yield very different results. All threecontrols – on feeder, lateral or both – need something like6 hours with steady inflow and some 3 h more with fluctu-ating inflow. However, control in the canals combined withcontrol of fields (Table 2) results in some different results.Both scenarios in this category keep irrigation times forsteady and fluctuating inflow more or less stable. However,full control of flows – water is only allowed to flow to a nextfield and/or canal once a field has reached target water level– appears to result in larger irrigation times compared to acontrol scenario where only inflow into laterals and fields iscontrolled. An explanation may be that with full control it
www.hydrol-earth-syst-sci.net/18/1369/2014/ Hydrol. Earth Syst. Sci., 18, 1369–1382, 2014
1380 M. W. Ertsen et al.: A journey of a thousand miles begins with one small step
takes time for the water to reach enough head. These resultsmay indicate that it is favorable in terms of irrigation timesto irrigate a field and bring water further downstream evenwhen a field upstream has not reached its target level yet.If this is correct – and not a creation of the modeling setuptoo much – the hydraulic characteristics of the control sce-nario may ease the need for full coordination between fieldsand irrigators. It is also an indication that the canals are largecompared to the fields.
In some irrigation systems, the order of irrigation is oc-casionally turned around from the natural preferential situ-ation of gravity in the sense that downstream users are al-lowed to irrigate first before upstream users can do so. Ourdownstream-first scenario shows no clear differences fromthe upstream scenario. Irrigation times with fluctuations areactually much longer. On this scale, the order of irrigationseems to have less impact than the type of water controlthat is applied. Although these first results are preliminary,they indicate that coordination between laterals in terms ofwhen to open and close them combined with individual deci-sions when to close fields after reaching a target water depthmay have been the control scenario with higher benefits interms of stability and lower demands in terms of coordinat-ing actions required. Obviously, our simulation of 28 fieldsis a simplification of the archaeologically attested examplewith its more than 1000 fields. Nevertheless, we clearly showlower delivery times and greater stability under certain con-trol scenarios. We cannot be certain that these differences inirrigation delivery times between scenarios would have trans-lated into markedly different societal/individual benefits inour specific case, as we have not done this analysis yet. Suchanalysis would require using all the data sets we discussedin the paper. However, comparing our findings with irriga-tion systems in general suggests that it is beneficial to havestability and lower demands in terms of coordinating actions.
6 The long and the short: which view to choose?
The three views given here – long-term climatic reconstruc-tion; middle-term pattern of canal construction, use, repair,and abandonment; and the short-term interplay of canal op-eration and management – are separate examples from timesand places that are close to one another but cannot be fullyintegrated; we offer them instead as examples of the picturesof irrigation that archaeological studies can give. Our point,however, is that these three views, are not – and indeed can-not be – incompatible: in the real progress of events they allplayed out simultaneously. The daily management of fieldswas conducted within the larger context of which canals wereoperational, which were in need of repair, which had beenabandoned but could be reused, and whether new canals wereneeded. This, in turn, played out against a longer backdropof shifting water supply: solutions that made sense when wetyears were rare might be less useful when wet years were
more common, and the search for the best solution meantchasing nature’s moving target. All of these components arerevealed through archaeological means; the picture is brokenand incomplete across time and space, but as more data areacquired and organized it fills in and sharpens.
Our question here is whether the modeling effort can se-lect the appropriate scale at which to approach the dynamicsunder study. Murphy (2009) has shown that a simple inter-action between upstream and downstream field systems bothdrawing from a single water source can lead to complex dy-namics that, in turn, might be deeply shaped by water supply,and thus be markedly different in wet vs. dry years; this kindof game in turn would have impacted the way that the fieldswere fed, changing the hydraulic dynamics, which wouldpresumably have impacted the social dynamics among thefield managers. If, as the simulations described here show,different patterns of filling fields lead to different efficiencies,then the negotiations of how the fields were watered – theperennial questions of who gets the water when – would havebeen affected as well. The middle-term shifts in infrastruc-ture would have meant that no solution would have servedpermanently.
This integrated picture argues for a modeling effort thatbegins with the input data provided by medium- and long-term views, but that specifically uses these to address thesmall scale: the formal and informal institutions that webelieved would have maintained these systems would havegrown out of the shifting dynamics at the tightest scales. Ourmodeling must capture this. From this we can hope to applythe lessons gained from the long-term archaeological recordto the present, where the day-to-day scale is, of course, farmore salient. With the objective of better understanding hu-man agency through modeling, this paper puts forward therelevance of combining hydrological, geographical, archae-ological, and social studies when studying water systems.Human agency articulates itself around short-term socio-environmental dynamics as agents and networks continu-ously interact. Similar concepts related to the co-evolutionof humans and their environment has been developed byother disciplines and the importance of pluri-disciplinaryapproaches is not new. However, crossing disciplinary andmethodological barriers is not easy. On the other hand, therapid development of agent-based modeling, which aims tounderstand human behaviors, opens new research perspec-tives and requires inter-disciplinarity. Because we argue thatmodels rely on a bottom-up principle, they need to be sup-plied and validated by observed data from various fields ofresearch. Therefore, data on irrigation management, hydrol-ogy and high-resolution soil data will provide a relevant basisfor modeling.
This type of socio-hydrology recognizes that organismslike humans change their environment; the famous beaversbuild dams, termites build huge mounds. On its own turn,environment changes organisms; selective pressures froman environment have an influence on survival strategies of
Hydrol. Earth Syst. Sci., 18, 1369–1382, 2014 www.hydrol-earth-syst-sci.net/18/1369/2014/
M. W. Ertsen et al.: A journey of a thousand miles begins with one small step 1381
those living within that environment (Nelson et al., 2010).Such a process of niche construction (Kendall et al., 2011)includes the bidirectional nature of interactions betweenmaterial environment and social arrangements, in order tocapture how humans change their environment, and howsubsequent environmental changes alter societal functioning.This calls for many more studies providing empirical ev-idence for co-evolving social/economic and environmentalsystems – e.g., studies that take a historical or archaeolog-ical approach, or use social science methods to assess howcommunities/societies create and respond to environmentalchange.
The full approach that we envision, one that places agent-based models in simulations that can integrate data from arange of disparate sources and explore alternatives at a rangeof scale, is not yet developed. The software, and the scientificstrategy for using such software, remain possibilities but arenot yet complete. Our concern is that traditional approachesto modeling human social action in social-ecological con-texts avoid the central issues of human agency; our hope isthat future examples will build on the position here, and thegoal of understanding how human agency shapes relation-ships and institutions in contexts such as irrigation will soonbe within our reach.
Acknowledgements.Authors would like to thank the School ofHuman Evolution and Social Change and well as the School ofSustainability at Arizona State University (Tempe, Arizona) fortheir support in the collection of the data. Louise Purdue wouldalso like to thank Soil System Inc. (Paleowest) and the GEOPHENlaboratory (University of Caen Basse-Normandie, France) for thesupport they provided in collecting and preparing the data as well asthe Fyssen Foundation for its financial support in the developmentof this project. Fieldwork at the Las Capas site in 2008 and 2009was undertaken by Desert Archaeology, Inc, and was funded byPima County, Arizona, bonds as part of the Ina Road RegionalWastewater Reclamation Facility Upgrade Project. All photos andsource data are courtesy of Desert Archaeology, Inc., Tucson,Arizona, and we gratefully acknowledge the opportunity to workwith the data their excavations have collected and the effort theymade in providing the data in a useful format. Special thanks aredue to Desert Archaeology’s James Vint and Fred Nials; withouttheir contributions of materials, data, and insight this project wouldnot have been possible. All errors are our own.
Edited by: M. Sivapalan
References
Altaweel, M.: Investigating agricultural sustainability and strat-egy in Northern Mesopotamia: Results produced using a socio-ecological modeling approach, J. Archaeol. Sci., 35, 821–835,2008.
Bayman, J.: The Hohokam of Southwest North America, J. WorldPrehist., 15, 257–311, 2001.
Berger, G. W., Henderson, T. K., Banerjee, D., and Nials, F. L.: Pho-tonic dating of prehistoric irrigation canals at Phoenix, Arizona,U.S.A., Geoarchaeology, 19, 1–19, 2004.
Berger, J.-F.: Les fossés bordiers historiques et l’histoire agrairerhodanienne, Etudes rurales, La très longue durée, 153–154, 59–90, 2000.
Chen, J., Brissette, F. P., and Leconte, R.: Uncertainty of downscal-ing method in quantifying the impact of climate change on hy-drology, J. Hydrol., 401, 190–202, 2011.
Courty, M. A., Goldberg, P., and Macphail, R. I.: Soils and micro-morphology in archaeology. Cambridge Manuals in Archaeol-ogy, Cambridge University Press, Cambridge, 1989.
Ertsen, M. W.: Structuring properties of irrigation systems, Under-standing relations between humans and hydraulics through mod-eling, Water History, 2, 165–183, 2010.
Ertsen, M. W.: Modelling human agency in ancient irrigation, in:XXXIIe rencontres internationales d’archéologie et d’histoired’Antibes “Variabilites environnementales, mutations sociales?:Nature, Intensités, Échelles et Temporalités des changements”,edited by: Bertoncello, F. and Braemer, F., Antibes, 199–209,2012a.
Ertsen, M. W.: Irrigation and landscape: an interdisciplinary ap-proach, in: Landscape Archaeology between Art and Sci-ence – From a multi- to an interdisciplinary approach, Land-scape & Heritage Series, edited by: Kluiving, S. J. and Guttmann-Bond, E. B., Amsterdam University Press, Amsteredam, 45–58,2012b.
Ertsen, M. W. and Van der Spek, J.: Modeling an irrigation ditchopens up the world. Hydrology and hydraulics of an ancient irri-gation system in Peru, Phys. Chem. Earth, 34, 176–191, 2009.
Fish, P. R.: The Hohokam: 1,000 Years of Prehistory in the SonoranDesert, in: Dynamics of Southwest Prehistory, edited by: Cordell,L. S. and Gumerman, G. J., Smithsonian Institution Press, Wash-ington, D.C., 19–63, 1989.
Fish, S. K. and Fish, P. R. (Eds.): The Hohokam Millennium, in: TheHohokam Millennium, School for Advanced Research Press,Santa Fe, New Mexico, 1–11, 2007.
Gentelle, P.: Le Croissant Fertile, Le monde de la Bible et TerreSainte, 15, 4–8, 1980.
Graybill, D. A., Gregory, D. A., Funkhouser, G. S., and Nials, F. L.:Long-term streamflow reconstructions, river channel morphol-ogy, and aboriginal irrigation systems along the Salt and GilaRivers, in: Environmental change and human adaptation in theancient Southwest, edited by: Dean, J. S. and Doyel, D. E., Uni-versity of Utah Press, Salt Lake City, 69–123, 2006.
Gumerman, G.: Understanding the Hohokam, in: Exploring the Ho-hokam, Prehistoric desert peoples of the American Southwest,edited by: Gumerman, G. J., University of New Mexico Press,Albuquerque, 1–27, 1991.
Howard, J. B.: A Paleohydraulic Approach to Examining Agricul-tural Intensification in Hohokam Irrigation Systems, Res. Econ.Anthropol., 7, 263–324, 1993.
Howard, J. B. and Huckleberry, G.: The operation and evolution ofan irrigation system: the East Papago Canal study, Publicationno. 18, Soil Systems Publication in Archaeology, Phoenix, 1991.
Huckleberry, G.: Stratigraphic identification of destructive floods inrelict canals: a case study from the Middle Gila River, Arizona,the Kiva, Kiva, 65, 7–33, 1999.
www.hydrol-earth-syst-sci.net/18/1369/2014/ Hydrol. Earth Syst. Sci., 18, 1369–1382, 2014

1382 M. W. Ertsen et al.: A journey of a thousand miles begins with one small step
Huckleberry, G. and Rittenour, T.: Combining radiocarbon andsingle-grain optically stimulated luminescence methods to ac-curately date pre-ceramic irrigation canals, Tucson, Arizona, J.Archaeol. Sci., 41, 156–170, 2013.
Huckleberry, G., Onken, J., Graves, W., and Wegener, R.: Climatic,geomorphic, and archaeological implications of a late Quater-nary alluvial chronology the lower Salt River, Arizona, USA,Geomorphology, 185, 39–53, 2013.
Hunt, E. and Hunt, R. C.: Irrigation, conflict, and politics: a Mexi-can case, in: Irrigation’s impact on Society, edited by: Downing,T. and MacGuire, G., University of Arizona Press, Tucson, 129–157, 1973.
Kendal, J., Tehrani, J. J., and Odling-Smee, F. J.: Human niche con-struction in interdisciplinary focus, Philos. T. Roy. Soc. B, 366,785–792, 2011.
Kohler, T. A. (Ed.): Modeling Agricultural Productivity and Farm-ing Effort. In Emergence and Collapse of Early Villages: Mod-els of Central Mesa Verde Archaeology, University of CaliforniaPress, Berkeley, Los Angeles, 2012.
Latour, B.: Reassembling the Social: An Introduction to Actor Net-work Theorym, Oxford University Press, Oxford, 2005.
Mabry, J. B.: Chronology, in: Las Capas: Early Irrigation andSedentism in a Southwestern Floodplain, Anthropological Pa-pers 28, Center for Desert Archaeology, Tucson, 55–76, 2008a.
Mabry, J. B. (Ed.): Las Capas: Early Irrigation and Sedentism in aSouthwestern Floodplain, Anthropological Papers No. 28, Cen-ter for Desert Archaeology, Tucson, 2008b.
Midvale, F.: The Prehistoric irrigation of the Salt River valley,4th Edn., Map on file, Department of Anthropology, ArizonaState University, Tempe, 1966.
Murphy, J. T.: Exploring Complexity in the Past: The HohokamWater Management Simulation, PhD Dissertation, Departmentof Anthropology, University of Arizona, Tucson, 2009.
Murphy, J. T.: Exploring complexity with the Hohokam Water Man-agement Simulation: A middle way for archaeological modeling,Ecol. Modell., 241, 15–29, 2012.
Nelson, M. C., Kintigh, K., Abbott, D. R., and Anderies, J. M.: Thecross-scale interplay between social and biophysical context andthe vulnerability of irrigation-dependent societies: archaeology’slong-term perspective, Ecol. Soc., 15, 31, 2010.
Ni, F., Cavazos, T., Hughes, M. K., Comrie, A. C., and Funkhouser,G.: Cool-season precipitation in the southwestern USA sinceAD 1000: comparison of linear and nonlinear techniques for re-construction, Int. J. Climatol., 22, 1645–1662, 2002.
Onken, J., Waters, M. R., and Homburg, J. A.: Geoarchaeologicalassessment for the Tres Rios Project, Maricopa County, Arizona,Technical Report 03-68, Statistical Research Inc., Redlands, Cal-ifornia, 2004.
Pande, S. and Ertsen, M.: Endogenous change: on cooperation andwater in ancient history, Hydrol. Earth Syst. Sci. Discuss., 10,4829–4868, doi:10.5194/hessd-10-4829-2013, 2013.
Phillips, B. G., Gibbson, A., Miller, A., Droz, M. S., and Walker,L. A.: Paleoenvironnement, in: Life on the Lehi terrace: the ar-chaeology of the Red Mountain Freeway between State Route 87and Gilbert road, Archaeological Consulting Services CulturalResources Report 135, edited by: Powell, S. and Boston, R. L.,Archaeological Consulting Services, Tempe, 11–47, 2004.
Purdue, L.: Dynamique des paysages agraires et gestion de l’eaudans le bassin semi-désertique de Phoenix, Arizona de la Préhis-toire à l’époque modern, Unpublished Ph.D. doctoral in Envi-ronmental Archaeology, University of Nice Sophia Antipolis,France, 2011.
Purdue, L., Miles, W., Woodson, K., Darling, A., and Berger, J.-F.:Micromorphological study of irrigation canal sediments: land-scape evolution and hydraulic management in the middle GilaRiver valley (Phoenix Basin, Arizona) during the Hohokam oc-cupation, Quatern. Int., 216, 129–144, 2010.
Purdue, L., Miles, W., Wright, D., Palacios Fast, M., Phillips, B.,and Woodson, K.: Prehistoric agrosystems of Central Arizona: apaleoenvironmental approach to the study of Hohokam irrigatedfields and canals, in preparation, 2014.
Salzer, M. W. and Kipfmueller, K. F.: Reconstructed temperatureand precipitation on a millennial timescale from tree-rings inthe Southern Colorado Plateau, USA, Climatic Change, 70, 465–487, 2005.
SOBEK Hydraulic Modeling package:http://www.deltaressystems.com/hydro/product/108282/sobek-suite(last access: 12 Novem-ber 2013), 2014.
Vint, J. B.: Completion of Compliance-related ArchaeologicalFieldwork at the Site of Las Capas (AZ AA:12:111 [ASM])and Related Canals (AZ AA:12:753 [ASM]) on the Grounds ofthe Ina Road Regional Wastewater Reclamation Facility, PimaCounty, Arizona, MS on file at Desert Archaeology Inc., Tucson,Arizona, 2009.
Wöcherl, H.: Natural Site Formation Processes and ArchaeologicalInterpretation, in: Las Capas: Early Irrigation and Sedentism in aSouthwestern Floodplain, Anthropological Papers No. 28, Cen-ter for Desert Archaeology, Tucson, 77–94, 2008.
Hydrol. Earth Syst. Sci., 18, 1369–1382, 2014 www.hydrol-earth-syst-sci.net/18/1369/2014/


![Zhu, Yong[U+2010]Guan; Gillings, Michael; Simonet, Pascal](https://static.fdokumen.com/doc/165x107/6319bfe04cd7b34424092af9/zhu-yongu2010guan-gillings-michael-simonet-pascal.jpg)