Murphy Oil Corporation - AnnualReports.com
104
Murphy Oil Corporation 2009 Annual Report
-
Upload
khangminh22 -
Category
Documents
-
view
0 -
download
0
Transcript of Murphy Oil Corporation - AnnualReports.com

Murphy Oil Corporation2009 Annual Report
Financial and Operating Highlights
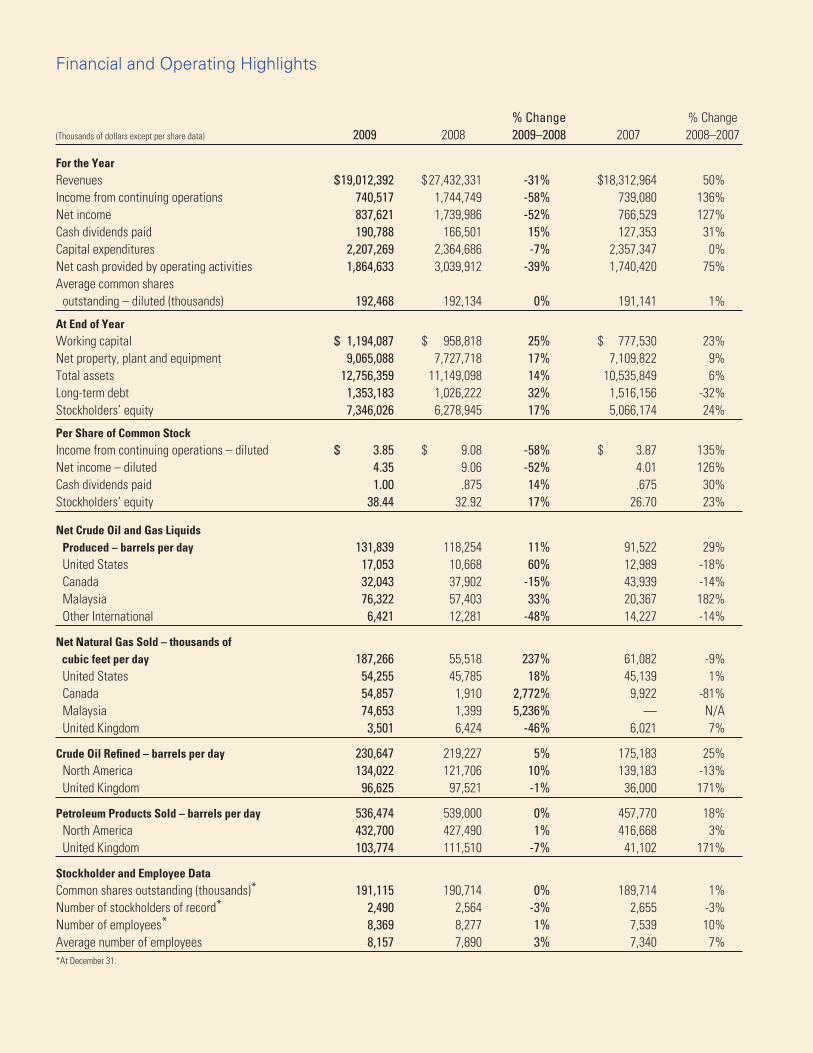
%Change %Change(Thousandsofdollarsexceptpersharedata) 2009 2008 2009–2008 2007 2008–2007
For the YearRevenues $19,012,392 $27,432,331 -31% $18,312,964 50%Incomefromcontinuingoperations 740,517 1,744,749 -58% 739,080 136%Netincome 837,621 1,739,986 -52% 766,529 127%Cashdividendspaid 190,788 166,501 15% 127,353 31%Capitalexpenditures 2,207,269 2,364,686 -7% 2,357,347 0%Netcashprovidedbyoperatingactivities 1,864,633 3,039,912 -39% 1,740,420 75%Averagecommonshares outstanding–diluted(thousands) 192,468 192,134 0% 191,141 1%
At End of YearWorkingcapital $ 1,194,087 $ 958,818 25% $ 777,530 23%Netproperty,plantandequipment 9,065,088 7,727,718 17% 7,109,822 9%Totalassets 12,756,359 11,149,098 14% 10,535,849 6%Long-termdebt 1,353,183 1,026,222 32% 1,516,156 -32%Stockholders’equity 7,346,026 6,278,945 17% 5,066,174 24%
Per Share of Common StockIncomefromcontinuingoperations–diluted $ 3.85 $ 9.08 -58% $ 3.87 135%Netincome–diluted 4.35 9.06 -52% 4.01 126%Cashdividendspaid 1.00 .875 14% .675 30%Stockholders’equity 38.44 32.92 17% 26.70 23%
Net Crude Oil and Gas Liquids Produced – barrels per day 131,839 118,254 11% 91,522 29% UnitedStates 17,053 10,668 60% 12,989 -18% Canada 32,043 37,902 -15% 43,939 -14% Malaysia 76,322 57,403 33% 20,367 182% OtherInternational 6,421 12,281 -48% 14,227 -14%
Net Natural Gas Sold – thousands of cubic feet per day 187,266 55,518 237% 61,082 -9% UnitedStates 54,255 45,785 18% 45,139 1% Canada 54,857 1,910 2,772% 9,922 -81% Malaysia 74,653 1,399 5,236% — N/A UnitedKingdom 3,501 6,424 -46% 6,021 7%
Crude Oil Refined – barrels per day 230,647 219,227 5% 175,183 25% NorthAmerica 134,022 121,706 10% 139,183 -13% UnitedKingdom 96,625 97,521 -1% 36,000 171%
Petroleum Products Sold – barrels per day 536,474 539,000 0% 457,770 18% NorthAmerica 432,700 427,490 1% 416,668 3% UnitedKingdom 103,774 111,510 -7% 41,102 171%
Stockholder and Employee DataCommonsharesoutstanding(thousands)* 191,115 190,714 0% 189,714 1%Numberofstockholdersofrecord* 2,490 2,564 -3% 2,655 -3%Numberofemployees* 8,369 8,277 1% 7,539 10%Averagenumberofemployees 8,157 7,890 3% 7,340 7%*AtDecember31.
Murphy Oil at a Glance
Murphy Oil Corporation (“Murphy” or “the Company”) is an international oil and gas company that conducts business through various operating subsidiaries. The Company produces oil and/or natural gas in the United States, Canada, the United Kingdom, Malaysia and Republic of the Congo and conducts exploration activities worldwide. Murphy also has an interest in a Canadian synthetic oil operation, owns two petroleum refineries and an ethanol production facility in the United States and one petroleum refinery in the United Kingdom. The Company operates a growing retail marketing gasoline station chain on the parking lots of Walmart Supercenters and at stand-alone locations in the United States, and also markets petroleum products under various brand names and to unbranded wholesale customers in the United States and the United Kingdom. Murphy is headquartered in El Dorado, Arkansas and has over 8,000 employees worldwide. The Company’s common stock is traded on the New York Stock Exchange under the ticker symbol “MUR”.
Offices
El Dorado, Arkansas
Houston, Texas
Calgary, Alberta, Canada
St. Albans, Hertfordshire, England
Kuala Lumpur, Malaysia
Pointe-Noire, Republic of the Congo
Jakarta, Indonesia
Perth, Western Australia, Australia
Major Subsidiaries of Murphy Oil Corporation
Murphy Exploration & Production Company, through various operating subsidiaries and affiliates, is engaged in crude oil and natural gas production activities in the United States, Malaysia, the U.K. sector of the North Sea and Republic of the Congo, and explores for oil and natural gas worldwide. The subsidiary has its headquarters in Houston, Texas, and conducts business from offices in Kuala Lumpur, Malaysia; St. Albans, England; Pointe-Noire, Republic of the Congo; Jakarta, Indonesia; and Perth, Western Australia.
Murphy Oil Company Ltd. is engaged in conventional crude oil and natural gas exploration and production in Western Canada and offshore Eastern Canada as well as the extraction and sale of synthetic crude oil from oil sands. The subsidiary’s office is located in Calgary, Alberta, and is operated as a component of the Company’s worldwide exploration and production operation directed from Houston.
Murphy Oil USA, Inc. is engaged in refining and marketing of petroleum products in the United States. It is headquartered in El Dorado, Arkansas. Refineries in Meraux, Louisiana, and Superior, Wisconsin, provide petroleum products to high-volume, low-cost Murphy USA® branded gasoline stations located on-site at Walmart Supercenters and at stand-alone Murphy Express locations in 21 Southern and Midwestern states. Murphy Oil USA also operates a network of 12 Company-owned terminals. These terminals, along with a number of third-party terminals, supply fuel to retail and wholesale stations in 24 states and to various asphalt and marine fuel customers. A subsidiary acquired an ethanol production facility in Hankinson, North Dakota in October 2009.
Murco Petroleum Limited is engaged in refining and marketing of petroleum products in the United Kingdom. Headquartered near London, England, Murco owns a refinery in Milford Haven, Wales and operates a network of fueling stations in the United Kingdom.
1
Dear Fellow Shareholders
2
Challenging but rewarding; perhaps the best way to describe
2009 and my first year as CEO. One thing that I witnessed first-
hand over the past year and am pleased to report to you is that
ours is a resilient company made up of capable and resourceful
individuals, just what you search for when the going is toughest.
As in previous economic and commodity market downturns, we
adapted our strategy and managed to both utilize and maintain a
healthy balance sheet while moving our business forward. Net
income for 2009 totaled $837.6 million ($4.35 per share). This is
down from a record setting 2008, due mainly to lower crude oil
and natural gas prices coupled with poorer downstream product
margins. In 2009, we remained financially disciplined resulting in
a debt to capital employed ratio of 15.6% at year end, up slightly
from the 2008 level.
Exploration and Production During 2009, three important development projects in separate
regions of the world successfully started production. Two new oil fields–Thunder Hawk (37.5%) in
the Gulf of Mexico and Azurite (50%) in Republic of the Congo–were joined by a new natural gas
area offshore Sarawak (85%) Malaysia. These fields along with growth from existing projects at
Tupper (100%) in British Columbia and associated natural gas at Kikeh (80%) in Malaysia, delivered
record production for 2009. For the full year, production averaged 163,000 barrels of oil equivalent
per day, an increase of 28% over the previous year. This comes on the heels of the 25% increase in
2008 compared to 2007. On a full year-to-year comparison 2010 will again show marked production
growth. I am also pleased to report that during 2009, Murphy Oil replaced 168% of oil and gas
reserves produced and brought down our overall finding and development costs in a marked way;
both facts underscoring the quality within our producing portfolio.
Further production growth is lined up from projects already identified. In August 2009, our Board
sanctioned the Tupper West development (100%) in British Columbia’s Montney formation. This
sizable onshore natural gas resource will start producing in the second quarter of 2011 and will
significantly enhance our North American natural gas volumes. A new gas treatment plant with a
capacity of 180 million cubic feet per day will be constructed to process the gas. We have diligently
accumulated an important position in this play and are presently one of the leading producers in the
region despite production currently sourced only from Tupper Main.
To strengthen our onshore North American natural gas position further we added during 2009 a
second development area in the Eagle Ford Shale of South Texas. Our initial three-well drilling
program is progressing and we are now adding a second rig to the program. We have a high working
interest covering a good acreage spread in key areas of the play and encouraging flow rates. With
existing infrastructure in place nearby, we have already begun selling natural gas.
David M. WoodPresident and Chief Executive Officer
3
Our entry into the onshore natural gas resource business was deliberate and measured. Selecting
plays that could deliver long-life, high-quality reserves at very competitive all-in costs was key.
Being able to execute on new business during industry down cycles has again brought its rewards.
North American natural gas is and will be a very important source of domestic energy and we are
now well positioned with opportunity still ahead of us.
While our natural gas assets position us to capitalize on future price escalations, we are weighted
and focused towards growth in our oil portfolio as we look forward. In 2009 three of the four
discoveries that we made were oil. First, a discovery was made at Samurai (33.33%) in Gulf of
Mexico Green Canyon Blocks 432/476. We will be drilling an appraisal well later in 2010 to size the
discovery and help choose development options. In the Mer Profonde Sud (MPS) Block offshore
Republic of the Congo, an oil discovery was made at Turquoise Marine (50%). Further appraisal wells
will be drilled in 2010 and the most likely development plan calls for production to flow through the
Azurite facility in the same block. Lastly, Siakap North (80%) in Block K, offshore Malaysia, was also
an oil discovery. The field is part of a larger structure that will likely be jointly developed.
In 2010, our pace of exploration will increase with at least ten important exploration wells planned
in various regions around the world including the Gulf of Mexico, Republic of the Congo, Malaysia,
Indonesia and Suriname. The majority of the prospects will be targeting oil while some could be
either oil or natural gas. It is exciting to see a quality program lie ahead of us and to shift back to the
“wildcatting” levels seen before the price collapse that started in late 2008. This led to us naturally
pulling back our horns during uncertain times. Several of the areas being targeted are frontier in
nature and offer “move the needle” upsides.
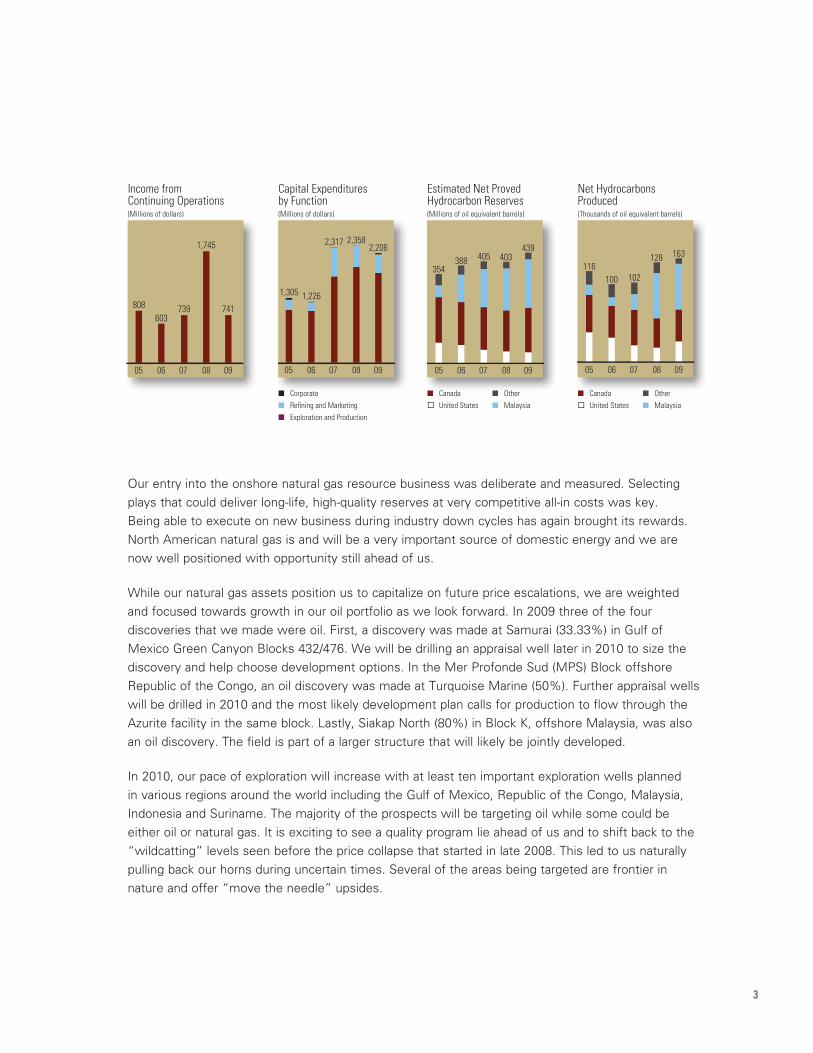
05 06
808
07
603
08
739
09
1,745
741
Income from Continuing Operations(Millions of dollars)
05 06
1,305
07
1,226
08
2,317
09
2,3582,206
Capital Expenditures by Function(Millions of dollars)
n Corporaten Refining and Marketingn Exploration and Production
05 06
354
07
388
08
405
09
403439
Estimated Net Proved Hydrocarbon Reserves(Millions of oil equivalent barrels)
n Canada United States
n Othern Malaysia
05 06
116
07
100
08
102
09
128 163
Net Hydrocarbons Produced(Thousands of oil equivalent barrels)
n Canada United States
n Othern Malaysia
4
Refining and Marketing Downstream results in 2009 were hampered by weaker margins and
overall decreased consumer demand. This down cycle has been experienced before and it too will
ameliorate. Our aim in 2010 is to run our facilities better and more consistently and minimize capital
spend. We will resume our build-out of the U.S. retail gasoline chain with construction of 80 new
sites planned in 2010.
Refining plant turnarounds at facilities in Meraux, Louisiana, and Milford Haven, Wales, are occurring
in the first quarter. The Milford Haven turnaround is the lengthier of the two as the scope of work
is more intensive. During the downtime, the facility will undergo de-bottlenecking that will increase
the throughput capacity from 108,000 barrels of oil per day (bopd) to 130,000 bopd for limited capital
outlay. The bulk of this new capacity will add distillate capability to the stream and better suit the
U.K. market. At the Superior, Wisconsin plant, we have obtained additional asphalt storage capacity
as we move to further capitalize on our niche in that market.
In U.S. retail operations, our business model of providing quality fuel directly to our customers at
the most competitive price possible continues to strengthen. We ended 2009 with 1,048 locations
spread throughout 21 states. Of these, 996 locations are Murphy USA sites located on Walmart
Supercenter parking lots and 52 are Murphy Express sites which are independently located. As this
industry will likely see consolidation over the next decade we are poised to be able to grow and fill
our customers’ needs.
In October, we entered the bio-fuels business by acquiring a corn-based ethanol plant in Hankinson,
North Dakota. With an annual production capacity of 110 million gallons, this plant is a natural fit
for our retail business where we already sell this mandated fuel. Adding a new community to our
enterprise is a great feeling and we have been delighted with the hard work and effort shown by our
recently added employees at Hankinson.
In Closing While unpredictable and challenging external factors within the political and economic
arena will invariably linger, we are well positioned to meet them head on. Our portfolio reflects an
international breadth that I believe is necessary to facilitate the continued longevity of our company;
being where and when the growth and opportunities exist. We have superbly talented people who
work every day to make their community and country better and stronger and who have demonstrated
the ability to act upon opportunity to help our company grow. I see more of this happening in 2010.
I greatly appreciate the support shown me over the past year. Murphy is a unique company, one we
can all take great pride in. With your continued support, we will continue to lead on!
David M. WoodPresident and Chief Executive Officer
February 11, 2010El Dorado, Arkansas
Exploration and Production Statistical Summary
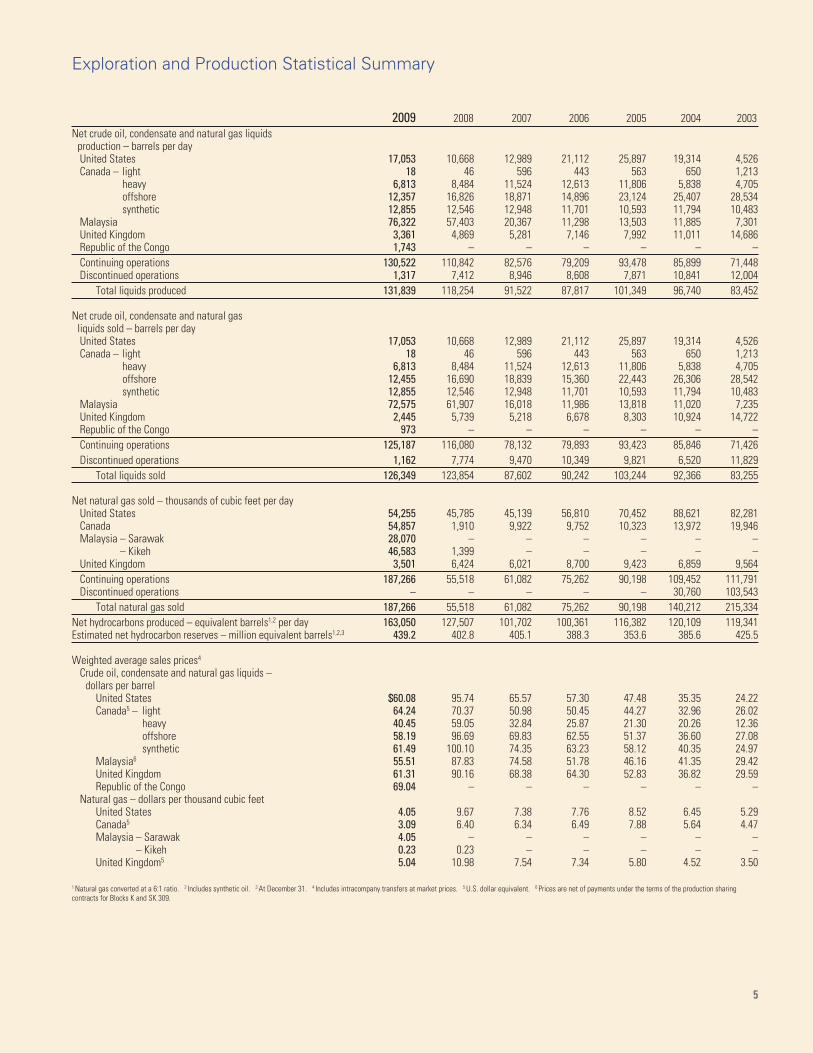
2009 2008 2007 2006 2005 2004 2003Net crude oil, condensate and natural gas liquids production – barrels per day United States 17,053 10,668 12,989 21,112 25,897 19,314 4,526 Canada – light 18 46 596 443 563 650 1,213 heavy 6,813 8,484 11,524 12,613 11,806 5,838 4,705 offshore 12,357 16,826 18,871 14,896 23,124 25,407 28,534 synthetic 12,855 12,546 12,948 11,701 10,593 11,794 10,483 Malaysia 76,322 57,403 20,367 11,298 13,503 11,885 7,301 United Kingdom 3,361 4,869 5,281 7,146 7,992 11,011 14,686 Republic of the Congo 1,743 – – – – – – Continuing operations 130,522 110,842 82,576 79,209 93,478 85,899 71,448 Discontinued operations 1,317 7,412 8,946 8,608 7,871 10,841 12,004 Total liquids produced 131,839 118,254 91,522 87,817 101,349 96,740 83,452
Net crude oil, condensate and natural gas liquids sold – barrels per day United States 17,053 10,668 12,989 21,112 25,897 19,314 4,526 Canada – light 18 46 596 443 563 650 1,213 heavy 6,813 8,484 11,524 12,613 11,806 5,838 4,705 offshore 12,455 16,690 18,839 15,360 22,443 26,306 28,542 synthetic 12,855 12,546 12,948 11,701 10,593 11,794 10,483 Malaysia 72,575 61,907 16,018 11,986 13,818 11,020 7,235 United Kingdom 2,445 5,739 5,218 6,678 8,303 10,924 14,722 Republic of the Congo 973 – – – – – – Continuing operations 125,187 116,080 78,132 79,893 93,423 85,846 71,426 Discontinued operations 1,162 7,774 9,470 10,349 9,821 6,520 11,829 Total liquids sold 126,349 123,854 87,602 90,242 103,244 92,366 83,255
Net natural gas sold – thousands of cubic feet per day United States 54,255 45,785 45,139 56,810 70,452 88,621 82,281 Canada 54,857 1,910 9,922 9,752 10,323 13,972 19,946 Malaysia – Sarawak 28,070 – – – – – –
– Kikeh 46,583 1,399 – – – – – United Kingdom 3,501 6,424 6,021 8,700 9,423 6,859 9,564 Continuing operations 187,266 55,518 61,082 75,262 90,198 109,452 111,791 Discontinued operations – – – – – 30,760 103,543 Total natural gas sold 187,266 55,518 61,082 75,262 90,198 140,212 215,334Net hydrocarbons produced – equivalent barrels1,2 per day 163,050 127,507 101,702 100,361 116,382 120,109 119,341Estimated net hydrocarbon reserves – million equivalent barrels1,2,3 439.2 402.8 405.1 388.3 353.6 385.6 425.5
Weighted average sales prices4
Crude oil, condensate and natural gas liquids – dollars per barrel United States $60.08 95.74 65.57 57.30 47.48 35.35 24.22 Canada5 – light 64.24 70.37 50.98 50.45 44.27 32.96 26.02 heavy 40.45 59.05 32.84 25.87 21.30 20.26 12.36 offshore 58.19 96.69 69.83 62.55 51.37 36.60 27.08 synthetic 61.49 100.10 74.35 63.23 58.12 40.35 24.97 Malaysia6 55.51 87.83 74.58 51.78 46.16 41.35 29.42 United Kingdom 61.31 90.16 68.38 64.30 52.83 36.82 29.59 Republic of the Congo 69.04 – – – – – – Natural gas – dollars per thousand cubic feet United States 4.05 9.67 7.38 7.76 8.52 6.45 5.29 Canada5 3.09 6.40 6.34 6.49 7.88 5.64 4.47 Malaysia – Sarawak 4.05 – – – – – –
– Kikeh 0.23 0.23 – – – – – United Kingdom5 5.04 10.98 7.54 7.34 5.80 4.52 3.50
1 Natural gas converted at a 6:1 ratio. 2 Includes synthetic oil. 3 At December 31. 4 Includes intracompany transfers at market prices. 5 U.S. dollar equivalent. 6 Prices are net of payments under the terms of the production sharing contracts for Blocks K and SK 309.
5
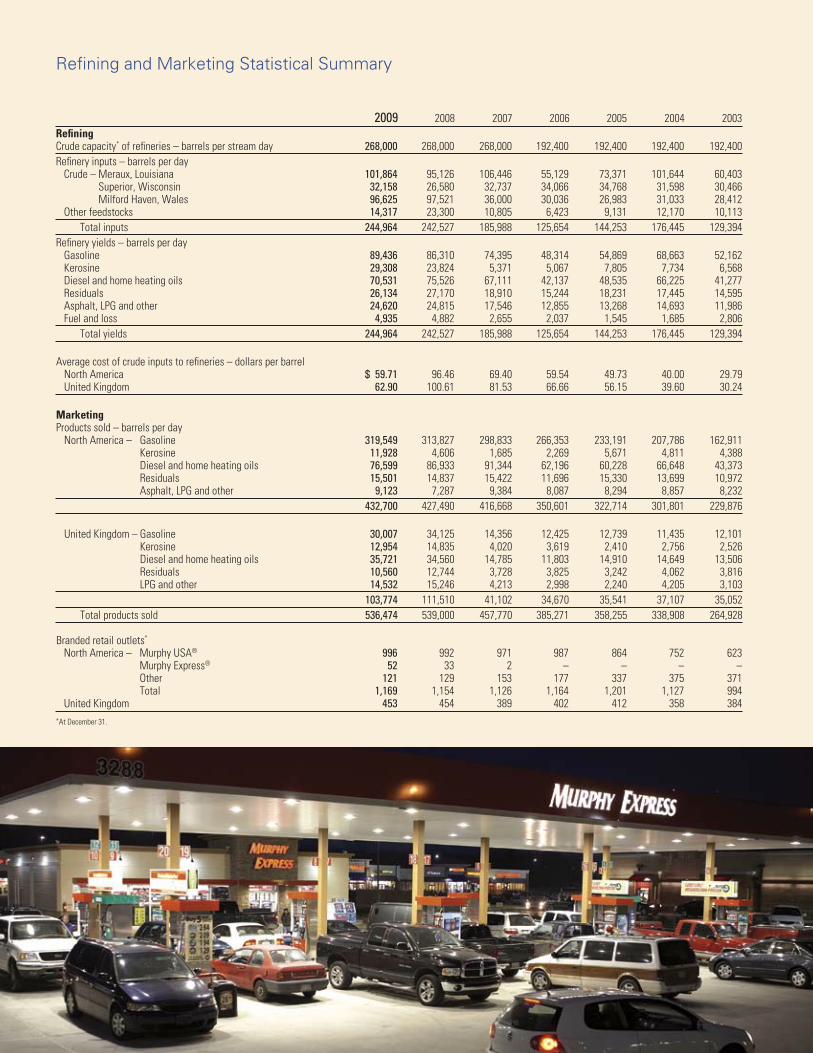
Refining and Marketing Statistical Summary
2009 2008 2007 2006 2005 2004 2003RefiningCrude capacity* of refineries – barrels per stream day 268,000 268,000 268,000 192,400 192,400 192,400 192,400Refinery inputs – barrels per day Crude – Meraux, Louisiana 101,864 95,126 106,446 55,129 73,371 101,644 60,403 Superior, Wisconsin 32,158 26,580 32,737 34,066 34,768 31,598 30,466 Milford Haven, Wales 96,625 97,521 36,000 30,036 26,983 31,033 28,412 Other feedstocks 14,317 23,300 10,805 6,423 9,131 12,170 10,113 Total inputs 244,964 242,527 185,988 125,654 144,253 176,445 129,394Refinery yields – barrels per day Gasoline 89,436 86,310 74,395 48,314 54,869 68,663 52,162 Kerosine 29,308 23,824 5,371 5,067 7,805 7,734 6,568 Diesel and home heating oils 70,531 75,526 67,111 42,137 48,535 66,225 41,277 Residuals 26,134 27,170 18,910 15,244 18,231 17,445 14,595 Asphalt, LPG and other 24,620 24,815 17,546 12,855 13,268 14,693 11,986 Fuel and loss 4,935 4,882 2,655 2,037 1,545 1,685 2,806 Total yields 244,964 242,527 185,988 125,654 144,253 176,445 129,394
Average cost of crude inputs to refineries – dollars per barrel North America $ 59.71 96.46 69.40 59.54 49.73 40.00 29.79 United Kingdom 62.90 100.61 81.53 66.66 56.15 39.60 30.24
MarketingProducts sold – barrels per day North America – Gasoline 319,549 313,827 298,833 266,353 233,191 207,786 162,911 Kerosine 11,928 4,606 1,685 2,269 5,671 4,811 4,388 Diesel and home heating oils 76,599 86,933 91,344 62,196 60,228 66,648 43,373 Residuals 15,501 14,837 15,422 11,696 15,330 13,699 10,972 Asphalt, LPG and other 9,123 7,287 9,384 8,087 8,294 8,857 8,232 432,700 427,490 416,668 350,601 322,714 301,801 229,876
United Kingdom – Gasoline 30,007 34,125 14,356 12,425 12,739 11,435 12,101 Kerosine 12,954 14,835 4,020 3,619 2,410 2,756 2,526 Diesel and home heating oils 35,721 34,560 14,785 11,803 14,910 14,649 13,506 Residuals 10,560 12,744 3,728 3,825 3,242 4,062 3,816 LPG and other 14,532 15,246 4,213 2,998 2,240 4,205 3,103 103,774 111,510 41,102 34,670 35,541 37,107 35,052 Total products sold 536,474 539,000 457,770 385,271 358,255 338,908 264,928
Branded retail outlets*
North America – Murphy USA® 996 992 971 987 864 752 623 Murphy Express® 52 33 2 – – – – Other 121 129 153 177 337 375 371 Total 1,169 1,154 1,126 1,164 1,201 1,127 994 United Kingdom 453 454 389 402 412 358 384*At December 31.

Board of Directors
William C. Nolan, Jr.Partner, Nolan & Alderson, Attorneys,El Dorado, Arkansas. Director since 1977.Chairman of the Board, ex-officio member of all other committees
David M. WoodPresident and Chief Executive Officer, Murphy Oil Corporation, El Dorado, Arkansas. Director since January 2009.Committees: Executive
Frank W. BlueInternational Legal Advisor/Arbitrator, Santa Barbara, California.Director since 2003. Committees: Audit; Nominating and Governance
Claiborne P. DemingPresident and Chief Executive Officer, Retired, Murphy Oil Corporation, El Dorado, Arkansas. Director since 1993.Committees: Executive (Chairman)
Robert A. HermesChairman of the Board, Retired, Purvin & Gertz, Inc., Houston, Texas. Director since 1999.Committees: Executive; Nominating and Governance(Chairman); Environmental, Health & Safety
James V. KelleyPresident and Chief Operating Officer, BancorpSouth, Inc., Tupelo, Mississippi.Director since 2006.Committees: Audit; Executive Compensation
R. Madison MurphyManaging Member, Murphy Family Management, LLC, El Dorado, Arkansas. Director since 1993; Chairman from 1994–2002.Committees: Executive; Audit (Chairman)
Ivar B. RambergExecutive Officer, Ramberg Consulting AS, Osteraas, Norway. Director since 2003. Committees: Nominating and Governance;Environmental, Health & Safety
Neal E. SchmalePresident and Chief Operating Officer, Sempra Energy, San Diego, California. Director since 2004.Committees: Audit; Executive Compensation
David J. H. SmithChief Executive Officer, Retired, Whatman plc, Maidstone, Kent, England.Director since 2001.Committees: Executive Compensation (Chairman);Environmental, Health & Safety
Caroline G. TheusPresident, Inglewood Land and Development Co., Alexandria, Louisiana. Director since 1985.Committees: Executive; Environmental, Health & Safety (Chairman)
7

Murphy Exploration &Production CompanyEngages in worldwide crude oil and natural gas exploration and production.
16290 Katy FreewaySuite 600Houston, Texas 77094(281) 675-9000
Roger W. Jenkins President
Eugene T. Coleman Senior Vice President, South East Asia
Sam Algar Vice President, Worldwide Exploration
Daniel R. Hanchera Vice President, Business Development and Planning
Harry J. Howard Vice President, Africa, Europe and Latin America
Derek M. Stewart Vice President, U.S. Operations
Keith S. Caldwell Vice President, Finance
Steven A. Cossé Vice President and General Counsel
Kevin G. Fitzgerald Vice President
Mindy K. West Vice President and Treasurer
John W. Eckart Vice President
Walter K. Compton Secretary
Principal Subsidiaries
Murphy Oil Company Ltd.Engages in crude oil and natural gas exploration and production, and extraction and sale of synthetic crude oil.
1700-555-4th Avenue SWCalgary, Alberta T2P 3E7(403) 294-8000
Mailing Address:P.O. Box 2721, Station MCalgary, Alberta T2P 3Y3Canada
Michael McFadyen President
Cal Buchanan Vice President, Joint Ventures and Business Development
Dennis Ward Vice President, Finance
Mindy K. West Vice President and Treasurer
Georg R. McKay Secretary
Murphy Oil USA, Inc.Engages in manufacturing and marketing of petroleum and ethanolproducts in the United States.
200 Peach StreetEl Dorado, Arkansas 71730(870) 862-6411
Mailing Address:P.O. Box 7000El Dorado, Arkansas 71731-7000
David M. Wood President
Henry J. Heithaus Senior Vice President, Marketing and President, Murphy USA Marketing Company
Thomas McKinlay Senior Vice President, U.S. Manufacturing
Ernest C. Cagle Vice President, Refining Support
Marn Cheng Vice President, Renewable Fuels
Stephen F. Hunkus Vice President, Refining
Steven A. Cossé Vice President and General Counsel
Mindy K. West Vice President and Treasurer
John W. Eckart Vice President and Controller
Walter K. Compton Secretary
Murco Petroleum LimitedEngages in refining and marketing of petroleum products in the United Kingdom.
4 Beaconsfield RoadSt. Albans, HertfordshireAL1 3RH, England44-1727-892-400
Charles A. Ganus Managing Director
Jeremy Clarke Marketing Director
Bernard Pouille Supply Director
Simon V. Rhodes Financial Director
Patricia E. Haylock Secretary
8
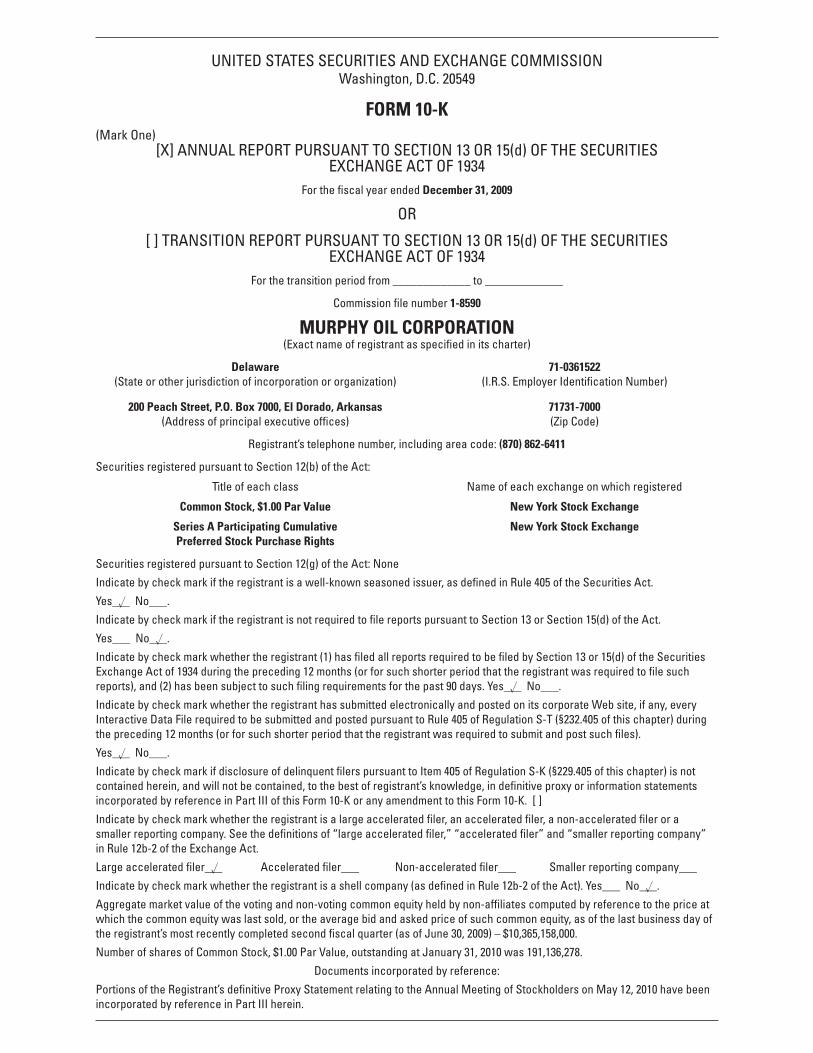
UNITED STATES SECURITIES AND EXCHANGE COMMISSIONWashington, D.C. 20549
FORM 10-K(Mark One)
[X] ANNUAL REPORT PURSUANT TO SECTION 13 OR 15(d) OF THE SECURITIES EXCHANGE ACT OF 1934
For the fiscal year ended December 31, 2009
OR
[ ] TRANSITION REPORT PURSUANT TO SECTION 13 OR 15(d) OF THE SECURITIESEXCHANGE ACT OF 1934
For the transition period from _____________ to _____________
Commission file number 1-8590
MURPHY OIL CORPORATION(Exact name of registrant as specified in its charter)
Delaware 71-0361522 (State or other jurisdiction of incorporation or organization) (I.R.S. Employer Identification Number)
200 Peach Street, P.O. Box 7000, El Dorado, Arkansas 71731-7000 (Address of principal executive offices) (Zip Code)
Registrant’s telephone number, including area code: (870) 862-6411
Securities registered pursuant to Section 12(b) of the Act:
Title of each class Name of each exchange on which registered
Common Stock, $1.00 Par Value New York Stock Exchange
Series A Participating Cumulative New York Stock Exchange Preferred Stock Purchase Rights
Securities registered pursuant to Section 12(g) of the Act: None
Indicate by check mark if the registrant is a well-known seasoned issuer, as defined in Rule 405 of the Securities Act.
Yes_u__ No___.
Indicate by check mark if the registrant is not required to file reports pursuant to Section 13 or Section 15(d) of the Act.
Yes___ No_u__.
Indicate by check mark whether the registrant (1) has filed all reports required to be filed by Section 13 or 15(d) of the Securities Exchange Act of 1934 during the preceding 12 months (or for such shorter period that the registrant was required to file such reports), and (2) has been subject to such filing requirements for the past 90 days. Yes_u__ No___.
Indicate by check mark whether the registrant has submitted electronically and posted on its corporate Web site, if any, every Interactive Data File required to be submitted and posted pursuant to Rule 405 of Regulation S-T (§232.405 of this chapter) during the preceding 12 months (or for such shorter period that the registrant was required to submit and post such files).
Yes_u__ No___.
Indicate by check mark if disclosure of delinquent filers pursuant to Item 405 of Regulation S-K (§229.405 of this chapter) is not contained herein, and will not be contained, to the best of registrant’s knowledge, in definitive proxy or information statements incorporated by reference in Part III of this Form 10-K or any amendment to this Form 10-K. [ ]
Indicate by check mark whether the registrant is a large accelerated filer, an accelerated filer, a non-accelerated filer or a smaller reporting company. See the definitions of “large accelerated filer,” “accelerated filer” and “smaller reporting company” in Rule 12b-2 of the Exchange Act.
Large accelerated filer_u__ Accelerated filer___ Non-accelerated filer___ Smaller reporting company___
Indicate by check mark whether the registrant is a shell company (as defined in Rule 12b-2 of the Act). Yes___ No_u__.
Aggregate market value of the voting and non-voting common equity held by non-affiliates computed by reference to the price at which the common equity was last sold, or the average bid and asked price of such common equity, as of the last business day of the registrant’s most recently completed second fiscal quarter (as of June 30, 2009) – $10,365,158,000.
Number of shares of Common Stock, $1.00 Par Value, outstanding at January 31, 2010 was 191,136,278.
Documents incorporated by reference:
Portions of the Registrant’s definitive Proxy Statement relating to the Annual Meeting of Stockholders on May 12, 2010 have been incorporated by reference in Part III herein.

This page intentionally left blank.
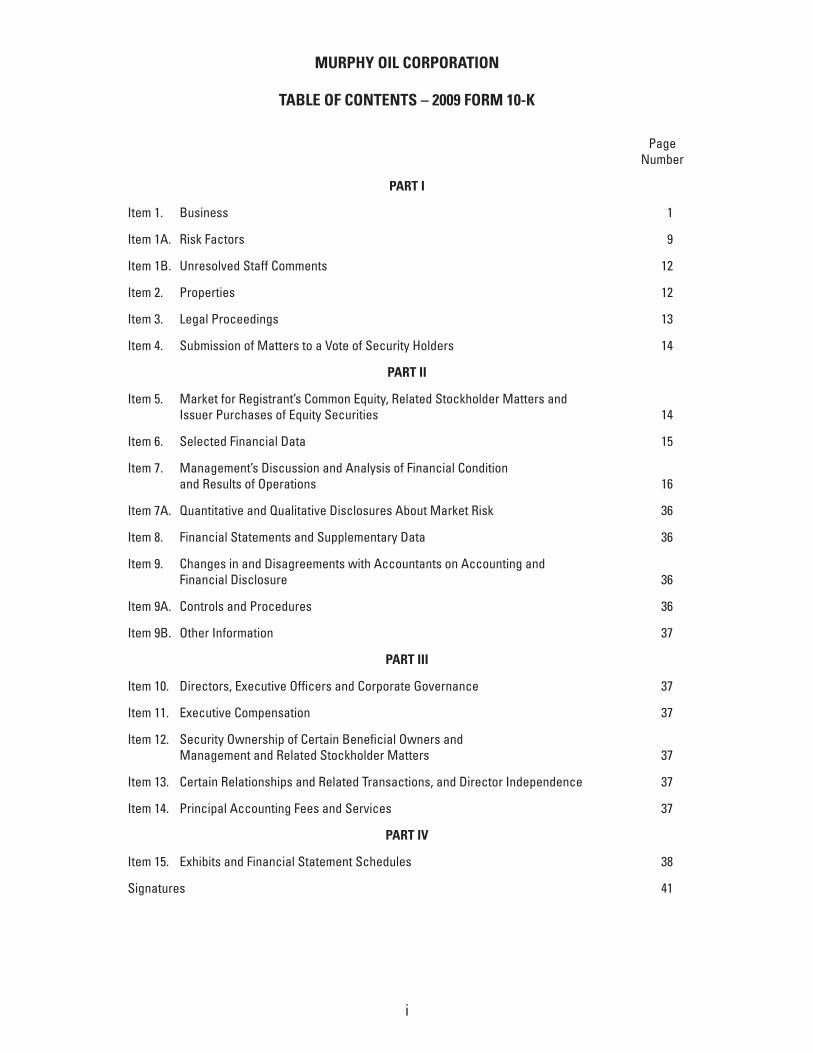
MURPHY OIL CORPORATION
TABLE OF CONTENTS – 2009 FORM 10-K
Page Number
PART I
Item 1. Business 1
Item 1A. Risk Factors 9
Item 1B. Unresolved Staff Comments 12
Item 2. Properties 12
Item 3. Legal Proceedings 13
Item 4. Submission of Matters to a Vote of Security Holders 14
PART II
Item 5. Market for Registrant’s Common Equity, Related Stockholder Matters and Issuer Purchases of Equity Securities 14
Item 6. Selected Financial Data 15
Item 7. Management’s Discussion and Analysis of Financial Condition and Results of Operations 16
Item 7A. Quantitative and Qualitative Disclosures About Market Risk 36
Item 8. Financial Statements and Supplementary Data 36
Item 9. Changes in and Disagreements with Accountants on Accounting and Financial Disclosure 36
Item 9A. Controls and Procedures 36
Item 9B. Other Information 37
PART III
Item 10. Directors, Executive Officers and Corporate Governance 37
Item 11. Executive Compensation 37
Item 12. Security Ownership of Certain Beneficial Owners and Management and Related Stockholder Matters 37
Item 13. Certain Relationships and Related Transactions, and Director Independence 37
Item 14. Principal Accounting Fees and Services 37
PART IV
Item 15. Exhibits and Financial Statement Schedules 38
Signatures 41
i

This page intentionally left blank.
PART I
Item 1. BUSINESS
Summary
Murphy Oil Corporation is a worldwide oil and gas exploration and production company with refining and marketing operations in the United States and the United Kingdom. As used in this report, the terms Murphy, Murphy Oil, we, our, its and Company may refer to Murphy Oil Corporation or any one or more of its consolidated subsidiaries.
The Company was originally incorporated in Louisiana in 1950 as Murphy Corporation. It was reincorporated in Delaware in 1964, at which time it adopted the name Murphy Oil Corporation, and was reorganized in 1983 to operate primarily as a holding company of its various businesses. Its operations are classified into two business activities: (1) “Exploration and Production” and (2) “Refining and Marketing.” For reporting purposes, Murphy’s exploration and production activities are subdivided into six geographic segments, including the United States, Canada, Malaysia, the United Kingdom, Republic of the Congo and all other countries. Murphy’s refining and marketing activities are subdivided into geographic segments for North America and United Kingdom. Murphy exited the gasoline retailing business in Canada during 2007, but the relatively insignificant historical results for the Canadian operations have been combined with U.S. refining and marketing operations in the North American segment. Additionally, “Corporate” activities include interest income, interest expense, foreign exchange effects and overhead not allocated to the segments.
The information appearing in the 2009 Annual Report to Security Holders (2009 Annual Report) is incorporated in this Form 10-K report as Exhibit 13 and is deemed to be filed as part of this Form 10-K report as indicated under Items 1, 2 and 7.
In addition to the following information about each business activity, data about Murphy’s operations, properties and business segments, including revenues by class of products and financial information by geographic area, are provided on pages 16 through 30, F-13 and F-14, F-31 through F-40, and F-42 of this Form 10-K report and on pages 5 and 6 of the 2009 Annual Report.
At December 31, 2009, Murphy had 8,369 employees, including 3,261 full-time and 5,108 part-time.
Interested parties may access the Company’s public disclosures filed with the Securities and Exchange Commission (SEC), including Form 10-K, Form 10-Q, Form 8-K and other documents, by accessing the Investor Relations section of Murphy Oil Corporation’s Web site at www.murphyoilcorp.com.
Exploration and Production
The Company’s exploration and production business explores for and produces crude oil, natural gas and natural gas liquids worldwide. The Company’s exploration and production management team in Houston, Texas directs the Company’s worldwide exploration and production activities.
During 2009, Murphy’s principal exploration and production activities were conducted in the United States by wholly owned Murphy Exploration & Production Company – USA (Murphy Expro USA), in Malaysia, Republic of the Congo, Indonesia, Australia and Suriname by wholly owned Murphy Exploration & Production Company – International (Murphy Expro International) and its subsidiaries, in Western Canada and offshore Eastern Canada by wholly owned Murphy Oil Company Ltd. (MOCL) and its subsidiaries, and in the U.K. North Sea and the Atlantic Margin by wholly owned Murphy Petroleum Limited. Murphy’s crude oil and natural gas liquids production in 2009 was in the United States, Canada, Malaysia, the United Kingdom and Republic of the Congo; its natural gas was produced and sold in the United States, Canada, Malaysia and the United Kingdom. MOCL owns a 5% undivided interest in Syncrude Canada Ltd. in northern Alberta, one of the world’s largest producers of synthetic crude oil.
Unless otherwise indicated, all references to the Company’s oil and gas production volumes and proved oil and gas reserves are net to the Company’s working interest excluding applicable royalties.
Murphy’s worldwide crude oil, condensate and natural gas liquids production in 2009 averaged 131,839 barrels per day, an increase of 11% compared to 2008. The increase was primarily due to new oil production at the Thunder Hawk field in the Gulf of Mexico and the Azurite field offshore Republic of the Congo, both of which started production in the third quarter 2009. The Company’s worldwide sales volume of natural gas averaged 187 million cubic feet (MMCF) per day in 2009, up 237% from 2008 levels. The higher natural gas sales volumes were primarily attributable to ramp up of natural gas production at the Tupper area in Western Canada and the Kikeh field in Block K, offshore Sabah, Malaysia, both of which started production in December 2008, and new gas production that commenced in September 2009 in Block SK 309,
1
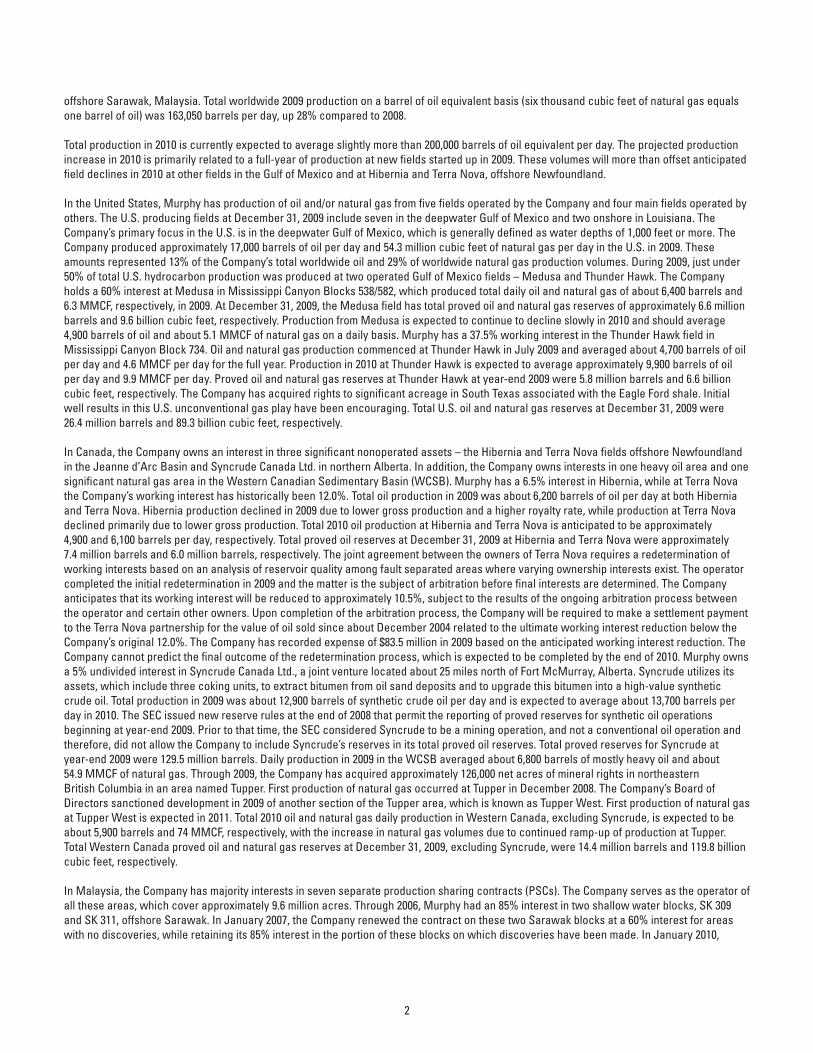
offshore Sarawak, Malaysia. Total worldwide 2009 production on a barrel of oil equivalent basis (six thousand cubic feet of natural gas equals one barrel of oil) was 163,050 barrels per day, up 28% compared to 2008.
Total production in 2010 is currently expected to average slightly more than 200,000 barrels of oil equivalent per day. The projected production increase in 2010 is primarily related to a full-year of production at new fields started up in 2009. These volumes will more than offset anticipated field declines in 2010 at other fields in the Gulf of Mexico and at Hibernia and Terra Nova, offshore Newfoundland.
In the United States, Murphy has production of oil and/or natural gas from five fields operated by the Company and four main fields operated by others. The U.S. producing fields at December 31, 2009 include seven in the deepwater Gulf of Mexico and two onshore in Louisiana. The Company’s primary focus in the U.S. is in the deepwater Gulf of Mexico, which is generally defined as water depths of 1,000 feet or more. The Company produced approximately 17,000 barrels of oil per day and 54.3 million cubic feet of natural gas per day in the U.S. in 2009. These amounts represented 13% of the Company’s total worldwide oil and 29% of worldwide natural gas production volumes. During 2009, just under 50% of total U.S. hydrocarbon production was produced at two operated Gulf of Mexico fields – Medusa and Thunder Hawk. The Company holds a 60% interest at Medusa in Mississippi Canyon Blocks 538/582, which produced total daily oil and natural gas of about 6,400 barrels and 6.3 MMCF, respectively, in 2009. At December 31, 2009, the Medusa field has total proved oil and natural gas reserves of approximately 6.6 million barrels and 9.6 billion cubic feet, respectively. Production from Medusa is expected to continue to decline slowly in 2010 and should average 4,900 barrels of oil and about 5.1 MMCF of natural gas on a daily basis. Murphy has a 37.5% working interest in the Thunder Hawk field in Mississippi Canyon Block 734. Oil and natural gas production commenced at Thunder Hawk in July 2009 and averaged about 4,700 barrels of oil per day and 4.6 MMCF per day for the full year. Production in 2010 at Thunder Hawk is expected to average approximately 9,900 barrels of oil per day and 9.9 MMCF per day. Proved oil and natural gas reserves at Thunder Hawk at year-end 2009 were 5.8 million barrels and 6.6 billion cubic feet, respectively. The Company has acquired rights to significant acreage in South Texas associated with the Eagle Ford shale. Initial well results in this U.S. unconventional gas play have been encouraging. Total U.S. oil and natural gas reserves at December 31, 2009 were 26.4 million barrels and 89.3 billion cubic feet, respectively.
In Canada, the Company owns an interest in three significant nonoperated assets – the Hibernia and Terra Nova fields offshore Newfoundland in the Jeanne d’Arc Basin and Syncrude Canada Ltd. in northern Alberta. In addition, the Company owns interests in one heavy oil area and one significant natural gas area in the Western Canadian Sedimentary Basin (WCSB). Murphy has a 6.5% interest in Hibernia, while at Terra Nova the Company’s working interest has historically been 12.0%. Total oil production in 2009 was about 6,200 barrels of oil per day at both Hibernia and Terra Nova. Hibernia production declined in 2009 due to lower gross production and a higher royalty rate, while production at Terra Nova declined primarily due to lower gross production. Total 2010 oil production at Hibernia and Terra Nova is anticipated to be approximately 4,900 and 6,100 barrels per day, respectively. Total proved oil reserves at December 31, 2009 at Hibernia and Terra Nova were approximately 7.4 million barrels and 6.0 million barrels, respectively. The joint agreement between the owners of Terra Nova requires a redetermination of working interests based on an analysis of reservoir quality among fault separated areas where varying ownership interests exist. The operator completed the initial redetermination in 2009 and the matter is the subject of arbitration before final interests are determined. The Company anticipates that its working interest will be reduced to approximately 10.5%, subject to the results of the ongoing arbitration process between the operator and certain other owners. Upon completion of the arbitration process, the Company will be required to make a settlement payment to the Terra Nova partnership for the value of oil sold since about December 2004 related to the ultimate working interest reduction below the Company’s original 12.0%. The Company has recorded expense of $83.5 million in 2009 based on the anticipated working interest reduction. The Company cannot predict the final outcome of the redetermination process, which is expected to be completed by the end of 2010. Murphy owns a 5% undivided interest in Syncrude Canada Ltd., a joint venture located about 25 miles north of Fort McMurray, Alberta. Syncrude utilizes its assets, which include three coking units, to extract bitumen from oil sand deposits and to upgrade this bitumen into a high-value synthetic crude oil. Total production in 2009 was about 12,900 barrels of synthetic crude oil per day and is expected to average about 13,700 barrels per day in 2010. The SEC issued new reserve rules at the end of 2008 that permit the reporting of proved reserves for synthetic oil operations beginning at year-end 2009. Prior to that time, the SEC considered Syncrude to be a mining operation, and not a conventional oil operation and therefore, did not allow the Company to include Syncrude’s reserves in its total proved oil reserves. Total proved reserves for Syncrude at year-end 2009 were 129.5 million barrels. Daily production in 2009 in the WCSB averaged about 6,800 barrels of mostly heavy oil and about 54.9 MMCF of natural gas. Through 2009, the Company has acquired approximately 126,000 net acres of mineral rights in northeastern British Columbia in an area named Tupper. First production of natural gas occurred at Tupper in December 2008. The Company’s Board of Directors sanctioned development in 2009 of another section of the Tupper area, which is known as Tupper West. First production of natural gas at Tupper West is expected in 2011. Total 2010 oil and natural gas daily production in Western Canada, excluding Syncrude, is expected to be about 5,900 barrels and 74 MMCF, respectively, with the increase in natural gas volumes due to continued ramp-up of production at Tupper. Total Western Canada proved oil and natural gas reserves at December 31, 2009, excluding Syncrude, were 14.4 million barrels and 119.8 billion cubic feet, respectively.
In Malaysia, the Company has majority interests in seven separate production sharing contracts (PSCs). The Company serves as the operator of all these areas, which cover approximately 9.6 million acres. Through 2006, Murphy had an 85% interest in two shallow water blocks, SK 309 and SK 311, offshore Sarawak. In January 2007, the Company renewed the contract on these two Sarawak blocks at a 60% interest for areas with no discoveries, while retaining its 85% interest in the portion of these blocks on which discoveries have been made. In January 2010,
2
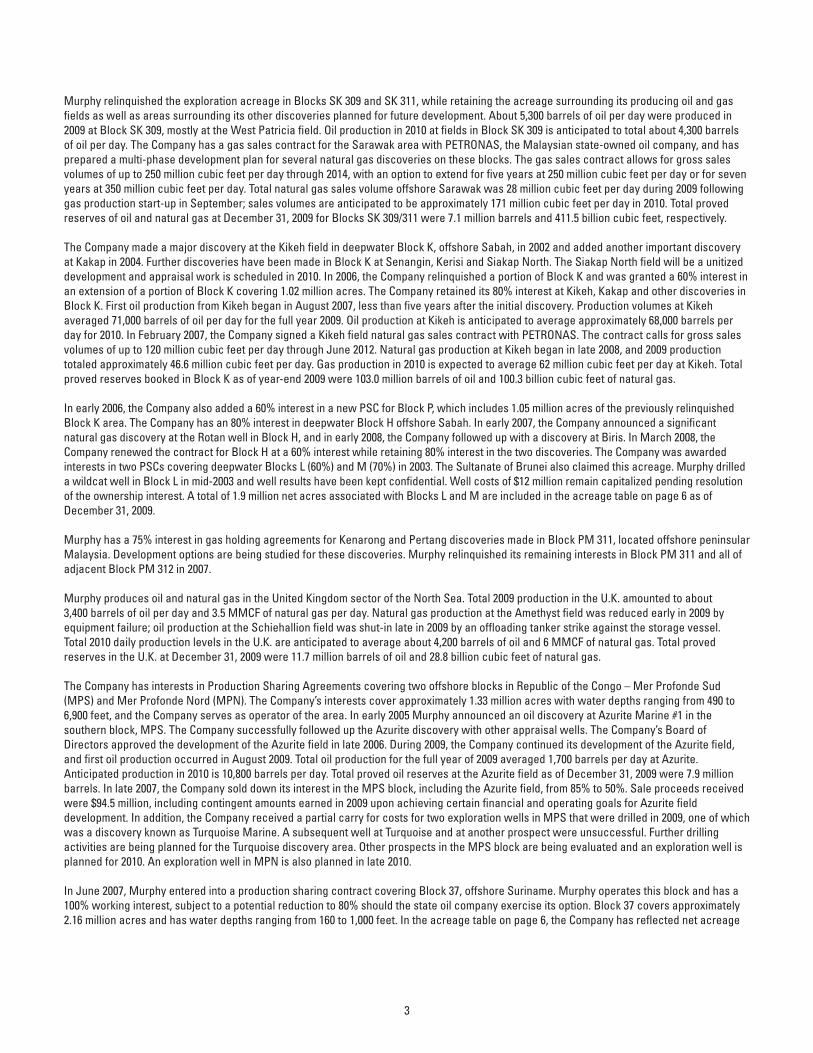
Murphy relinquished the exploration acreage in Blocks SK 309 and SK 311, while retaining the acreage surrounding its producing oil and gas fields as well as areas surrounding its other discoveries planned for future development. About 5,300 barrels of oil per day were produced in 2009 at Block SK 309, mostly at the West Patricia field. Oil production in 2010 at fields in Block SK 309 is anticipated to total about 4,300 barrels of oil per day. The Company has a gas sales contract for the Sarawak area with PETRONAS, the Malaysian state-owned oil company, and has prepared a multi-phase development plan for several natural gas discoveries on these blocks. The gas sales contract allows for gross sales volumes of up to 250 million cubic feet per day through 2014, with an option to extend for five years at 250 million cubic feet per day or for seven years at 350 million cubic feet per day. Total natural gas sales volume offshore Sarawak was 28 million cubic feet per day during 2009 following gas production start-up in September; sales volumes are anticipated to be approximately 171 million cubic feet per day in 2010. Total proved reserves of oil and natural gas at December 31, 2009 for Blocks SK 309/311 were 7.1 million barrels and 411.5 billion cubic feet, respectively.
The Company made a major discovery at the Kikeh field in deepwater Block K, offshore Sabah, in 2002 and added another important discovery at Kakap in 2004. Further discoveries have been made in Block K at Senangin, Kerisi and Siakap North. The Siakap North field will be a unitized development and appraisal work is scheduled in 2010. In 2006, the Company relinquished a portion of Block K and was granted a 60% interest in an extension of a portion of Block K covering 1.02 million acres. The Company retained its 80% interest at Kikeh, Kakap and other discoveries in Block K. First oil production from Kikeh began in August 2007, less than five years after the initial discovery. Production volumes at Kikeh averaged 71,000 barrels of oil per day for the full year 2009. Oil production at Kikeh is anticipated to average approximately 68,000 barrels per day for 2010. In February 2007, the Company signed a Kikeh field natural gas sales contract with PETRONAS. The contract calls for gross sales volumes of up to 120 million cubic feet per day through June 2012. Natural gas production at Kikeh began in late 2008, and 2009 production totaled approximately 46.6 million cubic feet per day. Gas production in 2010 is expected to average 62 million cubic feet per day at Kikeh. Total proved reserves booked in Block K as of year-end 2009 were 103.0 million barrels of oil and 100.3 billion cubic feet of natural gas.
In early 2006, the Company also added a 60% interest in a new PSC for Block P, which includes 1.05 million acres of the previously relinquished Block K area. The Company has an 80% interest in deepwater Block H offshore Sabah. In early 2007, the Company announced a significant natural gas discovery at the Rotan well in Block H, and in early 2008, the Company followed up with a discovery at Biris. In March 2008, the Company renewed the contract for Block H at a 60% interest while retaining 80% interest in the two discoveries. The Company was awarded interests in two PSCs covering deepwater Blocks L (60%) and M (70%) in 2003. The Sultanate of Brunei also claimed this acreage. Murphy drilled a wildcat well in Block L in mid-2003 and well results have been kept confidential. Well costs of $12 million remain capitalized pending resolution of the ownership interest. A total of 1.9 million net acres associated with Blocks L and M are included in the acreage table on page 6 as of December 31, 2009.
Murphy has a 75% interest in gas holding agreements for Kenarong and Pertang discoveries made in Block PM 311, located offshore peninsular Malaysia. Development options are being studied for these discoveries. Murphy relinquished its remaining interests in Block PM 311 and all of adjacent Block PM 312 in 2007.
Murphy produces oil and natural gas in the United Kingdom sector of the North Sea. Total 2009 production in the U.K. amounted to about 3,400 barrels of oil per day and 3.5 MMCF of natural gas per day. Natural gas production at the Amethyst field was reduced early in 2009 by equipment failure; oil production at the Schiehallion field was shut-in late in 2009 by an offloading tanker strike against the storage vessel. Total 2010 daily production levels in the U.K. are anticipated to average about 4,200 barrels of oil and 6 MMCF of natural gas. Total proved reserves in the U.K. at December 31, 2009 were 11.7 million barrels of oil and 28.8 billion cubic feet of natural gas.
The Company has interests in Production Sharing Agreements covering two offshore blocks in Republic of the Congo – Mer Profonde Sud (MPS) and Mer Profonde Nord (MPN). The Company’s interests cover approximately 1.33 million acres with water depths ranging from 490 to 6,900 feet, and the Company serves as operator of the area. In early 2005 Murphy announced an oil discovery at Azurite Marine #1 in the southern block, MPS. The Company successfully followed up the Azurite discovery with other appraisal wells. The Company’s Board of Directors approved the development of the Azurite field in late 2006. During 2009, the Company continued its development of the Azurite field, and first oil production occurred in August 2009. Total oil production for the full year of 2009 averaged 1,700 barrels per day at Azurite. Anticipated production in 2010 is 10,800 barrels per day. Total proved oil reserves at the Azurite field as of December 31, 2009 were 7.9 million barrels. In late 2007, the Company sold down its interest in the MPS block, including the Azurite field, from 85% to 50%. Sale proceeds received were $94.5 million, including contingent amounts earned in 2009 upon achieving certain financial and operating goals for Azurite field development. In addition, the Company received a partial carry for costs for two exploration wells in MPS that were drilled in 2009, one of which was a discovery known as Turquoise Marine. A subsequent well at Turquoise and at another prospect were unsuccessful. Further drilling activities are being planned for the Turquoise discovery area. Other prospects in the MPS block are being evaluated and an exploration well is planned for 2010. An exploration well in MPN is also planned in late 2010.
In June 2007, Murphy entered into a production sharing contract covering Block 37, offshore Suriname. Murphy operates this block and has a 100% working interest, subject to a potential reduction to 80% should the state oil company exercise its option. Block 37 covers approximately 2.16 million acres and has water depths ranging from 160 to 1,000 feet. In the acreage table on page 6, the Company has reflected net acreage
3
for Suriname as if the state company’s option will be exercised. The contract provides for a six-year exploration period with two phases. Phase I has a four-year period that requires the acquisition of 3D seismic and the drilling of two wells. The 3D seismic was shot in late 2008 and early 2009, and interpretation of this data occurred in 2009. The first exploration well is expected to be drilled in late 2010.
The Company acquired a 40% interest and operatorship of an exploration permit covering approximately 1.00 million gross acres in Block AC/P36 in the Browse Basin offshore northwestern Australia in November 2007. Three-dimensional seismic data was obtained in late 2007 and drilling of a commitment exploration well at a prospect named Abalone Deep in late 2008 was unsuccessful. In November 2008, the Company acquired a 70% interest and operatorship of a second Browse Basin exploration permit in Block WA-423-P. Murphy farmed down its interest in WA-423-P to 40% in the first quarter of 2009. This permit covers approximately 1.43 million gross acres and calls for a 3D seismic survey and one exploration well, which is expected to be drilled in 2011. In June 2009, the Company acquired a 70% interest and operatorship of Block NT/P80 in the Bonaparte Basin, offshore northwestern Australia. The block covers approximately 1.21 million gross acres and reprocessing of seismic covering the area is in progress. The Company has an office in Perth, Western Australia to support the operations of these permits in Australia and the operations of the Company in Southeast Asia.
In May 2008, the Company entered into a production sharing contract in Indonesia covering a 100% interest in the South Barito block in South Kalimantan on the island of Borneo. The block covers approximately 1.24 million acres. The contract permits a six-year exploration term with an optional four-year extension. The work commitment calls for geophysical work, 2D seismic acquisition and processing, and two exploration wells. The contract requires relinquishment of 25% of acreage after three years and an additional 55% after six years. In November 2008, Murphy entered into a production sharing contract in the Semai II Block offshore West Papua, Indonesia. The Company has a 33% interest in the block which covers about 835,000 acres. The permit calls for a 3D seismic program and three exploration wells. Murphy is the operator of both the South Barito and Semai II concessions.
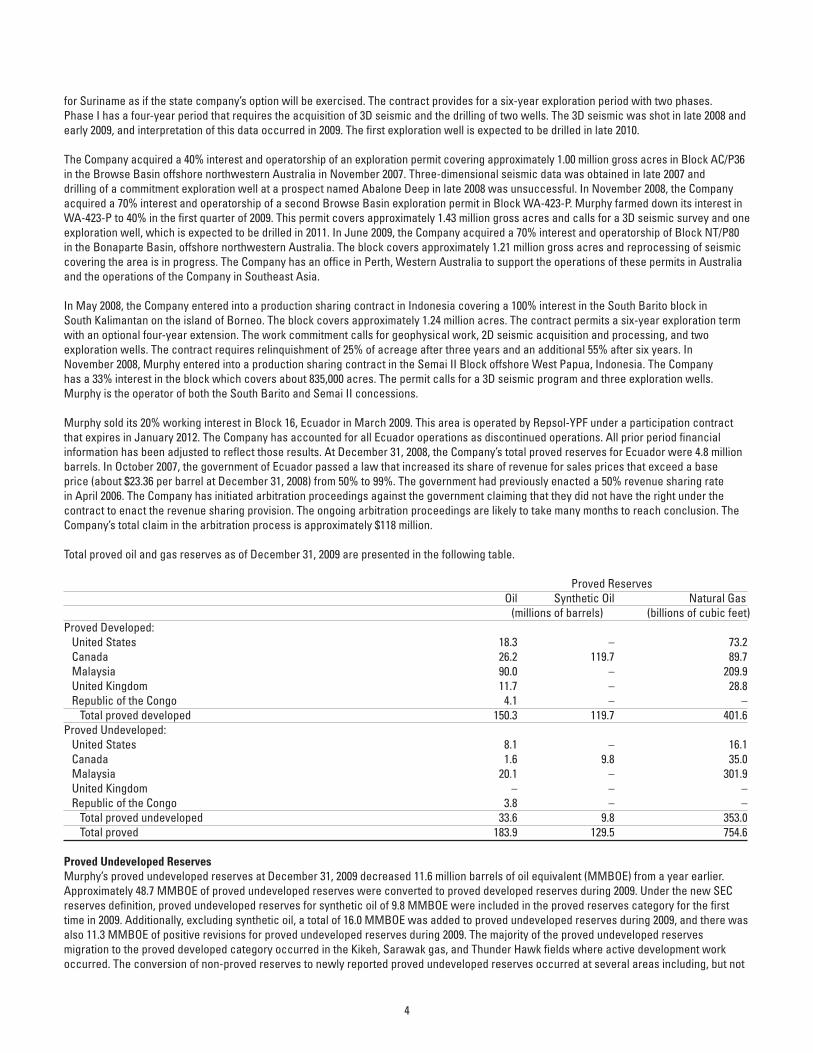
Murphy sold its 20% working interest in Block 16, Ecuador in March 2009. This area is operated by Repsol-YPF under a participation contract that expires in January 2012. The Company has accounted for all Ecuador operations as discontinued operations. All prior period financial information has been adjusted to reflect those results. At December 31, 2008, the Company’s total proved reserves for Ecuador were 4.8 million barrels. In October 2007, the government of Ecuador passed a law that increased its share of revenue for sales prices that exceed a base price (about $23.36 per barrel at December 31, 2008) from 50% to 99%. The government had previously enacted a 50% revenue sharing rate in April 2006. The Company has initiated arbitration proceedings against the government claiming that they did not have the right under the contract to enact the revenue sharing provision. The ongoing arbitration proceedings are likely to take many months to reach conclusion. The Company’s total claim in the arbitration process is approximately $118 million. Total proved oil and gas reserves as of December 31, 2009 are presented in the following table.
Proved Reserves Oil Synthetic Oil Natural Gas (millions of barrels) (billions of cubic feet)Proved Developed: United States 18.3 – 73.2 Canada 26.2 119.7 89.7 Malaysia 90.0 – 209.9 United Kingdom 11.7 – 28.8 Republic of the Congo 4.1 – – Total proved developed 150.3 119.7 401.6Proved Undeveloped: United States 8.1 – 16.1 Canada 1.6 9.8 35.0 Malaysia 20.1 – 301.9 United Kingdom – – – Republic of the Congo 3.8 – – Total proved undeveloped 33.6 9.8 353.0 Total proved 183.9 129.5 754.6
Proved Undeveloped ReservesMurphy’s proved undeveloped reserves at December 31, 2009 decreased 11.6 million barrels of oil equivalent (MMBOE) from a year earlier. Approximately 48.7 MMBOE of proved undeveloped reserves were converted to proved developed reserves during 2009. Under the new SEC reserves definition, proved undeveloped reserves for synthetic oil of 9.8 MMBOE were included in the proved reserves category for the first time in 2009. Additionally, excluding synthetic oil, a total of 16.0 MMBOE was added to proved undeveloped reserves during 2009, and there was also 11.3 MMBOE of positive revisions for proved undeveloped reserves during 2009. The majority of the proved undeveloped reserves migration to the proved developed category occurred in the Kikeh, Sarawak gas, and Thunder Hawk fields where active development work occurred. The conversion of non-proved reserves to newly reported proved undeveloped reserves occurred at several areas including, but not
4
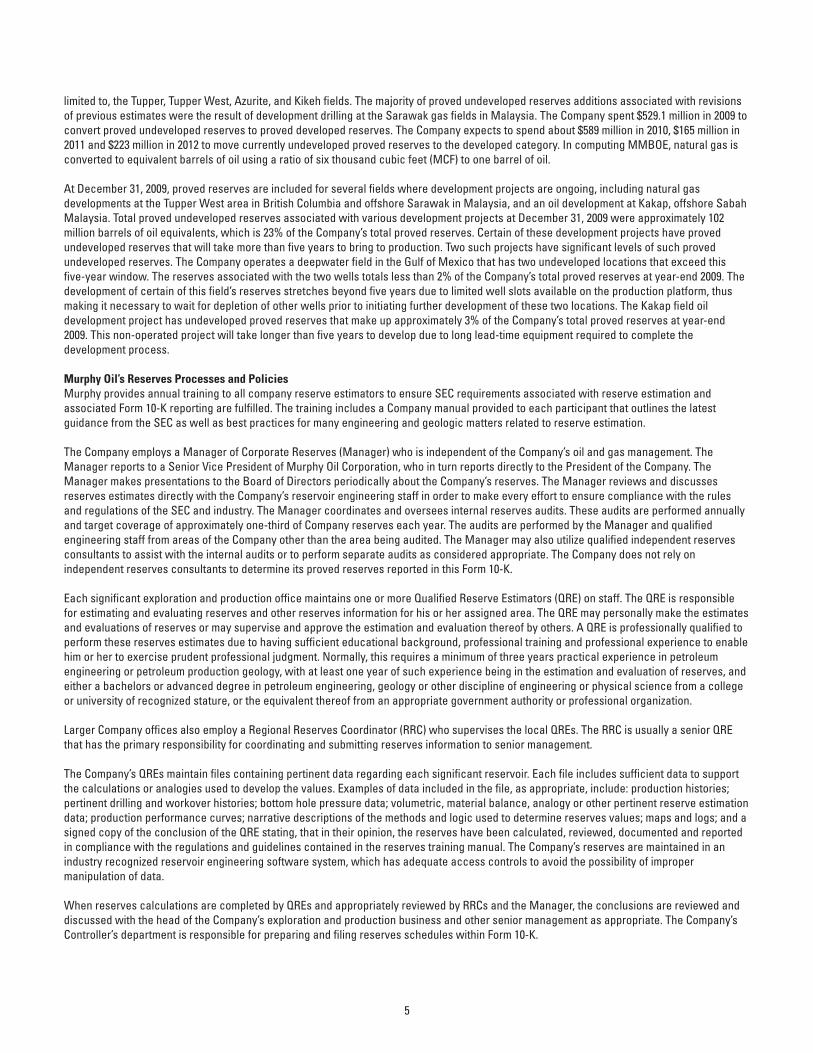
limited to, the Tupper, Tupper West, Azurite, and Kikeh fields. The majority of proved undeveloped reserves additions associated with revisions of previous estimates were the result of development drilling at the Sarawak gas fields in Malaysia. The Company spent $529.1 million in 2009 to convert proved undeveloped reserves to proved developed reserves. The Company expects to spend about $589 million in 2010, $165 million in 2011 and $223 million in 2012 to move currently undeveloped proved reserves to the developed category. In computing MMBOE, natural gas is converted to equivalent barrels of oil using a ratio of six thousand cubic feet (MCF) to one barrel of oil.
At December 31, 2009, proved reserves are included for several fields where development projects are ongoing, including natural gas developments at the Tupper West area in British Columbia and offshore Sarawak in Malaysia, and an oil development at Kakap, offshore Sabah Malaysia. Total proved undeveloped reserves associated with various development projects at December 31, 2009 were approximately 102 million barrels of oil equivalents, which is 23% of the Company’s total proved reserves. Certain of these development projects have proved undeveloped reserves that will take more than five years to bring to production. Two such projects have significant levels of such proved undeveloped reserves. The Company operates a deepwater field in the Gulf of Mexico that has two undeveloped locations that exceed this five-year window. The reserves associated with the two wells totals less than 2% of the Company’s total proved reserves at year-end 2009. The development of certain of this field’s reserves stretches beyond five years due to limited well slots available on the production platform, thus making it necessary to wait for depletion of other wells prior to initiating further development of these two locations. The Kakap field oil development project has undeveloped proved reserves that make up approximately 3% of the Company’s total proved reserves at year-end 2009. This non-operated project will take longer than five years to develop due to long lead-time equipment required to complete the development process.
Murphy Oil’s Reserves Processes and PoliciesMurphy provides annual training to all company reserve estimators to ensure SEC requirements associated with reserve estimation and associated Form 10-K reporting are fulfilled. The training includes a Company manual provided to each participant that outlines the latest guidance from the SEC as well as best practices for many engineering and geologic matters related to reserve estimation.
The Company employs a Manager of Corporate Reserves (Manager) who is independent of the Company’s oil and gas management. The Manager reports to a Senior Vice President of Murphy Oil Corporation, who in turn reports directly to the President of the Company. The Manager makes presentations to the Board of Directors periodically about the Company’s reserves. The Manager reviews and discusses reserves estimates directly with the Company’s reservoir engineering staff in order to make every effort to ensure compliance with the rules and regulations of the SEC and industry. The Manager coordinates and oversees internal reserves audits. These audits are performed annually and target coverage of approximately one-third of Company reserves each year. The audits are performed by the Manager and qualified engineering staff from areas of the Company other than the area being audited. The Manager may also utilize qualified independent reserves consultants to assist with the internal audits or to perform separate audits as considered appropriate. The Company does not rely on independent reserves consultants to determine its proved reserves reported in this Form 10-K.
Each significant exploration and production office maintains one or more Qualified Reserve Estimators (QRE) on staff. The QRE is responsible for estimating and evaluating reserves and other reserves information for his or her assigned area. The QRE may personally make the estimates and evaluations of reserves or may supervise and approve the estimation and evaluation thereof by others. A QRE is professionally qualified to perform these reserves estimates due to having sufficient educational background, professional training and professional experience to enable him or her to exercise prudent professional judgment. Normally, this requires a minimum of three years practical experience in petroleum engineering or petroleum production geology, with at least one year of such experience being in the estimation and evaluation of reserves, and either a bachelors or advanced degree in petroleum engineering, geology or other discipline of engineering or physical science from a college or university of recognized stature, or the equivalent thereof from an appropriate government authority or professional organization.
Larger Company offices also employ a Regional Reserves Coordinator (RRC) who supervises the local QREs. The RRC is usually a senior QRE that has the primary responsibility for coordinating and submitting reserves information to senior management.
The Company’s QREs maintain files containing pertinent data regarding each significant reservoir. Each file includes sufficient data to support the calculations or analogies used to develop the values. Examples of data included in the file, as appropriate, include: production histories; pertinent drilling and workover histories; bottom hole pressure data; volumetric, material balance, analogy or other pertinent reserve estimation data; production performance curves; narrative descriptions of the methods and logic used to determine reserves values; maps and logs; and a signed copy of the conclusion of the QRE stating, that in their opinion, the reserves have been calculated, reviewed, documented and reported in compliance with the regulations and guidelines contained in the reserves training manual. The Company’s reserves are maintained in an industry recognized reservoir engineering software system, which has adequate access controls to avoid the possibility of improper manipulation of data.
When reserves calculations are completed by QREs and appropriately reviewed by RRCs and the Manager, the conclusions are reviewed and discussed with the head of the Company’s exploration and production business and other senior management as appropriate. The Company’s Controller’s department is responsible for preparing and filing reserves schedules within Form 10-K.
5
Qualifications of Manager of Corporate ReservesThe Company believes that it has qualified employees generating oil and gas reserves. Mr. Brad Gouge serves as Manager of Corporate Reserves after joining the Company in mid-2008. Prior to that time, Mr. Gouge was Vice President of a major petroleum engineering consulting firm. He previously was a reservoir and production engineer with a major integrated oil company. Mr. Gouge earned a Bachelors of Science degree in Petroleum Engineering from Texas A&M University and has attended numerous industry training courses. Mr. Gouge is a registered Professional Engineer in the state of Texas and is an instructor for a Society of Petroleum Engineers (SPE) Petroleum Reserves course. He is also co-author of two papers on reservoir engineering which have been published by the SPE.
More information regarding Murphy’s estimated quantities of proved oil and gas reserves for the last three years are presented by geographic area on pages F-36 and F-37 of this Form 10-K report. Murphy has not filed and is not required to file any estimates of its total proved oil or gas reserves on a recurring basis with any federal or foreign governmental regulatory authority or agency other than the U.S. Securities and Exchange Commission. Annually, Murphy reports gross reserves of properties operated in the United States to the U.S. Department of Energy; such reserves are derived from the same data from which estimated proved reserves of such properties are determined.
Crude oil, condensate and gas liquids production and sales, and natural gas sales by geographic area with weighted average sales prices for each of the seven years ended December 31, 2009 are shown on page 5 of the 2009 Annual Report. In 2009, the Company’s production of oil and natural gas represented approximately 0.1% of worldwide totals.
Production expenses for the last three years in U.S. dollars per equivalent barrel are discussed beginning on page 22 of this Form 10-K report. For purposes of these computations, natural gas sales volumes are converted to equivalent barrels of oil using a ratio of six MCF of natural gas to one barrel of oil.
Supplemental disclosures relating to oil and gas producing activities are reported on pages F-34 through F-42 of this Form 10-K report.
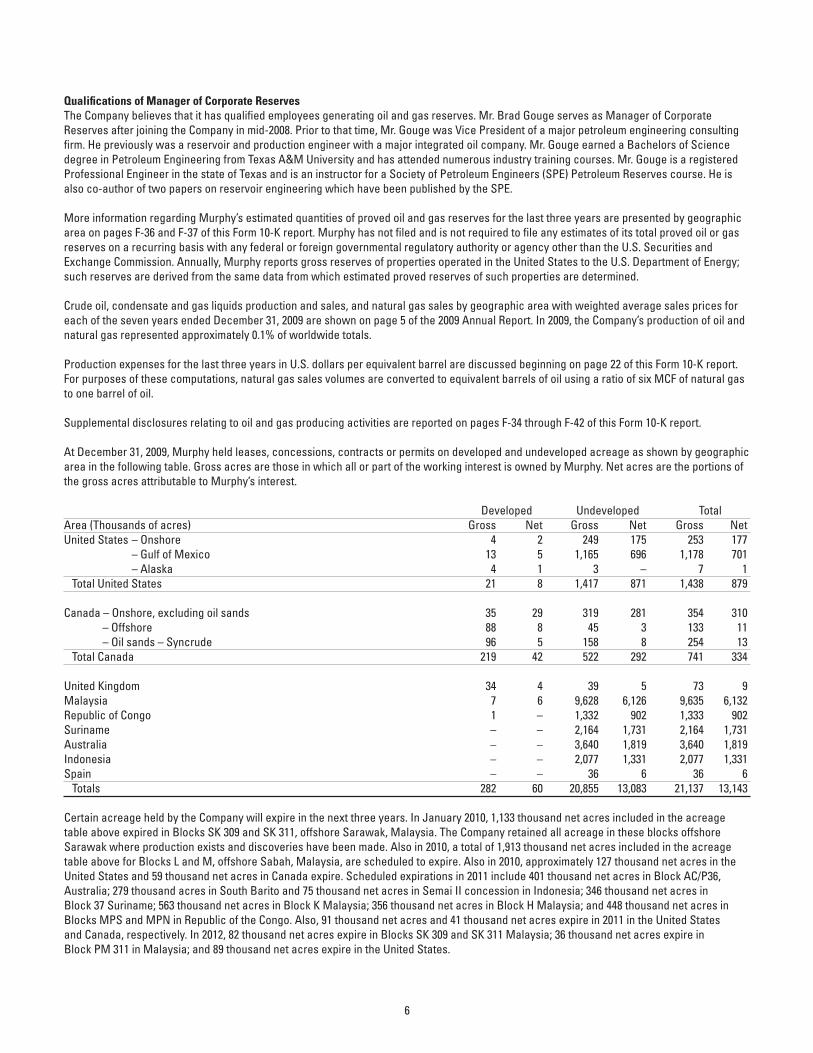
At December 31, 2009, Murphy held leases, concessions, contracts or permits on developed and undeveloped acreage as shown by geographic area in the following table. Gross acres are those in which all or part of the working interest is owned by Murphy. Net acres are the portions of the gross acres attributable to Murphy’s interest.
Developed Undeveloped Total Area (Thousands of acres) Gross Net Gross Net Gross Net United States – Onshore 4 2 249 175 253 177 – Gulf of Mexico 13 5 1,165 696 1,178 701 – Alaska 4 1 3 – 7 1 Total United States 21 8 1,417 871 1,438 879
Canada – Onshore, excluding oil sands 35 29 319 281 354 310 – Offshore 88 8 45 3 133 11 – Oil sands – Syncrude 96 5 158 8 254 13 Total Canada 219 42 522 292 741 334
United Kingdom 34 4 39 5 73 9Malaysia 7 6 9,628 6,126 9,635 6,132Republic of Congo 1 – 1,332 902 1,333 902Suriname – – 2,164 1,731 2,164 1,731Australia – – 3,640 1,819 3,640 1,819Indonesia – – 2,077 1,331 2,077 1,331Spain – – 36 6 36 6 Totals 282 60 20,855 13,083 21,137 13,143
Certain acreage held by the Company will expire in the next three years. In January 2010, 1,133 thousand net acres included in the acreage table above expired in Blocks SK 309 and SK 311, offshore Sarawak, Malaysia. The Company retained all acreage in these blocks offshore Sarawak where production exists and discoveries have been made. Also in 2010, a total of 1,913 thousand net acres included in the acreage table above for Blocks L and M, offshore Sabah, Malaysia, are scheduled to expire. Also in 2010, approximately 127 thousand net acres in the United States and 59 thousand net acres in Canada expire. Scheduled expirations in 2011 include 401 thousand net acres in Block AC/P36, Australia; 279 thousand acres in South Barito and 75 thousand net acres in Semai II concession in Indonesia; 346 thousand net acres in Block 37 Suriname; 563 thousand net acres in Block K Malaysia; 356 thousand net acres in Block H Malaysia; and 448 thousand net acres in Blocks MPS and MPN in Republic of the Congo. Also, 91 thousand net acres and 41 thousand net acres expire in 2011 in the United States and Canada, respectively. In 2012, 82 thousand net acres expire in Blocks SK 309 and SK 311 Malaysia; 36 thousand net acres expire in Block PM 311 in Malaysia; and 89 thousand net acres expire in the United States.
6
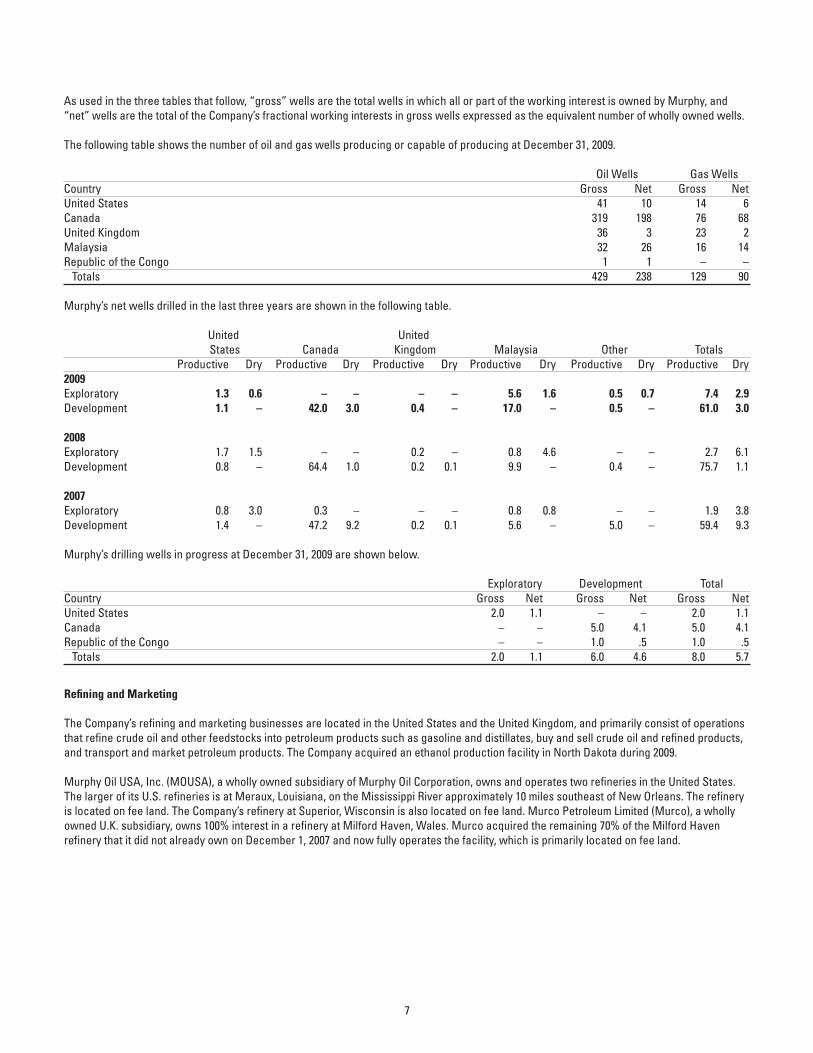
As used in the three tables that follow, “gross” wells are the total wells in which all or part of the working interest is owned by Murphy, and “net” wells are the total of the Company’s fractional working interests in gross wells expressed as the equivalent number of wholly owned wells.
The following table shows the number of oil and gas wells producing or capable of producing at December 31, 2009.
Oil Wells Gas Wells Country Gross Net Gross Net United States 41 10 14 6Canada 319 198 76 68United Kingdom 36 3 23 2Malaysia 32 26 16 14Republic of the Congo 1 1 – – Totals 429 238 129 90
Murphy’s net wells drilled in the last three years are shown in the following table.
United United States Canada Kingdom Malaysia Other Totals Productive Dry Productive Dry Productive Dry Productive Dry Productive Dry Productive Dry2009Exploratory 1.3 0.6 – – – – 5.6 1.6 0.5 0.7 7.4 2.9Development 1.1 – 42.0 3.0 0.4 – 17.0 – 0.5 – 61.0 3.0
2008Exploratory 1.7 1.5 – – 0.2 – 0.8 4.6 – – 2.7 6.1Development 0.8 – 64.4 1.0 0.2 0.1 9.9 – 0.4 – 75.7 1.1
2007Exploratory 0.8 3.0 0.3 – – – 0.8 0.8 – – 1.9 3.8Development 1.4 – 47.2 9.2 0.2 0.1 5.6 – 5.0 – 59.4 9.3
Murphy’s drilling wells in progress at December 31, 2009 are shown below.
Exploratory Development Total Country Gross Net Gross Net Gross NetUnited States 2.0 1.1 – – 2.0 1.1Canada – – 5.0 4.1 5.0 4.1Republic of the Congo – – 1.0 .5 1.0 .5 Totals 2.0 1.1 6.0 4.6 8.0 5.7
Refining and Marketing
The Company’s refining and marketing businesses are located in the United States and the United Kingdom, and primarily consist of operations that refine crude oil and other feedstocks into petroleum products such as gasoline and distillates, buy and sell crude oil and refined products, and transport and market petroleum products. The Company acquired an ethanol production facility in North Dakota during 2009.
Murphy Oil USA, Inc. (MOUSA), a wholly owned subsidiary of Murphy Oil Corporation, owns and operates two refineries in the United States. The larger of its U.S. refineries is at Meraux, Louisiana, on the Mississippi River approximately 10 miles southeast of New Orleans. The refinery is located on fee land. The Company’s refinery at Superior, Wisconsin is also located on fee land. Murco Petroleum Limited (Murco), a wholly owned U.K. subsidiary, owns 100% interest in a refinery at Milford Haven, Wales. Murco acquired the remaining 70% of the Milford Haven refinery that it did not already own on December 1, 2007 and now fully operates the facility, which is primarily located on fee land.
7
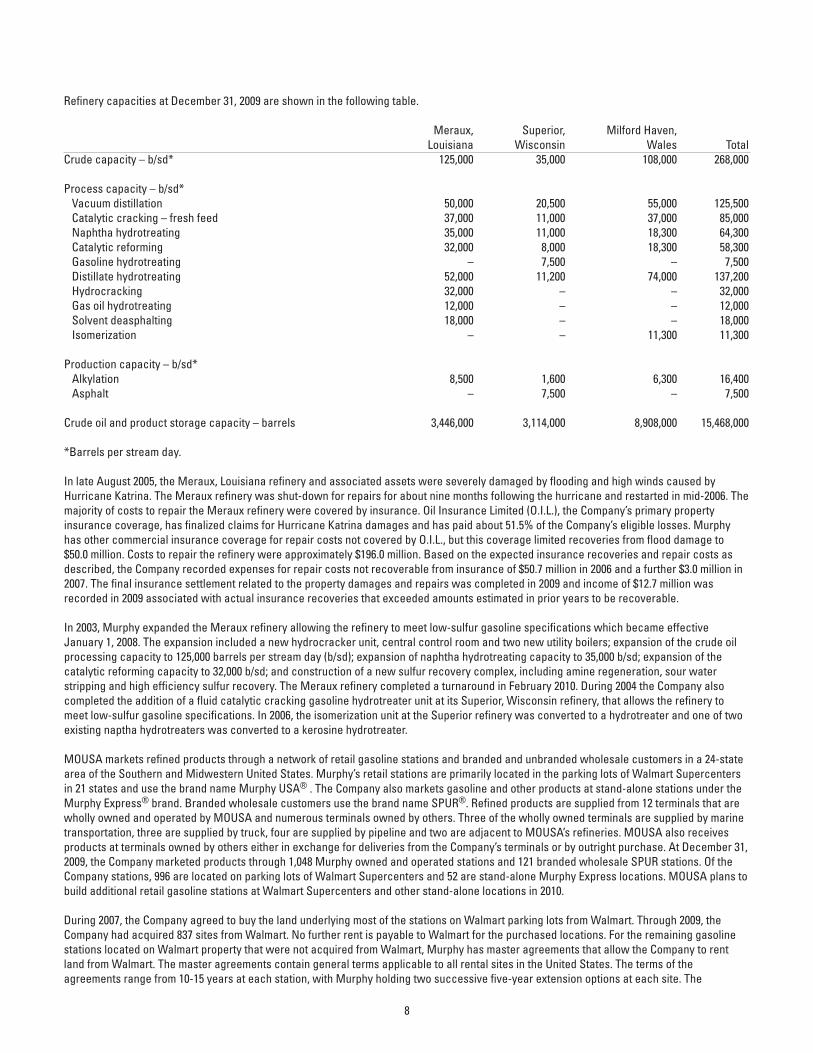
Refinery capacities at December 31, 2009 are shown in the following table.
Meraux, Superior, Milford Haven, Louisiana Wisconsin Wales Total Crude capacity – b/sd* 125,000 35,000 108,000 268,000
Process capacity – b/sd* Vacuum distillation 50,000 20,500 55,000 125,500 Catalytic cracking – fresh feed 37,000 11,000 37,000 85,000 Naphtha hydrotreating 35,000 11,000 18,300 64,300 Catalytic reforming 32,000 8,000 18,300 58,300 Gasoline hydrotreating – 7,500 – 7,500 Distillate hydrotreating 52,000 11,200 74,000 137,200 Hydrocracking 32,000 – – 32,000 Gas oil hydrotreating 12,000 – – 12,000 Solvent deasphalting 18,000 – – 18,000 Isomerization – – 11,300 11,300
Production capacity – b/sd* Alkylation 8,500 1,600 6,300 16,400 Asphalt – 7,500 – 7,500
Crude oil and product storage capacity – barrels 3,446,000 3,114,000 8,908,000 15,468,000
*Barrels per stream day.
In late August 2005, the Meraux, Louisiana refinery and associated assets were severely damaged by flooding and high winds caused by Hurricane Katrina. The Meraux refinery was shut-down for repairs for about nine months following the hurricane and restarted in mid-2006. The majority of costs to repair the Meraux refinery were covered by insurance. Oil Insurance Limited (O.I.L.), the Company’s primary property insurance coverage, has finalized claims for Hurricane Katrina damages and has paid about 51.5% of the Company’s eligible losses. Murphy has other commercial insurance coverage for repair costs not covered by O.I.L., but this coverage limited recoveries from flood damage to $50.0 million. Costs to repair the refinery were approximately $196.0 million. Based on the expected insurance recoveries and repair costs as described, the Company recorded expenses for repair costs not recoverable from insurance of $50.7 million in 2006 and a further $3.0 million in 2007. The final insurance settlement related to the property damages and repairs was completed in 2009 and income of $12.7 million was recorded in 2009 associated with actual insurance recoveries that exceeded amounts estimated in prior years to be recoverable.
In 2003, Murphy expanded the Meraux refinery allowing the refinery to meet low-sulfur gasoline specifications which became effective January 1, 2008. The expansion included a new hydrocracker unit, central control room and two new utility boilers; expansion of the crude oil processing capacity to 125,000 barrels per stream day (b/sd); expansion of naphtha hydrotreating capacity to 35,000 b/sd; expansion of the catalytic reforming capacity to 32,000 b/sd; and construction of a new sulfur recovery complex, including amine regeneration, sour water stripping and high efficiency sulfur recovery. The Meraux refinery completed a turnaround in February 2010. During 2004 the Company also completed the addition of a fluid catalytic cracking gasoline hydrotreater unit at its Superior, Wisconsin refinery, that allows the refinery to meet low-sulfur gasoline specifications. In 2006, the isomerization unit at the Superior refinery was converted to a hydrotreater and one of two existing naptha hydrotreaters was converted to a kerosine hydrotreater.
MOUSA markets refined products through a network of retail gasoline stations and branded and unbranded wholesale customers in a 24-state area of the Southern and Midwestern United States. Murphy’s retail stations are primarily located in the parking lots of Walmart Supercenters in 21 states and use the brand name Murphy USA® . The Company also markets gasoline and other products at stand-alone stations under the Murphy Express® brand. Branded wholesale customers use the brand name SPUR®. Refined products are supplied from 12 terminals that are wholly owned and operated by MOUSA and numerous terminals owned by others. Three of the wholly owned terminals are supplied by marine transportation, three are supplied by truck, four are supplied by pipeline and two are adjacent to MOUSA’s refineries. MOUSA also receives products at terminals owned by others either in exchange for deliveries from the Company’s terminals or by outright purchase. At December 31, 2009, the Company marketed products through 1,048 Murphy owned and operated stations and 121 branded wholesale SPUR stations. Of the Company stations, 996 are located on parking lots of Walmart Supercenters and 52 are stand-alone Murphy Express locations. MOUSA plans to build additional retail gasoline stations at Walmart Supercenters and other stand-alone locations in 2010.
During 2007, the Company agreed to buy the land underlying most of the stations on Walmart parking lots from Walmart. Through 2009, the Company had acquired 837 sites from Walmart. No further rent is payable to Walmart for the purchased locations. For the remaining gasoline stations located on Walmart property that were not acquired from Walmart, Murphy has master agreements that allow the Company to rent land from Walmart. The master agreements contain general terms applicable to all rental sites in the United States. The terms of the agreements range from 10-15 years at each station, with Murphy holding two successive five-year extension options at each site. The
8
agreements permit Walmart to terminate the agreements in their entirety, or only as to affected sites, at its option for the following reasons: Murphy vacates or abandons the property; Murphy improperly transfers the rights under this agreement to another party; an agreement or a premises is taken upon execution or by process of law; Murphy files a petition in bankruptcy or becomes insolvent; Murphy fails to pay its debts as they become due; Murphy fails to pay rent or other sums required to be paid within 90 days after written notice; or Murphy fails to perform in any material way as required by the agreements. Sales from the Company’s U.S. retail marketing stations represented 45.7% of consolidated Company revenues in 2009, 42.7% in 2008 and 49.4% in 2007. As the Company continues to expand the number of retail operated gasoline stations, total revenue generated by this business is expected to grow.
In October 2009, MOUSA acquired an ethanol production facility located in Hankinson, North Dakota. The facility can produce 110 million gallons of corn-based ethanol per year. The $92 million acquisition price was primarily financed by $82 million of seller-provided nonrecourse debt that matures in 2014.
Murphy owns a 20% interest in a 120-mile refined products pipeline, with a capacity of 165,000 barrels per day, that transports products from the Meraux refinery to two common carrier pipelines serving the southeastern United States. The Company also owns a 3.2% interest in the Louisiana Offshore Oil Port LLC (LOOP), which provides deepwater unloading accommodations off the Louisiana coast for oil tankers and onshore facilities for storage of crude oil. A crude oil pipeline with a diameter of 24 inches connects LOOP storage at Clovelly, Louisiana to the Meraux refinery. Murphy owns a 40.1% interest in the first 22 miles of this pipeline from Clovelly to Alliance, Louisiana, and 100% of the remaining 24 miles from Alliance to Meraux. This crude oil pipeline is connected to another company’s pipeline system, allowing crude oil transported by that system to also be shipped to the Meraux refinery.
The Milford Haven, Wales, refinery was shut down for a planned 60-day turnaround beginning in late February 2010. During the downtime, the Company anticipates completing an expansion project that will increase the plant’s crude oil throughput capacity from 108,000 barrels per day to 130,000 barrels per day.
At the end of 2009, Murco distributed refined products in the United Kingdom from the wholly-owned Milford Haven refinery, three wholly owned terminals supplied by rail, seven terminals owned by others where products are received in exchange for deliveries from the Company’s terminals and five terminals owned by others where products are purchased for delivery. There are 230 Company stations, 172 of which are branded MURCO with the remainder under various third party brands. The Company owns the freehold under 156 of the sites and leases the remainder. The Company supplies 223 MURCO branded dealer stations.
In 2009, Murphy owned approximately 1.0% of the crude oil refining capacity in the United States and 5.9% of the refining capacity in the United Kingdom. The Company’s market share of U.S. retail gasoline sales was approximately 2.7% in 2009 and in the U.K. our fuel sales represented 3.3% of the total market share.
A statistical summary of key operating and financial indicators for each of the seven years ended December 31, 2009 are reported on page 6 of the 2009 Annual Report.
EnvironmentalMurphy’s businesses are subject to various U.S. federal, state and local environmental, health and safety laws and regulations, and are also subject to similar laws and regulations in other countries in which it operates. These regulatory requirements continue to change and increase in number and complexity, and the requirements govern the manner in which the company conducts its operations and the products it sells. The Company anticipates more environmental regulations in the future in the countries where it has operations.
Further information on environmental matters and their impact on Murphy are contained in Management’s Discussion and Analysis of Financial Condition and Results of Operations on pages 27 through 30.
Web site Access to SEC ReportsOur Internet Web site address is http://www.murphyoilcorp.com. Information contained on our Web site is not part of this report on Form 10-K.
Our Annual Reports on Form 10-K, Quarterly Reports on Form 10-Q, Current Reports on Form 8-K and any amendments to these reports filed or furnished pursuant to Section 13(a) or 15(d) of the Securities Exchange Act of 1934 are available on our Web site, free of charge, as soon as reasonably practicable after such reports are filed with, or furnished to, the SEC. Alternatively, you may access these reports at the SEC’s Web site at http://www.sec.gov.
Item 1A. RISK FACTORS
Murphy Oil’s businesses operate in highly competitive environments, which could adversely affect it in many ways, including its profitability, its ability to grow, and its ability to manage its businesses.Murphy operates in the oil and gas industry and experiences intense competition from other oil and gas companies, which include state-owned foreign oil companies, major integrated oil companies, independent producers of oil and natural gas and independent refining companies. Virtually all of the state-owned and major integrated oil companies and many of the independent producers and refiners that compete with the
9
Company have substantially greater resources than Murphy. In addition, the oil industry as a whole competes with other industries in supplying energy requirements around the world. Murphy competes, among other things, for valuable acreage positions, exploration licenses, drilling equipment and human resources.
If Murphy cannot replace its oil and natural gas reserves, it will not be able to sustain or grow its business.Murphy continually depletes its oil and natural reserves as production occurs. In order to sustain and grow its business, the Company must successfully replace the crude oil and natural gas it produces with additional reserves. Therefore, it must create and maintain a portfolio of good prospects for future reserve additions and production by obtaining rights to explore for, develop and produce hydrocarbons in promising areas. In addition, it must find, develop and produce and/or purchase reserves found at a competitive cost structure to be successful in the long-term. Murphy’s ability to operate profitably in the exploration and production segments of its business, therefore, is dependent on its ability to find, develop and produce and/or purchase oil and natural gas reserves at costs that are less than the realized sales price for these products and at costs competitive with competing companies in the industry.
Murphy’s proved reserves are based on the professional judgment of its engineers and may be subject to revision.Proved oil and natural gas reserves included in this report on pages F-36 and F-37 have been prepared by Company personnel based on an unweighted average of oil and natural gas prices in effect at the beginning of each month in 2009 as well as other conditions and information available at the time the estimates were prepared. Estimation of reserves is a subjective process that involves professional judgment by engineers about volumes to be recovered in future periods from underground crude oil and natural gas reservoirs. Estimates of economically recoverable crude oil and natural gas reserves and future net cash flows depend upon a number of variable factors and assumptions, and consequently, different engineers could arrive at different estimates of reserves and future net cash flows based on the same available data and using industry accepted engineering practices and scientific methods. Under existing Securities and Exchange Commission rules, reported proved reserves must be reasonably certain of recovery in future periods.
Actual future crude oil and natural gas production may vary substantially from the reported quantity of our proved reserves due to a number of factors, including:
• Oil and natural gas prices which are materially different than prices used to compute proved reserves• Operating and/or capital costs which are materially different than those assumed to compute proved reserves• Future reservoir performance which is materially different from models used to compute proved reserves, and• Governmental regulations or actions which materially change operations of a field.
The Company’s proved undeveloped reserves represent significant portions of total proved reserves. As of December 31, 2009, approximately 14% of the Company’s proved oil reserves and 47% of proved natural gas reserves are undeveloped. The ability of the Company to reclassify these undeveloped proved reserves to the proved developed classification is generally dependent on the successful completion of one or more operations, which might include further development drilling, construction of facilities or pipelines, and well workovers.
The discounted future net revenues from our proved reserves should not be considered as the market value of the reserves attributable to our properties. As required by generally accepted accounting principles, the estimated discounted future net revenues from our proved reserves are based on an unweighted average of the oil and natural gas prices in effect at the beginning of each month during the year. Actual future prices and costs may be materially higher or lower than those used in the reserves computations. In addition, the 10 percent discount factor that is required to be used to calculate discounted future net revenues for reporting purposes under generally accepted accounting principles is not necessarily the most appropriate discount factor based on our cost of capital and the risks associated with our business and the crude oil and natural gas business in general.
The volatility in the global prices of oil, natural gas and petroleum products significantly affects the Company’s operating results.The most significant variables affecting the Company’s results of operations are the sales prices for crude oil, natural gas and refined products that it produces. The Company’s income in 2008 was favorably affected by high crude oil and natural gas prices. In the second half of 2008, crude oil prices began to fall precipitously. Although West Texas Intermediate (WTI) crude oil prices averaged about $99 per barrel for all 2008, the year-end 2008 price for WTI was below $45 per barrel. Crude oil prices gradually recovered during 2009, with WTI crude oil sales prices averaging about $62 per barrel during 2009 and about $79 per barrel at year-end 2009. The Company’s results of operations were negatively impacted in 2009 by lower oil and natural gas prices compared to 2008. In addition, the Company’s net income was adversely affected in 2009 by lower refining and marketing margins. The Company cannot predict how changes in the sales prices of oil and natural gas and changes in refining and marketing margins will affect its results of operations in future periods. Except in limited cases, the Company typically does not seek to hedge any significant portion of its exposure to the effects of changing prices of crude oil, natural gas and refined products. Certain of the Company’s crude oil production is heavy and more sour than WTI quality crude; therefore, this crude oil usually sells at a discount to WTI and other light and sweet crude oils. In addition, the sales prices for heavy and sour crude oils do not always move in relation to price changes for WTI and lighter/sweeter crude oils.
10
The results of exploration drilling can significantly affect the Company’s operating results.The Company generally drills numerous wildcat wells each year which subjects its exploration and production operating results to significant exposure to dry holes expense, which have adverse effects on, and create volatility for, the Company’s net income. In 2009, significant wildcat wells were primarily drilled offshore Malaysia, offshore Australia, offshore Republic of the Congo and in the U.S. Gulf of Mexico. The Company’s 2010 budget calls for wildcat drilling primarily in the Gulf of Mexico, and in waters offshore Malaysia, Republic of the Congo, Suriname and Indonesia.
Capital financing may not always be available to fund Murphy’s activities.Murphy usually must spend and risk a significant amount of capital to find and develop reserves before revenue is generated from production. Although most capital needs are funded from operating cash flow, the timing of cash flows from operations and capital funding needs may not always coincide, and the levels of cash flow may not fully cover capital funding requirements. Therefore, the Company maintains financing arrangements with lending institutions to meet certain funding needs. The Company must periodically renew these financing arrangements based on foreseeable financing needs. Although not considered likely, there is the possibility that financing arrangements may not always be available at sufficient levels required to fund the Company’s activities. The Company’s primary current financing facility expires in June 2012.
Murphy has limited or virtually no control over several factors that could adversely affect the Company.The ability of the Company to successfully manage development and operating costs is important because virtually all of the products it sells are energy commodities such as crude oil, natural gas and refined products, for which the Company has little or no influence on the sales prices or regional and worldwide consumer demand for these products. An economic slowdown in late 2008 and 2009 had a detrimental effect on the worldwide demand for these energy commodities, which effectively led to reduced prices for oil, natural gas and refined products. Lower prices for crude oil and natural gas inevitably led to lower earnings in the Company’s exploration and production operations. Murphy is a net purchaser of crude oil and other refinery feedstocks, and also purchases refined products, particularly gasoline, needed to supply its retail marketing stations. Therefore, its most significant costs are subject to volatility of prices for these commodities. The Company also often experiences pressure on its operating and capital expenditures in periods of strong crude oil, natural gas and refined product prices such as those experienced in 2008 because an increase in exploration and production activities due to high oil and gas sales prices generally leads to higher demand for, and consequently higher costs for, goods and services in the oil and gas industry.
Many of the Company’s major oil and natural gas producing properties are operated by others. During 2009, approximately 25% of the Company’s total production was at fields operated by others, while at December 31, 2009, approximately 42% of the Company’s total proved reserves were at fields operated by others. Therefore, Murphy does not fully control all activities at certain of its significant revenue generating properties.
The operations and earnings of Murphy have been and will continue to be affected by worldwide political developments.Many governments, including those that are members of the Organization of Petroleum Exporting Countries (OPEC), unilaterally intervene at times in the orderly market of crude oil and natural gas produced in their countries through such actions as setting prices, determining rates of production, and controlling who may buy and sell the production. As of December 31, 2009, approximately 46% of proved reserves, as defined by the U.S. Securities and Exchange Commission, were located in countries other than the U.S., Canada and the U.K. Certain of the reserves held outside these three countries could be considered to have more political risk. In addition, prices and availability of crude oil, natural gas and refined products could be influenced by political unrest and by various governmental policies to restrict or increase petroleum usage and supply. Other governmental actions that could affect Murphy’s operations and earnings include tax changes, royalty increases and regulations concerning: currency fluctuations, protection and remediation of the environment (See the caption “Environmental Matters” beginning on page 27 of this Form 10-K report for additional discussion of this risk), preferential and discriminatory awarding of oil and gas leases, restrictions on drilling and/or production, restraints and controls on imports and exports, safety, and relationships between employers and employees. Because these and other factors too numerous to list are subject to changes caused by governmental and political considerations and are often made in response to changing internal and worldwide economic conditions and to actions of other governments or specific events, it is not practical to attempt to predict the effects of such factors on Murphy’s future operations and earnings.
Murphy’s business is subject to operational hazards and risks normally associated with the exploration for and production of oil and natural gas and the refining and marketing of crude oil and petroleum products.The Company operates in urban and remote, and often inhospitable, areas around the world. The occurrence of an event, including but not limited to acts of nature such as hurricanes, floods, earthquakes and other forms of severe weather, and mechanical equipment failures, industrial accidents, fires, explosions, acts of war and intentional terrorist attacks could result in the loss of hydrocarbons and associated revenues, environmental pollution or contamination, and personal injury, including death, for which the Company could be deemed to be liable, and which could subject the Company to substantial fines and/or claims for punitive damages.
The location of many of Murphy’s key assets causes the Company to be vulnerable to severe weather, including hurricanes and tropical storms. A number of significant oil and natural gas fields lie in offshore waters around the world. Probably the most vulnerable of the Company’s offshore fields are in the U.S. Gulf of Mexico, where severe hurricanes and tropical storms have often led to shutdowns and damages. The U.S. hurricane season runs from June through November, but the most severe storm activities usually occur in late summer, such as with
11
Hurricanes Katrina and Rita in 2005. Additionally, the Company’s largest refinery is located about 10 miles southeast of New Orleans, Louisiana. In August 2005, Hurricane Katrina passed near the refinery causing major flooding and severe wind damage. The gradual loss of coastal wetlands in southeast Louisiana increases the risk of future flooding should storms such as Katrina recur. Other assets such as gasoline terminals and certain retail gasoline stations also lie near the Gulf of Mexico coastlines and are vulnerable to storm damages. During the repairs at Meraux following Hurricane Katrina, the refinery took steps to try to reduce the potential for damages from future storms of similar magnitude. For example, certain key equipment such as motors and pumps were raised above ground level when feasible. These steps may somewhat reduce the damages associated with windstorm and major flooding that could occur with a future storm similar in strength to Katrina, but the risks from such a storm are not eliminated. Although the Company also maintains insurance for such risks as described below, due to policy deductibles and possible coverage limits, weather-related risks are not fully insured.
There can be no assurance that Murphy’s insurance will be adequate to offset costs associated with certain events or that insurance coverage will continue to be available in the future on terms that justify its purchase.Murphy maintains insurance against certain, but not all, hazards that could arise from its operations, and such insurance is believed to be reasonable for the hazards and risks faced by the Company. As of December 31, 2009, the Company maintained total excess liability insurance with limits of $775 million per occurrence covering certain general liability and certain “sudden and accidental” environmental risks. The Company also maintained insurance coverage with an additional limit of $250 million per occurrence, all or part of which could be applicable to certain sudden and accidental pollution events. The occurrence of an event that is not insured or not fully insured could have a material adverse effect on the Company’s financial condition and results of operations in the future. During 2005, damages from hurricanes caused a temporary shut-down of certain U.S. oil and gas production operations as well as the Meraux, Louisiana refinery. The Company repaired the Meraux refinery and it restarted operations in mid-2006, but the Company did not fully recover repair costs incurred at Meraux under its insurance policies. Damages incurred by the Company from 2008 hurricanes did not exceed deductible limits under the insurance policies. See Notes P and R in the consolidated financial statements for further discussion. Lawsuits against Murphy and its subsidiaries could adversely affect its operating results.The Company is involved in numerous lawsuits seeking cash settlements for alleged personal injuries, property damages and other business-related matters. The most significant of these matters are addressed in more detail in Item 3 beginning on page 13 of this Form 10-K report.
The Company is exposed to credit risks associated with sales of certain of its products to third parties.Although Murphy limits its credit risk by selling its products to numerous entities worldwide, it still, at times, carries substantial credit risk from its customers. For certain oil and gas properties operated by the Company, other companies which own partial interests may not be able to meet their financial obligation to pay for their share of capital and operating costs as they come due.
The costs and funding requirements related to the Company’s retirement plans are affected by several factors.A number of actuarial assumptions impact funding requirements for the Company’s retirement plans. The most significant of these assumptions include return on assets, long-term interest rates and mortality. If the actual results for the plans vary significantly from the actuarial assumptions used, or if laws regulating such retirement plans are changed, Murphy could be required to make significant funding payments to one or more of its retirement plans in the future and/or it could be required to record a larger liability for future obligations in its Consolidated Balance Sheet.
Item 1B. UNRESOLVED STAFF COMMENTS
The Company had no unresolved comments from the staff of the U.S. Securities and Exchange Commission as of December 31, 2009.
Item 2. PROPERTIES
Descriptions of the Company’s oil and natural gas and refining and marketing properties are included in Item 1 of this Form 10-K report beginning on page 1. Information required by the Securities Exchange Act Industry Guide No. 2 can be found in the Supplemental Oil and Gas Information section of this Annual Report on Form 10-K on pages F-34 to F-42 and in Note E—Property, Plant and Equipment on page F-13.
12
Executive Officers of the Registrant
The age at January 1, 2010, present corporate office and length of service in office of each of the Company’s executive officers are reported in the following listing. Executive officers are elected annually but may be removed from office at any time by the Board of Directors.
David M. Wood – Age 52; President and Chief Executive Officer and Director and Member of the Executive Committee since January 2009. Mr. Wood served as Executive Vice President responsible for the Company’s worldwide exploration and production operations from January 2007 through December 2008, President of Murphy Exploration & Production Company-International from March 2003 through December 2006 and Senior Vice President of Frontier Exploration & Production from April 1999 through February 2003.
Steven A. Cossé – Age 62; Executive Vice President since February 2005 and General Counsel since August 1991. Mr. Cossé was elected Senior Vice President in 1994 and Vice President in 1993.
Roger W. Jenkins – Age 48; Executive Vice President Exploration and Production since August 2009. Mr. Jenkins has served as President of the Company’s exploration and production subsidiary since January 2009. He was Senior Vice President, North America for this subsidiary from September 2007 to December 2008, and prior to that time, held various positions, including General Manager of the Company’s exploration and production operations in Sabah, Malaysia.
Kevin G. Fitzgerald – Age 54; Senior Vice President and Chief Financial Officer since January 1, 2007. He served as Treasurer from July 2001 through December 2006 and was Director of Investor Relations from 1996 through June 2001.
Bill H. Stobaugh – Age 58; Senior Vice President since February 2005. Mr. Stobaugh joined the Company as Vice President in 1995.
Charles A. Ganus – Age 55; Vice President, International Downstream since August 2009. Mr. Ganus has been Managing Director of the Company’s U.K. refining and marketing subsidiary since May 2008 and was Senior Vice President, Marketing of the Company’s U.S. refining and marketing subsidiary from June 2003 to April 2008.
Henry J. Heithaus – Age 58; Vice President, Marketing since August 2009. Mr. Heithaus has also served as Senior Vice President, Marketing of the Company’s U.S. refining and marketing subsidiary since May 2008, and was Vice President, Retail Marketing for this subsidiary from June 2003 to April 2008.
Thomas McKinlay – Age 46; Vice President, U.S. Manufacturing since August 2009. Mr. McKinlay has been Vice President, Supply and Transportation of the Company’s U.S. refining and marketing subsidiary since April 2009. From August 2008 to March 2009, Mr. McKinlay was General Manager, Supply and Transportation of this U.S. subsidiary, and from January 2007 to August 2008 was Supply Director for the Company’s U.K. refining and marketing subsidiary.
Mindy K. West – Age 40; Vice President and Treasurer since January 1, 2007. Ms. West was Director of Investor Relations from July 2001 through December 2006.
John W. Eckart – Age 51; Vice President and Controller since January 1, 2007. Mr. Eckart served as Controller since March 2000.
Kelli M. Hammock – Age 38; Vice President, Administration since December 2009. Ms. Hammock was General Manager, Administration from June 2006 to November 2009.
Walter K. Compton – Age 47; Vice President, Law since February 2009 and Secretary since December 1996.
Item 3. LEGAL PROCEEDINGS
Class action litigation and related opt-out claims involving the Hurricane Katrina related crude oil release in 2005 at the Company’s Meraux, Louisiana refinery have been resolved. Remaining litigation arising out of this incident consists of fewer than ten individual claims from outside the class area for which the Company’s exposure is de minimis. The Company originally recorded expense of $18 million in 2006 related to settlement costs not expected to be covered by insurance. As a result of a confidential arbitral tribunal ruling issued on September 10, 2009 relating to liability insurance coverage issues, the Company recorded a benefit of $6.5 million (inclusive of $2.0 million of associated interest income) in 2009 to reduce the total overall expected expense related to this matter. Accordingly, the matter will not have a material adverse effect on the Company’s net income, financial condition or liquidity in a future period.
Litigation arising out of a June 10, 2003 fire in the Residual Oil Supercritical Extraction (ROSE) unit at the Company’s Meraux, Louisiana refinery was settled in July 2009 and memorialized via a filing in the U.S. District Court for the Eastern District of Louisiana on July 24, 2009. An arbitral tribunal heard the Company’s claim for indemnity from one of its insurers, AEGIS, in September 2009 and a decision is pending. The Company
13
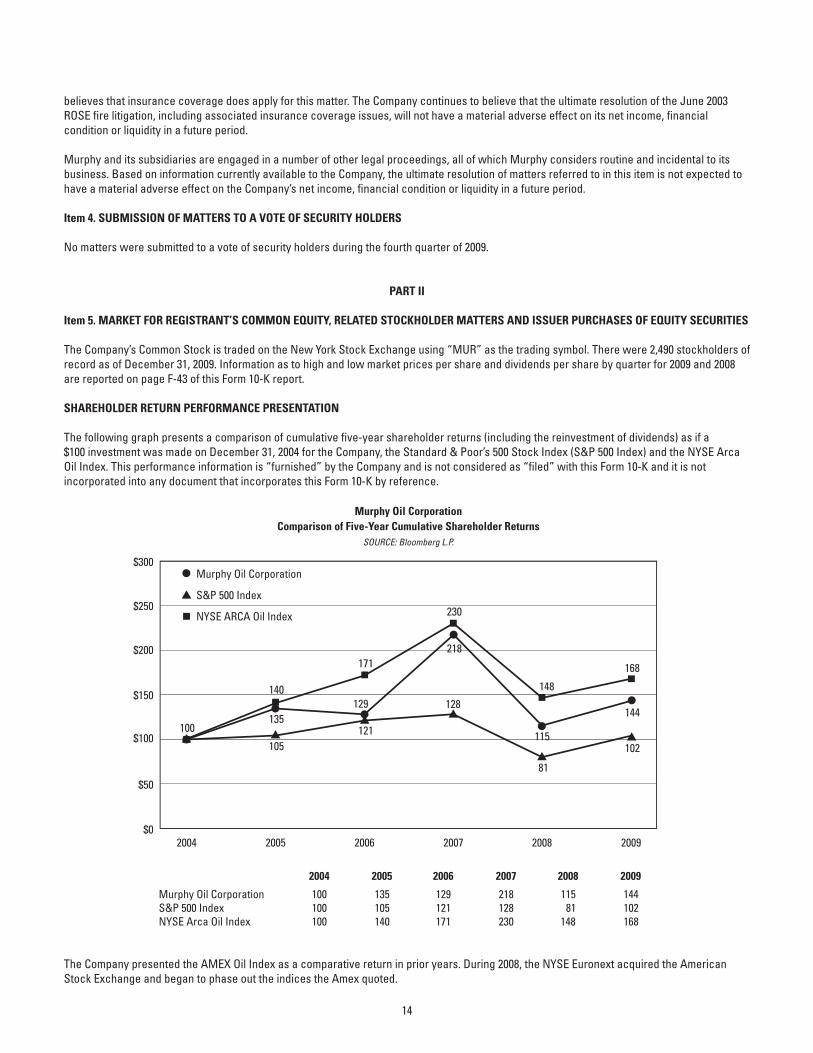
believes that insurance coverage does apply for this matter. The Company continues to believe that the ultimate resolution of the June 2003 ROSE fire litigation, including associated insurance coverage issues, will not have a material adverse effect on its net income, financial condition or liquidity in a future period.
Murphy and its subsidiaries are engaged in a number of other legal proceedings, all of which Murphy considers routine and incidental to its business. Based on information currently available to the Company, the ultimate resolution of matters referred to in this item is not expected to have a material adverse effect on the Company’s net income, financial condition or liquidity in a future period.
Item 4. SUBMISSION OF MATTERS TO A VOTE OF SECURITY HOLDERS
No matters were submitted to a vote of security holders during the fourth quarter of 2009.
PART II
Item 5. MARKET FOR REGISTRANT’S COMMON EQUITY, RELATED STOCKHOLDER MATTERS AND ISSUER PURCHASES OF EQUITY SECURITIES
The Company’s Common Stock is traded on the New York Stock Exchange using “MUR” as the trading symbol. There were 2,490 stockholders of record as of December 31, 2009. Information as to high and low market prices per share and dividends per share by quarter for 2009 and 2008 are reported on page F-43 of this Form 10-K report.
SHAREHOLDER RETURN PERFORMANCE PRESENTATION
The following graph presents a comparison of cumulative five-year shareholder returns (including the reinvestment of dividends) as if a $100 investment was made on December 31, 2004 for the Company, the Standard & Poor’s 500 Stock Index (S&P 500 Index) and the NYSE Arca Oil Index. This performance information is “furnished” by the Company and is not considered as “filed” with this Form 10-K and it is not incorporated into any document that incorporates this Form 10-K by reference.
The Company presented the AMEX Oil Index as a comparative return in prior years. During 2008, the NYSE Euronext acquired the American Stock Exchange and began to phase out the indices the Amex quoted.
14
14
2004$0
$100
$50
$150
$200
$250
$300
2005 2006
Murphy Oil CorporationComparison of Five-Year Cumulative Shareholder Returns
SOURCE: Bloomberg L.P.
2007 2008 2009
Murphy Oil Corporation
S&P 500 Index
NYSE ARCA Oil Index
Murphy Oil CorporationS&P 500 IndexNYSE Arca Oil Index
100100100
2004
135105140
2005
129121171
2006
218128230
2007
11581
148
2008
144102168
2009
140
135
105
171
121
129
230
218
128
148
115
81
168
144
102
100
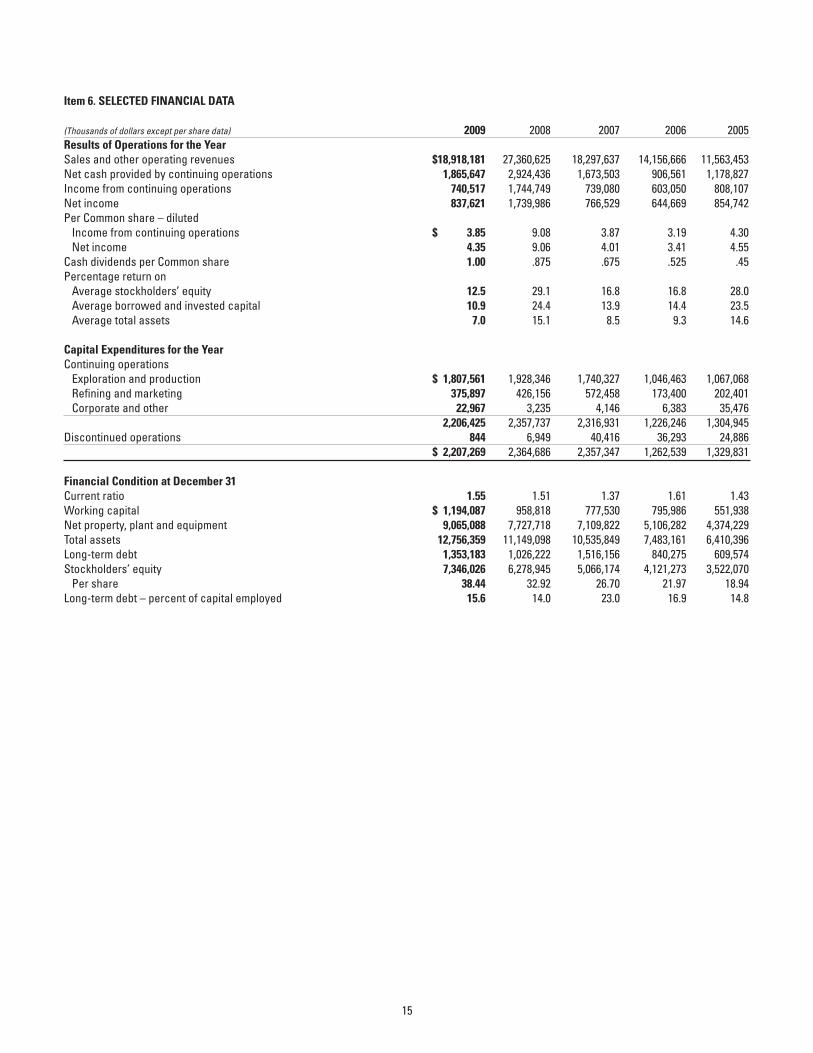
Item 6. SELECTED FINANCIAL DATA
(Thousands of dollars except per share data) 2009 2008 2007 2006 2005Results of Operations for the YearSales and other operating revenues $18,918,181 27,360,625 18,297,637 14,156,666 11,563,453Net cash provided by continuing operations 1,865,647 2,924,436 1,673,503 906,561 1,178,827Income from continuing operations 740,517 1,744,749 739,080 603,050 808,107Net income 837,621 1,739,986 766,529 644,669 854,742Per Common share – diluted Income from continuing operations $ 3.85 9.08 3.87 3.19 4.30 Net income 4.35 9.06 4.01 3.41 4.55Cash dividends per Common share 1.00 .875 .675 .525 .45Percentage return on Average stockholders’ equity 12.5 29.1 16.8 16.8 28.0 Average borrowed and invested capital 10.9 24.4 13.9 14.4 23.5 Average total assets 7.0 15.1 8.5 9.3 14.6
Capital Expenditures for the YearContinuing operations Exploration and production $ 1,807,561 1,928,346 1,740,327 1,046,463 1,067,068 Refining and marketing 375,897 426,156 572,458 173,400 202,401 Corporate and other 22,967 3,235 4,146 6,383 35,476 2,206,425 2,357,737 2,316,931 1,226,246 1,304,945Discontinued operations 844 6,949 40,416 36,293 24,886 $ 2,207,269 2,364,686 2,357,347 1,262,539 1,329,831
Financial Condition at December 31Current ratio 1.55 1.51 1.37 1.61 1.43Working capital $ 1,194,087 958,818 777,530 795,986 551,938Net property, plant and equipment 9,065,088 7,727,718 7,109,822 5,106,282 4,374,229Total assets 12,756,359 11,149,098 10,535,849 7,483,161 6,410,396Long-term debt 1,353,183 1,026,222 1,516,156 840,275 609,574Stockholders’ equity 7,346,026 6,278,945 5,066,174 4,121,273 3,522,070 Per share 38.44 32.92 26.70 21.97 18.94Long-term debt – percent of capital employed 15.6 14.0 23.0 16.9 14.8
15
Item 7. MANAGEMENT’S DISCUSSION AND ANALYSIS OF FINANCIAL CONDITION AND RESULTS OF OPERATIONS
Overview
Murphy Oil Corporation is a worldwide oil and gas exploration and production company with refining and marketing operations in the United States and United Kingdom. A more detailed description of the Company’s significant assets can be found in Item 1 of this Form 10-K report.
Murphy generates revenue primarily by selling oil and natural gas production and refined petroleum products to customers at hundreds of locations in the United States, Canada, Malaysia, the United Kingdom and other countries. The Company’s revenue is highly affected by the prices of oil, natural gas and refined petroleum products that it sells. Also, because crude oil is purchased by the Company for refinery feedstocks, natural gas is purchased for fuel at its refineries and oil production facilities, and gasoline is purchased to supply its retail gasoline stations in the U.S. that are primarily located at Walmart Supercenters, the purchase prices for these commodities also have a significant effect on the Company’s costs. In order to make a profit and generate cash in its exploration and production business, revenue generated from the sales of oil and natural gas produced must exceed the combined costs of producing these products, amortization of capital expenditures and expenses related to exploration and administration. Profits and generation of cash in the Company’s refining and marketing operations are dependent upon achieving adequate margins, which are determined by the sales prices for refined petroleum products less the costs of purchased refinery feedstocks and gasoline and expenses associated with manufacturing, transporting and marketing these products. Murphy also incurs certain costs for general company administration and for capital borrowed from lending institutions.
Worldwide oil and North American natural gas prices were significantly lower on average in 2009 than in 2008. The sales price for a barrel of West Texas Intermediate crude oil in 2009 averaged $62.05, 37% lower than in 2008. The NYMEX natural gas price averaged $3.94 per million British Thermal Units (MMBTU) in 2009, down 56% from 2008. Crude oil and North American natural gas prices fell precipitously with the economic decline in late 2008. The year 2009 began with quite low demand for hydrocarbons and consequently very weak prices for oil and natural gas. Crude oil and natural gas prices generally rose as 2009 progressed as the worldwide economy began a slow recovery from the significant downturn. Changes in the price of crude oil and natural gas have a significant impact on the profitability of the Company, especially the price of crude oil as oil represented approximately 80% of the total hydrocarbons produced on an energy equivalent basis by the Company in 2009. In 2010, the percentage of hydrocarbon production represented by oil is expected to decline to about 70% due to higher natural gas production at Kikeh and Block SK 309 in Malaysia, Tupper in British Columbia and at the Eagle Ford shale area in South Texas. If the prices for crude oil and natural gas should weaken in 2010 or beyond, the Company would expect this to have an unfavorable impact on operating profits for its exploration and production business. Such lower oil and gas prices could, but may not, have a favorable impact on the Company’s refining and marketing operating profits.
Results of Operations
The Company generated net income in 2009 of $837.6 million ($4.35 per diluted share) compared to net income in 2008 of $1.74 billion ($9.06 per diluted share). In 2007 the Company’s net income was $766.5 million ($4.01 per diluted share). The large decline in 2009 net income in comparison to 2008 was attributable to lower earnings in both the exploration and production and refining and marketing operations. Weaker oil and natural gas sales prices were the primary reasons for lower 2009 earnings in the exploration and production business, while lower retail gasoline margins in the U.S. and weaker refining margins in the U.K. led to the earnings decline for refining and marketing. The significant increase in 2008 net income compared to 2007 was caused by improved earnings for exploration and production operations in 2008, primarily due to higher sales prices for the Company’s oil and natural gas production, higher crude oil production volumes and gains on sale of two assets in Canada. The earnings for the Company’s refining and marketing operations were an annual record in 2008, with the improvement from 2007 primarily in the U.K. and mostly caused by strong margins at the Milford Haven, Wales refinery following the Company’s purchase of the remaining 70% of this asset in December 2007. The net cost of corporate activities not allocated to the operating segments was lower in 2009 than in 2008, after rising in 2008 compared to the prior year. Further explanations of each of these variances are found in the following sections. Income from continuing operations, excluding results from Ecuador operations which are reported as discontinued operations, was $740.5 million ($3.85 per diluted share) in 2009, $1.74 billion ($9.08 per diluted share) in 2008, and $739.1 million ($3.87 per diluted share) in 2007.
2009 vs. 2008 – Net income in 2009 totaled $837.6 million ($4.35 per diluted share) compared to $1.74 billion ($9.06 per diluted share) in 2008. Net income included income from discontinued operations of $97.1 million ($0.50 per diluted share) in 2009 and a loss of $4.8 million ($0.02 per diluted share) in 2008. Discontinued operations are associated with the Company’s former operations in Ecuador which were sold in March 2009. The favorable result from discontinued operations in 2009 was mostly attributable to an after-tax gain of $103.6 million from disposal of the Ecuador properties. Income from continuing operations amounted to $740.5 million ($3.85 per diluted share) in 2009, down from $1.74 billion ($9.08 per diluted share) in 2008. The lower earnings in 2009 from continuing operations was attributable to lower income in the exploration and production (E&P) and refining and marketing (R&M) businesses.
E&P income from continuing operations was $911.0 million lower in 2009 compared to 2008, primarily attributable to weaker sales prices for crude oil, which were down about $33.00 per barrel for the Company’s production. Other unfavorable impacts in 2009 included a $58.4 million charge after taxes to effect an anticipated reduction in the Company’s working interest in the Terra Nova oil field offshore Newfoundland, lower North American natural gas sales prices, gains on sale of Canadian assets in 2008 that did not repeat in 2009, and higher extraction costs for oil
16
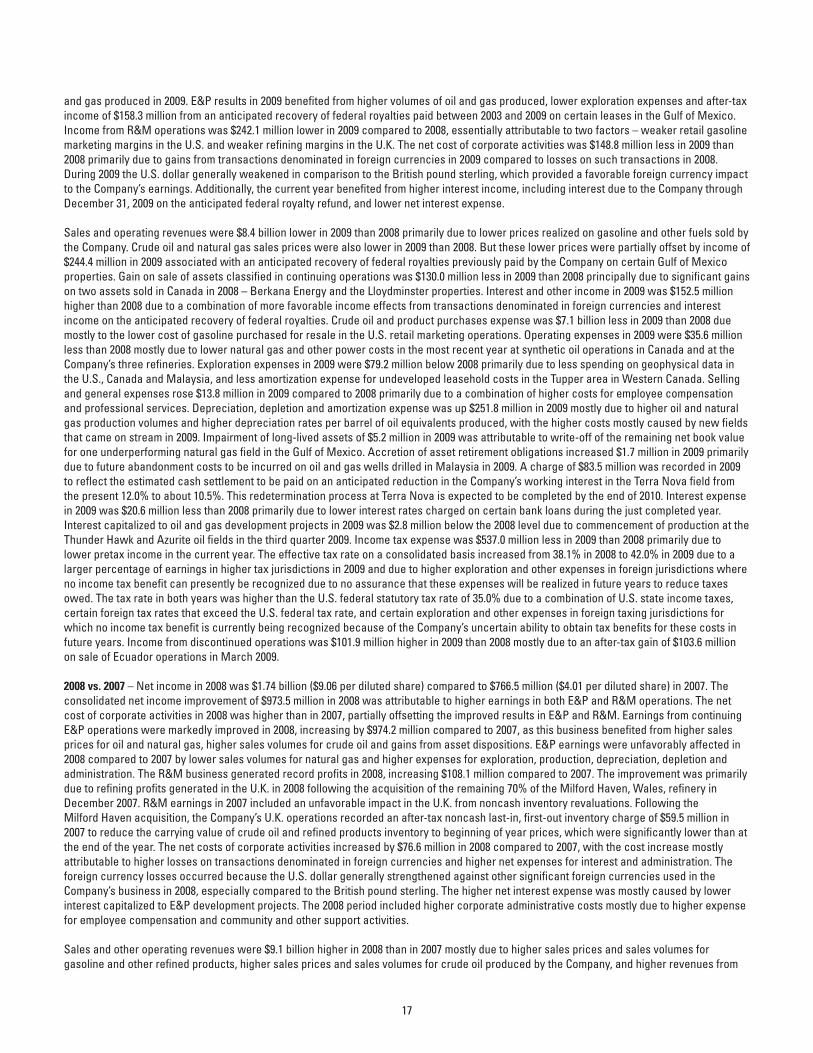
and gas produced in 2009. E&P results in 2009 benefited from higher volumes of oil and gas produced, lower exploration expenses and after-tax income of $158.3 million from an anticipated recovery of federal royalties paid between 2003 and 2009 on certain leases in the Gulf of Mexico. Income from R&M operations was $242.1 million lower in 2009 compared to 2008, essentially attributable to two factors – weaker retail gasoline marketing margins in the U.S. and weaker refining margins in the U.K. The net cost of corporate activities was $148.8 million less in 2009 than 2008 primarily due to gains from transactions denominated in foreign currencies in 2009 compared to losses on such transactions in 2008. During 2009 the U.S. dollar generally weakened in comparison to the British pound sterling, which provided a favorable foreign currency impact to the Company’s earnings. Additionally, the current year benefited from higher interest income, including interest due to the Company through December 31, 2009 on the anticipated federal royalty refund, and lower net interest expense.
Sales and operating revenues were $8.4 billion lower in 2009 than 2008 primarily due to lower prices realized on gasoline and other fuels sold by the Company. Crude oil and natural gas sales prices were also lower in 2009 than 2008. But these lower prices were partially offset by income of $244.4 million in 2009 associated with an anticipated recovery of federal royalties previously paid by the Company on certain Gulf of Mexico properties. Gain on sale of assets classified in continuing operations was $130.0 million less in 2009 than 2008 principally due to significant gains on two assets sold in Canada in 2008 – Berkana Energy and the Lloydminster properties. Interest and other income in 2009 was $152.5 million higher than 2008 due to a combination of more favorable income effects from transactions denominated in foreign currencies and interest income on the anticipated recovery of federal royalties. Crude oil and product purchases expense was $7.1 billion less in 2009 than 2008 due mostly to the lower cost of gasoline purchased for resale in the U.S. retail marketing operations. Operating expenses in 2009 were $35.6 million less than 2008 mostly due to lower natural gas and other power costs in the most recent year at synthetic oil operations in Canada and at the Company’s three refineries. Exploration expenses in 2009 were $79.2 million below 2008 primarily due to less spending on geophysical data in the U.S., Canada and Malaysia, and less amortization expense for undeveloped leasehold costs in the Tupper area in Western Canada. Selling and general expenses rose $13.8 million in 2009 compared to 2008 primarily due to a combination of higher costs for employee compensation and professional services. Depreciation, depletion and amortization expense was up $251.8 million in 2009 mostly due to higher oil and natural gas production volumes and higher depreciation rates per barrel of oil equivalents produced, with the higher costs mostly caused by new fields that came on stream in 2009. Impairment of long-lived assets of $5.2 million in 2009 was attributable to write-off of the remaining net book value for one underperforming natural gas field in the Gulf of Mexico. Accretion of asset retirement obligations increased $1.7 million in 2009 primarily due to future abandonment costs to be incurred on oil and gas wells drilled in Malaysia in 2009. A charge of $83.5 million was recorded in 2009 to reflect the estimated cash settlement to be paid on an anticipated reduction in the Company’s working interest in the Terra Nova field from the present 12.0% to about 10.5%. This redetermination process at Terra Nova is expected to be completed by the end of 2010. Interest expense in 2009 was $20.6 million less than 2008 primarily due to lower interest rates charged on certain bank loans during the just completed year. Interest capitalized to oil and gas development projects in 2009 was $2.8 million below the 2008 level due to commencement of production at the Thunder Hawk and Azurite oil fields in the third quarter 2009. Income tax expense was $537.0 million less in 2009 than 2008 primarily due to lower pretax income in the current year. The effective tax rate on a consolidated basis increased from 38.1% in 2008 to 42.0% in 2009 due to a larger percentage of earnings in higher tax jurisdictions in 2009 and due to higher exploration and other expenses in foreign jurisdictions where no income tax benefit can presently be recognized due to no assurance that these expenses will be realized in future years to reduce taxes owed. The tax rate in both years was higher than the U.S. federal statutory tax rate of 35.0% due to a combination of U.S. state income taxes, certain foreign tax rates that exceed the U.S. federal tax rate, and certain exploration and other expenses in foreign taxing jurisdictions for which no income tax benefit is currently being recognized because of the Company’s uncertain ability to obtain tax benefits for these costs in future years. Income from discontinued operations was $101.9 million higher in 2009 than 2008 mostly due to an after-tax gain of $103.6 million on sale of Ecuador operations in March 2009.
2008 vs. 2007 – Net income in 2008 was $1.74 billion ($9.06 per diluted share) compared to $766.5 million ($4.01 per diluted share) in 2007. The consolidated net income improvement of $973.5 million in 2008 was attributable to higher earnings in both E&P and R&M operations. The net cost of corporate activities in 2008 was higher than in 2007, partially offsetting the improved results in E&P and R&M. Earnings from continuing E&P operations were markedly improved in 2008, increasing by $974.2 million compared to 2007, as this business benefited from higher sales prices for oil and natural gas, higher sales volumes for crude oil and gains from asset dispositions. E&P earnings were unfavorably affected in 2008 compared to 2007 by lower sales volumes for natural gas and higher expenses for exploration, production, depreciation, depletion and administration. The R&M business generated record profits in 2008, increasing $108.1 million compared to 2007. The improvement was primarily due to refining profits generated in the U.K. in 2008 following the acquisition of the remaining 70% of the Milford Haven, Wales, refinery in December 2007. R&M earnings in 2007 included an unfavorable impact in the U.K. from noncash inventory revaluations. Following the Milford Haven acquisition, the Company’s U.K. operations recorded an after-tax noncash last-in, first-out inventory charge of $59.5 million in 2007 to reduce the carrying value of crude oil and refined products inventory to beginning of year prices, which were significantly lower than at the end of the year. The net costs of corporate activities increased by $76.6 million in 2008 compared to 2007, with the cost increase mostly attributable to higher losses on transactions denominated in foreign currencies and higher net expenses for interest and administration. The foreign currency losses occurred because the U.S. dollar generally strengthened against other significant foreign currencies used in the Company’s business in 2008, especially compared to the British pound sterling. The higher net interest expense was mostly caused by lower interest capitalized to E&P development projects. The 2008 period included higher corporate administrative costs mostly due to higher expense for employee compensation and community and other support activities.
Sales and other operating revenues were $9.1 billion higher in 2008 than in 2007 mostly due to higher sales prices and sales volumes for gasoline and other refined products, higher sales prices and sales volumes for crude oil produced by the Company, and higher revenues from
17
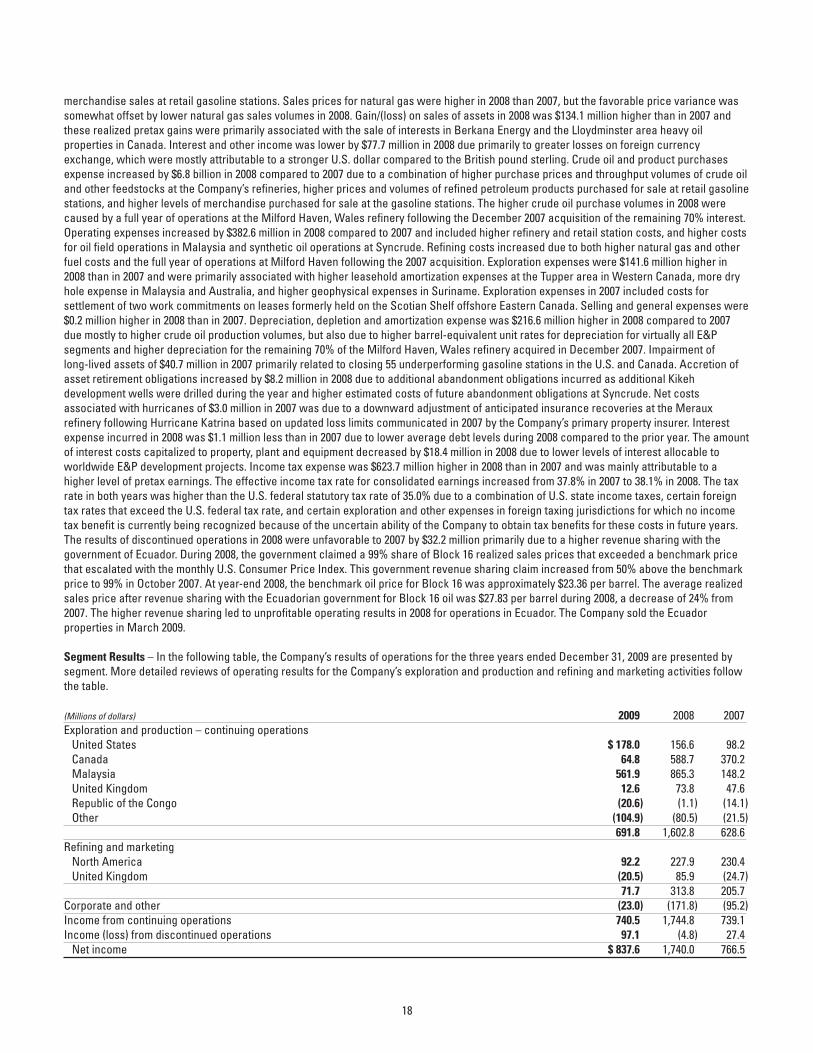
merchandise sales at retail gasoline stations. Sales prices for natural gas were higher in 2008 than 2007, but the favorable price variance was somewhat offset by lower natural gas sales volumes in 2008. Gain/(loss) on sales of assets in 2008 was $134.1 million higher than in 2007 and these realized pretax gains were primarily associated with the sale of interests in Berkana Energy and the Lloydminster area heavy oil properties in Canada. Interest and other income was lower by $77.7 million in 2008 due primarily to greater losses on foreign currency exchange, which were mostly attributable to a stronger U.S. dollar compared to the British pound sterling. Crude oil and product purchases expense increased by $6.8 billion in 2008 compared to 2007 due to a combination of higher purchase prices and throughput volumes of crude oil and other feedstocks at the Company’s refineries, higher prices and volumes of refined petroleum products purchased for sale at retail gasoline stations, and higher levels of merchandise purchased for sale at the gasoline stations. The higher crude oil purchase volumes in 2008 were caused by a full year of operations at the Milford Haven, Wales refinery following the December 2007 acquisition of the remaining 70% interest. Operating expenses increased by $382.6 million in 2008 compared to 2007 and included higher refinery and retail station costs, and higher costs for oil field operations in Malaysia and synthetic oil operations at Syncrude. Refining costs increased due to both higher natural gas and other fuel costs and the full year of operations at Milford Haven following the 2007 acquisition. Exploration expenses were $141.6 million higher in 2008 than in 2007 and were primarily associated with higher leasehold amortization expenses at the Tupper area in Western Canada, more dry hole expense in Malaysia and Australia, and higher geophysical expenses in Suriname. Exploration expenses in 2007 included costs for settlement of two work commitments on leases formerly held on the Scotian Shelf offshore Eastern Canada. Selling and general expenses were $0.2 million higher in 2008 than in 2007. Depreciation, depletion and amortization expense was $216.6 million higher in 2008 compared to 2007 due mostly to higher crude oil production volumes, but also due to higher barrel-equivalent unit rates for depreciation for virtually all E&P segments and higher depreciation for the remaining 70% of the Milford Haven, Wales refinery acquired in December 2007. Impairment of long-lived assets of $40.7 million in 2007 primarily related to closing 55 underperforming gasoline stations in the U.S. and Canada. Accretion of asset retirement obligations increased by $8.2 million in 2008 due to additional abandonment obligations incurred as additional Kikeh development wells were drilled during the year and higher estimated costs of future abandonment obligations at Syncrude. Net costs associated with hurricanes of $3.0 million in 2007 was due to a downward adjustment of anticipated insurance recoveries at the Meraux refinery following Hurricane Katrina based on updated loss limits communicated in 2007 by the Company’s primary property insurer. Interest expense incurred in 2008 was $1.1 million less than in 2007 due to lower average debt levels during 2008 compared to the prior year. The amount of interest costs capitalized to property, plant and equipment decreased by $18.4 million in 2008 due to lower levels of interest allocable to worldwide E&P development projects. Income tax expense was $623.7 million higher in 2008 than in 2007 and was mainly attributable to a higher level of pretax earnings. The effective income tax rate for consolidated earnings increased from 37.8% in 2007 to 38.1% in 2008. The tax rate in both years was higher than the U.S. federal statutory tax rate of 35.0% due to a combination of U.S. state income taxes, certain foreign tax rates that exceed the U.S. federal tax rate, and certain exploration and other expenses in foreign taxing jurisdictions for which no income tax benefit is currently being recognized because of the uncertain ability of the Company to obtain tax benefits for these costs in future years. The results of discontinued operations in 2008 were unfavorable to 2007 by $32.2 million primarily due to a higher revenue sharing with the government of Ecuador. During 2008, the government claimed a 99% share of Block 16 realized sales prices that exceeded a benchmark price that escalated with the monthly U.S. Consumer Price Index. This government revenue sharing claim increased from 50% above the benchmark price to 99% in October 2007. At year-end 2008, the benchmark oil price for Block 16 was approximately $23.36 per barrel. The average realized sales price after revenue sharing with the Ecuadorian government for Block 16 oil was $27.83 per barrel during 2008, a decrease of 24% from 2007. The higher revenue sharing led to unprofitable operating results in 2008 for operations in Ecuador. The Company sold the Ecuador properties in March 2009.
Segment Results – In the following table, the Company’s results of operations for the three years ended December 31, 2009 are presented by segment. More detailed reviews of operating results for the Company’s exploration and production and refining and marketing activities follow the table.
(Millions of dollars) 2009 2008 2007Exploration and production – continuing operations United States $ 178.0 156.6 98.2 Canada 64.8 588.7 370.2 Malaysia 561.9 865.3 148.2 United Kingdom 12.6 73.8 47.6 Republic of the Congo (20.6) (1.1) (14.1) Other (104.9) (80.5) (21.5) 691.8 1,602.8 628.6Refining and marketing North America 92.2 227.9 230.4 United Kingdom (20.5) 85.9 (24.7) 71.7 313.8 205.7Corporate and other (23.0) (171.8) (95.2)Income from continuing operations 740.5 1,744.8 739.1Income (loss) from discontinued operations 97.1 (4.8) 27.4 Net income $ 837.6 1,740.0 766.5
18
Exploration and Production – Earnings from exploration and production continuing operations were $691.8 million in 2009, $1.60 billion in 2008 and $628.6 million in 2007. E&P income from continuing operations in 2009 was $911.0 million less than in 2008 primarily due to significantly lower realized sales prices for the Company’s crude oil production in 2009. The 2009 period was also unfavorably affected by several other factors, including lower North American natural gas sales prices, higher production and depreciation expenses, a $58.4 million after-tax charge in 2009 for an anticipated reduction of its working interest in the Terra Nova field, and higher gains on asset sales in 2008 compared to 2009. The just completed year benefited from higher oil and natural gas sales volumes, lower exploration expense and after-tax income of $158.3 million from an anticipated recovery of previously paid federal royalties on production from certain Gulf of Mexico properties. Crude oil, condensate and gas liquids sales volumes from continuing operations were 8% higher in 2009 compared to 2008, compared to an increase in oil production volumes of 18% in 2009. Oil sales volumes did not rise as much as oil production volumes during 2009 primarily due to the timing of oil tanker liftings at the Kikeh field offshore Malaysia. Sales volumes at Kikeh were below production levels in 2009 due to an increase in the volume of unsold barrels at the field at year-end and a higher percentage of such unsold inventory barrels at the field being attributable to the Company’s account. During 2008, Kikeh sales volumes exceeded production, which effectively reduced the Company’s unsold inventory balance from year-end 2007. Higher U.S. crude oil sales volume in 2009 was primarily attributable to a partial year of production at the Gulf of Mexico Thunder Hawk field, which started up in July 2009, and less downtime in the Gulf of Mexico for hurricanes. Lower crude oil sales volumes in Canada in 2009 were mostly attributable to the sale of the Lloydminster heavy oil field in early 2008 and production declines at the maturing Hibernia and Terra Nova fields. Lower crude oil sales volume in the U.K. in 2009 was primarily due to no lifting at the Schiehallion field in the current year. Damage to sales equipment at the Schiehallion production facility caused the Company’s scheduled lifting in December 2009 to be deferred until 2010. Crude oil sales volumes at Kikeh in 2009 rose compared to 2008 due to higher annual production. Natural gas sales volumes increased 237% in 2009 and the improvement was partially attributable to higher gas volumes produced during 2009 in the Gulf of Mexico, the Tupper area in Western Canada and at Kikeh, and partially due to new production at the Sarawak gas fields offshore Malaysia following start-up in September 2009. The Company’s realized crude oil sales prices averaged 37% less in 2009 than 2008 and North American natural gas sales prices averaged 63% below 2008 levels. E&P earnings improved $974.2 million in 2008 compared to 2007 with the significant increase primarily due to higher realized sales prices for the Company’s oil and natural gas production, higher crude oil production volumes and gains on disposals of Canadian assets. Results in 2007 were favorably impacted by income tax benefits associated with tax rate reductions in Canada. The 2008 results were unfavorably affected compared to 2007 by lower natural gas sales volumes and higher expenses for exploration, production, depreciation, depletion, administration and accretion of discounted abandonment liabilities. Crude oil sales volumes from continuing operations in 2008 were 49% higher than in 2007, compared with a 34% increase in crude oil production from continuing operations in 2008 compared to 2007. Crude oil sales volumes grew more than production in 2008 due to the timing of sale transactions as the Company had a lower inventory of unsold crude oil at year-end 2008 compared to a year earlier. The significant unsold crude oil inventory at year-end 2007 was mostly at Kikeh where sales volumes lagged production in late 2007 during the start-up phase of this field. During 2008, oil sales volumes were higher than in 2007 as larger volumes produced at the Kikeh field were partially offset by lower oil sales volumes at most other producing areas. Lower U.S. crude oil sales volumes in 2008 were primarily due to reduced production levels at several Gulf of Mexico fields following Hurricanes Gustav and Ike. Certain Gulf of Mexico facilities owned by other companies downstream of our producing fields were shut down for repairs for an extended period of time in the fourth quarter 2008. Lower oil sales volumes in Canada were attributable to field decline at Hibernia, field decline and a higher royalty rate at Terra Nova, sale of the Lloydminster heavy oil property in Western Canada and more downtime at Syncrude. Lower crude oil sales volumes in the U.K. and at the West Patricia field, offshore Sarawak Malaysia, were mostly caused by production declines as these fields mature. Natural gas sales volumes were 9% lower in 2008 than 2007 and the reduction was mostly due to the sale of Berkana Energy in January 2008. Additionally, several of the Company’s Gulf of Mexico fields were either shut in or had curtailed gas production in late 2008 while downstream facilities owned by others were repaired following third quarter hurricanes. The Company’s average realized oil sales price was 37% higher in 2008 than 2007, and the average North American natural gas sales price was 33% higher in 2008.
The results of operations for oil and gas producing activities for each of the last three years are shown by major operating areas on pages F-39 and F-40 of this Form 10-K report. Average daily production and sales rates and weighted average sales prices are shown on page 5 of the 2009 Annual Report.
19
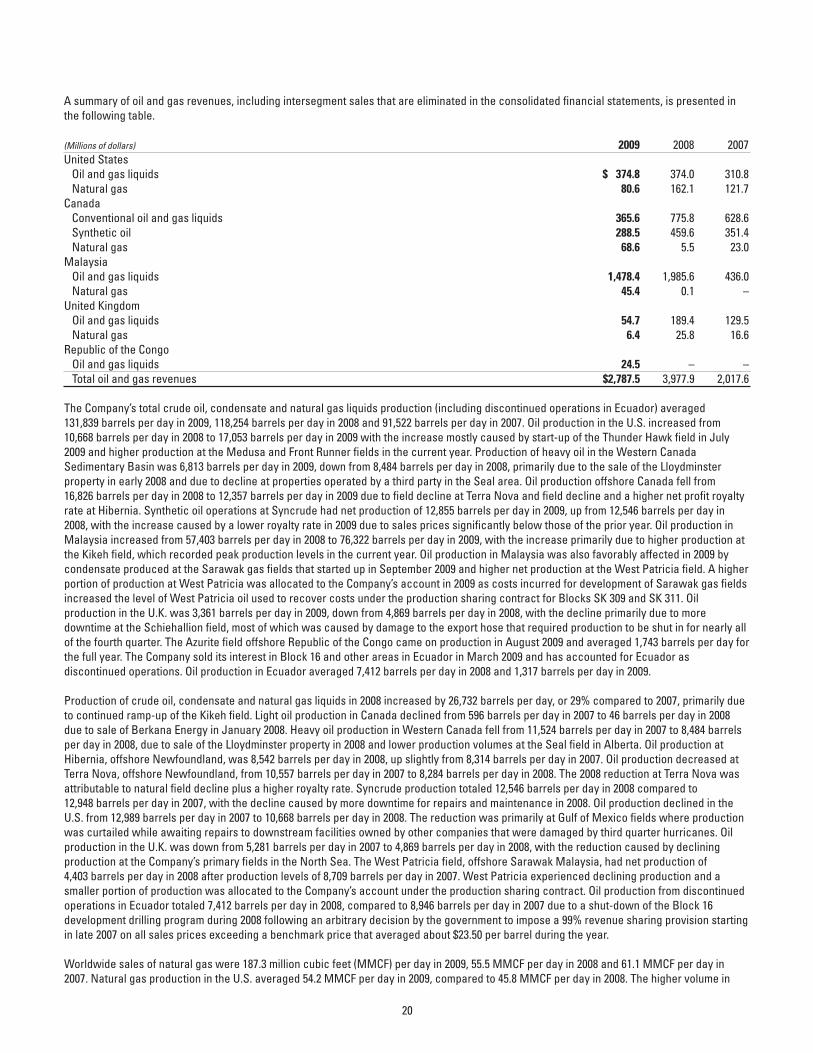
A summary of oil and gas revenues, including intersegment sales that are eliminated in the consolidated financial statements, is presented in the following table.
(Millions of dollars) 2009 2008 2007United States Oil and gas liquids $ 374.8 374.0 310.8 Natural gas 80.6 162.1 121.7Canada Conventional oil and gas liquids 365.6 775.8 628.6 Synthetic oil 288.5 459.6 351.4 Natural gas 68.6 5.5 23.0Malaysia Oil and gas liquids 1,478.4 1,985.6 436.0 Natural gas 45.4 0.1 –United Kingdom Oil and gas liquids 54.7 189.4 129.5 Natural gas 6.4 25.8 16.6Republic of the Congo Oil and gas liquids 24.5 – – Total oil and gas revenues $2,787.5 3,977.9 2,017.6
The Company’s total crude oil, condensate and natural gas liquids production (including discontinued operations in Ecuador) averaged 131,839 barrels per day in 2009, 118,254 barrels per day in 2008 and 91,522 barrels per day in 2007. Oil production in the U.S. increased from 10,668 barrels per day in 2008 to 17,053 barrels per day in 2009 with the increase mostly caused by start-up of the Thunder Hawk field in July 2009 and higher production at the Medusa and Front Runner fields in the current year. Production of heavy oil in the Western Canada Sedimentary Basin was 6,813 barrels per day in 2009, down from 8,484 barrels per day in 2008, primarily due to the sale of the Lloydminster property in early 2008 and due to decline at properties operated by a third party in the Seal area. Oil production offshore Canada fell from 16,826 barrels per day in 2008 to 12,357 barrels per day in 2009 due to field decline at Terra Nova and field decline and a higher net profit royalty rate at Hibernia. Synthetic oil operations at Syncrude had net production of 12,855 barrels per day in 2009, up from 12,546 barrels per day in 2008, with the increase caused by a lower royalty rate in 2009 due to sales prices significantly below those of the prior year. Oil production in Malaysia increased from 57,403 barrels per day in 2008 to 76,322 barrels per day in 2009, with the increase primarily due to higher production at the Kikeh field, which recorded peak production levels in the current year. Oil production in Malaysia was also favorably affected in 2009 by condensate produced at the Sarawak gas fields that started up in September 2009 and higher net production at the West Patricia field. A higher portion of production at West Patricia was allocated to the Company’s account in 2009 as costs incurred for development of Sarawak gas fields increased the level of West Patricia oil used to recover costs under the production sharing contract for Blocks SK 309 and SK 311. Oil production in the U.K. was 3,361 barrels per day in 2009, down from 4,869 barrels per day in 2008, with the decline primarily due to more downtime at the Schiehallion field, most of which was caused by damage to the export hose that required production to be shut in for nearly all of the fourth quarter. The Azurite field offshore Republic of the Congo came on production in August 2009 and averaged 1,743 barrels per day for the full year. The Company sold its interest in Block 16 and other areas in Ecuador in March 2009 and has accounted for Ecuador as discontinued operations. Oil production in Ecuador averaged 7,412 barrels per day in 2008 and 1,317 barrels per day in 2009.
Production of crude oil, condensate and natural gas liquids in 2008 increased by 26,732 barrels per day, or 29% compared to 2007, primarily due to continued ramp-up of the Kikeh field. Light oil production in Canada declined from 596 barrels per day in 2007 to 46 barrels per day in 2008 due to sale of Berkana Energy in January 2008. Heavy oil production in Western Canada fell from 11,524 barrels per day in 2007 to 8,484 barrels per day in 2008, due to sale of the Lloydminster property in 2008 and lower production volumes at the Seal field in Alberta. Oil production at Hibernia, offshore Newfoundland, was 8,542 barrels per day in 2008, up slightly from 8,314 barrels per day in 2007. Oil production decreased at Terra Nova, offshore Newfoundland, from 10,557 barrels per day in 2007 to 8,284 barrels per day in 2008. The 2008 reduction at Terra Nova was attributable to natural field decline plus a higher royalty rate. Syncrude production totaled 12,546 barrels per day in 2008 compared to 12,948 barrels per day in 2007, with the decline caused by more downtime for repairs and maintenance in 2008. Oil production declined in the U.S. from 12,989 barrels per day in 2007 to 10,668 barrels per day in 2008. The reduction was primarily at Gulf of Mexico fields where production was curtailed while awaiting repairs to downstream facilities owned by other companies that were damaged by third quarter hurricanes. Oil production in the U.K. was down from 5,281 barrels per day in 2007 to 4,869 barrels per day in 2008, with the reduction caused by declining production at the Company’s primary fields in the North Sea. The West Patricia field, offshore Sarawak Malaysia, had net production of 4,403 barrels per day in 2008 after production levels of 8,709 barrels per day in 2007. West Patricia experienced declining production and a smaller portion of production was allocated to the Company’s account under the production sharing contract. Oil production from discontinued operations in Ecuador totaled 7,412 barrels per day in 2008, compared to 8,946 barrels per day in 2007 due to a shut-down of the Block 16 development drilling program during 2008 following an arbitrary decision by the government to impose a 99% revenue sharing provision starting in late 2007 on all sales prices exceeding a benchmark price that averaged about $23.50 per barrel during the year.
Worldwide sales of natural gas were 187.3 million cubic feet (MMCF) per day in 2009, 55.5 MMCF per day in 2008 and 61.1 MMCF per day in 2007. Natural gas production in the U.S. averaged 54.2 MMCF per day in 2009, compared to 45.8 MMCF per day in 2008. The higher volume in
20
2009 was primarily attributable to the Mondo NW field that reached peak production in the current year, start-up of the Thunder Hawk field in July 2009 and less downtime in the Gulf of Mexico due to hurricanes. Natural gas production in Canada rose from 1.9 MMCF per day in 2008 to 54.9 MMCF per day in 2009 due to ramp-up of Tupper area production in Western Canada. Tupper started up in December 2008. Natural gas production in Malaysia also rose significantly as the Sarawak gas development started up in September 2009 and Kikeh gas production, which started up in December 2008, was onstream for a full year in 2009. Natural gas production during 2009 at Sarawak and Kikeh averaged 28.1 MMCF per day and 46.6 MMCF per day, respectively. Natural gas production in the U.K. fell from 6.4 MMCF per day in 2008 to 3.5 MMCF per day in 2009 primarily due to the Amethyst field being shut in for the first four months of 2009 for equipment repairs.
Natural gas sales volumes in the United States averaged 45.8 MMCF per day in 2008 compared to 45.1 MMCF per day in 2007. The increase of 0.7 MMCF per day in 2008 would have been significantly higher but for the reduced gas production associated with hurricane damage to downstream facilities late in the year. Natural gas sales volumes in Canada averaged 1.9 MMCF per day in 2008, down from 9.9 MMCF per day in 2007. In January 2008, the Company sold Berkana Energy, formerly its largest gas producing asset in Canada. Natural gas sales volumes in the U.K. averaged 6.4 MMCF per day in 2008 compared to 6.0 MMCF per day in 2007. The higher U.K. gas sales volumes were mostly attributable to more gas volumes sold at the Mungo and Monan fields in the North Sea. Natural gas production commenced from the Kikeh field offshore Sabah Malaysia in December 2008 and sales volumes averaged 1.4 MMCF per day for the year.
The Company’s average worldwide realized sales price for crude oil, condensate and gas liquids from continuing operations fell from $89.16 per barrel in 2008 to $56.41 per barrel in 2009. The decline of 37% was attributable to lower average prices in 2009 for crude oil and matches the decline in the average price of West Texas Intermediate (WTI) crude oil during the year. Crude oil prices began to weaken in late 2008 as the economic downturn worsened. Crude oil prices started 2009 at low levels due to a weakening worldwide demand for energy. But oil prices improved as the year progressed and in December 2009 WTI averaged $74.38 per barrel. Compared to 2008, the Company’s average 2009 crude oil sales prices fell 37% in the U.S. to $60.08 per barrel; heavy oil prices in Canada fell 31% to $40.45 per barrel; offshore Canada oil was sold for 40% less and averaged $58.19 per barrel; synthetic crude oil sold for 39% less at $61.49 per barrel; crude oil in Malaysia was down 37% and averaged $55.51 per barrel; and U.K. crude oil production sold for 32% less at $61.31 per barrel.
The Company’s average worldwide realized crude oil, condensate and gas liquids sales price from continuing operations was $89.16 per barrel in 2008 compared to $65.15 per barrel in 2007. This was an increase of 37% in 2008. In the U.S., the Company realized an average price of $95.74 per barrel in 2008, up 46% from 2007. The average sales price in 2008 for heavy oil produced in Canada was $59.05 per barrel, 80% higher than in 2007. Hibernia and Terra Nova sales prices averaged $97.09 and $96.23 per barrel, respectively, during 2008, which were increases of 36% and 40%. Synthetic oil production sold for $100.10 per barrel in 2008, up 35% from a year earlier. U.K. oil prices increased 32% to $90.16 per barrel in 2008. In Malaysia, oil produced at the Kikeh field sold for 2% less in 2008 than in 2007, with an average of $89.36 per barrel for 2008. Kikeh came on stream in August 2007 and all sales during that year occurred in the fourth quarter when prices were at the strongest point during 2007. At the West Patricia field offshore Sarawak the 2008 average sales price of $72.04 per barrel was 22% above the 2007 average price.
The Company’s natural gas sales prices fell significantly in 2009 compared to 2008 as weaker demand for energy led to an oversupply of natural gas inventories. The Company’s average realized North American natural gas sales prices were $3.57 per thousand cubic feet (MCF) in 2009, a decline of 63% from the $9.54 per MCF realized in 2008. In the U.K. the average sales price fell from $10.98 per MCF in 2008 to $5.04 per MCF in 2009. Natural gas produced in 2009 offshore Sarawak was sold at an average price of $4.05 per MCF during the year.
The Company’s natural gas sales prices rose in 2008 compared to 2007. The Company’s average realized North American natural gas sales prices increased by 33% in 2008 to $9.54 per thousand cubic feet (MCF). In the U.K., the average 2008 natural gas price rose 46% to $10.98 per MCF.
Based on 2009 sales volumes and deducting taxes at marginal rates, each $1.00 per barrel and $0.10 per MCF fluctuation in prices would have affected 2009 earnings from exploration and production continuing operations by $28.8 million and $4.4 million, respectively. The effect of these price fluctuations on consolidated net income cannot be measured precisely because operating results of the Company’s refining and marketing segments could be affected differently.
21
Production expenses from continuing operations were $654.5 million in 2009, $611.5 million in 2008 and $425.9 million in 2007. These amounts are shown by major operating area on pages F-39 and F-40 of this Form 10-K report. Costs per equivalent barrel during the last three years are shown in the following table.
(Dollars per equivalent barrel) 2009 2008 2007United States $10.62 10.01 10.75Canada Excluding synthetic oil 9.44 9.44 8.77 Synthetic oil 36.64 41.08 30.56Malaysia 8.00 10.31 12.60United Kingdom 17.97 13.21 10.34Republic of the Congo 43.51 – –Worldwide – excluding synthetic oil 9.21 10.24 10.23
Production expense per equivalent barrel in the U.S. increased in 2009 compared to 2008 due to start up of the Thunder Hawk field in July 2009. Production costs per barrel decreased in the U.S. in 2008 compared to 2007 due to lower costs incurred for workovers and repairs at fields in the Gulf of Mexico. The per-unit cost for Canadian conventional oil and gas operations, excluding synthetic oil, was flat in 2009 compared to 2008 as the benefit of a full year of natural gas production at Tupper was offset by lower production volumes without a comparable reduction in costs at Hibernia and Terra Nova. Cost per barrel in the Canada conventional area was higher in 2008 than 2007 mostly due to lower production levels. Lower cost per barrel in 2009 compared to 2008 at Canadian synthetic oil operations was mostly caused by lower natural gas fuel costs. The increase in production costs per barrel for synthetic oil in 2008 compared to 2007 was due to higher costs for fuel and repairs and lower production levels. Production cost per unit in Malaysia was lower in 2009 compared to 2008 due to higher oil production at Kikeh, and new natural gas production offshore Sarawak and higher natural gas production at Kikeh that collectively altered the production mix toward lower cost natural gas in the current year. The lower average cost per barrel in Malaysia in 2008 compared to 2007 was attributable to higher production at Kikeh where unit costs per equivalent barrel are lower than at West Patricia. Higher per-barrel production expense in the U.K. in 2009 compared to 2008 was primarily attributable to lower production levels at the Schiehallion and Amethyst fields, both of which were offline for repairs for a portion of 2009. The increase in the average cost per barrel in the U.K. in 2008 versus 2007 was caused by lower overall production levels and higher repair costs. The high per-unit production cost in Republic of the Congo in 2009 is expected to be significantly lower in future years due to higher production associated with a full year of operations at the Azurite field beginning in 2010.
Exploration expenses from continuing operations for each of the last three years are shown in total in the following table, and amounts are reported by major operating area on pages F-39 and F-40 on this Form 10-K report. Expenses other than leasehold amortization are included in the capital expenditures total for exploration and production activities.
(Millions of dollars) 2009 2008 2007Dry holes $125.3 129.5 66.8Geological and geophysical 40.5 85.2 67.7Other 16.2 17.7 35.1 182.0 232.4 169.6Undeveloped lease amortization 83.2 112.0 33.2 Total exploration expenses $265.2 344.4 202.8
Dry hole expense was $4.2 million lower in 2009 than 2008 due to more successful exploratory drilling results during a year with higher drilling capital expended. During 2009, lower dry hole costs in Malaysia and the U.S. was somewhat offset by higher costs in Australia and Republic of the Congo. Dry hole expense was $62.7 million more in 2008 than in 2007 and was attributable to more exploration drilling capital expenditures in 2008. With mostly new E&P management in 2007, much of that year was spent reevaluating the Company’s worldwide exploration drilling prospects. The higher costs for dry holes in 2008 was mostly in the offshore waters of Malaysia and Western Australia. Geological and geophysical (G&G) expenses were $44.7 million lower in 2009 compared to 2008. The reduction in G&G in 2009 was attributable to less spending on seismic in the Gulf of Mexico, the Tupper area in Western Canada, and offshore Sabah in Malaysia, but 2009 included higher spending for seismic covering the Semai II concession, offshore Indonesia. G&G expenses were $17.5 million higher in 2008 mostly due to a 3D seismic program at Block 37, offshore Suriname, and more seismic activities in the Tupper area in Western Canada. Other exploration costs were $1.5 million lower in 2009 compared to 2008 mostly due to less office costs allocable to Republic of the Congo exploration activities in the current year. Other exploration expense in 2008 was $17.4 million lower than 2007 mostly due to a $21.9 million settlement in 2007 for unfulfilled work commitments on two expiring Scotian Shelf leases, offshore Eastern Canada. Undeveloped leasehold amortization expense was $28.8 million lower in 2009 compared to 2008 mostly due to lower amortization for Tupper and Tupper West area leases in Western Canada, but partially offset by higher lease amortization cost at Eagle Ford shale leases in South Texas in the current year. Undeveloped leasehold amortization expense rose $78.8 million in 2008 compared to 2007, primarily due to amortization of undeveloped land acquisition costs at the Tupper property where the Company aggressively added undeveloped acreage in recent years.
22
An impairment charge of $5.2 million was recorded in 2009 to write-off the remaining costs of a poorly performing natural gas field in the Gulf of Mexico. A $2.6 million charge in the exploration and production business for asset impairment in 2007 related to write-down of an unused E&P administrative office to estimated fair value.
Depreciation, depletion and amortization expense for exploration and production continuing operations totaled $775.8 million in 2009, $527.8 million in 2008 and $337.6 million in 2007. The $248.0 million increase in 2009 compared to 2008 was primarily attributable to a combination of higher overall hydrocarbon production levels and start-up of new fields in the Gulf of Mexico, Western Canada and Republic of the Congo that had higher per-unit depreciation rates than older fields already on production. The increase in expense of $190.2 million in 2008 compared to 2007 was mostly caused by a much higher production level at the Kikeh field, offshore Sabah, Malaysia.
The exploration and production business recorded expenses of $25.5 million in 2009, $23.5 million in 2008 and $16.1 million in 2007 for accretion on discounted abandonment liabilities. Because the abandonment liability is carried on the balance sheet at a discounted fair value, accretion must be recorded annually so that the liability will be recorded at full value at the projected time of abandonment. The increase in accretion costs in 2009 compared to 2008 was mostly attributable to additional wells drilled in the current year at the Kikeh and Sarawak fields, offshore Malaysia. The increase in accretion costs in 2008 was associated with higher estimated abandonment costs at Syncrude and additional development wells drilled at the Kikeh field.
The effective income tax rate for exploration and production continuing operations was 40.8% in 2009, 37.4% in 2008 and 34.2% in 2007. The effective tax rate was higher in 2009 than 2008 due to both higher expenses in foreign tax jurisdictions where no tax benefit can be currently recognized due to lack of sufficient revenue to realize a current benefit and a higher percentage of profits in Malaysia where the effective tax rate of 38% is higher than the effective rates in the U.S. and Canada. The effective tax rate was higher in 2008 than the previous year as 2007 included net tax benefits from an enacted reduction of the federal tax rate in Canada. The net benefit from the Canadian tax rate reduction, which effectively reduced recorded deferred tax liabilities, was $38.7 million in 2007. The effective tax rates in 2009 and 2008 exceeded the U.S. statutory tax rate of 35.0% due to higher overall foreign tax rates and exploration activities in areas where current tax benefits cannot be recorded by the Company. The effective tax rate in 2007 was slightly below the U.S. statutory tax rate primarily due to the enacted Canadian federal tax rate reduction during the year. A $4.4 million U.S. tax benefit was realized in 2007 for a charitable building donation. Tax jurisdictions with no current tax benefit on expenses primarily include non-revenue generating areas in Malaysia, Suriname, Australia and Indonesia. Each main exploration area in Malaysia is currently considered a distinct taxable entity and expenses in certain areas may not be used to offset revenues generated in other areas. No tax benefits have thus far been recognized for costs incurred for Blocks H, P, L and M, offshore Sabah, and Blocks PM 311/312, offshore Peninsula Malaysia.
At December 31, 2009, approximately 31% of the Company’s U.S. proved oil reserves and 18% of the U.S. proved natural gas reserves are undeveloped. Virtually all of the total U.S. undeveloped reserves (on a barrel of oil equivalent basis) are associated with the Company’s various deepwater Gulf of Mexico fields. Further drilling, facility construction and well workovers are required to move undeveloped reserves to developed. In Block K Malaysia, virtually all oil reserves of 14.7 million barrels for the Kakap field are undeveloped pending completion of facilities and development drilling directed by another company. Also in Malaysia, there were 294.9 billion cubic feet of undeveloped natural gas reserves at various fields offshore Sarawak at year-end 2009, which were held under this category pending completion of development drilling and facilities. On a worldwide basis, the Company spent approximately $1.34 billion in 2009, $783 million in 2008 and $769 million in 2007 to develop proved reserves.
Refining and Marketing – The Company’s refining and marketing (R&M) operations generated earnings of $71.7 million in 2009 following record earnings of $313.8 million in 2008. Earning from R&M operations were $205.7 million in 2007. The R&M earnings decline of 77% in 2009 compared to 2008 was driven primarily by significantly weaker margins in the U.S. retail fuel marketing business and lower refining margins in the U.K. The 53% improvement in 2008 earnings compared to 2007 was caused by favorable U.K. refining profits following the acquisition of the remaining 70% of the Milford Haven refinery in December 2007, and nonrecurring charges in 2007 for a last-in, first-out (LIFO) inventory writedown in the U.K. and retail gasoline station impairments in North America.
The Company’s North American R&M operations generated earnings of $92.2 million in 2009, $227.9 million in 2008 and $230.4 million in 2007. North American operations include refining activities in the United States, marketing activities in the United States and Canada, and ethanol production operations in the U.S. North American R&M earnings fell significantly in 2009 compared to 2008 primarily due to weaker margins in the Company’s retail gasoline chain. Fuel margins in the retail chain were hurt in 2009 by both lower demand for gasoline and diesel due to the weak economy and generally rising wholesale fuel costs caused by crude oil prices that rose gradually during the year. Results for the refining business in the U.S. was slightly improved in 2009 compared to 2008 primarily due to insurance proceeds at the Meraux, Louisiana plant, and higher asphalt sales volumes and better asphalt margins at the Superior, Wisconsin plant. Final insurance settlements at the Meraux refinery for Hurricane Katrina-related property damage and a crude oil spill and damages caused by a 2003 fire provided pretax benefits of $32.6 million during 2009. On October 1, 2009, the Company acquired an ethanol production facility in Hankinson, North Dakota. The ethanol facility generated profitable operations in the fourth quarter 2009 due to the favorable spread between corn prices and ethanol sales prices.
North American R&M earnings were down slightly in 2008 compared to 2007 as lower profits generated by the U.S. refining operations were not fully offset by significantly stronger retail marketing profits in 2008. Demand for gasoline declined in the U.S. in 2008 compared to 2007 due to
23
higher costs and a weakening economy. This lower demand led to much tighter crack spreads for U.S. refineries in 2008 compared to 2007. Crack spreads represent the uplift of gasoline and distillate prices over the cost of crude oil feedstocks. The 2007 operating results for the Company’s North American refining business were negatively impacted by Hurricane Katrina-related costs of $3.0 million, which was caused by a downward adjustment of expected insurance recoveries based on an updated loss limit estimated by the Company’s primary insurer. The Company’s refinery in Superior, Wisconsin also generated weaker earnings in 2008 than in 2007 as a result of tighter crack spreads in the later year. North American retail gasoline station operations had improved results in 2008 compared to 2007 as this business enjoyed higher per gallon margins, higher sales volumes and lower store closure costs compared to the prior year. The Company recorded impairment expense of $38.2 million in 2007 associated with closures of 55 underperforming stores, including 47 in the U.S. and all eight stations in Canada.
Unit margins (sales realization less costs of crude and other feedstocks, transportation to point of sale and refinery operating and depreciation expenses) averaged $2.45 per barrel in North America in 2009, compared $4.30 per barrel in 2008 and $4.28 per barrel in 2007. Meraux refinery throughput volumes of crude oil and other feedstocks averaged 109,725 barrels per day in 2009, 103,169 barrels per day in 2008 and 112,840 barrels per day in 2007. Superior refinery throughput volumes averaged 32,280 barrels per day of crude oil and other feedstocks in 2009, compared to 26,770 barrels per day in 2008 and 33,392 barrels per day in 2007. Both U.S. refineries were temporarily shut-down for turnaround activities during 2008. North American refined product sales volumes increased 1% to a record 432,700 barrels per day in 2009, following a 3% increase to 427,490 barrels per day in 2008. The increase in 2009 was mostly attributable to more finished products produced at the U.S. refineries, plus the addition of ethanol production from the facility acquired in October 2009. The retail marketing business built 23 stations in 2009, following additions of 52 stations in 2008. The U.S. retail marketing network included 1,048 stations at year-end 2009. Station additions were purposefully restricted in 2009 based on lower Company consolidated cash flow compared to 2008. This operation’s business model of always offering competitive fuel prices usually leads to increased sales volumes during periods of high gasoline prices such as in the first nine months of 2008. In 2008, fuel sales volumes per station increased for the 11th consecutive year, and were 10% higher than 2007. However, in 2009 average site fuel sales fell by 4% due to lower demand for gasoline in the U.S.
Operations in the United Kingdom incurred a loss of $20.5 million in 2009 compared to earnings of $85.9 million in 2008 and a loss of $24.7 million in 2007. The loss in 2009 for U.K. R&M operations was primarily due to very weak margins at the Company’s Milford Haven, Wales refinery. The refining margin was hurt by weak demand for refined products during the period, which led to an industry-wide oversupply of gasoline and diesel products in the area during 2009.
The improved U.K. earnings in 2008 compared to 2007 were mostly related to profits generated by the Milford Haven refinery as the refinery generated stronger margins in 2008 and the 2007 period included a significant inventory charge. The Company acquired 100% of the Milford Haven, Wales refinery on December 1, 2007, after having a 30% interest in the asset prior to that date. In association with the late 2007 Milford Haven acquisition, the Company built a significant additional layer of crude oil and refined products inventory. The 2007 period included a $59.5 million after-tax non-cash charge to reduce the carrying value of these higher inventory levels to early 2007 prices. Under the Company’s LIFO inventory accounting policy, inventory volume increases are priced at the first purchase prices during the year, and the prices of crude oil and refined products were at a much lower level in early 2007 compared to the price at the time these products were acquired near year-end 2007. The LIFO inventory charge reduced the average carrying value for these additional inventories in the U.K. by approximately $40 per barrel. In late 2008, the Company purchased six existing fuel stations and leased 63 stations in England and Scotland.
Unit margins in the United Kingdom averaged $0.50 per barrel in 2009, $4.30 per barrel in 2008 and $0.22 per barrel in 2007. Overall sales of refined products in the U.K. declined 7% to 103,774 barrels per day in 2009, essentially due to lower production of finished products at the Company’s Milford Haven, Wales refinery. Sales of refined products in the U.K. increased more than 200% in 2008 compared to the prior year, which was attributable to additional quantities of refined products produced and sold throughout 2008 at the Milford Haven refinery following the Company’s acquisition of the remaining 70% interest in December 2007.
Corporate – The after-tax costs of corporate activities, which include interest income, interest expense, foreign exchange gains and losses, and corporate overhead not allocated to operating functions, were $23.0 million in 2009, $171.8 million in 2008 and $95.2 million in 2007. The net cost of corporate activities in 2009 was $148.8 million lower than in 2008, primarily due to more favorable effects of foreign currency exchange, which is associated with transactions that are denominated in currencies other than the respective operation’s predominant functional currency. The effect of foreign currency exchange after taxes in the corporate segment was a gain of $33.3 million in 2009 compared to a cost of $87.8 million in 2008. The favorable effects in 2009 were primarily associated with the Company’s U.K. downstream operations where a significant amount of transactions for this sterling functional currency business are denominated in U.S. dollars. The U.S. dollar generally weakened against the British pound sterling in 2009 after having gained significant ground on the U.K. currency during 2008. Foreign currency transaction effects in Canada, Malaysia and other foreign countries were generally not significant for the full year 2009. The corporate area also benefited in 2009 from higher interest income of $10.9 million compared to 2008, principally due to $42.0 million of interest recognized on an anticipated recovery of U.S. federal royalties previously paid on certain production in the Gulf of Mexico. The interest on royalties more than offset lower interest earned in 2009 on cash deposits and other longer-term investments as these amounts attracted much lower interest rates during 2009 compared to the prior year. Net interest expense, after capitalization of finance-related costs to development projects, was $17.8 million less in 2009 than 2008, principally due to lower interest rates charged on certain borrowings under the Company’s credit facilities. Certain of these facilities charge interest based on a spread above LIBOR rates, which were held low in 2009 due to weakness in the overall
24
economy. Administrative and depreciation expenses associated with corporate activities were both slightly higher in 2009 compared to 2008. Income tax expense in 2009 was significantly unfavorable to 2008 in the corporate area primarily due to the aforementioned favorable pretax variances for foreign exchange, interest income and net interest expense.
The net cost of corporate activities increased $76.6 million in 2008 compared to 2007 primarily due to higher costs associated with foreign exchange where transactions are denominated in currencies other than the operation’s functional currency. Additionally, interest costs, net of amounts capitalized to development projects, and administrative costs were also higher in 2008 than in 2007. The after-tax costs of foreign currency exchange amounted to $87.8 million in 2008 compared to costs of $13.8 million in 2007. The additional costs were primarily related to U.S. dollar transactions within the U.K.’s sterling functional downstream operations, as these dollar transactions expanded significantly with the 70% addition of Milford Haven, Wales refinery ownership beginning in December 2007. At year-end 2008 the U.S. dollar had strengthened 28% against the British pound sterling, 5% against the Euro, and 18% against the Canadian dollar compared to the end of 2007. Net interest expense increased $17.4 million in 2008 compared to 2007 mostly due to lower amounts of interest capitalized to ongoing oil and gas development projects during 2008. Administrative expenses in the corporate area increased in 2008 primarily due to higher total compensation expense and higher contributions to community and educational programs in the current year. Interest income increased $6.6 million in 2008 versus 2007 and was mostly associated with higher average short-term invested funds in Canada and the U.K. Income taxes in 2008 were favorable to 2007, and were primarily related to benefits on the higher foreign exchange losses and higher net interest expense as discussed above.
Capital Expenditures
As shown in the selected financial data on page 15 of this Form 10-K report, capital expenditures, including exploration expenditures, were $2.21 billion in 2009 compared to $2.36 billion in both 2008 and 2007. These amounts included capital expenditures of $0.8 million in 2009, $6.9 million in 2008 and $40.4 million in 2007 related to discontinued operations in Ecuador. Capital expenditures included $182.0 million, $232.4 million and $169.6 million, respectively, in 2009, 2008 and 2007 for exploration costs that were expensed. Capital expenditures for exploration and production continuing operations totaled $1.81 billion in 2009, $1.93 billion in 2008 and $1.74 billion in 2007, representing 82%, 82% and 75%, respectively, of the Company’s total capital expenditures from continuing operations for these years. E&P capital expenditures in 2009 included $118.1 million for acquisition of undeveloped leases, which primarily included leases acquired in the Eagle Ford shale area of South Texas and at the Tupper area in Western Canada, $307.6 million for exploration activities, and $1.38 billion for development projects. Development expenditures included $197.2 million at the Tupper and Tupper West natural gas areas in Western Canada, $195.5 million for deepwater fields in the Gulf of Mexico; $237.5 million for the Kikeh field in Malaysia; $392.8 million for natural gas and other development activities in SK Blocks 309/311; $49.2 million for development of the Kakap field in Block K, offshore Malaysia; $46.1 million for synthetic oil operations at the Syncrude project in Canada; $25.6 million for Western Canada heavy oil projects; $186.3 million for development of the Azurite field in Republic of the Congo; $24.3 million for the Terra Nova and Hibernia oil fields, offshore Newfoundland; and $17.3 million for fields in the U.K. North Sea. Exploration and production capital expenditures are shown by major operating area on page F-38 of this Form 10-K report.
Refining and marketing capital expenditures totaled $375.9 million in 2009, $426.2 million in 2008 and $572.5 million in 2007. These amounts represented 17%, 18% and 25% of capital expenditures from continuing operations of the Company in 2009, 2008 and 2007, respectively. Refining capital spending was $206.0 million in 2009 compared to $141.8 million in 2008 and $330.0 million in 2007. Refining spending in 2009 mostly included projects at Meraux for benzene reduction, distillate hydrotreater revamp and crude oil storage expansion; a sulfur recovery project at Superior; and a crude oil capacity expansion project at Milford Haven. The Milford Haven project will increase the crude throughput capacity of the refinery to 130,000 barrels per day when completed in 2010. Refining capital in 2008 included project costs for additional sulfur recovery capacity and property acquisition and improvements at the Meraux, Louisiana refinery, and a cogeneration energy plant at the Milford Haven, Wales refinery. The 2007 refining capital included $240.7 million for acquisition of the remaining 70% of the Milford Haven, Wales refinery. Most of the remaining refinery capital in 2007 was related to property acquired surrounding the Meraux refinery. Marketing expenditures amounted to $78.5 million in 2009, $284.4 million in 2008 and $242.5 million in 2007. Marketing capital expenditures in 2009 were primarily associated with new station builds and other improvements within the U.S. retail gasoline station network. Marketing capital spending in 2008 was split between station construction costs and land acquisitions costs for existing and future retail gasoline stations. The capital spending in 2007 was mostly attributable to acquisition of land underlying retail gasoline stations located at Walmart Supercenters. The Company added 23 stations within its U.S. retail gasoline network in 2009, after adding 52 in 2008 and 33 in 2007. The Company also spent $92.0 million in 2009 to acquire an ethanol production facility in Hankinson, North Dakota. The ethanol plant was financed with an $82.0 million nonrecourse loan from the seller and a cash payment of $10.0 million. See Note D of the consolidated financial statements for further details about this acquisition.
Cash Flows
Cash provided by operating activities was $1.86 billion in 2009, $3.04 billion in 2008 and $1.74 billion in 2007. Cash provided by continuing operations in 2009 was $1.18 billion less than in 2008 primarily due to lower net income and an increase in working capital in 2009 mostly associated with an anticipated recovery of U.S. federal royalties and related interest thereon. Cash provided by operating activities in 2008 was $1.30 billion more than in 2007 primarily due to higher net income, higher depreciation and higher exploration drilling expenditures. Cash provided by operating activities was reduced by expenditures for abandonment of oil and gas properties totaling $48.7 million in 2009, $9.2 million in 2008 and $13.0 million in 2007.
25
Cash proceeds from property sales classified as continuing operations were $1.6 million in 2009, $362.0 million in 2008 and $21.6 million in 2007. The 2008 proceeds related to sales of two of the Company’s Canadian assets, including its interest in Berkana Energy and the Lloydminster heavy oil property, and a sale of 35% of its working interest in the MPS block offshore Republic of the Congo. The sales proceeds in 2007 primarily related to sales of various assets. During 2009, the Company generated cash of $78.9 million from the sale of its 20% working interest in Block 16 in Ecuador. The results of Ecuador operations have been classified as discontinued operations in the Company’s consolidated financial statements. During 2008, the Company used available cash flow to repay $492.8 million of long-term debt. During 2009 and 2007, the Company borrowed $243.5 million and $686.2 million, respectively, through long-term debt primarily to fund a portion of the Company’s development capital expenditures. Cash proceeds from stock option exercises and employee stock purchase plans, including income tax benefits on stock options classified as financing activities, amounted to $16.9 million in 2009, $50.0 million in 2008 and $72.4 million in 2007. Proceeds from maturities of Canadian government securities with maturities greater than 90 days at date of acquisition were $2.17 billion in 2009 and $623.1 million in 2008.
Property additions and dry hole costs used cash of $1.98 billion in 2009, $2.18 billion in 2008 and $1.91 billion in 2007. Cash used to pay for capital expenditures was down in 2009 compared to 2008 essentially in line with lower capital expenditures in the latter year. The higher capital expenditures in 2008 compared to 2007 were primarily associated with a more robust exploration program and higher spending on development projects including Kikeh development drilling, Sarawak natural gas, Kakap, Azurite, Tupper and Thunder Hawk. In 2009, the Company paid $10.0 million to partially finance the acquisition of the Hankinson, North Dakota ethanol plant; the remaining $82.0 million was financed with a seller-provided nonrecourse loan. In December 2007, the Company spent $348.3 million to acquire the remaining 70% interest in the Milford Haven, Wales refinery and associated inventory. Cash of $2.53 billion and $1.04 billion was spent in 2009 and 2008, respectively, to acquire Canadian government securities with maturities greater than 90 days at the time of purchase. Cash of $30.3 million in 2009, $57.6 million in 2008 and $14.6 million in 2007 was used for turnarounds at refineries and Syncrude. Cash used for dividends to stockholders was $190.8 million in 2009, $166.5 million in 2008 and $127.4 million in 2007. The Company raised its annualized dividend rate from $0.75 per share to $1.00 per share beginning in the third quarter of 2008. The Company had previously increased the annualized dividend rate from $0.60 per share to $0.75 per share beginning in the third quarter of 2007.
Financial Condition
Year-end working capital (total current assets less total current liabilities) totaled $1.19 billion in 2009 and $958.8 million in 2008. The current level of working capital does not fully reflect the Company’s liquidity position as the carrying value for inventories under last-in, first-out accounting was $551.2 million below fair value at December 31, 2009. Cash and cash equivalents at the end of 2009 totaled $301.1 million compared to $666.1 million at year-end 2009.
The long-term portion of debt, including nonrecourse loans, increased by $327.0 million during 2009 and totaled $1.35 billion at year-end 2009, representing 15.6% of total capital employed. Long-term debt decreased by $489.0 million in 2008 as the Company utilized available free cash flow arising primarily from strong crude oil sales prices to repay a portion of long-term debt during 2008. Stockholders’ equity was $7.35 billion at the end of 2009 compared to $6.28 billion a year ago and $5.07 billion at the end of 2007. A summary of transactions in stockholders’ equity accounts is presented on page F-6 of this Form 10-K report.
Other significant changes in Murphy’s year-end 2009 balance sheet compared to 2008 included a $358.7 million increase in the balance of short-term investments in Canadian government securities with maturities greater than 90 days at the time of purchase. The total investment in these Canadian government securities was $779.0 million at year-end 2009. These slightly longer-term investments were purchased in 2009 and 2008 because of a tight supply of shorter-term securities available for purchase in Canada. A $429.3 million increase in accounts receivable was caused by anticipated recoveries of federal royalties and associated interest totaling $286.4 million at year-end 2009 and sales of crude oil and refined petroleum products at higher average prices near the end of 2009 compared to 2008. Inventory values were $129.8 million higher at year-end 2009 than in 2008 mostly due to more unsold crude oil production held in inventory at year-end 2009 compared to 2008 and higher valued refined products held in storage at year-end 2009. Prepaid expenses decreased $9.3 million in 2009 primarily due to lower prepaid insurance costs and lower prepaid U.K. taxes compared to 2008. Short-term deferred income tax assets were $14.8 million less at year-end 2009 compared to 2008 due mostly to the tax effects of lower retirement plan liabilities owed in the upcoming year. Net property, plant and equipment increased by $1.34 billion in 2009 as a significant level of property additions during the year exceeded the additional depreciation and amortization expensed. Goodwill increased $3.3 million in 2009 due to a stronger Canadian dollar exchange rate versus the U.S. dollar. Deferred charges and other assets decreased $262.1 million mostly due to an asset derecognition of equipment under construction in prior years since this equipment is now in use under operating lease arrangements. Current maturities of long-term debt declined $2.5 million during 2009 primarily due to the final repayment of nonrecourse debt associated with the Hibernia field. Accounts payable increased by $364.9 million at year-end 2009 compared to 2008 mostly due to higher amounts owed for crude oil purchases by the Company’s refineries, plus higher amounts owed for capital expenditures in Malaysia and for estimated amounts related to redetermination of working interest at Terra Nova. Income taxes payable was $64.2 million lower at year-end 2009 primarily due to lower pretax income in 2009. Other taxes payable were $13.9 million higher mostly due to greater excise taxes owed by the Company’s U.S. downstream operations and more excise and value added taxes owed by the U.K. downstream operations at year-end 2009 compared to 2008. Other accrued liabilities were down by $18.6 million in 2009 mostly due to lower employee retirement plan liabilities classified as a current liability at December 31, 2009. Deferred income tax liabilities were $140.6 million more at year-end 2009 due to a higher foreign exchange rate causing Canadian liabilities to exceed the prior year amount and an
26
additional year of accelerated tax depreciation associated with the Company’s 2009 capital expenditures. The liability associated with future asset retirement obligations increased by $41.3 million mostly due to development wells drilled during 2009 offshore Malaysia. Deferred credits and other liabilities were $262.2 million lower in 2009 compared to 2008 mostly due to derecognition of liabilities associated with equipment previously under construction that is now in use by the Company under operating lease arrangements.
Murphy had commitments for future capital projects of approximately $1.34 billion at December 31, 2009, including $839.5 million for field development and future work commitments in Malaysia, $93.2 million for costs to develop deepwater Gulf of Mexico fields and $71.0 million for field development and a work commitment in Republic of the Congo.
The primary sources of the Company’s liquidity are internally generated funds, access to outside financing and working capital. The Company uses its internally generated funds to finance the major portion of its capital and other expenditures, but it also maintains lines of credit with banks and borrows as necessary to meet spending requirements. At December 31, 2009, the Company had access to a long-term committed credit facility in the amount of $1.962 billion. A total of $625.0 million was borrowed under the committed credit facility at year-end 2009. The most restrictive covenants under this committed credit facility limit the Company’s long-term debt to capital ratio (as defined in the agreements) to 60%. The committed credit facility expires in 2012. At December 31, 2009, the Company had borrowed $47.0 million under uncommitted credit lines, and the long-term debt to capital ratio was approximately 15.7%. In September 2009, the Company filed a Form S-3 registration statement with the U.S. Securities and Exchange Commission which permits the offer and sale of debt and/or equity securities. The Company may use this shelf registration, if needed, in future years to raise debt or equity capital to fund operational requirements. This shelf registration expires in September 2012. Current financing arrangements are set forth more fully in Note F to the consolidated financial statements. The Company anticipates matching its spending plans to cash inflows during 2010 in order to borrow little or no funds under its available credit facilities during the year. However, if future oil and natural gas prices and/or refining and marketing margins weaken significantly, the Company may have to borrow under these credit facilities to fund ongoing development projects. At February 26, 2010, the Company’s long-term debt rating by Standard & Poor’s was “BBB” and by Moody’s Investors Service was “Baa3”. The Company has a rating of A (low) from Dominion Bond Rating Service. The Company’s ratio of earnings to fixed charges was 16.7 to 1 in 2009, 28.3 to 1 in 2008 and 14.0 to 1 in 2007.
Environmental Matters
Murphy and other companies in the oil and gas industry are subject to numerous federal, state, local and foreign laws and regulations dealing with the environment. Compliance with existing and anticipated environmental regulations affects our overall cost of business. Areas affected include capital costs to construct, maintain and upgrade equipment and facilities, in concert with ongoing operating costs for environmental compliance. Anticipated and existing regulations affect our capital expenditures and earnings, and they may affect our competitive position to the extent that regulatory requirements with respect to a particular production technology may give rise to costs that our competitors might not bear. Environmental regulations have historically been subject to frequent change by regulatory authorities, and we are unable to predict the ongoing cost to us of complying with these laws and regulations or the future impact of such regulations on our operations. Violation of federal or state environmental laws, regulations and permits can result in the imposition of significant civil and criminal penalties, injunctions and construction bans or delays. A discharge of hazardous substances into the environment could, to the extent such event is not insured, subject us to substantial expense, including both the cost to comply with applicable regulations and claims by neighboring landowners and other third parties for any personal injury and property damage that might result.
The most significant of those laws and the corresponding regulations affecting our U.S. operations are:• The U.S. Clean Air Act, which regulates air emissions• The U.S. Clean Water Act, which regulates discharges into U.S. waters• The U.S. Comprehensive Environmental Response, Compensation and Liability Act (CERCLA), which addresses liability for hazardous
substance releases• The U.S. Federal Resource Conservation and Recovery Act (RCRA), which regulates the handling and disposal of solid wastes• The U.S. Federal Oil Pollution Act of 1990 (OPA90), which addresses liability for discharges of oil into navigable waters of the
United States• The U.S Safe Drinking Water Act, which regulates disposal of wastewater into underground wells• Regulations of the U.S. Department of the Interior governing offshore oil and gas operations.
These laws and their associated regulations establish limits on emissions and standards for quality of air, water and solid waste discharges. They also generally require permits for new or modified operations. Many states and foreign countries where the Company operates also have or are developing similar statutes and regulations governing air and water as well as the characteristics and composition of refined products, which in some cases impose or could impose additional and more stringent requirements. We are also subject to certain acts and regulations, including legal and administrative proceedings, governing remediation of wastes or oil spills from current and past operations, which include but may not be limited to leaks from pipelines, underground storage tanks and general environmental operations.
CERCLA commonly referred to as the Superfund Act, and comparable state statutes primarily address historic contamination and impose joint and several liability upon Potentially Responsible Parties (PRP), without regard to fault or the legality of the original act that contributed to the release of a “hazardous substance” into the environment. Cleanup of contaminated sites is the responsibility of the owners and operators of
27
the sites that released, disposed, or arranged for the disposal of the hazardous substances found at the site. CERCLA also authorizes the U.S. Environmental Protection Agency (EPA) and, in some instances, third parties to act in response to threats to the public health or the environment and to seek to recover the costs they incur from the responsible persons. In the course of our ordinary operations, we generate waste that falls within CERCLA’s definition of a “hazardous substance.” We may be jointly and severally liable under CERCLA for all or part of the costs required to clean up sites at which such hazardous substances have been disposed of or released into the environment. CERCLA also requires reporting of releases to the environment of substances defined as hazardous or extremely hazardous and must be reported to the National Response Center, if they exceed an EPA established reportable quantity.
The EPA currently considers us to be a PRP at two Superfund sites. The potential total cost to all parties to perform necessary remedial work at these sites may be substantial. However, based on current negotiations and available information, we believe that we are a de minimis party as to ultimate responsibility at these Superfund sites. We have not recorded a liability for remedial costs on Superfund sites. We could be required to bear a pro rata share of costs attributable to nonparticipating PRPs or could be assigned additional responsibility for remediation at these sites or other Superfund sites. We believe that our share of the ultimate costs to clean-up the Superfund sites will be immaterial and will not have a material adverse effect on Murphy’s net income, financial condition or liquidity in a future period.
We currently own or lease, and have in the past owned or leased, properties at which hazardous substances have been or are being handled. Although we have used operating and disposal practices that were standard in the industry at the time, hazardous substances may have been disposed of or released on or under the properties owned or leased by us or on or under other locations where these wastes have been taken for disposal. In addition, many of these properties have been operated by third parties whose treatment and disposal or release of hydrocarbons or other wastes were not under our control. These properties and the wastes disposed thereon may be subject to CERCLA, RCRA and analogous state laws. Under such laws we could be required to remove or remediate previously disposed wastes (including wastes disposed of or released by prior owners or operators), to clean up contaminated property (including contaminated groundwater) or to perform remedial plugging operations to prevent future contamination. While some of these historical properties are in various stages of negotiation, investigation, and/or cleanup, we are investigating the extent of any such liability and the availability of applicable defenses and believe costs related to these sites will not have a material adverse affect on Murphy’s net income, financial condition or liquidity in a future period.
RCRA and comparable state statutes govern the management and disposal of solid wastes, with the most stringent regulations applicable to treatment, storage or disposal of hazardous wastes. We generate non-hazardous solid wastes that are subject to the requirements of RCRA and comparable state statutes. Our operating sites also incur costs to handle and dispose of hazardous waste and other chemical substances. The types of waste and substances disposed of generally fall into the following categories: spent catalysts (usually hydrotreating catalysts); spent/used filter media; tank bottoms and API separator sludge; contaminated soils; laboratory and maintenance spent solvents; and industrial debris. The costs of disposing of these substances are expensed as incurred and are not expected to have a material adverse effect on net income, financial condition or liquidity in a future period. However, it is possible that additional wastes, which could include wastes currently generated during operations, will in the future be designated as “hazardous wastes.” Hazardous wastes are subject to more rigorous and costly disposal requirements than are non-hazardous wastes. Such changes in the regulations could result in additional capital expenditures and operating expenses.
Murphy allocates a portion of its capital expenditure program to comply with environmental laws and regulations, and such capital expenditures were $109.2 million in 2009 and are projected to be $146.9 million in 2010.
Our liability for remedial obligations includes certain amounts that are based on anticipated regulatory approval for proposed remediation of former refinery waste sites. Although regulatory authorities may require more costly alternatives than the proposed processes, the cost of such potential alternative processes is not expected to exceed the accrued liability by a material amount. Certain environmental expenditures are likely to be recovered by us from other sources, primarily environmental funds maintained by certain states. Since no assurance can be given that future recoveries from other sources will occur, we have not recorded a benefit for likely recoveries as of December 31, 2009.
We are also involved in personal injury and property damage claims, allegedly caused by exposure to or by the release or disposal of materials manufactured or used in our operations. Under our accounting policies, an environmental liability is recorded when such an obligation is probable and the cost can be reasonably estimated. If there is a range of reasonably estimated costs, the most likely amount will be recorded, or if no amount is most likely, the minimum of the range is used. Recorded liabilities are reviewed quarterly. Actual cash expenditures often occur one or more years after a liability is recognized.
Under OPA90, owners and operators of tankers, owners and operators of onshore facilities and pipelines, and lessees or permittees of an area in which an offshore facility is located are liable for removal and cleanup costs of oil discharges into navigable waters of the United States. To the best of our knowledge, there has been no such OPA90 claims made against Murphy.
The EPA has issued several standards applicable to the formulation of motor fuels, primarily related to the level of sulfur found in highway diesel and gasoline, which are designed to reduce emissions of certain air pollutants when the fuel is used. Several states have passed similar or more stringent regulations governing the formulation of motor fuels. The EPA’s mandated requirements for low-sulfur gasoline became effective in 2008 and both of our U.S. refineries are now capable of producing the required low-sulfur gasoline. Each of the U.S. refineries must
28
begin to produce the EPA required ultra low-sulfur diesel (ULSD) beginning in 2010. The Meraux refinery is currently capable of producing this ULSD for all of its diesel production, and at the Superior refinery equipment is being installed which will make the refinery capable of meeting the ULSD standard by the June 2010 compliance date.
The Energy Independence and Security Act (EISA) was signed into law in December 2007. The EISA through EPA regulation requires refiners and gasoline blenders to obtain renewable fuel volume or representative trading credits as a percentage of their finished product production. EISA greatly increases the renewable fuels obligation defined in the Renewable Fuels Standard which began in September 2007. Murphy is actively blending renewable fuel volumes through its retail and wholesale operations and trading corresponding credits known as Renewable Identification Numbers (RINs) to meet its obligation.
The Federal Water Pollution Control Act of 1972 (FWPCA) imposes restrictions and strict controls regarding the discharge of pollutants into navigable waters. Permits must be obtained to discharge pollutants into state and federal waters. The FWPCA imposes substantial potential liability for the costs of removal, remediation and damages. We maintain wastewater discharge permits for our facilities where required pursuant to the FWPCA and comparable state laws. We have also applied for all necessary permits to discharge storm water under such laws. We believe that compliance with existing permits and foreseeable new permit requirements will not have a material adverse effect on our net income, financial condition or liquidity in a future period.
Our U.S. operations are subject to the Federal Clean Air Act and comparable state and local statutes. We believe that our operations are in substantial compliance with these statutes in all states in which we operate. Amendments to the Federal Clean Air Act enacted in late 1990 require or will require most refining operations in the U.S. to incur capital expenditures in order to meet air emission control standards developed by the EPA and state environmental agencies.
Under the EPA’s Clean Air Act authority, the National Petroleum Refinery (NPR) Initiative (Global Consent Decree) was initiated as a national priority to investigate four marquee compliance areas for refinery operations: (i) New Source Review/Prevention of Significant Deterioration for fluidized catalytic cracking units, heaters and boilers; (ii) New Source Performance Standards for flares, sulfur recovery units, fuel gas combustion devices (including heaters and boilers); (iii) Leak Detection and Repair requirements; and (iv) Benzene National Emissions Standards for Hazardous Air Pollutants. Murphy began negotiations with the EPA in 2005, but was interrupted by the events of Hurricane Katrina. The states of Louisiana and Wisconsin are both parties to the NPR. Negotiations with EPA resumed in 2007 and are continuing. While substantial progress has been made in these negotiations, the Company expects to conclude NPR negotiations in 2010 and will at that time have estimates of any additional capital and operating costs and penalty assessments, if any, which may be required because of the EPA’s findings.
Our Meraux, Louisiana refinery is also currently negotiating with the Louisiana Department of Environmental Quality (LDEQ) regarding three Compliance Order/Notice of Proposed Penalty (CO/NOPP) notifications regarding air and water discharges. While we are in various stages of negotiations and/or settlement, the Company has proposed a settlement offer related to these CO/NOPP negotiations. The Company does not expect the settlement of this matter to have a material adverse effect on Company’s net income, financial condition or liquidity in a future period.
World leaders have held numerous discussions about the level of worldwide greenhouse gas emissions. As part of these discussions, the Kyoto Agreement was adopted in 1997 and was ratified by certain countries in which we operate or may operate in the future, with the United States being the primary country that has yet to ratify the agreement. The agreement became effective for ratifying countries in 2005 and these countries have implemented regulations or are in various stages of developing regulations to address its contents that ultimately target a reduction in greenhouse gas emissions. We are unable to predict how U.S. regulations (if any) associated with the Kyoto Agreement will impact costs in future years. The European Union has adopted an Emissions Trading Scheme in response to the Kyoto Agreement in order to achieve reductions in greenhouse gas emissions. Our refining operations at Milford Haven currently have the most exposure to these requirements and may require purchase of emission allowances to maintain compliance with environmental permit requirements. These environmental expenditures are expensed as incurred.
Currently, various national and international legislative and regulatory measures to address greenhouse gas emissions (including carbon dioxide, methane and nitrous oxides) are in various phases of discussion or implementation. These include a recently promulgated EPA regulation, Mandatory Reporting of Greenhouse Gases, which became effective December 29, 2009, and existing proposed U.S. federal legislation (Cap and Trade Legislation, EPA’s Greenhouse Gas Endangerment Finding, EPA’s Prevention of Significant Deterioration and Title V Greenhouse Gas Tailoring Rule, Low Carbon Fuel Standards, etc.) and various state actions to develop statewide or regional programs, each of which have or could impose mandatory reductions in greenhouse gas emissions. The impact of existing and pending climate change legislation, regulations, international treaties and accords could result in increased costs to (i) operate and maintain our facilities; (ii) install new emission controls on our facilities; and (iii) administer and manage any greenhouse gas emissions trading program. These actions could also impact the consumption of refined products, thereby affecting our refinery operations. The physical impacts of climate change present potential risks for severe weather (floods, hurricanes, tornadoes, etc.) at our Meraux, Louisiana refinery in southern Louisiana and our offshore platforms in the Gulf of Mexico. Commensurate with this risk is the possibility of indirect financial and operational impacts to the Company from disruptions to
29
the operations of major customers or suppliers caused by severe weather. The Company has repositioned itself to take advantage of potential climate change opportunities by acquiring a renewable energy source through the acquisition of an ethanol production facility in Hankinson, North Dakota, thereby achieving a lower carbon footprint and an enhanced capability to meet governmental fuel standards. The Company is unable to predict at this time how much the cost of compliance with any future legislation or regulation of greenhouse gas emissions, or the cost impact of natural catastrophic events resulting from climate change, if it occurs, will be in future periods.
The Company recognizes the importance of environmental stewardship as a core component of its mission as a responsible international energy company and has implemented sufficient disclosure controls and procedures to process climate-change related information. Indeed, our Environmental, Health, and Safety Committee is a standing committee of the Board of Directors created to oversee and monitor the Company’s environmental, health, and safety (EHS) policies and practices. Further, in February 2009, our Board approved a worldwide environmental, health, and safety policy (the EHS Policy), which is available on the Company’s Web site. In addition to requiring that the Company comply with all applicable EHS laws and regulations, the EHS Policy includes a directive that the Company will “continue to minimize the impact of our operations, products and services on the environment by implementing economically feasible projects that promote energy efficiency and use natural resources effectively.” We likewise apply this conscientious approach to the issue of climate change. As a companion to the EHS Policy, the Company’s Web site also contains a statement on climate change. Not only does this statement on climate change include our goal of reducing greenhouse gas emissions on an absolute basis while growing our upstream and downstream operations, the information on our Web site describes actions we have already taken to move towards that goal. While we are admittedly at the beginning of a process that will grow over time, the Company has formed an internal Climate Change Workgroup to address emerging climate change issues and improve energy efficiencies via the development of an Energy Efficiency Forum. This Climate Change Workgroup is developing a comprehensive climate change plan aimed at preparing the company to succeed in a world challenged to reduce greenhouse gas emissions. The plan includes incorporating climate change into our planning processes, reducing our own emissions, pursuing new opportunities and engaging legislative and regulatory entities externally. Greenhouse gas inventories have been conducted since 2001. Moreover, a Low Carbon Fuel Standard sub-committee was formed in 2009 to monitor, evaluate and develop implementation plans that may arise in connection with state climate change consortiums to legislate fuel standards.
Although the initiatives cited above demonstrate the Company’s focus on environmental issues at the forefront of today’s global public policy dialogue, the Company’s commitment in this area is nothing new. For example, in 2003 the Company completed its Clean Fuels Project at the Meraux refinery, making it one of the first refineries able to produce 100 percent low-sulfur gasoline, thereby reducing emissions and meeting or bettering current sulfur fuels standards. As a result of this Clean Fuels initiative, the Company estimates that the Meraux refinery’s low-sulfur gasoline reduces vehicle emissions by more than 2,000 tons per year.
Murphy is actively engaged in the legislative and regulatory process, both nationally and internationally, in response to climate change issues and to protect our competitive advantage. Additionally, Murphy participates in the Massachusetts Institute of Technology (MIT) Joint Program on the Science and Policy of Global Change.
Safety Matters
We are also subject to the requirements of the Federal Occupational Safety and Health Act (OSHA) and comparable state statutes that regulate the protection of the health and safety of workers. In addition, the OSHA hazard communication standard requires that certain information be maintained about hazardous materials used or produced in our operations and that this information be provided to employees, state and local government authorities and citizens. We believe that our operations are in substantial compliance with OSHA requirements, including general industry standards, record-keeping requirements and monitoring of occupational exposure to regulated substances.
In 2007, OSHA announced a National Emphasis Program (NEP) for inspecting all refineries in the U.S. for compliance with OSHA’s Process Safety Management (PSM) regulations. OSHA conducted an inspection of our Meraux, Louisiana refinery from July-September 2009 and on December 29, 2009 OSHA issued several compliance related citations and a proposed penalty. The matter was settled with OSHA through payment of a $63,000 penalty with many of the OSHA items abated and agreement of a compliance schedule that calls for all items to be abated in 2010.
Other Matters
Impact of inflation – General inflation was moderate during the last three years in most countries where the Company operates; however, the Company’s revenues and capital and operating costs are influenced to a larger extent by specific price changes in the oil and gas and allied industries than by changes in general inflation. Crude oil and petroleum product prices generally reflect the balance between supply and demand, with crude oil prices being particularly sensitive to OPEC production levels and/or attitudes of traders concerning supply and demand in the near future. Natural gas prices are affected by supply and demand, which to a significant extent are affected by the weather and by the fact that delivery of gas is generally restricted to specific geographic areas. Prices for oil field goods and services have generally risen (with certain of these price increases such as drilling rig day rates having been significant) during the last few years primarily driven by high demand for such goods and services when oil and gas prices were strong. As noted earlier, oil and natural gas prices were considerably weaker in late 2008 and early 2009; however, the prices for oil goods and services did not generally decline as significantly as oil and gas prices. Oil prices,
30
and to a lesser extent natural gas prices, rebounded somewhat in 2009 from the low levels experienced in late 2008 and early 2009. Should a low price environment for oil and gas return, the Company anticipates that prices for certain equipment and services will decline due to falling demand for such items. Due to the volatility of oil and natural gas prices, it is not possible to determine what effect these prices will have on the future cost of oil field goods and services.
Accounting changes and recent accounting pronouncements – The Company adopted new accounting guidance issued by the Financial Accounting Standards Board (FASB) for noncontrolling interests in consolidated financial statements effective January 1, 2009. This guidance is to be applied prospectively, except for presentation and disclosure requirements which are applied retrospectively. This guidance required noncontrolling interests to be reclassified as equity, and consolidated net income and comprehensive income shall include the respective results attributable to noncontrolling interests. The adoption of this guidance did not have a significant effect on the Company’s consolidated financial statements.
The Company adopted new accounting guidance covering business combinations effective January 1, 2009. The new guidance established principles and requirements for how an acquirer in a business combination recognizes and measures in its financial statements the identifiable assets acquired, the liabilities assumed and any noncontrolling interest in the acquired business. It also established how to recognize and measure goodwill acquired in the business combination or a gain from a bargain purchase, if applicable. This guidance impacts the recognition and measurement of assets and liabilities in business combinations that occur beginning in 2009. Assets and liabilities that arose from business combinations that occurred prior to 2009 are not affected by this guidance. The adoption of this guidance did not have a significant effect on the Company’s financial statements for the year ended December 31, 2009. The Company is unable to predict how the application of this guidance will affect its financial statements in future periods.
The Company adopted new accounting guidance which addresses disclosures about derivative instruments and hedging activities in January 2009. This guidance expands required disclosures regarding derivative instruments to include qualitative information about objectives and strategies for using derivatives, quantities disclosures about fair value amounts and gains and losses on derivative instruments, and disclosures about credit-risk related contingent features in derivative agreements. See Note L of this Form 10-K for further disclosures.
In 2009, the Company adopted new accounting guidance for determining whether instruments granted in share-based payment transactions are participating securities. This guidance specifies that unvested share-based payment awards that contain nonforfeitable rights to dividends or dividend equivalents (whether paid or unpaid) are participating securities and, therefore, need to be included in the earnings per share (EPS) calculation under the two-class method, and also requires that all prior-period EPS calculations be adjusted retrospectively. The adoption of this guidance did not have a significant impact on the Company’s prior-period EPS calculations.
The Company adopted new accounting guidance addressing certain equity method investment accounting considerations in January 2009, which has been applied prospectively. The guidance addresses how to initially measure contingent consideration for an equity method investment, how to recognize other-than-temporary impairments of an equity method investment, and how an equity method investor is to account for a share issuance by an investee. The adoption of this guidance did not have a significant impact on the Company’s consolidated financial statements.
The Company adopted new accounting guidance addressing subsequent events effective June 30, 2009. The guidance clarified the accounting for and disclosure of subsequent events that occur after the balance sheet date through the date of issuance of the applicable financial statements. The adoption of this guidance did not have a significant effect on the Company’s consolidated financial statements. See Note U of this Form 10-K for further disclosures.
The FASB’s Accounting Standards Codification and the Hierarchy of Generally Accepted Accounting Principles guidance became effective for interim and annual periods ended after September 15, 2009 (the third calendar quarter for Murphy Oil) and it recognized the FASB Accounting Standards Codification as the single source of authoritative nongovernment U.S. generally accepted accounting principles. The codification superseded all existing accounting standards documents issued by the FASB, and established that all other accounting literature not included in the codification is considered nonauthoritative. Although the codification does not change U.S. generally accepted accounting principles, it does reorganize the principles into accounting topics using a consistent structure. The codification also includes relevant U.S. Securities and Exchange Commission guidance following the same topical structure. For periods ending after September 15, 2009, all references to U.S. generally accepted accounting principles will use the new topical guidelines established with the codification. Otherwise, this new standard is not expected to have a material impact on the Company’s consolidated financial statements in future periods.
The FASB has provided additional guidance regarding disclosures about postretirement benefit plan assets, including how asset investment allocation decisions are made, the fair value of each major category of plan assets, and how fair value is determined for each major asset category. This guidance was effective for the Company as of December 31, 2009. Upon adoption, no comparative disclosures are required for earlier years presented. See Note K of this Form 10-K for additional disclosures.
31
In December 2008, the U.S. Securities and Exchange Commission adopted revisions to oil and natural gas reserves reporting requirements which became effective for the Company at year-end 2009. The primary changes to reserves reporting include:
• A revised definition of proved reserves, including the use of unweighted average oil and natural gas prices in effect at the beginning of each month during the year to compute such reserves,
• Expanding the definition of oil and gas producing activities to include non-traditional and unconventional resources, which includes the Company’s synthetic oil operations in Alberta,
• Allowing companies to voluntarily disclose probable and possible reserves in SEC filings,• Amending required proved reserve disclosures to include separate amounts for synthetic oil and gas,• Expanding disclosures of proved undeveloped reserves, including discussion of such proved undeveloped reserves five years old or
more, and• Disclosure of the qualifications of the chief technical person who oversees the Company’s overall reserve process.
The Company utilized this new guidance at year-end 2009 to determine its proved reserves and to develop associated disclosures. The Company chose not to provide voluntary disclosures of probable and possible reserves in this Form 10-K.
In June 2009, the FASB issued new guidance regarding accounting for transfers of financial assets. This guidance makes the concept of a qualifying special-purpose entity as defined previously no longer relevant for accounting purposes. Therefore, formerly qualifying special-purpose entities must be reevaluated for consolidation by reporting entities in accordance with the applicable consolidation guidance. This guidance is effective for the Company beginning on January 1, 2010. The Company is currently evaluating this guidance and is unable to predict at this time how it will impact its consolidated financial statements in future periods. In June 2009, the FASB issued new guidance that requires a company to perform an analysis to determine whether its variable interests give it a controlling financial interest in a variable interest entity. The primary beneficiary of a variable interest entity has both the power to direct the activities of the entity that most significantly impact the entity’s economic performance and the obligation to absorb potentially significant losses of the entity or the right to receive potentially significant benefits from the entity. A company is required to make ongoing reassessments of whether it is the primary beneficiary of a variable interest entity. This guidance also amends previous guidance for determining whether an entity is considered a variable interest entity. This guidance is effective for the Company beginning on January 1, 2010. The Company is currently evaluating this guidance and is unable to predict at this time how it will impact its consolidated financial statements in future periods.
Significant accounting policies – In preparing the Company’s consolidated financial statements in accordance with U.S. generally accepted accounting principles, management must make a number of estimates and assumptions related to the reporting of assets, liabilities, revenues and expenses and the disclosure of contingent assets and liabilities. Application of certain of the Company’s accounting policies requires significant estimates. The most significant of these accounting policies and estimates are described below.
• Proved oil and natural gas reserves – Proved oil and gas reserves are defined by the U.S. Securities and Exchange Commission (SEC) as those quantities of oil and gas, which, by analysis of geoscience and engineering data, can be estimated with reasonable certainty to be economically producible from a given date forward, from known reservoirs, and under existing economic conditions, operating methods, and government regulation before the time at which contracts providing the right to operate expire, unless evidence indicates that renewal is reasonably certain, regardless of whether deterministic method or probabilistic method is used for the estimation. Proved developed oil and gas reserves are proved reserves that can be expected to be recovered through existing wells with existing equipment and operating methods or in which the cost of the required equipment is relatively minor compared with the cost of a new well, or through installed extraction equipment and infrastructure operational at the time of the reserves estimate if the extraction is by means not involving a well. Although the Company’s engineers are knowledgeable of and follow the guidelines for reserves as established by the SEC, the estimation of reserves requires the engineers to make a significant number of assumptions based on professional judgment. SEC rules require that we use an unweighted average of the oil and gas prices in effect at the beginning of each month of the year for determining proved reserve quantities. These historical prices often do not approximate the average price that the Company expects to receive for its oil and natural gas production in the future. The Company often uses significantly different oil and natural gas price and reserve assumptions when making its own internal economic property evaluations. Estimated reserves are subject to future revision, certain of which could be substantial, based on the availability of additional information, including: reservoir performance, new geological and geophysical data, additional drilling, technological advancements, price changes and other economic factors. Changes in oil and gas prices can lead to a decision to start-up or shut-in production, which can lead to revisions to reserve quantities. Reserve revisions inherently lead to adjustments of the Company’s depreciation rates and the timing of settlement of asset retirement obligations.
The Company’s proved reserves of oil and gas are presented on pages F-36 and F-37 of this Form 10-K. A favorable oil reserve revision in 2009 in the United States was attributable to favorable performance of the Thunder Hawk and Front Runner fields and federal royalty relief for various deepwater fields. A favorable conventional oil revision in Canada in 2009 was caused by performance of the Terra Nova field and improved heavy oil pricing which added reserves in the Seal area. Due to changes in the SEC’s definition of proved oil reserves, which were first effective as of December 31, 2009, synthetic oil reserves are now included as proved oil reserves. Consequently, total synthetic oil reserves as of January 1, 2009 of 131.6 million barrels have been added to total oil reserves in 2009. The positive revision to
32
synthetic oil reserves during 2009 was attributable to lower royalties compared to a year ago. An unfavorable revision to oil reserves in Malaysia in 2009 was due to current-year drilling results for a well in the Kikeh field, along with reduced entitlements at Kikeh and West Patricia due to increased prices as compared to year-end 2008. Oil reserves in the U.K. reflected an unfavorable revision in 2009 because of an anticipated reduction in life expectancy for major equipment at the Schiehallion project. An unfavorable U.S. oil revision in 2008 resulted from updated reservoir modeling of one field in the deepwater Gulf of Mexico. An unfavorable revision in Canada in 2008 was related to low heavy oil prices at year-end, but this was partially offset by a favorable impact from better field performance in 2008 at Hibernia. A favorable oil reserve revision in Malaysia in 2008 was attributable to better than anticipated drilling results and additional drilling opportunities in the main reservoir at the Kikeh field, coupled with better reservoir performance and artificial lift improvements at the West Patricia field. An unfavorable oil reserve revision in the U.S. in 2007 was mostly related to poor performance at one deepwater field in the Gulf of Mexico. Favorable oil reserve revisions in 2007 in Canada related primarily to better performance at the Hibernia and Terra Nova fields. Favorable 2007 oil revisions in Malaysia related to West Patricia and Kikeh well performances. In the U.S., a positive gas reserve revision in 2009 was caused by favorable performance of the Thunder Hawk, Front Runner and Mondo NW fields as well as federal royalty relief for various deepwater fields. In Malaysia, a combination of increased entitlements due to pricing and drilling performance at the Sarawak gas project led to positive gas revisions in 2009. Gas reserves in the U.K. were favorably revised in 2009 because of the Amethyst field gas compression project and better Mungo field performance. An unfavorable natural gas reserve revision in Malaysia in 2008 was related to entitlement adjustments under the Sarawak Blocks SK 309 and SK 311 production sharing contract and gas volumes lost due to operational delays that restricted sales volumes at the Kikeh field, offshore Sabah. The downward revisions to U.S. natural gas reserves in 2007 was mostly caused by unfavorable production performance for gas wells at various fields in the Gulf of Mexico and onshore south Louisiana. The favorable natural gas reserve revision in Canada in 2007 was mostly attributable to well performance at the natural gas field owned by a consolidated subsidiary. The downward revision to 2007 natural gas reserves in Malaysia is based on higher contractual sales prices at year-end 2007 compared to 2006. The Company cannot predict the type of reserve revisions that will be required in future periods.
• Successful efforts accounting – The Company utilizes the successful efforts method to account for exploration and development expenditures. Unsuccessful exploration wells are expensed and can have a significant effect on net income. Successful exploration drilling costs, all development capital expenditures and asset retirement costs are capitalized and systematically charged to expense using the units of production method based on proved developed oil and natural gas reserves as estimated by the Company’s engineers.
In some cases, a determination of whether a drilled well has found proved reserves cannot be made immediately. This is generally due to the need for a major capital expenditure to produce and/or evacuate the hydrocarbon(s) found. The determination of whether to make such a capital expenditure is, in turn, usually dependent on whether additional exploratory wells find a sufficient quantity of additional reserves. Under current accounting rules, the Company holds well costs in Property, Plant and Equipment in the Consolidated Balance Sheet when the well has found a sufficient quantity of reserves to justify its completion as a producing well and the Company is making sufficient progress assessing the reserves and the economic and operating viability of the project.
Based on the time required to complete further exploration and appraisal drilling in areas where hydrocarbons have been found but proved reserves have not been booked, dry hole expense may be recorded one or more years after the original drilling costs are incurred. There were no dry holes in 2009, 2008 or 2007 that were drilled in prior years.
• Impairment of long-lived assets – The Company continually monitors its long-lived assets recorded in Property, Plant and Equipment and
Goodwill in the Consolidated Balance Sheet to make sure that they are fairly presented. The Company must evaluate its properties for potential impairment when circumstances indicate that the carrying value of an asset may not be recoverable from future cash flows. Goodwill is evaluated for impairment at least annually. A significant amount of judgment is involved in performing these evaluations since the results are based on estimated future events. Such events include a projection of future oil and natural gas sales prices, an estimate of the amount of oil and natural gas that will be produced from a field, the timing of this future production, future costs to produce the oil and natural gas, future capital and abandonment costs, future margins on refined products produced and sold, and future inflation levels. The need to test a property for impairment can be based on several factors, including but not limited to a significant reduction in sales prices for oil and/or natural gas, unfavorable reserve revisions, expected deterioration of future refining and/or marketing margins for refined products, or other changes to contracts, environmental regulations or tax laws. All of these same factors must be considered when evaluating a property’s carrying value for possible impairment.
In making its impairment assessments involving exploration and production property and equipment, the Company must make a number of projections involving future oil and natural gas sales prices, future production volumes, and future capital and operating costs. Due to the volatility of world oil and gas markets, the actual sales prices for oil and natural gas have often been quite different from the Company’s projections. Estimates of future oil and gas production and sales volumes are based on a combination of proved and risked probable and possible reserves. Although the estimation of reserves and future production is uncertain, the Company believes that its estimates are reasonable; however, there have been cases where actual production volumes were higher or lower than projected and the timing was different than the original projection. The Company adjusts reserves and production estimates as new information becomes available. The Company generally projects future costs by using historical costs adjusted for both assumed long-term inflation rates and known or expected changes in future operations. Although the projected future costs are considered to be reasonable, at
33
times, costs have been higher or lower than originally estimated. In assessing potential impairment involving refining and marketing assets, the Company evaluates its properties when circumstances indicate that carrying value of an asset may not be recoverable from future cash flows. A significant amount of judgment is involved in performing these evaluations since the results are based on estimated future events, which include projections of future margins, future capital expenditures and future operating expenses. Future marketing or operating decisions, such as closing or selling certain assets, and future regulatory or tax changes could also impact the Company’s conclusion about potential asset impairment. Impairment expense of $5.2 million was recorded in 2009 to write-off the remaining carrying value of one underperforming natural gas field in the Gulf of Mexico. Based on an evaluation of expected future cash flows from properties at year-end 2009, the Company does not believe it had any other significant properties with carrying values that were impaired at that date. The expected future sales prices for crude oil and natural gas used in the evaluation were based on quoted future prices for the respective production periods. These quoted prices often reflect higher expected prices for oil and natural gas in the future compared to the existing spot prices at the time of assessment. If quoted prices for future years had been lower, the smaller projected cash flows for properties could have led to significant impairment charges being recorded for certain properties in 2009. In addition, one or a combination of factors such as lower future sales prices, lower future production, higher future costs, lower future margins on refining and marketing sales, or the actions of government authorities could lead to impairment expenses in future periods. Based on these unknown future factors as described herein, the Company cannot predict the amount or timing of impairment expenses that may be recorded in the future.
• Income taxes – The Company is subject to income and other similar taxes in all areas in which it operates. When recording income tax expense, certain estimates are required because: (a) income tax returns are generally filed months after the close of its annual accounting period; (b) tax returns are subject to audit by taxing authorities and audits can often take years to complete and settle; and (c) future events often impact the timing of when income tax expenses and benefits are recognized by the Company. The Company has deferred tax assets mostly relating to basis differences for property, equipment and inventories, and dismantlements and retirement benefit plan liabilities. The Company routinely evaluates all deferred tax assets to determine the likelihood of their realization. A valuation allowance has been recognized for deferred tax assets related to basis differences for Blocks H, PM 311/312, P, L and M in Malaysia, exploration licenses in Republic of the Congo, Suriname and Australia, and certain basis differences in the U.K. due to management’s belief that these assets cannot be deemed to be realizable with any degree of confidence at this time. The Company occasionally is challenged by taxing authorities over the amount and/or timing of recognition of revenues and deductions in its various income tax returns. Although the Company believes that it has adequate accruals for matters not resolved with various taxing authorities, gains or losses could occur in future years from changes in estimates or resolution of outstanding matters.
• Accounting for retirement and postretirement benefit plans – Murphy Oil and certain of its subsidiaries maintain defined benefit retirement plans covering most of its full-time employees. The Company also sponsors health care and life insurance benefit plans covering most retired U.S. employees. The expense associated with these plans is determined by management based on a number of assumptions and with consultation assistance from qualified third-party actuaries. The most important of these assumptions for the retirement plans involve the discount rate used to measure future plan obligations and the expected long-term rate of return on plan assets. For the retiree medical and insurance plans, the most important assumptions are the discount rate for future plan obligations and the health care cost trend rate. Discount rates are based on the universe of high-quality corporate bonds that are available within each country. Cash flow analyses are performed in which a spot yield curve is used to discount projected benefit payment streams for the most significant plans. The discounted cash flows are used to determine an equivalent single rate which is the basis for selecting the discount rate within each country. Expected plan asset returns are based on long-term expectations for asset portfolios with similar investment mix characteristics. Anticipated health care cost trend rates are determined based on prior experience of the Company and an assessment of near-term and long-term trends for medical and drug costs.
Based on bond yields at year-end 2009, the Company has used a discount rate of 5.90% in 2009 and beyond for the primary U.S. plans. Although the Company presently assumes a return on plan assets of 6.50% for the primary U.S. plan, it periodically reconsiders the appropriateness of this and other key assumptions. The smoothing effect of current accounting regulations tends to buffer the current year’s pension expense from wide swings in liabilities and asset valuations. The Company’s normal annual retirement and postretirement plan expenses are expected to increase slightly in 2010 compared to 2009 based on the effects of a growing employee base. In 2009, the Company paid $50.8 million into various retirement plans and $4.4 million into postretirement plans. The 2009 retirement plan contribution included a voluntary contribution of $30.0 million to the primary U.S. retirement plan. In 2010, the Company is expecting to fund payments of approximately $20.8 million into various retirement plans and $5.8 million for postretirement plans. Approximately $10.2 million of these anticipated payments in 2010 are not mandatory. The Company could be required to make additional and more significant funding payments to retirement plans in future years. Future required payments and the amount of liabilities recorded on the balance sheet associated with the plans could be unfavorably affected if the discount rate declines, the actual return on plan assets falls below the assumed 6.5%, or the health care cost trend rate increase is higher than expected. As described above, the Company’s retirement and postretirement expenses are sensitive to certain assumptions, primarily related to discount rates and assumed return on plan assets. A 0.5% decline in the discount rate would increase 2010 annual retirement and postretirement expenses by $4.8 million and $0.7 million, respectively, and a 0.5% decline in the assumed rate of return on plan assets would increase 2010 retirement expense by $1.8 million.
34
• Legal, environmental and other contingent matters – A provision for legal, environmental and other contingent matters is charged to expense when the loss is probable and the cost can be reasonably estimated. Judgment is often required to determine when expenses should be recorded for legal, environmental and other contingent matters. In addition, the Company often must estimate the amount of such losses. In many cases, management’s judgment is based on interpretation of laws and regulations, which can be interpreted differently by regulators and/or courts of law. The Company’s management closely monitors known and potential legal, environmental and other contingent matters, and makes its best estimate of the amount of losses and when they should be recorded based on information available to the Company.
Contractual obligations and guarantees – The Company is obligated to make future cash payments under borrowing arrangements, operating leases, purchase obligations primarily associated with existing capital expenditure commitments, and other long-term liabilities. In addition, the Company expects to extend certain operating leases beyond the minimum contractual period. Total payments due after 2009 under such contractual obligations and arrangements are shown below.
Amount of Obligation (Millions of dollars) Total 2010 2011-2012 2013-2014 After 2014Total debt including current maturities $1,353.2 – 1,038.8 65.1 249.3Operating leases 1,078.9 146.8 276.9 253.9 401.3Purchase obligations 2,218.3 1,550.3 488.3 51.2 128.5Other long-term liabilities 660.4 23.0 45.7 53.2 538.5 Total $5,310.8 1,720.1 1,849.7 423.4 1,317.6
The Company has entered into agreements to lease production facilities for various producing oil fields. In addition, the Company has other arrangements that call for future payments as described in the following section. The Company’s share of the contractual obligations under these leases and other arrangements has been included in the table above.
In the normal course of its business, the Company is required under certain contracts with various governmental authorities and others to provide financial guarantees or letters of credit that may be drawn upon if the Company fails to perform under those contracts. The amount of commitments as of December 31, 2009 that expire in future periods is shown below.
Amount of Commitment (Millions of dollars) Total 2010 2011-2012 2013-2014 After 2014Financial guarantees $ 7.8 – – 3.2 4.6Letters of credit 102.9 61.3 40.0 – 1.6 Total $110.7 61.3 40.0 3.2 6.2
Material off-balance sheet arrangements – The Company occasionally utilizes off-balance sheet arrangements for operational or funding purposes. The most significant of these arrangements at year-end 2009 includes operating leases of floating, production, storage and offloading vessels (FPSO) for the Kikeh and Azurite oil fields, an operating lease for a production facility at the Thunder Hawk field, a natural gas transportation contract for the Tupper area in Western Canada and a hydrogen purchase contract for the Meraux refinery. The leases call for future monthly net lease payments through 2015 at Kikeh, through 2016 at Azurite, and through 2014 at Thunder Hawk. The Tupper transportation contract requires minimum monthly payments through 2013. The Meraux refinery contract to purchase hydrogen ends in 2021. The hydrogen contract requires a monthly minimum base facility charge whether or not any hydrogen is purchased. Future required minimum annual payments under these arrangements are included in the contractual obligation table shown above.
Outlook
Prices for the Company’s primary products are often quite volatile. A strong global economy during 2007 and the first half of 2008, which fueled demand for energy, led to high prices for crude oil and refined petroleum products. Beginning in the second half of 2008 and continuing into early 2009, crude oil prices fell precipitously from the highs at mid-year 2008. As the worldwide economy started to show signs of improvement in 2009, crude oil prices began to strengthen. The change in the prices for crude oil is primarily attributable to the level of demand for energy. In January 2010, West Texas Intermediate crude oil traded in a band between $73 and $83 per barrel. NYMEX natural gas has traded in a band of $5 to $6 per MMBTU. Refining and marketing margins were very weak in January 2010 and these operations in the U.S. and U.K. were showing operating losses during this time. The Company continually monitors the prices for its main products and often alters its operations and spending based on these prices.
The Company’s capital expenditure budget for 2010 was prepared during the fall of 2009 and based on this budget capital expenditures are expected to be slightly above 2009 levels. Since the budget was approved by the Company’s Board of Directors, crude oil prices have generally been above the levels assumed in the 2010 budget, but North American natural gas prices have generally trailed the budgeted prices. Based on a recent review of capital expenditure projects, capital expenditures in 2010 are projected to total approximately $2.4 billion. Of this amount, $2.0 billion or about 83%, is allocated for the exploration and production program. Geographically, E&P capital is spread approximately as
35
36
follows: 23% for the United States, 34% for Malaysia, 30% for Canada and 13% for all other areas. Spending in the U.S. is primarily associated with continued development of producing and nonproducing deepwater fields as well as for the Company’s Gulf of Mexico and Eagle Ford shale exploration programs. In Malaysia, the majority of the spending is for continued development of natural gas fields in Blocks SK 309 and SK 311 offshore Sarawak and at the Kikeh and Kakap fields in Block K. The bulk of Canadian spending in 2010 will relate to natural gas developments at the Tupper and Tupper West areas in Western Canada. Other spending is primarily in Republic of the Congo for continued development of the Azurite offshore field. Refining and marketing expenditures in 2010 should be about $400 million, or 17% of the Company total, including funds for construction of additional U.S. retail gasoline stations and final costs for an expansion of crude throughput capacity at the Milford Haven, Wales refinery. Capital and other expenditures will be routinely reviewed during 2010 and planned capital expenditures may be adjusted to reflect differences between budgeted and actual cash flow during the year. Capital expenditures may also be affected by asset purchases, which often are not anticipated at the time the Budget is prepared.
The Company will primarily fund its capital program in 2010 using operating cash flow, but will supplement funding where necessary using borrowings under available credit facilities. The Company’s 2010 budget calls for no increase in long-term debt during the year, but if oil and/or natural gas prices weaken or refining and marketing margins remain weak actual cash flow generated from operations could be reduced to such a level that borrowings might be required during the year to maintain funding of the Company’s ongoing development projects. As noted earlier, North American natural gas prices in early 2010 were below the levels assumed in the 2010 budget. Also, through early 2010, margins within the Company’s refining and marketing operations were significantly below amounts assumed in the Company’s 2010 budget.
The Company currently expects production in 2010 to average slightly more than 200,000 barrels of oil equivalent per day. A key assumption in projecting the level of 2010 Company production is the anticipated ramp-up of natural gas production from fields at Tupper in Western Canada and Sarawak, offshore Malaysia, and ramp-up of oil production from the Thunder Hawk field in the Gulf of Mexico and the Azurite field offshore Republic of the Congo. In addition, continued reliability of production at significant fields such as Kikeh, Syncrude, Hibernia and Terra Nova are necessary to achieve the anticipated 2010 production levels.
Forward-Looking Statements
This Form 10-K contains forward-looking statements as defined in the Private Securities Litigation Reform Act of 1995. These statements, which express management’s current views concerning future events or results, are subject to inherent risks and uncertainties. Factors that could cause actual results to differ materially from those expressed or implied in our forward-looking statements include, but are not limited to, the volatility and level of crude oil and natural gas prices, the level and success rate of our exploration programs, our ability to maintain production rates and replace reserves, political and regulatory instability, and uncontrollable natural hazards. For further discussion of risk factors, see Item 1A. Risk Factors, which begins on page 9 of this Annual Report on Form 10-K. Murphy undertakes no duty to publicly update or revise any forward-looking statements.
Item 7A. QUANTITATIVE AND QUALITATIVE DISCLOSURES ABOUT MARKET RISK
The Company is exposed to market risks associated with interest rates, prices of crude oil, natural gas and petroleum products, and foreign currency exchange rates. As described in Note A to the consolidated financial statements, Murphy makes limited use of derivative financial and commodity instruments to manage risks associated with existing or anticipated transactions.
There were short-term derivative foreign exchange contracts in place at December 31, 2009 to hedge the value of U.S. dollars against two foreign currencies. A 10% strengthening of the U.S. dollar against these foreign currencies would have reduced the recorded net asset associated with these contracts by approximately $8.7 million, while a 10% weakening of the U.S. dollar would have increased the recorded net asset by approximately $5.2 million. Changes in the fair value of these derivative contracts generally offset the financial statement impact of an equivalent volume of foreign currency exposures associated with other assets and/or liabilities.
Item 8. FINANCIAL STATEMENTS AND SUPPLEMENTARY DATA
Information required by this item appears on pages F-1 through F-43, which follow page 41 of this Form 10-K report.
Item 9. CHANGES IN AND DISAGREEMENTS WITH ACCOUNTANTS ON ACCOUNTING AND FINANCIAL DISCLOSURE
None
Item 9A. CONTROLS AND PROCEDURES
Under the direction of its principal executive officer and principal financial officer, controls and procedures have been established by Murphy to ensure that material information relating to the Company and its consolidated subsidiaries is made known to the officers who certify the Company’s financial reports and to other members of senior management and the Board of Directors.
37
Based on their evaluation, with the participation of the Company’s management, as of December 31, 2009, the principal executive officer and principal financial officer of Murphy Oil Corporation have concluded that the Company’s disclosure controls and procedures (as defined in Rules 13a-15(e) and 15d-15(e) under the Securities Exchange Act of 1934) were effective to ensure that the information required to be disclosed by Murphy Oil Corporation in reports that it files or submits under the Securities Exchange Act of 1934 is recorded, processed, summarized and reported within the time periods specified in SEC rules and forms.
Murphy’s management is responsible for establishing and maintaining adequate internal control over financial reporting, as such term is defined in Exchange Act Rules 13a-15(f). Management has conducted an evaluation of the effectiveness of our internal control over financial reporting based on the criteria set forth in Internal Control – Integrated Framework issued by the Committee of Sponsoring Organizations of the Treadway Commission. Based on our evaluation, management has concluded that our internal control over financial reporting was effective as of December 31, 2009. Our report is included on page F-2 of the annual report. KPMG LLP, an independent registered public accounting firm, has made an independent assessment of the effectiveness of our internal control over financial reporting as of December 31, 2009 and their report is also included on page F-2 of this annual report.
There were no changes in the Company’s internal controls over financial reporting that occurred during the fourth quarter of 2009 that have materially affected, or are reasonably likely to materially affect, the Company’s internal control over financial reporting.
Item 9B. OTHER INFORMATION
None
PART III
Item 10. DIRECTORS, EXECUTIVE OFFICERS AND CORPORATE GOVERNANCE
Certain information regarding executive officers of the Company is included beginning on page 13 of this Form 10-K report. Other information required by this item is incorporated by reference to the Registrant’s definitive Proxy Statement for the Annual Meeting of Stockholders on May 12, 2010 under the captions “Election of Directors” and “Committees.”
Murphy Oil has adopted a Code of Ethical Conduct for Executive Management, which can be found under the Corporate Governance and Responsibility tab at www.murphyoilcorp.com. Stockholders may also obtain free of charge a copy of the Code of Ethical Conduct for Executive Management by writing to the Company’s Secretary at P.O. Box 7000, El Dorado, AR 71731-7000. Any future amendments to or waivers of the Company’s Code of Ethical Conduct for Executive Management will be posted on the Company’s internet Web site.
Item 11. EXECUTIVE COMPENSATION
Information required by this item is incorporated by reference to Murphy’s definitive Proxy Statement for the Annual Meeting of Stockholders on May 12, 2010 under the captions “Compensation Discussion and Analysis” and “Compensation of Directors,” and in various compensation schedules.
Item 12. SECURITY OWNERSHIP OF CERTAIN BENEFICIAL OWNERS AND MANAGEMENT AND RELATED STOCKHOLDER MATTERS
Information required by this item is incorporated by reference to Murphy’s definitive Proxy Statement for the Annual Meeting of Stockholders on May 12, 2010 under the captions “Security Ownership of Certain Beneficial Owners,” “Security Ownership of Management,” and “Equity Compensation Plan Information.”
Item 13. CERTAIN RELATIONSHIPS AND RELATED TRANSACTIONS, AND DIRECTOR INDEPENDENCE
Information required by this item is incorporated by reference to Murphy’s definitive Proxy Statement for the Annual Meeting of Stockholders on May 12, 2010 under the caption “Election of Directors.”
Item 14. PRINCIPAL ACCOUNTING FEES AND SERVICES
Information required by this item is incorporated by reference to Murphy’s definitive Proxy Statement for the Annual Meeting of Stockholders on May 12, 2010 under the caption “Audit Committee Report.”
PART IV
Item 15. EXHIBITS AND FINANCIAL STATEMENT SCHEDULES
(a) 1. Financial Statements – The consolidated financial statements of Murphy Oil Corporation and consolidated subsidiaries are located or begin on the pages of this Form 10-K report as indicated below.
Page No. Report of Management – Consolidated Financial Statements F-1 Report of Independent Registered Public Accounting Firm F-1 Report of Management – Internal Control Over Financial Reporting F-2 Report of Independent Registered Public Accounting Firm F-2 Consolidated Statements of Income F-3 Consolidated Balance Sheets F-4 Consolidated Statements of Cash Flows F-5 Consolidated Statements of Stockholders’ Equity F-6 Consolidated Statements of Comprehensive Income F-7 Notes to Consolidated Financial Statements F-8 Supplemental Oil and Gas Information (unaudited) F-34 Supplemental Quarterly Information (unaudited) F-43
2. Financial Statement Schedules
Schedule II – Valuation Accounts and Reserves F-44
All other financial statement schedules are omitted because either they are not applicable or the required information is included in the consolidated financial statements or notes thereto.
3. Exhibits – The following is an index of exhibits that are hereby filed as indicated by asterisk (*), that are to be filed by an amendment as indicated by pound sign (#), or that are incorporated by reference. Exhibits other than those listed have been omitted since they either are not required or are not applicable.
ExhibitNo. Incorporated by Reference to_______ ____________________________________________________ 3.1 Certificate of Incorporation of Murphy Oil Corporation Exhibit 3.1 of Murphy’s Form 10-Q report for the quarterly period as amended, effective May 11, 2005 ended June 30, 2005
3.2 By-Laws of Murphy Oil Corporation as amended Exhibit 3.2 of Murphy’s Form 8-K report filed February 4, 2010 effective February 3, 2010
4 Instruments Defining the Rights of Security Holders. Murphy is party to several long-term debt instruments in addition to those in Exhibit 4.1 and 4.2, none of which authorizes securities exceeding 10% of the total consolidated assets of Murphy and its subsidiaries. Pursuant to Regulation S-K, item 601(b), paragraph 4(iii)(A), Murphy agrees to furnish a copy of each such instrument to the Securities and Exchange Commission upon request.
38
4.1 Form of Second Supplemental Indenture between Exhibit 4.1 of Murphy’s Form 10-K report for the year ended Murphy Oil Corporation and SunTrust Bank, as Trustee December 31, 2008
*4.2 Form of Indenture and Form of Supplemental Indenture between Murphy Oil Corporation and SunTrust Bank, as Trustee
10.1 1992 Stock Incentive Plan as amended May 14, 1997, Exhibit 10.1 of Murphy’s Form 10-K report for the year ended December 1, 1999, May 14, 2003 and December 7, 2005 December 31, 2005
10.2 2007 Long-Term Incentive Plan Exhibit 10.1 of Murphy’s Form 8-K report filed April 24, 2007
10.3 Employee Stock Purchase Plan as amended May 9, 2007 Exhibit C of Murphy’s definitive proxy statement (Definitive 14A) dated March 30, 2007
10.4 2008 Stock Plan for Non-Employee Directors, as approved Form S-8 report filed February 5, 2009 by shareholders on May 14, 2008
*12.1 Computation of Ratio of Earnings to Fixed Charges
*13 2009 Annual Report to Security Holders
*21 Subsidiaries of the Registrant
*23 Consent of Independent Registered Public Accounting Firm
*31.1 Certification required by Rule 13a-14(a) pursuant to Section 302 of the Sarbanes-Oxley Act of 2002
*31.2 Certification required by Rule 13a-14(a) pursuant to Section 302 of the Sarbanes-Oxley Act of 2002
32 Certifications pursuant to 18 U.S.C. Section 1350, as adopted See footnote1 below. pursuant to Section 906 of the Sarbanes-Oxley Act of 2002
*99.1 Form of employee stock option
99.2 Form of performanced-based employee restricted Exhibit 99.2 of Murphy’s Form 10-K report for the year ended stock unit grant agreement December 31, 2008
99.3 Form of non-employee director stock option Exhibit 99.3 of Murphy’s Form 10-K report for the year ended December 31, 2005
1 These certifications will not be deemed to be filed with the Commission or incorporated by reference into any filing by the Company under the Securities Act of 1933 or the Securities Exchange Act of 1934, except to the extent that the Company specifically incorporates such certifications by reference.
39
ExhibitNo. Incorporated by Reference to_______ ____________________________________________________
99.4 Form of non-employee director restricted stock award Exhibit 99.4 of Murphy’s Form 10-K report for the year ended December 31, 2006
99.5 Form of non-employee director restricted stock unit award Exhibit 99.5 of Murphy’s Form 10-K report for the year ended December 31, 2008
101 Interactive Data Files
Attached as Exhibit 101 to this report are documents formatted in XBRL (Extensible Business Reporting Language). Users of this data are advised pursuant to Rule 406T of Regulation S-T that the interactive data file is deemed not filed or part of a registration statement or prospectus for purposes of section 11 or 12 of the Securities Act of 1933, is deemed not filed for purposes of section 18 of the Securities Exchange Act of 1934, and otherwise not subject to liability under these sections. The financial information contained in the XBRL-related documents is “unaudited” or “unreviewed.”
40
ExhibitNo. Incorporated by Reference to_______ ____________________________________________________
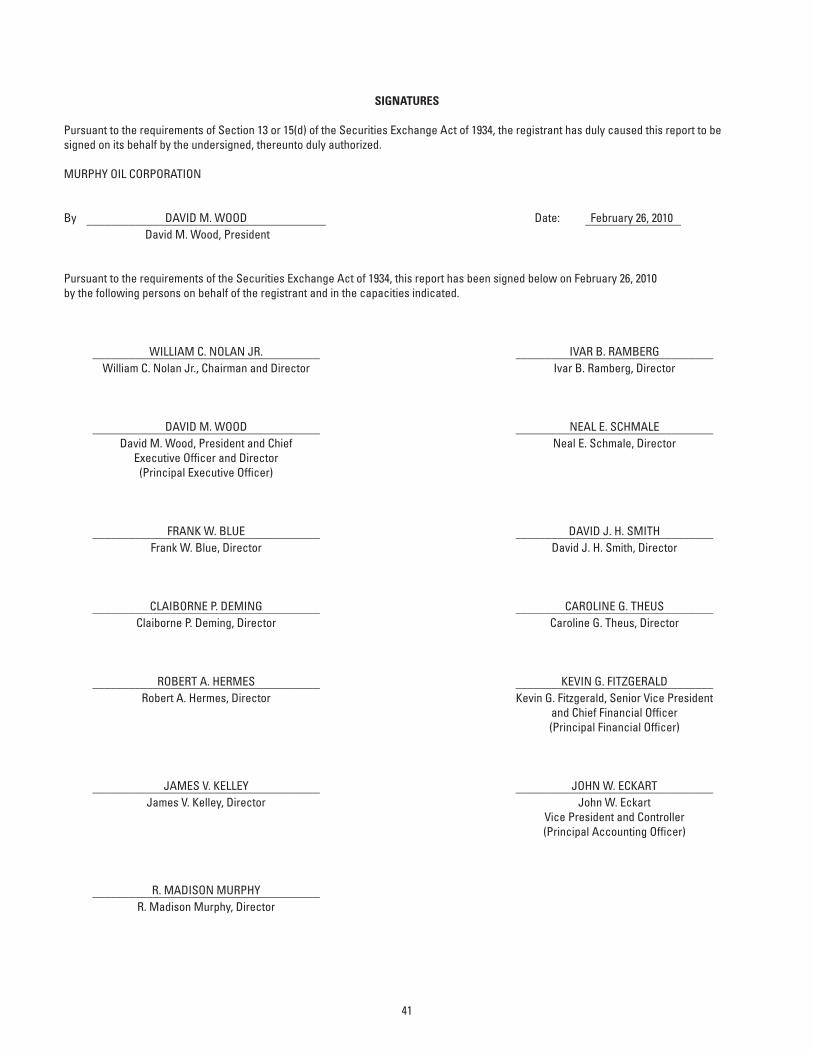
SIGNATURES
Pursuant to the requirements of Section 13 or 15(d) of the Securities Exchange Act of 1934, the registrant has duly caused this report to be signed on its behalf by the undersigned, thereunto duly authorized.
MURPHY OIL CORPORATION
By DAVID M. WOOD Date: February 26, 2010 ________________________________________ ________________ David M. Wood, President
Pursuant to the requirements of the Securities Exchange Act of 1934, this report has been signed below on February 26, 2010 by the following persons on behalf of the registrant and in the capacities indicated.
WILLIAM C. NOLAN JR. IVAR B. RAMBERG ______________________________________ _________________________________ William C. Nolan Jr., Chairman and Director Ivar B. Ramberg, Director
DAVID M. WOOD NEAL E. SCHMALE ______________________________________ _________________________________ David M. Wood, President and Chief Neal E. Schmale, Director Executive Officer and Director (Principal Executive Officer)
FRANK W. BLUE DAVID J. H. SMITH ______________________________________ _________________________________ Frank W. Blue, Director David J. H. Smith, Director
CLAIBORNE P. DEMING CAROLINE G. THEUS ______________________________________ _________________________________ Claiborne P. Deming, Director Caroline G. Theus, Director
ROBERT A. HERMES KEVIN G. FITZGERALD ______________________________________ _________________________________ Robert A. Hermes, Director Kevin G. Fitzgerald, Senior Vice President and Chief Financial Officer (Principal Financial Officer)
JAMES V. KELLEY JOHN W. ECKART ______________________________________ _________________________________ James V. Kelley, Director John W. Eckart Vice President and Controller (Principal Accounting Officer)
R. MADISON MURPHY ______________________________________ R. Madison Murphy, Director
41

This page intentionally left blank.
REPORT OF MANAGEMENT – CONSOLIDATED FINANCIAL STATEMENTS
The management of Murphy Oil Corporation is responsible for the preparation and integrity of the accompanying consolidated financial statements and other financial data. The statements were prepared in conformity with U.S. generally accepted accounting principles appropriate in the circumstances and include some amounts based on informed estimates and judgments, with consideration given to materiality.
An independent registered public accounting firm, KPMG LLP, has audited the Company’s consolidated financial statements in accordance with the standards of the Public Company Accounting Oversight Board and provides an objective, independent opinion about the fair presentation of the consolidated financial statements. The Audit Committee of the Board of Directors appoints the independent registered public accounting firm; ratification of the appointment is solicited annually from the shareholders.
The Board of Directors appoints an Audit Committee annually to implement and to support the Board’s oversight function of the Company’s financial reporting, accounting policies, internal controls and independent registered public accounting firm. This Committee is composed solely of directors who are not employees of the Company. The Committee meets routinely with representatives of management, the Company’s audit staff and the independent registered public accounting firm to review and discuss the adequacy and effectiveness of the Company’s internal controls, the quality and clarity of its financial reporting, the scope and results of independent and internal audits, and to fulfill other responsibilities included in the Committee’s Charter. The independent registered public accounting firm and the Company’s audit staff have unrestricted access to the Committee, without management presence, to discuss audit findings and other financial matters.
Our report of management covering internal control over financial reporting and the associated report of the independent registered public accounting firm can be found at page F-2.
REPORT OF INDEPENDENT REGISTERED PUBLIC ACCOUNTING FIRM
The Board of Directors and Stockholders of Murphy Oil Corporation: We have audited the accompanying consolidated balance sheets of Murphy Oil Corporation and subsidiaries as of December 31, 2009 and 2008, and the related consolidated statements of income, comprehensive income, stockholders’ equity and cash flows for each of the years in the three-year period ended December 31, 2009. In connection with our audits of the consolidated financial statements, we also have audited financial statement Schedule II. These consolidated financial statements and financial statement schedule are the responsibility of the Company’s management. Our responsibility is to express an opinion on these consolidated financial statements and financial statement schedule based on our audits.
We conducted our audits in accordance with the Standards of the Public Company Accounting Oversight Board (United States). Those standards require that we plan and perform the audit to obtain reasonable assurance about whether the financial statements are free of material misstatement. An audit includes examining, on a test basis, evidence supporting the amounts and disclosures in the financial statements. An audit also includes assessing the accounting principles used and significant estimates made by management, as well as evaluating the overall financial statement presentation. We believe that our audits provide a reasonable basis for our opinion.
In our opinion, the consolidated financial statements referred to above present fairly, in all material respects, the financial position of Murphy Oil Corporation and subsidiaries as of December 31, 2009 and 2008, and the results of their operations and their cash flows for each of the years in the three-year period ended December 31, 2009, in conformity with U.S. generally accepted accounting principles. Also, in our opinion, the related financial statement schedule, when considered in relation to the basic consolidated financial statements taken as a whole, presents fairly, in all material respects, the information set forth therein.
As discussed in Note B to the consolidated financial statements, effective January 1, 2007, the Company changed its accounting for uncertain tax positions, and measurement of defined benefit pension and other postretirement plans.
We also have audited, in accordance with the standards of the Public Company Accounting Oversight Board (United States), Murphy Oil Corporation’s internal control over financial reporting as of December 31, 2009, based on criteria established in Internal Control – Integrated Framework issued by the Committee of Sponsoring Organizations of the Treadway Commission (COSO), and our report dated February 26, 2010 expressed an unqualified opinion on the effectiveness of the Company’s internal control over financial reporting.
Houston, TexasFebruary 26, 2010
F-1
REPORT OF MANAGEMENT – INTERNAL CONTROL OVER FINANCIAL REPORTING
Management is responsible for establishing and maintaining adequate internal control over financial reporting, as such term is defined in Exchange Act Rules 13a-15(f). The Company’s internal controls have been designed to provide reasonable assurance regarding the reliability of financial reporting and the preparation of consolidated financial statements in accordance with U.S. generally accepted accounting principles. All internal control systems have inherent limitations, and therefore, can provide only reasonable assurance with respect to the reliability of financial reporting and preparation of consolidated financial statements.
Management has conducted an evaluation of the effectiveness of our internal control over financial reporting based on the criteria set forth in Internal Control – Integrated Framework issued by the Committee of Sponsoring Organizations of the Treadway Commission. Based on our evaluation, management concluded that our internal control over financial reporting was effective as of December 31, 2009.
REPORT OF INDEPENDENT REGISTERED PUBLIC ACCOUNTING FIRM
The Board of Directors and Stockholders of Murphy Oil Corporation: We have audited Murphy Oil Corporation’s internal control over financial reporting as of December 31, 2009, based on criteria established in Internal Control – Integrated Framework issued by the Committee of Sponsoring Organizations of the Treadway Commission (COSO). Murphy Oil Corporation’s management is responsible for maintaining effective internal control over financial reporting and for its assessment of the effectiveness of internal control over financial reporting included in the accompanying Report of Management – Internal Control Over Financial Reporting. Our responsibility is to express an opinion on the Company’s internal control over financial reporting based on our audit.
We conducted our audit in accordance with the standards of the Public Company Accounting Oversight Board (United States). Those standards require that we plan and perform the audit to obtain reasonable assurance about whether effective internal control over financial reporting was maintained in all material respects. Our audit included obtaining an understanding of internal control over financial reporting, assessing the risk that a material weakness exists, and testing and evaluating the design and operating effectiveness of internal control based on the assessed risk. Our audit also included performing such other procedures as we considered necessary in the circumstances. We believe that our audit provides a reasonable basis for our opinion.
A company’s internal control over financial reporting is a process designed to provide reasonable assurance regarding the reliability of financial reporting and the preparation of financial statements for external purposes in accordance with generally accepted accounting principles. A company’s internal control over financial reporting includes those policies and procedures that (1) pertain to the maintenance of records that, in reasonable detail, accurately and fairly reflect the transactions and dispositions of the assets of the company; (2) provide reasonable assurance that transactions are recorded as necessary to permit preparation of financial statements in accordance with generally accepted accounting principles, and that receipts and expenditures of the company are being made only in accordance with authorizations of management and directors of the company; and (3) provide reasonable assurance regarding prevention or timely detection of unauthorized acquisition, use, or disposition of the company’s assets that could have a material effect on the financial statements.
Because of its inherent limitations, internal control over financial reporting may not prevent or detect misstatements. Also, projections of any evaluation of effectiveness to future periods are subject to the risk that controls may become inadequate because of changes in conditions, or that the degree of compliance with the policies or procedures may deteriorate.
In our opinion, Murphy Oil Corporation maintained, in all material respects, effective internal control over financial reporting as of December 31, 2009, based on criteria established in Internal Control – Integrated Framework issued by the Committee of Sponsoring Organizations of the Treadway Commission.
We also have audited, in accordance with the standards of the Public Company Accounting Oversight Board (United States), the consolidated balance sheets of Murphy Oil Corporation as of December 31, 2009 and 2008, and the related consolidated statements of income, comprehensive income, stockholders’ equity, and cash flows for each of the years in the three-year period ended December 31, 2009, and our report dated February 26, 2010 expressed an unqualified opinion on those consolidated financial statements.
Houston, TexasFebruary 26, 2010
F-2
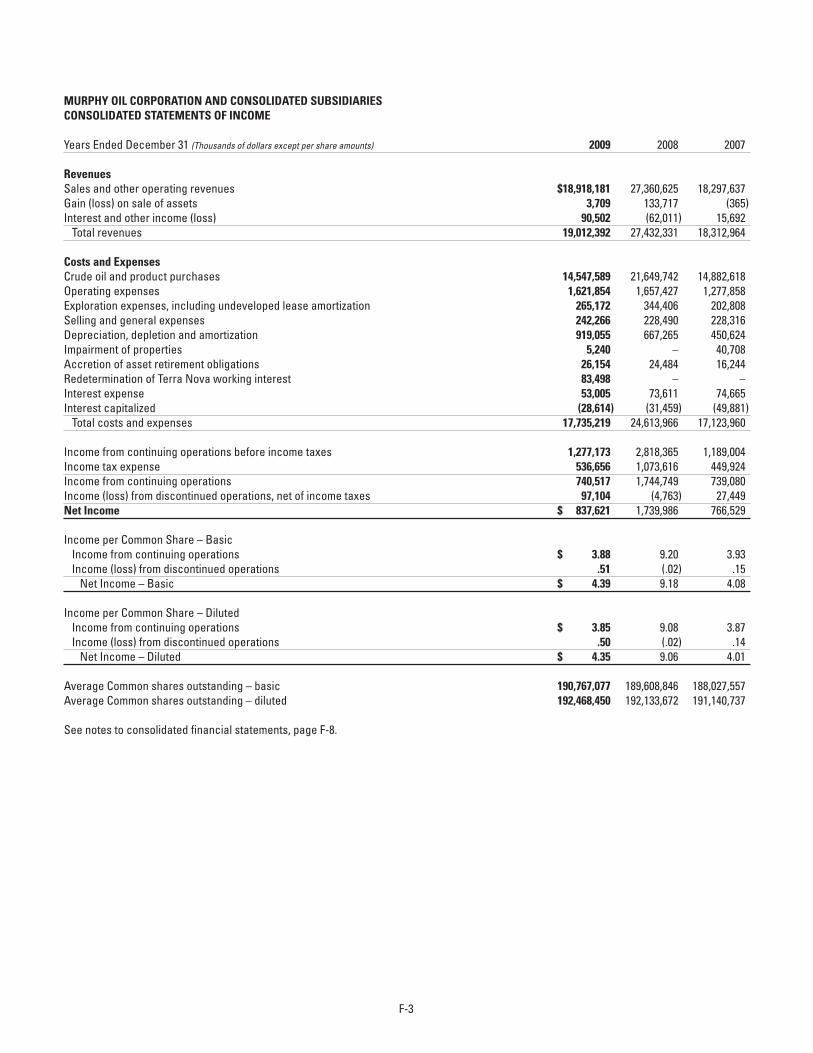
MURPHY OIL CORPORATION AND CONSOLIDATED SUBSIDIARIESCONSOLIDATED STATEMENTS OF INCOME
Years Ended December 31 (Thousands of dollars except per share amounts) 2009 2008 2007
RevenuesSales and other operating revenues $18,918,181 27,360,625 18,297,637Gain (loss) on sale of assets 3,709 133,717 (365)Interest and other income (loss) 90,502 (62,011) 15,692 Total revenues 19,012,392 27,432,331 18,312,964
Costs and Expenses Crude oil and product purchases 14,547,589 21,649,742 14,882,618Operating expenses 1,621,854 1,657,427 1,277,858Exploration expenses, including undeveloped lease amortization 265,172 344,406 202,808Selling and general expenses 242,266 228,490 228,316Depreciation, depletion and amortization 919,055 667,265 450,624Impairment of properties 5,240 – 40,708Accretion of asset retirement obligations 26,154 24,484 16,244Redetermination of Terra Nova working interest 83,498 – –Interest expense 53,005 73,611 74,665Interest capitalized (28,614) (31,459) (49,881) Total costs and expenses 17,735,219 24,613,966 17,123,960
Income from continuing operations before income taxes 1,277,173 2,818,365 1,189,004Income tax expense 536,656 1,073,616 449,924Income from continuing operations 740,517 1,744,749 739,080Income (loss) from discontinued operations, net of income taxes 97,104 (4,763) 27,449Net Income $ 837,621 1,739,986 766,529
Income per Common Share – Basic Income from continuing operations $ 3.88 9.20 3.93 Income (loss) from discontinued operations .51 (.02) .15 Net Income – Basic $ 4.39 9.18 4.08
Income per Common Share – Diluted Income from continuing operations $ 3.85 9.08 3.87 Income (loss) from discontinued operations .50 (.02) .14 Net Income – Diluted $ 4.35 9.06 4.01
Average Common shares outstanding – basic 190,767,077 189,608,846 188,027,557Average Common shares outstanding – diluted 192,468,450 192,133,672 191,140,737
See notes to consolidated financial statements, page F-8.
F-3
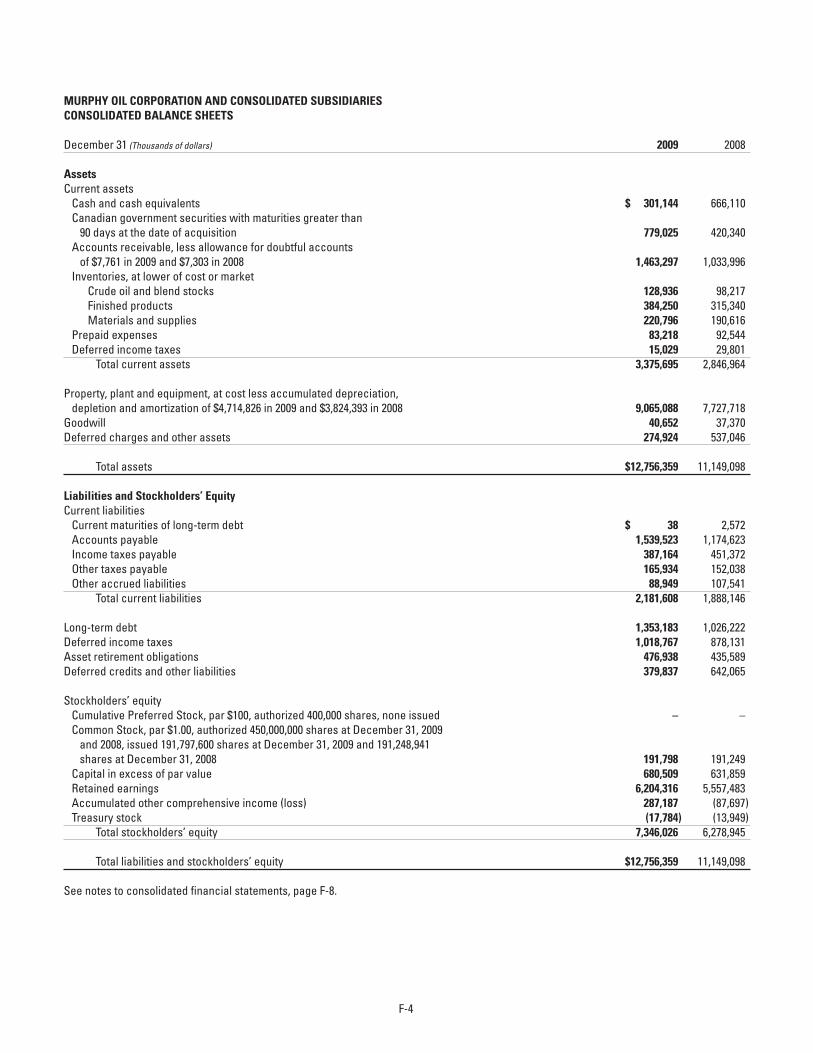
MURPHY OIL CORPORATION AND CONSOLIDATED SUBSIDIARIESCONSOLIDATED BALANCE SHEETS
December 31 (Thousands of dollars) 2009 2008
AssetsCurrent assets Cash and cash equivalents $ 301,144 666,110 Canadian government securities with maturities greater than 90 days at the date of acquisition 779,025 420,340 Accounts receivable, less allowance for doubtful accounts of $7,761 in 2009 and $7,303 in 2008 1,463,297 1,033,996 Inventories, at lower of cost or market Crude oil and blend stocks 128,936 98,217 Finished products 384,250 315,340 Materials and supplies 220,796 190,616 Prepaid expenses 83,218 92,544 Deferred income taxes 15,029 29,801 Total current assets 3,375,695 2,846,964
Property, plant and equipment, at cost less accumulated depreciation, depletion and amortization of $4,714,826 in 2009 and $3,824,393 in 2008 9,065,088 7,727,718Goodwill 40,652 37,370Deferred charges and other assets 274,924 537,046
Total assets $12,756,359 11,149,098
Liabilities and Stockholders’ EquityCurrent liabilities Current maturities of long-term debt $ 38 2,572 Accounts payable 1,539,523 1,174,623 Income taxes payable 387,164 451,372 Other taxes payable 165,934 152,038 Other accrued liabilities 88,949 107,541 Total current liabilities 2,181,608 1,888,146
Long-term debt 1,353,183 1,026,222Deferred income taxes 1,018,767 878,131Asset retirement obligations 476,938 435,589Deferred credits and other liabilities 379,837 642,065
Stockholders’ equity Cumulative Preferred Stock, par $100, authorized 400,000 shares, none issued – – Common Stock, par $1.00, authorized 450,000,000 shares at December 31, 2009 and 2008, issued 191,797,600 shares at December 31, 2009 and 191,248,941 shares at December 31, 2008 191,798 191,249 Capital in excess of par value 680,509 631,859 Retained earnings 6,204,316 5,557,483 Accumulated other comprehensive income (loss) 287,187 (87,697) Treasury stock (17,784) (13,949) Total stockholders’ equity 7,346,026 6,278,945
Total liabilities and stockholders’ equity $12,756,359 11,149,098
See notes to consolidated financial statements, page F-8.
F-4
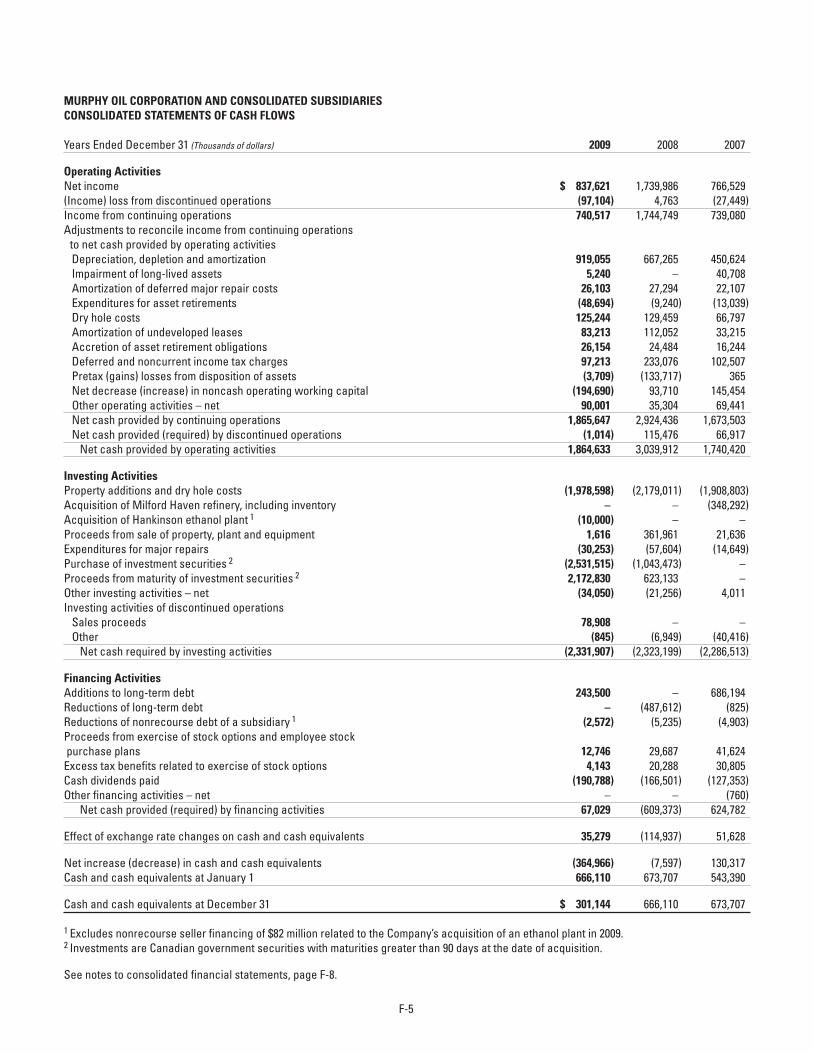
MURPHY OIL CORPORATION AND CONSOLIDATED SUBSIDIARIESCONSOLIDATED STATEMENTS OF CASH FLOWS
Years Ended December 31 (Thousands of dollars) 2009 2008 2007
Operating ActivitiesNet income $ 837,621 1,739,986 766,529(Income) loss from discontinued operations (97,104) 4,763 (27,449)Income from continuing operations 740,517 1,744,749 739,080Adjustments to reconcile income from continuing operations to net cash provided by operating activities Depreciation, depletion and amortization 919,055 667,265 450,624 Impairment of long-lived assets 5,240 – 40,708 Amortization of deferred major repair costs 26,103 27,294 22,107 Expenditures for asset retirements (48,694) (9,240) (13,039) Dry hole costs 125,244 129,459 66,797 Amortization of undeveloped leases 83,213 112,052 33,215 Accretion of asset retirement obligations 26,154 24,484 16,244 Deferred and noncurrent income tax charges 97,213 233,076 102,507 Pretax (gains) losses from disposition of assets (3,709) (133,717) 365 Net decrease (increase) in noncash operating working capital (194,690) 93,710 145,454 Other operating activities – net 90,001 35,304 69,441 Net cash provided by continuing operations 1,865,647 2,924,436 1,673,503 Net cash provided (required) by discontinued operations (1,014) 115,476 66,917 Net cash provided by operating activities 1,864,633 3,039,912 1,740,420
Investing ActivitiesProperty additions and dry hole costs (1,978,598) (2,179,011) (1,908,803)Acquisition of Milford Haven refinery, including inventory – – (348,292)Acquisition of Hankinson ethanol plant 1 (10,000) – –Proceeds from sale of property, plant and equipment 1,616 361,961 21,636Expenditures for major repairs (30,253) (57,604) (14,649)Purchase of investment securities 2 (2,531,515) (1,043,473) –Proceeds from maturity of investment securities 2 2,172,830 623,133 –Other investing activities – net (34,050) (21,256) 4,011Investing activities of discontinued operations Sales proceeds 78,908 – – Other (845) (6,949) (40,416) Net cash required by investing activities (2,331,907) (2,323,199) (2,286,513)
Financing ActivitiesAdditions to long-term debt 243,500 – 686,194Reductions of long-term debt – (487,612) (825)Reductions of nonrecourse debt of a subsidiary 1 (2,572) (5,235) (4,903)Proceeds from exercise of stock options and employee stock purchase plans 12,746 29,687 41,624Excess tax benefits related to exercise of stock options 4,143 20,288 30,805Cash dividends paid (190,788) (166,501) (127,353)Other financing activities – net – – (760) Net cash provided (required) by financing activities 67,029 (609,373) 624,782
Effect of exchange rate changes on cash and cash equivalents 35,279 (114,937) 51,628
Net increase (decrease) in cash and cash equivalents (364,966) (7,597) 130,317Cash and cash equivalents at January 1 666,110 673,707 543,390
Cash and cash equivalents at December 31 $ 301,144 666,110 673,707 1 Excludes nonrecourse seller financing of $82 million related to the Company’s acquisition of an ethanol plant in 2009.2 Investments are Canadian government securities with maturities greater than 90 days at the date of acquisition.
See notes to consolidated financial statements, page F-8.
F-5
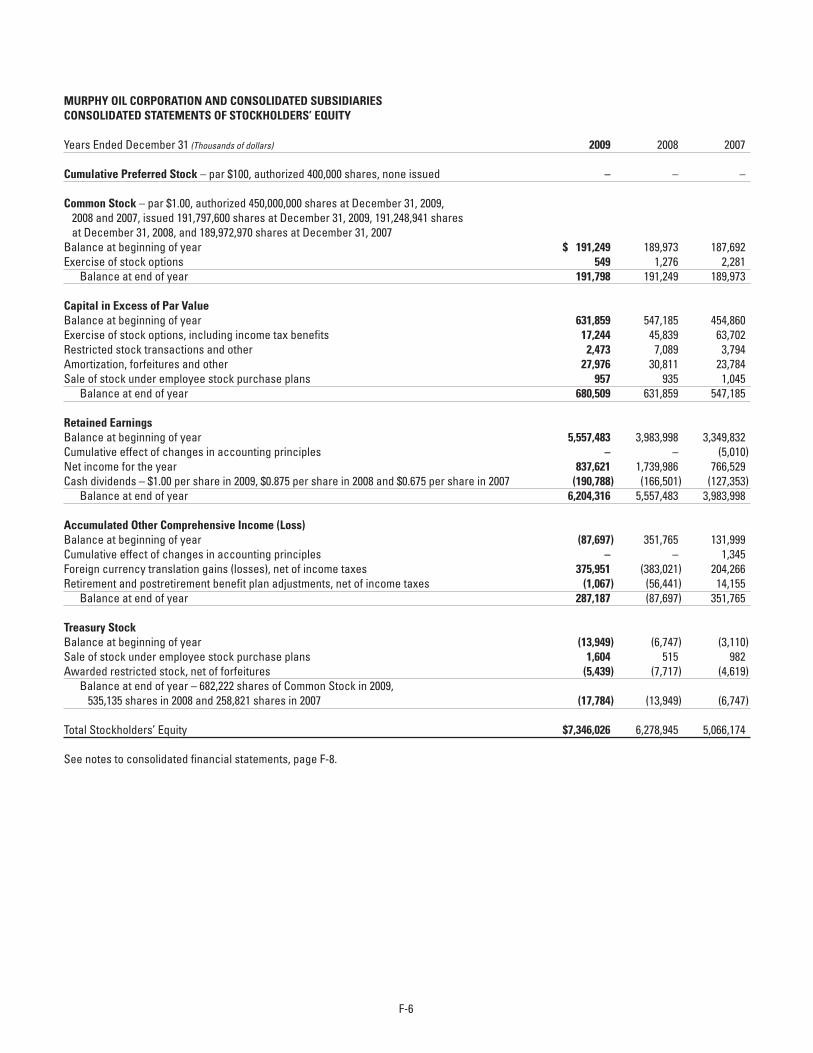
MURPHY OIL CORPORATION AND CONSOLIDATED SUBSIDIARIESCONSOLIDATED STATEMENTS OF STOCKHOLDERS’ EQUITY
Years Ended December 31 (Thousands of dollars) 2009 2008 2007
Cumulative Preferred Stock – par $100, authorized 400,000 shares, none issued – – –
Common Stock – par $1.00, authorized 450,000,000 shares at December 31, 2009, 2008 and 2007, issued 191,797,600 shares at December 31, 2009, 191,248,941 shares at December 31, 2008, and 189,972,970 shares at December 31, 2007 Balance at beginning of year $ 191,249 189,973 187,692Exercise of stock options 549 1,276 2,281 Balance at end of year 191,798 191,249 189,973
Capital in Excess of Par ValueBalance at beginning of year 631,859 547,185 454,860Exercise of stock options, including income tax benefits 17,244 45,839 63,702Restricted stock transactions and other 2,473 7,089 3,794Amortization, forfeitures and other 27,976 30,811 23,784Sale of stock under employee stock purchase plans 957 935 1,045 Balance at end of year 680,509 631,859 547,185
Retained Earnings Balance at beginning of year 5,557,483 3,983,998 3,349,832Cumulative effect of changes in accounting principles – – (5,010)Net income for the year 837,621 1,739,986 766,529Cash dividends – $1.00 per share in 2009, $0.875 per share in 2008 and $0.675 per share in 2007 (190,788) (166,501) (127,353) Balance at end of year 6,204,316 5,557,483 3,983,998
Accumulated Other Comprehensive Income (Loss)Balance at beginning of year (87,697) 351,765 131,999Cumulative effect of changes in accounting principles – – 1,345Foreign currency translation gains (losses), net of income taxes 375,951 (383,021) 204,266Retirement and postretirement benefit plan adjustments, net of income taxes (1,067) (56,441) 14,155 Balance at end of year 287,187 (87,697) 351,765
Treasury StockBalance at beginning of year (13,949) (6,747) (3,110)Sale of stock under employee stock purchase plans 1,604 515 982Awarded restricted stock, net of forfeitures (5,439) (7,717) (4,619) Balance at end of year – 682,222 shares of Common Stock in 2009, 535,135 shares in 2008 and 258,821 shares in 2007 (17,784) (13,949) (6,747)
Total Stockholders’ Equity $7,346,026 6,278,945 5,066,174
See notes to consolidated financial statements, page F-8.
F-6
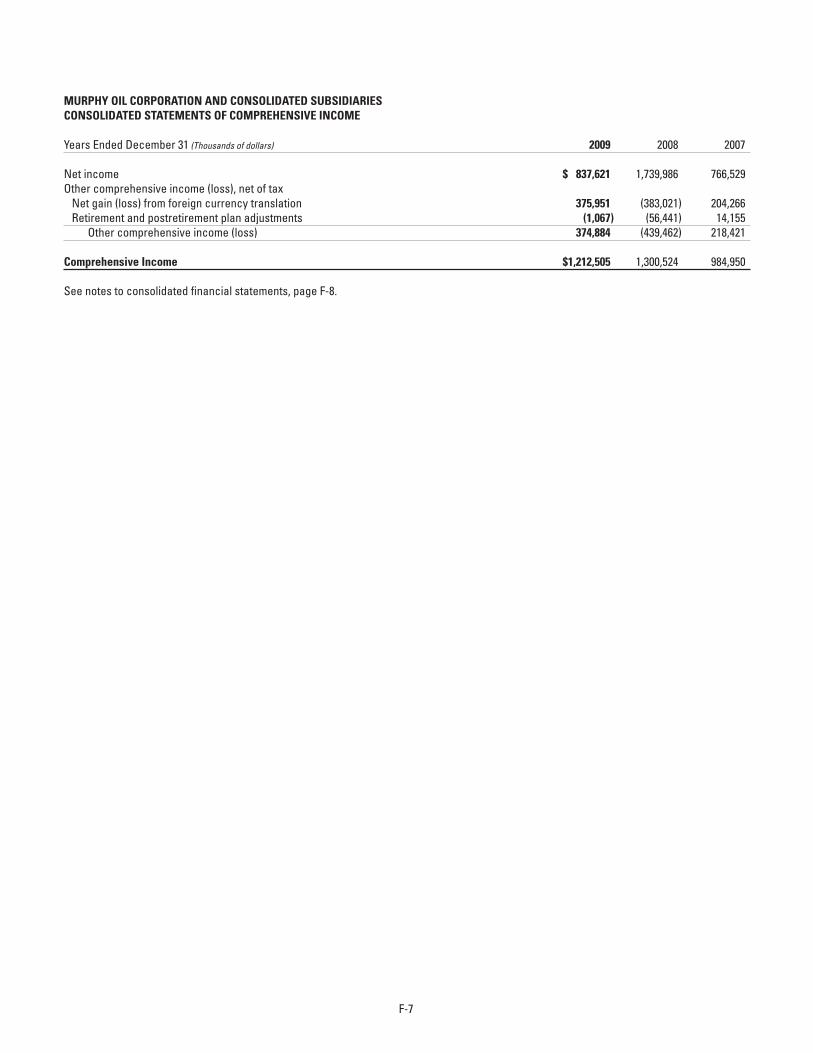
MURPHY OIL CORPORATION AND CONSOLIDATED SUBSIDIARIESCONSOLIDATED STATEMENTS OF COMPREHENSIVE INCOME
Years Ended December 31 (Thousands of dollars) 2009 2008 2007
Net income $ 837,621 1,739,986 766,529Other comprehensive income (loss), net of tax Net gain (loss) from foreign currency translation 375,951 (383,021) 204,266 Retirement and postretirement plan adjustments (1,067) (56,441) 14,155 Other comprehensive income (loss) 374,884 (439,462) 218,421
Comprehensive Income $1,212,505 1,300,524 984,950
See notes to consolidated financial statements, page F-8.
F-7
MURPHY OIL CORPORATION AND CONSOLIDATED SUBSIDIARIESNOTES TO CONSOLIDATED FINANCIAL STATEMENTS
Note A – Significant Accounting Policies
NATURE OF BUSINESS – Murphy Oil Corporation is an international oil and gas company that conducts its business through various operating subsidiaries. The Company produces oil and/or natural gas in the United States, Canada, the United Kingdom, Malaysia and Republic of the Congo and conducts oil and natural gas exploration activities worldwide. The Company has an interest in a Canadian synthetic oil operation, owns two petroleum refineries and one ethanol production facility in the United States and one refinery in the United Kingdom. Murphy markets petroleum products under various brand names and to unbranded wholesale customers in the United States and United Kingdom.
PRINCIPLES OF CONSOLIDATION – The consolidated financial statements include the accounts of Murphy Oil Corporation and all majority-owned subsidiaries. For consolidated subsidiaries that are less than wholly owned, the noncontrolling interest is reflected in the balance sheet as a component of Stockholders’ Equity. Undivided interests in oil and gas joint ventures are consolidated on a proportionate basis. Investments in affiliates in which the Company owns from 20% to 50% are accounted for by the equity method. Other investments are generally carried at cost. All significant intercompany accounts and transactions have been eliminated.
REVENUE RECOGNITION – Revenues from sales of crude oil, natural gas and refined petroleum products are recorded when deliveries have occurred and legal ownership of the commodity transfers to the customer. Title transfers for crude oil, natural gas and bulk refined products generally occur at pipeline custody points or when a tanker lifting has occurred. Refined products sold at retail are recorded when the customer takes delivery at the pump. Merchandise revenues are recorded at the point of sale. Revenues from the production of oil and natural gas properties in which Murphy shares an undivided interest with other producers are recognized based on the actual volumes sold by the Company during the period. Gas imbalances occur when the Company’s actual sales differ from its entitlement under existing working interests. The Company records a liability for gas imbalances when it has sold more than its working interest of gas production and the estimated remaining reserves make it doubtful that partners can recoup their share of production from the field. At December 31, 2009 and 2008, the liabilities for natural gas balancing were immaterial.
The Company enters into buy/sell and similar arrangements when crude oil and other petroleum products are held at one location but are needed at a different location. The Company often pays or receives funds related to the buy/sell arrangement based on location or quality differences. The Company accounts for such transactions on a net basis in its consolidated statement of income.
TAXES COLLECTED FROM CUSTOMERS AND REMITTED TO GOVERNMENT AUTHORITIES – Excise and other taxes collected on sales of refined products and remitted to governmental agencies are excluded from revenues and costs and expenses in the Consolidated Statement of Income.
CASH EQUIVALENTS – Short-term investments, which include government securities and other instruments with government securities as collateral, that have a maturity of three months or less from the date of purchase are classified as cash equivalents.
MARKETABLE SECURITIES – The Company classifies investments in marketable securities as available-for-sale or held-to-maturity. The Company does not have any investments classified as trading. Available-for-sale securities are carried at fair value with the unrealized gain or loss, net of tax, reported in other comprehensive income. Held-to-maturity securities are recorded at amortized cost. Premiums and discounts are amortized or accreted into earnings over the life of the related available-for-sale or held-to-maturity security. Dividend and interest income is recognized when earned. Unrealized losses considered to be “other than temporary” are recognized currently in earnings. The cost of securities sold is based on the specific identification method. The fair value of investment securities is determined by available market prices. At December 31, 2009, the Company owned Canadian government securities with maturities greater than 90 days at date of acquisition that had a carrying value of $779,025,000.
ACCOUNTS RECEIVABLE – The Company’s accounts receivable primarily consists of amounts owed to the Company by customers for sales of crude oil, natural gas and refined products under varying credit arrangements. The allowance for doubtful accounts is the Company’s best estimate of the amount of probable credit losses on these receivables. The Company reviews this allowance for adequacy at least quarterly and bases its assessment on a combination of current information about its customers and historical write-off experience.
PROPERTY, PLANT AND EQUIPMENT – The Company uses the successful efforts method to account for exploration and development expenditures. Leasehold acquisition costs are capitalized. If proved reserves are found on an undeveloped property, leasehold cost is transferred to proved properties. Costs of undeveloped leases are generally expensed over the life of the leases. Exploratory well costs are capitalized pending determination about whether proved reserves have been found. In certain cases, a determination of whether a drilled exploratory well has found proved reserves can not be made immediately. This is generally due to the need for a major capital expenditure to produce and/or evacuate the hydrocarbon(s) found. The determination of whether to make such a capital expenditure is usually dependent on whether further exploratory wells find a sufficient quantity of additional reserves. The Company continues to capitalize exploratory well costs in Property, Plant and Equipment when the well has found a sufficient quantity of reserves to justify its completion as a producing well and the
F-8
Company is making sufficient progress assessing the reserves and the economic and operating viability of the project. The Company reevaluates its capitalized drilling costs at least annually to ascertain whether drilling costs continue to qualify for ongoing capitalization. Other exploratory costs, including geological and geophysical costs, are charged to expense as incurred. Development costs, including unsuccessful development wells, are capitalized. Interest is capitalized on development projects that are expected to take one year or more to complete.
Oil and gas properties are evaluated by field for potential impairment. Other properties are evaluated for impairment on a specific asset basis or in groups of similar assets as applicable. An impairment is recognized when the estimated undiscounted future net cash flows of an asset are less than its carrying value. If an impairment occurs, the carrying value of the impaired asset is reduced to fair value.
The Company records a liability for asset retirement obligations (ARO) equal to the fair value of the estimated cost to retire an asset. The ARO liability is initially recorded in the period in which the obligation meets the definition of a liability, which is generally when a well is drilled or the asset is placed in service. The ARO liability is estimated by the Company’s engineers using existing regulatory requirements and anticipated future inflation rates. When the liability is initially recorded, the Company increases the carrying amount of the related long-lived asset by an amount equal to the original liability. The liability is increased over time to reflect the change in its present value, and the capitalized cost is depreciated over the useful life of the related long-lived asset. Actual costs of asset retirements such as dismantling oil and gas production facilities and site restoration are charged against the related liability. Any difference between costs incurred upon settlement of an asset retirement obligation and the recorded liability is recognized as a gain or loss in the Company’s earnings.
Depreciation and depletion of producing oil and gas properties is recorded based on units of production. Unit rates are computed for unamortized exploration drilling and development costs using proved developed reserves; unit rates for unamortized leasehold costs and asset retirement costs are amortized over proved reserves. As more fully described on page F-34, proved reserves are estimated by the Company’s engineers and are subject to future revisions based on availability of additional information. Refineries, certain marketing facilities and certain common natural gas processing facilities are depreciated primarily using the composite straight-line method with depreciable lives ranging from 14 to 25 years. Gasoline stations and other properties are depreciated over 3 to 20 years by individual unit on the straight-line method. Gains and losses on asset disposals or retirements are included in income as a separate component of revenues.
Turnarounds for major processing units are scheduled at four to five year intervals at the Company’s three refineries. Turnarounds for coking units at Syncrude Canada Ltd. are scheduled at intervals of two to three years. Turnaround work associated with various other less significant units at the Company’s refineries and Syncrude will vary depending on operating requirements and events. Murphy defers turnaround costs incurred and amortizes such costs through Operating Expenses over the period until the next scheduled turnaround. All other maintenance and repairs are expensed as incurred. Renewals and betterments are capitalized.
INVENTORIES – Unsold crude oil production is carried in inventory at the lower of cost, generally applied on a first-in, first-out (FIFO) basis, or market, and include costs incurred to bring the inventory to its existing condition. Refinery inventories of crude oil and other feedstocks and finished product inventories are valued at the lower of cost, generally applied on a last-in, first-out (LIFO) basis, or market. Inventory held for resale at retail marketing stations is generally carried at average cost and is included in Finished Products Inventory. Materials and supplies are valued at the lower of average cost or estimated value and generally consist of tubulars and other drilling equipment as well as spare parts for refinery operations. Cash collected upon the sale of inventory to customers is classified as an operating activity in the Consolidated Statement of Cash Flows.
GOODWILL – Goodwill is recorded in an acquisition when the purchase price exceeds the fair value of net assets acquired. All recorded goodwill arose from the purchase of Beau Canada Exploration Ltd. by the Company’s wholly owned Canadian subsidiary in 2000. Goodwill is not amortized, but is assessed at least annually for recoverability of the carrying value. The Company assesses goodwill recoverability at each year-end by comparing the fair value of net assets for conventional oil and natural gas properties in Canada with the carrying value of these net assets including goodwill. The fair value of the conventional oil and natural gas reporting unit is determined using the expected present value of future cash flows. The change in the carrying value of goodwill during 2009 was primarily caused by a change in the foreign currency translation rate between years. Based on its assessment of the fair value of its Canadian conventional oil and natural gas operations, the Company believes the recorded value of goodwill is not impaired at December 31, 2009. Should a future assessment indicate that goodwill is not fully recoverable, an impairment charge to write down the carrying value of goodwill would be required.
ENVIRONMENTAL LIABILITIES – A liability for environmental matters is established when it is probable that an environmental obligation exists and the cost can be reasonably estimated. If there is a range of reasonably estimated costs, the most likely amount will be recorded, or if no amount is most likely, the minimum of the range is used. Related expenditures are charged against the liability. Environmental remediation liabilities have not been discounted for the time value of future expected payments. Environmental expenditures that have future economic benefit are capitalized.
INCOME TAXES – The Company accounts for income taxes using the asset and liability method. Under this method, income taxes are provided for amounts currently payable and for amounts deferred as tax assets and liabilities based on differences between the financial statement carrying amounts and the tax bases of existing assets and liabilities. Deferred income taxes are measured using the enacted tax rates that are assumed will be in effect when the differences reverse. Petroleum revenue taxes are provided using the estimated effective tax rate over the life of applicable U.K. properties. The Company uses the deferral method to account for Canadian investment tax credits associated with the
F-9
Hibernia and Terra Nova oil fields. As described in Note I, the Company adopted new accounting rules for income taxes uncertainties as of January 1, 2007. This rule permits recognition of income tax benefits only when they are more likely than not to be realized. The Company includes potential penalties and interest for uncertain income tax positions in income tax expense.
FOREIGN CURRENCY – Local currency is the functional currency used for recording operations in Canada and Spain and for refining and marketing activities in the United Kingdom. The U.S. dollar is the functional currency used to record all other operations. Exchange gains or losses from transactions in a currency other than the functional currency are included in earnings. Gains or losses from translating foreign functional currency into U.S. dollars are included in Accumulated Other Comprehensive Income (Loss) in Stockholders’ Equity.
DERIVATIVE INSTRUMENTS AND HEDGING ACTIVITIES – The fair value of a derivative instrument is recognized as an asset or liability in the Company’s Consolidated Balance Sheet. Upon entering into a derivative contract, the Company may designate the derivative as either a fair value hedge or a cash flow hedge, or decide that the contract is not a hedge, and thenceforth, recognize changes in the fair value of the contract in earnings. The Company documents the relationship between the derivative instrument designated as a hedge and the hedged items as well as its objective for risk management and strategy for use of the hedging instrument to manage the risk. Derivative instruments designated as fair value or cash flow hedges are linked to specific assets and liabilities or to specific firm commitments or forecasted transactions. The Company assesses at inception and on an ongoing basis whether a derivative instrument used as a hedge is highly effective in offsetting changes in the fair value or cash flows of the hedged item. A derivative that is not a highly effective hedge does not qualify for hedge accounting. Changes in the fair value of a qualifying fair value hedge are recorded in earnings along with the gain or loss on the hedged item. Changes in the fair value of a qualifying cash flow hedge are recorded in other comprehensive income until the hedged item is recognized in earnings. When the income effect of the underlying cash flow hedged item is recognized in the Statement of Income, the fair value of the associated cash flow hedge is reclassified from other comprehensive income into earnings. Ineffective portions of a cash flow hedge derivative’s change in fair value are recognized currently in earnings. If a derivative instrument no longer qualifies as a cash flow hedge and the underlying forecasted transaction is no longer probable of occurring, hedge accounting is discontinued and the gain or loss recorded in other comprehensive income is recognized immediately in earnings.
STOCK-BASED COMPENSATION – The fair value of awarded stock options, restricted stock and restricted stock units is determined based on a combination of management assumptions and the market value of the Company’s common stock. The Company uses the Black-Scholes option pricing model for computing the fair value of stock options. The primary assumptions made by management include the expected life of the stock option award and the expected volatility of Murphy’s common stock prices. The Company uses both historical data and current information to support its assumptions. Stock option expense is recognized on a straight-line basis over the respective vesting period of two or three years. The Company uses a Monte Carlo valuation model to determine the fair value of performance-based restricted stock and restricted stock units and expense is recognized over the three-year vesting period. The fair value of time-lapse restricted stock is determined based on the price of Company stock on the date of grant and expense is recognized over the vesting period. The Company estimates the number of stock options and performance-based restricted stock and restricted stock units that will not vest and adjusts its compensation expense accordingly. Differences between estimated and actual vested amounts are accounted for as an adjustment to expense when known.
NET INCOME PER COMMON SHARE – Basic income per Common share is computed by dividing net income for each reporting period by the weighted average number of Common shares outstanding during the period. Diluted income per Common share is computed by dividing net income for each reporting period by the weighted average number of Common shares outstanding during the period plus the effects of all potentially dilutive Common shares.
USE OF ESTIMATES – In preparing the financial statements of the Company in conformity with U.S. generally accepted accounting principles, management has made a number of estimates and assumptions related to the reporting of assets, liabilities, revenues, and expenses and the disclosure of contingent assets and liabilities. Actual results may differ from the estimates.
Note B – New Accounting Principles and Recent Accounting Pronouncements
New Accounting Principles AdoptedThe Company adopted new accounting guidance issued by the Financial Accounting Standards Board (FASB) for noncontrolling interests in consolidated financial statements effective January 1, 2009. This guidance is to be applied prospectively, except for presentation and disclosure requirements which are applied retrospectively. This guidance required noncontrolling interests to be reclassified as equity, and consolidated net income and comprehensive income shall include the respective results attributable to noncontrolling interests. The adoption of this guidance did not have a significant effect on the Company’s consolidated financial statements.
The Company adopted new accounting guidance covering business combinations effective January 1, 2009. The new guidance established principles and requirements for how an acquirer in a business combination recognizes and measures in its financial statements the identifiable assets acquired, the liabilities assumed and any noncontrolling interest in the acquired business. It also established how to recognize and measure goodwill acquired in the business combination or a gain from a bargain purchase, if applicable. This guidance impacts the recognition
F-10
and measurement of assets and liabilities in business combinations that occur beginning in 2009. Assets and liabilities that arose from business combinations that occurred prior to 2009 are not affected by this guidance. The adoption of this guidance did not have a significant effect on the Company’s financial statements for the year ended December 31, 2009. The Company is unable to predict how the application of this guidance will affect its financial statements in future periods.
The Company adopted new accounting guidance which addresses disclosures about derivative instruments and hedging activities in January 2009. This guidance expands required disclosures regarding derivative instruments to include qualitative information about objectives and strategies for using derivatives, quantities disclosures about fair value amounts and gains and losses on derivative instruments, and disclosures about credit-risk related contingent features in derivative agreements. See Note L for further disclosures.
In 2009, the Company adopted new accounting guidance for determining whether instruments granted in share-based payment transactions are participating securities. This guidance specifies that unvested share-based payment awards that contain nonforfeitable rights to dividends or dividend equivalents (whether paid or unpaid) are participating securities and, therefore, need to be included in the earnings per share (EPS) calculation under the two-class method, and also requires that all prior-period EPS calculations be adjusted retrospectively. The adoption of this guidance did not have a significant impact on the Company’s prior-period EPS calculations.
The Company adopted new accounting guidance addressing certain equity method investment accounting considerations in January 2009, which has been applied prospectively. The guidance addresses how to initially measure contingent consideration for an equity method investment, how to recognize other-than-temporary impairments of an equity method investment, and how an equity method investor is to account for a share issuance by an investee. The adoption of this guidance did not have a significant impact on the Company’s consolidated financial statements.
The Company adopted new accounting guidance addressing subsequent events effective June 30, 2009. The guidance clarified the accounting for and disclosure of subsequent events that occur after the balance sheet date through the date of issuance of the applicable financial statements. The adoption of this guidance did not have a significant effect on the Company’s consolidated financial statements. See Note U for further disclosures.
The FASB’s Accounting Standards Codification and the Hierarchy of Generally Accepted Accounting Principles guidance became effective for interim and annual periods ended after September 15, 2009 (the third calendar quarter for Murphy Oil) and it recognized the FASB Accounting Standards Codification as the single source of authoritative nongovernment U.S. generally accepted accounting principles. The codification superseded all existing accounting standards documents issued by the FASB, and established that all other accounting literature not included in the codification is considered nonauthoritative. Although the codification does not change U.S. generally accepted accounting principles, it does reorganize the principles into accounting topics using a consistent structure. The codification also includes relevant U.S. Securities and Exchange Commission guidance following the same topical structure. For periods ending after September 15, 2009, all references to U.S. generally accepted accounting principles will use the new topical guidelines established with the codification. Otherwise, this new standard is not expected to have a material impact on the Company’s consolidated financial statements in future periods.
The FASB has provided additional guidance regarding disclosures about postretirement benefit plan assets, including how asset investment allocation decisions are made, the fair value of each major category of plan assets, and how fair value is determined for each major asset category. This guidance was effective for the Company as of December 31, 2009. Upon adoption, no comparative disclosures are required for earlier years presented. See Note K for these disclosures.
In December 2008, the U.S. Securities and Exchange Commission adopted revisions to oil and natural gas reserves reporting requirements which became effective for the Company at year-end 2009. The primary changes to reserves reporting included:
• A revised definition of proved reserves, including the use of unweighted average oil and natural gas prices in effect at the beginning of each month during the year to compute such reserves,
• Expanding the definition of oil and gas producing activities to include non-traditional and unconventional resources, which includes the Company’s synthetic oil operations in Alberta,
• Allowing companies to voluntarily disclose probable and possible reserves in SEC filings,• Amending required proved reserve disclosures to include separate amounts for synthetic oil and gas,• Expanding disclosures of proved undeveloped reserves, including discussion of such proved undeveloped reserves five years old or
more, and• Disclosure of the qualifications of the chief technical person who oversees the Company’s overall reserve process.
The Company utilized this new guidance at year-end to determine its proved reserves and to develop associated disclosures. The Company chose not to provide voluntary disclosures of probable and possible reserves in this Form 10-K.
F-11
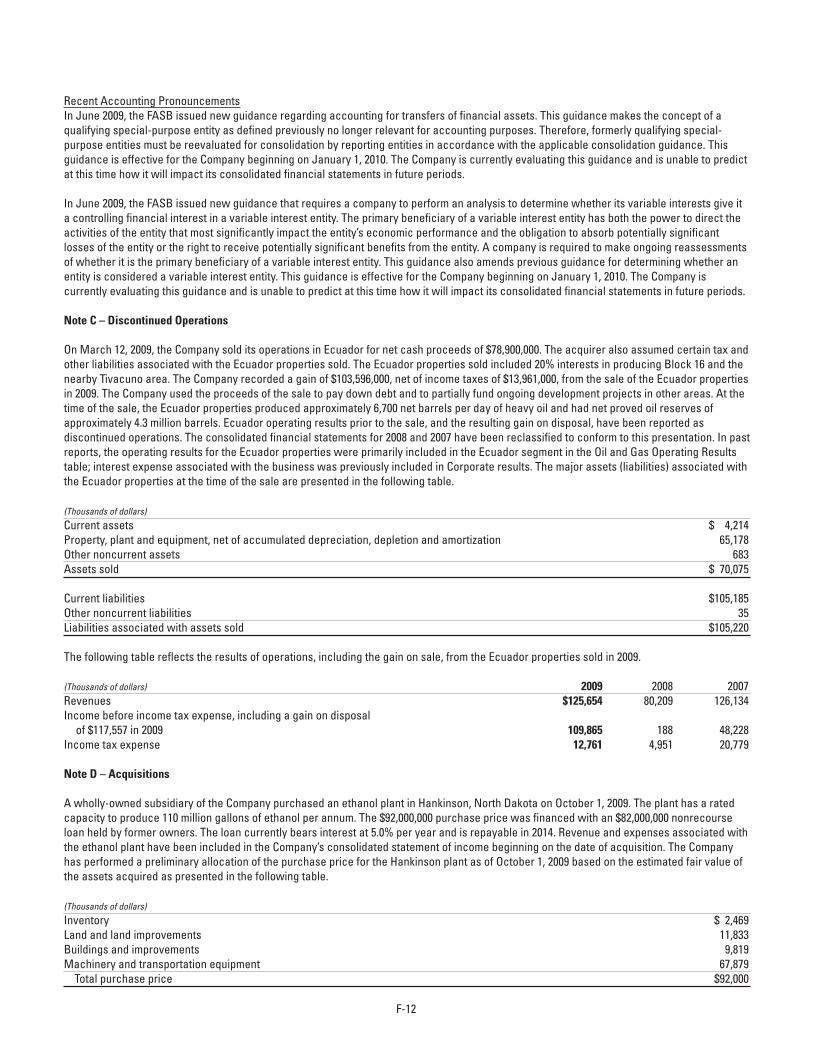
Recent Accounting PronouncementsIn June 2009, the FASB issued new guidance regarding accounting for transfers of financial assets. This guidance makes the concept of a qualifying special-purpose entity as defined previously no longer relevant for accounting purposes. Therefore, formerly qualifying special-purpose entities must be reevaluated for consolidation by reporting entities in accordance with the applicable consolidation guidance. This guidance is effective for the Company beginning on January 1, 2010. The Company is currently evaluating this guidance and is unable to predict at this time how it will impact its consolidated financial statements in future periods.
In June 2009, the FASB issued new guidance that requires a company to perform an analysis to determine whether its variable interests give it a controlling financial interest in a variable interest entity. The primary beneficiary of a variable interest entity has both the power to direct the activities of the entity that most significantly impact the entity’s economic performance and the obligation to absorb potentially significant losses of the entity or the right to receive potentially significant benefits from the entity. A company is required to make ongoing reassessments of whether it is the primary beneficiary of a variable interest entity. This guidance also amends previous guidance for determining whether an entity is considered a variable interest entity. This guidance is effective for the Company beginning on January 1, 2010. The Company is currently evaluating this guidance and is unable to predict at this time how it will impact its consolidated financial statements in future periods.
Note C – Discontinued Operations
On March 12, 2009, the Company sold its operations in Ecuador for net cash proceeds of $78,900,000. The acquirer also assumed certain tax and other liabilities associated with the Ecuador properties sold. The Ecuador properties sold included 20% interests in producing Block 16 and the nearby Tivacuno area. The Company recorded a gain of $103,596,000, net of income taxes of $13,961,000, from the sale of the Ecuador properties in 2009. The Company used the proceeds of the sale to pay down debt and to partially fund ongoing development projects in other areas. At the time of the sale, the Ecuador properties produced approximately 6,700 net barrels per day of heavy oil and had net proved oil reserves of approximately 4.3 million barrels. Ecuador operating results prior to the sale, and the resulting gain on disposal, have been reported as discontinued operations. The consolidated financial statements for 2008 and 2007 have been reclassified to conform to this presentation. In past reports, the operating results for the Ecuador properties were primarily included in the Ecuador segment in the Oil and Gas Operating Results table; interest expense associated with the business was previously included in Corporate results. The major assets (liabilities) associated with the Ecuador properties at the time of the sale are presented in the following table.
(Thousands of dollars)
Current assets $ 4,214Property, plant and equipment, net of accumulated depreciation, depletion and amortization 65,178Other noncurrent assets 683Assets sold $ 70,075
Current liabilities $105,185Other noncurrent liabilities 35Liabilities associated with assets sold $105,220
The following table reflects the results of operations, including the gain on sale, from the Ecuador properties sold in 2009. (Thousands of dollars) 2009 2008 2007Revenues $125,654 80,209 126,134Income before income tax expense, including a gain on disposal of $117,557 in 2009 109,865 188 48,228Income tax expense 12,761 4,951 20,779 Note D – Acquisitions
A wholly-owned subsidiary of the Company purchased an ethanol plant in Hankinson, North Dakota on October 1, 2009. The plant has a rated capacity to produce 110 million gallons of ethanol per annum. The $92,000,000 purchase price was financed with an $82,000,000 nonrecourse loan held by former owners. The loan currently bears interest at 5.0% per year and is repayable in 2014. Revenue and expenses associated with the ethanol plant have been included in the Company’s consolidated statement of income beginning on the date of acquisition. The Company has performed a preliminary allocation of the purchase price for the Hankinson plant as of October 1, 2009 based on the estimated fair value of the assets acquired as presented in the following table.
(Thousands of dollars)
Inventory $ 2,469Land and land improvements 11,833Buildings and improvements 9,819Machinery and transportation equipment 67,879 Total purchase price $92,000
F-12
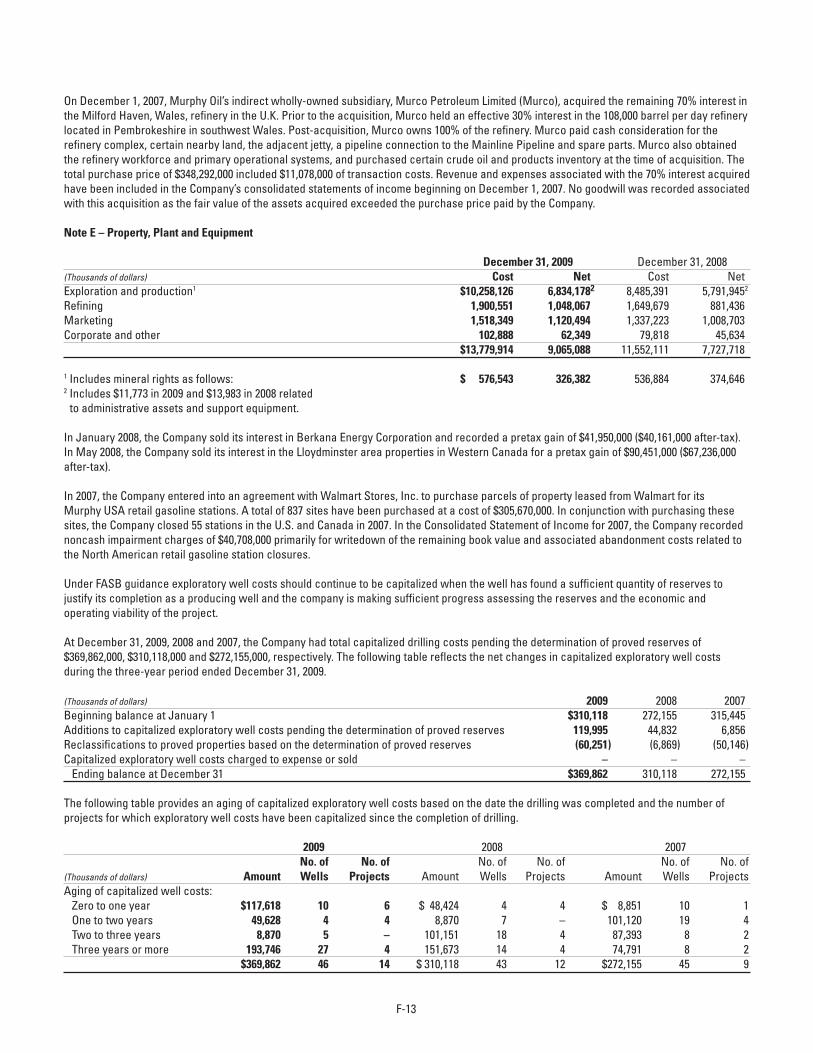
On December 1, 2007, Murphy Oil’s indirect wholly-owned subsidiary, Murco Petroleum Limited (Murco), acquired the remaining 70% interest in the Milford Haven, Wales, refinery in the U.K. Prior to the acquisition, Murco held an effective 30% interest in the 108,000 barrel per day refinery located in Pembrokeshire in southwest Wales. Post-acquisition, Murco owns 100% of the refinery. Murco paid cash consideration for the refinery complex, certain nearby land, the adjacent jetty, a pipeline connection to the Mainline Pipeline and spare parts. Murco also obtained the refinery workforce and primary operational systems, and purchased certain crude oil and products inventory at the time of acquisition. The total purchase price of $348,292,000 included $11,078,000 of transaction costs. Revenue and expenses associated with the 70% interest acquired have been included in the Company’s consolidated statements of income beginning on December 1, 2007. No goodwill was recorded associated with this acquisition as the fair value of the assets acquired exceeded the purchase price paid by the Company.
Note E – Property, Plant and Equipment
December 31, 2009 December 31, 2008(Thousands of dollars) Cost Net Cost Net Exploration and production1 $10,258,126 6,834,1782 8,485,391 5,791,9452
Refining 1,900,551 1,048,067 1,649,679 881,436Marketing 1,518,349 1,120,494 1,337,223 1,008,703Corporate and other 102,888 62,349 79,818 45,634 $13,779,914 9,065,088 11,552,111 7,727,718
1 Includes mineral rights as follows: $ 576,543 326,382 536,884 374,6462 Includes $11,773 in 2009 and $13,983 in 2008 related
to administrative assets and support equipment.
In January 2008, the Company sold its interest in Berkana Energy Corporation and recorded a pretax gain of $41,950,000 ($40,161,000 after-tax). In May 2008, the Company sold its interest in the Lloydminster area properties in Western Canada for a pretax gain of $90,451,000 ($67,236,000 after-tax).
In 2007, the Company entered into an agreement with Walmart Stores, Inc. to purchase parcels of property leased from Walmart for its Murphy USA retail gasoline stations. A total of 837 sites have been purchased at a cost of $305,670,000. In conjunction with purchasing these sites, the Company closed 55 stations in the U.S. and Canada in 2007. In the Consolidated Statement of Income for 2007, the Company recorded noncash impairment charges of $40,708,000 primarily for writedown of the remaining book value and associated abandonment costs related to the North American retail gasoline station closures.
Under FASB guidance exploratory well costs should continue to be capitalized when the well has found a sufficient quantity of reserves to justify its completion as a producing well and the company is making sufficient progress assessing the reserves and the economic and operating viability of the project.
At December 31, 2009, 2008 and 2007, the Company had total capitalized drilling costs pending the determination of proved reserves of $369,862,000, $310,118,000 and $272,155,000, respectively. The following table reflects the net changes in capitalized exploratory well costs during the three-year period ended December 31, 2009.
(Thousands of dollars) 2009 2008 2007Beginning balance at January 1 $310,118 272,155 315,445Additions to capitalized exploratory well costs pending the determination of proved reserves 119,995 44,832 6,856Reclassifications to proved properties based on the determination of proved reserves (60,251) (6,869) (50,146)Capitalized exploratory well costs charged to expense or sold – – – Ending balance at December 31 $369,862 310,118 272,155
The following table provides an aging of capitalized exploratory well costs based on the date the drilling was completed and the number of projects for which exploratory well costs have been capitalized since the completion of drilling.
2009 2008 2007 No. of No. of No. of No. of No. of No. of(Thousands of dollars) Amount Wells Projects Amount Wells Projects Amount Wells ProjectsAging of capitalized well costs: Zero to one year $117,618 10 6 $ 48,424 4 4 $ 8,851 10 1 One to two years 49,628 4 4 8,870 7 – 101,120 19 4 Two to three years 8,870 5 – 101,151 18 4 87,393 8 2 Three years or more 193,746 27 4 151,673 14 4 74,791 8 2 $369,862 46 14 $ 310,118 43 12 $272,155 45 9
F-13
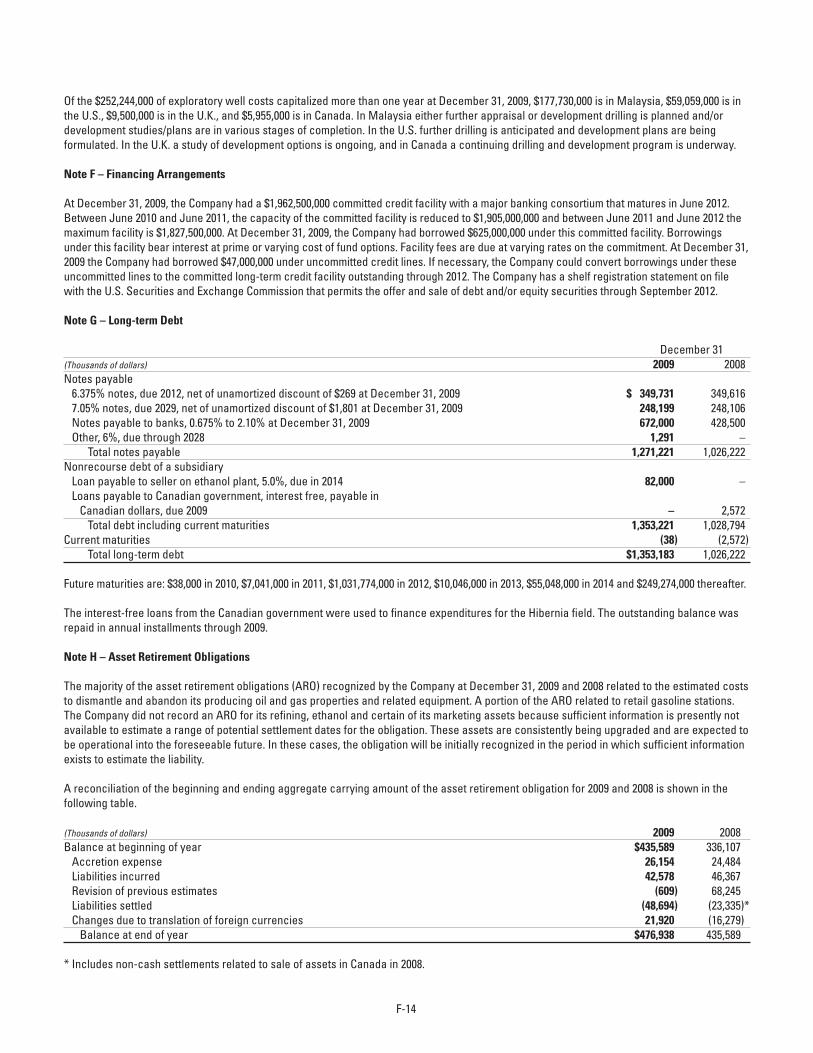
Of the $252,244,000 of exploratory well costs capitalized more than one year at December 31, 2009, $177,730,000 is in Malaysia, $59,059,000 is in the U.S., $9,500,000 is in the U.K., and $5,955,000 is in Canada. In Malaysia either further appraisal or development drilling is planned and/or development studies/plans are in various stages of completion. In the U.S. further drilling is anticipated and development plans are being formulated. In the U.K. a study of development options is ongoing, and in Canada a continuing drilling and development program is underway.
Note F – Financing Arrangements
At December 31, 2009, the Company had a $1,962,500,000 committed credit facility with a major banking consortium that matures in June 2012. Between June 2010 and June 2011, the capacity of the committed facility is reduced to $1,905,000,000 and between June 2011 and June 2012 the maximum facility is $1,827,500,000. At December 31, 2009, the Company had borrowed $625,000,000 under this committed facility. Borrowings under this facility bear interest at prime or varying cost of fund options. Facility fees are due at varying rates on the commitment. At December 31, 2009 the Company had borrowed $47,000,000 under uncommitted credit lines. If necessary, the Company could convert borrowings under these uncommitted lines to the committed long-term credit facility outstanding through 2012. The Company has a shelf registration statement on file with the U.S. Securities and Exchange Commission that permits the offer and sale of debt and/or equity securities through September 2012.
Note G – Long-term Debt
December 31(Thousands of dollars) 2009 2008Notes payable 6.375% notes, due 2012, net of unamortized discount of $269 at December 31, 2009 $ 349,731 349,616 7.05% notes, due 2029, net of unamortized discount of $1,801 at December 31, 2009 248,199 248,106 Notes payable to banks, 0.675% to 2.10% at December 31, 2009 672,000 428,500 Other, 6%, due through 2028 1,291 – Total notes payable 1,271,221 1,026,222Nonrecourse debt of a subsidiary Loan payable to seller on ethanol plant, 5.0%, due in 2014 82,000 – Loans payable to Canadian government, interest free, payable in Canadian dollars, due 2009 – 2,572 Total debt including current maturities 1,353,221 1,028,794Current maturities (38) (2,572) Total long-term debt $1,353,183 1,026,222
Future maturities are: $38,000 in 2010, $7,041,000 in 2011, $1,031,774,000 in 2012, $10,046,000 in 2013, $55,048,000 in 2014 and $249,274,000 thereafter.
The interest-free loans from the Canadian government were used to finance expenditures for the Hibernia field. The outstanding balance was repaid in annual installments through 2009.
Note H – Asset Retirement Obligations
The majority of the asset retirement obligations (ARO) recognized by the Company at December 31, 2009 and 2008 related to the estimated costs to dismantle and abandon its producing oil and gas properties and related equipment. A portion of the ARO related to retail gasoline stations. The Company did not record an ARO for its refining, ethanol and certain of its marketing assets because sufficient information is presently not available to estimate a range of potential settlement dates for the obligation. These assets are consistently being upgraded and are expected to be operational into the foreseeable future. In these cases, the obligation will be initially recognized in the period in which sufficient information exists to estimate the liability.
A reconciliation of the beginning and ending aggregate carrying amount of the asset retirement obligation for 2009 and 2008 is shown in the following table.
(Thousands of dollars) 2009 2008Balance at beginning of year $435,589 336,107 Accretion expense 26,154 24,484 Liabilities incurred 42,578 46,367 Revision of previous estimates (609) 68,245 Liabilities settled (48,694) (23,335)* Changes due to translation of foreign currencies 21,920 (16,279) Balance at end of year $476,938 435,589
* Includes non-cash settlements related to sale of assets in Canada in 2008.
F-14
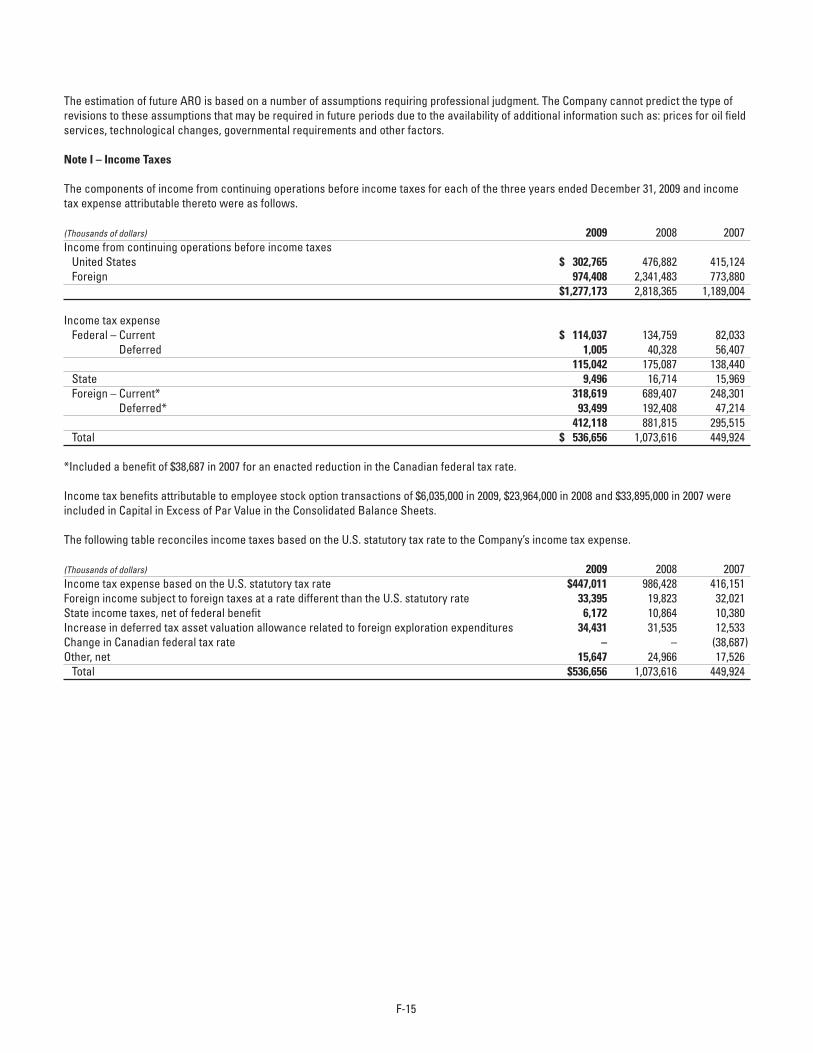
The estimation of future ARO is based on a number of assumptions requiring professional judgment. The Company cannot predict the type of revisions to these assumptions that may be required in future periods due to the availability of additional information such as: prices for oil field services, technological changes, governmental requirements and other factors.
Note I – Income Taxes
The components of income from continuing operations before income taxes for each of the three years ended December 31, 2009 and income tax expense attributable thereto were as follows.
(Thousands of dollars) 2009 2008 2007Income from continuing operations before income taxes United States $ 302,765 476,882 415,124 Foreign 974,408 2,341,483 773,880 $1,277,173 2,818,365 1,189,004
Income tax expense Federal – Current $ 114,037 134,759 82,033 Deferred 1,005 40,328 56,407 115,042 175,087 138,440 State 9,496 16,714 15,969 Foreign – Current* 318,619 689,407 248,301 Deferred* 93,499 192,408 47,214 412,118 881,815 295,515 Total $ 536,656 1,073,616 449,924
* Included a benefit of $38,687 in 2007 for an enacted reduction in the Canadian federal tax rate.
Income tax benefits attributable to employee stock option transactions of $6,035,000 in 2009, $23,964,000 in 2008 and $33,895,000 in 2007 were included in Capital in Excess of Par Value in the Consolidated Balance Sheets.
The following table reconciles income taxes based on the U.S. statutory tax rate to the Company’s income tax expense.
(Thousands of dollars) 2009 2008 2007Income tax expense based on the U.S. statutory tax rate $447,011 986,428 416,151Foreign income subject to foreign taxes at a rate different than the U.S. statutory rate 33,395 19,823 32,021State income taxes, net of federal benefit 6,172 10,864 10,380Increase in deferred tax asset valuation allowance related to foreign exploration expenditures 34,431 31,535 12,533Change in Canadian federal tax rate – – (38,687)Other, net 15,647 24,966 17,526 Total $536,656 1,073,616 449,924
F-15
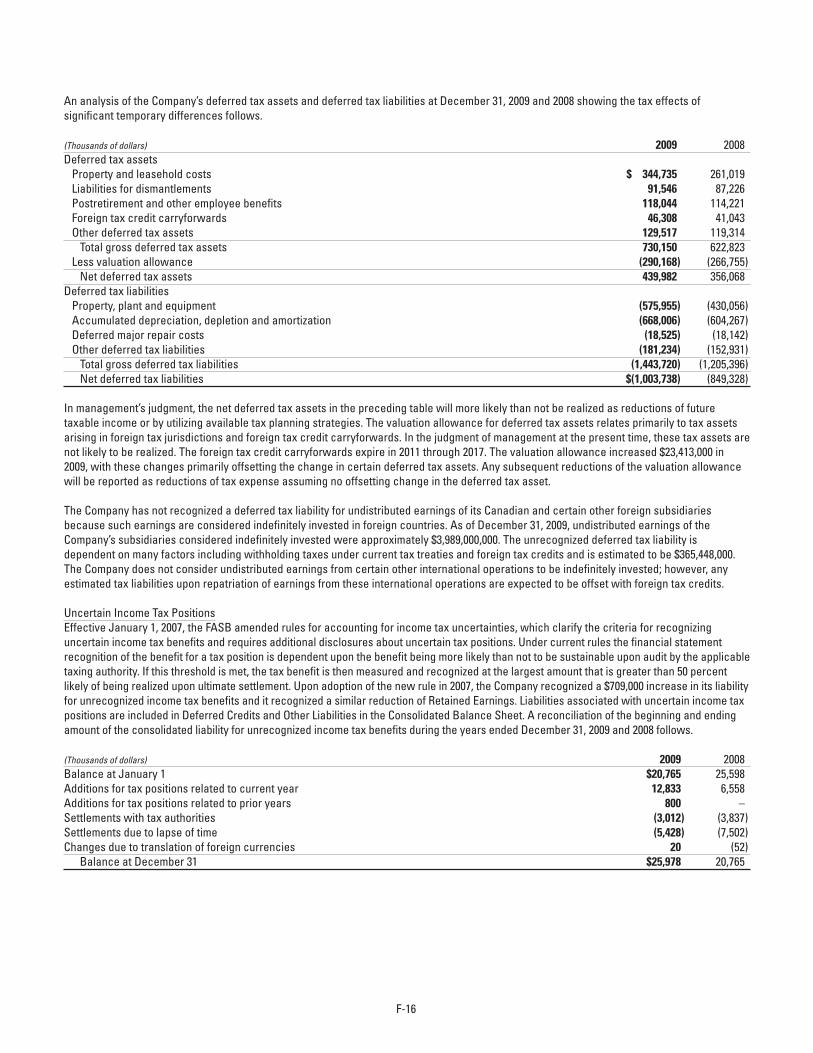
An analysis of the Company’s deferred tax assets and deferred tax liabilities at December 31, 2009 and 2008 showing the tax effects of significant temporary differences follows.
(Thousands of dollars) 2009 2008Deferred tax assets Property and leasehold costs $ 344,735 261,019 Liabilities for dismantlements 91,546 87,226 Postretirement and other employee benefits 118,044 114,221 Foreign tax credit carryforwards 46,308 41,043 Other deferred tax assets 129,517 119,314 Total gross deferred tax assets 730,150 622,823 Less valuation allowance (290,168) (266,755) Net deferred tax assets 439,982 356,068Deferred tax liabilities Property, plant and equipment (575,955) (430,056) Accumulated depreciation, depletion and amortization (668,006) (604,267) Deferred major repair costs (18,525) (18,142) Other deferred tax liabilities (181,234) (152,931) Total gross deferred tax liabilities (1,443,720) (1,205,396) Net deferred tax liabilities $(1,003,738) (849,328)
In management’s judgment, the net deferred tax assets in the preceding table will more likely than not be realized as reductions of future taxable income or by utilizing available tax planning strategies. The valuation allowance for deferred tax assets relates primarily to tax assets arising in foreign tax jurisdictions and foreign tax credit carryforwards. In the judgment of management at the present time, these tax assets are not likely to be realized. The foreign tax credit carryforwards expire in 2011 through 2017. The valuation allowance increased $23,413,000 in 2009, with these changes primarily offsetting the change in certain deferred tax assets. Any subsequent reductions of the valuation allowance will be reported as reductions of tax expense assuming no offsetting change in the deferred tax asset.
The Company has not recognized a deferred tax liability for undistributed earnings of its Canadian and certain other foreign subsidiaries because such earnings are considered indefinitely invested in foreign countries. As of December 31, 2009, undistributed earnings of the Company’s subsidiaries considered indefinitely invested were approximately $3,989,000,000. The unrecognized deferred tax liability is dependent on many factors including withholding taxes under current tax treaties and foreign tax credits and is estimated to be $365,448,000. The Company does not consider undistributed earnings from certain other international operations to be indefinitely invested; however, any estimated tax liabilities upon repatriation of earnings from these international operations are expected to be offset with foreign tax credits.
Uncertain Income Tax PositionsEffective January 1, 2007, the FASB amended rules for accounting for income tax uncertainties, which clarify the criteria for recognizing uncertain income tax benefits and requires additional disclosures about uncertain tax positions. Under current rules the financial statement recognition of the benefit for a tax position is dependent upon the benefit being more likely than not to be sustainable upon audit by the applicable taxing authority. If this threshold is met, the tax benefit is then measured and recognized at the largest amount that is greater than 50 percent likely of being realized upon ultimate settlement. Upon adoption of the new rule in 2007, the Company recognized a $709,000 increase in its liability for unrecognized income tax benefits and it recognized a similar reduction of Retained Earnings. Liabilities associated with uncertain income tax positions are included in Deferred Credits and Other Liabilities in the Consolidated Balance Sheet. A reconciliation of the beginning and ending amount of the consolidated liability for unrecognized income tax benefits during the years ended December 31, 2009 and 2008 follows.
(Thousands of dollars) 2009 2008Balance at January 1 $20,765 25,598Additions for tax positions related to current year 12,833 6,558Additions for tax positions related to prior years 800 –Settlements with tax authorities (3,012) (3,837)Settlements due to lapse of time (5,428) (7,502)Changes due to translation of foreign currencies 20 (52) Balance at December 31 $25,978 20,765
F-16
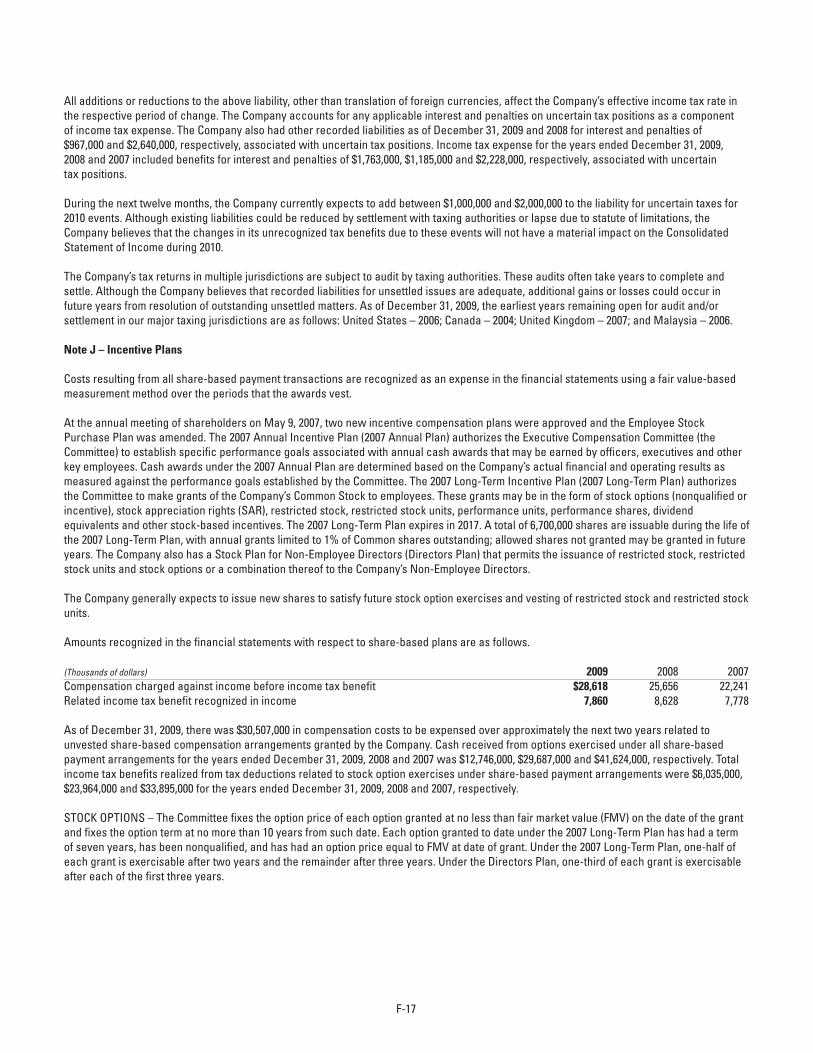
All additions or reductions to the above liability, other than translation of foreign currencies, affect the Company’s effective income tax rate in the respective period of change. The Company accounts for any applicable interest and penalties on uncertain tax positions as a component of income tax expense. The Company also had other recorded liabilities as of December 31, 2009 and 2008 for interest and penalties of $967,000 and $2,640,000, respectively, associated with uncertain tax positions. Income tax expense for the years ended December 31, 2009, 2008 and 2007 included benefits for interest and penalties of $1,763,000, $1,185,000 and $2,228,000, respectively, associated with uncertain tax positions.
During the next twelve months, the Company currently expects to add between $1,000,000 and $2,000,000 to the liability for uncertain taxes for 2010 events. Although existing liabilities could be reduced by settlement with taxing authorities or lapse due to statute of limitations, the Company believes that the changes in its unrecognized tax benefits due to these events will not have a material impact on the Consolidated Statement of Income during 2010.
The Company’s tax returns in multiple jurisdictions are subject to audit by taxing authorities. These audits often take years to complete and settle. Although the Company believes that recorded liabilities for unsettled issues are adequate, additional gains or losses could occur in future years from resolution of outstanding unsettled matters. As of December 31, 2009, the earliest years remaining open for audit and/or settlement in our major taxing jurisdictions are as follows: United States – 2006; Canada – 2004; United Kingdom – 2007; and Malaysia – 2006.
Note J – Incentive Plans
Costs resulting from all share-based payment transactions are recognized as an expense in the financial statements using a fair value-based measurement method over the periods that the awards vest.
At the annual meeting of shareholders on May 9, 2007, two new incentive compensation plans were approved and the Employee Stock Purchase Plan was amended. The 2007 Annual Incentive Plan (2007 Annual Plan) authorizes the Executive Compensation Committee (the Committee) to establish specific performance goals associated with annual cash awards that may be earned by officers, executives and other key employees. Cash awards under the 2007 Annual Plan are determined based on the Company’s actual financial and operating results as measured against the performance goals established by the Committee. The 2007 Long-Term Incentive Plan (2007 Long-Term Plan) authorizes the Committee to make grants of the Company’s Common Stock to employees. These grants may be in the form of stock options (nonqualified or incentive), stock appreciation rights (SAR), restricted stock, restricted stock units, performance units, performance shares, dividend equivalents and other stock-based incentives. The 2007 Long-Term Plan expires in 2017. A total of 6,700,000 shares are issuable during the life of the 2007 Long-Term Plan, with annual grants limited to 1% of Common shares outstanding; allowed shares not granted may be granted in future years. The Company also has a Stock Plan for Non-Employee Directors (Directors Plan) that permits the issuance of restricted stock, restricted stock units and stock options or a combination thereof to the Company’s Non-Employee Directors.
The Company generally expects to issue new shares to satisfy future stock option exercises and vesting of restricted stock and restricted stock units.
Amounts recognized in the financial statements with respect to share-based plans are as follows.
(Thousands of dollars) 2009 2008 2007Compensation charged against income before income tax benefit $28,618 25,656 22,241Related income tax benefit recognized in income 7,860 8,628 7,778
As of December 31, 2009, there was $30,507,000 in compensation costs to be expensed over approximately the next two years related to unvested share-based compensation arrangements granted by the Company. Cash received from options exercised under all share-based payment arrangements for the years ended December 31, 2009, 2008 and 2007 was $12,746,000, $29,687,000 and $41,624,000, respectively. Total income tax benefits realized from tax deductions related to stock option exercises under share-based payment arrangements were $6,035,000, $23,964,000 and $33,895,000 for the years ended December 31, 2009, 2008 and 2007, respectively.
STOCK OPTIONS – The Committee fixes the option price of each option granted at no less than fair market value (FMV) on the date of the grant and fixes the option term at no more than 10 years from such date. Each option granted to date under the 2007 Long-Term Plan has had a term of seven years, has been nonqualified, and has had an option price equal to FMV at date of grant. Under the 2007 Long-Term Plan, one-half of each grant is exercisable after two years and the remainder after three years. Under the Directors Plan, one-third of each grant is exercisable after each of the first three years.
F-17
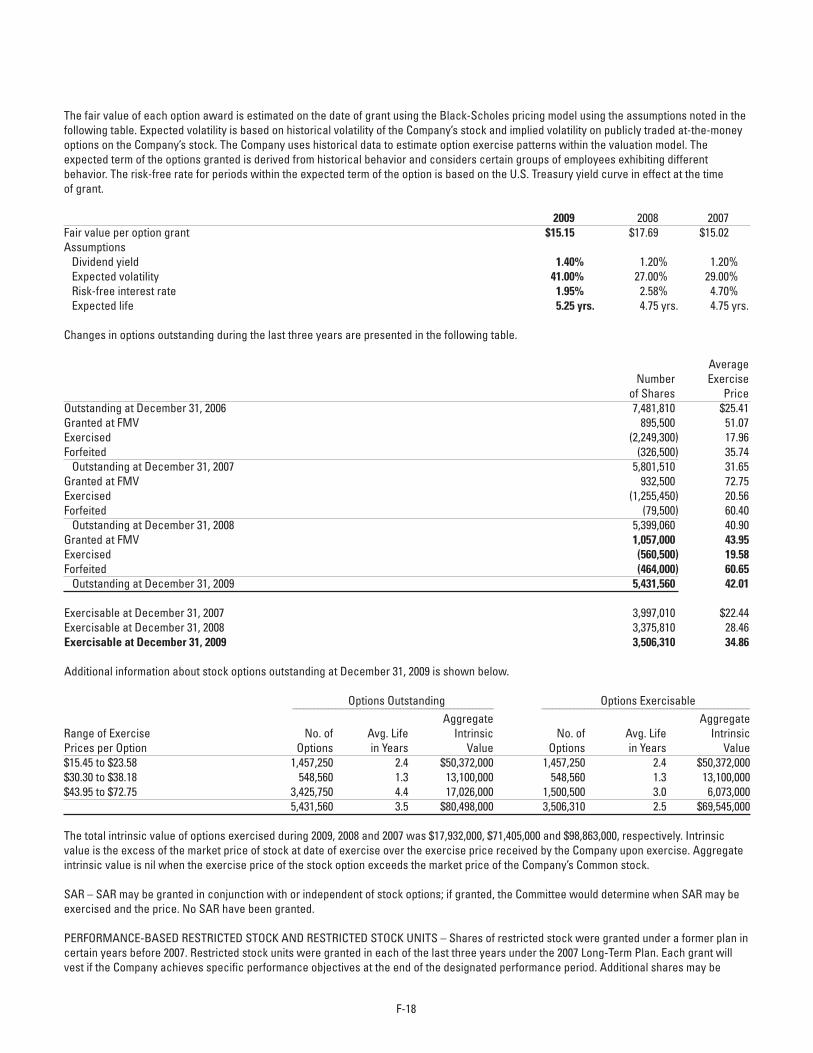
The fair value of each option award is estimated on the date of grant using the Black-Scholes pricing model using the assumptions noted in the following table. Expected volatility is based on historical volatility of the Company’s stock and implied volatility on publicly traded at-the-money options on the Company’s stock. The Company uses historical data to estimate option exercise patterns within the valuation model. The expected term of the options granted is derived from historical behavior and considers certain groups of employees exhibiting different behavior. The risk-free rate for periods within the expected term of the option is based on the U.S. Treasury yield curve in effect at the time of grant.
2009 2008 2007Fair value per option grant $15.15 $17.69 $15.02Assumptions Dividend yield 1.40% 1.20% 1.20% Expected volatility 41.00% 27.00% 29.00% Risk-free interest rate 1.95% 2.58% 4.70% Expected life 5.25 yrs. 4.75 yrs. 4.75 yrs.
Changes in options outstanding during the last three years are presented in the following table.
Average Number Exercise of Shares PriceOutstanding at December 31, 2006 7,481,810 $25.41Granted at FMV 895,500 51.07Exercised (2,249,300) 17.96Forfeited (326,500) 35.74 Outstanding at December 31, 2007 5,801,510 31.65Granted at FMV 932,500 72.75Exercised (1,255,450) 20.56Forfeited (79,500) 60.40 Outstanding at December 31, 2008 5,399,060 40.90Granted at FMV 1,057,000 43.95Exercised (560,500) 19.58Forfeited (464,000) 60.65 Outstanding at December 31, 2009 5,431,560 42.01
Exercisable at December 31, 2007 3,997,010 $22.44Exercisable at December 31, 2008 3,375,810 28.46Exercisable at December 31, 2009 3,506,310 34.86
Additional information about stock options outstanding at December 31, 2009 is shown below.
Options Outstanding Options Exercisable ________________________________________________________ __________________________________________________________
Aggregate AggregateRange of Exercise No. of Avg. Life Intrinsic No. of Avg. Life IntrinsicPrices per Option Options in Years Value Options in Years Value$15.45 to $23.58 1,457,250 2.4 $50,372,000 1,457,250 2.4 $50,372,000$30.30 to $38.18 548,560 1.3 13,100,000 548,560 1.3 13,100,000$43.95 to $72.75 3,425,750 4.4 17,026,000 1,500,500 3.0 6,073,000 5,431,560 3.5 $80,498,000 3,506,310 2.5 $69,545,000
The total intrinsic value of options exercised during 2009, 2008 and 2007 was $17,932,000, $71,405,000 and $98,863,000, respectively. Intrinsic value is the excess of the market price of stock at date of exercise over the exercise price received by the Company upon exercise. Aggregate intrinsic value is nil when the exercise price of the stock option exceeds the market price of the Company’s Common stock.
SAR – SAR may be granted in conjunction with or independent of stock options; if granted, the Committee would determine when SAR may be exercised and the price. No SAR have been granted.
PERFORMANCE-BASED RESTRICTED STOCK AND RESTRICTED STOCK UNITS – Shares of restricted stock were granted under a former plan in certain years before 2007. Restricted stock units were granted in each of the last three years under the 2007 Long-Term Plan. Each grant will vest if the Company achieves specific performance objectives at the end of the designated performance period. Additional shares may be
F-18
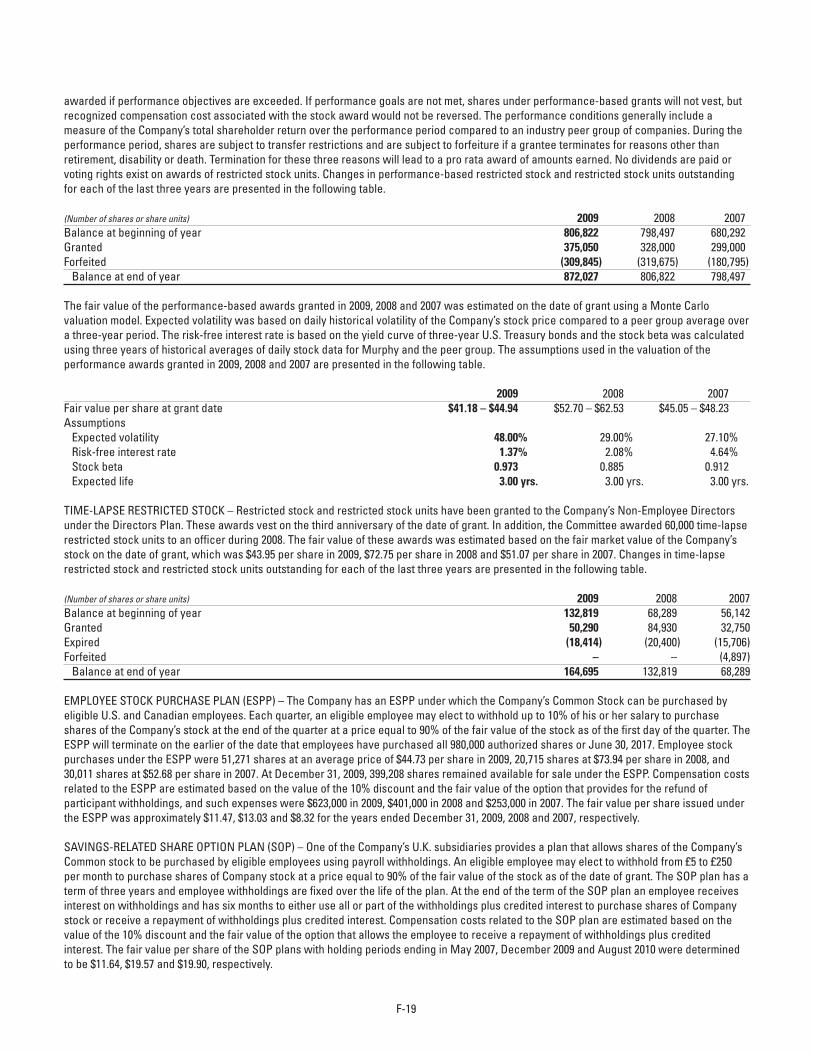
awarded if performance objectives are exceeded. If performance goals are not met, shares under performance-based grants will not vest, but recognized compensation cost associated with the stock award would not be reversed. The performance conditions generally include a measure of the Company’s total shareholder return over the performance period compared to an industry peer group of companies. During the performance period, shares are subject to transfer restrictions and are subject to forfeiture if a grantee terminates for reasons other than retirement, disability or death. Termination for these three reasons will lead to a pro rata award of amounts earned. No dividends are paid or voting rights exist on awards of restricted stock units. Changes in performance-based restricted stock and restricted stock units outstanding for each of the last three years are presented in the following table.
(Number of shares or share units) 2009 2008 2007Balance at beginning of year 806,822 798,497 680,292Granted 375,050 328,000 299,000Forfeited (309,845) (319,675) (180,795) Balance at end of year 872,027 806,822 798,497
The fair value of the performance-based awards granted in 2009, 2008 and 2007 was estimated on the date of grant using a Monte Carlo valuation model. Expected volatility was based on daily historical volatility of the Company’s stock price compared to a peer group average over a three-year period. The risk-free interest rate is based on the yield curve of three-year U.S. Treasury bonds and the stock beta was calculated using three years of historical averages of daily stock data for Murphy and the peer group. The assumptions used in the valuation of the performance awards granted in 2009, 2008 and 2007 are presented in the following table.
2009 2008 2007Fair value per share at grant date $41.18 – $44.94 $52.70 – $62.53 $45.05 – $48.23Assumptions Expected volatility 48.00% 29.00% 27.10% Risk-free interest rate 1.37% 2.08% 4.64% Stock beta 0.973 0.885 0.912 Expected life 3.00 yrs. 3.00 yrs. 3.00 yrs.
TIME-LAPSE RESTRICTED STOCK – Restricted stock and restricted stock units have been granted to the Company’s Non-Employee Directors under the Directors Plan. These awards vest on the third anniversary of the date of grant. In addition, the Committee awarded 60,000 time-lapse restricted stock units to an officer during 2008. The fair value of these awards was estimated based on the fair market value of the Company’s stock on the date of grant, which was $43.95 per share in 2009, $72.75 per share in 2008 and $51.07 per share in 2007. Changes in time-lapse restricted stock and restricted stock units outstanding for each of the last three years are presented in the following table.
(Number of shares or share units) 2009 2008 2007Balance at beginning of year 132,819 68,289 56,142Granted 50,290 84,930 32,750Expired (18,414) (20,400) (15,706)Forfeited – – (4,897) Balance at end of year 164,695 132,819 68,289
EMPLOYEE STOCK PURCHASE PLAN (ESPP) – The Company has an ESPP under which the Company’s Common Stock can be purchased by eligible U.S. and Canadian employees. Each quarter, an eligible employee may elect to withhold up to 10% of his or her salary to purchase shares of the Company’s stock at the end of the quarter at a price equal to 90% of the fair value of the stock as of the first day of the quarter. The ESPP will terminate on the earlier of the date that employees have purchased all 980,000 authorized shares or June 30, 2017. Employee stock purchases under the ESPP were 51,271 shares at an average price of $44.73 per share in 2009, 20,715 shares at $73.94 per share in 2008, and 30,011 shares at $52.68 per share in 2007. At December 31, 2009, 399,208 shares remained available for sale under the ESPP. Compensation costs related to the ESPP are estimated based on the value of the 10% discount and the fair value of the option that provides for the refund of participant withholdings, and such expenses were $623,000 in 2009, $401,000 in 2008 and $253,000 in 2007. The fair value per share issued under the ESPP was approximately $11.47, $13.03 and $8.32 for the years ended December 31, 2009, 2008 and 2007, respectively.
SAVINGS-RELATED SHARE OPTION PLAN (SOP) – One of the Company’s U.K. subsidiaries provides a plan that allows shares of the Company’s Common stock to be purchased by eligible employees using payroll withholdings. An eligible employee may elect to withhold from £5 to £250 per month to purchase shares of Company stock at a price equal to 90% of the fair value of the stock as of the date of grant. The SOP plan has a term of three years and employee withholdings are fixed over the life of the plan. At the end of the term of the SOP plan an employee receives interest on withholdings and has six months to either use all or part of the withholdings plus credited interest to purchase shares of Company stock or receive a repayment of withholdings plus credited interest. Compensation costs related to the SOP plan are estimated based on the value of the 10% discount and the fair value of the option that allows the employee to receive a repayment of withholdings plus credited interest. The fair value per share of the SOP plans with holding periods ending in May 2007, December 2009 and August 2010 were determined to be $11.64, $19.57 and $19.90, respectively.
F-19
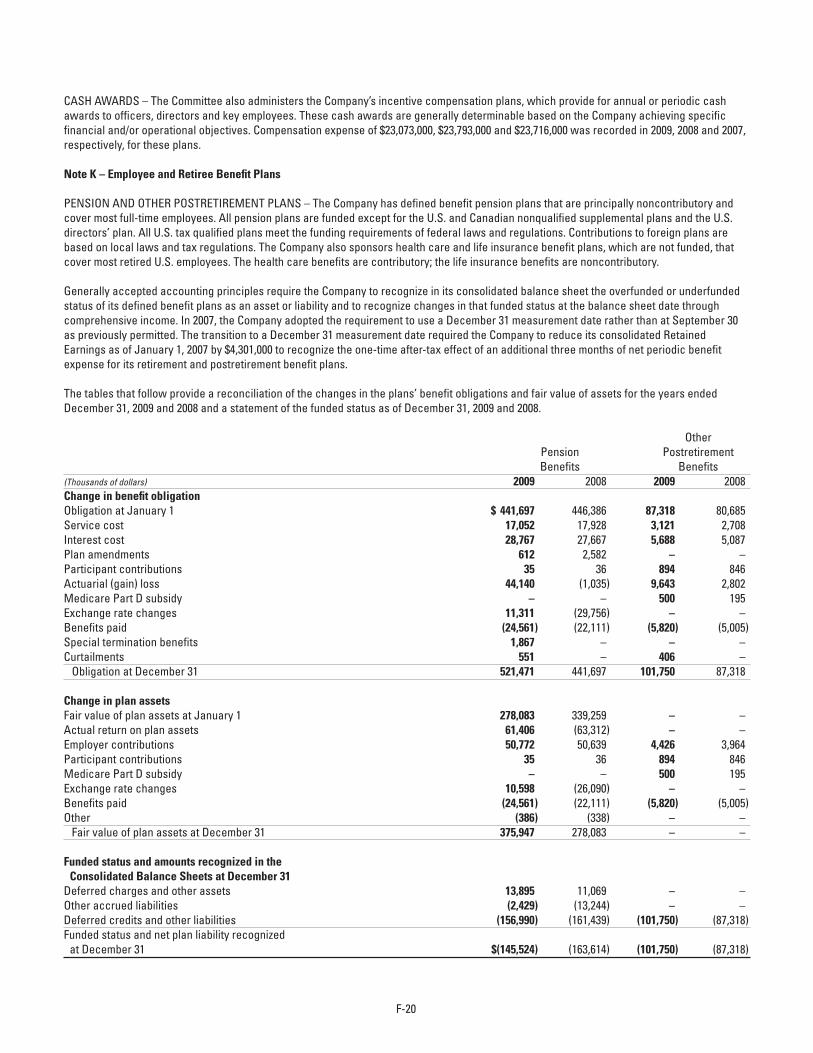
CASH AWARDS – The Committee also administers the Company’s incentive compensation plans, which provide for annual or periodic cash awards to officers, directors and key employees. These cash awards are generally determinable based on the Company achieving specific financial and/or operational objectives. Compensation expense of $23,073,000, $23,793,000 and $23,716,000 was recorded in 2009, 2008 and 2007, respectively, for these plans.
Note K – Employee and Retiree Benefit Plans
PENSION AND OTHER POSTRETIREMENT PLANS – The Company has defined benefit pension plans that are principally noncontributory and cover most full-time employees. All pension plans are funded except for the U.S. and Canadian nonqualified supplemental plans and the U.S. directors’ plan. All U.S. tax qualified plans meet the funding requirements of federal laws and regulations. Contributions to foreign plans are based on local laws and tax regulations. The Company also sponsors health care and life insurance benefit plans, which are not funded, that cover most retired U.S. employees. The health care benefits are contributory; the life insurance benefits are noncontributory.
Generally accepted accounting principles require the Company to recognize in its consolidated balance sheet the overfunded or underfunded status of its defined benefit plans as an asset or liability and to recognize changes in that funded status at the balance sheet date through comprehensive income. In 2007, the Company adopted the requirement to use a December 31 measurement date rather than at September 30 as previously permitted. The transition to a December 31 measurement date required the Company to reduce its consolidated Retained Earnings as of January 1, 2007 by $4,301,000 to recognize the one-time after-tax effect of an additional three months of net periodic benefit expense for its retirement and postretirement benefit plans. The tables that follow provide a reconciliation of the changes in the plans’ benefit obligations and fair value of assets for the years ended December 31, 2009 and 2008 and a statement of the funded status as of December 31, 2009 and 2008.
Other Pension Postretirement Benefits Benefits (Thousands of dollars) 2009 2008 2009 2008Change in benefit obligationObligation at January 1 $ 441,697 446,386 87,318 80,685Service cost 17,052 17,928 3,121 2,708Interest cost 28,767 27,667 5,688 5,087Plan amendments 612 2,582 – – Participant contributions 35 36 894 846Actuarial (gain) loss 44,140 (1,035) 9,643 2,802Medicare Part D subsidy – – 500 195Exchange rate changes 11,311 (29,756) – –Benefits paid (24,561) (22,111) (5,820) (5,005)Special termination benefits 1,867 – – –Curtailments 551 – 406 – Obligation at December 31 521,471 441,697 101,750 87,318
Change in plan assetsFair value of plan assets at January 1 278,083 339,259 – –Actual return on plan assets 61,406 (63,312) – –Employer contributions 50,772 50,639 4,426 3,964Participant contributions 35 36 894 846Medicare Part D subsidy – – 500 195Exchange rate changes 10,598 (26,090) – –Benefits paid (24,561) (22,111) (5,820) (5,005)Other (386) (338) – – Fair value of plan assets at December 31 375,947 278,083 – –
Funded status and amounts recognized in the Consolidated Balance Sheets at December 31Deferred charges and other assets 13,895 11,069 – –Other accrued liabilities (2,429) (13,244) – –Deferred credits and other liabilities (156,990) (161,439) (101,750) (87,318)Funded status and net plan liability recognized at December 31 $(145,524) (163,614) (101,750) (87,318)
F-20
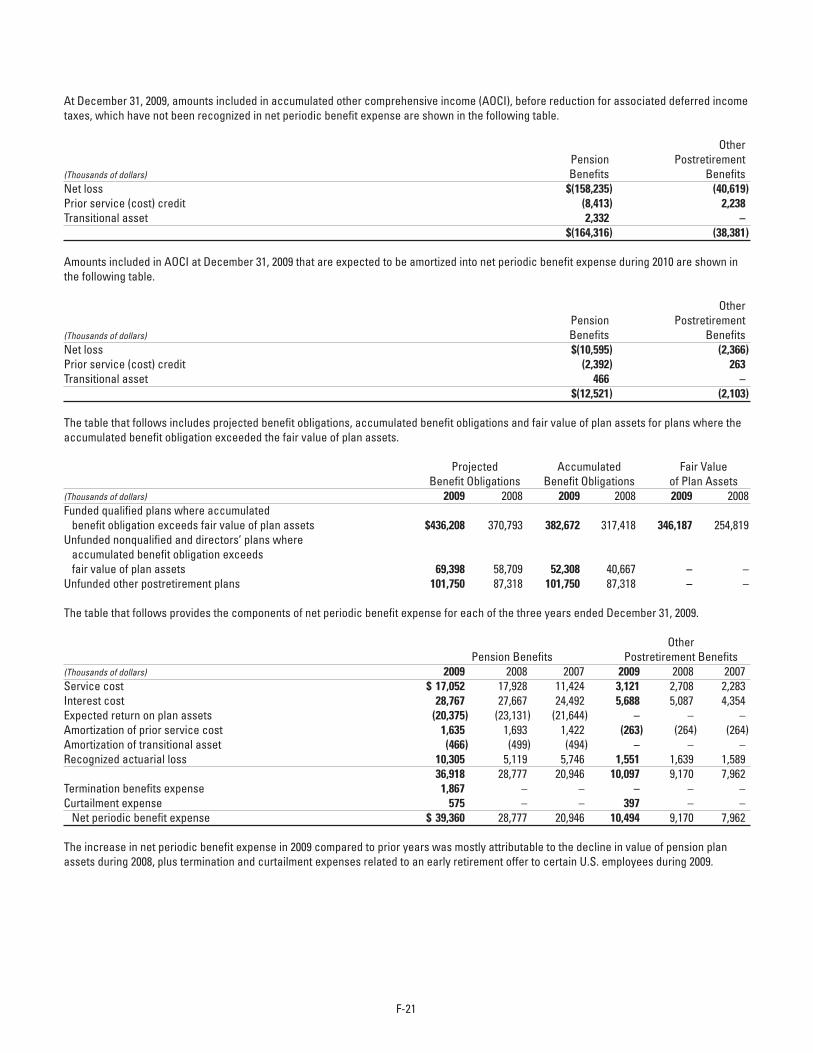
At December 31, 2009, amounts included in accumulated other comprehensive income (AOCI), before reduction for associated deferred income taxes, which have not been recognized in net periodic benefit expense are shown in the following table.
Other Pension Postretirement(Thousands of dollars) Benefits BenefitsNet loss $(158,235) (40,619)Prior service (cost) credit (8,413) 2,238Transitional asset 2,332 – $(164,316) (38,381)
Amounts included in AOCI at December 31, 2009 that are expected to be amortized into net periodic benefit expense during 2010 are shown in the following table.
Other Pension Postretirement(Thousands of dollars) Benefits BenefitsNet loss $(10,595) (2,366)Prior service (cost) credit (2,392) 263Transitional asset 466 – $(12,521) (2,103)
The table that follows includes projected benefit obligations, accumulated benefit obligations and fair value of plan assets for plans where the accumulated benefit obligation exceeded the fair value of plan assets.
Projected Accumulated Fair Value Benefit Obligations Benefit Obligations of Plan Assets(Thousands of dollars) 2009 2008 2009 2008 2009 2008Funded qualified plans where accumulated benefit obligation exceeds fair value of plan assets $436,208 370,793 382,672 317,418 346,187 254,819Unfunded nonqualified and directors’ plans where accumulated benefit obligation exceeds fair value of plan assets 69,398 58,709 52,308 40,667 – –Unfunded other postretirement plans 101,750 87,318 101,750 87,318 – –
The table that follows provides the components of net periodic benefit expense for each of the three years ended December 31, 2009.
Other Pension Benefits Postretirement Benefits(Thousands of dollars) 2009 2008 2007 2009 2008 2007Service cost $ 17,052 17,928 11,424 3,121 2,708 2,283Interest cost 28,767 27,667 24,492 5,688 5,087 4,354Expected return on plan assets (20,375) (23,131) (21,644) – – –Amortization of prior service cost 1,635 1,693 1,422 (263) (264) (264)Amortization of transitional asset (466) (499) (494) – – –Recognized actuarial loss 10,305 5,119 5,746 1,551 1,639 1,589 36,918 28,777 20,946 10,097 9,170 7,962Termination benefits expense 1,867 – – – – –Curtailment expense 575 – – 397 – – Net periodic benefit expense $ 39,360 28,777 20,946 10,494 9,170 7,962
The increase in net periodic benefit expense in 2009 compared to prior years was mostly attributable to the decline in value of pension plan assets during 2008, plus termination and curtailment expenses related to an early retirement offer to certain U.S. employees during 2009.
F-21
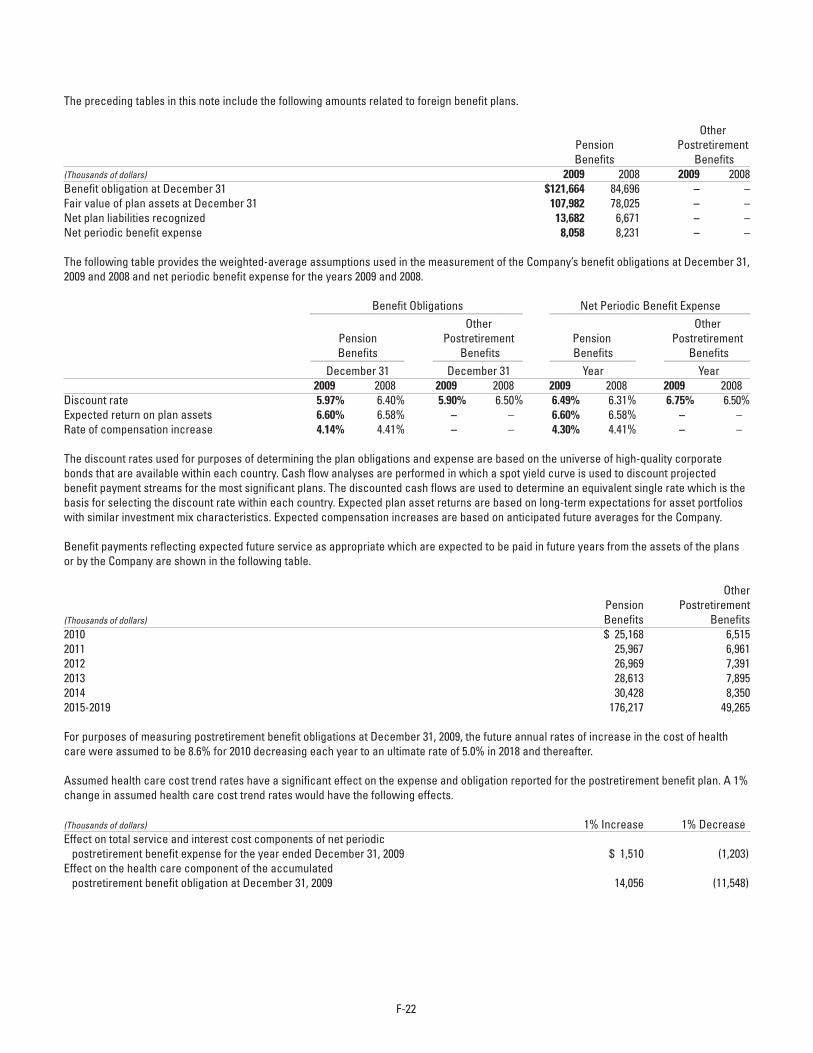
The preceding tables in this note include the following amounts related to foreign benefit plans.
Other Pension Postretirement Benefits Benefits (Thousands of dollars) 2009 2008 2009 2008Benefit obligation at December 31 $121,664 84,696 – –Fair value of plan assets at December 31 107,982 78,025 – –Net plan liabilities recognized 13,682 6,671 – –Net periodic benefit expense 8,058 8,231 – –
The following table provides the weighted-average assumptions used in the measurement of the Company’s benefit obligations at December 31, 2009 and 2008 and net periodic benefit expense for the years 2009 and 2008.
Benefit Obligations Net Periodic Benefit Expense ______________________________________________________ ___________________________________________________
Other Other Pension Postretirement Pension Postretirement Benefits Benefits Benefits Benefits ________________________ _______________________ ______________________ ______________________
December 31 December 31 Year Year 2009 2008 2009 2008 2009 2008 2009 2008Discount rate 5.97% 6.40% 5.90% 6.50% 6.49% 6.31% 6.75% 6.50%Expected return on plan assets 6.60% 6.58% – – 6.60% 6.58% – –Rate of compensation increase 4.14% 4.41% – – 4.30% 4.41% – –
The discount rates used for purposes of determining the plan obligations and expense are based on the universe of high-quality corporate bonds that are available within each country. Cash flow analyses are performed in which a spot yield curve is used to discount projected benefit payment streams for the most significant plans. The discounted cash flows are used to determine an equivalent single rate which is the basis for selecting the discount rate within each country. Expected plan asset returns are based on long-term expectations for asset portfolios with similar investment mix characteristics. Expected compensation increases are based on anticipated future averages for the Company.
Benefit payments reflecting expected future service as appropriate which are expected to be paid in future years from the assets of the plans or by the Company are shown in the following table.
Other Pension Postretirement (Thousands of dollars) Benefits Benefits 2010 $ 25,168 6,5152011 25,967 6,9612012 26,969 7,3912013 28,613 7,8952014 30,428 8,3502015-2019 176,217 49,265
For purposes of measuring postretirement benefit obligations at December 31, 2009, the future annual rates of increase in the cost of health care were assumed to be 8.6% for 2010 decreasing each year to an ultimate rate of 5.0% in 2018 and thereafter.
Assumed health care cost trend rates have a significant effect on the expense and obligation reported for the postretirement benefit plan. A 1% change in assumed health care cost trend rates would have the following effects.
(Thousands of dollars) 1% Increase 1% DecreaseEffect on total service and interest cost components of net periodic postretirement benefit expense for the year ended December 31, 2009 $ 1,510 (1,203)Effect on the health care component of the accumulated postretirement benefit obligation at December 31, 2009 14,056 (11,548)
F-22
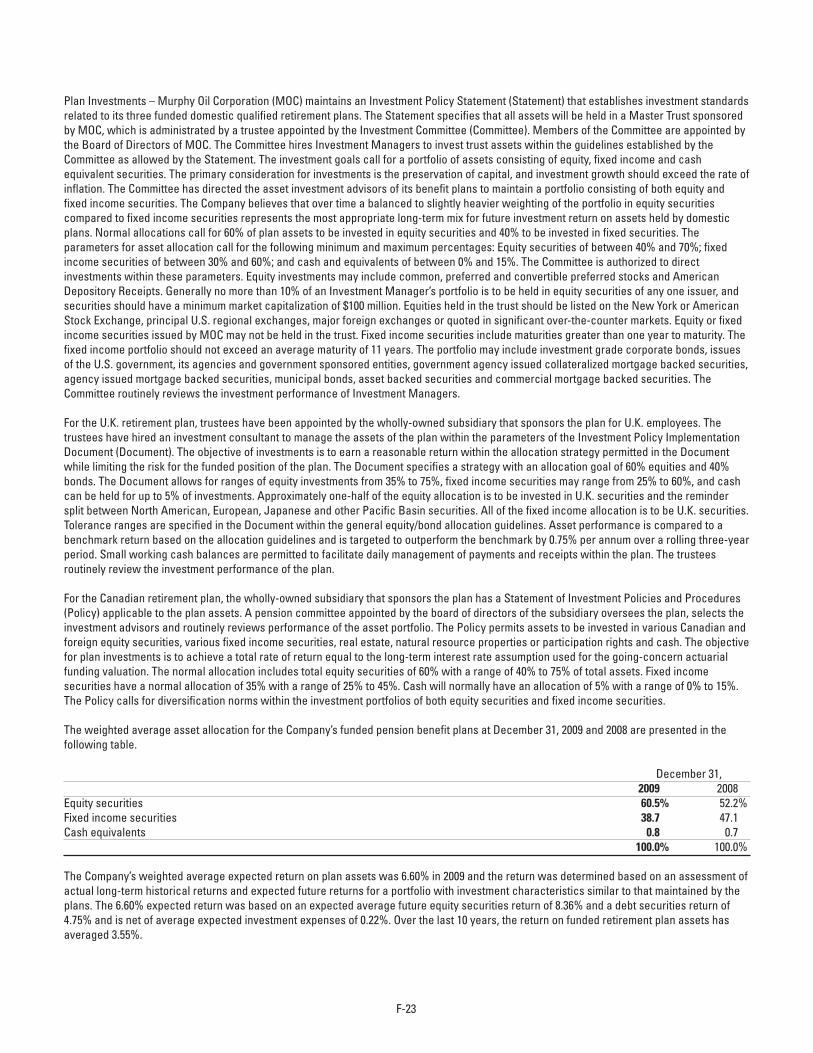
Plan Investments – Murphy Oil Corporation (MOC) maintains an Investment Policy Statement (Statement) that establishes investment standards related to its three funded domestic qualified retirement plans. The Statement specifies that all assets will be held in a Master Trust sponsored by MOC, which is administrated by a trustee appointed by the Investment Committee (Committee). Members of the Committee are appointed by the Board of Directors of MOC. The Committee hires Investment Managers to invest trust assets within the guidelines established by the Committee as allowed by the Statement. The investment goals call for a portfolio of assets consisting of equity, fixed income and cash equivalent securities. The primary consideration for investments is the preservation of capital, and investment growth should exceed the rate of inflation. The Committee has directed the asset investment advisors of its benefit plans to maintain a portfolio consisting of both equity and fixed income securities. The Company believes that over time a balanced to slightly heavier weighting of the portfolio in equity securities compared to fixed income securities represents the most appropriate long-term mix for future investment return on assets held by domestic plans. Normal allocations call for 60% of plan assets to be invested in equity securities and 40% to be invested in fixed securities. The parameters for asset allocation call for the following minimum and maximum percentages: Equity securities of between 40% and 70%; fixed income securities of between 30% and 60%; and cash and equivalents of between 0% and 15%. The Committee is authorized to direct investments within these parameters. Equity investments may include common, preferred and convertible preferred stocks and American Depository Receipts. Generally no more than 10% of an Investment Manager’s portfolio is to be held in equity securities of any one issuer, and securities should have a minimum market capitalization of $100 million. Equities held in the trust should be listed on the New York or American Stock Exchange, principal U.S. regional exchanges, major foreign exchanges or quoted in significant over-the-counter markets. Equity or fixed income securities issued by MOC may not be held in the trust. Fixed income securities include maturities greater than one year to maturity. The fixed income portfolio should not exceed an average maturity of 11 years. The portfolio may include investment grade corporate bonds, issues of the U.S. government, its agencies and government sponsored entities, government agency issued collateralized mortgage backed securities, agency issued mortgage backed securities, municipal bonds, asset backed securities and commercial mortgage backed securities. The Committee routinely reviews the investment performance of Investment Managers.
For the U.K. retirement plan, trustees have been appointed by the wholly-owned subsidiary that sponsors the plan for U.K. employees. The trustees have hired an investment consultant to manage the assets of the plan within the parameters of the Investment Policy Implementation Document (Document). The objective of investments is to earn a reasonable return within the allocation strategy permitted in the Document while limiting the risk for the funded position of the plan. The Document specifies a strategy with an allocation goal of 60% equities and 40% bonds. The Document allows for ranges of equity investments from 35% to 75%, fixed income securities may range from 25% to 60%, and cash can be held for up to 5% of investments. Approximately one-half of the equity allocation is to be invested in U.K. securities and the reminder split between North American, European, Japanese and other Pacific Basin securities. All of the fixed income allocation is to be U.K. securities. Tolerance ranges are specified in the Document within the general equity/bond allocation guidelines. Asset performance is compared to a benchmark return based on the allocation guidelines and is targeted to outperform the benchmark by 0.75% per annum over a rolling three-year period. Small working cash balances are permitted to facilitate daily management of payments and receipts within the plan. The trustees routinely review the investment performance of the plan.
For the Canadian retirement plan, the wholly-owned subsidiary that sponsors the plan has a Statement of Investment Policies and Procedures (Policy) applicable to the plan assets. A pension committee appointed by the board of directors of the subsidiary oversees the plan, selects the investment advisors and routinely reviews performance of the asset portfolio. The Policy permits assets to be invested in various Canadian and foreign equity securities, various fixed income securities, real estate, natural resource properties or participation rights and cash. The objective for plan investments is to achieve a total rate of return equal to the long-term interest rate assumption used for the going-concern actuarial funding valuation. The normal allocation includes total equity securities of 60% with a range of 40% to 75% of total assets. Fixed income securities have a normal allocation of 35% with a range of 25% to 45%. Cash will normally have an allocation of 5% with a range of 0% to 15%. The Policy calls for diversification norms within the investment portfolios of both equity securities and fixed income securities.
The weighted average asset allocation for the Company’s funded pension benefit plans at December 31, 2009 and 2008 are presented in the following table.
December 31, 2009 2008Equity securities 60.5% 52.2%Fixed income securities 38.7 47.1Cash equivalents 0.8 0.7 100.0% 100.0%
The Company’s weighted average expected return on plan assets was 6.60% in 2009 and the return was determined based on an assessment of actual long-term historical returns and expected future returns for a portfolio with investment characteristics similar to that maintained by the plans. The 6.60% expected return was based on an expected average future equity securities return of 8.36% and a debt securities return of 4.75% and is net of average expected investment expenses of 0.22%. Over the last 10 years, the return on funded retirement plan assets has averaged 3.55%.
F-23
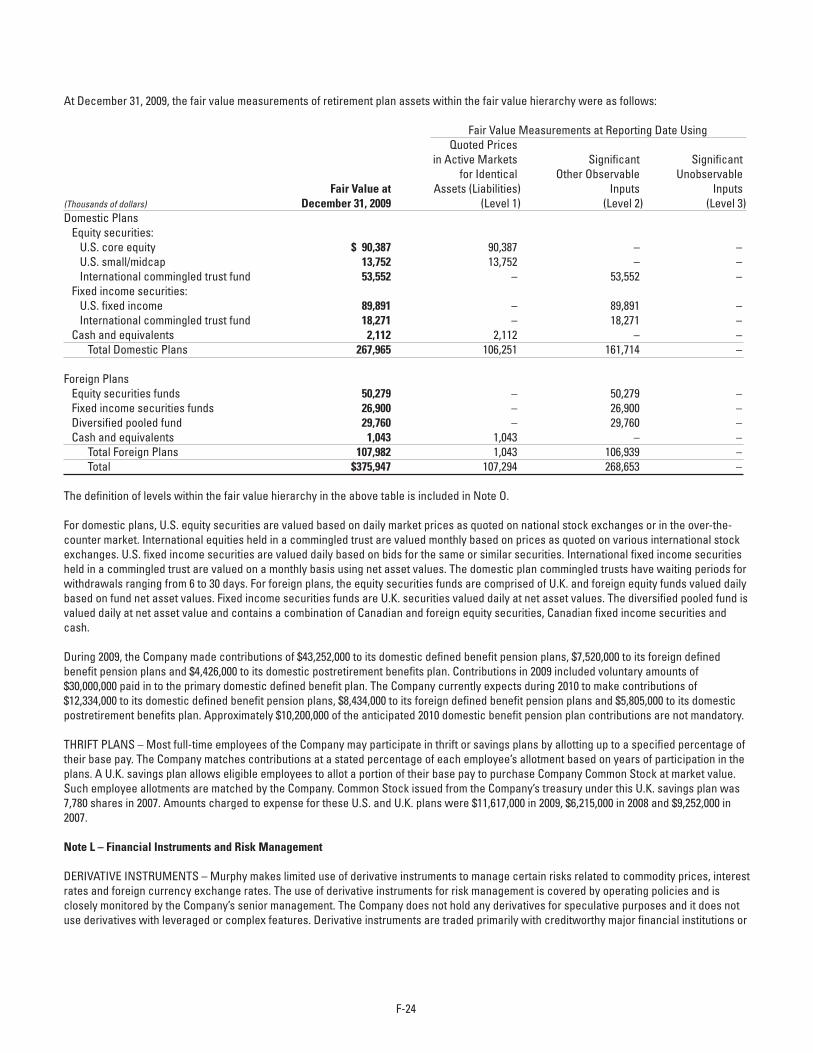
At December 31, 2009, the fair value measurements of retirement plan assets within the fair value hierarchy were as follows:
Fair Value Measurements at Reporting Date Using Quoted Prices in Active Markets Significant Significant for Identical Other Observable Unobservable Fair Value at Assets (Liabilities) Inputs Inputs (Thousands of dollars) December 31, 2009 (Level 1) (Level 2) (Level 3)Domestic Plans Equity securities: U.S. core equity $ 90,387 90,387 – – U.S. small/midcap 13,752 13,752 – – International commingled trust fund 53,552 – 53,552 – Fixed income securities: U.S. fixed income 89,891 – 89,891 – International commingled trust fund 18,271 – 18,271 – Cash and equivalents 2,112 2,112 – – Total Domestic Plans 267,965 106,251 161,714 –
Foreign Plans Equity securities funds 50,279 – 50,279 – Fixed income securities funds 26,900 – 26,900 – Diversified pooled fund 29,760 – 29,760 – Cash and equivalents 1,043 1,043 – – Total Foreign Plans 107,982 1,043 106,939 – Total $375,947 107,294 268,653 –
The definition of levels within the fair value hierarchy in the above table is included in Note O.
For domestic plans, U.S. equity securities are valued based on daily market prices as quoted on national stock exchanges or in the over-the-counter market. International equities held in a commingled trust are valued monthly based on prices as quoted on various international stock exchanges. U.S. fixed income securities are valued daily based on bids for the same or similar securities. International fixed income securities held in a commingled trust are valued on a monthly basis using net asset values. The domestic plan commingled trusts have waiting periods for withdrawals ranging from 6 to 30 days. For foreign plans, the equity securities funds are comprised of U.K. and foreign equity funds valued daily based on fund net asset values. Fixed income securities funds are U.K. securities valued daily at net asset values. The diversified pooled fund is valued daily at net asset value and contains a combination of Canadian and foreign equity securities, Canadian fixed income securities and cash.
During 2009, the Company made contributions of $43,252,000 to its domestic defined benefit pension plans, $7,520,000 to its foreign defined benefit pension plans and $4,426,000 to its domestic postretirement benefits plan. Contributions in 2009 included voluntary amounts of $30,000,000 paid in to the primary domestic defined benefit plan. The Company currently expects during 2010 to make contributions of $12,334,000 to its domestic defined benefit pension plans, $8,434,000 to its foreign defined benefit pension plans and $5,805,000 to its domestic postretirement benefits plan. Approximately $10,200,000 of the anticipated 2010 domestic benefit pension plan contributions are not mandatory.
THRIFT PLANS – Most full-time employees of the Company may participate in thrift or savings plans by allotting up to a specified percentage of their base pay. The Company matches contributions at a stated percentage of each employee’s allotment based on years of participation in the plans. A U.K. savings plan allows eligible employees to allot a portion of their base pay to purchase Company Common Stock at market value. Such employee allotments are matched by the Company. Common Stock issued from the Company’s treasury under this U.K. savings plan was 7,780 shares in 2007. Amounts charged to expense for these U.S. and U.K. plans were $11,617,000 in 2009, $6,215,000 in 2008 and $9,252,000 in 2007.
Note L – Financial Instruments and Risk Management
DERIVATIVE INSTRUMENTS – Murphy makes limited use of derivative instruments to manage certain risks related to commodity prices, interest rates and foreign currency exchange rates. The use of derivative instruments for risk management is covered by operating policies and is closely monitored by the Company’s senior management. The Company does not hold any derivatives for speculative purposes and it does not use derivatives with leveraged or complex features. Derivative instruments are traded primarily with creditworthy major financial institutions or
F-24
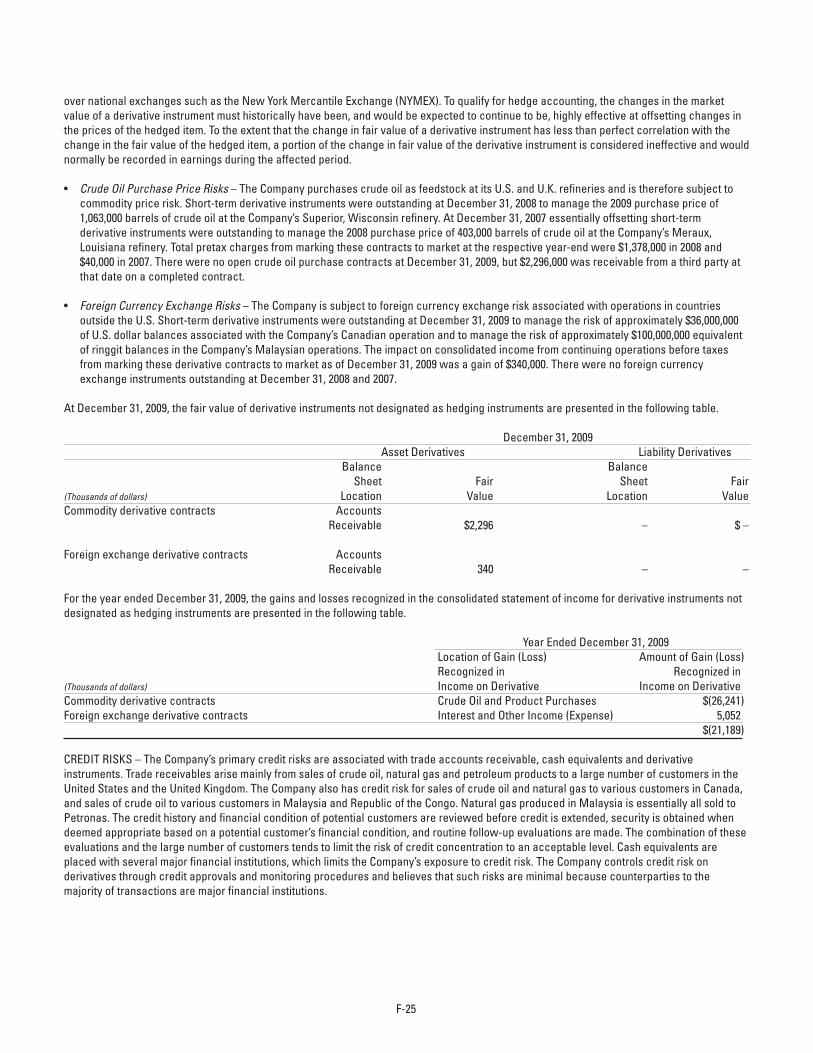
over national exchanges such as the New York Mercantile Exchange (NYMEX). To qualify for hedge accounting, the changes in the market value of a derivative instrument must historically have been, and would be expected to continue to be, highly effective at offsetting changes in the prices of the hedged item. To the extent that the change in fair value of a derivative instrument has less than perfect correlation with the change in the fair value of the hedged item, a portion of the change in fair value of the derivative instrument is considered ineffective and would normally be recorded in earnings during the affected period.
• Crude Oil Purchase Price Risks – The Company purchases crude oil as feedstock at its U.S. and U.K. refineries and is therefore subject to commodity price risk. Short-term derivative instruments were outstanding at December 31, 2008 to manage the 2009 purchase price of 1,063,000 barrels of crude oil at the Company’s Superior, Wisconsin refinery. At December 31, 2007 essentially offsetting short-term derivative instruments were outstanding to manage the 2008 purchase price of 403,000 barrels of crude oil at the Company’s Meraux, Louisiana refinery. Total pretax charges from marking these contracts to market at the respective year-end were $1,378,000 in 2008 and $40,000 in 2007. There were no open crude oil purchase contracts at December 31, 2009, but $2,296,000 was receivable from a third party at that date on a completed contract.
• Foreign Currency Exchange Risks – The Company is subject to foreign currency exchange risk associated with operations in countries outside the U.S. Short-term derivative instruments were outstanding at December 31, 2009 to manage the risk of approximately $36,000,000 of U.S. dollar balances associated with the Company’s Canadian operation and to manage the risk of approximately $100,000,000 equivalent of ringgit balances in the Company’s Malaysian operations. The impact on consolidated income from continuing operations before taxes from marking these derivative contracts to market as of December 31, 2009 was a gain of $340,000. There were no foreign currency exchange instruments outstanding at December 31, 2008 and 2007.
At December 31, 2009, the fair value of derivative instruments not designated as hedging instruments are presented in the following table.
December 31, 2009 Asset Derivatives Liability Derivatives Balance Balance Sheet Fair Sheet Fair(Thousands of dollars) Location Value Location ValueCommodity derivative contracts Accounts Receivable $2,296 – $ –
Foreign exchange derivative contracts Accounts Receivable 340 – –
For the year ended December 31, 2009, the gains and losses recognized in the consolidated statement of income for derivative instruments not designated as hedging instruments are presented in the following table.
Year Ended December 31, 2009 Location of Gain (Loss) Amount of Gain (Loss) Recognized in Recognized in(Thousands of dollars) Income on Derivative Income on DerivativeCommodity derivative contracts Crude Oil and Product Purchases $(26,241)Foreign exchange derivative contracts Interest and Other Income (Expense) 5,052 $(21,189)
CREDIT RISKS – The Company’s primary credit risks are associated with trade accounts receivable, cash equivalents and derivative instruments. Trade receivables arise mainly from sales of crude oil, natural gas and petroleum products to a large number of customers in the United States and the United Kingdom. The Company also has credit risk for sales of crude oil and natural gas to various customers in Canada, and sales of crude oil to various customers in Malaysia and Republic of the Congo. Natural gas produced in Malaysia is essentially all sold to Petronas. The credit history and financial condition of potential customers are reviewed before credit is extended, security is obtained when deemed appropriate based on a potential customer’s financial condition, and routine follow-up evaluations are made. The combination of these evaluations and the large number of customers tends to limit the risk of credit concentration to an acceptable level. Cash equivalents are placed with several major financial institutions, which limits the Company’s exposure to credit risk. The Company controls credit risk on derivatives through credit approvals and monitoring procedures and believes that such risks are minimal because counterparties to the majority of transactions are major financial institutions.
F-25
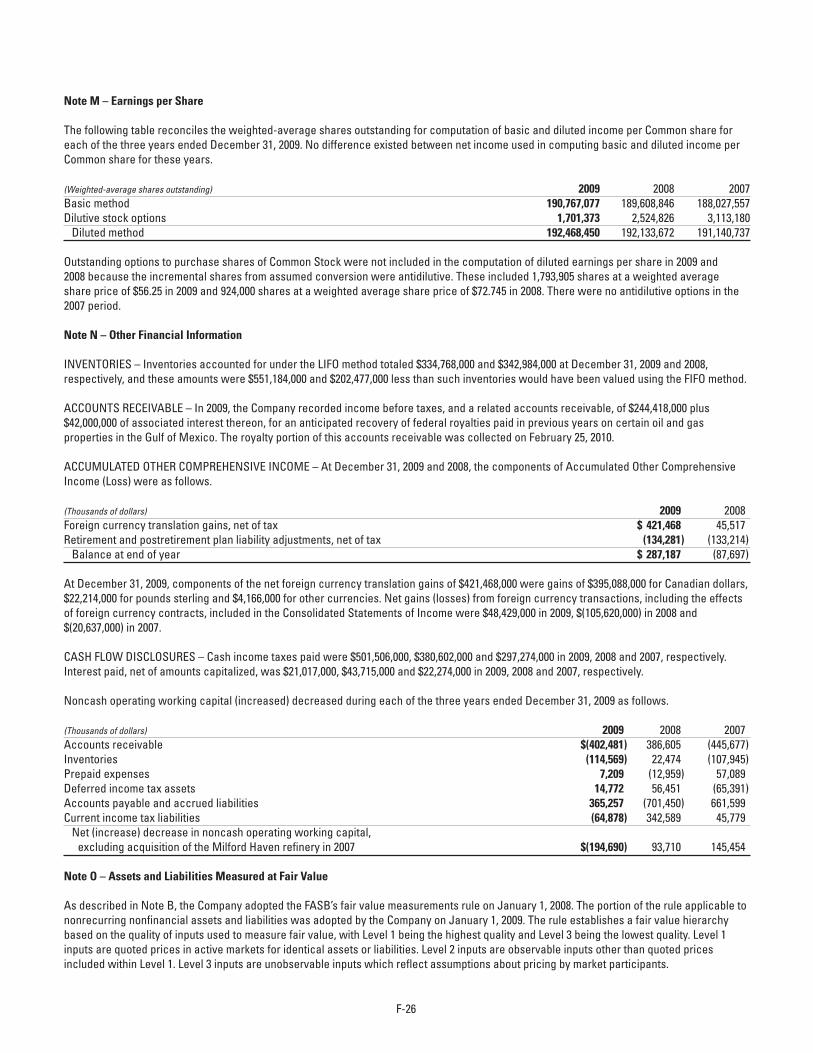
Note M – Earnings per Share
The following table reconciles the weighted-average shares outstanding for computation of basic and diluted income per Common share for each of the three years ended December 31, 2009. No difference existed between net income used in computing basic and diluted income per Common share for these years.
(Weighted-average shares outstanding) 2009 2008 2007Basic method 190,767,077 189,608,846 188,027,557Dilutive stock options 1,701,373 2,524,826 3,113,180 Diluted method 192,468,450 192,133,672 191,140,737
Outstanding options to purchase shares of Common Stock were not included in the computation of diluted earnings per share in 2009 and 2008 because the incremental shares from assumed conversion were antidilutive. These included 1,793,905 shares at a weighted average share price of $56.25 in 2009 and 924,000 shares at a weighted average share price of $72.745 in 2008. There were no antidilutive options in the 2007 period.
Note N – Other Financial Information
INVENTORIES – Inventories accounted for under the LIFO method totaled $334,768,000 and $342,984,000 at December 31, 2009 and 2008, respectively, and these amounts were $551,184,000 and $202,477,000 less than such inventories would have been valued using the FIFO method.
ACCOUNTS RECEIVABLE – In 2009, the Company recorded income before taxes, and a related accounts receivable, of $244,418,000 plus $42,000,000 of associated interest thereon, for an anticipated recovery of federal royalties paid in previous years on certain oil and gas properties in the Gulf of Mexico. The royalty portion of this accounts receivable was collected on February 25, 2010.
ACCUMULATED OTHER COMPREHENSIVE INCOME – At December 31, 2009 and 2008, the components of Accumulated Other Comprehensive Income (Loss) were as follows.
(Thousands of dollars) 2009 2008Foreign currency translation gains, net of tax $ 421,468 45,517Retirement and postretirement plan liability adjustments, net of tax (134,281) (133,214) Balance at end of year $ 287,187 (87,697)
At December 31, 2009, components of the net foreign currency translation gains of $421,468,000 were gains of $395,088,000 for Canadian dollars, $22,214,000 for pounds sterling and $4,166,000 for other currencies. Net gains (losses) from foreign currency transactions, including the effects of foreign currency contracts, included in the Consolidated Statements of Income were $48,429,000 in 2009, $(105,620,000) in 2008 and $(20,637,000) in 2007.
CASH FLOW DISCLOSURES – Cash income taxes paid were $501,506,000, $380,602,000 and $297,274,000 in 2009, 2008 and 2007, respectively. Interest paid, net of amounts capitalized, was $21,017,000, $43,715,000 and $22,274,000 in 2009, 2008 and 2007, respectively.
Noncash operating working capital (increased) decreased during each of the three years ended December 31, 2009 as follows.
(Thousands of dollars) 2009 2008 2007Accounts receivable $(402,481) 386,605 (445,677)Inventories (114,569) 22,474 (107,945)Prepaid expenses 7,209 (12,959) 57,089Deferred income tax assets 14,772 56,451 (65,391)Accounts payable and accrued liabilities 365,257 (701,450) 661,599Current income tax liabilities (64,878) 342,589 45,779 Net (increase) decrease in noncash operating working capital, excluding acquisition of the Milford Haven refinery in 2007 $(194,690) 93,710 145,454
Note O – Assets and Liabilities Measured at Fair Value
As described in Note B, the Company adopted the FASB’s fair value measurements rule on January 1, 2008. The portion of the rule applicable to nonrecurring nonfinancial assets and liabilities was adopted by the Company on January 1, 2009. The rule establishes a fair value hierarchy based on the quality of inputs used to measure fair value, with Level 1 being the highest quality and Level 3 being the lowest quality. Level 1 inputs are quoted prices in active markets for identical assets or liabilities. Level 2 inputs are observable inputs other than quoted prices included within Level 1. Level 3 inputs are unobservable inputs which reflect assumptions about pricing by market participants.
F-26
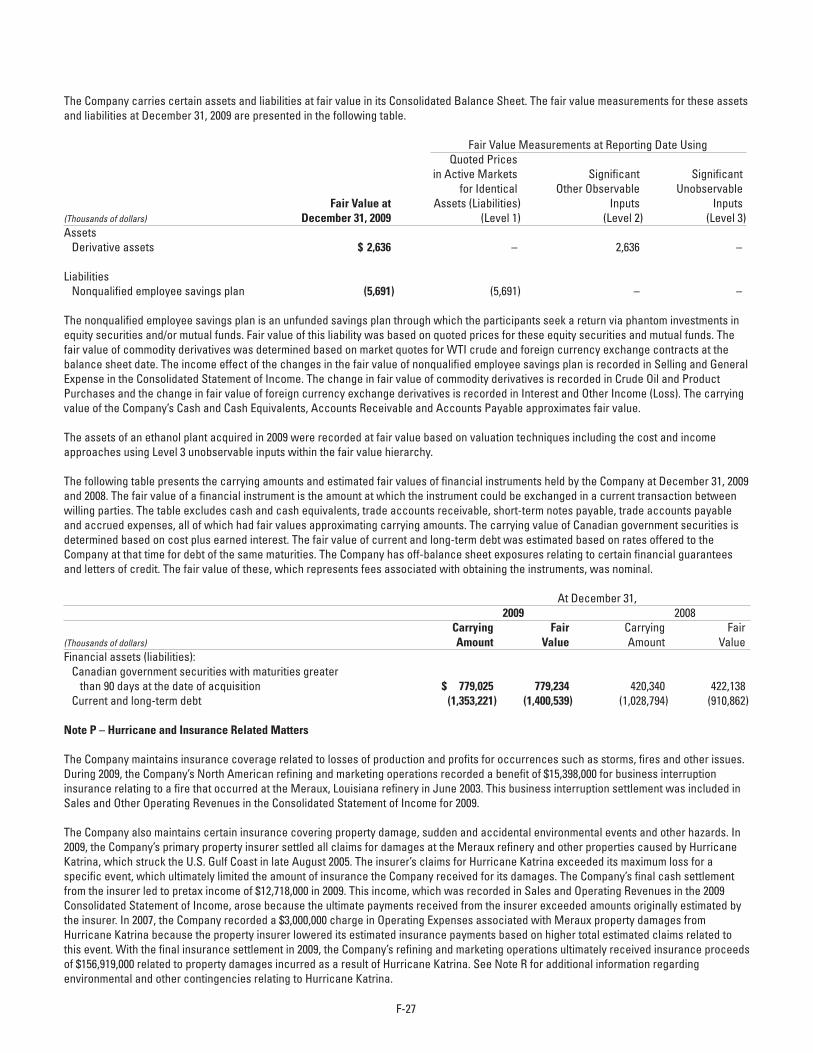
The Company carries certain assets and liabilities at fair value in its Consolidated Balance Sheet. The fair value measurements for these assets and liabilities at December 31, 2009 are presented in the following table.
Fair Value Measurements at Reporting Date Using Quoted Prices in Active Markets Significant Significant for Identical Other Observable Unobservable Fair Value at Assets (Liabilities) Inputs Inputs (Thousands of dollars) December 31, 2009 (Level 1) (Level 2) (Level 3)Assets Derivative assets $ 2,636 – 2,636 –
Liabilities Nonqualified employee savings plan (5,691) (5,691) – –
The nonqualified employee savings plan is an unfunded savings plan through which the participants seek a return via phantom investments in equity securities and/or mutual funds. Fair value of this liability was based on quoted prices for these equity securities and mutual funds. The fair value of commodity derivatives was determined based on market quotes for WTI crude and foreign currency exchange contracts at the balance sheet date. The income effect of the changes in the fair value of nonqualified employee savings plan is recorded in Selling and General Expense in the Consolidated Statement of Income. The change in fair value of commodity derivatives is recorded in Crude Oil and Product Purchases and the change in fair value of foreign currency exchange derivatives is recorded in Interest and Other Income (Loss). The carrying value of the Company’s Cash and Cash Equivalents, Accounts Receivable and Accounts Payable approximates fair value.
The assets of an ethanol plant acquired in 2009 were recorded at fair value based on valuation techniques including the cost and income approaches using Level 3 unobservable inputs within the fair value hierarchy.
The following table presents the carrying amounts and estimated fair values of financial instruments held by the Company at December 31, 2009 and 2008. The fair value of a financial instrument is the amount at which the instrument could be exchanged in a current transaction between willing parties. The table excludes cash and cash equivalents, trade accounts receivable, short-term notes payable, trade accounts payable and accrued expenses, all of which had fair values approximating carrying amounts. The carrying value of Canadian government securities is determined based on cost plus earned interest. The fair value of current and long-term debt was estimated based on rates offered to the Company at that time for debt of the same maturities. The Company has off-balance sheet exposures relating to certain financial guarantees and letters of credit. The fair value of these, which represents fees associated with obtaining the instruments, was nominal.
At December 31, 2009 2008 Carrying Fair Carrying Fair(Thousands of dollars) Amount Value Amount ValueFinancial assets (liabilities): Canadian government securities with maturities greater than 90 days at the date of acquisition $ 779,025 779,234 420,340 422,138 Current and long-term debt (1,353,221) (1,400,539) (1,028,794) (910,862)
Note P – Hurricane and Insurance Related Matters
The Company maintains insurance coverage related to losses of production and profits for occurrences such as storms, fires and other issues. During 2009, the Company’s North American refining and marketing operations recorded a benefit of $15,398,000 for business interruption insurance relating to a fire that occurred at the Meraux, Louisiana refinery in June 2003. This business interruption settlement was included in Sales and Other Operating Revenues in the Consolidated Statement of Income for 2009.
The Company also maintains certain insurance covering property damage, sudden and accidental environmental events and other hazards. In 2009, the Company’s primary property insurer settled all claims for damages at the Meraux refinery and other properties caused by Hurricane Katrina, which struck the U.S. Gulf Coast in late August 2005. The insurer’s claims for Hurricane Katrina exceeded its maximum loss for a specific event, which ultimately limited the amount of insurance the Company received for its damages. The Company’s final cash settlement from the insurer led to pretax income of $12,718,000 in 2009. This income, which was recorded in Sales and Operating Revenues in the 2009 Consolidated Statement of Income, arose because the ultimate payments received from the insurer exceeded amounts originally estimated by the insurer. In 2007, the Company recorded a $3,000,000 charge in Operating Expenses associated with Meraux property damages from Hurricane Katrina because the property insurer lowered its estimated insurance payments based on higher total estimated claims related to this event. With the final insurance settlement in 2009, the Company’s refining and marketing operations ultimately received insurance proceeds of $156,919,000 related to property damages incurred as a result of Hurricane Katrina. See Note R for additional information regarding environmental and other contingencies relating to Hurricane Katrina.
F-27
The Company also settled with an insurance consortium in 2009 for its claims related to a crude oil spill that occurred at the Meraux refinery after Hurricane Katrina. The settlement led to pretax income of $6,500,000 in the Consolidated Statement of Income for 2009, with $4,500,000 related to the insurance claim included in Sales and Other Operating Revenues for the North American Refining and Marketing segment and $2,000,000 of associated interest income included in Interest and Other Income for Corporate activities. At year-end 2009, the Company had not settled its claim against one insurer for legal and professional costs associated with the insurance coverage negotiation process. During early 2010, the Company agreed to accept a final settlement of $3,000,000 from the insurer for these costs.
Note Q – Commitments
In September 2009, the Company entered into a forward sales contract to mitigate the price risk for a portion of its 2010 natural gas sales volumes at the Tupper field in Western Canada. The contract calls for natural gas deliveries of approximately 33 million cubic feet per day during 2010 at a price of Cdn$5.30 per thousand cubic feet at the AECO “C” sales point. The contract has been accounted for as a normal sale for accounting purposes.
The Company leases land, gasoline stations, and production and other facilities under operating leases. The most significant operating leases are associated with floating, production, storage and offloading facilities at the Kikeh and Azurite oil fields and a production facility at the Thunder Hawk field. During the next five years, expected future rental payments under all operating leases are approximately $146,784,000 in 2010, $139,490,000 in 2011, $137,362,000 in 2012, $132,035,000 in 2013 and $121,925,000 in 2014. Rental expense for noncancellable operating leases, including contingent payments when applicable, was $124,693,000 in 2009, $88,890,000 in 2008 and $61,439,000 in 2007. During the construction period for these leased assets at Azurite and Thunder Hawk, the Company was considered the proportionate owner of this equipment for accounting purposes, and therefore, recorded equivalent assets and liabilities in the Consolidated Balance Sheet prior to the commencement of the leases. Upon completion of the construction of the two pieces of equipment, the assets and liabilities of approximately $282,700,000 associated with these equipment leases were removed from the Company’s Consolidated Balance Sheet through a non-cash related sale and leaseback transaction. There was no impact on net income, cash flow or stockholders’ equity from these sale and leaseback transactions.
To assure a long-term supply of hydrogen at its Meraux, Louisiana refinery, the Company has contracted to purchase up to 35 million standard cubic feet of hydrogen per day at market prices through 2021. The contract requires the payment of a base facility charge for use of the facility. Future required minimum annual payments for base facility charges for the next five years are $6,550,000 in 2010, $6,812,000 in 2011, $7,084,000 in 2012, $7,368,000 in 2013 and $7,663,000 in 2014. Base facility charges and hydrogen costs incurred in 2009, 2008 and 2007 totaled $26,888,000, $45,396,000 and $42,512,000, respectively.
The Company has operating, production handling and transportation agreements providing for processing, production handling and transportation services for hydrocarbon production from certain fields in the Gulf of Mexico and Western Canada. These agreements require minimum monthly or annual payments for processing and/or transportation charges through 2018. Future required minimum monthly payments for the next five years are $9,912,000 in 2010, $17,972,000 in 2011, $17,814,000 in 2012, $12,720,000 in 2013 and $15,779,000 in 2014. Under certain circumstances, the Company is required to pay additional amounts depending on the actual hydrocarbon quantities processed under the agreement. Costs incurred under these arrangements were $11,860,000 in 2009, $9,276,000 in 2008 and $13,476,000 in 2007.
Additionally, the Company has a Reserved Capacity Service Agreement providing for the availability of needed crude oil storage capacity for certain oil fields through 2020. Under the agreement, the Company must make specified minimum payments monthly. Future required minimum annual payments are approximately $3,500,000 in 2010 through 2014. In addition, the Company is required to pay additional amounts depending on actual crude oil quantities stored under the agreement. Total payments under the agreement were $2,743,000 in 2009, $3,703,000 in 2008 and $3,992,000 in 2007.
In 2006, the Company committed to fund an educational assistance program known as the “El Dorado Promise.” Under this commitment, the Company will pay $5,000,000 per year from 2007 to 2016 to provide scholarships for a specified amount of college expenses for eligible graduates of El Dorado High School in Arkansas. The first four payments have been made through January 2010. The Company recorded a discounted liability of $38,700,000 in 2006 for this unconditional commitment. The liability was discounted at the Company’s 10-year borrowing rate and the discounted liability increases for accretion monthly with a corresponding charge to Selling and General Expenses in the Consolidated Statement of Income. Total accretion cost included in Selling and General Expense was $1,739,000 in 2009, $1,931,000 in 2008 and $2,112,000 in 2007.
Commitments for capital expenditures were approximately $1,335,943,000 at December 31, 2009, including $839,505,000 for field development and future work commitments in Malaysia, $93,223,000 for costs to develop deepwater Gulf of Mexico fields, and $71,019,000 for field development and a work commitment in Republic of the Congo.
F-28
The Company has entered into contracts to hire various drilling rigs and associated equipment for periods beyond December 31, 2009. These rigs are primarily utilized for drilling operations in the Gulf of Mexico, Malaysia, Canada and Republic of the Congo. Future commitments under these contracts, all of which expire by 2012, total approximately $625,276,000. A significant portion of these costs are expected to be borne by other working interest owners as partners of the Company when the wells are drilled. These drilling costs are generally expected to be accounted for as capital expenditures as incurred during the contract periods.
Note R – Contingencies
The Company’s operations and earnings have been and may be affected by various forms of governmental action both in the United States and throughout the world. Examples of such governmental action include, but are by no means limited to: tax increases and retroactive tax claims; royalty and revenue sharing increases; import and export controls; price controls; currency controls; allocation of supplies of crude oil and petroleum products and other goods; expropriation of property; restrictions and preferences affecting the issuance of oil and gas or mineral leases; restrictions on drilling and/or production; laws and regulations intended for the promotion of safety and the protection and/or remediation of the environment; governmental support for other forms of energy; and laws and regulations affecting the Company’s relationships with employees, suppliers, customers, stockholders and others. Because governmental actions are often motivated by political considerations, may be taken without full consideration of their consequences, and may be taken in response to actions of other governments, it is not practical to attempt to predict the likelihood of such actions, the form the actions may take or the effect such actions may have on the Company.
ENVIRONMENTAL MATTERS – Murphy and other companies in the oil and gas industry are subject to numerous federal, state, local and foreign laws and regulations dealing with the environment. Violation of federal or state environmental laws, regulations and permits can result in the imposition of significant civil and criminal penalties, injunctions and construction bans or delays. A discharge of hazardous substances into the environment could, to the extent such event is not insured, subject the Company to substantial expense, including both the cost to comply with applicable regulations and claims by neighboring landowners and other third parties for any personal injury and property damage that might result.
The Company currently owns or leases, and has in the past owned or leased, properties at which hazardous substances have been or are being handled. Although the Company has used operating and disposal practices that were standard in the industry at the time, hazardous substances may have been disposed of or released on or under the properties owned or leased by the Company or on or under other locations where these wastes have been taken for disposal. In addition, many of these properties have been operated by third parties whose treatment and disposal or release of hydrocarbons or other wastes were not under Murphy’s control. Under existing laws the Company could be required to remove or remediate previously disposed wastes (including wastes disposed of or released by prior owners or operators), to clean up contaminated property (including contaminated groundwater) or to perform remedial plugging operations to prevent future contamination. While some of these historical properties are in various stages of negotiation, investigation, and/or cleanup, the Company is investigating the extent of any such liability and the availability of applicable defenses and believes costs related to these sites will not have a material adverse affect on Murphy’s net income, financial condition or liquidity in a future period.
The Company’s liability for remedial obligations includes certain amounts that are based on anticipated regulatory approval for proposed remediation of former refinery waste sites. Although regulatory authorities may require more costly alternatives than the proposed processes, the cost of such potential alternative processes is not expected to exceed the accrued liability by a material amount. Certain environmental expenditures are likely to be recovered by the Company from other sources, primarily environmental funds maintained by certain states. Since no assurance can be given that future recoveries from other sources will occur, the Company has not recorded a benefit for likely recoveries at December 31, 2009.
The U.S. Environmental Protection Agency (EPA) currently considers the Company to be a Potentially Responsible Party (PRP) at two Superfund sites. The potential total cost to all parties to perform necessary remedial work at these sites may be substantial. However, based on current negotiations and available information, the Company believes that it is a de minimis party as to ultimate responsibility at these Superfund sites. The Company has not recorded a liability for remedial costs on Superfund sites. The Company could be required to bear a pro rata share of costs attributable to nonparticipating PRPs or could be assigned additional responsibility for remediation at the two sites or other Superfund sites. The Company believes that its share of the ultimate costs to clean-up the Superfund sites will be immaterial and will not have a material adverse effect on its net income, financial condition or liquidity in a future period.
There is the possibility that environmental expenditures could be required at currently unidentified sites, and new or revised regulations could require additional expenditures at known sites. However, based on information currently available to the Company, the amount of future remediation costs incurred at known or currently unidentified sites is not expected to have a material adverse effect on the Company’s future net income, cash flows or liquidity.
F-29
LEGAL MATTERS – Class action litigation and related opt-out claims involving the Hurricane Katrina related crude oil release in 2005 at the Company’s Meraux, Louisiana refinery have been resolved. Remaining litigation arising out of this incident consists of fewer than ten individual claims from outside the class area for which the Company’s exposure is de minimis. The Company originally recorded expense of $18,000,000 in 2006 related to settlement costs not expected to be covered by insurance. As a result of a confidential arbitral tribunal ruling issued on September 10, 2009 relating to liability insurance coverage issues, the Company recorded a benefit of $6,500,000 (inclusive of $2,000,000 of associated interest income) in 2009 to reduce the total overall expected expense related to this matter. Accordingly, the matter will not have a material adverse effect on the Company’s net income, financial condition or liquidity in a future period.
Litigation arising out of a June 10, 2003 fire in the Residual Oil Supercritical Extraction (ROSE) unit at the Company’s Meraux, Louisiana refinery was settled in July 2009 and memorialized via a filing in the U.S. District Court for the Eastern District of Louisiana on July 24, 2009. An arbitral tribunal heard the Company’s claim for indemnity from one of its insurers, AEGIS, in September 2009 and a decision is pending. The Company believes that insurance coverage does apply for this matter. The Company continues to believe that the ultimate resolution of the June 2003 ROSE fire litigation, including associated insurance coverage issues, will not have a material adverse effect on its net income, financial condition or liquidity in a future period.
Murphy and its subsidiaries are engaged in a number of other legal proceedings, all of which Murphy considers routine and incidental to its business. Based on information currently available to the Company, the ultimate resolution of environmental and legal matters referred to in this note is not expected to have a material adverse effect on the Company’s net income, financial condition or liquidity in a future period.
OTHER MATTERS – In the normal course of its business, the Company is required under certain contracts with various governmental authorities and others to provide financial guarantees or letters of credit that may be drawn upon if the Company fails to perform under those contracts. At December 31, 2009, the Company had contingent liabilities of $7,798,000 under a financial guarantee described in the following paragraph and $102,902,000 on outstanding letters of credit. The Company has not accrued a liability in its balance sheet related to these contingent liabilities and letters of credit because it is believed that the likelihood of having these drawn is remote.
The Company owns a 3.2% interest in the Louisiana Offshore Oil Port (LOOP) that it accounts for at cost. At year-end 2009, LOOP had $243,690,000 of outstanding bonds, which mature in varying amounts between 2014 and 2027 and which are secured by a Throughput and Deficiency Agreement (T&D). The Company is obligated to ship crude oil in quantities sufficient for LOOP to pay certain of its expenses and obligations, including long-term debt secured by the T&D, or to make cash payments for which the Company will receive credit for future throughput. No other collateral secures the investee’s obligation or the Company’s guarantee. As of December 31, 2009, it is not probable that the Company will be required to make payments under the guarantee; therefore, no liability has been recorded for the Company’s obligation under the T&D agreement. The Company continues to monitor conditions that are subject to guarantees to identify whether it is probable that a loss has occurred, and it would recognize any such losses under the guarantees should losses become probable.
Note S – Terra Nova Working Interest Redetermination
The joint agreement between the owners of the Terra Nova field, offshore Eastern Canada, requires a redetermination of working interests based on an analysis of reservoir quality among fault separated areas where varying ownership interests exist. The operator of Terra Nova completed the initial redetermination assessment in 2009 and the matter is the subject of arbitration before final interests are determined. The Company anticipates that its working interest at Terra Nova will be reduced from its current 12.0% to approximately 10.5%, subject to the results of the ongoing arbitration process between the operator and certain other owners. Upon completion of the arbitration process, the Company will be required to make a cash settlement payment to the Terra Nova partnership for the value of oil sold since about December 2004 related to the ultimate working interest reduction below 12.0%. The Company has recorded expense of $83,498,000 in 2009 based on the anticipated working interest reduction, with this amount reflected as Redetermination of Terra Nova Working Interest in the Consolidated Statement of Income. The Company cannot predict the final outcome of the redetermination process, which is expected to be completed by the end of 2010.
Note T – Common Stock Issued and Outstanding
Activity in the number of shares of Common Stock issued and outstanding for the three years ended December 31, 2009 is shown below.
(Number of shares outstanding) 2009 2008 2007At beginning of year 190,713,806 189,714,149 187,572,200Stock options exercised 548,659 1,275,971 2,249,300Employee stock purchase and thrift plans 61,575 19,755 37,679Restricted stock awards, net of forfeitures (208,662) (299,334) (144,442)All other – 3,265 (588) At end of year 191,115,378 190,713,806 189,714,149
F-30
Note U – Subsequent Events
The Company has evaluated subsequent events through the date of issuance of these consolidated financial statements (February 26, 2010). In certain cases, events that occur after the balance sheet date lead to recognition and/or disclosure in the consolidated financial statements.
Note V – Business Segments
Murphy’s reportable segments are organized into two major types of business activities, each subdivided into geographic areas of operations. The Company’s exploration and production activity is subdivided into segments for the United States, Canada, Malaysia, the United Kingdom, Republic of the Congo and all other countries; each of these segments derives revenues primarily from the sale of crude oil and/or natural gas. The Company’s refining and marketing segments are North America and the United Kingdom and each derives revenue mainly from the sale of petroleum products and merchandise. The Company sells gasoline in the United States at retail stations built primarily at Walmart Supercenters. The U.S. refining, ethanol and marketing businesses, and the former Canadian marketing business are included in the North American segment. In 2007, the Company exited the gasoline marketing business in Canada by closing and writing off all eight gasoline stations in that country. The Company’s management evaluates segment performance based on income from operations, excluding interest income and interest expense. Intersegment transfers of crude oil, natural gas and petroleum products are at market prices and intersegment services are recorded at cost.
Information about business segments and geographic operations is reported in the following tables. For geographic purposes, revenues are attributed to the country in which the sale occurs. The Company had no single customer from which it derived more than 10% of its revenues. Corporate and other activities, including interest income, miscellaneous gains and losses, interest expense and unallocated overhead, are shown in the tables to reconcile the business segments to consolidated totals. As used in the table on page F-32, Certain Long-Lived Assets at December 31 exclude investments, noncurrent receivables, deferred tax assets and goodwill and other intangible assets.
Excise taxes on petroleum products of $2,069,323,000, $2,140,338,000 and $2,070,777,000 for the years 2009, 2008 and 2007, respectively, that were collected by the Company and remitted to various government entities were excluded from revenues and costs and expenses.
F-31
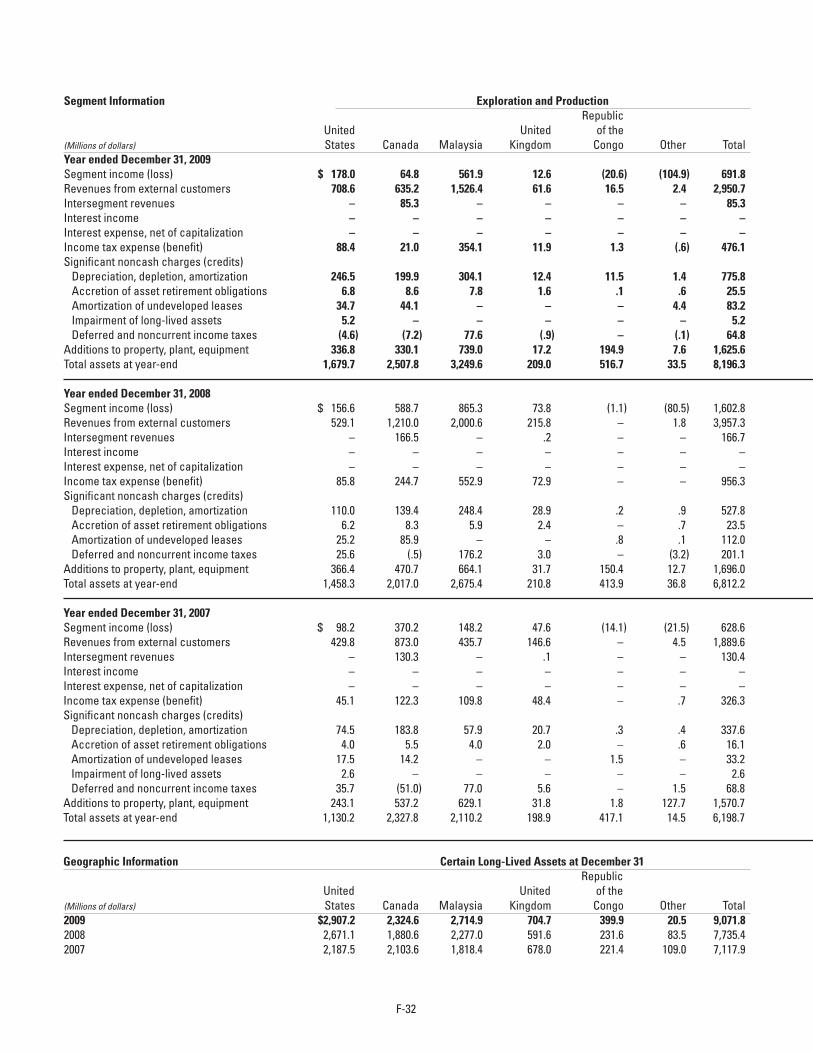
Segment Information Exploration and Production Republic United United of the(Millions of dollars) States Canada Malaysia Kingdom Congo Other TotalYear ended December 31, 2009Segment income (loss) $ 178.0 64.8 561.9 12.6 (20.6) (104.9) 691.8Revenues from external customers 708.6 635.2 1,526.4 61.6 16.5 2.4 2,950.7Intersegment revenues – 85.3 – – – – 85.3Interest income – – – – – – –Interest expense, net of capitalization – – – – – – –Income tax expense (benefit) 88.4 21.0 354.1 11.9 1.3 (.6) 476.1Significant noncash charges (credits) Depreciation, depletion, amortization 246.5 199.9 304.1 12.4 11.5 1.4 775.8 Accretion of asset retirement obligations 6.8 8.6 7.8 1.6 .1 .6 25.5 Amortization of undeveloped leases 34.7 44.1 – – – 4.4 83.2 Impairment of long-lived assets 5.2 – – – – – 5.2 Deferred and noncurrent income taxes (4.6) (7.2) 77.6 (.9) – (.1) 64.8Additions to property, plant, equipment 336.8 330.1 739.0 17.2 194.9 7.6 1,625.6Total assets at year-end 1,679.7 2,507.8 3,249.6 209.0 516.7 33.5 8,196.3
Year ended December 31, 2008Segment income (loss) $ 156.6 588.7 865.3 73.8 (1.1) (80.5) 1,602.8Revenues from external customers 529.1 1,210.0 2,000.6 215.8 – 1.8 3,957.3Intersegment revenues – 166.5 – .2 – – 166.7Interest income – – – – – – –Interest expense, net of capitalization – – – – – – –Income tax expense (benefit) 85.8 244.7 552.9 72.9 – – 956.3Significant noncash charges (credits) Depreciation, depletion, amortization 110.0 139.4 248.4 28.9 .2 .9 527.8 Accretion of asset retirement obligations 6.2 8.3 5.9 2.4 – .7 23.5 Amortization of undeveloped leases 25.2 85.9 – – .8 .1 112.0 Deferred and noncurrent income taxes 25.6 (.5) 176.2 3.0 – (3.2) 201.1Additions to property, plant, equipment 366.4 470.7 664.1 31.7 150.4 12.7 1,696.0Total assets at year-end 1,458.3 2,017.0 2,675.4 210.8 413.9 36.8 6,812.2
Year ended December 31, 2007Segment income (loss) $ 98.2 370.2 148.2 47.6 (14.1) (21.5) 628.6Revenues from external customers 429.8 873.0 435.7 146.6 – 4.5 1,889.6Intersegment revenues – 130.3 – .1 – – 130.4Interest income – – – – – – –Interest expense, net of capitalization – – – – – – –Income tax expense (benefit) 45.1 122.3 109.8 48.4 – .7 326.3Significant noncash charges (credits) Depreciation, depletion, amortization 74.5 183.8 57.9 20.7 .3 .4 337.6 Accretion of asset retirement obligations 4.0 5.5 4.0 2.0 – .6 16.1 Amortization of undeveloped leases 17.5 14.2 – – 1.5 – 33.2 Impairment of long-lived assets 2.6 – – – – – 2.6 Deferred and noncurrent income taxes 35.7 (51.0) 77.0 5.6 – 1.5 68.8Additions to property, plant, equipment 243.1 537.2 629.1 31.8 1.8 127.7 1,570.7Total assets at year-end 1,130.2 2,327.8 2,110.2 198.9 417.1 14.5 6,198.7
Geographic Information Certain Long-Lived Assets at December 31 Republic United United of the(Millions of dollars) States Canada Malaysia Kingdom Congo Other Total2009 $2,907.2 2,324.6 2,714.9 704.7 399.9 20.5 9,071.82008 2,671.1 1,880.6 2,277.0 591.6 231.6 83.5 7,735.42007 2,187.5 2,103.6 1,818.4 678.0 221.4 109.0 7,117.9
F-32
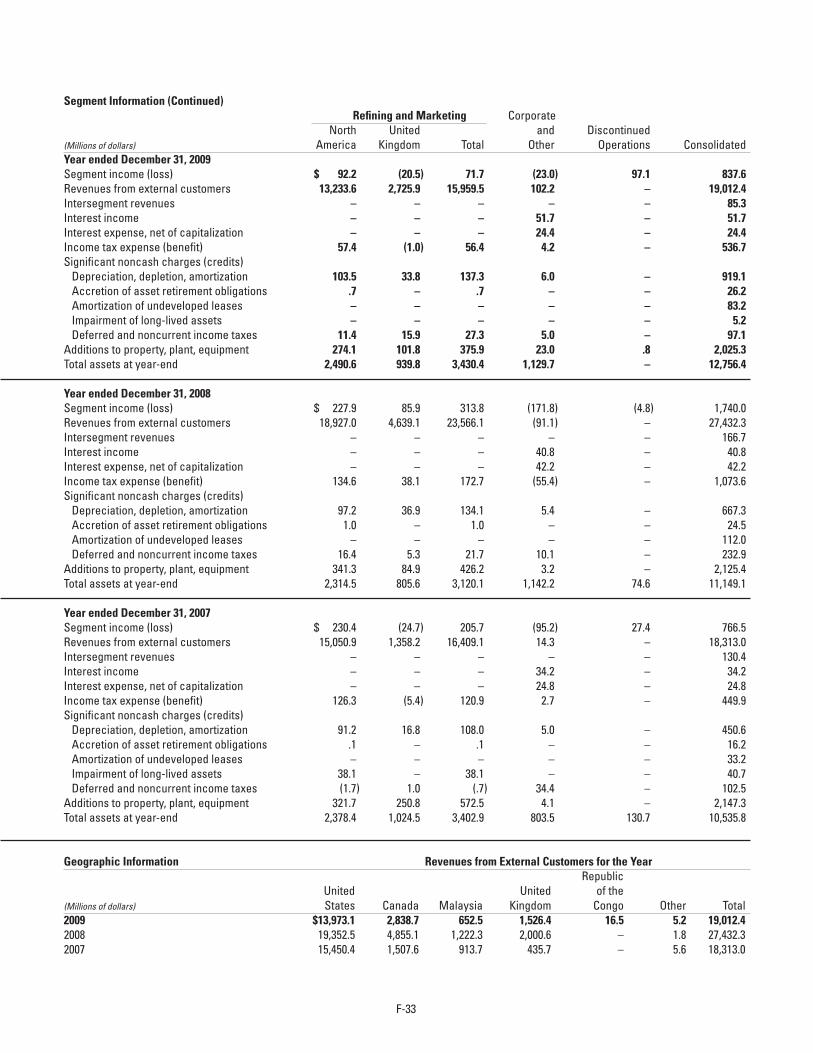
Segment Information (Continued) Refining and Marketing Corporate North United and Discontinued(Millions of dollars) America Kingdom Total Other Operations ConsolidatedYear ended December 31, 2009Segment income (loss) $ 92.2 (20.5) 71.7 (23.0) 97.1 837.6Revenues from external customers 13,233.6 2,725.9 15,959.5 102.2 – 19,012.4Intersegment revenues – – – – – 85.3Interest income – – – 51.7 – 51.7Interest expense, net of capitalization – – – 24.4 – 24.4Income tax expense (benefit) 57.4 (1.0) 56.4 4.2 – 536.7Significant noncash charges (credits) Depreciation, depletion, amortization 103.5 33.8 137.3 6.0 – 919.1 Accretion of asset retirement obligations .7 – .7 – – 26.2 Amortization of undeveloped leases – – – – – 83.2 Impairment of long-lived assets – – – – – 5.2 Deferred and noncurrent income taxes 11.4 15.9 27.3 5.0 – 97.1Additions to property, plant, equipment 274.1 101.8 375.9 23.0 .8 2,025.3Total assets at year-end 2,490.6 939.8 3,430.4 1,129.7 – 12,756.4
Year ended December 31, 2008 Segment income (loss) $ 227.9 85.9 313.8 (171.8) (4.8) 1,740.0Revenues from external customers 18,927.0 4,639.1 23,566.1 (91.1) – 27,432.3Intersegment revenues – – – – – 166.7Interest income – – – 40.8 – 40.8Interest expense, net of capitalization – – – 42.2 – 42.2Income tax expense (benefit) 134.6 38.1 172.7 (55.4) – 1,073.6Significant noncash charges (credits) Depreciation, depletion, amortization 97.2 36.9 134.1 5.4 – 667.3 Accretion of asset retirement obligations 1.0 – 1.0 – – 24.5 Amortization of undeveloped leases – – – – – 112.0 Deferred and noncurrent income taxes 16.4 5.3 21.7 10.1 – 232.9Additions to property, plant, equipment 341.3 84.9 426.2 3.2 – 2,125.4Total assets at year-end 2,314.5 805.6 3,120.1 1,142.2 74.6 11,149.1
Year ended December 31, 2007 Segment income (loss) $ 230.4 (24.7) 205.7 (95.2) 27.4 766.5Revenues from external customers 15,050.9 1,358.2 16,409.1 14.3 – 18,313.0Intersegment revenues – – – – – 130.4Interest income – – – 34.2 – 34.2Interest expense, net of capitalization – – – 24.8 – 24.8Income tax expense (benefit) 126.3 (5.4) 120.9 2.7 – 449.9Significant noncash charges (credits) Depreciation, depletion, amortization 91.2 16.8 108.0 5.0 – 450.6 Accretion of asset retirement obligations .1 – .1 – – 16.2 Amortization of undeveloped leases – – – – – 33.2 Impairment of long-lived assets 38.1 – 38.1 – – 40.7 Deferred and noncurrent income taxes (1.7) 1.0 (.7) 34.4 – 102.5Additions to property, plant, equipment 321.7 250.8 572.5 4.1 – 2,147.3Total assets at year-end 2,378.4 1,024.5 3,402.9 803.5 130.7 10,535.8
Geographic Information Revenues from External Customers for the Year Republic United United of the(Millions of dollars) States Canada Malaysia Kingdom Congo Other Total2009 $13,973.1 2,838.7 652.5 1,526.4 16.5 5.2 19,012.42008 19,352.5 4,855.1 1,222.3 2,000.6 – 1.8 27,432.32007 15,450.4 1,507.6 913.7 435.7 – 5.6 18,313.0
F-33
MURPHY OIL CORPORATION AND CONSOLIDATED SUBSIDIARIESSUPPLEMENTAL OIL AND GAS INFORMATION (UNAUDITED)
The following unaudited schedules are presented in accordance with required disclosures about Oil and Gas Producing Activities to provide users with a common base for preparing estimates of future cash flows and comparing reserves among companies. Additional background information follows concerning four of the schedules.
SCHEDULE 1 – SUMMARY OF OIL RESERVES AND SCHEDULE 2 – SUMMARY OF NATURAL GAS RESERVES – Reserves of crude oil, condensate, natural gas liquids, natural gas and synthetic oil are estimated by the Company’s engineers and are adjusted to reflect contractual arrangements and royalty rates in effect at the end of each year. Many assumptions and judgmental decisions are required to estimate reserves. Reported quantities are subject to future revisions, some of which may be substantial, as additional information becomes available from reservoir performance, new geological and geophysical data, additional drilling, technological advancements, price changes and other economic factors.
In 2008, the U.S. Securities and Exchange Commission (SEC) adopted new definitions and rules for oil and gas reserves that became effective for the Company as of December 31, 2009. The SEC now defines proved reserves as those quantities of oil and gas which, by analysis of geoscience and engineering data, can be estimated with reasonable certainty to be economically producible from a given date forward, from known reservoirs and under existing economic conditions, operating methods and government regulations before the time at which contracts providing the right to operate expire, unless evidence indicates that renewal is reasonably certain, regardless of whether deterministic or probabilistic method is used for the estimation. Proved developed oil and gas reserves are proved reserves that can be expected to be recovered through existing wells with existing equipment and operating methods or in which the cost of the required equipment is relatively minor compared with the cost of a new well, or through installed extraction equipment and infrastructure operational at the time of the reserves estimate if the extraction is by means not involving a well. Proved undeveloped oil and gas reserves are proved reserves that are expected to be recovered from new wells on undrilled acreage, or from existing wells where a relatively major expenditure is required for recompletion. The new SEC rules have expanded oil and gas producing activities to include non-traditional and unconventional resources such as the Company’s 5% interest in synthetic oil operations at Syncrude in Western Canada. Therefore, net oil reserves after royalties for this synthetic oil operations have been included as a separate column in the proved oil reserves schedule at December 31, 2009. The SEC also now requires expanded disclosures of proved undeveloped reserves, to include discussion of such reserves held for five or more years, plus disclosures of the Company’s controls over the oil and gas reserves processes, including the qualifications of the chief technical person who oversees the Company’s reserves process. The SEC also now permits companies to voluntarily disclose probable and possible reserves in SEC filings, but the Company has elected not to provide these voluntary disclosures.
Due to new SEC proved reserve definitions beginning at year-end 2009, Murphy has included synthetic crude oil from its 5% interest in the Syncrude project in Alberta, Canada in its proved oil reserves for the first time. This operation involves a process of mining tar sands and converting the raw bitumen into a pipeline-quality crude. The proved reserves associated with this project are estimated through a combination of core-hole drilling and realized process efficiencies. The high-density core-hole drilling, at a spacing of less than 500 meters (proved area), provides engineering and geologic data needed to estimate the volumes of tar sand in place and its associated bitumen content. The bitumen generally constitutes approximately 10% of the total bulk tar sand that is mined. The bitumen extraction process is fairly efficient and removes about 90% of the bitumen that is contained within the tar sand. The final step of the process converts the 8.4° API bitumen into 30°-34° API crude oil. A catalytic cracking process is used to crack the long hydrocarbon chains into shorter ones yielding a final crude oil that can be shipped via pipelines. The cracking process has an efficiency ranging from 85% – 90%. Overall, it takes approximately two metric tons of oil sand to produce one barrel of synthetic crude oil. All synthetic oil volumes reported as reserves in this filing are the final synthetic crude oil product.
Production quantities shown are net volumes withdrawn from reservoirs. These may differ from sales quantities due to inventory changes, volumes consumed for fuel and/or shrinkage from extraction of natural gas liquids. Proved oil reserves shown in Schedule 1 include natural gas liquids.
Oil and natural gas reserves in Malaysia are associated with production sharing contracts for Blocks SK 309/311 and K. Malaysia reserves include oil and gas to be received for both cost recovery and profit provisions under the contracts. Oil and natural gas reserves associated with the production sharing contracts in Malaysia totaled 110.1 million barrels and 511.8 billion cubic feet, respectively, at December 31, 2009. Oil reserves attributable to a production sharing agreement in Republic of the Congo amounted to 7.9 million barrels at December 31, 2009.
F-34
SCHEDULE 4 – RESULTS OF OPERATIONS FOR OIL AND GAS PRODUCING ACTIVITIES – Results of operations from exploration and production activities by geographic area are reported as if these activities were not part of an operation that also refines crude oil and sells refined products.
SCHEDULE 5 – STANDARDIZED MEASURE OF DISCOUNTED FUTURE NET CASH FLOWS RELATING TO PROVED OIL AND GAS RESERVES – Generally accepted accounting principles require calculation of future net cash flows using a 10% annual discount factor, an unweighted average of oil and gas prices in effect at the beginning of each month of the year, and year-end costs and statutory tax rates, except for known future changes such as contracted prices and legislated tax rates.
The reported value of proved reserves is not necessarily indicative of either fair market value or present value of future cash flows because prices, costs and governmental policies do not remain static; appropriate discount rates may vary; and extensive judgment is required to estimate the timing of production. Other logical assumptions would likely have resulted in significantly different amounts. Generally accepted accounting principles require that an unweighted average oil and natural gas prices in effect at the beginning of each month of the year be used for calculation of the standardized measure of discounted future net cash flows.
Schedule 5 also presents the principal reasons for change in the standardized measure of discounted future net cash flows for each of the three years ended December 31, 2009.
F-35
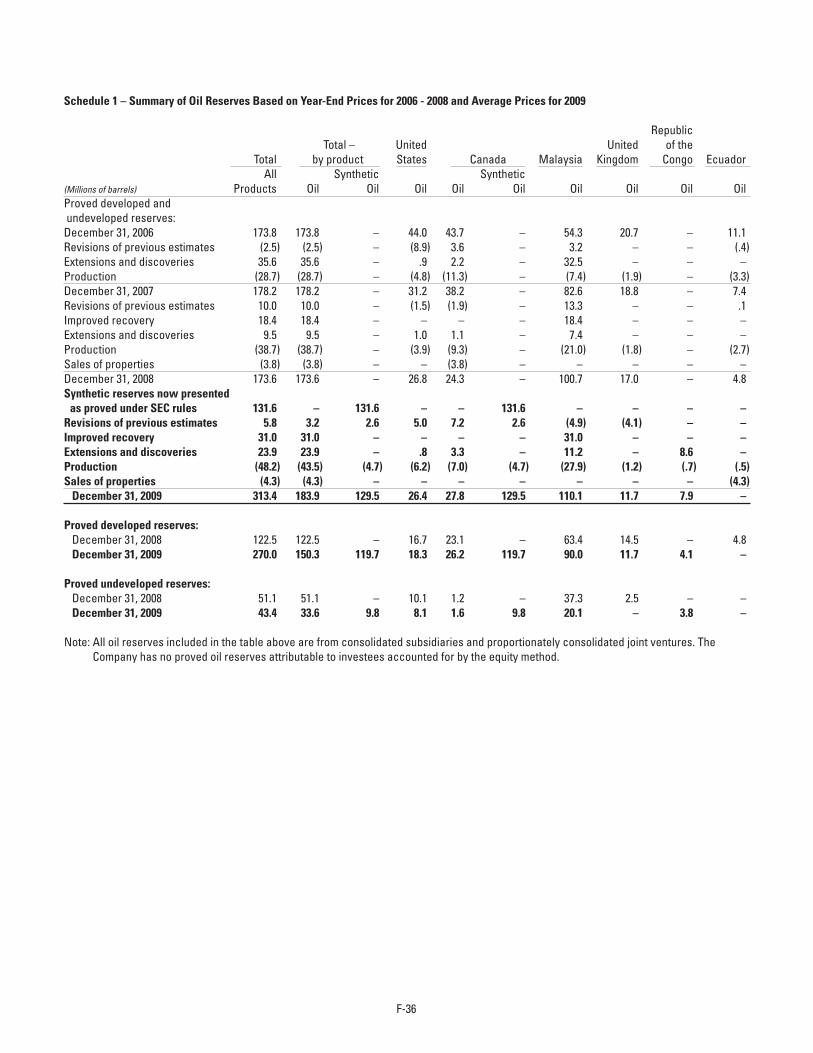
Schedule 1 – Summary of Oil Reserves Based on Year-End Prices for 2006 - 2008 and Average Prices for 2009
Republic Total – United United of the Total by product States Canada Malaysia Kingdom Congo Ecuador All Synthetic Synthetic(Millions of barrels) Products Oil Oil Oil Oil Oil Oil Oil Oil OilProved developed and undeveloped reserves:December 31, 2006 173.8 173.8 – 44.0 43.7 – 54.3 20.7 – 11.1Revisions of previous estimates (2.5) (2.5) – (8.9) 3.6 – 3.2 – – (.4)Extensions and discoveries 35.6 35.6 – .9 2.2 – 32.5 – – – Production (28.7) (28.7) – (4.8) (11.3) – (7.4) (1.9) – (3.3)December 31, 2007 178.2 178.2 – 31.2 38.2 – 82.6 18.8 – 7.4Revisions of previous estimates 10.0 10.0 – (1.5) (1.9) – 13.3 – – .1Improved recovery 18.4 18.4 – – – – 18.4 – – – Extensions and discoveries 9.5 9.5 – 1.0 1.1 – 7.4 – – – Production (38.7) (38.7) – (3.9) (9.3) – (21.0) (1.8) – (2.7)Sales of properties (3.8) (3.8) – – (3.8) – – – – –December 31, 2008 173.6 173.6 – 26.8 24.3 – 100.7 17.0 – 4.8Synthetic reserves now presented as proved under SEC rules 131.6 – 131.6 – – 131.6 – – – – Revisions of previous estimates 5.8 3.2 2.6 5.0 7.2 2.6 (4.9) (4.1) – – Improved recovery 31.0 31.0 – – – – 31.0 – – – Extensions and discoveries 23.9 23.9 – .8 3.3 – 11.2 – 8.6 – Production (48.2) (43.5) (4.7) (6.2) (7.0) (4.7) (27.9) (1.2) (.7) (.5)Sales of properties (4.3) (4.3) – – – – – – – (4.3) December 31, 2009 313.4 183.9 129.5 26.4 27.8 129.5 110.1 11.7 7.9 –
Proved developed reserves: December 31, 2008 122.5 122.5 – 16.7 23.1 – 63.4 14.5 – 4.8 December 31, 2009 270.0 150.3 119.7 18.3 26.2 119.7 90.0 11.7 4.1 –
Proved undeveloped reserves: December 31, 2008 51.1 51.1 – 10.1 1.2 – 37.3 2.5 – – December 31, 2009 43.4 33.6 9.8 8.1 1.6 9.8 20.1 – 3.8 –
Note: All oil reserves included in the table above are from consolidated subsidiaries and proportionately consolidated joint ventures. The Company has no proved oil reserves attributable to investees accounted for by the equity method.
F-36
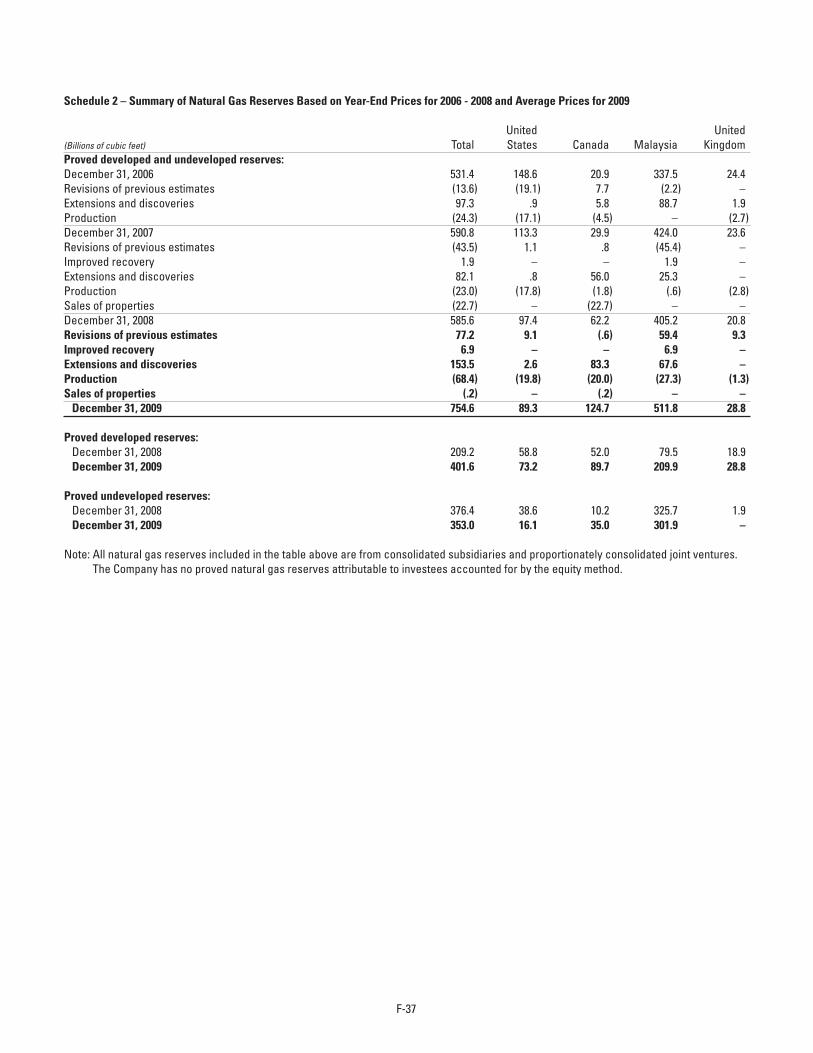
Schedule 2 – Summary of Natural Gas Reserves Based on Year-End Prices for 2006 - 2008 and Average Prices for 2009
United United(Billions of cubic feet) Total States Canada Malaysia KingdomProved developed and undeveloped reserves:December 31, 2006 531.4 148.6 20.9 337.5 24.4Revisions of previous estimates (13.6) (19.1) 7.7 (2.2) – Extensions and discoveries 97.3 .9 5.8 88.7 1.9Production (24.3) (17.1) (4.5) – (2.7)December 31, 2007 590.8 113.3 29.9 424.0 23.6Revisions of previous estimates (43.5) 1.1 .8 (45.4) – Improved recovery 1.9 – – 1.9 – Extensions and discoveries 82.1 .8 56.0 25.3 – Production (23.0) (17.8) (1.8) (.6) (2.8)Sales of properties (22.7) – (22.7) – – December 31, 2008 585.6 97.4 62.2 405.2 20.8Revisions of previous estimates 77.2 9.1 (.6) 59.4 9.3Improved recovery 6.9 – – 6.9 – Extensions and discoveries 153.5 2.6 83.3 67.6 – Production (68.4) (19.8) (20.0) (27.3) (1.3)Sales of properties (.2) – (.2) – – December 31, 2009 754.6 89.3 124.7 511.8 28.8
Proved developed reserves: December 31, 2008 209.2 58.8 52.0 79.5 18.9 December 31, 2009 401.6 73.2 89.7 209.9 28.8
Proved undeveloped reserves: December 31, 2008 376.4 38.6 10.2 325.7 1.9 December 31, 2009 353.0 16.1 35.0 301.9 –
Note: All natural gas reserves included in the table above are from consolidated subsidiaries and proportionately consolidated joint ventures. The Company has no proved natural gas reserves attributable to investees accounted for by the equity method.
F-37
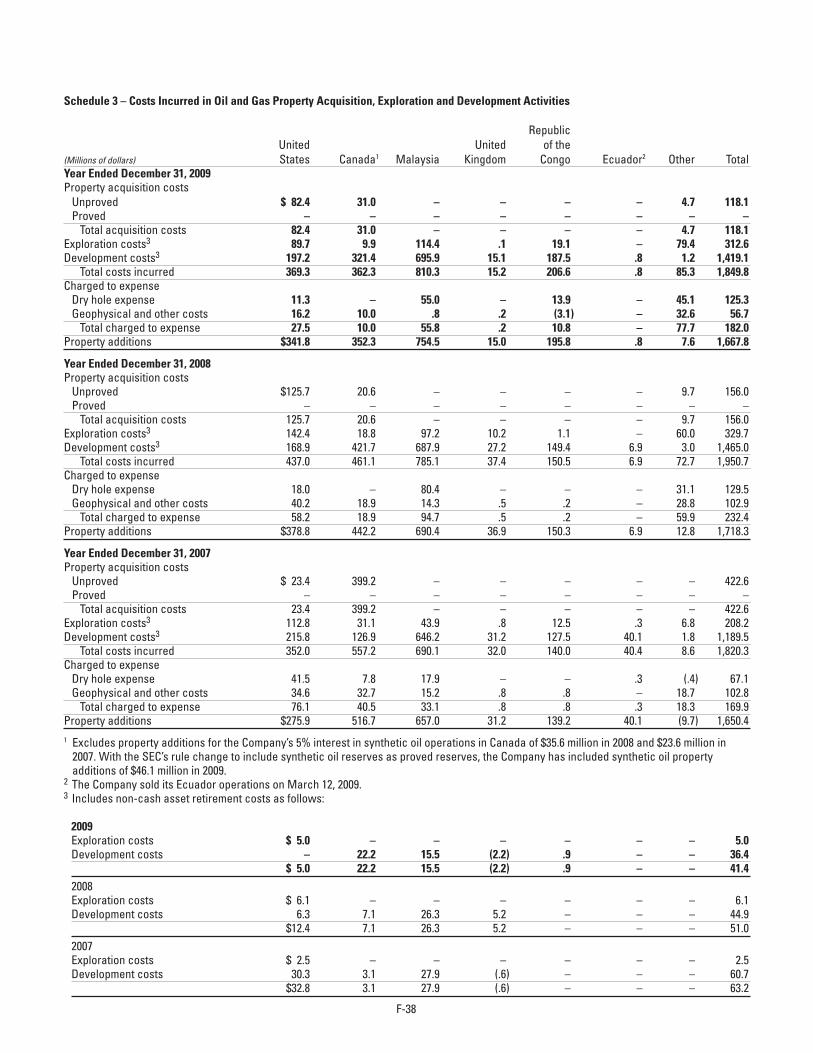
Schedule 3 – Costs Incurred in Oil and Gas Property Acquisition, Exploration and Development Activities
Republic United United of the(Millions of dollars) States Canada1 Malaysia Kingdom Congo Ecuador2 Other TotalYear Ended December 31, 2009Property acquisition costs Unproved $ 82.4 31.0 – – – – 4.7 118.1 Proved – – – – – – – – Total acquisition costs 82.4 31.0 – – – – 4.7 118.1Exploration costs3 89.7 9.9 114.4 .1 19.1 – 79.4 312.6Development costs3 197.2 321.4 695.9 15.1 187.5 .8 1.2 1,419.1 Total costs incurred 369.3 362.3 810.3 15.2 206.6 .8 85.3 1,849.8Charged to expense Dry hole expense 11.3 – 55.0 – 13.9 – 45.1 125.3 Geophysical and other costs 16.2 10.0 .8 .2 (3.1) – 32.6 56.7 Total charged to expense 27.5 10.0 55.8 .2 10.8 – 77.7 182.0Property additions $341.8 352.3 754.5 15.0 195.8 .8 7.6 1,667.8
Year Ended December 31, 2008 Property acquisition costs Unproved $125.7 20.6 – – – – 9.7 156.0 Proved – – – – – – – – Total acquisition costs 125.7 20.6 – – – – 9.7 156.0Exploration costs3 142.4 18.8 97.2 10.2 1.1 – 60.0 329.7Development costs3 168.9 421.7 687.9 27.2 149.4 6.9 3.0 1,465.0 Total costs incurred 437.0 461.1 785.1 37.4 150.5 6.9 72.7 1,950.7Charged to expense Dry hole expense 18.0 – 80.4 – – – 31.1 129.5 Geophysical and other costs 40.2 18.9 14.3 .5 .2 – 28.8 102.9 Total charged to expense 58.2 18.9 94.7 .5 .2 – 59.9 232.4Property additions $378.8 442.2 690.4 36.9 150.3 6.9 12.8 1,718.3
Year Ended December 31, 2007Property acquisition costs Unproved $ 23.4 399.2 – – – – – 422.6 Proved – – – – – – – – Total acquisition costs 23.4 399.2 – – – – – 422.6Exploration costs3 112.8 31.1 43.9 .8 12.5 .3 6.8 208.2Development costs3 215.8 126.9 646.2 31.2 127.5 40.1 1.8 1,189.5 Total costs incurred 352.0 557.2 690.1 32.0 140.0 40.4 8.6 1,820.3Charged to expense Dry hole expense 41.5 7.8 17.9 – – .3 (.4) 67.1 Geophysical and other costs 34.6 32.7 15.2 .8 .8 – 18.7 102.8 Total charged to expense 76.1 40.5 33.1 .8 .8 .3 18.3 169.9Property additions $275.9 516.7 657.0 31.2 139.2 40.1 (9.7) 1,650.41 Excludes property additions for the Company’s 5% interest in synthetic oil operations in Canada of $35.6 million in 2008 and $23.6 million in
2007. With the SEC’s rule change to include synthetic oil reserves as proved reserves, the Company has included synthetic oil property additions of $46.1 million in 2009.
2 The Company sold its Ecuador operations on March 12, 2009.3 Includes non-cash asset retirement costs as follows:
2009 Exploration costs $ 5.0 – – – – – – 5.0 Development costs – 22.2 15.5 (2.2) .9 – – 36.4 $ 5.0 22.2 15.5 (2.2) .9 – – 41.4 2008 Exploration costs $ 6.1 – – – – – – 6.1 Development costs 6.3 7.1 26.3 5.2 – – – 44.9 $12.4 7.1 26.3 5.2 – – – 51.0 2007 Exploration costs $ 2.5 – – – – – – 2.5 Development costs 30.3 3.1 27.9 (.6) – – – 60.7 $32.8 3.1 27.9 (.6) – – – 63.2
F-38
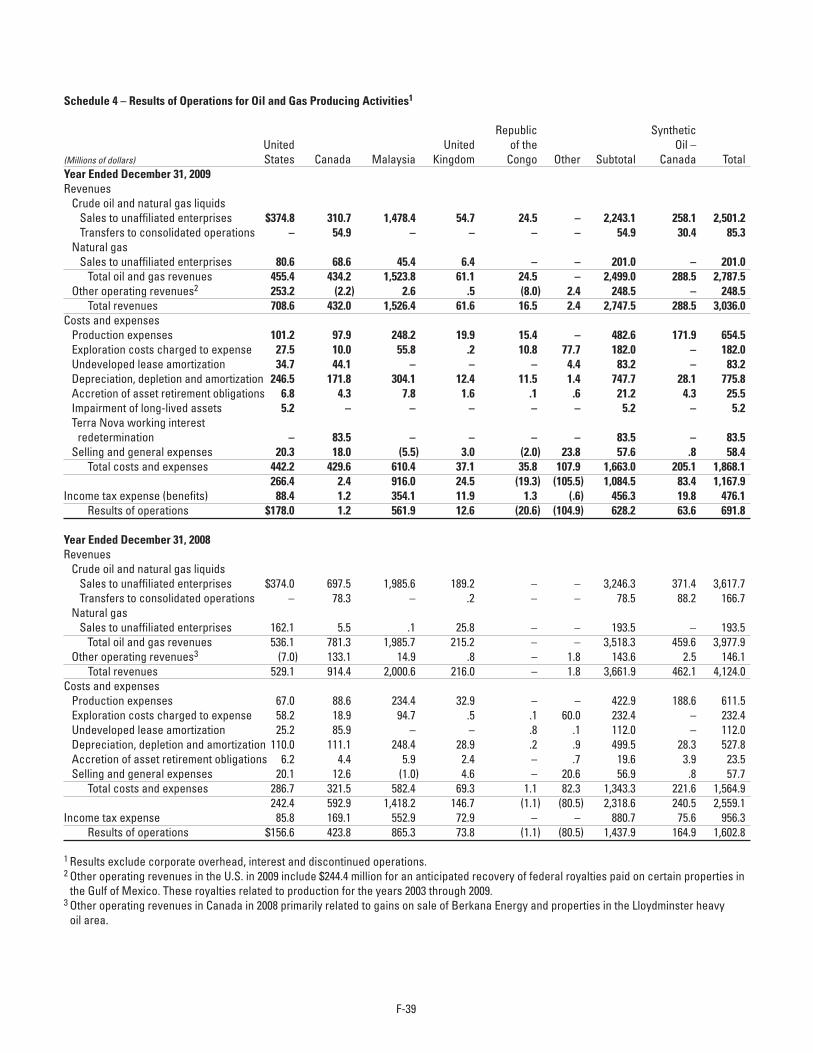
Schedule 4 – Results of Operations for Oil and Gas Producing Activities1
Republic Synthetic United United of the Oil –(Millions of dollars) States Canada Malaysia Kingdom Congo Other Subtotal Canada TotalYear Ended December 31, 2009Revenues Crude oil and natural gas liquids Sales to unaffiliated enterprises $374.8 310.7 1,478.4 54.7 24.5 – 2,243.1 258.1 2,501.2 Transfers to consolidated operations – 54.9 – – – – 54.9 30.4 85.3 Natural gas Sales to unaffiliated enterprises 80.6 68.6 45.4 6.4 – – 201.0 – 201.0 Total oil and gas revenues 455.4 434.2 1,523.8 61.1 24.5 – 2,499.0 288.5 2,787.5 Other operating revenues2 253.2 (2.2) 2.6 .5 (8.0) 2.4 248.5 – 248.5 Total revenues 708.6 432.0 1,526.4 61.6 16.5 2.4 2,747.5 288.5 3,036.0Costs and expenses Production expenses 101.2 97.9 248.2 19.9 15.4 – 482.6 171.9 654.5 Exploration costs charged to expense 27.5 10.0 55.8 .2 10.8 77.7 182.0 – 182.0 Undeveloped lease amortization 34.7 44.1 – – – 4.4 83.2 – 83.2 Depreciation, depletion and amortization 246.5 171.8 304.1 12.4 11.5 1.4 747.7 28.1 775.8 Accretion of asset retirement obligations 6.8 4.3 7.8 1.6 .1 .6 21.2 4.3 25.5 Impairment of long-lived assets 5.2 – – – – – 5.2 – 5.2 Terra Nova working interest redetermination – 83.5 – – – – 83.5 – 83.5 Selling and general expenses 20.3 18.0 (5.5) 3.0 (2.0) 23.8 57.6 .8 58.4 Total costs and expenses 442.2 429.6 610.4 37.1 35.8 107.9 1,663.0 205.1 1,868.1 266.4 2.4 916.0 24.5 (19.3) (105.5) 1,084.5 83.4 1,167.9Income tax expense (benefits) 88.4 1.2 354.1 11.9 1.3 (.6) 456.3 19.8 476.1 Results of operations $178.0 1.2 561.9 12.6 (20.6) (104.9) 628.2 63.6 691.8
Year Ended December 31, 2008Revenues Crude oil and natural gas liquids Sales to unaffiliated enterprises $374.0 697.5 1,985.6 189.2 – – 3,246.3 371.4 3,617.7 Transfers to consolidated operations – 78.3 – .2 – – 78.5 88.2 166.7 Natural gas Sales to unaffiliated enterprises 162.1 5.5 .1 25.8 – – 193.5 – 193.5 Total oil and gas revenues 536.1 781.3 1,985.7 215.2 – – 3,518.3 459.6 3,977.9 Other operating revenues3 (7.0) 133.1 14.9 .8 – 1.8 143.6 2.5 146.1 Total revenues 529.1 914.4 2,000.6 216.0 – 1.8 3,661.9 462.1 4,124.0Costs and expenses Production expenses 67.0 88.6 234.4 32.9 – – 422.9 188.6 611.5 Exploration costs charged to expense 58.2 18.9 94.7 .5 .1 60.0 232.4 – 232.4 Undeveloped lease amortization 25.2 85.9 – – .8 .1 112.0 – 112.0 Depreciation, depletion and amortization 110.0 111.1 248.4 28.9 .2 .9 499.5 28.3 527.8 Accretion of asset retirement obligations 6.2 4.4 5.9 2.4 – .7 19.6 3.9 23.5 Selling and general expenses 20.1 12.6 (1.0) 4.6 – 20.6 56.9 .8 57.7 Total costs and expenses 286.7 321.5 582.4 69.3 1.1 82.3 1,343.3 221.6 1,564.9 242.4 592.9 1,418.2 146.7 (1.1) (80.5) 2,318.6 240.5 2,559.1Income tax expense 85.8 169.1 552.9 72.9 – – 880.7 75.6 956.3 Results of operations $156.6 423.8 865.3 73.8 (1.1) (80.5) 1,437.9 164.9 1,602.8
1 Results exclude corporate overhead, interest and discontinued operations. 2 Other operating revenues in the U.S. in 2009 include $244.4 million for an anticipated recovery of federal royalties paid on certain properties in
the Gulf of Mexico. These royalties related to production for the years 2003 through 2009.3 Other operating revenues in Canada in 2008 primarily related to gains on sale of Berkana Energy and properties in the Lloydminster heavy
oil area.
F-39
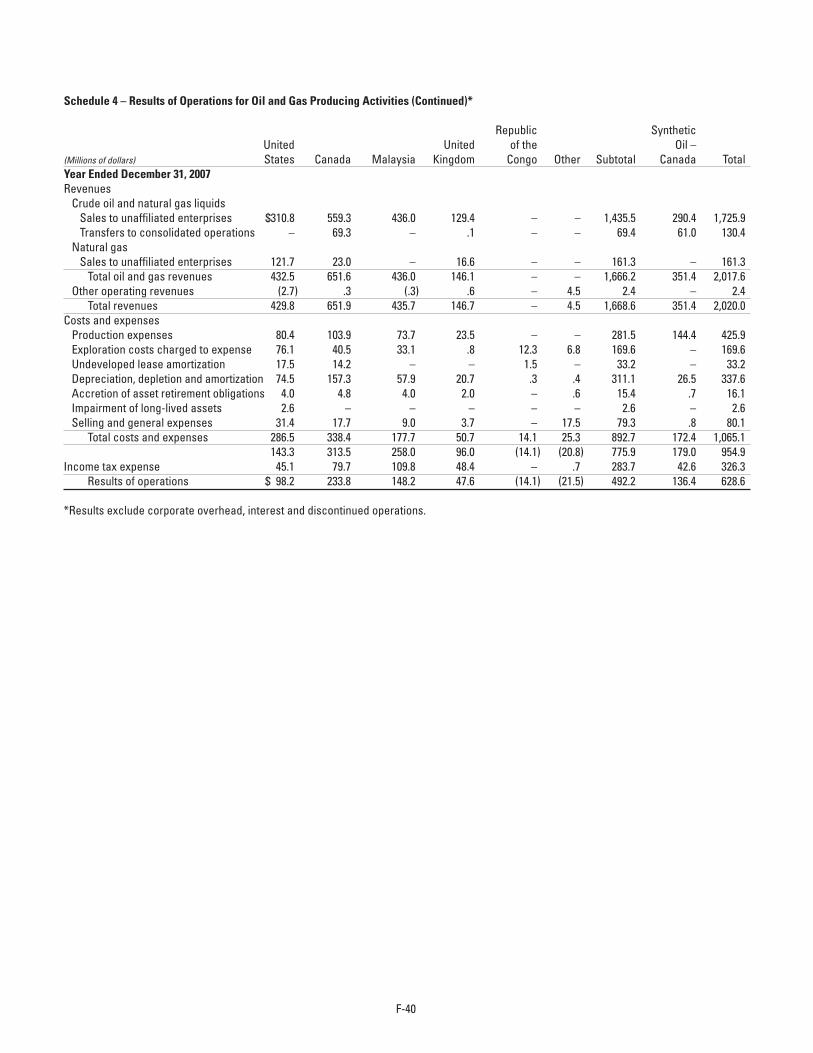
Schedule 4 – Results of Operations for Oil and Gas Producing Activities (Continued)*
Republic Synthetic United United of the Oil –(Millions of dollars) States Canada Malaysia Kingdom Congo Other Subtotal Canada TotalYear Ended December 31, 2007Revenues Crude oil and natural gas liquids Sales to unaffiliated enterprises $310.8 559.3 436.0 129.4 – – 1,435.5 290.4 1,725.9 Transfers to consolidated operations – 69.3 – .1 – – 69.4 61.0 130.4 Natural gas Sales to unaffiliated enterprises 121.7 23.0 – 16.6 – – 161.3 – 161.3 Total oil and gas revenues 432.5 651.6 436.0 146.1 – – 1,666.2 351.4 2,017.6 Other operating revenues (2.7) .3 (.3) .6 – 4.5 2.4 – 2.4 Total revenues 429.8 651.9 435.7 146.7 – 4.5 1,668.6 351.4 2,020.0Costs and expenses Production expenses 80.4 103.9 73.7 23.5 – – 281.5 144.4 425.9 Exploration costs charged to expense 76.1 40.5 33.1 .8 12.3 6.8 169.6 – 169.6 Undeveloped lease amortization 17.5 14.2 – – 1.5 – 33.2 – 33.2 Depreciation, depletion and amortization 74.5 157.3 57.9 20.7 .3 .4 311.1 26.5 337.6 Accretion of asset retirement obligations 4.0 4.8 4.0 2.0 – .6 15.4 .7 16.1 Impairment of long-lived assets 2.6 – – – – – 2.6 – 2.6 Selling and general expenses 31.4 17.7 9.0 3.7 – 17.5 79.3 .8 80.1 Total costs and expenses 286.5 338.4 177.7 50.7 14.1 25.3 892.7 172.4 1,065.1 143.3 313.5 258.0 96.0 (14.1) (20.8) 775.9 179.0 954.9Income tax expense 45.1 79.7 109.8 48.4 – .7 283.7 42.6 326.3 Results of operations $ 98.2 233.8 148.2 47.6 (14.1) (21.5) 492.2 136.4 628.6
*Results exclude corporate overhead, interest and discontinued operations.
F-40
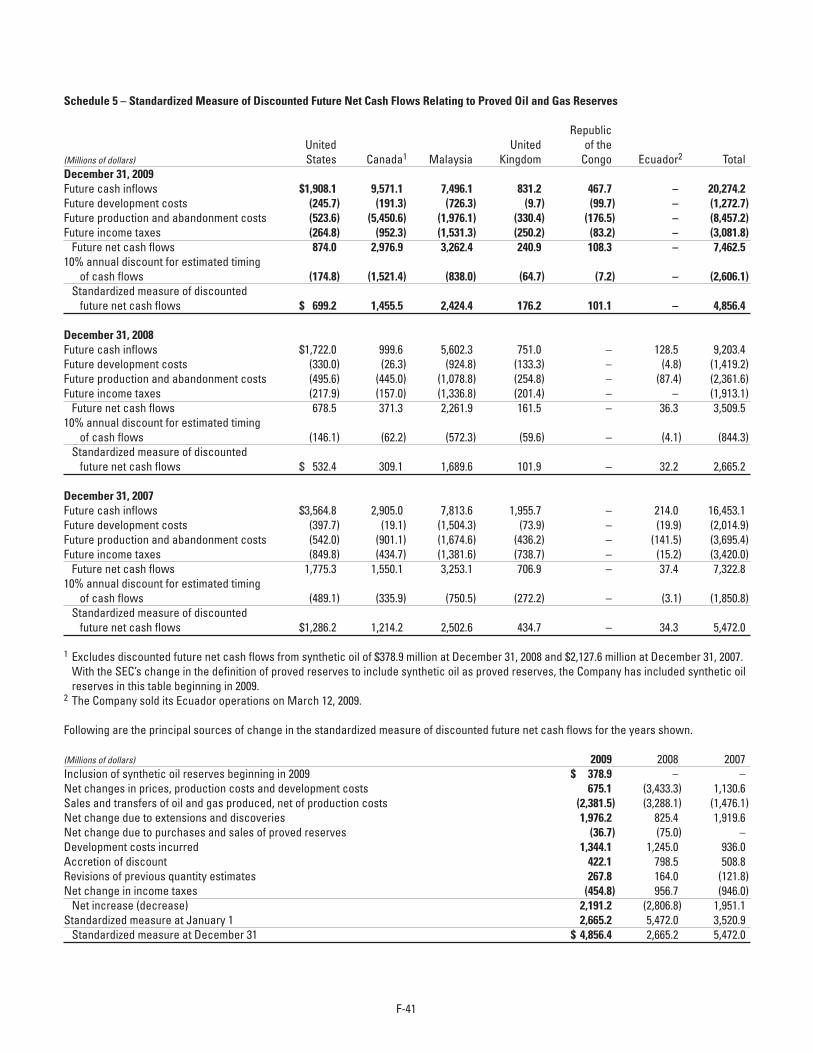
Schedule 5 – Standardized Measure of Discounted Future Net Cash Flows Relating to Proved Oil and Gas Reserves
Republic United United of the(Millions of dollars) States Canada1 Malaysia Kingdom Congo Ecuador2 TotalDecember 31, 2009Future cash inflows $1,908.1 9,571.1 7,496.1 831.2 467.7 – 20,274.2Future development costs (245.7) (191.3) (726.3) (9.7) (99.7) – (1,272.7)Future production and abandonment costs (523.6) (5,450.6) (1,976.1) (330.4) (176.5) – (8,457.2)Future income taxes (264.8) (952.3) (1,531.3) (250.2) (83.2) – (3,081.8) Future net cash flows 874.0 2,976.9 3,262.4 240.9 108.3 – 7,462.510% annual discount for estimated timing of cash flows (174.8) (1,521.4) (838.0) (64.7) (7.2) – (2,606.1) Standardized measure of discounted future net cash flows $ 699.2 1,455.5 2,424.4 176.2 101.1 – 4,856.4
December 31, 2008Future cash inflows $1,722.0 999.6 5,602.3 751.0 – 128.5 9,203.4Future development costs (330.0) (26.3) (924.8) (133.3) – (4.8) (1,419.2)Future production and abandonment costs (495.6) (445.0) (1,078.8) (254.8) – (87.4) (2,361.6)Future income taxes (217.9) (157.0) (1,336.8) (201.4) – – (1,913.1) Future net cash flows 678.5 371.3 2,261.9 161.5 – 36.3 3,509.510% annual discount for estimated timing of cash flows (146.1) (62.2) (572.3) (59.6) – (4.1) (844.3) Standardized measure of discounted future net cash flows $ 532.4 309.1 1,689.6 101.9 – 32.2 2,665.2
December 31, 2007 Future cash inflows $3,564.8 2,905.0 7,813.6 1,955.7 – 214.0 16,453.1Future development costs (397.7) (19.1) (1,504.3) (73.9) – (19.9) (2,014.9)Future production and abandonment costs (542.0) (901.1) (1,674.6) (436.2) – (141.5) (3,695.4)Future income taxes (849.8) (434.7) (1,381.6) (738.7) – (15.2) (3,420.0) Future net cash flows 1,775.3 1,550.1 3,253.1 706.9 – 37.4 7,322.810% annual discount for estimated timing of cash flows (489.1) (335.9) (750.5) (272.2) – (3.1) (1,850.8) Standardized measure of discounted future net cash flows $1,286.2 1,214.2 2,502.6 434.7 – 34.3 5,472.0
1 Excludes discounted future net cash flows from synthetic oil of $378.9 million at December 31, 2008 and $2,127.6 million at December 31, 2007. With the SEC’s change in the definition of proved reserves to include synthetic oil as proved reserves, the Company has included synthetic oil reserves in this table beginning in 2009.
2 The Company sold its Ecuador operations on March 12, 2009.
Following are the principal sources of change in the standardized measure of discounted future net cash flows for the years shown.
(Millions of dollars) 2009 2008 2007Inclusion of synthetic oil reserves beginning in 2009 $ 378.9 – –Net changes in prices, production costs and development costs 675.1 (3,433.3) 1,130.6Sales and transfers of oil and gas produced, net of production costs (2,381.5) (3,288.1) (1,476.1)Net change due to extensions and discoveries 1,976.2 825.4 1,919.6Net change due to purchases and sales of proved reserves (36.7) (75.0) –Development costs incurred 1,344.1 1,245.0 936.0Accretion of discount 422.1 798.5 508.8Revisions of previous quantity estimates 267.8 164.0 (121.8)Net change in income taxes (454.8) 956.7 (946.0) Net increase (decrease) 2,191.2 (2,806.8) 1,951.1Standardized measure at January 1 2,665.2 5,472.0 3,520.9 Standardized measure at December 31 $ 4,856.4 2,665.2 5,472.0
F-41
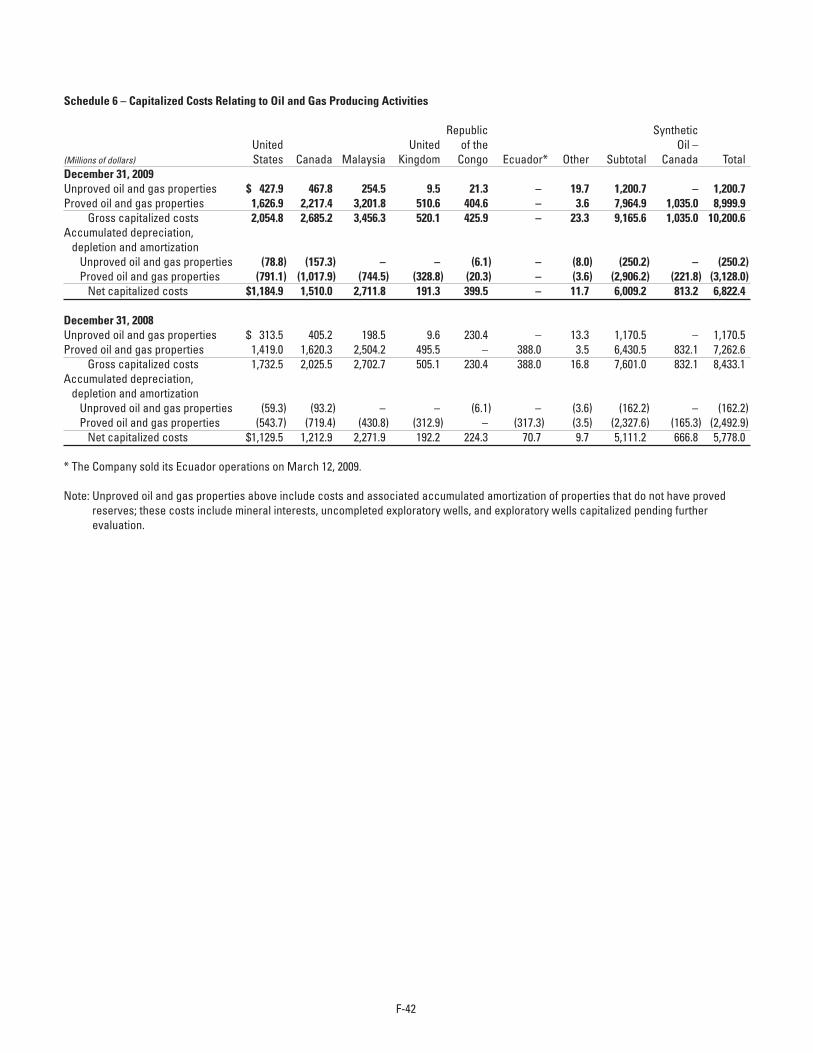
Schedule 6 – Capitalized Costs Relating to Oil and Gas Producing Activities
Republic Synthetic United United of the Oil –(Millions of dollars) States Canada Malaysia Kingdom Congo Ecuador* Other Subtotal Canada TotalDecember 31, 2009Unproved oil and gas properties $ 427.9 467.8 254.5 9.5 21.3 – 19.7 1,200.7 – 1,200.7Proved oil and gas properties 1,626.9 2,217.4 3,201.8 510.6 404.6 – 3.6 7,964.9 1,035.0 8,999.9 Gross capitalized costs 2,054.8 2,685.2 3,456.3 520.1 425.9 – 23.3 9,165.6 1,035.0 10,200.6Accumulated depreciation, depletion and amortization Unproved oil and gas properties (78.8) (157.3) – – (6.1) – (8.0) (250.2) – (250.2) Proved oil and gas properties (791.1) (1,017.9) (744.5) (328.8) (20.3) – (3.6) (2,906.2) (221.8) (3,128.0) Net capitalized costs $1,184.9 1,510.0 2,711.8 191.3 399.5 – 11.7 6,009.2 813.2 6,822.4
December 31, 2008Unproved oil and gas properties $ 313.5 405.2 198.5 9.6 230.4 – 13.3 1,170.5 – 1,170.5Proved oil and gas properties 1,419.0 1,620.3 2,504.2 495.5 – 388.0 3.5 6,430.5 832.1 7,262.6 Gross capitalized costs 1,732.5 2,025.5 2,702.7 505.1 230.4 388.0 16.8 7,601.0 832.1 8,433.1Accumulated depreciation, depletion and amortization Unproved oil and gas properties (59.3) (93.2) – – (6.1) – (3.6) (162.2) – (162.2) Proved oil and gas properties (543.7) (719.4) (430.8) (312.9) – (317.3) (3.5) (2,327.6) (165.3) (2,492.9) Net capitalized costs $1,129.5 1,212.9 2,271.9 192.2 224.3 70.7 9.7 5,111.2 666.8 5,778.0
* The Company sold its Ecuador operations on March 12, 2009.
Note: Unproved oil and gas properties above include costs and associated accumulated amortization of properties that do not have proved reserves; these costs include mineral interests, uncompleted exploratory wells, and exploratory wells capitalized pending further evaluation.
F-42
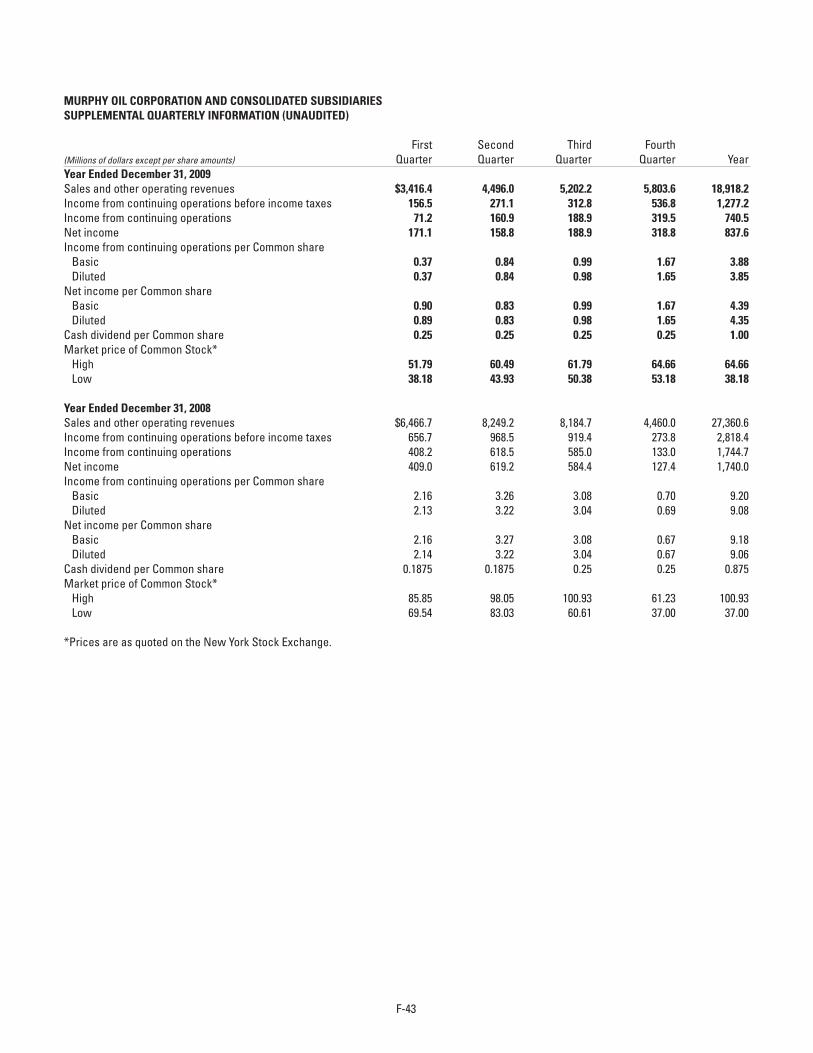
MURPHY OIL CORPORATION AND CONSOLIDATED SUBSIDIARIESSUPPLEMENTAL QUARTERLY INFORMATION (UNAUDITED)
First Second Third Fourth(Millions of dollars except per share amounts) Quarter Quarter Quarter Quarter YearYear Ended December 31, 2009Sales and other operating revenues $3,416.4 4,496.0 5,202.2 5,803.6 18,918.2Income from continuing operations before income taxes 156.5 271.1 312.8 536.8 1,277.2Income from continuing operations 71.2 160.9 188.9 319.5 740.5Net income 171.1 158.8 188.9 318.8 837.6Income from continuing operations per Common share Basic 0.37 0.84 0.99 1.67 3.88 Diluted 0.37 0.84 0.98 1.65 3.85Net income per Common share Basic 0.90 0.83 0.99 1.67 4.39 Diluted 0.89 0.83 0.98 1.65 4.35Cash dividend per Common share 0.25 0.25 0.25 0.25 1.00Market price of Common Stock* High 51.79 60.49 61.79 64.66 64.66 Low 38.18 43.93 50.38 53.18 38.18
Year Ended December 31, 2008Sales and other operating revenues $6,466.7 8,249.2 8,184.7 4,460.0 27,360.6Income from continuing operations before income taxes 656.7 968.5 919.4 273.8 2,818.4Income from continuing operations 408.2 618.5 585.0 133.0 1,744.7Net income 409.0 619.2 584.4 127.4 1,740.0Income from continuing operations per Common share Basic 2.16 3.26 3.08 0.70 9.20 Diluted 2.13 3.22 3.04 0.69 9.08Net income per Common share Basic 2.16 3.27 3.08 0.67 9.18 Diluted 2.14 3.22 3.04 0.67 9.06Cash dividend per Common share 0.1875 0.1875 0.25 0.25 0.875Market price of Common Stock* High 85.85 98.05 100.93 61.23 100.93 Low 69.54 83.03 60.61 37.00 37.00
*Prices are as quoted on the New York Stock Exchange.
F-43
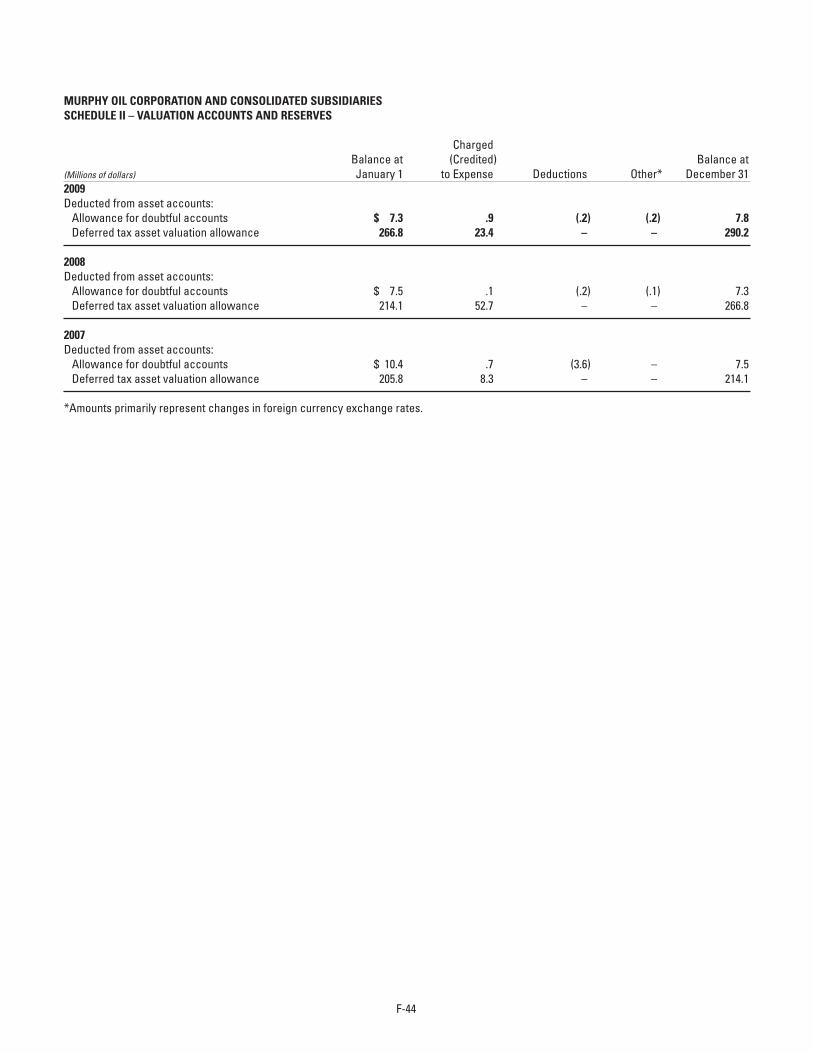
MURPHY OIL CORPORATION AND CONSOLIDATED SUBSIDIARIESSCHEDULE II – VALUATION ACCOUNTS AND RESERVES
Charged Balance at (Credited) Balance at(Millions of dollars) January 1 to Expense Deductions Other* December 312009Deducted from asset accounts: Allowance for doubtful accounts $ 7.3 .9 (.2) (.2) 7.8 Deferred tax asset valuation allowance 266.8 23.4 – – 290.2
2008Deducted from asset accounts: Allowance for doubtful accounts $ 7.5 .1 (.2) (.1) 7.3 Deferred tax asset valuation allowance 214.1 52.7 – – 266.8
2007Deducted from asset accounts: Allowance for doubtful accounts $ 10.4 .7 (3.6) – 7.5 Deferred tax asset valuation allowance 205.8 8.3 – – 214.1
*Amounts primarily represent changes in foreign currency exchange rates.
F-44
GLOSSARY OF TERMS
3-D seismicthree-dimensional images created by bouncing sound waves off underground rock formations that are used to determine the best places to drill for hydrocarbons
bitumen or oil sandstar-like hydrocarbon-bearing substance that occurs naturally in certain areas at the Earth’s surface or at relatively shallow depths and which can be recovered, processed and upgraded into a light, sweet synthetic crude oil
deepwateroffshore location in greater than 1,000 feet of water
downstreamrefining and marketing operations
dry holean unsuccessful exploration well that is plugged and abandoned, with associated costs written off to expense
exploratorywildcat and delineation, e.g., exploratory wells
F-45
feedstockcrude oil, natural gas liquids and other materials used as raw materials for making gasoline and other refined products by the Company’s refineries
hydrocarbonsorganic chemical compounds of hydrogen and carbon atoms that form the basis of all petroleum products
synthetic oilA light, sweet crude oil produced by upgrading bitumen recovered from oil sands
throughputaverage amount of raw material processed in a given period by a facility
upstreamoil and natural gas exploration and production operations, including synthetic oil operation
wildcatwell drilled to target an untested or unproved geologic formation

This page intentionally left blank.

CorporateOffice200PeachStreetP.O.Box7000ElDorado,Arkansas71731-7000(870)862-6411
StockExchangeListingsTradingSymbol:MURNewYorkStockExchange
TransferAgentandRegistrarComputershareInvestorServices,L.L.C.2NorthLaSalleSt.Chicago,Illinois60602Toll-free(888)239-5303LocalChicago(312)360-5303
ElectronicPaymentofDividendsShareholdersmayhavedividendsdepositeddirectlyintotheirbankaccountsbyelectronicfundstransfer.Authorizationformsmaybeobtainedfrom:
ComputershareInvestorServices,L.L.C.2NorthLaSalleSt.Chicago,Illinois60602Toll-free(888)239-5303LocalChicago(312)360-5303
AnnualMeetingTheannualmeetingoftheCompany’sshareholderswillbeheldat10:00a.m.onMay12,2010,attheSouthArkansasArtsCenter,110East5thStreet,ElDorado,Arkansas.Aformalnoticeofthemeeting,togetherwithaproxystatementandproxyform,willbeprovidedtoallshareholders.
WebSitewww.murphyoilcorp.comMurphyOil’sWebsiteprovidesfrequentlyupdatedinformationabouttheCompanyanditsoperations,including:•Newsreleases•Annualreport•Quarterlyreports•Livewebcastsofquarterly
conferencecalls•LinkstotheCompany’sSECfilings•Stockquotes•ProfilesoftheCompany’soperations•On-linestockinvestmentaccounts•Murphy’sU.S.retailgasolinestationlocator
InquiriesInquiriesregardingshareholderaccountmattersshouldbeaddressedto:
WalterK.ComptonVicePresident,LawandSecretaryMurphyOilCorporationP.O.Box7000ElDorado,[email protected]
Membersofthefinancialcommunityshoulddirecttheirinquiriesto:
CraigBonsallSupervisor,InvestorRelationsMurphyOilCorporationP.O.Box7000ElDorado,Arkansas71731-7000(870)[email protected]
Corporate Information
Executive Officers
DavidM.WoodPresidentandChiefExecutiveOfficerandDirectorandMemberoftheExecutiveCommitteesinceJanuary2009.Mr.WoodservedasExecutiveVicePresidentandPresidentofMurphyExploration&ProductionCompanyfromJanuary2007untilDecember2008,PresidentofMurphyExploration&ProductionCompany-InternationalfromMarch2003throughDecember2006andSeniorVicePresidentofFrontierExploration&ProductionfromApril1999throughFebruary2003.
StevenA.CosséExecutiveVicePresidentsinceFebruary2005andGeneralCounselsinceAugust1991.Mr.CosséwaselectedSeniorVicePresidentin1994andVicePresidentin1993.
RogerW.JenkinsExecutiveVicePresidentsinceAugust2009.Mr.JenkinshasservedasPresidentofMurphyExploration&ProductionCompanysinceJanuary2009,andpriortothatwasSeniorVicePresident,NorthAmericaforthissubsidiaryfromSeptember2007toDecember2008.
KevinG.FitzgeraldSeniorVicePresidentandChiefFinancialOfficersinceJanuary2007.Mr.FitzgeraldwasTreasurerfromJuly2001throughDecember2006andDirectorofInvestorRelationsfrom1996throughJune2001.
BillH.StobaughSeniorVicePresidentsinceFebruary2005.Mr.StobaughjoinedtheCompanyasVicePresidentin1995.
CharlesA.GanusVicePresident,InternationalDownstreamsinceAugust2009.Additionally,Mr.GanushasbeenManagingDirectorofMurcoPetroleumLimitedsinceMay2008,andwasSeniorVicePresident,MarketingofMurphyOilUSA,Inc.fromJune2003toApril2008.
HenryJ.HeithausVicePresident,MarketingsinceAugust2009.Additionally,Mr.HeithaushasbeenSeniorVicePresident,MarketingofMurphyOilUSA,Inc.sinceMay2008,andwasVicePresident,RetailMarketingforthissubsidiaryfromJune2003toApril2008.
ThomasMcKinlayVicePresident,U.S.ManufacturingsinceAugust2009.Additionally,Mr.McKinlayhasservedasSeniorVicePresidentofMurphyOilUSA,Inc.sinceApril2009.FromAugust2008toMarch2009,hewasGeneralManager,SupplyandTransportationforthisU.S.subsidiary.
MindyK.WestVicePresidentandTreasurersinceJanuary2007.Ms.WestwasDirectorofInvestorRelationsfromJuly2001throughDecember2006.
JohnW.EckartVicePresidentandControllersinceJanuary2007.Mr.EckarthasbeenControllersinceMarch2000.
KelliM.HammockVicePresident,AdministrationsinceDecember2009.Ms.HammockwasGeneralManager,AdministrationfromJune2006toNovember2009.
WalterK.ComptonVicePresident,LawsinceFebruary2009.Mr.ComptonhasbeenSecretarysinceDecember1996.

Corporate Office200PeachStreetP.O.Box7000ElDorado,Arkansas71731-7000