
Lysine Requirements of Largemouth Bass, Micropterus salmoides : A Comparison of Methods of Analysis...
27
Lysine Requirements of Largemouth Bass, Micropterus salmoides: A Comparison of Methods of Analysis of Dose-Response Trials Data Jony Koji Dairiki Carlos Tadeu dos Santos Dias José Eurico Possebon Cyrino ABSTRACT. Lysine is a strictly essential amino acid, the reference for dose-response trials to determine dietary amino acids requirements of fish. This study compares estimation of amino acids require- ments of largemouth bass, Micropterus salmoides, from data of lysine dose-response trials, analyzed through different statistical methods: Polynomial regression analysis, broken-line regression analysis, and specific mathematical modeling. Amino acids requirements were esti- mated through the A/E relationship [A/E = (essential amino acid total essential amino acids cystine tyrosine) 1.000]. Groups of 25 feed-conditioned largemouth bass fingerlings (1.29 ± 0.03 g; 4.35 ± 0.17 cm) were stocked in 60-L cages (5 mm mesh) housed in 1,000-L plastic, Jony Koji Dairiki, Doctoral Student, Departamento de Zootecnia, Escola Superior de Agricultura “Luiz de Queiroz,” Universidade de São Paulo, P.O. Box 9, 13418-900, Piracicaba, SP, Brazil. Carlos Tadeu dos Santos Dias, Associate Professor, Departamento de Ciências Exatas, Escola Superior de Agricultura “Luiz de Queiroz,” Universidade de São Paulo, P.O. Box 9, 13418-900, Piracicaba, SP, Brazil. José Eurico Possebon Cyrino, Associate Professor, Departamento de Zootecnia, Escola Superior de Agricultura “Luiz de Queiroz,” Universidade de São Paulo, P.O. Box 9, 13418-900, Piracicaba, SP, Brazil. Address correspondence to: José Eurico Possebon Cyrino at the above address (E-mail: [email protected]). Journal of Applied Aquaculture, Vol. 19(4) 2007 Available online at http://jaa.haworthpress.com © 2007 by The Haworth Press, Inc. All rights reserved. doi:10.1300/J028v19n04_01 1
Transcript of Lysine Requirements of Largemouth Bass, Micropterus salmoides : A Comparison of Methods of Analysis...
Lysine Requirements of LargemouthBass, Micropterus salmoides:
A Comparison of Methods of Analysisof Dose-Response Trials Data
Jony Koji DairikiCarlos Tadeu dos Santos DiasJosé Eurico Possebon Cyrino
ABSTRACT. Lysine is a strictly essential amino acid, the referencefor dose-response trials to determine dietary amino acids requirementsof fish. This study compares estimation of amino acids require-ments of largemouth bass, Micropterus salmoides, from data of lysinedose-response trials, analyzed through different statistical methods:Polynomial regression analysis, broken-line regression analysis, andspecific mathematical modeling. Amino acids requirements were esti-mated through the A/E relationship [A/E = (essential amino acid totalessential amino acids � cystine � tyrosine) � 1.000]. Groups of 25feed-conditioned largemouth bass fingerlings (1.29 ± 0.03 g; 4.35 ± 0.17cm) were stocked in 60-L cages (5 mm mesh) housed in 1,000-L plastic,
Jony Koji Dairiki, Doctoral Student, Departamento de Zootecnia, Escola Superiorde Agricultura “Luiz de Queiroz,” Universidade de São Paulo, P.O. Box 9, 13418-900,Piracicaba, SP, Brazil.
Carlos Tadeu dos Santos Dias, Associate Professor, Departamento de CiênciasExatas, Escola Superior de Agricultura “Luiz de Queiroz,” Universidade de São Paulo,P.O. Box 9, 13418-900, Piracicaba, SP, Brazil.
José Eurico Possebon Cyrino, Associate Professor, Departamento de Zootecnia,Escola Superior de Agricultura “Luiz de Queiroz,” Universidade de São Paulo, P.O.Box 9, 13418-900, Piracicaba, SP, Brazil.
Address correspondence to: José Eurico Possebon Cyrino at the above address(E-mail: [email protected]).
Journal of Applied Aquaculture, Vol. 19(4) 2007Available online at http://jaa.haworthpress.com
© 2007 by The Haworth Press, Inc. All rights reserved.doi:10.1300/J028v19n04_01 1
indoor tanks, closed circulation system, and fed diets containing 1.0, 1.5,2.0, 2.5, 3.0, or 3.5% lysine, in a totally randomized experimental designtrial (n = 4). The broken-line analysis method yielded more reliable andprecise estimations of lysine requirements–2.1% of diet or 4.9% dietaryprotein–for final weight, weight gain, and specific growth rate. Best-feed conversion ratio was attained with 1.69% lysine in the diet or 3.9%lysine in dietary protein. Body amino acids profile was an adequatereference for estimation of largemouth bass amino acids requirements.doi:10.1300/J028v19n04_01 [Article copies available for a fee from TheHaworth Document Delivery Service: 1-800-HAWORTH. E-mail address:<[email protected]> Website: <http://www.HaworthPress.com>© 2007 by The Haworth Press, Inc. All rights reserved.]
KEYWORDS. Lysine, requirement, largemouth bass, Micropterus sal-moides, polynomial regression, broken-line regression, dose-response trial
INTRODUCTION
Proteins are the main organic constituent of fish body and represent65 to 75% of its dry mass. Dietary protein sources differ nutritionallyand biologically. The biological value of a given protein varies with thecomposition and availability of amino acids. The deficiency of or lowessential amino acid availability leads to a poor use of the protein, and con-sequently hampers growth and reduces fish feeding efficiency (Andersonet al. 1995; Masumoto et al. 1996).
Lysine is the most important of all essential amino acids. It can beused as dietary amino acid requirement reference because it is strictlyessential and solely related to body protein deposition, the most limitingamino acid in fish feeds (Griffin et al. 1992; Schuhmacher et al. 1997).For instance, low lysine content in the diet of rainbow trout lowers thespecies’ collagen synthesis and deposition (Steffens 1989). Adequatedietary lysine contents improve survival and growth rate and preventerosion and deformities of fish dorsal, pectoral, and ventral fins (Halver1989; Keembiyehetty and Gatlin III 1992).
Lysine requirements of fish range from 5.0 to 6.8% of dietary protein,the highest values ordinarily related to nutritional requirements ofcarnivorous fish (NRC 1993). As a matter of fact, Coyle et al. (2000)reported that lysine requirementof largemouth is 2.8% of the dietor 6.0%of the dietary protein.
2 JOURNAL OF APPLIED AQUACULTURE
The carnivorous largemouth bass, introduced in Brazil in 1920 (Godoy1954), is now considered not only as an important sport fish all through thecountry’s South and Southeastern regions, but also an excellent ex-perimental model. However, research on feeding and nutritional require-ments of the species in sub-tropical environments is scarce and recent(PortzandCyrino2003,2004;Portzet al. 2001). Inaddition,definingandvalidating suitable methodology for data analysis of dose-response trialsaligned with nitrogen and amino acids utilization trials still concern re-search groups (Liebert et al. 2000; Portz et al. 2000; Robbins 1986). Thiswork is targeted at these two research needs.
MATERIALS AND METHODS
Experimental Design, Data Collection, and Analysis
Feed-conditioned largemouth bass fingerlings (1.29 ± 0.03 g; 4.35 ±0.17 cm) were stocked in 60-L plastic cages (5 mm mesh; 25 fish percage) installed in 1,000-L, indoor plastic tanks, set in a closed recircu-lation, continuous water flow and aeration system (temperature 24.7 ±1.7�C; pH = 7.5 ± 0.3; dissolved oxygen 7.02 ± 0.2 mg/L), and fed adlibitum for 62 days with semi-purified diets (Table 1) (NRC 1993) con-taining 1.0, 1.5, 2.0, 2.5, 3.0, and 3.5% lysine, in a totally randomizedexperimental design (n = 4). The following performance parameterswere recorded: Initial weight (Wi); final weight (Wf); weight gain (WG =Wf � Wi); feed consumption (FC); feed conversion ratio (FCR = FC �WG); specific growth rate [SGR = (ln Wf � ln Wi) � number of days �100]; hepato-somatic index (%) [HSI = (weight of liver � body weight) �100]; and survival rate (%).
All measurements were taken in the metric system (g; cm), exceptwhere otherwise noted. Data were submitted to ANOVA by the PROCGLM, SAS statistical package (SAS Institute 2000). Regression (PROCNLIN; SAS) and broken-line analysis (Robbins 1986; Portz et al. 2000)were used for decomposition of the ANOVA results, and further com-parison with mathematical modeling of nitrogen and amino acids utili-zation trials (Liebert et al. 2000).
Preparation of Experimental Diets
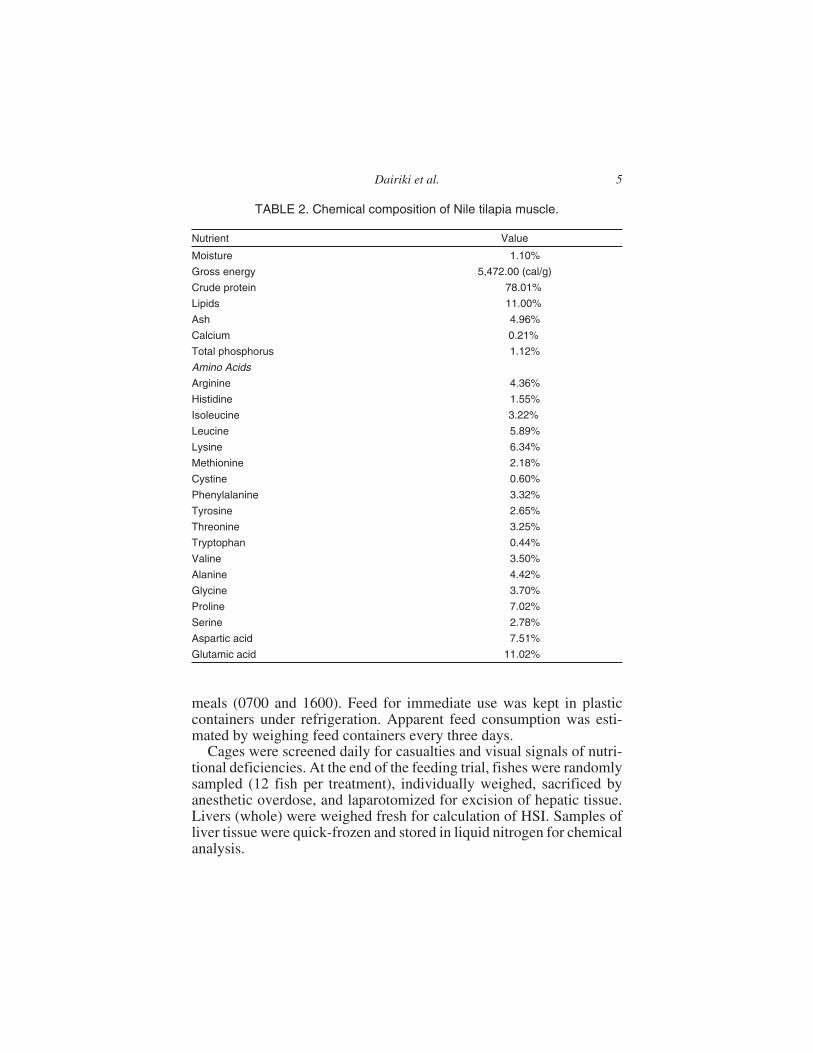
Diets were formulated to contain 43.6% crude protein (Portz et al.2001;Ruchimatet al. 1997), observedas the idealproteinconcept (Ogino1980). Powdered, lyophilized Nile tilapia (Oreochromis niloticus) fillets
Dairiki et al. 3
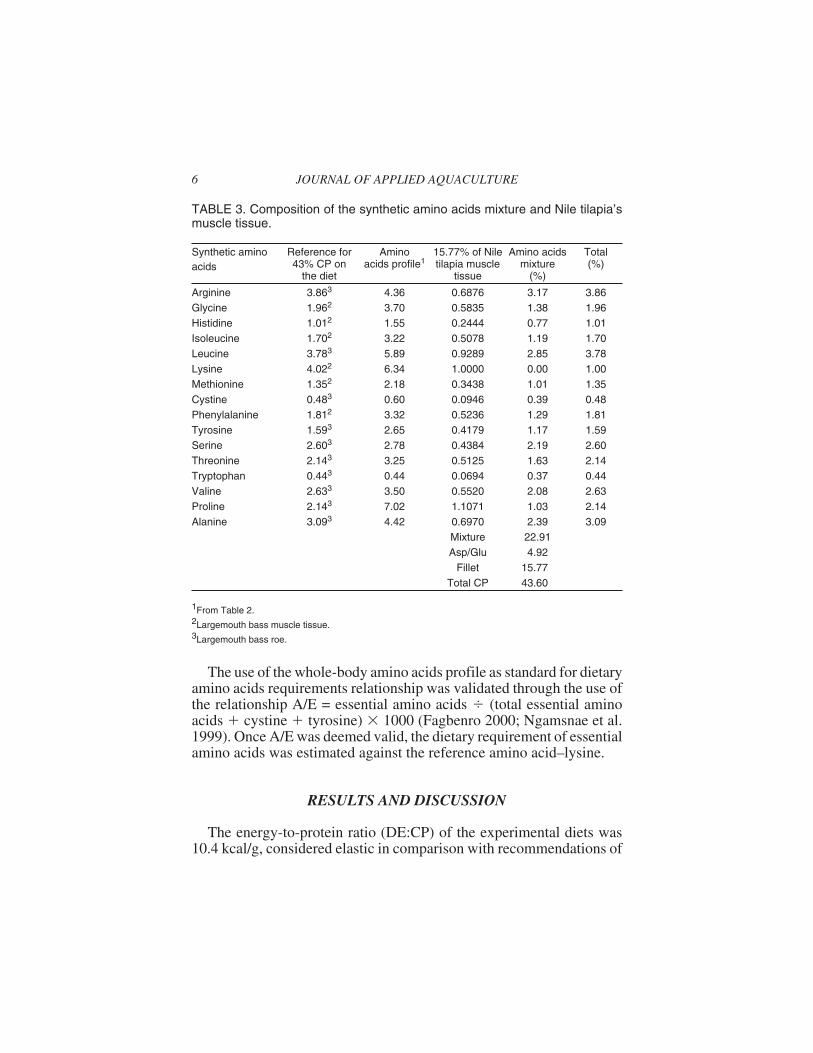
were used as intact protein source (Table 2). Amino acids profiles oflargemouth bass roe and fillets (Portz 2001) were used as referencedietary amino acids profile. Based on recommendations of De Silva andAnderson (1995), synthetic amino acids were added to equalize aminoacids contents of the intact protein source to the reference amino acidsprofile (Table 3). Synthetic lysine was added to set the different treat-ments in replacement of the cellulose in the basal diet.
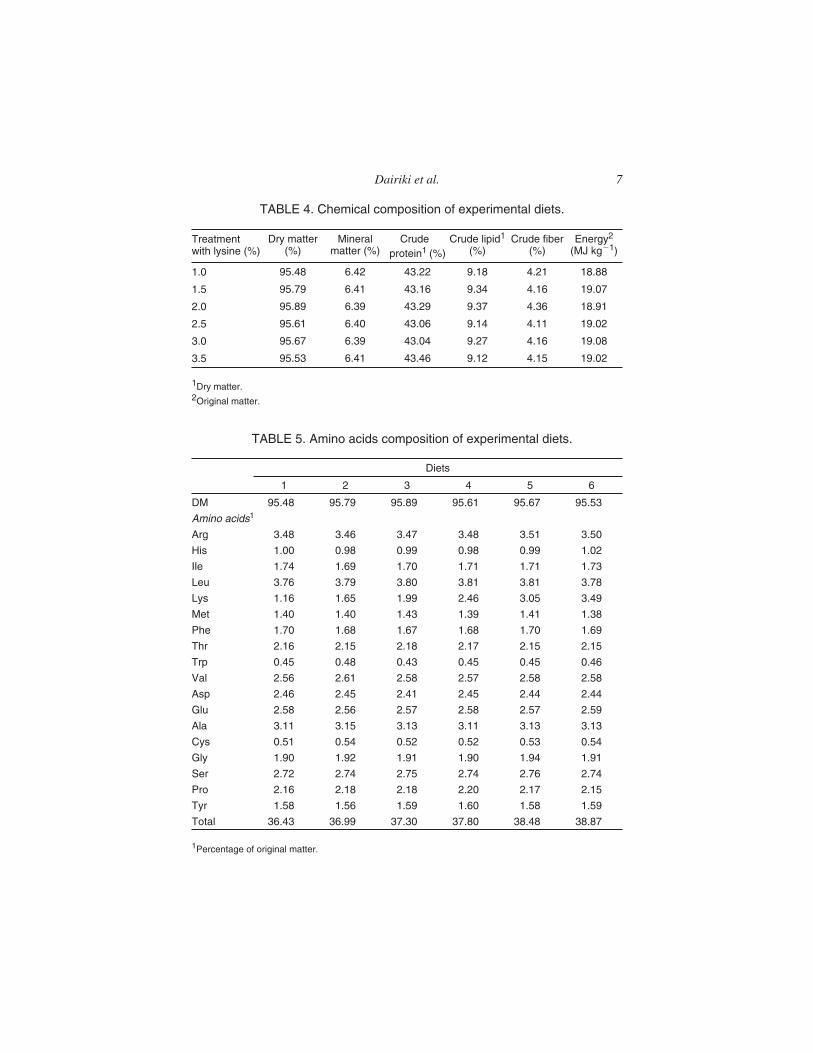
Feed ingredients were mixed, added with 20% warm water, pelletedin industrial mincer, oven-dried (force air circulation; 45�C; 22 hours),broken down to 1-2 mm pellets, sized, seal-bagged, and frozen-stored(�20�C) before use. Chemical composition of diets (Tables 4 and 5) wasdetermined at Institute of Animal Physiology and Animal Nutrition, Col-lege of Agriculture, George-August University, Götingen, Germany.
Routine Management and Sampling Procedures
Laboratory light conditionswere kept at14 h light and 8 h dark (Cyrinoet al. 2000; Heinen 1998; Portz et al. 2001). Fishes received two daily
4 JOURNAL OF APPLIED AQUACULTURE
TABLE 1. Experimental, semi-purified diet.
Ingredients Quantity (%)
Nile tilapia fillet 15.77
Amino acids mixture 22.91
Dextrin 30.66
Fish oil 7.50
Mineral mixture1 4.00
Vitamin mixture2 3.00
Carboximethylcellulose 2.00
Bicalcium phosphate 1.00
Cellulose 8.24
Asp/Glu3 4.92
L-lysine HCl 0.00
Total 100.00
1Mineral mixture: Ca, 11.42%; P, 9.57%; K, 10.78%; Mg, 1.30%; S, 1.83%; Na, 3.30%; Cl, 14.62%; Fe,3,000 ppm; Cu, 424.89 ppm; Zn, 3,750.04 ppm; I, 22.49 ppm; Mn, 746.52 ppm; Se, 15 ppm; Co, 5.01 ppm and
Cr, 1.98 ppm.2Vitamin mixture: vit. A, 290.000 UI; vit. D3, 143.500 UI; vit. E, 5.700 mg; vit. K3, 143.82 mg; thiamine (B1),334.42 mg; riboflavin (B2), 667.20 mg; niacin (B3), 1,333.53 mg; pyridoxine (B6), 666.63 mg; pantothenic acid
(B5), 1.334 mg; biotin, 34 mg; folic acid, 67 mg; cobalamine, 1.000 μg and ascorbic acid (vit. C) 999.85 mg.3Mixture of aspartic and glutamic acid to adjust the quantity of nitrogen (protein) in all diets.
meals (0700 and 1600). Feed for immediate use was kept in plasticcontainers under refrigeration. Apparent feed consumption was esti-mated by weighing feed containers every three days.
Cages were screened daily for casualties and visual signals of nutri-tional deficiencies. At the end of the feeding trial, fishes were randomlysampled (12 fish per treatment), individually weighed, sacrificed byanesthetic overdose, and laparotomized for excision of hepatic tissue.Livers (whole) were weighed fresh for calculation of HSI. Samples ofliver tissue were quick-frozen and stored in liquid nitrogen for chemicalanalysis.
Dairiki et al. 5
TABLE 2. Chemical composition of Nile tilapia muscle.
Nutrient Value
Moisture 1.10%
Gross energy 5,472.00 (cal/g)
Crude protein 78.01%
Lipids 11.00%
Ash 4.96%
Calcium 0.21%
Total phosphorus 1.12%
Amino Acids
Arginine 4.36%
Histidine 1.55%
Isoleucine 3.22%
Leucine 5.89%
Lysine 6.34%
Methionine 2.18%
Cystine 0.60%
Phenylalanine 3.32%
Tyrosine 2.65%
Threonine 3.25%
Tryptophan 0.44%
Valine 3.50%
Alanine 4.42%
Glycine 3.70%
Proline 7.02%
Serine 2.78%
Aspartic acid 7.51%
Glutamic acid 11.02%
The use of the whole-body amino acids profile as standard for dietaryamino acids requirements relationship was validated through the use ofthe relationship A/E = essential amino acids � (total essential aminoacids � cystine � tyrosine) � 1000 (Fagbenro 2000; Ngamsnae et al.1999). Once A/E was deemed valid, the dietary requirement of essentialamino acids was estimated against the reference amino acid–lysine.
RESULTS AND DISCUSSION
The energy-to-protein ratio (DE:CP) of the experimental diets was10.4 kcal/g, considered elastic in comparison with recommendations of
6 JOURNAL OF APPLIED AQUACULTURE
TABLE 3. Composition of the synthetic amino acids mixture and Nile tilapia’smuscle tissue.
Synthetic aminoacids
Reference for43% CP on
the diet
Aminoacids profile1
15.77% of Niletilapia muscle
tissue
Amino acidsmixture
(%)
Total(%)
Arginine 3.863 4.36 0.6876 3.17 3.86Glycine 1.962 3.70 0.5835 1.38 1.96Histidine 1.012 1.55 0.2444 0.77 1.01Isoleucine 1.702 3.22 0.5078 1.19 1.70Leucine 3.783 5.89 0.9289 2.85 3.78Lysine 4.022 6.34 1.0000 0.00 1.00Methionine 1.352 2.18 0.3438 1.01 1.35Cystine 0.483 0.60 0.0946 0.39 0.48Phenylalanine 1.812 3.32 0.5236 1.29 1.81Tyrosine 1.593 2.65 0.4179 1.17 1.59Serine 2.603 2.78 0.4384 2.19 2.60Threonine 2.143 3.25 0.5125 1.63 2.14Tryptophan 0.443 0.44 0.0694 0.37 0.44Valine 2.633 3.50 0.5520 2.08 2.63Proline 2.143 7.02 1.1071 1.03 2.14Alanine 3.093 4.42 0.6970 2.39 3.09
Mixture 22.91Asp/Glu 4.92
Fillet 15.77Total CP 43.60
1From Table 2.2Largemouth bass muscle tissue.3Largemouth bass roe.
Dairiki et al. 7
TABLE 4. Chemical composition of experimental diets.
Treatmentwith lysine (%)
Dry matter(%)
Mineralmatter (%)
Crudeprotein1 (%)
Crude lipid1
(%)Crude fiber
(%)Energy2
(MJ kg�1)
1.0 95.48 6.42 43.22 9.18 4.21 18.88
1.5 95.79 6.41 43.16 9.34 4.16 19.07
2.0 95.89 6.39 43.29 9.37 4.36 18.91
2.5 95.61 6.40 43.06 9.14 4.11 19.02
3.0 95.67 6.39 43.04 9.27 4.16 19.08
3.5 95.53 6.41 43.46 9.12 4.15 19.02
1Dry matter.2Original matter.
TABLE 5. Amino acids composition of experimental diets.
Diets
1 2 3 4 5 6
DM 95.48 95.79 95.89 95.61 95.67 95.53
Amino acids1
Arg 3.48 3.46 3.47 3.48 3.51 3.50
His 1.00 0.98 0.99 0.98 0.99 1.02
Ile 1.74 1.69 1.70 1.71 1.71 1.73
Leu 3.76 3.79 3.80 3.81 3.81 3.78
Lys 1.16 1.65 1.99 2.46 3.05 3.49
Met 1.40 1.40 1.43 1.39 1.41 1.38
Phe 1.70 1.68 1.67 1.68 1.70 1.69
Thr 2.16 2.15 2.18 2.17 2.15 2.15
Trp 0.45 0.48 0.43 0.45 0.45 0.46
Val 2.56 2.61 2.58 2.57 2.58 2.58
Asp 2.46 2.45 2.41 2.45 2.44 2.44
Glu 2.58 2.56 2.57 2.58 2.57 2.59
Ala 3.11 3.15 3.13 3.11 3.13 3.13
Cys 0.51 0.54 0.52 0.52 0.53 0.54
Gly 1.90 1.92 1.91 1.90 1.94 1.91
Ser 2.72 2.74 2.75 2.74 2.76 2.74
Pro 2.16 2.18 2.18 2.20 2.17 2.15
Tyr 1.58 1.56 1.59 1.60 1.58 1.59
Total 36.43 36.99 37.30 37.80 38.48 38.87
1Percentage of original matter.
Portz (1999), who determined DE:CP = 7.78-8.83 kcal/g as ideal for nu-trition of juvenile largemouth bass (14.46±0.81 g). However, no problemsrelated to high dietary DE:CP were observed, since values registered forboth weight gain (WG) and specific growth rate (SGR) were consideredsatisfactory and compatible with literature data.
Animal growth is understood and defined as increase of mass of thestructural tissues–that is, bone and muscle–and organs; protein is theprimary constituent of structural tissues (Millward 1989; Young 1974;1985). Fish fed with energy-deficient diets usually present reduced growthrate, for part of the ingested protein will be spared as energy source. On theother hand, disproportionately higher dietary energy can halt voluntaryfeed intake before enough protein is ingested, impairing the use of othernutrients and increasing body fat deposition (NRC 1993; Cho andKaushik 1990; De Silva and Anderson 1995).
Performance of Fish
Performance data were submitted to exploratory analysis by outlierdata test, variance homogeneity, sample size, range of the response vari-able, and Box-Cox optimal potency test (SAS 2000). Data on feed con-version ratio (FCR) of a single replication of treatment 3.5% dietarylysine were detected as outlier and disconsidered for analysis. Treatmentmeans differed (P < 0.05) regarding final weight (Wf), absolute weightgain (WGa), relative weight gain (WGr), feed consumption (FC), spe-cific growth rate (SGR) and FCR.
Foster and Ogata (1998) reported that juvenile Japanese flounderParalichthys olivaceus fed lysine-deficient diets presented abnormalcolor pattern. Also, caudal fin erosion was reported by Ketola (1983) forrainbow trout Onchorhynchus mykiss (1.1 g) fed with lysine-deficientdiets. No external deficiency signs or body deformities were registeredfor largemouth bass fingerlings in this study, independent of dietarylysine level.
Polynomial Regression Analysis
If quantitative factors interact at more than two levels, data analysiswill establish functional correlations between factors’ levels and thestudied variable (Gomes and Garcia 2002), for example the polynomialregression analysis herein used. Solving polynomial regression equa-tions allows not only estimating nutrients’ requirement levels (Tibaldiand Tulli 1999), but also representing it graphically.
8 JOURNAL OF APPLIED AQUACULTURE
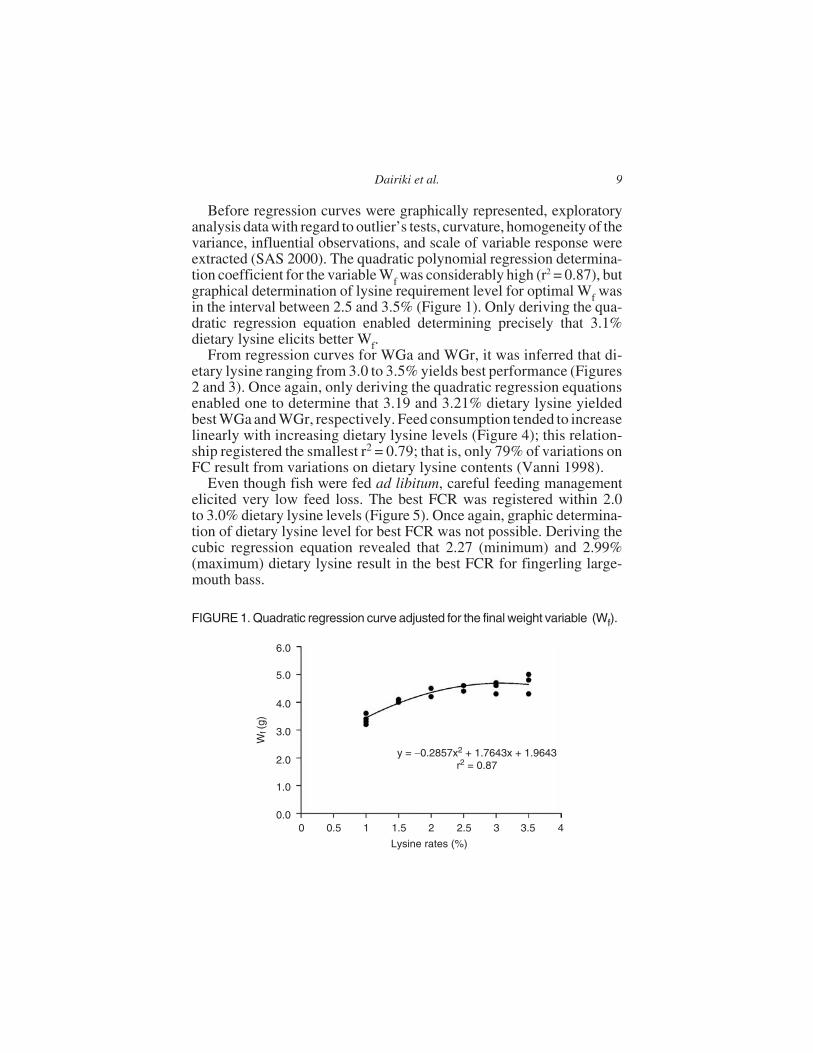
Before regression curves were graphically represented, exploratoryanalysis data with regard to outlier’s tests, curvature, homogeneity of thevariance, influential observations, and scale of variable response wereextracted (SAS 2000). The quadratic polynomial regression determina-tion coefficient for the variable Wf was considerably high (r2 = 0.87), butgraphical determination of lysine requirement level for optimal Wf wasin the interval between 2.5 and 3.5% (Figure 1). Only deriving the qua-dratic regression equation enabled determining precisely that 3.1%dietary lysine elicits better Wf.
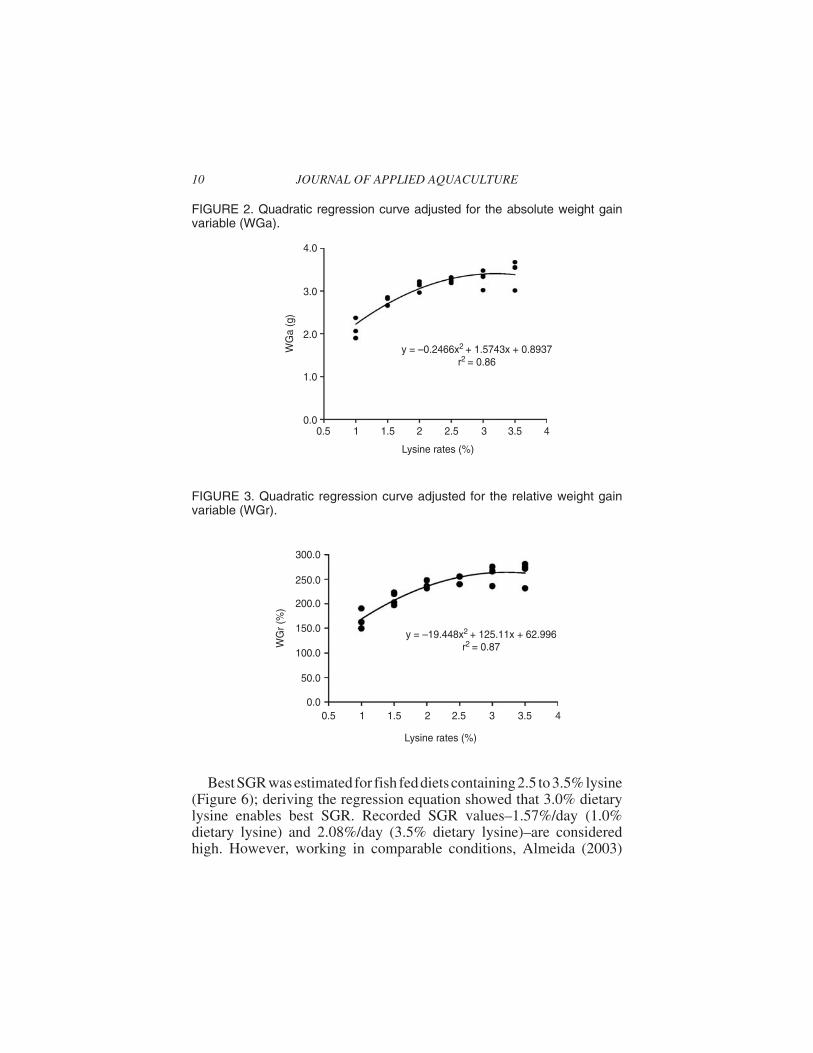
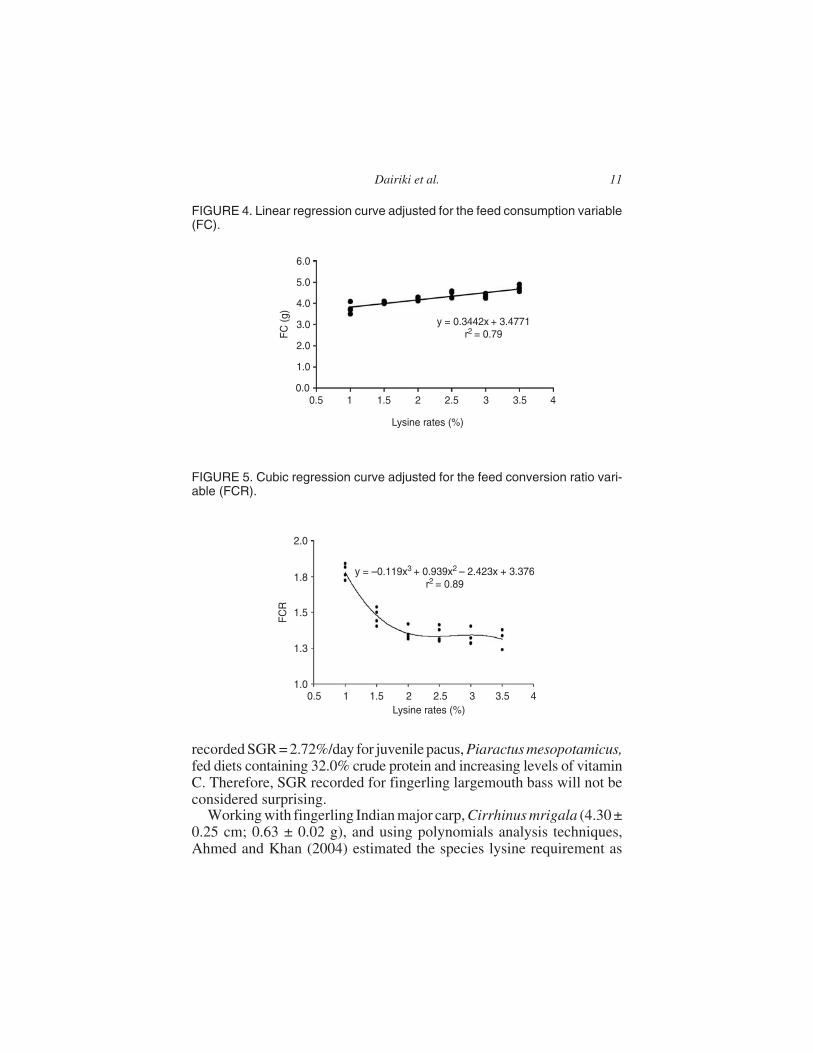
From regression curves for WGa and WGr, it was inferred that di-etary lysine ranging from 3.0 to 3.5% yields best performance (Figures2 and 3). Once again, only deriving the quadratic regression equationsenabled one to determine that 3.19 and 3.21% dietary lysine yieldedbest WGa and WGr, respectively. Feed consumption tended to increaselinearly with increasing dietary lysine levels (Figure 4); this relation-ship registered the smallest r2 = 0.79; that is, only 79% of variations onFC result from variations on dietary lysine contents (Vanni 1998).
Even though fish were fed ad libitum, careful feeding managementelicited very low feed loss. The best FCR was registered within 2.0to 3.0% dietary lysine levels (Figure 5). Once again, graphic determina-tion of dietary lysine level for best FCR was not possible. Deriving thecubic regression equation revealed that 2.27 (minimum) and 2.99%(maximum) dietary lysine result in the best FCR for fingerling large-mouth bass.
Dairiki et al. 9
6.0
5.0
4.0
3.0
2.0
Wf(
g)
1.0
0.00 0.5 1 1.5 2
y = −0.2857x2 + 1.7643x + 1.9643r2 = 0.87
2.5 3 3.5 4
Lysine rates (%)
FIGURE 1. Quadratic regression curve adjusted for the final weight variable (Wf).
BestSGR was estimatedfor fish feddietscontaining2.5 to3.5%lysine(Figure 6); deriving the regression equation showed that 3.0% dietarylysine enables best SGR. Recorded SGR values–1.57%/day (1.0%dietary lysine) and 2.08%/day (3.5% dietary lysine)–are consideredhigh. However, working in comparable conditions, Almeida (2003)
10 JOURNAL OF APPLIED AQUACULTURE
4.0
3.0
2.0
WG
a (g
)
1.0
0.00.5 1
y = –0.2466x2 + 1.5743x + 0.8937r2 = 0.86
1.5 2 2.5
Lysine rates (%)
3 3.5 4
FIGURE 2. Quadratic regression curve adjusted for the absolute weight gainvariable (WGa).
300.0
250.0
200.0
150.0
WG
r (%
)
Lysine rates (%)
100.0
50.0
0.00.5 1 1.5 2 2.5 3 3.5 4
y = –19.448x2 + 125.11x + 62.996r2 = 0.87
FIGURE 3. Quadratic regression curve adjusted for the relative weight gainvariable (WGr).
recorded SGR = 2.72%/day for juvenile pacus, Piaractus mesopotamicus,fed diets containing 32.0% crude protein and increasing levels of vitaminC. Therefore, SGR recorded for fingerling largemouth bass will not beconsidered surprising.
Working with fingerling Indian major carp, Cirrhinus mrigala (4.30 ±0.25 cm; 0.63 ± 0.02 g), and using polynomials analysis techniques,Ahmed and Khan (2004) estimated the species lysine requirement as
Dairiki et al. 11
Lysine rates (%)
FC
(g)
0.50.0
1.0
2.0
3.0
4.0
5.0
6.0
1 1.5 2 2.5 3 3.5 4
y = 0.3442x + 3.4771r2 = 0.79
FIGURE 4. Linear regression curve adjusted for the feed consumption variable(FC).
Lysine rates (%)
2.0
1.8
FC
R
1.5
1.3
1.00.5 1 1.5 2 2.5 3 3.5 4
y = –0.119x3 + 0.939x2 – 2.423x + 3.376r2 = 0.89
FIGURE 5. Cubic regression curve adjusted for the feed conversion ratio vari-able (FCR).
being 2.30% of the diet or 5.75% lysine in the dietary protein (LDP).These values are closer to those resulting from broken-line regressionanalysis, than to those resulting from graphic and algebraic analysis ofpolynomial regressions, in this experiment. Similar results were reportedfor fingerling grass carp, Ctenopharyngodon idella (3.15 ± 0.01 g), byWang et al. (2005) who, using the polynomial regression analysismethod, determined the species’ dietary lysine requirement to be 2.24%(5.89% dietary protein).
The graphic analysis of the regression curves reveals that lowest di-etary lysine levels–1.0 and 1.5%–resulted in low Wf, WG, FC, SGR, andpoor FCR. Therefore, using polynomial regression analysis to evaluateresults of nutrient requirement dose-response trials was effective only toa certain extent, once observation of the tendency lines elicited drawingpreliminary conclusions. However, this analysis method does not allowprecise graphic determination of the best requirement levels; only alge-braic solution elicited estimation of optimal dietary lysine requirements,and from there on, determination of the best performance responses.
Broken-Line Analysis Method
Analyzing dose-response trials data of nutritional requirementsthrough the broken-line regression analysis method allows determiningaccurately the minimum level of a given nutrient that guarantees themaximum performance of a certain species. This result/response is con-sidered an important determinant of the cost-benefit relationship for for-mulation of fish feeds. Using this method through the SAS PROC NLINprocedure is a simple, fast, and efficient method of determination of
12 JOURNAL OF APPLIED AQUACULTURE
Lysine rates (%)
SG
R (
%)
0.500.0
0.5
1.0
1.5
2.0
2.5
1 1.5 2 2.5 3 3.5 4
y = –0.125x2 + 0.7508x + 0.9623r2 = 0.84
FIGURE 6. Quadratic regression curve adjusted for the specific growth rate(SGR).
nutritional requirements. However, results can underestimate values de-termined by models traditionally used, which may not be necessarilymore precise (Portz et al. 2000; Robbins 1986; Zeitoun et al. 1976).
According to Robbins (1986), the broken-line regression curve con-sists of an ascending or descending line, followed by a horizontal line,and their intersection points will determine the break (optimal) point.This inclination model is better fitted to estimate growth parameters. Theutilized regression model (1) used was:
Yi L U(R X e , i 1, 2...n n , ... nLRi i 1 1+1= + + =� ) , , (1)
where(R�XLRi)=0,for i� n1+1,n1 beingthenumberofobservationsbe-fore the break point and n the number of pairs of observations; L =coordinate of the ordinates axis; R = coordinate of the abscissas axis of agiven break point; and U = line inclination coefficient when X < R.
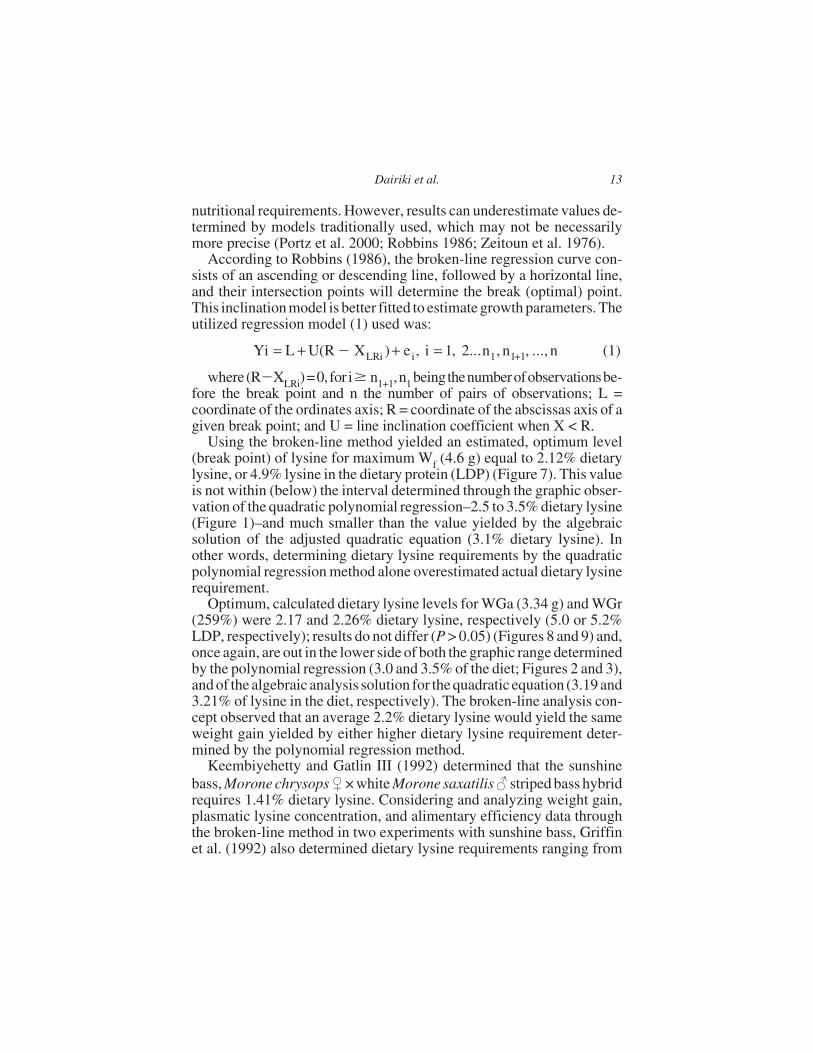
Using the broken-line method yielded an estimated, optimum level(break point) of lysine for maximum Wf (4.6 g) equal to 2.12% dietarylysine, or 4.9% lysine in the dietary protein (LDP) (Figure 7). This valueis not within (below) the interval determined through the graphic obser-vation of the quadratic polynomial regression–2.5 to 3.5% dietary lysine(Figure 1)–and much smaller than the value yielded by the algebraicsolution of the adjusted quadratic equation (3.1% dietary lysine). Inother words, determining dietary lysine requirements by the quadraticpolynomial regression method alone overestimated actual dietary lysinerequirement.
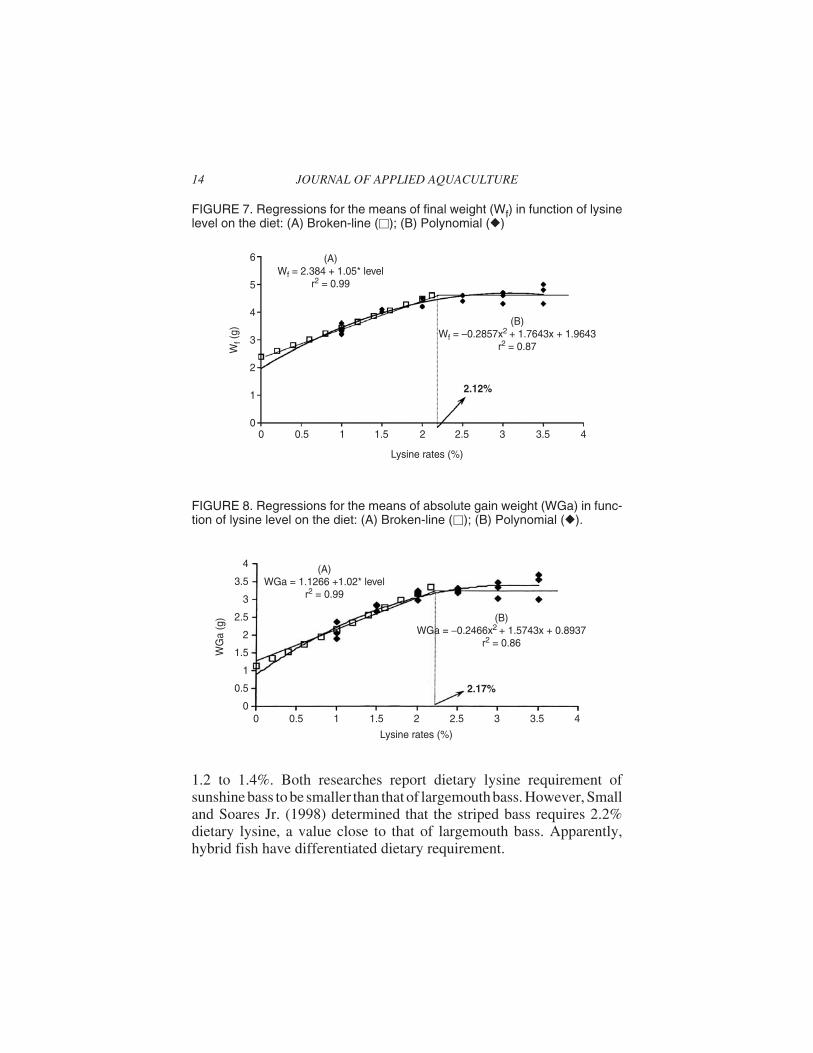
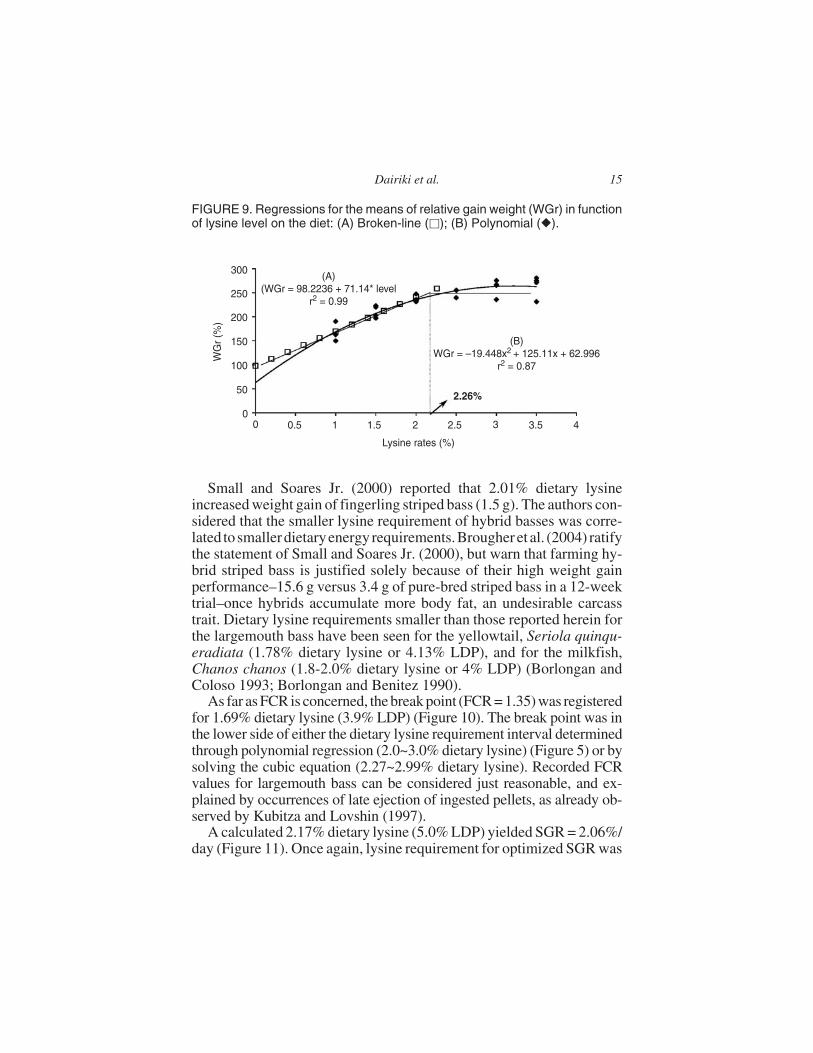
Optimum, calculated dietary lysine levels for WGa (3.34 g) and WGr(259%) were 2.17 and 2.26% dietary lysine, respectively (5.0 or 5.2%LDP, respectively); results do not differ (P > 0.05) (Figures 8 and 9) and,once again, are out in the lower side of both the graphic range determinedby the polynomial regression (3.0 and 3.5% of the diet; Figures 2 and 3),and of the algebraic analysis solution for the quadratic equation (3.19 and3.21% of lysine in the diet, respectively). The broken-line analysis con-cept observed that an average 2.2% dietary lysine would yield the sameweight gain yielded by either higher dietary lysine requirement deter-mined by the polynomial regression method.
Keembiyehetty and Gatlin III (1992) determined that the sunshinebass, Morone chrysops�× white Morone saxatilis� striped bass hybridrequires 1.41% dietary lysine. Considering and analyzing weight gain,plasmatic lysine concentration, and alimentary efficiency data throughthe broken-line method in two experiments with sunshine bass, Griffinet al. (1992) also determined dietary lysine requirements ranging from
Dairiki et al. 13
1.2 to 1.4%. Both researches report dietary lysine requirement ofsunshine bass to be smaller than that of largemouth bass. However, Smalland Soares Jr. (1998) determined that the striped bass requires 2.2%dietary lysine, a value close to that of largemouth bass. Apparently,hybrid fish have differentiated dietary requirement.
14 JOURNAL OF APPLIED AQUACULTURE
Lysine rates (%)
Wf (
g)
0.500
2
1
3
4
5
6
1 1.5 2 2.5 3 3.5 4
2.12%
(A)Wf = 2.384 + 1.05* level
r2 = 0.99
(B)Wf = –0.2857x2 + 1.7643x + 1.9643
r2 = 0.87
FIGURE 7. Regressions for the means of final weight (Wf) in function of lysinelevel on the diet: (A) Broken-line (�); (B) Polynomial (�)
Lysine rates (%)
WG
a (g
)
0.500
2
3.5
2.5
0.5
1
1.5
3
4
1 1.5 2 2.5 3 3.5 4
(A)WGa = 1.1266 +1.02* level
r2 = 0.99
2.17%
(B)WGa = −0.2466x2 + 1.5743x + 0.8937
r2 = 0.86
FIGURE 8. Regressions for the means of absolute gain weight (WGa) in func-tion of lysine level on the diet: (A) Broken-line (�); (B) Polynomial (�).
Small and Soares Jr. (2000) reported that 2.01% dietary lysineincreased weight gain of fingerling striped bass (1.5 g). The authors con-sidered that the smaller lysine requirement of hybrid basses was corre-lated to smallerdietaryenergy requirements.Brougher et al. (2004) ratifythe statement of Small and Soares Jr. (2000), but warn that farming hy-brid striped bass is justified solely because of their high weight gainperformance–15.6 g versus 3.4 g of pure-bred striped bass in a 12-weektrial–once hybrids accumulate more body fat, an undesirable carcasstrait. Dietary lysine requirements smaller than those reported herein forthe largemouth bass have been seen for the yellowtail, Seriola quinqu-eradiata (1.78% dietary lysine or 4.13% LDP), and for the milkfish,Chanos chanos (1.8-2.0% dietary lysine or 4% LDP) (Borlongan andColoso 1993; Borlongan and Benitez 1990).
As far as FCR is concerned, the break point (FCR = 1.35) was registeredfor 1.69% dietary lysine (3.9% LDP) (Figure 10). The break point was inthe lower side of either the dietary lysine requirement interval determinedthrough polynomial regression (2.0~3.0% dietary lysine) (Figure 5) or bysolving the cubic equation (2.27~2.99% dietary lysine). Recorded FCRvalues for largemouth bass can be considered just reasonable, and ex-plained by occurrences of late ejection of ingested pellets, as already ob-served by Kubitza and Lovshin (1997).
A calculated 2.17% dietary lysine (5.0% LDP) yielded SGR = 2.06%/day (Figure 11). Once again, lysine requirement for optimized SGR was
Dairiki et al. 15
Lysine rates (%)
0.500
50
100
150
200
WG
r (%
)
250
300
1 1.5 2 2.5 3 3.5 4
(A)(WGr = 98.2236 + 71.14* level
r2 = 0.99
2.26%
(B)WGr = –19.448x2 + 125.11x + 62.996
r2 = 0.87
FIGURE 9. Regressions for the means of relative gain weight (WGr) in functionof lysine level on the diet: (A) Broken-line (�); (B) Polynomial (�).
in the lower side of both the intervals obtained by the graphic analysisof the regression curve (2.5~3.5% dietary lysine; Figure 6), and thealgebraic solving of the quadratic regression equation (3.0% dietarylysine). Working with fingerlings striped bass (1.5 g), Small and SoaresJr. (2000) registered SGR = 1.55%/day for 2.01% dietary lysine. For thissame dietary lysine level, fingerling largemouth bass would presentlarger SGR (2.06%/day).
Dietary lysine requirements reported by several authors for severalfish (Rollin et al. 2003; Rodehutscord et al. 2000a, b; Rollin et al. 2003;Ruchimat et al. 1997; Tibaldi and Lanari 1991) were very close to thoseregistered in this work for the largemouth bass. Notwithstanding, Coyleet al. (2000) determined lysine requirement of largemouth bass (2.8%dietary lysine; 6.0% LDP) as considerably higher than those determinedin this study. However, fish used by Coyle et al. (2000) were also consid-erably older and larger (36.0 ± 0.5 g).
Comparing the graphic analysis polynomial regression curves with re-sults yielded by the broken-line analysis method, fingerling largemouthbass fed diets containing lysine levels estimated by polynomial regres-sion curves (1.0 and 1.5% dietary lysine) would have Wf, WG, and SGRsignificantly smaller, and FCR significantly worse. In addition, because
16 JOURNAL OF APPLIED AQUACULTURE
Lysine rates (%)
0.500
0.5
1
1.5
2
2.5
3.5
3
FC
R
1 1.5 2 2.5 3 3.5 4
(A)FCR = 2.43 – 0.64* level
r2 = 0.99
(B)FCR = –0.119x3 + 0.939x2 – 2.423x + 3.376
r2 = 0.89
1.69%
FIGURE 10. Regressions for the means of feed conversion ratio (FCR) in func-tion of lysine level on the diet: (A) Broken-line (�); (B) Polynomial (�).
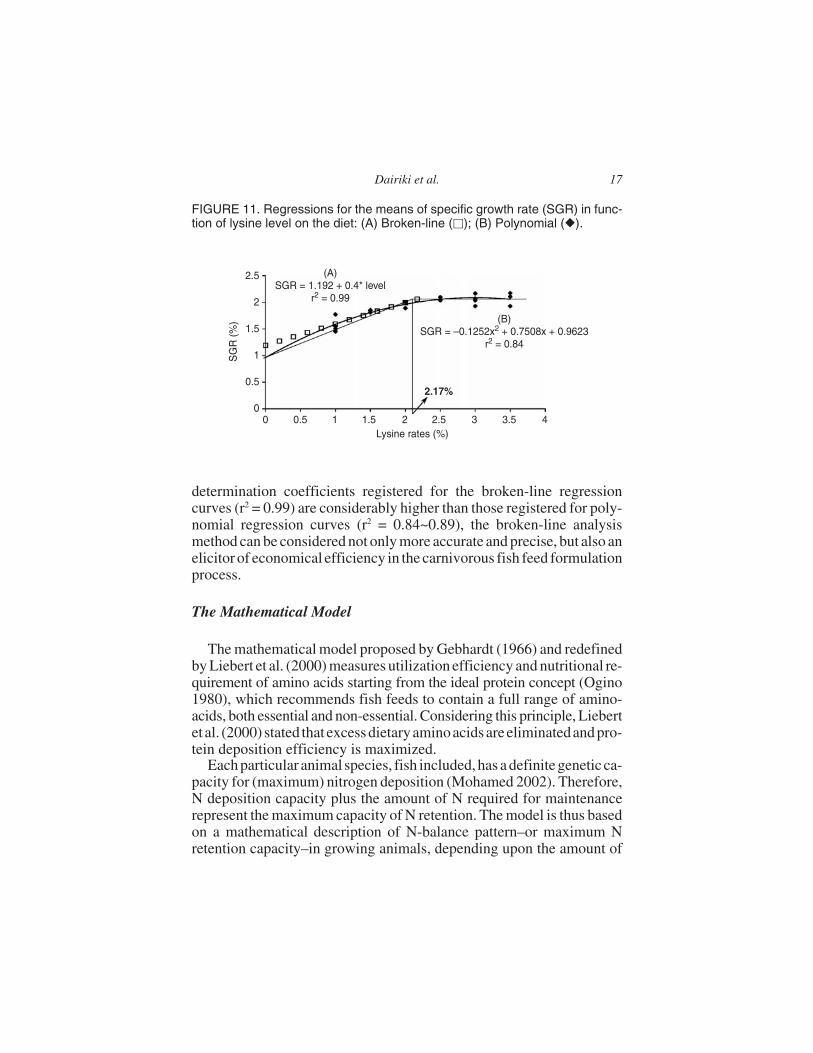
determination coefficients registered for the broken-line regressioncurves (r2 = 0.99) are considerably higher than those registered for poly-nomial regression curves (r2 = 0.84~0.89), the broken-line analysismethod can be considered not only more accurate and precise, but also anelicitor of economical efficiency in the carnivorous fish feed formulationprocess.
The Mathematical Model
The mathematical model proposed by Gebhardt (1966) and redefinedby Liebert et al. (2000) measures utilization efficiency and nutritional re-quirement of amino acids starting from the ideal protein concept (Ogino1980), which recommends fish feeds to contain a full range of amino-acids, both essential and non-essential. Considering this principle, Liebertet al. (2000) stated that excess dietaryaminoacidsare eliminatedand pro-tein deposition efficiency is maximized.
Each particular animal species, fish included, has a definite genetic ca-pacity for (maximum) nitrogen deposition (Mohamed 2002). Therefore,N deposition capacity plus the amount of N required for maintenancerepresent the maximum capacity of N retention. The model is thus basedon a mathematical description of N-balance pattern–or maximum Nretention capacity–in growing animals, depending upon the amount of
Dairiki et al. 17
Lysine rates (%)0.50
0
0.5
1
1.5
SG
R (
%)
2
2.5
1 1.5 2 2.5 3 3.5 4
(A)SGR = 1.192 + 0.4* level
r2 = 0.99
(B)SGR = –0.1252x2 + 0.7508x + 0.9623
r2 = 0.84
2.17%
FIGURE 11. Regressions for the means of specific growth rate (SGR) in func-tion of lysine level on the diet: (A) Broken-line (�); (B) Polynomial (�).
ingested nitrogen and quality of the food/feed protein, represented byequation (2):
y PD T (1 e )maxbx= − − (2)
where y = actual daily N-balance � NMR1/LW2 kg0.67 (mg), PDmax T =maximum theoretical capacity for daily N-balance � NMR/LW kg0.67
(mg), x = daily N-intake/LW 0.67 (mg), b = slope of the curve, and e = basicnumber of natural logarithm (1nitrogen maintenance requirement and2live weight).
The value of b is calculated through equation (3) (Mohamed 2002):
b =ln a ln (a y)
x
− −(3)
where a = 500 (fixed; Mohamed 2002); x and y same as equation (2).In this model, b is the quality of the protein ingested as feed, which is
linearly related to contents and availability of essential amino acids.Therefore, b depends solely on the utilization of dietary, essential aminoacids, as regulated by dietary protein’s digestibility, absorption, and me-tabolism. Nitrogen balance trials in growing animals thus allow deter-mining maximum values for essential amino acids utilization.
Average N retention (%/day) did not differ among treatments (P >0.05). It was thus impossible to calculate levels of dietary lysine thatwould favor best N-retention efficiency. The studied model was origi-nally developed and successfully used for swine and poultry, whichare homoeothermic and have nutritional requirements dissimilar to fish.Adjustment and adaptation of the model’s principles are necessary toelicit its use in fish nutrition research (Cho and Bureau 1998), especiallywith regard to neotropical, fresh-water fish.
A/E Relationship and Amino Acids Requirements
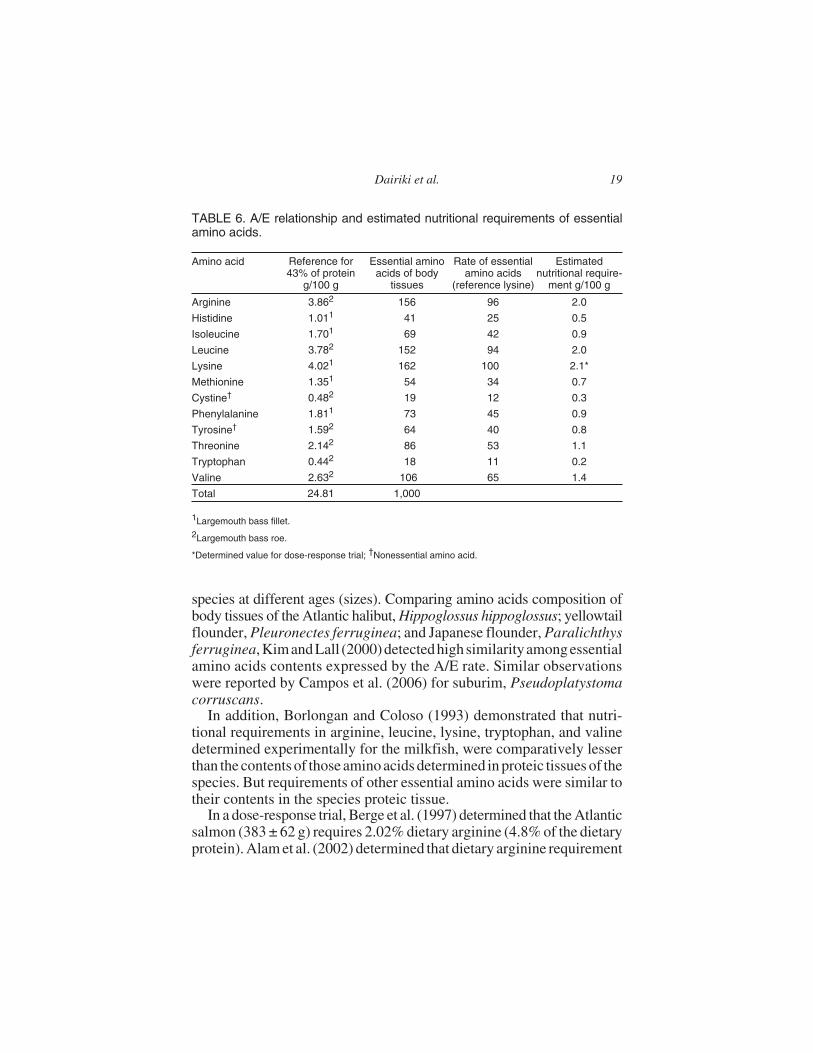
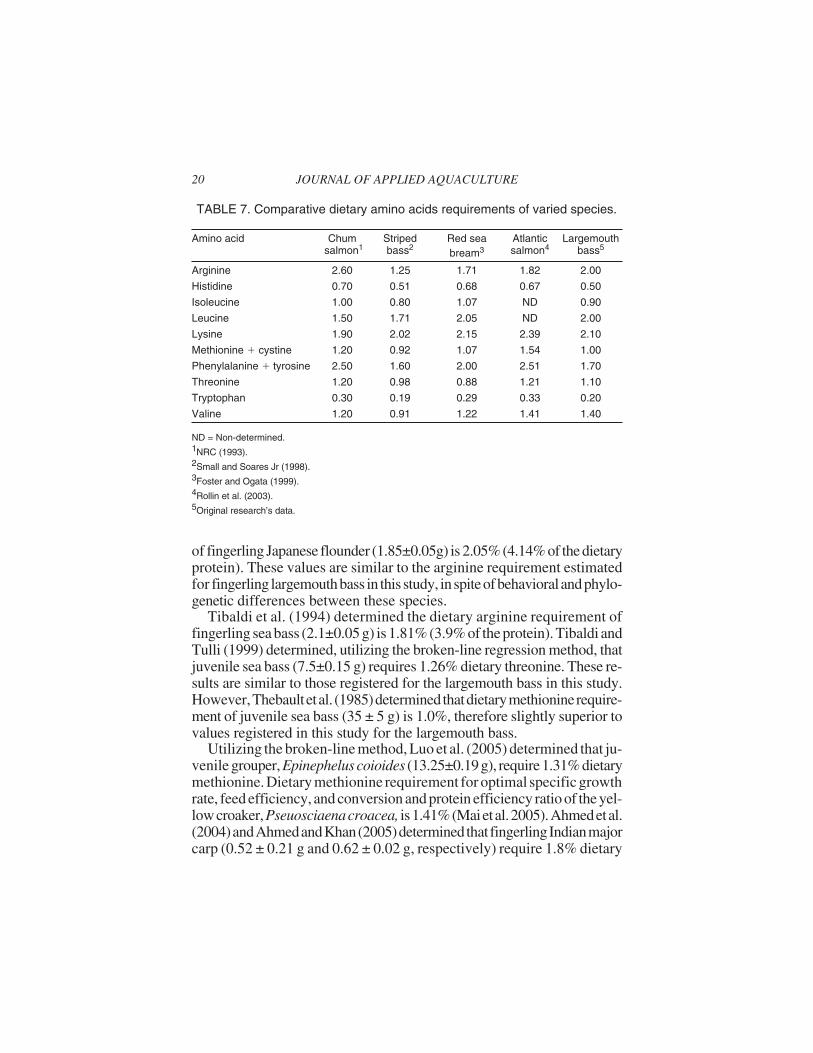
Tables 6 and 7 present and compare data on amino acids requirementsof largemouth bass estimated through the A/E relationship, and aminoacids requirementsdeterminedfor other fish species; results are homoge-neous and similar. In exception of NRC (1993), data on amino acidsrequirements were determined with the aid of the A/E relationship andamino acids profiles of selected fish tissues.
Kim and Lall (2000) postulate that using the A/E rate enables deter-mining similarities in essential amino acids requirements of different
18 JOURNAL OF APPLIED AQUACULTURE
species at different ages (sizes). Comparing amino acids composition ofbody tissues of the Atlantic halibut, Hippoglossus hippoglossus; yellowtailflounder, Pleuronectes ferruginea; and Japanese flounder, Paralichthysferruginea, KimandLall (2000) detectedhighsimilarityamongessentialamino acids contents expressed by the A/E rate. Similar observationswere reported by Campos et al. (2006) for suburim, Pseudoplatystomacorruscans.
In addition, Borlongan and Coloso (1993) demonstrated that nutri-tional requirements in arginine, leucine, lysine, tryptophan, and valinedetermined experimentally for the milkfish, were comparatively lesserthan the contents of those amino acids determined in proteic tissues of thespecies. But requirements of other essential amino acids were similar totheir contents in the species proteic tissue.
In a dose-response trial, Berge et al. (1997) determined that the Atlanticsalmon (383 ± 62 g) requires 2.02% dietary arginine (4.8% of the dietaryprotein). Alam et al. (2002) determined that dietary arginine requirement
Dairiki et al. 19
TABLE 6. A/E relationship and estimated nutritional requirements of essentialamino acids.
Amino acid Reference for43% of protein
g/100 g
Essential aminoacids of body
tissues
Rate of essentialamino acids
(reference lysine)
Estimatednutritional require-
ment g/100 g
Arginine 3.862 156 96 2.0
Histidine 1.011 41 25 0.5
Isoleucine 1.701 69 42 0.9
Leucine 3.782 152 94 2.0
Lysine 4.021 162 100 2.1*
Methionine 1.351 54 34 0.7
Cystine† 0.482 19 12 0.3
Phenylalanine 1.811 73 45 0.9
Tyrosine† 1.592 64 40 0.8
Threonine 2.142 86 53 1.1
Tryptophan 0.442 18 11 0.2
Valine 2.632 106 65 1.4
Total 24.81 1,000
1Largemouth bass fillet.2Largemouth bass roe.
*Determined value for dose-response trial; †Nonessential amino acid.
of fingerling Japanese flounder (1.85±0.05g) is 2.05% (4.14% of the dietaryprotein). These values are similar to the arginine requirement estimatedfor fingerling largemouthbass in this study, inspiteofbehavioralandphylo-genetic differences between these species.
Tibaldi et al. (1994) determined the dietary arginine requirement offingerling sea bass (2.1±0.05 g) is 1.81% (3.9% of the protein). Tibaldi andTulli (1999) determined, utilizing the broken-line regression method, thatjuvenile sea bass (7.5±0.15 g) requires 1.26% dietary threonine. These re-sults are similar to those registered for the largemouth bass in this study.However,Thebaultetal. (1985)determinedthatdietarymethioninerequire-ment of juvenile sea bass (35 ± 5 g) is 1.0%, therefore slightly superior tovalues registered in this study for the largemouth bass.
Utilizing the broken-line method, Luo et al. (2005) determined that ju-venile grouper,Epinephelus coioides (13.25±0.19g), require1.31%dietarymethionine. Dietary methionine requirement for optimal specific growthrate, feed efficiency, and conversion and protein efficiency ratio of the yel-low croaker,Pseuosciaenacroacea, is1.41%(Maietal.2005).Ahmedetal.(2004)andAhmedandKhan(2005)determinedthat fingerlingIndianmajorcarp (0.52 ± 0.21 g and 0.62 ± 0.02 g, respectively) require 1.8% dietary
20 JOURNAL OF APPLIED AQUACULTURE
TABLE 7. Comparative dietary amino acids requirements of varied species.
Amino acid Chumsalmon1
Stripedbass2
Red seabream3
Atlanticsalmon4
Largemouthbass5
Arginine 2.60 1.25 1.71 1.82 2.00
Histidine 0.70 0.51 0.68 0.67 0.50
Isoleucine 1.00 0.80 1.07 ND 0.90
Leucine 1.50 1.71 2.05 ND 2.00
Lysine 1.90 2.02 2.15 2.39 2.10
Methionine � cystine 1.20 0.92 1.07 1.54 1.00
Phenylalanine � tyrosine 2.50 1.60 2.00 2.51 1.70
Threonine 1.20 0.98 0.88 1.21 1.10
Tryptophan 0.30 0.19 0.29 0.33 0.20
Valine 1.20 0.91 1.22 1.41 1.40
ND = Non-determined.1NRC (1993).2Small and Soares Jr (1998).3Foster and Ogata (1999).4Rollin et al. (2003).5Original research’s data.
threonine and 0.38% dietary tryptophan. All aforementioned amino ac-ids requirements were superior to those registered here for largemouthbass. Notwithstanding, estimated essential amino acids requirements oflargemouth bass through the A/E ratio are closely similar to the valuesregistered for salmonids and other basses (Table 6).
The relationship A/E is a reliable and useful tool to estimate essentialamino acids requirements of species, but species-specific variationsshould be considered. Using body amino acids profile to set base fordietary amino acids profile and requirements is a viable technique andmay bring additional benefits of formulating diets eliciting higher feed-ing efficiency and reduced nutrient loss and waste and metabolitesexcretion.
Survival Rate and Hepato-Somatic Index (HSI)
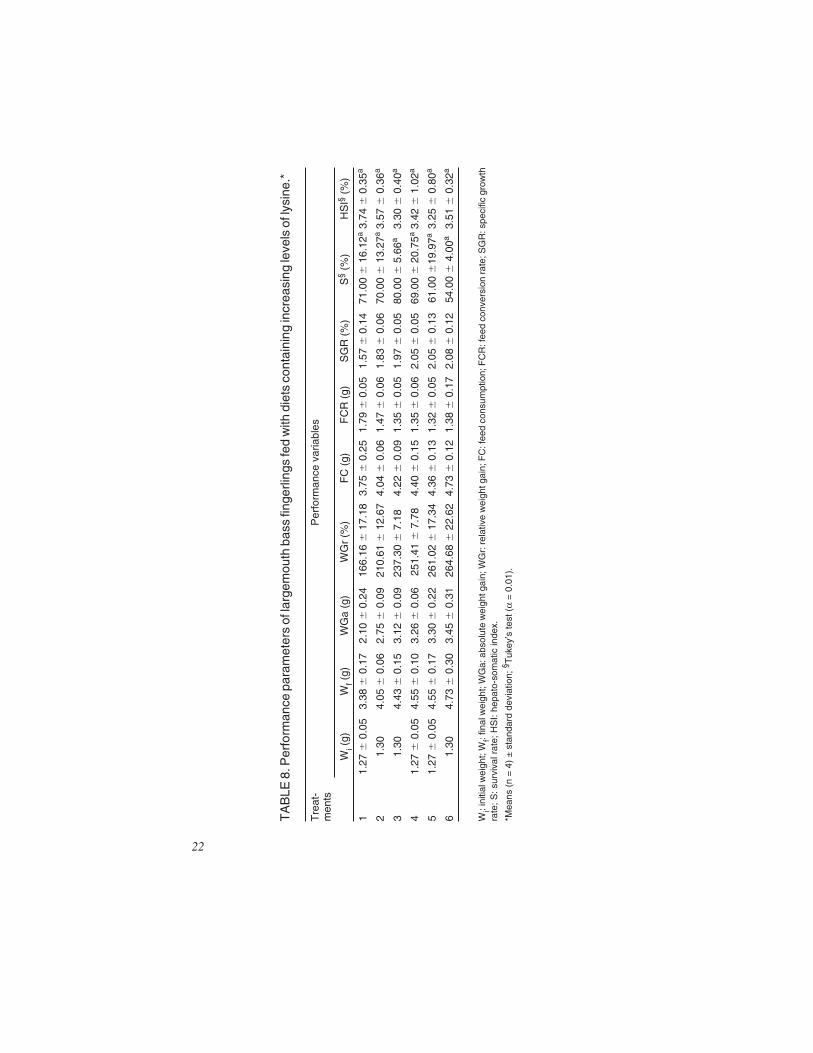
Dietary essential amino acids deficiency may affect the survival rateof farmed fish. Working on dietary lysine requirement of juvenile hybridstriped (8.0 g), KeembiyehettyandGatlin III (1992) registered100% sur-vival, even for fish fed lysine-deficientdiets. Moon and Gatlin III (1991),working with red drum, Sciaenopsocellatus (0.9 g), observed thatgroupsof fish fed methionine-deficient diets presented smaller survival rate.
Over 50% mortality was registered by Rodehutscord et al. (1997) fortrout fed lysine-deficient diets–0.45, 0.55, and 0.70% dietary lysine; fishfed diet containing 0.85 and 1.0% lysine presented improved survivalrate; when dietary lysine exceeded 1.0%, survival rate was 100%. Inthe present study, survival rate (54.00~71.00%; Table 8) did not differamong treatments (P > 0.01).
The occurrence of metabolism disturbances was screened through thestudy of the HSI variation. HSI did not differ (P > 0.01) in the treatments(Table 8); values herein recorded were close to those reported by Tibaldiet al. (1994) for the sea bass (HSI = 2.39~3.28%), and by Cyrino et al.(2000) for fingerling largemouth bass (HSI = 3.62~4.39%) fed dietswith varying protein contents. Seemingly, either the lysine-poor or thelysine-rich diets did not induce severe physiologic disturbances in thelargemouth fingerlings (possibly as a result of the somewhat short exper-imental period). Finally, Berge et al. (2002) report that the main clinicalsign of dietary arginine to lysine imbalance is reduced growth. Growthrate of fingerling largemouth bass fed the highest dietary lysine ratewas either equal or superior to growth rate of fish fed diets containing the
Dairiki et al. 21
TA
BLE
8.P
erfo
rman
cepa
ram
eter
sof
larg
emou
thba
ssfin
gerli
ngs
fed
with
diet
sco
ntai
ning
incr
easi
ngle
vels
ofly
sine
.*
Tre
at-
men
tsP
erfo
rman
ceva
riabl
es
Wi(g
)W
f(g
)W
Ga
(g)
WG
r(%
)F
C(g
)F
CR
(g)
SG
R(%
)S
§(%
)H
SI§
(%)
11.
27�
0.05
3.38
�0.
172.
10�
0.24
166.
16�
17.1
83.
75�
0.25
1.79
�0.
051.
57�
0.14
71.0
0�
16.1
2a3.
74�
0.35
a
21.
304.
05�
0.06
2.75
�0.
0921
0.61
�12
.67
4.04
�0.
061.
47�
0.06
1.83
�0.
0670
.00
�13
.27a
3.57
�0.
36a
31.
304.
43�
0.15
3.12
�0.
0923
7.30
�7.
184.
22�
0.09
1.35
�0.
051.
97�
0.05
80.0
0�
5.66
a3.
30�
0.40
a
41.
27�
0.05
4.55
�0.
103.
26�
0.06
251.
41�
7.78
4.40
�0.
151.
35�
0.06
2.05
�0.
0569
.00
�20
.75a
3.42
�1.
02a
51.
27�
0.05
4.55
�0.
173.
30�
0.22
261.
02�
17.3
44.
36�
0.13
1.32
�0.
052.
05�
0.13
61.0
0�
19.9
7a3.
25�
0.80
a
61.
304.
73�
0.30
3.45
�0.
3126
4.68
�22
.62
4.73
�0.
121.
38�
0.17
2.08
�0.
1254
.00
�4.
00a
3.51
�0.
32a
Wi:i
nitia
lwei
ght;
Wf:f
inal
wei
ght;
WG
a:ab
solu
tew
eigh
tgai
n;W
Gr:
rela
tive
wei
ghtg
ain;
FC
:fee
dco
nsum
ptio
n;F
CR
:fee
dco
nver
sion
rate
;SG
R:s
peci
ficgr
owth
rate
;S:s
urvi
valr
ate;
HS
I:he
pato
-som
atic
inde
x.
*Mea
ns(n
=4)
±st
anda
rdde
viat
ion;
§ Tuk
ey’s
test
(α=
0.01
).
22
estimated amino acids requirement. Therefore, the hypothesis of aminoacid antagonism should be definitely ruled out.
ACKNOWLEDGMENTS
The authors are grateful to Fundação de Amparo à Pesquisa do Estadode São Paulo (FAPESP) and to Dr. Leandro Portz from Departamento deZootecnia, Escola de Agronomia, Universidade Federal da Bahia, Cruzdas Almas, BA, Brazil.
REFERENCES
Ahmed, I. and M.A. Khan. 2004. Dietary lysine requirement of fingerling Indian majorcarp, Cirrhinus mrigala (Hamilton). Aquaculture 235: 499-511.
Ahmed, I. and M.A. Khan. 2005. Dietary tryptophan requirement of fingerling Indianmajor carp, Cirrhinus mrigala (Hamilton). Aquaculture Research 36: 687-695.
Ahmed, I., M.A. Khan, and A.K. Jafri. 2004. Dietary treonine requirement of fin-gerling Indian major carp, Cirrhinus mrigala (Hamilton). Aquaculture Research35: 162-170.
Alam, M.S., S.I. Teshima, S. Koshio, and M. Ishikawa. 2002. Arginine requirement ofjuvenile Japanese flounder Paralichthys olivaceus estimated by growth and bio-chemical parameters. Aquaculture 205: 127-140.
Almeida, G.S.C. 2003. Suplementação dietética de vitamina C, desenvolvimentoe sanidade do pacu (Piaractus mesopotamicus Holmberg, 1887). Piracicaba.47p. Dissertação (Mestrado)–Escola Superior de Agricultura “Luiz de Queiroz,”Universidade de São Paulo.
Anderson, J.S., S.P. Lall, D.M. Anderson, and M.A. McNiven. 1995. Availabilityof amino acids from various fish meals fed to Atlantic salmon (Salmo salar).Aquaculture 138: 291-301.
Berge, G.E., E. Lied, and H. Sveier. 1997. Nutrition of Atlantic salmon (Salmo salar),the requirement and metabolism of arginine. Comparative Biochemistry and Physi-ology 117: 501-509.
Berge, G.E., H. Sveier, and E. Lied. 2002. Effects of feeding Atlantic salmon (Salmosalar L.) imbalanced levels of lysine and arginine. Aquaculture Nutrition 8: 239-248.
Borlongan, I.G. and L.V. Benitez. 1990. Quantitative lysine requirement of milkfish(Chanos chanos) juveniles. Aquaculture 87: 341-347.
Borlongan, I.G. and R.M. Coloso. 1993. Requirements of juvenile milkfish (Chanoschanos Forsskal) for essential amino acids. Journal of Nutrition 123: 125-132.
Brougher, D.S., L.W. Douglas, and J.H. Soares Jr. 2004. A comparative study of thedietary lysine requirement of juvenile striped bass Morone saxatilis and sunshinebass M. chrysops x M. saxatilis. Journal of the World Aquaculture Society 35:143-158.
Dairiki et al. 23

Campos, P., R.C. Martino, and L.C. Trugo. 2006. Amino acid composition of Braziliansurubim fish (Pseudoplatystoma corruscans) fed different diets with differentlevels and sources of fat. Food Chemistry 96: 126-130.
Cho, C.Y. and D. Bureau. 1998. Development of bioenergetic models and the Fish-PrFEQsoftware to estimate production, feeding ration and waste output in aquaculture.Aquatic Living Resource 11(4): 199-210.
Cho, C.Y. and S.J. Kaushik. 1990. Nutrition energetics in fish: Energy and protein uti-lization in rainbow trout–Salmo gairdneri. World Review of Nutritional and Dietet-ics 61: 132-172.
Coyle, S.D., J.H. Tidwell, and C. Webster. 2000. Response of largemouth bass(Micropterus salmoides) to dietary supplementation of lysine, methionine, andhighly unsaturated fatty acids. Journal of World Aquaculture Society 31: 89-95.
Cyrino, J.E.P., L. Portz, and R.C. Martino. 2000. Retenção de proteína e energia emjuvenis de “black bass” Micropterus salmoides. Scientia Agricola 57 (4): 609-616.
De Silva, S.S. and T.A. Anderson. 1995. Fish nutrition in aquaculture. London:Chapman & Hall. 319p.
Fagbenro, O.A. 2000. Validation of the essential amino acid requirements of Niletilapia, Oreochromis niloticus (Linne 1758), assessed by the ideal protein concept.Pages 154-155. In: International Symposium on Tilapia Aquaculture, 5., Rio deJaneiro, Proceedings. Rio de Janeiro: Panorama da Aqüicultura.
Foster, I. and H.Y. Ogata. 1998. Lysine requirement of juvenile Japanese flounderParalichthys olivaceus and juvenile red sea bream Pagrus major. Aquaculture 161:131-142.
Gebhardt, G. 1966. Die bewertung der eiwei Bqualitat von nahrungs- und futtermitteinmit hilfe des N-bilanzversuches. In A. Hock: Vergleichende Ernaehrungslehre desMenschen und seiner Haustiere. Fischer Publ. Jena, Pages 323-348 (apud Liebertet al., 2000).
Godoy, M.P. 1954. Observações sobre a adaptação do “black bass” (Micropterussalmoides) em Pirassununga, Estado de São Paulo. Revista Brasileira de Biologia14 (2): 32-38.
Gomes, F.P. and C.H. Garcia. 2002. Estatística aplicada a experimentos agronômicos eflorestais: Exposição com exemplos e orientação para uso de aplicativos. Piracicaba:FEALQ. 309p.
Griffin, M.E., P.B. Brown, and A.L. Grant. 1992. The dietary lysine requirement ofjuvenile hybrid striped bass. Journal of Nutrition 122: 1332-1337.
Halver, J.E. 1989. Fish nutrition. San Diego: Academic Press. 256p.Heinen, J.M. 1998. Light control for fish tanks. The Progressive Fish Culturist 60:
323-330.Keembiyehetty, C.N. and D.M. Gatlin III. 1992. Dietary lysine requirement of juve-
nile hybrid striped bass (Morone chrysops × M. saxatilis). Aquaculture 104: 271-277.Ketola, H.G. 1983. Requirement for dietary lysine and arginine by fry of rainbow trout.
Journal of Animal Science 56: 101-107.Kim, J.D. and S.P. Lall. 2000. Amino acid composition of whole body tissue of Atlantic
halibut (Hippoglossus hippoglossus), yellowtail flounder (Pleuronectes ferruginea)and Japanese flounder (Paralichthys olivaceus). Aquaculture 187: 367-373.
24 JOURNAL OF APPLIED AQUACULTURE
Kubitza, F. and L.L. Lovshin. 1997. Pond production of pellet-fed advanced juvenileand food-size largemouth bass. Aquaculture 149: 253-262.
Liebert, F., M. Rimbach, and M. Peisker. 2000. Model for estimation of amino acid uti-lization and its requirements in growing animals. Australian Poultry Science Sym-posium 12: 81-89.
Luo, Z., Y. Liu, K. Mai, L. Tian, H. Yang, X. Tan, and D. Liu. 2005. DietaryL-methionine requirement of juvenile grouper Epinephelus coioides at a constantdietary cystine level. Aquaculture 249: 409-418.
Mai, K., J. Wan, Q. Ai, W. Xu, Z. Liufu, L. Zhang, C. Zhang, and H. Li. 2006. Di-etary methionine requirement of large yellow croaker, Pseudosciaena croceaR. Aquaculture 253: 564-572.
Masumoto, T., T. Ruchimat, Y. Ito, H. Hosokawa, and S. Shimeno. 1996. Aminoacid availability values for several protein sources for yellowtail (Seriolaquinqueradiata). Aquaculture 146: 109-119.
Millward, D.J. 1989. The nutritional regulation of muscle growth and protein turnover.Aquaculture 79: 1-28.
Mohamed, K.A.E.S.A. 2002. Study to determine maximum growth capacity andamino acid requirements of tilapia genotypes. Göttingen, 106p. Thesis (Doctoral)–Georg-August University.
Moon, H.Y. and D.M. Gatlin III. 1991. Total sulfur amino acid requirement of juvenilered drum, Sciaenops ocellatus. Aquaculture 95: 97-106.
National Research Council. 1993. Nutrient requirements of fish. Washington: NationalAcademic Press. 114p.
Ngamsnae, P., S.S. De Silva, and R.M. Gunasekera. 1999. Arginine and phenylalaninerequirement of juvenile silver perch Bidyanus bidyanus and validation of the use ofbody amino acid composition for estimating individual amino acid requirements.Aquaculture Nutrition 5: 173-180.
Ogino, C. 1980. Requirements of carp and rainbow trout for essential amino acids. Bul-letin of Japanese Society of Scientific Fisheries 42: 71-75.
Portz, L. 1999. Relação energia: Proteína na nutrição do “black bass” (Micropterussalmoides). Piracicaba. 88p. Dissertação (Mestrado)–Escola Superior de Agric-ultura “Luiz de Queiroz,” Universidade de São Paulo.
Portz, L. 2001. Utilização de diferentes fontes protéicas em dietas formuladaspelo conceito de proteína ideal para o “black bass” (Micropterus salmoides).Piracicaba. 111p. Tese (Doutorado)–Escola Superior de Agricultura “Luiz deQueiroz,” Universidade de São Paulo.
Portz, L. and J.E.P. Cyrino. 2003. Comparison of the amino acid contents of roe, wholebody and muscle tissue and their A/E ratios for largemouth bass Micropterussalmoides (Lacepéde, 1802). Aquaculture Research 34: 585-592.
Portz, L. and J.E.P. Cyrino. 2004. Digestibility of nutrients and amino acids of differ-ent protein sources in practical diets by largemouth bass Micropterus salmoides(Lacepéde, 1802). Aquaculture Research 35: 312-320.
Portz, L., J.E.P. Cyrino, and R.C. Martino. 2001. Growth and body composition of ju-venile largemouth bass Micropterus salmoides in response to dietary protein andenergy levels. Aquaculture Nutrition 7: 247-254.
Dairiki et al. 25
Portz, L., C.T.S. Dias, and J.E.P. Cyrino. 2000. Regressão segmentada como modelona determinação de exigências nutricionais de peixes. Scientia Agricola 57 (4):601-607.
Robbins, K.L. 1986. A method, SAS program, and example for fitting the broken line togrowth data. Tennessee: University of Tennessee, Agricultural Experiment Station. 8p.
Rodehutscord, M., A. Becker, M. Pack, and E. Pfeffer. 1997. Response of rainbowtrout (Oncorhynchus mykiss) to supplements of individual essential amino acids in asemipurified diet, including an estimate of the maintenance requirement for essen-tial amino acids. Journal of Nutrition 126: 1166-1175.
Rodehutscord, M., F. Borchert, Z. Gregus, and E. Pfeffer. 2000a. Availability and utili-zation of free lysine in rainbow trout (Oncorhynchus mykiss). 2. Comparison ofL-lysine.HCl and L-lysine sulphate. Aquaculture 187: 177-183.
Rodehutscord, M., F. Borchert, Z. Gregus, M. Pack, and E. Pfeffer. 2000b. Availabilityand utilization of free lysine in rainbow trout (Oncorhynchus mykiss). 1. Effect ofdietary crude protein level. Aquaculture 187: 163-176.
Rollin, X., M. Mambrini, T. Abboudi, Y. Larondelle, and S.J. Kaushik. 2003. Theoptimum dietary indispensable amino acid pattern for growing Atlantic salmon(Salmo salar) fry. British Journal of Nutrition 90: 865-876.
Ruchimat, T., T. Masumoto, H. Hosokawa, Y. Itoh, and S. Shimeno. 1997. Quantita-tive lysine requirement of yellowtail (Seriola quinqueradiata). Aquaculture 158:331-339.
SAS Institute. 2000. SAS/STAT User’s guide, statistics version 8. SAS Institute, Cary, NC.Schuhmacher, A., C. Wax, and J.M. Gropp. 1997. Plasma amino acids in rainbow trout
(Oncorhynchus mykiss) fed intact protein or a crystalline amino acid diet.Aquaculture 151: 15-28.
Small, B.C. and J.H. Soares, Jr. 1998. Estimating the quantitative essential amino acidrequirements of striped bass Morone saxatilis, using fillet A/E ratios. AquacultureNutrition 4: 225-232.
Small, B.C. and J.H. Soares, Jr. 2000. Quantitative dietary lysine requirement ofjuvenile striped bass Morone saxatilis. Aquaculture Nutrition 6: 207-212.
Steffens, W. 1989. Principles of fish nutrition. Chichester: Ellis Harwood. 384p.Thebault, H., E. Alliot, and A. Pastoureud. 1985. Quantitative methionine requirement
of juvenile sea bass (Dicentrarchus labrax). Aquaculture 50: 75-87.Tibaldi, E. and D. Lanari. 1991. Optimal dietary lysine levels for growth and protein
utilization of fingerling sea bass (Dicentrarchus labrax L.) fed semipurified diets.Aquaculture 95: 297-304.
Tibaldi, E. and F. Tulli. 1999. Dietary threonine requirement of juvenile European seabass (Dicentrarchus labrax). Aquaculture 175: 155-166.
Tibaldi, E., F. Tulli, and D. Lanari. 1994. Arginine requirement and effect of differentdietary arginine and lysine levels for fingerling sea bass (Dicentrarchus labrax L.).Aquaculture 127: 207-218.
Vanni, S.M. 1998. Modelos de regressão linear e não linear simples: Estatísticaaplicada, inclui solução pela HP 12C e Excel. São Paulo: Legnar Informática. 177p.
Wang, S., Y. Liu, L. Tian, M. Xie, H. Yang, Y. Wang, and G. Liang. 2005. Quantitativedietary lysine requirement of juvenile grass carp Ctenopharyngodon idella. Aqua-culture 249: 419-429.
26 JOURNAL OF APPLIED AQUACULTURE
Young, V.R. 1974. Regulation of protein synthesis and skeletal muscle growth. Journalof Animal Science 38(5): 1054-1070.
Young, V.R. 1985. Muscle protein accretion. Journal of Animal Science 61 (Supple-ment 2): 39-56.
Zeitoun, I.H., D.E. Dullrey, W.T. Magee, J.L. Gill, and W.G. Bergen. 1976. Quantify-ing nutrient requirements of fish. Journal of the Fisheries Research Board of Canada33: 167-172.
doi:10.1300/J028v19n04_01
Dairiki et al. 27


![Regulation of Lysine Catabolism through Lysine[mdash]Ketoglutarate Reductase and Saccharopine Dehydrogenase in Arabidopsis](https://static.fdokumen.com/doc/165x107/631cc83693f371de19019c93/regulation-of-lysine-catabolism-through-lysinemdashketoglutarate-reductase-and.jpg)

