Archeológia ranostredovekej služobníckej organizácie vo východnej Európe
Cryst. Res. Technol., 1 – 7 (2009) / DOI 10.1002/crat.200900339
© 2009 WILEY-VCH Verlag GmbH & Co. KGaA, Weinheim
Low temperature powder diffraction and DFT solid state
computational study of hydrogen bonding in NH4VO3
Ľ. Smrčok*1, B. Bitschnau
2, and Y. Filinchuk
3
1 Institute of Inorganic Chemistry, Slovak Academy of Sciences, Dúbravská cesta 9, 84536 Bratislava, Slovak Republic
2 Institute of Physical and Theoretical Chemistry, Graz University of Technology, Rechbauerstraße 12, 8010 Graz, Austria
3 Swiss-Norwegian Beam Lines, European Synchrotron Radiation Facility, 6 rue Jules Horowitz, BP-220, 38043 Grenoble, France
Received 2 June 2009, revised 6 July 2009, accepted 8 July 2009 Published online 22 July 2009
Key words ammonium metavanadate, low temperature diffraction, hydrogen bond, DFT. PACS 78.55.Hx
The crystal structure of the title compound was refined by the geometry optimization done by total energy minimization in solid state using DFT/plane waves approach. The lattice parameters were derived by the Le Bail technique from the low temperature X-ray (40-293 K) and synchrotron (100-293 K) powder diffraction data. The structure is formed by the infinite chains of irregular VO4 tetrahedra running approximately parallel to the c-axis, which are interlinked by the ammonium ions placed between them. The ammonium ions link to the [VO4]∞ chains through one linear, one bifurcated and two trifurcated N-H…O hydrogen bonds. Considering their stability there are six distinct N-H…O hydrogen bonds: two strong with the N-H…O bond angles close to the straight, two medium with the bond angles of 123° and 148° and two very bent (105° and 107°) and hence weak hydrogen bonds. There is a reasonable agreement between the energies of the stretching ν(NH) modes estimated using the optimised N…O contact distances and those obtained experimentally.
© 2009 WILEY-VCH Verlag GmbH & Co. KGaA, Weinheim
1 Introduction
The investigation of the hydrogen bonds in the ammonium metavanadate was carried out as a part of our studies of vibrational spectra of the selected compounds taken by the inelastic neutron scattering technique (INS) [1]. These spectra can be quite straightforwardly and accurately interpreted by comparing to the theoretically calculated, which are normally obtained from the calculations utilizing known crystal structures. Ammonium metavanadate was chosen for this program because it represents a group of compounds with ammonium in the confinement of oxygen atoms [2] and its crystal structure is relatively simple. The accurate positions of all but the hydrogen atoms in its orthorhombic structure were obtained by Hawthorne and Calvo [3] from the refinement utilizing single crystal room-temperature counter data. The basic structural motif is the infinity chains of irregular, corner sharing VO4 tetrahedra extending along the c-axis with the ammonium ions placed between the VO4 chains. All non-hydrogen atoms are located either in the 4d or the 4c special positions of the Pbcm space group. The positions of the hydrogen atoms were also estimated and refined, but the resulting positions are not sufficiently accurate to be directly used in calculations of vibrational spectra. The next reason for our study was that in the low temperature (10-300 K) Raman study of the title compound [4] some minor anomalies near 150 K were recognized, which could have appeared due to a phase transition. As ____________________
* Corresponding author: e-mail: [email protected]
Early View publication on www.interscience.wiley.com
(issue and page numbers not yet assigned;
citable using Digital Object Identifier – DOI (www.doi.org))
2 Ľ. Smrčok et al.: Study of hydrogen bonding in NH4VO3
© 2009 WILEY-VCH Verlag GmbH & Co. KGaA, Weinheim www.crt-journal.org
INS spectra are as a rule collected at the temperatures below 100 K it was desirable to understand if the compound undergoes any phase transitions within 300-10 K, because it could complicate their interpretation based on the only known crystal structure.
After a series of unsuccessful attempts to grow a single crystal suitable for single crystal neutron diffraction it was decided to solve the problem by the combination of a low temperature powder experiment combined with optimization of the structure by the solid state DFT method. This method can provide accurate positions of all atoms in the structure, but the knowledge of accurate values of the lattice parameters is desirable, especially if the structure under extreme conditions is studied. Those are, however, easily obtainable from powder diffraction data (see e.g. [5-8]).
The aim of this study was i) to find if there is a symmetry change upon cooling down to 40 K and ii) to obtain accurate geometry of the hydrogen bonds in the structure that is needed in future spectroscopic studies.
2 Experimental and calculations
The powder data were taken in two steps. In the first one the laboratory X-ray data were collected in the reflection mode at 40, 80, 110, 120, 130, 140, 150, 175, 200, 250 and 293 K with a Philips X’Pert diffracto-meter using CuKα radiation. The cooling equipment was a closed cycle He cryostat (He-TTK Anton Paar) with the possible cooling range between 10 K and 300 K. The data sets were collected within 10 to 70° 2Θ, Δ2Θ = 0.02° and step-time τ=35 s. The values of the lattice parameters were refined by Le Bail technique as implemented in the FullProf program [9].
To improve the accuracy of the lattice parameters at the next stage the synchrotron powder diffraction data were collected at the Swiss-Norwegian Beam Lines at the ESRF (Grenoble, France) with a sample put into a 0.5 mm diameter glass capillary. The data collections were performed at 293, 250, 200, 150, and 100 K using a
monochromatic wavelength of λ = 0.729061 Å with a MAR345 Image Plate detector. Sample temperature was controlled with an Oxford Cryostream 600. Two sample-to-detector distances were used (150 and 350 mm) at each temperature in order to combine the advantages of high structural and angular resolutions. The detector parameters and the wavelength were calibrated with a standard sample of LaB6 from NIST. The capillary was rotated by 60° during 60 seconds of exposure. The uncertainties of the integrated intensities obtained by
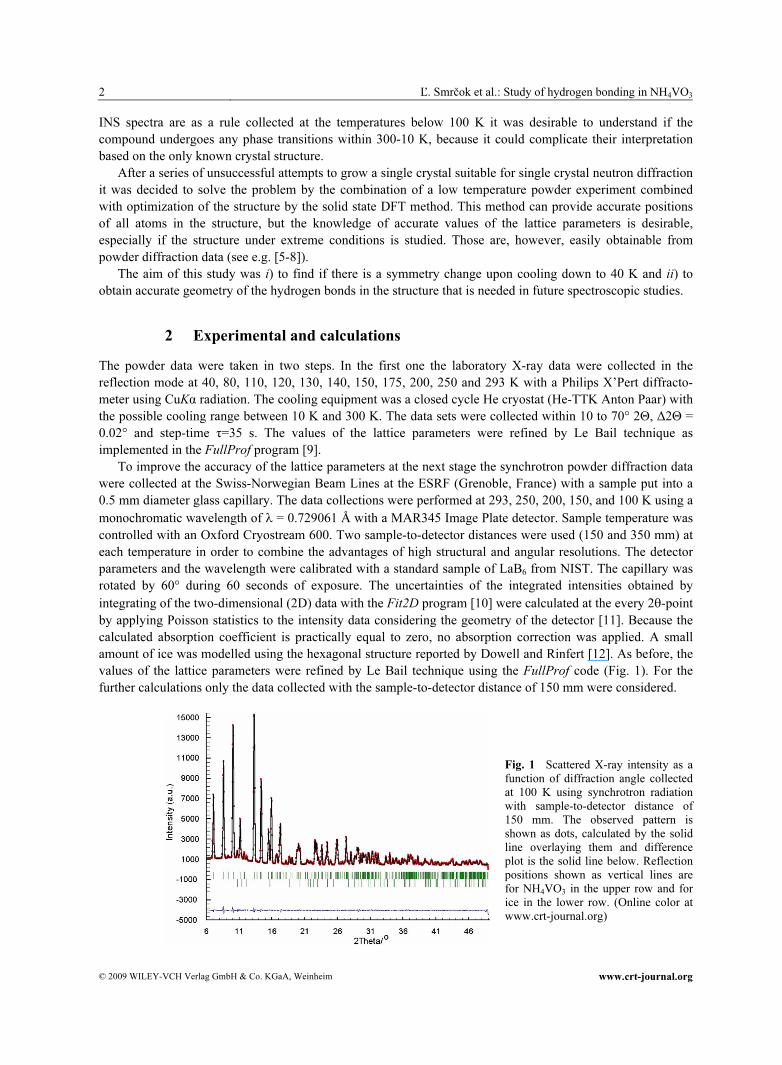
integrating of the two-dimensional (2D) data with the Fit2D program [10] were calculated at the every 2θ-point by applying Poisson statistics to the intensity data considering the geometry of the detector [11]. Because the calculated absorption coefficient is practically equal to zero, no absorption correction was applied. A small amount of ice was modelled using the hexagonal structure reported by Dowell and Rinfert [12]. As before, the values of the lattice parameters were refined by Le Bail technique using the FullProf code (Fig. 1). For the further calculations only the data collected with the sample-to-detector distance of 150 mm were considered.
Fig. 1 Scattered X-ray intensity as a function of diffraction angle collected at 100 K using synchrotron radiation with sample-to-detector distance of 150 mm. The observed pattern is shown as dots, calculated by the solid line overlaying them and difference plot is the solid line below. Reflection positions shown as vertical lines are for NH4VO3 in the upper row and for ice in the lower row. (Online color at www.crt-journal.org)
Cryst. Res. Technol. (2009) 3
www.crt-journal.org © 2009 WILEY-VCH Verlag GmbH & Co. KGaA, Weinheim
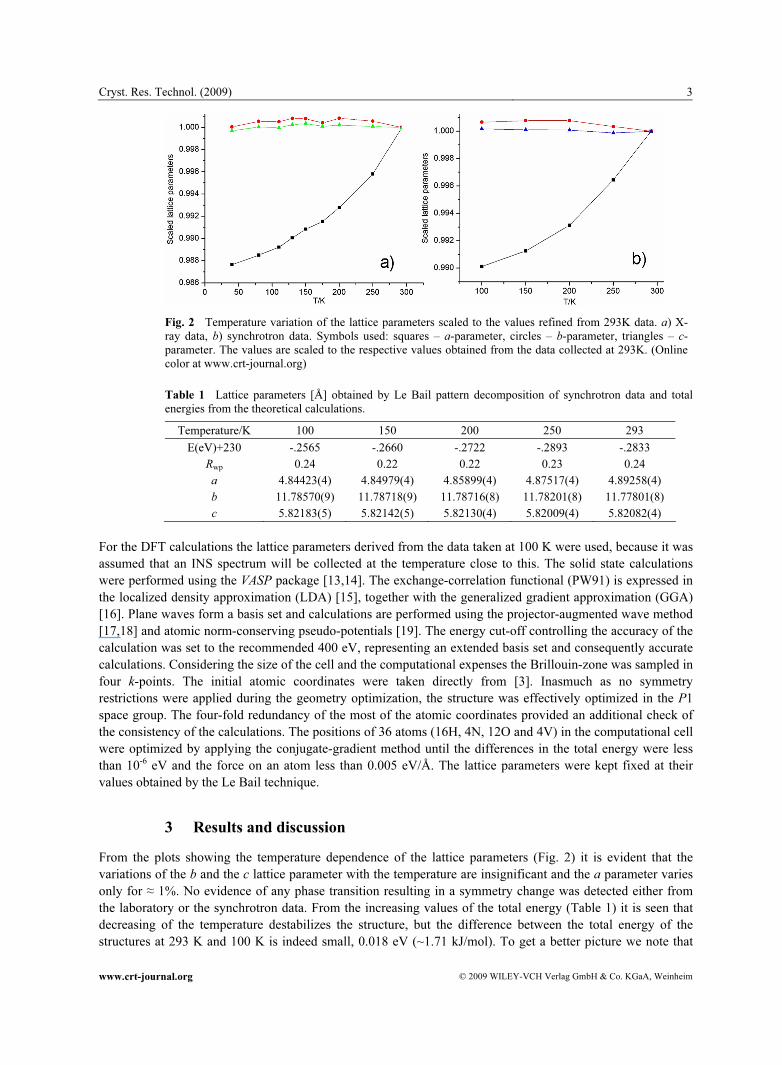
Fig. 2 Temperature variation of the lattice parameters scaled to the values refined from 293K data. a) X-ray data, b) synchrotron data. Symbols used: squares – a-parameter, circles – b-parameter, triangles – c-parameter. The values are scaled to the respective values obtained from the data collected at 293K. (Online color at www.crt-journal.org)
Table 1 Lattice parameters [Å] obtained by Le Bail pattern decomposition of synchrotron data and total energies from the theoretical calculations.
Temperature/K 100 150 200 250 293
E(eV)+230 -.2565 -.2660 -.2722 -.2893 -.2833
Rwp 0.24 0.22 0.22 0.23 0.24
a 4.84423(4) 4.84979(4) 4.85899(4) 4.87517(4) 4.89258(4)
b 11.78570(9) 11.78718(9) 11.78716(8) 11.78201(8) 11.77801(8)
c 5.82183(5) 5.82142(5) 5.82130(4) 5.82009(4) 5.82082(4)
For the DFT calculations the lattice parameters derived from the data taken at 100 K were used, because it was assumed that an INS spectrum will be collected at the temperature close to this. The solid state calculations were performed using the VASP package [13,14]. The exchange-correlation functional (PW91) is expressed in the localized density approximation (LDA) [15], together with the generalized gradient approximation (GGA) [16]. Plane waves form a basis set and calculations are performed using the projector-augmented wave method [17,18] and atomic norm-conserving pseudo-potentials [19]. The energy cut-off controlling the accuracy of the calculation was set to the recommended 400 eV, representing an extended basis set and consequently accurate calculations. Considering the size of the cell and the computational expenses the Brillouin-zone was sampled in four k-points. The initial atomic coordinates were taken directly from [3]. Inasmuch as no symmetry restrictions were applied during the geometry optimization, the structure was effectively optimized in the P1 space group. The four-fold redundancy of the most of the atomic coordinates provided an additional check of the consistency of the calculations. The positions of 36 atoms (16H, 4N, 12O and 4V) in the computational cell were optimized by applying the conjugate-gradient method until the differences in the total energy were less than 10-6 eV and the force on an atom less than 0.005 eV/Å. The lattice parameters were kept fixed at their values obtained by the Le Bail technique.
3 Results and discussion
From the plots showing the temperature dependence of the lattice parameters (Fig. 2) it is evident that the variations of the b and the c lattice parameter with the temperature are insignificant and the a parameter varies only for ≈ 1%. No evidence of any phase transition resulting in a symmetry change was detected either from the laboratory or the synchrotron data. From the increasing values of the total energy (Table 1) it is seen that decreasing of the temperature destabilizes the structure, but the difference between the total energy of the structures at 293 K and 100 K is indeed small, 0.018 eV (~1.71 kJ/mol). To get a better picture we note that
4 Ľ. Smrčok et al.: Study of hydrogen bonding in NH4VO3
© 2009 WILEY-VCH Verlag GmbH & Co. KGaA, Weinheim www.crt-journal.org
such a value is comparable, for instance, to the energies characteristic for the weak C-H…O hydrogen bonds [33]. Nearly constant value of the Rwp factors of agreement indicates very similar quality of the diffraction patterns.
Table 2 Optimized atomic coordinates were transformed to the Pbcm space group and rounded off to four decimal places. The numbering of the atoms is identical with that in [3].
Atom x y z
V(4d) 0.4608 0.1736 ¼ O1(4d) 0.1193 0.1723 ¼ O2(4d) 0.5664 0.0379 ¼ O3(4c) 0.5808 ¼ 0 N(4d) 0.9401 0.4156 ¼ H1(4d) 0.7544 0.4619 ¼ H2(4d) 0.1141 0.4691 ¼ H3(8e) 0.9439 0.3633 0.3943
Table 3 Selected bond lengths and angles (Å, o). Calculated bond distances and angles were rounded to be in keeping with the precision of the experimentally determined values. Symmetry operations: i) x,y,1/2-z; ii) x,1/2-y,-z; iii) x,y,3/2-z.
This work Hawthorne & Calvo [3]
V-O1 1.655 1.640(4) V-O2 1.679 1.647(4)
V-O3, O3i 1.808 1.803(1) O1-V-O2 107.2 107.3(1) O1-V-O3 109.0 109.7(1) O1-V-O3i 109.0 107.9(1) O2-V-O3 112.1 111.1(1) O3-V-O3i 107.2 107.9(1) V-O3-Vii 142.5 142.7(2) O1-O2 2.683 2.648(5) O1-O3 2.821 2.816(4) O1-O3i 2.821 2.915(1) O2-O3 2.894 2.846(3)
H1-N-H2 112 111(6) H1-N-H3 109 106(3) H2-N-H3 110 107(3)
H3-N-H3iii 108 119(5)
Table 4 Hydrogen bonding parameters (Å, o). Symmetry operations: i) 1-x,-y,1/2+z; ii) 2-x,-y,1/2+z; iii) 1+x,y,z ; iv) 1+x,1/2-y,1-z ; v) x,y,1/2-z. Weak hydrogen bonds are given in italic, the labels in the rightmost column are the links to figure 4.
N-H H…O N…O N-H…O Label
N-H1…O1i 1.05 2.55 3.040 107 a
N-H1…O2i 1.05 1.79 2.846 179 b
N-H2…O2ii 1.05 1.75 2.792 171 c
N-H3…O1iii 1.04 2.28 3.209 148 d
N-H3…O1iv 1.04 2.55 2.996 105 e
N-H3…O3v 1.04 2.29 2.992 123 f
The analysis of the 100 K structure done by the PLATON program [20] revealed, that the symmetry of the optimized structure could really be increased from the P1 to the Pbcm, as the root mean square deviations between the atomic coordinates of four structural units expected to be symmetrically equivalent in the Pbcm were negligible. Furthermore, the typical deviation of the optimized fractional coordinates from the expected 4c and 4d special Wyckoff positions of the Pbcm space group was in the P1 model only ~0.002. Because such a value is comparable to the accuracy of the calculation method (see e.g. [31,32])], the coordinates of the atoms appearing in the Pbcm in the 4d (4c) special positions were set to the respective ideal values. The optimised
Cryst. Res. Technol. (2009) 5
www.crt-journal.org © 2009 WILEY-VCH Verlag GmbH & Co. KGaA, Weinheim
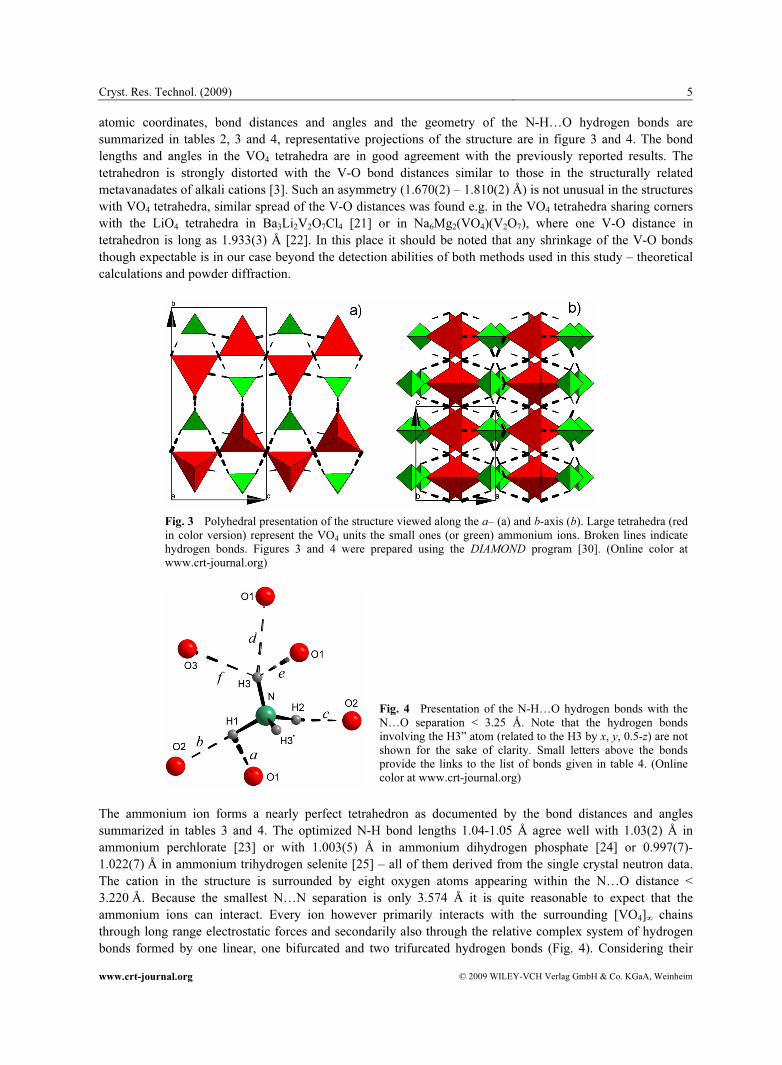
atomic coordinates, bond distances and angles and the geometry of the N-H…O hydrogen bonds are summarized in tables 2, 3 and 4, representative projections of the structure are in figure 3 and 4. The bond lengths and angles in the VO4 tetrahedra are in good agreement with the previously reported results. The tetrahedron is strongly distorted with the V-O bond distances similar to those in the structurally related metavanadates of alkali cations [3]. Such an asymmetry (1.670(2) – 1.810(2) Å) is not unusual in the structures with VO4 tetrahedra, similar spread of the V-O distances was found e.g. in the VO4 tetrahedra sharing corners with the LiO4 tetrahedra in Ba3Li2V2O7Cl4 [21] or in Na6Mg2(VO4)(V2O7), where one V-O distance in tetrahedron is long as 1.933(3) Å [22]. In this place it should be noted that any shrinkage of the V-O bonds though expectable is in our case beyond the detection abilities of both methods used in this study – theoretical calculations and powder diffraction.
Fig. 3 Polyhedral presentation of the structure viewed along the a– (a) and b-axis (b). Large tetrahedra (red in color version) represent the VO4 units the small ones (or green) ammonium ions. Broken lines indicate hydrogen bonds. Figures 3 and 4 were prepared using the DIAMOND program [30]. (Online color at www.crt-journal.org)
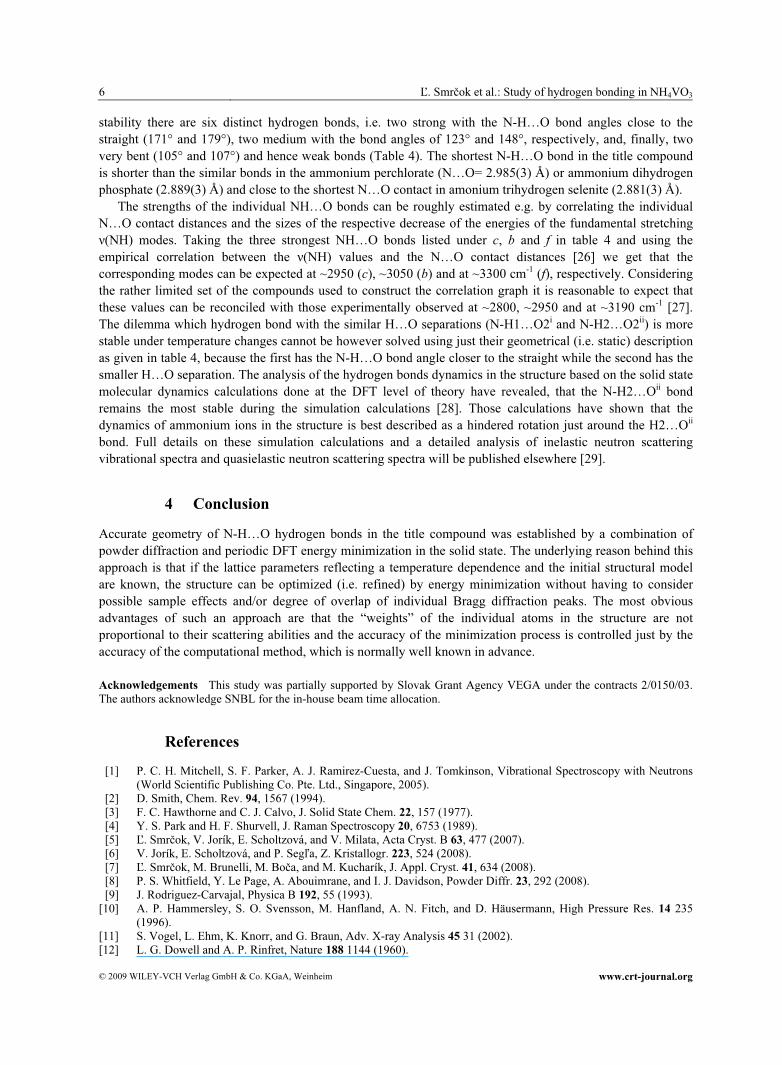
Fig. 4 Presentation of the N-H…O hydrogen bonds with the N…O separation < 3.25 Å. Note that the hydrogen bonds involving the H3” atom (related to the H3 by x, y, 0.5-z) are not shown for the sake of clarity. Small letters above the bonds provide the links to the list of bonds given in table 4. (Online color at www.crt-journal.org)
The ammonium ion forms a nearly perfect tetrahedron as documented by the bond distances and angles summarized in tables 3 and 4. The optimized N-H bond lengths 1.04-1.05 Å agree well with 1.03(2) Å in ammonium perchlorate [23] or with 1.003(5) Å in ammonium dihydrogen phosphate [24] or 0.997(7)-1.022(7) Å in ammonium trihydrogen selenite [25] – all of them derived from the single crystal neutron data. The cation in the structure is surrounded by eight oxygen atoms appearing within the N…O distance < 3.220 Å. Because the smallest N…N separation is only 3.574 Å it is quite reasonable to expect that the ammonium ions can interact. Every ion however primarily interacts with the surrounding [VO4]∞ chains through long range electrostatic forces and secondarily also through the relative complex system of hydrogen bonds formed by one linear, one bifurcated and two trifurcated hydrogen bonds (Fig. 4). Considering their
6 Ľ. Smrčok et al.: Study of hydrogen bonding in NH4VO3
© 2009 WILEY-VCH Verlag GmbH & Co. KGaA, Weinheim www.crt-journal.org
stability there are six distinct hydrogen bonds, i.e. two strong with the N-H…O bond angles close to the straight (171° and 179°), two medium with the bond angles of 123° and 148°, respectively, and, finally, two very bent (105° and 107°) and hence weak bonds (Table 4). The shortest N-H…O bond in the title compound is shorter than the similar bonds in the ammonium perchlorate (N…O= 2.985(3) Å) or ammonium dihydrogen phosphate (2.889(3) Å) and close to the shortest N…O contact in amonium trihydrogen selenite (2.881(3) Å).
The strengths of the individual NH…O bonds can be roughly estimated e.g. by correlating the individual N…O contact distances and the sizes of the respective decrease of the energies of the fundamental stretching ν(NH) modes. Taking the three strongest NH…O bonds listed under c, b and f in table 4 and using the empirical correlation between the ν(NH) values and the N…O contact distances [26] we get that the corresponding modes can be expected at ~2950 (c), ~3050 (b) and at ~3300 cm-1 (f), respectively. Considering the rather limited set of the compounds used to construct the correlation graph it is reasonable to expect that these values can be reconciled with those experimentally observed at ~2800, ~2950 and at ~3190 cm-1 [27]. The dilemma which hydrogen bond with the similar H…O separations (N-H1…O2i and N-H2…O2ii) is more stable under temperature changes cannot be however solved using just their geometrical (i.e. static) description as given in table 4, because the first has the N-H…O bond angle closer to the straight while the second has the smaller H…O separation. The analysis of the hydrogen bonds dynamics in the structure based on the solid state molecular dynamics calculations done at the DFT level of theory have revealed, that the N-H2…Oii bond remains the most stable during the simulation calculations [28]. Those calculations have shown that the dynamics of ammonium ions in the structure is best described as a hindered rotation just around the H2…Oii bond. Full details on these simulation calculations and a detailed analysis of inelastic neutron scattering vibrational spectra and quasielastic neutron scattering spectra will be published elsewhere [29].
4 Conclusion
Accurate geometry of N-H…O hydrogen bonds in the title compound was established by a combination of powder diffraction and periodic DFT energy minimization in the solid state. The underlying reason behind this approach is that if the lattice parameters reflecting a temperature dependence and the initial structural model are known, the structure can be optimized (i.e. refined) by energy minimization without having to consider possible sample effects and/or degree of overlap of individual Bragg diffraction peaks. The most obvious advantages of such an approach are that the “weights” of the individual atoms in the structure are not proportional to their scattering abilities and the accuracy of the minimization process is controlled just by the accuracy of the computational method, which is normally well known in advance.
Acknowledgements This study was partially supported by Slovak Grant Agency VEGA under the contracts 2/0150/03. The authors acknowledge SNBL for the in-house beam time allocation.
References
[1] P. C. H. Mitchell, S. F. Parker, A. J. Ramirez-Cuesta, and J. Tomkinson, Vibrational Spectroscopy with Neutrons (World Scientific Publishing Co. Pte. Ltd., Singapore, 2005).
[2] D. Smith, Chem. Rev. 94, 1567 (1994). [3] F. C. Hawthorne and C. J. Calvo, J. Solid State Chem. 22, 157 (1977). [4] Y. S. Park and H. F. Shurvell, J. Raman Spectroscopy 20, 6753 (1989). [5] Ľ. Smrčok, V. Jorík, E. Scholtzová, and V. Milata, Acta Cryst. B 63, 477 (2007). [6] V. Jorík, E. Scholtzová, and P. Segľa, Z. Kristallogr. 223, 524 (2008). [7] Ľ. Smrčok, M. Brunelli, M. Boča, and M. Kucharík, J. Appl. Cryst. 41, 634 (2008). [8] P. S. Whitfield, Y. Le Page, A. Abouimrane, and I. J. Davidson, Powder Diffr. 23, 292 (2008). [9] J. Rodriguez-Carvajal, Physica B 192, 55 (1993).
[10] A. P. Hammersley, S. O. Svensson, M. Hanfland, A. N. Fitch, and D. Häusermann, High Pressure Res. 14 235 (1996).
[11] S. Vogel, L. Ehm, K. Knorr, and G. Braun, Adv. X-ray Analysis 45 31 (2002). [12] L. G. Dowell and A. P. Rinfret, Nature 188 1144 (1960).
Cryst. Res. Technol. (2009) 7
www.crt-journal.org © 2009 WILEY-VCH Verlag GmbH & Co. KGaA, Weinheim
[13] G. Kresse and J. Hafner, Phys. Rev. B 48, 13115 (1993). [14] G. Kresse and J. Furthmüller, Comp. Mat. Sci. 6, 15 (1996). [15] J. P. Perdew and A. Zunger, Phys. Rev. B 23, 5048 (1981). [16] J. P. Perdew and Y. Wang, Phys. Rev. B 45, 13244 (1992). [17] P. E. Blöchl, Phys. Rev. B 50, 17953 (1994). [18] G. Kresse and D. Joubert, Phys. Rev. B 59, 1758 (1999). [19] G. Kresse and J. Hafner, J. Phys. Condens. Matter 6, 8245 (1994). [20] A. L. Spek, J. Appl. Cryst. 36, 7 (2003). [21] T. Reeswinkel, K. M. Sparta, and G. Roth, Acta Cryst. C 64, i38 (2008). [22] A. Mitiaev, A. Mironov, R. Shpanenko, and E. Antipov, Acta Cryst. C 60, i56 (2004). [23] C. S. Choi, H. J. Prask, and E. Prince, J. Chem. Phy. 61, 3523 (1974). [24] N. Pérès, M. Souhassou, B. Wyncke, G. Gavoille, A. Cousson, and W. Paulus, J. Phys.: Condens. Matter. 9, 6555
(1997). [25] R. Tellgren and R. Liminga, Acta Cryst. B 30, 2497 (1974). [26] A. Lautié, F. Froment, and A. Novak, Spect. Lett. 9, 289 (1976). [27] S. Onodera and Y. Ikegami, Inorg. Chem. 19, 615 (1980). [28] M. Sládkovičová, PhD Thesis (Institute of Inorganic Chemistry, Slovak Academy of Sciences, Bratislava, Slovak
Republic, 2007). [29] Ľ. Smrčok, M. Derzsi, A. H. Rammirez-Cuesta, D. Tunega, and M. Rusina, (in preparation 2009). [30] K. Brandenburg, Diamond. Version 3.1.e (Crystal Impact GbR, Bonn, Germany, 2007). [31] Ľ. Smrčok, M. Sládkovičová, V. Langer, C. C. Wilson, and M. Koóš, Acta Cryst. B 62, 912 (2006). [32] M. Sládkovičová, P. Mach, Ľ. Smrčok, and H. Rundlöf, Cent. Europ. J. Chem. 5, 55 (2007). [33] G. R. Desiraju and T. Steiner, The Weak Hydrogen Bond (Oxford Science Publications, Oxford, New York, 2006).
Copyright © 2022 FDOKUMEN