Low Frequency Raman Scattering from Acoustic Phonons Confined in ZnO Nanoparticles
18
Low Frequency Raman Scattering from Acoustic Phonon Confined in CdS 1-x Se x Nanoparticles in Borosilicate Glass Sanjeev K. Gupta, Satyaprakash Sahoo * , Prafulla K. Jha, A. K. Arora * , Y. M. Azhniuk # Nanotechnology Centre, Department of Physics, Bhavnagar University, Bhavnagar, 364 002, India. * Light Scattering Section Studies, Material Science Division, Indira Gandhi Centre for Atomic Research, Kalpakkam, Tamilnadu, 602103, India. # Institute of Electron Physics, Ukr. Nat. Acad Sci., Universytetska St. 21, Uzhhorod 88000, Ukraine. ABSTRACT Phonon modes found in low frequency Raman scattering from CdS 1-x Se x nanocrystals embedded in borosilicate glass arising from confined acoustic phonons are investigated. In addition to the breathing modes and quadrupolar modes, two additional modes are found in the spectra. In order to assign the new modes, confined acoustic phonon frequencies are calculated using CFM, CSM and the Lamb model. Based on the ratio of the frequencies of the new modes to those of the quadrupolar mode, the new modes are assigned to first overtone of the quadrupolar mode (l=2, n=1) and l=1, n=0 torsional mode. The appearance of the forbidden torsional mode is attributed to nonspherical appearance shape of the nanoparticle found from high-resolution TEM. Keywords: Phonon Confinement, Low Frequency Raman Spectra, Electron-Phonon Interaction PACS number(s): 33.20.Fb, 33.20.Tp, 68.65.Hb
Transcript of Low Frequency Raman Scattering from Acoustic Phonons Confined in ZnO Nanoparticles
Low Frequency Raman Scattering from Acoustic Phonon Confined in
CdS1-xSex Nanoparticles in Borosilicate Glass
Sanjeev K. Gupta, Satyaprakash Sahoo*, Prafulla K. Jha, A. K. Arora*, Y. M. Azhniuk#
Nanotechnology Centre, Department of Physics, Bhavnagar University,
Bhavnagar, 364 002, India. *Light Scattering Section Studies, Material Science Division,
Indira Gandhi Centre for Atomic Research, Kalpakkam, Tamilnadu, 602103, India. #Institute of Electron Physics, Ukr. Nat. Acad Sci., Universytetska St. 21,
Uzhhorod 88000, Ukraine.
ABSTRACT
Phonon modes found in low frequency Raman scattering from CdS1-xSex nanocrystals
embedded in borosilicate glass arising from confined acoustic phonons are investigated. In
addition to the breathing modes and quadrupolar modes, two additional modes are found in the
spectra. In order to assign the new modes, confined acoustic phonon frequencies are calculated
using CFM, CSM and the Lamb model. Based on the ratio of the frequencies of the new modes
to those of the quadrupolar mode, the new modes are assigned to first overtone of the
quadrupolar mode (l=2, n=1) and l=1, n=0 torsional mode. The appearance of the forbidden
torsional mode is attributed to nonspherical appearance shape of the nanoparticle found from
high-resolution TEM.
Keywords: Phonon Confinement, Low Frequency Raman Spectra, Electron-Phonon Interaction
PACS number(s): 33.20.Fb, 33.20.Tp, 68.65.Hb
I. INTRODUCTION
In the last two decades, the glass-embedded CdS1-xSex semiconductor quantum dots
have attracted considerable attention due to their significantly different behavior from those of
the corresponding bulk crystals [1-7]. They are interesting due to the size-dependent effects
related to spatial confinement of charge carrier and their applications as optical processing
devices [1-2, 8-12]. The chemical compositions of mixed nanocrystals as well as their size are
the main parameters determining the properties of glass-embedded quantum dots. To
understand the optical properties of semiconductor nanocrystals, it is absolutely necessary to
consider the zero dimensional confinement effects on the electronic states in a system. Raman
spectroscopy has emerged as a powerful and non destructive technique for estimating the
composition of glass embedded nanocrystal [13-14] and their size [15-16]. Raman scattering
probes the vibrational states of the particles such as the confined acoustic, optical phonons and
surface phonon modes. It also provides an understanding of electron-phonon interactions. This
has led to several investigations of acoustic vibrations of spherical nanoparticles, particularly
the semiconductor nanoparticles leading to an understanding of the role of vibrations in the
performance of some optical devices (for example, in electronic dephasing due to emission of
phonons) [17-18]. The low frequency phonon modes (acoustic phonons) of nanoparticles bear
a unique signature of their structural and mechanical properties besides modifying the
electronic structure. There exist several studies on low frequency Raman scattering from elastic
spherical nanoparticles vibrating with frequencies inversely proportional to their size. Acoustic
vibrations of the elastic sphere having frequency very low compared to laser light lead to
variations in the dielectric response of the sphere to the light. As the sphere slowly vibrates, its
dielectric response leads to Raman or Brillouin scattered light whose frequency is slightly
above or below that of the incident laser. To describe these vibrations usually the continuum
elastic models have been used. The original 1882 work by Lamb [19] is the basis for these
models which describes the vibrations as eigenfrequencies of a homogeneous elastic sphere
under stress-free boundary conditions. The frequencies are classified into two categories,
spheroidal and torsional; torsional modes being Raman inactive. In most of the studies on the
low frequency Raman scattering of CdS1-xSex, only the spheroidal modes of l=0 (symmetrical
mode) and for l=2 (quadrupole mode) are observed. However, there are controversies on the
identification of modes [20-21]. A number of detailed studies were devoted to specific
broadening and asymmetry of the phonon bands in the optical range of Raman spectra of
CdS1-xSex nanoparticles [13] but lacks in the range of low frequency range particularly for the
wide range of compositional intervals [22]. It is not clear whether the peaks appearing in the
Raman spectra are l=0, l=2 and their overtones or torsional modes which should be absent
according to the selection rule [23]. As far as, the overtones of the confined phonon modes
(n>1) and the compositional dependent on low frequency phonon modes in the CdS1-xSex are
concerned, to the best of our knowledge, there are only two reports [24-25]. However, they
focus only on the overtones of symmetrical modes as they have been only able to observe them
in their spectra. Moreover, they are not able to observe the torsional modes, which is quite
obvious due to the selection rule for the perfect spherical nanoparticles [23]. But, their
nanoparticles are not completely spherical [24-25].
In this paper, we present a systematic study of the low frequency Raman
scattering from CdS1-xSex nanocrystals of various composition and sizes embedded in a
borosilicate glass matrix. For this we have considered four samples having two different sizes
of four different compositions. In order to identify the two additional peaks appearing in the
experimental Raman spectra, the calculation of the low frequency phonon modes of CdS1-xSex
nanoparticle embedded in borosilicate glass has been performed by using complex frequency
model [25-28], core-shell model (CSM) [27,29,30] as well as classical Lamb model [19]. Out
of these CFM and CSM consider the presence of medium, and estimates the damping of the
vibrational modes resulting from the nanoparticle-medium interaction. These modes are used
for distinguishing the overtone of spheroidal l=2, n=0 and torsional l=1, n=0 modes from the
spheroidal l=0,n=0 and l=2,n=0 modes. The sizes obtained from the experimental spectra are in
good agreement with these obtained from high-resolution transmission electron microscopy
(HRTEM) [31]. The reason for the appearance of the forbidden torsional mode in the Raman
spectra is discussed.
II. EXPERIMENTAL DETAILS
CdS1-xSex nanocrystals were grown in a borosilicate glass matrix by a conventional
technique of solid-state precipitation at temperatures of 600-800°C from a supersaturated
solution formed by dissolving the initial reactants in the glass at high temperature and
subsequent quenching [31]. Low frequency Raman spectra for all the four samples of different
composition and sizes and are designated as CSS100, CSS82, CSS78 and CSS25 in the paper.
The numbers next to the letters represent the concentration of selenium (Se) in the samples
were recorded at room temperature in the backscattering geometry. A vertically polarized 488
nm line of an argon-ion laser (Coherent) with 500mW power was used to excite the samples.
Unpolarized scattered light from the samples was dispersed using a double monochromator
(Spex, model 14018) and detected using a photomultiplier tube (FW ITT 130) operated in the
photon-counting mode. Scanning of the spectra and data acquisition was carried out using a
microprocessor-based data-acquisition-cum-control system. For all the samples, low-frequency
Raman spectra were recorded from 5 to 40 cm-1 at 0.5 cm-1 steps with 10 s integration time.
III. THEORETICAL CONSIDERATIONS
Confined acoustic phonons in nanoparticles give rise to low frequency modes in the
vibrational spectra of the materials. These low frequency phonon modes in borosilicate glass
embedded CdS1-xSex nanoparticle can be obtained by solving the equation of motion of a
homogeneous, free standing elastic sphere, first proposed by Lamb [19] and later used by
several others in one or another forms [ 20-21, 24, 26-27].
However, to understand the key features of experimental Raman spectra and the
vibrations of the CdS1-xSex nanoparticles are calculated by using three approach (i) using the
original Lamb’s approach [19] (ii) Solution of an embedded isotropic sphere by using complex
frequency model [26-28] and (iii) core-shell model applicable to both free as well embedded
nanoparticles [27,29-30]. Though the details of the original Lamb’s approach can be found in
existing literatures [19, 20], but for the sake of completeness and to make comparison with
other two approaches, we describe briefly the model. The displacement field ( , )u r t of an
elastic medium of density ( )rρ is governed by Navier’s equation which is written as
, , ,ijkl j k l ijkl k lj ic u c u u&&ρ+ = (1)
Where ( )ijklc r is the fourth rank elastic constant tensor field. However, the present equation
for the homogenous, isotropic medium is written as [19]
( 2 ) ( . ) ( )u u u&&λ µ µ ρ+ ∇ ∇ − ∇× ∇× = (2)
Where, λ and µ are Lame’s constants and ρ is the mass density of nanoparticle, which is
related to each other by the expressions (2 )lV µ λ
ρ+= and tV µ
ρ= , lV and tV are the
longitudinal and transverse sound velocities in nanoparticles. Under stress free boundary
conditions, Eq. (2) can be solved by introducing a scalar and vector potentials and yields two
types of vibrational modes: spheroidal and torsional mode. These modes are described by
orbital angular momentum quantum numbers l and harmonic n . The eigen value equation for
the spheroidal mode is expressed as [19]
2 4 2 21 1 1( ) ( ) ( )12 ( 1)( 2) ( 1) ( 1)(2 1) [ 2 ( 1)( 2)] 0
( ) ( ) 2 ( )
l l l
l l l
j j jl l l l l l l l
j j j
η η ζ ζ η ηη η η ηη ζ η
+ + + + − + − + − + − + + − − + =
(3)
Here η is the dimensionless eigenvalue expressed as
sRs l
lVt
ωη = (4)
And ζ is related to η as VtVl
ζ η= . The torsional mode is a vibration without dilatation, and
its eigenvalue equation is given by [19]
( ) ( ) ( )1 01
l jll
j η ηη−− =+
for l=1 (5)
The torsional modes are purely transverse in nature and independent of material
property and are defined for l =1 and are orthogonal to the spheroidal modes [19-20]. The
spheroidal modes are characterized by l =0, where l=0 is the symmetric breathing mode, l=1 is
the dipolar mode and l=2 is the quadrupole mode. The l=0 mode is purely radial and produces
polarized spectra, while l=2 mode is quadrupolar and produces partially unpolarized spectra.
The spheroidal modes for even l (i.e. l=0 and 2) are Raman active [23]. The lowest Eigen
frequencies for n=0 for both spheroidal and torsional modes corresponds to the surface modes
while for n =1 corresponds to inner modes.
In the complex frequency model (CFM) [26-28], the nanoparticle is surrounded by a
homogeneous and isotropic matrix of density ?m and speeds of sound Vlm and Vtm. The CFM is
the result of fixed boundary condition and is different from the free boundary condition in the
sense that it takes into account the stresses at the nanoparticles boundary, continuity of u and
force balance at the nanoparticle-matrix interface due to the existence of the boundaries
between particle and matrix interface. The boundaries between the particle and matrix modify
the confined phonon modes and even some times responsible for the appearance of new modes.
The boundary condition at large R is that u is an outgoing travelling wave. This model yields
complex frequency, the real part Re(? ) represents the frequency of the free oscillations. The
imaginary part Im(? ), which is always positive, stands for the attenuation coefficient of the
oscillations because the amplitude of the displacement is proportional to eiRe(? )t-Im(? )t at any
place and therefore Im(? ) yields damping. The real frequency, Re(? ) in the present case are
shifted from the frequency ? obtained from Lamb equations. Therefore, the resulting complex
nature of the frequency due to radiative decay enables to estimate both frequencies and their
damping. Unlike the free vibrations of an elastic body the scalar and vector potentials include
first kind of spherical Hankel functions, whose variable is purely imaginary in the region
outside the nanoparticle in embedded systems. Verma et al [24] have also used a similar
approach, to calculate the low frequency phonon modes of nanoparticle embedded in matrix. In
experimental observations of such modes a broadened peak is observed with its centre at real
frequency.
Though CFM model is able to predict the real frequency i.e. the actual peak position
and broadening (FWHM) of the peak due to the damping actually observed in the Raman
spectra but contains several inherent limitations. In these the most important one is the absence
of valid wave functions required for the Raman scattering spectra calculations. In addition, the
correspondence to quantum theory is also unclear due to the modes not being
orthonormalizable and blowing up exponentially with the radial coordinate. To overcome this,
Portalés et al [30] proposed an approach known as core-shell model (CSM) considering
nanoparticles as core surrounded by a macroscopically large spherical matrix as shell which
leads to real valued mode frequencies [28]. Therefore for calculating the absolute intensity or
shape of low frequency Raman a spectrum, the CSM is the right approach for the comparison
with the experimental Raman spectra. However, in a Raman scattering experiment the
vibrational eigen frequencies for which the Raman intensity is related to the displacement
inside the particle (core) of the systems are important [29].
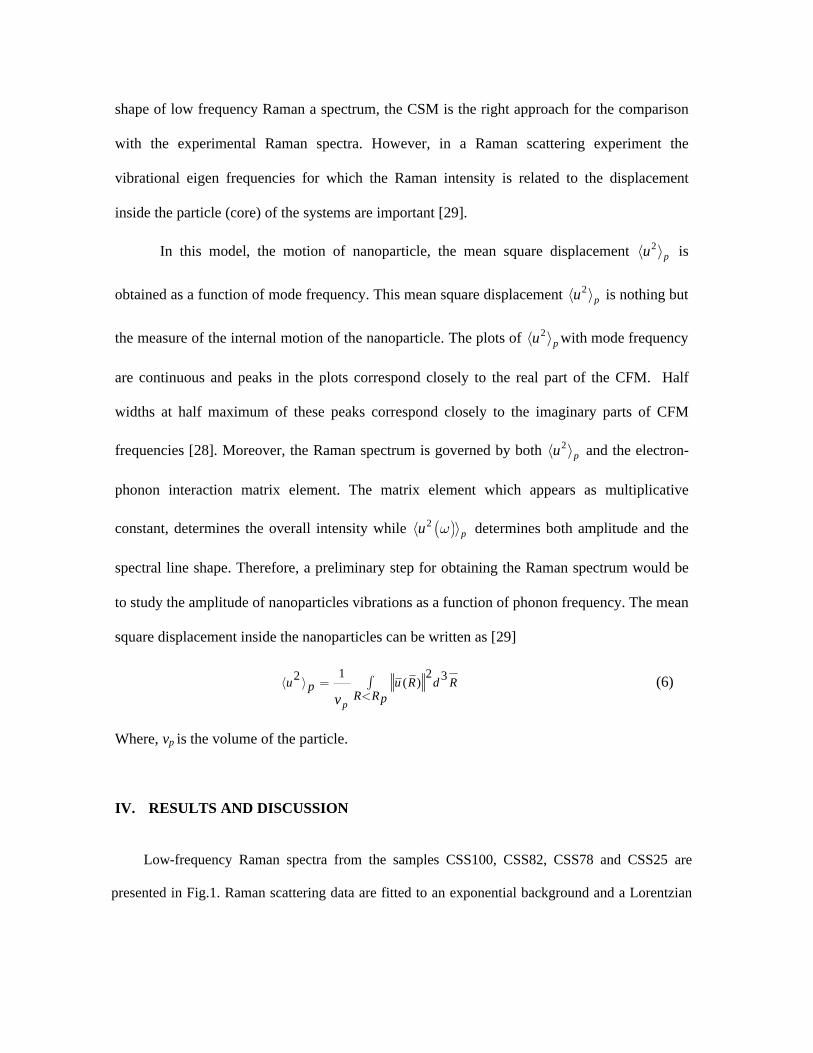
In this model, the motion of nanoparticle, the mean square displacement 2pu⟨ ⟩ is
obtained as a function of mode frequency. This mean square displacement 2pu⟨ ⟩ is nothing but
the measure of the internal motion of the nanoparticle. The plots of 2pu⟨ ⟩ with mode frequency
are continuous and peaks in the plots correspond closely to the real part of the CFM. Half
widths at half maximum of these peaks correspond closely to the imaginary parts of CFM
frequencies [28]. Moreover, the Raman spectrum is governed by both 2pu⟨ ⟩ and the electron-
phonon interaction matrix element. The matrix element which appears as multiplicative
constant, determines the overall intensity while ( )2pu ω⟨ ⟩ determines both amplitude and the
spectral line shape. Therefore, a preliminary step for obtaining the Raman spectrum would be
to study the amplitude of nanoparticles vibrations as a function of phonon frequency. The mean
square displacement inside the nanoparticles can be written as [29]
1 22 3( )
p
u u R d RpR Rpv
⟨ ⟩ = ∫<
(6)
Where, vp is the volume of the particle.
IV. RESULTS AND DISCUSSION
Low-frequency Raman spectra from the samples CSS100, CSS82, CSS78 and CSS25 are
presented in Fig.1. Raman scattering data are fitted to an exponential background and a Lorentzian
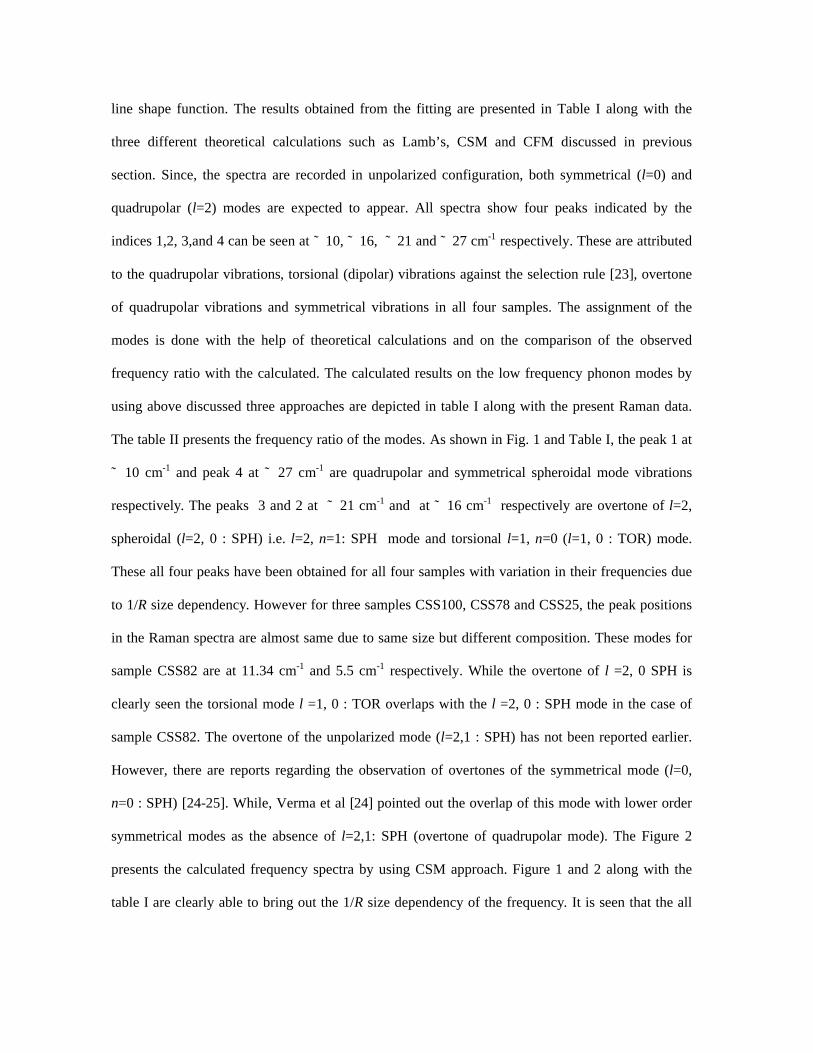
line shape function. The results obtained from the fitting are presented in Table I along with the
three different theoretical calculations such as Lamb’s, CSM and CFM discussed in previous
section. Since, the spectra are recorded in unpolarized configuration, both symmetrical (l=0) and
quadrupolar (l=2) modes are expected to appear. All spectra show four peaks indicated by the
indices 1,2, 3,and 4 can be seen at ˜ 10, ˜ 16, ˜ 21 and ˜ 27 cm-1 respectively. These are attributed
to the quadrupolar vibrations, torsional (dipolar) vibrations against the selection rule [23], overtone
of quadrupolar vibrations and symmetrical vibrations in all four samples. The assignment of the
modes is done with the help of theoretical calculations and on the comparison of the observed
frequency ratio with the calculated. The calculated results on the low frequency phonon modes by
using above discussed three approaches are depicted in table I along with the present Raman data.
The table II presents the frequency ratio of the modes. As shown in Fig. 1 and Table I, the peak 1 at
˜ 10 cm-1 and peak 4 at ˜ 27 cm-1 are quadrupolar and symmetrical spheroidal mode vibrations
respectively. The peaks 3 and 2 at ˜ 21 cm-1 and at ˜ 16 cm-1 respectively are overtone of l=2,
spheroidal (l=2, 0 : SPH) i.e. l=2, n=1: SPH mode and torsional l=1, n=0 (l=1, 0 : TOR) mode.
These all four peaks have been obtained for all four samples with variation in their frequencies due
to 1/R size dependency. However for three samples CSS100, CSS78 and CSS25, the peak positions
in the Raman spectra are almost same due to same size but different composition. These modes for
sample CSS82 are at 11.34 cm-1 and 5.5 cm-1 respectively. While the overtone of l =2, 0 SPH is
clearly seen the torsional mode l =1, 0 : TOR overlaps with the l =2, 0 : SPH mode in the case of
sample CSS82. The overtone of the unpolarized mode (l=2,1 : SPH) has not been reported earlier.
However, there are reports regarding the observation of overtones of the symmetrical mode (l=0,
n=0 : SPH) [24-25]. While, Verma et al [24] pointed out the overlap of this mode with lower order
symmetrical modes as the absence of l=2,1: SPH (overtone of quadrupolar mode). The Figure 2
presents the calculated frequency spectra by using CSM approach. Figure 1 and 2 along with the
table I are clearly able to bring out the 1/R size dependency of the frequency. It is seen that the all
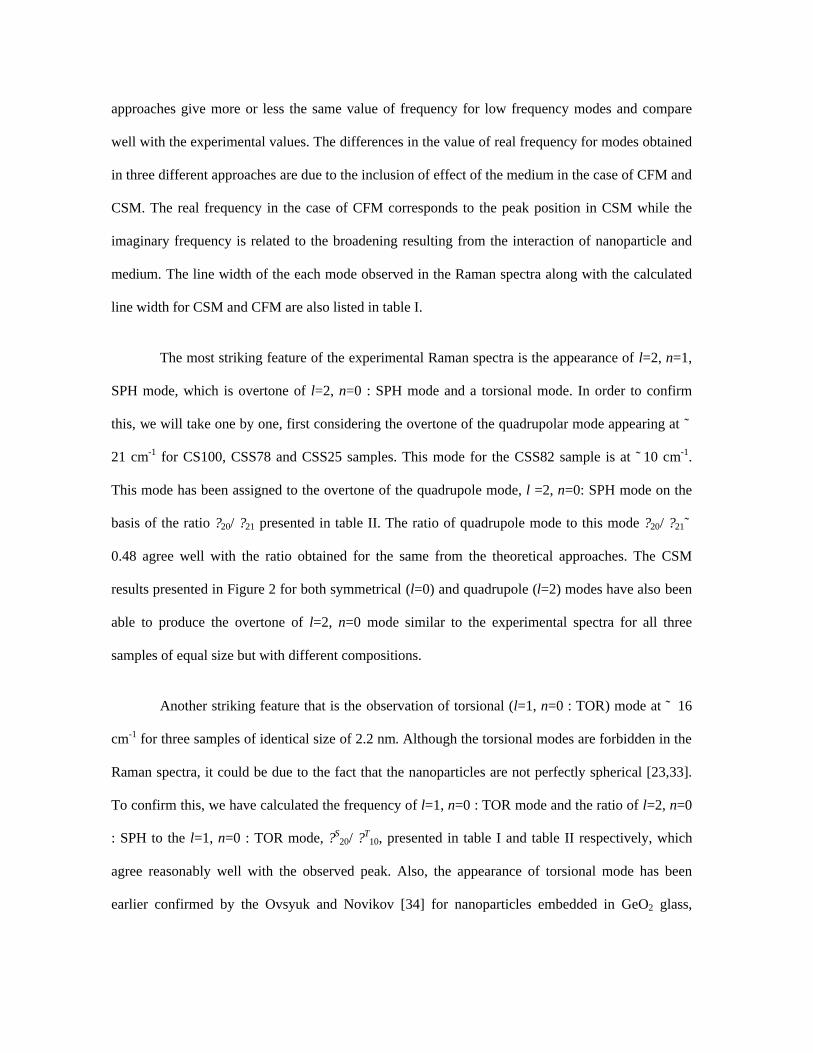
approaches give more or less the same value of frequency for low frequency modes and compare
well with the experimental values. The differences in the value of real frequency for modes obtained
in three different approaches are due to the inclusion of effect of the medium in the case of CFM and
CSM. The real frequency in the case of CFM corresponds to the peak position in CSM while the
imaginary frequency is related to the broadening resulting from the interaction of nanoparticle and
medium. The line width of the each mode observed in the Raman spectra along with the calculated
line width for CSM and CFM are also listed in table I.
The most striking feature of the experimental Raman spectra is the appearance of l=2, n=1,
SPH mode, which is overtone of l=2, n=0 : SPH mode and a torsional mode. In order to confirm
this, we will take one by one, first considering the overtone of the quadrupolar mode appearing at ˜
21 cm-1 for CS100, CSS78 and CSS25 samples. This mode for the CSS82 sample is at ˜ 10 cm-1.
This mode has been assigned to the overtone of the quadrupole mode, l =2, n=0: SPH mode on the
basis of the ratio ?20/ ?21 presented in table II. The ratio of quadrupole mode to this mode ?20/ ?21˜
0.48 agree well with the ratio obtained for the same from the theoretical approaches. The CSM
results presented in Figure 2 for both symmetrical (l=0) and quadrupole (l=2) modes have also been
able to produce the overtone of l=2, n=0 mode similar to the experimental spectra for all three
samples of equal size but with different compositions.
Another striking feature that is the observation of torsional (l=1, n=0 : TOR) mode at ˜ 16
cm-1 for three samples of identical size of 2.2 nm. Although the torsional modes are forbidden in the
Raman spectra, it could be due to the fact that the nanoparticles are not perfectly spherical [23,33].
To confirm this, we have calculated the frequency of l=1, n=0 : TOR mode and the ratio of l=2, n=0
: SPH to the l=1, n=0 : TOR mode, ?S20/ ?T
10, presented in table I and table II respectively, which
agree reasonably well with the observed peak. Also, the appearance of torsional mode has been
earlier confirmed by the Ovsyuk and Novikov [34] for nanoparticles embedded in GeO2 glass,
which they claim is due to the effect of surrounding matrix. However, we attribute the appearance of
torsional mode to the non-spherical shape of nanoparticle as the presence of surrounding medium
alone has not been able to produce the torsional mode for this mixed system [24, 25]. The non-
spherical shape of the present glass embedded CdS1-xSex nanoparticle has been confirmed from high
resolution transmission electron microscopy [31], In this case the selection rule is relaxed and the
torsional vibrational mode with odd l can be seen in the Raman spectra [23]. Absence of torsional
modes l=1, n=0 : TOR for the sample CSSS82 in Raman spectra may be due to either overlap of this
mode with l=2, n=0 : SPH mode or exact spherical shape of the nanoparticle. Former can be justified
with fact that the calculated torsional mode l=1, n=0 : TOR frequency is close to the calculated l=2,
n=0 : SPH mode.
Furthermore, the present results show that the frequency of quadrupolar mode (l=2, n=0 :
SPH) remain more or less constant while the breathing mode (l=0, n=0 : SPH) shows some change
with the composition.
V. CONCLUSION
Low frequency acoustic phonon modes have been investigated for the CdS1-xSex
nanoparticles embedded in the borosilicate glass using the low frequency Raman scattering and
three different models namely classical Lamb’s approach, the complex frequency model and
core shell model. Based on the calculated spheroidal and torsional mode frequencies of
nanoparticle the low frequency Raman spectra has been interpreted. A good agreement
between theoretical and experimental results is obtained. The experimental Raman spectra
show four peaks in the low frequency region. The torsional mode, forbidden by the selection
rule for spherical particles has been observed and been attributed to the non-spherical shape of
nanoparticles. In addition, the first harmonic of the quadrupolar mode has also been observed.
ACKNOWLEDGEMENT
The financial assistance from BRNS, Department of Atomic Energy is highly appreciated.
REFERENCES
1. Efros Al L and Efros A L 1982 Fiz. Tekh. Pouprovodn 16 1209 ; [1982 Sov. Phys. Semicond.
16 772]
2. Ekimov A I and Onushchenko A A 1984 Pis’ma Zh. Éksp. Teor. Fiz. 40 337 ; [1984 JETP
Lett. 40 1136]
3. Ekimov A I, Hache F, Schanne-Klein M C, Ricard D, Flyt-zanis C, Kudryavtsev I A, Yazeva
T V, Rodina A V and Efros Al L 1993 J. Opt. Soc. Am. B 10 100
4. Scroeder J and Persans P D 1996J. Lumin. 70 69
5. Persans P D, Lurio L B, Pant J, Yükselici H, Lian G and Hayes T M 2000 J. Appl. Phys. 87
3850
6. Ekimov A 1996 J. Lumin. 70 1
7. Rajalakshmi M and Arora A K 1999 Solid State Commun. 110 75
8. Gomonnai A V, Azhniuk Yu M, Lopushansky V V, Megela I G, Turok I I, Kranjcec M and
Yukhymchuk V O 2002 Phys. Rev. B 65 245327
9. Yumoto J, Fukuskima S and Kubodera K 1987 Opt. Lett. 12 832
10. Ironside C N, Cullen T J, Bhumbra B S, Bell J, Banyai W C, Finlayson N, Seaton C T and
Stegeman G I 1988 J. Opt. Soc. Am. B 5 492
11. Najafi S I, Belanger M, Maciejko R and Black R J 1988 Appl. Opt. 27 806
12. Scmitt-Rink S, Miller D A and Chemla D S 1987 Phys. Rev. B 35 8113
13. Rajalakshmi M, Sakuntala T and Arora A K 1997 J. Phys.: Condens. Matter 9 9745
14. Nemanich R J, Solin S A and Martin R M 1979 Phys. Rev. B 20 392
15. Campbell I H and Fauchet P M 1986 Solid State Commun. 58 739
16. Ravindran T R, Arora A K, Balamurugan B and Mehta B R 1999 Nanostructured Materials
11 603

17. Alisatos A P 1996 J. Phys. Chem. 100 13226
18. Wise F W 2000 Acc. Chem. Res 33 773
19. Lamb H 1882 Proc. London Math. Soc. 13 189
20. Tanaka A, Onari S and Arai T 1993 Phys. Rev. B 47 1237
21. Saviot L, Champagnon B, Duval E and Ekimov A I 1998 Phys. Rev. B 57 341
22. Murray D B and Saviot L 2004 Phys. Rev. B 69 094305 23. Duval E 1992 Phys. Rev. B 46 5795
24. Verma P, Cordts W, Irmer G and Monecke J 1999 Phys. Rev. B 60 5778
25. Ivanda M, Babocsi K, Dem C, Schmitt M, Montagna M and Kiefer W 2003 Phys. Rev. B 67
235329
26. Saviot L and Murray D B 2004 Phy. Rev. Lett. 93 055506
27. Talati M and Jha P K 2006 Phys. Rev. E 73 011901
28. Dubrovskiy V A and Morochnik V S 1981 Izv. Earth Phys. 17 494 29. Saviot L and Murray D B 2005 Phys. Rev. B 72 205433 30. Portalés H, Saviot L, Duval E, Gaudry M, Cottanum E, Pellarin M, Lerme J and Broyer M
2002 Phys. Rev. B 65 165422
31. Azhniuk Yu M, Milekhin A G, Gomonnai A V, Lopushansky V V, Yukhymchuk V O,
Schulze S, Zenkevich E I and Zahn D R T 2004 J. Phys.: Condens. Matter 16 9069
32. Arora A K, Rajalakshmi M, Ravindran T R in Encyclopedia of Nanoscience and
Nanotechnology, Ed. H S Nalwa Vol. 8 (American Scientific Publishers, Los Angeles
2004) p. 499 33. Merlin R 1997 Solid State Commun. 102 207 34. Ovsyuk N N and Novikov V N 1996 Phys. Rev. B 53 3113

Figures Caption
1. Low frequency Raman spectra of CdSxSe1-x nanoparticle embedded in borosilicate glass (a) CdSe (b) CdS0.18Se0.82 (c) CdS0.22Se0.78 and (d) CdS0.25Se0.75. Small circles, full curve and straight line are for the experimental Raman data, Curve obtained from fitting software peak fit and background respectively.
2. Low frequency spectra by using CSM for CdSxSe1-x nanoparticle embedded in borosilicate glass (a) CdSe (b) CdS0.18Se0.82 (c) CdS0.22Se0.78 and (d) CdS0.25Se0.75.
Tables Caption
1. Frequency for CdSxSe1-x nanoparticle embedded in borosilicate glass from low frequency Raman spectra and theoretical models. In the embedded i.e. CSM and CFM case damping [Im (?)] is half width at half maxima. For Raman spectra the Im(?) is ? ?/2.
2. Comparison of frequency ratio. ?S20 is the frequency of l=2,n=0 ; SPH mode and ?T
10 is the frequency of the l=1,n=0;TOR mode.
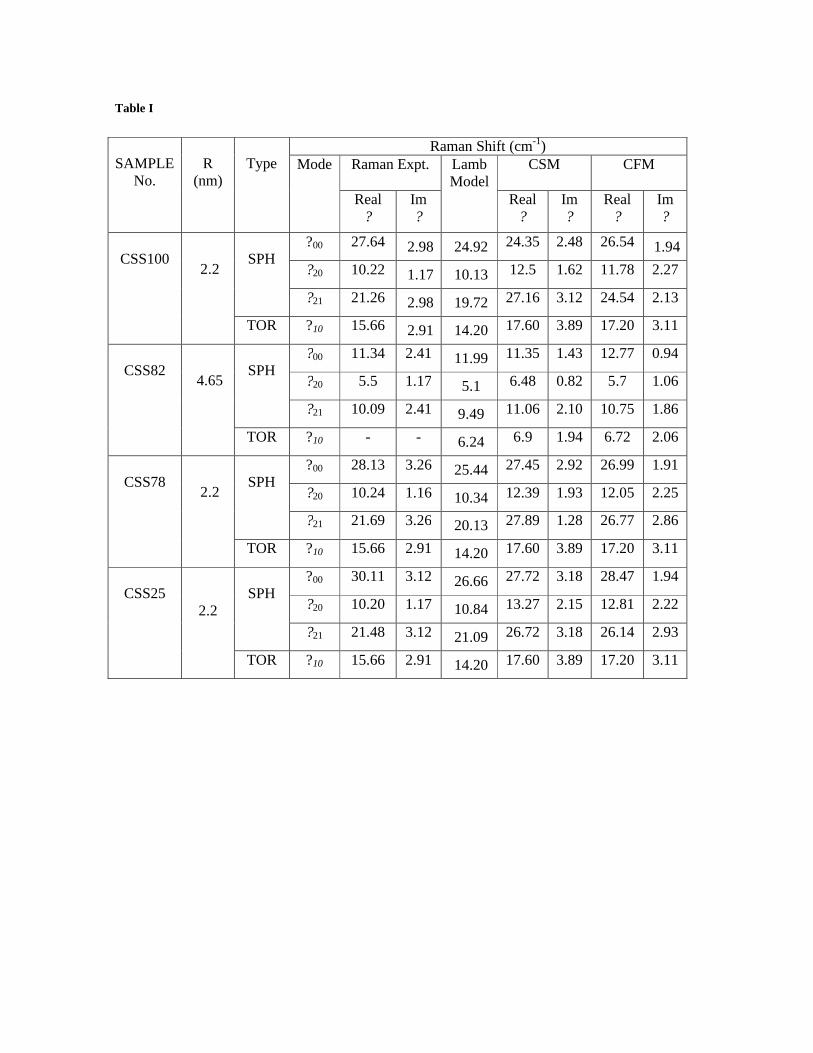
Table I
SAMPLE
No.
R
(nm)
Type
Raman Shift (cm-1) Mode Raman Expt.
Lamb Model
CSM
CFM
Real ?
Im ?
Real ?
Im ?
Real ?
Im ?
CSS100
2.2
SPH
?00 27.64 2.98 24.92 24.35 2.48 26.54 1.94
?20 10.22 1.17 10.13 12.5 1.62 11.78 2.27
?21 21.26 2.98 19.72 27.16 3.12 24.54 2.13
TOR ?10 15.66 2.91 14.20 17.60 3.89 17.20 3.11
CSS82
4.65
SPH
?00 11.34 2.41 11.99 11.35 1.43 12.77 0.94
?20 5.5 1.17 5.1 6.48 0.82 5.7 1.06
?21 10.09 2.41 9.49 11.06 2.10 10.75 1.86
TOR ?10 - - 6.24 6.9 1.94 6.72 2.06
CSS78
2.2
SPH
?00 28.13 3.26 25.44 27.45 2.92 26.99 1.91
?20 10.24 1.16 10.34 12.39 1.93 12.05 2.25
?21 21.69 3.26 20.13 27.89 1.28 26.77 2.86
TOR ?10 15.66 2.91 14.20 17.60 3.89 17.20 3.11
CSS25
2.2
SPH
?00 30.11 3.12 26.66 27.72 3.18 28.47 1.94
?20 10.20 1.17 10.84 13.27 2.15 12.81 2.22
?21 21.48 3.12 21.09 26.72 3.18 26.14 2.93
TOR ?10 15.66 2.91 14.20 17.60 3.89 17.20 3.11
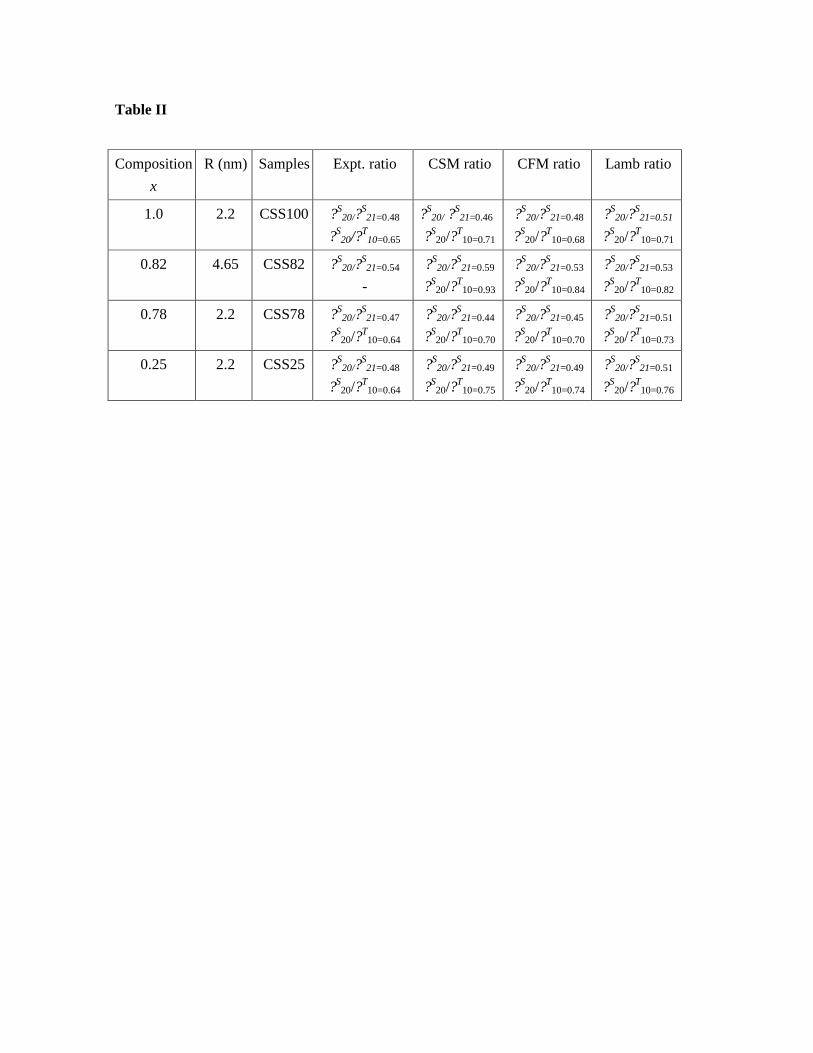
Table II
Composition x
R (nm) Samples Expt. ratio CSM ratio CFM ratio Lamb ratio
1.0 2.2 CSS100 ?S20/?S
21=0.48
?S20/?T
10=0.65 ?S
20/ ?S21=0.46
?S20/?T
10=0.71 ?S
20/?S21=0.48
?S20/?T
10=0.68 ?S
20/?S21=0.51
?S20/?T
10=0.71
0.82 4.65 CSS82 ?S20/?S
21=0.54
- ?S
20/?S21=0.59
?S20/?T
10=0.93 ?S
20/?S21=0.53
?S20/?T
10=0.84 ?S
20/?S21=0.53
?S20/?T
10=0.82
0.78 2.2 CSS78 ?S20/?S
21=0.47
?S20/?T
10=0.64 ?S
20/?S21=0.44
?S20/?T
10=0.70 ?S
20/?S21=0.45
?S20/?T
10=0.70 ?S
20/?S21=0.51
?S20/?T
10=0.73
0.25 2.2 CSS25 ?S20/?S
21=0.48
?S20/?T
10=0.64 ?S
20/?S21=0.49
?S20/?T
10=0.75 ?S
20/?S21=0.49
?S20/?T
10=0.74 ?S
20/?S21=0.51
?S20/?T
10=0.76
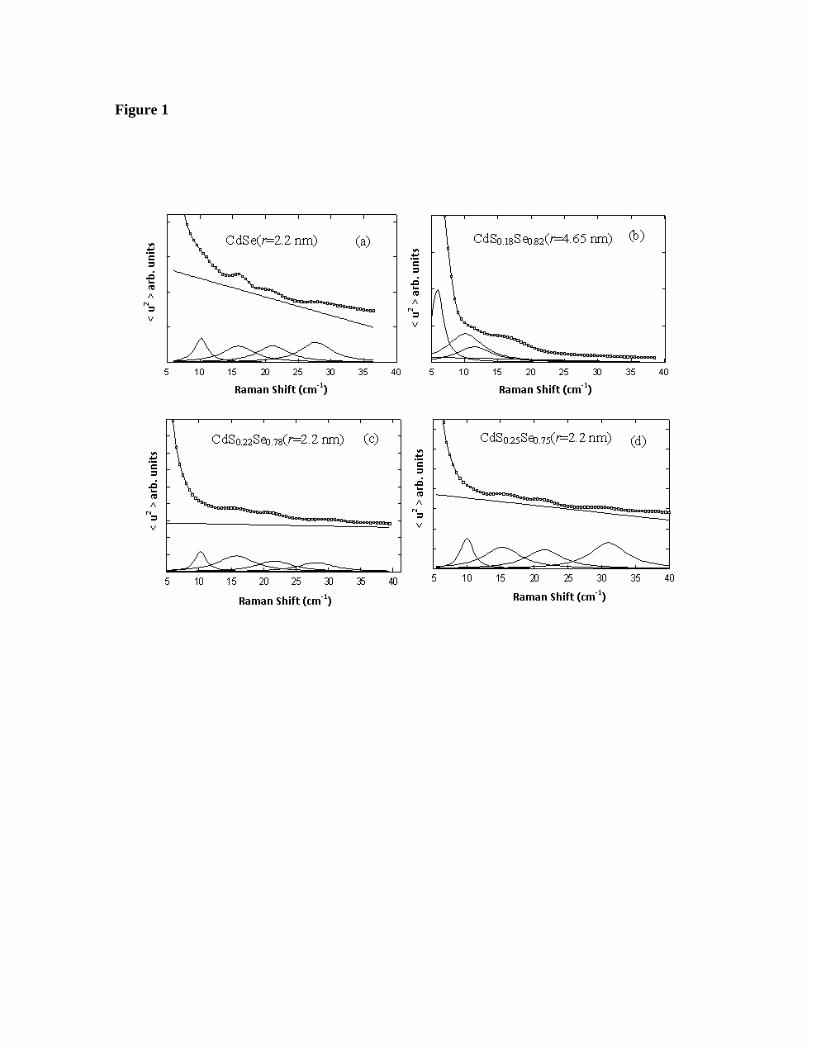
Figure 1
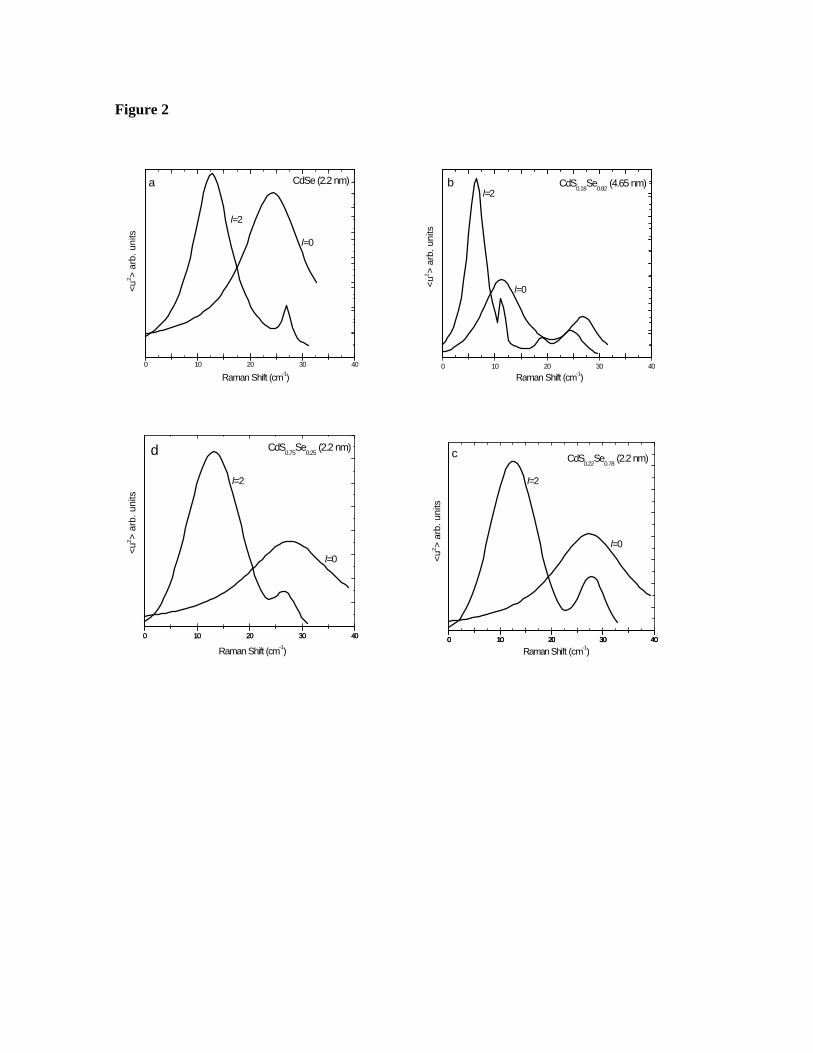
Figure 2
0 10 20 30 40
<u
2 > ar
b. u
nits
Raman Shift (cm-1)
CdSe (2.2 nm)
l=2
l=0
a
0 10 20 30 40
<u
2 > ar
b. u
nits
Raman Shift (cm-1)
l=2
l=0
CdS0.18
Se0.82
(4.65 nm)
b
0 10 20 30 400 10 20 30 40
Raman Shift (cm-1)
l=0
l=2
CdS0.75
Se0.25
(2.2 nm)
<u2 >
arb.
uni
ts
d
0 10 20 30 400 10 20 30 400 10 20 30 40
<u
2 > ar
b. u
nits
l=0
l=2
CdS0.22
Se0.78
(2.2 nm)c
Raman Shift (cm-1)