![[IN FIRST-ANGLE PROJECTION METHOD]](https://static.fdokumen.com/doc/165x107/6312eb38b1e0e0053b0e36b0/in-first-angle-projection-method.jpg)
Low energy super-elastic scattering studies of calcium over the complete angular range using a...
24
Southern Cross University ePublications@SCU Chancellery 2008 Low energy super-elastic scaering studies of calcium over the complete angular range using a magnetic angle changing device Martyn Hussey University of Manchester Andrew James Murray University of Manchester William R. MacGillivray Southern Cross University George C. King University of Manchester ePublications@SCU is an electronic repository administered by Southern Cross University Library. Its goal is to capture and preserve the intellectual output of Southern Cross University authors and researchers, and to increase visibility and impact through open access to researchers around the world. For further information please contact [email protected]. Publication details Post-print of: Hussey, M, Murray, AJ, MacGillivray, WR & King, GC 2008, 'Low energy super-elastic scaering studies of calcium over the complete angular range using a magnetic angle changing device', Journal of Physics B: Atomic, Molecular and Optical Physics, vol. 41, 055202. Published version available from: hp://dx.doi.org/10.1088/0953-4075/41/5/055202
-
Upload
independent -
Category
Documents
-
view
2 -
download
0
Transcript of Low energy super-elastic scattering studies of calcium over the complete angular range using a...

Southern Cross UniversityePublications@SCU
Chancellery
2008
Low energy super-elastic scattering studies ofcalcium over the complete angular range using amagnetic angle changing deviceMartyn HusseyUniversity of Manchester
Andrew James MurrayUniversity of Manchester
William R. MacGillivraySouthern Cross University
George C. KingUniversity of Manchester
ePublications@SCU is an electronic repository administered by Southern Cross University Library. Its goal is to capture and preserve the intellectualoutput of Southern Cross University authors and researchers, and to increase visibility and impact through open access to researchers around theworld. For further information please contact [email protected].
Publication detailsPost-print of: Hussey, M, Murray, AJ, MacGillivray, WR & King, GC 2008, 'Low energy super-elastic scattering studies of calcium overthe complete angular range using a magnetic angle changing device', Journal of Physics B: Atomic, Molecular and Optical Physics, vol. 41,055202.Published version available from:http://dx.doi.org/10.1088/0953-4075/41/5/055202

Low energy super-elastic scattering studies of calcium overthe complete angular range using a Magnetic AngleChanging device.
Martyn Hussey1, Andrew Murray1, William MacGillivray1,2 and George King1
1School of Physics and Astronomy, University of Manchester, Manchester, M13 9PL, UK
2Southern Cross University, Lismore, NSW 2480, Australia.
Email: [email protected]
Abstract.
Super-elastic scattering processes can be considered as the ‘time-reversal’ of electron-photon
coincidence measurements, with the advantage that data are accumulated thousands of times
faster. This allows a far more extensive and accurate study of electron excitation of atoms which
can also be excited using laser radiation. The application of a newly invented Magnetic Angle
Changing (MAC) device to these experiments has allowed the complete scattering geometry to be
accessed for the first time, and experimental methods adopted in these new experiments are
discussed here. Data are presented for excitation of the 41P1 state of calcium by electron impact at
scattering angles from near 0° to beyond 180°, with incident energies of 45eV and 55eV. The
results are compared to the DWBA theory of Stauffer and colleagues, with generally excellent
agreement.
PACS No. 34.80.Dp.
1.0 Introduction.
Electron impact excitation of atoms is one of the most fundamental collision processes that allows
accurate comparison between experiment and quantum theories [1]. These comparisons allow
models of the collision process to be refined and enhanced, with the ultimate goal being the
development of a general theory that is applicable over all collision energies. These goals have
yet to be met, although there has been considerable advancement in recent years in both the high
energy regime using distorted wave calculations [2,3], and in the low energy regime using
convergent close coupling methods [4,5].
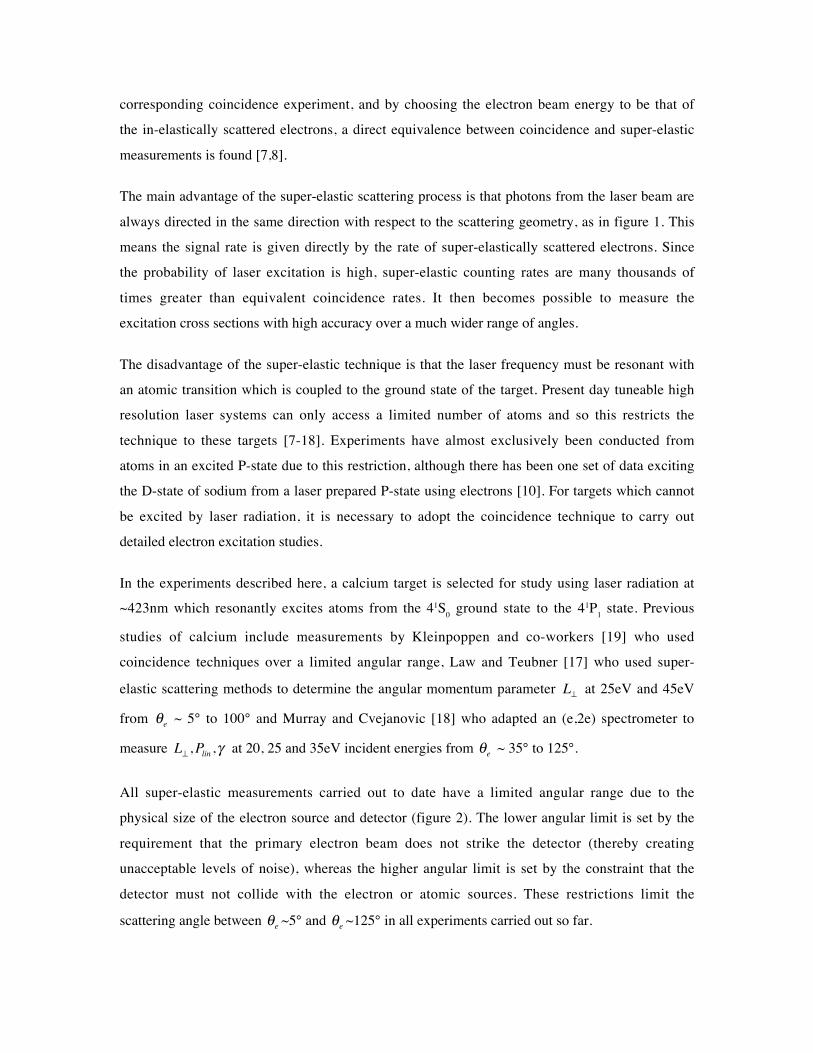
Experiments have also improved their accuracy through the development of different methods
and through application of new technologies. The most detailed comparison to theory occurs
when the experiment determines the ‘shape’ and rotational dynamics of the excited target
following the collision. The conventional technique which establishes this structure measures the
polarization state of photons emitted from the excited target in coincidence with electrons that in-
elastically scatter from the target. The resulting polarization ellipse is then directly related to the
electronic structure of the excited atom, which is described in the natural frame by the parameters
L ,Plin , , 00A [6]. In this parameterization, L describes the angular momentum perpendicular to
the scattering plane which is transferred to the atom during the collision, Plin , describe the
alignment of the charge cloud, and 00A describes the probability that the incident electron spin
changes during the interaction (see figure 1).
Whereas coincidence techniques are robust and well tested, they are difficult to perform over a
wide range of scattering geometries due to their low yield. The low rates in these experiments are
a direct consequence of their high selectivity, which requires simultaneous detection of the
scattered electron and correlated photon to produce ‘true’ coincidence signals. Since an atom
excited by the detected electron may not emit a photon in the direction of the photon detector,
many events do not register, and the accumulation of coincidence signals is slow.
An alternative which does not suffer from these restrictions is the super-elastic scattering
technique which is essentially the time-reversal of the coincidence experiment. In this method,
the atom is initially excited by laser radiation of well defined polarization and frequency, as
shown in figure 1. Since the continuous wave laser beam propagates always in the same direction,
the excited atomic state is excited coherently. Further, the intensity of the laser radiation is
sufficiently high that there is a significant probability that atoms in the interaction region will be
promoted to an excited state.
Following laser excitation of the target, the incident electron beam scatters from the excited
atoms in the ensemble and the electron detector selects electrons that have gained energy from the
interaction (super-elastic scattering). The probability of super-elastic scattering into a given angle
e is then determined as a function of the polarization state of the laser beam. By selecting the
energy of the super-elastically scattered electrons to be that of the incident electrons in the
corresponding coincidence experiment, and by choosing the electron beam energy to be that of
the in-elastically scattered electrons, a direct equivalence between coincidence and super-elastic
measurements is found [7,8].
The main advantage of the super-elastic scattering process is that photons from the laser beam are
always directed in the same direction with respect to the scattering geometry, as in figure 1. This
means the signal rate is given directly by the rate of super-elastically scattered electrons. Since
the probability of laser excitation is high, super-elastic counting rates are many thousands of
times greater than equivalent coincidence rates. It then becomes possible to measure the
excitation cross sections with high accuracy over a much wider range of angles.
The disadvantage of the super-elastic technique is that the laser frequency must be resonant with
an atomic transition which is coupled to the ground state of the target. Present day tuneable high
resolution laser systems can only access a limited number of atoms and so this restricts the
technique to these targets [7-18]. Experiments have almost exclusively been conducted from
atoms in an excited P-state due to this restriction, although there has been one set of data exciting
the D-state of sodium from a laser prepared P-state using electrons [10]. For targets which cannot
be excited by laser radiation, it is necessary to adopt the coincidence technique to carry out
detailed electron excitation studies.
In the experiments described here, a calcium target is selected for study using laser radiation at
~423nm which resonantly excites atoms from the 41S0 ground state to the 41P
1 state. Previous
studies of calcium include measurements by Kleinpoppen and co-workers [19] who used
coincidence techniques over a limited angular range, Law and Teubner [17] who used super-
elastic scattering methods to determine the angular momentum parameter L at 25eV and 45eV
from e ~ 5° to 100° and Murray and Cvejanovic [18] who adapted an (e,2e) spectrometer to
measure L ,Plin , at 20, 25 and 35eV incident energies from e ~ 35° to 125°.
All super-elastic measurements carried out to date have a limited angular range due to the
physical size of the electron source and detector (figure 2). The lower angular limit is set by the
requirement that the primary electron beam does not strike the detector (thereby creating
unacceptable levels of noise), whereas the higher angular limit is set by the constraint that the
detector must not collide with the electron or atomic sources. These restrictions limit the
scattering angle between e ~5° and e ~125° in all experiments carried out so far.
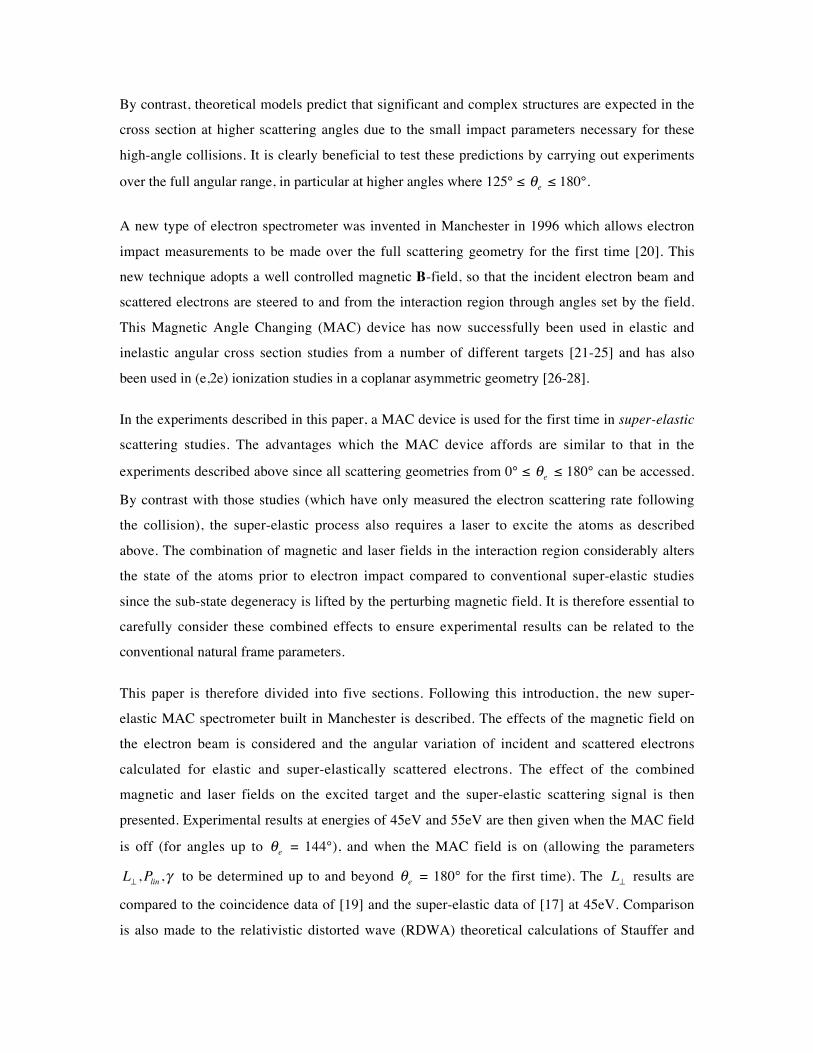
By contrast, theoretical models predict that significant and complex structures are expected in the
cross section at higher scattering angles due to the small impact parameters necessary for these
high-angle collisions. It is clearly beneficial to test these predictions by carrying out experiments
over the full angular range, in particular at higher angles where 125° e 180°.
A new type of electron spectrometer was invented in Manchester in 1996 which allows electron
impact measurements to be made over the full scattering geometry for the first time [20]. This
new technique adopts a well controlled magnetic B-field, so that the incident electron beam and
scattered electrons are steered to and from the interaction region through angles set by the field.
This Magnetic Angle Changing (MAC) device has now successfully been used in elastic and
inelastic angular cross section studies from a number of different targets [21-25] and has also
been used in (e,2e) ionization studies in a coplanar asymmetric geometry [26-28].
In the experiments described in this paper, a MAC device is used for the first time in super-elastic
scattering studies. The advantages which the MAC device affords are similar to that in the
experiments described above since all scattering geometries from 0° e 180° can be accessed.
By contrast with those studies (which have only measured the electron scattering rate following
the collision), the super-elastic process also requires a laser to excite the atoms as described
above. The combination of magnetic and laser fields in the interaction region considerably alters
the state of the atoms prior to electron impact compared to conventional super-elastic studies
since the sub-state degeneracy is lifted by the perturbing magnetic field. It is therefore essential to
carefully consider these combined effects to ensure experimental results can be related to the
conventional natural frame parameters.
This paper is therefore divided into five sections. Following this introduction, the new super-
elastic MAC spectrometer built in Manchester is described. The effects of the magnetic field on
the electron beam is considered and the angular variation of incident and scattered electrons
calculated for elastic and super-elastically scattered electrons. The effect of the combined
magnetic and laser fields on the excited target and the super-elastic scattering signal is then
presented. Experimental results at energies of 45eV and 55eV are then given when the MAC field
is off (for angles up to e = 144°), and when the MAC field is on (allowing the parameters
L ,Plin , to be determined up to and beyond e = 180° for the first time). The L results are
compared to the coincidence data of [19] and the super-elastic data of [17] at 45eV. Comparison
is also made to the relativistic distorted wave (RDWA) theoretical calculations of Stauffer and

colleagues [29] who have kindly sent us the predictions from their model. Finally, conclusions are
drawn as to the results and methods adopted, and further studies using this technique are
considered.
2.0 Experimental Setup.
A new spectrometer has been constructed to carry out the super-elastic experiments with a MAC
device. The spectrometer is shown in figure 3. The vacuum chamber is constructed of 310 grade
stainless steel, and is lined with µ -metal both inside and outside the chamber. The chamber is
pumped using a 400l/s Leybold turbo-molecular pump and reaches around 10-7 torr when
operating. The spectrometer locates from the top vacuum flange as shown, so that laser radiation
can pass to the interaction region through a window centrally located on this flange.
The calcium atomic beam is produced from a collimated source which has been described
elsewhere [30]. This source produces a beam of calcium atoms whose angular divergence is
~2.5°, which is essential to ensure minimum contamination of the MAC coil surfaces located
around the interaction region. The oven is operated at a temperature of 1070K to ensure a beam
density in the interaction region of 3 x 10⁹atoms/cm3. The atomic beam that passes through the
interaction region is deposited on to a trap which is cooled using liquid nitrogen from a re-
circulating dewar [31]. This trap also freezes out any water vapour in the vacuum chamber when
the spectrometer is operating.
The electron source is a two stage gun that produces an energy-unselected beam with an
adjustable energy from ~10eV to 300eV. The gun is designed to produce an electron beam at the
interaction region of diameter 1mm with zero beam angle and an angular width of ~2°. The
electron current from the gun is typically around 5µA when operating. Electrons that pass
directly through the interaction region are collected onto a Faraday cup consisting of a curved
collector plate located behind a fine tungsten mesh. This curved plate is located on the inner wall
of the vacuum chamber, has an arc length of 200mm and is positioned so as to intercept the
primary electron beam both with and without the MAC operating. This Faraday plate is biased at
a potential of +100V with respect to the tungsten mesh (which is set at ground potential), so that
electrons which impinge upon the plate do not scatter back into the vacuum chamber. The
electron source is located immediately next to the oven to maximise the angular range of the
analyser (see figure 2).
The electron analyser is of a new design which is described in detail in a forthcoming paper [32].
This analyser has a 3-element electrostatic lens which incorporates a new design of deflector to
steer the beam, and a hemi-spherical energy analyser which is used to select super-elastically
scattered electrons that are then detected by a Photonis 719BL channel electron multiplier (CEM).
The analyser is positioned using three high precision vacuum compatible translators, so that the
input lens accurately aligns to the interaction region. The translator consists of a ‘standard’
translator for horizontal alignment [33] and a new ‘wedge-type’ translator for precision alignment
in the vertical direction [34]. Signal from the CEM is sent to a Philips Scientific 6954 amplifier
(bandwidth 1.8GHz, gain 100X) before passing to an ORTEC 584 constant fraction discriminator
(CFD). The output from the CFD passes to a Labview PCI-6621 digital acquisition (DAQ) card
inside a control PC.
The electron analyser can move through the angular range from e = 10° to e = 144° before
colliding with the electron gun, as shown in figure 2. At e ~ 20° the calcium beam from the
oven would enter the analyser, and so measurements in this region are taken by moving the
analyser to the opposite side of the spectrometer (nearest the oven). Since this is also the region
where fluorescence from the interaction region is monitored for stabilization of the laser
frequency (see below), most measurements are taken with the analyser on the opposite side to the
oven.
Laser radiation at ~423nm (resonant with the 41S0 – 41P1 transition in calcium) is produced from a
Coherent MBR-110 Ti:Sapphire laser whose output frequency is doubled using an MBD-200
external cavity doubler. The line-width of the laser radiation is ~200kHz, and the laser
wavelength is controlled by an external locking system that monitors fluorescence from the
interaction region (see below). The polarization of the laser beam is controlled using a
combination of high quality optical components. The initial state of the laser is set using a Glan-
laser polarizer with an extinction ratio of ~105. Light passing through this polarizer (located
externally on the top flange) then passes through either a zero order 2 retardation plate for
studies involving Plin and , or passes through a zero order 4 plate for L measurements.
The 423nm laser beam (power ~80mW) is accurately aligned to the interaction region by
following a counter-propagating tracer beam from a visible laser diode (VLD) operating at
650nm located inside the chamber (figure 3). The VLD is accurately aligned to the interaction
region while the spectrometer is outside the vacuum chamber, again using two high precision

vacuum compatible translators. The VLD is isolated from the more powerful 423nm laser
radiation using a 650nm narrow band optical filter positioned immediately above the VLD.
2.1 The Magnetic Angle Changing (MAC) Device.
The MAC coils are constructed from a pair of counter-propagating coils which locate around the
interaction region as shown. The design of these coils closely follows that of [35], with the coil
formers being constructed from oxygen-free copper to assist cooling. The coils are wound from
1mm diameter copper wire which is clad in a thin coating of PTFE. The coil formers are inserted
into 310 stainless steel housings to protect the copper formers from the calcium beam, since hot
calcium reacts strongly with copper. The shielded formers are anchored in position using rigid
oxygen-free copper mounts that locate from the base of the spectrometer and from the top flange.
These mounts are coated in colloidal graphite to reduce contamination by calcium deposition. The
wires which feed input and output current to the MAC coils are constructed from tightly wound
PTFE coated copper wire that is pocketed inside the mounts so as to ensure no insulating surfaces
are exposed to stray electrons.
Figure 4 shows the B-field from the MAC coils in the axial direction calculated using the CPO-
3D programme developed in Manchester [36]. Figure 4a shows the B-field variation over a radial
distance of 30mm from the interaction region (located at the centre of the coils). It can be seen
that the B-field has reduced to zero at 30mm, which is essential to ensure the electron trajectories
beyond this region are not affected by the field. At radial distances from 30mm to ~11mm the
field is negative, after which it rapidly increases to a maximum value ~2.45mT at a distance of
3mm from the interaction region. Figure 4b shows an expanded plot of this region so as to show
the field variation in detail. The calculated field in the interaction region (defined by the laser
beam radius of 1mm) is seen to vary by less than 0.1%, and so can be treated as uniform over the
laser beam profile.
The B-field from the MAC coils was measured using a high accuracy Bartington MAG-03MC 3-
axis magnetometer (resolution ±0.05µT ) which measured all field components a distance of
30mm from the interaction region. The currents through the coils required to set the B-field to
zero at this distance were in close agreement with those calculated using the CPO-3D
programme, and it was found that the fields beyond this distance remained zero as predicted for
this MAC design.
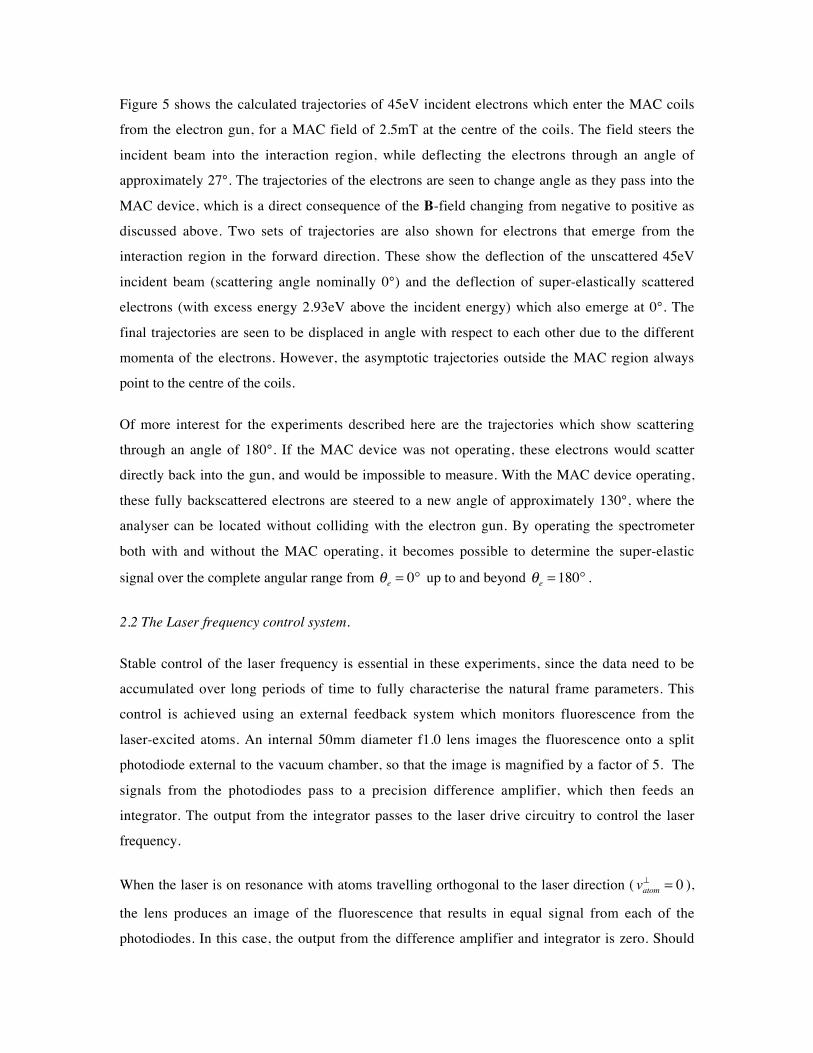
Figure 5 shows the calculated trajectories of 45eV incident electrons which enter the MAC coils
from the electron gun, for a MAC field of 2.5mT at the centre of the coils. The field steers the
incident beam into the interaction region, while deflecting the electrons through an angle of
approximately 27°. The trajectories of the electrons are seen to change angle as they pass into the
MAC device, which is a direct consequence of the B-field changing from negative to positive as
discussed above. Two sets of trajectories are also shown for electrons that emerge from the
interaction region in the forward direction. These show the deflection of the unscattered 45eV
incident beam (scattering angle nominally 0°) and the deflection of super-elastically scattered
electrons (with excess energy 2.93eV above the incident energy) which also emerge at 0°. The
final trajectories are seen to be displaced in angle with respect to each other due to the different
momenta of the electrons. However, the asymptotic trajectories outside the MAC region always
point to the centre of the coils.
Of more interest for the experiments described here are the trajectories which show scattering
through an angle of 180°. If the MAC device was not operating, these electrons would scatter
directly back into the gun, and would be impossible to measure. With the MAC device operating,
these fully backscattered electrons are steered to a new angle of approximately 130°, where the
analyser can be located without colliding with the electron gun. By operating the spectrometer
both with and without the MAC operating, it becomes possible to determine the super-elastic
signal over the complete angular range from e = 0° up to and beyond e = 180° .
2.2 The Laser frequency control system.
Stable control of the laser frequency is essential in these experiments, since the data need to be
accumulated over long periods of time to fully characterise the natural frame parameters. This
control is achieved using an external feedback system which monitors fluorescence from the
laser-excited atoms. An internal 50mm diameter f1.0 lens images the fluorescence onto a split
photodiode external to the vacuum chamber, so that the image is magnified by a factor of 5. The
signals from the photodiodes pass to a precision difference amplifier, which then feeds an
integrator. The output from the integrator passes to the laser drive circuitry to control the laser
frequency.
When the laser is on resonance with atoms travelling orthogonal to the laser direction ( vatom = 0 ),
the lens produces an image of the fluorescence that results in equal signal from each of the
photodiodes. In this case, the output from the difference amplifier and integrator is zero. Should

the laser frequency drift, a different section of the atomic beam with vatom 0 becomes resonant,
thereby creating an imbalance in the signals from the photodiodes. The difference amplifier hence
produces a non-zero output, which feeds current to the integrator. The output of the integrator
(time constant ~2 seconds) then steers the laser frequency so as to return the output of the
difference amplifier to zero (while maintaining the integrator output non-zero). In this way, the
laser frequency is brought back in resonance with the atomic beam travelling orthogonal to the
laser beam, with an accuracy of ±3MHz.
2.3 Energy loss/gain spectra.
The yield of scattered electrons is measured by scanning the collection energy of the electron
analyser while holding the incident electron beam energy constant. This gives an energy loss/gain
spectrum. The super-elastic signal appears at a higher energy than elastically scattered electrons
due to de-excitation of the laser-prepared atoms. For calcium, this energy is 2.93eV
corresponding to excitation energy of the 41P1 state.
Figure 6 shows an example of an energy loss/gain spectrum taken at a scattering angle e = 35°
with an incident energy of 45eV plotted on a logarithmic scale. The elastic peak is the dominant
feature in the spectrum as expected, since this is the most probable scattering process. Two
inelastic scattering peaks are also seen to the left hand side of the elastic peak, the largest being
from direct electron excitation to the 41P1 state. The super-elastic scattering peak is seen to the
right of the spectrum, and is found to lie 2.93eV above the elastic peak as expected. The
amplitude of the super-elastic peak varies with the polarization of the laser beam, reflecting the
different probabilities for de-excitation of the laser prepared state. The natural frame parameters
for each selected scattering angle are derived from this signal as the polarization is varied [18].
3.0 Theory.
A paper describing the theory of laser-atom interactions in a magnetic field has recently been
submitted [37]. A full Quantum-Electrodynamic (QED) model describes the dynamics of the
interaction. The conclusions drawn from this work for the super-elastic scattering process in a
MAC device are that the B-field plays an important role in determining the ‘shape’ of the charge
cloud prior to electron de-excitation occurring. The predictions of the model are closely borne out
by experiment, and so must be carefully considered when processing the data.

Figure 7 shows the excitation that occurs when a B-field is applied to the calcium 41P1 state. In
this model, the quantization z-axis is along the B-field, so the state prepared by the laser is also
described in this frame. For the experiments conducted here, the B-field aligns with the laser
propagation direction, and is aligned with the Natural frame axis shown in figure 1. The basis
states for the laser interaction can hence be described using the basis states in the Natural frame.
Application of a B-field results in Zeeman splitting of states with mJ 0 in the usual way. The
energy perturbation by the field is small, and an LS coupling scheme is used to calculate the
Lande gJ -factors for each state. The energy difference between states is then given by :
EmJ
= mJ L = µBgJmJ B (1)
where L is the Larmor precession frequency and µB is the Bohr magneton. For the 41P1 state of
calcium J = L and so gJ = 1 . For a field of 2.5mT as in figure 5, the Larmor frequency is
L 2 = 35MHz , which compares closely with the decay rate of the 41P1 state given by
2 = 34.6MHz . It is therefore necessary to allow for state detuning in the experiment.
For circularly polarized ( ± ) laser radiation, the quantization axis usually adopted to describe the
laser-atom interaction is along the laser beam and so the atoms can be described as in figure 7. In
this case, the laser must be detuned by the Larmor frequency upon application of the B-field, for
the atom to remain in resonance. For linearly -polarized radiation, the quantization axis usually
chosen to describe the interaction is along the Electric E-field of the laser (the polarization axis),
resulting in mJ = 0 transitions in this frame. However, by choosing the quantization axis along
the B-field, -polarized radiation can be considered as a coherent combination of + and
light leading to simultaneous excitation of the mJ = ±1 sub-states shown in figure 7. Any red or
blue detuning from resonance will therefore preferentially excite one of the mJ = ±1 sub-states
compared to the other, resulting in partial orientation of the atom, rather than full alignment.
A further consequence of the application of the B-field for linearly polarized laser excitation is
that the electron charge cloud will precess around the B-field axis (the Hanle effect). However,
since the laser optically drives the atom so as to be aligned along the polarization vector of the
laser field, there is a direct competition between these two processes. The QED model was
derived to establish how these effects compete in the super-elastic scattering process [37]. As an

example, for a field of 20G in the interaction region, the steady state alignment angle differs by
~10° compared to that with no B-field, as can be seen in figure 4 of [37].
3.1 The orientation parameter L .
The conclusion from these QED studies [37] is that for the 41P1 state of calcium, the orientation
parameter L can be directly calculated from the super-elastic signal using circularly polarized
laser radiation [7], as long as the laser is resonant with the Zeeman shifted sub-states produced
by each polarization. The orientation parameter is then calculated from the pseudo-Stokes
parameter P3S
e( ) using the relationship:
L e( ) = P3S
e( ) =Sres
+
e( ) Sres e( )
Sres+
e( ) + Sres e( )(2)
where Sres±
e( ) is the super-elastic rate for a given scattering angle e when on resonance with
the mJ = ±1 sub-state.
3.2 The alignment parameters Plin , .
For calculation of the alignment parameters Plin e( ), e( ) , the QED model [37] indicates that
under steady state conditions the charge cloud stabilises at a different angle PSS to the laser
polarization vector (thereby influencing the measurement of ), and that the length to width ratio
(which defines Plin ) reduces when compared to that with no B-field. As noted above, if the laser
is blue- or red-detuned with respect to the non-perturbed resonance frequency, there will be a
contribution to the super-elastic signal from orientation as well as from alignment of the state. It
is therefore necessary to ensure the laser frequency remains at the non-perturbed resonance
frequency once the B-field is applied, so that the scattering signal is not influenced by any
orientation of the atom. In this case, the super-elastic scattering signal can be measured by
rotating the linear polarization vector through an angle around the scattering plane (with
respect to the direction of the outgoing electrons), and taking measurements of the scattering
signal S e ,( ) as a function of this angle. It can be shown that the super-elastic signal is then
given by [37]:
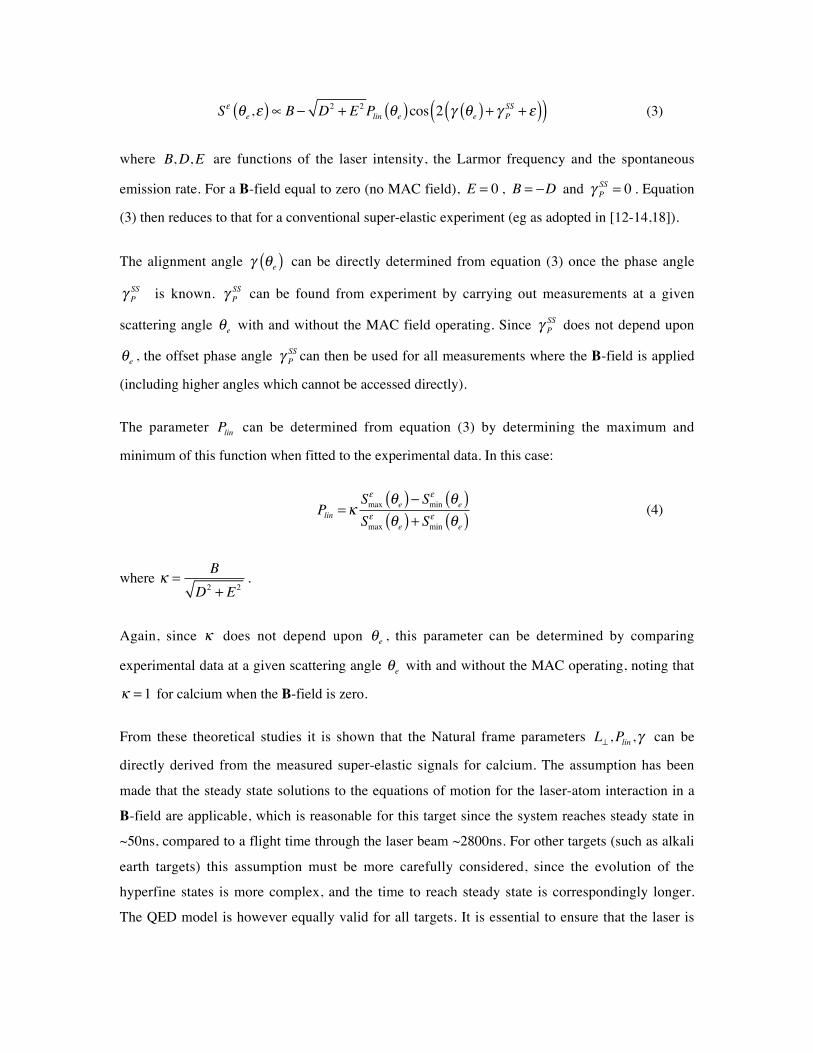
S e ,( ) B D2+ E2Plin e( )cos 2 e( ) + P
SS+( )( ) (3)
where B,D,E are functions of the laser intensity, the Larmor frequency and the spontaneous
emission rate. For a B-field equal to zero (no MAC field), E = 0 , B = D and PSS= 0 . Equation
(3) then reduces to that for a conventional super-elastic experiment (eg as adopted in [12-14,18]).
The alignment angle e( ) can be directly determined from equation (3) once the phase angle
PSS is known. P
SS can be found from experiment by carrying out measurements at a given
scattering angle e with and without the MAC field operating. Since PSS does not depend upon
e , the offset phase angle PSS can then be used for all measurements where the B-field is applied
(including higher angles which cannot be accessed directly).
The parameter Plin can be determined from equation (3) by determining the maximum and
minimum of this function when fitted to the experimental data. In this case:
Plin =Smax e( ) Smin e( )Smax e( ) + Smin e( )
(4)
where =B
D2+ E2
.
Again, since does not depend upon e , this parameter can be determined by comparing
experimental data at a given scattering angle e with and without the MAC operating, noting that
= 1 for calcium when the B-field is zero.
From these theoretical studies it is shown that the Natural frame parameters L ,Plin , can be
directly derived from the measured super-elastic signals for calcium. The assumption has been
made that the steady state solutions to the equations of motion for the laser-atom interaction in a
B-field are applicable, which is reasonable for this target since the system reaches steady state in
~50ns, compared to a flight time through the laser beam ~2800ns. For other targets (such as alkali
earth targets) this assumption must be more carefully considered, since the evolution of the
hyperfine states is more complex, and the time to reach steady state is correspondingly longer.
The QED model is however equally valid for all targets. It is essential to ensure that the laser is

tuned to resonance with the B-field on for calculation of the L e( ) parameter, whereas it is
important to ensure that the laser is tuned to resonance with the B-field off for calculation of
Plin e( ) and e( ) . Results of these measurements at 45eV and 55eV incident energy for a
calcium target are presented in the next section.
4.0 Experimental Results.
The new super-elastic spectrometer can access scattering angles up to e = 144° without the
MAC operating (see figure 2), and can access angles in excess of e = 180° with the MAC
activated. Measurements were taken for scattered electron energies of 45eV and 55eV, equivalent
to the incident electron energies in a coincidence experiment. Measurements of L e( ) were
obtained by rotating a / 4 plate through angles of 45°, 135°, 225° and 315° with respect to the
pass-axis of the Glan-laser polarizer, with the signal at each angle being accumulated for up to
100 seconds. These measurements were repeated several times so as to establish their uncertainty.
L e( ) was then calculated as in equation (2).
For determination of Plin e( ) and e( ) , a / 2 plate was rotated through 180° in 5° steps so as
to establish S e ,( ) . In this case, the angle is twice that of the / 2 plate (ie a rotation of
180° for the / 2 plate rotates the polarization vector by 360°). The angle = 0 was determined
from the angle of the scattered electron, and equations (3) and (4) used to determine Plin e( ) and
e( ) both without the MAC operating (B = 0) and with the MAC in operation.
4.1 The L e( ) parameter.
The results for this parameter have been published previously [38], and so are reproduced here for
completeness. Figure 8 shows these results for (a) 45eV and (b) 55eV equivalent incident
energies. The results are compared to the data from Kleinpoppen and co-workers who used a
coincidence technique [19], and to the results of the Flinders group [17]. The theoretical
prediction of Stauffer and colleagues [29] is also shown for comparison (convoluted with the
angular response of the new spectrometer, which is ~4° FWHM).
It is clear from these data that there is excellent agreement between the Flinders work and this
work at 45eV, however significant discrepancies are seen with the earlier coincidence data from

the Stirling group. The Flinders data extends to e = 100° , whereas the new results presented here
extend beyond e = 180° . The close agreement between data taken with and without the MAC
device operating confirms that the techniques presented in section (3) for calculation of the data
are accurate for this parameter. Three different MAC currents were used in collecting the data,
with the correction angle due to the MAC being established for each of these fields. This was
used to eliminate noise on the signal which occurred at certain scattering angles for a given MAC
field, as discussed in [38].
The theoretical prediction of a sharp maximum at around e = 150° is strikingly confirmed in the
present data, and the overall agreement between theory and experiment is excellent throughout.
There is a small discrepancy between theory and experiment in the minimum around e = 60°
which is predicted to be shallower than measured. Overall, the calculation accurately predicts the
structure seen in the experiment.
In a similar way, agreement between theory and experiment at 55eV is also excellent, apart from
once again the minimum around e = 60° . The results from the MAC were only taken at a single
current for this energy. Once again, there is excellent agreement between the data with and
without the MAC device operating. The agreement between theory and experiment at both
energies clearly shows that the model is including the essential physics which governs the angular
momentum transferred to the atom.
4.2 The Plin e( ), e( ) parameters.
Figure 9 shows results for (a) 45eV and (b) 55eV equivalent incident energy for the alignment
angle of the charge cloud e( ) with respect to the scattering geometry. There are no other
experimental results to compare to these data, however the theoretical predictions from [29] are
also shown for comparison. Agreement between theory and experiment is remarkable, the
calculation passing through virtually every data point. The only discrepancy that is seen is at
45eV around e = 30° , where the experiment deviates towards negative angles whereas the
calculation predicts positive angles. This is a consequence of the calculation showing a sharp
change in angle around this region, which tends to be enhanced once the convolution over the
spectrometer resolution is included. Private correspondence with Stauffer and colleagues
indicates that they believe this to be a numerical artefact in their calculation. By contrast, the
results at 55eV do not show this discrepancy once the convolution is included.

The results with and without the MAC operating are in very close agreement once the offset angle
PSS and the variation in scattering angle due to the MAC are included. The QED model is clearly
predicting an accurate description of the charge cloud angle under the influence of the laser and
magnetic fields, as described by equation (3).
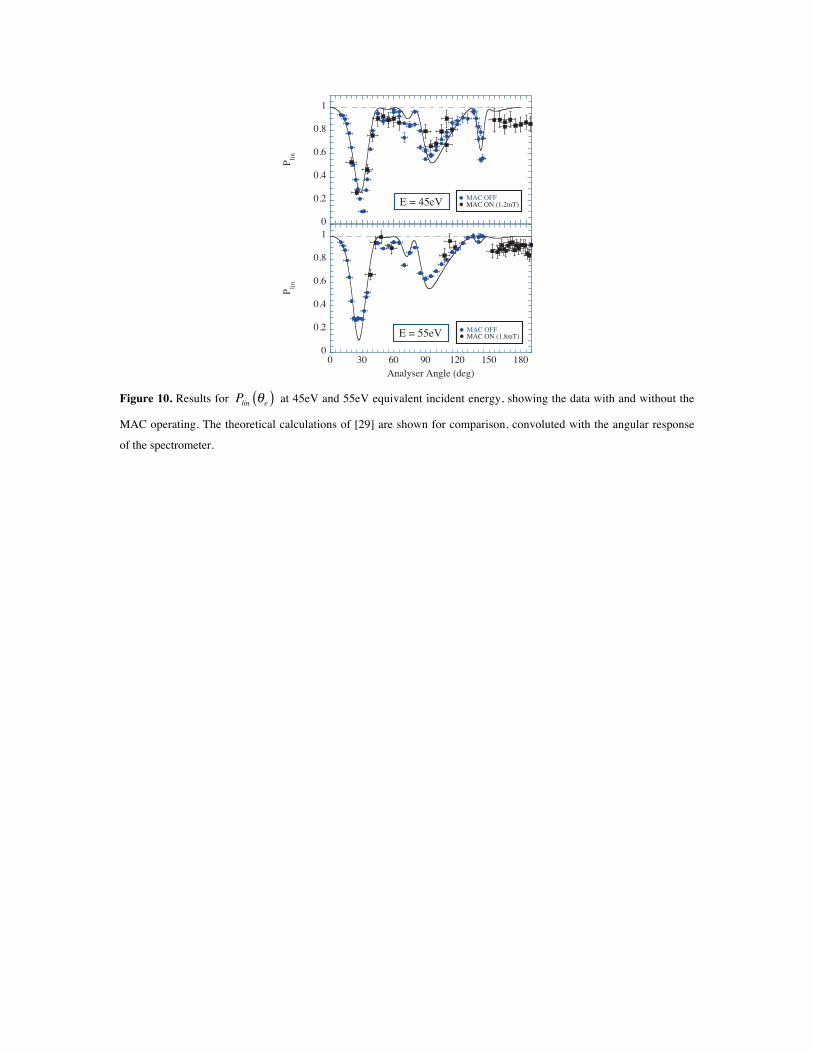
Figure 10 shows results for the Plin e( ) parameter. The results with the MAC were renormalized
to those without the MAC operating at several scattering angles, and an average derived for .
This was then used to determine the value of Plin e( ) at angles beyond e = 144° where the MAC
was required. The values of at each energy were found to be 45eV= 1.4 ± 0.1 and
55eV= 1.55 ± 0.11 (differences being due to the different B-fields used at each energy).
As for L e( ) and e( ) , there is generally good agreement with theory over much of the
scattering plane. However at the higher scattering angles theory predicts Plin e( ) to be greater
than measurement for both energies. Differences can also be seen for the minima around
e = 30° , where the results at 45eV show a deeper minimum compared to theory, whereas at
55eV the data indicate Plin e( ) to be larger than predicted. The sharp minimum at e 150°
predicted at 45eV is again confirmed by experiment. The overall calculated structure of this
parameter agrees well with experiment, once again indicating the RDWA model has included the
important physical processes.
Comparison between data for Plin e( ) with and without the MAC operating is not as satisfactory
as for the other Natural frame parameters (as reflected by the uncertainty in ), although overall
agreement is still good. The reduction in Plin from unity around e = 180° is probably due to the
‘finite volume’ effect [40] that all measurements suffer from (since the scattering plane in no
longer well defined at this angle), however this does not explain the difference between theory
and experiment seen from e = 150° to e = 180° . Since both L e( ) and e( ) are in good
agreement with theory at these angles, the discrepancy in Plin e( ) is considered to be a
shortcoming of the RDWA model, rather than a systematic problem with experiment.
These experiments do not measure 00N
e( ) , which would require the laser beam to lie in the
scattering plane. The 00N parameter describes the effects of ‘spin-flip’ in the interaction. It is
measured as a ratio of the ‘height’ of the charge cloud out of the scattering plane with respect to
the ‘length’, and is predicted to be close to zero for all scattering angles. As such, it is a difficult
parameter to determine accurately. Measurement of 00N would require modification to the
vacuum system, and this is being considered for future studies.
5. Conclusions and future work.
In this paper measurements of the Natural frame parameters Plin e( ), e( ),L e( ) have been
presented for excitation of calcium by electron impact over scattering angles which extend
through e = 180° . These results were obtained by installing a Magnetic Angle Changer into the
super-elastic spectrometer and by carefully considering the effects of the magnetic field on the
electron trajectories and the laser-atom interaction. The new data are in good agreement with
previous super-elastic measurements, and are in close agreement with theory. The data with and
without the MAC operating are self consistent, and confirm that the QED model [37] developed
to describe the interaction of the laser and magnetic fields is reliable.
The results show close agreement with theory, apart from Plin e( ) at higher scattering angles
where there is some discrepancy. The results for e( ) are in almost perfect agreement with the
RDWA model as has been seen previously in calcium at energies of 25eV and 35eV [18]. The
high accuracy of these measurements is due to the method of calculating e( ) from equation
(3), rather than by simply measuring the pseudo-Stokes parameters P1S ,P2
S as is usually done [7-
9]. Although it is more time consuming to rotate the laser polarization through 360° in small
increments as used here, the accuracy of the ensuing results clearly shows that this is worthwhile.
The measurement of L e( ) also shows very good agreement with the RDWA model, apart from
small differences at low angles. This parameter is easy to measure with the MAC device
operating, since the effect of the B-field is simply to detune the sub-states from resonance, rather
than cause precessional motion of the charge cloud as occurs for the alignment parameters.
It is clear from these results that the distorted wave models of the scattering and excitation
process are providing an accurate description of the interaction at these energies. However, as the
interaction energy is lowered below ~20eV, previous work in Manchester [18] has shown that the
distorted wave model no longer describes the interaction accurately. As the energy decreases, it
becomes necessary to invoke different models to treat the Hamiltonian, such as close coupling
(CC) methods. There is some evidence that these models have trouble converging when the

incident energy is below 10eV in calcium [39]. This is a regime which requires investigation in
future.
As stated in the introduction, one of the aims of this work is to produce accurate experimental
data for all scattering angles so that different models of the interaction can be tested over a wide
range of energies. By providing data which span from low to high energy, it is hoped that new
models can be formulated that are applicable over all energy regimes. It has now been
demonstrated that experiments can obtain accurate data over the complete scattering geometry by
adopting techniques such as the MAC device within a ‘conventional’ spectrometer. Our aim is to
extend these measurements to lower energies which approach threshold so as to further test
theory, and to use different targets beyond the alkali and alkali-earth atoms normally studied. It is
also important to test theory by studying the excitation of atoms with angular momentum higher
than J = 1 (such as D-states and F-states), and to develop techniques to study excitation of atoms
in states with high principal quantum numbers. Such experiments are difficult, but with new laser
technologies and by developing novel methods to address these difficulties, it should be possible
to implement these goals in the near future.
Acknowledgments.
We would like to than the EPSRC for funding this work, and for providing a postdoctoral
fellowship for one of us (MH). We would also like to thank Dave Coleman and Alan Venables
for providing technical expertise in the development and building of the new spectrometer, and
Professor Nick Bowring for implementation of the Labview control software. We gratefully
acknowledge Professor Al Stauffer and colleagues who provided us with their natural frame
calculations at these energies.

REFERENCES.
[1] N Andersen, J W Gallagher and I V Hertel Phys Rep 65, 1 (1988).[2] R Srivastava, T Zuo, R P McEachran and A D Stauffer J. Phys. B 25, 3709 (1992)[3] D H Madison, K Bartschat and R P McEachran, J Phys B 25, 5199 (1992)[4] I Bray, D V Fursa, A S kheifets and A T Stelbovics, J Phys B 35, R117 (2002)[5] K Bartschat, J Phys B 32, L355 (1999)[6] Andersen N and Bartschat K Polarization, Alignment and Orientation in Atomic Collisions(New York: Springer) (2001)[7] I V Hertel and W Stoll J. Phys. B 7 583 (1974)[8] I V Hertel and W Stoll Adv At Mol Phys 13 113 (1977)[9] P M Farrell, W R MacGillivray and M C Standage Phys Rev A 37, 4240 (1988)[10] M Shurgalin, A J Murray, W R MacGillivray and M C Standage, J Phys B 31, 4205 (1998)[11] B V Hall, Y Shen, A J Murray, M C Standage, W R MacGillivray and I Bray, J Phys B 37,1113 (2004)[12] P V Johnson, C Spanu, Y Li and P W Zetner, J Phys B 33, 5367 (2000)[13] P W Zetner, Y Li and S Trajmar, Phys. Rev. A 48 495 (1993)[14] P V Johnson and PW Zetner, J Phys B 38, 2793 (2005)[15] K A Stockman, V Karaganov, I Bray and P J O Teubner, J Phys B 34, 1105 (2001)[16] V Karaganov, I Bray and P J O Teubner, J Phys B 31, L187 (1998)[17] M R Law & P J O Teubner J Phys B 28, 2257 (1995).[18] A J Murray & D Cvejanovic J Phys B 36, 4875 (2003).[19] M A K El-Fayoumi, H Hamdy, H-J Beyer, Y Eid, F Shahin and H Kleinpoppen At Phys 11,173 (1988).[20] F H Read & J M Channing Rev Sci Inst 67, 2372 (1996).[21] D Cubric, D J L Mercer, J M Channing, G C King, and F H Read, J. Phys. B 32, L45 (1999)[22] M Allan, J Phys B 33, L215 (2000)[23] H Cho, R J Gulley, K W Trantham, L J Uhlmann, C J Dedman, and S J Buckman, J Phys B33, 3531 (2000)[24] B Mielewska, I Linert, G C King and M Zubek, Phys Rev A 69, 062716 (2004)[25] L Klosowski, M Piwinski, D Dziczek, K Wisniewska and S Chwirot, Meas Sci Tech 18 3801(2007)[26] N J Bowring, F H Read & A J Murray, J de Phys 9, Pr6-45 (1999)[27] A J Murray, M J Hussey, J Gao and D H Madison, J Phys B 39, 3945 (2006)[28] M A Stevenson and B Lohmann, Phys Rev A 73, 020701R (2006)[29] R K Chauhan, R Srivastava and A D Stauffer, J Phys B 38, 2385 (2005)[30] A J Murray, M J Hussey and M Needham, Meas Sci Tech 17, 3094 (2006)[31] A J Murray, Meas Sci Tech 13, N12 (2002)[32] M J Hussey and A J Murray, Meas Sci Tech (in preparation) (2007)[33] A J Murray, Meas Sci Tech 14, N72 (2003)[34] A J Murray, M J Hussey and A Venables, Meas Sci Tech 16, N19 (2005)[35] I Linert, G C King and M Zubek, J Phys B 37, 4681 (2004)[36] F H Read and N J Bowring, CPO programme, Email: [email protected][37] A J Murray, W R MacGillivray and M Hussey, Phys Rev A 77, 013409 (2008)[38] M Hussey, A J Murray, W R MacGillivray and G C King, Phys Rev Lett 99, 133202 (2007)[39] O Zatsarinny, K Bartschat, L Bandurina and S Gedeon, J. Phys. B. 40, (2007) 4023[40] P W Zetner and S Trajmar, Phys Rev A 41, 5980 (1990).
Incident Electron
detectedelectron
Eout
Scattering Plane
Ein
Laser Beam
λ/4 plate
Electron Gun θ e
Linear Polarizer
L⊥
l
w γ
1
2
Laser
3
Electron Analyser
P =linl - wl + w
PolarizationControl
Eout > E in
k in
kout
B-field
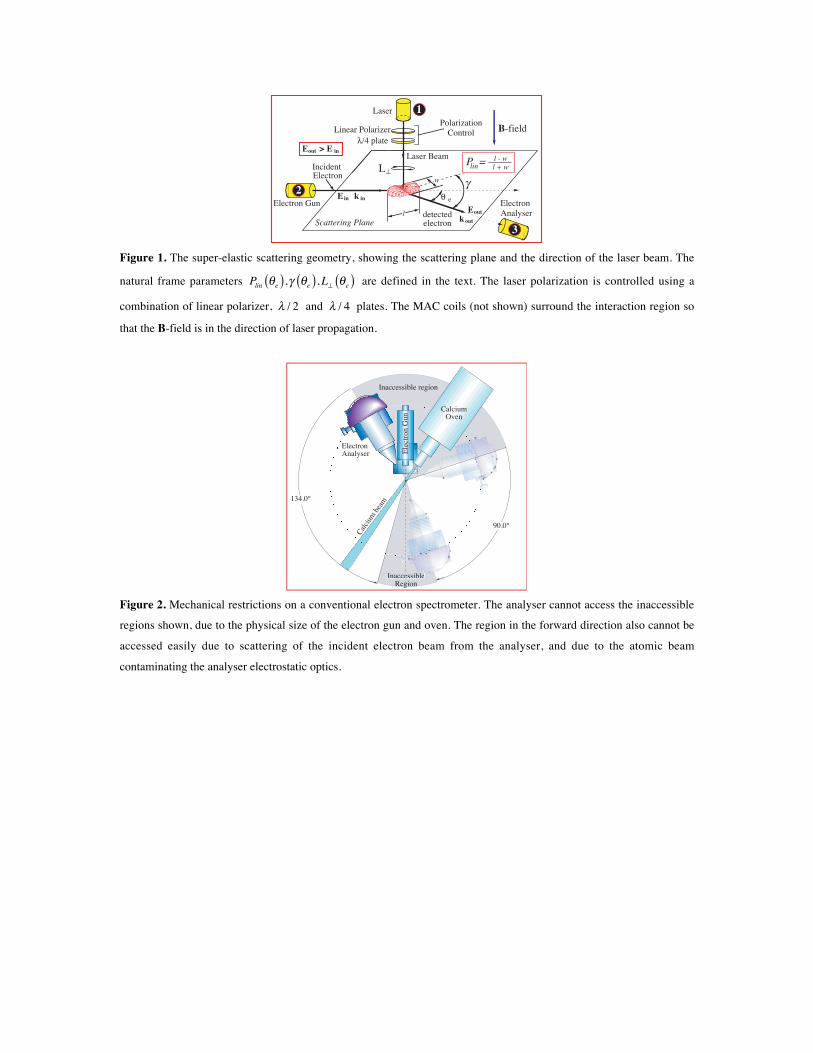
Figure 1. The super-elastic scattering geometry, showing the scattering plane and the direction of the laser beam. The
natural frame parameters Plin e( ), e( ),L e( ) are defined in the text. The laser polarization is controlled using a
combination of linear polarizer, / 2 and / 4 plates. The MAC coils (not shown) surround the interaction region so
that the B-field is in the direction of laser propagation.
ElectronAnalyser
CalciumOven
Ele
ctro
n G
un
134.0°
90.0°
Inaccessible region
InaccessibleRegion
Calci
um b
eam
Figure 2. Mechanical restrictions on a conventional electron spectrometer. The analyser cannot access the inaccessible
regions shown, due to the physical size of the electron gun and oven. The region in the forward direction also cannot be
accessed easily due to scattering of the incident electron beam from the analyser, and due to the atomic beam
contaminating the analyser electrostatic optics.
Input Laser Beam Rotary
Feedthrough
Oven
ElectronAnalyserElectron
Gun
Laser Diode+ xy Translator
Turntable
MACCoils
OpticsTable
Drive Gear
Vacuum Flange
Mounting Table
Electron Beam
Translator
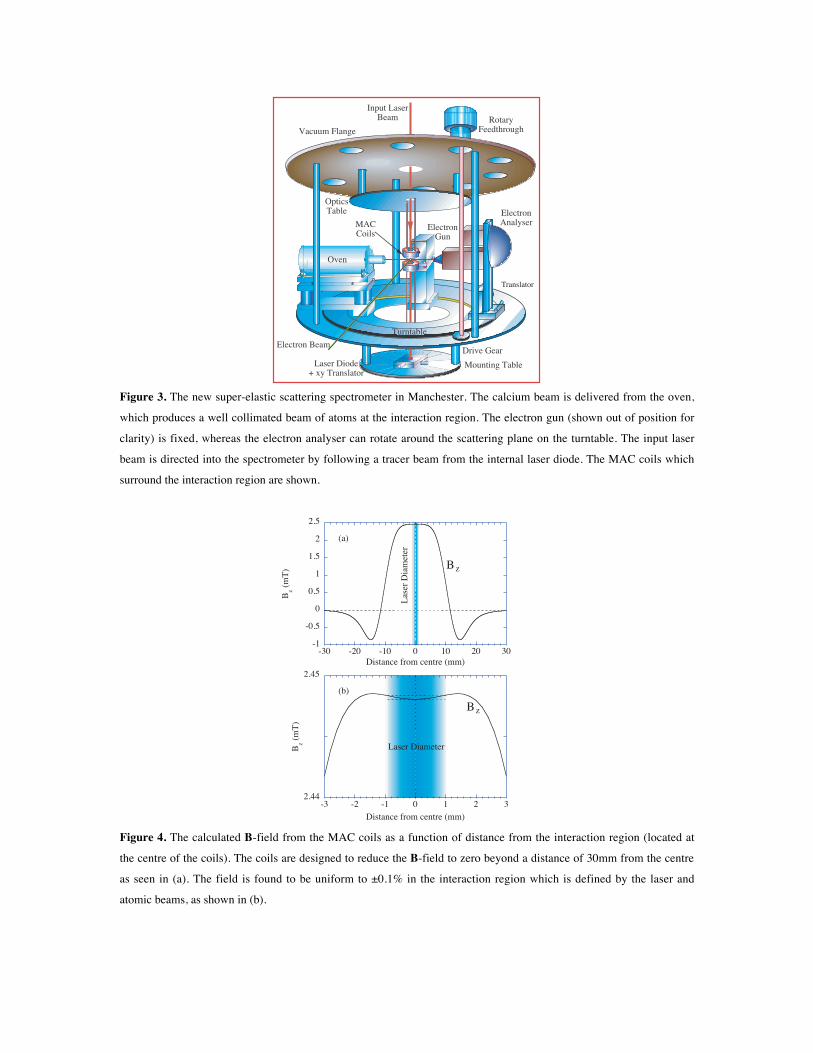
Figure 3. The new super-elastic scattering spectrometer in Manchester. The calcium beam is delivered from the oven,
which produces a well collimated beam of atoms at the interaction region. The electron gun (shown out of position for
clarity) is fixed, whereas the electron analyser can rotate around the scattering plane on the turntable. The input laser
beam is directed into the spectrometer by following a tracer beam from the internal laser diode. The MAC coils which
surround the interaction region are shown.
-1
-0.5
0
0.5
1
1.5
2
2.5
-30 -20 -10 0 10 20 30
Bz (
mT
)
Distance from centre (mm)
Las
er D
iam
eter
2.44
2.45
-3 -2 -1 0 1 2 3
Bz (
mT
)
Distance from centre (mm)
Laser Diameter
(a)
(b)
Bz
Bz
Figure 4. The calculated B-field from the MAC coils as a function of distance from the interaction region (located at
the centre of the coils). The coils are designed to reduce the B-field to zero beyond a distance of 30mm from the centre
as seen in (a). The field is found to be uniform to ±0.1% in the interaction region which is defined by the laser and
atomic beams, as shown in (b).

IncidentElectronBeam
0° super-elastic scattering
180° super-elastic scattering
180° elastic scattering
ExitElectronBeam
Magnetic Coils
Interaction Region
B-Field
Figure 5. Calculated trajectories of the electrons within the MAC device. The incident beam is seen to be steered into
and out of the interaction region, undergoing an angular change of ~55°. Electrons that are backscattered through 180°
are also shown. The asymptotic trajectories outside the MAC region always point to the centre of the coils.
101
102
103
104
105
40 42 44 46 48
Inelastic Superelastic
Elastic Peak
41P
1
SuperelasticPeak
Detected Electron Energy (eV)
Cou
nt r
ate
(Hz)
θe = 35°
InelasticPeak
Figure 6. Energy loss/gain spectrum from calcium at a scattering angle e = 35° for an energy of 45eV. Inelastic
scattering is shown to the left of the elastic peak, whereas super-elastic scattering is to the right. The super-elastic peak
is clearly resolved in these studies.
RH
C
LHC
mJ = 0
mJ = -1
mJ = +1
Polarizing Optics
Laser~423nm
1S0
1P
1
1
Exc
itatio
n
ZeemanShift
σ-σ+
Figure 7. Effect of the B-field on the 41P1 sub-states in calcium. The B-field lifts the degeneracy of the mJ = ±1
states when the quantization axis is along the B-field direction. For details, see text.

-1
-0.5
0
0.5
1
0 30 60 90 120 150 180
Lpe
rp
Scattering Angle (deg)
-1
-0.5
0
0.5
1
Lpe
rp
MAC OFFMAC ON B=1.8mT
E = 45eV
E = 55eV
MAC OFFMAC ON (0.3mT)MAC ON (1.2mT)MAC ON (1.5mT)Flinders groupKleinpoppen et al
Figure 8. Results for L e( ) at 45eV and 55eV equivalent incident energy, showing the data with and without the
MAC operating. The results are compared to data from the Flinders group [17] and the Stirling group [19]. The
theoretical calculations of Stauffer and colleagues [29] are shown for comparison, convoluted with the angular response
of the spectrometer. For details, see text.
-80
-40
0
40
80
γ (d
eg)
-80
-40
0
40
80
0 30 60 90 120 150 180
γ (d
eg)
Scattering Angle (deg)
E = 45eV
E = 55eV
MAC OFFMAC ON (1.2mT)
MAC OFFMAC ON (1.8mT)
Figure 9. Results for e( ) at 45eV and 55eV equivalent incident energy, showing the data with and without the
MAC operating. The theoretical calculations of [29] are shown for comparison, convoluted with the angular response
of the spectrometer.
0
0.2
0.4
0.6
0.8
1
Plin
0
0.2
0.4
0.6
0.8
1
0 30 60 90 120 150 180
Plin
Analyser Angle (deg)
E = 45eV
E = 55eV
MAC OFFMAC ON (1.2mT)
MAC OFFMAC ON (1.8mT)
Figure 10. Results for Plin e( ) at 45eV and 55eV equivalent incident energy, showing the data with and without the
MAC operating. The theoretical calculations of [29] are shown for comparison, convoluted with the angular response
of the spectrometer.