Chaos in driven Alfvén systems: unstable periodic orbits and chaotic saddles

Vol. 2, No. 1/January 1985/J. Opt. Soc. Am. B 47
Low-dimensional chaotic attractors for an unstable,inhomogeneously broadened, single-mode laser
A. M. Albano, J. Abounadi, T. H. Chyba,* C. E. Searle, and S. Yong
Department of Physics, Bryn Mawr College, Bryn Mawr, Pennsylvania 19010
R. S. Gioggia
Department of Physics, Widener University, Chester, Pennsylvania 19013
N. B. Abraham t
Istituto Nazionale di Ottica, Largo Enrico Fermi 6, 50125 Firenze, Italy
Received August 15, 1984; accepted September 24, 1984
Quantitative characterization of the intensity pulsations from an inhomogeneously broadened laser confirm thatobserved irregular pulsing has its origins in deterministic chaos corresponding to motion on a strange attractor oflow fractal dimensionality. The pointwise information dimension and the Grassberger-Procaccia K2 (estimatorsfrom below of the fractal dimensionality of the attractor and the Kolmogorov entropy, respectively) have been de-termined for digitized time series from parameter regions identified qualitatively by power spectra as representingperiodic, period-doubled, quasi-periodic, and chaotic behavior. Some amount of chaos seems present for almostall operating conditions.
INTRODUCTION
Advances in theoretical understanding of the behavior ofdissipative nonlinear dynamical systems far from thermo-dynamic equilibrium have provided a basis for describingcertain kinds of irregular asymptotic evolution as determin-istic chaos.' Key features of such chaos are irregular timeevolution and broadband power spectra, which are never-theless associated with deterministic motion on an attractingsubspace of the underlying physical variables. These at-tractors are called strange attractors, in part because evolutionis sensitively dependent on initial conditions and the at-tracting subspace has fractal dimensionality.
Qualitatively, one can identify the likely presence of anunderlying strange attractor when irregular time dependenceand broadband power spectra appear for a system that wasevolving in an obviously deterministic fashion (such as withoutput that was constant or strictly periodic) for nearby pa-rameter values. Such identifications of chaos are reinforcedif the system is observed to make one of the relatively uni-versal progressions of increasing complexity as a parameteris slowly changed [e.g., period doubling (the sequential ap-pearance of subharmonics to the original pulsing frequency)or quasi-periodicity (the successive appearance of two in-commensurate frequencies)] before the appearance of irreg-ular pulsing and broadband spectra.
Following these prescriptions, we recently studied unstable,single-mode, inhomogeneously broadened lasers for variousoperating conditions.2 Measurements of the temporal andspectral output characteristics have led to the identificationof regimes of chaotic behavior. Chaotic behavior in lasers isnot unexpected, as analogies have been established between
simple models for single-mode and multimode homogeneouslybroadened lasers3 4 and the Lorenz equations,5 which weredesigned for the study of convective instabilities in hydro-dynamics and which were shown to contain deterministicchaos among their possible solutions. However, the temporalevolution of inhomogeneously broadened lasers, which haveexperimentally accessible regions of unstable operation, 6 hasbeen modeled successfully only by extremely large numbers(hundreds) of coupled equations, 7 and the origin or nature ofchaotic solutions is not yet clearly established.
In our previous experimental identification of chaotic be-havior using qualitative measures, we were not able to dis-tinguish unambiguously between low-dimensional deter-ministic chaos and broadband stochastic noise originatingfrom the contributions of many uncorrelated sources. Suchnoisy behavior may arise from direct multisource contribu-tions or because the deterministic states of the system arerelatively unstable (or only weakly stable) and act as sensitiveamplifiers of noisy perturbations.
Quantitative methods of analyzing digitized time series todistinguish stochastic noise from deterministic chaos wererecently reported.8 -10 Since their introduction, these meth-ods have been refined, greatly reducing the data requirementsfor obtaining reliable estimates of such characteristic prop-erties as Lyapunov exponents, metric entropies, and attractordimensionalities.1 The reduced data requirements make itpossible to apply these techniques to the kinds of digitizeddata that can be obtained from our low-power lasers with theirhigh pulsing frequencies. An added benefit of these tech-niques is that, when noise acts as a simple additive diffusion,either originating in the laser system (e.g., mechanical dis-turbances of the laser or spontaneous emission12"13) or arising
0740-3224/85/010047-09$02.00 © 1985 Optical Society of America
Albano et al.

48 J. Opt. Soc. Am. B/Vol. 2, No. 1/January 1985
from the detection electronics, it can be separated from dy-namical behavior if the noise blurring is small compared withthe characteristic dynamical features.9 Another advantageof these techniques is that recording of a single digitizedvariable of the system permits the reconstruction of thetopological character of the attractor in the total variablespace. This is accomplished by embedding the time series inan N-dimensional vector space in which each vector hascomponents that are data values taken with equal time-delayseparations.4' 6 By the Whitney embedding theorem, 1 4 theattractor constructed in a sufficiently large embedding spacehas the same topological structure as the true attractor in thevariable space (that is, it will have the same Lyapunov expo-nents, metric entropies, and dimensionalities).
A good introduction to these measurement and analysistechniques can be found in descriptions of their recentlysuccessful application in the study of low-frequency insta-bilities in hydrodynamic systems.' 7 Here, we demonstrate therobustness of the methods by moving to systems that differby nearly 108 in the fundamental pulsing frequency.
EXPERIMENTAL SYSTEM
The laser system studied was that previously described2"18 thatuses the high-gain 3.51-Am laser transition in xenon. Thepopulation inversion is created by a dc discharge in the lasertube controlled by a well-regulated high-voltage power supplyand a series ballast resistor, which effectively suppress fluc-tuations in the excitation process.
The intensity output was digitized by a Tektronix fasttransient digitizer, which provided 10-bit resolution and se-quences of up to 512 data points. The data sets were storedby an Apple microcomputer and were transferred to a Bur-roughs 6900 computer for analysis.
For fixed pressure and discharge current, data sets weretaken for different cavity detunings, which gave qualitativelydifferent power spectra. The pressure mixture used was 180mTorr of xenon (99% enriched 136Xe) and 600 mTorr of heli-um at an excitation current of 4 mA, a particular parameterset from the complete survey of the laser operating conditionsreported elsewhere.18
Control data sets were taken by supplying a sine-wave inputto the digitizer (thus retaining any systematic errors that weredue to the digitizer) and by computer generation of periodic,quasi-periodic, and random data sets with suitable resolutionand data-set length.
RESULTS
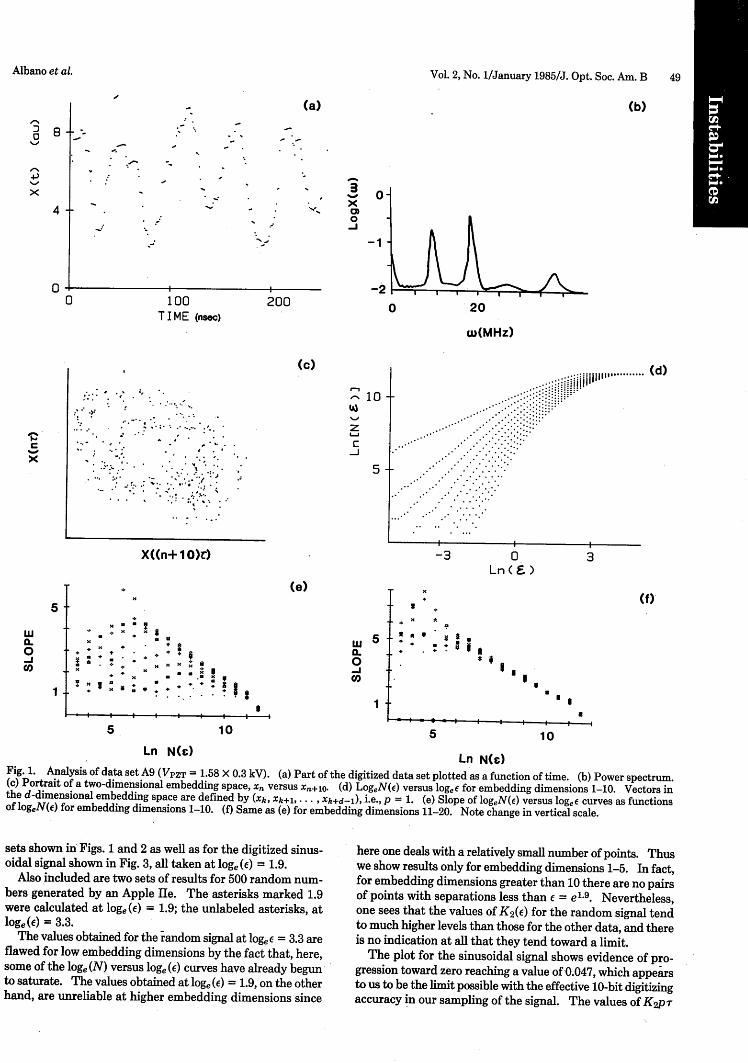
Figures 1 and 2 show two typical data sets, with a portion ofthe digitized time series shown in Figs. 1 (a) and 1 (b) and theassociated intensity power spectrum from a scanning, time-averaging rf-spectrum analyzer shown in Figs. 1(b) and 2(b).The sampling interval r for Figs. 1(a) and 2(a) was set to 1nsec. In Figs. 1(c) and 2(c) we give, for visualization, a sampletwo-dimensional embedding of the data [x (t) versus x t + pr)forp = 10].
In Figs. 1(d) and 2(d) we plot curves following the pre-scription of Procaccia and Grassberger, 9 namely, for eachembedding dimension q, a vector is defined as x(t), x(t + p T),x (t + 2pr), .. ., x [t + (q - 1)pT], where p is an integer andr is the sampling interval. Then we determine the totalnumber of distances between these vectors that are less than
, and we plot this number N(e) versus e in a log-log plot forembedding dimensions 1-10, as shown in Figs. 1(d) and 2(d).Although for simplicity this is not shown, we continue theprocess of calculations and plots up to embedding dimension20.
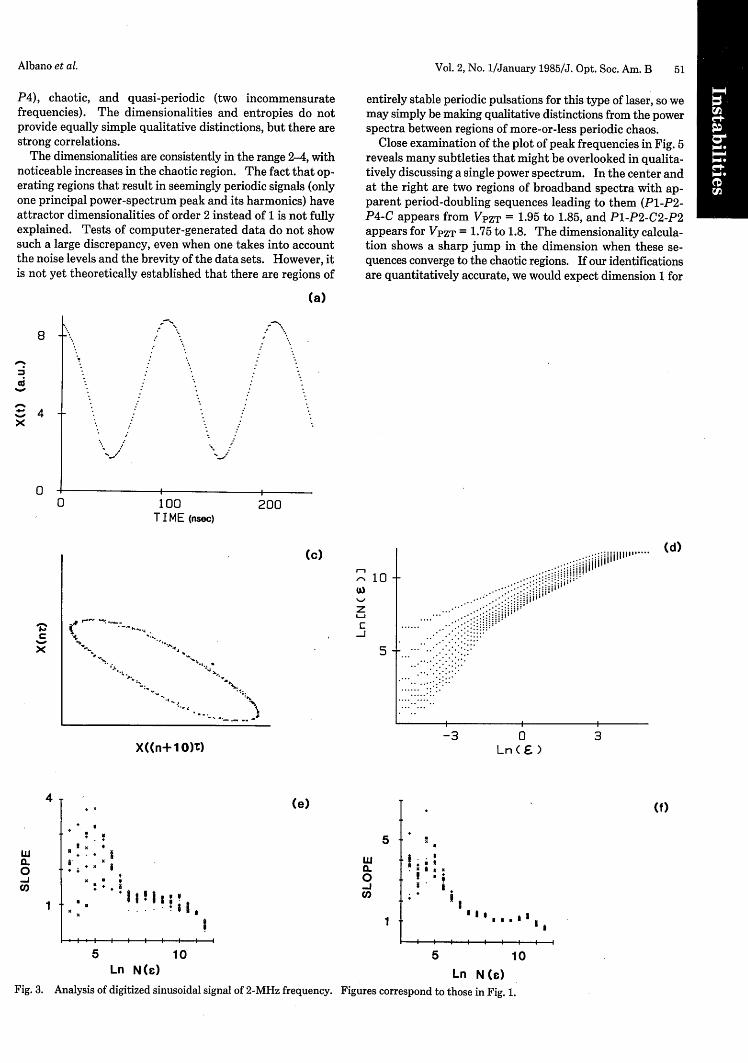
To interpret these data, we refer to Fig. 3, where we havethe corresponding results for the digitized sine wave. Thelog-log plot of N(E) versus e shows three distinct regions foreach dimension. For e large enough to exceed the largest in-terpoint distance, N(e) saturates at a constant Npq (-), thetotal number of interpoint distances given by Npq (H) = [N- (q - )p](N - qp)/2, where N is the total number of datapoints and q and p are as defined above. For small e, thedistances are blurred by noise sources, so the dependence ofN(E) on e increases with increasing embedding dimension.For intermediate e values, we expect to find that N(E) scalesas eP, when the embedding dimension is large enough to reflectfully the topological character of the strange attractor, wherev is defined by Grassberger and Procaccia 9 as the pointwiseinformation dimension and is an estimator from below for thefractal dimensionality of the attractor. For a simple periodicsignal we expect v = 1, while quasi-periodic signals from amixture of two incommensurate frequencies should give v =2 and chaotic signals should give v > 2.
Figures 1(e), 2(e), and (3e) show the slope v of the log-logplots versus log N(E) for dimensions 1-10, and Figs. 1(f), 2(f),and 3(f) show these results for dimensions 11-20. Thesefigures were drawn to determine those regions in the logeN(e)versus loge (e) plots that are relatively free of the effects of bothnoise [low e or low N(e)] and saturation [high E or high N(E)].Since there are crucial restrictions imposed by our relativelysmall number of data points, we chose to seek regions definedby logeN rather than loge (E), as was done, for instance, byBrandstatter et al."7 In Figures 3(d) and 3(f), the interme-diate regions of e[for logeN(e) between 8.5 and 9.5], we see thatthe curves approach the same slope with a value of 1.0 ± 0.1.The values converge rapidly with increasing embedding di-mension, although we see that 10% accuracy is achieved onlyfor dimensions 11 and larger. We have indications fromvarious control data sets that a small overestimate may occurbecause of the limited number of data points and the finiteresolution of the digitizer, yet these results show powerfulquantitative accuracy for the method when applied to datasets with our experimental limitations.
Procaccia and Grassberger also define an entropy K2 (Ref.9), which can readily be extracted from these plots and whichprovides an estimate from below for the Kolmogorov entropyK. The useful relationships are that K2 and K should be zerofor periodic (ordered) signals, finite (and nonzero) for chaoticattractors, and infinite for stochastic random noise. In thelimit of a sufficiently large embedding dimension to recoverthe attractor topology, the spacing between the parallel lineparts of the log-log plots of N(E) versus e should be given byK 2 pr, where pT is the delay time used in the embeddingprocedure. [This is strictly true in the limitE - 0 and if in-stead of N(e) one plots a true probability N(E)/N(co) in eachcase.] As our plots are made for N(e), and N(e) changes withincreasing embedding dimension, we obtain values of K 2proverestimated by 0.004p. Here we calculate K 2 (e)pr, theseparations at finite E.
Figure 4(a) shows the values of the vertical separation of thecurves of Figs. 1(d), 2(d), 3(d) and their extensions to higherdimensions versus the embedding dimension for the two data
Albano et al.
Vol. 2, No. 1/January 1985/J. Opt. Soc. Am. B 49
(b)
LLA.~-jv01
-1
o . I0 .20
w(MHz)
(c)
10 -
z-J
5-
X((n+ 1 O)r)
x C** XAt O x x | "~~~~~~~-3
(e)
0-Jcn
I I
0TLn ( )
Ea
3
a1
5 10 5Ln N)
10
Ln N(e)Fig. 1. Analysis of data set A9 (VPZT = 1.58 X 0.3 kV). (a) Part of the digitized data set plotted as a function of time. (b) Power spectrum.(c) Portrait of a two-dimensional embedding space, x versus x+1. (d) LogeN(e) versus logeE for embedding dimensions 1-10. Vectors inthe d-dimensional embedding space are defined by (Xk, Xk+l,.,Xk+d-1), i.e., p = 1. (e) Slope of logeN(e) versus loges curves as functionsof logeN(e) for embedding dimensions 1-10. (f) Same as (e) for embedding dimensions 11-20. Note change in vertical scale.
sets shown in Figs. 1 and 2 as well as for the digitized sinus-oidal signal shown in Fig. 3, all taken at loge(e) = 1.9.
Also included are two sets of results for 500 random num-bers generated by an Apple LIe. The asterisks marked 1.9were calculated at loge(e) = 1.9; the unlabeled asterisks, atloge(e) = 3.3.
The values obtained for the random signal at logeE = 3.3 areflawed for low embedding dimensions by the fact that, here,some of the loge (N) versus loge (E) curves have already begunto saturate. The values obtained at loge (e) = 1.9, on the otherhand, are unreliable at higher embedding dimensions since
here one deals with a relatively small number of points. Thuswe show results only for embedding dimensions 1-5. In fact,for embedding dimensions greater than 10 there are no pairsof points with separations less than e = e 9. Nevertheless,one sees that the values of K2 (e) for the random signal tendto much higher levels than those for the other data, and thereis no indication at all that they tend toward a limit.
The plot for the sinusoidal signal shows evidence of pro-gression toward zero reaching a value of 0.047, which appearsto us to be the limit possible with the effective 10-bit digitizingaccuracy in our sampling of the signal. The values of K2 pr
Albano et al.
8
4
0
(a)
I a
x0_
0 100T I ME (nsec)
200
5
1
f)
a * I I
a l l i
A_
I I
-2-
............
.. 21 .
5 .. .1 .4 . ! II I

50 J. Opt. Soc. Am. B/Vol. 2, No. 1/January 1985
0 8
4-
x4
00
(a)
. 1 . * . 1 , I
(b)
a
cm0-J
100T I ME (nsec)
o
-1-
-2200
0 2 . .0 20
w(MHz)
Cx
5'
a-0-JCO,
1
(c) 10 +
z-J
5
X((n+ 1 O)t)
- x*
. * - - * t b X b~~~~~~~~~~~
5Ln N(0)
10
-3
(e)
LUa.0-Jco
5]
1 -
5
** *I
(d)
0
Ln( )3
f)
a I I
* Iax I
l
10
Ln N ()
Fig. 2. Analysis of data set I4 (Vpzr = 1.82 X 0.3 kV). Figures correspond to those in Fig. 1 except that for (e) and (f) vectors in the d-dimensional
embedding space are defined by (Xk, Xk+2, . - Xk+2s-2), i.e., p = 2.
for the two data sets are distinctly above the value for the si-nusoidal signal with values (corrected for the offset) of 0.175
for the results of Fig. 1 and 0.190 for the results of Fig. 2 when
taken at dimension 19, and these seem to be converging tovalues above the value for the sine-wave data. These nonzero
values suggest that the data sets are taken from a chaoticoperating condition, a result that is consistent with the cor-responding values of the dimension that can be extracted from
Fig. 4(b). Here, we see that the slope converges with in-
creasing dimension, just as the curve separation did. Theasymptotic values are greater than 2, again suggesting chaoticbehavior.
Returning to the data sets in Figs. 1 and 2, we again see that
for sufficiently large N(E) the values of the slopes coalesce,
becoming independent of the embedding dimension. Theplateau regions of these coalesced values are smaller than inthe sine-wave case because of the poorer signal-to-noise ratio
of the low-power laser output compared with the noise con-
tributions of the detector, preamplifier, and digitizer. Ap-parently noise and signal are resolved for high dimensions, butthe continuous decline of the slope with increasing N(e), wherethe curves have converged (rather than a strict plateau), sig-nals that we may underestimate the true attractor dimen-sionality by taking the value of convergence. We cannotachieve a better noise rejection with our limited number ofpoints. Variations of the delay (controlled by p) in definingthe vectors were found to make only minor qualitative andquantitative changes in these results.
Summarizing many data sets for each parameter value anda wide variety of different cavity detunings, we plot in Fig. 5the laser-power output, the frequencies of the principal peaksin the power spectrum, and the values of v and K2(f)T for each
setting. The error bars indicate the range of results for dif-ferent data sets.
From the frequencies we can identify regions that might be
classified qualitatively as periodic, period-doubled (P2 and
. l
Albano et al.
. .
X,
I
Vol. 2, No. 1/January 1985/J. Opt. Soc. Am. B 51
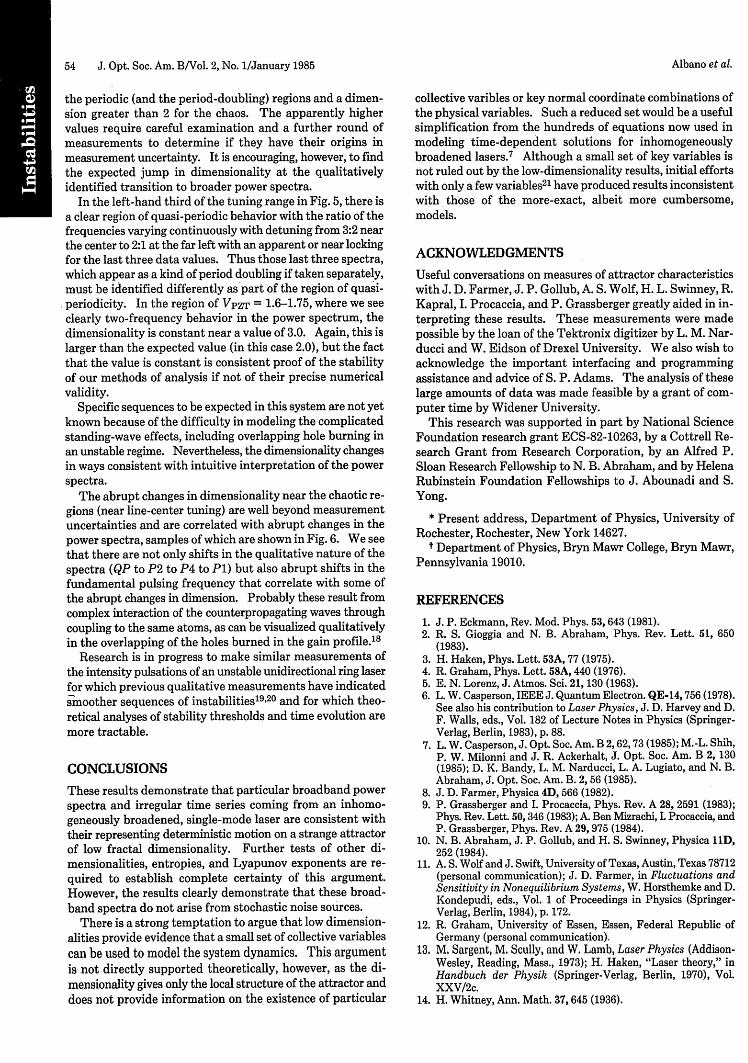
P4), chaotic, and quasi-periodic (two incommensuratefrequencies). The dimensionalities and entropies do notprovide equally simple qualitative distinctions, but there arestrong correlations.
The dimensionalities are consistently in the range 2-4, withnoticeable increases in the chaotic region. The fact that op-erating regions that result in seemingly periodic signals (onlyone principal power-spectrum peak and its harmonics) haveattractor dimensionalities of order 2 instead of 1 is not fullyexplained. Tests of computer-generated data do not showsuch a large discrepancy, even when one takes into accountthe noise levels and the brevity of the data sets. However, itis not yet theoretically established that there are regions of
(a)
8
4
0
Cx-
0 100TIME (nsec)
(c)
W
zC-I
entirely stable periodic pulsations for this type of laser, so wemay simply be making qualitative distinctions from the powerspectra between regions of more-or-less periodic chaos.
Close examination of the plot of peak frequencies in Fig. 5reveals many subtleties that might be overlooked in qualita-tively discussing a single power spectrum. In the center andat the right are two regions of broadband spectra with ap-parent period-doubling sequences leading to them (P1-P2-P4-C appears from VPZT = 1.95 to 1.85, and P1-P2-C2-P2appears for VPZT = 1.75 to 1.8. The dimensionality calcula-tion shows a sharp jump in the dimension when these se-quences converge to the chaotic regions. If our identificationsare quantitatively accurate, we would expect dimension 1 for
200
.ll" .(d)
10 ±
5
-3X((n+ 1 O)t)
4
wa.0-Jco
1
(e)
5I,1
ui
0-Ja). I ;101.
5 10
1
0Ln ( )
3
f)
*1IA*
1I,,
5Ln N(c) Ln N (W)
Fig. 3. Analysis of digitized sinusoidal signal of 2-MHz frequency. Figures correspond to those in Fig. 1.
. II
10
i
e '-..%----n.__'
-1.
"t.. I--.1
Albano et al.
T'
I
%11 1_/
x1
i xt
;* iI

52 J. Opt. Soc. Am. B/Vol. 2, No. 1/January 1985
K2 (e)t0 . 5-
0
**
* 1.9
*
**
*
* ** ** **
*
*
X)<fx X X)< X XX XX XX XX
1EMBEDD ING
10DIMENSION
(a)
10 ±
x
xx
x
x xx x x x
x xx
19
x xx
a 00 0 0 0 0 o 00 0 0 0 0 0 0 0 0 D
1EMBEDD ING
10DIMENSION
19
(b)
Fig. 4. (a) Vertical separation K2 (e)r of the curves in Figs. 1(d), 2(d),and 3(d) (taken at logee = 1.9) versus embedding dimension for datasets A9, I4, and sine and for a set of random numbers. The asterisksshow the random signal, evaluated at logeE = 3.3. Values of K2 r forembedding dimension 19 are 0.18 for data set A9, 0.19 for data set I4,and 0.05 for sine. These values have systematic errors of 0.004. (b)Slopes of the plots in Figs. 1(d), 2(d), and 3(d) taken at logeN(e) =8.5.
0.17-
0.15-
k2t
0.10
(c)
I*I0I I * I
I I I
1.6 1.8
VPZT(X.300 kV)
2.0
Fig. 5. (a) Principal pulsing frequencies, (b) pointwise dimension,(C) K 2T, and (d) average output power as functions of voltage appliedto piezoelectric transducer to change the cavity length (VPZT). In(a) the X's mark much broader spectral peaks qualitatively identifiedas chaotic regions. (d) Shows characteristic variations in poweroutput identified previously in Refs. 2 and 18.
_Ifi 1{R +
(a)
fI
N
:C
C
C)
a-
I
20
10
0
I
I T }
I ii
K".1
p11i i1
I
LLJ
0JIf)
3.5t
5
1)
3.0I jI 1:
11:.2.5
I
220
1101-
a)
0C-
02
VPZT(X.300kV)
l l l
Albano et al.
1Csxsx 1
f
i
1

Vol. 2, No. 1/January 1985/J. Opt. Soc. Am. B 53
Power SpectraLogX(cw)
(a)
Ia I KVo
20 30 40
(b)
I I I 2 3 4I a 20 36 40
MHz
(e)
10 20 30 40 MHz
(I)
MHz 20 30 40 MHz
( C ) (g)
I .
10 20I I I
30 40 MHz
(d)
. II - I -- I
1 0 20 30 40
(h)
40 MHz
I II10 20 30 40 MHz
Fig. 6. Power spectra near line center showing qualitative changes in spectral features with small changes in cavity detunings. Values of VPZTare 0.537, 0.540, 0.546, 0.564, 0.570, 0.591, 0.597, and 0.606 kV for (a), (b), (c), (d), (e), (f), (g), and (h), respectively.
MHz
. ........ -
I I
Albano et al.
10
I
I U 20 30
54 J. Opt. Soc. Am. B/Vol. 2, No. 1/January 1985
the periodic (and the period-doubling) regions and a dimen-sion greater than 2 for the chaos. The apparently highervalues require careful examination and a further round ofmeasurements to determine if they have their origins inmeasurement uncertainty. It is encouraging, however, to findthe expected jump in dimensionality at the qualitativelyidentified transition to broader power spectra.
In the left-hand third of the tuning range in Fig. 5, there isa clear region of quasi-periodic behavior with the ratio of thefrequencies varying continuously with detuning from 3:2 nearthe center to 2:1 at the far left with an apparent or near lockingfor the last three data values. Thus those last three spectra,which appear as a kind of period doubling if taken separately,must be identified differently as part of the region of quasi-periodicity. In the region of VPZT = 1.6-1.75, where we seeclearly two-frequency behavior in the power spectrum, thedimensionality is constant near a value of 3.0. Again, this islarger than the expected value (in this case 2.0), but the factthat the value is constant is consistent proof of the stabilityof our methods of analysis if not of their precise numericalvalidity.
Specific sequences to be expected in this system are not yetknown because of the difficulty in modeling the complicatedstanding-wave effects, including overlapping hole burning inan unstable regime. Nevertheless, the dimensionality changesin ways consistent with intuitive interpretation of the powerspectra.
The abrupt changes in dimensionality near the chaotic re-gions (near line-center tuning) are well beyond measurementuncertainties and are correlated with abrupt changes in thepower spectra, samples of which are shown in Fig. 6. We seethat there are not only shifts in the qualitative nature of thespectra (QP to P2 to P4 to P1) but also abrupt shifts in thefundamental pulsing frequency that correlate with some ofthe abrupt changes in dimension. Probably these result fromcomplex interaction of the counterpropagating waves throughcoupling to the same atoms, as can be visualized qualitativelyin the overlapping of the holes burned in the gain profile.'8
Research is in progress to make similar measurements ofthe intensity pulsations of an unstable unidirectional ring laserfor which previous qualitative measurements have indicatedsmoother sequences of instabilities'9 '2 0 and for which theo-retical analyses of stability thresholds and time evolution aremore tractable.
CONCLUSIONS
These results demonstrate that particular broadband powerspectra and irregular time series coming from an inhomo-geneously broadened, single-mode laser are consistent withtheir representing deterministic motion on a strange attractorof low fractal dimensionality. Further tests of other di-mensionalities, entropies, and Lyapunov exponents are re-quired to establish complete certainty of this argument.However, the results clearly demonstrate that these broad-band spectra do not arise from stochastic noise sources.
There is a strong temptation to argue that low dimension-alities provide evidence that a small set of collective variablescan be used to model the system dynamics. This argumentis not directly supported theoretically, however, as the di-mensionality gives only the local structure of the attractor anddoes not provide information on the existence of particular
collective varibles or key normal coordinate combinations ofthe physical variables. Such a reduced set would be a usefulsimplification from the hundreds of equations now used inmodeling time-dependent solutions for inhomogeneouslybroadened lasers. 7 Although a small set of key variables isnot ruled out by the low-dimensionality results, initial effortswith only a few variables21 have produced results inconsistentwith those of the more-exact, albeit more cumbersome,models.
ACKNOWLEDGMENTS
Useful conversations on measures of attractor characteristicswith J. D. Farmer, J. P. Gollub, A. S. Wolf, H. L. Swinney, R.Kapral, I. Procaccia, and P. Grassberger greatly aided in in-terpreting these results. These measurements were madepossible by the loan of the Tektronix digitizer by L. M. Nar-ducci and W. Eidson of Drexel University. We also wish toacknowledge the important interfacing and programmingassistance and advice of S. P. Adams. The analysis of theselarge amounts of data was made feasible by a grant of com-puter time by Widener University.
This research was supported in part by National ScienceFoundation research grant ECS-82-10263, by a Cottrell Re-search Grant from Research Corporation, by an Alfred P.Sloan Research Fellowship to N. B. Abraham, and by HelenaRubinstein Foundation Fellowships to J. Abounadi and S.Yong.
* Present address, Department of Physics, University ofRochester, Rochester, New York 14627.
t Department of Physics, Bryn Mawr College, Bryn Mawr,Pennsylvania 19010.
REFERENCES
1. J. P. Eckmann, Rev. Mod. Phys. 53, 643 (1981).2. R. S. Gioggia and N. B. Abraham, Phys. Rev. Lett. 51, 650
(1983).3. H. Haken, Phys. Lett. 53A, 77 (1975).4. R. Graham, Phys. Lett. 58A, 440 (1976).5. E. N. Lorenz, J. Atmos. Sci. 21, 130 (1963).6. L. W. Casperson, IEEE J. Quantum Electron. QE-14,756 (1978).
See also his contribution to Laser Physics, J. D. Harvey and D.F. Walls, eds., Vol. 182 of Lecture Notes in Physics (Springer-Verlag, Berlin, 1983), p. 88.
7. L. W. Casperson, J. Opt. Soc. Am. B 2,62,73 (1985); M.-L. Shih,P. W. Milonni and J. R. Ackerhalt, J. Opt. Soc. Am. B 2, 130(1985); D. K. Bandy, L. M. Narducci, L. A. Lugiato, and N. B.Abraham, J. Opt. Soc. Am. B. 2, 56 (1985).
8. J. D. Farmer, Physica 4D, 566 (1982).9. P. Grassberger and I. Procaccia, Phys. Rev. A 28, 2591 (1983);
Phys. Rev. Lett. 50, 346 (1983); A. Ben Mizrachi, I. Procaccia, andP. Grassberger, Phys. Rev. A 29, 975 (1984).
10. N. B. Abraham, J. P. Gollub, and H. S. Swinney, Physica lID,252 (1984).
11. A. S. Wolf and J. Swift, University of Texas, Austin, Texas 78712(personal communication); J. D. Farmer, in Fluctuations andSensitivity in Nonequilibrium Systems, W. Horsthemke and D.Kondepudi, eds., Vol. 1 of Proceedings in Physics (Springer-Verlag, Berlin, 1984), p. 172.
12. R. Graham, University of Essen, Essen, Federal Republic ofGermany (personal communication).
13. M. Sargent, M. Scully, and W. Lamb, Laser Physics (Addison-Wesley, Reading, Mass., 1973); H. Haken, "Laser theory," inHandbuch der Physik (Springer-Verlag, Berlin, 1970), Vol.XXV/2c.
14. H. Whitney, Ann. Math. 37, 645 (1936).
Albano et al.

Vol. 2, No. 1/January 1985/J. Opt. Soc. Am. B 55
15. N. H. Packard, J. P. Crutchfield, J. D. Farmer, and R. S. Shaw,Phys. Rev. Lett. 45, 712 (1980).
16. F. Takens, in Proceedings of the Warwick Symposium 1981, D.Rand and L. S. Young, eds. (Springer-Verlag, New York,1981).
17. A. Brandstater, J. Swift, H. Swinney, A. Wolf, D. Farmer, E. Jen,and J. Gutchfield, Phys. Rev. Lett. 51,1442 (1983); A. Brandstaterand H. L. Swinney, in Fluctuations and Sensitivity in Non-equilibrium Systems, W. Horsthemke and D. K. Kondepudi, eds.,Vol. 1 of Proceedings in Physics (Springer-Verlag, Berlin, 1984),
p. 166; S. Cilberto and J. P. Gollub, J. Fluid Mech. (to be pub-lished).
18. R. S. Gioggia and N. B. Abraham in Coherence and QuantumOptics V, L. Mandel and E. Wolf, eds. (Plenum, New York, 1984),p. 563.
19. L. E. Urbach, S.-N. Liu, and N. B. Abraham in Coherence andQuantum Optics V, L. Mandel and E. Wolf, eds. (Plenum, NewYork, 1984), p. 593.
20. L. M. Hoffer, T. H. Chyba, and N. B. Abraham, J. Opt. Soc. Am.B 2, 102 (1985).
21. R. Graham and Y. Cho, Opt. Commun. 47,52 (1983).
A. M. Albano C. E. Searle
A. M. Albano, who was born in the Phil-ippines on August 2, 1939, is professorof physics at Bryn Mawr College. Hewas awarded the B.S. degree in physicsby the University of the Philippines in1959, the M.S. degree in physics by theUniversity of Iowa in 1964, and the
0 Ph.D. degree in physics from the StateUniversity of New York at Stony Brookin 1969. Although his dissertation topicwas high-energy physics, he has, in thepast decade, worked on problems innonequilibrium thermodynamics of
interfacial systems, statistical mechanics, molecular dynamics, andnonlinear phenomena. He has taught as an instructor at the Uni-versity of the Philippines and at SUNY-Stony Brook and has beenwith Bryn Mawr College since 1970, serving as chairman of the De-partment of Physics from 1979 to 1984. In 1974-1975 and 1978-1979,he was a visiting physicist at the Lorentz Institute for TheoreticalPhysics in Leiden, The Netherlands.
J. Abounadi
J. Abounadi was born in Marrakesh,Morocco, on July 13, 1966. She is cur-
%. rently a sophomore physics major atiBryn Mawr College and participated in
this work under the auspices of a HelenaRubinstein Foundation Summer Re-search Fellowship 1984).
C. E. Searle was born in Berkeley, Cali-fornia on July 19, 1962. She obtainedthe A.B. degree cum laude, majoring inmathematics and physics with honors inphysics, from Bryn Mawr College in1984. She is currently working at theCentre d'Etudes Nucleaires at Saclay,France, while taking courses for the mai-trise in physics and mathematics at theUniversity of Paris-Orsay.
S. Yong
S. Yong was born in Cali, Colombia, onDecember 31, 1963. She is a juniorphysics major at Bryn Mawr College andparticipated in this work as a HelenaRubinstein Foundation Summer Re-search Fellow in 1984.
R. S. Gioggia
T. H. Chyba
T. H. Chyba was born in Baltimore,Maryland, in September 1956. He re-
ceived the B.A. degree in mathematicsand the B.S. degree in physics from theUniversity of Rochester in 1978 and theM.S. degree in physics from the Univer-sity of Michigan in 1980. From Septem-ber 1981 to June 1983, he was an assis-tant professor of physics at Randolph-Macon College in Ashland, Virginia.During the summers of 1982 and 1983,he was a research assistant at Bryn
Mawr College. He is now enrolled in the Ph.D. program in the De-partment of Physics and Astronomy at the University of Rochester.Mr. Chyba is a student member of the Optical Society of America, theAmerican Physic4,1 Society, the American Association of PhysicsTeachers, and the Society of Physics Students.
R. S. Gioggia is professor of physics atWidener University. He was born onFebruary 29, 1943, in New York, NewYork. He obtained the B.S. degree inengineering science from New York Uni-versity in 1965 and the M.S. degree inphysics from Trinity College in Hart-ford, Connecticut, in 1967. As a gradu-ate student at Bryn, Mawr College,
Asocato ofP ewhere he received the Ph.D. degree in1975, he worked onthe kinetics of theCurie transition in nickel. For the pastseveral years, his research has dealt
mainly with the study of instabilities in laser systems. Dr. Gioggiahas taught at Weidener University since 1967 and was chairman ofthe faculty there from 1970 to 1976. He is a member of the AmericanAssociation of Physics Teachers, the American Physical Society, andthe Optical Society of America. He was elected a Danforth Foun-dation Associate in 1980.
Albano et al.
Copyright © 2022 FDOKUMEN