Low-cycle fatigue behavior of 7075-T6 aluminum alloy at ...
6
IP: 5.10.31.211 On: Fri, 14 Jan 2022 19:44:46 Copyright: American Scientific Publishers Delivered by Ingenta Materials Express Article Copyright © 2020 by American Scientific Publishers All rights reserved. Printed in the United States of America 2158-5849/2020/10/942/006 doi:10.1166/mex.2020.1696 www.aspbs.com/mex Low-cycle fatigue behavior of 7075-T6 aluminum alloy at different strain amplitudes Lei Fu 1, 2 , Heng Duan 3 , Hui Li 2 , Li Lin 4 , Qingyuan Wang 1, ∗ , Ji Yao 3 , and Yunrong Luo 2 1 School of Aeronautics and Astronautics, Sichuan University, Chengdu 610065, China 2 College of Mechanical Engineering, Sichuan University of Science & Engineering, Zigong 643000, China 3 Faculty of Civil Engineering and Architecture, Kunming University of Science and Technology, Kunming 650000, China 4 School of Materials Science and Engineering, Sichuan University of Science & Engineering, Zigong 643000, China ABSTRACT Low-cycle fatigue (LCF) life and failure mechanism of 7075-T6 high strength aluminum alloys were investigated under MTS 809. The cycling stress response and the cyclic stress–strain relationships under different strain amplitudes were investigated. Using Manson-Coffin law, the three parameter exponential function equation and the damage function model of tensile hysteresis energy (Ostergren equation), the regression analysis of LCF test data was carried out, it was found that the fatigue life prediction results of the three parameter exponential function equation were better than the other two life prediction methods in terms of statistical analysis methods of standard deviation and dispersion band. Analysis of microstructure and fatigue failure fracture revealed that fatigue crack initiated at the interface of precipitations and -phase aluminium substrate in surface or near surface of the sample. Keywords: Low-Cycle Fatigue (LCF) Life, Failure Mechanism, Life Prediction. 1. INSTRUCTION The 7075 aluminum alloy is widely used in fields of aerospace, weapons and transportation industries, etc., owing to its excellent corrosion resistance, high specific strength and good machinability characteristics. This alloy have been widely applied in critical components subjected to mechanical fatigue loading conditions in industrial applications [1]. During service, the applications experi- ence cyclic loading leading to premature failure of mate- rials. Therefore, it is of great significance to study the fatigue behavior of 7075-T6. Most of the existing investi- gations are related to effect of surface strengthening treat- ment on LCF performance of aluminum alloy [2], very high cycle fatigue [3], and ratcheting strain on LCF life of the metallic material [1, 4]. Further, many researchers proposed or modified some constructive modes to pre- dict LCF life [5, 6]. Only few investigations revealed ∗ Author to whom correspondence should be addressed. LCF properties of 7075-T6 alloy and its failure mecha- nism [7, 8]. According to statistics, most of the damages of aircraft and automobile components are caused by fatigue fracture. Therefore, in-depth study on the fatigue perfor- mance of 7075 aluminum alloy is beneficial to the safety design of aircraft, automobile and other components. So far there were still a lack of theoretical or experimental research on its LCF micro-fracture mechanism. Therefore, this paper would carry out detailed investiga- tions on the 7075 aluminum alloy LCF fatigue behaviors including cyclic stress response, cyclic stress–strain rela- tionships and fatigue lifetime prediction model, etc., are expected for a better understanding of its fatigue failure mechanisms. 2. EXPERIMENTAL DETAILS 2.1. Experimental Materials The experimental material was 7075 aluminum alloy produced by southwest aluminum corporation (China). 942 Mater. Express, Vol. 10, No. 6, 2020
-
Upload
khangminh22 -
Category
Documents
-
view
0 -
download
0
Transcript of Low-cycle fatigue behavior of 7075-T6 aluminum alloy at ...

IP: 5.10.31.211 On: Fri, 14 Jan 2022 19:44:46Copyright: American Scientific Publishers
Delivered by Ingenta
Materials ExpressArticle
Copyright © 2020 by American Scientific PublishersAll rights reserved.Printed in the United States of America
2158-5849/2020/10/942/006doi:10.1166/mex.2020.1696
www.aspbs.com/mex
Low-cycle fatigue behavior of 7075-T6 aluminumalloy at different strain amplitudesLei Fu1,2, Heng Duan3, Hui Li2, Li Lin4, Qingyuan Wang1,∗, Ji Yao3, and Yunrong Luo2
1School of Aeronautics and Astronautics, Sichuan University, Chengdu 610065, China2College of Mechanical Engineering, Sichuan University of Science & Engineering, Zigong 643000, China3Faculty of Civil Engineering and Architecture, Kunming University of Science and Technology, Kunming 650000, China4School of Materials Science and Engineering, Sichuan University of Science & Engineering, Zigong 643000, China
ABSTRACT
Low-cycle fatigue (LCF) life and failure mechanism of 7075-T6 high strength aluminum alloys were investigatedunder MTS 809. The cycling stress response and the cyclic stress–strain relationships under different strainamplitudes were investigated. Using Manson-Coffin law, the three parameter exponential function equation andthe damage function model of tensile hysteresis energy (Ostergren equation), the regression analysis of LCFtest data was carried out, it was found that the fatigue life prediction results of the three parameter exponentialfunction equation were better than the other two life prediction methods in terms of statistical analysis methodsof standard deviation and dispersion band. Analysis of microstructure and fatigue failure fracture revealed thatfatigue crack initiated at the interface of precipitations and �-phase aluminium substrate in surface or nearsurface of the sample.
Keywords: Low-Cycle Fatigue (LCF) Life, Failure Mechanism, Life Prediction.
1. INSTRUCTIONThe 7075 aluminum alloy is widely used in fields ofaerospace, weapons and transportation industries, etc.,owing to its excellent corrosion resistance, high specificstrength and good machinability characteristics. This alloyhave been widely applied in critical components subjectedto mechanical fatigue loading conditions in industrialapplications [1]. During service, the applications experi-ence cyclic loading leading to premature failure of mate-rials. Therefore, it is of great significance to study thefatigue behavior of 7075-T6. Most of the existing investi-gations are related to effect of surface strengthening treat-ment on LCF performance of aluminum alloy [2], veryhigh cycle fatigue [3], and ratcheting strain on LCF lifeof the metallic material [1, 4]. Further, many researchersproposed or modified some constructive modes to pre-dict LCF life [5, 6]. Only few investigations revealed
∗Author to whom correspondence should be addressed.
LCF properties of 7075-T6 alloy and its failure mecha-nism [7, 8]. According to statistics, most of the damages ofaircraft and automobile components are caused by fatiguefracture. Therefore, in-depth study on the fatigue perfor-mance of 7075 aluminum alloy is beneficial to the safetydesign of aircraft, automobile and other components. Sofar there were still a lack of theoretical or experimentalresearch on its LCF micro-fracture mechanism.Therefore, this paper would carry out detailed investiga-
tions on the 7075 aluminum alloy LCF fatigue behaviorsincluding cyclic stress response, cyclic stress–strain rela-tionships and fatigue lifetime prediction model, etc., areexpected for a better understanding of its fatigue failuremechanisms.
2. EXPERIMENTAL DETAILS2.1. Experimental MaterialsThe experimental material was 7075 aluminum alloyproduced by southwest aluminum corporation (China).
942 Mater. Express, Vol. 10, No. 6, 2020

IP: 5.10.31.211 On: Fri, 14 Jan 2022 19:44:46Copyright: American Scientific Publishers
Delivered by Ingenta
Materials ExpressLow-cycle fatigue behavior of 7075-T6 aluminum alloy at different strain amplitudesFu et al.
Article
Table I. Nominal chemical constant of the test material (wt.% ).
Al Zn Mg Cu Mn Ti Cr Ni Fe Si
Balance 5.29 2.5 1.52 0.05 0.02 0.19 0.044 0.29 0.09
Table II. The mechanical properties.
Elasticmodulus/ Tensile strength/ Yield strength/Gpa Mpa Mpa Elongation/%
71.3 550 476 12
Fig. 1. Sample of 7075-T6 aluminum alloy (unit: mm).
The heat treatment state of the material was T6, whichrepresented the supply state of artificial aging after coolingby high temperature forming process. The nominal chem-ical constant and mechanical properties of the employed7075-T6 alloy are listed in Tables I and II, respectively.
2.2. Experimental ProcessesLow cycle fatigue tests of the employed aluminum alloywere carried out according to the National Standardfor fatigue testing (GB/T15248-2008), and the hourglassshaped samples are fabricated from the sheet material, thedetailed dimensions are shown in Figure 1. The stress ratiowas R= −1, the cyclic waveform was a triangular wave,the loading frequency was 1 Hz, the strain amplitude was0.7%∼0.9%, and the material failure criterion was 5%peak load drop.
3. RESULTS AND DISCUSSION3.1. Metallographic Structure and XRD AnalysisFigure 2 shows the microstructure of 7075-T6 observedunder the metallographic microscope. The microstructureof the alloy is uniformly distributed, in which intensivefine precipitates dispersed. The Energy Dispersive Spec-trometer (EDS) analysis determines that these precipitatesare Al7Cu2Fe intermetallic and Mg-rich precipitates. TheX-ray diffraction (XRD) pattern of the tested alloy shownin Figure 3 confirms that the alloy is mainly consistedof overwhelming �-Al phase and few second phase �(MgZn2) at the equilibrium state, without diffraction peakfrom Al7Cu2Fe phase. This might be a result that theAl7Cu2Fe precipitated particles are too small to show sig-nificant characteristic peaks on XRD. It is meaningful toillustrate that the formation of these fine precipitates can
Fig. 2. Micro-structure of the test material.
play a significant role in enhancing dislocation and matrixstrengthening, which is one of the main reasons for thehigh strength of the alloy [9].
3.2. Characteristics of Cyclic Stress–StrainFigure 4 shows the cyclic stress–strain curves of the test-ing material in different strain amplitudes. Obviously, thecyclic response curves can be divided into 3 stages. At theinitial stage, the cyclic stress amplitude increases withthe increase in cyclic numbers, and the testing sampleshows obvious cyclic hardening characteristics. In the mid-dle stage, the test material exhibits relatively good cyclicstability. At the last stage, occurrence of macro-cracksleads to the decrease in the stress amplitude and final frac-ture. The testing material shows basically the cyclic stabil-ity during the total cyclic process, which is beneficial toimprove the dynamic bearing capacity and thus sustains along life without premature damage or failure [10].
3.3. Hysteresis Curves of Typical Stress and StrainFigure 5 shows the hysteretic loops at the first and lastcycles under two different strain amplitudes of the testing
30 40 50 60 70 80
�
inte
nsit
y
�
2θ/(deg.)
Al♣
♦ MgZn2
♣
♣
♣ ♣ ♣
Fig. 3. X-ray diffraction pattern of the test alloy.
Mater. Express, Vol. 10, 2020 943

IP: 5.10.31.211 On: Fri, 14 Jan 2022 19:44:46Copyright: American Scientific Publishers
Delivered by Ingenta
Materials ExpressLow-cycle fatigue behavior of 7075-T6 aluminum alloy at different strain amplitudes
Fu et al.
Article
200 400 600 800 1000 1200 1400350
400
450
500
0.7%
0.8%
0.9%
Stre
ss a
mpl
itud
e/M
Pa
Cylces/N
Strain amplitude
Fig. 4. Cycle stress response characteristic curves of test material.
material, respectively. It can be seen that the hystere-sis curve in the first cycle is almost “a solid line” andthere is little plastic strain. With continuous cyclic load-ing, the hysteresis loop is gradually plump, indicating thatthe plastic strain amplitude becomes larger and larger.Under the action of two strain amplitudes, the narrowhysteresis loops show the characteristic of cyclic strainhardening [11]. In Figure 5(a), the narrow hysteresisloop is smaller than that in Figure 5(b), suggesting thatthe plastic deformation at the strain amplitude of 0.9%is significantly larger than that at the strain amplitudeof 0.7%.
3.4. Life Prediction Model Investigations3.4.1. Manson-Coffin ModelFor the strain-controlled LCF experiment, fatigue lifeestimations are commonly performed using the Manson-Coffin formula. According to the Basquin formula andthe Manson-Coffin formula, the strain-life has the follow-ing relationship. The total strain range (��t) is equal to
Strain amplitude(mm/mm)
-600
-400
-200
0
200
400
600
Cycle 1
Cycle 398
(b)
Stre
ss a
mpl
itud
e/(M
Pa)
-0.9 0.9-0.6 0.6-0.3 0.30.0-600
-400
-200
0
200
400
600
Stre
ss a
mpl
itud
e(M
Pa)
Strain amplitude(mm/mm)
Cycle 1255
Cycle 1
(a)
-0.6 0.6-0.3 0.30.0
Fig. 5. Hysteresis loops of the tested material. (a) Strain amplitude of 0.7%, (b) strain amplitude of 0.9%.
Table III. The fatigue test results.
Amplitude of Amplitude of Amplitude of Fatigue lifetotal strain (�t) elastic strain (�e) plastic strain (�p) (2Nf )/cycle
0.007 0.005843 0.001157 28220.0075 0.006162 0.001338 17300.008 0.006446 0.001554 14820.0085 0.006666 0.001834 11380.009 0.006783 0.002217 640
the elastic strain range (��e) plus the plastic strain range(��p) [12, 13].
��t/2= ��e/2+��p/2=� ′f
E�2Nf �
b +�′f �2Nf �c (1)
Where � ′f , E, b, �
′f , c, Nf are the fatigue strength coef-
ficient, the Young’s modulus (MPa), the fatigue strengthexponent, the fatigue ductility coefficient, the fatigue duc-tility exponent and the fatigue life (cycle), respectively.The results of LCF experiment are shown in Table III,
the test data were fitted with Eq. (1), the strain fatigueparameters are listed in Table IV. Then, the relation-ship between cyclic strain and life can be obtained byEq. (2), the life prediction results obtained by Manson-Coffin model is given in Figure 6.
�t = 0.0136�2Nf�−0.105+0.044�2Nf�
−0.461 (2)
3.4.2. Three Parameter Exponential Function ModelFu [14] studied the LCF fatigue results of materials, andobtained a three parameter exponential function equationto represent the �–N curves for most materials, as shownby Eq. (3):
Nf ���t −��0�m = c (3)
Where Nf is the cycles to failure (cycle), ��t is the totalstrain range (%), ��0, m and c are undetermined constants.In accordance with LCF life test data, the fatigue
strain-life (�–N ) curve can be characterized by the three
944 Mater. Express, Vol. 10, 2020

IP: 5.10.31.211 On: Fri, 14 Jan 2022 19:44:46Copyright: American Scientific Publishers
Delivered by Ingenta
Materials ExpressLow-cycle fatigue behavior of 7075-T6 aluminum alloy at different strain amplitudesFu et al.
Article
Table IV. Strain fatigue parameters of the test material.
� ′f /GPa b �
′f /% c
3.14 −0.105 0.0136 −0.461
parameter exponential function equation, as shown byEq. (4), the life prediction results obtained by three-parameter power function equation are shown in Figure 7.
Nf = 3.4×10⁻⁹× ���t�−5.4 (4)
3.4.3. Ostergren ModelThe damage function life model of the tensile hystere-sis energy was proposed by Ostergren [15]. This methodconsiders that the damage of LCF with strain control isdecided by the testing samples stored strain energy underaction of alternating stress. The energy �Wt is character-ized by the damage function approximation as the prod-uct of the inelastic strain range ��in and the peak tensilestress ��t .
�WtNaf = c (5)
�Wt = ��in��t (6)
Where c and a are constants, �Wt stands for maximumcyclic tensile stress, and ��in is plastic strain.The tensile hysteresis energy damage function equation
is obtained as Eq. (7):
�Wt = 36866Nf−1.632 (7)
The life prediction results obtained by the tensile hys-teresis energy damage function equation are shown inFigure 8.
700 1300 1900250
500
900
1300
1700
2100
250
Experimental Nf/cycle
Pre
dict
ed N
f/cyc
le
Fig. 6. Life prediction results obtained by Manson-Coffin equation.
650 1200 1750240
600
1000
1400
1800
2200
240200
Experimental Nf/cycle
Pre
dict
ed N
f/cyc
le
Fig. 7. Life prediction results obtained by three-parameter powerfunction equation.
3.5. Assessment of Life Prediction AbilityThe ability of a life prediction model to correlate test datais commonly used in engineering to assess the predictivepower of the predictive model. The correlation of the testdata can be expressed in terms of the dispersion bandand the standard deviation, The dispersion band representsthe degree of deviation between the predictable lifetimeand the experimental lifetime, while the standard deviationindicates the extent to which the data set is near the mean.The smaller the standard deviation is, the higher the accu-racy of the fatigue life prediction model is. The standarddeviation expression is usually defined as:
S =[
1n−1
n∑i=1
�lgNpre− lgNob�2
]1/2
(8)
Where Npre is predictable lifetime and Nob is experimen-tal lifetime.
750 1300 1850280200
600
1000
1400
1800
2200
280
200
Experimental Nf/cycle
Pre
dict
ed N
f/cyc
le
Fig. 8. Life prediction results predicted by tensile hysteresis energydamage function equation.
Mater. Express, Vol. 10, 2020 945
IP: 5.10.31.211 On: Fri, 14 Jan 2022 19:44:46Copyright: American Scientific Publishers
Delivered by Ingenta
Materials ExpressLow-cycle fatigue behavior of 7075-T6 aluminum alloy at different strain amplitudes
Fu et al.
Article
Table V. Evaluation of life prediction using different prediction models.
Prediction Dispersion Standardmodel band deviation
Manson-coffin formula 1.25 0.0565Three-parameter exponential function 1.17 0.0557Ostergren equation 1.36 0.1255
Regardless of the dispersion band or standard devia-tion comparison, as shown in Table V, the LCF life of theexperimental material anticipated by the three-parameterpower function model has higher precision than thoseacquired by virtue of the Ostergren equation and theManson-Coffin equation.
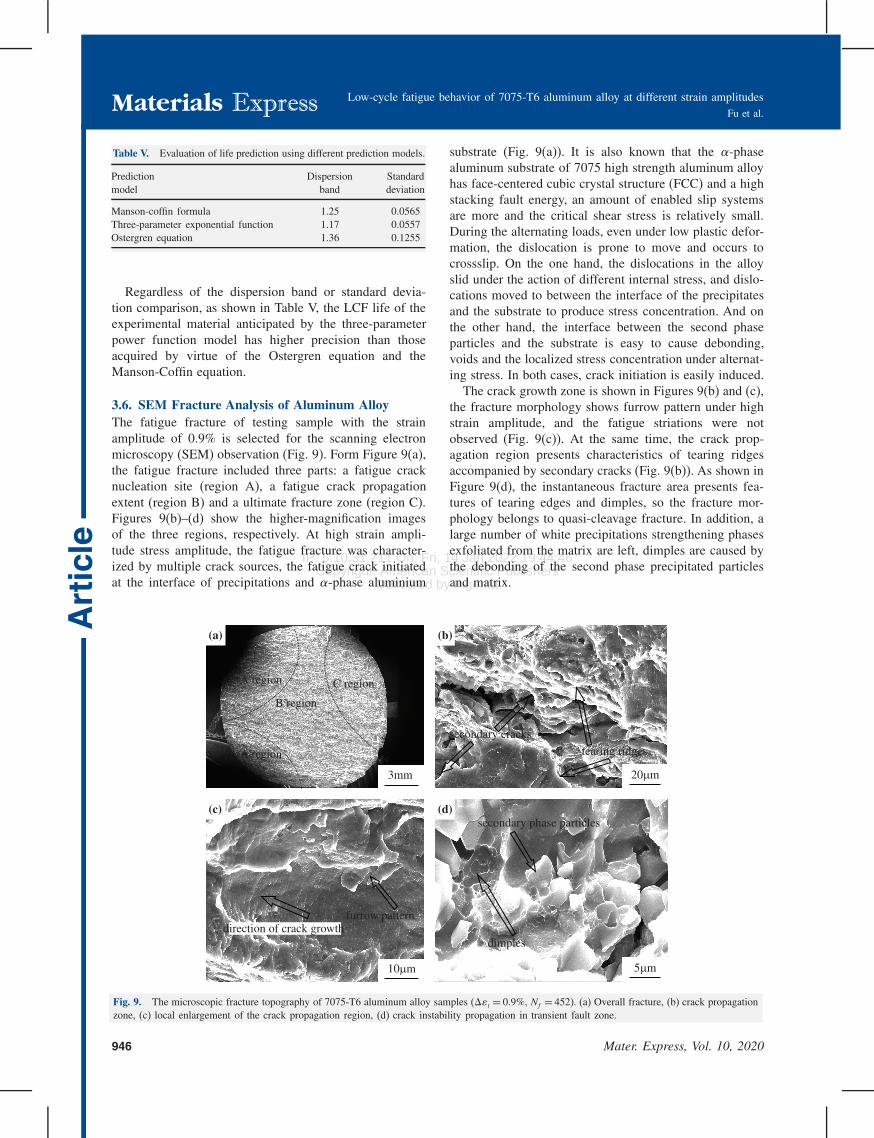
3.6. SEM Fracture Analysis of Aluminum AlloyThe fatigue fracture of testing sample with the strainamplitude of 0.9% is selected for the scanning electronmicroscopy (SEM) observation (Fig. 9). Form Figure 9(a),the fatigue fracture included three parts: a fatigue cracknucleation site (region A), a fatigue crack propagationextent (region B) and a ultimate fracture zone (region C).Figures 9(b)–(d) show the higher-magnification imagesof the three regions, respectively. At high strain ampli-tude stress amplitude, the fatigue fracture was character-ized by multiple crack sources, the fatigue crack initiatedat the interface of precipitations and �-phase aluminium
tearing ridges
secondary cracks
20μm
secondary phase particles
dimples
furrow patterndirection of crack growth
B region
C region
A region
A region
3mm
5μm10μm
(a) (b)
(c) (d)
Fig. 9. The microscopic fracture topography of 7075-T6 aluminum alloy samples (��t = 0.9%, Nf = 452). (a) Overall fracture, (b) crack propagationzone, (c) local enlargement of the crack propagation region, (d) crack instability propagation in transient fault zone.
substrate (Fig. 9(a)). It is also known that the �-phasealuminum substrate of 7075 high strength aluminum alloyhas face-centered cubic crystal structure (FCC) and a highstacking fault energy, an amount of enabled slip systemsare more and the critical shear stress is relatively small.During the alternating loads, even under low plastic defor-mation, the dislocation is prone to move and occurs tocrossslip. On the one hand, the dislocations in the alloyslid under the action of different internal stress, and dislo-cations moved to between the interface of the precipitatesand the substrate to produce stress concentration. And onthe other hand, the interface between the second phaseparticles and the substrate is easy to cause debonding,voids and the localized stress concentration under alternat-ing stress. In both cases, crack initiation is easily induced.The crack growth zone is shown in Figures 9(b) and (c),
the fracture morphology shows furrow pattern under highstrain amplitude, and the fatigue striations were notobserved (Fig. 9(c)). At the same time, the crack prop-agation region presents characteristics of tearing ridgesaccompanied by secondary cracks (Fig. 9(b)). As shown inFigure 9(d), the instantaneous fracture area presents fea-tures of tearing edges and dimples, so the fracture mor-phology belongs to quasi-cleavage fracture. In addition, alarge number of white precipitations strengthening phasesexfoliated from the matrix are left, dimples are caused bythe debonding of the second phase precipitated particlesand matrix.
946 Mater. Express, Vol. 10, 2020

IP: 5.10.31.211 On: Fri, 14 Jan 2022 19:44:46Copyright: American Scientific Publishers
Delivered by Ingenta
Materials ExpressLow-cycle fatigue behavior of 7075-T6 aluminum alloy at different strain amplitudesFu et al.
Article
4. CONCLUSIONS(1) The hysteretic properties of materials show the typicalcyclic hardening in the initial stage of fatigue loading, thenthe test material exhibits relatively good cyclic stability,the elastic deformation acts as a dominant factor duringcycling loading.(2) The three-parameter power function equation predic-tion on LCF life of 7075-T6 alloy is more precisely thanthe other life prediction methods.(3) Under cyclic loading, on the one hand, the disloca-tions move to the interface between the precipitates andthe substrate to produce stress concentration. On the otherhand, the interface between the second phase particles andthe substrate was easy to cause debonding, voids and stressconcentration under cycle stress. In both cases, crack ini-tiation was easily induced.
Acknowledgments: This work was financially sup-ported by National Nature Science Foundation of China(No. 51701133), the Opening Foundation of SichuanProvince Engineering Center for Powder Metallurgy (SC-FMYJ2019-07), the Project of Key Lab in SichuanColleges on Industry Process Equipment and Control Engi-neering (GK201808, GK201816) and the Opening Projectof Sichuan Province University Key Laboratory of BridgeNon-destruction Detecting and Engineering Computing(2018QYJ03, 2018QZY01).
References and Notes1. Sreenivasan, S., Mishra, S.K. and Dutta K., 2017. Ratcheting strain
and its effect on low cycle fatigue behavior of Al 7075-T6 alloy.Materials Science and Engineering: A, 698, pp.46–53.
2. Pandey, V., Chattopadhyay, K., Srinivas, N.C.S. and Singh, V., 2017.Role of ultrasonic shot peening on low cycle fatigue behavior of7075 aluminium alloy. International Journal of Fatigue, 103(10),pp.426–435.
3. Deng, C., Gao, R., Gong, B., Yin, T., Liu, Y., Deng, C.,Gao, R., Gong, B., Yin, T. and Liu, Y., 2017. Correlation between
micro-mechanical property and very high cycle fatigue (VHCF)crack initiation in friction stir welds of 7050 aluminum alloy. Inter-national Journal of Fatigue, 104, pp.283–292.
4. Dutta, K. and Ray, K.K., 2012. Ratcheting phenomenon and post-ratcheting tensile behaviour of an aluminum alloy. Materials Scienceand Engineering: A, 540(1), pp.30–37.
5. Ding, J., Kang, G.Z., Kan, Q.H. and Liu, Y.J., 2012. Constitutivemodel for uniaxial time-dependent ratcheting of 6061-T6 aluminumalloy. Computational Materials Science, 57(5), pp.67–72.
6. Chen, G., Ren, C.Z. and Ke, Z.H., 2016. Modeling of flow behaviorfor 7050-T7451 aluminum alloy considering microstructural evolu-tion over a wide range of strain rates. Mechanics of Materials, 95(4),pp.146–157.
7. Borrego, L.P., Abreu, L.M., Costa, J.M. and Ferreira, J.M., 2004.Analysis of low cycle fatigue in AlMgSi aluminium alloys. Engi-neering Failure Analysis, 11(5), pp.715–725.
8. Salerno, G., Magnabosco, R. and Neto, C.D.M., 2007. Meanstrain influence in low cycle fatigue behavior of AA7175-T1 aluminum alloy. International Journal of Fatigue, 29(5),pp.829–835.
9. Min, J., Sheng, G.M. and Wu, J.C., 2009. Study on high strain andlow cycle fatigue performance of hot-rolled h-section steel. Journalof Steel Research, 11, pp.44–48.
10. Yang, X.J., 2005. Low cycle fatigue and cyclic stress ratcheting fail-ure behavior of carbon steel 45 under uniaxial cyclic loading. Inter-national Journal of Fatigue, 27(9), pp.1124–1132.
11. Agius, D., Kyriako, M., Kourousis, K.I., Wallbrink, C., Wang, C.H.,Hu, W.P. and Silva, J., 2017. Sensitivity and optimisation of theChaboche plasticity model parameters in strain-life fatigue predic-tions. Materials & Design, 118(15), pp.107–121.
12. Koh, S.K., Oh, S.J., Li, C. and Ellyin, F., 1999. Low-cycle fatiguelife of SiC particulate-reinforced Al–Si cast alloy composites withtensile mean strain effects. International Journal of Fatigue, 21(10),pp.1019–1032.
13. Xu, L.Y., Xin, N. and Fan, J.S., 2016. Cyclic hardening and softeningbehavior of the low yield point steel BLY160: Experimental responseand constitutive modeling. International Journal of Plasticity, 78(3),pp.44–63.
14. Fu, H.M., 1993. A formula of three-parameter power functionfor �–N curves. Acta Aeronautica et Astronautica Sinica, 14(3),pp.173–176.
15. Ostergren, W.J., 1976. A damage function and associated failureequation for predicting hold time and frequency effects in elevatedtemperature low cycle fatigue. Journal of Testing and Evaluation,4(5), pp.327–339.
Received: 12 November 2019. Accepted: 4 January 2020.
Mater. Express, Vol. 10, 2020 947