Failure investigation and design improvements of Al 7075 piston for hydraulic actuators
14
Failure investigation and design improvements of Al 7075 piston for hydraulic actuators A. Cerrini, S. Beretta * Dipartimento di Ingegneria Meccanica, Politecnico di Milano, Via La Masa 34, 20158/20156 Milano, Italy Received 10 December 2004; accepted 11 December 2004 Available online 31 March 2005 Abstract Failure analysis was applied to a hydraulic actuator piston made of aluminium alloy 7075 T6 which failed at a rel- atively low number of cycles. Cracks were seen to nucleate from some defects naturally present in the material, and their propagation lead to component failure before 100,000 cycles. Experimental tests were carried out to characterize the material by means of the cyclic curve and the fatigue threshold DK th . The resultant failure analysis showed the problem in terms of crack propagation thus justifying a fracture mechanics approach to the component failure. Finally, some design recommendations were suggested to increase the fatigue life of the component. Ó 2005 Elsevier Ltd. All rights reserved. Keywords: Fatigue life; Crack propagation; Microflaws; Anisotropy 1. Introduction A common cause of failure seen in aluminium alloy hydraulic actuator pistons was the fracture of the component in the fillet zones, after a few numbers of cycle at load ratio R = 0. The dimensions and the geometry of the piston are given in Fig. 1, where the critical zones are also underlined. The piston is screwed on the steel shaft of the actuator, and failures occur at the fillet after the last engaged thread and at the seal groove fillet. The nucleation and propagation of cracks can be seen in these areas. The piston was extracted from a cold drawn bar made of the aluminium alloy 7075 T6. The alloyÕs material tensile properties are achieved using the heat treatment properties [1]. The resultant microstructure of 7075 T6 alloy is not homo- geneous, and microcracks initiate where microstructure is relatively weak [1]. 1350-6307/$ - see front matter Ó 2005 Elsevier Ltd. All rights reserved. doi:10.1016/j.engfailanal.2004.12.026 * Corresponding author. Tel.: +39 2 2399 8246; fax: +39 2 2399 8202. E-mail address: [email protected] (S. Beretta). Engineering Failure Analysis 13 (2006) 18–31 www.elsevier.com/locate/engfailanal
Transcript of Failure investigation and design improvements of Al 7075 piston for hydraulic actuators
Engineering Failure Analysis 13 (2006) 18–31
www.elsevier.com/locate/engfailanal
Failure investigation and design improvements of Al 7075piston for hydraulic actuators
A. Cerrini, S. Beretta *
Dipartimento di Ingegneria Meccanica, Politecnico di Milano, Via La Masa 34, 20158/20156 Milano, Italy
Received 10 December 2004; accepted 11 December 2004
Available online 31 March 2005
Abstract
Failure analysis was applied to a hydraulic actuator piston made of aluminium alloy 7075 T6 which failed at a rel-
atively low number of cycles. Cracks were seen to nucleate from some defects naturally present in the material, and their
propagation lead to component failure before 100,000 cycles. Experimental tests were carried out to characterize the
material by means of the cyclic curve and the fatigue threshold DKth. The resultant failure analysis showed the problem
in terms of crack propagation thus justifying a fracture mechanics approach to the component failure. Finally, some
design recommendations were suggested to increase the fatigue life of the component.
� 2005 Elsevier Ltd. All rights reserved.
Keywords: Fatigue life; Crack propagation; Microflaws; Anisotropy
1. Introduction
A common cause of failure seen in aluminium alloy hydraulic actuator pistons was the fracture of the
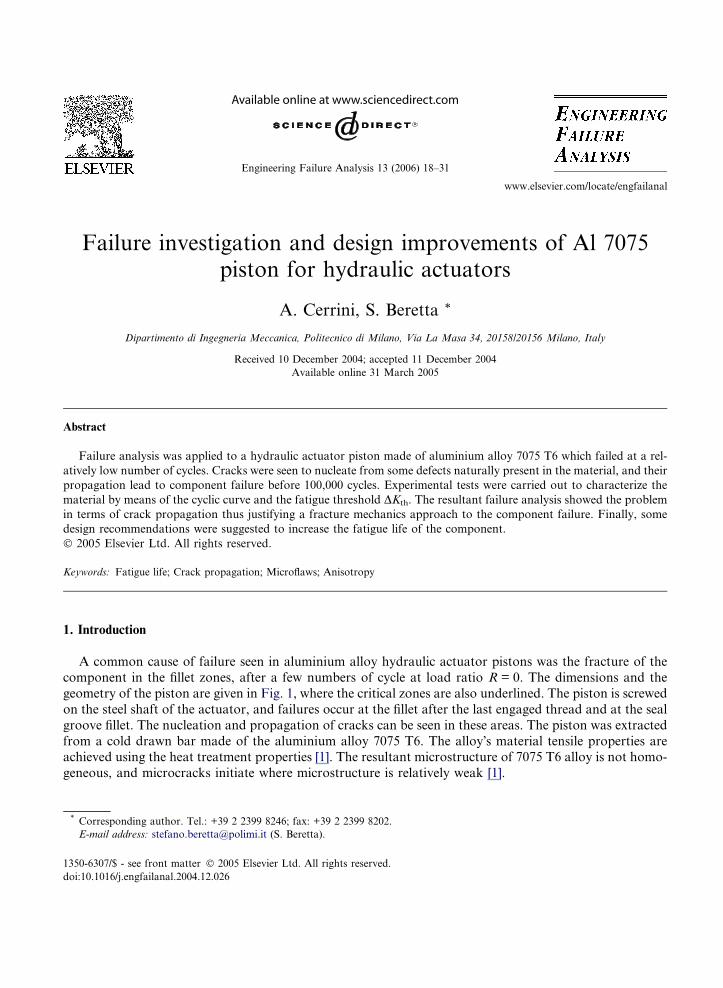
component in the fillet zones, after a few numbers of cycle at load ratio R = 0. The dimensions and the
geometry of the piston are given in Fig. 1, where the critical zones are also underlined. The piston is screwed
on the steel shaft of the actuator, and failures occur at the fillet after the last engaged thread and at the seal
groove fillet. The nucleation and propagation of cracks can be seen in these areas. The piston was extracted
from a cold drawn bar made of the aluminium alloy 7075 T6. The alloy�s material tensile properties areachieved using the heat treatment properties [1]. The resultant microstructure of 7075 T6 alloy is not homo-
geneous, and microcracks initiate where microstructure is relatively weak [1].
1350-6307/$ - see front matter � 2005 Elsevier Ltd. All rights reserved.
doi:10.1016/j.engfailanal.2004.12.026
* Corresponding author. Tel.: +39 2 2399 8246; fax: +39 2 2399 8202.
E-mail address: [email protected] (S. Beretta).
Nomenclature
n 0, H 0 Ramberg–Osgood coefficientsKt elastic stress concentrator factor
Kr stress concentration factor
Ke strain concentration factor
DKth fatigue threshold
DKI stress intensity factor range for mode I
DKII stress intensity factor range for mode II
DKeq equivalent stress intensity factor (MTS criterion)
R load ratioC,m Paris coefficients
mIp, mIiq weight functions for an edge crack
bi weight function coefficients
A. Cerrini, S. Beretta / Engineering Failure Analysis 13 (2006) 18–31 19
Piston failure occurred on a prototype hydraulic cylinder which was subjected to fatigue tests with a pul-
sating pressure of 400 bar (40 MPa): failures at both aforementioned locations occurred before 100,000
cycles.
The failure investigations which are presented in this paper were carried out primarily considering the
possibility of nucleation at notches, and then considering the presence of small flaws in the critical regions.
The analysis has been based on material properties (cyclic curves and fatigue thresholds) which have been
obtained in different directions in order investigate the presence of a possible anisotropy due to the drawing
process.
Fig. 1. Piston dimensions.
20 A. Cerrini, S. Beretta / Engineering Failure Analysis 13 (2006) 18–31
1.1. Failures
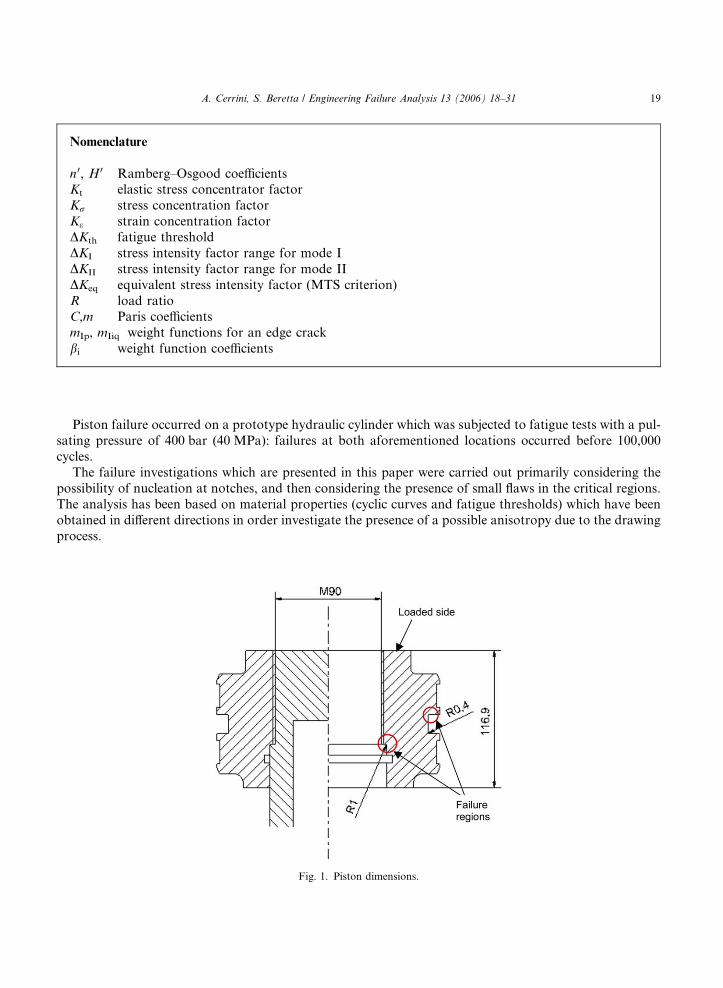
In Fig. 2(a) the end thread fillet crack path is shown. The first segment at 45� to the loading direction is
about 4 mm long, after which the crack deviates and grows for 3.8 mm along the drawing direction. Then
the crack returns to the angled direction until component failure. Fig. 2(b) details the first segment of thecrack at 45� with respect to the drawing and loading direction. Fig. 3 shows the fracture which occurred at
the fillet of the seal groove. The crack nucleates at the fillet and propagates along the fibres stretched in the
drawing direction. Furthermore, Fig. 4 clearly reveals the inhomogeneities of the material; defects even of
the order of 100 lm can be seen, which, by finding a weakness in the material microstructure, could begin to
propagate and lead to piston failure.
Fig. 2. Failure at the thread end fillet: (a) crack path; (b) detail of crack in the initial phase.
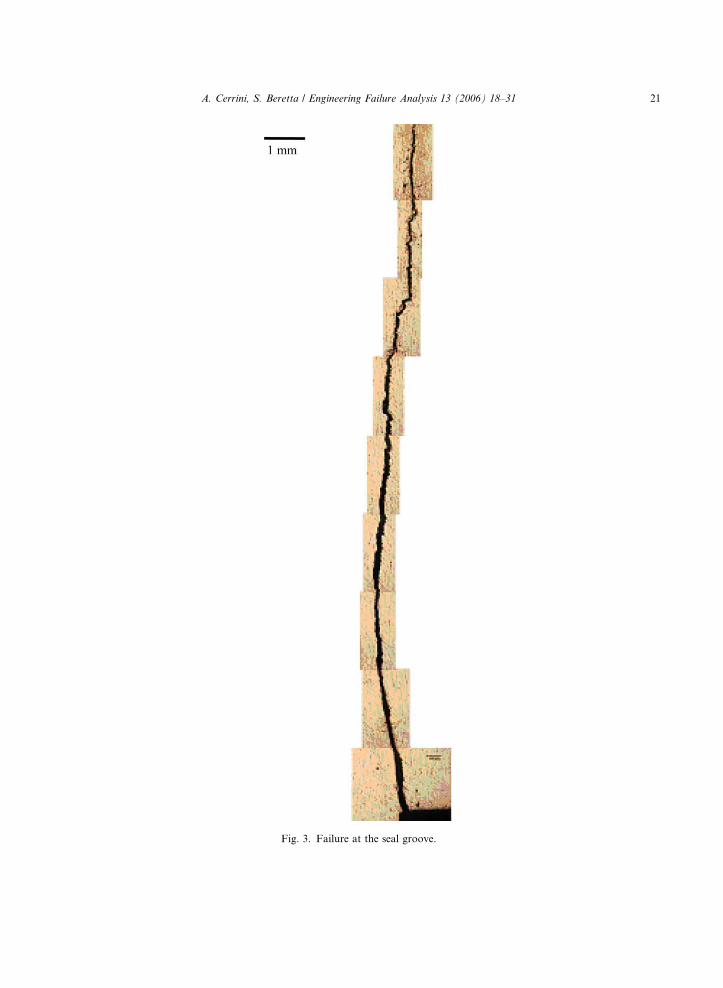
Fig. 3. Failure at the seal groove.
A. Cerrini, S. Beretta / Engineering Failure Analysis 13 (2006) 18–31 21

Fig. 4. Small flaws revealed by polished sections.
22 A. Cerrini, S. Beretta / Engineering Failure Analysis 13 (2006) 18–31
1.2. Methods
First of all an analysis of the fracture surfaces was done in order to visually analyze the path followed by
the cracks. Then, an experimental investigation of the material characteristics was conducted to produce thecyclic curve, fatigue limit, mode I fatigue threshold and Paris curve. Attention was focused on a possible
anisotropy effect on the fatigue limit and fatigue threshold due to the drawing process. A FE analysis of
the component was carried out to determine the stress intensity factors at the crack (using the ABAQUS
SIF calculation and the weight function method) and thus the life of the component in terms of fatigue cy-
cles at R = 0. Using the results obtained from the experimental tests and FE analysis, a design solution to
improve the fatigue life was presented.
2. Experimental details
Tests were run to characterise the component material and determine its cyclic curve, mode I fatigue
threshold, and to ascertain how the drawing process could cause anisotropy in material properties. All
of the tests were carried out on specimens extracted in three different characteristic directions with respect
to the drawing direction: longitudinal, transversal and at 45� with respect to the drawing direction.
Table 1
Mechanical properties of Al 7075 T6
E (MPa) Rp0.2 (MPa) Rm (MPa)
66000 325 465

A. Cerrini, S. Beretta / Engineering Failure Analysis 13 (2006) 18–31 23
2.1. Tensile test
A preliminary tensile test was carried out to determine the monotonic properties of the material. Table 1
shows the material mechanical properties for specimens cut in the longitudinal direction.
2.2. Cyclic curve
The geometry and the dimensions of the specimens tested are indicated in Fig. 5(a), in Fig. 5(b) the direc-
tions of specimen extraction are shown.
The cyclic test was run at R = �1 with deformation control set at 0.2% – 0.3% – 0.4% – 0.5% – 0.6% –
0.7% – 0.8% ascending and descending until the specimen failure. The cyclic curves were obtained by inter-
polating the extreme values of the stabilized cycles at the different imposed deformations by means of the
Ramberg–Osgood equations:
Table
Cyclic
Specim
Longit
Transv
45�
e ¼ eae þ eap ¼rEþ r
H 0
� �1=n0
: ð1Þ
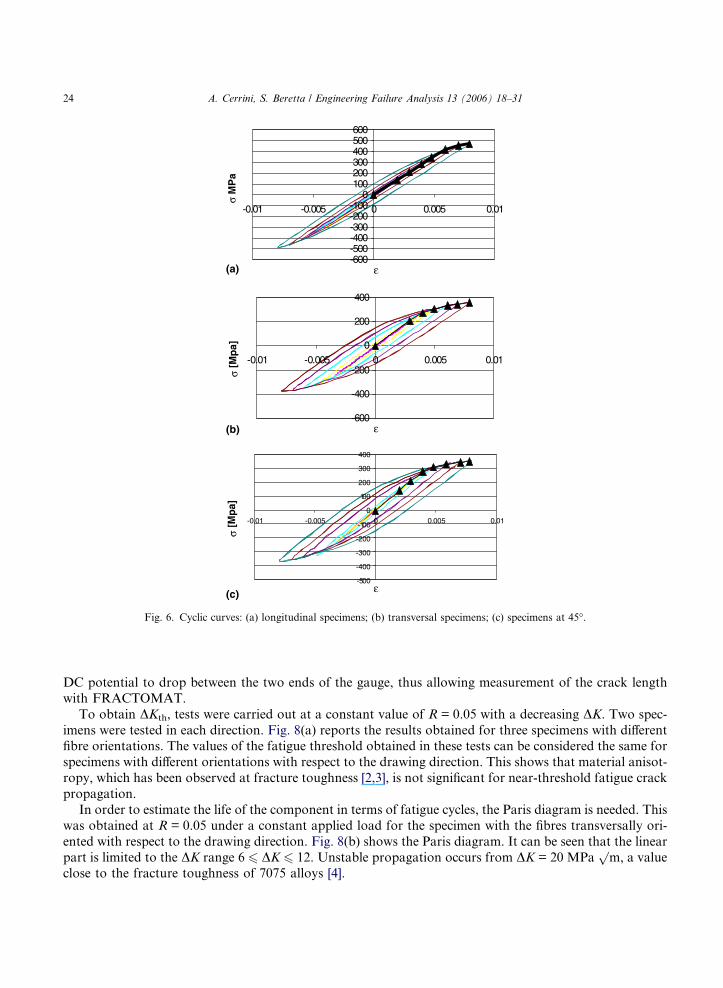
Table 2 reports the cyclic properties and Fig. 6 shows the cyclic curves obtained for the specimens in the
three specified directions. Comparing the curves, it can be noted how at a relatively high deformation per-
centage (0.5–0.8%), the cyclic curve for the specimen loaded parallel to the drawing direction is different
from the other two curves, and in particular it shows higher values along the drawing direction.
2.3. Fatigue threshold and Paris’ curve
The geometry and the dimensions of the SEB specimen tested in order to ascertain the mode I fatigue
threshold DKth and the Paris curve for the three different directions described are shown in Fig. 7(a) and
(b). Fatigue tests were performed by means of a high frequency electro-resonance machine. The crack
length was monitored using a Crack gauge that cracked along with the specimen crack. This caused the
Fig. 5. Experiments for cyclic curve determination: (a) specimen dimension; (b) specimen extraction directions.
2
properties of Al 7075 T6
en extraction direction H 0 n 0 Rp0.05,cycl (MPa) Rp0.2,cycl (MPa)
udinal 630 0.044 460 480
ersal 630 0.096 305 350
530 0.068 310 350
-600-500-400-300-200-100
0100200300400500600
-0.01 -0.005 0 0.005 0.01
σM
Pa
-600
-400
-200
0
200
400
-0.01 -0.005 0 0.005 0.01
ε
ε
σ [M
pa]
-500
-400
-300
-200
-100
0
100
200
300
400
-0.01 -0.005 0 0.005 0.01
ε
σ [M
pa]
(a)
(b)
(c)
Fig. 6. Cyclic curves: (a) longitudinal specimens; (b) transversal specimens; (c) specimens at 45�.
24 A. Cerrini, S. Beretta / Engineering Failure Analysis 13 (2006) 18–31
DC potential to drop between the two ends of the gauge, thus allowing measurement of the crack length
with FRACTOMAT.
To obtain DKth, tests were carried out at a constant value of R = 0.05 with a decreasing DK. Two spec-
imens were tested in each direction. Fig. 8(a) reports the results obtained for three specimens with differentfibre orientations. The values of the fatigue threshold obtained in these tests can be considered the same for
specimens with different orientations with respect to the drawing direction. This shows that material anisot-
ropy, which has been observed at fracture toughness [2,3], is not significant for near-threshold fatigue crack
propagation.
In order to estimate the life of the component in terms of fatigue cycles, the Paris diagram is needed. This
was obtained at R = 0.05 under a constant applied load for the specimen with the fibres transversally ori-
ented with respect to the drawing direction. Fig. 8(b) shows the Paris diagram. It can be seen that the linear
part is limited to the DK range 6 6 DK 6 12. Unstable propagation occurs from DK = 20 MPapm, a value
close to the fracture toughness of 7075 alloys [4].

Fig. 7. Crack propagation experiments: (a) SEB specimen dimensions; (b) specimen extraction directions.
0.01
0.1
1
10
100
1 10
∆K [MPam1/2]
da/
dN
[n
m/L
w]
Trasv
Long
45˚
0.001
0.01
0.1
11
10
100
1000
10 100
∆K [MPam1/2]
da/
dN
[n
m/L
w]
(a)
(b)
Fig. 8. Crack propagation results: (a) DK-decreasing threshold data; (b) da/dN diagram for longitudinal direction.
A. Cerrini, S. Beretta / Engineering Failure Analysis 13 (2006) 18–31 25

26 A. Cerrini, S. Beretta / Engineering Failure Analysis 13 (2006) 18–31
3. Failure analysis
The finite element code ABAQUS was used to determine the stress distribution of the piston-shaft sys-
tem at the threaded attachment point with focus on the stress distribution near the fillets at the end of the
threads and the seal groove. This is where the cracks which caused component failure were seen. The modelused in analysis was built as axisymmetric (Fig. 9). The element used to create the mesh was the QUAD4
quadratic element, and the mesh was refined in areas where the stress gradient was predicted to be higher,
hence near the fillets. The contact area between the piston and the shaft in the threaded region between the
two deformable surfaces corresponding to thread flanks was defined as a �hard contact�.
3.1. Thread end fillet Neuber analysis
In defining Kt as the elastic stress concentration factor of the section, it can be correlated to the stressconcentration factor and the strain concentration factor, which are valid in the case of localised plastic
deformation at the fillet (r > ryield) [5]:
Kr ¼r
rnom
Ke ¼e
enom; ð2Þ
K t ¼ffiffiffiffiffiffiffiffiffiffiffiKrKe
p: ð3Þ
Substituting Eq. (2) in Eq. (3) and rearranging:
re ¼ ðK trnomÞ2
E: ð4Þ
The stress and strain at the notch is given by the intersection of the above equation with the cyclic curve of
the material:
Fig. 9. FE analysis: (a) model of the piston; (b) detail of the engaged threads.
A. Cerrini, S. Beretta / Engineering Failure Analysis 13 (2006) 18–31 27
rrEþ r
H 0
� �1=n0� �
¼ ðK trnomÞ2
E: ð5Þ
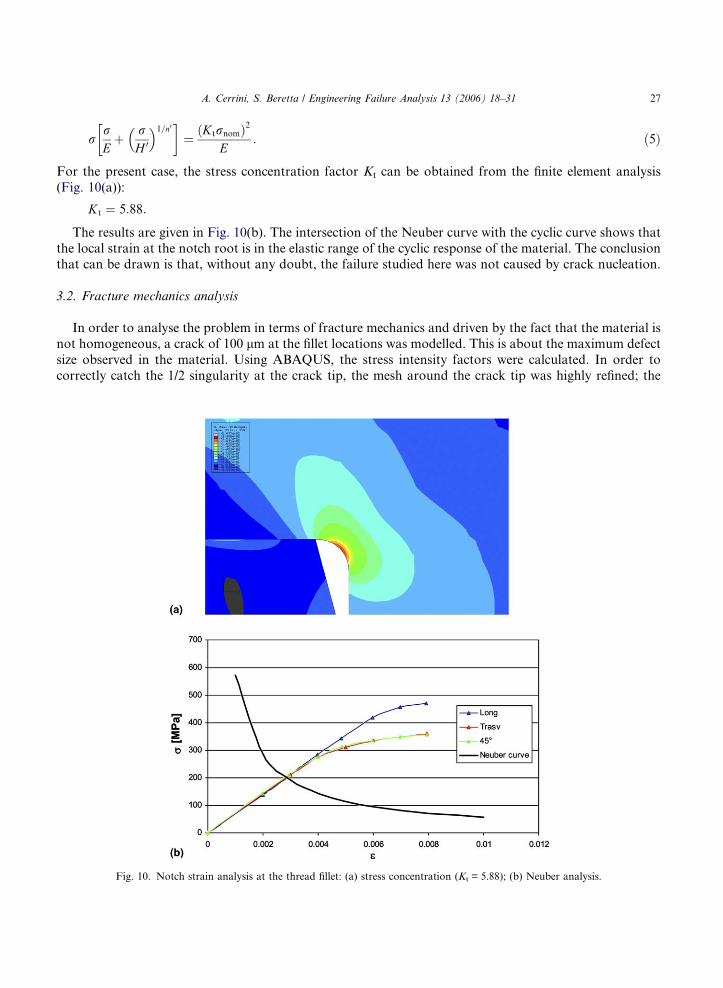
For the present case, the stress concentration factor Kt can be obtained from the finite element analysis
(Fig. 10(a)):
K t ¼ 5:88:
The results are given in Fig. 10(b). The intersection of the Neuber curve with the cyclic curve shows that
the local strain at the notch root is in the elastic range of the cyclic response of the material. The conclusionthat can be drawn is that, without any doubt, the failure studied here was not caused by crack nucleation.
3.2. Fracture mechanics analysis
In order to analyse the problem in terms of fracture mechanics and driven by the fact that the material is
not homogeneous, a crack of 100 lm at the fillet locations was modelled. This is about the maximum defect
size observed in the material. Using ABAQUS, the stress intensity factors were calculated. In order to
correctly catch the 1/2 singularity at the crack tip, the mesh around the crack tip was highly refined; the
Fig. 10. Notch strain analysis at the thread fillet: (a) stress concentration (Kt = 5.88); (b) Neuber analysis.

28 A. Cerrini, S. Beretta / Engineering Failure Analysis 13 (2006) 18–31
smallest element had a length of 4 lm. The element size was increased when moving away from the singu-
larity. In order to allow the pre and post processor to visualize the mesh, and the computer to analyze with
a reasonable number of elements and within relatively short time, a submodel of the crack zone was created
(Fig. 11). The global model from which the sub model was extracted, ‘‘drives’’ the analysis of the sub model
by means the contour driving nodes common to the global model and sub model. It does this by imposingthe nodal displacements obtained for the driving nodes in the global model onto the identical nodes in the
sub model.
3.2.1. Thread end fillet
The calculation of the variations in the stress intensity factors DKI and DKII for a 100 lm crack in the
fillet zone inclined at 45� with respect to the loading direction (and then the drawing direction) and with
R = 0, lead to the following results:
Fig
DKI ¼ 5:53 MPaffiffiffiffim
p;
DKII ¼ 0:03 MPaffiffiffiffim
p:
The propagation angle was determined using the maximum tensile stress criterion [6,7]. The crack practi-
cally grows following the mode I criterion; the crack growth angle is, in fact, about �0.6� with respect to themain crack direction. The comparison of the value of DKI with the fatigue limit threshold of the material
(DKth = 3 MPapm) can surely explain the early failure of the piston at the thread fillet.
An estimation of the component fatigue life in terms of number of cycles can be obtained by interpolat-
ing and numerically integrating the curve in Fig. 8(b),which represents the stable crack propagation before
the unstable brittle fracture of the component. By means of the weight function (WF) method suggested by
Bertini and Beghini [8], the variation of DKI for a crack perpendicular to the surface described by the thread
end fillet was calculated as a function of crack length. The WF technique permits calculation of the stress
intensity factors for a crack perpendicular to the surface by integrating numerically the WF expressionsmultiplied by the normal and the tangential stresses along the crack (r and s).
KIðaÞ ¼1ffiffiffiffiffiffiffiffi2pa
pZ a
0
mIpðx; aÞrðxÞdx;
KIIðaÞ ¼1ffiffiffiffiffiffiffiffi2pa
pZ a
0
mIIqðx; aÞsðxÞdx:ð6Þ
. 11. SIF at the tip of a flaw located at the root of thread end fillet: (a) FE crack detail; (b) submodel for a 100 lm crack.

Table 3
SIF calculations for cracks at the thread fillet
Crack length KI (MPapm) KII (MPa
pm)
100 lm ABAQUS 5.53 0.029
WF 5.89 0.031
4 mm ABAQUS 11 �0.515
WF 12 0.059
A. Cerrini, S. Beretta / Engineering Failure Analysis 13 (2006) 18–31 29
For a crack perpendicular to the surface:
mIpðx; aÞ ¼ mIIqðx; aÞ ¼X5
i¼1
bIð1� xÞði�3=2Þ: ð7Þ
The results obtained in terms of DKI and DKII correlated well with the FE results (Table 3).
To estimate the number of cycle to failure, the curve in Fig. 8(b) was interpolated:
logdadN
� �¼ aðlogDKÞ3 þ bðlogDKÞ2 þ cðlogDKÞ þ d: ð8Þ
Eq. (8) was then numerically integrated from a crack of 100 lm, which is the size of defects present in the
material, to 4 mm (Fig. 12). The value of stress intensity factor range DKI for a 4 mm crack is 12 MPapm.
This corresponds to the region where the crack growth data deviates from the Paris line and tends to unsta-
ble growth controlled by the fracture toughness KIC = 20 MPapm [4]. The calculated propagation life for
crack growth to a length of 4 mm is about 50,000 cycles.
3.2.2. Seal groove fillet
A similar analysis was conducted for the crack which can be really observed at the fillet of the seal
groove. Using FE analysis, DKI and DKII were calculated for a 100 lm crack with the loading direction
defined as parallel to the drawing fibres. The results obtained for the stress intensity factors are as follows:
DKI ¼ 3:44 MPaffiffiffiffim
p;
DKII ¼ 1:90 MPaffiffiffiffim
p:
In this case the value of DKII cannot be ignored. In order to find a value which could be compared with the
fatigue threshold, DKeq was calculated using the MTS criterion:
DKeq ¼ 4:6 MPaffiffiffiffim
p:
4 mm
3.8 mm
0.001
0.01
0.1
11
10
100
1000
1 1 10
∆K [MPam ]1/2
da/
dN
[n
m/L
w]
100µm 100
45˚
Fig. 12. Analysis of crack propagation at the thread fillet.
30 A. Cerrini, S. Beretta / Engineering Failure Analysis 13 (2006) 18–31
The comparison between DKeq and the fatigue threshold DKth permits the conclusion that the crack nucle-
ated from a pre-existing flaw and started to grow under the applied pressure cycles.
4. Design improvements
Considering that the material is not homogeneous and that some defects such as cracks are naturally
present in the material due to the forming process, it becomes necessary to reduce the value of DKI (for
the end thread fillet) and DKeq (for the seal groove fillet) near the fatigue threshold DKth in order to increase
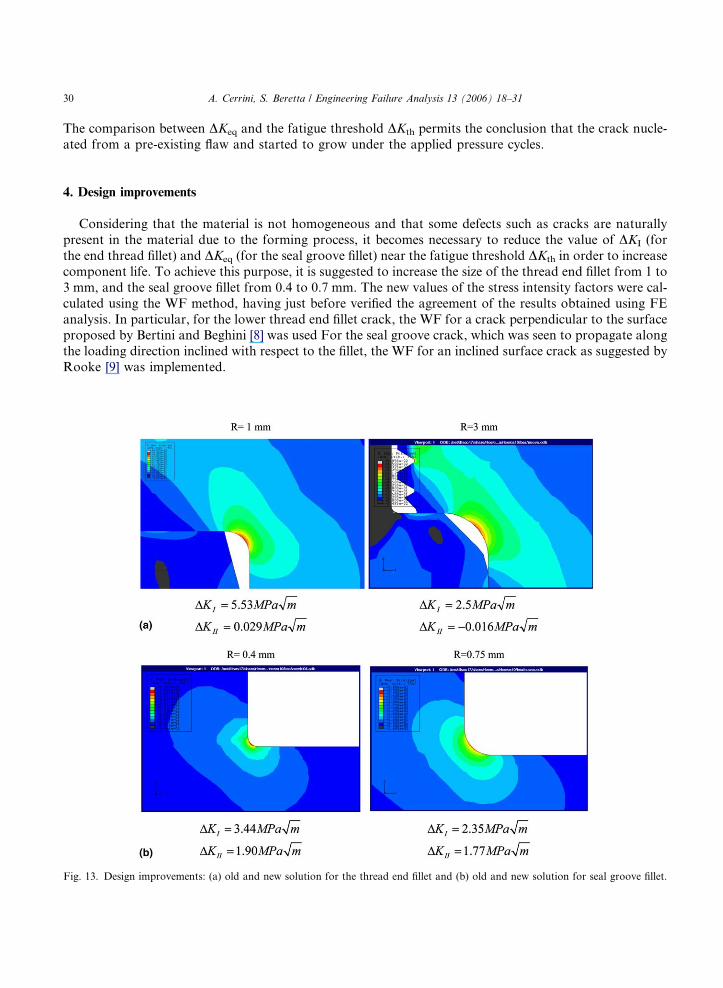
component life. To achieve this purpose, it is suggested to increase the size of the thread end fillet from 1 to
3 mm, and the seal groove fillet from 0.4 to 0.7 mm. The new values of the stress intensity factors were cal-
culated using the WF method, having just before verified the agreement of the results obtained using FE
analysis. In particular, for the lower thread end fillet crack, the WF for a crack perpendicular to the surfaceproposed by Bertini and Beghini [8] was used For the seal groove crack, which was seen to propagate along
the loading direction inclined with respect to the fillet, the WF for an inclined surface crack as suggested by
Rooke [9] was implemented.
Fig. 13. Design improvements: (a) old and new solution for the thread end fillet and (b) old and new solution for seal groove fillet.
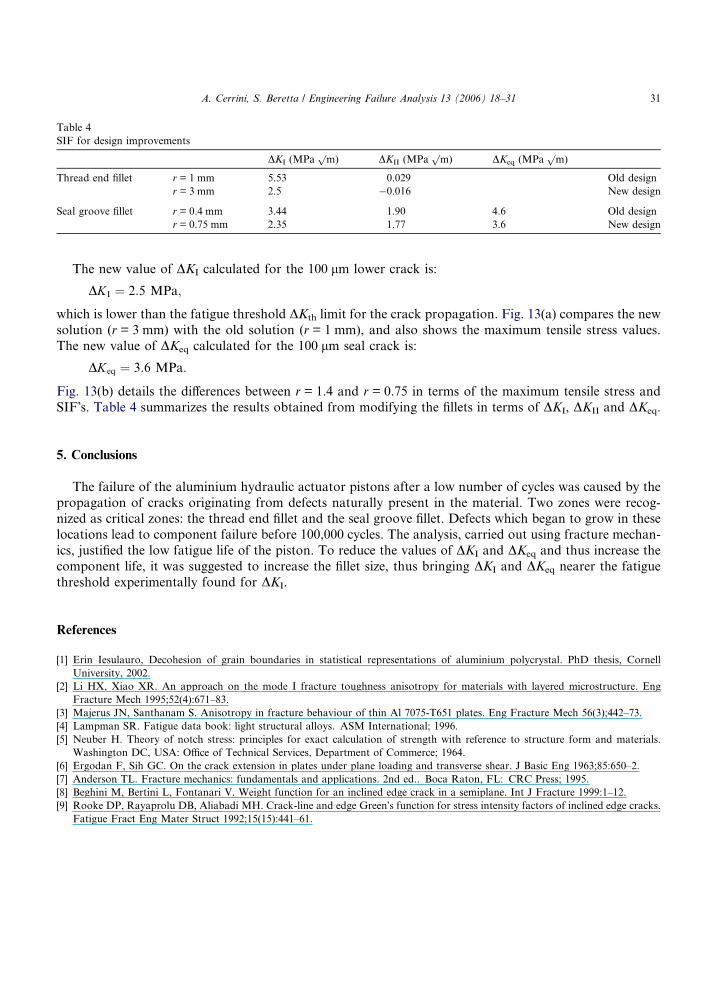
Table 4
SIF for design improvements
DKI (MPapm) DKII (MPa
pm) DKeq (MPa
pm)
Thread end fillet r = 1 mm 5.53 0.029 Old design
r = 3 mm 2.5 �0.016 New design
Seal groove fillet r = 0.4 mm 3.44 1.90 4.6 Old design
r = 0.75 mm 2.35 1.77 3.6 New design
A. Cerrini, S. Beretta / Engineering Failure Analysis 13 (2006) 18–31 31
The new value of DKI calculated for the 100 lm lower crack is:
DKI ¼ 2:5 MPa;
which is lower than the fatigue threshold DKth limit for the crack propagation. Fig. 13(a) compares the new
solution (r = 3 mm) with the old solution (r = 1 mm), and also shows the maximum tensile stress values.
The new value of DKeq calculated for the 100 lm seal crack is:
DKeq ¼ 3:6 MPa:
Fig. 13(b) details the differences between r = 1.4 and r = 0.75 in terms of the maximum tensile stress and
SIF�s. Table 4 summarizes the results obtained from modifying the fillets in terms of DKI, DKII and DKeq.
5. Conclusions
The failure of the aluminium hydraulic actuator pistons after a low number of cycles was caused by the
propagation of cracks originating from defects naturally present in the material. Two zones were recog-nized as critical zones: the thread end fillet and the seal groove fillet. Defects which began to grow in these
locations lead to component failure before 100,000 cycles. The analysis, carried out using fracture mechan-
ics, justified the low fatigue life of the piston. To reduce the values of DKI and DKeq and thus increase the
component life, it was suggested to increase the fillet size, thus bringing DKI and DKeq nearer the fatigue
threshold experimentally found for DKI.
References
[1] Erin Iesulauro, Decohesion of grain boundaries in statistical representations of aluminium polycrystal. PhD thesis, Cornell
University, 2002.
[2] Li HX, Xiao XR. An approach on the mode I fracture toughness anisotropy for materials with layered microstructure. Eng
Fracture Mech 1995;52(4):671–83.
[3] Majerus JN, Santhanam S. Anisotropy in fracture behaviour of thin Al 7075-T651 plates. Eng Fracture Mech 56(3);442–73.
[4] Lampman SR. Fatigue data book: light structural alloys. ASM International; 1996.
[5] Neuber H. Theory of notch stress: principles for exact calculation of strength with reference to structure form and materials.
Washington DC, USA: Office of Technical Services, Department of Commerce; 1964.
[6] Ergodan F, Sih GC. On the crack extension in plates under plane loading and transverse shear. J Basic Eng 1963;85:650–2.
[7] Anderson TL. Fracture mechanics: fundamentals and applications. 2nd ed.. Boca Raton, FL: CRC Press; 1995.
[8] Beghini M, Bertini L, Fontanari V. Weight function for an inclined edge crack in a semiplane. Int J Fracture 1999:1–12.
[9] Rooke DP, Rayaprolu DB, Aliabadi MH. Crack-line and edge Green�s function for stress intensity factors of inclined edge cracks.
Fatigue Fract Eng Mater Struct 1992;15(15):441–61.