Failure investigation and design improvements of Al 7075 piston for hydraulic actuators
Upload
unishivajiCategory
view
0download
0
Wear 261 (2006) 426–434
Fretting fatigue behavior in 7075-T6 aluminum alloy
Sachin R. Shinde a,∗, David W. Hoeppner b,1
a Department of Mechanical Engineering, University of Utah, 50 S, Central Campus Dr. Rm # 2110, Salt Lake City, UT 84112, USAb QIDEC, Department of Mechanical Engineering, University of Utah, 50 S, Central Campus Dr. Rm # 2110, Salt Lake City, UT 84112, USA
Received 28 March 2005; received in revised form 27 October 2005; accepted 12 December 2005Available online 23 January 2006
Abstract
Fretting fatigue conditions play an important role in a surface degradation and debris formation; sometimes, these conditions are neglected butare important in some applications, such as the aerospace industry and orthopedic implants. The objective of this study was to understand thefretting fatigue behavior in 7075-T6 aluminum alloy by characterization of fretting damage zones to gain insight into the nucleation of crack(s).
Results showed that fretting degradation depends on the microstructure of the material. The differences in microstructure between two thicknessesof 7075-T6 aluminum alloy (1.6 and 4.06 mm) seem to hold the key to understanding fretting damage formation, pit to crack transition and crackpropagation.©
K
1
cwdamifFttgfinaa
h
0d
2005 Elsevier B.V. All rights reserved.
eywords: Fretting; Scanning electron microscope; Fatigue; Fretting fatigue
. Introduction
Fretting is a wear phenomenon that occurs between twoontacting surfaces having small-amplitude oscillatory motion,hich is usually tangential [1,2]. Fretting fatigue can beescribed as a combination of two concomitant processes: wearnd fatigue. In addition, the formation of debris and its entrap-ent between the surfaces is another of fretting fatigue’s defin-
ng characteristics. Fretting fatigue is a very complex issue asretting plays an important role in component crack nucleation.retting fatigue can be defined as the concomitant action of fret-
ing with fatigue that results in surface or subsurface degradationhat may culminate in cracks that merge to form a single propa-ating crack, with a significant reduction of fatigue life. Frettingatigue may occur in various instances; for example, a mechan-cally fastened joint or specimen modeling a joint. The complexature of the fretting fatigue phenomenon has led to a smallmount of development in this field. The aviation industry is onerea in which fretting fatigue failures are commonly observed.
Fretting fatigue conditions play an important role in surfacedegradation and debris formation during component utiliza-tion. Sometimes the effects of fretting are neglected, but theyare very important in many applications, such as aircraft andorthopedic implants. However, there is still a great deal of con-troversy as to when cracks nucleate out of fretting damagezones.
In 1911, Eden et al. [3] noted oxide debris between grips andspecimens. In 1941, Warlow-Davies [4] conducted an investiga-tion on the effects of fretting on fatigue properties. The rate offretting fatigue damage varies with material, cyclic load or stressstate (provides energy for crack nucleation and crack propaga-tion), the amplitude of cyclic slip displacement, the normal con-tact pressure, the coefficient of friction between fretted surfaces,which is strongly influenced by the roughness of surface asperi-ties, environment and temperature, and manufacturing processes[3–6].
Clark and Hoeppner [7] used confocal and scanning elec-tron microscopy to characterize damage through interruptedfretting fatigue tests. This study was conducted on 2024-T3 alu-minum alloy. Fretting damage levels were created at stepped
∗ Corresponding author. Tel.: +1 801 581 4025; fax: +1 801 585 5889.E-mail addresses: [email protected] (S.R. Shinde),
[email protected] (D.W. Hoeppner).1 Tel.: +1 801 581 3851; fax: +1 801 585 5889.
down stages (80, 60, 40, 20 and 10%, respectively) basedon a specimen subjected to 100% fretting fatigue cycles tofailure (both axial and normal force were applied). Hundredpercent was defined as the total cycles to fracture for speci-mens with both axial and normal force applied for the entire
043-1648/$ – see front matter © 2005 Elsevier B.V. All rights reserved.oi:10.1016/j.wear.2005.12.015
S.R. Shinde, D.W. Hoeppner / Wear 261 (2006) 426–434 427
Fig. 1. Fretting fatigue test specimen.
experiment duration. Stepped down damage levels (80, 60, 40and 20%, respectively) were subjected to the appropriate num-ber of fretting fatigue cycles as a percentage of the averagecycles of the 100% fretting fatigue specimens, after whichthe test was stopped. Clark and Hoeppner also reported thatthe damaged area near the edge of the fretting pad contactand specimen had a more detrimental effect than a damagedarea at the center of the fretting pad. The damage at the edgewas more significant because of a higher stress concentra-tion, due to the specimen shape. 2024-T3 aluminum alloy hasa higher fracture toughness but lower strength compared to7075-T6, therefore it was expected to have a different cracknucleation process and propagation during the fretting fatigueprocess.
The objective of this study was to understand the frettingfatigue behavior by characterization of fretting damage zonesto gain insight into the nucleation of crack(s) in 7075-T6 alu-minum alloy. Determination of the influence of fretting onfatigue life and identification of the damage threshold for 7075-T6 aluminum alloy were also performed. A damage thresholdrefers to the specific amount of fretting damage required beforefatigue life reduction occurs at any given stress level. Twodifferent thicknesses of 7075-T6 aluminum alloy were charac-terized under fretting fatigue conditions. An additional goal ofthis study was to identify causes and mechanisms related tofretting fatigue by fractographic inspection of surfaces usingsioc
ci
tinued to yield insights into when cracks nucleate from frettingdamage zones.
2. Experimental conditions
Fretting fatigue experiments were performed using a closedloop electro-hydraulic servo controlled system. The experimentswere conducted using flat on flat contact. The specimens weredog bone in shape and had an orientation in the L–T plane. Fig. 1shows a drawing of the specimen. Two different specimens ofthicknesses of 1.6 mm (B1) and 4.06 mm (B2) with a flat fret-ting pad of 6.35 mm × 8.9 mm were tested under fretting fatigueconditions.
The material used for this study was 7075-T6 aluminum alloy.The material ultimate and yield strength (tensile) properties for7075-T6 aluminum alloy are given in Table 1 [8]. The 7xxxseries of aluminum alloys contain zinc, magnesium, and copperas their major alloying elements, with chromium, manganese,zirconium, iron, and silicon typically present. 7075 has a nom-inal composition (percentage by weight) of 1.6% copper, 2.5%magnesium, 0.23% chromium, 5.6% zinc, with aluminum com-prising the rest [9]. The 7075 aluminum alloy, a high strengthcommercial wrought aluminum alloy, is used mainly in aircraftapplications.
T7
A
7
canning electron and confocal microscopy. Experiments werenterrupted at various fretting damage levels to gain informationn pit generation (pit depth, area and proximity) and potentialracking.
Fretting fatigue cracks nucleate at pits formed by adhesiveontact of asperities, oxides, scratches, fretting/wear tracks. Thenterrupted fretting fatigue experimentation approach has con-
able 1075-T6 aluminum alloy basic properties
lloy Ultimatestrength(tensile, MPa)
Ultimatestrength(tensile, ksi)
Yield strength(tensile, MPa)
Yield strength(tensile, ksi)
075-T6 570 82.7 505 73.3
428 S.R. Shinde, D.W. Hoeppner / Wear 261 (2006) 426–434
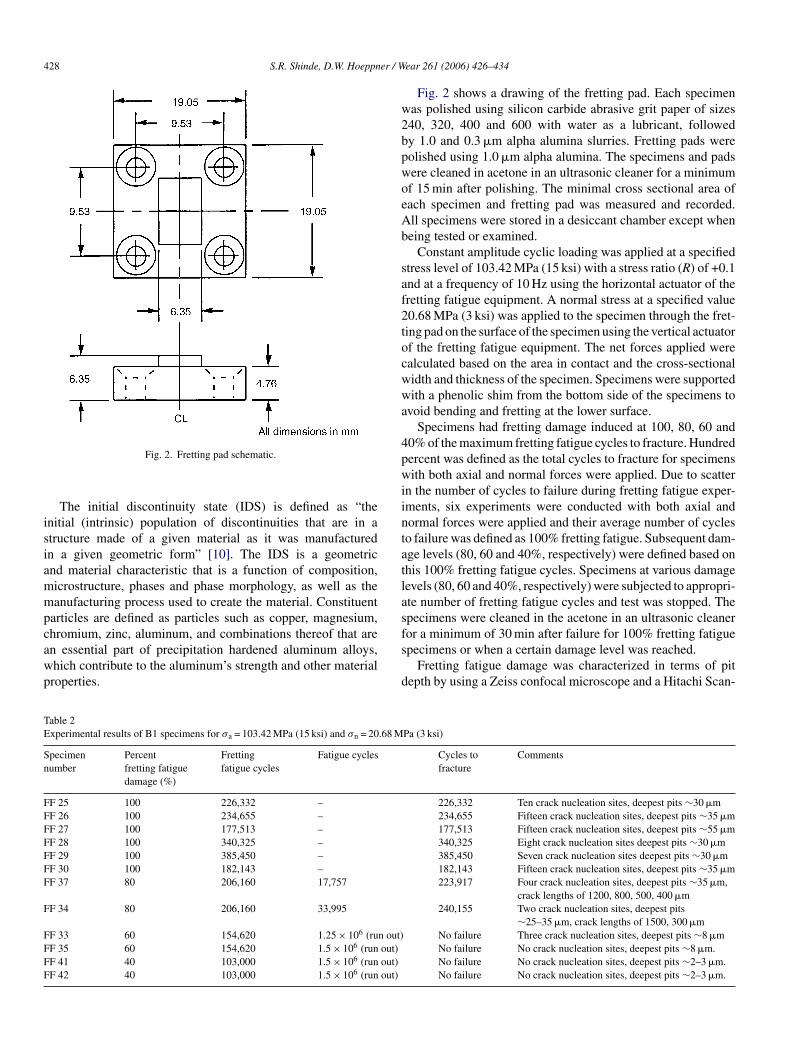
Fig. 2. Fretting pad schematic.
The initial discontinuity state (IDS) is defined as “theinitial (intrinsic) population of discontinuities that are in astructure made of a given material as it was manufacturedin a given geometric form” [10]. The IDS is a geometricand material characteristic that is a function of composition,microstructure, phases and phase morphology, as well as themanufacturing process used to create the material. Constituentparticles are defined as particles such as copper, magnesium,chromium, zinc, aluminum, and combinations thereof that arean essential part of precipitation hardened aluminum alloys,which contribute to the aluminum’s strength and other materialproperties.
Fig. 2 shows a drawing of the fretting pad. Each specimenwas polished using silicon carbide abrasive grit paper of sizes240, 320, 400 and 600 with water as a lubricant, followedby 1.0 and 0.3 �m alpha alumina slurries. Fretting pads werepolished using 1.0 �m alpha alumina. The specimens and padswere cleaned in acetone in an ultrasonic cleaner for a minimumof 15 min after polishing. The minimal cross sectional area ofeach specimen and fretting pad was measured and recorded.All specimens were stored in a desiccant chamber except whenbeing tested or examined.
Constant amplitude cyclic loading was applied at a specifiedstress level of 103.42 MPa (15 ksi) with a stress ratio (R) of +0.1and at a frequency of 10 Hz using the horizontal actuator of thefretting fatigue equipment. A normal stress at a specified value20.68 MPa (3 ksi) was applied to the specimen through the fret-ting pad on the surface of the specimen using the vertical actuatorof the fretting fatigue equipment. The net forces applied werecalculated based on the area in contact and the cross-sectionalwidth and thickness of the specimen. Specimens were supportedwith a phenolic shim from the bottom side of the specimens toavoid bending and fretting at the lower surface.
Specimens had fretting damage induced at 100, 80, 60 and40% of the maximum fretting fatigue cycles to fracture. Hundredpercent was defined as the total cycles to fracture for specimenswith both axial and normal forces were applied. Due to scatterin the number of cycles to failure during fretting fatigue exper-intatlasfs
d
Table 2Experimental results of B1 specimens for σa = 103.42 MPa (15 ksi) and σn = 20.68 M
Specimennumber
Percentfretting fatiguedamage (%)
Frettingfatigue cycles
Fatigue cycles
FF 25 100 226,332 –FF 26 100 234,655 –FF 27 100 177,513 –FF 28 100 340,325 –FF 29 100 385,450 –FF 30 100 182,143 –FF 37 80 206,160 17,757
F
F n out)F out)F out)F out)
F 34 80 206,160 33,995
F 33 60 154,620 1.25 × 10⁶ (ruF 35 60 154,620 1.5 × 10⁶ (runF 41 40 103,000 1.5 × 10⁶ (runF 42 40 103,000 1.5 × 10⁶ (run
ments, six experiments were conducted with both axial andormal forces were applied and their average number of cycleso failure was defined as 100% fretting fatigue. Subsequent dam-ge levels (80, 60 and 40%, respectively) were defined based onhis 100% fretting fatigue cycles. Specimens at various damageevels (80, 60 and 40%, respectively) were subjected to appropri-te number of fretting fatigue cycles and test was stopped. Thepecimens were cleaned in the acetone in an ultrasonic cleaneror a minimum of 30 min after failure for 100% fretting fatiguepecimens or when a certain damage level was reached.
Fretting fatigue damage was characterized in terms of pitepth by using a Zeiss confocal microscope and a Hitachi Scan-
Pa (3 ksi)
Cycles tofracture
Comments
226,332 Ten crack nucleation sites, deepest pits ∼30 �m234,655 Fifteen crack nucleation sites, deepest pits ∼35 �m177,513 Fifteen crack nucleation sites, deepest pits ∼55 �m340,325 Eight crack nucleation sites deepest pits ∼30 �m385,450 Seven crack nucleation sites deepest pits ∼30 �m182,143 Fifteen crack nucleation sites, deepest pits ∼35 �m223,917 Four crack nucleation sites, deepest pits ∼35 �m,
crack lengths of 1200, 800, 500, 400 �m240,155 Two crack nucleation sites, deepest pits
∼25–35 �m, crack lengths of 1500, 300 �mNo failure Three crack nucleation sites, deepest pits ∼8 �mNo failure No crack nucleation sites, deepest pits ∼8 �m.No failure No crack nucleation sites, deepest pits ∼2–3 �m.No failure No crack nucleation sites, deepest pits ∼2–3 �m.
S.R. Shinde, D.W. Hoeppner / Wear 261 (2006) 426–434 429
Table 3Experimental results of B2 specimens for σa = 103.42 MPa (15 ksi) and σn = 20.68 MPa (3 ksi)
Specimennumber
Percentfretting fatiguedamage (%)
Frettingfatigue cycles
Fatigue cycles Cycles to fracture Comments
FF 49 100 283,346 – 283,346 Six crack nucleation sites, deepest pits ∼45 �mFF 50 100 331,653 – 331,653 Two crack nucleation sites, deepest pits ∼30 �mFF 69 100 209,727 – 209,727 Three crack nucleation, deepest pits ∼20 �mFF 52 100 330,094 – 330,094 Six crack nucleation sites, deepest pits ∼30 �mFF 55 100 289,350 – 289,350 Six crack nucleation sites, deepest pits ∼30 �mFF 63 100 153,387 – 153,387 Eight crack nucleation sites, deepest pits ∼75 �mFF 62 80 214,200 1.5 × 10⁶ (run out) 1,714,000 No crack nucleation sites, deepest pits ∼8–10 �mFF 64 80 214,200 1.5 × 10⁶ (run out) 1,714,000 No crack nucleation sites, deepest pits ∼8–10 �mFF 70 80 214,200 1.5 × 10⁶ (run out) 1,714,000 One crack nucleation sites, deepest pits ∼8–10 �m,
crack length −100 �mFF 66 60 160,700 84,388 245,088 Two crack nucleation sites, deepest pits
∼10–12 �m, crack lengths of 600 and 400 �mFF 67 60 160,700 208,914 369,614 Two crack nucleation sites, deepest pits ∼10 �m,
crack length of 500 �mFF 78 60 160,700 1.5 × 10⁶ (run out) 1,660,700 (run out) No crack nucleation sites, deepest pits ∼4–6 �mFF 79 60 160,700 1.5 × 10⁶ (run out) 1,660,700 (run out) No crack nucleation sites, deepest pits ∼4–6 �mFF 74 40 106,400 1.5 × 10⁶ (run out) 1,606,400 No crack nucleation sites, deepest pits ∼2–4 �mFF 75 40 106,400 1.5 × 10⁶ (run out) 1,606,400 No crack nucleation sites, deepest pits ∼2–4 �m
ning Electron Microscope (SEM). Pitting is confined to a pointor small area that takes the form of small cavities. The criticalpit is defined as the pit from which the crack ultimately caus-ing failure originated and propagated to fracture. Surface cracklengths were measured from using the confocal microscope aftercorresponding fretting damage levels were achieved (80, 60 and40%, respectively). Residual life fatigue testing was performedon the specimens using in situ fatigue test equipment in labair.
3. Results
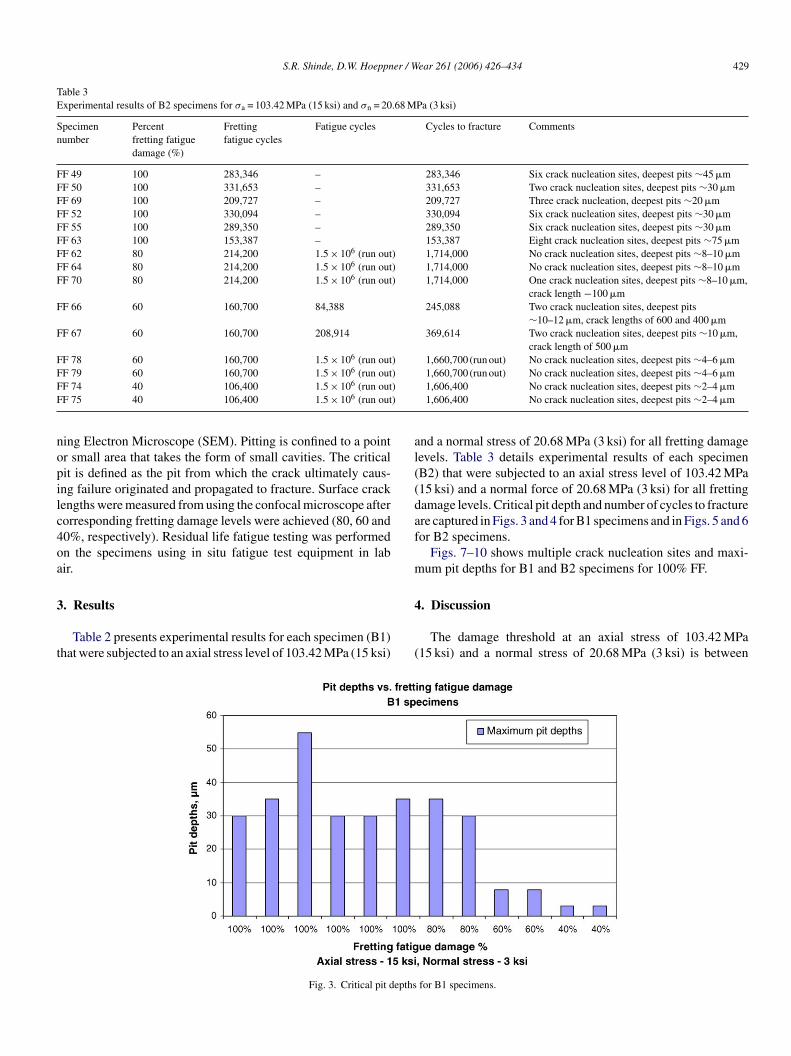
Table 2 presents experimental results for each specimen (B1)that were subjected to an axial stress level of 103.42 MPa (15 ksi)
and a normal stress of 20.68 MPa (3 ksi) for all fretting damagelevels. Table 3 details experimental results of each specimen(B2) that were subjected to an axial stress level of 103.42 MPa(15 ksi) and a normal force of 20.68 MPa (3 ksi) for all frettingdamage levels. Critical pit depth and number of cycles to fractureare captured in Figs. 3 and 4 for B1 specimens and in Figs. 5 and 6for B2 specimens.
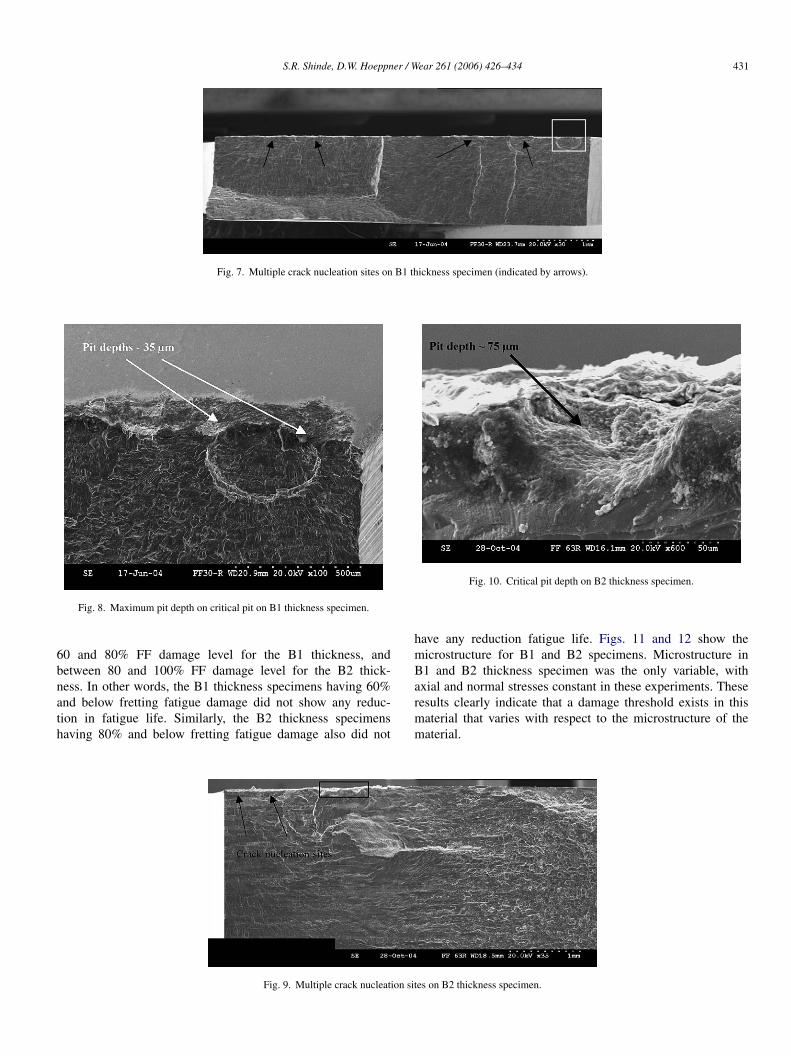
Figs. 7–10 shows multiple crack nucleation sites and maxi-mum pit depths for B1 and B2 specimens for 100% FF.
4. Discussion
The damage threshold at an axial stress of 103.42 MPa(15 ksi) and a normal stress of 20.68 MPa (3 ksi) is between
epths
Fig. 3. Critical pit d for B1 specimens.
430 S.R. Shinde, D.W. Hoeppner / Wear 261 (2006) 426–434
Fig. 4. Number of cycles to fracture for B1 specimens.
Fig. 5. Critical pit depths for B2 specimens.
Fig. 6. Number of cycles to fracture for B2 specimens.
S.R. Shinde, D.W. Hoeppner / Wear 261 (2006) 426–434 431
Fig. 7. Multiple crack nucleation sites on B1 thickness specimen (indicated by arrows).
Fig. 8. Maximum pit depth on critical pit on B1 thickness specimen.
60 and 80% FF damage level for the B1 thickness, andbetween 80 and 100% FF damage level for the B2 thick-ness. In other words, the B1 thickness specimens having 60%and below fretting fatigue damage did not show any reduc-tion in fatigue life. Similarly, the B2 thickness specimenshaving 80% and below fretting fatigue damage also did not
Fig. 10. Critical pit depth on B2 thickness specimen.
have any reduction fatigue life. Figs. 11 and 12 show themicrostructure for B1 and B2 specimens. Microstructure inB1 and B2 thickness specimen was the only variable, withaxial and normal stresses constant in these experiments. Theseresults clearly indicate that a damage threshold exists in thismaterial that varies with respect to the microstructure of thematerial.
Fig. 9. Multiple crack nucleation sites on B2 thickness specimen.

432 S.R. Shinde, D.W. Hoeppner / Wear 261 (2006) 426–434
Fig. 11. A typical three dimensional microstructure for B1 (1.6 mm) thicknessspecimen 7075-T6 aluminum alloy.
From all the specimens (B1 and B2 thicknesses) subjectedto fretting fatigue experiments that fractured, it was observedthat multiple crack nucleation sites were created due to fret-ting degradation on the surface of the specimen. The criti-cal pit depths were noted as approximately 30–50 �m in allB1 specimens compared to critical pit depths of 20–75 �m inall B2 specimens for 100% FF. Results of interrupted experi-ments show that fretting degradation was progressive in boththicknesses.
It was observed from the results that there was an effectof microstructure in the fretting degradation between B1 and
Fig. 12. A typical three dimensional microstructure for B2 (4.06 mm) thicknessspecimen 7075-T6 aluminum alloy.
B2 thicknesses. To investigate the effect of microstructure inboth thicknesses as shown in Figs. 11 and 12, grain sizeswere analyzed by sectioning the specimens in all planes. Thisanalysis shows that the diameter of grains in S–T plane was5–20 �m for B1 and 30–55 �m for B2 thicknesses in theS–T plane. There was no statistically significant differencebetween average numbers of cycles to failure for 100% FF in
ibuted
Fig. 13. Constituent particles in the material contr to the degradation on the surface and to fracture.
S.R. Shinde, D.W. Hoeppner / Wear 261 (2006) 426–434 433
B1 (257,700 cycles) and B2 (266,200 cycles) thickness spec-imens. In other words, there was not a significant differencein number of cycles to failure for B1 and B2 thickness spec-imens. Six repetitions were conducted at B1 and B2 thick-ness respectively at the 100% fretting fatigue level. Since axialand normal stresses were constant and microstructure was theonly variable for these experiments, fretting degradation wassignificantly different for B1 and B2 thicknesses. This illus-trates an influence of microstructure on the fretting degradationin 7075-T6 aluminum alloy. Results indicated that a largergrain size is more susceptible to increased fretting degrada-tion and a smaller grain size has more resistance to frettingdegradation.
Figs. 8 and 10 show the fretting damage degradation ofthe critical pit for both thicknesses. For the B1 thickness, allthe specimens that had fretting damage below 80% FF didnot fracture during the fatigue test and were removed fromfatigue cycling after 1.5 million cycles. For the B2 thickness,all specimens except two in 60% FF that had fretting damagebelow 100% FF did not fracture during the fatigue test andwere removed fatigue cycling after 1.5 million cycles. Failureof the 60% FF specimens during the fatigue test was attributedto the presence of the particles near the surface and the loca-tion of the critical pit near the edge of specimens. Two moreexperiments conducted at this level resulted in run out (nofailure).
cTtwsws
Fig. 14. Constituent particles in the material contributed to the degradation onthe surface and to fracture.
stituent particles assisted cracks in propagating underneath theparticles, thereby removing a chunk of material, causing thepocket like formation shown in Fig. 13. It illustrates that frettingdegradation may cause delamination of material, thereby sup-porting the delamination theory of wear. These cracks nucleatebelow the surface because the triaxial state of stress at the sur-face may prevent crack nucleation. This is significant to thefretting fatigue process since subsurface damage is difficult todetect.
Fig. 15 shows reduction in the fatigue life due to fret-ting under cyclic loading. The results of the uninterruptedfretting fatigue experiments (B1 and B2 thicknesses atσa = 15 ksi and σn = 3 ksi) were plotted with the fatigue data for7075-T6.
sure to
Constituent particles affect the fretting damage and fatiguerack propagation that is illustrated by the following example.he presence of subsurface constituent particles beneath the fret-
ing damage contributed to fracture as shown in Figs. 13 and 14,ith maximum fretting damage of 10 �m. Fig. 13A and B
how the dark region near pits indicating constituent particles,hich were not part of the metal matrix. Evidence seems to
uggest that fretting fatigue degradation on the surface near con-
Fig. 15. Chart illustrating reduction of fatigue life due to expo
fretting under cyclic loading (adapted from MIL handbook).
434 S.R. Shinde, D.W. Hoeppner / Wear 261 (2006) 426–434
5. Conclusions
1. A fretting fatigue damage threshold exists in this materialthat varies with microstructure of the material. The exposureto fretting while under cyclic loading substantially reduceslife of the specimens compared to fatigue alone.
2. The fretting damage transition to cracking was trackedthrough interrupted tests. SEM and confocal microscopyimages of the specimens revealed the role of fretting damageon crack nucleation. Most of the specimens that failed due tofretting damage showed multiple damage sites formed on thesurface and multiple crack nucleation sites. The interruptedfretting fatigue tests showed progressive fretting damage andformation of cracks that nucleated from the fretted pits on thesurface.
3. Pit depth was not the most critical factor in critical cracknucleation due to the fretting. Interactions of following fac-tors play important roles in the crack formation from fretting.These factors include:• Microstructure and initial discontinuity state (IDS)• Pitting depth• Location of pits• Proximity to other pits• Pit size and shape (geometry) and• Pit surface area and volume
4. Constituent particles affect fretting damage and fatigue crack
5
Acknowledgements
The authors would like to thank the University of Utah forthe use of their facilities and continued support for research.The authors are also thankful to FASIDE International Inc., whoprovided funding for this research work and use of FASIDE’sequipment. The authors would also like to Dr. Kim Jones forinsights and assistance during this work.
References
[1] American Society for Testing and Materials, Compilation of ASTMStandard Definitions, eight ed., ASTM, Philadelphia, 1994, p. 223.
[2] ASM Handbook on Friction, Lubrication, and Wear Technology, vol.18, 1992, p. 9.
[3] E.M. Eden, W.N. Rose, F.L. Cunningham, The endurance of metals,Inst. Mech. Eng. (1911) 875.
[4] E.J. Warlow-Davies, Fretting corrosion and fatigue strength: brief resultsof preliminary experiments, Inst. Mech. Eng. 146 (1941) 32–38.
[5] G.A. Tomlinson, P.L. Thorpe, H.J. Gough, An investigation of frettingcorrosion of closely fitting surfaces, Inst. Mech. Eng. 141 (1939) 223.
[6] V. Chandrasekaran, Y. Yoon, D.W. Hoeppner, Analysis of fretting dam-age using confocal microscopy, fretting fatigue: current technology andpractices, ASTM STP 1367 (1999) 337–351.
[7] P.N. Clark, D.W. Hoeppner, “Fretting Fatigue Initial Damage State toCracking State: Observations and Analysis,” Fretting Fatigue: Experi-mental and Analytical Results, STP 1425, American Society for Testingand Materials, West Conshohocken, PA, 2002, pp. 44–57.
[8] American Society for Metals, Aluminum: Properties and Physical Metal-
[
propagation. The presence of subsurface constituent particlesbeneath the fretting damage contributed to fracture.
. Fretting degradation depends on the microstructure of thematerial. The differences in microstructure between 7075-T6 aluminum alloys (B1 and B2 thicknesses) seem to holdthe key to understanding the fretting damage formation, pitto crack transition and crack propagation.
lurgy, American Society for Metals, Metals Park, Ohio, 1984, pp. 84–90,274–275, 354 and 364.
[9] American Society for Metals, Aluminum: Properties and Physical Metal-lurgy, American Society for Metals, Metals Park, Ohio, 1984, pp. 84–90,274–275, 354 and 364 (Chapters 3, 7 and 9).
10] D.W. Hoeppner, Corrosion and Corrosion Fatigue Related Definitions ofTerms For Use in CFSD Phase II, CMI and CP Programs, Salt LakeCity, UT, 2002.
Copyright © 2022 FDOKUMEN