Longitudinal unzipping of carbon nanotubes to form graphene nanoribbons
6
LETTERS Longitudinal unzipping of carbon nanotubes to form graphene nanoribbons Dmitry V. Kosynkin 1 , Amanda L. Higginbotham 1 , Alexander Sinitskii 1 , Jay R. Lomeda 1 , Ayrat Dimiev 1 , B. Katherine Price 1 & James M. Tour 1,2,3 Graphene, or single-layered graphite, with its high crystallinity and interesting semimetal electronic properties, has emerged as an exciting two-dimensional material showing great promise for the fabrication of nanoscale devices 1–3 . Thin, elongated strips of graphene that possess straight edges, termed graphene ribbons, gradually transform from semiconductors to semimetals as their width increases 4–7 , and represent a particularly versatile variety of graphene. Several lithographic 7,8 , chemical 9–11 and synthetic 12 procedures are known to produce microscopic samples of graphene nanoribbons, and one chemical vapour deposition process 13 has successfully produced macroscopic quantities of nanoribbons at 950 6C. Here we describe a simple solution-based oxidative process for producing a nearly 100% yield of nanoribbon structures by lengthwise cutting and unravelling of multiwalled carbon nano- tube (MWCNT) side walls. Although oxidative shortening of MWCNTs has previously been achieved 14 , lengthwise cutting is hitherto unreported. Ribbon structures with high water solubility are obtained. Subsequent chemical reduction of the nanoribbons from MWCNTs results in restoration of electrical conductivity. These early results affording nanoribbons could eventually lead to applications in fields of electronics and composite materials where bulk quantities of nanoribbons are required 15–17 . We obtained oxidized nanoribbons by suspending MWCNTs in concentrated sulphuric acid followed by treatment with 500 wt% KMnO 4 for 1 h at room temperature (22 uC) and 1 h at 55–70 uC (Methods). After isolation, the resulting nanoribbons were highly soluble in water (12 mg ml 21 ), ethanol and other polar organic solvents. The opening of the nanotubes appears to occur along a line, similar to the ‘unzipping’ of graphite oxide 18,19 , affording straight- edged ribbons. This could occur in a linear longitudinal cut (Fig. 1a) or in a spiralling manner, depending upon the initial site of attack and the chiral angle of the nanotube. Although depicted in Fig. 1a as occurring on the mid-section of the nanotube rather than at one end, the location of the initial attack is not known. The mechanism of opening is based on previous work on the oxida- tion of alkenes by permanganate in acid. The proposed first step in the process is manganate ester formation (2, Fig. 1b) as the rate- determining step, and further oxidation is possible to afford the dione (3, Fig. 1b) in the dehydrating medium 20 . Juxtaposition of the buttressing ketones distorts the b,c-alkenes (red in 3), making them more prone to the next attack by permanganate. As the process continues, the buttressing-induced strain on the b,c-alkenes lessens because there is more space for carbonyl projection; however, the bond-angle strain induced by the enlarging hole (or tear if originating from the end of the nanotube) would make the b,c-alkenes (4, Fig. 1b) increasingly reactive. Hence, once an opening has been initiated, its further opening is enhanced relative to an unopened tube or to an uninitiated site on the same tube. The ketones can be further converted, through their O-protonated forms, to the carboxylic acids 21 that will line the edges of the nanoribbons. Finally, relief of the bond-angle strain when the nanotube opens to the graphene ribbon (5, Fig. 1b) slows further dione formation and cutting 20 . Thus, the preference for sequential bond cleavage over random opening and subsequent cutting, as occurs with nitric acid oxidation, can be explained by concerted attachment to neighbouring carbon atoms by permanganate, contrasting with the random attack on non- neighbouring carbon atoms by the nitronium species from nitric acid. The surface of the now-less-strained nanoribbon remains prone to 1,2-diol formation, which leads to the overall highly oxidized ribbon, but this is less likely to result in further oxidative cutting to the dione owing to relief of the tubular strain on the double bonds. We achieved the same unzipping process in single-walled carbon nanotubes (SWCNTs), to produce narrow nanoribbons, but their subsequent disentanglement is more difficult. See Supplementary Figs 5 and 6 for images and analysis of those SWCNT-derived narrow nanoribbons and their reduction products. We used transmission electron microscopy (TEM), atomic force microscopy (AFM) and scanning electron microscopy (SEM) to image the ribbon structures. TEM analysis shows nanoribbons (Fig. 1c) produced from MWCNTs with a starting diameter of 40– 80 nm and approximately 15–20 inner nanotube layers (additional TEM images of untreated MWCNTs can be found in the Supplementary Fig. 1a, b). After reaction, the width of the carbon nanostructures increased to .100 nm and they had linear edges with little pristine MWCNT side-wall structure remaining (see Supplementary Figs 1 and 2 for more images). The MWCNTs used were produced from a chemical vapour deposition process 22 ; we attempted the same H 2 SO 4 –KMnO 4 treatment on a single sample of laser-oven-produced MWCNTs, but fewer nanoribbon-like struc- tures were detected. AFM imaging (Fig. 1d) shows the presence of single atomic layers after tip sonication of the solution for 30 min to yield well-dispersed and sonication-shortened ribbons suitable for imaging. SEM imaging (Fig. 1e) of nanoribbons on a silicon surface shows that the ribbons remain long (,4 mm in this image) when not cut by tip sonication; they can be dispersed as single or thin layers and they display uniform widths and predominantly straight edges over their entire length (see Supplementary Fig. 1c, d for other images). The degree of consecutive tube opening in the MWCNTs can also be controlled by adjusting the amount of oxidizing agent introduced into the system; using TEM, we found that in 80–100% of the MWCNTs present, the side walls completely unravelled to form nanoribbons when 500 wt% KMnO 4 was used. The successive open- ing reaction was demonstrated in five iterations, each containing a stepwise increase in the amount of KMnO 4 : 100 wt% KMnO 4 in the 1 Department of Chemistry, 2 Department of Mechanical Engineering and Materials Science, 3 Smalley Institute for Nanoscale Science and Technology, Rice University, MS-222, 6100 Main Street, Houston, Texas 77005, USA. Vol 458 | 16 April 2009 | doi:10.1038/nature07872 872 Macmillan Publishers Limited. All rights reserved ©2009
Transcript of Longitudinal unzipping of carbon nanotubes to form graphene nanoribbons
LETTERS
Longitudinal unzipping of carbon nanotubes to formgraphene nanoribbonsDmitry V. Kosynkin1, Amanda L. Higginbotham1, Alexander Sinitskii1, Jay R. Lomeda1, Ayrat Dimiev1,B. Katherine Price1 & James M. Tour1,2,3
Graphene, or single-layered graphite, with its high crystallinity andinteresting semimetal electronic properties, has emerged as anexciting two-dimensional material showing great promise for thefabrication of nanoscale devices1–3. Thin, elongated strips ofgraphene that possess straight edges, termed graphene ribbons,gradually transform from semiconductors to semimetals as theirwidth increases4–7, and represent a particularly versatile variety ofgraphene. Several lithographic7,8, chemical9–11 and synthetic12
procedures are known to produce microscopic samples of graphenenanoribbons, and one chemical vapour deposition process13 hassuccessfully produced macroscopic quantities of nanoribbons at950 6C. Here we describe a simple solution-based oxidative processfor producing a nearly 100% yield of nanoribbon structures bylengthwise cutting and unravelling of multiwalled carbon nano-tube (MWCNT) side walls. Although oxidative shortening ofMWCNTs has previously been achieved14, lengthwise cutting ishitherto unreported. Ribbon structures with high water solubilityare obtained. Subsequent chemical reduction of the nanoribbonsfrom MWCNTs results in restoration of electrical conductivity.These early results affording nanoribbons could eventually leadto applications in fields of electronics and composite materialswhere bulk quantities of nanoribbons are required15–17.
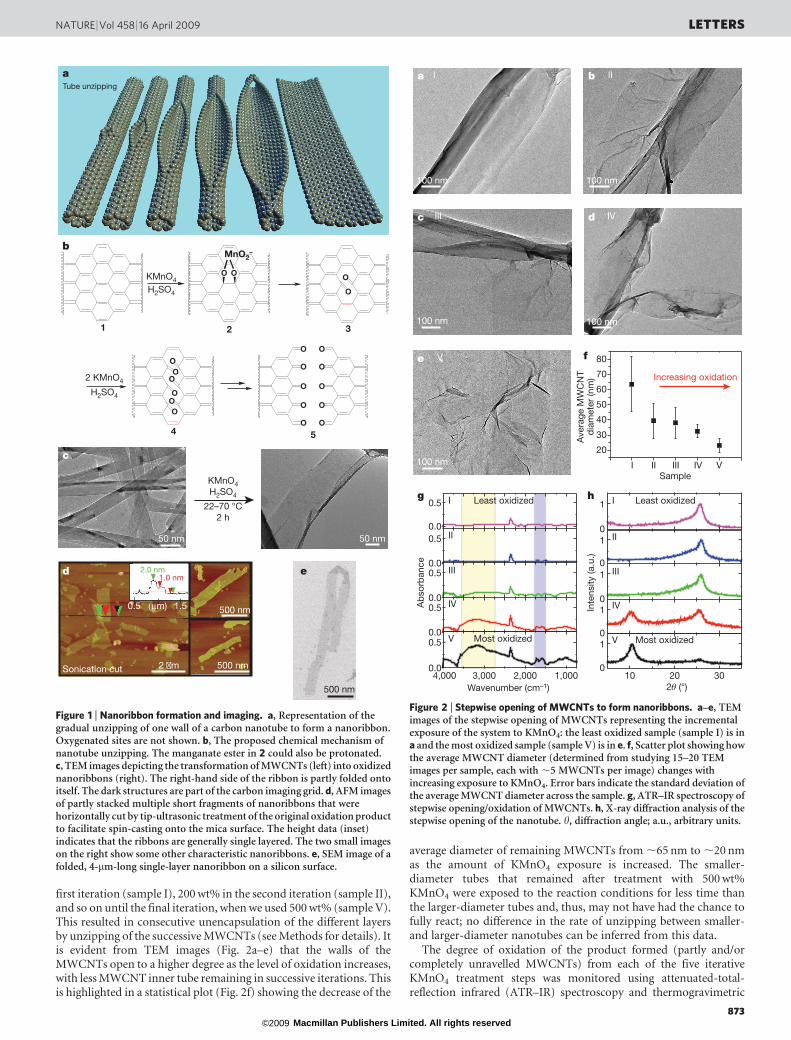
We obtained oxidized nanoribbons by suspending MWCNTs inconcentrated sulphuric acid followed by treatment with 500 wt%KMnO4 for 1 h at room temperature (22 uC) and 1 h at 55–70 uC(Methods). After isolation, the resulting nanoribbons were highlysoluble in water (12 mg ml21), ethanol and other polar organicsolvents. The opening of the nanotubes appears to occur along a line,similar to the ‘unzipping’ of graphite oxide18,19, affording straight-edged ribbons. This could occur in a linear longitudinal cut (Fig. 1a)or in a spiralling manner, depending upon the initial site of attackand the chiral angle of the nanotube. Although depicted in Fig. 1a asoccurring on the mid-section of the nanotube rather than at one end,the location of the initial attack is not known.
The mechanism of opening is based on previous work on the oxida-tion of alkenes by permanganate in acid. The proposed first step inthe process is manganate ester formation (2, Fig. 1b) as the rate-determining step, and further oxidation is possible to afford thedione (3, Fig. 1b) in the dehydrating medium20. Juxtaposition of thebuttressing ketones distorts the b,c-alkenes (red in 3), making themmore prone to the next attack by permanganate. As the processcontinues, the buttressing-induced strain on the b,c-alkenes lessensbecause there is more space for carbonyl projection; however, thebond-angle strain induced by the enlarging hole (or tear if originatingfrom the end of the nanotube) would make theb,c-alkenes (4, Fig. 1b)increasingly reactive. Hence, once an opening has been initiated, itsfurther opening is enhanced relative to an unopened tube or to an
uninitiated site on the same tube. The ketones can be furtherconverted, through their O-protonated forms, to the carboxylicacids21 that will line the edges of the nanoribbons. Finally, relief ofthe bond-angle strain when the nanotube opens to the grapheneribbon (5, Fig. 1b) slows further dione formation and cutting20.Thus, the preference for sequential bond cleavage over randomopening and subsequent cutting, as occurs with nitric acid oxidation,can be explained by concerted attachment to neighbouring carbonatoms by permanganate, contrasting with the random attack on non-neighbouring carbon atoms by the nitronium species from nitric acid.The surface of the now-less-strained nanoribbon remains prone to1,2-diol formation, which leads to the overall highly oxidized ribbon,but this is less likely to result in further oxidative cutting to the dioneowing to relief of the tubular strain on the double bonds.
We achieved the same unzipping process in single-walled carbonnanotubes (SWCNTs), to produce narrow nanoribbons, but theirsubsequent disentanglement is more difficult. See SupplementaryFigs 5 and 6 for images and analysis of those SWCNT-derived narrownanoribbons and their reduction products.
We used transmission electron microscopy (TEM), atomic forcemicroscopy (AFM) and scanning electron microscopy (SEM) toimage the ribbon structures. TEM analysis shows nanoribbons(Fig. 1c) produced from MWCNTs with a starting diameter of 40–80 nm and approximately 15–20 inner nanotube layers (additionalTEM images of untreated MWCNTs can be found in theSupplementary Fig. 1a, b). After reaction, the width of the carbonnanostructures increased to .100 nm and they had linear edges withlittle pristine MWCNT side-wall structure remaining (seeSupplementary Figs 1 and 2 for more images). The MWCNTs usedwere produced from a chemical vapour deposition process22; weattempted the same H2SO4–KMnO4 treatment on a single sampleof laser-oven-produced MWCNTs, but fewer nanoribbon-like struc-tures were detected. AFM imaging (Fig. 1d) shows the presence ofsingle atomic layers after tip sonication of the solution for 30 min toyield well-dispersed and sonication-shortened ribbons suitable forimaging. SEM imaging (Fig. 1e) of nanoribbons on a silicon surfaceshows that the ribbons remain long (,4mm in this image) when notcut by tip sonication; they can be dispersed as single or thin layers andthey display uniform widths and predominantly straight edges overtheir entire length (see Supplementary Fig. 1c, d for other images).
The degree of consecutive tube opening in the MWCNTs can alsobe controlled by adjusting the amount of oxidizing agent introducedinto the system; using TEM, we found that in 80–100% of theMWCNTs present, the side walls completely unravelled to formnanoribbons when 500 wt% KMnO4 was used. The successive open-ing reaction was demonstrated in five iterations, each containing astepwise increase in the amount of KMnO4: 100 wt% KMnO4 in the
1Department of Chemistry, 2Department of Mechanical Engineering and Materials Science, 3Smalley Institute for Nanoscale Science and Technology, Rice University, MS-222, 6100Main Street, Houston, Texas 77005, USA.
Vol 458 | 16 April 2009 | doi:10.1038/nature07872
872 Macmillan Publishers Limited. All rights reserved©2009
first iteration (sample I), 200 wt% in the second iteration (sample II),and so on until the final iteration, when we used 500 wt% (sample V).This resulted in consecutive unencapsulation of the different layersby unzipping of the successive MWCNTs (see Methods for details). Itis evident from TEM images (Fig. 2a–e) that the walls of theMWCNTs open to a higher degree as the level of oxidation increases,with less MWCNT inner tube remaining in successive iterations. Thisis highlighted in a statistical plot (Fig. 2f) showing the decrease of the
average diameter of remaining MWCNTs from ,65 nm to ,20 nmas the amount of KMnO4 exposure is increased. The smaller-diameter tubes that remained after treatment with 500 wt%KMnO4 were exposed to the reaction conditions for less time thanthe larger-diameter tubes and, thus, may not have had the chance tofully react; no difference in the rate of unzipping between smaller-and larger-diameter nanotubes can be inferred from this data.
The degree of oxidation of the product formed (partly and/orcompletely unravelled MWCNTs) from each of the five iterativeKMnO4 treatment steps was monitored using attenuated-total-reflection infrared (ATR–IR) spectroscopy and thermogravimetric
Tube unzipping
a
O O
MnO2–
O
O
O
O
OO
OO
O
O
O
O
O
O
O
O
O
O
1 2 3
4 5
KMnO4
H2SO4
2 KMnO4
H2SO4
b
KMnO4H2SO4
22–70 °C2 h
50 nm 50 nm
c
2 �m
d 2.0 nm
(μm)0.5 1.5
1.0 nm
500 nm
500 nmSonication cut
500 nm
e
Figure 1 | Nanoribbon formation and imaging. a, Representation of thegradual unzipping of one wall of a carbon nanotube to form a nanoribbon.Oxygenated sites are not shown. b, The proposed chemical mechanism ofnanotube unzipping. The manganate ester in 2 could also be protonated.c, TEM images depicting the transformation of MWCNTs (left) into oxidizednanoribbons (right). The right-hand side of the ribbon is partly folded ontoitself. The dark structures are part of the carbon imaging grid. d, AFM imagesof partly stacked multiple short fragments of nanoribbons that werehorizontally cut by tip-ultrasonic treatment of the original oxidation productto facilitate spin-casting onto the mica surface. The height data (inset)indicates that the ribbons are generally single layered. The two small imageson the right show some other characteristic nanoribbons. e, SEM image of afolded, 4-mm-long single-layer nanoribbon on a silicon surface.
20
30
40
50
60
70
80
Ave
rage
MW
CN
Td
iam
eter
(nm
)
Sample
100 nm 100 nm
100 nm 100 nm
100 nm
a b
c d
e f
Increasing oxidation
I II III IV V
I II
III IV
V
4,000 3,000 2,000 1,0000.0
0.5
Ab
sorb
ance
Wavenumber (cm–1)
V Most oxidized0.0
0.5 IV0.0
0.5 III0.0
0.5 II0.0
0.5 I Least oxidizedg
10 20 300
1
Inte
nsity
(a.u
.)
2θ (°)
V Most oxidized0
1 IV0
1 III0
1 II0
1 I Least oxidizedh
Figure 2 | Stepwise opening of MWCNTs to form nanoribbons. a–e, TEMimages of the stepwise opening of MWCNTs representing the incrementalexposure of the system to KMnO4: the least oxidized sample (sample I) is ina and the most oxidized sample (sample V) is in e. f, Scatter plot showing howthe average MWCNT diameter (determined from studying 15–20 TEMimages per sample, each with ,5 MWCNTs per image) changes withincreasing exposure to KMnO4. Error bars indicate the standard deviation ofthe average MWCNT diameter across the sample. g, ATR–IR spectroscopy ofstepwise opening/oxidation of MWCNTs. h, X-ray diffraction analysis of thestepwise opening of the nanotube. h, diffraction angle; a.u., arbitrary units.
NATURE | Vol 458 | 16 April 2009 LETTERS
873 Macmillan Publishers Limited. All rights reserved©2009
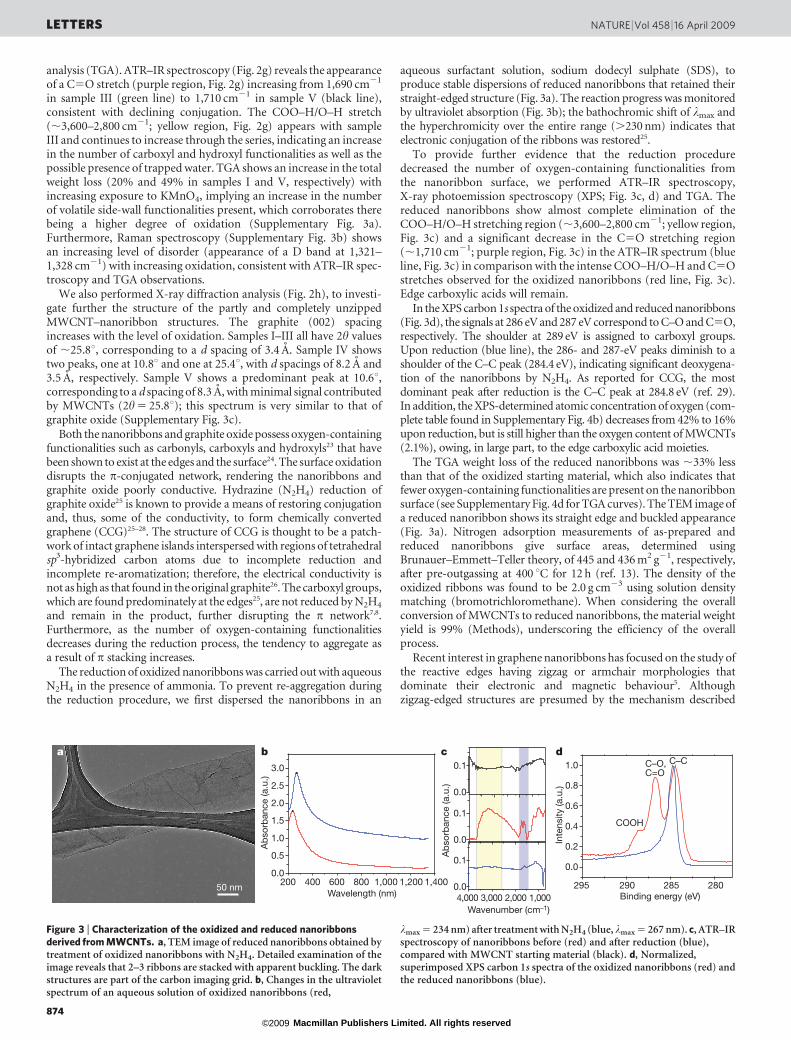
analysis (TGA). ATR–IR spectroscopy (Fig. 2g) reveals the appearanceof a C5O stretch (purple region, Fig. 2g) increasing from 1,690 cm21
in sample III (green line) to 1,710 cm21 in sample V (black line),consistent with declining conjugation. The COO–H/O–H stretch(,3,600–2,800 cm21; yellow region, Fig. 2g) appears with sampleIII and continues to increase through the series, indicating an increasein the number of carboxyl and hydroxyl functionalities as well as thepossible presence of trapped water. TGA shows an increase in the totalweight loss (20% and 49% in samples I and V, respectively) withincreasing exposure to KMnO4, implying an increase in the numberof volatile side-wall functionalities present, which corroborates therebeing a higher degree of oxidation (Supplementary Fig. 3a).Furthermore, Raman spectroscopy (Supplementary Fig. 3b) showsan increasing level of disorder (appearance of a D band at 1,321–1,328 cm21) with increasing oxidation, consistent with ATR–IR spec-troscopy and TGA observations.
We also performed X-ray diffraction analysis (Fig. 2h), to investi-gate further the structure of the partly and completely unzippedMWCNT–nanoribbon structures. The graphite (002) spacingincreases with the level of oxidation. Samples I–III all have 2h valuesof ,25.8u, corresponding to a d spacing of 3.4 A. Sample IV showstwo peaks, one at 10.8u and one at 25.4u, with d spacings of 8.2 A and3.5 A, respectively. Sample V shows a predominant peak at 10.6u,corresponding to a d spacing of 8.3 A, with minimal signal contributedby MWCNTs (2h 5 25.8u); this spectrum is very similar to that ofgraphite oxide (Supplementary Fig. 3c).
Both the nanoribbons and graphite oxide possess oxygen-containingfunctionalities such as carbonyls, carboxyls and hydroxyls23 that havebeen shown to exist at the edges and the surface24. The surface oxidationdisrupts the p-conjugated network, rendering the nanoribbons andgraphite oxide poorly conductive. Hydrazine (N2H4) reduction ofgraphite oxide25 is known to provide a means of restoring conjugationand, thus, some of the conductivity, to form chemically convertedgraphene (CCG)25–28. The structure of CCG is thought to be a patch-work of intact graphene islands interspersed with regions of tetrahedralsp3-hybridized carbon atoms due to incomplete reduction andincomplete re-aromatization; therefore, the electrical conductivity isnot as high as that found in the original graphite26. The carboxyl groups,which are found predominately at the edges25, are not reduced by N2H4
and remain in the product, further disrupting the p network7,8.Furthermore, as the number of oxygen-containing functionalitiesdecreases during the reduction process, the tendency to aggregate asa result of p stacking increases.
The reduction of oxidized nanoribbons was carried out with aqueousN2H4 in the presence of ammonia. To prevent re-aggregation duringthe reduction procedure, we first dispersed the nanoribbons in an
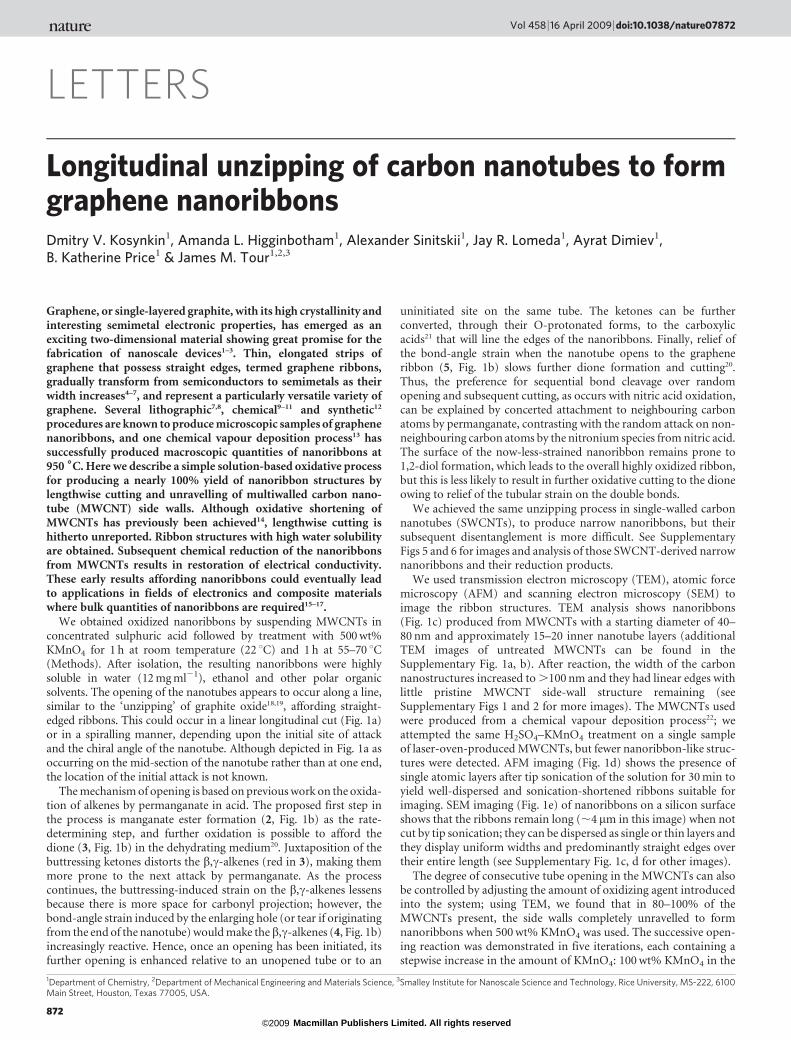
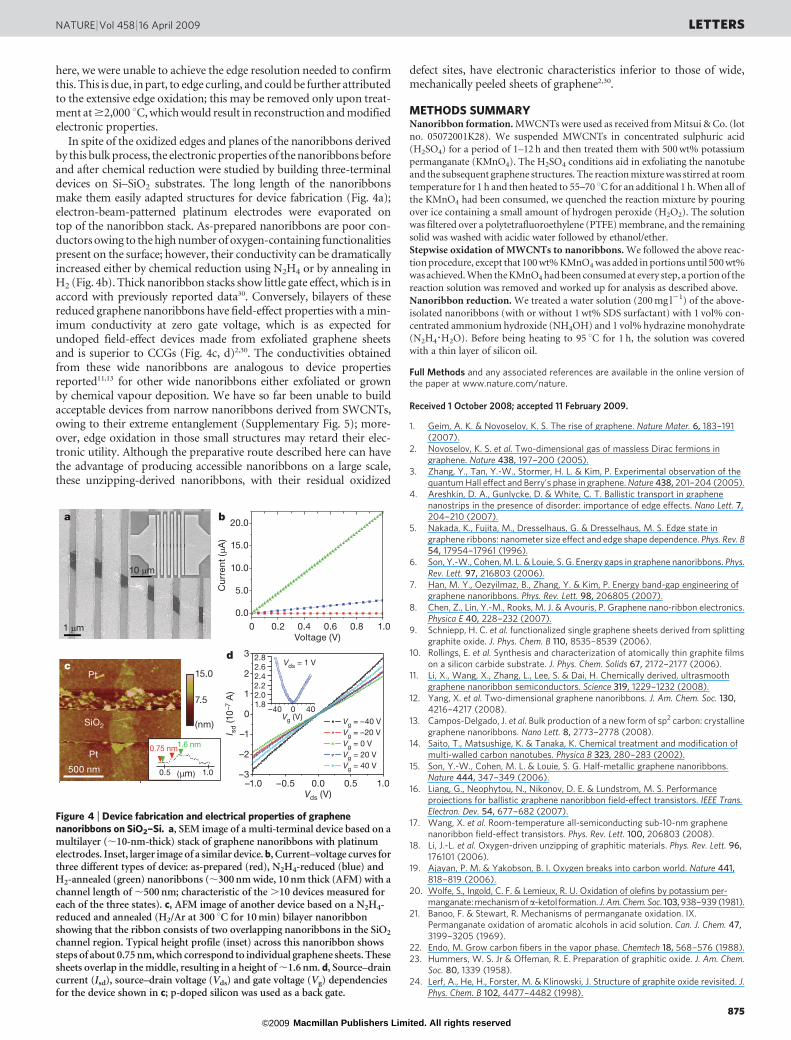
aqueous surfactant solution, sodium dodecyl sulphate (SDS), toproduce stable dispersions of reduced nanoribbons that retained theirstraight-edged structure (Fig. 3a). The reaction progress was monitoredby ultraviolet absorption (Fig. 3b); the bathochromic shift of lmax andthe hyperchromicity over the entire range (.230 nm) indicates thatelectronic conjugation of the ribbons was restored25.
To provide further evidence that the reduction proceduredecreased the number of oxygen-containing functionalities fromthe nanoribbon surface, we performed ATR–IR spectroscopy,X-ray photoemission spectroscopy (XPS; Fig. 3c, d) and TGA. Thereduced nanoribbons show almost complete elimination of theCOO–H/O–H stretching region (,3,600–2,800 cm21; yellow region,Fig. 3c) and a significant decrease in the C5O stretching region(,1,710 cm21; purple region, Fig. 3c) in the ATR–IR spectrum (blueline, Fig. 3c) in comparison with the intense COO–H/O–H and C5Ostretches observed for the oxidized nanoribbons (red line, Fig. 3c).Edge carboxylic acids will remain.
In the XPS carbon 1s spectra of the oxidized and reduced nanoribbons(Fig. 3d), the signals at 286 eV and 287 eV correspond to C–O and C5O,respectively. The shoulder at 289 eV is assigned to carboxyl groups.Upon reduction (blue line), the 286- and 287-eV peaks diminish to ashoulder of the C–C peak (284.4 eV), indicating significant deoxygena-tion of the nanoribbons by N2H4. As reported for CCG, the mostdominant peak after reduction is the C–C peak at 284.8 eV (ref. 29).In addition, the XPS-determined atomic concentration of oxygen (com-plete table found in Supplementary Fig. 4b) decreases from 42% to 16%upon reduction, but is still higher than the oxygen content of MWCNTs(2.1%), owing, in large part, to the edge carboxylic acid moieties.
The TGA weight loss of the reduced nanoribbons was ,33% lessthan that of the oxidized starting material, which also indicates thatfewer oxygen-containing functionalities are present on the nanoribbonsurface (see Supplementary Fig. 4d for TGA curves). The TEM image ofa reduced nanoribbon shows its straight edge and buckled appearance(Fig. 3a). Nitrogen adsorption measurements of as-prepared andreduced nanoribbons give surface areas, determined usingBrunauer–Emmett–Teller theory, of 445 and 436 m2 g21, respectively,after pre-outgassing at 400 uC for 12 h (ref. 13). The density of theoxidized ribbons was found to be 2.0 g cm23 using solution densitymatching (bromotrichloromethane). When considering the overallconversion of MWCNTs to reduced nanoribbons, the material weightyield is 99% (Methods), underscoring the efficiency of the overallprocess.
Recent interest in graphene nanoribbons has focused on the study ofthe reactive edges having zigzag or armchair morphologies thatdominate their electronic and magnetic behaviour5. Althoughzigzag-edged structures are presumed by the mechanism described
50 nm 295 290 285 280
0.0
0.2
0.4
0.6
0.8
1.0
Inte
nsity
(a.u
.)
Binding energy (eV)
C–O,C=O
COOH
C–C
4,000 3,000 2,000 1,0000.0
0.1
0.0
0.1
0.0
0.1
Ab
sorb
ance
(a.u
.)
200 400 600 800 1,000 1,200 1,4000.0
0.5
1.0
1.5
2.0
2.5
3.0
Ab
sorb
ance
(a.u
.)
Wavelength (nm)
cba d
Wavenumber (cm–1)
Figure 3 | Characterization of the oxidized and reduced nanoribbonsderived from MWCNTs. a, TEM image of reduced nanoribbons obtained bytreatment of oxidized nanoribbons with N2H4. Detailed examination of theimage reveals that 2–3 ribbons are stacked with apparent buckling. The darkstructures are part of the carbon imaging grid. b, Changes in the ultravioletspectrum of an aqueous solution of oxidized nanoribbons (red,
lmax 5 234 nm) after treatment with N2H4 (blue, lmax 5 267 nm). c, ATR–IRspectroscopy of nanoribbons before (red) and after reduction (blue),compared with MWCNT starting material (black). d, Normalized,superimposed XPS carbon 1s spectra of the oxidized nanoribbons (red) andthe reduced nanoribbons (blue).
LETTERS NATURE | Vol 458 | 16 April 2009
874 Macmillan Publishers Limited. All rights reserved©2009
here, we were unable to achieve the edge resolution needed to confirmthis. This is due, in part, to edge curling, and could be further attributedto the extensive edge oxidation; this may be removed only upon treat-ment at $2,000 uC, which would result in reconstruction and modifiedelectronic properties.
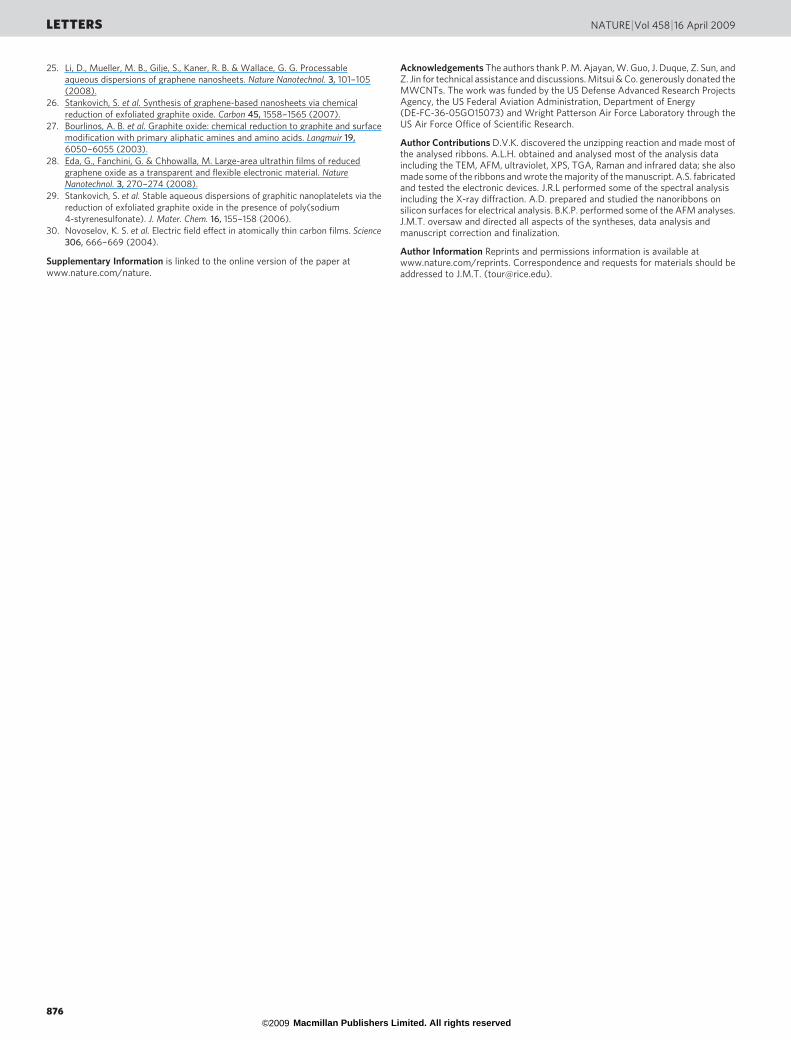
In spite of the oxidized edges and planes of the nanoribbons derivedby this bulk process, the electronic properties of the nanoribbons beforeand after chemical reduction were studied by building three-terminaldevices on Si–SiO2 substrates. The long length of the nanoribbonsmake them easily adapted structures for device fabrication (Fig. 4a);electron-beam-patterned platinum electrodes were evaporated ontop of the nanoribbon stack. As-prepared nanoribbons are poor con-ductors owing to the high number of oxygen-containing functionalitiespresent on the surface; however, their conductivity can be dramaticallyincreased either by chemical reduction using N2H4 or by annealing inH2 (Fig. 4b). Thick nanoribbon stacks show little gate effect, which is inaccord with previously reported data30. Conversely, bilayers of thesereduced graphene nanoribbons have field-effect properties with a min-imum conductivity at zero gate voltage, which is as expected forundoped field-effect devices made from exfoliated graphene sheetsand is superior to CCGs (Fig. 4c, d)2,30. The conductivities obtainedfrom these wide nanoribbons are analogous to device propertiesreported11,13 for other wide nanoribbons either exfoliated or grownby chemical vapour deposition. We have so far been unable to buildacceptable devices from narrow nanoribbons derived from SWCNTs,owing to their extreme entanglement (Supplementary Fig. 5); more-over, edge oxidation in those small structures may retard their elec-tronic utility. Although the preparative route described here can havethe advantage of producing accessible nanoribbons on a large scale,these unzipping-derived nanoribbons, with their residual oxidized
defect sites, have electronic characteristics inferior to those of wide,mechanically peeled sheets of graphene2,30.
METHODS SUMMARYNanoribbon formation. MWCNTs were used as received from Mitsui & Co. (lot
no. 05072001K28). We suspended MWCNTs in concentrated sulphuric acid
(H2SO4) for a period of 1–12 h and then treated them with 500 wt% potassium
permanganate (KMnO4). The H2SO4 conditions aid in exfoliating the nanotube
and the subsequent graphene structures. The reaction mixture was stirred at room
temperature for 1 h and then heated to 55–70 uC for an additional 1 h. When all of
the KMnO4 had been consumed, we quenched the reaction mixture by pouring
over ice containing a small amount of hydrogen peroxide (H2O2). The solution
was filtered over a polytetrafluoroethylene (PTFE) membrane, and the remaining
solid was washed with acidic water followed by ethanol/ether.
Stepwise oxidation of MWCNTs to nanoribbons. We followed the above reac-
tion procedure, except that 100 wt% KMnO4 was added in portions until 500 wt%
was achieved. When the KMnO4 had been consumed at every step, a portion of the
reaction solution was removed and worked up for analysis as described above.
Nanoribbon reduction. We treated a water solution (200 mg l21) of the above-
isolated nanoribbons (with or without 1 wt% SDS surfactant) with 1 vol% con-centrated ammonium hydroxide (NH4OH) and 1 vol% hydrazine monohydrate
(N2H4?H2O). Before being heating to 95 uC for 1 h, the solution was covered
with a thin layer of silicon oil.
Full Methods and any associated references are available in the online version ofthe paper at www.nature.com/nature.
Received 1 October 2008; accepted 11 February 2009.
1. Geim, A. K. & Novoselov, K. S. The rise of graphene. Nature Mater. 6, 183–191(2007).
2. Novoselov, K. S. et al. Two-dimensional gas of massless Dirac fermions ingraphene. Nature 438, 197–200 (2005).
3. Zhang, Y., Tan, Y.-W., Stormer, H. L. & Kim, P. Experimental observation of thequantum Hall effect and Berry’s phase in graphene. Nature 438, 201–204 (2005).
4. Areshkin, D. A., Gunlycke, D. & White, C. T. Ballistic transport in graphenenanostrips in the presence of disorder: importance of edge effects. Nano Lett. 7,204–210 (2007).
5. Nakada, K., Fujita, M., Dresselhaus, G. & Dresselhaus, M. S. Edge state ingraphene ribbons: nanometer size effect and edge shape dependence. Phys. Rev. B54, 17954–17961 (1996).
6. Son, Y.-W., Cohen, M. L. & Louie, S. G. Energy gaps in graphene nanoribbons. Phys.Rev. Lett. 97, 216803 (2006).
7. Han, M. Y., Oezyilmaz, B., Zhang, Y. & Kim, P. Energy band-gap engineering ofgraphene nanoribbons. Phys. Rev. Lett. 98, 206805 (2007).
8. Chen, Z., Lin, Y.-M., Rooks, M. J. & Avouris, P. Graphene nano-ribbon electronics.Physica E 40, 228–232 (2007).
9. Schniepp, H. C. et al. functionalized single graphene sheets derived from splittinggraphite oxide. J. Phys. Chem. B 110, 8535–8539 (2006).
10. Rollings, E. et al. Synthesis and characterization of atomically thin graphite filmson a silicon carbide substrate. J. Phys. Chem. Solids 67, 2172–2177 (2006).
11. Li, X., Wang, X., Zhang, L., Lee, S. & Dai, H. Chemically derived, ultrasmoothgraphene nanoribbon semiconductors. Science 319, 1229–1232 (2008).
12. Yang, X. et al. Two-dimensional graphene nanoribbons. J. Am. Chem. Soc. 130,4216–4217 (2008).
13. Campos-Delgado, J. et al. Bulk production of a new form of sp2 carbon: crystallinegraphene nanoribbons. Nano Lett. 8, 2773–2778 (2008).
14. Saito, T., Matsushige, K. & Tanaka, K. Chemical treatment and modification ofmulti-walled carbon nanotubes. Physica B 323, 280–283 (2002).
15. Son, Y.-W., Cohen, M. L. & Louie, S. G. Half-metallic graphene nanoribbons.Nature 444, 347–349 (2006).
16. Liang, G., Neophytou, N., Nikonov, D. E. & Lundstrom, M. S. Performanceprojections for ballistic graphene nanoribbon field-effect transistors. IEEE Trans.Electron. Dev. 54, 677–682 (2007).
17. Wang, X. et al. Room-temperature all-semiconducting sub-10-nm graphenenanoribbon field-effect transistors. Phys. Rev. Lett. 100, 206803 (2008).
18. Li, J.-L. et al. Oxygen-driven unzipping of graphitic materials. Phys. Rev. Lett. 96,176101 (2006).
19. Ajayan, P. M. & Yakobson, B. I. Oxygen breaks into carbon world. Nature 441,818–819 (2006).
20. Wolfe, S., Ingold, C. F. & Lemieux, R. U. Oxidation of olefins by potassium per-manganate: mechanism ofa-ketol formation. J. Am. Chem. Soc. 103, 938–939 (1981).
21. Banoo, F. & Stewart, R. Mechanisms of permanganate oxidation. IX.Permanganate oxidation of aromatic alcohols in acid solution. Can. J. Chem. 47,3199–3205 (1969).
22. Endo, M. Grow carbon fibers in the vapor phase. Chemtech 18, 568–576 (1988).23. Hummers, W. S. Jr & Offeman, R. E. Preparation of graphitic oxide. J. Am. Chem.
Soc. 80, 1339 (1958).24. Lerf, A., He, H., Forster, M. & Klinowski, J. Structure of graphite oxide revisited. J.
Phys. Chem. B 102, 4477–4482 (1998).
15.0
–1.0 –0.5 0.0 0.5 1.0–3
–2
–1
0
1
2
3
I sd (1
0–7
A)
Vds (V)
Vg = –40 VVg = –20 VVg = 0 VVg = 20 VVg = 40 V
Pt
SiO2
Pt
500 nm
0 0.2 0.4 0.6 0.8 1.0
0.0
5.0
10.0
15.0
20.0
Cur
rent
(µA
)
Voltage (V)
b
dc
7.5
(nm)
(µm)0.5 1.0
1.6 nm0.75 nm
–40 0 401.82.02.22.42.62.8
Vg (V)
Vds = 1 V
a
1 µm
10 µm
Figure 4 | Device fabrication and electrical properties of graphenenanoribbons on SiO2–Si. a, SEM image of a multi-terminal device based on amultilayer (,10-nm-thick) stack of graphene nanoribbons with platinumelectrodes. Inset, larger image of a similar device. b, Current–voltage curves forthree different types of device: as-prepared (red), N2H4-reduced (blue) andH2-annealed (green) nanoribbons (,300 nm wide, 10 nm thick (AFM) with achannel length of ,500 nm; characteristic of the .10 devices measured foreach of the three states). c, AFM image of another device based on a N2H4-reduced and annealed (H2/Ar at 300 uC for 10 min) bilayer nanoribbonshowing that the ribbon consists of two overlapping nanoribbons in the SiO2
channel region. Typical height profile (inset) across this nanoribbon showssteps of about 0.75 nm, which correspond to individual graphene sheets. Thesesheets overlap in the middle, resulting in a height of ,1.6 nm. d, Source–draincurrent (Isd), source–drain voltage (Vds) and gate voltage (Vg) dependenciesfor the device shown in c; p-doped silicon was used as a back gate.
NATURE | Vol 458 | 16 April 2009 LETTERS
875 Macmillan Publishers Limited. All rights reserved©2009
25. Li, D., Mueller, M. B., Gilje, S., Kaner, R. B. & Wallace, G. G. Processableaqueous dispersions of graphene nanosheets. Nature Nanotechnol. 3, 101–105(2008).
26. Stankovich, S. et al. Synthesis of graphene-based nanosheets via chemicalreduction of exfoliated graphite oxide. Carbon 45, 1558–1565 (2007).
27. Bourlinos, A. B. et al. Graphite oxide: chemical reduction to graphite and surfacemodification with primary aliphatic amines and amino acids. Langmuir 19,6050–6055 (2003).
28. Eda, G., Fanchini, G. & Chhowalla, M. Large-area ultrathin films of reducedgraphene oxide as a transparent and flexible electronic material. NatureNanotechnol. 3, 270–274 (2008).
29. Stankovich, S. et al. Stable aqueous dispersions of graphitic nanoplatelets via thereduction of exfoliated graphite oxide in the presence of poly(sodium4-styrenesulfonate). J. Mater. Chem. 16, 155–158 (2006).
30. Novoselov, K. S. et al. Electric field effect in atomically thin carbon films. Science306, 666–669 (2004).
Supplementary Information is linked to the online version of the paper atwww.nature.com/nature.
Acknowledgements The authors thank P. M. Ajayan, W. Guo, J. Duque, Z. Sun, andZ. Jin for technical assistance and discussions. Mitsui & Co. generously donated theMWCNTs. The work was funded by the US Defense Advanced Research ProjectsAgency, the US Federal Aviation Administration, Department of Energy(DE-FC-36-05GO15073) and Wright Patterson Air Force Laboratory through theUS Air Force Office of Scientific Research.
Author Contributions D.V.K. discovered the unzipping reaction and made most ofthe analysed ribbons. A.L.H. obtained and analysed most of the analysis dataincluding the TEM, AFM, ultraviolet, XPS, TGA, Raman and infrared data; she alsomade some of the ribbons and wrote the majority of the manuscript. A.S. fabricatedand tested the electronic devices. J.R.L performed some of the spectral analysisincluding the X-ray diffraction. A.D. prepared and studied the nanoribbons onsilicon surfaces for electrical analysis. B.K.P. performed some of the AFM analyses.J.M.T. oversaw and directed all aspects of the syntheses, data analysis andmanuscript correction and finalization.
Author Information Reprints and permissions information is available atwww.nature.com/reprints. Correspondence and requests for materials should beaddressed to J.M.T. ([email protected]).
LETTERS NATURE | Vol 458 | 16 April 2009
876 Macmillan Publishers Limited. All rights reserved©2009
METHODSMWCNTs were used as received from Mitsui & Co. (lot no. 05072001K28). The
remaining chemicals were purchased from Sigma-Aldrich and used as received,
except for the concentrated sulphuric acid (Fisher Scientific). Deionized water
(18-MV resistivity) obtained from a NanoPure system (Barnstead) was used
throughout this work.
Nanoribbon formation. In a typical procedure, MWCNTs (150 mg,
12.5 mequiv. carbon) were suspended in 150 ml of concentrated H2SO4 for 1 h
to 12 h. KMnO4 (750 mg, 4.75 mmol) was then added and the mixture allowed to
stir for 1 h at room temperature. The reaction was then heated in an oil bath at
55 uC for 30 min. The progress of the reaction was monitored by preparing two
test tubes, one containing 1 ml of deionized water and 2–3 drops of hydrogen
peroxide (30%), and one containing 1 ml of water only. Four or five drops of the
reaction mixture were added to the test tubes and bath-sonicated for 3 min. The
colour and dispersibility of the solution in the test tube containing the hydrogen
peroxide was noted; if the solution was yellow/brown and the solid broke up intovery small pieces, the reaction was complete. The other test tube was used to
check the level of permanganate consumption; if a dark purple/blue hue was
observed (like that seen when KMnO4 is dissolved in water), the reaction was not
complete. Alternatively, a solution with a red hue signified the presence of
manganese(IV), indicating permanganate consumption and a complete reaction.
It was also important to note the colour of the reaction mixture itself; the colour
went from black to dark brown with the green colour of permanganate in acid
disappearing by reaction completion. If the reaction had not completed after
30 min at 55 uC, the temperature was increased to 65 uC. When the reaction
temperature stabilized to 65 uC, the reaction status was checked again using
the above test-tube procedure. Continued heating at 65 uC was needed if the
permanganate was not entirely consumed.
When the reaction appeared nearly complete or complete, the temperature
was increased to 70 uC and the solution was allowed to stabilize. Upon stabiliza-
tion to 70 uC, the reaction was removed from the heat source, allowed to cool to
room temperature and poured onto 400 ml of ice containing 5 ml of 30% H2O2
(to prevent precipitation of insoluble MnO2). After vacuum filtration through a
PTFE membrane (5.0-mm pore size), the solid was removed and stirred in 150 ml
of water for 30 min, and then bath-sonicated (Cole Parmer ultrasonic cleaner,Model 08849-00) for 15 min. The material was then flocculated by addition of
20 vol% concentrated HCl (30 ml). The solid was then filtered through a PTFE
membrane (0.45-mm pore size). The product was removed and stirred in 150 ml
of ethanol for 30 min, then bath-sonicated (device as above) for 15 min. The
material was flocculated by addition of 100 vol% ether (150 ml) followed by
filtration through a PTFE membrane (0.45-mm pore size). The final product
was washed twice with ether (50 ml each time) and dried in vacuo to afford
321 mg of oxidized nanoribbons. Shortened ribbons (Fig. 1d) were formed from
an aqueous solution of washed nanoribbons that were tip-sonicated at 30-W
power (Misonix Sonicator 3000) for a total of 30 min (2 min on and 1 min off, for
a total on-time of 30 min).
Stepwise oxidation. The stepwise oxidation was performed by first running the
reaction, under the conditions specified above, with a 1:1 mass ratio of
KMnO4:MWCNT (denoted sample I, least oxidized). After 1 h at 55 uC, approxi-
mately one-fifth of the volume of the reaction mixture was extracted and worked
up as outlined above. The remaining portion was then treated with 100 wt%
KMnO4 (relative to the portion of MWCNTs remaining) and allowed to react for
another 1 h at 55 uC. After extracting one-quarter of the volume of the reaction
mixture, to be worked up, the rest was treated again with 100 wt% KMnO4. The
process was repeated until the final batch of ribbons was exposed to a total of
500 wt% KMnO4 (denoted sample V, most oxidized; Fig. 2e).
Reduction of nanoribbons. Reduction in aqueous N2H4 can be done with or
without SDS surfactant. To introduce the SDS surfactant, 50 mg of the as-prepared
nanoribbons were homogenized (IKA T-25 digital ULTRA-TURRAX disperser
with 18 G dispersing element, 7,000 r.p.m.) in 250 ml of 1% aqueous SDS solution
for 1 h. The suspension was then cup-sonicated (Cole Parmer ultrasonic processer,
75% power) for 10 min and filtered through a 5-cm plug of glass wool. If SDS was
not present, 50 mg of as-prepared nanoribbons was dissolved in 250 ml nanopure
water. In both cases, 150 ml of the nanoribbon solution was covered by a 5-mm
layer of silicon oil in an Erlenmeyer flask. To this solution we added 150ml of
concentrated NH4OH (2.22 mmol), followed by 150ml of N2H4?H2O (98%,
3.03 mmol). The oil was added to eliminate the air–water interface that causes
agglomeration of the reduced ribbons as water evaporates25. The reaction mixture
was heated at 95 uC for 1 h in a gently boiling water bath (no stirring). Excess N2H4
was removed by dialysis (CelluSep H1 regenerated cellulose tubular membrane;
nominal molecular weight, 5,000 (relative molecular mass); 400-mm width) for
24 h in 1% NH4OH. Filtering and drying in vacuo afforded 23.2 mg of reduced
nanoribbons. Therefore, the overall weight conversion efficiencies from MWCNTs
to the reduced nanoribbons were 215% and 46% for the two steps, yielding 99%.
Device fabrication. Fabrication of graphene devices was performed by tracking
individual nanoribbons on the surface of highly doped Si substrates, covered with
200-nm-thick dielectric SiO2, by SEM (JEOL-6500 microscope), followed by
patterning of 20-nm-thick Pt contacts by standard electron beam lithography.
Before being tested, the devices used to produce the data in Fig. 4d were annealed
in H2/Ar (1:1, ,1 atm) atmosphere at 300 uC for 10 min. The electrical properties
were tested using a probe station (Desert Cryogenics TT-probe 6 system) under
vacuum with a chamber base pressure below 1025 mm Hg. The current–voltage
data were collected using an Agilent 4155C semiconductor parameter analyser.
Sample analysis. TEM imaging was performed on a JEOL-2010 microscope.
Samples were prepared by dispersing the nanoribbons in a 1:1 ethanol:water
mixture and dropped onto 300 mesh holey, lacey carbon grids on copper support
(Ted Pella). AFM images were obtained with a Nanoscope IIIa (Digital
Instruments/Veeco Metrology), operating in tapping mode, using Si tips n-doped
with 1–10V cm phosphorus (Veeco, MPP-11100-140) at a scan rate of 2 Hz and a
resolution of 512 3 512. Samples for AFM analysis were prepared by spin-coating
aqueous solutions of nanoribbons at 3,000 r.p.m. onto a freshly cleaved mica
surface (Ted Pella) and rinsed with deionized water and 2-isopropanol.
Ultraviolet–visible spectra were obtained on a Shimadzu UV-3101 PC with
samples contained in 1-ml quartz cuvettes. Fourier-transform infrared spectro-
scopy was performed using a Nicolet FTIR Infrared Microscope with an ATR
attachment. XPS was performed on a PHI Quantera SXM scanning X-ray micro-
probe with a pass energy of 26.00 eV, 45u take-off angle and a 100-mm beam size.
TGA (Q50, TA Instruments) was performed from room temperature to 950 uC at
10 uC min21 under argon. Raman spectroscopy was performed on a Renishaw
Raman scope using a 633-nm HeNe laser. The X-ray diffraction measurements
were carried out with a Rigaku diffractometer (Cu Ka radiation; X-ray wavelength,
l 5 1.5406 A; operating energy, 40 keV; cathode current, 40 mA; scan rate,
1umin21). Brunauer–Emmett–Teller surface-area analysis was performed at 77 K
on a Quantachrome Autosorb-1 Physisorption system using N2 as the sorption gas.
doi:10.1038/nature07872
Macmillan Publishers Limited. All rights reserved©2009