Long-term sea-level change revisited: the role of salinity
11
Long-term sea-level change revisited: the role of salinity Paul J Durack 1,2,3 , Susan E Wijffels 2,3 and Peter J Gleckler 1 1 Program for Climate Model Diagnosis and Intercomparison, Lawrence Livermore National Laboratory, Livermore CA, USA 2 Centre for Australian Weather and Climate Research, CSIRO Marine and Atmospheric Research, Hobart, Tasmania, Australia 3 CSIRO Oceans and Atmosphere Flagship, Hobart, Tasmania, Australia E-mail: [email protected] Received 11 August 2014, revised 17 October 2014 Accepted for publication 22 October 2014 Published 18 November 2014 Abstract Of the many processes contributing to long-term sea-level change, little attention has been paid to the large-scale contributions of salinity-driven halosteric changes. We evaluate observed and simulated estimates of long-term (1950-present) halosteric patterns and compare these to corresponding thermosteric changes. Spatially coherent halosteric patterns are visible in the historical record, and are consistent with estimates of long-term water cycle amplification. Our results suggest that long-term basin-scale halosteric changes in the Pacific and Atlantic are substantially larger than previously assumed, with observed estimates and coupled climate models suggesting magnitudes of ∼25% of the corresponding thermosteric changes. In both observations and simulations, Pacific basin-scale freshening leads to a density reduction that augments coincident thermosteric expansion, whereas in the Atlantic halosteric changes partially compensate strong thermosteric expansion via a basin-scale enhanced salinity density increase. Although regional differences are apparent, at basin-scales consistency is found between the observed and simulated partitioning of halosteric and thermosteric changes, and suggests that models are simulating the processes driving observed long-term basin-scale steric changes. Further analysis demonstrates that the observed halosteric changes and their basin partitioning are consistent with CMIP5 simulations that include anthropogenic CO 2 forcings (Historical), but are found to be inconsistent with simulations that exclude anthropogenic forcings (HistoricalNat). Keywords: oceanography, sea level, salinity, climate model, CMIP5, global change, water cycle 1. Introduction Changes to global mean sea-level (GMSL) are a well-docu- mented response to a changing climate (Church et al 2013a), and many processes associated with sea-level (SL) changes are active areas of research (e.g. Alley et al 2005, Veli- cogna 2009, Stammer 2010, Rignot et al 2011, Bouttes et al 2012, 2013, Griffies and Greatbatch 2012, Lorbacher et al 2012, Brunnabend et al 2012, Shepherd et al 2012, Wada et al 2012, Bouttes and Gregory 2014, Griffies et al 2014). These changes can be summarized into two pri- mary mechanisms: mass addition from land-based glaciers and ice-sheets which act to increase the liquid mass content of the global oceans; and, in situ density changes either ther- mosteric, primarily driven by thermal expansion (contraction) as ocean waters warm (cool), or halosteric, driven by regional salinity changes, where a salinity reduction leads to expansion and enhanced salinity to a contraction. While thermosteric changes have received considerable attention, salinity-driven halosteric patterns of long-term SL change have not been throughly investigated. Regional halosteric anomalies are considered to be important drivers of steric SL variability on short timescales (Pattullo et al 1955, Tabata et al 1986, Maes 1998, Sato et al 2000, Wunsch et al 2007, Suzuki and Ishii 2011). However, these changes have been largely Environmental Research Letters Environ. Res. Lett. 9 (2014) 114017 (11pp) doi:10.1088/1748-9326/9/11/114017 Content from this work may be used under the terms of the Creative Commons Attribution 3.0 licence. Any further distribution of this work must maintain attribution to the author(s) and the title of the work, journal citation and DOI. 1748-9326/14/114017+11$33.00 © 2014 IOP Publishing Ltd 1
Transcript of Long-term sea-level change revisited: the role of salinity
Long-term sea-level change revisited: therole of salinity
Paul J Durack1,2,3, Susan E Wijffels2,3 and Peter J Gleckler1
1 Program for Climate Model Diagnosis and Intercomparison, Lawrence Livermore National Laboratory,Livermore CA, USA2Centre for Australian Weather and Climate Research, CSIRO Marine and Atmospheric Research, Hobart,Tasmania, Australia3 CSIRO Oceans and Atmosphere Flagship, Hobart, Tasmania, Australia
E-mail: [email protected]
Received 11 August 2014, revised 17 October 2014Accepted for publication 22 October 2014Published 18 November 2014
AbstractOf the many processes contributing to long-term sea-level change, little attention has been paid tothe large-scale contributions of salinity-driven halosteric changes. We evaluate observed andsimulated estimates of long-term (1950-present) halosteric patterns and compare these tocorresponding thermosteric changes. Spatially coherent halosteric patterns are visible in thehistorical record, and are consistent with estimates of long-term water cycle amplification. Ourresults suggest that long-term basin-scale halosteric changes in the Pacific and Atlantic aresubstantially larger than previously assumed, with observed estimates and coupled climate modelssuggesting magnitudes of ∼25% of the corresponding thermosteric changes. In both observationsand simulations, Pacific basin-scale freshening leads to a density reduction that augmentscoincident thermosteric expansion, whereas in the Atlantic halosteric changes partiallycompensate strong thermosteric expansion via a basin-scale enhanced salinity density increase.Although regional differences are apparent, at basin-scales consistency is found between theobserved and simulated partitioning of halosteric and thermosteric changes, and suggests thatmodels are simulating the processes driving observed long-term basin-scale steric changes.Further analysis demonstrates that the observed halosteric changes and their basin partitioning areconsistent with CMIP5 simulations that include anthropogenic CO2 forcings (Historical), but arefound to be inconsistent with simulations that exclude anthropogenic forcings (HistoricalNat).
Keywords: oceanography, sea level, salinity, climate model, CMIP5, global change, water cycle
1. Introduction
Changes to global mean sea-level (GMSL) are a well-docu-mented response to a changing climate (Church et al 2013a),and many processes associated with sea-level (SL) changesare active areas of research (e.g. Alley et al 2005, Veli-cogna 2009, Stammer 2010, Rignot et al 2011, Boutteset al 2012, 2013, Griffies and Greatbatch 2012, Lorbacheret al 2012, Brunnabend et al 2012, Shepherd et al 2012,Wada et al 2012, Bouttes and Gregory 2014, Griffies
et al 2014). These changes can be summarized into two pri-mary mechanisms: mass addition from land-based glaciersand ice-sheets which act to increase the liquid mass content ofthe global oceans; and, in situ density changes either ther-mosteric, primarily driven by thermal expansion (contraction)as ocean waters warm (cool), or halosteric, driven by regionalsalinity changes, where a salinity reduction leads to expansionand enhanced salinity to a contraction. While thermostericchanges have received considerable attention, salinity-drivenhalosteric patterns of long-term SL change have not beenthroughly investigated. Regional halosteric anomalies areconsidered to be important drivers of steric SL variability onshort timescales (Pattullo et al 1955, Tabata et al 1986,Maes 1998, Sato et al 2000, Wunsch et al 2007, Suzuki andIshii 2011). However, these changes have been largely
Environmental Research Letters
Environ. Res. Lett. 9 (2014) 114017 (11pp) doi:10.1088/1748-9326/9/11/114017
Content from this work may be used under the terms of theCreative Commons Attribution 3.0 licence. Any further
distribution of this work must maintain attribution to the author(s) and thetitle of the work, journal citation and DOI.
1748-9326/14/114017+11$33.00 © 2014 IOP Publishing Ltd1

ignored in long-term (>30 yr) observed estimates of SLchange because halosteric fluctuations (excluding compara-tively small mass contributions associated with land–icechanges e.g. Antonov et al 2002, Munk 2003, Ishiiet al 2006) sum to near zero in the global mean (e.g. Gregoryand Lowe 2000), and additionally due to the paucity of his-torical salinity measurements (e.g. Boyer et al 2013, Duracket al 2013). Consequently previous GMSL change estimateshave primarily considered thermosteric effects along withmass contributions (Church et al 2013a).
Estimates of halosteric and thermosteric changes arerespectively derived from in situ observations of salinity andtemperature. Previous studies have reported long-term changeestimates for ocean salinity (Antonov et al 2002, Boyeret al 2005, Ishii et al 2006, Hosoda et al 2009, Durack andWijffels 2010, Helm et al 2010, Durack et al 2012, 2013,Skliris et al 2014) and temperature (Levitus et al 2000, 2005a,Antonov et al 2005, Ishii et al 2006, Smith and Murphy 2007,Domingues et al 2008, Ishii and Kimoto 2009, Gleckleret al 2012, Levitus et al 2012, Durack et al 2014). There is ageneral agreement in the broad-scale patterns and magnitudesof salinity and temperature changes among these independentstudies. Formal climate change detection and attribution stu-dies (Barnett et al 2005, Pierce et al 2006, 2012, Pardaenset al 2008, Gleckler et al 2012) have attributed ocean tem-perature changes to anthropogenic CO2 forcing. Two recentstudies have investigated observed ocean salinity changes,and have successfully attributed anthropogenic influence asthe cause of these salinity changes globally (60°S–60°N;Pierce et al 2012) and for the tropical Pacific and AtlanticOceans (Terray et al 2012).
Fewer studies have focused on derived steric changesthan on the underlying changes to the salinity and temperaturefields. Several observational (e.g. Pattullo et al 1955, Tabataet al 1986, Maes 1998, Sato et al 2000, Antonov et al 2002,Levitus et al 2005b, Ishii et al 2006, Suzuki and Ishii 2011)and ocean reanalysis (e.g. Carton et al 2005, Wunschet al 2007, Köhl and Stammer 2008, Köhl 2014) studies havehighlighted the importance of salinity to regionally observedSL. Others have considered the global patterns of projected21st century SL changes from climate models (Landereret al 2007, Yin et al 2010, Pardaens et al 2011, Yin 2012,Bouttes and Gregory 2014).
In the present study we extend upon these previousanalyses to contrast the relative importance of basin-scalehalosteric and thermosteric changes in two independentobservational datasets over the period 1950–2008, and usethese estimates to evaluate the historically forced simulationsavailable from CMIP5 (Taylor et al 2012). We show thathalosteric patterns can be very important at basin-scales eventhough they do not contribute to GMSL change.
The paper is organized as follows: in section 2 wedescribe the observations, model simulations and methodsused in this study, in section 3 we compare multi-decadalobserved and simulated halosteric and thermosteric trends atbasin- to regional-scales. In section 4 we conclude by dis-cussing the implications of this work, touch on the limitations
of the present study and outline further work required to betterunderstand large-scale observed and simulated SL changes.
2. Data and methods
To evaluate the long-term halosteric and thermosteric SLchanges from CMIP5 Historical simulations (Tayloret al 2012), we consider data from two independent obser-vational analyses (Ishii and Kimoto 2009, Durack and Wijf-fels 2010—hereafter Ish09 and DW10 respectively).
The Ish09 analysis exploits the full salinity and thermalarchive and employs a bias correction scheme in order toutilize problematic eXpendable BathyThermograph (XBT)and Mechanical BathyThermograph (MBT) profiles, thatcontain well-documented depth and thermister biases (Gour-etski and Koltermann 2007, Wijffels et al 2008, Abrahamet al 2013, Cowley et al 2013). This analysis uses anobjective mapping technique to generate monthly meanglobally gridded salinity and temperature maps for the period1945–2012. We note that long-term temperature trends (andthe corresponding thermosteric patterns) from the Ish09analysis compare well with other objectively analysed pro-ducts (e.g. Levitus et al 2012, Good et al 2014).
The DW10 analysis is based on the full salinity archivethat is comprised of high-quality Niskin and Nansen (bottle)casts and CTD (conductivity–temperature–depth) profiles ofsalinity and temperature. As a consequence, while exploitingconsiderably less data than corresponding temperature-onlyanalyses (CTD/bottle profiles comprise ∼30% of the globalocean temperature archive), the results are free from XBT andMBT biases. We note however, that this analysis compareswell to other globally integrated estimates of ocean heatcontent (OHC) change that use the full temperature archive(Durack et al 2014). The analysis uses a spatial and temporalparametric model, optimized to recover the broad-scale oceanmean structure, the annual and semi-annual cycle (and theirspatial gradients) and the multidecadal linear trends from thesparse hydrographic (salinity and temperature) database over1950–2008. Importantly, this analysis uses the Argo data andexploits the unprecedented spatial and seasonal coverage tobest reduce seasonal and spatial sampling bias. In the sparselyobserved Southern Hemisphere oceans, the analysis relies onArgo’s ability to highly resolve the mean, seasonal and El-Nino Southern Oscillation responses in salinity and tem-perature, and thus reduces aliasing due to these dominatingmodes of variability.
The CMIP5 models assessed in this study are a subset ofthe full suite, as drift correction in the deeper ocean wasnecessary. Consequently, 26 independent models (rather than42 in a previous study: Durack et al 2014) were assessed andspecific details on the model simulations used in this analysisare contained in table 1.
In order to directly compare the observational trends withthose of the CMIP5 models it was necessary to account formodel drift (Covey et al 2006, Sen Gupta et al 2012, 2013).To account for drift, a linear least-squares fit to a con-temporaneous 150 yr portion of the piControl simulation
2
Environ. Res. Lett. 9 (2014) 114017 P J Durack et al

(1900–2049) was obtained at each grid point in threedimensions, and this drift estimate was then subtracted gridpoint by grid point from the corresponding forced simulationtrend estimate before calculation of steric anomalies wasundertaken.
From each observational dataset, 59 yr mean climatolo-gies (1950–2008) were constructed along with least-squareslinear trends. For models, 55 yr mean climatologies(1950–2004) were constructed along with least-squares lineartrends. These fields were calculated on the original grid of theavailable observational products and models, from annualmeans derived from monthly mean data for Ish09 and modelsthat contributed to CMIP5. We note the temporal discrepancybetween observed and simulated analyses which is a result ofthe limitation of CMIP5 Historical simulations which end in2005 and the DW10 study which is dependent on the modernArgo period (2004–2008) to estimate the mean climatologyand seasonal cycle. We investigated this temporal discrepancyusing the Ish09 data, and found that the 1950–2008 and1950–2004 trend maps are very similar. Consequently theobservation-model temporal discrepancy does not have muchinfluence on the key conclusions of the study.
Estimates of total steric, thermosteric and halostericspecific volume anomalies (svan) were then calculated fromall data using the UNESCO equation of state (Millero
et al 1980, Millero and Poisson 1981):
α α= −( ) ( )S T P S T Psvan , , , , , (1)total exp exp
α α= −( ) ( )S T P S T Psvan , , , , , (2)thermosteric exp
= −svan svan svan , (3)halosteric total thermosteric
where α denotes specific volume, S denotes Practical Salinity,T denotes in situ temperature and P pressure (dbar). In (1) and(2) overbars represent the climatological mean and subscriptexp indicates the climatological values plus trend anomaliesobtained from the observations and models. For comparisonbetween observed and modelled estimates, we present allchanges in units of mm yr−1. A key advantage of this methodis that the nonlinearities in the equation of state are explicitlyresolved, rather than calculating halosteric and thermostericchanges independently by using the coincident climatologicalvalues and perturbing salinity or temperature individually.However, we note that this methodology provides verysimilar results to halosteric quantities calculated using a per-turbed salinity equivalent to (2), and our conclusions areinsensitive to the method of analysis.
To enable observation and model intercomparison, andthe calculation of a multi-model mean (MMM), all fields wereregridded to a 2° longitude by 1° latitude grid extending from70°S to 70°N which excludes marginal seas (Mediterranean
Table 1. Observational and CMIP5 model datasets (model numbers denote realization X and model physics version Y: rXi1pY).
1950–2004 1950–2004 Hist. drift correction
Model/Observation Historical (obs. version) HistoricalNat piControl
Ishii and Kimoto (2009)—1950–2008 6.13 — —
Durack and Wijffels (2010)—1950–2008 1.0 — —
1 ACCESS1-0 1 — 12 ACCESS1-3 1-2 — 13 CCSM4 1-4,6 1-2,4,6 14 CESM1-BGC 1 — 15 CMCC-CESM 1 — 16 CMCC-CMS 1 — 17 CNRM-CM5 1-10 1-5,8 18 CSIRO-Mk3.6.0 1-10 1-5 19 CanESM2 1-5 1-5 110 EC-EARTH 2-3,5-7,9-10,12,14 — 111 FGOALS-s2 1-3 — 112 GFDL-CM3 1-5 — 113 GISS-E2-H 1-5 (p= 1-3) 1-5 (p = 1,3) 1 (p = 1-3)14 GISS-E2-H-CC 1 — 115 GISS-E2-R 1-6 (p= 1,3) 1-5 (p = 1,3) 116 GISS-E2-R-CC 1 — 117 HadGEM2-CC 1-3 — 118 HadGEM2-ES 1-4 1-4 119 IPSL-CM5A-LR 1-6 1-3 120 IPSL-CM5A-MR 1-3 1-3 121 IPSL-CM5B-LR 1 — 122 MPI-ESM-LR 1-3 — 123 MPI-ESM-P 1 — 124 NorESM1-M 1-3 1 125 NorESM1-ME 1 — 126 bcc-csm1-1 2 — 1
3
Environ. Res. Lett. 9 (2014) 114017 P J Durack et al

Sea, Baltic Sea, Red Sea, Persian Gulf, China Seas, Sea ofJapan, Java Sea, Banda Sea and Arafura Sea) and verticallyinterpolated to 18 standard pressure levels (5, 10, 20, 30, 40,50, 75, 100, 125, 150, 200, 300, 500, 700, 1000, 1500, 1800,2000 dbar). To fairly compare both observations and modelsthat have differing land/sea masks, after horizontal inter-polation an iterative nearest neighbour filling algorithm wasemployed to infill regions so that the land/sea masks of allanalyses were identical.
3. Results
3.1. Steric changes: global perspective
Warming-driven thermosteric expansion (figure 1 (A2) versus(B2)) is fairly homogenous throughout and between indivi-dual basins in the global ocean. There is agreement in the signof observed estimates nearly everywhere, particularly in thewell-sampled Northern Hemisphere, where a relatively largerthermosteric expansion is apparent in the Atlantic and in theWestern subtropical North Pacific. In the Southern Hemi-sphere we find agreement along the axis of the AntarcticCircumpolar current. These features are also captured in theCMIP5 MMM (figure 1 (C2)), however as expected theMMM result is smoother, with magnitudes smaller than theobservations as a result of averaging across simulations withuncorrelated variability. The thermosteric contraction (cool-ing) in the Western subpolar North Pacific and around Aus-tralia, though present in the two observational estimates, islargely absent in the MMM. There is less agreement between
observations in the Southern Hemisphere with larger magni-tude changes apparent in DW10 and the MMM (figure 1 (B2)and (C2)) compared to a muted result in Ish09 (figure 1 (A2)).We note that discrepancies between the observations in theSouthern Hemisphere are likely due to poor spatio-temporalobservational coverage and conservative infilling methodswhich yield conservative change estimates in Ish09 (e.g.Gille 2002, 2008, Gregory et al 2004, Gouretski and Kol-termann 2007, Durack et al 2014). Discrepancies between theobserved and simulated estimates, particularly in the NorthPacific, may be in part associated with the unresolved long-term mode of natural variability in observations (e.g. PacificDecadal Oscillation; Mantua et al 1997) as agreement existsin the observations however is absent in the MMM.
In both observational estimates large-scale halostericcontraction (increased salinity) is evident across most of theAtlantic and Western Indian Oceans, in contrast to expansion(decreased salinity) in the Pacific (figure 1 (A3) versus (B3)).This basin contrast between halosteric contraction andexpansion is also apparent in the MMM (figure 1 (C3)), butinter-model agreement greater than 50% is only found in theequatorial and South Pacific regions due to uncorrelatedvariability found across models and independent modelsimulations (no stippling, figure 1 (C3)). In the Atlantic,observations express a sign reversal to halosteric expansionfor latitudes greater than 50°N. This may be linked to coin-cident enhancements to precipitation and riverine dischargesinto the Arctic Ocean, as well as cryospheric contributions(Peterson et al 2006, Kwok and Cunningham 2010, Krishfieldet al 2012, Straneo and Heimbach 2013) or may also be
Figure 1. Long-term trends in 0–2000 dbar total steric anomaly (left column; (A1)–(C1)), thermosteric anomaly (middle column; (A2)–(C2))and halosteric anomaly (right column; (A3)–(C3)). Units are mm yr−1. Observational maps show results from (A) Ishii and Kimoto (2009;1950–2008), (B) Durack and Wijffels (2010; 1950–2008) and (C) the CMIP5 Historical multi-model mean (MMM; 1950–2004). Stippling isused to mark regions where the two observational estimates do not agree in their sign ((A1)–(A3), (B1)–(B3)) and where less than 50% of thecontributing models do not agree in sign with the averaged (MMM) map obtained from the ensemble ((C1)–(C3)). Results presented incolumns 1–3 (above) relate to equations (1)–(3) presented in section 2.
4
Environ. Res. Lett. 9 (2014) 114017 P J Durack et al

explained by ocean dynamical responses to changing surfacebuoyancy fluxes (e.g. Bouttes et al 2013), however we do notfurther investigate potential sources here.
We note that the largest magnitude halosteric and ther-mosteric changes are often opposite in sign, and therefore leadto a more homogeneous pattern in the resolved total stericchanges, a feature particularly prominent in the North Atlantic(figures 1 (A1)–(C1)). This density compensation is not wellunderstood, however mechanisms driving the compensationhave been discussed by Mauritzen et al (2012), Bouttes et al(2013) and Köhl (2014).
3.2. Regional importance of salinity
As noted earlier, GMSL change estimates have mostlyneglected halosteric effects, however a number of more recentthermosteric (OHC) change estimates have utilized coincidentsea surface height (SSH; total steric) in order to better esti-mate the regional distribution of ocean heat uptake andthermosteric SL changes (Domingues et al 2008) or provideOHC change uncertainty estimates (Lyman and John-son 2008, 2014). However, as shown (figures 1 (A3)–(C3))we note that halosteric change magnitudes are large enough inmany regions that they play an important role in column-integrated total steric volumes and salinity-driven changesshould not be neglected in future SL studies.
To further evaluate the importance of salinity, we presentmaps that show the contribution of the absolute halostericchange to the sum of absolute thermosteric and absolutehalosteric changes. To highlight changes on larger spatialscales and reduce noise associated with the observationalestimates, all fields were smoothed before plotting using a 3-point boxcar filter, which is applied to the 2° longitude by 1°latitude grid. These maps show where the halosteric magni-tude is less than 30% (orange) or greater than 30% (blue) ofthe absolute total, with the 30% threshold obtained by com-paring basin mean MMM halosteric to their coincident ther-mosteric values (see observed and simulated basin-scalecomparisons in a subsequent section, figure 4). We note thatthis is an extremely difficult test, as both change sign andmagnitude in three dimensions are combined to provide thegrid point value. The spatial disagreement between observa-tions (stippling) due to observational sparsity and differinganalysis techniques is apparent, however large-scale simila-rities exist (figure 2). Blue regions are shown in the highlatitude North Pacific and Atlantic along with the Westernequatorial Pacific and Southern subtropical Pacific and IndianOcean, and suggest halosteric changes may in some regionsbe the leading contributor to total steric change (greater than50% of the absolute total: dark blue). However, we note thateven though correspondence exists between the observedestimates, the differences require further investigation tobetter understand the influence of data sparsity convolvedwith unresolved modes of variability.
3.3. Regional steric compensation
Previous studies have identified several regional featureswhere counteracting halosteric contraction (increased salinity)and thermosteric expansion (warming) changes occur (e.g.Antonov et al 2002, Levitus et al 2005b, Ishii et al 2006,Lowe and Gregory 2006, Pardaens et al 2011, Mauritzenet al 2012, Bouttes et al 2013, Griffies et al 2014). As a resultthe total steric change is more spatially uniform between andacross basins (figures 1 (A1)–(C1)). In observations, exam-ples include the thermosteric expansion (warming) that ispartially offset by halosteric contraction (enhanced salinity) inthe North Atlantic, and thermosteric contraction (cooling) thatis largely offset by halosteric expansion (decreased salinity) in
Figure 2. The magnitude of the 0–2000 dbar column-integratedabsolute halosteric changes compared to the integrated absolutesteric change (the sum of absolute halosteric and thermostericchanges). Orange colours indicate where the halosteric anomalycomprises 0–30% of the total steric magnitude, whereas bluesindicate where halosteric comprises >30%. Stippling is used to markregions where the two observational estimates (A) and (B) do notagree in their magnitude (either greater than (blue) or less than 30%(orange) which is a threshold obtained from the analysis of basinaverage halosteric and thermosteric changes (figure 4)). Observa-tional maps show results from (A) Ishii and Kimoto (2009;1950–2008), (B) Durack and Wijffels (2010; 1950–2008) and (C)the CMIP5 Historical multi-model mean (MMM; 1950–2004).
5
Environ. Res. Lett. 9 (2014) 114017 P J Durack et al

the equatorial and Southwestern Pacific. A similar compen-sation occurs in the Eastern Indian Ocean, while in theNorthwestern Indian Ocean strong halosteric contraction(enhanced salinity) compensates for a strong thermostericexpansion (warming). Another key region where strongcompensation occurs is in the subpolar North Atlantic, whichshows a halosteric expansion (decreased salinity) and corre-sponding thermosteric contraction (cooling) in observations(figure 1). The models exhibit a large spread in the polar andsubpolar regions, and the sign of changes in the subpolarNorth Atlantic is highly variable even between multiple rea-lizations of the same model (not shown). Some of the regionswhere observed halosteric and thermosteric changes com-pensate are also present in the MMM, but are much weakerthan in the observations and are likely due to averaging acrossmodelled results.
To further investigate the basin-scale consistency in thepatterns of thermosteric and halosteric changes, basin zonalmeans for each observational estimate and the MMM areshown (figure 3). The sign consistency between the observedand modelled estimates is encouraging, with particularly goodbroad-scale agreement in the Pacific and Atlantic basins. Inthe Pacific (figure 3(B)), all estimates suggest a freshening-driven halosteric and warming-driven thermosteric expansionis occurring—steric changes that augment. Observations andsimulations are also consistent in the Atlantic, however withthe opposite signed changes—density compensation throughhalosteric contraction and thermosteric expansion. For theSouthern Hemisphere Pacific and Indian Oceans, both theDW10 and MMM suggest larger halosteric change ampli-tudes than Ish09, and their corresponding thermosteric
changes are approximately equal in both hemispheres. Thelarger Southern Hemisphere result is not reproduced in Ish09possibly due to the conservative nature of resolved changes inregions of poor spatial coverage (e.g. Gille 2002, 2008,Gregory et al 2004, Gouretski and Koltermann 2007, Duracket al 2014). In the Atlantic (figure 3(C)), a strong warming-driven thermosteric expansion and a near basin-wide halos-teric contraction approximately half the thermosteric magni-tude is present in observations, a feature that is matched bythe MMM in the North Atlantic. In the subpolar Atlantic,strong halosteric and thermosteric agreement is presentbetween observations, however the MMM shows an equallylarge halosteric change of the opposite sign. For the Indian(figure 3(D)), the observations and MMM mostly agree insign of the thermosteric change, with warming across theentire basin. However, due to the presence of marginal seaswith strong regional trends (Arabian Sea and Bay of Bengal),there is no agreement in halosteric sign between the obser-vations and MMM North of the equator. In the globallyintegrated result, reasonably good agreement exists betweenthe observations and MMM (figure 3(A)), with the exceptionof the Northern high latitudes. However, these global zonalmean results mask the strong zonal salinity structure withinbasins as well as the compensation in the halosteric responseswithin and between basins (the full-depth, global meanhalosteric response should be near zero).
3.4. Observed and simulated basin-scale comparisons
To further examine the ability of the CMIP5 suite to simulatethe observed basins-scale steric responses, we contrast theAtlantic and Pacific long-term basin mean halosteric trends
Figure 3. Zonal mean 0–2000 dbar thermosteric anomaly (light colours) and halosteric anomaly (dark colours) for (A) Global, (B) Pacific, (C)Atlantic and (D) Indian Ocean basins. Observational results from Ishii and Kimoto (2009; light and dark blue, 1950–2008), Durack andWijffels (2010; orange and red, 1950–2008) and the CMIP5 Historical multi-model mean (MMM; grey and black, 1950–2004).
6
Environ. Res. Lett. 9 (2014) 114017 P J Durack et al
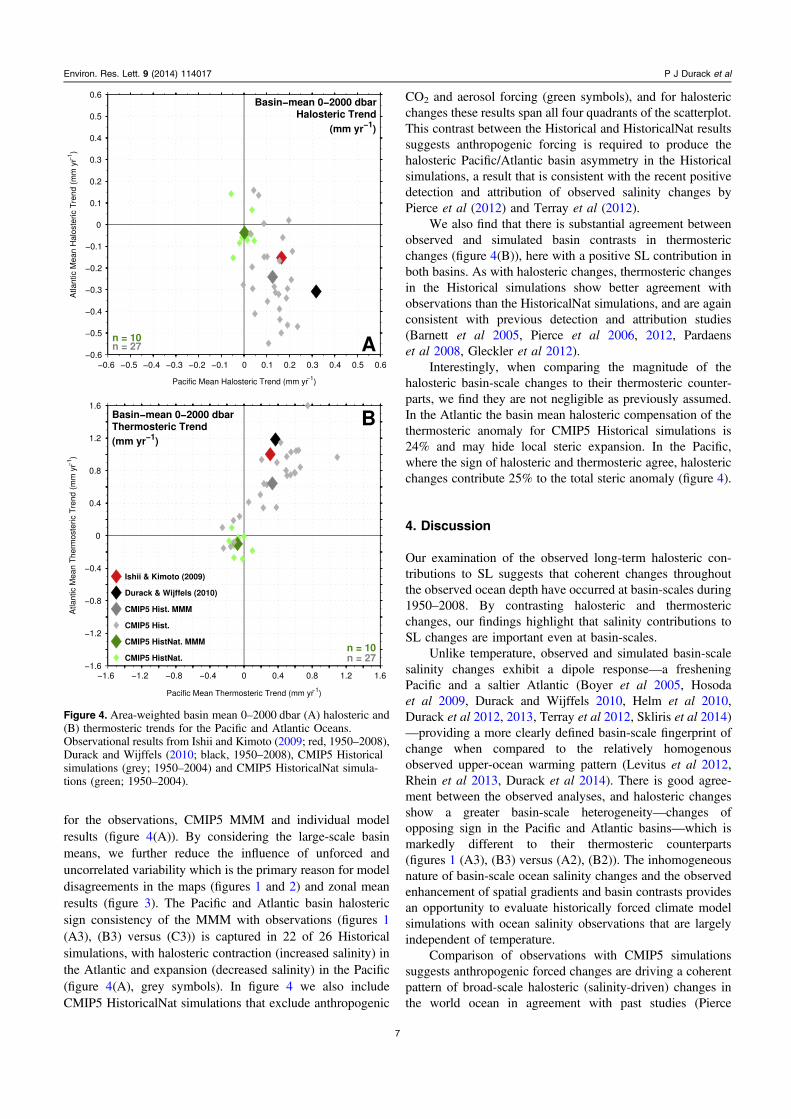
for the observations, CMIP5 MMM and individual modelresults (figure 4(A)). By considering the large-scale basinmeans, we further reduce the influence of unforced anduncorrelated variability which is the primary reason for modeldisagreements in the maps (figures 1 and 2) and zonal meanresults (figure 3). The Pacific and Atlantic basin halostericsign consistency of the MMM with observations (figures 1(A3), (B3) versus (C3)) is captured in 22 of 26 Historicalsimulations, with halosteric contraction (increased salinity) inthe Atlantic and expansion (decreased salinity) in the Pacific(figure 4(A), grey symbols). In figure 4 we also includeCMIP5 HistoricalNat simulations that exclude anthropogenic
CO2 and aerosol forcing (green symbols), and for halostericchanges these results span all four quadrants of the scatterplot.This contrast between the Historical and HistoricalNat resultssuggests anthropogenic forcing is required to produce thehalosteric Pacific/Atlantic basin asymmetry in the Historicalsimulations, a result that is consistent with the recent positivedetection and attribution of observed salinity changes byPierce et al (2012) and Terray et al (2012).
We also find that there is substantial agreement betweenobserved and simulated basin contrasts in thermostericchanges (figure 4(B)), here with a positive SL contribution inboth basins. As with halosteric changes, thermosteric changesin the Historical simulations show better agreement withobservations than the HistoricalNat simulations, and are againconsistent with previous detection and attribution studies(Barnett et al 2005, Pierce et al 2006, 2012, Pardaenset al 2008, Gleckler et al 2012).
Interestingly, when comparing the magnitude of thehalosteric basin-scale changes to their thermosteric counter-parts, we find they are not negligible as previously assumed.In the Atlantic the basin mean halosteric compensation of thethermosteric anomaly for CMIP5 Historical simulations is24% and may hide local steric expansion. In the Pacific,where the sign of halosteric and thermosteric agree, halostericchanges contribute 25% to the total steric anomaly (figure 4).
4. Discussion
Our examination of the observed long-term halosteric con-tributions to SL suggests that coherent changes throughoutthe observed ocean depth have occurred at basin-scales during1950–2008. By contrasting halosteric and thermostericchanges, our findings highlight that salinity contributions toSL changes are important even at basin-scales.
Unlike temperature, observed and simulated basin-scalesalinity changes exhibit a dipole response—a fresheningPacific and a saltier Atlantic (Boyer et al 2005, Hosodaet al 2009, Durack and Wijffels 2010, Helm et al 2010,Durack et al 2012, 2013, Terray et al 2012, Skliris et al 2014)—providing a more clearly defined basin-scale fingerprint ofchange when compared to the relatively homogenousobserved upper-ocean warming pattern (Levitus et al 2012,Rhein et al 2013, Durack et al 2014). There is good agree-ment between the observed analyses, and halosteric changesshow a greater basin-scale heterogeneity—changes ofopposing sign in the Pacific and Atlantic basins—which ismarkedly different to their thermosteric counterparts(figures 1 (A3), (B3) versus (A2), (B2)). The inhomogeneousnature of basin-scale ocean salinity changes and the observedenhancement of spatial gradients and basin contrasts providesan opportunity to evaluate historically forced climate modelsimulations with ocean salinity observations that are largelyindependent of temperature.
Comparison of observations with CMIP5 simulationssuggests anthropogenic forced changes are driving a coherentpattern of broad-scale halosteric (salinity-driven) changes inthe world ocean in agreement with past studies (Pierce
Figure 4. Area-weighted basin mean 0–2000 dbar (A) halosteric and(B) thermosteric trends for the Pacific and Atlantic Oceans.Observational results from Ishii and Kimoto (2009; red, 1950–2008),Durack and Wijffels (2010; black, 1950–2008), CMIP5 Historicalsimulations (grey; 1950–2004) and CMIP5 HistoricalNat simula-tions (green; 1950–2004).
7
Environ. Res. Lett. 9 (2014) 114017 P J Durack et al

et al 2012, Terray et al 2012). This basin contrast of depth-integrated halosteric changes are consistent with previouswork that reported near-surface (and subsurface) ocean sali-nity pattern amplification and associated water cycle change(Boyer et al 2005, Hosoda et al 2009, Durack and Wijf-fels 2010, Helm et al 2010, Durack et al 2012, 2013, Pierceet al 2012, Terray et al 2012, Skliris et al 2014), however wenote that attribution of the processes driving such changes iscomplex (e.g. Lowe and Gregory 2006, Boutteset al 2012, 2013, Bouttes and Gregory 2014) and not yet wellunderstood. Conversely, simulations that exclude anthro-pogenic forcing (CO2 and aerosols; HistoricalNat) over theperiod of analysis cannot reproduce the pattern of halostericand thermosteric changes that are captured in observedestimates.
We note that natural variability associated with climatemodes can drive measurable changes to regional patterns ofocean surface freshwater fluxes that can influence GMSL onshort timescales (Pardaens et al 2008, Boening et al 2012,Fasullo et al 2013, Cazenave et al 2014). However, theinfluence of natural variability is likely reduced in long-term(50 yr or longer) observed and modelled change estimates,particularly as we consider the MMM (figures 1–4) whichaverages across the unforced, uncorrelated variability presentin individual model simulations. In addition to changes in thesurface freshwater fluxes (evaporation minus precipitation;E−P), depth-integrated changes are also influenced by oceancirculation changes that can also be responsible for salinity/freshwater redistribution, or water mass changes attributableto the coincident broad-scale warming (Lowe and Gre-gory 2006, Durack and Wijffels 2010, Boutteset al 2012, 2013, Bouttes and Gregory 2014).
The current generation CMIP5 climate models do notinteractively simulate land-ice changes, and glacier and ice-sheet changes are primarily calculated using offline models(Church et al 2013b). The inclusion of these processes is ananticipated improvement for future coupled modelling sys-tems that will be contributing to CMIP6 (Meehl et al 2014).Consequently, consideration for such differences must beaccounted for during observation-model intercomparisonstudies and particularly when considering future model pro-jections, as land–ice contributions become a more dominantcontributor to GMSL.
Further work is necessary to better understand andquantify the processes responsible for the observed andsimulated regional SL changes, and for this idealized ocean-only simulations are a well suited compliment to results fromfully-coupled models (Griffies et al 2009, Stammer 2010,Bouttes et al 2012, 2013, Durack et al 2012, Lorbacheret al 2012, Bouttes and Gregory 2014, Danabasogluet al 2014, Griffies et al 2014). Additional work is alsoneeded to better understand the complex space–time obser-vational coverage and its impact on estimates of spatiallycomplete steric changes (e.g. Gille 2006, Cheng andZhu 2014a, 2014b, Lyman and Johnson 2014). This is par-ticularly relevant as recent works have highlighted thatSouthern Hemispheric long-term global OHC and thermos-teric change estimates are likely biased low due to the poor
spatial coverage of historical observations and current ana-lysis techniques (Gille 2002, 2008, Gregory et al 2004,Gouretski and Koltermann 2007, Durack et al 2014).
Our study confirms that halosteric contributions to stericSL changes are non-negligible on regional to basin-scales.This result has not been acknowledged in previous works asmost long-term SL change assessments have been largelyfocused on GMSL change, thereby explicitly excluding theconsideration of halosteric effects. The magnitude of halos-teric changes suggests that some care is required when usingSSH altimetry to infer regional thermosteric or heat contentchange (Domingues et al 2008) or their uncertainties (Lymanand Johnson 2008, 2014), because neglecting halostericeffects may mask (or enhance) regional warming signals(figure 2).
Our new results also demonstrate that contrasting basin-scale halosteric and thermosteric changes reveals robust sig-natures in observations, and that the current CMIP5 genera-tion of historically forced climate models capture theintegrated basin-scale characteristics of the observed halos-teric changes, even in the presence of substantial regionaldiscrepancies.
Acknowledgements
The work of PJD and PJG from the Climate Program atLawrence Livermore National Laboratory is a contribution tothe US Department of Energy, Office of Science, Climate andEnvironmental Sciences Division, Regional and Global Cli-mate Modeling Program under contract DE-AC52-07NA27344. The Australian Government Department ofEnvironment, the Bureau of Meteorology and CSIRO throughthe Australian Climate Change Science Program supportedthe work of SEW. We thank J Durack of the University ofCalifornia, San Francisco and J A Church from CSIRO,Hobart, Australia for helpful comments with early drafts ofthis manuscript. We acknowledge the efforts of F Fernandesin writing and maintaining the python seawater toolbox(Fernandes 2014) and D Williams, C Doutriaux and theirteam for developing and maintaining the UV-CDAT analysispackage (Williams et al 2014). We acknowledge the sourcesof observed data used in this study: M Ishii and M Kimoto(Ish09) and the International Argo Program and the nationalprogrammes that contribute to it. We acknowledge the WorldClimate Research Programme’s Working Group on CoupledModeling, which is responsible for CMIP, and we thank theclimate modeling groups (listed in table 1) for producing andmaking available their model output. For CMIP the USDepartment of Energy’s Program for Climate Model Diag-nosis and Intercomparison provides coordinating support andled development of software infrastructure in partnership withthe Global Organization for Earth System Science Portals.The DW10 data presented in this study can be downloadedfrom the CSIRO Ocean Change website at www.cmar.csiro.au/oceanchange. LLNL Release #: LLNL-JRNL-653602.
8
Environ. Res. Lett. 9 (2014) 114017 P J Durack et al
References
Abraham J P et al 2013 A review of global ocean temperatureobservations: implications for ocean heat content estimates andclimate change Rev. Geophys. 51 450–83
Alley R B, Clark P U, Huybrechts P and Joughin I 2005 Ice-sheetand sea-level changes Science 310 456–60
Antonov J I, Levitus S and Boyer T P 2002 Steric sea levelvariations during 1957–1994: importance of salinityJ. Geophys. Res. 107 8013
Antonov J I, Levitus S and Boyer T P 2005 Thermosteric sea levelrise, 1955–2003 Geophys. Res. Lett. 32 L12602
Barnett T P, Pierce D W, AchutaRao K M, Gleckler P J, Santer B D,Gregory J M and Washington W M 2005 Penetration ofhuman-induced warming into the world’s oceans Science 309284–7
Boening C, Willis J K, Landerer F W, Nerem R S and Fasullo J 2012The 2011 La Nina: so strong, the oceans fell Geophys. Res.Lett. 39 L19602
Bouttes N and Gregory J M 2014 Attribution of the spatial pattern ofCO2-forced sea level change to ocean surface flux changesEnviron. Res. Lett. 9 034004
Bouttes N, Gregory J M, Kuhlbrodht T and Smith R S 2013 Thedrivers of projected North Atlantic sea level change Clim. Dyn.43 1531–44
Bouttes N, Gregory J M, Kuhlbrodt T and Suzuki T 2012 The effectof windstress change on future sea level change in the SouthernOcean Geophys. Res. Lett. 39 L23602
Boyer T P et al 2013 World Ocean Database 2013 ed S Levitus andA Mishonov (Technical ed) NOAA Atlas NESDIS 72 (USDepartment of Commerce) p 209 Available online: (http://data.nodc.noaa.gov/woa/WOD13/DOC/wod13_intro.pdf)
Boyer T P, Levitus S, Antonov J I, Locarnini R A and Garcia H E2005 Linear trends in salinity for the World Ocean, 1955–1998Geophys. Res. Lett. 32 L01604
Brunnabend S-E, Shröter J, Timmermann R, Rietbroek R andKusche J 2012 Modeled steric and mass-driven sea levelchange caused by Greenland ice sheet melting J. Geodyn.59–60 219–25
Carton J A, Giese B S and Grodsky S A 2005 Sea level rise and thewarming of the oceans in the simple ocean data assimilation(SODA) ocean reanalysis J. Geophys. Res. 110 C09006
Cazenave A, Dieng H B, Meyssignac B, von Schuckmann K,Decharme B and Berthier E 2014 The rate of sea-level rise Nat.Clim. Change 4 358–61
Cheng L and Zhu J 2014a Uncertainties of the ocean heat contentestimation induced by insufficient vertical resolution ofhistorical ocean subsurface observations J. Atmos. Ocean.Technol. 31 1383–96
Cheng L and Zhu J 2014b Artifacts in variations of ocean heatcontent induced by the observation system changes Geophys.Res. Lett. doi:10.1002/2014GL061881 in press
Church J A et al 2013a Sea level change Climate Change 2013: ThePhysical Science Basis. Contribution of Working Group I tothe Fifth Assessment Report of the Intergovernmental Panel onClimate Change ed T F Stocker, D Qin, G-K Plattner,M Tignor, S K Allen, J Boschung, A Nauels, Y Xia,V Bex and P M Midgley (Cambridge: Cambridge UniversityPress) pp 1137–216 Chapter 13 Available online: (www.climatechange2013.org/report/full-report/)
Church J A, Monselesan D, Gregory J M and Marzeion B 2013bEvaluating the ability of process based models to project sea-level change Environ. Res. Lett. 8 014051
Covey C, Gleckler P J, Phillips T J and Bader D C 2006 Seculartrends and climate drift in coupled ocean-atmosphere generalcirculation models J. Geophys. Res. 111 D03107
Cowley R, Wijffels S, Cheng L, Boyer T and Kizu S 2013 Biases inexpendable bathythermograph data: a new view based in
historical side-by-side comparisons J. Atmos. Ocean. Technol.30 1195–225
Danabasoglu G et al 2014 North Atlantic simulations in coordinatedocean-ice reference experiments phase II (CORE-II). Part I:mean states Ocean Modelling 73 76–107
Domingues C M, Church J A, White N J, Gleckler P J, Wijffels S E,Barker P M and Dunn J R 2008 Improved estimates of upper-ocean warming and multi-decadal sea-level rise Nature 4531090–3
Durack P J, Gleckler P J, Landerer F W and Taylor K E 2014Quantifying underestimates of long-term upper-ocean warmingNat. Clim. Change 4 999–1005
Durack P J and Wijffels S E 2010 Fifty-year trends in global oceansalinities and their relationship to broadscale warming J. Clim.23 4342–62
Durack P J, Wijffels S E and Boyer T P 2013 Long-term salinitychanges and implications for the global water cycle OceanCirculation and Climate, A 21st Century Perspective 2nd edned G Siedler, S M Griffies, J Gould and J A Church (Oxford:International Geophysics, Academic, Elsevier) vol 103pp 727–57 chapter 28
Durack P J, Wijffels S E and Matear R J 2012 Ocean salinities revealstrong global water cycle intensification during 1950–2000Science 336 455–8
Fasullo J T, Boening C, Landerer F W and Nerem R S 2013Australia’s unique influence on global sea level in 2010–11Geophys. Res. Lett. 40 4368–73
Fernandes F 2014 python-seawater v3.3.2. doi:10.5281/zenodo.11395 Available online: (http://doi.org/10.5281/zenodo.11395)
Gille S T 2002 Warming of the Southern Ocean Since the 1950sScience 295 1275–7
Gille S T 2006 How nonlinearities in the equation of state ofseawater can confound estimates of steric sea level changeJ. Geophys. Res. 109 C03005
Gille S T 2008 Decadal-scale temperature trends in the SouthernHemisphere Ocean J. Clim. 21 4749–65
Gleckler P J et al 2012 Human-induced global ocean warming onmultidecadal timescales Nat. Clim. Change 2 524–9
Good S A, Martin M J and Rayner N A 2014 EN4: quality controlledocean temperature and salinity profiles and monthly objectiveanalyses with uncertainty estimates J. Geophys. Res. 1186704–16
Gouretski V and Koltermann K P 2007 How much is the oceanreally warming? Geophys. Res. Lett. 34 L01610
Gregory J M, Banks H T, Stott P A, Lowe J A and Palmer M D 2004Simulated and observed decadal variability in ocean heatcontent Geophys. Res. Lett. 31 L15312
Gregory J M and Lowe J A 2000 Predictions of global and regionalsea-level rise using AOGCMs with and without fluxadjustment Geophys. Res. Lett. 27 3069–72
Griffies S M and Greatbatch R J 2012 Physical processes that impactthe evolution of global mean sea level in ocean climate modelsOcean Modelling 51 37–73
Griffies S M et al 2009 Coordinated ocean-ice reference experiments(COREs) Ocean Modelling 26 1–46
Griffies S M et al 2014 An assessment of global and regional sealevel for years 1993–2007 in a suite of interannual CORE-IIsimulations Ocean Modelling 78 35–89
Helm K P, Bindoff N L and Church J A 2010 Changes in the globalhydrological-cycle inferred from ocean salinity Geophys. Res.Lett. 37 L18701
Hosoda S, Suga T, Shikama N and Mizuno K 2009 Globalsurface layer salinity change detected by argo and itsimplication for hydrological cycle intensificationJ. Oceanogr. 65 579–96
Ishii M and Kimoto M 2009 Reevaluation of historical ocean heatcontent variations with time-varying XBT and MBT depth biascorrections J. Oceanogr. 65 287–99
9
Environ. Res. Lett. 9 (2014) 114017 P J Durack et al
Ishii M, Kimoto M, Sakamoto K and Iwasaki S-I 2006 Steric sealevel changes estimated from historical ocean subsurfacetemperature and salinity analyses J. Oceanogr. 62 155–70
Krishfield R A, Proshutinsky A, Tateyama K, Williams W J,Carmack E C, McLaughlin F A and Timmermanns. M-L 2012Deterioration of perennial sea ice in the Beaufort Gyre from2003 to 2012 and its impact on the oceanic freshwater cycleJ. Geophys. Res. 119 1271–305
Köhl A 2014 Detecting processes contributing to interannualhalosteric and thermosteric sea level variability J. Clim. 272417–26
Köhl A and Stammer D 2008 Decadal sea level changes in the 50 yrGECCO ocean synthesis J. Clim. 21 1876–90
Kwok R and Cunningham G F 2010 Contribution of melt in thebeaufort sea to the decline in arctic multiyear sea ice coverage:1993–2009 Geophys. Res. Lett. 37 L20501
Landerer F W, Jungclaus J H and Marotzke J 2007 Regionaldynamic and steric sea level change in response to the IPCC-A1B scenario J. Phys. Oceanogr. 37 296–312
Levitus S et al 2012 World ocean heat content and thermosteric sealevel change (0–2000 m), 1955–2010 Geophys. Res. Lett. 39L10603
Levitus S, Antonov J and Boyer T 2005a Warming of the worldocean, 1955–2003 Geophys. Res. Lett. 32 L02604
Levitus S, Antonov J I, Wang J, Delworth T L, Dixon K W andBroccoli A J 2000 Anthropogenic warming of Earth’s climatesystem Science 292 267–70
Levitus S, Antonov J I, Boyer T P, Garcia H E and Locarnini R A2005b Linear trends of zonally averaged thermosteric,halosteric and total steric sea level for individual ocean basinsand the world ocean, (1955–1959)–(1994–1998) Geophys.Res. Lett. 32 L16601
Lorbacher K, Marsland S J, Church J A, Griffies S M andStammer D 2012 Rapid barotropic sea level rise from ice sheetmelting J. Geophys. Res. 117 C06003
Lowe J A and Gregory J M 2006 Understanding projections of sealevel rise in a Hadley Centre coupled climate modelJ. Geophys. Res. 111 C11014
Lyman J M and Johnson G C 2008 Estimating annual global upper-ocean heat content anomalies despite irregular in situ oceansampling J. Clim. 21 5629–41
Lyman J M and Johnson G C 2014 Estimating global ocean heatcontent changes in the upper 1800 m since 1950 and theinfluence of climatology choice J. Clim. 27 1945–57
Maes C 1998 Estimating the influence of salinity on sea levelanomaly in the ocean Geophys. Res. Lett. 25 3551–4
Mantua N J, Hare S R, Zhang Y, Wallace J M and Francis R C 1997A pacific interdecadal climate oscillation with impacts onsalmon production Bull. Am. Meteorol. Soc. 78 1069–79
Mauritzen C, Melsom A and Sutton R T 2012 Importance of density-compensated temperature change for deep North AtlanticOcean heat uptake Nat. Geosci. 5 905–10
Meehl G A, Moss R, Taylor K E, Eyring V, Stouffer R J,Bony S and Stevens B 2014 Climate model intercomparisons:preparing for the next phase EOS, Trans. Am. Geophys. Union95 77–8
Millero F J, Chen C-T, Bradshaw A and Schleicher K 1980 A newhigh pressure equation of state for seawater Deep-Sea Res. 27A255–64
Millero F J and Poisson A 1981 International one-atmosphereequation of state of seawater Deep-Sea Res. 28A 625–9
Munk W 2003 Ocean freshening, sea level rising Science 3002041–3
Pardaens A K, Gregory J M and Lowe J A 2011 A model study offactors influencing projected changes in regional sea level overthe 21st century Clim. Dyn. 36 2015–33
Pardaens A K, Vellinga M, Wu P and Ingleby B 2008 Large-scaleatlantic salinity changes over the last half-century: a model-observation comparison J. Clim. 21 1698–720
Pattullo J W, Munk R, Revelle and Strong E 1955 The seasonaloscillation in sea level J. Mar. Res. 14 88–156
Peterson B J, McClelland J, Curry R, Holmes R M, Walsh J E andAagaard K 2006 Trajectory shifts in the arctic and subarcticfreshwater cycle Science 313 1061–6
Pierce D W, Barnett T P, AchutaRao K M, Gleckler P J,Gregory J M and Washington W M 2006 Anthropogenicwarming of the ocean: observations and model results J. Clim.19 1873–900
Pierce D W, Gleckler P J, Barnett T P, Santer B D and Durack P J2012 The fingerprint of human-induced changes in the ocean’ssalinity and temperature fields Geophys. Res. Lett. 39 L21704
Rhein M et al 2013 Observations: ocean Climate Change 2013: ThePhysical Science Basis. Contribution of Working Group I tothe Fifth Assessment Report of the Intergovernmental Panel onClimate Change ed T F Stocker, D Qin, G-K Plattner,M Tignor, S K Allen, J Boschung, A Nauels, Y Xia,V Bex and P M Midgley (Cambridge: Cambridge UniversityPress) pp 255–315 chapter 3 Available online: (www.climatechange2013.org/report/full-report/)
Rignot E, Velicogna I, van den Broeke M R, Monaghan A andLenaerts J T M 2011 Acceleration of the contribution of theGreenland and Antarctic ice sheets to sea level rise Geophys.Res. Lett. 38 L05503
Sato O T, Polito P S and Liu W T 2000 Importance of salinitymeasurements in the heat storage estimation from TOPEX/POSEIDON Geophys. Res. Lett. 27 549–51
Sen Gupta A, Jourdain N C, Brown J N and Monselesan D 2013Climate drift in the CMIP5 models J. Clim. 26 8597–615
Sen Gupta A, Muir L C, Brown J N, Phipps S J, Durack P J,Monselesan D and Wijffels S E 2012 Climate drift in theCMIP3 models J. Clim. 25 4621–40
Shepherd A et al 2012 A reconciled estimate of ice-sheet massbalance Science 338 1183–9
Skliris N, Marsh R, Josey S A, Good S A, Liu C and Allan R P 2014Salinity changes in the world ocean since 1950 in relation tochanging surface freshwater fluxes Clim. Dyn. 43 709–36
Smith D M and Murphy J M 2007 An objective ocean temperatureand salinity analysis using covariances from a global climatemodel J. Geophys. Res. 112 C02022
Stammer D 2010 Reply to comment by JFR Gower on ‘Response ofthe global ocean to Greenland and Antarctic ice melting’J. Geophys. Res. 115 C10010
Straneo F and Heimbach P 2013 North Atlantic warming and theretreat of Greenland’s outlet glaciers Nature 504 36–43
Suzuki T and Ishii M 2011 Long-term regional sea level changes dueto variations in water mass density during the period1981–2007 Geophys. Res. Lett. 38 L21604
Tabata S, Thomas B and Ramsen D 1986 Annual and interannualvariability of steric sea level along line P in the NortheastPacific Ocean J. Phys. Oceanogr. 16 1378–98
Taylor K E, Stouffer R J and Meehl G A 2012 An overview ofCMIP5 and the experiment design Bull. Am. Meteorol. Soc. 93485–98
Terray L, Corre L, Cravatte S, Delcroix T, Reverdin G and Ribes A2012 Near-surface salinity as nature’s rain gauge to detecthuman influence on the tropical water cycle J. Clim. 25 958–77
Velicogna I 2009 Increasing rates of ice mass loss from theGreenland and Antarctic ice sheets revealed by GRACEGeophys. Res. Lett. 36 L19503
Wada Y, van Beek L P H, Sperna Weiland F C, Chao B F,Wu Y-H and Bierkens M F B 2012 Past and futurecontribution of global groundwater depletion to sea-level riseGeophys. Res. Lett. 39 L09402
Wijffels S E, Willis J, Domingues C M, Barker P, White N J,Gronell A, Ridgway K and Church J A 2008 Changingexpendable bathythermograph fall rates and their impacton estimates of thermosteric sea level rise J. Clim. 215657–72
10
Environ. Res. Lett. 9 (2014) 114017 P J Durack et al

Williams D N et al 2014 UV-CDAT v2.0. doi:10.5281/zenodo.12251Available online (http://doi.org/10.5281/zenodo.12251)
Wunsch C, Ponte R M and Heimbach P 2007 Decadal trends in sealevel patterns: 1993–2004 J. Clim. 20 5889–911
Yin J 2012 Century to multi-century sea level rise projections fromCMIP5 models Geophys. Res. Lett. 39 L17709
Yin J, Griffies S M and Stouffer R J 2010 Spatial variability of sealevel rise in 21st century projections J. Clim. 23 4585–607
11
Environ. Res. Lett. 9 (2014) 114017 P J Durack et al