Invisible carers: young people in Zimbabwe's home-based healthcare
Upload
khangminh22Category
view
2download
0
V '
ZIMBABWE'SAGRICULTURAL REVOLUTION REVISITEDEdited By:Mandivamba Rukuni,Patrick Tawonezvi,Carl Eicher
brought to you by COREView metadata, citation and similar papers at core.ac.uk
provided by IDS OpenDocs

ZIMBABWE'S AORK ULTURAL REVOLUTION REVISITED
Mandivamba Rukuni, PatrickTawonezvi and Carl Eicher
with Mabel Munyuki-Hungwea n d P rn<:n f>r M ^ t o n r l i
U.Z.
Publications

12 A g ricu ltu ra l in p u t su p p ly ...................................................................................... 279Joseph Rusike and Chrispen SukumeEvolution of fertilizer systems and perform ance: 1 9 3 0 -1990 ....................... 279Agricultural input su p p ly ............................................................................................281Supply systems and perform ance under structural ad justm ent........................287Supply systems and perform ance under the fast track land resettlementp ro g ram m e......................................................................................................................291Restructuring fertilizer supply systems: major ch a lle n g es ............................. 293C o n c lu sio n ......................................................................................................................295
13 A g ricu ltu ra l m a r k e t in g ............................................................................................299Kay Muir-Leresche and Chiedza MuchopaEvolution of agricultural m arketing ........................................................................ 299Agricultural m arketing ................................................................................................ 300Producer price p o lic y ...................................................................................................302M arket liberalization in the 1 9 9 0 s ...........................................................................303M aize m a rk e tin g ........................................................................................................... 305Cotton m a rk e tin g ........................................................................................................ 311Dairy m ark e tin g ............................................................................................................ 313Livestock and beef m arketing ................................................................................... 313Tobacco m arketing ........................................................................................................314M arketing of other com m odities............................................................................ 3 15M arketing through Z 1M A C E .................................................................................... 316C o n c lu s io n ......................................................................................................................317
14 R u ra l f inanc ia l m a rk e ts : h is to rica l overview 1924-1991............................ 321Ruvimbo ChimedzaPre-independence rural financial m arkets..............................................................322Post-independence rural financial in stitu tions..................................................... 323Perform ance of rural finance institutions: 1980-1991 .................................... 327Informal fin an ce ............................................................................................................ 330Policy is su e s ................................................................................................................... 333
15 A g ric u ltu ra l finance: 1 9 9 0 -2 0 0 4 ..........................................................................339Naison ZumbikaB ackground .....................................................................................................................340The rural credit market ............................................................................................... 342G overnm ent funding through key agricultural m in istries.................................343Reserve Bank o f Z im babw e and agro-b ills........................................................... 347Private sector funding: com m ercial banks and agro-processors..................... 349Changes in the supply o f c re d it.................................................................................350Lessons from experience ............................................................................................350C o n c lu s io n ......................................................................................................................353

Timely production and distribution of fertilizer will increase farmer productivity

Agricultural input supply
Joseph Rusike and Chrispen Sukume
The preconditions for the development and growth of agricultural input supply systems for smallholders were established in the 1940s and 1950s, mainly as spin-offs from public and private investments targeted at large-scale commercial farmers. These included government agricultural research stations that released new cultivars, nutrients, pesticides and farm equipment technologies that private sector firms could sell to farmers at a profit. They also included public extension services that cooperated with private firms, farm credit, market channels and favourable government policies. Agribusiness firms entered the input markets by initially focusing on large-scale commercial farmers and later expanding to smallholders in favourable areas.
This chapter discusses the historical development of the fertilizer and chemical industries from the pre-independence and post-independence eras to the introduction of structural adjustment reforms in 1991, changes during the economic reforms in the 1990s, and finally changes and challenges emanating with the land and agrarian reforms since 2000. After 70 years o f servicing mainly large-scale commercial farmers, the fertilizer and chemical industry is now being challenged to re-invent itself and supply relevant farm management information, knowledge, technology, capital and services to an increased number of black commercial and smallholder fanners, scattered in all parts of the country. The smallholder fertilizer problem is complex and has been debated for decades.
Evolution of fertilizer systems and performance: 1930-1990
The industries supplying fertilizer, pesticide and farm machinery and equipment emerged in the 1930s and initially grew through market expansion of multinationals based in South Africa, Europe and the United States of America. For example, Fisons Limited (United Kingdom) registered Fison Albatros (Zimbabwe) in 1930 to market fertilizers and chemical products. Phosphate production started in 1930 when African Explosives and Chemical Industries of South
38 See Crawford et al., 2003 and 2005; Kelly et al., 2003 and Lele et al., 1989.
279

Organ i sat ion/C'ompany Yearformed
Purpose Strategy
Zimplow (formerly Rhodesia Plough and Marketing Company)
1939 Distribute farm machinery and equipment
Reduce imports from Europe
African Explosives & Chemical Industries
1946 Subsidiary formed at Dorowa
Develop local phosphate ore
Windmill fertilizer Company (subsidiary of Windmill Holland formed in 1928)
1947 Production and marketing facilities for fertilizer, pesticides and veterinary products
Largest phosphate factory in Europe seeking export markets in southern Africa
Milborrow Animal Health (formerly Milborrow and Company)
1951 Subsidiary of Glaxo Group Limited of London to supply veterinary medicines, instruments and equipment
Cyanamid (formerly Shell Chemicals)
1952 Supply shell chemicals
Technical Services (Africa)
1952 Import and distribute agricultural fumigants and insecticides
Hoeschst (established Chemimpo Company)
1956 Import and distribute agricultural fumigants and insecticides
Chemimpo was a subsidiary of Chemimpo South Africa which in turn was a subsidiary of the Dutch & Overseas Trading of Holland. Chemimpo changed its name in 1960 to Hoeschst
Pfizer Corporation (United States) (subsidiary Central African Pfizer Limited)
1957 Manufacture, distribute pharmaceutical, agricultural and chemical products
Bayer (formerly Agrochemicals)
1961 Registered in South Africa and also incorporated in Canada
Cooper McDougall and Robertson (Central Africa) registered as Cooper (Zimbabwe)
1957 Changed its name to Cooper (Rhodesia) in 1972 then Welcome (Zimbabwe) in 1990. Restructured to Ecological Marketing (Ecomark) in 1992 and trading as Agrevo
280

Africa established a subsidiary to manufacture fertilizers and other chemicals in Harare using imported raw materials.
During the immediate years after the Second World War, there was significant expansion in large-scale commercial farming in Zimbabwe because of the rapid increase in the growing of tobacco for export and maize to satisfy the staple food requirements of the increasing population and stockfeed for the beef and dairy industries. Greater crop production markedly increased the demand for mineral fertilizers, pesticides and farm machinery and equipment. To support the development of fertilizer and pesticide supply systems, the government enacted the Fertilizer, Farm Feeds and Remedies Act of 1952, which it amended in 1965, and the Fertilizers Regulations in 1972 to prevent the adulteration of products. The Act required all fertilizer and agrochemical companies to first register their products with the registering officer of the former Department of Research and Specialist Services before they could sell them in the country. In addition, all pesticides had to be placed in group II or III of hazardous substances under the provisions of the Hazardous Substances and Articles Act (Chapter 322).
The increased demand was initially met from the domestic production of granular compound fertilizers using imported nitrogen, phosphate and potash raw materials. In 1960 African Explosives and Chemical Industries, the forerunners of the current Zimbabwe Phosphate Industries (Zimphos), tapped the apatite deposit at Dorowa in the east of Zimbabwe. The concentrated rock was transported by road and rail to the phosphate manufacturing plant in Harare and converted into single and triple superphosphate. This process used sulphuric acid derived from the local pyrites deposits at Glendale. For the next 35 years, Zimphos supplied nearly all the phosphate needs of the local compound fertilizer manufacturing industry.
When the United Nations imposed mandatory sanctions on Zimbabwe (then Rhodesia) in 1965, it enforced restrictions on importation of raw materials and finished products. Several companies were formed to circumvent sanctions. For example, Agricura was established in 1965 as a subsidiary of Agricura South Africa with 50 per cent equity, the other 50 per cent equity being controlled by Tobacco Sales. Agricura produced and distributed crop chemicals, cosmetics, detergents, maize and stockfeeds. Similarly, Spray Equipment was incorporated in 1965 to trade as agents for veterinary and pharmaceutical supplies, fertilizers, insecticides and livestock foods, and to manufacture agricultural sprayers and equipment. Sable Chemical Industries was established in 1969 to produce the necessary nitrogen component for fertilizer in Zimbabwe. The company opted for the production of ammonium nitrate based on the local synthesis of ammonia. The necessary nitrogen feedstock was obtained by air separation and the hydrogen component by the water electrolysis process. The company chose water electrolysis because electricity at that time was abun-
281

dantly available at low prices from the Kariba South power station.The Zimbabwe Fertilizer Company was formed in 1971 as a result of a
merger of the fertilizer and crop chemical interests of African Explosives and Chemical Industries, Albatros Fisons and Fisons Pest Control (Central Africa) Limited. The Zimbabwe Phosphate Industries (formerly Rodia Chemical Industries) was formed in 1972 as a subsidiary of African Explosives and Chemical Industries to manufacture fertilizers, disinfectants, animal dips, pesticides and herbicides. Windmill’s shareholding was restructured and domestic investors controlled the majority shareholding. This resulted in the concentration of the fertilizer and chemical industries being dominated by Zimbabwean- based companies. The domination of Zimbabwean-based firms was considered strategically important to the agricultural industry as fertilizer supply was based primarily on indigenous raw materials: phosphate rock from Dorowa, sulphuric acid from local pyrites and nitrogenous fertilizers from Sable. Since there are no local sources of potash that can be exploited, potassium chloride and potassium sulphate components had to be imported. This raw material scenario gave rise to a range of granular fertilizer components whose plant nutrient concentrations were restricted by the raw materials available: ammonium nitrate, single superphosphate, triple superphosphate, muriate of potash and sulphate of potash. Because of foreign currency allocations by the government, there were few opportunities for new competitors to enter fertilizer and chemical manufacturing and distribution.
The expansion of Zimbabwean fertilizer production was fostered by agreements between government and local companies and by the foreign exchange allocation system and import licensing which made it difficult for potential entrants to enter the domestic fertilizer market. For example, Sable Chemical Company and the Minister of Industry and Commerce signed an agreement at its formation for the erection and operation of a nitrogenous fertilizer plant under which the company sold its production at cost plus a profit equal to 4 per cent per annum of the nominal value of issued share capital and the govern
139Fison Albatros changed its name to Fisons Fertilizers in 1958. Fisons Fertilizers then changed its name to Albatros Fisons Fertilizers in 1967. Albatros Fisons Fertilizers changed its name to AFF Holdings in 1972 because Albatros were no longer shareholders in the
^ co m p an y .Zimbabwe Fertilizer Company was linked to Kynoch Feeds and Triomf Fertilizers in South Africa through African Explosives and Chemical Industries.In 1970 an American company bought Windmill Holland but then sold shares to local commodity associations: the Commercial Cotton Growers’ Association (30 per cent), the Zimbabwe Tobacco Association (10 percent), the Commercial Grain Producers’Association (10 per cent), and the Farmers’ Cooperative (14 per cent). Windmill Holland held 25 per cent equity while the remaining 2 per cent was held by the Windmill Pension Fund and staff members. There have been changes since the 1970s. The shares held by tobacco growers have been bought by Consolidated Farming Investments, which now controls 23 per cent of the equity of Windmill.
282

ment purchased the company’s entire production. The profit level was gradually increased from 4 per cent to 22.5 per cent from 1975 until its termination in 1990. Sable was also protected from international competition by the foreign exchange allocation system that provided foreign currency for importing fertilizer raw materials only to established firms and prevented imports of finished products through import licensing. The government entered into similar agreements with the management of African Explosives and Chemical Industries, and Windmill. The government also controlled the selling prices of the products of Zimphos, Zimbabwe Fertilizer Company and Windmill by taking into account production cost variances from predetermined standards when establishing current prices. This arrangement induced fertilizer companies to operate price stabilization accounts that carried forward the value of variances of production costs from preceding years to be included in subsequent price increases. At that time, the government also controlled the producer prices of the major crop commodities, namely maize, wheat, cotton, sugar cane, soyabeans and sunflowers. These crops have historically consumed more than 75 per cent of fertilizer and chemical sales.
Another barrier to entry by external companies was that foreign currency was never made available to import any o f the nitrogen or phosphate compounds unless it could be clearly shown that local demand would exceed local production capabilities. By 1980 there were six major companies engaged in fertilizer production and marketing: Dorowa Minerals, G. D. Haulage, Zimbabwe Phosphate Industries, Sable Chemicals, Zimbabwe Fertilizer Company Limited and Windmill. Dorowa Minerals, G. D. Haulage, and Zimbabwe Phosphate Industries primarily produced superphosphates and Sable produced ammonium nitrate. The superphosphates and ammonium nitrate were supplied
142The agreement provided for any pre-tax profit made in excess of that guaranteed to shareholders to be treated as credit or to be taken into account when fixing the selling price of ammonium nitrate. Conversely, pre-tax profit less than guarantees to shareholders was a debt and the selling price for the following year would be fixed to provide for the recovery of the amount due to the company. The agreement resulted in a price stabilization account
|4j which reached Z$62.9 million (US$ 26 million) by 1990.During the early 1970s fertilizer was heavily subsidized. Direct subsidies were removed in 1975 and replaced with equalization funds under which the cheaper raw materials subsidized the more expensive ones. For example, urea was sold at the same price per nutrient tonne as ammonium nitrate despite ammonium nitrate’s lower price per unit of nitro
g e n (FAO, 1996).This embargo continued until the introduction of the structural adjustment policy reforms in the 1990s.
145Dorowa Minerals, G. D. Haulage, Zimbabwe Phosphate Industries, Sable Chemicals and Zimbabwe Fertilizer Company are controlled by the Chemplex Corporation which is now wholly-owned by the Industrial Development Corporation, a government company. Windmill is owned by the Commercial Cotton Growers’ Association, the Tobacco Association, the Grain Producers’ Association, the Farmers’ Coop, the Windmill Pension Fund and Windmill Holland.
283

to Zimbabwe Fertilizer Company and Windmill for granulation into compound fertilizers and marketing to farmers. Both Windmill and Zimbabwe Fertilizer Company had invested in sophisticated laboratories and plants for formulating, granulating, mixing and bagging fertilizers and crop protection chemicals. The companies had sufficient capacity to supply the fertilizer requirements of the country. Because it was unusual for demand to exceed domestic capacity, the agricultural input industry was largely controlled by a cartel through agricultural input priority committees and membership of the input trade association. Zimbabwe Fertilizer Company and Windmill sold fertilizers on an ex-factory basis for distribution to smallholder farmers. By 1985 roughly 52 per cent of total fertilizer and pesticide sales was distributed through supply and marketing cooperative unions located throughout smallholder areas; 21 per cent was through the Agricultural Finance Corporation (AFC) small lending groups; 15 per cent was direct sales from manufacturers; and 12 per cent was through rural traders (table 12.2).
Table 12.2: Changes in relative importance of fertilizer distribution channels in Zimbabwe, 1985-1995
Year
Distribution channel1985
%1990
%1993%
1994%
Cooperative unions 52 15 4 1
AFC Small lending groups 21 13 8 9
AFC Large lending groups n/a n/a 6 5
Rural traders 12 29 30 35
Manufacturers 15 43 52 50
TOTAL 100 100 100 100
Source: Bushnell (1999)146
The factories of Windmill and ZFC are located in Harare, which is well situated for dis 4;tnbuting products by road and rail to different parts of the country.
The agricultural input priority committee system was established by the Ministry of Agriculture in the 1980s to provide estimates of crop areas and livestock numbers and fore-casts of farmers’ requirements for fertilizers, farm machinery, pesticides, veterinary medicaments and packing materials. This information was used by the Ministry of Trade and Commerce to assess the foreign exchange requirements of agriculture and help with the rationing of foreign currency among different imports. Agricultural input companies jointly made decisions about inventories, production, expected sales, import requirements and selling prices, and submitted these to the committees for ratification.
284
The lack of developed markets for the smallholder sector (poor roads, unavailability of trucks and limited competition among transport firms and retailers) led to high transport and marketing costs that resulted in retail prices being as much as 40 per cent more than ex-factory prices. In addition, farmers had to move fertilizer from supply points to their homesteads by wheelbarrows, bicycles and ox-carts.
The crop chemical industry was organized into agents and distributors because of division of labour and specialization among firms to permit the benefit of economies of scale and scope. Ten companies traded as agents and local representatives of multinational chemical companies and competed directly in the marketplace: Windmill, Zimbabwe Fertilizer Company, Agricura, Cyana- mid, Technical Services, Sprayquip, Graniteside Chemicals, Agrevo and Milborrow. Five subsidiaries of multinationals supplied agents with products without directly competing in the marketplace: Ciba-Geigy, Hoeschst, Bayer, BASF and Rhone-Poulenc. Ciba-Geigy carried out a few direct sales to smallholders and commercial farmers but these were limited by the high financial, transportation and human resource investments and time needed to set up distribution channels.
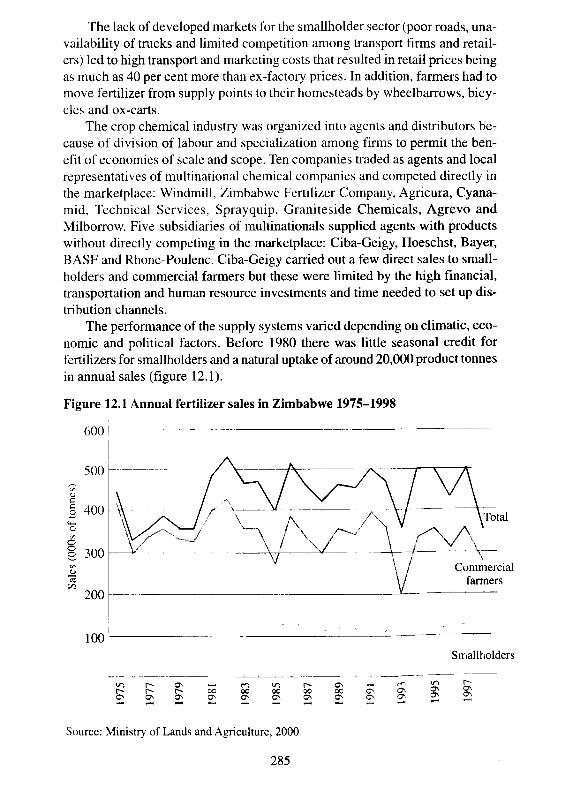
The performance of the supply systems varied depending on climatic, economic and political factors. Before 1980 there was little seasonal credit for fertilizers for smallholders and a natural uptake of around 20,000 product tonnes in annual sales (figure 12.1).
Figure 12.1 Annual fertilizer sales in Zimbabwe 1975-1998
600 !
Source: Ministry of Lands and Agriculture, 2000
285

From graph 12.1, smallholder fertilizer sales increased fourfold from 1981 to 1986. Sales increased to a peak of 127,000 tonnes during the 1985/86 cropping season. The increase was in response to seasonal loans granted by the Agricultural Finance Corporation. However, sales began to decline after the 1986/87 cropping season as the Agricultural Finance Corporation curtailed seasonal loans to smallholders following high default rates. This decrease in sales of fertilizer was offset by increased cash purchases. Domestic fertilizer prices were lower than import parity prices due to price controls. Using locally manufactured fertilizer was profitable and farmers required less than eight kilograms of maize grain to buy one kilogram of nitrogen applied as ammonium nitrate and less than 15 kilograms of maize to buy one kilogram of compound D fertilizer (figure 12.2).
However, use of inorganic fertilizers by smallholders started declining from the early 1990s because of increased poverty, high prices and lack of conven-
Figure 12.2 Fertilizer to maize grain price ratio, 1970-2001
o SO 00 o T f SO 00 8 SO 00r-* r-~ r - r-* r -- 00 00 00 00 00 O s ON Os O n0\ ON ON ON ON ON ON ON ON O s O s O s ON O s O s1—H H H •“N
Source: Ministry of Lands and Agriculture, 2000
286

ient packages at rural trading stores within walking distance o f their homes. It was also during this period when environmental sustainability issues arose and use of inorganic fertilizers was deemed to be risky. However, the few smallholders who used inorganic fertilizers applied lower rates than those recommended. Also in smallholder areas, low and erratic rainfall, low soil moisture retention and poor soil and crop management limited responses to fertilizer, and these reduced returns on investments.
Supply systems and performance under structural adjustment
Before the introduction of the economic structural adjustment programme in 1990, the government controlled fertilizer and chemical production and trade through the allocation of foreign exchange and interventions in domestic trade. For example, the government provided an annual foreign exchange budget to the Ministry of Agriculture which allocated it among trade associations for agricultural machinery, pesticides and seeds. Trade associations, in turn, distributed foreign exchange to their members. The Ministry of Agriculture also required mandatory testing and registration of agricultural inputs before they could be offered for sale to farmers and registered producers and traders in ways that restricted competition. The ministry protected a private oligopoly in fertilizer, pesticide and farm equipment supply by limiting registrations for input companies. To limit exploitative pricing by oligopolies, the ministry administered price controls on agricultural inputs and commodities in domestic trade.
In the wake of structural adjustment policy reforms in the early 1990s, the government introduced an export retention scheme, the special horticultural facility and the export promotion programme to ease foreign exchange shortages and improve the availability of inputs. In 1992 the government modified the foreign exchange allocation system to provide some imported inputs such as stockfeeds and tyres under the open general import licence system and to expand foreign exchange under the export retention scheme that replaced the agricultural promotion programme. The government also removed price and marketing controls on agricultural machinery, seed, pesticides and fertilizers. At the same time government removed controls on producer prices of all crops. Following the worst drought in living memory in the 1991/92 season, government introduced free crop packs, consisting of seeds, fertilizers and crop chemicals, and contract ploughing through public mechanical tillage units in order to
In 1993, the government lifted price controls for all but two fertilizers, ammonium nitrate and compound D (recommended for maize) which are important for smallholder farmers. The government then lifted all price controls on fertilizer in mid-1995 and removed the subsidies on electricity for Sable’s ammonia plant.
287

help resource-poor fanners recover and increase their productivity. After 1992, the government implemented five consecutive years of seed, fertilizer and transport crop pack programmes even during favourable rainfall years to ensure that smallholders achieved food security and to reduce the cost of drought relief food distribution. The government stopped the free crop pack programme during the 1997/98 cropping season and began to support development of agroinput dealers.
The agricultural market liberalization policies of the 1990s resulted in the restructuring of the agricultural input industry. For example, Omnia began marketing brand fertilizers imported from South Africa in 1995, capturing about 2 per cent of fertilizer sales in that year. Several small niche players started setting up fertilizer companies by targeting overhead, drip or mist irrigation markets. These included Hygrotech, Agrevo, BASF, Sprayquip, Ocean Agriculture, Agrigrow, Garden Rains Irrigation, Lances Link and Cit Chem. But there remained several barriers to entry resulting from controls on registration of fertilizer products, distribution, imports and exports. Only large companies with resources to circumvent the barriers entered the industry.
In 1996, the demand for fertilizer was projected to grow at 3 per cent per annum, mostly because of more intensive fertilizer use by smallholders. During that period, the industry had sufficient capacity to meet expected growth in demand from domestic production because of four factors. Firstly, the move to bulk blending would enable companies to produce any rate relatively quickly compared to granulation. ’ Secondly, the establishment of bulk blending plants by Omnia and Nutrichem provided additional capacity to that of Zimbabwe Fertilizer Company and Windmill. Thirdly, increased use of high analysis fertilizers by fanners reduced the quantity that had to be manufactured and applied in crop production. Finally, the local fertilizer market had opened up to international competition, particularly from South African based fertilizer companies. South African firms have competitive advantages resulting from excess capacity, larger plants and economies of scale because of access to a larger
144
149The drought recovery programme was aided by financial support from the World Bank
]5 jand the Japanese and German governments.Zimbabwe Fertilizer Company and Windmill responded to this competition by setting up entire horticulture divisions to compete in this segment.Currently many smallholders are growing crops without fertilizer or applying small quantities. Fertilizer companies are expanding investments in advertising and demonstration trials in the better-favoured areas to show smallholders the effects of applying different
.ra tes of fertilizer.152 _
Because of bulk blending, fertilizer companies have more flexibility so they can produce any product more quickly than with granulation. For example, a granulation plant needs a minimum efficient size of 300 to 400 tonnes per run per day. This explains why fertilizer firms were restricted to 13 compounds. But with bulk blendings production is simpler, quicker and more flexible, enabling the manufacture of a wider range of products.
288

domestic market, location in relation to the Zimbabwean market, better production know-how, low-cost raw materials, more advanced technology and export incentives.
Because of increasing competition, fertilizer companies expanded investments in marketing their products, particularly to smallholders. Consequently, distribution channels were restructured. For example, cooperatives retained distribution of less than 1 per cent of fertilizer sales because they collapsed following government removal of their monopoly to distribute Agricultural Finance Corporation financed sales after farmers complained about high markups, late deliveries and incorrect deliveries. Fertilizer manufacturers distributed more than 50 per cent of sales directly through their depots in Harare and through sales representatives in specific areas who arranged for groups of farmers to collectively purchase fertilizer for cash and then helped arrange truckloads for delivery to farmer groups. Table 12.1 reveals that rural trader sales share tripled to 35 per cent between 1985 and 1994 while the share of cooperative unions plummeted from 52 to 1 per cent during the same period. Likewise, the share of Agricultural Finance Corporation small lending groups had fallen because the corporation had drastically reduced credit to smallholders due to high default rates. Because the cooperatives were the only fertilizer distributors located within walking distance of farmers in communal areas, their exit meant that farmers had to travel greater distances to acquire inputs. Because of location, monopolistic behaviour by rural traders - the high price escalations - consequently reduced farmers’ use of fertilizers.
Fertilizer firms have been experimenting with various organizational innovations to more efficiently distribute products to smallholders in remote areas. Starting in 1992, Zimbabwe Fertilizer Company established depots in smallholder areas to improve the availability of fertilizer in areas poorly served by traders. However, the company later closed its depots in smallholder areas because they sold fertilizer for only a few months of the year making them noncompetitive compared to rural traders who could spread their overheads throughout the year by selling an array of consumer products. During the 1995/96 cropping season, CARE Zimbabwe and the African Centre for Fertilizer Development began to support the development of a network of community-based agribusiness dealers in five districts in Masvingo and Midlands provinces. The project then scaled up and by 2001 had covered a network of 500 community- based agribusiness agents throughout smallholder areas around the country,
In the early 1980s, the South African fertilizer industry consisted of several players: Triomf, Senlrachem, Omnia, Fedmis, and Bonus. These consolidated through mergers and acquisitions into three companies: Kynock, Sasol and Omnia. Annual fertilizer production capacity in South Africa is 3 million tonnes. Currently annual sales average 2.2 million tonnes, which leaves a balance of 800,000 tonnes in excess capacity.
289

linked to agricultural input suppliers (CARE Zimbabwe, 2001).The opening up of the fertilizer market meant local companies had to trans
form themselves to operate under the new environment. Thus fertilizer firms refurbished plants and expanded capability and flexibility to supply adequate quantities under the competitive environment. Reforms began to have an impact from 1995 when government ended price controls on common maize fertilizers. Also, in February 1996, contracts that bound Zimbabwe Fertilizer Company and Windmill to buy ammonium nitrate from Sable expired resulting in competitive sourcing of fertilizers from outside the region and imported through South Africa. The annual imports of compound (NPK) fertilizers sharply increased from below 500 tonnes, the average from 1990 to 1993, to 12,000 tonnes in 1994, 14,310 tonnes in 1995 and 48,435 tonnes in 1996. The reforms also had some impact on technology transfer as more compounds were registered (over 260 products registered between 1991 and 1996 compared to 18 products available from 1960 to 1990), private soil tests were undertaken (four privately-owned laboratories offering soil testing services in competition with the government’s laboratory) and there were new entrants to the business but impact on volume of fertilizer applied cannot be claimed (Gisselquist and Rusike, 1997).
Overall, use of fertilizers during the 1990s was dominated by unfavourable weather conditions, free fertilizer programmes and unstable economic conditions. Following the 1991/92 record drought season, smallholder farmer fertilizer purchases fell to 33,000 tonnes in 1992/93. But the government supplied 180,000 tonnes of fertilizer to smallholder farmers for free in 1992/93 through the drought relief crop packs programme. The government reduced fertilizer distributed through drought relief to 69,000 tonnes in 1993/94; 18,600 in 1994/ 95; and 28,600 in 1995/96. Thus smallholder farmer fertilizer sales had a downward trend as compared to commercial purchase levels. The fertilizer prices rose to import parity following the lifting of production subsidies and price controls. Fertilizer to maize price ratios increased and this reduced levels of use of inorganic fertilizers by smallholder farmers. Because of the decrease in international urea prices, it became cheaper to import nitrogen into Zimbabwe than to manufacture it.
4 If nitrogen is landed in Zimbabwe at US$ 120 per tonne of ammonium nitrate equivalent, then Sable’s electrolysis-based production is uncompetitive. However, if nitrogen is imported at a price higher than US$ 210 then Sable’s plant is competitive. Sable currently has an advantage compared lo competitors of US$ 50 per tonne in moving fertilizers from Durban to Harare.
290

Supply systems and performance under the fast track land resettlem ent programme
The land occupations from 2000 coincided with a downfall in economic performance, changes of policy in the agriculture sector and political instability. The land reform commonly referred to as the fast track land resettlement programme and the resulting agrarian reform came with a new structure in land ownership. The new land ownership structure in place resulted in increased demand for fertilizers and pesticides. Within this period, the country experienced critical foreign currency and fuel shortages, mainly due to the country’s poor economic performance plus strained relationships with donor agencies. While there was an increase in areas planted to most crops, productivity was affected by problems in the availability and accessibility of important inputs for fertilizers.
The country has a well-developed fertilizer industry whose ownership is shared but dominated by about six entities, including government, private firms and former large-scale commercial farmers. The crucial raw material for fertilizer production is nitrogen. Ammonium nitrate, manufactured by Sable, supplies over 90 per cent of the country's total fertilizer requirements. The ammonia plant has an annual capacity of 80,000 tonnes while the ammonium nitrate plant has a capacity of 250,000 tonnes, requiring 115,000 tonnes of ammonia. These capacities are currently underused. In 2002 there was an annual ammonia shortfall of 35,000 tonnes which was imported from Sasol in South Africa. Extra demand was filled by imports by Zimbabwe Fertilizer Company, Omnia and Windmill in the form of urea because ammonium nitrate remained banned in South Africa and could not pass overland in South Africa for export. Ammonia sulphate and sodium nitrate are imported because of a lack of capacity for local manufacture. These are used in tea estates and tobacco production. Norsk Hydro has been retailing imported calcium nitrate for the horticultural industry.
Zimphos manufactures single superphosphate by reacting phosphate rock concentrate from Dorowa Minerals mining operations with mainly imported sulphuric acid and triple superphosphate by reacting phosphoric acid with rock phosphate. Zimphos has an annual production capacity of 200,000 tonnes single superphosphate and 60,000 tonnes triple superphosphate, which in normal seasons is just sufficient to meet the country’s total phosphate requirement. The third most important raw material is potassium which is mainly imported. The superphosphates and ammonium nitrate are supplied to Zimbabwe Fertilizer Company and Windmill for granulation into compound fertilizers and distribution to farmers. Zimbabwe Fertilizer Company and Windmill produce 13 compound fertilizers approved by the fertilizer advisory committee. The total annual production capacity of granulation plants is 300,000 tonnes. Zimbabwe
291

Fertilizer Company and Windmill have installed bulk blenders with a capacity of 100,000 tonnes and 50,000 tonnes respectively. Omnia imports all its fertilizers from its parent company in South Africa. From 2002, an input dealing company called Farmers World started importing small amounts of fertilizer blends. This meant that the fertilizer industry continued to be heavily dependent on imports.
Whilst demand for all types of fertilizers has increased tremendously, local companies fail to produce to full capacity due to shortages and controls of foreign exchange needed to purchase raw materials. For example, Zimphos annually needs about US$915,000 for sulphur importation and US$580,000 for sulphuric acid plant maintenance. Sourcing this foreign currency on the parallel market in the face of controlled product price has not been viable. Capacity use is also affected by shortages of fuel and electricity and poor transport services by the National Railways of Zimbabwe. The demand for fertilizers was estimated at 600,000 tonnes for the 2003/04 season and industry was expected to produce only 350,000 tonnes, well below the projected requirements (Eben Makonese, Chemplex CEO). Price controls on products introduced in 2001 were another factor that restricted production to capacity levels. Zimbabwe had the lowest fertilizer prices in the region at US$3 to US$6 per 50kg bag in 2002 when regional prices were more than US$20 per bag. These prices continued to provide incentives for cross-border informal exportation of the subsidized fertilizer to neighbouring countries. Only compound D and ammonium nitrate remained controlled by the government. To evade the price controls, companies manufacture brands of fertilizers that are not controlled and these are priced at levels that most new farmers cannot afford, thus reducing use of fertilizer and production.
The fertilizer industry could potentially become self sufficient in its foreign currency requirements if it were allowed to export part of its output. The foreign currency earned would then be used in the industry to self-finance imports of essential raw materials. Estimates from Zimbabwe Fertilizer Company and Windmill suggest that permission to export 40,000 to 100,000 tonnes of fertilizer products would remove the foreign currency constraint to production currently being experienced by the industry.
Prior to the fast track land reform programme, large-scale commercial farmers planted 570,000 hectares, using an average of 700kgs of fertilizer product per hectare, thus purchasing about 400.000 tonnes per annum. At least 1.2 million smallholder farmers planted 2.3 million hectares, using less than 50kgs of product per hectare and purchasing about 100,000 tonnes. The projected requirements of 600,000 tonnes of fertilizer in any season as suggested seemed too optimistic in the short term, given the following constraints: historical levels of smallholder fertilizer application rates; most new farmers being former communal farmers; the low uptake of A2 land; and financial resource limita-
292

tions, among other reasons. It is estimated that the effective demand is below 500,000 tonnes of fertilizer and well within the potential capacity of the existing production infrastructure, even though it is underused. However, there is need to upgrade the existing production infrastructure for envisaged increased future demand. As more farmers take up land, especially under the A2 scheme, demand for fertilizer will increase. Given the current low capacity use due to the low foreign currency allocation to the industry and fuel, electricity and transport constraints, fertilizer shortfalls are likely to continue for the coming seasons.
The fertilizer availability problems have been compounded by accessibility constraints faced by traditional outlets. A key problem is that the huge demand from government-managed input schemes (through the Grain Marketing Board and Agricultural Rural Development Authority) has diverted inputs from traditional outlets such as retail shops, leading to shortages. Late ordering which at times required foreign currency and posed logistical problems within the systems, has led to late deliveries to farmers. Limitations on the quantities one can acquire as well as non-discrimination in terms of capability of farmers - including whether or not one is really a farmer - has meant farmers with the resources and skills to plant larger areas could not access adequate inputs. The fact that non-farmers could acquire fertilizer at low, government-controlled prices also led to the development of a thriving parallel market and hoarding by some large-scale farmers where prices became as high as double the official prices, further reducing access to inputs. This marketing pattern had the effect of increasing farmers’ transaction and production costs in general, and added to the limited access that small, poor and vulnerable farmers faced (Jayne et al., 2003).
Restructuring fertilizer supply systems: major challenges
A number of challenges face the fertilizer supply industries and demand for fertilizer in the future. The shortages of foreign currency are likely to continue for some time and this will continue to affect fertilizer supplies. Although the Reserve Bank of Zimbabwe has introduced a system to ensure access to foreign currency to import raw materials and concessional financing for increasing operations in the productive sector, the allocations are still below company requirements. Thus, Zimphos and Sable Chemicals will continue operating below capacity for some time and will not be able to meet demand. The second challenge is to find ways of significantly increasing levels of fertilizer use by smallholders and the newly resettled farmers in order to raise their productivity, incomes and food security. Although most smallholders are poor and lack purchasing power for the technologies and services at recommended levels, high returns for investments can only be achieved when guidelines are fol-
293
lowed. The HIV and AIDS pandemic is compounding farmers’ problems of access to working capital and labour because of the loss of family members working on farms and members supplying remittances from urban areas. Nevertheless, increased use of fertilizers has to be achieved without subsidies because the government has a budgetary constraint and donors are unwilling to fund subsidies. The third challenge is to restructure marketing channels to reduce farm-gate prices and improve product availability within walking distance of farmers and the quality of local dealer services. The fourth challenge is to increase the competitiveness of fertilizer firms in the domestic, regional and international markets to meet increasing competition resulting from falling trade barriers and globalization.
A number of strategies can be used to ensure capacity use of fertilizer companies. Demand for fertilizer is envisaged to increase as more farmers grasp farming skills and supplies can be increased by either allocating all foreign currency requirements or allowing companies to export some products. Fertilizer use by farmers could be increased by the adoption of new agricultural research and extension practices, including learning-based and empowerment methods such as farmer participatory research and farmer field schools which help farmers analyze broad technology options instead of focusing on a single technical recommendation. Technology development, dissemination and adoption are more likely to be successful if the options are farmer-driven and consistent with the portfolio of investments households have made to support their diverse livelihoods. Opportunities also exist to expand use by reducing farm- gate prices and improving timeliness and availability through adoption by manufacturers of more aggressive marketing strategies, by shortening distribution channels and by improving the quality of services provided by rural retailers. To improve competitiveness, Zimbabwean firms need to: rationalize their product lines; invest in more efficient plant and equipment; innovate and upgrade products; search for new portfolios of products and service offerings tailored to diverse types of farmers; ensure customers of quality through certification under international standards organizations; establish strategic alliances with global players; and expand sales in regional markets in order to achieve economies of scale and scope and to drive down unit costs of farm inputs.
A major constraint on expanded use is price escalation which results from long chains of distribution and high transport and transaction costs. Under structural adjustment, the government was expected to exit input markets and let the private sector take over. Because of high transport costs, the lack of storage facilities, the lack of credit and high risk, farm input manufacturers and rural traders have not expanded investments. Consequently, most farmers are unable to access the right type of inputs in the right amounts at the right place, time and price. Mechanisms are needed to build missing rural markets in order to improve and broaden farmers’ access to inputs while also reducing transaction
294

costs and expanding output markets, productivity and incomes. The government urgently needs to improve access to markets, especially in view of the ongoing land reform. The current emphasis on training and linking rural traders with agricultural input suppliers represents one way of linking agricultural technology development with market improvement to facilitate widespread use of improved technologies. But sm allholders and new farm ers need countervailing power to reduce location monopolistic behaviour by rural traders. Because of the high cost of imports, the government needs to make strategic investments in roads and rails to reduce the cost of raw materials and products. Zimbabwean companies need to increase their competitiveness in the Southern African Development Community and Common Market for Eastern and Southern Africa (COMESA) markets to diversify business and financial risks. For example, Zimplow is currently penetrating new markets in Tanzania, Kenya, Nigeria, Cameroon and Ghana with high-quality but competitively priced products manufactured in ISO 9002 rated factories. Suppliers from India currently dominate these markets and yet Zimbabwean companies are better positioned to service these countries. Agricultural input exports would benefit from a devaluation of the Zimbabwean dollar and reduction of intra-regional trade barriers through harmonization of agricultural input policies between Southern African Development Community member states.
Conclusion
Smallholder agricultural input supply systems began to emerge during the 1940s and 1950s from spill-overs of public and private sector investments targeted at large-scale commercial farmers. Initial growth resulted from market expansion of multinational firms based in South Africa and Europe. Following UDI and the imposition of sanctions in 1965, the pattern of development changed when several Zimbabwean-based firms were established to substitute for imports using local raw materials in order to circumvent sanctions. This resulted in the development of a diversified and sophisticated agricultural input industry capable of meeting large-scale commercial farmers’ requirements for inputs. However, fertilizer industries functioned under regulatory controls by the government to protect domestic industry from international competitors. Regulatory controls on agricultural inputs trade blocked technology transfer to smallholders through markets. This resulted in poor product availability and limited choice for fertilizers, blocked entry of competing brands, high costs and delays on introduction of new products for pesticides and limited choices for agricultural machinery.
Following independence in 1980, there was a rapid growth in the use of hybrid maize seed, fertilizers, pesticides and farm equipment by smallholders, especially in the better-favoured farming areas. This was because of access to
295

Agricultural Finance Corporation seasonal credit. Hybrid seed and fertilizer use declined following the collapse of the seasonal credit scheme during the late 1980s. The government implemented reforms in the 1990s to expand input firms’ access to foreign exchange and remove mandatory testing and registration of inputs, price controls and fertilizer subsidies. Removal of subsidies and price controls resulted in increased product availability, product quality and innovation, information and manufacturer and dealer services.
The industry is being challenged to re-engineer itself, strategize on how to meet increased demand following the land and agrarian reform, find ways of increasing levels of use of inputs by smallholders and new farmers, and supply technologies relevant to the boundaries of resource endowments and diverse livelihoods for smallholders, especially in marginal semi-arid areas. The industry needs to find ways of meeting increased demand in the wake of the ever- changing operating environment, meeting such constraints as foreign currency shortages and price controls by the government. The market is also rapidly globalizing following the entry of several South African and global players so the industry needs to increase its competitiveness in domestic and regional markets.
ReferencesBushnell, D. G., Zimbabwe: some agricultural facts, African Centre for Fertilizer Developm ent, Harare, 1999.
CARE Zimbabwe, ‘Agribusiness entrepreneur network and training (AGENT) program m e', paper presented at the Rockefeller Foundation, ‘Soil fertility research review ’, Zimbabwe stakeholders' workshop, Imba M atombo Lodge, Harare, 29 October to 2 N ovem ber 2001.
Com mercial Farm ers Union, ‘Survey of current input costs and recent input cost increases', Harare, 2001.
Crawford, E., E. Kelly, T. Jayne and J. Howard, ‘Input use and market development in sub-Saharan Africa: An overview ’ in Food Policy 28:4 (277-292), 2003.
Crawford, E., T. Jayne and V. Kelly, ‘W hy prom ote increased use of fertilizer in A frica?’, draft paper prepared for the W orld Bank (Africa Region, Environmental, Rural and Social Developm ent Unit) as part o f a project that supports its Africa fertilizer strategy review, 2005.
Departm ent o f Research and Specialist Services, 'General fertilizer recom m endations’, in Zimbabwe Agricultural Journal 64: 120-121, 1967.
Food and Agriculture Organization, ‘Fertilizer marketing in Z im babw e’, a paper prepared for the FAO/fertilizer industry advisory com m ittee working party on ‘Fertilizer marketing and credit’, Rome, 1996.- ‘A fertilizer strategy for Z im babw e’, Rome, 1999.
296

Gisselquist, D. and J. Rusike, Zimbabwe’s agricultural inputs trade 1990-1996: regulations, reforms and impacts, World Bank, Washington DC, 1997.
Grant, P. M., ‘The fertility of sandveld soil under continuous cultivation’, in The Rhodesia, Zambia and Malawi Journal of Agricultural Research, 5: 71-79 and 117-128,1967.- ‘Restoration of productivity of depleted sands’, in Zimbabwe Agricultural Journal,67: 131-137, 1970.- ‘Peasant fanning on infertile sands’, in Rhodesia Science News, 10: 282-284, 1976.- ‘The fertilization of sandy soils in peasant agriculture’, in Zimbabwe Agricultural Journal, 78 (5): 169-175, 1981.
Jayne, T. S., J. Govereh, M. Wanzala and M. Demeke, ‘Fertilizer market development: A comparative analysis of Ethiopia, Kenya, and Zambia’, in Food Policy 28 (4):293-316, 2003.Kachere, M. S., ‘The Zimbabwe fertilizer industry: Its strengths, weaknesses and role in a liberalized environment', paper presented at the African Centre for Fertilizer Development national workshop on ‘Agri-inputs marketing in a liberalized environment in Zimbabwe’, Harare, 2-5 May 1995.- ‘The strengths and weaknesses of the Zimbabwean fertilizer industry’, paper presented at the African Centre for Fertilizer Development workshop, Masvingo, 26-29 February 1996.- ‘The status of the southern African fertilizer industry and outlook in the coming years’, paper presented at the African Centre for Fertilizer Development regional consultative workshop on ‘Coordinated fertilizer procurement and distribution in the SADC countries’, Harare, 20-22 February 2002.
Kelly, V., A. Adesina and A. Gordon, ‘Expanding access to agricultural inputs in Africa: a review of recent market development experience’, in Food Policy 28, 379-^04, 2003.
Lele, U., R. Christiansen and K. Kadiresan, Fertilizer policy in Africa: lessons from development programmes and adjustment lending, 1970-19X7, MADIA discussion paper 5, World Bank, Washington DC, 1989.
Ministry of Lands and Agriculture, The agricultural sector of Zimbabwe: statistical bulletin, Policy and Planning Division, Ministry of Lands and Agriculture, Harare, 2000.
Winrock Foundation, ‘Environmental and natural resources policy and training project’, mimeo, 1994.
297

This work is licensed under a Creative CommonsAttribution - Noncommercial - NoDerivs 3.0 License.
To view a copy of the license please see: http://creativecommons.org/licenses/by-nc-nd/3.0/
This is a download from the BLDS Digital Library on OpenDocshttp://opendocs.ids.ac.uk/opendocs/
Institute o f Development Studies
Copyright © 2022 FDOKUMEN