Long Term Metabolic Syndrome Induced by a High Fat High Fructose Diet Leads to Minimal Renal Injury...
14
Long Term Metabolic Syndrome Induced by a High Fat High Fructose Diet Leads to Minimal Renal Injury in C57BL/6 Mice Romain Dissard 1,2 , Julie Klein 3 , Cécile Caubet 1,2 , Benjamin Breuil 1,3 , Justyna Siwy 4,5 , Janosch Hoffman 4 , Laurent Sicard 1,2 , Laure Ducassé 1,2 , Simon Rascalou 1,2 , Bruno Payre 6 , Marie Buléon 1,2 , William Mullen 7 , Harald Mischak 4,7 , Ivan Tack 1,2 , Jean-Loup Bascands 1,2 , Bénédicte Buffin-Meyer 1,2 , Joost P. Schanstra 1,2* 1 Institut National de la Santé et de la Recherche Médicale (INSERM), U1048, Institut of Cardiovascular and Metabolic Disease, Toulouse, France, 2 Université Toulouse III Paul-Sabatier, Toulouse, France, 3 Plateau de Protéomique des Liquides Biologiques, Institut of Cardiovascular and Metabolic Disease, Toulouse, France, 4 Mosaiques Diagnostics GmbH, Hannover, Germany, 5 Charite-Universitatsmedizin Berlin, Berlin, Germany, 6 Centre de Microscopie Electronique Appliquée à la Biologie, Toulouse, France, 7 Department of Proteomics and Systems Medicine, BHF Glasgow Cardiovascular Research Centre, Institute of Cardiovascular and Medical Sciences, College of Medical Veterinary and Life Sciences, University of Glasgow, Glasgow, United Kingdom Abstract Metabolic syndrome can induce chronic kidney disease in humans. Genetically engineered mice on a C57BL/6 background are highly used for mechanistic studies. Although it has been shown that metabolic syndrome induces cardiovascular lesions in C57BL/6 mice, in depth renal phenotyping has never been performed. Therefore in this study we characterized renal function and injury in C57BL/6 mice with long-term metabolic syndrome induced by a high fat and fructose diet (HFFD). C57BL/6 mice received an 8 months HFFD diet enriched with fat (45% energy from fat) and drinking water enriched with fructose (30%). Body weight, food/water consumption, energy intake, fat/lean mass ratio, plasma glucose, HDL, LDL, triglycerides and cholesterol levels were monitored. At 3, 6 and 8 months, renal function was determined by inulin clearance and measure of albuminuria. At sacrifice, kidneys and liver were collected. Metabolic syndrome in C57BL/6 mice fed a HFFD was observed as early 4 weeks with development of type 2 diabetes at 8 weeks after initiation of diet. However, detailed analysis of kidney structure and function showed only minimal renal injury after 8 months of HFFD. HFFD induced moderate glomerular hyperfiltration (436,4 µL/min vs 289,8 µL/min; p-value=0.0418) together with a 2-fold increase in albuminuria only after 8 months of HFFD. This was accompanied by a 2-fold increase in renal inflammation (p-value=0.0217) but without renal fibrosis or mesangial matrix expansion. In addition, electron microscopy did not show alterations in glomeruli such as basal membrane thickening and foot process effacement. Finally, comparison of the urinary peptidome of these mice with the urinary peptidome from humans with diabetic nephropathy also suggested absence of diabetic nephropathy in this model. This study provides evidence that the HFFD C57BL/6 model is not the optimal model to study the effects of metabolic syndrome on the development of diabetic kidney disease. Citation: Dissard R, Klein J, Caubet C, Breuil B, Siwy J, et al. (2013) Long Term Metabolic Syndrome Induced by a High Fat High Fructose Diet Leads to Minimal Renal Injury in C57BL/6 Mice. PLoS ONE 8(10): e76703. doi:10.1371/journal.pone.0076703 Editor: Wenke Feng, University of Louisville School of Medicine, United States of America Received June 2, 2013; Accepted August 24, 2013; Published October 3, 2013 Copyright: © 2013 Dissard et al. This is an open-access article distributed under the terms of the Creative Commons Attribution License, which permits unrestricted use, distribution, and reproduction in any medium, provided the original author and source are credited. Funding: Part of this work was supported by the FP7 program "Improvement of tools and portability of mass spectrometry based clinical proteomics as applied to chronic kidney disease" (Protoclin, PEOPLE-2009-IAPP, GA 251368). Romain Dissard is a recipient of a research grant from the French Ministry of Education, Research and Technology. The funders had no role in study design, data collection and analysis, decision to publish, or preparation of the manuscript. Competing interests: Harald Mischak is the founder and co-owner of Mosaiques Diagnostics, who developed the CE-MS technology. Justyna Siwy, Julie Klein and Janosch Hoffman are employed by Mosaiques. This does not alter the authors’ adherence to all the PLOS ONE policies on sharing data and materials. * E-mail: [email protected] Introduction The food industry has evolved, providing a supply of increasingly rich diet in terms of fatty acids [1] and fructose [2]. This shift is not without consequences on general health including increase risk of developing obesity, insulin resistance, hepatic steatosis and diabetes [3-10]. Metabolic syndrome is a complex pattern of disorders referring to the joint occurrence of several risk factors including obesity, mixed dyslipidemia and high glucose blood levels [11]. Metabolic syndrome is very common in developed countries and its prevalence is expected to further increase in the near future [12], in parallel with the PLOS ONE | www.plosone.org 1 October 2013 | Volume 8 | Issue 10 | e76703
-
Upload
independent -
Category
Documents
-
view
2 -
download
0
Transcript of Long Term Metabolic Syndrome Induced by a High Fat High Fructose Diet Leads to Minimal Renal Injury...

Long Term Metabolic Syndrome Induced by a High FatHigh Fructose Diet Leads to Minimal Renal Injury inC57BL6 MiceRomain Dissard12 Julie Klein3 Ceacutecile Caubet12 Benjamin Breuil13 Justyna Siwy45 Janosch Hoffman4Laurent Sicard12 Laure Ducasseacute12 Simon Rascalou12 Bruno Payre6 Marie Buleacuteon12 William Mullen7Harald Mischak47 Ivan Tack12 Jean-Loup Bascands12 Beacuteneacutedicte Buffin-Meyer12 Joost P Schanstra12
1 Institut National de la Santeacute et de la Recherche Meacutedicale (INSERM) U1048 Institut of Cardiovascular and Metabolic Disease Toulouse France 2 UniversiteacuteToulouse III Paul-Sabatier Toulouse France 3 Plateau de Proteacuteomique des Liquides Biologiques Institut of Cardiovascular and Metabolic Disease ToulouseFrance 4 Mosaiques Diagnostics GmbH Hannover Germany 5 Charite-Universitatsmedizin Berlin Berlin Germany 6 Centre de Microscopie ElectroniqueAppliqueacutee agrave la Biologie Toulouse France 7 Department of Proteomics and Systems Medicine BHF Glasgow Cardiovascular Research Centre Institute ofCardiovascular and Medical Sciences College of Medical Veterinary and Life Sciences University of Glasgow Glasgow United Kingdom
Abstract
Metabolic syndrome can induce chronic kidney disease in humans Genetically engineered mice on a C57BL6background are highly used for mechanistic studies Although it has been shown that metabolic syndrome inducescardiovascular lesions in C57BL6 mice in depth renal phenotyping has never been performed Therefore in thisstudy we characterized renal function and injury in C57BL6 mice with long-term metabolic syndrome induced by ahigh fat and fructose diet (HFFD) C57BL6 mice received an 8 months HFFD diet enriched with fat (45 energy fromfat) and drinking water enriched with fructose (30) Body weight foodwater consumption energy intake fatleanmass ratio plasma glucose HDL LDL triglycerides and cholesterol levels were monitored At 3 6 and 8 monthsrenal function was determined by inulin clearance and measure of albuminuria At sacrifice kidneys and liver werecollected Metabolic syndrome in C57BL6 mice fed a HFFD was observed as early 4 weeks with development oftype 2 diabetes at 8 weeks after initiation of diet However detailed analysis of kidney structure and function showedonly minimal renal injury after 8 months of HFFD HFFD induced moderate glomerular hyperfiltration (4364 microLminvs 2898 microLmin p-value=00418) together with a 2-fold increase in albuminuria only after 8 months of HFFD Thiswas accompanied by a 2-fold increase in renal inflammation (p-value=00217) but without renal fibrosis or mesangialmatrix expansion In addition electron microscopy did not show alterations in glomeruli such as basal membranethickening and foot process effacement Finally comparison of the urinary peptidome of these mice with the urinarypeptidome from humans with diabetic nephropathy also suggested absence of diabetic nephropathy in this modelThis study provides evidence that the HFFD C57BL6 model is not the optimal model to study the effects of metabolicsyndrome on the development of diabetic kidney disease
Citation Dissard R Klein J Caubet C Breuil B Siwy J et al (2013) Long Term Metabolic Syndrome Induced by a High Fat High Fructose Diet Leads toMinimal Renal Injury in C57BL6 Mice PLoS ONE 8(10) e76703 doi101371journalpone0076703
Editor Wenke Feng University of Louisville School of Medicine United States of America
Received June 2 2013 Accepted August 24 2013 Published October 3 2013
Copyright copy 2013 Dissard et al This is an open-access article distributed under the terms of the Creative Commons Attribution License which permitsunrestricted use distribution and reproduction in any medium provided the original author and source are credited
Funding Part of this work was supported by the FP7 program Improvement of tools and portability of mass spectrometry based clinical proteomics asapplied to chronic kidney disease (Protoclin PEOPLE-2009-IAPP GA 251368) Romain Dissard is a recipient of a research grant from the French Ministryof Education Research and Technology The funders had no role in study design data collection and analysis decision to publish or preparation of themanuscript
Competing interests Harald Mischak is the founder and co-owner of Mosaiques Diagnostics who developed the CE-MS technology Justyna Siwy JulieKlein and Janosch Hoffman are employed by Mosaiques This does not alter the authorsrsquo adherence to all the PLOS ONE policies on sharing data andmaterials
E-mail joost-peterschanstrainsermfr
Introduction
The food industry has evolved providing a supply ofincreasingly rich diet in terms of fatty acids [1] and fructose [2]This shift is not without consequences on general healthincluding increase risk of developing obesity insulin resistance
hepatic steatosis and diabetes [3-10] Metabolic syndrome is acomplex pattern of disorders referring to the joint occurrence ofseveral risk factors including obesity mixed dyslipidemia andhigh glucose blood levels [11] Metabolic syndrome is verycommon in developed countries and its prevalence is expectedto further increase in the near future [12] in parallel with the
PLOS ONE | wwwplosoneorg 1 October 2013 | Volume 8 | Issue 10 | e76703
rapidly increasing prevalence of obesity [1314] Metabolicsyndrome and its risk factors potentially play a role in thedevelopment of chronic kidney diseases (CKD) Indeed it hasbeen shown that metabolic syndrome is associated with ahigher prevalence of microalbuminuria [15-20] and an higherrisk of development of CKD [21] and subsequent end stagerenal disease (ESRD) in type II diabetic patients [22] Howeverdetailed mechanistic information on the link between metabolicsyndrome and CKD is not available
Hence to better understand this link rodent modelsmimicking as best as possible human metabolic syndrome-induced CKD will be of great help It has been shown that a 3or 4 months diet containing respectively 60 or 45 kcal of fatleads to mesangial matrix area expansion in renal glomeruliand to a significant rise in urinary albumin excretion in C57BL6mouse [2324] Furthermore the use of fructose alone(between 20 and 40) in mouse and rat diets has beenreported to induce renal tubulointerstitial injury [2526] Thedrawback of these models is that they only mimic certainaspects of metabolic syndrome but not the entire repertoire
[27] In contrast a combination of high fat and highcarbohydrate diet in animals leads to the development of alltypical metabolic complications present in human metabolicsyndrome such as increased body weight increasedtriglycerides and cholesterol plasma concentrations andabdominal fat deposition [28-31] The latter is thus probably themost appropriate model to study human metabolic syndrome inanimal models [27] and therefore its impact on kidney functionRecent studies by Panchal et al [32] submitting rats to both ahigh fat and high fructose diet for 4 months showedcardiovascular remodeling (ie endothelial dysfunctioninflammation and fibrosis in the heart) in the presence ofmetabolic syndrome Unfortunately effects on the kidney wereonly minimally described which did not allow concluding on thesuitability of this metabolic syndrome model to induce CKD Inaddition the workhorse for genetically engineered mice is theC57BL6 strain and induction of metabolic syndrome in thisstrain deficient for specific genes would be of great help tobetter understand the development of CKD in metabolicsyndrome
Figure 1 Changes in body weight (A) energy intake (B) food intake (C) water intake (D) fat mass (E) and lean mass (F) incontrol fed mice () and HFFD fed mice () Data are means plusmn SEM for 36 mice per group at 1 2 and 3 months 24 mice pergroup at 6 months and 12 mice per group at 8 months Ple005 Ple001 Ple0001doi 101371journalpone0076703g001
Kidney Lesions in Metabolic Syndrome in Mice
PLOS ONE | wwwplosoneorg 2 October 2013 | Volume 8 | Issue 10 | e76703
Therefore in the current study we describe the in depthcharacterization of kidney lesions after a long term (8 months)high fat high fructose diet (HFFD) in the C57BL6 mouse strainWe observed that the kidney is particularly resistant tometabolic syndrome in this strain since only very mild signs ofkidney damage were observed after 8 months of HFFD
Materials and Methods
Mice and dietsSeventy-eight adult male C57BL6 (nomenclature C57BL
6NCrl) mice were purchased at Charles River Laboratory(LrsquoArbresle France) at the age of 5 weeks and divided in twoequal experimental groups (n=36) Mice were housed 4 percage and maintained on a 12h light12h dark cycle in apathogen-free environment Mice were fed with either a controldiet or a high fat fructose diet (HFFD) The control diet(D12450B 382 kcal per g Research Diet USA) contained192 protein 673 carbohydrate and 43 fat and wasserved with regular drinking water both ad libitum The HFFD(D12451 473 kcal per g Research Diet USA) contained 24
protein 41 carbohydrate and 24 fat and was served with30 fructose (F0127 powder diluted in ultrapure water 12 kcalper ml Sigma France) enriched drinking water both adlibitum All experiments reported were conducted inaccordance with the NIH guide for the care and use oflaboratory animals and were approved by the animal care anduse committee from UMS US006INSERM Toulouse France(protocol 1110481219)
Body weight composition and energy intakeMice were weighed weekly The body composition (fat and
lean mass) of awake mice was analyzed by nuclear magneticresonance using an EchoMRI-3in1 apparatus for Live Animals(EchoMRI USA) [33] Food intake was estimated as thedifference of weight between the offered and the remnantamount of food at 7-days intervals The food was provided aspressed pellets so the residual spillage was not consideredhere Beverage intake was estimated with the same processbased this time on the volume Total energy intake determinedfrom the energy content in each diet and mass consumed wascalculated on a per-week basis
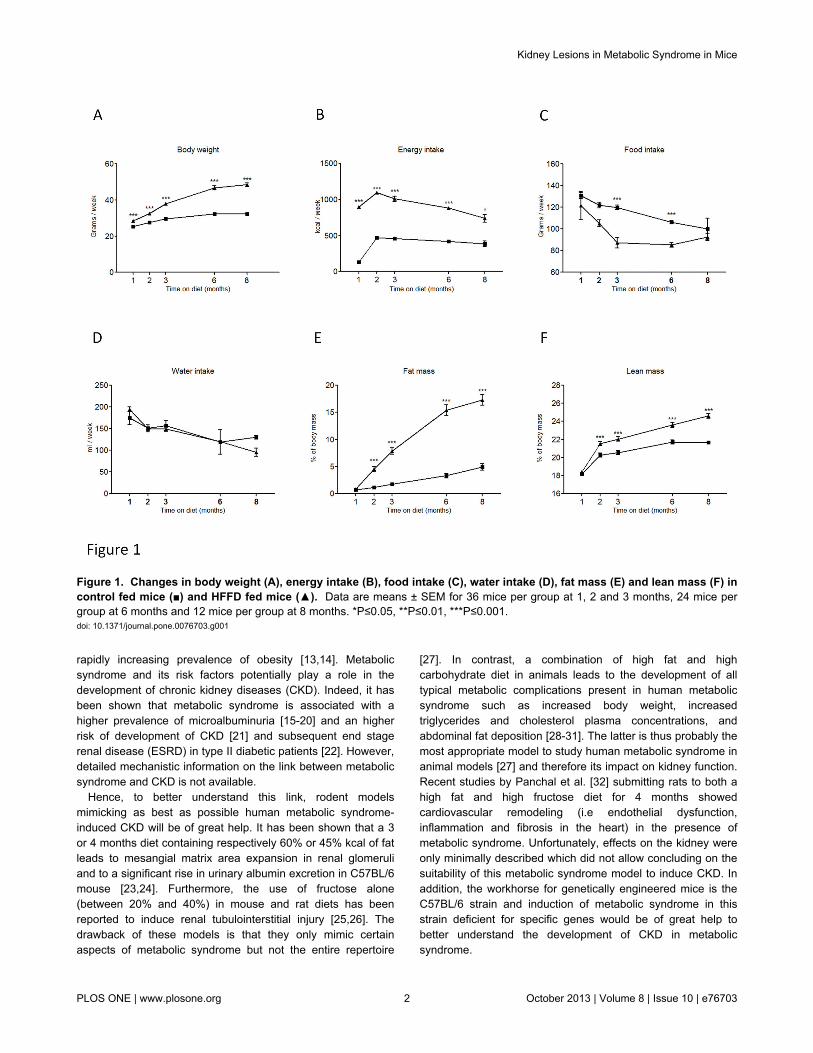
Figure 2 Plasma level of triglycerides (A) cholesterol (B) HDL (C) LDL (D) and glucose (E) in control fed mice () andHFFD fed mice () Data are means plusmn SEM for 12 mice per group Ple005 Ple001 Ple0001doi 101371journalpone0076703g002
Kidney Lesions in Metabolic Syndrome in Mice
PLOS ONE | wwwplosoneorg 3 October 2013 | Volume 8 | Issue 10 | e76703
Blood analysisPrior to blood collection we performed a 6 hours fasting
period This time point was chosen to avoid a postprandialglycemic peak and to prevent an induced catabolic state in themice [3435] All the blood samples were collected inMicrovette CB 300 PlasmaLithium heparin (SarstedtGermany) tubes from the tail vain under local anesthesia (n=12per group) The samples were centrifuged at 3000 g for 10minutes at 4degC The supernatants were separated and plasmaconcentrations of glucose cholesterol HDL LDL andtriglycerides were measured by fluorescence on ABX Pentra400 apparatus (Horiba medical France) In order to bypassmultiple periods of fasting and blood collection all theparameters were measured from the same sample
Renal function studyAfter 3 6 and 8 months of diet glomerular filtration rate
(GFR) was evaluated by measurement of inulin clearance in 9mice per group as previously described [36] Briefly mice wereanesthetized with an intraperitoneal injection of 150 mgkg ofthiobutabarbital sodium (Inactin Sigma) and placed on athermostatically controlled heating table After a tracheotomythe left jugular vein was cannulated to infuse Gelofusine and amixture of NaCl (09) thiopenthal sodium (pentothal083mgmiddotkg-1middotmin-1) inulin (18 mgmiddotkg-1middotmin-1) The rate ofinfusions was 01 mlh The left femoral artery was cannulatedto monitor mean arterial blood pressure (MABP) and to obtainblood samples Urine was obtained in the following way A 3mm ventral incision was made opposite to the bladder belowthe peritoneum allowing to expose the bladder Then a
polyethylene catheter (internal diameter 058 mm externaldiameter 096 mm) was introduced in the bladder lumen by a 1mm incision The bladder was then tied around the catheterusing surgical suture The residual urine is removed from thebladder and a 30 min period of recovery is observed DuringGFR evaluation a 500 microl tube is disposed at the free extremityof the catheter to collect urine during 60 minutes At the end ofsurgery a bolus of inulin (inulin 100 mgkg) was perfused andmice were allowed to recover for 30 min Renal function wasevaluated for a 60-min clearance period Inulin levels in plasmaand urine samples were determined by enzymaticquantification of released fructose units (Enzytec D-GlucoseFructose kit r-biopharmreg) on a Pentra 400 analyzer (HoribaMedicalreg) after a one hour 37degC incubation of the samples withinulinase (Sigmareg) The GFR is equal to the inulin clearance(GFR = ([urinary inulin] x urine flow) [inulin])
AlbuminuriaMice were placed in metabolic cages in order to collect 24-h
urine Urinary albumin excretion was determined with a mouseantigen specific ELISA (Mouse Albumin Quantitation Kit BethylLaboratoriesreg USA) Creatinine measurements weredetermined by an enzymatic colorimetric assay using an ID-MStraceable calibration (Creatinine Enzymatic Beckman Coulter)on the Pentra 400 analyzer (Horiba Medicalreg) Albuminexcretions were related to urine creatinine concentrations inorder to take into account the differences in urinary flows
Figure 3 Marked vacuolar degeneration indicating fat accumulation in the liver of HFFD fed mice () compared to controlfed mice () Hematoxylineosin staining Data are means plusmn SEM for 12 mice per group Ple00001doi 101371journalpone0076703g003
Kidney Lesions in Metabolic Syndrome in Mice
PLOS ONE | wwwplosoneorg 4 October 2013 | Volume 8 | Issue 10 | e76703
Organ collectionKidneys and liver were collected from each mouse included
in the renal function study For brightfield microscopy tissueswere fixed in Carnoyrsquos solution for 24 h For electronmicroscopy tissues were fixed and stored with 2glutaraldehyde in Sorensen buffer for 1 hour
Histological analysis and immunochemistryFour-micrometer paraffin-embedded sections were cut
Renal and liver sections were subjected to histologicalanalysis using hematoxylin-eosin and periodic acid-Schiffstaining For immunohistochemistry experiments renalsections were first dewaxed in toluene and rehydrated througha series of graded ethanol washes before endogenousperoxidase blockage (S2001 DakoCytomation TrappesFrance) Specific primary antibodies were incubated (1h atroom temperature) for the detection of collagen type III (1500Tebu-Bio Le Perray-en-Yvelines France) and F480 positivecells (1250 RM2900 Caltag Laboratories Inc BurlingameCA USA) Slides were further incubated with peroxidase-conjugated secondary antibodies during 30 min Immunologicalcomplexes were visualized by the addition of the DABsubstrate during 10 min (K4010 DakoCytomation EnvisionHRP system) Sections were counterstained with hematoxylinand mounted Negative controls for the immunohistochemicalprocedures included substitution of the primary antibody withnonimmune sera Sections were scanned using a Nanozoomer20 RS (Hamamatsu Photonics SARL Massy France) andtreated with the Morpho-expert image-analysis software
(version 100 Explora Nova La Rochelle France) formorphometric analyses
Transmission electron microscopySamples were fixed with 2 glutaraldehyde in Sorensen
phosphate buffer (01 M pH 74) for 1 hour washed with theSorensen phosphate buffer for 12 hours and post fixed with 1OsO4 in Sorensen phosphate buffer for 1 hour Samples weredehydrated with increasing ethanol concentration (30 5070 95) until a 100 ethanol solution was reached and thensubsequently stored for 30 min in a propylene oxide solutionNext samples were embedded in epoxy resin (Epon 812)After 24 h of polymerization at 60degC ultrathin sections (70 nm)were mounted on 100 mesh collodion-coated copper grids andpoststained with 3 uranyl acetate in 50 ethanol and with85 lead citrate before being examined on a HT7700 Hitachielectron microscope at an accelerating voltage of 80 KV Aseries of 10 photographs were taken at x12000 magnificationFor assessment of basement membrane thickness a grid (gridsize = 30cm by 30 cm with a 05 cm step) was projected oneach photograph and basement membrane thickness wasmeasured at points where it intersected with the grid [37] Forassessment of foot process effacement the number ofpodocytic foot processes was manually counted and expressedas the number of foot processes per microm of glomerularbasement membrane length [38]
Figure 4 Glomerular hyperfiltration (A) urinary albumin to creatinine ratio (ACR) (B) and arterial blood pressure (C) inHFFD fed mice () compared to control fed mice () Data are means plusmn SEM for 9 mice per group p=00429 p=0004doi 101371journalpone0076703g004
Kidney Lesions in Metabolic Syndrome in Mice
PLOS ONE | wwwplosoneorg 5 October 2013 | Volume 8 | Issue 10 | e76703
Urine sample preparation for CE-MS analysisFor the analysis of the urinary peptidome urine samples
from all mice of each group were collected during 12 hoursusing a metabolic cage and frozen at -80degC until CE-MSanalysis Urine for peptidome analysis was obtained 2 daysprior to inulin based GFR measurements Immediately beforepreparation mouse urine aliquots were thawed and 150 microl wasmixed with 150 microl of a buffer 2 M urea 10 mM NH4OHcontaining 002 SDS Subsequently samples wereultrafiltered using a Centristat 20 kDa cut-off centrifugal filterdevice (SatoriusGottingen Germany) to eliminate highmolecular weight compounds The obtained filtrate wasdesalted using a NAP5 gel filtration column (GE Healthcare BioSciences Uppsala Sweden) to remove urea and electrolytesThe sample was lyophilized in a Christ Speed-Vac RVC 2 18Alpha 1 2 (Christ Osterode am Harz Germany) and stored at4degC until use Finally the samples were re-suspended in 200microL HPLCgrade H2O and injected into CE-MS with 2 psi for 99sec resulting in injection volumes of 280 nL Capillary
electrophoresis coupled to mass spectrometry (CE-MS)analysis was performed as described using a PACE MDQcapillary electrophoresis system (Beckman Coulter FullertonUSA) on-line coupled to a MicroQTOF MS (Bruker) [39] TheESI sprayer (Agilent Technologies Palo Alto CA USA) wasgrounded and the ion spray interface potential was setbetween minus40 and minus45 kV Data and MS acquisition methodswere automatically controlled by the CE via contact-close-relays Spectra were accumulated every 3 s over a range ofmz 350 to 3000 Details on accuracy precision selectivitysensitivity reproducibility and stability of the CE-MS methodhave been provided previously [4041]
Peptide sequencingFor sequencing processed urine samples were also
separated on a Dionex Ultimate 3000 RSLS nano flow system(Dionex Camberly UK) A 5 ml sample was loaded onto aDionex 5 mm C18 nano trap column at a flow rate of 5 mlminElution was performed on an Acclaim PepMap 75 mm C18
Figure 5 Macrophage infiltration (A) and collagen accumulation (B) in HFFD fed mice () compared to control fed mice() Data are means plusmn SEM for 12 mice per group p=00217 Pictures for macrophage staining display representative areas ofkidneys from control or HFFD fed mice Magnification x20 Pictures for collagen staining display representative tubulointerstitium ofkidneys from control or HFFD fed mice Magnification x20doi 101371journalpone0076703g005
Kidney Lesions in Metabolic Syndrome in Mice
PLOS ONE | wwwplosoneorg 6 October 2013 | Volume 8 | Issue 10 | e76703
nano column over 100 min The sample was ionised in positiveion mode using a Proxeon nano spray ESI source (ThermoFisher Hemel UK) and analysed in an Orbitrap Velos FTMS(Thermo Finnigan Bremen Germany) The MS was operatedin data-dependent mode to switch between MS and MSMSacquisition and parent ions were fragmented by (high-) energycollision-induced dissociation and also electron transferdissociation Data files were searched against Mus musculusentries in the Swiss-Prot database without any enzymespecificity using Open Mass Spectrometry Search Algorithm(OMSSA httppubchemncbinlmnihgovomssa) with an e-value cut-off of 01 No fixed modification and oxidation ofmethionine as variable modifications were selected Mass errorwindows of 10 ppm for MS and 005 Da (HCD) or 05 Da (CIDETD) for MSMS were allowed For further validation ofobtained peptide identifications the strict correlation betweenpeptide charge at pH 2 and CE-migration time was utilized tominimize false-positive identification rates [42] Calculated CE-migration time of the sequence candidate based on its peptidesequence (number of basic amino acids) was compared to theexperimental migration time Peptides were accepted only ifthey had a mass deviation below plusmn 80 ppm and a CE-migrationtime deviations below plusmn 2 min
Data processingMass spectral ion peaks representing identical molecules at
different charge states were deconvoluted into single massesusing MosaiquesVisu software [43] Only those signals with z
gt1 that were observed in a minimum of 2 consecutive spectrawith signal-to-noise ratios gt4 were included The softwareemploys a probabilistic clustering algorithm and uses bothisotopic distribution as well as conjugated masses for charge-state determination of peptidesproteins The resulting peak listcharacterizes each polypeptide by its molecular mass CE-migration time and ion signal intensity (amplitude) value Tominimize effects of biological and analytical variability betweenthe different lots a normalization of retention time signalintensity and mass was performed as described [44] Alldetected peptides were deposited matched and annotated ina Microsoft SQL database allowing further analysis andcomparison of multiple samples [45] Peptides were consideredidentical within different samples when mass deviation waslower than 50 ppm for small peptides or 75 ppm for largerpeptides and proteins Due to analyte diffusion CE peak widthsincrease with CE migration time In the data clustering processthis effect was compensated by linearly increasing clusterwidths over the entire measurement from 2 to 5
Statistical analysisAll data are presented as means plusmn SEM Statistical analysis
was performed using GraphPad software(wwwgraphpadcom) Analysis of the two groups (control vshigh fat fructose diet) was assessed by a two-tailed unpaired t-test Statistical significance was reached at a p-value below005
Figure 6 Absence of mesangial matrix expansion in HFFD fed mice () compared to control fed mice () Mesangial matrixexpansion is evaluated by the ratio of the matrix surface to the total surface of the glomerulus after Periodic Acid Staining Data aremeans plusmn SEM for 12 mice per group ns Pictures display representative glomeruli of kidneys from control or HFFD fed miceMagnification x40doi 101371journalpone0076703g006
Kidney Lesions in Metabolic Syndrome in Mice
PLOS ONE | wwwplosoneorg 7 October 2013 | Volume 8 | Issue 10 | e76703
Results
HFFD diet induces metabolic syndrome and T2D inmice
Five weeks old male C57BL6 mice were separated into twogroups (n=36 micegroup) The control group received astandard control diet and tap water The other group (HFFD)received a high fat diet (45 of fat) and 30 fructose in tapwater In Table 1 we summarized the parameters to determineinstauration of metabolic syndrome in HFFD fed C57BL6 miceThe different parameters are ordered based on firstappearance of significance in time Mice receiving HFFDdisplayed a significantly higher energy intake starting at week1 Body weight of the HFFD group was increased starting atweek 3 while the food intake in this group started to decreaseAfter 4 weeks on HFFD we observed that plasma triglyceridestotal cholesterol and HDL were significantly elevated Thedifference observed for weight between HFFD and control micewas confirmed by a significant gain of fat and lean mass inHFFD mice at week 8 At the same time the HFFD mice
started to be hyperglycemic compared with controls At week16 plasma LDL levels were significantly higher in the HFFDmice The figures 1 and 2 show the evolution of theseparameters throughout the eight months of study No differencewas observed in the water intake Histological analysis of theliver performed at 8 months revealed a marked vacuolardegeneration indicating fat accumulation in the liver (Figure 3)This observation is consistent with the development of nonalcoholic fatty liver (NAFLD) due to the excess of fructoseintake [46] Collectively these data strongly suggest thepresence of metabolic syndrome as early as 4 weeks and ofassociated type 2 diabetes (T2D) as early as 8 weeks afterinitiation of a HFFD in C57BL6 mice
HFFD diet induces glomerular hyperfiltration andmicroalbuminuria only in late stage metabolicsyndrome
Next we studied the effect of metabolic syndrome and T2Don kidney function The glomerular filtration rate (GFR) wasdetermined based on inulin clearance after 3 6 and 8 months
Figure 7 The measurement of glomerular capillary basement membrane thickness by electron microscopy showed atendency to increase in the HFFD group at 8 months (A) HFFD fed mice () compared to control fed mice () and datarepresent means plusmn SEM for 12 mice per group ns The assessment of foot process effacement expressed as the mean width ofthe podocytes foot process (FPW) did not showed a significant difference between the HFFD fed mice (5) compared to control fedmice (lt) (B) Data represent means plusmn SEM for 12 mice per group nsdoi 101371journalpone0076703g007
Kidney Lesions in Metabolic Syndrome in Mice
PLOS ONE | wwwplosoneorg 8 October 2013 | Volume 8 | Issue 10 | e76703
of HFFD GFR was not significantly different between thecontrol and the HFFD group at the early time points (3 and 6months) but HFFD mice displayed low but significanthyperfiltration after 8 months of diet (Figure 4A) Thishyperfiltration was accompanied by a 2-fold increase inalbuminuria (Figure 4B) but without change in the bloodpressure (Figure 4C) This assessment suggests late and mildkidney dysfunction in metabolic syndrome in C57BL6 mice
HFFD induces only minor histological modifications inthe kidney
Since we only observed mild functional changes after 8months of HFFD we studied kidney histological modificationsat this time point Macrophage infiltration was quantified byimmunohistological staining for F480 in the tubulointerstitiumWe observed a 2-fold increased F480 staining in kidneys ofHFFD mice compared to the control group (Figure 5A)Tubulointerstitial collagen accumulation was also studied byimmunostaining for collagen III (Figure 5B) Eight months ofHFFD was without effect on tubulointerstitial collagen IIIdeposition Moreover Periodic Acid staining did not showmesangial matrix expansion (Figure 6) Glomerular basementmembrane (GBM) thickening and foot process effacement areearly events in diabetic nephropathy [47] We studied thethickness of the GBM and assessed the foot process
Table 1 Parameters to determine instauration of metabolicsyndrome in HFFD fed C57BL6 mice
Onset ofsignificance
Controlgroupvalues
HFFDgroupvalues p-value
Testfrequency
Energy intake(kcal)
1 week4562 plusmn123
1398 plusmn1292
lt00001
weekly
Body weight(grams)
3 weeks2488 plusmn019
2679 plusmn023
lt00001
weekly
Food intake(grams)
3 weeks1600 plusmn817
9633 plusmn926
00004 weekly
Triglycerides(mmolL)
4 weeks100 plusmn007
145 plusmn012
00023 monthly
Cholesterol(mmolL)
4 weeks289 plusmn009
346 plusmn018
00083 monthly
HDL (mmolL) 4 weeks264 plusmn008
310 plusmn016
00148 monthly
Fat mass ( ofbody mass)
8 weeks116 plusmn011
455 plusmn045
lt00001
monthly
Lean mass ( ofbody mass)
8 weeks2026 plusmn024
2153 plusmn022
00003 monthly
Glucose(mmolL)
8 weeks1477 plusmn079
1841 plusmn121
00164 monthly
LDL (mmolL) 16 weeks014plusmn001
020 plusmn002
00071 monthly
The different parameters are ordered based on first appearance of significance intime The frequency of analysis for each parameter is displayed in the last columnn=36 groupdoi 101371journalpone0076703t001
effacement using electron microscopy This analysis showed anon-significant difference (0353plusmn0009 vs 0375plusmn00106 microM)towards increased GBM thickness and no foot processeffacement in HFFD mice (Figure 7) These data suggestabsence of advanced diabetic nephropathy lesions butinflammation of the kidney tissue after 8 months of HFFD
Comparison of the HFFD mouse urinary peptidomewith the human urinary peptidome of T2D patientssuggests absence of T2Ddiabetic nephropathy
The results obtained so far suggest that 8 months of HFFDwas not associated with significant renal lesions in C57BL6mice In previous studies in humans analysis of the urinaryproteome allowed the identification of 273 peptides associatedto CKD [40] These peptides were also significantly modified inT2D patients with diabetic nephropathy [48] [49] Similarly wehave studied the HFFD-induced changes in the mouse urinarypeptidome The analysis of the urinary peptidome of control(n=10) and mice fed 8 months of HFFD (n=11) led to thedetection of a total of 2591 urinary peptides for control miceand 2687 peptides for HFFD mice (Figure 8A shown for HFFDmice) When comparing the urinary peptide content of controland HFFD mice we observed 62 peptides with different urinaryabundance (Figure 8B) To date sequence analysis identified30 peptides of these 62 (Table S1) Around 80 (24 out of 30)of these peptides were found to be fragments of collagen with27 being down-regulated and 53 up-regulated (Figure 9A)For comparison with the human situation we next studied theregulation of the 273 peptides associated to CKD in healthycontrols (n=33 data obtained from [40]) in patients with T2Dwithout diabetic nephropathy (albuminurialt30mgL n=75) andin patients with T2D with diabetic nephropathy(albuminuriagt300mgL n=47) that were previously studied byMolin [50] In the T2D patients without diabetic nephropathythe peptidome profile was very similar to HFFD mice with 29of collagen fragments down-regulated and 45 up-regulatedcompared to healthy controls (Figure 9B) However thepeptidome of HFFD mice was different from T2D patients withdiabetic nephropathy as in these patients collagen fragmentswere mostly down-regulated (47 down- and 27 up-regulated Figure 9B)
Discussion
The purpose of our study was to investigate renal lesionsafter long term (8 months) of high fat high fructose diet-inducedmetabolic syndrome in the highly used and studied C57BL6mouse strain We confirmed that consumption of a 45 kcal fatwith 30 fructose water diet by wild type C57BL6 led to therapid installation of metabolic syndrome (4 weeks) and T2D (8weeks) We next studied in detail the renal phenotype andcompared our results to the specifications of the DiabeticComplications Consortium (DiaComp wwwdiacomporg) TheDiaComp research criteria for validating a progressive mousemodel of diabetic nephropathy implies a decline greater than50 in GFR over the lifetime of the animal an increase greaterthan 10 fold in albuminuria advanced mesangial matrixexpansion tubulointerstitial fibrosis and glomerular basement
Kidney Lesions in Metabolic Syndrome in Mice
PLOS ONE | wwwplosoneorg 9 October 2013 | Volume 8 | Issue 10 | e76703
membrane thickening superior by 50 over baseline Duringour study we observed that mice with metabolic syndromedevelop minimal renal injury exemplified by low levelalbuminuria (2 fold higher than the control group) or mildhyperfiltration (15 fold higher than the control group) after 8months of HFFD In addition we observed neither mesangialmatrix expansion nor fibrosis or significant GBM thickening butonly some minor podocyte effacement Clearly thesecharacteristics are far from the DiaComp recommendations
Analysis of human urine proteomic profile allows earlydiagnosis of kidney diseases such as CKD [51] or diabeticnephropathy [48] and increasingly proteomics are involved inthe clinical diagnosis [5253] Here we compared the urinarypeptide content of control mice to HFFD mice and identified 62differentially excreted peptides We obtained sequenceinformation for 30 of these 62 peptides and we compared thoseto the human urinary peptide markers of diabetic nephropathy[48] In both human and mice most of the urinary peptideswere collagen fragments suggesting similarities between the
human and C57BL6 mouse urinary peptidome Interestinglythe observed ldquoup and downrdquo collagen peptide profile in HFFDmice was very similar to that of T2D patients without diabeticnephropathy but clearly different from that of T2D patients withdiabetic nephropathy This result suggests absence of diabeticnephropathy in HFFD mice thereby confirming the functionaland histological observations In addition this inversion of thedirection regulation of urinary collagen fragments in diabeticnephropathy in humans ie a significant decrease in urinarycollagen fragments is thought to be related to increasedcollagen deposition in the diabetic kidney [54] and correlates tothe absence of tubulointerstitial fibrosis in mice receiving 8months of HFFD Overall these data based on urinarypeptidome analysis further suggest that the HFFD diet does notlsquolsquomodelrsquorsquo chronic kidney disease in T2D patients
Five stages in the development of renal changes in humandiabetes have been described [55] but an official description ofstaging of diabetic nephropathy in mice is not available Basedon our results 8 months of HFFD diet in C57BL6 mice
Figure 8 Comparison of the urinary peptidome content between control (n=10) and HFFD (n=11) at 8 months of agemice (A) A contour plot representing the compiled urinary peptidome of all HFFD mice showing 2687 urinary peptides Each blueto white colored dot or peak represents a urinary peptide identified by a specific mass (kDa) and migration time on the CE (min)When a peptide is detected but of low abundance it is represented by a blue dot Increasing abundance of peptide is represented bya change of color towards white At the same time the abundance is given by the height of the peak Therefore a dot equals lowabundance and a peak equals higher abundance with the height of the peak being the relative abundance compared to the otherpeptides (B) Representation of the 62 peptides which differ in urinary abundance between control and HFFD fed mice In panel Bthe scale was amplified 2-fold to improve the representation of the peptidesdoi 101371journalpone0076703g008
Kidney Lesions in Metabolic Syndrome in Mice
PLOS ONE | wwwplosoneorg 10 October 2013 | Volume 8 | Issue 10 | e76703
corresponds best to human stage 1 renal changes in diabetes(hyperfiltration absence of thickened GBM and slightlyelevated urinary albumin) Together with our other observationsof absence of diabetic nephropathy it is clear that the C57BL6strain is not the most adequate strain for studies of renallesions in HFFD induced T2D
The influence of the genetic background on the diseasephenotype has been described in mice [56] A number ofstudies already described the impact of the mouse strain on theresponsiveness to treatment C57BL6 mice are for examplerelatively resistant to STZ-induced type 1 diabetes compared toDBA2J and KKH1J mice [5758] The genetic background canalso have significant impact on the responsiveness to a specificdiet C57BL6 mice fed with a high fat high carbohydrate dietdisplayed increased body weight had more overall fat andparticularly increased adipose tissue in comparison with AJmice although developing similar levels of hyperglycemiahyperinsulinemia and hypercholesterolemia [5960] Thegenetic background has also been reported to influence theoutcome of CKD or glomerulosclerosis In reversible unilateral
ureteral obstruction [61] the development of CKD wasobserved in C57BL6 mice but not in BALBc On the contraryin a 56 nephrectomy model C57BL6 mice presented onlymild glomerulosclerosis in contrast to both 129Sv and Swissmice [62] Hence one of the possibilities to improve on thedevelopment of kidney disease in HFFD is testing differentmouse strains However deviation from the C57BL6 strainrules out the use of the wealth of genetically engineered miceon this genetic background
Our choice to use a high fat high fructose diet was driven byits high similarity with the actual human western diet and by thepanel of symptoms it causes (eg hyperinsulinemia insulinresistance impaired glucose tolerance increase abdominal fatdeposition hepatic steatosis and inflammation) Thehypothesis to study the renal complications in this establishedmodel of metabolic syndrome was supported by impaired renalfunction and the renal lesions observed in studies using highfat or high fructose separately in rodents [23-26] Surprisinglythe combination of these two diets although clearly inducingmetabolic syndrome did not lead to the expected kidney
Figure 9 Comparison of the regulation of urinary peptide fragments in the HFFD mouse model (a) with human with type2 diabetes (T2D) with or without diabetic nephropathy (9B) doi 101371journalpone0076703g009
Kidney Lesions in Metabolic Syndrome in Mice
PLOS ONE | wwwplosoneorg 11 October 2013 | Volume 8 | Issue 10 | e76703
damage A possible explanation of the absence of effect onrenal lesions of the HFFD is when compared to a high fat dietonly [23] that the quantity of the daily ingested fat in ourexperiments is lower (052 g of fatday for HFFD vs 062g offatday for high fat diet) The additional calories provided by thefructose beverage are compensated by decrease in food intake[63] This minor daily difference in fat intake over a long period(ie 8 months) potentially explains the observed difference inrenal lesions Another possible explanation could be modifiedwater intake due to the presence of fructose Indeed asdescribed by Bouby et al [64] glucose in drinking water canincrease water intake slowing down the progression of renalinjury in rats However we observed that the highconcentration of fructose in the drinking water did not lead to ahigher water intake
Thus the current challenge is to find the balance betweendiets that lead quickly to advanced renal disease (but that donot mimic the situation from human nutritional perspective) anddiets that need a longer time of exposure to induce the samestage of disease (but imitating closely the human nutritionalinput) An option to accelerate renal lesions in C57BL6 micecould be to superimpose high fat high fructose diets to strainspredisposed to obesity such as the Lepob Leprdb KKCg-Ay
strain Indeed Zhang et al [65] combined a strain predisposedto obesity (dbdb) and a high fat diet and showed that a high fatdiet exacerbates nephropathy and causes early renal failureHowever instauration of renal failure was fast (4 weeks) anddoes not correspond to chronic disease observed in humansOnce again a balance needs to be found between models thatquickly lead to severe renal disease and models that allowstudies of development of chronic disease Moreover most ofthe knockout animals are on the C57BL6 background The useof these genetic models of T2D could necessitate crossingthem with knockout animals in futures studies but genetic T2Dmodel are associated with issues such as reduced fertility [66]and many backcrosses (around 10) to reach a unique (999)new genetic background will be necessary Increasing thequantity of fat or fructose could be also considered toaccelerate the renal lesions but a review of existing literaturehas highlighted their serious consequences Using of a 60 fatdiet instead of the 45 on this study would quickly inducedobesity on a much shorter time but should be consideredextreme from a nutritional perspective In the same way some
studies use fructose concentrations up to 55 If we assumedthat the fatty liver a symptom of metabolic syndrome is earlierobserved in these mice we cannot overshadow the increasedrisk of severe NAFLD and hepatic necroinflammatory [67]
An ultimate option to accelerate renal lesions in C57BL6mice subjected to a HFFD is to remove one of the kidneysbefore initiation of the diet Indeed it has been shown thatuninephrectomy leads to exacerbation of the lesions of diabeticnephropathy in dbdb obese mice [68] In addition chronicingestion of fructose worsens the decrease of renal functionproteinuria and glomerulosclerosis induced by subtotalnephrectomy in the rat [23-26]
In conclusion the present study demonstrates that the HFFDis an efficient animal model of metabolic syndrome in C57BL6mice but suggests that the kidney is particularly resistant in thisstrain because only very early signs of kidney damage areobserved Potential solutions to exploit this model for advancedrenal lesions in C57BL6 mice include prolongation of the dietwhich is feasible but clearly time consuming or acceleratedisease progression by coupling a HFFD with unilateralnephrectomy
Supporting Information
Table S1 List of all significant regulated peptides atcontrol vs HFFD Given are Identification (internal databaseof Mosaiques diagnostics) mass in Dalton Capillaryelectrophoresis migration time in minutes mean amplitude atcontrols mean amplitude at HFFD regulation factor at diseaseAUC (Area under Curve Receiver operating statistics) p-valueadjusted (Benjamini and Hochberg) amino acid sequence(modified amino acids p=hydroxyproline k=hydroxylysinem=oxidized methionine)(XLS)
Author Contributions
Conceived and designed the experiments RD JPS JLB BBMPerformed the experiments RD LD BB SR LS MB BPAnalyzed the data RD JK CC JS JH WM Contributedreagentsmaterialsanalysis tools RD HM IT Wrote themanuscript RD JPS JLB BBM CC HM IT JK
References
1 Drewnowski A Popkin BM (1997) The nutrition transition new trends inthe global diet Nutr Rev 55 31-43 PubMed 9155216
2 Bleich SN Wang YC Wang Y Gortmaker SL (2009) Increasingconsumption of sugar-sweetened beverages among US adults1988-1994 to 1999-2004 Am J Clin Nutr 89 372-381 PubMed19056548
3 Reedy J Krebs-Smith SM (2010) Dietary sources of energy solid fatsand added sugars among children and adolescents in the UnitedStates J Am Diet Assoc 110 1477-1484 doi101016jjada201007010 PubMed 20869486
4 US Department of Health and Human Services CfDCaP (2011)National diabetes fact sheet national estimates and generalinformation on diabetes and prediabetes in the United States
5 Organization WH (2011) Diabetes fact sheet6 Malik VS Schulze MB Hu FB (2006) Intake of sugar-sweetened
beverages and weight gain a systematic review Am J Clin Nutr 84274-288 PubMed 16895873
7 Vartanian LR Schwartz MB Brownell KD (2007) Effects of soft drinkconsumption on nutrition and health a systematic review and meta-analysis Am J Public Health 97 667-675 doi102105AJPH2005083782 PubMed 17329656
8 Dekker MJ Su Q Baker C Rutledge AC Adeli K (2010) Fructose ahighly lipogenic nutrient implicated in insulin resistance hepaticsteatosis and the metabolic syndrome Am J Physiol Endocrinol Metab299 E685-E694 doi101152ajpendo002832010 PubMed20823452
9 Tappy L Lecirc KA (2010) Metabolic effects of fructose and the worldwideincrease in obesity Physiol Rev 90 23-46 doi101152physrev000192009 PubMed 20086073
10 Tappy L Lecirc KA Tran C Paquot N (2010) Fructose and metabolicdiseases new findings new questions Nutrition 26 1044-1049 doi101016jnut201002014 PubMed 20471804
11 Grundy SM Brewer HB Jr Cleeman JI Smith SC Jr Lenfant C (2004)Definition of metabolic syndrome Report of the National Heart Lung
Kidney Lesions in Metabolic Syndrome in Mice
PLOS ONE | wwwplosoneorg 12 October 2013 | Volume 8 | Issue 10 | e76703
and Blood InstituteAmerican Heart Association conference on scientificissues related to definition Circulation 109 433-438 doi10116101CIR000011124575752C6 PubMed 14744958
12 Ford ES Giles WH Dietz WH (2002) Prevalence of the metabolicsyndrome among US adults findings from the third National Health andNutrition Examination Survey JAMA 287 356-359 doi101001jama2873356 PubMed 11790215
13 Flegal KM Carroll MD Kit BK Ogden CL (2012) Prevalence of obesityand trends in the distribution of body mass index among US adults1999-2010 JAMA 307 491-497 doi101001jama201239 PubMed22253363
14 Ogden CL Carroll MD Kit BK Flegal KM (2012) Prevalence of obesityand trends in body mass index among US children and adolescents1999-2010 JAMA 307 483-490 doi101001jama201240 PubMed22253364
15 Abuaisha B Kumar S Malik R Boulton AJ (1998) Relationship ofelevated urinary albumin excretion to components of the metabolicsyndrome in non-insulin-dependent diabetes mellitus Diabetes ResClin Pract 39 93-99 doi101016S0168-8227(97)00111-3 PubMed9597378
16 Isomaa B Henricsson M Almgren P Tuomi T Taskinen MR et al(2001) The metabolic syndrome influences the risk of chroniccomplications in patients with type II diabetes Diabetologia 441148-1154 doi101007s001250100615 PubMed 11596670
17 Palaniappan L Carnethon M Fortmann SP (2003) Associationbetween microalbuminuria and the metabolic syndrome NHANES IIIAm J Hypertens 16 952-958 doi101016S0895-7061(03)01009-4PubMed 14573334
18 Chen J Muntner P Hamm LL Jones DW Batuman V et al (2004) Themetabolic syndrome and chronic kidney disease in US adults AnnIntern Med 140 167-174 doi1073260003-4819-140-3-200402030-00007 PubMed 14757614
19 Rowley K OrsquoDea K Best JD (2003) Association of albuminuria and themetabolic syndrome Curr Diab Rep 3 80-86 doi101007s11892-003-0058-1 PubMed 12643150
20 Bonnet F Marre M Halimi JM Stengel B Lange C et al (2006) Waistcircumference and the metabolic syndrome predict the development ofelevated albuminuria in non-diabetic subjects the DESIR Study JHypertens 24 1157-1163 doi10109701hjh000022620603560acPubMed 16685216
21 Kurella M Lo JC Chertow GM (2005) Metabolic syndrome and the riskfor chronic kidney disease among nondiabetic adults J Am SocNephrol 16 2134-2140 doi101681ASN2005010106 PubMed15901764
22 Iseki K Ikemiya Y Kinjo K Inoue T Iseki C et al (2004) Body massindex and the risk of development of end-stage renal disease in ascreened cohort Kidney Int 65 1870-1876 doi101111j1523-1755200400582x PubMed 15086929
23 Kume S Uzu T Araki S Sugimoto T Isshiki K et al (2007) Role ofaltered renal lipid metabolism in the development of renal injuryinduced by a high-fat diet J Am Soc Nephrol 18 2715-2723 doi101681ASN2007010089 PubMed 17855643
24 Deji N Kume S Araki S Soumura M Sugimoto T et al (2009)Structural and functional changes in the kidneys of high-fat diet-inducedobese mice Am J Physiol Renal Physiol 296 F118-F126 PubMed18971213
25 Aoyama M Isshiki K Kume S Chin-Kanasaki M Araki H et al (2012)Fructose induces tubulointerstitial injury in the kidney of mice BiochemBiophys Res Commun 419 244-249 doi101016jbbrc201202001PubMed 22342673
26 Gersch MS Mu W Cirillo P Reungjui S Zhang L et al (2007)Fructose but not dextrose accelerates the progression of chronickidney disease Am J Physiol Renal Physiol 293 F1256-F1261 doi101152ajprenal001812007 PubMed 17670904
27 Panchal SK Brown L (2010) Rodent models for metabolic syndromeresearch J Biomed Biotechnol 2011 351982 PubMed 21253582
28 Wada T Kenmochi H Miyashita Y Sasaki M Ojima M et al (2010)Spironolactone improves glucose and lipid metabolism by amelioratinghepatic steatosis and inflammation and suppressing enhancedgluconeogenesis induced by high-fat and high-fructose dietEndocrinology 151 2040-2049 doi101210en2009-0869 PubMed20211973
29 Axelsen LN Lademann JB Petersen JS Holstein-Rathlou NH Ploug Tet al (2010) Cardiac and metabolic changes in long-term high fructose-fat fed rats with severe obesity and extensive intramyocardial lipidaccumulation Am J Physiol Regul Integr Comp Physiol 298 R1560-R1570 doi101152ajpregu003922009 PubMed 20357025
30 Meacutenard SL Croteau E Sarrhini O Geacutelinas R Brassard P et al (2010)Abnormal in vivo myocardial energy substrate uptake in diet-induced
type 2 diabetic cardiomyopathy in rats Am J Physiol Endocrinol Metab298 E1049-E1057 doi101152ajpendo005602009 PubMed20159856
31 Couturier K Qin B Batandier C Awada M Hininger-Favier I et al(2011) Cinnamon increases liver glycogen in an animal model of insulinresistance Metabolism 60 1590-1597 doi101016jmetabol201103016 PubMed 21550075
32 Panchal SK Poudyal H Iyer A Nazer R Alam MA et al (2011) High-carbohydrate high-fat diet-induced metabolic syndrome andcardiovascular remodeling in rats J Cardiovasc Pharmacol 57611-624 doi101097FJC0b013e3181feb90a PubMed 21572266
33 Calderan L Marzola P Nicolato E Fabene PF Milanese C et al(2006) In vivo phenotyping of the obob mouse by magnetic resonanceimaging and 1H-magnetic resonance spectroscopy Obesity (SilverSpring) 14 405-414 doi101038oby200654 PubMed 16648611
34 Ayala JE Samuel VT Morton GJ Obici S Croniger CM et al (2010)Standard operating procedures for describing and performing metabolictests of glucose homeostasis in mice Dis Model J Mech 3 525-534
35 Han BG Hao CM Tchekneva EE Wang YY Lee CA et al (2008)Markers of glycemic control in the mouse comparisons of 6-h- andovernight-fasted blood glucoses to Hb A1c Am J Physiol EndocrinolMetab 295 E981-E986 doi101152ajpendo902832008 PubMed18664598
36 Buleacuteon M Allard J Jaafar A Praddaude F Dickson Z et al (2008)Pharmacological blockade of B2-kinin receptor reduces renal protectiveeffect of angiotensin-converting enzyme inhibition in dbdb mice modelAm J Physiol Renal Physiol 294 F1249-F1256 doi101152ajprenal005012007 PubMed 18367657
37 Hudkins KL Pichaiwong W Wietecha T Kowalewska J Banas MC etal (2010) BTBR ObOb mutant mice model progressive diabeticnephropathy J Am Soc Nephrol 21 1533-1542 doi101681ASN2009121290 PubMed 20634301
38 van den Berg JG van den Bergh Weerman MA Assmann KJ WeeningJJ Florquin S (2004) Podocyte foot process effacement is notcorrelated with the level of proteinuria in human glomerulopathiesKidney Int 66 1901-1906 doi101111j1523-1755200400964xPubMed 15496161
39 Carty DM Siwy J Brennand JE Zuumlrbig P Mullen W et al (2011)Urinary proteomics for prediction of preeclampsia Hypertension 57561-569 doi101161HYPERTENSIONAHA110164285 PubMed21199994
40 Good DM Zuumlrbig P Argileacutes A Bauer HW Behrens G et al (2010)Naturally occurring human urinary peptides for use in diagnosis ofchronic kidney disease Mol Cell Proteomics 9 2424-2437 doi101074mcpM110001917 PubMed 20616184
41 Mischak H Vlahou A Ioannidis JP (2013) Technical aspects and inter-laboratory variability in native peptide profiling the CE-MS experienceClin Biochem 46 432-443 doi101016jclinbiochem201209025PubMed 23041249
42 Zuumlrbig P Renfrow MB Schiffer E Novak J Walden M et al (2006)Biomarker discovery by CE-MS enables sequence analysis via MSMSwith platform-independent separation Electrophoresis 27 2111-2125doi101002elps200500827 PubMed 16645980
43 Wittke S Fliser D Haubitz M Bartel S Krebs R et al (2003)Determination of peptides and proteins in human urine with capillaryelectrophoresis-mass spectrometry a suitable tool for theestablishment of new diagnostic markers J Chromatogr A 1013173-181 doi101016S0021-9673(03)00713-1 PubMed 14604118
44 von zur Muhlen C Schiffer E Sackmann C Zurbig P Neudorfer I et al(2012) Urine proteome analysis reflects atherosclerotic disease in anApoE-- mouse model and allows the discovery of new candidatebiomarkers in mouse and human atherosclerosis Mol Cell Proteomics11 013847
45 Siwy J Mullen W Golovko I Franke J Zuumlrbig P (2011) Human urinarypeptide database for multiple disease biomarker discovery ProteomicsClin Appl 5 367-374 doi101002prca201000155 PubMed21591268
46 Yilmaz Y (2012) Review article fructose in non-alcoholic fatty liverdisease Aliment Pharmacol Ther 35 1135-1144 doi101111j1365-2036201205080x PubMed 22469071
47 Brosius FC 3rd Alpers CE Bottinger EP Breyer MD Coffman TM etal (2009) Mouse models of diabetic nephropathy J Am Soc Nephrol20 2503-2512 doi101681ASN2009070721 PubMed 19729434
48 Zuumlrbig P Jerums G Hovind P Macisaac RJ Mischak H et al (2012)Urinary proteomics for early diagnosis in diabetic nephropathyDiabetes 61 3304-3313 doi102337db12-0348 PubMed 22872235
49 Roscioni SS de Zeeuw D Hellemons ME Mischak H Zuumlrbig P et al(2013) A urinary peptide biomarker set predicts worsening of
Kidney Lesions in Metabolic Syndrome in Mice
PLOS ONE | wwwplosoneorg 13 October 2013 | Volume 8 | Issue 10 | e76703
albuminuria in type 2 diabetes mellitus Diabetologia 56 259-267 doi101007s00125-012-2755-2 PubMed 23086559
50 Molin L Seraglia R Lapolla A Ragazzi E Gonzalez J et al (2012) Acomparison between MALDI-MS and CE-MS data for biomarkerassessment in chronic kidney diseases J Proteomics 75 5888-5897doi101016jjprot201207024 PubMed 22842158
51 Mullen W Delles C Mischak H Euro KUPCa (2011) Urinaryproteomics in the assessment of chronic kidney disease Curr OpinNephrol Hypertens 20 654-661
52 Mischak H (2012) How to get proteomics to the clinic Issues in clinicalproteomics exemplified by CE-MS Proteomics Clin Appl 6 437-442doi101002prca201200027 PubMed 22821927
53 Stalmach A Albalat A Mullen W Mischak H (2013) Recent advancesin capillary electrophoresis coupled to mass spectrometry for clinicalproteomic applications Electrophoresis 34 1452ndash64 PubMed23512263
54 Rossing K Mischak H Rossing P Schanstra JP Wiseman A et al(2008) The urinary proteome in diabetes and diabetes-associatedcomplications New ways to assess disease progression and evaluatetherapy Proteomics Clin Appl 2 997-1007 doi101002prca200780166 PubMed 21136900
55 Mogensen CE Christensen CK Vittinghus E (1983) The stages indiabetic renal disease With emphasis on the stage of incipient diabeticnephropathy Diabetes 32 Suppl 2 64-78 doi102337diab322S64PubMed 6400670
56 Montagutelli X (2000) Effect of the genetic background on thephenotype of mouse mutations J Am Soc Nephrol 11 Suppl 16 S101-S105 PubMed 11065339
57 Qi Z Fujita H Jin J Davis LS Wang Y et al (2005) Characterization ofsusceptibility of inbred mouse strains to diabetic nephropathy Diabetes54 2628-2637 doi102337diabetes5492628 PubMed 16123351
58 Gurley SB Clare SE Snow KP Hu A Meyer TW et al (2006) Impactof genetic background on nephropathy in diabetic mice Am J PhysiolRenal Physiol 290 F214-F222 PubMed 16118394
59 Rebuffeacute-Scrive M Surwit R Feinglos M Kuhn C Rodin J (1993)Regional fat distribution and metabolism in a new mouse model
(C57BL6J) of non-insulin-dependent diabetes mellitus Metabolism 421405-1409 doi1010160026-0495(93)90190-Y PubMed 8231834
60 Surwit RS Feinglos MN Rodin J Sutherland A Petro AE et al (1995)Differential effects of fat and sucrose on the development of obesityand diabetes in C57BL6J and AJ mice Metabolism 44 645-651 doi1010160026-0495(95)90123-X PubMed 7752914
61 Puri TS Shakaib MI Chang A Mathew L Olayinka O et al (2010)Chronic kidney disease induced in mice by reversible unilateral ureteralobstruction is dependent on genetic background Am J Physiol RenalPhysiol 298 F1024-F1032 doi101152ajprenal003842009 PubMed20089676
62 Ma LJ Fogo AB (2003) Model of robust induction of glomerulosclerosisin mice importance of genetic background Kidney Int 64 350-355 doi101046j1523-1755200300058x PubMed 12787428
63 Juumlrgens H Haass W Castantildeeda TR Schuumlrmann A Koebnick C et al(2005) Consuming fructose-sweetened beverages increases bodyadiposity in mice Obes Res 13 1146-1156 doi101038oby2005136PubMed 16076983
64 Bouby N Bachmann S Bichet D Bankir L (1990) Effect of water intakeon the progression of chronic renal failure in the 56 nephrectomizedrat Am J Physiol 258 F973-F979 PubMed 2184677
65 Zhang HM Dang H Kamat A Yeh CK Zhang BX (2012)Geldanamycin derivative ameliorates high fat diet-induced renal failurein diabetes PLOS ONE 7 e32746 doi101371journalpone0032746PubMed 22412919
66 Ingalls AM Dickie MM Snell GD (1950) Obese a new mutation in thehouse mouse J Hered 41 317-318 PubMed 14824537
67 Tetri LH Basaranoglu M Brunt EM Yerian LM Neuschwander-TetriBA (2008) Severe NAFLD with hepatic necroinflammatory changes inmice fed trans fats and a high-fructose corn syrup equivalent Am JPhysiol Gastrointest Liver Physiol 295 G987-G995 doi101152ajpgi902722008 PubMed 18772365
68 Levine DZ Iacovitti M Robertson SJ (2008) Modulation of single-nephron GFR in the dbdb mouse model of type 2 diabetes mellitus IIEffects of renal mass reduction Am J Physiol Regul Integr CompPhysiol 294 R1840-R1846 doi101152ajpregu004572007 PubMed18417648
Kidney Lesions in Metabolic Syndrome in Mice
PLOS ONE | wwwplosoneorg 14 October 2013 | Volume 8 | Issue 10 | e76703
rapidly increasing prevalence of obesity [1314] Metabolicsyndrome and its risk factors potentially play a role in thedevelopment of chronic kidney diseases (CKD) Indeed it hasbeen shown that metabolic syndrome is associated with ahigher prevalence of microalbuminuria [15-20] and an higherrisk of development of CKD [21] and subsequent end stagerenal disease (ESRD) in type II diabetic patients [22] Howeverdetailed mechanistic information on the link between metabolicsyndrome and CKD is not available
Hence to better understand this link rodent modelsmimicking as best as possible human metabolic syndrome-induced CKD will be of great help It has been shown that a 3or 4 months diet containing respectively 60 or 45 kcal of fatleads to mesangial matrix area expansion in renal glomeruliand to a significant rise in urinary albumin excretion in C57BL6mouse [2324] Furthermore the use of fructose alone(between 20 and 40) in mouse and rat diets has beenreported to induce renal tubulointerstitial injury [2526] Thedrawback of these models is that they only mimic certainaspects of metabolic syndrome but not the entire repertoire
[27] In contrast a combination of high fat and highcarbohydrate diet in animals leads to the development of alltypical metabolic complications present in human metabolicsyndrome such as increased body weight increasedtriglycerides and cholesterol plasma concentrations andabdominal fat deposition [28-31] The latter is thus probably themost appropriate model to study human metabolic syndrome inanimal models [27] and therefore its impact on kidney functionRecent studies by Panchal et al [32] submitting rats to both ahigh fat and high fructose diet for 4 months showedcardiovascular remodeling (ie endothelial dysfunctioninflammation and fibrosis in the heart) in the presence ofmetabolic syndrome Unfortunately effects on the kidney wereonly minimally described which did not allow concluding on thesuitability of this metabolic syndrome model to induce CKD Inaddition the workhorse for genetically engineered mice is theC57BL6 strain and induction of metabolic syndrome in thisstrain deficient for specific genes would be of great help tobetter understand the development of CKD in metabolicsyndrome
Figure 1 Changes in body weight (A) energy intake (B) food intake (C) water intake (D) fat mass (E) and lean mass (F) incontrol fed mice () and HFFD fed mice () Data are means plusmn SEM for 36 mice per group at 1 2 and 3 months 24 mice pergroup at 6 months and 12 mice per group at 8 months Ple005 Ple001 Ple0001doi 101371journalpone0076703g001
Kidney Lesions in Metabolic Syndrome in Mice
PLOS ONE | wwwplosoneorg 2 October 2013 | Volume 8 | Issue 10 | e76703
Therefore in the current study we describe the in depthcharacterization of kidney lesions after a long term (8 months)high fat high fructose diet (HFFD) in the C57BL6 mouse strainWe observed that the kidney is particularly resistant tometabolic syndrome in this strain since only very mild signs ofkidney damage were observed after 8 months of HFFD
Materials and Methods
Mice and dietsSeventy-eight adult male C57BL6 (nomenclature C57BL
6NCrl) mice were purchased at Charles River Laboratory(LrsquoArbresle France) at the age of 5 weeks and divided in twoequal experimental groups (n=36) Mice were housed 4 percage and maintained on a 12h light12h dark cycle in apathogen-free environment Mice were fed with either a controldiet or a high fat fructose diet (HFFD) The control diet(D12450B 382 kcal per g Research Diet USA) contained192 protein 673 carbohydrate and 43 fat and wasserved with regular drinking water both ad libitum The HFFD(D12451 473 kcal per g Research Diet USA) contained 24
protein 41 carbohydrate and 24 fat and was served with30 fructose (F0127 powder diluted in ultrapure water 12 kcalper ml Sigma France) enriched drinking water both adlibitum All experiments reported were conducted inaccordance with the NIH guide for the care and use oflaboratory animals and were approved by the animal care anduse committee from UMS US006INSERM Toulouse France(protocol 1110481219)
Body weight composition and energy intakeMice were weighed weekly The body composition (fat and
lean mass) of awake mice was analyzed by nuclear magneticresonance using an EchoMRI-3in1 apparatus for Live Animals(EchoMRI USA) [33] Food intake was estimated as thedifference of weight between the offered and the remnantamount of food at 7-days intervals The food was provided aspressed pellets so the residual spillage was not consideredhere Beverage intake was estimated with the same processbased this time on the volume Total energy intake determinedfrom the energy content in each diet and mass consumed wascalculated on a per-week basis
Figure 2 Plasma level of triglycerides (A) cholesterol (B) HDL (C) LDL (D) and glucose (E) in control fed mice () andHFFD fed mice () Data are means plusmn SEM for 12 mice per group Ple005 Ple001 Ple0001doi 101371journalpone0076703g002
Kidney Lesions in Metabolic Syndrome in Mice
PLOS ONE | wwwplosoneorg 3 October 2013 | Volume 8 | Issue 10 | e76703
Blood analysisPrior to blood collection we performed a 6 hours fasting
period This time point was chosen to avoid a postprandialglycemic peak and to prevent an induced catabolic state in themice [3435] All the blood samples were collected inMicrovette CB 300 PlasmaLithium heparin (SarstedtGermany) tubes from the tail vain under local anesthesia (n=12per group) The samples were centrifuged at 3000 g for 10minutes at 4degC The supernatants were separated and plasmaconcentrations of glucose cholesterol HDL LDL andtriglycerides were measured by fluorescence on ABX Pentra400 apparatus (Horiba medical France) In order to bypassmultiple periods of fasting and blood collection all theparameters were measured from the same sample
Renal function studyAfter 3 6 and 8 months of diet glomerular filtration rate
(GFR) was evaluated by measurement of inulin clearance in 9mice per group as previously described [36] Briefly mice wereanesthetized with an intraperitoneal injection of 150 mgkg ofthiobutabarbital sodium (Inactin Sigma) and placed on athermostatically controlled heating table After a tracheotomythe left jugular vein was cannulated to infuse Gelofusine and amixture of NaCl (09) thiopenthal sodium (pentothal083mgmiddotkg-1middotmin-1) inulin (18 mgmiddotkg-1middotmin-1) The rate ofinfusions was 01 mlh The left femoral artery was cannulatedto monitor mean arterial blood pressure (MABP) and to obtainblood samples Urine was obtained in the following way A 3mm ventral incision was made opposite to the bladder belowthe peritoneum allowing to expose the bladder Then a
polyethylene catheter (internal diameter 058 mm externaldiameter 096 mm) was introduced in the bladder lumen by a 1mm incision The bladder was then tied around the catheterusing surgical suture The residual urine is removed from thebladder and a 30 min period of recovery is observed DuringGFR evaluation a 500 microl tube is disposed at the free extremityof the catheter to collect urine during 60 minutes At the end ofsurgery a bolus of inulin (inulin 100 mgkg) was perfused andmice were allowed to recover for 30 min Renal function wasevaluated for a 60-min clearance period Inulin levels in plasmaand urine samples were determined by enzymaticquantification of released fructose units (Enzytec D-GlucoseFructose kit r-biopharmreg) on a Pentra 400 analyzer (HoribaMedicalreg) after a one hour 37degC incubation of the samples withinulinase (Sigmareg) The GFR is equal to the inulin clearance(GFR = ([urinary inulin] x urine flow) [inulin])
AlbuminuriaMice were placed in metabolic cages in order to collect 24-h
urine Urinary albumin excretion was determined with a mouseantigen specific ELISA (Mouse Albumin Quantitation Kit BethylLaboratoriesreg USA) Creatinine measurements weredetermined by an enzymatic colorimetric assay using an ID-MStraceable calibration (Creatinine Enzymatic Beckman Coulter)on the Pentra 400 analyzer (Horiba Medicalreg) Albuminexcretions were related to urine creatinine concentrations inorder to take into account the differences in urinary flows
Figure 3 Marked vacuolar degeneration indicating fat accumulation in the liver of HFFD fed mice () compared to controlfed mice () Hematoxylineosin staining Data are means plusmn SEM for 12 mice per group Ple00001doi 101371journalpone0076703g003
Kidney Lesions in Metabolic Syndrome in Mice
PLOS ONE | wwwplosoneorg 4 October 2013 | Volume 8 | Issue 10 | e76703
Organ collectionKidneys and liver were collected from each mouse included
in the renal function study For brightfield microscopy tissueswere fixed in Carnoyrsquos solution for 24 h For electronmicroscopy tissues were fixed and stored with 2glutaraldehyde in Sorensen buffer for 1 hour
Histological analysis and immunochemistryFour-micrometer paraffin-embedded sections were cut
Renal and liver sections were subjected to histologicalanalysis using hematoxylin-eosin and periodic acid-Schiffstaining For immunohistochemistry experiments renalsections were first dewaxed in toluene and rehydrated througha series of graded ethanol washes before endogenousperoxidase blockage (S2001 DakoCytomation TrappesFrance) Specific primary antibodies were incubated (1h atroom temperature) for the detection of collagen type III (1500Tebu-Bio Le Perray-en-Yvelines France) and F480 positivecells (1250 RM2900 Caltag Laboratories Inc BurlingameCA USA) Slides were further incubated with peroxidase-conjugated secondary antibodies during 30 min Immunologicalcomplexes were visualized by the addition of the DABsubstrate during 10 min (K4010 DakoCytomation EnvisionHRP system) Sections were counterstained with hematoxylinand mounted Negative controls for the immunohistochemicalprocedures included substitution of the primary antibody withnonimmune sera Sections were scanned using a Nanozoomer20 RS (Hamamatsu Photonics SARL Massy France) andtreated with the Morpho-expert image-analysis software
(version 100 Explora Nova La Rochelle France) formorphometric analyses
Transmission electron microscopySamples were fixed with 2 glutaraldehyde in Sorensen
phosphate buffer (01 M pH 74) for 1 hour washed with theSorensen phosphate buffer for 12 hours and post fixed with 1OsO4 in Sorensen phosphate buffer for 1 hour Samples weredehydrated with increasing ethanol concentration (30 5070 95) until a 100 ethanol solution was reached and thensubsequently stored for 30 min in a propylene oxide solutionNext samples were embedded in epoxy resin (Epon 812)After 24 h of polymerization at 60degC ultrathin sections (70 nm)were mounted on 100 mesh collodion-coated copper grids andpoststained with 3 uranyl acetate in 50 ethanol and with85 lead citrate before being examined on a HT7700 Hitachielectron microscope at an accelerating voltage of 80 KV Aseries of 10 photographs were taken at x12000 magnificationFor assessment of basement membrane thickness a grid (gridsize = 30cm by 30 cm with a 05 cm step) was projected oneach photograph and basement membrane thickness wasmeasured at points where it intersected with the grid [37] Forassessment of foot process effacement the number ofpodocytic foot processes was manually counted and expressedas the number of foot processes per microm of glomerularbasement membrane length [38]
Figure 4 Glomerular hyperfiltration (A) urinary albumin to creatinine ratio (ACR) (B) and arterial blood pressure (C) inHFFD fed mice () compared to control fed mice () Data are means plusmn SEM for 9 mice per group p=00429 p=0004doi 101371journalpone0076703g004
Kidney Lesions in Metabolic Syndrome in Mice
PLOS ONE | wwwplosoneorg 5 October 2013 | Volume 8 | Issue 10 | e76703
Urine sample preparation for CE-MS analysisFor the analysis of the urinary peptidome urine samples
from all mice of each group were collected during 12 hoursusing a metabolic cage and frozen at -80degC until CE-MSanalysis Urine for peptidome analysis was obtained 2 daysprior to inulin based GFR measurements Immediately beforepreparation mouse urine aliquots were thawed and 150 microl wasmixed with 150 microl of a buffer 2 M urea 10 mM NH4OHcontaining 002 SDS Subsequently samples wereultrafiltered using a Centristat 20 kDa cut-off centrifugal filterdevice (SatoriusGottingen Germany) to eliminate highmolecular weight compounds The obtained filtrate wasdesalted using a NAP5 gel filtration column (GE Healthcare BioSciences Uppsala Sweden) to remove urea and electrolytesThe sample was lyophilized in a Christ Speed-Vac RVC 2 18Alpha 1 2 (Christ Osterode am Harz Germany) and stored at4degC until use Finally the samples were re-suspended in 200microL HPLCgrade H2O and injected into CE-MS with 2 psi for 99sec resulting in injection volumes of 280 nL Capillary
electrophoresis coupled to mass spectrometry (CE-MS)analysis was performed as described using a PACE MDQcapillary electrophoresis system (Beckman Coulter FullertonUSA) on-line coupled to a MicroQTOF MS (Bruker) [39] TheESI sprayer (Agilent Technologies Palo Alto CA USA) wasgrounded and the ion spray interface potential was setbetween minus40 and minus45 kV Data and MS acquisition methodswere automatically controlled by the CE via contact-close-relays Spectra were accumulated every 3 s over a range ofmz 350 to 3000 Details on accuracy precision selectivitysensitivity reproducibility and stability of the CE-MS methodhave been provided previously [4041]
Peptide sequencingFor sequencing processed urine samples were also
separated on a Dionex Ultimate 3000 RSLS nano flow system(Dionex Camberly UK) A 5 ml sample was loaded onto aDionex 5 mm C18 nano trap column at a flow rate of 5 mlminElution was performed on an Acclaim PepMap 75 mm C18
Figure 5 Macrophage infiltration (A) and collagen accumulation (B) in HFFD fed mice () compared to control fed mice() Data are means plusmn SEM for 12 mice per group p=00217 Pictures for macrophage staining display representative areas ofkidneys from control or HFFD fed mice Magnification x20 Pictures for collagen staining display representative tubulointerstitium ofkidneys from control or HFFD fed mice Magnification x20doi 101371journalpone0076703g005
Kidney Lesions in Metabolic Syndrome in Mice
PLOS ONE | wwwplosoneorg 6 October 2013 | Volume 8 | Issue 10 | e76703
nano column over 100 min The sample was ionised in positiveion mode using a Proxeon nano spray ESI source (ThermoFisher Hemel UK) and analysed in an Orbitrap Velos FTMS(Thermo Finnigan Bremen Germany) The MS was operatedin data-dependent mode to switch between MS and MSMSacquisition and parent ions were fragmented by (high-) energycollision-induced dissociation and also electron transferdissociation Data files were searched against Mus musculusentries in the Swiss-Prot database without any enzymespecificity using Open Mass Spectrometry Search Algorithm(OMSSA httppubchemncbinlmnihgovomssa) with an e-value cut-off of 01 No fixed modification and oxidation ofmethionine as variable modifications were selected Mass errorwindows of 10 ppm for MS and 005 Da (HCD) or 05 Da (CIDETD) for MSMS were allowed For further validation ofobtained peptide identifications the strict correlation betweenpeptide charge at pH 2 and CE-migration time was utilized tominimize false-positive identification rates [42] Calculated CE-migration time of the sequence candidate based on its peptidesequence (number of basic amino acids) was compared to theexperimental migration time Peptides were accepted only ifthey had a mass deviation below plusmn 80 ppm and a CE-migrationtime deviations below plusmn 2 min
Data processingMass spectral ion peaks representing identical molecules at
different charge states were deconvoluted into single massesusing MosaiquesVisu software [43] Only those signals with z
gt1 that were observed in a minimum of 2 consecutive spectrawith signal-to-noise ratios gt4 were included The softwareemploys a probabilistic clustering algorithm and uses bothisotopic distribution as well as conjugated masses for charge-state determination of peptidesproteins The resulting peak listcharacterizes each polypeptide by its molecular mass CE-migration time and ion signal intensity (amplitude) value Tominimize effects of biological and analytical variability betweenthe different lots a normalization of retention time signalintensity and mass was performed as described [44] Alldetected peptides were deposited matched and annotated ina Microsoft SQL database allowing further analysis andcomparison of multiple samples [45] Peptides were consideredidentical within different samples when mass deviation waslower than 50 ppm for small peptides or 75 ppm for largerpeptides and proteins Due to analyte diffusion CE peak widthsincrease with CE migration time In the data clustering processthis effect was compensated by linearly increasing clusterwidths over the entire measurement from 2 to 5
Statistical analysisAll data are presented as means plusmn SEM Statistical analysis
was performed using GraphPad software(wwwgraphpadcom) Analysis of the two groups (control vshigh fat fructose diet) was assessed by a two-tailed unpaired t-test Statistical significance was reached at a p-value below005
Figure 6 Absence of mesangial matrix expansion in HFFD fed mice () compared to control fed mice () Mesangial matrixexpansion is evaluated by the ratio of the matrix surface to the total surface of the glomerulus after Periodic Acid Staining Data aremeans plusmn SEM for 12 mice per group ns Pictures display representative glomeruli of kidneys from control or HFFD fed miceMagnification x40doi 101371journalpone0076703g006
Kidney Lesions in Metabolic Syndrome in Mice
PLOS ONE | wwwplosoneorg 7 October 2013 | Volume 8 | Issue 10 | e76703
Results
HFFD diet induces metabolic syndrome and T2D inmice
Five weeks old male C57BL6 mice were separated into twogroups (n=36 micegroup) The control group received astandard control diet and tap water The other group (HFFD)received a high fat diet (45 of fat) and 30 fructose in tapwater In Table 1 we summarized the parameters to determineinstauration of metabolic syndrome in HFFD fed C57BL6 miceThe different parameters are ordered based on firstappearance of significance in time Mice receiving HFFDdisplayed a significantly higher energy intake starting at week1 Body weight of the HFFD group was increased starting atweek 3 while the food intake in this group started to decreaseAfter 4 weeks on HFFD we observed that plasma triglyceridestotal cholesterol and HDL were significantly elevated Thedifference observed for weight between HFFD and control micewas confirmed by a significant gain of fat and lean mass inHFFD mice at week 8 At the same time the HFFD mice
started to be hyperglycemic compared with controls At week16 plasma LDL levels were significantly higher in the HFFDmice The figures 1 and 2 show the evolution of theseparameters throughout the eight months of study No differencewas observed in the water intake Histological analysis of theliver performed at 8 months revealed a marked vacuolardegeneration indicating fat accumulation in the liver (Figure 3)This observation is consistent with the development of nonalcoholic fatty liver (NAFLD) due to the excess of fructoseintake [46] Collectively these data strongly suggest thepresence of metabolic syndrome as early as 4 weeks and ofassociated type 2 diabetes (T2D) as early as 8 weeks afterinitiation of a HFFD in C57BL6 mice
HFFD diet induces glomerular hyperfiltration andmicroalbuminuria only in late stage metabolicsyndrome
Next we studied the effect of metabolic syndrome and T2Don kidney function The glomerular filtration rate (GFR) wasdetermined based on inulin clearance after 3 6 and 8 months
Figure 7 The measurement of glomerular capillary basement membrane thickness by electron microscopy showed atendency to increase in the HFFD group at 8 months (A) HFFD fed mice () compared to control fed mice () and datarepresent means plusmn SEM for 12 mice per group ns The assessment of foot process effacement expressed as the mean width ofthe podocytes foot process (FPW) did not showed a significant difference between the HFFD fed mice (5) compared to control fedmice (lt) (B) Data represent means plusmn SEM for 12 mice per group nsdoi 101371journalpone0076703g007
Kidney Lesions in Metabolic Syndrome in Mice
PLOS ONE | wwwplosoneorg 8 October 2013 | Volume 8 | Issue 10 | e76703
of HFFD GFR was not significantly different between thecontrol and the HFFD group at the early time points (3 and 6months) but HFFD mice displayed low but significanthyperfiltration after 8 months of diet (Figure 4A) Thishyperfiltration was accompanied by a 2-fold increase inalbuminuria (Figure 4B) but without change in the bloodpressure (Figure 4C) This assessment suggests late and mildkidney dysfunction in metabolic syndrome in C57BL6 mice
HFFD induces only minor histological modifications inthe kidney
Since we only observed mild functional changes after 8months of HFFD we studied kidney histological modificationsat this time point Macrophage infiltration was quantified byimmunohistological staining for F480 in the tubulointerstitiumWe observed a 2-fold increased F480 staining in kidneys ofHFFD mice compared to the control group (Figure 5A)Tubulointerstitial collagen accumulation was also studied byimmunostaining for collagen III (Figure 5B) Eight months ofHFFD was without effect on tubulointerstitial collagen IIIdeposition Moreover Periodic Acid staining did not showmesangial matrix expansion (Figure 6) Glomerular basementmembrane (GBM) thickening and foot process effacement areearly events in diabetic nephropathy [47] We studied thethickness of the GBM and assessed the foot process
Table 1 Parameters to determine instauration of metabolicsyndrome in HFFD fed C57BL6 mice
Onset ofsignificance
Controlgroupvalues
HFFDgroupvalues p-value
Testfrequency
Energy intake(kcal)
1 week4562 plusmn123
1398 plusmn1292
lt00001
weekly
Body weight(grams)
3 weeks2488 plusmn019
2679 plusmn023
lt00001
weekly
Food intake(grams)
3 weeks1600 plusmn817
9633 plusmn926
00004 weekly
Triglycerides(mmolL)
4 weeks100 plusmn007
145 plusmn012
00023 monthly
Cholesterol(mmolL)
4 weeks289 plusmn009
346 plusmn018
00083 monthly
HDL (mmolL) 4 weeks264 plusmn008
310 plusmn016
00148 monthly
Fat mass ( ofbody mass)
8 weeks116 plusmn011
455 plusmn045
lt00001
monthly
Lean mass ( ofbody mass)
8 weeks2026 plusmn024
2153 plusmn022
00003 monthly
Glucose(mmolL)
8 weeks1477 plusmn079
1841 plusmn121
00164 monthly
LDL (mmolL) 16 weeks014plusmn001
020 plusmn002
00071 monthly
The different parameters are ordered based on first appearance of significance intime The frequency of analysis for each parameter is displayed in the last columnn=36 groupdoi 101371journalpone0076703t001
effacement using electron microscopy This analysis showed anon-significant difference (0353plusmn0009 vs 0375plusmn00106 microM)towards increased GBM thickness and no foot processeffacement in HFFD mice (Figure 7) These data suggestabsence of advanced diabetic nephropathy lesions butinflammation of the kidney tissue after 8 months of HFFD
Comparison of the HFFD mouse urinary peptidomewith the human urinary peptidome of T2D patientssuggests absence of T2Ddiabetic nephropathy
The results obtained so far suggest that 8 months of HFFDwas not associated with significant renal lesions in C57BL6mice In previous studies in humans analysis of the urinaryproteome allowed the identification of 273 peptides associatedto CKD [40] These peptides were also significantly modified inT2D patients with diabetic nephropathy [48] [49] Similarly wehave studied the HFFD-induced changes in the mouse urinarypeptidome The analysis of the urinary peptidome of control(n=10) and mice fed 8 months of HFFD (n=11) led to thedetection of a total of 2591 urinary peptides for control miceand 2687 peptides for HFFD mice (Figure 8A shown for HFFDmice) When comparing the urinary peptide content of controland HFFD mice we observed 62 peptides with different urinaryabundance (Figure 8B) To date sequence analysis identified30 peptides of these 62 (Table S1) Around 80 (24 out of 30)of these peptides were found to be fragments of collagen with27 being down-regulated and 53 up-regulated (Figure 9A)For comparison with the human situation we next studied theregulation of the 273 peptides associated to CKD in healthycontrols (n=33 data obtained from [40]) in patients with T2Dwithout diabetic nephropathy (albuminurialt30mgL n=75) andin patients with T2D with diabetic nephropathy(albuminuriagt300mgL n=47) that were previously studied byMolin [50] In the T2D patients without diabetic nephropathythe peptidome profile was very similar to HFFD mice with 29of collagen fragments down-regulated and 45 up-regulatedcompared to healthy controls (Figure 9B) However thepeptidome of HFFD mice was different from T2D patients withdiabetic nephropathy as in these patients collagen fragmentswere mostly down-regulated (47 down- and 27 up-regulated Figure 9B)
Discussion
The purpose of our study was to investigate renal lesionsafter long term (8 months) of high fat high fructose diet-inducedmetabolic syndrome in the highly used and studied C57BL6mouse strain We confirmed that consumption of a 45 kcal fatwith 30 fructose water diet by wild type C57BL6 led to therapid installation of metabolic syndrome (4 weeks) and T2D (8weeks) We next studied in detail the renal phenotype andcompared our results to the specifications of the DiabeticComplications Consortium (DiaComp wwwdiacomporg) TheDiaComp research criteria for validating a progressive mousemodel of diabetic nephropathy implies a decline greater than50 in GFR over the lifetime of the animal an increase greaterthan 10 fold in albuminuria advanced mesangial matrixexpansion tubulointerstitial fibrosis and glomerular basement
Kidney Lesions in Metabolic Syndrome in Mice
PLOS ONE | wwwplosoneorg 9 October 2013 | Volume 8 | Issue 10 | e76703
membrane thickening superior by 50 over baseline Duringour study we observed that mice with metabolic syndromedevelop minimal renal injury exemplified by low levelalbuminuria (2 fold higher than the control group) or mildhyperfiltration (15 fold higher than the control group) after 8months of HFFD In addition we observed neither mesangialmatrix expansion nor fibrosis or significant GBM thickening butonly some minor podocyte effacement Clearly thesecharacteristics are far from the DiaComp recommendations
Analysis of human urine proteomic profile allows earlydiagnosis of kidney diseases such as CKD [51] or diabeticnephropathy [48] and increasingly proteomics are involved inthe clinical diagnosis [5253] Here we compared the urinarypeptide content of control mice to HFFD mice and identified 62differentially excreted peptides We obtained sequenceinformation for 30 of these 62 peptides and we compared thoseto the human urinary peptide markers of diabetic nephropathy[48] In both human and mice most of the urinary peptideswere collagen fragments suggesting similarities between the
human and C57BL6 mouse urinary peptidome Interestinglythe observed ldquoup and downrdquo collagen peptide profile in HFFDmice was very similar to that of T2D patients without diabeticnephropathy but clearly different from that of T2D patients withdiabetic nephropathy This result suggests absence of diabeticnephropathy in HFFD mice thereby confirming the functionaland histological observations In addition this inversion of thedirection regulation of urinary collagen fragments in diabeticnephropathy in humans ie a significant decrease in urinarycollagen fragments is thought to be related to increasedcollagen deposition in the diabetic kidney [54] and correlates tothe absence of tubulointerstitial fibrosis in mice receiving 8months of HFFD Overall these data based on urinarypeptidome analysis further suggest that the HFFD diet does notlsquolsquomodelrsquorsquo chronic kidney disease in T2D patients
Five stages in the development of renal changes in humandiabetes have been described [55] but an official description ofstaging of diabetic nephropathy in mice is not available Basedon our results 8 months of HFFD diet in C57BL6 mice
Figure 8 Comparison of the urinary peptidome content between control (n=10) and HFFD (n=11) at 8 months of agemice (A) A contour plot representing the compiled urinary peptidome of all HFFD mice showing 2687 urinary peptides Each blueto white colored dot or peak represents a urinary peptide identified by a specific mass (kDa) and migration time on the CE (min)When a peptide is detected but of low abundance it is represented by a blue dot Increasing abundance of peptide is represented bya change of color towards white At the same time the abundance is given by the height of the peak Therefore a dot equals lowabundance and a peak equals higher abundance with the height of the peak being the relative abundance compared to the otherpeptides (B) Representation of the 62 peptides which differ in urinary abundance between control and HFFD fed mice In panel Bthe scale was amplified 2-fold to improve the representation of the peptidesdoi 101371journalpone0076703g008
Kidney Lesions in Metabolic Syndrome in Mice
PLOS ONE | wwwplosoneorg 10 October 2013 | Volume 8 | Issue 10 | e76703
corresponds best to human stage 1 renal changes in diabetes(hyperfiltration absence of thickened GBM and slightlyelevated urinary albumin) Together with our other observationsof absence of diabetic nephropathy it is clear that the C57BL6strain is not the most adequate strain for studies of renallesions in HFFD induced T2D
The influence of the genetic background on the diseasephenotype has been described in mice [56] A number ofstudies already described the impact of the mouse strain on theresponsiveness to treatment C57BL6 mice are for examplerelatively resistant to STZ-induced type 1 diabetes compared toDBA2J and KKH1J mice [5758] The genetic background canalso have significant impact on the responsiveness to a specificdiet C57BL6 mice fed with a high fat high carbohydrate dietdisplayed increased body weight had more overall fat andparticularly increased adipose tissue in comparison with AJmice although developing similar levels of hyperglycemiahyperinsulinemia and hypercholesterolemia [5960] Thegenetic background has also been reported to influence theoutcome of CKD or glomerulosclerosis In reversible unilateral
ureteral obstruction [61] the development of CKD wasobserved in C57BL6 mice but not in BALBc On the contraryin a 56 nephrectomy model C57BL6 mice presented onlymild glomerulosclerosis in contrast to both 129Sv and Swissmice [62] Hence one of the possibilities to improve on thedevelopment of kidney disease in HFFD is testing differentmouse strains However deviation from the C57BL6 strainrules out the use of the wealth of genetically engineered miceon this genetic background
Our choice to use a high fat high fructose diet was driven byits high similarity with the actual human western diet and by thepanel of symptoms it causes (eg hyperinsulinemia insulinresistance impaired glucose tolerance increase abdominal fatdeposition hepatic steatosis and inflammation) Thehypothesis to study the renal complications in this establishedmodel of metabolic syndrome was supported by impaired renalfunction and the renal lesions observed in studies using highfat or high fructose separately in rodents [23-26] Surprisinglythe combination of these two diets although clearly inducingmetabolic syndrome did not lead to the expected kidney
Figure 9 Comparison of the regulation of urinary peptide fragments in the HFFD mouse model (a) with human with type2 diabetes (T2D) with or without diabetic nephropathy (9B) doi 101371journalpone0076703g009
Kidney Lesions in Metabolic Syndrome in Mice
PLOS ONE | wwwplosoneorg 11 October 2013 | Volume 8 | Issue 10 | e76703
damage A possible explanation of the absence of effect onrenal lesions of the HFFD is when compared to a high fat dietonly [23] that the quantity of the daily ingested fat in ourexperiments is lower (052 g of fatday for HFFD vs 062g offatday for high fat diet) The additional calories provided by thefructose beverage are compensated by decrease in food intake[63] This minor daily difference in fat intake over a long period(ie 8 months) potentially explains the observed difference inrenal lesions Another possible explanation could be modifiedwater intake due to the presence of fructose Indeed asdescribed by Bouby et al [64] glucose in drinking water canincrease water intake slowing down the progression of renalinjury in rats However we observed that the highconcentration of fructose in the drinking water did not lead to ahigher water intake
Thus the current challenge is to find the balance betweendiets that lead quickly to advanced renal disease (but that donot mimic the situation from human nutritional perspective) anddiets that need a longer time of exposure to induce the samestage of disease (but imitating closely the human nutritionalinput) An option to accelerate renal lesions in C57BL6 micecould be to superimpose high fat high fructose diets to strainspredisposed to obesity such as the Lepob Leprdb KKCg-Ay
strain Indeed Zhang et al [65] combined a strain predisposedto obesity (dbdb) and a high fat diet and showed that a high fatdiet exacerbates nephropathy and causes early renal failureHowever instauration of renal failure was fast (4 weeks) anddoes not correspond to chronic disease observed in humansOnce again a balance needs to be found between models thatquickly lead to severe renal disease and models that allowstudies of development of chronic disease Moreover most ofthe knockout animals are on the C57BL6 background The useof these genetic models of T2D could necessitate crossingthem with knockout animals in futures studies but genetic T2Dmodel are associated with issues such as reduced fertility [66]and many backcrosses (around 10) to reach a unique (999)new genetic background will be necessary Increasing thequantity of fat or fructose could be also considered toaccelerate the renal lesions but a review of existing literaturehas highlighted their serious consequences Using of a 60 fatdiet instead of the 45 on this study would quickly inducedobesity on a much shorter time but should be consideredextreme from a nutritional perspective In the same way some
studies use fructose concentrations up to 55 If we assumedthat the fatty liver a symptom of metabolic syndrome is earlierobserved in these mice we cannot overshadow the increasedrisk of severe NAFLD and hepatic necroinflammatory [67]
An ultimate option to accelerate renal lesions in C57BL6mice subjected to a HFFD is to remove one of the kidneysbefore initiation of the diet Indeed it has been shown thatuninephrectomy leads to exacerbation of the lesions of diabeticnephropathy in dbdb obese mice [68] In addition chronicingestion of fructose worsens the decrease of renal functionproteinuria and glomerulosclerosis induced by subtotalnephrectomy in the rat [23-26]
In conclusion the present study demonstrates that the HFFDis an efficient animal model of metabolic syndrome in C57BL6mice but suggests that the kidney is particularly resistant in thisstrain because only very early signs of kidney damage areobserved Potential solutions to exploit this model for advancedrenal lesions in C57BL6 mice include prolongation of the dietwhich is feasible but clearly time consuming or acceleratedisease progression by coupling a HFFD with unilateralnephrectomy
Supporting Information
Table S1 List of all significant regulated peptides atcontrol vs HFFD Given are Identification (internal databaseof Mosaiques diagnostics) mass in Dalton Capillaryelectrophoresis migration time in minutes mean amplitude atcontrols mean amplitude at HFFD regulation factor at diseaseAUC (Area under Curve Receiver operating statistics) p-valueadjusted (Benjamini and Hochberg) amino acid sequence(modified amino acids p=hydroxyproline k=hydroxylysinem=oxidized methionine)(XLS)
Author Contributions
Conceived and designed the experiments RD JPS JLB BBMPerformed the experiments RD LD BB SR LS MB BPAnalyzed the data RD JK CC JS JH WM Contributedreagentsmaterialsanalysis tools RD HM IT Wrote themanuscript RD JPS JLB BBM CC HM IT JK
References
1 Drewnowski A Popkin BM (1997) The nutrition transition new trends inthe global diet Nutr Rev 55 31-43 PubMed 9155216
2 Bleich SN Wang YC Wang Y Gortmaker SL (2009) Increasingconsumption of sugar-sweetened beverages among US adults1988-1994 to 1999-2004 Am J Clin Nutr 89 372-381 PubMed19056548
3 Reedy J Krebs-Smith SM (2010) Dietary sources of energy solid fatsand added sugars among children and adolescents in the UnitedStates J Am Diet Assoc 110 1477-1484 doi101016jjada201007010 PubMed 20869486
4 US Department of Health and Human Services CfDCaP (2011)National diabetes fact sheet national estimates and generalinformation on diabetes and prediabetes in the United States
5 Organization WH (2011) Diabetes fact sheet6 Malik VS Schulze MB Hu FB (2006) Intake of sugar-sweetened
beverages and weight gain a systematic review Am J Clin Nutr 84274-288 PubMed 16895873
7 Vartanian LR Schwartz MB Brownell KD (2007) Effects of soft drinkconsumption on nutrition and health a systematic review and meta-analysis Am J Public Health 97 667-675 doi102105AJPH2005083782 PubMed 17329656
8 Dekker MJ Su Q Baker C Rutledge AC Adeli K (2010) Fructose ahighly lipogenic nutrient implicated in insulin resistance hepaticsteatosis and the metabolic syndrome Am J Physiol Endocrinol Metab299 E685-E694 doi101152ajpendo002832010 PubMed20823452
9 Tappy L Lecirc KA (2010) Metabolic effects of fructose and the worldwideincrease in obesity Physiol Rev 90 23-46 doi101152physrev000192009 PubMed 20086073
10 Tappy L Lecirc KA Tran C Paquot N (2010) Fructose and metabolicdiseases new findings new questions Nutrition 26 1044-1049 doi101016jnut201002014 PubMed 20471804
11 Grundy SM Brewer HB Jr Cleeman JI Smith SC Jr Lenfant C (2004)Definition of metabolic syndrome Report of the National Heart Lung
Kidney Lesions in Metabolic Syndrome in Mice
PLOS ONE | wwwplosoneorg 12 October 2013 | Volume 8 | Issue 10 | e76703
and Blood InstituteAmerican Heart Association conference on scientificissues related to definition Circulation 109 433-438 doi10116101CIR000011124575752C6 PubMed 14744958
12 Ford ES Giles WH Dietz WH (2002) Prevalence of the metabolicsyndrome among US adults findings from the third National Health andNutrition Examination Survey JAMA 287 356-359 doi101001jama2873356 PubMed 11790215
13 Flegal KM Carroll MD Kit BK Ogden CL (2012) Prevalence of obesityand trends in the distribution of body mass index among US adults1999-2010 JAMA 307 491-497 doi101001jama201239 PubMed22253363
14 Ogden CL Carroll MD Kit BK Flegal KM (2012) Prevalence of obesityand trends in body mass index among US children and adolescents1999-2010 JAMA 307 483-490 doi101001jama201240 PubMed22253364
15 Abuaisha B Kumar S Malik R Boulton AJ (1998) Relationship ofelevated urinary albumin excretion to components of the metabolicsyndrome in non-insulin-dependent diabetes mellitus Diabetes ResClin Pract 39 93-99 doi101016S0168-8227(97)00111-3 PubMed9597378
16 Isomaa B Henricsson M Almgren P Tuomi T Taskinen MR et al(2001) The metabolic syndrome influences the risk of chroniccomplications in patients with type II diabetes Diabetologia 441148-1154 doi101007s001250100615 PubMed 11596670
17 Palaniappan L Carnethon M Fortmann SP (2003) Associationbetween microalbuminuria and the metabolic syndrome NHANES IIIAm J Hypertens 16 952-958 doi101016S0895-7061(03)01009-4PubMed 14573334
18 Chen J Muntner P Hamm LL Jones DW Batuman V et al (2004) Themetabolic syndrome and chronic kidney disease in US adults AnnIntern Med 140 167-174 doi1073260003-4819-140-3-200402030-00007 PubMed 14757614
19 Rowley K OrsquoDea K Best JD (2003) Association of albuminuria and themetabolic syndrome Curr Diab Rep 3 80-86 doi101007s11892-003-0058-1 PubMed 12643150
20 Bonnet F Marre M Halimi JM Stengel B Lange C et al (2006) Waistcircumference and the metabolic syndrome predict the development ofelevated albuminuria in non-diabetic subjects the DESIR Study JHypertens 24 1157-1163 doi10109701hjh000022620603560acPubMed 16685216
21 Kurella M Lo JC Chertow GM (2005) Metabolic syndrome and the riskfor chronic kidney disease among nondiabetic adults J Am SocNephrol 16 2134-2140 doi101681ASN2005010106 PubMed15901764
22 Iseki K Ikemiya Y Kinjo K Inoue T Iseki C et al (2004) Body massindex and the risk of development of end-stage renal disease in ascreened cohort Kidney Int 65 1870-1876 doi101111j1523-1755200400582x PubMed 15086929
23 Kume S Uzu T Araki S Sugimoto T Isshiki K et al (2007) Role ofaltered renal lipid metabolism in the development of renal injuryinduced by a high-fat diet J Am Soc Nephrol 18 2715-2723 doi101681ASN2007010089 PubMed 17855643
24 Deji N Kume S Araki S Soumura M Sugimoto T et al (2009)Structural and functional changes in the kidneys of high-fat diet-inducedobese mice Am J Physiol Renal Physiol 296 F118-F126 PubMed18971213
25 Aoyama M Isshiki K Kume S Chin-Kanasaki M Araki H et al (2012)Fructose induces tubulointerstitial injury in the kidney of mice BiochemBiophys Res Commun 419 244-249 doi101016jbbrc201202001PubMed 22342673
26 Gersch MS Mu W Cirillo P Reungjui S Zhang L et al (2007)Fructose but not dextrose accelerates the progression of chronickidney disease Am J Physiol Renal Physiol 293 F1256-F1261 doi101152ajprenal001812007 PubMed 17670904
27 Panchal SK Brown L (2010) Rodent models for metabolic syndromeresearch J Biomed Biotechnol 2011 351982 PubMed 21253582
28 Wada T Kenmochi H Miyashita Y Sasaki M Ojima M et al (2010)Spironolactone improves glucose and lipid metabolism by amelioratinghepatic steatosis and inflammation and suppressing enhancedgluconeogenesis induced by high-fat and high-fructose dietEndocrinology 151 2040-2049 doi101210en2009-0869 PubMed20211973
29 Axelsen LN Lademann JB Petersen JS Holstein-Rathlou NH Ploug Tet al (2010) Cardiac and metabolic changes in long-term high fructose-fat fed rats with severe obesity and extensive intramyocardial lipidaccumulation Am J Physiol Regul Integr Comp Physiol 298 R1560-R1570 doi101152ajpregu003922009 PubMed 20357025
30 Meacutenard SL Croteau E Sarrhini O Geacutelinas R Brassard P et al (2010)Abnormal in vivo myocardial energy substrate uptake in diet-induced
type 2 diabetic cardiomyopathy in rats Am J Physiol Endocrinol Metab298 E1049-E1057 doi101152ajpendo005602009 PubMed20159856
31 Couturier K Qin B Batandier C Awada M Hininger-Favier I et al(2011) Cinnamon increases liver glycogen in an animal model of insulinresistance Metabolism 60 1590-1597 doi101016jmetabol201103016 PubMed 21550075
32 Panchal SK Poudyal H Iyer A Nazer R Alam MA et al (2011) High-carbohydrate high-fat diet-induced metabolic syndrome andcardiovascular remodeling in rats J Cardiovasc Pharmacol 57611-624 doi101097FJC0b013e3181feb90a PubMed 21572266
33 Calderan L Marzola P Nicolato E Fabene PF Milanese C et al(2006) In vivo phenotyping of the obob mouse by magnetic resonanceimaging and 1H-magnetic resonance spectroscopy Obesity (SilverSpring) 14 405-414 doi101038oby200654 PubMed 16648611
34 Ayala JE Samuel VT Morton GJ Obici S Croniger CM et al (2010)Standard operating procedures for describing and performing metabolictests of glucose homeostasis in mice Dis Model J Mech 3 525-534
35 Han BG Hao CM Tchekneva EE Wang YY Lee CA et al (2008)Markers of glycemic control in the mouse comparisons of 6-h- andovernight-fasted blood glucoses to Hb A1c Am J Physiol EndocrinolMetab 295 E981-E986 doi101152ajpendo902832008 PubMed18664598
36 Buleacuteon M Allard J Jaafar A Praddaude F Dickson Z et al (2008)Pharmacological blockade of B2-kinin receptor reduces renal protectiveeffect of angiotensin-converting enzyme inhibition in dbdb mice modelAm J Physiol Renal Physiol 294 F1249-F1256 doi101152ajprenal005012007 PubMed 18367657
37 Hudkins KL Pichaiwong W Wietecha T Kowalewska J Banas MC etal (2010) BTBR ObOb mutant mice model progressive diabeticnephropathy J Am Soc Nephrol 21 1533-1542 doi101681ASN2009121290 PubMed 20634301
38 van den Berg JG van den Bergh Weerman MA Assmann KJ WeeningJJ Florquin S (2004) Podocyte foot process effacement is notcorrelated with the level of proteinuria in human glomerulopathiesKidney Int 66 1901-1906 doi101111j1523-1755200400964xPubMed 15496161
39 Carty DM Siwy J Brennand JE Zuumlrbig P Mullen W et al (2011)Urinary proteomics for prediction of preeclampsia Hypertension 57561-569 doi101161HYPERTENSIONAHA110164285 PubMed21199994
40 Good DM Zuumlrbig P Argileacutes A Bauer HW Behrens G et al (2010)Naturally occurring human urinary peptides for use in diagnosis ofchronic kidney disease Mol Cell Proteomics 9 2424-2437 doi101074mcpM110001917 PubMed 20616184
41 Mischak H Vlahou A Ioannidis JP (2013) Technical aspects and inter-laboratory variability in native peptide profiling the CE-MS experienceClin Biochem 46 432-443 doi101016jclinbiochem201209025PubMed 23041249
42 Zuumlrbig P Renfrow MB Schiffer E Novak J Walden M et al (2006)Biomarker discovery by CE-MS enables sequence analysis via MSMSwith platform-independent separation Electrophoresis 27 2111-2125doi101002elps200500827 PubMed 16645980
43 Wittke S Fliser D Haubitz M Bartel S Krebs R et al (2003)Determination of peptides and proteins in human urine with capillaryelectrophoresis-mass spectrometry a suitable tool for theestablishment of new diagnostic markers J Chromatogr A 1013173-181 doi101016S0021-9673(03)00713-1 PubMed 14604118
44 von zur Muhlen C Schiffer E Sackmann C Zurbig P Neudorfer I et al(2012) Urine proteome analysis reflects atherosclerotic disease in anApoE-- mouse model and allows the discovery of new candidatebiomarkers in mouse and human atherosclerosis Mol Cell Proteomics11 013847
45 Siwy J Mullen W Golovko I Franke J Zuumlrbig P (2011) Human urinarypeptide database for multiple disease biomarker discovery ProteomicsClin Appl 5 367-374 doi101002prca201000155 PubMed21591268
46 Yilmaz Y (2012) Review article fructose in non-alcoholic fatty liverdisease Aliment Pharmacol Ther 35 1135-1144 doi101111j1365-2036201205080x PubMed 22469071
47 Brosius FC 3rd Alpers CE Bottinger EP Breyer MD Coffman TM etal (2009) Mouse models of diabetic nephropathy J Am Soc Nephrol20 2503-2512 doi101681ASN2009070721 PubMed 19729434
48 Zuumlrbig P Jerums G Hovind P Macisaac RJ Mischak H et al (2012)Urinary proteomics for early diagnosis in diabetic nephropathyDiabetes 61 3304-3313 doi102337db12-0348 PubMed 22872235
49 Roscioni SS de Zeeuw D Hellemons ME Mischak H Zuumlrbig P et al(2013) A urinary peptide biomarker set predicts worsening of
Kidney Lesions in Metabolic Syndrome in Mice
PLOS ONE | wwwplosoneorg 13 October 2013 | Volume 8 | Issue 10 | e76703
albuminuria in type 2 diabetes mellitus Diabetologia 56 259-267 doi101007s00125-012-2755-2 PubMed 23086559
50 Molin L Seraglia R Lapolla A Ragazzi E Gonzalez J et al (2012) Acomparison between MALDI-MS and CE-MS data for biomarkerassessment in chronic kidney diseases J Proteomics 75 5888-5897doi101016jjprot201207024 PubMed 22842158
51 Mullen W Delles C Mischak H Euro KUPCa (2011) Urinaryproteomics in the assessment of chronic kidney disease Curr OpinNephrol Hypertens 20 654-661
52 Mischak H (2012) How to get proteomics to the clinic Issues in clinicalproteomics exemplified by CE-MS Proteomics Clin Appl 6 437-442doi101002prca201200027 PubMed 22821927
53 Stalmach A Albalat A Mullen W Mischak H (2013) Recent advancesin capillary electrophoresis coupled to mass spectrometry for clinicalproteomic applications Electrophoresis 34 1452ndash64 PubMed23512263
54 Rossing K Mischak H Rossing P Schanstra JP Wiseman A et al(2008) The urinary proteome in diabetes and diabetes-associatedcomplications New ways to assess disease progression and evaluatetherapy Proteomics Clin Appl 2 997-1007 doi101002prca200780166 PubMed 21136900
55 Mogensen CE Christensen CK Vittinghus E (1983) The stages indiabetic renal disease With emphasis on the stage of incipient diabeticnephropathy Diabetes 32 Suppl 2 64-78 doi102337diab322S64PubMed 6400670
56 Montagutelli X (2000) Effect of the genetic background on thephenotype of mouse mutations J Am Soc Nephrol 11 Suppl 16 S101-S105 PubMed 11065339
57 Qi Z Fujita H Jin J Davis LS Wang Y et al (2005) Characterization ofsusceptibility of inbred mouse strains to diabetic nephropathy Diabetes54 2628-2637 doi102337diabetes5492628 PubMed 16123351
58 Gurley SB Clare SE Snow KP Hu A Meyer TW et al (2006) Impactof genetic background on nephropathy in diabetic mice Am J PhysiolRenal Physiol 290 F214-F222 PubMed 16118394
59 Rebuffeacute-Scrive M Surwit R Feinglos M Kuhn C Rodin J (1993)Regional fat distribution and metabolism in a new mouse model
(C57BL6J) of non-insulin-dependent diabetes mellitus Metabolism 421405-1409 doi1010160026-0495(93)90190-Y PubMed 8231834
60 Surwit RS Feinglos MN Rodin J Sutherland A Petro AE et al (1995)Differential effects of fat and sucrose on the development of obesityand diabetes in C57BL6J and AJ mice Metabolism 44 645-651 doi1010160026-0495(95)90123-X PubMed 7752914
61 Puri TS Shakaib MI Chang A Mathew L Olayinka O et al (2010)Chronic kidney disease induced in mice by reversible unilateral ureteralobstruction is dependent on genetic background Am J Physiol RenalPhysiol 298 F1024-F1032 doi101152ajprenal003842009 PubMed20089676
62 Ma LJ Fogo AB (2003) Model of robust induction of glomerulosclerosisin mice importance of genetic background Kidney Int 64 350-355 doi101046j1523-1755200300058x PubMed 12787428
63 Juumlrgens H Haass W Castantildeeda TR Schuumlrmann A Koebnick C et al(2005) Consuming fructose-sweetened beverages increases bodyadiposity in mice Obes Res 13 1146-1156 doi101038oby2005136PubMed 16076983
64 Bouby N Bachmann S Bichet D Bankir L (1990) Effect of water intakeon the progression of chronic renal failure in the 56 nephrectomizedrat Am J Physiol 258 F973-F979 PubMed 2184677
65 Zhang HM Dang H Kamat A Yeh CK Zhang BX (2012)Geldanamycin derivative ameliorates high fat diet-induced renal failurein diabetes PLOS ONE 7 e32746 doi101371journalpone0032746PubMed 22412919
66 Ingalls AM Dickie MM Snell GD (1950) Obese a new mutation in thehouse mouse J Hered 41 317-318 PubMed 14824537
67 Tetri LH Basaranoglu M Brunt EM Yerian LM Neuschwander-TetriBA (2008) Severe NAFLD with hepatic necroinflammatory changes inmice fed trans fats and a high-fructose corn syrup equivalent Am JPhysiol Gastrointest Liver Physiol 295 G987-G995 doi101152ajpgi902722008 PubMed 18772365
68 Levine DZ Iacovitti M Robertson SJ (2008) Modulation of single-nephron GFR in the dbdb mouse model of type 2 diabetes mellitus IIEffects of renal mass reduction Am J Physiol Regul Integr CompPhysiol 294 R1840-R1846 doi101152ajpregu004572007 PubMed18417648
Kidney Lesions in Metabolic Syndrome in Mice
PLOS ONE | wwwplosoneorg 14 October 2013 | Volume 8 | Issue 10 | e76703
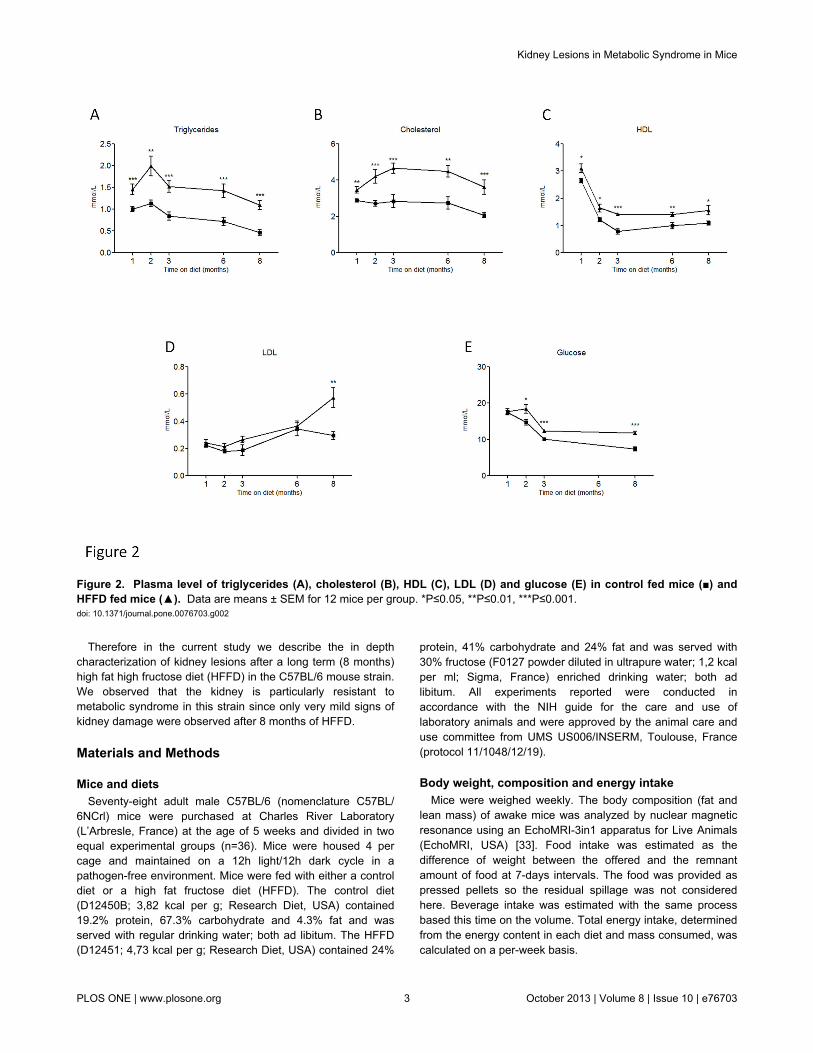
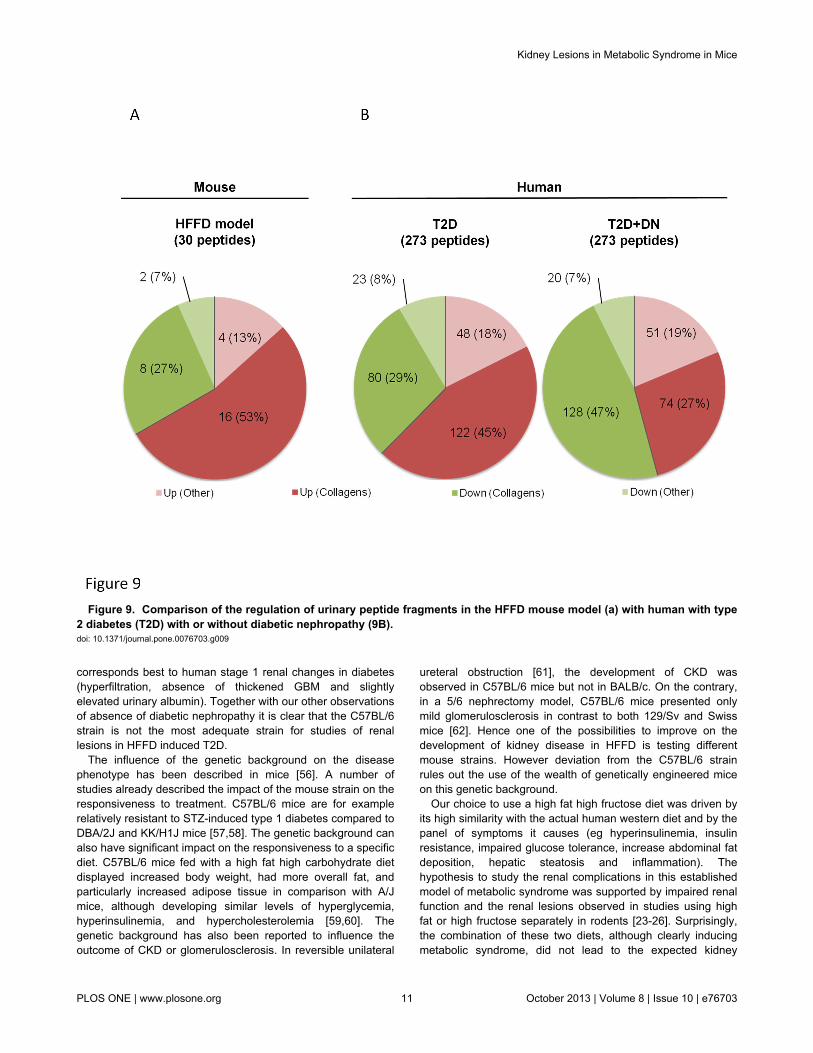